annual report 2020 - arab bank
TRANSCRIPT
Arab Bank Group
Annual Report 2020
years

2
CHAIRMAN’S MESSAGE
CEO’S MESSAGE
BOARD OF DIRECTORS’ REPORT
- MAIN BUSINESS ACTIVITIES OF ARAB BANK
- GEOGRAPHICAL COVERAGE
- BRANCHES & STAFF DISTRIBUTION ACCORDING TO GOVERNORATES
- ADDRESSES OF ARAB BANK BRANCHES AND OFFICES ABROAD
- TOTAL EMPLOYEES OF ARAB BANK GROUP
- CAPITAL INVESTMENT OF ARAB BANK
- SUBSIDIARIES & SISTER COMPANY
- DETAILED INFORMATION ON THE BANK’S SUBSIDIARIES & SISTER COMPANY
- MEMBERS OF THE BOARD OF DIRECTORS
- RESIGNED MEMBERS OF THE BOARD OF DIRECTORS DURING 2020
- SENIOR EXECUTIVES
- RESIGNED SENIOR EXECUTIVES DURING 2020
- SUMMARY OF PERFORMANCE APPRAISAL AND PERFORMANCE INCENTIVES POLICIES
- COMPETITIVENESS AND MARKET SHARE
- PATENTS & GOVERNMENT PROTECTION
- MAJOR SUPPLIERS AND CLIENTS
- GOVERNMENT OR INTERNATIONAL ORGANIZATIONS REGULATIONS
- ARAB BANK ORGANIZATION CHART / HEAD OFFICE
- NUMBER OF STAFF AND ACADEMIC QUALIFCATIONS
- TRAINING COURSES VS. TRAINEES IN JORDAN & ARAB AREAS IN 2020
- RISK MANAGEMENT
- ACCOMPLISHMENTS 2020
- FINANCIAL IMPACT OF NON-RECURRING OPERATIONS
- TIME SERIES DATA FOR MAJOR FINANCIAL INDICATORS (2016 – 2020)
4
5
7
8
8
9
11
12
12
18
23
34
35
43
44
45
46
46
46
47
48
50
52
59
60
61
TABLE OF CONTENTS

3
- FINANCIAL PERFORMANCE
- FUTURE OUTLOOK AND PLANS FOR 2021
- EXTERNAL AUDITORS’ COMPENSATION IN JORDAN AND ABROAD
- NUMBER OF ARAB BANK SHARES OWNED BY MEMBERS OF THE BOARD
- NUMBER OF ARAB BANK SHARES OWNED BY SENIOR EXECUTIVES
- NUMBER OF ARAB BANK SHARES OWNED BY THE RELATIVES OF THE BOARD MEMBERS
- NUMBER OF ARAB BANK SHARES OWNED BY THE RELATIVES OF THE SENIOR EXECUTIVES
- BOARD OF DIRECTORS COMPENSATIONS AND BENEFITS PAID IN 2020
- NAMES OF MAJOR SHAREHOLDERS OF 5% AND MORE AND SHAREHOLDERS WHO OWN 1% OR MORE OF THE SHARE CAPITAL OF THE BANK, THE ULTIMATE BENEFICIAL OWNER AND NUMBER OF PLEDGED SHARES
- EXECUTIVE MANAGEMENT COMPENSATION AND BENEFITS IN 2020
- ARAB BANK’S DONATIONS DURING YEAR 2020
- TRANSACTIONS WITH RELATED PARTIES
- ENVIRONMENTAL PROTECTION
- CORPORATE SOCIAL RESPONSIBILITY
ARAB BANK GROUP
- CONSOLIDATED FINANCIAL STATEMENTS FOR THE YEAR 2020
- INDEPENDENT AUDITOR’S REPORT
ARAB BANK PLC
- FINANCIAL STATEMENTS FOR THE YEAR 2020
- INDEPENDENT AUDITOR’S REPORT
ATTESTATION STATEMENTS
CORPORATE GOVERNANCE CODE
GOVERNANCE REPORT
DISCLOSURE ABOUT CORPORATE GOVERNANCE
AGENDAS OF THE 91ST ORDINARY GENERAL ASSEMBLY MEETING
ADDRESSES OF ARAB BANK’S MAIN BRANCHES AND SUBSIDIARIES, AFFILIATES AND SISTER COMPANIES
62
68
70
71
72
73
74
75
76
78
79
80
82
83
95
181
187
271
277
281
295
305
306
307

4
Distinguished Shareholders,
The global economy in 2020 had an unprecedented contraction in its geographic coverage and intensity. The COVID-19 crisis, with its worldwide lockdowns and social distancing, disrupted the production process and led to a significant fall in private investment and consumption, particularly of services, including travel and tourism. The global trade had a large drop as well. The harsh economic impact of the pandemic was particularly evident during the first half of the year, as global economies adapted the production and consumption processes to minimize economic disruptions while safeguarding people’s health and livelihood, ensuring a resilient economy, and mitigating the health, economic and social repercussions of the pandemic.
To various degrees, governments responded to the crisis by raising public spending on healthcare and social welfare, and supporting the most affected sectors and households. Also, global and Arab central banks adopted timely and solid policy measures, including reducing interest rates, quantitative easing, and liquidity injections. These measures ensured that the health and economic crisis does not turn into a financial and monetary crisis, thus helping various sectors in coping with the pandemic’s implications.
The global economic contraction included the Arab region. Oil-exporting countries were affected by the sharp drop in the global demand for oil and in oil prices, particularly in the first half of the year. Also, the large drop in tourism, workers’ remittances and trade had a severe impact on Arab oil-importing economies, especially those that are more reliant on these economic flows.
The Arab banking sector was severely affected by the unprecedented global and regional economic contraction. Banking profitability dropped regionally and globally, due to lower interest rates and commission fees, a large increase in provisions to meet the expected rise in non-performing loans, weak lending opportunities, along with a retreat in portfolio quality and increased cost of risk.
In response to the challenges the COVID-19 pandemic presented, Arab Bank was careful to support corporate and consumer customers, both of whom were affected by the pandemic. In line with government and regulator initiatives, Arab Bank supported community programs aimed at alleviating the burden on customers by restructuring, deferring, or reducing instalments and lowering interest rates for the most exposed sectors, particularly small and medium enterprises. Arab Bank Group also donated US$25 million to support national efforts aimed at mitigating COVID-19’s health, economic, and social repercussions on citizens in Jordan and the other countries in which the bank operates.
Since the beginning of the pandemic, we have prioritized our employees and customers by harnessing our extensive expertise across various levels to protect the bank’s interests and ensure the continuity of its operations. I would like to reaffirm Arab Bank’s solid financial position and our immense belief in the ability of the local and global economy to recover, enabling the Bank to achieve higher future growth rates.
To conclude, I would like to take the opportunity to thank the Central Bank of Jordan and the local authorities for their pivotal role and efforts in overcoming the exceptional circumstances we currently face.
I would also like to extend our sincere appreciation and gratitude to our shareholders and valued customers for their loyalty and trust. Our thanks also go to all our employees across the different markets for their relentless efforts and dedication, especially during this crisis. As always, we are confident in Arab Bank’s ability to overcome all challenges and continue to achieve the best results across all levels.
Sabih Taher MasriChairman of the Board of Directors
CHAIRMAN,S MESSAGE
5
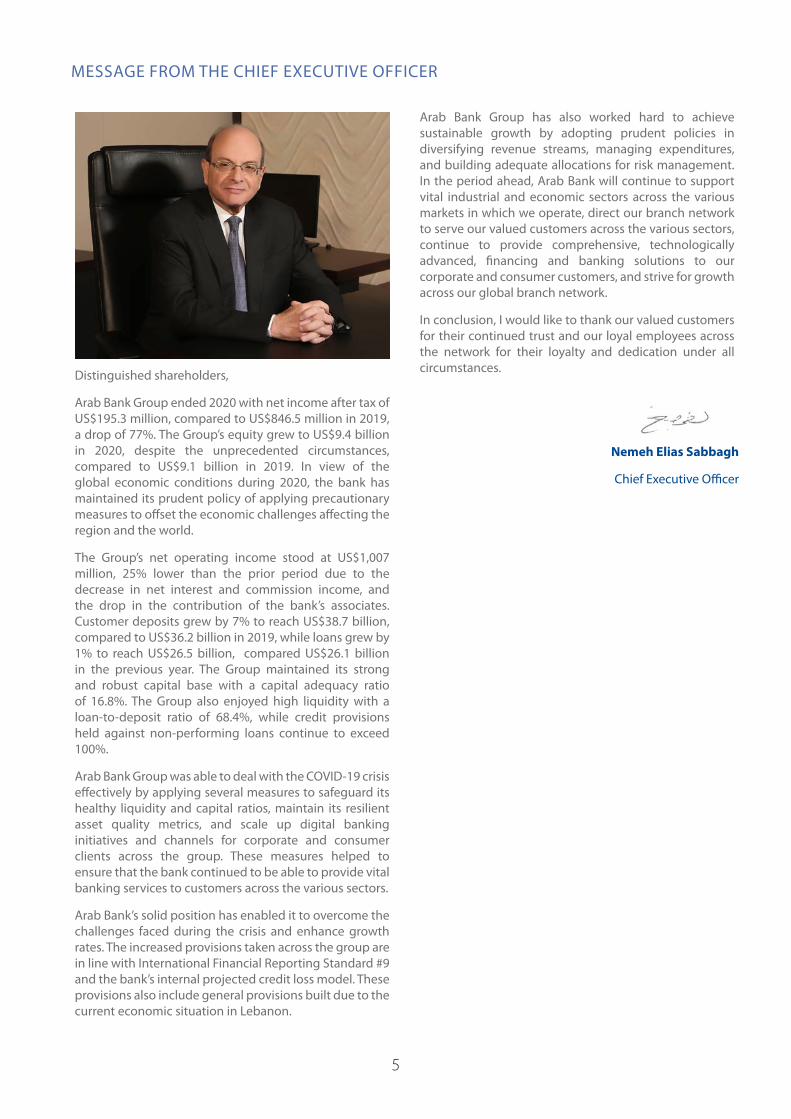
Distinguished shareholders,
Arab Bank Group ended 2020 with net income after tax of US$195.3 million, compared to US$846.5 million in 2019, a drop of 77%. The Group’s equity grew to US$9.4 billion in 2020, despite the unprecedented circumstances, compared to US$9.1 billion in 2019. In view of the global economic conditions during 2020, the bank has maintained its prudent policy of applying precautionary measures to offset the economic challenges affecting the region and the world.
The Group’s net operating income stood at US$1,007 million, 25% lower than the prior period due to the decrease in net interest and commission income, and the drop in the contribution of the bank’s associates. Customer deposits grew by 7% to reach US$38.7 billion, compared to US$36.2 billion in 2019, while loans grew by 1% to reach US$26.5 billion, compared US$26.1 billion in the previous year. The Group maintained its strong and robust capital base with a capital adequacy ratio of 16.8%. The Group also enjoyed high liquidity with a loan-to-deposit ratio of 68.4%, while credit provisions held against non-performing loans continue to exceed 100%.
Arab Bank Group was able to deal with the COVID-19 crisis effectively by applying several measures to safeguard its healthy liquidity and capital ratios, maintain its resilient asset quality metrics, and scale up digital banking initiatives and channels for corporate and consumer clients across the group. These measures helped to ensure that the bank continued to be able to provide vital banking services to customers across the various sectors.
Arab Bank’s solid position has enabled it to overcome the challenges faced during the crisis and enhance growth rates. The increased provisions taken across the group are in line with International Financial Reporting Standard #9 and the bank’s internal projected credit loss model. These provisions also include general provisions built due to the current economic situation in Lebanon.
Arab Bank Group has also worked hard to achieve sustainable growth by adopting prudent policies in diversifying revenue streams, managing expenditures, and building adequate allocations for risk management. In the period ahead, Arab Bank will continue to support vital industrial and economic sectors across the various markets in which we operate, direct our branch network to serve our valued customers across the various sectors, continue to provide comprehensive, technologically advanced, financing and banking solutions to our corporate and consumer customers, and strive for growth across our global branch network.
In conclusion, I would like to thank our valued customers for their continued trust and our loyal employees across the network for their loyalty and dedication under all circumstances.
MESSAGE FROM THE CHIEF EXECUTIVE OFFICER
Nemeh Elias Sabbagh
Chief Executive Officer
CHA
IRMA
N,S M
ESSAG
E

7
MAIN BUSINESS ACTIVITIES OF ARAB BANKCorporate and Institutional Banking Arab Bank’s Corporate and Institutional Banking (CIB) division manages the group’s corporate and institutional client base, providing access to a full range of lending and financial solutions through an extensive branch network and electronic channels. CIB also offers a comprehensive range of advanced corporate digital banking solutions in line with the latest developments in the banking industry. The broad range and efficient delivery of its solutions enable Arab Bank to remain the bank of choice for local, regional, and international companies and institutions.CIB is uniquely positioned to provide high quality products and services to meet clients’ business requirements. The banking solutions offered are enriched by Arab Bank’s global network, understanding of local markets, and in-depth expertise. Using a client-centric approach, CIB’s strategy is to strengthen its franchise in key markets by building on and solidifying existing client relationships and adding new clients through targeted acquisition efforts.The CIB division caters to clients’ needs throughout the different stages of their business cycle and across different markets, providing consistent service levels at all levels of the network. CIB’s objective is to provide its clients with an exceptional banking experience and a well-rounded range of tailored financial solutions, including products and services from across the bank’s different business lines. The quality of its staff underpins CIB’s success. The division closely monitors the changing dynamics of the business environment and constantly invests in strengthening and expanding the capabilities and capacities of its teams and specialists to meet clients’ needs and banking requirements.
Consumer BankingThe Consumer Banking division offers customers an extensive range of features and benefits through its vast branch network and integrated direct banking channels, both locally and regionally.Advanced digital solutions are important to our ability to serve customers efficiently and to streamline our internal operations. New solutions are constantly under review and are introduced regularly to ensure that customers benefit from the latest and most effective direct banking services and channels.A focus on customers throughout their lifecycle remains the pillar of Arab Bank’s business programs, starting with our Arabi junior program, which is specially designed for children under the age of 18, through to our exclusive Elite program, which is offered to our high-net-worth customers. A key element of the bank’s long-term strategy is to offer banking solutions and services at a regional level. We do this by providing cross-border solutions and services to our Elite and Arabi Premium clients through the bank’s branch network and online banking services.
We closely monitor and measure the level of service we offer our customers. Providing a high level of service is important to us as a way of maintaining the bank’s leading position, strengthening its competitive edge, and continuously improving our customers’ satisfaction.
TreasuryArab Bank’s Treasury manages the bank’s liquidity and market risks and provides expert advice and dealing services to Arab Bank’s customers around the globe. Through its state-of-the art systems, Arab Bank’s Treasury remains fully up to date with the latest market developments and regulatory standards and it is well positioned to meet a wide range of both bank and customer needs.Arab Bank’s Treasury has a wide-ranging mandate, including the following responsibilities:• To manage and optimize the liquidity of the bank
within approved limits, so that the business is always adequately funded
• To manage the market risk of the bank within approved limits
• To earn revenues from the effective management of liquidity and market risk
• To execute bond, foreign exchange, and money market transactions with market professionals
• To promote and support the distribution of foreign exchange, derivatives, and other treasury products to customers
• To advise internal stakeholders on the consumption and management of liquidity and market risk
Treasury’s main role is to manage the bank’s liquidity and market risk and to ensure that the bank not only generates surplus liquidity, but also invests this liquidity prudently using the following instruments:• Short-term placements with central banks• Short-term deposits with high quality banks • A multi-currency portfolio of highly liquid bonds,
treasury bills, and certificates of depositIt is important for Treasury to balance the need to maintain high liquidity with low credit and low market risk. This approach is consistent with the bank’s objective of being fully liquid at all times and under all circumstances, wherever the bank operates.A full range of treasury products and services is available to customers throughout the bank’s network, whether they are exporters, importers, or savers. Arab Bank also believes in the importance of protecting the income and interests of the bank and its clients from market volatility. Arab Bank offers a wide range of risk management and hedging tools and services to customers who require protection from interest rate and foreign exchange risks.

8
GEOGRAPHICAL COVERAGEThe following list contains basic information of Arab Bank plc’s branch network and geographical coverage as of the end of 2020.
Country Number of Branches Operating Since No. of Employees
Jordan 82 (Including HO) 1934 3244
Algeria 10 2001 237
Bahrain 6 1960 186
UAE 8 1963 286
Egypt 43 1944 1177
Lebanon 10 1944 305
Morocco 5 1962 114
Palestine 33 1930 918
Qatar 3 1957 123
Yemen 7 1972 198
China 1 1985 18
South Korea (Representative Office) 1 1989 3
Singapore 1 1984 47
USA (New York Agency) 1 1982 5
Kazakhstan (Representative Office) -- 2004 --
Total 211 -- 6861
BRANCHES & STAFF DISTRIBUTION ACCORDING TO GOVERNORATESBranches & Staff Distribution According to Governorates
Governorate Number of Branches No. of Employees
Amman (Including Head Office) 55 3025
Irbid 4 46
Zarqa 7 56
Aqaba 1 19
Balqa’a 6 33
Karak 2 19
Mafraq 1 9
Ma’adaba 1 9
Jarash 1 7
Ma’an 2 10
Tafeila 1 6
Ajloun 1 5
Total 82 3244

9
Country Operating Since
No. of Branches Address No. of
Employees
Algeria 2001 10 237
15 Al-Sa’ada Street, Shabani Haidara Valley, Algeria Tel. 00213 (21) 608725Fax. 00213 (21) 480001
Bahrain 1960 6 186
P.O Box 813 Building No. 540 Road 1706 - Block 317 Diplomatic Area , Bahrain Tel. 00973 17549000Fax. 00973 17541116
United Arab Emirates
1963 8 286
Abu Dhabi Branch
Dubai Branch
Abu Dhabi:P.O Box 875 Al-Naser St.Sh. Tahnoun Bin Mohammad Building, Tel. 00971 (2) 6392225Fax. 00971 (2) 6212370
Dubai:P.O Box 11364 – Emaar Square, Building #2 Tel. 00971 (4) 3737400Fax. 00971 (4) 3385022
Egypt 1944 43 1177
46 Gameit El Dowal Street,Al-MohandesseenGizaTel. 0020 (2) 33328500Fax. 0020 (2) 33328618
Lebanon 1944 10 305
P.O Box 11-1015 Riad El Solh Sq. Banks Street Commercial Buildings Co. Bldg. Tel. 00961 (1) 980246/9Fax. 00961 (1) 980803/299
Morocco 1962 5 114
P.O Box 13810174 Mohamed V Street, CasablancaTel. 00212 (5) 2222 3152Fax. 00212 (5) 2220 0233
Palestine 1930 33 918
P.O Box 1476 - Grand Park Hotel Street Al Masyoon – Ramallah - PalestineTel. 00970 (2) 2978100Fax. 00970 (2) 2982444
ADDRESSES OF ARAB BANK BRANCHES AND OFFICES ABROAD
10
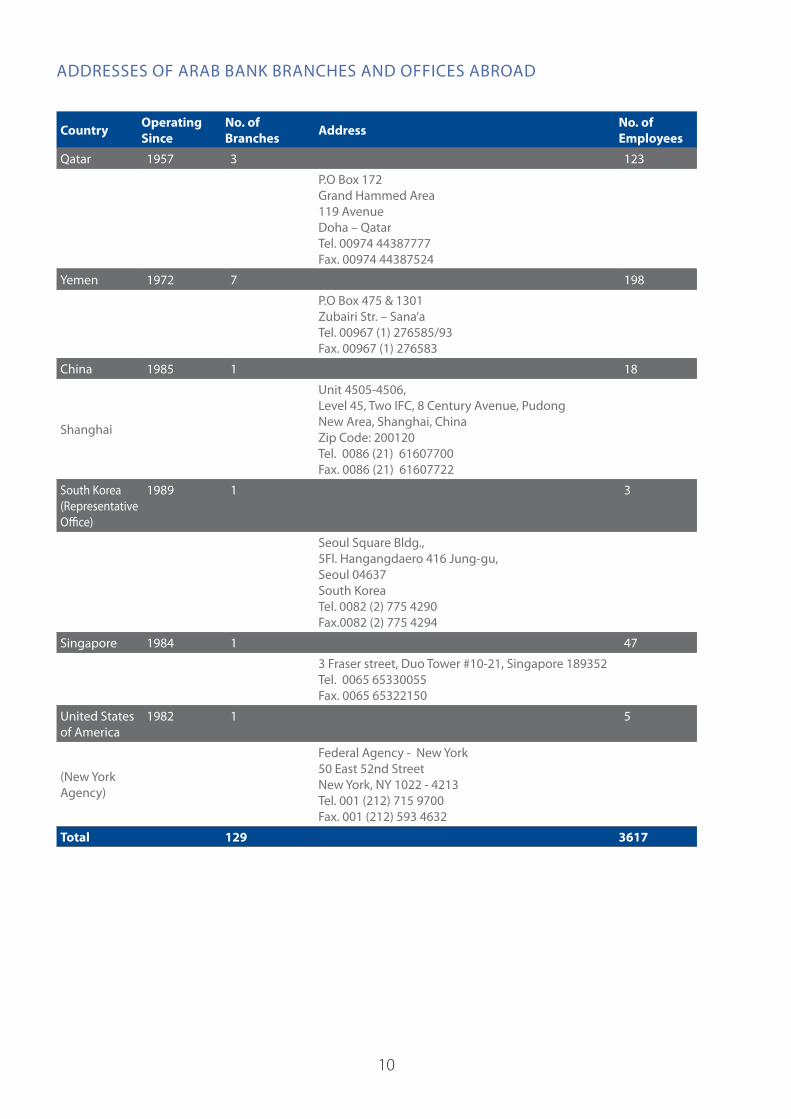
ADDRESSES OF ARAB BANK BRANCHES AND OFFICES ABROAD
Country Operating Since
No. of Branches Address No. of
Employees
Qatar 1957 3 123
P.O Box 172 Grand Hammed Area119 AvenueDoha – QatarTel. 00974 44387777Fax. 00974 44387524
Yemen 1972 1972 7 198
P.O Box 475 & 1301Zubairi Str. – Sana’aTel. 00967 (1) 276585/93Fax. 00967 (1) 276583
China 1985 1 18
Shanghai
Unit 4505-4506, Level 45, Two IFC, 8 Century Avenue, Pudong New Area, Shanghai, ChinaZip Code: 200120Tel. 0086 (21) 61607700Fax. 0086 (21) 61607722
South Korea (Representative Office)
1989 1 3
Seoul Square Bldg.,5Fl. Hangangdaero 416 Jung-gu,Seoul 04637South KoreaTel. 0082 (2) 775 4290Fax.0082 (2) 775 4294
Singapore 1984 1 47
3 Fraser street, Duo Tower #10-21, Singapore 189352 Tel. 0065 65330055Fax. 0065 65322150
United States of America
1982 1 5
(New York Agency)
Federal Agency - New York50 East 52nd StreetNew York, NY 1022 - 4213Tel. 001 (212) 715 9700Fax. 001 (212) 593 4632
Total 129 3617

11
TOTAL EMPLOYEES OF ARAB BANK GROUP
Entity No. of Employees
Arab Bank plc 6861
Europe Arab Bank plc 139
Arab Bank (Switzerland) Limited 130
Arab Bank Australia Limited 96
Islamic International Arab Bank 996
Arab Sudanese Bank Limited 84
Arab Tunisian Bank 1403
Arab Bank – Syria 271
Al Arabi Investment Group (AB Invest) 43
Al Arabi Investment Group / Palestine 8
Al Nisr Al Arabi Insurance Company 256
Arab Company for Shared Services FZ 119
Arab Gulf Tech for IT Services FZ 39
Arab National Leasing Company 29
Total 10474
12
ارةلإد
س اجل
مرير
تق
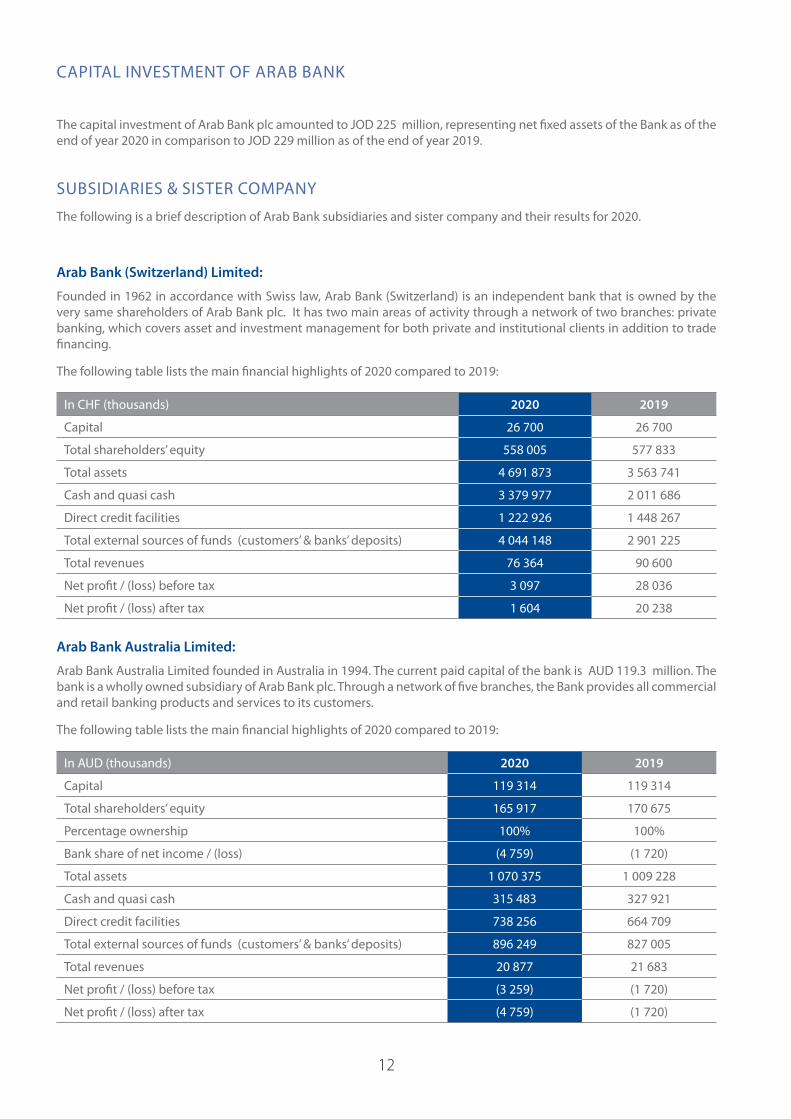
The capital investment of Arab Bank plc amounted to JOD 225 million, representing net fixed assets of the Bank as of the end of year 2020 in comparison to JOD 229 million as of the end of year 2019.
CAPITAL INVESTMENT OF ARAB BANK
SUBSIDIARIES & SISTER COMPANY
The following is a brief description of Arab Bank subsidiaries and sister company and their results for 2020.
Arab Bank (Switzerland) Limited:
Founded in 1962 in accordance with Swiss law, Arab Bank (Switzerland) is an independent bank that is owned by the very same shareholders of Arab Bank plc. It has two main areas of activity through a network of two branches: private banking, which covers asset and investment management for both private and institutional clients in addition to trade financing.
The following table lists the main financial highlights of 2020 compared to 2019:
In CHF (thousands) 2020 2019
Capital 26 700 26 700
Total shareholders’ equity 558 005 577 833
Total assets 4 691 873 3 563 741
Cash and quasi cash 3 379 977 2 011 686
Direct credit facilities 1 222 926 1 448 267
Total external sources of funds (customers’ & banks’ deposits) 4 044 148 2 901 225
Total revenues 76 364 90 600
Net profit / (loss) before tax 3 097 28 036
Net profit / (loss) after tax 1 604 20 238
Arab Bank Australia Limited:
Arab Bank Australia Limited founded in Australia in 1994. The current paid capital of the bank is AUD 119.3 million. The bank is a wholly owned subsidiary of Arab Bank plc. Through a network of five branches, the Bank provides all commercial and retail banking products and services to its customers.
The following table lists the main financial highlights of 2020 compared to 2019:
In AUD (thousands) 2020 2019
Capital 119 314 119 314
Total shareholders’ equity 165 917 170 675
Percentage ownership 100% 100%
Bank share of net income / (loss) (4 759) (1 720)
Total assets 1 070 375 1 009 228
Cash and quasi cash 315 483 327 921
Direct credit facilities 738 256 664 709
Total external sources of funds (customers’ & banks’ deposits) 896 249 827 005
Total revenues 20 877 21 683
Net profit / (loss) before tax (3 259) (1 720)
Net profit / (loss) after tax (4 759) (1 720)

13
Europe Arab Bank plc:
Europe Arab Bank plc is a limited liability company established in 2006. The current paid capital of the bank is EUR 570 Million. The Bank is a wholly owned subsidiary of Arab Bank plc, with its headquarters in London. EAB has a European passport that enables it to open branches anywhere in the European Union. The Bank operates in UK and in Germany, Italy, and France through its subsidiary. EAB provides all types of banking products and services, including retail banking and treasury services, to its customers.
The following table lists the main financial highlights of 2020 compared to 2019:
In EUR (thousands) 2020 2019
Capital 569 985 569 985
Total shareholders’ equity 269 913 280 099
Percentage ownership 100% 100%
Bank share of net income / (loss) (1 565) 2 237
Total assets 2 417 375 3 049 538
Cash and quasi cash 1 349 449 1 816 015
Direct credit facilities 1 011 634 1 167 220
Total external sources of funds (customers’ & banks’ deposits) 2 079 938 2 700 566
Total revenues 35 694 47 132
Net profit / (loss) before tax (1 277) 4 032
Net profit / (loss) after tax (1 565) 2 237
Islamic International Arab Bank plc:
A wholly owned subsidiary of Arab Bank plc was established in Jordan in 1997 and started its operations in the year 1998. The current paid capital of the bank is JOD 100 Million. The bank offers a full range of banking products and services, which are in accordance with Islamic Sharia rules through a network of 45 branches spread in Jordan.
The following table lists the main financial highlights of 2020 compared to 2019:
In JOD (thousands) 2020 2019
Capital 100 000 100 000
Total shareholders’ equity 244 942 214 489
Percentage ownership 100% 100%
Bank share of net income / (loss) 30 440 34 384
Total assets 2 539 154 2 287 463
Cash and quasi cash 857 755 760 467
Direct credit facilities * 1 612 058 1 469 529
Total external sources of funds (customers’ & banks’ deposits) 2 244 172 2 012 351
Total revenues 82 309 85 172
Net profit / (loss) before tax 44 726 48 488
Net profit / (loss) after tax 30 440 34 384
* This includes futures sales receivables, other accounts receivables, financings, assets leasing finished with ownership, and interest free loans. The net figure was taken for each item.
SUBSIDIARIES & SISTER COMPANY

14
Arab Sudanese Bank Ltd.:
In 2008, Arab Bank plc obtained the license to establish and operate a fully owned subsidiary in Khartoum – Sudan, under the name “Arab Sudanese Bank”, which offers a full range of banking products and services that are Islamic Sharia – compliant through a network of three branches.
The Bank started its operational activities in 2009 with a paid up capital of USD 50 Million.
The following table lists the main financial highlights of 2020 compared to 2019:
In SDG (thousands) 2020 2019
Capital 117 515 117 515
Total shareholders’ equity 697 508 617 631
Percentage ownership 100% 100%
Bank share of net income / (loss) 153 792 17 267
Total assets 9 604 823 7 194 995
Cash and quasi cash 7 182 506 6 041 398
Direct credit facilities 2 333 613 1 082 724
Total external sources of funds (customers’ & banks’ deposits) 8 598 381 6 425 588
Total revenues 417 052 171 533
Net profit / (loss) before tax 218 510 46 964
Net profit / (loss) after tax 153 792 17 267
Arab Tunisian Bank:
Arab Tunisian Bank (ATB) was incorporated in Tunisia in 1982. The bank current paid capital is TND 100 Million. The bank is a majority-owned subsidiary of Arab Bank plc with a 64.24% share of its capital. Arab Tunisian Bank provides all banking products and services to its customers through a network of 136 branches, spread in Tunisia.
The following table lists the main financial highlights of 2020 compared to 2019:
In TND (thousands) 2020 2019
Capital 100 000 100 000
Total shareholders’ equity 510 164 502 040
Percentage ownership 64.24% 64.24%
Bank share of net income / (loss) (2 978) (1 451)
Total assets 7 247 884 7 090 268
Cash and quasi cash 1 894 270 2 047 876
Direct credit facilities 5 088 625 4 804 101
Total external sources of funds (customers’ & banks’ deposits) 6 516 471 6 391 434
Total revenues 254 098 233 748
Net profit / (loss) before tax (3 482) (7 255)
Net profit / (loss) after tax (4 636) 2 258
SUBSIDIARIES & SISTER COMPANY
15
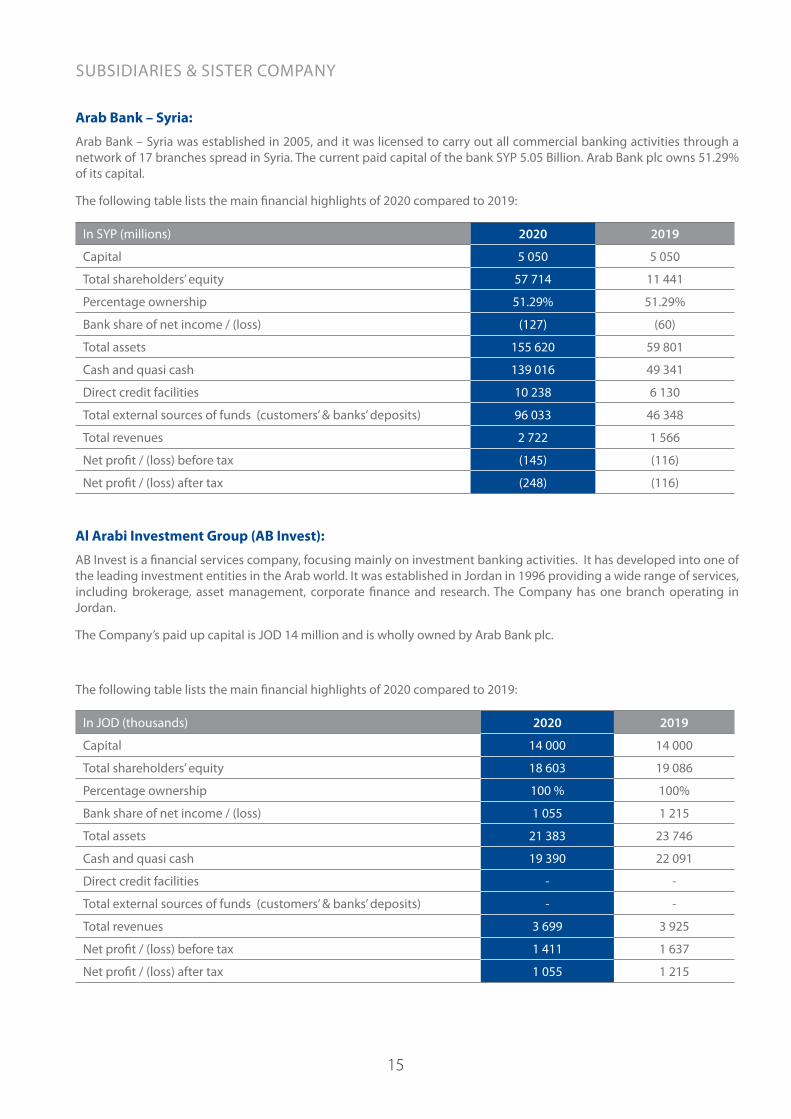
Arab Bank – Syria:
Arab Bank – Syria was established in 2005, and it was licensed to carry out all commercial banking activities through a network of 17 branches spread in Syria. The current paid capital of the bank SYP 5.05 Billion. Arab Bank plc owns 51.29% of its capital.
The following table lists the main financial highlights of 2020 compared to 2019:
In SYP (millions) 2020 2019
Capital 5 050 5 050
Total shareholders’ equity 57 714 11 441
Percentage ownership 51.29% 51.29%
Bank share of net income / (loss) (127) (60)
Total assets 155 620 59 801
Cash and quasi cash 139 016 49 341
Direct credit facilities 10 238 6 130
Total external sources of funds (customers’ & banks’ deposits) 96 033 46 348
Total revenues 2 722 1 566
Net profit / (loss) before tax (145) (116)
Net profit / (loss) after tax (248) (116)
Al Arabi Investment Group (AB Invest):
AB Invest is a financial services company, focusing mainly on investment banking activities. It has developed into one of the leading investment entities in the Arab world. It was established in Jordan in 1996 providing a wide range of services, including brokerage, asset management, corporate finance and research. The Company has one branch operating in Jordan.
The Company’s paid up capital is JOD 14 million and is wholly owned by Arab Bank plc.
The following table lists the main financial highlights of 2020 compared to 2019:
In JOD (thousands) 2020 2019
Capital 14 000 14 000
Total shareholders’ equity 18 603 19 086
Percentage ownership 100 % 100%
Bank share of net income / (loss) 1 055 1 215
Total assets 21 383 23 746
Cash and quasi cash 19 390 22 091
Direct credit facilities - -
Total external sources of funds (customers’ & banks’ deposits) - -
Total revenues 3 699 3 925
Net profit / (loss) before tax 1 411 1 637
Net profit / (loss) after tax 1 055 1 215
SUBSIDIARIES & SISTER COMPANY

16
Arab National Leasing Company:
Arab National Leasing Co. was established in 1996 as a limited liability company and wholly-owned non-banking subsidiary of Arab Bank plc. The company current capital is JOD 50 Million, and it offers financial leasing services that cover a wide range of assets and products through one branch in Amman- Jordan.
The following table lists the main financial highlights of 2020 compared to 2019:
In JOD (thousands) 2020 2019
Capital 50 000 50 000
Total shareholders’ equity 71 472 72 422
Percentage ownership 100% 100%
Bank share of net income / (loss) 4 050 4 239
Total assets 100 615 100 915
Cash and quasi cash - -
Investment in leasing contracts 96 234 96 429
Total external sources of funds (customers’ & banks’ deposits) 5 000 5 000
Total revenues 7 063 8 270
Net profit / (loss) before tax 5 722 5 906
Net profit / (loss) after tax 4 050 4 239
Al Nisr Al Arabi Insurance Company:
Al Nisr Al Arabi Insurance Co. is part of Arab Bank Group. It is a majority-owned subsidiary of the Bank that offers a full range of insurance products. The company was founded in 1976 with a current paid capital of JOD 10 Million. The Company has developed into one of the leading insurance companies in Jordan. The company has three branch operating in Jordan.
In 2006, Arab Bank acquired 50% in addition to two shares of the total shares representing the company’s capital.
The following table lists the main financial highlights of 2020 compared to 2019:
In JOD (thousands) 2020 2019
Capital 10 000 10 000
Total shareholders’ equity 22 713 22 288
Percentage ownership 50% + 2 shares 50% + 2 shares
Bank share of net income / (loss) 1 531 1 421
Total assets 113 979 104 904
Cash and quasi cash 25 298 26 142
Total Investments 83 625 74 061
Total external sources of funds (customers’ & banks’ deposits) - -
Total revenues 28 967 29 455
Net profit / (loss) before tax 4 133 3 590
Net profit / (loss) after tax 3 062 2 842
SUBSIDIARIES & SISTER COMPANY
17
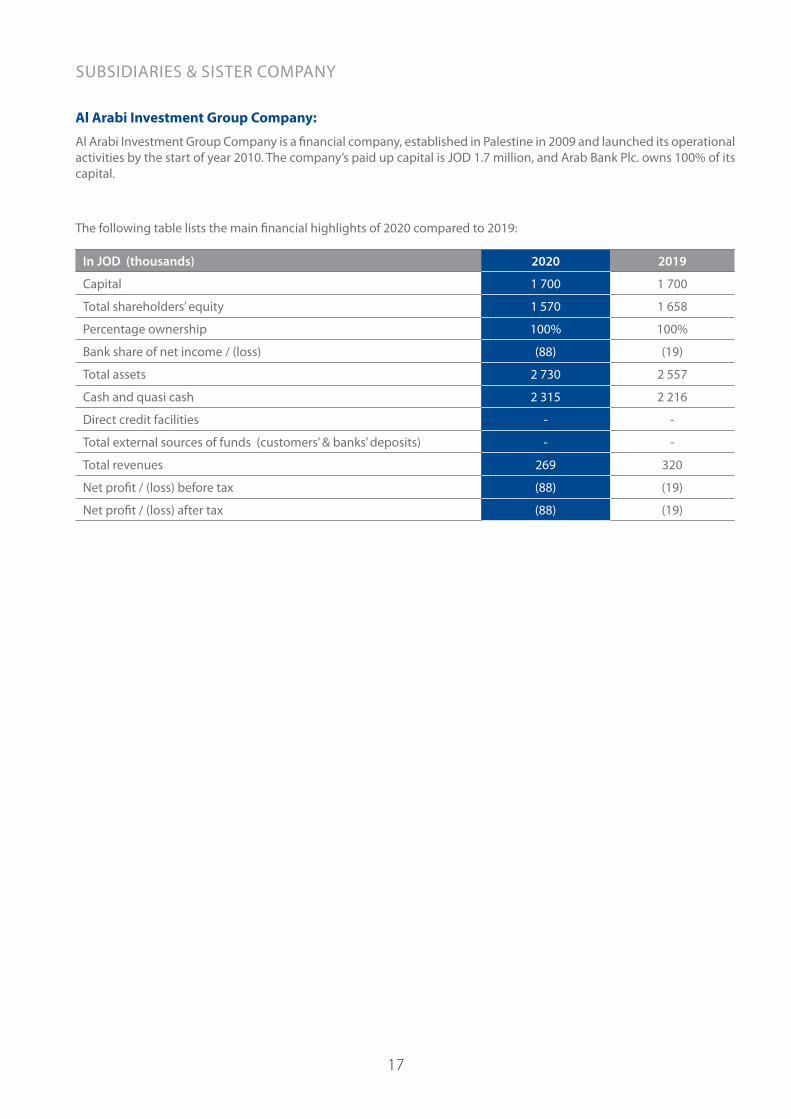
Al Arabi Investment Group Company:
Al Arabi Investment Group Company is a financial company, established in Palestine in 2009 and launched its operational activities by the start of year 2010. The company’s paid up capital is JOD 1.7 million, and Arab Bank Plc. owns 100% of its capital.
The following table lists the main financial highlights of 2020 compared to 2019:
In JOD (thousands) 2020 2019
Capital 1 700 1 700
Total shareholders’ equity 1 570 1 658
Percentage ownership 100% 100%
Bank share of net income / (loss) (88) (19)
Total assets 2 730 2 557
Cash and quasi cash 2 315 2 216
Direct credit facilities - -
Total external sources of funds (customers’ & banks’ deposits) - -
Total revenues 269 320
Net profit / (loss) before tax (88) (19)
Net profit / (loss) after tax (88) (19)
SUBSIDIARIES & SISTER COMPANY

18
First : Jordanian Companies:
Entity Type Address Typeof Activity Capital No. of
EmployeesNo. of
Branches
Major Shareholders (5% or more of capital)
Name No. of Sharesas of 31/12/2019 % No. of Shares as of
31/12/2020 %
Arab NationalLeasing Co.
LimitedLiability
Amman, Madina Monawwara St., Arab Bank Bldg. no. 255, PO Box 940638 Amman 11194 JordanTel. +962 6 5531640/49/50Fax. +962 6 5529891 www.anl-jo.com
Financialleasing
JOD50 Million 29 1 Arab Bank plc 50 000 000
JD/Share 100% 50 000 000JD/Share 100%
Al Arabi Investment Group (AB Invest)
LimitedLiability
Shmeisani, Esam Ajlouni St.,Bldg. no. 3, PO Box 143156Amman 11814 JordanTel. +962 6 5522239Fax. +962 6 5519064www.ab-invest.net
Investment &Financialservices
JOD14 Million 43 1 Arab Bank plc 14 000 000
JD/Share 100% 14 000 000JD/Share 100%
Al Nisr Al Arabi Insurance Co.
PublicShareholding
Shmeisani, Esam Ajlouni St.,Bldg. no. 21, PO Box 9194 Amman 11191 JordanTel. +962 6 5685171Fax. +962 6 5685890 www.al-nisr.com
Insuranceservices
JOD10 Million 256 3
Arab Bank plc 5 000 002 50% 5 000 002 50%
Allianz Mena Holding 1 801 264 18.01% 1 801 264 18.01%
Yacoub Sabella 1 009 081 10.09% 1 009 599 10.10%
Zaid Sabella 907 294 9.07% 907 634 9.08%
Islamic International Arab Bank
PublicShareholding
Wasfi Al Tal St., Bldg. no. 20,PO Box 925802 Amman 11190 JordanTel. +962 6 5694901Fax. +962 6 5694914www.iiabank.com.jo
Islamicbanking
JOD100 Million 996 45 Arab Bank plc 100 000 000 100% 100 000 000 100%
Second: Arab & Foreign Companies:
Al Arabi Investment Group/ Palestine
PrivateShareholding
Rammallah, old town , Al-Harjeh Bldg., PO Box 1476 PalestineTel. +970 2 2980240Fax. +970 2 2980249www.abinvest.ps
Investment& Financial services
JOD 1.7Million 8 1 Arab Bank plc 1 700 000 100% 1 700 000 100%
Arab Tunisian Bank PublicShareholding
9 Hadi Nouira St, Tunis 1001 Tel. +216 71 351 155Fax. +216 71 342 852E-Mail : [email protected]
Commercial banking
TND 100Million 1403 136
Arab Bank plc 64 237 531 64.24% 64 237 531 64.24%
Zarzari Complex 5 412 807 5.41% 5 383 483 5.38%
Arab Bank – Syria PublicShareholding
Damascus, Abu Rummana, Mahdi Bin Baraka St., PO Box 38 Damascus, SyriaTel. +963 11 9421Fax. +963 11 3349844www.arabbank-syria.sy
Commercial banking
SYP 5.05Billion 271 17
Arab Bank plc 25 899 385 51.29% 25 899 385 51.29%
Alia Talal Zain 2 525 000 5% 2 525 000 5%
Moh’d Kamel Sharabati 2 525 000 5% 2 525 000 5%
DETAILED INFORMATION ON THE BANK’S SUBSIDIARIES & SISTER COMPANY

19
First : Jordanian Companies:
Entity Type Address Typeof Activity Capital No. of
EmployeesNo. of
Branches
Major Shareholders (5% or more of capital)
Name No. of Sharesas of 31/12/2019 % No. of Shares as of
31/12/2020 %
Arab NationalLeasing Co.
LimitedLiability
Amman, Madina Monawwara St., Arab Bank Bldg. no. 255, PO Box 940638 Amman 11194 JordanTel. +962 6 5531640/49/50Fax. +962 6 5529891 www.anl-jo.com
Financialleasing
JOD50 Million 29 1 Arab Bank plc 50 000 000
JD/Share 100% 50 000 000JD/Share 100%
Al Arabi Investment Group (AB Invest)
LimitedLiability
Shmeisani, Esam Ajlouni St.,Bldg. no. 3, PO Box 143156Amman 11814 JordanTel. +962 6 5522239Fax. +962 6 5519064www.ab-invest.net
Investment &Financialservices
JOD14 Million 43 1 Arab Bank plc 14 000 000
JD/Share 100% 14 000 000JD/Share 100%
Al Nisr Al Arabi Insurance Co.
PublicShareholding
Shmeisani, Esam Ajlouni St.,Bldg. no. 21, PO Box 9194 Amman 11191 JordanTel. +962 6 5685171Fax. +962 6 5685890 www.al-nisr.com
Insuranceservices
JOD10 Million 256 3
Arab Bank plc 5 000 002 50% 5 000 002 50%
Allianz Mena Holding 1 801 264 18.01% 1 801 264 18.01%
Yacoub Sabella 1 009 081 10.09% 1 009 599 10.10%
Zaid Sabella 907 294 9.07% 907 634 9.08%
Islamic International Arab Bank
PublicShareholding
Wasfi Al Tal St., Bldg. no. 20,PO Box 925802 Amman 11190 JordanTel. +962 6 5694901Fax. +962 6 5694914www.iiabank.com.jo
Islamicbanking
JOD100 Million 996 45 Arab Bank plc 100 000 000 100% 100 000 000 100%
Second: Arab & Foreign Companies:
Al Arabi Investment Group/ Palestine
PrivateShareholding
Rammallah, old town , Al-Harjeh Bldg., PO Box 1476 PalestineTel. +970 2 2980240Fax. +970 2 2980249www.abinvest.ps
Investment& Financial services
JOD 1.7Million 8 1 Arab Bank plc 1 700 000 100% 1 700 000 100%
Arab Tunisian Bank PublicShareholding
9 Hadi Nouira St, Tunis 1001 Tel. +216 71 351 155Fax. +216 71 342 852E-Mail : [email protected]
Commercial banking
TND 100Million 1403 136
Arab Bank plc 64 237 531 64.24% 64 237 531 64.24%
Zarzari Complex 5 412 807 5.41% 5 383 483 5.38%
Arab Bank – Syria PublicShareholding
Damascus, Abu Rummana, Mahdi Bin Baraka St., PO Box 38 Damascus, SyriaTel. +963 11 9421Fax. +963 11 3349844www.arabbank-syria.sy
Commercial banking
SYP 5.05Billion 271 17
Arab Bank plc 25 899 385 51.29% 25 899 385 51.29%
Alia Talal Zain 2 525 000 5% 2 525 000 5%
Moh’d Kamel Sharabati 2 525 000 5% 2 525 000 5%
20
Entity Type Address Typeof Activity Capital No. of
EmployeesNo. of
Branches
Major Shareholders (5% or more of capital)
Name No. of Sharesas of 31/12/2019 % No. of Shares as of
31/12/2020 %
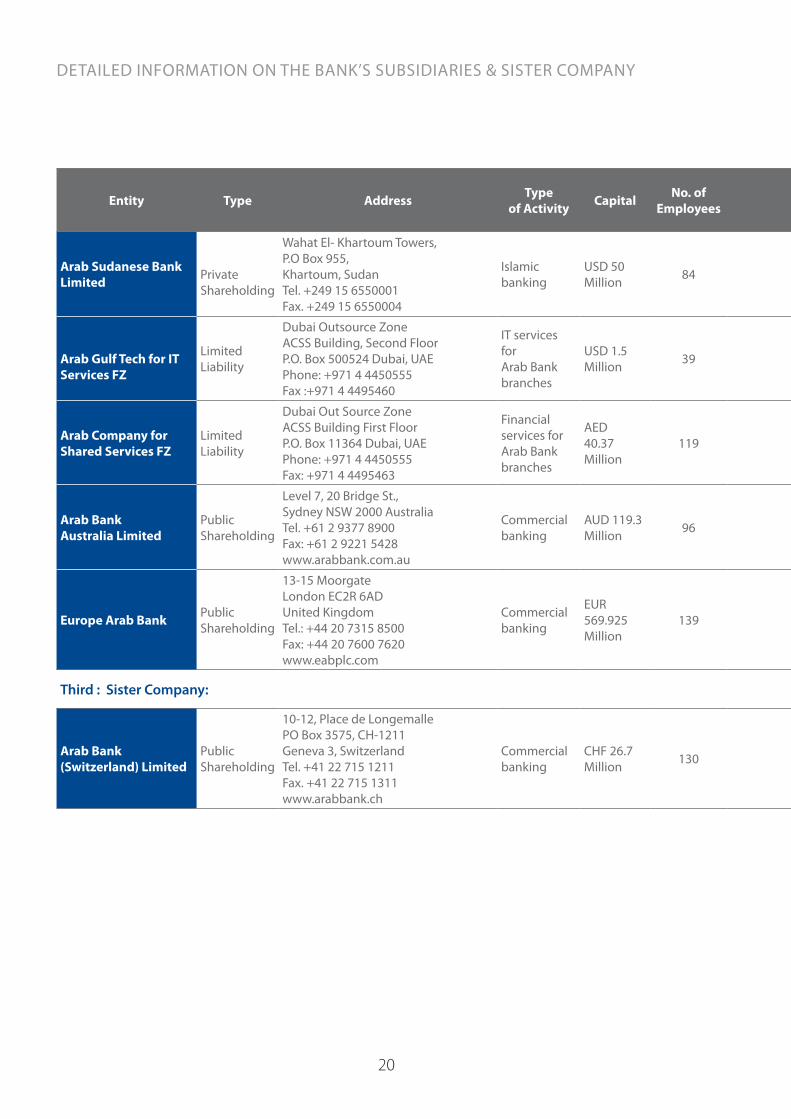
Arab Sudanese Bank Limited Private
Shareholding
Wahat El- Khartoum Towers, P.O Box 955,Khartoum, SudanTel. +249 15 6550001 Fax. +249 15 6550004
Islamicbanking
USD 50Million 84 3 Arab Bank plc 5 000 000 100% 5 000 000 100%
Arab Gulf Tech for IT Services FZ
Limited Liability
Dubai Outsource ZoneACSS Building, Second Floor P.O. Box 500524 Dubai, UAEPhone: +971 4 4450555 Fax :+971 4 4495460
IT servicesforArab Bank branches
USD 1.5Million 39 1 Arab Bank plc 5 509
Shares 100% 5 509Shares 100%
Arab Company for Shared Services FZ
Limited Liability
Dubai Out Source ZoneACSS Building First Floor P.O. Box 11364 Dubai, UAEPhone: +971 4 4450555Fax: +971 4 4495463
Financialservices for Arab Bank branches
AED40.37Million
119 1 Arab Bank plc 40 370 Shares 100% 40 370
Shares 100%
Arab Bank Australia Limited
Public Shareholding
Level 7, 20 Bridge St., Sydney NSW 2000 Australia Tel. +61 2 9377 8900Fax: +61 2 9221 5428www.arabbank.com.au
Commercial banking
AUD 119.3Million 96 5 Arab Bank plc 119 314 274 100% 119 314 274 100%
Europe Arab Bank Public Shareholding
13-15 MoorgateLondon EC2R 6ADUnited KingdomTel.: +44 20 7315 8500Fax: +44 20 7600 7620www.eabplc.com
Commercial banking
EUR 569.925Million
139 5 Arab Bank plc
50 000 deferred shares of £1
and569 925 540
ordinary sharesof €1
100%
50 000deferred shares of £1
and569 925 540
ordinary shares of €1
100%
Third : Sister Company:
Arab Bank(Switzerland) Limited
PublicShareholding
10-12, Place de Longemalle PO Box 3575, CH-1211Geneva 3, Switzerland Tel. +41 22 715 1211Fax. +41 22 715 1311www.arabbank.ch
Commercial banking
CHF 26.7Million 130 2 Shareholders of Arab Bank (Switzerland) Ltd. are the same shareholders of Arab Bank plc, with an
identical ownership structure.
DETAILED INFORMATION ON THE BANK’S SUBSIDIARIES & SISTER COMPANY
21
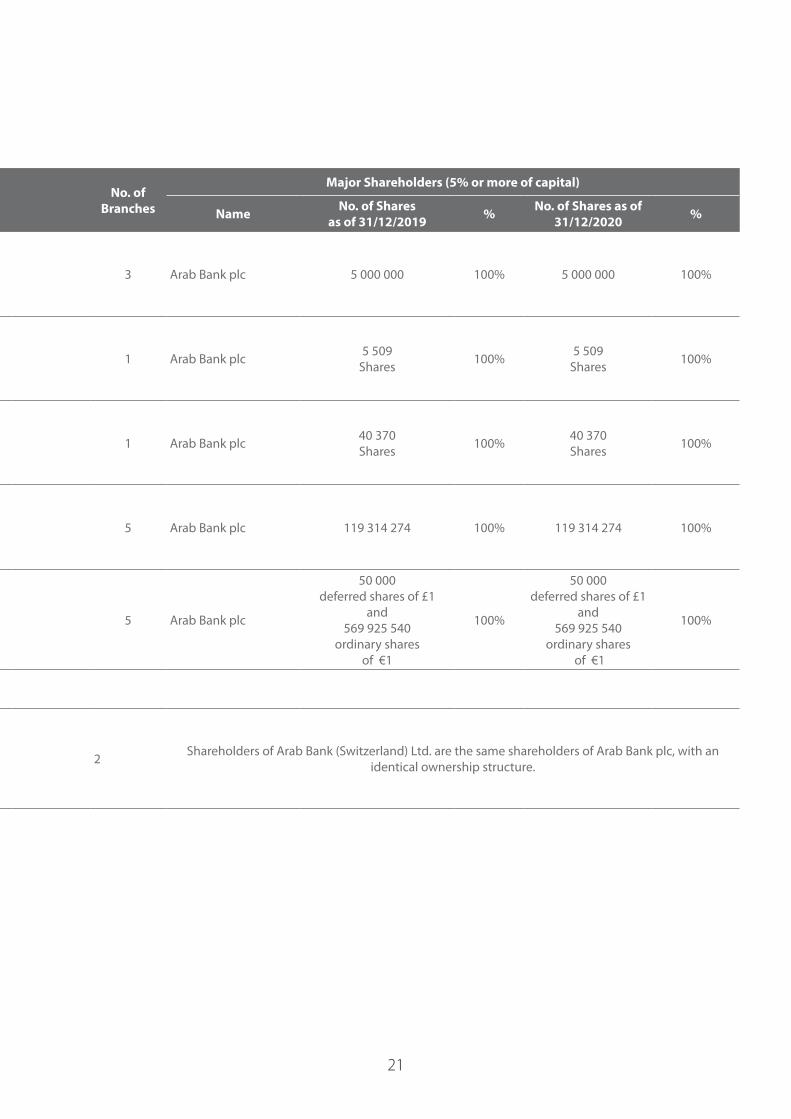
Entity Type Address Typeof Activity Capital No. of
EmployeesNo. of
Branches
Major Shareholders (5% or more of capital)
Name No. of Sharesas of 31/12/2019 % No. of Shares as of
31/12/2020 %
Arab Sudanese Bank Limited Private
Shareholding
Wahat El- Khartoum Towers, P.O Box 955,Khartoum, SudanTel. +249 15 6550001 Fax. +249 15 6550004
Islamicbanking
USD 50Million 84 3 Arab Bank plc 5 000 000 100% 5 000 000 100%
Arab Gulf Tech for IT Services FZ
Limited Liability
Dubai Outsource ZoneACSS Building, Second Floor P.O. Box 500524 Dubai, UAEPhone: +971 4 4450555 Fax :+971 4 4495460
IT servicesforArab Bank branches
USD 1.5Million 39 1 Arab Bank plc 5 509
Shares 100% 5 509Shares 100%
Arab Company for Shared Services FZ
Limited Liability
Dubai Out Source ZoneACSS Building First Floor P.O. Box 11364 Dubai, UAEPhone: +971 4 4450555Fax: +971 4 4495463
Financialservices for Arab Bank branches
AED40.37Million
119 1 Arab Bank plc 40 370 Shares 100% 40 370
Shares 100%
Arab Bank Australia Limited
Public Shareholding
Level 7, 20 Bridge St., Sydney NSW 2000 Australia Tel. +61 2 9377 8900Fax: +61 2 9221 5428www.arabbank.com.au
Commercial banking
AUD 119.3Million 96 5 Arab Bank plc 119 314 274 100% 119 314 274 100%
Europe Arab Bank Public Shareholding
13-15 MoorgateLondon EC2R 6ADUnited KingdomTel.: +44 20 7315 8500Fax: +44 20 7600 7620www.eabplc.com
Commercial banking
EUR 569.925Million
139 5 Arab Bank plc
50 000 deferred shares of £1
and569 925 540
ordinary sharesof €1
100%
50 000deferred shares of £1
and569 925 540
ordinary shares of €1
100%
Third : Sister Company:
Arab Bank(Switzerland) Limited
PublicShareholding
10-12, Place de Longemalle PO Box 3575, CH-1211Geneva 3, Switzerland Tel. +41 22 715 1211Fax. +41 22 715 1311www.arabbank.ch
Commercial banking
CHF 26.7Million 130 2 Shareholders of Arab Bank (Switzerland) Ltd. are the same shareholders of Arab Bank plc, with an
identical ownership structure.

22
Arab Bank Plc Investments in the Subsidiaries Companies As at 31/12/2020:
Name Of Company Nature of Business Ownership % OwnershipType Country
Europe Arab Bank Plc Commercial Banking 100% Subsidiary UK
Arab Bank Australia Limited Commercial Banking 100% Subsidiary Australia
Islamic International Arab Bank plc Islamic Banking 100% Subsidiary Jordan
Arab National Leasing Company Financial Leasing 100% Subsidiary Jordan
Al- Arabi Investment Group Co.
(AB Invest)
Investment & Financial
Services100% Subsidiary Jordan
Arab Sudanese Bank Limited Islamic Banking 100% Subsidiary Sudan
Al – Arabi Investment Group / Palestine Investment & Financial
Services100% Subsidiary Palestine
Arab Tunisian Bank Commercial Banking 64.24% Subsidiary Tunisia
Al – Nisr Al – Arabi Co . Ltd. Insurance Services50% + 2
SharesSubsidiary Jordan
Arab Bank - Syria Commercial Banking 51.29% Subsidiary Syria
Arab Bank Plc Investments in Affiliated Companies As at 31/12/2020:
Name Of Company Nature of Business Ownership % OwnershipType Country
Turkland Bank Commercial Banking 50% Affiliated Turkey
Oman Arab Bank Commercial Banking 49% Affiliated Oman
Arab National Bank Commercial Banking 40% Affiliated Saudi Arabia
Arabia Insurance Co. Insurance Services 42.51% Affiliated Lebanon
Commercial Building Co. S.A.L Real Estate Leasing 35.24% Affiliated Lebanon
DETAILED INFORMATION ON THE BANK’S SUBSIDIARIES & SISTER COMPANY
23
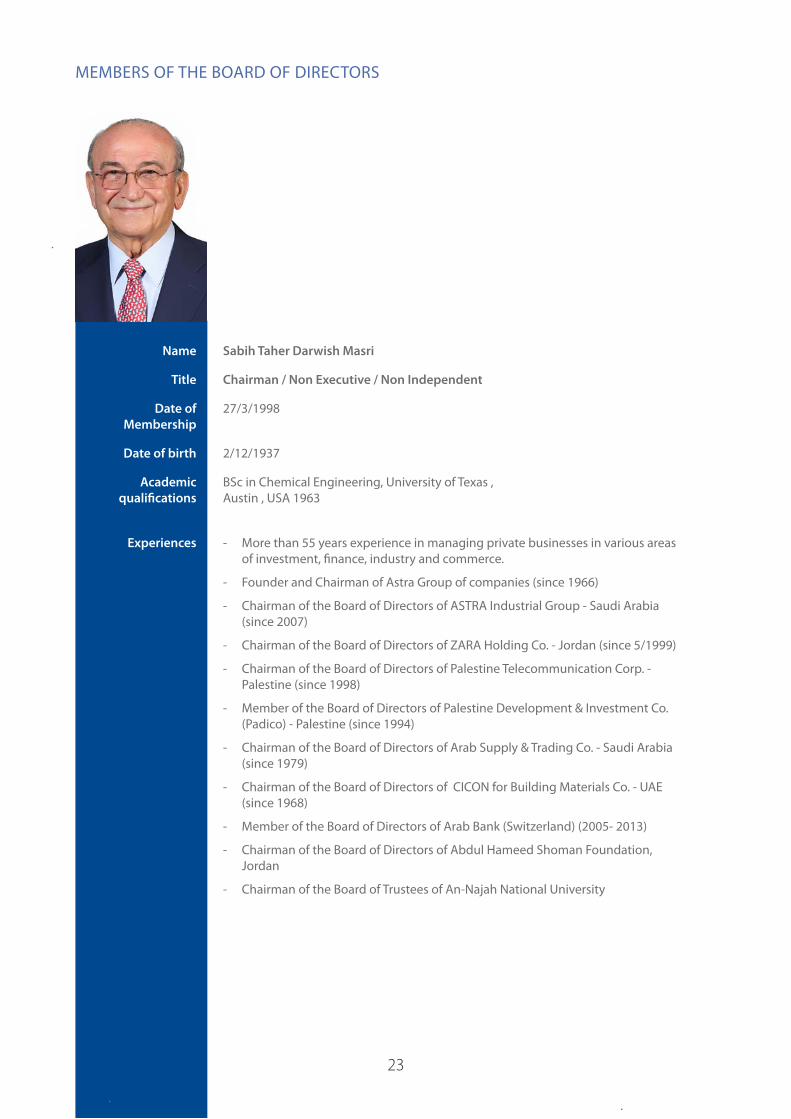
Name Sabih Taher Darwish Masri
Title Chairman / Non Executive / Non Independent
Date of Membership
27/3/1998
Date of birth 2/12/1937
Academic qualifications
BSc in Chemical Engineering, University of Texas , Austin , USA 1963
Experiences - More than 55 years experience in managing private businesses in various areas of investment, finance, industry and commerce.
- Founder and Chairman of Astra Group of companies (since 1966)
- Chairman of the Board of Directors of ASTRA Industrial Group - Saudi Arabia (since 2007)
- Chairman of the Board of Directors of ZARA Holding Co. - Jordan (since 5/1999)
- Chairman of the Board of Directors of Palestine Telecommunication Corp. - Palestine (since 1998)
- Member of the Board of Directors of Palestine Development & Investment Co. (Padico) - Palestine (since 1994)
- Chairman of the Board of Directors of Arab Supply & Trading Co. - Saudi Arabia (since 1979)
- Chairman of the Board of Directors of CICON for Building Materials Co. - UAE (since 1968)
- Member of the Board of Directors of Arab Bank (Switzerland) (2005- 2013)
- Chairman of the Board of Directors of Abdul Hameed Shoman Foundation, Jordan
- Chairman of the Board of Trustees of An-Najah National University
MEMBERS OF THE BOARD OF DIRECTORS

24
Name Dr. Bassem Ibrahim Yousef Awadallah
Title Deputy Chairman / Non Executive / Independent
Date of Membership
31/3/2016
Date of birth 21/12/1964
Academic qualifications
- Doctor of Philosophy in Economics, University of London 1988
- Master of Science in Economics, University of London 1985
- Bachelor of Science in Foreign Service, International Economics, International Finance and Commerce, Georgetown University 1984
Experiences - Chief Executive Officer / Tomoh Advisory (2009 - present)
- Member of the Board of Directors / Arab National Bank – Saudi Arabia (Representing Arab Bank plc since 1/9/2016 - present)
- Deputy Chairman of the Board of Trustees / Al Quds University (2014 - present)
- Chief of the Royal Hashemite Court (11/2007 – 10/2008)
- Director of the Office of His Majesty King Abdullah II (4/2006 – 11/2007)
- Minister of Finance (4/2005 – 6/2005)
- Minister of Planning and International Cooperation (10/2001 – 2/2005)
MEMBERS OF THE BOARD OF DIRECTORS

25
Name Ministry of Finance, Saudi Arabia Represented by Mr. Hisham Mohammed Attar
Title Member of the Board of Directors /Non Executive / Non Independent
Date of membership
- Legal Entity : 29/4/1966- Legal Entity’s Representative : 29/3/2018
Date of birth 29/6/1981
Academic qualifications
- Bachelor in Business Economics and Public Private Sector Organizations / Brown University – Rhode Island USA, 2004
- Director Local Partnerships Development / The Public Investment Fund - Saudi Arabia (September 2019 - Present)
- Senior Vice President / The Public Investment Fund - Saudi Arabia (2016 - August 2019)
- Chairman of the Saudi Jordanian Investment Funds - Jordan (2017 - Present)- Member of the Board of Directors of Mobile Telecommunication (Zain) - Saudi
Arabia (2016 - Present)- Member of the Board of Directors of Saudi Industrial Investment Company (Dussur)
- Saudi Arabia (2017 - Present)- Member of the Board of Directors of the Industrialization and Energy Services -
Saudi Arabia (TAQA) (2017 - Nov. 2019)- Member of the Executive Committee in the Saudi Arabian Military Industries
company (SAMI) - Saudi Arabia (2018 - Present) - Member of the M&A Committee in the Saudi Arabian Military Industries
company(SAMI) - Saudi Arabia (2018 - Present)
Experiences
MEMBERS OF THE BOARD OF DIRECTORS

26
Name Social Security CorporationRepresented by Dr. Hamzeh Ahmad Khalifeh Jaradat
Title Member of the Board of Directors /Non Executive / Non Independent
Date of Membership Legal Entity : 20/9/2001Legal Entity’s Representative : 15/11/2017
Date of birth 1/10/1963
Academic qualifications
- Ph.D., Macro and Monetary economics, Econometrics, Finance, The University of Tennessee, Knoxville, U.S.A, August 2000
- M.Sc., Economics, University of Jordan, August 1994- B.Sc., Economics & Computer Science, Yarmouk University, Jordan, January
1987
Experiences - Director, Business Development & Research, Social Security Investment Fund, Jordan (March 2019 – Present)
- Director, Equity’s Support Department, Social Security Investment Fund, Jordan (Feb. 2018 - March 2019)
- Director, Research Department, Social Security Investment Fund, Jordan (September 2015 – Feb. 2018)
- General Director, Jordan Post (May 2014 – May 2015)- Director, Public Private Partnership (PPP) Unit, Ministry of Finance, Jordan
(2013- 2014)- Director, Public Debt Department, Ministry of Finance, Jordan (2012-2013)- Senior Economist, International Monetary Fund, IMF Center for Economics and
Finance, Kuwait (2011-2012)- Advisor to the Minister, Ministry of Finance, Jordan (2004-2011)- Economic Researcher, Economic Research and Studies Department, Central
Bank of Jordan, (1989-2000)- Assistant Professor of Economics and Finance, The University of Tennessee and
Hanover College, USA (2000-2004)- Board Member and Head of Committees of several companies, including
Jordan Telecom/ Orange, National Electricity Company, Airports Company, Commercial Bank, Housing Bank for Trade & Finance, Jordan Press
- National Coordinator, OECD-MENA Initiatives and member of Governance and Public Finance Experts groups (2009-2014)
MEMBERS OF THE BOARD OF DIRECTORS
27
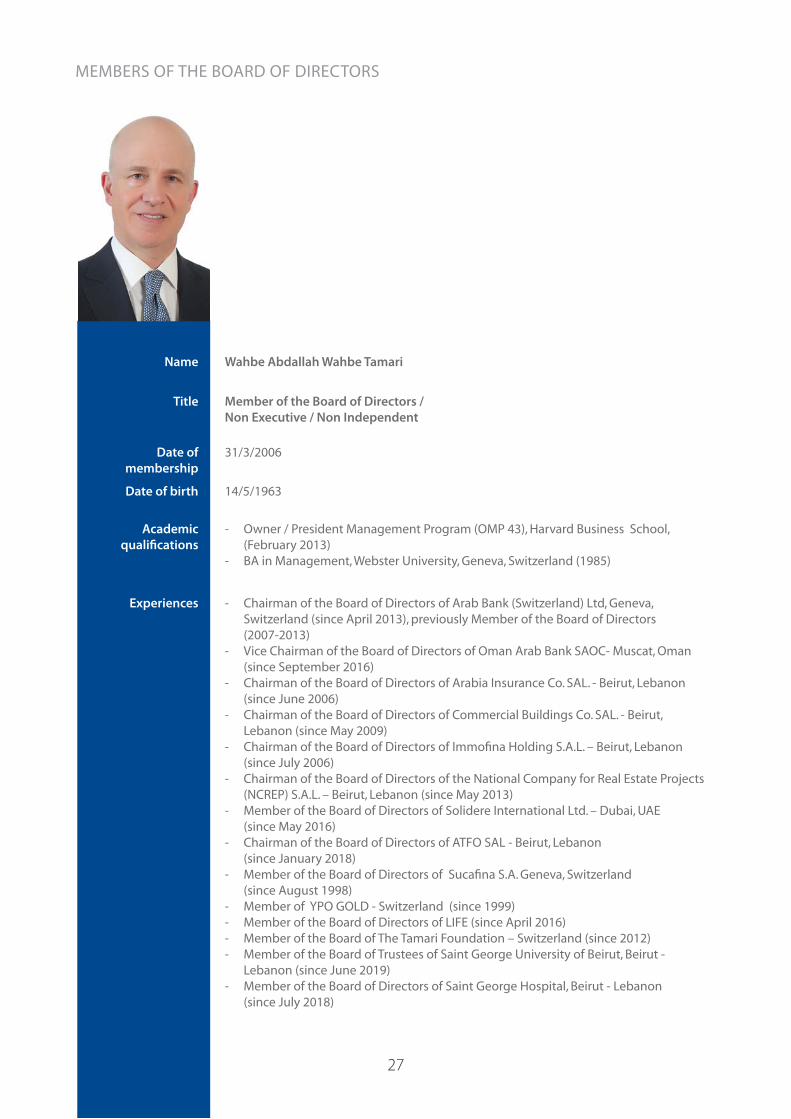
Name Wahbe Abdallah Wahbe Tamari
Title Member of the Board of Directors / Non Executive / Non Independent
Date of membership
31/3/2006
Date of birth 14/5/1963
Academicqualifications
- Owner / President Management Program (OMP 43), Harvard Business School, (February 2013)
- BA in Management, Webster University, Geneva, Switzerland (1985)
Experiences - Chairman of the Board of Directors of Arab Bank (Switzerland) Ltd, Geneva, Switzerland (since April 2013), previously Member of the Board of Directors (2007-2013)
- Vice Chairman of the Board of Directors of Oman Arab Bank SAOC- Muscat, Oman (since September 2016)
- Chairman of the Board of Directors of Arabia Insurance Co. SAL. - Beirut, Lebanon (since June 2006)
- Chairman of the Board of Directors of Commercial Buildings Co. SAL. - Beirut, Lebanon (since May 2009)
- Chairman of the Board of Directors of Immofina Holding S.A.L. – Beirut, Lebanon (since July 2006)
- Chairman of the Board of Directors of the National Company for Real Estate Projects (NCREP) S.A.L. – Beirut, Lebanon (since May 2013)
- Member of the Board of Directors of Solidere International Ltd. – Dubai, UAE (since May 2016)
- Chairman of the Board of Directors of ATFO SAL - Beirut, Lebanon (since January 2018)
- Member of the Board of Directors of Sucafina S.A. Geneva, Switzerland (since August 1998)
- Member of YPO GOLD - Switzerland (since 1999)- Member of the Board of Directors of LIFE (since April 2016)- Member of the Board of The Tamari Foundation – Switzerland (since 2012)- Member of the Board of Trustees of Saint George University of Beirut, Beirut -
Lebanon (since June 2019)- Member of the Board of Directors of Saint George Hospital, Beirut - Lebanon
(since July 2018)
MEMBERS OF THE BOARD OF DIRECTORS

28
Name Abdul Hameed Shoman Foundation Represented by Mr. Khaled Anis Moh’d (Zand Irani)
Title Member of the Board of Directors / Non Executive / Non Independent
Date of membership
- Legal Entity : 31/3/2006 - Legal Entity’s Representative : 27/12/2010
Date of birth 21/8/1964
Academic qualifications
- M.S.c. Degree in national parks management and tourism, New Mexico Univer-sity 1993
- M.S.c. Degree in Arid Land Use, Jordan University 1989- B.Sc. Degree in Soils, Jordan University 1986
Experiences - Member of the Upper House of Parliament (2013 - 2016)- President of the Royal Society for the Conservation of Nature (since 2011)- Founder of E2e Company (since Jan. 2011)- Chairman of SMART AE Company (Energy Management) under E2e (since
1/2015)- General Manager/Senior Advisor – Alcazar Energy / Jordan (since 2016)- Chairman of Birdlife International (since 2012)- Minister of Energy and Mineral Resources (Dec. 2009 - Nov. 2010)- Minister of Environment (April 2005 - Dec. 2009)- Director General for the Royal Society for the Conservation of Nature
(Oct. 1996 - June 2005) - Manager of the Protected Areas Dept.
(Jan. 1986 - Jan. 1989)- Research Assistant / Jordan University
(Oct.1986 - Jan. 1989)- Member of International Environmental Committees- Member of Royal Energy Committee- Member of Royal Water Committee
MEMBERS OF THE BOARD OF DIRECTORS
29
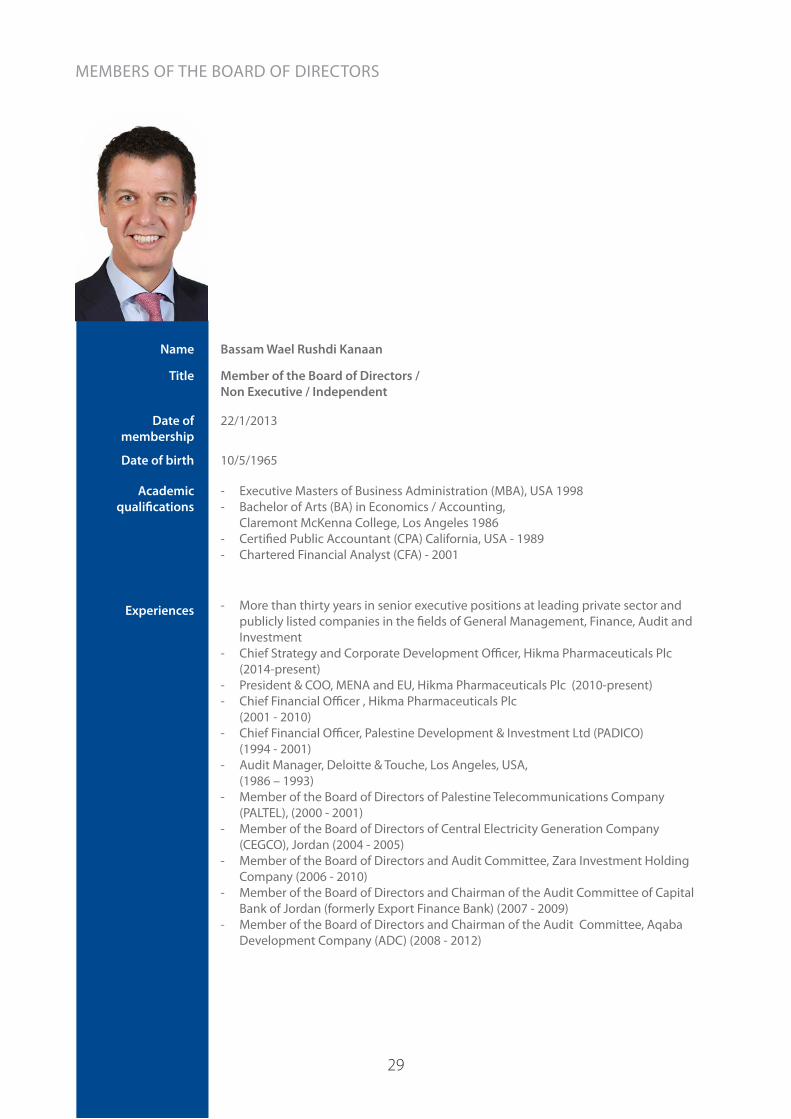
Name Bassam Wael Rushdi Kanaan
Title Member of the Board of Directors / Non Executive / Independent
Date of membership
22/1/2013
Date of birth 10/5/1965
Academic qualifications
- Executive Masters of Business Administration (MBA), USA 1998- Bachelor of Arts (BA) in Economics / Accounting,
Claremont McKenna College, Los Angeles 1986- Certified Public Accountant (CPA) California, USA - 1989- Chartered Financial Analyst (CFA) - 2001
Experiences - More than thirty years in senior executive positions at leading private sector and publicly listed companies in the fields of General Management, Finance, Audit and Investment
- Chief Strategy and Corporate Development Officer, Hikma Pharmaceuticals Plc (2014-present)
- President & COO, MENA and EU, Hikma Pharmaceuticals Plc (2010-present)- Chief Financial Officer , Hikma Pharmaceuticals Plc
(2001 - 2010)- Chief Financial Officer, Palestine Development & Investment Ltd (PADICO)
(1994 - 2001)- Audit Manager, Deloitte & Touche, Los Angeles, USA,
(1986 – 1993)- Member of the Board of Directors of Palestine Telecommunications Company
(PALTEL), (2000 - 2001)- Member of the Board of Directors of Central Electricity Generation Company
(CEGCO), Jordan (2004 - 2005)- Member of the Board of Directors and Audit Committee, Zara Investment Holding
Company (2006 - 2010)- Member of the Board of Directors and Chairman of the Audit Committee of Capital
Bank of Jordan (formerly Export Finance Bank) (2007 - 2009)- Member of the Board of Directors and Chairman of the Audit Committee, Aqaba
Development Company (ADC) (2008 - 2012)
MEMBERS OF THE BOARD OF DIRECTORS

30
Name Abbas Farouq Ahmad Zuaiter
Title Member of the Board of Directors / Non Executive / Independent
Date of membership
27/3/2014
Date of birth 16/7/1967
Academic qualifications
Experiences
- BSBA, Finance & Accounting, Georgetown University 1989
- Co-Founder & Managing Member, Zuaiter Capital Holdings, LLC (April 2013- present)
- Member of the Board of Directors of Trine Acquisition Corp, Inc. (NYSE:TRNE) (March 2019-Present)
- Member of the Board of Directors of Ossia, Inc. (Seattle, WA) (2017-Present)- Chairman of Investment Committee, Alcazar Capital (January 2019-Present)- Member of the Board of Directors of The Capital Holdings Funds plc
(2014-present) - Member of the Board of Advisors, iMENA Group (2013–present)- Member of the Board of Advisors, Jibrel Networks, (2018-present)- Member of the Board of Advisors, Atom Investors, LP (2017-present)- Member of the Board of Advisors, EuroMena Capital, LP (2010-present) - Member of the Board of Advisors, McDonough School at Georgetown
University (2015-present)- Member of the Board of Regents at Georgetown University (2014–present)- Chairman of the Board of Directors of Adecoagro
(2003-2018) - Member of the Executive, Investment, Management, Capital Allocation & Risk
Committees, Soros Fund Management (September 2002 – April 2013)- Chief Operating Officer, Soros Fund Management (September 2002-April 2013)- Group Chief Financial Officer, Soros Fund Management
(September 2002- December 2004)- Partner, PricewaterhouseCoopers LLP – USA Firm (April 1994-September 2002)
MEMBERS OF THE BOARD OF DIRECTORS

31
Name Alaa Arif Saad Batayneh
Title Member of the Board of Directors / Non Executive / Independent
Date of membership
22/4/2015
Date of birth 6/6/1969
Academicqualifications
- MS Degree in Management Information Systems, The George Washington University 1993
- B.S.c of Science in Electrical Engineering, The George Washington University 1991
Experiences - General Manager – Alarif Consultancy (present)- Chief Executive Officer – Eagle Hills / Jordan (2015–2017)- Senator in The Upper House of Parliament (2013–2016)- Minister of Energy & Mineral Resources & Minister of Transport (2012–2013)- Minister of Energy & Mineral Resources
(May 2012–Oct. 2012) - Minister of Transport (2011–2012)- Minister of Transport (2009–2011)- Minister of Public Works & Housing (Feb. 2009–Dec. 2009)- Minister of Transport (2007–2009)- Director General / Customs Department (2005–2007)- Secretary General of Ministry of Transport / Ministry of Transport (2000–2005)- General Manager / Al Ajdal Consultancy (1998–2000)- Head of Project Management / New Work Co.
(1994–1998)- Communication Engineer / Racal Avionics, London (1992–1994)- Engineer, Research Department / Intelsat, Washington – USA (1991)- Member of the Board of Trustees / The King Hussein Cancer Foundation
(2014–present)- Member of the Board of Trustees / King Abdullah II Centre for Excellence
(2012–present)- Member of the Board/ Jordan Petroleum Refinery Company plc. (2014–13/10/2020)- Chairman / Jordan Petroleum Refinery Company plc. (14/10/2020 - present)- Member of the Board of Directors / Euro Arab Insurance group plc. (June
2020-present)
MEMBERS OF THE BOARD OF DIRECTORS
32
Name Suleiman Hafez Suleiman Al Masri
Title Member of the Board of Directors / Non Executive / Independent
Date of membership
27/10/2016
Date of birth 1/1/1941
Academic qualifications
- Bachelor Degree in Trade / University of Alexandria - Beirut Branch 1968- Financial and Management courses in the United States of America, United
Kingdom and Austria
Experiences - Member of the Board of Trustees of The Higher Council for Science and Technology (2013-2017)
- Minister of Finance (1997-1998)- Minister of Finance (2012-2013)- Minister of Post & Telecommunications (1998-1999)- Minister of Energy (2010)- Secretary General of the Ministry of Finance (1991-1996)- Chairman / Royal Jordanian Airlines (2014-2016)- Chairman / Social Security Investment Fund / Social Security Corporation (2013-2016)- Chairman / Electricity Regulatory Commission (2009-2010)- Chairman / Telecommunication Regulatory Commission (1998-1999)- Chairman / Jordan Telecommunications Corporation (1999-2001)- Chairman / Arab Potash Co. (2001-2003)- Chairman / KEMAPCO (Kemera Co.) for Fertilizers & Chemicals Industries (2001-2003)- Chairman / Jordan Bromine Co. (2001-2003)- Chairman / Free Zones Corp. & Jordan Investment Corp (1997-1999)- Member of Royal Commission for Modernization and Development (1993-1996)- Governor of the International Monetary Fund “Representing Jordan” for various periods- Deputy Governor of the Islamic Development Bank / Jeddah “Representing Jordan”
(1991-1997)- Deputy Governor of the Arab Monetary Fund “Representing Jordan” (1991-1997)- Chairman of the Ministerial Development Committee for various periods - Member of the Board of Directors / Royal Jordanian Airlines (1991-1997)- Member of the Board of Directors / Jordan Electricity Authority (1991-1997)- Member of the Board of Directors / Social Security Corporation (1991-1997)- Member of the Board of Directors / Orphan Development Corp. (1991-1997)- Member of the Board of Directors / Agriculture Credit Corp. (1991-1997)- Member of the Board of Directors / Arab Engineering Industries (1992-1997)- Member of the Board of Directors / Civil Aviation Authority (1991-1997)- Member of the Board of Directors / Jordan Cement Factories Co. (1990-1997)- Member of the Board of Directors / Jordan Phosphate Co. (1992-1997)- Member of the Board of Directors / Arab African Bank (1991-1997)- Member of the Board of Directors / Arab Organisation for Agricultural Development
(1992-1997)- Member of the Board of Directors / Royal Automobile Club of Jordan (2012-present)
MEMBERS OF THE BOARD OF DIRECTORS

33
Name Usama Ramez Mikdashi
Title Member of the Board of Directors / Non Executive / Independent
Date of membership
29/3/2018
Date of birth 20/10/1941
Academic qualifications
- M.B.A. / American University of Beirut - Lebanon, 1963- B.A.A. / American University of Beirut - Lebanon, 1961
Experiences - Board of Directors of Arabia Insurance Co. SAL. - Beirut, Lebanon (since June 2019)- Chairman of the Banking Control Commission of Lebanon
(2010-2015)- Board Directorships in Banking, Telecoms, Insurance, Real State in UK, South Africa,
Turkey, Lebanon, Jordan & Bahrain (2007-2010)- Career Citibank / Citigroup (1962-2007):
• Managing Director Corporate and Investment Banking Risk Management in Europe, Middle East & Africa, London (1995-2007)
• Group Credit Officer, Financial Institutions Trade Finance, Securities and Cash Management, New York (1989-1995)
• Division Head, Investment Banking, Middle East and Africa, London (1986-1989)• Credit Policy Committee Member, Europe, Middle East and South Asia, London
(1982-1986) • Division Credit Officer, Middle East, Athens (1979-1982)• Senior Credit Officer, Asia Pacific Region, Manila (1977-1979)• Chief of Staff and Senior Credit Officer, Middle East & Africa, Beirut and Athens
(1975-1977)• Project Finance Officer, Middle East Region, Bahrain (1973-1975)• Marketing and Credit Officer, South Asia and Middle East, New York (1970-1973)• Corporate Banking and Marketing Officer, Karachi (1969-1970)• Senior Operations Officer, Riyadh (1968-1969)• Assistant Manager, Beirut (1962-1968)
MEMBERS OF THE BOARD OF DIRECTORS

34
RESIGNED MEMBERS OF THE BOARD OF DIRECTORS DURING 2020
There were no resignations during the year 2020

35
Mr. Nemeh Elias Sabbagh
Chief Executive Officer
Date of appointment : 31/1/2010
Date of birth : 15/3/1951
Academic Qualifications:
- B.A. in Economics and French at Austin College in Texas, 1972 with studies at L’Institut d’Etudes Politiques in Paris.
- MA in International Economics and Middle East Studies - Johns Hopkins University, 1974
- MBA in Finance - University of Chicago, 1976
- Completed the Senior Executive Program at the Graduate School of Business - Stanford University, 1990
Experience:
- Chief Executive Officer - Arab Bank (since February, 2010)
- Executive General Manager - Bank Med in Lebanon( 2006-2009)
- Managing Director and Chief Executive Officer - Arab National Bank in Riyadh, Saudi Arabia (1998-2005)
- General Manager of the International Banking Group- National Bank of Kuwait (1979-1998)
- Worked with the Industrial Bank of Kuwait (1976-1979), First Chicago in Chicago (1974-1975) and the World Bank in Washington, D.C., 1973
- Board Member of Europe Arab Bank plc –London (Chairman)
- Board Member of Association of Banks in Jordan since 15/12/2010
- Vice Chairman - Jordan Payments and Clearing Company
- Member of the Board of Trustees - American University of Beirut
SENIOR EXECUTIVES

36
Ms. Randa Muhammad Sadik
Deputy Chief Executive Officer
Date of appointment : 1/ 7/2010
Date of birth : 14/11/1962
Academic Qualifications:
- B.A. in Business Administration - American University of Beirut, 1984
- M.B.A in Finance - American University of Beirut, 1986
Experience:
- Deputy Chief Executive Officer - Arab Bank (since July 1, 2010)
- Group General Manager for International Banking Group - National Bank of Kuwait (2006-2010)
- Managing Director - National Bank of Kuwait (International) plc, London (2005-2006)
- Assistant General Manager - National Bank of Kuwait (International) plc, London (1998-2005)
- Executive Manager & Treasurer - National Bank of Kuwait (International) plc, London (1993-1998)
- Head of Asset Liquidity Management - National Bank of Kuwait (International) plc, London (1991-1993)
- Financial Analyst - National Bank of Kuwait (1986-1990)
- Graduate Assistant - American University of Beirut (1985-1986)
- Chairman of Arab Tunisian Bank-Tunisia
- Board Member of Oman Arab Bank- Oman
- Vice Chairman of Arab Bank Australia ltd.
- Chairman of the Management Committee for Al-Arabi Investment Group Co.
- Board Member of Endeavor Jordan
SENIOR EXECUTIVES

37
Mr. Ziyad A. AkroukEVP-Head of Group Risk Management
Date of appointment : 10/6/2018
Date of birth : 26/4/1958
Academic Qualifications:
- Master of Business Administration: Finance, December 1988.
Syracuse University, Syracuse, N.Y.
- Bachelor of Science Degree with Honors, Civil Engineering, 1981
University of Leeds, Leeds, England
Experience:
- Head of Group Risk, Arab Bank plc, Amman, Jordan (since 6/2018)
- Chief Executive Officer, Member of the Board of Directors, Europe Arab Bank plc, United Kingdom (2011-2018)
- Chief Executive Officer, Citibank, Kuwait (2010-2011)
- Chief Executive Officer, Citibank, Jordan (2005-2010)
- Regional Risk Manager, Senior Credit Officer, Citibank Egypt, Jordan, Lebanon and Libya (2003-2005)
- Risk Manager, Senior Credit Officer, Bank Handlowy (Memebr of Citigroup), Poland (2000-2003)
- Unit Head, Corporate Banking, Corporate Finance & Project Finance, Vice President, Citibank Bahrain (1995-2000)
- Relationship Manager, Financial Institutions , Vice President, Citibank Bahrain (1989-1994)
- Marketing and Technical Support Engineer, Saudi Arabia (1984-1986)
- Project Management Engineer, Kuwait (1981-1984)
- Chairman of the Board of Directors, Al Nisr AlArabi Insurance Company, Jordan
- Member of the Board of Directors, Arab National Bank, Saudi Arabia
- Member of the Board of Directory, Jordan Mortgage Refinance Company, Jordan
Mr. Mohamed A. Hamad Ghanameh EVP - Chief Credit Officer
Date of appointment : 1/2/2007Date of birth : 6/1/1953
Academic Qualifications:- B.Sc. in Mathematics, Riyadh University – Saudi Arabia,
1975- Diploma in Computer Programming, London, 1976
Experience:
- EVP - Head of Credit, Arab Bank plc – Head Office, Jordan (since 4/2010)
- Executive Vice President / Global Head of Corporate & Investment Banking, Arab Bank plc – Head Office, Jordan (2007 –2010)
- Head of Corporate & Investment Banking Banque Saudi Fransi - Riyadh / Saudi Arabia (1999 – 2007)
- Head of Corporate & Investment Banking United Saudi Bank / USCB - Riyadh / Saudi Arabia (1995 – 1999)
- Assistant General Manager / Head of Corporate - Retail Banking Groups Cairo Amman Bank – Jordan (1990 –1995)
- Vice President / Head of Saudi Corporate Marketing Unit Gulf International Bank – Bahrain (1989 –1990)
- Manager International Corporate - Credit Division Arab Bank plc – General Management Jordan (1987–1989)
- Head of Corporate Banking / Central Region Saudi American Bank / Citibank - Riyadh / Saudi Arabia (1976 –1987)
- Chairman of the Supervisory Board of Arab National Leasing Company, Amman - Jordan
- Vice Chairman of International Islamic Arab Bank- Deputy of the Supervisory Board of AB Invest , Amman
– Jordan- Member of the Board of Directors of Arab National Bank
- Riyadh / Saudi Arabia- Member of the Board of Directors of Arab Bank - Syria- Vice Chairman of T - Bank - Turkey
SENIOR EXECUTIVES

38
Mr. Mohammed Ahmed Khaled Masri
EVP - Head of Corporate and Institutional Banking
Date of appointment : 20/5/2018 Date of birth : 23/4/1972
Academic Qualifications:
- BA, Business Administration, Faculty of Economics and Administrative Sciences - University of Jordan, 1995
Experience:
- Executive Vice President / Corporate and Institutional
Banking (5/2018-present)
- Country Manager, Arab Bank / United Arab Emirates
(2011-2018)
- Senior General Manager, Chief Business Officer, Bank
Audi/ Egypt (2006-2011)
- Head of Corporate and Institutional Banking,
Millennium Capital Holding/ UAE/ Sudan (2006)
- Head of Corporate and Institutional Banking,
Standard Chartered Bank / Jordan (2001-2004)
- Regional Manager, Standard Chartered Bank /
Palestine (1999-2001)
- Branch Management, Standard Chartered Bank
(Formerly ANZ Grindlays Bank)/ Palestine (1995-1999)
Mr. Antonio Mancuso-Marcello
EVP - Head of Treasury
Date of appointment : 1/6/2008 Date of birth : 2/5/1966
Academic Qualifications:
- BA (Honours), Business Studies and German, Nottingham – UK, 1989
- Certificate in Business Sciences, Universitaet-GHS Paderborn – Germany, 1987
Experience:
- Executive Vice President / Treasury, Arab Bank (6/2008
- present)
- Group Treasurer, UniCredit – Italy (2007-2008)
- Global Treasurer, GE Insurance Solutions – UK and US (2002-2006)
- Assistant Treasurer / Head of European Funding, GE Capital – France (1999-2002)
- Associate Director / Fixed Income, UBS – UK (1997-1999)
- Associate Director / Fixed Income, NatWest Markets – UK (1992-1997)
- Assistant Director / Money Markets, Yamaichi International – UK (1990-1992)
- Alumni Fellow of Nottingham Business School, Nottingham Trent University (since 2014)
SENIOR EXECUTIVES
39
Mr. Naim Rassem Kamel Al-HussainiEVP - Head of Consumer Banking
Date of appointment : 20/11/2011 Date of birth : 28/11/1962
Academic Qualifications:- B.Sc. of Science, Industrial Management, University of
Petroleum & Minerals – Saudi Arabia, 1985
Experience:- Head of Retail Banking Group, Banque Saudi Fransi,
Saudi Arabia (2008 – 2011).- Acting Head, Retail Banking Group, Banque Saudi
Fransi, Saudi Arabia (2006 – 2007).- Division Manager, Consumer Assets Sales Division,
Retail Banking Group, Banque Saudi Fransi, Saudi Arabia (2005).
- Regional Manager, Retail Banking Division, Eastern Region, Banque Saudi Fransi, Saudi Arabia (2000 – 2005).
- Manager, Network & Financial Planning Department, Retail Banking Group, Head Office, Banque Saudi Fransi, Saudi Arabia (1995 – 2000).
- Personnel Manager, Corporate Human Resources Division, Head Office, Banque Saudi Fransi, Saudi Arabia (1993 – 1995).
- Manager, Recruitment & Government Relations, Corporate Human Resources Division, Head Office, Banque Saudi Fransi, Saudi Arabia (1990 – 1993).
- Manager, Budget & Financial Planning, ITISALAT ALSAUDIA (1988 – 1990).
- Head, Tender & Contracting, ITISALAT ALSAUDIA (1986 – 1988).
- Member of the Board - Arab Tunisian Bank - Tunisia- Member of the Board - International Islamic Arab
Bank- Board Member of Jordan Hotels and Tourism Company
Mr. Walid Muhi Eddin Mohammed Al SamhouriEVP- Jordan Country Head
Date of appointment : 15/8/1988 Date of birth : 27/10/1962
Academic Qualifications:
- MSc in Economics University of Jordan, Amman 1994.- BSc in Economics, Statistics & Public Administration -
University of Jordan, Amman 1985.
Experience:
- Executive Vice President – Jordan Country Head (10/2015)
- Senior Vice President – Senior Credit Officer - Credit Group, Gulf, Egypt & Subsidiaries (2012-10/2015)
- Senior Vice President- Senior Credit Officer - Credit Group, Gulf, International & subsidiaries (2010-2011)
- Senior Vice President- Senior Credit Officer - Credit Group, North Africa and Lebanon (2008-2010)
- Head of Global Credit Administration & Control- Credit Group (2007-2008)
- Department Head – Corporate & Institutional Banking - Research & Support - Global Banking Group (GBG ) (2003-2007)
- Senior Credit Officer - Credit Group (Country Risk, Sovereign and Quasi Sovereign) (1998-2003)
- Various responsibilities in credit, banking operations and trade finance in Jordan and Bahrain (1988-1998)
- Chairman - Arab Sudanese Bank- Sudan- Board Member - Arab Tunisian Bank- Board Member- Oman Arab Bank - Board Member - Jordan Loan Guarantee Corp.
SENIOR EXECUTIVES

40
Mr. Eric J. ModaveEVP - Chief Operating Officer
Date of appointment : 01/07/2014Date of birth : 28/05/1966
Academic Qualifications:- Master in Engineering and Business Management
(HEC Liege) – 1989- Certified Chartered Accountant (Luxembourg) – 2006- AMP Insead (France) - 2013
Experience:
- Arab Bank: Chief Operating Officer, Arab Bank plc (Jor-dan), since (1/7/2014)
- Chief Operating Officer, Barclays Africa (Kenya) (2009 - 2014)
- Global Payment Operating Head, Barclays (London) (2006 - 2009)
- Head of Operations, Global Consumer Bank Europe Middle-East, Africa and Russia, Citigroup, (London) (2005 –2006)
- Head of Retail Operations and Process Re-engineering Global Consumer Bank, Europe Middle-East, Africa and Russia, Citigroup (London) (2003 – 2005)
- Operations and Technology Head, Europe International Personal Banking, Citigroup (London) (2001 – 2002)
- Chief Financial Officer, Europe International Personal Banking, Citigroup (London) (1999 - 2000)
- Head of Business Planning and Analysis, Europe Con-sumer Bank, Citigroup (Brussels) (1996 - 1999)
- Audit Manager Arthur Andersen (Luxembourg), (1991 - 1996)
- Board Member - Europe Arab Bank plc- Chairman of the Board of Arab Gulf Tech for IT Services
- Dubai- Chairman of the Board of Arab Company for Shared
Services - Dubai
Mr. Ghassan Hanna Suleiman Tarazi EVP - Chief Financial Officer
Date of appointment : 1/8/2003Date of birth : 8/1/1964
Academic Qualifications:- B.Sc. in Economics, Acadia University – Canada, 1984- M.Sc. in Business Management, Leuven University,
Belgium, 1986- Professional certification (CBA & CPA) from the USA
and FAIBF from Australia
Experience:- Chief Financial Officer, Arab Bank, (since 8/1/2017)- Secretary of the Board, Head of Secretariat Division,
Investments and Investors Relations (January 2013 - 31/12/2015)
- Chief Financial Officer, 1/7/2008 - 31/12/2012- Head of Group Internal Audit, Arab Bank (1/8/2003 -
30/6/2008)- Head of Financial Control and Risk Management, Gulf
Investment Corporation, Kuwait, (2/2003 – 7/2003)- Partner, KPMG Certified Accountants & Auditors, Am-
man, Jordan (1994 – 2003)- Assistant Manager, Jordan National Bank, Amman,
(1992 – 1993)- Senior Audit, Arthur Andersen & Co. (1989 – 1992)
- Member of the Board of Directors of Arab Tunisian Bank - Tunisia
- Member of the Board of Directors of Europe Arab Bank plc- London
- Board Member- Oman Arab Bank
SENIOR EXECUTIVES

41
Basem Ali Al-Imam, LawyerBoard Secretary / Head of Legal Affairs Division
Date of appointment : 15/4/2003Date of birth : 19/4/1968
Academic Qualifications:- B.A. in Law, Faculty of Law, University of Jordan, 1988- Masters in Law, Faculty of Higher Studies, University of
Jordan, 1994
Experience:- Head of Legal Affairs Division, starting September 5,
2012- Head of Legal Department – Arab Countries, (7/2007 –
9/2012)- Legal Counsel (4/2003 – 7/2007)- Advocate and Legal Consultant, The Housing Bank for
Trade and Commerce, (6/1993 – 4/2003)- Advocate, private law office (7/1991 - 6/1993)- Legal Trainee (4/1989 – 6/1991)
Ms. Rabab Jamil Said Abbadi MCIPD
EVP - Head of Human Resources
Date of appointment : 22/4/2018
Date of birth : 10/12/1963
Academic Qualifications:
- B.Sc. Chemical Engineering, University of Baghdad, 1987
- Masters of Business Administration (MBA) Marketing, Coventry University, UK, 2003
- Member of the Chartered Institute of Personnel and Development, UK, 2016
Experience:
- Executive Vice President / Head of Human Resources/Arab Bank (Since 4/2018)
- Executive Director / Human Resources/Bank of Jordan” Jordan, Palestine, Syria & Bahrain” (2009-2018)
- Head of Human Resources, “Bahrain & Egypt”/ Standard Chartered Bank (2006-2009)
- Head of Human Resources, Levant/ Standard Chartered Bank (2004-2006)
- HR Product Manager /Great Plains Middle East “Dubai” (2000-2002)
- Human Resources Officer/American University of Sharjah (1999-2000)
SENIOR EXECUTIVES

42
Mr. Michael Matossian
EVP - Chief Compliance Officer
Date of appointment : 28/11/2005
Date of birth : 23/2/1956
Academic Qualifications:
- B.Sc. Accounting, Montclair State University – USA, 1978
- Professional Certificates: Certified Public Accountant, Certified Management Accountant, Certified Fraud Examiner, Certified Risk Professional, Certified Anti-Money Laundering Specialist - USA
Experience:
- Executive Vice President / Group Regulatory Compliance, Arab Bank plc – (since 11/2005)
- Chief Compliance Officer, Fifth Third Bank – USA (2003 - 2005)
- Senior Vice President and Director of Regulatory Risk Management, Director Anti-Money Laundering, Director Operational Risk Governance – Wachovia Corporation (formerly First Union) – USA, (1995 – 2003)
- Vice President and Director of Management Internal Control, First Fidelity Bancorporation (acquired by First Union) - USA, (1993 - 1995)
- Senior Vice President and Chief Internal Auditor, National Community Banks, Inc. – USA, (1989 – 1993)
- Senior Audit Manager, Arthur Andersen, LLP – USA, (1979 - 1989)
- Regulatory Inspector, U.S. Treasury Department, Office of the Comptroller of the Currency – USA (1976 – 1979)
- Deputy Chair of the MENA Financial Crime Compliance Group, Member Global Coalition to Fight Financial Crime
Mr. Fadi J. Zouein
EVP - Head of Internal Audit
Date of appointment : 1/11/2009
Date of birth : 14/04/1965
Academic Qualifications:
- BA, Business Administration, Saint Joseph University – Beirut, 1987
- High Diploma in Commercial Studies, Banking and Finance , Saint Joseph University – Beirut, 1992
- Professional Certifications (CIA, CISA,CFE)
Experience:
- Executive Vice President/ Head of Internal Audit , Arab Bank plc – (since 2009)
- General Manager Internal Audit, Gulf Bank – Kuwait, (2008 – 2009)
- Head of Internal Audit, Bank of Beirut – Lebanon, (1993- 2008)
- Senior Auditor Wedge Bank Middle East – Lebanon, (1992-1993)
- Credit Analyst, Bank Tohme - Lebanon, (1989 - 1992)
- Member of the Institute of Internal Auditors
SENIOR EXECUTIVES

43
Mrs. Khulud Walid EisawiHead of Secretariat Department
Date of appointment : 23/9/1989
Date of birth : 3/10/1967
Academic Qualifications:
- M.S.c in English Language – University of Jordan 1995- B.S.c in English Language – University of Jordan 1989
Experience:- Head of Secretariat Department (5/2015 – present)- Manager / Secretariat Department (9/2012 – 5/2015)- Office of Chairman of the Board of Directors (1/1996
– 8/2012)- Employee at the Credit Department – International
Branches (9/1989 – 12/1995)
RESIGNED SENIOR EXECUTIVES DURING 2020
There were no resignations during the year 2020

44
SUMMARY OF PERFORMANCE APPRAISAL AND PERFORMANCE INCENTIVES POLICIES
Arab Bank complies with the corporate governance regulations issued by the Central Bank of Jordan and the other central banks, and the relevant official entities in the countries where Arab Bank operates. Its performance management and incentives policies link performance bonuses with the employee’s performance, the results of the respective division, the performance of the country where Arab Bank operates, and the overall performance of the bank.
Arab Bank believes that the performance salary and bonus policy should be competitive so that it is able to attract and retain people with high levels of knowledge, skill, and expertise in their fields. For that reason, the bonus scheme is based on the different levels of performance categories.
The bank’s salary and bonus policies do not accept or approve any achievements that may expose the bank to unacceptable short- or long-term risks and do not reward poor performance. The bank applies tools in line with governance regulations that promote the optimal use of the bonus pool based on achievement levels and allow for the possibility of deferring, reducing, or clawing back the already approved or granted bonuses.
The policies take into account all types of risks associated with the core activities of the bank (liquidity, credit, operational and market risks, general circumstances in the regions where the bank operates, etc.). These risks are identified to help achieve the balance between financial performance and risk levels that could arise through its banking activities and business deals.
The purpose of the policies is to enhance the bank’s long-term performance and ensure that revenues have been achieved, while taking into account that future revenues may be subject to changing circumstances. For this reason, granting bonuses is based not only on the current year’s performance, but also on the period it may take for such revenues to be attained. This policy applies to long-term objectives that cannot be achieved in the same year, thereby emphasizing the link between the bonus amount, the period over which it will be granted, and the actual attainment of future results.
Arab Bank is also keen to apply the best practices in measuring and evaluating performance by benchmarking itself against set Key Performance Indicators (KPIs). These KPIs help to determine the bonus amounts that reward high performance, achieve differentiation between various levels of performance, and help to motivate and retain outstanding performers at all management levels.
The performance bonus policy helps the bank to be objective and independent of the employees working in control functions, such as risk management, compliance, and internal control, where their performance is measured and their bonuses are determined independently from the business functions they control.

45
COMPETITIVENESS AND MARKET SHARE
Arab Bank has one of the largest global Arab banking branch networks, with over 600 branches across five continents. In addition to being one of the most important banks in the Middle East and North Africa, Arab Bank is also one of the most competitive and diverse financial institutions. It enjoys an excellent reputation and high levels of credibility, and it has earned the trust of its customers and shareholders.
Despite the challenges posed by the current situation in the Middle East and the volatility of the global economy, Arab Bank continues to meet the needs and expectations of its customers and to protect the interests of its shareholders. The bank maintains a policy of strong liquidity and high capital adequacy ratios. This strategy enables it to work efficiently under difficult and volatile conditions and achieve sustainable profits that are underpinned by a foundation of solid financial performance.
THE LEADING REGIONAL BANK
Arab Bank received several international awards and recognitions from reputable international parties. Some of the notable awards it received during 2020 are:
Global Finance Magazine:
- Best Bank in the Middle East (for five consecutive years)
- The World’s Best Bank in Frontier Markets
- Best Trade Finance Provider in Jordan
- Best Bank for Cash Management in the Middle East, Jordan, Bahrain, Lebanon, and Qatar
- Best Mobile Banking App in the Middle East and Jordan
- Best Online Trade Finance Services
- Best in Social Media Marketing & Services in Jordan
- Best Bill Payment & Presentment in Jordan
- Best Website Design in Jordan
- Best Consumer Digital Bank in Palestine
- Best Foreign Exchange Provider in Jordan
- Best Bank in Jordan
- Best Bank in Yemen
Euromoney Magazine
- Jordan’s Best Bank
- Best Cash Management Services in Jordan
Asiamoney Magazine
- Best Domestic Bank in Jordan
EMEA Finance Magazine
- Best Trade Finance Services in the Middle East
- Best Local Bank in Jordan
The Banker Magazine (published by the Financial Times)
- Bank of the Year in Jordan
Global Investor Magazine
- Cash Manager of the Year in the Middle East
Global Trade Review Magazine
- Best Trade Finance Bank in Jordan
World Union of Arab Bankers
- Best Mobile Banking Application in the Middle East

46
COMPETITIVENESS AND MARKET SHARE
Market shares in specific Locations:
Arab Bank operates in 28 countries in five continents. Its market share varies by country, according to the nature of business it conducts. The following table presents the Bank’s market share in selected Arab countries where the Bank operates:
Country Total Assets % Deposits % Direct Credit Facilities %
Jordan 20.19% 20.39 % 15.63 %
Palestine 23.35 % 24.29 % 20.05 %
Bahrain 3.73 % 2.37 % 3.10 %
Egypt 0.91 % 1.00 % 1.22 %
Lebanon 0.63 % 0.69 % 0.83 %
Qatar 0.41 % 0.58 % 0.40 %
UAE 0.63 % 0.75 % 0.78 %
Note: Market Share was calculated based on the most recent data released by the central banks in the respective countries.
Arab Bank ranks first among banks operating in Jordan in terms of total assets, deposits and credit facilities
Arab Bank competes in free and open economies on the basis of fair competition. It does not enjoy any government or preferential protection. It has obtained neither preferential advantages nor specific patents.
PATENTS & GOVERNMENT PROTECTION
No specific individual supplier or client accounts for 10% or more of the Bank’s total purchases and / or sales.
MAJOR SUPPLIERS AND CLIENTS
No decrees, laws or regulations were issued by any governmental bodies or international organizations that would have material impact on the Bank, its products or its competitive capabilities, noting that the international quality standards are not applicable to the Bank.
In 2020, Arab Bank received the following ratings from international credit rating agencies, considering the credit rating for the Jordanian Government.
• (BB) with (Negative) outlook from Fitch, in August 2020
• (Ba2) with (Stable) outlook from Moody’s, in December 2020
• (B+) for Arab Bank plc with (Stable) outlook in September 2020, as well as (BB+) with a (Negative) outlook for Europe Arab Bank from Standard and Poor’s
In their reports, the aforementioned agencies stated that Arab Bank follows a prudent risk approach and enjoys a strong franchise and a diverse geographic presence, in addition to sound management.
GOVERNMENT OR INTERNATIONAL ORGANIZATIONS REGULATIONS

47
ARAB BANK ORGANIZATION CHART / HEAD OFFICE
Board of Directors
Corporate Strategy Committee
Credit Committee
Nomination & Remuneration Committee
IT Governance Committee
Corporate Governance Committee
Audit Committee
Compliance Committee
Risk Management Committee
Chairman
Secretary General
Deputy Chief Executive OfficerChief Executive
Officer
Trea
sury
Econ
omic
Res
earc
h IT
Real
Est
ate
& C
onst
ruct
ion
Mgt
.
Ope
ratio
ns
Proc
urem
ent
EPM
O
Cons
umer
Ban
king
Corp
orat
e &
Inst
itutio
nal
Bank
ing
(CIB
)
Chief Operating Officer (COO)
Hum
an R
esou
rces
Bran
ding
Fina
nce
Lega
l
Secr
etar
iat
Cred
it
Ris
k
Regu
lato
ry C
ompl
ianc
e
Inte
rnal
Aud
it
ControlSupport
Secr
etar
iat
Cred
it
Business
Lega
l

48
Academic Qualifications
Arab Bank plc
Europe Arab Bank
plc
Arab Bank (Switzerland)
Ltd.
Arab Bank
Australia Ltd.
Islamic International
Arab Bank
Arab Sudanese Bank Ltd.
Al-Arabi Investment Group (AB
Invest)
Arab Tunisian
Bank
Arab Bank - Syria
Al Nisr Al Arabi
Insurance Company
Arab Company for Shared
Services
Arab Gulf Tech for IT Services
Arab National Leasing
Company
Al-Arabi Investment
Group Total
PhD 7 1 3 1 10 1 0 2 1 0 0 0 0 0 26
Master's degree 663 25 42 15 109 21 9 290 21 14 18 5 6 1 1 239
Advanced diplomas 24 22 31 2 3 7 1 337 3 0 2 0 0 1 433
Bachelor's degree 4787 55 16 39 655 47 27 272 177 215 79 29 16 5 6 419
Junior college 463 6 27 28 110 1 1 112 41 14 13 3 4 0 823
High school 476 30 10 10 44 5 1 175 17 5 5 1 2 1 782
Sub high school 441 0 1 1 65 2 4 215 11 8 2 1 1 0 752
Total Employees 6861 139 130 96 996 84 43 1403 271 256 119 39 29 8 10 474
NUMBER OF STAFF AND ACADEMIC QUALIFICATIONS

49
Academic Qualifications
Arab Bank plc
Europe Arab Bank
plc
Arab Bank (Switzerland)
Ltd.
Arab Bank
Australia Ltd.
Islamic International
Arab Bank
Arab Sudanese Bank Ltd.
Al-Arabi Investment Group (AB
Invest)
Arab Tunisian
Bank
Arab Bank - Syria
Al Nisr Al Arabi
Insurance Company
Arab Company for Shared
Services
Arab Gulf Tech for IT Services
Arab National Leasing
Company
Al-Arabi Investment
Group Total
PhD 7 1 3 1 10 1 0 2 1 0 0 0 0 0 26
Master's degree 663 25 42 15 109 21 9 290 21 14 18 5 6 1 1 239
Advanced diplomas 24 22 31 2 3 7 1 337 3 0 2 0 0 1 433
Bachelor's degree 4787 55 16 39 655 47 27 272 177 215 79 29 16 5 6 419
Junior college 463 6 27 28 110 1 1 112 41 14 13 3 4 0 823
High school 476 30 10 10 44 5 1 175 17 5 5 1 2 1 782
Sub high school 441 0 1 1 65 2 4 215 11 8 2 1 1 0 752
Total Employees 6861 139 130 96 996 84 43 1403 271 256 119 39 29 8 10 474
NUMBER OF STAFF AND ACADEMIC QUALIFICATIONS

50
TRAINING COURSES VS. TRAINEES IN JORDAN & ARAB AREAS IN 2020
AreaTalent and Ruwad
In house External E-Learning
Certifications and Business Skills
Grand Total Per AreaInternal Trainers In house/Training Partners
Technical Soft Technical Soft Technical Soft
Courses Trainees Courses Trainees Courses Trainees Courses Trainees Courses Trainees Courses Trainees Courses Trainees Courses Trainees Courses Trainees Courses Trainees
Jordan 36 430 20 359 63 939 16 184 2 19 6 27 0 0 450 7782 6 32 599 9772
Palestine 0 017 387 1 22 5 43 7 38 17 107 10 60 20
17565 70
82 2483
Egypt 0 0 9 89 10 98 31 290 1 26 36 187 3 28 24 3022 2 5 116 3745
Morocco 0 0 0 0 0 0 0 0 0 0 1 4 0 0 11 278 2 5 14 287
Algeria 0 0 1 15 0 0 2 73 0 0 6 34 0 0 12 506 0 0 21 628
Lebanon 0 0 0 0 1 15 9 43 3 10 4 5 0 0 24 674 2 4 43 751
Yemen 0 0 0 0 0 0 0 0 0 0 7 20 1 1 11 321 2 3 21 345
Bahrain 0 0 0 0 0 0 0 0 0 0 22 68 41 82 14 424 3 5 80 579
UAE 0 0 0 0 0 0 0 0 0 0 147 326 48 257 20 741 6 21 221 1345
Qatar 0 0 0 0 0 0 0 0 0 0 4 12 0 0 13 254 0 0 17 266
Total per Item 36 430 47 850 75 1074 63 633 13 93 250 790 103 428 599 15758 28 145 1214 20201

51
TRAINING COURSES VS. TRAINEES IN JORDAN & ARAB AREAS IN 2020
AreaTalent and Ruwad
In house External E-Learning
Certifications and Business Skills
Grand Total Per AreaInternal Trainers In house/Training Partners
Technical Soft Technical Soft Technical Soft
Courses Trainees Courses Trainees Courses Trainees Courses Trainees Courses Trainees Courses Trainees Courses Trainees Courses Trainees Courses Trainees Courses Trainees
Jordan 36 430 20 359 63 939 16 184 2 19 6 27 0 0 450 7782 6 32 599 9772
Palestine 0 017 387 1 22 5 43 7 38 17 107 10 60 20
17565 70
82 2483
Egypt 0 0 9 89 10 98 31 290 1 26 36 187 3 28 24 3022 2 5 116 3745
Morocco 0 0 0 0 0 0 0 0 0 0 1 4 0 0 11 278 2 5 14 287
Algeria 0 0 1 15 0 0 2 73 0 0 6 34 0 0 12 506 0 0 21 628
Lebanon 0 0 0 0 1 15 9 43 3 10 4 5 0 0 24 674 2 4 43 751
Yemen 0 0 0 0 0 0 0 0 0 0 7 20 1 1 11 321 2 3 21 345
Bahrain 0 0 0 0 0 0 0 0 0 0 22 68 41 82 14 424 3 5 80 579
UAE 0 0 0 0 0 0 0 0 0 0 147 326 48 257 20 741 6 21 221 1345
Qatar 0 0 0 0 0 0 0 0 0 0 4 12 0 0 13 254 0 0 17 266
Total per Item 36 430 47 850 75 1074 63 633 13 93 250 790 103 428 599 15758 28 145 1214 20201

52
RISK MANAGEMENT
OVERVIEW
Arab Bank (the ‘Bank’) addresses the challenges of banking risks comprehensively through an Enterprise-Wide Risk Management Framework built in line with leading best practices, and supported by a Board and Executive level risk governance structure and risk oversight.
The Board of Directors reviews and ratifies the Bank’s overall risk management strategy, and oversees its execution. In addition, the Board of Directors, through its various committees, oversees and ensures that comprehensive risk management policies and procedures are established in all of the Bank’s locations to manage all types of risks including Credit Risk, Market Risk, Liquidity Risk, Operational Risk, Information Security and Business Continuity and Crisis Management. Furthermore, the Board of Directors approves the Bank’s Risk Management Strategy, Risk Management Frameworks, High Level Policies and the Group Risk Appetite.
The Bank governs risk through the following Board and Executive Committees:
• Audit Committee. (Board of Directors)
• Risk Management Committee. (Board of Directors)
• Compliance Committee. (Board of Directors)
• Credit Committee. (Board of Directors)
• Executive Credit Committees.
• High Asset and Liability Management Committee.
• Operational Risk-related committees including Investigation Committee, Information Security and Business Continuity Committee.
The Bank adopts three lines of defense model for risk control and oversight and each line has a distinct but interrelated role to play to ensure that the Bank as a whole manages risk. Each line has a number of responsibilities, which are laid out below:
First Line: Strategic Business Lines and Country Internal Control Units. The Heads of the Strategic Business Lines manage risks within their specific business lines whether credit or operational. In addition, the Treasury is responsible for the management of market and liquidity risks. They operate within formally delegated risk limits and are responsible and accountable for identifying, assessing, mitigating and reporting on risks in the course of their business activities.
Second Line: Group Risk Management (GRM) and Group Regulatory Compliance (GRC). The Risk Management Function is responsible for ensuring that the Bank has a robust system for
the identification and management of risk and for establishing appropriate risk frameworks consistent with the Bank’s overall business strategy and risk appetite. The Compliance Function challenges the first line on effective compliance risk management, provides advice and guidance, and is responsible for assuring that the Bank is in compliance with applicable laws, rules and regulations issued by local regulatory authorities as well as adherence with the Bank’s Code of Conduct.
Third Line: Group Internal Audit (GIA): The Bank’s Internal Audit Function is independent from executive management and reports to the Audit Committee of the Board. It contributes to achieving the Bank’s objectives by following a systematic and disciplined approach to evaluate and improve the effectiveness of risk management control and governance processes. The function conducts its activities in accordance with the Internal Audit Standards and provides an independent and objective assurance that the Bank’s functions work in compliance with approved policies and procedures and that all functions are committed to maintain an effective and efficient internal control environment, within approved methodologies and frameworks. Group Internal Audit provides the Board Audit Committee, the Chief Executive Officer and the respective business units with the audit outcome and monitors the implementation of remedial actions.
RISK MANAGEMENT
Group Risk Management represents one of the fundamental levels of oversight and is part of the organizational structure framework for managing the Bank’s risks. Arab Bank’s Risk Management Strategy is designed to provide a structured approach for identifying, assessing, controlling, reporting and monitoring financial and non-financial risks within the Bank. Within this structure, the Risk Management Function is responsible for:
1. Developing an integrated Risk Management Framework aligned with the Bank’s overall strategy.
2. Implementing the Risk Management Framework and developing policies and procedures for all types of risks and monitoring their implementation across all Arab Bank plc entities.
3. Defining the Risk Appetite Statement and establishing the appropriate risk acceptance parameters and limits supported by clear methodologies to evaluate risk. This is carried out the Group level and cascaded down at the local level.
4. Developing appropriate risk measurement tools and models to measure, control and oversee all types of risk at the Group and local level.

53
5. Designing, implementing and following-up on a risk and control self-assessment for the Bank’s products, activities, systems and processes in coordination with all the functional heads.
6. Ensuring that Business Continuity Management, Crisis Management and Disaster Recovery Plans are in place and developing related policies and procedures in line with local regulatory regulations and international best practices in that regard.
7. Perform Internal Capital Adequacy Assessment (ICAAP) for the Group and locally according to requirements.
8. Develop the Bank’s “Recovery Plan” for the Group and locally according to requirements.
9. Putting in place the Contingency Funding Plan framework, in coordination with Global Treasury, that clearly sets out the strategies for addressing liquidity shortfalls in emergency situations, at the Group and country levels.
10. Conduct stress-testing on the Bank’s Credit, Liquidity, Market and Operational risks exposures to measure the ability of the Bank to withstand shocks and elevated risks.
11. Monitoring the level of compliance of executive divisions with defined acceptable risks.
12. Developing and enhancing internal risk management practices in line with regulatory changes and industry best practices.
13. Submitting reports to the Board (through the Risk Committee) and to Executive Management on the Risk Profile of the Bank and its status in relation to the Bank’s Risk Appetite, and follow-up to ensure the proper remediation of deviations.
14. Providing recommendations to the Risk Committee of the Board on mitigating risk exposures and documenting and reporting any exception to policies and standards.
15. Providing the necessary information for required risk reporting and disclosures.
16. Improving and raising the level of risk awareness among all employees based on best practices and standards especially those pertaining to the financial sector.
17. Ensuring proper integration between risk measuring tools and IT systems.
Each of the following departments within Group Risk Management has specific roles and responsibilities aimed at advancing the Bank’s risk management
capabilities based on best practices, international guidelines and requirements of regulatory authorities. Group Risk Management Division includes the following departments: Credit Risk Department, Business Risk Review Department, Market and Liquidity Risk Department, Treasury Middle Office Department, Operational Risk Department, Information Security Department, Business Continuity Management Department, Insurance Department, and the Policy Center.
• The Credit Risk Management Department is responsible for the centralized reporting of credit risk, credit policy review, the International Financial Reporting Standard (IFRS9) Impairment Methodology, and the internal risk rating systems, which are designed to enhance “probability of default” measurement. The department is also responsible for the implementation of Central Banks and Basel Committee requirements that are related to Credit Risk and any amendments thereof.
• The Business Risk Review Department conducts comprehensive individual, portfolio and business risk reviews to ensure that the Bank’s various portfolios are aligned to their economic perspective, business strategy and target market and recommends corrective action, if necessary. The department also assesses the quality of the loan portfolio, the sound implementation of the lending policies and processes and the capabilities of the credit staff. Supplemental targeted reviews are undertaken based on market conditions, the size and sectoral nature of portfolios. In specific instances, such reviews are supported by tailored stress testing scenarios.
• The Market and Liquidity Risk Management Department is responsible for setting comprehensive market and liquidity risk policy frameworks. The policy framework ensures independent measurement, monitoring and control of the Bank’s market and liquidity risks. The department is also responsible for setting and monitoring risk limits and development of market and liquidity risks measurement tools, such as Value-at-Risk, stress testing and other quantitative risk assessments (such as those related to Basel II and III), which are performed in coordination with Treasury and Finance. The Treasury Middle Office function is a Treasury Front Office control unit responsible for trade monitoring and validation, monitoring of limits, escalation of breaches and risk reporting.
• The Operational Risk Management Department, which also covers strategic and reputation risks, leads the implementation of a Bank-wide operational risk management framework, as part of the overall strengthening and continuous improvement of the internal control systems within
RISK MANAGEMENT

54
the Bank. The framework consists of policies and aims at the identification, assessment, controlling/responding to, monitoring, and reporting of operational risks in all business activities. The Bank monitors operational risk exposures against the risk appetite at various levels across the Bank. The operational risk appetite is articulated in the Board approved Risk Appetite Statement. Operational Risk Management Department supports innovation and digital transformation to enable the Bank to effectively manage related risks and support process optimization, growth and performance, while maintaining risks within the acceptable levels. Major tools used for operational risk management include:
• Risk and Control Self-Assessment (RCSA); through which the Bank assesses the operational risks of the Bank’s products and services and their potential impact.
• Key Risk Indicators provide early signals of changes in risk exposures in various areas of the Bank.
• Loss data collection and analysis of operational risks provide meaningful information for assessing the Bank’s exposure to operational risk and the effectiveness of internal controls.
• Operational Risk Stress Testing used by the Bank to assess the impact of possible future operational risk stresses on its capital adequacy and limits.
• The Information Security Department aims at enabling and supporting business growth by minimizing information and technology risks, ensuring compliance and enabling technology adoption in all lines of business including the digital banking services enjoyed by our clients. The goal is to ensure that assets (information, people, processes and technologies) are adequately protected from possible threats, whether internal or external, deliberate or accidental. Our strategy recognizes the importance of Information Security in establishing and maintaining a trust relationship with our customers, business partners, and Bank employees. This is built to instill good security practices, raise information risk awareness, strengthen controls, and ongoing enhancement for the effectiveness of prevention security controls, monitoring and incident response.
• The Business Continuity Management Department aims to counteract interruptions in business activities, to protect critical processes from the effects of major information systems failures or disasters, whether natural or otherwise, and to ensure their timely resumption. The framework is based on identifying major risks and analyzing their impact on business. The teams conduct risk
assessments and use a centralized database to build the Bank’s comprehensive continuity plans. These plans are kept up-to-date by each country using a web-based application, and are tested on a regular basis to ensure timely resumption of essential operations and services.
• The Insurance Department oversees all the Bank’s insurance operations using a centralized database at the local and group levels. It also arranges adequate insurance cover for all insurable risks. Additionally, the department provides the Bank’s divisions with the necessary support in reviewing, recommending, and delivering customized insurance coverage for products, portfolios, credit facilities, and financial transactions related to the Bank’s clients. In addition, the Insurance Department is responsible for the setup and maintenance of the Bancassurance products and agreements.
• The Policy Center Department is responsible for centrally managing all the Bank’s high level policies from the development phase until final ratification, according to a standard framework specifically customized for the Bank and in line with best international market practices. These high level policies are then embedded in more details into the Bank’s various operational processes and its policies and procedures. The high level policies of the Bank are periodically reviewed in order to increase the effectiveness of the risk measurement and monitoring tools, and to reflect new regulatory requirements.
The various Group Risk Management departments work in coordination with the Finance division on Capital Management to assess the impact of new regulations (e.g. Basel III), and to deliver a comprehensive Internal Capital Adequacy Assessment Process (ICAAP) and the Recovery Plan. This is supplemented by a stress testing framework which includes multiple scenarios covering credit, market, liquidity and operational risk events. Periodic reporting to Senior Management and to banking regulators further ensures that our capital is managed effectively.
CREDIT RISK:
Arab Bank’s conservative risk strategy combined with its dynamic and proactive approach in managing credit risk are key elements in achieving its strategic objective of maintaining and further enhancing its asset quality and credit risk profile. The conservative, prudent and well-established credit standards, policies and procedures and risk methodologies, as well as strong risk monitoring and control infrastructure enable the Bank to deal effectively with emerging risks and challenges.
RISK MANAGEMENT

55
Credit management decisions are based on the Bank’s business strategy and risk appetite. The quality of the portfolio is examined on a regular basis in relation to key performance indicators. Diversification is the cornerstone for mitigating portfolio risks, which is achieved through industry, geographical, and customer tolerance limits. Periodic stress testing based on conservative scenarios, which are regularly reviewed, are key tools in managing the credit portfolio.
The credit process at Arab Bank is well defined and is institutionally predicated on:
• Clear tolerance limits and risk appetite set at the Board level, well communicated to the business units, periodically reviewed, and adjusted as appropriate.
• Credit Committee structure that ensures credit approvals are made by consensus through committees and not individuals.
• Clear segregation between Business and Credit.
• Authorities are delegated based on risk-differentiated grids for each committee at Country and Head Office levels, which are reviewed on a regular basis.
• Well-defined target market and risk asset acceptance criteria.
• Rigorous financial, credit and overall risk analysis for each customer/transaction.
• Regular credit risk reporting to Senior Management, Credit Committees and Risk Committee of the Board.
• Concentrations together with mitigation strategies are continuously assessed.
• Early warning system is continually validated and modified to ensure proper functioning for risk identification.
• Advanced systematic and objective credit risk rating methodologies that are based on quantitative, qualitative and expert judgment, these methodologies undergo regular validation and calibration processes.
• Systematic credit limits management enabling the Bank to monitor its credit exposure on daily basis at country, borrower, industry, credit risk rating and credit facility type levels.
• Solid documentation and collateral management processes where collateral is continuously monitored and assessed to ensure proper coverage and top-up triggers.
• Annual and interim individual credit reviews to ensure detecting any signs of weakness or warning signals and considering proper remedies in case of need.
• Implementation of strict control and monitoring systems, which are based on disciplined follow up and monitoring.
• The Bank offers several consumer banking products which are managed on a product portfolio basis through a well-established Credit Product Program. The program is considered the principal approval vehicle for credit products offered to a homogenous set of customers in multiple locations, and is subject to annual review and approval and regular assessment of the program’s performance at Arab Bank Head Office.
• Starting January 2018 Arab Bank has applied the International Financial Reporting Standard (IFRS9). A forward looking expected credit loss model that closely aligns with the clients’ credit worthiness, the significant increase in credit risk based on three stages and taking into consideration related macroeconomic factors. The Bank adopts the credit provisioning requirement in accordance with IFRS9 guidelines, Central Bank of Jordan or other regulators’ guidelines in countries where the Bank has presence, whichever is stricter.
• Conservative approach to provisioning and managing bad debt collection and early identification of problem areas. Such approach is subject to periodic legal and credit reviews and account strategies set to minimize NPLs and maximize recoveries and collections.
• Regular stress-testing scenarios for top exposures and portfolios and assessment of impact on capital and earnings.
• The Bank enhances its processes and technology infrastructure on an ongoing basis taking into account the changing banking environment and the availability of new systems in the industry.
• Our credit processes are supplemented by sectoral portfolio reviews focused on countries, regions or specific industries, which are intended to identify any inherent risks in the portfolios resulting from changes in market conditions.
• Business Risk Review department within Group Risk Management and Group Internal Audit provide independent regular reviews and assessments on the quality of the credit portfolios within the Bank and the related credit management processes.
• The Bank is focused on developing and enhancing its credit staff competencies through specialized training programs to ensure that they are well equipped to effectively carry out their roles and responsibilities.
RISK MANAGEMENT
56
LIQUIDITY RISK:
Liquidity is defined by the Bank for International Settlements as the ability of a Bank to fund increases in assets and meet obligations as they come due, without incurring unacceptable losses. The objective of the liquidity risk management framework is to ensure that the Group can fulfill its payment obligations at all times and can manage liquidity and funding risks within its risk appetite. Arab Bank has a robust infrastructure of policies, processes and people, in order to support its strategy and ensure that all obligations are met in a timely manner, under all circumstances and without undue cost.
Liquidity continues to be an area of great focus for Arab Bank. The Bank has a highly diversified and stable funding footprint. In addition, it maintains a large portfolio of highly liquid assets, which acts as a contingent funding source which further boosts liquidity. Arab Bank’s long-standing emphasis on maintaining a broad and stable liquidity base has protected the Bank from any negative effects of market volatility.
Arab Bank’s liquidity management strategy is determined by the High Asset and Liability Management Committee (High ALCO). The operations of the country level Treasury teams are centrally controlled, and monitored. In coordination with local Asset and Liability Management Committees, the various countries’ Treasury teams across Arab Bank work together to meet local and Group needs. The Asset and Liability Management Committees analyse market and liquidity risk exposures and take action where appropriate to adjust the pricing and product mix, in order to ensure an optimal balance sheet structure and market and liquidity risk profile for the Bank.
Treasury Department is mandated to manage the overall liquidity and funding position of the Bank, with Group Risk Management Department acting as an independent control function, responsible for reviewing the liquidity risk framework, setting the risk appetite and developing of Liquidity Risk models, which are used by Treasury, to measure and manage the Group’s liquidity risk profile.
The Global Treasury and Group Risk Management receive daily information on actual, forecast and modeled liquidity. Such information is received at country level and at Group level. This provides the Treasurer with high quality decision support information and ensures that Treasury can provide the High ALCO with comprehensive management information on liquidity across the Group. The establishment of limits for Arab Bank’s liquidity risk appetite, as with other forms of risk, is managed by the Head of Group Risk and the High ALCO.
The Bank uses a variety of tools to measure liquidity risk in the balance sheet. These metrics help the Bank to plan and manage its funding and help to identify any mismatches in assets and liabilities, which may expose the Bank to
roll risk. These metrics include one week and one month liquidity ratios, cumulative liquidity gap modeling, inter-group borrowing and lending analysis, loan to deposit ratios, large depositor concentration monitoring, Basel III liquidity ratios, and stress testing.
Liquidity Stress Testing framework is one of the key tools for anticipating liquidity risk and evaluating the Group’s short term liquidity positon. The Bank uses stress tests and scenario analysis to assess the impact of possible future liquidity stresses on its cash flow and liquidity. The liquidity stress testing methodology consists of hypothetical events inspired by the Bank’s own experience, regulatory requirements and external events of relevance to the Bank’s portfolio.
Arab Bank’s comprehensive approach to measuring and managing liquidity gives the Group a great deal of confidence in its ability to endure all unforeseen market events, while still being able to meet all of its obligations to its customers and regulators. This is supported by the Bank’s Treasury and Risk systems.
Liquidity risk will continue to have a major influence on how the world’s banks operate and interact, and regulators will continue to require increasingly high standards of liquidity governance. Arab Bank’s approach to liquidity management, along with its current and contingent funding structures, leaves it very well placed to face the future with great confidence. Arab Bank’s funding model has shown itself to be extremely resilient for many years and hence remains materially unchanged.
MARKET RISK:
Market risk is defined as the potential for loss from changes in the value of the Bank’s portfolios due to movements in interest rates, foreign exchange rates, equity prices and commodity prices. One of the main objectives of Market Risk Management is to ensure that the Bank’s risk exposure is within the approved market risk appetite. Market Risk Management defines and implements a framework to systematically identify, assess, monitor and report the Bank’s market risk.
Historically the Bank has managed its market risk across its Trading and Banking Books on a consolidated basis as this is a more conservative approach to the management of this risk. In addition, through its Funds Transfer Pricing Policy, the Bank ensures that market risk is transferred from Corporate and Institutional Banking and Consumer Banking to Treasury, where it can be aggregated and centrally managed.
In addition to customer deposit taking and lending activity, three main activities which can expose the Bank to market risk are: Money Markets Trading, Foreign Exchange Trading and Capital Markets Trading.
RISK MANAGEMENT
57
The Bank’s market risk management strategy is to maximise the economic return of assets taking into account the Bank’s risk appetite as well as local regulatory constraints. Market risk is governed by the Global Treasurer, the Head of Group Risk and the Chief Financial Officer. The High ALCO provides market risk oversight and guidance on risk appetite and policy settings, and establishes the overall limits, which are then allocated to the various entities by the Global Treasurer. The Global Treasury Policies and Procedures clearly define the rules that exist for the active management of all the Group’s portfolios, which are subject to market risk. Group Risk Management, in coordination with Global Treasury, ensures that the policies and procedures are updated on a regular basis, or when the need arises. The market risk limits are established based on the Bank’s strategy and risk appetite, and risks are monitored by an independent Middle Office and are reviewed on a regular basis by Global Treasury and Group Risk Management.
The Bank is subject to three types of market risks:
- Interest Rate Risk: Interest rate risk in the Group is limited, well managed, and continuously supervised. A large proportion of the interest rate exposure is concentrated in the short end of the yield curve, with durations of up to one year. Exposures of more than one year are particularly limited and well controlled. Interest rate risk is managed in accordance with the policies and limits established by the High ALCO. The Asset and Liability Management Committees in the various countries, as well as the respective treasurers, handle the day-to-day management of interest rate risks.
The Group manages its IRR exposures using economic value (PV01) as well as earnings based (NII 100) measures. The Treasury Department is mandated to manage the interest rate risk, with Group Risk Management Department acting as an independent oversight function.
- Capital Markets Exposures: Investments in capital markets instruments are exposed to market risk arising from changes in interest rates and credit spreads. Arab Bank Group’s exposure to this kind of risk is limited due to its strong control over credit and interest rate risk.
The equity investment portfolio represents a very small percent of the Bank’s overall investments and generally consists of direct investments in strategic alliances as well as seed investment in mutual funds originated from within the Group.
- Foreign Exchange Risk: Foreign exchange activity arises from mismatches in assets and liabilities that are denominated in currencies other than the functional currency of the respective entity. Strict foreign exchange risk limits are set to define exposure and sensitivity
tolerance for trading in foreign exchange. The Bank hedges itself appropriately against potential currency fluctuations in order to minimise foreign exchange exposure.
In Treasury, positions are usually held open only for small risk equivalents. The majority of positions arising from customers are covered on a daily basis. Positions are measured and supervised by local management daily and by global management weekly.
Market Risk Management and Measurement Techniques:
Managing market risk is a key part of the Bank’s business planning process, and in line with the Bank’s risk appetite, exposure to market risk is kept at a minimal level. The main tools used for measuring and managing market risk are the following:
1. PV01: PV01 uses the interest rate gaps at the balance sheet level to measure the risk to economic value arising from changes in interest rates by 0.01%. This is measured at country and Group levels. All interest rate positions are included in the PV01 calculation, including both on-balance sheet and off-balance sheet products in the Trading and Banking Books.
2. NII 100: NII100 measures the effect of a 1% increase in interest rates on first and second year pretax earnings. This is measured at country and Group levels.
3. Overall Net Open FX Position: The Overall Net Open FX Position measures the open position for each currency, including precious metals, at country and Group levels.
4. Value at Risk (VaR): VaR is currently used as an internal measure of market risk to estimate the maximum loss that may be experienced by the Group over a one day holding period with 99% confidence level using the Historical Simulation approach supported by 500 days of data. The Group’s VaR calculation is run at consolidated and country levels and covers both interest rate and foreign exchange risks.
5. Stress Testing: The Stress Testing model aims to complement the Group’s Market Risk calculations by identifying and quantifying the effects of extreme, but plausible events on the Group’s portfolio. The methodologies used range from single factor to multi-factor stress tests. The single factor stress tests incorporate a number of standard shocks in addition to worst historical movements for each risk factor. The multi-factor tests consist of hypothetical and historical tests as well as a hybrid of the two. All scenarios are tailored to account for the special characteristics of the Group’s portfolio.
RISK MANAGEMENT

58
OTHER RISKS:
Arab Bank faces a number of other banking risks, which include compliance risk and strategic risk.
COMPLIANCE RISK:
Arab Bank maintains an unwavering commitment to integrity and exercises the highest ethical standards across its operation, applying both the letter and spirit of regulations to ensure compliance with statutory, regulatory, and supervisory requirements. The Board’s Compliance Committee has primary oversight responsibility for all aspects of compliance risks, including financial crime risk, and adherence to the Bank’s Code of Conduct.
Group Regulatory Compliance Division, reporting directly to the Chief Executive Officer and with direct access to the Compliance Committee of the Board of Directors, is responsible for maintaining appropriate policies, procedures and controls to identify and mitigate risks arising from financial crime including terrorist financing, money laundering, bribery and corruption, and sanctions and interdiction. Our combating financial crime standards and controls set the minimum requirements and control objectives to guard against involvement in illicit activity and are reflective of applicable regulatory requirements and industry leading practices. Compliance processes are in place across our Branches and Subsidiaries while also taking into consideration applicable local requirements. Where local laws and regulations are more stringent, these more stringent local laws and regulations are applied. Appropriate processes are also applied to manage compliance risks arising from the conduct of our employees including personal conduct related conflicts of interest, treating customers fairly, and privacy.
To preserve the Bank’s reputation and integrity, all employees are expected to adhere to applicable laws, policies, and our Code of Conduct which provides an ethical compass guiding their daily actions. Senior management leads by example encouraging a culture of ethics. Employees and third parties are required to promptly report any actual or potential irregularity or misconduct within Arab Bank. There have been no regulatory sanctions nor any significant fines associated with non-compliance.
Arab Bank endeavors to protect customers’ interests and that they are treated fairly by applying a customer centric approach in developing and marketing products and services. Therefore, internal communications and training reiterate and foster customer centricity while treating customers fairly and transparently
Arab Bank gives great importance to customer complaints, recognizing that it is one of the key indicators of the level of service quality and performance of its products and services offered to customers. In Jordan, Egypt, Palestine, and IIAB Customer Complaints are managed by separate units within the Compliance function in accordance with local regulatory guidelines / requirements in these countries, and has been equipped with qualified and trained staff who are able to handle, analyze, and act on customer complaints as required. In the rest of the countries, Customer Complaints are managed by the Service Excellence Unit under the Consumer Banking Division. All complaints are handled in an effective and highly professional manner including the identification of root causes to avoid repeated complaints. All customer complaints received by Arab Bank during 2020, have been reviewed, analyzed, and handled in accordance with the Bank’s policies and procedures and in a fair and transparent manner.
With the steadfast support and commitment of the Arab Bank Board of Directors and Senior Management, coupled with the dedication of Bank staff, Arab Bank is resolved to sustain and further strengthen its sound compliance program and to continue to adhere with applicable regulatory requirements while also adapting to changing customer demands.
STRATEGIC RISK:
The Bank maintains clearly defined work standards for comprehensive strategic planning. The Board of Directors, together with the Bank’s management, periodically analyses the impact of the Bank’s major operations on its strategy, including the internal and external working conditions, the implications of competition, customer requirements, changes in laws and information technology as well as the Bank’s existing systems.
Achievement of the Bank’s clearly-defined objectives depends on a basic principle; its ability to fully leverage its widespread network of branches, maintain and develop its strong customer base, continuously expand and improve its products and services and maintain its sound financial position.
Management assesses the Group’s financial performance in light of the current strategy and the need to revise its objectives, if necessary, in the context of a continuously changing work and market environment. As such, profitability and commitments of projects to be undertaken are assessed in the context of “Business As Usual” as well as “Stressed Conditions” scenarios. This ensures the Bank is able to quickly react to developing situations in managing its longer term strategy.
RISK MANAGEMENT

59
In 2020 there were unprecedented challenges locally, regionally, and globally as the result of the COVID-19 pandemic, which had health, economic, and social repercussions on virtually every country, region, and economy of the world.Arab Bank Group closed 2020 reporting net income after tax of US$195.3 million, as compared to US$846.5 million in 2019, recording a drop of 77%. Group equity grew to reach US $9.4 billion. The year 2020 was challenging for the global and regional banking sectors due to economic contraction, higher cost of risk, and lower interest rates in addition to the plunge in oil prices since the outbreak of the pandemic. The bank entered the crisis from a position of strength, with stable credit quality coupled with sound liquidity and capital ratios. The drop in profits is attributable to the build up of higher provisions, driven by the deterioration of the macro-economic environment regionally and globally, and to lower revenues from interest and fee income due to the COVID-19 pandemic, and to lower market interest rates and weakening oil prices.Group net operating income is at US$1,007 million, 25% lower than the prior period, as a result of a decrease in net interest and commission income, and the drop in the contribution of the bank’s associates in the Gulf. Customer deposits grew by 7% to reach $38.7 billion as compared to US$36.2 billion, while loans grew by 1% to reach US$26.5 billion as compared to US$26.1 billion. The Group maintained its strong and robust capital base with equity of US$9.4 billion and a capital adequacy ratio of 16.8% calculated in accordance with Basel III regulations. The Group enjoys high liquidity with a loan-to-deposit ratio of 68.4%, while credit provisions held against non-performing loans continue to exceed 100%.The Corporate and Institutional Banking (CIB) division successfully navigated the challenges of the COVID-19 pandemic in a manner that enabled continuity of business and customer support. The division also deployed robust portfolio management across the network.Over the past year, CIB has focused on solidifying its product and service offerings and strengthening its digital proposition. Its client-centric strategy has served the needs of both multinational corporations and corporate clients, nationally and regionally. CIB continued to provide its corporate clients with comprehensive well-rounded products and services that complement their business cycle, size, and industry specialization. These solutions span jurisdictions and have enabled our clients address the challenges of a diversified region and the COVID-19 pandemic. CIB continued to focus on achieving the bank’s strategy to accelerate digital transformation. Its digital product offerings, such as ArabiConnect cash management and trade finance corporate platform and the ArabiSync host-to-host solution, allowed clients to manage their
liquidity, conduct their business and trade operations, and carry out their day-to-day financial transactions, locally and across borders. These solutions have helped ensure business continuity while making financial services accessible to its customers. Arab Bank remains a prominent financier in the region for major corporations involved in trade and projects related to power, electricity, water treatment and desalination, and road infrastructure across the MENA region. CIB also continued to provide services to SMEs, with specialized solutions and dedicated business centers across the bank’s network.Consumer Banking Department continued to make progress with its digital strategy by enriching the customer experience through digital onboarding and engagement, products and programs development, and revamped customer journeys. Many services were introduced to help customers conduct their banking transactions during the pandemic.The ability to open an account digitally through the Arab Mobile application in Jordan was a key objective that was achieved during the year. The introduction of cross-border account opening also enabled customers to open accounts in Jordan, Palestine, Egypt, and the UAE. In Jordan, digital instant account opening for children and enrolment in the Arabi Junior program was also added. It gave parents mobile access to their children’s accounts, provided an instant saving feature, offered a new card design for ATM and eCommerce access, and gave free subscriptions to the digital learning platforms, I Read Arabic and Abwaab.To help us better understand our customers’ needs, a customer relationship management (CRM) system was introduced in Palestine and Egypt to help the bank develop more customer-focused services and products. E-Tawfeer, a digital saving program, was introduced in Jordan and Palestine. It offers special features, such as saving goals management.Consumer Banking introduced its “Arabi Fitness” service in Jordan to encourage healthy living and enable customers to convert points earned from walking into Arabi Points for extra benefits. Several tie-ups with different business partners were introduced to give Arab Bank customers lifestyle benefits and special offers, such as digital eVouchers, beIN subscription, Uber, Al-Tibbi, Wafii, Total Gas, Toghi.com, Noon, Shahid.net, Rentalcars.com, and reports on the latest weather conditions, among others.Consumer Banking added many personalized real time alerts to its Arabi Mobile application in Jordan to help direct customers to offers and let them know that their transactions were going through. Customers are able to place ATM cash withdrawal orders and enjoy enhanced bill payment capabilities by connecting to the Fawry bill payment gateway in Egypt and the PayKii gateway in the UAE.
ACCOMPLISHMENTS 2020
Board of Directors ,
Report

60
ACCOMPLISHMENTS 2020
The bank introduced several campaigns to reward customers for using their cards for either Commerce or in-store purchases and free money transfers from credit cards to accounts. Contactless payment options were introduced in Jordan, Palestine, Egypt, the UAE, and Bahrain which are accessible on ATMs and merchant shops through special bracelets and stickers, which have been welcome payment methods during the pandemic. Arabi Mobicash users benefit from rewards, whether they are Arab Bank customers or not. A new concierge service for Visa Signature cards was launched on WhatsApp and our kiosk machines were equipped with the ability to issue, replace, and renew credit cards instantly. Loyalty voucher dispensing through ATMs was introduced in Jordan to provide immediate access to merchant discounts. In 2020, we focused on rewarding the customers who are using our new services, thereby strengthening their loyalty and enabling the bank to build long-lasting relationship with them.Special services for the e-wallet were launched, enabling customers to withdraw and deposit from their accounts without the need for a card. A special services portfolio was also launched to enable customers to enjoy card-free electronic withdrawals and deposits. POS acquiring was introduced as a new business line in Jordan to expand the network of merchants working with the bank. Wallet holders gained the ability to cash in and cash out their wallets without the need for a card. Consumer Banking launched an electronic wallet application to provide customers in Palestine with easy access to financial services.A new branch was opened in Cairo, Egypt, which features a self-service plug-in that offers customers interactive and innovative tools. The branch network in Jordan and Palestine was expanded with the opening of the Al-Thaniyah and Hay Al-Basateen branches respectively.Despite the unprecedented economic and operational challenges of 2020, Arab Bank ended the year with a strong liquidity position and a conservative loan-to-deposit ratio. These positive results were made possible thanks to a significant growth in deposits and the bank’s prudent liquidity management strategies.During the year, the impact of the pandemic, combined with a sharp decrease in interest rates, led to significant market volatility. However, the bank’s Treasury continued to serve its customers and provide consistent access to the markets, despite the unprecedented challenges. As a result, the bank was able to deliver stable earnings, while maintaining its conservative risk position.More Treasury employees were trained and professionally certified in 2020. The bank’s integrated Treasury and risk management systems have been extended to all Arab Bank countries and Europe Arab Bank plc. These systems
give the bank’s Treasury straight-through-processing, real-time information, and high quality analysis. Front-office dealers have access to their systems remotely and were able to work flexibly throughout 2020.
There have been no non-recurring operations that had a material effect on the bank or the group financial position in 2020.
FINANCIAL IMPACT OF NON-RECURRING OPERATIONS
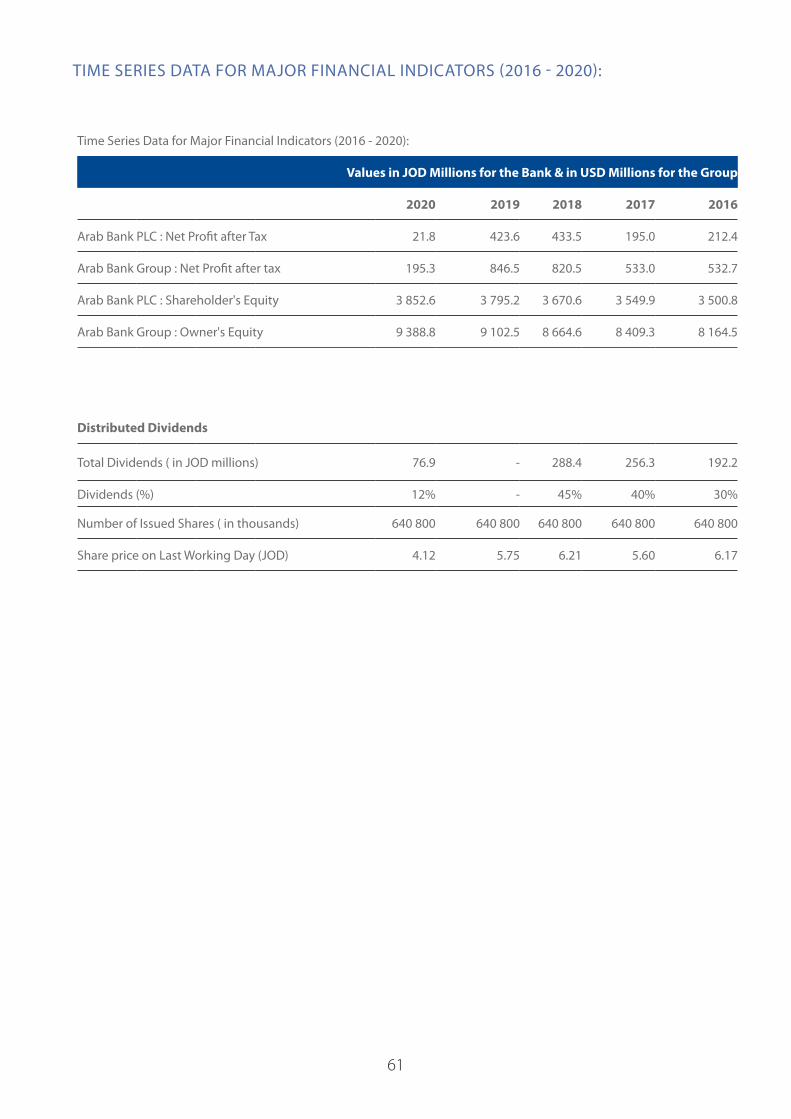
61
TIME SERIES DATA FOR MAJOR FINANCIAL INDICATORS (2016 - 2020):
Time Series Data for Major Financial Indicators (2016 - 2020):
Values in JOD Millions for the Bank & in USD Millions for the Group
2020 2019 2018 2017 2016
Arab Bank PLC : Net Profit after Tax 21.8 423.6 433.5 195.0 212.4
Arab Bank Group : Net Profit after tax 195.3 846.5 820.5 533.0 532.7
Arab Bank PLC : Shareholder's Equity 3 852.6 3 795.2 3 670.6 3 549.9 3 500.8
Arab Bank Group : Owner's Equity 9 388.8 9 102.5 8 664.6 8 409.3 8 164.5
Distributed Dividends
Total Dividends ( in JOD millions) 76.9 - 288.4 256.3 192.2
Dividends (%) 12% - 45% 40% 30%
Number of Issued Shares ( in thousands) 640 800 640 800 640 800 640 800 640 800
Share price on Last Working Day (JOD) 4.12 5.75 6.21 5.60 6.17
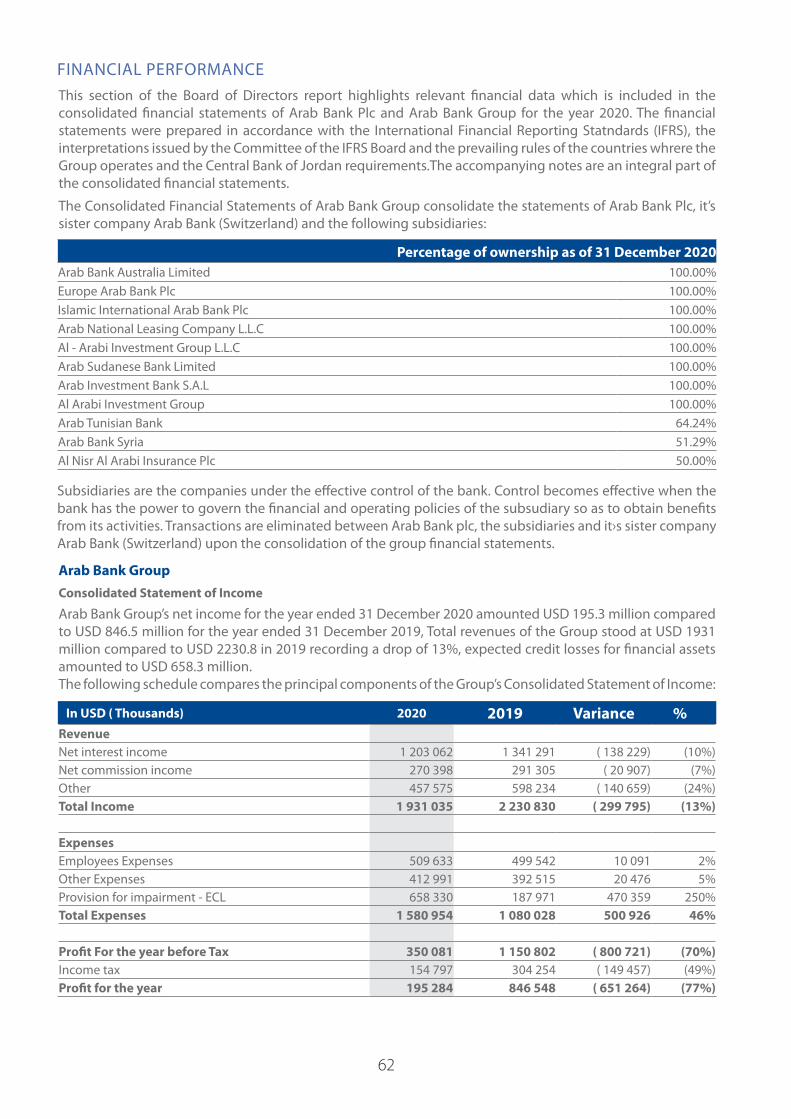
62
FINANCIAL PERFORMANCEThis section of the Board of Directors report highlights relevant financial data which is included in the consolidated financial statements of Arab Bank Plc and Arab Bank Group for the year 2020. The financial statements were prepared in accordance with the International Financial Reporting Statndards (IFRS), the interpretations issued by the Committee of the IFRS Board and the prevailing rules of the countries whrere the Group operates and the Central Bank of Jordan requirements.The accompanying notes are an integral part of the consolidated financial statements.
The Consolidated Financial Statements of Arab Bank Group consolidate the statements of Arab Bank Plc, it’s sister company Arab Bank (Switzerland) and the following subsidiaries:
Percentage of ownership as of 31 December 2020Arab Bank Australia Limited 100.00%Europe Arab Bank Plc 100.00%Islamic International Arab Bank Plc 100.00%Arab National Leasing Company L.L.C 100.00%Al - Arabi Investment Group L.L.C 100.00%Arab Sudanese Bank Limited 100.00%Arab Investment Bank S.A.L 100.00%Al Arabi Investment Group 100.00%Arab Tunisian Bank 64.24%Arab Bank Syria 51.29%Al Nisr Al Arabi Insurance Plc 50.00%
Subsidiaries are the companies under the effective control of the bank. Control becomes effective when the bank has the power to govern the financial and operating policies of the subsudiary so as to obtain benefits from its activities. Transactions are eliminated between Arab Bank plc, the subsidiaries and it›s sister company Arab Bank (Switzerland) upon the consolidation of the group financial statements. Arab Bank Group Consolidated Statement of Income
Arab Bank Group’s net income for the year ended 31 December 2020 amounted USD 195.3 million compared to USD 846.5 million for the year ended 31 December 2019, Total revenues of the Group stood at USD 1931 million compared to USD 2230.8 in 2019 recording a drop of 13%, expected credit losses for financial assets amounted to USD 658.3 million.The following schedule compares the principal components of the Group’s Consolidated Statement of Income:
In USD ( Thousands) 2020 2019 Variance %RevenueNet interest income 1 203 062 1 341 291 ( 138 229) (10%)Net commission income 270 398 291 305 ( 20 907) (7%)Other 457 575 598 234 ( 140 659) (24%)Total Income 1 931 035 2 230 830 ( 299 795) (13%)
Expenses Employees Expenses 509 633 499 542 10 091 2%Other Expenses 412 991 392 515 20 476 5%Provision for impairment - ECL 658 330 187 971 470 359 250%Total Expenses 1 580 954 1 080 028 500 926 46%
Profit For the year before Tax 350 081 1 150 802 ( 800 721) (70%)Income tax 154 797 304 254 ( 149 457) (49%)Profit for the year 195 284 846 548 ( 651 264) (77%)

63
Board of Directors ,
Report
Consolidated Statement of Comprehensive Income
Arab Bank Group’s comprehensive income for the year ended 31 December 2020 amounted USD 302.2 mil-lion compared to USD 883 million for the year ended 31 December 2019, the following schedule shows the principal components of the Group’s consolidated statement ofcomprehensive income:
In USD (Thousands) 2020 2019
Profit for the year 195 284 846 548
Add:
Items that will be subsequently transferred to the statement of income
Exchange differences arising on the translation of foreign operations 105 061 15 875
Items that will not be subsequently transferred to the statement of income
Net change in fair value of financial assets at fair value through other comprehensive income 1 848 20 610
Total Comprehensive income for the year 302 193 883 033
Consolidated Statement of Financial Position
Arab Bank Group assets reached USD 54.4 billion as at 31 December 2020,Customer deposits amounted USD 38.7 billion. Investment portfolio has reached USD 9.5 billion, Credit facilities amounted USD 24 billion forming 44% of total assets while Shareholders’ equity reached USD 9.4 billion.
The Following schedule compares the principal components of the Group’s consolidated statement of financial posotion:
In USD (thousands) 2020 2019 Variance %
Assets
Cash and due from Banks 15 696 957 12 477 959 3 218 998 26%
Investment Portfolio 9 476 558 9 799 604 ( 323 046) (3%)
Direct credit facilities at amortized cost 23 907 858 23 960 625 ( 52 767) (0%)
Other 5 332 310 4 976 656 355 654 7%
Total Assets 54 413 683 51 214 844 3 198 839 6%
Liabilities
Due to banks 4 584 017 4 094 831 489 186 12%
Due to customers 38 718 391 36 237 748 2 480 643 7%
Other 1 722 512 1 779 814 ( 57 302) (3%)
Shareholders' Equity 9 388 763 9 102 451 286 312 3%
Total Liabilities and Shareholders' Equity 54 413 683 51 214 844 3 198 839 6%
FINANCIAL PERFORMANCE

64
Arab Bank plc
Statement of Income
Arab Bank plc’s net income for the year ended 31 December 2020 amounted JOD 21.8 million compared to JOD 423.6 million for the year ended 31 December 2019, total revenues of the Bank stood at JOD 928.8 million compared to JOD 1116.7 million in 2019 recording a drop of 17%, expected credit losses for financial assets amounted JOD 404.9 million.The following schedule compares the principal components of the Arab Bank Plc’s statement of income:
In JOD (thousands) 2020 2019 Variance %RevenueNet Interest income 678 844 774 911 ( 96 067) (12%)Net commission income 128 404 146 471 ( 18 067) (12%)other 121 550 195 341 ( 73 791) (38%)Total Income 928 798 1 116 723 ( 187 925) (17%)
Expenses Employees expenses 230 016 232 255 ( 2 239) (1%)
Other expenses 225 291 209 390 15 901 8%
Provision for impairment - ECL 404 870 118 858 286 012 241%
Total Expenses 860 177 560 503 299 674 53%
Profit for the year before tax 68 621 556 220 ( 487 599) (88%)Income tax 46 821 132 660 ( 85 839) (65%)Profit for the year 21 800 423 560 ( 401 760) (95%)
Statement of Comprehensive Income
Arab Bank Plc’s comprehensive income for the year ended 31 December 2020 amounted JOD 57.3 million compared to JOD 415.5 million for the year ended 31 December 2019. The Following schedule shows the principal components of the Arab Bank plc’s statement of comprehensive income :
In JOD (Thousands) 2020 2019
Profit for the year 21 800 423 560
Add:
Items that will be subsequently transferred to the statement of income
Net exchange differences arising on the translation of foreign operations 38 431 ( 8 191)
Items that will not be subsequently transferred to the statement of income
Net change in fair value of financial assets at fair value through other comprehensive income ( 2 904) 41
Total Comprehensive income for the year 57 327 415 410
FINANCIAL PERFORMANCE

65
Statement of Financial Position
Arab bank Plc assets reached JOD 27.2 billion as at 31 December 2020 . Customer deposits amounted JOD 20.2 billion . Investment portfolio has reached JOD 5.3 billion . Credit facilities amount to JOD 11.6 billion forming 43% of total assets while shareholder’s equity reached JOD 3.9 billion.The following schedule compares the principal components of the Arab Bank Plc’s statement of financial position
In JOD (Thousands) 2020 2019 Variance %
Assets
Cash and due from banks 8 395 409 7 181 661 1 213 748 17%
Investment Portfolio 5 281 922 5 510 524 ( 228 602) (4%)
Direct credit facilities at amortized cost 11 649 462 11 926 366 ( 276 904) (2%)
other 1 862 300 1 710 134 152 166 9%
Total Assets 27 189 093 26 328 685 860 408 3%
Liabilities
Due to banks 2 383 267 2 162 497 220 770 10%
Due to Customers 20 156 730 19 506 889 649 841 3%
Other 796 527 864 057 ( 67 530) (8%)
Shareholders' equity 3 852 569 3 795 242 57 327 2%
Total Liabilities and shareholders' equity 27 189 093 26 328 685 860 408 3%
Capital Adequacy Arab Bank maintains capital adequacy ratios that exceed the required levels as per Basel committee, and Central Bank of Jordan requirements. The following table presents a summary of the capital adequacy calculations for the years 2020 and 2019 in accordance with Basel III:
Arab Bank Group
In USD (Thousands)
Capital Adequacy Ratio as at December 31, 2020 and 2019 in accordance with Basel III requirements
Risk-weighted assets (RWA) 36 180 487 36 551 328
Common Equity Tier 1 9 006 760 8 825 797
Regulatory Adjustments ( Deductions from Common Equity Tier 1) (3 356 130) (2 999 626)
Additional Tier 1 439 437
Supplementary Capital 416 260 395 519
Regulatory Capital 6 067 329 6 222 127
Common Equity Tier 1 Ratio 15.62% 15.94%
Tier 1 Capital Ratio 15.62% 15.94%
Capital Adequacy Ratio 16.77% 17.02%
FINANCIAL PERFORMANCE

66
Arab Bank PLC
In JOD (Thousands)
Capital Adequacy Ratio as at December 31, 2020 and 2019 in accordance with Basel III requirements
Risk-weighted assets (RWA) 19 231 625 19 786 137
Common Equity Tier 1 3 665 214 3 684 482
Regulatory Adjustments ( Deductions from Common Equity Tier 1) (1 049 673) ( 790 566)
Additional Tier 1 - -
Supplementary Capital 195 873 179 850
Regulatory Adjustments ( Deductions from Supplementary Capital) ( 13 229) ( 67 849)
Regulatory Capital 2 798 185 3 005 917
Common Equity Tier 1 Ratio 13.60% 14.63%
Tier 1 Capital Ratio 13.60% 14.63%
Capital Adequacy Ratio 14.55% 15.19%
Income Appropriation for Arab Bank plcArab Bank follows a well established policy with regards to cash dividends, which aims at achieving the enhancement of its revenues and financial position , and the distribution of a reasonable dividends to the shareholders.“The Board of Directors recommends the distribution of cash dividends of 12% of the shares par value or JOD 76.9 million for the year 2020 (According to Central Bank of Jordan circular no. 1/1/4693 dated 9 April 2020, Arab Bank did not distribute dividends for the year 2019) as shown in the table below:
In JOD (Millions) 2020 2019
Income available for appropriation 21.8 423.6
Statutory Reserve - 23.6
Voluntary Reserve - -
General Reserve - -
General banking risk reserve - -
Proposed Cash dividends 76.9 -
Retained earnings (55.1) 400.0
Total Appropriation 21.8 423.6
FINANCIAL PERFORMANCE

67
In JOD (Thousands) 2015 2014Represented
Variance %
Assets
Cash and due from banks 7 505 361 7 527 360 ( 21 999) (0%)
Investment Portfolio 5 623 548 5 692 244 ( 68 696) (1%)
Direct credit facilities at amortized cost 11 264 977 11 050 831 214 146 2%
other 1 465 276 1 589 342 ( 124 066) (8%)
Total Assets 25 859 162 25 859 777 ( 615) (0%)
Liabilities
Due to banks 1 961 521 2 283 072 ( 321 551) (14%)
Due to Customers 19 123 137 18 938 148 184 989 1%
Other 1 256 363 1 080 663 175 700 16%
Shareholders' equity 3 518 141 3 557 894 ( 39 753) (1%)
Total Liabilities and shareholders' equity 25 859 162 25 859 777 ( 615) (0%)
INCOME APPRORIATIONArab Bank maintains capital adeqaucy ratios that exceed the required levels as per Basel Committee , which is 8% , and Central Bank of Jordan requirements of 12%. The following table presents a summary of the capital adequacy calculations in accordance with Basel II requirements for 2012 and 2011 :
In JOD (thousands) 2011 2010Income available for appropriation 263 145Proposed appropriation:
Financial Ratios related to Arab Bank Group:
2020 2019
Owners' equity / Total Assets 17.3% 17.8%
Loans / Deposits 61.7% 66.1%
Liquidity Ratio (cash and quasi cash) 46.4% 43.6%
Cost / Income 81.9% 48.4%
Cost / Income (excluding provision for doubtful debt) 46.6% 38.6%
Common Equity Tier 1 Ratio - Basel III 15.62% 15.94%
Tier 1 Capital Ratio - Basel III 15.62% 15.94%
Capital Adequacy Ratio - Basel III 16.77% 17.02%
Return on Equity 2.1% 9.3%
Return on Assets 0.4% 1.7%
Net interest and commission income / total Assets 2.7% 3.2%
EPS (USD) 0.30 1.32
Financial Ratios related to Arab bank Plc :
2020 2019
Shareholders' equity / Total Assets 14.2% 14.4%
Loans / Deposits 57.8% 61.1%
Liquidity ratio ( cash and quasi cash ) 50.5% 48.3%
Cost / Income 92.6% 50.2%
Cost / income ( excluding provision for doubtful debt) 47.9% 38.4%
Common Equity Tier 1 Ratio - Basel III 13.60% 14.63%
Tier 1 Capital Ratio - Basel III 13.60% 14.63%
Capital Adequacy Ratio - Basel III 14.55% 15.19%
Return on equity 0.6% 11.2%
Return on Assets 0.1% 1.6%
Net interest and commission income / Total Assets 3.0% 3.5%
FINANCIAL PERFORMANCE

68
Board of Directors ,
Report
Looking toward 2021 and beyond, Arab Bank has taken into consideration the prevailing and anticipated market conditions locally, regionally, and internationally. We remain focused on preserving the following values and principles:
• Liquidity:Our priority is to maintain ample liquidity to support our operations and protect our shareholders and customers in the regions where we operate. This has always been, and will continue to be, one of the main pillars of Arab Bank.
• Capital adequacy:We are committed to maintaining a comfortable capital adequacy ratio that exceeds limits set by Basel, the Central Bank of Jordan, and other regulatory bodies in the countries in which we operate, at all times.
• Risk management:We believe in taking calculated risks. We have not, and will not enter into, any business that we do not understand, cannot calculate, and the risks of which we cannot mitigate.
• Excellence:We will continue to build upon and enhance our customers’ satisfaction and operational efficiency, and our shareholders’ returns.
Our objectives for 2021 are to reinforce our financial position by expanding the bank’s business in a responsible and sustainable manner, improving our customer service and business processes, maintaining prudent credit policies, and enhancing our risk management platform. By taking a cautious approach, we ensure that shareholders’ equity is safe-guarded and we are well positioned to deal with any unexpected crises in the MENA region and the world.
Arab Bank’s Corporate and Institutional Banking (CIB) division will continue to enrich its client offerings with new and innovative products and solutions across the Arab Bank network. The COVID-19 experience has emphasized the importance of clear and robust client journeys, which are at the core of the CIB digital strategy. Key processes will continue to be assessed in response to market changes, whilst ensuring that CIB’s capabilities, specialized knowledge, and systems are continuously improved. Corporate clients rely heavily on our digital services and level of engagement with the business teams and support centers. These important relationships contribute to business continuity and the effective processing of service requests.
In line with our digital strategy, which focuses on creating new, easily accessed services and products, Consumer Banking will introduce digital onboarding to additional markets where regulations allow, roll out the e-Tawfeer product and CRM to key markets, and upgrade the current loan management platform to make it more flexible in terms of both product offerings and diversity.
Encouraged by the success of previously opened self-service branches, Consumer Banking will open more branches of this kind in Egypt and Palestine and expand Jordan’s network.
In the year ahead, we will capitalize on our regional presence so that we maximize the benefits of our Cross Border program. We will add further services to this program to increase our customer base in the region.
In the youth and children’s market segments, we will add a variety of new services and enhance existing ones so that we build relationships with young customers. The Arabi Junior Program will be launched in Egypt.
As one of our key Elite program pillars, expanding our wealth management offerings is an important area of focus for the future and we plan to build and attract a new segment of young investors to capitalize on this growing market.
Consumer Banking will continue to enhance the customer experience and launch new, high quality services that meet customers’ evolving needs, including Arabi Junior, Shabab, Arabi Extra, Premium, and Elite programs.
The rapid development of digital services is vitally important to Arab Bank. Consumer Banking will continue to develop its digital banking propositions in line with evolving customers’ expectations and its strategic plan for 2021, which is focused on remote and digital channels. We will also continue to develop remote, contactless, and
FUTURE OUTLOOK AND PLANS FOR 2021

69
digital payments to improve the ability to make payments in local communities and promote financial inclusion.
Consumer Banking continues to work toward its goal of making Arab Bank’s cards the top choice for customers. These cards are underpinned by their unique features, advanced loyalty program, international coverage, and the heritage of Arab Bank’s trademark. Consumer Banking strives to manage customers’ experiences throughout all their banking card transactions and add value through promotions, best-in-class digital services, and innovative solutions. Work will continue to develop the credit and debit card products and value-added campaigns.
Our vision is supported by a digital strategy, underpinned by data analytics, that focuses on creating new, easily accessed services and products that fit in with our customers’ lifestyles.
We will continue to reward our most loyal customers for their ongoing relationship with Arab Bank through the Arabi Points loyalty program.
At the beginning of 2022, the London Interbank Offered Rate (LIBOR) will be replaced by alternative reference rates as a global interest rate benchmark for loans and other banking products. 2021 will therefore be a pivotal year for all banks as they prepare for the new post-LIBOR environment. Arab Bank’s Treasury will coordinate the work required to prepare for the new alternate reference rates across the bank.
The bank’s vision continues to be supported by a digital strategy. In 2021, through increasing use of data analytics and digital solutions, we will continue to serve clients, protect the bank, and generate stable, high quality earnings thanks to our network of highly trained treasury teams.
FUTURE OUTLOOK AND PLANS FOR 2021 FUTURE OUTLOOK AND PLANS FOR 2021
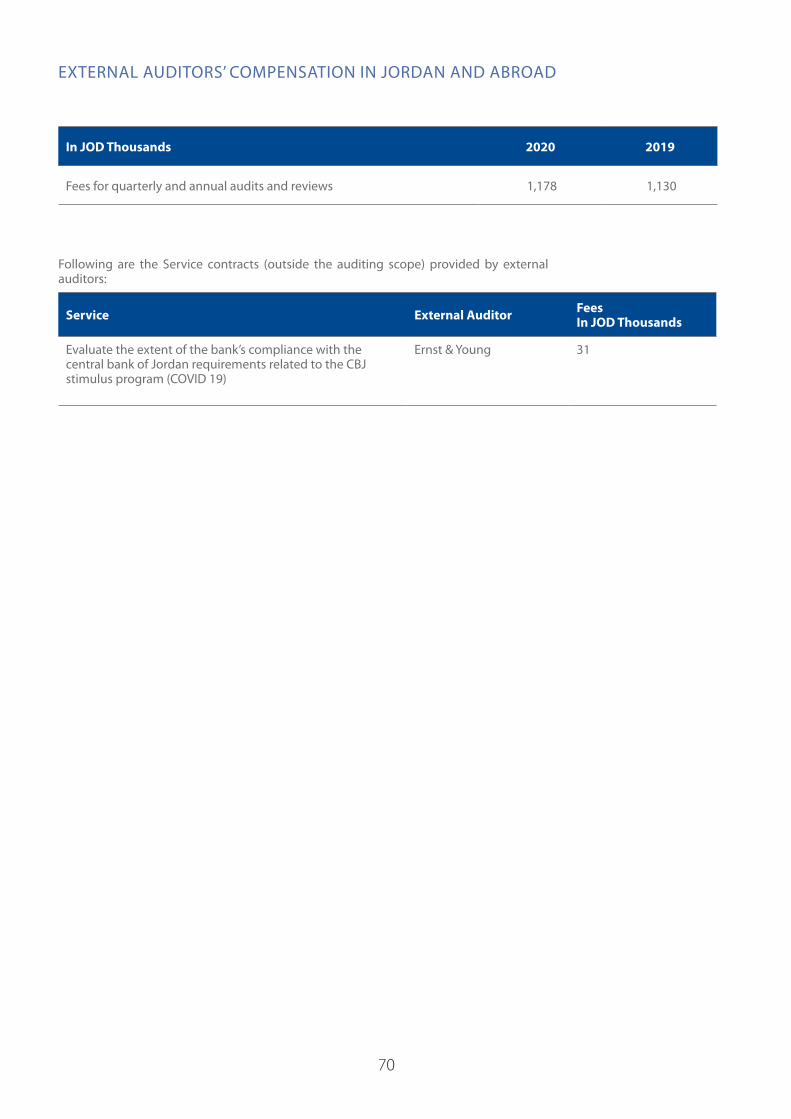
70
20192020In JOD Thousands
1,130 1,178Fees for quarterly and annual audits and reviews
Following are the Service contracts (outside the auditing scope) provided by external auditors:
Service External Auditor Fees In JOD Thousands
Evaluate the extent of the bank’s compliance with the central bank of Jordan requirements related to the CBJ stimulus program (COVID 19)
Ernst & Young 31
EXTERNAL AUDITORS’ COMPENSATION IN JORDAN AND ABROAD

71
Board of Directors ,
ReportNUMBER OF ARAB BANK SHARES OWNED BY MEMBERS OF THE BOARD
Board of Directors ,
Report
Number of Arab Bank Shares Owned by Members of the Board and the companies controlled by them in comparison with last year
No. Name Position Nationality
Number of sharesNo. of shares owned by
companies controlled by them
31/12/2020 31/12/2019 31/12/2020 31/12/2019
1. Mr. Sabih Taher D. Masri Chairman Jordanian 1007370 1007370 68153598 68153598
2. Dr. Bassem Ibrahim Y. Awadallah Deputy Chairman Jordanian 11016 11016 - - - - - -
3.Messrs. Ministry of Finance, Saudi Arabia Represented by Mr. Hisham Mohammad M. Attar
Member Saudi 28800000 28800000 - - - - - -
4.Messrs. Social Security CorporationRepresented by Dr. Hamzeh Ahmad Kh. Jaradat
Member Jordanian 109952136 108891558 - - - - - -
5. Mr. Wahbe Abdallah W. Tamari Member Lebanese 18000 18000 8168256 8168256
6.
Messrs. Abdul Hameed Shoman FoundationRepresented by Mr. Khaled Anis M. (Zand Irani)
Member Jordanian 32023026 32023026 - - - - - -
7. Mr. Bassam Wael R. Kana’an Member Jordanian 112410 112410 - - - - - -
8. Mr. Abbas Farouq A. Zuaiter Member Jordanian 148086 148086 - - - - - -
9. Mr. Alaa Arif S. Batayneh Member Jordanian 70812 50004 - - - - - -
10. Mr. Suleiman Hafez S. AL Masri Member Jordanian 10008 10008 - - - - - -
11. Mr. Usama Ramez Mikdashi Member Lebanese 10008 10008 - - - - - -
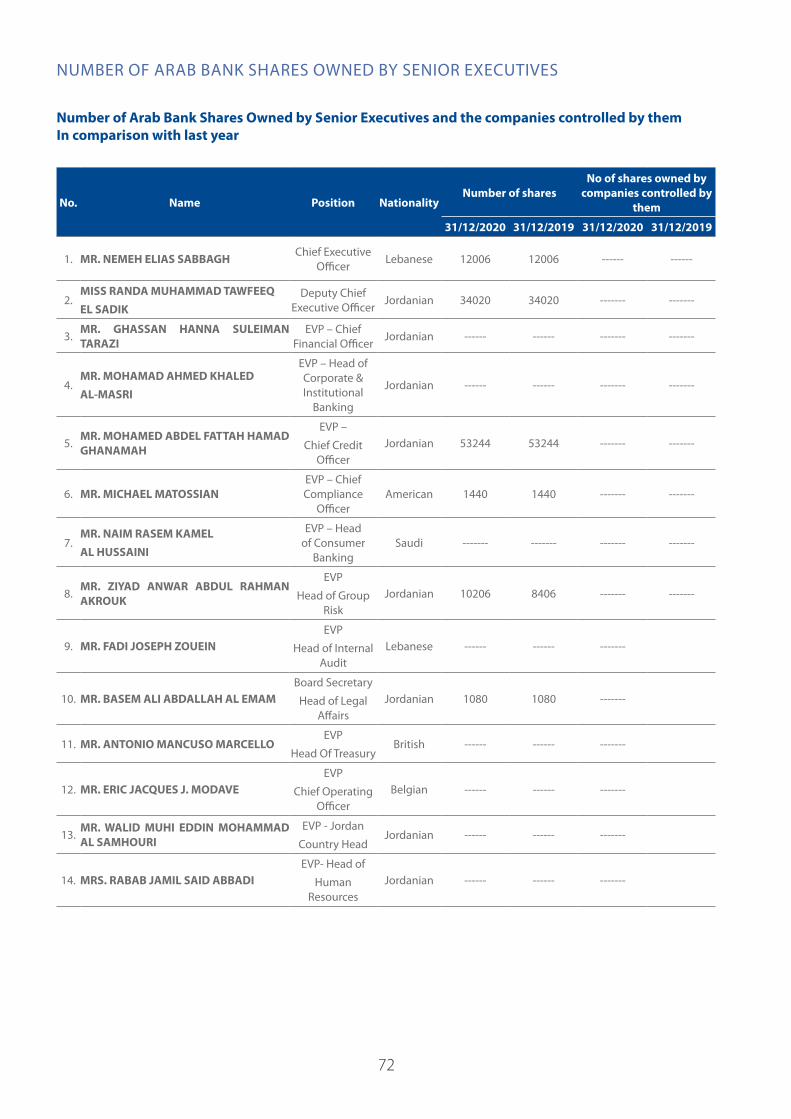
72
NUMBER OF ARAB BANK SHARES OWNED BY SENIOR EXECUTIVES
Number of Arab Bank Shares Owned by Senior Executives and the companies controlled by themIn comparison with last year
No. Name Position NationalityNumber of shares
No of shares owned by companies controlled by
them
31/12/2020 31/12/2019 31/12/2020 31/12/2019
1. MR. NEMEH ELIAS SABBAGH Chief Executive Officer
Lebanese 12006 12006 ------ ------
2.MISS RANDA MUHAMMAD TAWFEEQ EL SADIK
Deputy Chief Executive Officer
Jordanian 34020 34020 ------- -------
3.MR. GHASSAN HANNA SULEIMAN TARAZI
EVP – Chief Financial Officer
Jordanian ------ ------ ------- -------
4.MR. MOHAMAD AHMED KHALED AL-MASRI
EVP – Head of Corporate & Institutional
Banking
Jordanian ------ ------ ------- -------
5.MR. MOHAMED ABDEL FATTAH HAMAD GHANAMAH
EVP –
Chief Credit Officer
Jordanian 53244 53244 ------- -------
6. MR. MICHAEL MATOSSIANEVP – Chief Compliance
OfficerAmerican 1440 1440 ------- -------
7.MR. NAIM RASEM KAMEL AL HUSSAINI
EVP – Head of Consumer
BankingSaudi ------- ------- ------- -------
8.MR. ZIYAD ANWAR ABDUL RAHMAN AKROUK
EVP
Head of Group Risk
Jordanian 10206 8406 ------- -------
9. MR. FADI JOSEPH ZOUEINEVP
Head of Internal Audit
Lebanese ------ ------ -------
10. MR. BASEM ALI ABDALLAH AL EMAMBoard Secretary
Head of Legal Affairs
Jordanian 1080 1080 -------
11. MR. ANTONIO MANCUSO MARCELLOEVP
Head Of TreasuryBritish ------ ------ -------
12. MR. ERIC JACQUES J. MODAVEEVP
Chief Operating Officer
Belgian ------ ------ -------
13.MR. WALID MUHI EDDIN MOHAMMAD AL SAMHOURI
EVP - Jordan
Country Head Jordanian ------ ------ -------
14. MRS. RABAB JAMIL SAID ABBADIEVP- Head of
Human Resources
Jordanian ------ ------ -------

73
Number of Arab Bank Shares Owned by the Relatives of the Board Members and the companies controlled by them in comparison with last year
No. Name Relation-ship Nationality
Number of sharesNo of shares owned by companies controlled
by them31/12/2020 31/12/2019 31/12/2020 31/12/2019
1.Mr. Sabih Taher D. MasriChairman
SpouseMinors
------------
------------
------------
------------
------------
2.Dr. Basem Ibrahim Y. AwadallahDeputy Chairman
SpouseMinors
------------
------------
------------
------------
------------
3.Messrs. Ministry of Finance, Saudi ArabiaMember Represented by Mr. Hisham Mohammad M. Attar
------------
------------
------------
------------
------------
4.Messrs. Social Security CorporationMember Represented by Dr. Hamzeh Ahmad Kh. Jaradat
------------
------------
------------
------------
------------
5.Mr. Wahbe Abdallah W. TamariMember
SpouseMinors
------------
------------
------------
------------
------------
6.Messrs. Abdul Hameed Shoman FoundationMember Represented by Mr. Khaled Anis M. (Zand Irani)
------------
------------
------------
------------
------------
7.Mr. Bassam Wael R. Kana’anMember
SpouseMinors
------------
------------
------------
------------
------------
8.Mr. Abbas Farouq A. ZuaiterMember
SpouseMinors
------------
------------
------------
------------
------------
9.
Mr. Alaa Arif S. BataynehMember
AREF ALAA' AREF AL BATAINEH SpouseMinors
------Jordanian
------3294
------3096
------------
------------
10.Mr. Sulaiman Hafez S. AL MasriMember Mrs. Rusaila Mohamad Lutfe Mohamad Hasan Bayazidi
SpouseMinors
Jordanian--------
2214------
2214------
------------
------------
11.Mr. Usama Ramiz MikdashiMember
SpouseMinors
------------
------------
------------
------------
------------
NUMBER OF ARAB BANK SHARES OWNED BY THE RELATIVES OF THE BOARD MEMBERS

74
NUMBER OF ARAB BANK SHARES OWNED BY THE RELATIVES OF THE SENIOR EXECUTIVES
Number of Arab Bank Shares Owned by the Relatives of Senior Executives and the companies controlled by them in comparison with last year
No. Name Relationship Nationality Number of sharesNo of shares owned by companies controlled
by them31/12/2020 31/12/2019 31/12/2020 31/12/2019
1. MR. NEMEH ELYAS SABBAGH
SpouseMinors
Lebanese ------ ------ ------ ------
2. MISS RANDA MOHAMMAD TAWFEEQ ALSADEQ
------ ------- ------- ------- -------
3. MR. GHASSAN HANNA SULEIMAN TARAZI
MRS. NAWAL WAFA NAJIB TARAZI SpouseMinors
Jordanian 1206 1206 ------- -------
4. MR. MOHAMAD AHMED KHALED AL-MASRI
SpouseMinors
Jordanian ------ ------ ------- -------
5. MR. MOHAMED ABDUL FATTAH HAMAD GHANAME
SpouseMinors
Jordanian ------ ------ ------- -------
6. MR. MICHAEL MATOSSIAN
SpouseMinors
American ------ ------ ------- -------
7. MR. NAEM RASEM KAMEL AL HUSSEINI
SpouseMinors
Saudi ------ ------ ------- -------
8. MR. ZIYAD ANWAR ABDUL RAHMAN AKROUK
MRS. JUMANA SHUJA’ MOHAMMAD AL-ASAD
SpouseMinors
Jordanian 21762 21762 ------- -------
9. MR. FADY ZOUEIN
SpouseMinors
Lebanese ------ ------ ------- -------
10. MR. BASEM ALI ABDULLAH AL EMAM
SpouseMinors
Jordanian ------ ------ ------- -------
11. MR. ANTONIO MANCUSO MARCELLO
SpouseMinors
British ------ ------ ------- -------
12. Mr. Eric Jacques J. Modave
SpouseMinors
Belgian ------ ------ ------- -------
13. MR. WALID MOHY ELDEIN MOHAMMAD SAMHOURIMRS. RIMA MOHAMMAD ABDULKAREEM SHWAIKA
SpouseMinors
Jordanian 90 90
14. MRS. RABAB JAMIL SAID ABBADI
SpouseMinors
------- ------ ------ ------- -------

75
Board of Directors Remuneration and Benefits paid in 2020
(Amounts in Jordanian Dinar)
No. Member Name Title Annual Salary
Annual Transportation
Allowance
Annual Remuneration For attendence Board
& Committees Meetings
Annual Board
Remuneration Total
1 Mr. Sabih Taher D. Al-Masri Chairman - 24,000 45,000 5,000 74,000
2 Dr. Bassem Ibrahim Y. Awadallah Deputy Chairman - 24,000 47,500 5,000 76,500
3Messrs Mininstry of Finance, Saudi Arabia Represented by Mr. Hisham Attar
Member - 24,000 32,500 3,572 60,072
4 Messrs Social Security Corporation Member - 24,000 47,500 5,000 76,500
5 Mr. Wahbe Abdallah W. Tamari Member - 24,000 42,500 5,000 71,500
6
Messrs Abdul Hameed Shoman Foundation Represented by Mr. Khaled Anis (Zand Irani)
Member - 24,000 50,000 5,000 79,000
7 Mr. Bassam Wael R. Kana'an Member - 24,000 42,500 3,572 70,072
8 Mr. Abbas Farouq A. Zuaiter Member - 24,000 50,000 5,000 79,000
9 Mr. Alaa Arif S. Batayneh Member - 24,000 52,500 5,000 81,500
10 Mr. Suleiman Hafez S. Al Masri Member - 24,000 42,500 5,000 71,500
11 Mr. Usama Ramez Mikdashi Member - 24,000 35,000 5,000 64,000
BOARD OF DIRECTORS REMUNERATION AND BENEFITS
(Amounts in Jordanian Dinar)

76
NAMES OF MAJOR SHAREHOLDERS OF 5% AND MOREAND SHAREHOLDERS WHO OWN 1% OR MORE OF THE SHARE CAPITAL OF THE BANK, THE ULTIMATE BENEFICIAL OWNER AND NUMBER OF PLEDGED SHARES
Names of Major Beneficial Shareholders of 5% and more -
Shareholder’s Name Number of shares 31.12.2019
Ownership % 31.12.2019 Number of shares 31.12.2020 Ownership %
Social Security Corporation 108891558 16.993% 109952136 17.159%
Shareholders who own 1% or more of the share capital of the Bank, the ultimate beneficial owner and number of pledged shares
Shareholder name Nationality No. of Shares as 31/12/2020 Percentage % Ultimate Beneficial Owner No. of pledged
Shares Percentage % Pledgee
Social Security Corporation Jordanian 109952136 17.159% Same. - - -
Abdul Hameed Shoman Foundation Jordanian 32023026 4.997% Abdul Hameed Shoman Foundation, Panama/ Private Interest Foundation, Foundation Council. - - -
Ministry of Finance, Saudi Arabia Saudi 28800000 4.494% Same / Government. - - -
Arab supply & Trading Co Saudi 28043226 4.376% Mr. Sabih Taher Masri Mr.Khalid Sabih Masri Desert peak Company - - -
Percentage of Ownership: 9% 90% 1%
Ultimate Beneficial Owner: 0.416% 3.96%
Musallam Ali Hussein Musallam Saudi 22705758 3.543% Same. 22695750 3.542% Housing Bank
Palestinian Telecommunications Co. Palestinian 19999998 3.121%* Palestine Development & Investmant LTD (PADICO) 30.63% (Palestinian Telecommunications Co. 16.91%,- AlMaseera International Co. E.C. 12.47%, Siraj Palestine Fund 1,LTD 6.53%, Massar International 12.46%, Munib Rashed Al -Masri and related parties 5.09%.)
SIRAJ PALESTINE FUND 1 ,LTD (Bashar Masri 12.01%, Bayti Real Estate Investment Company 15.35%, Soros Economic Development Fund 12.01%, Siraj Palestine GP I, LP 50.03%) Massar International, Bashar Masri 100%.
- - -
* Palestine Investments Fund 6.74% (Sovereign Wealth Fund for the State of Palestine / Palestinian People).
Ultimate Beneficial Owner 1% or More : None
AlMaseera International Co. E.C. Bahraini 17442846 2.722% Mr. Sabih Taher Masri Mr.Khalid Sabih Masri
17442846 2.722% Gulf International BankPercentage of Owership: 50% 50%
Ultimate Beneficial Owner: 1.361% 1.361%
Dar Al Handasa (Shair and Partners) Co. Emirate 13608972 2.124% Holding Limited Company owned by Mr. Talal Al Shair (28.5%) & others. - - -
Ultimate Beneficial Owner 1% or More : None
Ministry of Economy and Finance / Qatar Qatari 10564164 1.649% Same / Government. - - -
Palestine Development and Investment LTD (PADICO) Liberia 7211790 1.125%
Palestinian Telecommunications Co. 16.91%, AlMaseera International Co. E.C. 12.47%, Siraj Palestine Fund 1,LTD 6.53%, Massar International 12.46%, Munib Rashed Al -Masri and related parties 5.09%.)
1067778 0.166% Ahli Bank
Ultimate Beneficial Owner 1% or More : None 3312000 0.517% Housing Bank
UBHAR CAPITAL SAOC Omani 7121808 1.111%
* Oman International Development and Investment Company AOG (“Ominvest” with 36%) UBHAR CAPITAL SAOC 17.287%, Mr. Khalid Muhammad Alzubair 16.50%, Al Hilal Investment CO.LLC 16.029%, Civil Service Employees Pension Fund (Goverment entity) 11.740%, Oman Investment Authority /2 (Goverment entity) 5.725%.* Arab Bank (Switzerland) Ltd. (“ABS” with 34%)The same Arab Bank plc shareholders, with the same ownership percentage. * Jabreen International Development Company SAOC («Jabreen Capital» with 30%) Oman International Development and Investment Company AOG “Ominvest” 99.6%.
- - -
Ultimate Beneficial Owner 1% or More : None
Mary Issa A. Alousi Jordanian 6544656 1.021% Same. - - -

77
NAMES OF MAJOR SHAREHOLDERS OF 5% AND MOREAND SHAREHOLDERS WHO OWN 1% OR MORE OF THE SHARE CAPITAL OF THE BANK, THE ULTIMATE BENEFICIAL OWNER AND NUMBER OF PLEDGED SHARES
Names of Major Beneficial Shareholders of 5% and more -
Shareholder’s Name Number of shares 31.12.2019
Ownership % 31.12.2019 Number of shares 31.12.2020 Ownership %
Social Security Corporation 108891558 16.993% 109952136 17.159%
Shareholders who own 1% or more of the share capital of the Bank, the ultimate beneficial owner and number of pledged shares
Shareholder name Nationality No. of Shares as 31/12/2020 Percentage % Ultimate Beneficial Owner No. of pledged
Shares Percentage % Pledgee
Social Security Corporation Jordanian 109952136 17.159% Same. - - -
Abdul Hameed Shoman Foundation Jordanian 32023026 4.997% Abdul Hameed Shoman Foundation, Panama/ Private Interest Foundation, Foundation Council. - - -
Ministry of Finance, Saudi Arabia Saudi 28800000 4.494% Same / Government. - - -
Arab supply & Trading Co Saudi 28043226 4.376% Mr. Sabih Taher Masri Mr.Khalid Sabih Masri Desert peak Company - - -
Percentage of Ownership: 9% 90% 1%
Ultimate Beneficial Owner: 0.416% 3.96%
Musallam Ali Hussein Musallam Saudi 22705758 3.543% Same. 22695750 3.542% Housing Bank
Palestinian Telecommunications Co. Palestinian 19999998 3.121%* Palestine Development & Investmant LTD (PADICO) 30.63% (Palestinian Telecommunications Co. 16.91%,- AlMaseera International Co. E.C. 12.47%, Siraj Palestine Fund 1,LTD 6.53%, Massar International 12.46%, Munib Rashed Al -Masri and related parties 5.09%.)
SIRAJ PALESTINE FUND 1 ,LTD (Bashar Masri 12.01%, Bayti Real Estate Investment Company 15.35%, Soros Economic Development Fund 12.01%, Siraj Palestine GP I, LP 50.03%) Massar International, Bashar Masri 100%.
- - -
* Palestine Investments Fund 6.74% (Sovereign Wealth Fund for the State of Palestine / Palestinian People).
Ultimate Beneficial Owner 1% or More : None
AlMaseera International Co. E.C. Bahraini 17442846 2.722% Mr. Sabih Taher Masri Mr.Khalid Sabih Masri
17442846 2.722% Gulf International BankPercentage of Owership: 50% 50%
Ultimate Beneficial Owner: 1.361% 1.361%
Dar Al Handasa (Shair and Partners) Co. Emirate 13608972 2.124% Holding Limited Company owned by Mr. Talal Al Shair (28.5%) & others. - - -
Ultimate Beneficial Owner 1% or More : None
Ministry of Economy and Finance / Qatar Qatari 10564164 1.649% Same / Government. - - -
Palestine Development and Investment LTD (PADICO) Liberia 7211790 1.125%
Palestinian Telecommunications Co. 16.91%, AlMaseera International Co. E.C. 12.47%, Siraj Palestine Fund 1,LTD 6.53%, Massar International 12.46%, Munib Rashed Al -Masri and related parties 5.09%.)
1067778 0.166% Ahli Bank
Ultimate Beneficial Owner 1% or More : None 3312000 0.517% Housing Bank
UBHAR CAPITAL SAOC Omani 7121808 1.111%
* Oman International Development and Investment Company AOG (“Ominvest” with 36%) UBHAR CAPITAL SAOC 17.287%, Mr. Khalid Muhammad Alzubair 16.50%, Al Hilal Investment CO.LLC 16.029%, Civil Service Employees Pension Fund (Goverment entity) 11.740%, Oman Investment Authority /2 (Goverment entity) 5.725%.* Arab Bank (Switzerland) Ltd. (“ABS” with 34%)The same Arab Bank plc shareholders, with the same ownership percentage. * Jabreen International Development Company SAOC («Jabreen Capital» with 30%) Oman International Development and Investment Company AOG “Ominvest” 99.6%.
- - -
Ultimate Beneficial Owner 1% or More : None
Mary Issa A. Alousi Jordanian 6544656 1.021% Same. - - -
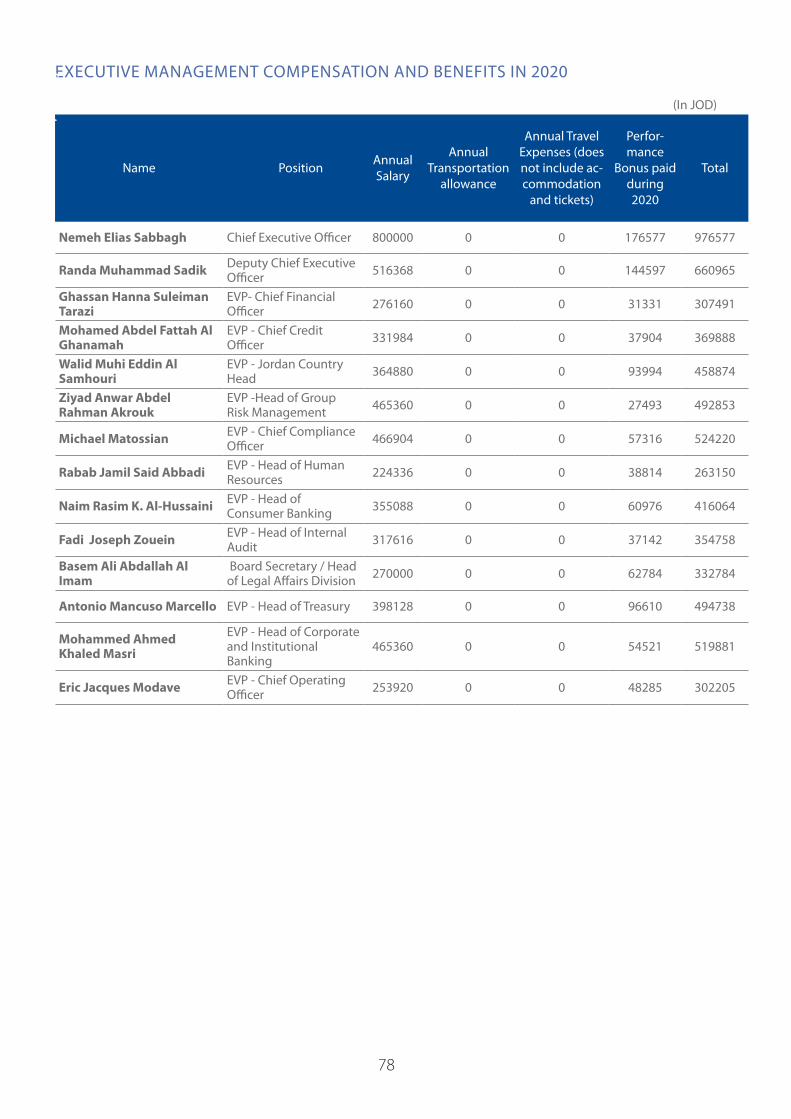
78
EXECUTIVE MANAGEMENT COMPENSATION AND BENEFITS IN 2020
(In JOD)
Name Position Annual Salary
Annual Transportation
allowance
Annual Travel Expenses (does not include ac-commodation
and tickets)
Perfor-mance
Bonus paid during 2020
Total
Nemeh Elias Sabbagh Chief Executive Officer 800000 0 0 176577 976577
Randa Muhammad Sadik Deputy Chief Executive Officer 516368 0 0 144597 660965
Ghassan Hanna Suleiman Tarazi
EVP- Chief Financial Officer 276160 0 0 31331 307491
Mohamed Abdel Fattah Al Ghanamah
EVP - Chief Credit Officer 331984 0 0 37904 369888
Walid Muhi Eddin Al Samhouri
EVP - Jordan Country Head 364880 0 0 93994 458874
Ziyad Anwar Abdel Rahman Akrouk
EVP -Head of Group Risk Management 465360 0 0 27493 492853
Michael Matossian EVP - Chief Compliance Officer 466904 0 0 57316 524220
Rabab Jamil Said Abbadi EVP - Head of Human Resources 224336 0 0 38814 263150
Naim Rasim K. Al-Hussaini EVP - Head of Consumer Banking 355088 0 0 60976 416064
Fadi Joseph Zouein EVP - Head of Internal Audit 317616 0 0 37142 354758
Basem Ali Abdallah Al Imam
Board Secretary / Head of Legal Affairs Division 270000 0 0 62784 332784
Antonio Mancuso Marcello EVP - Head of Treasury 398128 0 0 96610 494738
Mohammed Ahmed Khaled Masri
EVP - Head of Corporate and Institutional Banking
465360 0 0 54521 519881
Eric Jacques Modave EVP - Chief Operating Officer 253920 0 0 48285 302205
Board of Directors ,
Report

79
ARAB BANK’S DONATIONS DURING YEAR 2020
JOD Project / Entity
15 000 000 Himmat Watan Fund - COVID 19
825 207 The Queen Rania Foundation for Education and Development
782 579 King Hussein Cancer Foundation
674 217 Abdul Hameed Shoman Foundation
450 000 The project of spreading the community's financial culture
237 410 Scholarships for Employees' Children
55 000 Royal Medical Services
47 460 King's Academy
42 001 Jordan River Foundation
26 520 Tkiyet Um Ali
7 500 SOS Children Villages
73 799 Others
18 221 693

80
Board of Directors ,
Report
JD ‘000
JD ‘000
JD ‘000
Excluding transactions carried out within the context of the Bank’s regular business, the Bank did not enter in any form of contracts, projects or commitments with any of it’s subsidiaries, sister companies and affiliates. The Bank has neither entered in any form of contracts with it’s chairman, any of it’s directors, the Chief Executives Officer, any of it’s staff or their relatives.
The details of the outstanding balances with related parties are as follows:
December 31, 2020
Deposits owed from Related
Parties
Direct Credit Facilities at Amortized Cost
Deposits owed to Related Parties
LCs, LGs, Unutilized Credit
Facilities and Acceptances
Sister and subsidiary companies 1 287 793 23 625 104 169 138 445
Associates companies 123 000 - 12 924 31 233
Major shareholders and members of the Board of Directors - 184 619 460 907 63 484
Total 1 410 793 208 244 578 000 233 162
December 31, 2019
Deposits owed from Related Par-
ties
Direct Credit Facilities at Amortized Cost
Deposits owed to Related Parties
LCs, LGs, Unutilized Credit
Facilities and Acceptances
Sister and subsidiary companies 1 294 016 23 477 93 189 139 233
Associates companies 264 006 - 15 142 28 014
Major shareholders and members of the Board of Directors - 174 316 434 187 59 198
Total 1 558 022 197 793 542 518 226 445
The details of transactions with related parties are as follows:
2020 2019
Interest Income Interest Expense Interest Income Interest Expense
Sister and subsidiary companies 7 490 1 142 24 739 2 111
Associates companies 1 242 64 2 365 398
Total 8 732 1 206 27 104 2 509
TRANSACTIONS WITH RELATED PARTIES

81
TRANSACTIONS WITH RELATED PARTIES
JD ‘000
The details of the credit facilities granted to members of the Board of Directors and related parties are as follows:
December 31, 2020
Granted to BOD Members Granted to Related Parties Total
Direct Credit
Facilities
Indirect Credit
FacilitiesTotal
Direct Credit
Facilities
Indirect Credit
FacilitiesTotal
Direct Credit
Facilities
Indirect Credit
FacilitiesTotal
Mr. Sabih Masri - 1 1 125 737 62 773 188 510 125 737 62 774 188 511
Mr. Wahbeh Tamari - - - 58 872 709 59 581 58 872 709 59 581
Mr.Khaled Irani 4 - 4 - - - 4 - 4
Mr.Bassam Kanaan 1 - 1 - - - 1 - 1
Mr. Ala Batayneh 5 - 5 - - - 5 - 5
Abdul Hamid Foundation - 1 1 - - - - 1 1
Total 10 2 12 184 609 63 482 248 091 184 619 63 484 248 103
- Interest on facilities granted to major shareholders and members of the Board of Directors is recorded at arm’s length.

82
ENVIRONMENTAL PROTECTION
Arab Bank believes that a clean and sustainable environment is essential for the welfare of future generations, including employees, their families, and wider society. That is why the bank actively participates in internal and external initiatives and activities aimed at protecting the environment.
The bank switched all lighting units used in its buildings to LED. This change contributed significantly to a reduction in energy consumption during the year in our HO and COU buildings. In addition, the UPS systems of HQ and 70% of Arab Bank branches were replaced to reduce the amount of electricity loss and reduce energy consumption.
Indirect energy – Our electricity consumption witnessed a reduction. Additionally, with the aim to reduce the environmental impact associated with our electricity consumption, we have replaced 79% of our total con-sumption from conventional resources with renewable energy.
Direct energy – Direct energy consumption has decreased. This is the result of several initiatives taken to reduce our number of vehicles and heating fuel consumption during the year. The bank applied the Global Positioning System to track the bank’s vehicles with the objective of reducing fuel consumption, harmful and toxic emissions, and preventive maintenance for the fleet.
With the aim of reducing both energy consumption and toxic emissions, the bank installed a more advanced VRF air-conditioning system in the new locations.
As part of Arab Bank’s commitment to environmental sustainability, it continued to encourage its employees, business partners, and customers to think about their environmental footprint when carrying out their transactions. As part of these efforts, the bank has established a paperless working environment and several HR digital initiatives, both of which have been integrated into daily business practice. The paperless approach has enabled both employees and customers to reduce their paper usage thus their environmental impact. Arab Bank continued to work to reduce the amount of paper used in correspondence by extending its use of e-statements and e-advices and other digital initiatives.
Arab Bank pays special attention to the renewable energy sector in the MENA region, particularly Jordan, as part of its vision to improve local environmental and social conditions through the greater use of renewable energy sources.
The bank continued to cooperate with different international financial institutions and multilaterals, including the International Finance Corporation IFC and the European Bank for Reconstruction and Development (EBRD), to provide the sector with special financing
requirements. During 2020, Arab Bank provided an offer to Scatec Solar (Norway) to participate in a loan with the EBRD and the French Development Institution Proparco to finance renewable energy projects with a capacity of 100 MW in Tunisia, which is expected to achieve financial closure in April 2021. Arab Bank is also considering participating in another loan to create additional renewable projects with a total capacity of 200 MW under the same Tunisian Ministry of Mines and Energy program.
In view of the sector’s growth and strategic importance for the economy, the bank is constantly monitoring the financing needs of solar energy projects. During the year, Arab Bank finalized several financing agreements with local firms to establish PV Solar Power Plants that will produce electricity under ‘Wheeling’ guidelines. Arab Bank also provides agency services by acting as the onshore account bank and security agent on several renewable energy projects.
Arab Bank collaborated with the Royal Society for the Conservation of Nature (RSCN) to support initiatives to protect the environment in Jordan. The bank is collaborating with the RSCN to support the Fifa Eco-village project on initiatives such as planting date trees to create income-generating home gardens, installing grey water systems, and generating organic fertilizers from food waste, all of which are contributing to enhancing the environmental awareness of the residents of the village, while improving their living conditions. Around 20 homes benefited from phase two of the project, for a total of 40 homes across both phases.

83
Board of Directors ,
ReportCORPORATE SOCIAL RESPONSIBILITY
Sustainability at Arab BankArab Bank’s sustainability journey began in 1930 when the bank was founded. The pursuit of sustainability has evolved over time to become an integral objective of the bank, particularly in the development of the Arab world. Over time, the bank has played a significant role in shaping the lives of people in the Arab world and developing the economies and communities in which it operates. The bank believes in supporting and financing strategic projects in the region that develop the capacity of the Arab world through serving community needs and priorities.Recognizing the importance of a comprehensive management approach to sustainability, the bank has set several sustainability-related strategic objectives for itself, based on international best practices, to address these challenges:
• To align Arab Bank’s sustainability approach with the evolving expectations and aspirations of its various stakeholders
• To expand the bank’s role and impact in supporting social and economic development
• To address all potential environmental and social risks at a strategic level
• To maintain and reinforce Arab Bank’s reputation as a social, environmental, and economic leader
The bank has implemented many initiatives aimed at achieving economic, environmental, and social sustainability. Building on a long history of community investment, it developed an inclusive stakeholder model to optimize the bank’s contribution to its community and create long-term financial and non-financial value for the bank and its stakeholders. The model consists of three main pillars that drive the bank’s community cooperation and goals: the bank’s dedicated CSR program, Together, which supports the community’s fundamental causes, the Abdul Hameed Shoman Foundation, and our direct charitable donations and sponsorships.The bank issues annual sustainability report, based on the first international sustainability reporting standards of the Global Reporting Initiative (GRI). By reporting in this way, the bank measures, understands, and communicates its economic, environmental, and social performance, and manages change in line with international best practices. This approach allows the bank to measure its strategic goals for sustainability regularly. During 2020, the bank issued its tenth sustainability report.
Arab Bank’s response to the COVID-19 crisisCommitted to social responsibility and prompted by the unprecedented COVID-19 crisis during 2020, Arab Bank cooperated with different stakeholders to combat the economic, social, and health consequences of the COVID-19 pandemic in a way that would protect the health of our community and conserve its resources. These efforts embody the bank’s values of cooperation, corporate citizenship, and active social responsibilities:
Community support through the Himmat Watan Fund Arab Bank donated a total of JOD 15 million to the national Himmat Watan Fund. This fund was established by the government of Jordan to receive donations in support of national efforts to combat the COVID-19 crisis in Jordan and mitigate its repercussions. JOD 3 million of this donation went to the Ministry of Health. Arab Bank’s employees also donated JOD 1.25 million to the fund, and the board of directors donated JOD 150,000.
Support for clients• At the onset of the pandemic, Arab Bank acted
quickly to ensure the continuity of fundamental financial services to our customers, while ensuring the flexibility to reduce or expand the bank branch operation, as needed, based on the authorities recommendations.
• Corporate and Institutional Banking (CIB) ensured that a strong support mechanism was in place to give clients the interaction and engagement they needed during the lockdowns. Corporate clients rely heavily on CIB’s digital services and appreciated the engagement with the Corporate Business Center and business teams.
• The bank offered its customers a wide array of innovative digital banking services, providing them with secure contactless payments solutions. These services enabled customers to conduct their daily banking transactions digitally without the need to visit the branches, including digital on-boarding through the Arabi Mobile app and cashless payments through advanced mobile apps.
84
• The bank provided loans to SMEs under the Central Bank of Jordan soft loans program, which were aimed at helping SMEs cope with the impact of COVID-19 on their businesses. The bank’s latest digital lending platform was introduced, which allows Arab Bank and non-Arab Bank SME customers to apply for support loans digitally, without the need to visit a branch.
• The bank automatically postponed the repayment of all loans for individual customers for several months without fees or commissions and reduced their interest rates by at least 1.5%.
• The bank extended debit and credit card validity for two months from their expiry dates. Credit card monthly payments were also deferred for the months of March and April.
• The bank offered its customers a 50% cash back on COVID-19 tests when paying with Arab Bank’s Arabi MobiCash application.
• The bank enabled customers to donate to the Himmat Watan Fund and other official government accounts through its digital channels.
New health and safety measuresArab Bank took proactive measures to protect the health of its employees and clients at the bank’s premises. Some of the measures were:
• Operating with a minimal number of staff, mandating social distancing, the wearing of facemasks and gloves for staff and customers at the branches, using hand sanitizers, and conducting frequent sanitization of facilities.
• Offering customers digital banking services that allowed them to make secure contactless payments and conduct their daily banking transactions without the need to visit the branches.
• Enabling remote working capabilities for its non-branch workforce
• Implementing body temperature measurement prior to entering the bank’s premises.
• Conducting meetings virtually using approved video conferencing tools.
• Distancing between staff desks was introduced and staff seating was rearranged in cubicles to provide adequate spacing.
• The return to work was delayed for older employees and those with special medical conditions.
• Conducting internal campaigns to spread awareness of hygiene and health practices among staff.
In Palestine, the bank donated USD$2 million to the government’s COVID-19 fund, Wakfet Izz, which was set up to focus all national efforts on addressing the economic, social, and health impacts of the crisis. Arab Bank’s employees and AB Invest in Palestine donated JOD 200,000 to this fund.
The bank contributed to several initiatives in the other countries in which it operates to combat the effects of COVID-19.
Corporate social responsibility program: TogetherThe bank established Together as an integrated, full-fledged corporate social responsibility (CSR) program to get the bank’s employees, customers, and selected NGOs involved in supporting causes that are aligned with the community’s needs and priorities and the bank’s sustainability direction. The bank adopted five main community causes as the primary focus areas for Together, based on the community’s primary needs and the bank’s ability to make a positive and long-lasting impact. These areas are health, poverty alleviation, environmental protection, education, and orphan support. Our community interventions have affected the lives of over 125,234 beneficiaries from our local community.Through Together, the bank’s engagement with its employees, customers, and partner NGOs is channeled through the following paths:
• Employee volunteering: Arab Bank encourages its employees to donate their time, efforts, and experience to initiatives and programs that are aligned with the five main community causes the bank has adopted. The volunteering program is driven by a set of KPIs and is managed by a full-fledged system that drives and monitors its performance and deliverables. In response to the pandemic, the bank switched all volunteering activities to become virtual in 2020. This change had an impact on the total number of staff volunteering, but we put the safety of our volunteers and beneficiaries first. Our employees volunteered in around 57 instances, contributing over 204 hours through 11 community programs, including virtual training and courses.
• Collaboration with NGOs: The bank works closely with reputable NGOs in each of the bank’s CSR focus areas. Our efforts included developing and implementing community initiatives and intervention programs through Arab Bank community investments. These programs set
CORPORATE SOCIAL RESPONSIBILITY

85
deliverables and KPIs that are aligned with the bank’s sustainability strategy. As part of working with partner NGOs, the bank offers a capacity building program that focuses on strengthening the functional, technical, and interpersonal skills of the NGO’s staff in a way that positively affects the NGO’s performance and community role. During 2020, the courses benefited 87 employees at our partner NGOs through 369 training hours.
• Customer donations: Through Together, the bank enables its customers to contribute financially to its five main community causes. A donation mechanism within the bank’s service channels – ATMs, online banking, Together credit card, the branch network, and the efawateercom service – enables customers to donate to any of the Together partner NGOs easily and conveniently. During 2020, customer donations reached more than JOD 1,789,000.
Here are the highlights of Arab Bank’s community contributions through the Together program:
HealthArab Bank has collaborated with several organizations to support initiatives aimed at advancing health-related causes in the community. The bank sponsored the Back to School Program with the King Hussein Cancer Foundation (KHCF), supporting around 402 young patients and giving them a chance to continue their education while undergoing treatment at the King Hussein Cancer Center. Eight of the bank’s employees volunteered their time to tutor cancer patient students virtually.The bank collaborated with the Royal Health Awareness Society (RHAS) to support implementing Healthy Schools National Accreditation program at eight schools. This program is aimed at creating health-promoting environments within schools that reflect positively on students’ physical and social growth and academic performance. Additionally, the bank worked with RHAS to increase awareness of healthy nutrition through the use of arts for public school students. The bank supported the Jordan Air Ambulance Center (JAAC) in providing emergency air transportation services to patients. The bank also continued its sponsorship of Jordan National Football team and the Professional Football League as part of its commitment to promote sport and active lifestyle. For the third year, the bank sponsored doctor training sessions held by the Palestinian Medical Council, aimed at enhancing Palestinian doctors’ efficiency and educational level. One hundred doctors attended the session. The bank also donated three ventilator devices for patients who required intensive care, in response to the emergency situation in the Nablus Governorate hospitals as a result of the pandemic.
Poverty alleviationArab Bank continued supporting programs aimed at alleviating poverty pockets in the Kingdom. In collaboration with Tkiyet Um Ali (TUA), the bank supported 53 underprivileged families by providing them with monthly food packages for one year. Additionally, the bank collaborated with TUA during the month of Ramadan to sponsor the distribution of over 1,460 hot meals for families that live under the poverty line. The bank also collaborated with Jordan River Foundation to alleviate poverty through the Child Safety and Women Empowerment programs. In Palestine, Arab Bank supported the Sanad Society for Children with Special Needs and Autism to cover the cost of establishing a new sensory room at the organization and pay the rehabilitation expenses of 10 underprivileged children.
Environmental protectionArab Bank collaborated with the Royal Society for the Conservation of Nature (RSCN) to support initiatives to protect the environment in Jordan. The bank is collaborating with the RSCN to support the FIFA Eco-village project on initiatives such as planting date trees to create income-generating home gardens, installing grey water systems, and generating organic fertilizers from food waste, all of which are contributing to enhancing the environmental awareness of the residents of the village, while improving their living conditions. Around 20 homes benefited from phase two of the project, for a total of 40 homes across both phases.
CORPORATE SOCIAL RESPONSIBILITY
86
EducationArab Bank collaborated with several organizations to empower youth through education and training. Bank employees volunteered with INJAZ to deliver courses in schools and universities, and through its sponsorship of the Digitization and Cyber Security program, which is the first of its kind for university students in Jordan. The bank also supported training for university students in a variety of soft and technical skills through the bank’s employees. The bank also supported projects aimed at developing innovative problem solving skills for students and teachers through a virtual idea proposing competition across national schools. The bank continued to support the national financial educational program, which the Central Bank of Jordan started, to increase financial literacy among school students and teach them how to develop smart saving habits and make sound financial decisions. The bank also supported this initiative through the Abdul Hameed Shoman Foundation. The program aims to bridge the gap between financial knowledge and behavior, while acquainting students in grades 7 to 12 with basic economic and financial concepts. Under the umbrella of the Queen Rania Foundation, the bank supported the Karim and Jana – Literacy application, which is aimed at children aged three to seven to address the gap in the Arabic literacy market. This free application focuses on critical areas within emergent literacy: phonological awareness (or the awareness of how sounds make words) and alphabet knowledge through a gamified approach. In addition, the bank sponsored the Parents Education program. The bank also supported the Madrasati initiative by renovating the facilities and infrastructure of four schools to provide a better educational environment and to support Masahati student clubs with the aim of enriching the student and teacher experience. The bank also supported the Teach Like a Champion 2.0 program under the Queen Rania Teacher Academy and sponsored three online courses through EDRAAK, which is the first massive open online platform (MOOC) in the Arab world. After the Children Museum was closed in mid-March because of the pandemic, the bank supported several virtual workshops to give children access to fun and exciting learning experiences. As the main sponsor of the Community Connection program at the Children’s Museum, the bank also supported the Digital Ramadan Program, Arab Financial Inclusion Day, World Health Day, and Persons with Disabilities Month. The bank also donated computer equipment to be refurbished and used at schools and youth centers in the most underprivileged areas in the Kingdom.
Orphan supportThe bank supported several initiatives to improve the quality of orphans’ lives, prepare them to be integrated into society, and to become self-reliant and productive members of their communities. The bank supported Al Aman Fund for the Future of Orphans by providing
university education to 35 older orphans who have aged out of care. The bank also sponsored one of the SOS houses in Amman.
Other initiativesAs part of its strategic partnership with the Union of Arab Banks, the bank sponsored a number of its virtual conferences and forums, including the “Global Banking in Light of COVID-19 and Geopolitical Developments” conference, the “Central Banks Support to Financial Markets in the Coronavirus Pandemic” conference, and the “Banking in the Next Normal” forum. The bank also sponsored several forums, including, “Banking Industry and the Future of Financial Services” and the “Chief Risk Officers in Arab Banks” forum in Egypt, the “Sanctions Risks and Dealing with Critical AML Issues” forum in Lebanon, and the “Compliance and Combating Financial Crime” conference in Qatar.Arab Bank was the diamond sponsor of the BAFT MENA bank-to-bank virtual forum, which attracted attendees from transaction banking, trade, payments and cash management, FI/sales/relationship management, and more. It focused on correspondent banking with topics such as technology, digitization, and innovation; regula-tory issues; an economic update; and compliance.
CORPORATE SOCIAL RESPONSIBILITY
87
The Abdul Hameed Shoman FoundationThe Abdul Hameed Shoman Foundation is a non-profit pioneering initiative that was established by Arab Bank in 1978 to support cultural and social responsibility initiatives in the Arab World. The Foundation aims to serve as a beacon of light in Jordan and the Arab World by laying the groundwork for a society that encourages reading and caters to scientific research, cultural enlightenment, and innovation.The Foundation was built on three pillars: thought leadership, literature and arts, and social innovation. In 2020, the Foundation maintained its mission by reaching out to various communities to advance Arab scientific and cultural standards through its focus on education, innovation, scientific research, and creativity, in addition to strengthening and instilling the culture of reading in society.During the early stages of the pandemic, the Jordanian government imposed a full two-month lockdown, which was followed by a partial lockdown that allowed only some sectors to resume their operations at less than half their capacity. During this time, the Foundation resumed some of its activities and initiatives within the permissible limits, although they had a negative impact on the effectiveness and reach of the Foundation’s services and onsite cultural activities.Despite these difficult circumstances, the Foundation pursued its transition to digital and virtual delivery of its programs and activities to ensure their continuity and provide easy access for all within in the Arab world. This digital transformation resulted in a significant increase in all key indicators related to the Foundation’s different activities. Most significantly, the electronic content offered by the Foundation’s public library enabled readers and patrons to find and access the information resources easily.
Abdul Hameed Shoman Foundation Innovation Award 2020The Foundation launched the second edition of the Abdul Hameed Shoman Foundation Innovation Award in 2020 to support innovations that have a wide social impact. The Innovation Award aims to foster a society of culture, knowledge, and creativity, drive economic growth, and accelerate social gains leading to job creation and new projects that improve quality of life. The second edition of the award, which took place from June 23 to August 4, attracted more than 1,200 award applications, out of which 207 met all application criteria. During the last quarter of 2020, the Foundation evaluated the competing projects by conducting specialized trainings, supervised by 120 experts and professionals in the field of innovation. The winning projects will be selected in early 2021 and will receive approximately JOD 1 million. The Innovation Award is considered the largest award for innovative projects in the Kingdom. In 2020, the award themes were: Green Technology and Environmental Sustainability, Agriculture, Health Care and Biomedical Technology, the Labor Market and Economic Productivity Solutions, Education Solutions,
and Arts and Culture. The award process goes through three stages: (1) Proof of Concept and Prototyping, (2) Go-to-Market - Product Development, Validation, Minimum Viable Product and (3) Growth and Scale Up. The projects were evaluated based on these three stages by internal and external expert committees. During the project evaluations and shortlist, the Foundation launched the “Deep Dive 1” training program, which is aimed at developing the capacities of participants and equipping them with the necessary skills and tools. The program consists of 20 training days on 12 different subjects, carried out in partnership with iPark and Impact MENA.During 2019 and 2020, the Foundation completed its support for the eight winning projects of the first edition of the Innovation Award, including financial and technical support, training, mentorship, expansion, and partnerships. The Foundation worked to adapt its follow up on these projects to counteract the effects of the pandemic, sustain these companies, and ensure they overcome the challenges that affected the innovation sector. The Abdul Hameed Shoman Creativity Award for Children and Youth (Abde’)The Abdul Hameed Shoman Creativity Award for Children and Youth (Abde’) targets children and youth aged 8 to 18 across the Kingdom. In 2020, the Foundation invited children and youth to unleash their creativity in seven fields: drawing, Arabic calligraphy, article writing, poetry, music, dancing, and scientific innovation. It succeeded in attracting 745 eligible applications from Jordanian and Arab students from across the Kingdom. 207 competitors were qualified to receive specialized training, out of which 20 finalists will be honored and awarded USD 1,000 each, at a special award ceremony. The philosophy behind this award is based on the Foundation’s belief in the pivotal role children and youth have in shaping the future. The intention behind the award is to enhance the creative works done by children and youth in different literary, performance, and artistic
CORPORATE SOCIAL RESPONSIBILITY

88
fields, and scientific innovation. These creative activities help to develop children’s minds, ultimately leading to an enlightened generation of children and youth. The award also aims to promote healthy competition among children and youth, showcase their talents and enrich their minds, develop their literary and artistic tastes, skills, and capabilities, and support scientific innovation. The award also promotes and develops self-expression among children and youth through imagination and sound Arabic linguistic proficiency, and fosters a culture of creativity through the discovery of talents at an early age. A committee of experts oversees the awards, while jury members and advisors with proven experience and expertise in the selected fields are appointed annually. The 2020 award faced many unforeseen challenges, as a result of school closures and remote learning, which made it difficult to reach and communicate with the students. In addition, the closure of cultural centers and organizations made it difficult to share information about the award with potential participants. Consequently, the number of applications received during this cycle was below expectations. The Abde’ Award faced additional obstacles in implementing the training workshops. The closure of schools and cultural centers led to the cancellation of some of the practical workshops, which were replaced with online training. Based on this experience, the Foundation is confident that similar online training can be conducted successfully in the future.
Scientific researchDuring 2020, the Foundation honored the winners of its 37th annual Abdul Hameed Shoman Arab Researchers’ Award in a virtual award ceremony that was held under the patronage of H.E. Mr. Sabih Al-Masri, chairman of the board of directors of Arab Bank and chairman of the board of directors of the Abdul Hameed Shoman Foundation. A distinguished group of Arab researchers, scientists, scholars, and representatives of several Arab awards participated in the ceremony, which honored 13 winners in the fields of medical and health sciences; engineering sciences; basic sciences; literature and the humanities, social and educational sciences; economics and administration sciences, and agriculture and technology. The total number of winners since the award was launched is 447 male and female researchers from various Arab nationalities. The Foundation also continues to support applied research in universities, institutions, and research centers in Jordan through the Abdul Hameed Shoman Scientific Research Support Fund, considered to be the first private sector-funded support fund. In 2020, the Foundation signed 14 grant agreements with 14 researchers in 10 research organizations, for approximately JOD 200,000. Moreover, a special call soliciting research proposals related to the COVID-19 pandemic was announced during the year. From the 80 eligible research project requests received, eight research requests were approved for support in the amount of JOD 100,000. Researchers have also published scientific papers resulting from research supported by the Fund in international and Arab peer-reviewed scientific journals.
As part of the Foundation’s mission to invest in scientific research, a new support fund for scientific research was launched in cooperation with the Massachusetts Institute of Technology MISTI program. The aim of the fund is to support early-stage joint research projects between researchers from Jordan and their counterparts at MIT. The Foundation will support five to seven joint research projects annually for a total of JOD 100,000.
The Abdul Hameed Shoman Award for Children’s LiteratureThe Abdul Hameed Shoman Award for Children’s Literature was launched in 2006 to elevate the quality of Arabic literature produced for children with the aim of encouraging children to read by stimulating their imagination and creativity.At the end of 2019, a new committee was established for the award and it chose Fiction Stories for children (aged 4-7) as the theme for the 2020 award.The committee’s decision emanated from children’s need for both imagination and reality. Both contribute to a child’s intellectual, cognitive, cultural, and social development. Although reality helps shape and root children’s moral and ethical codes and connects them to their surroundings and the social collective, the value of imagination arises from the ability to think, free from the constraints and limitations of the material world, and to go beyond the tangible and the senses. Imagination is an essential cognitive process that can broaden the horizons of children through the development of all aspects of their intelligence, which ultimately leads to enhanced creativity. The award received 1,436 eligible applications, 814 of which were from female applicants, and 622 were from male applicants. The applicants were from 19 different Arab nationalities, distributed among 35 countries across the world.The award was presented to three finalists, from Jordan and the region. A virtual award ceremony to honor the winners was held under the patronage of H.E. Mr. Sabih Al-Masri, chairman of the board of directors of Arab Bank and chairman of the board of directors of the Abdul Hameed Shoman Foundation. The Foundation is currently in the process of editing the winning literary works prior to publishing the first edition, both in print and electronically.
The Abdul Hameed Shoman Public Library/Jabal Amman and Al-Ashrafieh BranchesThe public library, as with the rest of the Foundation’s departments and divisions, witnessed several transformations and changes due to the limitations imposed by the pandemic. During the first phase and first quarter of the year (up to mid-March), the library remained open and received more than 68,000 visitors in the Jabal Amman branch and 12,400 visitors in the Ashrafieh branch. Several of the library’s regular programs and activities were held, including three book launches, two training workshops, and two training courses in both branches, in
CORPORATE SOCIAL RESPONSIBILITY

89
addition to an educational session in Al-Ashrafieh branch. Seven book clubs were hosted in the Jabal Amman branch.Despite a full lockdown during the second quarter, the library continued to operate online through the launch and activation of its e-library platform. During that period, 575 e-books were borrowed by 292 individuals, and free subscriptions were provided for readers to be able to access the digital library and the Abjad platform for Arabic books. The library also continued to provide its electronic database services to subscribers and non-subscribers from home. In addition, the borrowing period of 8,229 books was extended, out of which 1,320 of the books borrowed were from the Al-Ashrafieh branch.The third quarter of the year involved the easing of closures and the gradual reopening of the library at the beginning of May. The library seized this opportunity to develop its online strategy and resumed its normal activities while adhering to all COVID-19 health and safety measures. During this phase, equipment for disinfecting books was purchased and all activities were held virtually and marketed through the Foundation’s social media platforms. A new program entitled A Book and A Writer (Kateb Wa Kitab) was launched, and five renowned male and female writers were invited to take part in it. Four book launches were also held and three educational sessions on a variety of technology-related topics were conducted. In addition, the library held three virtual training workshops, two poetry readings, and 11 book club sessions. Training was provided to nine students who are studying Library Science on the library’s operations, programs, and services, and 31 one-on-one training sessions were held for beneficiaries on various library services and technology-related topics.The fifth library symposium was held virtually with a special edition on operating during COVID-19 titled “The Library as an Engine of Change in the New Normal”. The symposium hosted experts from the US, the Netherlands, and Britain to share their library experiences in managing during the crisis and the lessons learnt. While some libraries decided to close down to develop their services and create new opportunities for sharing and transferring knowledge, delivering their programs and events remotely, others chose to reopen their libraries and adopt a hybrid approach to their work, taking into consideration all the necessary health measures. The experiences of both the Foundation’s public library and the Knowledge Path children’s library were presented during the symposium, which attracted 336 participants from 28 different countries. The Foundation also launched “The Internal Innovation Program” within the public library this year, to come up with innovative ideas and solutions to some of the challenges the library is facing, such as declining numbers of readers and library visitors in Jordan. As a result, several activities were identified and launched in the library, such as chess, training programs, artistic photography using mobile phones, sign language, first aid, the basics of drawing, and Open Space. The library also held a one-day reading marathon with 82 participants covering a total of 11,404 pages. Finally, the library started “The Shoman Book Club” an internal initiative to promote reading, which hosted 14 reading sessions during the year.
The AHSF Library in figuresDespite the challenges of the pandemic and repeated closures, the total number of library visitors during the year reached 131,514, out of which 20,359 visited the Ashrafieh branch. The total represents a 66% drop compared to the same period last year. The library received 1,376 new members this year, 245 of which were in Ashrafieh. The number of visitors borrowing printed books reached 19,255, which is an 85% decrease over the previous year, while 1,128 visitors borrowed e-books. The library also lent out 41,148 printed books during the year, a 75% decrease from the previous year, and 2,054 e-books. Similarly affected was the number of books used inside the library, which decreased by 40% compared to the previous year, totaling of 30,089 books. A total of 16,720 searches were made on the library’s electronic databases, while the number of beneficiaries from the electronic databases increased by 122% compared to the previous year. It is important to note that the Abdul Hameed Shoman Library branch in Al-Ashrafieh was affected more severely by the lockdown and repeated closures due to the area being a hot-spot for the spread of the Corona virus.
Knowledge Path Library for Children and Youth/Jabal Amman and Al-AshrafiehThe Knowledge Path Library’s goal is to revive the role of books in a child’s upbringing. Its mission is to promote reading as an essential skill in children’s lives, by offering a friendly and fun environment for reading and creative activities in which to raise a generation of gifted children.The re-opening of the Knowledge Path Library for children and youth in 2013 provided a free and lively space in which children of all ages and backgrounds can meet, search, and discover through interactive reading and inspiring activities that promote creative thinking.Since the beginning of the pandemic in Jordan, the Knowledge Path Library suffered badly from the continuous closures and need for social distancing, combined with children’s lack of presence on social media platforms. Despite this, the Knowledge Path Library persisted and continued to provide its services and cultural activities while following all health and safety protocols. The Knowledge Path Library also transitioned its activities online, delivering them via the Foundation’s social media platforms to enhance their reach. It also experimented with many activities online to reach the largest number of children and parents. The library enhanced its presence on Facebook, reaching about 738,000 people, while the number of subscribers on the “Friends of the Knowledge Path” Facebook group increased by more than 60%. The library also launched its e-library and stocked it with more than 200 books, offered free of charge to all, to ensure that readers had free access to the books no matter where they are. A total of 693 posts promoting and encouraging reading were posted on the Knowledge Path Facebook group (interactive questions, book of the day, interactive activities, and story readings).
CORPORATE SOCIAL RESPONSIBILITY

90
In addition to these activities, the library proceeded with the following programs:• Conducting five specialized workshops that targeted
parents and addressed child-related issues related to creativity, staying engaged during the lockdown, the value of reading, and how to foster a reading household. A total of 1,879 parents participated in these online activities via Zoom and Facebook.
• Offering 323 storytelling and reading activities in person and virtually and hosting eight Jordanian and Arab children book authors to launch their new publications online. Total attendance for these events reached 422,000 children through the Knowledge Path Facebook group, out of which 16,000 children attended physically in the library.
• Holding several programs that strengthen critical thinking, problem-solving, and stimulate scientific curiosity in children and youth during COVID-19. Among these programs is the Scientific Film Festival, which was held for the seventh consecutive year in cooperation with the Goethe Institute. The program is an international festival that aims to make science fun for children by screening films that explore scientific themes, followed by hands-on scientific experiments and illustrations. Both the Scientific Film Festival and the annual summer camp the library organizes took place virtually. Through these programs, 13 scientific films were screened, 21 scientific activities were held, and 77 cultural activities were carried out, all of which were attended by 6,263 children online and 1,200 offline.
• Launching an updated version of the reading competition (Sixteen before Sixteen) for children and youth that was offered in-person and online to extend its reach to all governorates. The number of children and youth who participated exceeded 1,000.
• Organizing field trips before COVID-19 to children’s hospitals and schools. Five visits to Al-Bashir Hospital were made prior to the lockdown, and 16 storytelling and interactive activities were held virtually via Zoom for children at the King Hussein Cancer Center. The two libraries (in Jabal Amman and Al-Achrafieh) hosted 24 school visits, including daily reading and creative activities. Ten similar sessions were held via Zoom.
• Launching its Adolescents Forum, which is aimed at strengthening critical and creative thinking, philosophy skills among youth, and encouraging reading. The library also launched board game programs for adolescents, aimed at developing their critical thinking, strategizing skills, and collaboration and communication skills. A total of 25 sessions was held in both libraries.
• Designing a financial literary program with Nahji Company that will target the 7- 11 age group. The program addressed financial literacy for children through interactive training sessions, combined with educational puppet shows and questions and activities on financial literacy.
The Knowledge Path Library in figuresDespite the challenges of 2020, the Knowledge Path Library was visited by 34,052 children (17,010 in the Jabal Amman branch, and 17,042 in the Al-Ashrafieh branch). A total of 34,602 books was borrowed (20,859 from the Jabal Amman branch and 13,743 books from the Al-Ashrafieh branch). The number of books read inside the library reached 52,244 (25,060 in the Jabal Amman branch and 27,184 books in the Al-Ashrafieh branch). Around 1,216 e-books were borrowed by children nationwide through the Foundation’s e-library. Extended closures of the Al-Ashrafieh branch led to an 80% drop in the number of library patrons, and a 60% decrease was experienced in the number of books borrowed. However, these percentages are close to those experienced by the Jabal Amman branch, even though it did not endure the same extended periods of closures. These numbers are an indication of the importance of libraries in disadvantaged areas in Jordan. The number of female children who use the library remains higher than the number of male children.
The Young Innovators LabIn 2020, the Foundation’s Knowledge Path Library completed its fifth year-long cycle of the Young Innovators Lab, which was held in both Amman and Zarqa in cooperation with Thinking Oasis. The program targets children aged 10 to 13 years who are passionate about science and innovation and works on developing their critical thinking skills and nurturing their love for science through practical projects and scientific experiments. Both programs in Amman and Zarqa had 22 participants each. The participants received training spread over eight months, resulting in 11 innovative and scientific projects that were created under the supervision of students from different universities and across diverse fields. The purpose of these projects is to find solutions for social problems jointly identified by the participants and their supervisors. The projects will be presented during two separate celebrations to honor the students and their supervisors.
The Innovation StudioThe Innovation Studio is an inclusive space aimed at developing innovative solutions and critical thinking skills in children and youth through training workshops and by providing the tools and resources needed for research and experimentation. The studio strengthens participants’ knowledge of science and technology by linking its activities and training with sources of knowledge at the Abdul Hameed Shoman Public Library and the Knowledge Path Libraries. Six innovation workshops were held during the year, with a total of 70 children and youth taking part. Workshop topics included: How to make a Spectrophotometer, Microcontrollers, Creative Design (Design Squad), Problem Solving, 3D Printing, and Robotics.The Foundation also signed a three-year MOU with Techworks, an initiative of the Crown Prince Foundation,
CORPORATE SOCIAL RESPONSIBILITY
91
to provide youth and children with access to experts and professionals to accelerate their skills and knowledge in the field and boost the creative environment in Jordan.
The Cultural ForumThe Cultural Forum continued to hold events throughout the year with the participation of a group of prominent Arab and foreign thought-leaders and experts. As part of the forum’s Weekly Monday Meetings, eight events were held at the Foundation between January and March 2020, attended by more than 1,296 people.In response to the pandemic, the forum began to offer it activities virtually through Facebook and Zoom. Thirty-one activities in the form of online discussions and dialogue sessions were held, the majority of which revolved around the pandemic and its impact. Over 11,120 individuals attended these events. A total of 42 cultural events were held during the year despite the lockdowns and interruptions, and were attended by 12,424 individuals, an increase of 11% over the previous year. Through these cultural events, the forum hosted several Arab, international, and local prominent figures.The Cultural Forum tackled a variety of thematic areas within its Monday Program. Most notable was the implementation of the Environment Today Program for the third consecutive year, in cooperation with the Arab Forum for Environment and Development in Beirut. Many environmental experts attended this event. Within the education thematic area, seven dialogue sessions and a debate were held. The Monday Program also included testimonies and meetings with youth as part of the Forum’s youth platform, and a general thematic area, which included 26 dialogue sessions.Many events were held throughout the year, including a dialogue session with the Massachusetts Institute of Technology called “Rebuilding the Economy following the Corona Crisis Repercussions through Innovation,” and a dialogue session called “Corona’s Impact on Jordan: Expected Scenarios.” In addition, two political testimonies were presented by ex-prime ministers Mr. Taher Al-Masri and Dr. Faisal Al-Fayez. Several dialogue sessions were held to discuss the most prominent developments and findings on the Corona pandemic. The forum also hosted the launch and discussion of the book, The Decision, by ex-prime minister Mr. Mudar Badran. Additional book launches included the Secrets of the Sufi Path, and The Jordanian Political Economy: Building in the Womb of Crises. At the beginning of the year, the forum launched its Youth Platform to attract a wider audience of youth and engage them as partners in designing the forum’s program. It included seminars and dialogue sessions on topics of interest to youth in Jordan.Mrs. Haifa Al-Bashir was selected as “Guest of the year” for 2020. She was honored during a hybrid ceremony in which 40 male and female speakers recalled the significant work and charitable and volunteer efforts she carried out in service to the community. The ceremony was attended by 129 individuals via Zoom.
The Forum also organized a seminar entitled “The Pandemic and its Impact on the Cultural Scene,” with 12 selected speakers from different cultural sectors discussing the extent of damage inflicted by the pandemic on different cultural sectors, and exploring some successful work models within the cultural field that were developed to offset or alleviate the effect of the pandemic. The likelihood of government intervention through the Ministry of Culture to uphold the sectors and the possibility of establishing a union for cultural sectors and its legal implications was discussed.
Cinema programThe cinema section at the Abdul Hameed Shoman Foundation continued its weekly film screenings of Arab and International films during the year. The screenings were followed by a discussion, review, and analysis of the film. The cinema section also continued to enrich its film library with new international films (with Arabic subtitles), in addition to holding specialized cinema workshops. Before the onset of the pandemic, the cinema section held 10 film screenings, attended by 1,131 people. It also conducted an educational workshop entitled “How Do You Read the Film?”, presented by Lebanese film critic Mohamed Reda and attended by 68 people. When all movie theaters closed due to the pandemic, the cinema section merged its film weeks with the weekly screening into one program called “The Online Weekly Screenings”. These online screenings were carried out in cooperation with several film distributers, including Mad Solutions in Egypt, Mec Film in Germany, and a selection of Arab producers and moviemakers who allowed the Foundation to screen their films through its website. By the end of November, 25 film screenings had been held online, with each one preceded by a promotional video presented by the Foundation’s cinema consultant. All online screenings were followed by a discussion between the film director and viewers on Zoom and Facebook. The screenings were viewed by 2,706 people, while 18,973 people followed the online discussions.To highlight the importance of the culture of cinema, the cinema section created a weekly cinematic post called “Creative Scenes”, featuring a memorable scene from a film, accompanied by a description explaining the aesthetics of the scene and its technical and narrative ingenuity. The posts were shared with the public via social media channels and were an instant success, with over 30,000 views.
The Abdul Hameed Shoman Musical EveningsIn 2014, the Foundation launched a music program for showcasing promising Jordanian talent, celebrating local musicians, and introducing Arab and international music to a wider audience. The Abdul Hameed Shoman Musical Evenings are held for free once a month. The program also celebrates notable Arab and international musicians and artists and encourages collaboration between them and Jordanian musicians during the Music Festival Evenings held in downtown Amman.
CORPORATE SOCIAL RESPONSIBILITY

92
Two musical evenings were held at the Foundation at the beginning of 2020 with young, local Jordanian performers in cooperation with the Amman Jazz Festival and professional Jordanian artists. More than 500 spectators attended these performances.The pandemic lockdown brought an end to live musical evenings and instead a live-streamed musical event was launched and broadcast called “Music in the Library”. The Foundation held six live-streamed performances through the Foundation’s social media platforms. These evenings were widely successful, attracting online attendance of around 98,000 people.
Grants and Support Program (2014-2020)In line with its strategy to invest in intellectual, cultural, and social creativity to revive them in society, the Abdul Hameed Shoman Foundation offers annual grants amounting to JOD 2 million to realize its vision for a society of culture and Innovation in Jordan and Palestine.The Foundation’s Grants program includes:(1) The Arts and Literature Grants Program, which
has supported more than 147 projects during the years 2014-2020 (of which 13 were in 2020), within six sectors: performing arts, audiovisual arts, festivals, and cultural activities, cultural national heritage, artistic and literary spaces, and library development support.
(2) The Thought Leadership Grants Program, which supports four sectors: scientific research conferences, scientific activities, scientific spaces, educational applications, and youth forums and debates. Between 2014 and 2020, more than 81 projects were supported (seven of which were in 2020).
Through the Grants and Support Program, more than 220 educational and cultural projects have received around JOD 8 million in funding over the past six years. These investments support some of the needs in Jordan and Palestine and also help to identify new talents, provide creative resources and spaces aimed at spreading art and culture, help to preserve the cultural and national heritage, encourage the theater and performing arts, support the Arabic language by encouraging the reading of Arabic language books, and enrich distinguished Arabic literary and artistic content on digital platforms. The investments support libraries, including 14 in Palestine, and projects to boost reading. There was also support for educational projects and for providing learning resources to all. The Foundation supported several scientific spaces and educational applications, various scientific activities, and youth forums and conferences in cooperation with universities and/or scientific centers.Unfortunately, six of the supported projects, which were scheduled to be held in Jordan and Palestine during the year 2020, were suspended when the pandemic hit. Other projects continued at minimum capacity, lessening their impact and having significant financial consequences for both the project founders and those working on them.During the year, the Foundation provided financial support in the amount of JOD 90,500 to the Royal Society of Fine Arts, the Young Journalist Project, the “My Talent from My Home” competition, and the Ministry of Culture’s Family Library.
At the beginning of 2019, the Foundation officially shifted from year-round grant applications to biannual calls for applications. During the first year, it supported 20 projects in Jordan and Palestine. Preparations are now underway for the second call for applications for the literature and arts and thought leadership programs in the second quarter of 2021.
The Foundation’s digital transformationThe Abdul Hameed Shoman Foundation embarked on a path of digital transformation in 2020, taking all its programs online to enable it to achieve some of its strategic goals. The Foundation added new services to its electronic library management system in 2020. These included electronic indexing for children and adults, an online search for library resources, online self-services for reserving, borrowing, and renewing a book subscription, and mobile phone access to the Foundation’s e-library services. Additional achievements within the Foundation’s 2020 vision for digital transformation include: • Online management systems for its four awards:
1. The Abdul Hameed Shoman Creativity Award for Children and Youth (Abde’)
2. The Abdul Hameed Shoman Arab Researcher’s Award.
3. The Abdul Hameed Shoman Award for Children’s Literature.
4. The Abdul Hameed Shoman Foundation Innovation Award.
• The launch of the first phase of the Single Sign-on system, which improves access to all the Foundation’s programs and services through a single unified account and sign-on process.
• The launch of an electronic payment system for the Abdul Hameed Shoman Library, including e-library services.
• The launch of an electronic platform that allows beneficiaries to provide the Foundation with suggestions for improvements and follow up on them electronically.
• The launch of the second phase of the Customer Relationship Management system.
The Foundation is also developing an administrative decision support system to assess the outcomes of the Foundation’s different programs.The repeated closures and the suspension of printed newspapers, both as a result of the pandemic, led the Foundation to focus its efforts on spreading awareness about its programs and services through a variety of online platforms. It strengthened its presence on social media channels, including holding 123 live broadcasts of its cultural activities and producing 55 promotional videos. These efforts led to a 40% increase in the number of followers across all social media platforms, reaching 390,800 followers, with more than 565,000 interactions and 8,790,000 video views. In addition, 38,000,000 accounts were reached through various social media platforms, an increase of 90% over the previous year.
CORPORATE SOCIAL RESPONSIBILITY

93
Arab Bank Group
CONSOLIDATED STATEMENT OF FINANCIAL POSITION 95
CONSOLIDATED STATEMENT OF INCOME 96
CONSOLIDATED STATEMENT OF COMPREHENSIVE INCOME 97
CONSOLIDATED STATEMENT OF CHANGES IN OWNERS’ EQUITY 98
CONSOLIDATED STATEMENT OF CASH FLOWS 100
NOTES TO THE CONSOLIDATED FINANCIAL STATEMENTS 101
INDEPENDENT AUDITOR’S REPORT 181
Arab Bank plc
STATEMENT OF FINANCIAL POSITION 187
STATEMENT OF INCOME 188
STATEMENT OF COMPREHENSIVE INCOME 189
STATEMENT OF CHANGES IN SHAREHOLDERS’ EQUITY 190
STATEMENT OF CASH FLOWS 192
NOTES TO THE FINANCIAL STATEMENTS 193
INDEPENDENT AUDITOR’S REPORT 271


95
AS
SE
TS
LIA
BIL
ITIE
S A
ND
OW
NE
RS
’ E
QU
ITY
ARAB BANK GROUP
CONSOLIDATED STATEMENT OF FINANCIAL POSITION
The accompanying notes from (1) to (60) are an integral part of these consolidated financial statements and should be read with them.
USD ‘000
Notes31 December
2020 2019Cash and balances with central banks 7 10 807 627 7 905 810Balances with banks and financial institutions 8 4 601 165 4 258 593Deposits with banks and financial institutions 9 288 165 313 556Financial assets at fair value through profit or loss 10 304 054 519 053Financial derivatives - positive fair value 41 91 510 54 212Direct credit facilities at amortized cost 12 23 907 858 23 960 625Financial assets at fair value through other comprehensive income 11 409 715 385 933Other financial assets at amortized cost 13 8 762 789 8 894 618Investments in associates 14 3 804 212 3 513 651Fixed assets 15 458 518 461 117Other assets 16 763 137 792 291Deferred tax assets 17 214 933 155 385Total Assets 54 413 683 51 214 844
Banks’ and financial institutions’ deposits 18 3 974 226 3 761 895Customers’ deposits 19 36 235 138 33 154 995Cash margin 20 2 483 253 3 082 753Financial derivatives - negative fair value 41 170 956 75 887Borrowed funds 21 609 791 332 936Provision for income tax 22 275 406 345 054Other provisions 23 230 069 226 521Other liabilities 24 1 040 409 1 125 950Deferred tax liabilities 25 5 672 6 402Total Liabilities 45 024 920 42 112 393
Share capital 26 926 615 926 615Share premium 26 1 225 747 1 225 747Statutory reserve 27 926 615 926 615Voluntary reserve 28 977 315 977 315General reserve 29 1 141 824 1 141 824General banking risks reserve 30 224 274 238 952Reserves with associates 1 540 896 1 540 896Foreign currency translation reserve 31 ( 160 209) ( 252 925)Investments revaluation reserve 32 ( 295 797) ( 298 403)Retained earnings 33 2 775 635 2 584 537Total Equity Attributable to the Shareholders of the Bank 9 282 915 9 011 173Non-controlling interests 33 105 848 91 278Total Shareholders’ Equity 9 388 763 9 102 451TOTAL LIABILITIES AND SHAREHOLDERS’ EQUITY 54 413 683 51 214 844

96
ARAB BANK GROUP
CONSOLIDATED STATEMENT OF INCOME
USD ‘000
PRO
FIT
FOR
THE
YEA
RE
XP
EN
SE
SR
EV
EN
UE
Notes 2020 2019
Interest income 34 2 068 368 2 430 077
Less: interest expense 35 865 306 1 088 786
Net interest income 1 203 062 1 341 291
Net commissions income 36 270 398 291 305
Net interest and commissions income 1 473 460 1 632 596
Foreign exchange differences 100 624 112 915
Gain from financial assets at fair value through profit or loss 37 3 580 7 053
Dividends on financial assets at fair value through other comprehensive income 11 5 710 6 964
Group’s share of profits of associates 14 296 365 424 019
Other revenue 38 51 296 47 283
TOTAL INCOME 1 931 035 2 230 830
Employees’ expenses 39 509 633 499 542
Other expenses 40 327 420 299 623
Depreciation and amortization 15/16 63 350 61 806
Provision for impairment - ECL 6 658 330 187 971
Other provisions 23 22 221 31 086
TOTAL EXPENSES 1 580 954 1 080 028
PROFIT FOR THE YEAR BEFORE INCOME TAX 350 081 1 150 802
Less: Income tax expense 22 154 797 304 254
PROFIT FOR THE YEAR 195 284 846 548
Attributable to :
Bank’s shareholders 192 791 844 937
Non-controlling interests 33 2 493 1 611
Total 195 284 846 548
Earnings per share attributable to the Bank’s Shareholders
- Basic and Diluted (US Dollars) 55 0.30 1.32
The accompanying notes from (1) to (60) are an integral part of these consolidated financial statements and should be read with them.
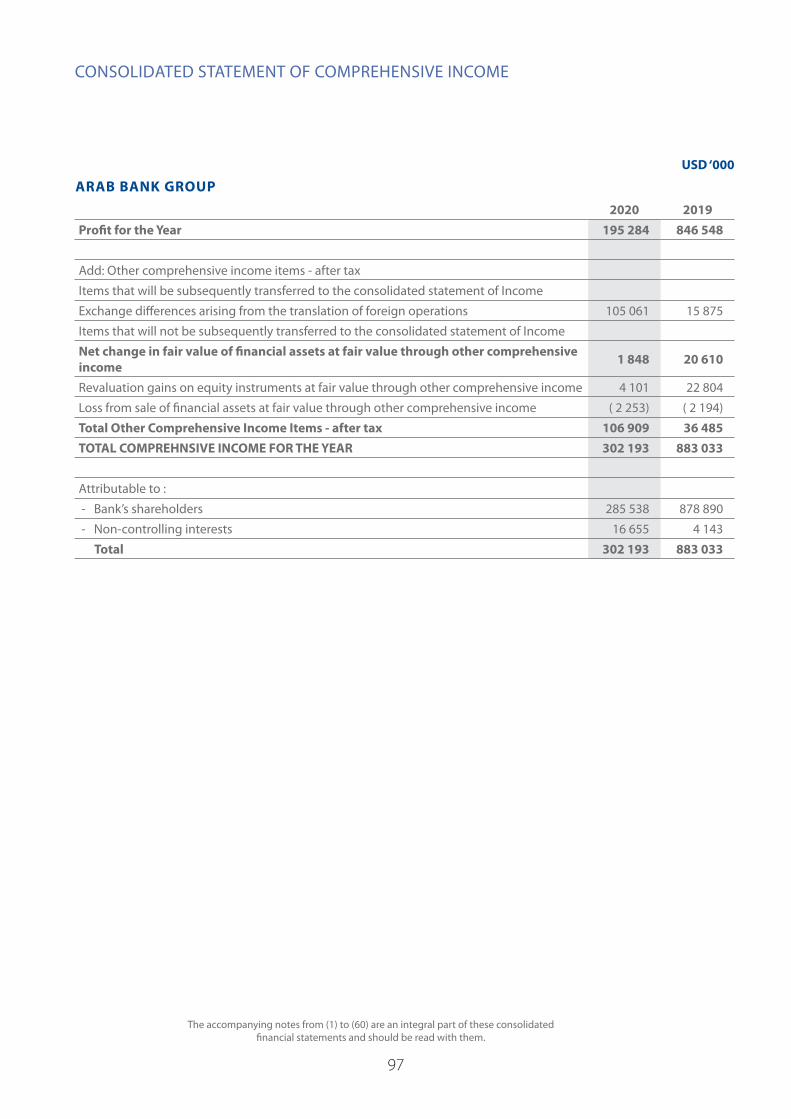
97
ARAB BANK GROUP
CONSOLIDATED STATEMENT OF COMPREHENSIVE INCOME
2020 2019Profit for the Year 195 284 846 548
Add: Other comprehensive income items - after tax
Items that will be subsequently transferred to the consolidated statement of Income
Exchange differences arising from the translation of foreign operations 105 061 15 875
Items that will not be subsequently transferred to the consolidated statement of Income
Net change in fair value of financial assets at fair value through other comprehensive income 1 848 20 610
Revaluation gains on equity instruments at fair value through other comprehensive income 4 101 22 804
Loss from sale of financial assets at fair value through other comprehensive income ( 2 253) ( 2 194)
Total Other Comprehensive Income Items - after tax 106 909 36 485TOTAL COMPREHNSIVE INCOME FOR THE YEAR 302 193 883 033
Attributable to :
- Bank’s shareholders 285 538 878 890
- Non-controlling interests 16 655 4 143
Total 302 193 883 033
USD ‘000
The accompanying notes from (1) to (60) are an integral part of these consolidated financial statements and should be read with them.

98
20
20
20
19
ARAB BANK GROUP
CONSOLIDATED STATEMENT OF CHANGES IN SHAREHOLDERS’ EQUITY
- Retained earnings include restricted deferred tax assets in the amount of USD 214.9 million. Restricted retained earnings that cannot be distributed or otherwise utilized except only under certain circumstances, as a result of adopting of certain International Accounting Standards, amounted to USD 2.8 million as of 31 December 2020.
- The Bank cannot use a restricted amount of USD (295.8) million which represents the negative investments revaluation reserve in accordance with the instructions of the Jordan Securities Commission and Central Bank of Jordan as of 31 December 2020.
Notes Share Capital Share Premium
Statutory Reserve
Voluntary Reserve
General Reserve
General Banking Risks Re-
serve
Reserves with As-sociates
Foreign Currency
Translation Reserve
Investments Revaluation
Reserve
Retained Earnings
Total Equity Attributable to the Share-
holders of the Bank
Non-Con-trolling
Interests
Total Share holoders’
Equity
Balance at the Beginning of the year 926 615 1 225 747 926 615 977 315 1 141 824 238 952 1 540 896 ( 252 925) ( 298 403) 2 584 537 9 011 173 91 278 9 102 451
Profit for the year - - - - - - - - - 192 791 192 791 2 493 195 284
Other comprehensive income for the year - - - - - - - 92 716 31 - 92 747 14 162 106 909
Total Comprehensive Income for the Year - - - - - - - 92 716 31 192 791 285 538 16 655 302 193
Transferred from general banking risk reserve - - - - - ( 14 678) - - - 14 678 - - -
Transferred from Investments revaluation reserve to retained earnings - - - - - - - - 2 575 ( 2 575) - - -
Investments revaluation reserve transferred to non-controlling interests - - - - - - - - - - - ( 322) ( 322)
Dividends 33 - - - - - - - - - - - ( 1 763) ( 1 763)
changes in associate equity - - - - - - - - - ( 5 504) ( 5 504) - ( 5 504)
Adjustments during the year - - - - - - - - - ( 8 292) ( 8 292) - ( 8 292)
Balance at the End of the Year 926 615 1 225 747 926 615 977 315 1 141 824 224 274 1 540 896 ( 160 209) ( 295 797) 2 775 635 9 282 915 105 848 9 388 763
Balance at the Beginning of the year 926 615 1 225 747 919 507 977 315 1 141 824 237 124 1 540 896 ( 264 651) ( 322 831) 2 192 006 8 573 552 91 037 8 664 589
Effect of IFRS (16) adoption - - - - - - - - - ( 5 327) ( 5 327) - ( 5 327)
Restated Balance at the Beginning of the year 926 615 1 225 747 919 507 977 315 1 141 824 237 124 1 540 896 ( 264 651) ( 322 831) 2 186 679 8 568 225 91 037 8 659 262
Profit for the year - - - - - - - - - 844 937 844 937 1 611 846 548
Other comprehensive income for the year - - - - - - - 11 726 22 227 - 33 953 2 532 36 485
Total Comprehensive Income for the Year - - - - - - - 11 726 22 227 844 937 878 890 4 143 883 033
Transferred to statutory reserve - - 7 108 - - - - - - ( 7 108) - - -
Transferred to general banking risk reserve - - - - - 1 828 - - - ( 1 828) - - -
Transferred from Investments revaluation reserve to retained earnings - - - - - - - - 2 201 ( 2 201) - - -
Investments revaluation reserve transferred to non- controlling interests - - - - - - - - - - - ( 7) ( 7)
Dividends 33 - - - - - - - - - ( 417 997) ( 417 997) ( 2 604) ( 420 601)
changes in associate equity - - - - - - - - - ( 13 724) ( 13 724) - ( 13 724)
Adjustments during the year - - - - - - - - - ( 4 221) ( 4 221) ( 1 291) ( 5 512)
Balance at the End of the Year 926 615 1 225 747 926 615 977 315 1 141 824 238 952 1 540 896 ( 252 925) ( 298 403) 2 584 537 9 011 173 91 278 9 102 451
The accompanying notes from (1) to (60) are an integral part of these consolidated financial statements and should be read with them.

99
USD ‘000
Notes Share Capital Share Premium
Statutory Reserve
Voluntary Reserve
General Reserve
General Banking Risks Re-
serve
Reserves with As-sociates
Foreign Currency
Translation Reserve
Investments Revaluation
Reserve
Retained Earnings
Total Equity Attributable to the Share-
holders of the Bank
Non-Con-trolling
Interests
Total Share holoders’
Equity
Balance at the Beginning of the year 926 615 1 225 747 926 615 977 315 1 141 824 238 952 1 540 896 ( 252 925) ( 298 403) 2 584 537 9 011 173 91 278 9 102 451
Profit for the year - - - - - - - - - 192 791 192 791 2 493 195 284
Other comprehensive income for the year - - - - - - - 92 716 31 - 92 747 14 162 106 909
Total Comprehensive Income for the Year - - - - - - - 92 716 31 192 791 285 538 16 655 302 193
Transferred from general banking risk reserve - - - - - ( 14 678) - - - 14 678 - - -
Transferred from Investments revaluation reserve to retained earnings - - - - - - - - 2 575 ( 2 575) - - -
Investments revaluation reserve transferred to non-controlling interests - - - - - - - - - - - ( 322) ( 322)
Dividends 33 - - - - - - - - - - - ( 1 763) ( 1 763)
changes in associate equity - - - - - - - - - ( 5 504) ( 5 504) - ( 5 504)
Adjustments during the year - - - - - - - - - ( 8 292) ( 8 292) - ( 8 292)
Balance at the End of the Year 926 615 1 225 747 926 615 977 315 1 141 824 224 274 1 540 896 ( 160 209) ( 295 797) 2 775 635 9 282 915 105 848 9 388 763
Balance at the Beginning of the year 926 615 1 225 747 919 507 977 315 1 141 824 237 124 1 540 896 ( 264 651) ( 322 831) 2 192 006 8 573 552 91 037 8 664 589
Effect of IFRS (16) adoption - - - - - - - - - ( 5 327) ( 5 327) - ( 5 327)
Restated Balance at the Beginning of the year 926 615 1 225 747 919 507 977 315 1 141 824 237 124 1 540 896 ( 264 651) ( 322 831) 2 186 679 8 568 225 91 037 8 659 262
Profit for the year - - - - - - - - - 844 937 844 937 1 611 846 548
Other comprehensive income for the year - - - - - - - 11 726 22 227 - 33 953 2 532 36 485
Total Comprehensive Income for the Year - - - - - - - 11 726 22 227 844 937 878 890 4 143 883 033
Transferred to statutory reserve - - 7 108 - - - - - - ( 7 108) - - -
Transferred to general banking risk reserve - - - - - 1 828 - - - ( 1 828) - - -
Transferred from Investments revaluation reserve to retained earnings - - - - - - - - 2 201 ( 2 201) - - -
Investments revaluation reserve transferred to non- controlling interests - - - - - - - - - - - ( 7) ( 7)
Dividends 33 - - - - - - - - - ( 417 997) ( 417 997) ( 2 604) ( 420 601)
changes in associate equity - - - - - - - - - ( 13 724) ( 13 724) - ( 13 724)
Adjustments during the year - - - - - - - - - ( 4 221) ( 4 221) ( 1 291) ( 5 512)
Balance at the End of the Year 926 615 1 225 747 926 615 977 315 1 141 824 238 952 1 540 896 ( 252 925) ( 298 403) 2 584 537 9 011 173 91 278 9 102 451

100
CA
SH
FL
OW
S F
RO
M O
PE
RA
TIN
G A
CT
IVIT
IES
CA
SH F
LOW
S FR
OM
IN
VES
TIN
G A
CTI
VIT
IES
CASH
FLO
WS
FRO
M
FIN
AN
CIN
G A
CTIV
ITIE
SARAB BANK GROUP
CONSOLIDATED STATEMENT OF CASH FLOWS USD ‘000
Notes 2020 2019Profit for the year before income tax 350 081 1 150 802Adjustments for: - Depreciation 15 48 906 48 981 - Amortization of intangible assets 16 14 444 12 825 - Expected credit losses on financial assets 6 658 330 187 971 - Net accrued interest ( 50 881) 23 118 - (Gain) from sale of fixed assets ( 795) ( 453) - (Gain) from revaluation of financial assets at fair value through profit or loss 37 ( 516) ( 4 017) - Dividends from financial assets at fair value through other comprehensive income 11 ( 5 710) ( 6 964) - Group’s share of profits of associates 14 ( 296 365) ( 424 019) - Impairment of investment held for sale 13 000 - - Other provisions 22 221 31 086Total 752 715 1 019 330
(Increase) decrease in assets:Balances with central banks (maturing after 3 months) 68 001 ( 54 411)Deposits with banks and financial institutions (maturing after 3 months) 24 326 10 765Direct credit facilities at amortized cost ( 450 370) ( 374 978)Financial assets at fair value through profit and loss 215 515 ( 75 207)Other assets and financial derivatives ( 35 652) ( 168 596)Increase (decrease) in liabilities:Bank and financial institutions deposits (maturing after 3 months) 362 743 ( 3 162)Customers’ deposits 3 080 143 1 724 082Cash margin ( 599 500) 169 282Other liabilities and financial derivatives 43 622 83 480Net Cash from Operating Activities before Income Tax 3 461 543 2 330 585Income tax paid 22 ( 284 714) ( 301 419)Net Cash from Operating Activities 3 176 829 2 029 166
(Purchase) Sale of financial assets at fair value through other comprehensive income ( 23 751) 7 304Maturity (Purchase) of other financial assets at amortized cost 131 029 ( 386 955)(Increase) of investments in associates 14 ( 139 532) ( 4 383)Dividends received from associates 14 143 364 222 950Dividends from financial assets at fair value through other comprehensive income 11 5 710 6 964
(Purchase) of fixed assets 15 ( 47 827) ( 58 572)Proceeds from selling fixed assets - Net 2 672 5 022(Purchase) of intangible assets 16 ( 18 425) ( 19 453)Net Cash generated from (used in) Investing Activities 53 240 ( 227 123)
Increased borrowed funds 276 855 51 457Dividends paid to shareholders ( 928) ( 414 933)Dividends paid to non-controlling interests ( 1 763) ( 2 604)Net Cash generated From (Used in) Financing Activities 274 164 ( 366 080)Net increase in Cash and Cash Equivalents 3 504 233 1 435 963Exchange differences - change in foreign exchange rates 92 716 11 726Cash and cash equivalent at the beginning of the year 8 815 119 7 367 430Cash and Cash Equivalent at the End of the Year 57 12 412 068 8 815 119
Operational cash flows from interestInterest Received 2 089 363 2 423 145Interest Paid 937 182 1 058 736
The accompanying notes from (1) to (60) are an integral part of these consolidated financial statements and should be read with them.

101
ARAB BANK GROUP
1. General
Arab Bank was established in 1930, and is registered as a Jordanian public shareholding limited company. The Head Office of the Bank is domiciled in Amman – Hashemite Kingdom of Jordan and the Bank operates worldwide through its 82 branches in Jordan and 129 branches abroad. Also, the Bank operates through its subsidiaries and Arab Bank (Switzerland).
Arab Bank PLC shares are traded on Amman Stock Exchange. The shareholders of Arab Bank PLC are the same shareholders of Arab Bank Switzerland (every 18 shares of Arab Bank PLC equal/ traded for 1 share of Arab Bank Switzerland).
The accompanying consolidated financial statements were approved by the Board of Directors in its meeting number (1) on 25 January 2021 and are subject to the approval of the General Assembly.
2. (a) Basis of PreparationThe accompanying consolidated financial statements are prepared in accordance with International Financial Reporting Standards issued by the International Accounting Standards Board.
Arab Bank Group adheres to the local regulations and instructions of the Central Bank of Jordan, as well as to the prevailing regulations in the countries where the Group operates.
The financial statements are prepared in accordance with the historical cost principle, except for financial assets through profit or loss , financial assets through other comprehensive income and financial derivatives which are stated at fair value as of the date of the financial statements.
The consolidated financial statements are presented in US dollars (USD). For each entity in the group, the Bank determines the functional currency and items included in the financial statements of each entity are measured using that functional currency.
2. (b) Basis of ConsolidationThe accompanying consolidated financial statements of Arab Bank Group, presented in US dollars, comprise the financial statements of Arab Bank plc, Arab Bank Switzerland (Limited) and the following key subsidiaries:
Company Name Percentage of ownership (%)
Date of Acquisition Principal Activity Place of
IncorporationPaid-up Capital
2020 2019
Europe Arab Bank plc 100.00 100.00 2006 Banking United Kingdom € 570m
Arab Bank Australia Limited 100.00 100.00 1994 Banking Australia AUD 119.3m
Islamic International Arab Bank plc 100.00 100.00 1997 Banking Jordan JD 100m
Arab National Leasing Company L.L.C. 100.00 100.00 1996 Financial
Leasing Jordan JD 50m
Al-Arabi Investment Group L.L.C. 100.00 100.00 1996 Brokerage and Financial Services Jordan JD 14m
Arab Sudanese Bank Limited 100.00 100.00 2008 Banking Sudan SDG 117.5m
Al Arabi Investment Group - Palestine 100.00 100.00 2009 Brokerage and
Financial Services Palestine JD 1.7m
Arab Tunisian Bank 64.24 64.24 1982 Banking Tunisia TND 100m
Arab Bank Syria 51.29 51.29 2005 Banking Syria SYP 5.05b
Al Nisr Al Arabi Insurance Company PLC 50.00 50.00 2006 Insurance Jordan JD 10m
NOTES TO THE CONSOLIDATED FINANCIAL STATEMENTS

102
Control is achieved when the Group is exposed, or has rights, to variable returns from its involvement with the investee and has the ability to affect those returns through its power over the investee. Specifically, the Group controls an investee if and only if the Group has:
• Power over the investee (i.e. existing rights that give it the current ability to direct the relevant activities of the investee).
• Exposure, or rights, to variable returns from its involvement with the investee.
• The ability to use its power over the investee to affect its returns.
When the Group has less than a majority of the voting or similar rights of an investee, the Group considers all relevant facts and circumstances in assessing whether it has power over an investee, including:
• The contractual arrangement with the other vote holders of the investee.
• Rights arising from other contractual arrangements.
• The Group’s voting rights and potential voting rights.
The Group re-assesses whether or not it controls an investee if facts and circumstances indicate that there are changes to one or more of the three elements of control.
Consolidation of a subsidiary begins when the Group obtains control over the subsidiary and ceases when the Group loses control of the subsidiary. Income and expenses of a subsidiary acquired or disposed of during the year are included in the statement of comprehensive income from the date the Group gains control until the date the Group ceases to control the subsidiary.
Profit or loss and each component of other comprehensive income (OCI) are attributed to the equity holders of the parent of the Group and to the non-controlling interests, even if this results in the non-controlling interests having a deficit balance. When necessary, adjustments are made to the financial statements of subsidiaries to bring their accounting policies into line with the Group’s accounting policies. All intra-group assets and liabilities, equity, income, expenses and cash flows relating to transactions between members of the Group are eliminated in full on consolidation.
A change in the ownership interest of a subsidiary without a loss of control is accounted for as an equity transaction. If the Group loses control over a subsidiary, it:
- Derecognizes the assets (including goodwill) and liabilities of the subsidiary.
- Derecognizes the carrying amount of any non- controlling interests.
- Derecognizes the cumulative translation differences, recorded in equity.
- Recognizes the fair value of the consideration received.
- Recognizes the fair value of any investment retained.
- Recognizes the gain or loss resulted from loss of control.
- Reclassifies the parent’s share of components previously recognized in OCI to profit or loss.
3. Changes in Accounting Policies The accounting policies adopted in the preparation of the consolidated financial statements are consistent with those used in the preparation of the consolidated financial statements for the year ended 31 December 2019, except for the adoption of the following new standards effective as of 1 January 2020:
Amendments to IFRS 3: Definition of a Business
The amendment to IFRS 3 Business Combinations clarifies that to be considered a business, an integrated set of activities and assets must include, at a minimum, an input and a substantive process that, together, significantly contribute to the ability to create output. Furthermore, it clarifies that a business can exist without including all of the inputs and processes needed to create outputs. These amendments had no impact on the consolidated financial statements of the Bank, but may impact future periods should the Bank enter into any business combinations.
Amendments to IAS 1 and IAS 8: Definition of “Material”
The IASB issued amendments to IAS 1 Presentation of Financial Statements and IAS 8 Accounting Policies, Changes in Accounting Estimates and Errors to align the definition of ‘material’ across the standards and to clarify certain aspects of the definition. The new definition states that, ’Information is material if
NOTES TO THE CONSOLIDATED FINANCIAL STATEMENTS

103
omitting, misstating or obscuring it could reasonably be expected to influence decisions that the primary users of general-purpose financial statements make on the basis of those financial statements, which provide financial information about a specific reporting entity. These amendments had no impact on the consolidated financial statements of, nor is there expected to be any future impact to, the Bank.
Amendments to IFRS 7, IFRS 9 and IAS 39 Interest Rate Benchmark Reform
Interest Rate Benchmark Reform Amendments to IFRS 9 and IFRS 7 includes a number of reliefs, which apply to all hedging relationships that are directly affected by interest rate benchmark reform. A hedging relationship is affected if the reform gives rise to uncertainties about the timing and or amount of benchmark-based cash flows of the hedged item or the hedging instrument. These amendments have no impact on the consolidated financial statements of the Bank.
Amendments to IFRS 16 Covid-19 Related Rent Concessions
On 28 May 2020, the IASB issued Covid-19-Related Rent Concessions - amendment to IFRS 16 Leases. The amendments provide relief to lessees from applying IFRS 16 guidance on lease modification accounting for rent concessions arising as a direct consequence of the Covid-19 pandemic. This relates to any reduction in lease payments which are originally due on or before 30 June 2021. As a practical expedient, a lessee may elect not to assess whether a Covid-19 related rent concession from a lessor is a lease modification.
The amendment applies to annual reporting periods beginning on or after 1 June 2020. Earlier application is permitted.
The Bank did not have any leases impacted by the amendment.
4. Significant Accounting Policies
Recognition of Interest IncomeThe effective interest rate method
In accordance with IFRS 9, interest income is recognized using the effective interest rate method for all financial instruments at amortized cost and financial instruments at fair value through the income statement or through other comprehensive income. The effective interest rate is the rate that discounts estimated future cash receipts over the expected life of the financial instrument, or, shorter period, to the net carrying amount of the financial asset.
The EIR (and therefore, the amortized cost of the asset) is calculated by taking into account any discount or premium on acquisition, fees and costs that are an integral part of the EIR. The Group recognizes interest income using a rate of return that represents the best estimate of a constant rate of return over the expected life of the loan. Hence, it recognizes the effect of potentially different interest rates charged at various stages, and other characteristics of the product life cycle (including prepayments, penalty interest and charges).
If expectations regarding the cash flows on the financial asset are revised for reasons other than credit risk. The adjustment is booked as a positive or negative adjustment to the carrying amount of the asset in the consolidated statement of financial position with an increase or reduction in interest income. The adjustment is subsequently amortized through interest and similar income in the consolidated statement of income.
Interest and similar income and expense For all financial instruments measured at amortized cost, financial instruments designated at FVOCI and FVTPL, interest income or expense is recorded using the EIR. The calculation takes into account all of the contractual terms of the financial instrument (for example, prepayment options) and includes any fees or incremental costs that are directly attributable to the instrument and are an integral part of the EIR, but not future credit losses.
When the recorded value of a financial asset or a group of similar financial assets has been reduced by an impairment loss, interest income continues to be recognized using the rate of interest used to discount the future cash flows for the purpose of measuring the impairment loss.
NOTES TO THE CONSOLIDATED FINANCIAL STATEMENTS

104
The Bank also holds investments in assets of countries with negative interest rates. The Bank discloses interest paid on these assets as interest expense.
Fee and commission incomeFee income can be divided into the following two categories:
A. Fee income earned from services that are provided over a certain period of time
Fees earned for the provision of services over a period of time are accrued over that period. These fees include commission income and private wealth and asset management fees, custody and other management fees.
B. Fee income forming an integral part of the corresponding financial instrument
Fees that the Bank considers to be an integral part of the corresponding financial instruments include:
loan origination fees, loan commitment fees for loans that are likely to be drawn down and other credit related fees.
Financial Instruments – Initial RecognitionDate of recognition
Financial assets and liabilities, with the exception of loans and advances to customers and balances due to customers, are initially recognized on the trade date, i.e., the date that the Group becomes a party to the contractual provisions of the instrument. This includes regular way trades: purchases or sales of financial assets that require delivery of assets within the time frame generally established by regulation or convention in the market place. Loans and advances to customers are recognized when
funds are transferred to the customers’ accounts. The Group recognizes balances due to customers when funds are transferred to the Group.
Initial measurement of financial instruments
The classification of financial instruments at initial recognition depends on their contractual terms and the business model for managing the instruments. Financial instruments are initially measured at their fair value, except in the case of financial assets and financial liabilities recorded at FVTPL, transaction costs are added to, or subtracted from, this amount. Trade receivables are measured at the transaction price. When the fair value of financial instruments at
initial recognition differs from the transaction price, the Group accounts for the Day 1 profit or loss, as described below.
Day 1 profit or loss
When the transaction price of the instrument differs from the fair value at origination and the fair value is based on a valuation technique using only inputs observable in market transactions, the Group recognizes the difference between the transaction price and fair value in net trading income. In those cases where fair value is based on models for which some of the inputs are not observable, the difference between the transaction price and the fair value is deferred and is only recognized in profit or loss when the inputs become observable, or when the instrument is derecognized.
Measurement categories of financial assets and liabilities
The Group classifies its financial assets (Debt Instruments) based on the business model for managing the assets and the asset’s contractual terms, measured at either:
• Amortized cost
• FVOCI
• FVTPL
The Group classifies and measures its derivative and trading portfolio at FVTPL. The Group may designate financial instruments at FVTPL, if so doing eliminates or significantly reduces measurement or recognition inconsistencies.
Financial liabilities, other than loan commitments and financial guarantees, are measured at amortized cost or at FVTPL when they are held for trading and derivative instruments or the fair value designation is applied.
Financial Assets and LiabilitiesDue from banks, loans and advances to customers and financial investments at amortized cost
The Group only measures due from banks, loans and advances to customers and other financial investments at amortized cost if both of the following conditions are met:
NOTES TO THE CONSOLIDATED FINANCIAL STATEMENTS

105
• The financial asset is held within a business model with the objective to hold financial assets in order to collect contractual cash flows
• The contractual terms of the financial asset give rise on specified dates to cash flows that are solely payments of principal and interest (SPPI) on the principal amount outstanding.
The details of these conditions are outlined below.
Business model assessment
The Group determines its business model at the level that best reflects how it manages groups of financial assets to achieve its business objective.
The Group’s business model is not assessed on an instrument-by-instrument basis, but at a higher level of aggregated portfolios and is based on observable factors such as:
• How the performance of the business model and the financial assets held within that business model are evaluated and reported to the entity's key management personnel
• The risks that affect the performance of the business model (and the financial assets held within that business model) and, in particular, the way those risks are managed
• How managers of the business are compensated (for example, whether the compensation is based on the fair value of the assets managed or on the contractual cash flows collected)
• The expected frequency, value and timing of sales are also important aspects of the Group’s assessment
The business model assessment is based on reasonably expected scenarios without taking 'worst case' or 'stress case’ scenarios into account. If cash flows after initial recognition are realized in a way that is different from the Group’s original expectations, the Group does not change the classification of the remaining financial assets held in that business model, but incorporates such information when assessing newly originated or newly purchased financial assets going forward.
The SPPI test
As a second step of its classification process the Group assesses the contractual terms of financial to identify whether they meet the SPPI test.
‘Principal’ for the purpose of this test is defined as the fair value of the financial asset at initial recognition and may change over the life of the financial asset (for example, if there are repayments of principal or amortization of the premium/discount).
The most significant elements of interest within a lending arrangement are typically the consideration for the time value of money and credit risk. To make the SPPI assessment, the Group applies judgement and considers relevant factors such as the currency in which the financial asset is denominated, and the period for which the interest rate is set.
In contrast, contractual terms that introduce a more than de minimis exposure to risks or volatility in the contractual cash flows that are unrelated to a basic lending arrangement do not give rise to contractual cash flows that are solely payments of principal and interest on the amount outstanding. In such cases, the financial asset is required to be measured at FVTPL.
Derivatives recorded at fair value through profit or loss
A derivative is a financial instrument or other contract with all three of the following characteristics:
• Its value changes in response to the change in a specified interest rate, financial instrument price, commodity price, foreign exchange rate, index of prices or rates, credit rating or credit index, or other variable, provided that, in the case of a non-financial variable, it is not specific to a party to the contract (i.e., the 'underlying').
• It requires no initial net investment or an initial net investment that is smaller than would be required for other types of contracts expected to have a similar response to changes in market factors.
• It is settled at a future date.
The Group enters into derivative transactions with various counterparties. These include interest rate swaps, futures and cross-currency swaps. Derivatives are recorded at fair value and carried as assets when their fair value is positive and as liabilities when their fair value is negative. Changes in the fair value of derivatives are included in net trading income unless hedge accounting is applied.
Debt instruments at FVOCI
The Group measures of debt instruments at FVOCI when both of the following conditions are met:
NOTES TO THE CONSOLIDATED FINANCIAL STATEMENTS
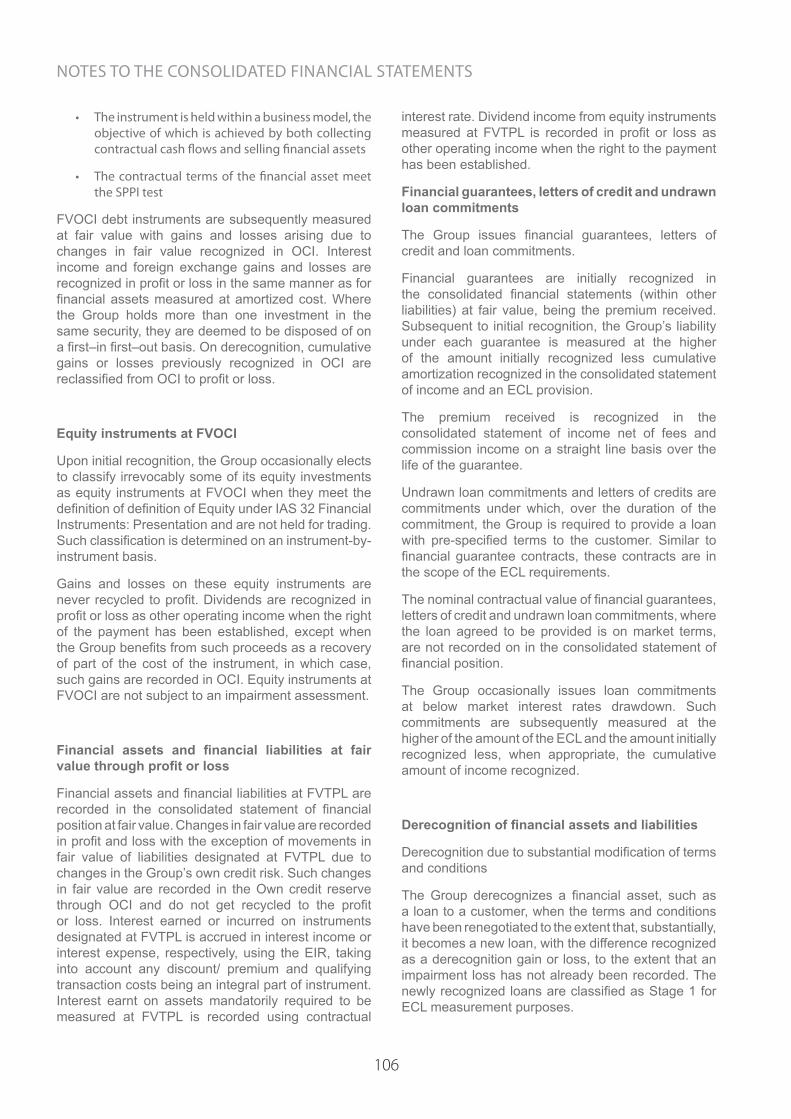
106
• The instrument is held within a business model, the objective of which is achieved by both collecting contractual cash flows and selling financial assets
• The contractual terms of the financial asset meet the SPPI test
FVOCI debt instruments are subsequently measured at fair value with gains and losses arising due to changes in fair value recognized in OCI. Interest income and foreign exchange gains and losses are recognized in profit or loss in the same manner as for financial assets measured at amortized cost. Where the Group holds more than one investment in the same security, they are deemed to be disposed of on a first–in first–out basis. On derecognition, cumulative gains or losses previously recognized in OCI are reclassified from OCI to profit or loss.
Equity instruments at FVOCI
Upon initial recognition, the Group occasionally elects to classify irrevocably some of its equity investments as equity instruments at FVOCI when they meet the definition of definition of Equity under IAS 32 Financial Instruments: Presentation and are not held for trading. Such classification is determined on an instrument-by-instrument basis.
Gains and losses on these equity instruments are never recycled to profit. Dividends are recognized in profit or loss as other operating income when the right of the payment has been established, except when the Group benefits from such proceeds as a recovery of part of the cost of the instrument, in which case, such gains are recorded in OCI. Equity instruments at FVOCI are not subject to an impairment assessment.
Financial assets and financial liabilities at fair value through profit or loss
Financial assets and financial liabilities at FVTPL are recorded in the consolidated statement of financial position at fair value. Changes in fair value are recorded in profit and loss with the exception of movements in fair value of liabilities designated at FVTPL due to changes in the Group’s own credit risk. Such changes in fair value are recorded in the Own credit reserve through OCI and do not get recycled to the profit or loss. Interest earned or incurred on instruments designated at FVTPL is accrued in interest income or interest expense, respectively, using the EIR, taking into account any discount/ premium and qualifying transaction costs being an integral part of instrument. Interest earnt on assets mandatorily required to be measured at FVTPL is recorded using contractual
interest rate. Dividend income from equity instruments measured at FVTPL is recorded in profit or loss as other operating income when the right to the payment has been established.
Financial guarantees, letters of credit and undrawn loan commitments
The Group issues financial guarantees, letters of credit and loan commitments.
Financial guarantees are initially recognized in the consolidated financial statements (within other liabilities) at fair value, being the premium received. Subsequent to initial recognition, the Group’s liability under each guarantee is measured at the higher of the amount initially recognized less cumulative amortization recognized in the consolidated statement of income and an ECL provision.
The premium received is recognized in the consolidated statement of income net of fees and commission income on a straight line basis over the life of the guarantee.
Undrawn loan commitments and letters of credits are commitments under which, over the duration of the commitment, the Group is required to provide a loan with pre-specified terms to the customer. Similar to financial guarantee contracts, these contracts are in the scope of the ECL requirements.
The nominal contractual value of financial guarantees, letters of credit and undrawn loan commitments, where the loan agreed to be provided is on market terms, are not recorded on in the consolidated statement of financial position.
The Group occasionally issues loan commitments at below market interest rates drawdown. Such commitments are subsequently measured at the higher of the amount of the ECL and the amount initially recognized less, when appropriate, the cumulative amount of income recognized.
Derecognition of financial assets and liabilities
Derecognition due to substantial modification of terms and conditions
The Group derecognizes a financial asset, such as a loan to a customer, when the terms and conditions have been renegotiated to the extent that, substantially, it becomes a new loan, with the difference recognized as a derecognition gain or loss, to the extent that an impairment loss has not already been recorded. The newly recognized loans are classified as Stage 1 for ECL measurement purposes.
NOTES TO THE CONSOLIDATED FINANCIAL STATEMENTS

107
If the modification does not result in cash flows that are substantially different, the modification does not result in derecognition. Based on the change in cash flows discounted at the original EIR, the Group records a modification gain or loss, to the extent that an impairment loss has not already been recorded.
Derecognition other than for substantial modification
A. Financial assets
A financial asset (or, where applicable, a part of a financial asset or part of a group of similar financial assets) is derecognized when the rights to receive cash flows from the financial asset have expired. The Group also derecognizes the financial asset if it has both transferred the financial asset and the transfer qualifies for derecognition.
The Group has transferred the financial asset if, and only if, either:
• The Group has transferred its contractual rights to receive cash flows from the financial asset
Or
• It retains the rights to the cash flows, but has assumed an obligation to pay the received cash flows in full without material delay to a third party under a ‘pass–through’ arrangement
Pass-through arrangements are transactions whereby the Group retains the contractual rights to receive the cash flows of a financial asset (the 'original asset'), but assumes a contractual obligation to pay those cash flows to one or more entities (the 'eventual recipients'), when all of the following three conditions are met:
• The Group has no obligation to pay amounts to the eventual recipients unless it has collected equivalent amounts from the original asset, excluding short-term advances with the right to full recovery of the amount lent plus accrued interest at market rates
• The Group cannot sell or pledge the original asset other than as security to the eventual recipients
• The Group has to remit any cash flows it collects on behalf of the eventual recipients without material delay. In addition, the Group is not entitled to reinvest such cash flows, except for investments in cash or cash equivalents including interest earned, during the period between the collection date and the date of required remittance to the eventual recipients.
A transfer only qualifies for derecognition if either:
• The Group has transferred substantially all the risks and rewards of the asset
Or
• The Group has neither transferred nor retained substantially all the risks and rewards of the asset, but has transferred control of the asset
The Group considers control to be transferred if and only if, the transferee has the practical ability to sell the asset in its entirety to an unrelated third party and is able to exercise that ability unilaterally and without imposing additional restrictions on the transfer.
When the Group has neither transferred nor retained substantially all the risks and rewards and has retained control of the asset, the asset continues to be recognized only to the extent of the Group’s continuing involvement, in which case, the Group also recognizes an associated liability. The transferred asset and the associated liability are measured on a basis that reflects the rights and obligations that the Group has retained.
Continuing involvement that takes the form of a guarantee over the transferred asset is measured at the lower of the original carrying amount of the asset and the maximum amount of consideration the Group could be required to pay.
If continuing involvement takes the form of a written or purchased option (or both) on the transferred asset, the continuing involvement is measured at the value the Group would be required to pay upon repurchase. In the case of a written put option on an asset that is measured at fair value, the extent of the entity's continuing involvement is limited to the lower of the fair value of the transferred asset and the option exercise price.
B. Financial liabilities
A financial liability is derecognized when the obligation under the liability is discharged, cancelled or expires. Where an existing financial liability is replaced by another from the same lender on substantially different terms, or the terms of an existing liability are substantially modified, such an exchange or modification is treated as a derecognition of the original liability and the recognition of a new liability. The difference between the carrying value of the original financial liability and the consideration paid is recognized in profit or loss.
NOTES TO THE CONSOLIDATED FINANCIAL STATEMENTS

108
Impairment of financial assetsOverview of the ECL principles
The Group records the allowance for expected credit loss for all loans and other debt financial assets not held at FVTPL, together with loan commitments and financial guarantee contracts, in this section all referred to as ‘financial instruments’. Equity instruments are not subject to impairment under IFRS 9.
The ECL allowance is based on the credit losses expected to arise over the life of the asset (the lifetime expected credit loss or LTECL), unless there has been no significant increase in credit risk since origination, in which case, the allowance is based on the 12 months’ expected credit loss.
The 12mECL is the portion of LTECLs that represent the ECLs that result from default events on a financial instrument that are possible within the 12 months after the reporting date.
Both LTECLs and 12mECLs are calculated on either an individual basis or a collective basis, depending on the nature of the underlying portfolio of financial instruments.
The Group has established a policy to perform an assessment, at the end of each reporting period, of whether a financial instrument’s credit risk has increased significantly since initial recognition, by considering the change in the risk of default occurring over the remaining life of the financial instrument.
Based on the above process, the Group groups its financial assets into Stage 1, Stage 2 and Stage 3, as described below:
Stage 1: When financial assets are first recognized, the Group recognizes an allowance based on 12mECLs. Stage 1 loans also include facilities where the credit risk has improved and the loan has been reclassified from Stage 2.
Stage 2: When a financial asset has shown a significant increase in credit risk since origination, the Group records an allowance for the LTECLs. Stage 2 loans also include facilities, where the credit risk has improved and the loan has been reclassified from Stage 3.
Stage 3: Financial assets considered credit-impaired. The Group records an allowance for the LTECLs.
For financial assets for which the Group has no reasonable expectations of recovering either the entire outstanding amount, or a proportion thereof, the gross carrying amount of the financial asset is reduced. This is considered a (partial) derecognition of the financial asset.
The Group’s internal credit rating system:
The main measure of Credit Risk is at the counterparty level where the exposure is measured in line with the bank’s credit standards applicable by the bank and detailed in the policies and procedures. Therefore, Arab Bank implemented an Internal Rating methodology to assess the customers financially and non-financially. In parallel, Arab Bank is using Moody’s Risk Analyst (MRA), it is a financial analysis and ratings platform that aggregates quantitative and qualitative information on individual obligors to obtain an assessment that can be used to determine a credit rating for each obligor and the related probability of default (PD). The MRA model went through validation, optimization and calibration phases which lead to the development of a new model. It worthwhile to mention that MRA is complementing AB Internal Rating to better comply with regulatory requirements i.e BASEL.
The MRA Rating System is centrally managed by Risk Management Department at Head Office noting that the Corporate and Investment Banking and the Credit Department are the main users. The Customers’ Ratings are being reviewed on annual basis using the two rating methodology (AB Internal Rating and MRA) during the annual review of the customers’ facilities.
The calculation of ECLs
The Group calculates ECLs based on a three probability-weighted scenarios to measure the expected cash shortfalls, discounted at an approximation to the EIR. A cash shortfall is the difference between the cash flows that are due to an entity in accordance with the contract and the cash flows that the entity expects to receive. Due to the recent developments and the abnormal situation resulted from COVID-19, an additional downside scenario was used by the management for calculating the ECL for the year ended 31 December 2020. Accordingly, the Bank has updated the macroeconomic factors used for calculating the ECL for the year ended 31 December 2020 in addition to changing the probability of weights assigned to the macroeconomic scenarios by giving higher weight to the downside scenarios as follows:
NOTES TO THE CONSOLIDATED FINANCIAL STATEMENTS
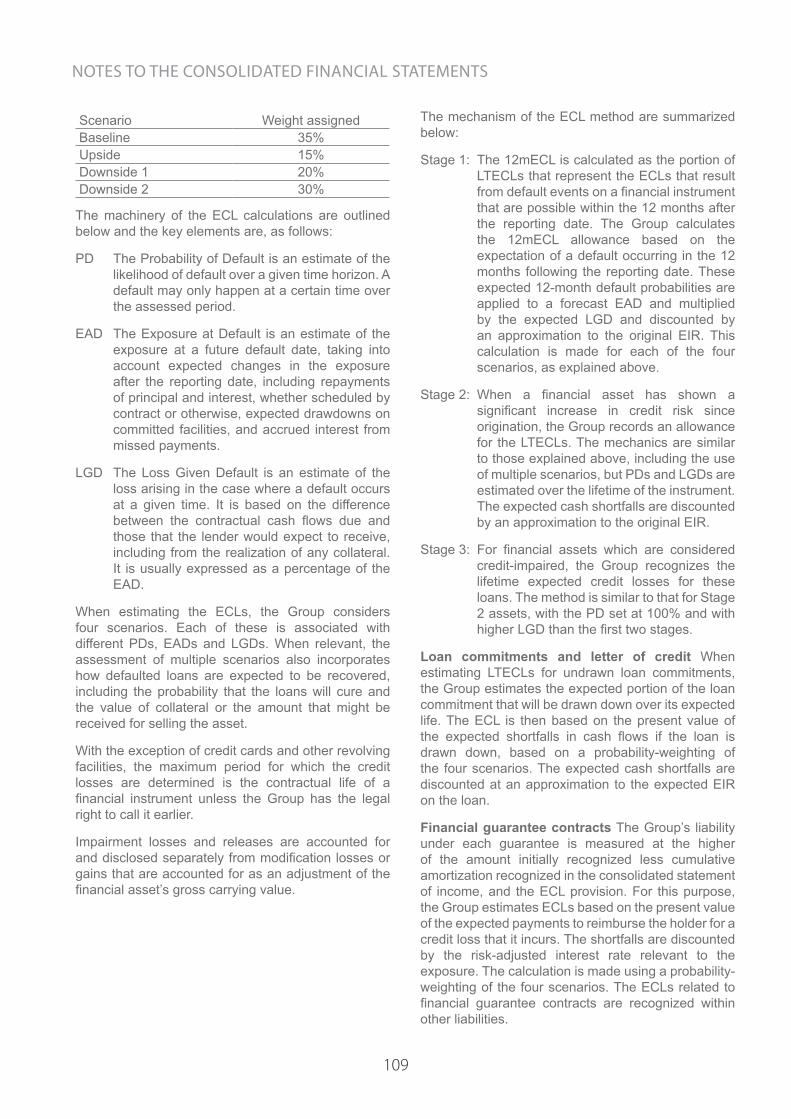
109
Scenario Weight assigned Baseline 35%Upside 15%Downside 1 20%Downside 2 30%
The machinery of the ECL calculations are outlined below and the key elements are, as follows:
PD The Probability of Default is an estimate of the likelihood of default over a given time horizon. A default may only happen at a certain time over the assessed period.
EAD The Exposure at Default is an estimate of the exposure at a future default date, taking into account expected changes in the exposure after the reporting date, including repayments of principal and interest, whether scheduled by contract or otherwise, expected drawdowns on committed facilities, and accrued interest from missed payments.
LGD The Loss Given Default is an estimate of the loss arising in the case where a default occurs at a given time. It is based on the difference between the contractual cash flows due and those that the lender would expect to receive, including from the realization of any collateral. It is usually expressed as a percentage of the EAD.
When estimating the ECLs, the Group considers four scenarios. Each of these is associated with different PDs, EADs and LGDs. When relevant, the assessment of multiple scenarios also incorporates how defaulted loans are expected to be recovered, including the probability that the loans will cure and the value of collateral or the amount that might be received for selling the asset.
With the exception of credit cards and other revolving facilities, the maximum period for which the credit losses are determined is the contractual life of a financial instrument unless the Group has the legal right to call it earlier.
Impairment losses and releases are accounted for and disclosed separately from modification losses or gains that are accounted for as an adjustment of the financial asset’s gross carrying value.
The mechanism of the ECL method are summarized below:
Stage 1: The 12mECL is calculated as the portion of LTECLs that represent the ECLs that result from default events on a financial instrument that are possible within the 12 months after the reporting date. The Group calculates the 12mECL allowance based on the expectation of a default occurring in the 12 months following the reporting date. These expected 12-month default probabilities are applied to a forecast EAD and multiplied by the expected LGD and discounted by an approximation to the original EIR. This calculation is made for each of the four scenarios, as explained above.
Stage 2: When a financial asset has shown a significant increase in credit risk since origination, the Group records an allowance for the LTECLs. The mechanics are similar to those explained above, including the use of multiple scenarios, but PDs and LGDs are estimated over the lifetime of the instrument. The expected cash shortfalls are discounted by an approximation to the original EIR.
Stage 3: For financial assets which are considered credit-impaired, the Group recognizes the lifetime expected credit losses for these loans. The method is similar to that for Stage 2 assets, with the PD set at 100% and with higher LGD than the first two stages.
Loan commitments and letter of credit When estimating LTECLs for undrawn loan commitments, the Group estimates the expected portion of the loan commitment that will be drawn down over its expected life. The ECL is then based on the present value of the expected shortfalls in cash flows if the loan is drawn down, based on a probability-weighting of the four scenarios. The expected cash shortfalls are discounted at an approximation to the expected EIR on the loan.
Financial guarantee contracts The Group’s liability under each guarantee is measured at the higher of the amount initially recognized less cumulative amortization recognized in the consolidated statement of income, and the ECL provision. For this purpose, the Group estimates ECLs based on the present value of the expected payments to reimburse the holder for a credit loss that it incurs. The shortfalls are discounted by the risk-adjusted interest rate relevant to the exposure. The calculation is made using a probability-weighting of the four scenarios. The ECLs related to financial guarantee contracts are recognized within other liabilities.
NOTES TO THE CONSOLIDATED FINANCIAL STATEMENTS
110
Debt instruments measured at fair value through OCI
The ECLs for debt instruments measured at FVOCI do not reduce the carrying amount of these financial assets in the consolidated statement of financial position, which remains at fair value. Instead, an amount equal to the allowance that would arise if the assets were measured at amortized cost is recognized in OCI as an accumulated impairment amount, with a corresponding charge to profit or loss. The accumulated loss recognized in OCI is recycled to the profit and loss upon derecognition of the assets.
Credit cards and other revolving facilities
The Group’s product offering includes a variety of corporate and retail overdraft and credit cards facilities, in which the Group has the right to cancel and/or reduce the facilities with one day’s notice. The Group does not limit its exposure to credit losses to the contractual notice period, but, instead calculates ECL over a period that reflects the Group’s expectations of the customer behavior, its likelihood of default and the Group’s future risk mitigation procedures, which could include reducing or cancelling the facilities.
The ongoing assessment of whether a significant increase in credit risk has occurred for revolving facilities is similar to other lending products. This is based on shifts in the customer’s internal credit grade.
The interest rate used to discount the ECLs for credit cards is based on the effective interest rate.
The calculation of ECLs, including the estimation of the expected period of exposure and discount rate is made, on an individual basis for corporate and on a collective basis for retail products. The collective assessments are made separately for portfolios of facilities with similar credit risk characteristics.
Forward looking information
In its ECL models, the Group relies on a broad range of forward looking information as economic inputs, such as:
• GDP growth
• Unemployment rates
• Central Bank base rates
The inputs and models used for calculating ECLs may not always capture all characteristics of the market at the date of the consolidated financial statements. To reflect this, qualitative adjustments or overlays are occasionally made as temporary adjustments when such differences are significantly material.
Collateral valuation
To mitigate its credit risks on financial assets, the Group seeks to use collateral, where possible. The collateral comes in various forms, such as cash, securities, letters of credit/guarantees, real estate, receivables, inventories, other non-financial assets and credit enhancements such as netting agreements. Collateral, unless repossessed, is not recorded on the Group’s consolidated statement of financial position. However, the fair value of collateral affects the calculation of ECLs. It is generally assessed, at a minimum, at inception and re-assessed periodically. However, some collateral, for example, cash or securities relating to margining requirements, is valued daily.
To the extent possible, the Group uses active market data for valuing financial assets held as collateral. Other financial assets which do not have readily determinable market values are valued using models. Non-financial collateral, such as real estate, is valued based on data provided by third parties such as mortgage brokers, or based on housing price indices.
Collateral repossessed
The Group’s policy is to determine whether a repossessed asset can be best used for its internal operations or should be sold. Assets determined to be useful for the internal operations are transferred to their relevant asset category at the lower of their repossessed value or the carrying value of the original secured asset. Assets for which selling is determined to be a better option are transferred to assets held for sale at their fair value (if financial assets) and fair value less cost to sell for non-financial assets at the repossession date in, line with the Group’s policy.
In its normal course of business, the Group does not physically repossess properties or other assets in its retail portfolio, but engages external agents to recover funds, generally at auction, to settle outstanding debt. Any surplus funds are returned to the customers/obligors. As a result of this practice, the residential properties under legal repossession processes are not recorded on the balance sheet.
NOTES TO THE CONSOLIDATED FINANCIAL STATEMENTS
111
Write-offs
Financial assets are written off either partially or in their entirety only when the Group has stopped pursuing the recovery. If the amount to be written off is greater than the accumulated loss allowance, the difference is first treated as an addition to the allowance that is then applied against the gross carrying amount. Any subsequent recoveries are credited to credit loss expense.
Modified loans
The Group sometimes makes concessions or modifications to the original terms of loans as a response to the borrower’s financial difficulties, (rather than taking possession or to otherwise enforce collection of collateral.) The Group considers a loan forborne when such concessions or modifications are provided as a result of the borrower’s present or expected financial difficulties and the Group would not have agreed to them if the borrower had been financially healthy. (Indicators of financial difficulties include defaults on covenants, or significant concerns raised by the Credit Risk Department). Forbearance may involve extending the payment arrangements and the agreement of new loan conditions. (Once the terms have been renegotiated, any impairment is measured using the original EIR as calculated before the modification of terms). It is the Group’s policy to monitor forborne loans to help ensure that future payments continue to be likely to occur. Derecognition decisions and classification between Stage 2 and Stage 3 are determined on a case-by-case basis. If these procedures identify a loss in relation to a loan, it is disclosed and managed as an impaired Stage 3 forborne asset until it is collected or written off.
Leases The Group assesses at contract inception whether a contract is, or contains, a lease. That is, if the contract conveys the right to control the use of an identified asset for a period of time in exchange for consideration.
The Group applies a single recognition and measurement approach for all leases, except for short-term leases and leases of low-value assets. The Group recognizes lease liabilities to make lease payments and right-of-use assets representing the right to use the underlying assets.
Right-of-use assetsThe Group recognizes right-of-use assets at the
commencement date of the lease (i.e., the date the underlying asset is available for use). Right-of-use assets are measured at cost, less any accumulated depreciation and impairment losses, and adjusted for any remeasurement of lease liabilities.
The cost of right-of-use assets includes the amount of lease obligations recognized, initial direct costs incurred, and lease payments made at or before the commencement date less any lease incentives received. Unless the Group is reasonably certain to obtain ownership of the leased asset at the end of the lease term, the recognized right-of-use assets are depreciated on a straight-line basis over the shorter of its estimated useful life or the lease term. Right-of-use assets are subject to impairment.
Lease liabilitiesAt the commencement date of the lease, the Group recognizes lease liabilities measured at the present value of lease payments to be made over the lease term. The lease payments include fixed payments (including in-substance fixed payments) less any lease incentives receivable, variable lease payments that depend on an index or a rate, and amounts expected to be paid under residual value guarantees. The lease payments also include the exercise price of a purchase option reasonably certain to be exercised by the Group and payments of penalties for terminating a lease, if the lease term reflects the Group exercising the option to terminate.
The variable lease payments that do not depend on an index or a rate are recognized as expense in the period on which the event or condition that triggers the payment occurs.
Foreign currency translation1) Transactions and balances
Transactions in foreign currencies are initially recorded in the functional currency at the spot rate of exchange ruling at the date of the transaction.
Monetary assets and liabilities denominated in foreign currencies are retranslated into the functional currency at the spot rate of exchange at the reporting date. All foreign exchange differences arising on non–trading activities are taken to other operating income/expense in the income statement.
Non–monetary items that are measured at historical cost in a foreign currency are translated using the spot exchange rates as at the date of recognition.
NOTES TO THE CONSOLIDATED FINANCIAL STATEMENTS

112
2) Group companies
On consolidation, the assets and liabilities in foreign operations are translated into dollars at the spot rate of exchange prevailing at the reporting date and their income statements are translated at spot exchange rates prevailing at the dates of the transactions. The exchange differences arising on translation for consolidation are recognised in OCI.
Fixed assets Fixed assets are stated at historical cost, net of accumulated depreciation and any accumulated impairment in value. Such cost includes expenditures that are directly attributable to the acquisition of the asset. When parts of an item of fixed assets have different useful lives, they are accounted for as separate items of fixed assets.
Depreciation is charged so as to allocate the cost of assets using the straight-line method, using the useful lives of the respective assets
Land and assets under construction are not depreciated.
Assets under construction is carried at cost, less any accumulated impairment losses and is depreciated when the assets are ready for intended use using the same depreciation rate of the related category with fixed assets.
Fixed assets are derecognized when disposed of or when no future benefits are expected from their use or disposal.
The gain or loss arising on the disposal of an item (the difference between the net realizable value and the carrying amount of the asset) is recognized in the consolidated statement of income in the year that the assets were disposed.
Impairment of non-financial assets -The Bank assesses at each reporting date whether there is an indication that an asset may be impaired. If any such indication exists, or when annual impairment testing for an asset is required, the Bank makes an estimate of the asset's recoverable amount. An asset's recoverable amount is the higher of an asset's or cash-generating unit's fair value less costs to sell and its value in use and is determined for an individual asset, unless the asset does not generate cash inflows that are largely independent of those from other assets or groups of assets. Where the carrying amount of an asset exceeds its recoverable amount,
the asset is considered impaired and is written down to its recoverable amount. In assessing value in use, the estimated future cash flows are discounted to their present value using a pre-tax discount rate that reflects current market assessments of the time value of money and the risks specific to the asset. In determining fair value less costs to sell, an appropriate valuation model is used.
These calculations are corroborated by valuation multiples, quoted share prices for publicly traded subsidiaries or other available fair value indicators.
Intangible Assets Goodwill
Goodwill is recorded at cost, and represents the excess amount paid to acquire or purchase the investment in an associate or a subsidiary on the date of the transaction over the fair value of the net assets of the associate or subsidiary at the acquisition date. Goodwill resulting from the investment in a subsidiary is recorded as a separate item as part of intangible assets, while goodwill resulting from the investment in an associated company constitutes part of the investment in that company.
Goodwill is distributed over the cash generating units for the purpose of testing the impairment in its value.
The value of goodwill is tested for impairment on the date of the consolidated financial statements. Goodwill value is reduced when there is evidence that its value has declined or the recoverable value of the cash generating units is less than book value. The decline in the values is recoded in the consolidated statement of income as impairment loss.
Other Intangible Assets
Other intangible assets acquired through mergers are stated at fair value at the date of acquisition, while other intangible assets (not acquired through mergers) are recorded at cost.
Intangible assets are to be classified on the basis of either definite or indefinite useful life. Intangible assets with definite useful economic lives are amortized over their useful lives using the straight line method, and recorded as an expense in the consolidated statement of income. Intangible assets with indefinite lives are reviewed in statement income for impairment as of the consolidated financial statements date, and impairment loss is recorded in the consolidated statement of income.
NOTES TO THE CONSOLIDATED FINANCIAL STATEMENTS

113
Intangible assets resulting from the banks operations are not capitalized. They are rather recorded in the consolidated statement of income in the same period.
Any indications of impairment in the value of intangible assets as of the consolidated financial statements date are reviewed. Furthermore, the estimated useful lives of the impaired intangible assets are reassessed, and any adjustment is made in the subsequent period.
Repurchase and Resale Agreements Assets sold with a simultaneous commitment to repurchase them at a future date continue to be recognized in the consolidated financial statements as a result of the bank’s continuous control over these assets and as the related risk and benefits are transferred to the Bank upon occurrence. They also continue to be measured in accordance with the adopted accounting policies. Amounts received against these contracts are recorded within liabilities under borrowed funds. The difference between the sale price and the repurchase price is recognized as an interest expense amortized over the contract period using the effective interest rate method.
Purchased assets with corresponding commitment to sell at a specific future date are not recognized in the consolidated financial statements because the bank has no control over such assets and the related risks and benefits are not transferred to the Bank upon occurrence. Payments related to these contracts are recoded under deposits with banks and other financial institutions or loans and advances in accordance with the nature of each case. The difference between the purchase price and resale price is recoded as interest revenue amortized over the life of the contract using the effective interest rate method.
CapitalCost of issuing or purchasing the Group’s shares are recorded in retained earnings net of any tax effect related to these costs. If the issuing or purchase process has not been completed, these costs are recorded as expenses in the consolidated statement of income.
Investments in AssociatesAn associate is an entity over which the Group has significant influence. Significant influence is the power to participate in the financial and operating policy decisions of the investee, but is not control or joint control over those policies.
The considerations made in determining significant influence or joint control are similar to those necessary to determine control over subsidiaries.
The Group’s investments in its associates are accounted for using the equity method.
Under the equity method, the investment in an associates initially recognised at cost, the carrying amount of the investment is adjusted to recognise changes in the Group’s share of net assets of the associates since the acquisition date. Goodwill relating to the associates is included in the carrying amount of the investment and is neither amortised nor individually tested for impairment.
The consolidated income statement reflects the Group’s share of the results of operations of the associates. Any change in other comprehensive income of those investees is presented as part of the Group’s other comprehensive income (OCI). In addition, when there has been a change recognised directly in the equity of the associates, the Group recognises its share of any changes, when applicable, in the statement of changes in equity. Unrealised gains and losses resulting from transactions between the Group and the associates are eliminated to the extent of the interest in the associates.
The aggregate of the Group’s share of profit or loss of an associate is shown on the face of the consolidated income statement within operating profit and represents profit or loss after tax and non-controlling interests in the subsidiaries of the associate.
The financial statements of the associates are prepared for the same reporting period as the Group. When necessary, adjustments are made to bring the accounting policies in line with those of the Group.
Income TaxesIncome tax expenses represent current and deferred taxes for the year.
Income tax expense is measured on the basis of taxable income. Taxable income differs from income reported in the consolidated financial statements, as the latter includes non-taxable revenue, tax expenses not deductible in the current year but deductible in subsequent years, accumulated losses approved by tax authorities and items not accepted for tax purposes or subject to tax.
Taxes are calculated on the basis of the enacted tax rates according to the prevailing laws, regulations and instructions of countries where the Group operates.
NOTES TO THE CONSOLIDATED FINANCIAL STATEMENTS

114
Taxes expected to be incurred or recovered as a result of temporary timing differences between the value of the assets and liabilities in the consolidated financial statements and their respective tax bases. Deferred taxes are calculated on the basis of the liability method, and according to the rates expected to be enacted when it is anticipated that the liability will be settled or when tax assets are recognized.
Deferred tax assets are reviewed on the date of the consolidated financial statements, and reduced if it is expected that no benefit will arise from the deferred tax, partially or totally.
Fair valueThe Bank measures financial instruments is at fair value at each financial statements date.
Fair value is the price that would be received to sell an asset or paid to transfer a liability in an orderly transaction between market participants at the measurement date.
The fair value measurement is based on the presumption that the transaction to sell the asset or transfer the liability takes place either, in the principal market for the asset or liability, or in the absence of a principal market, in the most advantageous market for the asset or liability.
The fair value of an asset or a liability is measured using the assumptions that market participants would use when pricing the asset or liability, assuming that market participants act in their economic best interest.
A fair value measurement of a non-financial asset takes into account a market participant's ability to generate economic benefits by using the asset in its highest and best use or by selling it to another market participant that would use the asset in its highest and best use.
The Bank uses valuation techniques that are appropriate in the circumstances and for which sufficient data are available to measure fair value, maximizing the use of relevant observable inputs and minimizing the use of unobservable inputs.
All assets and liabilities for which fair value is measured or disclosed in the financial statements are categorized within the fair value hierarchy, described as follows, based on the lowest level input that is significant to the fair value measurement as a whole:
• Level 1 - Quoted (unadjusted) market prices in active markets for identical assets or liabilities.
• Level 2 - Valuation techniques for which the lowest level input that is significant to the fair value measurement is directly or indirectly observable.
• Level 3 - Valuation techniques for which the lowest level input that is significant to the fair value measurement is unobservable.
For assets and liabilities that are recognised in the financial statements on a recurring basis, the Bank determines whether transfers have occurred between Levels in the hierarchy by re-assessing categorization (based on the lowest level input that is significant to the fair value measurement as a whole) at the end of each reporting period.
For the purpose of fair value disclosures, the Bank has determined classes of assets and liabilities on the basis of the nature, characteristics and risks of the asset or liability and the level of the fair value hierarchy as explained above.
Financial derivativesFinancial derivatives (e.g. currency forward contracts, forward rate agreements, swaps and option contracts) are recognized at fair value in the consolidated statement of financial position.
Financial derivatives held for hedge purposesFair value hedge: Represents hedging for changes in the fair value of the Group’s assets and liabilities. When the conditions for an effective fair value hedge are met, gains or losses from changes in the fair value of financial derivatives are recognized in the consolidated statement of income. Changes in the fair value of the hedged assets or liabilities are also recognized in the consolidated statement of income.
Cash flow hedge: Represents hedging for changes in the current and expected cash flows of the Group’s assets and liabilities that affects the consolidated statement of income. When the conditions for an effective cash flow hedge are met, gains or losses from changes in the fair value of financial derivatives are recognized in other comprehensive income and are reclassified to the statement of income in the period in which the hedge transaction has an impact on the consolidated statement of income.
When the conditions for an effective hedge are not met, gains or losses from changes in the fair value of financial derivatives are recognized in the consolidated statement of income.
NOTES TO THE CONSOLIDATED FINANCIAL STATEMENTS
115
The ineffective portion is recognized in the consolidated statement of income.
Hedge for net investment in foreign entities when the conditions of the hedge for net investment in foreign entities are met, fair value is measured for the hedging instrument of the hedged net assets. In case of an effective relationship, the effective portion of the loss or profit related to the hedging instrument is recognized in the consolidated statement of comprehensive income and recorded in the consolidated statement of income when the investment in foreign entities is sold. The ineffective portion is recognized in the consolidated statement of income.
When the conditions of the effective hedge do not apply, gain or loss resulting from the change in the fair value of the hedging instrument is recorded in the consolidated statement of income.
Financial derivatives for trading Financial derivatives held for trading are recognized at fair value in the consolidated statement of financial position with changes in fair value recognized in the consolidated statement of income.
Foreclosed assetsSuch assets are those that have been the subject of foreclosure by the Group, and are initially recognized among "other assets" at the foreclosure value or fair value whichever is least.
At the date of the consolidated financial statements, foreclosed assets are revalued individually (fair value less selling cost); any decline in fair value is recognized in the consolidated statement of income. Any subsequent increase in value is recognized only to the extent that it does not exceed the previously recognized impairment losses.
Provisions Provisions are recognized when the Group has an obligation as of the date of the consolidated financial statements as a result of past events, the obligation is likely to be settled, and a reliable estimate can be made of the amount of the obligation.
Provision for employees’ end-of-service indemnities is estimated in accordance with the prevailing rules and regulations in the countries in which the Group operates. The expense for the year is recognized in the consolidated statement of income. Indemnities paid to employees are reduced from the provision.
Segments InformationSegment business represents a group of assets and operations shared to produce products or risk attributable services different from which related to other segments.
Geographic sector linked to present the products or the services in a specific economic environment attributable for risk and other income different from which related to other sectors work in other economic environment.
Assets under ManagementThese represent the accounts managed by the Group on behalf of its customers, but do not represent part of the Group’s assets. The fees and commissions on managing these accounts are taken to the consolidated statement of income. Moreover, a provision is taken for the decline in the value of capital-guaranteed portfolios managed on behalf of its customers.
Offsetting Financial assets and financial liabilities are offset, and the net amount is presented in the consolidated statement of financial position only when there is a legal right to offset the recognized amounts, and the Group intends to either settle them on a net basis or to realize the assets and settle the liabilities simultaneously
Cash and cash equivalents Cash and cash equivalents comprise cash and balances with central banks and balances with banks and financial institutions maturing within three months, less restricted funds and balances owing to banks and financial institutions maturing within three months.
5. Significant accounting judgements, estimates and assumptionsThe preparation of the Group’s consolidated financial statements requires management to make judgements, estimates and assumptions that affect the reported amounts of revenues, expenses, assets and liabilities, and the accompanying disclosures, and the disclosure of contingent liabilities. Uncertainty about these assumptions and estimates could result in outcomes that require a material adjustment to the carrying amount of assets or liabilities affected in future periods.
NOTES TO THE CONSOLIDATED FINANCIAL STATEMENTS
116
In the process of applying the Group’s accounting policies, management has made various judgements. Those which management has assessed to have the most significant effect on the amounts recognised in the consolidated financial statements have been discussed in the individual notes of the related financial statement line items.
The key assumptions concerning the future and other key sources of estimation uncertainty at the reporting date, that have a significant risk of causing a material adjustment to the carrying amounts of assets and liabilities within the next financial year, are also described in the individual notes of the related financial statement line items below. The Group based its assumptions and estimates on parameters available when the consolidated financial statements were prepared. Existing circumstances and assumptions about future developments, however, may change due to market changes or circumstances arising that are beyond the control of the Group. Such changes are reflected in the assumptions when they occur.
Management believes that the assumptions adopted in the consolidated financial statements are reasonable. The details are as follows:
- Impairment loss for foreclosed assets is booked after a recent valuation of the acquired properties has been conducted by approved surveyors. The impairment loss is reviewed periodically.
- The fiscal year is charged with its portion of income tax expenditures in accordance with the
regulations, laws, and accounting standards. Moreover, deferred tax assets and liabilities and
the income tax provision are recorded.
- The Management periodically reassesses the economic useful life of tangible and
Intangible assets for the purpose of calculating annual depreciation and amortization
based on the general condition of these assets and assessing their expected useful life in
the future. The impairment loss is recorded in the consolidated income statement..
- A provision is set for lawsuits raised against the Group. This provision is based to an adequate legal study prepared by the Group’s legal advisor. Moreover, the study highlights potential risks that the Group may encounter in the future. Such legal assessments are reviewed periodically.
- Fair value hierarchy:
The level in the fair value hierarchy is determined and disclosed into which the fair value measurements are categorized in their entirety, segregating fair value measurements in accordance with the levels defined in IFRS. The difference between Level 2 and Level 3 fair value measurements represents whether inputs are observable and whether the unobservable inputs are significant, which may require judgment and a careful analysis of the inputs used to measure fair value, including consideration of factors specific to the asset or liability.
- Provisions for impairment - ECL
In determining impairment of financial assets, judgement is required in the estimation of the amount and timing of future cash flows as well as an assessment of whether the credit risk on the financial asset has increased significantly since initial recognition and incorporation of forward-looking information in the measurement of ECL.
Inputs, assumptions and techniques used for ECL calculation - IFRS 9 Methodology
Key concepts in IFRS 9 that have the most significant impact and require a high level of judgment, as considered by the Group while determining the impact assessment, are:
In accordance with IFRS 9, a significant increase in credit risk can be assessed at the group / portfolio level if the common risk characteristics are shared. Any instruments that are collectively assessed must have common credit risk characteristics. The bank has followed the following criteria for determining the ECL calculation on a collective versus individual basis as follows
• Retail Portfolio: on Collective Basis based on the product level (Loans, Housing Loans, Car Loans, and Credit Cards)
• Corporate Portfolio: individual basis at customer/ facility level
• Financial Institutions: Individual Basis at Bank/ facility Level.
• Debt instruments measured at amortized cost: Individual Level at Instrument level.
• Assessment of Significant Increase in Credit Risk (SICR)
NOTES TO THE CONSOLIDATED FINANCIAL STATEMENTS

117
To assess whether the credit risk on a financial asset has increased significantly since origination, the Group compares the risk of default occurring over the expected life of the financial asset at the reporting date to the corresponding risk of default at origination, using key risk indicators that are used in the Group’s existing risk management processes.
Our assessment of significant increases in credit risk will be performed periodically for each individual exposure based on three factors. If any of the following factors indicates that a significant increase in credit risk has occurred, the instrument will be moved from Stage 1 to Stage 2:
1. We have established thresholds for significant increases in credit risk based on movement in the customer’s internal credit grade and the related PDs relative to initial recognition.
2. Restructuring and/or Rescheduling on the customers’ accounts/ facilities during the assessment period is considered as indicator for SICR.
Movements between Stage 2 and Stage 3 are based on whether financial assets are credit-impaired as at the reporting date. The determination of credit-impairment under IFRS 9, is mentioned in the “Definition of default” below.
• Macroeconomic Factors, Forward Looking Information (FLI) and Multiple Scenarios
The measurement of expected credit losses for each stage and the assessment of significant increases in credit risk must consider information about past events and current conditions as well as reasonable and supportable forecasts of future events and economic conditions. The estimation and application of forward-looking information will require significant judgment in cooperation with international expert in this area.
PD, Loss Given Default (LGD) and Exposure At Default (EAD) inputs used to estimate Stage 1 and Stage 2 credit loss allowances are modelled based on the macroeconomic variables (or changes in macroeconomic variables) that are most closely correlated with credit losses in the relevant portfolio.
Each macroeconomic scenario used in our expected credit loss calculation will have forecasts of the relevant macroeconomic variables.
The estimation of expected credit losses in Stage 1 and Stage 2 will be a discounted probability-weighted estimate that considers a minimum of four future macroeconomic scenarios.
The base case scenario will be based on macroeconomic forecasts (e.g.: GDP, inflation, interest rate). Upside, downside1 and downside 2 scenarios will be set relative to our base case scenario based on reasonably possible alternative macroeconomic conditions.
Scenarios will be probability-weighted according to the best estimate of their relative likelihood based on historical frequency and current trends and conditions. Probability weights will be updated on a quarterly basis. All scenarios considered will be applied to all portfolios subject to expected credit losses with the same probabilities.
• Definition of default The definition of default used in the measurement of expected credit losses and the assessment to determine movement between stages will be consistent with the definition of default used for internal credit risk management purposes. IFRS 9 does not define default, but contains a rebuttable presumption that default has occurred when an exposure is greater than 90 days past due.
Notwithstanding the above, the classification of credit facilities is governed by the Central Bank of Jordan regulations unless local regulations in other countries are stricter, or the Bank has to adopt the same by law.
The Group has set out the definition of default where a default is considered to have occurred when either or both of the two following events have taken place:
• The obligor is considered unlikely to pay its credit obligations in full
• The obligor is past due for 90 days or more on any material credit obligation.
• Expected Life When measuring ECL, the Group must consider the maximum contractual period over which the Bank is exposed to credit risk. All contractual terms should be considered when determining the expected life, including prepayment options and extension and rollover options. For certain revolving credit facilities that do not have a fixed maturity, the expected life is estimated based on the period over which the Group is exposed to credit risk and where the credit losses would not be mitigated by management actions.
NOTES TO THE CONSOLIDATED FINANCIAL STATEMENTS
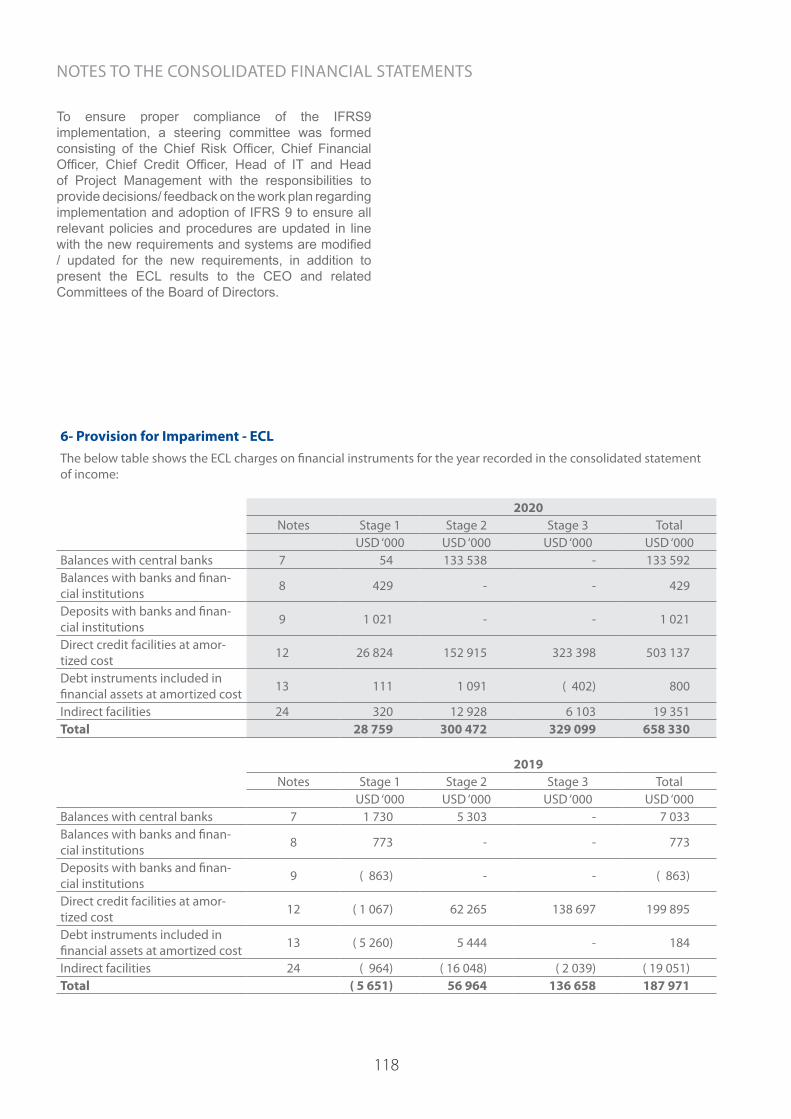
118
To ensure proper compliance of the IFRS9 implementation, a steering committee was formed consisting of the Chief Risk Officer, Chief Financial Officer, Chief Credit Officer, Head of IT and Head of Project Management with the responsibilities to provide decisions/ feedback on the work plan regarding implementation and adoption of IFRS 9 to ensure all relevant policies and procedures are updated in line with the new requirements and systems are modified / updated for the new requirements, in addition to present the ECL results to the CEO and related Committees of the Board of Directors.
6- Provision for Impariment - ECLThe below table shows the ECL charges on financial instruments for the year recorded in the consolidated statement of income:
2020Notes Stage 1 Stage 2 Stage 3 Total
USD ‘000 USD ‘000 USD ‘000 USD ‘000Balances with central banks 7 54 133 538 - 133 592Balances with banks and finan-cial institutions 8 429 - - 429
Deposits with banks and finan-cial institutions 9 1 021 - - 1 021
Direct credit facilities at amor-tized cost 12 26 824 152 915 323 398 503 137
Debt instruments included in financial assets at amortized cost 13 111 1 091 ( 402) 800
Indirect facilities 24 320 12 928 6 103 19 351Total 28 759 300 472 329 099 658 330
2019Notes Stage 1 Stage 2 Stage 3 Total
USD ‘000 USD ‘000 USD ‘000 USD ‘000Balances with central banks 7 1 730 5 303 - 7 033Balances with banks and finan-cial institutions 8 773 - - 773
Deposits with banks and finan-cial institutions 9 ( 863) - - ( 863)
Direct credit facilities at amor-tized cost 12 ( 1 067) 62 265 138 697 199 895
Debt instruments included in financial assets at amortized cost 13 ( 5 260) 5 444 - 184
Indirect facilities 24 ( 964) ( 16 048) ( 2 039) ( 19 051)Total ( 5 651) 56 964 136 658 187 971
NOTES TO THE CONSOLIDATED FINANCIAL STATEMENTS
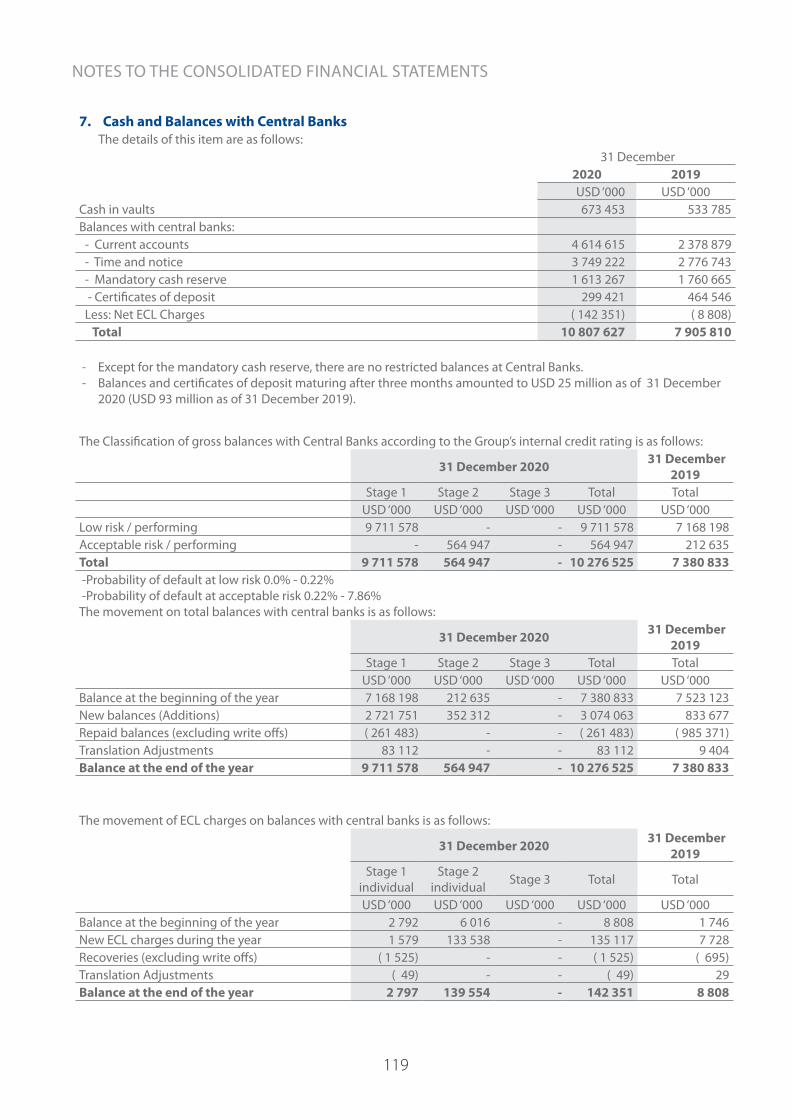
119
7. Cash and Balances with Central Banks The details of this item are as follows:
31 December2020 2019USD ‘000 USD ‘000
Cash in vaults 673 453 533 785Balances with central banks: - Current accounts 4 614 615 2 378 879 - Time and notice 3 749 222 2 776 743 - Mandatory cash reserve 1 613 267 1 760 665 - Certificates of deposit 299 421 464 546 Less: Net ECL Charges ( 142 351) ( 8 808) Total 10 807 627 7 905 810
- Except for the mandatory cash reserve, there are no restricted balances at Central Banks. - Balances and certificates of deposit maturing after three months amounted to USD 25 million as of 31 December
2020 (USD 93 million as of 31 December 2019).
The Classification of gross balances with Central Banks according to the Group’s internal credit rating is as follows:
31 December 2020 31 December 2019
Stage 1 Stage 2 Stage 3 Total TotalUSD ‘000 USD ‘000 USD ‘000 USD ‘000 USD ‘000
Low risk / performing 9 711 578 - - 9 711 578 7 168 198Acceptable risk / performing - 564 947 - 564 947 212 635Total 9 711 578 564 947 - 10 276 525 7 380 833 -Probability of default at low risk 0.0% - 0.22% -Probability of default at acceptable risk 0.22% - 7.86%The movement on total balances with central banks is as follows:
31 December 2020 31 December 2019
Stage 1 Stage 2 Stage 3 Total TotalUSD ‘000 USD ‘000 USD ‘000 USD ‘000 USD ‘000
Balance at the beginning of the year 7 168 198 212 635 - 7 380 833 7 523 123New balances (Additions) 2 721 751 352 312 - 3 074 063 833 677Repaid balances (excluding write offs) ( 261 483) - - ( 261 483) ( 985 371)Translation Adjustments 83 112 - - 83 112 9 404Balance at the end of the year 9 711 578 564 947 - 10 276 525 7 380 833
The movement of ECL charges on balances with central banks is as follows:
31 December 2020 31 December 2019
Stage 1 individual
Stage 2 individual Stage 3 Total Total
USD ‘000 USD ‘000 USD ‘000 USD ‘000 USD ‘000Balance at the beginning of the year 2 792 6 016 - 8 808 1 746New ECL charges during the year 1 579 133 538 - 135 117 7 728Recoveries (excluding write offs) ( 1 525) - - ( 1 525) ( 695)Translation Adjustments ( 49) - - ( 49) 29Balance at the end of the year 2 797 139 554 - 142 351 8 808
NOTES TO THE CONSOLIDATED FINANCIAL STATEMENTS
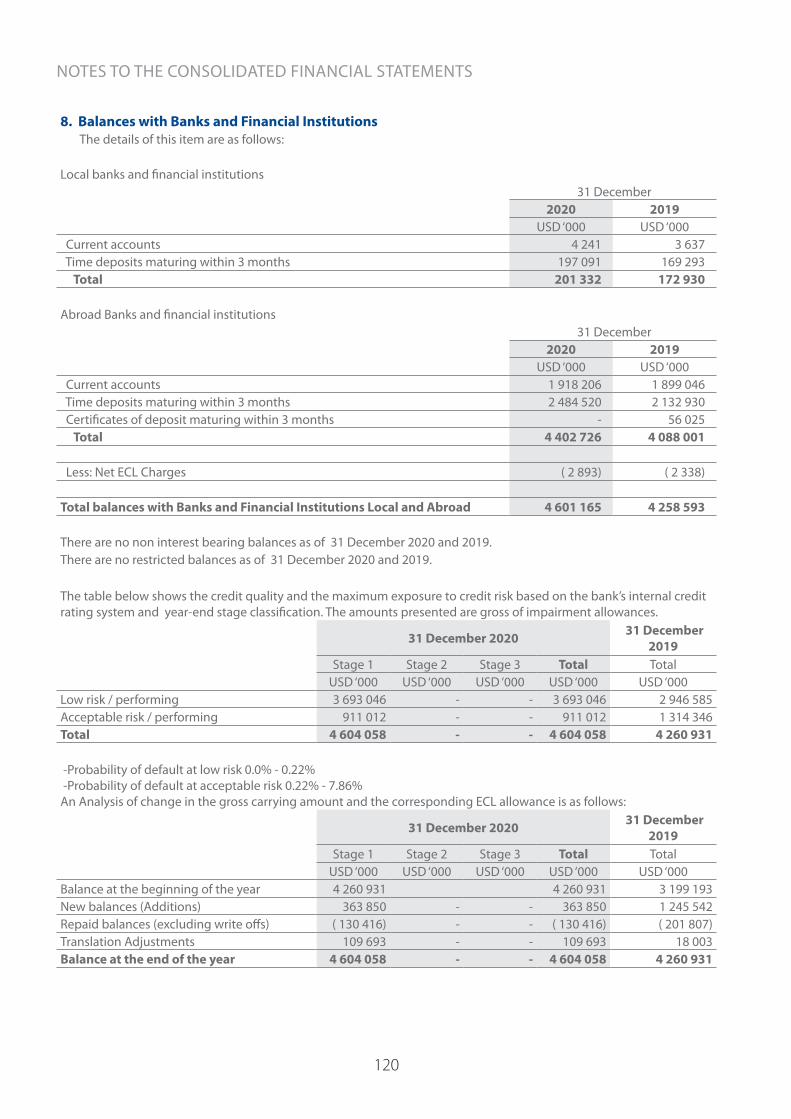
120
8. Balances with Banks and Financial Institutions The details of this item are as follows:
Local banks and financial institutions 31 December
2020 2019USD ‘000 USD ‘000
Current accounts 4 241 3 637 Time deposits maturing within 3 months 197 091 169 293 Total 201 332 172 930
Abroad Banks and financial institutions 31 December
2020 2019USD ‘000 USD ‘000
Current accounts 1 918 206 1 899 046 Time deposits maturing within 3 months 2 484 520 2 132 930 Certificates of deposit maturing within 3 months - 56 025 Total 4 402 726 4 088 001
Less: Net ECL Charges ( 2 893) ( 2 338)
Total balances with Banks and Financial Institutions Local and Abroad 4 601 165 4 258 593
There are no non interest bearing balances as of 31 December 2020 and 2019.There are no restricted balances as of 31 December 2020 and 2019.
The table below shows the credit quality and the maximum exposure to credit risk based on the bank’s internal credit rating system and year-end stage classification. The amounts presented are gross of impairment allowances.
31 December 2020 31 December 2019
Stage 1 Stage 2 Stage 3 Total TotalUSD ‘000 USD ‘000 USD ‘000 USD ‘000 USD ‘000
Low risk / performing 3 693 046 - - 3 693 046 2 946 585Acceptable risk / performing 911 012 - - 911 012 1 314 346Total 4 604 058 - - 4 604 058 4 260 931
-Probability of default at low risk 0.0% - 0.22% -Probability of default at acceptable risk 0.22% - 7.86%An Analysis of change in the gross carrying amount and the corresponding ECL allowance is as follows:
31 December 2020 31 December 2019
Stage 1 Stage 2 Stage 3 Total TotalUSD ‘000 USD ‘000 USD ‘000 USD ‘000 USD ‘000
Balance at the beginning of the year 4 260 931 4 260 931 3 199 193New balances (Additions) 363 850 - - 363 850 1 245 542Repaid balances (excluding write offs) ( 130 416) - - ( 130 416) ( 201 807)Translation Adjustments 109 693 - - 109 693 18 003Balance at the end of the year 4 604 058 - - 4 604 058 4 260 931
NOTES TO THE CONSOLIDATED FINANCIAL STATEMENTS

121
The movement of ECL charges on balances with banks and financial institutions is as follows:
31 December 2020 31 December 2019
Stage 1 Stage 2 Stage 3 Total TotalUSD ‘000 USD ‘000 USD ‘000 USD ‘000 USD ‘000
Balance at the beginning of the year 2 338 - - 2 338 1 550New ECL charges during the year 1 568 - - 1 568 2 312Recoveries (excluding write offs) ( 1 139) - - ( 1 139) ( 1 539)Adjustments during the year ( 3) - - ( 3) - Translation Adjustments 129 - - 129 15Balance at the end of the year 2 893 - - 2 893 2 338
9. Deposits with Banks and Financial Institutions The details of this item are as follows:
31 December Local banks and financial institutions 2020 2019
USD ‘000 USD ‘000 Time deposits maturing after 6 months and before 9 months 20 552 - Time deposits maturing after 9 months and before one year 33 280 - Time deposits maturing after one year 21 150 167 726 Total 74 982 167 726
31 December Abroad banks and financial institutions 2020 2019
USD ‘000 USD ‘000 Time deposits maturing after 3 months and before 6 months 110 419 33 883 Time deposits maturing after 6 months and before 9 months 100 354 57 600 Time deposits maturing after 9 months and before one year 5 153 - Certificates of deposit maturing after 9 months and before one year - 56 025 Total 215 926 147 508
Less: Net ECL Charges ( 2 743) ( 1 678)
Total Deposits with banks and financial institutions Local and Abroad 288 165 313 556
There are no restricted deposits as of 31 December 2020 and 2019.
NOTES TO THE CONSOLIDATED FINANCIAL STATEMENTS

122
The table below shows the credit quality and the maximum exposure to credit risk based on the bank’s internal credit rating system and year-end stage classification. The amounts presented are gross of impairment allowances.
31 December 2020 31 December 2019
Stage 1 Stage 2 Stage 3 Total TotalUSD ‘000 USD ‘000 USD ‘000 USD ‘000 USD ‘000
Low risk / performing 137 258 - - 137 258 261 745Acceptable risk / performing 153 650 - - 153 650 53 489Total 290 908 - - 290 908 315 234 -Probability of default at low risk 0.0% - 0.22% -Probability of default at acceptable risk 0.22% - 7.86%An Analysis of change in the gross carrying amount and the corresponding ECL allowance is as follows:
31 December 2020 31 December 2019
Stage 1 Stage 2 Stage 3 Total TotalUSD ‘000 USD ‘000 USD ‘000 USD ‘000 USD ‘000
Balance at the beginning of the year 315 234 - - 315 234 325 960New balances (Additions) 110 422 - - 110 422 47 015Repaid balances (excluding write offs) ( 143 615) - - ( 143 615) ( 60 607)Translation Adjustments 8 867 - - 8 867 2 866Balance at the end of the year 290 908 - - 290 908 315 234
The movement of ECL charges on Deposits with Banks and Financial Institutions is as follows:
31 December 2020 31 December 2019
Stage 1 Stage 2 Stage 3 Total TotalUSD ‘000 USD ‘000 USD ‘000 USD ‘000 USD ‘000
Balance at the beginning of the year 1 678 - - 1 678 2 517New ECL charges during the year 1 801 - - 1 801 151Recoveries (excluding write offs) ( 780) - - ( 780) ( 1 014)Adjustments during the year 3 - - 3 - Translation Adjustments 41 - - 41 24Balance at the end of the year 2 743 - - 2 743 1 678
10. Financial Assets at Fair Value through Profit or Loss The details of this item are as follows:
31 December2020 2019
USD ‘000 USD ‘000 Treasury bills and Government bonds 79 694 207 411 Corporate bonds 204 136 257 574 Loans and advances - 29 624 Corporate shares 2 532 1 767 Mutual funds 17 692 22 677 Total 304 054 519 053
NOTES TO THE CONSOLIDATED FINANCIAL STATEMENTS

123
31 December 2020
Designated as FV Carried Mandatorily at FV Total
USD ‘000 USD ‘000 USD ‘000 Treasury bills and Government bonds 79 694 - 79 694 Corporate bonds 204 136 - 204 136 Corporate shares - 2 532 2 532 Mutual funds - 17 692 17 692 Total 283 830 20 224 304 054
31 December 2019
Designated as FV Carried Mandatorily at FV Total
USD ‘000 USD ‘000 USD ‘000 Treasury bills and Government bonds 207 411 - 207 411 Corporate bonds 257 574 - 257 574 Loans and advances 29 624 - 29 624 Corporate shares - 1 767 1 767 Mutual funds - 22 677 22 677 Total 494 609 24 444 519 053
11. Financial Assets at Fair Value through Other Comprehensive Income The details of this item are as follows:
31 December2020 2019
USD ‘000 USD ‘000 Quoted shares 122 363 133 480 Un-quoted shares 287 352 252 453 Total 409 715 385 933* Cash dividends from investments above amounted to USD 5.7 million for the year ended 31 December 2020 (USD 7 million as of 31 December 2019).
31 December 2020
Designated as FV Carried Mandatorily at FV Total
USD ‘000 USD ‘000 USD ‘000 Quoted shares - 122 363 122 363 Un-quoted shares - 287 352 287 352 Total - 409 715 409 715
31 December 2019
Designated as FV Carried Mandatorily at FV Total
USD ‘000 USD ‘000 USD ‘000 Quoted shares - 133 480 133 480 Un-quoted shares - 252 453 252 453 Total - 385 933 385 933
NOTES TO THE CONSOLIDATED FINANCIAL STATEMENTS

124
12. Direct Credit Facilities at Amortized CostThe details of this item are as follows: 31 December 2020
Consumer Banking
Corporates Banks and Financial Institu-
tions
Government and Public
SectorTotalSmall and
Medium Large
USD ‘000 USD ‘000 USD ‘000 USD ‘000 USD ‘000 USD ‘000Discounted bills * 68 294 91 600 549 247 157 770 13 764 880 675Overdrafts * 92 404 1 136 980 3 359 056 5 662 442 991 5 037 093Loans and advances * 3 533 021 1 967 850 11 255 638 32 626 906 931 17 696 066Real-estate loans 2 336 319 145 412 210 500 - - 2 692 231Credit cards 185 802 - - - - 185 802Total 6 215 840 3 341 842 15 374 441 196 058 1 363 686 26 491 867
Less: Interest and commission in sus-pense 92 524 115 426 411 265 53 - 619 268
Provision for impairment - ECL 260 547 300 441 1 390 880 5 230 7 643 1 964 741Total 353 071 415 867 1 802 145 5 283 7 643 2 584 009Net Direct Credit Facilities at Amor-tized Cost 5 862 769 2 925 975 13 572 296 190 775 1 356 043 23 907 858
* Net of interest and commission received in advance, which amounted to USD 123.5 million as of 31 December 2020. - Rescheduled loans during the year ended 31 December 2020 amounted to USD 491.7 million. - Restructured loans (transferred from non performing to watch list loans) during the year ended 31 December 2020
amounted to USD 8 million. - Direct credit facilities granted to and guaranteed by the government of Jordan as of 31 December 2020 amounted
to USD 77.9 million, or 0.3% of total direct credit facilities. - Non-performing direct credit facilities as of 31 December 2020 amounted to USD 2358.4 million, or 8.9% of total
direct credit facilities. - Non-performing direct credit facilities net of interest and commission in suspense as of 31 December 2020 amount-
ed to USD 1763.3 million or 6.8% of direct credit facilities, after deducting interest and commission in suspense.
NOTES TO THE CONSOLIDATED FINANCIAL STATEMENTS
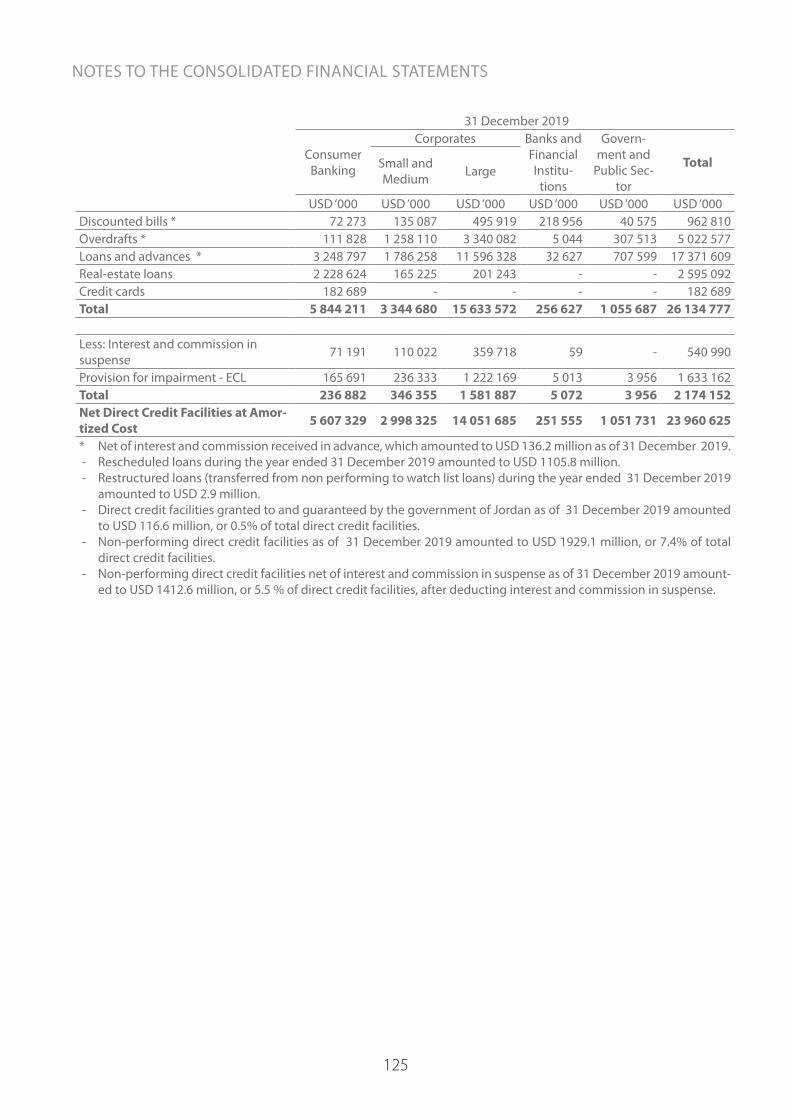
125
31 December 2019
Consumer Banking
Corporates Banks and Financial Institu-
tions
Govern-ment and
Public Sec-tor
TotalSmall and Medium Large
USD ‘000 USD ‘000 USD ‘000 USD ‘000 USD ‘000 USD ‘000Discounted bills * 72 273 135 087 495 919 218 956 40 575 962 810Overdrafts * 111 828 1 258 110 3 340 082 5 044 307 513 5 022 577Loans and advances * 3 248 797 1 786 258 11 596 328 32 627 707 599 17 371 609Real-estate loans 2 228 624 165 225 201 243 - - 2 595 092Credit cards 182 689 - - - - 182 689Total 5 844 211 3 344 680 15 633 572 256 627 1 055 687 26 134 777
Less: Interest and commission in suspense 71 191 110 022 359 718 59 - 540 990
Provision for impairment - ECL 165 691 236 333 1 222 169 5 013 3 956 1 633 162Total 236 882 346 355 1 581 887 5 072 3 956 2 174 152Net Direct Credit Facilities at Amor-tized Cost 5 607 329 2 998 325 14 051 685 251 555 1 051 731 23 960 625
* Net of interest and commission received in advance, which amounted to USD 136.2 million as of 31 December 2019. - Rescheduled loans during the year ended 31 December 2019 amounted to USD 1105.8 million. - Restructured loans (transferred from non performing to watch list loans) during the year ended 31 December 2019
amounted to USD 2.9 million. - Direct credit facilities granted to and guaranteed by the government of Jordan as of 31 December 2019 amounted
to USD 116.6 million, or 0.5% of total direct credit facilities. - Non-performing direct credit facilities as of 31 December 2019 amounted to USD 1929.1 million, or 7.4% of total
direct credit facilities. - Non-performing direct credit facilities net of interest and commission in suspense as of 31 December 2019 amount-
ed to USD 1412.6 million, or 5.5 % of direct credit facilities, after deducting interest and commission in suspense.
NOTES TO THE CONSOLIDATED FINANCIAL STATEMENTS
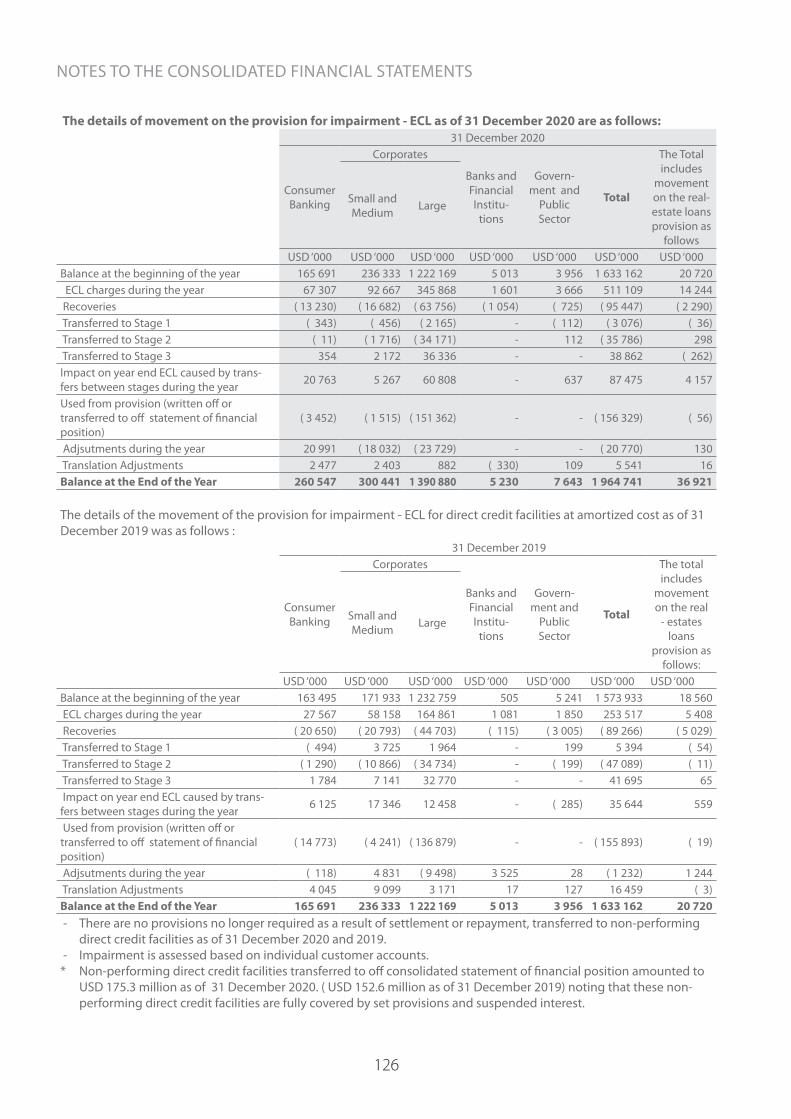
126
The details of movement on the provision for impairment - ECL as of 31 December 2020 are as follows: 31 December 2020
Consumer Banking
Corporates
Banks and Financial Institu-
tions
Govern-ment and
Public Sector
Total
The Total includes
movement on the real-estate loans provision as
follows
Small and Medium Large
USD ‘000 USD ‘000 USD ‘000 USD ‘000 USD ‘000 USD ‘000 USD ‘000Balance at the beginning of the year 165 691 236 333 1 222 169 5 013 3 956 1 633 162 20 720 ECL charges during the year 67 307 92 667 345 868 1 601 3 666 511 109 14 244 Recoveries ( 13 230) ( 16 682) ( 63 756) ( 1 054) ( 725) ( 95 447) ( 2 290) Transferred to Stage 1 ( 343) ( 456) ( 2 165) - ( 112) ( 3 076) ( 36) Transferred to Stage 2 ( 11) ( 1 716) ( 34 171) - 112 ( 35 786) 298 Transferred to Stage 3 354 2 172 36 336 - - 38 862 ( 262)Impact on year end ECL caused by trans-fers between stages during the year 20 763 5 267 60 808 - 637 87 475 4 157
Used from provision (written off or transferred to off statement of financial position)
( 3 452) ( 1 515) ( 151 362) - - ( 156 329) ( 56)
Adjsutments during the year 20 991 ( 18 032) ( 23 729) - - ( 20 770) 130 Translation Adjustments 2 477 2 403 882 ( 330) 109 5 541 16Balance at the End of the Year 260 547 300 441 1 390 880 5 230 7 643 1 964 741 36 921
The details of the movement of the provision for impairment - ECL for direct credit facilities at amortized cost as of 31 December 2019 was as follows :
31 December 2019
Consumer Banking
Corporates
Banks and Financial Institu-
tions
Govern-ment and
Public Sector
Total
The total includes
movement on the real
- estates loans
provision as follows:
Small and Medium Large
USD ‘000 USD ‘000 USD ‘000 USD ‘000 USD ‘000 USD ‘000 USD ‘000Balance at the beginning of the year 163 495 171 933 1 232 759 505 5 241 1 573 933 18 560 ECL charges during the year 27 567 58 158 164 861 1 081 1 850 253 517 5 408 Recoveries ( 20 650) ( 20 793) ( 44 703) ( 115) ( 3 005) ( 89 266) ( 5 029) Transferred to Stage 1 ( 494) 3 725 1 964 - 199 5 394 ( 54) Transferred to Stage 2 ( 1 290) ( 10 866) ( 34 734) - ( 199) ( 47 089) ( 11) Transferred to Stage 3 1 784 7 141 32 770 - - 41 695 65 Impact on year end ECL caused by trans-fers between stages during the year 6 125 17 346 12 458 - ( 285) 35 644 559
Used from provision (written off or transferred to off statement of financial position)
( 14 773) ( 4 241) ( 136 879) - - ( 155 893) ( 19)
Adjsutments during the year ( 118) 4 831 ( 9 498) 3 525 28 ( 1 232) 1 244 Translation Adjustments 4 045 9 099 3 171 17 127 16 459 ( 3)Balance at the End of the Year 165 691 236 333 1 222 169 5 013 3 956 1 633 162 20 720 - There are no provisions no longer required as a result of settlement or repayment, transferred to non-performing
direct credit facilities as of 31 December 2020 and 2019. - Impairment is assessed based on individual customer accounts.* Non-performing direct credit facilities transferred to off consolidated statement of financial position amounted to
USD 175.3 million as of 31 December 2020. ( USD 152.6 million as of 31 December 2019) noting that these non-performing direct credit facilities are fully covered by set provisions and suspended interest.
NOTES TO THE CONSOLIDATED FINANCIAL STATEMENTS

127
The following tables outline the impact of multiple scenarios on the ECL (Without Consumer banking):
31 December 2020
Due from Banks
Financial Assets at
amortized Cost
CorporatesBanks and Financial
Institutions
Government and Public
Sector
items off statement of financial
position
TotalSmall and Medium Large
USD ‘000 USD ‘000 USD ‘000 USD ‘000 USD ‘000 USD ‘000 USD ‘000 USD ‘000Upside (15%) 126 477 34 214 1 188 717 256 772 4 470 6 532 78 585 1 695 767Base case (35%) 135 682 36 704 1 275 231 275 460 4 795 7 007 84 305 1 819 184
Downside 1 (20%) 156 634 42 372 1 472 154 317 997 5 536 8 090 97 323 2 100 106
Downside 2 (30%) 167 333 45 266 1 572 703 339 716 5 914 8 642 103 970 2 243 544
31 December 2019
Due from Banks
Financial Assets at
amortized Cost
CorporatesBanks and Financial
Institutions
Government and Public
Sector
items off statement of financial
position
TotalSmall and Medium Large
USD ‘000 USD ‘000 USD ‘000 USD ‘000 USD ‘000 USD ‘000 USD ‘000 USD ‘000Upside (30%) 10 880 34 543 1 036 854 200 498 4 253 3 356 50 235 1 340 619Base case (40%) 12 227 38 823 1 165 307 225 337 4 780 3 772 56 458 1 506 704
Downside (30%) 15 564 49 417 1 483 300 286 828 6 084 4 801 71 865 1 917 859
The following tables outline the impact of multiple scenarios on the ECL (Consumer banking):31 December 2020 31 December 2019
USD ‘000 USD ‘000Upside (30%) 249 214 158 484Base case (40%) 257 993 164 067Downside (30%) 275 286 175 064The above table shows both the contribution to the total ECL for each probability-weighted scenario, in addition to the total additional impact on the ECL for applying multiple economic scenarios compared to the ECL that would have resulted from applying a 100% weighting to the base case scenario.
NOTES TO THE CONSOLIDATED FINANCIAL STATEMENTS

128
The of movement on interest and commissions in suspense are as follows:31 December 2020
Consumer Banking
Corporates
Banks and Financial Institu-
tions
Govern-ment and
Public Sector
Total
The total includes
interest and commission in suspense movement
on real - estates loans
as follows:
Small and Medium Large
USD ‘000 USD ‘000 USD ‘000 USD ‘000 USD ‘000 USD ‘000 USD ‘000Balance at the beginning of the year 71 191 110 022 359 718 59 - 540 990 13 611
Interest and commission suspended during the year 20 019 20 317 100 421 - - 140 757 5 793
Interest and commission in suspense settled (written off or transferred to off consoli-dated statement of financial position)
( 4 259) ( 4 148) ( 26 905) - - ( 35 312) ( 190)
Recoveries ( 3 855) ( 1 857) ( 15 733) - - ( 21 445) ( 1 771)Adjustments during the year 8 941 ( 9 140) 199 - - - - Translation adjustments 487 232 ( 6 435) ( 6) - ( 5 722) ( 28)Balance at the End of the Year 92 524 115 426 411 265 53 - 619 268 17 415
31 December 2019
Consumer Banking
Corporates
Banks and Financial Institu-
tions
Govern-ment and
Public Sector
Total
The total includes
interest and commission in suspense movement
on real - estates loans
as follows:
Small and Medium Large
USD ‘000 USD ‘000 USD ‘000 USD ‘000 USD ‘000 USD ‘000 USD ‘000Balance at the beginning of the year 73 128 98 914 273 939 7 955 - 453 936 14 211
Interest and commission suspended during the year 18 020 19 913 94 017 1 581 - 133 531 4 061
Interest and commission in suspense settled (written off or transferred to off consoli-dated statement of financial position)
( 15 621) ( 7 146) ( 3 858) ( 9 534) - ( 36 159) ( 1 632)
Recoveries ( 3 561) ( 4 095) ( 5 256) - - ( 12 912) ( 3 076)Adjustments during the year ( 33) ( 190) 166 57 - - - Translation adjustments ( 742) 2 626 710 - - 2 594 47Balance at the End of the Year 71 191 110 022 359 718 59 - 540 990 13 611
NOTES TO THE CONSOLIDATED FINANCIAL STATEMENTS
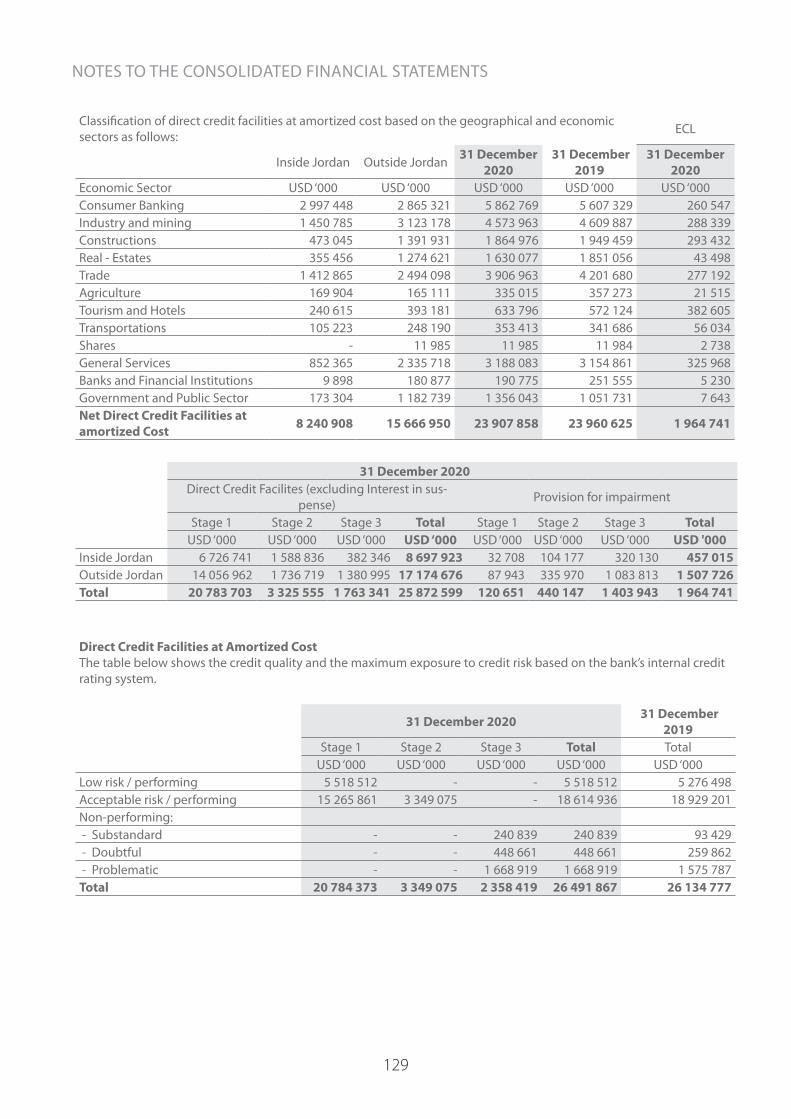
129
Classification of direct credit facilities at amortized cost based on the geographical and economic sectors as follows: ECL
Inside Jordan Outside Jordan 31 December 2020
31 December 2019
31 December 2020
Economic Sector USD ‘000 USD ‘000 USD ‘000 USD ‘000 USD ‘000Consumer Banking 2 997 448 2 865 321 5 862 769 5 607 329 260 547Industry and mining 1 450 785 3 123 178 4 573 963 4 609 887 288 339Constructions 473 045 1 391 931 1 864 976 1 949 459 293 432Real - Estates 355 456 1 274 621 1 630 077 1 851 056 43 498Trade 1 412 865 2 494 098 3 906 963 4 201 680 277 192Agriculture 169 904 165 111 335 015 357 273 21 515Tourism and Hotels 240 615 393 181 633 796 572 124 382 605Transportations 105 223 248 190 353 413 341 686 56 034Shares - 11 985 11 985 11 984 2 738General Services 852 365 2 335 718 3 188 083 3 154 861 325 968Banks and Financial Institutions 9 898 180 877 190 775 251 555 5 230Government and Public Sector 173 304 1 182 739 1 356 043 1 051 731 7 643Net Direct Credit Facilities at amortized Cost 8 240 908 15 666 950 23 907 858 23 960 625 1 964 741
31 December 2020Direct Credit Facilites (excluding Interest in sus-
pense) Provision for impairment
Stage 1 Stage 2 Stage 3 Total Stage 1 Stage 2 Stage 3 TotalUSD ‘000 USD ‘000 USD ‘000 USD ‘000 USD ‘000 USD ‘000 USD ‘000 USD '000
Inside Jordan 6 726 741 1 588 836 382 346 8 697 923 32 708 104 177 320 130 457 015Outside Jordan 14 056 962 1 736 719 1 380 995 17 174 676 87 943 335 970 1 083 813 1 507 726Total 20 783 703 3 325 555 1 763 341 25 872 599 120 651 440 147 1 403 943 1 964 741
Direct Credit Facilities at Amortized Cost The table below shows the credit quality and the maximum exposure to credit risk based on the bank’s internal credit rating system.
31 December 2020 31 December 2019
Stage 1 Stage 2 Stage 3 Total TotalUSD ‘000 USD ‘000 USD ‘000 USD ‘000 USD ‘000
Low risk / performing 5 518 512 - - 5 518 512 5 276 498Acceptable risk / performing 15 265 861 3 349 075 - 18 614 936 18 929 201Non-performing: - Substandard - - 240 839 240 839 93 429 - Doubtful - - 448 661 448 661 259 862 - Problematic - - 1 668 919 1 668 919 1 575 787Total 20 784 373 3 349 075 2 358 419 26 491 867 26 134 777
NOTES TO THE CONSOLIDATED FINANCIAL STATEMENTS

130
The movement on total direct credit facilities at amortized cost - Total:
31 December 2020 31 December 2019
Stage 1 Stage 2 Stage 3 Total TotalUSD ‘000 USD ‘000 USD ‘000 USD ‘000 USD ‘000
Balance at the beginning of the year 21 465 979 2 739 720 1 929 078 26 134 777 25 813 411New balances (Additions) 5 736 942 570 932 281 639 6 589 513 5 739 666Repaid balances (excluding write offs) (5 695 816) ( 501 563) ( 103 114) (6 300 493) (5 367 502)Transfers to stage 1 154 192 ( 151 203) ( 2 989) - - Transfers to stage 2 ( 889 112) 897 367 ( 8 255) - - Transfers to stage 3 ( 235 780) ( 219 164) 454 944 - - Written off balances or transferred to off statement of financial position - ( 571) ( 189 776) ( 190 347) ( 177 248)
Adjustments during the year - - - - - Translation Adjustments 247 968 13 557 ( 3 108) 258 417 126 450Total 20 784 373 3 349 075 2 358 419 26 491 867 26 134 777
The movement of ECL charges on direct credit facilities at amortized cost by stage is as follows:
31 December 2020 31 December 2019
Stage 1 Stage 2 Stage 3 Total TotalUSD ‘000 USD ‘000 USD ‘000 USD ‘000 USD ‘000
Balance at the beginning of the year 94 539 319 979 1 218 644 1 633 162 1 573 933 ECL charges during the year 59 308 145 474 306 327 511 109 253 517Recoveries (excluding write offs) ( 32 484) ( 27 405) ( 35 558) ( 95 447) ( 89 266)Transfers to stage 1 4 759 ( 4 487) ( 272) - - Transfers to stage 2 ( 5 802) 6 750 ( 948) - - Transfers to stage 3 ( 2 033) ( 38 049) 40 082 - - Impact on year end ECL caused by transfers between stages during the year
- 34 846 52 629 87 475 35 644
Written off balances or transferred to off statement of financial position - ( 571) ( 155 758) ( 156 329) ( 155 893)
Adjustments during the year 264 3 928 ( 24 962) ( 20 770) ( 1 232)Translation Adjustments 2 100 ( 318) 3 759 5 541 16 459Total 120 651 440 147 1 403 943 1 964 741 1 633 162
Direct Credit Facilities at Amortized Cost - Consumer BankingThe table below shows the credit quality and the maximum exposure to credit risk based on the bank’s internal credit rating system.
31 December 2020 31 December 2019
Stage 1 Stage 2 Stage 3 Total TotalUSD ‘000 USD ‘000 USD ‘000 USD ‘000 USD ‘000
Low risk / performing 1 126 771 - - 1 126 771 1 023 206Acceptable risk / performing 4 551 804 167 930 - 4 719 734 4 568 172Non-performing: - Substandard - - 52 036 52 036 31 443 - Doubtful - - 36 538 36 538 32 056 - Problematic - - 280 761 280 761 189 334Total 5 678 575 167 930 369 335 6 215 840 5 844 211 -Probability of default at low risk 2% -3.5% -Probability of default at acceptable risk 3.5% - 57% -Probability of default at High risk 100%
NOTES TO THE CONSOLIDATED FINANCIAL STATEMENTS
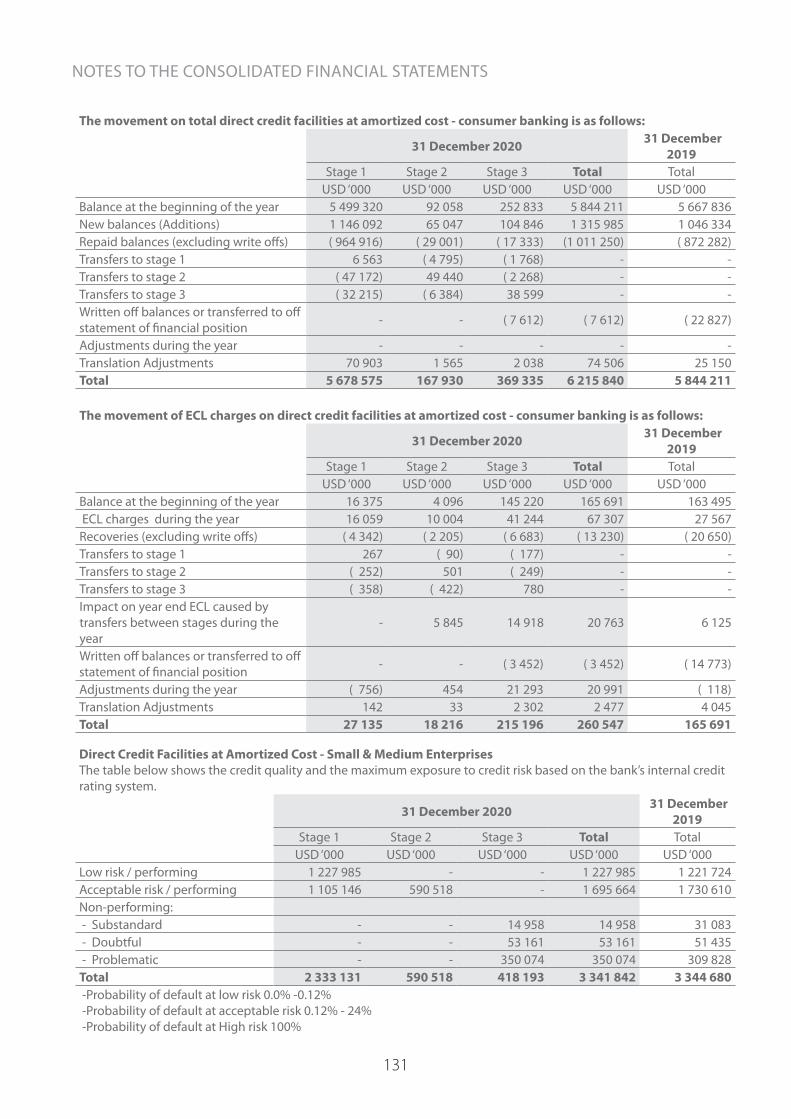
131
The movement on total direct credit facilities at amortized cost - consumer banking is as follows:
31 December 2020 31 December 2019
Stage 1 Stage 2 Stage 3 Total TotalUSD ‘000 USD ‘000 USD ‘000 USD ‘000 USD ‘000
Balance at the beginning of the year 5 499 320 92 058 252 833 5 844 211 5 667 836New balances (Additions) 1 146 092 65 047 104 846 1 315 985 1 046 334Repaid balances (excluding write offs) ( 964 916) ( 29 001) ( 17 333) (1 011 250) ( 872 282)Transfers to stage 1 6 563 ( 4 795) ( 1 768) - - Transfers to stage 2 ( 47 172) 49 440 ( 2 268) - - Transfers to stage 3 ( 32 215) ( 6 384) 38 599 - - Written off balances or transferred to off statement of financial position - - ( 7 612) ( 7 612) ( 22 827)
Adjustments during the year - - - - - Translation Adjustments 70 903 1 565 2 038 74 506 25 150Total 5 678 575 167 930 369 335 6 215 840 5 844 211
The movement of ECL charges on direct credit facilities at amortized cost - consumer banking is as follows:
31 December 2020 31 December 2019
Stage 1 Stage 2 Stage 3 Total TotalUSD ‘000 USD ‘000 USD ‘000 USD ‘000 USD ‘000
Balance at the beginning of the year 16 375 4 096 145 220 165 691 163 495 ECL charges during the year 16 059 10 004 41 244 67 307 27 567Recoveries (excluding write offs) ( 4 342) ( 2 205) ( 6 683) ( 13 230) ( 20 650)Transfers to stage 1 267 ( 90) ( 177) - - Transfers to stage 2 ( 252) 501 ( 249) - - Transfers to stage 3 ( 358) ( 422) 780 - - Impact on year end ECL caused by transfers between stages during the year
- 5 845 14 918 20 763 6 125
Written off balances or transferred to off statement of financial position - - ( 3 452) ( 3 452) ( 14 773)
Adjustments during the year ( 756) 454 21 293 20 991 ( 118)Translation Adjustments 142 33 2 302 2 477 4 045Total 27 135 18 216 215 196 260 547 165 691
Direct Credit Facilities at Amortized Cost - Small & Medium EnterprisesThe table below shows the credit quality and the maximum exposure to credit risk based on the bank’s internal credit rating system.
31 December 2020 31 December 2019
Stage 1 Stage 2 Stage 3 Total TotalUSD ‘000 USD ‘000 USD ‘000 USD ‘000 USD ‘000
Low risk / performing 1 227 985 - - 1 227 985 1 221 724Acceptable risk / performing 1 105 146 590 518 - 1 695 664 1 730 610Non-performing: - Substandard - - 14 958 14 958 31 083 - Doubtful - - 53 161 53 161 51 435 - Problematic - - 350 074 350 074 309 828Total 2 333 131 590 518 418 193 3 341 842 3 344 680 -Probability of default at low risk 0.0% -0.12% -Probability of default at acceptable risk 0.12% - 24% -Probability of default at High risk 100%
NOTES TO THE CONSOLIDATED FINANCIAL STATEMENTS

132
The movement on total direct credit facilities at amortized cost - Small & Medium Enterprises is as follows:31 December 2020 31 December 2019
Stage 1 Stage 2 Stage 3 Total TotalUSD ‘000 USD ‘000 USD ‘000 USD ‘000 USD ‘000
Balance at the beginning of the year 2 480 241 472 093 392 346 3 344 680 3 288 007
New balances (Additions) 441 225 91 251 46 008 578 484 790 300Repaid balances (excluding write offs) ( 579 061) ( 52 222) ( 35 543) ( 666 826) ( 769 964)
Transfers to stage 1 43 065 ( 42 061) ( 1 004) - - Transfers to stage 2 ( 123 245) 123 932 ( 687) - - Transfers to stage 3 ( 4 761) ( 11 626) 16 387 - - Written off balances or trans-ferred to off statement of finan-cial position
- - ( 5 178) ( 5 178) ( 5 624)
Adjustments during the year - - - - - Translation Adjustments 75 667 9 151 5 864 90 682 41 961Total 2 333 131 590 518 418 193 3 341 842 3 344 680
The movement of ECL charges on direct credit facilities at amortized cost - Small & Medium Enterprises is as follows:31 December 2020 31 December 2019
Stage 1 Stage 2 Stage 3 Total TotalUSD ‘000 USD ‘000 USD ‘000 USD ‘000 USD ‘000
Balance at the beginning of the year 16 017 31 882 188 434 236 333 171 933
ECL charges during the year 5 478 27 758 59 431 92 667 58 158Recoveries (excluding write offs) ( 7 036) ( 1 359) ( 8 287) ( 16 682) ( 20 793)
Transfers to stage 1 418 ( 344) ( 74) - - Transfers to stage 2 ( 847) 1 012 ( 165) - - Transfers to stage 3 ( 27) ( 2 384) 2 411 - - Impact on year end ECL caused by transfers between stages during the year
- 3 559 1 708 5 267 17 346
Written off balances or trans-ferred to off statement of finan-cial position
- - ( 1 515) ( 1 515) ( 4 241)
Adjustments during the year 376 1 224 ( 19 632) ( 18 032) 4 831Translation Adjustments 521 90 1 792 2 403 9 099Total 14 900 61 438 224 103 300 441 236 333
Direct Credit Facilities at Amortized Cost - Large CorporatesThe table below shows the credit quality and the maximum exposure to credit risk based on the bank’s internal credit rating system.
31 December 2020 31 December 2019Stage 1 Stage 2 Stage 3 Total Total
USD ‘000 USD ‘000 USD ‘000 USD ‘000 USD ‘000Low risk / performing 2 246 233 - - 2 246 233 2 343 500Acceptable risk / performing 9 123 922 2 438 120 - 11 562 042 12 010 797Non-performing: - Substandard - - 173 845 173 845 30 903 - Doubtful - - 358 962 358 962 176 371 - Problematic - - 1 033 359 1 033 359 1 072 001Total 11 370 155 2 438 120 1 566 166 15 374 441 15 633 572 -Probability of default at low risk 0.0% -0.12% -Probability of default at acceptable risk 0.12% - 24% -Probability of default at High risk 100%
NOTES TO THE CONSOLIDATED FINANCIAL STATEMENTS
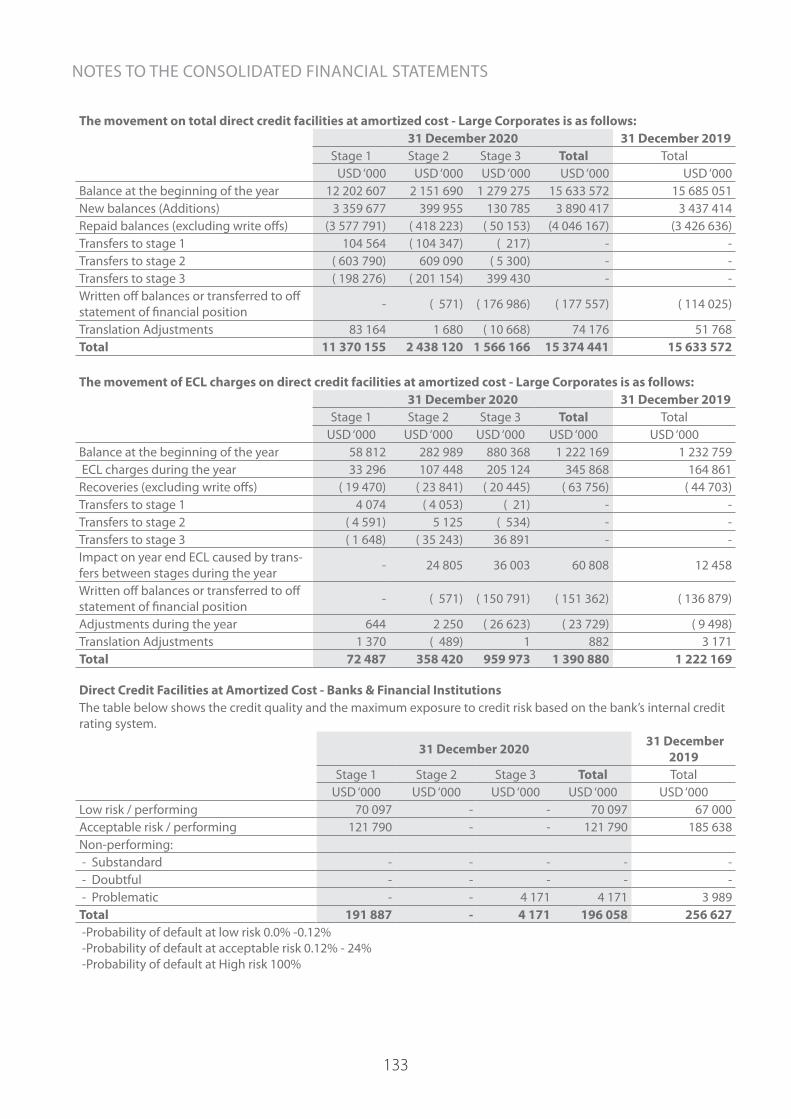
133
The movement on total direct credit facilities at amortized cost - Large Corporates is as follows:31 December 2020 31 December 2019
Stage 1 Stage 2 Stage 3 Total TotalUSD ‘000 USD ‘000 USD ‘000 USD ‘000 USD ‘000
Balance at the beginning of the year 12 202 607 2 151 690 1 279 275 15 633 572 15 685 051New balances (Additions) 3 359 677 399 955 130 785 3 890 417 3 437 414Repaid balances (excluding write offs) (3 577 791) ( 418 223) ( 50 153) (4 046 167) (3 426 636)Transfers to stage 1 104 564 ( 104 347) ( 217) - - Transfers to stage 2 ( 603 790) 609 090 ( 5 300) - - Transfers to stage 3 ( 198 276) ( 201 154) 399 430 - - Written off balances or transferred to off statement of financial position - ( 571) ( 176 986) ( 177 557) ( 114 025)
Translation Adjustments 83 164 1 680 ( 10 668) 74 176 51 768Total 11 370 155 2 438 120 1 566 166 15 374 441 15 633 572
The movement of ECL charges on direct credit facilities at amortized cost - Large Corporates is as follows:31 December 2020 31 December 2019
Stage 1 Stage 2 Stage 3 Total TotalUSD ‘000 USD ‘000 USD ‘000 USD ‘000 USD ‘000
Balance at the beginning of the year 58 812 282 989 880 368 1 222 169 1 232 759 ECL charges during the year 33 296 107 448 205 124 345 868 164 861Recoveries (excluding write offs) ( 19 470) ( 23 841) ( 20 445) ( 63 756) ( 44 703)Transfers to stage 1 4 074 ( 4 053) ( 21) - - Transfers to stage 2 ( 4 591) 5 125 ( 534) - - Transfers to stage 3 ( 1 648) ( 35 243) 36 891 - - Impact on year end ECL caused by trans-fers between stages during the year - 24 805 36 003 60 808 12 458
Written off balances or transferred to off statement of financial position - ( 571) ( 150 791) ( 151 362) ( 136 879)
Adjustments during the year 644 2 250 ( 26 623) ( 23 729) ( 9 498)Translation Adjustments 1 370 ( 489) 1 882 3 171Total 72 487 358 420 959 973 1 390 880 1 222 169
Direct Credit Facilities at Amortized Cost - Banks & Financial InstitutionsThe table below shows the credit quality and the maximum exposure to credit risk based on the bank’s internal credit rating system.
31 December 2020 31 December 2019
Stage 1 Stage 2 Stage 3 Total TotalUSD ‘000 USD ‘000 USD ‘000 USD ‘000 USD ‘000
Low risk / performing 70 097 - - 70 097 67 000Acceptable risk / performing 121 790 - - 121 790 185 638Non-performing: - Substandard - - - - - - Doubtful - - - - - - Problematic - - 4 171 4 171 3 989Total 191 887 - 4 171 196 058 256 627 -Probability of default at low risk 0.0% -0.12% -Probability of default at acceptable risk 0.12% - 24% -Probability of default at High risk 100%
NOTES TO THE CONSOLIDATED FINANCIAL STATEMENTS
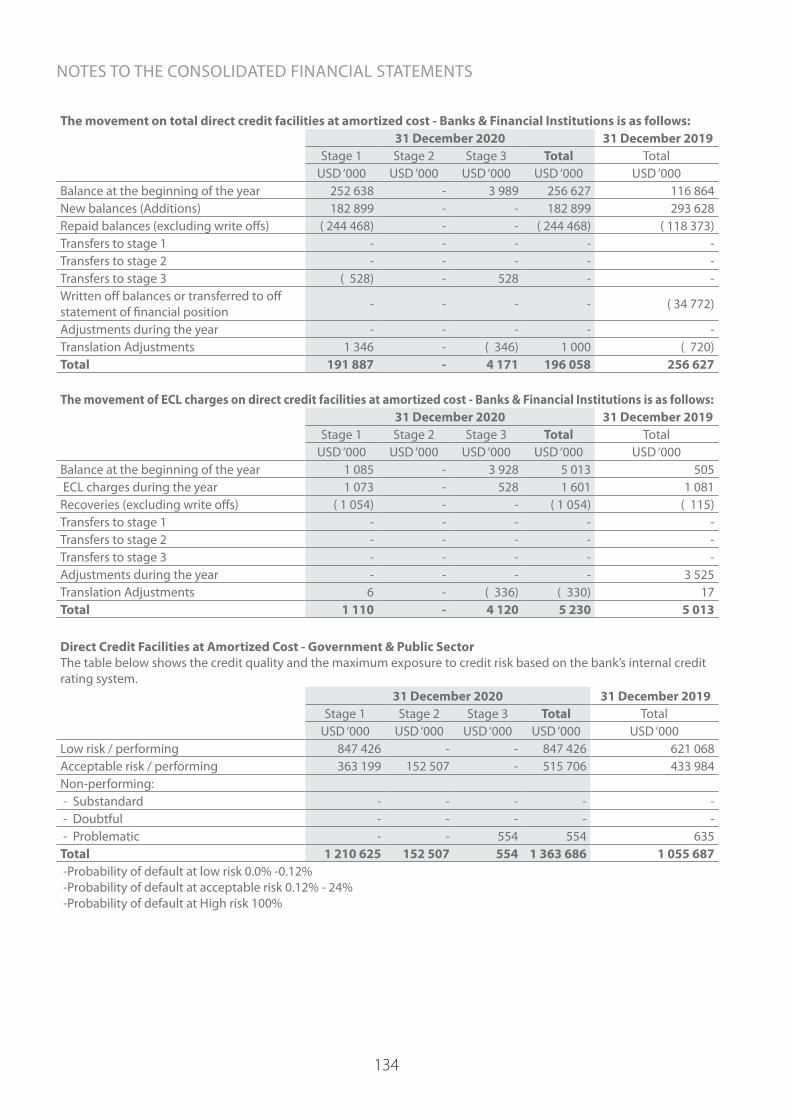
134
The movement on total direct credit facilities at amortized cost - Banks & Financial Institutions is as follows:31 December 2020 31 December 2019
Stage 1 Stage 2 Stage 3 Total TotalUSD ‘000 USD ‘000 USD ‘000 USD ‘000 USD ‘000
Balance at the beginning of the year 252 638 - 3 989 256 627 116 864New balances (Additions) 182 899 - - 182 899 293 628Repaid balances (excluding write offs) ( 244 468) - - ( 244 468) ( 118 373)Transfers to stage 1 - - - - - Transfers to stage 2 - - - - - Transfers to stage 3 ( 528) - 528 - - Written off balances or transferred to off statement of financial position - - - - ( 34 772)
Adjustments during the year - - - - - Translation Adjustments 1 346 - ( 346) 1 000 ( 720)Total 191 887 - 4 171 196 058 256 627
The movement of ECL charges on direct credit facilities at amortized cost - Banks & Financial Institutions is as follows:31 December 2020 31 December 2019
Stage 1 Stage 2 Stage 3 Total TotalUSD ‘000 USD ‘000 USD ‘000 USD ‘000 USD ‘000
Balance at the beginning of the year 1 085 - 3 928 5 013 505 ECL charges during the year 1 073 - 528 1 601 1 081Recoveries (excluding write offs) ( 1 054) - - ( 1 054) ( 115)Transfers to stage 1 - - - - - Transfers to stage 2 - - - - - Transfers to stage 3 - - - - - Adjustments during the year - - - - 3 525Translation Adjustments 6 - ( 336) ( 330) 17Total 1 110 - 4 120 5 230 5 013
Direct Credit Facilities at Amortized Cost - Government & Public SectorThe table below shows the credit quality and the maximum exposure to credit risk based on the bank’s internal credit rating system.
31 December 2020 31 December 2019Stage 1 Stage 2 Stage 3 Total Total
USD ‘000 USD ‘000 USD ‘000 USD ‘000 USD ‘000Low risk / performing 847 426 - - 847 426 621 068Acceptable risk / performing 363 199 152 507 - 515 706 433 984Non-performing: - Substandard - - - - - - Doubtful - - - - - - Problematic - - 554 554 635Total 1 210 625 152 507 554 1 363 686 1 055 687 -Probability of default at low risk 0.0% -0.12% -Probability of default at acceptable risk 0.12% - 24% -Probability of default at High risk 100%
NOTES TO THE CONSOLIDATED FINANCIAL STATEMENTS
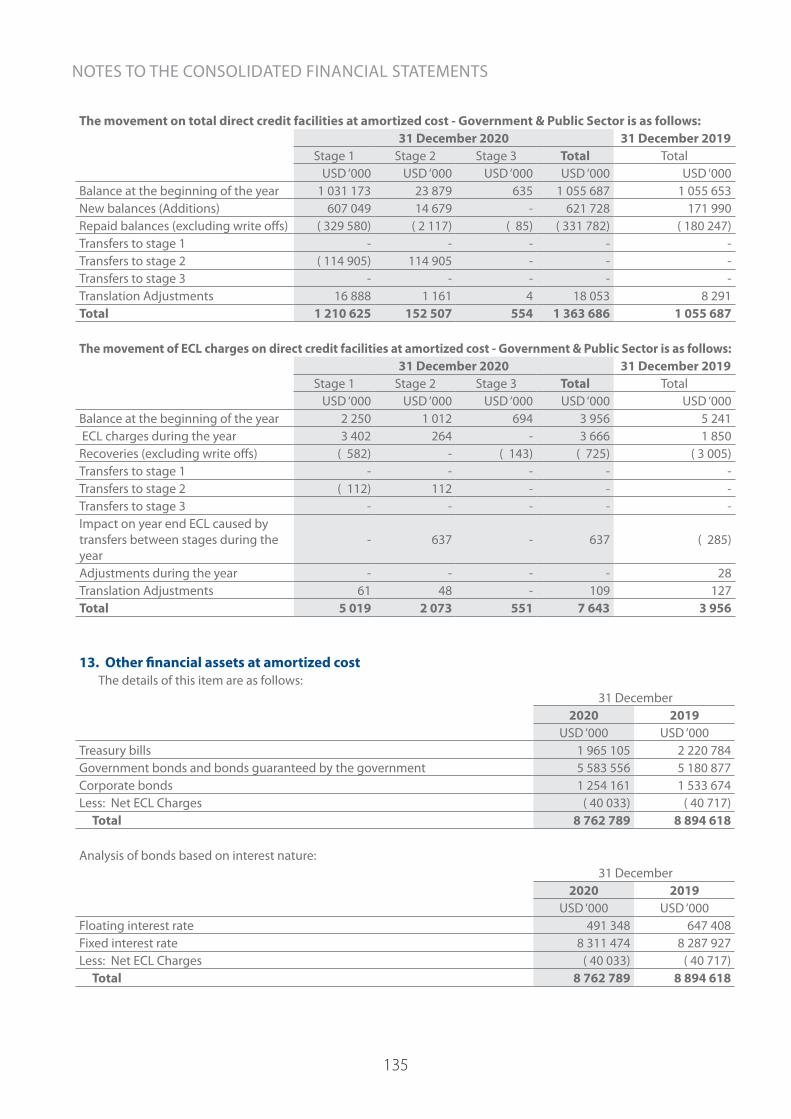
135
The movement on total direct credit facilities at amortized cost - Government & Public Sector is as follows:31 December 2020 31 December 2019
Stage 1 Stage 2 Stage 3 Total TotalUSD ‘000 USD ‘000 USD ‘000 USD ‘000 USD ‘000
Balance at the beginning of the year 1 031 173 23 879 635 1 055 687 1 055 653New balances (Additions) 607 049 14 679 - 621 728 171 990Repaid balances (excluding write offs) ( 329 580) ( 2 117) ( 85) ( 331 782) ( 180 247)Transfers to stage 1 - - - - - Transfers to stage 2 ( 114 905) 114 905 - - - Transfers to stage 3 - - - - - Translation Adjustments 16 888 1 161 4 18 053 8 291Total 1 210 625 152 507 554 1 363 686 1 055 687
The movement of ECL charges on direct credit facilities at amortized cost - Government & Public Sector is as follows:31 December 2020 31 December 2019
Stage 1 Stage 2 Stage 3 Total TotalUSD ‘000 USD ‘000 USD ‘000 USD ‘000 USD ‘000
Balance at the beginning of the year 2 250 1 012 694 3 956 5 241 ECL charges during the year 3 402 264 - 3 666 1 850Recoveries (excluding write offs) ( 582) - ( 143) ( 725) ( 3 005)Transfers to stage 1 - - - - - Transfers to stage 2 ( 112) 112 - - - Transfers to stage 3 - - - - - Impact on year end ECL caused by transfers between stages during the year
- 637 - 637 ( 285)
Adjustments during the year - - - - 28Translation Adjustments 61 48 - 109 127Total 5 019 2 073 551 7 643 3 956
13. Other financial assets at amortized cost The details of this item are as follows:
31 December2020 2019
USD ‘000 USD ‘000Treasury bills 1 965 105 2 220 784Government bonds and bonds guaranteed by the government 5 583 556 5 180 877Corporate bonds 1 254 161 1 533 674Less: Net ECL Charges ( 40 033) ( 40 717) Total 8 762 789 8 894 618
Analysis of bonds based on interest nature: 31 December
2020 2019USD ‘000 USD ‘000
Floating interest rate 491 348 647 408Fixed interest rate 8 311 474 8 287 927Less: Net ECL Charges ( 40 033) ( 40 717) Total 8 762 789 8 894 618
NOTES TO THE CONSOLIDATED FINANCIAL STATEMENTS

136
Analysis of financial assets based on market quotation: 31 December
Financial assets quoted in the market: 2020 2019USD ‘000 USD ‘000
Treasury bills 216 465 663 617Government bonds and bonds guaranteed by the government 1 131 354 988 913Corporate bonds 1 149 860 1 428 472Total 2 497 679 3 081 002
31 DecemberFinancial assets unquoted in the market: 2020 2019
USD ‘000 USD ‘000Treasury bills 1 748 640 1 557 167Government bonds and bonds guaranteed by the government 4 452 202 4 191 964Corporate bonds 104 301 105 202Total 6 305 143 5 854 333
Less: Net ECL Charges ( 40 033) ( 40 717)
Grand Total 8 762 789 8 894 618
Other Financial Assets at Amortized Cost The table below shows the credit quality and the maximum exposure to credit risk based on the bank’s internal credit rating system and year-end stage classification. The amounts presented are gross of impairment allowances.
31 December 2020 31 December 2019Stage 1 Stage 2 Stage 3 Total Total
Internal rating grade performing USD ‘000 USD ‘000 USD ‘000 USD ‘000 USD ‘000Low risk / performing 8 430 731 - - 8 430 731 8 574 582Acceptable risk / performing 239 060 133 031 - 372 091 355 977Non-performing: - - Substandard - - - - - - Doubtful - - - - - - Problematic - - - - 4 776Total 8 669 791 133 031 - 8 802 822 8 935 335 -Probability of default at low risk 0.0% -0.9% -Probability of default at acceptable risk 0.9% - 40.2% -Probability of default at High risk 100%
An analysis of change in the gross carrying amount and the corresponding ECL allowance is as follows:31 December 2020 31 December 2019
Stage 1 Stage 2 Stage 3 Total TotalUSD ‘000 USD ‘000 USD ‘000 USD ‘000 USD ‘000
Balance at the beginning of the year 8 742 991 187 568 4 776 8 935 335 8 548 363
New investments (Additions) 7 180 164 40 187 - 7 220 351 5 321 961Matured investments (7 334 914) ( 103 294) - (7 438 208) (4 953 129)Transfers to stage 1 - - - - - Transfers to stage 2 ( 4 000) 4 000 - - - Transfers to stage 3 - - - - - Investments written off - - ( 4 776) ( 4 776) - Adjustments during the year - - - - Translation Adjustments 85 550 4 570 - 90 120 18 140Total 8 669 791 133 031 - 8 802 822 8 935 335
NOTES TO THE CONSOLIDATED FINANCIAL STATEMENTS

137
The movement of ECL charges on other financial assets at amortized cost is as follows:31 December 2020 31 December 2019
Stage 1 Stage 2 Stage 3 Total TotalUSD ‘000 USD ‘000 USD ‘000 USD ‘000 USD ‘000
Balance at the beginning of the year 17 153 18 788 4 776 40 717 40 516 ECL charges during the year 11 245 2 150 - 13 395 7 552Recoveries from matured investments ( 11 134) ( 1 059) ( 402) ( 12 595) ( 9 294)Transfers to stage 1 - - - - - Transfers to stage 2 ( 46) 46 - - - Transfers to stage 3 - - - - - Impact on year end ECL caused by transfers between stages during the year - - - - 1 926
Investments written off - - ( 4 374) ( 4 374) - Adjustments during the year 1 565 842 - 2 407 ( 137)Translation Adjustments 417 66 - 483 154Total 19 200 20 833 - 40 033 40 717During the year ended 31 December 2020 certain financial assets at amortized cost amounted to USD 81.1 million were sold (USD 10.2 million during the year ended 31 December 2019).
14. Investments in Associates The details of this item are as follows:
31 December 2020
Ownership and Voting
Rights
Investment Carrying
Value
Place of Incorpora-
tionFair Value
Published Financial
Statements Date
Principal Activity
Date of Acquisi-
tion
2020 % USD ‘000Oman Arab Bank S.A.O. 49.00 499 805 Oman 420 665 2020 Banking 1984
Arab National Bank 40.00 3 231 147 Saudi Arabia 3 216 000 2020 Banking 1979
Arabia Insurance Company 42.51 38 455 Lebanon Unquoted 2019 Insurance 1972
Commercial buildings 35.39 9 631 Lebanon Unquoted 2019Real Estate Operating Lease
1966
Ubhar Capital SAOC (An Associate Company of Arab Bank Switzer-land)
34.00 9 678 Oman Unquoted 2020Investment and Financial Services
2016
Other Associates (Mostly owned by Arab Tunisian Bank)* Various 15 496 Various Various
Total 3 804 212
31 December 2019
Ownership and Voting
Rights
Investment Carrying
Value
Place of Incorpora-
tionFair Value
Published Financial
Statements Date
Principal Activity
Date of Acquisi-
tion
2019 % USD ‘000Oman Arab Bank S.A.O. 49.00 375 439 Oman Unquoted 2019 Banking 1984
Arab National Bank 40.00 3 068 877 Saudi Arabia 4 384 000 2019 Banking 1979
Arabia Insurance Company 42.51 36 296 Lebanon Unquoted 2018 Insurance 1972
Commercial buildings 35.39 9 369 Lebanon Unquoted 2018Real Estate Operating Lease
1966
Ubhar Capital SAOC (An Associate Company of Arab Bank Switzer-land)
34.00 8 614 Oman Unquoted 2019Investment and Financial Services
2016
Other Associates (Mostly owned by Arab Tunisian Bank)* Various 15 056 Various Various
Total 3 513 651
NOTES TO THE CONSOLIDATED FINANCIAL STATEMENTS

138
The details of movement on investments in associates are as follows:2020 2019
USD ‘000 USD ‘000Balance at the beginning of the year 3 513 651 3 298 251Purchase of investments in associates 139 532 4 383Group’s share of profits for the year 296 365 424 019Dividends received ( 143 364) ( 222 950)Translation Adjustment 1 270 828Group’s share of other changes in equity ( 3 242) 9 120 Balance at the end of the year 3 804 212 3 513 651
Group’s share of taxes 69 862 92 877
* This account represents mostly the investments in Arab Tunisian Lease Company, Arabia Sicaf and Arab Tunisian Invest Company amounting to USD 10.5 million, USD 2 million and USD 1 million respectively, as of 31 December 2020. (As of 31 December 2019 these investments amounted to USD 10 million, USD 1.7 million and USD 1.1 million respectively.)
The Group’s share from the profit and loss of the associates are as follows: 31 December
2020 2019USD ‘000 USD ‘000
Oman Arab Bank S.A.O. 9 947 41 436Arab National Bank 283 982 378 885Arabia Insurance Company 1 583 2 054Other 853 1 644Total 296 365 424 019
The Group’s share of associates are as follows: 31 December
2020 2019Arab Na-
tional Bank Oman Arab Bank S.A.O. Others Total Arab Na-
tional Bank Oman Arab Bank S.A.O. Others Total
USD ‘000 USD ‘000 USD ‘000 USD ‘000 USD ‘000 USD ‘000 USD ‘000 USD ‘000Total Assets 19 664 106 4 224 625 264 464 24 153 195 19 567 198 3 176 258 256 432 22 999 888Total Liabilities 16 432 959 3 724 820 191 204 20 348 983 16 498 321 2 800 819 187 097 19 486 237
Total Revenue 624 315 130 407 18 554 773 276 719 357 118 315 18 244 855 916Total Expenses 340 333 120 460 16 118 476 911 340 471 76 879 14 547 431 897Net Profit 283 982 9 947 2 436 296 365 378 885 41 436 3 697 424 019
NOTES TO THE CONSOLIDATED FINANCIAL STATEMENTS

139
15. Fixed AssetsThe details of this item are as follows:
Land Buildings
Furniture, Fixtures
and Equip-ment
Computers and Com-
munication Equipment
Motor Vehicles Other Total
Historical Cost: USD ‘000 USD ‘000 USD ‘000 USD ‘000 USD ‘000 USD ‘000 USD ‘000Balance as of 1 January 2019 69 968 414 895 210 321 162 773 14 468 89 498 961 923Additions - 21 283 7 950 22 016 2 047 5 276 58 572Disposals ( 2 112) - ( 2 722) ( 8 746) ( 1 424) ( 5 201) ( 20 205)Adjustments during the year - ( 2) ( 167) ( 1 902) - 2 ( 2 069)Translation Adjustments 99 2 224 239 596 221 998 4 377Balance as of 31 December 2019 67 955 438 400 215 621 174 737 15 312 90 573 1 002 598
Additions 29 599 24 958 36 721 23 166 975 6 083 121 502Disposals ( 99) ( 75 064) ( 1 588) ( 823) ( 760) ( 2 977) ( 81 311)Adjustments during the year - - 10 ( 10) - - - Translation Adjustments ( 1 084) 2 294 503 2 078 168 1 896 5 855Balance at 31 December 2020 96 371 390 588 251 267 199 148 15 695 95 575 1 048 644
Accumulated Depreciation :Balance as of 1 January 2019 - 145 518 167 605 123 019 10 641 59 421 506 204Depreciation charge for the year - 9 670 11 127 19 655 1 400 7 129 48 981
Disposals - - ( 2 670) ( 8 537) ( 1 420) ( 3 009) ( 15 636)Adjustments during the year - 54 ( 28) ( 26) - - - Translation adjustments - 533 148 429 161 661 1 932Balance as of 31 December 2019 - 155 775 176 182 134 540 10 782 64 202 541 481
Depreciation charge for the year - 10 051 11 635 19 441 1 537 6 242 48 906
Disposals - ( 3) ( 1 647) ( 836) ( 643) ( 2 630) ( 5 759)Adjustments during the year - - - - - - - Translation adjustments - 1 520 542 1 858 121 1 457 5 498Balance at 31 December 2020 - 167 343 186 712 155 003 11 797 69 271 590 126
Net Book Value as of 31 December 2020 96 371 223 245 64 555 44 145 3 898 26 304 458 518
Net Book Value as of 31 December 2019 67 955 282 625 39 439 40 197 4 530 26 371 461 117
* The cost of fully depreciated fixed assets amounted to USD 335.2 million as of 31 December 2020 (USD 293.7 million as of 31 December 2019).
NOTES TO THE CONSOLIDATED FINANCIAL STATEMENTS

140
16. Other Assets The details of this item are as follows: 31 December
2020 2019USD ‘000 USD ‘000
Accrued interest receivable 192 113 213 108Prepaid expenses 71 568 100 410Foreclosed assets * 152 401 121 457Intangible assets ** 34 272 29 820Right of use assets *** 86 315 98 608Other miscellaneous assets 226 468 228 888 Total 763 137 792 291* The Central Bank of Jordan instructions require a disposal of these assets during a maximum period of two years from the date of foreclosure.
* The details of movement on foreclosed assets are as follows:2020
Land Buildings Other TotalUSD ‘000 USD ‘000 USD ‘000 USD ‘000
Balance at the beginning of the year 51 803 69 654 - 121 457Additions 24 990 16 733 271 41 994Disposals ( 1 700) ( 1 824) - ( 3 524)Provision for impairment and impariment losses ( 3 802) ( 753) - ( 4 555)Translation adjustments ( 1 695) ( 1 276) - ( 2 971)Balance at the end of the year 69 596 82 534 271 152 401
2019Land Buildings Other Total
USD ‘000 USD ‘000 USD ‘000 USD ‘000Balance at the beginning of the year 50 377 37 967 - 88 344Additions 4 414 32 787 - 37 201Disposals ( 75) ( 1 089) - ( 1 164)Provision for impairment and impariment losses ( 2 913) ( 77) - ( 2 990)Translation adjustments - 66 - 66Balance at the End of the Year 51 803 69 654 - 121 457
** The details of movement on intangible assets are as follows: 31 December
2020 2019USD ‘000 USD ‘000
Balance at the beginning of the year 29 820 22 587Additions 18 425 19 453Amortization charge for the year ( 14 444) ( 12 825)Adjustment during the yeat and translation adjustments 471 605 Balance at the End of the Year 34 272 29 820
*** The dateails of movement of right of use assets are as follows : 2020 2019
USD ‘000 USD ‘000Balance at the beginning of the year 98 608 104 211Additions 5 004 11 929Depreciation ( 17 297) ( 17 532) Balance at the End of the Year 86 315 98 608
NOTES TO THE CONSOLIDATED FINANCIAL STATEMENTS

141
17. Deferred Tax AssetsThe details of this item are as follows : Items attributable to deferred tax assets are as follows:
2020
Balance at the Beginning of the Year (Restated)
Amounts Added
Amounts Released
Adjustments During the Year and Translation
Adjustments
Balance at the End of
the Year
Deferred Tax
USD ‘000 USD ‘000 USD ‘000 USD ‘000 USD ‘000 USD ‘000ECL on direct credit facilities at amortized cost 376 802 315 180 ( 99 694) 1 392 593 680 147 028
End-of-Service indemnity 72 173 7 920 ( 4 087) 777 76 783 22 038Interest in suspense 52 497 43 661 ( 16 252) - 79 906 19 937Other 113 399 4 772 ( 35 580) ( 2 164) 80 427 25 930 Total 614 871 371 533 ( 155 613) 5 830 796 214 933
2019
Balance at the Beginning of the
Year
Amounts Added
Amounts Released
Adjustments During the Year and Translation
Adjustments
Balance at the End of
the Year
Deferred Tax
USD ‘000 USD ‘000 USD ‘000 USD ‘000 USD ‘000 USD ‘000ECL on direct credit facilities at amortized cost 315 176 170 516 ( 108 742) ( 148) 376 802 91 569
End-of-Service indemnity 68 401 9 300 ( 5 370) ( 158) 72 173 20 716Interest in suspense 30 695 26 817 ( 5 125) 110 52 497 12 536Other 101 686 29 019 ( 19 446) 2 140 113 399 30 564Total 515 958 235 652 ( 138 683) 1 944 614 871 155 385 Deferred tax results from temporary timing differences of the provisions not deducted for tax purposes in the current year or previous years. This is calculated according to the regulations of the countries where the Group operates.
The details of movements on deferred tax assets are as follows:2020 2019
USD ‘000 USD ‘000Balance at the beginning of the year 155 385 131 946Additions during the year 105 382 63 698Amortized during the year ( 45 846) ( 40 515)Adjustments during the year and translation adjustments 12 256Balance at the end of the year 214 933 155 385
18. Banks and Financial Institutions Deposits The details of this item are as follows:
31 December 2020 31 December 2019
Inside Jordan Outside Jordan Total Inside Jordan Outside
Jordan Total
USD ‘000 USD ‘000 USD ‘000 USD ‘000 USD ‘000 USD ‘000Current and demand - 746 957 746 957 - 411 539 411 539Time deposits 104 836 3 122 433 3 227 269 136 654 3 213 702 3 350 356 Total 104 836 3 869 390 3 974 226 136 654 3 625 241 3 761 895
NOTES TO THE CONSOLIDATED FINANCIAL STATEMENTS

142
19. Customers’ DepositsThe details of this item are as follows:
31 December 2020
Consumer Banking
Corporates Government and Public
SectorTotalSmall and
Medium Large
USD ‘000 USD ‘000 USD ‘000 USD ‘000 USD ‘000Current and demand 9 878 466 2 482 453 2 583 737 221 441 15 166 097Savings 3 574 548 113 032 15 119 63 868 3 766 567Time and notice 9 202 810 1 382 303 3 482 528 2 524 787 16 592 428Certificates of deposit 507 979 69 222 94 423 38 422 710 046Total 23 163 803 4 047 010 6 175 807 2 848 518 36 235 138
31 December 2019
Consumer Banking
Corporates Government and Public
SectorTotalSmall and
Medium Large
USD ‘000 USD ‘000 USD ‘000 USD ‘000 USD ‘000Current and demand 7 707 130 2 161 544 2 087 225 219 873 12 175 772Savings 3 139 015 100 503 15 204 10 545 3 265 267Time and notice 9 302 986 1 128 913 4 914 718 1 763 826 17 110 443Certificates of deposit 406 515 29 008 119 607 48 383 603 513Total 20 555 646 3 419 968 7 136 754 2 042 627 33 154 995 - Government of Jordan and Jordanian public sector deposits amounted to USD 1057.7 million, or 2.9 % of total
customer deposits as of 31 December 2020 (USD 869.8 million , or 2.6% of total customer deposits as of 31 December 2019).
- Non-interest bearing deposits amounted to USD 13732.4 million, or 37.9 % of total customer deposits as of 31 December 2020 (USD 10968.4 million or 33.1% of total customer deposits as of 31 December 2019).
- Blocked deposits amounted to USD 159.8 million, or 0.4% of total customer deposits as of 31 December 2020 (USD 193.9 million or 0.6% of total customer deposit as of 31 December 2019).
- Dormant deposits amounted to USD 492.1 million, or 1.4% of total customer deposits as of 31 December2020 (USD 342.1 million , or 1% of total customer deposits as of 31 December 2019).
20. Cash Margin The details of this item are as follows: 31 December
2020 2019USD ‘000 USD ‘000
Against direct credit facilities at amortized cost 1 750 146 2 015 162Against indirect credit facilities 723 870 1 058 857Against margin trading 2 421 2 665Other cash margins 6 816 6 069Total 2 483 253 3 082 753
21. Borrowed Funds The details of this item are as follows: 31 December
2020 2019USD ‘000 USD ‘000
From Central Banks * 167 340 86 237From banks and financial institutions ** 442 451 246 699Total 609 791 332 936
NOTES TO THE CONSOLIDATED FINANCIAL STATEMENTS

143
Analysis of borrowed funds according to interest nature is as follows: 31 December
2020 2019USD ‘000 USD ‘000
Floating interest rate 364 386 210 210Fixed interest rate 245 405 122 726Total 609 791 332 936
* During 2013, Arab Bank (Jordan branches) signed a loan agreement with the Central Bank of Jordan amounting to USD 5.6 million, for the duration of 15 years of which 5 years are grace period with an interest rate of (2.5%) for the year 2013 and a floating interest rate of (1.8%+LIBOR 6 months) for the years after 2013. The agreement aims to support SMEs and Extra Small Companies. The loan is repaid semi-annually, with installments in March and September of each year. The Balance of the loan as of 31 December 2020 amounted to USD 3.95 million (USD 4.5 million as of 31 December 2019).
* During 2014, Arab Bank (Jordan branches) signed a loan agreement with the Central Bank of Jordan amounting to USD 3.95 million, for the duration of 10 years of which 3 years are grace period and with a fixed interest rate of 2.5%. The agreement aims to support SMEs and Extra Small Companies. The loan is repaid semi-annually, with installments in March and September of each year. The Balance of the loan as of 31 December 2020 amounted to USD 2 million (USD 2.5 million as of 31 December 2019).
* Untill December 31, 2020, Arab Bank (Jordan branches) granted loans against medium term advances from the Central Bank of Jordan with fixed interest rate equal to the discount rate disclosed on the grant day after deducting 0.5% for advances outside Amman and 1% for advances inside Amman , The advances are repaid in accordance with customers monthly installments, these advances amounted USD 98.2 million as of 31 December 2020 (USD 69.4 million as of 31 December 2019)
* During 2016, Arab Bank (Jordan branches) signed a loan agreement with the Central Bank of Jordan amounting to USD 5.1 million, for the duration of 15 years of which 5 years are grace period with a floating interest rate of (1.85%+LIBOR 6 months). The agreement aims to support SMEs and Extra Small Companies. The loan is repaid semi-annually, with installments in March and September of each year. The Balance of the loan as of 31 December 2020 amounted to USD 4.8 million (USD 5.1 million as of 31 December 2019).
* During 2017, Arab Bank (Jordan branches) signed a loan agreement with the Central Bank of Jordan amounting to USD 10.9 million, for the duration of 22 years of which 5 years are grace period with a fixed interest rate of 3% (CBJ has the right to amend the interest rate every two years up to 3.5%). The agreement aims to support SMEs and Extra Small Companies. The loan is repaid semi-annually, with installments in May and November of each year. The Balance of the loan as of 31 December 2020 amounted to USD 6.6 million (USD 4.8 million as of 31 December 2019).
* During 2018, Arab Bank (Jordan branches) signed loans agreements with European investment Bank amounting to USD 331 million, for the duration of 7 years, in the same year Arab Bank withdrew the first installment in the amount of USD 100 million for the duration of 7 years with a floating interest rate of (1.392%+LIBOR 6 months) the interest is repaid in 2 installments during the year, the loan is repaid semi-annually in March and September of each year, the first installment started on 15 September 2020 and the last one will be on 15 September 2025. the Balance of the loan as of 31 December 2020 amounted to USD 90.88 million (USD 100 million as of 31 December 2019)
* During 2019, Arab Bank (Jordan branches) withdrew the second installment in the amount of USD 69.82 million for the duration of 7 years with a floating interest rate of (1.503%+LIBOR 6 months) the interest is repaid in 2 installments during the year, the loan is repaid semi-annually in March and September of each year, the first installment will be on 15 September 2021 and the last one will be on 16 March 2026. the Balance of the loan as of 31 December 2020 amounted to USD 69.82 million.
During 2020, Arab Bank (Jordan branches) withdrew the third installment in the amount of USD 161.81 million for the duration of 7 years with a floating interest rate of (1.704%+LIBOR 6 months) the interest is repaid in 2 installments during the year, the loan is repaid semi-annually in March and September of each year, the first installment will be on 15 September 2022 and the last one will be on 15 March 2027.
NOTES TO THE CONSOLIDATED FINANCIAL STATEMENTS
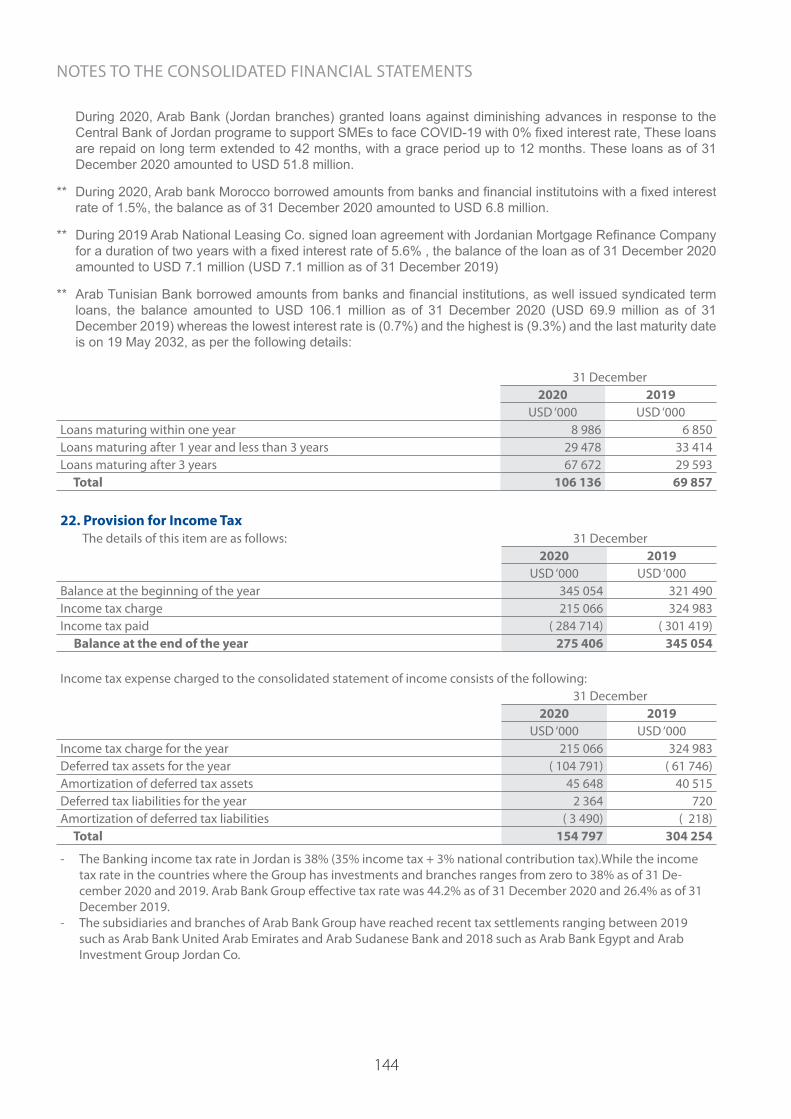
144
During 2020, Arab Bank (Jordan branches) granted loans against diminishing advances in response to the Central Bank of Jordan programe to support SMEs to face COVID-19 with 0% fixed interest rate, These loans are repaid on long term extended to 42 months, with a grace period up to 12 months. These loans as of 31 December 2020 amounted to USD 51.8 million.
** During 2020, Arab bank Morocco borrowed amounts from banks and financial institutoins with a fixed interest rate of 1.5%, the balance as of 31 December 2020 amounted to USD 6.8 million.
** During 2019 Arab National Leasing Co. signed loan agreement with Jordanian Mortgage Refinance Company for a duration of two years with a fixed interest rate of 5.6% , the balance of the loan as of 31 December 2020 amounted to USD 7.1 million (USD 7.1 million as of 31 December 2019)
** Arab Tunisian Bank borrowed amounts from banks and financial institutions, as well issued syndicated term loans, the balance amounted to USD 106.1 million as of 31 December 2020 (USD 69.9 million as of 31 December 2019) whereas the lowest interest rate is (0.7%) and the highest is (9.3%) and the last maturity date is on 19 May 2032, as per the following details:
31 December2020 2019
USD ‘000 USD ‘000Loans maturing within one year 8 986 6 850Loans maturing after 1 year and less than 3 years 29 478 33 414Loans maturing after 3 years 67 672 29 593 Total 106 136 69 857
22. Provision for Income Tax The details of this item are as follows: 31 December
2020 2019USD ‘000 USD ‘000
Balance at the beginning of the year 345 054 321 490Income tax charge 215 066 324 983Income tax paid ( 284 714) ( 301 419) Balance at the end of the year 275 406 345 054
Income tax expense charged to the consolidated statement of income consists of the following: 31 December
2020 2019USD ‘000 USD ‘000
Income tax charge for the year 215 066 324 983Deferred tax assets for the year ( 104 791) ( 61 746)Amortization of deferred tax assets 45 648 40 515Deferred tax liabilities for the year 2 364 720Amortization of deferred tax liabilities ( 3 490) ( 218) Total 154 797 304 254
- The Banking income tax rate in Jordan is 38% (35% income tax + 3% national contribution tax).While the income tax rate in the countries where the Group has investments and branches ranges from zero to 38% as of 31 De-cember 2020 and 2019. Arab Bank Group effective tax rate was 44.2% as of 31 December 2020 and 26.4% as of 31 December 2019.
- The subsidiaries and branches of Arab Bank Group have reached recent tax settlements ranging between 2019 such as Arab Bank United Arab Emirates and Arab Sudanese Bank and 2018 such as Arab Bank Egypt and Arab Investment Group Jordan Co.
NOTES TO THE CONSOLIDATED FINANCIAL STATEMENTS

145
23. Other Provisions The details of this item are as follows:
2020
Balance at the Beginning of
the Year
Additions during the
Year
Utilized or transferred during the
Year
Released to Income
Adjustments during the Year and
Translation Adjustments
Balance at the End of the
Year
USD ‘000 USD ‘000 USD ‘000 USD ‘000 USD ‘000 USD ‘000End-of-service indemnity 122 761 14 607 ( 10 912) ( 38) 162 126 580Legal cases 9 744 872 ( 627) ( 1 249) 43 8 783Other 94 016 10 737 ( 6 907) ( 2 708) ( 432) 94 706 Total 226 521 26 216 ( 18 446) ( 3 995) ( 227) 230 069
2019
Balance at the Beginning of
the Year
Addition during the
Year
Utilized or transferred during the
Year
Released to Income
Adjustments during the Year and
Translation Adjustments
Balance at the End of the
Year
USD ‘000 USD ‘000 USD ‘000 USD ‘000 USD ‘000 USD ‘000End-of-service indemnity 116 787 16 103 ( 10 158) ( 14) 43 122 761Legal cases 6 473 4 858 ( 818) ( 808) 39 9 744Other 87 043 11 871 ( 4 227) ( 924) 253 94 016 Total 210 303 32 832 ( 15 203) ( 1 746) 335 226 521
24. Other Liabilities The details of this item are as follows: 31 December
2020 2019USD ‘000 USD ‘000
Accrued interest payable 139 822 211 698Notes payable 203 883 168 629Interest and commission received in advance 61 133 75 085Accrued expenses 90 349 77 471Dividends payable to shareholders 19 405 20 332Provision for impairment - ECL of the indirect credit facilities* 91 950 59 213Lease liabilities 84 245 95 880Other miscellaneous liabilities 349 622 417 642 Total 1 040 409 1 125 950
Indirect Credit Facilities The table below shows the credit quality and the maximum exposure to credit risk based on the bank’s internal credit rating system and year-end stage classification. The amounts presented are gross of impairment allowances.
31 December 2020 31 December 2019Stage 1 Stage 2 Stage 3 Total Total
USD ‘000 USD ‘000 USD ‘000 USD ‘000 USD ‘000Low risk / performing 770 296 - - 770 296 1 074 744Acceptable risk / performing 14 044 464 653 092 - 14 697 556 16 035 613Non-performing: - - 168 269 168 269 51 167Total 14 814 760 653 092 168 269 15 636 121 17 161 524 -Probability of default at low risk 0.0% -0.12% -Probability of default at acceptable risk 0.12% - 24% -Probability of default at High risk 100%
NOTES TO THE CONSOLIDATED FINANCIAL STATEMENTS

146
The movement on total indirect credit facilities is as follows:31 December 2020 31 December 2019
Stage 1 Stage 2 Stage 3 Total TotalUSD ‘000 USD ‘000 USD ‘000 USD ‘000 USD ‘000
Balance at beginning of the year 16 693 719 416 638 51 167 17 161 524 18 097 656New balances (Additions) 4 429 340 570 745 237 5 000 322 6 433 697Matured balances (6 014 780) ( 510 201) ( 24 816) (6 549 797) (7 373 878)Transfers to stage 1 45 758 ( 45 132) ( 626) - - Transfers to stage 2 ( 287 172) 287 321 ( 149) - - Transfers to stage 3 ( 75 659) ( 66 736) 142 395 - - Balances written off - - - - - Adjustments during the year - - - - - Translation Adjustments 23 554 457 61 24 072 4 049Total 14 814 760 653 092 168 269 15 636 121 17 161 524
The movement of ECL charges on indirect credit facilitiess is as follows:
31 December 2020 31 December 2019Stage 1 Stage 2 Stage 3 Total Total
USD ‘000 USD ‘000 USD ‘000 USD ‘000 USD ‘000Balance at beginning of the year 36 152 13 515 9 546 59 213 77 358 ECL charges during the year 11 616 14 322 3 630 29 568 14 823Recoveries (excluding write offs) ( 11 296) ( 1 769) ( 72) ( 13 137) ( 33 646)Transfers to stage 1 537 ( 537) - - - Transfers to stage 2 ( 890) 890 - - - Transfers to stage 3 ( 14) ( 16) 30 - - Impact on year end ECL caused by trans-fers between stages during the year - 375 2 545 2 920 ( 228)
Balances written off - - - - - Adjustments during the year 346 275 12 372 12 993 64Translation Adjustments ( 88) 402 79 393 842Total 36 363 27 457 28 130 91 950 59 213
25. Deferred Tax LiabilitiesItems attributable to deferred tax liabilities are as follows:
2020
Balance at the Begin-ning of the Year
Amounts Added
Amounts Released
Adjustments during the Year and Trans-lation Adjustments
Balance at the End of
the Year
Deferred Tax
USD ‘000 USD ‘000 USD ‘000 USD ‘000 USD ‘000 USD ‘000 Total 31 792 12 094 ( 21 720) 1 152 23 318 5 672
2019
Balance at the Begin-ning of the Year
Amounts Added
Amounts Released
Adjustments during the Year and Trans-lation Adjustments
Balance at the End of
the Year
Deferred Tax
USD ‘000 USD ‘000 USD ‘000 USD ‘000 USD ‘000 USD ‘000 Total 33 598 4 434 ( 5 310) ( 930) 31 792 6 402
NOTES TO THE CONSOLIDATED FINANCIAL STATEMENTS

147
The details of movements on deferred tax liabilities are as follows:2020 2019
USD ‘000 USD ‘000Balance at the beginning of the year 6 402 8 210Additions during the year 2 364 811Amortized during the year ( 3 542) ( 218)Adjustments during the year and translation adjustments 448 ( 2 401) Balance at the end of the year 5 672 6 402
26. Share Capital & Premiuma .Share Capital amounted to USD 926.6 million distributed to 640.8 million shares as of 31 December 2020 and 2019 with
an authorized capital of 640.8 million shares (at a par value of USD1.41 per share).
b. Share premium amounted to USD 1225.7 million as of 31 December 2020 and 2019.
27. Statutory ReserveStatutory reserve amounted to USD 926.6 million as of 31 December 2020 (USD 926.6 million as of 31 December 2019) according to the regulations of the Central Bank of Jordan and Companies Law and it can not be distributed to the shareholders of the banks.
28. Voluntary ReserveThe voluntary reserve amounted to USD 977.3 million as of 31 December 2020 and 2019. This reserve is used for purposes determined by the Board of Directors, and the General Assembly has the right to distribute it in whole or part thereof to shareholders as dividends.
29. General ReserveThe general reserve amounted to USD 1141.8 million as of 31 December 2020 and 2019. This reserve is used for purposes determined by the Board of Directors, and the General Assembly has the right to distribute it in whole or part thereof to shareholders as dividends.
30. General Banking Risks ReserveThe general banking risk reserve amounted to USD 224.3 million as of 31 December 2020 (USD 239 million as of 31 December 2019).
31. Foreign currency translation reserve The details of this item are as follows:
31 December2020 2019
USD ‘000 USD ‘000 Balance at the beginning of the year ( 252 925) ( 264 651) Changes during the year 92 716 11 726 Balance at the end of the year ( 160 209) ( 252 925)
NOTES TO THE CONSOLIDATED FINANCIAL STATEMENTS

148
32. Investment Revaluation Reserve The details of this item are as follows: 31 December
2020 2019USD ‘000 USD ‘000
Balance at the beginning of the year ( 298 403) ( 322 831)Change in fair value during the year 31 22 227Net realized losses transferred to retained earnings 2 575 2 201 Balance at the End of the Year ( 295 797) ( 298 403)
33. Retained Earnings and Non-controlling interests The movement of retained earnings are as follows: 31 December
2020 2019USD ‘000 USD ‘000
Balance at the beginning of the year 2 584 537 2 192 006Profit for the year Attributable to Shareholders of the Bank 192 791 844 937Investments revaluation reserve transferred to retained earnings ( 2 575) ( 2 201)Dividends paid * - ( 417 997)Transferred to statutory reserve - ( 7 108)Transferred from / to general banking risk reserve ** 14 678 ( 1 828)Changes in associates equity ( 5 504) ( 13 724)Adjustments during the year ( 8 292) ( 4 221)Effect of IFRS (16) option - ( 5 327) Balance at the end of the year ** 2 775 635 2 584 537* Arab Bank plc Board of Directors recommended a 12 % of USD 1.4 par value as cash dividend, equivalent to USD 108.4 million, for the year 2020. This proposal is subject to the approval of the General Assembly of shareholders. (Ac-cording to Central Bank of Jordan circular no. 1/1/4693 dated 9 April 2020, Arab Bank did not distribute dividends for the year 2019).
The details of non-controlling interests are as follows:2020 2019
USD ‘000 USD ‘000 USD ‘000 USD ‘000 USD ‘000 USD ‘000
Non-controlling interests %
Share of non-controlling
interests of net assets
Share of non-controlling
interests of net profits (loss)
Non-controlling interests %
Share of non-
controlling interests of net assets
Share of non-controlling
interests of net profits (loss)
Arab Tunisian Bank 35.76 68 057 ( 618) 35.76 63 868 287Arab Bank Syria 48.71 22 318 671 48.71 12 744 ( 129)Al Nisr Al Arabi Insur-ance Company plc 50.00 15 473 2 440 50.00 14 666 1 453
Total 105 848 2 493 91 278 1 611
The following are some basic financial data related to basic subsidiaries that contrains non contorlling interests: 2020 2019
Arab Tuni-sian Bank Arab Bank Syria
Al Nisr Al Arabi Insurance
Company plc
Arab Tuni-sian Bank
Arab Bank Syria
Al Nisr Al Arabi Insurance
Company plcUSD ‘000 USD ‘000 USD ‘000 USD ‘000 USD ‘000 USD ‘000
Total Assets 2 703 848 123 901 161 942 2 522 400 137 157 145 883Total Liabilities 2 513 530 77 950 130 996 2 343 796 110 917 116 551Net Assets 190 318 45 951 30 946 178 604 26 240 29 332
Total Income 94 792 3 746 14 230 83 157 3 591 11 540Total Expenses 96 521 2 364 9 350 82 354 3 858 8 634Net Profit (Loss) ( 1 729) 1 382 4 880 803 ( 267) 2 906
NOTES TO THE CONSOLIDATED FINANCIAL STATEMENTS
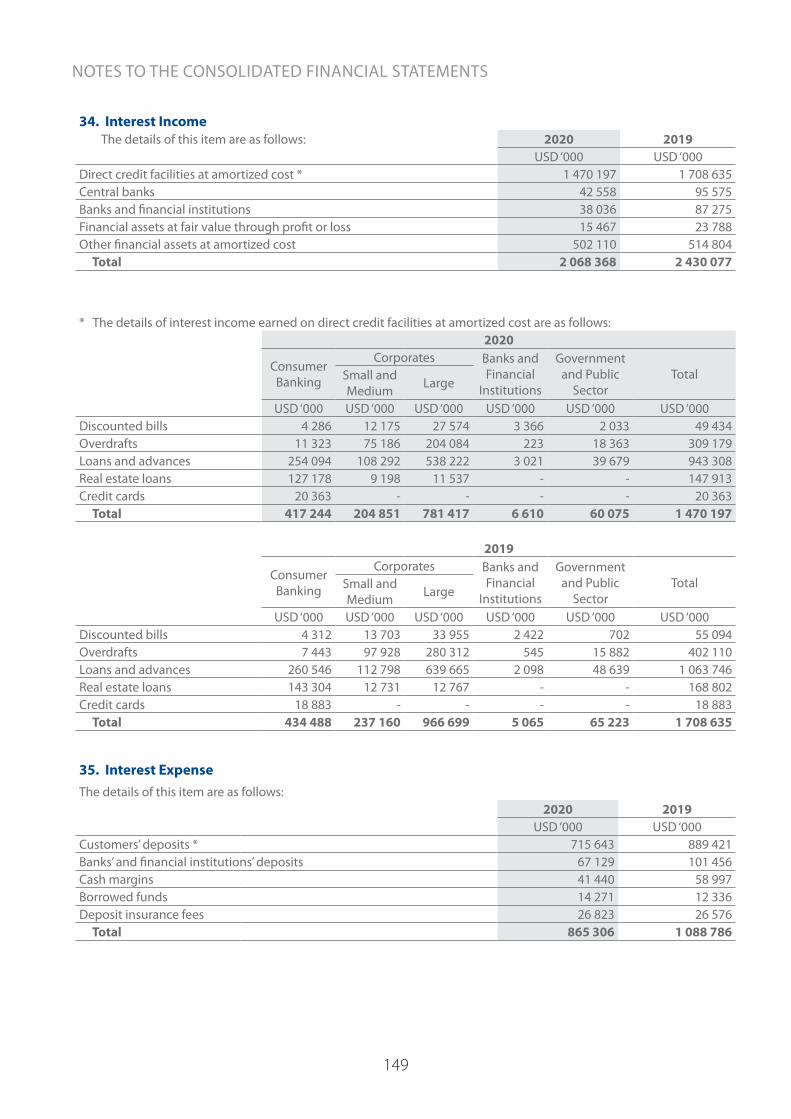
149
34. Interest Income The details of this item are as follows: 2020 2019
USD ‘000 USD ‘000Direct credit facilities at amortized cost * 1 470 197 1 708 635Central banks 42 558 95 575Banks and financial institutions 38 036 87 275Financial assets at fair value through profit or loss 15 467 23 788Other financial assets at amortized cost 502 110 514 804 Total 2 068 368 2 430 077
* The details of interest income earned on direct credit facilities at amortized cost are as follows:2020
Consumer Banking
Corporates Banks and Financial
Institutions
Government and Public
SectorTotalSmall and
Medium Large
USD ‘000 USD ‘000 USD ‘000 USD ‘000 USD ‘000 USD ‘000Discounted bills 4 286 12 175 27 574 3 366 2 033 49 434Overdrafts 11 323 75 186 204 084 223 18 363 309 179Loans and advances 254 094 108 292 538 222 3 021 39 679 943 308Real estate loans 127 178 9 198 11 537 - - 147 913Credit cards 20 363 - - - - 20 363 Total 417 244 204 851 781 417 6 610 60 075 1 470 197
2019
Consumer Banking
Corporates Banks and Financial
Institutions
Government and Public
SectorTotalSmall and
Medium Large
USD ‘000 USD ‘000 USD ‘000 USD ‘000 USD ‘000 USD ‘000Discounted bills 4 312 13 703 33 955 2 422 702 55 094Overdrafts 7 443 97 928 280 312 545 15 882 402 110Loans and advances 260 546 112 798 639 665 2 098 48 639 1 063 746Real estate loans 143 304 12 731 12 767 - - 168 802Credit cards 18 883 - - - - 18 883 Total 434 488 237 160 966 699 5 065 65 223 1 708 635
35. Interest ExpenseThe details of this item are as follows:
2020 2019USD ‘000 USD ‘000
Customers’ deposits * 715 643 889 421Banks’ and financial institutions’ deposits 67 129 101 456Cash margins 41 440 58 997Borrowed funds 14 271 12 336Deposit insurance fees 26 823 26 576 Total 865 306 1 088 786
NOTES TO THE CONSOLIDATED FINANCIAL STATEMENTS
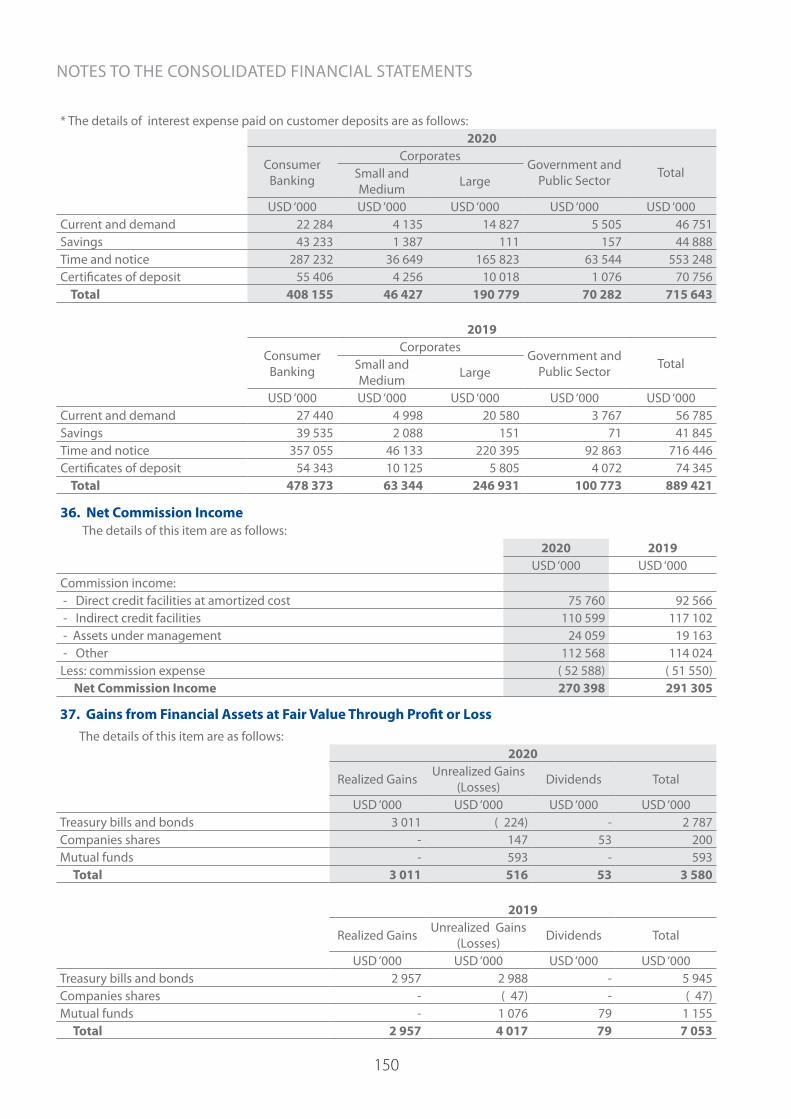
150
* The details of interest expense paid on customer deposits are as follows:2020
Consumer Banking
CorporatesGovernment and
Public Sector TotalSmall and Medium Large
USD ‘000 USD ‘000 USD ‘000 USD ‘000 USD ‘000Current and demand 22 284 4 135 14 827 5 505 46 751Savings 43 233 1 387 111 157 44 888Time and notice 287 232 36 649 165 823 63 544 553 248Certificates of deposit 55 406 4 256 10 018 1 076 70 756 Total 408 155 46 427 190 779 70 282 715 643
2019
Consumer Banking
CorporatesGovernment and
Public Sector TotalSmall and Medium Large
USD ‘000 USD ‘000 USD ‘000 USD ‘000 USD ‘000Current and demand 27 440 4 998 20 580 3 767 56 785Savings 39 535 2 088 151 71 41 845Time and notice 357 055 46 133 220 395 92 863 716 446Certificates of deposit 54 343 10 125 5 805 4 072 74 345 Total 478 373 63 344 246 931 100 773 889 421
36. Net Commission Income The details of this item are as follows:
2020 2019USD ‘000 USD ‘000
Commission income: - Direct credit facilities at amortized cost 75 760 92 566 - Indirect credit facilities 110 599 117 102 - Assets under management 24 059 19 163 - Other 112 568 114 024Less: commission expense ( 52 588) ( 51 550) Net Commission Income 270 398 291 305
37. Gains from Financial Assets at Fair Value Through Profit or Loss The details of this item are as follows:
2020
Realized Gains Unrealized Gains (Losses) Dividends Total
USD ‘000 USD ‘000 USD ‘000 USD ‘000Treasury bills and bonds 3 011 ( 224) - 2 787Companies shares - 147 53 200Mutual funds - 593 - 593 Total 3 011 516 53 3 580
2019
Realized Gains Unrealized Gains (Losses) Dividends Total
USD ‘000 USD ‘000 USD ‘000 USD ‘000Treasury bills and bonds 2 957 2 988 - 5 945Companies shares - ( 47) - ( 47)Mutual funds - 1 076 79 1 155 Total 2 957 4 017 79 7 053
NOTES TO THE CONSOLIDATED FINANCIAL STATEMENTS

151
38. Other Revenue The details of this item are as follows:
2020 2019USD ‘000 USD ‘000
Revenue from customer services 14 246 14 876Safe box rent 3 936 4 078Losses from derivatives ( 732) ( 994)Miscellaneous revenue 33 846 29 323 Total 51 296 47 283
39. Employees’ Expenses The details of this item are as follows:
2020 2019USD ‘000 USD ‘000
Salaries and other benefits 371 098 360 191Social security 37 265 36 090Savings fund 3 052 5 099Indemnity compensation 2 058 1 917Medical 15 123 14 975Training 1 718 3 105Allowances 69 129 66 510Other 10 190 11 655 Total 509 633 499 542
40. Other Expenses The details of this item are as follows:
2020 2019USD ‘000 USD ‘000
Utilities and rent 77 391 76 810Office 60 714 69 920Services 42 357 47 839Fees 15 656 13 397Information technology 55 602 48 087Other administrative expenses 75 700 43 570 Total 327 420 299 623
NOTES TO THE CONSOLIDATED FINANCIAL STATEMENTS
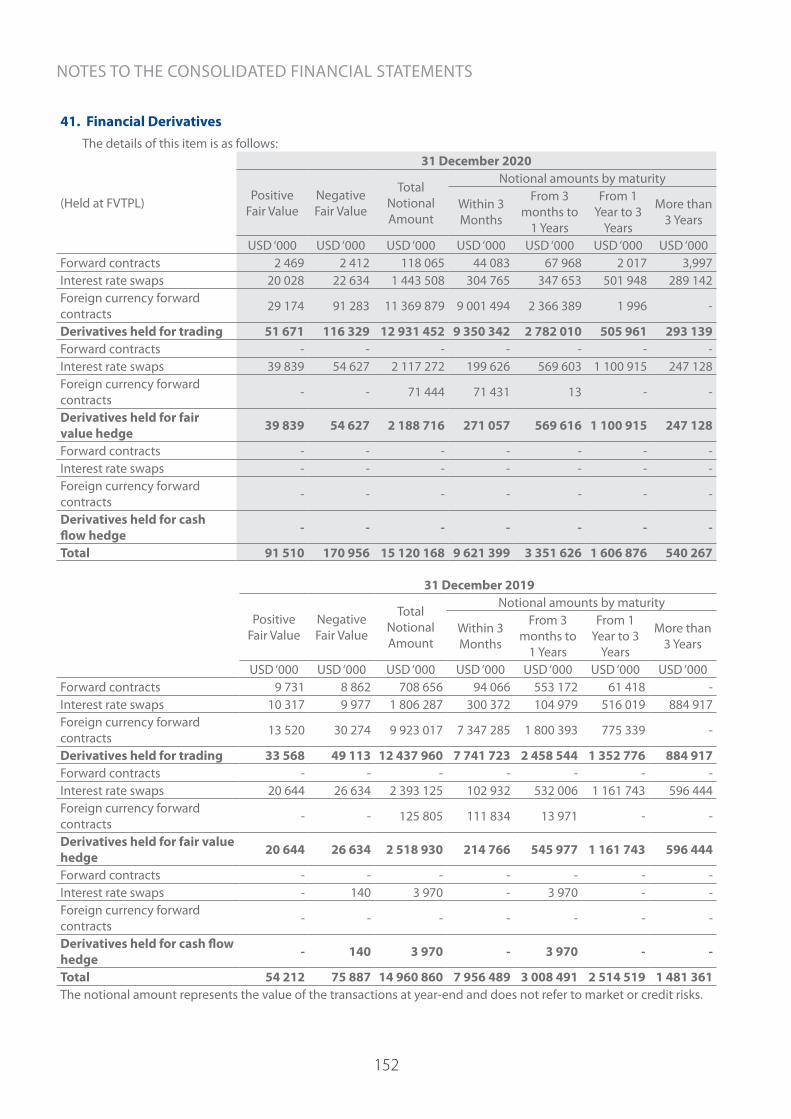
152
41. Financial Derivatives The details of this item is as follows:
31 December 2020
(Held at FVTPL) Positive Fair Value
Negative Fair Value
Total Notional Amount
Notional amounts by maturity
Within 3 Months
From 3 months to
1 Years
From 1 Year to 3
Years
More than 3 Years
USD ‘000 USD ‘000 USD ‘000 USD ‘000 USD ‘000 USD ‘000 USD ‘000Forward contracts 2 469 2 412 118 065 44 083 67 968 2 017 3,997 Interest rate swaps 20 028 22 634 1 443 508 304 765 347 653 501 948 289 142Foreign currency forward contracts 29 174 91 283 11 369 879 9 001 494 2 366 389 1 996 -
Derivatives held for trading 51 671 116 329 12 931 452 9 350 342 2 782 010 505 961 293 139Forward contracts - - - - - - - Interest rate swaps 39 839 54 627 2 117 272 199 626 569 603 1 100 915 247 128Foreign currency forward contracts - - 71 444 71 431 13 - -
Derivatives held for fair value hedge 39 839 54 627 2 188 716 271 057 569 616 1 100 915 247 128
Forward contracts - - - - - - - Interest rate swaps - - - - - - - Foreign currency forward contracts - - - - - - -
Derivatives held for cash flow hedge - - - - - - -
Total 91 510 170 956 15 120 168 9 621 399 3 351 626 1 606 876 540 267
31 December 2019
Positive Fair Value
Negative Fair Value
Total Notional Amount
Notional amounts by maturity
Within 3 Months
From 3 months to
1 Years
From 1 Year to 3
Years
More than 3 Years
USD ‘000 USD ‘000 USD ‘000 USD ‘000 USD ‘000 USD ‘000 USD ‘000Forward contracts 9 731 8 862 708 656 94 066 553 172 61 418 - Interest rate swaps 10 317 9 977 1 806 287 300 372 104 979 516 019 884 917Foreign currency forward contracts 13 520 30 274 9 923 017 7 347 285 1 800 393 775 339 -
Derivatives held for trading 33 568 49 113 12 437 960 7 741 723 2 458 544 1 352 776 884 917Forward contracts - - - - - - - Interest rate swaps 20 644 26 634 2 393 125 102 932 532 006 1 161 743 596 444Foreign currency forward contracts - - 125 805 111 834 13 971 - -
Derivatives held for fair value hedge 20 644 26 634 2 518 930 214 766 545 977 1 161 743 596 444
Forward contracts - - - - - - - Interest rate swaps - 140 3 970 - 3 970 - - Foreign currency forward contracts - - - - - - -
Derivatives held for cash flow hedge - 140 3 970 - 3 970 - -
Total 54 212 75 887 14 960 860 7 956 489 3 008 491 2 514 519 1 481 361The notional amount represents the value of the transactions at year-end and does not refer to market or credit risks.
NOTES TO THE CONSOLIDATED FINANCIAL STATEMENTS

153
42. Concentration of Assets, Revenues and Capital Expenditures According to the Geographical DistributionThe Group undertakes its banking activities through its branches in Jordan and abroad. The following are the details of
the distribution of assets, revenues and capital expenditures inside and outside Jordan:Inside Jordan Outside Jordan Total
2020 2019 2020 2019 2020 2019USD’000 USD’000 USD’000 USD’000 USD’000 USD’000
Revenues 609 004 668 928 1 322 031 1 561 902 1 931 035 2 230 830 Assets 17 376 980 16 258 619 37 036 703 34 956 225 54 413 683 51 214 844 Capital Expenditures 20 064 27 261 119 863 50 764 139 927 78 025
43. BUSINESS SEGMENTSThe Group has an integrated group of products and services dedicated to serve the Group’s customers and constantly developed in response to the ongoing changes in the banking business environment, and related state-of-the-art tools.
The following is a summary of these groups’ activities stating their business nature and future plans:
1. Corporate and Institutional Banking This group provides banking services and finances the following: corporate sector, private projects, foreign trading, small and medium sized projects, and banks and financial institutions.
2. Treasury GroupThis group is considered a source of financing for the Group, in general, and for the strategic business units, in particular. It steers the financing of the Group, and manages both the Group’s cash liquidity and market risks.
Moreover, this group is responsible for the management of the Group’s assets and liabilities within the frame set by the Assets and Liabilities Committee.
This group is considered the main source in determining the internal transfer prices within the Group’s business unit, in addition to being a central unit for the financial organization and main dealing in the following:
- Foreign exchange.
- Foreign exchange derivatives.
- Money market instruments.
- Certificates of deposit.
- Interest rate swaps.
- Other various derivatives.
3. Consumer BankingThe Consumer Banking division is focused on offering customers an extensive range of feature-rich value proposition through its vast branch network and integrated direct banking channels, both locally and regionally. Consumer Banking provides a comprehensive range of programs that are specifically designed to cater to the needs of a diverse customer base. These range from Jeel Al Arabi, the special program for children, to Elite, the exclusive service offered to our high net worth clients. The bank believes in building meaningful customer relationships, placing client needs at the heart of our services and constantly reassessing those services in line with evolving customer needs and expectations.
NOTES TO THE CONSOLIDATED FINANCIAL STATEMENTS

154
Advanced digital solutions are important to our ability to serve customers efficiently and to streamline our internal operations. New solutions are constantly under review and are introduced regularly to ensure that customers benefit from the latest and most effective direct banking services and channels.
A key element of the bank’s long term strategy is to offer banking services at a regional level by introducing cross-border solutions to our Elite and Arabi Premium clients throughout the bank’s branch network and online banking services.
44. BANKING RISK MANAGEMENT Arab Bank Group addresses the challenges of banking risks comprehensively through an Enterprise-Wide Risk Management Framework. This framework is built in line with leading practices, and is supported by a risk governance structure consisting of risk-related Board Committees, Executive Management Committees, and three independent levels of control.
As part of the risk governance structure of the Bank, and as the second level of control, Group Risk Management is responsible for ensuring that the Bank has a robust system for the identification and management of risk. Its mandate is to:
- Establish risk management frameworks, policies and procedures for all types of risks and monitor their implementation
- Develop appropriate risk measurement tools and models
- Assess risk positions against established limits
- Monitor and report to Senior Management and the Board on a timely basis
- Advise and promote risk awareness based on leading practices
a. Credit Risk ManagementArab Bank maintains a low risk strategy towards the activities it takes on. This combined with its dynamic and proactive approach in managing credit risk are key elements in achieving its strategic objective of maintaining and further enhancing its asset quality and credit portfolio risk profile. The conservative, prudent and well-established credit standards, policies and procedures, risk methodologies and frameworks, solid structure and infrastructure, risk monitoring and control enable the Bank to deal with the emerging risks and challenges with a high level of confidence and determination. Portfolio management decisions are based on the Bank’s business strategy and risk appetite as reflected in the tolerance limits. Diversification is the cornerstone for mitigating portfolio risks which is achieved through industry, geographical and customer tolerance limits.
b. Geographic Concentration RiskThe Bank reduces the geographic concentration risk through distributing its operations over various sectors and various geographic locations inside and outside the Kingdom.
Note (45- E ) shows the details of the geographical distribution of assets.
c. Liquidity RiskLiquidity is defined by the Bank for International Settlements as the ability of a bank to fund increases in assets and meet obligations as they come due, without incurring unacceptable losses. Arab Bank has built a robust infrastructure of policies, processes and people, in order to ensure that all obligations are met in a timely manner, under all circumstances and without undue cost. The Bank uses a variety of tools to measure liquidity risk in the balance sheet. These metrics help the Bank to plan and manage its funding and help to identify any mismatches in assets and liabilities which may expose the Bank to roll risk.
Note (48) shows the maturities of the assets and liabilities of the Bank.
NOTES TO THE CONSOLIDATED FINANCIAL STATEMENTS

155
d. Market RiskMarket risk is defined as the potential for loss from changes in the value of the Group’s portfolios due to movements in interest rates, foreign exchange rates, and equity or commodity prices. The three main activities that expose the Group to market risk are: Money Markets, Foreign Exchange and Capital Markets, across the Trading and Banking books.
Note (46) shows the details of market risk sensitivity analysis.
1. Interest Rate Risk
Interest rate risk in the Group is limited, well managed, and continuously supervised. A large proportion of the interest rate exposure is concentrated in the short end of the yield curve, with durations of up to one year. Exposures of more than one year are particularly limited. Interest rate risk is managed in accordance with the policies and limits established by the ALCO.
Derivatives held for risk management purposes and hedge accounting:
The Group holds derivatives for risk management purposes, some of which are designated as hedging relationships and management is in the process of assessing the impact.
Note (47) shows the details of the interest rate risk sensitivity of the Group.
2. Capital Market Exposures
Investments in capital markets instruments are subject to market risk stemming from changes in their prices. Arab Bank Group’s exposure to this kind of risk is limited due to its strong control over credit and interest rate risk. The equities investment portfolio represents a very small percent of the Bank’s overall investments.
3. Foreign Exchange Risk
Foreign exchange activity arises principally from customers’ transactions. Strict foreign exchange risk limits are set to define exposure and sensitivity tolerance for trading in foreign exchange. The Bank hedges itself appropriately against potential currency fluctuations in order to minimize foreign exchange exposure.
Note (49) shows the net positions of foreign currencies.
e. Operational RiskOperational risk is defined as the loss incurred by the Bank due to disorder in work policies or procedures, personnel, automated systems, technological infrastructure, in addition to external accidents. Such risk is managed through a comprehensive framework, as part of the overall strengthening and continuous improvement of the controls within the Group.
NOTES TO THE CONSOLIDATED FINANCIAL STATEMENTS
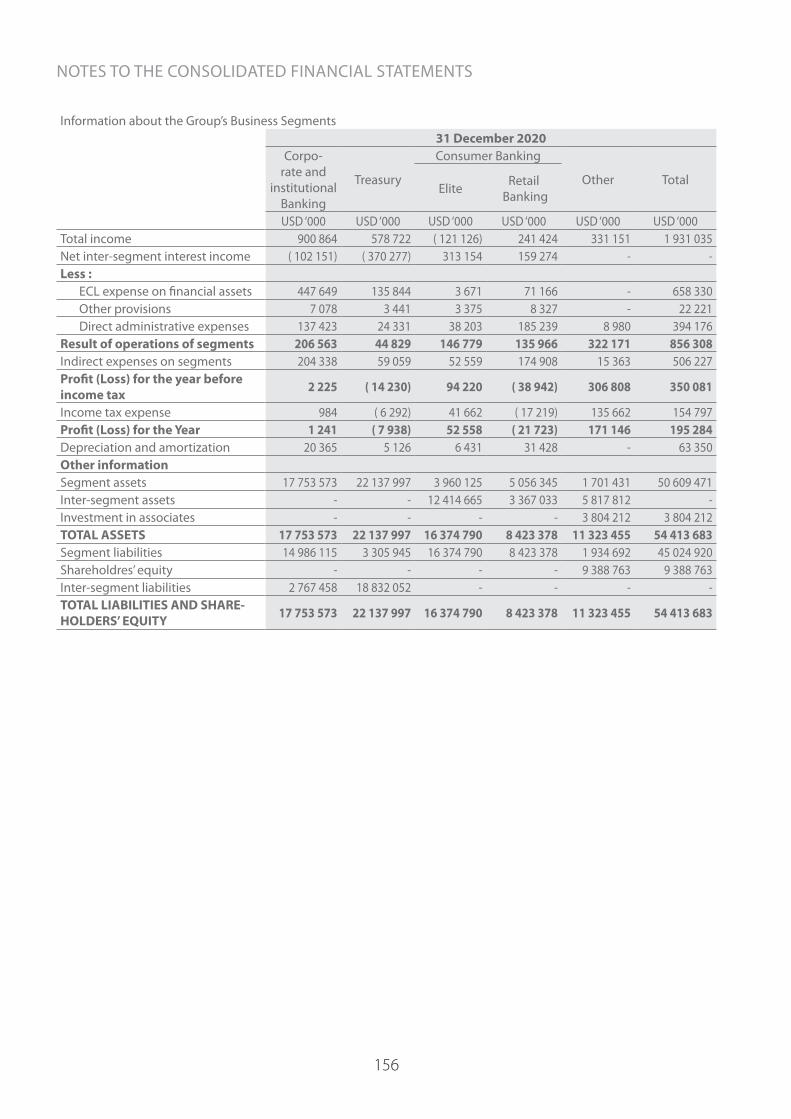
156
Information about the Group’s Business Segments31 December 2020
Corpo-rate and
institutional Banking
Treasury
Consumer Banking
Other Total Elite Retail
Banking
USD ‘000 USD ‘000 USD ‘000 USD ‘000 USD ‘000 USD ‘000Total income 900 864 578 722 ( 121 126) 241 424 331 151 1 931 035Net inter-segment interest income ( 102 151) ( 370 277) 313 154 159 274 - - Less :
ECL expense on financial assets 447 649 135 844 3 671 71 166 - 658 330Other provisions 7 078 3 441 3 375 8 327 - 22 221Direct administrative expenses 137 423 24 331 38 203 185 239 8 980 394 176
Result of operations of segments 206 563 44 829 146 779 135 966 322 171 856 308Indirect expenses on segments 204 338 59 059 52 559 174 908 15 363 506 227Profit (Loss) for the year before income tax 2 225 ( 14 230) 94 220 ( 38 942) 306 808 350 081
Income tax expense 984 ( 6 292) 41 662 ( 17 219) 135 662 154 797Profit (Loss) for the Year 1 241 ( 7 938) 52 558 ( 21 723) 171 146 195 284Depreciation and amortization 20 365 5 126 6 431 31 428 - 63 350Other information Segment assets 17 753 573 22 137 997 3 960 125 5 056 345 1 701 431 50 609 471Inter-segment assets - - 12 414 665 3 367 033 5 817 812 - Investment in associates - - - - 3 804 212 3 804 212TOTAL ASSETS 17 753 573 22 137 997 16 374 790 8 423 378 11 323 455 54 413 683Segment liabilities 14 986 115 3 305 945 16 374 790 8 423 378 1 934 692 45 024 920Shareholdres’ equity - - - - 9 388 763 9 388 763Inter-segment liabilities 2 767 458 18 832 052 - - - - TOTAL LIABILITIES AND SHARE-HOLDERS’ EQUITY 17 753 573 22 137 997 16 374 790 8 423 378 11 323 455 54 413 683
NOTES TO THE CONSOLIDATED FINANCIAL STATEMENTS
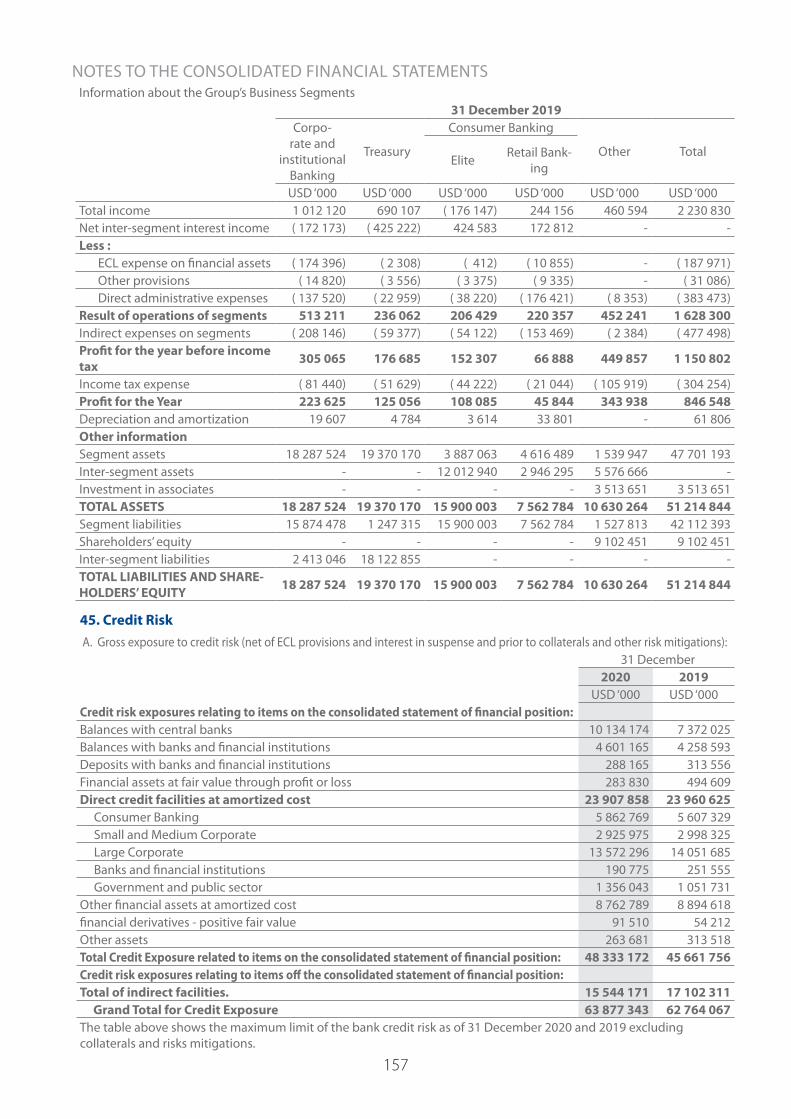
157
Information about the Group’s Business Segments 31 December 2019
Corpo-rate and
institutional Banking
Treasury
Consumer Banking
Other Total Elite Retail Bank-
ing
USD ‘000 USD ‘000 USD ‘000 USD ‘000 USD ‘000 USD ‘000Total income 1 012 120 690 107 ( 176 147) 244 156 460 594 2 230 830Net inter-segment interest income ( 172 173) ( 425 222) 424 583 172 812 - - Less :
ECL expense on financial assets ( 174 396) ( 2 308) ( 412) ( 10 855) - ( 187 971)Other provisions ( 14 820) ( 3 556) ( 3 375) ( 9 335) - ( 31 086)Direct administrative expenses ( 137 520) ( 22 959) ( 38 220) ( 176 421) ( 8 353) ( 383 473)
Result of operations of segments 513 211 236 062 206 429 220 357 452 241 1 628 300Indirect expenses on segments ( 208 146) ( 59 377) ( 54 122) ( 153 469) ( 2 384) ( 477 498)Profit for the year before income tax 305 065 176 685 152 307 66 888 449 857 1 150 802
Income tax expense ( 81 440) ( 51 629) ( 44 222) ( 21 044) ( 105 919) ( 304 254)Profit for the Year 223 625 125 056 108 085 45 844 343 938 846 548Depreciation and amortization 19 607 4 784 3 614 33 801 - 61 806Other information Segment assets 18 287 524 19 370 170 3 887 063 4 616 489 1 539 947 47 701 193Inter-segment assets - - 12 012 940 2 946 295 5 576 666 - Investment in associates - - - - 3 513 651 3 513 651TOTAL ASSETS 18 287 524 19 370 170 15 900 003 7 562 784 10 630 264 51 214 844Segment liabilities 15 874 478 1 247 315 15 900 003 7 562 784 1 527 813 42 112 393Shareholders’ equity - - - - 9 102 451 9 102 451Inter-segment liabilities 2 413 046 18 122 855 - - - - TOTAL LIABILITIES AND SHARE-HOLDERS’ EQUITY 18 287 524 19 370 170 15 900 003 7 562 784 10 630 264 51 214 844
45. Credit Risk A. Gross exposure to credit risk (net of ECL provisions and interest in suspense and prior to collaterals and other risk mitigations):
31 December2020 2019
USD ‘000 USD ‘000Credit risk exposures relating to items on the consolidated statement of financial position:Balances with central banks 10 134 174 7 372 025Balances with banks and financial institutions 4 601 165 4 258 593Deposits with banks and financial institutions 288 165 313 556Financial assets at fair value through profit or loss 283 830 494 609Direct credit facilities at amortized cost 23 907 858 23 960 625 Consumer Banking 5 862 769 5 607 329 Small and Medium Corporate 2 925 975 2 998 325 Large Corporate 13 572 296 14 051 685 Banks and financial institutions 190 775 251 555 Government and public sector 1 356 043 1 051 731Other financial assets at amortized cost 8 762 789 8 894 618financial derivatives - positive fair value 91 510 54 212Other assets 263 681 313 518Total Credit Exposure related to items on the consolidated statement of financial position: 48 333 172 45 661 756Credit risk exposures relating to items off the consolidated statement of financial position:Total of indirect facilities. 15 544 171 17 102 311 Grand Total for Credit Exposure 63 877 343 62 764 067The table above shows the maximum limit of the bank credit risk as of 31 December 2020 and 2019 excluding collaterals and risks mitigations.
NOTES TO THE CONSOLIDATED FINANCIAL STATEMENTS

158
B. Fair value of collaterals obtained against total credit exposures :
31 December 2020
Total Credit Risk Exposure
Fair Value of Collaterals
Cash Banks accepted letters of guaran-
tees
Real estate properties
Listed securi-ties
Vehicles and equipment Other Total Net Exposure Expected
Credit Loss
USD ‘000 USD ‘000 USD ‘000 USD ‘000 USD ‘000 USD ‘000 USD ‘000 USD ‘000 USD ‘000 USD ‘000Credit exposures relating to items on statement of financial position:Balances with central banks 10 276 525 - - - - - - - 10 276 525 142 351Balances with banks and financial institutions 4 604 058 - - - - - - - 4 604 058 2 893Deposits with banks and financial institutions 290 908 - - - - - - - 290 908 2 743Financial assets at fair value through profit or loss 283 830 - - - - - - - 283 830Direct credit facilities at amortized cost 26 491 867 1 660 086 254 573 3 899 447 553 005 599 820 4 868 866 11 835 797 14 656 070 1 964 741 Consumer Banking 6 215 840 488 120 6 463 185 391 2 309 84 534 1 513 571 2 280 388 3 935 452 260 547 Small and Medium Corporates 3 341 842 327 976 34 067 681 345 159 276 23 199 524 678 1 750 541 1 591 301 300 441 Large Corporates 15 374 441 828 781 213 060 3 027 773 391 007 492 087 2 625 140 7 577 848 7 796 593 1 390 880 Banks and Financial Institutions 196 058 - 983 - - - 381 1 364 194 694 5 230 Government and Public Sector 1 363 686 15 209 - 4 938 413 - 205 096 225 656 1 138 030 7 643Other financial assets at amortized cost 8 802 822 - - - - - - - 8 802 822 40 033Financial derivatives - positive fair value 91 510 - - - - - - - 91 510 - Other assets 263 681 - - - - - - - 263 681 - Total 51 105 201 1 660 086 254 573 3 899 447 553 005 599 820 4 868 866 11 835 797 39 269 404 2 152 761
Credit exposures relating to items off statement of financial position: Total 15 636 121 773 372 26 855 232 595 19 093 24 443 2 128 090 3 204 448 12 431 673 91 950
Grand Total 66 741 322 2 433 458 281 428 4 132 042 572 098 624 263 6 996 956 15 040 245 51 701 077 2 244 711
Grand Total as of 31 December 2019 65 050 973 2 869 447 399 597 3 890 000 569 094 440 816 6 936 650 15 105 604 49 945 369 1 745 916
NOTES TO THE CONSOLIDATED FINANCIAL STATEMENTS

159
B. Fair value of collaterals obtained against total credit exposures :
31 December 2020
Total Credit Risk Exposure
Fair Value of Collaterals
Cash Banks accepted letters of guaran-
tees
Real estate properties
Listed securi-ties
Vehicles and equipment Other Total Net Exposure Expected
Credit Loss
USD ‘000 USD ‘000 USD ‘000 USD ‘000 USD ‘000 USD ‘000 USD ‘000 USD ‘000 USD ‘000 USD ‘000Credit exposures relating to items on statement of financial position:Balances with central banks 10 276 525 - - - - - - - 10 276 525 142 351Balances with banks and financial institutions 4 604 058 - - - - - - - 4 604 058 2 893Deposits with banks and financial institutions 290 908 - - - - - - - 290 908 2 743Financial assets at fair value through profit or loss 283 830 - - - - - - - 283 830Direct credit facilities at amortized cost 26 491 867 1 660 086 254 573 3 899 447 553 005 599 820 4 868 866 11 835 797 14 656 070 1 964 741 Consumer Banking 6 215 840 488 120 6 463 185 391 2 309 84 534 1 513 571 2 280 388 3 935 452 260 547 Small and Medium Corporates 3 341 842 327 976 34 067 681 345 159 276 23 199 524 678 1 750 541 1 591 301 300 441 Large Corporates 15 374 441 828 781 213 060 3 027 773 391 007 492 087 2 625 140 7 577 848 7 796 593 1 390 880 Banks and Financial Institutions 196 058 - 983 - - - 381 1 364 194 694 5 230 Government and Public Sector 1 363 686 15 209 - 4 938 413 - 205 096 225 656 1 138 030 7 643Other financial assets at amortized cost 8 802 822 - - - - - - - 8 802 822 40 033Financial derivatives - positive fair value 91 510 - - - - - - - 91 510 - Other assets 263 681 - - - - - - - 263 681 - Total 51 105 201 1 660 086 254 573 3 899 447 553 005 599 820 4 868 866 11 835 797 39 269 404 2 152 761
Credit exposures relating to items off statement of financial position: Total 15 636 121 773 372 26 855 232 595 19 093 24 443 2 128 090 3 204 448 12 431 673 91 950
Grand Total 66 741 322 2 433 458 281 428 4 132 042 572 098 624 263 6 996 956 15 040 245 51 701 077 2 244 711
Grand Total as of 31 December 2019 65 050 973 2 869 447 399 597 3 890 000 569 094 440 816 6 936 650 15 105 604 49 945 369 1 745 916
NOTES TO THE CONSOLIDATED FINANCIAL STATEMENTS

160
C. Fair value of collaterals obtained against Stage 3 Credit Exposures :
31 December 2020
Total Credit Risk Exposure
Fair Value of Collaterals
Cash Banks accepted letters of guaran-
tees
Real estate properties
Listed securi-ties
Vehicles and equipment Other Total Net Exposure Expected
Credit Loss
USD ‘000 USD ‘000 USD ‘000 USD ‘000 USD ‘000 USD ‘000 USD ‘000 USD ‘000 USD ‘000 USD ‘000Credit exposures relating to items on statement of financial position:Cash and balances with central banks - - - - - - - - - - Balances with banks and financial institutions - - - - - - - - - - Deposits with banks and financial institutions - - - - - - - - - - Financial assets at fair value through profit or loss - - - - - - - - - - Direct credit facilities at amortized cost 2 358 419 14 488 3 605 255 070 6 569 36 213 157 858 473 803 1 884 616 1 403 943 Consumer Banking 369 335 35 59 40 772 4 845 169 30 868 76 748 292 587 215 196 Small and Medium Corporates 418 193 1 352 595 84 907 - 1 712 6 879 95 445 322 748 224 103 Large Corporates 1 566 166 13 101 2 951 129 391 1 724 34 332 120 111 301 610 1 264 556 959 973 Banks and Financial Institutions 4 171 - - - - - - - 4 171 4 120 Government and Public Sector 554 - - - - - - - 554 551Other financial assets at amortized cost - - - - - - - - - Financial derivatives - positive fair value - - - - - - - - - - Other assets - - - - - - - - - - Total 2 358 419 14 488 3 605 255 070 6 569 36 213 157 858 473 803 1 884 616 1 403 943
Credit exposures relating to items off statement of financial position: Total 168 269 3 076 1 017 14 933 - - 5 892 24 918 143 351 28 130
Grand Total 2 526 688 17 564 4 622 270 003 6 569 36 213 163 750 498 721 2 027 967 1 432 073
Grand Total as of 31 Decmeber 2019 1 985 021 15 257 182 285 793 3 530 36 317 51 097 392 176 1 592 845 1 232 966
NOTES TO THE CONSOLIDATED FINANCIAL STATEMENTS

161
C. Fair value of collaterals obtained against Stage 3 Credit Exposures :
31 December 2020
Total Credit Risk Exposure
Fair Value of Collaterals
Cash Banks accepted letters of guaran-
tees
Real estate properties
Listed securi-ties
Vehicles and equipment Other Total Net Exposure Expected
Credit Loss
USD ‘000 USD ‘000 USD ‘000 USD ‘000 USD ‘000 USD ‘000 USD ‘000 USD ‘000 USD ‘000 USD ‘000Credit exposures relating to items on statement of financial position:Cash and balances with central banks - - - - - - - - - - Balances with banks and financial institutions - - - - - - - - - - Deposits with banks and financial institutions - - - - - - - - - - Financial assets at fair value through profit or loss - - - - - - - - - - Direct credit facilities at amortized cost 2 358 419 14 488 3 605 255 070 6 569 36 213 157 858 473 803 1 884 616 1 403 943 Consumer Banking 369 335 35 59 40 772 4 845 169 30 868 76 748 292 587 215 196 Small and Medium Corporates 418 193 1 352 595 84 907 - 1 712 6 879 95 445 322 748 224 103 Large Corporates 1 566 166 13 101 2 951 129 391 1 724 34 332 120 111 301 610 1 264 556 959 973 Banks and Financial Institutions 4 171 - - - - - - - 4 171 4 120 Government and Public Sector 554 - - - - - - - 554 551Other financial assets at amortized cost - - - - - - - - - Financial derivatives - positive fair value - - - - - - - - - - Other assets - - - - - - - - - - Total 2 358 419 14 488 3 605 255 070 6 569 36 213 157 858 473 803 1 884 616 1 403 943
Credit exposures relating to items off statement of financial position: Total 168 269 3 076 1 017 14 933 - - 5 892 24 918 143 351 28 130
Grand Total 2 526 688 17 564 4 622 270 003 6 569 36 213 163 750 498 721 2 027 967 1 432 073
Grand Total as of 31 Decmeber 2019 1 985 021 15 257 182 285 793 3 530 36 317 51 097 392 176 1 592 845 1 232 966
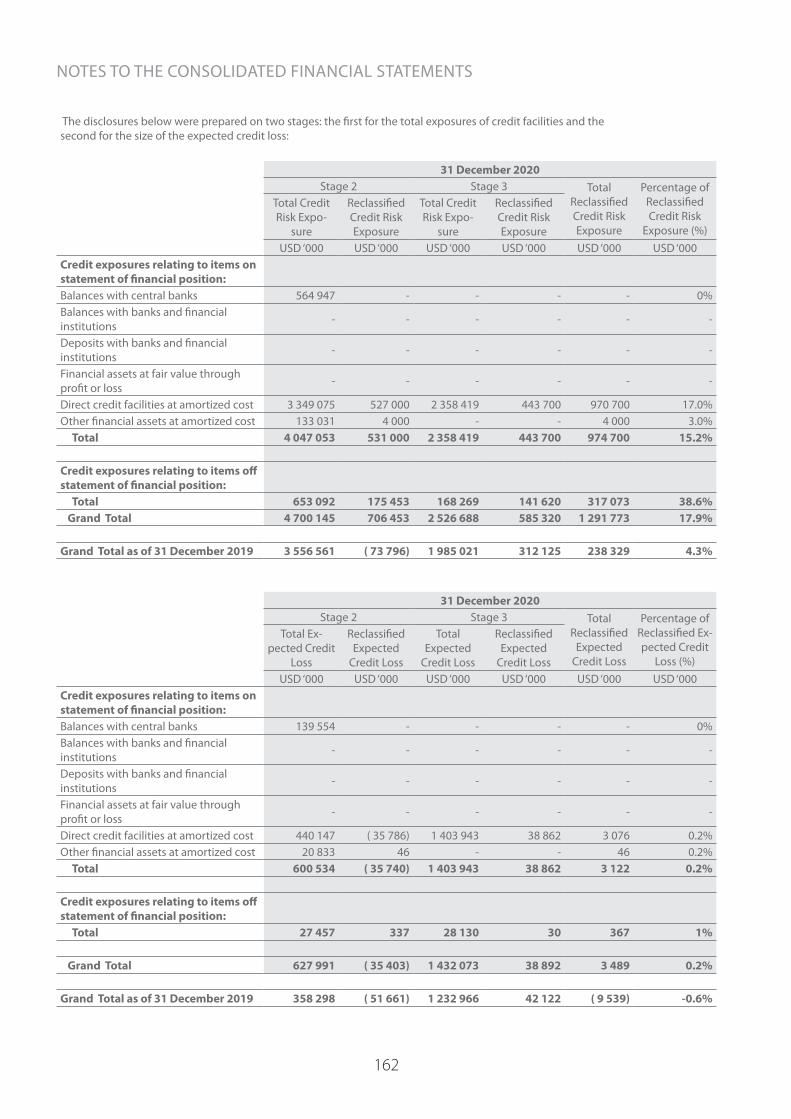
162
The disclosures below were prepared on two stages: the first for the total exposures of credit facilities and the second for the size of the expected credit loss:
31 December 2020Stage 2 Stage 3 Total
Reclassified Credit Risk Exposure
Percentage of Reclassified Credit Risk
Exposure (%)
Total Credit Risk Expo-
sure
Reclassified Credit Risk Exposure
Total Credit Risk Expo-
sure
Reclassified Credit Risk Exposure
USD ‘000 USD ‘000 USD ‘000 USD ‘000 USD ‘000 USD ‘000Credit exposures relating to items on statement of financial position:Balances with central banks 564 947 - - - - 0%Balances with banks and financial institutions - - - - - -
Deposits with banks and financial institutions - - - - - -
Financial assets at fair value through profit or loss - - - - - -
Direct credit facilities at amortized cost 3 349 075 527 000 2 358 419 443 700 970 700 17.0%Other financial assets at amortized cost 133 031 4 000 - - 4 000 3.0% Total 4 047 053 531 000 2 358 419 443 700 974 700 15.2%
Credit exposures relating to items off statement of financial position: Total 653 092 175 453 168 269 141 620 317 073 38.6% Grand Total 4 700 145 706 453 2 526 688 585 320 1 291 773 17.9%
Grand Total as of 31 December 2019 3 556 561 ( 73 796) 1 985 021 312 125 238 329 4.3%
31 December 2020Stage 2 Stage 3 Total
Reclassified Expected
Credit Loss
Percentage of Reclassified Ex-pected Credit
Loss (%)
Total Ex-pected Credit
Loss
Reclassified Expected
Credit Loss
Total Expected
Credit Loss
Reclassified Expected
Credit LossUSD ‘000 USD ‘000 USD ‘000 USD ‘000 USD ‘000 USD ‘000
Credit exposures relating to items on statement of financial position:Balances with central banks 139 554 - - - - 0%Balances with banks and financial institutions - - - - - -
Deposits with banks and financial institutions - - - - - -
Financial assets at fair value through profit or loss - - - - - -
Direct credit facilities at amortized cost 440 147 ( 35 786) 1 403 943 38 862 3 076 0.2%Other financial assets at amortized cost 20 833 46 - - 46 0.2% Total 600 534 ( 35 740) 1 403 943 38 862 3 122 0.2%
Credit exposures relating to items off statement of financial position: Total 27 457 337 28 130 30 367 1%
Grand Total 627 991 ( 35 403) 1 432 073 38 892 3 489 0.2%
Grand Total as of 31 December 2019 358 298 ( 51 661) 1 232 966 42 122 ( 9 539) -0.6%
NOTES TO THE CONSOLIDATED FINANCIAL STATEMENTS
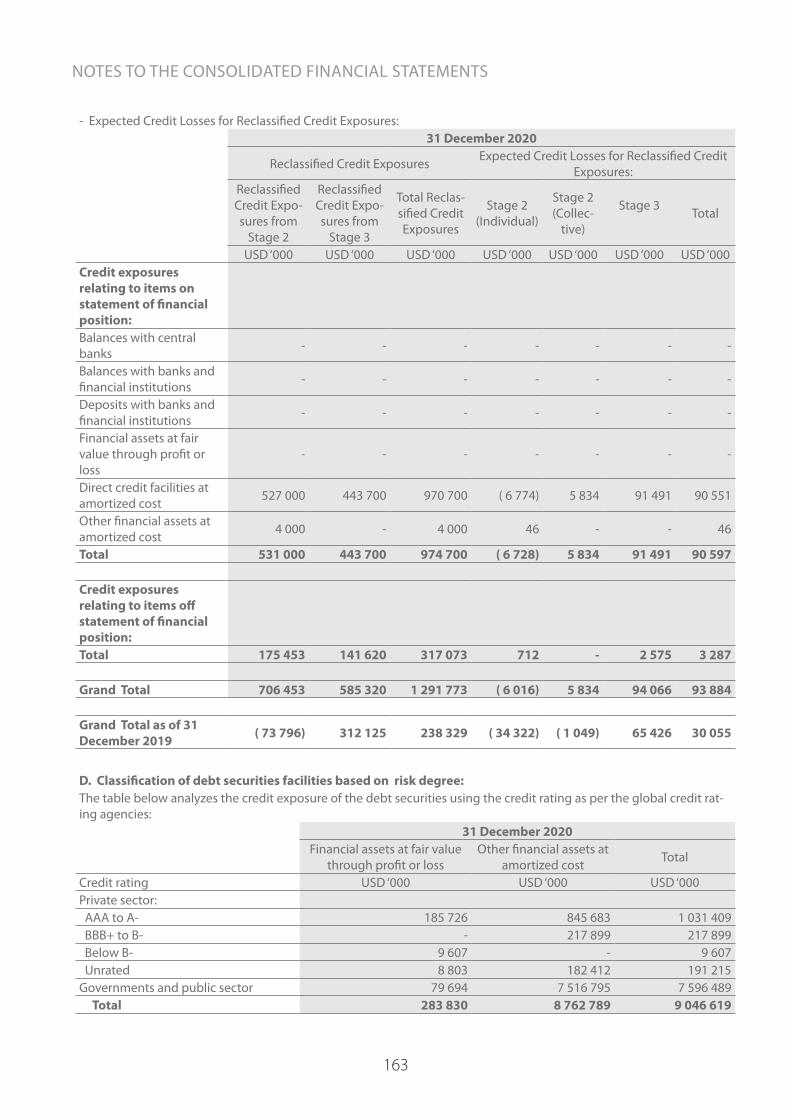
163
- Expected Credit Losses for Reclassified Credit Exposures:31 December 2020
Reclassified Credit Exposures Expected Credit Losses for Reclassified Credit Exposures:
Reclassified Credit Expo-sures from
Stage 2
Reclassified Credit Expo-sures from
Stage 3
Total Reclas-sified Credit Exposures
Stage 2 (Individual)
Stage 2 (Collec-
tive)
Stage 3 Total
USD ‘000 USD ‘000 USD ‘000 USD ‘000 USD ‘000 USD ‘000 USD ‘000Credit exposures relating to items on statement of financial position:Balances with central banks - - - - - - -
Balances with banks and financial institutions - - - - - - -
Deposits with banks and financial institutions - - - - - - -
Financial assets at fair value through profit or loss
- - - - - - -
Direct credit facilities at amortized cost 527 000 443 700 970 700 ( 6 774) 5 834 91 491 90 551
Other financial assets at amortized cost 4 000 - 4 000 46 - - 46
Total 531 000 443 700 974 700 ( 6 728) 5 834 91 491 90 597
Credit exposures relating to items off statement of financial position:Total 175 453 141 620 317 073 712 - 2 575 3 287
Grand Total 706 453 585 320 1 291 773 ( 6 016) 5 834 94 066 93 884
Grand Total as of 31 December 2019 ( 73 796) 312 125 238 329 ( 34 322) ( 1 049) 65 426 30 055
D. Classification of debt securities facilities based on risk degree:The table below analyzes the credit exposure of the debt securities using the credit rating as per the global credit rat-ing agencies:
31 December 2020Financial assets at fair value
through profit or lossOther financial assets at
amortized cost Total
Credit rating USD ‘000 USD ‘000 USD ‘000Private sector: AAA to A- 185 726 845 683 1 031 409 BBB+ to B- - 217 899 217 899 Below B- 9 607 - 9 607 Unrated 8 803 182 412 191 215Governments and public sector 79 694 7 516 795 7 596 489 Total 283 830 8 762 789 9 046 619
NOTES TO THE CONSOLIDATED FINANCIAL STATEMENTS

164
31 December 2019Financial Assets at Fair Value
through P&L Other Financial Assets at
Amortized Cost Total
Credit rating USD ‘000 USD ‘000 USD ‘000Private sector: AAA to A- 240 142 1 172 701 1 412 843 BBB+ to B- 6 283 255 068 261 351 Below B- 9 259 - 9 259 Unrated 31 514 96 993 128 507Governments and public sector 207 411 7 369 856 7 577 267 Total 494 609 8 894 618 9 389 227
E. Credit exposure categorized by geographical distribution:31 December 2020
Jordan Other Arab Countries Asia * Europe America Rest of the
World Total
USD ‘000 USD ‘000 USD ‘000 USD ‘000 USD ‘000 USD ‘000 USD ‘000Balances with central banks 3 818 078 3 688 772 372 2 615 394 - 11 558 10 134 174Balances and deposits with banks and financial institutions
275 624 1 496 781 446 204 1 907 399 710 639 52 683 4 889 330
Financial assets at fair value through profit or loss - 92 695 20 515 163 895 - 6 725 283 830
Direct credit facilities at amortized cost 8 240 908 13 288 426 359 683 1 186 119 9 517 823 205 23 907 858
Consumer Banking 2 997 448 2 379 220 13 133 981 - 352 107 5 862 769Small and Medium Corporates 925 621 1 333 124 30 936 433 558 5 369 197 367 2 925 975
Large Corporates 4 134 637 8 303 158 328 717 527 905 4 148 273 731 13 572 296Banks and Financial Institutions 9 898 180 860 17 - - - 190 775
Government and public Sector 173 304 1 092 064 - 90 675 - - 1 356 043
Other financial assets at amortized cost 4 000 610 3 844 852 53 354 459 946 125 004 279 023 8 762 789
financial derivatives - positive fair value 18 522 64 416 - 8 566 4 2 91 510
Other assets 64 581 162 298 1 213 32 604 342 2 643 263 681Total 16 418 323 22 638 240 881 341 6 373 923 845 506 1 175 839 48 333 172
Total - as of 31 December 2019 15 388 603 22 551 532 864 029 4 611 622 1 122 361 1 123 609 45 661 756
* Excluding Arab Countries
NOTES TO THE CONSOLIDATED FINANCIAL STATEMENTS

165
E. Credit exposure categorized by geographical distribution and stagings according to IFRS 9:31 December 2020
Stage 1 Stage 2Stage 3 Total
(Individual) (Collective) (Individual) (Collective)USD ‘000 USD ‘000 USD ‘000 USD ‘000 USD ‘000 USD ‘000
Jordan 11 900 866 2 925 339 1 484 604 45 298 62 216 16 418 323Other Arab Countries 18 228 928 2 262 077 1 764 188 83 539 299 508 22 638 240Asia* 881 328 13 - - - 881 341Europe 6 238 352 129 006 10 584 4 971 ( 8 990) 6 373 923America 508 798 334 616 2 092 - - 845 506Rest of the World 1 141 440 - 14 681 13 991 5 727 1 175 839 Total 38 899 712 5 651 051 3 276 149 147 799 358 461 48 333 172
Total as of 31 December 2019 37 213 261 5 482 313 2 676 611 87 398 202 173 45 661 756
* Excluding Arab Countries.
NOTES TO THE CONSOLIDATED FINANCIAL STATEMENTS

166
F. Credit exposure categorized by economic sector31 December 2020
Consumer Banking
CorporatesBanks and Financial
Institutions
Government and Public Sector TotalIndustry and
Mining Constructions Real Estate Trade AgricultureTourism
and Hotels
Transportation Shares General Services
USD ‘000 USD ‘000 USD ‘000 USD ‘000 USD ‘000 USD ‘000 USD ‘000 USD ‘000 USD ‘000 USD ‘000 USD ‘000 USD ‘000 USD ‘000Balances with Central Banks - - - - - - - - - - - 10 134 174 10 134 174Balances and deposits with banks and financial institutions - - - - - - - - - - 4 889 330 - 4 889 330
Financial assets at fair value through profit or loss - 16 331 - - - - - - - - 187 805 79 694 283 830
Direct credit facilities at amortized cost 5 862 769 4 573 963 1 864 976 1 630 077 3 906 963 335 015 633 796 353 413 11 985 3 188 083 190 775 1 356 043 23 907 858
Other financial assets at amortized cost - 66 355 - 6 881 - - - - - 277 970 897 294 7 514 289 8 762 789
Financial derivatives - positive fair value - 16 195 - - 1 496 - - 1 369 - 4 72 446 - 91 510
Other assets 20 584 27 354 7 281 6 667 17 779 1 587 3 187 3 776 - 44 699 22 027 108 740 263 681Total 5 883 353 4 700 198 1 872 257 1 643 625 3 926 238 336 602 636 983 358 558 11 985 3 510 756 6 259 677 19 192 940 48 333 172
Total as of 31 December 2019 5 623 802 4 749 338 1 963 260 1 864 346 4 230 169 358 643 574 675 376 120 11 984 3 367 976 6 373 184 16 168 259 45 661 756
NOTES TO THE CONSOLIDATED FINANCIAL STATEMENTS

167
F. Credit exposure categorized by economic sector31 December 2020
Consumer Banking
CorporatesBanks and Financial
Institutions
Government and Public Sector TotalIndustry and
Mining Constructions Real Estate Trade AgricultureTourism
and Hotels
Transportation Shares General Services
USD ‘000 USD ‘000 USD ‘000 USD ‘000 USD ‘000 USD ‘000 USD ‘000 USD ‘000 USD ‘000 USD ‘000 USD ‘000 USD ‘000 USD ‘000Balances with Central Banks - - - - - - - - - - - 10 134 174 10 134 174Balances and deposits with banks and financial institutions - - - - - - - - - - 4 889 330 - 4 889 330
Financial assets at fair value through profit or loss - 16 331 - - - - - - - - 187 805 79 694 283 830
Direct credit facilities at amortized cost 5 862 769 4 573 963 1 864 976 1 630 077 3 906 963 335 015 633 796 353 413 11 985 3 188 083 190 775 1 356 043 23 907 858
Other financial assets at amortized cost - 66 355 - 6 881 - - - - - 277 970 897 294 7 514 289 8 762 789
Financial derivatives - positive fair value - 16 195 - - 1 496 - - 1 369 - 4 72 446 - 91 510
Other assets 20 584 27 354 7 281 6 667 17 779 1 587 3 187 3 776 - 44 699 22 027 108 740 263 681Total 5 883 353 4 700 198 1 872 257 1 643 625 3 926 238 336 602 636 983 358 558 11 985 3 510 756 6 259 677 19 192 940 48 333 172
Total as of 31 December 2019 5 623 802 4 749 338 1 963 260 1 864 346 4 230 169 358 643 574 675 376 120 11 984 3 367 976 6 373 184 16 168 259 45 661 756
F. Credit exposure categorized by economic sector and stagings according to IFRS 9:31 December 2020
Stage 1 Stage 2Stage 3 Total
(Individual) (Collective) (Individual) (Collective)USD ‘000 USD ‘000 USD ‘000 USD ‘000 USD ‘000 USD ‘000
Consumer Banking 20 584 5 651 051 - 147 799 63 919 5 883 353Industry and Mining 3 946 807 - 715 734 - 37 657 4 700 198Constructions 1 469 007 - 320 498 - 82 752 1 872 257Real Estate 1 378 172 - 254 311 - 11 142 1 643 625Trade 3 253 848 - 653 367 - 19 023 3 926 238Agriculture 218 911 - 112 131 - 5 560 336 602Tourism and Hotels 321 968 - 253 067 - 61 948 636 983Transportation 274 388 - 82 443 - 1 727 358 558Shares 11 985 - - - - 11 985General Service 3 239 453 - 196 573 - 74 730 3 510 756Banks and Financial Institutions 6 259 677 - - - - 6 259 677Government and Public Sector 18 504 912 - 688 025 - 3 19 192 940 Total 38 899 712 5 651 051 3 276 149 147 799 358 461 48 333 172
Total as of 31 December 2019 37 213 261 5 482 313 2 676 611 87 398 202 173 45 661 756
NOTES TO THE CONSOLIDATED FINANCIAL STATEMENTS

168
46. Market RiskMarket Risk SensitivityAssuming market prices as at December 31, 2020 and 2019 change by 5%, the impact on the consolidated statement of income and the consolidated statement of owners’ equity will be as follows:
31 December 2020 31 December 2019Statement of
Incomeowners’ equity Total Statement of
Incomeowners’ equity Total
USD ‘000 USD ‘000 USD ‘000 USD ‘000 USD ‘000 USD ‘000 Interest rate sensitivity 34 215 - 34 215 49 807 - 49 807 Foreign exchange rate sensi-tivity 668 6 780 7 448 1 375 6 348 7 723
Equity instruments price sensitivity 1 011 20 486 21 497 1 222 19 297 20 519
Total 35 894 27 266 63 160 52 404 25 645 78 049
47. Interest Rate RiskBelow is the Group Exposure to interest rate volatility as of 31 December 2020 (classification is based on interest rate repricing or maturity date, whichever is closer).
Up to 1 month
More than 1 month
and till 3 months
More than 3 months and till 6 months
More than 6 months and till 1
year
More than 1 year and till 3
years
More than 3 years
Not tied to interest
rate risk Total
ASSETS USD ‘000 USD ‘000 USD ‘000 USD ‘000 USD ‘000 USD ‘000 USD ‘000 USD ‘000Cash at vaults - - - - - - 673 453 673 453Mandatory cash reserve - - - - - - 1 613 267 1 613 267Balances with central banks 3 841 204 561 880 - - 25 000 - 4 092 823 8 520 907Balances and deposits with banks and financial institutions 3 730 747 848 164 119 607 170 319 20 493 - - 4 889 330
Financial assets at fair value through profit or loss 7 128 30 695 2 500 47 321 133 994 62 192 20 224 304 054
Direct credit facilities at amor-tized cost 8 112 608 3 368 324 3 059 725 1 825 026 2 418 899 5 123 276 - 23 907 858
Financial assets at fair value through other comprehensive income
- - - - - - 409 715 409 715
Other financial assets at amor-tized cost 1 342 698 1 237 244 723 662 1 424 066 2 929 114 1 106 005 - 8 762 789
Investments in associates - - - - - - 3 804 212 3 804 212Fixed assets - - - - - - 458 518 458 518Other assets and financial deriva-tives - positive fair value 85 890 44 664 56 956 12 702 58 266 12 863 583 306 854 647
Deferred tax assets - - - - - - 214 933 214 933TOTAL ASSETS 17 120 275 6 090 971 3 962 450 3 479 434 5 585 766 6 304 336 11 870 451 54 413 683
LIABILITIESBanks and financial institutions’ deposits 1 580 838 669 833 836 839 56 032 82 509 1 218 746 957 3 974 226
Customer deposits 10 841 019 4 274 800 2 630 853 4 126 637 533 001 96 423 13 732 405 36 235 138Cash margin 567 159 1 113 940 228 895 243 415 24 503 18 882 286 459 2 483 253Borrowed funds 123 372 345 304 28 183 13 219 32 476 67 237 - 609 791Provision for income tax - - - - - - 275 406 275 406Other provisions - - - - - - 230 069 230 069Other liabilities and financial derivatives - negative fair value 197 025 66 562 56 736 16 787 8 039 4 591 861 625 1 211 365
Deferred tax liabilities - - - - - - 5 672 5 672Total liabilities 13 309 413 6 470 439 3 781 506 4 456 090 680 528 188 351 16 138 593 45 024 920Gap 3 810 862 ( 379 468) 180 944 ( 976 656) 4 905 238 6 115 985 (4 268 142) 9 388 763
NOTES TO THE CONSOLIDATED FINANCIAL STATEMENTS

169
Below is the Group Exposure to interest rate volatility as of 31 December 2019 (classification is based on interest rate repricing or maturity date, whichever is closer).
Up to 1 month
More than 1 month and till 3 months
More than 3
months and till 6 months
More than 6 months and till 1
year
More than 1 year and till 3 years
More than 3 years
Not tied to interest
rate risk Total
ASSETS USD ‘000 USD ‘000 USD ‘000 USD ‘000 USD ‘000 USD ‘000 USD ‘000 USD ‘000Cash at vaults - - - - - - 533 785 533 785Mandatory cash reserve - - - - - - 1 760 665 1 760 665Balances with central banks 3 047 048 100 902 68 050 - 25 000 - 2 370 360 5 611 360Balances and deposits with banks and financial institu-tions
3 840 499 516 063 33 872 113 105 - 68 610 - 4 572 149
Financial assets at fair value through profit or loss 11 899 81 179 121 005 21 475 126 361 132 690 24 444 519 053
Direct credit facilities at amor-tized cost 7 087 753 3 559 992 2 759 446 3 138 758 2 421 966 4 992 710 - 23 960 625
Financial assets at fair value through OCI - - - - - - 385 933 385 933
Other financial assets at am-ortized cost 1 166 331 1 212 308 1 097 739 840 723 3 420 596 1 156 921 - 8 894 618
Investments in associates - - - - - - 3 513 651 3 513 651Fixed assets - - - - - - 461 117 461 117Other assets and financial derivatives - positive fair value 42 832 46 033 49 022 8 709 17 854 17 452 664 601 846 503
Deferred tax assets - - - - - - 155 385 155 385 TOTAL ASSETS 15 196 362 5 516 477 4 129 134 4 122 770 6 011 777 6 368 383 9 869 941 51 214 844
LIABILITIESBanks and financial institutions’ deposits 1 561 405 1 544 078 97 479 90 148 55 718 1 528 411 539 3 761 895
Customer deposits 10 723 528 4 747 273 2 848 527 3 107 765 634 207 125 295 10 968 400 33 154 995Cash margin 680 950 215 626 1 447 022 397 446 12 615 7 932 321 162 3 082 753Borrowed funds 56 146 186 624 13 655 5 389 33 333 37 789 - 332 936Provision for income tax - - - - - - 345 054 345 054Other provisions - - - - - - 226 521 226 521Other liabilities and financial derivatives - negative fair value
137 742 56 209 60 924 13 843 10 697 5 344 917 078 1 201 837
Deferred tax liabilities - - - - - - 6 402 6 402 Total liabilities 13 159 771 6 749 810 4 467 607 3 614 591 746 570 177 888 13 196 156 42 112 393
Gap 2 036 591 (1 233 333) ( 338 473) 508 179 5 265 207 6 190 495 (3 326 215) 9 102 451
NOTES TO THE CONSOLIDATED FINANCIAL STATEMENTS

170
Reference Rates
Following the decision by global regulators to phase out LIBOR rates and replace them with alternative reference rates, to be applied to loans and other banking products. Arab Bank formed the LIBOR Sucession Committee to manage this transition.
This committee is managed by the Head of Treasury and consists of senior representatives of other functions of the bank. In 2020 the committee drafted a comprehensive plan to prepare the bank to migrate to alternative reference rates after LIBOR, and these are the key areas of work.
1. Revise all the documents of the affected contracts. 2. Make any amendments required to the bank’s systems.3. Communicate with affected customers to keep them updated.4. Communicate with regulators as necessary.5. Plan for any changes required in hedge accounting.
There are some potential risks which the bank may be exposed to as a result of the changes. These have been identified, and for each one, plans were made and solutions were identified during 2020. The bank has been successful in its work, and all work will be completed to cover all the required modifications in 2021, to ensure the bnank’s smooth transition to the post-LIBOR market environment.
1. The following table shows the bank’s assets, liabilities and derivatives linked to LIBOR whose maturity date is later than 31 December 2021.
31 December 2020 Financial Assets other than
derivatives at purchasing value
Financial Liabilities other than derivatives at
purchasing value
Notional Value of derivatives
USD ‘000 USD ‘000 USD ‘000USD Libor (1 month) - - 38 774USD Libor (3 months) 1 652 763 80 000 1 975 447USD Libor (6 months) 68 000 436 711 450 092Other 82 914 - 259 396Total 1 803 677 516 711 2 723 709
2. The impact of changing interest rates is managed by the bank on an ongoing basis, as well as carefully hedging the effects of such change.
The table below shows the nominal value of the hedging instruments of the bank’s assets and liabilities for contracts maturing after 12/31/2021 and the weighted rate for the remaining periods to maturity.
31 December 2020Notional Value Average Period (years)
USD ‘000 USD ‘000USD Libor (1 month) 38 774 6.7 USD Libor (3 months) 1 975 447 2.5 USD Libor (6 months) 450 092 7.4 Other 259 396 2.0 Total 2 723 709
31 December 2019Notional Value Average Period (years)
USD Libor (1 month) 237 850 1.0 USD Libor (3 months) 2 051 046 3.0 USD Libor (6 months) 378 153 5.5 Other 375 680 2.0 Total 3 042 729
NOTES TO THE CONSOLIDATED FINANCIAL STATEMENTS
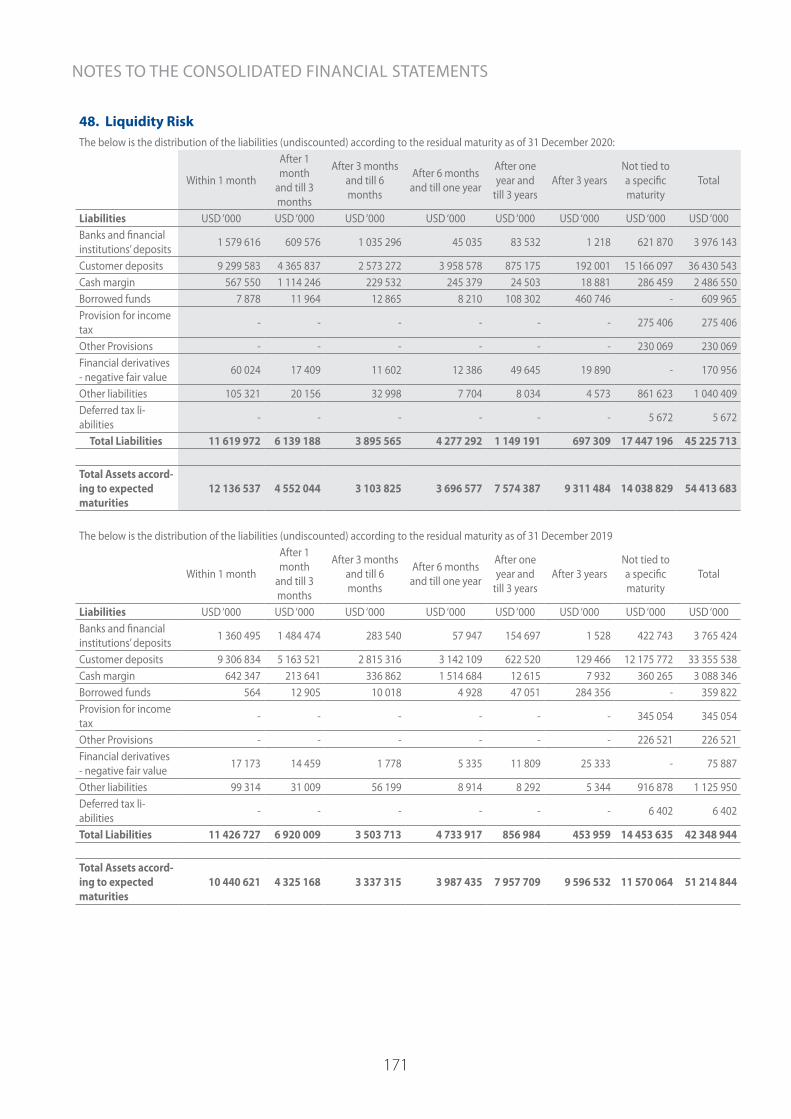
171
48. Liquidity RiskThe below is the distribution of the liabilities (undiscounted) according to the residual maturity as of 31 December 2020:
Within 1 month
After 1 month
and till 3 months
After 3 months and till 6 months
After 6 months and till one year
After one year and
till 3 yearsAfter 3 years
Not tied to a specific maturity
Total
Liabilities USD ‘000 USD ‘000 USD ‘000 USD ‘000 USD ‘000 USD ‘000 USD ‘000 USD ‘000Banks and financial institutions’ deposits 1 579 616 609 576 1 035 296 45 035 83 532 1 218 621 870 3 976 143
Customer deposits 9 299 583 4 365 837 2 573 272 3 958 578 875 175 192 001 15 166 097 36 430 543Cash margin 567 550 1 114 246 229 532 245 379 24 503 18 881 286 459 2 486 550Borrowed funds 7 878 11 964 12 865 8 210 108 302 460 746 - 609 965Provision for income tax - - - - - - 275 406 275 406
Other Provisions - - - - - - 230 069 230 069Financial derivatives - negative fair value 60 024 17 409 11 602 12 386 49 645 19 890 - 170 956
Other liabilities 105 321 20 156 32 998 7 704 8 034 4 573 861 623 1 040 409Deferred tax li-abilities - - - - - - 5 672 5 672
Total Liabilities 11 619 972 6 139 188 3 895 565 4 277 292 1 149 191 697 309 17 447 196 45 225 713
Total Assets accord-ing to expected maturities
12 136 537 4 552 044 3 103 825 3 696 577 7 574 387 9 311 484 14 038 829 54 413 683
The below is the distribution of the liabilities (undiscounted) according to the residual maturity as of 31 December 2019
Within 1 month
After 1 month
and till 3 months
After 3 months and till 6 months
After 6 months and till one year
After one year and
till 3 yearsAfter 3 years
Not tied to a specific maturity
Total
Liabilities USD ‘000 USD ‘000 USD ‘000 USD ‘000 USD ‘000 USD ‘000 USD ‘000 USD ‘000Banks and financial institutions’ deposits 1 360 495 1 484 474 283 540 57 947 154 697 1 528 422 743 3 765 424
Customer deposits 9 306 834 5 163 521 2 815 316 3 142 109 622 520 129 466 12 175 772 33 355 538Cash margin 642 347 213 641 336 862 1 514 684 12 615 7 932 360 265 3 088 346Borrowed funds 564 12 905 10 018 4 928 47 051 284 356 - 359 822Provision for income tax - - - - - - 345 054 345 054
Other Provisions - - - - - - 226 521 226 521Financial derivatives - negative fair value 17 173 14 459 1 778 5 335 11 809 25 333 - 75 887
Other liabilities 99 314 31 009 56 199 8 914 8 292 5 344 916 878 1 125 950Deferred tax li-abilities - - - - - - 6 402 6 402
Total Liabilities 11 426 727 6 920 009 3 503 713 4 733 917 856 984 453 959 14 453 635 42 348 944
Total Assets accord-ing to expected maturities
10 440 621 4 325 168 3 337 315 3 987 435 7 957 709 9 596 532 11 570 064 51 214 844
NOTES TO THE CONSOLIDATED FINANCIAL STATEMENTS

172
49. Net Foreign Currency Positions The details of this item are as follows: 31 December 2020 31 December 2019
Base currency in thousands
Equivalent inUSD 000
Base currency in thousands
Equivalent in USD 000
USD 9 029 9 029 ( 17 006) ( 17 006) GBP 26 081 35 525 26 652 34 947 EUR 18 167 22 319 8 219 9 211 JPY 14 753 ( 143) 34 688 319 CHF ( 1 260) ( 1 428) ( 893) ( 922) Other currencies * ( 78 653) ( 54 041)
(13 351) (27 492)* Various foreign currencies translated to US Dollars.
50. Fair Value HierarchyFinancial instruments include financial assets and financial liabilities.The Bank uses the following methods and alternatives of valuating and presenting the fair value of financial instru-ments:Level 1: Quoted (unadjusted) market prices in active markets for identical assets or liabilities.Level 2: Valuation techniques for which the lowest level input that is significant to the fair value measurement is
directly or indirectly observable.Level 3: Valuation techniques for which the lowest level input that is significant to the fair value measurement is un-
observable.a. Fair value of financial assets and financial liabilities measured at fair value on recurring basis.Some of the financial assets and financial liabilities are measured at fair value at the end of each reporting period. The following table gives information about how the fair value of these
financial assets and financial liabilities are determined (valuation techniques and key inputs).
Fair Value as at 31 December
Fair Value Hierarchy
Valuation techniques and key inputs
Significant unobservable inputs
Relationship of unobservable inputs to fair value
Financial assets / Financial liabilities
2020 2019Financial assets at fair value USD ‘000 USD ‘000Financial assets at fair value through profit or lossGovernment Bonds and bills 79 694 207 411 Level 1 Quoted Not Applicable Not ApplicableCorporate bonds 204 136 257 574 Level 1 Quoted Not Applicable Not Applicable
Loans and advances - 29 624 Level 2Through Comparison of similar financial instruments
Not Applicable Not Applicable
Shares and mutual funds 20 224 24 444 Level 1 Quoted Not Applicable Not ApplicableTotal Financial Assets at fair value through Profit or Loss 304 054 519 053
Financial derivatives - positive fair value 91 510 54 212 Level 2Through Comparison of similar financial instruments
Not Applicable Not Applicable
Financial assets at fair value through other comprehensive income:Quoted shares 122 363 133 480 Level 1 Quoted Shares Not Applicable Not Applicable
Unquoted shares 287 352 252 453 Level 2 Through using the index sector in the market Not Applicable Not Applicable
Total Financial Assets at fair value through other comprehensive income 409 715 385 933
Total Financial Assets at Fair Value 805 279 959 198Financial Liabilities at Fair Value
Financial derivatives - negative fair value 170 956 75 887 Level 2Through Comparison of similar financial instruments
Not Applicable Not Applicable
Total Financial Liabilities at Fair Value 170 956 75 887
There were no transfers between Level 1 and 2 during 2020 & 2019.
NOTES TO THE CONSOLIDATED FINANCIAL STATEMENTS

173
B. Fair value of financial assets and financial liabilities that are not measured at fair value on recurring basis.Except as detailed in the following table, we believe that the carrying amounts of financial assets and financial liabili-ties recognized in the Group consolidated financial statements approximate their fair values:
31 December 2020 31 December 2019Book value Fair value Book value Fair value
USD ‘000 USD ‘000 USD ‘000 USD ‘000Financial assets not calculated at fair value Mandatory reserve , time and notice and certificates of deposits at Central Banks 5 519 559 5 520 337 4 993 146 4 994 782 Level 2
Balances and Deposits with banks and Finan-cial institutions 4 889 330 4 890 794 4 572 149 4 575 696 Level 2
Direct credit facilities at amortized cost 23 907 858 23 985 577 23 960 625 24 034 879 Level 2 Other Financial assets at amortized cost 8 762 789 8 859 096 8 894 618 8 996 983 Level 1 & 2Total financial assets not calculated at fair value 43 079 536 43 255 804 42 420 538 42 602 340
Financial liabilities not calculated at fair value Banks’ and financial institutions’ deposits 3 974 226 3 984 107 3 761 895 3 774 410 Level 2 Customer deposits 36 235 138 36 328 603 33 154 995 33 297 984 Level 2 Cash margin 2 483 253 2 491 389 3 082 753 3 097 979 Level 2 Borrowed funds 609 791 615 966 332 936 338 201 Level 2Total financial liabilities not calculated at fair value 43 302 408 43 420 065 40 332 579 40 508 574
The fair values of the financial assets and financial liabilities included in level 2 categories above have been deter-mined in accordance with the generally accepted pricing models based on a discounted cash flow analysis, with the most significant inputs being that discount rate.
NOTES TO THE CONSOLIDATED FINANCIAL STATEMENTS

174
51.- Analysis of Assets and Liabilities MaturitiesThe below is an analysis for assets and liabilities maturities according to the expected period to be recovered or set-tled as at 31 December 2020:
UP to one year More than one year TotalUSD ‘000 USD ‘000 USD ‘000
Assets Cash at vaults 673 453 - 673 453 Mandatory cash reserve 1 613 267 - 1 613 267 Balances with central banks 8 495 907 25 000 8 520 907Balances and deposits with banks and financial institutions 4 868 180 21 150 4 889 330 Financial assets at fair value through profit or loss 77 805 226 249 304 054 Direct credit facilities at amortized cost 11 774 548 12 133 310 23 907 858 Financial assets at fair value through other comprehensive income - 409 715 409 715
Other financial assets at amortized cost 4 488 236 4 274 553 8 762 789 Investment in associates - 3 804 212 3 804 212 Fixed assets 48 906 409 612 458 518 Other assets and financial derivatives - positive fair value 649 565 205 082 854 647 Deferred tax assets 214 933 - 214 933 Total assets 32 904 800 21 508 883 54 413 683
Liabilities Banks’ and financial institutions’ deposits 3 890 499 83 727 3 974 226 Customer deposits 35 371 384 863 754 36 235 138 Cash margin 2 442 532 40 721 2 483 253 Borrowed funds 49 116 560 675 609 791 Provision for income tax 275 406 - 275 406 Other Provisions 230 069 - 230 069 Other liabilities and financial derivatives - negative fair value 1 177 486 33 879 1 211 365
Deferred tax liabilities 5 672 - 5 672 Total liabilities 43 442 164 1 582 756 45 024 920Net (10 537 364) 19 926 127 9 388 763
NOTES TO THE CONSOLIDATED FINANCIAL STATEMENTS

175
The below is an analysis for assets and liabilities maturities according to the expected period to be recovered or settled as at 31 December 2019:
UP to one year More than one year Total
USD ‘000 USD ‘000 USD ‘000Assets Cash at vaults 533 785 - 533 785 Mandatory cash reserve 1 760 665 - 1 760 665 Balances with central banks 5 586 360 25 000 5 611 360 Balances and deposits with banks and financial institutions 4 404 423 167 726 4 572 149 Financial assets at fair value through profit or loss 239 214 279 839 519 053 Direct credit facilities at amortized cost 11 905 341 12 055 284 23 960 625 Financial assets at fair value through other comprehensive income - 385 933 385 933
Other financial assets at amortized cost 4 050 141 4 844 477 8 894 618 Investment in associates - 3 513 651 3 513 651 Fixed assets 48 981 412 136 461 117 Other assets and financial derivatives - positive fair value 803 425 43 078 846 503 Deferred tax assets 155 385 - 155 385 Total assets 29 487 720 21 727 124 51 214 844
Liabilities Banks’ and financial institutions’ deposits 3 605 671 156 224 3 761 895 Customer deposits 32 449 948 705 047 33 154 995 Cash margin 3 065 528 17 225 3 082 753 Borrowed funds 28 210 304 726 332 936Provision for Income Tax 345 054 - 345 054Other Provisions 226 521 - 226 521 Other liabilities and financial derivatives - negative fair value 1 174 331 27 506 1 201 837 Deferred tax liabilities 6 402 - 6 402 Total liabilities 40 901 665 1 210 728 42 112 393Net (11 413 945) 20 516 396 9 102 451
52. Contractual Maturity of the Contingent Accounts The table below details the maturity of expected liabilities and commitments on the basis of contractual maturity:
31 December 2020
Within 1 year More than 1 year and up to 5 years More than 5 years Total
USD ‘000 USD ‘000 USD ‘000 USD ‘000Letters of credit 1 618 727 92 907 - 1 711 634Acceptances 584 809 5 743 - 590 552Letters of guarantee: - Payment guarantees 1 190 935 121 408 74 204 1 386 547 - Performance guarantees 3 319 003 1 228 769 183 237 4 731 009 - Other guarantees 2 615 665 316 772 34 233 2 966 670Unutilized credit facilities 3 901 956 314 266 33 487 4 249 709 Total 13 231 095 2 079 865 325 161 15 636 121
Constructions projects contracts 3 502 - - 3 502Procurement contracts 10 537 3 033 2 528 16 098 Total 14 039 3 033 2 528 19 600
NOTES TO THE CONSOLIDATED FINANCIAL STATEMENTS
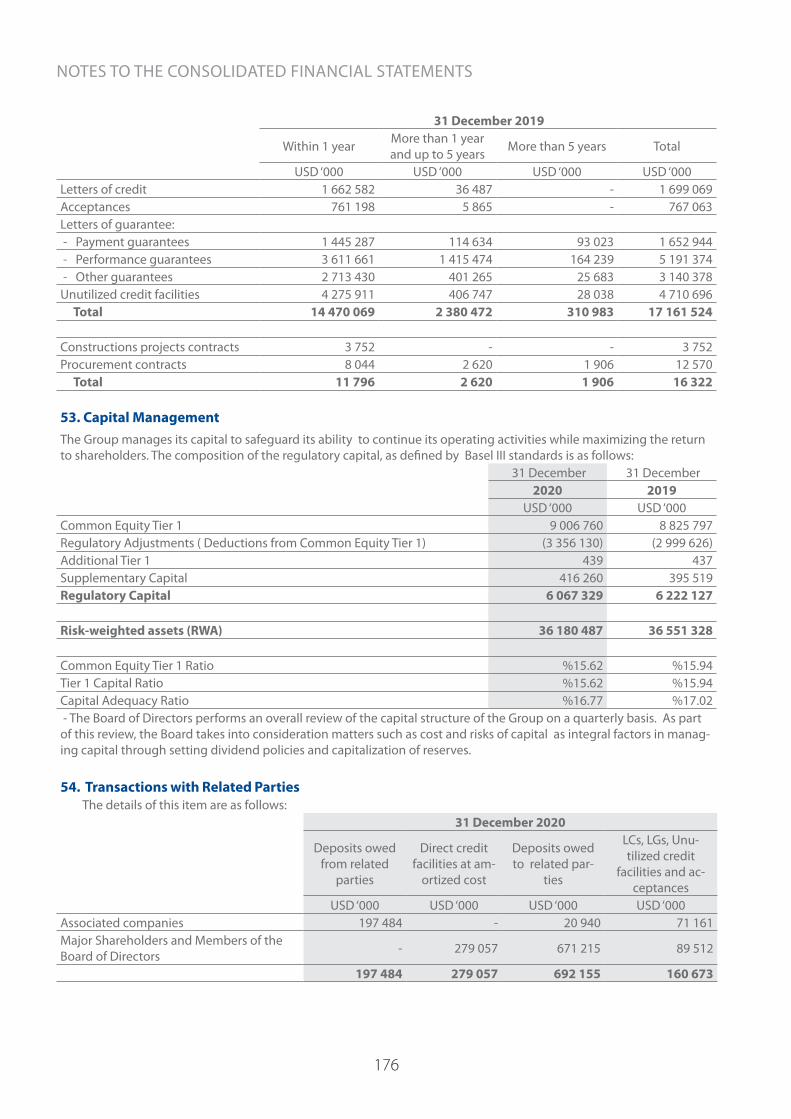
176
31 December 2019
Within 1 year More than 1 year and up to 5 years More than 5 years Total
USD ‘000 USD ‘000 USD ‘000 USD ‘000Letters of credit 1 662 582 36 487 - 1 699 069Acceptances 761 198 5 865 - 767 063Letters of guarantee: - Payment guarantees 1 445 287 114 634 93 023 1 652 944 - Performance guarantees 3 611 661 1 415 474 164 239 5 191 374 - Other guarantees 2 713 430 401 265 25 683 3 140 378Unutilized credit facilities 4 275 911 406 747 28 038 4 710 696 Total 14 470 069 2 380 472 310 983 17 161 524
Constructions projects contracts 3 752 - - 3 752Procurement contracts 8 044 2 620 1 906 12 570 Total 11 796 2 620 1 906 16 322
53. Capital ManagementThe Group manages its capital to safeguard its ability to continue its operating activities while maximizing the return to shareholders. The composition of the regulatory capital, as defined by Basel III standards is as follows:
31 December 31 December2020 2019
USD ‘000 USD ‘000Common Equity Tier 1 9 006 760 8 825 797Regulatory Adjustments ( Deductions from Common Equity Tier 1) (3 356 130) (2 999 626)Additional Tier 1 439 437Supplementary Capital 416 260 395 519Regulatory Capital 6 067 329 6 222 127
Risk-weighted assets (RWA) 36 180 487 36 551 328
Common Equity Tier 1 Ratio %15.62 %15.94Tier 1 Capital Ratio %15.62 %15.94Capital Adequacy Ratio %16.77 %17.02 - The Board of Directors performs an overall review of the capital structure of the Group on a quarterly basis. As part of this review, the Board takes into consideration matters such as cost and risks of capital as integral factors in manag-ing capital through setting dividend policies and capitalization of reserves.
54. Transactions with Related Parties The details of this item are as follows:
31 December 2020
Deposits owed from related
parties
Direct credit facilities at am-
ortized cost
Deposits owed to related par-
ties
LCs, LGs, Unu-tilized credit
facilities and ac-ceptances
USD ‘000 USD ‘000 USD ‘000 USD ‘000Associated companies 197 484 - 20 940 71 161Major Shareholders and Members of the Board of Directors - 279 057 671 215 89 512
197 484 279 057 692 155 160 673
NOTES TO THE CONSOLIDATED FINANCIAL STATEMENTS

177
31 December 2019
Deposits owed from related
parties
Direct credit facilities at am-
ortized cost
Deposits owed to related par-
ties
LCs, LGs, Unu-tilized credit
facilities and ac-ceptances
USD ‘000 USD ‘000 USD ‘000 USD ‘000Associated companies 372 918 - 55 768 67 888Major Shareholders and Member of the Board of Directors - 268 698 633 541 83 469
372 918 268 698 689 309 151 357
- All facilities granted to related parties are performing loans in accordance with the credit rating of the Group. No provisions for the year have been recorded in relation to impairment in value.The details of transactions with related parties are as follows:
2020Interest Income Interest Expense
USD ‘000 USD ‘000Associated companies 1 750 127
2019Interest Income Interest Expense
USD ‘000 USD ‘000Associated companies 1 436 655
- Direct credit facilitates granted to key management personnel amounted to USD 1.8 million and indirect credit facilities amounted to USD 217.1 thousand as of 31 December 2020 (USD 2.3 million direct credit facilities and USD 217.1 thousand indirect credit facilities as of 31 December 2019).
- Deposits of key management personnel amounted to USD 5.4 million as of 31 December 2020 (USD 4.4 million as of 31 December 2019)
- Interest on credit facilities granted to major shareholders and members of the Board of Directors is recorded at arm’s length.
- The salaries and other fringe benefits of the Group’s key management personnel, inside and outside Jordan, amounted to USD 68.9 million for the year ended on 31 December 2020 (USD 66.9 million for the year ended on 31 December 2019).
55. Earnings Per Share The details of this item are as follows: 31 December
2020 2019USD ‘000 USD ‘000
Profit for the year attributable to Shareholders of the Bank 192 791 844 937Thousand Shares
Average number of shares 640 800 640 800
USD / ShareEarnings Per Share (Basic and diluted) 0.30 1.32There are no instruments that could potentially dilute basic earnings per share in the future.
56. Assets under managementAssets under management as of 31 December 2020 amounted to USD 5094 million (USD 4274 million as of 31 Decem-ber 2019). These assets are not included in the Group’s consolidated financial statements.
NOTES TO THE CONSOLIDATED FINANCIAL STATEMENTS

178
57. Cash and Cash Equivalent The details of this item are as follows: 31 December
2020 2019USD ‘000 USD ‘000
Cash and balances with central banks maturing within 3 months 10 924 978 7 821 568Add: balances with banks and financial institutions maturing within 3 months 4 604 058 4 260 931Less: banks and financial institutions deposits maturing within 3 months 3 116 968 3 267 380 Total 12 412 068 8 815 119
58. LEGAL CASESThere are lawsuits filed against the Group totaling USD 289.1 million as of 31 December 2020, (USD 210.8 million as of 31 December 2019). In the opinion of the management and the lawyers representing the Group in the litigation at issue, the provisions taken in connection with the lawsuits are adequate.
59. STANDARDS ISSUED BUT NOT YET EFFECTIVEThe standards and interpretations that are issued but not yet effective, up to the date of issuance of the Group’s financial statements are disclosed below. The Group intends to adopt these standards, if applicable, when they become effective.
IFRS 17 Insurance Contracts
IFRS 17 provides a comprehensive model for insurance contracts covering the recognition and measurement and presentation and disclosure of insurance contracts and replaces IFRS 4 -Insurance Contracts. The standard applies to all types of insurance contracts (i.e. life, non-life, direct insurance and re-insurance), regardless of the type of entities that issue them, as well as to certain guarantees and financial instruments with discretionary participation features. The standard general model is supplemented by the variable fee approach and the premium allocation approach.
The new standard will be effective for annual periods beginning on or after 1 January 2023 with comparative figures required. Early application is permitted provided that the entity also applies IFRS 9 and IFRS 15 on or before the date it first applies IFRS 17.
Amendments to IAS 1: Classification of Liabilities as Current or Non-current
In January 2020, the IASB issued amendments to paragraphs 69 to 76 of IAS 1 to specify the requirements for classifying liabilities as current or non-current. The amendments clarify:
- what is meant by a right to defer settlement,
- the right to defer must exist at the end of the reporting period,
- that classification is unaffected by the likelihood,
- that an entity will exercise its deferral right,
- and that only if an embedded derivative in a convertible liability is itself an equity instrument would the terms of a liability not impact its classification.
The amendments are effective for annual reporting periods beginning on or after 1 January 2023 and must be applied retrospectively.
Reference to the Conceptual Framework – Amendments to IFRS 3
In May 2020, the IASB issued Amendments to IFRS 3 Business Combinations - Reference to the Conceptual Framework. The amendments are intended to replace a reference to the Framework for the Preparation and Presentation of Financial Statements, issued in 1989, with a reference to the Conceptual Framework for Financial Reporting issued in March 2018 without significantly changing its requirements.
The Board also added an exception to the recognition principle of IFRS 3 to avoid the issue of potential ‘day 2’ gains or losses arising for liabilities and contingent liabilities that would be within the scope of IAS 37 or IFRIC 21 Levies, if incurred separately.
At the same time, the Board decided to clarify existing guidance in IFRS 3 for contingent assets that would not be affected by replacing the reference to the Framework for the Preparation and Presentation of Financial Statements.
The amendments are effective for annual reporting periods beginning on or after 1 January 2022 and apply prospectively.
The amendments are not expected to have a material impact on the Bank.
NOTES TO THE CONSOLIDATED FINANCIAL STATEMENTS
179
Property, Plant and Equipment: Proceeds before Intended Use – Amendments to IAS 16
In May 2020, the IASB issued Property, Plant and Equipment — Proceeds before Intended Use, which prohibits entities from deducting from the cost of an item of property, plant and equipment, any proceeds from selling items produced while bringing that asset to the location and condition necessary for it to be capable of operating in the manner intended by management. Instead, an entity recognises the proceeds from selling such items, and the costs of producing those items, in profit or loss.
The amendment is effective for annual reporting periods beginning on or after 1 January 2022 and must be applied retrospectively to items of property, plant and equipment made available for use on or after the beginning of the earliest period presented when the entity first applies the amendment.
The amendments are not expected to have a material impact on the Bank.
Onerous Contracts – Costs of Fulfilling a Contract – Amendments to IAS 37
In May 2020, the IASB issued amendments to IAS 37 to specify which costs an entity needs to include when assessing whether a contract is onerous or loss-making.
The amendments apply a “directly related cost approach”. The costs that relate directly to a contract to provide goods or services include both incremental costs and an allocation of costs directly related to contract activities.
General and administrative costs do not relate directly to a contract and are excluded unless they are explicitly chargeable to the counterparty under the contract.
The amendments are effective for annual reporting periods beginning on or after 1 January 2022. The Group will apply these amendments to contracts for which it has not yet fulfilled all its obligations at the beginning of the annual reporting period in which it first applies the amendments.
The amendments are not expected to have a material impact on the Bank.
IFRS 9 Financial Instruments – Fees in the ’10 per cent’ test for derecognition of financial liabilities
As part of its 2018-2020 annual improvements to IFRS standards process the IASB issued amendment to IFRS 9. The amendment clarifies the fees that an entity includes when assessing whether the terms of a new or modified financial liability are substantially different from the terms of the original financial liability. These fees include only those paid or received by the borrower and the lender, including fees paid or received by either the borrower or lender on the other’s behalf. An entity applies the amendment to financial liabilities that are modified or exchanged on or after the beginning of the annual reporting period in which the entity first applies the amendment.
The amendment is effective for annual reporting periods beginning on or after 1 January 2022 with earlier adoption permitted. The Group will apply the amendments to financial liabilities that are modified or exchanged on or after the beginning of the annual reporting period in which the entity first applies the amendment.
The amendments are not expected to have a material impact on the Bank.
IBOR reform Phase 2
IBOR reform Phase 2, which will be effective on 1 January 2021, includes a number of reliefs and additional disclosures. The reliefs apply upon the transition of a financial instrument from an IBOR to a risk-free-rate (RFR).
Changes to the basis for determining contractual cash flows as a result of interest rate benchmark reform are required as a practical expedient to be treated as changes to a floating interest rate, provided that, for the financial instrument, the transition from the IBOR benchmark rate to RFR takes place on an economically equivalent basis.
IBOR reform Phase 2 provides temporary reliefs that allow the Bank’s hedging relationships to continue upon the replacement of an existing interest rate benchmark with an RFR. The reliefs require the Bank to amend hedge designations and hedge documentation. This includes redefining the hedged risk to reference an RFR, redefining the description of the hedging instrument and / or the hedged item to reference the RFR and amending the method for assessing hedge effectiveness. Updates to the hedging documentation must be made by the end of the reporting period in which a replacement takes place. For the retrospective assessment of hedge
NOTES TO THE CONSOLIDATED FINANCIAL STATEMENTS
180
effectiveness, the Bank may elect on a hedge by hedge basis to reset the cumulative fair value change to zero. The Bank may designate an interest rate as a non-contractually specified, hedged risk component of changes in the fair value or cash flows of a hedged item, provided the interest rate risk component is separately identifiable, e.g., it is an established benchmark that is widely used in the market to price loans and derivatives. For new RFRs that are not yet an established benchmark, relief is provided from this requirement provided the Bank reasonably expects the RFR to become separately identifiable within 24 months. For hedges of groups of items, the Bank is required to transfer to subgroups those instruments that reference RFRs. Any hedging relationships that prior to application of IBOR reform Phase 2, have been discontinued solely due to IBOR reform and meet the qualifying criteria for hedge accounting when IBOR reform Phase 2 is applied, must be reinstated upon initial application.
60. COMPARATIVE FIGURES Some of the comparative figures in the consolidated financial statements for the year 2019 have been reclassified to be consistent with the year 2020 presentation, with no effect on profit and equity for the year 2019.
NOTES TO THE CONSOLIDATED FINANCIAL STATEMENTS
181
INDEPENDENT AUDITOR’S REPORT To the Shareholders of Arab Bank Group Amman - Jordan Opinion We have audited the consolidated financial statements of Arab Bank Group (the “Group”) which comprise the consolidated statement of financial position as at 31 December 2020, and the consolidated statement of income, consolidated statement of comprehensive income, consolidated statement of changes in equity and consolidated statement of cash flows for the year then ended, and notes to the consolidated financial statements, including a summary of significant accounting policies. In our opinion, the accompanying consolidated financial statements present fairly, in all material respects, the financial position of the Group as at 31 December 2020, and its financial performance and its cash flows for the year then ended in accordance with International Financial Reporting Standards (IFRSs). Basis for Opinion We conducted our audit in accordance with International Standards on Auditing (ISAs). Our responsibilities under those standards, are further described in the Auditor’s Responsibilities for the Audit of the Consolidated Financial Statements section of our report. We are independent of the Group in accordance with the International Ethics Standards Board for Accountants’ Code of Ethics for Professional Accountants (IESBA Code) together with the ethical requirements that are relevant to our audit of the consolidated financial statements in Jordan, and we have fulfilled our other ethical responsibilities in accordance with these requirements and the IESBA Code. We believe that the audit evidence we have obtained is sufficient and appropriate to provide a basis for our opinion.
Ernst & Young Jordan P.O. Box 1140 300 King Abdulla Street Amman 11118 Jordan Tel:00962 6 580 0777 /00962 6552 6111 Fax:00962 6 5538 300 www.ey.com
INDEPENDENT AUDITOR’S REPORT

182
Key Audit Matters Key audit matters are those matters that, in our professional judgment, were of most significance in our audit of the consolidated financial statements for the year ended 31 December 2020. These matters were addressed in the context of our audit of the consolidated financial statements as a whole, and in forming our opinion thereon, and we do not provide a separate opinion on these matters. For each matter below, our description of how our audit addressed the matter provided in that context . We have fulfilled the responsibilities described in the Auditor’s responsibilities for the audit of the consolidated financial statements section of our report, including in relation to these matters. Accordingly, our audit included the performance of procedures designed to respond to our assessment of the risks of material misstatement of the consolidated financial statements. The results of our audit procedures, including the procedures performed to address the matters below, provide the basis for our audit opinion on the accompanying consolidated financial statements.
1. Inadequate allowances (ECL) for credit facilities Refer to note (12) to the consolidated financial statements
Key audit matter: This is considered as a key audit matter as the group exercises significant judgement to determine when and how much to record as impairment. Credit facilities form a major portion of the Group's assets, there is a risk that inappropriate impairment provisions are booked, whether from the use of inaccurate underlying data, or the use of unreasonable assumptions. Due to the significance of the judgments used in classifying credit facilities into various stages stipulated in IFRS 9 and determining related provision requirements, this audit area is considered a key audit risk. As at 31 December 2020, the Group's gross credit facilities amounted to USD 26.5 billion and the related impairment provisions amounted to USD 2 billion. The impairment provision policy is presented in the accounting policies in note (4) to the consolidated financial statements.
How the key audit matter was addressed in the audit: Our audit procedures included the following:
• We gained an understanding of the Group's key credit processes comprising granting and booking and tested the operating effectiveness of key controls over these processes.
• We read the Group’s impairment provisioning policy and compared it with the requirements of IFRS 9 as well as relevant regulatory guidelines and pronouncements.
• We assessed the Group’s expected credit loss model, in particular focusing on its alignment of the expected credit loss model and its underlying methodology with the requirements of IFRS 9.
• We examined a sample of exposures, assessed on an individual basis and performed procedures to evaluate the following:
o Appropriateness of the group’s staging.
o Appropriateness of determining Exposure at Default, including the consideration of repayments in the cash flows and the resultant arithmetical calculations
o Appropriateness of the PD, EAD and LGD used for different exposures at different stages.
o Appropriateness of the internal
rating and the objectivity,
INDEPENDENT AUDITOR’S REPORT
183
competency and independence of the experts involved in this exercise.
o Soundness and mathematical integrity of the ECL Model.
o For exposures moved between stages we have checked the appropriateness of the Group’s determination of significant increase in credit risk and the resultant basis for classification of exposures into various stages. We also checked the timely identification of exposures with a significant deterioration in credit quality.
o For exposures determined to be individually impaired, we re-preformed the ECL calculation. We also obtained an understanding of the latest developments in the counterparty’s situation of the latest developments in estimate of future cash flows, current financial position any rescheduling or restructuring agreements.
• For forward looking assumptions used by the
Group in its Expected Credit Loss (“ECL”) calculations, we held discussions with management and corroborated the assumptions using publicly available information.
• We assessed the financial statements
disclosures to ensure compliance with IFRS 9. Refer to the accounting policies, critical accounting estimates and judgments, disclosures of credit facilities and on ECL in notes (4), (5), (6) and (12) to the consolidated financial statements.
2. Valuation of Unquoted Investments & Derivatives Refer to notes (11) and (41) to the consolidated financial statements
Key audit matter: The valuation of investments in private equities and the valuation of derivatives are complex areas that require the use of models and forecasting of future cash flows including other factors to determine the fair value of investments and derivatives. As at 31 December 2020, the unquoted equities, positive and negative fair value of derivatives amounted to USD 287 million, USD 92 million and USD 171 million, respectively.
How the key audit matter was addressed in the audit: Our audit procedures included, amongst others, an assessment of the methodology and the appropriateness of the valuation models and inputs used to value the unquoted equities and derivatives. As part of these audit procedures, we assessed the reasonableness of key inputs used in the valuation such as the expected cash flows, discount rate by benchmarking them with external data. Disclosures of unquoted investments and derivatives are detailed in notes (11) and (41) to the consolidated financial statements.
INDEPENDENT AUDITOR’S REPORT

184
Other information included in the Group’s 2020 annual report. Other information consists of the information included in the Bank’s 2020 Annual Report other than the consolidated financial statements and our auditor’s report thereon. Management is responsible for the other information. The Bank’s 2020 Annual Report is expected to be made available to us after the date of this auditor’s report. Our opinion on the consolidated financial statements does not cover the other information and we will not express any form of assurance conclusion thereon. In connection with our audit of the consolidated financial statements, our responsibility is to read the other information identified above when it becomes available and, in doing so, consider whether the other information is materially inconsistent with the consolidated financial statements or our knowledge obtained in the audit or otherwise appears to be materially misstated. Responsibilities of Management and Those Charged with Governance for the Consolidated Financial Statements Management is responsible for the preparation and fair presentation of the consolidated financial statements in accordance with IFRSs, and for such internal control as management determines is necessary to enable the preparation of consolidated financial statements that are free from material misstatement, whether due to fraud or error. In preparing the consolidated financial statements, management is responsible for assessing the Group’s ability to continue as a going concern, disclosing, as applicable, matters related to going concern and using the going concern basis of accounting unless management either intends to liquidate the Group or to cease operations, or has no realistic alternative but to do so. Those charged with governance are responsible for overseeing the Group’s financial reporting process. Auditor’s Responsibilities for the Audit of the Consolidated Financial Statements Our objectives are to obtain reasonable assurance about whether the consolidated financial statements as a whole are free from material misstatement, whether due to fraud or error, and to issue an auditor’s report that includes our opinion.
Reasonable assurance is a high level of assurance, but is not a guarantee that an audit conducted in accordance with ISAs will always detect a material misstatement when it exists. Misstatements can arise from fraud or error and are considered material if, individually or in the aggregate, they could reasonably be expected to influence the economic decisions of users taken on the basis of these consolidated financial statements.
INDEPENDENT AUDITOR’S REPORT

185
As part of an audit in accordance with ISAs, we exercise professional judgment and maintain professional skepticism throughout the audit. We also: • Identify and assess the risks of material misstatement of the consolidated financial
statements, whether due to fraud or error, design and perform audit procedures responsive to those risks, and obtain audit evidence that is sufficient and appropriate to provide a basis for our opinion. The risk of not detecting a material misstatement resulting from fraud is higher than for one resulting from error, as fraud may involve collusion, forgery, intentional omissions, misrepresentations, or the override of internal control.
• Obtain an understanding of internal control relevant to the audit in order to design audit procedures that are appropriate in the circumstances, but not for the purpose of expressing an opinion on the effectiveness of the Group’s internal control.
• Evaluate the appropriateness of accounting policies used and the reasonableness of
accounting estimates and related disclosures made by management. • Conclude on the appropriateness of management’s use of the going concern basis of
accounting and, based on the audit evidence obtained, whether a material uncertainty exists related to events or conditions that may cast significant doubt on the Group’s ability to continue as a going concern. If we conclude that a material uncertainty exist, we are required to draw attention in our auditor’s report to the related disclosures in the consolidated financial statements or, if such disclosures are inadequate, to modify our opinion. Our conclusions are based on the audit evidence obtained up to the date of our auditor’s report. However future events or conditions may cause the Group to cease to continue as a going concern.
• Evaluate the overall presentation, structure and content of the consolidated financial
statements, including the disclosures, and whether the consolidated financial statements represent the underlying transactions and events in a manner that achieves fair presentation.
• Obtain sufficient appropriate audit evidence regarding the financial information of the entities or business activities within the Group to express an opinion on the consolidated financial statements. We are responsible for the direction, supervision and performance of the group audit. We remain solely responsible for our audit opinion.
We communicate with those charged with governance regarding, among other matters, the planned scope and timing of the audit and significant audit findings, including any significant deficiencies in internal control that we identify during our audit. We also provide those charged with governance with a statement that we have complied with relevant ethical requirements regarding independence, and to communicate with them all relationships and other matters that may reasonably be thought to bear on our independence, and where applicable, related safeguards.
INDEPENDENT AUDITOR’S REPORT
186
From the matters communicated with those charged with governance, we determine those matters that were of most significance in the audit of the consolidated financial statements of the current period, and are therefore the key audit matters. We describe these matters in our auditor’s report, unless law or regulation precludes public disclosure about the matter or when, in extremely rare circumstances, we determine that a matter should not be communicated in our report because the adverse consequences of doing so would reasonable be expected to outweigh the public interest benefits of such communication.
Report on Other Legal and Regulatory Requirements
The Bank maintains proper books of accounts, which are in agreement with the consolidated financial statements.
The partner in charge of the audit resulting in this auditor’s report was Bishr Ibrahim Baker; license number 592.
Amman – Jordan 1 February 2021
INDEPENDENT AUDITOR’S REPORT
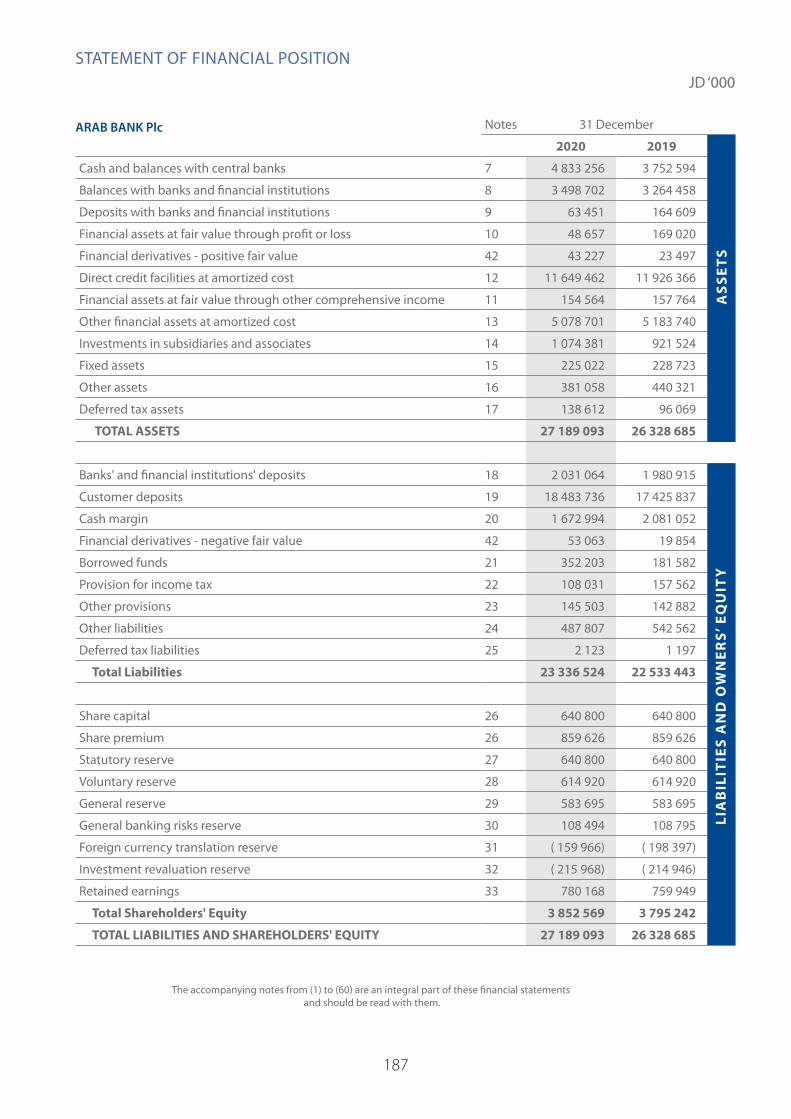
187
AS
SE
TS
LIA
BIL
ITIE
S A
ND
OW
NE
RS
’ E
QU
ITY
STATEMENT OF FINANCIAL POSITION
The accompanying notes from (1) to (60) are an integral part of these financial statements and should be read with them.
Notes 31 December
2020 2019
Cash and balances with central banks 7 4 833 256 3 752 594
Balances with banks and financial institutions 8 3 498 702 3 264 458
Deposits with banks and financial institutions 9 63 451 164 609
Financial assets at fair value through profit or loss 10 48 657 169 020
Financial derivatives - positive fair value 42 43 227 23 497
Direct credit facilities at amortized cost 12 11 649 462 11 926 366
Financial assets at fair value through other comprehensive income 11 154 564 157 764
Other financial assets at amortized cost 13 5 078 701 5 183 740
Investments in subsidiaries and associates 14 1 074 381 921 524
Fixed assets 15 225 022 228 723
Other assets 16 381 058 440 321
Deferred tax assets 17 138 612 96 069
TOTAL ASSETS 27 189 093 26 328 685
Banks' and financial institutions' deposits 18 2 031 064 1 980 915
Customer deposits 19 18 483 736 17 425 837
Cash margin 20 1 672 994 2 081 052
Financial derivatives - negative fair value 42 53 063 19 854
Borrowed funds 21 352 203 181 582
Provision for income tax 22 108 031 157 562
Other provisions 23 145 503 142 882
Other liabilities 24 487 807 542 562
Deferred tax liabilities 25 2 123 1 197
Total Liabilities 23 336 524 22 533 443
Share capital 26 640 800 640 800
Share premium 26 859 626 859 626
Statutory reserve 27 640 800 640 800
Voluntary reserve 28 614 920 614 920
General reserve 29 583 695 583 695
General banking risks reserve 30 108 494 108 795
Foreign currency translation reserve 31 ( 159 966) ( 198 397)
Investment revaluation reserve 32 ( 215 968) ( 214 946)
Retained earnings 33 780 168 759 949
Total Shareholders' Equity 3 852 569 3 795 242
TOTAL LIABILITIES AND SHAREHOLDERS' EQUITY 27 189 093 26 328 685
JD ‘000
ARAB BANK Plc

188
STATEMENT OF INCOME E
XP
EN
SE
SR
EV
EN
UE
Notes 2020 2019
Interest income 34 1 141 265 1 377 051
Less: Interest expense 35 462 421 602 140
Net Interest Income 678 844 774 911
Net commission income 36 128 404 146 471
Net Interest and Commission Income 807 248 921 382
Foreign exchange differences 43 302 50 411
Gain from financial assets at fair value through profit or loss 37 2 617 4 100
Dividends from financial assets at fair value through other comprehensive income 11 3 159 3 989
Dividends from subsidiaries and associates 38 52 742 121 253
Other revenue 39 19 730 15 588
TOTAL INCOME 928 798 1 116 723
Employees expenses 40 230 016 232 255
Other expenses 41 182 234 164 942
Depreciation and amortization 15&16 32 888 31 563
Provision for impairment - ECL 6 404 870 118 858
Other provisions 23 10 169 12 885
TOTAL EXPENSES 860 177 560 503
PROFIT FOR THE YEAR BEFORE INCOME TAX 68 621 556 220
Less: Income tax expense 22 46 821 132 660
PROFIT FOR THE YEAR 21 800 423 560
JD ‘000
ARAB BANK Plc
The accompanying notes from (1) to (60) are an integral part of these financial statements and should be read with them.

189
STATEMENT OF COMPREHENSIVE INCOME
Notes 2020 2019
Profit for the year 21 800 423 560
Add: Other comprehensive income items - after tax
Items that will be subsequently transferred to the statement of income
Exchange differences arising on the translation of foreign operations 31 38 431 ( 8 191)
Items that will not be subsequently transferred to the statement of incomeChange in fair value of financial assets at fair value through other comprehansice income 32 ( 2 904) 41
Net change in fair value of financial assets at fair value through other comprehensive income ( 1 022) 241
(Loss) from sale of finacial assets at fair value through the statement of comprehansive income ( 1 882) ( 200)
Total Other Comprehensive Income Items - After Tax 35 527 ( 8 150)
TOAL COMPREHENSIVE INCOME FOR THE YEAR 57 327 415 410
JD ‘000
ARAB BANK Plc
The accompanying notes from (1) to (60) are an integral part of these financial statements and should be read with them.
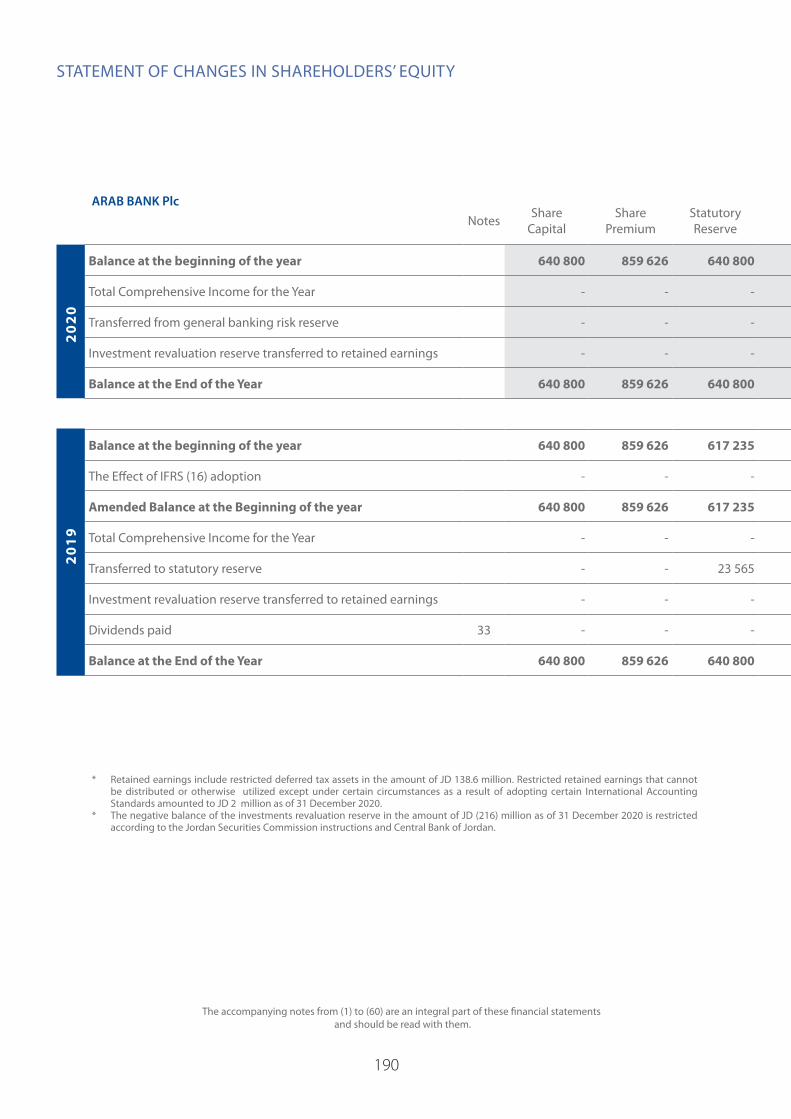
190
20
20
20
19
STATEMENT OF CHANGES IN SHAREHOLDERS’ EQUITY
* Retained earnings include restricted deferred tax assets in the amount of JD 138.6 million. Restricted retained earnings that cannot be distributed or otherwise utilized except under certain circumstances as a result of adopting certain International Accounting Standards amounted to JD 2 million as of 31 December 2020.
* The negative balance of the investments revaluation reserve in the amount of JD (216) million as of 31 December 2020 is restricted according to the Jordan Securities Commission instructions and Central Bank of Jordan.
Notes Share Capital
Share Premium
Statutory Reserve
Voluntary Reserve
General Reserve
General Banking Risk
Reserve
Foreign Currency Translation
Reserve
Investment Revaluation
Reserve
Retained Earnings
Total Shareholders
Equity
Balance at the beginning of the year 640 800 859 626 640 800 614 920 583 695 108 795 ( 198 397) ( 214 946) 759 949 3 795 242
Total Comprehensive Income for the Year - - - - - - 38 431 ( 2 904) 21 800 57 327
Transferred from general banking risk reserve - - - - - ( 301) - - 301 -
Investment revaluation reserve transferred to retained earnings - - - - - - - 1 882 ( 1 882) -
Balance at the End of the Year 640 800 859 626 640 800 614 920 583 695 108 494 ( 159 966) ( 215 968) 780 168 3 852 569
Balance at the beginning of the year 640 800 859 626 617 235 614 920 583 695 108 795 ( 190 206) ( 215 187) 650 945 3 670 623
The Effect of IFRS (16) adoption - - - - - - - - ( 2 431) ( 2 431)
Amended Balance at the Beginning of the year 640 800 859 626 617 235 614 920 583 695 108 795 ( 190 206) ( 215 187) 648 514 3 668 192
Total Comprehensive Income for the Year - - - - - - ( 8 191) 41 423 560 415 410
Transferred to statutory reserve - - 23 565 - - - - - ( 23 565) -
Investment revaluation reserve transferred to retained earnings - - - - - - - 200 ( 200) -
Dividends paid 33 - - - - - - - - ( 288 360) ( 288 360)
Balance at the End of the Year 640 800 859 626 640 800 614 920 583 695 108 795 ( 198 397) ( 214 946) 759 949 3 795 242
ARAB BANK Plc
The accompanying notes from (1) to (60) are an integral part of these financial statements and should be read with them.

191
Notes Share Capital
Share Premium
Statutory Reserve
Voluntary Reserve
General Reserve
General Banking Risk
Reserve
Foreign Currency Translation
Reserve
Investment Revaluation
Reserve
Retained Earnings
Total Shareholders
Equity
Balance at the beginning of the year 640 800 859 626 640 800 614 920 583 695 108 795 ( 198 397) ( 214 946) 759 949 3 795 242
Total Comprehensive Income for the Year - - - - - - 38 431 ( 2 904) 21 800 57 327
Transferred from general banking risk reserve - - - - - ( 301) - - 301 -
Investment revaluation reserve transferred to retained earnings - - - - - - - 1 882 ( 1 882) -
Balance at the End of the Year 640 800 859 626 640 800 614 920 583 695 108 494 ( 159 966) ( 215 968) 780 168 3 852 569
Balance at the beginning of the year 640 800 859 626 617 235 614 920 583 695 108 795 ( 190 206) ( 215 187) 650 945 3 670 623
The Effect of IFRS (16) adoption - - - - - - - - ( 2 431) ( 2 431)
Amended Balance at the Beginning of the year 640 800 859 626 617 235 614 920 583 695 108 795 ( 190 206) ( 215 187) 648 514 3 668 192
Total Comprehensive Income for the Year - - - - - - ( 8 191) 41 423 560 415 410
Transferred to statutory reserve - - 23 565 - - - - - ( 23 565) -
Investment revaluation reserve transferred to retained earnings - - - - - - - 200 ( 200) -
Dividends paid 33 - - - - - - - - ( 288 360) ( 288 360)
Balance at the End of the Year 640 800 859 626 640 800 614 920 583 695 108 795 ( 198 397) ( 214 946) 759 949 3 795 242
JD ‘000

192
CA
SH
FL
OW
S F
RO
M O
PE
RA
TIN
G A
CT
IVIT
IES
CA
SH F
LOW
S FR
OM
IN
VES
TIN
G A
CTI
VIT
IES
CASH
FLO
WS
FRO
M
FIN
AN
CIN
G A
CTIV
ITIE
S
STATEMENT OF CASH FLOWS
Notes 2020 2019Profit for the year before tax 68 621 556 220Adjustments for:Depreciation 15 24 981 25 100Amortization of intangible assets 16 7 907 6 463Provision for impairment - ECL 6 404 870 118 858Net accrued Interest 55 897 14 457(Gain) from sale of fixed assets ( 321) ( 92)(Gain) from revaluation of financial assets at fair value through profit or loss 37 ( 492) ( 1 926)Dividends from financial assets at fair value through other comprehensive income 11 ( 3 159) ( 3 989)
Dividends from subsidiaries and associates 38 ( 52 742) ( 121 253)Impairment of investment held for sale 9 220 - Other provisions 23 10 169 12 885Total 524 951 606 723(Increase) Decrease in AssetsBalances with central banks (maturing after 3 months) 48 252 ( 38 610)Deposits with banks and financial institutions (maturing after 3 months) 101 498 ( 33 408)Direct credit facilities at amortized cost ( 37 599) 104 087Financial assets at fair value through profit or loss 120 855 ( 83 573)Other assets and financial derivatives ( 37 974) ( 134 962)(Decrease) Increase in Liabilities:Banks and financial institutions deposits (maturing after 3 months) 462 817 ( 233 553)Customer deposits 1 057 899 640 361Cash margin ( 408 058) 131 232Other liabilities and financial derivatives ( 24 001) ( 6 491)Net Cash Generated by Operating Activities before Income Tax 1 808 640 951 806Income tax paid 22 ( 138 186) ( 131 982)Net Cash Generated by Operating Activities 1 670 454 819 824
Sale (Purchase) of financial assets at fair value through other comprehensive income 296 ( 1 559)
Maturity (Purchase) of other financial assets at amortized cost 102 353 ( 184 688)(Paid for) investments in subsidiaries and associates - net ( 104 674) ( 3 970)Dividends from subsidiaries and associates - net 38 52 742 121 253Dividends from financial assets at fair value through other comprehensive income 11 3 159 3 989
(Purchase) of fixed assets - net 15 ( 24 384) ( 32 935)Proceeds from selling fixed assets 1 597 3 337(Purchase) of intangible assets - net ( 8 658) ( 8 146)Net Cash flows from (Used in) Investing Activities 22 431 ( 102 719)
Increase in borrowed funds 170 621 39 775Dividends paid to shareholders ( 658) ( 286 187)Net Cash flows from (Used in) Financing Activities 169 963 ( 246 412)Net Increase in Cash and Cash Equivalent 1 862 848 470 693Exchange differences - change in foreign exchange rates ( 9 752) ( 903)Cash and cash equivalent at the beginning of the year 5 117 410 4 647 620Cash and Cash Equivalent at the End of the Year 57 6 970 506 5 117 410
Operational cash flows from interestInterest Paid 500 413 582 401Interest Received 1 159 170 1 371 769
ARAB BANK Plc
The accompanying notes from (1) to (60) are an integral part of these financial statements and should be read with them.
JD ‘000
193
NOTES TO THE FINANCIAL STATEMENTSARAB BANK Plc
(1) GeneralArab Bank was established in 1930 and is registered as a Jordanian public shareholding limited company. The Head Office of the Bank is domiciled in Amman - Hashemite Kingdom of Jordan and the Bank operates worldwide through its 82 branches in Jordan and 129 abroad. Also, the bank operates through its subsidiaries and Arab Bank (Switzerland).
Arab Bank PLC shares are traded on Amman Stock Exchange. The shareholders of Arab Bank PLC are the same shareholders of Arab Bank Switzerland (every 18 shares of Arab Bank PLC equal/ traded for 1 share of Arab Bank Switzerland).
The accompanying financial statements was approved by the Board of Directors in its meeting Number (1) on 25 January 2021 and are subject to the approval of the General Assembly.
(2) Basis Of Preparation Of The Financial StatementsThe accompanying financial statements are prepared in accordance with International Financial Reporting Standards issued by the International Accounting Standards Board.
Arab Bank PLC adheres to the local regulations and instructions of the Central Bank of Jordan, as well as to the prevailing regulations in the countries where the Bank operates.
The financial statements of Arab Bank PLC are presented in conjunction with the consolidated financial statements of Arab Bank Group and which form integral part of the Bank’s financial statements.
The financial statements are prepared in accordance with the historical cost principle, except for financial assets through profit or loss , financial assets through other comprehensive income and financial derivatives which are stated at fair value as of the date of the financial statements.
The financial statements have been presented in Jordan Dinars, being the functional and presentation currency of the bank.
The accounting policies adopted in the preparation of the financial statements are consistent with those adopted for the year ended 31 December 2019, except for the adoption of new standards and amendments mentioned in note (3).
Basis of presentation of the financial statementsThe accompanying financial statement of Arab Bank Plc comprise the financial statements of Arab Bank branches within the Hashemite Kingdom of Jordan and it’s foreign branches after excluding balances and transactions between the branches. Transactions on the way the end of the year are shown under other assets or other liabilities as the case may be. The financial statement of the Bank’s branches operating outside the Hashemite Kingdom of Jordan are translated into Jordanian Dinars at the prevailing at rates as at the balance sheet date.
The Bank prepares consolidated financial statements for the Bank, its subsidiaries and Arab Bank Switzerland Limited.
(3) Changes of Accounting PoliciesThe accounting policies adopted in the preparation of the financial statements are consistent with those used in the preparation of the financial statements for the year ended 31 December 2019, except for the adoption of the following new standards effective as of 1 January 2020:
Amendments to IFRS 3: Definition of a Business The amendment to IFRS 3 Business Combinations clarifies that to be considered a business, an integrated set of activities and assets must include, at a minimum, an input and a substantive process that, together, significantly contribute to the ability to create output. Furthermore, it clarifies that a business can exist without including all the inputs and processes needed to create outputs. These amendments had no impact on the financial statements of the Bank but may impact future periods should the Bank enter any business combinations.
Amendments to IAS 1 and IAS 8: Definition of “Material”The IASB issued amendments to IAS 1 Presentation of Financial Statements and IAS 8 Accounting Policies, Changes in Accounting Estimates and Errors to align the definition of ‘material’ across the standards and to clarify certain aspects of the definition. The new definition states that, ’Information is material if omitting, misstating or obscuring it could reasonably be expected to influence decisions that the primary users of general-purpose financial statements make on the basis of those financial statements, which provide financial information about a specific reporting

194
NOTES TO THE FINANCIAL STATEMENTS
entity. These amendments had no impact on the financial statements of, nor is there expected to be any future impact to, the Bank.
Amendments to IFRS 7, IFRS 9 and IAS 39 Interest Rate Benchmark Reform Interest Rate Benchmark Reform Amendments to IFRS 9 and IFRS 7 includes a number of reliefs, which apply to all hedging relationships that are directly affected by interest rate benchmark reform. A hedging relationship is affected if the reform gives rise to uncertainties about the timing and or amount of benchmark-based cash flows of the hedged item or the hedging instrument. These amendments have no impact on the financial statements of the Bank.
Amendments to IFRS 16 Covid-19 Related Rent Concessions On 28 May 2020, the IASB issued Covid-19-Related Rent Concessions - amendment to IFRS 16 Leases. The amendments provide relief to lessees from applying IFRS 16 guidance on lease modification accounting for rent concessions arising as a direct consequence of the Covid-19 pandemic. This relates to any reduction in lease payments which are originally due on or before 30 June 2021. As a practical expedient, a lessee may elect not to assess whether a Covid-19 related rent concession from a lessor is a lease modification.
The amendment applies to annual reporting periods beginning on or after 1 June 2020. Earlier application is permitted.
The Bank did not have any leases impacted by the amendment.
4. Significant Accounting Policies
Recognition of Interest IncomeThe effective interest rate method
In accordance with IFRS 9, interest income is recognized using the effective interest rate method for all financial instruments at amortized cost and financial instruments at fair value through the income statement or through other comprehensive income. The effective interest rate is the rate that discounts estimated future cash receipts over the expected life of the financial instrument, or, shorter period, to the net carrying amount of the financial asset.
The EIR (and therefore, the amortized cost of the asset) is calculated by taking into account any discount or premium on acquisition, fees and costs that are an integral part of the EIR. The Bank recognizes interest income using a rate of return that represents the best estimate of a constant rate of return over the expected life of the loan. Hence, it recognizes the effect of potentially
different interest rates charged at various stages, and other characteristics of the product life cycle (including prepayments, penalty interest and charges).
If expectations regarding the cash flows on the financial asset are revised for reasons other than credit risk. The adjustment is booked as a positive or negative adjustment to the carrying amount of the asset in the statement of financial position with an increase or reduction in interest income. The adjustment is subsequently amortized through interest and similar income in the statement of income.
Interest and similar income and expense For all financial instruments measured at amortized cost, financial instruments designated at FVOCI and FVTPL, interest income or expense is recorded using the EIR. The calculation takes into account all of the contractual terms of the financial instrument (for example, prepayment options) and includes any fees or incremental costs that are directly attributable to the instrument and are an integral part of the EIR, but not future credit losses.
When the recorded value of a financial asset or a group of similar financial assets has been reduced by an impairment loss, interest income continues to be recognized using the rate of interest used to discount the future cash flows for the purpose of measuring the impairment loss.
The Bank also holds investments in assets of countries with negative interest rates. The Bank discloses interest paid on these assets as interest expense.
Fee and commission incomeFee income can be divided into the following two categories:
A. Fee income earned from services that are provided over a certain period of time
Fees earned for the provision of services over a period of time are accrued over that period. These fees include commission income and private wealth and asset management fees, custody and other management fees.
195
NOTES TO THE FINANCIAL STATEMENTS
B. Fee income forming an integral part of the corresponding financial instrument
Fees that the Bank considers to be an integral part of the corresponding financial instruments include:
loan origination fees, loan commitment fees for loans that are likely to be drawn down and other credit related fees.
Financial Instruments – Initial RecognitionDate of recognition
Financial assets and liabilities, with the exception of loans and advances to customers and balances due to customers, are initially recognized on the trade date, i.e., the date that the Bank becomes a party to the contractual provisions of the instrument. This includes regular way trades: purchases or sales of financial assets that require delivery of assets within the time frame generally established by regulation or convention in the market place. Loans and advances to customers are recognized when funds are transferred to the customers’ accounts. The Bank recognizes balances due to customers when funds are transferred to the Bank.
Initial measurement of financial instruments
The classification of financial instruments at initial recognition depends on their contractual terms and the business model for managing the instruments. Financial instruments are initially measured at their fair value, except in the case of financial assets and financial liabilities recorded at FVTPL, transaction costs are added to, or subtracted from, this amount. Trade receivables are measured at the transaction price. When the fair value of financial instruments at initial recognition differs from the transaction price, the Bank accounts for the Day 1 profit or loss, as described below.
Day 1 profit or loss
When the transaction price of the instrument differs from the fair value at origination and the fair value is based on a valuation technique using only inputs observable in market transactions, the Bank recognizes the difference between the transaction price and fair value in net trading income. In those cases where fair value is based on models for which some of the inputs are not observable, the difference between the transaction price and the fair value is deferred and is only recognized in profit or loss when the inputs become observable, or when the instrument is derecognized.
Measurement categories of financial assets and liabilities
The Bank classifies its financial assets (Debt Instruments) based on the business model for managing the assets and the asset’s contractual terms, measured at either:
• Amortized cost
• FVOCI
• FVTPL
The Bank classifies and measures its derivative and trading portfolio at FVTPL. The Bank may designate financial instruments at FVTPL, if so doing eliminates or significantly reduces measurement or recognition inconsistencies.
Financial liabilities, other than loan commitments and financial guarantees, are measured at amortized cost or at FVTPL when they are held for trading and derivative instruments or the fair value designation is applied.
Financial Assets and LiabilitiesDue from banks, loans and advances to customers and financial investments at amortized cost
The Bank only measures due from banks, loans and advances to customers and other financial investments at amortized cost if both of the following conditions are met:
• The financial asset is held within a business model with the objective to hold financial assets in order to collect contractual cash flows
• The contractual terms of the financial asset give rise on specified dates to cash flows that are solely payments of principal and interest (SPPI) on the principal amount outstanding.
The details of these conditions are outlined below.
Business model assessment
The Bank determines its business model at the level that best reflects how it manages Banks of financial assets to achieve its business objective.
The Bank’s business model is not assessed on an instrument-by-instrument basis, but at a higher level of aggregated portfolios and is based on observable factors such as:
196
• How the performance of the business model and the financial assets held within that business model are evaluated and reported to the entity’s key management personnel
• The risks that affect the performance of the business model (and the financial assets held within that business model) and, in particular, the way those risks are managed
• How managers of the business are compensated (for example, whether the compensation is based on the fair value of the assets managed or on the contractual cash flows collected)
• The expected frequency, value and timing of sales are also important aspects of the Bank’s assessment
The business model assessment is based on reasonably expected scenarios without taking ‘worst case’ or ‘stress case’ scenarios into account. If cash flows after initial recognition are realized in a way that is different from the Bank’s original expectations, the Bank does not change the classification of the remaining financial assets held in that business model, but incorporates such information when assessing newly originated or newly purchased financial assets going forward.
The SPPI test
As a second step of its classification process the Bank assesses the contractual terms of financial to identify whether they meet the SPPI test.
‘Principal’ for the purpose of this test is defined as the fair value of the financial asset at initial recognition and may change over the life of the financial asset (for example, if there are repayments of principal or amortization of the premium/discount).
The most significant elements of interest within a lending arrangement are typically the consideration for the time value of money and credit risk. To make the SPPI assessment, the Bank applies judgement and considers relevant factors such as the currency in which the financial asset is denominated, and the period for which the interest rate is set.
In contrast, contractual terms that introduce a more than de minimis exposure to risks or volatility in the contractual cash flows that are unrelated to a basic lending arrangement do not give rise to contractual cash flows that are solely payments of principal and interest on the amount outstanding. In such cases, the financial asset is required to be measured at FVTPL.
Derivatives recorded at fair value through profit or loss
A derivative is a financial instrument or other contract with all three of the following characteristics:
• Its value changes in response to the change in a specified interest rate, financial instrument price, commodity price, foreign exchange rate, index of prices or rates, credit rating or credit index, or other variable, provided that, in the case of a non-financial variable, it is not specific to a party to the contract (i.e., the ‘underlying’).
• It requires no initial net investment or an initial net investment that is smaller than would be required for other types of contracts expected to have a similar response to changes in market factors.
• It is settled at a future date.
The Bank enters into derivative transactions with various counterparties. These include interest rate swaps, futures and cross-currency swaps. Derivatives are recorded at fair value and carried as assets when their fair value is positive and as liabilities when their fair value is negative. Changes in the fair value of derivatives are included in net trading income unless hedge accounting is applied.
Debt instruments at FVOCI
The Bank measures its debt instruments at FVOCI when both of the following conditions are met:
• The instrument is held within a business model, the objective of which is achieved by both collecting contractual cash flows and selling financial assets
• The contractual terms of the financial asset meet the SPPI test
FVOCI debt instruments are subsequently measured at fair value with gains and losses arising due to changes in fair value recognized in OCI. Interest income and foreign exchange gains and losses are recognized in profit or loss in the same manner as for financial assets measured at amortized cost. Where the Bank holds more than one investment in the same security, they are deemed to be disposed of on a first–in first–out basis. On derecognition, cumulative gains or losses previously recognized in OCI are reclassified from OCI to profit or loss.
NOTES TO THE FINANCIAL STATEMENTS

197
Equity instruments at FVOCIUpon initial recognition, the Bank occasionally elects to classify irrevocably some of its equity investments as equity instruments at FVOCI when they meet the definition of definition of Equity under IAS 32 Financial Instruments: Presentation and are not held for trading. Such classification is determined on an instrument-by-instrument basis.
Gains and losses on these equity instruments are never recycled to profit. Dividends are recognized in profit or loss as other operating income when the right of the payment has been established, except when the Bank benefits from such proceeds as a recovery of part of the cost of the instrument, in which case, such gains are recorded in OCI. Equity instruments at FVOCI are not subject to an impairment assessment.
Financial assets and financial liabilities at fair value through profit or loss
Financial assets and financial liabilities at FVTPL are recorded in the statement of financial position at fair value. Changes in fair value are recorded in profit and loss with the exception of movements in fair value of liabilities designated at FVTPL due to changes in the Bank’s own credit risk. Such changes in fair value are recorded in the Own credit reserve through OCI and do not get recycled to the profit or loss. Interest earned or incurred on instruments designated at FVTPL is accrued in interest income or interest expense, respectively, using the EIR, taking into account any discount/ premium and qualifying transaction costs being an integral part of instrument. Interest earnt on assets mandatorily required to be measured at FVTPL is recorded using contractual interest rate. Dividend income from equity instruments measured at FVTPL is recorded in profit or loss as other operating income when the right to the payment has been established.
Financial guarantees, letters of credit and undrawn loan commitments
The Bank issues financial guarantees, letters of credit and loan commitments.
Financial guarantees are initially recognized in the financial statements (within other liabilities) at fair value, being the premium received. Subsequent to initial recognition, the Bank’s liability under each guarantee is measured at the higher of the amount initially recognized less cumulative amortization recognized in the statement of income and an ECL provision.
The premium received is recognized in the statement of income net of fees and commission income on a straight line basis over the life of the guarantee.
Undrawn loan commitments and letters of credits are commitments under which, over the duration of the commitment, the Bank is required to provide a loan with pre-specified terms to the customer. Similar to financial guarantee contracts, these contracts are in the scope of the ECL requirements.
The nominal contractual value of financial guarantees, letters of credit and undrawn loan commitments, where the loan agreed to be provided is on market terms, are not recorded on in the statement of financial position.
The Bank occasionally issues loan commitments at below market interest rates drawdown. Such commitments are subsequently measured at the higher of the amount of the ECL and the amount initially recognized less, when appropriate, the cumulative amount of income recognized.
Derecognition of financial assets and liabilities
Derecognition due to substantial modification of terms and conditions
The Bank derecognizes a financial asset, such as a loan to a customer, when the terms and conditions have been renegotiated to the extent that, substantially, it becomes a new loan, with the difference recognized as a derecognition gain or loss, to the extent that an impairment loss has not already been recorded. The newly recognized loans are classified as Stage 1 for ECL measurement purposes.
If the modification does not result in cash flows that are substantially different, the modification does not result in derecognition. Based on the change in cash flows discounted at the original EIR, the Bank records a modification gain or loss, to the extent that an impairment loss has not already been recorded.
Derecognition other than for substantial modification
A. Financial assets
A financial asset (or, where applicable, a part of a financial asset or part of a Bank of similar financial assets) is derecognized when the rights to receive cash flows from the financial asset have expired. The Bank also derecognizes the financial asset if it has both transferred the financial asset and the transfer qualifies for derecognition.
The Bank has transferred the financial asset if, and only if, either:
• The Bank has transferred its contractual rights to receive cash flows from the financial asset
Or
NOTES TO THE FINANCIAL STATEMENTS

198
• It retains the rights to the cash flows, but has assumed an obligation to pay the received cash flows in full without material delay to a third party under a ‘pass–through’ arrangement
Pass-through arrangements are transactions whereby the Bank retains the contractual rights to receive the cash flows of a financial asset (the ‘original asset’), but assumes a contractual
obligation to pay those cash flows to one or more entities (the ‘eventual recipients’), when all of the following three conditions are met:
• The Bank has no obligation to pay amounts to the eventual recipients unless it has collected equivalent amounts from the original asset, excluding short-term advances with the right to full recovery of the amount lent plus accrued interest at market rates
• The Bank cannot sell or pledge the original asset other than as security to the eventual recipients
• The Bank has to remit any cash flows it collects on behalf of the eventual recipients without material delay. In addition, the Bank is not entitled to reinvest such cash flows, except for investments in cash or cash equivalents including interest earned, during the period between the collection date and the date of required remittance to the eventual recipients.
A transfer only qualifies for derecognition if either:
• The Bank has transferred substantially all the risks and rewards of the asset
Or
• The Bank has neither transferred nor retained substantially all the risks and rewards of the asset, but has transferred control of the asset
The Bank considers control to be transferred if and only if, the transferee has the practical ability to sell the asset in its entirety to an unrelated third party and is able to exercise that ability unilaterally and without imposing additional restrictions on the transfer.
When the Bank has neither transferred nor retained substantially all the risks and rewards and has retained control of the asset, the asset continues to be recognized only to the extent of the Bank’s continuing involvement, in which case, the Bank also recognizes an associated liability. The transferred asset and the associated liability are measured on a basis that reflects the rights and obligations that the Bank has retained.
Continuing involvement that takes the form of a guarantee over the transferred asset is measured at the lower of the original carrying amount of the asset and the maximum amount of consideration the Bank could be required to pay.
If continuing involvement takes the form of a written or purchased option (or both) on the transferred asset, the continuing involvement is measured at the value the Bank would be required to pay upon repurchase. In the case of a written put option on an asset that is measured at fair value, the extent of the entity’s continuing involvement is limited to the lower of the fair value of the transferred asset and the option exercise price.
B. Financial liabilities
A financial liability is derecognized when the obligation under the liability is discharged, cancelled or expires. Where an existing financial liability is replaced by another from the same lender on substantially different terms, or the terms of an existing liability are substantially modified, such an exchange or modification is treated as a derecognition of the original liability and the recognition of a new liability. The difference between the carrying value of the original financial liability and the consideration paid is recognized in profit or loss.
Impairment of financial assetsOverview of the ECL principles
The Bank records the allowance for expected credit loss for all loans and other debt financial assets not held at FVTPL, together with loan commitments and financial guarantee contracts, in this section all referred to as ‘financial instruments’. Equity instruments are not subject to impairment under IFRS 9.
The ECL allowance is based on the credit losses expected to arise over the life of the asset (the lifetime expected credit loss or LTECL), unless there has been no significant increase in credit risk since origination, in which case, the allowance is based on the 12 months’ expected credit loss.
The 12mECL is the portion of LTECLs that represent the ECLs that result from default events on a financial instrument that are possible within the 12 months after the reporting date.
Both LTECLs and 12mECLs are calculated on either an individual basis or a collective basis, depending on the nature of the underlying portfolio of financial instruments.
NOTES TO THE FINANCIAL STATEMENTS
199
The Bank has established a policy to perform an assessment, at the end of each reporting period, of whether a financial instrument’s credit risk has increased significantly since initial recognition, by considering the change in the risk of default occurring over the remaining life of the financial instrument.
Based on the above process, the Bank Banks its financial assets into Stage 1, Stage 2 and Stage 3, as described below:
Stage 1: When financial assets are first recognized, the Bank recognizes an allowance based on 12mECLs. Stage 1 loans also include facilities where the credit risk has improved and the loan has been reclassified from Stage 2.
Stage 2: When a financial asset has shown a significant increase in credit risk since origination, the Bank records an allowance for the LTECLs. Stage 2 loans also include facilities, where the credit risk has improved and the loan has been reclassified from Stage 3.
Stage 3: Financial assets considered credit-impaired. The Bank records an allowance for the LTECLs.
For financial assets for which the Bank has no reasonable expectations of recovering either the entire outstanding amount, or a proportion thereof, the gross carrying amount of the financial asset is reduced. This is considered a (partial) derecognition of the financial asset.
The Bank’s internal credit rating system:
The main measure of Credit Risk is at the counterparty level where the exposure is measured in line with the bank’s credit standards applicable by the bank and detailed in the policies and procedures. Therefore, Arab Bank implemented an Internal Rating methodology to assess the customers financially and non-financially. In parallel, Arab Bank is using Moody’s Risk Analyst (MRA), it is a financial analysis and ratings platform that aggregates quantitative and qualitative information on individual obligors to obtain an assessment that can be used to determine a credit rating for each obligor and the related probability of default (PD). The MRA model went through validation, optimization and calibration phases which lead to the development of a new model. It worthwhile to mention that MRA is complementing AB Internal Rating to better comply with regulatory requirements i.e. BASEL.
The MRA Rating System is centrally managed by Risk Management Department at Head Office noting that the Corporate and Investment Banking and the Credit Department are the main users. The Customers’ Ratings are being reviewed on annual basis using the two rating methodology (AB Internal Rating and MRA) during the annual review of the customers’ facilities.
The calculation of ECLs
The Bank calculates ECLs based on a three probability-weighted scenarios to measure the expected cash shortfalls, discounted at an approximation to the EIR. A cash shortfall is the difference between the cash flows that are due to an entity in accordance with the contract and the cash flows that the entity expects to receive. Due to the recent developments and the abnormal situation resulted from COVID-19, an additional downside scenario was used by the management for calculating the ECL for the year ended 31 December 2020. Accordingly, the Bank has updated the macroeconomic factors used for calculating the ECL for the year ended 31 December 2020 in addition to changing the probability of weights assigned to the macroeconomic scenarios by giving higher weight to the downside scenarios as follows:
Scenario Weight assigned Baseline 35%Upside 15%Downside 1 20%Downside 2 30%
The machinery of the ECL calculations are outlined below and the key elements are, as follows:
PD The Probability of Default is an estimate of the likelihood of default over a given time horizon. A default may only happen at a certain time over the assessed period.
EAD The Exposure at Default is an estimate of the exposure at a future default date, taking into account expected changes in the exposure after the reporting date, including repayments of principal and interest, whether scheduled by contract or otherwise, expected drawdowns on committed facilities, and accrued interest from missed payments.
LGD The Loss Given Default is an estimate of the loss arising in the case where a default occurs at a given time. It is based on the difference between the contractual cash flows due and those that the lender would expect to receive, including from the realization of any collateral. It is usually expressed as a percentage of the EAD.
NOTES TO THE FINANCIAL STATEMENTS

200
When estimating the ECLs, the Bank considers four. Each of these is associated with different PDs, EADs and LGDs. When relevant, the assessment of multiple scenarios also incorporates how defaulted loans are expected to be recovered, including the probability that the loans will cure and the value of collateral or the amount that might be received for selling the asset.
With the exception of credit cards and other revolving facilities, the maximum period for which the credit losses are determined is the contractual life of a financial instrument unless the Bank has the legal right to call it earlier.
Impairment losses and releases are accounted for and disclosed separately from modification losses or gains that are accounted for as an adjustment of the financial asset’s gross carrying value.
The mechanism of the ECL method are summarized below:
Stage 1: The 12mECL is calculated as the portion of LTECLs that represent the ECLs that result from default events on a financial instrument that are possible within the 12 months after the reporting date. The Bank calculates the 12mECL allowance based on the expectation of a default occurring in the 12 months following the reporting date. These expected 12-month default probabilities are applied to a forecast EAD and multiplied by the expected LGD and discounted by an approximation to the original EIR. This calculation is made for each of the four scenarios, as explained above.
Stage 2: When a financial asset has shown a significant increase in credit risk since origination, the Bank records an allowance for the LTECLs. The mechanics are similar to those explained above, including the use of multiple scenarios, but PDs and LGDs are estimated over the lifetime of the instrument. The expected cash shortfalls are discounted by an approximation to the original EIR.
Stage 3: For financial assets which are considered credit-impaired, the Bank recognizes the lifetime expected credit losses for these loans. The method is similar to that for Stage 2 assets, with the PD set at 100% and with higher LGD than the first two stages.
Loan commitments
and letter of credit When estimating LTECLs for undrawn loan commitments, the Bank estimates the expected portion of the loan commitment that will be drawn down over its expected life. The ECL is then based on the present value of the expected shortfalls in cash flows if the loan is drawn down, based on a probability-weighting of the four scenarios. The expected cash shortfalls are discounted at an approximation to the expected EIR on the loan.
Financial guarantee
contracts The Bank’s liability under each guarantee is measured at the higher of the amount initially recognized less cumulative amortization recognized in the statement of income, and the ECL provision. For this purpose, the Bank estimates ECLs based on the present value of the expected payments to reimburse the holder for a credit loss that it incurs. The shortfalls are discounted by the risk-adjusted interest rate relevant to the exposure. The calculation is made using a probability-weighting of the four scenarios. The ECLs related to financial guarantee contracts are recognized within other liabilities.
Debt instruments measured at fair value through OCI
The ECLs for debt instruments measured at FVOCI do not reduce the carrying amount of these financial assets in the statement of financial position, which remains at fair value. Instead, an amount equal to the allowance that would arise if the assets were measured at amortized cost is recognized in OCI as an accumulated impairment amount, with a corresponding charge to profit or loss. The accumulated loss recognized in OCI is recycled to the profit and loss upon derecognition of the assets.
NOTES TO THE FINANCIAL STATEMENTS
201
Credit cards and other revolving facilities
The Bank’s product offering includes a variety of corporate and retail overdraft and credit cards facilities, in which the Bank has the right to cancel and/or reduce the facilities with one day’s notice. The Bank does not limit its exposure to credit losses to the contractual notice period, but, instead calculates ECL over a period that reflects the Bank’s expectations of the customer behavior, its likelihood of default and the Bank’s future risk mitigation procedures, which could include reducing or cancelling the facilities.
The ongoing assessment of whether a significant increase in credit risk has occurred for revolving facilities is similar to other lending products. This is based on shifts in the customer’s internal credit grade.
The interest rate used to discount the ECLs for credit cards is based on the effective interest rate.
The calculation of ECLs, including the estimation of the expected period of exposure and discount rate is made, on an individual basis for corporate and on a collective basis for retail products. The collective assessments are made separately for portfolios of facilities with similar credit risk characteristics.
Forward looking information
In its ECL models, the Bank relies on a broad range of forward looking information as economic inputs, such as:
• GDP growth• Unemployment rates• Central Bank base rates
The inputs and models used for calculating ECLs may not always capture all characteristics of the market at the date of the financial statements. To reflect this, qualitative adjustments or overlays are occasionally made as temporary adjustments when such differences are significantly material.
Collateral valuation
To mitigate its credit risks on financial assets, the Bank seeks to use collateral, where possible. The collateral comes in various forms, such as cash, securities, letters of credit/guarantees, real estate, receivables, inventories, other non-financial assets and credit enhancements such as netting agreements. Collateral, unless repossessed, is not recorded on the Bank’s statement of financial position. However, the fair value of collateral affects the calculation of ECLs. It is generally assessed, at a minimum, at inception and re-assessed periodically. However, some collateral, for example, cash or securities relating to margining requirements, is valued daily.
To the extent possible, the Bank uses active market data for valuing financial assets held as collateral. Other financial assets which do not have readily determinable market values are valued using models. Non-financial collateral, such as real estate, is valued based on data provided by third parties such as mortgage brokers, or based on housing price indices.
Collateral repossessed
The Bank’s policy is to determine whether a repossessed asset can be best used for its internal operations or should be sold. Assets determined to be useful for the internal operations are transferred to their relevant asset category at the lower of their repossessed value or the carrying value of the original secured asset. Assets for which selling is determined to be a better option are transferred to assets held for sale at their fair value (if financial assets) and fair value less cost to sell for non-financial assets at the repossession date in, line with the Bank’s policy.
In its normal course of business, the Bank does not physically repossess properties or other assets in its retail portfolio, but engages external agents to recover funds, generally at auction, to settle outstanding debt. Any surplus funds are returned to the customers/obligors. As a result of this practice, the residential properties under legal repossession processes are not recorded on the balance sheet.
Write-offs
Financial assets are written off either partially or in their entirety only when the Bank has stopped pursuing the recovery. If the amount to be written off is greater than the accumulated loss allowance, the difference is first treated as an addition to the allowance that is then applied against the gross carrying amount. Any subsequent recoveries are credited to credit loss expense.
Modified loans
The Bank sometimes makes concessions or modifications to the original terms of loans as a response to the borrower’s financial difficulties, (rather than taking possession or to otherwise enforce collection of collateral.) The Bank considers a loan forborne when such concessions or modifications are provided as a result of the borrower’s present or expected financial difficulties and the Bank would not have agreed to them if the borrower had been financially healthy. (Indicators of financial difficulties include defaults on covenants, or significant concerns raised by the Credit Risk Department). Forbearance may involve extending the payment arrangements and the agreement of new loan conditions. (Once the terms have been renegotiated, any impairment is
NOTES TO THE FINANCIAL STATEMENTS

202
measured using the original EIR as calculated before the modification of terms). It is the Bank’s policy to monitor forborne loans to help ensure that future payments continue to be likely to occur. Derecognition decisions and classification between Stage 2 and Stage 3 are determined on a case-by-case basis. If these procedures identify a loss in relation to a loan, it is disclosed and managed as an impaired Stage 3 forborne asset until it is collected or written off.
Leases The Bank assesses at contract inception whether a contract is, or contains, a lease. That is, if the contract conveys the right to control the use of an identified asset for a period of time in exchange for consideration.
The Bank applies a single recognition and measurement approach for all leases, except for short-term leases and leases of low-value assets. The Bank recognizes lease liabilities to make lease payments and right-of-use assets representing the right to use the underlying assets.
Right-of-use assetsThe Bank recognizes right-of-use assets at the commencement date of the lease (i.e., the date the underlying asset is available for use). Right-of-use assets are measured at cost, less any accumulated depreciation and impairment losses, and adjusted for any remeasurement of lease liabilities.
The cost of right-of-use assets includes the amount of lease obligations recognized, initial direct costs incurred, and lease payments made at or before the commencement date less any lease incentives received. Unless the Bank is reasonably certain to obtain ownership of the leased asset at the end of the lease term, the recognized right-of-use assets are depreciated on a straight-line basis over the shorter of its estimated useful life or the lease term. Right-of-use assets are subject to impairment.
Lease liabilitiesAt the commencement date of the lease, the Bank recognizes lease liabilities measured at the present value of lease payments to be made over the lease term. The lease payments include fixed payments (including in-substance fixed payments) less any lease incentives receivable, variable lease payments that depend on an index or a rate, and amounts expected to be paid under residual value guarantees. The lease payments also include the exercise price of
a purchase option reasonably certain to be exercised by the Bank and payments of penalties for terminating a lease, if the lease term reflects the Bank exercising the option to terminate.
The variable lease payments that do not depend on an index or a rate are recognized as expense in the period on which the event or condition that triggers the payment occurs.
Foreign currency translationTransactions and balances
Transactions in foreign currencies are initially recorded in the functional currency at the spot rate of exchange ruling at the date of the transaction.
Monetary assets and liabilities denominated in foreign currencies are retranslated into the functional currency at the spot rate of exchange at the reporting date. All foreign exchange differences arising on non–trading activities are taken to other operating income/expense in the income statement.
Non–monetary items that are measured at historical cost in a foreign currency are translated using the spot exchange rates as at the date of recognition.
Fixed assets Fixed assets are stated at historical cost, net of accumulated depreciation and any accumulated impairment in value. Such cost includes expenditures that are directly attributable to the acquisition of the asset. When parts of an item of fixed assets have different useful lives, they are accounted for as separate items of fixed assets.
Depreciation is charged so as to allocate the cost of assets using the straight-line method, using the useful lives of the respective assets
Land and assets under construction are not depreciated.
Assets under construction is carried at cost, less any accumulated impairment losses and is depreciated when the assets are ready for intended use using the same depreciation rate of the related category with fixed assets.
Fixed assets are derecognized when disposed of or when no future benefits are expected from their use or disposal.
The gain or loss arising on the disposal of an item (the difference between the net realizable value and
NOTES TO THE FINANCIAL STATEMENTS

203
the carrying amount of the asset) is recognized in the statement of income in the year that the assets were disposed.
Impairment of non-financial assets -The Bank assesses at each reporting date whether there is an indication that an asset may be impaired. If any such indication exists, or when annual impairment testing for an asset is required, the Bank makes an estimate of the asset’s recoverable amount. An asset’s recoverable amount is the higher of an asset’s or cash-generating unit’s fair value less costs to sell and its value in use and is determined for an individual asset, unless the asset does not generate cash inflows that are largely independent of those from other assets or groups of assets. Where the carrying amount of an asset exceeds its recoverable amount, the asset is considered impaired and is written down to its recoverable amount. In assessing value in use, the estimated future cash flows are discounted to their present value using a pre-tax discount rate that reflects current market assessments of the time value of money and the risks specific to the asset. In determining fair value less costs to sell, an appropriate valuation model is used.
These calculations are corroborated by valuation multiples, quoted share prices for publicly traded subsidiaries or other available fair value indicators.
Intangible Assets Goodwill
Goodwill is recorded at cost, and represents the excess amount paid to acquire or purchase the investment in an associate or a subsidiary on the date of the transaction over the fair value of the net assets of the associate or subsidiary at the acquisition date. Goodwill resulting from the investment in a subsidiary is recorded as a separate item as part of intangible assets, while goodwill resulting from the investment in an associated company constitutes part of the investment in that company.
Goodwill is distributed over the cash generating units for the purpose of testing the impairment in its value.
The value of goodwill is tested for impairment on the date of the financial statements. Good will value is reduced when there is evidence that its value has declined or the recoverable value of the cash generating units is less than book value. The decline in the values is recoded in the statement of income as impairment loss.
Other Intangible Assets
Other intangible assets acquired through mergers are stated at fair value at the date of acquisition, while other intangible assets (not acquired through mergers) are recorded at cost.
Intangible assets are to be classified on the basis of either definite or indefinite useful life. Intangible assets with definite useful economic lives are amortized over their useful lives using the straight line method, and recorded as an expense in the statement of income. Intangible assets with indefinite lives are reviewed in statement income for impairment as of the financial statements date, and impairment loss is recorded in the statement of income.
Intangible assets resulting from the banks operations are not capitalized. They are rather recorded in the statement of income in the same period.
Any indications of impairment in the value of intangible assets as of the financial statements date are reviewed. Furthermore, the estimated useful lives of the impaired intangible assets are reassessed, and any adjustment is made in the subsequent period.
Repurchase and Resale Agreements Assets sold with a simultaneous commitment to repurchase them at a future date continue to be recognized in the financial statements as a result of the bank’s continuous control over these assets and as the related risk and benefits are transferred to the Bank upon occurrence. They also continue to be measured in accordance with the adopted accounting policies. Amounts received against these contracts are recorded within liabilities under borrowed funds. The difference between the sale price and the repurchase price is recognized as an interest expense amortized over the contract period using the effective interest rate method.
Purchased assets with corresponding commitment to sell at a specific future date are not recognized in the financial statements because the bank has no control over such assets and the related risks and benefits are not transferred to the Bank upon occurrence. Payments related to these contracts are recoded under deposits with banks and other financial institutions or loans and advances in accordance with the nature of each case. The difference between the purchase price and resale price is recoded as interest revenue amortized over the life of the contract using the effective interest rate method.
NOTES TO THE FINANCIAL STATEMENTS
204
CapitalCost of issuing or purchasing the Bank’s shares are recorded in retained earnings net of any tax effect related to these costs. If the issuing or purchase process has not been completed, these costs are recorded as expenses in the statement of income.
Investments in AssociatesAn associate is an entity over which the Bank has significant influence. Significant influence is the power to participate in the financial and operating policy decisions of the investee, but is not control or joint control over those policies.
The considerations made in determining significant influence or joint control are similar to those necessary to determine control over subsidiaries.
The Bank’s investments in its associates are accounted for using the equity method.
Under the equity method, the investment in an associates initially recognised at cost, the carrying amount of the investment is adjusted to recognise changes in the Bank’s share of net assets of the associates since the acquisition date. Goodwill relating to the associates is included in the carrying amount of the investment and is neither amortised nor individually tested for impairment.
The income statement reflects the Bank’s share of the results of operations of the associates. Any change in other comprehensive income of those investees is presented as part of the Bank’s other comprehensive income (OCI). In addition, when there has been a change recognised directly in the equity of the associates, the Bank recognises its share of any changes, when applicable, in the statement of changes in equity. Unrealised gains and losses resulting from transactions between the Bank and the associates are eliminated to the extent of the interest in the associates.
The aggregate of the Bank’s share of profit or loss of an associate is shown on the face of the income statement within operating profit and represents profit or loss after tax and non-controlling interests in the subsidiaries of the associate.
The financial statements of the associates are prepared for the same reporting period as the Bank. When necessary, adjustments are made to bring the accounting policies in line with those of the Bank.
Income TaxesIncome tax expenses represent current and deferred taxes for the year.
Income tax expense is measured on the basis of taxable income. Taxable income differs from income reported in the financial statements, as the latter includes non-taxable revenue, tax expenses not deductible in the current year but deductible in subsequent years, accumulated losses approved by tax authorities and items not accepted for tax purposes or subject to tax.
Taxes are calculated on the basis of the enacted tax rates according to the prevailing laws, regulations and instructions of countries where the Bank operates.
Taxes expected to be incurred or recovered as a result of temporary timing differences between the value of the assets and liabilities in the financial statements and their respective tax bases. Deferred taxes are calculated on the basis of the liability method, and according to the rates expected to be enacted when it is anticipated that the liability will be settled or when tax assets are recognized.
Deferred tax assets are reviewed on the date of the financial statements, and reduced if it is expected that no benefit will arise from the deferred tax, partially or totally.
Fair valueThe Bank measures financial instruments is at fair value at each financial statements date.
Fair value is the price that would be received to sell an asset or paid to transfer a liability in an orderly transaction between market participants at the measurement date.
The fair value measurement is based on the presumption that the transaction to sell the asset or transfer the liability takes place either, in the principal market for the asset or liability, or in the absence of a principal market, in the most advantageous market for the asset or liability.
The fair value of an asset or a liability is measured using the assumptions that market participants would use when pricing the asset or liability, assuming that market participants act in their economic best interest.
A fair value measurement of a non-financial asset takes into account a market participant’s ability to generate economic benefits by using the asset in its highest and best use or by selling it to another market participant that would use the asset in its highest and best use.
NOTES TO THE FINANCIAL STATEMENTS

205
The Bank uses valuation techniques that are appropriate in the circumstances and for which sufficient data are available to measure fair value, maximizing the use of relevant observable inputs and minimizing the use of unobservable inputs.
All assets and liabilities for which fair value is measured or disclosed in the financial statements are categorized within the fair value hierarchy, described as follows, based on the lowest level input that is significant to the fair value measurement as a whole:
• Level 1 - Quoted (unadjusted) market prices in active markets for identical assets or liabilities.
• Level 2 - Valuation techniques for which the lowest level input that is significant to the fair value measurement is directly or indirectly observable.
• Level 3 - Valuation techniques for which the lowest level input that is significant to the fair value measurement is unobservable.
For assets and liabilities that are recognised in the financial statements on a recurring basis, the Bank determines whether transfers have occurred between Levels in the hierarchy by re-assessing categorization (based on the lowest level input that is significant to the fair value measurement as a whole) at the end of each reporting period.
For the purpose of fair value disclosures, the Bank has determined classes of assets and liabilities on the basis of the nature, characteristics and risks of the asset or liability and the level of the fair value hierarchy as explained above.
Financial derivativesFinancial derivatives (e.g. currency forward contracts, forward rate agreements, swaps and option contracts) are recognized at fair value in the statement of financial position.
Financial derivatives held for hedge purposesFair value hedge: Represents hedging for changes in the fair value of the Bank’s assets and liabilities. When the conditions for an effective fair value hedge are met, gains or losses from changes in the fair value of financial derivatives are recognized in the statement of income. Changes in the fair value of the hedged assets or liabilities are also recognized in the statement of income.
Cash flow hedge: Represents hedging for changes in the current and expected cash flows of the Bank’s assets and liabilities that affects the statement of income. When the conditions for an effective cash flow hedge are met, gains or losses from changes in the fair value of financial derivatives are recognized in other comprehensive income and are reclassified to the statement of income in the period in which the hedge transaction has an impact on the statement of income.
When the conditions for an effective hedge are not met, gains or losses from changes in the fair value of financial derivatives are recognized in the statement of income.
The ineffective portion is recognized in the statement of income.
Hedge for net investment in foreign entities when the conditions of the hedge for net investment in foreign entities are met, fair value is measured for the hedging instrument of the hedged net assets. In case of an effective relationship, the effective portion of the loss or profit related to the hedging instrument is recognized in the statement of comprehensive income and recorded in the statement of income when the investment in foreign entities is sold. The ineffective portion is recognized in the statement of income.
When the conditions of the effective hedge do not apply, gain or loss resulting from the change in the fair value of the hedging instrument is recorded in the statement of income.
Financial derivatives for trading Financial derivatives held for trading are recognized at fair value in the statement of financial position with changes in fair value recognized in the statement of income.
Foreclosed assetsSuch assets are those that have been the subject of foreclosure by the Bank, and are initially recognized among “other assets” at the foreclosure value or fair value whichever is least.
At the date of the financial statements, foreclosed assets are revalued individually (fair value less selling cost); any decline in fair value is recognized in the statement of income. Any subsequent increase in value is recognized only to the extent that it does not exceed the previously recognized impairment losses.
NOTES TO THE FINANCIAL STATEMENTS
206
Provisions Provisions are recognized when the Bank has an obligation as of the date of the financial statements as a result of past events, the obligation is likely to be settled, and a reliable estimate can be made of the amount of the obligation.
Provision for employees’ end-of-service indemnities is estimated in accordance with the prevailing rules and regulations in the countries in which the Bank operates. The expense for the year is recognized in the statement of income. Indemnities paid to employees are reduced from the provision.
Segments InformationSegment business represents a Bank of assets and operations shared to produce products or risk attributable services different from which related to other segments.
Geographic sector linked to present the products or the services in a specific economic environment attributable for risk and other income different from which related to other sectors work in other economic environment.
Assets under ManagementThese represent the accounts managed by the Bank on behalf of its customers, but do not represent part of the Bank’s assets. The fees and commissions on managing these accounts are taken to the statement of income. Moreover, a provision is taken for the decline in the value of capital-guaranteed portfolios managed on behalf of its customers.
Offsetting Financial assets and financial liabilities are offset, and the net amount is presented in the statement of financial position only when there is a legal right to offset the recognized amounts, and the Bank intends to either settle them on a net basis or to realize the assets and settle the liabilities simultaneously
Cash and cash equivalents Cash and cash equivalents comprise cash and balances with central banks and balances with banks and financial institutions maturing within three months, less restricted funds and balances owing to banks and financial institutions maturing within three months.
5. Significant accounting judgements, estimates and assumptionsThe preparation of the Bank’s financial statements requires management to make judgements, estimates and assumptions that affect the reported amounts of revenues, expenses, assets and liabilities, and the accompanying disclosures, and the disclosure of contingent liabilities. Uncertainty about these assumptions and estimates could result in outcomes that require a material adjustment to the carrying amount of assets or liabilities affected in future periods.
In the process of applying the Bank’s accounting policies, management has made various judgements. Those which management has assessed to have the most significant effect on the amounts recognised in the financial statements have been discussed in the individual notes of the related financial statement line items.
The key assumptions concerning the future and other key sources of estimation uncertainty at the reporting date, that have a significant risk of causing a material adjustment to the carrying amounts of assets and liabilities within the next financial year, are also described in the individual notes of the related financial statement line items below. The Bank based its assumptions and estimates on parameters available when the financial statements were prepared. Existing circumstances and assumptions about future developments, however, may change due to market changes or circumstances arising that are beyond the control of the Bank. Such changes are reflected in the assumptions when they occur.
Management believes that the assumptions adopted in the financial statements are reasonable. The details are as follows:
- Impairment loss for foreclosed assets is booked after a recent valuation of the acquired properties has been conducted by approved surveyors. The impairment loss is reviewed periodically.
- The fiscal year is charged with its portion of income tax expenditures in accordance with the regulations, laws, and accounting standards. Moreover, deferred tax assets and liabilities and the income tax provision are recorded.
- The Management periodically reassesses the economic useful life of tangible and Intangible assets for the purpose of calculating annual depreciation and amortization based on the general condition of these assets and assessing their expected useful life in The future. The impairment loss is recorded in the consolidated income statement.
NOTES TO THE FINANCIAL STATEMENTS
207
- A provision is set for lawsuits raised against the Bank. This provision is based to an adequate legal study prepared by the Bank’s legal advisor. Moreover, the study highlights potential risks that the Bank may encounter in the future. Such legal assessments are reviewed periodically.
- Management frequently reviews financial assets stated at amortized cost and compares to fair value to estimate any impairment in their value. The impairment amount is taken to the statement of income for the year.
- Fair value hierarchy:The level in the fair value hierarchy is determined and disclosed into which the fair value measurements are categorized in their entirety, segregating fair value measurements in accordance with the levels defined in IFRS. The difference between Level 2 and Level 3 fair value measurements represents whether inputs are observable and whether the unobservable inputs are significant, which may require judgment and a careful analysis of the inputs used to measure fair value, including consideration of factors specific to the asset or liability.
- Provisions for impairment - ECL In determining impairment of financial assets, judgement is required in the estimation of the amount and timing of future cash flows as well as an assessment of whether the credit risk on the financial asset has increased significantly since initial recognition and incorporation of forward-looking information in the measurement of ECL.
Inputs, assumptions and techniques used for ECL calculation – IFRS 9 Methodology
Key concepts in IFRS 9 that have the most significant impact and require a high level of judgment, as considered by the Bank while determining the impact assessment, are:
In accordance with IFRS 9, a significant increase in credit risk can be assessed at the group / portfolio level if the common risk characteristics are shared. Any instruments that are collectively assessed must have common credit risk characteristics. The bank has followed the following criteria for determining the ECL calculation on a collective versus individual basis as follows:
• Retail Portfolio: on Collective Basis based on the product level (Loans, Housing Loans, Car Loans, and Credit Cards)
• Corporate Portfolio: individual basis at customer/ facility level
• Financial Institutions: Individual Basis at Bank/ facility Level.
• Debt instruments measured at amortized cost: Individual Level at Instrument level.
• Assessment of Significant Increase in Credit Risk (SICR)
To assess whether the credit risk on a financial asset has increased significantly since origination, the Bank compares the risk of default occurring over the expected life of the financial asset at the reporting date to the corresponding risk of default at origination, using key risk indicators that are used in the Bank’s existing risk management processes.
Our assessment of significant increases in credit risk will be performed periodically for each individual exposure based on three factors. If any of the following factors indicates that a significant increase in credit risk has occurred, the instrument will be moved from Stage 1 to Stage 2:
1. We have established thresholds for significant increases in credit risk based on movement in the customer’s internal credit grade and the related PDs relative to initial recognition.
2. Restructuring and/or Rescheduling on the customers’ accounts/ facilities during the assessment period is considered as indicator for SICR.
Movements between Stage 2 and Stage 3 are based on whether financial assets are credit-impaired as at the reporting date. The determination of credit-impairment under IFRS 9, is mentioned in the “Definition of default” below.
• Macroeconomic Factors, Forward Looking Information (FLI) and Multiple Scenarios
The measurement of expected credit losses for each stage and the assessment of significant increases in credit risk must consider information about past events and current conditions as well as reasonable and supportable forecasts of future events and economic conditions. The estimation and application of forward-looking information will require significant judgment in cooperation with international expert in this area.
NOTES TO THE FINANCIAL STATEMENTS

208
PD, Loss Given Default (LGD) and Exposure At Default (EAD) inputs used to estimate Stage 1 and Stage 2 credit loss allowances are modelled based on the macroeconomic variables (or changes in macroeconomic variables) that are most closely correlated with credit losses in the relevant portfolio.
Each macroeconomic scenario used in our expected credit loss calculation will have forecasts of the relevant macroeconomic variables.
The estimation of expected credit losses in Stage 1 and Stage 2 will be a discounted probability-weighted estimate that considers a minimum of four future macroeconomic scenarios.
The base case scenario will be based on macroeconomic forecasts (e.g.: GDP, inflation, interest rate). Upside, downside 1 and downside 2 scenarios will be set relative to our base case scenario based on reasonably possible alternative macroeconomic conditions.
Scenarios will be probability-weighted according to the best estimate of their relative likelihood based on historical frequency and current trends and conditions. Probability weights will be updated on a quarterly basis. All scenarios considered will be applied to all portfolios subject to expected credit losses with the same probabilities.
• Definition of default
The definition of default used in the measurement of expected credit losses and the assessment to determine movement between stages will be consistent with the definition of default used for internal credit risk management purposes. IFRS 9 does not define default, but contains a rebuttable presumption that default has occurred when an exposure is greater than 90 days past due.
Notwithstanding the above, the classification of credit facilities is governed by the Central Bank of Jordan regulations unless local regulations in other countries are stricter, or the Bank has to adopt the same by law.
The Bank has set out the definition of default where a default is considered to have occurred when either or both of the two following events have taken place:
• The obligor is considered unlikely to pay its credit obligations in full
• The obligor is past due for 90 days or more on any material credit obligation.
• Expected Life
When measuring ECL, the Bank must consider the maximum contractual period over which the Bank is exposed to credit risk. All contractual terms should be considered when determining the expected life, including prepayment options and extension and rollover options. For certain revolving credit facilities that do not have a fixed maturity, the expected life is estimated based on the period over which the Bank is exposed to credit risk and where the credit losses would not be mitigated by management actions.
To ensure proper compliance of the IFRS9 implementation, a steering committee was formed consisting of the Chief Risk Officer, Chief Financial Officer, Chief Credit Officer, Head of IT and Head of Project Management with the responsibilities to provide decisions/ feedback on the work plan regarding implementation and adoption of IFRS 9 to ensure all relevant policies and procedures are updated in line with the new requirements and systems are modified / updated for the new requirements, in addition to present the ECL results to the CEO and related Committees of the Board of Directors.
NOTES TO THE FINANCIAL STATEMENTS

209
6-Provision for impairment - ECL:The below table shows the expected credit losses on financial assets during the year:
31 December 2020Notes Stage 1 Stage 2 Stage 3 Total
JD '000 JD '000 JD '000 JD '000Balances with central banks 7 321 76 977 - 77 298Balances with banks and financial institutions 8 ( 24) - - ( 24)
Deposits with banks and financial institutions 9 ( 344) - - ( 344)
Direct credit facilities at amortized cost 12 18 245 104 897 191 361 314 503
Debt instruments included in financial assets at amortized cost 13 1 414 1 482 ( 210) 2 686
Indirect facilities 24 ( 1 236) 7 650 4 337 10 751Total 18 376 191 006 195 488 404 870
31 December 2019Notes Stage 1 Stage 2 Stage 3 Total
JD '000 JD '000 JD '000 JD '000Balances with central banks 7 357 3 761 - 4 118Balances with banks and financial institutions 8 135 - - 135
Deposits with banks and financial institutions 9 ( 214) - - ( 214)
Direct credit facilities at amortized cost 12 5 592 36 797 87 854 130 243
Debt instruments included in financial assets at amortized cost 13 ( 4 814) 1 418 - ( 3 396)
Indirect facilities 24 ( 457) ( 11 229) ( 342) ( 12 028)Total 599 30 747 87 512 118 858
7. Cash and Balances with Central Banks The details of this item are as follows:
31 December2020 2019
JD ‘000 JD ‘000Cash in vaults 422 391 328 993Balances with central banks: - Current accounts 1 007 933 534 546 - Time and notice 2 237 728 1 459 776 - Mandatory cash reserve 1 035 110 1 104 788 - Certificates of deposit 212 355 329 465 Less: Net ECL Charges ( 82 261) ( 4 974) Total 4 833 256 3 752 594 - Except for the mandatory cash reserve, there are no restricted balances at Central Banks. - Balances and certificates of deposit maturing after three months amounted to JD 17.7 million as of 31 December
2020 (JD 66 million as of 31 December 2019).
NOTES TO THE FINANCIAL STATEMENTS

210
The table below shows the credit quality and the maximum exposure to credit risk based on the bank’s internal credit rating system.
31 December 2020 31 December 2019Stage 1
individualStage 2
individual Stage 3 Total Total
JD ‘000 JD ‘000 JD ‘000 JD ‘000 JD ‘000Low risk / performing 4 092 455 - - 4 092 455 3 277 770Acceptable risk / performing - 400 671 - 400 671 150 805Total 4 092 455 400 671 - 4 493 126 3 428 575 -Probability of default at low risk 0.0% - 0.22% -Probability of default at acceptable risk 0.22% - 7.86%The movement on total balances with central banks is as follows:
31 December 2020 31 December 2019Stage 1
individualStage 2
individual Stage 3 Total Total
JD ‘000 JD ‘000 JD ‘000 JD ‘000 JD ‘000Balance at the beginning of the year 3 277 770 150 805 - 3 428 575 2 987 544New balances (Additions) 1 029 842 249 866 - 1 279 708 543 291Repaid balances (excluding write offs) ( 206 775) - - ( 206 775) ( 101 578)Transfers to stage 2 - - - - - Translation Adjustments ( 8 382) - - ( 8 382) ( 682)Total 4 092 455 400 671 - 4 493 126 3 428 575
The movement of ECL charges on balances with central banks is as follows:
31 December 2020 31 December 2019Stage 1
individualStage 2
individual Stage 3 Total Total
JD ‘000 JD ‘000 JD ‘000 JD ‘000 JD ‘000Balance at the beginning of the year 707 4 267 - 4 974 856 ECL charges during the year 1 013 76 977 - 77 990 4 605Recoveries (excluding write offs) ( 692) - - ( 692) ( 487)Transfers to stage 2 - - - - - Translation Adjustments ( 11) - - ( 11) - Total 1 017 81 244 - 82 261 4 974
8. Balances with Banks and Financial Institutions
Local banks and financial institutions 31 December
2020 2019JD ‘000 JD ‘000
Current accounts 412 769 Time deposits maturing within 3 months 123 896 88 320 Total 124 308 89 089
NOTES TO THE FINANCIAL STATEMENTS

211
Abroad Banks and financial institutions 31 December
2020 2019JD ‘000 JD ‘000
Current accounts 998 295 842 633 Time deposits maturing within 3 months 2 376 584 2 293 515 Certificates of deposit - 39 734 Total 3 374 879 3 175 882
Less: Net ECL Charges ( 485) ( 513)
Total balances with Banks and Financial Institutions Local and Abroad 3 498 702 3 264 458
There are no non-interest bearing balances as of 31 December 2020 and 2019.There are no restricted balances as of 31 December 2020 and 2019.
The table below shows the credit quality and the maximum exposure to credit risk based on the bank’s internal credit rating system.
31 December 2020 31 December 2019Stage 1
individualStage 2
individual Stage 3 Total Total
JD ‘000 JD ‘000 JD ‘000 JD ‘000 JD ‘000Low risk / performing 3 288 673 - - 3 288 673 2 782 949Acceptable risk / performing 210 514 - - 210 514 482 022Total 3 499 187 - - 3 499 187 3 264 971
-Probability of default at low risk 0.0% - 0.22% -Probability of default at acceptable risk 0.22% - 7.86%
The movement on total balances with banks and financial institutions is as follows:
31 December 2020 31 December 2019
Stage 1 individual
Stage 2 individual Stage 3 Total Total
JD ‘000 JD ‘000 JD ‘000 JD ‘000 JD ‘000Balance at the beginning of the year 3 264 971 - - 3 264 971 3 209 750
New balances (Additions) 610 258 - - 610 258 617 480Repaid balances (excluding write offs) ( 368 469) - - ( 368 469) ( 561 885)
Translation Adjustments ( 7 573) - - ( 7 573) ( 374)Total 3 499 187 - - 3 499 187 3 264 971
NOTES TO THE FINANCIAL STATEMENTS

212
The movement of ECL charges on balances with banks and financial institutions is as follows:
31 December 2020 31 December 2019Stage 1
individualStage 2
individual Stage 3 Total Total
JD ‘000 JD ‘000 JD ‘000 JD ‘000 JD ‘000Balance at the beginning of the year 513 - - 513 379
ECL charges during the year 776 - - 776 1 135Recoveries (excluding write offs) ( 800) - - ( 800) ( 1 000)Adjustments during the year (2) - - ( 2) - Translation Adjustments (2) - - (2) (1)Total 485 - - 485 513
9. Deposits with Banks and Financial Institutions
The details of this item are as follows:31 December
Deposits with local banks and financial institutions 2020 2019JD '000 JD '000
Time deposits maturing after 6 months and before 9 months 14 576 - Time deposits maturing after 9 months and before one year 19 378 - Time deposits maturing after one year 15 000 118 955 Total 48 954 118 955
31 December Deposits with abroad banks and financial institutions 2020 2019
JD '000 JD '000 Time deposits maturing after 3 months and before 6 months 7 090 6 735 Time deposits maturing after 9 months and before one year 7 880 - Certificate of deposits maturing after 9 months and before one year - 39 734 Total 14 970 46 469
Less: Net ECL Charges ( 473) ( 815)
Total Deposits with banks and financial institutions Local and Abroad 63 451 164 609
There are no restricted deposits as of 31 December 2020 and 2019.
NOTES TO THE FINANCIAL STATEMENTS

213
The movement on total deposits with banks and financial institutions is as follows:
31 December 2020 31 December 2019Stage 1
individualStage 2
individual Stage 3 Total Total
JD '000 JD '000 JD '000 JD '000 JD '000Balance at the beginning of the year 165 424 - - 165 424 132 017
New balances (Additions) 8 234 - - 8 234 40 442Repaid balances (excluding write offs) ( 109 734) - - ( 109 734) ( 7 035)
Total 63 924 - - 63 924 165 424
The movement of ECL charges on Deposits with Banks and Financial Institutions is as follows:
31 December 2020 31 December 2019Stage 1
individualStage 2
individual Stage 3 Total Total
JD '000 JD '000 JD '000 JD '000 JD '000Balance at the beginning of the year 815 - - 815 1 030
ECL charges during the year 194 - - 194 109Recoveries (excluding write offs) ( 538) - - ( 538) ( 323)Adjustments during the year 2 - - 2 - Translation Adjustments - - - - (1)Total 473 - - 473 815
The table below shows the credit quality and the maximum exposure to credit risk based on the bank’s internal credit rating system.
31 December 2020 31 December 2019Stage 1
individualStage 2
individual Stage 3 Total Total
JD '000 JD '000 JD '000 JD '000 JD '000Low risk / performing 63 924 - - 63 924 165 424Acceptable risk / performing - - - - - Total 63 924 - - 63 924 165 424
-Probability of default at low risk 0.0% - 0.22% -Probability of default at acceptable risk 0.22% - 7.86%
NOTES TO THE FINANCIAL STATEMENTS

214
10. Financial Assets at Fair Value through Profit or Loss The details of this item are as follows:
31 December2020 2019
JD ‘000 JD ‘000Treasury bills and Government bonds 47 642 147 100Loans and advances - 21 010Corporate shares 1 015 910 Total 48 657 169 020
2020 Designated as FV
Carried Mandatorily at FV Total
JD ‘000 JD ‘000 JD ‘000 Treasury bills and Government bonds 47 642 - 47 642 Corporate shares - 1 015 1 015 Total 47 642 1 015 48 657
2019 Designated as FV
Carried Mandatorily at FV Total
JD ‘000 JD ‘000 JD ‘000 Treasury bills and Government bonds 147 100 - 147 100 Loans and advances 21 010 - 21 010 Corporate shares - 910 910 Total 168 110 910 169 020
11. Financial Assets at Fair Value through Other Comprehensive Income The details of this item are as follows:
31 December2020 2019
JD ‘000 JD ‘000Quoted shares 67 810 72 290Unquoted shares 86 754 85 474 Total 154 564 157 764
2020 Designated as FV
Carried Mandatorily at FV Total
JD ‘000 JD ‘000 JD ‘000Quoted shares - 67 810 67 810Unquoted shares - 86 754 86 754 Total - 154 564 154 564
2019 Designated as FV
Carried Mandatorily at FV Total
JD ‘000 JD ‘000 JD ‘000Quoted shares - 72 290 72 290Unquoted shares - 85 474 85 474 Total - 157 764 157 764* Cash dividends on the investments above amounted to JD 3.2 million for the year ended 31 December 2020 ( JD 4 million for the year ended 31 December 2019).
NOTES TO THE FINANCIAL STATEMENTS

215
12. Direct Credit Facilities at Amortized CostThe details of this item are as follows: 31 December 2020
Consumer Banking
Corporates Banks and Financial
Institutions
Government and Public
SectorTotalSmall and
Medium Large
JD ‘000 JD ‘000 JD ‘000 JD ‘000 JD ‘000 JD ‘000 Discounted bills * 41 662 34 013 270 813 31 392 103 100 378 911 Overdrafts * 23 070 544 827 2 218 736 2 664 243 159 3 032 456 Loans and advances * 1 284 402 697 351 6 027 897 42 982 487 953 8 540 585 Real-estate loans 1 045 119 1 277 - - - 1 046 396 Credit cards 84 703 - - - - 84 703Total 2 478 956 1 277 468 8 517 446 77 038 732 143 13 083 051 Less: Interest and commission in suspense 49 572 70 062 218 650 34 - 338 318
Provision for impairment - direct credit facilities at amortized cost
138 259 143 937 808 368 2 849 1 858 1 095 271
Total 187 831 213 999 1 027 018 2 883 1 858 1 433 589Net Direct Credit Facilities at Amortized Cost 2 291 125 1 063 469 7 490 428 74 155 730 285 11 649 462
* Net of interest and commission received in advance, which amounted to JD 18.9 million as at 31 December 2020. - Rescheduled loans during the year ended 31 December 2020 amounted to JD 339.5 million. - Retsructured loans (transferred from non performing to watch list loans) amounted to JD 4.2 during the year ended
31 December 2020. - Direct credit facilities granted to and guaranteed by government of Jordan as of 31 December 2020 amounted to JD
55.2 million or 0.42% of total direct credit facilities. - Non-performing direct credit facilities as of 31 December 2020 amounted to JD 1260.3 million or 9.6 % of total direct
credit facilities. - Non-performing direct credit facilities, net of interest and commission in suspense, as of 31 December 2020 amounted
to JD 938.4 million or 7.4 % of direct credit facilities, after deducting interest and commission in suspense.
31 December 2019
Consumer Banking
Corporates Banks and Financial
Institutions
Government and Public
SectorTotalSmall and
Medium Large
JD ‘000 JD ‘000 JD ‘000 JD ‘000 JD ‘000 JD ‘000 Discounted bills * 50 997 50 279 247 005 85 728 - 434 009 Overdrafts * 28 852 580 703 2 148 978 2 540 128 864 2 889 937 Loans and advances * 1 284 307 696 051 6 218 323 42 062 407 172 8 647 915 Real-estate loans 1 059 719 1 328 - - - 1 061 047 Credit cards 85 623 - - - - 85 623Total 2 509 498 1 328 361 8 614 306 130 330 536 036 13 118 531Less: Interest and commission in suspense 42 427 63 455 190 999 38 - 296 919
Provision for impairment - direct credit facilities at amortized cost 90 084 113 500 687 628 3 080 954 895 246
Total 132 511 176 955 878 627 3 118 954 1 192 165Net Direct Credit Facilities at Amortized Cost 2 376 987 1 151 406 7 735 679 127 212 535 082 11 926 366
* Net of interest and commission received in advance, which amounted to JD 24.3 million as at 31 December 2019. - Rescheduled loans during the year ended 31 December 2019 amounted to JD 776.6 million. - There were no Retsructured loans (transferred from non performing to watch list loans) during the year ended 31
December 2019. - Direct credit facilities granted to and guaranteed by government of Jordan as of 31 December 2019 amounted to JD
82.7 million or 0.6% of total direct credit facilities. - Non-performing direct credit facilities as of 31 December 2019 amounted to JD 1032.6 million or 7.9 % of total direct
credit facilities. - Non-performing direct credit facilities, net of interest and commission in suspense, as of 31 December 2019 amounted
to JD 752.4 million or 5.9 % of direct credit facilities, after deducting interest and commission in suspense.
NOTES TO THE FINANCIAL STATEMENTS

216
- The details of movement on the provision for impairment of direct credit facilities at amortized cost are as follows:
31 December 2020
Consumer Banking
Corporates
Banks and Financial
Institutions
Government and Public
SectorTotal
The Total includes
movement on the real-estate loans provision
as follows
Small and Medium Large
JD ‘000 JD ‘000 JD ‘000 JD ‘000 JD ‘000 JD ‘000 JD ‘000Balance at the beginning of the year 90 084 113 500 687 628 3 080 954 895 246 9 878
ECL charges during the year 44 419 32 911 230 807 576 823 309 536 9 055Recoveries ( 9 221) ( 6 418) ( 34 943) ( 557) ( 386) ( 51 525) ( 883)Transferred to Stage 1 ( 393) ( 292) ( 1 641) - ( 79) ( 2 405) ( 72)Transferred to Stage 2 54 ( 1 376) ( 24 425) - 79 ( 25 668) 56Transferred to Stage 3 339 1 668 26 066 - - 28 073 16Impact on year end ECL caused by transfers between stages during the year
14 667 3 441 37 932 - 452 56 492 2 837
Used from provision (written off or transferred to off statement of financial position)
( 2 393) ( 1 075) ( 107 348) - - ( 110 816) ( 39)
Adjsutments during the year (10) 33 ( 8 723) - - ( 8 700) - Translation Adjustments 713 1 545 3 015 ( 250) 15 5 038 10Balance at the End of the Year 138 259 143 937 808 368 2 849 1 858 1 095 271 20 858
The details of movement on the provision for impairment of ECL are as follows:31 December 2019
Consumer Banking
Corporates
Banks and Financial
Institutions
Government and Public
SectorTotal
The Total includes
movement on the real-estate loans provision
as follows
Small and Medium Large
JD ‘000 JD ‘000 JD ‘000 JD ‘000 JD ‘000 JD ‘000 JD ‘000Balance at the beginning of the year 88 291 79 290 699 733 15 2 846 870 175 9 494
ECL charges during the year 18 758 32 396 102 828 580 358 154 920 2 376Recoveries ( 11 784) ( 10 348) ( 23 922) ( 28) ( 2 131) ( 48 213) ( 2 149)Transferred to Stage 1 ( 383) ( 158) 1 446 - 141 1 046 15Transferred to Stage 2 ( 924) ( 4 909) ( 24 791) - ( 141) ( 30 765) ( 93)Transferred to Stage 3 1 307 5 067 23 345 - - 29 719 78Impact on year end ECL caused by transfers between stages during the year
4 294 12 011 7 441 - ( 210) 23 536 34
Used from provision (written off or transferred to off statement of financial position)
( 10 400) ( 2 783) ( 97 077) - - ( 110 260) ( 14)
Adjsutments during the year - 435 ( 3 231) 2 500 20 ( 276) 138Translation Adjustments 925 2 499 1 856 13 71 5 364 ( 1)Balance at the End of the Year 90 084 113 500 687 628 3 080 954 895 246 9 878 - There are no provisions no longer required as a result of settlement or repayment, transferred to non-performing direct credit
facilities as of 31 December 2020 and 2019. - Impairment is assessed based on individual customer accounts. * Non-performing direct credit facilities transferred to off statement of financial position amounted to JD 124 million as of 31
December 2020 (JD 108 million as of 31 December 2019) noting that these non-performing direct credit facilities are fully covered by set provisions and suspended interest.
NOTES TO THE FINANCIAL STATEMENTS

217
The following tables outline the impact of multiple scenarios on the ECL (without Consumer):
31 December 2020
Due from Banks
Financial Assets at
amortized Cost
Direct Credit Facilities at Amortized Coatitems off
statement of financial
position
Total Small
and Medium
Corporates
Large Corporates
Banks and Financial
Institutions
Government
and Public Sector
JD ‘000 JD ‘000 JD ‘000 JD ‘000 JD ‘000 JD ‘000 JD ‘000 JD ‘000Upside (15%) 70 932 10 160 689 014 122 685 2 428 1 584 29 690 926 493
Base case (35%) 76 190 10 913 740 090 131 780 2 608 1 701 31 891 995 174
Downside 1 (20%) 88 159 12 628 856 351 152 481 3 018 1 968 36 901 1 151 505
Downside 2 (30%) 94 270 13 503 915 714 163 051 3 227 2 105 39 459 1 231 328
31 December 2019
Due from Banks
Financial Assets at
amortized Cost
Direct Credit Facilities at Amortized Coat
Total Small
and Medium
Corporates
Large Corporates
Banks and Financial
Institutions
Government
and Public Sector
items off statement of financial
positionJD ‘000 JD ‘000 JD ‘000 JD ‘000 JD ‘000 JD ‘000 JD ‘000 JD ‘000
Upside (30%) 5 319 10 003 580 355 95 794 2 600 805 12 904 707 779
Base case (40%) 6 000 11 285 654 712 108 067 2 933 908 14 557 798 462
Downside (30%) 7 687 14 457 838 788 138 451 3 757 1 164 18 650 1 022 954
The following tables outline the impact of multiple scenarios on the ECL (Consumer):31 December 2020 31 December 2019
JD ‘000 JD ‘000Upside (30%) 133 138 87 159Base case (40%) 136 489 89 098Downside (30%) 145 740 94 324The above table shows both the contribution to the total ECL for each probability-weighted scenario, in addition to the total additional impact on the ECL for applying multiple economic scenarios compared to the ECL that would have resulted from applying a 100% weighting to the base case scenario.
NOTES TO THE FINANCIAL STATEMENTS

218
The details of movement on interest and commissions in suspense are as follows:31 December 2020
Consumer Banking
Corporates
Banks and Financial
Institutions
Government and Public
SectorTotal
The total includes
interest and commission in suspense movement
on real-estate loans as follows
Small and Medium Large
JD ‘000 JD ‘000 JD ‘000 JD ‘000 JD ‘000 JD ‘000 JD ‘000Balance at the beginning of the year 42 427 63 455 190 999 38 - 296 919 9 386
Interest and commission suspended during the year 12 657 10 119 56 604 - - 79 380 3 672
Interest and commission in suspense settled (written off or transferred to off statement of financial position)
( 3 020) ( 2 916) ( 18 898) - - ( 24 834) ( 135)
Intrest and commission settled (transferd to revenues) ( 2 516) ( 581) ( 10 124) - - ( 13 221) ( 1 123)
Adjustments during the year - - - - - - - Translation adjustments 24 ( 15) 69 ( 4) - 74 - Balance at the End of the Year 49 572 70 062 218 650 34 - 338 318 11 800
31 December 2019
Consumer Banking
Corporates
Banks and Financial
Institutions
Government and Public
SectorTotal
The total includes
interest and commission in suspnese movement
on real-estate loans as follows
Small and Medium Large
JD ‘000 JD ‘000 JD ‘000 JD ‘000 JD ‘000 JD ‘000 JD ‘000Balance at the beginning of the year 43 819 61 083 147 338 5 639 - 257 879 8 993
Interest and commission suspended during the year 11 904 8 879 48 625 1 121 - 70 529 2 619
Interest and commission in suspense settled (written off or transferred to off statement of financial position)
( 11 076) ( 5 065) ( 2 629) ( 6 762) - ( 25 532) ( 1 157)
Intrest and commission settled (transferd to revenues) ( 2 250) ( 1 580) ( 2 557) - - ( 6 387) ( 1 069)
Adjustments during the year - ( 148) 108 40 - - - Translation adjustments 30 286 114 - - 430 - Balance at the End of the Year 42 427 63 455 190 999 38 - 296 919 9 386
NOTES TO THE FINANCIAL STATEMENTS
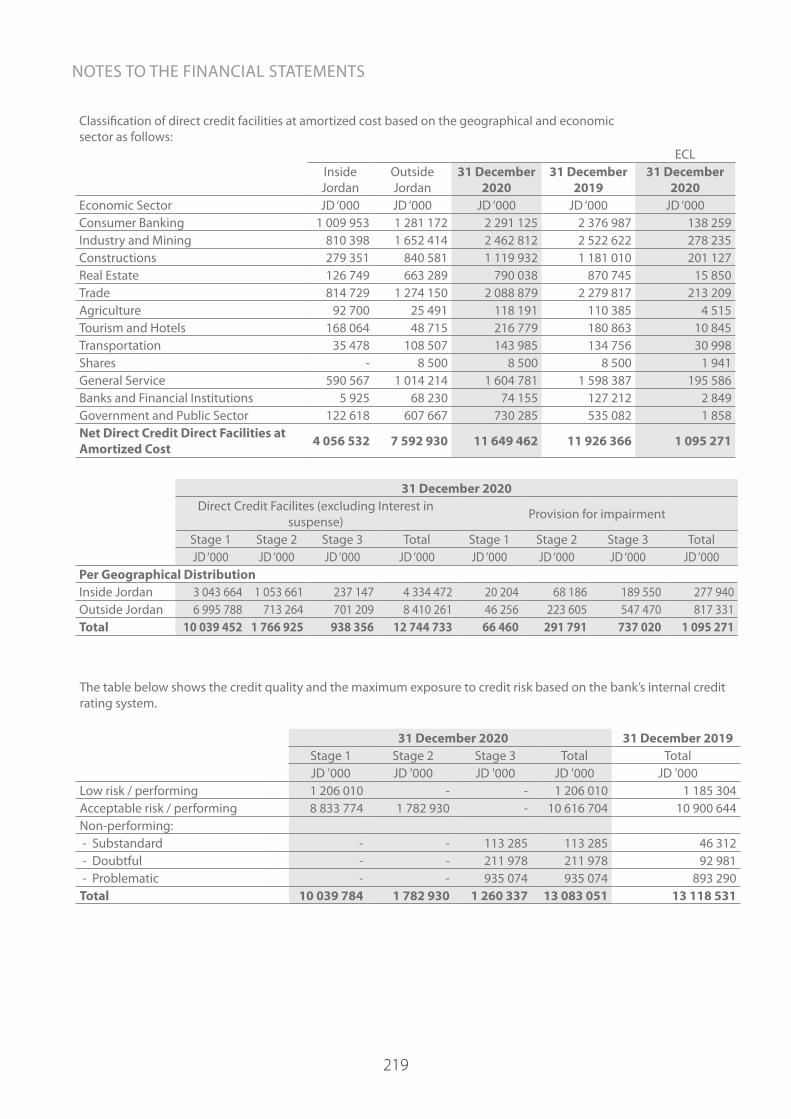
219
Classification of direct credit facilities at amortized cost based on the geographical and economic sector as follows:
ECLInside Jordan
Outside Jordan
31 December 2020
31 December 2019
31 December 2020
Economic Sector JD ‘000 JD ‘000 JD ‘000 JD ‘000 JD ‘000Consumer Banking 1 009 953 1 281 172 2 291 125 2 376 987 138 259Industry and Mining 810 398 1 652 414 2 462 812 2 522 622 278 235Constructions 279 351 840 581 1 119 932 1 181 010 201 127Real Estate 126 749 663 289 790 038 870 745 15 850Trade 814 729 1 274 150 2 088 879 2 279 817 213 209Agriculture 92 700 25 491 118 191 110 385 4 515Tourism and Hotels 168 064 48 715 216 779 180 863 10 845Transportation 35 478 108 507 143 985 134 756 30 998Shares - 8 500 8 500 8 500 1 941General Service 590 567 1 014 214 1 604 781 1 598 387 195 586Banks and Financial Institutions 5 925 68 230 74 155 127 212 2 849Government and Public Sector 122 618 607 667 730 285 535 082 1 858Net Direct Credit Direct Facilities at Amortized Cost 4 056 532 7 592 930 11 649 462 11 926 366 1 095 271
31 December 2020Direct Credit Facilites (excluding Interest in
suspense) Provision for impairment
Stage 1 Stage 2 Stage 3 Total Stage 1 Stage 2 Stage 3 TotalJD ‘000 JD ‘000 JD ‘000 JD ‘000 JD ‘000 JD ‘000 JD ‘000 JD ‘000
Per Geographical DistributionInside Jordan 3 043 664 1 053 661 237 147 4 334 472 20 204 68 186 189 550 277 940Outside Jordan 6 995 788 713 264 701 209 8 410 261 46 256 223 605 547 470 817 331Total 10 039 452 1 766 925 938 356 12 744 733 66 460 291 791 737 020 1 095 271
The table below shows the credit quality and the maximum exposure to credit risk based on the bank’s internal credit rating system.
31 December 2020 31 December 2019Stage 1 Stage 2 Stage 3 Total TotalJD '000 JD '000 JD '000 JD '000 JD '000
Low risk / performing 1 206 010 - - 1 206 010 1 185 304Acceptable risk / performing 8 833 774 1 782 930 - 10 616 704 10 900 644Non-performing: - Substandard - - 113 285 113 285 46 312 - Doubtful - - 211 978 211 978 92 981 - Problematic - - 935 074 935 074 893 290Total 10 039 784 1 782 930 1 260 337 13 083 051 13 118 531
NOTES TO THE FINANCIAL STATEMENTS

220
The movement on total balances of direct credit facilities at amortized cost is as follows:31 December 2020 31 December 2019
Stage 1 individual
Stage 2 individual Stage 3 Total Total
JD '000 JD '000 JD '000 JD '000 JD '000Balance at the beginning of the year 10 611 276 1 474 672 1 032 583 13 118 531 13 301 409New balances (Additions) 3 077 390 261 097 125 875 3 464 362 2 965 962Repaid balances (excluding write offs) (2 980 762) ( 332 470) ( 36 411) (3 349 643) (3 022 461)
Transfers to stage 1 97 296 ( 96 383) ( 913) - - Transfers to stage 2 ( 590 799) 595 628 ( 4 829) - - Transfers to stage 3 ( 159 024) ( 116 338) 275 362 - - Written off balances or transferred to off statement of financial position - ( 404) ( 134 367) ( 134 771) ( 125 533)
Adjustments during the year - - - - - Translation Adjustments ( 15 593) ( 2 872) 3 037 ( 15 428) ( 846)Total 10 039 784 1 782 930 1 260 337 13 083 051 13 118 531
The movement of ECL charges on direct credit facilities at amortized cost is as follows: 31 December 2020 31 December 2019
Stage 1 Stage 2 Stage 3 Total TotalJD '000 JD '000 JD '000 JD '000 JD '000
Balance at the beginning of the year 49 838 213 412 631 996 895 246 870 175 ECL charges during the year 36 682 96 968 175 886 309 536 154 920Recoveries (excluding write offs) ( 18 437) ( 17 083) ( 16 005) ( 51 525) ( 48 213)Transfers to stage 1 2 714 ( 2 710) ( 4) - - Transfers to stage 2 ( 3 689) 3 989 ( 300) - - Transfers to stage 3 ( 1 430) ( 26 947) 28 377 - - Impact on year end ECL caused by transfers between stages during the year
- 25 012 31 480 56 492 23 536
Written off balances or transferred to off statement of financial position - ( 404) ( 110 412) ( 110 816) ( 110 260)
Adjustments during the year ( 64) 59 ( 8 695) ( 8 700) ( 276)Translation Adjustments 846 ( 505) 4 697 5 038 5 364Total 66 460 291 791 737 020 1 095 271 895 246
The table below shows the credit quality and the maximum exposure to credit risk based on the bank’s internal credit rating system.
31 December 2020 31 December 2019Stage 1
CollectiveStage 2
Collective Stage 3 Total Total
JD '000 JD '000 JD '000 JD '000 JD '000Low risk / performing 208 488 - - 208 488 224 942Acceptable risk / performing 2 001 264 83 677 - 2 084 941 2 145 305Non-performing: - Substandard - - 31 024 31 024 20 060 - Doubtful - - 17 498 17 498 16 551 - Problematic - - 137 005 137 005 102 640Total 2 209 752 83 677 185 527 2 478 956 2 509 498
-Probability of default at low risk 2% -3.5% -Probability of default at acceptable risk 3.5% - 57% -Probability of default at High risk 100%
NOTES TO THE FINANCIAL STATEMENTS

221
The movement on total balances of direct credit facilities at amortized cost - consumer banking is as follows:31 December 2020 31 December 2019
Stage 1 Collective
Stage 2 Collective Stage 3 Total Total
JD '000 JD '000 JD '000 JD '000 JD '000Balance at the beginning of the year 2 326 958 43 289 139 251 2 509 498 2 437 542New balances (Additions) 271 866 36 261 37 440 345 567 461 803Repaid balances (excluding write offs) ( 350 979) ( 11 603) ( 8 402) ( 370 984) ( 373 648)
Transfers to stage 1 1 972 ( 1 063) ( 909) - - Transfers to stage 2 ( 18 957) 20 401 ( 1 444) - - Transfers to stage 3 ( 21 355) ( 3 609) 24 964 - - Written off balances or transferred to off statement of financial position - - ( 5 397) ( 5 397) ( 16 184)
Adjustments during the year - - - - - Translation Adjustments 247 1 24 272 ( 15)Total 2 209 752 83 677 185 527 2 478 956 2 509 498
The movement of ECL charges on direct credit facilities at amortized cost - consumer banking is as follows:31 December 2020 31 December 2019
Stage 1 Collective
Stage 2 Collective Stage 3 Total Total
JD '000 JD '000 JD '000 JD '000 JD '000Balance at the beginning of the year 9 343 2 575 78 166 90 084 88 291 ECL charges during the year 10 611 6 813 26 995 44 419 18 758Recoveries (excluding write offs) ( 2 996) ( 1 564) ( 4 661) ( 9 221) ( 11 784)Transfers to stage 1 8 ( 4) ( 4) - - Transfers to stage 2 ( 151) 308 ( 157) - - Transfers to stage 3 ( 250) ( 250) 500 - - Impact on year end ECL caused by transfers between stages during the year
- 4 134 10 533 14 667 4 294
Written off balances or transferred to off statement of financial position - - ( 2 393) ( 2 393) ( 10 400)
Adjustments during the year ( 10) ( 2) 2 ( 10) - Translation Adjustments 18 5 690 713 925Total 16 573 12 015 109 671 138 259 90 084
Direct Credit Facilities at Amortized Cost - Small & Medium EnterprisesThe table below shows the credit quality and the maximum exposure to credit risk based on the bank’s internal credit rating system.
31 December 2020 31 December 2019Stage 1 Stage 2 Stage 3 Total TotalJD '000 JD '000 JD '000 JD '000 JD '000
Low risk / performing 126 289 - - 126 289 154 357Acceptable risk / performing 731 369 228 276 - 959 645 992 149Non-performing: - Substandard - - 2 812 2 812 11 260 - Doubtful - - 5 600 5 600 18 872 - Problematic - - 183 122 183 122 151 723Total 857 658 228 276 191 534 1 277 468 1 328 361
-Probability of default at low risk 0.0% -0.12% -Probability of default at acceptable risk 0.12% - 24% -Probability of default at High risk 100%
NOTES TO THE FINANCIAL STATEMENTS

222
The movement on total balances of direct credit facilities at amortized cost - Small & Medium Enterprises is as follows:31 December 2020 31 December 2019
Stage 1 Stage 2 Stage 3 Total TotalJD '000 JD '000 JD '000 JD '000 JD '000
Balance at the beginning of the year 956 205 190 301 181 855 1 328 361 1 307 221New balances (Additions) 199 811 27 643 10 925 238 379 384 235Repaid balances (excluding write offs) ( 242 872) ( 33 845) ( 7 936) ( 284 653) ( 359 841)
Transfers to stage 1 28 355 ( 28 351) ( 4) - - Transfers to stage 2 ( 80 014) 80 310 (296) - - Transfers to stage 3 ( 2 409) ( 7 757) 10 166 - - Written off balances or transferred to off statement of financial position - - ( 3 646) ( 3 646) ( 3 983)
Adjustments during the year - - - - - Translation Adjustments ( 1 418) ( 25) 470 ( 973) 729Total 857 658 228 276 191 534 1 277 468 1 328 361
The movement of ECL charges on direct credit facilities at amortized cost - Small & Medium Enterprises is as follows.31 December 2020 31 December 2019
Stage 1 Stage 2 Stage 3 Total TotalJD '000 JD '000 JD '000 JD '000 JD '000
Balance at the beginning of the year 4 677 19 646 89 177 113 500 79 290
ECL charges during the year 2 795 16 471 13 645 32 911 32 396Recoveries (excluding write offs) ( 1 882) ( 650) ( 3 886) ( 6 418) ( 10 348)Transfers to stage 1 193 ( 193) - - Transfers to stage 2 ( 471) 483 ( 12) - - Transfers to stage 3 ( 14) ( 1 666) 1 680 - - Impact on year end ECL caused by transfers between stages during the year
2 274 1 167 3 441 12 011
Written off balances or transferred to off statement of financial position
- - ( 1 075) ( 1 075) ( 2 783)
Adjustments during the year ( 28) 61 - 33 435Translation Adjustments ( 9) - 1 554 1 545 2 499Total 5 261 36 426 102 250 143 937 113 500
Direct Credit Facilities at Amortized Cost - Large CorporatesThe table below shows the credit quality and the maximum exposure to credit risk based on the bank’s internal credit rating system..
31 December 2020 31 December 2019Stage 1 Stage 2 Stage 3 Total TotalJD '000 JD '000 JD '000 JD '000 JD '000
Low risk / performing 435 391 - - 435 391 497 435Acceptable risk / performing 5 810 456 1 390 987 - 7 201 443 7 407 934Non-performing: - Substandard - - 79 449 79 449 14 992 - Doubtful - - 188 880 188 880 57 558 - Problematic - - 612 283 612 283 636 387Total 6 245 847 1 390 987 880 612 8 517 446 8 614 306
-Probability of default at low risk 0.0% -0.12%-Probability of default at acceptable risk 0.12% - 24%-Probability of default at High risk 100%
NOTES TO THE FINANCIAL STATEMENTS
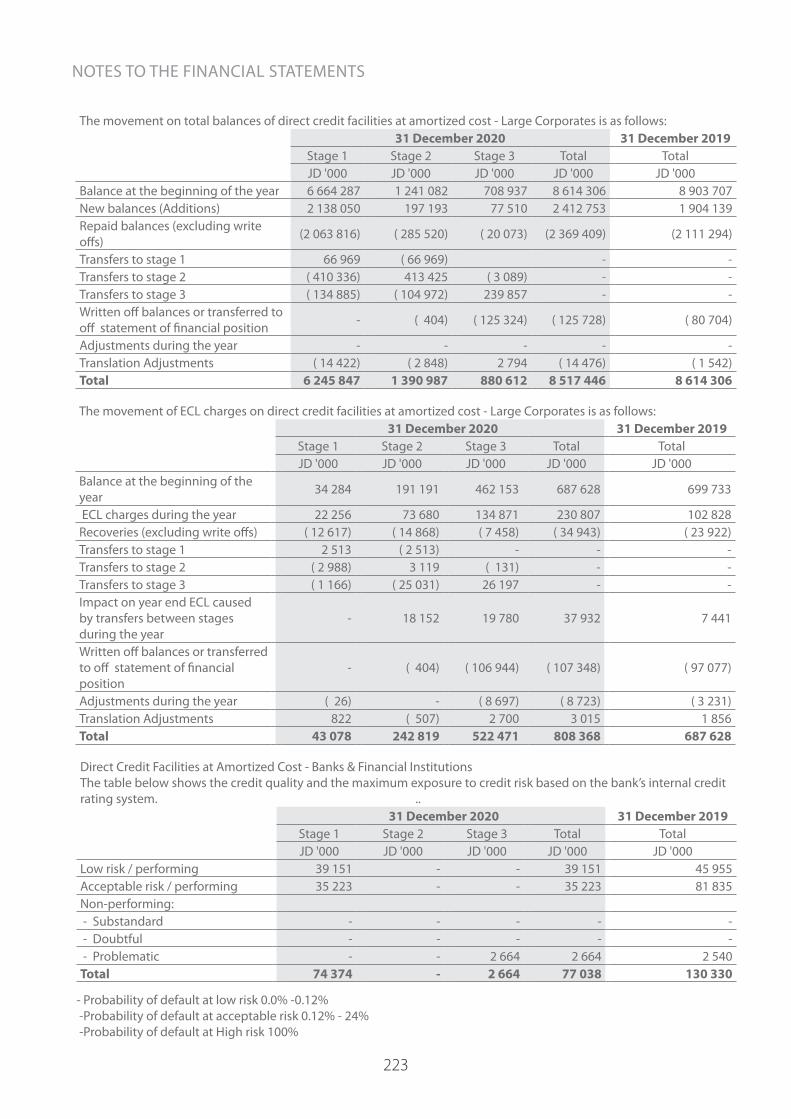
223
The movement on total balances of direct credit facilities at amortized cost - Large Corporates is as follows:31 December 2020 31 December 2019
Stage 1 Stage 2 Stage 3 Total TotalJD '000 JD '000 JD '000 JD '000 JD '000
Balance at the beginning of the year 6 664 287 1 241 082 708 937 8 614 306 8 903 707New balances (Additions) 2 138 050 197 193 77 510 2 412 753 1 904 139Repaid balances (excluding write offs) (2 063 816) ( 285 520) ( 20 073) (2 369 409) (2 111 294)
Transfers to stage 1 66 969 ( 66 969) - - Transfers to stage 2 ( 410 336) 413 425 ( 3 089) - - Transfers to stage 3 ( 134 885) ( 104 972) 239 857 - - Written off balances or transferred to off statement of financial position - ( 404) ( 125 324) ( 125 728) ( 80 704)
Adjustments during the year - - - - - Translation Adjustments ( 14 422) ( 2 848) 2 794 ( 14 476) ( 1 542)Total 6 245 847 1 390 987 880 612 8 517 446 8 614 306
The movement of ECL charges on direct credit facilities at amortized cost - Large Corporates is as follows:31 December 2020 31 December 2019
Stage 1 Stage 2 Stage 3 Total TotalJD '000 JD '000 JD '000 JD '000 JD '000
Balance at the beginning of the year 34 284 191 191 462 153 687 628 699 733
ECL charges during the year 22 256 73 680 134 871 230 807 102 828Recoveries (excluding write offs) ( 12 617) ( 14 868) ( 7 458) ( 34 943) ( 23 922)Transfers to stage 1 2 513 ( 2 513) - - - Transfers to stage 2 ( 2 988) 3 119 ( 131) - - Transfers to stage 3 ( 1 166) ( 25 031) 26 197 - - Impact on year end ECL caused by transfers between stages during the year
- 18 152 19 780 37 932 7 441
Written off balances or transferred to off statement of financial position
- ( 404) ( 106 944) ( 107 348) ( 97 077)
Adjustments during the year ( 26) - ( 8 697) ( 8 723) ( 3 231)Translation Adjustments 822 ( 507) 2 700 3 015 1 856Total 43 078 242 819 522 471 808 368 687 628
Direct Credit Facilities at Amortized Cost - Banks & Financial InstitutionsThe table below shows the credit quality and the maximum exposure to credit risk based on the bank’s internal credit rating system. ..
31 December 2020 31 December 2019Stage 1 Stage 2 Stage 3 Total TotalJD '000 JD '000 JD '000 JD '000 JD '000
Low risk / performing 39 151 - - 39 151 45 955Acceptable risk / performing 35 223 - - 35 223 81 835Non-performing: - Substandard - - - - - - Doubtful - - - - - - Problematic - - 2 664 2 664 2 540Total 74 374 - 2 664 77 038 130 330
- Probability of default at low risk 0.0% -0.12% -Probability of default at acceptable risk 0.12% - 24% -Probability of default at High risk 100%
NOTES TO THE FINANCIAL STATEMENTS
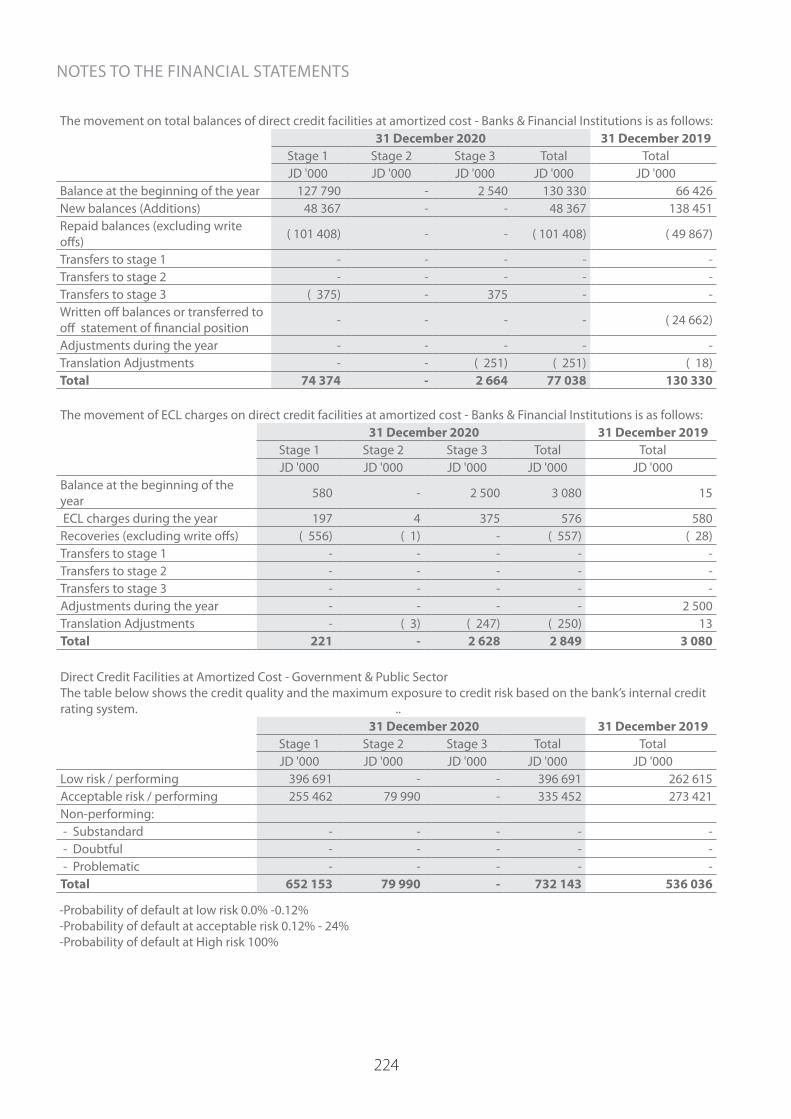
224
The movement on total balances of direct credit facilities at amortized cost - Banks & Financial Institutions is as follows:31 December 2020 31 December 2019
Stage 1 Stage 2 Stage 3 Total TotalJD '000 JD '000 JD '000 JD '000 JD '000
Balance at the beginning of the year 127 790 - 2 540 130 330 66 426New balances (Additions) 48 367 - - 48 367 138 451Repaid balances (excluding write offs) ( 101 408) - - ( 101 408) ( 49 867)
Transfers to stage 1 - - - - - Transfers to stage 2 - - - - - Transfers to stage 3 ( 375) - 375 - - Written off balances or transferred to off statement of financial position - - - - ( 24 662)
Adjustments during the year - - - - - Translation Adjustments - - ( 251) ( 251) ( 18)Total 74 374 - 2 664 77 038 130 330
The movement of ECL charges on direct credit facilities at amortized cost - Banks & Financial Institutions is as follows:31 December 2020 31 December 2019
Stage 1 Stage 2 Stage 3 Total TotalJD '000 JD '000 JD '000 JD '000 JD '000
Balance at the beginning of the year 580 - 2 500 3 080 15
ECL charges during the year 197 4 375 576 580Recoveries (excluding write offs) ( 556) ( 1) - ( 557) ( 28)Transfers to stage 1 - - - - - Transfers to stage 2 - - - - - Transfers to stage 3 - - - - - Adjustments during the year - - - - 2 500Translation Adjustments - ( 3) ( 247) ( 250) 13Total 221 - 2 628 2 849 3 080
Direct Credit Facilities at Amortized Cost - Government & Public SectorThe table below shows the credit quality and the maximum exposure to credit risk based on the bank’s internal credit rating system. ..
31 December 2020 31 December 2019Stage 1 Stage 2 Stage 3 Total TotalJD '000 JD '000 JD '000 JD '000 JD '000
Low risk / performing 396 691 - - 396 691 262 615Acceptable risk / performing 255 462 79 990 - 335 452 273 421Non-performing: - Substandard - - - - - - Doubtful - - - - - - Problematic - - - - - Total 652 153 79 990 - 732 143 536 036
-Probability of default at low risk 0.0% -0.12% -Probability of default at acceptable risk 0.12% - 24% -Probability of default at High risk 100%
NOTES TO THE FINANCIAL STATEMENTS

225
The movement of ECL charges on direct credit facilities at amortized cost - Government & Public Sector is as follows:31 December 2020 31 December 2019
Stage 1 Stage 2 Stage 3 Total TotalJD '000 JD '000 JD '000 JD '000 JD '000
Balance at the beginning of the year 954 - - 954 2 846 ECL charges during the year 823 - - 823 358Recoveries (excluding write offs) ( 386) - - ( 386) ( 2 131)Transfers to stage 1 - - - - - Transfers to stage 2 ( 79) 79 - - - Transfers to stage 3 - - - - - Impact on year end ECL caused by transfers between stages during the year
- 452 - 452 ( 210)
Written off balances or transferred to off statement of financial position - - - - -
Adjustments during the year - - - - 20Translation Adjustments 15 - - 15 71Total 1 327 531 - 1 858 954
The movement on total balances of direct credit facilities at amortized cost - Government & Public Sector is as follows:31 December 2020 31 December 2019
Stage 1 Stage 2 Stage 3 Total TotalJD '000 JD '000 JD '000 JD '000 JD '000
Balance at the beginning of the year 536 036 - - 536 036 586 513New balances (Additions) 419 296 - - 419 296 77 334Repaid balances (excluding write offs) ( 221 687) ( 1 502) - ( 223 189) ( 127 811)
Transfers to stage 1 - - - Transfers to stage 2 ( 81 492) 81 492 - - - Transfers to stage 3 - - - - - Written off balances or transferred to off statement of financial position - - - - -
Adjustments during the year - - - - - Translation Adjustments - - - - - Total 652 153 79 990 - 732 143 536 036
13. Other Financial Assets at Amortized Cost The details of this item are as follows: 31 December
2020 2019JD ‘000 JD ‘000
Treasury bills 1 324 645 1 523 510Government bonds and bonds guaranteed by the government 3 534 493 3 233 664Corporate bonds 231 483 438 418Less: Net ECL Charges ( 11 920) ( 11 852) Total 5 078 701 5 183 740
NOTES TO THE FINANCIAL STATEMENTS

226
Analysis of bonds based on interest nature:31 December
2020 2019JD ‘000 JD ‘000
Floating interest rate 83 856 172 248Fixed interest rate 5 006 765 5 023 344 Total 5 090 621 5 195 592
Less: Net ECL Charges ( 11 920) ( 11 852)Grand Total 5 078 701 5 183 740
Analysis of financial assets based on market quotation:31 December
2020 2019 Financial assets quoted in the market: JD ‘000 JD ‘000
Treasury bills 146 429 470 650Government bonds and bonds guaranteed by the government 575 622 503 577Corporate bonds 178 147 386 033 Total 900 198 1 360 260
31 December2020 2019
Financial assets unquoted in the market: JD ‘000 JD ‘000
Treasury bills 1 178 216 1 052 860Government bonds and bonds guaranteed by the government 2 958 871 2 730 087Corporate bonds 53 336 52 385 Total 4 190 423 3 835 332
Less: Net ECL Charges ( 11 920) ( 11 852)
Grand Total 5 078 701 5 183 740
Other Financial Assets at Amortized Cost The table below shows the credit quality and the maximum exposure to credit risk based on the bank’s internal credit rating system. . ..
31 December 2020 31 December 2019Stage 1 Stage 2 Stage 3 Total TotalJD '000 JD '000 JD '000 JD '000 JD '000
Low risk / performing 4 934 916 - - 4 934 916 5 118 173Acceptable risk / performing 74 695 81 010 - 155 705 74 587Non-performing: - Substandard - - - - - - Doubtful - - - - - - Problematic - - - - 2 832Total 5 009 611 81 010 - 5 090 621 5 195 592
-Probability of default at low risk 0.0% -0.9% -Probability of default at acceptable risk 0.9% - 40.2% -Probability of default at High risk 100%
NOTES TO THE FINANCIAL STATEMENTS
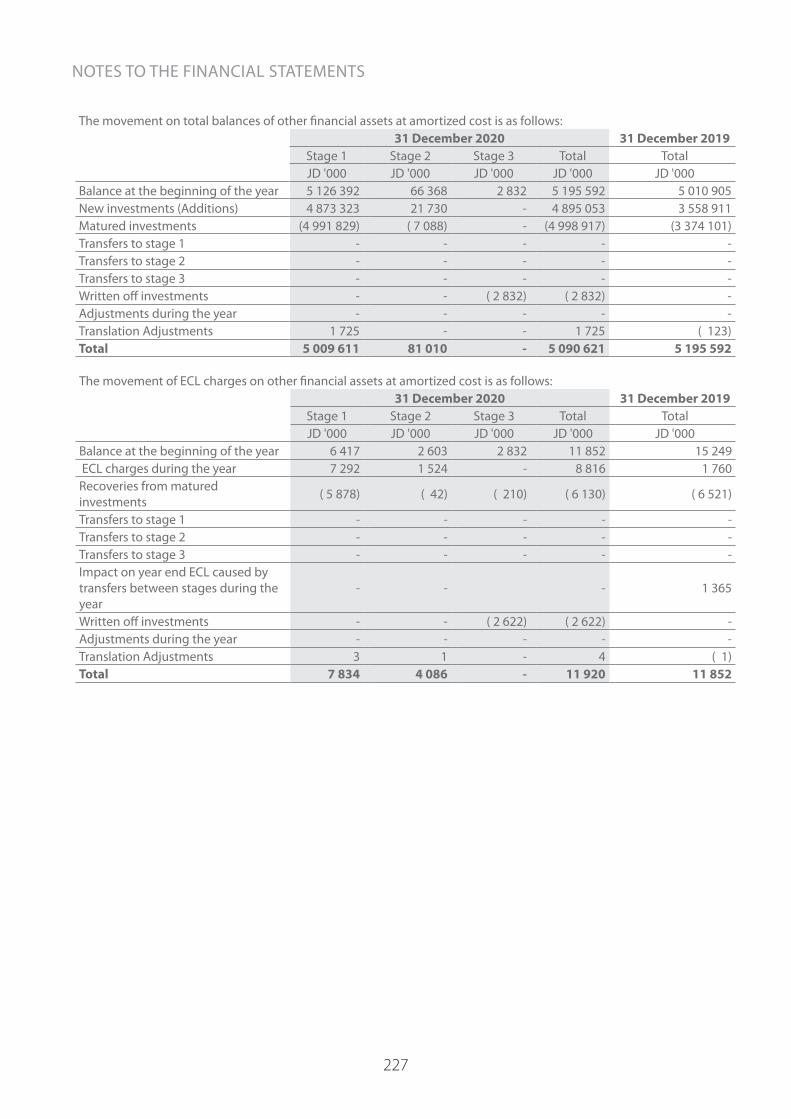
227
The movement on total balances of other financial assets at amortized cost is as follows:31 December 2020 31 December 2019
Stage 1 Stage 2 Stage 3 Total TotalJD '000 JD '000 JD '000 JD '000 JD '000
Balance at the beginning of the year 5 126 392 66 368 2 832 5 195 592 5 010 905New investments (Additions) 4 873 323 21 730 - 4 895 053 3 558 911Matured investments (4 991 829) ( 7 088) - (4 998 917) (3 374 101)Transfers to stage 1 - - - - - Transfers to stage 2 - - - - - Transfers to stage 3 - - - - - Written off investments - - ( 2 832) ( 2 832) - Adjustments during the year - - - - - Translation Adjustments 1 725 - - 1 725 ( 123)Total 5 009 611 81 010 - 5 090 621 5 195 592
The movement of ECL charges on other financial assets at amortized cost is as follows:31 December 2020 31 December 2019
Stage 1 Stage 2 Stage 3 Total TotalJD '000 JD '000 JD '000 JD '000 JD '000
Balance at the beginning of the year 6 417 2 603 2 832 11 852 15 249 ECL charges during the year 7 292 1 524 - 8 816 1 760Recoveries from matured investments ( 5 878) ( 42) ( 210) ( 6 130) ( 6 521)
Transfers to stage 1 - - - - - Transfers to stage 2 - - - - - Transfers to stage 3 - - - - - Impact on year end ECL caused by transfers between stages during the year
- - - 1 365
Written off investments - - ( 2 622) ( 2 622) - Adjustments during the year - - - - - Translation Adjustments 3 1 - 4 ( 1)Total 7 834 4 086 - 11 920 11 852
NOTES TO THE FINANCIAL STATEMENTS

228
14. Investment in Subsidiaries and Associates The details of this item are as follows:
31 December 2020Place of
Incorporation Principal activity Date of Ownership
Ownership and Voting
RightCost
% JD ‘000The Bank‘s investments in subsidiaries: Europe Arab Bank plc 100 496 655 U.K. Banking 2006 Arab Bank Australia Limited 100 65 166 Australia Banking 1994 Islamic International Arab Bank 100 73 500 Jordan Banking 1997 Arab National Leasing Company Ltd 100 15 000 Jordan Finance leasing 1996 Al-Arabi Investment Group Ltd 100 8 900 Jordan Financial services 1996 Arab Sudanese Bank Limited 100 1 512 Sudan Banking 2008 Al Arabi Investment Group Limited - Palestine 100 1 600 Palestine Financial services 2009
Arab Tunisian Bank 64.24 38 220 Tunisia Banking 1982 Arab Bank Syria 51.29 2 001 Syria Banking 2005 Al-Nisr Al Arabi plc 50.00 11 250 Jordan Insurance 2006 Other 18 537 Total 732 341The Bank‘s investments in associates Oman Arab Bank 49.00 174 802 Oman Banking 1984 Arab National Bank 40.00 161 534 Saudi Arabia Banking 1979 Arabia Insurance Company S.A.L 42.51 5 324 Lebanon Insurance 1972
Commercial Building Company S.A.L 35.39 380 Lebanon Real estate operating leasing 1966
Total 342 040 Grand Total 1 074 381
The details of this item are as follows: 31 December 2019
Place of Incorporation Principal activity Date of
OwnershipOwnership and Voting
RightCost
% JD ‘000The Bank‘s investments in subsidiaries: Europe Arab Bank plc 100 453 070 U.K. Banking 2006 Arab Bank Australia Limited 100 59 288 Australia Banking 1994 Islamic International Arab Bank 100 73 500 Jordan Banking 1997 Arab National Leasing Company Ltd 100 15 000 Jordan Finance leasing 1996 Al-Arabi Investment Group Ltd 100 8 900 Jordan Financial services 1996 Arab Sudanese Bank Limited 100 1 848 Sudan Banking 2008 Al Arabi Investment Group Limited - Palestine 100 1 600 Palestine Financial services 2009
Arab Tunisian Bank 64.24 36 449 Tunisia Banking 1982 Arab Bank Syria 51.29 4 718 Syria Banking 2005 Al-Nisr Al Arabi plc 50.00 11 250 Jordan Insurance 2006 Other 12 863 Total 678 486The Bank‘s investments in associates Oman Arab Bank 49.00 75 800 Oman Banking 1984 Arab National Bank 40.00 161 534 Saudi Arabia Banking 1979 Arabia Insurance Company S.A.L 42.51 5 324 Lebanon Insurance 1972
Commercial Building Company S.A.L 35.24 380 Lebanon Real estate operating leasing 1966
Total 243 038 Grand Total 921 524
NOTES TO THE FINANCIAL STATEMENTS

229
The details of movement on investments in associates and subsidiares are as follows:31 December
2020 2019JD ‘000 JD ‘000
Balance at the beginning of the year 921 524 912 182Purchase of additional investments 104 674 16 630Translation adjustment 48 183 ( 7 288)Balance at the End of the Year 1 074 381 921 524
15. Fixed AssetsThe details of this item are as follows:
Land BuildingsFurniture,
Fixtures and Equipment
Computers and Communication
Equipment
Motor Vehicles Others Total
JD ‘000 JD ‘000 JD ‘000 JD ‘000 JD ‘000 JD ‘000 JD ‘000
Historical Cost : Balance as of 1 January 2019 39 738 207 834 130 489 73 663 6 859 27 558 486 141 Additions - 14 068 4 331 11 795 735 2 006 32 935 Disposals ( 1 498) - ( 1 630) ( 4 652) ( 509) ( 2 853) ( 11 142) Adjustments during the year - - - - - - - Translation adjustments ( 19) ( 147) ( 22) ( 36) ( 2) ( 4) ( 230) Balance as of 31 December 2019 38 221 221 755 133 168 80 770 7 083 26 707 507 704
Additions 20 992 17 326 24 871 10 682 115 2 650 76 636 Disposals ( 64) ( 53 240) ( 550) ( 213) ( 16) ( 1 163) ( 55 246) Adjustments during the year - - - - - - - Translation adjustments ( 231) ( 1 442) 103 267 ( 5) ( 45) ( 1 353)Balance as of 31 December 2020 58 918 184 399 157 592 91 506 7 177 28 149 527 741
Accumulated Depreciation : Balance as of 1 January 2019 - 80 047 105 456 54 335 5 067 16 956 261 861 Depreciation charge for the year - 4 810 6 644 10 132 588 2 926 25 100
Disposals - - ( 1 576) ( 4 510) ( 509) ( 1 302) ( 7 897) Adjustments during the year - 38 ( 19) ( 19) - - - Translation adjustments - ( 42) ( 12) ( 27) ( 2) - ( 83)Balance as of 31 December 2019 - 84 853 110 493 59 911 5 144 18 580 278 981
Depreciation charge for the year - 4 884 7 076 9 834 622 2 565 24 981
Disposals - ( 2) ( 542) ( 207) ( 16) ( 951) ( 1 718) Adjustments during the year - - - - - - - Translation adjustments - 141 115 235 ( 8) ( 8) 475Balance as of 31 December 2020 - 89 876 117 142 69 773 5 742 20 186 302 719
Net Book Value as of 31 December 2020 58 918 94 523 40 450 21 733 1 435 7 963 225 022
Net Book Value as of 31 December 2019 38 221 136 902 22 675 20 859 1 939 8 127 228 723
The cost of the fully depreciated fixed assets amounted to JD 175.2 million as of 31 December 2020 (JD 152.7 million as of 31 December 2019).
NOTES TO THE FINANCIAL STATEMENTS
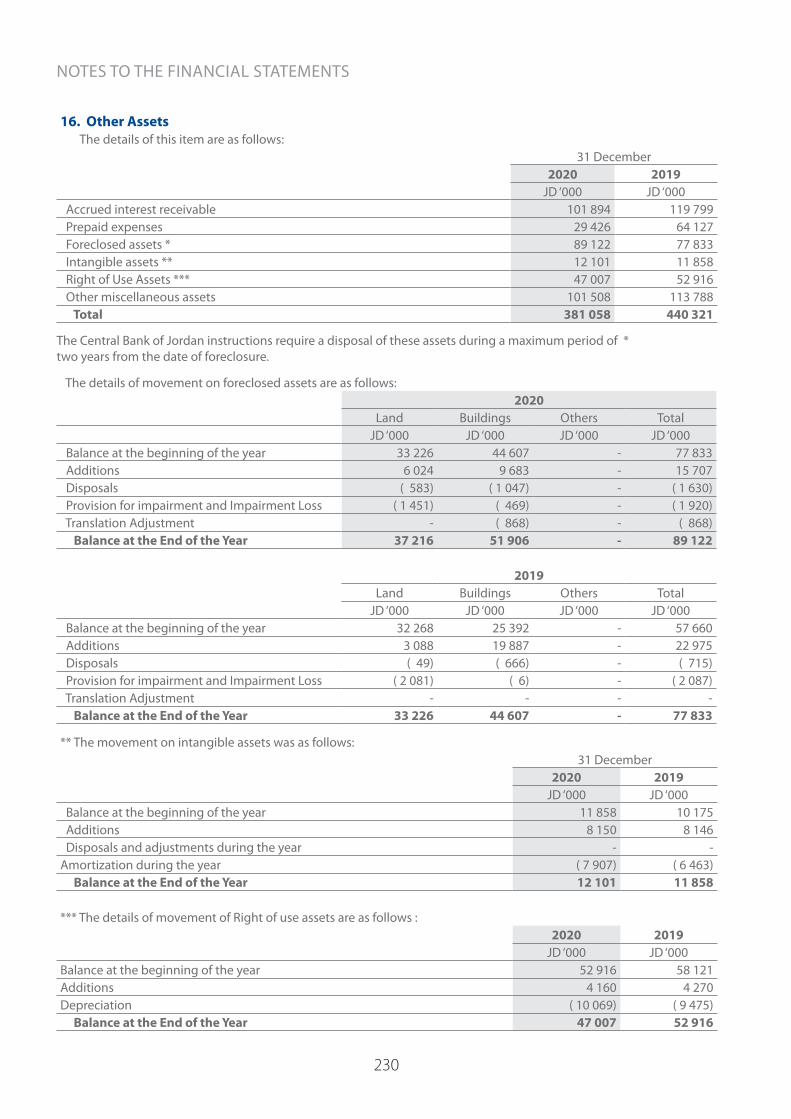
230
16. Other Assets The details of this item are as follows:
31 December 2020 2019
JD ‘000 JD ‘000 Accrued interest receivable 101 894 119 799 Prepaid expenses 29 426 64 127 Foreclosed assets * 89 122 77 833 Intangible assets ** 12 101 11 858 Right of Use Assets *** 47 007 52 916 Other miscellaneous assets 101 508 113 788 Total 381 058 440 321
The Central Bank of Jordan instructions require a disposal of these assets during a maximum period of * two years from the date of foreclosure.
The details of movement on foreclosed assets are as follows:2020
Land Buildings Others TotalJD ‘000 JD ‘000 JD ‘000 JD ‘000
Balance at the beginning of the year 33 226 44 607 - 77 833 Additions 6 024 9 683 - 15 707 Disposals ( 583) ( 1 047) - ( 1 630) Provision for impairment and Impairment Loss ( 1 451) ( 469) - ( 1 920) Translation Adjustment - ( 868) - ( 868) Balance at the End of the Year 37 216 51 906 - 89 122
2019Land Buildings Others Total
JD ‘000 JD ‘000 JD ‘000 JD ‘000 Balance at the beginning of the year 32 268 25 392 - 57 660 Additions 3 088 19 887 - 22 975 Disposals ( 49) ( 666) - ( 715) Provision for impairment and Impairment Loss ( 2 081) ( 6) - ( 2 087) Translation Adjustment - - - - Balance at the End of the Year 33 226 44 607 - 77 833
** The movement on intangible assets was as follows:31 December
2020 2019JD ‘000 JD ‘000
Balance at the beginning of the year 11 858 10 175 Additions 8 150 8 146 Disposals and adjustments during the year - - Amortization during the year ( 7 907) ( 6 463) Balance at the End of the Year 12 101 11 858
*** The details of movement of Right of use assets are as follows : 2020 2019
JD ‘000 JD ‘000Balance at the beginning of the year 52 916 58 121Additions 4 160 4 270Depreciation ( 10 069) ( 9 475) Balance at the End of the Year 47 007 52 916
NOTES TO THE FINANCIAL STATEMENTS
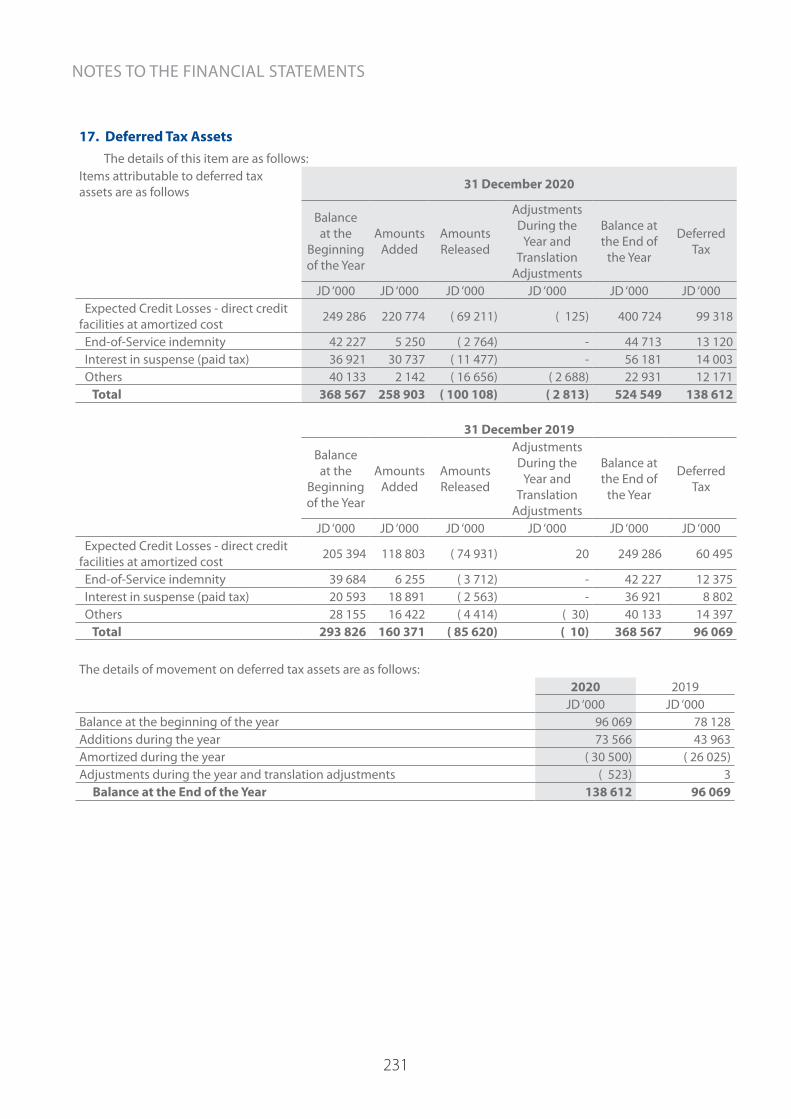
231
17. Deferred Tax Assets The details of this item are as follows:Items attributable to deferred tax assets are as follows 31 December 2020
Balance at the
Beginning of the Year
Amounts Added
Amounts Released
Adjustments During the
Year and Translation
Adjustments
Balance at the End of
the Year
Deferred Tax
JD ‘000 JD ‘000 JD ‘000 JD ‘000 JD ‘000 JD ‘000 Expected Credit Losses - direct credit facilities at amortized cost 249 286 220 774 ( 69 211) ( 125) 400 724 99 318
End-of-Service indemnity 42 227 5 250 ( 2 764) - 44 713 13 120 Interest in suspense (paid tax) 36 921 30 737 ( 11 477) - 56 181 14 003 Others 40 133 2 142 ( 16 656) ( 2 688) 22 931 12 171 Total 368 567 258 903 ( 100 108) ( 2 813) 524 549 138 612
31 December 2019
Balance at the
Beginning of the Year
Amounts Added
Amounts Released
Adjustments During the
Year and Translation
Adjustments
Balance at the End of
the Year
Deferred Tax
JD ‘000 JD ‘000 JD ‘000 JD ‘000 JD ‘000 JD ‘000 Expected Credit Losses - direct credit facilities at amortized cost 205 394 118 803 ( 74 931) 20 249 286 60 495
End-of-Service indemnity 39 684 6 255 ( 3 712) - 42 227 12 375 Interest in suspense (paid tax) 20 593 18 891 ( 2 563) - 36 921 8 802 Others 28 155 16 422 ( 4 414) ( 30) 40 133 14 397 Total 293 826 160 371 ( 85 620) ( 10) 368 567 96 069
The details of movement on deferred tax assets are as follows:2020 2019
JD ‘000 JD ‘000Balance at the beginning of the year 96 069 78 128Additions during the year 73 566 43 963Amortized during the year ( 30 500) ( 26 025)Adjustments during the year and translation adjustments ( 523) 3 Balance at the End of the Year 138 612 96 069
NOTES TO THE FINANCIAL STATEMENTS

232
18. Banks and Financial Institutions Deposits The details of this item are as follows:
31 December 2020 31 December 2019
Inside Jordan Outside Jordan Total Inside Jordan Outside
Jordan Total
JD ‘000 JD ‘000 JD ‘000 JD ‘000 JD ‘000 JD ‘000 Current and demand 16 166 132 728 148 894 21 737 68 200 89 937 Time deposits 74 352 1 807 818 1 882 170 96 918 1 794 060 1 890 978 Total 90 518 1 940 546 2 031 064 118 655 1 862 260 1 980 915
19. Customer Deposits The details of this item are as follows:
31 December 2020
Consumer BankingCorporates
Government and public sector TotalSmall and
medium Large
JD ‘000 JD ‘000 JD ‘000 JD ‘000 JD ‘000 Current and demand 4 640 799 1 220 147 1 442 339 95 222 7 398 507 Savings 1 878 709 6 244 2 507 31 1 887 491 Time and notice 4 882 846 637 722 1 943 776 1 386 444 8 850 788 Certificates of deposit 346 378 411 161 - 346 950 Total 11 748 732 1 864 524 3 388 783 1 481 697 18 483 736
31 December 2019
Consumer BankingCorporates
Government and public sector TotalSmall and
medium Large
JD ‘000 JD ‘000 JD ‘000 JD ‘000 JD ‘000 Current and demand 4 000 946 1 041 507 1 203 639 113 364 6 359 456 Savings 1 657 559 7 504 3 115 30 1 668 208 Time and notice 4 976 078 497 072 2 842 111 796 432 9 111 693 Certificates of deposit 285 786 515 179 - 286 480 Total 10 920 369 1 546 598 4 049 044 909 826 17 425 837- Government of Jordan and Jordanian Public Sector deposits amounted to JD 470.1 million, or 2.5% of total customer
deposits as of 31 December 2020 (JD 429.6 million, or 2.5% of total customer deposits as of 31 December 2019).- Non-interest bearing deposits amounted to JD 6451.3 million, or 34.9% of total customer deposits as of 31 December
2020 (JD 5572.3 million, or 32% of total customer deposits as of 31 December 2019).- Blocked deposits amounted to JD 51.1 million, or 0.28% of total customer deposits as of 31 December 2020 ( JD 70.4
million, or 0.40% of total customer deposits as of 31 December 2019). - Dormant deposits amounted to JD 237.4 million, or 1.3% of total customer deposits as of 31 December 2020 (JD
170.5 million, or 0.98% of total customer deposits as of 31 December 2019).
NOTES TO THE FINANCIAL STATEMENTS
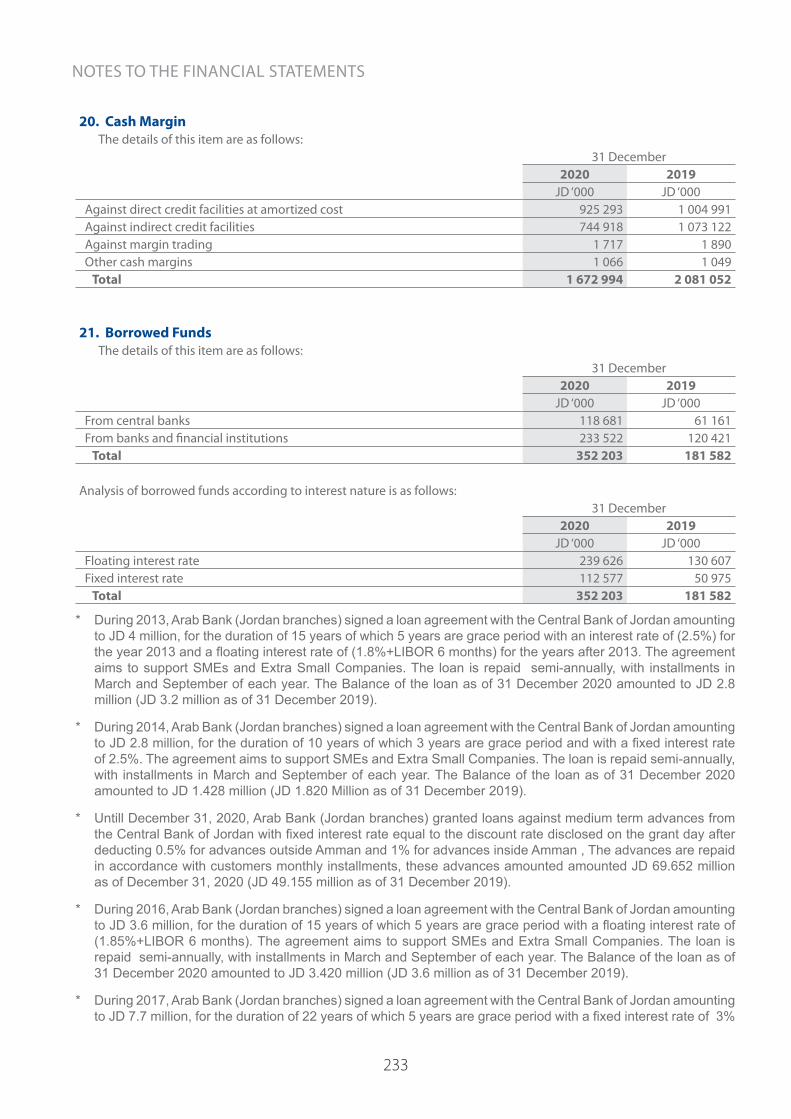
233
20. Cash Margin The details of this item are as follows:
31 December 2020 2019
JD ‘000 JD ‘000 Against direct credit facilities at amortized cost 925 293 1 004 991 Against indirect credit facilities 744 918 1 073 122 Against margin trading 1 717 1 890 Other cash margins 1 066 1 049 Total 1 672 994 2 081 052
21. Borrowed Funds The details of this item are as follows:
31 December 2020 2019
JD ‘000 JD ‘000 From central banks 118 681 61 161 From banks and financial institutions 233 522 120 421 Total 352 203 181 582
Analysis of borrowed funds according to interest nature is as follows:
31 December 2020 2019
JD ‘000 JD ‘000 Floating interest rate 239 626 130 607 Fixed interest rate 112 577 50 975 Total 352 203 181 582
* During 2013, Arab Bank (Jordan branches) signed a loan agreement with the Central Bank of Jordan amounting to JD 4 million, for the duration of 15 years of which 5 years are grace period with an interest rate of (2.5%) for the year 2013 and a floating interest rate of (1.8%+LIBOR 6 months) for the years after 2013. The agreement aims to support SMEs and Extra Small Companies. The loan is repaid semi-annually, with installments in March and September of each year. The Balance of the loan as of 31 December 2020 amounted to JD 2.8 million (JD 3.2 million as of 31 December 2019).
* During 2014, Arab Bank (Jordan branches) signed a loan agreement with the Central Bank of Jordan amounting to JD 2.8 million, for the duration of 10 years of which 3 years are grace period and with a fixed interest rate of 2.5%. The agreement aims to support SMEs and Extra Small Companies. The loan is repaid semi-annually, with installments in March and September of each year. The Balance of the loan as of 31 December 2020 amounted to JD 1.428 million (JD 1.820 Million as of 31 December 2019).
* Untill December 31, 2020, Arab Bank (Jordan branches) granted loans against medium term advances from the Central Bank of Jordan with fixed interest rate equal to the discount rate disclosed on the grant day after deducting 0.5% for advances outside Amman and 1% for advances inside Amman , The advances are repaid in accordance with customers monthly installments, these advances amounted amounted JD 69.652 million as of December 31, 2020 (JD 49.155 million as of 31 December 2019).
* During 2016, Arab Bank (Jordan branches) signed a loan agreement with the Central Bank of Jordan amounting to JD 3.6 million, for the duration of 15 years of which 5 years are grace period with a floating interest rate of (1.85%+LIBOR 6 months). The agreement aims to support SMEs and Extra Small Companies. The loan is repaid semi-annually, with installments in March and September of each year. The Balance of the loan as of 31 December 2020 amounted to JD 3.420 million (JD 3.6 million as of 31 December 2019).
* During 2017, Arab Bank (Jordan branches) signed a loan agreement with the Central Bank of Jordan amounting to JD 7.7 million, for the duration of 22 years of which 5 years are grace period with a fixed interest rate of 3%
NOTES TO THE FINANCIAL STATEMENTS

234
(CBJ has the right to amend the interest rate every two years up to 3.5%). The agreement aims to support SMEs and Extra Small Companies. The loan is repaid semi-annually, with installments in May and November of each year. The Balance of the loan as of 31 December 2020 amounted to JD 4.668 million (JD 3.386 million as of 31 December 2019).
During 2020, Arab Bank (Jordan branches) granted loans against diminishing advances in response to the Central Bank of Jordan programe to support SMEs to face COVID-19 with 0% fixed interest rate, These loans are repaid on long term extended to 42 months, with a grace period up to 12 months. These loans as of 31 December 2020 amounted to JD 36.713 million.
** During 2018, Arab Bank (Jordan branches) signed loans agreements with European investment Bank amounting to JD 235 million, for the duration of 7 years, in the same year Arab Bank withdrew the first installment in the amount of JD 70.9 million for the duration of 7 years with a floating interest rate of (1.392%+LIBOR 6 months) the interest is repaid in 2 installments during the year, the loan is repaid semi-annually in March and September of each year, the first installment started on 15 September 2020 and the last one will be on 15 September 2025. the Balance of the loan as of 31 December 2020 amounted to JD 64.455 million (JD 70.9 million as of 31 December 2019)
** During 2019, Arab Bank (Jordan branches) withdrew the second installment in the amount of JD 49.521 million for the duration of 7 years with a floating interest rate of (1.503%+LIBOR 6 months) the interest is repaid in 2 installments during the year, the loan is repaid semi-annually in March and September of each year, the first installment will be on 15 September 2021 and the last one will be on 16 March 2026. the Balance of the loan as of 31 December 2020 amounted to JD 49.521 million.
** During 2020, Arab Bank (Jordan branches) withdrew the third installment in the amount of JD 114.762 million for the duration of 7 years with a floating interest rate of (1.704%+LIBOR 6 months) the interest is repaid in 2 installments during the year, the loan is repaid semi-annually in March and September of each year, the first installment will fall due on 15 September 2022 and the last one will be on 15 March 2027.
During 2020, Arab bank Morocco borrowed amounts from banks and financial institutoins with a fixed interest rate of 1.5%, the balance as of 31 December 2020 amounted to JD 4.8 million.
22. Provision for Income Tax The details of this item are as follows:
2020 2019JD ‘000 JD ‘000
Balance at the beginning of the year 157 562 140 408 Income tax charge 88 655 149 136 Income tax paid ( 138 186) ( 131 982) Balance at the End of the Year 108 031 157 562
- Income tax expense charged to the statement of income consists of the following:2020 2019
JD ‘000 JD ‘000Income tax charge for the year 88 655 149 136Deferred tax assets for the year ( 73 258) ( 42 717)Amortization of deferred tax assets 30 500 26 025Deferred tax liabilities for the year 927 216Amortization of deferred tax liabilities ( 3) - Total 46 821 132 660The bank has calculated the income tax expense according to The Jordanian income tax law No. (38) issued in 2018, for the years ended in 2020 and 2019 The Banking income tax rate in Jordan is 38 % ( 35% income tax + 3% national contribution tax). While the income tax rate in the countries where the Bank has investments and branches ranges from zero to 38% as of 31 December 2020 and 2019. The branches of Arab bank Plc have reached a recent tax settlements ranging between 2019 as for Arab Bank United Arab Emirates and 2018 as for Arab Bank Egypt as of 31 December 2020.
NOTES TO THE FINANCIAL STATEMENTS

235
23. Other ProvisionsThe details of this item are as follows:
2020
Balance at the
Beginning of the Year
Additions during the
Year
Utilized or transferred
during the Year
Returned to Income
Adjustments During the
Year and Translation
Adjustments
Balance at the End of
the Year
JD ‘000 JD ‘000 JD ‘000 JD ‘000 JD ‘000 JD ‘000 End-of-service indemnity 81 066 9 516 ( 7 493) ( 27) 23 83 085 Legal cases 5 105 85 ( 108) ( 5) 4 5 081 Other 56 711 642 - ( 42) 26 57 337 Total 142 882 10 243 ( 7 601) ( 74) 53 145 503
2019
Balance at the
Beginning of the Year
Additions during the
Year
Utilized or transferred
during the Year
Returned to Income
Adjustments During the
Year and Translation
Adjustments
Balance at the End of
the Year
JD ‘000 JD ‘000 JD ‘000 JD ‘000 JD ‘000 JD ‘000 End-of-service indemnity 77 290 10 569 ( 6 918) - 125 81 066 Legal cases 3 376 2 776 ( 579) ( 466) (2) 5 105 Other 56 974 14 ( 293) ( 8) 24 56 711 Total 137 640 13 359 ( 7 790) ( 474) 147 142 882
24. Other Liabilities The details of this item are as follows:
31 December 2020 2019
JD ‘000 JD ‘000 Accrued interest payable 86 734 124 726 Notes payable 102 733 82 756 Interest and commission received in advance 40 763 51 072 Accrued expenses 31 007 30 343 Dividends payable to shareholders 13 762 14 420 Lease Contracts Liabilites 45 723 51 345 Other miscellaneous liabilities 132 252 172 611 Provision for impairment - ECL of the indirect credit facilities 34 833 15 289 Total 487 807 542 562
Indirect Credit Facilities The table below shows the credit quality and the maximum exposure to credit risk based on the bank’s internal credit rating system.
31 December 2020 31 December 2019Stage 1 Stage 2 Stage 3 Total TotalJD ‘000 JD ‘000 JD ‘000 JD ‘000 JD ‘000
Low risk / performing 763 949 - - 763 949 1 046 740Acceptable risk / performing 8 495 000 302 290 - 8 797 290 9 705 891Non-performing - - 111 566 111 566 28 936Total 9 258 949 302 290 111 566 9 672 805 10 781 567 -Probability of default at low risk 0.0% -0.12% -Probability of default at acceptable risk 0.12% - 24% -Probability of default at High risk 100%
NOTES TO THE FINANCIAL STATEMENTS

236
The movement on total balances of indirect credit facilities is as follows:31 December 2020 31 December 2019
Stage 1 Stage 2 Stage 3 Total TotalJD ‘000 JD ‘000 JD ‘000 JD ‘000 JD ‘000
Balance at the beginning of the year 10 532 110 220 521 28 936 10 781 567 11 473 172New balances (Additions) 2 762 040 372 264 17 3 134 321 4 036 491Matured balances (3 816 625) ( 346 341) ( 16 677) (4 179 643) (4 720 046)Transfers to stage 1 21 865 ( 21 816) ( 49) - - Transfers to stage 2 ( 137 443) 137 458 ( 15) - - Transfers to stage 3 ( 39 933) ( 59 416) 99 349 - - Written off balances - - - - - Adjustments during the year - - - - - Translation Adjustments ( 63 065) ( 380) 5 ( 63 440) ( 8 050)Total 9 258 949 302 290 111 566 9 672 805 10 781 567
The movement of ECL charges on indirect credit facilities is as follows:31 December 2020 31 December 2019
Stage 1 Stage 2 Stage 3 Total TotalJD ‘000 JD ‘000 JD ‘000 JD ‘000 JD ‘000
Balance at the beginning of the year 12 765 1 994 530 15 289 26 416ECL charges during the year 6 518 8 668 2 532 17 718 9 442Recoveries (excluding write offs) ( 7 754) ( 1 237) ( 36) ( 9 027) ( 21 308)Transfers to stage 1 303 ( 303) - - - Transfers to stage 2 ( 542) 542 - - - Transfers to stage 3 ( 10) ( 10) 20 - - Impact on year end ECL caused by transfers between stages during the year
- 219 1 841 2 060 ( 162)
Written off balances - - - - - Adjustments during the year 2 ( 1) 8 699 8 700 277Translation Adjustments ( 172) 262 3 93 624Total 11 110 10 134 13 589 34 833 15 289
25. Deferred Tax LiabilitiesItems attributable to deferred tax liabilities are as follows:
2020Balance at the
Beginning of the YearAmounts
Added Amounts Released
Translation Adjustments
Balance at the End of the Year Deferred Tax
JD ‘000 JD ‘000 JD ‘000 JD ‘000 JD ‘000 JD ‘000Other 5 326 4 159 (11) 8 9 482 2 123Total 5 326 4 159 ( 11) 8 9 482 2 123
2019Balance at the
Beginning of the YearAmounts
Added Amounts Released
Translation Adjustments
Balance at the End of the Year Deferred Tax
JD ‘000 JD ‘000 JD ‘000 JD ‘000 JD ‘000 JD ‘000Other 4 211 1 115 - - 5 326 1 197Total 4 211 1 115 - - 5 326 1 197
NOTES TO THE FINANCIAL STATEMENTS

237
- The details of movement on deferred tax liabilities are as follows: 2020 2019
JD ‘000 JD ‘000Balance at the beginning of the year 1 197 948Additions during the year 925 249Amortized during the year - - Adjustments during the year and Translation Adjustments 1 - Balance at the End of the Year 2 123 1 197
26. Share Capital and Share Premium A. Share capital amounted to JD 640.8 million distributed on 640.8 million shares as of 31 December 2020 and 2019 with a authorized capital of JD 640.8 million shares (at par value of JD 1 per share).
B. Share premium amounted to JD 859.6 million as at 31 December 2020 and 2019.
27. Statutory ReserveThe statutory reserve amounted to JD 640.8 million as at 31 December 2020 and 2019 according to the regulations of the central bank of Jordan and companies law and it can’t be distributed to the shareholders of the bank.
28. Voluntary ReserveThe voluntary reserve amounted to JD 614.9 million as at 31 December 2020 and 2019. This reserve is used for the purposes determined by the Board of Directors, and the General Assembly has the right to distribute it in whole or part thereof to shareholders as dividends.
29. General ReserveThe general reserve amounted to JD 583.7 million as of 31 December 2020 and 2019. This reserve is used for purposes determined by the Board of Directors, and the General Assembly has the right to distribute it in whole or part thereof to shareholders as dividends.
30. General Banking Risk ReserveThe general banking risk reserve amounted to JD 108.5 million as at 31 December 2020 (JD 108.8 million as at 31 December 2019)
31. Foreign Currency Translation Reserve The details of this item are as follows:
31 December 2020 2019
JD ‘000 JD ‘000 Balance at the beginning of the year ( 198 397) ( 190 206) Additions (disposals) during the year transferred to other comprehensive income 38 431 ( 8 191) Balance at the End of the Year ( 159 966) ( 198 397)
NOTES TO THE FINANCIAL STATEMENTS

238
NOTES TO THE FINANCIAL STATEMENTS
32. Investment Revaluation Reserve The details of this item are as follows: 31 December
2020 2019JD ‘000 JD ‘000
Balance at the beginning of the year ( 214 946) ( 215 187) Change in fair value during the year ( 2 904) 41 Net realized losses transferred to retained earnings 1 882 200 Balance at the End of the Year * ( 215 968) ( 214 946)
33. Retained Earnings The details of the movement on the retained earnings are as follows:
2020 2019JD ‘000 JD ‘000
Balance at the beginning of the year 759 949 650 945 Profit for the year 21 800 423 560 Investments revaluation reserve transferred to retained earnings ( 1 882) ( 200) Dividends paid ** - ( 288 360) Transferred to statutory reserve - ( 23 565) Transferred from general banking risk reserve 301 - The Effect of IFRS (16) adoption - ( 2 431) Balance at the End of the Year * 780 168 759 949** Arab Bank plc Board of Directors recommended a 12 % of JOD1 par value as cash dividend, equivalent to JOD
76.9 million, for the year 2020. This proposal is subject to the approval of the General Assembly of shareholders. (According to Central Bank of Jordan circular no. 1/1/4693 dated 9 April 2020, Arab Bank did not distribute dividends for the year 2019)
* Retained earnings include restricted deferred tax assets in the amount of JD 138.6 million. Restricted retained earnings that cannot be distributed or otherwise utilized except under certain circumstances as a result of adopting certain International Accounting Standards amounted to JD 2 million as of 31 December 2020.
* The negative balance of the investments revaluation reserve in the amount of JD (216) million as of 31 December 2020 is restricted according to the Jordan Securities Commission instructions and Central Bank of Jordan.
34. Interest Income The details of this item are as follows:
2020 2019JD ‘000 JD ‘000
Direct credit facilities at amortized cost * 742 515 903 493 Central Banks 36 432 70 455 Banks and financial institutions deposits 27 997 63 760 Financial assets at fair value through profit or loss 7 851 9 237 Other financial assets at amortized cost 326 470 330 106 Total 1 141 265 1 377 051
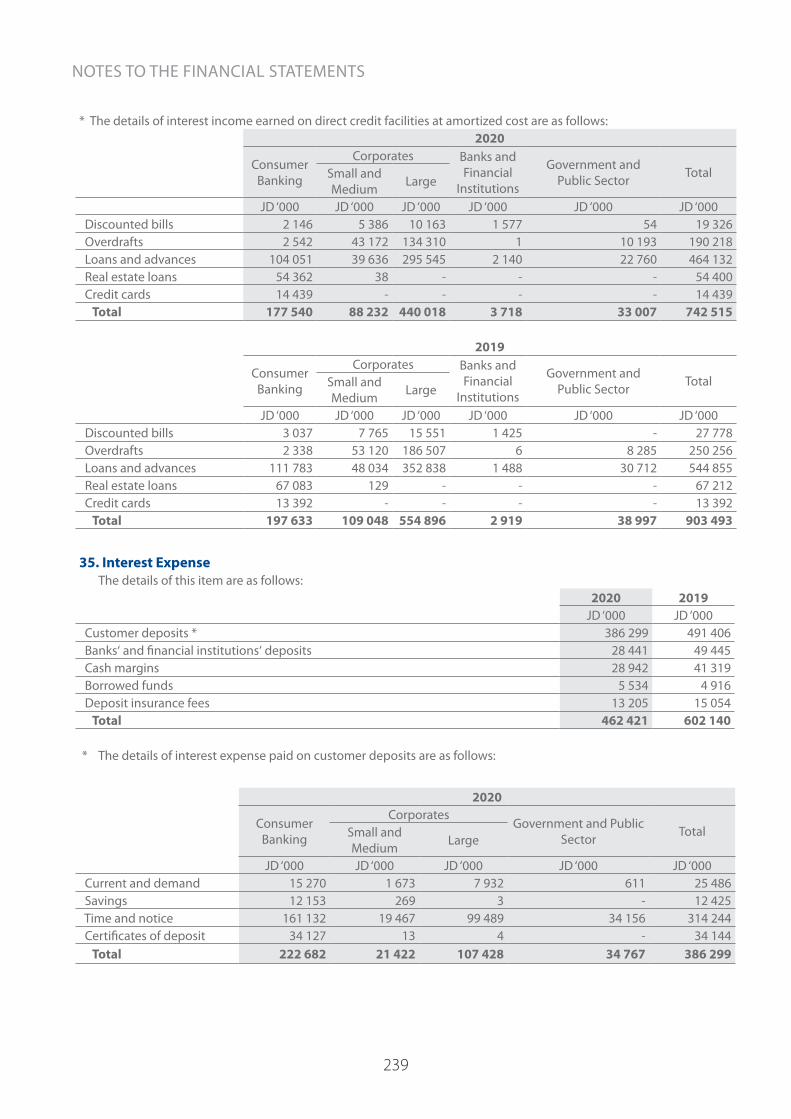
239
NOTES TO THE FINANCIAL STATEMENTS
* The details of interest income earned on direct credit facilities at amortized cost are as follows:2020
Consumer Banking
Corporates Banks and Financial
Institutions
Government and Public Sector TotalSmall and
Medium Large
JD ‘000 JD ‘000 JD ‘000 JD ‘000 JD ‘000 JD ‘000 Discounted bills 2 146 5 386 10 163 1 577 54 19 326 Overdrafts 2 542 43 172 134 310 1 10 193 190 218 Loans and advances 104 051 39 636 295 545 2 140 22 760 464 132 Real estate loans 54 362 38 - - - 54 400 Credit cards 14 439 - - - - 14 439 Total 177 540 88 232 440 018 3 718 33 007 742 515
2019
Consumer Banking
Corporates Banks and Financial
Institutions
Government and Public Sector TotalSmall and
Medium Large
JD ‘000 JD ‘000 JD ‘000 JD ‘000 JD ‘000 JD ‘000 Discounted bills 3 037 7 765 15 551 1 425 - 27 778 Overdrafts 2 338 53 120 186 507 6 8 285 250 256 Loans and advances 111 783 48 034 352 838 1 488 30 712 544 855 Real estate loans 67 083 129 - - - 67 212 Credit cards 13 392 - - - - 13 392 Total 197 633 109 048 554 896 2 919 38 997 903 493
35. Interest Expense The details of this item are as follows:
2020 2019JD ‘000 JD ‘000
Customer deposits * 386 299 491 406 Banks‘ and financial institutions‘ deposits 28 441 49 445 Cash margins 28 942 41 319 Borrowed funds 5 534 4 916 Deposit insurance fees 13 205 15 054 Total 462 421 602 140
* The details of interest expense paid on customer deposits are as follows:
2020
Consumer Banking
CorporatesGovernment and Public
Sector TotalSmall and Medium Large
JD ‘000 JD ‘000 JD ‘000 JD ‘000 JD ‘000 Current and demand 15 270 1 673 7 932 611 25 486 Savings 12 153 269 3 - 12 425 Time and notice 161 132 19 467 99 489 34 156 314 244 Certificates of deposit 34 127 13 4 - 34 144 Total 222 682 21 422 107 428 34 767 386 299

240
2019
Consumer Banking
CorporatesGovernment and Public
Sector TotalSmall and Medium Large
JD ‘000 JD ‘000 JD ‘000 JD ‘000 JD ‘000 Current and demand 19 141 2 736 12 311 274 34 462 Savings 11 094 238 3 - 11 335 Time and notice 199 167 22 680 137 351 48 762 407 960 Certificates of deposit 37 623 23 3 - 37 649 Total 267 025 25 677 149 668 49 036 491 406
36. Net Commission Income The details of this item are as follows:
2020 2019JD ‘000 JD ‘000
Commission income: Direct credit facilities at amortized cost 46 781 59 519 Indirect credit facilities 57 625 63 288 Other 52 381 51 835Less: Commission expense ( 28 383) ( 28 171) Net Commission Income 128 404 146 471
37. Gains from Financial Assets at Fair Value Through Profit or Loss The details of this item are as follows:
2020Realized
Gains Unrealized Gains Dividends Total
JD ‘000 JD ‘000 JD ‘000 JD ‘000 Treasury bills and bonds 2 088 387 - 2 475 Corporate shares - 105 37 142 Total 2 088 492 37 2 617
2019Realized
GainsUnrealized Gains
(Loss) Dividends Total
JD ‘000 JD ‘000 JD ‘000 JD ‘000 Treasury bills and bonds 2 118 1 960 - 4 078 Corporate shares - ( 34) 56 22 Total 2 118 1 926 56 4 100
NOTES TO THE FINANCIAL STATEMENTS
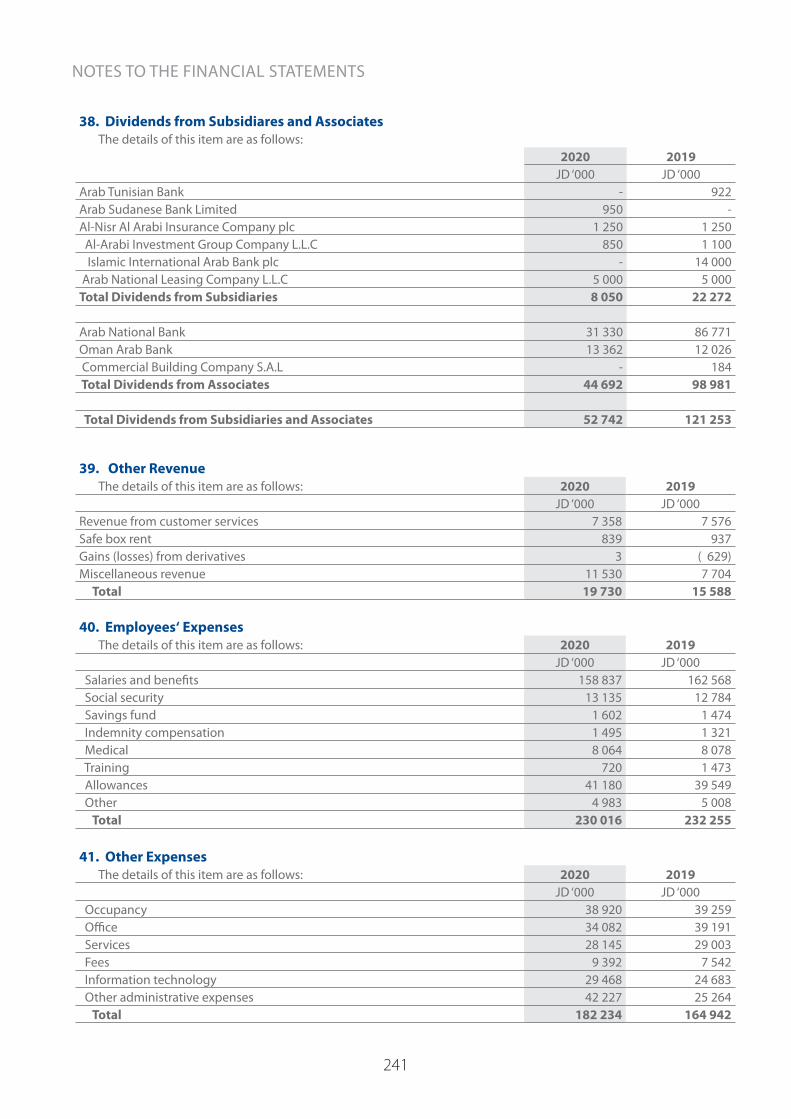
241
38. Dividends from Subsidiares and Associates The details of this item are as follows:
2020 2019JD ‘000 JD ‘000
Arab Tunisian Bank - 922Arab Sudanese Bank Limited 950 - Al-Nisr Al Arabi Insurance Company plc 1 250 1 250 Al-Arabi Investment Group Company L.L.C 850 1 100 Islamic International Arab Bank plc - 14 000 Arab National Leasing Company L.L.C 5 000 5 000Total Dividends from Subsidiaries 8 050 22 272
Arab National Bank 31 330 86 771Oman Arab Bank 13 362 12 026 Commercial Building Company S.A.L - 184 Total Dividends from Associates 44 692 98 981
Total Dividends from Subsidiaries and Associates 52 742 121 253
39. Other Revenue The details of this item are as follows: 2020 2019
JD ‘000 JD ‘000Revenue from customer services 7 358 7 576Safe box rent 839 937Gains (losses) from derivatives 3 ( 629)Miscellaneous revenue 11 530 7 704 Total 19 730 15 588
40. Employees‘ Expenses The details of this item are as follows: 2020 2019
JD ‘000 JD ‘000 Salaries and benefits 158 837 162 568 Social security 13 135 12 784 Savings fund 1 602 1 474 Indemnity compensation 1 495 1 321 Medical 8 064 8 078 Training 720 1 473 Allowances 41 180 39 549 Other 4 983 5 008 Total 230 016 232 255
41. Other Expenses The details of this item are as follows: 2020 2019
JD ‘000 JD ‘000 Occupancy 38 920 39 259 Office 34 082 39 191 Services 28 145 29 003 Fees 9 392 7 542 Information technology 29 468 24 683 Other administrative expenses 42 227 25 264 Total 182 234 164 942
NOTES TO THE FINANCIAL STATEMENTS
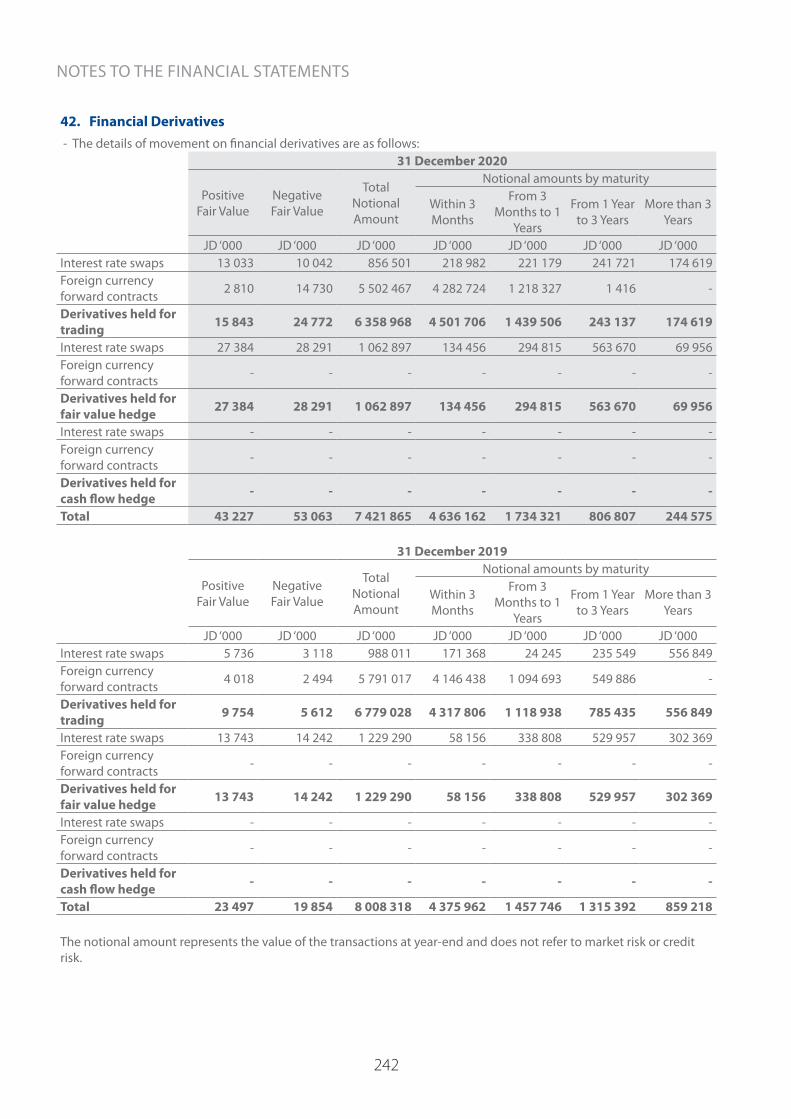
242
42. Financial Derivatives - The details of movement on financial derivatives are as follows:
31 December 2020
Positive Fair Value
Negative Fair Value
Total Notional Amount
Notional amounts by maturity
Within 3 Months
From 3 Months to 1
Years
From 1 Year to 3 Years
More than 3 Years
JD ‘000 JD ‘000 JD ‘000 JD ‘000 JD ‘000 JD ‘000 JD ‘000Interest rate swaps 13 033 10 042 856 501 218 982 221 179 241 721 174 619Foreign currency forward contracts 2 810 14 730 5 502 467 4 282 724 1 218 327 1 416 -
Derivatives held for trading 15 843 24 772 6 358 968 4 501 706 1 439 506 243 137 174 619
Interest rate swaps 27 384 28 291 1 062 897 134 456 294 815 563 670 69 956Foreign currency forward contracts - - - - - - -
Derivatives held for fair value hedge 27 384 28 291 1 062 897 134 456 294 815 563 670 69 956
Interest rate swaps - - - - - - - Foreign currency forward contracts - - - - - - -
Derivatives held for cash flow hedge - - - - - - -
Total 43 227 53 063 7 421 865 4 636 162 1 734 321 806 807 244 575
31 December 2019
Positive Fair Value
Negative Fair Value
Total Notional Amount
Notional amounts by maturity
Within 3 Months
From 3 Months to 1
Years
From 1 Year to 3 Years
More than 3 Years
JD ‘000 JD ‘000 JD ‘000 JD ‘000 JD ‘000 JD ‘000 JD ‘000Interest rate swaps 5 736 3 118 988 011 171 368 24 245 235 549 556 849Foreign currency forward contracts 4 018 2 494 5 791 017 4 146 438 1 094 693 549 886 -
Derivatives held for trading 9 754 5 612 6 779 028 4 317 806 1 118 938 785 435 556 849
Interest rate swaps 13 743 14 242 1 229 290 58 156 338 808 529 957 302 369Foreign currency forward contracts - - - - - - -
Derivatives held for fair value hedge 13 743 14 242 1 229 290 58 156 338 808 529 957 302 369
Interest rate swaps - - - - - - - Foreign currency forward contracts - - - - - - -
Derivatives held for cash flow hedge - - - - - - -
Total 23 497 19 854 8 008 318 4 375 962 1 457 746 1 315 392 859 218
The notional amount represents the value of the transactions at year-end and does not refer to market risk or credit risk.
NOTES TO THE FINANCIAL STATEMENTS
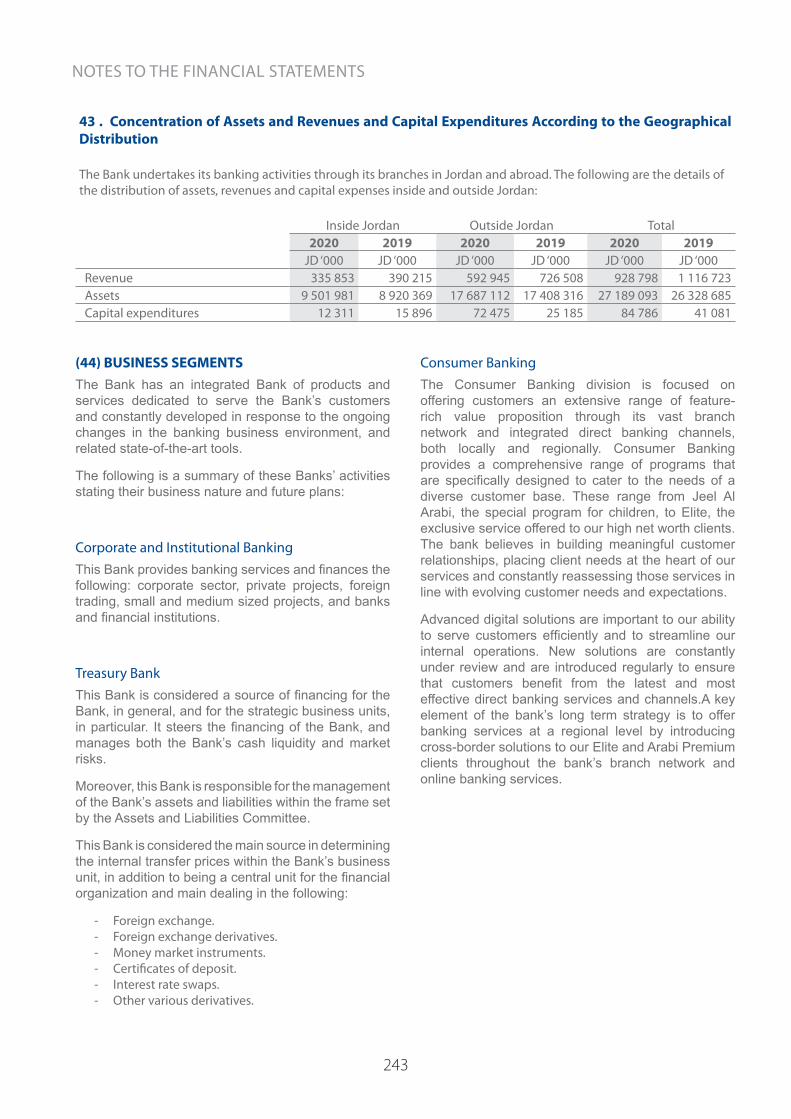
243
43 . Concentration of Assets and Revenues and Capital Expenditures According to the Geographical Distribution
The Bank undertakes its banking activities through its branches in Jordan and abroad. The following are the details of the distribution of assets, revenues and capital expenses inside and outside Jordan:
Inside Jordan Outside Jordan Total2020 2019 2020 2019 2020 2019
JD ‘000 JD ‘000 JD ‘000 JD ‘000 JD ‘000 JD ‘000 Revenue 335 853 390 215 592 945 726 508 928 798 1 116 723 Assets 9 501 981 8 920 369 17 687 112 17 408 316 27 189 093 26 328 685 Capital expenditures 12 311 15 896 72 475 25 185 84 786 41 081
(44) BUSINESS SEGMENTSThe Bank has an integrated Bank of products and services dedicated to serve the Bank’s customers and constantly developed in response to the ongoing changes in the banking business environment, and related state-of-the-art tools.
The following is a summary of these Banks’ activities stating their business nature and future plans:
Corporate and Institutional Banking This Bank provides banking services and finances the following: corporate sector, private projects, foreign trading, small and medium sized projects, and banks and financial institutions.
Treasury BankThis Bank is considered a source of financing for the Bank, in general, and for the strategic business units, in particular. It steers the financing of the Bank, and manages both the Bank’s cash liquidity and market risks.
Moreover, this Bank is responsible for the management of the Bank’s assets and liabilities within the frame set by the Assets and Liabilities Committee.
This Bank is considered the main source in determining the internal transfer prices within the Bank’s business unit, in addition to being a central unit for the financial organization and main dealing in the following:
- Foreign exchange.- Foreign exchange derivatives.- Money market instruments.- Certificates of deposit.- Interest rate swaps.- Other various derivatives.
Consumer BankingThe Consumer Banking division is focused on offering customers an extensive range of feature-rich value proposition through its vast branch network and integrated direct banking channels, both locally and regionally. Consumer Banking provides a comprehensive range of programs that are specifically designed to cater to the needs of a diverse customer base. These range from Jeel Al Arabi, the special program for children, to Elite, the exclusive service offered to our high net worth clients. The bank believes in building meaningful customer relationships, placing client needs at the heart of our services and constantly reassessing those services in line with evolving customer needs and expectations.
Advanced digital solutions are important to our ability to serve customers efficiently and to streamline our internal operations. New solutions are constantly under review and are introduced regularly to ensure that customers benefit from the latest and most effective direct banking services and channels.A key element of the bank’s long term strategy is to offer banking services at a regional level by introducing cross-border solutions to our Elite and Arabi Premium clients throughout the bank’s branch network and online banking services.
NOTES TO THE FINANCIAL STATEMENTS
244
45. BANKING RISK MANAGEMENT Arab Bank addresses the challenges of banking risks comprehensively through an Enterprise-Wide Risk Management Framework. This framework is built in line with leading practices, and is supported by a risk governance structure consisting of risk-related Board Committees, Executive Management Committees, and three independent levels of control.
As part of the risk governance structure of the Bank, and as the second level of control, Bank Risk Management is responsible for ensuring that the Bank has a robust system for the identification and management of risk. Its mandate is to:
- Establish risk management frameworks, policies and procedures for all types of risks and monitor their implementation
- Develop appropriate risk measurement tools and models
- Assess risk positions against established limits
- Monitor and report to Senior Management and the Board on a timely basis
- Advise and promote risk awareness based on leading practices
a. Credit Risk ManagementArab Bank maintains a low risk strategy towards the activities it takes on. This combined with its dynamic and proactive approach in managing credit risk are key elements in achieving its strategic objective of maintaining and further enhancing its asset quality and credit portfolio risk profile. The conservative, prudent and well-established credit standards, policies and procedures, risk methodologies and frameworks, solid structure and infrastructure, risk monitoring and control enable the Bank to deal with the emerging risks and challenges with a high level of confidence and determination. Portfolio management decisions are based on the Bank’s business strategy and risk appetite as reflected in the tolerance limits. Diversification is the cornerstone for mitigating portfolio risks which is achieved through industry, geographical and customer tolerance limits.
b. Geographic Concentration RiskThe Bank reduces the geographic concentration risk through distributing its operations over various sectors and various geographic locations inside and outside the Kingdom.
Note (46- E) shows the details of the geographical distribution of assets.
c. Liquidity RiskLiquidity is defined by the Bank for International Settlements as the ability of a bank to fund increases in assets and meet obligations as they come due, without incurring unacceptable losses. Arab Bank has built a robust infrastructure of policies, processes and people, in order to ensure that all obligations are met in a timely manner, under all circumstances and without undue cost. The Bank uses a variety of tools to measure liquidity risk in the balance sheet. These metrics help the Bank to plan and manage its funding and help to identify any mismatches in assets and liabilities which may expose the Bank to roll risk.
Note (49) shows the maturities of the assets and liabilities of the Bank.
d. Market RiskMarket risk is defined as the potential for loss from changes in the value of the Bank’s portfolios due to movements in interest rates, foreign exchange rates, and equity or commodity prices. The three main activities that expose the Bank to market risk are: Money Markets, Foreign Exchange and Capital Markets, across the Trading and Banking books.
Note (47) shows the details of market risk sensitivity analysis.
1. Interest Rate Risk
Interest rate risk in the Bank is limited, well managed, and continuously supervised. A large proportion of the interest rate exposure is concentrated in the short end of the yield curve, with durations of up to one year. Exposures of more than one year are particularly limited. Interest rate risk is managed in accordance with the policies and limits established by the ALCO.
Derivatives held for risk management purposes and hedge accounting:
The Bank holds derivatives for risk management purposes, some of which are designated as hedging relationships and management is in the process of assessing the impact.
NOTES TO THE FINANCIAL STATEMENTS
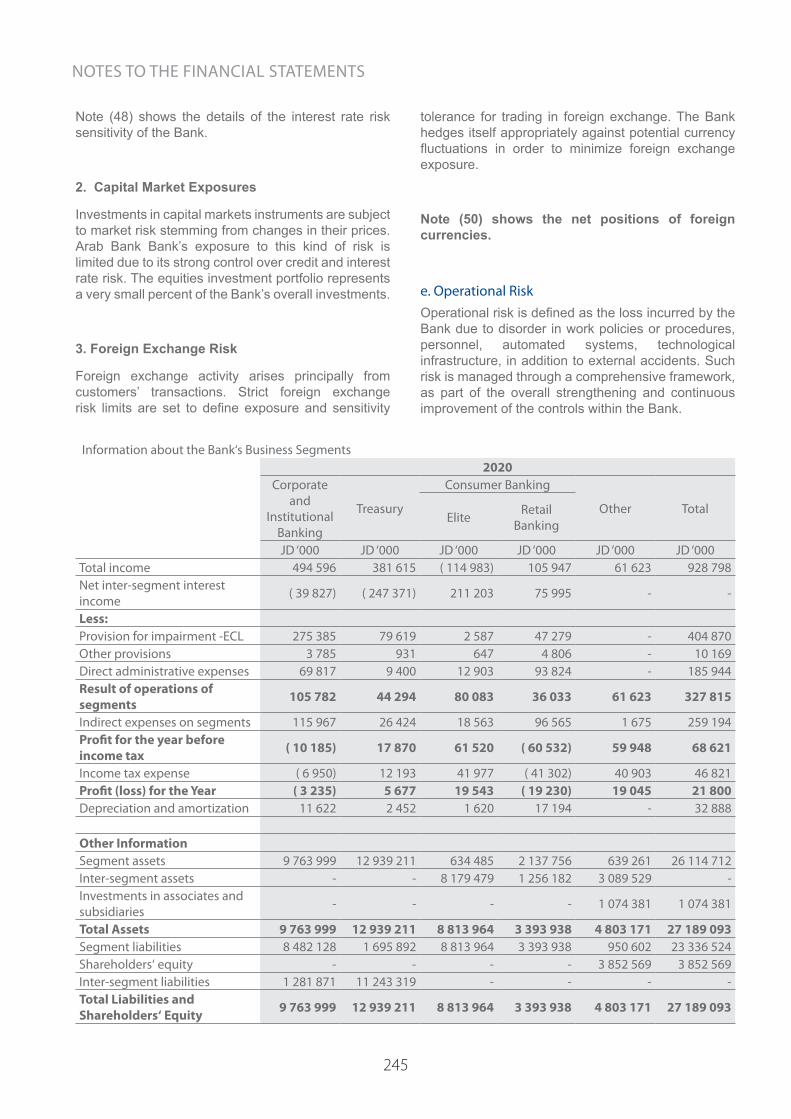
245
Information about the Bank‘s Business Segments2020
Corporate and
Institutional Banking
Treasury
Consumer Banking
Other TotalElite Retail
Banking
JD ‘000 JD ‘000 JD ‘000 JD ‘000 JD ‘000 JD ‘000Total income 494 596 381 615 ( 114 983) 105 947 61 623 928 798Net inter-segment interest income ( 39 827) ( 247 371) 211 203 75 995 - -
Less:Provision for impairment -ECL 275 385 79 619 2 587 47 279 - 404 870Other provisions 3 785 931 647 4 806 - 10 169Direct administrative expenses 69 817 9 400 12 903 93 824 - 185 944Result of operations of segments 105 782 44 294 80 083 36 033 61 623 327 815
Indirect expenses on segments 115 967 26 424 18 563 96 565 1 675 259 194Profit for the year before income tax ( 10 185) 17 870 61 520 ( 60 532) 59 948 68 621
Income tax expense ( 6 950) 12 193 41 977 ( 41 302) 40 903 46 821Profit (loss) for the Year ( 3 235) 5 677 19 543 ( 19 230) 19 045 21 800Depreciation and amortization 11 622 2 452 1 620 17 194 - 32 888
Other InformationSegment assets 9 763 999 12 939 211 634 485 2 137 756 639 261 26 114 712Inter-segment assets - - 8 179 479 1 256 182 3 089 529 - Investments in associates and subsidiaries - - - - 1 074 381 1 074 381
Total Assets 9 763 999 12 939 211 8 813 964 3 393 938 4 803 171 27 189 093Segment liabilities 8 482 128 1 695 892 8 813 964 3 393 938 950 602 23 336 524Shareholders‘ equity - - - - 3 852 569 3 852 569Inter-segment liabilities 1 281 871 11 243 319 - - - - Total Liabilities and Shareholders‘ Equity 9 763 999 12 939 211 8 813 964 3 393 938 4 803 171 27 189 093
Note (48) shows the details of the interest rate risk sensitivity of the Bank.
2. Capital Market Exposures
Investments in capital markets instruments are subject to market risk stemming from changes in their prices. Arab Bank Bank’s exposure to this kind of risk is limited due to its strong control over credit and interest rate risk. The equities investment portfolio represents a very small percent of the Bank’s overall investments.
3. Foreign Exchange Risk
Foreign exchange activity arises principally from customers’ transactions. Strict foreign exchange risk limits are set to define exposure and sensitivity
tolerance for trading in foreign exchange. The Bank hedges itself appropriately against potential currency fluctuations in order to minimize foreign exchange exposure.
Note (50) shows the net positions of foreign currencies.
e. Operational RiskOperational risk is defined as the loss incurred by the Bank due to disorder in work policies or procedures, personnel, automated systems, technological infrastructure, in addition to external accidents. Such risk is managed through a comprehensive framework, as part of the overall strengthening and continuous improvement of the controls within the Bank.
NOTES TO THE FINANCIAL STATEMENTS
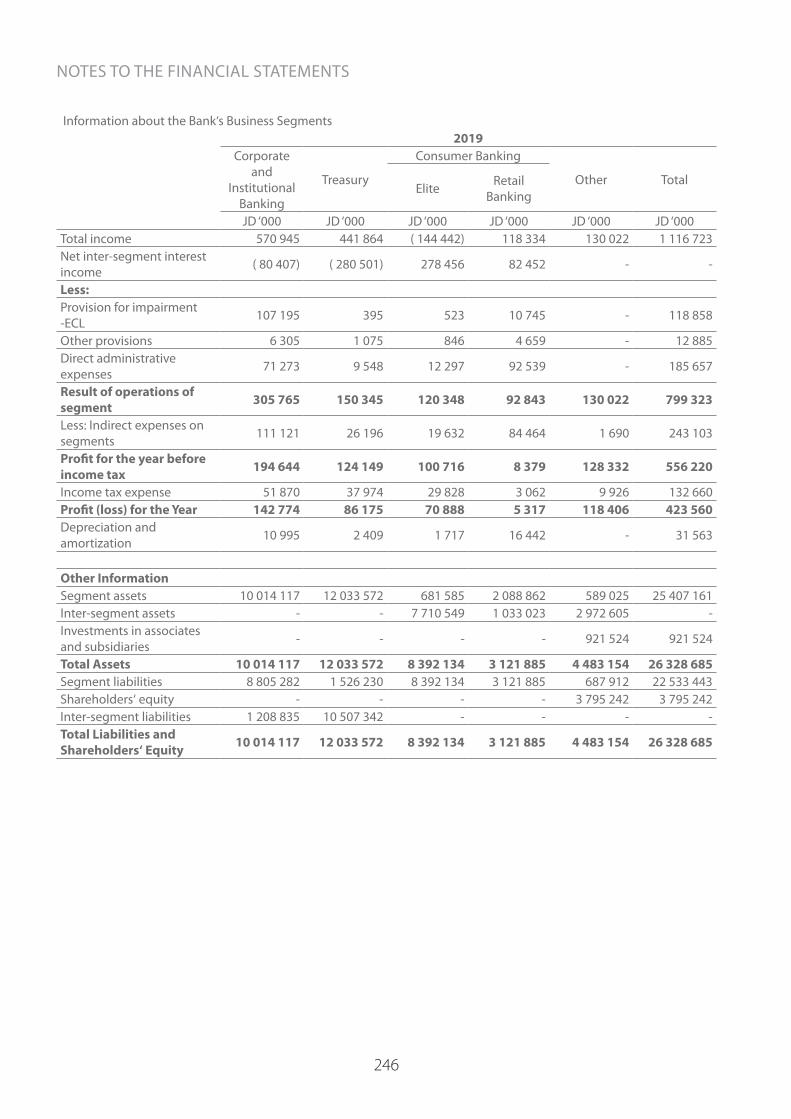
246
Information about the Bank‘s Business Segments2019
Corporate and
Institutional Banking
Treasury
Consumer Banking
Other TotalElite Retail
Banking
JD ‘000 JD ‘000 JD ‘000 JD ‘000 JD ‘000 JD ‘000Total income 570 945 441 864 ( 144 442) 118 334 130 022 1 116 723Net inter-segment interest income ( 80 407) ( 280 501) 278 456 82 452 - -
Less:Provision for impairment -ECL 107 195 395 523 10 745 - 118 858
Other provisions 6 305 1 075 846 4 659 - 12 885Direct administrative expenses 71 273 9 548 12 297 92 539 - 185 657
Result of operations of segment 305 765 150 345 120 348 92 843 130 022 799 323
Less: Indirect expenses on segments 111 121 26 196 19 632 84 464 1 690 243 103
Profit for the year before income tax 194 644 124 149 100 716 8 379 128 332 556 220
Income tax expense 51 870 37 974 29 828 3 062 9 926 132 660Profit (loss) for the Year 142 774 86 175 70 888 5 317 118 406 423 560Depreciation and amortization 10 995 2 409 1 717 16 442 - 31 563
Other InformationSegment assets 10 014 117 12 033 572 681 585 2 088 862 589 025 25 407 161Inter-segment assets - - 7 710 549 1 033 023 2 972 605 - Investments in associates and subsidiaries - - - - 921 524 921 524
Total Assets 10 014 117 12 033 572 8 392 134 3 121 885 4 483 154 26 328 685Segment liabilities 8 805 282 1 526 230 8 392 134 3 121 885 687 912 22 533 443Shareholders‘ equity - - - - 3 795 242 3 795 242Inter-segment liabilities 1 208 835 10 507 342 - - - - Total Liabilities and Shareholders‘ Equity 10 014 117 12 033 572 8 392 134 3 121 885 4 483 154 26 328 685
NOTES TO THE FINANCIAL STATEMENTS
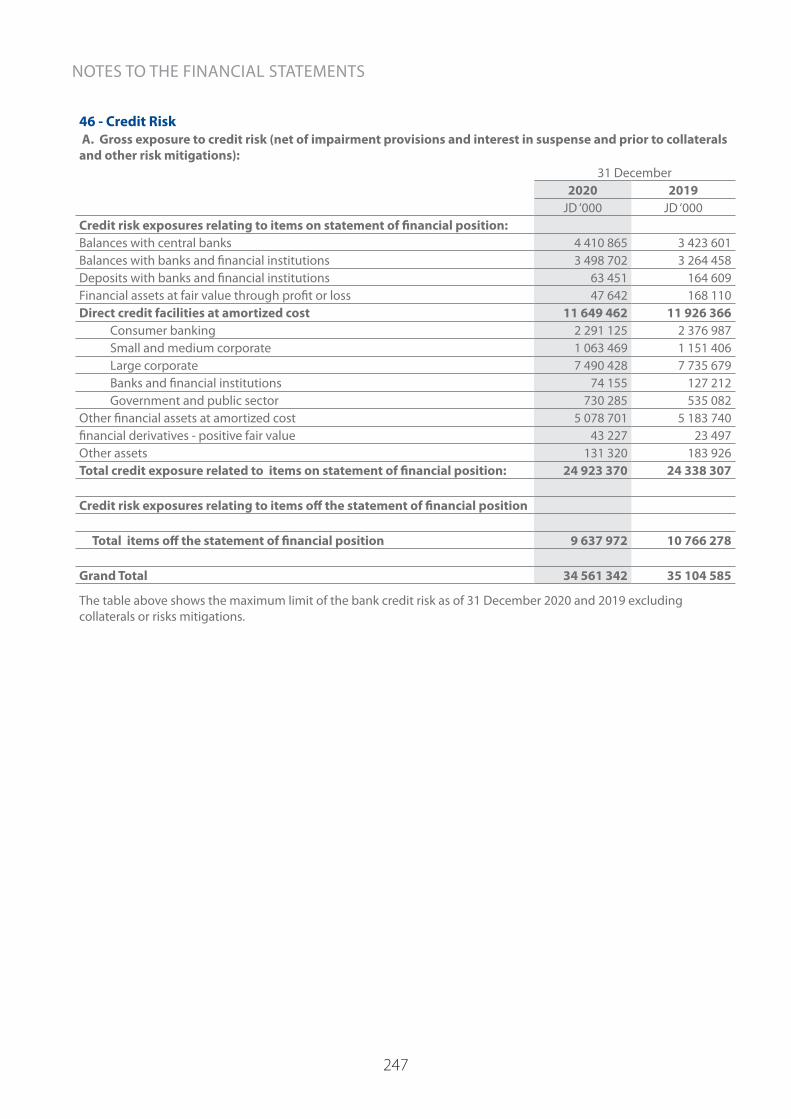
247
46 - Credit Risk A. Gross exposure to credit risk (net of impairment provisions and interest in suspense and prior to collaterals and other risk mitigations):
31 December 2020 2019
JD ‘000 JD ‘000Credit risk exposures relating to items on statement of financial position:Balances with central banks 4 410 865 3 423 601Balances with banks and financial institutions 3 498 702 3 264 458Deposits with banks and financial institutions 63 451 164 609Financial assets at fair value through profit or loss 47 642 168 110Direct credit facilities at amortized cost 11 649 462 11 926 366 Consumer banking 2 291 125 2 376 987 Small and medium corporate 1 063 469 1 151 406 Large corporate 7 490 428 7 735 679 Banks and financial institutions 74 155 127 212 Government and public sector 730 285 535 082Other financial assets at amortized cost 5 078 701 5 183 740financial derivatives - positive fair value 43 227 23 497Other assets 131 320 183 926Total credit exposure related to items on statement of financial position: 24 923 370 24 338 307
Credit risk exposures relating to items off the statement of financial position
Total items off the statement of financial position 9 637 972 10 766 278
Grand Total 34 561 342 35 104 585
The table above shows the maximum limit of the bank credit risk as of 31 December 2020 and 2019 excluding collaterals or risks mitigations.
NOTES TO THE FINANCIAL STATEMENTS
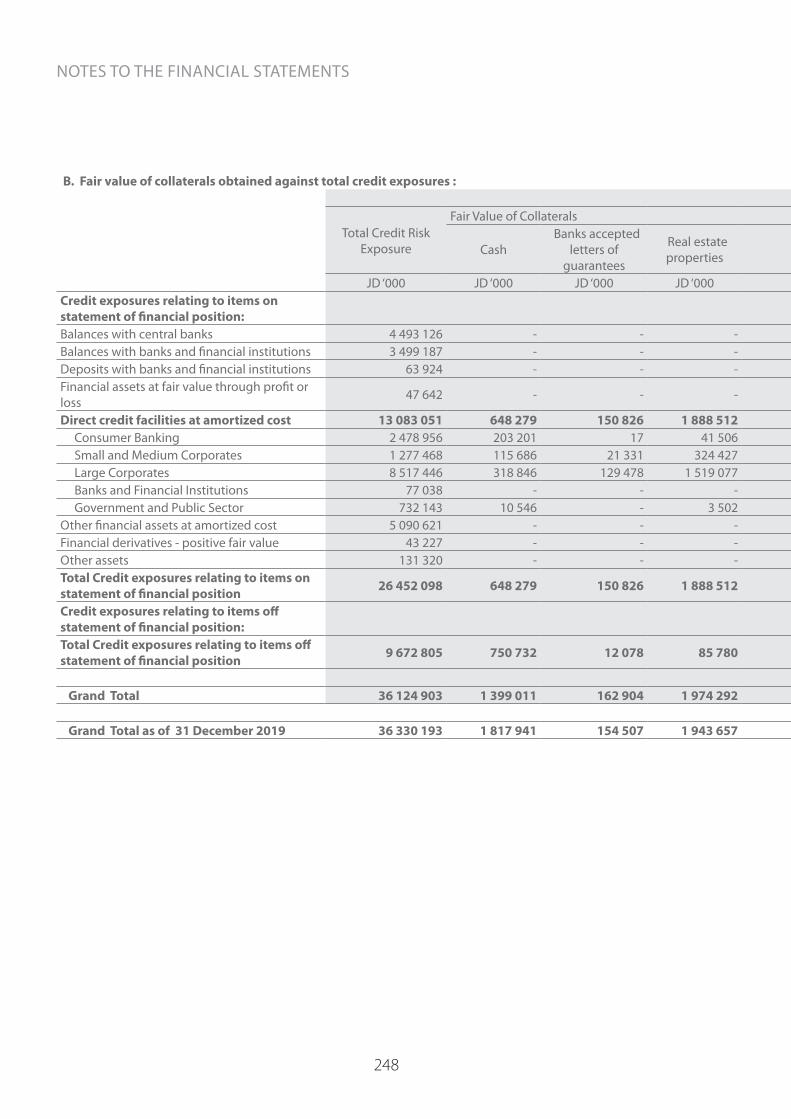
248
B. Fair value of collaterals obtained against total credit exposures :31 December 2020
Total Credit Risk Exposure
Fair Value of Collaterals
Cash Banks accepted
letters of guarantees
Real estate properties Listed securities Vehicles and
equipment Other Total Net Exposure Expected Credit Loss
JD ‘000 JD ‘000 JD ‘000 JD ‘000 JD ‘000 JD ‘000 JD ‘000 JD ‘000 JD ‘000 JD ‘000Credit exposures relating to items on statement of financial position:Balances with central banks 4 493 126 - - - - - - - 4 493 126 82 261Balances with banks and financial institutions 3 499 187 - - - - - - - 3 499 187 485Deposits with banks and financial institutions 63 924 - - - - - - - 63 924 473Financial assets at fair value through profit or loss 47 642 - - - - - - - 47 642 -
Direct credit facilities at amortized cost 13 083 051 648 279 150 826 1 888 512 258 752 359 440 2 764 317 6 070 126 7 012 925 1 095 271 Consumer Banking 2 478 956 203 201 17 41 506 1 436 583 752 742 999 485 1 479 471 138 259 Small and Medium Corporates 1 277 468 115 686 21 331 324 427 3 568 13 391 261 292 739 695 537 773 143 937 Large Corporates 8 517 446 318 846 129 478 1 519 077 253 748 345 466 1 630 329 4 196 944 4 320 502 808 368 Banks and Financial Institutions 77 038 - - - - - - - 77 038 2 849 Government and Public Sector 732 143 10 546 - 3 502 - - 119 954 134 002 598 141 1 858Other financial assets at amortized cost 5 090 621 - - - - - - - 5 090 621 11 920Financial derivatives - positive fair value 43 227 - - - - - - - 43 227 - Other assets 131 320 - - - - - - - 131 320 - Total Credit exposures relating to items on statement of financial position 26 452 098 648 279 150 826 1 888 512 258 752 359 440 2 764 317 6 070 126 20 381 972 1 190 410
Credit exposures relating to items off statement of financial position:
Total Credit exposures relating to items off statement of financial position 9 672 805 750 732 12 078 85 780 849 17 335 1 453 576 2 320 350 7 352 455 34 833
Grand Total 36 124 903 1 399 011 162 904 1 974 292 259 601 376 775 4 217 893 8 390 476 27 734 427 1 225 243
Grand Total as of 31 December 2019 36 330 193 1 817 941 154 507 1 943 657 199 587 247 598 4 027 505 8 390 795 27 939 398 928 689
NOTES TO THE FINANCIAL STATEMENTS
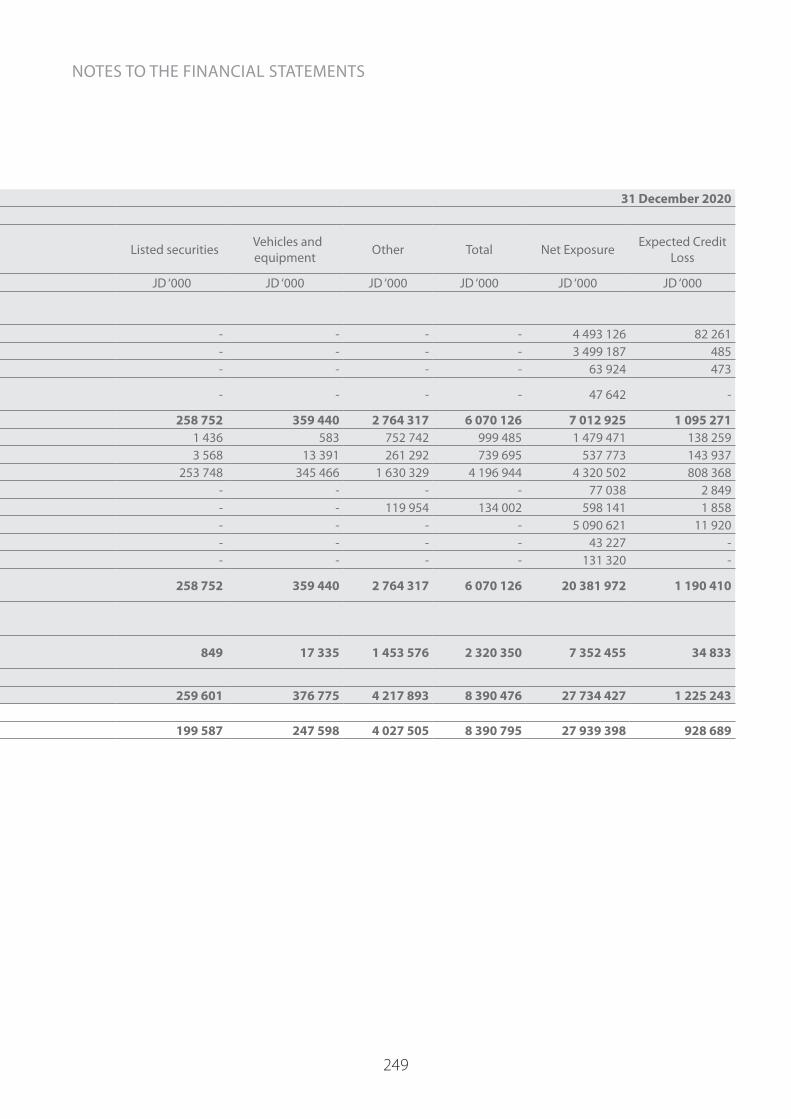
249
B. Fair value of collaterals obtained against total credit exposures :31 December 2020
Total Credit Risk Exposure
Fair Value of Collaterals
Cash Banks accepted
letters of guarantees
Real estate properties Listed securities Vehicles and
equipment Other Total Net Exposure Expected Credit Loss
JD ‘000 JD ‘000 JD ‘000 JD ‘000 JD ‘000 JD ‘000 JD ‘000 JD ‘000 JD ‘000 JD ‘000Credit exposures relating to items on statement of financial position:Balances with central banks 4 493 126 - - - - - - - 4 493 126 82 261Balances with banks and financial institutions 3 499 187 - - - - - - - 3 499 187 485Deposits with banks and financial institutions 63 924 - - - - - - - 63 924 473Financial assets at fair value through profit or loss 47 642 - - - - - - - 47 642 -
Direct credit facilities at amortized cost 13 083 051 648 279 150 826 1 888 512 258 752 359 440 2 764 317 6 070 126 7 012 925 1 095 271 Consumer Banking 2 478 956 203 201 17 41 506 1 436 583 752 742 999 485 1 479 471 138 259 Small and Medium Corporates 1 277 468 115 686 21 331 324 427 3 568 13 391 261 292 739 695 537 773 143 937 Large Corporates 8 517 446 318 846 129 478 1 519 077 253 748 345 466 1 630 329 4 196 944 4 320 502 808 368 Banks and Financial Institutions 77 038 - - - - - - - 77 038 2 849 Government and Public Sector 732 143 10 546 - 3 502 - - 119 954 134 002 598 141 1 858Other financial assets at amortized cost 5 090 621 - - - - - - - 5 090 621 11 920Financial derivatives - positive fair value 43 227 - - - - - - - 43 227 - Other assets 131 320 - - - - - - - 131 320 - Total Credit exposures relating to items on statement of financial position 26 452 098 648 279 150 826 1 888 512 258 752 359 440 2 764 317 6 070 126 20 381 972 1 190 410
Credit exposures relating to items off statement of financial position:
Total Credit exposures relating to items off statement of financial position 9 672 805 750 732 12 078 85 780 849 17 335 1 453 576 2 320 350 7 352 455 34 833
Grand Total 36 124 903 1 399 011 162 904 1 974 292 259 601 376 775 4 217 893 8 390 476 27 734 427 1 225 243
Grand Total as of 31 December 2019 36 330 193 1 817 941 154 507 1 943 657 199 587 247 598 4 027 505 8 390 795 27 939 398 928 689
NOTES TO THE FINANCIAL STATEMENTS
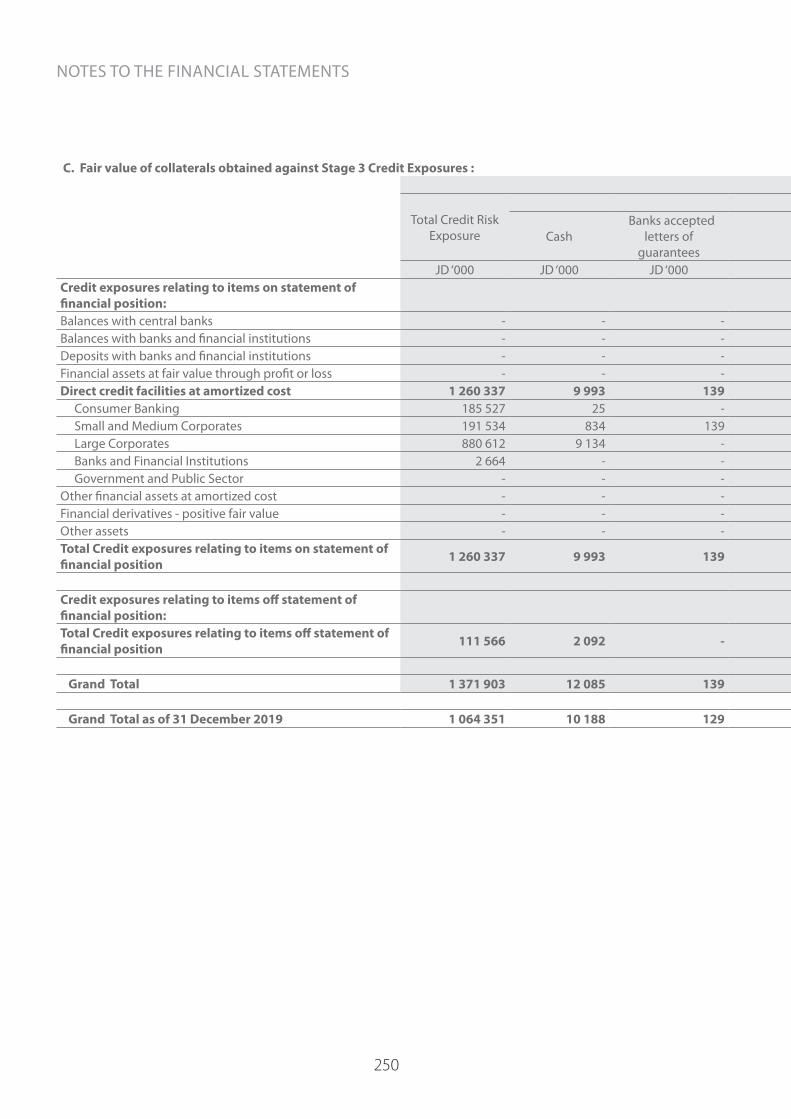
250
C. Fair value of collaterals obtained against Stage 3 Credit Exposures :31 December 2020
Total Credit Risk Exposure
Fair Value of Collaterals
Cash Banks accepted
letters of guarantees
Real estate properties
Listed securities
Vehicles and equipment Other Total Net Exposure Expected
Credit Loss
JD ‘000 JD ‘000 JD ‘000 JD ‘000 JD ‘000 JD ‘000 JD ‘000 JD ‘000 JD ‘000 JD ‘000Credit exposures relating to items on statement of financial position:Balances with central banks - - - - - - - - - - Balances with banks and financial institutions - - - - - - - - - - Deposits with banks and financial institutions - - - - - - - - - - Financial assets at fair value through profit or loss - - - - - - - - - - Direct credit facilities at amortized cost 1 260 337 9 993 139 106 635 84 24 716 24 081 165 648 1 094 689 737 020 Consumer Banking 185 527 25 - 6 797 - 99 17 927 24 848 160 679 109 671 Small and Medium Corporates 191 534 834 139 30 472 - 313 536 32 294 159 240 102 250 Large Corporates 880 612 9 134 - 69 366 84 24 304 5 618 108 506 772 106 522 471 Banks and Financial Institutions 2 664 - - - - - - - 2 664 2 628 Government and Public Sector - - - - - - - - - - Other financial assets at amortized cost - - - - - - - - - - Financial derivatives - positive fair value - - - - - - - - - - Other assets - - - - - - - - - - Total Credit exposures relating to items on statement of financial position 1 260 337 9 993 139 106 635 84 24 716 24 081 165 648 1 094 689 737 020
Credit exposures relating to items off statement of financial position:Total Credit exposures relating to items off statement of financial position 111 566 2 092 - 6 524 - - 3 744 12 360 99 206 13 589
Grand Total 1 371 903 12 085 139 113 159 84 24 716 27 825 178 008 1 193 895 750 609
Grand Total as of 31 December 2019 1 064 351 10 188 129 118 101 60 24 478 21 421 174 377 889 974 635 358
NOTES TO THE FINANCIAL STATEMENTS
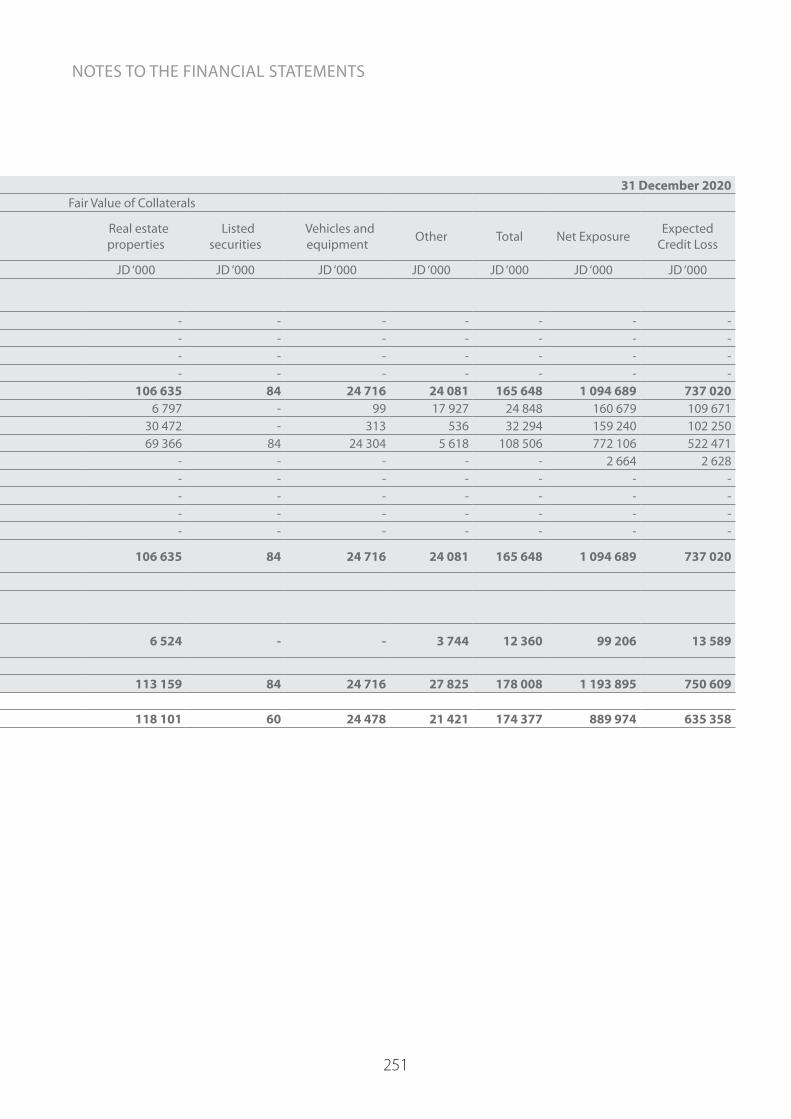
251
C. Fair value of collaterals obtained against Stage 3 Credit Exposures :31 December 2020
Total Credit Risk Exposure
Fair Value of Collaterals
Cash Banks accepted
letters of guarantees
Real estate properties
Listed securities
Vehicles and equipment Other Total Net Exposure Expected
Credit Loss
JD ‘000 JD ‘000 JD ‘000 JD ‘000 JD ‘000 JD ‘000 JD ‘000 JD ‘000 JD ‘000 JD ‘000Credit exposures relating to items on statement of financial position:Balances with central banks - - - - - - - - - - Balances with banks and financial institutions - - - - - - - - - - Deposits with banks and financial institutions - - - - - - - - - - Financial assets at fair value through profit or loss - - - - - - - - - - Direct credit facilities at amortized cost 1 260 337 9 993 139 106 635 84 24 716 24 081 165 648 1 094 689 737 020 Consumer Banking 185 527 25 - 6 797 - 99 17 927 24 848 160 679 109 671 Small and Medium Corporates 191 534 834 139 30 472 - 313 536 32 294 159 240 102 250 Large Corporates 880 612 9 134 - 69 366 84 24 304 5 618 108 506 772 106 522 471 Banks and Financial Institutions 2 664 - - - - - - - 2 664 2 628 Government and Public Sector - - - - - - - - - - Other financial assets at amortized cost - - - - - - - - - - Financial derivatives - positive fair value - - - - - - - - - - Other assets - - - - - - - - - - Total Credit exposures relating to items on statement of financial position 1 260 337 9 993 139 106 635 84 24 716 24 081 165 648 1 094 689 737 020
Credit exposures relating to items off statement of financial position:Total Credit exposures relating to items off statement of financial position 111 566 2 092 - 6 524 - - 3 744 12 360 99 206 13 589
Grand Total 1 371 903 12 085 139 113 159 84 24 716 27 825 178 008 1 193 895 750 609
Grand Total as of 31 December 2019 1 064 351 10 188 129 118 101 60 24 478 21 421 174 377 889 974 635 358
NOTES TO THE FINANCIAL STATEMENTS
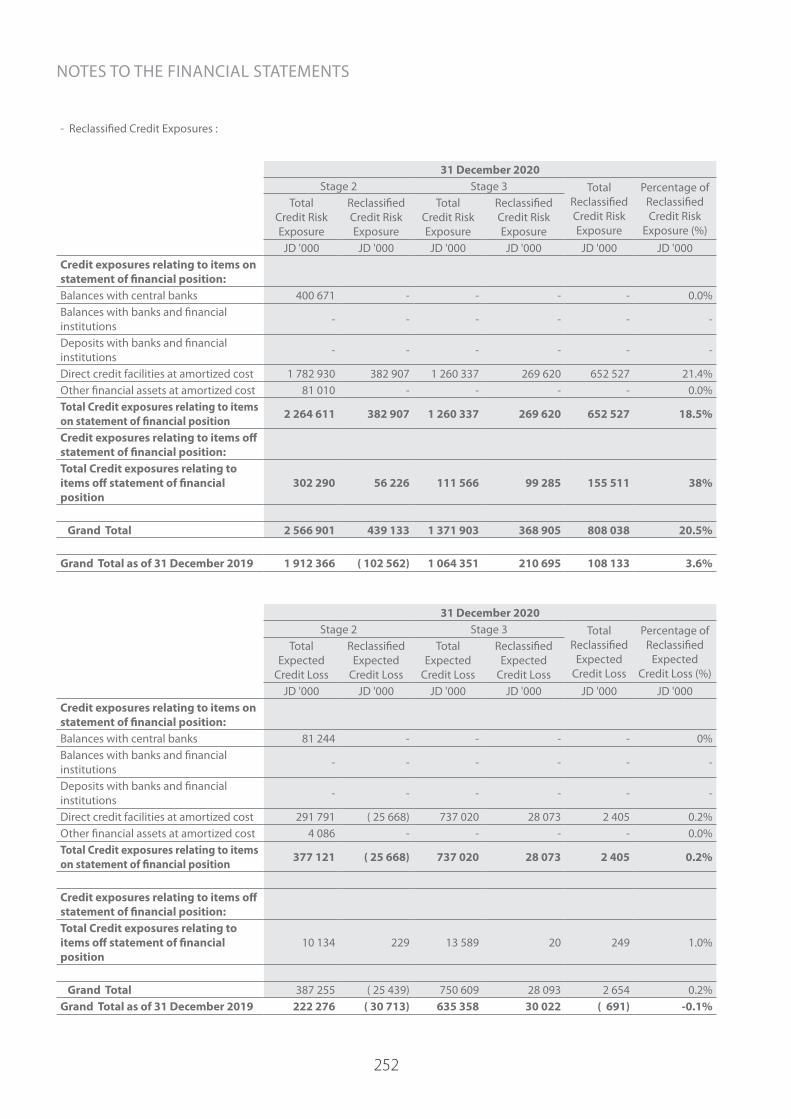
252
- Reclassified Credit Exposures :
31 December 2020Stage 2 Stage 3 Total
Reclassified Credit Risk Exposure
Percentage of Reclassified Credit Risk
Exposure (%)
Total Credit Risk Exposure
Reclassified Credit Risk Exposure
Total Credit Risk Exposure
Reclassified Credit Risk Exposure
JD '000 JD '000 JD '000 JD '000 JD '000 JD '000Credit exposures relating to items on statement of financial position:
Balances with central banks 400 671 - - - - 0.0%Balances with banks and financial institutions - - - - - -
Deposits with banks and financial institutions - - - - - -
Direct credit facilities at amortized cost 1 782 930 382 907 1 260 337 269 620 652 527 21.4%Other financial assets at amortized cost 81 010 - - - - 0.0%Total Credit exposures relating to items on statement of financial position 2 264 611 382 907 1 260 337 269 620 652 527 18.5%
Credit exposures relating to items off statement of financial position:Total Credit exposures relating to items off statement of financial position
302 290 56 226 111 566 99 285 155 511 38%
Grand Total 2 566 901 439 133 1 371 903 368 905 808 038 20.5%
Grand Total as of 31 December 2019 1 912 366 ( 102 562) 1 064 351 210 695 108 133 3.6%
31 December 2020Stage 2 Stage 3 Total
Reclassified Expected
Credit Loss
Percentage of Reclassified
Expected Credit Loss (%)
Total Expected
Credit Loss
Reclassified Expected
Credit Loss
Total Expected
Credit Loss
Reclassified Expected
Credit LossJD '000 JD '000 JD '000 JD '000 JD '000 JD '000
Credit exposures relating to items on statement of financial position:
Balances with central banks 81 244 - - - - 0%Balances with banks and financial institutions - - - - - -
Deposits with banks and financial institutions - - - - - -
Direct credit facilities at amortized cost 291 791 ( 25 668) 737 020 28 073 2 405 0.2%Other financial assets at amortized cost 4 086 - - - - 0.0%Total Credit exposures relating to items on statement of financial position 377 121 ( 25 668) 737 020 28 073 2 405 0.2%
Credit exposures relating to items off statement of financial position:Total Credit exposures relating to items off statement of financial position
10 134 229 13 589 20 249 1.0%
Grand Total 387 255 ( 25 439) 750 609 28 093 2 654 0.2%Grand Total as of 31 December 2019 222 276 ( 30 713) 635 358 30 022 ( 691) -0.1%
NOTES TO THE FINANCIAL STATEMENTS
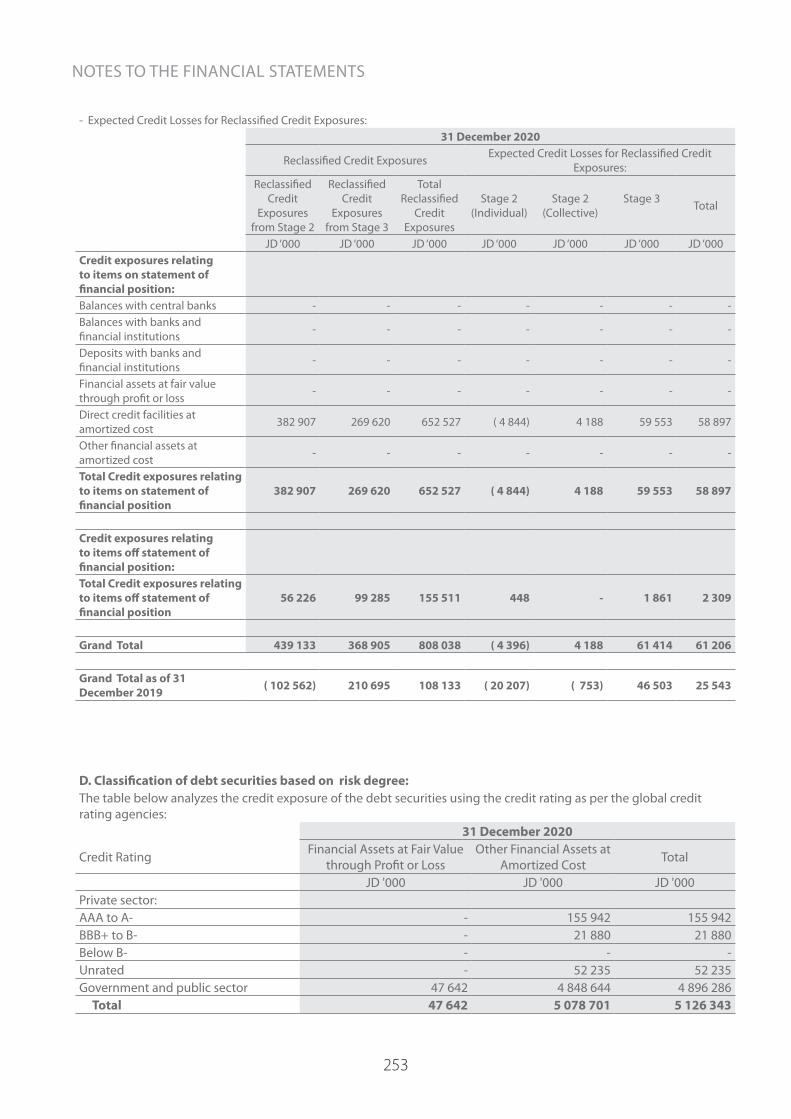
253
D. Classification of debt securities based on risk degree:The table below analyzes the credit exposure of the debt securities using the credit rating as per the global credit rating agencies:
31 December 2020
Credit Rating Financial Assets at Fair Value through Profit or Loss
Other Financial Assets at Amortized Cost Total
JD '000 JD '000 JD '000Private sector:AAA to A- - 155 942 155 942BBB+ to B- - 21 880 21 880Below B- - - - Unrated - 52 235 52 235Government and public sector 47 642 4 848 644 4 896 286 Total 47 642 5 078 701 5 126 343
- Expected Credit Losses for Reclassified Credit Exposures:31 December 2020
Reclassified Credit Exposures Expected Credit Losses for Reclassified Credit Exposures:
Reclassified Credit
Exposures from Stage 2
Reclassified Credit
Exposures from Stage 3
Total Reclassified
Credit Exposures
Stage 2 (Individual)
Stage 2 (Collective)
Stage 3 Total
JD ‘000 JD ‘000 JD ‘000 JD ‘000 JD ‘000 JD ‘000 JD ‘000Credit exposures relating to items on statement of financial position:Balances with central banks - - - - - - - Balances with banks and financial institutions - - - - - - -
Deposits with banks and financial institutions - - - - - - -
Financial assets at fair value through profit or loss - - - - - - -
Direct credit facilities at amortized cost 382 907 269 620 652 527 ( 4 844) 4 188 59 553 58 897
Other financial assets at amortized cost - - - - - - -
Total Credit exposures relating to items on statement of financial position
382 907 269 620 652 527 ( 4 844) 4 188 59 553 58 897
Credit exposures relating to items off statement of financial position:Total Credit exposures relating to items off statement of financial position
56 226 99 285 155 511 448 - 1 861 2 309
Grand Total 439 133 368 905 808 038 ( 4 396) 4 188 61 414 61 206
Grand Total as of 31 December 2019 ( 102 562) 210 695 108 133 ( 20 207) ( 753) 46 503 25 543
NOTES TO THE FINANCIAL STATEMENTS

254
31 December 2019
Credit Rating Financial Assets at Fair Value through Profit or Loss
Other Financial Assets at Amortized Cost Total
JD '000 JD '000 JD '000Private sector:AAA to A- - 360 998 360 998BBB+ to B- - 32 333 32 333Below B- - - - Unrated 21 010 41 034 62 044Government and public sector 147 100 4 749 375 4 896 475 Total 168 110 5 183 740 5 351 850
E. Credit exposure categorized by geographical distribution:31 December 2020
Jordan Other Arab Countries Asia* Europe America Rest of
the World Total
JD '000 JD '000 JD '000 JD '000 JD '000 JD '000 JD '000 Balances with central banks 1 953 749 2 456 852 264 - - - 4 410 865 Balances and deposits with banks and financial institutions
172 743 1 002 244 293 652 1 684 048 392 925 16 541 3 562 153
Financial assets at fair value through profit or loss - 47 642 - - - - 47 642
Direct credit facilities at amortized cost 4 056 532 7 387 276 188 885 13 826 2 943 - 11 649 462
Consumer Banking 1 009 953 1 281 100 9 63 - - 2 291 125Small and Medium Corporates 473 432 589 857 - 180 - - 1 063 469
Large Corporates 2 444 604 4 840 422 188 876 13 583 2 943 - 7 490 428Banks and Financial Institutions 5 925 68 230 - - - - 74 155
Government and Public Sector 122 618 607 667 - - - - 730 285
Other financial assets at amortized cost 2 741 349 2 278 970 29 880 - 26 464 2 038 5 078 701
Financial derivatives - positive fair value 12 067 31 160 - - - - 43 227
Other assets 43 333 87 071 794 35 87 - 131 320 Total 8 979 773 13 291 215 513 475 1 697 909 422 419 18 579 24 923 370
Total - as of 31 December 2019 8 446 182 13 271 778 540 759 1 689 150 321 545 68 893 24 338 307
* Excluding Arab Countries
NOTES TO THE FINANCIAL STATEMENTS

255
E. Credit exposure categorized by geographical distribution and stagings according to IFRS 9:31 December 2020
Stage 1 Stage 2Stage 3 Total
(Individual) (Collective) (Individual) (Collective)JD '000 JD '000 JD '000 JD '000 JD '000 JD '000
Jordan 6 956 482 977 145 983 355 15 196 47 595 8 979 773Other Arab Countries 11 042 163 1 215 634 816 341 55 108 161 969 13 291 215Asia* 513 466 9 - - - 513 475Europe 1 706 073 63 - - ( 8 227) 1 697 909America 420 933 - 1 486 - - 422 419Rest of the World 18 579 - - - - 18 579 Total 20 657 696 2 192 851 1 801 182 70 304 201 337 24 923 370
Total as of 31 December 2019 20 444 570 2 316 695 1 416 499 40 135 120 408 24 338 307
* Excluding Arab Countries.
NOTES TO THE FINANCIAL STATEMENTS

256
F. Credit exposure categorized by economic sector31 December 2020
Consumer Banking
CorporatesBanks and Financial
Institutions
Government and Public Sector TotalIndustry
and Mining Constructions Real estate Trade AgricultureTourism
and Hotels
Transportation Shares General Services
JD '000 JD '000 JD '000 JD '000 JD '000 JD '000 JD '000 JD '000 JD '000 JD '000 JD '000 JD '000 JD '000Balances with Central Banks - - - - - - - - - - - 4 410 865 4 410 865Balances and deposits with banks and financial institutions - - - - - - - - - - 3 562 153 - 3 562 153
Financial assets at fair value through profit or loss - - - - - - - - - - - 47 642 47 642
Direct credit facilities at amortized cost 2 291 125 2 462 812 1 119 932 790 038 2 088 879 118 191 216 779 143 985 8 500 1 604 781 74 155 730 285 11 649 462
Other financial assets at amortized cost - 47 060 - 4 880 - - - - - 20 972 157 059 4 848 730 5 078 701
financial derivatives - positive fair value - 11 486 - - 1 061 - - - - 3 30 677 - 43 227
Other assets 11 402 10 063 3 638 2 139 7 979 239 388 257 - 17 913 13 427 63 875 131 320 Total 2 302 527 2 531 421 1 123 570 797 057 2 097 919 118 430 217 167 144 242 8 500 1 643 669 3 837 471 10 101 397 24 923 370
Total as of 31 December 2019 2 386 409 2 573 161 1 189 513 877 728 2 295 751 110 693 181 344 156 100 8 500 1 626 573 3 957 840 8 974 695 24 338 307
NOTES TO THE FINANCIAL STATEMENTS

257
F. Credit exposure categorized by economic sector31 December 2020
Consumer Banking
CorporatesBanks and Financial
Institutions
Government and Public Sector TotalIndustry
and Mining Constructions Real estate Trade AgricultureTourism
and Hotels
Transportation Shares General Services
JD '000 JD '000 JD '000 JD '000 JD '000 JD '000 JD '000 JD '000 JD '000 JD '000 JD '000 JD '000 JD '000Balances with Central Banks - - - - - - - - - - - 4 410 865 4 410 865Balances and deposits with banks and financial institutions - - - - - - - - - - 3 562 153 - 3 562 153
Financial assets at fair value through profit or loss - - - - - - - - - - - 47 642 47 642
Direct credit facilities at amortized cost 2 291 125 2 462 812 1 119 932 790 038 2 088 879 118 191 216 779 143 985 8 500 1 604 781 74 155 730 285 11 649 462
Other financial assets at amortized cost - 47 060 - 4 880 - - - - - 20 972 157 059 4 848 730 5 078 701
financial derivatives - positive fair value - 11 486 - - 1 061 - - - - 3 30 677 - 43 227
Other assets 11 402 10 063 3 638 2 139 7 979 239 388 257 - 17 913 13 427 63 875 131 320 Total 2 302 527 2 531 421 1 123 570 797 057 2 097 919 118 430 217 167 144 242 8 500 1 643 669 3 837 471 10 101 397 24 923 370
Total as of 31 December 2019 2 386 409 2 573 161 1 189 513 877 728 2 295 751 110 693 181 344 156 100 8 500 1 626 573 3 957 840 8 974 695 24 338 307
F. Credit exposure categorized by economic sector and stagings according to IFRS 9:31 December 2020
Stage 1 Stage 2Stage 3 Total
(Individual) (Collective) (Individual) (Collective)JD '000 JD '000 JD '000 JD '000 JD '000 JD '000
Consumer Banking 11 402 2 192 851 - 70 304 27 970 2 302 527Industry and Mining 2 148 121 - 342 871 - 40 429 2 531 421Constructions 864 120 - 201 606 - 57 844 1 123 570Real Estate 647 813 - 143 311 - 5 933 797 057Trade 1 739 872 - 340 585 - 17 462 2 097 919Agriculture 71 566 - 44 414 - 2 450 118 430Tourism and Hotels 71 102 - 144 840 - 1 225 217 167Transportation 115 046 - 29 174 - 22 144 242Shares 8 500 - - - - 8 500General Service 1 517 098 - 78 571 - 48 000 1 643 669Banks and Financial Institutions 3 837 469 - - - 2 3 837 471Government and Public Sector 9 625 587 - 475 810 - - 10 101 397 Total 20 657 696 2 192 851 1 801 182 70 304 201 337 24 923 370
Total as of 31 December 2019 20 444 570 2 316 695 1 416 499 40 135 120 408 24 338 307
NOTES TO THE FINANCIAL STATEMENTS

258
47. Market RiskAssuming market prices as at December 31, 2020 and 2019 change by 5%, the impact on statement of income and Owners’ equity will be as follows:
31 December 2020 31 December 2019Statement of
IncomeOwners' Equity Total Statement of
IncomeOwners' Equity Total
JD '000 JD '000 JD '000 JD '000 JD '000 JD '000Interest rate sensitivity 10 943 - 10 943 29 584 - 29 584Foreign exchange rate sensitivity 597 30 994 31 591 1 320 28 387 29 707
Equity instruments price sensitivity 51 7 728 7 779 46 7 888 7 934
Total 11 591 38 722 50 313 30 950 36 275 67 225
48. Interest Rate Risk Exposure to interest rate volatility as of 31 December 2020 (classification is based on interest rate repricing or maturity date, whichever is nearer).
Up to 1 Month
More than 1 Month
and till 3 Months
More than 3 Months and till 6 Months
More than 6 Months and till 1
Year
More than 1 Year and till 3
Years
More than 3 Years
Not Tied to Interest Rate Risk
Total
JD '000 JD '000 JD '000 JD '000 JD '000 JD '000 JD '000 JD '000Assets Cash at vaults - - - - - - 422 391 422 391 Mandatory cash reserve - - - - - - 1 035 110 1 035 110 Balances with central banks 2 302 964 398 496 - - 17 730 - 656 565 3 375 755 Balances and deposits with banks and financial institutions 2 195 836 1 302 867 7 090 41 826 14 534 - - 3 562 153
Financial assets at fair value through profit or loss 286 133 1 772 3 465 12 838 29 148 1 015 48 657
Direct credit facilities at amortized cost 3 419 657 1 579 501 1 642 361 982 465 1 047 449 2 978 029 - 11 649 462
Financial assets at fair value through other comprehensive income
- - - - - - 154 564 154 564
Other financial assets at amortized cost 838 234 736 367 445 687 915 925 1 765 265 377 223 - 5 078 701
Investment in subsidiaries and associates - - - - - - 1 074 381 1 074 381
Fixed assets - - - - - - 225 022 225 022 Other assets and financial derivatives - positive fair value 52 262 26 547 32 650 37 18 285 5 294 499 424 285
Deferred tax assets - - - - - - 138 612 138 612 Total assets 8 809 239 4 043 911 2 129 560 1 943 718 2 876 101 3 384 405 4 002 159 27 189 093Liabilities Banks' and financial institutions' deposits 904 959 372 613 532 726 17 659 53 349 864 148 894 2 031 064
Customer deposits 6 239 286 2 263 258 1 320 826 1 863 503 281 174 64 378 6 451 311 18 483 736 Cash margin 388 018 789 879 157 475 161 191 17 378 13 391 145 662 1 672 994 Borrowed funds 87 393 244 544 15 423 3 951 892 - - 352 203 Provision for income tax - - - - - - 108 031 108 031 Other Provisions - - - - - - 145 503 145 503 Other liabilities and financial derivatives - negative fair value 84 682 24 808 24 055 2 198 - 13 405 114 540 870
Deferred tax liabilities - - - - - - 2 123 2 123 Total liabilities 7 704 338 3 695 102 2 050 505 2 048 502 352 793 78 646 7 406 638 23 336 524 Gap 1 104 901 348 809 79 055 ( 104 784) 2 523 308 3 305 759 (3 404 479) 3 852 569
NOTES TO THE FINANCIAL STATEMENTS
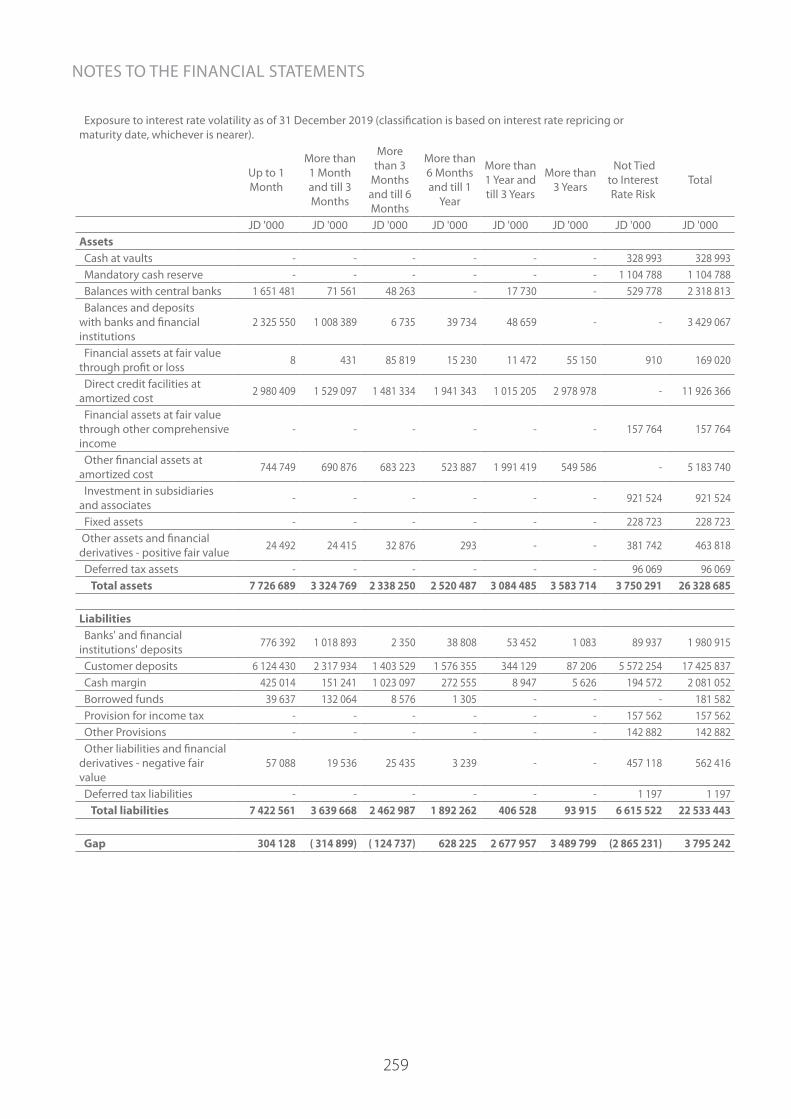
259
Exposure to interest rate volatility as of 31 December 2019 (classification is based on interest rate repricing or maturity date, whichever is nearer).
Up to 1 Month
More than 1 Month and till 3 Months
More than 3
Months and till 6 Months
More than 6 Months and till 1
Year
More than 1 Year and till 3 Years
More than 3 Years
Not Tied to Interest Rate Risk
Total
JD '000 JD '000 JD '000 JD '000 JD '000 JD '000 JD '000 JD '000Assets Cash at vaults - - - - - - 328 993 328 993 Mandatory cash reserve - - - - - - 1 104 788 1 104 788 Balances with central banks 1 651 481 71 561 48 263 - 17 730 - 529 778 2 318 813 Balances and deposits with banks and financial institutions
2 325 550 1 008 389 6 735 39 734 48 659 - - 3 429 067
Financial assets at fair value through profit or loss 8 431 85 819 15 230 11 472 55 150 910 169 020
Direct credit facilities at amortized cost 2 980 409 1 529 097 1 481 334 1 941 343 1 015 205 2 978 978 - 11 926 366
Financial assets at fair value through other comprehensive income
- - - - - - 157 764 157 764
Other financial assets at amortized cost 744 749 690 876 683 223 523 887 1 991 419 549 586 - 5 183 740
Investment in subsidiaries and associates - - - - - - 921 524 921 524
Fixed assets - - - - - - 228 723 228 723 Other assets and financial derivatives - positive fair value 24 492 24 415 32 876 293 - - 381 742 463 818
Deferred tax assets - - - - - - 96 069 96 069 Total assets 7 726 689 3 324 769 2 338 250 2 520 487 3 084 485 3 583 714 3 750 291 26 328 685
Liabilities Banks' and financial institutions' deposits 776 392 1 018 893 2 350 38 808 53 452 1 083 89 937 1 980 915
Customer deposits 6 124 430 2 317 934 1 403 529 1 576 355 344 129 87 206 5 572 254 17 425 837 Cash margin 425 014 151 241 1 023 097 272 555 8 947 5 626 194 572 2 081 052 Borrowed funds 39 637 132 064 8 576 1 305 - - - 181 582 Provision for income tax - - - - - - 157 562 157 562 Other Provisions - - - - - - 142 882 142 882 Other liabilities and financial derivatives - negative fair value
57 088 19 536 25 435 3 239 - - 457 118 562 416
Deferred tax liabilities - - - - - - 1 197 1 197 Total liabilities 7 422 561 3 639 668 2 462 987 1 892 262 406 528 93 915 6 615 522 22 533 443
Gap 304 128 ( 314 899) ( 124 737) 628 225 2 677 957 3 489 799 (2 865 231) 3 795 242
NOTES TO THE FINANCIAL STATEMENTS

260
Referential Interest Rate
“Following the decision by global regulators to phase out LIBOR rates and replace them with alternative reference rates, to be applied to loans and other banking products from 01/01/2022, Arab Bank formed the LIBOR Sucession Committee to manage this transition.
This committee is managed by the Head of Treasury and consists of senior representatives of other functions of the bank. In 2020 the committee drafted a comprehensive plan to prepare the bank to migrate to alternative reference rates after LIBOR, and these are the key areas of work:
1. Revise all the documents of the affected contracts. 2. Make any amendments required to the bank’s systems.3. Communicate with affected customers to keep them updated.4. Communicate with regulators as necessary.5. Plan for any changes required in hedge accounting.
There are some potential risks which the bank may be exposed to as a result of the changes. These have been identified, and for each one, plans were made and solutions were identified during 2020.
The bank has been successful in its work, and all work will be completed to cover all the required modifications in 2021, to ensure the bnank’s smooth transition to the post-LIBOR market environment.
1. The following table shows the bank’s assets, liabilities and derivatives linked to LIBOR whose maturity date is later than 31/12/2021:
31 December 2020 Financial Assets other than
derivatives at purchasing value
Financial Liabilities other than derivatives at
purchasing value
Notional Value of derivatives
JD '000 JD '000 JD '000
USD Libor (1 month) - - 27 500USD Libor (3 months) 1 131 747 - 1 099 959USD Libor (6 months) 48 227 235 255 245 000Other 18 707 - - Total 1 198 681 235 255 1 372 459
The impact of changing interest rates is managed by the bank on an ongoing basis, as well as carefully hedging the effects of such change 2. The table below shows the nominal value of the hedging instruments of the bank’s assets and liabilities for contracts maturing after 12/31/2021 and the weighted rate for the remaining periods to maturity.
31 December 2020Notional Value Average Period (years)
JD '000 JD '000
USD Libor (1 month) 27 500 6.7 USD Libor (3 months) 1 099 959 2.7 USD Libor (6 months) 245 000 8.7 Total 1 372 459
31 December 2019Notional Value Average Period (years)
JD '000 JD '000
USD Libor (1 month) 168 688 1.0 USD Libor (3 months) 1 088 469 3.4 USD Libor (6 months) 178 627 6.6 Total 1 435 784
NOTES TO THE FINANCIAL STATEMENTS

261
49. Liquidity Risk The below is the distribution of the liabilities (undiscounted) according to the residual maturity as of 31 December 2020:
Within1 Month
After 1 Month
and till 3 Months
After 3 Months and till 6 Months
After 6 Months and till One Year
After One Year and till 3
Years
After 3 Years
Not Tied to a
Specific Maturity
Total
JD '000 JD '000 JD '000 JD '000 JD '000 JD '000 JD '000 JD '000Liabilities Banks' and financial institutions' deposits 905 172 372 678 532 731 17 706 54 327 864 148 894 2 032 372
Customer deposits 5 252 904 2 284 668 1 302 763 1 743 360 504 415 132 164 7 398 507 18 618 781Cash margin 388 292 790 096 157 922 162 582 17 378 13 391 145 664 1 675 325Borrowed funds 5 385 8 162 7 906 3 056 56 316 271 500 - 352 325Provision for income tax - - - - - - 108 031 108 031Other provisions - - - - - - 145 503 145 503Financial derivatives - negative fair value 16 134 815 324 1 559 24 797 9 434 - 53 063
Other liabilities 50 236 12 146 18 110 2 198 - - 405 117 487 807Deferred tax liabilities - - - - - - 2 123 2 123Total Liabilities 6 618 123 3 468 565 2 019 756 1 930 461 657 233 427 353 8 353 839 23 475 330
Total assets according to expected maturities 6 808 882 3 075 293 1 676 203 1 958 534 3 562 106 4 909 097 5 198 978 27 189 093
The below is the distribution of the liabilities (undiscounted) according to the residual maturity as of 31 December 2019:
Within 1 Month
After 1 Month
and till 3 Months
After 3 Months and till 6 Months
After 6 Months and till One Year
After One Year and
till 3 YearsAfter 3 Years
Not Tied to a Specific Maturity
Total
JD '000 JD '000 JD '000 JD '000 JD '000 JD '000 JD '000 JD '000Liabilities Banks' and financial institutions' deposits 730 336 1 018 983 2 375 16 149 123 650 1 083 89 937 1 982 513
Customer deposits 5 185 547 2 609 334 1 374 891 1 597 050 335 775 89 995 6 359 456 17 552 048Cash margin 397 567 149 795 235 695 1 064 887 8 947 5 626 222 305 2 084 822Borrowed funds 216 8 859 5 997 979 9 729 155 947 - 181 727Provision for income tax - - - - - - 157 562 157 562Other provisions - - - - - - 142 882 142 882Financial derivatives - negative fair value 2 771 241 309 - 3 291 13 242 - 19 854
Other liabilities 43 246 15 196 23 763 3 239 - - 457 118 542 562Deferred tax liabilities - - - - - - 1 197 1 197Total Liabilities 6 359 683 3 802 408 1 643 030 2 682 304 481 392 265 893 7 430 457 22 665 167
Total assets according to expected maturities 5 836 716 2 793 706 1 872 284 2 250 144 3 935 325 5 106 555 4 533 955 26 328 685
50. Net Foreign Currency Positions The details of this item are as follows: 31 December 2020 31 December 2019
Base Currency in Thousand
Equivalent inJD '000
Base Currency in Thousand
Equivalent inJD '000
USD 44 618 31 644 29 153 20 676 GBP ( 292) ( 282) ( 1 728) ( 1 607) EUR 8 474 7 384 3 389 2 694 JPY 32 875 226 17 939 117 Other currencies * ( 50 903) ( 48 286)Total ( 11 931) ( 26 406)
* Various foreign currencies translated to Jordanian Dinars.
NOTES TO THE FINANCIAL STATEMENTS
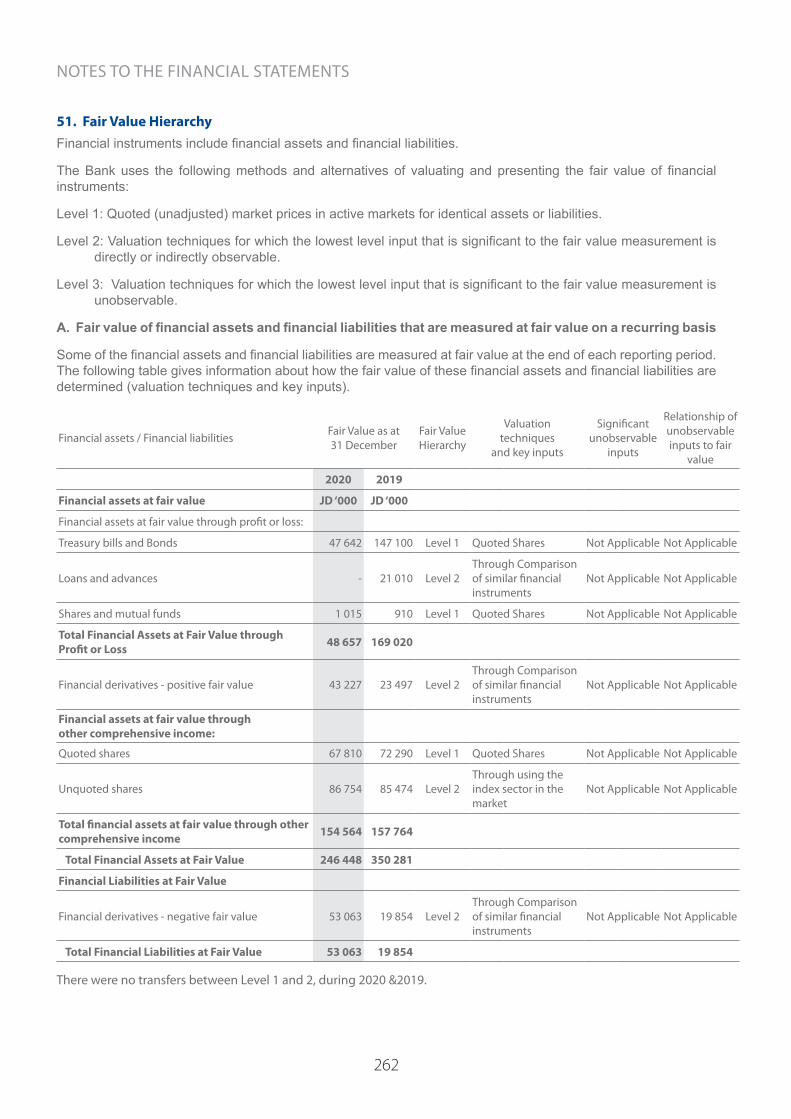
262
51. Fair Value Hierarchy Financial instruments include financial assets and financial liabilities.
The Bank uses the following methods and alternatives of valuating and presenting the fair value of financial instruments:
Level 1: Quoted (unadjusted) market prices in active markets for identical assets or liabilities.
Level 2: Valuation techniques for which the lowest level input that is significant to the fair value measurement is directly or indirectly observable.
Level 3: Valuation techniques for which the lowest level input that is significant to the fair value measurement is unobservable.
A. Fair value of financial assets and financial liabilities that are measured at fair value on a recurring basis
Some of the financial assets and financial liabilities are measured at fair value at the end of each reporting period. The following table gives information about how the fair value of these financial assets and financial liabilities are determined (valuation techniques and key inputs).
Financial assets / Financial liabilities Fair Value as at 31 December
Fair Value Hierarchy
Valuation techniques
and key inputs
Significant unobservable
inputs
Relationship of unobservable inputs to fair
value
2020 2019
Financial assets at fair value JD ‘000 JD ‘000
Financial assets at fair value through profit or loss:
Treasury bills and Bonds 47 642 147 100 Level 1 Quoted Shares Not Applicable Not Applicable
Loans and advances - 21 010 Level 2Through Comparison of similar financial instruments
Not Applicable Not Applicable
Shares and mutual funds 1 015 910 Level 1 Quoted Shares Not Applicable Not Applicable
Total Financial Assets at Fair Value through Profit or Loss 48 657 169 020
Financial derivatives - positive fair value 43 227 23 497 Level 2Through Comparison of similar financial instruments
Not Applicable Not Applicable
Financial assets at fair value through other comprehensive income:
Quoted shares 67 810 72 290 Level 1 Quoted Shares Not Applicable Not Applicable
Unquoted shares 86 754 85 474 Level 2Through using the index sector in the market
Not Applicable Not Applicable
Total financial assets at fair value through other comprehensive income 154 564 157 764
Total Financial Assets at Fair Value 246 448 350 281
Financial Liabilities at Fair Value
Financial derivatives - negative fair value 53 063 19 854 Level 2Through Comparison of similar financial instruments
Not Applicable Not Applicable
Total Financial Liabilities at Fair Value 53 063 19 854
There were no transfers between Level 1 and 2, during 2020 &2019.
NOTES TO THE FINANCIAL STATEMENTS

263
B. Fair value of financial assets and financial liabilities that are not measured at fair value on a recurring basis.Except as detailed in the following table, we believe that the carrying amounts of financial assets and financial liabilities recognized in the banks financial statements approximate their fair values:
31 December 2020 31 December 2019
Book value Fair value Book value Fair value Fair Value Hierarchy
JD ‘000 JD ‘000 JD ‘000 JD ‘000
Financial assets not calculated at fair value Mandatory reserve, time and notice and certificates of deposits with central banks 3 402 932 3 403 461 2 889 055 2 890 210 Level 2
Balances and Deposits with banks and financial institutions 3 562 153 3 563 017 3 429 067 3 431 382 Level 2
Direct credit facilities at amortized cost 11 649 462 11 684 026 11 926 366 11 964 617 Level 2 Other Financial assets at amortized cost 5 078 701 5 132 469 5 183 740 5 239 494 Level 1 & 2Total financial assets not calculated at fair value 23 693 248 23 782 973 23 428 228 23 525 703
Financial liabilities not calculated at fair value Banks' and financial institutions' deposits 2 031 064 2 036 501 1 980 915 1 988 389 Level 2 Customer deposits 18 483 736 18 542 349 17 425 837 17 505 943 Level 2 Cash margin 1 672 994 1 678 755 2 081 052 2 091 656 Level 2 Borrowed funds 352 203 353 571 181 582 182 971 Level 2Total financial liabilities not calculated at fair value 22 539 997 22 611 176 21 669 386 21 768 959
The fair values of the financial assets and financial liabilities included in level 2 categories above have been determined in accordance with the generally accepted pricing models based on a discounted cash flow analysis, with the most significant inputs being the discount rate that reflects the credit risk of counterparties..
NOTES TO THE FINANCIAL STATEMENTS

264
52. Analysis for Assets and Liabilities MaturitiesThe below is an analysis for assets and liabilities maturities according to the expected period to be recovered or settled as at 31 December 2020:
UP to One Year More than One Year TotalJD ‘000 JD ‘000 JD ‘000
Assets Cash at vaults 422 391 - 422 391 Mandatory cash reserve 1 035 110 - 1 035 110 Balances with central banks 3 358 025 17 730 3 375 755 Balances and deposits with banks and financial institutions 3 547 619 14 534 3 562 153
Financial assets at fair value through profit or loss 6 670 41 987 48 657 Direct credit facilities at amortized cost 5 531 933 6 117 529 11 649 462 Financial assets at fair value through other comprehensive income - 154 564 154 564
Other financial assets at amortized cost 2 908 912 2 169 789 5 078 701 Investment in subsidiaries and associates - 1 074 381 1 074 381 Fixed assets 24 981 200 041 225 022 Other assets and financial derivatives - positive fair value 314 651 109 634 424 285 Deferred tax assets 138 612 - 138 612 Total Assets 17 288 904 9 900 189 27 189 093
Liabilities Banks' and financial institutions' deposits 1 976 851 54 213 2 031 064 Customer deposits 17 971 992 511 744 18 483 736 Cash margin 1 644 113 28 881 1 672 994 Borrowed funds 24 387 327 816 352 203 Provision for income tax 108 031 - 108 031 Other provisions 145 503 - 145 503 Other liabilities and financial derivatives - negative fair value 540 870 - 540 870
Deferred tax liabilities 2 123 - 2 123 Total Liabilities 22 413 870 922 654 23 336 524
Net (5 124 966) 8 977 535 3 852 569
NOTES TO THE FINANCIAL STATEMENTS

265
The below is an analysis for assets and liabilities maturities according to the expected period to be recovered or settled as at 31 December 2019:
UP to One Year More than One Year Total
JD ‘000 JD ‘000 JD ‘000
Assets Cash at vaults 328 993 - 328 993 Mandatory cash reserve 1 104 788 - 1 104 788 Balances with central banks 2 301 083 17 730 2 318 813 Balances and deposits with banks and financial institutions 3 310 925 118 142 3 429 067 Financial assets at fair value through profit or loss 102 399 66 621 169 020 Direct credit facilities at amortized cost 5 732 459 6 193 907 11 926 366 Financial assets at fair value through other comprehensive income - 157 764 157 764
Other financial assets at amortized cost 2 538 260 2 645 480 5 183 740 Investment in subsidiaries and associates - 921 524 921 524 Fixed assets 25 100 203 623 228 723 Other assets and financial derivatives - positive fair value 463 818 - 463 818 Deferred tax assets 96 069 - 96 069 Total Assets 16 003 894 10 324 791 26 328 685
Liabilities Banks' and financial institutions' deposits 1 856 182 124 733 1 980 915 Customer deposits 17 033 895 391 942 17 425 837 Cash margin 2 068 835 12 217 2 081 052 Borrowed funds 15 906 165 676 181 582 Provision for income tax 157 562 - 157 562 Other provisions 142 882 - 142 882 Other liabilities and financial derivatives - negative fair value 562 416 - 562 416 Deferred tax liabilities 1 197 - 1 197 Total Liabilities 21 838 875 694 568 22 533 443Net (5 834 981) 9 630 223 3 795 242
53. Contractual Maturity of the Contingent Accounts The table below details the maturity of expected liabilities and commitments on the basis of contractual maturity:
31 December 2020
Within 1 year After 1 year and before 5 years After 5 years Total
JD ‘000 JD ‘000 JD ‘000 JD ‘000 Letters of credit 747 569 55 414 - 802 983 Acceptances 375 886 4 073 - 379 959 Letters of guarantee: - Payment guarantees 868 804 49 274 638 918 716 - Performance guarantees 2 113 111 810 181 13 993 2 937 285 - Other guarantees 1 852 237 213 478 5 907 2 071 622 Unutilized credit facilities 2 371 646 190 594 - 2 562 240 Total 8 329 253 1 323 014 20 538 9 672 805
NOTES TO THE FINANCIAL STATEMENTS

266
31 December 2020JD ‘000 JD ‘000 JD ‘000 JD ‘000
Constructions projects contracts 1 088 - - 1 088 Procurement contracts 7 473 2 151 1 793 11 417 Total 8 561 2 151 1 793 12 505
31 December 2019JD ‘000 JD ‘000 JD ‘000 JD ‘000
Constructions projects contracts 1 385 - - 1 385 Procurement contracts 5 705 1 858 1 352 8 915 Total 7 090 1 858 1 352 10 300
31 December 2019
Within 1 year After 1 year and before 5 years After 5 years Total
JD ‘000 JD ‘000 JD ‘000 JD ‘000
Letters of credit 790 550 14 655 - 805 205 Acceptances 462 533 4 160 - 466 693 Letters of guarantee: - Payment guarantees 1 154 067 31 485 639 1 186 191 - Performance guarantees 2 299 508 920 527 7 961 3 227 996 - Other guarantees 1 895 597 279 929 417 2 175 943 Unutilized credit facilities 2 687 653 231 886 - 2 919 539 Total 9 289 908 1 482 642 9 017 10 781 567
54. Capital ManagementThe Bank manages it’s capital to safeguard it’s ability to continue it’s operating activities while maximizing the returnto shareholders. The composition of the regulatory capital as defined by Basel III Committee is as follows:
31 December 31 December2020 2019JD ‘000 JD ‘000
Common Equity Tier 1 3 665 214 3 684 482Regulatory Adjustments ( Deductions from Common Equity Tier 1) (1 049 673) (790 566)Additional Tier 1 - - Supplementary Capital 195 873 179 850Regulatory Adjustments ( Deductions from Supplementary Capital) ( 13 229) ( 67 849)Regulatory Capital 2 798 185 3 005 918
Risk-weighted assets (RWA) 19 231 625 19 786 137
Common Equity Tier 1 Ratio %13.60 %14.63Tier 1 Capital Ratio %13.60 %14.63Capital Adequacy Ratio %14.55 %15.19 - The Board of Directors performs an overall review of the capital structure of the Bank on quarterly basis. As part of this review, the Board takes into consideration matters such as cost and risks of capital as integral factors in managing capital through setting dividend policies and capitalization of reserves.
NOTES TO THE FINANCIAL STATEMENTS

267
55. Transactions with Related Parties The details of this item are as follows:
31 December 2020
Deposits owed from Related
Parties
Direct Credit Facilities at
Amortized Cost
Deposits owed to Related
Parties
LCs, LGs, Unutilized Credit
Facilities and Acceptances
JD '000 JD '000 JD '000 JD '000Sister and subsidiary companies 1 287 793 23 625 104 169 138 445Associates companies 123 000 - 12 924 31 233Major shareholders and members of the Board of Directors - 184 619 460 907 63 484
Total 1 410 793 208 244 578 000 233 162
31 December 2019
Deposits owed from Related
Parties
Direct Credit Facilities at
Amortized Cost
Deposits owed to Related
Parties
LCs, LGs, Unutilized Credit
Facilities and Acceptances
JD '000 JD '000 JD '000 JD '000Sister and subsidiary companies 1 294 016 23 477 93 189 139 233Associates companies 264 006 - 15 142 28 014Major shareholders and members of the Board of Directors - 174 316 434 187 59 198
Total 1 558 022 197 793 542 518 226 445
Direct credit facilities granted to key management personnel amounted to JD 1.3 million and indirect credit facilities amounted to JD 154 thousands as of 31December 2020 (Direct credit facilities JD 1.6 million and indirect credit facilities JD 154 thousand as of 31 December 2019 ) Top management deposits amounted to JD 3.9 million as of 31 December 2020 ( JD 3.1 million as of 31 December 2019) All facilities granted to related parties are performing loans in accordance with the credit rating of the Bank. No provisions for the year have been recorded in relation to impairment in value.
The details of transactions with related parties are as follows:
2020Interest Income Interest Expense
JD ‘000 JD ‘000Subsidiaries and sister companies 7 490 1 142Associated companies 1 242 64Total 8 732 1 206
2019Interest Income Interest Expense
JD ‘000 JD ‘000Subsidiaries and sister companies 24 739 2 111Associated companies 2 365 398Total 27 104 2 509- Interest on facilities granted to major shareholders and members of the Board of Directors is recorded at arm’s
length.- The salaries and other fringe benefits of the Bank’s key management personnel, inside and outside Jordan, amounted
to JD 32.5 million for the year ended on 31 December 2020 (JD 31.9 million for the year ended on 31 December 2019).
NOTES TO THE FINANCIAL STATEMENTS

268
56. Assets under Management- There are no assets under management as of 31 December 2020 and 2019.
57. Cash and Cash Equivalent The details of this item are as follows: 31 December
2020 2019JD '000 JD '000
Cash and balances with central banks maturing within 3 months 4 897 787 3 691 575Add: Balances with banks and financial institutions maturing within 3 months 3 499 187 3 264 971Less: Banks and financial institutions deposits maturing within 3 months 1 426 468 1 839 136Total 6 970 506 5 117 410
58. LEGAL CASESThere are lawsuits filed against the Bank totaling JOD 171.7 million as of 31 December 2020, (JOD 130.8 million as of 31 December 2019). In the opinion of the management and the lawyers representing the Bank in the litigation at issue, the provisions taken in connection with the lawsuits are adequate.
59. STANDARDS ISSUED BUT NOT YET EFFECTIVEThe standards and interpretations that are issued but not yet effective, up to the date of issuance of the Bank’s financial statements are disclosed below. The Bank intends to adopt these standards, if applicable, when they become effective.
IFRS 17 Insurance ContractsIFRS 17 provides a comprehensive model for insurance contracts covering the recognition and measurement and presentation and disclosure of insurance contracts and replaces IFRS 4 -Insurance Contracts. The standard applies to all types of insurance contracts (i.e. life, non-life, direct insurance and re-insurance), regardless of the type of entities that issue them, as well as to certain guarantees and financial instruments with discretionary participation features. The standard general model is supplemented by the variable fee approach and the premium allocation approach.
The new standard will be effective for annual periods beginning on or after 1 January 2023 with comparative figures required. Early application is permitted provided that the entity also applies IFRS 9 and IFRS 15 on or before the date it first applies IFRS 17.
Amendments to IAS 1: Classification of Liabilities as Current or Non-current In January 2020, the IASB issued amendments to paragraphs 69 to 76 of IAS 1 to specify the requirements for classifying liabilities as current or non-current. The amendments clarify:
- what is meant by a right to defer settlement,
- the right to defer must exist at the end of the reporting period,
- that classification is unaffected by the likelihood,
- that an entity will exercise its deferral right,
- and that only if an embedded derivative in a convertible liability is itself an equity instrument would the terms of a liability not impact its classification.
The amendments are effective for annual reporting periods beginning on or after 1 January 2023 and must be applied retrospectively.
Reference to the Conceptual Framework - Amendments to IFRS 3 In May 2020, the IASB issued Amendments to IFRS 3 Business Combinations - Reference to the Conceptual Framework. The amendments are intended to replace a reference to the Framework for the Preparation and Presentation of Financial Statements, issued in 1989, with a reference to the Conceptual Framework for Financial Reporting issued in March 2018 without significantly changing its requirements.
The Board also added an exception to the recognition principle of IFRS 3 to avoid the issue of potential ‘day 2’ gains or losses arising for liabilities and contingent liabilities that would be within the scope of IAS 37 or IFRIC 21 Levies, if incurred separately.
At the same time, the Board decided to clarify existing guidance in IFRS 3 for contingent assets that would not be affected by replacing the reference to the Framework for the Preparation and Presentation of Financial Statements.
The amendments are effective for annual reporting periods beginning on or after 1 January 2022 and apply prospectively.
NOTES TO THE FINANCIAL STATEMENTS
269
The amendments are not expected to have a material impact on the Bank.
Property, Plant and Equipment: Proceeds before Intended Use – Amendments to IAS 16 In May 2020, the IASB issued Property, Plant and Equipment — Proceeds before Intended Use, which prohibits entities from deducting from the cost of an item of property, plant and equipment, any proceeds from selling items produced while bringing that asset to the location and condition necessary for it to be capable of operating in the manner intended by management. Instead, an entity recognizes the proceeds from selling such items, and the costs of producing those items, in profit or loss.
The amendment is effective for annual reporting periods beginning on or after 1 January 2022 and must be applied retrospectively to items of property, plant and equipment made available for use on or after the beginning of the earliest period presented when the entity first applies the amendment.
The amendments are not expected to have a material impact on the Bank.
Onerous Contracts – Costs of Fulfilling a Contract – Amendments to IAS 37 In May 2020, the IASB issued amendments to IAS 37 to specify which costs an entity needs to include when assessing whether a contract is onerous or loss-making.
The amendments apply a “directly related cost approach”. The costs that relate directly to a contract to provide goods or services include both incremental costs and an allocation of costs directly related to contract activities.
General and administrative costs do not relate directly to a contract and are excluded unless they are explicitly chargeable to the counterparty under the contract.
The amendments are effective for annual reporting periods beginning on or after 1 January 2022. The Bank will apply these amendments to contracts for which it has not yet fulfilled all its obligations at the beginning of the annual reporting period in which it first applies the amendments.
The amendments are not expected to have a material impact on the Bank.
IFRS 9 Financial Instruments – Fees in the ’10 per cent’ test for derecognition of financial liabilities As part of its 2018-2020 annual improvements to IFRS standards process the IASB issued amendment to IFRS 9. The amendment clarifies the fees that an entity includes when assessing whether the terms of a new or modified financial liability are substantially different from the terms of the original financial liability. These fees include only those paid or received by the borrower and the lender, including fees paid or received by either the borrower or lender on the other’s behalf. An entity applies the amendment to financial liabilities that are modified or exchanged on or after the beginning of the annual reporting period in which the entity first applies the amendment.
The amendment is effective for annual reporting periods beginning on or after 1 January 2022 with earlier adoption permitted. The Bank will apply the amendments to financial liabilities that are modified or exchanged on or after the beginning of the annual reporting period in which the entity first applies the amendment.
The amendments are not expected to have a material impact on the Bank.
IBOR reform Phase 2 IBOR reform Phase 2, which will be effective on 1 January 2021, includes a number of reliefs and additional disclosures. The reliefs apply upon the transition of a financial instrument from an IBOR to a risk-free-rate (RFR).
Changes to the basis for determining contractual cash flows as a result of interest rate benchmark reform are required as a practical expedient to be treated as changes to a floating interest rate, provided that, for the financial instrument, the transition from the IBOR benchmark rate to RFR takes place on an economically equivalent basis.
IBOR reform Phase 2 provides temporary reliefs that allow the Bank’s hedging relationships to continue upon the replacement of an existing interest rate benchmark with an RFR. The reliefs require the Bank to amend hedge designations and hedge documentation. This includes redefining the hedged risk to reference an RFR, redefining the description of the hedging instrument and / or the hedged item to reference the RFR and amending the method for assessing hedge effectiveness. Updates to the hedging documentation must be made by the end of the reporting period in which a replacement takes place. For the retrospective assessment of hedge effectiveness, the Bank may elect on a hedge by
NOTES TO THE FINANCIAL STATEMENTS

270
hedge basis to reset the cumulative fair value change to zero. The Bank may designate an interest rate as a non-contractually specified, hedged risk component of changes in the fair value or cash flows of a hedged item, provided the interest rate risk component is separately identifiable, e.g., it is an established benchmark that is widely used in the market to price loans and derivatives. For new RFRs that are not yet an established benchmark, relief is provided from this requirement provided the Bank reasonably expects the RFR to become separately identifiable within 24 months. For hedges of groups of items, the Bank is required to transfer to subgroups those instruments that reference RFRs. Any hedging relationships that prior to application of IBOR reform Phase 2, have been discontinued solely due to IBOR reform and meet the qualifying criteria for hedge accounting when IBOR reform Phase 2 is applied, must be reinstated upon initial application.
60. COMPARATIVE FIGURES Some of the comparative figures in the financial statements for the year 2019 have been reclassified to be consistent with the year 2020 presentation, with no effect on profit and equity for the year 2019.
NOTES TO THE FINANCIAL STATEMENTS

271
INDEPENDENT AUDITOR’S REPORT To the Shareholders Arab Bank PLC Amman - Jordan Report on the Audit of the Financial Statements Opinion We have audited the financial statements of Arab Bank PLC Company (a Public Shareholding Company) which comprise the statement of financial position as at 31 December 2020, and the statement of income, statement of comprehensive income, statement of changes in equity and statement of cash flows for the year then ended, and notes to the financial statements, including a summary of significant accounting policies. In our opinion, the accompanying financial statements present fairly, in all material respects, the financial position of the Bank as at 31 December 2020, and its financial performance and its cash flows for the year then ended in accordance with International Financial Reporting Standards (IFRSs). Basis for Opinion We conducted our audit in accordance with International Standards on Auditing (ISAs). Our responsibilities under those standards, are further described in the Auditor’s Responsibilities for the Audit of the Financial Statements section of our report. We are independent of the Bank in accordance with the International Ethics Standards Board for Accountants’ Code of Ethics for Professional Accountants (IESBA Code) together with the ethical requirements that are relevant to our audit of the financial statements in Jordan, and we have fulfilled our other ethical responsibilities in accordance with these requirements and the IESBA Code. We believe that the audit evidence we have obtained is sufficient and appropriate to provide a basis for our opinion.
Ernst & Young Jordan P.O. Box 1140 300 King Abdulla Street Amman 11118 Jordan Tel:00962 6 580 0777 /00962 6552 6111 Fax:00962 6 5538 300 www.ey.com
INDEPENDENT AUDITOR’S REPORT

272
Key Audit Matters Key audit matters are those matters that, in our professional judgment, were of most significance in our audit of the financial statements for the year ended 31 December 2020. These matters were addressed in the context of our audit of the financial statements as a whole, and in forming our opinion thereon, and we do not provide a separate opinion on these matters. For each matter below, our description of how our audit addressed the matter provided in that context . We have fulfilled the responsibilities described in the Auditor’s responsibilities for the audit of the financial statements section of our report, including in relation to these matters. Accordingly, our audit included the performance of procedures designed to respond to our assessment of the risks of material misstatement of the financial statements. The results of our audit procedures, including the procedures performed to address the matters below, provide the basis for our audit opinion on the accompanying financial statements.
1. Inadequate allowances (ECL) for credit facilities Refer to note (12) on the financial statements
Key audit matter: This is considered as a key audit matter as the bank exercises significant judgement to determine when and how much to record as impairment. The provision for credit facilities at amortized cost are determined in accordance with the bank’s impairment and provisioning policy, which is aligned to the requirements of IFRS 9. Credit facilities at amortized cost form a major portion of the Bank's assets, there is a risk that inappropriate impairment provisions are booked, whether from the use of inaccurate underlying data, or the use of unreasonable assumptions. Due to the significance of the judgments used in classifying credit facilities into various stages stipulated in IFRS 9 and determining related provision requirements, this audit area is considered a key audit risk. As at 31 December 2020, the Bank's gross credit facilities amounted to JD 13,083 million and the related impairment provisions amounted to JD 1,095 million. The impairment provision policy is presented in the accounting policies in (note 4) to the financial statements.
How the key audit matter was addressed in the audit: Our audit procedures included the following:
• We gained an understanding of the Bank's key credit processes comprising granting, booking and tested the operating effectiveness of key controls over these processes.
• We read the Bank’s impairment provisioning policy and compared it with the requirements of IFRS 9 as well as relevant regulatory guidelines and pronouncements.
• We assessed the Bank’s expected credit loss model, in particular focusing on its alignment of the expected credit loss model and its underlying methodology with the requirements of IFRS 9.
• We examined a sample of exposures,
assessed on an individual basis and performed procedures to evaluate the following:
o Appropriateness of the bank’s
staging. o Appropriateness of determining
Exposure at Default, including the consideration of repayments in the cash flows and the resultant arithmetical calculations
o Appropriateness of the PD, EAD, LGD and EIR used for different exposures at different stages.
o Appropriateness of the internal rating and the objectivity,
INDEPENDENT AUDITOR’S REPORT
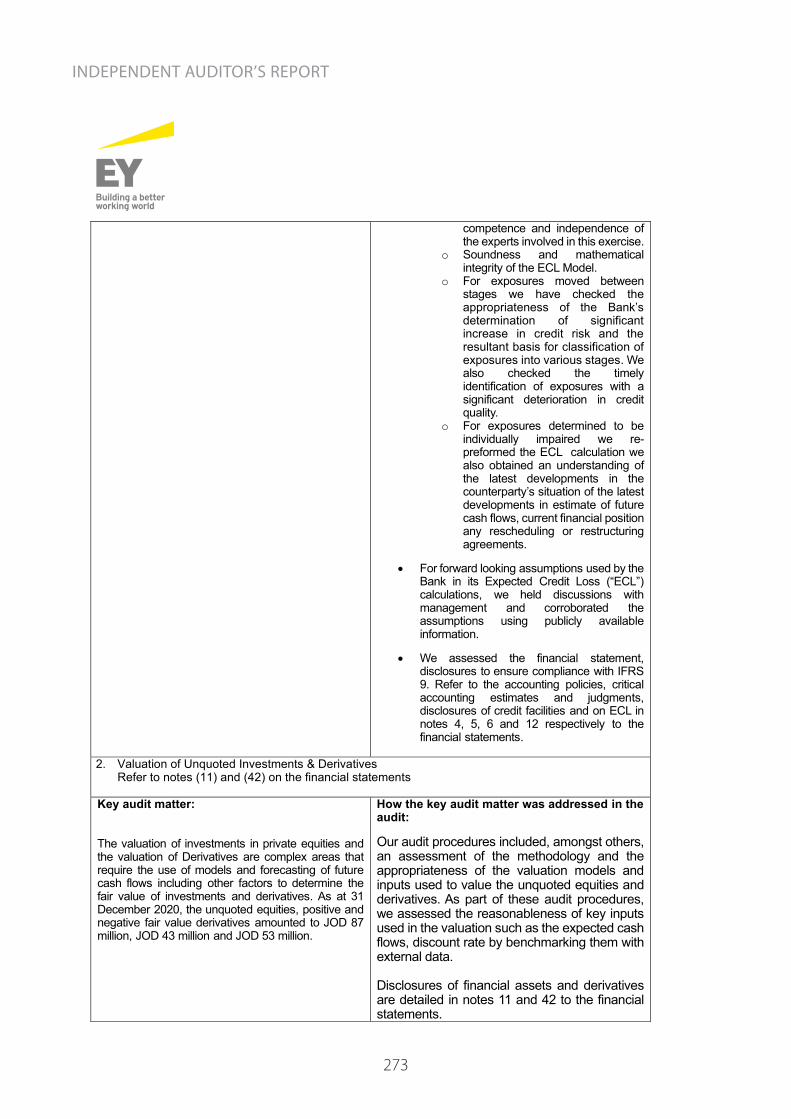
273
competence and independence of the experts involved in this exercise.
o Soundness and mathematical integrity of the ECL Model.
o For exposures moved between stages we have checked the appropriateness of the Bank’s determination of significant increase in credit risk and the resultant basis for classification of exposures into various stages. We also checked the timely identification of exposures with a significant deterioration in credit quality.
o For exposures determined to be individually impaired we re-preformed the ECL calculation we also obtained an understanding of the latest developments in the counterparty’s situation of the latest developments in estimate of future cash flows, current financial position any rescheduling or restructuring agreements.
• For forward looking assumptions used by the
Bank in its Expected Credit Loss (“ECL”) calculations, we held discussions with management and corroborated the assumptions using publicly available information.
• We assessed the financial statement,
disclosures to ensure compliance with IFRS 9. Refer to the accounting policies, critical accounting estimates and judgments, disclosures of credit facilities and on ECL in notes 4, 5, 6 and 12 respectively to the financial statements.
2. Valuation of Unquoted Investments & Derivatives Refer to notes (11) and (42) on the financial statements
Key audit matter: The valuation of investments in private equities and the valuation of Derivatives are complex areas that require the use of models and forecasting of future cash flows including other factors to determine the fair value of investments and derivatives. As at 31 December 2020, the unquoted equities, positive and negative fair value derivatives amounted to JOD 87 million, JOD 43 million and JOD 53 million.
How the key audit matter was addressed in the audit: Our audit procedures included, amongst others, an assessment of the methodology and the appropriateness of the valuation models and inputs used to value the unquoted equities and derivatives. As part of these audit procedures, we assessed the reasonableness of key inputs used in the valuation such as the expected cash flows, discount rate by benchmarking them with external data. Disclosures of financial assets and derivatives are detailed in notes 11 and 42 to the financial statements.
INDEPENDENT AUDITOR’S REPORT
274
Other information included in the Bank’s 2020 annual report. Other information consists of the information included in The Bank’s 2020 Annual Report other than the financial statements and our auditor’s report thereon. Management is responsible for the other information. The Bank’s 2020 Annual Report is expected to be made available to us after the date of this auditor’s report. Our opinion on the financial statements does not cover the other information and we will not express any form of assurance conclusion thereon. In connection with our audit of the financial statements, our responsibility is to read the other information identified above when it becomes available and, in doing so, consider whether the other information is materially inconsistent with the financial statements or our knowledge obtained in the audit or otherwise appears to be materially misstated. Responsibilities of Management and Those Charged with Governance for the Financial Statements Management is responsible for the preparation and fair presentation of the financial statements in accordance with IFRSs, and for such internal control as management determines is necessary to enable the preparation of financial statements that are free from material misstatement, whether due to fraud or error. In preparing the financial statements, management is responsible for assessing the Bank’s ability to continue as a going concern, disclosing, as applicable, matters related to going concern and using the going concern basis of accounting unless management either intends to liquidate the Bank or to cease operations, or has no realistic alternative but to do so. Those charged with governance are responsible for overseeing the Bank’s financial reporting process.
INDEPENDENT AUDITOR’S REPORT
275
Auditor’s Responsibilities for the Audit of the Financial Statements Our objectives are to obtain reasonable assurance about whether the financial statements as a whole are free from material misstatement, whether due to fraud or error, and to issue an auditor’s report that includes our opinion.
Reasonable assurance is a high level of assurance, but is not a guarantee that an audit conducted in accordance with ISAs will always detect a material misstatement when it exists. Misstatements can arise from fraud or error and are considered material if, individually or in the aggregate, they could reasonably be expected to influence the economic decisions of users taken on the basis of these financial statements. As part of an audit in accordance with ISAs, we exercise professional judgment and maintain professional skepticism throughout the audit. We also: • Identify and assess the risks of material misstatement of the financial statements, whether
due to fraud or error, design and perform audit procedures responsive to those risks, and obtain audit evidence that is sufficient and appropriate to provide a basis for our opinion. The risk of not detecting a material misstatement resulting from fraud is higher than for one resulting from error, as fraud may involve collusion, forgery, intentional omissions, misrepresentations, or the override of internal control.
• Obtain an understanding of internal control relevant to the audit in order to design audit procedures that are appropriate in the circumstances, but not for the purpose of expressing an opinion on the effectiveness of the Bank’s internal control.
• Evaluate the appropriateness of accounting policies used and the reasonableness of
accounting estimates and related disclosures made by management. • Conclude on the appropriateness of management’s use of the going concern basis of
accounting and, based on the audit evidence obtained, whether a material uncertainty exists related to events or conditions that may cast significant doubt on the Bank’s ability to continue as a going concern. If we conclude that a material uncertainty exist, we are required to draw attention in our auditor’s report to the related disclosures in the financial statements or, if such disclosures are inadequate, to modify our opinion. Our conclusions are based on the audit evidence obtained up to the date of our auditor’s report. However future events or conditions may cause the Bank to cease to continue as a going concern.
• Evaluate the overall presentation, structure and content of the financial statements, including
the disclosures, and whether the financial statements represent the underlying transactions and events in a manner that achieves fair presentation.
INDEPENDENT AUDITOR’S REPORT

276
We communicate with those charged with governance regarding, among other matters, the planned scope and timing of the audit and significant audit findings, including any significant deficiencies in internal control that we identify during our audit.
We also provide those charged with governance with a statement that we have complied with relevant ethical requirements regarding independence, and to communicate with them all relationships and other matters that may reasonably be thought to bear on our independence, and where applicable, related safeguards.
From the matters communicated with those charged with governance, we determine those matters that were of most significance in the audit of the financial statements of the current period, and are therefore the key audit matters. We describe these matters in our auditor’s report, unless law or regulation precludes public disclosure about the matter or when, in extremely rare circumstances, we determine that a matter should not be communicated in our report because the adverse consequences of doing so would reasonable be expected to outweigh the public interest benefits of such communication.
The partner in charge of the audit resulting in this auditor’s report was Bishr Ibrahim Baker; license number 592.
Amman – Jordan 1 February 2021
INDEPENDENT AUDITOR’S REPORT

277
ATTESTATION STATEMENT ON COMPANY”S CONTINUITY
The Board of Directors confirms that there are no significant issues that may affect the continued operations of the Bank during the financial year 2021.

278
ATTESTATION ON THE FINANCIAL STATEMENTS
The Board of Directors confirms its responsibility for the preparation of the financial statements, and for implementing an effective internal control system.
279
ATTESTATION
ON
THE FIN
AN
CIAL STATEM
ENTS A
ND
THE IN
TERNA
L CON
TROL SYSTEM
ATTESTATION STATEMENT ON COMPLETENESS OF FINANCIAL INFORMATIONATTESTATION ON THE FINANCIAL STATEMENTS
The Chairman, the Chief Executive Officer and the Group Chief Financial Officer attest to the accuracy and completeness of the financial statements and the financial information of this report as at 31 December 2020.
/Ghassan TaraziChief Financial Officer

280
ATTESTATION STATEMENT CONFIRMING THAT NON OF THE BOARD OF DIRECTORS MEMEBERS OR THOSE RELATED TO THEM RECEIVED ANY BENEFITS, WHETHER MATERIAL OR IN-KIND
The Board of Directors confirms that none of its members or those related to them received any benefits, whether material or in-kind, for the fiscal year 2020.

281
Page
Introduction 282
Article (1): Commitment to Corporate Governance 282
Article (2): Definitions 282
Article (3): Composition of the Board 283
Article (4): Board Meetings 283
Article (5): Responsibilities of the Board of Directors 283
Article (6): Chief Executive Officer 286
Article (7): Board Committees 286
a) The Corporate Governance Committee 286
b) The Audit Committee 287
c) The Nomination & Remuneration Committee 287
d) The Risk Management Committee 288
e) The Corporate Strategy Committee 288
f ) The Credit Committee 289
g) The IT Governance Committee 289
h) The Compliance Committee 289
Article (8): Suitability of the Board Members 290
Article (9): Suitability of Senior Executives 290
Article (10): Evaluating the performance of the Board and Senior Executives 291
Article (11): The Remuneration for the Board and Executives 291
Article (12): Conflict of Interests 292
Article (13): Internal Audit 292
Article (14): External Audit 293
Article (15): Risk Management 293
Article (16): Compliance 293
Article (17): Stakeholders’ Rights 294
Article (18): Disclosure & Transparency 294
CORPORATE GOVERNANCE CODE
282
Introduction
Arab Bank attaches considerable importance to good corporate governance practices and the Board is committed to implementing the highest professional standards in all the Bank’s activities. In this regard the Bank follows the instructions of the Central Bank of Jordan which adopted the Basel Committee’s recommendations on Corporate Governance. The Bank also observes the requirements of the relevant regulatory / official entities in Jordan and in the other countries in which it operates.
A pioneer to commit to best practices of Corporate Governance in the Middle East, Arab Bank established the Audit Committee in early 1996 followed by the Corporate Governance Board Committee in 2002. The Nomination and Remuneration Committee was established in 2006, while the Risk Management Committee and the Strategy Committee were formed in 2007.
This Corporate Governance Code is based on the Code of Corporate Governance for Banks in Jordan and related instructions issued by the Central Bank of Jordan and after aligning it with the Jordanian Banking Law, the Companies Law in addition to the Memorandum and Articles of Association of the Bank.
This Code will continue to be reviewed and developed from time to time and whenever necessary to meet the Bank’s changing needs and expectations and to keep up with the changes that may occur in the marketplace.
Article (1): Commitment to Corporate Governance
There is a consistent set of relationships between the Bank, its Board of Directors, Shareholders and other related parties. The relationship structure deals with the general framework of the Bank’s strategy and the necessary means to achieve its goals. The general framework of corporate governance ensures a fair treatment of all shareholders including minority and foreign shareholders. The Bank also recognizes the rights of all shareholders as stipulated by the law, and assures providing them with all necessary information on the Bank’s activities and the commitment of its Board members and their accountability to the Bank and its Shareholders.
The Bank has amended this Code in compliance with the instructions of the Central Bank of Jordan issued in its circular No. 58/2014 “The Corporate Governance Regulations for Banks” and in alignment with its needs and policies. This Code has been approved by the Board of Directors in its meeting of 29/1/2015 and has been amended on 28/1/2016. On 27/10/2016 this Code was amended in compliance with the requirements of the Amended Corporate Governance Regulations for Banks issued by the Central Bank of Jordan No. 63/2016. An updated version has been posted on the Bank’s website. It is also available to the public upon request. The Bank
discloses its compliance with the Corporate Governance Code in its Annual Report.
Article (2): Definitions
In this Code (and unless the context requires otherwise) the following words and expressions shall have the meanings respectively assigned to them herein below:
a) Corporate Governance:
The system of rules by which the Bank is directed and controlled and which essentially involves identifying the Bank’s corporate objectives and the framework for attaining them, the safe operation of the Bank’s business, securing the interests of depositors, shareholders and other stakeholders, and compliance with the Bank’s bylaws and internal policies.
b) Suitability: the fulfilment of certain requirements and criteria by the members of the Board and senior executives.
c) The Board: the Board of Directors of the Bank.
d) Stakeholders: any person/group/organization that has interest or concern in the Bank such as depositors, shareholders, employees, creditors, customers or competent regulatory authorities.
e) Major Shareholder: The person holding not less than (5%) of the Bank’s share capital whether directly or indirectly.
f) An Executive Director: a member of the Board who is paid in consideration for his/her employment at the Bank.
g) An Independent Director: a member of the Board apart from major shareholders and who is not under control of any of them and who is not subject to any influences that may restrict his/her ability to make objective decisions for the benefit of the Bank and who satisfies the conditions set out in Article (3/c) of this Code.
h) Senior Executive Management: Include the Chief Executive Officer, Deputy Chief Executive Officer, Chief Financial Officer, Chief Operations Officer, Chief Risk Officer, Head of Audit, Head of Treasury, Head of Regulatory Compliance in addition to any other Bank employee who has an executive authority that is equal to the authority of any of the aforementioned and reports directly to the Chief Executive Officer.
CORPORATE GOVERNANCE CODE
283
Article (3): Composition of the Board
a) The Board shall be comprised of eleven non-executive members who shall be elected by the General Assembly for a term of four years. The Chairman and Deputy Chairman shall be elected by the members of the Board.
b) The Board shall have one third of its members as independent with a minimum of four members.
c) The Nomination and Remuneration Committee shall specify the necessary conditions that ensure the independence of the Board Member. The conditions shall include, at a minimum, that the independent member:
1. Has not been an executive member of the Board during the three years preceding the date of his election.
2. Has not been employed by the Bank or any of its subsidiaries in the three years preceding the date of his election.
3. Is not a relative (up to the second degree) of any of the other members of the Board or any Board member of the subsidiaries of the Bank or a relative of any of the Bank’s major shareholders.
4. Is not a relative of any of the senior executive management members of the Bank or any of the senior executive management members of the subsidiaries of the Bank up to the second degree.
5. Is not a partner or employee of the external auditor of the Bank, or has been such a partner or employee during the past three years preceding the date of his election as member of the Board and is not a relative (up to the first degree) with the partner responsible for the audit.
6. Is not a major shareholder in the bank or a representative or associate of a major shareholder in the Bank, nor should his shareholding constitute, along with his associate shareholder, a major shareholding, nor is a major shareholder of one of the Bank’s subsidiaries.
7. Has not been a member of the Board of Directors of the Bank or any of its subsidiaries or its management committee for more than eight consecutive years.
8. Has not obtained, personally or through any other company in which he is a Board Member or owner or a major shareholder, credit facilities from the bank in excess of 5% of the Bank’s subscribed share capital, nor is a guarantor of a facility which amount is in excess of the said percentage.
9. Has adequate knowledge or experience in the financial and banking sectors.
Article (4): Board Meetings
a) The Board shall meet not less than 6 times per year.
b) Board members shall attend the meetings in person, if unable to attend, the member can give his/her views through video (video phone) after the approval of the Chairman. The Chairman and the Board Secretary shall endorse the minutes of the meeting and the legal quorum.
c) The Senior Executive Management should, and the Chairman should ensure that, the Members of the Board are provided with the agenda of the meeting and all relevant documents prior to the meetings.
d) Deliberations and proceedings of the meetings of the Board and its Committees shall be fully and accurately noted down along with any reservation that may be voiced by any member. Such minutes shall be duly and properly kept.
Article (5): Responsibilities of the Board of Directors
(1) The Board of Directors should:
a) Oversee and monitor the executive management and its performance, ensure the financial soundness and solvency of the Bank, and approve appropriate policies and procedures to supervise and control the Bank’s performance.
b) Specify the strategic objectives of the Bank, instruct the executive management to set a strategy for achieving those objectives and approve the strategy and such work plans that are compatible therewith.
c) Approve a policy for monitoring and supervising the performance of the executive management by setting key performance indicators to gauge and observe performance and progress towards the implementation of the strategic plan of the Bank.
d) Ensure the availability of policies, plans and procedures for all the Bank’s activities and that such policies, plans and procedures are in compliance with the relevant applicable legislation, are being circulated to all levels of management and are being regularly reviewed
e) Identify a corporate culture of high ethical standards and integrity alongside setting and enforcing clear lines of responsibility and accountability throughout the Bank.
CORPORATE GOVERNANCE CODE

284
f ) Set Code of Conduct for the Board of Directors, the Executive Management and the employees and review them annually.
g) Bear the ultimate responsibility for the Bank’s business including its financial status, and its compliance with the requirements of the Central Bank of Jordan and such other regulatory authorities. The Board shall also be ultimately responsible for safeguarding the interests of the Stakeholders, ensuring that the Bank is being operated in accordance with its legislations and internal policies and that effective supervision and control measures over the activities of the Bank, including those outsourced, are always available.
h) Appoint and accept the resignation or terminate the employment of any member of the Senior Executive Management based on the recommendation of the Nomination and Remuneration Committee. The Bank shall obtain a no – objection letter from the Central Bank of Jordan to the appointment, resignation or termination of employment of the Chief Executive Officer, and the audit, compliance and risk management directors.
i) Approve and annually review the internal control systems of the Bank and ensure that the internal and external auditors review the structure of these systems once a year at least.
j) Approve a succession plan and approve a policy for human resources and training.
k) Ensure the constant independence of the external auditor.
l) Approve and monitor the implementation of the risk management strategy including the Bank’s risk tolerance/appetite and ensure that the Bank is not exposed to high risks, that the Board is cognizant of the operational environment and associated risks and that all needed risk management instruments and infra structure are available and able to identify, measure, control and supervise all kinds of risks to which the Bank may be exposed.
m) Ensure an adequate and reliable information management system covering all the activities of the Bank.
n) Ensure that the Bank’s credit policy includes a corporate governance evaluation system for its corporate customers, in particular the public shareholding companies whereby the risk is evaluated by points of weakness and strength according to their implementation of sound corporate governance practices.
o) Ensure that the Bank adopts social initiatives in the field of environment, health and education.
p) Set a policy for Corporate Social Responsibility and its programs to support the local community and environment.
q) Adopt sufficient procedures to ensure clear separation of powers between controlling shareholders on the one part and executive management of the Bank on the other in order to reinforce sound corporate governance. The Board shall also attain proper mechanisms to limit the influence of the controlling shareholders through, inter alia, the following:
1. Preclude the employment of a controlling shareholder in a senior executive position.
2. Ensure that the Senior Executive Management obtains its authority solely from the Board and that it functions within the framework of the authorizations granted to it thereby.
r) Approve the organizational structure of the Bank that shows the administrative hierarchy including Board Committees and executive management.
s) Approve the strategies and policies at the Group level and its subsidiaries, approve the administrative structures for the subsidiaries and establish a corporate governance code at the Group level taking into account the instructions issued in this regard by the central banks or regulatory authorities in the countries in which the subsidiaries operate.
t) Determine the banking operations which require the approval of the Board of Directors subject always to limiting the scope of operations requiring the Board’s approval in order not to prejudice the supervisory role of the Board and subject also to not granting the Board any executive authorities including the granting of credit to a single Board Member including the Chairman.
u) Establish Board Committees and determine their responsibilities.
v) Appoint the Secretary of the Board and determine his/her responsibilities which shall include: -
1. Attending all meetings of the Board and recording all deliberations, suggestions, objections, reservations, and results of voting on Board resolutions.
2. Setting the dates for the Board meetings in coordination with the Chairman.
3. Ensuring that all Board members sign the minutes of the meetings and the Board resolutions.
4. Monitor the implementation of the Board resolutions, and following-up on topics postponed from previous meetings.
CORPORATE GOVERNANCE CODE
285
5. Keeping records and documents of board meetings.
6. Ensuring that the draft resolutions intended to be issued by the Board are consistent with the applicable rules and regulations.
7. Prepare for the General Assembly meetings and to coordinate with the Board’s Committees.
8. Submit the suitability attestations signed by each of the Board members to the Central Bank.
w) Allow direct communication between the members of the Board of Directors and its Committees with the executive management and the Secretary of the Board and facilitate the performance of their duties including seeking the assistance, at the expense of the Bank and upon the Board approval, of third parties provided always that the acts of the members of the Board do not influence the decisions of the executive management apart from through deliberations during the meetings of the Board or its Committees.
(2) Role of the chairman:
a) Encourage efficient relationship between the Board of Directors and the executive management.
b) Promote critical discussions of issues deliberated by the Board and ensure different views are expressed and discussed during the decision-making process.
c) Ensure that the Board Secretary provide the Board members with the minutes of previous meetings and get them signed, and ensure timely provision of board meetings’ agendas and documents provided that the said agendas contain sufficient information about the items that will be discussed. The Secretary of the Board shall be responsible for providing the Board members with the documents.
d) Ensure that there exists a charter that sets out the Board of Directors’ mandate and scope of work.
e) Encourage thorough discussions of strategic and critical issues by the Board.
f ) Provide each Board Member, upon his election, with the laws and regulations that govern bank’s activities and the instructions of the Central Bank of Jordan including this Corporate Governance Code and a manual outlining the rights, responsibilities and duties of the Member and the responsibilities and duties of the Secretary of the Board.
g) Provide each member with comprehensive summary of the Bank’s activities upon his/her election or request.
h) To accommodate the Board members’ needs for continuous enhancement of their knowledge and expertise and to allow new Board members, taking into consideration his/her banking background, to join a orientation program that includes at the minimum:
1. The organizational structure of the Bank, corporate governance and the code of conduct.
2. Corporate objectives and the Bank’s strategic plan and approved policies.
3. The financial position of the Bank.
4. The Bank’s risk structure and the risk management framework.
i) Discussing with each new Member and in cooperation with the Bank’s legal Counsel, the duties and responsibilities of the Board, in particular; issues pertaining to the legal and regulatory requirements, the term of the Board membership, dates of the meetings, responsibilities and duties of the Board Committees, the amount of remuneration and the ability to seek and obtain an independent specialized opinion if the need arises.
(3) Members of the Board of Directors shall:
a) Have adequate knowledge of applicable legislation and principles pertaining to the banking industry and the operational environment of the Bank and keep up with major changes in these fields including the requirements of employment in Senior Executive Management positions.
b) Attend Board meetings, Board Committees and the General Assembly meetings.
c) Not disclose any Bank confidential information or use the same for his or another’s benefit.
d) Prioritize the Bank’s interest in all transactions with any other company in which he/she has a personal interest, not allow competition over business opportunities between the Bank and such other company, avert conflict of interests and disclose to the Board of Directors the details of any conflict of interest situation and abstain from attending or voting in the meeting in which such matter is to be discussed. Such disclosure should be recorded in the minutes of meeting.
e) Dedicate enough time to fulfill his/her duties as a member of the Board of Directors.
CORPORATE GOVERNANCE CODE

286
(4) The responsibility of the Board of Directors and its accountability:
a) Set and enforce clear guidelines for responsibility and accountability at all levels at the Bank and comply and ensure compliance therewith.
b) Ensure that the organizational chart clearly reflects the lines of responsibility and authority, which chart shall include at least the following supervisory levels:
1. Board of Directors and its Committees.
2. Separate departments for risk, compliance and internal audit that do not carry out daily executive tasks.
3. Units/employees not involved in the daily operations of the Bank’s activities.
c) Ensure that the Senior Executive Management carries out its duties relating to the oversight of the day-to-day management of the Bank, contributes to the implementation of sound corporate governance, delegates duties to employees, establishes an effective management structure that promotes accountability, and ensures that the Bank’s activities are consistent with the policies and procedures approved by the Board.
d) Approve appropriate controls systems that enables it to hold the Senior Executive Management accountable.
e) Ensure that there is no Chairman /Chief Executive Officer duality and that neither the Chairman nor any of the Board members is related to the Chief Executive Officer up to the third degree.
Article (6): Chief Executive Officer
In addition to what is stipulated in the legislation, the Chief Executive Officer shall have the following responsibilities:
a) Develop the strategic objectives of the Bank.
b) Implement the Bank’s strategies policies.
c) Implement the Board’s decisions.
d) Provide guidance for the implementation of short and long-term action plans.
e) Communicate the Bank’s vision, mission and strategy to the Bank’s employees.
f ) Inform the Board of all significant aspects of the Bank’s operations.
g) Manage day-to-day operations of the Bank.
Article (7): Board Committees
Board Committees shall be formed by the Board from among its members. The Board shall define the Committees’ objectives and delegate its authorities thereto according to the Charter of each Committee. These committees shall periodically submit its reports to the Board of Directors. The formation of these Committees shall not exonerate the Board from its responsibilities.
A member of the Board of Directors cannot be Chairman of more than one of these Committees (Corporate Governance, Audit, Nomination and Remuneration and Risk Management Committees). Moreover, a member of the Board of Directors cannot be chairman of more than two of the Board Committees.
The Board Committees are:
a. The Corporate Governance Committee:
1. The Committee shall comprise of, at least, three Board members provided that the majority of the members are independent directors and should include the Chairman of the Board. The Committee shall direct and examine the preparation and review of the corporate governance code and monitor its implementation.
2. The committee shall meet at least twice during the year.
3. Quorum of the meeting shall be deemed legal if attended by two thirds of the committee members.
4. The committee shall take its decisions by a majority of the votes of the attendees, votes by phone or video are allowed when the personal presence of the member is not possible, provided that the number of members present in person is not less than two thirds of the members of the committee, and that the percentage of personal attendance of the member is not less than 50% of the committee’s meetings during the year.
5. The Corporate Governance Committee shall undertake the following:
a. Establish written work procedures to implement the regulations for Corporate Governance, review them and evaluate their implementation annually.
b. Ensure that the Bank complies with the corporate governance regulations issued by the regulatory authorities.
c. Review the regulators’ observations regarding the implementation of corporate governance in the Bank and follow up on what has been done in this regard.
d. Prepare the corporate governance report and submit it to the Board.
CORPORATE GOVERNANCE CODE
287
b. The Audit Committee:
1. The Audit Committee shall be comprised of a chairman and two members at least, provided that the chairman and at least another member are independent members and also provided that the chairman of the Committee shall neither be the Chairman of the Board nor the chairman of any other Board Committee.
2. The Audit Committee members should have professional financial or accounting qualifications and practical experience in the fields of accountancy, finance or any other specializations or similar areas that are relevant to the Bank’s business.
3. The Audit Committee shall meet periodically every three months as a minimum and shall submit its reports to the Board of Directors, provided that the number of its meetings is not less than four times per year, and that the minutes of these meetings are duly recorded.
4. The meeting shall be considered legal if attended by two thirds of the committee members.
5. The committee shall take its decisions by a majority of the votes of the attendees, in case the votes are equal, the chairman shall have the casting vote. Votes by phone or video are allowed when the personal presence of the member is not possible, provided that the number of members present in person is not less than two thirds of the members of the committee, and that the percentage of personal attendance of the member not less than 50% of the committee’s meetings during the year.
6. The Audit Committee shall review the following:
a) The scope, results and adequacy of the Bank’s internal and external audits.
b) Accountancy issues that will have a significant impact on the Bank’s financial statements.
c) The Bank’s internal controls.
7. The Audit Committee shall submit its recommendations to the Board regarding the external auditor’s appointment / termination of appointment, remuneration, and other terms of engagement taking into account any non-audit services that they have performed, in addition to assessing the independence of the external auditor.
8. The Committee has the authority to obtain any information from executive management, and summon any executive or Board member to attend its meetings, the committee has at its disposal all the necessary capabilities including obtaining assistance from experts whenever necessary.
9. The Audit Committee shall meet, at least once a year, with each of the Bank’s external auditor, the internal auditor, without the presence of the Senior Executive Management.
10. The Audit Committee shall review and monitor the procedures that enable employees to confidentially communicate any error in the financial reports or any other observation. The Committee shall ensure proper arrangements to ascertain an independent investigation and follow up.
11. The duties of any other Committee may not be merged with the duties of this Committee.
c. The Nomination & Remuneration Committee:
1. The Nomination and Remuneration Committee shall be comprised of at least three Board members the majority of whom including its Chairman shall be Independent members.
2. The Committee shall meet at least twice during the year.
3. The meeting shall be considered legal if attended by two thirds of the committee members.
4. The committee shall take its decisions by a majority of the votes of the attendees, in case the votes are equal, the chairman shall have the casting vote. Votes by phone or video are allowed when the personal presence of the member is not possible, provided that the number of members present in person is not less than two thirds of the members of the committee, and that the percentage of personal attendance of the member not less than 50% of the committee’s meetings during the year.
5. Duties and responsibilities of the Nomination and Remuneration Committee shall be as follows:
a) Recommending qualified candidates for the membership of the Board of Directors taking into consideration the candidates’ qualifications and skills. In case of re-nomination, the regular attendance of such candidate of Board meetings and active participation in the meetings shall be taken into consideration.
b) Identify competency requirements at the Senior Executive Management level and the basis for their selection and recommend to the Board the qualified candidates for appointment in Senior Executive Management jobs.
c) Ensuring that Board members attend workshops or seminars related to Banking topics with particular emphasis on Risk management, Corporate Governance and other latest updates in the banking industry.
CORPORATE GOVERNANCE CODE
288
d) Defining and annually reviewing the fulfilment of criteria that designates a member as independent.
e) Setting specific standards to evaluate the performance of the Board, its committees and the Chief Executive Officer objectively, and duly inform the relevant regulators of the outcome of this evaluation.
f ) Review the succession plan policy and the policy for human resources and training and monitor their implementation annually.
g) Providing, upon request, background information and summaries to the members of the Board regarding certain significant matters about the Bank and ensure keeping the members up with material updates in the Banking industry.
h) Ensuring that there exists a Performance Incentives Policy and that such policy is being implemented and periodically reviewed. The Committee shall also recommend the compensation and benefit plan for the Chief Executive Officer and other senior executive managers.
i) Creating a clear methodology to ascertain that a member of the Board dedicates adequate time to carry out their duties as a Board member.
d. The Risk Management Committee:
1. The Risk Management Committee shall be comprised of three Board members (one of whom shall be an independent member) in addition to the Chief Executive Officer and Head of Risk Management.
2. The Committee shall meet four times a year and whenever necessary.
3. The meeting shall be considered legal if attended by two thirds of the committee members.
4. The committee shall take its decisions by the majority of the votes of the attendees, in case the votes are equal, the chairman shall have the casting vote. Votes by phone or video are allowed when the personal presence of the member is not possible, provided that the number of members present in person is not less than two thirds of the members of the committee, and that the percentage of personal attendance of the member is not less than 50% of the committee’s meetings during the year.
5. Duties and responsibilities of The Risk Management committee shall include:
a) Annual review of the Bank’s risk management strategy and framework, approve high level policies related to risk management operations and obtain the Board’s approval.
b) Ensure that policies and frameworks for risk management are in place, ensure availability of the necessary tools and programs and review them annually.
c) Review the group risk management organizational structure.
d) Annual review and approval of credit risk appetite limits for Arab Bank and lending limits authority for the Subsidiaries.
e) Annual review and approval of group risk appetite for operational, market and liquidity risks.
f ) Ongoing monitoring of risk factors that might affect the risk profile of the Bank and submitting regular reports to the Board.
g) Identify any variance between the actual risk taken by the Bank and risk appetite, report them to the Board and continue to address them.
h) To create proper conditions that would ensure that all significant risks and any activities performed by the Bank that may expose it to higher than the acceptable risks are well identified, and to submit reports of the same to the Board of Directors and to follow up on them and find solutions thereof.
i) Ensure that there is a business continuity plan and review it periodically.
j) Review the results of the Internal Capital Adequacy Assessment Process (ICAAP).
k) Review the Recovery Plan according to the requirements of the Central Bank of Jordan.
l) Oversee/review the performance of credit portfolios.
m) Oversee the development of the database necessary for risk management.
n) Discuss risk management reports.
e. The Corporate Strategy Committee:
1. The Corporate Strategy Committee shall be comprised of three Board members at least in addition to the Chairman of the Board, Chief Executive Officer and Deputy Chief Executive Officer.
2. The Committee shall meet whenever necessary.
3. The meeting is considered legal if attended by two thirds of the committee members.
4. The committee shall take its decisions by the majority of the votes of the attendees, in case the votes are equal, the chairman shall have the casting vote. Votes
CORPORATE GOVERNANCE CODE
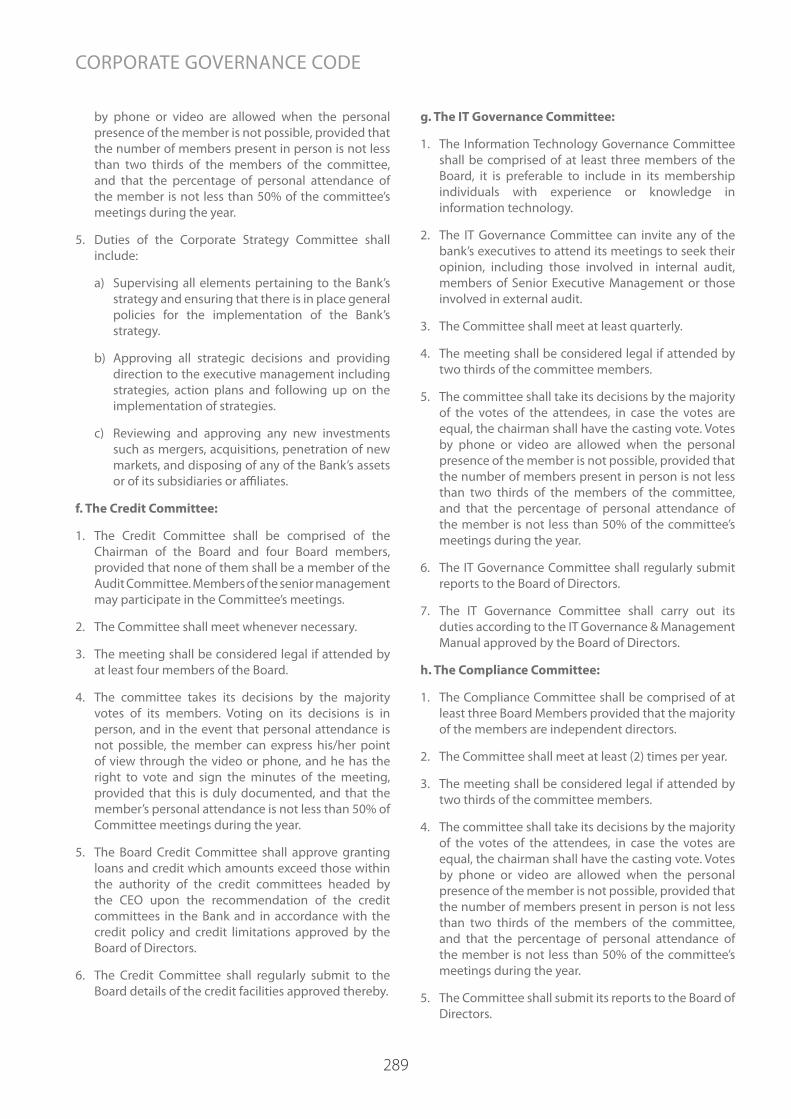
289
by phone or video are allowed when the personal presence of the member is not possible, provided that the number of members present in person is not less than two thirds of the members of the committee, and that the percentage of personal attendance of the member is not less than 50% of the committee’s meetings during the year.
5. Duties of the Corporate Strategy Committee shall include:
a) Supervising all elements pertaining to the Bank’s strategy and ensuring that there is in place general policies for the implementation of the Bank’s strategy.
b) Approving all strategic decisions and providing direction to the executive management including strategies, action plans and following up on the implementation of strategies.
c) Reviewing and approving any new investments such as mergers, acquisitions, penetration of new markets, and disposing of any of the Bank’s assets or of its subsidiaries or affiliates.
f. The Credit Committee:
1. The Credit Committee shall be comprised of the Chairman of the Board and four Board members, provided that none of them shall be a member of the Audit Committee. Members of the senior management may participate in the Committee’s meetings.
2. The Committee shall meet whenever necessary.
3. The meeting shall be considered legal if attended by at least four members of the Board.
4. The committee takes its decisions by the majority votes of its members. Voting on its decisions is in person, and in the event that personal attendance is not possible, the member can express his/her point of view through the video or phone, and he has the right to vote and sign the minutes of the meeting, provided that this is duly documented, and that the member’s personal attendance is not less than 50% of Committee meetings during the year.
5. The Board Credit Committee shall approve granting loans and credit which amounts exceed those within the authority of the credit committees headed by the CEO upon the recommendation of the credit committees in the Bank and in accordance with the credit policy and credit limitations approved by the Board of Directors.
6. The Credit Committee shall regularly submit to the Board details of the credit facilities approved thereby.
g. The IT Governance Committee:
1. The Information Technology Governance Committee shall be comprised of at least three members of the Board, it is preferable to include in its membership individuals with experience or knowledge in information technology.
2. The IT Governance Committee can invite any of the bank’s executives to attend its meetings to seek their opinion, including those involved in internal audit, members of Senior Executive Management or those involved in external audit.
3. The Committee shall meet at least quarterly.
4. The meeting shall be considered legal if attended by two thirds of the committee members.
5. The committee shall take its decisions by the majority of the votes of the attendees, in case the votes are equal, the chairman shall have the casting vote. Votes by phone or video are allowed when the personal presence of the member is not possible, provided that the number of members present in person is not less than two thirds of the members of the committee, and that the percentage of personal attendance of the member is not less than 50% of the committee’s meetings during the year.
6. The IT Governance Committee shall regularly submit reports to the Board of Directors.
7. The IT Governance Committee shall carry out its duties according to the IT Governance & Management Manual approved by the Board of Directors.
h. The Compliance Committee:
1. The Compliance Committee shall be comprised of at least three Board Members provided that the majority of the members are independent directors.
2. The Committee shall meet at least (2) times per year.
3. The meeting shall be considered legal if attended by two thirds of the committee members.
4. The committee shall take its decisions by the majority of the votes of the attendees, in case the votes are equal, the chairman shall have the casting vote. Votes by phone or video are allowed when the personal presence of the member is not possible, provided that the number of members present in person is not less than two thirds of the members of the committee, and that the percentage of personal attendance of the member is not less than 50% of the committee’s meetings during the year.
5. The Committee shall submit its reports to the Board of Directors.
CORPORATE GOVERNANCE CODE

290
6. The Committee shall exercise its duties and responsibilities as specified in the relevant laws and legislations, ensuring that necessary measures are taken to implement the values of integrity and professionalism within the Bank, thus ensuring that complying with the applicable laws, regulations and instructions, orders and applied standards is an essential objective that has to be applied.
7. The Committee shall supervise and monitor the operations of the Compliance Department and ensure that the Bank is in full compliance with the applicable legislations and regulatory requirements.
Article (8): Suitability of Board members:
a) The Board of Directors shall approve an effective policy to ensure suitability of its members provided that the said policy include the minimum standards, requirements and conditions that a nominated or elected member should fulfil and that such policy be reviewed whenever necessary. Sufficient procedures and controls should also be identified to ensure that all members fulfil and remain fulfilling those requirements.
b) The Chairman and Board members should meet the following criteria:
1. Not to be less than twenty-five years of age.
2. Not to be a member of the Board of any other bank in Jordan or its General Manager or employee unless the other bank is a subsidiary of Arab Bank’s.
3. Not to be the Bank’s lawyer, legal advisor or auditor.
4. Have a bachelor degree at a minimum specializing either in economics, finance, accounting or business administration or any other related field.
5. Not to be a government employee or employee of an official public institution unless he/she is a representative of that entity.
6. Not to be a member of the board of directors of more than five public shareholding companies in the Kingdom whether in a personal capacity or as representative of a legal entity.
7. Possess expertise of not less than 5 years in banking, finance or similar specializations.
c) The Chairman and members of the Board should each sign a Suitability Attestation in the approved form. The signed form shall be kept at the Bank and a copy thereof shall be sent to the Central Bank of Jordan along with the Member’s Curriculum Vitae.
d) The Chairman shall ensure that any critical information that may adversely affect the suitability of any Member is disclosed to the Central Bank of Jordan.
Article (9): Suitability of Senior Executives:
a) The Board of Directors shall:
1. Approve a policy that would ensure the suitability of the members of the Senior Executive Management provided that such policy include the minimum criteria, procedures and controls that ought to be met by the members. The policy is to be reviewed by the Board of Directors from time to time and the Board should set out procedures, and adequate controls to ascertain that the criteria is being met by all members of the Senior Executive Management and they continue to be met.
2. Appoints a Chief Executive Officer of integrity, technical competence and banking experience after obtaining the no- objection from the Central Bank of Jordan.
3. Approve the appointment of any of the Senior Executive Management members after obtaining a no-objection statement from the Central Bank of Jordan.
4. Approve a succession plan for the Senior Executive Management and review the plan once at year at a minimum.
5. Timely disclose to the Central Bank of Jordan any material information that may adversely affect the suitability of any member of the Senior Executive Management.
b) The Following conditions should be fulfilled by an appointed senior executive:
The appointed member:
1. Should not be a member of the Board of Directors of any other bank in Jordan unless the other bank is a subsidiary of Arab Bank’s.
2. Should be dedicated full time to the management of the Bank’s business.
3. Should have, at a minimum, a bachelor degree in economics, finance, accounting or business administration or any other related field.
4. Should have a minimum of five year experience in banking or a related field, except for the position of Chief Executive Officer which occupant should have a minimum of ten year experience in banking.
CORPORATE GOVERNANCE CODE
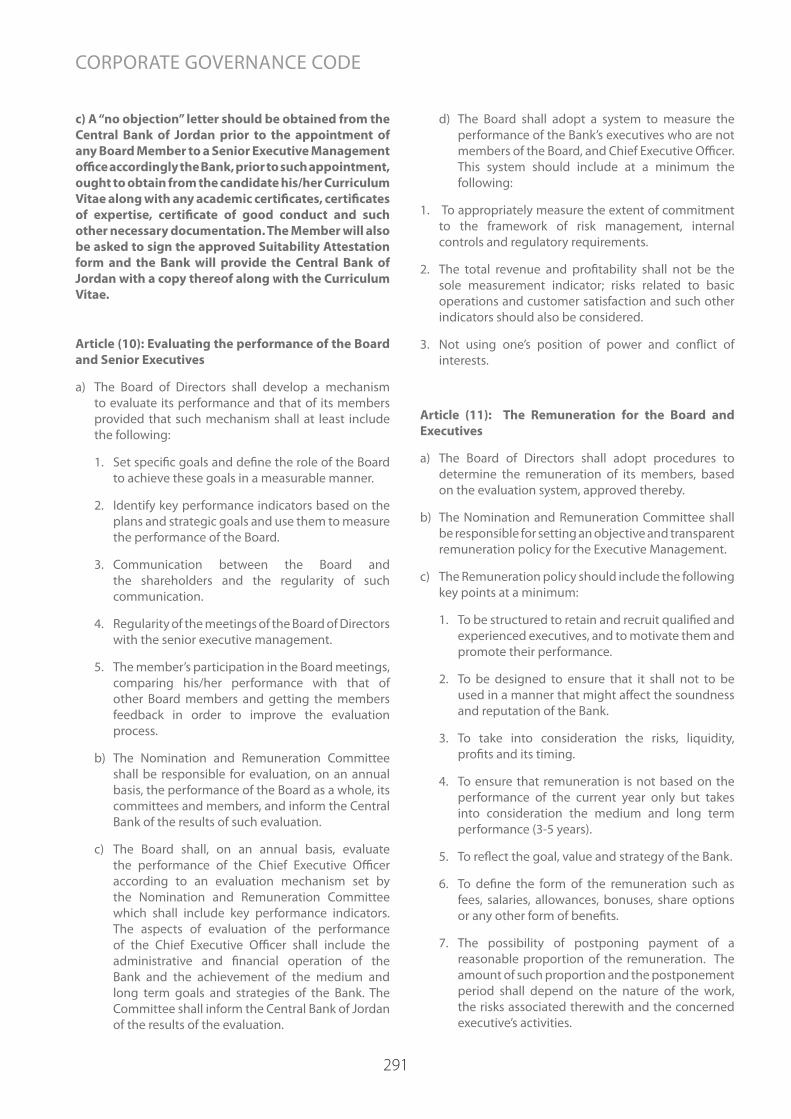
291
c) A “no objection” letter should be obtained from the Central Bank of Jordan prior to the appointment of any Board Member to a Senior Executive Management office accordingly the Bank, prior to such appointment, ought to obtain from the candidate his/her Curriculum Vitae along with any academic certificates, certificates of expertise, certificate of good conduct and such other necessary documentation. The Member will also be asked to sign the approved Suitability Attestation form and the Bank will provide the Central Bank of Jordan with a copy thereof along with the Curriculum Vitae.
Article (10): Evaluating the performance of the Board and Senior Executives
a) The Board of Directors shall develop a mechanism to evaluate its performance and that of its members provided that such mechanism shall at least include the following:
1. Set specific goals and define the role of the Board to achieve these goals in a measurable manner.
2. Identify key performance indicators based on the plans and strategic goals and use them to measure the performance of the Board.
3. Communication between the Board and the shareholders and the regularity of such communication.
4. Regularity of the meetings of the Board of Directors with the senior executive management.
5. The member’s participation in the Board meetings, comparing his/her performance with that of other Board members and getting the members feedback in order to improve the evaluation process.
b) The Nomination and Remuneration Committee shall be responsible for evaluation, on an annual basis, the performance of the Board as a whole, its committees and members, and inform the Central Bank of the results of such evaluation.
c) The Board shall, on an annual basis, evaluate the performance of the Chief Executive Officer according to an evaluation mechanism set by the Nomination and Remuneration Committee which shall include key performance indicators. The aspects of evaluation of the performance of the Chief Executive Officer shall include the administrative and financial operation of the Bank and the achievement of the medium and long term goals and strategies of the Bank. The Committee shall inform the Central Bank of Jordan of the results of the evaluation.
d) The Board shall adopt a system to measure the performance of the Bank’s executives who are not members of the Board, and Chief Executive Officer. This system should include at a minimum the following:
1. To appropriately measure the extent of commitment to the framework of risk management, internal controls and regulatory requirements.
2. The total revenue and profitability shall not be the sole measurement indicator; risks related to basic operations and customer satisfaction and such other indicators should also be considered.
3. Not using one’s position of power and conflict of interests.
Article (11): The Remuneration for the Board and Executives
a) The Board of Directors shall adopt procedures to determine the remuneration of its members, based on the evaluation system, approved thereby.
b) The Nomination and Remuneration Committee shall be responsible for setting an objective and transparent remuneration policy for the Executive Management.
c) The Remuneration policy should include the following key points at a minimum:
1. To be structured to retain and recruit qualified and experienced executives, and to motivate them and promote their performance.
2. To be designed to ensure that it shall not to be used in a manner that might affect the soundness and reputation of the Bank.
3. To take into consideration the risks, liquidity, profits and its timing.
4. To ensure that remuneration is not based on the performance of the current year only but takes into consideration the medium and long term performance (3-5 years).
5. To reflect the goal, value and strategy of the Bank.
6. To define the form of the remuneration such as fees, salaries, allowances, bonuses, share options or any other form of benefits.
7. The possibility of postponing payment of a reasonable proportion of the remuneration. The amount of such proportion and the postponement period shall depend on the nature of the work, the risks associated therewith and the concerned executive’s activities.
CORPORATE GOVERNANCE CODE

292
8. Executives of supervisory departments (risk management, audit, compliance, etc.) should not be given remunerations based on the performance of the departments that they monitor.
Article (12): Conflict of Interests
a) Executives should avoid conflict of interests.
b) The Board shall adopt a policy and procedures to handle conflict of interests and disclose any such conflicts which may arise as a result of the inter-group relationships.
c) The Board shall adopt policies and procedures for dealing with related parties to include the definition of these parties, taking into consideration the regulations, terms of transactions, approval procedures and a mechanism to monitor these transactions, to ensure consistency with the policies and procedures.
d) The supervisory departments in the Bank shall ensure that any dealings involving the related parties have been carried out in accordance with the approved policy and procedures; the Audit Committee shall review and monitor all related parties’ transactions and update the Board on the same.
e) The Board shall ascertain that the Senior Executive Management implement the adopted policies and procedures.
f ) The Board shall adopt controls to manage the transfer of information within various departments, to prevent using such information for personal gain.
g) The Board should approve policies and a Code of Conduct and circulate the same to executives, that shall, at a minimum, include:
1. Executives not to use any inside information for personal gain.
2. Rules and procedures for managing dealings with related parties.
3. Situations that may result in conflict of interests.
h) The Board shall ensure that executive management exercise high integrity and avoid conflict of interests.
Article (13): Internal Audit
(1) The Board of Directors shall:
a) Ensure that the Bank’s internal audit department is capable of fulfilling, among others, the following duties:
1. To ascertain that there are adequate internal controls of the Bank’s and subsidiaries’ activities and to ensure compliance therewith.
2. To ascertain adherence to internal policies, international standards and procedures, and applicable laws and regulations.
3. To audit the Bank’s financial statements and administrative reports while ensuring accuracy and timeliness.
4. To assess compliance with the Corporate Governance Code.
5. To examine the comprehensiveness and accuracy of the stress tests in accordance with the methodology approved by the Board.
6. To ensure the accuracy of the procedures used for the internal evaluation of the Bank’s capital adequacy.
b) To ensure and enhance the independence of internal auditors, ensure that they are well positioned in the bank’s hierarchical structure and that they are well qualified to perform their duties including being entitled to access all records and information and to communicate with any employee of the Bank in order to perform their work and prepare reports with no external influence.
c) Take necessary measures to enhance the efficiency of the internal audit through:
1. Emphasize the importance of the internal audit function and reinforce that in the Bank.
2. Requiring timely correction of audit findings.
d) To adopt Internal Audit charter that includes duties, authorities and responsibilities of the Internal Audit, and circulate it within the Bank.
e) To ensure that the Internal Audit Department is under the direct supervision of the Audit Committee, and submit its reports directly to the Chairman of the Committee.
(2) The Audit Committee shall be responsible for:
a) Ensuring the sufficiency of human resources assigned to manage the internal audit work and to train them.
b) Ensuring rotation of internal auditors to audit the various aspects of the Bank’s business at least every three years.
c) Ensuring that internal auditors are not assigned do any executive function.
CORPORATE GOVERNANCE CODE
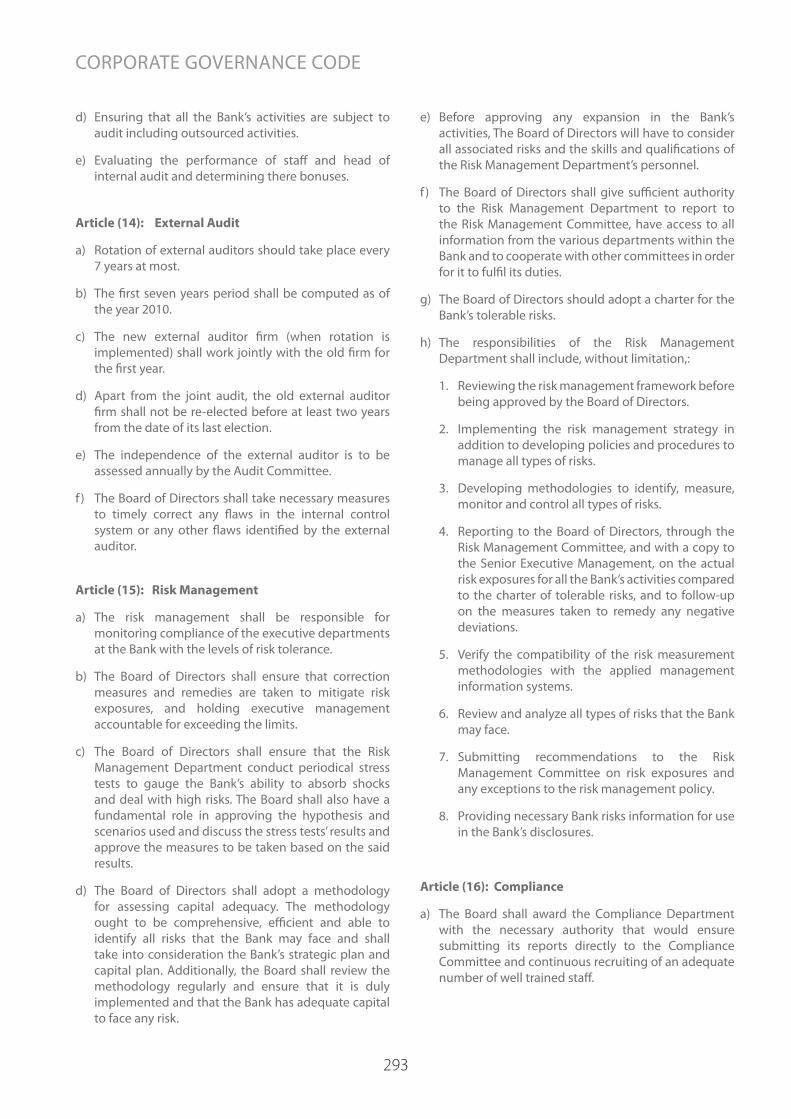
293
d) Ensuring that all the Bank’s activities are subject to audit including outsourced activities.
e) Evaluating the performance of staff and head of internal audit and determining there bonuses.
Article (14): External Audit
a) Rotation of external auditors should take place every 7 years at most.
b) The first seven years period shall be computed as of the year 2010.
c) The new external auditor firm (when rotation is implemented) shall work jointly with the old firm for the first year.
d) Apart from the joint audit, the old external auditor firm shall not be re-elected before at least two years from the date of its last election.
e) The independence of the external auditor is to be assessed annually by the Audit Committee.
f ) The Board of Directors shall take necessary measures to timely correct any flaws in the internal control system or any other flaws identified by the external auditor.
Article (15): Risk Management
a) The risk management shall be responsible for monitoring compliance of the executive departments at the Bank with the levels of risk tolerance.
b) The Board of Directors shall ensure that correction measures and remedies are taken to mitigate risk exposures, and holding executive management accountable for exceeding the limits.
c) The Board of Directors shall ensure that the Risk Management Department conduct periodical stress tests to gauge the Bank’s ability to absorb shocks and deal with high risks. The Board shall also have a fundamental role in approving the hypothesis and scenarios used and discuss the stress tests’ results and approve the measures to be taken based on the said results.
d) The Board of Directors shall adopt a methodology for assessing capital adequacy. The methodology ought to be comprehensive, efficient and able to identify all risks that the Bank may face and shall take into consideration the Bank’s strategic plan and capital plan. Additionally, the Board shall review the methodology regularly and ensure that it is duly implemented and that the Bank has adequate capital to face any risk.
e) Before approving any expansion in the Bank’s activities, The Board of Directors will have to consider all associated risks and the skills and qualifications of the Risk Management Department’s personnel.
f ) The Board of Directors shall give sufficient authority to the Risk Management Department to report to the Risk Management Committee, have access to all information from the various departments within the Bank and to cooperate with other committees in order for it to fulfil its duties.
g) The Board of Directors should adopt a charter for the Bank’s tolerable risks.
h) The responsibilities of the Risk Management Department shall include, without limitation,:
1. Reviewing the risk management framework before being approved by the Board of Directors.
2. Implementing the risk management strategy in addition to developing policies and procedures to manage all types of risks.
3. Developing methodologies to identify, measure, monitor and control all types of risks.
4. Reporting to the Board of Directors, through the Risk Management Committee, and with a copy to the Senior Executive Management, on the actual risk exposures for all the Bank’s activities compared to the charter of tolerable risks, and to follow-up on the measures taken to remedy any negative deviations.
5. Verify the compatibility of the risk measurement methodologies with the applied management information systems.
6. Review and analyze all types of risks that the Bank may face.
7. Submitting recommendations to the Risk Management Committee on risk exposures and any exceptions to the risk management policy.
8. Providing necessary Bank risks information for use in the Bank’s disclosures.
Article (16): Compliance
a) The Board shall award the Compliance Department with the necessary authority that would ensure submitting its reports directly to the Compliance Committee and continuous recruiting of an adequate number of well trained staff.
CORPORATE GOVERNANCE CODE

294
b) The Board shall approve the compliance policy, ensure its annual review and implementation.
c) The Board of Directors shall approve roles and responsibilities of the compliance management.
d) Compliance management shall submit its reports to the Compliance Committee with a copy to the Chief Executive Officer.
Article (17): Stakeholders’ Rights
a) A mechanism shall be developed to guarantee communication with stakeholders by disclosing and providing relevant information about the Bank’s activities through:
1. General Assembly meetings.
2. Annual Report.
3. Quarterly financial reports which enclose financial data, and the Board’s report on the Bank’s share trading and the Bank’s financial status during the year.
4. The Bank’s website.
5. Shareholders’ division.
b) A part of the Bank’s website shall be designated to clarify shareholders’ rights and to encourage them to attend and vote at the General Assembly meetings. Also the documents of the General Assembly meetings, including the invitation and minutes of meetings, shall be published on the website.
Article (18): Disclosure and Transparency
a) The Board shall ensure that all financial and non-financial information that are of interest to the stakeholders shall be published.
b) The annual report shall include a statement to the effect that the Board is liable for the accuracy and completeness of the financial statements of the Bank and all other information in the report in addition to the adequacy of the internal control systems.
c) The Board shall ensure that the Bank’s financial disclosures are consistent with the International Financial Reporting Standards (IFRS), International Accounting Standards (IAS), Central Bank of Jordan regulations, and other relevant legislations and also that the executive management keep well informed of changes and updates on the related International Financial Reporting Standards.
d) The Board shall ensure that the Bank’s annual and quarterly reports identify key financial and operational results that enables the shareholders to understand the financial position of the Bank.
e) The Board shall ensure that the annual report include, at a minimum, the following information:
1. Summary of the organizational chart of the Bank;
2. Summary of the roles and responsibilities of the Board Committees, and the authorities delegated to each Committee;
3. Useful information to stakeholders as identified in the Corporate Governance Code and the extent of compliance with the code;
4. Information about each Board member in terms of his/her qualifications, experience, shareholding, status (independent/non-executive, etc) membership in Board Committees, date of appointment, any other board memberships in the boards of other companies and remunerations of all forms for the previous year in addition to loans granted to the Member by the Bank and any other transaction that has taken between the Bank on the one part and the Member or related parties on the other;
5. Information about Risk Management Department, including its structure and nature of its operations and its development;
6. Number of Board and Board Committee meetings and attendance of each member at such meetings;
7. Names of each board member and senior executives who have resigned during the year;
8. Summary of the remuneration policy and full disclosure of all forms of remuneration to board members and executive management individually for the previous year;
9. A list of shareholders who own 1% or more of the share capital of the Bank, the ultimate beneficiary owner of such shareholdings or any part thereof, in addition to a clarification as to whether the shareholdings are wholly or partially pledged;
10. Attestations of all Board members confirming that he/she or any of the members’ relatives did not receive any benefits from the Bank during his/her tenor, which has not been previously disclosed.
CORPORATE GOVERNANCE CODE

295
GOVERNANCE REPORT
Governance Report
Arab Bank is one of the leading banks and financial institutions to implement corporate governance. The Bank has established the Audit Committee, the Nomination and Remuneration Committee, the Corporate Governance Committee and the Risk Management Committee also the Corporate Strategy Committee and the Credit Committee and this followed by established the other Committees IT Governance Committee and Compliance Committee. Arab Bank issued its first Corporate Governance Code in 2007 and continued to update this Code in alignment with the Regulations issued by the relevant regulatory authorities; also the Bank regularly makes necessary amendments to the Memorandum & Articles of Association, the internal controls and policies to comply with any legislative amendments related to banking regulations or the Companies Law and the Securities Commission.
Arab Bank put in place the following mechanism and procedures to assure the proper implementation of the Corporate Governance Regulations issued by all regulatory authorities, which is being revised annually:
1. Ensure that there exists an approved corporate governance code prepared in accordance with the Corporate Governance Regulations issued by the Central Bank of Jordan and the Jordan Securities Commission, and ensure that the code is being revised and updated in alignment with the requirement of the regulatory authorities.
2. Ensure that there exists a Charter for the Board of Directors and charters for all committees in alignment with the Regulations.
3. Ensure that there exists written and approved policies for the Bank’s various activities in accordance with the Regulations.
4. Ensure that the Board of Directors’ meetings are held in accordance with the Regulations.
5. Ensure that there exist timetables set for the work of the Board and committees to ensure that all tasks and responsibilities are carried out according to the instructions.
6. Ensure that the Board of Directors and its respective committees carry out an annual self-assessment prepared according to the Regulations.
7. Ensure that the supervisory departments (Audit, Risk, Compliance) submit their reports to the relevant committees of the Board of Directors.
8. Ensure that the new Board Member is enrolled in an Orientation Program.
9. Ensure timely provisions of the Board and the Committee invitations in addition to the related agenda documents.
In compliance with the Corporate Governance Regulations for Listed Shareholding Companies for the year 2017 issued by the Jordan Securities Commission, this report has been prepared to include the following data:
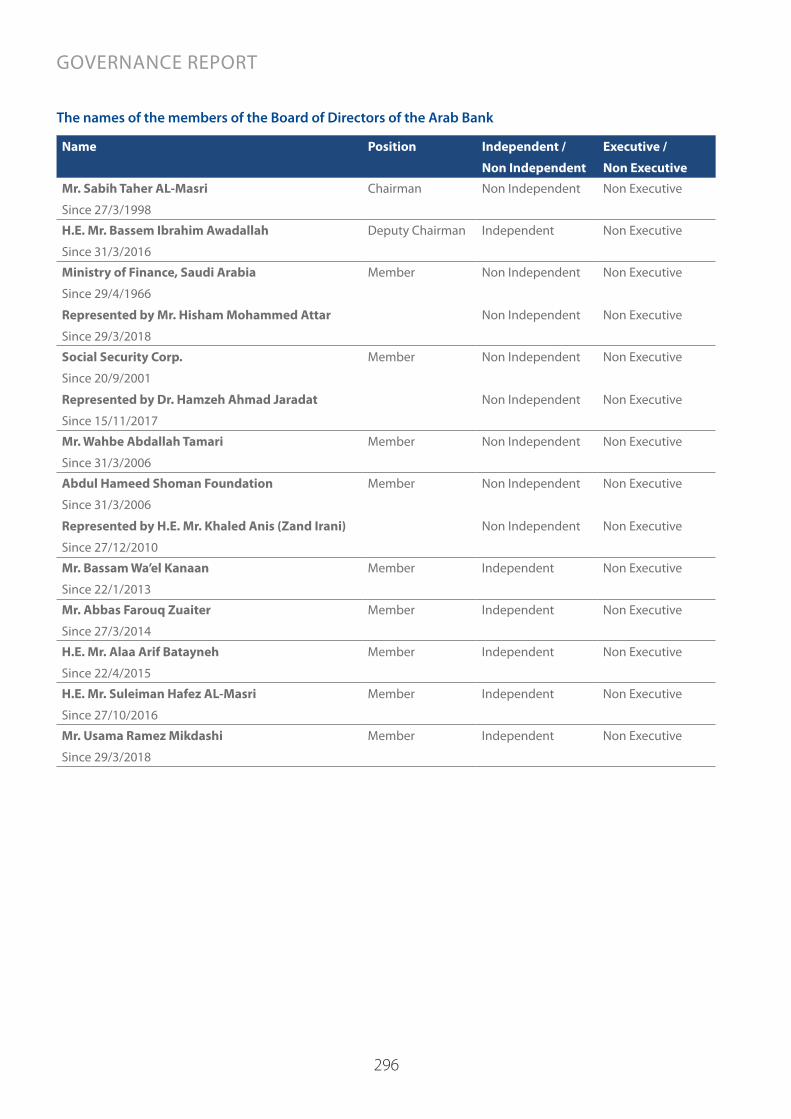
296
The names of the members of the Board of Directors of the Arab Bank
Name Position Independent /
Non Independent
Executive /
Non Executive
Mr. Sabih Taher AL-Masri
Since 27/3/1998
Chairman Non Independent Non Executive
H.E. Mr. Bassem Ibrahim Awadallah
Since 31/3/2016
Deputy Chairman Independent Non Executive
Ministry of Finance, Saudi Arabia
Since 29/4/1966
Represented by Mr. Hisham Mohammed Attar
Since 29/3/2018
Member Non Independent
Non Independent
Non Executive
Non Executive
Social Security Corp.
Since 20/9/2001
Represented by Dr. Hamzeh Ahmad Jaradat
Since 15/11/2017
Member Non Independent
Non Independent
Non Executive
Non Executive
Mr. Wahbe Abdallah Tamari
Since 31/3/2006
Member Non Independent Non Executive
Abdul Hameed Shoman Foundation
Since 31/3/2006
Represented by H.E. Mr. Khaled Anis (Zand Irani)
Since 27/12/2010
Member Non Independent
Non Independent
Non Executive
Non Executive
Mr. Bassam Wa’el Kanaan
Since 22/1/2013
Member Independent Non Executive
Mr. Abbas Farouq Zuaiter
Since 27/3/2014
Member Independent Non Executive
H.E. Mr. Alaa Arif Batayneh
Since 22/4/2015
Member Independent Non Executive
H.E. Mr. Suleiman Hafez AL-Masri
Since 27/10/2016
Member Independent Non Executive
Mr. Usama Ramez Mikdashi
Since 29/3/2018
Member Independent Non Executive
GOVERNANCE REPORT

297
Executive positions in the Bank and the names of the persons who occupy them
Name Position
Mr. Nemeh Elias Sabbagh Chief Executive Officer
Ms. Randa Mohammad El Sadek Deputy Chief Executive Officer
Mr. Ziyad Anwar Akrouk EVP – Head of Group Risk
Mr. Mohammad Abdel Fattah Al Ghanamah EVP – Chief Credit Officer
Mr. Mohammad Ahmad Khaled Masri EVP – Head of Corporate & Institutional Banking
Mr. Antonio Mancuso Marcello EVP – Head of Treasury
Mr. Naim Rasim K. AlHussaini EVP – Head of Consumer Banking
Mr. Walid Muhi Eddin Al Samhouri EVP – Jordan Country Head
Mr. Eric Jacques Modave EVP – Chief Operating Officer
Mr. Ghassan Hanna Suleiman Tarazi EVP – Chief Financial Officer
Mr. Basem Ali Abdallah Al Imam Board Secretary / Head of Legal Affairs
Ms. Rabab Jamil Said Abbadi EVP – Head of Human Resource
Mr. Michael Matossian EVP – Chief Compliance Officer
Mr. Fadi Joseph Zouein EVP – Head of Internal Audit
Memberships of the Board of Directors (Natural person) held by the Board of Directors in Public Share-holding Companies inside Jordan
Name Membership in the Boards of Public Shareholding Companies
Mr. Sabih Taher AL-MasriChairman of the Board of Directors of ZARA Holding Co. - Jordan (since 5/1999)
H.E. Dr. Bassem Ibrahim Awadallah None
Mr. Wahbe Abdallah Tamari None
Mr. Bassam Wa’el Kanaan None
Mr. Abbas Farouq Zuaiter None
H.E. Mr. Alaa Arif Batayneh - Chairman / Jordan Petroleum Refinery Company plc (14/10/2020-present)
- Member of the Board of Directors / Euro Arab Insurance group plc (June 2020-present)
H.E. Mr. Suleiman Hafez AL-Masri None
Mr. Usama Ramez Mikdashi None
GOVERNANCE REPORT

298
The Name of the Corporate Governance Officer in the bank
- Mrs. Khulud Walid Khaled Eisawi / Head of Secretariat Department – Shareholders Section
List of Board Committees Corporate Governance CommitteeAudit Committee Nomination & Remuneration Committee Risk Management Committee Corporate Strategy CommitteeIT Governance Committee Compliance CommitteeCredit Committee
The names of the members of the Audit Committee and their financial and accounting qualifications
Member Qualifications Experience
Dr. Bassem Ibrahim Yousef Awadallah / Chairman
- Doctor of Philosophy in Economics, University of London 1988
- Master of Science in Economics, University of London 1985
- Bachelor of Science in Foreign Service, International Economics, International Finance and Commerce, Georgetown University 1984
- Chief Executive Officer / Tomoh Advisory (2009 - present)- Member of the Board of Directors / Arab National Bank – Saudi
Arabia (Representing Arab Bank plc since 1/9/2016 - present)- Deputy Chairman of the Board of Trustees / Al Quds University
(2014 - present)- Chief of the Royal Hashemite Court (11/2007 – 10/2008)- Director of the Office of His Majesty King Abdullah II (4/2006 –
11/2007)- Minister of Finance (4/2005 – 6/2005)- Minister of Planning and International Cooperation (10/2001 –
2/2005)
Dr. Hamzeh Ahmad Khalifeh JaradatRepresentative of Social Security Corporation / Member
- Ph.D., Macro and Monetary economics, Econometrics, Finance, The University of Tennessee, Knoxville, U.S.A, August 2000
- M.Sc., Economics, University of Jordan, August 1994
- B.Sc., Economics & Computer Science, Yarmouk University, Jordan, January 1987
- Director, Business Development & Research, Social Security Investment Fund, Jordan (March 2019 – Present)
- Director, Equity’s Support Department, Social Security Investment Fund (February 2018-March 2019)
- Director, Research Department, Social Security Investment Fund (September 2015 – February 2018)
- General Director, Jordan Post (May 2014 – May 2015)- Director, Public Private Partnership (PPP) Unit, Ministry of
Finance, Jordan (2013- 2014)- Director, Public Debt Department, Ministry of Finance, Jordan
(2012-2013)- Senior Economist, International Monetary Fund, IMF Center for
Economics and Finance, Kuwait (2011-2012)- Advisor to the Minister, Ministry of Finance, Jordan (2004-
2011)- Economic Researcher, Economic Research and Studies
Department, Central Bank of Jordan, (1989-2000)- Assistant Professor of Economics and Finance, The University
of Tennessee and Hanover College, USA (2000-2004)- Board Member and Head of Committees of several
companies, including Jordan Telecom / Orange, National Electricity Company, Airports Company, Jordan Post, Commercial Bank, Housing Bank for Trade & Finance, Jordan Press
- National Coordinator, OECD-MENA Initiatives and member of Governance and Public Finance Experts groups (2009-2014)
GOVERNANCE REPORT

299
Abbas Farouq Ahmad Zuaiter/ Member
- BSBA, Finance & Accounting, Georgetown University 1989
- Co-Founder & Managing Member, Zuaiter Capital Holdings, LLC (April 2013-present)
- Member of the Board of Directors of Trine Acquisition Corp, Inc. (NYSE:TRNE) (March 2019-Present)
- Member of the Board of Directors of Ossia, Inc. (Seattle, WA) (2017-Present)
- Chairman of Investment Committee, Alcazar Capital (January 2019-Present)
- Member of the Board of Directors of The Capital Holdings Funds plc (2014-present)
- Member of the Board of Advisors, iMENA Group (2013–present)
- Member of the Board of Advisors, Jibrel Networks, (2018-present)
- Member of the Board of Advisors, Atom Investors, LP (2017-present)
- Member of the Board of Advisors, EuroMena Capital, LP (2010-present)
- Member of the Board of Advisors, McDonough School at Georgetown University (2015-present)
- Member of the Board of Regents at Georgetown University (2014–present)
- Chairman of the Board of Directors of Adecoagro (2003-2018)
- Member of the Executive, Investment, Management, Capital Allocation & Risk Committees, Soros Fund Management (September 2002 – April 2013)
- Chief Operating Officer, Soros Fund Management (September 2002-April 2013)
- Group Chief Financial Officer, Soros Fund Management (September 2002- December 2004)
- Partner, PricewaterhouseCoopers LLP – USA Firm (April 1994-September 2002)
GOVERNANCE REPORT

300
Suleiman Hafez Suleiman Al Masri / Member
- Bachelor Degree in Trade / University of Alexandria - Beirut Branch 1968
- Financial and Management courses in the United States of America, United Kingdom and Austria
- Member of the Board of Trustees of The Higher Council for Science and Technology (2013-2017)
- Minister of Finance (1997-1998)- Minister of Finance (2012-2013)- Minister of Post & Telecommunications (1998-1999)- Minister of Energy (2010)- Secretary General of the Ministry of Finance (1991-1996)- Chairman / Royal Jordanian Airlines (2014-2016)- Chairman / Social Security Investment Fund / Social Security
Corporation (2013-2016)- Chairman / Electricity Regulatory Commission (2009-2010)- Chairman / Telecommunication Regulatory Commission
(1998-1999)- Chairman / Jordan Telecommunications Corporation (1999-
2001)- Chairman / Arab Potash Co. (2001-2003)- Chairman / KEMAPCO (Kemera Co.) for Fertilizers & Chemicals
Industries (2001-2003)- Chairman / Jordan Bromine Co. (2001-2003)- Chairman / Free Zones Corp. & Jordan Investment Corp (1997-
1999)- Member of Royal Commission for Modernization and
Development (1993-1996)- Governor of the International Monetary Fund “Representing
Jordan” for various periods- Deputy Governor of the Islamic Development Bank / Jeddah
“Representing Jordan” (1991-1997)- Deputy Governor of the Arab Monetary Fund “Representing
Jordan” (1991-1997)- Chairman of the Ministerial Development Committee for
various periods - Member of the Board of Directors / Royal Jordanian Airlines
(1991-1997)- Member of the Board of Directors / Jordan Electricity Authority
(1991-1997)- Member of the Board of Directors / Social Security Corporation
(1991-1997)- Member of the Board of Directors / Orphan Development
Corp. (1991-1997)- Member of the Board of Directors / Agriculture Credit Corp.
(1991-1997)- Member of the Board of Directors / Arab Engineering
Industries (1992-1997)- Member of the Board of Directors / Civil Aviation Authority
(1991-1997)- Member of the Board of Directors / Jordan Cement Factories
Co. (1990-1997)- Member of the Board of Directors / Jordan Phosphate Co.
(1992-1997)- Member of the Board of Directors / Arab African Bank (1991-
1997)- Member of the Board of Directors / Arab Organisation for
Agricultural Development (1992-1997)- Member of the Board of Directors / Royal Automobile Club of
Jordan (2012-present)
GOVERNANCE REPORT
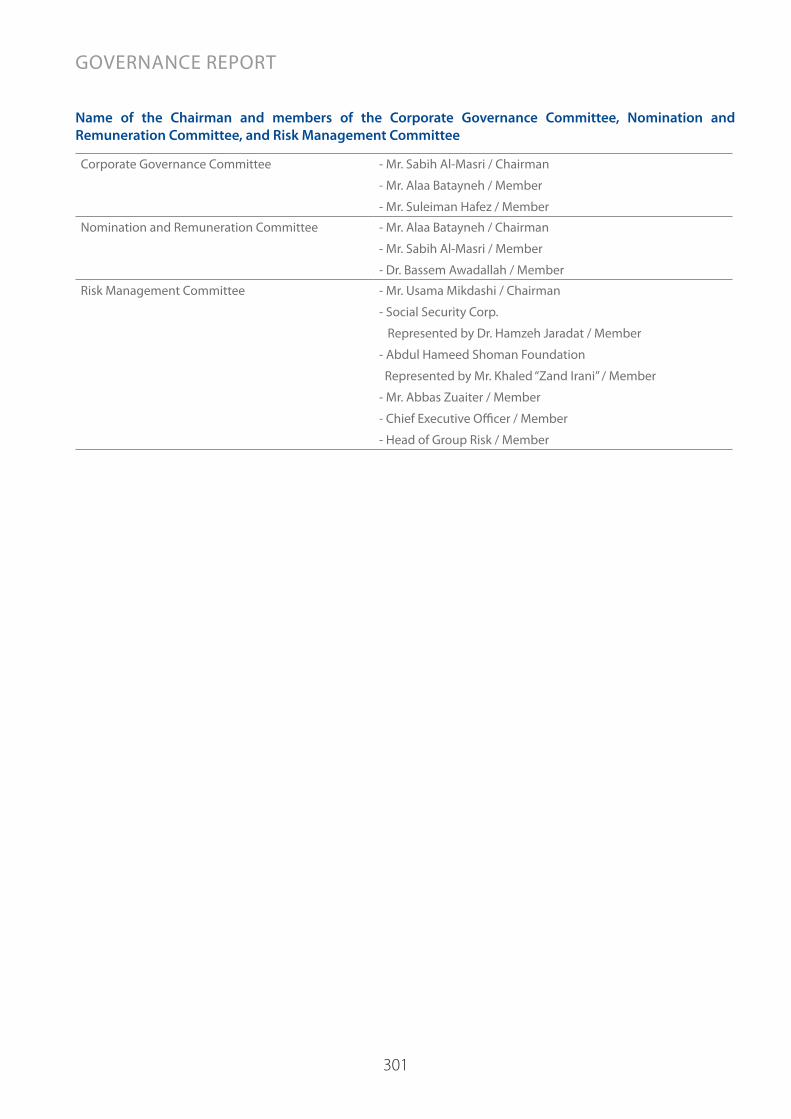
301
Name of the Chairman and members of the Corporate Governance Committee, Nomination and Remuneration Committee, and Risk Management Committee
- Mr. Sabih Al-Masri / Chairman
- Mr. Alaa Batayneh / Member
- Mr. Suleiman Hafez / Member
Corporate Governance Committee
- Mr. Alaa Batayneh / Chairman
- Mr. Sabih Al-Masri / Member
- Dr. Bassem Awadallah / Member
Nomination and Remuneration Committee
- Mr. Usama Mikdashi / Chairman
- Social Security Corp.
Represented by Dr. Hamzeh Jaradat / Member
- Abdul Hameed Shoman Foundation
Represented by Mr. Khaled “Zand Irani” / Member
- Mr. Abbas Zuaiter / Member
- Chief Executive Officer / Member
- Head of Group Risk / Member
Risk Management Committee
GOVERNANCE REPORT
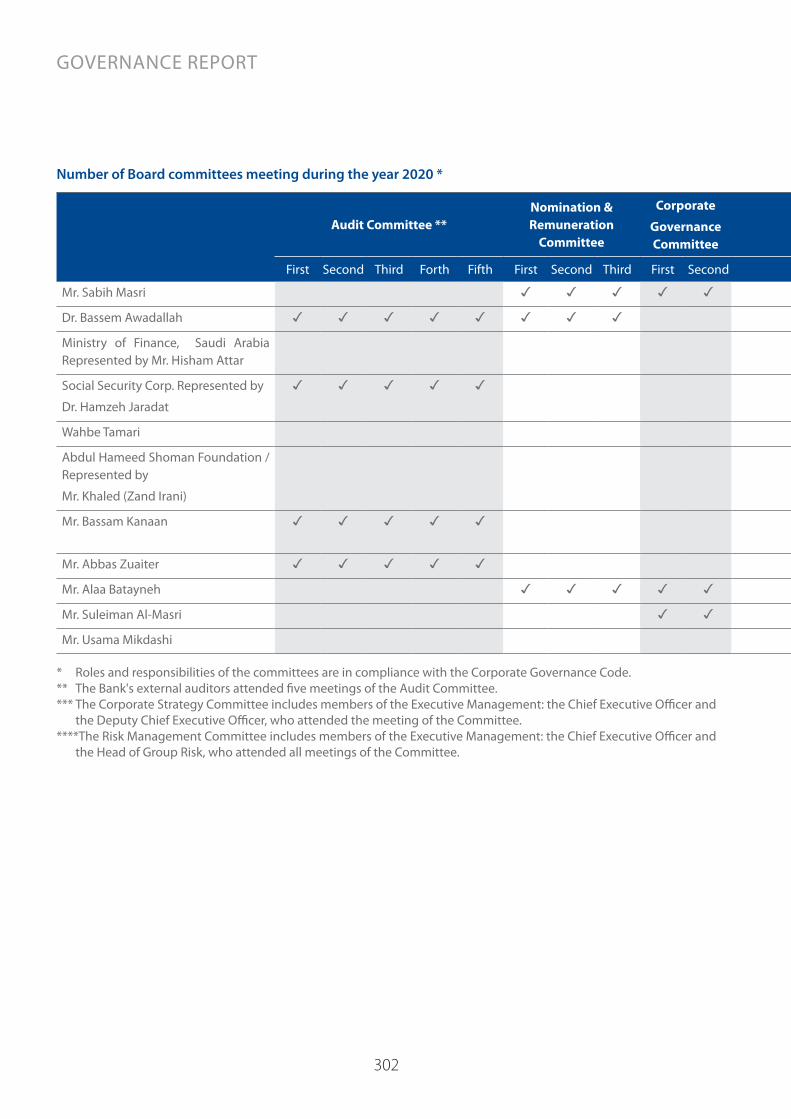
302
Number of Board committees meeting during the year 2020 *
Audit Committee **Nomination & Remuneration
Committee
Corporate
Governance Committee
Strategy Committee
***Risk Committee **** IT Governance Committee
Compliance Committee
Credit Committee
First Second Third Forth Fifth First Second Third First Second First First Second Third Forth First Second Third Forth First Second Third First Second
Mr. Sabih Masri ✓ ✓ ✓ ✓ ✓ ✓ ✓ ✓
Dr. Bassem Awadallah ✓ ✓ ✓ ✓ ✓ ✓ ✓ ✓ ✓
Ministry of Finance, Saudi Arabia Represented by Mr. Hisham Attar
✓ ✓ ✓
Social Security Corp. Represented by
Dr. Hamzeh Jaradat
✓ ✓ ✓ ✓ ✓ ✓ ✓ ✓ ✓
Wahbe Tamari ✓ ✓ ✓ ✓ ✓ ✓ ✓
Abdul Hameed Shoman Foundation /Represented by
Mr. Khaled (Zand Irani)
✓ ✓ ✓ ✓ ✓ ✓ ✓ ✓ ✓ ✓
Mr. Bassam Kanaan ✓ ✓ ✓ ✓ ✓ ✓ ✓ ✓ ✓
Mr. Abbas Zuaiter ✓ ✓ ✓ ✓ ✓ ✓ ✓ ✓ ✓ ✓
Mr. Alaa Batayneh ✓ ✓ ✓ ✓ ✓ ✓ ✓ ✓ ✓ ✓ ✓
Mr. Suleiman Al-Masri ✓ ✓ ✓ ✓ ✓ ✓ ✓
Mr. Usama Mikdashi ✓ ✓ ✓ ✓
* Roles and responsibilities of the committees are in compliance with the Corporate Governance Code.** The Bank's external auditors attended five meetings of the Audit Committee. *** The Corporate Strategy Committee includes members of the Executive Management: the Chief Executive Officer and
the Deputy Chief Executive Officer, who attended the meeting of the Committee.****The Risk Management Committee includes members of the Executive Management: the Chief Executive Officer and
the Head of Group Risk, who attended all meetings of the Committee.
GOVERNANCE REPORT
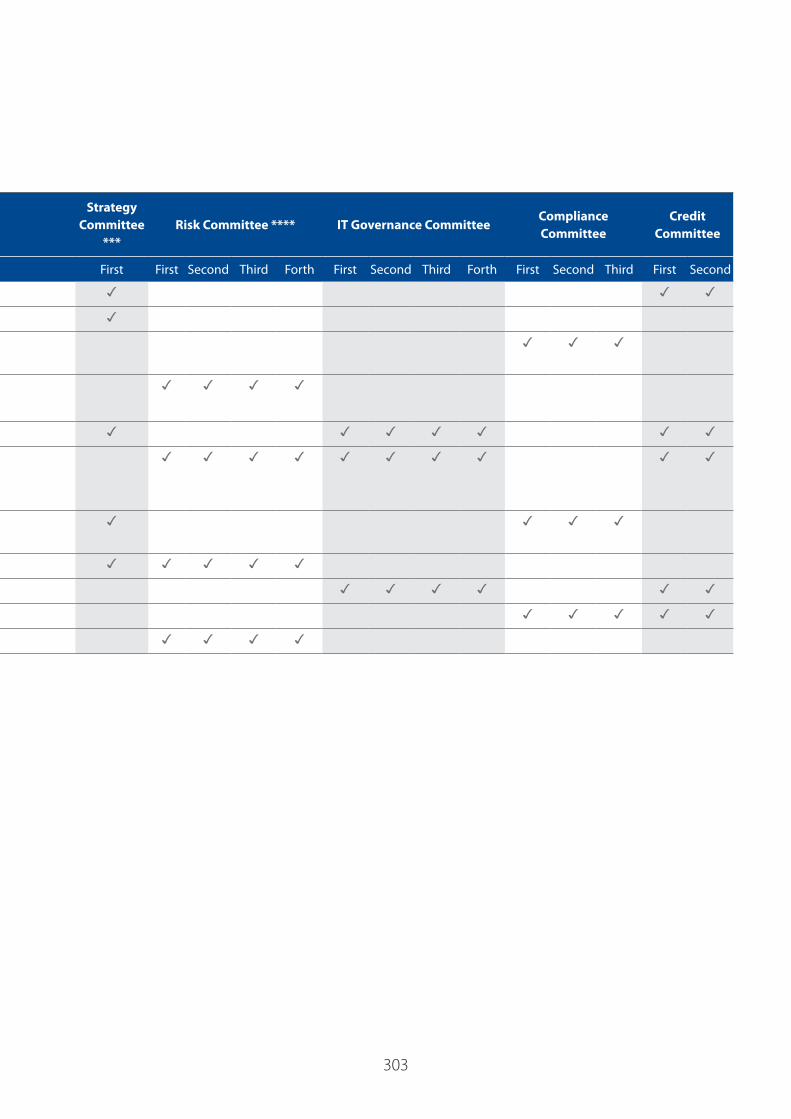
303
Number of Board committees meeting during the year 2020 *
Audit Committee **Nomination & Remuneration
Committee
Corporate
Governance Committee
Strategy Committee
***Risk Committee **** IT Governance Committee
Compliance Committee
Credit Committee
First Second Third Forth Fifth First Second Third First Second First First Second Third Forth First Second Third Forth First Second Third First Second
Mr. Sabih Masri ✓ ✓ ✓ ✓ ✓ ✓ ✓ ✓
Dr. Bassem Awadallah ✓ ✓ ✓ ✓ ✓ ✓ ✓ ✓ ✓
Ministry of Finance, Saudi Arabia Represented by Mr. Hisham Attar
✓ ✓ ✓
Social Security Corp. Represented by
Dr. Hamzeh Jaradat
✓ ✓ ✓ ✓ ✓ ✓ ✓ ✓ ✓
Wahbe Tamari ✓ ✓ ✓ ✓ ✓ ✓ ✓
Abdul Hameed Shoman Foundation /Represented by
Mr. Khaled (Zand Irani)
✓ ✓ ✓ ✓ ✓ ✓ ✓ ✓ ✓ ✓
Mr. Bassam Kanaan ✓ ✓ ✓ ✓ ✓ ✓ ✓ ✓ ✓
Mr. Abbas Zuaiter ✓ ✓ ✓ ✓ ✓ ✓ ✓ ✓ ✓ ✓
Mr. Alaa Batayneh ✓ ✓ ✓ ✓ ✓ ✓ ✓ ✓ ✓ ✓ ✓
Mr. Suleiman Al-Masri ✓ ✓ ✓ ✓ ✓ ✓ ✓
Mr. Usama Mikdashi ✓ ✓ ✓ ✓
* Roles and responsibilities of the committees are in compliance with the Corporate Governance Code.** The Bank's external auditors attended five meetings of the Audit Committee. *** The Corporate Strategy Committee includes members of the Executive Management: the Chief Executive Officer and
the Deputy Chief Executive Officer, who attended the meeting of the Committee.****The Risk Management Committee includes members of the Executive Management: the Chief Executive Officer and
the Head of Group Risk, who attended all meetings of the Committee.
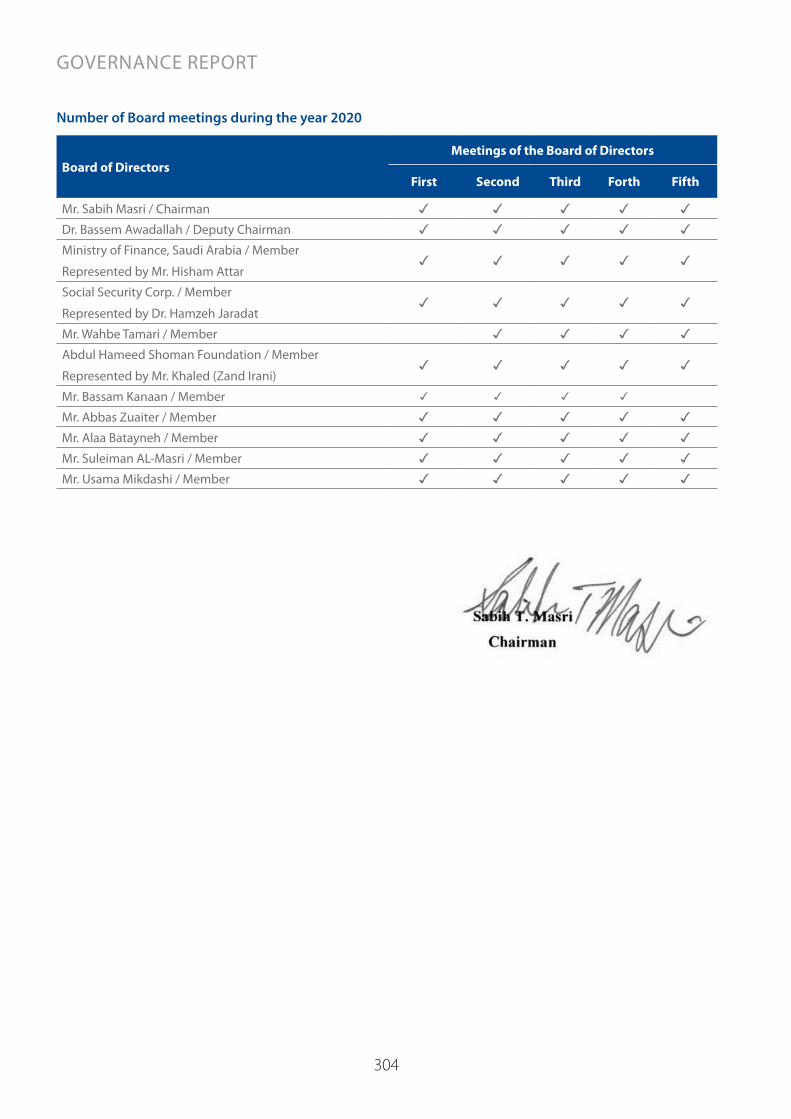
304
Number of Board meetings during the year 2020
Meetings of the Board of DirectorsBoard of Directors
FifthForthThirdSecondFirst
✓✓✓✓✓Mr. Sabih Masri / Chairman
✓✓✓✓✓Dr. Bassem Awadallah / Deputy Chairman
✓✓✓✓✓Ministry of Finance, Saudi Arabia / Member
Represented by Mr. Hisham Attar
✓✓✓✓✓Social Security Corp. / Member
Represented by Dr. Hamzeh Jaradat
✓✓✓✓Mr. Wahbe Tamari / Member
✓✓✓✓✓Abdul Hameed Shoman Foundation / Member
Represented by Mr. Khaled (Zand Irani)✓✓✓✓Mr. Bassam Kanaan / Member
✓✓✓✓✓Mr. Abbas Zuaiter / Member
✓✓✓✓✓Mr. Alaa Batayneh / Member
✓✓✓✓✓Mr. Suleiman AL-Masri / Member
✓✓✓✓✓Mr. Usama Mikdashi / Member
GOVERNANCE REPORT

305
Arab Bank confirms its commitment to apply all articles of the Corporate Governance Code as approved by the Board of Directors and published on the website.
Arab Bank approved and published the IT Governance Management Manual on its website in line with the regulations of the Central Bank of Jordan and confirms its commitment to apply all articles of the code.
DISCLOSURE ABOUT CORPORATE GOVERNANCE

306
1. Reciting the resolutions of the previous 90th General Assembly Ordinary Meeting.
2. Voting and approval of the report of the Board of Directors for the fiscal year 2020 and the future business plan of the Bank.
3. Voting and approval of the auditors’ report for the fiscal year 2020 and voting on the financial statements and balance sheet of the Bank for the fiscal year 2020, and approval of the recommendation of the Board of Directors to pay dividends to shareholders at the rate of JOD 0.120 per share, i.e. 12% of the nominal value of the share being JOD 1.00.
4. Obtaining the approval of the General Assembly on the resolution of the Board of Directors to appoint Mr. Khaled Sabih Taher Masri as a member of the Board of Directors for its current period ending on 28/3/2022, to fill the vacancy following the resignation of Abdul Hameed Shoman Foundation in accordance with Section 150 of Companies Law Number 22 for the Year 1997 and Article 28 of the Articles of Association of the Bank.
5. Release of the members of the Board of Directors from liability for the fiscal year 2020.
6. Election of the Bank’s auditors for the fiscal year 2021 and the determination of their remuneration.
AGENDA OF THE 91ST ORDINARY GENERAL ASSEMBLY:
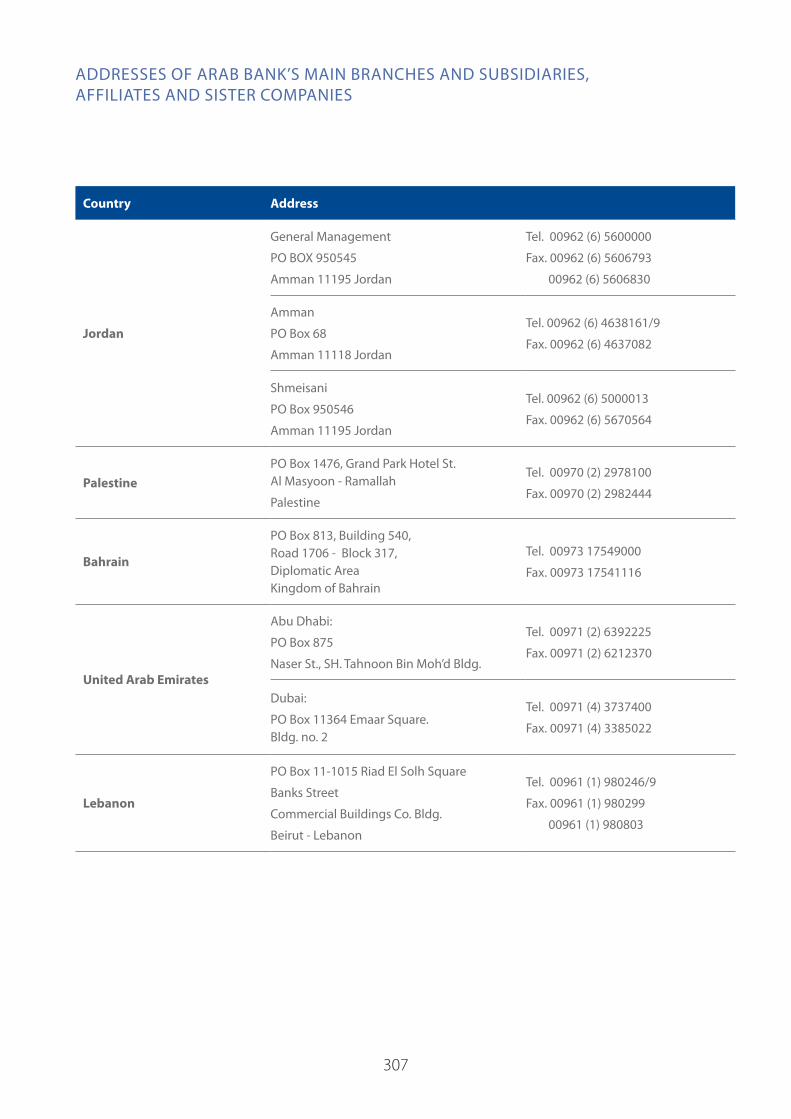
307
Country Address
Jordan
General Management
PO BOX 950545
Amman 11195 Jordan
Tel. 00962 (6) 5600000
Fax. 00962 (6) 5606793
00962 (6) 5606830
Amman
PO Box 68
Amman 11118 Jordan
Tel. 00962 (6) 4638161/9
Fax. 00962 (6) 4637082
Shmeisani
PO Box 950546
Amman 11195 Jordan
Tel. 00962 (6) 5000013
Fax. 00962 (6) 5670564
PalestinePO Box 1476, Grand Park Hotel St. Al Masyoon - Ramallah
Palestine
Tel. 00970 (2) 2978100
Fax. 00970 (2) 2982444
Bahrain
PO Box 813, Building 540, Road 1706 - Block 317, Diplomatic Area Kingdom of Bahrain
Tel. 00973 17549000
Fax. 00973 17541116
United Arab Emirates
Abu Dhabi:
PO Box 875
Naser St., SH. Tahnoon Bin Moh’d Bldg.
Tel. 00971 (2) 6392225
Fax. 00971 (2) 6212370
Dubai:
PO Box 11364 Emaar Square. Bldg. no. 2
Tel. 00971 (4) 3737400
Fax. 00971 (4) 3385022
Lebanon
PO Box 11-1015 Riad El Solh Square
Banks Street
Commercial Buildings Co. Bldg.
Beirut - Lebanon
Tel. 00961 (1) 980246/9
Fax. 00961 (1) 980299
00961 (1) 980803
ADDRESSES OF ARAB BANK’S MAIN BRANCHES AND SUBSIDIARIES, AFFILIATES AND SISTER COMPANIES

308
Country Address
Egypt46 Gamet El Dowal El Arabia St.
Mohandessein - Al Giza
Tel. 00 20 (2) 3332 8500
Fax. 00 20 (2) 3332 8618
YemenPO Box 475 & 1301 Zubairi St.
Sana’a
Tel. 00967 (1) 276585/93
Fax. 00967 (1) 276583
Morocco
PO Box 13810
174 Mohamed V St.
Casablanca
Tel. 00212 (5) 2222 3152
Fax. 00 212 (5) 2220 0233
Qatar
PO Box 172, Grand Hammed Area
Avenue no. 119
Doha – Qatar
Tel. 00974 44387777
Fax. 00 974 44387677
Algeria
15 Boulevard du bonheur residence Chaabani Val D’Hydra Alger - Algeria
Tel: 00 213 (21) 60 87 25 Fax: 00 213 (21) 48 00 01
Singapore80 Raffles Place
UOB Plaza 2 # 32-20 Singapore 048624
Tel. 0065 65330055
Fax. 0065 65322150
United States of America (New York Agency)
Federal Agency- New York
150 East 52nd St.
New York , NY 10022 - 4213
Tel.: 001 (212) 7159700
Fax.: 001 (212) 5934632
China
Unit 1803,
Shanghai Trade Square
188 Si Ping Road,
Shanghai 200086, China
Tel. 0086 (21) 65077737/38
Fax. 0086 (21) 65072776
South Korea
(Representative Office)
Seoul Square Bldg.,
5Fl. Hangangdaero 416 Jung-gu,
Seoul 04637
South Korea
Tel. 0082 (2) 775 4290
Fax. 0082 (2) 775 4294
Europe Arab Bank plc United Kingdom
13-15 MoorgateLondon EC2R 6AD
Tel. 0044 (20) 73158500Fax. 0044 (20) 76007620
France
Paris 41 Avenue de Friedland 75008 Paris (Entrance at the corner of rue Arsène Houssaye)
Tel. 0033 (1) 45616000Fax. 0033 (1) 42890978
ADDRESSES OF ARAB BANK’S MAIN BRANCHES AND SUBSIDIARIES, AFFILIATES AND SISTER COMPANIES

309
Country Address
ItalyCorso Matteotti 1A 20121 Milan
Tel. 0039 (2) 76398521Fax. 0039 (2) 782172
GermanyNiedenau 61-63D-60325 Frankfurt am MainGermany
Tel. 0049 (69) 242590 Fax. 0049 (69) 235471
Arab Bank Australia Ltd.Level 7, 20 Bridge Street Sydney NSW 2000 Australia
Tel. 0061 (2) 93778900 Fax. 0061 (2) 92215428
Arab Bank (Switzerland) Ltd.
Geneva Place de Longemalle 10-12 P.O. Box 3575CH - 1211 Geneva 3
Tel. 0041 (22) 7151211 Fax. 0041 (22) 7151311
ZurichNüschelerstrasse 1P.O. Box 1065CH–8001 Zurich
Tel. 0041 (44) 2657111Fax. 0041 (44) 2657268
Finance Accountancy Mohassaba 24 Rue Neuve du Molard P.O.Box 3155CH – 1211 Geneva 3
Tel . 0041 (22) 9083000Fax. 0041 (22) 7387229
Islamic International Arab Bank Wasfi Al-Tal St., Bldg. no. 20P.O.Box 925802 Amman 11190 Jordan
Tel. 00962 (6) 5694901Fax. 00962 (6) 5694914
Arab National Leasing Co.Madina Monawwara St.,Bldg. no. 255P.O.Box 940638 Amman 11194 Jordan
Tel. 00962 (6) 5531649Fax. 00962 (6) 5529891
Al- Arabi Investment Group Co.
Shmeisani, Esam Ajlouni St.,Bldg. No. 3 P.O.Box 143156Amman 11814 Jordan
Tel. 00962 (6) 5522239Fax. 00962 (6) 5519064
Al Arabi Investment Group Co. / Palestine
Ramallah, Old TownP.O.Box 1476 Palestine
Tel. 00970 (2) 2980240Fax. 00970 (2) 2980249
Arab Sudanese Bank Ltd. Wahat El- Khartoum TowersP.O.Box 955 Khartoum - Sudan
Tel. 00249 (15) 6550001 Fax. 00249 (15) 6550004
Arab Tunisian Bank9 Hedi Nouira Street, Tunis 1001 Tel. 00216 (71) 351155
Fax. 00216 (71) 342852
ADDRESSES OF ARAB BANK’S MAIN BRANCHES AND SUBSIDIARIES, AFFILIATES AND SISTER COMPANIES

310
Country Address
Al Nisr Al Arabi Insurance Co. Esam Ajlouni St., Bldg. no. 21 ShmeisaniP.O.Box 9194 Amman 11191
Tel. 00962 (6) 5685171Fax. 00962 (6) 5685890
Arab Bank - SyriaMahdi Bin Baraka St., Abu RummanaP.O.Box 38 Damascus- Syria
Tel. 00963 (11) 9421Fax. 00963 (11) 3349844
Turkland Bank
19 Mayis Mah.19 Mayis Cad.Sisli Plaza A Blok No. 734360 Sisli- Istanbul – Turkey
Tel. 0090 (212) 3683434Fax. 0090 (212) 3683535
Oman Arab Bank North Ghubra,P.O.Box 2240 PC 130 Sultanate of Oman
Tel. 00968 (24) 754000Tel. 00968 (24) 797736
Arab National BankP.O.Box 56921 Riyadh 11564Saudi Arabia
Tel. 00966 (11) 4029000Fax. 00966 (11) 4027747
Arabia Insurance Co. Company’s Bldg., Phoenicia St. P.O.Box 2172 - 11 Beirut – Lebanon
Tel. 00961 (1) 363610Fax. 00961 (1) 363659
Commercial Building Co. Riad El-Solh Sq., Banks St., P.O.Box 6498 - 11 Beirut - Lebanon
Tel. 00961 (1) 980750 00961 (1) 980751Fax. 00961 (1) 980752
ADDRESSES OF ARAB BANK’S MAIN BRANCHES AND SUBSIDIARIES, AFFILIATES AND SISTER COMPANIES