annual report 2019–20 - tourism western australia
TRANSCRIPT

GOVERNMENT OFWESTERN AUSTRALIA
Department of Jobs, Tourism, Science and Innovation
A N N U A L R E P O R T 2 0 1 9 – 2 0
T O U R I S M W E S T E R N A U S T R A L I A

B
1 . 0 OV E R V I E W 2 . 0 A G E N C Y P E R F O R M A N C E
M E S S A G E T O T H E M I N I S T E R
3 . 0 S I G N I F I C A N T I S S U E S I M PA C T I N G T H E A G E N C Y
4 . 0 D I S C L O S U R E S A N D L E G A L C O M P L I A N C E
MESSAGE TO THE MINISTER 2
1.0 OVERVIEW 5
1.1 Executive Summary 5
1.2 Operational Structure 10
1.3 Performance Management Framework
14
2.0 AGENCY PERFORMANCE 20
2.1 Report on Operations 20
2.2 Financial Targets 44
2.3 Key Performance Indicators 45
3.0 SIGNIFICANT ISSUES IMPACTING THE AGENCY
46
4.0 DISCLOSURES AND LEGAL COMPLIANCE
50
4.1 Independent Auditor’s Report 52
4.2 Financial Statements 54
4.3 Key Performance Indicators 98
4.4 Ministerial Directives 106
4.5 Other Financial Disclosures 106
4.6 Other Legal Requirements 107
4.7 Government Policy Requirements 111
C O N T E N T S
R O E B U C K B AY , N E A R B R O O M E
1 . 0 OV E R V I E W 2 . 0 A G E N C Y P E R F O R M A N C E
M E S S A G E T O T H E M I N I S T E R
3 . 0 S I G N I F I C A N T I S S U E S I M PA C T I N G T H E A G E N C Y
4 . 0 D I S C L O S U R E S A N D L E G A L C O M P L I A N C E
A C K N O W L E D G M E N T
O F C O U N T R Y
Tourism Western Australia acknowledges the
Traditional Custodians throughout Western
Australia and their continuing connection to the
land, waters and culture. We pay our respects
to all Aboriginal peoples and their Elders, past,
present and emerging.
1

M E S S A G E T O T H E M I N I S T E RTo the Honourable Paul Papalia CSC MLA, Minister for Tourism
Dear Minister
In accordance with Section 63 of the Financial Management Act 2006, it is my pleasure to submit for your information and presentation to Parliament, the Annual Report of the Western Australian Tourism Commission (operating as Tourism Western Australia) for the year ended June 30, 2020.
The Annual Report has been prepared in accordance with the provisions of the Financial Management Act 2006.
Nathan HardingCHAIRMANTOURISM WESTERN AUSTRALIA
August 28, 2020
2 TOURISM WESTERN AUSTRALIA / ANNUAL REPORT 2019 – 20
1 . 0 OV E R V I E W 2 . 0 A G E N C Y P E R F O R M A N C E
M E S S A G E T O T H E M I N I S T E R
3 . 0 S I G N I F I C A N T I S S U E S I M PA C T I N G T H E A G E N C Y
4 . 0 D I S C L O S U R E S A N D L E G A L C O M P L I A N C E

L I T T L E B E A C H , A L B A N Y
$ 1 1 B I L L I O N
R E C O R D
V I S I T O RS P E N D I N 2 0 1 9
3
1 . 0 OV E R V I E W 2 . 0 A G E N C Y P E R F O R M A N C E
M E S S A G E T O T H E M I N I S T E R
3 . 0 S I G N I F I C A N T I S S U E S I M PA C T I N G T H E A G E N C Y
4 . 0 D I S C L O S U R E S A N D L E G A L C O M P L I A N C E

T H E S E V I S I T O R S
O V E R N I G H T V I S I T O R S
C A M E T O O R T R A V E L L E DS P E N T
$ 1 1 B I L L I O N
1 2 M I L L I O N2 4 . 2 M I L L I O N
D A Y T R I P S
W I T H I N W ASource: Tourism Research Australia, International and National Visitor Surveys, Year Ending December 2019
W E R E T A K E N I N W A
4 B U N G L E B U N G L E R A N G E , P U R N U L U L U N AT I O N A L PA R K
1 . 0 OV E R V I E W 2 . 0 A G E N C Y P E R F O R M A N C E
M E S S A G E T O T H E M I N I S T E R
3 . 0 S I G N I F I C A N T I S S U E S I M PA C T I N G T H E A G E N C Y
4 . 0 D I S C L O S U R E S A N D L E G A L C O M P L I A N C E
1.1 Executive Summary
M E S S A G E F R O M T H E C H A I R M A N
This has been a year of celebratory highs and unprecedented challenges for Tourism WA and our industry.
In just a few months, the WA tourism industry went from celebrating its highest visitor numbers and record $11 billion spend in 2019, to a complete industry shutdown with the onset of the COVID-19 global pandemic in 2020.
The hardship faced by the tourism industry with border closures has been devastating, with businesses losing income and staff, and some sadly closing their doors.
As a result of the COVID-19 pandemic , the Board shifted its focus to support our industry’s operators and ensure a sustainable tourism industry in the future. We want to make sure that when it is safe for people to travel again, our industry has remained viable and is able to reactivate the quality tourism experiences Western Australia is world-renowned for.
In April, Tourism WA launched an Industry Support Team, which contacted more than 700 operators across the State to see how they were coping, provide advice and be informed of issues that may help guide possible future support or recovery initiatives. In May, we announced the $14.4 million WA Tourism Recovery Program in two stages. The first was to provide immediate financial support to small and micro tourism operators around the State, to adapt and refocus their businesses in the new environment. The second was a program of larger grants for tourism businesses suffering extreme hardship.
The easing of WA regional border travel restrictions in June presented an opportunity for more West Australians to holiday in WA instead of going interstate or overseas and, in turn, support the local economy, businesses and jobs. To encourage West Australians to explore their own backyard and seek out new experiences across the State, Tourism WA launched a major intrastate campaign – Wander out Yonder. With a $2 million investment in media and partnerships, the campaign includes targeted cooperative marketing campaigns and holiday offers.
The Tourism WA Board is now focused on recovery efforts, in line with the State Government’s WA Recovery Plan. This will ensure that when the time is right, we are the destination of choice for holiday makers, and once again attract record visitor numbers and visitor spend to grow jobs and the WA economy.
There is still uncertainty around when domestic and international travel will be permitted, and the impacts border restrictions will have on our industry.
However, it is important to acknowledge the achievements in 2019-20 that laid the ground work for a strong tourism industry pre-COVID-19. Much of the Board’s focus in 2019 was on maximising the return on investment to the State through the implementation of the Two-Year Action Plan for Tourism in Western Australia - 2018 and 2019.
Thanks to the success of the plan, we entered 2020 in a strong position as a tourism destination, and this will be used to our advantage when we are once again open for business.
5 TOURISM WESTERN AUSTRALIA / ANNUAL REPORT 2019 – 20
1 . 0 OV E R V I E W 2 . 0 A G E N C Y P E R F O R M A N C E
M E S S A G E T O T H E M I N I S T E R
3 . 0 S I G N I F I C A N T I S S U E S I M PA C T I N G T H E A G E N C Y
4 . 0 D I S C L O S U R E S A N D L E G A L C O M P L I A N C E
1 . 0 O V E R V I E W

Our goal to become the western gateway to Australia was strengthened as we welcomed direct flights between Japan and Perth in September 2019, as well as Shanghai and Perth in January 2020.
We also implemented major campaigns with our cooperative marketing partners to attract visitors from our key international markets as part of the $12 million international marketing boost, of which $9 million was allocated in 2019-20.
Our drive to change perceptions of Perth and reignite the east coast market was further cemented thanks to our successful 2019 AFL marketing campaign, which attracted more than 23,800 interstate visitors who spent close to $26 million in WA.
Following a successful Australian Tourism Exchange in Perth in 2019, WA hosted other major travel trade events – Corroboree West and Dreamtime. These events welcomed hundreds of agents to the State which helped promote WA and Perth’s transformation.
In addition, we held some of the biggest national and international sporting events in 2019-20. World-famous football club, Manchester United, played two matches at Optus Stadium, which attracted more than 13,000 out-of-state visitors who spent nearly $16.5 million. More than 61,000 fans also flocked to the Bledisloe Cup match in August, setting an attendance record for a sporting event at Optus Stadium. Close to 7,400 visitors from outside WA travelled to Perth, spending more than $12.5 million.
The success of the Two-Year Action Plan demonstrates the underlying strength of WA’s tourism industry and provides hope for the industry’s recovery from the COVID-19 pandemic.
As we continue to work through the challenges that COVID-19 has presented, I would like to extend my thanks to the Board for its ongoing guidance.
I would also like to acknowledge the State Government, in particular the Premier, the Hon Mark McGowan MLA, and the Minister for Tourism, the Hon Paul Papalia CSC MLA, for their support in helping the industry during the COVID-19 pandemic.
World-famous football club,
Manchester United, played
two matches at Optus
Stadium, which attracted
more than 13,000 out-of-state
visitors who spent nearly
$16.5 million.
6 TOURISM WESTERN AUSTRALIA / ANNUAL REPORT 2019 – 20
1 . 0 OV E R V I E W
1 . 0 OV E R V I E W 2 . 0 A G E N C Y P E R F O R M A N C E
M E S S A G E T O T H E M I N I S T E R
3 . 0 S I G N I F I C A N T I S S U E S I M PA C T I N G T H E A G E N C Y
4 . 0 D I S C L O S U R E S A N D L E G A L C O M P L I A N C E
In addition, I would like to sincerely thank Tourism WA staff for all their hard work, professionalism and commitment during this difficult and challenging time.
Finally, to our incredible tourism industry, I know it has been tough, but we will get through this. We have many dedicated operators, authentic and amazing experiences and products right here on our doorstep, and a strong foundation to grow tourism in WA. This will all play to our advantage as we work together to rebuild our industry and regain our pre-COVID-19 momentum.
Nathan HardingCHAIRMANTOURISM WESTERN AUSTRALIA
August 28, 2020
L A K E B A L L A R D
7 TOURISM WESTERN AUSTRALIA / ANNUAL REPORT 2019 – 20
1 . 0 OV E R V I E W
1 . 0 OV E R V I E W 2 . 0 A G E N C Y P E R F O R M A N C E
M E S S A G E T O T H E M I N I S T E R
3 . 0 S I G N I F I C A N T I S S U E S I M PA C T I N G T H E A G E N C Y
4 . 0 D I S C L O S U R E S A N D L E G A L C O M P L I A N C E
M E S S A G E F R O M T H E C H I E F E X E C U T I V E O F F I C E R
This financial year, and the year 2020, will forever be viewed through the lens of COVID-19.
It has been a year of unexpected changes for the tourism industry. No one could have predicted a global pandemic and the extraordinary measures that had to be taken to protect our community and minimise the impact of COVID-19 on the State.
For many in the tourism industry, it has deeply affected their livelihood.
I am extremely proud of the resolve our industry has shown, and how Tourism WA has responded to these circumstances.
I would like to acknowledge the excellent leadership of Rebecca Brown, as the Tourism WA Chief Executive Officer and the Department of Jobs, Tourism, Science and Innovation (JTSI) Director General, before being appointed to the Department of the Premier and Cabinet (DPC) on March 30, 2020 as Acting Director General.
During her tenure at JTSI, Tourism WA was beginning to reap the rewards of a Two-Year Action Plan for Tourism that had mapped out a clear pathway and objectives for WA to maximise tourism growth and create jobs.
Our tourism industry was valued at a record $11 billion and our State’s growth rate for international holiday visitors and spend outstripped all other states and territories in the nation.
The WA Government made tourism a priority in the 2019-20 Budget, in recognition of the potential for the industry to become an economic powerhouse for the State, creating jobs and growth, particularly in regional areas.
Significant allocations were made by the Government towards tourism initiatives and cross-government projects with tourism at the forefront, including an injection of $16.2 million for infrastructure on Rottnest Island, $10 million for Collie Adventure Trails and $3.6 million for Aboriginal tourism initiatives.
This investment proved beneficial for the hard times to come, as the progression of these, or alternative projects, will contribute to cushioning the impact of the COVID-19 outbreak on the State’s economy.
In March, Tourism WA staff made the move from their former Mill Street premises to co-locate with the wider JTSI agency at One William Street. This has made it even easier for us to work together and proved particularly valuable in the fast-moving early days of the COVID-19 outbreak, which coincided with the move.
No sooner had Tourism WA staff relocated to One William Street, than some were seconded to contribute their skills and expertise to DPC’s world-leading response, to manage the impact of COVID-19 on the State.
I continue to be delighted at the feedback I have received regarding their valuable contribution, as I am with the work of all at Tourism WA who have responded incredibly well and proven their adaptability during a crisis.
No industry was hit harder than tourism by the challenges of COVID-19. JTSI, and in particular Tourism WA, were forced to revisit future plans in line with the WA Government’s key priorities, including economic resilience and recovery.
For Tourism WA, this led to the development of a three-phase strategy, with the first phase an immediate effort to sustain industry operators with emotional and practical support through the formation of an Industry Support Team. The second and third phase were about sustaining our industry and future, and a key element of this was the launch of the $14.4 million WA Tourism Recovery Program in May.
8 TOURISM WESTERN AUSTRALIA / ANNUAL REPORT 2019 – 20
1 . 0 OV E R V I E W
1 . 0 OV E R V I E W 2 . 0 A G E N C Y P E R F O R M A N C E
M E S S A G E T O T H E M I N I S T E R
3 . 0 S I G N I F I C A N T I S S U E S I M PA C T I N G T H E A G E N C Y
4 . 0 D I S C L O S U R E S A N D L E G A L C O M P L I A N C E

Economic recovery is now a priority of the WA Government, which in May announced a State Recovery Advisory Group, of which I am a member, to guide WA’s COVID-19 recovery.
The group has representatives from a wide range of important sectors, who have provided input into the WA Government’s Draft Impact Statement, designed to inform recovery activities.
The Statement, released on June 9, 2020, focuses on five recovery areas: industry, economic and infrastructure, social, health and regions.
As the lead Director General for the Industry Recovery Plan, I have a unique perspective on how COVID-19 has affected all industries throughout the State, including tourism. While the impacts have been far-reaching, I am impressed with the teamwork and innovation this crisis has forced upon us.
The pandemic response has rightly taken priority for our Government, delaying the 2020-21 Western Australian State Budget announcement until October.
It will be a difficult budget to deliver, however tourism and its potential to reinvigorate the economy means it is an area of focus for Government.
While we won’t come out of this pandemic unscathed, WA is poised to fare well compared to other parts of Australia.
Our Government has provided clear direction for a path forward and our people are proving to be our best asset, with industry operators and tourism staff showing both resilience and ingenuity.
I would like to extend my thanks to Managing Director Brodie Carr, the Executive Management Team and Tourism WA staff for their hard work during the year and ongoing commitment to our recovery efforts.
By working together, we will ensure we are in the best position possible for the year ahead.
Richard SellersA/CHIEF EXECUTIVE OFFICER TOURISM WESTERN AUSTRALIA
August 28, 2020
N I N G A L O O R E E F
9 TOURISM WESTERN AUSTRALIA / ANNUAL REPORT 2019 – 20
1 . 0 OV E R V I E W
1 . 0 OV E R V I E W 2 . 0 A G E N C Y P E R F O R M A N C E
M E S S A G E T O T H E M I N I S T E R
3 . 0 S I G N I F I C A N T I S S U E S I M PA C T I N G T H E A G E N C Y
4 . 0 D I S C L O S U R E S A N D L E G A L C O M P L I A N C E
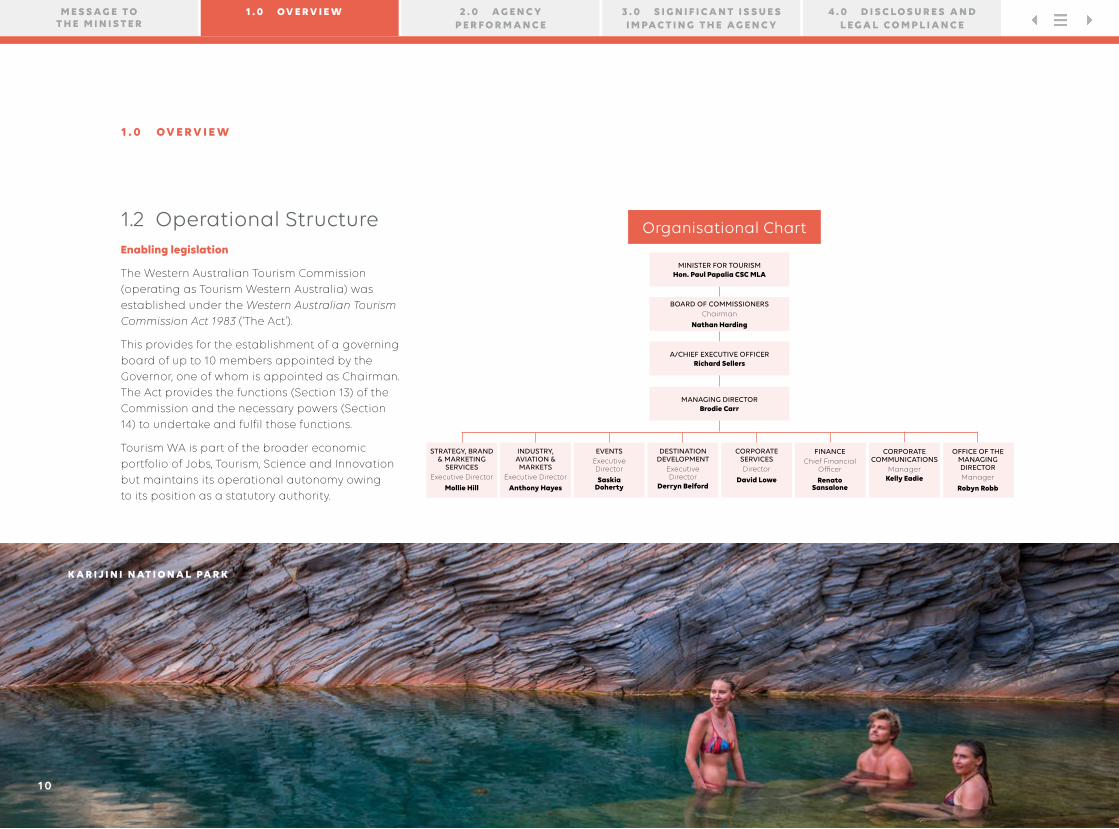
1.2 Operational StructureEnabling legislation
The Western Australian Tourism Commission (operating as Tourism Western Australia) was established under the Western Australian Tourism Commission Act 1983 (‘The Act’).
This provides for the establishment of a governing board of up to 10 members appointed by the Governor, one of whom is appointed as Chairman. The Act provides the functions (Section 13) of the Commission and the necessary powers (Section 14) to undertake and fulfil those functions.
Tourism WA is part of the broader economic portfolio of Jobs, Tourism, Science and Innovation but maintains its operational autonomy owing to its position as a statutory authority.
MINISTER FOR TOURISMHon. Paul Papalia CSC MLA
BOARD OF COMMISSIONERSChairman
Nathan Harding
A/CHIEF EXECUTIVE OFFICER Richard Sellers
STRATEGY, BRAND & MARKETING
SERVICES Executive Director
Mollie Hill
EVENTSExecutive Director
Saskia Doherty
INDUSTRY, AVIATION &
MARKETSExecutive Director
Anthony Hayes
DESTINATION DEVELOPMENT
Executive Director
Derryn Belford
CORPORATE SERVICESDirector
David Lowe
FINANCEChief Financial
Officer
Renato Sansalone
CORPORATE COMMUNICATIONS
ManagerKelly Eadie
Organisational Chart
MANAGING DIRECTOR Brodie Carr
OFFICE OF THE MANAGING DIRECTORManager
Robyn Robb
K A R I J I N I N AT I O N A L PA R K
1 0
1 . 0 OV E R V I E W
1 . 0 OV E R V I E W 2 . 0 A G E N C Y P E R F O R M A N C E
M E S S A G E T O T H E M I N I S T E R
3 . 0 S I G N I F I C A N T I S S U E S I M PA C T I N G T H E A G E N C Y
4 . 0 D I S C L O S U R E S A N D L E G A L C O M P L I A N C E

Responsible Minister
The Minister responsible for Tourism WA during 2019-20 was the Hon Paul Papalia CSC MLA.
Our vision
The overall vision statement for both Tourism WA and for the Western Australian tourism industry is:
To make Western Australia the most desirable leisure and business events destination in Australia.
Other key legislation
Key legislation impacting on our operations includes:
– Auditor General Act 2006
– Disability Services Act 1993
– Equal Opportunity Act 1984
– Financial Management Act 2006
– Freedom of Information Act 1992
– Occupational Safety and Health Act 1984
– Public Interest Disclosure Act 2003
– Public Sector Management Act 1994
– State Records Act 2000
– State Supply Commission Act 1991
– Worker Compensation and Injury Management Act 1981
Board of Commissioners
Tourism WA is governed by a Board of Commissioners appointed under the Western Australian Tourism Commission Act 1983 and can include up to 10 members. The Board is the accountable authority and responsible for the outcomes of Tourism WA; it sets the strategic direction of the agency and goals for management. The Board delegates day-to-day operations to the Chief Executive Officer. During 2019-20, the Board was made up of the following members.
– Nathan Harding – Chairman
– Manny Papadoulis – Deputy Chairman
– Di Bain
– Kevin Brown
– Valerie Davies
– Bruce Davis*
– Kia Dowell
– Tracey Horton AO
– Karen Priest
– Linda Wayman
Board members’ biographies are available at tourism.wa.gov.au.
Tourism WA Board meetings and attendance
In 2019-20, seven Board meetings were held. Attendance was as follows:
Meetings attended
Meetings eligible to
attend
Nathan Harding 7 7
Manny Papadoulis 7 7
Di Bain 7 7
Kevin Brown 7 7
Valerie Davies 7 7
Bruce Davis* 1 2
Kia Dowell 7 7
Tracey Horton AO 7 7
Karen Priest 7 7
Linda Wayman 7 7
*Term commenced October 15, 2019, resigned January 16, 2020
Declarations of interest
The Board has a standing declaration of interest process included in the Board Charter. A standing agenda item at all meetings provides for the declaration and management of any potential conflicts of interest and an agency Interest Register is maintained on an ongoing basis.
1 1 TOURISM WESTERN AUSTRALIA / ANNUAL REPORT 2019 – 20
1 . 0 OV E R V I E W
1 . 0 OV E R V I E W 2 . 0 A G E N C Y P E R F O R M A N C E
M E S S A G E T O T H E M I N I S T E R
3 . 0 S I G N I F I C A N T I S S U E S I M PA C T I N G T H E A G E N C Y
4 . 0 D I S C L O S U R E S A N D L E G A L C O M P L I A N C E

Independent external advice
Individual Board members have the right to seek independent professional advice on particular matters before the Board, subject to approval by the Chairman, at Tourism WA’s expense.
Board sub-committees
To assist the Board in achieving the highest standards of corporate governance, Board members closely involve themselves with critical areas of Tourism WA’s activities through four Board appointed sub-committees:
– The Strategic Marketing Committee provides high-level strategic advice on Tourism WA’s marketing activities in domestic and international markets, and monitors the success of its activities.
– The Destination Development Committee provides input, advice and advocacy on strategies, policies and initiatives that drive significant tourism infrastructure development.
– The Events Committee guides the strategy to ensure a world-class, annual major events calendar for the State featuring unique home-grown events, as well as cultural, arts and sporting events.
– The Audit and Risk Committee assists the Board in fulfilling its oversight responsibilities for the financial reporting process, the system of internal control, the audit process and Tourism WA’s process for monitoring compliance with laws and regulations.
Executive Management Team
Tourism WA is a State Government statutory authority and part of the broader economic development portfolio of Jobs, Tourism, Science and Innovation. The department became the employing authority of Tourism WA’s employees on July 1, 2017. As at June 30, 2020, the Executive Management Team comprises:
– Richard Sellers (A/Chief Executive Officer)
– Brodie Carr (Managing Director)
– Saskia Doherty (Executive Director Events)
– Mollie Hill (Executive Director Strategy, Brand and Marketing Services)
– Anthony Hayes (Executive Director Industry, Aviation and Markets)
– Derryn Belford (Executive Director Destination Development)
– David Lowe (Director Corporate Services)
– Renato Sansalone (Chief Financial Officer)
– Kelly Eadie (Manager Corporate Communications)
– Robyn Robb (Manager Office of the Managing Director)
– Carroll Selwood (Manager Executive Services)
Changes to the Executive Management Team
The following changes were made to Tourism WA’s Executive Management Team during 2019-20:
– Current Chief Executive Officer of Tourism WA Rebecca Brown commenced as Acting Director General of the Department of the Premier and Cabinet in March 2020.
– Richard Sellers was appointed Acting Chief Executive Officer of Tourism WA in March 2020.
– Anthony Hayes was appointed Executive Director Industry, Aviation and Markets in April 2020.
– David Lowe was appointed Director Corporate Services for the Department of Jobs, Tourism, Science and Innovation in July 2019.
Executive Management Team biographies are available at tourism.wa.gov.au.
1 2 TOURISM WESTERN AUSTRALIA / ANNUAL REPORT 2019 – 20
1 . 0 OV E R V I E W
1 . 0 OV E R V I E W 2 . 0 A G E N C Y P E R F O R M A N C E
M E S S A G E T O T H E M I N I S T E R
3 . 0 S I G N I F I C A N T I S S U E S I M PA C T I N G T H E A G E N C Y
4 . 0 D I S C L O S U R E S A N D L E G A L C O M P L I A N C E
H U T T L A G O O N
1 3
1 . 0 OV E R V I E W 2 . 0 A G E N C Y P E R F O R M A N C E
M E S S A G E T O T H E M I N I S T E R
3 . 0 S I G N I F I C A N T I S S U E S I M PA C T I N G T H E A G E N C Y
4 . 0 D I S C L O S U R E S A N D L E G A L C O M P L I A N C E

1.3 Performance Management Framework
1 . 3 .1 O U T C O M E - B A S E D M A N A G E M E N T F R A M E W O R K
Broad government goals are supported at agency level by specific outcomes. Agencies deliver services to achieve these outcomes. The following table demonstrates the relationship between Tourism WA’s services and desired outcomes, and the Government goal of ‘Future jobs and skills.’ Key effectiveness indicators measure the extent of impact of the delivery of services on achieving desired outcomes, and key efficiency indicators monitor the relationship between the service delivered and the resources used to produce the service.
Government goal:
Future jobs and skills
Grow and diversify the economy, create jobs, and support skills development.
Desired outcome
Increased competitiveness and viability of the Western Australian tourism industry.
Services
1 Destination Marketing
2 Event Tourism
3 Tourism Destination Development
Tourism WA’s results against performance indicators are audited by the Auditor General. Our results are summarised in the ‘Key Performance Indicators’ section of this report.
P E R T H C I T Y
1 4 TOURISM WESTERN AUSTRALIA / ANNUAL REPORT 2019 – 20
1 . 0 OV E R V I E W
1 . 0 OV E R V I E W 2 . 0 A G E N C Y P E R F O R M A N C E
M E S S A G E T O T H E M I N I S T E R
3 . 0 S I G N I F I C A N T I S S U E S I M PA C T I N G T H E A G E N C Y
4 . 0 D I S C L O S U R E S A N D L E G A L C O M P L I A N C E
1 . 3 . 2 C H A N G E S T O O U T C O M E - B A S E D M A N A G E M E N T F R A M E W O R K
Tourism WA’s outcome-based management framework did not change for 2019-20.
1 . 3 . 3 S H A R E D R E S P O N S I B I L I T I E S W I T H O T H E R A G E N C I E S
Tourism WA does not share any statutory responsibilities with other agencies.
However, Tourism WA works closely with a range of Australian and State government entities to achieve cross-government coordination of tourism initiatives. Some of these agencies include: Austrade; Tourism Australia; Indigenous Business Australia; Department of the Premier and Cabinet; Department of Primary Industries and Regional Development; Department of Transport; Department of Planning, Lands and Heritage; Department of Biodiversity, Conservation and Attractions; Development WA; Main Roads WA; Department of Local Government, Sport and Cultural Industries; Public Transport Authority; VenuesWest; Small Business Development Corporation; Rottnest Island Authority; Infrastructure WA and the nine Regional Development Commissions.
W I L L I A M B AY N AT I O N A L PA R K
1 5 TOURISM WESTERN AUSTRALIA / ANNUAL REPORT 2019 – 20
1 . 0 OV E R V I E W 2 . 0 A G E N C Y P E R F O R M A N C E
M E S S A G E T O T H E M I N I S T E R
3 . 0 S I G N I F I C A N T I S S U E S I M PA C T I N G T H E A G E N C Y
4 . 0 D I S C L O S U R E S A N D L E G A L C O M P L I A N C E
Tourism WA works with those agencies in the following ways:
– A member of a number of Regional Development Commission-led committees for the development and implementation of regional tourism initiatives, such as the Mid-West, Gascoyne, Pilbara and Kimberley.
– Participates in a number of cross-government working groups investigating a range of destination and product experience development projects including:
• Board memberships: Swan Bells Foundation (Minister for Tourism representative); National Trust WA (Tourism WA’s appointed councillor); Gravity Discovery Centre (Tourism WA appointee).
• Advisory/steering committees: Albany Bicentenary Committee; National ANZAC Centre; Perth Convention and Exhibition Centre Master Plan; State Cycling Strategy; Attractions and Partnerships Project Group; Geraldton Alternative Settlement Agreement; Australian Regional Tourism.
• Working groups: Pickering Brook and Surrounds Sustainability and Tourism Strategy; Victoria Quay Steering Group; Perth Water Precinct Vision; Minninup Pool Tourism Precinct; Murujuga Living Knowledge Centre; Broome Cultural Centre; Dampier Peninsula State Steering Group; Trails Reference Group and Iconic Trails subcommittee; Exmouth Wharf Investigation; Kimberley Cultural Centre; Abrolhos Islands Working Group; Dwellingup and Collie Adventure Trails Hubs; and The Governor’s Round Table Digital Action Plan Working Group.
• Hosts (and is the secretariat to) the Cruise WA Committee – a cross-industry and government committee directing the implementation of the WA Cruise Shipping Strategic Plan.
• Lead agency for the Camping with Custodians program, which during the planning and land assembly of campgrounds involves working with a range of State and Local Government planning, regulatory and service provision agencies.
• Lead agency in developing the State’s Aboriginal Tourism Action Plan – working with a range of agencies including the Department of the Premier and Cabinet; Department of Biodiversity, Conservation and Attractions; Department of Training and Workforce Development; Department of Local Government, Sport and Cultural Industries; Department of Primary Industries and Regional Development; as well as Australian government agencies and the WA Indigenous Tourism Operators Council.
• Chairs the City Activation Working Group which includes Development WA, Australian Hotels Association (WA), the City of Perth and Activate Perth. The working group’s role is to ensure the city is activated during major events.
• Recognises, and participates where possible in, whole-of-government initiatives, including the building and sharing of the capacity and capability of the WA Public Sector workforce.
1 6 TOURISM WESTERN AUSTRALIA / ANNUAL REPORT 2019 – 20
1 . 0 OV E R V I E W
1 . 0 OV E R V I E W 2 . 0 A G E N C Y P E R F O R M A N C E
M E S S A G E T O T H E M I N I S T E R
3 . 0 S I G N I F I C A N T I S S U E S I M PA C T I N G T H E A G E N C Y
4 . 0 D I S C L O S U R E S A N D L E G A L C O M P L I A N C E
C YG N E T B AY P E A R L FA R M
1 7
1 . 0 OV E R V I E W 2 . 0 A G E N C Y P E R F O R M A N C E
M E S S A G E T O T H E M I N I S T E R
3 . 0 S I G N I F I C A N T I S S U E S I M PA C T I N G T H E A G E N C Y
4 . 0 D I S C L O S U R E S A N D L E G A L C O M P L I A N C E
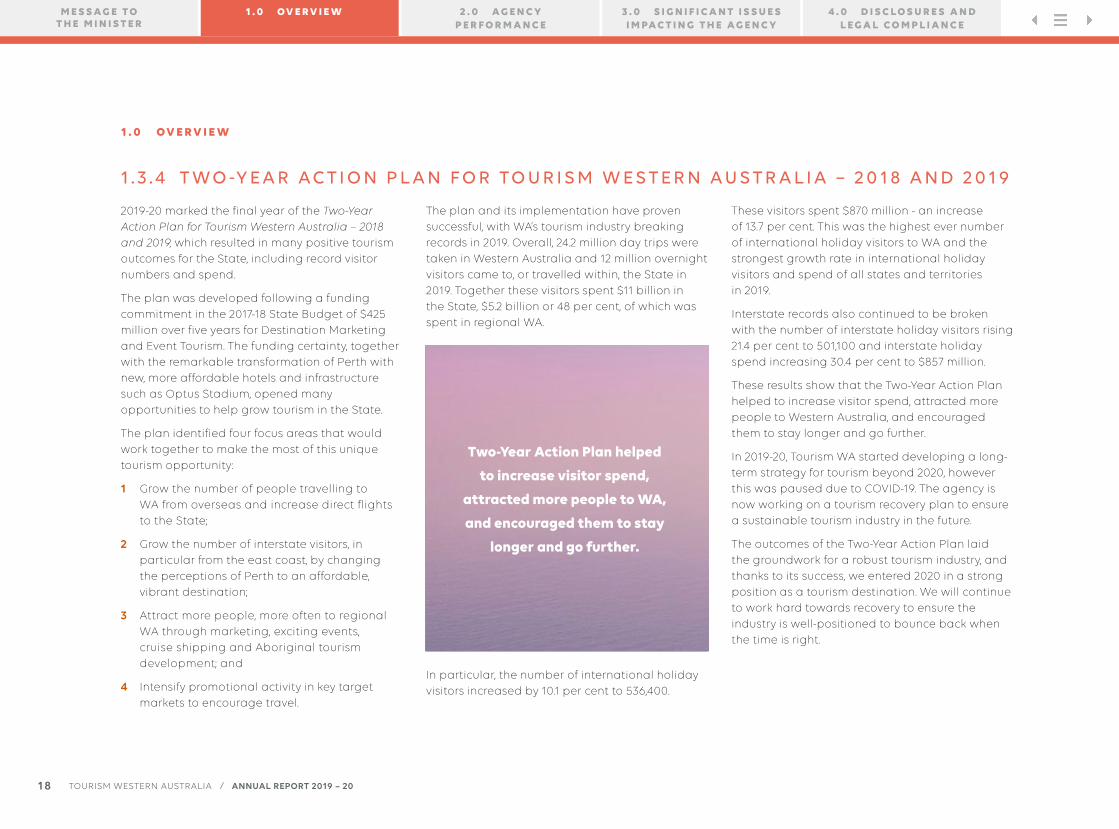
1 . 3 . 4 T WO -Y E A R AC T I O N P L A N F O R TO U R I S M W E S T E R N A U S T R A L I A – 2 0 1 8 A N D 2 0 1 9
2019-20 marked the final year of the Two-Year Action Plan for Tourism Western Australia – 2018 and 2019, which resulted in many positive tourism outcomes for the State, including record visitor numbers and spend.
The plan was developed following a funding commitment in the 2017-18 State Budget of $425 million over five years for Destination Marketing and Event Tourism. The funding certainty, together with the remarkable transformation of Perth with new, more affordable hotels and infrastructure such as Optus Stadium, opened many opportunities to help grow tourism in the State.
The plan identified four focus areas that would work together to make the most of this unique tourism opportunity:
1 Grow the number of people travelling to WA from overseas and increase direct flights to the State;
2 Grow the number of interstate visitors, in particular from the east coast, by changing the perceptions of Perth to an affordable, vibrant destination;
3 Attract more people, more often to regional WA through marketing, exciting events, cruise shipping and Aboriginal tourism development; and
4 Intensify promotional activity in key target markets to encourage travel.
The plan and its implementation have proven successful, with WA’s tourism industry breaking records in 2019. Overall, 24.2 million day trips were taken in Western Australia and 12 million overnight visitors came to, or travelled within, the State in 2019. Together these visitors spent $11 billion in the State, $5.2 billion or 48 per cent, of which was spent in regional WA.
In particular, the number of international holiday visitors increased by 10.1 per cent to 536,400.
These visitors spent $870 million - an increase of 13.7 per cent. This was the highest ever number of international holiday visitors to WA and the strongest growth rate in international holiday visitors and spend of all states and territories in 2019.
Interstate records also continued to be broken with the number of interstate holiday visitors rising 21.4 per cent to 501,100 and interstate holiday spend increasing 30.4 per cent to $857 million.
These results show that the Two-Year Action Plan helped to increase visitor spend, attracted more people to Western Australia, and encouraged them to stay longer and go further.
In 2019-20, Tourism WA started developing a long-term strategy for tourism beyond 2020, however this was paused due to COVID-19. The agency is now working on a tourism recovery plan to ensure a sustainable tourism industry in the future.
The outcomes of the Two-Year Action Plan laid the groundwork for a robust tourism industry, and thanks to its success, we entered 2020 in a strong position as a tourism destination. We will continue to work hard towards recovery to ensure the industry is well-positioned to bounce back when the time is right.
Two-Year Action Plan helped
to increase visitor spend,
attracted more people to WA,
and encouraged them to stay
longer and go further.
1 8 TOURISM WESTERN AUSTRALIA / ANNUAL REPORT 2019 – 20
1 . 0 OV E R V I E W
1 . 0 OV E R V I E W 2 . 0 A G E N C Y P E R F O R M A N C E
M E S S A G E T O T H E M I N I S T E R
3 . 0 S I G N I F I C A N T I S S U E S I M PA C T I N G T H E A G E N C Y
4 . 0 D I S C L O S U R E S A N D L E G A L C O M P L I A N C E

V I S I T O R S T O W A
5 3 6 , 4 0 0
I N T E R N A T I O N A L
H I G H E S T E V E R N U M B E R O F
H O L I D A Y
L A K E A R G Y L E , T H E K I M B E R L E Y
Source: Tourism Research Australia, International Visitor Survey, Year Ending December 20191 9
1 . 0 OV E R V I E W 2 . 0 A G E N C Y P E R F O R M A N C E
M E S S A G E T O T H E M I N I S T E R
3 . 0 S I G N I F I C A N T I S S U E S I M PA C T I N G T H E A G E N C Y
4 . 0 D I S C L O S U R E S A N D L E G A L C O M P L I A N C E
2.1 Report on OperationsTourism WA is responsible for promoting WA as an extraordinary holiday and event destination. We aim to build WA into a highly desirable destination by delivering strong and sustainable growth across key tourism markets.
The four focus areas of the Two-Year Action Plan for Tourism in Western Australia guided the activities of Tourism WA in 2018 and 2019, and our three service areas – Destination Marketing, Event Tourism and Tourism Destination Development – helped deliver these goals.
Through our marketing divisions, we aim to develop the State’s tourism brand, build awareness and consideration of WA as a destination, and increase the number of visitors to the State. The divisions’ role is to convince people a holiday in WA will give them a unique experience they won’t find anywhere else in the world. In addition, we focus on growing aviation access into and around the State.
The Events Division develops, sponsors and promotes a diverse range of sporting, arts, cultural and culinary events that highlight everything WA has to offer as a destination. It actively bids for major international events to attract significant numbers of international and interstate visitors, which results in a positive economic impact for WA and helps to showcase the State.
Our Destination Development Division works across government and industry to improve access, accommodation and tourism experiences in WA. Major focus areas include Aboriginal tourism, cruise tourism as a means of dispersing visitors around the State, and supporting private sector investors with significant tourism projects to navigate government approval processes.
As well as the work the agency performs, Tourism WA provided $12.3 million in 2019-20 to partner organisations to attract business events, conduct intrastate and international marketing, promote Aboriginal tourism and help visitors at the WA Visitor Centre. Funding was also provided to the Australian Hotels Association (WA) to deliver a Hospitality and Tourism COVID-19 Hygiene Course.
Tourism WA also supported tourism product capability, competiveness and sustainability through grants and services agreements worth $6.4 million to councils, shires, other government agencies and Tourism Council WA. This includes grants to small and micro tourism businesses under the WA Tourism Recovery Fund (as a response to COVID-19 impacts on the tourism industry).
2 0 TOURISM WESTERN AUSTRALIA / ANNUAL REPORT 2019 – 20
2 . 0 A G E N C Y P E R F O R M A N C E
1 . 0 OV E R V I E W 2 . 0 A G E N C Y P E R F O R M A N C E
M E S S A G E T O T H E M I N I S T E R
3 . 0 S I G N I F I C A N T I S S U E S I M PA C T I N G T H E A G E N C Y
4 . 0 D I S C L O S U R E S A N D L E G A L C O M P L I A N C E
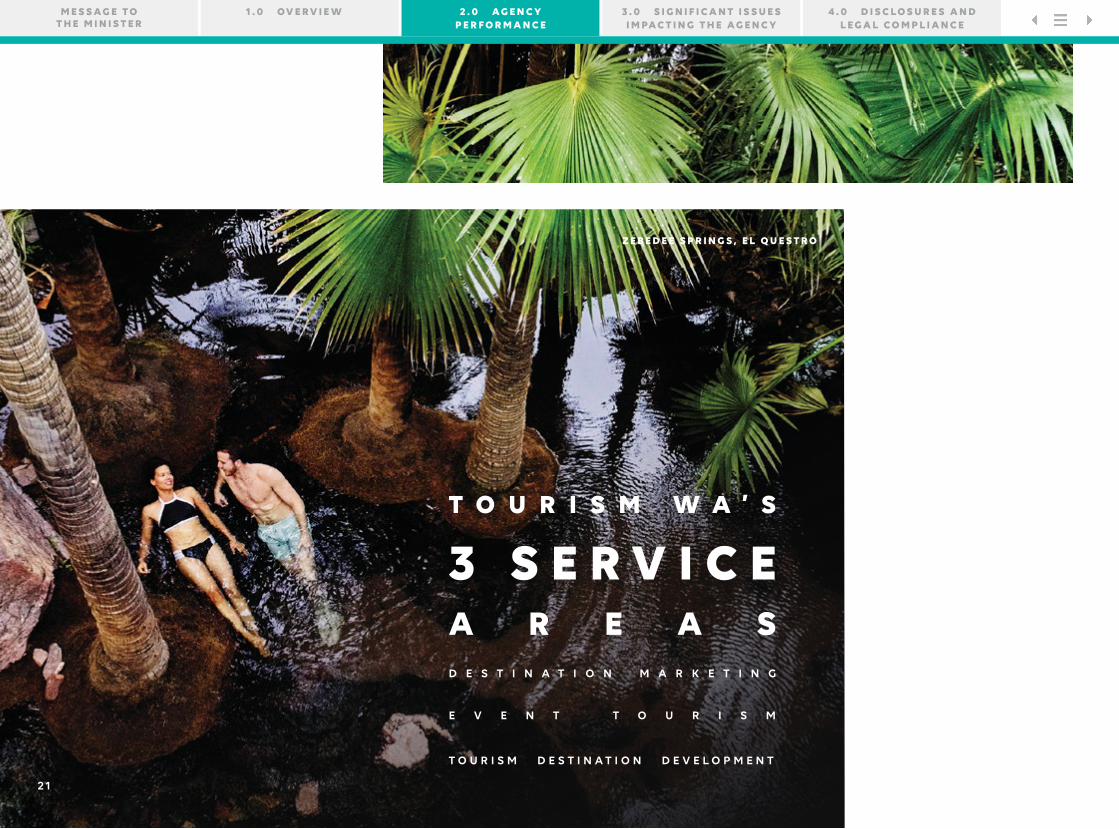
Z E B E D E E S P R I N G S , E L Q U E S T R O
3 S E R V I C E
D E S T I N A T I O N M A R K E T I N G
T O U R I S M W A ’ S
T O U R I S M D E S T I N A T I O N D E V E L O P M E N T
E V E N T T O U R I S M
A R E A S
2 1
1 . 0 OV E R V I E W 2 . 0 A G E N C Y P E R F O R M A N C E
M E S S A G E T O T H E M I N I S T E R
3 . 0 S I G N I F I C A N T I S S U E S I M PA C T I N G T H E A G E N C Y
4 . 0 D I S C L O S U R E S A N D L E G A L C O M P L I A N C E

The success of the Two-Year Action Plan would not have been possible without collaboration with our partners. These are the five Regional Tourism Organisations, Business Events Perth, the WA Indigenous Tourism Operators Council and Tourism Council WA.
The Two-Year Action Plan concluded in 2019-20, and below are the achievements that Tourism WA delivered that year against the four focus areas of the plan.
1 . W E W I L L P O S I T I O N W E S T E R N A U S T R A L I A A S T H E W E S T E R N G AT E WAY TO A U S T R A L I A
Tourism WA worked hard to position the State as the western gateway to WA, focusing on increasing visitors from high-growth Asian markets by securing more direct flights, especially from China and Japan. In addition, a $12 million boost to international marketing, of which $9 million was allocated in 2019-20, enabled a number of campaigns to be run promoting Perth as Australia’s primary entry point from key markets and further leverage Qantas’ London-Perth direct flights. The opportunity to host major trade shows in Perth allowed Tourism WA to showcase the State to travel trade, and our support to grow the cruise shipping sector resulted in new homeporting announcements and cruise ship visits to our 10 unique and diverse port destinations.
In 2019-20, the following was achieved in helping to position WA as the western gateway to Australia:
International holiday visitation
2019 marked the highest number of international visitors on record, with growth of 3.3 per cent to 995,700 visitors travelling to WA. This growth was driven by the holiday sector, increasing 10.1 per cent to 536,400 visitors – a new record for WA. Holiday spend grew by 13.7 per cent to $870 million, driven by strong visitation, increased average daily spend and average length of stay. WA’s growth rate in international holiday visitation and spend outstripped all the states and territories, with WA’s market share of international holiday visitors to Australia growing to 11.4 per cent, and spend increasing to 9.1 per cent.
International cooperative marketing
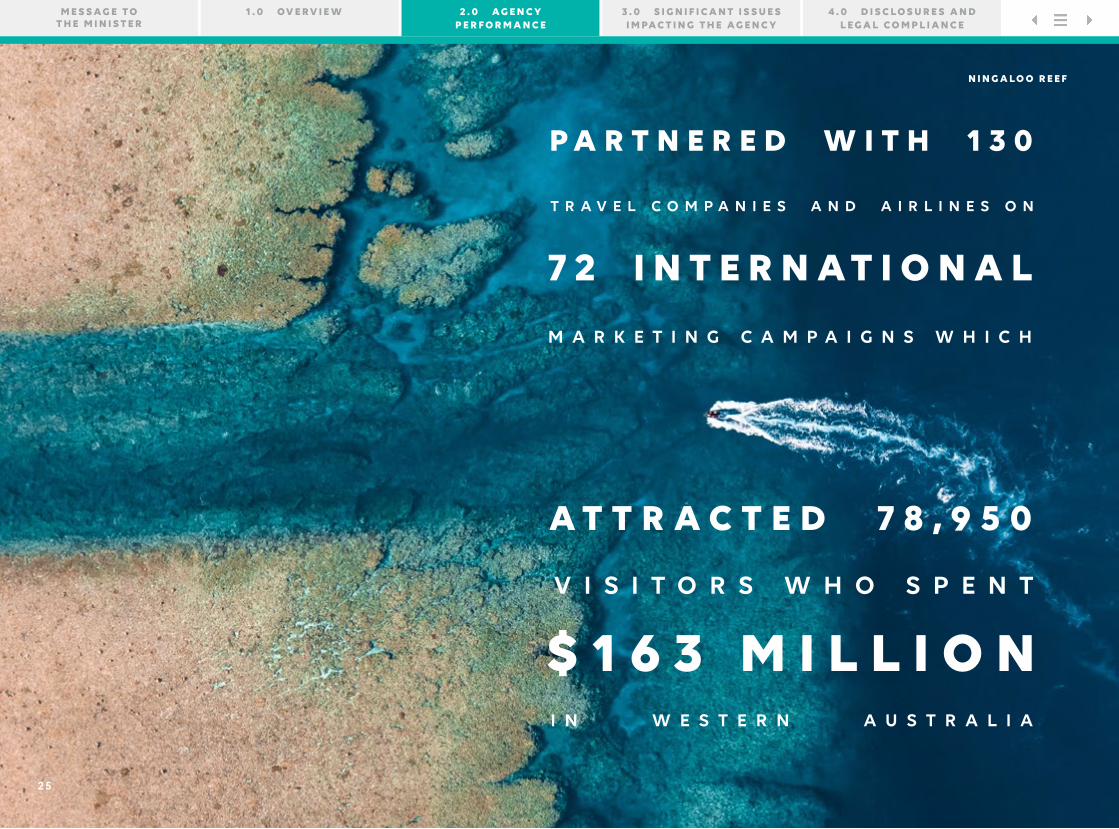
During 2019-20, Tourism WA partnered with 130 international travel companies and airlines on 72 international cooperative marketing campaigns. Tourism WA invested $6.4 million, with industry partners contributing $6.7 million. This resulted in 78,950 visitors to WA who spent $163 million, and a return on investment of 32:1.
International marketing boost
In 2019, the State Government announced a $12 million boost to Tourism WA’s international marketing over the next two years, to further attract holidaymakers to WA. The $12 million funding, of which $9 million was allocated in 2019-20, would enable Tourism WA to implement cooperative marketing campaigns with airlines and travel companies; partnerships with key Perth hotels for stopover programs; and extend existing campaign activity. However the global impact of COVID-19 has affected our international marketing activities, which have been paused and will be re-evaluated once we know the full impact of the pandemic.
2 2
2 . 0 A G E N C Y P E R F O R M A N C E
TOURISM WESTERN AUSTRALIA / ANNUAL REPORT 2019 – 20
1 . 0 OV E R V I E W 2 . 0 A G E N C Y P E R F O R M A N C E
M E S S A G E T O T H E M I N I S T E R
3 . 0 S I G N I F I C A N T I S S U E S I M PA C T I N G T H E A G E N C Y
4 . 0 D I S C L O S U R E S A N D L E G A L C O M P L I A N C E

Source: Tourism Research Australia, International Visitor Survey, Year Ending December 2019
2018
2018
2018
2019
2019
2019
Visitors
Spend
Nights
Change
536,400 + 1 0 .1 %
+ 1 3 . 7 %
+ 1 0 . 8 %
$870m
$765m
8,547,000
I N T E R N AT I O N A L H O L I DAY V I S I TO R S A N D S P E N D I N WA
487,100
8,857,0007,712,100
2 3
1 . 0 OV E R V I E W 2 . 0 A G E N C Y P E R F O R M A N C E
M E S S A G E T O T H E M I N I S T E R
3 . 0 S I G N I F I C A N T I S S U E S I M PA C T I N G T H E A G E N C Y
4 . 0 D I S C L O S U R E S A N D L E G A L C O M P L I A N C E

Major international marketing activities included:
– Major partnership with Ma Feng Wo, one of the largest user generated platforms in China, was expected to reach millions of Chinese consumers. More than 4,600 bookings were reached before being paused due to COVID-19.
– Campaign with Singapore’s Dynasty Travel featured large-scale images of WA on four train carriages on Singapore’s busy North East Mass Rapid Transit (MRT) train line and the Serangoon MRT station.
– Cooperative marketing campaign with Chan Brothers in Singapore promoted campervan road trips to explore WA’s regional areas.
– Marketing agreement between Tourism WA and the Dnata Travel Group promoted Perth as the primary entry point to Australia across Dnata’s travel brands to encourage more visitors from the UK. The partnership resulted in nearly 5,600 bookings before being paused due to COVID-19.
– Biggest campaign ever with Trailfinders (UK’s largest operator to Australia) showcased Perth
as an affordable destination before travelling to the east coast. The campaign generated an economic impact of $13 million.
– Tourism WA partnered with Signature Travel Network, Virtuoso, Expedia and Helloworld to promote luxury travel from the USA to WA, aligned with Tourism Australia’s ‘There’s Nothing Like Australia’ campaign. The campaign was paused due to COVID-19.
– Campaign with one of the largest tour operators in Europe, FTI Touristik, promoted holidays in WA to German and Swiss visitors. The campaign reached more than half of its target bookings before being paused in March due to COVID-19.
– Campaign with European travel agency, Boomerang Reisen, also encouraged Swiss and German visitors to experience WA.
24
2 . 0 A G E N C Y P E R F O R M A N C E
TOURISM WESTERN AUSTRALIA / ANNUAL REPORT 2019 – 20
1 . 0 OV E R V I E W 2 . 0 A G E N C Y P E R F O R M A N C E
M E S S A G E T O T H E M I N I S T E R
3 . 0 S I G N I F I C A N T I S S U E S I M PA C T I N G T H E A G E N C Y
4 . 0 D I S C L O S U R E S A N D L E G A L C O M P L I A N C E
N I N G A L O O R E E F
$ 1 6 3 M I L L I O N
7 2 I N T E R N A T I O N A L
V I S I T O R S W H O S P E N T
A T T R A C T E D 7 8 , 9 5 0
P A R T N E R E D W I T H 1 3 0
T R A V E L C O M P A N I E S A N D A I R L I N E S O N
I N W E S T E R N A U S T R A L I A
M A R K E T I N G C A M P A I G N S W H I C H
2 5
1 . 0 OV E R V I E W 2 . 0 A G E N C Y P E R F O R M A N C E
M E S S A G E T O T H E M I N I S T E R
3 . 0 S I G N I F I C A N T I S S U E S I M PA C T I N G T H E A G E N C Y
4 . 0 D I S C L O S U R E S A N D L E G A L C O M P L I A N C E
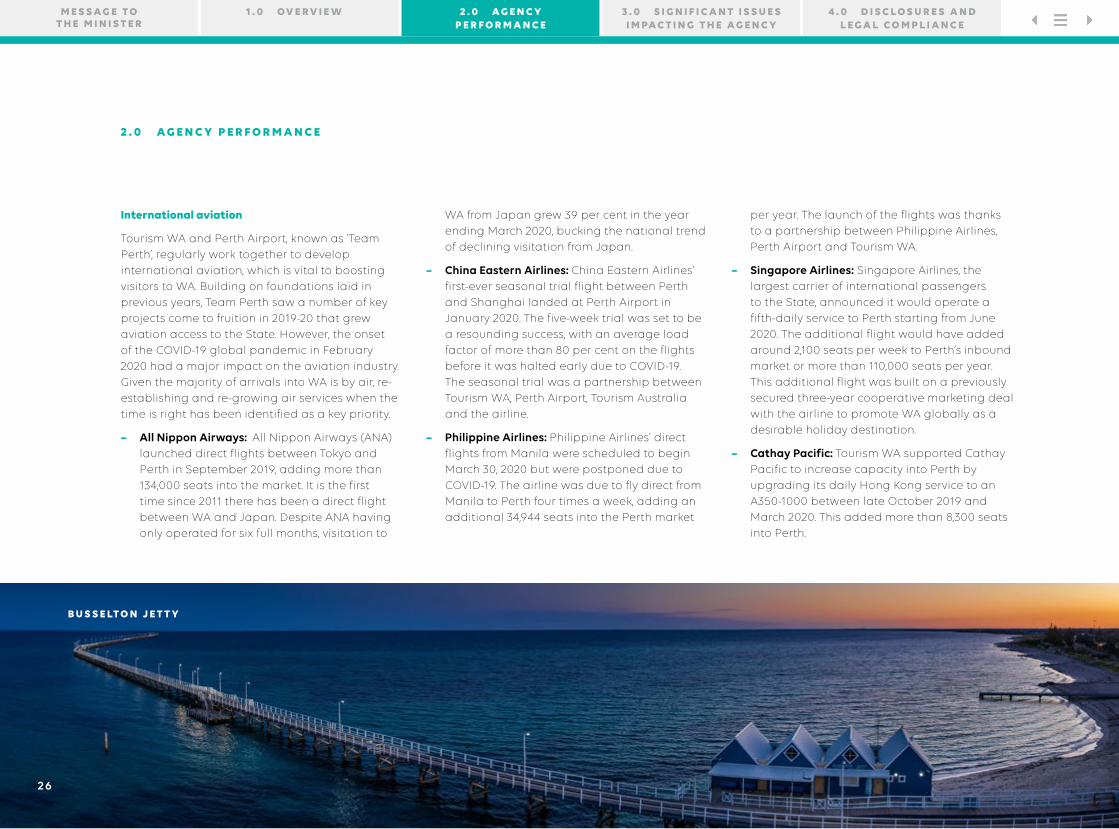
International aviation
Tourism WA and Perth Airport, known as ‘Team Perth’, regularly work together to develop international aviation, which is vital to boosting visitors to WA. Building on foundations laid in previous years, Team Perth saw a number of key projects come to fruition in 2019-20 that grew aviation access to the State. However, the onset of the COVID-19 global pandemic in February 2020 had a major impact on the aviation industry. Given the majority of arrivals into WA is by air, re-establishing and re-growing air services when the time is right has been identified as a key priority.
– All Nippon Airways: All Nippon Airways (ANA) launched direct flights between Tokyo and Perth in September 2019, adding more than 134,000 seats into the market. It is the first time since 2011 there has been a direct flight between WA and Japan. Despite ANA having only operated for six full months, visitation to
WA from Japan grew 39 per cent in the year ending March 2020, bucking the national trend of declining visitation from Japan.
– China Eastern Airlines: China Eastern Airlines’ first-ever seasonal trial flight between Perth and Shanghai landed at Perth Airport in January 2020. The five-week trial was set to be a resounding success, with an average load factor of more than 80 per cent on the flights before it was halted early due to COVID-19. The seasonal trial was a partnership between Tourism WA, Perth Airport, Tourism Australia and the airline.
– Philippine Airlines: Philippine Airlines’ direct flights from Manila were scheduled to begin March 30, 2020 but were postponed due to COVID-19. The airline was due to fly direct from Manila to Perth four times a week, adding an additional 34,944 seats into the Perth market
per year. The launch of the flights was thanks to a partnership between Philippine Airlines, Perth Airport and Tourism WA.
– Singapore Airlines: Singapore Airlines, the largest carrier of international passengers to the State, announced it would operate a fifth-daily service to Perth starting from June 2020. The additional flight would have added around 2,100 seats per week to Perth’s inbound market or more than 110,000 seats per year. This additional flight was built on a previously secured three-year cooperative marketing deal with the airline to promote WA globally as a desirable holiday destination.
– Cathay Pacific: Tourism WA supported Cathay Pacific to increase capacity into Perth by upgrading its daily Hong Kong service to an A350-1000 between late October 2019 and March 2020. This added more than 8,300 seats into Perth.
B U S S E LT O N J E T T Y
26
2 . 0 A G E N C Y P E R F O R M A N C E2 . 0 A G E N C Y P E R F O R M A N C E
1 . 0 OV E R V I E W 2 . 0 A G E N C Y P E R F O R M A N C E
M E S S A G E T O T H E M I N I S T E R
3 . 0 S I G N I F I C A N T I S S U E S I M PA C T I N G T H E A G E N C Y
4 . 0 D I S C L O S U R E S A N D L E G A L C O M P L I A N C E

Travel trade events
Western Australia hosted two major travel trade events in 2019-20, providing the opportunity to showcase the State and ensure agents are educated about what we offer.
– Corroboree West: In October 2019, Tourism WA and Tourism Australia co-hosted Corroboree West in Perth. The event attracted around 300 qualified Aussie Specialist Agents from key markets such as the UK, Europe, USA, Canada and New Zealand who actively sell Australia as a preferred long haul destination. Tourism WA hosted 28 familiarisations across Perth and WA’s regions, giving agents first-hand experience of what WA has to offer to enhance their ability to promote the State as a holiday destination.
– Dreamtime 2019: Business Events Perth, in partnership with Tourism Australia, hosted Dreamtime 2019 in December, to promote Australia’s event destinations and experiences to tourism markets specialising in meetings, incentives, conferences and events. The event is the largest of its kind in the nation and attracted more than 80 Australian industry sellers; 100 international buyers from Japan, South Korea, Greater China, India, Singapore, Malaysia, Indonesia, the UK, New Zealand and North America; and 16 international and domestic media representatives. Buyers were also given the opportunity to experience the world-class attractions and unique experiences of Perth and surrounds.
K A R I J I N I E C O R E T R E AT
2 7
2 . 0 A G E N C Y P E R F O R M A N C E
TOURISM WESTERN AUSTRALIA / ANNUAL REPORT 2019 – 20
1 . 0 OV E R V I E W 2 . 0 A G E N C Y P E R F O R M A N C E
M E S S A G E T O T H E M I N I S T E R
3 . 0 S I G N I F I C A N T I S S U E S I M PA C T I N G T H E A G E N C Y
4 . 0 D I S C L O S U R E S A N D L E G A L C O M P L I A N C E

Cruise shipping
Cruise shipping helps to disperse visitors around the State and showcases WA’s unique onshore experiences and attractions available at WA’s 10 diverse port destinations. Tourism WA heavily promoted the State’s port destinations to international cruise lines, which helped set the industry up for a thriving year before the outbreak of the COVID-19 pandemic.
– Homeporting announcements: Princess Cruises’ Sun Princess arrived in Fremantle in November 2019 to begin its homeporting season for a record 141 days, injecting an estimated $32 million into WA’s economy. Cruise & Maritime Voyages’ Vasco De Gama, with a 1,220 guest capacity, also called Fremantle home from January to February 2020.
– WA Cruise Exchange: The fifth WA Cruise Exchange, hosted by Tourism WA in July 2019, attracted 19 cruise industry participants including eight cruise line executives, Australia’s four main shore-excursion ground handlers, and Journey Beyond with its Rail and Sail product. The event enabled cruise industry leaders to learn about WA’s on-shore activities and visit some of the port destinations, including Albany, the Coral Coast and Burrup Peninsula, with the aim of including them in future itineraries.
2 . W E W I L L C H A N G E P E R C E P T I O N S O F P E R T H & R E I G N I T E T H E E A S T C OA S T M A R K E T
Perth has undergone a significant transformation in recent years, and changing the perception of the city and positioning it as an affordable and vibrant tourism destination was a key priority for Tourism WA. In 2019-20, we held important trade events such as Corroboree West and Dreamtime, which further helped to promote the ‘new’ Perth to hundreds of key travel representatives. In addition, we hosted a number of blockbuster events which not only gave interstate and international visitors a reason to visit the State, but also provided us with the opportunity to showcase our incredible city.
We also helped grow awareness and interest of Perth on the east coast through our creative marketing campaigns and by encouraging more leisure visitors for AFL games at Optus Stadium to stay longer and further explore WA.
In 2019-20, the following was achieved in helping to change perceptions of Perth and grow visitors from the east coast:
Interstate holiday visitation
Interstate holiday visitor numbers and spend were the highest on record for year ending December 2019. The number of interstate holiday visitors rose 21.4 per cent to 501,100 and interstate holiday spend increased 30.4 per cent to $857 million – the highest growth rate of all states and territories. WA’s market share of interstate holiday visitor spend increased 0.8 per cent to 5.9 per cent, while WA’s share of interstate holiday visitors increased by 0.4 per cent to 4 per cent.
2 8
2 . 0 A G E N C Y P E R F O R M A N C E
TOURISM WESTERN AUSTRALIA / ANNUAL REPORT 2019 – 20
1 . 0 OV E R V I E W 2 . 0 A G E N C Y P E R F O R M A N C E
M E S S A G E T O T H E M I N I S T E R
3 . 0 S I G N I F I C A N T I S S U E S I M PA C T I N G T H E A G E N C Y
4 . 0 D I S C L O S U R E S A N D L E G A L C O M P L I A N C E
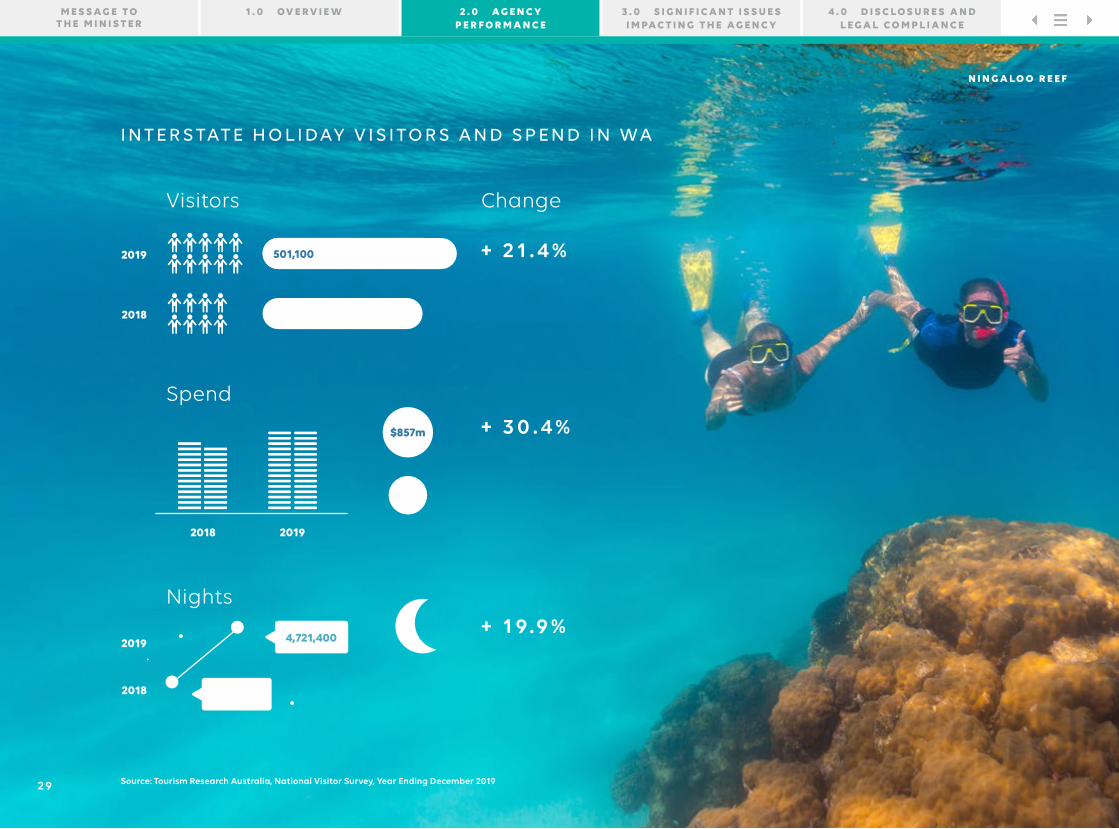
I N T E R S TAT E H O L I DAY V I S I TO R S A N D S P E N D I N WA
Visitors
Spend
Nights
Change
501,100 + 2 1 . 4 %
+ 3 0 . 4 %
+ 1 9.9 % 4,721,400
$857m
N I N G A L O O R E E F
Source: Tourism Research Australia, National Visitor Survey, Year Ending December 2019
2018
2018
2018
2019
2019
2019
$657m
412,900
3,936,400
2 9
1 . 0 OV E R V I E W 2 . 0 A G E N C Y P E R F O R M A N C E
M E S S A G E T O T H E M I N I S T E R
3 . 0 S I G N I F I C A N T I S S U E S I M PA C T I N G T H E A G E N C Y
4 . 0 D I S C L O S U R E S A N D L E G A L C O M P L I A N C E

Marketing campaigns
– Domestic cooperative marketing campaigns: During 2019-20, Tourism WA delivered 21 domestic cooperative campaigns, contributing more than $90 million in economic impact. Tourism WA partnered with eight different travel companies to deliver marketing activity that resulted in an average return on investment (ROI) of 74:1, and brought more than 60,000 additional interstate visitors to WA. Our cooperative marketing campaigns were aligned with brand and PR activities to help generate even more visitors to WA. An example of this is featured below through the Create your own Gourmet Escape campaign and our partnership with Helloworld Travel. Tourism WA also worked with Virgin, Jetstar and Qantas to deliver a total of 11 airline cooperative marketing campaigns across the year. Domestic cooperative activities were paused in March 2020 due to travel restrictions.
– MasterChef Australia – WA Week: Thanks to a partnership between Tourism WA and MasterChef Australia, some of the State’s best local produce, experiences and destinations were showcased as part of the show’s WA Week, which aired nationally in prime time on Network 10 in July 2019. Across five episodes, contestants participated in challenges at a range of WA locations, including Optus Stadium, Perth, the Swan Valley, Margaret River region and Rottnest Island, reaching more than
3.7 million people. In addition, Network 10’s catch-up site, 10 Plus, attracted 300,356 viewers, and social media content reached more than 1.4 million people. The episodes were also broadcast internationally in some of our key markets including New Zealand, India and the USA. WA operators reported significant benefits as a result of the episodes, in particular strong social and website engagement.
– Create your own Gourmet Escape campaign: To leverage the television broadcast of MasterChef Australia WA week and help promote the expanded Western Australia Gourmet Escape event, Tourism WA developed a Create Your Own Gourmet Escape campaign to encourage east coast viewers to travel to WA. We partnered with Jetstar to promote affordable airfares, and with Helloworld Travel to promote holiday packages with the chance to Create Your Own Gourmet Escape through a variety of WA itineraries featuring either Perth or the Margaret River region. Each package included accommodation and local experiences such as watching an AFL game at Optus Stadium, sampling some of the best of Perth’s local food scene as part of an Eat Drink Walk Perth tour, learning more about WA wines on a Swan Valley gourmet wine cruise or indulging in an ultimate food and wine experience in Margaret River.
– AFL tourism: Optus Stadium has given Tourism WA the ability to increase interstate visitors like never before through the development of marketing campaigns to promote travel to WA for various AFL matches during the season. WA’s 23 AFL fixtures for the 2019 season attracted more than 60,000 visitors to Perth, who spent nearly $60 million. More than 23,800 of these visitors came from interstate and spent close to $26 million. Visitors from within WA accounted for more than 36,500, spending upwards of $33.5 million. In 2019, a strong marketing campaign in the eastern states, featuring legendary commentator Dennis Cometti, helped promote travel packages to AFL games in Perth. This campaign involved print, television and digital advertising. Tourism WA also worked with travel groups, including AFL partner Virgin Australia, and Optus Stadium operator VenuesLive, to develop promotional packages.
WA’s 23 AFL fixtures for the
2019 season attracted more
than 60,000 visitors to Perth,
who spent close to $60 million.
3 0
2 . 0 A G E N C Y P E R F O R M A N C E
TOURISM WESTERN AUSTRALIA / ANNUAL REPORT 2019 – 20
1 . 0 OV E R V I E W 2 . 0 A G E N C Y P E R F O R M A N C E
M E S S A G E T O T H E M I N I S T E R
3 . 0 S I G N I F I C A N T I S S U E S I M PA C T I N G T H E A G E N C Y
4 . 0 D I S C L O S U R E S A N D L E G A L C O M P L I A N C E

– WA Tourism – Our Story: The Spirit of Adventure: In 2019-20, Tourism WA developed and launched ‘Western Australia Tourism – Our Story: The Spirit of Adventure’. This unique tourism brand story was created following consultation with more than 500 tourism industry business owners and leaders from across the State, and tested with more than 110 local, national and international consumers. Throughout this process, five pillars were developed - Western Australia is ancient tracks, new journeys (Trademark: WAITOC); Western Australia is barefoot luxury; Western Australia is otherworldly phenomena; Western Australia is majestic landscapes and big skies; and Western Australia is full of characters. Put together, these create ‘Our Story:’ The Spirit of Adventure. ‘Our Story’ will provide the foundation for future Tourism WA marketing campaigns, and inspire our events, destination development, partnerships and policy. ‘Our Story’ belongs to the entire WA tourism industry and Tourism WA has developed a toolkit to encourage industry to integrate it into their marketing, product development and business planning.
1 1 0
2
4 5
5 0 0
local, national and international consumers
barefoot luxury
tourism industry business owners and leaders
TESTED
5 PILLARS DEVELOPED TO CREATE ‘OUR STORY’The Spirit of Adventure
CONSULTED
majestic landscapes
and big skies
full of characters
3otherworldly phenomena
ancient tracks, new journeys
1
W E S T E R N A U S T R A L I A I S . . .
3 1
2 . 0 A G E N C Y P E R F O R M A N C E
TOURISM WESTERN AUSTRALIA / ANNUAL REPORT 2019 – 20
1 . 0 OV E R V I E W 2 . 0 A G E N C Y P E R F O R M A N C E
M E S S A G E T O T H E M I N I S T E R
3 . 0 S I G N I F I C A N T I S S U E S I M PA C T I N G T H E A G E N C Y
4 . 0 D I S C L O S U R E S A N D L E G A L C O M P L I A N C E

World-class events
Tourism WA’s events strategy focuses on attracting mass participation events to increase visitors to WA, encouraging more leisure visitors for AFL games to stay longer and further explore WA, and leveraging infrastructure such as Optus Stadium to secure and host major sporting events. In 2019-20, Tourism WA sponsored a number of successful events in the State, which attracted interstate and international visitors, provided a boost to the economy and showcased WA through valuable media exposure.
– Manchester United Tour: Thanks to Tourism WA, world-famous Manchester United made Perth their home for 10 days in July 2019, playing local A-league side Perth Glory and traditional rivals, Leeds United. The event was a huge drawcard for interstate and international visitors, with more than 13,000 out-of-state visitors coming to Perth from countries such as the UK, New Zealand, Singapore, Malaysia, USA, Czech Republic, Netherlands and Indonesia. Total visitor spend was nearly $16.5 million, providing a boost to the economy. Manchester United has one of the biggest supporter bases in the world with more than 659 million fans across the globe, providing invaluable exposure for WA.
– Bledisloe Cup: More than 61,000 fans flocked to the Bledisloe Cup match in August 2019, setting an attendance record for a sporting event at Optus Stadium. Close to 7,400 visitors from outside WA travelled to Perth to witness the Wallabies defeat their traditional rivals, the All Blacks. The total spend by visiting rugby fans was measured at more than $12.5 million. The game, secured by Tourism WA, was broadcast to around 280 million people worldwide, including into WA’s key tourism markets of New Zealand, the UK and Japan.
– NRL Nines: Thanks to a successful bid by Tourism WA, Perth hosted the National Rugby League (NRL) Nines tournament in February 2020. Playing in Australia for the first time, the event attracted 16 of the men’s and four of the women’s NRL clubs. The two-day festival attracted 3,783 visitors to WA, who spent more than $5.7 million, providing a great boost for local businesses and the economy. In addition, the event generated nearly $40 million in media impact – providing significant exposure to WA.
– Mass participation events: Tourism WA supported a number of mass participation events in 2019-20, which attracted more than 9,000 visitors from outside the State, generating 68,325 visitor nights and contributing more than $16 million to the economy in visitor spend. These events were the Australian Men’s Hockey Masters, All Schools Athletic Championships, Ironman WA, Ironman 70.3 and Cape to Cape MTB. Supporting mass participation events was a key priority of the Two-Year Action Plan because they help attract thousands of competitors, officials and supporters, providing a significant boost to the economy.
– Fed Cup Final: Perth hosted the Fed Cup Final between Australia and France in November 2019. This was the first time Perth staged the final of the world’s largest annual international women’s tennis team competition since 1971. Australia’s Fed Cup Final team was captained by Perth-based Alicia Molik and spearheaded by Ashleigh Barty. The event attracted 3,242 out-of-state fans to Perth who spent $4.5 million. The Final was also broadcast Australia-wide and internationally in some of WA’s key tourism markets, including Singapore, Hong Kong, Malaysia, Indonesia, USA and New Zealand.
3 2
2 . 0 A G E N C Y P E R F O R M A N C E
TOURISM WESTERN AUSTRALIA / ANNUAL REPORT 2019 – 20
1 . 0 OV E R V I E W 2 . 0 A G E N C Y P E R F O R M A N C E
M E S S A G E T O T H E M I N I S T E R
3 . 0 S I G N I F I C A N T I S S U E S I M PA C T I N G T H E A G E N C Y
4 . 0 D I S C L O S U R E S A N D L E G A L C O M P L I A N C E
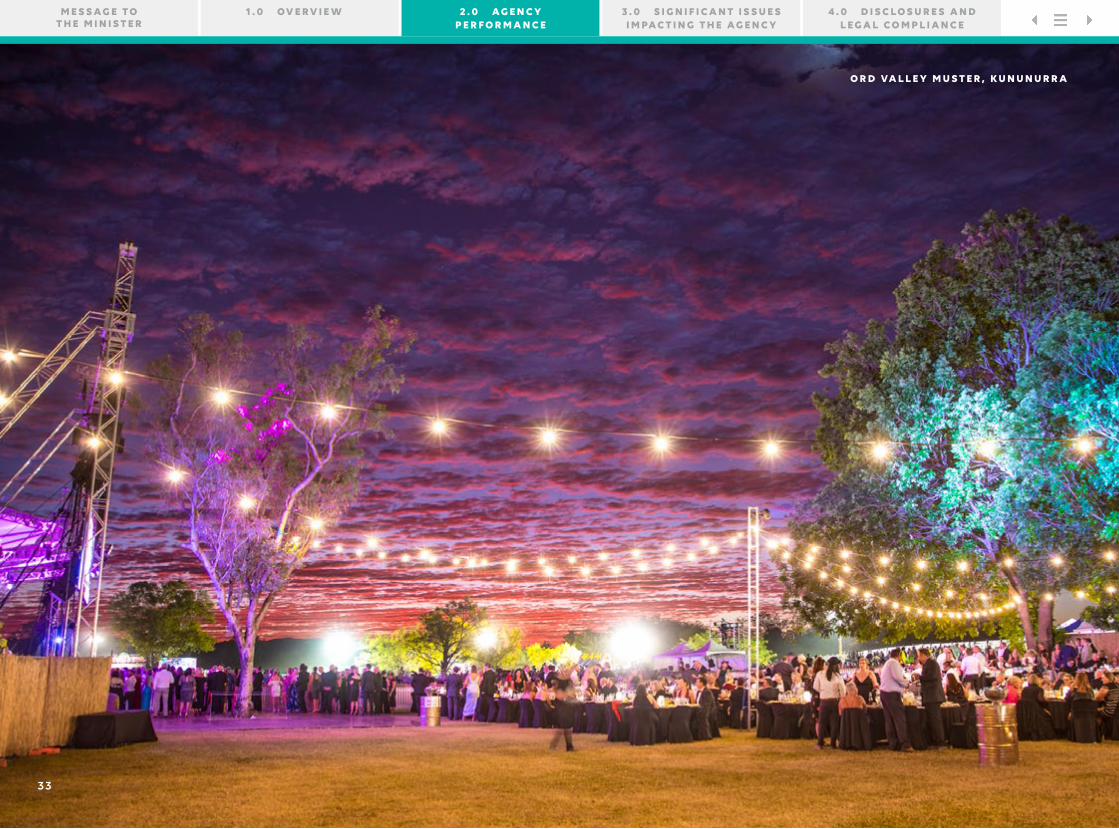
O R D VA L L E Y M U S T E R , K U N U N U R R A
3 3
1 . 0 OV E R V I E W 2 . 0 A G E N C Y P E R F O R M A N C E
M E S S A G E T O T H E M I N I S T E R
3 . 0 S I G N I F I C A N T I S S U E S I M PA C T I N G T H E A G E N C Y
4 . 0 D I S C L O S U R E S A N D L E G A L C O M P L I A N C E
– Perth Festival Highway to Hell: Tourism WA was a proud sponsor of the 2020 Perth Festival closing event, Highway to Hell, as part of a four-year deal to support Perth Festival’s annual headline event until 2023. Canning Highway turned into a 10km-long stage, celebrating the 40th anniversary of AC/DC frontman Bon Scott being laid to rest. This uniquely WA event was a massive success, attracting an estimated 150,000 attendees, including more than 1,000 visitors to the State. It also provided a huge boost to the economy, with many local businesses along Canning Highway, including pubs, cafes and restaurants, recording their strongest turnover on record.
– ICC T20 Women’s World Cup (Cricket): In February 2020, Perth hosted five cricket matches across three days as part of the International Cricket Council (ICC) Women’s T20 World Cup. The event attracted nine of the 10 international women’s cricket teams from New Zealand, Sri Lanka, England, South Africa, the West Indies, Thailand, India, Bangladesh and Australia. Overall the tournament in Perth saw 9,292 spectators attend across the three match days. According to organisers the event delivered direct expenditure of $2.4 million to the State.
Tourism WA had secured a number of other major events in 2019-20 for the State. However, the following events have been postponed due to restrictions on mass gatherings and travel as a result of COVID-19:
– UFC 251: Tourism WA secured its second, top-level UFC event in February 2020. UFC 251 was to be a pay-per-view sanctioned event which represent the top tier of UFC events, attracting massive global audiences - with only 12 held each year, and only two or three of those hosted outside North America. Broadcasts of UFC pay-per-views have the potential to reach one billion households in 172 countries. The event was scheduled for June 2020, however has been postponed to June 2021.
– Pirtek Perth SuperNight: In February 2020, Tourism WA entered into a two-year agreement with Australian Supercars to host the 2020 and 2021 Pirtek Perth SuperNight. The event was expected to deliver a minimum of 3,126 out-of-state visitors and national and international broadcast opportunities to showcase the State. The event, originally scheduled to take place in May, has been postponed until October 2020.
– Sikh Games: Tourism WA was successful in securing the 2020 Australian Sikh Games. The event was expected to attract around 2,000 out-of-state visitors. It was meant to be held in April 2020, but has been postponed until April 2021.
– UniSport Nationals: In October 2019, Tourism WA announced Perth would welcome more than 6,000 visitors for the UniSport Nationals 2020. The event features individual and team sports such as badminton, basketball, futsal, golf, netball, cheer and dance, sailing, tenpin bowling and water polo. It has been postponed to September/October 2022.
– AFL Masters: In January 2020, Tourism WA announced it would host the 2020 AFL Masters National Carnival for the first time in 17 years. The competition is the country’s largest mass participation Australian Rules football carnival with an average 40 teams taking part. The event was expected to attract more than 1,100 interstate visitors and has been postponed until September/October 2021.
The following events have been secured by Tourism WA in 2019-20 and will take place in future years:
– Bledisloe Cup: Perth will host its second Bledisloe Cup in 2021 at Optus Stadium when the Wallabies take on the New Zealand All Blacks. New Zealand has a significant expat population in WA, with the opportunity to visit friends and relatives and watch world-class rugby expected to be a big motivator for people to travel to the State. The Bledisloe Cup will be televised in a number of Tourism WA’s key international markets.
3 4
2 . 0 A G E N C Y P E R F O R M A N C E
TOURISM WESTERN AUSTRALIA / ANNUAL REPORT 2019 – 20
1 . 0 OV E R V I E W 2 . 0 A G E N C Y P E R F O R M A N C E
M E S S A G E T O T H E M I N I S T E R
3 . 0 S I G N I F I C A N T I S S U E S I M PA C T I N G T H E A G E N C Y
4 . 0 D I S C L O S U R E S A N D L E G A L C O M P L I A N C E

– Rowing: In February, Tourism WA announced it had secured the Australian Masters Rowing Championships in May 2022 and May 2026, and the Australian Rowing Championships in March 2023. Together, the events will deliver thousands of visitors, contribute $12 million to the economy over five years and significantly lift the profile of the State within the rowing community.
– 2023 FIFA Women’s World Cup: The 2023 FIFA Women’s World Cup will be held in Australia and New Zealand, with WA securing the rights to host a series of matches. The win represents an historic achievement for football in Australia - marking the first time the country has hosted a senior FIFA tournament. The matches in WA are expected to draw a significant number of visitors to the State and provide extensive international media exposure.
Business events
Tourism WA continued its partnership with Business Events Perth to bring business and incentive events to WA in 2019-20. Business Events Perth secured 124 conferences and 125 corporate meetings and incentive events for the year. This represents 277,569 delegate days, generating an estimated Direct Delegate Expenditure (DDE) of $140.94 million. The impact of COVID-19 on business events in WA has been significant, with 84 per cent of events secured by Business Events Perth and scheduled for 2020 (from March) cancelled or postponed. As at June 30, 2020, 66
events had been cancelled worth more than $50 million in DDE and a total of 117 events had been postponed worth more than $109 million in DDE. Concentrated efforts by Business Events Perth ensured more events were postponed than cancelled, contributing to a pipeline of conferences to assist in recovery once borders and restrictions are lifted.
Visitor experiences and attractions
A key part of Tourism WA’s role is to help proponents develop visitor experiences and tourism infrastructure, especially those that can help generate jobs. We work with many government agencies and the private sector to achieve this. In addition, new attractions and experiences help to draw more visitors to particular destinations, and encourage them to stay longer by ensuring there is a wide range of things for them to see and do. Key achievements for 2019-20 include:
– Tourism Attractions Case Management Framework: The Tourism Attractions Case Management Framework continued to help proponents of new tourism businesses, that will have a significant impact on the State’s tourism industry, navigate the relevant approval processes. In 2019-20, 48 tourism businesses of varied scale and stages of development received advice and support under the framework. Examples include Tawarri Hot Springs in Dalkeith, which is
O P T U S S TA D I U M
3 5
2 . 0 A G E N C Y P E R F O R M A N C E
TOURISM WESTERN AUSTRALIA / ANNUAL REPORT 2019 – 20
1 . 0 OV E R V I E W 2 . 0 A G E N C Y P E R F O R M A N C E
M E S S A G E T O T H E M I N I S T E R
3 . 0 S I G N I F I C A N T I S S U E S I M PA C T I N G T H E A G E N C Y
4 . 0 D I S C L O S U R E S A N D L E G A L C O M P L I A N C E
now well advanced in its design through the new State Design Review Panel process. A development application is expected to be submitted later this year. The second example is the Matagarup Bridge Climb and Zip Line, which underwent a tender process to select the operator, and is due to open at the end of 2020.
– Fremantle cycle trails: Tourism WA, in partnership with Westcycle, developed two cycle trails and brochures for visitors looking
for a cycling experience around Fremantle and along the Indian Ocean coast. The two trails cater for different markets and incorporate key attractions for visitors. Fremantle Highlights provides visitors with a trail connecting the key tourist sites of Fremantle; and the Indian Ocean Explorer is a longer trail, which takes visitors from Fremantle along the coast to Cottesloe.
– Yagan Square Nyumbi: The initiative, developed by Tourism WA, Development WA and the City
of Perth, provided a free Aboriginal cultural performance regularly in the city. The event was held every Friday night for seven weeks, with increasing interest before being paused due to COVID-19. Tourism WA continues to work with Development WA to determine the most appropriate timing to reinstate Nyumbi as a regular activation from July 2020.
3 . W E W I L L AT T R AC T M O R E P E O P L E , M O R E O F T E N TO R E G I O N A L WA
To attract more people to regional WA and grow tourism, Tourism WA works with airlines, local governments and communities to help increase air services and lower airfares. We also support exciting events and focus on Aboriginal tourism development to encourage people to travel to the regions. As a result of COVID-19 and travel restrictions, for the first time in decades Tourism WA is actively marketing to an intrastate audience through our new campaign – Wander out Yonder, which we launched in June 2020. As a result, now more than ever, it is critical to work together with the State’s five Regional Tourism Organisations to align our marketing to encourage WA locals to go further and do more than they have before.
In 2019-20, the following was achieved in attracting more people, more often to regional WA:
Regional visitation
In 2019, West Australians took more overnight trips within the State, increasing by 11.2 per cent to 9.17 million intrastate overnight visitors. Intrastate spend in WA grew by 13.8 per cent to $4.35 billion as a result of increases in visitation from both leisure and business segments, as well as in their average length of stay. The number of intrastate holiday trips grew by 11.6 per cent to 3.74 million overnight visitors, whilst intrastate holiday visitor spend rose by 5.4 per cent to $2.13 billion. The number of day trips taken intrastate increased by 20.1 per cent to 24.2 million.
Road trips campaign
Tourism WA continued its global campaign to promote driving holidays in WA and encourage people to explore more of the State. The Home of the Road Trip campaign highlighted how WA’s size provides the opportunity to discover a
variety of destinations and experiences through a range of road trip itineraries, from easy short trips within Perth, to more challenging drives off-road in the outback. The campaign was promoted domestically and internationally in 2019-20 to key markets including east coast Australia, the UK, Germany, Singapore, Malaysia, Indonesia, Japan, New Zealand, China and Hong Kong.
Do it in WA intrastate campaign
On March 12, 2020, Tourism WA launched the Do it in WA intrastate campaign. West Australians were encouraged to holiday at home and support the State’s tourism industry as it dealt with the emerging impacts of COVID-19. Due to the rapidly changing environment, Tourism WA stopped the Do it in WA campaign, along with our interstate and international tactical campaigns.
3 6
2 . 0 A G E N C Y P E R F O R M A N C E
TOURISM WESTERN AUSTRALIA / ANNUAL REPORT 2019 – 20
1 . 0 OV E R V I E W 2 . 0 A G E N C Y P E R F O R M A N C E
M E S S A G E T O T H E M I N I S T E R
3 . 0 S I G N I F I C A N T I S S U E S I M PA C T I N G T H E A G E N C Y
4 . 0 D I S C L O S U R E S A N D L E G A L C O M P L I A N C E
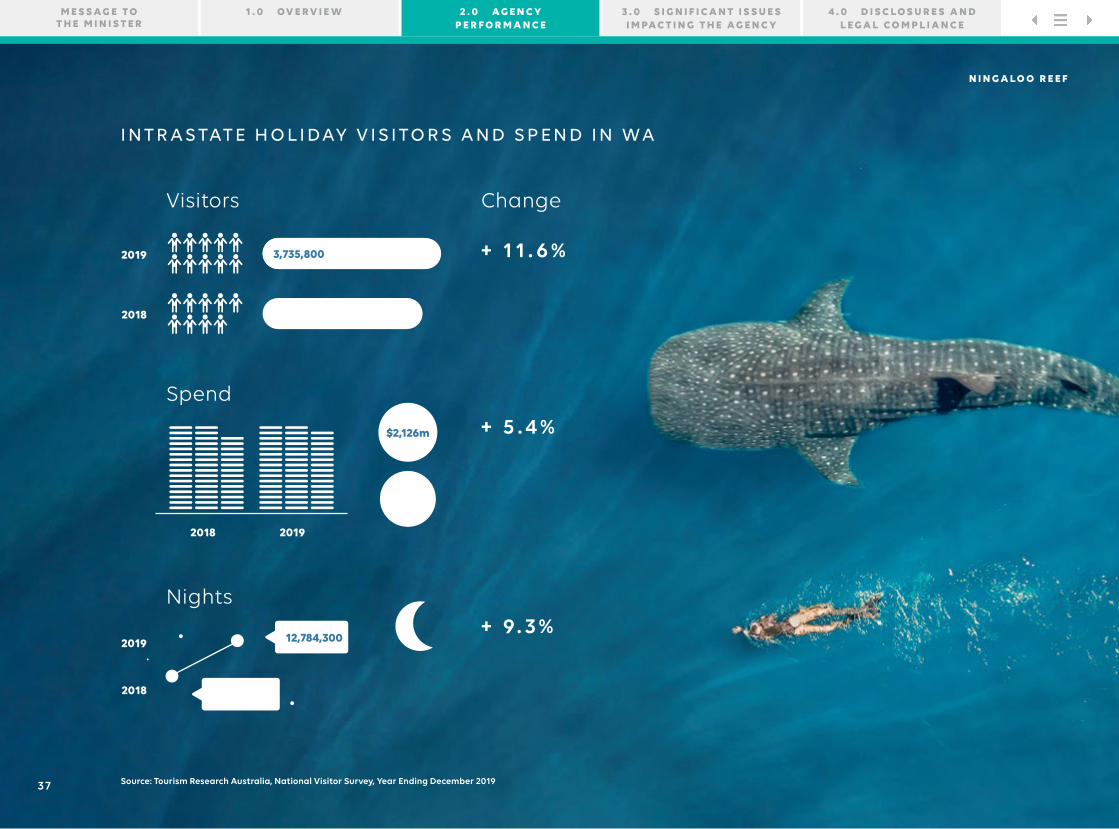
I N T R A S TAT E H O L I DAY V I S I TO R S A N D S P E N D I N WA
N I N G A L O O R E E F
Visitors
Spend
Nights
Change
3,735,800 + 1 1 . 6 %
+ 5 . 4 %
+ 9. 3 % 12,784,300
$2,126m
Source: Tourism Research Australia, National Visitor Survey, Year Ending December 2019
2018
2018
2019
2019
$2,017m
3,346,500
11,699,400
2018 2019
3 7
1 . 0 OV E R V I E W 2 . 0 A G E N C Y P E R F O R M A N C E
M E S S A G E T O T H E M I N I S T E R
3 . 0 S I G N I F I C A N T I S S U E S I M PA C T I N G T H E A G E N C Y
4 . 0 D I S C L O S U R E S A N D L E G A L C O M P L I A N C E

Wander out Yonder intrastate campaign
In response to the majority of WA’s regional travel border restrictions being lifted, Tourism WA launched a major intrastate marketing campaign, Wander out Yonder, in June 2020. The campaign encourages West Australians to explore our incredible State and support the local tourism industry. It inspires West Australians to enjoy a staycation in Perth or travel to new places, and seek out new experiences across the State. The campaign features print, digital media and radio advertising, as well as targeted cooperative marketing campaigns, including holiday offers across hotels, holiday parks, campervans and a variety of tours and experiences. With more West Australians able to holiday and explore WA, instead of going interstate or overseas during the COVID-19 pandemic, it is a chance to drive more economic activity to WA tourism businesses and support local jobs.
Regional events
The Regional Events Program and Regional Events Scheme are managed by Tourism WA with funding from Royalties for Regions. These programs support regional events across WA, and play an important role in positioning WA as an exciting destination and a great place to live by showcasing a region’s unique and diverse attractions. Due to COVID-19, many events were paused, cancelled or postponed. However, with
the opening of regional borders an opportunity now exists to attract more intrastate visitors to enjoy these regional events.
– Regional Events Program: Tourism WA’s Regional Events Program (REP) supports medium to large events across the State. The program provides funding of $40,000 and above, for events that will deliver significant benefits to regional communities, generate strong community engagement, encourage intrastate visitors and attract national media attention. In 2019-20, 14 regional events were sponsored through the REP, however six of these were cancelled or postponed due to COVID-19.
– Regional Events Scheme: Tourism WA’s Regional Events Scheme (RES), is an annual funding round that supports smaller and emerging events in regional Western Australia to boost tourism, increase community vibrancy and participation, and develop regional areas. The total funding pool is $1 million, inclusive of a quarantined pool of $150,000 for the Regional Aboriginal Events Scheme (RAES). The RAES supports events that deliver Aboriginal activities and experiences though the leadership and participation of Aboriginal people. In 2019-20, 68 events were supported through the RES, which included seven events under the Regional Aboriginal Events Scheme. Due to COVID-19, 15 events were cancelled and three events were postponed to 2020-21.
Regional aviation access
Improving access to and around WA will help draw visitors to particular destinations around the State. Tourism WA works with a number of commercial partners and government departments to help increase air services and make airfares more affordable. For example, we worked alongside the Department of Transport to help with the review of the State Aviation Strategy.
– Affordable Airfares Program: The Affordable Airfares Program was part of Tourism WA’s commitment to work with airlines and other partners to introduce affordable fares where possible, encouraging more people to holiday in regional WA, and making trips to Perth more economical for regional residents. After the success of the special weekend airfares on the Perth-Broome route in its first year in 2018, Tourism WA and Qantas announced a one-year extension to the program in August 2019. The special fares offered passengers the opportunity to fly between Perth and Broome from $199 one-way during high season and $179 during low season if booked at least 45 or 60 days in advance. This was paused due to the impact of COVID-19 and the restrictions placed on WA’s regional travel and borders. A second Affordable Airfares Program with Qantas on the Perth-Exmouth route operated between June and September 2019. More than 1,100 Perth residents took advantage of the $169 one-way fares, helping to inject $1.3 million
3 8
2 . 0 A G E N C Y P E R F O R M A N C E
TOURISM WESTERN AUSTRALIA / ANNUAL REPORT 2019 – 20
1 . 0 OV E R V I E W 2 . 0 A G E N C Y P E R F O R M A N C E
M E S S A G E T O T H E M I N I S T E R
3 . 0 S I G N I F I C A N T I S S U E S I M PA C T I N G T H E A G E N C Y
4 . 0 D I S C L O S U R E S A N D L E G A L C O M P L I A N C E

into the region’s economy. A second trial was due to run from April to October 2020, which included using a larger Airbus A320 on some of the flights. However, this was also paused due to COVID-19.
– East coast to Busselton flights: Supported by Tourism WA and the City of Busselton, Jetstar announced it would launch the first commercial route between Melbourne and Busselton from March 25, 2020. The three-times a week, year-round flights were expected to bring thousands of new visitors to the South West and provide an economic boost to the region. The flights have been paused due to COVID-19.
– Melbourne to Kununurra flights: Tourism WA, in partnership with the Kimberley Development Commission, the Shire of Wyndham-East Kimberley, the East Kimberley Marketing Group, Alliance Airlines and Virgin Australia, helped secure direct flights from Melbourne to Kununurra. The flights were due to launch May 15, 2020, however were paused due to COVID-19.
As we begin our recovery journey, Tourism WA continues to negotiate with airlines to secure competitive airfare deals into regional WA for residents and tourists. Increasing visitors to key tourism destinations will help with the recovery of the State’s tourism industry.
Aboriginal tourism experiences
– WA Indigenous Tourism Operators Council (WAITOC): Tourism WA entered into a new Marketing and Services Agreement for four years with WAITOC to support its operations in the area of administration, marketing and business development. The strength of the relationship between Tourism WA and WAITOC is paramount to the ongoing development of the sector. WAITOC has a membership of more than 120 Aboriginal tourism businesses.
– Aboriginal Tourism Action Plan: The Aboriginal Tourism Action Plan was well progressed and close to release prior to COVID-19. The document is a cross-government plan, working closely with industry partners including WAITOC on marketing, business development and infrastructure development across the sector. The plan will now be reviewed and realigned to a post-COVID-19 environment prior to release.
– Camping with Custodians: Tourism WA’s Camping with Custodians initiative builds community-operated campgrounds on Aboriginal lands where tourists and the public have the chance to stay with traditional Aboriginal owners and experience local culture. The Violet Valley and Doon Doon campgrounds were completed in time for the 2019 tourist season. Formal openings have
been postponed until 2021 due to COVID-19. Tourism WA is currently finalising detailed design and approval processes for a new Camping with Custodians campground at Djarindjin on the Dampier Peninsula.
– Discover Aboriginal Experiences Program: Western Australia increased the number of Aboriginal export-ready products featured within Tourism Australia’s Discover Aboriginal Experiences (DAE) program, with the inclusion of WA’s Ngurrangga Tours. The program provides support to further build Aboriginal tourism businesses through attendance at trade shows such as the Australian Tourism Exchange and involvement in a range of marketing activities. Tourism WA is working with operators in order to qualify them for possible inclusion in the DAE for 2021.
– Kooljaman at Cape Leveque: Tourism WA partnered with Indigenous Business Australia to undertake a review of business operations of Kooljaman at Cape Leveque, and work on a masterplan for the redevelopment of the facility. Kooljaman at Cape Leveque is a remote wilderness camp owned and run by the Aboriginal Bardi Jawi communities. The project was delayed due to COVID-19, as community engagement was not possible during this time.
3 9
2 . 0 A G E N C Y P E R F O R M A N C E
TOURISM WESTERN AUSTRALIA / ANNUAL REPORT 2019 – 20
1 . 0 OV E R V I E W 2 . 0 A G E N C Y P E R F O R M A N C E
M E S S A G E T O T H E M I N I S T E R
3 . 0 S I G N I F I C A N T I S S U E S I M PA C T I N G T H E A G E N C Y
4 . 0 D I S C L O S U R E S A N D L E G A L C O M P L I A N C E
4 . W E W I L L I N T E N S I F Y O U R F O C U S O N C O N V E R T I N G C O R E TA R G E T A U D I E N C E S
To encourage more people to visit the State from Tourism WA’s key target markets, we implemented a new model to develop our creative assets and focused our marketing towards an increasing digital audience. A key achievement for 2019-20 has been appointing new marketing agencies to guide our marketing strategy, creative and production work. This will help us create a new tourism brand for the State, which we are currently working on, to guide our intrastate marketing and future interstate and international marketing efforts when the time is right. With an increasing digital audience, we also implemented the use of new technology and a market segmentation model to ensure our marketing efforts effectively target the right consumers.
In 2019-20, the following was achieved in intensifying our focus on converting core target audiences:
Creative agencies tender
Following a tender process, Tourism WA appointed The Monkeys, Marketforce, The Brand Agency and Sandbox in February 2020 as its new Strategy and Creative; and Production and Implementation agencies. The Monkeys, part of Accenture Interactive, lead the strategic and creative services part of the contract while the other agencies, in addition to The Monkeys, undertake the implementation and production work. The tender process gave Tourism WA the opportunity to find the best partners to help make an impact with the State’s destination marketing. Appointing local companies to deliver production and implementation services means a significant amount of work will be done in WA, supporting local jobs.
Launch of a data management platform
In 2019-20, Tourism WA launched a Data Management Platform (DMP) to improve our ability to target a growing digital audience. The purpose of the DMP is to capture preferences and interests of users that access content (e.g. regions or activities) via westernaustralia.com and our partners’ websites, which are then used to re-target them through our marketing activities. This makes Tourism WA’s marketing more efficient. Tourism WA successfully negotiated various data sharing agreements with Tourism Australia, Singapore Airlines, Perth Fringe, Air New Zealand and others to integrate their data into our platform. In addition, we established data partnerships with the Regional Tourism Organisations to enable them to leverage Tourism WA’s data infrastructure.
4 0
2 . 0 A G E N C Y P E R F O R M A N C E
TOURISM WESTERN AUSTRALIA / ANNUAL REPORT 2019 – 20
1 . 0 OV E R V I E W 2 . 0 A G E N C Y P E R F O R M A N C E
M E S S A G E T O T H E M I N I S T E R
3 . 0 S I G N I F I C A N T I S S U E S I M PA C T I N G T H E A G E N C Y
4 . 0 D I S C L O S U R E S A N D L E G A L C O M P L I A N C E

T O U R I S M WA’ S R E S P O N S E T O T H E C OV I D -1 9 PA N D E M I C
WHO* informed of unexplained
pneumonia case
WHO* declares global health
emergency
Coronavirus identified
1st coronavirus case in
Australia
China Eastern Airlines’ last flight to WA
State of Emergency
declared in WA
Tourism WA launches
Wander out Yonder campaign
WA intrastate travel restricted
National Bushfire Recovery Agency
established
DEC31
JAN06
JAN15
JAN29
FEB10
JUN05
MAR16
APR05
JAN07
JAN25
JAN31
FEB07
MAR15
JUN01
APR01
2 0 1 9 2 0 2 0
China Eastern Airlines’ first flight to WA
Airlines begin cancelling
flights to China
China Southern Airlines’ last flight
to WA
Most WA regional travel restrictions
removed
Tourism WA’s interstate and international
marketing campaigns paused
(except social media)
Do it in WA intrastate campaign
paused
WA hard border closure
*WHO – World Health Organization
a
MAR18
41 TOURISM WESTERN AUSTRALIA / ANNUAL REPORT 2019 – 20
1 . 0 OV E R V I E W 2 . 0 A G E N C Y P E R F O R M A N C E
M E S S A G E T O T H E M I N I S T E R
3 . 0 S I G N I F I C A N T I S S U E S I M PA C T I N G T H E A G E N C Y
4 . 0 D I S C L O S U R E S A N D L E G A L C O M P L I A N C E

2020 will be regarded as one of the toughest years for Western Australia’s tourism industry. The reputational damage from the east coast bushfires, followed by the COVID-19 global pandemic, has significantly impacted our industry and resulted in extraordinary measures being adopted by the State Government, resulting in a hard border closure to protect the community.
The WA Government launched stimulus packages to assist West Australians and small businesses affected by the pandemic. Nineteen staff from Tourism WA were also deployed to other areas of Government to help with the State’s response to the COVID-19 pandemic.
As the leading agency for tourism in Western Australia, Tourism WA acted swiftly to provide support to our industry. We established an Industry Support Team in April to work closely with tourism operators through the challenges of the pandemic.
The team reached out to more than 700 operators to help them navigate through various assistance packages and offer a friendly voice to talk through recovery ideas for when the time is right. These conversations not only helped our industry, but informed us about existing or emerging issues to guide future support or recovery initiatives.
To sustain our industry and future, in May 2020 we launched the $14.4 million WA Tourism Recovery Program to support the tourism industry during the COVID-19 pandemic.
The support package comprised two funding programs: the Tourism Recovery Fund and the Tourism Business Survival Grant.
The Tourism Recovery Fund provided immediate support to eligible small businesses with one-off funding of $6,500 to adapt and refocus their business in the new environment.
The Tourism Business Survival Grant was made available to tourism operators demonstrating extreme business hardship, with grants of $25,000 to $100,000 to aid in recovery. With applications closing in July 2020, Tourism WA hopes this assistance will help businesses that rely heavily on inbound visitors, to adapt and mobilise their operations through the recovery period.
With the opening of regional borders in June 2020, Tourism WA launched a major intrastate tourism campaign to encourage West Australians to book an adventure in WA. Wander out Yonder was launched with a $2 million investment in media and partnerships.
M E N Z I E S
4 2
2 . 0 A G E N C Y P E R F O R M A N C E
TOURISM WESTERN AUSTRALIA / ANNUAL REPORT 2019 – 20
1 . 0 OV E R V I E W 2 . 0 A G E N C Y P E R F O R M A N C E
M E S S A G E T O T H E M I N I S T E R
3 . 0 S I G N I F I C A N T I S S U E S I M PA C T I N G T H E A G E N C Y
4 . 0 D I S C L O S U R E S A N D L E G A L C O M P L I A N C E

Due to COVID-19 travel restrictions, we now have a whole new market of intrastate travellers – many who haven’t taken holidays in WA for decades. The campaign focuses on inspiring locals to spend their holiday time and money in WA, exploring locations they have never been to, and embarking on experiences they have never had.
Tourism WA is working with the Regional Tourism Organisations and the Western Australian Indigenous Tourism Operators Council to promote the Wander out Yonder campaign and encourage people to book tours, accommodation or experiences, directly with WA tourism operators.
The tourism industry was certainly one of the most severely impacted by the challenges of the pandemic, however tourism will play a vital role in the post COVID-19 economic recovery when we are ready to once again welcome visitors.
There are still many uncertainties about the full impact of the pandemic and when interstate and international borders will open, but when they do we will be ready.
The successful outcomes of the Two-Year Action Plan for Tourism in Western Australia proves how well we are able to strengthen our industry with a robust plan, solid partnerships and industry support.
Tourism WA is now developing a recovery plan to restart and rebuild the State’s tourism industry, and we will work closely with our partners, Government and operators to ensure a sustainable and resilient industry in the future.
R O E B U C K B AY , N E A R B R O O M E
4 3
2 . 0 A G E N C Y P E R F O R M A N C E
TOURISM WESTERN AUSTRALIA / ANNUAL REPORT 2019 – 20
1 . 0 OV E R V I E W 2 . 0 A G E N C Y P E R F O R M A N C E
M E S S A G E T O T H E M I N I S T E R
3 . 0 S I G N I F I C A N T I S S U E S I M PA C T I N G T H E A G E N C Y
4 . 0 D I S C L O S U R E S A N D L E G A L C O M P L I A N C E
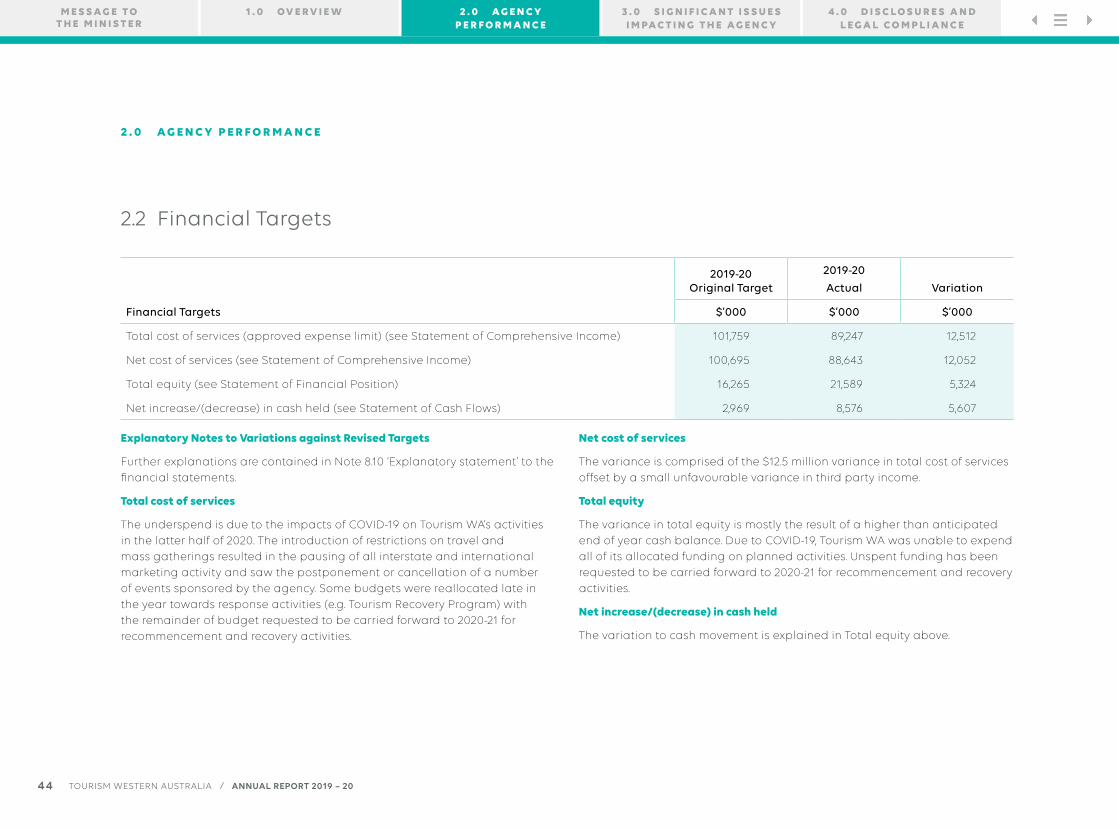
2.2 Financial Targets
Financial Targets
2019-20 Original Target
2019-20
Actual Variation
$’000 $’000 $’000
Total cost of services (approved expense limit) (see Statement of Comprehensive Income) 101,759 89,247 12,512
Net cost of services (see Statement of Comprehensive Income) 100,695 88,643 12,052
Total equity (see Statement of Financial Position) 16,265 21,589 5,324
Net increase/(decrease) in cash held (see Statement of Cash Flows) 2,969 8,576 5,607
Explanatory Notes to Variations against Revised Targets
Further explanations are contained in Note 8.10 ‘Explanatory statement’ to the financial statements.
Total cost of services
The underspend is due to the impacts of COVID-19 on Tourism WA’s activities in the latter half of 2020. The introduction of restrictions on travel and mass gatherings resulted in the pausing of all interstate and international marketing activity and saw the postponement or cancellation of a number of events sponsored by the agency. Some budgets were reallocated late in the year towards response activities (e.g. Tourism Recovery Program) with the remainder of budget requested to be carried forward to 2020-21 for recommencement and recovery activities.
Net cost of services
The variance is comprised of the $12.5 million variance in total cost of services offset by a small unfavourable variance in third party income.
Total equity
The variance in total equity is mostly the result of a higher than anticipated end of year cash balance. Due to COVID-19, Tourism WA was unable to expend all of its allocated funding on planned activities. Unspent funding has been requested to be carried forward to 2020-21 for recommencement and recovery activities.
Net increase/(decrease) in cash held
The variation to cash movement is explained in Total equity above.
4 4
2 . 0 A G E N C Y P E R F O R M A N C E
TOURISM WESTERN AUSTRALIA / ANNUAL REPORT 2019 – 20
1 . 0 OV E R V I E W 2 . 0 A G E N C Y P E R F O R M A N C E
M E S S A G E T O T H E M I N I S T E R
3 . 0 S I G N I F I C A N T I S S U E S I M PA C T I N G T H E A G E N C Y
4 . 0 D I S C L O S U R E S A N D L E G A L C O M P L I A N C E
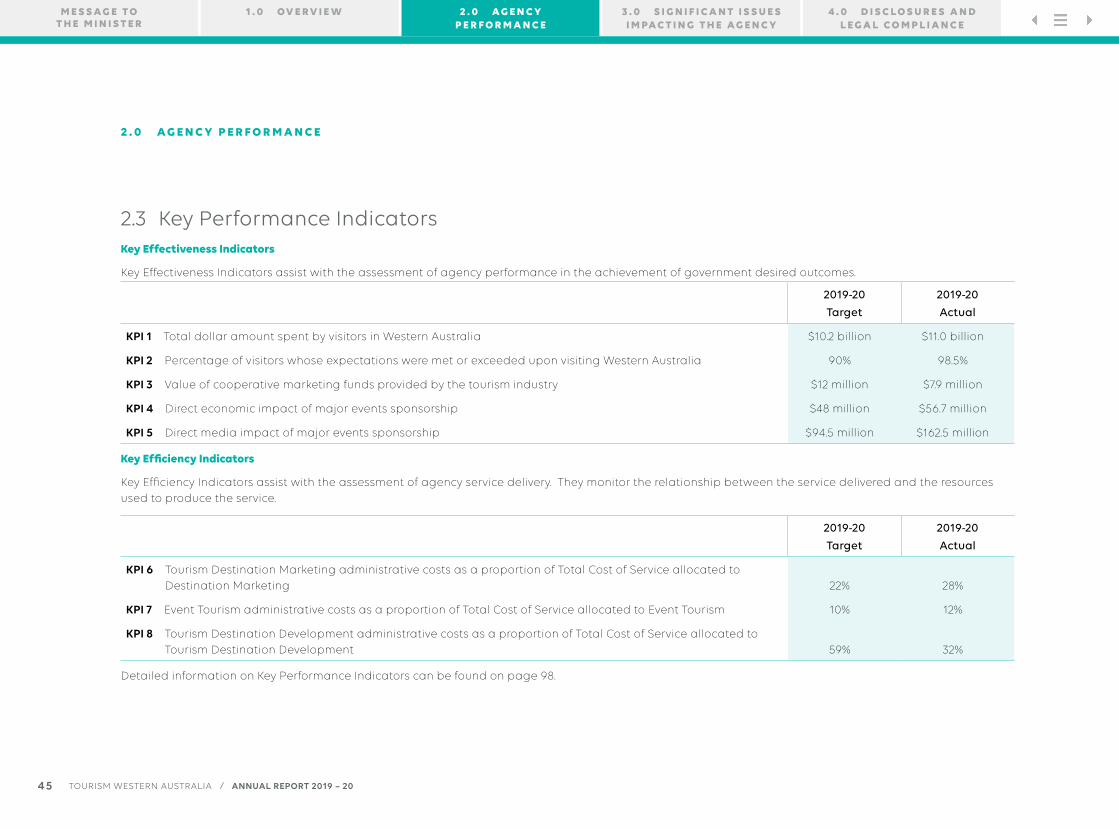
2.3 Key Performance IndicatorsKey Effectiveness Indicators
Key Effectiveness Indicators assist with the assessment of agency performance in the achievement of government desired outcomes.
2019-20
Target
2019-20
Actual
KPI 1 Total dollar amount spent by visitors in Western Australia $10.2 billion $11.0 billion
KPI 2 Percentage of visitors whose expectations were met or exceeded upon visiting Western Australia 90% 98.5%
KPI 3 Value of cooperative marketing funds provided by the tourism industry $12 million $7.9 million
KPI 4 Direct economic impact of major events sponsorship $48 million $56.7 million
KPI 5 Direct media impact of major events sponsorship $94.5 million $162.5 million
Key Efficiency Indicators
Key Efficiency Indicators assist with the assessment of agency service delivery. They monitor the relationship between the service delivered and the resources used to produce the service.
2019-20
Target
2019-20
Actual
KPI 6 Tourism Destination Marketing administrative costs as a proportion of Total Cost of Service allocated to Destination Marketing 22% 28%
KPI 7 Event Tourism administrative costs as a proportion of Total Cost of Service allocated to Event Tourism 10% 12%
KPI 8 Tourism Destination Development administrative costs as a proportion of Total Cost of Service allocated to Tourism Destination Development 59% 32%
Detailed information on Key Performance Indicators can be found on page 98.
4 5
2 . 0 A G E N C Y P E R F O R M A N C E
TOURISM WESTERN AUSTRALIA / ANNUAL REPORT 2019 – 20
1 . 0 OV E R V I E W 2 . 0 A G E N C Y P E R F O R M A N C E
M E S S A G E T O T H E M I N I S T E R
3 . 0 S I G N I F I C A N T I S S U E S I M PA C T I N G T H E A G E N C Y
4 . 0 D I S C L O S U R E S A N D L E G A L C O M P L I A N C E
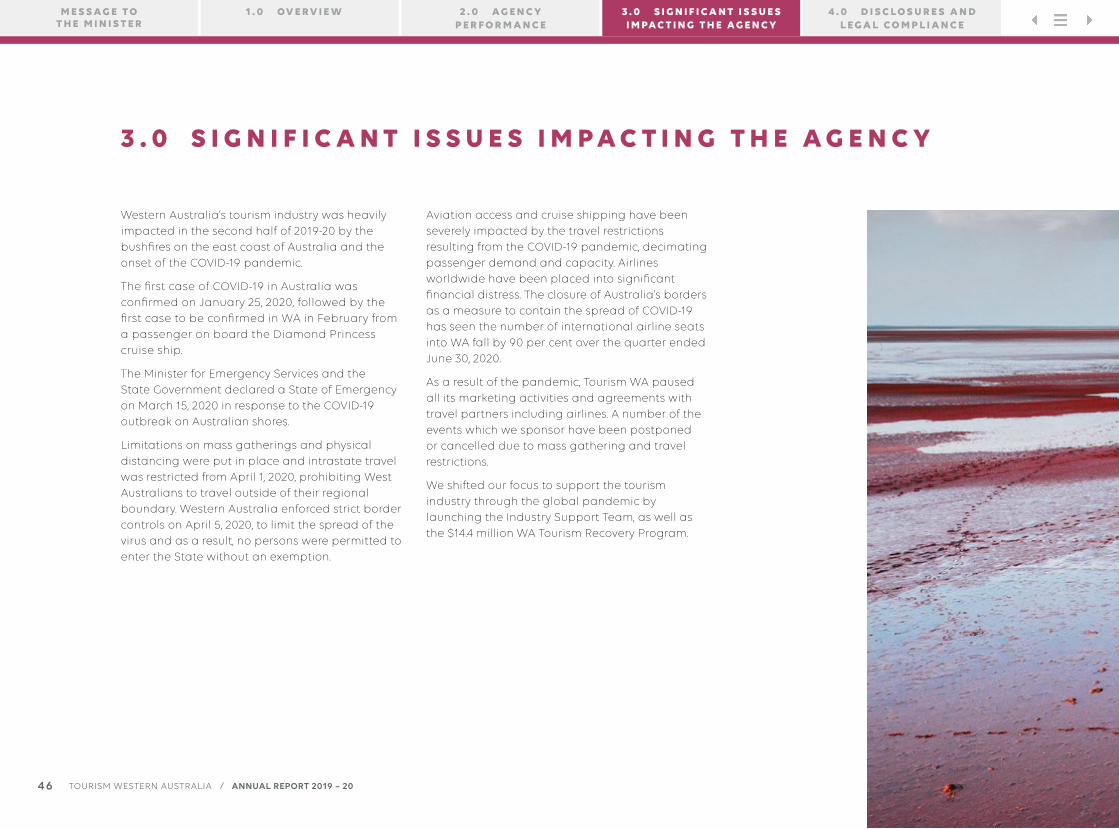
Western Australia’s tourism industry was heavily impacted in the second half of 2019-20 by the bushfires on the east coast of Australia and the onset of the COVID-19 pandemic.
The first case of COVID-19 in Australia was confirmed on January 25, 2020, followed by the first case to be confirmed in WA in February from a passenger on board the Diamond Princess cruise ship.
The Minister for Emergency Services and the State Government declared a State of Emergency on March 15, 2020 in response to the COVID-19 outbreak on Australian shores.
Limitations on mass gatherings and physical distancing were put in place and intrastate travel was restricted from April 1, 2020, prohibiting West Australians to travel outside of their regional boundary. Western Australia enforced strict border controls on April 5, 2020, to limit the spread of the virus and as a result, no persons were permitted to enter the State without an exemption.
Aviation access and cruise shipping have been severely impacted by the travel restrictions resulting from the COVID-19 pandemic, decimating passenger demand and capacity. Airlines worldwide have been placed into significant financial distress. The closure of Australia’s borders as a measure to contain the spread of COVID-19 has seen the number of international airline seats into WA fall by 90 per cent over the quarter ended June 30, 2020.
As a result of the pandemic, Tourism WA paused all its marketing activities and agreements with travel partners including airlines. A number of the events which we sponsor have been postponed or cancelled due to mass gathering and travel restrictions.
We shifted our focus to support the tourism industry through the global pandemic by launching the Industry Support Team, as well as the $14.4 million WA Tourism Recovery Program.
4 6 TOURISM WESTERN AUSTRALIA / ANNUAL REPORT 2019 – 20
3 . 0 S I G N I F I C A N T I S S U E S I M P A C T I N G T H E A G E N C Y
1 . 0 OV E R V I E W 2 . 0 A G E N C Y P E R F O R M A N C E
M E S S A G E T O T H E M I N I S T E R
3 . 0 S I G N I F I C A N T I S S U E S I M PA C T I N G T H E A G E N C Y
4 . 0 D I S C L O S U R E S A N D L E G A L C O M P L I A N C E

L A K E B A L L A R D
$ 1 4 . 4 M I L L I O N
P R O G R A M
W A T O U R I S M
R E C O V E R Y
4 7
1 . 0 OV E R V I E W 2 . 0 A G E N C Y P E R F O R M A N C E
M E S S A G E T O T H E M I N I S T E R
3 . 0 S I G N I F I C A N T I S S U E S I M PA C T I N G T H E A G E N C Y
4 . 0 D I S C L O S U R E S A N D L E G A L C O M P L I A N C E
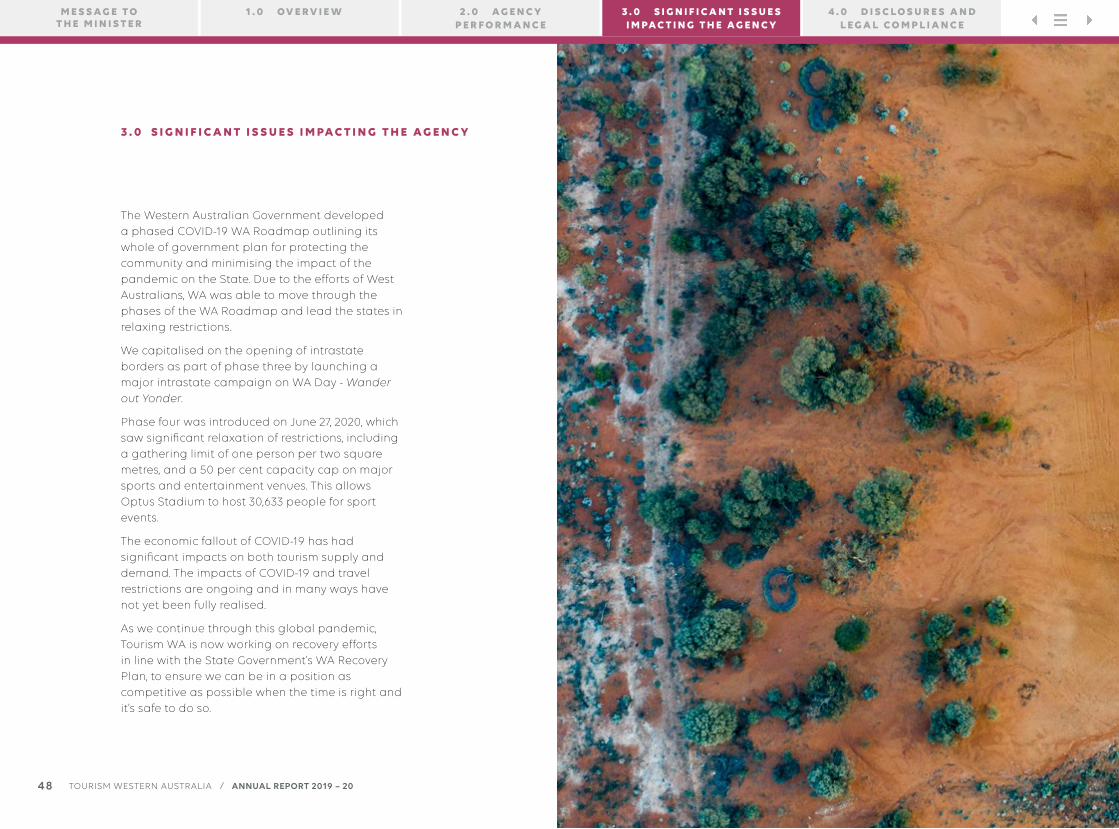
The Western Australian Government developed a phased COVID-19 WA Roadmap outlining its whole of government plan for protecting the community and minimising the impact of the pandemic on the State. Due to the efforts of West Australians, WA was able to move through the phases of the WA Roadmap and lead the states in relaxing restrictions.
We capitalised on the opening of intrastate borders as part of phase three by launching a major intrastate campaign on WA Day - Wander out Yonder.
Phase four was introduced on June 27, 2020, which saw significant relaxation of restrictions, including a gathering limit of one person per two square metres, and a 50 per cent capacity cap on major sports and entertainment venues. This allows Optus Stadium to host 30,633 people for sport events.
The economic fallout of COVID-19 has had significant impacts on both tourism supply and demand. The impacts of COVID-19 and travel restrictions are ongoing and in many ways have not yet been fully realised.
As we continue through this global pandemic, Tourism WA is now working on recovery efforts in line with the State Government’s WA Recovery Plan, to ensure we can be in a position as competitive as possible when the time is right and it’s safe to do so.
4 8 TOURISM WESTERN AUSTRALIA / ANNUAL REPORT 2019 – 20
3 . 0 S I G N I F I C A N T I S S U E S I M PA C T I N G T H E A G E N C Y
1 . 0 OV E R V I E W 2 . 0 A G E N C Y P E R F O R M A N C E
M E S S A G E T O T H E M I N I S T E R
3 . 0 S I G N I F I C A N T I S S U E S I M PA C T I N G T H E A G E N C Y
4 . 0 D I S C L O S U R E S A N D L E G A L C O M P L I A N C E

C U E
C O M P E T I T I V E
P O S I T I O N
A N D S A F E
W H E N T H E T I M E
R I G H TI S
49
1 . 0 OV E R V I E W 2 . 0 A G E N C Y P E R F O R M A N C E
M E S S A G E T O T H E M I N I S T E R
3 . 0 S I G N I F I C A N T I S S U E S I M PA C T I N G T H E A G E N C Y
4 . 0 D I S C L O S U R E S A N D L E G A L C O M P L I A N C E
5 0
4 . 0 D I S C L O S U R E S A N D L E G A L C O M P L I A N C E
1 . 0 OV E R V I E W 2 . 0 A G E N C Y P E R F O R M A N C E
M E S S A G E T O T H E M I N I S T E R
3 . 0 S I G N I F I C A N T I S S U E S I M PA C T I N G T H E A G E N C Y
4 . 0 D I S C L O S U R E S A N D L E G A L C O M P L I A N C E
Z B E N D , K A L B A R R I N AT I O N A L PA R K
5 1
1 . 0 OV E R V I E W 2 . 0 A G E N C Y P E R F O R M A N C E
M E S S A G E T O T H E M I N I S T E R
3 . 0 S I G N I F I C A N T I S S U E S I M PA C T I N G T H E A G E N C Y
4 . 0 D I S C L O S U R E S A N D L E G A L C O M P L I A N C E
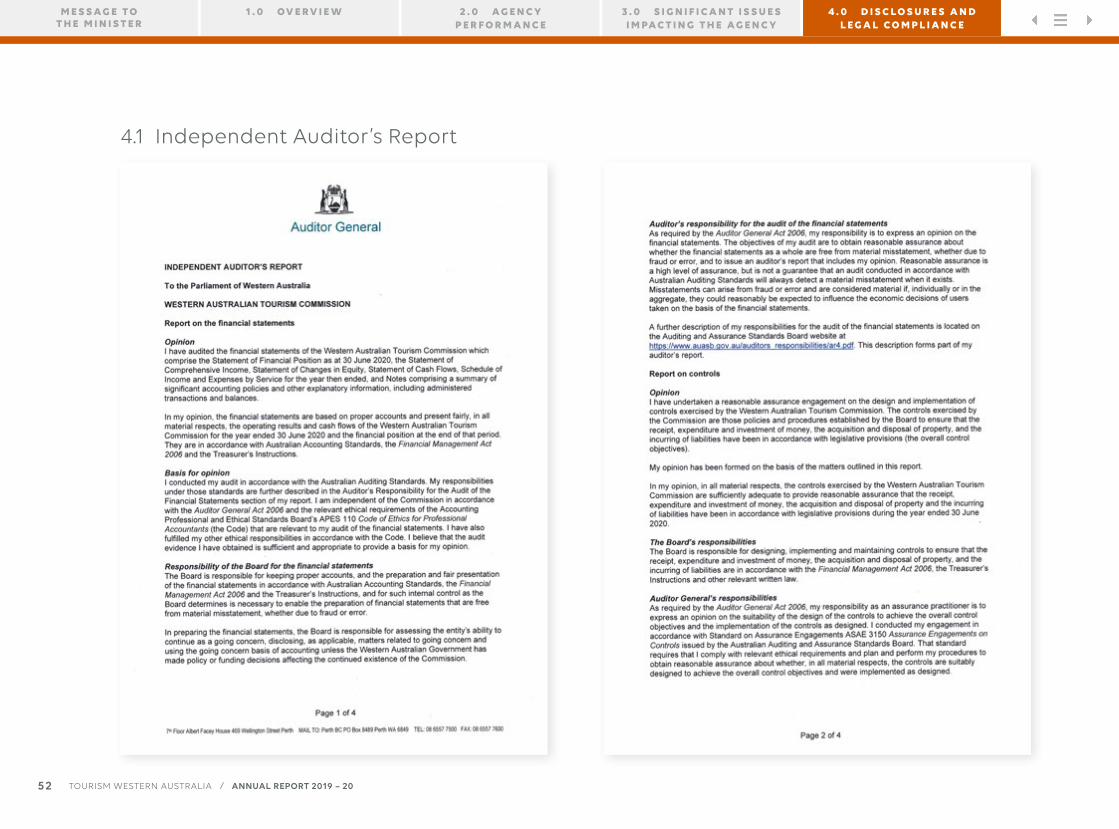
4.1 Independent Auditor’s Report
5 2 TOURISM WESTERN AUSTRALIA / ANNUAL REPORT 2019 – 20
1 . 0 OV E R V I E W 2 . 0 A G E N C Y P E R F O R M A N C E
M E S S A G E T O T H E M I N I S T E R
3 . 0 S I G N I F I C A N T I S S U E S I M PA C T I N G T H E A G E N C Y
4 . 0 D I S C L O S U R E S A N D L E G A L C O M P L I A N C E

5 3
4 . 0 D I S C L O S U R E S A N D L E G A L C O M P L I A N C E
TOURISM WESTERN AUSTRALIA / ANNUAL REPORT 2019 – 20
1 . 0 OV E R V I E W 2 . 0 A G E N C Y P E R F O R M A N C E
M E S S A G E T O T H E M I N I S T E R
3 . 0 S I G N I F I C A N T I S S U E S I M PA C T I N G T H E A G E N C Y
4 . 0 D I S C L O S U R E S A N D L E G A L C O M P L I A N C E
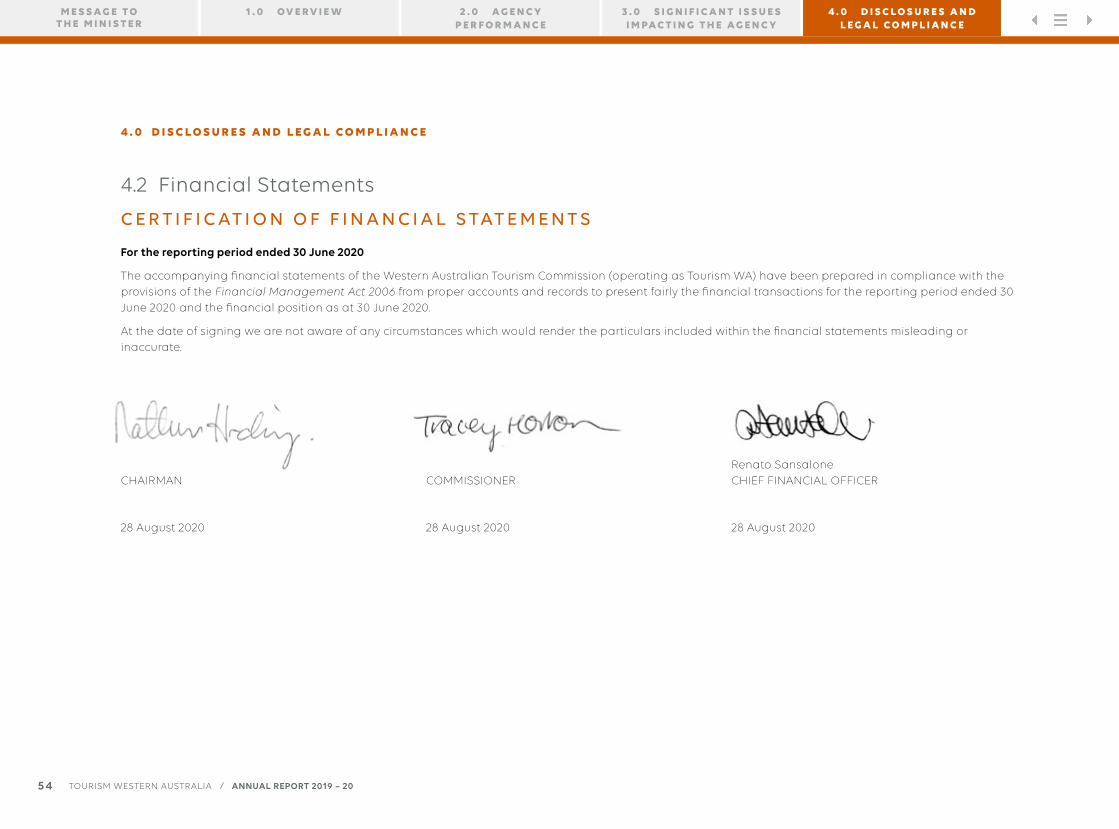
4.2 Financial Statements
C E R T I F I C AT I O N O F F I N A N C I A L S TAT E M E N T S
For the reporting period ended 30 June 2020
The accompanying financial statements of the Western Australian Tourism Commission (operating as Tourism WA) have been prepared in compliance with the provisions of the Financial Management Act 2006 from proper accounts and records to present fairly the financial transactions for the reporting period ended 30 June 2020 and the financial position as at 30 June 2020.
At the date of signing we are not aware of any circumstances which would render the particulars included within the financial statements misleading or inaccurate.
Nathan HardingCHAIRMAN
28 August 2020
Tracey Horton COMMISSIONER
28 August 2020
Renato Sansalone CHIEF FINANCIAL OFFICER
28 August 2020
5 4
4 . 0 D I S C L O S U R E S A N D L E G A L C O M P L I A N C E
TOURISM WESTERN AUSTRALIA / ANNUAL REPORT 2019 – 20
1 . 0 OV E R V I E W 2 . 0 A G E N C Y P E R F O R M A N C E
M E S S A G E T O T H E M I N I S T E R
3 . 0 S I G N I F I C A N T I S S U E S I M PA C T I N G T H E A G E N C Y
4 . 0 D I S C L O S U R E S A N D L E G A L C O M P L I A N C E

Note2020 2019$’000 $’000
COST OF SERVICESExpenses
Employee benefits expense 3.5.1 377 369
Supplies and services 3.1 39,855 40,463
Depreciation and amortisation expense 5.1.1, 5.2, 5.3.1 541 604
Accommodation expenses 3.5.3 2,205 1,847
Grants and subsidies 3.2 5,914 1,381
Event operations expenses 3.3 24,418 26,137
Advertising and promotion expenses 3.4 15,890 29,504
Other expenses 3.5.4 47 1,105
Total cost of services 89,247 101,410
Revenue
Commonwealth grants and contributions 4.2 14 99
Interest revenue 179 402
Other revenue 4.3 411 484
Total Revenue 604 985
Total income other than income from State Government 604 985
NET COST OF SERVICES 88,643 100,425
Income from State Government 4.1
State grants and contributions 69,841 70,439
Services received free of charge 12,378 10,785
Royalties for Regions Fund 13,366 16,432
Total income from State Government 95,585 97,656
SURPLUS/(DEFICIT) FOR THE PERIOD 6,942 (2,769)
S TAT E M E N T O F C O M P R E H E N S I V E I N C O M EFor the year ended 30 June 2020
See also note 2.2 ‘Schedule of Income and Expenses by Service’.
The Statement of Comprehensive Income should be read in conjunction with the accompanying notes.
5 5
4 . 0 D I S C L O S U R E S A N D L E G A L C O M P L I A N C E
TOURISM WESTERN AUSTRALIA / ANNUAL REPORT 2019 – 20
1 . 0 OV E R V I E W 2 . 0 A G E N C Y P E R F O R M A N C E
M E S S A G E T O T H E M I N I S T E R
3 . 0 S I G N I F I C A N T I S S U E S I M PA C T I N G T H E A G E N C Y
4 . 0 D I S C L O S U R E S A N D L E G A L C O M P L I A N C E

Note2020 2019$’000 $’000
ASSETSCurrent AssetsCash and cash equivalents 6.3 8,804 1,416Restricted cash and cash equivalents 6.3 2,012 824Receivables 5.4 848 1,206Prepayments 5.5 6,638 10,597Amounts receivable for services 5.6 475 475Total Current Assets 18,777 14,518
Non-Current AssetsAmounts receivable for services 5.6 5,095 5,570Property, plant and equipment 5.1 121 206Right-of-use assets 5.2 141 -Intangible assets 5.3 346 581Other non-current assets 5.7 300 229Total Non-Current Assets 6,003 6,586TOTAL ASSETS 24,780 21,104
LIABILITIESCurrent LiabilitiesPayables 5.8 2,909 6,523Lease liabilities 6.1 42 -Employee related provisions 3.5.2 139 123Total Current Liabilities 3,090 6,646
Non-Current LiabilitiesLease liabilities 6.1 101 -Total Non-Current Liabilities 101 -
TOTAL LIABILITIES 3,191 6,646NET ASSETS 21,589 14,458
EQUITY 8.8Contributed equity 10,672 10,486Accumulated surplus 10,917 3,972TOTAL EQUITY 21,589 14,458
S TAT E M E N T O F F I N A N C I A L P O S I T I O NAs at 30 June 2020
The Statement of Financial Position should be read in conjunction with the accompanying notes.
5 6
4 . 0 D I S C L O S U R E S A N D L E G A L C O M P L I A N C E
TOURISM WESTERN AUSTRALIA / ANNUAL REPORT 2019 – 20
1 . 0 OV E R V I E W 2 . 0 A G E N C Y P E R F O R M A N C E
M E S S A G E T O T H E M I N I S T E R
3 . 0 S I G N I F I C A N T I S S U E S I M PA C T I N G T H E A G E N C Y
4 . 0 D I S C L O S U R E S A N D L E G A L C O M P L I A N C E
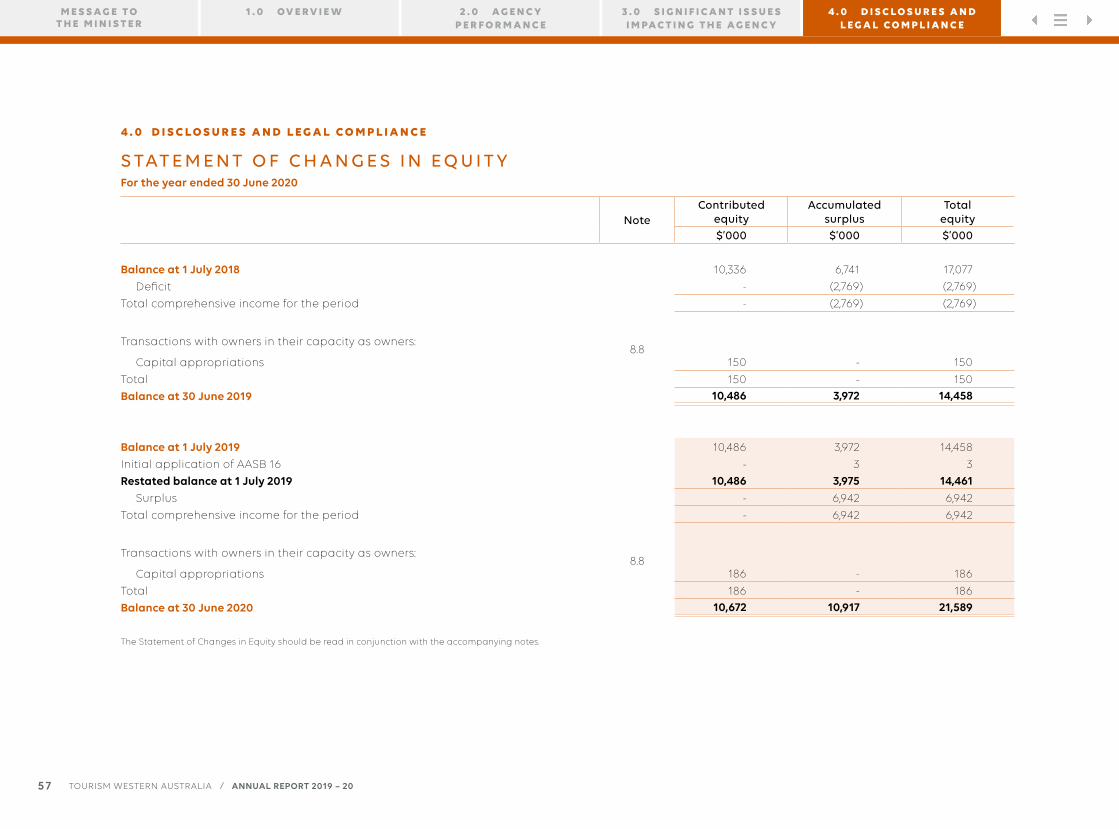
NoteContributed
equityAccumulated
surplusTotal
equity$’000 $’000 $’000
Balance at 1 July 2018 10,336 6,741 17,077
Deficit - (2,769) (2,769)
Total comprehensive income for the period - (2,769) (2,769)
Transactions with owners in their capacity as owners:8.8
Capital appropriations 150 - 150
Total 150 - 150
Balance at 30 June 2019 10,486 3,972 14,458
Balance at 1 July 2019 10,486 3,972 14,458
Initial application of AASB 16 - 3 3
Restated balance at 1 July 2019 10,486 3,975 14,461
Surplus - 6,942 6,942
Total comprehensive income for the period - 6,942 6,942
Transactions with owners in their capacity as owners:8.8
Capital appropriations 186 - 186
Total 186 - 186
Balance at 30 June 2020 10,672 10,917 21,589
S TAT E M E N T O F C H A N G E S I N E Q U I T YFor the year ended 30 June 2020
The Statement of Changes in Equity should be read in conjunction with the accompanying notes.
5 7
4 . 0 D I S C L O S U R E S A N D L E G A L C O M P L I A N C E
TOURISM WESTERN AUSTRALIA / ANNUAL REPORT 2019 – 20
1 . 0 OV E R V I E W 2 . 0 A G E N C Y P E R F O R M A N C E
M E S S A G E T O T H E M I N I S T E R
3 . 0 S I G N I F I C A N T I S S U E S I M PA C T I N G T H E A G E N C Y
4 . 0 D I S C L O S U R E S A N D L E G A L C O M P L I A N C E
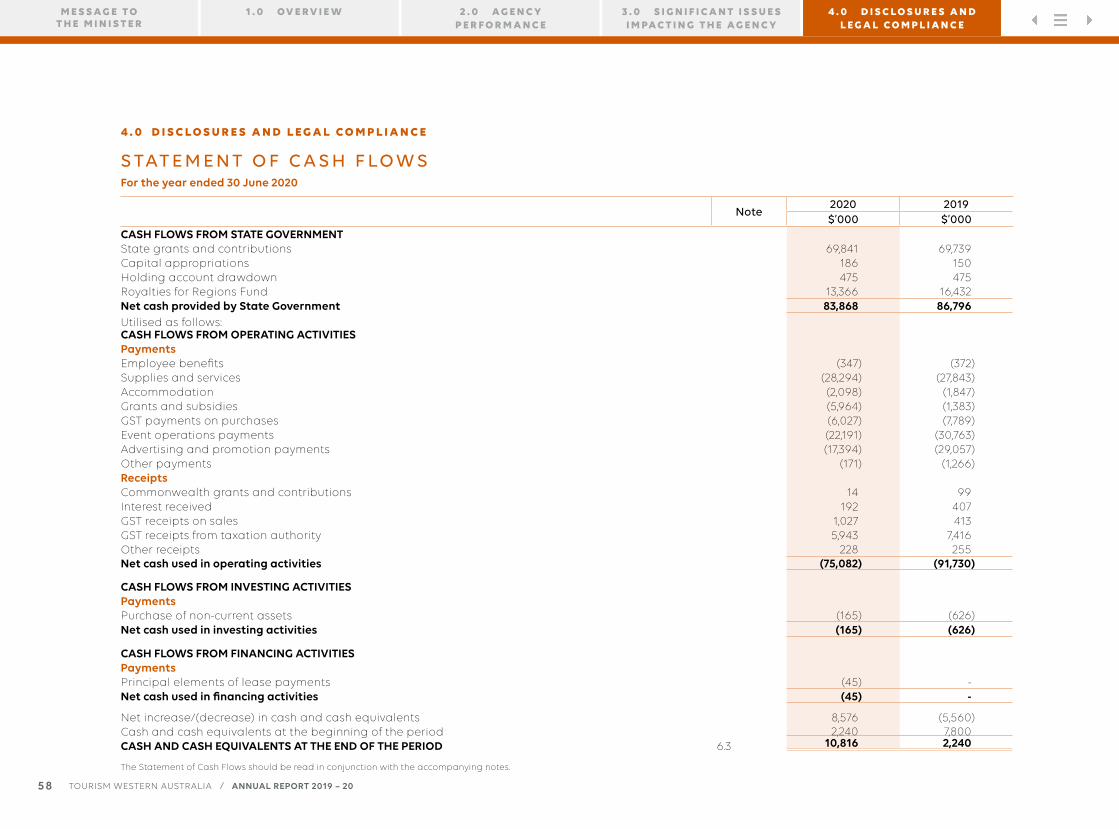
Note2020 2019$’000 $’000
CASH FLOWS FROM STATE GOVERNMENTState grants and contributions 69,841 69,739Capital appropriations 186 150Holding account drawdown 475 475Royalties for Regions Fund 13,366 16,432Net cash provided by State Government 83,868 86,796Utilised as follows:CASH FLOWS FROM OPERATING ACTIVITIESPaymentsEmployee benefits (347) (372)Supplies and services (28,294) (27,843)Accommodation (2,098) (1,847)Grants and subsidies (5,964) (1,383)GST payments on purchases (6,027) (7,789)Event operations payments (22,191) (30,763)Advertising and promotion payments (17,394) (29,057)Other payments (171) (1,266)ReceiptsCommonwealth grants and contributions 14 99Interest received 192 407GST receipts on sales 1,027 413GST receipts from taxation authority 5,943 7,416Other receipts 228 255Net cash used in operating activities (75,082) (91,730)
CASH FLOWS FROM INVESTING ACTIVITIESPaymentsPurchase of non-current assets (165) (626)Net cash used in investing activities (165) (626)
CASH FLOWS FROM FINANCING ACTIVITIESPaymentsPrincipal elements of lease payments (45) -Net cash used in financing activities (45) -
Net increase/(decrease) in cash and cash equivalents 8,576 (5,560)Cash and cash equivalents at the beginning of the period 2,240 7,800CASH AND CASH EQUIVALENTS AT THE END OF THE PERIOD 6.3 10,816 2,240
S TAT E M E N T O F C A S H F LO W SFor the year ended 30 June 2020
The Statement of Cash Flows should be read in conjunction with the accompanying notes.
5 8
4 . 0 D I S C L O S U R E S A N D L E G A L C O M P L I A N C E
TOURISM WESTERN AUSTRALIA / ANNUAL REPORT 2019 – 20
1 . 0 OV E R V I E W 2 . 0 A G E N C Y P E R F O R M A N C E
M E S S A G E T O T H E M I N I S T E R
3 . 0 S I G N I F I C A N T I S S U E S I M PA C T I N G T H E A G E N C Y
4 . 0 D I S C L O S U R E S A N D L E G A L C O M P L I A N C E
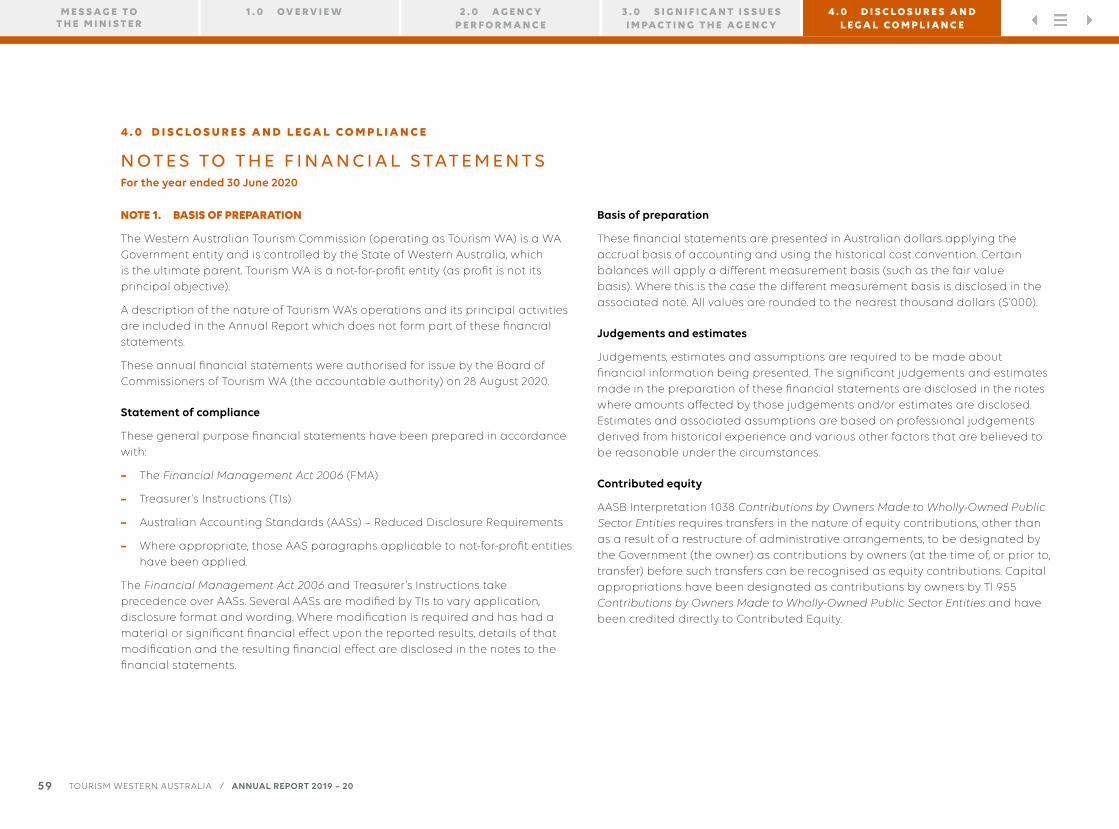
NOTE 1. BASIS OF PREPARATION
The Western Australian Tourism Commission (operating as Tourism WA) is a WA Government entity and is controlled by the State of Western Australia, which is the ultimate parent. Tourism WA is a not-for-profit entity (as profit is not its principal objective).
A description of the nature of Tourism WA’s operations and its principal activities are included in the Annual Report which does not form part of these financial statements.
These annual financial statements were authorised for issue by the Board of Commissioners of Tourism WA (the accountable authority) on 28 August 2020.
Statement of compliance
These general purpose financial statements have been prepared in accordance with:
– The Financial Management Act 2006 (FMA)
– Treasurer’s Instructions (TIs)
– Australian Accounting Standards (AASs) – Reduced Disclosure Requirements
– Where appropriate, those AAS paragraphs applicable to not-for-profit entities have been applied.
The Financial Management Act 2006 and Treasurer’s Instructions take precedence over AASs. Several AASs are modified by TIs to vary application, disclosure format and wording. Where modification is required and has had a material or significant financial effect upon the reported results, details of that modification and the resulting financial effect are disclosed in the notes to the financial statements.
Basis of preparation
These financial statements are presented in Australian dollars applying the accrual basis of accounting and using the historical cost convention. Certain balances will apply a different measurement basis (such as the fair value basis). Where this is the case the different measurement basis is disclosed in the associated note. All values are rounded to the nearest thousand dollars ($’000).
Judgements and estimates
Judgements, estimates and assumptions are required to be made about financial information being presented. The significant judgements and estimates made in the preparation of these financial statements are disclosed in the notes where amounts affected by those judgements and/or estimates are disclosed. Estimates and associated assumptions are based on professional judgements derived from historical experience and various other factors that are believed to be reasonable under the circumstances.
Contributed equity
AASB Interpretation 1038 Contributions by Owners Made to Wholly-Owned Public Sector Entities requires transfers in the nature of equity contributions, other than as a result of a restructure of administrative arrangements, to be designated by the Government (the owner) as contributions by owners (at the time of, or prior to, transfer) before such transfers can be recognised as equity contributions. Capital appropriations have been designated as contributions by owners by TI 955 Contributions by Owners Made to Wholly-Owned Public Sector Entities and have been credited directly to Contributed Equity.
N O T E S T O T H E F I N A N C I A L S TAT E M E N T SFor the year ended 30 June 2020
59
4 . 0 D I S C L O S U R E S A N D L E G A L C O M P L I A N C E
TOURISM WESTERN AUSTRALIA / ANNUAL REPORT 2019 – 20
1 . 0 OV E R V I E W 2 . 0 A G E N C Y P E R F O R M A N C E
M E S S A G E T O T H E M I N I S T E R
3 . 0 S I G N I F I C A N T I S S U E S I M PA C T I N G T H E A G E N C Y
4 . 0 D I S C L O S U R E S A N D L E G A L C O M P L I A N C E

NOTE 2. AGENCY OUTPUTS
This section includes information regarding the nature of funding Tourism WA receives and how this funding is utilised to achieve Tourism WA’s objectives. This note also provides the distinction between controlled and administered funding.
Notes
Agency objectivesSchedule of income and expenses by service
2.12.2
2.1 Agency objectives
Mission
Tourism WA shares its goal with the Western Australian tourism industry, and federal, state and territory governments, to maximise tourism’s contribution to the Australian people. The national stretch target is a challenging one: To achieve $140 billion in annual overnight tourism expenditure by 2020. To bring this vision to life, over the decade between 2010 and 2020, a stretch goal for tourism in Western Australia has been developed. This is: To double the value of tourism in Western Australia from $6 billion in 2010 to $12 billion by 2020.
Services
Tourism WA comprises the following three service areas:
Service 1: Destination Marketing
In partnership with the tourism and travel industry, Regional Tourism Organisations, Business Events Perth (formerly the Perth Convention Bureau), Western Australian Indigenous Tourism Operators Council and Tourism Australia, Tourism WA promotes Western Australia as a desirable holiday destination in core intrastate, interstate and international markets and undertakes marketing strategies that maximise the economic benefit to the State.
Service 2: Event Tourism
Tourism WA develops, attracts and supports events that generate social and economic benefit to the State and market Western Australia nationally and internationally.
Service 3: Tourism Destination Development
This service focuses on tourism supply side issues; working across Government and the industry to determine the needs of destinations in terms of access, accommodation, attractions and amenities; and facilitating the filling of gaps through private or public investment and policy settings.
Tourism WA administers expenses on behalf of Government (for Qantas Hub infrastructure at Perth Airport) that are not controlled by, nor integral to, the function of the agency. These transactions are not recognised in the principal financial statements of Tourism WA but schedules are prepared using the same basis as the financial statements and are presented at Note 9.1 ‘Disclosure of administered income and expenses’.
6 0
4 . 0 D I S C L O S U R E S A N D L E G A L C O M P L I A N C E
TOURISM WESTERN AUSTRALIA / ANNUAL REPORT 2019 – 20
1 . 0 OV E R V I E W 2 . 0 A G E N C Y P E R F O R M A N C E
M E S S A G E T O T H E M I N I S T E R
3 . 0 S I G N I F I C A N T I S S U E S I M PA C T I N G T H E A G E N C Y
4 . 0 D I S C L O S U R E S A N D L E G A L C O M P L I A N C E

2.2 Schedule of income and expenses by service For the year ended 30 June 2020
Destination Marketing
Event Tourism
Tourism Destination Development
Total
2020 2019 2020 2019 2020 2019 2020 2019$’000 $’000 $’000 $’000 $’000 $’000 $’000 $’000
COST OF SERVICES
Expenses Employee benefits expense 244 214 65 80 68 75 377 369
Supplies and services 31,062 30,428 4,213 4,632 4,580 5,403 39,855 40,463
Depreciation and amortisation expense 344 350 102 130 95 124 541 604
Accommodation expenses 1,693 1,364 259 258 253 225 2,205 1,847
Grants and subsidies 224 34 - - 5,690 1,347 5,914 1,381
Event operations expenses - - 24,418 26,137 - - 24,418 26,137
Advertising and promotion expenses 15,086 27,742 530 1,323 274 439 15,890 29,504
Other expenses 28 43 11 1,046 8 16 47 1,105
Total cost of services 48,681 60,175 29,598 33,606 10,968 7,629 89,247 101,410
Revenue Commonwealth grants and contributions - - - - 14 99 14 99
Interest revenue 116 233 31 87 32 82 179 402
Other revenue 275 431 64 27 72 26 411 484
Total income other than income from State Government 391 664 95 114 118 207 604 985
NET COST OF SERVICES 48,290 59,511 29,503 33,492 10,850 7,422 88,643 100,425
Income from State GovernmentState grants and contributions 35,447 47,237 22,058 20,395 12,336 2,807 69,841 70,439
Services received free of charge 7,630 6,300 2,446 2,511 2,302 1,974 12,378 10,785
Royalties for Regions Fund 5,524 3,501 6,942 11,481 900 1,450 13,366 16,432
Total income from State Government 48,601 57,038 31,446 34,387 15,538 6,231 95,585 97,656
Surplus/(deficit) for the period 311 (2,473) 1,943 895 4,688 (1,191) 6,942 (2,769)
61
4 . 0 D I S C L O S U R E S A N D L E G A L C O M P L I A N C E
TOURISM WESTERN AUSTRALIA / ANNUAL REPORT 2019 – 20
1 . 0 OV E R V I E W 2 . 0 A G E N C Y P E R F O R M A N C E
M E S S A G E T O T H E M I N I S T E R
3 . 0 S I G N I F I C A N T I S S U E S I M PA C T I N G T H E A G E N C Y
4 . 0 D I S C L O S U R E S A N D L E G A L C O M P L I A N C E

NOTE 3. USE OF OUR FUNDING
Expenses incurred in the delivery of services
This section provides additional information about how Tourism WA’s funding is applied and the accounting policies that are relevant for an understanding of the items recognised in the financial statements. The primary expenses incurred by Tourism WA in achieving its objectives and the relevant notes are:
Notes2020 2019$’000 $’000
Supplies and services Grants and subsidiesEvent operations expensesAdvertising and promotion expensesOther expenses
3.13.23.33.43.5
39,8555,914
24,41815,890
2,629
40,4631,381
26,13729,504
3,321
3.1 Supplies and services
2020 2019$’000 $’000
Communications expensesComputer expensesContracts for serviceGeneral administration expensesInsuranceMarketing servicesOperating lease, rental and hire costsPrinting and stationeryProfessional servicesResearchServices provided by the Department of Jobs, Tourism, Science and Innovation (a)
TravelVehicles
2172,078
12,8843,035
522,708
32522
3,8211,69412,371
62226
1992,113
12,2113,071
672,683
33632
6,3591,886
10,764671
71
39,855 40,463
Supplies and services are recognised as an expense in the reporting period in which they are incurred. (a) Following Machinery of Government changes that became effective 1 July 2017, Tourism WA employees were transferred to the Department of Jobs, Tourism, Science and Innovation. As the employing authority,
the Department provides personnel to Tourism WA on a free of charge basis and retains the associated cash funding from Government. Services provided by the Department in 2019 represented all employment related expenses and on-costs. In 2020, these services extended to shared systems and accommodation costs. See also Notes 3.5.1 ‘Employee benefits expense’ and 4.1 ‘Income from State Government’.
6 2
4 . 0 D I S C L O S U R E S A N D L E G A L C O M P L I A N C E
TOURISM WESTERN AUSTRALIA / ANNUAL REPORT 2019 – 20
1 . 0 OV E R V I E W 2 . 0 A G E N C Y P E R F O R M A N C E
M E S S A G E T O T H E M I N I S T E R
3 . 0 S I G N I F I C A N T I S S U E S I M PA C T I N G T H E A G E N C Y
4 . 0 D I S C L O S U R E S A N D L E G A L C O M P L I A N C E
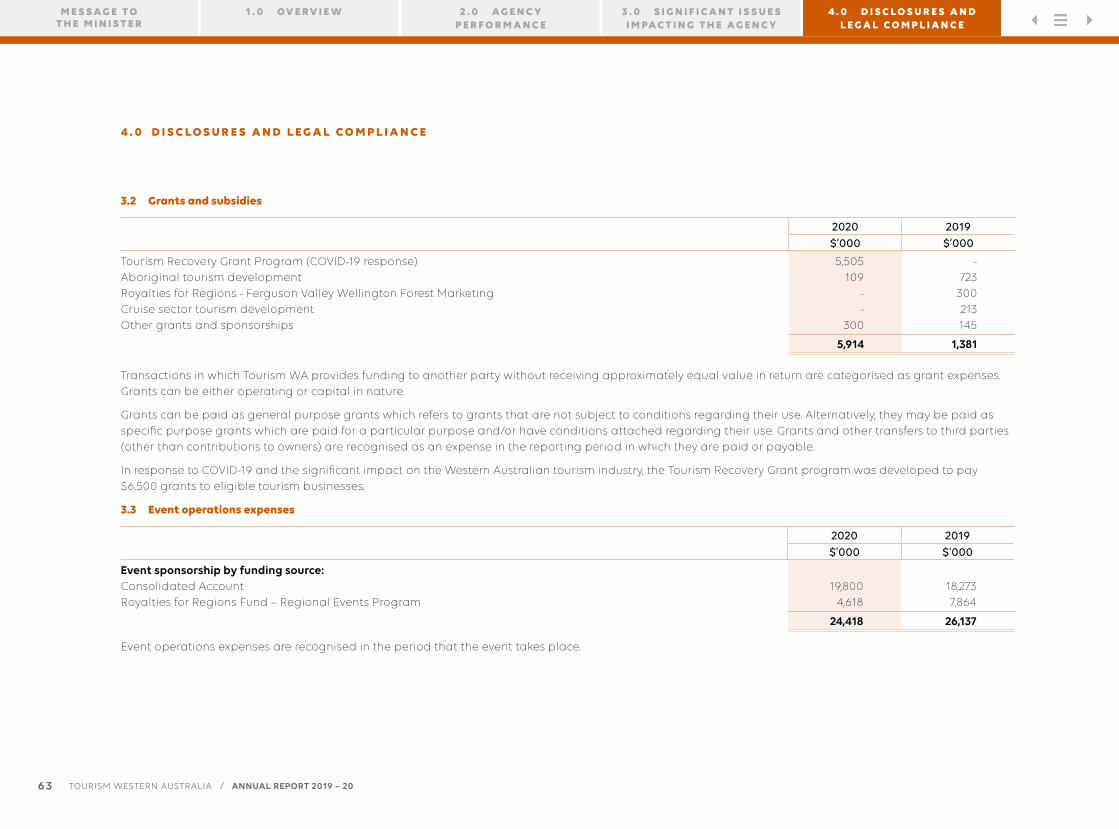
3.2 Grants and subsidies
2020 2019$’000 $’000
Tourism Recovery Grant Program (COVID-19 response)Aboriginal tourism developmentRoyalties for Regions - Ferguson Valley Wellington Forest MarketingCruise sector tourism developmentOther grants and sponsorships
5,505109
--
300
-723
300213145
5,914 1,381
Transactions in which Tourism WA provides funding to another party without receiving approximately equal value in return are categorised as grant expenses. Grants can be either operating or capital in nature.
Grants can be paid as general purpose grants which refers to grants that are not subject to conditions regarding their use. Alternatively, they may be paid as specific purpose grants which are paid for a particular purpose and/or have conditions attached regarding their use. Grants and other transfers to third parties (other than contributions to owners) are recognised as an expense in the reporting period in which they are paid or payable.
In response to COVID-19 and the significant impact on the Western Australian tourism industry, the Tourism Recovery Grant program was developed to pay $6,500 grants to eligible tourism businesses.
3.3 Event operations expenses
2020 2019$’000 $’000
Event sponsorship by funding source:Consolidated AccountRoyalties for Regions Fund – Regional Events Program
19,8004,618
18,2737,864
24,418 26,137
Event operations expenses are recognised in the period that the event takes place.
6 3
4 . 0 D I S C L O S U R E S A N D L E G A L C O M P L I A N C E
TOURISM WESTERN AUSTRALIA / ANNUAL REPORT 2019 – 20
1 . 0 OV E R V I E W 2 . 0 A G E N C Y P E R F O R M A N C E
M E S S A G E T O T H E M I N I S T E R
3 . 0 S I G N I F I C A N T I S S U E S I M PA C T I N G T H E A G E N C Y
4 . 0 D I S C L O S U R E S A N D L E G A L C O M P L I A N C E
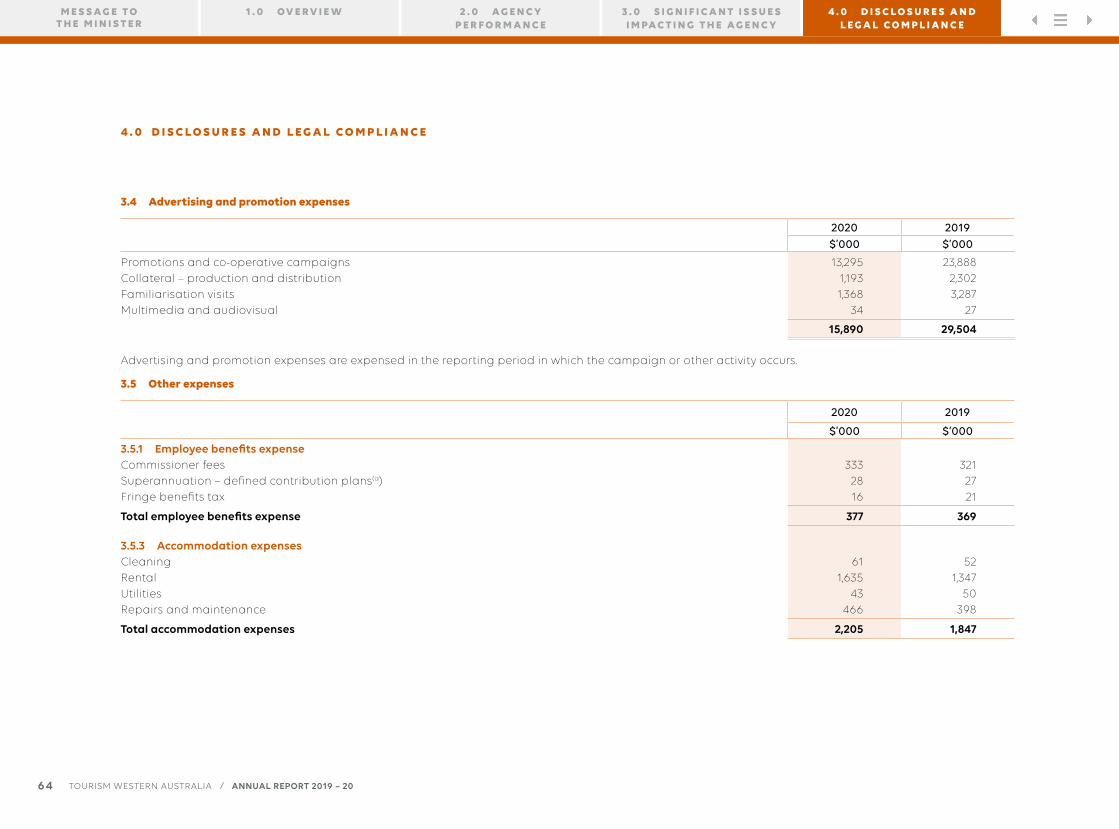
3.4 Advertising and promotion expenses
2020 2019$’000 $’000
Promotions and co-operative campaignsCollateral – production and distributionFamiliarisation visitsMultimedia and audiovisual
13,2951,1931,368
34
23,8882,3023,287
27
15,890 29,504
Advertising and promotion expenses are expensed in the reporting period in which the campaign or other activity occurs.
3.5 Other expenses
2020 2019
$’000 $’000
3.5.1 Employee benefits expenseCommissioner feesSuperannuation – defined contribution plans(a)Fringe benefits tax
3332816
3212721
Total employee benefits expense 377 369
3.5.3 Accommodation expensesCleaningRentalUtilitiesRepairs and maintenance
611,635
43466
521,347
50398
Total accommodation expenses 2,205 1,847
6 4
4 . 0 D I S C L O S U R E S A N D L E G A L C O M P L I A N C E
TOURISM WESTERN AUSTRALIA / ANNUAL REPORT 2019 – 20
1 . 0 OV E R V I E W 2 . 0 A G E N C Y P E R F O R M A N C E
M E S S A G E T O T H E M I N I S T E R
3 . 0 S I G N I F I C A N T I S S U E S I M PA C T I N G T H E A G E N C Y
4 . 0 D I S C L O S U R E S A N D L E G A L C O M P L I A N C E

2020 2019
$’000 $’000
3.5.4 Other expendituresLoss on foreign exchangeLoss on disposal of non-current assetsLease interest expenseRoyalties for Regions – refund of cash balancesMiscellaneous expenditure
33932-
54--
1,03021
Total other expenditures 47 1,105
Total other expenses 2,629 3,321
(a) Defined contribution plans for Commissioners are either Government Employees Superannuation Board Schemes (GESBs) or other eligible funds.
3.5.1 Employee benefits expense
Employee benefits represents costs associated with the Board of Commissioners of Tourism WA.
Tourism WA employees, excluding Commissioners, were transferred to the new Department of Jobs, Tourism, Science and Innovation on 1 July 2017. The Department provides personnel to Tourism WA on a free of charge basis and associated costs are recognised under ‘Supplies and services’ (see also Note 3.1 ‘Supplies and services’ and 4.1 ‘Income from State Government’).
3.5.2 Employee related provisions
Provision is made for benefits accruing to employees in respect of annual leave for services rendered up to the reporting date and recorded as an expense during the period the services are delivered.
Employee related provisions associated with local staff were transferred to the Department of Jobs, Tourism, Science and Innovation following the transfer of staff to the Department on 1 July 2017. Reported provisions solely represent annual leave provisions for international staff of Tourism WA. The Board of Commissioners of Tourism WA are paid at a set remuneration rate and do not accrue leave entitlements.
6 5
4 . 0 D I S C L O S U R E S A N D L E G A L C O M P L I A N C E
TOURISM WESTERN AUSTRALIA / ANNUAL REPORT 2019 – 20
1 . 0 OV E R V I E W 2 . 0 A G E N C Y P E R F O R M A N C E
M E S S A G E T O T H E M I N I S T E R
3 . 0 S I G N I F I C A N T I S S U E S I M PA C T I N G T H E A G E N C Y
4 . 0 D I S C L O S U R E S A N D L E G A L C O M P L I A N C E

2020 2019$’000 $’000
CurrentEmployee benefits provisionAnnual leave(a) 139 123
Total employee related provisions 139 123
(a) Annual leave liabilities: Classified as current as there is no unconditional right to defer settlement for at least 12 months after the end of the reporting period.
The provision for annual leave is calculated at the present value of expected payments to be made in relation to services provided by employees up to the reporting date.
3.5.3 Rental expenses include lease and variable lease payments that are recognised in the period in which the event or condition that triggers those payments occurs. Rental expenses in this category include the costs of leases and other agreements that do not meet the criteria of AASB 16 Leases and have therefore been expensed.
Cleaning, utilities and repairs and maintenance are recognised as expenses are incurred.
NOTE 4. OUR FUNDING SOURCES
How we obtain our funding
This section provides additional information about how Tourism WA obtains its funding and the relevant accounting policy notes that govern the recognition and measurement of this funding. The primary income received by Tourism WA and the relevant notes are:
Notes2020 2019$’000 $’000
Income from State GovernmentCommonwealth grants and contributionsInterest revenueOther revenue
4.14.2
4.3
95,58514
179411
97,65699
402484
6 6
4 . 0 D I S C L O S U R E S A N D L E G A L C O M P L I A N C E
TOURISM WESTERN AUSTRALIA / ANNUAL REPORT 2019 – 20
1 . 0 OV E R V I E W 2 . 0 A G E N C Y P E R F O R M A N C E
M E S S A G E T O T H E M I N I S T E R
3 . 0 S I G N I F I C A N T I S S U E S I M PA C T I N G T H E A G E N C Y
4 . 0 D I S C L O S U R E S A N D L E G A L C O M P L I A N C E
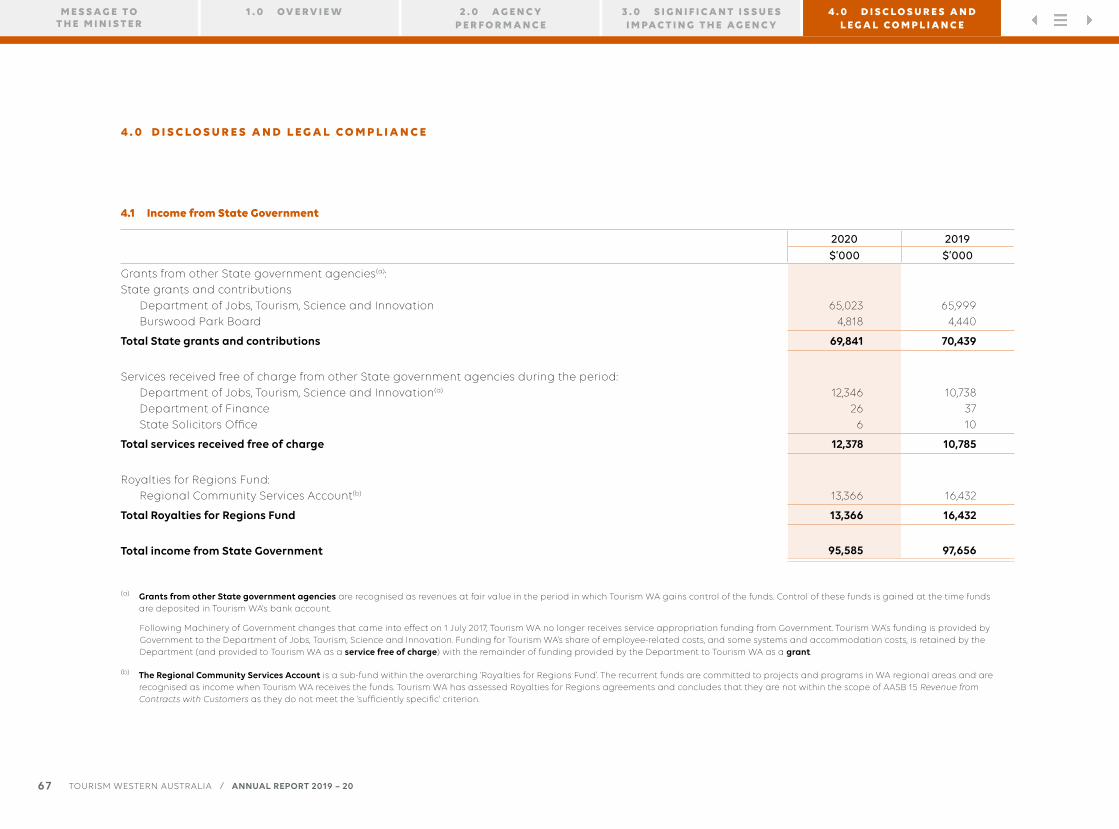
4.1 Income from State Government
2020 2019$’000 $’000
Grants from other State government agencies(a):State grants and contributions
Department of Jobs, Tourism, Science and InnovationBurswood Park Board
65,0234,818
65,9994,440
Total State grants and contributions 69,841 70,439
Services received free of charge from other State government agencies during the period:Department of Jobs, Tourism, Science and Innovation(a)
Department of FinanceState Solicitors Office
12,346266
10,7383710
Total services received free of charge 12,378 10,785
Royalties for Regions Fund:Regional Community Services Account(b) 13,366 16,432
Total Royalties for Regions Fund 13,366 16,432
Total income from State Government 95,585 97,656
(a) Grants from other State government agencies are recognised as revenues at fair value in the period in which Tourism WA gains control of the funds. Control of these funds is gained at the time funds are deposited in Tourism WA’s bank account.
Following Machinery of Government changes that came into effect on 1 July 2017, Tourism WA no longer receives service appropriation funding from Government. Tourism WA’s funding is provided by Government to the Department of Jobs, Tourism, Science and Innovation. Funding for Tourism WA’s share of employee-related costs, and some systems and accommodation costs, is retained by the Department (and provided to Tourism WA as a service free of charge) with the remainder of funding provided by the Department to Tourism WA as a grant.
(b) The Regional Community Services Account is a sub-fund within the overarching ‘Royalties for Regions Fund’. The recurrent funds are committed to projects and programs in WA regional areas and are recognised as income when Tourism WA receives the funds. Tourism WA has assessed Royalties for Regions agreements and concludes that they are not within the scope of AASB 15 Revenue from Contracts with Customers as they do not meet the ‘sufficiently specific’ criterion.
6 7
4 . 0 D I S C L O S U R E S A N D L E G A L C O M P L I A N C E
TOURISM WESTERN AUSTRALIA / ANNUAL REPORT 2019 – 20
1 . 0 OV E R V I E W 2 . 0 A G E N C Y P E R F O R M A N C E
M E S S A G E T O T H E M I N I S T E R
3 . 0 S I G N I F I C A N T I S S U E S I M PA C T I N G T H E A G E N C Y
4 . 0 D I S C L O S U R E S A N D L E G A L C O M P L I A N C E
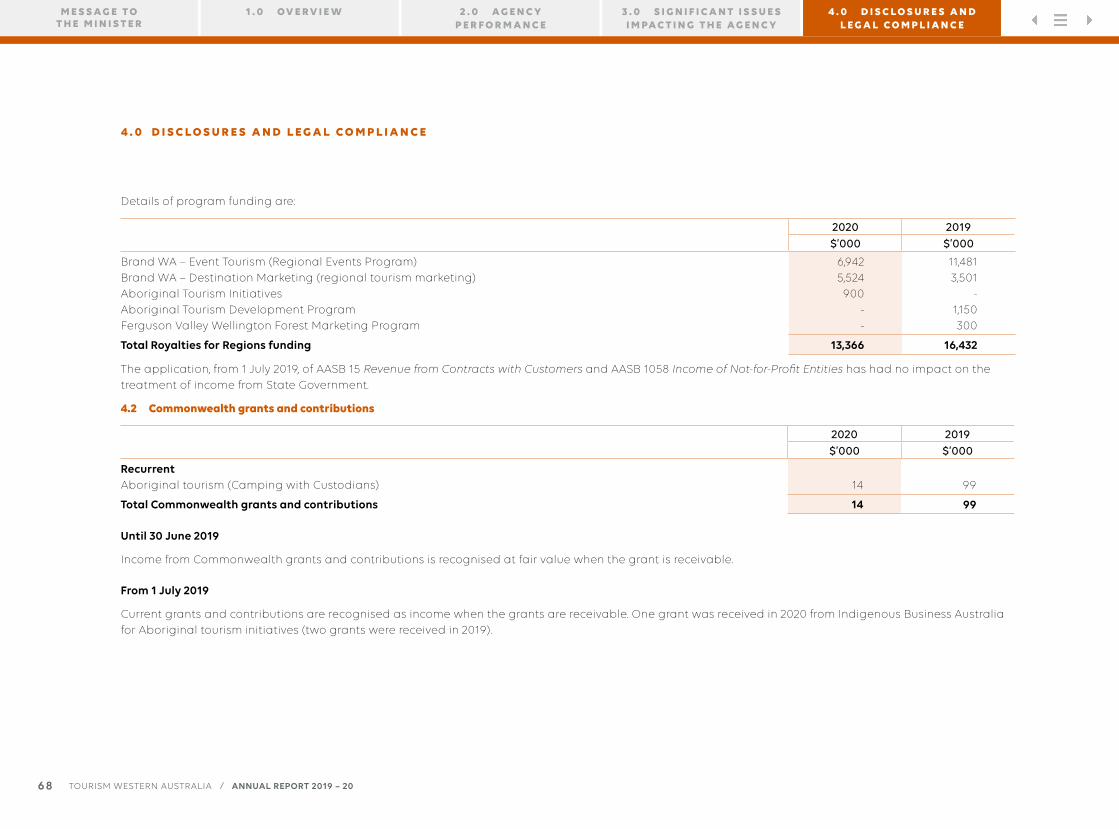
Details of program funding are:
2020 2019$’000 $’000
Brand WA – Event Tourism (Regional Events Program)Brand WA – Destination Marketing (regional tourism marketing)Aboriginal Tourism InitiativesAboriginal Tourism Development ProgramFerguson Valley Wellington Forest Marketing Program
6,9425,524900
--
11,4813,501
-1,150300
Total Royalties for Regions funding 13,366 16,432
The application, from 1 July 2019, of AASB 15 Revenue from Contracts with Customers and AASB 1058 Income of Not-for-Profit Entities has had no impact on the treatment of income from State Government.
4.2 Commonwealth grants and contributions
2020 2019$’000 $’000
RecurrentAboriginal tourism (Camping with Custodians) 14 99
Total Commonwealth grants and contributions 14 99
Until 30 June 2019
Income from Commonwealth grants and contributions is recognised at fair value when the grant is receivable.
From 1 July 2019
Current grants and contributions are recognised as income when the grants are receivable. One grant was received in 2020 from Indigenous Business Australia for Aboriginal tourism initiatives (two grants were received in 2019).
6 8
4 . 0 D I S C L O S U R E S A N D L E G A L C O M P L I A N C E
TOURISM WESTERN AUSTRALIA / ANNUAL REPORT 2019 – 20
1 . 0 OV E R V I E W 2 . 0 A G E N C Y P E R F O R M A N C E
M E S S A G E T O T H E M I N I S T E R
3 . 0 S I G N I F I C A N T I S S U E S I M PA C T I N G T H E A G E N C Y
4 . 0 D I S C L O S U R E S A N D L E G A L C O M P L I A N C E
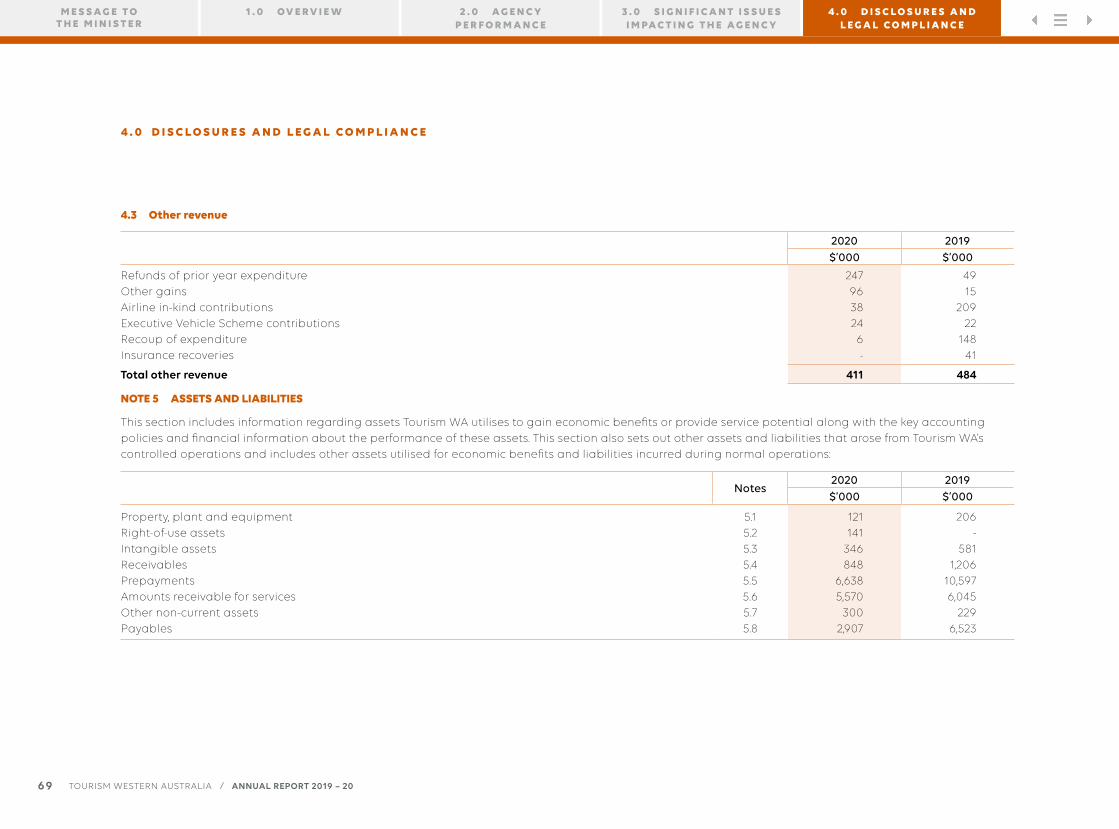
4.3 Other revenue
2020 2019$’000 $’000
Refunds of prior year expenditureOther gainsAirline in-kind contributionsExecutive Vehicle Scheme contributionsRecoup of expenditureInsurance recoveries
2479638246-
4915
20922
14841
Total other revenue 411 484
NOTE 5 ASSETS AND LIABILITIES
This section includes information regarding assets Tourism WA utilises to gain economic benefits or provide service potential along with the key accounting policies and financial information about the performance of these assets. This section also sets out other assets and liabilities that arose from Tourism WA’s controlled operations and includes other assets utilised for economic benefits and liabilities incurred during normal operations:
Notes2020 2019$’000 $’000
Property, plant and equipmentRight-of-use assetsIntangible assetsReceivablesPrepaymentsAmounts receivable for servicesOther non-current assetsPayables
5.15.25.35.45.55.65.75.8
121141
346848
6,6385,570
3002,907
206-
5811,206
10,5976,045
2296,523
69
4 . 0 D I S C L O S U R E S A N D L E G A L C O M P L I A N C E
TOURISM WESTERN AUSTRALIA / ANNUAL REPORT 2019 – 20
1 . 0 OV E R V I E W 2 . 0 A G E N C Y P E R F O R M A N C E
M E S S A G E T O T H E M I N I S T E R
3 . 0 S I G N I F I C A N T I S S U E S I M PA C T I N G T H E A G E N C Y
4 . 0 D I S C L O S U R E S A N D L E G A L C O M P L I A N C E

5.1 Property, plant and equipment
Year ended 30 June 2020
Furniture, fittings and equipment
Computer equipment
Work in progress
Total
$’000 $’000 $’000 $’000
1 July 2019Gross carrying amountAccumulated depreciationAccumulated impairment loss
2,930(2,793)
-
431(362)
-
---
3,361(3,155)
-
Carrying amount at start of period 137 69 - 206
AdditionsDisposals – gross carrying amountDisposals – accumulated depreciationImpairment losses (a)Impairment losses reversed (a)Depreciation
-(2,733)2,719
--
(123)
22(221)221
--
(21)
51-----
73(2,954)2,940
--
(144)
Carrying amount at 30 June 2020 - 70 51 121
Comprising:Gross carrying amountAccumulated depreciationAccumulated impairment loss
197(197)
-
232(162)
-
51--
480(359)
-
Carrying amount at 30 June 2020 - 70 51 121
(a) Recognised in the Statement of Comprehensive Income. Where an asset measured at cost is written down to recoverable amount, an impairment loss is recognised in profit or loss. Where a previously revalued asset is written down to recoverable amount, the loss is recognised as a revaluation decrement in other comprehensive income.
7 0
4 . 0 D I S C L O S U R E S A N D L E G A L C O M P L I A N C E
TOURISM WESTERN AUSTRALIA / ANNUAL REPORT 2019 – 20
1 . 0 OV E R V I E W 2 . 0 A G E N C Y P E R F O R M A N C E
M E S S A G E T O T H E M I N I S T E R
3 . 0 S I G N I F I C A N T I S S U E S I M PA C T I N G T H E A G E N C Y
4 . 0 D I S C L O S U R E S A N D L E G A L C O M P L I A N C E

Initial recognition
Items of property, plant and equipment costing $5,000 or more are measured initially at cost. Where an asset is acquired for no cost or significantly less than fair value, the cost is valued at its fair value at the date of acquisition. Items of property, plant and equipment costing less than $5,000 are immediately expensed direct to the Statement of Comprehensive Income (other than where they form part of a group of similar items which are significant in total).
Assets transferred as part of a Machinery of Government change are transferred at their fair value. There were no asset transfers affecting Tourism WA as part of Machinery of Government changes during the reporting period.
The cost of a leasehold improvement is capitalised and depreciated over the shorter of the remaining term of the lease or the estimated useful life of the leasehold improvement. As at the reporting date, Tourism WA did not carry any leasehold improvement assets.
Subsequent measurement
Subsequent to initial recognition as an asset, property, plant and equipment are stated at historical cost less accumulated depreciation and accumulated impairment losses.
5.1.1 Depreciation and impairment
Charge for the period
2020 2019
$’000 $’000
DepreciationFurniture, fittings and equipmentComputing equipment
12321
749
Total depreciation for the period 144 83
As at 30 June 2020 there were no indications of impairment to property, plant and equipment.
All surplus assets at 30 June 2020 have either been classified as assets held for sale or have been written off.
Finite useful lives
All items of property, plant and equipment having a limited useful life are systematically depreciated over their estimated useful lives in a manner that reflects the consumption of their future economic benefits.
7 1
4 . 0 D I S C L O S U R E S A N D L E G A L C O M P L I A N C E
TOURISM WESTERN AUSTRALIA / ANNUAL REPORT 2019 – 20
1 . 0 OV E R V I E W 2 . 0 A G E N C Y P E R F O R M A N C E
M E S S A G E T O T H E M I N I S T E R
3 . 0 S I G N I F I C A N T I S S U E S I M PA C T I N G T H E A G E N C Y
4 . 0 D I S C L O S U R E S A N D L E G A L C O M P L I A N C E

Depreciation is calculated on a straight-line basis, at rates that allocate the asset’s value, less any estimated residual value, over its estimated useful life. The estimated useful lives for the different asset classes for current and prior years are as follows:
Asset class Useful life
Furniture, fittings and equipment 5 to 10 years
Computer equipment 3 to 5 years
Leasehold improvements Shorter of remaining term of lease or estimated useful life of improvement
The estimated useful lives, residual values and depreciation method are reviewed at the end of each annual reporting period and adjustments made where appropriate.
Impairment
Non-financial assets, including items of property, plant and equipment, right-of-use assets and intangible assets, are tested for impairment whenever there is an indication that the asset may be impaired. Where there is an indication of impairment, the recoverable amount is estimated. Where the recoverable amount is less than the carrying amount, the asset is considered impaired and is written down to the recoverable amount and an impairment loss is recognised.
Where an asset measured at cost is written down to its recoverable amount, an impairment loss is recognised through profit or loss.
Where a previously revalued asset is written down to its recoverable amount, the loss is recognised as a revaluation decrement through other comprehensive income.
As Tourism WA is a not-for-profit agency, the recoverable amount of regularly revalued specialised assets is anticipated to be materially the same as fair value.
If there is an indication that there has been a reversal in impairment, the carrying amount is increased to its recoverable amount. However this reversal does not increase the asset’s carrying amount above what would have been determined, net of depreciation or amortisation, if no impairment loss had been recognised in prior years.
The risk of impairment is generally limited to circumstances where an asset’s depreciation is materially understated, where the replacement cost is falling or where there is a significant change in useful life. Each relevant class of assets is reviewed annually to verify that the accumulated depreciation/amortisation reflects the level of consumption or expiration of the asset’s future economic benefits and to evaluate any impairment risk from declining replacement costs.
7 2
4 . 0 D I S C L O S U R E S A N D L E G A L C O M P L I A N C E
TOURISM WESTERN AUSTRALIA / ANNUAL REPORT 2019 – 20
1 . 0 OV E R V I E W 2 . 0 A G E N C Y P E R F O R M A N C E
M E S S A G E T O T H E M I N I S T E R
3 . 0 S I G N I F I C A N T I S S U E S I M PA C T I N G T H E A G E N C Y
4 . 0 D I S C L O S U R E S A N D L E G A L C O M P L I A N C E

5.2 Right-of-use assets
2020 2019$’000 $’000
Right-of-use assets
AccommodationVehicles
8754
--
Net carrying amount at 30 June 2020 141 -
Additions to right-of-use assets during the 2020 financial year were $96,581.
Initial recognition
Right-of-use assets are measured at cost including the following:
– the amount of the initial measurement of lease liability;
– any lease payments made at or before the commencement date less any lease incentives received;
– any initial direct costs; and
– restoration costs, including dismantling and removing the underlying asset.
Tourism WA has elected not to recognise right-of-use assets and lease liabilities for short-term leases (with a lease term of 12 months or less) and low value leases (with an underlying value less than $5,000). In addition, accommodation leases held centrally by the Department of Finance are not recognised as right-of-use assets by Tourism WA. Lease payments associated with these leases are expensed over a straight-line basis over the lease term.
Subsequent measurement
The cost model is applied for subsequent measurement of right-of-use assets, requiring the asset to be carried at cost less any accumulated depreciation and accumulated impairment losses and adjusted for any re-measurement of lease liability.
Depreciation and impairment of right-of-use assets
Right-of-use assets are depreciated on a straight-line basis over the shorter of the lease term and the estimated useful lives of the underlying assets.
If ownership of the leased asset transfers to Tourism WA at the end of the lease term, or the cost reflects the exercise of a purchase option, depreciation is calculated using the estimated useful life of the asset.
Right-of-use assets are tested for impairment when an indication of impairment is identified. The policy in connection with testing for impairment is outlined in note 5.1.1.
7 3
4 . 0 D I S C L O S U R E S A N D L E G A L C O M P L I A N C E
TOURISM WESTERN AUSTRALIA / ANNUAL REPORT 2019 – 20
1 . 0 OV E R V I E W 2 . 0 A G E N C Y P E R F O R M A N C E
M E S S A G E T O T H E M I N I S T E R
3 . 0 S I G N I F I C A N T I S S U E S I M PA C T I N G T H E A G E N C Y
4 . 0 D I S C L O S U R E S A N D L E G A L C O M P L I A N C E
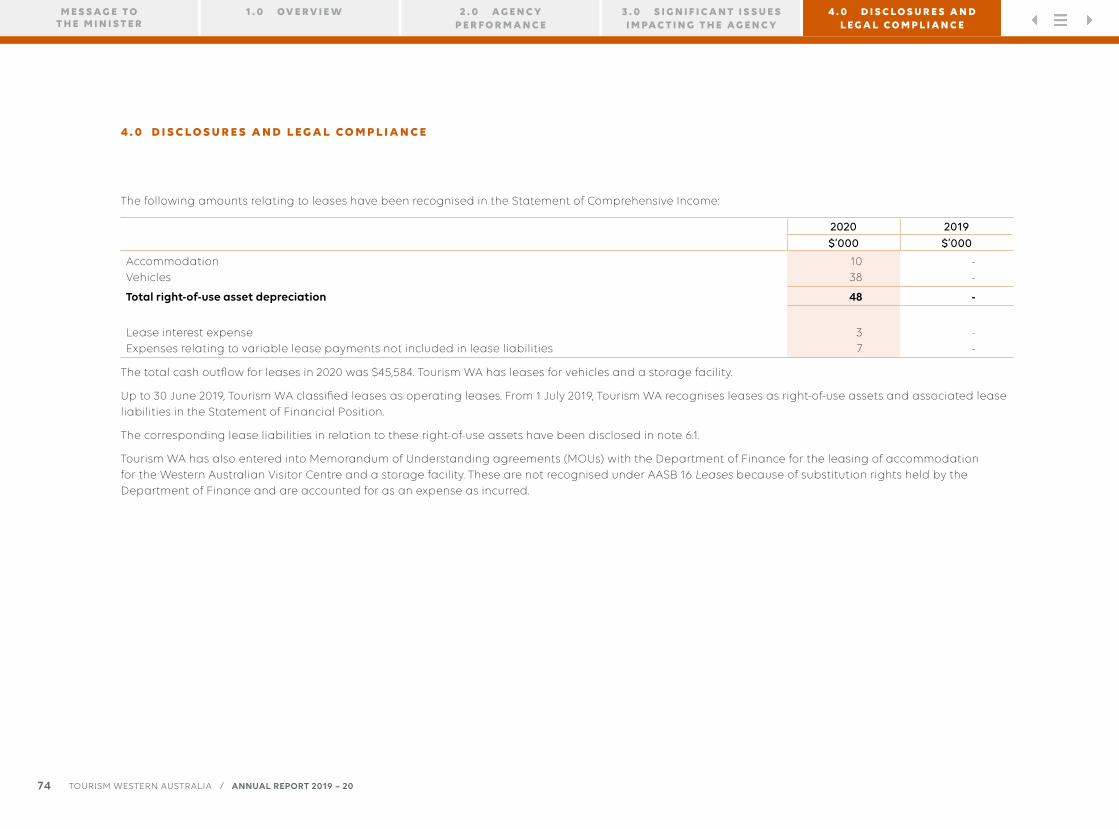
The following amounts relating to leases have been recognised in the Statement of Comprehensive Income:
2020 2019$’000 $’000
AccommodationVehicles
1038
--
Total right-of-use asset depreciation 48 -
Lease interest expenseExpenses relating to variable lease payments not included in lease liabilities
37
--
The total cash outflow for leases in 2020 was $45,584. Tourism WA has leases for vehicles and a storage facility.
Up to 30 June 2019, Tourism WA classified leases as operating leases. From 1 July 2019, Tourism WA recognises leases as right-of-use assets and associated lease liabilities in the Statement of Financial Position.
The corresponding lease liabilities in relation to these right-of-use assets have been disclosed in note 6.1.
Tourism WA has also entered into Memorandum of Understanding agreements (MOUs) with the Department of Finance for the leasing of accommodation for the Western Australian Visitor Centre and a storage facility. These are not recognised under AASB 16 Leases because of substitution rights held by the Department of Finance and are accounted for as an expense as incurred.
74
4 . 0 D I S C L O S U R E S A N D L E G A L C O M P L I A N C E
TOURISM WESTERN AUSTRALIA / ANNUAL REPORT 2019 – 20
1 . 0 OV E R V I E W 2 . 0 A G E N C Y P E R F O R M A N C E
M E S S A G E T O T H E M I N I S T E R
3 . 0 S I G N I F I C A N T I S S U E S I M PA C T I N G T H E A G E N C Y
4 . 0 D I S C L O S U R E S A N D L E G A L C O M P L I A N C E

5.3 Intangible assets
Year ended 30 June 2020
Software and website development
Development costs
Campaign production costs
Works in Progress Total
$’000 $’000 $’000 $’000 $’000
1 July 2019 Gross carrying amountAccumulated amortisation
739(287)
706(660)
990(907)
--
2,435(1,854)
Carrying amount at start of period 452 46 83 - 581
AdditionsDisposals – gross carrying amountDisposals – accumulated amortisationImpairment lossesImpairment losses reversedAmortisation expense
-(18)18
--
(220)
-----
(46)
-(990)990
--
(83)
114-----
114(1,008)1,008
--
(349)
Carrying amount at 30 June 2020 232 - - 114 346
Comprising:Gross carrying amountAccumulated amortisation
721(489)
706(706)
--
114-
1,541(1,195)
Carrying amount at 30 June 2020 232 - - 114 346
Software and website development
Software that is an integral part of the related hardware is recognised as property, plant and equipment. Software that is not an integral part of the related hardware is recognised as an intangible asset. Software licences have a finite useful life and are carried at cost less accumulated amortisation and accumulated impairment losses.
7 5
4 . 0 D I S C L O S U R E S A N D L E G A L C O M P L I A N C E
TOURISM WESTERN AUSTRALIA / ANNUAL REPORT 2019 – 20
1 . 0 OV E R V I E W 2 . 0 A G E N C Y P E R F O R M A N C E
M E S S A G E T O T H E M I N I S T E R
3 . 0 S I G N I F I C A N T I S S U E S I M PA C T I N G T H E A G E N C Y
4 . 0 D I S C L O S U R E S A N D L E G A L C O M P L I A N C E
Development costs
Research costs are expensed as incurred. Development costs incurred for an individual project are carried forward when the future economic benefits can reasonably be regarded as assured and the total project costs are likely to exceed $50,000. Other development costs are expensed as incurred.
Campaign production costs
Internally developed campaign production costs associated with researching campaign concepts, including fees paid to creative agencies, are expensed as incurred up to approval of the final concept. Costs incurred for development of the approved campaign concepts, including casting, travel and accommodation, licencing, music, location costs, filming and other production and post-production costs, are carried forward when the future economic benefits can reasonably be regarded as assured. These are carried at cost less accumulated amortisation and accumulated impairment losses. All costs of advertisement placement are expenses when incurred.
Website costs
Website costs are charged as expenses when they are incurred unless they relate to the acquisition or development of an asset when they may be capitalised and amortised. Generally, costs in relation to feasibility studies during the planning phase of a website, and ongoing costs of maintenance during the maintenance phase are expensed. Costs incurred in building or enhancing a website that can be reliably measured, are capitalised to the extent that they represent probable future economic benefits.
Initial recognition
Intangible assets are initially recognised at cost. For assets acquired at a cost significantly less than fair value, the cost is their fair value at the date of acquisition.
An internally generated intangible asset arising from development (or from the development phase of an internal project) is recognised if, and only if, all of the following are demonstrated:
a. The technical feasibility of completing the intangible asset so that it will be available for use or sale;
b. An intention to complete the intangible asset, and use or sell it;
c. The ability to use or sell the intangible asset;
d. The intangible asset will generate probable future economic benefit;
e. The availability of adequate technical, financial and other resources to complete the development and to use or sell the intangible asset; and
f. The ability to measure reliably the expenditure attributable to the intangible asset during its development.
76
4 . 0 D I S C L O S U R E S A N D L E G A L C O M P L I A N C E
TOURISM WESTERN AUSTRALIA / ANNUAL REPORT 2019 – 20
1 . 0 OV E R V I E W 2 . 0 A G E N C Y P E R F O R M A N C E
M E S S A G E T O T H E M I N I S T E R
3 . 0 S I G N I F I C A N T I S S U E S I M PA C T I N G T H E A G E N C Y
4 . 0 D I S C L O S U R E S A N D L E G A L C O M P L I A N C E
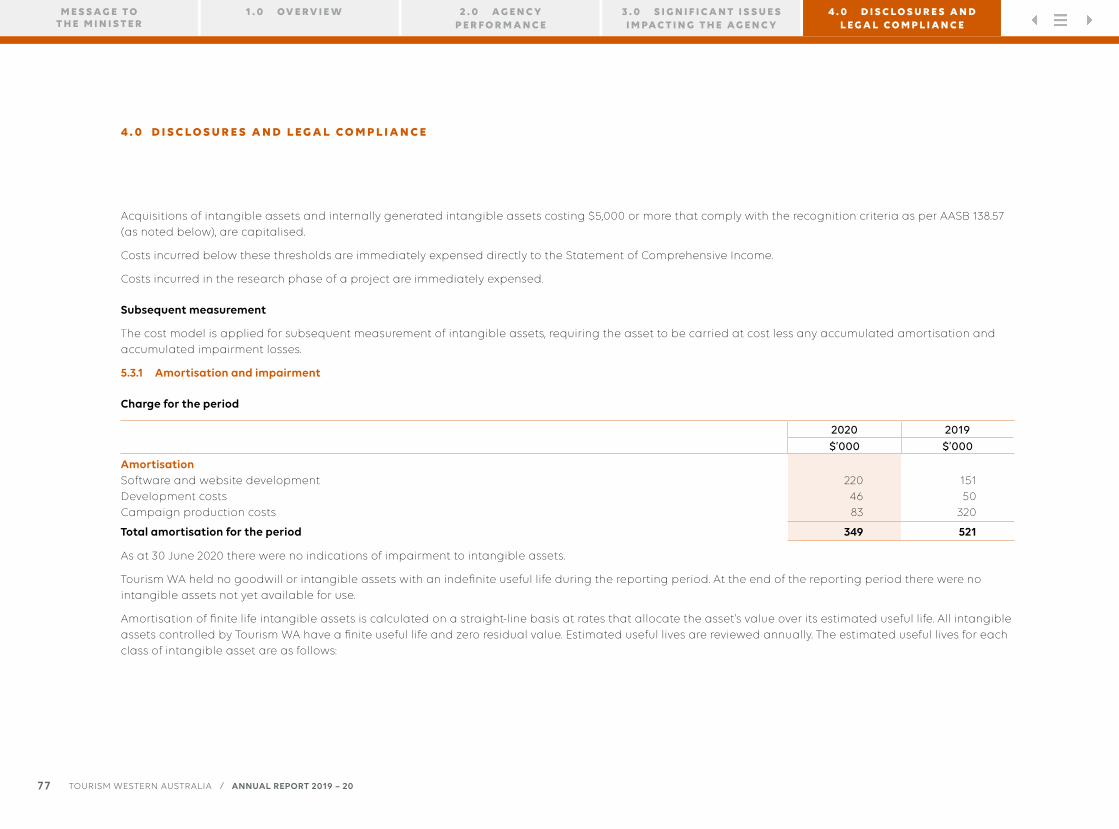
Acquisitions of intangible assets and internally generated intangible assets costing $5,000 or more that comply with the recognition criteria as per AASB 138.57 (as noted below), are capitalised.
Costs incurred below these thresholds are immediately expensed directly to the Statement of Comprehensive Income.
Costs incurred in the research phase of a project are immediately expensed.
Subsequent measurement
The cost model is applied for subsequent measurement of intangible assets, requiring the asset to be carried at cost less any accumulated amortisation and accumulated impairment losses.
5.3.1 Amortisation and impairment
Charge for the period
2020 2019$’000 $’000
AmortisationSoftware and website developmentDevelopment costsCampaign production costs
2204683
15150
320
Total amortisation for the period 349 521
As at 30 June 2020 there were no indications of impairment to intangible assets.
Tourism WA held no goodwill or intangible assets with an indefinite useful life during the reporting period. At the end of the reporting period there were no intangible assets not yet available for use.
Amortisation of finite life intangible assets is calculated on a straight-line basis at rates that allocate the asset’s value over its estimated useful life. All intangible assets controlled by Tourism WA have a finite useful life and zero residual value. Estimated useful lives are reviewed annually. The estimated useful lives for each class of intangible asset are as follows:
7 7
4 . 0 D I S C L O S U R E S A N D L E G A L C O M P L I A N C E
TOURISM WESTERN AUSTRALIA / ANNUAL REPORT 2019 – 20
1 . 0 OV E R V I E W 2 . 0 A G E N C Y P E R F O R M A N C E
M E S S A G E T O T H E M I N I S T E R
3 . 0 S I G N I F I C A N T I S S U E S I M PA C T I N G T H E A G E N C Y
4 . 0 D I S C L O S U R E S A N D L E G A L C O M P L I A N C E
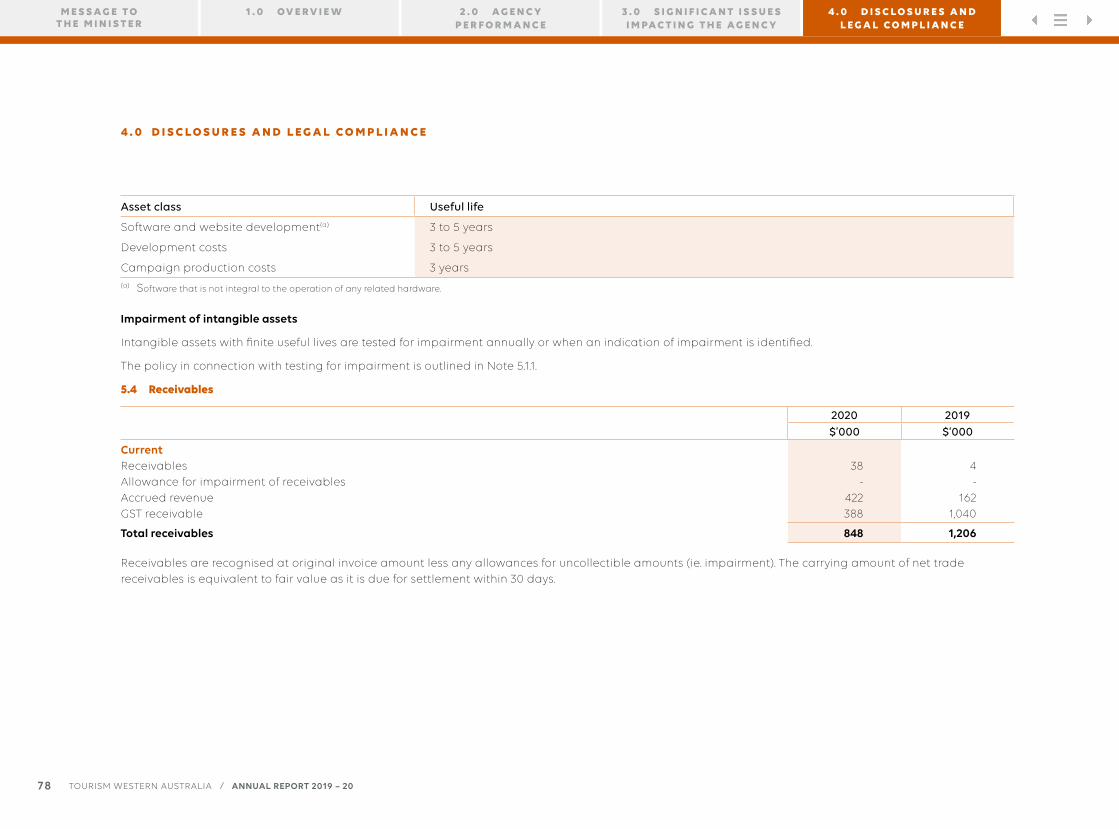
Asset class Useful life
Software and website development(a) 3 to 5 years
Development costs 3 to 5 years
Campaign production costs 3 years(a) Software that is not integral to the operation of any related hardware.
Impairment of intangible assets
Intangible assets with finite useful lives are tested for impairment annually or when an indication of impairment is identified.
The policy in connection with testing for impairment is outlined in Note 5.1.1.
5.4 Receivables
2020 2019$’000 $’000
CurrentReceivablesAllowance for impairment of receivablesAccrued revenueGST receivable
38-
422388
4-
1621,040
Total receivables 848 1,206
Receivables are recognised at original invoice amount less any allowances for uncollectible amounts (ie. impairment). The carrying amount of net trade receivables is equivalent to fair value as it is due for settlement within 30 days.
7 8
4 . 0 D I S C L O S U R E S A N D L E G A L C O M P L I A N C E
TOURISM WESTERN AUSTRALIA / ANNUAL REPORT 2019 – 20
1 . 0 OV E R V I E W 2 . 0 A G E N C Y P E R F O R M A N C E
M E S S A G E T O T H E M I N I S T E R
3 . 0 S I G N I F I C A N T I S S U E S I M PA C T I N G T H E A G E N C Y
4 . 0 D I S C L O S U R E S A N D L E G A L C O M P L I A N C E

5.5 Prepayments
2020 2019$’000 $’000
Event sponsorshipMarketing campaign activityLicence, maintenance and support feesAccommodation expensesOther
5,782689
59-
108
9,71998
573135
72
Total prepayments 6,638 10,597
Prepayments represent payments in advance of receipt of goods or services or that part of expenditure made in one accounting period covering a term extending beyond that period.
5.6 Amounts receivable for services (holding account)
2020 2019$’000 $’000
CurrentNon-current
4755,095
4755,570
Balance at end of period 5,570 6,045
Amounts receivable for services represent the non-cash component of service appropriations. For Tourism WA, the non-cash component of service appropriations was received up to 30 June 2017 (prior to Machinery of Government changes). The balance of amounts receivable for services is restricted in that it can only be used for asset replacement.
Amounts receivable for services are considered not impaired (ie. there is no expected credit loss of the holding account).
7 9
4 . 0 D I S C L O S U R E S A N D L E G A L C O M P L I A N C E
TOURISM WESTERN AUSTRALIA / ANNUAL REPORT 2019 – 20
1 . 0 OV E R V I E W 2 . 0 A G E N C Y P E R F O R M A N C E
M E S S A G E T O T H E M I N I S T E R
3 . 0 S I G N I F I C A N T I S S U E S I M PA C T I N G T H E A G E N C Y
4 . 0 D I S C L O S U R E S A N D L E G A L C O M P L I A N C E
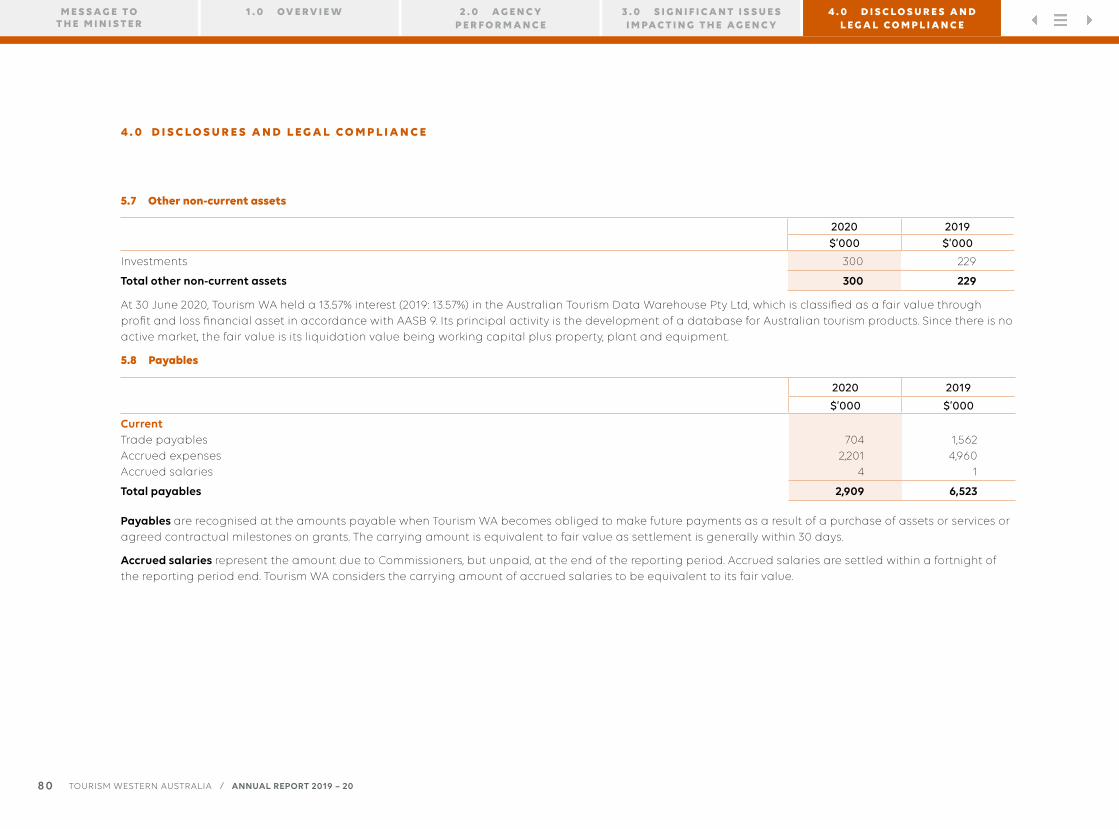
5.7 Other non-current assets
2020 2019$’000 $’000
Investments 300 229
Total other non-current assets 300 229
At 30 June 2020, Tourism WA held a 13.57% interest (2019: 13.57%) in the Australian Tourism Data Warehouse Pty Ltd, which is classified as a fair value through profit and loss financial asset in accordance with AASB 9. Its principal activity is the development of a database for Australian tourism products. Since there is no active market, the fair value is its liquidation value being working capital plus property, plant and equipment.
5.8 Payables
2020 2019
$’000 $’000
CurrentTrade payablesAccrued expensesAccrued salaries
7042,201
4
1,5624,960
1
Total payables 2,909 6,523
Payables are recognised at the amounts payable when Tourism WA becomes obliged to make future payments as a result of a purchase of assets or services or agreed contractual milestones on grants. The carrying amount is equivalent to fair value as settlement is generally within 30 days.
Accrued salaries represent the amount due to Commissioners, but unpaid, at the end of the reporting period. Accrued salaries are settled within a fortnight of the reporting period end. Tourism WA considers the carrying amount of accrued salaries to be equivalent to its fair value.
8 0
4 . 0 D I S C L O S U R E S A N D L E G A L C O M P L I A N C E
TOURISM WESTERN AUSTRALIA / ANNUAL REPORT 2019 – 20
1 . 0 OV E R V I E W 2 . 0 A G E N C Y P E R F O R M A N C E
M E S S A G E T O T H E M I N I S T E R
3 . 0 S I G N I F I C A N T I S S U E S I M PA C T I N G T H E A G E N C Y
4 . 0 D I S C L O S U R E S A N D L E G A L C O M P L I A N C E
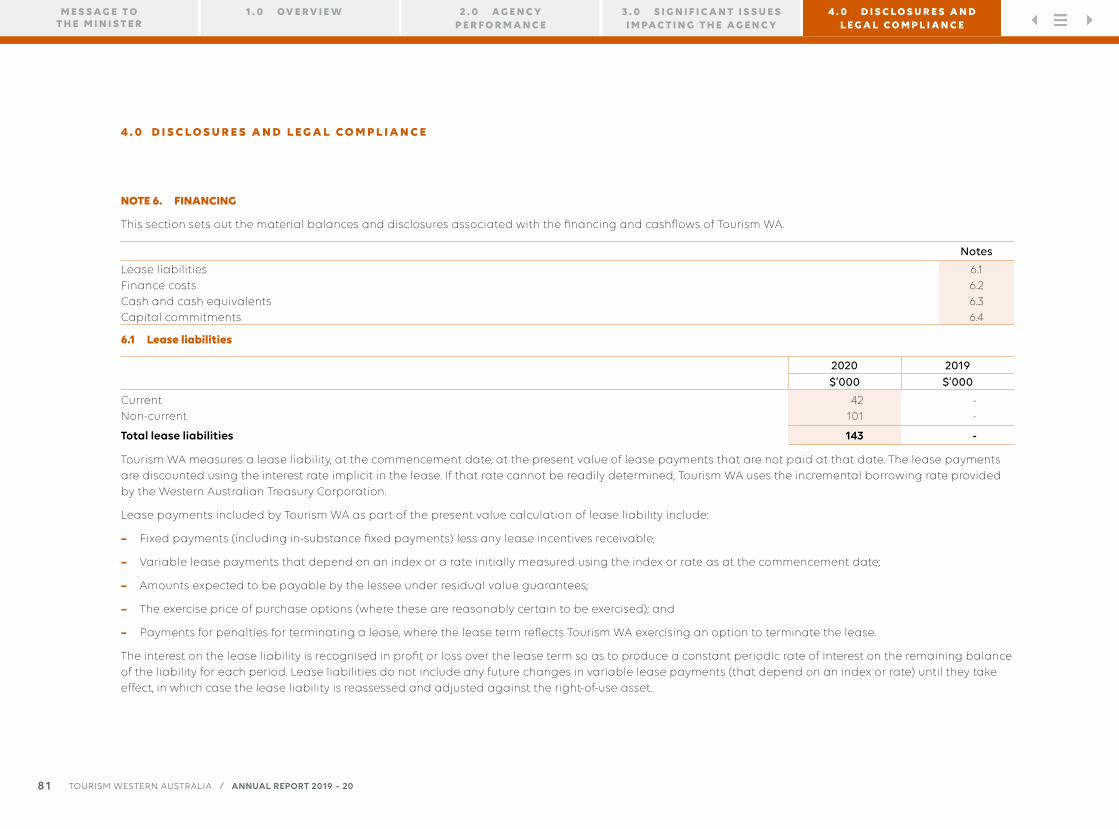
NOTE 6. FINANCING
This section sets out the material balances and disclosures associated with the financing and cashflows of Tourism WA.
Notes
Lease liabilitiesFinance costsCash and cash equivalentsCapital commitments
6.16.26.36.4
6.1 Lease liabilities
2020 2019$’000 $’000
CurrentNon-current
42101
--
Total lease liabilities 143 -
Tourism WA measures a lease liability, at the commencement date, at the present value of lease payments that are not paid at that date. The lease payments are discounted using the interest rate implicit in the lease. If that rate cannot be readily determined, Tourism WA uses the incremental borrowing rate provided by the Western Australian Treasury Corporation.
Lease payments included by Tourism WA as part of the present value calculation of lease liability include:
– Fixed payments (including in-substance fixed payments) less any lease incentives receivable;
– Variable lease payments that depend on an index or a rate initially measured using the index or rate as at the commencement date;
– Amounts expected to be payable by the lessee under residual value guarantees;
– The exercise price of purchase options (where these are reasonably certain to be exercised); and
– Payments for penalties for terminating a lease, where the lease term reflects Tourism WA exercising an option to terminate the lease.
The interest on the lease liability is recognised in profit or loss over the lease term so as to produce a constant periodic rate of interest on the remaining balance of the liability for each period. Lease liabilities do not include any future changes in variable lease payments (that depend on an index or rate) until they take effect, in which case the lease liability is reassessed and adjusted against the right-of-use asset.
8 1
4 . 0 D I S C L O S U R E S A N D L E G A L C O M P L I A N C E
TOURISM WESTERN AUSTRALIA / ANNUAL REPORT 2019 – 20
1 . 0 OV E R V I E W 2 . 0 A G E N C Y P E R F O R M A N C E
M E S S A G E T O T H E M I N I S T E R
3 . 0 S I G N I F I C A N T I S S U E S I M PA C T I N G T H E A G E N C Y
4 . 0 D I S C L O S U R E S A N D L E G A L C O M P L I A N C E
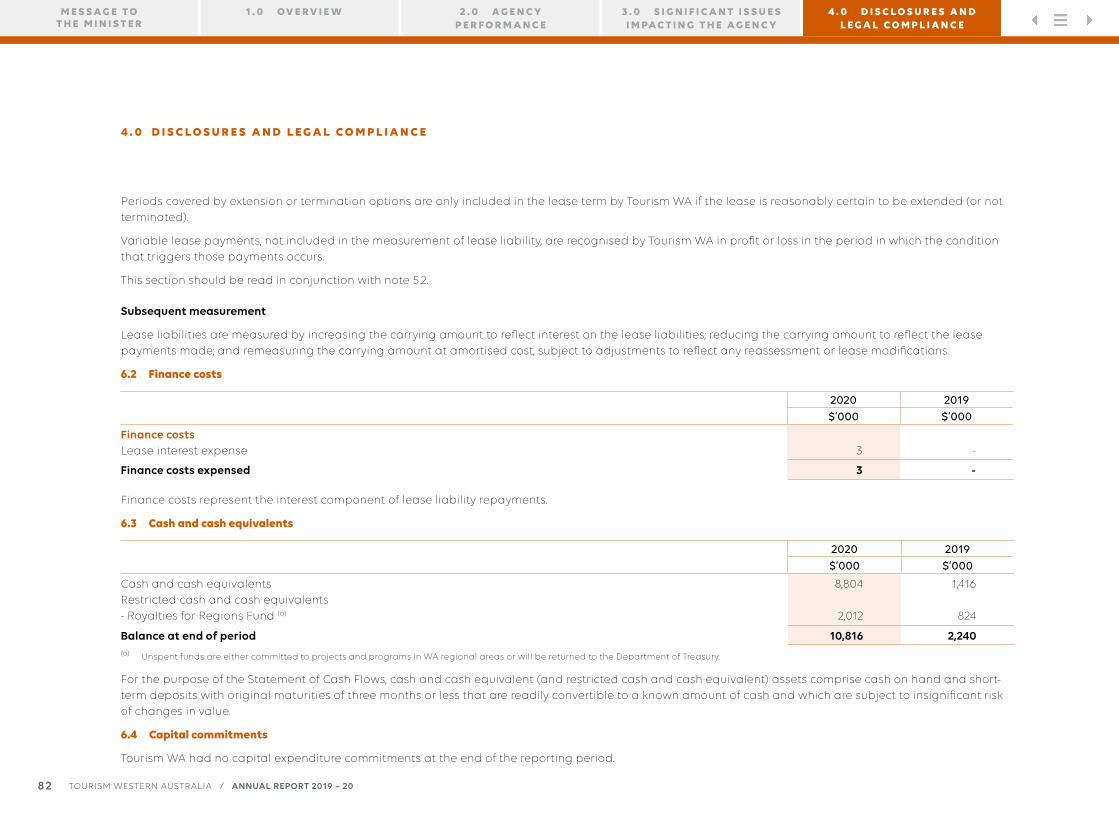
Periods covered by extension or termination options are only included in the lease term by Tourism WA if the lease is reasonably certain to be extended (or not terminated).
Variable lease payments, not included in the measurement of lease liability, are recognised by Tourism WA in profit or loss in the period in which the condition that triggers those payments occurs.
This section should be read in conjunction with note 5.2.
Subsequent measurement
Lease liabilities are measured by increasing the carrying amount to reflect interest on the lease liabilities; reducing the carrying amount to reflect the lease payments made; and remeasuring the carrying amount at amortised cost, subject to adjustments to reflect any reassessment or lease modifications.
6.2 Finance costs
2020 2019$’000 $’000
Finance costsLease interest expense 3 -
Finance costs expensed 3 -
Finance costs represent the interest component of lease liability repayments.
6.3 Cash and cash equivalents
2020 2019$’000 $’000
Cash and cash equivalentsRestricted cash and cash equivalents- Royalties for Regions Fund (a)
8,804
2,012
1,416
824
Balance at end of period 10,816 2,240(a) Unspent funds are either committed to projects and programs in WA regional areas or will be returned to the Department of Treasury.
For the purpose of the Statement of Cash Flows, cash and cash equivalent (and restricted cash and cash equivalent) assets comprise cash on hand and short-term deposits with original maturities of three months or less that are readily convertible to a known amount of cash and which are subject to insignificant risk of changes in value.
6.4 Capital commitments
Tourism WA had no capital expenditure commitments at the end of the reporting period.
8 2
4 . 0 D I S C L O S U R E S A N D L E G A L C O M P L I A N C E
TOURISM WESTERN AUSTRALIA / ANNUAL REPORT 2019 – 20
1 . 0 OV E R V I E W 2 . 0 A G E N C Y P E R F O R M A N C E
M E S S A G E T O T H E M I N I S T E R
3 . 0 S I G N I F I C A N T I S S U E S I M PA C T I N G T H E A G E N C Y
4 . 0 D I S C L O S U R E S A N D L E G A L C O M P L I A N C E
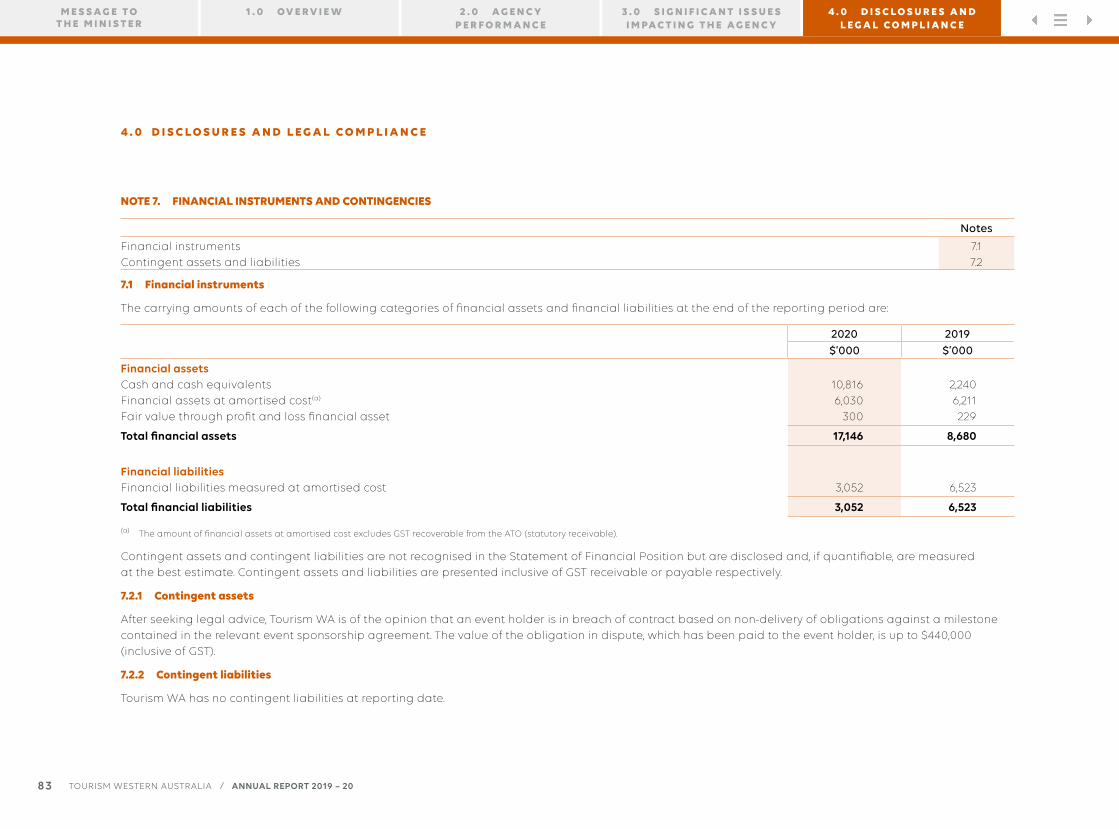
NOTE 7. FINANCIAL INSTRUMENTS AND CONTINGENCIES
Notes
Financial instrumentsContingent assets and liabilities
7.17.2
7.1 Financial instruments
The carrying amounts of each of the following categories of financial assets and financial liabilities at the end of the reporting period are:
2020 2019$’000 $’000
Financial assetsCash and cash equivalentsFinancial assets at amortised cost(a)
Fair value through profit and loss financial asset
10,8166,030
300
2,2406,211229
Total financial assets 17,146 8,680
Financial liabilitiesFinancial liabilities measured at amortised cost 3,052 6,523
Total financial liabilities 3,052 6,523
(a) The amount of financial assets at amortised cost excludes GST recoverable from the ATO (statutory receivable).
Contingent assets and contingent liabilities are not recognised in the Statement of Financial Position but are disclosed and, if quantifiable, are measured at the best estimate. Contingent assets and liabilities are presented inclusive of GST receivable or payable respectively.
7.2.1 Contingent assets
After seeking legal advice, Tourism WA is of the opinion that an event holder is in breach of contract based on non-delivery of obligations against a milestone contained in the relevant event sponsorship agreement. The value of the obligation in dispute, which has been paid to the event holder, is up to $440,000 (inclusive of GST).
7.2.2 Contingent liabilities
Tourism WA has no contingent liabilities at reporting date.
8 3
4 . 0 D I S C L O S U R E S A N D L E G A L C O M P L I A N C E
TOURISM WESTERN AUSTRALIA / ANNUAL REPORT 2019 – 20
1 . 0 OV E R V I E W 2 . 0 A G E N C Y P E R F O R M A N C E
M E S S A G E T O T H E M I N I S T E R
3 . 0 S I G N I F I C A N T I S S U E S I M PA C T I N G T H E A G E N C Y
4 . 0 D I S C L O S U R E S A N D L E G A L C O M P L I A N C E
NOTE 8. OTHER DISCLOSURES
This section includes additional material disclosures required by accounting standards or other pronouncements for further understanding of this financial report.
Notes
Events occurring after the end of the reporting periodInitial application of Australian Accounting StandardsKey management personnelRelated party transactionsRelated bodiesAffiliated bodiesRemuneration of auditorsEquitySupplementary financial informationExplanatory statement
8.18.28.38.48.58.68.78.88.98.10
8.1 Events occurring after the end of the reporting period
The Statement of Comprehensive Income and Statement of Financial Position have been prepared on the basis of conditions existing at reporting date. There is no additional evidence of events or conditions occurring after balance date that may have an impact on the financial statements.
8.2 Initial application of Australian Accounting Standards
AASB 15 Revenue from Contracts with Customers and AASB 1058 Income of Not-for-Profit Entities
AASB 15 Revenue from Contracts with Customers replaces AASB 118 Revenue and AASB 111 Construction Contracts for annual reporting periods on or after 1 January 2019. Under the new model, an entity shall recognise revenue when (or as) the entity satisfies a performance obligation by transferring a promised good or service to a customer and is based upon the transfer of control rather than transfer of risks and rewards.
AASB 15 focuses on providing sufficient information to the users of financial statements about the nature, amount, timing and uncertainty of revenue and cash flows arising from contracts with customers. Revenue is recognised by applying the following five steps:
– Identifying contracts with customers;
– Identifying separate performance obligations;
– Determining the transaction price of the contract;
– Allocating the transaction price to each of the performance obligations; and
– Recognising revenue when or as each performance obligation is satisfied.
8 4
4 . 0 D I S C L O S U R E S A N D L E G A L C O M P L I A N C E
TOURISM WESTERN AUSTRALIA / ANNUAL REPORT 2019 – 20
1 . 0 OV E R V I E W 2 . 0 A G E N C Y P E R F O R M A N C E
M E S S A G E T O T H E M I N I S T E R
3 . 0 S I G N I F I C A N T I S S U E S I M PA C T I N G T H E A G E N C Y
4 . 0 D I S C L O S U R E S A N D L E G A L C O M P L I A N C E
Revenue is recognised either over time or at a point in time. Any distinct goods or services are separately identified and any discounts or rebates in the contract price are allocated to the separate elements.
In addition, income other than from contracts with customers are subject to AASB 1058 Income of Not-for-Profit Entities. Income recognition under AASB 1058 depends on whether such a transaction gives rise to liabilities or a contribution by owners related to an asset (such as cash or another asset) recognised by Tourism WA.
Tourism WA has assessed contracts with customers and determined that no contracts were, or are, in place during the 2020 financial year or at reporting date. There is therefore no financial impact on Tourism WA in the adoption of AASB 15 and AASB 1058.
AASB 16 Leases
AASB 16 Leases supersedes AASB 117 Leases and related Interpretations. AASB 16 primarily affects lessee accounting and provides a comprehensive model for the identification of lease arrangements and their treatment in the financial statements of both lessees and lessors.
Tourism WA applied AASB 16 Leases from 1 July 2019 using the modified retrospective approach. As permitted under the specific transition provisions, comparatives are not restated. The cumulative effect of initially applying this Standard is recognised as an adjustment to the opening balance of accumulated surplus.
The main changes introduced by this Standard include identification of a lease within a contract and a new lease accounting model for lessees that require lessees to recognise all leases (operating and finance leases) in the Statement of Financial Position as right-of-use assets and lease liabilities, except for short-term leases (with lease terms of 12 months or less at commencement date) and low-value assets (where the underlying asset is valued at less than $5,000). The operating lease and finance lease distinction for lessees no longer exists.
Under AASB 16, Tourism WA takes into consideration all operating leases that were off balance sheet under AASB 117 and recognises:
a. right-of-use assets and lease liabilities in the Statement of Financial Position, initially measured at the present value of future lease payments, discounted using the incremental borrowing rate on 1 July 2019;
b. depreciation of right-of-use assets and interest on lease liabilities in the Statement of Comprehensive Income; and
c. the total amount of cash paid as principal amount, which is presented in the cash flows from financing activities, and interest paid, which is presented in the cash flows from operating activities, in the Statement of Cash Flows.
The right-of-use assets are assessed for impairment at the date of transition and Tourism WA has not identified any impairments to its right-of-use assets.
8 5
4 . 0 D I S C L O S U R E S A N D L E G A L C O M P L I A N C E
TOURISM WESTERN AUSTRALIA / ANNUAL REPORT 2019 – 20
1 . 0 OV E R V I E W 2 . 0 A G E N C Y P E R F O R M A N C E
M E S S A G E T O T H E M I N I S T E R
3 . 0 S I G N I F I C A N T I S S U E S I M PA C T I N G T H E A G E N C Y
4 . 0 D I S C L O S U R E S A N D L E G A L C O M P L I A N C E
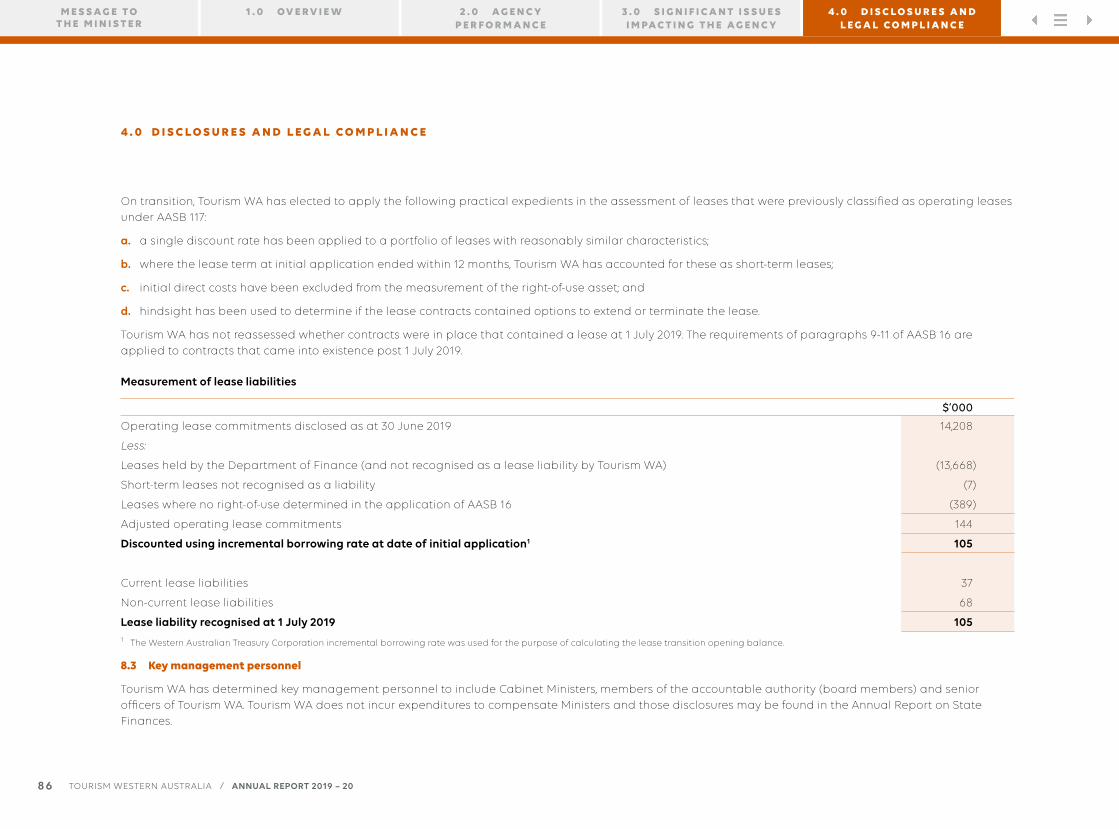
On transition, Tourism WA has elected to apply the following practical expedients in the assessment of leases that were previously classified as operating leases under AASB 117:
a. a single discount rate has been applied to a portfolio of leases with reasonably similar characteristics;
b. where the lease term at initial application ended within 12 months, Tourism WA has accounted for these as short-term leases;
c. initial direct costs have been excluded from the measurement of the right-of-use asset; and
d. hindsight has been used to determine if the lease contracts contained options to extend or terminate the lease.
Tourism WA has not reassessed whether contracts were in place that contained a lease at 1 July 2019. The requirements of paragraphs 9-11 of AASB 16 are applied to contracts that came into existence post 1 July 2019.
Measurement of lease liabilities
$’000
Operating lease commitments disclosed as at 30 June 2019 14,208
Less:
Leases held by the Department of Finance (and not recognised as a lease liability by Tourism WA) (13,668)
Short-term leases not recognised as a liability (7)
Leases where no right-of-use determined in the application of AASB 16 (389)
Adjusted operating lease commitments 144
Discounted using incremental borrowing rate at date of initial application1 105
Current lease liabilities 37
Non-current lease liabilities 68
Lease liability recognised at 1 July 2019 1051 The Western Australian Treasury Corporation incremental borrowing rate was used for the purpose of calculating the lease transition opening balance.
8.3 Key management personnel
Tourism WA has determined key management personnel to include Cabinet Ministers, members of the accountable authority (board members) and senior officers of Tourism WA. Tourism WA does not incur expenditures to compensate Ministers and those disclosures may be found in the Annual Report on State Finances.
8 6
4 . 0 D I S C L O S U R E S A N D L E G A L C O M P L I A N C E
TOURISM WESTERN AUSTRALIA / ANNUAL REPORT 2019 – 20
1 . 0 OV E R V I E W 2 . 0 A G E N C Y P E R F O R M A N C E
M E S S A G E T O T H E M I N I S T E R
3 . 0 S I G N I F I C A N T I S S U E S I M PA C T I N G T H E A G E N C Y
4 . 0 D I S C L O S U R E S A N D L E G A L C O M P L I A N C E

The total fees, salaries, superannuation, non-monetary benefits and other benefits for Board members and senior officers of Tourism WA for the reporting period are presented below.
Compensation of members of the accountable authority
Compensation band ($) 2020 2019
0 – 10,00030,001 – 40,00040,001 – 50,00060,001 – 70,000
1521
1521
$’000 $’000
Total compensation of members of the accountable authority 343 350
Commissioner fees for Kevin Brown are excluded from the above tables as these fees are paid directly to Perth Airport Pty Ltd.
Compensation of senior officers
Compensation band ($) 2020 2019
40,001 – 50,00050,001 – 60,00060,001 – 70,00080,001 – 90,000100,001 – 110,000130,001 – 140,000140,001 – 150,000150,001 – 160,000160,001 – 170,000170,001 – 180,000190,001 – 200,000200,001 – 210,000220,001 – 230,000250,001 – 260,000340,001 – 350,000
-11--1-1211-1-1
2--11111--21-1-
$’000 $’000
Total compensation of senior officers 1,670 1,578
8 7
4 . 0 D I S C L O S U R E S A N D L E G A L C O M P L I A N C E
TOURISM WESTERN AUSTRALIA / ANNUAL REPORT 2019 – 20
1 . 0 OV E R V I E W 2 . 0 A G E N C Y P E R F O R M A N C E
M E S S A G E T O T H E M I N I S T E R
3 . 0 S I G N I F I C A N T I S S U E S I M PA C T I N G T H E A G E N C Y
4 . 0 D I S C L O S U R E S A N D L E G A L C O M P L I A N C E

Senior officers are defined as those officers who sat on the Executive Management Team for part or all of the financial year.
Compensation details of senior officers are disclosed in this note however these personnel are remunerated by the Department of Jobs, Tourism, Science and Innovation. The Department provides personnel to Tourism WA, including senior officers, on a free of charge basis and associated costs are recognised under ‘Supplies and services’ (see Note 3.1).
8.4 Related party transactions
Tourism WA is a wholly-owned public sector entity that is controlled by the State of Western Australia.
Related parties of Tourism WA include:
– all Cabinet Ministers and their close family members, and their controlled or jointly controlled entities;
– all key management personnel and their close family members, and their controlled or jointly controlled entities;
– other agencies and statutory authorities, including related bodies, that are included in the whole of government consolidated financial statements (ie. wholly-owned public sector entities);
– associates and joint ventures of a wholly-owned public sector entity; and
– the Government Employees Superannuation Board (GESB).
Material transactions with related parties
There were no related party transactions during the year that involved key management personnel and/or their close family members and/or their controlled (or jointly controlled) entities.
8.5 Related bodies
Tourism WA had no related bodies during the financial year.
8.6 Affiliated bodies
Business Events Perth (previously Perth Convention Bureau)
Tourism WA has an agreement with Business Events Perth (BEP) for the provision of business events marketing and promotional services. The current agreement expires 30 June 2021.
Tourism WA controls the activities of BEP to the extent that it provides the majority of BEP’s funding and that BEP has contracted to submit its annual operation plan and budget for approval by Tourism WA prior to implementation. BEP is not subject to operational control by Tourism WA. BEP received more than 50% of its total funding from Tourism WA in 2019-20.
Payments inclusive of GST made to BEP in 2019-20 totalled $6,439,399 (2018-19: $5,865,553).
8 8
4 . 0 D I S C L O S U R E S A N D L E G A L C O M P L I A N C E
TOURISM WESTERN AUSTRALIA / ANNUAL REPORT 2019 – 20
1 . 0 OV E R V I E W 2 . 0 A G E N C Y P E R F O R M A N C E
M E S S A G E T O T H E M I N I S T E R
3 . 0 S I G N I F I C A N T I S S U E S I M PA C T I N G T H E A G E N C Y
4 . 0 D I S C L O S U R E S A N D L E G A L C O M P L I A N C E

Regional Tourism Organisations
Tourism WA has Marketing and Services Agreements with each of the five Regional Tourism Organisations (RTOs) in Western Australia to promote and market the regions. The RTOs comprise Destination Perth, Australia’s Coral Coast, Australia’s Golden Outback, Australia’s South West and Australia’s North West. The current agreements expire 30 June 2021.
The RTOs are not subject to operational control by Tourism WA but are required to submit their annual business plan for approval prior to implementation. All five RTOs received more than 50% of their total funding from Tourism WA in 2019-20.
Base payments, inclusive of GST, made to each RTO in 2019-20 were $786,030 (2018-19: $777,478). Total additional payments made to the RTOs in 2019-20 for other activities were $466,604 (2018-19: $675,329).
8.7 Remuneration of auditors
Remuneration paid or payable to the Auditor General in respect of the audit for the current financial year is as follows:
2020 2019$’000 $’000
Auditing the accounts, financial statements, controls and key performance indicatorsAuditing Royalties for Regions Annual Report financials
1157
1158
122 123
8.8 Equity
2020 2019$’000 $’000
Contributed equityBalance at start of period
Contributions by ownersCapital appropriation
10,486
186
10,336
150
Total contributions by owners 186 150
Balance at end of period 10,672 10,486
8 9
4 . 0 D I S C L O S U R E S A N D L E G A L C O M P L I A N C E
TOURISM WESTERN AUSTRALIA / ANNUAL REPORT 2019 – 20
1 . 0 OV E R V I E W 2 . 0 A G E N C Y P E R F O R M A N C E
M E S S A G E T O T H E M I N I S T E R
3 . 0 S I G N I F I C A N T I S S U E S I M PA C T I N G T H E A G E N C Y
4 . 0 D I S C L O S U R E S A N D L E G A L C O M P L I A N C E

8.9 Supplementary financial information
(a) Write-offsDuring the financial year, nil was written off Tourism WA’s asset register under the authority of:
2020 2019$’000 $’000
The accountable authorityThe MinisterExecutive Council
---
---
- -
(b) Losses through theft, defaults and other causes
2020 2019$’000 $’000
Losses of public money and public and other property through theft or defaultAmounts recovered
--
8-
- 8
A suspected cyber fraud incident occurred during the 2019 year resulting in the payment of $7,500 (plus GST) to an unknown third party. The matter is still under investigation by the Victoria Police and it is not yet known whether the amount will be recovered.
(c) Gifts of public property
2020 2019$’000 $’000
Gifts of public property provided by Tourism WA 10 59
10 59
8.10 Explanatory statement (controlled operations)
All variances between annual estimates (original budget) and actual results for 2020, and between the actual results for 2020 and 2019, are shown below. Narratives are provided for key major variances, which are generally greater than 10% and $1 million for the Statements of Comprehensive Income, Financial Position and Cash Flows.
Estimates reported in this note represent original budget estimates. During the course of any given year, budgets are revised to account for new or adjusted Government initiatives through the whole-of-Government Mid Year Budget Review Process and other State Budget review processes.
9 0
4 . 0 D I S C L O S U R E S A N D L E G A L C O M P L I A N C E
TOURISM WESTERN AUSTRALIA / ANNUAL REPORT 2019 – 20
1 . 0 OV E R V I E W 2 . 0 A G E N C Y P E R F O R M A N C E
M E S S A G E T O T H E M I N I S T E R
3 . 0 S I G N I F I C A N T I S S U E S I M PA C T I N G T H E A G E N C Y
4 . 0 D I S C L O S U R E S A N D L E G A L C O M P L I A N C E

S TAT E M E N T O F C O M P R E H E N S I V E I N C O M E
Variance Note
Original Estimate 2020
Actual 2020
Actual 2019
Variance between estimate and
actual
Variance between actual results for
2020 and 2019
$’000 $’000 $’000 $’000 $’000
COST OF SERVICESExpensesEmployee benefits expenseSupplies and servicesDepreciation and amortisation expenseAccommodation expensesGrants and subsidiesEvent operations expensesAdvertising and promotion expensesOther expensesTotal cost of services
RevenueCommonwealth grants and contributionsInterest revenueOther revenueTotal RevenueTotal income other than income from State Government
NET COST OF SERVICES
Income from State GovernmentState grants and contributionsServices received free of chargeRoyalties for Regions FundTotal income from State Government
SURPLUS/(DEFICIT) FOR THE PERIOD
11
2, a3
3, bc
de
41140,697
2,042562800
31,30025,500
177101,759
14250800
1,0641,064
100,695
74,38111,84013,476
99,697
(998)
37739,855
5412,2055,914
24,41815,890
4789,247
14179411
604604
88,643
69,84112,37813,366
95,585
6,942
36940,463
6041,8471,381
26,13729,504
1,105101,410
99402484985985
100,425
70,43910,78516,43297,656
(2,769)
(34)(1,112)
(1,501)1,6435,114
(6,882)(9,610)
(130)(12,512)
-(71)
(389)(460)(460)
(12,052)
(4,540)538
(110)(4,112)
7,940
8(608)
(63)358
4,533(1,719)
(13,614)(1,058)
(12,163)
(85)(223)
(73)(381)(381)
(11,782)
(598)1,593
(3,066)(2,071)
9,711
9 1
4 . 0 D I S C L O S U R E S A N D L E G A L C O M P L I A N C E
TOURISM WESTERN AUSTRALIA / ANNUAL REPORT 2019 – 20
1 . 0 OV E R V I E W 2 . 0 A G E N C Y P E R F O R M A N C E
M E S S A G E T O T H E M I N I S T E R
3 . 0 S I G N I F I C A N T I S S U E S I M PA C T I N G T H E A G E N C Y
4 . 0 D I S C L O S U R E S A N D L E G A L C O M P L I A N C E
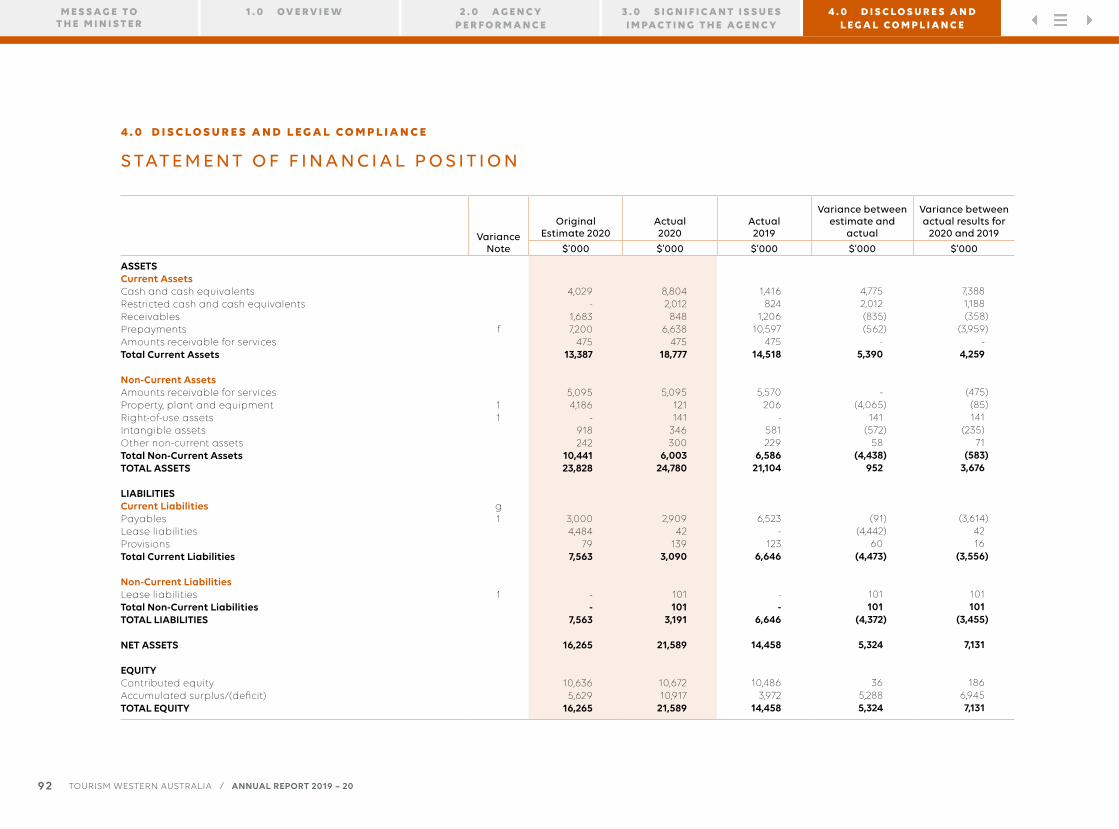
S TAT E M E N T O F F I N A N C I A L P O S I T I O N
Variance Note
Original Estimate 2020
Actual 2020
Actual 2019
Variance between estimate and
actual
Variance between actual results for
2020 and 2019
$’000 $’000 $’000 $’000 $’000
ASSETSCurrent AssetsCash and cash equivalentsRestricted cash and cash equivalentsReceivablesPrepaymentsAmounts receivable for servicesTotal Current Assets
Non-Current AssetsAmounts receivable for servicesProperty, plant and equipmentRight-of-use assetsIntangible assetsOther non-current assetsTotal Non-Current AssetsTOTAL ASSETS
LIABILITIESCurrent LiabilitiesPayablesLease liabilitiesProvisionsTotal Current Liabilities
Non-Current LiabilitiesLease liabilitiesTotal Non-Current LiabilitiesTOTAL LIABILITIES
NET ASSETS
EQUITYContributed equityAccumulated surplus/(deficit)TOTAL EQUITY
f
11
g1
1
4,029-
1,6837,200
47513,387
5,0954,186
-918242
10,44123,828
3,0004,484
797,563
--
7,563
16,265
10,6365,629
16,265
8,8042,012848
6,638475
18,777
5,095121141
346300
6,00324,780
2,90942
1393,090
101101
3,191
21,589
10,67210,917
21,589
1,416824
1,20610,597
47514,518
5,570206
-581229
6,58621,104
6,523-
1236,646
--
6,646
14,458
10,4863,972
14,458
4,7752,012(835)(562)
-5,390
-(4,065)
141(572)
58(4,438)
952
(91)(4,442)
60(4,473)
101101
(4,372)
5,324
365,2885,324
7,3881,188(358)
(3,959)-
4,259
(475)(85)141
(235)71
(583)3,676
(3,614)4216
(3,556)
101101
(3,455)
7,131
1866,9457,131
9 2
4 . 0 D I S C L O S U R E S A N D L E G A L C O M P L I A N C E
TOURISM WESTERN AUSTRALIA / ANNUAL REPORT 2019 – 20
1 . 0 OV E R V I E W 2 . 0 A G E N C Y P E R F O R M A N C E
M E S S A G E T O T H E M I N I S T E R
3 . 0 S I G N I F I C A N T I S S U E S I M PA C T I N G T H E A G E N C Y
4 . 0 D I S C L O S U R E S A N D L E G A L C O M P L I A N C E
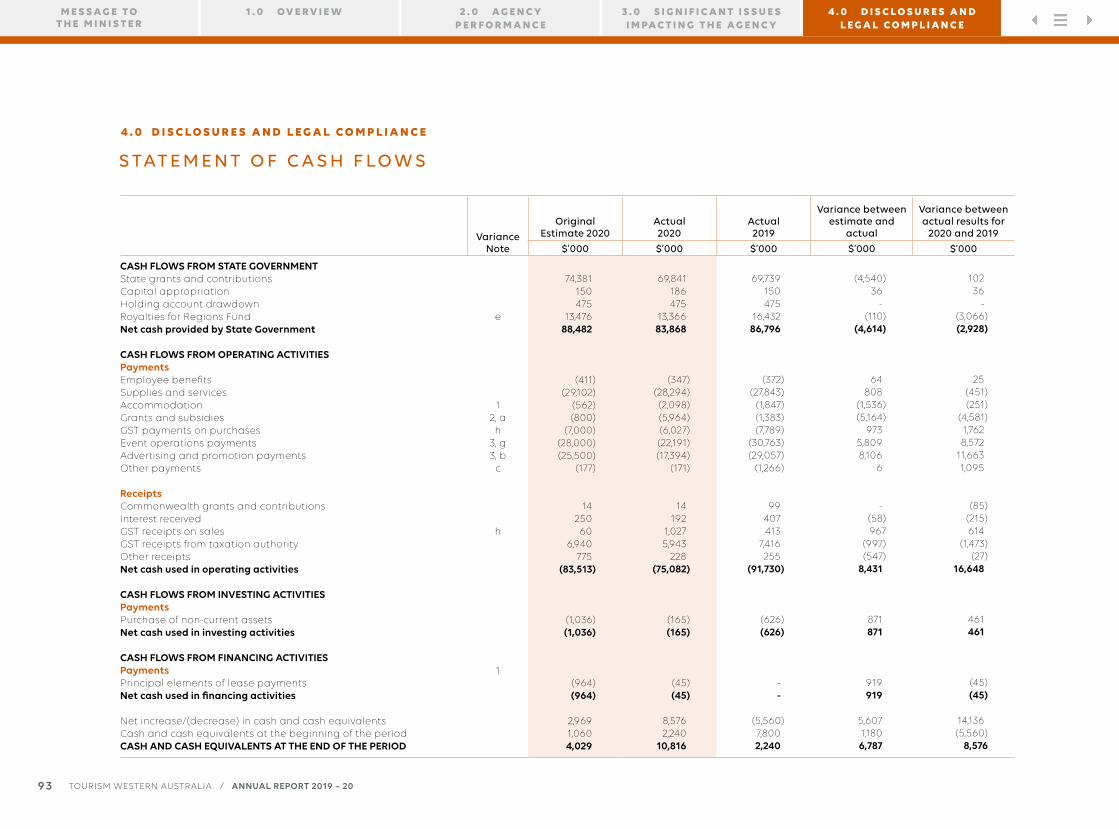
S TAT E M E N T O F C A S H F LO W S
Variance Note
Original Estimate 2020
Actual 2020
Actual 2019
Variance between estimate and
actual
Variance between actual results for
2020 and 2019
$’000 $’000 $’000 $’000 $’000
CASH FLOWS FROM STATE GOVERNMENTState grants and contributionsCapital appropriationHolding account drawdownRoyalties for Regions FundNet cash provided by State Government
CASH FLOWS FROM OPERATING ACTIVITIESPaymentsEmployee benefitsSupplies and servicesAccommodationGrants and subsidiesGST payments on purchasesEvent operations paymentsAdvertising and promotion paymentsOther payments
ReceiptsCommonwealth grants and contributionsInterest receivedGST receipts on salesGST receipts from taxation authorityOther receiptsNet cash used in operating activities
CASH FLOWS FROM INVESTING ACTIVITIESPaymentsPurchase of non-current assetsNet cash used in investing activities
CASH FLOWS FROM FINANCING ACTIVITIESPaymentsPrincipal elements of lease paymentsNet cash used in financing activities
Net increase/(decrease) in cash and cash equivalentsCash and cash equivalents at the beginning of the periodCASH AND CASH EQUIVALENTS AT THE END OF THE PERIOD
e
12, ah
3, g3, b
c
h
1
74,381150475
13,47688,482
(411)(29,102)
(562)(800)
(7,000)(28,000)(25,500)
(177)
1425060
6,940775
(83,513)
(1,036)(1,036)
(964)(964)
2,9691,0604,029
69,841186475
13,36683,868
(347)(28,294)(2,098)(5,964)(6,027)(22,191)(17,394)
(171)
14192
1,0275,943
228(75,082)
(165)(165)
(45)(45)
8,5762,240
10,816
69,739150475
16,43286,796
(372)(27,843)
(1,847)(1,383)(7,789)
(30,763)(29,057)
(1,266)
99407413
7,416255
(91,730)
(626)(626)
--
(5,560)7,8002,240
(4,540)36
-(110)
(4,614)
64808
(1,536)(5,164)
9735,8098,106
6
-(58)967
(997)(547)
8,431
871871
919919
5,6071,1806,787
10236
-(3,066)(2,928)
25(451)(251)
(4,581)1,7628,572
11,6631,095
(85)(215)614
(1,473)(27)
16,648
461461
(45)(45)
14,136(5,560)
8,576
9 3
4 . 0 D I S C L O S U R E S A N D L E G A L C O M P L I A N C E
TOURISM WESTERN AUSTRALIA / ANNUAL REPORT 2019 – 20
1 . 0 OV E R V I E W 2 . 0 A G E N C Y P E R F O R M A N C E
M E S S A G E T O T H E M I N I S T E R
3 . 0 S I G N I F I C A N T I S S U E S I M PA C T I N G T H E A G E N C Y
4 . 0 D I S C L O S U R E S A N D L E G A L C O M P L I A N C E

Major Estimate and Actual (2020) Variance Narratives
1. The original 2020 budget estimates included the take-up of assets and liabilities for Government Office Accommodation (GOA) leasing arrangements to comply with the requirements of AASB 16 Leases that came into effect 1 July 2019. Subsequent guidance was published by the Department of Treasury, in conjunction with the Department of Finance, that these leasing arrangements fall out of scope of AASB 16 and are therefore no longer to be reported in the Statement of Financial Position. Leasing arrangements through the Department of Finance are now expensed as incurred.
The 2019-20 budget and mid-year review update had already been published when this change was effected. The accounting treatment change has resulted in a number of material variances between estimates and actuals for 2020 as follows:
Statement of Comprehensive Income
– Depreciation and amortisation expense – actual expenditure is less than original estimates of which $1.3 million is attributable to Department of Finance leases that were subsequently out of scope of AASB 16.
– Accommodation expenses – approximately $1.3 million more than originally estimated has been recognised to reflect the expensing of Department of Finance leases.
Statement of Financial Position
– Right-of-use assets – when original 2020 estimates were prepared, right-of-use assets were classified as ‘Property, plant and equipment’ but are now classified as a separate item in the Statement of Financial Position. Approximately $4 million less than originally estimated has been recognised as right-of-use assets at 30 June 2020.
– Current and non-current lease liabilities – approximately $4.3 million less than originally estimated has been recognised as lease liabilities under AASB 16 largely due to Department of Finance leases being out of scope.
Statement of Cash Flows
– Accommodation costs - approximately $1.3 million more than originally estimated has been recognised to reflect the expensing of Department of Finance leases.
– Principal elements of lease payments – almost $1 million less than originally estimated has been recognised as the non-interest element of lease rental payments.
2. Grants and subsidies are greater than estimates and prior year due to the creation of the Tourism Recovery Grant program. A total of $5.5 million in grants was paid in May and June 2020 to eligible small businesses in response to the significant COVID-19 impacts on the tourism industry.
3. Event operations and advertising and promotion expenses are lower than original 2020 estimates and prior year actuals largely as a result of restrictions put in place on mass gathering and travel in the last quarter of the year in response to the COVID-19 pandemic. These restrictions have resulted in a number of sponsored events being postponed and the majority of international marketing activity being paused.
9 4
4 . 0 D I S C L O S U R E S A N D L E G A L C O M P L I A N C E
TOURISM WESTERN AUSTRALIA / ANNUAL REPORT 2019 – 20
1 . 0 OV E R V I E W 2 . 0 A G E N C Y P E R F O R M A N C E
M E S S A G E T O T H E M I N I S T E R
3 . 0 S I G N I F I C A N T I S S U E S I M PA C T I N G T H E A G E N C Y
4 . 0 D I S C L O S U R E S A N D L E G A L C O M P L I A N C E

Major Actual (2020) and Comparative (2019) Variance Narratives
a. See Note 2 above.
b. See Note 3 above.
c. Other expenses in the prior year included a $1.03 million refund to Government of Royalties for Regions cash. The refund represented unused Regional Events Program funds (2015-16 to 2017-18).
d. The increase in services received free of charge compared to the prior year is mostly due to a greater level of personnel services provided by the Department of Jobs, Tourism, Science and Innovation.
e. The decrease in Royalties for Regions funding is the combined net result of:
– new and expiring programs;
– a decrease in funding, from 2019-20, for regional events; and
– an increase in funding, from 2019-20, for regional tourism marketing.
See Note 4.1 (b) in the notes to the financial statements for a breakdown of funded programs.
f. Prepayments at the end of 2019 were substantially more than 2020 due to blockbuster events that were held at Optus Stadium in July and August 2019.
g. Payables at the end of 2020 are significantly lower than prior year which can be mostly attributed to an overall decreased level of events and marketing activity in the last quarter of the year due to restrictions on mass gatherings and travel associated with the COVID-19 pandemic.
h. GST payments on purchases and receipts from taxation authority are less than prior year which is the result of overall operating expenditure being lower than originally estimated due to COVID-19 impacts on the activities of Tourism WA.
9 5
4 . 0 D I S C L O S U R E S A N D L E G A L C O M P L I A N C E
TOURISM WESTERN AUSTRALIA / ANNUAL REPORT 2019 – 20
1 . 0 OV E R V I E W 2 . 0 A G E N C Y P E R F O R M A N C E
M E S S A G E T O T H E M I N I S T E R
3 . 0 S I G N I F I C A N T I S S U E S I M PA C T I N G T H E A G E N C Y
4 . 0 D I S C L O S U R E S A N D L E G A L C O M P L I A N C E
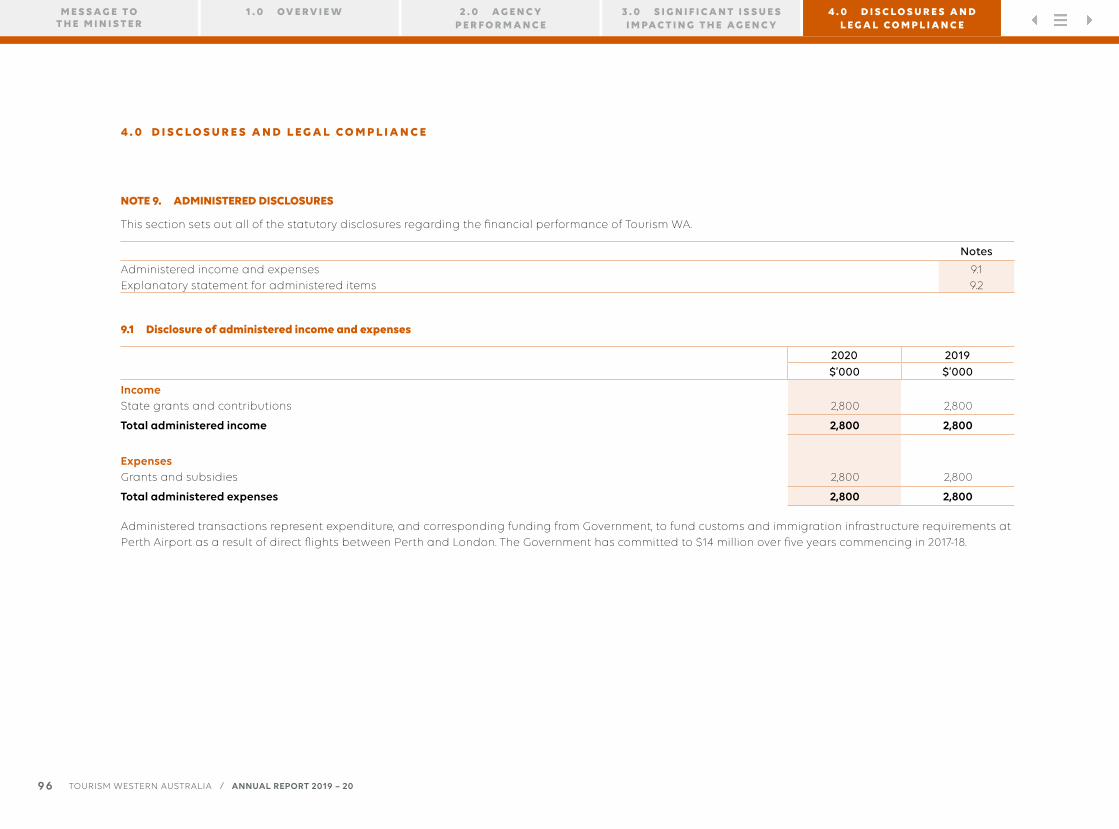
NOTE 9. ADMINISTERED DISCLOSURES
This section sets out all of the statutory disclosures regarding the financial performance of Tourism WA.
Notes
Administered income and expensesExplanatory statement for administered items
9.19.2
9.1 Disclosure of administered income and expenses
2020 2019$’000 $’000
IncomeState grants and contributions 2,800 2,800
Total administered income 2,800 2,800
ExpensesGrants and subsidies 2,800 2,800
Total administered expenses 2,800 2,800
Administered transactions represent expenditure, and corresponding funding from Government, to fund customs and immigration infrastructure requirements at Perth Airport as a result of direct flights between Perth and London. The Government has committed to $14 million over five years commencing in 2017-18.
9 6
4 . 0 D I S C L O S U R E S A N D L E G A L C O M P L I A N C E
TOURISM WESTERN AUSTRALIA / ANNUAL REPORT 2019 – 20
1 . 0 OV E R V I E W 2 . 0 A G E N C Y P E R F O R M A N C E
M E S S A G E T O T H E M I N I S T E R
3 . 0 S I G N I F I C A N T I S S U E S I M PA C T I N G T H E A G E N C Y
4 . 0 D I S C L O S U R E S A N D L E G A L C O M P L I A N C E
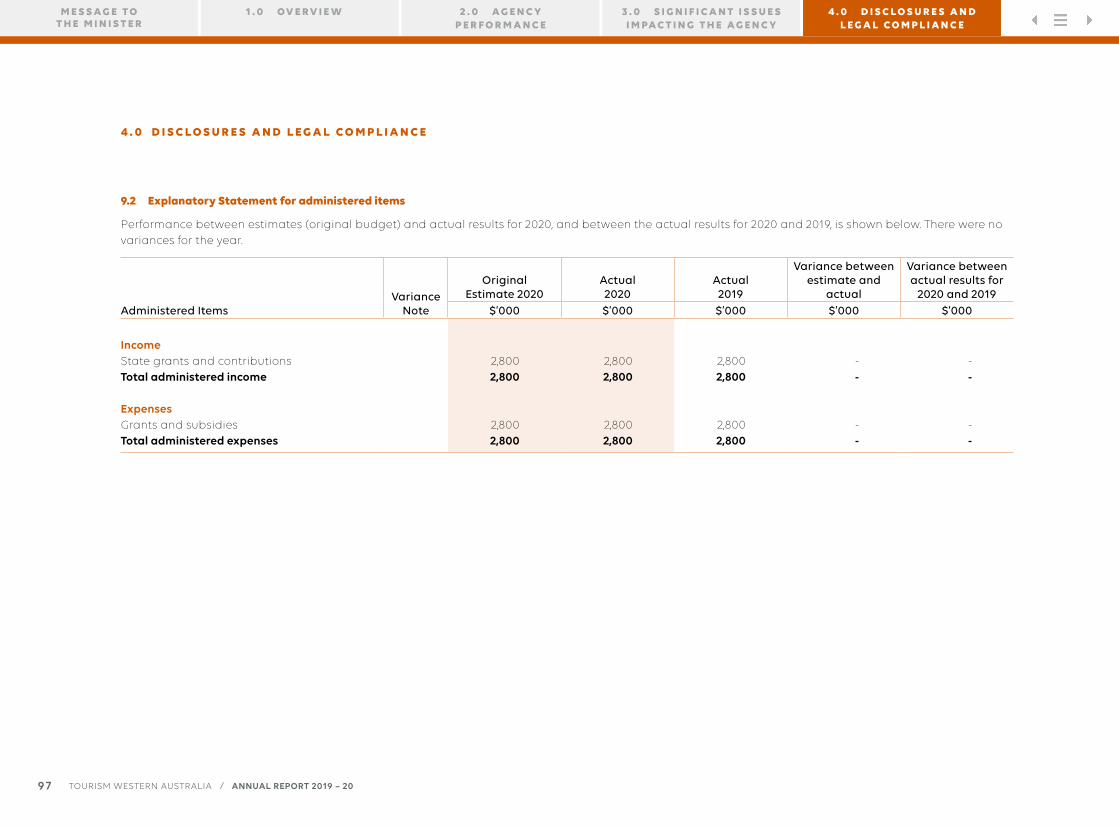
9.2 Explanatory Statement for administered items
Performance between estimates (original budget) and actual results for 2020, and between the actual results for 2020 and 2019, is shown below. There were no variances for the year.
Administered ItemsVariance
Note
Original Estimate 2020
Actual 2020
Actual 2019
Variance between estimate and
actual
Variance between actual results for
2020 and 2019$’000 $’000 $’000 $’000 $’000
IncomeState grants and contributionsTotal administered income
ExpensesGrants and subsidiesTotal administered expenses
2,8002,800
2,8002,800
2,8002,800
2,8002,800
2,8002,800
2,8002,800
--
--
--
--
9 7
4 . 0 D I S C L O S U R E S A N D L E G A L C O M P L I A N C E
TOURISM WESTERN AUSTRALIA / ANNUAL REPORT 2019 – 20
1 . 0 OV E R V I E W 2 . 0 A G E N C Y P E R F O R M A N C E
M E S S A G E T O T H E M I N I S T E R
3 . 0 S I G N I F I C A N T I S S U E S I M PA C T I N G T H E A G E N C Y
4 . 0 D I S C L O S U R E S A N D L E G A L C O M P L I A N C E
4.3 Key Performance Indicators
C E R T I F I C AT I O N O F K E Y P E R F O R M A N C E I N D I C AT O R S
We hereby certify that the performance indicators are based on proper records, are relevant and appropriate for assisting users to assess the Western Australian Tourism Commission’s performance, and fairly represent the performance of the Western Australian Tourism Commission for the financial year ending 30 June 2020.
Nathan HardingCHAIRMAN
28 August 2020
Tracey Horton COMMISSIONER
28 August 2020
9 8
4 . 0 D I S C L O S U R E S A N D L E G A L C O M P L I A N C E
TOURISM WESTERN AUSTRALIA / ANNUAL REPORT 2019 – 20
1 . 0 OV E R V I E W 2 . 0 A G E N C Y P E R F O R M A N C E
M E S S A G E T O T H E M I N I S T E R
3 . 0 S I G N I F I C A N T I S S U E S I M PA C T I N G T H E A G E N C Y
4 . 0 D I S C L O S U R E S A N D L E G A L C O M P L I A N C E

K E Y P E R F O R M A N C E I N D I C AT O R S
The following Key Performance Indicators (KPIs) were developed in consultation with the Department of Treasury and the Office of the Auditor General (OAG). These KPIs came into effect in July 2015 and this is the fifth year they have been reported on. These changes occurred to more closely align agency KPIs with government goals. Where results are available and comparable, actuals for historical years have been provided.
The government goal that is supported by Tourism WA is: “Future jobs and skills: Grow and diversify the economy, create jobs, and support skills development.”
The desired outcome supporting this is: “Increased competitiveness and viability of the Western Australian tourism industry.” ‘Competitiveness’ reflects the fact Western Australia faces real product competition with other interstate and overseas destinations. Tourism industry ‘viability’ is secured when it is characterised by profitability and new investment whilst being sensitive to community views and environmental concerns.
The KPIs provide an indication of whether Tourism WA has achieved this outcome. Tourism WA has two types of KPIs.
Key Effectiveness Indicators
Key Effectiveness Indicators assist with the assessment of agency performance in the achievement of government desired outcomes.
Key Efficiency Indicators
Key Efficiency Indicators assist with the assessment of agency service delivery. They monitor the relationship between the service delivered and the resources used to produce the service.
9 9
4 . 0 D I S C L O S U R E S A N D L E G A L C O M P L I A N C E
TOURISM WESTERN AUSTRALIA / ANNUAL REPORT 2019 – 20
1 . 0 OV E R V I E W 2 . 0 A G E N C Y P E R F O R M A N C E
M E S S A G E T O T H E M I N I S T E R
3 . 0 S I G N I F I C A N T I S S U E S I M PA C T I N G T H E A G E N C Y
4 . 0 D I S C L O S U R E S A N D L E G A L C O M P L I A N C E

K E Y E F F E C T I V E N E S S I N D I C AT O R S
1. Total dollar amount spent by visitors in Western Australia
This KPI measures the result of successfully promoting Western Australia as a visitor destination and facilitating visitation through cooperative marketing campaigns and aviation access development. While Tourism WA does not directly control inbound visitor numbers, they are influenced by the agency’s activities.
2019-20 Target
Results
2019-20 Actual
2018-19 Actual
2017-18 Actual
2016-17 Actual
KPI 1 Total dollar amount spent by visitors in Western Australia $10.2 billion $11.0 billion $9.6 billion $9.1 billion $10.0 billion
Notes:
i. Spend information is sourced from the Regional Expenditure data, provided by Tourism Research Australia (TRA). The expenditure figures are based on responses from TRA’s National Visitor Survey (NVS) and International Visitor Survey (IVS) for the visitor’s entire trip. The Regional Expenditure model allocates visitor expenditure to specific tourism regions to determine spend estimates for each of Australia’s states.
ii. The results of the NVS and IVS, including the Regional Expenditure data, are released by TRA each quarter and figures are reported for the latest 12 month period (i.e. Year Ending (YE) December 2019 in this instance). YE December information is used as it is usually available ahead of each year’s State Budget process.
iii. The NVS figures are based on a large scale survey of Australians, while the IVS figures are based on interviews with international visitors at airport departure lounges across Australia.
iv. Overnight Domestic Visitors Definition: Australian residents aged 15 years and over who spent at least one night away from home in Western Australia.
v. Overnight International Visitors Definition: International visitors aged 15 years and over who spent at least one night in Western Australia.
vi. Visitors include those travelling for all purposes including leisure, business, visiting friends and relatives and education.
vii. Sample size for Western Australia: day trips n=2,553; interstate n=751; intrastate n=3,836; international n=5,747.
viii. Confidence intervals for Western Australia: day trips ± 1.94%; interstate ± 3.58%; intrastate ± 2.22%; international ± 1.29%. These confidence intervals are calculated by Tourism WA based on total sample sizes
ix. The response rate for the IVS is 59% and the NVS is 24%.
1 0 0
4 . 0 D I S C L O S U R E S A N D L E G A L C O M P L I A N C E
TOURISM WESTERN AUSTRALIA / ANNUAL REPORT 2019 – 20
1 . 0 OV E R V I E W 2 . 0 A G E N C Y P E R F O R M A N C E
M E S S A G E T O T H E M I N I S T E R
3 . 0 S I G N I F I C A N T I S S U E S I M PA C T I N G T H E A G E N C Y
4 . 0 D I S C L O S U R E S A N D L E G A L C O M P L I A N C E

2. Percentage of visitors whose expectations were met or exceeded upon visiting Western Australia
In order to build a strong market base, WA as a destination must at least meet visitor expectations, if not exceed them. This KPI measures the effectiveness of strategies being employed by Tourism WA and the tourism industry to develop and improve tourism product (including awareness, access, accommodation, amenities and attractions).
2019-20 Target
Results
2019-20 Actual
2018-19 Actual
2017-18 Actual
2016-17 Actual
KPI 2 Percentage of visitors whose expectations were met or exceeded upon visiting Western Australia
90% 98.5% 97.8% 98.5% 99.0%
Notes:
i. Visitor expectations are measured through the Visitor Expectation and Experience Research.
ii. This is conducted through a face-to-face survey of intrastate, interstate and international visitors to WA.
iii. Interviewing takes place across the full year to address seasonality issues. Data is analysed and reported annually.
iv. In 2019-20, the final (3rd) wave of interviews, due to take place in April 2020, was cancelled due to travel restrictions put in place as a result of COVID-19.
v. The KPI measure is based on a sample size of n=270 visitors for 2019-20.
vi. This was made up of n=85 intrastate, n=73 interstate and n=112 international visitors.
vii. The response rate for 2019-20 was 88%.
viii. The confidence interval for the sample of n=270 interviews is +/-6% at the 95% confidence level. This confidence interval is based on total sample size.
ix. The 2019-20 and prior year’s targets have been set on the premise that at least 9 out of 10 visitors to/within Western Australia should say their holiday met or exceeded their expectations.
3. Value of cooperative marketing funds provided by the tourism industry
This KPI measures Tourism WA’s success in encouraging the tourism industry to integrate into the State Government’s destination marketing activities, thereby achieving greater leverage of government funding and better outcomes for the State’s tourism industry.
Tourism WA allocates a sum of money each year that is available to industry when they participate in cooperative marketing campaigns, where the tourism operator and the agency match funds on the campaign. The industry operator also uses the Experience Extraordinary branding as part of the agreement. This KPI details the amount of money that the tourism industry puts into marketing campaigns, alongside the agency’s funds. This cooperative marketing approach provides significant benefits for the destination and the Western Australian tourism industry generally.
1 0 1
4 . 0 D I S C L O S U R E S A N D L E G A L C O M P L I A N C E
TOURISM WESTERN AUSTRALIA / ANNUAL REPORT 2019 – 20
1 . 0 OV E R V I E W 2 . 0 A G E N C Y P E R F O R M A N C E
M E S S A G E T O T H E M I N I S T E R
3 . 0 S I G N I F I C A N T I S S U E S I M PA C T I N G T H E A G E N C Y
4 . 0 D I S C L O S U R E S A N D L E G A L C O M P L I A N C E

2019-20 Target
Results
2019-20 Actual
2018-19 Actual
2017-18 Actual
2016-17 Actual
KPI 3 Value of cooperative marketing funds provided by the tourism industry
$12 million $7.9 million $15.1 million $9.9 million $8.7 million
Notes:
Domestic cooperative marketing
i. The domestic cooperative marketing program targets airlines, wholesalers, retailers, direct sell agents, and online travel agents to undertake joint campaigns with Tourism WA for WA product.
ii. A national Expression of Interest (EOI) process is undertaken by Tourism WA each year to secure relevant trade partners in cooperative campaign activity for the domestic market.
For those partners approved for funding, Tourism WA shares the brand campaign strategy and media buy details to allow partner alignment where possible with WA brand bursts. Domestic marketing leverages the distribution partner relationships across a number of campaign platforms including niche digital marketing (WA landing pages), eDM, sharing of rich media assets, trade communications and incentives (retail agents), social marketing, destination content and PR strategies and holiday deals on westernaustralia.com.
International cooperative marketing
iii. International cooperative marketing enables Tourism WA to leverage further economic benefit for the State through increased visitation, spend and brand awareness by working with selected partners in key source markets.
iv. Tourism WA’s International Market Managers identify cooperative opportunities with airlines, wholesalers, retailers and non-traditional partners and undertake joint campaigns in the United Kingdom, Germany, Singapore, Malaysia, Indonesia, China, Hong Kong, Japan, New Zealand, the USA and India.
v. Tourism WA’s participation in cooperative marketing activities in these international markets is evaluated based on the potential return on investment and alignment to the State’s tourism brand. In joint brand promotions, Tourism WA’s funding contribution is generally matched dollar for dollar and aims to promote regional dispersal and introduce new products to the market where possible.
Combined total
vi. The actual result for 2019-20 is significantly lower than the actual for 2018-19, and lower than the target set for 2019-20, largely due to the impact of bushfires, COVID-19 and the resultant closure of international and interstate borders.
1 0 2
4 . 0 D I S C L O S U R E S A N D L E G A L C O M P L I A N C E
TOURISM WESTERN AUSTRALIA / ANNUAL REPORT 2019 – 20
1 . 0 OV E R V I E W 2 . 0 A G E N C Y P E R F O R M A N C E
M E S S A G E T O T H E M I N I S T E R
3 . 0 S I G N I F I C A N T I S S U E S I M PA C T I N G T H E A G E N C Y
4 . 0 D I S C L O S U R E S A N D L E G A L C O M P L I A N C E
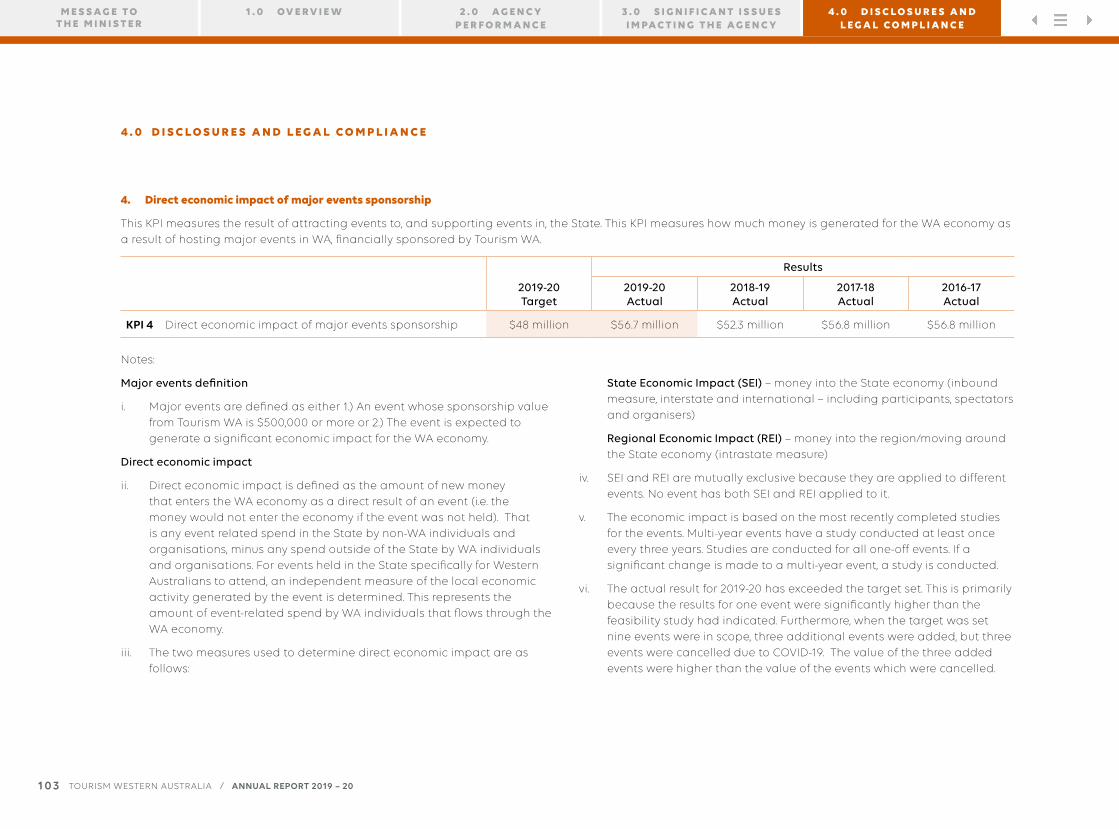
4. Direct economic impact of major events sponsorship
This KPI measures the result of attracting events to, and supporting events in, the State. This KPI measures how much money is generated for the WA economy as a result of hosting major events in WA, financially sponsored by Tourism WA.
2019-20 Target
Results
2019-20 Actual
2018-19 Actual
2017-18 Actual
2016-17 Actual
KPI 4 Direct economic impact of major events sponsorship $48 million $56.7 million $52.3 million $56.8 million $56.8 million
Notes:
Major events definition
i. Major events are defined as either 1.) An event whose sponsorship value from Tourism WA is $500,000 or more or 2.) The event is expected to generate a significant economic impact for the WA economy.
Direct economic impact
ii. Direct economic impact is defined as the amount of new money that enters the WA economy as a direct result of an event (i.e. the money would not enter the economy if the event was not held). That is any event related spend in the State by non-WA individuals and organisations, minus any spend outside of the State by WA individuals and organisations. For events held in the State specifically for Western Australians to attend, an independent measure of the local economic activity generated by the event is determined. This represents the amount of event-related spend by WA individuals that flows through the WA economy.
iii. The two measures used to determine direct economic impact are as follows:
State Economic Impact (SEI) – money into the State economy (inbound measure, interstate and international – including participants, spectators and organisers)
Regional Economic Impact (REI) – money into the region/moving around the State economy (intrastate measure)
iv. SEI and REI are mutually exclusive because they are applied to different events. No event has both SEI and REI applied to it.
v. The economic impact is based on the most recently completed studies for the events. Multi-year events have a study conducted at least once every three years. Studies are conducted for all one-off events. If a significant change is made to a multi-year event, a study is conducted.
vi. The actual result for 2019-20 has exceeded the target set. This is primarily because the results for one event were significantly higher than the feasibility study had indicated. Furthermore, when the target was set nine events were in scope, three additional events were added, but three events were cancelled due to COVID-19. The value of the three added events were higher than the value of the events which were cancelled.
1 0 3
4 . 0 D I S C L O S U R E S A N D L E G A L C O M P L I A N C E
TOURISM WESTERN AUSTRALIA / ANNUAL REPORT 2019 – 20
1 . 0 OV E R V I E W 2 . 0 A G E N C Y P E R F O R M A N C E
M E S S A G E T O T H E M I N I S T E R
3 . 0 S I G N I F I C A N T I S S U E S I M PA C T I N G T H E A G E N C Y
4 . 0 D I S C L O S U R E S A N D L E G A L C O M P L I A N C E

5. Direct media impact of major events sponsorship
This KPI measures how much media equivalent value is generated as a result of hosting major events that are financially supported by Tourism WA.
The current definition of media impact includes the Advertising Equivalent Value (AEV) of the exposure of Western Australian tourism imagery and branding within television production and traditional periphery media (e.g. print, radio). It does not include social media.
Tourism WA’s media and event strategies are targeted at a variety of digital media channels, and produce high levels of exposure through these platforms, including social media.
2019-20 Target
Results
2019-20 Actual
2018-19 Actual
2017-18 Actual
2016-17 Actual
KPI 5 Direct media impact of major events sponsorship $94.5 million $162.5 million $167.3 million $122.3 million $156 million
Notes:
Major events definition
i. Major events are defined as either 1.) An event whose sponsorship value from Tourism WA is $500,000 or more or 2.) The event is expected to generate a significant media impact for the State.
Media Impact
ii. Media Impact (MI) is defined as 1.) The dollar value of Western Australian tourism imagery and branding (including video postcards of WA tourism destinations, verbal commentary mentions about the destination, on-screen graphics and signage) integrated into television production related to the events plus 2.) The dollar value of the number of mentions of Western Australia in traditional periphery media (e.g. print, radio etc) as a result of the event.
iii. It is measured by independent media evaluation companies. In line with the rest of the agency, 100% of the Advertising Equivalent Value (AEV) is counted.
iv. The media impact is based on the most recently completed studies for the events. Multi-year events have a study conducted at least once every three years. Studies are conducted for all one-off events. If a significant change is made to a multi-year event, a study is conducted.
v. From 2019-20 the methodology for MI changed to exclude WA results for Perth-based events.
vi. The 2019-20 actual result is significantly more than the target set for 2019-20 because the results for two events were significantly higher than the feasibility study had indicated. Furthermore, when the target was set nine events were in scope, three additional events were added, but three events were cancelled due to COVID-19. The value of the three added events was significantly higher than the value of the events which were cancelled.
1 0 4
4 . 0 D I S C L O S U R E S A N D L E G A L C O M P L I A N C E
TOURISM WESTERN AUSTRALIA / ANNUAL REPORT 2019 – 20
1 . 0 OV E R V I E W 2 . 0 A G E N C Y P E R F O R M A N C E
M E S S A G E T O T H E M I N I S T E R
3 . 0 S I G N I F I C A N T I S S U E S I M PA C T I N G T H E A G E N C Y
4 . 0 D I S C L O S U R E S A N D L E G A L C O M P L I A N C E
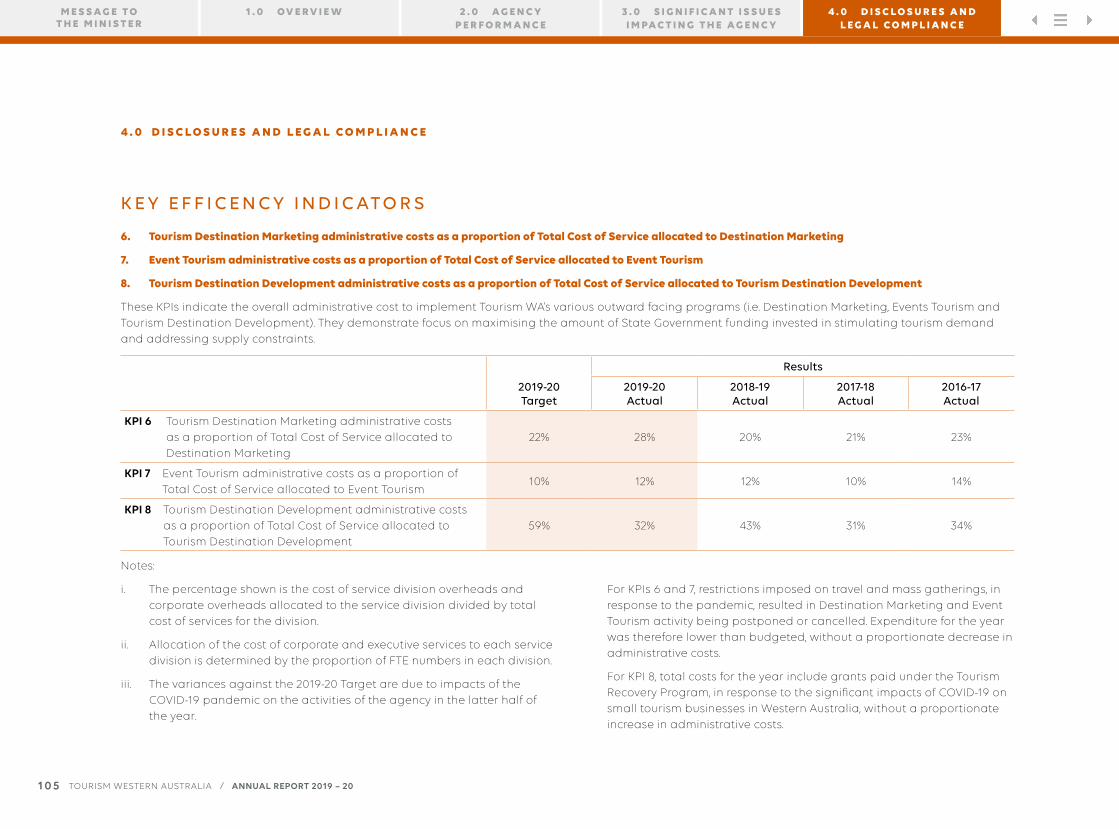
K E Y E F F I C E N C Y I N D I C AT O R S
6. Tourism Destination Marketing administrative costs as a proportion of Total Cost of Service allocated to Destination Marketing
7. Event Tourism administrative costs as a proportion of Total Cost of Service allocated to Event Tourism
8. Tourism Destination Development administrative costs as a proportion of Total Cost of Service allocated to Tourism Destination Development
These KPIs indicate the overall administrative cost to implement Tourism WA’s various outward facing programs (i.e. Destination Marketing, Events Tourism and Tourism Destination Development). They demonstrate focus on maximising the amount of State Government funding invested in stimulating tourism demand and addressing supply constraints.
2019-20 Target
Results
2019-20 Actual
2018-19 Actual
2017-18 Actual
2016-17 Actual
KPI 6 Tourism Destination Marketing administrative costs as a proportion of Total Cost of Service allocated to Destination Marketing
22% 28% 20% 21% 23%
KPI 7 Event Tourism administrative costs as a proportion of Total Cost of Service allocated to Event Tourism
10% 12% 12% 10% 14%
KPI 8 Tourism Destination Development administrative costs as a proportion of Total Cost of Service allocated to Tourism Destination Development
59% 32% 43% 31% 34%
Notes:
i. The percentage shown is the cost of service division overheads and corporate overheads allocated to the service division divided by total cost of services for the division.
ii. Allocation of the cost of corporate and executive services to each service division is determined by the proportion of FTE numbers in each division.
iii. The variances against the 2019-20 Target are due to impacts of the COVID-19 pandemic on the activities of the agency in the latter half of the year.
For KPIs 6 and 7, restrictions imposed on travel and mass gatherings, in response to the pandemic, resulted in Destination Marketing and Event Tourism activity being postponed or cancelled. Expenditure for the year was therefore lower than budgeted, without a proportionate decrease in administrative costs.
For KPI 8, total costs for the year include grants paid under the Tourism Recovery Program, in response to the significant impacts of COVID-19 on small tourism businesses in Western Australia, without a proportionate increase in administrative costs.
1 0 5
4 . 0 D I S C L O S U R E S A N D L E G A L C O M P L I A N C E
TOURISM WESTERN AUSTRALIA / ANNUAL REPORT 2019 – 20
1 . 0 OV E R V I E W 2 . 0 A G E N C Y P E R F O R M A N C E
M E S S A G E T O T H E M I N I S T E R
3 . 0 S I G N I F I C A N T I S S U E S I M PA C T I N G T H E A G E N C Y
4 . 0 D I S C L O S U R E S A N D L E G A L C O M P L I A N C E
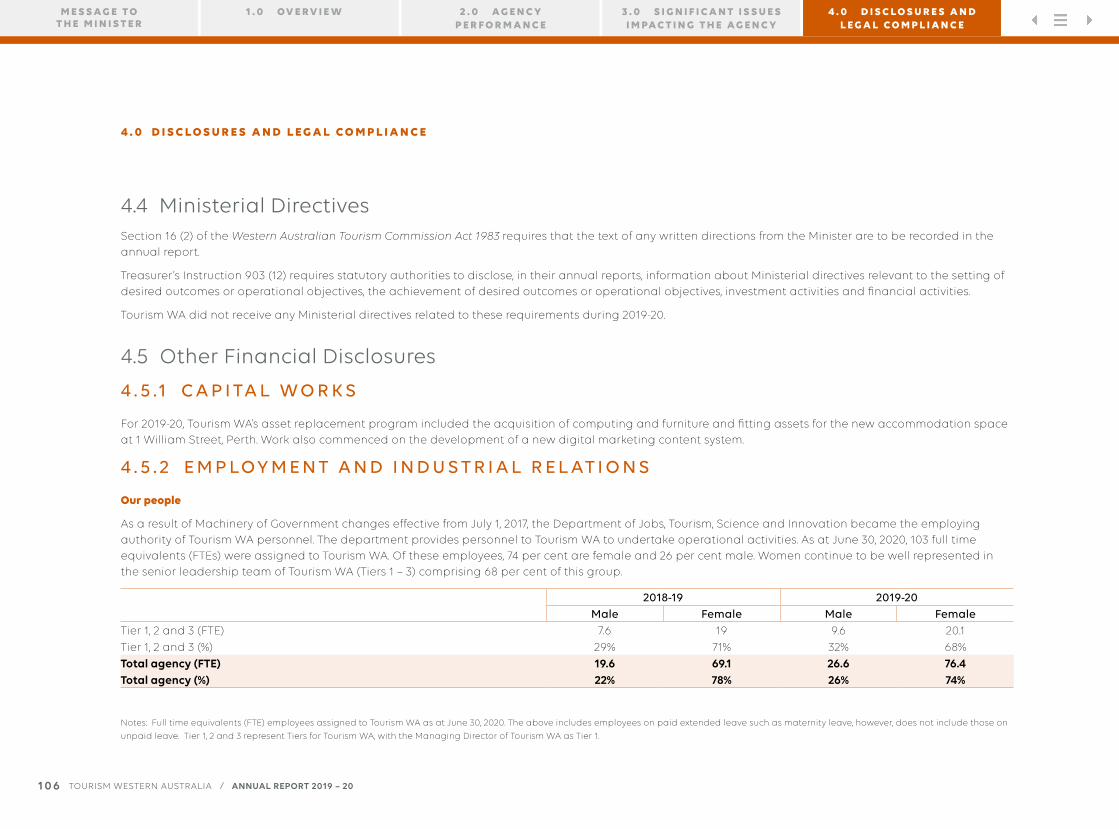
4.4 Ministerial DirectivesSection 16 (2) of the Western Australian Tourism Commission Act 1983 requires that the text of any written directions from the Minister are to be recorded in the annual report.
Treasurer’s Instruction 903 (12) requires statutory authorities to disclose, in their annual reports, information about Ministerial directives relevant to the setting of desired outcomes or operational objectives, the achievement of desired outcomes or operational objectives, investment activities and financial activities.
Tourism WA did not receive any Ministerial directives related to these requirements during 2019-20.
4.5 Other Financial Disclosures
4 . 5 .1 C A P I TA L W O R K S
For 2019-20, Tourism WA’s asset replacement program included the acquisition of computing and furniture and fitting assets for the new accommodation space at 1 William Street, Perth. Work also commenced on the development of a new digital marketing content system.
4 . 5 . 2 E M P LOY M E N T A N D I N D U S T R I A L R E L AT I O N S
Our people
As a result of Machinery of Government changes effective from July 1, 2017, the Department of Jobs, Tourism, Science and Innovation became the employing authority of Tourism WA personnel. The department provides personnel to Tourism WA to undertake operational activities. As at June 30, 2020, 103 full time equivalents (FTEs) were assigned to Tourism WA. Of these employees, 74 per cent are female and 26 per cent male. Women continue to be well represented in the senior leadership team of Tourism WA (Tiers 1 – 3) comprising 68 per cent of this group.
2018-19 2019-20Male Female Male Female
Tier 1, 2 and 3 (FTE) 7.6 19 9.6 20.1
Tier 1, 2 and 3 (%) 29% 71% 32% 68%
Total agency (FTE) 19.6 69.1 26.6 76.4Total agency (%) 22% 78% 26% 74%
Notes: Full time equivalents (FTE) employees assigned to Tourism WA as at June 30, 2020. The above includes employees on paid extended leave such as maternity leave, however, does not include those on
unpaid leave. Tier 1, 2 and 3 represent Tiers for Tourism WA, with the Managing Director of Tourism WA as Tier 1.
1 0 6
4 . 0 D I S C L O S U R E S A N D L E G A L C O M P L I A N C E
TOURISM WESTERN AUSTRALIA / ANNUAL REPORT 2019 – 20
1 . 0 OV E R V I E W 2 . 0 A G E N C Y P E R F O R M A N C E
M E S S A G E T O T H E M I N I S T E R
3 . 0 S I G N I F I C A N T I S S U E S I M PA C T I N G T H E A G E N C Y
4 . 0 D I S C L O S U R E S A N D L E G A L C O M P L I A N C E
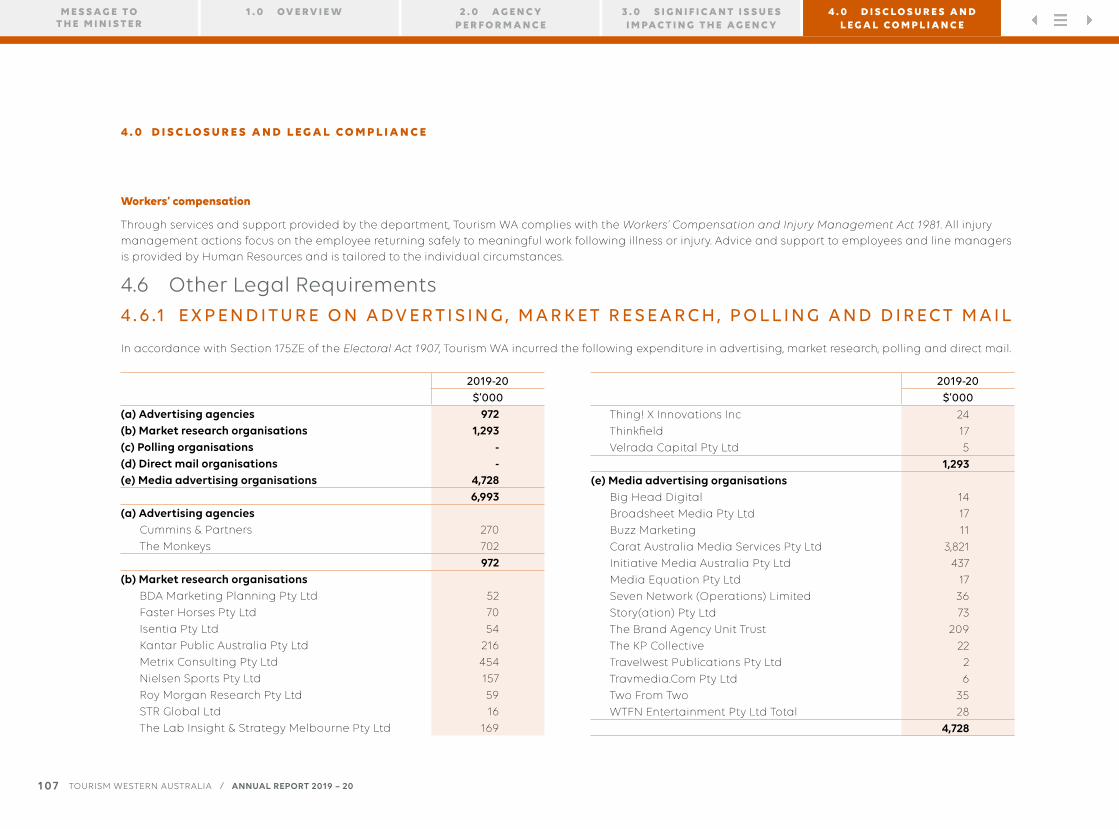
Workers’ compensation
Through services and support provided by the department, Tourism WA complies with the Workers’ Compensation and Injury Management Act 1981. All injury management actions focus on the employee returning safely to meaningful work following illness or injury. Advice and support to employees and line managers is provided by Human Resources and is tailored to the individual circumstances.
4.6 Other Legal Requirements4 . 6 .1 E X P E N D I T U R E O N A DV E R T I S I N G , M A R K E T R E S E A R C H , P O L L I N G A N D D I R E C T M A I L
In accordance with Section 175ZE of the Electoral Act 1907, Tourism WA incurred the following expenditure in advertising, market research, polling and direct mail.
2019-20$’000
(a) Advertising agencies 972(b) Market research organisations 1,293(c) Polling organisations -(d) Direct mail organisations -(e) Media advertising organisations 4,728
6,993(a) Advertising agencies
Cummins & Partners 270
The Monkeys 702
972(b) Market research organisations
BDA Marketing Planning Pty Ltd 52
Faster Horses Pty Ltd 70
Isentia Pty Ltd 54
Kantar Public Australia Pty Ltd 216
Metrix Consulting Pty Ltd 454
Nielsen Sports Pty Ltd 157
Roy Morgan Research Pty Ltd 59
STR Global Ltd 16
The Lab Insight & Strategy Melbourne Pty Ltd 169
2019-20$’000
Thing! X Innovations Inc 24
Thinkfield 17
Velrada Capital Pty Ltd 5
1,293(e) Media advertising organisations
Big Head Digital 14
Broadsheet Media Pty Ltd 17
Buzz Marketing 11
Carat Australia Media Services Pty Ltd 3,821
Initiative Media Australia Pty Ltd 437
Media Equation Pty Ltd 17
Seven Network (Operations) Limited 36
Story(ation) Pty Ltd 73
The Brand Agency Unit Trust 209
The KP Collective 22
Travelwest Publications Pty Ltd 2
Travmedia.Com Pty Ltd 6
Two From Two 35
WTFN Entertainment Pty Ltd Total 28
4,728
1 0 7
4 . 0 D I S C L O S U R E S A N D L E G A L C O M P L I A N C E
TOURISM WESTERN AUSTRALIA / ANNUAL REPORT 2019 – 20
1 . 0 OV E R V I E W 2 . 0 A G E N C Y P E R F O R M A N C E
M E S S A G E T O T H E M I N I S T E R
3 . 0 S I G N I F I C A N T I S S U E S I M PA C T I N G T H E A G E N C Y
4 . 0 D I S C L O S U R E S A N D L E G A L C O M P L I A N C E
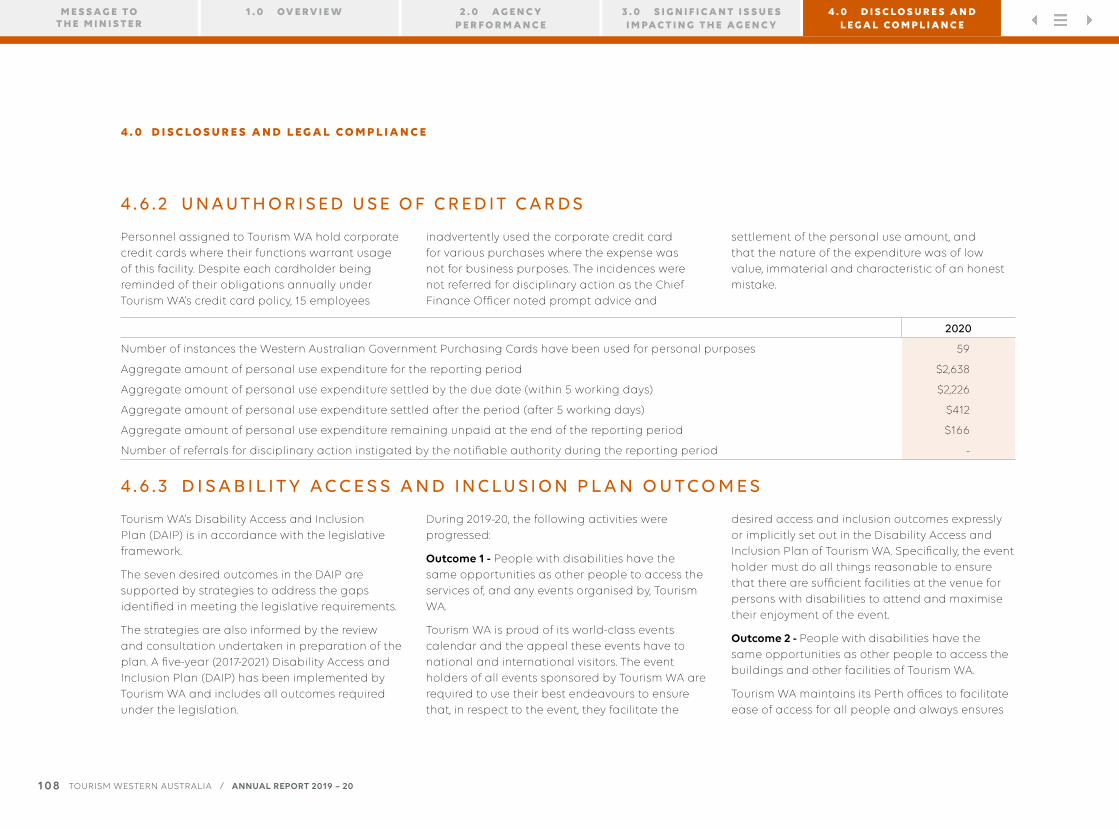
4 . 6 . 2 U N A U T H O R I S E D U S E O F C R E D I T C A R D S
Personnel assigned to Tourism WA hold corporate credit cards where their functions warrant usage of this facility. Despite each cardholder being reminded of their obligations annually under Tourism WA’s credit card policy, 15 employees
inadvertently used the corporate credit card for various purchases where the expense was not for business purposes. The incidences were not referred for disciplinary action as the Chief Finance Officer noted prompt advice and
settlement of the personal use amount, and that the nature of the expenditure was of low value, immaterial and characteristic of an honest mistake.
2020
Number of instances the Western Australian Government Purchasing Cards have been used for personal purposes 59
Aggregate amount of personal use expenditure for the reporting period $2,638
Aggregate amount of personal use expenditure settled by the due date (within 5 working days) $2,226
Aggregate amount of personal use expenditure settled after the period (after 5 working days) $412
Aggregate amount of personal use expenditure remaining unpaid at the end of the reporting period $166
Number of referrals for disciplinary action instigated by the notifiable authority during the reporting period -
4 . 6 . 3 D I S A B I L I T Y A C C E S S A N D I N C LU S I O N P L A N O U T C O M E S
Tourism WA’s Disability Access and Inclusion Plan (DAIP) is in accordance with the legislative framework.
The seven desired outcomes in the DAIP are supported by strategies to address the gaps identified in meeting the legislative requirements.
The strategies are also informed by the review and consultation undertaken in preparation of the plan. A five-year (2017-2021) Disability Access and Inclusion Plan (DAIP) has been implemented by Tourism WA and includes all outcomes required under the legislation.
During 2019-20, the following activities were progressed:
Outcome 1 - People with disabilities have the same opportunities as other people to access the services of, and any events organised by, Tourism WA.
Tourism WA is proud of its world-class events calendar and the appeal these events have to national and international visitors. The event holders of all events sponsored by Tourism WA are required to use their best endeavours to ensure that, in respect to the event, they facilitate the
desired access and inclusion outcomes expressly or implicitly set out in the Disability Access and Inclusion Plan of Tourism WA. Specifically, the event holder must do all things reasonable to ensure that there are sufficient facilities at the venue for persons with disabilities to attend and maximise their enjoyment of the event.
Outcome 2 - People with disabilities have the same opportunities as other people to access the buildings and other facilities of Tourism WA.
Tourism WA maintains its Perth offices to facilitate ease of access for all people and always ensures
1 0 8
4 . 0 D I S C L O S U R E S A N D L E G A L C O M P L I A N C E
TOURISM WESTERN AUSTRALIA / ANNUAL REPORT 2019 – 20
1 . 0 OV E R V I E W 2 . 0 A G E N C Y P E R F O R M A N C E
M E S S A G E T O T H E M I N I S T E R
3 . 0 S I G N I F I C A N T I S S U E S I M PA C T I N G T H E A G E N C Y
4 . 0 D I S C L O S U R E S A N D L E G A L C O M P L I A N C E
that advice is sought when planning and designing any facilities or undertaking major refurbishments.
Tourism WA moved to new premises during 2019-20 and these premises meet all current access standards.
Outcome 3 - People with disabilities receive information from Tourism WA in a format that will enable them to access the information as readily as other people are able to access it.
Tourism WA encourages people to contact the agency if they require information in alternative formats. This message is provided on both the corporate and consumer websites.
Tourism WA also continues to improve and upgrade its websites to facilitate stronger alignment with current standards.
All new online information and functionality implemented by Tourism WA is developed in line with best practice for people with disabilities wherever possible.
Outcome 4 - People with disabilities receive the same level and quality of service from staff as other people receive.
Staff members who interact with the public receive awareness training to enable them to assist visitors with a disability.
Outcome 5 - People with disabilities have the same opportunities as other people to make complaints to Tourism WA.
All existing complaint mechanisms meet the needs of people with disabilities. Tourism WA’s website provides a variety of feedback mechanisms for people with disabilities to lodge grievances and comment on tourism-related matters.
Outcome 6 - People with disabilities have the same opportunities as other people to participate in any public consultation by Tourism WA.
When required, Tourism WA seeks public consultation directly and through survey organisations and other research bodies.
Tourism WA reminds all staff and survey organisations of this requirement under the DAIP, including the ability to provide the same opportunities for people with disabilities to be involved in any public consultation.
Outcome 7 - People with disabilities have the same opportunities as other people to be employed by the Department of Jobs, Tourism, Science and Innovation.
The Department of Jobs, Tourism, Science and Innovation’s recruitment and employment policies and practices reflect the aim of having a diverse workforce. The department also captures accurate demographic and disability data from its employees.
4 . 6 . 4 C O M P L I A N C E W I T H P U B L I C S E C T O R S TA N D A R D S A N D E T H I C A L C O D E S
In accordance with Section 31 (1) of the Public Sector Management Act 1994, Tourism WA is required to report on compliance with the public sector standards and ethical codes.
Tourism WA is committed to fostering a culture of ethical behaviour and ensuring the highest standards of integrity and transparency in all interactions.
All new employees receive a comprehensive corporate induction with a strong focus on the expectation of highly ethical behaviour, declarations of conflicts of interest and responsibility for reporting suspected unethical
1 0 9
4 . 0 D I S C L O S U R E S A N D L E G A L C O M P L I A N C E
TOURISM WESTERN AUSTRALIA / ANNUAL REPORT 2019 – 20
1 . 0 OV E R V I E W 2 . 0 A G E N C Y P E R F O R M A N C E
M E S S A G E T O T H E M I N I S T E R
3 . 0 S I G N I F I C A N T I S S U E S I M PA C T I N G T H E A G E N C Y
4 . 0 D I S C L O S U R E S A N D L E G A L C O M P L I A N C E
behaviours or actions. The Code of Conduct and Conflict of Interest Policy, along with supporting policies, are available to all employees.
In 2019-20, an internal Conflict of Interest audit was conducted. The audit identified that processes and controls in place were operating effectively, with minor recommendations for
additional enhancement to the Conflict of Interest Framework. Progress on recommendations will be reported regularly to the Board.
The management of employees is undertaken in accordance with the public sector standards in human resource management and approved public sector policies and procedures.
In 2019-20, no breach claims against the public sector standards were received. No reports of non-compliance were lodged with respect to the Code of Ethics or the Department of Jobs, Tourism, Science and Innovation’s Code of Conduct.
4 . 6 . 5 R E C O R D - K E E P I N G P L A N
The State Records Act 2000 requires Tourism WA to have a record-keeping plan and to comment in the Annual Report on compliance with the plan.
Tourism WA’s current record-keeping plan, along with the record retention and disposal authority and record-keeping policies, has been approved by the State Records Commission.
The plan acknowledges Tourism WA’s responsibility to ensure all employees are aware of their compliance responsibilities and provided with training in these areas.
Under Section 28 of the State Records Act 2000, no more than five years must elapse between the record-keeping plan and its review. The current record-keeping plan was approved in 2018 and applies until 2022.
In accordance with State Records Standards, Standard 2, Principle 6 the following compliance information is provided:
Staff training and awareness
Tourism WA staff receive induction and ongoing training in relation to the agency’s record-keeping policies, practices and procedures.
Focused training sessions are conducted regularly and available to all staff. In addition, experienced Information Management staff are available to provide record-keeping advice and Electronic Document and Records Management System training on a one-on-one, ad hoc or project basis.
Information Management staff receive regular specialist external training such as Freedom of Information Coordinator workshops.
Fact sheets have been created for staff training purposes and are available on the corporate intranet. Also, regular communication to staff on records management is provided.
Performance indicators
Performance indicators on the efficiency and effectiveness of record-keeping programs and systems are submitted to the Chief Information Officer each month.
Reported statistics include record creation by business area; five-year comparisons; action tracking and workflow activity summaries; user activity; user requests; system maintenance tasks; and archive management.
Evaluation of record-keeping systems
Tourism WA maintains and evaluates its record-keeping system as follows:
The record-keeping system infrastructure is maintained at latest release levels to comply with required standards.
Regular reviews of the record-keeping system ensure its effectiveness and efficiency in meeting compliance and operational requirements.
Additional functions within the record-keeping system, such as workflow functionality, are utilised when required.
1 1 0
4 . 0 D I S C L O S U R E S A N D L E G A L C O M P L I A N C E
TOURISM WESTERN AUSTRALIA / ANNUAL REPORT 2019 – 20
1 . 0 OV E R V I E W 2 . 0 A G E N C Y P E R F O R M A N C E
M E S S A G E T O T H E M I N I S T E R
3 . 0 S I G N I F I C A N T I S S U E S I M PA C T I N G T H E A G E N C Y
4 . 0 D I S C L O S U R E S A N D L E G A L C O M P L I A N C E

4.7 Government Policy Requirements
4 . 7.1 O C C U PAT I O N A L S A F E T Y, H E A LT H A N D I N J U R Y M A N A G E M E N T
Tourism WA is committed to providing and maintaining a safe and healthy working environment for all assigned personnel, vocational students, contractors and visitors.
The Department of Jobs, Tourism, Science and Innovation provides human resource services including workplace safety and health to Tourism WA. A common integrated occupational safety and health management system and framework has been developed to meet both the department and Tourism WA’s duties under the Occupational
Safety and Health Act 1984 and aligns with the Code of Practice, Occupational Safety and Health in Western Australian Public Sector. An external audit of Tourism WA’s Occupational Health and Safety management system was undertaken in August 2018. The one improvement opportunity identified has been incorporated into the integrated occupational safety and health management system.
During 2019-20, following Tourism WA’s Perth office relocation, Tourism WA and the department’s
Occupational Safety and Health Committees combined. The Committee meet quarterly and continue to provide a key occupational safety and health consultative mechanism within Tourism WA and the department, actively working to promote and resolve any safety issues or hazards. All members are accessible to both management and employees in the discussion and resolution of occupational safety and health issues and related matters.
Performance indicators for 2019-20 (For department employees assigned to Tourism WA only)
Measure
2017-18 2018-19 2019-20
TargetComments
towards targetsActual Actual Actual
Number of fatalities 0 0 0 0 Achieved
Lost time injury and/or disease incidence rate 0 1.1% 0 0 or a 10% reduction
Achieved
Lost time injury and severity rate 0 0 0 0 or a 10% reduction in severity rate
Achieved
Percentage of injured workers returned to work (i) within 13 weeks N/A 100% N/A Greater than or equal to 80%
N/A
Percentage of injured workers returned to work within 26 weeks N/A 100% N/A Greater than or equal to 80%
N/A
1 1 1
4 . 0 D I S C L O S U R E S A N D L E G A L C O M P L I A N C E
TOURISM WESTERN AUSTRALIA / ANNUAL REPORT 2019 – 20
1 . 0 OV E R V I E W 2 . 0 A G E N C Y P E R F O R M A N C E
M E S S A G E T O T H E M I N I S T E R
3 . 0 S I G N I F I C A N T I S S U E S I M PA C T I N G T H E A G E N C Y
4 . 0 D I S C L O S U R E S A N D L E G A L C O M P L I A N C E

Percentage of managers trained in occupational safety, health and injury management responsibilities, including refresher training within three years.
68% 0 0 Greater than or equal to 80%
Not achieved. Training for managers is planned for 2020-21
4 . 7. 2 B O A R D R E M U N E R AT I O N
Remuneration of the Board of Commissioners of the Western Australian Tourism Commission in 2019-20 was as follows:
Position Name Period of membership Remuneration
Chairman Nathan Harding 1 July 2019 to 30 June 2020 63,690
Deputy Chairman Manny Papadoulis 1 July 2019 to 30 June 2020 37,012
Commissioner Dianne Bain 1 July 2019 to 30 June 2020 37,012
Commissioner Kevin Brown* 1 July 2019 to 30 June 2020 -
Commissioner Valerie Davies 1 July 2019 to 30 June 2020 43,806
Commissioner Bruce Davis 15 October 2019 to 16 January 2020 9,747
Commissioner Kia Dowell 1 July 2019 to 30 June 2020 37,012
Commissioner Tracey Horton 1 July 2019 to 30 June 2020 37,012
Commissioner Karen Priest 1 July 2019 to 30 June 2020 37,012
Commissioner Linda Wayman 1 July 2019 to 30 June 2020 40,936
Total 343,239
All members are paid a set annual fee. Remuneration includes superannuation and any allowances and non-cash benefits provided.
*Commissioner fees for Kevin Brown of $33,650 were paid directly to Perth Airport Pty Ltd.
1 1 2
4 . 0 D I S C L O S U R E S A N D L E G A L C O M P L I A N C E
TOURISM WESTERN AUSTRALIA / ANNUAL REPORT 2019 – 20
1 . 0 OV E R V I E W 2 . 0 A G E N C Y P E R F O R M A N C E
M E S S A G E T O T H E M I N I S T E R
3 . 0 S I G N I F I C A N T I S S U E S I M PA C T I N G T H E A G E N C Y
4 . 0 D I S C L O S U R E S A N D L E G A L C O M P L I A N C E

W I L L I A M B AY
F I T Z G E R A L D N AT I O N A L PA R K
1 1 3
Tourism Western Australia
Level 10, 1 William Street, PERTH WA 6000
GPO Box X2261 PERTH WA 6847
T. 08 9262 1700 F. 08 9262 1787
westernaustralia.com tourism.wa.gov.au
W E S T E R N A U S T R A L I A . C O MK U N U N U R R A