annual report 2019 - neometals ltd2019/10/17 · shre a hyretallrgical process rt ‘eyl plat’,...
TRANSCRIPT

ANNUAL REPORT
2019
For
per
sona
l use
onl
y

CORPORATE DIRECTORY
DIRECTORSSteven Cole Non-Executive Chairman
Christopher Reed Managing Director
David Reed Non-Executive Director
Dr Natalia Streltsova Non-Executive Director
Douglas Ritchie Non-Executive Director
Dr Jenny Purdie Non-Executive Director
Les Guthrie Non-Executive Director
COMPANY SECRETARY Jason Carone
REGISTERED OFFICELevel 3, 1292 Hay Street West Perth WA 6005
CONTACT DETAILS Telephone (+618) 9322 1182 Facsimile (+618) 9321 0556 www.neometals.com.au
AUDITORS Deloitte Touche Tohmatsu Brookfield Place, Tower 2 123 St Georges Terrace Perth WA 6000
SHARE REGISTRY Computershare Investor Services Pty Ltd Level 2, Reserve Bank Building
45 St Georges Terrace Perth WA 6000
STOCK EXCHANGE LISTINGNeometals Ltd are listed on the Australian Stock Exchange (Home Branch – Perth)
ASX Code: NMT
ACN: 099 116 631
ABN: 89 099 116 631
North American OTC Market
(DR Symbol: RDRUY)
ANNUAL GENERAL MEETING3pm Wednesday 20 November 2019 Parmelia Hilton Perth
14 Mill St, Perth WA 6000
For
per
sona
l use
onl
y

Neometals Annual Report 2019
1
CONTENTS
CHAIRMAN & 2-3 MANAGING DIRECTOR’S ADDRESS
REVIEW OF OPERATIONS 4
DIRECTORS’ REPORT 25
REMUNERATION REPORT 32
AUDIT REPORT 41
AUDITOR’S INDEPENDENCE 46 DECLARATION
DIRECTORS’ DECLARATION 47
CONSOLIDATED STATEMENT 48 OF PROFIT OR LOSS AND OTHER COMPREHENSIVE INCOME
CONSOLIDATED STATEMENT 49 OF FINANCIAL POSITION
CONSOLIDATED STATEMENT 50 OF CHANGES IN EQUITY
CONSOLIDATED STATEMENT 51 OF CASH FLOWS
FINANCIAL STATEMENTS CONTENTS 52
NOTES TO THE CONSOLIDATED 53 FINANCIAL STATEMENTS
ADDITIONAL SHAREHOLDER 98 INFORMATION
For
per
sona
l use
onl
y

Neometals Annual Report 2019
2
CHAIRMAN & MANAGING DIRECTOR’S ADDRESS
Dear Shareholders,
FY 2018/2019 proved to be a milestone year for Neometals with significant achievements on multiple fronts. Broadly, the year under review saw the Company refine its integrated project development focus with a move away from upstream lithium mining in favour of expediting the development of its mineral and advanced material growth projects.
The strategic sale of the Company’s remaining equity holding in the Mt Marion lithium mine with retention of annual offtake rights at market pricing proved to be prescient. The spodumene market has come under significant short to medium-term supply side pressure and a corresponding commodity price correction has validated the decision to sell. Importantly, the transaction generated a significant financial capital reserve for Neometals and the valuable life of mine offtake option underwrites Neometals’ continuing participation in lithium battery materials downstream processing opportunities which are projected to emerge in the medium term. It also marked the culmination of years spent strategically creating an ecosystem building inherent value for future realisation with exposure to downstream opportunities developed and retained.
Neometals has a clear strategy and a unique approach that looks to combine the following elements:
1. Identifying and securing diversified project development opportunities connected to the electric vehicle battery and stationary energy storage sectors;
2. Applying its ecosystem of expertise to build and realise inherent value in project and opportunity commercialisation through co-venturing with strong industry relevant partners to fast-track development and returns, minimise Neometals’ capital outlay and mitigate financial and operating risks;
3. Shortening the timeline to project development, commercialisation and cashflow realisation leading to the acceleration of returns to shareholders; and
4. Using returns from past project success to finance growth projects and to fund innovation to enable downstream processing of upstream mineral and advanced material feedstocks.
For
per
sona
l use
onl
y

Neometals Annual Report 2019
3
CHAIRMAN & MANAGING DIRECTOR’S ADDRESS (CONTINUED)
Neometals’ project development approach allowed the Company to deliver total realised returns to date from its Mt Marion project participation of almost $AUD200m off an initial $AUD3m investment. The Company’s business model and aim is to replicate this success.
Key business highlights that support the Company’s current position include:
Security • A strong balance sheet (~$AUD114m cash
and term deposits plus $AUD8.9m in net receivables and listed securities as at 30 June 2019) courtesy of internally generated returns. The Company has not raised dilutive equity capital since 2013;
• A history of de-risking opportunity development with strong operating and offtake partners;
• A history of disciplined capital allocation, value realisation and shareholder returns with $6 million in share buy backs and $39 million in total dividends being paid to shareholders progressively over the last 4 years; and
• A strong diversified board and disciplined management team.
Opportunity • The financial means to pursue development
of its growth projects;
• Diversified and mature portfolio of minerals and advanced materials required for a sustainable future;
• Risk-mitigating business model that supports innovation towards the head of the trend - so as to deliver enhanced margins;
• Clear growth strategy with an approach validated by prudent timing and value realisation;
• The assurance of its track record to leverage stronger financial outcomes from future project transactions;
• Three advanced core project priorities together with mineral exploration, processing and longer-term technology- based projects;
• All projects sharing common DNA with their connection to the globally relevant electric vehicle battery and stationary energy storage thematic; and
• A market discrepancy where share market capitalisation is less than cash backing and value crystallisation opportunities exist on multiple fronts as already mature projects continue to advance.
Over the year, your Company’s Board and management have worked hard to fulfil Neometals stated corporate purpose, “to innovatively develop opportunities in minerals and advanced materials essential for a sustainable future”.
Strong disciplined governance and focus on dynamic corporate strategy underpins the Neometals commitment to delivering value to our shareholders, partners and community. Neometals’ innovative business approach offers a combination of security, returns and growth opportunities in a diversified project pipeline.
Your Board is confident of the Company’s future, and together with the management team, we are committed to realising the Company’s success which we look forward to sharing with our loyal and supportive shareholder base.
Steven ColeCHAIRMAN
Chris ReedMANAGING DIRECTOR
17 October 2019
For
per
sona
l use
onl
y

Neometals Annual Report 2019
4
Neometals innovatively develops opportunities in minerals and advanced materials essential for a sustainable future. The Company strategy focuses on de-risking and developing long life projects with strong partners and integrating down the value chain to increase margins and return value to shareholders.
Neometals has three core projects:
REVIEW OF OPERATIONS
The directors of Neometals Ltd (‘Company’ and ‘Neometals’) present
the annual financial report for the Company and its controlled entities
(‘Consolidated Entity’ and ‘Group’).
A proprietary process for recovering cobalt, nickel, lithium and other valuable materials from scrap and end-of-life lithium batteries. Pilot plant testing currently underway with commercial development decision expected in the December 2020.
Progressing evaluation activities for the development of India’s first lithium refinery with Manikaran Power Limited to supply lithium hydroxide to the battery cathode industry. Project underpinned by a binding life-of-mine annual offtake option for 57,000 tonnes per annum of Mt Marion 6% spodumene concentrates. Commercial development decision expected in the 1H CY2021.
One of the world’s highest-grade hard-rock titanium-vanadium deposits, currently evaluating an all-hydrometallurgical process to extract high purity titanium and vanadium chemicals with a view to identifying the optimal process flowsheet for development of this globally significant resource in 2020.
For
per
sona
l use
onl
y

Neometals Annual Report 2019
5REVIEW OF OPERATIONS (CONTINUED)...
Figure 1 - High level flowsheet showing the materials generated from Feed Preparation and Hydrometallurgical Processing facilities
CORE PROJECTS:
(Neometals Ltd 100%) Neometals has developed a process flowsheet targeting the recovery of 90% of all battery materials from end-of-life lithium-ion batteries (LIBs) that might otherwise be disposed of in land fill or processed in energy-intensive
pyrometallurgical recovery circuits. Neometals’ process flowsheet targets the recovery of valuable materials from consumer electronic batteries (devices with lithium cobalt oxide (LCO) cathodes), and nickel-rich EV and stationary storage battery chemistries (lithium-nickel-manganese-cobalt (NMC) cathodes). The flowsheet is designed to recover cobalt, nickel, lithium, copper, iron, aluminium, manganese into saleable products and is being validated currently in a pilot plant at SGS Lakefield in Ontario, Canada (Pilot).
Scoping Study and Pilot Plant During the year Neometals announced the result of a Class 5 scoping study (‘Study’) to Association for the Advancement of Cost Engineering (‘AACE’) standard. Primero Group Ltd (‘Primero’) was engaged to complete the Study which determined operating and capital costs based on Neometals’ bench-scale validation and optimisation test work. Process design criteria and mass/energy balances were prepared by Strategic Metallurgy Pty Ltd (‘Strategic Metallurgy’) and financial modelling was undertaken by Azure Capital.
Neometals High-Level Flowsheet
STAGE 1 SHREDDING
Plastics
Metal Foil
LiCo/NMC Battery
Feed
2nd Life
STAGE 2 REFINING
Black Powder
Base MetalsCo, Ni, Cu
Lithium
Graphite
For
per
sona
l use
onl
y

Scoping Study Highlights
Annual Production 9,623 t Cobalt Sulphate
5,635 t Copper Sulphate
1,544 t Lithium Sulphate
2,020 t Nickel Sulphate
Life of Plant (LOP) 10 years
Life of Plant (LOM) Revenue US$ 850 million
Pre-tax Cashflow US$ 502 million
Pre-tax NPV (12% discount rate) US$ 220 million
Average Net Operating Cost of recovered cobalt as cobalt sulphate
excluding by-product credits
US$6.65/lb (US$14.65/kg)
Total initial capital costs US$66 million
Payback of capital costs 2 years
For full details refer to ASX announcement entitled “Neometals Completes Lithium Battery Recycling Scoping Study” released on 4 June 2019.
Neometals Annual Report 2019
6REVIEW OF OPERATIONS (CONTINUED)...
The Study indicated potentially robust economic outcomes with estimated operating costs of less than US$7/lb of contained cobalt as cobalt sulphate, before by-product credits, from the processing of 50 tonnes per day of an equal amount of lithium-cobalt (‘LCO’)(consumer electronic) and lithium-nickel-manganese-cobalt (‘NMC’)(electric vehicle) batteries.
Primero completed the Study considering both a 10 tonnes per day (‘tpd’) and a 50tpd battery shredding and hydrometallurgical processing circuit (‘Recycling Plant’), with AACE Class 5 order of magnitude (±35%) capital cost and (±35%) operating cost estimates.
The Recycling Plant flowsheet, which is being optimised at pilot scale, comprises two sections:
1. Shredding, removal of metal casings and plastics in the feed preparation facility (‘Feed Preparation Facility’); and
2. Leaching, recovery and refining to deliver chemical products via the hydrometallurgical processing facility (‘Hydrometallurgical Processing Facility’).
The Study estimate was based on a development scenario characterised by:
• Establishing a green-fields operation for an integrated shredding and processing plant nominally located in Kwinana (chosen as an assumed site for accuracy and estimation conservatism);
• Modular plant with a throughput capacity of 18,250tpa; and
• LIB feedstock comprising 50:50 LCO and NMC batteries.
Table 1 - Study Financial Highlights
For
per
sona
l use
onl
y

Neometals Annual Report 2019
7
During the year the Company commenced commissioning its mixed chemistry LIB recycling pilot in Canada. The Company awarded the contracts to SGS Canada Inc.(SGS) to construct and operate the bench-scale and pilot plant at their fully accredited Lakefield facility.
Stage 1 of the Pilot comprises feed preparation and Stage 2 is hydrometallurgical processing and refining of products to deliver high-purity materials for market qualification.
Neometals successfully commissioned its Stage 1 Feed Preparation Pilot in February 2019 then shredded approximately 2 tonnes of spent LIBs ready for subsequent leaching in the Stage 2 Hydrometallurgical Processing Pilot. During the June quarter, Neometals advanced the following aspects of its Pilot:
• Feed Preparation Facility design was improved based on lessons learned during the Feed Preparation Pilot;
• Pilot leaching of approximately 1,100kg of shredded and cleaned LIBs (‘Black Mass’) producing 2,500 litres of pregnant leach solution for subsequent product recovery in the Hydrometallurgical Processing Facility; and
• Bulk Hydrometallurgical Processing test-work commenced with successful copper recovery via solvent extraction.
Commercial Developments Neometals continued to advance its engagement with potential partners to commercialise the recycling project. Dialogues with brand name plant operators have been run in parallel with maturing feed supply dialogues with electric vehicle and battery manufacturers who have scrap and end of life LIBs to recycle now. The key takeaway from Neometals discussions with industry and extensive due diligence is that consensus forecasts on LIB demand, predominantly from electric vehicle applications, continue to predict sustained strong growth with LIB materials supply side deficits predicted to be the major constraint on growth. With internal combustion engine powered vehicles predicted to be phased out, the increase in LIB-powered electric vehicles means sustained increase in production scrap and in end of life cells that will require mandated disposal through recycling.
Neometals has used its Montreal laboratory facilities to evaluate more than 70 LIBs with a range of cathode chemistries from vehicle OEMs and electronic manufacturers. With the Pilot now progressing to recovery from solution and purification, it will soon be possible to commence end user market evaluation of finished chemical products from the Hydrometallurgical Processing Facility.
Post Pilot completion, Neometals plans to commence an AACE Class 3 feasibility study and look to demonstrate its Recycling Plant in advance of commercial deployment. Sites will be considered either in Montreal at the eometals industrial facility or at the site of a commercial partner.
For
per
sona
l use
onl
y

Neometals Annual Report 2019
8REVIEW OF OPERATIONS (CONTINUED)...
(Neometals Ltd 100%) During the year, the Company continued pursuing its integrated lithium chemical production goals. Key activities included:
• Completion of the capital cost estimate component of the FEED Study of the proposed Kalgoorlie Lithium Refinery, a peer review of the estimate and initial financial modelling of the project;
• Secured MoU with a leading Indian power trader, Manikaran Power, to evaluate the development of India’s first lithium refinery in a 50:50 Joint Venture; and
• Initial assessment of the impact of making a zeolite co-product on the economics of the project.
The key driver of the LR Project is to realise value from the conversion of future spodumene concentrates purchased under the Company’s Mt Marion Spodumene Concentrate Offtake Option (‘Offtake Option’). The annual Offtake Option
provides a fixed volume of up to 57,000tpa of 6% spodumene concentrate for conversion into battery grade lithium hydroxide (LiOH) and lithium carbonate (LC) for supply to LIB cathode and cell makers. The LR has been designed to produce lithium hydroxide and lithium carbonate in a plant with capacity of approximately 10,000tpa lithium hydroxide equivalent.
Neometals previously completed a capital cost study on a proposed lithium refinery operation in Kalgoorlie, WA, which indicated a higher than anticipated capital intensity for the 10,000t LiOH capacity. Neometals decided to delay further evaluation on the Kalgoorlie site but continues to advance the engineering and approvals processes. The Company has confidence in the medium-to-long term spodumene concentrate supply from existing and emerging mining projects in the Eastern Goldfields region to support consideration, in due course, of a larger (~20,000t LiOH capacity) conversion facility located in Kalgoorlie. Discussions with potential project and offtake partners are continuing.
The near term LR priority lies with joint development activities for a potential Indian project – see below.
For
per
sona
l use
onl
y

Neometals Annual Report 2019
9REVIEW OF OPERATIONS (CONTINUED)...
MOU with Manikaran Power Neometals and Manikaran Power Limited have agreed to contribute their respective skills, resources and know-how to evaluate development of a LR in India and to share the costs of the evaluation equally (for full details refer to ASX announcement entitled ‘MOU – Lithium Refinery in India’ released on 20 June 2019). Upon completion of the feasibility study analysis, and subject to agreement on terms, a final investment decision (‘FID’) will be considered for a 50:50 joint venture (‘JV’) to progress and develop the LR in India.
A positive FID and formal JV commitment would see Neometals contributing to the venture its ‘life-of-mine’ offtake option volume (i.e. up to 57,000t per annum of 6% spodumene concentrate) (‘Offtake Option’) retained as part of the Mt Marion equity sale agreement (for full details refer to ASX announcement entitled ‘Completion of Mt Marion Sale and Strategy Guidance’ released on 19 March 2019). Additional spodumene feed would be sourced as required from external sources to meet the LR’s needs depending on its nameplate capacity. In the event of a positive FID and formation of a JV, Manikaran will take the lead role in procuring project financing for not less than 50% of the capital expenditure required, securing regulatory approvals and Indian government subsidies (as available), securing a suitable site for the LR and securing necessary utility and reagent supplies.
The MOU represents a significant step forward for Neometals in its downstream lithium processing strategy. It allows the realisation of value from its Offtake Option to participate in higher value, higher margin lithium chemical production for electric vehicles, stationary energy storage and a more sustainable future.
It is estimated that the feasibility study, which needs to be completed irrespective of site, will take approximately 18 to 24 months, with an FID on whether to proceed with a potential JV likely to be considered thereafter.
Zeolite Zeolites are advanced industrial materials used for water treatment, gas adsorption and green chemistry applications. Manufacturing zeolites from LR waste (spodumene leach residue) could eliminate residue disposal and associated costs
from lithium chemical production and generate significant co-product revenue.
Zeolite materials are produced as both naturally occurring and synthetic materials. Synthetic zeolites such as the specifications now produced by Neometals at bench-scale, are typically used in more demanding industrial applications such as molecular sieves for air and hydrocarbon purification. According to Markets and Markets (2017), the global zeolite market was approximately 2.4Mtpa with a total estimated value in excess of US$13B per annum.
Late 2018 feedback from early engagement with market participants on the Company’s ‘Type A’ zeolite led to bench-scale process optimisation and the subsequent manufacture of a higher value ‘Type X’ zeolite product.
Neometals’ zeolite development work is running in parallel with continued evaluation of the optimal design scale for its LR. During the year Neometals advanced the work on its zeolite program and successfully produced commercial grade samples of ‘Type X’ zeolite from both Mt Marion and third-party sourced spodumene leach residue via its patent pending technology (for full details refer to ASX announcement entitled “Neometals Zeolite Production Evaluation Results” released on 24 June 2019). Benchmarking studies indicated Neometals product quality to be comparable to industry leading zeolite products from a leading Japanese manufacturer.
For
per
sona
l use
onl
y

Neometals Annual Report 2019
10REVIEW OF OPERATIONS (CONTINUED)...
Demonstrating that Type A and Type X zeolites could be produced from lithium refinery residue represented a proof of concept breakthrough. Subsequent production of synthetic zeolite, from various sources of lithium refinery residue, at or close to commercial benchmarks is extremely encouraging. Neometals has engaged global engineering company Exyte to complete a Class 4 Engineering Cost Study (pre-feasibility level) based on the current test-work.
Exyte is completing an AACE Class 4 pre-feasibility study for a zeolite manufacturing facility located adjacent to the Kalgoorlie Lithium Refinery. Neometals has since engaged Queensland University of Technology to perform continuous lab-scale process testing to be followed by pilot testing in 2020. A Class 3 Engineering Cost and Feasibility Study is planned to follow successful completion of the pilot plant demonstration of the process. The pilot plant will also generate customer evaluation samples of the zeolite products.
Lithium Market Commentary The demand side of the lithium market is continuing to grow in line with consensus forecasts. However, the high rate of growth
on the supply side through capacity expansions and committed new production facilities for raw materials and lithium compounds has exceeded the rate of demand growth.
The global lithium market is reported to be oversupplied currently and is forecast to remain oversupplied until 2024 due to the cumulative capacity of new conversion plants, particularly those under construction in Australia. The projected lithium market supply/demand balance (in LCE units) is described in the SFA Oxford chart below (Figure 2). A supply deficit from 2025 is probable at which time market conditions will once again support and stimulate the commissioning of new production capacity.
The Deutsche Bank price forecast (Figure 3) for the most commonly traded lithium chemicals, lithium carbonate and lithium hydroxide, and the main hard rock lithium mineral, spodumene, shows a trend for convergence between Chinese spot prices and international prices. Both Chinese spot prices and international prices have peaked and are trending down to more stable levels expected to prevail for the next five years. Deutsche Bank is not forecasting any price increases before 2025.
Figure 2 – Projected lithium market supply/demand
For
per
sona
l use
onl
y

REVIEW OF OPERATIONS (CONTINUED)...
Neometals Annual Report 2019
11
This price forecast is supported by the ‘probable’ supply/demand balance scenario forecast by SFA Oxford (Figure 2), which indicates that the market will once again move into a supply deficit at this time.
Figure 3 – Deutsche Bank Lithium price forecast
Forecast Lithium Prices Prices for lithium chemicals and mineral concentrates continued to soften in the June quarter and are now considerably lower than they were in 2018. According to Fastmarkets, Chinese domestic prices for battery grade lithium carbonate were in the range US$10,000 – 11,000/t ex works and in North Asia (i.e. Japan & Korea) at the end of June. Cost Insurance freight (‘CIF’) prices were in the range US$11,000 - 12,500/t. In the case of battery grade lithium hydroxide Chinese domestic prices were US$11,500 – 12,300/t ex works in June and in North Asia. CIF prices were US$14,000 – 15,000/t. Prices for industrial grades of these chemicals traded at slightly lower levels. The spread of prices results from a range of product qualities offered by different suppliers in the market.
Fastmarkets reported the CIF China price for spodumene (5 - 6% Li2O) to be US$585 – 650 per tonne at the end of June. This market has moved
into surplus as a result of the commissioning of four spodumene mining operations in Western Australia during 2018. In addition, Talison is expanding its Greenbushes production to satisfy demand for spodumene from the Tianqi lithium hydroxide plant in Kwinana and the Albemarle lithium hydroxide plant at Kemerton. Spodumene concentrates are expected to be in surplus supply for some years if current new entrants achieve their design capacities and the Greenbushes expansion proceeds as planned.
SQM has recently reported it will postpone a planned capacity expansion of its lithium brine operations in Chile in response to the current lithium supply surplus and softer pricing outlook.
Notwithstanding pressure on the lithium market in the near term, the longer-term outlook remains robust. This is primarily due to the world’s motor vehicle industry transitioning to the manufacture of electric vehicles and lithium-ion battery technology being the most suitable technology for this industry.
For
per
sona
l use
onl
y

Neometals Annual Report 2019
12
(Neometals Ltd 100%) The Barrambie Vanadium and Titanium Project in Western Australia (‘Barrambie’) is one of the largest vanadiferous-titanomagnetite (‘VTM’) resources globally (280.1Mt at 9.18% TiO2 and
0.44% V2O5)*, containing the world’s second highest-grade hard rock titanium resource (53.6Mt at 21.17% V2O5 and 0.63% V2O5)* and high-grade vanadium resource (64.9Mt at 0.82% V2O5 and 16.9% V2O5) subsets based on the latest Neometals 2018 Mineral Resource Estimate (*for full details refer to ASX announcement entitled ‘Updated Barrambie Mineral Resource Estimate’ released on 17 April 2018 and Figure 4 below).
Figure 4– Barrambie Mineral Resource Estimate, April 2018
Global Resource as at 17 April 20181
Tonnes (M) TiO2 (%) V2O5 (%)
Indicated 187.1 9.61 0.46
Inferred 93.0 8.31 0.40
Total 280.1 9.18 0.44
High Grade V2O5 Resource (at 0.5% V2O5 cut-off)2
Tonnes (M) TiO2 (%) V2O5 (%)
Indicated 49.0 16.93 0.82
Inferred 15.9 16.81 0.81
Total 64.9 16.90 0.82
High TiO2 Resource (14% TiO2 cut-off)2
Tonnes (M) TiO2 (%) V2O5 (%)
Indicated 39.3 21.18 0.65
Inferred 14.3 21.15 0.58
Total 53.6 21.17 0.63
(1) Based on cut-ff grades of 10% TiO2 or 0.2% V2O5
(2) The high grade titanium and vanadium figures are a sub-set of the total Mineral Resource. These figures are not additive and are reporting the same block model volume but using different cut-off grades.
REVIEW OF OPERATIONS (CONTINUED)...
For
per
sona
l use
onl
y

Neometals Annual Report 2019
13
Barrambie is located approximately 80km Northwest of Sandstone in Western Australia, has a granted mining permit and has been the subject of approximately AUD$30 million in Neometals exploration and evaluation expenditure since 2003.
During the year the Company completed an update to its 2009 definitive feasibility study (‘Updated DFS’) which considered primary vanadium production from a conventional salt roast-leach process at Barrambie. The Updated DFS focused on production of high purity vanadium pentoxide and ferrovanadium, primarily from Barrambie Central Band ore, which was confirmed to be technically feasible and economically viable. The Updated DFS did not consider the impact to project economics of exploiting the considerable quantity of contained titanium through a whole of deposit processing solution. This represents the next stage of project evaluation.
The Updated DFS used the latest Neometals 2018 Mineral Resource Estimate* as a basis. The Updated DFS establishes Ore Reserves, estimated using the guidelines of the 2012 edition of the Australian Code for Reporting Exploration Results, Mineral Resources and Ore Reserves ‘(JORC Code (2012))’.
REVIEW OF OPERATIONS (CONTINUED)...
Key highlights from the Updated DFS are shown in Figure 5 below:
MINERAL RESOURCE*
280.1Mt @ 0.44% V2O5
ORE RESERVE**
39.9Mt @ 0.78% V2O5
PROCESSING PLANT6,337t FEV80 pa
MINE LIFE***
15 YEARS
OPEXUS$26.27 /kg V in FE80
PAYBACK5.1 YEARS
CAPITAL COSTSUS484M**** A$692M
PRE TAX NPV10
IRR 21%***** A$692M
US$301MA$430M
For full details refer to ASX announcement entitled ‘Barrambie Vanadium Production and Commencement of Titanium Pilot Plant Program’ released on 22 May 2019.
*Refer to Figure 4
** Probable
*** Years of processing plant operation
**** USD: AUD 0.70
***** At US$48.71/kg V
For
per
sona
l use
onl
y

Neometals Annual Report 2019
14REVIEW OF OPERATIONS (CONTINUED)...
Neometals has made significant investment in the acquisition, exploration and evaluation of Barrambie since 2003. Given the size and scale of the titanium and vanadium resources, the Company continues to evaluate a range of metallurgical processing routes seeking how best to realise value from both minerals. The Company has maintained its focus on recovering a titanium co-product to maximise the probability of developing Barrambie and realising maximum value for shareholders. Going forward, subject to final board approval, this focus will see the 2015 titanium pre-feasibility study (‘PFS’) (for full details refer to ASX announcement entitled ‘Barrambie Pre-feasibility Study Results’ released on 25 August 2018) updated using data from a newly designed hydrometallurgical pilot test-work program. The aim is to identify the optimal ‘whole of deposit’ flowsheet to recover the maximum value from this globally significant VTM resource before moving to a Hydrometallurgical Definitive Feasibility Study and subsequent Front-End Engineering and Design (‘FEED’) Study.
The abovementioned titanium PFS was completed on a proprietary hydrometallurgical process which showed titanium chemical production to yield the highest returns). Forward work programs will focus on advancing towards pilot-scale evaluation of a hydrometallurgical flowsheet utilising atmospheric acid leaching to recover titanium, vanadium and iron products in combination with conventional and proprietary acid regeneration equipment.
Evaluation Activities The Barrambie project is unique owing to its exceptionally high titanium resource grade coupled with high vanadium content and the weathered nature of the orebody. Extracting value from both minerals is nuanced and has required Neometals to evaluate a range of metallurgical processing routes. The comprehensive approach has also been necessary to accommodate fluctuations in the markets for vanadium and titanium. At completion of the proposed hydrometallurgical feasibility process, Neometals will have a complete and extensive data set to choose the best processing path from which to base its FEED study.
Three conventional options exist for Barrambie processing:
1. Pyrometallurgy – electric arc smelting to produce slag precursors for titanium and vanadium chemical production;
2. Salt Roast Leach – production of vanadium chemical/s and a titanium-iron residue; and
3. Hydrometallurgy – multi-stage leaching coupled with acid regeneration to generate both titanium and vanadium products.
For
per
sona
l use
onl
y

EASTERN BAND
CENTRAL BANDS
Neometals Annual Report 2019
15REVIEW OF OPERATIONS (CONTINUED)...
Figure 6 – Barrambie Processing Options
Pilot plant work at AML commissioned
Pilot being repeated at IMUMR
Barambie Ore
Barambie Mineral Concentrates
Intermediate Product
Final Product
DFS complete
Hydromet Pilot Planned 2H CY19
0.79% V2O5
1.25% TiO2
1.21% V2O5
19% TiO298.5% V2O5 FeV (80% V)
0.56% V2O5
22% TiO2
0.73% V2O5
+30% TiO2
Ti Slag 90% TiO2
TiO2 Hydolosate
Vanadyl Sulphate
TiO2 Pigment
Vanadium Sulphate
(Solid State Batteries)
Vanadium Electrolyte(VRB Batteries)
Vanadium & Titanium Market Commentary
Vanadium Ferro-vanadium and vanadium pentoxide prices continued to drift lower during Q2 2019. The average weekly ferro-vanadium price in Europe in June was US$35.18/kg V, more than 50% down since January and more than 70% down from the November 2018 peak of US$124.59/kg V. Vanadium pentoxide prices also fell. The prices of the two products are highly correlated. Prices are now back to their Q4 2017 levels, erasing all the 2018 gains.
According to Fastmarkets, there were a few key factors contributing to the meteoric price rise in late 2018. On the demand side, the new Chinese rebar standards led to higher levels of demand for ferro-vanadium from Chinese steel mills. Additionally, there was an expectation of higher demand from the vanadium redox flow battery sector. On the supply side, the market was tight owing to the previous shuttering of capacity and a subsequent decline in global inventories. With approximately 70% of supply as co-product from the steel industry and with no major projects set to enter production in the near term, there were concerns over whether supply could meet demand.
For
per
sona
l use
onl
y

Neometals Annual Report 2019
16REVIEW OF OPERATIONS (CONTINUED)...
Fastmarkets considers that the subsequent downturn in prices was primarily a result of two factors. Firstly, the new Chinese rebar standards, implemented to eliminate low quality rebar produced via the quenching and tempering process, have not been strictly enforced. It is not clear when monitoring of the new standards will commence, however, some industry analysts predict that the new standards will start being enforced during the second half of 2019. The second reason for the price drop appears to be that niobium is substituting vanadium in some high strength low alloy (HSLA) products and in 400MPa rebar. The evidence for this is higher levels of ferro-niobium imports into China in H2 2018 and early 2019.
Now that vanadium prices have returned to 2017 levels there does not appear to be any incentive for steel mills to continue substituting ferro-vanadium with ferro-niobium, in which case the downward price trend of the last six months is expected to end. Looking ahead, the output of the Chinese
stone coal producers, who are swing producers in this industry, will be a factor in determining if the vanadium market remains in deficit or if vanadium prices resume their upward trend of recent years.
Titanium The main titanium raw material is the mineral ilmenite. Ilmenite is a relatively abundant mineral recovered from hard rock deposits and from heavy mineral sand deposits. The major hard rock deposits currently being exploited are in Canada, China, Norway and the Ukraine. The heavy mineral sand deposits are distributed globally, mostly in coastal regions of Australia, India, Vietnam, South Africa, Mozambique, Tanzania and Kenya. Other naturally occurring titanium minerals recovered from heavy mineral sand deposits include leucoxene and rutile. Beneficiated titanium feedstocks include chloride slag, sulphate slag, upgraded slag (‘UGS’) and synthetic rutile, all of which are produced from ilmenite. The TiO2 pigment industry accounts for approximately 90% of titanium feedstock demand.
Figure 7 - Weekly Average European Ferro-vanadium and Vanadium Pentoxide Prices (Source: Fastmarkets)
For
per
sona
l use
onl
y

REVIEW OF OPERATIONS (CONTINUED)...
Neometals Annual Report 2019
17
Figure 8 - TiO2 Pigment Price, Asia (Source: Fastmarkets)
China is the world’s largest market for TiO2 accounting for more than one third of global demand. Therefore, changes in the Chinese market have implications for the wider Asian market. According to Fastmarkets, titanium dioxide availability in China is increasing as exports to the United State have slowed in response to trade measures and currency fluctuations. Titanium dioxide prices in Asia fell as higher US tariffs increased availability in China, and the weakening yuan increased the buying power of the dollar. Fastmarkets assessed the price of titanium dioxide pigment, high quality, bulk volume, CFR Asia, at $2,350 - 2,550 per tonne on Thursday June 27, compared with $2,700 - 3,100 per tonne a year earlier.
Market participants attributed this to three main factors. The yuan is currently trading at its lowest level in more than six months. At the end of June, the Chinese currency was trading at approximately 6.9 yuan to the dollar, down by nearly 3% since April. This means dollar-denominated purchases
increase yuan-denominated receipts to sellers, improving producer margins and allowing them to consider lower offers. Chinese titanium dioxide is now subject to a 25% tariff on entry to the US. This is increasing the availability of the pigment within China because Chinese exporters are turning to the domestic market to avoid the tariffs, which puts pressure on domestic prices. At the same time US-China trade war concerns are unsettling the Chinese economy, weighing on local titanium dioxide demand.
For
per
sona
l use
onl
y

Neometals Annual Report 2019
18REVIEW OF OPERATIONS (CONTINUED)...
In China, a new round of environmental inspections commenced in May to ensure that protection measures are being properly implemented. These inspections are being undertaken in major cities and 25 regions across the country. These protection measures include the treatment of wastewater, protection of water resources, treatment of solid or hazardous waste, and the implementation of procedures for solid waste processing. The sulphate route TiO2 pigment producers are impacted by these measures due to their high output of iron sulphate, gypsum and other waste materials.
Neometals is currently evaluating hydrometallurgical flowsheets to recover and exploit titanium and vanadium. As it relates to titanium, Neometals aims to produce a high-grade titanium feedstock from Barrambie mineral concentrate using the hydrometallurgical process. This high-grade feedstock, which is suitable for the sulphate pigment process, should assist the Chinese pigment producers in their efforts to reduce their environmental footprint and comply with the increasingly stringent environmental controls in this country.
BARRAMBIE MINE PLAN
Barrambie - Potential Crushing and Beneficiation Plant layout
For
per
sona
l use
onl
y

19REVIEW OF OPERATIONS (CONTINUED)...
EXPLORATION PROJECTS:
Neometals Annual Report 2019
(Neometals Ltd 100%) The Mt Edwards tenements cover an area of 240 square kilometres in a historic nickel sulphide belt, located 40km south of Mt Marion and 35km west of Kambalda in Western Australia. The Mt Edwards project hosts 123,000 tonnes of contained nickel estimated across ten Nickel Sulphide Mineral Resources, within what is emerging as a highly endowed and globally significant lithium province (for full details refer to ASX announcement entitled ‘Mt Edwards Project Mineral Resource Over 120,000 Nickel Tonnes’ released on 22 June 2018).
A nickel targeting study has commenced, with Newexco Exploration consultants conducting a thorough review of geochemical and geophysical datasets. Neometals plans to carry out nickel exploration in parallel with lithium efforts over the project, with soil sampling, geological mapping and geophysical interpretation conducted during the year. Exploration at Mt Edwards continues to target fertile Lithium-Caesium-Tantalum (‘LCT’) pegmatites.
Figure 9 – Mt Edwards Project Tenure
For
per
sona
l use
onl
y

Neometals Annual Report 2019
20REVIEW OF OPERATIONS (CONTINUED)...
Late in the year the Company has carried out a 15-hole reverse circulation (RC) drill and sample program for a total of 2,705 metres. The program was conducted on three tenements:
1. E15/989 (Lake Eaton) - Neometals holds Nickel minerals rights in the exploration licence; all other mineral rights are held by Mincor Resources NL. Eight RC holes are drilled at Lake Eaton area, focussed on the ultramafic–basalt contact located along strike from the Mincor’s Cassini Nickel Mineral Resource (Cassini) (for full details refer to Mincor Resources ASX announcement entitled ‘Investor Presentation (by David Southam)’ released on 19 February 2019);
2. M15/97 (Zabel prospect) - Three holes have been drilled at the Zabel prospect to confirm targeting infill areas of the nickel Mineral Resource; and
3. M15/96 (a regional area west of the Mandilla gold prospects) - Four holes were drilled on M15/96 to test geophysical anomalies.
All drill holes were planned at -60 degree angles, with varying azimuth angles in order to ‘orthogonally’ intercept the favourable geological contact zones, which are known to host nickel mineralisation and deposits in this region. The Company announced significant nickel sulphide intercepts at the Zabel prospect confirms the high-grade tenor of mineralisation contained within a large, moderate grade nickel inventory at Mt Edwards, while the drilling at Lake Eaton has shown elevated nickel grades on and near the ultramafic – basalt contact along strike of Mincor Resources’ high-grade Cassini nickel deposits. (For full details refer to ASX announcement entitled ‘Mt Edwards Nickel – Drill Results’ released on 5 August 2019)
Lithium exploration continues in parallel with nickel over the project, with soil sampling, geological mapping and geophysical interpretation continuing to target fertile Lithium-Caesium-Tantalum (‘LCT’) pegmatites.The Mt Edwards Lithium & Nickel Project
For
per
sona
l use
onl
y

Neometals Annual Report 2019
21
Neometals Annual Report 2019
REVIEW OF OPERATIONS (CONTINUED)...
CORPORATE:
Finances Cash and term deposits on hand as of 30 June 2019 totalled A$113.7 million, including $4.2 million in restricted use term deposits supporting performance bonds and other contractual obligations. The Company has net receivables and listed securities totalling approximately $8.9 million.
Capital Management In keeping with the Company’s strategy to deliver prudent, capital efficient returns to shareholders, on 1 May 2019 the Board declared a dividend of 2 cents per share (of which 1 cent was franked). The total dividend paid out by the Company was $10.9 million.
Issued Capital The total number of shares on issue at 30 June 2019 was 543,974,269.
Compliance Statement The information in the Review of Operations that relates to Mineral Resource and Ore Reserve Estimates and updated DFS Results and start of Titanium Pilot for the Barrambie Vanadium/Titanium Project and Mineral Resource Estimates and Nickel drill results for the Mt Edwards Project are extracted from the ASX Announcements listed in the table below, which are also available on the Company’s website at www.neometals.com.au
05/08/2019 Mt Edwards Nickel – Drill Results
21/05/2019 Barrambie Vanadium DFS Results and Start of Titanium Pilot
25/06/2018 Mt Edwards Project Mineral Resource Over 120,000 Nickel Tonnes
17/04/2018 Updated Barrambie Mineral Resource Estimate
The Company confirms that it is not aware of any new information or data that materially affects the information included in the original market announcements and that all material assumptions and technical parameters underpinning the estimates in the market announcements continue to apply and have not materially changed. The Company confirms that the form and context in which the Competent Persons’ findings are presented have not been materially modified form the original market announcements.
Neometals Annual Report 2019
For
per
sona
l use
onl
y

Neometals Annual Report 2019
22REVIEW OF OPERATIONS (CONTINUED)...
Barrambie Project Mineral Resource Estimate
Classification Tonnes (Mt) TiO2 (%) V2O5 (%)
Indicated 187.1 9.61 0.46
Inferred 93.0 8.31 0.40
Total 280.1 9.18 0.44
Reporting criteria: 10% TiO2 or 0.2% V2O5; small discrepancies may occur due to rounding; Mineral Resources are reported inclusive of Ore Reserves.
See ASX Release 17 April 2018 titled: Updated Barrambie Mineral Resource Estimate
There has been no change in this estimate since last year’s Annual Statement.
JORC Code 2012 Reserve Category
Ore Tonnes (Mt) V2O5 (%) TiO2 (%) Fe2O3 (%) AI2O3 (%) SiO2 (%)
Probable 39.9 0.78 15.1 46.4 12.5 17.6
Changes since last year’s Annual Statement for the Barrambie Project. In May 2019 a Definitive Feasibility Study was completed on a salt roast leaching flowsheet with a focus on extracting value from the Vanadium content of the orebody. The Reserve applicable to this study is:
Cut-off based on 0.6% V2O5, cut-off (prior to dilution) and net value (revenue minus selling, processing, administration and incremental ore mining costs $0/t on a diluted block-by-block basis from the parameters used in the pit optimisation.
See ASX Release 22 May 2019 titled: DFS Results for Barrambie Vanadium Production and commencement of Titanium Pilot Program.
For
per
sona
l use
onl
y

Neometals Annual Report 2019
23REVIEW OF OPERATIONS (CONTINUED)...
Competent Persons Statement The information in this Annual Statement for Barrambie that relates to Mineral Resources is based on, and fairly represents, information and supporting documents compiled by John Graindorge who is a full-time employee of Snowden Mining Industry Consultants Pty Ltd and is a Chartered Professional (Geology) and a Member of the Australasian Institute of Mining and Metallurgy. John Graindorge has sufficient experience that is relevant to the style of mineralisation and type of deposit under consideration and to the activity being undertaken to qualify as a Competent Person as defined in the JORC Code (2012). John Graindorge consents to the inclusion in this Annual Statement of the matters based on his information in the form and context in which it appears.
The information in this Annual Statement for Barrambie that relates to Ore Reserves is based on, and fairly represents, information and supporting documents compiled by Frank Blanchfield who is an employee of Snowden Mining Industry Consultants Pty Ltd and is a Fellow of The Australasian Institute of Mining and Metallurgy. Frank Blanchfield has sufficient experience that is relevant to the style of mineralisation and type of deposit under consideration and to the activity being undertaken to qualify as a Competent Person as defined in the JORC Code (2012). Frank Blanchfield consents to the inclusion in the report of the matters based on his information in the form and context in which it appears.
The information in this announcement that relates to Ore Reserves (Metallurgy and Metallurgical Factors and Assumptions) is based on, and fairly represents, information and supporting documents, compiled by Gavin Beer who is a full-time employee of Neometals Ltd and is a Chartered Professional (Metallurgy) and Member of The Australasian Institute of Mining and Metallurgy. Gavin Beer has sufficient experience that is relevant to the style of mineralisation and type of deposit under consideration and to the activity being undertaken to qualify as a Competent Person as defined in the JORC Code (2012). Gavin Beer consents to the inclusion in the report of the matters based on his information in the form and context in which it appears.
The estimated Ore Reserves underpinning the production targets in this announcement have been prepared by a competent person in accordance with the requirements of the JORC code (2012).
Mt Edwards Nickel Mineral Resource Estimate
Measured Indicated Inferred TOTAL Mineral Resources
DepositTonne
(Kt)Nickel
(%)Tonne
(Kt)Nickel
(%)Tonne
(Kt)Nickel
(%)Tonne
(Kt)Nickel
(%)Nickel
(t)
132N1 110 3.5 10 1.8 120 3.4 4,070
Armstrong1 10 2.1 280 2.3 30 4.9 320 2.6 8,180
Cooke1 150 1.3 150 1.3 1,950
McEwen1 1,070 1.3 1,070 1.3 13,380
McEwen Hangingwall1 1,060 1.4 1,060 1.4 14,840
Zabel1 330 1.8 330 1.8 5,780
Mt Edwards 575 1.4 575 1.4 8,210
Widgie Townsite 2,190 1.9 2,193 1.9 40,720
Widgie1 625 1.5 625 1.5 9,160
Gillet 955 1.8 955 1.8 17,050
TOTAL 10 2.1 2,580 2.0 4,805 1.5 7,395 1.7 123,340
Note: 1 Refer announcement ASX:NMT 19 April
Reporting criteria: Mineral Resources quoted using a 1% Ni block cut-off grade; Small discrepancies may occur due to rounding
See ASX Release 25 June 2018 titled: Mt Edwards Project Mineral Resource Over 120,000 Nickel Tonnes
There has been no change in this estimate since last year’s Annual Statement.
For
per
sona
l use
onl
y

Neometals Annual Report 2019
24REVIEW OF OPERATIONS (CONTINUED)...
Competent Persons Statement The information in this Annual Statement for Mt Edwards that relates to Widgie Townsite, Widgie 3 and Gillet Mineral Resources is based on, and fairly represents, information and supporting documentation compiled and prepared by Mr Luke Marshall. Mr Marshall is a sole trader and independent contractor to Neometals Ltd.
The information in this Annual Statement for Mt Edwards that relates to the Mt Edwards Mineral Resources is based on, and fairly represents, information and supporting documentation compiled and prepared by Mr Andrew Bewsher. Mr Bewsher is an employee of BM Geological Services who provides consulting services to Neometals Ltd.
Both Mr Marshall and Mr Bewsher are Members of The Australasian Institute of Geoscientists have sufficient experience which is relevant to the styles of mineralisation and types of deposit under consideration and to the activity being undertaken to qualify as a Competent Person as defined in the 2012 Edition of the JORC Code.
Mr Marshall and Mr Bewsher have provided prior written consent as to the form and context in which the Mineral Resources and the supporting information are presented in this market announcement.
Other changes in Minerals Resources to that Reported in 2018 In 2018 Neometals reported on the Mineral Resources at the Mt Marion lithium project of which the Company had a 13.8% interest. During this financial year Neometals sold its interest in Reed Industrial Minerals Pty Ltd the holder of the Mt Marion Lithium Project. Accordingly, the Company no longer has any interest in the Mt Marion’s Mineral Resources.
Governance Arrangements The Company ensures that all Mineral Resource estimates are subject to appropriate levels of governance and internal controls.
Exploration results are collected and managed by a qualified geologists. All data collection activities are conducted to industry standards based on a framework of quality assurance and quality control protocols covering all aspects of sample collection, topographical and geophysical surveys, drilling, sample preparation, physical and chemical analysis and data and sample management.
Mineral Resource and Ore Reserve estimates for Barrambie and Mt Edwards have been prepared by qualified independent Competent Persons. If there is a material change in the estimate of a Mineral Resources and Ore Reserves, the estimate and supporting documentation in question is reviewed by a suitable qualified independent Competent Person. The Company is not aware of any new information or data that materially affects the information included in the Annual Statement with regard to Mineral Resources and Ore Reserves, and confirms that all material assumptions and technical parameters underpinning the estimates continue to apply and have not materially changed.
The Company reports its Mineral Resources and Ore Reserves for Barrambie and Mt Edwards on an annual basis in accordance with the 2012 JORC Code.
For
per
sona
l use
onl
y

Neometals Annual Report 2019
25DIRECTORS REPORT 2019
The directors of Neometals Ltd submit their report for the financial year ended 30 June 2019.
The names and particulars of the directors of the Company during or since the end of the financial year are:
Current Directors
Steven Cole Non-executive Chairman
Steven Cole has over 40 years of professional, corporate and business experience through senior legal consultancy, as well as a range of executive management and non-executive appointments.
His extensive boardroom and board sub-committee experience includes ASX listed, statutory, proprietary and NFP organisations covering the industrial, financial, educational, professional services, agribusiness, health and resources sectors.
David J. Reed OAM Non-executive Director
David Reed is a Fellow of CPA Australia with over 45 years’ experience in stock broking and corporate management. From 1985 to 1997 Mr. Reed was chairman of stock-broking firm Eyres Reed Ltd until its sale to CIBC World Markets in 1997 at which time he became Chairman of CIBC Australia, a position he held until 2003. Mr. Reed has served as chairman of several ASX listed mineral exploration companies and served as Chairman of Neometals Ltd since inception in 2001 to 27 November 2015 when he was succeeded by Steven Cole. Mr. Reed is a former chairman of the fund raising committee
Steven’s professional qualifications include:
• Llb (hons)– University of Western Australia
• AICD Company Directors Diploma and Fellow;
• Wharton Business School – University of Pennsylvania – Corporate Governance Program 2010
• Harvard – Corporate Governance Program 2015
Appointed: 24 July 2008
Special responsibilities: Chairman of each of the Nomination and Remuneration Committees and Member of the Audit Committee.
Directorships of other listed companies: Non-executive Director Matrix Composites and Engineering Ltd.
for the Australian Prospectors and Miners Hall of Fame and secretary of the Amalgamated Prospectors and Leaseholders Association and was a co-founder of the Diggers and Dealers Forum in Kalgoorlie. Mr. Reed received an Order of Australia Medal in 2002 for his service to the community.
Appointed: 20 December 2001
Special responsibilities: Deputy Chairman and Member of the Risk, Nomination and Remuneration Committees
Directorships of other listed companies: Nil.
For
per
sona
l use
onl
y

Neometals Annual Report 2019
26DIRECTORS REPORT 2019 (CONTINUED)
Christopher J. Reed Managing Director
Chris Reed is an accountant with over 25 years’ experience in the resource industry including more than 10 years in corporate administration and management. Chris served as Managing Director of Reed Resources Ltd (now Neometals Ltd) from September 2007 until May 2012 at which time he assumed the role executive director. Chris resumed the role as Managing Director from 1 October 2013. Mr. Reed is a councilor of
the Association of Mining and Exploration Companies having served for 13 years,10 years as Vice-president.
Mr. Reed holds a Bachelor of Commerce from the University of Notre Dame and a Graduate Certificate in Mineral Economics from the WA School of Mines. He is a member of the AusIMM.
Appointed: 20 December 2001
Special responsibilities: CEO
Dr. Natalia Streltsova Non-executive Director
Natalia Streltsova is a PhD qualified chemical engineer with over 25 years’ experience in the minerals industry, including over 10 years in senior technical and corporate roles with mining majors - WMC, BHP and Vale. Dr Streltsova has considerable international experience covering project development and acquisitions in South
America, Africa and the Former Soviet Union. She is currently a Non‐Executive Director of Western Areas Limited and Parkway Minerals.
Appointed: 14 April 2016
Special responsibilities: Chairman of the Risk Committee and Member of each of the Remuneration and Audit Committees.
Directorships of other listed companies: Parkway Minerals NL & Western Areas Ltd
Mr Douglas Ritchie Non-executive Director
Doug has four decades experience working in the mining industry, including as a member of Rio Tinto’s Executive Committee, and the Group Executive responsible for China, Doug’s expertise across the industry is extensive.
He has previously been a Director of Jinchuan Group International Resources (HKSE), Rossing Uranium Limited, Coal & Allied Limited (ASX 50), and various other ASX listed companies. He was also formerly Chairman of the Coal Industry Advisory Board to the International Energy Agency, a Director of the World Coal Association and a Director of the Queensland Resources Council. Between 2013 and April 2016, Doug was Chairman of UniQuest, the main commercialisation vehicle of the University of Queensland.
Doug is a Fellow of the Australian Institute of Mining and Metallurgy and a Fellow of the Australian Institute of Company Directors.
Appointed: 14 April 2016
Special responsibilities: Chairman of the Audit Committee and Member of each of the Nomination and Risk Committees.
Directorships of other listed companies: Nil.
For
per
sona
l use
onl
y

Neometals Annual Report 2019
27
Dr Jenny Purdie Non-executive Director
Dr Purdie’s extensive career has seen her hold roles in engineering, senior technology, strategy and operations for leading international mining companies. Dr. Purdie is currently a senior executive of Jemena Management Holdings – Executive General Manager Gas Distribution - which follows her role as CEO of Adani from 2017 to 2018. Dr. Purdie previously served as Executive Vice President at Aurizon, Global Practice Leader for Rio Tinto’s Technology and Innovation team (leading a global network of in-house technologists and suppliers to deploy innovative technologies across Rio Tinto operations) and she filled engineering and management roles with Rio Tinto, Alcoa and Altona Petrochemical.
Dr Purdie has worked in a number of senior management and operational roles and has been deeply immersed in technology development. She has a PhD and Bachelor of Engineering (Chemical and Materials, Hons 1) from Auckland
University and an Executive MBA from the University of Queensland. She is a committee member of Women in Mining and Resources Queensland, a fellow of the Institution of Chemical Engineers and a graduate of the Australian Institute of Company Directors.
Appointed: 27 September 2018
Special Responsibilities: Member of the Audit Committee
Directorships of other listed companies: Nil.
DIRECTORS REPORT 2019 (CONTINUED)
Mr Les Guthrie Non-executive Director
Mr Guthrie has over 40 years experience in the project delivery space. He has held corporate executive and project management roles, across the UK, Australia, North America and Asia. It is a background steeped in the strategy, development and delivery of major capital programs spanning mining, infrastructure and oil & gas.
He is currently Managing Director of Bedford Road Associates, where he has provided advice and delivery support to clients in Mongolia, S.Korea, New Zealand as well as in Australia. He was recently invited to be the sole international guest speaker at a conference jointly hosted by Seoul National University and the Koream Ministry of Trade & Industry.
Prior to establishing Bedford Road Mr Guthrie was Vice President Projects for BHP Billiton. Previously he held roles as Group Head of Capital Projects and President LNG for BG Group in the
UK, President of Aker Kvaerner Inc. in the US, and Managing Director of Aker Kvaerner Australia.
Mr Guthrie was a founding contributor to the John Grill Centre for Project Leadership at Sydney University and is engaged as a subject matter expert by Ernst & Young Advisory.
Appointed: 27 September 2018
Special responsibilities: Member of the Risk Committee.
Directorships of other listed companies: Nil.
For
per
sona
l use
onl
y

Neometals Annual Report 2019
28DIRECTORS REPORT 2019 (CONTINUED)
Jason Carone Chief Financial Officer and Company Secretary
Mr. Carone is a Chartered Accountant with over 20 years’ experience in accounting and company administration in Australia and South East Asia.
Mr. Carone holds a Bachelor of Commerce in Accounting and Business Law from Curtin University and is a member of the Institute of Chartered Accountants, and Chartered Secretaries Australia.
Appointed: 4 March 2009
Company Secretary
Review of operationsThe consolidated profit after income tax for the year attributable to members of Neometals Ltd was $76.1 million (2018: $15.7 million). A detailed review of the Company’s operations during the financial year can be found on pages 4 to 24 of this Annual Financial Report.
Changes in state of affairsDuring the financial year the Consolidated Entity’s primary focus centered on advancing its advanced minerals projects. There have not been any other significant changes in the affairs of the Consolidated Entity from the previous year other than as disclosed in the Director’s Report.
Principal activitiesThe Consolidated Entity’s principal activities during the year centred on advancing its advanced minerals projects and developing its technology business unit.
Events after the reporting periodNo matters or circumstances have arisen since the end of the financial year that have significantly affected, or may significantly affect the operations, results of operations or state of affairs of the Group in subsequent financial years.
Future developmentsThe Consolidated Entity intends to continue its focus on disciplined evaluation and development of its three core assets, the Lithium-ion Battery Recycling Project, the Lithium Refinery Project and the Barrambie Vanadium and Titanium Project. These core projects are characterised by a combination of proven and innovative process flow sheets, successful mining operations and large JORC – compliant Resources.
For
per
sona
l use
onl
y

Neometals Annual Report 2019
29DIRECTORS REPORT 2019 (CONTINUED)
Neometals Vision, Strategy & Execution
PURPOSE Neometals innovatively develops opportunities in minerals and advanced materials essential for a sustainable future.
STRATEGIC PILLARS
Opportunity EvaluationWe will take a disciplined and informed approach to sourcing, evaluating and developing and/or divesting opportunities consistent with our value creation objectives and appetite for risk.
Diversified PortfolioWe will develop a balanced porrfolio of assets and opportunities that mitigates risk throughout market cycles and ensures corporate sustainability.
InnovationWe will leverage value by applying innovative technologies and commercial models and co-venturing with strong partners.
CapabilityWe will build organisational capability to deliver our strategies.
CURRENT FOCUS
• Proactive opportunity identification not necessarily confined to Li and V.
• Dual path battery recycling evaluation.
• Final Barrambie decision 2020.
• Access nearer term value for Mt Edwards.
• Review other non-core assets.
• Agree on action plan for all other assets.
• Emphasis on means towards cash generation and/or market validation.
• Develop and formailise opportunity evaluation process and report against.
• Business development project management and HR resources.
DELIVERING VALUE TO OUR SHAREHOLDERS, PARTNERS & COMMUNITY
Environmental regulations As required by section 299(1)(f) of the Corporations Act the Company confirms that it has performed all of its environmental obligations in accordance with applicable environmental regulations.
DividendsIn respect of the financial year ended 30 June 2019, a special dividend of 2 cent per share, of which 1 share was franked, was paid to the holders of fully paid ordinary shares on 15 May 2019.
Indemnification of officers and auditorsDuring the financial year the Company paid a premium in respect of a contract insuring the directors and officers of the Company and of any related body corporate against a liability incurred as a director or officer, to the extent permitted by the Corporations Act 2001. The contract of insurance prohibits disclosure of the nature of the liability and the amount of the premium.
The Company has not otherwise, during or since the financial year, except to the extent permitted by law, indemnified or agreed to indemnify an officer or auditor of the Group or of any related body corporate against a liability incurred as such an officer or auditor.
Unissued shares under optionThere were no unissued ordinary shares of the company, Neometals Ltd, under option at the date of this report.
No shares of the Company were issued during or since the end of the financial year as a result of the exercise of an option over the unissued shares of the Company.
Please refer to the Remuneration Report on page 32 for details of Performance rights issued as part of KMP remuneration.
For
per
sona
l use
onl
y
Neometals Annual Report 2019
30
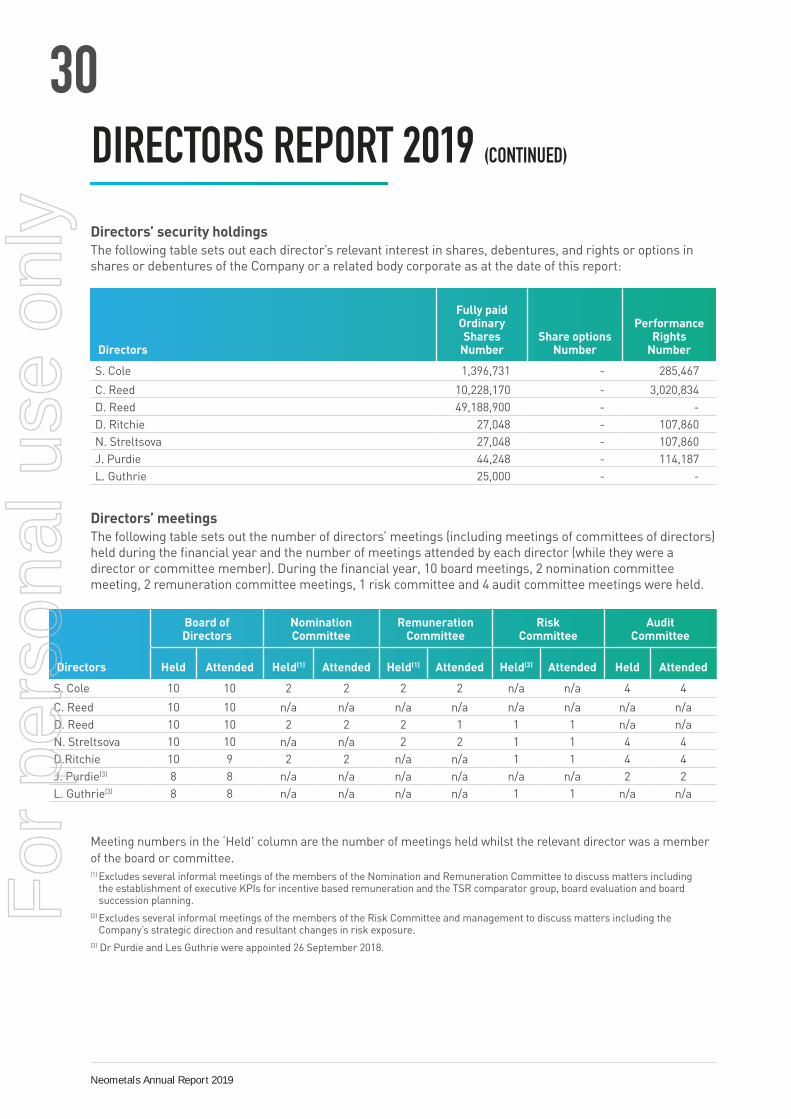
Directors’ security holdings The following table sets out each director’s relevant interest in shares, debentures, and rights or options in shares or debentures of the Company or a related body corporate as at the date of this report:
Directors
Fully paid Ordinary Shares
NumberShare options
Number
Performance Rights
Number
S. Cole 1,396,731 - 285,467
C. Reed 10,228,170 - 3,020,834
D. Reed 49,188,900 - -
D. Ritchie 27,048 - 107,860
N. Streltsova 27,048 - 107,860
J. Purdie 44,248 - 114,187
L. Guthrie 25,000 - -
Directors’ meetings The following table sets out the number of directors’ meetings (including meetings of committees of directors) held during the financial year and the number of meetings attended by each director (while they were a director or committee member). During the financial year, 10 board meetings, 2 nomination committee meeting, 2 remuneration committee meetings, 1 risk committee and 4 audit committee meetings were held.
Directors
Board of Directors
Nomination Committee
Remuneration Committee
RiskCommittee
Audit Committee
Held Attended Held(1) Attended Held(1) Attended Held(2) Attended Held Attended
S. Cole 10 10 2 2 2 2 n/a n/a 4 4
C. Reed 10 10 n/a n/a n/a n/a n/a n/a n/a n/a
D. Reed 10 10 2 2 2 1 1 1 n/a n/a
N. Streltsova 10 10 n/a n/a 2 2 1 1 4 4
D.Ritchie 10 9 2 2 n/a n/a 1 1 4 4
J. Purdie(3) 8 8 n/a n/a n/a n/a n/a n/a 2 2
L. Guthrie(3) 8 8 n/a n/a n/a n/a 1 1 n/a n/a
Meeting numbers in the ‘Held’ column are the number of meetings held whilst the relevant director was a member
of the board or committee.(1) Excludes several informal meetings of the members of the Nomination and Remuneration Committee to discuss matters including
the establishment of executive KPIs for incentive based remuneration and the TSR comparator group, board evaluation and board succession planning.
(2) Excludes several informal meetings of the members of the Risk Committee and management to discuss matters including the Company’s strategic direction and resultant changes in risk exposure.
(3) Dr Purdie and Les Guthrie were appointed 26 September 2018.
DIRECTORS REPORT 2019 (CONTINUED)
For
per
sona
l use
onl
y

Neometals Annual Report 2019
31DIRECTORS REPORT 2019 (CONTINUED)
Proceedings on behalf of the company No person has applied for leave of the court to bring proceedings on behalf of the Company or intervene in any proceedings to which the Company is a party for the purpose of taking responsibility on behalf of the Company for all or part of those proceedings. The Company was not a party to any such proceedings during the year.
Corporate Governance StatementThe Company is committed to high standards of corporate governance designed to enable the Company to meet its performance objectives and better manage its risks.
The Company has adopted a comprehensive governance framework in the form of a formal corporate governance charter together with associated policies, protocols and related instruments (together ‘Charter’).
The Company’s Charter is based on a template which has been professionally verified to be complementary to and in alignment with the ASX Corporate Governance Council Principles and Recommendations 3rd Edition 2014 (‘ASX CGC P&R’) in all material respects. The Charter also substantially addresses the suggestions of good corporate governance mentioned in the ‘Commentary’ sections of the ASX CGC P&R.
The Charter was formally adopted by the board on 28 November 2014. Prior to that date the Company’s corporate governance charter was substantially reflective of the ASX Corporate Governance Council Principles and Recommendations 2nd Edition.
The Board of Neometals is responsible for the corporate governance of the company and its subsidiaries. The Board has governance oversight of all matters relating to the strategic direction, corporate governance, policies, practices, management and operations of Neometals with the aim of delivering value to its Shareholders and respecting the legitimate interest of its other valued stakeholders, including employees, suppliers and joint venture partners.
Under ASX Listing Rule 4.10.3, Neometals is required to provide in its annual report details of where shareholders can obtain a copy of its corporate governance statement, disclosing the extent to which the Company has followed the ASX Corporate Governance Council Principles and Recommendations in the reporting period. Neometals has published its corporate governance statement on the Corporate section of its website:
www.neometals.com.au/reports/corporate-governance-statement.pdf
For
per
sona
l use
onl
y

Neometals Annual Report 2019
32REMUNERATION REPORT 2019
Key Management PersonnelThe following persons were deemed to be Key Management Personnel (“KMP”) during or since the end of the financial year for the purpose of Section 300A of the Corporations Act 2001 and unless otherwise stated were KMP for the entire reporting period.
Non-executive Directors • Steven Cole Non-executive Director/Chairman
• David Reed Non-executive Director/Deputy Chairman
• Natalia Streltsova Non-executive Director
• Douglas Ritchie Non-executive Director
• Jenny Purdie Non-executive Director (Appointed: 26 September 2018)
• Les Guthrie Non-executive Director (Appointed: 26 September 2018)
Executive Directors • Christopher Reed Managing Director and CEO
Other executives • Jason Carone Chief Financial Officer and Company Secretary
• Michael Tamlin Chief Operating Officer
• Darren Townsend Chief Development Officer
Remuneration policy for key management personnelNon-executive Directors The board’s policy is to remunerate Non-executive Directors at market rates for comparable companies for time, commitment and responsibilities. The remuneration committee on behalf of the board determines payments to the Non-executive Directors and reviews their remuneration annually, based on market practice, shareholder sentiment, board workload, company cashflow capacity and corporate performance generally. Independent external advice and/or benchmark comparisons are sought when required. The maximum aggregate amount of fees that can be paid to Non-executive Directors is $600,000 as approved by shareholders at the Annual General Meeting on 27 November 2015. Fees for Non-executive Directors are not linked to the performance of the economic entity. However, to align Directors’ interests with shareholder interests, the Directors are encouraged to hold shares in the Company and invited to salary sacrifice fees for performance rights pursuant to the company’s Performance Rights Plan (‘PRP’).
General The remuneration policy for employees is developed by the Remuneration Committee taking into account market conditions and comparable salary levels for companies of a similar size and operating in similar sectors.
The Company adopted a revised PRP for its staff, executive KMP and Non-executive Directors in November 2017 and shareholders reapproved the issue of securities under the plan in November 2017. The board believes that the PRP will assist the Consolidated Entity in remunerating and providing ongoing incentives to employees of the Group.
The rules of the PRP enable the Company to issue performance rights to eligible personnel subject to performance and vesting conditions determined by the Company. Each performance right entitles the holder, for nil cash consideration, to one fully paid ordinary share in the Company for every performance right offered, if the applicable performance and vesting conditions set for that holder are satisfied.
During the financial year a total of 2,137,056 (2018: 2,377,312) performance rights were offered to and accepted by KMP. Of this amount 1,894,413 performance rights are subject to relative and absolute Total Shareholder Return (TSR) and other strategic hurdles, details of which can be found in the ‘Service agreements - performance based remuneration’ section below. Testing undertaken for the period ended 30 June 2019 and 31 December 2019 resulted in 166,796 performance rights subject to the TSR criteria vesting.
For
per
sona
l use
onl
y

Neometals Annual Report 2019
33REMUNERATION REPORT 2019 (CONTINUED)
The Group’s remuneration policy for executive KMP seeks to balance its desire to attract, retain and motivate high quality personnel with the need to ensure that remuneration incentivises them to pursue growth and success of the Company without taking undue risks and without it being excessive remuneration.
To align the interests of the executive with that of the company remuneration packages for executive KMPs contain the following key elements:
a) Fixed Base Salary – salary, superannuation and non-monetary benefits;
b) Short Term Incentives – cash bonus incentives applied to a maximum percentage of Fixed Base Salary and structured against relative satisfaction (at the reasonable discretion of the board) of certain corporate and personally related key performance indicators of the executive.
c) Long Term Incentives – the grant of performance rights in the Company, with value capped to a maximum percentage of Fixed Base Salary, vesting progressively while the executive remains employed, with the degree of vesting structured against the Company’s relative and absolute TSR performance against a comparator group of companies as well as other strategic hurdles.
The Company’s remuneration is specifically designed to encourage loyalty and longevity of employment as well as aligning the employee’s interests with those of the Company and the creation of genuine long term sustainable value for security holders.
All remuneration provided to KMP in the form of share based payments are valued pursuant to AASB 2 Share-based Payment at fair value on grant date and are expensed on a pro rata basis over the vesting period of the relevant security.
Relationship between the remuneration policy and company performance The table below sets out summary information about the Consolidated Entity’s earnings and movements in shareholder wealth for the five years to June 2019:
30 June 2019$
30 June 2018$
Restated*30 June 2017
$30 June 2016
$30 June 2015
$
Revenue(i) - - - - 419,526
Net profit / (loss) before tax(ii) (19,242,733) 4,009,985 4,745,744 83,832,380 (10,314,405)
Net profit / (loss) after tax(iii) 76,178,556 15,679,541 4,963,444 84,606,280 (10,314,405)
Share price at start of year 0.30 0.27 0.450 0.091 0.018
Share price at end of year 0.21 0.30 0.270 0.450 0.091
Market capitalisation at year end (undiluted)
114,234,596 163,059,742 147,447,206 251,590,166 45,701,361
Basic profit / (loss) per share 0.1400 0.0290 0.0085 0.1568 (0.0203)
Diluted profit / (loss) per share 0.1401 0.0288 0.0084 0.1562 (0.0203)
Dividends Paid 10,879,485 5,435,325 11,260,217 11,181,785 Nil
(i) Although the past 4 financial years have returned a net profit before tax there has been no revenues from ordinary activities. The group has been profitable in these financial years from the sell down of the investment held in RIM in 2016 and 2019, and respective associate profits booked from the project in 2017 and 2018 and an impairment reversal in 2018 relating to the Barrambie project.
(ii) Exclusive of profits resulting from discontinued operations.
(iii) Inclusive of profits resulting from discontinued operations.
*Refer to note 6 for details of restatement.
For
per
sona
l use
onl
y

Neometals Annual Report 2019
34REMUNERATION REPORT 2019 (CONTINUED)
Key management personnel remuneration The KMP received the following amounts during the year as compensation for their services as directors and executives of the Company and/or the Group.
2019
Short-term employee benefits
Post-employment
benefits
Sharebased payments
Total$
% remuneration
linked to performance
Salary & fees
$
Bonus FY
18’19$
Non-Monetary(2)
$Other
$
Super-annuation
$Shares
$
Options and
rights$
Non-executive Directors
S. Cole 73,059 - - - 6,941 - 50,000 130,000 -
D. Reed 73,059 - - - 6,941 - - 80,000 -N. Streltsova 62,100 - - - 5,900 - 12,000 80,000 -D. Ritchie 62,100 - - - 5,900 - 12,000 80,000 -J. Purdie 54,795 - - - 5,205 - - 60,000 -L. Guthrie 54,795 - - - 5,205 - - 60,000 -
379,908 - - - 36,092 - 74,000 490,000 -
Executive directorsC. Reed 515,000 90,000 50,351 - 25,000 - 189,970 870,321 32
515,000 90,000 50,351 - 25,000 - 189,970 870,321 -
Other executivesM. Tamlin 349,400 60,000 9,218 - 25,000 - 70,290 513,908 25J. Carone 305,000 60,000 17,528 - 25,000 - 57,629 465,157 25D. Townsend 335,000 40,000 - 25,000 86,957 486,957 26
989,400 160,000 26,746 - 75,000 - 214,876 1,466,022 -
Total 1,884,308 250,000 77,097 - 136,092 - 478,846 2,826,343 -
2018
Short-term employee benefits
Post-employment
benefits
Sharebased payments
Total$
% remuneration
linked to performance
Salary & fees
$
Bonus FY
18’19$
Non-Monetary(2)
$Other
$
Super-annuation
$Shares
$
Options and
rights$
Non-executive DirectorsS. Cole 73,059 - - - 6,941 - 50,000 130,000 -D. Reed 73,059 - - - 6,941 - - 80,000 -N. Streltsova 62,100 - - - 5,900 - 12,000 80,000 -D. Ritchie 62,100 - - - 5,900 - 12,000 80,000 -
270,318 - - - 25,682 - 74,000 370,000 -
Executive directorsC. Reed 515,000 61,200 2,409 - 25,000 - 159,374 762,983 29
515,000 61,200 2,409 - 25,000 - 159,374 762,983 -
Other executivesM. Tamlin 349,400 50,000 127,866 - 25,000 - 67,803 620,069 19J. Carone 275,000 50,000 22,324 - 25,000 - 56,503 428,827 25D. Townsend(1) 209,414 50,000 - 15,909 32,271 307,594 27
833,814 150,000 150,190 - 65,909 - 156,577 1,356,490 -
Total 1,619,132 211,200 152,599 - 116,591 - 389,951 2,489,473 -
(1) Commenced 13 November 2018
(2) Relates to fringe benefits received by key management personnel
For
per
sona
l use
onl
y

Neometals Annual Report 2019
35
Service agreements - performance based remuneration The KMP of the Company, other than non-executive directors, are employed under service agreements. A summary of performance conditions for relevant KMP are detailed below:
Name: Mr. J. Carone Position: Chief Financial Officer / Company Secretary Term: No defined term Termination: 3 months notice period and 3 months termination payment
Incentive based remuneration
Short Term Incentive Each financial year during the term of his service agreement the board, at its sole discretion, may award the KMP a cash bonus up to 25% of the KMP’s annual salary package ($330,000 inclusive of superannuation for 2018-19). The basis for calculating the STI will be a range of criteria including both the KMP’s personal performance and the Company’s financial performance/position and share price. The STI for 2018-19 was set at a maximum of $82,500 of which 73% or $60,000 was agreed to be paid by management.
Long Term Incentive Each financial year during the term of his service agreement the KMP is entitled to receive performance rights granted under the Company’s Performance Rights Plan. The number of performance rights to which the KMP may be granted is based on the following calculation and vesting of the performance rights are subject to further criteria which are also set out below.
Calculation of potential entitlement to performance rights
P =33
10X
S
VWAP
Where: P is the potential performance rights entitlement. S is the KMP’s annual salary package for the applicable period VWAP is the 30 day volume weighted average price of ordinary shares in Neometals Ltd for the period ended 30 June of the preceding financial year.
Name: Mr. C. Reed Position: Managing Director Term: Expiry date of 30 June 2020 Termination notice period: 12 months by employee Termination notice period: 6 months by executive
Incentive based remuneration
Short Term Incentive Each financial year during the term of his service agreement the board, at its sole discretion, may award the KMP a cash bonus of up to one third of the KMP’s annual salary package ($540,000 inclusive of superannuation for 2018-19). The STI for 2018-19 was set at a maximum of $180,000 representing approximately 33% of the annual base salary package of which 50% or $90,000 was acknowledged and agreed by the Board and Mr C Reed. The basis for calculating the STI will be a range of criteria including both the KMP’s personal performance and the Company’s financial performance/position and share price.
Long Term Incentive Each financial year during the term of his service agreement the KMP is entitled to receive performance rights granted under the Company’s Performance Rights Plan. The maximum number of performance rights to which the KMP may be granted is based on the following calculation and vesting of the performance rights are subject to further criteria which are also set out below, as approved by shareholders.
REMUNERATION REPORT 2019 (CONTINUED)
For
per
sona
l use
onl
y

Neometals Annual Report 2019
36
Calculation of potential entitlement to performance rights
P =50
100X
S
VWAP
Where: P is the potential performance rights entitlement. S is the KMP’s annual salary package for the applicable period VWAP is the 60 day volume weighted average price of ordinary shares in Neometals Ltd for the period ended 30 June of the preceding financial year.
Name: Mr. M. Tamlin Position: Chief Operating Officer Term: No defined term Termination: 6 months
Incentive based remuneration
Short Term Incentive Each financial year during the term of his service agreement the board, at its sole discretion, may award the KMP a cash bonus of up to 33% of the KMP’s annual salary package ($374,400 inclusive of superannuation for 2018-19). The STI for 2018-19 was set at a maximum of $123,552 representing approximately 33% of the annual base salary package of which 49% or $60,000 was acknowledged and agreed by the board and Mr M Tamlin. The basis for calculating the STI will be a range of criteria including both the KMP’s personal performance and the Company’s financial performance/position and share price.
Long Term Incentive Each financial year during the term of his service agreement the KMP is entitled to receive performance rights granted under the Company’s Performance Rights Plan. The maximum number of performance rights to which the KMP may be granted is based on the following calculation and vesting of the performance rights are subject to further criteria which are also set out below, as approved by shareholders.
Calculation of potential entitlement to performance rights
P =33
100X
S
VWAP
Where: P is the potential performance rights entitlement. S is the KMP’s annual salary package for the applicable period VWAP is the 30 day volume weighted average price of ordinary shares in Neometals Ltd for the period ended 30 June of the preceding financial year.
Name: Mr. D. Townsend Position: Chief Development Officer Term: No defined term Termination: 6 months
Incentive based remuneration
Short Term Incentive Each financial year during the term of his service agreement the board, at its sole discretion, may award the KMP a cash bonus of up to 33% of the KMP’s annual salary package ($360,000 inclusive of superannuation for 2018-19). The STI for 2018-19 was set at a maximum of $118,000 representing approximately 33% of the
REMUNERATION REPORT 2019 (CONTINUED)
For
per
sona
l use
onl
y

Neometals Annual Report 2019
37REMUNERATION REPORT 2019 (CONTINUED)
annual base salary package of which 34% or $40,000 was acknowledged and agreed by the CEO and Mr D Townsend. The basis for calculating the STI will be a range of criteria including both the KMP’s personal performance and the Company’s financial performance/position and share price.
Long Term Incentive Each financial year during the term of his service agreement the KMP is entitled to receive performance rights granted under the Company’s Performance Rights Plan. The maximum number of performance rights to which the KMP may be granted is based on the following calculation and vesting of the performance rights are subject to further criteria which are also set out below, as approved by shareholders.
Calculation of potential entitlement to performance rights
P =33
100X
S
VWAP
Where: P is the potential performance rights entitlement. S is the KMP’s annual salary package for the applicable period VWAP is the 60 day volume weighted average price of ordinary shares in Neometals Ltd for the period ended 30 June of the preceding financial year.
Criteria The grant of Performance Rights is designed to reward long term sustainable business performance measured over a three year period with an opportunity for the performance conditions to be re-measured six months later should they not vest at the first vesting date. The KMP’s entitlement to the performance rights is dependent on 3 criteria:
(a) Tranche 1 – Relative TSR
The performance conditions of 40% of Performance Rights will be measured as at each vesting date by comparing the Company’s total shareholder return (TSR) with that of a comparator group of resource companies over the relevant period.
The Performance Rights will vest depending on the Company’s percentile ranking within the comparator group on the relevant Vesting Date as follows:
• If the Company ranks below the 50th percentile, none of the Performance Rights will vest.
• If the Company ranks at the 50th percentile, 50% of the Performance Rights will vest.
• For each 1% ranking at or above the 51st percentile, an additional 2% of the Performance Rights will vest, with 100% vesting where the Company ranks at or above the 75th percentile.
(b) Tranche 2 – Absolute TSR
The performance conditions of 40% of Performance Rights will be measured as at each vesting date by calculating the Company’s TSR calculated over the period commencing on the Comparator Start Date and ending on the relevant Vesting Date (Absolute TSR).
The Performance Rights will vest depending on the Company’s Absolute TSR on the relevant Vesting Date as follows:
• If the Company’s Absolute TSR is less than 15%, none of the Performance Rights will vest.
• If the Company’s Absolute TSR is 15%, 50% of the Performance Rights will vest.
• For each additional 1% TSR above 15% Absolute TSR, an additional 10% of the Performance Rights will vest, with 100% vesting where the Company’s Absolute TSR is at or above 20%.
For
per
sona
l use
onl
y

Neometals Annual Report 2019
38
(c) Tranche 3 – Business plan
The performance conditions of 20% of Performance Rights will be measured as at each Vesting Date s follows:
10% will vest if the combined market capitalisation of Neometals and any entity demerged from the Neometals Group and separately listed on the ASX would meet the threshold for entry into the ASX/S&P 200 Index.
10% will vest if any two of the following have been achieved (as assessed by the Board):
• an LiOH plant is under construction or in operation;
• a Barrambie/Neomet plant under construction/in operation;
• an Li-Battery recycling plant under construction/in operation;
• third party royalties received from the commercialisation of Neometals’ technology A$5M in aggregate.
Performance rights granted to the KMP have a vesting period of 3 years from grant date and will lapse on the KMP ceasing to be an employee of the Group prior to the vesting date.
The Company provides the KMP with performance based incentives in order to incentivise KMP to pursue strategies that are aligned with the overall business strategy and the interests of the shareholders. Where deemed appropriate the Company has set specific Key Performance Indicators as performance criteria for staff that have a direct role/responsibility in achieving a specific outcome. To ensure that KMP are also incentivised to pursue longer term strategies that increase shareholder wealth a portion of the KMP’s remuneration is linked to a ‘comparative TSR model’ which links the level of the KMP remuneration to the Company’s performance against a group of comparable ASX listed entities, using Total Shareholder Return as the basis of comparison. KMP are also issued with performance rights with service conditions as vesting criteria which assist the company retain staff as well as aligning the interests of the KMP with shareholders. The Company has deemed the issue of service based performance rights as an appropriate form of remuneration due to the uncertain nature of the Group’s business, that is, mineral exploration, mining and developing new mineral processing technologies.
REMUNERATION REPORT 2019 (CONTINUED)
The Company has selected the above group of companies as the comparator group for the following reasons:
1. It represents a reasonable cross section of resource companies with reasonably comparable market capitalisation, resource base and stage of development to that of the Company
2. The group is primarily focused on developing industrial minerals projects.
The Company’s performance rights plan was approved by shareholders at the 2017 AGM.
• Galaxy Resources Limited (ASX: GXY) • TNG Ltd (ASX: TNG) • Nemaska Lithium Inc. (TSX: NMX) • Iluka Resources Limited (ASX: ILU) • Argex Titanium Inc. (TSX: RGX)• Pilbara Minerals Limited (ASX: PLS)
• AVZ Minerals Limited (ASX:AVZ)• Global X Lithium ETF (NYSE Arca: LIT)• S&P ASX Small Resources Index (ASXR: ASX)• S&P ASX 300 (XKO: ASX)• Orocobre Limited (ORE.ASX)• Umicore Belgium (BSE:UMI)
The comparator group adopted by the company for LTI granted in 2018 (vest 2021) is as follows:
• Galaxy Resources Limited (ASX: GXY) • TNG Ltd (ASX: TNG) • Nemaska Lithium Inc. (TSX: NMX) • Iluka Resources Limited (ASX: ILU) • Argex Titanium Inc. (TSX: RGX)• Pilbara Minerals Limited (ASX: PLS)
• Global X Lithium ETF (NYSE Arca: LIT)• S&P ASX Small Resources Index (ASXR: ASX)• S&P ASX 300 (XKO: ASX)• Orocobre Limited (ORE.ASX)• Umicore Belgium (BSE: UMI)
The comparator group adopted by the company for LTI granted in 2017 (vest 2020) is as follows:
For
per
sona
l use
onl
y

Neometals Annual Report 2019
39REMUNERATION REPORT 2019 (CONTINUED)
Performance rights issued as part of KMP remuneration
Performance Rights granted to key management personnel The following tables summarises information relevant to the current financial year in relation to the grant of performance rights to KMP as part of their remuneration. Performance rights are issued by Neometals Ltd.
During the Financial Year
Name Grant dateNo.
grantedNo.
vestedFair value at grant date(3)
Earliest exercise date
Consideration payable on
exercise
KMP:
C. Reed(1) 10/08/2018 835,339 - 209,252 30/06/2021 -
J. Carone(1) 10/08/2018 307,156 - 76,943 30/06/2021 -
M. Tamlin(1) 10/08/2018 383,330 - 96,024 30/06/2021 -
D. Townsend(1) 10/08/2018 368,587 - 92,331 30/06/2021 -
N. Streltsova(2) 10/08/2018 39,348 - 12,000 30/06/2019 -
D. Ritchie(2) 10/08/2018 39,348 - 12,000 30/06/2019 -
S. Cole(2) 10/08/2018 163,948 - 50,000 30/06/2019 -
Total 2,137,056 - 548,550 -
(1) The number of performance rights that will actually vest, if any, is determined by the Company’s performance based on Neometals relative and absolute TSR compared to the comparative group of companies over a 3 year period and Business Plan strategic objectives.
(2) These Non-executive Directors elected to sacrifice Directors Fees for performance rights pursuant to the company’s PRP.
(3) These values have been calculated using the monte carlo valuation method.
Details of performance rights held by KMP and of shares issued during the financial year as a result of the vesting of performance rights:
2019
Balance at 01/07/18
No.Grant date
GrantedNo.
Fair value of rights at grant date
$
Vested during
the financial
yearNo.
Forfeited/ lapsed
during the financial
yearNo.
Balance at 30/06/2019
No.
Ordinary shares
issued on exercise of
rightsNo.
KMP:
C. Reed(1) 1,573,735 10/08/2018 835,339 209,252 - 621,261 1,787,813 -
J. Carone(1) 586,075 10/08/2018 307,156 76,943 - 216,063 677,168 -
M. Tamlin(1) 703,290 10/08/2018 383,330 96,024 - 259,275 827,345 -
D. Townsend(1) 444,015 10/08/2018 368,587 92,331 - - 812,602 -
N. Streltsova(2) - 10/08/2018 39,348 12,000 39,348 - 39,348 -
D. Ritchie(2) - 10/08/2018 39,348 12,000 39,348 - 39,348 -
S. Cole(2) - 10/08/2018 163,948 50,000 163,948 - 163,948 -
Total 3,307,115 2,137,056 548,550 242,644 1,096,599 4,347,572 -
(1) The number of performance rights that will actually vest, if any, is determined by the Company’s performance based on Neometals relative and absolute TSR compared to the comparative group of companies over a 3 year period and Business Plan strategic objectives.
(2) Under the Performance Rights Plan, Non-Executive Directors were invited to sacrifice part of their fees for their services in exchange for performance rights.
For
per
sona
l use
onl
y

Neometals Annual Report 2019
40REMUNERATION REPORT 2019 (CONTINUED)
2018
Balance at 01/07/17
No.Grant date
GrantedNo.
Fair value of rights at grant date
$
Vested during
the financial
yearNo.
Forfeited/ lapsed
during the financial
yearNo.
Balance at 30/06/2018
No.
Ordinary shares
issued on exercise of
rightsNo.
KMP:
J. Carone(1) 314,995 03/10/2017 370,012 149,419 - 98,932 586,075 494,540
C. Reed(1) 887,163 03/10/2017 952,474 482,512 - 265,902 1,573,735 1,329,190
M. Tamlin(1) 455,160 11/12/2017 444,015 179,304 - 195,885 703,290 979,189
D. Townsend(1) - 11/12/2017 444,015 149,633 - - 444,015 -
N. Streltsova(2) - 05/01/2017 27,048 12,000 27,048 - - -
D. Ritchie(2) - 05/01/2017 27,048 12,000 27,048 - - -
S. Cole(2) - 05/01/2017 112,700 50,000 112,700 - - -
Total 1,657,318 2,377,312 1,034,868 166,796 560,719 3,307,115 2,802,919
(1) The number of performance rights that will actually vest, if any, is determined by the Company’s performance based on Neometals relative and absolute TSR compared to the comparative group of companies over a 3 year period and Business Plan strategic objectives.
(2) Under the Performance Rights Plan, Non-Executive Directors were invited to sacrifice part of their fees for their services in exchange for performance rights.
Mr. Chris Reed Managing Director
West Perth, WA 13 September 2019
The performance rights granted entitle the grantee to one fully paid ordinary share in Neometals Ltd for nil cash consideration on satisfaction of the vesting criteria.
Use of remuneration consultants During the year no remuneration consultants were used in relation to the company’s Performance Rights Plan.
This is the end of the audited remuneration report.
Auditor’s Independence Declaration The auditor’s independence declaration is included on page 46 of the Annual Financial Report.
Signed in accordance with a resolution of directors
For
per
sona
l use
onl
y

Neometals Annual Report 2019
41AUDIT REPORT 2019
Liability limited by a scheme approved under Professional Standards Legislation.
Member of Deloitte Asia Pacific Limited and the Deloitte Network.
Independent Auditor’s Report to the Members of
Neometals Ltd
Report on the Audit of the Financial Report
Opinion
We have audited the financial report of Neometals Ltd (the “Company”) and its subsidiaries
(the “Group”) which comprises the consolidated statement of financial position as at 30 June 2019, the consolidated statement of profit or loss and other comprehensive income, the consolidated statement of changes in equity and the consolidated statement of cash flows for
the year then ended, and notes to the financial statements, including a summary of significant accounting policies and other explanatory information, and the directors’ declaration.
In our opinion, the accompanying financial report of the Group is in accordance with the
Corporations Act 2001, including: (i) giving a true and fair view of the Group’s financial position as at 30 June 2019 and of
its financial performance for the year then ended; and
(ii) complying with Australian Accounting Standards and the Corporations Regulations
2001.
Basis for Opinion
We conducted our audit in accordance with Australian Auditing Standards. Our responsibilities under those standards are further described in the Auditor’s Responsibilities for the Audit of
the Financial Report section of our report. We are independent of the Group in accordance with the auditor independence requirements of the Corporations Act 2001 and the ethical
requirements of the Accounting Professional and Ethical Standards Board’s APES 110 Code of
Ethics for Professional Accountants (the Code) that are relevant to our audit of the financial report in Australia. We have also fulfilled our other ethical responsibilities in accordance with
the Code.
We confirm that the independence declaration required by the Corporations Act 2001, which has been given to the directors of the Company, would be in the same terms if given to the
directors as at the time of this auditor’s report. We believe that the audit evidence we have obtained is sufficient and appropriate to provide a
basis for our opinion
For
per
sona
l use
onl
y

Neometals Annual Report 2019
42AUDIT REPORT 2019 (CONTINUED)
Key Audit Matter How the scope of our audit responded to
the Key Audit Matter
Accounting for non-current assets
held for sale
Neometals investment in Reed Industrial Minerals Pty Ltd (“RIM”) was equity
accounted in accordance with AASB128 for the period to 30 November 2018, the
date at which the Board endorsed the decision to complete the sale of RIM to co-shareholders (Mineral Resources &
Ganfeng). Accordingly, the classification of the investment was required to be
reassessed under AASB 5 Non-current Assets Held for Sale and Discontinued
Operations. The sale completed on 18 March 2019.
Accounting for sales of non-current
assets and liabilities and presentation of discontinued operations contain several judgments that affects timing,
presentation of the consolidated statement of profit or loss and other
comprehensive income.
Our procedures included, but were not limited to:
• Reading the sale agreement and assessing whether the classification was in accordance with accounting standards;
• Reviewing management’s assessment of any impairment triggers at the date of classification to Held for sale (“HFS”);
• Reconciling the carrying cost and recognised share of profit of the RIM joint
venture until the date of recognition as HFS; and
• Recalculating the profit on disposal of the HFS asset.
We also assessed the appropriateness of the
disclosures in Note 6 to the financial statements.
Exploration and Evaluation Assets
and
Expenditure
As at 30 June 2019 the carrying value of exploration and evaluation assets was
$36,983,106 as disclosed in Note 13. The Group’s accounting policy in respect of exploration and evaluation
expenditure is outlined in Note 2.
Significant judgement is required:
• in determining whether facts and circumstances indicate that the exploration and evaluation assets
should be tested for impairment in accordance with the relevant accounting standards
• in determining the treatment of exploration and evaluation
expenditure: o whether the particular areas of
interest meet the recognition conditions for an asset; and
o which elements of exploration
and evaluation expenditures
Our procedures included, but were not limited
to:
• assessing whether there were indicators of impairment:
o assessing whether the rights to tenure of the areas of interest remained current at balance date as
well as confirming that rights to tenure are expected to be renewed
for tenements that will expire in the near future;
o holding discussions with management as to the status of ongoing exploration programmes for the areas
of interest, as well as assessing if there was evidence that a decision
had been made to discontinue activities in any specific areas of
interest; and o assessing evidence of the Group’s
future intention for the areas of
For
per
sona
l use
onl
y

Neometals Annual Report 2019
43AUDIT REPORT 2019 (CONTINUED)
qualify for capitalisation for each
area of interest.
interest, including reviewing future
budgeted expenditure.
• testing, on a sample basis, exploration and evaluation expenditure incurred during the year for compliance with the relevant
accounting standards. We also assessed the appropriateness of the
disclosures in Notes 2 and 13 to the financial statements.
Other Information
The directors are responsible for the other information. The other information comprises the Directors’ Report and Review of Operations which we obtained prior to the date of this auditor’s
report, and also includes the following information which will be included in the Group’s annual report (but does not include the financial report and our auditor’s report thereon): letter from the Chairman, and additional stock exchange information, which is expected to be made
available to us after that date.
Our opinion on the financial report does not cover the other information and we do not and will not express any form of assurance conclusion thereon.
In connection with our audit of the financial report, our responsibility is to read the other information identified above and, in doing so, consider whether the other information is
materially inconsistent with the financial report or our knowledge obtained in the audit, or otherwise appears to be materially misstated. If, based on the work we have performed on the
other information that we obtained prior to the date of this auditor’s report, we conclude that there is a material misstatement of this other information, we are required to report that fact.
We have nothing to report in this regard. When we read the letter from the Chairman, and additional stock exchange information, if we
conclude that there is a material misstatement therein, we are required to communicate the matter to the directors and use our professional judgement to determine the appropriate action.
Responsibilities of the Directors for the Financial Report
The directors of the Company are responsible for the preparation of the financial report that gives a true and fair view in accordance with Australian Accounting Standards and the
Corporations Act 2001 and for such internal control as the directors determine is necessary to enable the preparation of the financial report that gives a true and fair view and is free from
material misstatement, whether due to fraud or error.
In preparing the financial report, the directors are responsible for assessing the ability of the Group to continue as a going concern, disclosing, as applicable, matters related to going concern and using the going concern basis of accounting unless the directors either intend to
liquidate the Group or to cease operations, or has no realistic alternative but to do so.
Auditor’s Responsibilities for the Audit of the Financial Report
Our objectives are to obtain reasonable assurance about whether the financial report as a whole is free from material misstatement, whether due to fraud or error, and to issue an auditor’s report that includes our opinion. Reasonable assurance is a high level of assurance, but is not
a guarantee that an audit conducted in accordance with the Australian Auditing Standards will always detect a material misstatement when it exists. Misstatements can arise from fraud or
error and are considered material if, individually or in the aggregate, they could reasonably be expected to influence the economic decisions of users taken on the basis of this financial report.
For
per
sona
l use
onl
y

Neometals Annual Report 2019
44AUDIT REPORT 2019 (CONTINUED)
As part of an audit in accordance with the Australian Auditing Standards, we exercise professional judgement and maintain professional scepticism throughout the audit. We also:
• Identify and assess the risks of material misstatement of the financial report, whether
due to fraud or error, design and perform audit procedures responsive to those risks,and obtain audit evidence that is sufficient and appropriate to provide a basis for our
opinion. The risk of not detecting a material misstatement resulting from fraud is higherthan for one resulting from error, as fraud may involve collusion, forgery, intentionalomissions, misrepresentations, or the override of internal control.
• Obtain an understanding of internal control relevant to the audit in order to design audit
procedures that are appropriate in the circumstances, but not for the purpose ofexpressing an opinion on the effectiveness of the Group’s internal control.
• Evaluate the appropriateness of accounting policies used and the reasonableness ofaccounting estimates and related disclosures made by the directors.
• Conclude on the appropriateness of the director’s use of the going concern basis of
accounting and, based on the audit evidence obtained, whether a material uncertaintyexists related to events or conditions that may cast significant doubt on the Group’s
ability to continue as a going concern. If we conclude that a material uncertainty exists,we are required to draw attention in our auditor’s report to the related disclosures inthe financial report or, if such disclosures are inadequate, to modify our opinion. Our
conclusions are based on the audit evidence obtained up to the date of our auditor’sreport. However, future events or conditions may cause the Group to cease to continue
as a going concern.
• Evaluate the overall presentation, structure and content of the financial report,including the disclosures, and whether the financial report represents the underlyingtransactions and events in a manner that achieves fair presentation.
• Obtain sufficient appropriate audit evidence regarding the financial information of the
entities or business activities within the Group to express an opinion on the financialreport. We are responsible for the direction, supervision and performance of the Group’s
audit. We remain solely responsible for our audit opinion.
We communicate with the directors regarding, among other matters, the planned scope and timing of the audit and significant audit findings, including any significant deficiencies in internal control that we identify during our audit.
We also provide the directors with a statement that we have complied with relevant ethical requirements regarding independence, and to communicate with them all relationships and other matters that may reasonably be thought to bear on our independence, and where applicable, related safeguards.
From the matters communicated with the directors we determine those matters that were of most significance in the audit of the financial report of the current period and are therefore the key audit matters. We describe these matters in our auditor’s report unless law or regulation precludes public disclosure about the matter or when, in extremely rare circumstances, we determine that a matter should not be communicated in our report because the adverse consequences of doing so would reasonably be expected to outweigh the public interest benefits of such communication.
Report on the Remuneration Report
Opinion on the Remuneration Report
We have audited the Remuneration Report included in pages 32 to 40 of the Director’s Report
for the year ended 30 June 2019.
For
per
sona
l use
onl
y

Neometals Annual Report 2019
45AUDIT REPORT 2019 (CONTINUED)
In our opinion, the Remuneration Report of Neometals Ltd for the year ended 30 June 2019 complies with section 300A of the Corporations Act 2001.
Responsibilities
The directors of the Company are responsible for the preparation and presentation of the
Remuneration Report in accordance with section 300A of the Corporations Act 2001. Our responsibility is to express an opinion on the Remuneration Report, based on our audit conducted in accordance with Australian Auditing Standards.
DELOITTE TOUCHE TOHMATSU
Ian Skelton
Partner Chartered Accountants Perth, 13 September 2019
For
per
sona
l use
onl
y

Neometals Annual Report 2019
46AUDITOR’S INDEPENDENCE DECLARATION
The Board of Directors
Neometals Ltd Level 3, 1292 Hay Street West Perth WA 6005
13 September 2019
Dear Board Members
Neometals Ltd
In accordance with section 307C of the Corporations Act 2001, I am pleased to provide the following declaration of independence to the directors of Neometals Ltd.
As lead audit partner for the audit of the financial statements of Neometals Ltd for the year
ended 30 June 2019, I declare that to the best of my knowledge and belief, there have been no contraventions of:
(i) the auditor independence requirements of the Corporations Act 2001 in relation to the audit; and
(ii) any applicable code of professional conduct in relation to the audit.
Yours sincerely
DELOITTE TOUCHE TOHMATSU
Ian Skelton
Partner
Chartered Accountants
Liability limited by a scheme approved under Professional Standards Legislation.
Member of Deloitte Asia Pacific Limited and the Deloitte Network.
Deloitte Touche Tohmatsu
ABN 74 490 121 060
Tower 2, Brookfield Place
123 St Georges Terrace
Perth WA 6000
GPO Box A46
Perth WA 6837 Australia
Tel: +61 8 9365 7000
Fax: +61 8 9365 7001
www.deloitte.com.au
For
per
sona
l use
onl
y

Neometals Annual Report 2019
47DIRECTORS’ DECLARATION
Directors’ declaration
The directors declare that:
(a) in the directors’ opinion, there are reasonable grounds to believe that the company will be able to pay its debts as and when they become due and payable;
(b) the attached financial statements are in compliance with International Financial Reporting Standards as stated in Note 2 to the financial statements;
(c) in the directors’ opinion, the attached financial statements and notes thereto are in accordance with the Corporations Act 2001, including compliance with accounting standards and giving a true and fair view of the financial position and performance of the consolidated entity; and
(d) the directors have been given the declarations required by s.295A of the Corporations Act 2001.
Signed in accordance with a resolution of the directors made pursuant to s.295(5) of the Corporations Act 2001.
On behalf of the directors of Neometals Ltd,
Mr. Chris Reed Managing Director
West Perth, WA 13 September 2019
For
per
sona
l use
onl
y

Neometals Annual Report 2019
48CONSOLIDATED STATEMENT OF PROFIT AND LOSS AND OTHER COMPREHENSIVE INCOME
Note
2019$
2018$
(Restated*)
Continuing operations
Other income 5 1,652,500 1,417,210
Employee expenses 5 (5,524,273) (3,815,040)
Occupancy expenses (879,782) (663,214)
Administration expenses (4,654,003) (3,284,845)
Finance costs 5 (60,649) (62,599)
Other expenses (3,675,525) (2,340,733)
Marketing expenses (405,217) -
Foreign exchange (loss)/gain (334) 53,231
Impairment 5 (5,226,805) (1,677,554)
Impairment reversal - 14,694,964
Share of loss of associate 23 (468,645) (311,435)
(Loss)/profit before income tax (19,242,733) 4,009,985
Income tax (expense)/benefit 7 (3,263,494) 568,605
(Loss)/profit for the year from continuing operations (22,506,227) 4,578,590
Discontinued operations
Profit for the year from discontinuing operations 6 98,684,783 11,100,951
Profit for the year from continuing and discontinuing operations 76,178,556 15,679,541
Other comprehensive income - -
Total comprehensive income for the year 76,178,556 15,679,541
Earnings per share
From continuing and discontinued operations:
Basic (cents per share) 19 14.00 2.90
Diluted (cents per share) 19 14.01 2.88
The consolidated statement of profit or loss and other comprehensive income should be read in conjunction with the accompanying notes.
*Refer to note 6 for details of restatement.
For
per
sona
l use
onl
y

Neometals Annual Report 2019
49CONSOLIDATED STATEMENT OF FINANCIAL POSITION
Note
2019$
2018$
(Restated*)
Current assets
Cash and cash equivalents 28 (a) 109,462,006 26,342,414
Related party loan - 4,104,458
Trade and other receivables 11 627,599 448,960
Other financial assets 12 782,927 252,181
Total current assets 110,872,532 31,148,013
Non-current assets
Exploration and evaluation expenditure 13 36,983,106 31,506,853
Intangibles 662,888 461,328
Investments in joint venture 22 1 1
Investment in associate 23 7,062,095 24,082,742
Other financial assets 12 4,787,118 4,536,000
Other assets 345,016 609,638
Property, plant and equipment 14 1,774,520 955,689
Total non-current assets 51,614,744 62,152,251
Total assets 162,487,276 93,300,264
Current liabilities
Trade and other payables 15 2,089,652 1,225,740
Provisions 16 1,154,882 1,177,288
Total current liabilities 3,244,534 2,403,028
Non-current liabilities
Provisions 16 1,378,062 2,807,526
Deferred tax liability 7 3,786,582 -
Total non-current liabilities 5,164,644 2,807,526
Total liabilities 8,409,178 5,210,554
Net assets 154,078,098 88,089,710
Equity
Issued capital 17 154,264,634 154,101,518
Reserves 18 7,620,733 7,094,532
Accumulated losses (7,807,269) (73,106,340)
Total equity 154,078,098 88,089,710
This consolidated statement of financial position should be read in conjunction with the accompanying notes.
*Refer to note 6 for details of restatement.
AS AT 30 JUNE 2019
For
per
sona
l use
onl
y

NeoMetals Annual Report 2019
50CONSOLIDATED STATEMENT OF CHANGES IN EQUITYAS AT 30 JUNE 2019
IssuedCapital
$
Investment revaluation
reserve$
Other equity
reserve$
Share basedpaymentsreserve
$
Accumulatedlosses
$Total
$
Balance at 01/07/17 155,367,391 1,019,637 300,349 5,531,947 (83,350,556) 78,868,768
Profit for the period - As restated*
- - - - 15,679,541 15,679,541
Total comprehensive income for the period - As restated*
- - - - 15,679,541 15,679,541
Recognition of share-based payments (see note 18)
- - - 501,324 - 501,324
Recognition of shares issued under performance rights plan
258,725 - - (258,725) - -
Recognition of share buy back
(1,524,598) - - - - (1,524,598)
Issue of dividends - - - - (5,435,325) (5,435,325)
Share issue costs, net of tax
- - - - - -
Balance at 30/06/18 154,101,518 1,019,637 300,349 5,774,546 (73,106,340) 88,089,710
Profit for the period - - - - 76,178,556 76,178,556
Total comprehensive income for the period
- - - - 76,178,556 76,178,556
Recognition of share-based payments (see note 18)
- - - 691,201 - 691,201
Recognition of shares issued under performance rights plan
165,000 - - (165,000) - -
Issue of dividends - - - - (10,879,485) (10,879,485)
Share issue costs, net of tax
(1,884) - - - - (1,884)
Balance at 30/06/19 154,264,634 1,019,637 300,349 6,300,747 (7,807,269) 154,078,098
This consolidated statement of changes in equity should be read in conjunction with the accompanying notes.
*Refer to note 6 for details of restatement.For
per
sona
l use
onl
y
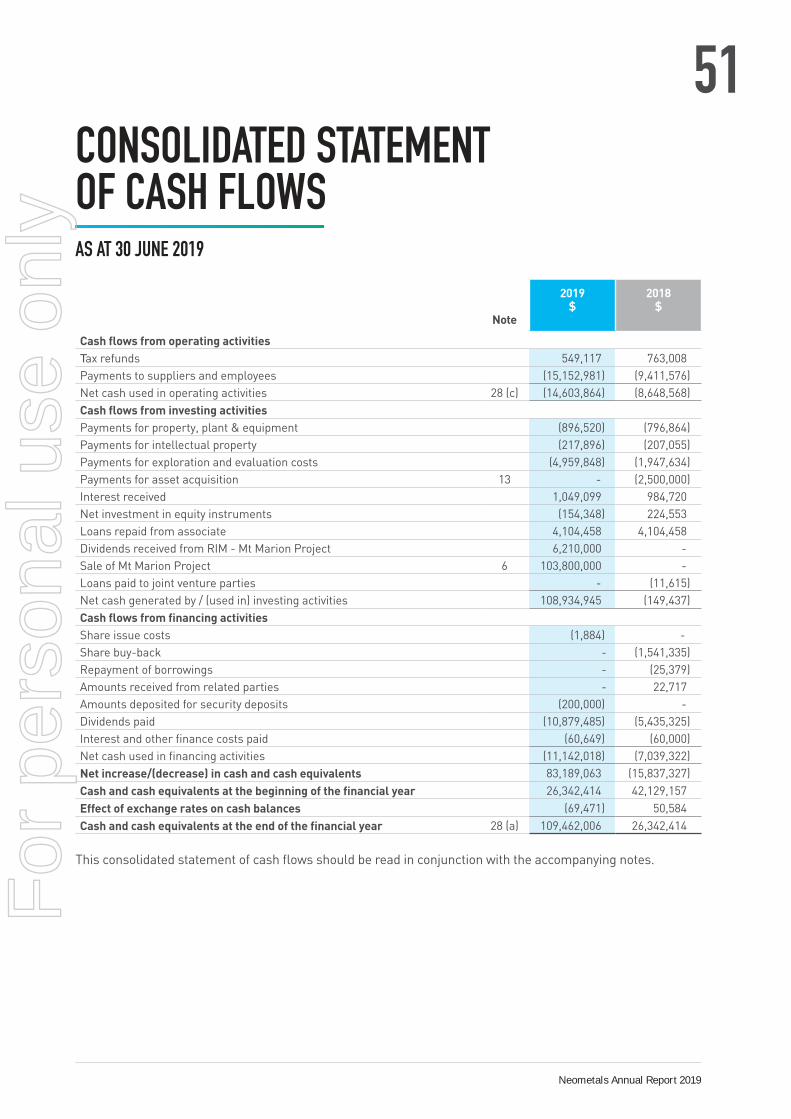
Neometals Annual Report 2019
51CONSOLIDATED STATEMENT OF CASH FLOWS
Note
2019$
2018$
Cash flows from operating activities
Tax refunds 549,117 763,008
Payments to suppliers and employees (15,152,981) (9,411,576)
Net cash used in operating activities 28 (c) (14,603,864) (8,648,568)
Cash flows from investing activities
Payments for property, plant & equipment (896,520) (796,864)
Payments for intellectual property (217,896) (207,055)
Payments for exploration and evaluation costs (4,959,848) (1,947,634)
Payments for asset acquisition 13 - (2,500,000)
Interest received 1,049,099 984,720
Net investment in equity instruments (154,348) 224,553
Loans repaid from associate 4,104,458 4,104,458
Dividends received from RIM - Mt Marion Project 6,210,000 -
Sale of Mt Marion Project 6 103,800,000 -
Loans paid to joint venture parties - (11,615)
Net cash generated by / (used in) investing activities 108,934,945 (149,437)
Cash flows from financing activities
Share issue costs (1,884) -
Share buy-back - (1,541,335)
Repayment of borrowings - (25,379)
Amounts received from related parties - 22,717
Amounts deposited for security deposits (200,000) -
Dividends paid (10,879,485) (5,435,325)
Interest and other finance costs paid (60,649) (60,000)
Net cash used in financing activities (11,142,018) (7,039,322)
Net increase/(decrease) in cash and cash equivalents 83,189,063 (15,837,327)
Cash and cash equivalents at the beginning of the financial year 26,342,414 42,129,157
Effect of exchange rates on cash balances (69,471) 50,584
Cash and cash equivalents at the end of the financial year 28 (a) 109,462,006 26,342,414
This consolidated statement of cash flows should be read in conjunction with the accompanying notes.
AS AT 30 JUNE 2019
For
per
sona
l use
onl
y

Neometals Annual Report 2019
52INDEX TO NOTES TO THE FINANCIAL STATEMENTS
Note Contents
1 General information
2 Significant accounting policies
3Critical accounting judgments and key sources of estimation uncertainty
4 Parent entity disclosure
5 Profit / loss for the year continuing operations
6 Discontinued operations
7 Income taxes
8 Key management personnel compensation
9 Share based payments
10 Dividends on equity instruments
11 Trade and other receivables
12 Other financial assets
13 Exploration and evaluation expenditure
14 Property, plant and equipment
15 Trade and other payables
16 Provisions
17 Issued capital
18 Reserves
19 Earnings per share
20 Commitments for expenditure
21 Leases
22 Joint arrangements
23 Investment in associates
24 Subsidiaries
25 Segment information
26 Related party disclosures
27 Auditors remuneration
28 Notes to the statement of cash flows
29 Financial instruments
30 Events after the reporting period
For
per
sona
l use
onl
y

Neometals Annual Report 2019
53NOTES TO THE FINANCIAL STATEMENTS (CONTINUED)
Neometals Ltd is a limited public company incorporated in Australia and listed on the Australian Securities Exchange. The principal activities of the Consolidated Entity are mineral exploration. Neometals Ltd is the ultimate parent.
Registered office and principal place of business Level 3, 1292 Hay St, West Perth WA 6005
Statement of compliance The financial report is a general purpose financial report which has been prepared in accordance with the
Corporations Act 2001, Accounting Standards and Interpretations, and complies with other requirements of the law. The financial statements comprise the consolidated financial statements of the Consolidated Entity, comprising Neometals Ltd and its controlled entities. For the purpose of preparing the financial statements the consolidated entity is a for-profit entity.
Accounting Standards include Australian Accounting Standards. Compliance with Australian Accounting Standards ensures that the financial statements and notes of the Company and the Group comply with International Financial Reporting Standards (‘IFRS’).
The financial statements were authorised for issue by the directors of Neometals Ltd on 11 September 2019.
Basis of preparation The accounting policies adopted are consistent with those adopted and disclosed in the Consolidated
Entity’s 2018 Annual Financial Report for the financial year ended 30 June 2018, except for the impact of the Standards and Interpretations described below. These accounting policies are consistent with Australian Accounting Standards and with IRFS.
The Group has adopted all of the new and revised Standards and Interpretations issued by the Australian Accounting Standards Boards (‘AASB’) that are relevant to its operations and effective for the current reporting period beginning 1 July 2018.
The financial report has been prepared on the basis of historical cost except for the revaluation of certain non-financial assets and financial instruments. Cost is based on the fair values of the consideration given in exchange for assets. All amounts are presented in Australian dollars, unless otherwise noted.
Standards and interpretations adopted in the current year The Group has adopted all of the new and revised Standards and Interpretations issued by the Australian
Accounting Standards Board that are relevant to their operations and are effective for the current financial reporting period beginning 1 July 2018.
The following new and revised Standards and Interpretations have been adopted in the current period:
AASB 9 ‘Financial Instruments’, and the relevant amending standards
AASB 15 ‘Revenue from Contracts with Customers’, AASB 2014-5 ‘Amendments to Australian Accounting Standards arising from AASB 15’, AASB 2015-8 ‘Amendments to Australian Accounting Standards – Effective date of AASB 15’
AASB 2016-5 Amendments to Australian Accounting Standards – Classification and Measurement of Share-based Payment Transactions
The impact of the adoption of these Standards and Interpretations did not have a material impact on the Group.
For
per
sona
l use
onl
y

Neometals Annual Report 2019
54
Standards and interpretations issued but not yet effective At the date of authorisation of the financial statements, the following Australian Accounting Standards
and Interpretations have been issued or amended but are not yet effective and have not been adopted by the Group for the year ended 30 June 2019:
Standard
Effective for annual reporting periods
beginning on or after
Expected to be initially applied in the financial year
ending
AASB 16 ‘Leases’ 1 January 2019 30 June 2020
AASB 2014-10 ‘Amendments to Australian Accounting Standards – Sale or Contribution of Assets between an Investor and its Associate or Joint Venture and AASB 2015-10 Amendments to Australian Accounting Standards – Effective Date of Amendments to AASB 10 and AASB 128’
1 January 2022 30 June 2023
Australian Accounting Standards and Interpretations that have recently been issued or amended but are not yet mandatory, have not been early adopted by the Company for the annual reporting period ended 30 June 2019. The Company’s assessment of the impact of these new or amended Accounting Standards and Interpretations, most relevant to the Company, are set out below.
(i) AASB 16 Leases The AASB has issued this new standard which eliminates the operating and finance lease classifications
for lessees currently accounted for under AASB 117 Leases. It instead requires an entity to bring most leases onto its Statement of Financial Position in a similar way to how existing finance leases are treated under AASB 117. An entity will be required to recognise a lease liability and a right of use asset in its balance sheet for most leases. There are some optional exemptions for leases with a period of 12 months or less and for low value leases. Lessor accounting remains largely unchanged from AASB 117. The Group is currently completing its assessment of the effects of applying the new standard on the Group’s financial statements, including the extent to which these commitments will result in the recognition of lease assets and liabilities for future lease payments and how this will affect the Group’s net assets, profit and classification of cash flows. The Group estimates, by implementing the modified retrospective approach, that on adoption of the new standard the Group’s assets and liabilities will increase by $1,403,426.
The financial impact of the new standard in the 2020 financial year will be dependent on the following factors:
(i) the number and value of the Group’s leases arrangements at the implementation date;
(ii) management judgements made regarding the likelihood of renewal of each lease (where renewal options are available) at the implementation date;
(iii) management judgements in relation to the applicable discount rate for each lease at the implementation date; and
(iv) the accounting approach adopted for each lease.
The final impact will be dependent on the lease arrangements in place at transition and the assessment of the factors outlined above. The Group’s assets and liabilities are estimated not to increase materially following recognition of assets and liabilities representing the present value of the operating lease commitments.
Statement of compliance (continued)
NOTES TO THE FINANCIAL STATEMENTS (CONTINUED)
For
per
sona
l use
onl
y

Neometals Annual Report 2019
55
Critical accounting judgments and key sources of estimation uncertainty In the application of the Group’s accounting policies, management is required to make judgments, estimates and assumptions about carrying values of assets and liabilities that are not readily apparent from other sources. The estimates and associated assumptions are based on historical experience and other factors that are considered to be relevant. Actual results may differ from these estimates.
The estimates and underlying assumptions are reviewed on an ongoing basis. Revisions to accounting estimates are recognised in the period in which the estimate is revised if the revision affects only that period or in the period of the revision and future periods if the revision affects both current and future periods. Refer to Note 3 for a discussion of critical judgments in applying the entity’s accounting policies, and key sources of estimation uncertainty.
The following significant accounting policies have been adopted in the preparation and presentation of the financial report:
(a) Cash and cash equivalents Cash comprises cash on hand and term deposits with a 30 day cancellation policy. Cash equivalents are
short-term, highly liquid investments that are readily convertible to known amounts of cash and which are subject to an insignificant risk of changes in value.
(b) Employee benefits A liability is recognised for benefits accruing to employees in respect of wages and salaries, annual leave,
long service leave, and sick leave when it is probable that settlement will be required and they are capable of being measured reliably.
Liabilities recognised in respect of short-term employee benefits, are measured at their nominal values using the remuneration rate expected to apply at the time of settlement.
Liabilities recognised in respect of long term employee benefits are measured as the present value of the estimated future cash outflows to be made by the Group in respect of services provided by employees up to reporting date.
(c) Foreign currency translation
Functional and presentation currency Items included in the financial statements of each of the group’s entities are measured using the
currency of the primary economic environment in which the entity operates (‘the functional currency’). The consolidated financial statements are presented in Australian dollar ($), which is Neometals Ltd’s functional and presentation currency.
Transactions and balances Foreign currency transactions are translated into the functional currency using the exchange rates
at the dates of the transactions. Foreign exchange gains and losses resulting from the settlement of such transactions and from the translation of monetary assets and liabilities denominated in foreign currencies at year end exchange rates are generally recognised in profit or loss. They are deferred in equity if they relate to qualifying cash flow hedges and qualifying net investment hedges or are attributable to part of the net investment in a foreign operation.
All other foreign exchange gains and losses are presented in the statement of profit or loss on a net basis within other income or other expenses.
Statement of compliance (continued)
NOTES TO THE FINANCIAL STATEMENTS (CONTINUED)
For
per
sona
l use
onl
y

Neometals Annual Report 2019
56
(d) Financial instruments issued by the company
Debt and equity instruments Debt and equity instruments are classified as either liabilities or as equity in accordance with the
substance of the contractual arrangement.
Financial assets Financial instruments are initially measured at fair value plus transaction costs except where the
instrument is classified ‘at fair value through profit or loss’ in which case transaction costs are expensed immediately.
Financial instruments are subsequently measured at fair value, amortised cost using the effective interest rate method or at cost. Fair value represents the price that would be received to sell an asset or paid to transfer a liability in an orderly transaction between market participants at the measurement date. Quoted prices in an active market are used to determine fair value where possible. The group does not designate any interest in subsidiaries, associates or joint venture entities as being subject to the requirements of accounting standards specifically applicable to financial instruments.
Amortised cost amounts are non-derivative financial assets with fixed or determinable payments that are not quoted in an active market and are subsequently measured at amortised cost using the effective interest rate method.
By default, all other debt investments and equity investments are measured subsequently at fair value through profit or loss (FVTPL).
The Group classifies its financial assets into the following categories: those to be measured subsequently at fair value (either through other comprehensive income ‘FVOCI’ or through the income statement ‘FVTPL’) and those to be held at amortised cost. The classification depends on the Group’s business model for managing its financial assets and the contractual terms of the cash flows. As part of the implementation of AASB 9, management have considered the categorisation of financial assets and no reclassification between categories were deemed necessary.
Financial liabilities Financial liabilities are classified as either financial liabilities ‘at fair value through profit or loss’ or other
financial liabilities.
Financial liabilities at fair value through profit or loss Financial liabilities are classified as at fair value through profit or loss where the financial liability is either
held for trading or it is designated as at fair value through profit or loss.
A financial liability is held for trading if:
• It has been incurred principally for the purpose of repurchasing in the near future; or
• It is a part of an identified portfolio of financial instruments that the Group manages together and has a recent actual pattern of short-term profit-taking; or
• It is a derivative that is not designated and effective as a hedging instrument.
A financial liability other than a financial liability held for trading is designated as at fair value through profit or loss upon initial recognition if:
Statement of compliance (continued)
NOTES TO THE FINANCIAL STATEMENTS (CONTINUED)
For
per
sona
l use
onl
y
Neometals Annual Report 2019
57
• such designation eliminates or significantly reduces a measurement or recognition inconsistency that would otherwise arise; or
• the financial liability forms part of a group of financial assets or financial liabilities or both, which is managed and its performance evaluated on a fair value basis, in accordance with the Group’s documented risk management or investment strategy, and information about the grouping is provided internally on that basis; or
• it forms part of a contract containing one or more embedded derivatives, and AASB 9 ‘Financial Instruments’ permits the entire combined contract (asset or liability) to be designated as at fair value through profit or loss.
Financial liabilities at fair value through profit or loss are stated at fair value, with any resultant gain or loss recognised in profit or loss. The net gain or loss recognised in profit or loss incorporates any interest paid on the financial liability.
Other financial liabilities Other financial liabilities, including borrowings, are initially measured at fair value, net of transaction
costs. Other financial liabilities are subsequently measured at amortised cost using the effective interest method, with interest expense recognised on an effective yield basis. The effective interest method is a method of calculating the amortised cost of a financial liability and of allocating interest expense over the relevant period. The effective interest rate is the rate that exactly discounts estimated future cash payments through the expected life of the financial liability, or, where appropriate, a shorter period.
Transaction costs on the issue of equity instruments Transaction costs arising on the issue of equity instruments are recognised directly in equity as a
reduction of the proceeds of the equity instruments to which the costs relate. Transaction costs are the costs that are incurred directly in connection with the issue of those equity instruments and which would not have been incurred had those instruments not been issued.
Interest and dividends Interest and dividends are classified as expenses or as distributions of profit consistent with the
balance sheet classification of the related debt or equity instruments or component parts of compound instruments.
(e) Goods and service tax Revenues, expenses and assets are recognised net of the amount of goods and services tax
(‘GST’), except:
i) where the amount of GST incurred is not recoverable from the taxation authority, it is recognised as part of the cost of acquisition of an asset or as part of an item of expense; or
ii) for receivables and payables which are recognised inclusive of GST.
The net amount of GST recoverable from, or payable to, the taxation authority is included as part of receivables or payables.
Cash flows are included in the cash flow statement on a gross basis. The GST component of cash flows arising from investing and financing activities which is recoverable from, or payable to, the taxation authority is classified as operating cash flows.
Statement of compliance (continued)
NOTES TO THE FINANCIAL STATEMENTS (CONTINUED)
For
per
sona
l use
onl
y

Neometals Annual Report 2019
58
(f) Non-current assets held for sale Non-current assets and their disposal groups are classified as held for sale if their carrying amount will
be recovered principally through a sale transaction rather than continuing use. This condition is regarded as met only when the sale is highly probable and the non-current asset (or disposal group) is available for immediate sale in its present condition. Management must be committed to the sale which should be expected to qualify for recognition as a completed sale within one year from the date of classification.
When the Group is committed to a sale plan involving loss of control of a subsidiary, all of the assets and liabilities of that subsidiary are classified as held for sale when the criteria described above are met, regardless of whether the Group will retain a non-controlling interest in its former subsidiary after the sale. Non-current assets (and disposal groups) classified as held for sale are measured at the lower of their previous carrying amount and fair value less cost to sell.
(g) Impairment of assets At each reporting date, the consolidated entity reviews the varying amounts of its tangible and intangible
assets to determine whether there is any indication that those assets have suffered an impairment loss. If any such indication exists, the recoverable amount of the asset is estimated in order to determine the extent of the impairment loss (if any). Where the asset does not generate cash flows that are independent from other assets, the consolidated entity estimates the recoverable amount of the cash-generating unit to which the asset belongs.
Recoverable amount is the higher of fair value less costs to sell and value in use. In assessing value in use, the estimated future cash flows are discounted to their present value using a pre-tax discount rate that reflects current market assessments of the time value of money and the risks specific to the asset for which the estimates of future cash flows have not been adjusted.
If the recoverable amount of an asset (or cash-generating unit) is estimated to be less than its carrying amount, the varying amount of the asset (cash-generating unit) is reduced to its recoverable amount. An impairment loss is recognised in profit or loss immediately.
Where an impairment loss subsequently reverses, the varying amount of the asset (cash-generating unit) is increased to the revised estimate of its recoverable amount, but only to the extent that the increased varying amount does not exceed the varying amount that would have been determined had no impairment loss been recognised for the asset (cash-generating unit) in prior years. A reversal of an impairment loss is recognised in profit or loss immediately.
(h) Income tax
Current tax Current tax is calculated by reference to the amount of income taxes payable or recoverable in respect
of the taxable profit or tax loss for the period. It is calculated using tax rates and tax laws that have been enacted or substantively enacted by reporting date. Current tax for current and prior periods is recognised as a liability (or asset) to the extent that it is unpaid (or refundable).
Deferred tax Deferred tax is accounted for using the comprehensive balance sheet liability method in respect of temporary differences arising from differences between the varying amount of assets and liabilities in
the financial statements and the corresponding tax base of those items.
Statement of compliance (continued)
NOTES TO THE FINANCIAL STATEMENTS (CONTINUED)
For
per
sona
l use
onl
y

Neometals Annual Report 2019
59
In principle, deferred tax liabilities are recognised for all taxable temporary differences. Deferred tax assets are recognised to the extent that it is probable that sufficient taxable amounts will be available against which deductible temporary differences or unused tax losses and tax offsets can be utilised. However, deferred tax assets and liabilities are not recognised if the temporary differences giving rise to them arise from the initial recognition of assets and liabilities (other than as a result of a business combination) which affects neither taxable income nor accounting profit. Furthermore, a deferred tax liability is not recognised in relation to taxable temporary differences arising from goodwill.
Deferred tax liabilities are recognised for taxable temporary differences arising on investments in subsidiaries, branches, associates and joint ventures except where the consolidated entity is able to control the reversal of the temporary differences and it is probable that the temporary differences will not reverse in the foreseeable future. Deferred tax assets arising from deductible temporary differences associated with these investments and interests are only recognised to the extent that it is probable that there will be sufficient taxable profits against which to utilise the benefits of the temporary differences and they are expected to reverse in the foreseeable future.
Deferred tax assets and liabilities are measured at the tax rates that are expected to apply to the period(s) when the asset and liability giving rise to them are realised or settled, based on tax rates (and tax laws) that have been enacted or substantively enacted by reporting date. The measurement of deferred tax liabilities and assets reflects the tax consequences that would follow from the manner in which the consolidated entity expects, at the reporting date, to recover or settle the carrying amount of its assets and liabilities.
Deferred tax assets and liabilities are offset when they relate to income taxes levied by the same taxation authority and the Company/Consolidated Entity intends to settle its current tax assets and liabilities on a net basis.
Current and deferred tax for the period Current and deferred tax is recognised as an expense or income in the profit and loss statement, except
when it relates to items credited or debited directly to equity, in which case the deferred tax is also recognised directly in equity, or where it arises from the initial accounting for a business combination, in which case it is taken into account in the determination of goodwill or excess.
Tax consolidation The Company and all its wholly-owned Australian resident entities are part of a tax-consolidated group
under Australian taxation law. Neometals Ltd is the head entity in the tax-consolidated group. Income tax expense/benefit, deferred tax liabilities and deferred tax assets arising from temporary differences of the members of the tax consolidated group are recognised in the separate financial statements of the members of the tax consolidated group using a ‘group allocation’ approach based on the allocation specified in the tax funding arrangement.
The tax funding arrangement requires a notional current and deferred tax calculation for each entity as if it were a taxpayer in its own right, except that unrealised profits, distributions made and received and capital gains and losses and similar items arising on transactions within the tax consolidated group are treated as having no consequence. Current tax liabilities and assets and deferred tax assets arising from unused tax losses and tax credits of the members of the tax consolidated group are recognised by the Company (as head entity in the tax consolidated group).
Statement of compliance (continued)
NOTES TO THE FINANCIAL STATEMENTS (CONTINUED)
For
per
sona
l use
onl
y

Neometals Annual Report 2019
60
Due to the existence of a tax funding arrangement between the entities in the tax consolidated group, amounts are recognised as payable to or receivable by the Company and each member of the group in relation to the tax contribution amounts paid or payable between the parent and the other members of the tax consolidated group in accordance with the arrangement.
Where the tax contribution amount recognised by each member of the tax consolidated group for a particular period is different to the aggregate of the current tax liability or asset and any deferred tax asset arising from the unused tax losses and tax credits in respect of that period, the difference is recognised as a contribution from, or distribution to, equity participants.
Research & Development Tax offset In respect of Research and Development tax offsets, the Income tax approach (AASB 112) of
accounting has been utilised, where the tax benefit is presented within the tax line in the Statement of Comprehensive Income.
(i) Exploration and evaluation expenditure Exploration and evaluation expenditures in relation to separate areas of interest are capitalised in the
year in which they are incurred and are carried at cost less accumulated impairment losses where the following conditions are satisfied;
` i) the rights to tenure of the area of interest are current; and
ii) at least one of the following conditions is also met:
- the exploration and evaluation expenditures are expected to be recouped through successful development and exploration of the area of interest, or alternatively, by its sale; or
- exploration and evaluation activities in the area of interest have not at the reporting date reached a stage which permits a reasonable assessment of the existence or otherwise of economically recoverable reserves, and active and significant operations in, or in relation to, the area of interest are continuing.
Capitalised exploration costs for each area of interest (considered to be the cash generating unit) are reviewed each reporting date to test whether an indication of impairment exists. If any such indication exists, the recoverable amount of the capitalised exploration costs is estimated to determine the extent of the impairment loss (if any). The recoverable amount for capitalised exploration costs has been determined as the fair value less costs to sell by reference to an active market. Where an impairment loss subsequently reverses, the carrying amount of the asset is increased to the revised estimate of its recoverable amount, but only to the extent that the increased carrying amount does not exceed the carrying amount that would have been determined had no impairment loss been recognised for the asset in previous years.
Where a decision is made to proceed with development, accumulated expenditure is tested for impairment and transferred to capitalised development and then amortised over the life of the reserves associated with the area of interest once mining operations have commenced.
Statement of compliance (continued)
NOTES TO THE FINANCIAL STATEMENTS (CONTINUED)
For
per
sona
l use
onl
y

Neometals Annual Report 2019
61
Development expenditure Development expenditure is recognised at cost less any impairment losses. Where commercial
production in an area of interest has commenced, the associated costs are amortised over the life of the reserves associated with the area of interest. Changes in factors such as estimates of proved and probable reserves that effect unit-of-production calculations are dealt with on a prospective basis.
(j) Payables Trade payables and other accounts payable are recognised when the Consolidated Entity becomes obliged
to make future payments resulting from the purchase of goods and services.
(k) Principles of consolidation The consolidated financial statements are prepared by combining the financial statements of all the
entities that comprise the Consolidated Entity, being the Company (the parent entity) and its subsidiaries as defined in Accounting Standard AASB 10 ‘Consolidated Financial Statements’. A list of subsidiaries appears in Note 24 to the financial statements. Consistent accounting policies are employed in the preparation and presentation of the consolidated financial statements.
On acquisition, the assets, liabilities and contingent liabilities of a subsidiary are measured at their fair values at the date of acquisition. Any excess of the cost of acquisition over the fair values of the identifiable net assets acquired is recognised as goodwill. If, after reassessment, the fair value of the identifiable net assets acquired exceeds the cost of acquisition, the excess is credited to profit and loss in the period of acquisition. The consolidated financial statements include the information and results of each subsidiary from the date on which the Company obtains control and until such time as the Company ceases to control such entity. In preparing the consolidated financial statements, all inter-company balances and transactions, and unrealised profits arising within the consolidated entity are eliminated in full.
(l) Property, plant and equipment Plant and equipment is stated at cost less accumulated depreciation and impairment. Cost includes
expenditure that is directly attributable to the acquisition of the item. In the event that settlement of all or part of the purchase consideration is deferred, costs are determined by discounting the amounts payable in the future to their present value as at the date of acquisition.
Depreciation is calculated on a diminishing value basis so as to write off the net cost or other re-valued amount of each asset over its expected useful life to its estimated residual value. The estimated useful lives, residual values and depreciation method are reviewed at the end of each annual reporting period with the effect of any changes recognised on a prospective basis.
The following estimated useful lives are used in the calculation of depreciation:
Furniture & Fittings 5-20 years
Plant and Equipment 2-10 years
Buildings 10-20 years
An item of property, plant and equipment is derecognised upon disposal when no future economic benefits are expected to arise from the continued use of the asset. Any gain or loss arising on the disposal or retirement of an item of property, plant and equipment is determined as the difference between the sales proceeds and the carrying amount of the asset and is recognised in profit and loss.
Statement of compliance (continued)
NOTES TO THE FINANCIAL STATEMENTS (CONTINUED)
For
per
sona
l use
onl
y
Neometals Annual Report 2019
62
(m) Intangibles Trademarks, licences and customer contracts Separately acquired trademarks and licences are shown at historical cost. Trademarks, licenses and
customer contracts acquired in a business combination are recognised at fair value at the acquisition date. They have a finite useful life and are subsequently carried at cost less accumulated amortisation and impairment losses.
Research and development Research expenditure is recognised as an expense as incurred. Development expenditure is recognised
as an asset as incurred. Research and development costs previously recognised as an expense are not recognised as an asset in a subsequent period.
(n) Provisions Provisions are recognised when the consolidated entity has a present obligation, the future sacrifice of
economic benefits is probable, and the amount of the provision can be measured reliably.
The amount recognised as a provision is the best estimate of the consideration required to settle the present obligation at reporting date, taking into account the risks and uncertainties surrounding the obligation. Where a provision is measured using the cash flows estimated to settle the present obligation, its carrying amount is the present value of those cash flows. When some or all of the economic benefits required to settle a provision are expected to be recovered from a third party, the receivable is recognised as an asset if it is virtually certain that recovery will be received and the amount of the receivable can be measured reliably.
Provision for onerous contract Present obligations arising under onerous contracts are recognised and measured as provisions.
An onerous contract is considered to exist where the Group has a contract under which the unavoidable costs of meeting the obligations under the contract exceed the economic benefits expected to be received from the contract.
(o) Revenue recognition Revenue is measured at the fair value of the consideration received or receivable.
Dividend and interest revenue Dividend revenue from investments is recognised when the shareholder’s right to receive the payment
has been established. Interest revenue is recognised on a time proportionate basis that takes into account the effective yield on the financial asset.
(p) Interests in joint operations A joint operation is a joint arrangement whereby the parties that have joint control of the arrangement
have rights to the assets, and obligations for the liabilities, relating to the arrangement. Joint control is the contractually agreed sharing of control of an arrangement, which exists only when decisions about the relevant activities require unanimous consent of the parties sharing control.
When a group entity undertakes its activities under joint operations, the Group as a joint operator recognises in relation to its interest in a joint operation:
• its assets, including its share of any assets held jointly;
• its liabilities, including its share of any liabilities incurred jointly;
Statement of compliance (continued)
NOTES TO THE FINANCIAL STATEMENTS (CONTINUED)
For
per
sona
l use
onl
y

Neometals Annual Report 2019
63
• its revenue from the sale of its share of the output arising from the joint operation;
• its share of the revenue from the sale of the output by the joint operation; and
• its expenses, including its share of any expenses incurred jointly.
The Group accounts for the assets, liabilities, revenues and expenses relating to its interest in a joint operation in accordance with the AASBs applicable to the particular assets, liabilities, revenues and expenses.
When a group entity transacts with a joint operation in which a group entity is a joint operator (such as a sale or contribution of assets), the Group is considered to be conducting the transaction with the other parties to the joint operation, and gains and losses resulting from the transactions are recognised in the Group’s consolidated financial statements only to the extent of other parties’ interests in the joint operation.
When a group entity transacts with a joint operation in which a group entity is a joint operator (such as a purchase of assets), the Group does not recognise its share of the gains and losses until it resells those assets to a third party.
(q) Share-based payments Equity-settled share-based payments to employees and others providing services to the Group are
measured at fair value at the date of grant.
The fair value determined at the grant date of the equity-settled share-based payments is expensed on a straight-line basis over the vesting period, based on the Consolidated Entity’s estimate of shares that will eventually vest, with a corresponding increase in equity.
Equity-settled share-based payments transactions with parties other than employees are measured at the fair value of the goods or services received, except where the fair value cannot be estimated reliably, in which case they are measured at the fair value of the equity instruments granted, measured at the date the entity obtains the goods or the counter party renders the service.
The fair value of performance rights are measured using a Monte Carlo Simulation.
(r) Leased assets Leases are classified as finance leases when the terms of the lease transfer substantially all the risks
and rewards incidental to ownership of the leased asset to the lessee. All other leases are classified as operating leases.
Assets held under finance leases are initially recognised at their fair value or, if lower, at amounts equal to the present value of the minimum lease payments, each determined at the inception of the lease. The corresponding liability to the Lessor is included in the balance sheet as a finance lease obligation.
Lease payments are apportioned between finance charges and reduction of the lease obligation so as to achieve a constant rate of interest on the remaining balance of the liability. Finance charges are charged directly to profit and loss, unless they are directly attributable to qualifying assets, in which case they are capitalised in accordance with the Group’s general policy on borrowing costs.
Contingent rentals are recognised as expenses in the periods in which they are incurred. Finance leased assets are amortised on a straight-line basis over the estimated useful life of the asset.
Statement of compliance (continued)
NOTES TO THE FINANCIAL STATEMENTS (CONTINUED)
For
per
sona
l use
onl
y

Neometals Annual Report 2019
64
(s) Investments in associates and joint ventures An associate is an entity over which the Group has significant influence. Significant influence is the power
to participate in the financial and operating policy decisions of the investee but is not control or joint control over those policies.
A joint venture is a joint arrangement whereby the parties that have joint control of the arrangement have rights to the net assets of the joint arrangement. Joint control is the contractually agreed sharing of control of an arrangement, which exists only when decisions about the relevant activities require unanimous consent of the parties sharing control.
The results and assets and liabilities of associates or joint ventures are incorporated in these consolidated financial statements using the equity method of accounting, except when the investment, or a portion thereof, is classified as held for sale, in which case it is accounted for in accordance with AASB 5. Under the equity method, an investment in an associate or a joint venture is initially recognised in the consolidated statement of financial position at cost and adjusted thereafter to recognise the Group’s share of the profit or loss and other comprehensive income of the associate or joint venture. When the Group’s share of losses of an associate or a joint venture exceeds the Group’s interest in that associate or joint venture (which includes any long-term interests that, in substance, form part of the Group’s net investment in the associate or joint venture), the Group discontinues recognising its share of further losses. Additional losses are recognised only to the extent that the Group has incurred legal or constructive obligations or made payments on behalf of the associate or joint venture.
An investment in an associate or a joint venture is accounted for using the equity method from the date on which the investee becomes an associate or a joint venture. On acquisition of the investment in an associate or a joint venture, any excess of the cost of the investment over the Group’s share of the net fair value of the identifiable assets and liabilities of the investee is recognised as goodwill, which is included within the carrying amount of the investment. Any excess of the Group’s share of the net fair value of the identifiable assets and liabilities over the cost of the investment, after reassessment, is recognised immediately in profit or loss in the period in which the investment is acquired.
The requirements of AASB 9 are applied to determine whether it is necessary to recognise any impairment loss with respect to the Group’s investment in an associate or a joint venture. When necessary, the entire carrying amount of the investment (including goodwill) is tested for impairment in accordance with AASB 136 Impairment of Assets as a single asset by comparing its recoverable amount (higher of value in use and fair value less costs to sell) with its carrying amount. Any impairment loss recognised forms part of the carrying amount of the investment. Any reversal of that impairment loss is recognised in accordance with AASB 136 to the extent that the recoverable amount of the investment subsequently increases.
The Group discontinues the use of the equity method from the date when the investment ceases to be an associate or a joint venture, or when the investment is classified as held for sale. When the Group retains an interest in the former associate or joint venture and the retained interest is a financial asset, the Group measures the retained interest at fair value at that date and the fair value is regarded as its fair value on initial recognition in accordance with AASB 9. The difference between the carrying amount of the associate or joint venture at the date the equity method was discontinued, and the fair value of any retained interest and any proceeds from disposing of a part interest in the associate or joint venture is included in the determination of the gain or loss on disposal of the associate or joint venture. In addition,
Statement of compliance (continued)
NOTES TO THE FINANCIAL STATEMENTS (CONTINUED)
For
per
sona
l use
onl
y

Neometals Annual Report 2019
65
the Group accounts for all amounts previously recognised in other comprehensive income in relation to that associate or joint venture on the same basis as would be required if that associate or joint venture had directly disposed of the related assets or liabilities. Therefore, if a gain or loss previously recognised in other comprehensive income by that associate or joint venture would be reclassified to profit or loss on the disposal of the related assets or liabilities, the Group reclassifies the gain or loss from equity to profit or loss (as a reclassification adjustment) when the equity method is discontinued.
The Group continues to use the equity method when an investment in an associate becomes an investment in a joint venture or an investment in a joint venture becomes an investment in an associate. There is no re-measurement to fair value upon such changes in ownership interests.
When the Group reduces its ownership interest in an associate or a joint venture but the Group continues to use the equity method, the Group reclassifies to profit or loss the proportion of the gain or loss that had previously been recognised in other comprehensive income relating to that reduction in ownership interest if that gain or loss would be reclassified to profit or loss on the disposal of the related assets or liabilities.
When a group entity transacts with an associate or a joint venture of the Group, profits and losses resulting from the transactions with the associate or joint venture are recognised in the Group’s consolidated financial statements only to the extent of interests in the associate or joint venture that are not related to the Group.
In the application of the Group’s accounting policies, which are described in Note 2, management is required to make judgments, estimates and assumptions about carrying values of assets and liabilities that are not readily apparent from other sources. The estimates and associated assumptions are based on historical experience and various other factors that are believed to be reasonable under the circumstance, the results of which form the basis of making the judgments. Actual results may differ from these estimates. The estimates and underlying assumptions are reviewed on an ongoing basis. Revisions to accounting estimates are recognised in the period in which the estimate is revised if the revision affects only that period, or in the period of the revision and future periods if the revision affects both current and future periods.
3.1 Critical judgments in applying the entity’s accounting policies
The following are the critical judgments that management has made in the process of applying the Group’s accounting policies and that have the most significant effect on the amounts recognised in the financial statements.
(a) Recovery of capitalised exploration evaluation and development expenditure The Group capitalises exploration, evaluation and development expenditure incurred on ongoing projects.
The recoverability of this capitalised exploration expenditure is entirely dependent upon returns from the successful development of mining operations or from surpluses from the sale of the projects or the subsidiary companies that control the projects. At the point that it is determined that any capitalised exploration expenditure is definitely not recoverable, it is written off.
Statement of compliance (continued)
NOTES TO THE FINANCIAL STATEMENTS (CONTINUED)
For
per
sona
l use
onl
y

Neometals Annual Report 2019
66
(b) Share-based payments Equity-settled share-based payments granted are measured at fair value at the date of grant. The fair
value of share options is measured by use of the Monte Carlo model and requires substantial judgement. Management has made its best estimate for the effects of non-transferability, exercise restrictions (including the probability of meeting market conditions attached to the option), and behavioural considerations.
The fair value of performance rights issued during the period was made with reference to the parent entity’s closing share price on the date of grant. Management has been required to estimate the probability that the employee will meet the performance criteria determined by the board and that the employee employed by the Group.
(c) Joint arrangements When determining the accounting treatment to apply to joint ventures and joint operations management
considers the factors which govern the relationship between itself and the other party or parties involved in the joint commitment. Based on information such as legal agreements and the structure of the vehicle under which the joint arrangement is executed management determine whether it is a joint venture or a joint operation. With respect to terms of agreements between two or more parties there is a risk that the parties may interpret the terms of the agreement differently. Management continually review the facts and circumstances under which these judgements are made and reassess whether the type of joint arrangement in which it is involved has changed.
3.2 Key areas of estimation uncertainty The following are key assumptions concerning the future, or other key sources of estimation uncertainty
at the reporting date, that have a significant risk of causing a material adjustment to the carrying amounts of assets and liabilities within the next financial year.
(a) Capitalised development and evaluation assets Certain assumptions are required to be made in order to assess the recoverability of long-lived assets.
Key assumptions include future commodity prices, future cash flows, estimated discount rate and estimates of Ore Reserves. Estimates of Ore Reserves are dependent on various assumptions. Changes in these estimates could materially impact on actual ore recovered, and could therefore affect estimates of future cash flows used in the assessment of recoverable amounts. The carrying amount of exploration evaluation and development assets which is included in the consolidated statement of financial position at 30 June 2019 is $37.0 million (2018: $31.5 million).
The Group estimates its Mineral Resources and Reserves based on information assessed by Competent Persons (as defined in the JORC code). In estimating the remaining life of the mine for the purpose of amortisation and depreciation calculations, due regard is given, not only to the amount of remaining Ore Reserves, but also to limitations which could arise from the potential for changes in technology, demand, and other issues which are inherently difficult to estimate over an extended timeframe.
(b) Value of deferred tax assets Deferred income tax assets, including those arising from un-utilised tax losses, require management to
assess the likelihood that the Group will generate sufficient taxable earnings in future periods, in order to utilise recognised deferred income tax assets. Assumptions about the generation of future taxable profits depend on management’s estimates of future cash flows. These estimates of future taxable income are based on forecast cash flows from operations (which are impacted by production and sales volumes,
Statement of compliance (continued)
NOTES TO THE FINANCIAL STATEMENTS (CONTINUED)
For
per
sona
l use
onl
y

Neometals Annual Report 2019
67
commodity prices, reserves, operating costs, closure and rehabilitation costs, capital expenditure, dividends and other capital management transactions) and judgement about the application of existing tax laws in Australia. To the extent that future cash flows and taxable income differ significantly from estimates, the ability of the Group to realise the net deferred income tax assets recorded at the reporting date could be impacted.
In addition, future changes in tax laws in Australia could limit the ability of the Group to obtain tax deductions in future periods. The carrying amount of deferred taxes included in the consolidated statement of financial position at 30 June 2019 is a deferred tax liability of $3,786,582 (2018: Nil).
(c) Onerous Contract The Company has an onerous contract which relates to a contract entered into by Neometals Energy
Pty Ltd, a wholly owned subsidiary of the Company, for the Company’s Barrambie Project. The contract with DBNGP (WA) Transmission Pty Ltd for gas transmission, commenced on 1 July 2010. The provision in the accounts represents the present value of the gas transmission obligations under the contract for gas transmission not expected to be utilised or on sold.
The estimates for the remaining term is subject to Management’s judgement and could change in future periods.
Statement of compliance (continued)
NOTES TO THE FINANCIAL STATEMENTS (CONTINUED)
For
per
sona
l use
onl
y

Neometals Annual Report 2019
68
2019$
2018$
Financial Position
Assets
Current assets 109,893,836 47,061,206
Non-current assets 22,467,652 18,547,206
Total assets 132,361,488 65,608,412
Liabilities
Current liabilities 2,101,075 1,303,468
Non-current liabilities 3,786,582 -
Total liabilities 5,887,657 1,303,468
Net Assets 126,473,831 64,304,944
Equity
Issued capital 154,264,362 154,101,518
Retained earnings (34,391,900) (95,871,470)
Reserves
Share based payments 6,601,369 6,074,896
Total equity 126,473,831 64,304,944
Financial Performance
Profit for the year 81,273,621 8,395,058
Other comprehensive income - -
Total comprehensive income 81,273,621 8,395,058
Guarantees entered into on behalf of subsidiaries(i) 4,000,000 4,000,000
(i) Neometals Energy Pty Ltd, a wholly owned subsidiary of the Company, is party to a gas transmission agreement with DBNGP (WA) Transmission Pty Ltd. The parent entity has provided security for a bank guarantee required under the contract for $4.0 million. Refer to Note 12 for details.
NOTES TO THE FINANCIAL STATEMENTS (CONTINUED)
For
per
sona
l use
onl
y

Neometals Annual Report 2019
69
Note2019
$2018
$
(a) Income
Income from operations consisted of the following items:
Other income:
Interest revenue 1,140,353 926,376
Other 512,147 490,834
1,652,500 1,417,210
(b) Profit / (loss) before income tax
Profit / (loss) before income tax has been arrived at after charging the following expenses:
Employee benefits expense:
Equity settled share-based payments (691,201) (501,324)
Superannuation expense (291,080) (183,793)
Other employee benefits (4,541,992) (3,129,923)
(5,524,273) (3,815,040)
Finance costs:
Borrowing costs - (490)
Facility fees (60,000) (60,000)
Interest expense (649) (2,109)
(60,649) (62,599)
Impairment of related party loan - (1,677,554)
Impairment of associate 23 (5,226,805) -
Depreciation of non-current assets (117,364) (42,530)
NOTES TO THE FINANCIAL STATEMENTS (CONTINUED)
For
per
sona
l use
onl
y

Neometals Annual Report 2019
70
At 30 June 2018, Neometals investment in RIM was equity accounted for as an investment in associate. On 30 November 2018, the Board endorsed the decision to complete the sale of RIM to co-shareholders (Mineral Resources & Ganfeng), and a sales agreement was executed in December 2018 to dispose of the remaining interest of 13.8% in Reed Industrial Minerals Pty Ltd. Accordingly, the classification of the investment was required to be reassessed for the current period end under AASB 5 Non-current Asset Held for Sale and Discontinued Operations.
The disposal was completed in March 2019 for a cash consideration of $103.8M, on which date the equity interest passed to the acquirer. Details of the investment disposed of and the calculation of the profit or loss on disposal are disclosed below.
Note2019
$
Profit on sale of associate
Opening carrying value of investment in the associate (a) 23 11,325,197
Share of profit / (loss) of associate recognised in profit or loss 11,561,336
Fully franked dividends received from associate (6,210,000)
Investment balance classified as held for sale 16,676,533
Proceeds from sale of associate (103,800,000)
Profit on sale of associate (87,123,467)
The results of the discontinued operation which have been included in the financial statements for the year were as follows:
2019$
2018$
(Restated*)
Results of discontinued operations
Profit / (loss) from discontinued operations (a) 98,684,783 11,100,951
Cash flows from discontinued operations
Cashflows from investing activities 114,114,458 4,104,458
Effect of disposal on the financial position of the group
investment in associate (16,676,533) -
(a) During the 2019 financial year, it was identified that as part of a review of the accounting treatment for the equity accounting profit take up in 2018, there had been an inappropriate take up of the share of associates profit, whereby the take up was done on a pre-tax profit basis, rather than a post-tax basis. In accordance with AASB108.42, the 2018 share of profit of associate and the opening carrying value of the investment in associate has been restated.
NOTES TO THE FINANCIAL STATEMENTS (CONTINUED)
For
per
sona
l use
onl
y

Neometals Annual Report 2019
71
The impact of the adjustment is as follows:
As previously reported
$
Share of profit
adjustment$
As restated adjustment
$
Impact on assets as at 30 June 2018
Investment in Associate 15,856,197 (4,531,000) 11,325,197
Impact on profit/(loss) for the year
Share of profit of associate 15,631,951 (4,531,000) 11,100,951
Impact on basic earnings per share (cents per share) 3.73 (0.83) 2.90
Impact on diluted earnings per share (cents per share) 3.72 (0.84) 2.88
2019$
2018$
(Restated*)
(a) Income tax benefit recognised in profit or loss
Tax benefit comprises:
Current tax expense 3,786,582 -
Research and development claim (523,088) (568,605)
Total tax benefit 3,263,494 (568,605)
The prima facie income tax expense on pre-tax accounting profitfrom continuing operations reconciles to the income tax benefit in thefinancial statements as follows:
Profit / (Loss) from operations 79,442,050 15,679,541
Income tax calculated at 30% 23,832,315 4,703,862
Effect of income and expenses that are not deductible in determining taxable profit
(3,150,651) (7,160,077)
Recognition of previously unrecognised tax losses (23,031,010) -
Tax effect on disposal of capital assets(i) 6,292,554 2,123,230
Non-assesable income - R&D credit (156,926) (170,581)
Non-deductible loan write-off - 503,266
Refund of prior year R&D claim (523,088) (568,605)
Income tax expense / (benefit) recognised 3,263,494 (568,605)
*Refer to note 6 for details of restatement.
NOTES TO THE FINANCIAL STATEMENTS (CONTINUED)
For
per
sona
l use
onl
y

Neometals Annual Report 2019
72
(i) Tax effect on disposal of capital assets was higher than the accounting gain on disposal.
The tax rate used in the above reconciliation is the corporate tax rate of 30% payable by Australian corporate entities on taxable income under Australian tax law. There has been no change in the corporate tax rate during the reporting period.
(b) Deferred tax balances
The impact of the adjustment is as follows:
2019$
2018$
Deferred tax liabilities (12,697,822) (8,130,761)
Deferred tax assets 8,911,240 8,130,761
Net deferred tax balance (3,786,582) -
(c) Deferred tax assets not brought to account
At 30 June 2019 the amount of unrecognised tax losses was (gross) $nil (June 2018: $76,770,032). Other losses may be available. Currently assessing the ability to carry these forward.
Tax Consolidation
Relevance of tax consolidation to the consolidated entity The Company and its wholly-owned Australian resident entities have formed a tax-consolidated group and are therefore taxed as a single entity. The head entity within the tax-consolidated group is Neometals Ltd. The members of the tax-consolidated group are identified at Note 24.
Nature of tax funding arrangements and tax sharing agreements Entities within the tax-consolidated group have entered into a tax funding arrangement and a tax sharing agreement with the head entity. Under the terms of the tax funding arrangement, Neometals Ltd and each of the entities in the tax consolidation group has agreed to pay a tax equivalent payment to or from the head entity, based on the current tax liability or current tax assets of the entity. Such amounts are reflected in amounts receivable from or payable to each entity in the tax consolidated group, and are eliminated on consolidation. The tax sharing agreement entered into between the members of the tax-consolidated group provides for the determination of the allocation of income tax liabilities between the entities should the head entity default on its payment obligations or if an entity should leave the tax-consolidated group. The effect of the tax sharing agreement is that each member’s tax liability for tax payable by the tax-consolidated group is limited to the amount payable to the head entity under the tax funding arrangement.
NOTES TO THE FINANCIAL STATEMENTS (CONTINUED)
For
per
sona
l use
onl
y

Neometals Annual Report 2019
73
Details of key management personnel compensation are provided on pages 32 to 40 of the Directors’ Report.
The aggregate compensation made to key management personnel of the Group is set out below:
2019$
2018$
Short-term employee benefits 2,211,405 1,982,931
Post-employment benefits 136,092 116,591
Share-based payments 478,846 389,951
2,826,343 2,489,473
Neometals Ltd has an ownership based remuneration scheme for executives and employees.
Performance Rights Plan (‘PRP’) In accordance with the provisions of the PRP, as approved by shareholders at the Company’s AGM on 24 November 2017, employees, Non-Executive Directors and consultants may be offered performance rights at such times and on such terms as the board considers appropriate.
General terms of performance rights granted under the PRP:
• The performance rights will not be quoted on the ASX.
• Performance rights can only be granted to employees, Non-Executive Directors and consultants of the Company.
• Performance rights are transferable to eligible nominees.
• Performance rights not exercised on or before the vesting date will lapse.
• All shares allotted upon the vesting of performance rights rank equally in all respects to all previously issued shares.
• Performance rights confer no right to vote, attend meetings, participate in a distribution of profit or a return of capital or another participating rights or entitlements on the grantee unless and until the performance rights vest.
NOTES TO THE FINANCIAL STATEMENTS (CONTINUED)
For
per
sona
l use
onl
y

Neometals Annual Report 2019
74
The following share-based payment arrangements in relation to performance rights were in existence during the period:
2019 Grant date NumberVesting date/ Expiry date
Grant date share price
Probability factor
Fair value at grant date
Jason Carone 03/10/2017 370,012 31/12/2020 0.30 n/a 93,243
Michael Tamlin 03/10/2017 444,015 31/12/2020 0.30 n/a 111,892
Staff and consultants 03/10/2017 150,000 30/06/2019 0.30 n/a 75,000
Chris Reed 11/12/2017 952,474 31/12/2020 0.385 n/a 320,984
Darren Townsend 11/12/2017 444,015 31/12/2020 0.385 n/a 149,633
Staff and consultants 11/12/2017 280,312 31/12/2020 0.385 n/a 94,465
Staff and consultants 11/12/2017 400,000 30/06/2019 0.385 n/a 192,500
Natalia Streltsova 10/08/2018 39,348 30/06/2019 0.32 n/a 12,000
Doug Ritchie 10/08/2018 39,348 30/06/2019 0.32 n/a 12,000
Steven Cole 10/08/2018 163,948 30/06/2019 0.32 n/a 50,000
Chris Reed 10/08/2018 835,339 30/06/2021 0.32 n/a 209,252
Jason Carone 10/08/2018 307,156 30/06/2021 0.32 n/a 76,943
Michael Tamlin 10/08/2018 383,330 30/06/2021 0.32 n/a 96,024
Darren Townsend 10/08/2018 368,587 30/06/2021 0.32 n/a 92,331
Staff and consultants 10/08/2018 739,501 30/06/2021 0.32 n/a 185,245
Staff and consultants 25/01/2019 356,797 30/06/2021 0.22 n/a 89,378
Total 6,274,181 1,860,890
The valuation of the Non-executive Directors performance rights has been based on the amount of their fees that have been sacrificed. The fair value of other KMP performance rights issued have been independently valued by a third party using a Monte Carlo simulation to determine fair value. The total expense recognised for the period arising from share-based payment transactions and accounted for as equity-settled share-based payment transactions is $691,201 (2018: $501,324).
The following reconciles the outstanding performance rights granted at the beginning and end of the financial year:
2019Performance
Rights No.
2018Performance
Rights No.
Balance at beginning of the financial year 4,654,223 4,460,237
Granted during the financial year as compensation 3,233,353 3,557,624
Vested during the financial year (i) (441,796) (2,802,919)
Lapsed during the financial year (ii) (1,171,599) (560,719)
Balance at the end of the financial year (iii) 6,274,181 4,654,223
(i) 441,796 shares in the Company were issued on vesting of performance rights (2018: 2,802,919).
(ii) 1,171,599 performance rights lapsed during the financial year (2018: 560,719).
(iii) Subject to the satisfaction of certain retention and performance conditions 542,643 performance rights vest at the end of the year (2018: 1,538,395)
NOTES TO THE FINANCIAL STATEMENTS (CONTINUED)
For
per
sona
l use
onl
y

Neometals Annual Report 2019
75
2019$
2018$
Declared and paid during the year:
Dividends paid on ordinary shares:
On 25 May 2019, the directors declared a partially franked dividend of 2 cent per share, 1 cent franked and 1 cent unfranked to the holders of fully paid ordinary shares, paid to shareholders on 8 June 2019. (2018: 1.0 cents)
10,879,485 5,435,325
The dividend franking account has a balance of $330,110 as at 30 June 2019 (2018: nil).
2019$
2018$
Current
Related party receivable(i) - 4,104,458
Other receivables 428,903 320,665
Prepayments 198,696 128,295
Total 627,599 4,553,418
(i) Related party receivable relates to the amount loaned to associate Reed Industrial Minerals Pty Ltd. The amount was repaid in full to Neometals in July 2018.
2019$
2018$
Current
Financial assets measured at FVTPL 782,927 252,181
Total Current 782,927 252,181
Non-current
Financial assets measured at FVTPL 543,000 493,000
Barrambie Gas term deposit (i) 4,000,000 4,000,000
Rental bond term deposit 244,118 43,000
Total Non-current 4,787,118 4,536,000
Total 5,570,045 4,788,181
(i) Neometals Energy Pty Ltd, a wholly owned subsidiary of the Company, is a party to a gas transmission agreement with DBNGP (WA) Transmission Pty Ltd (DBP) in relation to the Barrambie Project. As part of the agreement the Group was required to provide security by way of a $4.0 million bank guarantee.
NOTES TO THE FINANCIAL STATEMENTS (CONTINUED)
For
per
sona
l use
onl
y

Neometals Annual Report 2019
76
Consolidated
Capitalisedexploration and
evaluationexpenditure
$
Gross carrying amount
Balance at 1 July 2017 32,970,980
Transfer on deconsolidation of subsidiary -
Acquisition(i) 2,500,000
Additions 1,796,593
Balance at 1 July 2018 37,267,573
Transfer on deconsolidation of subsidiary -
Acquisition -
Additions 5,476,253
Balance at 30 June 2019 42,743,826
Accumulated amortisation and impairment
Balance at 1 July 2017 20,455,684
Amortisation expense -
Impairment reversal(ii) (14,694,964)
Expenditure written off -
Balance at 1 July 2018 5,760,720
Amortisation expense -
Impairment reversal -
Expenditure written off -
Balance at 30 June 2019 5,760,720
Net book value
As at 30 June 2018 31,506,853
As at 30 June 2019 36,983,106
The recovery of exploration expenditure carried forward is dependent upon the discovery of commercially viable mineral and other natural resource deposits, their development and exploration, or alternatively their sale.
(i) The Group acquired Mt Edwards Lithium Pty Ltd (MEL) in the previous financial year. Total cash consideration of $2,500,000 was paid to acquire the lithium and nickel rights and an exploration licence held within MEL. This was treated as an Asset Acquisition for accounting purposes as the company did not have active operations.
(ii) An impairment reversal in relation to the Barrambie Titanium/ Vanadium Project was made in the prior year.
NOTES TO THE FINANCIAL STATEMENTS (CONTINUED)
For
per
sona
l use
onl
y

Neometals Annual Report 2019
77
Consolidated
Plant and equipment at cost
$
Gross carrying amount
Balance at 1 July 2017 483,269
Additions 796,864
Disposals -
Transfers to property, plant and equipment -
Written off (65,881)
Balance at 1 July 2018 1,214,252
Additions 943,403
Disposals -
Transfers to property, plant and equipment -
Written off (131,331)
Balance at 30 June 2019 2,026,324
Accumulated depreciation
Balance at 1 July 2017 248,552
Disposals (32,518)
Depreciation expense 42,529
Balance at 1 July 2018 258,563
Disposals and write offs (116,188)
Depreciation expense 109,429
Balance at 30 June 2019 251,804
Net book value
As at 30 June 2018 955,689
As at 30 June 2019 1,774,520
2019$
2018$
Trade payables 738,530 504,948
Accrued expenses 1,306,976 690,207
Other 44,146 30,585
2,089,652 1,225,740
The average credit period on purchases is 30 days. No interest is charged on the trade payables. The Group has financial risk management policies in place to help ensure that all payables are paid within the settlement terms.
NOTES TO THE FINANCIAL STATEMENTS (CONTINUED)
For
per
sona
l use
onl
y

Neometals Annual Report 2019
78
2019$
2018$
Current
Annual leave 433,762 316,251
Long service leave 161,980 101,512
Other (a) 559,140 759,525
1,154,882 1,177,288
Non-current
Other (a) 1,378,062 2,807,526
1,378,062 2,807,526
2,532,944 3,984,814
(a) Detail of movement in other provisions
OnerousContracts
(i)$
2019
Balance at 1 July 2018 3,567,051
Additional provisions recognised -
Reductions resulting from re-measurement (653,832)
Balance at 30 June 2019 (976,017)
1,937,202
Comprised of:
Other (a) 559,140
Other (a) 1,378,062
1,937,202
(i) The onerous contract relates to a contract entered into by Neometals Energy Pty Ltd, a wholly owned subsidiary of the Company, for the Company’s Barrambie Project. The contract with DBNGP (WA) Transmission Pty Ltd for gas transmission, commenced on 1 July 2010. The provision in the accounts represents the present value of the remaining gas transmission obligations under the contract for gas transmission not expected to be utilised or on sold.
NOTES TO THE FINANCIAL STATEMENTS (CONTINUED)
For
per
sona
l use
onl
y

Neometals Annual Report 2019
79
OnerousContracts
(i)$
2018
Balance at 1 July 2017 4,322,333
Additional provisions recognised -
Reductions resulting from re-measurement (755,282)
Reductions resulting from re-measurement or settlement without cost -
Balance at 30 June 2018 3,567,051
Comprised of:
Current provision 759,525
Non-current provision 2,807,526
3,567,051
(i) The onerous contract relates to a contract entered into by Neometals Energy Pty Ltd, a wholly owned subsidiary of the Company, for the Company’s Barrambie Project. The contract with DBNGP (WA) Transmission Pty Ltd for gas transmission, commenced on 1 July 2010. The provision in the accounts represents the present value of the remaining gas transmission obligations under the contract for gas transmission not expected to be utilised or on sold.
2019$
2018$
543,974,269 fully paid ordinary shares (2018: 543,532,473) 154,264,634 154,101,518
Changes to the then Corporations Law abolished the authorised capital and par value concept in relation to share capital from 1 July 1998. Therefore, the Company does not have a limited amount of authorised capital and issued shares do not have a par value.
2019 2018
No. $ No. $
Fully paid ordinary shares
Balance at beginning of financial year 543,532,473 154,101,518 546,100,763 155,367,391
Share issue costs - (1,884) - -
Shares cancelled through share buy back - - (5,371,209) (1,524,598)
Other share based payments 441,796 165,000 2,802,919 258,725
Balance at the end of the financial year 543,974,269 154,264,634 543,532,473 154,101,518
Fully paid ordinary shares carry one vote per share and carry the right to dividends.
Share options At balance date there were no share options in existence over ordinary shares (2018: nil).
NOTES TO THE FINANCIAL STATEMENTS (CONTINUED)
For
per
sona
l use
onl
y

Neometals Annual Report 2019
80
The share-benefits reserve arises on the grant of share options and performance rights for the provision of services by consultants and to executives and employees under the employee share option plan, performance rights plan, employment contracts or as approved by shareholders. Amounts are transferred out of the reserve and into issued capital when the options are exercised or when shares are issued pursuant to the terms of the performance rights. Further information about share-based payments to employees is provided in Note 9 to the financial statements.
2019$
2018$
Share based payments reserve:
Balance at the beginning of the financial year 5,774,546 5,531,947
Increase in share based payments 691,201 501,324
Amounts transferred to share capital on exercise (165,000) (258,725)
Balance at the end of the financial year 6,300,747 5,774,546
Other reserve:
Balance at the beginning of the financial year 300,349 300,349
Balance at the end of the financial year 300,349 300,349
Investment revaluation reserve:
Balance at the beginning of the financial year 1,019,637 1,019,637
Investment revaluation reserve - -
Balance at the end of the financial year 1,019,637 1,019,637
Total Reserves 7,620,733 7,094,532
2019Cents per
share
2018Cents per
shareRestated*
Basic earnings per share:
Continuing and discontinued operations 14.00 2.90
Diluted earnings per share:
Continuing and discontinued operations 14.01 2.88
NOTES TO THE FINANCIAL STATEMENTS (CONTINUED)
For
per
sona
l use
onl
y

Neometals Annual Report 2019
81
Basic and diluted profit / (loss) per share The profit / (loss) and weighted average number of ordinary shares used in the calculation of basic and diluted profit / (loss) per share are as follows:
2019$
2018$
Restated*
Profit / (loss) (a)
Continuing and discontinued operations 76,178,556 15,679,541
2019$
2018$
Restated*
Weighted average number of ordinary shares for the purpose of basic profit / (loss) per share
543,974,269 541,458,075
Weighted average number of ordinary shares for the purpose of diluted profit / (loss) per share
543,911,970 543,961,504
(a) Profit / (loss) used in the calculation of profit / (loss) per share reconciles to net loss in the consolidated statement of comprehensive income.
*Refer to note 6 for details of restatement.
(a) Exploration and evaluation expenditure commitments The Consolidated Entity holds mineral exploration licences in order for it to undertake its exploration and evaluation activities. To continue to hold tenure over these areas the Group is required to undertake a minimum level of expenditure on or in relation to the leases. Minimum expenditure commitments for the exploration and mining leases for the 2020 financial year are outlined in the table below.
30 June 2019
$
30 June 2018
$
Exploration expenditure commitments
Not longer than 1 year(i) 2,570,503 2,612,527
(1) Due to the nature of this expenditure, in that the expenditure commitments may be reduced by the relinquishment of tenements, estimates for the commitment have not been forecast beyond June 2020. However, should the Group continue to hold the tenements beyond this date additional expenditure commitments would arise.
NOTES TO THE FINANCIAL STATEMENTS (CONTINUED)
For
per
sona
l use
onl
y

Neometals Annual Report 2019
82
(b) Lease commitments Non-cancellable operating lease commitments are disclosed in Note 21 to the financial statements.
(c) Other As referred to in Note 16 (i) to the accounts, Neometals Energy Pty Ltd, a wholly owned subsidiary of the Company, previously entered into a gas transmission agreement with DBNGP (WA) Transmission Pty Ltd for the Barrambie Project. As part of the agreement the Group was required to procure a ‘blocked’ term deposit for $4.0 million (30 June 2018: $4.0 million) as security a bank guarantee, which approximates the present value of the Group’s commitment under the agreement. The obligations under the gas transmission agreement commenced on 1 July 2010.
Operating leases:
Leasing arrangements Operating leases relate to the lease of commercial premises in West Perth, Welshpool and Canada and a photocopier. The lease agreement for the Company’s Canadian branch premises was entered into on 1 May 2016 for a 60 month period expiring on 30 April 2021. The lease of a photocopier is for a period of 48 months expiring in June 2022. The commitments are based on the fixed monthly lease payment. The commitments are based on the fixed monthly lease payment.
2019$
2018$
Payments recognised as an expense
Minimum lease payments 322,390 518,527
Contingent rentals 75,924 43,003
398,314 561,530
Non-cancellable operating lease commitments
Not longer than 1 year 908,595 505,626
Longer than 1 year and not longer than 5 years 2,011,702 507,443
2,920,297 1,013,069
NOTES TO THE FINANCIAL STATEMENTS (CONTINUED)
For
per
sona
l use
onl
y

Neometals Annual Report 2019
83
Name of operation Principal activity2019
%2018
%
Reed Advanced Materials Pty Ltd(i) Evaluation of lithium hydroxide process 70 70
The Consolidated Entity’s interest in assets employed in the above joint ventures is detailed below.
(i) Reed Advanced Materials Pty Ltd On 6 October 2015 Neometals and Process Minerals International Pty Ltd entered into a shareholders agreement for the purposes of establishing and operating a joint venture arrangement through RAM to operate a business of researching, designing and developing the capabilities and technology relating to the processing of lithium hydroxide. Following the execution of the shareholders agreement RAM was held 70:30 between Neometals and Process Minerals International.
Summarised financial information for the joint venture:
2019$
2018$
Carrying value of investment in the joint venture 1 1
Loan to joint venture - -
Share of (profit)/loss of joint venture not recognised in profit or loss 33,159 (87,657)
Current assets 79,847 184,537
Non-current assets 362,536 308,345
Current liabilities - (2,868)
Non-current liabilities (1,968,678) (1,968,678)
NOTES TO THE FINANCIAL STATEMENTS (CONTINUED)
For
per
sona
l use
onl
y

Neometals Annual Report 2019
84
(i) Reed Industrial Minerals Pty Ltd
Name of operation Principal activity
Interest
30 June 2019
%
30 June 2018
%
Reed Industrial Minerals Pty Ltd Mt Marion Lithium Project - 13.8
Summarised financial information for the associate:
30 June 2019
$
30 June 2018
$Restated*
Carrying value of investment in the associate - 11,325,197
Loan to associate - 4,104,458
Share of profit of associate recognised in profit or loss(i) 11,561,336 11,100,951
Current assets - 117,050,100
Non-current assets - 78,907,700
Current liabilities - (55,700,500)
Non-current liabilities - (46,489,000)
Net assets - 93,768,300
(i) The equity accounted share of the associates profit / (loss) is adjusted against the carrying value of the investment in the associate. The asset was sold during the financial year. Refer to Note 6 for further details.
The Group has no commitments in relation to RIM as the investment has been sold during the financial year. Refer to Note 6 for further details.
*Refer to note 6 for details of restatement.
NOTES TO THE FINANCIAL STATEMENTS (CONTINUED)
For
per
sona
l use
onl
y

Neometals Annual Report 2019
85
(ii) Hannans Limited
Name of operation Principal activity
Interest
30 June 2019
%
30 June 2018
%
Hannans Limited Exploration of nickel and lithium 35.5 35.7
The above associate is accounted for using the equity method in this consolidated financial report.
Summarised information for the associate:
30 June 2019
$
30 June 2018
$
Carrying value of investment in associate 7,062,095 12,757,545
Share of loss of associate recognised in profit or loss(i) (468,645) (311,435)
(i) The equity accounted share of the associate’s loss as adjusted as if applying the same accounting policies as Neometals is credited against the carrying value of the investment in the associate.
Shares held in associate are set out in the table below.
30 June 2019 30 June 2018
No. $ No. $
Shares held in Hannans prior to disposal of REX(i) 63,750,000 1,147,500 63,750,000 1,147,500
Consideration shares received on disposal of REX(i) 620,833,333 11,175,000 620,833,333 11,175,000
Close out of options(ii) 25,250,000 392,000 25,250,000 392,000
Net shares disposed(ii) (3,623,850) (157,330) (3,623,850) (157,330)
Impairment expense(iii) - (5,226,805) - -
Share of (loss)/profit in associate - (268,270) N/A 200,375
Balance at the end of the period 706,209,483 7,062,095 706,209,483 12,757,545
(i) Shares have been valued at the market value on settlement date, 26 September 2016.(ii) Shares valued at market rate on date of trade.(iii) The market value of the underlying shares has decreased significantly over a prolonged period as compared to the carrying value
on a per share basis. Accordingly, the investment in associate has been impaired to bring the balance down to the market value as at 30 June 2019 of 1.0 cent per share.
NOTES TO THE FINANCIAL STATEMENTS (CONTINUED)
For
per
sona
l use
onl
y

Neometals Annual Report 2019
86
(ii) Hannans Limited
Name of entityParent entity
Country of incorporation
Ownership interest
2019%
2018%
Neometals Ltd Australia
Subsidiaries
Australian Titanium Pty Ltd (formerly Australian Vanadium Corporation (Holdings) Pty Ltd)
Australia 100 100
Alphamet Management Pty Ltd (formerly Australian Vanadium Corporation (Investments) Pty Ltd)
Australia 100 100
Inneovation Pty Ltd (formerly Australian Vanadium Exploration Pty Ltd)
Australia 100 100
Neometals Energy Pty Ltd (formerly Barrambie Gas Pty Ltd) Australia 100 100
Neomaterials Pty Ltd (formerly GMK Administration Pty Ltd) Australia 100 100
Neometals Investments Pty Ltd (formerly Gold Mines of Kalgoorlie Pty Ltd)
Australia 100 100
Urban Mining Pty Ltd (formerly Mount Finnerty Pty Ltd) Australia 100 100
Adamant Technologies Pty Ltd Australia 100 100
Mt Edwards Lithium Pty Ltd Australia 100 100
Avanti Materials Ltd Australia 100 100
ACN 630 589 507 Pty Ltd Australia 100 100
All of these companies are members of a tax consolidated group. Neometals Ltd is the head entity of the tax consolidated group.
Basis for segmentation AASB 8 Operating Segments requires the presentation of information based on the components of the entity that management regularly reviews for its operational decision making. This review process is carried out by the Chief Operating Decision Maker (“CODM”) for the purpose of allocating resources and assessing the performance of each segment. The amounts reported for each operating segment is the same measure reviewed by the CODM in allocating resources and assessing performance of that segment.
For management purposes, the Group operates under three operating segments comprised of the Group’s lithium, titanium/vanadium and ‘other segments’ which comprises other minor exploration projects and mineral process technology businesses. The titanium/vanadium operating segment is separately identified given it possess different competitive and operating risks and meets the quantitative criteria as set out in the AASB 8. Previously the Group operated under two reportable operating segments comprised of the Group’s titanium/vanadium and ‘other segments’ which comprises the Mount Marion lithium project and other minor exploration projects. The ‘other segments’ category is the aggregation of all remaining operating segments given sufficient reportable operating segments have been identified.
During the year an investment in associate was classified as held for sale and the sale was completed in March 2019. The segment information reported on the next page does not include any amounts for this discontinued operation, which is described in more detail in note 6.
NOTES TO THE FINANCIAL STATEMENTS (CONTINUED)
For
per
sona
l use
onl
y

Neometals Annual Report 2019
87
For the year ended 30 June 2019
Reportable operating segmentsLithium
$
Vanadium /Titanium
$Other
$Unallocated
$Total
$
Revenue from external customers - - - - -
Cost of sales - - - - -
Gross profit/(loss) - - - - -
Other income 299,886 1,270 162,450 1,188,894 1,652,500
Depreciation and amortisation (41,583) (75,781) - - (117,364)
Total revenue 299,886 1,270 162,450 1,188,894 1,652,500
Total expense (2,285,531) (2,106,863) (5,697,277) (10,805,562) (20,895,233)
Profit/(loss) before tax (1,985,645) (2,105,593) (5,534,827) (9,616,668) (19,242,733)
Profit for the year from discontinued operations
- - - 98,684,783 98,684,783
Income tax expense - - - (3,263,494) (3,263,494)
Consolidated profit/(loss) after tax (1,985,645) (2,105,593) (5,534,827) 85,804,621 76,178,556
As at 30 June 2019
Reportable operating segmentsLithium
$
Vanadium /Titanium
$Other
$Unallocated
$Total
$
Increase/(decrease) in segment assets (17,676,310) 4,540,378 (5,411,673) 103,164,273 84,616,668
Impairment - - - - -
Deconsolidation - - - 19,960,655 19,960,655
Discontinued operations - - - - -
Decrease in classified as held for sale
Consolidated increase/(decrease) in segment assets
(17,676,310) 4,540,378 (5,411,673) 123,124,928 104,577,323
Total segment assets 5,605,277 34,287,512 8,388,092 114,206,395 162,487,276
Assets classified as held for sale - - - - -
Total assets 5,605,277 4,540,378 8,388,092 114,206,395 162,487,276
NOTES TO THE FINANCIAL STATEMENTS (CONTINUED)
For
per
sona
l use
onl
y

Neometals Annual Report 2019
88
For the year ended 30 June 2018
Reportable operating segments
Lithium$
Restated*
Vanadium /Titanium
$Other
$Unallocated
$Total
$
Revenue from external customers - - - - -
Cost of sales - - - - -
Gross profit/(loss) - - - - -
Other income 11,957,804 54 245,225 979,444 13,182,527
Expenditure written off - 14,694,964 - - 14,694,964
Depreciation and amortisation - - - (42,530) (42,530)
Total revenue 11,957,804 14,695,018 245,225 979,444 27,834,961
Total expense (1,864,557) (1,185,875) (320,047) (8,784,941) (12,155,420)
Profit/(loss) before tax 10,093,247 13,509,143 (74,822) (7,805,497) 15,679,541
Consolidated profit/(loss) after tax 10,093,247 13,509,143 (74,822) (7,805,497) 15,679,541
As at 30 June 2018
Reportable operating segments
Lithium$
Restated*
Vanadium /Titanium
$Other
$Unallocated
$Total
$
Increase/(decrease) in segment assets 8,651,486 16,293,980 (342,730) (15,905,723) 8,697,013
Decrease in classified as held for sale - - - - -
Consolidated increase/(decrease) in segment assets
8,651,486 16,293,980 (342,730) (15,905,723) 8,697,013
Total segment assets 18,750,587 29,747,134 13,799,765 31,002,778 93,300,264
Assets classified as held for sale - - - - -
Consolidated total assets 18,750,587 29,747,134 13,799,765 31,002,778 93,300,264
Geographical information The Group operates in a single geographical area being Australia (country of domicile).
*Refer to note 6 for details of restatement.
NOTES TO THE FINANCIAL STATEMENTS (CONTINUED)
For
per
sona
l use
onl
y

Neometals Annual Report 2019
89
(a) Equity interests in related parties
Equity interests in subsidiaries Details of the percentage of ordinary shares held in subsidiaries are disclosed in Note 24 to the
financial statements.
(b) Key management personnel remuneration Details of Key Management Personnel remuneration are disclosed on pages 32 to 40 of the
Directors’ Report.
(c) Key management personnel equity holdings
Fully paid ordinary shares of Neometals Ltd
2019
Balance at01/07/2018
No.
Balance onappointment
No.
Received onexercise ofperf rights
No.
Net otherchange
No.
Balance at30/06/2019
No.
Balanceheld
nominallyNo.
Non-executive directors
S. Cole 1,120,083 - 112,700 - 1,232,783 -
D. Ritchie - - 27,048 - 27,048 -
N. Streltsova - - 27,048 - 27,048 -
D. Reed 49,188,900 - - - 49,188,900 -
J. Purdie - - - 44,248 44,248 -
L. Guthrie - - - 25,000 25,000 -
Executive directors
C. Reed (i) 9,978,170 - - 250,000 10,228,170 -
Other executives
M. Tamlin (i) 979,189 - - - 979,189 -
J. Carone (i) 1,650,000 - - (200,000) 1,450,000 -
D. Townsend - - - 130,272 130,272 -
Total 62,916,342 - 166,796 249,520 63,332,658 -
2018
Balance at01/07/2017
No.
Balance onappointment
No.
Received onexercise ofperf rights
No.
Net otherchange
No.
Balance at30/06/2018
No.
Balanceheld
nominallyNo.
Non-executive directors
S. Cole 1,120,083 - - - 1,120,083 -
D. Reed 61,288,900 - - (12,100,000) 49,188,900 -
Executive directors
C. Reed (i) 10,548,980 - 1,329,190 (1,900,000) 9,978,170 -
Other executives
J. Carone (i) 4,400,000 - 494,540 (3,244,540) 1,650,000 -
M.Tamlin - - 979,189 - 979,189 -
Total 77,357,963 - 2,802,919 (17,244,540) 62,916,342 -
NOTES TO THE FINANCIAL STATEMENTS (CONTINUED)
For
per
sona
l use
onl
y

Neometals Annual Report 2019
90
Share options of Neometals Ltd No options were issued to related parties during the current period (2018: nil).
Performance rights of Neometals Ltd In the current reporting period the Company granted 2,137,056 (2018: 2,377,312) performance rights to executives and KMP pursuant to the Company’s Performance Rights Plan.
Further details of the employee share option plan and of share options and performance rights granted are contained in Note 8 to the financial statements.
Performance Rights granted to related parties The following tables summarises information relevant to the current financial year in relation to the grant of performance rights to KMP as part of their remuneration. Performance rights are issued by Neometals Ltd.
Name
During the Financial Year
Grant dateNo.
grantedNo.
vestedFair value at grant date
Earliest exercise date
Consideration payable on
exercise
KMP:
N. Streltsova(1) 10/08/2018 39,348 39,348 12,000 30/06/2019 -
D. Ritchie(1) 10/08/2018 39,348 39,348 12,000 30/06/2019 -
S. Cole(1) 10/08/2018 163,948 163,948 50,000 30/06/2019 -
C. Reed(2) 10/08/2018 835,339 - 209,252 30/06/2021 -
J. Carone(2) 10/08/2018 307,156 - 76,943 30/06/2021 -
M. Tamlin(2) 10/08/2018 383,330 - 96,024 30/06/2021 -
D. Townsend(2) 10/08/2018 368,587 - 92,331 30/06/2021 -
Total 2,137,056 242,644 548,550 -
(1) At 30 June 2019 Non-Executive Directors became entitled to securities whose vesting conditions were the subject to the rules of the Performance Rights Plan.
(2) The number of performance rights that will actually vest, if any, is determined by the Company’s performance based on Neometals relative and absolute TSR compared to the comparative group of companies over a 3 year period and Business Plan strategic objectives.
NOTES TO THE FINANCIAL STATEMENTS (CONTINUED)
For
per
sona
l use
onl
y

Neometals Annual Report 2019
91
Details of performance rights held by KMP and of shares issued during the financial year as a result of the vesting of performance rights:
Grant date
Fair value of rights at grant date
$No.
granted
Vested during the financial
yearNo.
Forfeited/ lapsed during the financial
yearNo.
Ordinary shares issued on
exercise of rights No.
KMP:
Chris Reed(1) 14/09/2016 161,528 621,261 - 621,261 -
Jason Carone(1) 14/09/2016 56,176 216,063 - 216,063 -
Michael Tamlin(1) 14/09/2016 67,412 259,275 - 259,275 -
Jason Carone(2) 03/10/2017 93,243 370,012 - - -
Michael Tamlin(2) 03/10/2017 111,892 444,015 - - -
Chris Reed(2) 11/12/2017 320,984 952,474 - - -
Darren Townsend(2) 11/12/2017 149,633 444,015 - - -
Steven Cole(3) 05/01/2018 50,000 112,700 - - 112,700
Doug Ritchie(3) 05/01/2018 12,000 27,048 - - 27,048
Natalia Streltsova(3) 05/01/2018 12,000 27,048 - - 27,048
Steven Cole(4) 10/08/2018 50,000 163,948 163,948 - -
Doug Ritchie(4) 10/08/2018 12,000 39,348 39,348 - -
Natalia Streltsova(4) 10/08/2018 12,000 39,348 39,348 - -
Chris Reed(2) 10/08/2018 209,252 835,339 - - -
Jason Carone(2) 10/08/2018 76,943 307,156 - - -
Michael Tamlin(2) 10/08/2018 96,024 383,330 - - -
Darren Townsend(2) 10/08/2018 92,331 368,587 - - -
Total 1,583,418 5,610,967 242,644 1,096,599 166,796
(1) The number of performance rights that will actually vest, if any, is determined by the Company’s performance based on Neometals TSR compared to the comparative group of companies over the 2-year period as set out in the relevant employee’s employment contract. At 30 June 2019 no employee had become entitled to securities whose vesting conditions were the subject of the TSR criteria and as a result, 1,096,599 performance rights have lapsed.
(2) The number of performance rights that will actually vest, if any, is determined by the Company’s performance based on Neometals TSR compared to the comparative group of companies over the 3-year period as set out in the employee’s employment contract. As a result of the testing of the Company’s performance over this period no rights vested and thus no shares were issued (2018: 2,802,919).
(3) Under the Performance Rights Plan, Non-Executive Directors were invited to sacrifice part of their fees for their services in exchange for performance rights. At 30 June 2018 all performance rights have vested. As a result of the testing of the Company’s performance over this period 166,796 rights vested and shares were issued (2018: nil).
(4) Under the Performance Rights Plan, Non-Executive Directors were invited to sacrifice part of their fees for their services in exchange for performance rights. At 30 June 2019 all performance rights have vested.
The performance rights granted entitle the grantee to one fully paid ordinary share in Neometals Ltd for nil cash consideration on satisfaction of the vesting criteria.
NOTES TO THE FINANCIAL STATEMENTS (CONTINUED)
For
per
sona
l use
onl
y
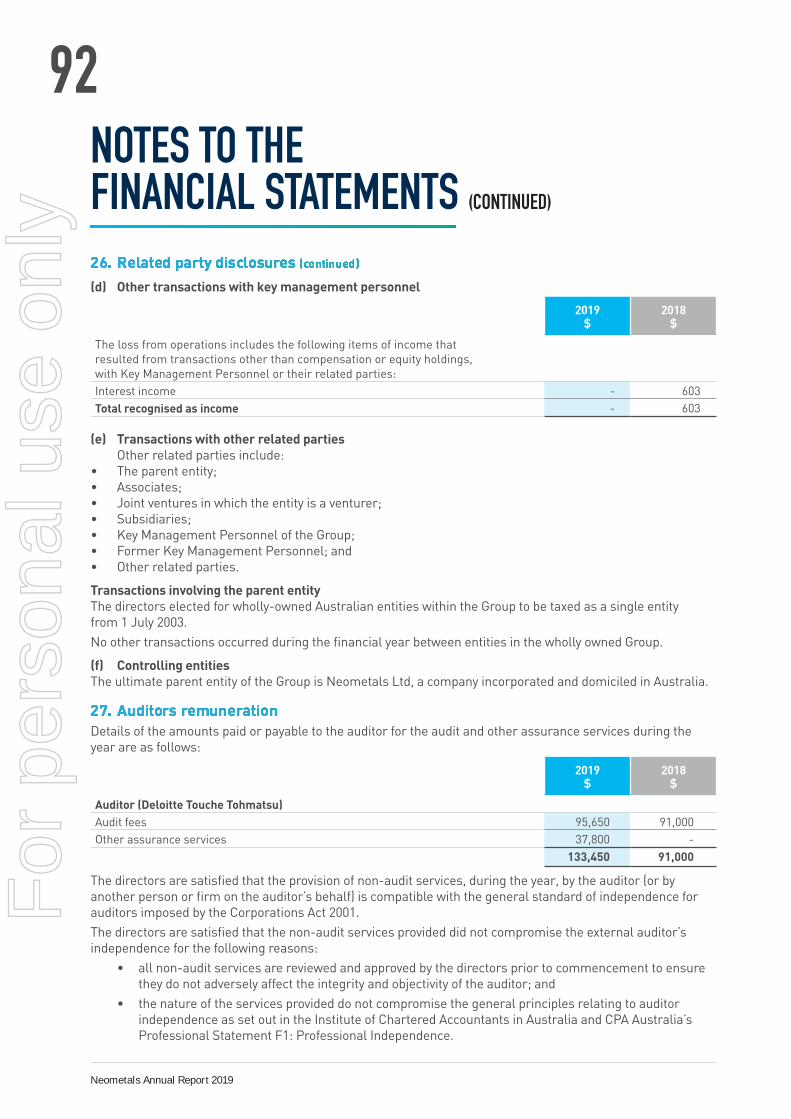
Neometals Annual Report 2019
92
(d) Other transactions with key management personnel
2019$
2018$
The loss from operations includes the following items of income that resulted from transactions other than compensation or equity holdings, with Key Management Personnel or their related parties:
Interest income - 603
Total recognised as income - 603 (e) Transactions with other related parties Other related parties include:• The parent entity;• Associates;• Joint ventures in which the entity is a venturer;• Subsidiaries;• Key Management Personnel of the Group;• Former Key Management Personnel; and• Other related parties.
Transactions involving the parent entity The directors elected for wholly-owned Australian entities within the Group to be taxed as a single entity from 1 July 2003.
No other transactions occurred during the financial year between entities in the wholly owned Group.
(f) Controlling entities The ultimate parent entity of the Group is Neometals Ltd, a company incorporated and domiciled in Australia.
Details of the amounts paid or payable to the auditor for the audit and other assurance services during the year are as follows:
2019$
2018$
Auditor (Deloitte Touche Tohmatsu)
Audit fees 95,650 91,000
Other assurance services 37,800 -
133,450 91,000
The directors are satisfied that the provision of non-audit services, during the year, by the auditor (or by another person or firm on the auditor’s behalf) is compatible with the general standard of independence for auditors imposed by the Corporations Act 2001.
The directors are satisfied that the non-audit services provided did not compromise the external auditor’s independence for the following reasons:
• all non-audit services are reviewed and approved by the directors prior to commencement to ensure they do not adversely affect the integrity and objectivity of the auditor; and
• the nature of the services provided do not compromise the general principles relating to auditor independence as set out in the Institute of Chartered Accountants in Australia and CPA Australia’s Professional Statement F1: Professional Independence.
NOTES TO THE FINANCIAL STATEMENTS (CONTINUED)
For
per
sona
l use
onl
y

Neometals Annual Report 2019
93
(a) Reconciliation of cash and cash equivalents
2019$
2018$
For the purposes of the cash flow statement, cash and cash equivalents includes cash on hand and in banks and investments in money market instruments, net of outstanding bank overdrafts. Cash and cash equivalents at the end of the financial year as shown in the Cash Flow Statement is reconciled to the related items in the statement of financial position as follows:
Cash and cash equivalents 109,462,006 26,342,414
Cash and cash equivalents included in a disposal group - -
109,462,006 26,342,414 (b) Funds not available for use Restrictions exist on bank deposits with a total value of $4,244,118. Deposits are classified as financial assets (see Note 12).
Of the $4,244,118 held in restricted bank deposits $4,000,000 is held as security in relation to an unconditional performance bond issued by the National Australia Bank in favour of the Minister for State Development and DBNGP (WA) Transmission Pty Ltd. In addition, the Group has $244,118 on deposit as security for a rental bond relating to its leased business premises.
NOTES TO THE FINANCIAL STATEMENTS (CONTINUED)
For
per
sona
l use
onl
y

Neometals Annual Report 2019
94
(c) Reconciliation of profit / (loss) for the period to net cash flows from operating activities
2019$
2018$
Restated*
Profit for the period 76,178,556 15,679,541
Profit on deconsolidation of subsidiary - -
Impairment 5,226,805 1,677,554
Impairment reversal - (14,694,964)
Profit on disposal of financial assets (71,441) (140,168)
Share of equity accounted entity’s profit - (10,789,516)
Profit on the sale of associate (98,216,158) -
Gains on financial assets measured at FVTPL (29,505) (72,599)
Interest received on investments (1,140,353) (926,376)
Finance costs 60,649 62,599
Share issue costs 1,884 -
Depreciation and amortisation of non-current assets 117,364 42,530
Equity settled share-based payment 691,201 501,324
Net foreign exchange loss/(gain) (334) (53,231)
(Increase) / decrease in assets:
Current receivables (178,640) 472,016
Other (29,652) 13,768
Increase / (decrease) in liabilities:
Current payables 451,047 268,476
Current borrowings - (11,278)
Deferred tax liability 3,786,582 -
Provisions (1,451,869) (678,244)
Net Cash used in operating activities (14,603,864) (8,648,568)
*Refer to note 6 for details of restatement.
NOTES TO THE FINANCIAL STATEMENTS (CONTINUED)
For
per
sona
l use
onl
y

Neometals Annual Report 2019
95
(a) Financial risk management objectives The Consolidated Entity does not enter into or trade financial instruments, including derivative financial instruments, for speculative purposes.
(b) Significant accounting policies Details of the significant accounting policies and methods adopted, including the criteria for recognition, the basis of measurement and the basis on which income and expenses are recognised, in respect of each class of financial asset, financial liability and equity instrument are disclosed in Note 2 to the financial statements.
(c) Interest rate risk
The following tables detail the Group’s exposure to interest rate risk:
2019
Weightedaverageeffectiveinterest
rate%
Fair value of rights at grant
date$
Maturity dates
Less than1 year
$
1-5 years
$
More than 5 years
$
Ordinary shares
issued on exercise of
rights No.
Total $
Financial assets:
Cash and cash equivalents AUD
2.00% - 107,140,847 - - - 107,140,847
Cash and cash equivalents CAD
0.00% - 284,108 - - - 284,108
Cash and cash equivalents USD
0.00% - 14,725 - - - 14,725
Barrambie Gas term deposit (i)
2.35% - 4,000,000 - - - 4,000,000
Bond term deposits(i) 2.13% - 244,118 - - - 244,118
Cash deposits trust 0.00% - 2,022,326 - - - 2,022,326
Trade and other receivables 0.00% - - - - 627,599 627,599
Financial liabilities:
Trade payables - - - - - 738,530 738,530
(i) The balances represent two term deposits that are restricted in their use and are classified in the current reporting period other financial assets. Additional information on all other term deposits is provided at Notes 12 and 28(b). The financial assets have contractual maturities of less than one year, however they are classified as non-current in the statement of financial position as they are not accessible to the Group due to restrictions placed on accessing the funds.
NOTES TO THE FINANCIAL STATEMENTS (CONTINUED)
For
per
sona
l use
onl
y

Neometals Annual Report 2019
96
2018
Weightedaverageeffectiveinterest
rate%
Fair value of rights at grant
date$
Maturity dates
Less than1 year
$
1-5 years
$
More than 5 years
$
Ordinary shares
issued on exercise of
rights No.
Total $
Financial assets:
Cash and cash equivalents AUD
2.46% - 24,467,829 - - - 24,467,829
Cash and cash equivalents USD
0.00% - 346,609 - - - 346,609
Barrambie Gas term deposit (i)
2.70% - 4,000,000 - - - 4,000,000
Bond term deposits(i) 2.60% - 43,000 - - - 43,000
Cash deposits trust 2.65% - 527,193 - - - 527,193
Trade and other receivables 0.00% - - - - 4,510,984 4,510,984
Financial liabilities:
Trade payables - - - - - 882,106 882,106
(i) The balances represent two term deposits that are restricted in their use and are classified in the current reporting period other financial assets. Additional information on all other term deposits is provided at Notes 12 and 28(b). The financial assets have contractual maturities of less than one year, however they are classified as non-current in the statement of financial position as they are not accessible to the Group due to restrictions placed on accessing the funds.
(d) Credit risk management Credit risk refers to the risk that counterparty will default on its contractual obligations resulting in financial loss to the consolidated entity. The consolidated entity has adopted a policy of only dealing with credit-worthy counterparties and obtaining sufficient collateral where appropriate as a means of mitigating the risk of financial loss from defaults. The consolidated entity exposure and the credit ratings of its counterparties are continuously monitored and the aggregate value of transactions concluded is spread amongst approved counterparties.
The consolidated entity does not have any significant credit risk exposure to any single counterparty or any group of counterparties having similar characteristics other than the Joint Venture. The credit risk on liquid funds is limited because the counterparties are banks with high credit-ratings assigned by international credit-rating agencies.
(e) Liquidity risk management Ultimate responsibility for liquidity risk management rests with the board of directors, who have built an appropriate liquidity risk management framework for the management of the Group’s short, medium and long-term funding and liquidity management requirements. The Group manages liquidity risk by maintaining adequate reserves and banking facilities, and by continuously monitoring forecast and actual cash flows and matching the maturity profiles of financial assets and liabilities.
In addition to financial liabilities in note 15, the Company is required to meet minimum spend commitments to maintain the tenure over the Company’s mineral exploration areas as described in note 20.
NOTES TO THE FINANCIAL STATEMENTS (CONTINUED)
For
per
sona
l use
onl
y

Neometals Annual Report 2019
97
(f) Fair value The carrying amount of financial assets and financial liabilities recorded in the financial statements approximates their respective net fair values.
(g) Commodity price risk The Group is exposed commodity price risk. These commodity prices can be volatile and are influenced by factors beyond the Group’s control. No hedging or derivative transactions have been used to manage commodity price risk.
(h) Capital management The board’s policy is to endeavour to maintain a strong capital base so as to maintain investor, creditor and market confidence and to sustain future development of the business. The Group sources any additional funding requirements from either debt or equity markets depending on the market conditions at the time the funds are sourced and the purpose for which the funds are to be used. The Group is not subject to externally imposed capital requirements.
(i) Interest rate risk management The Group is exposed to interest rate risk as the Group has funds on deposit as security for the head office lease and the Neometals Energy Pty Ltd onerous contract outlined at Note 16. The Group’s financial borrowings (motor vehicle hire purchase lease) are not subject to interest rate risk as the rate is fixed at time of entering into the financing agreement.
The sensitivity analysis below has been calculated based on the exposure to interest rates at the end of the reporting period. A 50 basis point increase and decrease has been used when reporting the interest rate risk and represents management’s assessment of the potential change in interest rates.
If interest rates had been 50 basis points higher/lower and all other variables were held constant, the Group’s profit for the year ended 30 June 2019 would decrease/increase by $568,530 (2018: decrease/increase $151,923). This is mainly attributable to the Group’s exposure to interest rates on the maturity of its term deposits.
No matters or circumstances have arisen since the end of the financial year that have significantly affected, or may significantly affect the operations, results of operations or state of affairs of the Group in subsequent financial years.
NOTES TO THE FINANCIAL STATEMENTS (CONTINUED)
For
per
sona
l use
onl
y

Neometals Annual Report 2019
98ADDITIONAL SHAREHOLDER INFORMATION
Top Holders Snapshot
Rank Name Units % of Units
1. MR DAVID JOHN REED 31,801,674 5.84
2. HSBC CUSTODY NOMINEES (AUSTRALIA) LIMITED 27,813,548 5.11
3. CITICORP NOMINEES PTY LIMITED 27,372,094 5.03
4. ZERO NOMINEES PTY LTD 16,381,477 3.01
5. J P MORGAN NOMINEES AUSTRALIA PTY LIMITED 13,707,492 2.52
6. FARJOY PTY LTD 9,540,999 1.75
7. TRUCKING NOMINEES PTY LTD 8,900,000 1.63
8. MR KENNETH JOSEPH HALL (HALL PARK A/C) 8,648,914 1.59
9. TRUCKING NOMINEES PTY LTD (D J REED SUPER FUND A/C) 8,000,000 1.47
10. WESTERN MINING CORPORATION PTY LIMITED (TWO BOYS A/C) 6,758,862 1.24
11. MR RICHARD ARTHUR LOCKWOOD 5,600,000 1.03
12. BOND STREET CUSTODIANS LIMITED (HP0DHH - V04614 A/C) 5,270,000 0.97
13. DELPHI UNTERNEHMENSBERATUNG AKTIENGESELLSCHAFT 5,154,998 0.95
14. MR FRANCIS JAMES ROBINSON 5,000,000 0.92
15. FANO PTY LTD (KIM HURLEY SUPER FUND A/C) 4,883,500 0.90
16. BNP PARIBAS NOMINEES PTY LTD (IB AU NOMS RETAILCLIENT DRP) 4,371,295 0.80
17. PESYAN PTY LTD (PARS FAMILY A/C) 4,154,325 0.76
18. LINFOOT ONE SUPER PTY LTD (LINFOOT SUPER PLAN NO 1 A/C) 3,873,000 0.71
19. BNP PARIBAS NOMS PTY LTD (DRP) 3,402,032 0.62
20. LINFOOT TWO SUPER PTY LTD (LINFOOT SUPER PLAN NO 2 A/C) 3,188,000 0.59
Totals: Top 20 holders of ORDINARY FULLY PAID SHARES 203,822,210 37.44
AS AT 20 SEPTEMBER 2019
For
per
sona
l use
onl
y

Neometals Annual Report 2019
99ADDITIONAL SHAREHOLDER INFORMATION (CONTINUED)
Analysis of number of equity security holders by size of holding:
Range Total holders
1 - 1,000 470
1,001 - 5,000 2,488
5,001 - 10,000 1,351
10,001 - 100,000 2,910
100,001 - 9,999,999,999 616
Total 7,835
Unmarketable Parcels* 2,632
*Minimum $ 500.00 parcel at $ 0.1900 per unit
Substantial holders in the Company are set out below:
Ordinary Shares Number Held Percentage
David Reed 49,188,900 9.03%
On a show of hands every member present at a meeting in person or by proxy shall have one vote and upon a poll each share shall have one vote.
Registers of Securities are held at the following addresses:
Level 3, 1292 Hay Street, West Perth, Western Australia 6005.
AS AT 20 SEPTEMBER 2019
For
per
sona
l use
onl
y

Neometals Annual Report 2019
100ADDITIONAL SHAREHOLDER INFORMATION (CONTINUED)
As at 20 September 2019 the Company has an interest in the following projects and tenements in Western Australia.
Project Name Licence Name Beneficial Interest Status
Barrambie E57/769 100% LiveBarrambie E57/770 100% LiveBarrambie E57/1041 100% LiveBarrambie L57/30 100% LiveBarrambie L20/55 100% LiveBarrambie M57/173 100% LiveBarrambie L20/80 100% PendingBarrambie G57/11 100% PendingBarrambie L20/81 100% PendingMt Edwards M15/45 100% (^) Live Mt Edwards M15/46 100% (^) Live Mt Edwards M15/48 100% (^) Live Mt Edwards M15/74 100% Live Mt Edwards M15/75 100% Live Mt Edwards M15/87 100% (**) Live Mt Edwards M15/77 100% (^) Live Mt Edwards M15/78 100% (^) Live Mt Edwards M15/79 100% (^) Live Mt Edwards M15/80 100% (^) Live Mt Edwards M15/94 100% (^) Live Mt Edwards M15/96 100% (#) Live Mt Edwards M15/97 100% (#) Live Mt Edwards M15/99 100% (#) Live Mt Edwards M15/100 100% (#) Live Mt Edwards M15/101 100% (#) Live Mt Edwards M15/102 100% (#) Live Mt Edwards M15/103 100% (^) Live Mt Edwards M15/105 100% (^) Live Mt Edwards L15/102 100% Live Mt Edwards M15/478 100% (^) Live Mt Edwards M15/633 100% (^) Live Mt Edwards M15/653 100% (#) Live Mt Edwards M15/693 100% (^) Live Mt Edwards M15/698 100% Live Mt Edwards M15/699 100% Live Mt Edwards M15/1271 100% (#) Live Mt Edwards L15/254 100% Live Mt Edwards E15/989 100% (^) Live Mt Edwards L15/280 100% Live Mt Edwards P15/5905 100% Live Mt Edwards P15/5906 100% Live Mt Edwards E15/1505 100% Live Mt Edwards E15/1507 100% LiveMt Edwards E77/2397 100% PendingMt Edwards E15/1562 100% PendingMt Edwards E15/1576 100% LiveMt Edwards E15/1583 100% LiveMt Edwards E77/2427 100% PendingMt Edwards E15/1679 100% PendingMt Edwards P15/6362 100% PendingMt Edwards P15/6387 100% PendingMt Edwards E15/1665 100% PendingMt Edwards E15/1711 100% PendingMt Edwards P15/6408 100% PendingMt Edwards P15/6539 100% Pending
^Nickel rights only **Lithium rights only # No gold interest
For
per
sona
l use
onl
y

ACN: 099 116 631 ABN: 89 099 116 631
REGISTERED OFFICE Level 3, 1292 Hay Street West Perth WA 6005
CONTACT DETAILS Telephone (+618) 9322 1182 Facsimile (+618) 9321 0556
neometals.com.au
For
per
sona
l use
onl
y