annual report 2018–19 - australian taxation office · 10 program 1.1 australian taxation office...
TRANSCRIPT

20 18 19
Commissioner of Taxation annual report
Com
missioner of Taxation annual report 2018–19

ContactMailDirectorMeasures, Enterprise Strategy and DesignAustralian Taxation OfficePO Box 9977Civic Square ACT 2608
Phone (02) 6216 1111Email [email protected] report ato.gov.au/annualreportWebsite ato.gov.au
Copyright© AUSTRALIAN TAXATION OFFICE FOR THE COMMONWEALTH OF AUSTRALIA, 2019
You are free to copy, adapt, modify, transmit and distribute this material as you wish (but not in any way that suggests the ATO or the Commonwealth endorses you or any of your services or products).
Find ustwitter.com/ato_gov_aufacebook.com/ato.gov.auyoutube.com/AusTaxOffice
PublishedAustralian Taxation OfficeCanberra, October 2019NAT 0995-10.2019 DE-5137
AcknowledgmentsThank you to all ATO contributors.
Designed and editedDigital Experience and Events, ATO Corporate, Australian Taxation Office
PrintedPrinted on Monza Recycled paper that contains 99% recycled fibre, and elemental chlorine free pulp. All virgin pulp is derived from well-managed forests and controlled sources. Monza Recycled is manufactured by an ISO 14001 certified mill.

Commissioner of Taxationannual report 2018–19
II
Commissioner’s review
II
I am pleased to report on our performance for 2018–19, with the major progress of our Towards 2024 Plan to build trust and confidence in the administration of the ATO and develop a more streamlined, integrated and data-driven organisation. At the core of Towards 2024 is the ongoing focus on improving the client and staff experience and fostering a culture of service.
Building community trust and confidence in our administration of the tax and superannuation systems is a key to fostering willing participation. This year, we: � collected gross tax of around $533 billion, and provided refunds of around $107 billion,
with net tax collections of $426 billion, up $29 billion (7.4%) over the previous year � delivered a successful Tax Time 2018, with over 10 million individual income tax returns lodged,
resulting in almost 8 million refunds � delivered on our government commitments, including through our funded taskforces on
corporate tax avoidance, the black economy and financial crime � supported individuals to correctly claim work-related expenses, with an estimated revenue
impact of $560 million over the last two years � continued our analysis of tax gaps and, for the first time, published the individuals gap,
moving away from a focus on audit liabilities to a more preventative and pre-emptive approach � implemented reforms to the superannuation system, including downsizer superannuation
contributions, the first home super saver scheme, and early release of super on compassionate grounds
� implemented the Member Account Attribute Service and the Member Account Transaction Service
� improved the process to apply for an Australian business number (ABN) to better identify ineligible applicants.
We introduced a new measure to better understand community confidence in our administration, with a first-year result of 65 out of 100 – a solid result but with room for improvement.
Complaint numbers show we’ve moved in the right direction, with less than 20,000 complaints received in 2018–19 – the lowest number since 2009.

IIIIII
We will further strengthen trust and confidence as we become a more streamlined, integrated and data-driven organisation. This year, we: � streamlined processes through Single Touch Payroll (STP), with its successful deployment
resulting in over 160,000 employers reporting information for around 8.1 million individuals � used information from STP to pre-fill 2018–19 tax returns � laid the groundwork to enable over 15 million Australians to securely access government
services online – delivering key elements to establish a digital identity and integrate GovPass into the broader digital ecosystem
� invested in better technology for staff, including new computers and data analysis tools, providing access to more data to ensure better and more consistent services for our clients.
Our work on whole-of-government solutions continues to deliver improved services for end users. In 2018–19, we saw another increase in the number of individual taxpayers using myTax.
We saw an unprecedented number of returns lodged in the first week of Tax Time 2019, with more than half a million lodgments and as many calls to our contact centres. At its peak, we were processing an average of 7 million transactions a day.
By 30 September 2019, we had received over 9 million individual tax return lodgments (including around 1 million for prior years) and issued over 7 million refunds totalling over $20 billion.
We continue to engage and work constructively with those who help us deliver technology and services. During the year, we: � implemented our Online services for agents system, working with digital service providers (DSPs)
to integrate this functionality into their agents’ practice management software � developed collaborative relationships with suppliers, using an agency-wide approach to
procurement to create savings for the ATO and our providers � implemented Online services for DSPs to provide a modern and secure platform for their
interactions with us.
We confirmed our commitment to developing our people and the tools they use to do their work. This investment is paying off, with staff engagement as high as it has ever been and comparing well to other similarly sized agencies and the APS average. We achieved our performance targets for both women in senior leadership and Indigenous employment, indicators that we are becoming a more progressive and inclusive workforce.

Commissioner of Taxation annual report 2018–19
IV
Looking forwardWe have made progress towards our goal of bettering our interactions with clients, but I also recognise there is room for improvement. That is why our Better as usual program will focus on improving our clients’ experience with the tax system. As part of the program, we are: � reviewing the series of interactions a client may have with us that forms their end-to-end
experience – this ‘pipeline’ work will help us understand the hotspots that need attention � improving our quality feedback loops so we are drawing on our past experiences to improve
our services and make better decisions � dedicating a team to work on our most complex cases – we need to identify these cases early,
give them the priority they need and, where appropriate, take action with empathy to deliver the best outcome
� putting in place the right safeguards (cultural and procedural) for decisions and actions that can have significant client impacts.
Clients will have improved digital access to our systems and real-time transactions; and a greater whole-of-client view for our staff will enable them to take an end-to-end approach to a client’s tax affairs.
We are investigating new ways of working smarter, using artificial learning and automation to deliver better services. As the use of data and automation increases, we remain conscious of our role as custodians of Australians’ information. We need to be able to assure people that our use of data is legal and ethical and that our systems are secure. I want the ATO to keep this focus to ensure we maintain community trust.
In September this year, we launched our new culture strategy to support our staff as we seek to improve services to clients.
My Executive Team and I would like to thank the people in the ATO and our partners, who have made these positive results possible. We are looking forward to the progress we will make together in 2019–20 and future years.
Chris Jordan AO Commissioner of Taxation Registrar of the Australian Business Register

V
Letter of transmittal
COMMISSIONER OF TAXATION
The Hon. Michael Sukkar MP Minister for Housing and Assistant Treasurer Parliament House CANBERRA ACT 2600
Senator the Hon. Zed Seselja Assistant Minister for Finance, Charities and Electoral Matters Parliament House CANBERRA ACT 2600
Dear ministers
As the Accountable Authority for the Australian Taxation Office (the ATO), the Australian Charities and Not-for-profits Commission (ACNC) and the Tax Practitioners Board (TPB), I present you with the annual reports for the year ended 30 June 2019 for presentation to Parliament, in compliance with section 46 of the Public Governance, Performance and Accountability Act 2013.
The reports follow the guidelines approved by the Joint Committee of Public Accounts and Audit, as well as other legislative reporting requirements as listed in: � sections 17AA to 17AJ of the Public Governance, Performance and Accountability Rule 2014 � subsection 60-130(1) of the Tax Agent Services Act 2009 (for the TPB) � Division 130 of the Australian Charities and Not-for-profits Commission Act 2012
(for the ACNC).
Due to their operational independence and statutory obligations, the TPB and the ACNC have produced their own annual reports.
As required by section 10 of the Public Governance, Performance and Accountability Rule 2014, I certify that we have: � prepared fraud risk assessments and fraud control plans � appropriate fraud prevention, detection, investigation and reporting mechanisms that meet the
specific needs of the ATO � taken all reasonable measures to appropriately deal with fraud.
Yours sincerely
Chris Jordan AO Commissioner of Taxation and Registrar of the Australian Business Register 8 October 2019
The Hon. Dr Gary Johns Commissioner Australian Charities and Not-for-profits Commission
Ian Klug AM Chair of the Tax Practitioners Board
Commissioner of Taxation annual report 2018–19
VI
Contents
II Commissioner’s review
V Letter of transmittal
01 Overview 1 About us
3 Outcome and program structure
5 ATO Executive
8 Organisational structure
02 Annual performance statement
9 Statement by the Accountable Authority
10 Program 1.1 Australian Taxation Office
36 Program 1.2 Tax Practitioners Board
37 Program 1.3 Australian Business Register
41 Program 1.4 Australian Charities and Not-for-profits Commission
42 Administered programs 1.5 to 1.18
03 Revenue performance 47 Revenue collection
50 Tax performance
54 Total revenue effects

VII
04 Management and accountability
59 Corporate governance
70 Workforce management
92 Financial performance
05 Financial statements 103 About the financial statements
104 Financial statements
06 Appendixes 164 Appendix 1: Laws conferring powers on the Commissioner
165 Appendix 2: Taxpayers’ Charter – our performance
167 Appendix 3: Public advice and dispute management
171 Appendix 4: Legal services expenditure
173 Appendix 5: Strategic litigation
177 Appendix 6: Debt management
179 Appendix 7: Compensation statistics
180 Appendix 8: Service commitments and activities
185 Appendix 9: Advertising, direct mail, media placement and market research
188 Appendix 10: Use of access powers
189 Appendix 11: Information provided to law enforcement agencies
195 Appendix 12: Corrections
198 Reference material

01 Commissioner of Taxation
annual report 2018–19
VIII

01Overview
About us
Our vision is to be a leading tax and superannuation administration known for our contemporary service, expertise and integrity.
As a Commonwealth entity within the Treasury portfolio, the ATO is accountable under the Public Governance, Performance and Accountability Act 2013 (PGPA Act) and the Public Service Act 1999 (PS Act).
Our ministersThe ministers with responsibility for matters relating to the tax and superannuation systems in 2018–19 were: � The Hon. Josh Frydenberg MP, Treasurer – from 24 August 2018 � The Hon. Scott Morrison MP, Treasurer – from 1 July 2018 to 24 August 2018 � The Hon. Michael Sukkar MP
— Minister for Housing and Assistant Treasurer – from 29 May 2019 — Assistant Minister to the Treasurer – from 1 July 2018 to 28 August 2018
� The Hon. Stuart Robert MP, Assistant Treasurer – from 28 August 2018 to 28 May 2019 � The Hon. Kelly O’Dwyer MP, Minister for Revenue and Financial Services – from 1 July 2018 to
28 August 2018 � Senator the Hon. Jane Hume, Assistant Minister for Superannuation, Financial Services and
Financial Technology – from 29 May 2019.
Senator the Hon. Zed Seselja was the minister responsible for the ACNC during 2018–19 as: � Assistant Minister for Finance, Charities and Electoral Matters – from 29 May 2019 � Assistant Minister for Treasury and Finance – from 28 August 2018 to 29 May 2019.
For more information on our ministers, see ministers.treasury.gov.au.

01 Commissioner of Taxation annual report 2018–19
2
ATO’s role and responsibilitiesThe Commissioner of Taxation is responsible for administering Australia’s tax system and significant aspects of Australia’s superannuation system. For the purposes of the PGPA Act, the Commissioner is the accountable authority for the ATO, the Tax Practitioners Board (TPB) and the Australian Charities and Not-for-profits Commission (ACNC). He is also the Registrar of the Australian Business Register (ABR).
The ATO operates as the Australian Government’s principal revenue collection agency, administering the legislation governing tax, and supporting the delivery of government benefits to the community. We are responsible for: � collecting revenue � administering the goods and services tax (GST) on behalf of the Australian states and territories � governing a range of programs that result in transfers and benefits back to the community � administering major aspects of Australia’s superannuation system � custodianship of the government’s Australian Business Register.
The TPB and ACNC operate independently of the ATO and each produces its own annual report. Their reports are available at tpb.gov.au and acnc.gov.au, respectively.
FIGURE 1.1 Scale of our activities
NOTEThe ATO interacts with groups shown in figure 1.1.
11.6 millionIndividuals not in business
4.2 millionSmall businesses including sole traders
865,000Employers
601,000Super funds
599,000self-managed super funds
230large APRA-regulated super funds
1,790small APRA-regulated super funds
201,000Not-for-profit organisations
164,000Privately owned and wealthy groups linked to over 769,000 entities
36,000Public and multinational business groups linked to over 81,000 entities
35,000Registered and active tax and BAS agents

01OverviewOutcome and program structure
3
Outcome and program structure
In 2018–19, the ATO had one outcome and was funded to deliver this through four agency programs and 14 administered programs. All deliverables for administered programs are achieved through making payments to eligible recipients in accordance with relevant laws.
ATO outcomeConfidence in the administration of aspects of Australia’s taxation and superannuation systems through helping people understand their rights and obligations, improving ease of compliance and access to benefits, and managing non-compliance with the law.
Agency programs
1.1 Australian Taxation Office (ATO)
1.2 Tax Practitioners Board (TPB)
1.3 Australian Business Register (ABR)
1.4 Australian Charities and Not-for-profits Commission (ACNC)
The ATO effectively manages and shapes the tax and superannuation systems that support and fund services for Australians, by:�� collecting revenue�� administering the goods and services tax on behalf of the Australian states and territories�� administering major aspects of Australia’s superannuation system.
The TPB ensures that tax practitioner services are provided to the public in accordance with appropriate standards of professional and ethical conduct by:�� administering a system to register tax practitioners, ensuring they have the necessary competence and personal attributes�� providing guidelines and information on relevant matters�� investigating conduct that may breach the Tax Agent Services Act 2009 (TASA), including non-compliance with the Code of Professional Conduct (the code), and breaches of the civil penalty provisions�� imposing administrative sanctions for non-compliance with the code�� applying to the Federal Court in relation to contraventions of the civil penalty provisions in the TASA.
The ABR program works with government, digital service providers, the business community and other key stakeholders to support a fairer business environment that fosters greater economic growth and job creation. This will be achieved through increased use of a trusted national business dataset and use of consistent information exchange standards.
The ACNC effectively manages a regulatory system for the Australian charitable sector by: �� registering eligible not-for-profit entities as charities in accordance with the ACNC Act 2012 and the Charities Act 2013�� providing information, guidance and advice about good governance practices and assisting charities to meet their obligations to maintain charity registration�� assessing concerns raised about registered charities, investigate where appropriate and initiate compliance action against charities that contravene the ACNC Act governance standards�� working with other government agencies (Commonwealth, state and territory) to reduce red tape on charities and align regulatory obligations through various mechanisms, including the ACNC’s Charity Passport.
NOTEWhile the TPB and ACNC are included in the ATO program structure and under the ATO outcome, they operate independently of the ATO and have produced their own annual reports. These are available at tpb.gov.au and acnc.gov.au respectively.

01 Commissioner of Taxation annual report 2018–19
4
Administered programs
Administered programs may be administered by the ATO with policy and delivery assistance from other Commonwealth agencies, or directly through the tax and superannuation systems. Our administered programs for 2018–19 were:
1.5 Australian Screen Production Incentive
1.6 Junior Minerals Exploration Incentive
1.7 Fuel Tax Credits Scheme
1.8 National Rental Affordability Scheme
1.9 Product Stewardship for Oil
1.10 Research and Development Tax Incentive
1.11 Low Income Superannuation Tax Offset
1.12 Private Health Insurance Rebate
1.13 Superannuation Co-contribution Scheme
1.14 Superannuation Guarantee Scheme
1.15 Targeted Assistance Through the Taxation System
1.16 Interest on Overpayment and Early Payments of Tax
1.17 Bad and Doubtful Debts and Remissions
1.18 Other administered programs:�� Seafarer Tax Offset

01OverviewATO Executive
5
ATO Executive
The Commissioner is supported by an executive team, with each member having responsibility for key aspects of the ATO’s performance.
The ATO Executive ensures that the ATO meets its commitments to government and the community. It determines priorities, sets direction and monitors progress towards achievement of strategic outcomes. The Executive also provides leadership, driving the client-focused culture of the ATO.
For more details about our senior leaders, see ato.gov.au/about-ato.
The Commissioner of TaxationChris Jordan AO was appointed as the 12th Commissioner of Taxation on 1 January 2013.
Chris has broad and lengthy experience in tax policy and law development and implementation, having held influential roles in the private sector and as a government advisor to both Labor and Coalition governments.
He was Chair of the Board of Taxation from June 2011 to December 2012 and a member of the Board since its inception in 2000. He also served as Chair of the Business Tax Working Group from 2011 to 2012, and as Chair of the New Tax System Advisory Board (1999 to 2001). He was a member of the Working Group that consulted with the mining industry about the resource rent tax (2011–12).
Chris has more than 35 years of experience in the tax and consulting profession. He started his accounting career with Arthur Andersen in 1979, was a senior lecturer in taxation at Sydney’s University of Technology from 1982 to 1985, and then worked at KPMG for over 25 years. From 1995 to 2000, he was Partner in Charge of the NSW Tax and Legal Division of KPMG, and from 2001 to 2012 was Chairman of Partners for KPMG NSW.
Until taking up his role as Commissioner of Taxation, Chris was the Chairman of the Committee for Sydney, a Director of the Bell Shakespeare Company and the Sydney Children’s’ Hospital Foundation, as well as a member of the Audit and Risk Committee for the NSW Art Gallery.
Chris has a Master of Laws (Sydney University) and Bachelors of Commerce and Law (University of NSW). He is a Fellow of Chartered Accountants Australia and New Zealand and a Chartered Tax Adviser with The Tax Institute.
Chris’s term as Commissioner of Taxation and Registrar of the Australian Business Register runs until 29 February 2024.
Chris Jordan AO, Commissioner of Taxation and Registrar of the Australian Business Register

01 Commissioner of Taxation annual report 2018–19
6
Executive team responsibilitiesFrances Cawthra is the Chief Finance Officer, providing leadership and direction to ATO Finance.
ATO Finance has a focus on strong financial and resource management, delivering a balanced budget, ensuring effective procurement and contract management, and providing insight into wise investment, productivity improvements, sustainability and agility.
Frances ensures that the ATO’s organisational strategy is informed by a financial perspective. She also leads ATO Finance to ensure the ATO is provided with robust reporting and insightful business intelligence, understands its obligations, and is supported in complying with Commonwealth requirements.
Jacqui Curtis, as Chief Operating Officer, is responsible for leading the ATO’s Enterprise Strategy and Corporate Operations Group.
The role of Enterprise Strategy and Corporate Operations is to ensure we are well positioned for Australian Public Service (APS)-wide reforms of corporate and shared services, and that our planning, governance, risk and change management are strategic and sensible.
Jacqui brings together an integrated picture of people and resource management, ensuring the ATO has the right capability and culture to deliver on our strategic intent. She plays a lead role in managing relationships with key stakeholders including scrutineers. All of these underpin our ability to deliver a better experience for both clients and staff.
Jeremy Hirschhorn is the Second Commissioner with overall responsibility for the ATO’s Client Engagement Group, which fosters willing participation in Australia’s tax and super systems through well-designed client experiences.
Across all client experiences – from the very largest public and multinational businesses to small businesses and individuals – the Client Engagement Group uses insights from client interactions to help design a tax system that makes it easier to comply, and harder not to. The group supports the integrity of the tax and superannuation systems by addressing non-compliance, and ensures increasing transparency about the operation of the system for taxpayers and key partners.
The group also plays an important role in working with the international tax community. Through collaborating with other jurisdictions the Client Engagement Group improves the way tax administrations work together to address arrangements used to evade and avoid tax.
Frances Cawthra Chief Finance Officer
Jacqui Curtis Chief Operating Officer, Enterprise Strategy and Corporate Operations Group
Jeremy Hirschhorn A/g Second Commissioner, Client Engagement Group

01OverviewATO Executive
7
Ramez Katf is the Second Commissioner with overall responsibility for the Enterprise Solutions and Technology Group, and the ATO’s Chief Information Officer.
Ramez provides leadership and strategic direction to modernising the revenue collection system and contributing to the government’s broader digital agenda.
The focus of Enterprise Solutions and Technology is ensuring we are taking advantage of the most innovative trends in technology to improve the experience of ATO staff and the community. This role has become increasingly important in balancing expectations and demand as new technology solutions continue to emerge.
Andrew Mills is the Second Commissioner with overall responsibility for the ATO’s law practice, including law interpretation, public advice and guidance, independent dispute prevention and resolution and our role in policy and law design.
The Law Design and Practice Group contributes to the administration of the tax and superannuation systems by seeking to make tax fair, simple and understood. We work collaboratively with Treasury and other agencies in supporting government outcomes and leading the ATO’s work on design of new policies and law. Our contribution also includes involvement at the early stages of engagement on advice or review and providing certainty through interpretation of the law and publication of guidance to support our clients in getting it right the first time.
We are committed to understanding the drivers of disputes, litigating only the right cases and encouraging prevention and ensuring earlier resolution where disputes happen.
Melinda Smith, as Chief Service Delivery Officer, has overall responsibility for the Service Delivery Group.
This part of the ATO is responsible for a broad range of the ATO’s foundation services for all segments of the community. These include processing payments, activity statements, income tax returns, superannuation lodgments and other forms, as well as administering the tax file number register, Australian Business Register and registers held on behalf of the superannuation industry.
The group focuses on working with ATO clients to understand their needs. It offers a tailored approach to help them meet their obligations as easily as possible through a range of contemporary tools, systems and services. It also engages with clients on a large scale and uses a strategic early intervention approach to educate them and influence willing participation.
The group is leading or contributing to a number of transformational initiatives for government. It works closely with other areas of the ATO to improve the experience for clients and drive greater efficiency and quality outcomes through better use of data, digitisation and building a strong service culture so the ATO is well positioned for the future.
Neil Olesen was the Second Commissioner with overall responsibility for the Client Engagement Group until November 2018.
Ramez Katf Second Commissioner, Enterprise Solutions and Technology Group
Andrew Mills Second Commissioner, Law Design and Practice Group
Melinda Smith Chief Service Delivery Officer, Service Delivery Group

0201 Commissioner of Taxation
annual report 2018–19
8
Organisational structure
The ATO is structured in five groups, each reporting to a member of the ATO Executive. Each group consists of a number of business areas.
FIGURE 1.2 ATO organisational structure, as at 30 June 2019
NOTEThe independent internal functions support the Commissioners and, for administrative purposes, are located in ATO Corporate.
Commissioner of Taxation and Registrar of the Australian Business Register
Chris Jordan AO
Enterprise Solutions and Technology GroupSecond Commissioner
Chief Information Officer
Ramez Katf
Client Engagement Group
Second CommissionerJeremy Hirschhorn
(acting)
Law Design and Practice Group
Second CommissionerAndrew Mills
Service Delivery Group
Chief Service Delivery OfficerMelinda Smith
Tax Counsel NetworkChief Tax Counsel
Kirsten FishDeputy Chief Tax Counsel
Peter WalmsleyDeputy Chief Tax CounselFiona Dillion
Deputy Chief Tax Counsel
Andrew EnglandDeputy Chief Tax Counsel
Hoa Wood (acting)Deputy Chief Tax Counsel
Public Advice and Guidance
Andrew Orme
Review and Dispute Resolution
Deputy CommissionerJeremy Geale
Policy, Analysis and Legislation
Deputy CommissionerLouise Clarke
Enterprise Strategy and Corporate
OperationsChief Operating Officer
Jacqui Curtis
Independent internal functions
Internal AuditChief Internal Auditor
Christina Li
Fraud Prevention and Internal Investigations
Assistant Commissioner
Susie Smith
Enterprise Strategy and Design
Deputy CommissionerDavid Allen
ATO PeopleDeputy Commissioner
Brad Chapman
ATO FinanceChief Finance Officer
Frances Cawthra
Enterprise Capabilities Deputy Commissioner
Matthew Hay
Technology, Architecture and
SecurityDeputy Commissioner
Susan Monkley
Digital DeliveryDeputy Commissioner
Chief Digital OfficerJohn Dardo
Service OperationsDeputy Commissioner
Alex Adams
Debt and LodgmentDeputy Commissioner
Robert Ravanello
Commonwealth Business Registry
ServicesDeputy Commissioner
Michelle Crosby
Strategy and SupportDeputy Commissioner
Emma Rosenzweig (acting)
Private WealthDeputy Commissioner
Tim Dyce
Small BusinessDeputy Commissioner
Deborah Jenkins
Integrated Compliance
Deputy CommissionerWill Day
Smarter Data ProgramDeputy Commissioner
Marek Rucinski
Public Groups and International
Deputy CommissionerRebecca Saint (acting)Deputy Commissioner
Mark Konza
Client Account Services
Deputy CommissionerGrant Brodie
ATO CorporateDeputy Commissioner
Sue Sinclair
Superannuation and Employer ObligationsDeputy Commissioner
James O’Halloran
Individuals and Intermediaries
Deputy CommissionerAlison Lendon
Machinery of Government TransitionDeputy Commissioner
Jane King
02Statement by the Accountable Authority
As the Accountable Authority of the Australian Taxation Office (ATO), I present the following annual performance statement. This statement has been prepared as required under paragraph 39(1)(b) of the Public Governance, Performance and Accountability Act 2013 (PGPA Act) and covers the period from 1 July 2018 to 30 June 2019.
In my opinion, and having considered the recommendations from the ATO Audit and Risk Committee, the annual performance statement accurately presents the ATO’s performance for the reporting period and complies with subsection 39(2) of the PGPA Act.
Chris Jordan AO Commissioner of Taxation and Registrar of the Australian Business Register
Annual performance statement

02 Commissioner of Taxation annual report 2018–19
10
Program 1.1 Australian Taxation Office
PurposeThe ATO purpose is to contribute to the economic and social wellbeing of Australians by fostering willing participation in the tax and superannuation systems. We achieve this through the delivery of our goals: � making it easier for people to participate � providing contemporary and tailored services � maintaining purposeful and respectful relationships � being a professional and productive organisation.
Our purpose is underpinned by nine strategic objectives. As shown in the ATO corporate plan, the objectives are grouped into five perspectives – Government, Client, Workforce, Operational and Financial.
Critically, the integrity of the tax and superannuation systems will be maintained by supporting those who choose to do the right thing and dealing with those who do not. Ultimately, client experience and participation will be the true measure of success. The following sections outline the results of our performance measures and progress on reaching our objectives.
Program overviewThis overview of ATO program performance aligns with the ATO corporate plan 2018–19, and presents our 2018–19 performance against each of the nine strategic objectives.
For each strategic objective, we outline our key 2018–19 achievements in relation to: � the strategic initiatives outlined in the corporate plan � our most significant business activities, such as Tax Time 2018.
A summary of performance results is provided for each strategic objective, with more detail and analysis provided on pages 26 to 35.

02Annual performance statementProgram 1.1 Australian Taxation Office
11
Strategic objective: G1 Government
We build community confidence by sustainably reducing the tax gap and providing assurance across the tax and superannuation systems
Overview
The ATO aims to provide the community with confidence in our administration of the tax and superannuation systems, and that this results in the collection of the right tax at the right time, for the wellbeing of all Australians. To provide that confidence, we need to understand the effectiveness of our approach, which we do by using performance measures, tools such as tax gap analysis, and sharing information with other agencies in Australia and internationally.
We use our understanding of the tax system to help design improvements to our administration. We will continue to shift to a more preventative and pre-emptive approach, sustainably closing the tax gap.
Of the eight performance measures for strategic objective G1, we fully met four targets, substantially met two, and have two targets under development. We also introduced a confidence measure aligned to our 2024 aspirations of building trust and confidence.
Strategic initiatives summary
We delivered on our government commitments, including through our taskforces on tax avoidance, serious financial crime, illegal phoenix activity and the cash economy. Significant achievements for the ATO’s taskforces include: � the Tax Avoidance Taskforce raised $1.9 billion in liabilities and $1.1 billion in cash collections
(apportioned figures) � the Serious Financial Crime Taskforce raised $235 million in liabilities and $71 million in cash
collections � the Black Economy program raised $1.1 billion in liabilities � the Phoenix Taskforce raised $163 million in liabilities and almost $66 million in cash collections.
We contributed to operations as part of the Illicit Tobacco Taskforce, which was established on 1 July 2018, as well as ATO-specific operations, which resulted in the seizure and destruction of illicit tobacco with an estimated excise duty of $42 million.
In July 2018, we released the first estimated individuals tax gap, covering taxpayers who are salary and wage earners and investors, but not in business and not high wealth individuals. We estimate that over 93% of income tax due from individuals is paid, mostly voluntarily, or with little intervention from us. The tax gap is discussed in greater detail on page 50 and on our website at ato.gov.au/taxgap.
Through our justified trust program, we assure the tax compliance of large corporate groups and privately owned and wealthy groups. We engage with the top 1,100 public and multinational businesses and superannuation funds and the top 320 privately owned and wealthy groups, obtaining positive assurance on a significant proportion of these clients. This year, we assured 50%

02 Commissioner of Taxation annual report 2018–19
12
of the $47 billion of income tax payable by public and multinational businesses for the 2016–17 financial year and increased our assurance of the $40 billion payable by these businesses in 2015–16 from 50% to 58%. We also assured $2 billion of income tax payable by privately owned wealthy groups across multiple income years.
To confirm or clarify our interpretation of the tax law, we use strategic litigation for cases with the most precedential value. We had a higher number of applications considered by the Test Case Litigation Panel this year, receiving 26 compared to 14 in 2017–18. During the year, there were 102 tax litigation decisions handed down, and 75 of these fully supported the ATO position. For more information about our strategic litigation, see Appendix 5. For statistics about our public rulings, see Appendix 3.
We implemented an integrated compliance approach to identify endemic non-compliers – those organisations that are not engaging in identified criminal behaviour but are failing to comply with multiple obligations. To illustrate the complexity of this work, one group we identified as high risk comprises over 40 entities, with assets totalling approximately $70 million.
In 2018–19, we supported the superannuation system by helping Australians connect with their super. ATO Online services were used to consolidate over 537,600 accounts worth $4.4 billion. To improve and streamline APRA-regulated fund reporting and provide greater ‘real time’ visibility of superannuation contributions and other transactions, we implemented the Member Account Attribute Service (MAAS) and Member Account Transaction Service (MATS). To protect retirement savings for members of self-managed super funds (SMSFs), we reviewed and audited SMSF funds, trustees and auditors. This work included: � cancelling 609 new registrations and withholding 229 funds from Super Fund Lookup, protecting
nearly $100 million of individuals’ retirement savings � responding to serious regulatory contraventions by issuing 26 notices of non-compliance,
disqualifying 145 trustees and issuing administrative penalties against the trustees of 146 SMSFs, resulting in net penalties of $3 million
� reviewing 151 SMSF auditors, resulting in 52 referrals to the Australian Securities and Investments Commission (ASIC).
02Annual performance statementProgram 1.1 Australian Taxation Office
13
Strategic objective: G2 Government
We design for a better tax and superannuation system to make it easy to comply and hard not to
Overview
The tax and superannuation systems need to evolve so that they remain sustainable for collecting Australia’s revenue. They need to be easy to comply with and hard not to, transparent in their operations, and provide for a seamless client experience. The ATO is well placed to influence the design of the law to fix system irritants, address loopholes that allow people to avoid their obligations, and make use of new technology.
The one measure for this objective achieved a rating of good. Although the target was still under development in 2018–19, a target has been set for 2019–20.
Strategic initiatives summary
We contribute to the shaping of the tax and superannuation systems, assessing where the law has not been working as intended, using insights and developing ideas to improve the systems. We endeavour to influence proposed policy and legislation and share our analytical expertise by: � providing data and costings advice on policy proposals � working closely with Treasury on ATO-generated new policy proposals, as well as those led
by Treasury, including revenue proposals sought by Treasury for the Budget and the Mid-Year Economic and Fiscal Outlook
� collaborating with Treasury on the design of new legislation, and providing input into explanatory materials and joint quality assurance of draft laws.
Our relationship with Treasury is a significant component in successfully influencing new legislation (see performance measure: Influence on page 31).
We provide tax and superannuation systems insights and responses and inform policy development and research. Along with our annual publication of aggregated taxation statistics, in 2018–19, we: � worked with the Board of Taxation on a survey on compliance costs associated with fringe
benefits tax � provided access to our database of ‘confidentialised’ longitudinal data on individual income tax
returns to researchers in 19 Australian universities, and expanded the database � contributed to a whole-of-government public data strategy overseen by the Department of
Prime Minister and Cabinet � provided research and data to inform the Council of Financial Regulators final report into risk
and leverage in the superannuation system, in addition to providing information and calculations to support the Productivity Commission’s review into the efficiency and competitiveness of the superannuation system
� assisted with the Australian Bureau of Statistics (ABS) Multi-Agency Data Integration Project, the Department of Social Security’s research into the National Disability Insurance Scheme (NDIS) workforce, and the work of the Department of Jobs and Small Business following closure of the Australian automotive manufacturing industry, including their assessment of retraining programs.

02 Commissioner of Taxation annual report 2018–19
14
Strategic objective: C1 Client
Our client experience and interactions are well designed, tailored, fair and transparent
Overview
We are improving the experience our clients have by designing a tax and superannuation system that is seamless and easy to use. This includes the experience for those of our clients who may disagree with our decisions and seek some form of formal review. We are taking advantage of the growing opportunities offered by the expanding digital world to provide people with the information they need, when they need it and in their preferred format.
We delivered a successful Tax Time 2018, with over 10 million individual income tax returns lodged, resulting in almost 8 million refunds.
Of the two performance measures for strategic objective C1, we fully met one target and substantially met the other. We continued to expand the scope of our digital services to progress our journey to 2024.
Strategic initiatives summary
We streamlined processes through Single Touch Payroll (STP) and worked with software developers to expand STP to employers with fewer than 20 employees, ensuring there will be a good range of low-cost reporting software in the market – including low-cost or no-cost products for employers with fewer than four employees.
As at 30 June 2019, we had 58,600 substantial employers (80% of the target population) reporting tax and superannuation information through STP, and another 108,000 employers with fewer than 20 employees voluntarily reporting before the legislative start date for this group. More information about STP is available at ato.gov.au/STP.
By delivering a range of digital channel experience options, we help meet client expectations of a ‘24x7’ service and reduce our reliance on paper to contact clients. By identifying what people need to know, we can make it available through self-service channels such as our website. This year we: � digitised the Australian business number (ABN) confirmation letter, replacing over 800,000 letters
a year � provided more self-help tools for tax professionals and coached callers on how to use the tools � stopped sending paper activity statements for monthly self-preparers and quarterly
agent lodgers.
Our support for small businesses included: � assistance to farmers and drought-affected businesses in New South Wales, Victoria and
South Australia through the federal government’s Drought Community Outreach program � the Reach Out Indigenous Business Support program pilot, with workshops held in Ipswich,
Darwin and on Palm Island, reaching up to 450 Indigenous business owners � over 2,300 workshops and webinars on a range of topics

02Annual performance statementProgram 1.1 Australian Taxation Office
15
� over 1.6 million emails distributed as part of our New to business essentials service � letters, emails and SMS to over 143,000 new clients in high-risk industries to provide information
on the taxable payments reporting system � our Small Business Newsroom service, with 19% more subscribers this year.
For more information about our small business workshops, see lets-talk.ato.gov.au/sbworkshops.
We produced proactive advice and guidance on a range of issues, including the expansion of the taxable payments reporting system, changes to the small business tax rates, and the tax treatment for compensation paid to individuals following the Royal Commission into banking misconduct. We continued our communication and education programs, delivering new training modules for small businesses to address specific tax avoidance behaviours identified by our Black Economy Taskforce, along with our regular workshops and webinars. Our Indigenous helpline received a record 25,000 calls for specialised tax and superannuation assistance this year.
Several dispute resolution initiatives were implemented during the year, including: � an Independent Review for Small Business program pilot, designed to give small businesses
an opportunity to have their audit with us reviewed before any assessments or amended assessments are issued
� our Dispute Assist service, offering help to unrepresented individuals and small businesses with significant or exceptional personal circumstances
� new National Tax Clinics operated by 10 universities for taxpayers who may not be able to afford professional advice or representation but are looking for independent guidance
� a new Small Business Taxation Division of the Administrative Appeals Tribunal (AAT), developed in conjunction with the Treasury, the AAT, the Inspector-General of Taxation and Taxation Ombudsman (IGTO) and the Australian Small Business and Family Enterprise Ombudsman.
We resolved over 26,000 objections, which represents less than 0.1% of over 37 million returns lodged. There were 441 applications for review or appeal to the AAT or other courts in 2018–19, with 102 decisions made either in relation to these applications or applications made in earlier years. The significant gap between the number of applications and actual decisions reflects the fact that most matters are resolved through alternative dispute resolution. For more information on the numbers of disputes, see Appendix 3.
We sought independent assurance and advice from experts on the application of complex legal matters, and referred our most significant decisions on disputes for review. During 2018–19: � the General Anti-Avoidance Rules (GAAR) Panel assessed 28 matters, including share buy-back
transactions, with the GAAR provisions held to apply in 10 matters � the Public Advice and Guidance Panel considered 7 matters, including employee travel
expenses, work-related expenses for truck drivers, and GST relating to financial services � under the Independent Assurance of Settlements program, 16 reviews were finalised, with our
actions considered to be fair and reasonable in 13 cases.
For more details on settlement cases, see Appendix 3.

02 Commissioner of Taxation annual report 2018–19
16
Strategic objective: C2 Client
We work with and through others to deliver efficient and effective tax and superannuation systems
Overview
Our goal is to make it as easy as possible for clients to meet their tax and superannuation obligations and to interact with our systems when they need to do so. It is also important to maintain a strong relationship with our international counterparts so effective action can be taken when people attempt to use jurisdictional borders to block our effective administration.
By working closely with and learning from tax practitioners, digital service providers and overseas jurisdictions, not only is our role as an advocate for change made easier, we can build better tools that support our clients, whether they deal with us directly or through a third party. By enabling access to ATO systems via application programming interfaces (APIs), we can work with partners to provide a more streamlined ecosystem.
The ‘working together’ measure for this objective achieved a result of 64/100. Although the target was still under development in 2018–19, a target has been set for 2019–20.
Strategic initiatives summary
Through our international collaboration with other tax administrators, information is shared to influence tax reform and identify global trends and best practices. This year, our involvement with the Organisation for Economic Co-operation and Development (OECD) included co-hosting the fifth meeting of the Global Forum on Value Added Tax and GST and presenting at the Forum on Tax Administration in Chile. Our work on issues raised by the Panama and Paradise papers was recognised by the Chair of the OECD’s Forum on Taxation Administration.
We completed our first international exchange under the new Common Reporting Standard, receiving over 1.5 million financial accounts to review from over 60 tax jurisdictions – including those that have been associated with tax havens and bank secrecy.
The Multilateral Convention to Implement Tax Treaty Related Measures to Prevent Base Erosion and Profit Shifting came into effect this year, enabling jurisdictions to swiftly modify their tax treaties to better address multinational tax avoidance and more effectively resolve tax disputes. Together with New Zealand Inland Revenue, we published a joint administrative approach, to provide certainty for eligible taxpayers and allow us to prioritise our resources on matters with material revenue consequences or a higher risk of tax avoidance.
We delivered significant changes to our tax and BAS agent services in 2018–19. Our practitioner lodgment service (PLS) became the sole channel for tax agents to electronically lodge current year income tax returns, with approximately 6.8 million returns successfully lodged during Tax Time 2018. For agents using the service, more of their clients had their refunds processed within five days compared to previous years.
02Annual performance statementProgram 1.1 Australian Taxation Office
17
Since March 2019, all tax and BAS agents have been able to access Online services for agents. This system replaces our tax and BAS agent portals with a modern, customisable interface that addresses portal irritants and provides access to new functionality. It delivers more real-time client information, such as individuals’ superannuation and income tax return history, and includes the ability to create payment plans and search for clients by name. More information is available at ato.gov.au/onlineservicesforagents.
We partnered with 530 digital service providers (DSPs) consuming 269 web services. An online service was introduced to streamline interactions with DSPs, providing a secure environment to access support. We reviewed all DSPs against the ATO’s Operational Framework, with all DSPs – representing 676 digital products – meeting the requirements. Extending on the framework and at the request of industry, ATO worked in collaboration with the Australian Business Software Industry Association to develop common cyber security standards for add-on marketplaces.
02 Commissioner of Taxation annual report 2018–19
18
Strategic objective: W1 Workforce
We are a high-performing, responsive and professional workforce with the right culture to deliver now and for the future
Overview
The ATO works to provide support and strategies to help us transform our culture and workforce so we can deliver now and into the future. This includes ensuring we have the right balance of capability to deliver the best client and staff experiences and drive a positive cultural change, with a focus on integrity, to foster a collaborative and contemporary way of working.
We met the performance target for each of the three measures for strategic objective W1, with two measures improving since last year and the other remaining at its highest level. This demonstrates continued improvement in the engagement of our staff and the diversity of our workforce.
Strategic initiatives summary
We developed our Workforce Strategy 2024 to describe our future workforce and outline the high-level initiatives required to achieve it. Given the dynamic environment the ATO operates in, and our dependencies on external influences, the strategy will be updated as our view of the future evolves. A new future-focused capability framework was implemented, outlining the core sets of skills, knowledge, attributes and behaviours we need to successfully deliver our administration of the tax and superannuation systems. Our training programs are being aligned to the new framework to support staff in their pursuit of ongoing learning and development.
Recognising the importance of a positive culture for the achievement of our strategic and organisational goals, we have committed to supporting our people in demonstrating the cultural traits. We communicate regularly with our staff about what our culture means for them, the community, and why it is critical to achieving our organisational outcomes. We assessed our progress at making cultural change through consultation, perception surveys and independent feedback, finding that our staff and the community have seen real and positive cultural change.
Our Integrity Adviser, Dr Simon Longstaff, worked with our Chief Risk Officer, the ATO Executive Committee and staff across the ATO, to help us extend our view of integrity so that we overtly consider our ‘integrity position’ in what we do and say, and make good decisions guided by ethics. We updated various processes for SES officers and staff to declare interests and other circumstances that could influence (or be seen to influence) their actions at work. This is fundamental to embedding transparency and integrity as part of our culture and providing confidence that we remain vigilant about managing perceived and real risks. A highlight this year was our Security, Integrity and Fraud Awareness week, with external speakers, panel discussions, webinars, and training sessions.
02Annual performance statementProgram 1.1 Australian Taxation Office
19
Strategic objective: W2 Workforce
We provide the right tools and workplace so staff can deliver the best client experience
Overview
We are committed to giving our staff contemporary tools that make it easier to help our clients and collaborate with each other. In 2018–19, we identified a number of system irritants that – while minor in themselves – added up to serious barriers across our organisation. We worked together to learn from our shared experiences and identify new ways to integrate solutions across the organisation.
In the ATO corporate plan 2018–19 we introduced a new measure for this objective, with a result of 63% this year. Although the target was under development in 2018–19, a target has been set for 2019–20.
Strategic initiative summary
To improve the staff experience, our highest priority for 2018–19 was to refresh our desktop and laptop hardware which has significantly improved the time it takes to log in, as well as overall speed and performance. The upgrade also ‘opens the door’ to new and better software, including contemporary collaboration tools. All laptops and 62% of our desktops have been replaced with newer models and any remaining aged desktop computers will be replaced by the end of 2019. This is a significant step in assisting the ATO in becoming streamlined, integrated and data-driven. This year, one of the biggest staff irritants of having to manage mailbox capacity was resolved by increasing staff mailbox size.
Not all innovations require such a large financial investment. Our staff are encouraged to find ways to work smarter and support each other in their day-to-day work. One example is our PowerPit tool, which was designed and built by staff using existing technology. PowerPit enables experienced staff to share their expertise with new front-line officers, using an immersive training environment. This gives trainees fundamental hands-on practice as part of their training – before they take calls from clients. It complements other training they undertake, enabling them to focus on providing the right information and ultimately improve the caller’s experience.
We continue to look for opportunities to build on and connect with other initiatives to drive improved staff and client outcomes by maximising the value from data and analytics, including our enterprise client profile. We listen to our people about the tools that will best support them, through focus groups, surveys and census results – recognising that our staff are at the heart of the ATO and their experience and engagement is critical to delivering the right client experience.
To provide staff with a view of the improvements being made, we have taken a coordinated and holistic approach to informing them of initiatives that affect them. In 2018–19, we launched an online ‘Improving Our Staff Experience’ hub, making it easy for staff to see the full set of experience improvements the organisation has made and plans to make in the future. Complementing the hub, we delivered a Staff Experience Showcase spotlighting the ‘now, soon and later’ improvements and helping staff envision how they can work smarter and more efficiently, both now and into the future, using the new ATO tools, technology and workspaces.

02 Commissioner of Taxation annual report 2018–19
20
Strategic objective: O1 Operational
We use data and insights to deliver value for our clients and inform decision making across everything we do
Overview
Our transition towards being a streamlined, integrated and data-driven organisation relies on having the right data available for our staff and clients, the tools to manage and derive insights, and the capabilities to understand and use the data in innovative ways. We are embracing new technologies, work patterns and data-learning programs to ensure our staff have the data, insights and skills they need to work smarter and improve interactions with clients. Our use of automation, artificial intelligence and sophisticated analytical techniques will continue to help us better understand our clients and provide the tailored and timely services they expect.
This objective had one measure, which achieved a result of 87.9%. While the target was still under development in 2018–19, a target has been set for 2019–20.
Strategic initiatives summary
Implementation of initiatives, such as Single Touch Payroll and the progress of the automatic exchange of information with other countries, means that much more data is coming into the ATO. We are focused on continuing to enhance our data acquisition and quality program and have the infrastructure and tools available to manage and use data we collect in an ethical and transparent way. More sophisticated tools have been implemented to ensure the quality of our data and better transform it into usable and repeatable processes that can be streamlined into automated processes. Faster and more precise insights enable improved compliance outcomes through greater personalisation and more targeted and effective interactions. The mapping of third-party datasets is a key element of our work and provides staff with more relevant information to improve decision making. For example, in 2018–19 we obtained data to better understand how ride-sharing and short-term accommodation providers may impact on the tax system.
Our enterprise client profile system is designed to provide our staff with access to client facts and insights. The system visualises consistent and timely information insights in a contemporary way that can be tailored to specific work requirements. The use of enterprise client profile has created efficiencies in providing a complete view of relevant information to support staff in their interactions with clients. For example, staff visiting around 10,000 small businesses as part of our work on the Black Economy Taskforce, were able to access a real-time profile of client facts, history and insights for use prior to and during visits.

02Annual performance statementProgram 1.1 Australian Taxation Office
21
We are progressing new and innovative ways of using automation and artificial intelligence to streamline business processes, automate repetitive tasks and improve decision making. Machine learning and robotic process automation (RPA) technologies provide opportunities to increase our understanding of client behaviours and create efficiencies for more repetitive tasks. This year, we designed and tested the suitability of RPA software and trialled the extension of machine learning to categorise taxpayer deduction claims and identify risks at a more detailed level. RPA effectively uses technology that follows a pre-programmed set of actions to automatically undertake repetitive, manual and high-volume tasks.
Using sophisticated analysis techniques, we are able to compare returns prepared by tax agents with a similar client base. To identify areas of concern or risky behaviour we apply a nearest neighbour approach to compare claims. This allows us to identify areas where agents would benefit from more information and support, and cases where intervention is necessary. This year, we developed a model to give us a holistic view of multiple risks in the tax agent profession, and systematically identify or predict changing behaviour in a timely way.
02 Commissioner of Taxation annual report 2018–19
22
Strategic objective: O2 Operational
Our technology and digital services deliver a reliable and contemporary client experience
Overview
Meeting community expectations that our systems will be secure and available when required and on a variety of platforms is an ongoing challenge. Our focus has been on making it easier for our clients to interact with us, as well as updating the systems we use to manage the tax and superannuation systems.
This objective had two measures, with our security policy report requirements met and our key digital systems availability achieving 99.5%. Although targets were still under development in 2018–19, a target has been set for the measure that was retained for 2019–20.
Strategic initiatives summary
With rapid growth in online activity there is greater opportunity for fraudsters to steal and sell personal data. The ATO will continue to invest in securing taxpayer information through robust identity, authentication and authorisation platforms. In June 2019, the myGovID app was released to enable people to securely establish and manage their digital identity with us and across government. We delivered Relationship Authorisation Manager (RAM), a new way for people to establish relationships and manage who is authorised to act on their behalf. Authorised representatives of businesses are now able to securely prove their identity using myGovID, link their ABN, manage their authorised contacts, and use the myGovID app to authenticate and access the ATO Business Portal. Tax agents operating on behalf of their clients will soon be able to use myGovID and RAM to access the new ATO Online service for agents.
We increased our cyber security capabilities in controls for compliance and protection against security threats, continuing maturity in detection and response functions, preparation for major initiatives that build our visibility of vulnerabilities and gaps in the environment, and increasing our security certification programs.
Modernisation of our infrastructure for improved ATO systems resilience included relocating critical applications to a more resilient storage system, and providing dedicated infrastructure for Online services for agents and ATO Online capability to improve performance and stability for Tax Time 2019. We upgraded the tools we use to interact with our clients over the phone, including improved voiceprint matching, which has reduced average call times for clients. To help our staff provide better services to clients and work together from different sites, we updated desktop and laptop computers and expanded security and functionality of online training and meeting rooms.

02Annual performance statementProgram 1.1 Australian Taxation Office
23
We improved the functionality of our systems, making significant progress in resolving an ongoing issue that means some clients with different taxes have more than one account with us, by creating a single client account. We will need to migrate close to 17 million activity statement accounts to our primary accounting system. The move will bring the processing of 95% of taxpayer financials into one system, resulting in fewer delays in issuing refunds and most account transfers happening without the need for a manual request. Our single case management system and analytics-driven approach to managing outstanding payments across all account types ensures more tailored treatments and interventions in the collection of debt.

02 Commissioner of Taxation annual report 2018–19
24
Strategic objective: F1 Financial
We strive for operational excellence to achieve efficiency and quality outcomes
Overview
We have established a range of initiatives to deliver better productivity and outcomes, improve data quality, and drive consistent and streamlined systems and processes for staff. This ensures we can meet client expectations in a cost effective way, reduce operating costs and get better value.
Of the two performance measures for strategic objective F1, we fully met both targets.
Strategic initiatives summary
Working smarter to be more efficient is one of the benefits from many of our objectives, from extending our use of data to developing our staff. In addition to automating processes where we can, we have made business improvements through work redesign. Simplifying how we work has resulted in faster processing speeds and fewer escalations and transfers. Our Debt staff now manage both debt and outstanding lodgments for clients, rather than only dealing with existing debt.
We recognised the nexus between delivering small changes and achieving operational excellence and efficiency. We will be looking at how we manage the implementation of small changes across the ATO in 2019–20.
In 2018–19, we initiated a program to transform our outbound communications to ‘digital first’. We reduced the paper correspondence we send by replacing it with email, SMS, the myGov Inbox and the tax and BAS agent portals, or by sending it less often. We estimate that we will save $2 million each year by sending clients their general interest charge (GIC) statement of account quarterly instead of monthly.
We continued to develop our strategic procurement capability in line with changes to government procurement, including the Modern Slavery Act 2018, Government Procurement (Judicial Review) Act 2018, and the updated Black Economy Procurement Connected Policy. Working with our outsource providers, we focused on building collaborative partnerships that create more value for the ATO and our providers. With so many active contracts to support our successful operation, we are also conscious of our responsibility to see that our procurement ensures supply chain integrity and delivers social outcomes.
02Annual performance statementProgram 1.1 Australian Taxation Office
25
Performance results overviewThe ATO performance results for 2018–19 show a year of solid performance in achieving our purpose, with some specific areas for improvement. The ATO has 21 measures for Program 1.1 to demonstrate how well we are achieving our purpose. These are set out in the Australian Taxation Office Budget Statements in the Treasury Portfolio Budget Statement (PBS), and in the ATO corporate plan 2018–19.
Thirteen of these measures had a 2018–19 performance target, with the target fully achieved for ten and substantially achieved for the remaining three. In 2019–20, we will be looking at what we need to do differently to fully meet our own and the community’s expectations and to build trust and confidence in our administration of the tax and superannuation systems.
The intention of the annual performance statement is to report on the performance criteria included in the PBS and corporate plan to accurately reflect the performance of the ATO in achieving its purpose. In considering our overall assessment of fostering willing participation we have regard to: � the complexity of the tax and superannuation environment and how our activities influence the
behaviour of clients in meeting their obligations � the interrelated nature of performance criteria, which means that results should be viewed as a
suite of indicators, rather than in isolation � the use of estimates for some criteria.
In addition, it is important to note the trends over time in results, both in absolute terms and relative to the performance target for the relevant year. We assess our performance targets annually to determine where existing results are expected to be maintained and where future performance is expected to be stronger. Some of our performance targets were under development, due to a lack of relevant external comparators to benchmark ourselves against and the time it can take to baseline results to understand what future improved performance we should be aiming for. We will continue to monitor and assess performance as we build on the outcomes we have achieved to date.
Performance results
Our performance criteria are set out on pages 185–189 of the Australian Taxation Office Budget Statements (in the Treasury PBS), and pages 5–13 and 22–23 of the ATO corporate plan 2018–19.
02 Commissioner of Taxation annual report 2018–19
26
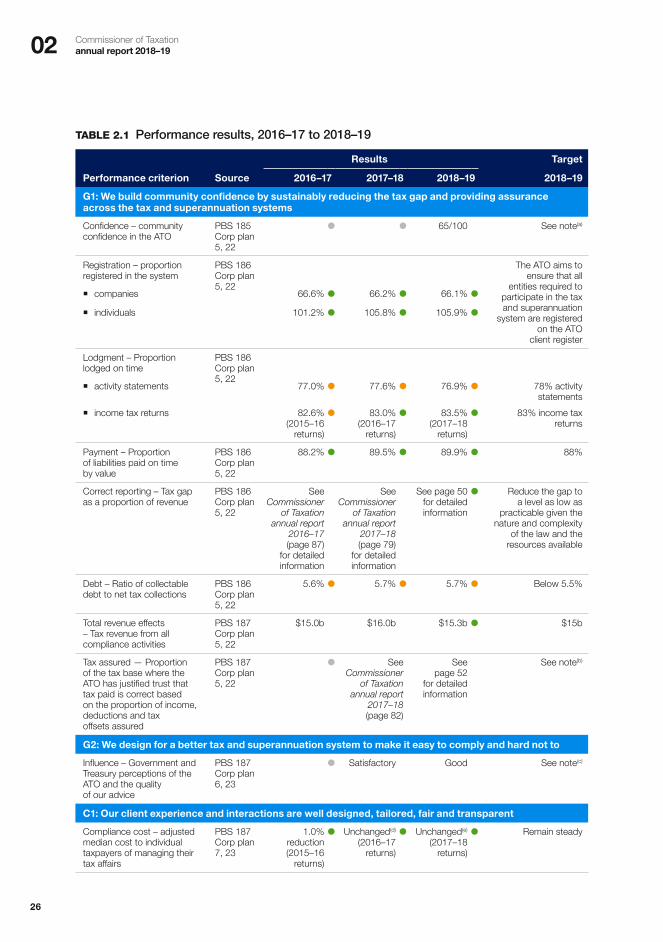
TABLE 2.1 Performance results, 2016–17 to 2018–19
Results Target
Performance criterion Source 2016–17 2017–18 2018–19 2018–19
G1: We build community confidence by sustainably reducing the tax gap and providing assurance across the tax and superannuation systems
Confidence – community confidence in the ATO
PBS 185 Corp plan 5, 22
65/100 See note(a)
Registration – proportion registered in the system
PBS 186 Corp plan 5, 22
The ATO aims to ensure that all
entities required to participate in the tax and superannuation
system are registered on the ATO
client register
� companies 66.6% 66.2% 66.1%
� individuals 101.2% 105.8% 105.9%
Lodgment – Proportion lodged on time
PBS 186 Corp plan 5, 22
� activity statements 77.0% 77.6% 76.9% 78% activity statements
� income tax returns 82.6% (2015–16
returns)
83.0% (2016–17
returns)
83.5% (2017–18
returns)
83% income tax returns
Payment – Proportion of liabilities paid on time by value
PBS 186 Corp plan 5, 22
88.2% 89.5% 89.9% 88%
Correct reporting – Tax gap as a proportion of revenue
PBS 186 Corp plan 5, 22
See Commissioner
of Taxation annual report
2016–17 (page 87)
for detailed information
See Commissioner
of Taxation annual report
2017–18 (page 79)
for detailed information
See page 50 for detailed information
Reduce the gap to a level as low as
practicable given the nature and complexity
of the law and the resources available
Debt – Ratio of collectable debt to net tax collections
PBS 186 Corp plan 5, 22
5.6% 5.7% 5.7% Below 5.5%
Total revenue effects – Tax revenue from all compliance activities
PBS 187 Corp plan 5, 22
$15.0b $16.0b $15.3b $15b
Tax assured — Proportion of the tax base where the ATO has justified trust that tax paid is correct based on the proportion of income, deductions and tax offsets assured
PBS 187 Corp plan 5, 22
See Commissioner
of Taxation annual report
2017–18 (page 82)
See page 52
for detailed information
See note(b)
G2: We design for a better tax and superannuation system to make it easy to comply and hard not to
Influence – Government and Treasury perceptions of the ATO and the quality of our advice
PBS 187 Corp plan 6, 23
Satisfactory Good See note(c)
C1: Our client experience and interactions are well designed, tailored, fair and transparent
Compliance cost – adjusted median cost to individual taxpayers of managing their tax affairs
PBS 187 Corp plan 7, 23
1.0% reduction (2015–16
returns)
Unchanged(d) (2016–17
returns)
Unchanged(e) (2017–18
returns)
Remain steady
02Annual performance statementProgram 1.1 Australian Taxation Office
27
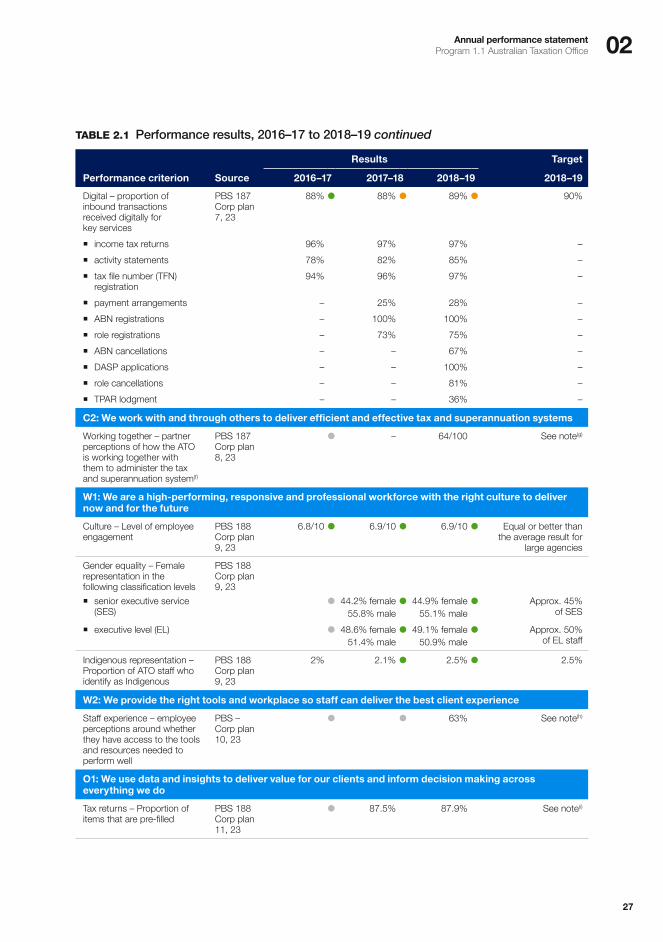
TABLE 2.1 Performance results, 2016–17 to 2018–19 continued
Results Target
Performance criterion Source 2016–17 2017–18 2018–19 2018–19
Digital – proportion of inbound transactions received digitally for key services
PBS 187 Corp plan 7, 23
88% 88% 89% 90%
� income tax returns 96% 97% 97% –
� activity statements 78% 82% 85% –
� tax file number (TFN) registration
94% 96% 97% –
� payment arrangements – 25% 28% –
� ABN registrations – 100% 100% –
� role registrations – 73% 75% –
� ABN cancellations – – 67% –
� DASP applications – – 100% –
� role cancellations – – 81% –
� TPAR lodgment – – 36% –
C2: We work with and through others to deliver efficient and effective tax and superannuation systems
Working together – partner perceptions of how the ATO is working together with them to administer the tax and superannuation system(f)
PBS 187 Corp plan 8, 23
– 64/100 See note(g)
W1: We are a high-performing, responsive and professional workforce with the right culture to deliver now and for the future
Culture – Level of employee engagement
PBS 188 Corp plan 9, 23
6.8/10 6.9/10 6.9/10 Equal or better than the average result for
large agencies
Gender equality – Female representation in the following classification levels
PBS 188 Corp plan 9, 23
� senior executive service (SES)
44.2% female55.8% male
44.9% female55.1% male
Approx. 45% of SES
� executive level (EL) 48.6% female51.4% male
49.1% female50.9% male
Approx. 50% of EL staff
Indigenous representation – Proportion of ATO staff who identify as Indigenous
PBS 188 Corp plan 9, 23
2% 2.1% 2.5% 2.5%
W2: We provide the right tools and workplace so staff can deliver the best client experience
Staff experience – employee perceptions around whether they have access to the tools and resources needed to perform well
PBS – Corp plan 10, 23
63% See note(h)
O1: We use data and insights to deliver value for our clients and inform decision making across everything we do
Tax returns – Proportion of items that are pre-filled
PBS 188 Corp plan 11, 23
87.5% 87.9% See note(i)

02 Commissioner of Taxation annual report 2018–19
28
TABLE 2.1 Performance results, 2016–17 to 2018–19 continued
Results Target
Performance criterion Source 2016–17 2017–18 2018–19 2018–19
O2: Our technology and digital services deliver a reliable and contemporary client experience
Security policy – Level of compliance with Protective Security Policy Framework mandatory requirements
PBS 188 Corp plan 12, 23
Compliant Report requirements
met
See note(j)
Availability – key digital systems availability
PBS 188 Corp plan 12, 23
99.4% 99.5% See note(k)
F1: We strive for operational excellence to achieve efficiency and quality outcomes
Budget – ATO manages its operating budget to balance
PBS 188 Corp plan 13, 23
0.13% surplus
1.0% deficit
0.1%
deficit
+/– 0.6% of budget
allocation
Cost of collection – Cost to collect $100(l)
PBS 189 Corp plan 13, 23
$0.81(incl GST)
$0.74 (excl GST)
$0.74 (incl GST)
$0.67 (excl GST)
$0.71 (incl GST)
$0.64 (excl GST)
Consistent with trend
Target achieved Target substantially achieved Target not achieved Result not available
NOTES(a) The target was under development in 2018–19. The target for 2019–20 is 65/100.(b) The target was under development in 2018–19. The target for 2019–20 is ‘increase the proportion of the tax base where the
ATO has justified trust to a level as high as practicable given the nature and complexity of the law and resources available’.(c) The target was under development in 2018–19. The target for 2019–20 is a ‘good’ rating.(d) The unchanged result for 2017–18 reflects a less than 0.1% change in the adjusted median.(e) The unchanged result for 2018–19 reflects a 0.2% increase in the adjusted median.(f) The methodology was refined in 2018–19 and results are not comparable to the result for ‘Empowerment – partner perceptions
of how the ATO empowers and includes them’ published in the 2017–18 annual report.(g) The target was under development in 2018–19. The target for 2019–20 is ‘equal to or better than the 2018–19 result’.(h) The target was under development in 2018–19. The target for 2019–20 is ‘equal to or better than the average result for
large agencies’.(i) The target was under development in 2018–19. The target for 2019–20 is 85%.(j) The target was under development in 2018–19. This measure has been retired for 2019–20.(k) The target was under development in 2018–19. The target for 2019–20 is 99.5% (excluding planned outages).(l) The description of the measure changed this year to ‘inclusive of GST’ and ‘exclusive of GST’.
Results analysis
Confidence – community confidence in the ATO
For 2018–19, the overall result for community confidence in the ATO was 65/100. As this measure was previously under development, there is no performance target against which to assess this result this year.
The methodology for this measure comprises survey questions to measure confidence in the ATO across two different audiences – clients who’ve had a recent interaction with the ATO, and the general community – and allow comparisons between these groups. In 2018–19, general community confidence in the ATO was slightly higher at 65/100, with recent clients’ confidence at 64/100.
In 2018–19, we developed two aspirations for the ATO’s journey to 2024 – to build trust and confidence in the tax and superannuation systems and to create a streamlined, integrated and data-driven future. This measure will be integral in tracking our progress in building trust and confidence.

02Annual performance statementProgram 1.1 Australian Taxation Office
29
Registration – Proportion of companies and individuals registered in the system
CompaniesThis measure compares the number of companies who are obligated to obtain Australian Securities and Investments Commission (ASIC) registration between ASIC and ATO.
The proportion has remained fairly stable, with no significant change in the last 12 months. This is expected, as the ATO-ASIC Registered Company client population continues to trend in line with Active Company Registrations data direct from the ASIC website.
The proportion is always expected to be well below 100%, as the ASIC register includes companies that have no taxation obligations or other ATO reporting obligations.
IndividualsThis measure compares active Individual clients (aged 15–64) in the ATO Client Register, to the ABS Estimated Resident population within the same age group.
The trends in registration of individuals are closely aligned to population growth.
The proportion remains fairly stable, with no significant change in the last 12 months. The proportion is always expected to remain above 100% for the following reasons: � The ATO’s definition of a ‘resident’ captures a greater number of people than the ABS estimated
‘resident’ population, because the duration of time spent in Australia to be considered a resident by the ATO is shorter than that required for the ABS definition.
� The ATO currently has difficulties identifying and deactivating tax file numbers for expatriates, resulting in unused TFNs within the system. This is due to the ATO not currently receiving information relating to expatriates exiting the country.
Lodgment – Proportion of activity statements and income tax returns lodged on time
Activity statementsOn-time lodgment performance for 2018–19 activity statements finished the year at 76.9%. This is 0.7 percentage points below the 2017–18 end-of-year result and 1.1 percentage points below the end-of-year target of 78%.
Most client experiences showed an improvement in on-time lodgment; however small business – representing 73% of the overall lodgment population – decreased. A change in on-time lodgment behaviour for small business therefore has a significant impact to the on-time lodgment performance across the overall population.
During 2018–19, the small business population increased by 4.1%; however there was only a 2.6% increase in the number of on-time lodgments. There is a continued focus on tailoring our lodgment strategies to obtain overdue lodgments and influencing future on-time lodgment behaviour, particularly for small businesses.
Income tax returnsOn-time lodgment performance for 2017–18 income tax returns finished the year at 83.5%. This is an improvement of 0.5 percentage points, compared to the 2017–18 end-of-year results for 2016–17 income tax returns.
This result is 0.5 percentage points above the end-of-year target of 83%.
02 Commissioner of Taxation annual report 2018–19
30
The trend of increased on-time lodgment of income tax returns is a result of ongoing end-to-end strategies including tax time messages and tailored client engagement to encourage a change in lodgment behaviour.
Payment – Proportion of liabilities paid on time by value
In 2018–19 the proportion of liabilities paid on time by value was 89.9%, which is 0.4 percentage points higher than last year. This result achieves the target of above 88%.
The main drivers of this increase in performance were improvements in individual and company income tax returns and pay as you go instalments. GST also contributed to this improvement.
We make it as easy as possible for taxpayers to pay their tax on time using a wide range of tools, payment channels and self-serve payment options. For example: � clients can use the ATO app to identify their due dates and these can then be loaded into their
phone calendar so that they receive a reminder prior to each due date � clients can manage their cash flow by pre-paying part or all of their income tax and activity
statement liabilities � we issue SMS payment reminders before the due date to clients that are unlikely to pay on time
or at all.
Correct reporting – Tax gap as a proportion of revenue
Tax gaps are an estimate of the difference between the amount the ATO collects and what we would have collected if every taxpayer was fully compliant with tax law.
For more information, refer to page 50 of this report.
Debt – Ratio of collectable debt to net tax collections
At 30 June 2019 the ratio of collectable debt to net tax collections was 5.7%, which is the same as last year. This result is above the target of below 5.5%.
We’re transforming our approach to build trust and confidence in our management of payment and debt. This involves designing processes, systems and approaches that make payment an easy and natural part of activities across all stages of tax and superannuation.
Our preference is to help taxpayers meet their payment obligations on time or address any debts that arise as early as possible, while they are manageable. We only take firmer or stronger action against the minority of taxpayers that don’t engage with us to address their tax debt to prevent them gaining an unfair financial advantage over the majority that pay, ensuring a level playing field for all.
Total revenue effects – Tax revenue from all compliance activities
The total revenue effects measure is an estimate of the additional tax revenue that comes from our client engagement activities. It is the combination of both audit yield and wider revenue effects.
In 2018–19, total revenue effects was $15.3 billion against a performance target of $15 billion. This amount comprises an audit yield of $10.5 billion and estimated wider revenue effects of $4.8 billion.
For more information, refer to page 54 of this report.

02Annual performance statementProgram 1.1 Australian Taxation Office
31
Tax assured — Proportion of the tax base where the ATO has justified trust that tax paid is correct based on income, deductions and tax offsets assured
At 30 June 2019, we estimated that 45.6% of total tax reported for the 2016–17 tax year could be assured. During 2018–19 we also assured an additional 1.9% for the 2015–16 tax year, bringing the total tax assured estimate for that year to 47.4%. The results reflect our growing confidence over a large portion of the tax base.
Around 70% of the tax that we assure is assured through system controls that collect third party data and match it against tax reported by individual taxpayers.
Around 30% of the tax that we assure is assured through direct taxpayer engagement with our larger clients.
For more information, refer to page 52 of this report.
Influence – Government and Treasury perceptions of the ATO and the quality of our advice
In 2018–19, the ATO and Treasury undertook a review of our working relationship, which found that the relationship had clearly improved over the past 12 months and identified ways to further improve collaboration between the two agencies. The recommendations of that review are being implemented.
The ATO contributed to the development of tax policy by providing input to Treasury on new tax proposals. The ATO’s experience in tax administration and our insights are valued by Treasury and are a crucial part of developing new law that delivers on the government’s agenda.
The ATO also worked with Treasury on the design of draft legislation and contributed to explanatory materials that accompanied the new law. Quality assurance that the draft law could be interpreted consistently with the policy was also provided by the ATO jointly with Treasury prior to each package of new law being introduced into Parliament.
Our Treasury secondment program is an important initiative designed to build capability in both agencies as well as foster a stronger working relationship between the ATO and the Treasury.
Compliance cost – Adjusted median cost to individual taxpayers of managing their tax affairs
This measure shows any movement in the cost to individual taxpayers of managing their tax affairs.
The adjusted(a) median cost of managing tax affairs for 2017–18(b) income tax returns remained broadly steady compared to the previous year (with only a marginal increase of 0.2%) and the performance target is considered to be fully met. Taxpayers who do not report an amount on this label are not captured in this calculation; however, over recent years a declining trend has emerged in the ratio of taxpayers claiming cost of managing tax affairs to the total individual taxpayer lodging population.
(a) AWOTE – average weekly ordinary time earnings (for full-time adults) is used to adjust these costs.(b) The 2017–18 income tax return has split the D10 label into three components:
� interest charged by the ATO � litigation costs � other expenses incurred in managing tax affairs.
02 Commissioner of Taxation annual report 2018–19
32
The cost of managing tax affairs includes the costs of preparing and lodging tax returns and activity statements, fees paid to tax advisers, and the costs of tax reference material. While the impact of external market forces can influence these, our strategies for making it easier to comply, through the provision of better guidance and advice and contemporary and digital services, also influence this trend.
For 2018–19 financial year reporting, data was extracted from each component and summed together to provide consistent results with previous years.
Digital – proportion of inbound transactions received digitally for key services
The scope of the measurement methodology was further broadened in 2018–19 to include ABN cancellations, role cancellations, departing Australia superannuation payments (DASP) applications and taxable payment annual report (TPAR) lodgments.
The inclusion of: � ABN and role cancellations provides an end-to-end view for business registrations and
cancellations � TPAR lodgments enables the establishment of a baseline for this service with additional
industries commencing reporting from 1 July 2018 � the DASP superannuation view provides a digital channel usage perspective that may assist in
future investment and service design decisions.
The ATO achieved an overall result of 89%, which is one percentage point below the target and represents a one percentage point increase compared with the previous year.
The digital take-up rates of the six original key services increased throughout 2018–19. Analysis of these original services indicates the 90% target would have been achieved if the additional services had not been included. Taking this into consideration, together with the increase in the target over recent years (target for 2016–17 was 85%), the target has been substantially achieved.
Working together – partner perceptions of how the ATO is working with them to administer the tax and superannuation system
For 2018–19, the overall result for partner perceptions of how the ATO is working together with them to administer the tax and superannuation systems was 64/100.
This result captures perceptions from tax professionals, APRA-regulated superannuation entities and digital service providers.
In 2018–19, the methodology for this measure was adjusted to an index and the measure name updated from the 2017–18 measure description of ‘Empowerment – partner perceptions of how the ATO empowers and includes them’.
Culture – Level of employee engagement
The June 2019 APS Census conducted by the Australian Public Service Commission (APSC) shows that our overall engagement of 6.9 out of 10 met the target. The 2019 results for overall engagement remain the same as for 2018, at the equal highest level they have been since we began participating in 2012. These results remain above the average for large and extra large agencies; and above the APS average overall, although the gap between results for ATO and the APS average decreased slightly in 2019.

02Annual performance statementProgram 1.1 Australian Taxation Office
33
Sustained engagement results over the last few years reflect our continued investment in culture and leadership, particularly our efforts to increase opportunities for our people to develop their capability and to better connect our staff and leaders.
Gender equality – Female representation in the SES and EL classification levels
As at 30 June 2019, female representation in the senior executive service (SES) was 44.9%, increasing from 44.2% the previous year, and continuing a positive long-term trend. The percentage of female staff at the executive level (EL) classification increased from 48.6% to 49.1%.
The end-of-year targets for female representation in both the SES and EL classifications are considered to be met, recognising that normal fluctuations in staffing levels make it highly unlikely for these results to be exactly 45% (for SES) and 50% (EL).
Indigenous representation – Proportion of staff who identify as Indigenous
The proportion of our staff identifying as Aboriginal and Torres Strait Islander was 2.5%, increasing from 2.1% the previous year, and meeting the performance target.
This result is due to continued investment in employment strategies to increase Indigenous representation in our workforce, with the objective of removing barriers to both gaining and retaining employment in the ATO for Aboriginal and Torres Strait Islander people.
Staff experience
The June 2019 APS Employee Census conducted by the Australian Public Service Commission (APSC) had 63% of ATO employees agreeing that their workgroup has the tools and resources needed to perform well. This result is significantly higher than the 2019 overall APS, larger operational agencies and the extra-large agencies results for the same question, whilst being a decrease on the 2018 ATO result of 69%. It is possible employee awareness and expectations have increased as tools and resources have not been reduced during the year, and a significant program of upgraded tools is currently being delivered.
In 2018–19, the ATO had a focus on improving the digital experience for staff. The full program is yet to be delivered and we have recognised that the value of individual improvements might not be fully appreciated unless they are viewed as part of a broader program of work. For example, during the year we rolled out a replacement to our instant messenger tool. When we have completed our associated telephony upgrade later this year, we will be able to maximise the full functionality of the instant messenger tool. Since April 2019, we have had a focus on showing staff how individual improvements to tools and technology and other resources are connected as a whole. The impact of improvements to staff’s digital experience including a refresh of our desktop and laptop hardware is likely to be reflected in the 2020 Census.
Tax returns – Proportion of items that are pre-filled
The presented result of 87.9% is a slight increase on last year’s result of 87.5%, indicating the continued quality and timeliness of pre-filling to support clients and tax agents to lodge their tax return and meet their obligations.
The result is solely focused on individuals who are not in business. It reflects the proportion of their total income where our pre-filling exactly matched their final income tax result. This measure uses a dollar-based systems assurance approach, where pre-filling makes it easier for clients to meet their obligations and increases trust and confidence in the accuracy of final tax outcomes.
02 Commissioner of Taxation annual report 2018–19
34
To allow for appropriate checking of our pre-fill results against the final income tax return, the methodology for this measure applies a time lag and reflects Tax Time 2017 results. This is to allow sufficient time for lodgment program periods for clients and tax agents to be completed and results assured by the ATO.
This measure was first reported in 2017–18, and there is not yet a performance target with which to assess the result. A performance target has been set for 2019–20.
Security policy – Level of compliance with Protective Security Policy Framework mandatory requirements
The purpose of this measure is to report the ATO’s overall level of maturity with the 16 Protective Security Policy Framework (PSPF) requirements following the introduction of the PSPF reforms on 1 October 2018.
The ATO has shown a strengthened security environment to ensure that it can effectively anticipate and manage security risks for stakeholders and the community.
There has been continued investment in developing and implementing a communication strategy to ensure staff understand their security obligations, including improvements made for staff annual refresher training. We have continued to engage with vendors and service providers to ensure that the security priorities of the ATO are aligned and that shared risks are managed while we continue to improve digital services for clients.
The ATO has reported our maturity with the new PSPF to the Attorney-General’s Department. Details on the levels of maturity are not made public for security reasons.
Availability – Key digital systems availability
Measuring availability of our digital systems ensures that we understand the reliability of services for clients interacting digitally. The overall result for 2018–19 was 99.5%, a 0.1 percentage point increase from 2017–18. There is no performance target for 2018–19 with which to assess this result. A target of 99.5% has been set for 2019–20.
The methodology for this measure comprises the availability of six externally facing and four internally facing key IT systems. Availability is the comparison between the planned availability with the actual availability of a system for users.
For externally facing systems used by our clients and partners, the average availability was 99.3% and for internally facing systems used by staff, the average availability was 99.8%.
Budget – ATO manages its operating budget to balance
The ATO commenced 2018–19 with an operating expense budget, excluding depreciation, of $3.4 billion. During the year, the following changes impacted our funding: � Small Business Package – making it easier for business (increase of $6.0 million) � Small Business Package – supporting small businesses with tax disputes (increase of
$1.0 million) � VET FEE-HELP debts – additional student protection (increase of $1.6 million) � Women’s Economic Security Package (decrease of $0.2 million) � revised start dates for tax measures (decrease of $1.9 million) � electronic invoicing adoption (decrease of $2.3 million) � appropriation reclassification from operating budget to departmental capital budget (decrease of
$20.0 million).

02Annual performance statementProgram 1.1 Australian Taxation Office
35
The ATO’s 2018–19 financial result (including the ACNC) was an operating deficit of $3.3 million, or 0.1% of budget This result excludes non-cash financial accounting adjustments such as write-off expenses, depreciation, amortisation, finance lease and revaluation adjustments made for our financial statements.
Refer to our financial statements in Part 5 for detailed information.
Cost of collection – Cost to collect $100
The decreased cost to collect $100 (both inclusive and exclusive of GST) met the performance target for 2018–19 and is largely due to the 8% increase in revenue collections in 2018–19.

02 Commissioner of Taxation annual report 2018–19
36
Program 1.2 Tax Practitioners Board
The Tax Practitioners Board (TPB) is an independent statutory body. It is responsible for the general administration of the Tax Agent Services Act 2009 and regulation of tax practitioners, including tax agents, business activity statement (BAS) agents and tax (financial) advisers.
Due to its operational independence and statutory obligations, the TPB has produced its own annual report, which is available at tpb.gov.au.
PurposeThe TPB’s role is to ensure that tax practitioner services are provided to the public in accordance with appropriate standards of professional and ethical conduct.
The TPB has three strategic objectives to achieve its purpose: � protect all consumers of tax practitioner services � maintain, protect and enhance the integrity of the registered tax practitioner profession � promote the TPB as an independent, efficient and effective regulator.
Annual performance statementThe annual performance statement for the TPB is included in the Tax Practitioners Board annual report 2018–19.
Performance criteria for the TPB are set out on pages 191–195 of the Australian Taxation Office Budget Statements (in the Treasury PBS) and pages 12–17 of the Tax Practitioners Board corporate plan 2018–19.

02Annual performance statementProgram 1.3 Australian Business Register
37
Program 1.3 Australian Business Register
The Commissioner of Taxation is also the Registrar of the Australian Business Register (ABR). The Registrar has separate and distinct responsibilities as outlined in section 28 of the A New Tax System (Australian Business Number) Act 1999.
The ABR program encompasses: � the Register, which is a trusted national business dataset, and business registry services � Standard Business Reporting (SBR), which defines a common language for business information
and standards, for digital information exchange and sharing with businesses and government � secure authentication options, giving business easy access to a range of services.
PurposeThe purpose of the ABR program is to: � deliver effective and efficient business registry services that provide trusted and accessible
national business data � encourage trust and confidence in the broader use of national business data – by the
community, businesses and government – to promote the development of new and better services for businesses, using the ABN as a key identifier
� reduce the administrative cost to businesses in their dealings with other businesses and government.
Program overviewThis overview of ABR program performance aligns with the ATO corporate plan 2018–19, and presents our 2018–19 performance against the three strategic initiatives to deliver the program.
Overview
The ABR program supports a fairer business environment for the community, businesses and government through trusted business registry services and digital standards. We are constantly working to increase the value of ABR data through understanding how it can be better used by businesses, governments and communities to unlock social and economic value for Australia.
This objective had two measures, both of which were fully met.

02 Commissioner of Taxation annual report 2018–19
38
Strategic initiatives summary
The ABR program commitments for 2018–19 included maintaining trust and confidence in the Register, and maintaining the digital exchange standards – through SBR.
The integrity of Australian business numbers (ABNs) is essential to establishing trust in the Register. This year, we changed the online application process to improve earlier identification of applicants not entitled to an ABN. We also removed almost 680,000 ABNs through our cancellation programs, including around 610,000 ABNs that had not received any business income in previously lodged income tax returns.
We developed a whole-of-government SBR definitions and API catalogue ‘working prototype’ with the Digital Transformation Agency.
We also commenced work with the New Zealand Ministry of Business Innovation & Employment to implement a standardised approach to e-invoicing, based on the Pan-European Public Procurement On-Line (PEPPOL) interoperability framework, for use within Australia and New Zealand. E-invoicing will enable the direct exchange of invoices between the financial systems of suppliers and buyers, helping to create a seamless Trans-Tasman business environment. It will be available for use by the end of 2019.
In the 2018–19 Budget, we received funding to develop a detailed business case outlining options to modernise business registry services and introduce a Director Identification Number (DIN). The government’s intention is for a modernised business registry service and DINs to be administered by the ATO.
Working with our government partners, including ASIC, we sought input from: � the public – via roundtable events and a second round of consultation with over 100 participants � key stakeholder groups on the Modernising Business Registry Program’s Review of registry fees
consultation paper, receiving 22 submissions during the consultation period.
Consultation and high level co-design for the DIN has been completed and options for implementation have been provided to government.
In response to Black Economy Taskforce findings, we conducted public consultation on ABN regulatory reform, seeking views on possible changes such as adjusting ABN entitlement rules, imposing conditions on ABN holders, and introducing a renewal process with a renewal fee. Overall interest was very high, with over 180 submissions on the public consultation paper from a diverse range of stakeholders. There was broad support to address ABN misuse and make ABN holders more accountable for meeting their government obligations, while minimising the regulatory impact on businesses doing the right thing.
In the 2019 Budget, the government announced measures to strengthen the ABN system to disrupt black economy behaviour. ABN holders will be required to meet obligations to lodge their income tax return from 2021 and review their ABN details annually from 2022. These changes will also continue to improve the overall quality of the information on the ABR.

02Annual performance statementProgram 1.3 Australian Business Register
39
Performance results
Our two performance criteria are set out on page 197 of the Australian Taxation Office Budget Statements (in the Treasury PBS), and pages 19 and 24 of the ATO corporate plan 2018–19.
TABLE 2.2 ABR results, 2016–17 to 2018–19
Results Target
Performance criterion Source 2016–17 2017–18 2018–19 2018–19
Increased use of the ABR as the national business dataset
PBS 197 Corp plan 19, 24
� government agencies 232 agencies using ABR
Explorer (66% increase)
312 agencies using ABR
Explorer (34% increase)
368 agencies using ABR
Explorer (18% increase)
340 agencies using ABR Explorer
12 agencies using ABR Connect
11 agencies using ABR
connect
17 agencies using ABR
connect
� community 32.5% increase in
ABN Lookup searches
1,031m ABN Lookup
searches (32.5%
increase)
1,445m ABN Lookup
searches (40%
increase)
1.1 billion ABN Lookups
Reduction in the administrative cost to businesses and government in dealing with each other
PBS 197 Corp plan 19, 24
$1.39b $1.58b $1.55b $1.55b
Target achieved Target substantially achieved Target not achieved Result not available
Results analysis
Increased use of the ABR as the national business dataset
Consumption of ABR data by government agencies and the community continues to increase through a variety of channels, including ABR Explorer, ABR Connect, Data Transfer Facility and ABN Lookup. In 2018–19, the number of agencies using ABR Explorer increased by 18% to 368, while the number using ABR Connect web services increased from 11 to 17, both exceeding their target. ABN Lookup downloads exceeded 1.4 billion, a 40% increase from the previous year and exceeding target.
We supported the increased use of ABR data by continuing to develop products that promote self-service, and education materials to facilitate interactions with ABR Explorer. System enhancements also improved the quality of data queries for agencies.
The second generation of ABR Connect web services (ABR Agency Connect) is currently in a Beta version with three participating agencies. Two agencies have completed testing and have transitioned the service into their production environments, while the third agency plans to release the service later in 2019. We are also working with Digital Communication and Identity Services (DCIS) to incorporate a whole-of-government authentication solution for the service. Our ABR Connect web services lower costs for government agencies by reducing the need for multiple databases or registers that duplicate information.

02 Commissioner of Taxation annual report 2018–19
40
Reduction in the administrative cost to businesses and government in dealing with each other
In 2018–19, there was a slight decrease ($38 million) in the reduction of administrative costs, compared with the previous year. This brought the total annual reduction, relative to the costs of businesses using lodgment methods via previous systems, to almost $1.6 billion, which met the performance target. The small decline is primarily due to a refinement of the methodology compared with previous years, together with the higher-than-expected result in 2017–18.
The result indicates that savings to business and government from ABR program initiatives continue to deliver in reducing the reporting burden, minimising cost to business and enhancing business interactions through natural-based systems for the business community.
As new initiatives such as e-invoicing and STP are implemented, savings are expected to increase further for both business and government.
02Annual performance statementProgram 1.4 Australian Charities and Not-for-profits Commission
41
Program 1.4 Australian Charities and Not-for-profits Commission
The Australian Charities and Not-for-profits Commission (ACNC) is the independent regulator of charities at the Commonwealth level. The ACNC Commissioner has a number of statutory functions and regulatory powers, as set out in the Australian Charities and Not-for-profits Commission Act 2012 and the Australian Charities and Not-for-profits Commission Regulation 2013.
Due to its operational independence and statutory obligations, the ACNC has produced its own annual report, which is available at acnc.gov.au.
PurposeThe ACNC’s objectives are to: � maintain, protect and enhance public trust and confidence in the Australian not-for-profit sector � support and sustain a robust, vibrant, independent and innovative Australian not-for-profit sector � promote the reduction of unnecessary regulatory obligations on the Australian
not-for-profit sector.
Annual performance statementThe annual performance statement for the ACNC is included as part of the Australian Charities and Not-for-profits Commission annual report 2018–19.
The performance criteria for the ACNC are set out on pages 198–201 of the Australian Taxation Office Budget Statements (in the Treasury PBS) and pages 6–7 of the ACNC corporate plan 2018–19.
02 Commissioner of Taxation annual report 2018–19
42
Administered programs 1.5 to 1.18
PurposeThe ATO contributes to the economic and social wellbeing of Australians through governing a range of programs that result in transfers and benefits back to the community.
Performance results overviewAll deliverables are achieved through making payments to eligible recipients in accordance with relevant laws.
We paid $11.7 billion in administered payments in 2018–19, $335 million (or 2.9%) higher than 2017–18 and $50 million (or 0.4%) less than forecast in the 2018–19 Budget. The largest expense was fuel tax credits with payments of $7.2 billion. This was $272 million (or 3.9%) above the 2018–19 Budget forecast.
TABLE 2.3 Administered payments 2016–17 to 2018–19(a)
Payments2016–17
$m2017–18
$m2018–19
$m
Energy/fuel schemes payments
Fuel tax credits 6,238 6,814 7,179
Product stewardship for oil program 72 75 73
Cleaner fuels grants scheme 1 0 0
Exploration Development Incentive(b) 19 4 0
Junior Minerals Exploration Incentive 0 0 0
Total energy/fuel scheme payments 6,330 6,892 7,252
Other administered payments
Education tax refund 1 0 0
Private health insurance rebate 249 249 240
National rental affordability 166 188 170
Superannuation co-contribution scheme 148 126 126
Research and development tax offsets(c) 2,546 2,463 2,311
Australian Screen Production Incentive(d) 280 282 328
Low income superannuation tax offset(e) 793 779 743
Interest payments on lost superannuation accounts 14 15 28
Seafarer tax offset 12 9 10

02Annual performance statementAdministered programs 1.5 to 1.18
43
TABLE 2.3 Administered payments 2016–17 to 2018–19(a) continued
Payments2016–17
$m2017–18
$m2018–19
$m
Total other administered payments 10,540 11,003 11,208
Distribution of super guarantee charge entitlements 281 402 532
TOTAL(f) 10,822 11,405 11,740
NOTES(a) Totals may differ from the sum of components due to rounding.(b) The 2017–18 exploration development incentive amount of $4 million is an estimate, due to difficulties associated with tracing
payments to the ultimate beneficiary. There were very small residual amounts for 2018–19.(c) Only refundable research and development tax offsets are administered payments.(d) The 2017–18 Australian Screen Production Incentive of $282 million is an estimate due to difficulties with data matching. The 2018–19
amount is materially accurate.(e) Low income superannuation tax offset replaced the low income super contribution from 1 July 2017.(f) The 2018–19 total excludes $91 million of interest on overpayments of tax.
Performance results – programs 1.5 to 1.13 and 1.15 to 1.18
The way the ATO measures the performance of administered programs and the achievement of their purpose is set out on pages 202–212 of the Australian Taxation Office Budget Statements (in the Treasury PBS), and pages 25–26 of the ATO corporate plan 2018–19.
TABLE 2.4 Programs 1.5 to 1.13 and 1.15 to 1.18 Administered programs performance
Results Target
Performance criterion Source 2016–17 2017–18 2018–19 2018–19
1.5 Australian Screen Production Incentive – Value of tax offsets processed
PBS 202 Corp plan 26
$279.7m $281.8m $328.0m Administer the program
in accordance with the law
1.6 Junior Minerals Exploration Incentive – All applications received are processed and taxpayers notified of their exploration credit allocation within 28 calendar days of the application period closing
PBS 203 Corp plan 25
Target met Within 28 calendar
days of the application
period closing
1.6 Junior Minerals Exploration Incentive – Public reporting data uploaded on data.gov.au (and linked to the ato.gov.au website) after determination letters are issued
PBS 203 Corp plan 25
Target met Within 56 calendar
days of the application
period closing
1.7 Fuel Tax Credits Scheme – Value of claims
PBS 203 Corp plan 26
$6.2b $6.8b $7.2b Administer the program
in accordance with the law
1.8 National Rental Affordability Scheme – Value of tax offsets processed
PBS 204 Corp plan 26
$166.2m $188.2m $170.3m Administer the program
in accordance with the law
1.9 Product Stewardship for Oil Program – Value of revenue collected
PBS 204 Corp plan 26
$33.9m $33.6m $30.9m Administer the program
in accordance with the law
1.9 Product Stewardship for Oil Program – Value of payments processed
PBS 204 Corp plan 26
$71.9m $74.9m $72.7m Administer the program
in accordance with the law

02 Commissioner of Taxation annual report 2018–19
44
TABLE 2.4 Programs 1.5 to 1.13 and 1.15 to 1.18 Administered programs performance continued
Results Target
Performance criterion Source 2016–17 2017–18 2018–19 2018–19
1.10 Research and Development Tax Incentive – Value of claims processed for 38.5%(a) non-refundable research & development tax offset claimants
PBS 205 Corp plan 26
$3.6b tax offset paid (based on 40% non-refundable research
and development tax offset claimants)
$2.9b tax offset paid
$2.7b tax offset paid
Administer the program
in accordance with the law
1.10 Research and Development Tax Incentive – Value of claims processed for 43.5%(b) refundable research & development tax offset claimants
PBS 205 Corp plan 26
$2.5b tax offset paid (based on 45% refundable research
and development tax offset claimants)
$2.5b tax offset paid
$2.3b tax offset paid
Administer the program
in accordance with the law
1.10 Research and Development Tax Incentive – Number of claims processed for 38.5% non-refundable research & development tax offset claimants
PBS 205 Corp plan 26
1,812 (based on 40% non-refundable
research and development tax offset claimants)
1,754 1,600 Administer the program
in accordance with the law
1.10 Research and Development Tax Incentive – Number of claims processed for 43.5% refundable research & development tax offset claimants
PBS 206 Corp plan 26
11,262 (based on 45% refundable
research and development tax offset claimants)
11,402 10,819 Administer the program
in accordance with the law
1.10 Research and Development Tax Incentive – Proportion of offsets processed within service standard timeframes
PBS 206 Corp plan 26
42.4% 76% 89.7% Administer the program
in accordance with the law
1.11 Low Income Superannuation Tax Offset – Value of entitlements paid
PBS 207 Corp plan 26
$793.5m $779.3m $743.4m Administer the program
in accordance with the law
1.12 Private Health Insurance Rebate – Value of rebates processed
PBS 207 Corp plan 26
$249.2m $248.8m $239.7m Administer the program
in accordance with the law
1.13 Superannuation Co-contribution Scheme – Value of entitlements paid
PBS 208 Corp plan 26
$147.8m distributed
$125.8m $125.9m Administer the program
in accordance with the law
See table 2.5 for Program 1.14 – Superannuation Guarantee Scheme
1.15 Targeted Assistance through the Taxation System – Value of interest payments processed
PBS 211 Corp plan 26
$14.2m $14.9m $27.7m Administer the program
in accordance with the law
1.16: Interest on Overpayments and Early Payments of Tax – Value of credit interest applied to client accounts due to processing performance
PBS 211 Corp plan 26
$29.8m $13.0m $9.4m Administer the program
in accordance with the law
1.17 Bad and Doubtful Debts – Provision for bad and doubtful debts as a proportion of total tax receivables
PBS 212 Corp plan 25
36% 35% 34% Below 35%
1.18 Seafarer Tax Offset – All eligible taxpayers are aware of how to claim the offset
PBS 212 Corp plan 25
100% 100% 100% 100%
NOTES
(a) For 2016–17 the research and development tax offset percentage was 40%. It was changed to 38.5% in 2017–18.(b) For 2016–17 the research and development tax offset percentage was 45%. It was changed to 43.5% in 2017–18.

02Annual performance statementAdministered programs 1.5 to 1.18
45
Results analysis
We use our systems, processes and controls to establish and maintain confidence that the correct level of payments and transfers delivered through the tax and superannuation systems are paid to eligible recipients in accordance with relevant laws, thus meeting our performance target for many of our administered program measures.
In many instances, small annual fluctuations in the value of benefits arise due to minor changes in economic conditions or the circumstances of our clients. However, there are some programs where a more substantial change in the value of benefits was observed in 2018–19. There is considerable interest in the Superannuation Guarantee scheme and changes in the number and value of liabilities raised by the ATO. Further discussion of these cases is provided below.
Administered program 1.15: Targeted Assistance through the Taxation System
The significant increase in the value of interest paid in the 2018–19 financial year can be attributed to: � The reuniting campaigns that were conducted during the 2018–19 year including the proactive
payments of unclaimed super money for those over 65 years old and amounts below $200. � The improvement resulting from the MAAS and MATS implementation. As we are now receiving
near real time information on the clients, this enables prompter matching of information. As a result of us being able to match our client data better and faster, we have paid out interest retrospectively in that year on the unclaimed super monies accounts that we have held for a number of years.
� The client awareness campaigns that we have run resulting in more clients joining myGov and consolidating their accounts.

0302 Commissioner of Taxation
annual report 2018–19
46
Performance results – programs 1.14
TABLE 2.5 Program 1.14 Superannuation Guarantee Scheme
Results Target
Performance criterion Source 2016–17 2017–18 2018–19 2018–19
Number of superannuation guarantee complaints leading to:
PBS 209 Corp plan 26
Administer the program
in accordance with the law � a superannuation liability being raised 5,598 13,441 10,917
� no result 7,060 5,472 3,804
Number of employees who have had superannuation guarantee entitlements raised as a result of:
PBS 209 Corp plan 26
Administer the program
in accordance with the law � ATO compliance activities 69,705 237,945 173,876
� voluntary disclosures 77,344 77,785 105,463
Number of: PBS 209 Corp plan 26
Administer the program
in accordance with the law
� employers whose records are checked
16,874 24,106 22,236
� checks leading to a superannuation liability being raised
7,700 16,416 15,965
Proportion of employers for whom superannuation guarantee liabilities were raised by the ATO
PBS 209 Corp plan 26
0.9% 1.8% 1.7% Administer the program
in accordance with the law
Value of superannuation guarantee charge:
PBS 209 Corp plan 25 � raised (including penalties and interest) $603.5m $1,107.2m $1,069.2m $841m
� collected $282.9m $440.9m $576.6m $311m
Value of superannuation guarantee entitlements distributed to individuals or superannuation funds
PBS 210 Corp plan 25
$281.1m $401.6m $532.3m $285m
Value of superannuation guarantee debt: PBS 210 Corp plan 25 � on hand $1.5b $1.9b $2.2b $3.4b
� irrecoverable at law or uneconomical to pursue
$167.0m $238.8m $191.7m $178m
Results analysis
Administered program 1.14: Superannuation Guarantee Scheme
Positive trends observed in 2017–18 with regard to superannuation guarantee funds collected and distributed to individuals and super funds continued in 2018–19, driven by a higher collection rate of compliance-related debt.
There was a decrease in case numbers across most of the superannuation guarantee measures. However the number of employees with entitlements raised as a result of voluntary disclosures increased substantially compared to 2017–18.

03Revenue collection
As Australia’s principal revenue agency, the ATO facilitates the collection of revenue to fund public goods and services for the community. We do this through a range of collection systems, including income tax, goods and services tax (GST) and excise duty.
Net tax collections in 2018–19 were $426.0 billion, up $29.2 billion (7.4%) over the previous year, and $8.3 billion (2.0%) above the amount expected at the time of the Budget 2018–19.
Company tax collections increased by $9.0 billion (10.7%) in 2018–19. The outcome was $4.5 billion above the Budget forecast, largely reflecting higher-than-expected mining profits due to high commodity prices.
Total individuals tax collections grew by $16.7 billion (8.1%) this year. The outcome was $5.7 billion above the Budget forecast, partly reflecting higher-than-expected capital gains and dividend income, and weaker deductions.
Superannuation income tax collections increased by $0.5 billion (4.3%) this year. The outcome was $1.0 billion above the Budget forecast.
GST collections increased by $2.0 billion (3.2%) this year. The outcome was $2.2 billion below the Budget forecast, reflecting weaker than expected growth in consumption and dwelling investment.
Excise collections were $0.6 billion (2.6%) higher than 2017–18 and $0.2 billion higher than the Budget forecast.
Revenue performance

03 Commissioner of Taxation annual report 2018–19
48
TABLE 3.1 ATO net tax cash collections, 2016–17 to 2018–19(a)
Tax2016–17
$m2017–18
$m2018–19
$m
Gross PAYG withholding(b) 179,355 192,229 204,764
Gross other individuals 42,871 43,866 48,423
Individual refunds –28,364 –29,102 –29,514
Total individuals 193,863 206,993 223,673
Companies 68,408 84,549 93,590
Superannuation funds(c) 8,218 10,804 11,269
Resource rent taxes(d) 981 1,116 1,053
Fringe benefits tax(e) 4,046 3,911 3,794
Total income tax 275,515 307,373 333,379
Excise 21,800 22,703 23,300
Goods and services tax (GST)(f) 60,022 63,265 65,270
Other indirect taxes(g) 1,506 1,586 1,657
Total indirect taxes 83,328 87,554 90,227
Major bank levy(h) – 1,139 1,560
Superannuation guarantee charge 283 441 577
Foreign investment application fees 134 114 94
Self-managed superannuation fund levy 122 129 144
Total net tax collections 359,381 396,749 425,980
Other revenue(i) 666 326 –59
Total collections 360,046 397,075 425,921
HELP/SFSS(j) 2,129 2,462 2,915
NOTES(a) The cash collections data presented in this table has been adjusted to exclude administered expenses and better align with
the financial statements and the Final Budget Outcome. Totals may differ from the sum of components due to rounding.(b) Includes amounts withheld from salaries and wages, TFN and ABN withholdings, dividend, interest, royalty, and mining
withholding taxes.(c) Includes income tax for superannuation funds and superannuation surcharge, and no TFN contributions tax.(d) For 2016–17 and 2018–19, resource rent taxes include both petroleum resource rent tax and minerals resource rent tax.(e) Includes Australian Government departments and authorities.(f) Includes some collections by the Department of Home Affairs; in 2018–19, these were $4.2 billion. Also includes GST non-general
interest charge penalties, which are not distributed to the state and territory governments under the intergovernmental agreement.(g) Includes wine equalisation tax (WET) and luxury car tax (LCT), of which a small amount was collected by the Department of
Home Affairs.(h) Started 1 July 2017.(i) The majority of ‘other revenue’ is net unclaimed superannuation monies. The ATO’s efforts to engage with and encourage fund
members to reunite with their lost and unclaimed super has meant that transfers from ATO-held superannuation accounts to members exceeded receipts of unclaimed superannuation monies in 2018–19.
(j) Higher Education Loan Program (HELP) and Student Financial Supplement Scheme (SFSS) collections.

03Revenue performanceRevenue collection
49
TABLE 3.2 Expected revenue – Variation between Budget forecast and actual net collections in 2018–19
Collected fromCollections
$mBudget
$mVariance
$m
Total individuals 223,673 218,000 5,673
Companies 93,590 89,100 4,490
GST 65,270 67,510 –2,240
Superannuation funds 11,269 10,310 959
Other 32,179 32,788 –609
Total net tax collections 425,980 417,708 8,273
In 2018–19, we issued income tax refunds with a total value of $43.1 billion. We also issued activity statement refunds with a total value of $64.0 billion. Total refunds were $107.2 billion, up 4.8% from 2017–18.
TABLE 3.3 Amount refunded, 2016–17 to 2018–19(a)
Type of refund2016–17
$m2017–18
$m2018–19
$m
Income tax � Income tax – Total individuals(b) 28,364 29,102 29,514
� Income tax – Companies 9,550 9,311 9,609
� Income tax – Superannuation funds(c) 3,674 3,473 3,296
� Income tax – Resource rent taxes(d) 110 42 167
� Income tax – Fringe benefits tax(e) 706 565 546
Total income tax 42,403 42,493 43,131
Excise 34 30 27
Activity statements(f) 56,700 59,777 64,006
TOTAL 99,137 102,300 107,164
NOTES(a) Refunds data presented in this table has been adjusted to exclude all administered expenses and better align with our financial
statements and the Final Budget Outcome. Totals may differ from the sum of components due to rounding.(b) Excludes administered payments, such as private health insurance rebate.(c) Includes superannuation surcharge refunds.(d) For 2016–17 and 2018–19, resource rent taxes includes both petroleum resource rent tax and minerals resource rent tax.(e) Includes Australian Government departments and authorities.(f) Excludes fuel tax credit business activity statement refunds.

03 Commissioner of Taxation annual report 2018–19
50
Tax performance
Our tax performance research program monitors the health of the system and our performance in managing it through a broad suite of measures including tax gap estimates and tax assured, which estimates the amount of tax that we are highly confident has been reported correctly. This provides insights into the operation of the tax and superannuation systems.
Addressing non-compliance through audits and other correction activities will always be an important part of our compliance approach. Our real success lies in ensuring taxpayers get things right from the start, locking in future compliance after we have made a correction and maintaining confidence that the right amount of taxes continue to be paid. This approach sustainably reduces the tax gap and our overall impact is measured as total revenue effects.
Tax gap estimatesTax gaps estimate the difference between what the ATO collects and the amount that would have been collected if every taxpayer was fully compliant with the law.
We separate our gap estimates into those relating to transactional-based taxes, income-based taxes and administered programs. The ATO aims to identify, manage and sustainably reduce tax gaps over time and maximise voluntary compliance. We engage with a range of stakeholders to understand the risks and drivers and how we can collaboratively address the issues.
Recognising the importance of having reliable and credible tax gap estimates, we engage an independent expert panel to provide advice on the suitability of our gap methodologies and the reliability of the estimates.
An explanation of our methodologies and an analysis of each of the gaps are available at ato.gov.au/taxgap.
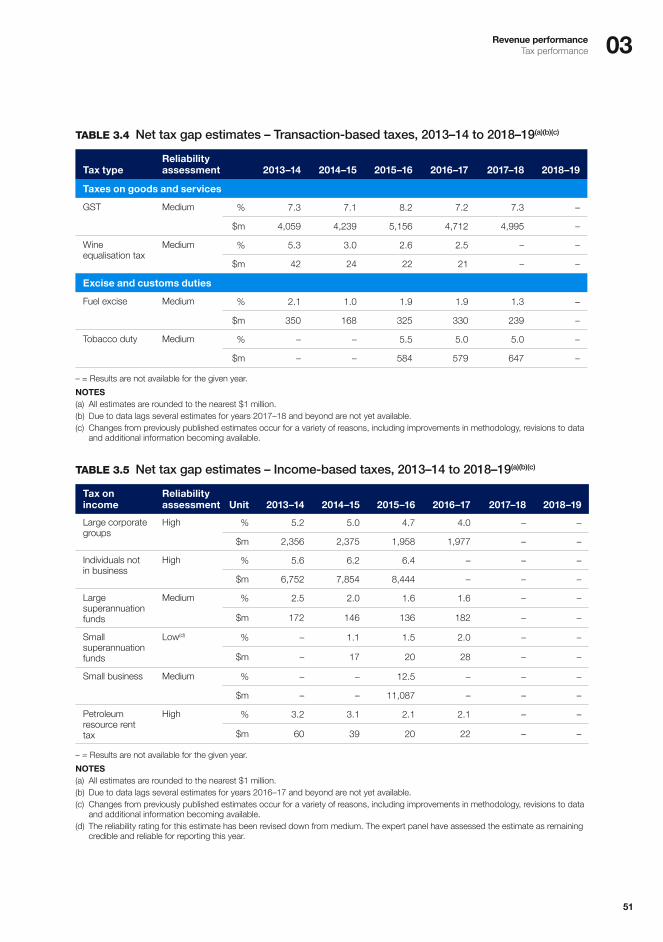
03Revenue performanceTax performance
51
TABLE 3.4 Net tax gap estimates – Transaction-based taxes, 2013–14 to 2018–19(a)(b)(c)
Tax typeReliability assessment 2013–14 2014–15 2015–16 2016–17 2017–18 2018–19
Taxes on goods and services
GST Medium % 7.3 7.1 8.2 7.2 7.3 –
$m 4,059 4,239 5,156 4,712 4,995 –
Wine equalisation tax
Medium % 5.3 3.0 2.6 2.5 – –
$m 42 24 22 21 – –
Excise and customs duties
Fuel excise Medium % 2.1 1.0 1.9 1.9 1.3 –
$m 350 168 325 330 239 –
Tobacco duty Medium % – – 5.5 5.0 5.0 –
$m – – 584 579 647 –
– = Results are not available for the given year.
NOTES(a) All estimates are rounded to the nearest $1 million.(b) Due to data lags several estimates for years 2017–18 and beyond are not yet available.(c) Changes from previously published estimates occur for a variety of reasons, including improvements in methodology, revisions to data
and additional information becoming available.
TABLE 3.5 Net tax gap estimates – Income-based taxes, 2013–14 to 2018–19(a)(b)(c)
Tax on income
Reliability assessment Unit 2013–14 2014–15 2015–16 2016–17 2017–18 2018–19
Large corporate groups
High % 5.2 5.0 4.7 4.0 – –
$m 2,356 2,375 1,958 1,977 – –
Individuals not in business
High % 5.6 6.2 6.4 – – –
$m 6,752 7,854 8,444 – – –
Large superannuation funds
Medium % 2.5 2.0 1.6 1.6 – –
$m 172 146 136 182 – –
Small superannuation funds
Low(d) % – 1.1 1.5 2.0 – –
$m – 17 20 28 – –
Small business Medium % – – 12.5 – – –
$m – – 11,087 – – –
Petroleum resource rent tax
High % 3.2 3.1 2.1 2.1 – –
$m 60 39 20 22 – –
– = Results are not available for the given year.
NOTES(a) All estimates are rounded to the nearest $1 million.(b) Due to data lags several estimates for years 2016–17 and beyond are not yet available.(c) Changes from previously published estimates occur for a variety of reasons, including improvements in methodology, revisions to data
and additional information becoming available.(d) The reliability rating for this estimate has been revised down from medium. The expert panel have assessed the estimate as remaining
credible and reliable for reporting this year.

03 Commissioner of Taxation annual report 2018–19
52
TABLE 3.6 Net gap estimates – Programs we administer, 2013–14 to 2018–19(a)(b)(c)
Administered programs
Reliability assessment Unit 2013–14 2014–15 2015–16 2016–17 2017–18 2018–19
Superannuation guarantee
Medium % 5.3 5.1 4.8 3.9 – –
$m 2,824 2,867 2,745 2,298 – –
Pay as you go (PAYG) withholding
Medium % 2.8 2.7 2.2 1.7 – –
$m 4,550 4,568 3,871 3,046 – –
Fuel tax credits
Medium % –0.1 –0.0(d) –0.1 –0.1 –0.1 –
$m –7 –3 –9 –7 –6 –
– = Results are not available for the given year.
NOTES(a) All estimates are rounded to the nearest $1 million.(b) Due to data lags several estimates for years 2017–18 and beyond are not yet available.(c) Changes from previously published estimates occur for a variety of reasons, including improvements in methodology, revisions to data
and additional information becoming available.(d) Figure less than zero when not rounded.
Tax assuredTax assured is an estimate of the proportion of tax that we are highly confident is correctly reported.
This measure is based on the concept of ‘justified trust’. We achieve justified trust and consider tax to be assured when we have evidence that the reporting of taxable income, deductions and offsets is complete and accurate.
We collect evidence to assure tax from a range of sources. Where possible we collect evidence from third-parties to match against information reported to us.
For individuals, our primary approach is to assure tax by matching information on taxpayers’ income tax returns with third-party data such as: � salary and wage information received from employers through the PAYG withholding system � interest and dividend data from financial institutions and public companies � pensions and allowances from government departments.
For businesses, particularly larger businesses, we primarily assure tax through one-to-one engagements.
Under our justified trust program, we undertake specific tax assurance engagements with: � the top 100 and next 1,000 public and multinational businesses � the top 320 private groups.
We also assure indirect tax through our ongoing relationships with large excise clients.
At 30 June 2019 we estimated that 45.6% of total tax reported for the 2016–17 tax year could be assured. During 2018–19 we also assured an additional 1.9% for the 2015–16 tax year, bringing the total tax assured estimate for that year to 47.4%.
In practice, we cannot gather third party data or other evidence to compare against all tax returns. As such our tax assured estimates will always be lower than the real amount of tax that is correctly reported.

03Revenue performanceTax performance
53
Where we cannot gather evidence to assure tax, we rely on our broader risk management approaches to provide us with confidence with respect to tax reporting. Our risk management approaches help us identify and deal with non-compliance through real-time analytics, benchmarking and sophisticated risk detection algorithms. This is supported by various administrative systems and tools including the Taxable Payments Reporting System.
When considered together with our total revenue effects measure and tax gap estimates, tax assured gives us confidence and valuable insight into the integrity of the revenue system.
For more information, refer to ato.gov.au/taxassured.

03 Commissioner of Taxation annual report 2018–19
54
Total revenue effects
Total revenue effects measures the impact our activities have on improving taxpayer compliance. These activities ultimately improve levels of willing participation with the tax and superannuation systems. By understanding and measuring the impact of our activities, it helps us to develop and improve effective strategies.
Total revenue effects is an estimate of the additional tax revenue that comes from our client engagement activities and interventions. It measures: � the estimated additional tax paid voluntarily by clients we influence where there is a clear causal
connection with our engagements (wider revenue) � the collection of liabilities, including penalties and interest, directly connected to adjustments we
make as a result of our ‘downstream’ interventions (audit yield).
Figure 3.1 shows how the wider revenue effects and audit yield combine with our other activities to add to the total tax base.
FIGURE 3.1 Total revenue effects
Penaltiesand interest
Total revenue effects
Wider revenue effects Audit yield
Tax base
Voluntary revenue
Voluntary payments
As part of our compliance program of work, in 2018–19, we completed approximately 4.3 million interventions with taxpayers to improve compliance.
Some interventions undertaken by the ATO are designed to obtain lodgment or correct a return after it has been lodged. This supports a level playing field and acts as a deterrent where needed. Through these interventions we raised a total of $15.3 billion in liabilities and $10.5 billion in audit yield (some relating to liabilities raised in previous years). This is compared to total liabilities of $15.6 and $16.9 billion raised and audit yield of $10.2 and $11.8 billion in 2016–17 and 2017–18 respectively.
The ATO is continuing to invest more effort and focus on supporting clients to get it right prior to lodging or even when they are first starting out in business. These are complemented by our deliberate efforts to improve future behaviour wherever we engage with clients. We estimate the impact of our pre-emptive strategies and of sustained compliance following our engagements in prior periods, known as wider revenue effects. In 2018–19, we estimated the impact of these interventions to be $4.8 billion.
The total revenue effects for 2018–19 from all of our interventions totalled $15.3 billion.
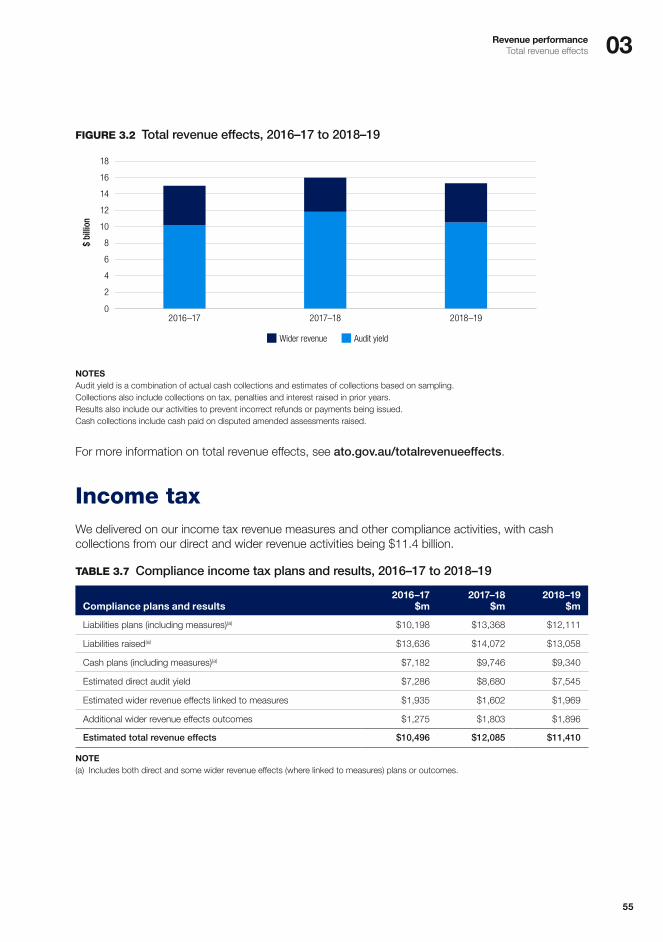
03Revenue performanceTotal revenue effects
55
FIGURE 3.2 Total revenue effects, 2016–17 to 2018–19
$ bi
llion
Wider revenue Audit yield
0
2
4
6
8
10
12
14
16
18
2018–192017–182016–17
NOTESAudit yield is a combination of actual cash collections and estimates of collections based on sampling.Collections also include collections on tax, penalties and interest raised in prior years.Results also include our activities to prevent incorrect refunds or payments being issued.Cash collections include cash paid on disputed amended assessments raised.
For more information on total revenue effects, see ato.gov.au/totalrevenueeffects.
Income taxWe delivered on our income tax revenue measures and other compliance activities, with cash collections from our direct and wider revenue activities being $11.4 billion.
TABLE 3.7 Compliance income tax plans and results, 2016–17 to 2018–19
Compliance plans and results2016–17
$m2017–18
$m2018–19
$m
Liabilities plans (including measures)(a) $10,198 $13,368 $12,111
Liabilities raised(a) $13,636 $14,072 $13,058
Cash plans (including measures)(a) $7,182 $9,746 $9,340
Estimated direct audit yield $7,286 $8,680 $7,545
Estimated wider revenue effects linked to measures $1,935 $1,602 $1,969
Additional wider revenue effects outcomes $1,275 $1,803 $1,896
Estimated total revenue effects $10,496 $12,085 $11,410
NOTE(a) Includes both direct and some wider revenue effects (where linked to measures) plans or outcomes.

03 Commissioner of Taxation annual report 2018–19
56
Goods and services taxWe delivered on our GST revenue measures to government and the states and territories, with cash collections from our direct and wider revenue activities being $3.6 billion.
TABLE 3.8 Compliance GST plans and results, 2016–17 to 2018–19
Compliance GST plans and results2016–17
$m2017–18
$m2018–19
$m
Liabilities plans (including measures)(a) $2,654 $3,011 $2,863
Liabilities raised(a) $3,548 $3,652 $3,531
Cash plans (including measures)(a) $2,113 $2,454 $2,716
Estimated direct audit yield $2,749 $2,821 $2,652
Estimated wider revenue effects linked to measures $134 $142 $146
Additional wider revenue effects outcomes $640 $719 $814
Estimated total revenue effects $3,523 $3,682 $3,612
NOTE(a) Includes both direct and some wider revenue effects (where linked to measures) plans or outcomes.
Excise and other indirect taxesWe raised excise liabilities of $122 million from compliance activities and collected almost $21 million in cash (including collections from liabilities raised in previous years).
For excise transfers (predominantly fuel tax credits), our compliance activities resulted in adjustments in favour of taxpayers of almost $88 million, and adjustments in favour of the revenue of $17 million. Of adjustments in favour of the revenue, we collected around $12 million this year and a further $4 million from liabilities raised in previous years.
As a result of undertaking activities aimed at improving levels of willing participation within the tax and superannuation systems, it is estimated that an additional $50 million in fuel tax credits has been claimed by taxpayers.
Voluntary disclosuresWhere people identify that they have made a mistake or omission in a previously lodged tax return or activity statement, we encourage them to disclose this and work with us to fix the problem.
We raised $1.0 billion in liabilities as a result of such voluntary disclosures. This included around $146 million in GST liabilities, with cash collections of $131 million, as a result of voluntary disclosures from large businesses in 2018–19.

03Revenue performanceTotal revenue effects
57
Penalties and interestInterest is charged on unpaid tax liabilities to ensure fairness for taxpayers who do pay on time and the community as a whole. The penalty provisions encourage taxpayers to take reasonable care in complying with their tax obligations. We can generally remit (reduce or cancel) interest charges and penalties where this is fair and reasonable.
Table 3.9 shows the penalties and interest for 2016–17 to 2018–19.
TABLE 3.9 Penalties and interest, 2016–17 to 2018–19
Penalties and interest2016–17
$m2017–18
$m2018–19
$m
Penalties Applicable 1,529 2,692 1,387
Remitted 399 473 375
Collected 1,139 685 562
Interest Applicable 688 4,728 3,871
Remitted 725 1,504 832
Collected 2,450 2,098 1,628
Working holiday maker frameworkWorking holiday makers (WHM) are subject to a different rate of income tax, including amounts of income tax withholding, regardless of their residency status.
Employers are required to register with us to allow them to apply the different rates of pay as you go (PAYG) withholding to the payments they make to working holiday makers. At 30 June 2019, there were over 46,800 employers registered.
Table 3.10 shows updated figures for tax returns that were lodged by 30 June 2019 where an amount of WHM net income was declared.
TABLE 3.10 Working holiday maker tax returns processed, 2016–17 to 2018–19
Results2016–17 tax
returns(a)2017–18 tax
returns2018–19 tax
returns(b)
Number of tax returns lodged by WHMs 75,614 93,040 2,205
Average taxable income $18,630 $21,098 $17,407
Average income tax withheld $3,259 $3,646 $2,983
Average income tax assessed as payable $2,800 $3,458 $2,860
NOTES(a) The scheme commenced from 1 January 2017. Average income tax calculations made using the whole 2016–17 income year.(b) These statistics are associated with 2018–19 tax returns lodged by 30 June 2019 and reflect early lodged tax returns.

0403 Commissioner of Taxation
annual report 2018–19
58

04Corporate governance
Our governance arrangements support the Commissioner in leading the ATO, setting our strategic direction and ensuring we meet our obligations to the community. We have arrangements in place to assist us in implementing the principles and objectives of corporate governance, which include: � sound governance structures � integrated fraud and risk management � open and transparent operations � being accountable to our stakeholders.
We fulfil our corporate governance responsibilities by complying with accountability requirements in legislation and policy, and meeting public expectations of good management. We regularly review our corporate governance arrangements and ensure our staff have training and information on how the ATO is governed and how we are all held to account.
Management and accountability

04 Commissioner of Taxation annual report 2018–19
60
Our governance structuresThe Commissioner is responsible for governing the ATO – from setting our strategic direction, through to ensuring we are meeting expected outcomes and obligations. He is supported by the ATO Executive and the Audit and Risk Committee. Our governance structure is shown in figure 4.1.
The ATO Executive is supported by an established structure of senior management committees, group executive committees, key corporate committees and consultation forums. These groups monitor various aspects of our performance, make decisions and recommendations, and help us to be responsive to emerging change. The members of the Executive team and their specific responsibilities are outlined on pages 5–7.
The Audit and Risk Committee provides independent advice and assurance to the Commissioner about the appropriateness of the ATO’s financial reporting, performance reporting, risk management oversight, and systems of internal control. The committee is a strong contributor to the good governance, performance and accountability of the ATO. For more information about the committee members, see the Audit and Risk Committee on page 62.
In 2018–19, we reviewed the roles of our senior committees and their membership. Some committees were merged or dissolved, others had changes to their purpose, frequency or membership, and some were unchanged.
FIGURE 4.1 ATO governance structure, at 30 June 2019
The ATO organisational structure is shown in figure 1.2 on page 8.
It is a requirement of the Public Governance, Performance and Accountability Act 2013 (PGPA Act) to list the details of the Accountable Authority during the current reporting period. This is provided in table 4.1.
TABLE 4.1 Details of the Accountable Authority, 2018–19
Name Position title
Period as the Accountable Authority
Date of commencement Date of cessation
Chris Jordan AO Commissioner of Taxation 1 January 2013 29 February 2024
Audit and Risk Committee
ATO Executive Committee
Enterprise Risk Management Committee
Security and Business Continuity
Management Committee
Group Executive committees
Resource Committee
Strategy and Integration Committee
The Commissioner of Taxation

04Management and accountabilityCorporate governance
61
Fraud and risk managementThe minimum standards for the management of fraud are set out in the PGPA Act. They include conducting fraud risk assessments, developing and implementing a fraud control plan, and having mechanisms for dealing with fraud. The PGPA Act also requires that agencies establish and maintain appropriate systems and internal controls for risk oversight and management.
Fraud management
The Commonwealth Fraud Control Framework outlines the Australian Government’s requirements for fraud control, including that government entities put in place a comprehensive fraud control program with appropriate prevention, detection, investigation and reporting strategies.
Fraud against the Commonwealth is a criminal offence that impacts directly on Australians. It reduces the funds available for delivering public goods and services, and undermines public confidence in the government. The ATO considers and addresses potentially fraudulent activity occurring within our organisation and fraud risks from external sources.
Internal fraud prevention and investigations
Throughout the year, we prevented, detected, disrupted and investigated potentially fraudulent activity in the ATO, in line with the Commonwealth Fraud Control Framework 2017.
Potential fraudulent behaviour is identified through a variety of means, including data integration, risk assessment, and reports through both internal and external channels. All reports are considered and assessed, and actioned appropriately, including collaborating with the Australian Federal Police if necessary. Over the course of this year, we assessed 390 allegations or reports, of which: � 74 were substantiated � 134 were unsubstantiated � 70 were not able to be determined � 112 remain open at the end of the year.
Unauthorised access continued to be the largest category of substantiated allegations, and was identified through proactive monitoring and integrity scanning. Unauthorised access predominantly involved an employee accessing their own records, those of their family members or other people known to them. While such access usually does not indicate malicious fraudulent behaviour, the ATO treats any unauthorised access seriously and comprehensive investigations are conducted.
In October 2018, the Inspector-General of Taxation and Taxation Ombudsman (IGTO) released the Review into the ATO’s fraud control management report. The review found no evidence of internal fraud or corruption of a systemic nature, and that the ATO has sound systems for managing risks of internal fraud. The recommendations included improvements to conflict of interest processes, high-risk roles and suitability checks, which we have actioned.
We invest extensively in fraud prevention activities and support for staff to minimise the risk of internal fraud and corruption. We continually develop our range of self-help material and contemporary communication products. We also run education and awareness sessions, engaging staff in conversations about potential internal fraud and corruption risks within their business areas. These sessions complement the ATO’s mandatory staff training package, Security, privacy and fraud, which is to be completed annually by all staff.

04 Commissioner of Taxation annual report 2018–19
62
Crime in the tax and superannuation systems
It is the responsibility of the ATO to protect the tax and superannuation systems against fraud and related crimes. While most taxpayers do the right thing, we need to safeguard the system from those who don’t.
We continually improve our systems to prevent and detect fraud. Our new Tax Integrity Centre makes it easier for the community to make tip-offs on suspected phoenix activity, tax evasion and the black economy.
This year, we investigated and prosecuted taxpayers who evaded their tax obligations, with a particular focus on work-related expenses, GST fraud and the cash economy.
We lead and participate in domestic and international taskforces that provide a whole-of-government response to serious financial crime and related non-compliant behaviour.
The ATO is the lead agency for the Serious Financial Crime, Black Economy and Phoenix taskforces and we contribute to the outcomes of the Illicit Tobacco Taskforce, by targeting, disrupting and dismantling organised crime syndicates that deal in illicit tobacco.
Through our involvement in the Organisation for Economic Co-operation and Development (OECD), the Financial Action Task Force and the Joint Chiefs of Global Tax Enforcement (the J5 Alliance), we are developing a shared understanding and approach to addressing serious financial crime internationally.
Risk management
Whole-of-government requirements for risk management are set out in the Commonwealth Risk Management Policy, and in section 16 of the PGPA Act – which specifies that agencies have a duty to establish and maintain an appropriate system of risk oversight, management and internal control.
The Commissioner and the other members of the ATO Executive team promote a positive and sensible approach to risk management, and continuous improvement of risk practice across the ATO.
The ATO Chief Risk Officer directs a corporate risk and assurance program, aligning with the strategic objectives in the ATO corporate plan 2018–19. The targeted risk advisory activities of the program support key ATO governance committees.
The Chief Internal Auditor directs a comprehensive program of assurance, audit and advisory services. This work assists the Commissioner, the Audit and Risk Committee and the ATO Executive to achieve their business objectives. They work together to develop and maintain efficient and effective systems of internal control, risk management and corporate governance. The ATO’s Internal Audit branch works with internal and external scrutineers on matters of mutual interest, coordinating assurance activity and reducing duplication of audit effort.
Audit and Risk Committee
Our Audit and Risk Committee provides independent assurance and advice on the ATO’s risk control and compliance frameworks, reviews the management of strategic risks, and monitors the effectiveness and performance of the risk management framework.
Committee members bring a broad range of private and public sector experience and skills, including finance, accounting, audit, legal, compliance, risk management, due diligence, and information technology. In order to provide advice and assurance to the Commissioner about the
04Management and accountabilityCorporate governance
63
appropriateness of the ATO’s financial and performance reporting, the committee is supported by specialised subcommittees for financial statements and performance statements. The committee complies with section 45 of the PGPA Act and section 17 of the PGPA Rule (on audit committees for Commonwealth entities).
In 2018–19, the committee comprised three independent members and two ATO senior executives. The independent members were: � Peter Achterstraat, AM, BCom, LLB, BEc (Hons), Chair of the committee since March 2018.
He is currently Commissioner of the NSW Productivity Commission and was Auditor-General of NSW (2006–2013) and NSW Chief Commissioner of State Revenue (1999–2006). He has been President of the Australian Institute of Company Directors (NSW Division) since 2014 and was President of the Institute of Public Administration Australia (NSW Division) from 2009 to 2014. Peter is a fellow of Chartered Accountants Australia and New Zealand, as well as CPA Australia, the Governance Institute of Australia and the Australian Institute of Management. He has more than 30 years experience in finance and governance.
� John Brown, BCom, a fellow of the Institute of Chartered Accountants in Australia, a member of the Australian Institute of Company Directors and former partner with KPMG. He has 26 years experience in a range of practice areas, including accounting, audit, IT audit, due diligence and risk management.
� Carole Ferguson, LLB (Hons), Executive GDipBus, who has over 25 years experience in the financial services industry, with legal, governance, risk, and compliance expertise. She is a former director of Risk and Compliance PwC and was awarded the 2016 Governance, Risk and Compliance Leader of the Year.
The ATO members were: � Second Commissioner Andrew Mills � Assistant Commissioner Kath Anderson (Deputy Chair).
The Australian Charities and Not-for-profits Commission (ACNC) and the Tax Practitioners Board (TPB) have their own Audit and Risk Committees, which have been established as subcommittees of the ATO’s Audit and Risk Committee.
Conformance with obligations
Our ‘Conformance with obligations’ program is a key component of our governance arrangements. The program is aligned with Australian Standards AS ISO 19600:2015 Compliance management systems – Guidelines.
The program aims to: � reduce risks of non-conformance, while increasing the likelihood of early detection and correction � improve employee awareness of legal and policy obligations at all levels of the organisation � foster a culture that does not tolerate illegal or unethical behaviour, preventing corporate
misconduct � drive positive organisational change through monitoring, measurement and assessment � enhance community confidence in our activities.
Assurance that we are meeting our legislative and policy obligations is provided in quarterly conformance statements from responsible senior management and from our integrity indicator results. By asking our business areas how they are managing potential risks and instances of non-conformance, we drive continuous improvement in our systems and procedures. Findings are regularly reviewed by the Audit and Risk Committee.

04 Commissioner of Taxation annual report 2018–19
64
Open and transparent operationsAustralia’s tax and superannuation systems are community assets. Access to information about these systems enhances transparency and leads to increased levels of trust and respect.
External scrutiny
External scrutineers provide independent reviews of the ATO’s operation – either as the result of their own annual program of work, or in response to concerns raised by members of the public and the Australian Parliament. Reviews help us to identify options for improving services to our clients, addressing potential barriers to willing participation, and ensuring the successful delivery of outcomes in our administration of the tax and superannuation systems.
Judicial reviews and administrative tribunals
The courts may be called upon to determine the application of tax law. See Appendix 5 for a list of significant cases decided by the courts and the Administrative Appeals Tribunal (AAT).
Australian Information Commissioner
The Office of the Australian Information Commissioner (OAIC), established under the Australian Information Commissioner Act 2010, provides independent oversight of privacy protection and access under the Freedom of Information Act 1982 (FOI Act).
In 2018–19, the OAIC notified the ATO of 44 of our FOI Act decisions for their review. In the same period, the OAIC finalised reviews of 30 of our FOI Act decisions. Of those, 16 were discontinued or closed by the OAIC or withdrawn by the applicant, and in the remaining 14 the OAIC affirmed the ATO’s decision or found in favour of the ATO.
Details of OAIC investigations are available at oaic.gov.au.
Auditor-General
The Auditor-General, operating under the Auditor-General Act 1997, is supported by the Australian National Audit Office (ANAO) to produce independent performance audits, financial statement audits, and assurance reviews.
The following performance audits concerning the ATO were tabled in 2018–19: � Farm management deposits scheme (June 2019) � Management of small business tax debt (May 2019) � Addressing illegal phoenix activity (March 2019).
The reports on these performance audits are available at anao.gov.au. Details of the ANAO financial audit of our operations are provided in Part 5 of this report.
Parliamentary committees
Each year, the ATO appears before a number of parliamentary committees to answer questions about our administration of the tax and superannuation systems.

04Management and accountabilityCorporate governance
65
House CommitteesThe House of Representatives Standing Committee on Tax and Revenue is tasked with reviewing the performance of the ATO as outlined in our annual reports. In 2018–19, we appeared before one House Committee inquiry – the Tax and Revenue Committee inquiry into the 2017 annual report of the Australian Taxation Office.
Senate CommitteesWe appeared with Treasury at four Senate Estimates hearings, responding to approximately 171 questions on notice, as well as the following Senate Committee inquiries: � Economics Legislation Committee inquiry into the Treasury Laws Amendment (Protecting Your
Superannuation Package) Bill 2018 � Economics References Committee inquiry into the financial and tax practices of for-profit aged
care providers � Education and Employment References Committee inquiry into the exploitation of general and
specialist cleaners working in retail chains for contracting or subcontracting cleaning companies � Legal and Constitutional Affairs Legislation Committee inquiry into the Judiciary Amendment
(Commonwealth Model Litigant Obligations) Bill 2017 � Senate Economics Legislation Committee inquiry into the Treasury Laws Amendment (Making
Sure Foreign Investors Pay Their Fair Share of Tax in Australia and Other Measures) Bill 2018; Income Tax (Managed Investment Trust Withholding Tax) Amendment Bill 2018; Income Tax Rates Amendment (Sovereign Entities) Bill 2018
� Select Committee on Charity Fundraising in the 21st Century inquiry into the framework of fundraising regulation for charities and options for reform
� Economics Legislation Committee inquiry into Treasury Laws Amendment (Making Sure Multinationals Pay Their Fair Share of Tax in Australia and Other Measures) Bill 2018
� Senate Economics Legislation Committee inquiry into the Commonwealth Registers Bill and four related bills.
Joint CommitteesWe appeared before one joint committee inquiry – the Joint Committee of Public Accounts and Audit (JCPAA) inquiry into foreign investment obligations in residential real estate.
Inspector-General of Taxation and Taxation Ombudsman
The Inspector-General of Taxation and Taxation Ombudsman (IGTO), established under the Inspector-General of Taxation Act 2003, undertakes reviews and investigations to identify systemic issues in the administration of tax law. These may be at the request of the government or the ATO, or following complaints from the public.
The ATO received 1,391 complaints via the IGTO in 2018–19. Of these: � 823 complaints (59%) had not previously been lodged with us and were subsequently
transferred back to our complaint-handling process � 568 complaints (41%) were referred to us to provide a response to the IGTO for resolution with
the client.

04 Commissioner of Taxation annual report 2018–19
66
The IGTO released four reports relating to the ATO in 2018–19: � The future of the tax profession (April 2019) � Review into the ATO’s use of garnishee notices (March 2019) � Review into the ATO’s fraud control management (October 2018) � GST refunds (August 2018).
The full reports are available at igt.gov.au.
Commonwealth Ombudsman
While the IGTO investigates complaints from the public about administrative actions of the ATO and TPB, the Commonwealth Ombudsman continues to deal with public interest disclosure issues relating to the ATO or TPB made under the Public Interest Disclosure Act 2013, along with conducting independent investigations into the administrative actions of the ACNC.
Public interest disclosures received by the ATO are managed in accordance with ATO procedures, which meet the requirements of the Act.
During 2018–19, we: � were not the subject of own-motion investigations completed by the Ombudsman � received 38 public interest disclosures.
Freedom of information
We use our website to give people access to documents and policies that we use in making decisions. In addition, we provide information under the Freedom of Information Act 1982 (FOI Act). Past documents released under the FOI Act are publicly listed on our FOI Act disclosure log, other than documents that are exempt from this requirement. The disclosure log is available at ato.gov.au/foi.
As an agency covered by the FOI Act, the ATO is also required to publish information as part of the Information Publication Scheme (IPS), displaying on our website a plan showing what information we publish in accordance with the IPS requirements. The ATO IPS plan is available at ato.gov.au/ips. As the ACNC and TPB operate as independent bodies, they publish separate plans on their websites. See acnc.gov.au and tpb.gov.au.
The IPS is a requirement in Part II of the FOI Act, and has replaced the former requirement to publish a ‘Section 8’ statement in an annual report.
Disability reporting
Since 1994, Commonwealth departments and agencies have reported on their performance as policy adviser, purchaser, employer, regulator and provider under the Commonwealth Disability Strategy. In 2007–08, reporting on the employer role was transferred to the Australian Public Service Commission’s (APSC’s) State of the Service report and the APS Statistical Bulletin. These reports are available at apsc.gov.au. From 2010–11, departments and agencies have no longer been required to report on these functions.
The Commonwealth Disability Strategy has been superseded by the National Disability Strategy 2010–20, which sets out a 10-year national policy framework to improve the lives of people with disability, promote participation and create a more inclusive society. A high-level report tracks progress against each of the six outcome areas of the strategy and presents a picture of how people with disability are faring. The first of these reports was released in late 2014, and is available at dss.gov.au.
04Management and accountabilityCorporate governance
67
The ATO’s Diversity and inclusion plan 2017–19 outlines our commitment to improve employment outcomes, retention rates, development opportunities and career progression for employees with disability. The number of employees who voluntarily identify as having a disability has been relatively stable this year at 3.1% of the ATO workforce.
We support people with disability applying for jobs with us by using the RecruitAbility scheme. Our employees with disability are supported in the workplace by a range of reasonable adjustment options, such as easy access to adaptive technology software and flexible working arrangements. Real-time local support is available through our People Support teams to employees with disability, their managers and colleagues. Our National Disability Network is an active and valued employee action group, and this is well supported by a strong and unified cohort of SES Disability Champions.
Being accountable to our stakeholdersWe are accountable to our ministers, parliament and the community for how we administer the tax and superannuation systems. This includes being accountable for how we deal with people and the information they share with us. � Our Taxpayers’ Charter outlines our commitment to dealing with taxpayers in a way that is
professional, considers their circumstances, and provides them with relevant information. � We understand that people will sometimes be unsatisfied with their interactions with us. Our
complaints process is designed to make it easy for them to raise an issue with us. � As required under Section 3B of the Taxation Administration Act 1953 (TAA), our annual report
includes additional information on disclosures of taxpayer information that occurred during the year.
Taxpayers’ Charter
We work to build a relationship with the community that is based on mutual trust and respect. Our Taxpayers’ Charter sets out what taxpayers can expect from us, along with their rights and obligations. The charter was reviewed in 2018, and we restated our commitment to act professionally, treat taxpayers fairly and reasonably, and help them meet their obligations by providing accurate, consistent and clear information. The charter explains: � taxpayers’ rights � taxpayers’ taxation obligations � what taxpayers can do if they are not satisfied with our decisions, actions or service � the standard of service taxpayers can expect from us.
The eight documents that describe how the charter applies in different contexts – for example, in an audit – are available on our website at ato.gov.au/charter.
For more information about how we measure the effectiveness of the Taxpayers’ Charter, see Appendix 2.

04 Commissioner of Taxation annual report 2018–19
68
Complaints handling
The number of complaints the ATO receives continues to be only a small proportion of our interactions with the community, representing 0.1% of the total tax returns lodged in 2018–19.
The ATO received 19,826 complaints (inclusive of IGTO complaints) in 2018–19. Our performance on complaint processing was 88% resolved in 15 business days (or within the date negotiated), which exceeded our target of 85%. The largest proportion of complaints received related to income tax.
FIGURE 4.2 Complaint issues, 2018–19
911Account action
1,043Activity statements
1,047Services
167Reporting obligations
1,720Debt
1,477People
2,135Audit and review
3,118Superannuation
3,386Income tax
1,781Client records
16,785Total issues
NOTESRevised complaint categories took effect from 2018 and cannot be compared to previous years.The number of complaint issues is different to the total number of complaints, for the following reasons: � a single complaint may include multiple issues � a complaint issue may not have been captured � the complaint issue is not captured for complaints resolved during the client’s first phone call to us (approximately 1,582 in 2018–19).
Reporting on tax administration
The Taxation Administration Act 1953 (TAA) provides the ATO with powers to administer the tax system. Under section 3B of the Act, we must report each year on whether the information we hold has been disclosed to other parties.
Disclosures to ministers
During 2018–19, there were 34 occasions on which information was disclosed to ministers under subsection 355-55(1) in Schedule 1 of the TAA: � 1 occasion to the Treasurer � 13 occasions to the Minister for Revenue and Financial Services � 20 occasions to the Assistant Treasurer.
Requests and disclosures made to law enforcement agencies
Subsection 355-70(1) in Schedule 1 of the TAA allows the ATO to disclose information to law enforcement agencies in certain circumstances. Details of the information requests made and subsequently provided under this section are reported in Appendix 11.

04Management and accountabilityCorporate governance
69
Disclosure of protected information
We are required to report on the number (if any) of taxation officers found guilty of disclosing protected information, which is a specific offence listed in section 355-25 in Schedule 1 of the TAA.
In 2018–19 there were no taxation officers found guilty of such an offence.
Exercise of the Commissioner’s remedial power
Subdivision 370-A in Schedule 1 of the TAA grants the Commissioner limited powers to modify the operation of the law where it is not working as intended or is creating disproportionate compliance costs. The Commissioner’s remedial power provides the ability to resolve smaller unforeseen or unintended outcomes in the tax and superannuation law in limited circumstances.
The Commissioner did not exercise this power in 2018–19. This year, we commenced publishing a list of when the Commissioner’s remedial power has been considered but not applied.
More information about the Commissioner’s remedial power and when it has been used is available on our website at ato.gov.au/CRP.

04 Commissioner of Taxation annual report 2018–19
70
Workforce management
The ATO’s workforce capability requirements are diverse and varied, with roles that span entry-level administration and customer service, through to professional specialist roles. We have invested in developing our employer brand to attract and retain the very best candidates with a mix of expertise. Our employee value proposition positions us as offering meaningful and rewarding work, competitive conditions, and a culture that appeals to people who will lead us into the future.
We have a highly engaged workforce supported by a robust performance and recognition framework and frontline human resource advisers who provide timely, tailored and tangible solutions to people and workforce challenges.
The ATO invests in contemporary, flexible learning solutions that build staff capabilities to complete priority work now and into the future. We continue to broaden our reach by offering staff a variety of ways to learn, beyond traditional classroom learning. Through technology-assisted products, including webinars, short learning events and online learning platforms, we provide staff with access to anywhere, anytime learning. This supplements our focus on ‘on the job’ learning, coaching, secondments to public and private sector organisations, tuition assistance and graduate development programs.
Our capability framework is integrated across the people system and reflected in our recruitment, talent management, performance and capability development strategies. The framework was refreshed in 2018 to balance our current and future workforce needs. We use enhanced capability appraisal processes to inform workforce planning activities, including learning and development investment strategies. These activities will continue into 2019–20.
Our performance and development framework and other employment arrangements are outlined in the ATO Enterprise Agreement. This guides our application of human resource principles and best practice.
Statistics on our employeesAlong with our legislative obligations, we need to understand the size and makeup of our workforce, including working patterns, employment types, diversity, skill sets, work distribution, accommodation requirements and employee retention rates.
Our workforce
Table 4.2 shows our staffing profile for the current financial year. It shows the numbers of employees by substantive classification level, employment type and working pattern, at 30 June 2019. Table 4.3 shows the same information for the previous financial year.

04Management and accountabilityWorkforce management
71
TABLE 4.2 Employees, by level and employment type, at 30 June 2019
Ongoing Non-ongoing Casual
Level Full
time Part time
Total ongoing
Full time
Part time
Total non-
ongoing Total
Casual Total
SES 3 2 0 2 0 0 0 0 2
SES 2 27 0 27 0 1 1 0 28
SES 1 175 10 185 1 0 1 0 186
EL 2 1,211 105 1,316 26 2 28 1 1,345
EL 1 2,705 352 3,057 20 9 29 0 3,086
APS 6 3,588 507 4,095 29 8 37 3 4,135
APS 5 1,662 258 1,920 11 0 11 1 1,932
APS 4 2,842 400 3,242 37 7 44 0 3,286
APS 3 2,250 546 2,796 100 26 126 21 2,943
APS 2 413 102 515 96 6 102 1,227 1,844
APS 1 17 6 23 8 0 8 326 357
Cadet 13 0 13 0 0 0 0 13
TOTAL 14,905 2,286 17,191 328 59 387 1,579 19,157
TABLE 4.3 Employees, by level and employment type, at 30 June 2018(a)
Ongoing Non-ongoing Casual
Level Full
time Part time
Total ongoing
Full time
Part time
Total non-
ongoing Total
Casual Total
SES 3 2 0 2 0 0 0 0 2
SES 2 28 0 28 1 0 1 0 29
SES 1 179 14 193 1 0 1 0 194
EL 2 1,283 114 1,397 22 5 27 2 1,426
EL 1 2,854 385 3,239 15 9 24 0 3,263
APS 6 3,839 516 4,355 14 10 24 3 4,382
APS 5 1,816 271 2,087 10 0 10 1 2,098
APS 4 2,933 424 3,357 37 4 41 0 3,398
APS 3 2,457 568 3,025 101 19 120 26 3,171
APS 2 540 109 649 108 5 113 1,081 1,843
APS 1 23 6 29 7 0 7 492 528
Cadet 16 0 16 0 0 0 0 16
TOTAL 15,970 2,407 18,377 316 52 368 1,605 20,350
NOTE(a) ACNC and TPB employees were not included in the corresponding table in the Commissioner of Taxation annual report 2017–18.

04 Commissioner of Taxation annual report 2018–19
72
Ongoing employees
Table 4.4 displays our ongoing workforce by substantive classification level, gender and working pattern for the current financial year, at 30 June 2019. Table 4.5 shows the same information for the previous financial year.
TABLE 4.4 Ongoing employees, by level and gender, at 30 June 2019(a)(b)
Male Female Indeterminate
Level Full
tim
e
Par
t tim
e
Tota
l mal
e
Full
tim
e
Par
t tim
e
Tota
l fem
ale
Full
tim
e
Tota
l in
det
erm
inat
e
Total
SES 3 0 0 0 2 0 2 0 0 2
SES 2 17 0 17 10 0 10 0 0 27
SES 1 100 1 101 75 9 84 0 0 185
EL 2 698 10 708 513 95 608 0 0 1,316
EL 1 1,483 35 1,518 1,222 317 1,539 0 0 3,057
APS 6 1,747 50 1,797 1,841 457 2,298 0 0 4,095
APS 5 798 22 820 864 236 1,100 0 0 1,920
APS 4 1,345 53 1,398 1,497 347 1,844 0 0 3,242
APS 3 917 72 989 1,330 474 1,804 3 3 2,796
APS 2 140 10 150 273 92 365 0 0 515
APS 1 10 4 14 7 2 9 0 0 23
Cadet 5 0 5 8 0 8 0 0 13
TOTAL 7,260 257 7,517 7,642 2,029 9,671 3 3 17,191
NOTES(a) Excludes casual employees.(b) There were no part-time ongoing employees who identified as indeterminate gender as at 30 June 2019.

04Management and accountabilityWorkforce management
73
TABLE 4.5 Ongoing employees, by level and gender, at 30 June 2018(a)(b)(c)
Male Female
Level Full time Part timeTotal male Full time Part time
Total female Total
SES 3 0 0 0 2 0 2 2
SES 2 17 0 17 11 0 11 28
SES 1 106 1 107 73 13 86 193
EL 2 757 7 764 526 107 633 1,397
EL 1 1,575 40 1,615 1,279 345 1,624 3,239
APS 6 1,882 53 1,935 1,957 463 2,420 4,355
APS 5 856 25 881 960 246 1,206 2,087
APS 4 1,359 50 1,409 1,574 374 1,948 3,357
APS 3 1,013 76 1,089 1,444 492 1,936 3,025
APS 2 189 14 203 351 95 446 649
APS 1 13 4 17 10 2 12 29
Cadet 6 0 6 10 0 10 16
TOTAL 7,773 270 8,043 8,197 2,137 10,334 18,377
NOTES(a) ACNC and TPB employees were not included in the corresponding table in the Commissioner of Taxation annual report 2017–18.(b) Excludes casual employees.(c) There were no ongoing employees who identified as indeterminate gender as at 30 June 2018.
Non-ongoing employees
Non-going employees are engaged for a specified term or for the duration of a specified task in accordance with the Public Service Act 1999, whereas casual employees are engaged to perform duties that are irregular or intermittent.
Table 4.6 shows our non-ongoing workforce by substantive level, gender and working pattern for the current financial year, at 30 June 2019. Table 4.7 shows the same information for the previous financial year.

04 Commissioner of Taxation annual report 2018–19
74
TABLE 4.6 Non-ongoing employees, by level and gender, at 30 June 2019(a)(b)
Male Female
Level Full time Part time Total male Full time Part time
Total female Total
SES 2 0 1 1 0 0 0 1
SES 1 0 0 0 1 0 1 1
EL 2 18 1 19 8 1 9 28
EL 1 11 0 11 9 9 18 29
APS 6 14 2 16 15 6 21 37
APS 5 3 0 3 8 0 8 11
APS 4 6 0 6 31 7 38 44
APS 3 38 6 44 62 20 82 126
APS 2 42 0 42 54 6 60 102
APS 1 5 0 5 3 0 3 8
TOTAL 137 10 147 191 49 240 387
NOTES(a) Excludes contractors and others paid through a third party. (b) There were no non-ongoing employees who identified as indeterminate gender as at 30 June 2019.
TABLE 4.7 Non-ongoing employees, by level and gender, at 30 June 2018(a)(b)(c)
Male Female
Level Full time Part time Total male Full time Part time
Total female Total
SES 2 1 0 1 0 0 0 1
SES 1 1 0 1 0 0 0 1
EL 2 17 1 18 5 4 9 27
EL 1 6 1 7 9 8 17 24
APS 6 5 1 6 9 9 18 24
APS 5 4 0 4 6 0 6 10
APS 4 2 0 2 35 4 39 41
APS 3 46 9 55 55 10 65 120
APS 2 50 0 50 58 5 63 113
APS 1 6 0 6 1 0 1 7
TOTAL 138 12 150 178 40 218 368
NOTES(a) ACNC and TPB employees were not included in the corresponding table in the Commissioner of Taxation annual report 2017–18. (b) Excludes contractors and others paid through a third party.(c) There were no non-ongoing employees who identified as indeterminate gender as at 30 June 2018.

04Management and accountabilityWorkforce management
75
Diversity
The ATO strives to have a workforce that reflects the diversity of Australia’s population. A diverse workforce provides a broader range of skills, experience and opportunities for innovation. As a measure of our success, we were awarded gold employer status at the LGBTI+ Inclusion Awards for the third year in a row.
In our Diversity and inclusion plan 2017–19, we recognise six diversity groups that face unique barriers to inclusion. The plan also outlines the four diversity and inclusion principles, for which all employees share responsibility. Our diversity and inclusion plan is complemented by our Reconciliation Action Plan 2018–20. In 2018–19, we: � facilitated deaf awareness training across six sites � organised accredited AUSLAN training for staff � delivered Indigenous employee secondment program � launched Indigenous employee ally network ‘Kawutilin’.
For more details about our diversity plans, see ato.gov.au/diversity.
Table 4.8 shows the proportion of our employees in diversity groups. Table 4.9 shows the numbers of Aboriginal and Torres Strait Islander employees by employment type.
TABLE 4.8 Ongoing employees belonging to diversity groups, at 30 June 2019(a)(b)(c)
Group2017–18
%2018–19
%Change from
2017–18
Aboriginal and Torres Strait Islander people 2.1 2.5 0.4
With disability 3.0 3.1 0.1
Culturally and linguistically diverse 21.5 21.9 0.4
Lesbian, gay, bisexual, trans/transgender and intersex (LGBTI+)(d) 3.5 3.8 0.3
Mature age(d) 36.6 36.9 0.3
NOTES(a) ACNC and TPB employees were not included in the corresponding table in the Commissioner of Taxation annual report 2017–18.(b) We provide staff with the opportunity to self-identify as Aboriginal and Torres Strait Islander people, having a disability, or being
culturally and linguistically diverse. The LGBTI+ results were obtained from the 2018 and 2019 Australian Public Service Employee Census.
(c) Information on gender equality (the sixth diversity group) is provided in Table 4.4.(d) In the Commissioner of Taxation annual report 2017–18:
� the LGBTI+ result was rounded from 3.5 to 4.0 � the mature age result was based on all staff, not ongoing only.
TABLE 4.9 Indigenous employees, by employment type, at 30 June 2018 and 30 June 2019(a)
At 30 June 2018 At 30 June 2019
TypeIndigenous employees
Total employees
Indigenous employees %
Indigenous employees
Total employees
Indigenous employees %
Ongoing 389 18,377 2.1 432 17,191 2.5
Non-ongoing 2 368 0.5 5 387 1.3
Casual 13 1,605 0.8 12 1,579 0.8
TOTAL 404 20,350 2.0 449 19,157 2.3
NOTE(a) ACNC and TPB employees were not included in the corresponding table in the Commissioner of Taxation annual report 2017–18.

04 Commissioner of Taxation annual report 2018–19
76
Job streams
We use job streams and families to categorise particular roles. While some roles lend themselves to particular work areas, others are found across the ATO.
TABLE 4.10 Employees, by job family, at 30 June 2018 and 30 June 2019(a)(b)
Job family2018
%2019
%
Accounting/finance 1.3 1.3
Administration 5.3 5.4
Analytics/intelligence 5.4 5.8
Communication/marketing 1.6 1.7
Engagement, assurance and compliance 27.4 29.1
Entry level programs 1.8 1.6
Governance and performance 4.1 4.5
Human resources management 3.0 3.3
Information and organisation professionals 1.8 1.8
Information technology 8.5 8.4
Law 8.7 8.6
Other agencies 0.9 0.9
Project management 3.1 3.0
Senior executive 1.9 1.7
Service delivery 25.2 23.0
TOTAL 100 100
NOTES(a) ACNC and TPB employees were not included in the corresponding table in the Commissioner of Taxation annual report 2017–18. (b) Includes ongoing, non-ongoing and casual employees but excludes external contractors.

04Management and accountabilityWorkforce management
77
TABLE 4.11 Employees, by business area, at 30 June 2019(a)
Business area Employees
Australian Charities and Not-for-profits Commission 107
ATO Corporate 519
ATO Executive 13
ATO Finance 569
ATO People(b) 1,086
Business Reporting and Registrations 186
Client Account Services 3,132
Client Engagement Group Strategy and Performance 90
Debt 1,960
Enterprise Strategy and Design 212
Enterprise Solutions and Technology 1,848
Intermediaries and Lodgment 123
Individuals 976
Indirect Tax 1,028
Policy, Analysis and Legislation 183
Private Groups and High Wealth Individuals 1,944
Public Groups and International 1,449
Review and Dispute Resolution 650
Strategy and Support 339
Smarter Data 520
Small Business 1,170
Superannuation 712
Tax Counsel Network 208
Tax Practitioners Board 133
TOTAL 19,157
NOTES(a) Includes ongoing, non-ongoing and casual employees but excludes external contractors.(b) Includes entry level program participants (graduates, cadets, apprentices, the Evergreen Indigenous Advancement Program and the
Executive Assistant Advancement Program).
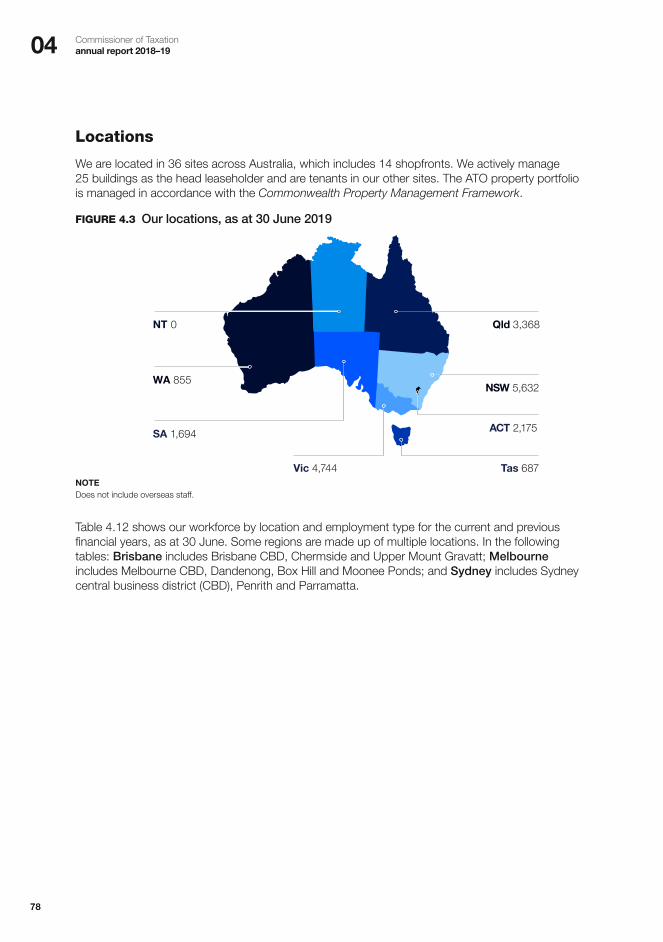
04 Commissioner of Taxation annual report 2018–19
78
Locations
We are located in 36 sites across Australia, which includes 14 shopfronts. We actively manage 25 buildings as the head leaseholder and are tenants in our other sites. The ATO property portfolio is managed in accordance with the Commonwealth Property Management Framework.
FIGURE 4.3 Our locations, as at 30 June 2019
NSW 5,632
Qld 3,368
Tas 687
ACT 2,175
Vic 4,744
NT 0
WA 855
SA 1,694
NOTEDoes not include overseas staff.
Table 4.12 shows our workforce by location and employment type for the current and previous financial years, as at 30 June. Some regions are made up of multiple locations. In the following tables: Brisbane includes Brisbane CBD, Chermside and Upper Mount Gravatt; Melbourne includes Melbourne CBD, Dandenong, Box Hill and Moonee Ponds; and Sydney includes Sydney central business district (CBD), Penrith and Parramatta.

04Management and accountabilityWorkforce management
79
TABLE 4.12 Total employees, by location and employment type, at 30 June 2018 and 30 June 2019(a)
At 30 June 2018 At 30 June 2019
State / Territory Region O
ngo
ing
No
n-o
ngo
ing
Cas
ual
Tota
l
Ong
oin
g
No
n-o
ngo
ing
Cas
ual
Tota
l
NSW Albury 606 21 437 1,064 546 15 368 929
Gosford 285 48 90 423 292 43 73 408
Newcastle 522 1 1 524 485 0 4 489
Sydney 3,275 66 299 3,640 3,042 75 277 3,394
Wollongong 318 9 149 476 281 4 127 412
Total NSW 5,006 145 976 6,127 4,646 137 849 5,632
QLD Brisbane 2,985 39 100 3,124 2,838 40 199 3,077
Townsville 298 2 9 309 275 6 10 291
Total QLD 3,283 41 109 3,433 3,113 46 209 3,368
SA Adelaide 1,613 18 168 1,799 1,529 23 142 1,694
TAS Burnie 54 1 0 55 52 0 1 53
Hobart 490 3 132 625 478 3 153 634
Total TAS 544 4 132 680 530 3 154 687
VIC Geelong 115 0 3 118 109 0 2 111
Melbourne 4,587 98 199 4,884 4,310 117 206 4,633
Total VIC 4,702 98 202 5,002 4,419 117 208 4,744
WA Perth 922 17 2 941 843 10 2 855
NT Alice Springs 1 0 0 1 0 0 0 0
Darwin 1 0 0 1 0 0 0 0
Total NT 2 0 0 2 0 0 0 0
ACT Canberra 2,303 45 16 2,364 2,109 51 15 2,175
Overseas 2 0 0 2 2 0 0 2
TOTAL 18,377 368 1,605 20,350 17,191 387 1,579 19,157
NOTE(a) ACNC and TPB employees were not included in the corresponding table in the Commissioner of Taxation annual report 2017–18.
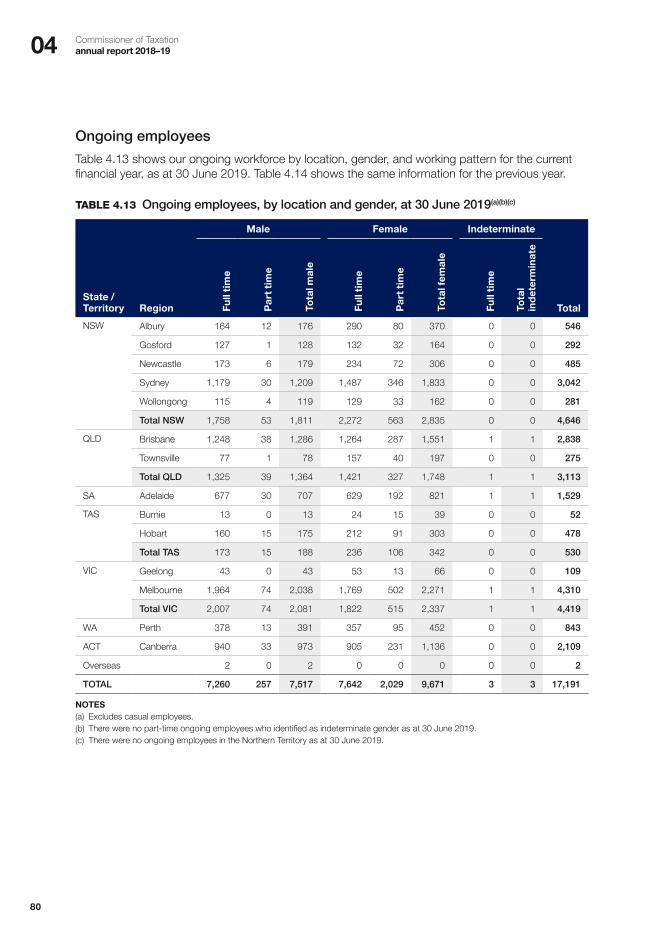
04 Commissioner of Taxation annual report 2018–19
80
Ongoing employees
Table 4.13 shows our ongoing workforce by location, gender, and working pattern for the current financial year, as at 30 June 2019. Table 4.14 shows the same information for the previous year.
TABLE 4.13 Ongoing employees, by location and gender, at 30 June 2019(a)(b)(c)
Male Female Indeterminate
State / Territory Region Fu
ll ti
me
Par
t tim
e
Tota
l mal
e
Full
tim
e
Par
t tim
e
Tota
l fem
ale
Full
tim
e
Tota
l in
det
erm
inat
e
Total
NSW Albury 164 12 176 290 80 370 0 0 546
Gosford 127 1 128 132 32 164 0 0 292
Newcastle 173 6 179 234 72 306 0 0 485
Sydney 1,179 30 1,209 1,487 346 1,833 0 0 3,042
Wollongong 115 4 119 129 33 162 0 0 281
Total NSW 1,758 53 1,811 2,272 563 2,835 0 0 4,646
QLD Brisbane 1,248 38 1,286 1,264 287 1,551 1 1 2,838
Townsville 77 1 78 157 40 197 0 0 275
Total QLD 1,325 39 1,364 1,421 327 1,748 1 1 3,113
SA Adelaide 677 30 707 629 192 821 1 1 1,529
TAS Burnie 13 0 13 24 15 39 0 0 52
Hobart 160 15 175 212 91 303 0 0 478
Total TAS 173 15 188 236 106 342 0 0 530
VIC Geelong 43 0 43 53 13 66 0 0 109
Melbourne 1,964 74 2,038 1,769 502 2,271 1 1 4,310
Total VIC 2,007 74 2,081 1,822 515 2,337 1 1 4,419
WA Perth 378 13 391 357 95 452 0 0 843
ACT Canberra 940 33 973 905 231 1,136 0 0 2,109
Overseas 2 0 2 0 0 0 0 0 2
TOTAL 7,260 257 7,517 7,642 2,029 9,671 3 3 17,191
NOTES(a) Excludes casual employees.(b) There were no part-time ongoing employees who identified as indeterminate gender as at 30 June 2019.(c) There were no ongoing employees in the Northern Territory as at 30 June 2019.
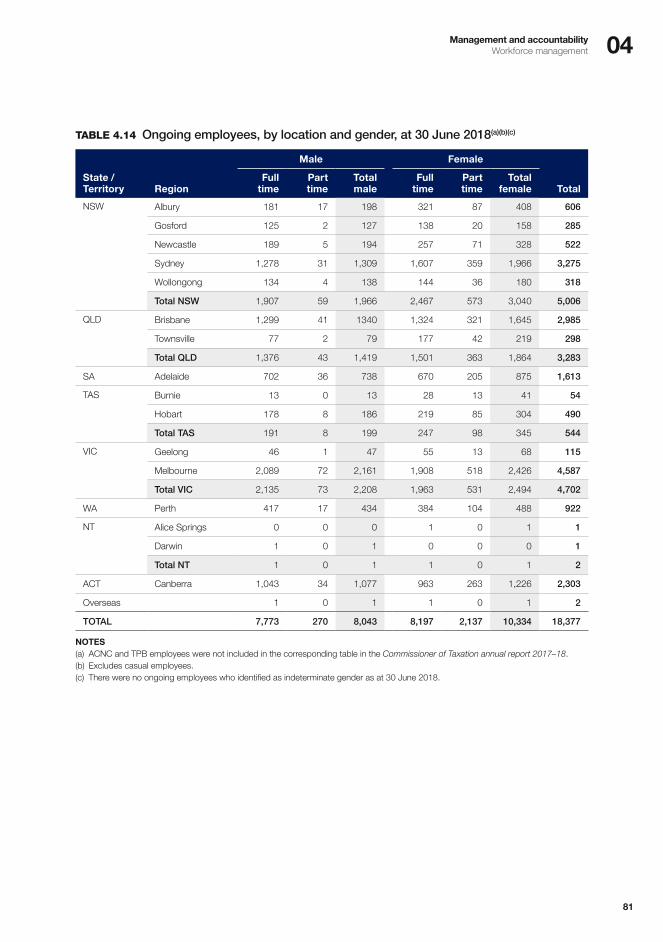
04Management and accountabilityWorkforce management
81
TABLE 4.14 Ongoing employees, by location and gender, at 30 June 2018(a)(b)(c)
Male Female
State / Territory Region
Full time
Part time
Total male
Full time
Part time
Total female Total
NSW Albury 181 17 198 321 87 408 606
Gosford 125 2 127 138 20 158 285
Newcastle 189 5 194 257 71 328 522
Sydney 1,278 31 1,309 1,607 359 1,966 3,275
Wollongong 134 4 138 144 36 180 318
Total NSW 1,907 59 1,966 2,467 573 3,040 5,006
QLD Brisbane 1,299 41 1340 1,324 321 1,645 2,985
Townsville 77 2 79 177 42 219 298
Total QLD 1,376 43 1,419 1,501 363 1,864 3,283
SA Adelaide 702 36 738 670 205 875 1,613
TAS Burnie 13 0 13 28 13 41 54
Hobart 178 8 186 219 85 304 490
Total TAS 191 8 199 247 98 345 544
VIC Geelong 46 1 47 55 13 68 115
Melbourne 2,089 72 2,161 1,908 518 2,426 4,587
Total VIC 2,135 73 2,208 1,963 531 2,494 4,702
WA Perth 417 17 434 384 104 488 922
NT Alice Springs 0 0 0 1 0 1 1
Darwin 1 0 1 0 0 0 1
Total NT 1 0 1 1 0 1 2
ACT Canberra 1,043 34 1,077 963 263 1,226 2,303
Overseas 1 0 1 1 0 1 2
TOTAL 7,773 270 8,043 8,197 2,137 10,334 18,377
NOTES(a) ACNC and TPB employees were not included in the corresponding table in the Commissioner of Taxation annual report 2017–18. (b) Excludes casual employees.(c) There were no ongoing employees who identified as indeterminate gender as at 30 June 2018.

04 Commissioner of Taxation annual report 2018–19
82
Non-ongoing employees
Table 4.15 shows our non-ongoing employees by location and gender, at 30 June 2019, further broken down by working pattern. Table 4.16 shows the same information for the previous year.
Non-ongoing employees are engaged for a specified term or task. In some circumstances their engagement can be extended up to three years. The term ‘non-ongoing’ does not include casual (irregular/intermittent) employees, contractors or others paid through a third party.
TABLE 4.15 Non-ongoing employees, by location and gender, at 30 June 2019(a)(b)
Male Female
State / Territory Region
Full time
Part time
Total male
Full time
Part time
Total female Total
NSW Albury 4 0 4 11 0 11 15
Gosford 14 0 14 27 2 29 43
Sydney 25 2 27 34 14 48 75
Wollongong 1 1 2 1 1 2 4
Total NSW 44 3 47 73 17 90 137
QLD Brisbane 20 0 20 18 2 20 40
Townsville 3 0 3 1 2 3 6
Total QLD 23 0 23 19 4 23 46
SA Adelaide 9 0 9 13 1 14 23
TAS Hobart 2 0 2 1 0 1 3
VIC Melbourne 42 6 48 51 18 69 117
WA Perth 5 0 5 4 1 5 10
ACT Canberra 12 1 13 30 8 38 51
TOTAL 137 10 147 191 49 240 387
NOTES(a) Excludes contractors and others paid through a third party.(b) There were no non-ongoing employees who identified as indeterminate gender as at 30 June 2019.

04Management and accountabilityWorkforce management
83
TABLE 4.16 Non-ongoing employees, by location and gender, at 30 June 2018(a)(b)(c)
Male Female
State / Territory Region
Full time
Part time
Total male
Full time
Part time
Total female Total
NSW Albury 5 0 5 15 1 16 21
Gosford 26 0 26 21 1 22 48
Newcastle 0 0 0 1 0 1 1
Sydney 23 1 24 37 5 42 66
Wollongong 3 1 4 4 1 5 9
Total NSW 57 2 59 78 8 86 145
QLD Brisbane 23 0 23 14 2 16 39
Townsville 0 0 0 1 1 2 2
Total QLD 23 0 23 15 3 18 41
SA Adelaide 9 0 9 8 1 9 18
TAS Burnie 0 0 0 1 0 1 1
Hobart 2 0 2 1 0 1 3
Total TAS 2 0 2 2 0 2 4
VIC Melbourne 30 10 40 35 23 58 98
WA Perth 7 0 7 8 2 10 17
ACT Canberra 10 0 10 32 3 35 45
TOTAL 138 12 150 178 40 218 368
NOTES(a) ACNC and TPB employees were not included in the corresponding table in the Commissioner of Taxation annual report 2017–18. (b) Excludes contractors and others paid through a third party.(c) There were no non-ongoing employees who identified as indeterminate gender as at 30 June 2018.

04 Commissioner of Taxation annual report 2018–19
84
Employee retention and separation
The following tables provide information on our ongoing employee retention rates and separations.
Table 4.17 shows the numbers of ongoing employees by years of service, at 30 June 2018 and 30 June 2019.
TABLE 4.17 Years of service for ongoing employees, at 30 June 2018 and 30 June 2019(a)
Years of serviceAt 30 June
2018At 30 June
2019 Change
0–4 years 3,829 3,318 –13.3%
5–9 years 3,303 3,279 –0.7%
10–14 years 3,886 3,671 –5.5%
15–19 years 4,239 3,936 –7.1%
20–24 years 735 922 25.4%
25–29 years 796 540 –32.2%
30–34 years 1,183 1,103 –6.8%
35–39 years 358 365 2.0%
40–44 years 43 51 18.6%
45–49 years 4 6 50%
50 years or more 1 0 –100%
TOTAL 18,377 17,191 –6.5%
NOTE(a) ACNC and TPB employees were not included in the corresponding table in the Commissioner of Taxation annual report 2017–18.
Table 4.18 shows the numbers of ongoing employees that left the ATO during the year, grouped by reason for separation, for 2017–18 and 2018–19.
TABLE 4.18 Reasons for ongoing employee separations, 2017–18 and 2018–19
Employee separations 2017–18 2018–19 Change
Resignation 405 432 6.7%
Age retirement 204 257 26.0%
Redundancy 180 580 222.2%
Dismissal 26 36 38.5%
Movement to another agency 130 185 42.3%
Invalidity and death 39 32 –17.9%
TOTAL 984 1,522 54.7%

04Management and accountabilityWorkforce management
85
Our employment arrangementsThe policy outlining remuneration and conditions for Australian Public Service (APS) agencies is set by government. The guiding principles are: � enterprise agreements and other workplace arrangements are not to contain restrictive work
practices, unduly limit flexibility, or otherwise impede workplace reform � remuneration increases are to be modest and to remain within agencies’ existing budgets,
reflecting the need for wages restraint in the current economic circumstances � public sector terms and conditions are to be reasonable, reflecting community standards � freedom of association is to be respected.
More information about remuneration in the APS is available in the APSC’s Remuneration report, available at apsc.gov.au.
The ATO’s remuneration policy is in accordance with the government parameters that apply across the APS.
Workplace agreements
The majority of our staff are employed under the ATO enterprise agreement 2017, which sets out our employment conditions. The agreement commenced on 3 August 2017 and runs for three years. Table 4.19 shows the numbers of staff covered by the enterprise agreement, and those employed under other arrangements.
TABLE 4.19 Employment arrangements of SES and non-SES employees, at 30 June 2019
Arrangement SES Non-SES Total
ATO Enterprise Agreement 2017 0 18,924 18,924
Individual flexibility arrangements 0 17 17
Determinations under subsection 24(1) of the Public Service Act 1999(a) 216 0 216
TOTAL 216 18,941 19,157
NOTE(a) Excludes a Band 2 SES who is a statutory position holder (Second Commissioner).
Remuneration
Base rates of pay and other remuneration arrangements are set, for the majority of non-SES staff, in the ATO enterprise agreement. The agreement includes provision for individual salary advancement subject to satisfactory performance, including some other assessment factors for EL2 employees. The rates for ATO staff for 2018–19 are shown in table 4.20.
The APS executive remuneration management policy sets out arrangements for the management of executive remuneration, including an approval process for remuneration proposals above a notional amount. Total remuneration for staff in the senior executive service (SES) includes a notional component for provision of a motor vehicle and parking, and for superannuation calculated at 15.4% of 101% of base salary.

04 Commissioner of Taxation annual report 2018–19
86
The Remuneration Tribunal sets the remuneration and conditions for the Commissioner. The Tribunal issues the Guide to the Principal Executive Office (PEO) structure, which is used by the Commissioner to determine remuneration and conditions for Second Commissioners. Second Commissioners and those who have acted in a Second Commissioner role for three months or more are also eligible for performance pay under the guidelines. The remuneration of our key management personnel, including performance pay, is shown in table 4.21.
TABLE 4.20 Salary ranges (excluding non-salary benefits) by classification level, at 30 June 2019
LevelMinimum
$Maximum
$
SES 3 290,621 333,553
SES 2 223,349 256,491
SES 1 171,645 202,910
EL 2 127,787 152,214
EL 1 106,183 115,762
APS 6 and equivalent 82,898 95,181
APS 5 and equivalent 76,778 81,394
APS 4 and equivalent 68,871 74,748
APS 3 and equivalent 61,825 66,701
APS 2 and equivalent 54,321 60,202
APS 1 and equivalent 48,036 53,052
Public affairs officer grade 3(a) 129,133 129,133
Information technology officer grade 1 66,701 76,778
Graduate administrative assistant 61,825 63,422
Cadets while undertaking practical training in the workplace 48,036 53,052
Cadets while undertaking study 16,518 26,705
NOTE(a) Public affairs officer salary ranges apply to employees engaged or promoted to these classifications on or before 30 June 2006 only.
At 30 June 2019, there were no public affairs officers at grade 1 or 2.

04Management and accountabilityWorkforce management
87
Key management personnel
The Commissioner and other members of the ATO Executive are considered key management personnel as they have responsibility and authority for planning, directing and controlling the activities of the ATO. Details about the responsibilities of the ATO Executive are in Part 1 of this report.
TABLE 4.21 Remuneration for key management personnel, 2018–19(a)(b)
Short-term benefits
Post-employment
benefits
Other long-term
benefits
Name Position title Bas
e sa
lary
Bo
nu
ses
Oth
er b
enef
its
and
allo
wan
ces
Su
per
ann
uat
ion
cont
rib
uti
on
s
Long
ser
vice
le
ave
Tota
l re
mu
ner
atio
n
Chris Jordan AO Commissioner of Taxation
$758,005 $0 $33,148 $20,497 $26,708 $838,357
Frances Cawthra
Chief Finance Officer
$257,592 $0 $50,628 $39,514 $10,611 $358,344
Jacqui Curtis Chief Operating Officer
$343,032 $0 $32,188 $58,576 $37,117 $470,913
Jeremy Hirschhorn(c)
Second Commissioner
$194,045 $31,959 $19,212 $24,699 $3,467 $273,381
Ramez Katf Second Commissioner
$361,058 $60,420 $0 $20,535 $10,084 $452,096
Andrew Mills Second Commissioner
$387,732 $50,350 $0 $20,535 $12,591 $471,208
Neil Olesen Second Commissioner
$358,667 $0 $0 $53,323 $17,872 $429,862
Melinda Smith Chief Service Delivery Officer
$399,624 $0 $1,190 $20,535 $9,392 $430,739
NOTES(a) Totals may differ from the sum of the components due to rounding.(b) Staff are not offered long-term benefits other than long service leave. Only Second Commissioners are eligible for bonuses.
No termination benefits were paid to key management personnel in 2018–19. (c) Figures reported for Jeremy Hirschhorn reflect the period he occupied a key management personnel position which commenced
part way through the year.

04 Commissioner of Taxation annual report 2018–19
88
Senior executives
Under the PGPA Act, we must provide summary information about the remuneration of senior executive officers who are not listed as key management personnel. For the ATO, this comprises our SES Band 1 and 2 officers. The information is provided in table 4.22.
TABLE 4.22 Remuneration for senior executives, 2018–19(a)(b)
Short-term benefits
Post-employment
benefits
Other long-term
benefitsTermination
benefitsTotal
remuneration
Total remuneration bands N
o. o
f sen
ior
exec
uti
ves
Ave
rag
e b
ase
sala
ry
Ave
rag
e o
ther
b
enef
its
and
al
low
ance
s
Ave
rag
e su
per
ann
uat
ion
cont
rib
uti
on
s
Ave
rag
e lo
ng
serv
ice
leav
e
Ave
rag
e te
rmin
atio
n b
enef
its
Ave
rag
e to
tal
rem
un
erat
ion
$0–$220,000 60 $93,681 $15,464 $15,479 $3,744 $11,280 $139,649
$220,001– $245,000 41 $172,664 $29,831 $30,968 $3,255 $0 $236,717
$245,001– $270,000 65 $185,685 $29,409 $34,178 $5,587 $3,125 $257,984
$270,001– $295,000 59 $200,585 $29,703 $36,489 $8,700 $3,494 $278,971
$295,001– $320,000 11 $225,287 $34,434 $35,918 $9,839 $0 $305,478
$320,001– $345,000 11 $252,442 $27,447 $40,656 $14,837 $0 $335,382
$345,001– $370,000 8 $243,226 $28,844 $42,121 $16,046 $25,769 $356,007
$370,001– $395,000 2 $242,065 $70,910 $42,535 $17,244 $0 $372,754
NOTES(a) Totals may differ from the sum of the components due to rounding.(b) Staff are not offered long-term benefits other than long service leave. Only Second Commissioners are eligible for bonuses.
Other highly paid staff
Other highly paid staff are those officials who are not listed as key management personnel or senior executives, and whose total remuneration in 2018–19 exceeded $220,000.
The ATO has 29 staff in this category. Details are provided in table 4.23.
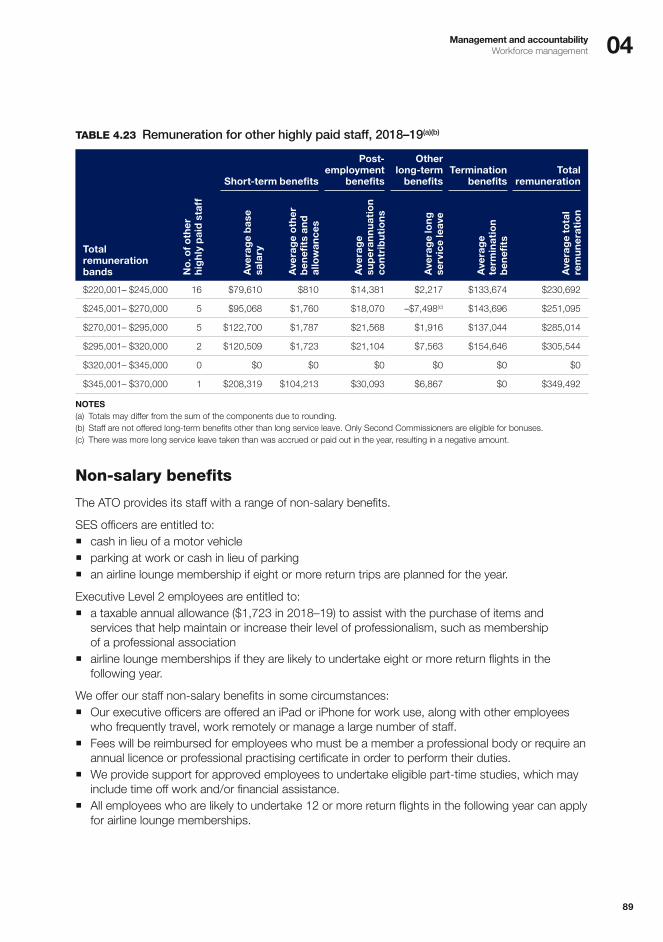
04Management and accountabilityWorkforce management
89
TABLE 4.23 Remuneration for other highly paid staff, 2018–19(a)(b)
Short-term benefits
Post-employment
benefits
Other long-term
benefitsTermination
benefitsTotal
remuneration
Total remuneration bands N
o. o
f oth
er
hig
hly
pai
d st
aff
Ave
rag
e b
ase
sala
ry
Ave
rag
e o
ther
b
enef
its
and
al
low
ance
s
Ave
rag
e su
per
ann
uat
ion
cont
rib
uti
on
s
Ave
rag
e lo
ng
serv
ice
leav
e
Ave
rag
e te
rmin
atio
n b
enef
its
Ave
rag
e to
tal
rem
un
erat
ion
$220,001– $245,000 16 $79,610 $810 $14,381 $2,217 $133,674 $230,692
$245,001– $270,000 5 $95,068 $1,760 $18,070 –$7,498(c) $143,696 $251,095
$270,001– $295,000 5 $122,700 $1,787 $21,568 $1,916 $137,044 $285,014
$295,001– $320,000 2 $120,509 $1,723 $21,104 $7,563 $154,646 $305,544
$320,001– $345,000 0 $0 $0 $0 $0 $0 $0
$345,001– $370,000 1 $208,319 $104,213 $30,093 $6,867 $0 $349,492
NOTES(a) Totals may differ from the sum of the components due to rounding.(b) Staff are not offered long-term benefits other than long service leave. Only Second Commissioners are eligible for bonuses.(c) There was more long service leave taken than was accrued or paid out in the year, resulting in a negative amount.
Non-salary benefits
The ATO provides its staff with a range of non-salary benefits.
SES officers are entitled to: � cash in lieu of a motor vehicle � parking at work or cash in lieu of parking � an airline lounge membership if eight or more return trips are planned for the year.
Executive Level 2 employees are entitled to: � a taxable annual allowance ($1,723 in 2018–19) to assist with the purchase of items and
services that help maintain or increase their level of professionalism, such as membership of a professional association
� airline lounge memberships if they are likely to undertake eight or more return flights in the following year.
We offer our staff non-salary benefits in some circumstances: � Our executive officers are offered an iPad or iPhone for work use, along with other employees
who frequently travel, work remotely or manage a large number of staff. � Fees will be reimbursed for employees who must be a member a professional body or require an
annual licence or professional practising certificate in order to perform their duties. � We provide support for approved employees to undertake eligible part-time studies, which may
include time off work and/or financial assistance. � All employees who are likely to undertake 12 or more return flights in the following year can apply
for airline lounge memberships.

04 Commissioner of Taxation annual report 2018–19
90
We also offer salary packaging to all ongoing employees, and employees with an individual agreement. We outsource salary packaging administration and novated leasing arrangements to an external company called Smartsalary. Our employees have access to salary packaging of the following items: � cars and utility vehicles (novated lease), with fringe benefits (FBT) applicable � car parking, with FBT applicable � superannuation, self-only, exempt from FBT � airline lounge membership, exempt from FBT � professional association membership fees and subscriptions, exempt from FBT.
Around 3,400 employees had salary packaging arrangements in place in 2018–19.
Work health and safetyThe ATO has a number of obligations under the Work Health and Safety Act 2011 (WHS Act) and our own enterprise agreement. We take these obligations seriously, as the health and wellbeing of our workforce is critical to supporting engagement, productivity and serving the community. We were a finalist in the Comcare Awards for our work in the Early Intervention category in 2018–19.
Our vision for health and safety is a healthy, engaged and productive workforce. We have a range of initiatives to support us in achieving this outcome and to eliminate or minimise work health and safety risks. Examples include: � a structured consultation program with our staff and their representatives about health and
safety matters � regular work health and safety inspections in all ATO sites � a bespoke IT program on all ATO computers that enables staff to self-manage and monitor
keyboard use, encouraging regular recuperative breaks and stretches/exercise � first aid services at all sites � annual flu vaccinations.
TABLE 4.24 Safety, Rehabilitation and Compensation Commission performance indicators, 2016–17 to 2018–19(a)
Indicator 2016–17 2017–18 2018–19
P1.1 Incidence of injuries with five or more days lost time per 1,000 full-time equivalent employees
1.9 1.6 1.4
P1.2 Incidence of injuries with 30 or more days lost time per 1,000 full-time equivalent employees
1.0 0.6 0.8
P1.3 Incidence of injuries with 60 or more days lost time per 1,000 full-time equivalent employees
0.7 0.6 0.5
P4 Lost time injury (claims) frequency rate 1.1 0.9 1.6
C1 Average time taken (in calendar days from date of injury to lodging claim with Comcare)
109 80 50
R1 Percentage of claims with incapacity for 10 or more days and a return to work plan (%)
54 33 52
R2 Quality of return to work (% achieving return to work on case closure) 64 39 44
NOTE(a) Figures for previous years in this table may vary from those reported in past annual reports as Comcare may continue to accept claims
for past years.

04Management and accountabilityWorkforce management
91
TABLE 4.25 Notifiable incidents, 2016–17 to 2018–19
Incident 2016–17 2017–18 2018–19
Dangerous occurrence 1 0 0
Serious personal injury 0 1 0
Death 0 1 0
TOTAL 1 2 0
Details of work health and safety investigations
The WHS Act requires that we provide information about any investigations conducted during the year that relate to us, including details of all notices given to us during the year under Part 10 of the Act.
During 2018–19, we: � investigated no incidents � received no notices under Part 10 of the Act – enforcement measures.
Carer recognitionThe ATO is not responsible for the development, implementation, provision or evaluation of care supports and, therefore, section 8(3) of the Carer Recognition Act 2010 does not apply.
We support carers in the workplace through our employment policies, including flexible hours, access to carers leave, and our network of Carers, Helpers and Interested Others in the ATO (CHIATO). Flexible working arrangements in the ATO have increased significantly in the last 12 months. The types of flexible working arrangements available to ATO staff to support carers include: � part-time work agreements � breastfeeding/lactation breaks � non-standard working hours � work from home/remote work arrangements � job share arrangements � individual flexibility arrangements � purchased leave schemes � career break or sabbatical schemes � flex leave.

04 Commissioner of Taxation annual report 2018–19
92
Financial performance
The ATO is responsible for the management of substantial Commonwealth funds and must be able to demonstrate sound financial management that accords with the Australian Government’s policies and meets the requirements of other agencies, such as the ANAO.
For our financial statements (as required by subsection 43(4) of the PGPA Act), see Part 5.
For details on how we have performed against our financial performance measures in our corporate plan, see strategic objective F1 in the annual performance statement on page 24.
Operating expense budgetThe ATO’s operating expense budget (excluding depreciation) was $3.4 billion.
The ATO’s 2018–19 financial result (including the ACNC) was an operating deficit of $3.3 million or 0.1% of budget. This result excludes non-cash financial accounting adjustments such as write-off expenses, depreciation, amortisation, finance lease and revaluation adjustments made for our financial statements. For our financial statements, see Part 5.
FIGURE 4.4 Operating expenditure, 2018–19
Labour 53.7%
Technology 12.8%
Consultants and contractors 10.0% 7.2% Property and operating lease rentals
5.5% Depreciation
3.0% Bank fees and collection charges
2.4% Other
1.9% Legal costs
1.4%Payment to the Department of Home Affairs for tax administration services
1.3%Printing, postage
and office operations
Travel 0.8%
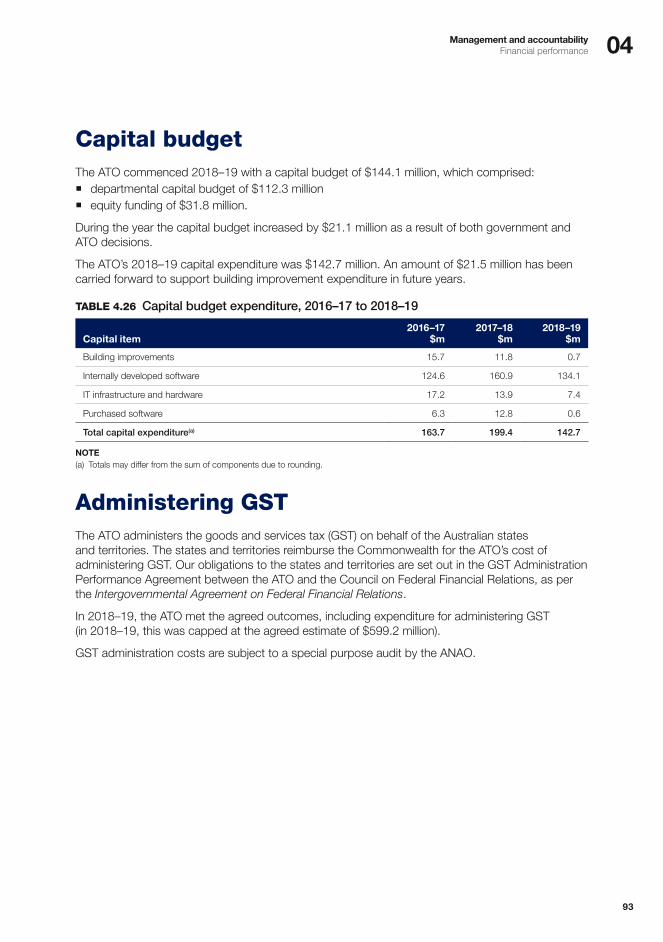
04Management and accountabilityFinancial performance
93
Capital budgetThe ATO commenced 2018–19 with a capital budget of $144.1 million, which comprised: � departmental capital budget of $112.3 million � equity funding of $31.8 million.
During the year the capital budget increased by $21.1 million as a result of both government and ATO decisions.
The ATO’s 2018–19 capital expenditure was $142.7 million. An amount of $21.5 million has been carried forward to support building improvement expenditure in future years.
TABLE 4.26 Capital budget expenditure, 2016–17 to 2018–19
Capital item2016–17
$m2017–18
$m2018–19
$m
Building improvements 15.7 11.8 0.7
Internally developed software 124.6 160.9 134.1
IT infrastructure and hardware 17.2 13.9 7.4
Purchased software 6.3 12.8 0.6
Total capital expenditure(a) 163.7 199.4 142.7
NOTE(a) Totals may differ from the sum of components due to rounding.
Administering GSTThe ATO administers the goods and services tax (GST) on behalf of the Australian states and territories. The states and territories reimburse the Commonwealth for the ATO’s cost of administering GST. Our obligations to the states and territories are set out in the GST Administration Performance Agreement between the ATO and the Council on Federal Financial Relations, as per the Intergovernmental Agreement on Federal Financial Relations.
In 2018–19, the ATO met the agreed outcomes, including expenditure for administering GST (in 2018–19, this was capped at the agreed estimate of $599.2 million).
GST administration costs are subject to a special purpose audit by the ANAO.
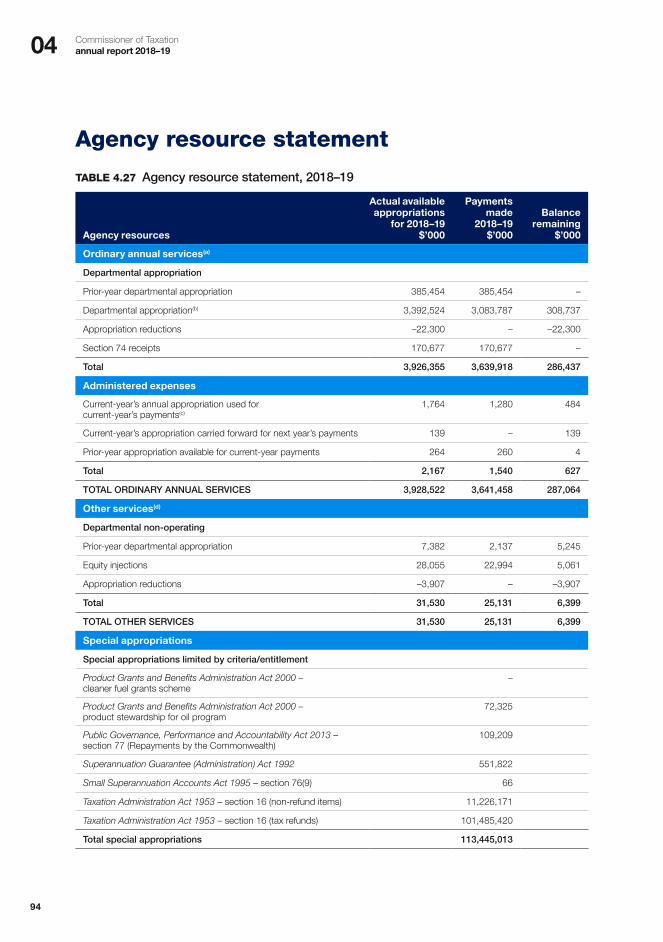
04 Commissioner of Taxation annual report 2018–19
94
Agency resource statement
TABLE 4.27 Agency resource statement, 2018–19
Agency resources
Actual available appropriations
for 2018–19 $’000
Payments made
2018–19 $’000
Balance remaining
$’000
Ordinary annual services(a)
Departmental appropriation
Prior-year departmental appropriation 385,454 385,454 –
Departmental appropriation(b) 3,392,524 3,083,787 308,737
Appropriation reductions –22,300 – –22,300
Section 74 receipts 170,677 170,677 –
Total 3,926,355 3,639,918 286,437
Administered expenses
Current-year’s annual appropriation used for current-year’s payments(c)
1,764 1,280 484
Current-year’s appropriation carried forward for next year’s payments 139 – 139
Prior-year appropriation available for current-year payments 264 260 4
Total 2,167 1,540 627
TOTAL ORDINARY ANNUAL SERVICES 3,928,522 3,641,458 287,064
Other services(d)
Departmental non-operating
Prior-year departmental appropriation 7,382 2,137 5,245
Equity injections 28,055 22,994 5,061
Appropriation reductions –3,907 – –3,907
Total 31,530 25,131 6,399
TOTAL OTHER SERVICES 31,530 25,131 6,399
Special appropriations
Special appropriations limited by criteria/entitlement
Product Grants and Benefits Administration Act 2000 – cleaner fuel grants scheme
–
Product Grants and Benefits Administration Act 2000 – product stewardship for oil program
72,325
Public Governance, Performance and Accountability Act 2013 – section 77 (Repayments by the Commonwealth)
109,209
Superannuation Guarantee (Administration) Act 1992 551,822
Small Superannuation Accounts Act 1995 – section 76(9) 66
Taxation Administration Act 1953 – section 16 (non-refund items) 11,226,171
Taxation Administration Act 1953 – section 16 (tax refunds) 101,485,420
Total special appropriations 113,445,013
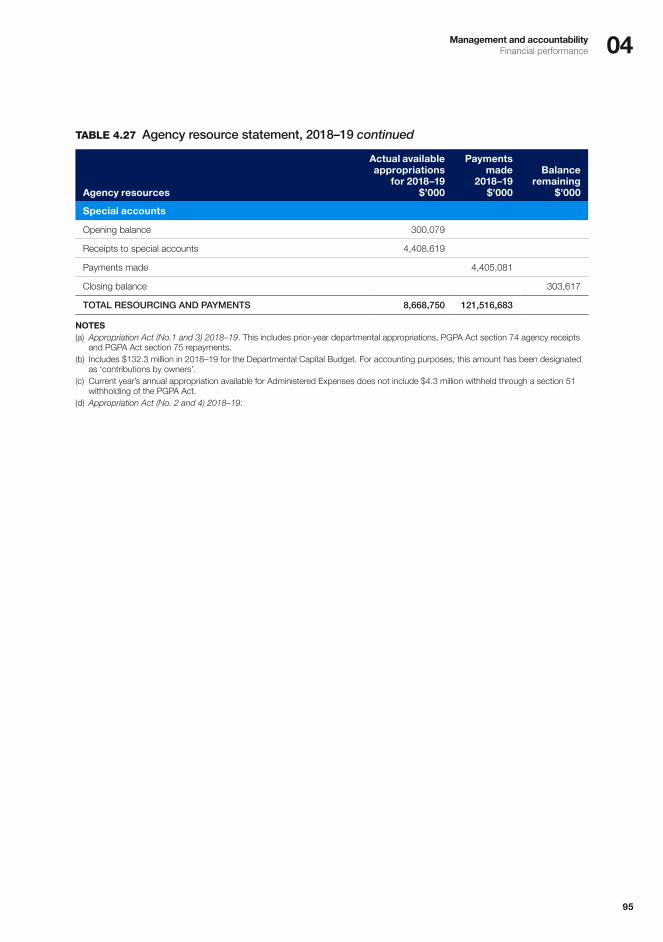
04Management and accountabilityFinancial performance
95
TABLE 4.27 Agency resource statement, 2018–19 continued
Agency resources
Actual available appropriations
for 2018–19 $’000
Payments made
2018–19 $’000
Balance remaining
$’000
Special accounts
Opening balance 300,079
Receipts to special accounts 4,408,619
Payments made 4,405,081
Closing balance 303,617
TOTAL RESOURCING AND PAYMENTS 8,668,750 121,516,683
NOTES(a) Appropriation Act (No.1 and 3) 2018–19. This includes prior-year departmental appropriations, PGPA Act section 74 agency receipts
and PGPA Act section 75 repayments.(b) Includes $132.3 million in 2018–19 for the Departmental Capital Budget. For accounting purposes, this amount has been designated
as ‘contributions by owners’.(c) Current year’s annual appropriation available for Administered Expenses does not include $4.3 million withheld through a section 51
withholding of the PGPA Act.(d) Appropriation Act (No. 2 and 4) 2018–19.

04 Commissioner of Taxation annual report 2018–19
96
TABLE 4.28 Budgeted expenses and resources for Outcome 1, 2018–19
Budgeted expenses and resources
Budget(a) 2018–19
$’000
Actual expenses
2018–19 $’000
Variation 2018–19
$’000
Program 1.1: Australian Taxation Office
Administered expenses
Ordinary Annual Services (Appropriation Bills No. 1) 1,903 1,419 484
Departmental expenses
Departmental items 3,483,942 3,474,405 9,537
Total for Program 1.1 3,485,845 3,475,824 10,021
Program 1.2: Tax Practitioners Board
Departmental expenses
Departmental items 19,582 19,138 444
Total for Program 1.2 19,582 19,138 444
Program 1.3: Australian Business Register
Departmental expenses
Departmental items 139,330 121,765 17,565
Total for Program 1.3 139,330 121,765 17,565
Program 1.4: Australian Charities and Not-for-profits
Departmental expenses
Special account 16,205 14,860 1,345
Total for Program 1.4 16,205 14,860 1,345
Program 1.5: Australian Screen Production Incentive
Administered expenses
Special appropriations 413,000 358,196 54,804
Total for Program 1.5 413,000 358,196 54,804
Program 1.6: Junior Minerals Exploration Incentive
Administered expenses
Special appropriations 28,300 9,300 19,000
Total for Program 1.6 28,300 9,300 19,000
Program 1.7: Fuel Tax Credits Scheme
Administered expenses
Special appropriations 7,168,000 7,247,116 –79,116
Total for Program 1.7 7,168,000 7,247,116 –79,116
Program 1.8: National Rental Affordability Scheme
Administered expenses
Special appropriations 153,927 119,690 34,237
Total for Program 1.8 153,927 119,690 34,237

04Management and accountabilityFinancial performance
97
TABLE 4.28 Budgeted expenses and resources for Outcome 1, 2018–19 continued
Budgeted expenses and resources
Budget(a) 2018–19
$’000
Actual expenses
2018–19 $’000
Variation 2018–19
$’000
Program 1.9: Product Stewardship for Oil
Administered expenses
Special appropriations 81,000 71,443 9,557
Total for Program 1.9 81,000 71,443 9,557
Program 1.10: Research and Development Tax Incentive
Administered expenses
Special appropriations 1,967,000 2,002,062 –35,062
Total for Program 1.10 1,967,000 2,002,062 –35,062
Program 1.11: Low Income Superannuation Tax Offset
Administered expenses
Special appropriations 788,000 691,944 96,056
Total for Program 1.11 788,000 691,944 96,056
Program 1.12: Private Health Insurance Rebate
Administered expenses
Special appropriations 223,000 228,656 –5,656
Total for Program 1.12 223,000 228,656 –5,656
Program 1.13: Superannuation Co-contribution Scheme
Administered expenses
Special appropriations 128,000 113,913 14,087
Total for Program 1.13 128,000 113,913 14,087
Program 1.14: Superannuation Guarantee Scheme
Administered expenses
Special appropriations 420,000 321,503 98,497
Total for Program 1.14 420,000 321,503 98,497
Program 1.15: Targeted Assistance Through the Taxation System
Administered expenses
Special appropriations 132,000 108,685 23,315
Total for Program 1.15 132,000 108,685 23,315
Program 1.16: Interest on Overpayment and Early Payments of Tax
Administered expenses
Special appropriations 140,000 113,495 26,505
Total for Program 1.16 140,000 113,495 26,505
Program 1.17: Bad and Doubtful Debts and Remissions
Administered expenses
Special appropriations 7,471,000 6,655,514 815,486
Total for Program 1.17 7,471,000 6,655,514 815,486

04 Commissioner of Taxation annual report 2018–19
98
TABLE 4.28 Budgeted expenses and resources for Outcome 1, 2018–19 continued
Budgeted expenses and resources
Budget(a) 2018–19
$’000
Actual expenses
2018–19 $’000
Variation 2018–19
$’000
Program 1.18: Other Administered
Administered expenses
Special appropriations
Exploration Development Incentive – –699 699
Seafarer Tax Offset 7,000 9,226 –2,226
Total for Program 1.18 7,000 8,527 –1,527
Outcome 1 Totals by appropriation type
Administered expenses
Ordinary Annual Services (Appropriation Bill No. 1) 1,903 1,419 484
Special appropriations 11,649,227 11,394,530 254,697
Expenses not requiring appropriation in budget year 7,471,000 6,655,514 815,486
Departmental expenses
Departmental appropriation 3,367,895 3,402,548 –34,653
Special accounts 16,205 14,860 1,345
Expenses not requiring appropriation in budget year(b) 274,959 212,760 62,199
TOTAL EXPENSES FOR OUTCOME 1 22,781,189 21,681,631 1,099,558
NOTESThis table is prepared on the basis of accrued expense amounts, while the administered payments table on page 42 is prepared on a cash basis.(a) Budget 2018–19 relates to Estimated Actual published in the 2019–20 Portfolio Budget Statements, and includes any subsequent
adjustments made to the original 2018–19 Budget.(b) Expenses not requiring appropriation in the Budget year includes depreciation, resources received free of charge and write-down and
impairment of assets.

04Management and accountabilityFinancial performance
99
Efficient administrative practicesAlong with agency budgets that provide funding to deliver specific programs, government expenditure is guided by specific legislation that provides direction and sets minimum requirements including reporting obligations. The ATO complies with the Public Governance, Performance and Accountability Act 2013 (PGPA Act), the PGPA Rule, ANAO requirements, and the Environment Protection and Biodiversity Conservation Act 1999.
Asset management
The ATO has an asset management framework in place which outlines how we plan and maintain the optimal asset mix for effective delivery of our programs. The ATO’s approach to asset management includes: � forums to oversee our strategic capital investments, deliver on our priorities and support
significant business transformation projects � a capital management plan that contains information about our proposed capital expenditure
from all funding sources � detailed procedures and guidance on asset management � an asset register, which is subject to an annual stocktake.
Procurement
Procurement refers to the whole process of acquiring goods or services – starting from identifying a need, through to obtaining and paying for the goods or services. If relevant, it also includes the ongoing contract management and disposal of goods.
The ATO’s approach to procuring goods and services – including consultancies – is consistent with, and reflects the principles of, the Commonwealth procurement rules and various procurement-related legislation and government policies. To ensure this, the ATO has a range of system-based and other controls in place and conducts regular assurance processes.
Consultancies
The ATO uses consultancy services to obtain independent advice – for example, in developing specialised ‘intellectual output’ to assist with decision-making at the agency level.
Consultants are engaged through a procurement process, using open tender, limited tender or an established panel arrangement. All consultants who require unsupervised access to ATO premises or ATO information are required to complete mandatory training on security, as well as work, health and safety.
During 2018–19, the ATO entered into 164 new consultancy contracts, resulting in total consultancy expenditure of $10 million. In addition, 87 ongoing consultancy contracts were active during 2018–19, resulting in total consultancy expenditure of almost $6 million. Prior year contracts accounted for 36% of total consultancy expenditure.
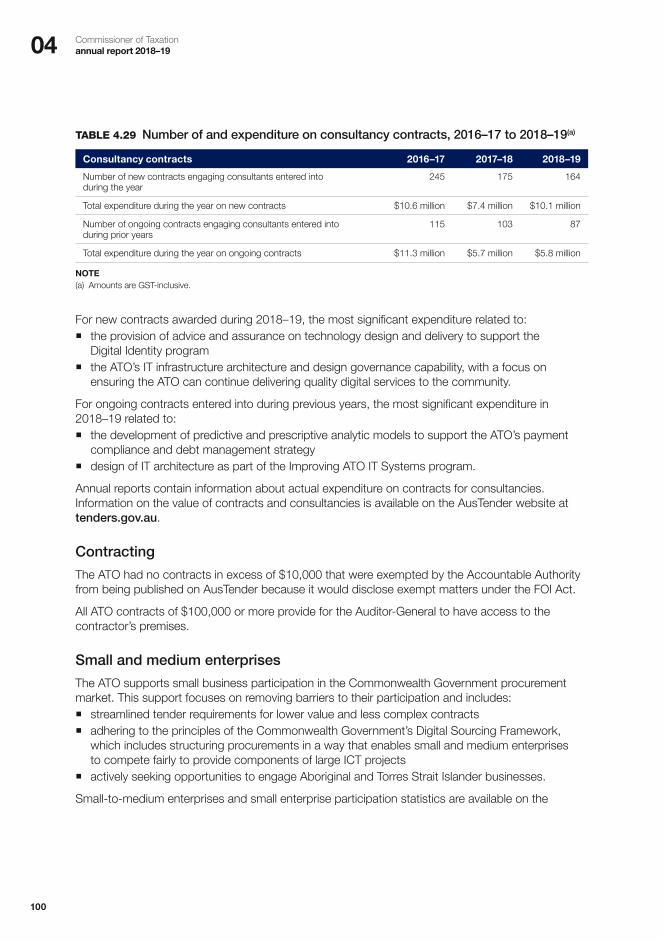
04 Commissioner of Taxation annual report 2018–19
100
TABLE 4.29 Number of and expenditure on consultancy contracts, 2016–17 to 2018–19(a)
Consultancy contracts 2016–17 2017–18 2018–19
Number of new contracts engaging consultants entered into during the year
245 175 164
Total expenditure during the year on new contracts $10.6 million $7.4 million $10.1 million
Number of ongoing contracts engaging consultants entered into during prior years
115 103 87
Total expenditure during the year on ongoing contracts $11.3 million $5.7 million $5.8 million
NOTE(a) Amounts are GST-inclusive.
For new contracts awarded during 2018–19, the most significant expenditure related to: � the provision of advice and assurance on technology design and delivery to support the
Digital Identity program � the ATO’s IT infrastructure architecture and design governance capability, with a focus on
ensuring the ATO can continue delivering quality digital services to the community.
For ongoing contracts entered into during previous years, the most significant expenditure in 2018–19 related to: � the development of predictive and prescriptive analytic models to support the ATO’s payment
compliance and debt management strategy � design of IT architecture as part of the Improving ATO IT Systems program.
Annual reports contain information about actual expenditure on contracts for consultancies. Information on the value of contracts and consultancies is available on the AusTender website at tenders.gov.au.
Contracting
The ATO had no contracts in excess of $10,000 that were exempted by the Accountable Authority from being published on AusTender because it would disclose exempt matters under the FOI Act.
All ATO contracts of $100,000 or more provide for the Auditor-General to have access to the contractor’s premises.
Small and medium enterprises
The ATO supports small business participation in the Commonwealth Government procurement market. This support focuses on removing barriers to their participation and includes: � streamlined tender requirements for lower value and less complex contracts � adhering to the principles of the Commonwealth Government’s Digital Sourcing Framework,
which includes structuring procurements in a way that enables small and medium enterprises to compete fairly to provide components of large ICT projects
� actively seeking opportunities to engage Aboriginal and Torres Strait Islander businesses.
Small-to-medium enterprises and small enterprise participation statistics are available on the
04Management and accountabilityFinancial performance
101
Department of Finance website at finance.gov.au/procurement. The Australian Government has a target for 10% of contracts (by value) to be awarded to businesses with less than 200 employees. In 2018, the government announced an additional commitment to source at least 35% of contracts valued up to $20 million (by number) from small-to-medium enterprises.
The ATO recognises the importance of ensuring small businesses are paid on time. The results of the Survey of Australian Government Payments to Small Business are available on the Treasury’s website at treasury.gov.au. The ATO pays our invoices to all businesses (including small businesses) within 30 days, achieving 98% compliance in 2018–19.
Indigenous procurement policy
This year the ATO continued to actively create opportunities for Aboriginal and Torres Strait Islander businesses to supply goods and services to us. For example, we conducted focus sessions to provide Indigenous suppliers with an opportunity to introduce their services and capability to us. The ATO considers Aboriginal and Torres Strait Islander businesses for all procurements regardless of value.
In 2018–19, we spent over $17 million with Aboriginal and Torres Strait Islander businesses. This expenditure relates to both new contracts entered into during 2018–19 (112 with a total value of almost $12 million) and contracts entered into during previous years.
In May 2019, at the Supply Nation Diversity Awards, the ATO was named a finalist for the Government Member of the Year Award, making it into the top three among federal and state government and university sectors in the country.
Grants
The ATO provides a small number of discretionary grants, including funding for legal institutes and to encourage community participation in the tax system through sponsorship and mentoring arrangements.
All of the ATO’s grant activities meet the requirements and principles of grants administration contained in the Commonwealth grants rules and guidelines 2017, including reporting and publishing of all funding provided throughout the year.
During 2018–19, 14 grants were awarded by the ATO. Information on grants awarded is available at grants.gov.au.
Compliance with finance law
The PGPA Act requires that agencies provide a statement of significant issues reported to the minister under paragraph 19(1)(e) of the Act, which relates to non-compliance with finance law and action taken to remedy non-compliance.
The ATO had no instances of significant non-compliance with the finance law to report to the minister in 2018–19.

0504 Commissioner of Taxation
annual report 2018–19
102
Ecologically sustainable development and environmental performance
Section 516A of the Environment Protection and Biodiversity Conservation Act 1999 requires all Commonwealth agencies to report on certain aspects of ecologically sustainable development and environmental performance.
Appropriations – Administered funding
In 2018–19, the ATO administered appropriations for two energy and fuel schemes that provide credits and grants to reduce the costs of some fuels, or to provide a benefit to encourage recycling of waste oils. These were: � Program 1.7 Fuel Tax Credits Scheme (page 43) � Program 1.9 Product Stewardship for Oil (page 43).
More information about fuel schemes is available at ato.gov.au/business/fuel-schemes.
Appropriations – Departmental funding
The ATO has no departmental funding for work that specifically contributes to ecologically sustainable development. However, in making decisions on expenditure, we apply the Commonwealth procurement rules and guidance from the Department of Finance on informed decision-making processes, to ensure our procurements achieve value for money.
The Commonwealth procurement rules include the need to consider the environmental aspects of the purchase, including whole-of-life costs and, where the procurement is via tender, a tenderer’s practices regarding environmental impacts.
In July 2017, the ATO adopted a new environmental strategy that aims to reduce the ATO’s greenhouse gas emissions by 2020. As at 30 June 2019, we had reduced our emissions by 14.5% from 2017 levels. The ATO is focused on sustainable environmental practices and continuing to reduce emissions.
In 2018–19, The ATO minimised our environmental impact by meeting the energy efficiency requirements of the Energy Efficiency in Government Operations (EEGO) policy for Tenant light and power and Central services performance ratings.
TABLE 4.30 Energy intensity ratings and EEGO targets, 2018–19
Category (and unit of measure) EEGO targetATO
performance
Tenant light and power (MJ per person per annum) 7,500 4,390
Central services (MJ per m2 per annum) 400 119
Additionally, 68.4% of ATO’s eligible tenancies that qualify for a rating have achieved or exceeded the minimum National Australian Built Environment Rating System (NABERS) rating of 4.5 stars.

05Financial statements
About the financial statements
The ATO’s financial statements are general purpose financial statements and are required by section 42 of the Public Governance, Performance and Accountability Act 2013 (PGPA Act). The financial statements have been prepared in accordance with: � the Public Governance, Performance and Accountability (Financial Reporting) Rule 2015, and � Australian Accounting Standards and Interpretations – Reduced Disclosure Requirements issued
by the Australian Accounting Standards Board (AASB) that apply for the reporting period.
The ATO’s financial statements have been prepared on an accrual basis and in accordance with the historical cost convention, except for certain assets and liabilities at fair value. Except where stated, no allowance is made for the effect of changing prices on the results or the financial position.
These financial statements incorporate the financial transactions of the Tax Practitioners Board (TPB), the Australian Business Register (ABR), and the Australian Charities and Not-for-profits Commission (ACNC).

05 Commissioner of Taxation annual report 2018–19
104
GPO Box 707 CANBERRA ACT 260119 National Circuit BARTON ACTPhone (02) 6203 7300 Fax (02) 6203 7777
Auditor-General for Australia
INDEPENDENT AUDITOR’S REPORT
To the Assistant Minister for Superannuation, Financial Services and Financial Technology
Opinion
In my opinion, the financial statements of the Australian Taxation Office (the Entity) for the year ended 30 June 2019:
(a) comply with Australian Accounting Standards – Reduced Disclosure Requirements and the Public Governance, Performance and Accountability (Financial Reporting) Rule 2015; and
(b) present fairly the financial position of the Entity as at 30 June 2019 and its financial performance and cash flows for the year then ended.
The financial statements of the Entity, which I have audited, comprise the following statements as at 30 June 2019and for the year then ended:
• Statement by the Commissioner of Taxation and Chief Finance Officer; • Statement of Comprehensive Income; • Statement of Financial Position; • Statement of Changes in Equity; • Cash Flow Statement; • Administered Schedule of Comprehensive Income; • Administered Schedule of Assets and Liabilities; • Administered Reconciliation Schedule; • Administered Cash Flow Statement; and • Notes to and forming part of the financial statements, comprising a Summary of Significant Accounting
Policies and other explanatory information.
Basis for Opinion
I conducted my audit in accordance with the Australian National Audit Office Auditing Standards, which incorporate the Australian Auditing Standards. My responsibilities under those standards are further described in the Auditor’s Responsibilities for the Audit of the Financial Statements section of my report. I am independent of the Entity in accordance with the relevant ethical requirements for financial statement audits conducted by me.These include the relevant independence requirements of the Accounting Professional and Ethical Standards Board’s APES 110 Code of Ethics for Professional Accountants (the Code) to the extent that they are not in conflict with the Auditor-General Act 1997. I have also fulfilled my other responsibilities in accordance with the Code. I believe that the audit evidence I have obtained is sufficient and appropriate to provide a basis for my opinion.
Key Audit Matters
Key audit matters are those matters that, in my professional judgement, were of most significance in my audit of the financial statements of the current period. These matters were addressed in the context of my audit of the financial statements as a whole, and in forming my opinion thereon, and I do not provide a separate opinion on these matters.
Financial statements

05Financial statements
105
Key audit matter
Accuracy of taxation revenue
Refer to Note 14 ‘Administered – Income’
I focused on the estimation processes adopted by the Entity for financial reporting of taxation revenuegiven the value of the transactions and the complexity and judgement involved in the estimation processesand calculations. The reliable estimation of taxation revenue is complex due to uncertain timing of tax return assessments and payments and forecasting of likely taxation revenue outcomes. The Entity applies significant judgement when selecting the appropriate base for revenue recognition.
The ATO uses two bases for revenue recognition – the Economic Transactions Method (ETM) and the Taxation Liability Method (TLM). Under the ETM the ATO recognises taxation revenue when it gains control over future economic benefits that arise from tax legislation. The ETM involves significant estimates based on available information.The TLM recognises revenue at the earlier of when an assessment of tax liability is or can be made or payment is received. Revenue recognised under the TLM is generally recognised at a later time than if it were measured under the ETM.
The methodologies used by the Entity to prepare taxation revenue for its financial statements involve data analysis and estimation processes with high inherent risk that elevate the risk of error. As part of the estimation process the Entity conducts data analysis of past taxpayer behaviours and recordstogether with assumptions about economic factors such as future wage growth and gross domestic product.
For the year ended 30 June 2019, the Entity reported total taxation revenue of $ 433,438 m.
How the audit addressed the matter
I assessed the appropriateness of the base for revenue recognition with reference to the accuracy of prior year results and historical trends.
I assessed the effectiveness of the taxation estimate process controls and the associated validation procedures together with the completeness, relevance and accuracy of data used in developing taxation revenue estimates.
I assessed the reasonableness of the interpretation and analysis of data used by the Entity for materialestimates and recalculated these estimates as at 30 June 2019.
I evaluated the adequacy of documentation to support the Entity’s judgements made in relation to key estimates and allocations of revenue at year-end. This included an assessment of the quality assuranceprocess over manual adjustments processed as at 30 June 2019.
Key audit matter
Completeness of taxation revenue
Refer to Note 14‘Administered - Income’
I focused on this area given the importance of the compliance risk management process in detecting and correcting non-compliant taxation returns.
The measurement and recognition of taxation revenue that is materially correct is dependent on information provided by taxpayers in a self-assessment and voluntary compliance taxation regime. Ineffective design and implementation of the compliance taxationregime elevates the risk that invalid taxation returns are not detected and corrected by the Entity resulting in an understatement of taxation revenue.
For the year ended 30 June 2019, the Entity reported total taxation revenue of $ 433,438 m.
How the audit addressed the matter
I assessed the completeness of taxation revenue by conducting an evaluation of the Entity’s compliance risk management processes by benchmarking the Entity’s compliance framework against the Organisation for Economic Co-operation and Development best practice principles of what constitutes an effective taxation compliance program.
I assessed the Entity’s risk identification, risk assessment and risk prioritisation processes for a selection of risks. In performing my procedures I also assessed the risk treatment strategies and implementation and assessed the process of monitoring performance and evaluating compliance outcomes on a sample basis at an enterprise level.
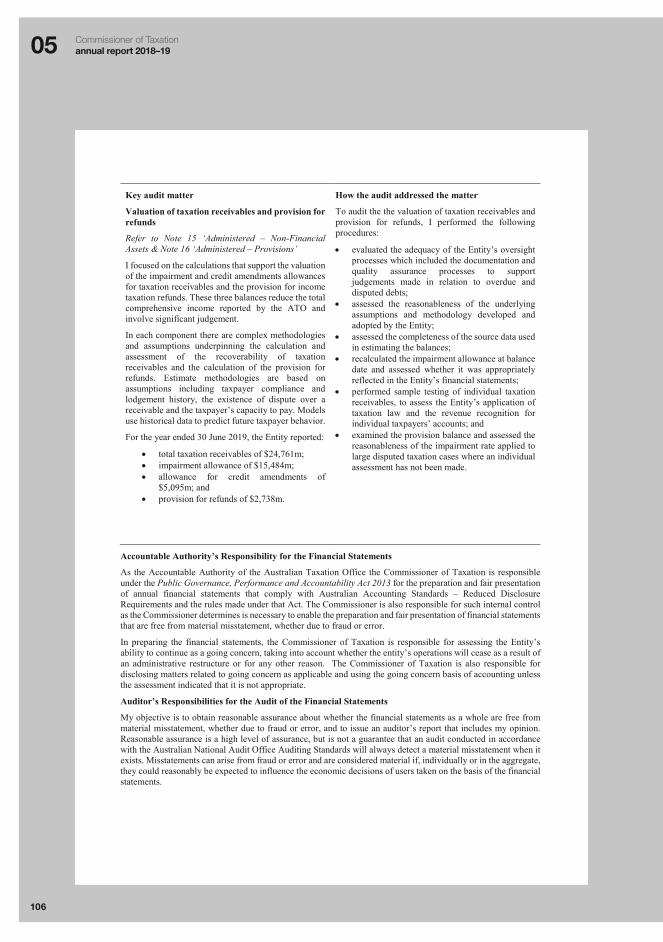
05 Commissioner of Taxation annual report 2018–19
106
Key audit matter
Valuation of taxation receivables and provision for refunds
Refer to Note 15 ‘Administered – Non-FinancialAssets & Note 16 ‘Administered – Provisions’
I focused on the calculations that support the valuationof the impairment and credit amendments allowances for taxation receivables and the provision for income taxation refunds. These three balances reduce the total comprehensive income reported by the ATO and involve significant judgement.
In each component there are complex methodologiesand assumptions underpinning the calculation and assessment of the recoverability of taxation receivables and the calculation of the provision for refunds. Estimate methodologies are based on assumptions including taxpayer compliance and lodgement history, the existence of dispute over a receivable and the taxpayer’s capacity to pay. Models use historical data to predict future taxpayer behavior.
For the year ended 30 June 2019, the Entity reported:
• total taxation receivables of $24,761m;• impairment allowance of $15,484m; • allowance for credit amendments of
$5,095m; and• provision for refunds of $2,738m.
How the audit addressed the matter
To audit the the valuation of taxation receivables andprovision for refunds, I performed the following procedures:
• evaluated the adequacy of the Entity’s oversightprocesses which included the documentation and quality assurance processes to support judgements made in relation to overdue and disputed debts;
• assessed the reasonableness of the underlying assumptions and methodology developed and adopted by the Entity;
• assessed the completeness of the source data used in estimating the balances;
• recalculated the impairment allowance at balance date and assessed whether it was appropriately reflected in the Entity’s financial statements;
• performed sample testing of individual taxation receivables, to assess the Entity’s application of taxation law and the revenue recognition for individual taxpayers’ accounts; and
• examined the provision balance and assessed the reasonableness of the impairment rate applied to large disputed taxation cases where an individual assessment has not been made.
Accountable Authority’s Responsibility for the Financial Statements
As the Accountable Authority of the Australian Taxation Office the Commissioner of Taxation is responsible under the Public Governance, Performance and Accountability Act 2013 for the preparation and fair presentation of annual financial statements that comply with Australian Accounting Standards – Reduced Disclosure Requirements and the rules made under that Act. The Commissioner is also responsible for such internal control as the Commissioner determines is necessary to enable the preparation and fair presentation of financial statements that are free from material misstatement, whether due to fraud or error.
In preparing the financial statements, the Commissioner of Taxation is responsible for assessing the Entity’sability to continue as a going concern, taking into account whether the entity’s operations will cease as a result of an administrative restructure or for any other reason. The Commissioner of Taxation is also responsible for disclosing matters related to going concern as applicable and using the going concern basis of accounting unless the assessment indicated that it is not appropriate.
Auditor’s Responsibilities for the Audit of the Financial Statements
My objective is to obtain reasonable assurance about whether the financial statements as a whole are free from material misstatement, whether due to fraud or error, and to issue an auditor’s report that includes my opinion. Reasonable assurance is a high level of assurance, but is not a guarantee that an audit conducted in accordance with the Australian National Audit Office Auditing Standards will always detect a material misstatement when it exists. Misstatements can arise from fraud or error and are considered material if, individually or in the aggregate, they could reasonably be expected to influence the economic decisions of users taken on the basis of the financial statements.

05Financial statements
107
As part of an audit in accordance with the Australian National Audit Office Auditing Standards, I exercise professional judgement and maintain professional scepticism throughout the audit.
I also:
• identify and assess the risks of material misstatement of the financial statements, whether due to fraud or error, design and perform audit procedures responsive to those risks, and obtain audit evidence that is sufficient and appropriate to provide a basis for my opinion. The risk of not detecting a material misstatement resulting from fraud is higher than for one resulting from error, as fraud may involve collusion, forgery, intentional omissions, misrepresentations, or the override of internal control;
• obtain an understanding of internal control relevant to the audit in order to design audit procedures that are appropriate in the circumstances, but not for the purpose of expressing an opinion on the effectiveness of the entity’s internal control;
• evaluate the appropriateness of accounting policies used and the reasonableness of accounting estimates and related disclosures made by the Accountable Authority;
• conclude on the appropriateness of the Accountable Authority’s use of the going concern basis of accounting and, based on the audit evidence obtained, whether a material uncertainty exists related to events or conditions that may cast significant doubt on the Entity’s ability to continue as a going concern. If I conclude that a material uncertainty exists, I am required to draw attention in my auditor’s report to the related disclosures in the financial statements or, if such disclosures are inadequate, to modify my opinion. My conclusions are based on the audit evidence obtained up to the date of my auditor’s report. However, future events or conditions may cause the entity to cease to continue as a going concern; and
• evaluate the overall presentation, structure and content of the financial statements, including the disclosures, and whether the financial statements represent the underlying transactions and events in a manner that achieves fair presentation.
I communicate with the Accountable Authority regarding, among other matters, the planned scope and timing of the audit and significant audit findings, including any significant deficiencies in internal control that I identify during my audit.
From the matters communicated with the Accountable Authority, I determine those matters that were of most significance in the audit of the financial statements of the current period and are therefore the key audit matters. I describe these matters in my auditor’s report unless law or regulation precludes public disclosure about the matter or when, in extremely rare circumstances, I determine that a matter should not be communicated in my report because the adverse consequences of doing so would reasonably be expected to outweigh the public interest benefits of such communication.
Australian National Audit Office
Grant Hehir
Auditor-General
Canberra
12 September 2019
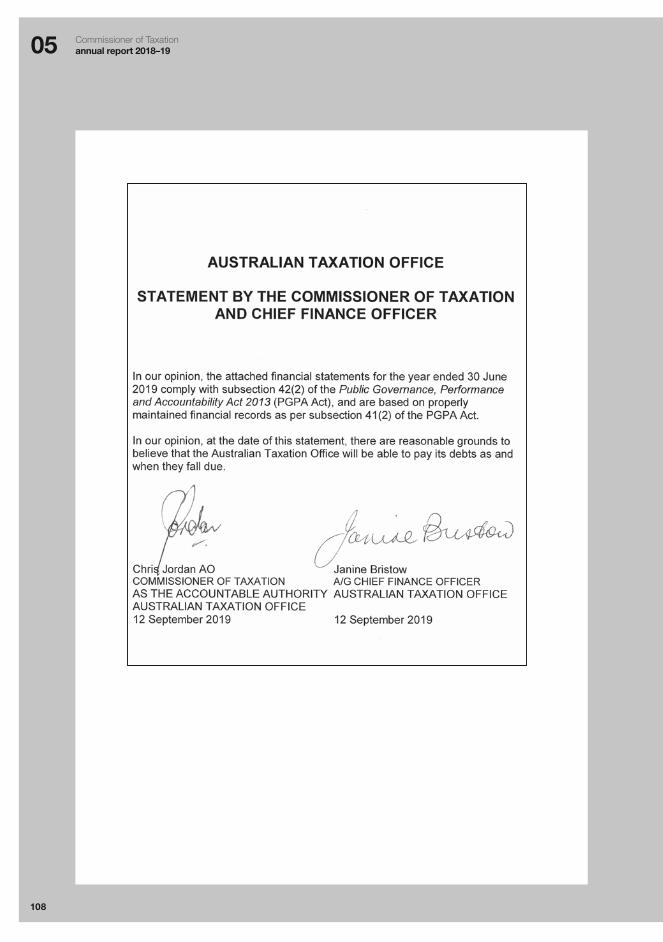
05 Commissioner of Taxation annual report 2018–19
108
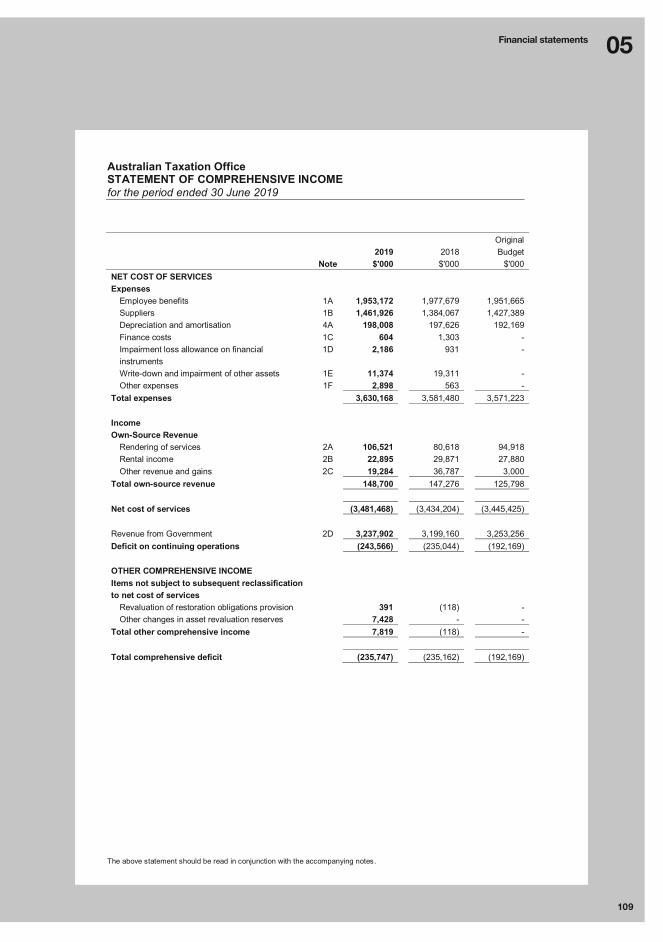
05Financial statements
109
Australian Taxation Office STATEMENT OF COMPREHENSIVE INCOME for the period ended 30 June 2019
The above statement should be read in conjunction with the accompanying notes.
2019 2018 Original Budget
Note $'000 $'000 $'000 NET COST OF SERVICES Expenses
Employee benefits 1A 1,953,172 1,977,679 1,951,665 Suppliers 1B 1,461,926 1,384,067 1,427,389 Depreciation and amortisation 4A 198,008 197,626 192,169 Finance costs 1C 604 1,303 - Impairment loss allowance on financial instruments
1D 2,186 931 -
Write-down and impairment of other assets 1E 11,374 19,311 - Other expenses 1F 2,898 563 -
Total expenses 3,630,168 3,581,480 3,571,223 Income Own-Source Revenue
Rendering of services 2A 106,521 80,618 94,918 Rental income 2B 22,895 29,871 27,880 Other revenue and gains 2C 19,284 36,787 3,000
Total own-source revenue 148,700 147,276 125,798 Net cost of services (3,481,468)
(3,434,204) (3,445,425)
Revenue from Government 2D 3,237,902 3,199,160 3,253,256 Deficit on continuing operations (243,566) (235,044) (192,169) OTHER COMPREHENSIVE INCOME Items not subject to subsequent reclassification to net cost of services
Revaluation of restoration obligations provision 391 (118) - Other changes in asset revaluation reserves 7,428 - -
Total other comprehensive income 7,819 (118) - Total comprehensive deficit (235,747) (235,162) (192,169)

05 Commissioner of Taxation annual report 2018–19
110
Australian Taxation Office STATEMENT OF COMPREHENSIVE INCOME for the period ended 30 June 2019
The above statement should be read in conjunction with the accompanying notes.
Budget Variances Commentary: Statement of Comprehensive Income
Affected line items Explanation of major variances Suppliers The higher than expected actual is primarily due to increased
expenditure on contractors, consultants and new communication infrastructure projects. This increase is partially offset by a lower than expected workers compensation premium expense.
Rendering of services Revenue from credit card merchant fees, due to increased volumes of credit card payments for lower level debt balances, and additional revenue from other government agencies was higher than anticipated. Actual recovery of legal costs and indemnity recoveries have been reclassified to other revenue.
Rental income Lower than expected rental income is driven by additional lease incentives provided that was not known at the time of budget preparation.
Other revenue and gains Higher other revenue is driven by increased indemnity recoveries, partially offset by lower recovery of legal costs, which have both been reclassified from rendering of services.

05Financial statements
111
Australian Taxation Office STATEMENT OF FINANCIAL POSITION as at 30 June 2019
The above statement should be read in conjunction with the accompanying notes.
2019 2018 Original Budget
Note $'000 $'000 $'000 ASSETS Financial Assets
Cash 3A 45,368 28,944 22,614 Trade and other receivables 3B 354,620 463,812 443,344
Total financial assets 399,988 492,756 465,958 Non-Financial Assets
Buildings - leasehold improvements 4A 173,318 195,175 197,278 Plant and equipment 4A 58,973 73,017 63,739 Intangibles - computer software 4A 502,278 520,746 479,348 Other non-financial assets 4B 98,482 89,544 79,323
Total non-financial assets 833,051 878,482 819,688 Total assets 1,233,039 1,371,238 1,285,646 LIABILITIES Payables
Employee benefits 5A 35,987 44,529 18,544 Suppliers 5B 325,516 384,402 294,747 Other payables 5C 69,598 84,619 66,873
Total payables 431,101 513,550 380,164 Interest Bearing Liabilities
Leases 6 7,232 10,859 - Total interest bearing liabilities 7,232 10,859 - Provisions
Employee provisions 7A 697,370 672,872 693,834 Other provisions 7B 29,831 29,881 24,854
Total provisions 727,201 702,753 718,688 Total liabilities 1,165,534 1,227,162 1,098,852 Net assets 67,505 144,076 186,794 EQUITY
Contributed equity 1,706,580 1,550,110 1,749,827 Reserves 123,220 115,401 115,518 Accumulated deficit (1,762,295)
(1,521,435) (1,678,551)
Total equity 67,505 144,076 186,794

05 Commissioner of Taxation annual report 2018–19
112
Australian Taxation Office STATEMENT OF FINANCIAL POSITION as at 30 June 2019
The above statement should be read in conjunction with the accompanying notes.
Budget Variances Commentary: Statement of Financial Position
Affected line items Explanation of major variances Cash The actual was higher than budgeted primarily due to timing
differences in cash receipts and payments.
Trade and other receivables The lower than budgeted actual is primarily driven by a lower than expected appropriation receivable aligned with the timing of payment for goods and services.
Buildings - leasehold improvements Lower than budgeted Buildings - leasehold improvements is due to delays in property works approvals, resulting in lower than expected asset additions.
Intangibles - computer software Higher than budgeted Intangibles - computer software is driven by higher than expected asset additions in relation to high priority IT system builds.
Other non-financial assets The higher than budgeted actual for Other non-financial assets is primarily driven by higher than expected prepayments in relation to IT licenses.
Employee benefits The higher than budgeted employee benefits payable is driven by higher than expected separation and redundancies towards the end of the financial year.
Suppliers The higher than budgeted suppliers payables is primarily driven by higher than expected trade creditors and accruals due to pending payments for services provided on behalf of the ATO.
Other provisions The higher than budgeted actual is largely driven by additional provisions for legal costs and indemnities for unforeseen cases not factored into the budget.
Equity The budgeted equity balances did not account for an operating deficit, asset revaluations or subsequent appropriation reductions associated with the repeal of a number of appropriation acts related to prior years.

05Financial statements
113
Aus
tral
ian
Taxa
tion
Offi
ce
STA
TEM
ENT
OF
CH
AN
GES
IN E
QU
ITY
for t
he p
erio
d en
ded
30 J
une
2019
Th
e ab
ove
stat
emen
t sho
uld
be re
ad in
con
junc
tion
with
the
acco
mpa
nyin
g no
tes.
C
ontr
ibut
ed E
quity
A
sset
Rev
alua
tion
Sur
plus
R
etai
ned
Ear
ning
s To
tal E
quity
20
19
2018
O
rigin
al
Bud
get
2019
20
18
Orig
inal
B
udge
t 20
19
2018
O
rigin
al
Bud
get
2019
20
18
Orig
inal
B
udge
t
$'00
0 $'
000
$'00
0 $'
000
$'00
0 $'
000
$'00
0 $'
000
$'00
0 $'
000
$'00
0 $'
000
Ope
ning
bal
ance
Bal
ance
car
ried
forw
ard
from
pre
viou
s
perio
d 1,
550,
110
1,45
3,37
0 1,
609,
450
115,
401
115,
519
115,
518
(1,5
21,4
35)
(1,2
86,4
11)
(1,4
86,3
82)
144,
076
282,
478
238,
586
Prio
r yea
r adj
ustm
ents
1 -
- -
- -
- 2,
706
20
- 2,
706
20
-
Adj
uste
d op
enin
g ba
lanc
e 1,
550,
110
1,45
3,37
0 1,
609,
450
115,
401
115,
519
115,
518
(1,5
18,7
29)
(1,2
86,3
91)
(1,4
86,3
82)
146,
782
282,
498
238,
586
Com
preh
ensi
ve in
com
e
Oth
er c
ompr
ehen
sive
inco
me
-
- 7,
819
(118
) -
- -
- 7,
819
(118
) -
(Def
icit)
for t
he p
erio
d -
- -
-
- (2
43,5
66)
(235
,044
) (1
92,1
69)
(243
,566
) (2
35,0
44)
(192
,169
)
Tota
l com
preh
ensi
ve in
com
e (d
efic
it)
- -
- 7,
819
(118
) -
(243
,566
) (2
35,0
44)
(192
,169
) (2
35,7
47)
(235
,162
) (1
92,1
69)
Tran
sact
ions
with
ow
ners
Dis
trib
utio
ns to
ow
ners
Ret
urns
of c
ontri
bute
d eq
uity
2 (3
,907
) (4
3,73
9)
- -
- -
- -
- (3
,907
) (4
3,73
9)
- C
ontr
ibut
ions
by
owne
rs
Equ
ity in
ject
ion
- app
ropr
iatio
ns
28,0
55
27,8
90
28,0
55
- -
- -
- -
28,0
55
27,8
90
28,0
55
Dep
artm
enta
l cap
ital b
udge
t 13
2,32
2 11
2,58
9 11
2,32
2 -
- -
- -
- 13
2,32
2 11
2,58
9 11
2,32
2
Tota
l tra
nsac
tions
with
ow
ners
15
6,47
0 96
,740
14
0,37
7 -
- -
- -
- 15
6,47
0 96
,740
14
0,37
7
Tran
sfer
s be
twee
n eq
uity
com
pone
nts
- -
- -
- -
- -
- -
- -
Clo
sing
bal
ance
as
at 3
0 Ju
ne
1,70
6,58
0 1,
550,
110
1,74
9,82
7 12
3,22
0 11
5,40
1 11
5,51
8 (1
,762
,295
) (1
,521
,435
) (1
,678
,551
) 67
,505
14
4,07
6 18
6,79
4 1 P
rior y
ear a
djus
tmen
t rel
ates
to o
peni
ng b
alan
ce a
djus
tmen
t for
the
new
acc
ount
ing
stan
dard
AA
SB
9 F
inan
cial
Inst
rum
ents
. 2 R
etur
ns o
f con
tribu
ted
equi
ty re
late
to a
mou
nts
with
held
thro
ugh
a se
ctio
n 51
det
erm
inat
ion
whi
ch re
pres
ent a
loss
of c
ontro
l to
the
ATO
. Cur
rent
yea
r am
ount
als
o in
clud
es re
peal
of 2
016-
17 a
nnua
l ap
prop
riatio
n an
d 20
16-1
7 su
pply
act
s w
hich
will
auto
mat
ical
ly la
pse
from
1 J
uly
2019
. The
se a
mou
nts
are
not l
egal
redu
ctio
ns a
nd a
re th
eref
ore
still
incl
uded
in N
ote
19B
Uns
pent
Ann
ual A
ppro
pria
tions
.

05 Commissioner of Taxation annual report 2018–19
114
Australian Taxation Office STATEMENT OF CHANGES IN EQUITY for the period ended 30 June 2019
The above statement should be read in conjunction with the accompanying notes.
Accounting Policy
Amounts appropriated which are designated as equity injections for a year (less any formal reductions) and Departmental Capital Budgets (DCBs) are recognised directly in contributed equity in that year.
Budget Variances Commentary: Statement of Changes in Equity
Explanation of major variances Additional Departmental capital budget of $20 million relates to a reclassification of departmental operating appropriation approved during the financial year. Other variances are supported by the explanations provided above in the Statement of Comprehensive Income and Statement of Financial Position.
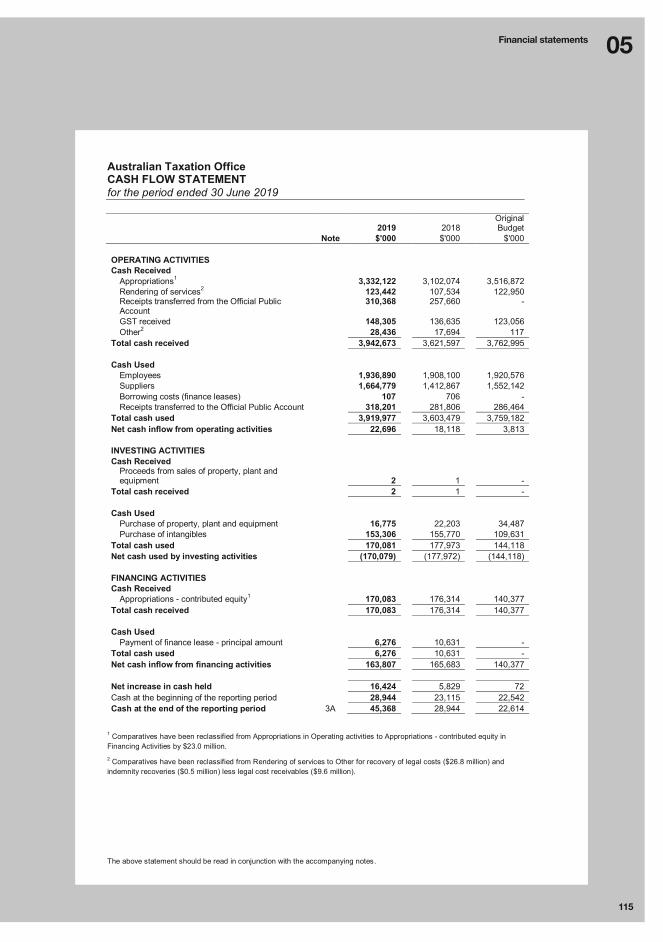
05Financial statements
115
Australian Taxation Office CASH FLOW STATEMENT for the period ended 30 June 2019
The above statement should be read in conjunction with the accompanying notes.
2019 2018 Original Budget
Note $'000 $'000 $'000 OPERATING ACTIVITIES Cash Received
Appropriations1 3,332,122 3,102,074 3,516,872 Rendering of services2 123,442 107,534 122,950 Receipts transferred from the Official Public Account
310,368 257,660 -
GST received 148,305 136,635 123,056 Other2 28,436 17,694 117
Total cash received 3,942,673 3,621,597 3,762,995 Cash Used
Employees 1,936,890 1,908,100 1,920,576 Suppliers 1,664,779 1,412,867 1,552,142 Borrowing costs (finance leases) 107 706 - Receipts transferred to the Official Public Account 318,201 281,806 286,464
Total cash used 3,919,977 3,603,479 3,759,182 Net cash inflow from operating activities 22,696 18,118 3,813 INVESTING ACTIVITIES Cash Received
Proceeds from sales of property, plant and equipment 2 1 -
Total cash received 2 1 - Cash Used
Purchase of property, plant and equipment 16,775 22,203 34,487 Purchase of intangibles 153,306 155,770 109,631
Total cash used 170,081 177,973 144,118 Net cash used by investing activities (170,079) (177,972) (144,118) FINANCING ACTIVITIES Cash Received
Appropriations - contributed equity1 170,083 176,314 140,377 Total cash received 170,083 176,314 140,377 Cash Used
Payment of finance lease - principal amount 6,276 10,631 - Total cash used 6,276 10,631 - Net cash inflow from financing activities 163,807 165,683 140,377 Net increase in cash held 16,424 5,829 72 Cash at the beginning of the reporting period 28,944 23,115 22,542 Cash at the end of the reporting period 3A 45,368 28,944 22,614
1 Comparatives have been reclassified from Appropriations in Operating activities to Appropriations - contributed equity in Financing Activities by $23.0 million. 2 Comparatives have been reclassified from Rendering of services to Other for recovery of legal costs ($26.8 million) and indemnity recoveries ($0.5 million) less legal cost receivables ($9.6 million).

05 Commissioner of Taxation annual report 2018–19
116
Australian Taxation Office CASH FLOW STATEMENT for the period ended 30 June 2019
The above statement should be read in conjunction with the accompanying notes.
Budget Variances Commentary: Statement of Cash Flows
Explanation of major variances The variances are supported by the explanations provided above in the Statement of Comprehensive Income and Statement of Financial Position.
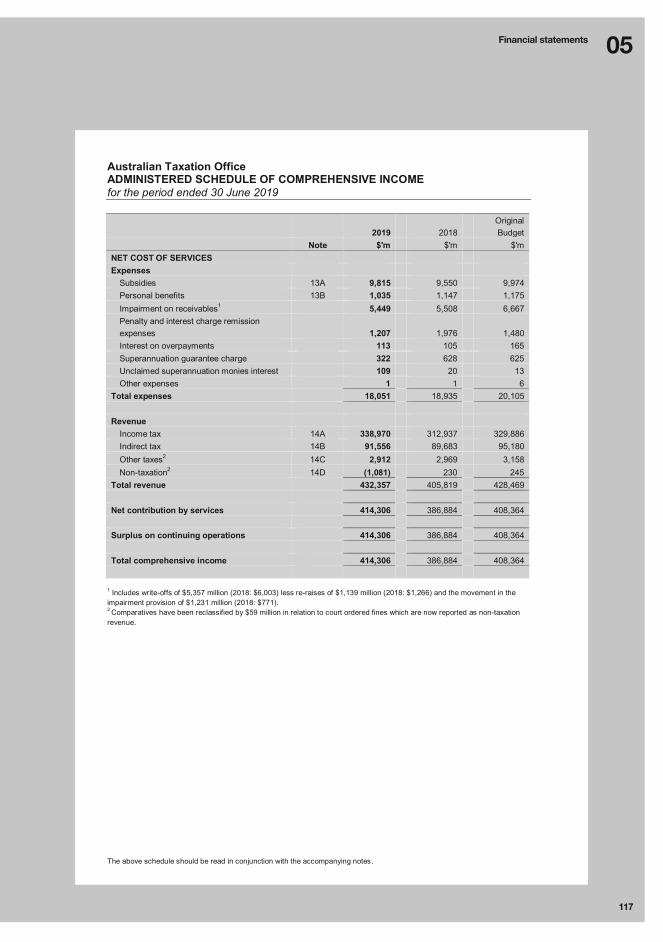
05Financial statements
117
Australian Taxation Office ADMINISTERED SCHEDULE OF COMPREHENSIVE INCOME for the period ended 30 June 2019
The above schedule should be read in conjunction with the accompanying notes.
2019 2018 Original Budget
Note $'m $'m $'m NET COST OF SERVICES Expenses
Subsidies 13A 9,815 9,550 9,974 Personal benefits 13B 1,035 1,147 1,175 Impairment on receivables1 5,449 5,508 6,667 Penalty and interest charge remission expenses 1,207 1,976 1,480 Interest on overpayments 113 105 165 Superannuation guarantee charge 322 628 625 Unclaimed superannuation monies interest 109 20 13 Other expenses 1 1 6
Total expenses 18,051 18,935 20,105 Revenue
Income tax 14A 338,970 312,937 329,886 Indirect tax 14B 91,556 89,683 95,180 Other taxes2 14C 2,912 2,969 3,158 Non-taxation2 14D (1,081) 230 245
Total revenue 432,357 405,819 428,469
Net contribution by services 414,306 386,884 408,364 Surplus on continuing operations 414,306 386,884 408,364 Total comprehensive income 414,306 386,884 408,364
1 Includes write-offs of $5,357 million (2018: $6,003) less re-raises of $1,139 million (2018: $1,266) and the movement in the impairment provision of $1,231 million (2018: $771). 2 Comparatives have been reclassified by $59 million in relation to court ordered fines which are now reported as non-taxation revenue.

05 Commissioner of Taxation annual report 2018–19
118
Australian Taxation Office ADMINISTERED SCHEDULE OF COMPREHENSIVE INCOME for the period ended 30 June 2019
The above schedule should be read in conjunction with the accompanying notes.
Budget Variances Commentary: Schedule of Comprehensive Income
Affected line items Explanation of major variances
Subsidies The actuals are lower than budget primarily due to lower than expected research and development (R&D) tax incentive, partially offset by higher than expected fuel tax credits (FTC) claims: • R&D claims are lower than expected due to a decline in
lodgments and aggregate claims. • FTC claims are higher primarily due to increased eligible
diesel usage in mining and transport industries.
Personal benefits The actuals are lower than budget primarily due to lower than expected low income super tax offset. This was due to a lower number of eligible recipients than expected at budget.
Impairment on receivables The actuals are lower than budget mainly due to lower than expected individuals, companies and goods and services tax write-offs. This is consistent with an overall increase of collectable debt in 2018-19.
Penalty and interest charge remission expenses
The actuals are lower than budget primarily due to lower penalty and interest remissions, consistent with less penalties and interest being imposed on taxpayers.
Interest on overpayments The actuals are lower than budget primarily due to continued improved work practices and increased automation. This has reduced review time and consequently the magnitude of interest on overpayment entitlements.
Superannuation guarantee charge The actuals are lower than budget primarily reflecting delays in the passage of the superannuation guarantee amnesty legislation as well as a higher than expected provisioning for bad and doubtful debt.
Unclaimed superannuation monies interest
The actuals are higher than budget primarily reflecting the recognition of the interest that will be paid on existing unclaimed superannuation monies that is able to be proactively reunited as part of the Protecting Your Super Package.

05Financial statements
119
Australian Taxation Office ADMINISTERED SCHEDULE OF COMPREHENSIVE INCOME for the period ended 30 June 2019
The above schedule should be read in conjunction with the accompanying notes.
Budget Variances Commentary: Schedule of Comprehensive Income (continued)
Affected line items Explanation of major variances
Income tax The actuals are higher than budget primarily due to higher taxes from individuals and companies:
Higher individuals revenue was driven by income tax withholding and net other individuals revenue which was partly due to lower than expected work related expense deductions. In addition, the budget was based on estimated revenue for 2017-18 which was lower than the actual outcome.
Company revenue is higher, consistent with stronger than expected key commodity prices.
Indirect tax The actuals are lower than budget primarily due to lower accrued revenue for goods and services tax (GST). This is consistent with lower than expected GST revenue reflecting weaker than expected growth in consumption and dwelling investment.
Other taxes The actuals are lower than budget partially due to lower than expected superannuation guarantee (SG) charge revenue reflecting delays in the passage of the SG amnesty legislation.
Non-taxation The actuals are lower than budget reflecting weakness in the statements for unclaimed superannuation monies (USM) as well as the recognition of the ATO-held USM that is able to be proactively reunited as part of the Protecting Your Super package.
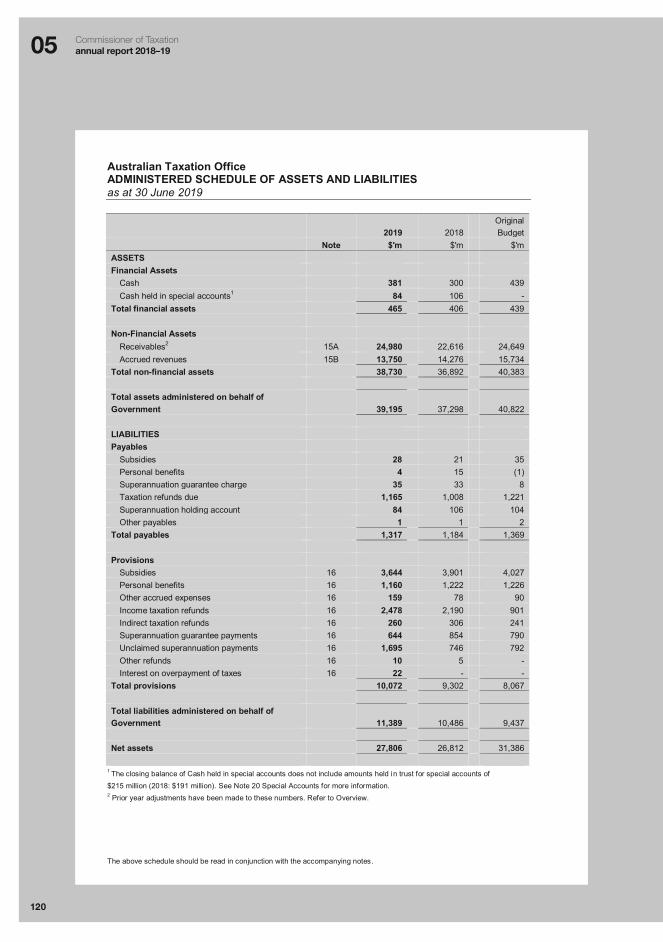
05 Commissioner of Taxation annual report 2018–19
120
Australian Taxation Office ADMINISTERED SCHEDULE OF ASSETS AND LIABILITIES as at 30 June 2019
The above schedule should be read in conjunction with the accompanying notes.
2019 2018 Original Budget
Note $'m $'m $'m ASSETS Financial Assets
Cash 381 300 439 Cash held in special accounts1 84 106 -
Total financial assets 465 406 439
Non-Financial Assets
Receivables2 15A 24,980 22,616 24,649 Accrued revenues 15B 13,750 14,276 15,734
Total non-financial assets 38,730 36,892 40,383 Total assets administered on behalf of Government 39,195 37,298 40,822 LIABILITIES Payables
Subsidies 28 21 35 Personal benefits 4 15 (1) Superannuation guarantee charge 35 33 8 Taxation refunds due 1,165 1,008 1,221 Superannuation holding account 84 106 104 Other payables 1 1 2
Total payables 1,317 1,184 1,369 Provisions
Subsidies 16 3,644 3,901 4,027 Personal benefits 16 1,160 1,222 1,226 Other accrued expenses 16 159 78 90 Income taxation refunds 16 2,478 2,190 901 Indirect taxation refunds 16 260 306 241 Superannuation guarantee payments 16 644 854 790 Unclaimed superannuation payments 16 1,695 746 792 Other refunds 16 10 5 - Interest on overpayment of taxes 16 22 - -
Total provisions 10,072 9,302 8,067 Total liabilities administered on behalf of Government 11,389 10,486 9,437 Net assets 27,806 26,812 31,386
1 The closing balance of Cash held in special accounts does not include amounts held in trust for special accounts of $215 million (2018: $191 million). See Note 20 Special Accounts for more information.
2 Prior year adjustments have been made to these numbers. Refer to Overview.

05Financial statements
121
Australian Taxation Office ADMINISTERED SCHEDULE OF ASSETS AND LIABILITIES as at 30 June 2019
The above schedule should be read in conjunction with the accompanying notes.
Accounting Policy
Administered liabilities
Administered liabilities include payables and provisions. Payables are recognised for claims on hand and provisions are raised for accrued expenses in accordance with the accounting policy in the Administered Expenses in Note 13. The majority of the ATO’s administered liabilities are not categorised as financial liabilities as they are statutory in nature.
Budget Variances Commentary: Schedule of Assets and Liabilities
Affected line items Explanation of major variances Receivables The actuals are higher than budget primarily due to individuals,
consistent with the increase in individuals revenue and a lower impairment allowance. This has been partially offset by higher than expected provisions for credit amendments and lower than expected company receivables.
Accrued revenues The actuals are lower than budget primarily due to the impact of the goods and services tax property measures that were yet to be fully factored into the budget.
Subsidies The actuals are lower than budget primarily due to the provision for research and development (R&D) tax incentives. R&D claims are lower than expected due to a decline in lodgments and aggregate claims.
Income taxation refunds The actuals are higher than budget primarily due to a higher provision for refunds for company income tax. Provisions for refunds can be volatile due to the timing of lodgments, payments and audit outcomes from year to year. It is noted that budget was based on the latest actual balance of the provision account available (2016-17), which was lower at that time.
Superannuation guarantee payments
The actuals are lower than budget primarily reflecting delays in the passage of the superannuation guarantee amnesty legislation as well as a higher than expected provisioning for bad and doubtful debt.
Unclaimed superannuation payments
The actuals are higher than budget reflecting the recognition of future outflow of existing ATO-held unclaimed superannuation monies as a result of the Protecting Your Super package.

05 Commissioner of Taxation annual report 2018–19
122
Australian Taxation Office ADMINISTERED RECONCILIATION SCHEDULE for the period ended 30 June 2019
The above schedule should be read in conjunction with the accompanying notes.
2019 2018 $'m $'m Opening assets less liabilities as at 1 July1 26,812 25,076 Adjustments to equity
FTB equity transfer 109 117 HELP equity transfer 614 359 TSL equity transfer 40 - SFSS equity transfer (1) (6)
Net (cost of)/contribution by services Income 432,357 405,819 Expenses (18,051) (18,935)
Transfers (to)/from Australian Government Appropriation transfers from the Official Public Account
Annual appropriations 2 - Special appropriations (unlimited) 113,445 107,534
Appropriation transfers to the Official Public Account Transfers to the Official Public Account (527,521) (493,152)
Closing assets less liabilities as at 30 June 27,806 26,812
1 Prior year adjustments have been made to these numbers. Refer to Overview. Accounting Policy
Administered cash transfers to and from the Official Public Account
Revenue collected by the ATO for use by the Government rather than the ATO is administered revenue. Collections are transferred to the Official Public Account (OPA) maintained by the Department of Finance. Cash, on the other hand, is drawn from the OPA to make payments under Parliamentary appropriations on behalf of the Government. These transfers to and from the OPA are adjustments to the administered cash held by the ATO on behalf of the Government and are reported in the schedule of administered cash flows and in the administered reconciliation schedule.

05Financial statements
123
Australian Taxation Office ADMINISTERED CASH FLOW STATEMENT for the period ended 30 June 2019
The above statement should be read in conjunction with the accompanying notes.
2019 2018 $'m $'m OPERATING ACTIVITIES
Income tax 333,312 307,352 Indirect tax 90,311 87,578 Other revenue 2,363 2,159 Superannuation holding account (22) 11 Subsidies paid (10,071) (9,834) Personal benefits (1,109) (1,154) Interest (91) (105) Other (560) (418)
Net cash from operating activities 414,133 385,589 Cash at the beginning of the reporting period 406 435 Cash from the Official Public Account
Appropriations 113,446 107,483 Special accounts 1 51
Total cash used from the Official Public Account 113,447 107,534 Cash to the Official Public Account
Administered receipts (527,520) (493,101) Special accounts (1) (51)
Total cash to the Official Public Account (527,521) (493,152) Cash at the end of the reporting period 465 406
Accounting Policy
The Administered Cash Flow Statement represents the total cash received or paid by the primary operating activities of the ATO. Therefore, the categories disclosed above are treated on a net basis. For example, a refund relating to income tax is defined as an overpayment of tax and treated as a reduction to the income tax category. Positive amounts represent an inflow and negative amounts represent an outflow for the relevant category. More detailed information in relation to refunds can be found in Note 19C Special Appropriations.

05 Commissioner of Taxation annual report 2018–19
124
Australian Taxation Office Notes to and forming part of the financial statements for the period ended 30 June 2019
Table of contents
Financial Statements
Overview
1: Expenses
2: Own-Source Revenue
3: Financial Assets
4: Non-Financial Assets
5: Payables
6: Interest Bearing Liabilities
7: Provisions
8: Financial Instruments
9: Contingent Assets and Liabilities
10: Key Management Personnel Remuneration
11: Related Party Disclosures
12: Aggregate Assets and Liabilities
13: Administered - Expenses
14: Administered - Income
15: Administered - Non-Financial Assets
16: Administered - Provisions
17: Administered - Contingent Liabilities
18: Administered - Aggregate Assets and Liabilities
19: Appropriations
20: Special Accounts
21: Regulatory Charging Summary

05Financial statements
125
Australian Taxation Office Notes to and forming part of the financial statements
Overview Basis of Preparation of the Financial Statements
The financial statements are general purpose financial statements and are required by section 42 of the Public Governance, Performance and Accountability Act 2013 (PGPA Act). The financial statements have been prepared in accordance with:
Public Governance, Performance and Accountability (Financial Reporting) Rule 2015 (FRR); and
Australian Accounting Standards and Interpretations - Reduced Disclosure Requirements issued by the Australian Accounting Standards Board (AASB) that apply for the reporting period.
The financial statements have been prepared on an accrual basis and in accordance with the historical cost convention, except for certain assets and liabilities at fair value. Except where stated, no allowance is made for the effect of changing prices on the results or the financial position.
The financial statements are presented in Australian dollars and values are rounded to the nearest thousand (departmental) or the nearest million (administered), unless disclosure of the full amount is required.
Unless an alternate treatment is required by an accounting standard or the FRRs, assets and liabilities are recognised in the Statement of Financial Position when, and only when, it is probable that economic benefits will flow to the ATO or a future sacrifice of economic benefits will be required and the amount can be reliably measured. However, assets and liabilities arising under executory contracts are not recognised unless required by an accounting standard. Unrecognised liabilities are reported in Note 9 Contingent Assets and Liabilities.
Unless an alternate treatment is required by an accounting standard, income and expenses are recognised in the Statement of Comprehensive Income when, and only when, the flow, consumption or loss of economic benefits has occurred and can be reliably measured.
The ATO Reporting Entity
Included in the ATO’s financial statements are the operations of the Australian Charities and Not-for-profit (ACNC) through the ACNC Special Account, and the operations of the Australian Business Register (ABR) and Tax Practitioners Board (TPB).
Reporting of Administered Activities
The Administered Schedules of Comprehensive Income, Assets and Liabilities, Administered Reconciliation Schedule and Administered Cash Flow Statement reflect the Government’s transactions, through the ATO, with parties outside the Government.
A commitment note is not required for administered financial statements due to the nature of the items reported being legislated and not contractual arrangements.
Significant Accounting Judgements and Estimates for Departmental Items
Significant accounting estimate / judgement Note
The fair value of leasehold improvements is determined by estimating the depreciated replacement cost, taking the useful life and remaining useful life of the asset into consideration.
4
The fair value of plant and equipment is determined based on the market value for items of similar type and age or, where there is no active or comparable market, by estimating depreciation replacement cost.
4
No accounting assumptions or estimates have been identified that have a significant risk of causing a material adjustment to the carrying amounts of assets and liabilities within the next reporting period.

05 Commissioner of Taxation annual report 2018–19
126
Australian Taxation Office Notes to and forming part of the financial statements
Significant Accounting Judgements and Estimates for Administered Items
Significant accounting estimate / judgement Note Taxation revenue items reported under the economic transaction method 14 General interest charge revenue and remission expense that have not as yet been posted to taxpayers’ accounts
14
Penalties and interest charges and settlements 14 Allowance for impairment losses 15 Allowance for credit amendments and provision for refunds – key assumptions and methodologies used
15
New Accounting Standards
No accounting standard has been adopted earlier than the application date as stated in the standard.
Australian Accounting Standard AASB 9 Financial Instruments was applied for the first time in 2018-19. Financial assets are assessed for impairment at the end of each reporting period based on expected credit losses, using the general approach which measures the loss allowance based on an amount equal to lifetime expected credit losses. Adoption of this standard did not have a material impact on the transactions and balances recognised in the financial statements. Changes in Accounting Estimates There have been no material changes in accounting estimates applied to the 2018-19 departmental financial statements. Changes in accounting estimates have been made to the following administered items:
Research and development tax incentive. Refer to the accounting policy at Note 13; Unclaimed superannuation monies. Refer to the accounting policy at Note 14; Impairment on taxation receivables. Refer to the accounting policy at Note 15; Allowance for credit amendments. Refer to the accounting policy at Note 15; and Contingent liabilities. Refer to accounting policy at Note 17.
Taxation
The ATO is exempt from all forms of taxation except fringe benefits tax and the goods and services tax (GST).
Revenues, expenses, assets and liabilities are recognised net of GST except: where the amount of GST incurred is not recoverable under the applicable legislation; and for receivables and payables.
Administered Prior Year Adjustment
Superannuation receivables adjustments
For the 2017-18 financial year, adjustments were made to superannuation receivables as the aggregate debts owing from taxpayers on the ATO’s business systems were not accurately recorded in the accounting system. This was identified through a continuation of the comprehensive reconciliation first conducted in 2017-18. Under AASB 108 Accounting Policies, Changes in Accounting Estimates and Errors, this change is considered an error and prior year adjustments have been made as per the adjustment in the table below.
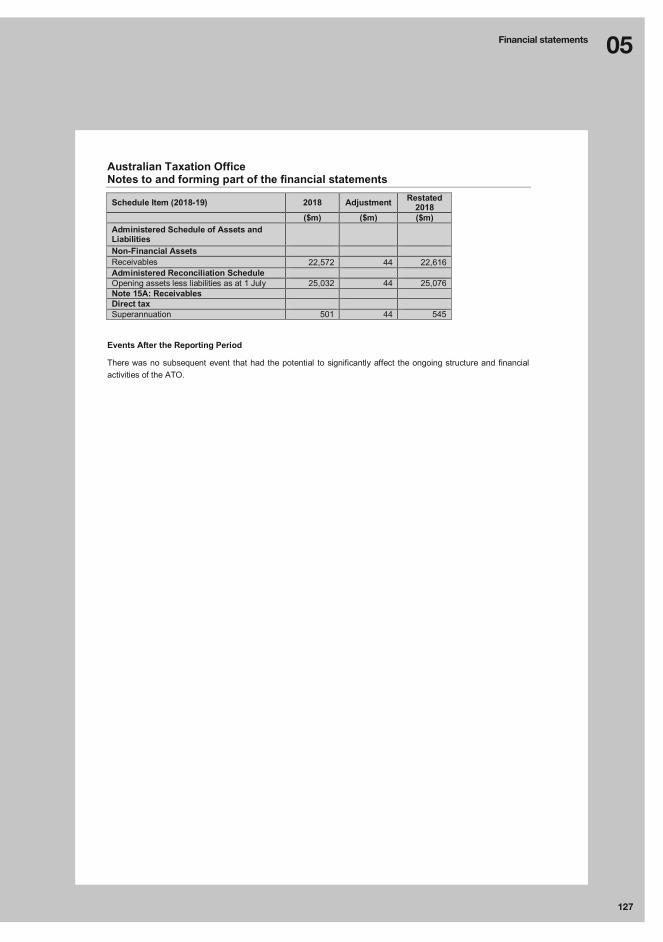
05Financial statements
127
Australian Taxation Office Notes to and forming part of the financial statements
Schedule Item (2018-19) 2018 Adjustment Restated 2018
($m) ($m) ($m) Administered Schedule of Assets and Liabilities Non-Financial Assets Receivables 22,572 44 22,616 Administered Reconciliation Schedule Opening assets less liabilities as at 1 July 25,032 44 25,076 Note 15A: Receivables Direct tax Superannuation 501 44 545
Events After the Reporting Period
There was no subsequent event that had the potential to significantly affect the ongoing structure and financial activities of the ATO.
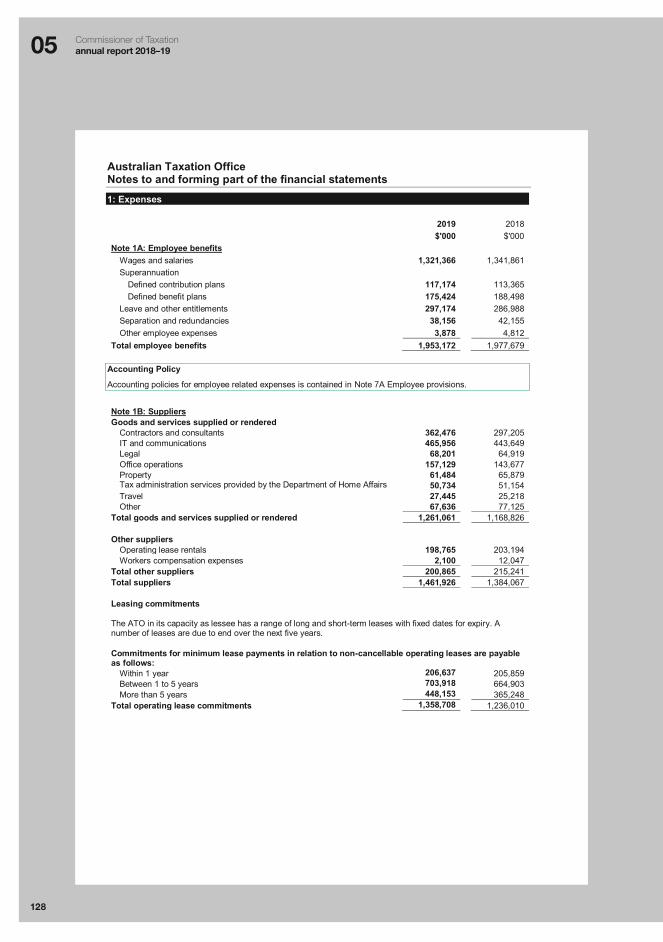
05 Commissioner of Taxation annual report 2018–19
128
Australian Taxation Office Notes to and forming part of the financial statements
1: Expenses 2019 2018 $'000 $'000 Note 1A: Employee benefits
Wages and salaries 1,321,366 1,341,861 Superannuation
Defined contribution plans 117,174 113,365 Defined benefit plans 175,424 188,498
Leave and other entitlements 297,174 286,988 Separation and redundancies 38,156 42,155 Other employee expenses 3,878 4,812
Total employee benefits 1,953,172 1,977,679 Accounting Policy
Accounting policies for employee related expenses is contained in Note 7A Employee provisions.
Note 1B: Suppliers Goods and services supplied or rendered
Contractors and consultants 362,476
297,205 IT and communications 465,956
443,649
Legal 68,201
64,919 Office operations 157,129
143,677
Property 61,484
65,879 Tax administration services provided by the Department of Home Affairs 50,734
51,154
Travel 27,445
25,218 Other 67,636
77,125
Total goods and services supplied or rendered 1,261,061
1,168,826 Other suppliers
Operating lease rentals 198,765 203,194 Workers compensation expenses 2,100 12,047
Total other suppliers 200,865 215,241 Total suppliers 1,461,926 1,384,067 Leasing commitments The ATO in its capacity as lessee has a range of long and short-term leases with fixed dates for expiry. A number of leases are due to end over the next five years. Commitments for minimum lease payments in relation to non-cancellable operating leases are payable as follows:
Within 1 year 206,637 205,859 Between 1 to 5 years 703,918 664,903 More than 5 years 448,153 365,248
Total operating lease commitments 1,358,708 1,236,010

05Financial statements
129
Australian Taxation Office Notes to and forming part of the financial statements
Accounting Policy
Leased assets
The ATO leases property for office accommodation under operating lease agreements. Operating lease payments are expensed on a straight-line basis.
Some of the ATO’s IT equipment is leased under embedded finance lease arrangements.
Where an asset is acquired by means of a finance lease, the asset is capitalised at the present value of minimum lease payments at the inception of the contract and a liability is recognised at the same time, for the same amount.
The discount rate used is the interest rate implicit in the lease. Leased assets are depreciated over the period of the lease and lease payments are allocated between the principal component and the interest expense.
Lease incentives
The threshold for the recognition of new lease incentives received is $150,000 per lease.
Where an incentive has been received by the ATO (such as a free fit out, rent-free period, reimbursement of lessee expenses or cash), the value of the lease incentive received is recognised as a liability. The liability is reduced over the period of the lease. Lease incentives that represent a rent reduction throughout the lease term are treated as an offset of the rent expense immediately rather than a liability.
Where an incentive has been provided by the ATO the value of the lease incentive received is recognised as an asset. The asset is reduced over the period of the lease. Lease incentives that represent a rent reduction throughout the lease term, are treated as an offset of the rent revenue immediately rather than an asset.
2019 2018 $'000 $'000 Note 1C: Finance Costs
Finance leases 107 706 Unwinding of discount 497 597
Total finance costs 604 1,303 Accounting Policy
All finance charges are expensed as incurred.
Finance expenses disclosed in the Statement of Comprehensive Income relate to changes in:
the discounted amount of onerous lease liabilities and provision for restoration obligation over time; and the interest expense for IT equipment held under a finance lease.
Note 1D: Impairment Loss Allowance on Financial Instruments
Impairment on financial instruments 2,186 931 Total impairment loss allowance on financial instruments 2,186 931
Note 1E: Write-Down and Impairment of Other Assets
Impairment and write-offs of non-financial assets Buildings - 211 Plant and equipment 35 1,234 Intangibles 7,372 7,417
Revaluation decrement (plant and equipment) 1,725 - Other financial assets 2,242 10,449
Total write-down and impairment of other assets 11,374 19,311

05 Commissioner of Taxation annual report 2018–19
130
Australian Taxation Office Notes to and forming part of the financial statements
2019 2018 $'000 $'000 Note 1F: Other Expenses
Compensation 2,282 554 Act of grace payments 613 - Losses from asset sales 3 9
Total other expenses 2,898 563 2: Own-Source Revenue 2019 2018 $'000 $'000 Note 2A: Rendering of Services
Rendering of services1 106,521 80,618 Total revenue from rendering of services 106,521 80,618
1 Comparatives have been reclassified from Rendering of services to Other revenue by $27.3 million for recovery of legal costs ($26.8 million) and indemnity recoveries ($0.5 million).
Accounting Policy
Revenue from rendering of services is recognised by reference to the stage of completion of contracts or other agreements at the reporting date. The revenue is recognised when:
the amount of revenue, stage of completion and transaction costs incurred can be reliably measured; and
the probable economic benefits associated with the transaction will flow to the ATO.
The stage of completion of contracts at the reporting date is determined according to the proportion of costs incurred to date against the estimated total costs of the transaction.
Receivables for services, which have 30 day terms, are recognised at the nominal amounts due less any estimated credit loss.
Note 2B: Rental Income Rental income 22,895 29,871
Total rental income 22,895 29,871 Subleasing rental income commitments The ATO in its capacity as lessor has a range of long and short-term leases with fixed dates for expiry. A number of subleases are due to end over the next five years. Commitments for sublease rental income receivables are as follows:
Within 1 year 18,082
14,416 Between 1 to 5 years 54,077
39,956
More than 5 years 8,201
9,463 Total sublease rental income commitments 80,360 63,835

05Financial statements
131
Australian Taxation Office Notes to and forming part of the financial statements
2019 2018 $'000 $'000 Note 2C: Other Revenue and Gains
Other revenue1 15,903 33,777 Resources received free of charge 3,378 3,000 Other gains2 3 10
Total other revenue and gains 19,284 36,787
1 Comparatives have been reclassified from Rendering of services to Other revenue by $27.3 million for recovery of legal costs ($26.8 million) and indemnity recoveries ($0.5 million). 2 Comparatives have been reclassified from Other gains to Other revenue by $10,000 for gains from disposal of miscellaneous infrastructure.
Accounting Policy
Resources received free of charge are recognised as revenue when the fair value can be reliably measured at the time the services would have been purchased if they had not been donated. Use of those resources is recognised as an expense. Resources received free of charge are recorded as either revenue or gains depending on their nature.
Note 2D: Revenue from Government Departmental appropriations 3,237,902 3,199,160
Total revenue from Government 3,237,902 3,199,160 Accounting Policy
Departmental appropriations for the year (adjusted for any formal additions and reductions) are recognised as Revenue from Government when the ATO gains control of the appropriation.
Appropriation receivables are recognised at their nominal amounts.
3: Financial Assets 2019 2018 $'000 $'000 Note 3A: Cash
Special Account - ACNC 4,246 3,044 Cash on hand or on deposit 41,122 25,900
Total cash 45,368 28,944 Accounting Policy
Cash is recognised at its nominal amount. Cash includes cash on hand or on deposit, and cash held in bank and the Official Public Account for special accounts.

05 Commissioner of Taxation annual report 2018–19
132
Australian Taxation Office Notes to and forming part of the financial statements
2019 2018 $'000 $'000 Note 3B: Trade and Other Receivables Services receivables in connection with
Service receivables1 22,671 14,341 Total services receivables 22,671 14,341
Appropriations receivables Existing programs
Cash held in the Official Public Account: ATO 292,834 392,835 Total appropriations receivables 292,834 392,835
Other receivables GST receivable from the ATO (as Tax Administrator) 27,947 31,926 Other receivables1 30,510 44,574
Total other receivables 58,457 76,500 Total trade and other receivables (gross) 373,962 483,676
Less impairment loss allowance2 Services (251) (201) Other receivables (19,091) (19,663)
Total impairment loss allowance (19,342) (19,864) Total trade and other receivables (net) 354,620 463,812
1 Comparatives have been reclassified from Service receivables to Other receivables by $38.9 million for legal cost receivables. 2 Comparatives have been reclassified by $19.6 million in relation to legal costs impairment from Services to Other receivables.

05Financial statements
133
Aus
tral
ian
Taxa
tion
Offi
ce
Not
es to
and
form
ing
part
of t
he fi
nanc
ial s
tate
men
ts
4: N
on-F
inan
cial
Ass
ets
Not
e 4A
: Cur
rent
Yea
r - R
econ
cilia
tion
of th
e O
peni
ng a
nd C
losi
ng B
alan
ces
of P
rope
rty,
Pla
nt, E
quip
men
t, In
tang
ible
s an
d A
sset
s H
eld
Und
er F
inan
ce L
ease
201
9
Bui
ldin
gs -
Leas
ehol
d Im
prov
emen
ts
Plan
t &
Equi
pmen
t Pl
ant &
Eq
uipm
ent -
Fi
nanc
e Le
ase
Tota
l Pla
nt
and
Equi
pmen
t
Com
pute
r
Soft
war
e Pu
rcha
sed
Com
pute
r So
ftw
are
- In
tern
ally
Dev
elop
ed
Tota
l Int
angi
bles
C
ompu
ter
Soft
war
e To
tal
$'
000
$'00
0 $'
000
$'00
0 $'
000
$'00
0 $'
000
$'00
0 A
s at
1 J
uly
2018
G
ross
boo
k va
lue
255,
095
94,8
51
21,6
46
116,
497
149,
953
1,44
8,75
1 1,
598,
704
1,97
0,29
6 A
ccum
ulat
ed d
epre
ciat
ion,
am
ortis
atio
n an
d im
pairm
ent
(59,
920)
(3
2,20
4)
(11,
276)
(4
3,48
0)
(116
,900
) (9
61,0
58)
(1,0
77,9
58)
(1,1
81,3
58)
Tota
l as
at 1
Jul
y 20
18
195,
175
62,6
47
10,3
70
73,0
17
33,0
53
487,
693
520,
746
788,
938
Add
ition
s
P
urch
ase
674
7,40
3 -
7,40
3 55
4 -
554
8,63
1 Fi
nanc
e le
ase
- -
2,16
6 2,
166
- -
- 2,
166
Inte
rnal
ly d
evel
oped
-
- -
- -
134,
069
134,
069
134,
069
Rev
alua
tions
reco
gnis
ed in
oth
er c
ompr
ehen
sive
inco
me
7,05
3 -
375
375
- -
- 7,
428
Rev
alua
tions
reco
gnis
ed in
net
cos
t of s
ervi
ces
- (1
,725
) -
(1,7
25)
- -
- (1
,725
) C
hang
e in
billi
ng ra
tes
by th
e le
ssor
-
- -
- -
- -
- Im
pairm
ent w
rite-
offs
reco
gnis
ed in
net
cos
t of s
ervi
ces
- (3
5)
- (3
5)
(103
) (7
,269
) (7
,372
) (7
,407
) Tr
ansf
ers
betw
een
asse
t cla
sses
in/(o
ut)
(128
) 12
8 -
128
6,92
7 (6
,927
) -
- D
ispo
sals
-
(5)
(162
) (1
67)
- -
- (1
67)
Oth
er m
ovem
ents
-
- 64
4 64
4 -
- -
644
Dep
reci
atio
n / a
mor
tisat
ion
expe
nse
(29,
456)
(1
6,58
6)
(6,2
47)
(22,
833)
(1
1,55
5)
(134
,164
) (1
45,7
19)
(198
,008
) To
tal a
s at
30
June
201
9 17
3,31
8 51
,827
7,
146
58,9
73
28,8
76
473,
402
502,
278
734,
569
To
tal a
s at
30
June
201
9 re
pres
ente
d by
G
ross
boo
k va
lue
180,
504
56,4
92
21,1
26
77,6
18
149,
821
1,46
3,93
9 1,
613,
760
1,87
1,88
2 W
ork
in p
rogr
ess
852
64
- 64
-
104,
683
104,
683
105,
599
Acc
umul
ated
am
ortis
atio
n an
d im
pairm
ent
(8,0
38)
(4,7
29)
(13,
980)
(1
8,70
9)
(120
,945
) (1
,095
,220
) (1
,216
,165
) (1
,242
,912
) To
tal a
s at
30
June
201
9 17
3,31
8 51
,827
7,
146
58,9
73
28,8
76
473,
402
502,
278
734,
569
Bui
ldin
gs -
Leas
ehol
d im
prov
emen
t ass
ets
wer
e as
sess
ed fo
r im
pairm
ent i
n ac
cord
ance
with
the
impa
irmen
t pol
icy
stat
ed b
elow
. No
indi
cato
rs o
f im
pairm
ent w
ere
foun
d in
201
9 (2
018:
nil)
.
Pla
nt a
nd e
quip
men
t ass
ets
wer
e as
sess
ed fo
r im
pairm
ent i
n ac
cord
ance
with
the
impa
irmen
t pol
icy
stat
ed b
elow
. No
indi
cato
rs o
f im
pairm
ent w
ere
foun
d in
201
9 (2
018:
nil)
. In
tang
ible
s w
ere
asse
ssed
for i
mpa
irmen
t in
acco
rdan
ce w
ith th
e im
pairm
ent p
olic
y st
ated
bel
ow. N
o in
dica
tors
of i
mpa
irmen
t wer
e fo
und
in 2
019
(201
8: n
il).
The
valu
atio
n of
fina
nce
leas
es a
re b
ased
on
the
pres
ent v
alue
of t
heir
min
imum
leas
e pa
ymen
ts.

05 Commissioner of Taxation annual report 2018–19
134
Australian Taxation Office Notes to and forming part of the financial statements
Revaluations of tangible assets
All revaluations are conducted in accordance with the ATO revaluation policy stated below. The ATO engaged the service of accredited valuer, Jones Lang LaSalle (JLL), to conduct a comprehensive review of carrying amounts for all tangible assets as at 30 June 2019.
Contractual commitments for the acquisition of property, plant, equipment and intangible assets There are no contractual commitments for the acquisition of property, plant, equipment and intangible assets for 2019 (2018: nil). Accounting Policy
Assets are recorded at cost on acquisition except as stated below. Assets are initially measured at their fair value plus transaction costs where appropriate.
Assets acquired at no cost, or for nominal consideration, are initially recognised as assets and income at their fair value at the date of acquisition.
Tangible Assets
Asset recognition thresholds
Purchases of leasehold improvements and plant and equipment are recognised initially at cost in the Statement of Financial Position, except for assets costing less than the relevant asset recognition threshold. Asset recognition thresholds can be found in the table below, except for ACNC and TPB assets, which have an asset recognition threshold of $3,000.
Revaluations
Following initial recognition at cost, leasehold improvements and plant and equipment assets are carried at fair value less accumulated depreciation and accumulated impairment losses. The ATO conducts a materiality review of carrying amounts annually, and a comprehensive valuation every three years for all tangible assets. Valuation reviews ensure that the carrying amounts of assets do not materially differ from the fair value as at the reporting date. Any accumulated depreciation and accumulated impairment as at the revaluation date are eliminated against the gross carrying amount of the asset and the asset is restated to the revalued amount.
Depreciation
Depreciation methods and rates (useful lives) are reviewed at each reporting date and necessary adjustments are recognised in the current or future reporting periods, as appropriate.
If an asset is not fully constructed at the reporting date, its cost to date is reported as an asset under construction. Depreciation does not commence until the asset is available for use.
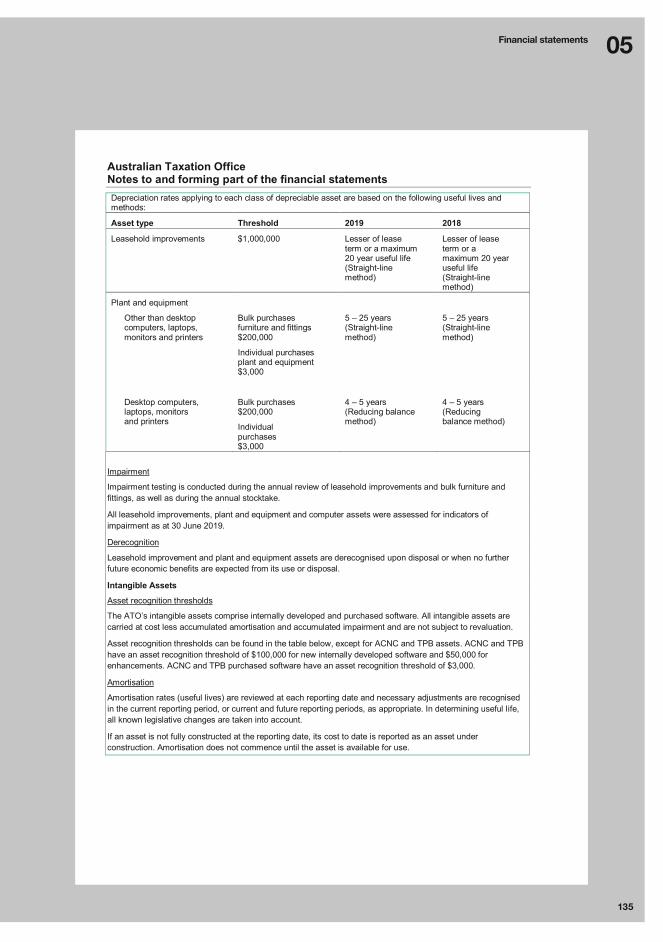
05Financial statements
135
Australian Taxation Office Notes to and forming part of the financial statements
Depreciation rates applying to each class of depreciable asset are based on the following useful lives and methods:
Asset type Threshold 2019 2018
Leasehold improvements
$1,000,000 Lesser of lease term or a maximum 20 year useful life (Straight-line method)
Lesser of lease term or a maximum 20 year useful life (Straight-line method)
Plant and equipment
Other than desktop computers, laptops, monitors and printers
Bulk purchases furniture and fittings $200,000
Individual purchases plant and equipment $3,000
5 – 25 years (Straight-line method)
5 – 25 years (Straight-line method)
Desktop computers, laptops, monitors and printers
Bulk purchases $200,000
Individual purchases $3,000
4 – 5 years (Reducing balance method)
4 – 5 years (Reducing balance method)
Impairment
Impairment testing is conducted during the annual review of leasehold improvements and bulk furniture and fittings, as well as during the annual stocktake.
All leasehold improvements, plant and equipment and computer assets were assessed for indicators of impairment as at 30 June 2019.
Derecognition
Leasehold improvement and plant and equipment assets are derecognised upon disposal or when no further future economic benefits are expected from its use or disposal.
Intangible Assets
Asset recognition thresholds
The ATO’s intangible assets comprise internally developed and purchased software. All intangible assets are carried at cost less accumulated amortisation and accumulated impairment and are not subject to revaluation.
Asset recognition thresholds can be found in the table below, except for ACNC and TPB assets. ACNC and TPB have an asset recognition threshold of $100,000 for new internally developed software and $50,000 for enhancements. ACNC and TPB purchased software have an asset recognition threshold of $3,000.
Amortisation
Amortisation rates (useful lives) are reviewed at each reporting date and necessary adjustments are recognised in the current reporting period, or current and future reporting periods, as appropriate. In determining useful life, all known legislative changes are taken into account.
If an asset is not fully constructed at the reporting date, its cost to date is reported as an asset under construction. Amortisation does not commence until the asset is available for use.

05 Commissioner of Taxation annual report 2018–19
136
Australian Taxation Office Notes to and forming part of the financial statements
Computer software assets are amortised based on the following useful lives.
Asset type Threshold 2019 2018
Purchased software $200,000 3 - 20 years (Straight-line method)
3 - 20 years (Straight-line method)
Internally developed software
$2,500,000 Enhancements to previously capitalised software $1,000,000
5 - 26 years (Straight-line method)
5 - 26 years (Straight-line method)
Impairment
Impairment testing is conducted through annual reviews of internally developed and purchased software. Where indicators of impairment are evident, the recoverable amount of the intangible asset is estimated and an impairment loss is recognised where the recoverable amount is less than the carrying amount.
The recoverable amount for purchased software and internally developed software in use is taken to be the depreciated replacement cost.
The recoverable amount for internally developed software assets under construction is the current replacement cost. In circumstances where the asset would be replaced if the ATO were deprived of it, the recoverable amount is taken to be the original budgeted cost as amended for additional functionality requirements. In circumstances where the asset would not be replaced if the ATO were deprived of the asset, the recoverable amount is assessed to be nil.
All computer software assets were assessed for indicators of impairment as at 30 June 2019. 2019 2018 $'000 $'000 Note 4B: Other Non-Financial Assets
Prepayments 88,939 72,833 Lease incentives 9,543 16,711
Total other non-financial assets 98,482 89,544

05Financial statements
137
Australian Taxation Office Notes to and forming part of the financial statements
5: Payables 2019 2018 $'000 $'000 Note 5A: Employee Benefits
Salaries and wages 13,394 13,693 Superannuation 2,272 2,346 Separations and redundancies 20,321 28,490
Total employee benefits payable 35,987 44,529 Note 5B: Suppliers
Trade creditors and accruals 241,737 305,831 Operating lease rentals 83,779 78,571
Total supplier payables 325,516 384,402 Settlement is usually made within 30 days. Note 5C: Other Payables
Prepayments received / unearned income 394 358 Lease incentives 66,305 81,035 Other 2,899 3,226
Total other payables 69,598 84,619
6: Interest Bearing Liabilities 2019 2018 $'000 $'000 Leases
Finance leases 7,232 10,859 Total finance leases 7,232 10,859 Leases expected to be settled
Within 1 year 5,035 5,442 Between 1 to 5 years 2,197 5,417
Total finance leases 7,232 10,859
Embedded finance leases have been recognised in respect of IT equipment provided under agreements with external information and communications technology suppliers. The finance lease liability relates to equipment under the agreements. The useful lives of the assets are for fixed terms of between 3 and 6 years. The average interest rate implicit in the leases was 0.99% (2018: 5.40%). Cancellation penalties apply on early termination of the leases. There are no significant contingent rentals.
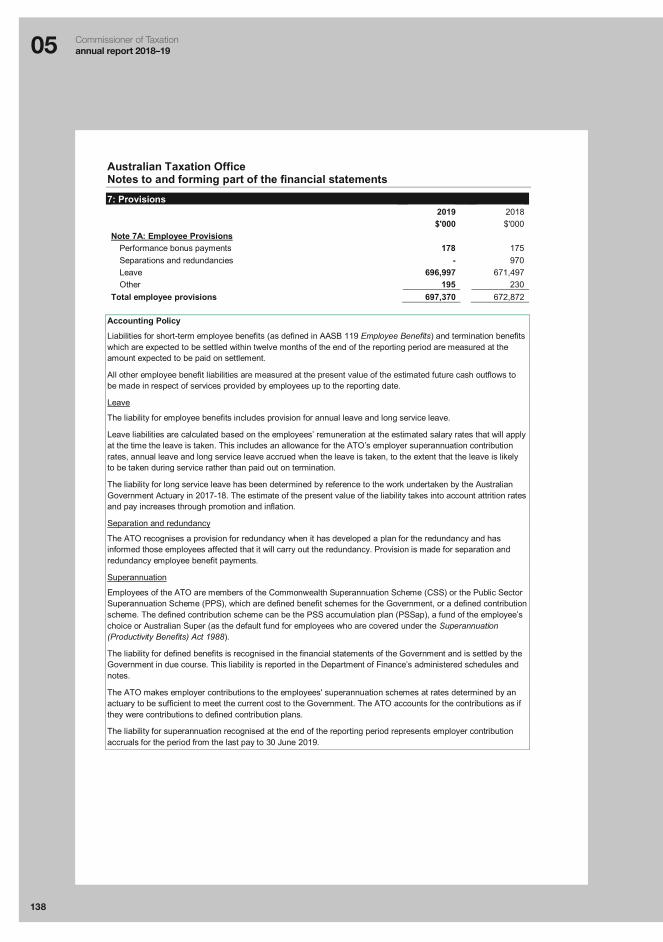
05 Commissioner of Taxation annual report 2018–19
138
Australian Taxation Office Notes to and forming part of the financial statements
7: Provisions 2019 2018 $'000 $'000 Note 7A: Employee Provisions
Performance bonus payments 178 175 Separations and redundancies - 970 Leave 696,997 671,497 Other 195 230
Total employee provisions 697,370 672,872 Accounting Policy
Liabilities for short-term employee benefits (as defined in AASB 119 Employee Benefits) and termination benefits which are expected to be settled within twelve months of the end of the reporting period are measured at the amount expected to be paid on settlement.
All other employee benefit liabilities are measured at the present value of the estimated future cash outflows to be made in respect of services provided by employees up to the reporting date.
Leave
The liability for employee benefits includes provision for annual leave and long service leave.
Leave liabilities are calculated based on the employees’ remuneration at the estimated salary rates that will apply at the time the leave is taken. This includes an allowance for the ATO’s employer superannuation contribution rates, annual leave and long service leave accrued when the leave is taken, to the extent that the leave is likely to be taken during service rather than paid out on termination.
The liability for long service leave has been determined by reference to the work undertaken by the Australian Government Actuary in 2017-18. The estimate of the present value of the liability takes into account attrition rates and pay increases through promotion and inflation.
Separation and redundancy
The ATO recognises a provision for redundancy when it has developed a plan for the redundancy and has informed those employees affected that it will carry out the redundancy. Provision is made for separation and redundancy employee benefit payments.
Superannuation
Employees of the ATO are members of the Commonwealth Superannuation Scheme (CSS) or the Public Sector Superannuation Scheme (PPS), which are defined benefit schemes for the Government, or a defined contribution scheme. The defined contribution scheme can be the PSS accumulation plan (PSSap), a fund of the employee’s choice or Australian Super (as the default fund for employees who are covered under the Superannuation (Productivity Benefits) Act 1988).
The liability for defined benefits is recognised in the financial statements of the Government and is settled by the Government in due course. This liability is reported in the Department of Finance’s administered schedules and notes.
The ATO makes employer contributions to the employees' superannuation schemes at rates determined by an actuary to be sufficient to meet the current cost to the Government. The ATO accounts for the contributions as if they were contributions to defined contribution plans.
The liability for superannuation recognised at the end of the reporting period represents employer contribution accruals for the period from the last pay to 30 June 2019.
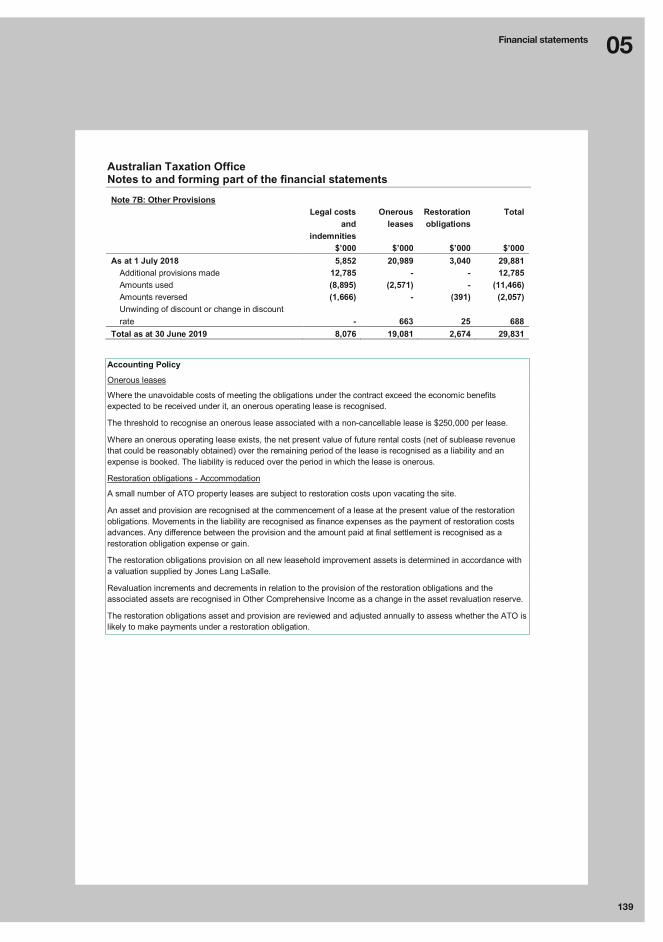
05Financial statements
139
Australian Taxation Office Notes to and forming part of the financial statements
Note 7B: Other Provisions
Legal costs and
indemnities
Onerous leases
Restoration obligations
Total
$’000 $’000 $’000 $’000 As at 1 July 2018 5,852 20,989 3,040 29,881
Additional provisions made 12,785 - - 12,785 Amounts used (8,895) (2,571) - (11,466) Amounts reversed (1,666) - (391) (2,057) Unwinding of discount or change in discount rate - 663 25 688
Total as at 30 June 2019 8,076 19,081 2,674 29,831 Accounting Policy
Onerous leases
Where the unavoidable costs of meeting the obligations under the contract exceed the economic benefits expected to be received under it, an onerous operating lease is recognised.
The threshold to recognise an onerous lease associated with a non-cancellable lease is $250,000 per lease.
Where an onerous operating lease exists, the net present value of future rental costs (net of sublease revenue that could be reasonably obtained) over the remaining period of the lease is recognised as a liability and an expense is booked. The liability is reduced over the period in which the lease is onerous.
Restoration obligations - Accommodation
A small number of ATO property leases are subject to restoration costs upon vacating the site.
An asset and provision are recognised at the commencement of a lease at the present value of the restoration obligations. Movements in the liability are recognised as finance expenses as the payment of restoration costs advances. Any difference between the provision and the amount paid at final settlement is recognised as a restoration obligation expense or gain.
The restoration obligations provision on all new leasehold improvement assets is determined in accordance with a valuation supplied by Jones Lang LaSalle.
Revaluation increments and decrements in relation to the provision of the restoration obligations and the associated assets are recognised in Other Comprehensive Income as a change in the asset revaluation reserve.
The restoration obligations asset and provision are reviewed and adjusted annually to assess whether the ATO is likely to make payments under a restoration obligation.
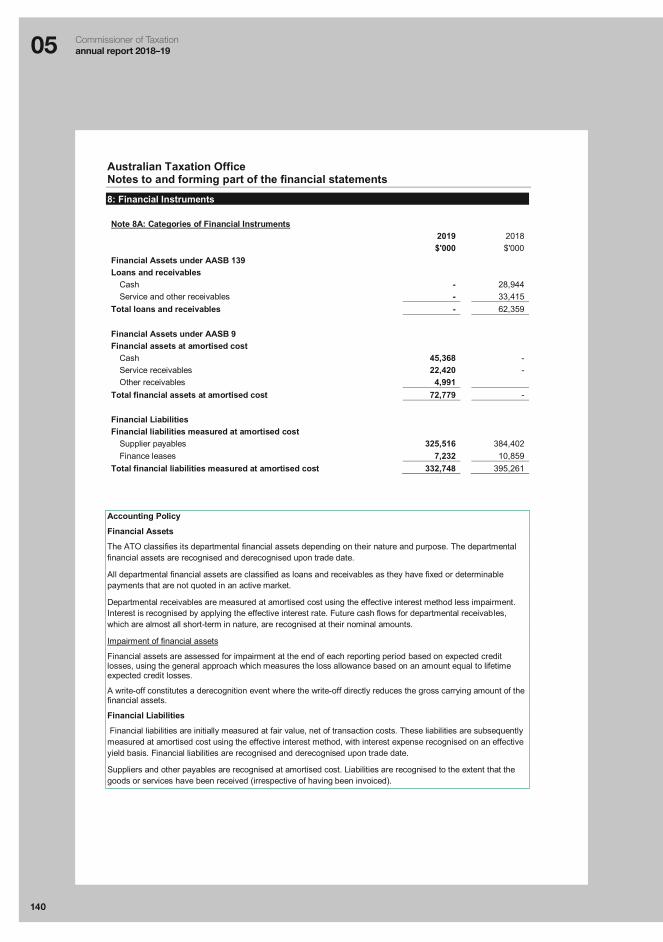
05 Commissioner of Taxation annual report 2018–19
140
Australian Taxation Office Notes to and forming part of the financial statements
8: Financial Instruments Note 8A: Categories of Financial Instruments 2019 2018 $'000 $'000 Financial Assets under AASB 139 Loans and receivables
Cash - 28,944 Service and other receivables - 33,415
Total loans and receivables - 62,359 Financial Assets under AASB 9 Financial assets at amortised cost
Cash 45,368 - Service receivables 22,420 - Other receivables 4,991
Total financial assets at amortised cost 72,779 - Financial Liabilities Financial liabilities measured at amortised cost
Supplier payables 325,516 384,402 Finance leases 7,232 10,859
Total financial liabilities measured at amortised cost 332,748 395,261
Accounting Policy
Financial Assets
The ATO classifies its departmental financial assets depending on their nature and purpose. The departmental financial assets are recognised and derecognised upon trade date.
All departmental financial assets are classified as loans and receivables as they have fixed or determinable payments that are not quoted in an active market.
Departmental receivables are measured at amortised cost using the effective interest method less impairment. Interest is recognised by applying the effective interest rate. Future cash flows for departmental receivables, which are almost all short-term in nature, are recognised at their nominal amounts.
Impairment of financial assets
Financial assets are assessed for impairment at the end of each reporting period based on expected credit losses, using the general approach which measures the loss allowance based on an amount equal to lifetime expected credit losses.
A write-off constitutes a derecognition event where the write-off directly reduces the gross carrying amount of the financial assets.
Financial Liabilities
Financial liabilities are initially measured at fair value, net of transaction costs. These liabilities are subsequently measured at amortised cost using the effective interest method, with interest expense recognised on an effective yield basis. Financial liabilities are recognised and derecognised upon trade date.
Suppliers and other payables are recognised at amortised cost. Liabilities are recognised to the extent that the goods or services have been received (irrespective of having been invoiced).
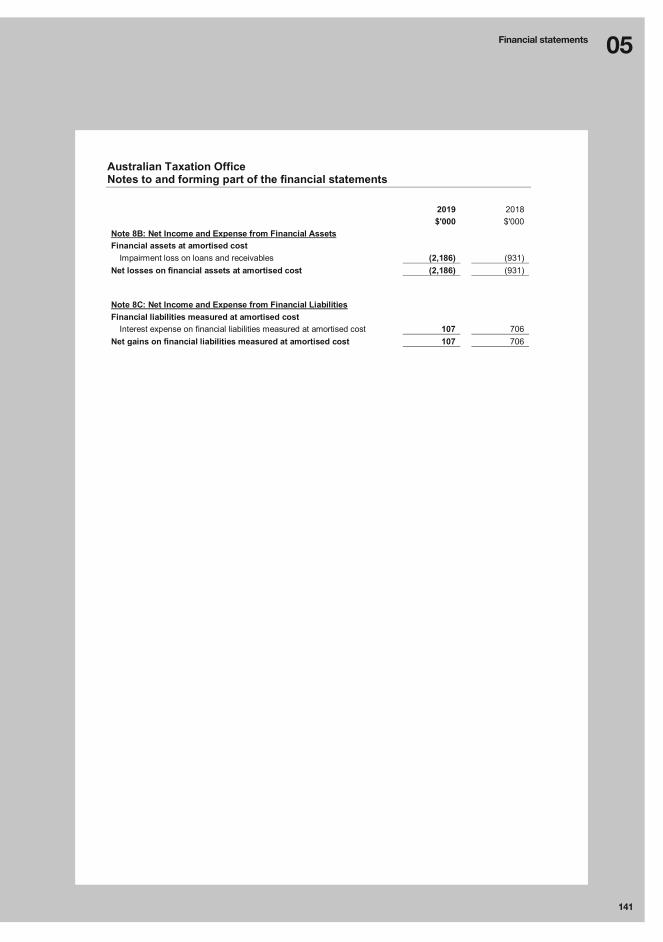
05Financial statements
141
Australian Taxation Office Notes to and forming part of the financial statements
2019 2018 $'000 $'000 Note 8B: Net Income and Expense from Financial Assets Financial assets at amortised cost
Impairment loss on loans and receivables (2,186) (931) Net losses on financial assets at amortised cost (2,186) (931)
Note 8C: Net Income and Expense from Financial Liabilities Financial liabilities measured at amortised cost
Interest expense on financial liabilities measured at amortised cost 107 706 Net gains on financial liabilities measured at amortised cost 107 706
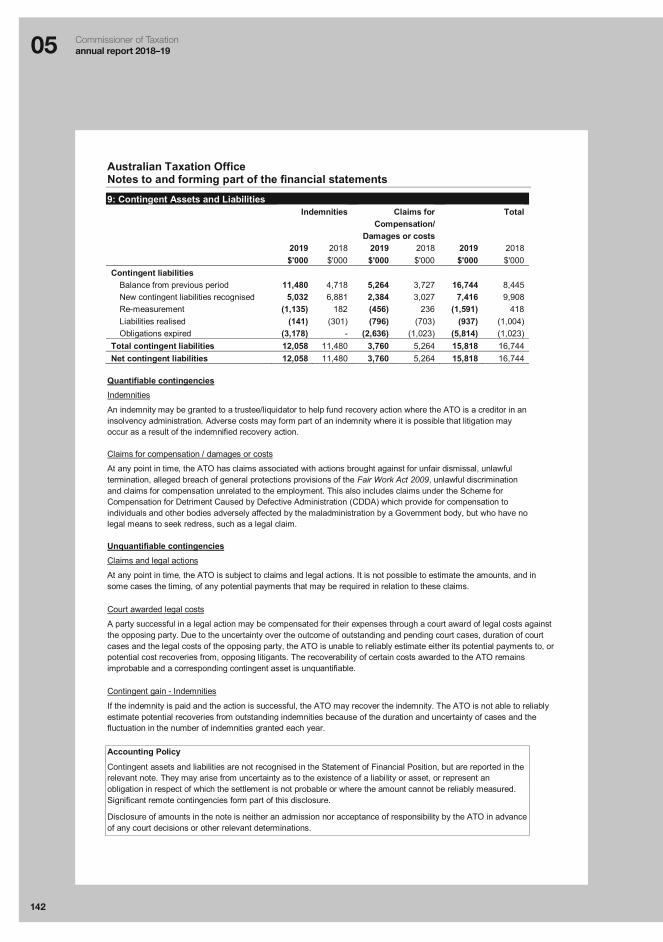
05 Commissioner of Taxation annual report 2018–19
142
Australian Taxation Office Notes to and forming part of the financial statements
9: Contingent Assets and Liabilities
Indemnities Claims for Compensation/
Damages or costs
Total
2019 2018 2019 2018 2019 2018 $'000 $'000 $'000 $'000 $'000 $'000 Contingent liabilities
Balance from previous period 11,480 4,718 5,264 3,727 16,744 8,445 New contingent liabilities recognised 5,032 6,881 2,384 3,027 7,416 9,908 Re-measurement (1,135) 182 (456) 236 (1,591) 418 Liabilities realised (141) (301) (796) (703) (937) (1,004) Obligations expired (3,178) - (2,636) (1,023) (5,814) (1,023)
Total contingent liabilities 12,058 11,480 3,760 5,264 15,818 16,744 Net contingent liabilities 12,058 11,480 3,760 5,264 15,818 16,744
Quantifiable contingencies Indemnities
An indemnity may be granted to a trustee/liquidator to help fund recovery action where the ATO is a creditor in an insolvency administration. Adverse costs may form part of an indemnity where it is possible that litigation may occur as a result of the indemnified recovery action.
Claims for compensation / damages or costs
At any point in time, the ATO has claims associated with actions brought against for unfair dismissal, unlawful termination, alleged breach of general protections provisions of the Fair Work Act 2009, unlawful discrimination and claims for compensation unrelated to the employment. This also includes claims under the Scheme for Compensation for Detriment Caused by Defective Administration (CDDA) which provide for compensation to individuals and other bodies adversely affected by the maladministration by a Government body, but who have no legal means to seek redress, such as a legal claim.
Unquantifiable contingencies Claims and legal actions
At any point in time, the ATO is subject to claims and legal actions. It is not possible to estimate the amounts, and in some cases the timing, of any potential payments that may be required in relation to these claims. Court awarded legal costs
A party successful in a legal action may be compensated for their expenses through a court award of legal costs against the opposing party. Due to the uncertainty over the outcome of outstanding and pending court cases, duration of court cases and the legal costs of the opposing party, the ATO is unable to reliably estimate either its potential payments to, or potential cost recoveries from, opposing litigants. The recoverability of certain costs awarded to the ATO remains improbable and a corresponding contingent asset is unquantifiable. Contingent gain - Indemnities
If the indemnity is paid and the action is successful, the ATO may recover the indemnity. The ATO is not able to reliably estimate potential recoveries from outstanding indemnities because of the duration and uncertainty of cases and the fluctuation in the number of indemnities granted each year. Accounting Policy
Contingent assets and liabilities are not recognised in the Statement of Financial Position, but are reported in the relevant note. They may arise from uncertainty as to the existence of a liability or asset, or represent an obligation in respect of which the settlement is not probable or where the amount cannot be reliably measured. Significant remote contingencies form part of this disclosure.
Disclosure of amounts in the note is neither an admission nor acceptance of responsibility by the ATO in advance of any court decisions or other relevant determinations.

05Financial statements
143
Australian Taxation Office Notes to and forming part of the financial statements
10: Key Management Personnel Remuneration Key management personnel are those persons having authority and responsibility for planning, directing and controlling the activities of the ATO, directly or indirectly. In 2019, the ATO had determined the key management personnel to be the Commissioner and members of the ATO Executive. 2019 2018 $'000 $'000
Short-term employee benefits 3,339 3,023 Post-employment benefits 258 243 Other long-term employee benefits 128 265 Termination benefits - -
Total key management personnel remuneration expenses1 3,725 3,531
The total number of key management personnel that are included in the above table is 8 (2018: 7). 1 The above key management personnel remuneration excludes the remuneration and other benefits of the Portfolio Minister. The Portfolio Minister's remuneration and other benefits are set by the Remuneration Tribunal and are not paid by the ATO. 11: Related Party Disclosures Related party relationships
The ATO is an Australian Government controlled entity. Related parties to the ATO are key management personnel including the ATO Executive, Cabinet Ministers, and other Australian Government entities. Transactions with related parties
Given the breadth of government activities, related parties may transact with the government sector in the same capacity as ordinary citizens. Such transactions include the payment or refund of taxes, receipt of a Medicare rebate or higher education loans. These transactions have not been separately disclosed in this note. Significant transactions with related parties can include: the payments of grants or loans; purchases of goods and services incurred on non-market terms and/or not part of normal business operations; asset purchases, sales transfers or leases; debts forgiven; and guarantees.
No related party transactions require disclosure in 2019.
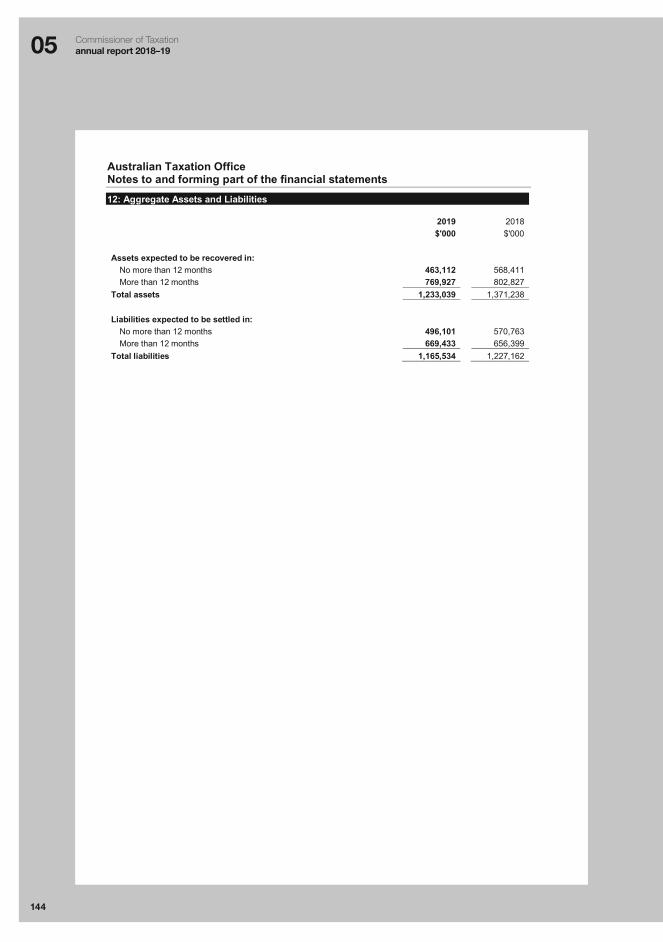
05 Commissioner of Taxation annual report 2018–19
144
Australian Taxation Office Notes to and forming part of the financial statements
12: Aggregate Assets and Liabilities 2019 2018 $'000 $'000 Assets expected to be recovered in:
No more than 12 months 463,112 568,411 More than 12 months 769,927 802,827
Total assets 1,233,039 1,371,238
Liabilities expected to be settled in: No more than 12 months 496,101 570,763 More than 12 months 669,433 656,399
Total liabilities 1,165,534 1,227,162

05Financial statements
145
Australian Taxation Office Notes to and forming part of the financial statements
13: Administered - Expenses 2019 2018 $'m $'m Note 13A: Subsidies Subsidies in connection with
Fuel tax credits scheme 7,247 6,908 Research and development tax incentive 2,002 2,093 Australian screen production incentive 358 292 Product stewardship for oil 71 74 Seafarer tax offset 9 10 National rental affordability scheme 120 189 Junior minerals exploration incentive 9 9 Exploration development incentive (1) (25)
Total subsidies 9,815 9,550 Note 13B: Personal Benefits Direct
Superannuation co-contribution scheme 114 109 Private health insurance rebate 229 266 Low income superannuation tax offset 692 772
Total personal benefits 1,035 1,147 Accounting Policy
Administered expenses include subsidies, personal benefits, impairment on taxation receivables, penalty and interest charge remission expenses, interest on overpayments, superannuation guarantee charge and unclaimed superannuation monies interest.
Subsidies, personal benefits and superannuation guarantee charge expenses are recognised when they can be reliably measured. This recognition point relies on estimation methodologies and techniques to determine taxpayer liabilities that the ATO is not aware of. Estimation techniques have inherent risks of error and rely on assumptions such as wage growth, gross domestic product (GDP) and recent historical information. At the reporting date, the amounts disclosed represent a reliable estimate of expenses incurred in the period.
For the research and development (R&D) tax incentive estimate, a change was made to the methodology. This is due to a continuing decline in later year lodgment trends with 2017-18 income year returns processed in 2018-19 showing a decline in aggregate claims.
Under the previous methodology, the later year lodgments were based on forecast growth in nominal GDP due to the expected stabilisation and maturity of the scheme with long-term growth consistent with nominal GDP. The new methodology now uses a growth rate factor for the current year based on the average growth in cash claims for the latest three years (limited to 12 months processing) instead of nominal GDP.
The effect of this change in accounting estimate as at 30 June 2019 is a reduction to the R&D subsidies expense and subsidies provision of around $123 million.
The expense recognition point for each material subsidy and personal benefit expense is noted in the table below.
The impairment on taxation receivables and penalty and interest charge remission expenses include both actual and accrued amounts in accordance with ATO operational policies. See Note 15.
Interest on overpayments represents estimates and actual payments of interest in accordance with the Taxation (Interest on Overpayments and Early Payments) Act 1983, and, an estimate of future interest charges, where the ATO considers that the probable outcome of tax in dispute at year-end will result in a refund being issued to the taxpayer.

05 Commissioner of Taxation annual report 2018–19
146
Australian Taxation Office Notes to and forming part of the financial statements
Administered Expense Product
Expense recognition point
Fuel tax credits scheme Fuel tax credits scheme expense is a subsidy for the fuel tax component of the price of fuel. The expense includes an estimate of claims not yet received relating to transactions that occurred in the reporting period.
Research and development tax incentive
Research and development (R&D) tax incentive expense is a subsidy for eligible companies incurring research and development expenditure during the reporting period. Companies claim the R&D tax incentive in their tax return as refundable tax offsets which are generally paid in the subsequent reporting periods.
Australian screen production incentive
Australian screen production incentive expense is recognised when film and television production companies receive certificates of eligibility from either Screen Australia or the Ministry for the Arts on qualifying Australian production expenditure during the reporting period.
Product stewardship for oil
Product stewardship for oil (PSO) expense is recognised when a registered client recycles used oil or consumes eligible oil. Claims for PSO are lodged at any time within three years after the start of the claim period.
National rental affordability scheme (ATO expense only)
National rental affordability scheme expense is recognised when participants are eligible to receive incentives from the Secretary of the Department of Social Services (DSS) for the reporting period. Claims paid through the tax system are made on income tax returns.
Junior minerals exploration incentive
Junior minerals exploration incentive expense (JMEI) is recognised when shareholders of mineral exploration companies are provided exploration credits, which is paid as a refundable tax offset.
Exploration development incentive
Exploration development incentive (EDI) expense is recognised when shareholders of mineral exploration companies are provided exploration credits, which is paid as a refundable tax offset. EDI expense was replaced by JMEI in the 2017-18 year. The expense is still recognised for amounts processed in the comparative reporting period.
Superannuation co-contribution scheme
Superannuation co-contribution expense is recognised when individuals make eligible personal superannuation contributions during the reporting period.
Private health insurance rebate (ATO expense only)
Private health insurance rebate expense is recognised when eligible claimants have paid private health insurance premiums during the reporting period and receive a rebate through the tax system on assessment of their individual tax return.
Low income superannuation tax offset
Low income superannuation tax offset expense is recognised when eligible concessional superannuation contributions are made to superannuation fund accounts of eligible individuals during the reporting period.

05Financial statements
147
Australian Taxation Office Notes to and forming part of the financial statements
14: Administered - Income 2019 2018 $'m $'m
Note 14A: Income Tax Individuals and others withholding tax 228,322 211,475 Companies 94,642 85,729 Superannuation funds 10,911 10,927 Fringe benefits tax 3,893 3,813 Resources rent tax 1,202 993
Total income tax 338,970 312,937 Note 14B: Indirect Tax
Goods and services tax 66,385 65,282 Excise duty 23,488 22,763 Wine equalisation tax 995 903 Luxury car tax 688 735
Total indirect tax 91,556 89,683 Note 14C: Other Taxes
Superannuation guarantee charge 1,069 1,107 Major bank levy 1,566 1,527 Self managed superannuation fund levy 146 148 Other1 131 187
Total other taxes 2,912 2,969 Note 14D: Non-Taxation Revenue Unclaimed superannuation monies2 (1,170) 158 Fines1 73 59 Other 16 13 Total non-taxation revenue (1,081) 230
1 Comparatives have been reclassified by $52 million in relation to court ordered fines which are now reported as non-taxation revenue. 2 The unclaimed superannuation monies (USM) revenue line item has a large negative balance as a result of the Treasury Laws Amendment (Protecting Your Superannuation Package) Act 2019 which substantially increased the ATO’s powers to
proactively reunite USM with members. As a result, large amounts recognised as revenue in prior years have been recognised as a reduction in revenue in the current year. See Accounting Policy for more details.
Accounting Policy
The ATO recognises revenue when, and only when, the following three conditions have been satisfied:
1. there is a basis establishing the ATO’s right to receive the revenue;
2. it is probable that future economic benefits will be received by the ATO; and
3. the amount of revenue to be received can be reliably measured.
Estimating some revenues can be difficult due to impacts of economic conditions and timing of final taxable income, hence the ATO uses two bases of recognition:
1. Economic Transaction Method (ETM)
Revenue is recognised when the ATO, through the application of legislation to taxation and other relevant activities, gains control over the future economic benefits that arise from taxes and other statutory charges.
Where a taxation revenue type is able to be measured reliably, including transactions that are yet to occur but are likely to be reported, the ETM is applied.

05 Commissioner of Taxation annual report 2018–19
148
Australian Taxation Office Notes to and forming part of the financial statements
Estimation techniques have inherent risks of error and rely on assumptions such as wage growth, gross domestic product (GDP) and recent historical information. Based on the information and evidence available at the date of these financial statements, the amounts disclosed represent a reliable estimate of revenue.
2. Taxation Liability Method (TLM)
Revenue is recognised at the earlier of when an assessment of a tax or superannuation liability is made, or payment is received by the ATO. Further, revenue is recognised when there is sufficient information to raise an assessment but an event has occurred which delays the issue of the assessment. This method is permitted under AASB 1004 Contributions (paragraph 30) in circumstances when there is an ‘inability to reliably measure taxes when the underlying transactions or events occur’. Revenue recognised under the TLM basis is generally measured at a later time than would be the case if it were measured under ETM.
For the unclaimed superannuation monies (USM) estimate, a change has been made to the methodology due to the introduction of the Treasury Laws Amendment (Protecting Your Superannuation Package) Act 2019. Under this amending Act the ATO is now required to proactively reunite USM to an active superannuation account where the balance will be $6,000 or greater. The result of this change is a significant increase in the provision for expected future payments for amounts that were recognised as revenue in prior years. The ATO’s accounting policy is to recognise revenue based on USM received less an estimate of future outflows, as a result these amounts are reported as a reduction to revenue.
In addition to the previous USM categories, the legislation introduced a new inactive low balance account category. This change will significantly increase USM received and paid during 2019-20. These amounts will be recognised on a TLM basis for 2018-19 as the amount of the payments received and proportion subsequently reunited by the Commissioner cannot be reliably measured.
In accordance with the revenue recognition approach adopted by the Government, the ATO applies the ETM and TLM approaches as set out in the following tables.
Revenue types recognised on an ETM basis
Type of taxation and superannuation revenue
Nature of revenue type
Fringe benefits tax Fringe benefits tax (FBT) is recognised on fringe benefits provided by employers to employees during the reporting period and includes an estimate of outstanding instalments and balancing payments for the annual FBT return.
Petroleum resource rent tax Petroleum resource rent tax is recognised based on actual taxable profits for the year in respect of offshore petroleum projects excluding some of the North-West Shelf production and associated exploration areas, which are subject to excise and royalties.
Goods and services tax The goods and services tax (GST) is a broad-based tax of 10 per cent on most goods and services supplied or sold during the reporting period. GST revenue includes actual liabilities raised during the year and an estimate of amounts outstanding that relate to transactions occurring in the reporting period.
Excise duty Excise duty is recognised based on the actual and estimated duty payable to the Government. Excise duty becomes payable when certain goods are distributed for home consumption during the reporting period.
Wine equalisation tax The wine equalisation tax revenue is recognised when an assessable dealing occurs within the reporting period giving rise to a tax liability and an estimate of amounts outstanding that related to transactions occurring in the reporting period.
Luxury car tax The luxury car tax revenue is recognised at the time the sale (or private import) of a luxury vehicle occurs within the reporting period and an estimate of amounts outstanding that relate to transactions occurring in the reporting period.
Unclaimed superannuation monies Revenue is recognised based on the annual amount of unclaimed superannuation received by the ATO less an estimate of future

05Financial statements
149
Australian Taxation Office Notes to and forming part of the financial statements
Type of taxation and superannuation revenue
Nature of revenue type
outflows relating to the annual amount received when account owners initiate a claim or the account owner is identified. Revenue in relation to inactive low balance accounts will be recognised on a TLM basis as the amount of the payments cannot be reliably measured.
Major bank levy Major bank levy is a levy calculated within the reporting period on authorised deposit-taking institutions with a total liability threshold of greater than $100 billion.
Revenue types recognised on a TLM basis Type of taxation and superannuation revenue
Nature of revenue type
Income tax - individuals Individuals income tax includes income tax withholding, other individuals, Medicare levy, and income tax refunds. Income tax withholding represents amounts withheld from remuneration paid during the year. Other individuals includes income tax instalments for the year and prior year final tax returns received by the ATO during the year. Income tax refunds are made where tax credits exceed the final liability on assessment. Refunds include prior year refunds made or assessed during the year. Individuals income tax does not include estimates of revenue or refunds related to the current taxation year that will be recognised in tax returns lodged after the end of the current financial year.
Income tax - companies Company tax includes company tax payable that relates to income tax instalments and final payments received/raised for the current and prior reporting periods. It does not include estimates of revenue related to the current taxation year that will be recognised in tax returns lodged after the end of the current financial year.
Income tax - superannuation funds
Superannuation income tax includes amounts payable by superannuation funds that relate to income tax instalments and final payments for the current and prior reporting periods. Superannuation funds income tax is levied on earnings and taxable contributions. It does not include estimates of revenue related to the current taxation year that will be recognised in tax returns lodged after the end of the current financial year.
Minerals resource rent tax
Minerals resource rent tax was a project based tax on the extraction of iron ore and coal and was abolished in 2015-16. Revenue is still recognised for amended assessments that are processed in the current reporting period.
Superannuation surcharge This tax was abolished from 1 July 2005. However, assessments and amendments continue to be issued for 2004–05 and previous financial years. Different arrangements exist for unfunded defined benefit funds (UDBs). Superannuation surcharge revenue relating to UDBs is

05 Commissioner of Taxation annual report 2018–19
150
Australian Taxation Office Notes to and forming part of the financial statements
Revenue types recognised on a TLM basis Type of taxation and superannuation revenue
Nature of revenue type
recognised at the time it can be assessed, even though it may not be collected for some years, until which time an annual interest charge accrues.
Superannuation guarantee charge Superannuation guarantee charge is a charge on employers that have not paid the compulsory superannuation guarantee for their employees. The ATO assesses and collects the guarantee, interest owing and an administrative fee.
Accounting Policy
Allowance for credit amendments and Provision for refunds
Taxpayers are entitled to dispute amounts assessed by the ATO. Where the ATO considers that the probable outcome will be a reduction in the amount of tax owed by a taxpayer, an allowance for credit amendment (if the disputed debt is unpaid) or a provision for refund (if the disputed debt has been paid) will be created and there will be a corresponding reduction in revenue.
Penalties and interest charges
Penalties and interest arising under taxation legislation are recognised as revenue at the time the penalty or interest is imposed on the taxpayer. Generally, subsequent remissions and write-offs of such penalties and interest are treated as an expense of the period. Penalties and interest that are imposed by law and immediately remitted by the Commissioner are not recognised as revenue or as an expense. Additional interest is raised for the period between the last imposition and the end of the financial year to recognise amounts not yet recorded on taxpayer accounts.
Settlements
A settlement involves an agreement between the ATO and the taxpayer to resolve matters in dispute where one or more parties make concessions on what they consider is the legally correct position. Where this results in a reduction of the amounts payable by the taxpayer, the reductions for the assessment and any associated penalties and interest charges, excluding failure to lodge penalty, are recognised as a reduction in revenue. This is consistent with AASB 1004 Contributions as the ATO never obtained control to impose the original assessment.
Pay as you go (PAYG) system
The ATO collects compulsory repayment amounts of accumulated HELP and other income contingent loan (ICL) debts through the PAYG tax system. The repayment of ICL debts reduces the loan that a person owes to the Commonwealth.
An adjustment is made to Individuals income tax revenue for the compulsory repayment of ICL debts as the collection of these amounts through the PAYG tax system does not represent revenue for the ATO and the compulsory repayments figure can be reliably estimated.

05Financial statements
151
Australian Taxation Office Notes to and forming part of the financial statements
15: Administered - Non-Financial Assets 2019 2018 $'m $'m Note 15A: Receivables
Direct tax Individuals 22,973 20,255 Company 11,366 10,423 Superannuation1 425 545 Fringe benefits tax 414 344 Resources rent tax 164 149
Total direct tax 35,342 31,716 Indirect tax
Goods and services tax 7,495 7,253 Excise duty 122 18 Wine equalisation tax 93 96 Luxury car tax 24 43
Total indirect tax 7,734 7,410 Other tax
Superannuation guarantee charge 2,192 1,917 Self managed superannuation fund levy 44 39 Other2 28 4
Total other tax 2,264 1,960 Non-taxation
Fines2 214 173 Unclaimed superannuation monies 2 2 Foreign investment review board infringements 3 1
Total non-taxation 219 176 Total receivables (gross) 45,559 41,262 Less: Impairment allowance (15,484) (14,252)
Allowance for credit amendments (5,095) (4,394) Total receivables (net) 24,980 22,616
Note 15B: Accrued Revenues Direct tax
Fringe benefit tax 851 836 Resource rent tax 296 249
Total direct tax 1,147 1,085 Indirect tax
Goods and services tax 11,283 11,867 Excise duty 569 489 Wine equalisation tax 90 84 Luxury car tax 75 79
Total indirect tax 12,017 12,519 Other revenue
Major bank levy 394 388 Unclaimed superannuation monies 141 230 Self managed superannuation fund levy 51 54
Total other revenue 586 672 Total accrued revenues 13,750 14,276
1 Prior year adjustments have been made to these numbers. Refer to Overview. 2 Comparatives have been reclassified by $173 million in relation to fines ordered by court.

05 Commissioner of Taxation annual report 2018–19
152
Australian Taxation Office Notes to and forming part of the financial statements
Accounting Policy
Cash
Cash is the only financial asset and meets the definition of a financial instrument. The net fair value equals the carrying amount.
Receivables
ATO receivables are non-financial assets recoverable under law.
Collectability of receivables is reviewed on an ongoing basis. Where estimation is used, it represents the best estimate as at the reporting date, however inherent risks and uncertainties exist in the estimation process.
Debts which are irrecoverable at law or uneconomic to pursue are written off. However this does not preclude the Commissioner from re-raising these debts if information subsequently becomes available which indicates that recoverability action may be viable.
Parallel liabilities
Where a company fails to remit withholding tax or superannuation guarantee amounts, the Commissioner is authorised to serve notices requiring payment of estimated and outstanding amounts on the company and all associated Directors. These are called parallel liabilities and are not included in receivables or revenue. Similarly, duplications arising from debts raised under alternative provisions of the law are excluded.
Impairment on taxation receivables
An impairment allowance is created when there is evidence that the ATO will not be able to collect all of the amounts due.
A threshold is applied to determine whether the impairment allowance is calculated manually or using a statistically automated model.
In 2018-19, the ATO undertook a review of its thresholds and methodologies. As a result of this review, the threshold has been increased from $10 million to $30 million for receivables being assessed by the automated model, as it still provides a reliable estimate of the amounts to be impaired.
The effect of this change in accounting estimate as at 30 June 2019 is a decrease of $242 million.
Both estimate methodologies are based on several factors including compliance and lodgment history, the existence of a dispute over a receivable and the taxpayer’s capacity to pay, in conjunction with interpretative judgement impacting the collectability of these receivables. The amount of the impairment loss is recognised as an administered expense.
Allowance for credit amendments
An allowance for credit amendment is created when there is evidence that the ATO is likely to amend a taxation assessment in favour of the taxpayer. Where the ATO expects to amend more than the value of taxation receivables owed by a taxpayer, the ATO will recognise a provision for refund equal to the amount to be amended in the taxpayer’s favour, less any allowance for credit amendment.
A threshold is applied to determine whether the allowance for credit amendment is calculated manually or using an automated model.
As a result of the 2018-19 review of thresholds and methodologies, the threshold has been increased from $1 million to $10 million for assessments that may be amended by the automated model, as it still provides a reliable estimate of the amounts to be credit amended. While the model uses historical trends in the calculation, it has been refined to utilise more recent data to better capture trends in the estimates.
The effect of this change in accounting estimate as at 30 June 2019 is a decrease of $165 million.
For all assessments greater than $10 million that may be amended, an allowance for credit amendment is calculated on an individual basis. Interpretative judgement is used to calculate the value of credit amendments. Where a manual case assessment cannot be made a statistical model is used to estimate the value of the credit amendment. The amount of the allowance for credit amendments is recognised as a reduction in revenue.
Accrued revenues
Accrued revenues include revenue estimates made on an ETM basis and interest charges in accordance with Note 14.
Other securities
In some instances the ATO will enter into an agreement with a taxpayer to hold a security over a tax debt. These securities are not recorded in the financial statements as assets because the primary cash generating asset is the debt rather than the security over the debt.
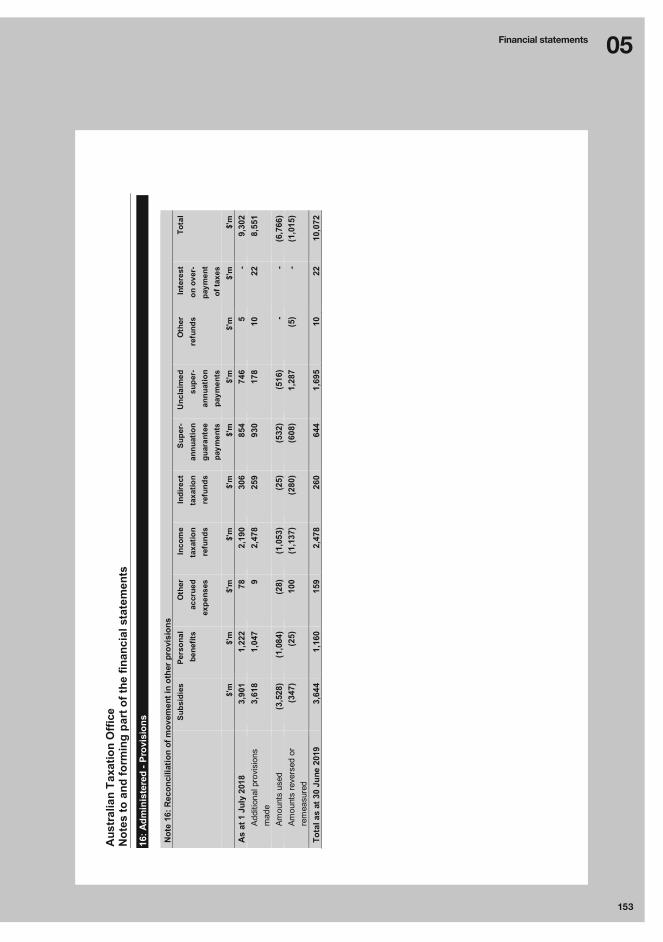
05Financial statements
153
Aus
tral
ian
Taxa
tion
Offi
ce
Not
es to
and
form
ing
part
of t
he fi
nanc
ial s
tate
men
ts
16: A
dmin
iste
red
- Pro
visi
ons
Not
e 16
: Rec
onci
liatio
n of
mov
emen
t in
othe
r pro
visi
ons
Subs
idie
s Pe
rson
al
bene
fits
Oth
er
accr
ued
expe
nses
Inco
me
taxa
tion
refu
nds
Indi
rect
ta
xatio
n re
fund
s
Supe
r-an
nuat
ion
guar
ante
e pa
ymen
ts
Unc
laim
ed
supe
r-an
nuat
ion
paym
ents
Oth
er
refu
nds
Inte
rest
on
ove
r-pa
ymen
t of
taxe
s
Tota
l
$'
m
$'m
$'
m
$'m
$'
m
$'m
$'
m
$'m
$'
m
$'m
A
s at
1 J
uly
2018
3,
901
1,22
2 78
2,
190
306
854
746
5 -
9,30
2 Ad
ditio
nal p
rovi
sion
s m
ade
3,61
8 1,
047
9 2,
478
259
930
178
10
22
8,55
1
Amou
nts
used
(3
,528
) (1
,084
) (2
8)
(1,0
53)
(25)
(5
32)
(516
) -
- (6
,766
) Am
ount
s re
vers
ed o
r re
mea
sure
d (3
47)
(25)
10
0 (1
,137
) (2
80)
(608
) 1,
287
(5)
- (1
,015
)
Tota
l as
at 3
0 Ju
ne 2
019
3,64
4 1,
160
159
2,47
8 26
0 64
4 1,
695
10
22
10,0
72

05 Commissioner of Taxation annual report 2018–19
154
Australian Taxation Office Notes to and forming part of the financial statements
17: Administered - Contingent Liabilities Tax in dispute 2019 2018 $'m $'m Contingent liabilities
Balance from previous period 5,544 4,588 New contingent liabilities recognised 584 1,737 Re-measurement 254 626 Obligations expired (944) (1,407)
Total contingent liabilities 5,438 5,544 Quantifiable Administered Contingencies At any point in time, the ATO is involved in a range of dispute resolution processes, including litigation, relating to tax disputes. Details of the outcome of dispute resolution processes are uncertain until a court ruling is made and/or an agreement is reached with the taxpayer at some future date. In most cases it is not possible to estimate with any reliability the likely financial impact of current disputes. Unquantifiable Administered Contingencies In some cases, the decision in relation to the cases above will be precedential. No estimate is able to be made as to whether contingent liabilities exist with respect to other taxpayers who may be impacted as a result of the decision. The ATO acknowledges that the incidence of tax evasion and other breaches of the taxation laws, unavoidably affect its fiduciary responsibilities to the Government. As a result, in most cases it is not possible to estimate with any reliability the likely financial impact of current disputes. Accounting Policy
The estimated aggregate value of tax in dispute, for which a liability has not been made, represents the contingent liability. A proportion of these cases will be decided in favour of the Commissioner, and as a result, the future financial impact associated with these contingent liabilities is likely to be lower than the estimated aggregate value of tax in dispute.
The amount disclosed as a contingent liability represents the total tax in dispute for cases assessed on an individual basis where an allowance for credit amendment has not been made. As a result of the review undertaken in 2018-19, more cases are being captured in the automated model and therefore will not form part of the contingent liability note.
The effect of this change in accounting estimate as at 30 June 2019 is decrease in contingent liabilities of $790 million.
Refer to Note 15 for the accounting policy on allowance for credit amendments and provisions for refunds.
18: Administered - Aggregate Assets and Liabilities 2019 2018 $'m $'m Note 18: Administered Aggregate Assets and Liabilities Assets expected to be recovered in:
No more than 12 months 31,594 30,243 More than 12 months 7,601 7,055
Total assets 39,195 37,298
Liabilities expected to be settled in: No more than 12 months 10,727 9,618 More than 12 months 662 868
Total liabilities 11,389 10,486

05Financial statements
155
Aus
tral
ian
Taxa
tion
Offi
ce
Not
es to
and
form
ing
part
of t
he fi
nanc
ial s
tate
men
ts
19: A
ppro
pria
tions
N
ote
19A
: Ann
ual A
ppro
pria
tions
A
nnua
l app
ropr
iatio
ns fo
r 201
9
Ann
ual a
ppro
pria
tion1,
2
Adj
ustm
ents
to
appr
opria
tion3
Tota
l app
ropr
iatio
n A
ppro
pria
tion
appl
ied
in 2
019
(cur
rent
and
pr
ior y
ears
)
Varia
nce4
$'
000
$'00
0 $'
000
$'00
0 $'
000
Dep
artm
enta
l
Ord
inar
y an
nual
ser
vice
s 3,
240,
202
170,
677
3,41
0,87
9 (3
,627
,181
) (2
16,3
02)
Cap
ital b
udge
t5 13
2,32
2 -
132,
322
(144
,952
) (1
2,63
0)
Oth
er s
ervi
ces
Eq
uity
28
,055
-
28,0
55
(25,
131)
2,
924
Tota
l dep
artm
enta
l 3,
400,
579
170,
677
3,57
1,25
6 (3
,797
,264
) (2
26,0
08)
Adm
inis
tere
d
Ord
inar
y an
nual
ser
vice
s
Cap
ital b
udge
t5 -
- -
- -
Adm
inis
tere
d ite
ms
6,18
1 -
6,18
1 1,
540
4,64
1 To
tal a
dmin
iste
red
6,18
1 -
6,18
1 1,
540
4,64
1 1
$2,3
00,0
00 f
rom
Ann
ual A
ppro
pria
tion
Act
(N
o.3)
201
8-19
has
bee
n w
ithhe
ld u
nder
sec
tion
51 o
f th
e P
GP
A A
ct.
$20,
000,
000
from
Ann
ual A
ppro
pria
tion
Act
(N
o.1)
201
8-19
has
bee
n w
ithhe
ld
unde
r sec
tion
51 o
f the
PG
PA
Act
and
tran
sfer
red
to A
nnua
l App
ropr
iatio
n A
ct (N
o.3)
201
8-19
- D
epar
tmen
tal C
apita
l Bud
get (
DC
B).
Ann
ual A
ppro
pria
tion
for A
dmin
iste
red
cons
ists
of $
6,18
1,00
0 fo
r
2018
-19.
$4,
278,
000
has
been
with
held
und
er s
ectio
n 51
of t
he P
GP
A A
ct.
2 Ann
ual A
ppro
pria
tion
ordi
nary
ann
ual s
ervi
ces
cons
ists
of $
16,2
05,0
00 tr
ansf
erre
d to
AC
NC
spe
cial
acc
ount
. 3 A
djus
tmen
ts re
pres
ent P
GP
A A
ct s
ectio
n 74
rece
ipts
. 4 D
epar
tmen
tal v
aria
nce
is d
ue to
acc
rued
exp
ense
s fro
m p
rior y
ear b
eing
dra
wn
dow
n in
the
curr
ent y
ear f
rom
ope
ratin
g, D
CB
and
equ
ity fu
ndin
g.
Adm
inis
tere
d va
rianc
e is
due
to:
- uns
pent
ann
ual a
ppro
pria
tion
for t
he y
ear o
f $62
3,40
9.56
; - p
lus
quar
antin
ed a
mou
nt o
f $4,
278,
000
whi
ch h
as b
een
mov
ed to
201
9-20
; and
- les
s ac
crue
d ca
mpa
ign
expe
nses
of $
259,
917.
59 fr
om th
e pr
ior y
ear d
raw
n do
wn
in th
e cu
rren
t yea
r.
5 D
epar
tmen
tal
and
Adm
inis
tere
d C
apita
l B
udge
ts a
re a
ppro
pria
ted
unde
r A
ppro
pria
tion
Act
s (N
o.1,
3,
5).
They
for
m p
art
of o
rdin
ary
annu
al s
ervi
ces,
and
are
not
sep
arat
ely
iden
tifie
d in
the
A
ppro
pria
tion
Act
s.

05 Commissioner of Taxation annual report 2018–19
156
Aus
tral
ian
Taxa
tion
Offi
ce
Not
es to
and
form
ing
part
of t
he fi
nanc
ial s
tate
men
ts
Ann
ual a
ppro
pria
tions
for 2
018
An
nual
app
ropr
iatio
n Ad
just
men
ts to
ap
prop
riatio
n2 To
tal a
ppro
pria
tion
Appr
opria
tion
appl
ied
in
2018
(cur
rent
and
pr
ior y
ears
)1
Varia
nce3
$'
000
$'00
0 $'
000
$'00
0 $'
000
Dep
artm
enta
l
Ord
inar
y an
nual
ser
vice
s 3,
199,
160
145,
945
3,34
5,10
5 (3
,350
,971
) ( 5
,866
) C
apita
l bud
get4,
5
112,
589
- 11
2,58
9 (1
17,3
18)
( 4,7
29)
Oth
er s
ervi
ces
Eq
uity
27
,890
-
27,8
90
(60,
655)
( 3
2,76
5)
Tota
l dep
artm
enta
l 3,
339,
639
145,
945
3,48
5,58
4 (3
,528
,944
) (4
3,36
0)
Adm
inis
tere
d
Ord
inar
y an
nual
ser
vice
s
Cap
ital b
udge
t5 -
- -
- -
Adm
inis
tere
d ite
ms
5,87
6 -
5,87
6 57
0 5,
306
Tota
l adm
inis
tere
d 5,
876
- 5,
876
570
5,30
6 1
$543
,000
fro
m t
he A
nnua
l A
ppro
pria
tion
Act
(N
o.1)
has
bee
n w
ithhe
ld u
nder
sec
tion
51 o
f th
e P
GP
A A
ct.
Ann
ual
App
ropr
iatio
n fo
r A
dmin
iste
red
cons
ists
of
$5,8
76,0
00 f
or 2
017-
18 A
nnua
l A
ppro
pria
tion
Act
(No.
1).
$4,8
38,0
00 h
as b
een
with
held
und
er s
ectio
n 51
of t
he P
GP
A A
ct.
2 A
djus
tmen
ts re
pres
ent P
GP
A A
ct s
ectio
n 74
rece
ipts
.
3 The
var
ianc
e in
the
depa
rtmen
tal e
xpen
ses
is d
ue to
acc
rued
exp
ense
s fro
m p
rior
year
bei
ng d
raw
n do
wn
in th
e cu
rren
t yea
r fro
m o
pera
ting
and
equi
ty fu
ndin
g, a
s w
ell a
s un
spen
t app
ropr
iatio
n fro
m d
epar
tmen
tal c
apita
l bud
get.
Adm
inis
tere
d va
rianc
e is
due
to t
he u
nspe
nt a
nnua
l app
ropr
iatio
n fo
r th
e ye
ar o
f $46
7,63
3.66
plu
s qu
aran
tined
am
ount
of $
4,83
8,00
0 w
hich
has
bee
n m
oved
to
2018
-19
finan
cial
yea
r. 4.
The
allo
catio
n of
am
ount
s be
twee
n ca
pita
l and
ope
ratin
g is
set
out
in th
e 20
17-1
8 P
ortfo
lio B
udge
t Sta
tem
ent a
s th
ere
is n
o ite
mis
atio
n in
app
ropr
iatio
n ac
ts. A
re-
allo
catio
n of
$15
.6 m
illio
n fro
m
depa
rtmen
t ope
ratin
g to
dep
artm
enta
l cap
ital w
as a
ppro
ved
by th
e Fi
nanc
e M
inis
ter
on 1
3/11
/201
7. A
s re
-allo
catio
ns b
etw
een
oper
atin
g an
d ca
pita
l are
not
per
mitt
ed u
nder
acc
ount
ing
stan
dard
s,
they
hav
e no
t bee
n re
flect
ed in
this
app
ropr
iatio
n no
te.
5 D
epar
tmen
tal
and
Adm
inis
tere
d C
apita
l B
udge
ts a
re a
ppro
pria
ted
unde
r A
ppro
pria
tion
Act
s (N
o.1,
3,
5).
They
for
m p
art
of o
rdin
ary
annu
al s
ervi
ces,
and
are
not
sep
arat
ely
iden
tifie
d in
the
A
ppro
pria
tion
Act
s.

05Financial statements
157
Australian Taxation Office Notes to and forming part of the financial statements
Note 19B: Unspent Annual Appropriations 2019 2018 $'000 $'000 Departmental
Appropriation Act (No.2) 2015-16 - 9,676 Appropriation Act (No.4) 2015-16 - 2,517 Supply Act (No.2) 2016-171 3,557 3,557 Appropriation Act (No.2) 2016-172 351 630 Appropriation Act (No.1) 2017-18 - 348,965 Appropriation Act (No.1) 2017-18 - DCB - 36,489 Appropriation Act (No.2) 2017-18 1,336 2,904 Appropriation Act (No.4) 2017-18 - 291 Appropriation Act (No.1) 2017-18 - Cash - 25,900 Appropriation Act (No.1) 2018-19 242,333 - Appropriation Act (No.1) 2018-19 - DCB 19,458 - Appropriation Act (No.2) 2018-19 5,061 - Appropriation Act (No.3) 2018-193 6,946 - Appropriation Act (No.3) 2018-19 - DCB 20,000 - Appropriation Act (No.4) 2018-19 - - Appropriation Act (No.1) 2018-19 - Cash 41,122 -
Total departmental 340,164 430,929 Administered Appropriation Act (No.1) 2015-164 - 211 Appropriation Act (No.1) 2016-175 2,843 2,843 Supply Act (No.1) 2016-176 2,210 2,210 Appropriation Act (No.1) 2017-187 5,046 5,132 Appropriation Act (No.1) 2018-198 4,604 - Total administered 14,703 10,396
Appropriation amounts in this note differ from those reported in the financial statements by the following: 1 $2,000,000 reduced through a section 51 determination and $1,556,924.48 remaining balance that will automatically lapse from 1 July 2019. 2 $350,970.65 that will automatically lapse from 1 July 2019. 3 $2,300,000 reduced through a section 51 determination. 4 $211,182.74 removed through 2015-16 annual Appropriation Acts repeal at the start of 1 July 2018. 5 $2,134,000 (2016-17 financial year) and $711,610.45 (2017-18 financial year) reduced through a section 51 determination. 6 $2,210,000 reduced through a section 51 determination. 7 $4,838,000 reduced through a section 51 determination. 8 $4,278,000 reduced through a section 51 determination.

05 Commissioner of Taxation annual report 2018–19
158
Australian Taxation Office Notes to and forming part of the financial statements
Note 19C: Special Appropriations
Appropriation
applied Appropriation
applied
2019 2018 $'000 $'000
Authority Taxation Administration Act 1953 - section 16 1,2 112,711,591 106,905,673 Product Grants and Benefits Administration Act 2000 - section 55 72,325 76,574 Superannuation Guarantee (Administration) Act 1992 - section 71 551,822 404,924 Small Superannuation Accounts Act 1995 - section 76(9) 66 104 Public Governance, Performance and Accountability Act 2013 - section 77 2 109,209 93,256 Total 113,445,013 107,480,531
The Department of Home Affairs (Home Affairs) spends money from the Consolidated Revenue Fund on behalf of the ATO. 1 Includes payments of $255,573,168 (2018: $227,642,802) made on behalf of the ATO by Home Affairs. 2 $219,139 of section 77 appropriations have been reclassified as section 16 appropriations for comparative purposes.
Accounting Policy
Appropriations provide a legislative basis to issue refunds. The amounts disclosed above represent the actual refunds paid by appropriation source for the financial year.

05Financial statements
159
Australian Taxation Office Notes to and forming part of the financial statements
Note 19D: Compliance with statutory conditions for payments from the Consolidated Revenue Fund For amounts to be paid out of the Consolidated Revenue Fund under section 83 of the Constitution there
must be an appropriation made by law. There have been circumstances where amounts have been paid out to taxpayers without any legislative basis and are considered a technical breach of section 83. It is impractical to fully remove the potential for section 83 breaches for all payments due to the manual nature of some transactions.
Appropriations
identified as subject to conditions
Payments in 2018-19
$
Review complete?
Breaches identified
#
Amount recovered
$
Amount to be
recovered $
Remedial action taken
Small Business Superannuation Clearing House (SBSCH) Special Account
22,474.29 Yes 40 14,072.08 8,412.21 Control
Superannuation Holding Accounts (SHA) Special Account
12,899.65 Yes 57 - 12,899.65 Control
TOTAL 35,373.94
97 14,072.08 21,311.86
The ATO performs an annual risk assessment for breaches of appropriations with statutory conditions as well as annual appropriations.
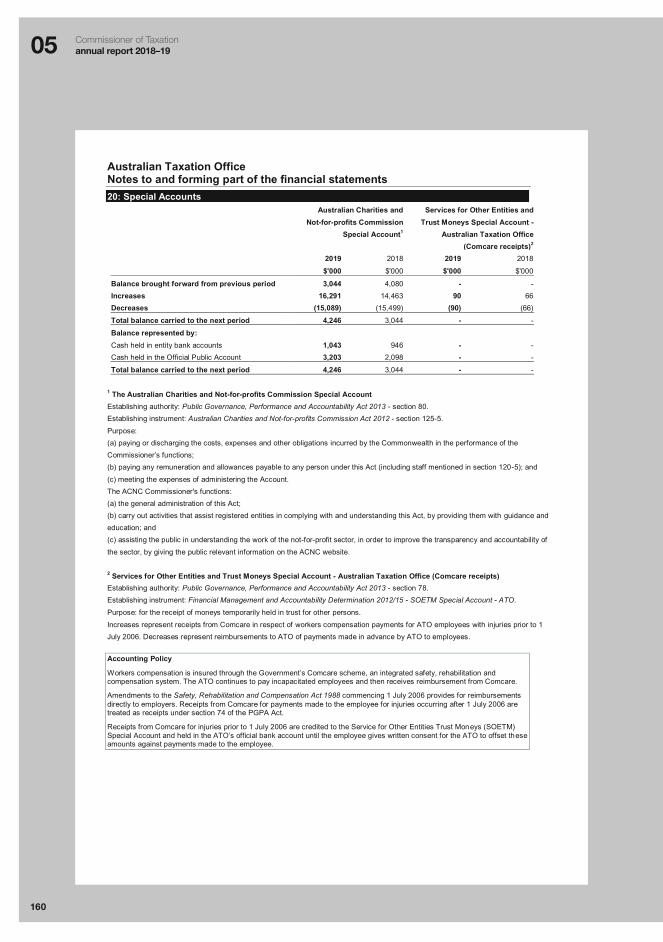
05 Commissioner of Taxation annual report 2018–19
160
Australian Taxation Office Notes to and forming part of the financial statements
20: Special Accounts
Australian Charities and Not-for-profits Commission
Special Account1
Services for Other Entities and Trust Moneys Special Account -
Australian Taxation Office (Comcare receipts)2
2019 2018 2019 2018
$'000 $'000 $'000 $'000
Balance brought forward from previous period 3,044 4,080 - - Increases 16,291 14,463 90 66 Decreases (15,089) (15,499) (90) (66)
Total balance carried to the next period 4,246 3,044 - -
Balance represented by:
Cash held in entity bank accounts 1,043 946 - - Cash held in the Official Public Account 3,203 2,098 - -
Total balance carried to the next period 4,246 3,044 - -
1 The Australian Charities and Not-for-profits Commission Special Account Establishing authority: Public Governance, Performance and Accountability Act 2013 - section 80. Establishing instrument: Australian Charities and Not-for-profits Commission Act 2012 - section 125-5.
Purpose: (a) paying or discharging the costs, expenses and other obligations incurred by the Commonwealth in the performance of the Commissioner’s functions; (b) paying any remuneration and allowances payable to any person under this Act (including staff mentioned in section 120-5); and
(c) meeting the expenses of administering the Account. The ACNC Commissioner's functions: (a) the general administration of this Act; (b) carry out activities that assist registered entities in complying with and understanding this Act, by providing them with guidance and education; and (c) assisting the public in understanding the work of the not-for-profit sector, in order to improve the transparency and accountability of
the sector, by giving the public relevant information on the ACNC website. 2 Services for Other Entities and Trust Moneys Special Account - Australian Taxation Office (Comcare receipts) Establishing authority: Public Governance, Performance and Accountability Act 2013 - section 78. Establishing instrument: Financial Management and Accountability Determination 2012/15 - SOETM Special Account - ATO.
Purpose: for the receipt of moneys temporarily held in trust for other persons.
Increases represent receipts from Comcare in respect of workers compensation payments for ATO employees with injuries prior to 1 July 2006. Decreases represent reimbursements to ATO of payments made in advance by ATO to employees. Accounting Policy
Workers compensation is insured through the Government’s Comcare scheme, an integrated safety, rehabilitation and compensation system. The ATO continues to pay incapacitated employees and then receives reimbursement from Comcare.
Amendments to the Safety, Rehabilitation and Compensation Act 1988 commencing 1 July 2006 provides for reimbursements directly to employers. Receipts from Comcare for payments made to the employee for injuries occurring after 1 July 2006 are treated as receipts under section 74 of the PGPA Act.
Receipts from Comcare for injuries prior to 1 July 2006 are credited to the Service for Other Entities Trust Moneys (SOETM) Special Account and held in the ATO’s official bank account until the employee gives written consent for the ATO to offset these amounts against payments made to the employee.

05Financial statements
161
Australian Taxation Office Notes to and forming part of the financial statements
Superannuation Holding Accounts Special Account1
Services for Other Entities and Trust Moneys Special
Account - Australian Taxation Office2
Superannuation Clearing House Special Account 3
2019 2018 2019 2018 2019 2018
$'000 $'000 $'000 $'000 $'000 $'000
Balance brought forward from previous period 106,218 94,844 2,290 2,172 188,527 65,566
Increases 17,654 52,572 7,715 5,902 4,366,869 4,261,352 Decreases (39,442) (41,198) (7,714) (5,784) (4,342,746) (4,138,391)
Total balance carried to the next period 84,430 106,218 2,291 2,290 212,650 188,527
Balance represented by:
Cash held in entity bank accounts 10 10 - - 105,341 52,797
Cash held in the Official Public Account 84,420 106,208 2,291 2,290 107,309 135,730
Total balance carried to the next period 84,430 106,218 2,291 2,290 212,650 188,527
1 Superannuation Holding Accounts Special Account Establishing instrument: Small Superannuation Accounts Act 1995 - section 8.
Establishing authority: Public Governance, Performance and Accountability Act 2013 - section 80.
Purpose: for the receipt of small superannuation contributions from depositors and distribution to individuals.
2 Services for Other Entities and Trust Moneys Special Account - Australian Taxation Office Establishing instrument: Financial Management and Accountability Determination 2012/15 - SOETM Special Account - ATO.
Establishing authority: Public Governance, Performance and Accountability Act 2013 - section 78.
Purpose: for the receipt of moneys temporarily held in trust for other persons.
The full closing balance of the Special Account is held in trust for both the current and comparative years.
3 Superannuation Clearing House Special Account Establishing instrument: Financial Management and Accountability 2010/05 - Superannuation Clearing House Special Account.
Establishing authority: Public Governance, Performance and Accountability Act 2013 - section 78.
Purpose:
(a) make payments to superannuation funds on behalf of small business employers in performance of the functions of the
Superannuation Clearing House;
(b) repay to an original payer amounts credited to the Special Account, including the residual after any necessary payments are made
for the purpose mentioned in paragraph (a);
(c) reduce the balance of the Special Account (therefore, the available appropriation for the Special Account) without making a real or
notional payment; and
(d) repay amounts where an Act or other law requires or permits the repayment of an amount received.
The full closing balance of the Special Account is held in trust for both the current and comparative years.
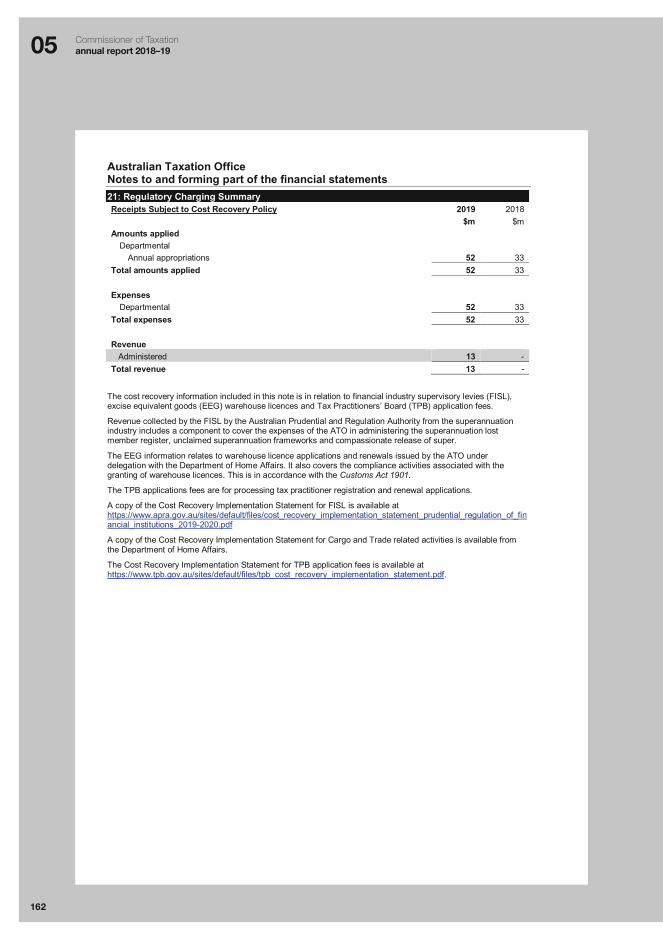
0605 Commissioner of Taxation
annual report 2018–19
162
Australian Taxation Office Notes to and forming part of the financial statements
21: Regulatory Charging Summary Receipts Subject to Cost Recovery Policy 2019 2018 $m $m Amounts applied
Departmental Annual appropriations 52 33
Total amounts applied 52 33 Expenses
Departmental 52 33 Total expenses 52 33 Revenue Administered 13 - Total revenue 13 -
The cost recovery information included in this note is in relation to financial industry supervisory levies (FISL), excise equivalent goods (EEG) warehouse licences and Tax Practitioners’ Board (TPB) application fees.
Revenue collected by the FISL by the Australian Prudential and Regulation Authority from the superannuation industry includes a component to cover the expenses of the ATO in administering the superannuation lost member register, unclaimed superannuation frameworks and compassionate release of super.
The EEG information relates to warehouse licence applications and renewals issued by the ATO under delegation with the Department of Home Affairs. It also covers the compliance activities associated with the granting of warehouse licences. This is in accordance with the Customs Act 1901.
The TPB applications fees are for processing tax practitioner registration and renewal applications.
A copy of the Cost Recovery Implementation Statement for FISL is available at https://www.apra.gov.au/sites/default/files/cost_recovery_implementation_statement_prudential_regulation_of_financial_institutions_2019-2020.pdf
A copy of the Cost Recovery Implementation Statement for Cargo and Trade related activities is available from the Department of Home Affairs.
The Cost Recovery Implementation Statement for TPB application fees is available at https://www.tpb.gov.au/sites/default/files/tpb_cost_recovery_implementation_statement.pdf.

06Appendixes
164 Appendix 1: Laws conferring powers on the Commissioner
165 Appendix 2: Taxpayers’ Charter – our performance
167 Appendix 3: Public advice and dispute management
171 Appendix 4: Legal services expenditure
173 Appendix 5: Strategic litigation
177 Appendix 6: Debt management
179 Appendix 7: Compensation statistics
180 Appendix 8: Service commitments and activities
185 Appendix 9: Advertising, direct mail, media placement and market research
188 Appendix 10: Use of access powers
189 Appendix 11: Information provided to law enforcement agencies
195 Appendix 12: Corrections
198 Reference material

06 Commissioner of Taxation annual report 2018–19
164
Appendix 1: Laws conferring powers on the Commissioner
The Commissioner of Taxation has responsibilities under a wide range of laws. The main tax and superannuation laws conferring powers or functions on the Commissioner in 2018–19 are:
� A New Tax System (Australian Business Number) Act 1999 � A New Tax System (Goods and Services Tax) Act 1999 � A New Tax System (Luxury Car Tax) Act 1999 � A New Tax System (Wine Equalisation Tax) Act 1999 � Commonwealth Places Windfall Tax (Collection) Act 1998 � Excise Act 1901 � Excise Tariff Act 1921 � Foreign Acquisitions and Takeovers Act 1975 � Fringe Benefits Tax Assessment Act 1986 � Fuel Tax Act 2006 � Higher Education Support Act 2003 � Income Tax Assessment Act 1936 � Income Tax Assessment Act 1997 � International Tax Agreements Act 1953 � Petroleum Excise (Prices) Act 1987 � Petroleum Resource Rent Tax Assessment Act 1987 � Product Grants and Benefits Administration Act 2000 � Product Stewardship (Oil) Act 2000 � Register of Foreign Ownership of Water or Agricultural Land Act 2015 � Small Superannuation Accounts Act 1995 � Superannuation Contributions Tax (Assessment and Collection) Act 1997 � Superannuation Contributions Tax (Members of Constitutionally Protected Superannuation
Funds) Assessment and Collection Act 1997 � Superannuation (Government Co-contribution for Low Income Earners) Act 2003 � Superannuation Guarantee (Administration) Act 1992 � Superannuation Industry (Supervision) Act 1993 � Superannuation (Self-managed Superannuation Funds) Taxation Act 1987 � Superannuation (Unclaimed Money and Lost Members) Act 1999 � Taxation Administration Act 1953 � Taxation (Interest on Overpayments and Early Payments) Act 1983 � Trust Recoupment Tax Assessment Act 1985.

06AppendixesAppendix 2: Taxpayers’ Charter – our performance
165
Appendix 2: Taxpayers’ Charter – our performance
The Taxpayers’ Charter outlines your rights and obligations. It explains what you can expect from us in administering the tax and superannuation systems. We are committed to following it in all our dealings with you. The following table shows how we performed against the commitments we make in our Taxpayers’ Charter, as measured by our Client and Community Confidence survey results and other data we hold.
The Client and Community Confidence survey was introduced in 2018–19, with the results below representing the baseline for measuring our performance against the Taxpayers’ Charter in future years. Our performance against the Taxpayers’ Charter in 2018–19 can be considered as satisfactory with scope for improvement with client and community perceptions. The survey results below are components of the ATO’s community confidence index which was 65/100 for 2018–19. For more information see page 28.
TABLE 6.1 Our performance against the Taxpayers’ Charter, 2018–19
Charter element How we measure this element(a) 2018–19 result(b)
Fair and reasonable: We treat you fairly and reasonably
Trustworthy: The ATO makes unbiased decisions. 65/100
Honest: We treat you as being honest unless you act otherwise
The ATO administers a self-assessment tax and superannuation system, adopting a risk-based approach to undertaking compliance activities. We treat taxpayers as being honest by default, and look more deeply where risk indicators are flagged. We look at the balance between self-assessment and compliance.
96% of total net tax collections arose through voluntary compliance
4% of total net tax collections arose through our compliance activities
Professional service and assistance: We offer you professional service and assistance
Timely: Any ATO services you want to use would be available at a convenient time that suits you.
Conscientious: The ATO takes care to think through your circumstances.
64/100
61/100
Representation: We accept you can be represented by a person of your choice and get advice
We support taxpayers to self-prepare or use the services of tax professionals. The proportion of income tax returns lodged during 2018–19 by both tax agents and self-preparers demonstrates the importance of intermediaries in the system.
74% lodged by tax agents
26% lodged by self-preparers
Privacy: We respect your privacy
Secure: The ATO keeps your / your clients’ personal information secure. 73/100Confidentiality: We keep the
information we hold about you confidential
Information access: We give you access to information we hold about you
The ATO is committed to providing taxpayers with transparency and visibility of the data we hold about them – for example by: � pre-filling individuals’ salary, interest and dividend data
in their income tax returns � providing client correspondence lists in the tax agent
portal / online services for tax and BAS agents.
Almost 8 million individuals have linked to the ATO through myGov
Almost 40,000 tax agents and almost 19,000 BAS agents have registered to use these services

06 Commissioner of Taxation annual report 2018–19
166
TABLE 6.1 Our performance against the Taxpayers’ Charter, 2018–19 continued
Charter element How we measure this element 2018–19 result
Help: We help you to get things right
Helpful: The ATO is helpful if you need them. 68/100
Decisions: We explain the decisions we make about you
The ATO explains the reasons for our decisions as a matter of course. To demonstrate this, we provide outcomes of decisions for objections and private binding rulings.
Objections resolved 26,276
Private binding rulings 5,285
Your right to question: We respect your right to a review and/ or to make a complaint
The ATO respects and supports taxpayers in reviewing our decisions. To demonstrate this, our review/complaint framework includes: � the right to object to an ATO decision � a dedicated complaints phone line and web form � the opportunity for independent review by the
Inspector-General of Taxation and Taxation Ombudsman (IGTO).
Complaints lodged 19,826
Easy for you to comply: We make it easier for you to comply
Easy: The amount of effort required for me to meet my tax obligations is reasonable.
64/100
Accountability: We are accountable
The ATO is accountable to a range of stakeholders in our administration of the tax and superannuation systems. This includes the community, government and external scrutineers, such as the IGTO and the Australian National Audit Office (ANAO).
Our service commitment framework (see page 180) demonstrates our accountability.
NOTES(a) Some elements of the Taxpayers’ Charter are measured by results to questions in our Client and Community Confidence survey,
while other elements are measured by other data we collect, such as the number of objections or the percentage of lodgments.(b) Some results are presented as an index, based on one or more survey questions. An 11 point Likert scale (0 to 10) is used to capture
the responses and these responses are converted to a score between 0 and 100 to create an index score out of 100.

06AppendixesAppendix 3: Public advice and dispute management
167
Appendix 3: Public advice and dispute management
The following tables provide statistics on how the ATO assists people to understand their tax and superannuation obligations, and how we work with people who disagree with our assessments.
Public adviceThe ATO provides advice in public rulings and a range of other product types as shown in table 6.2. Timeliness of our public advice is presented in table 6.3 (for public rulings).
TABLE 6.2 Key public advice and guidance products, 2016–17 to 2018–19
Product 2016–17 2017–18 2018–19
Total public rulings (including significant addenda)(a) 73 64 54
Practical compliance guidelines (including significant updates)(b) 20 13 20
Taxpayer alerts 11 1 4
Decision impact statements 11 10 7
Synthesised texts of the Multilateral Instrument and Australian tax treaties na na 6
NOTES(a) Includes both draft and final rulings, excludes class and product rulings.(b) Includes both draft and final guidelines.
TABLE 6.3 Timeliness(a) of draft public rulings finalised, 2018–19
Product Number 0–6 months 7–12 months Over 12 months
Taxation rulings and determinations(b) 10 3 5 2
Law companion rulings 6 4 1 1
Annual rulings 9 All published within tax time
requirements
All published within tax time
requirements
All published within tax time
requirements
NOTES(a) Timeliness refers to the time taken to finalise following the end of the public consultation period.(b) Excludes class and product rulings.

06 Commissioner of Taxation annual report 2018–19
168
TABLE 6.4 Business, partner and government interactions, 2016–17 to 2018–19
Activity 2016–17 2017–18 2018–19
Effectiveness of public advice issued. In particular, in 2018–19, responses showed: � steady results generally – indicating
that our public advice and guidance is continuing to meet the needs of our clients
� a marked improvement in clients reporting that they were able to find the guidance they needed.
The external survey results are positive overall. The perceptions of our public advice and guidance improved in nearly all areas compared with 2015–16.
The external survey results are positive overall, showing that our public advice and guidance is meeting the needs of our clients.
Responses for 2018–19 indicate overall a similar level of satisfaction to that reported for 2017–18, with a marked improvement in the ability of our clients to find the guidance they needed.
Dispute managementTable 6.5 presents information on the numbers and types of our dispute cases.
TABLE 6.5 Disputes, 2016–17 to 2018–19
Cases 2016–17 2017–18 2018–19
Returns lodged 35,540,854 36,572,123 37,628,879
Adjustments arising from audits 253,000 361,107 530,508(a)
Disputed cases resolved � objections(b) 24,490 24,350 26,276 � settlements 648 673 635 � litigations 437(c) 326 314 � independent reviews 12 16 13
Cases lodged to courts/tribunals 456 478 441
Cases resolved prior to court hearing 296 224 212
Cases proceeded to decision 141 102 102
Objections to new Part IVC litigation matters(d) 15.1 per thousand 15.8 per thousand 14.1 per thousand
Number of test case litigations finalised 2 5 7
NOTES(a) Increased use of advanced analytics and automation has led to increased review and audit activities for individuals not in business.(b) The increase in objections can in part be attributed to taxpayers objecting to their own self-assessments.(c) Previously published in the 2016–17 annual report as 408.(d) Previously reported as the proportion of objections that result in litigation.
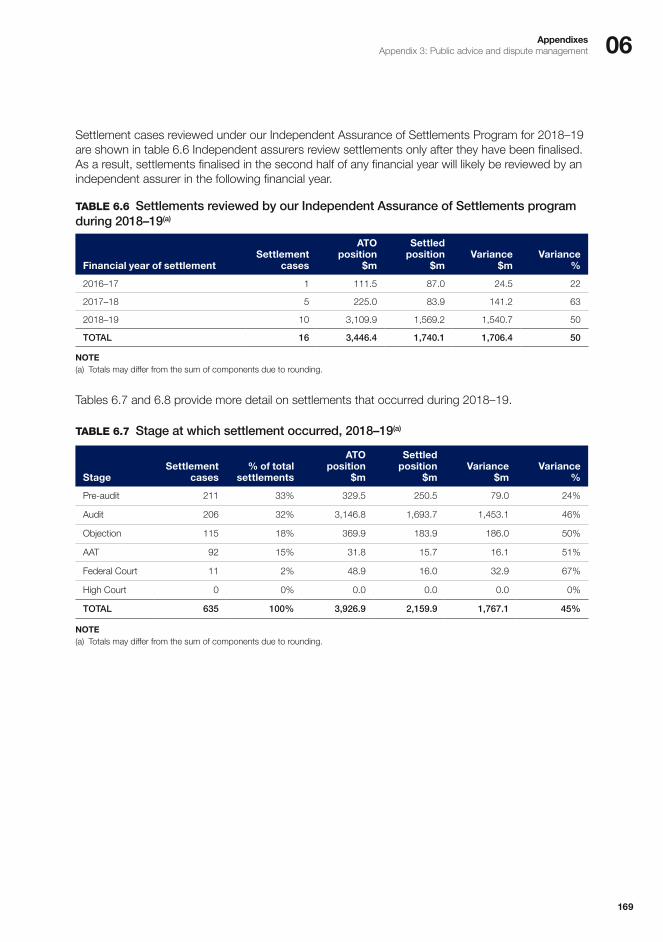
06AppendixesAppendix 3: Public advice and dispute management
169
Settlement cases reviewed under our Independent Assurance of Settlements Program for 2018–19 are shown in table 6.6 Independent assurers review settlements only after they have been finalised. As a result, settlements finalised in the second half of any financial year will likely be reviewed by an independent assurer in the following financial year.
TABLE 6.6 Settlements reviewed by our Independent Assurance of Settlements program during 2018–19(a)
Financial year of settlementSettlement
cases
ATO position
$m
Settled position
$mVariance
$mVariance
%
2016–17 1 111.5 87.0 24.5 22
2017–18 5 225.0 83.9 141.2 63
2018–19 10 3,109.9 1,569.2 1,540.7 50
TOTAL 16 3,446.4 1,740.1 1,706.4 50
NOTE(a) Totals may differ from the sum of components due to rounding.
Tables 6.7 and 6.8 provide more detail on settlements that occurred during 2018–19.
TABLE 6.7 Stage at which settlement occurred, 2018–19(a)
StageSettlement
cases% of total
settlements
ATO position
$m
Settled position
$mVariance
$mVariance
%
Pre-audit 211 33% 329.5 250.5 79.0 24%
Audit 206 32% 3,146.8 1,693.7 1,453.1 46%
Objection 115 18% 369.9 183.9 186.0 50%
AAT 92 15% 31.8 15.7 16.1 51%
Federal Court 11 2% 48.9 16.0 32.9 67%
High Court 0 0% 0.0 0.0 0.0 0%
TOTAL 635 100% 3,926.9 2,159.9 1,767.1 45%
NOTE(a) Totals may differ from the sum of components due to rounding.
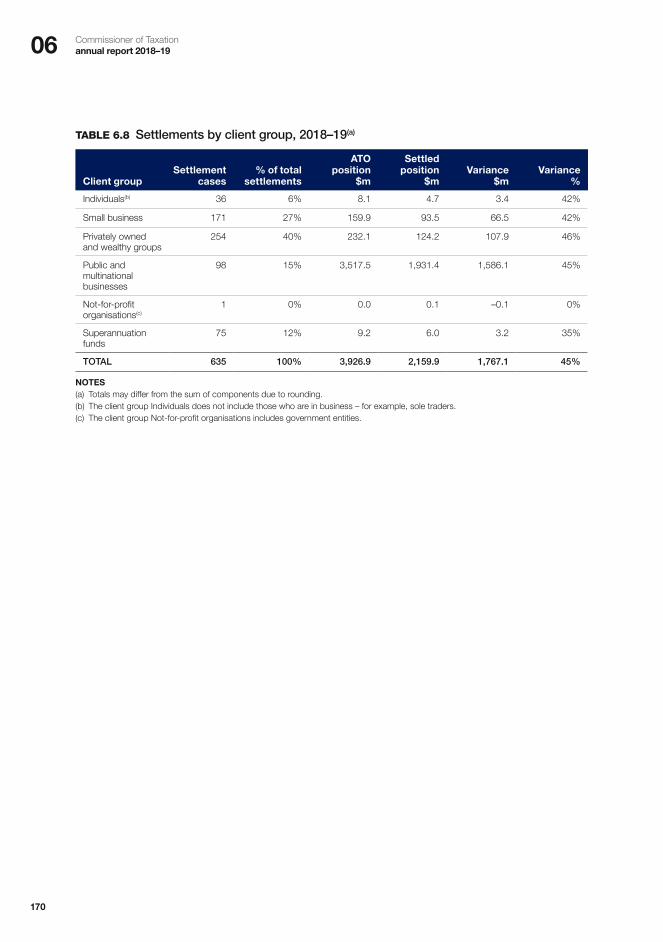
06 Commissioner of Taxation annual report 2018–19
170
TABLE 6.8 Settlements by client group, 2018–19(a)
Client groupSettlement
cases% of total
settlements
ATO position
$m
Settled position
$mVariance
$mVariance
%
Individuals(b) 36 6% 8.1 4.7 3.4 42%
Small business 171 27% 159.9 93.5 66.5 42%
Privately owned and wealthy groups
254 40% 232.1 124.2 107.9 46%
Public and multinational businesses
98 15% 3,517.5 1,931.4 1,586.1 45%
Not-for-profit organisations(c)
1 0% 0.0 0.1 –0.1 0%
Superannuation funds
75 12% 9.2 6.0 3.2 35%
TOTAL 635 100% 3,926.9 2,159.9 1,767.1 45%
NOTES(a) Totals may differ from the sum of components due to rounding.(b) The client group Individuals does not include those who are in business – for example, sole traders.(c) The client group Not-for-profit organisations includes government entities.

06AppendixesAppendix 4: Legal services expenditure
171
Appendix 4: Legal services expenditure
Our total legal expenditure for 2018–19 increased by $6.4 million (or 7%) when compared to the previous year, with the largest increase seen in the cost of briefs to counsel and other professional fees paid. This was primarily due to increased volume and complexity of cases including from the Tax Avoidance Taskforce and other compliance activities. The increase in expenditure is attributed to a rise in demand for external counsel and professional legal services, to enable the effective administration of matters which involve wide-ranging compliance issues from across the organisation.
TABLE 6.9 Legal services expenditure, 2018–19(a)(b)
Type of expenditure $
Total costs recovered(c) 3,967,365
Briefs to counsel 15,697,118
Briefs for Independent Assurance of Settlements work 392,033
Disbursements (excluding counsel) 25,807,326
Professional fees paid 24,351,865
External legal services expenditure(d) 66,248,343
Internal legal services expenditure(e) 28,757,065
Total (external and internal) expenditure 95,005,408
NOTES(a) Includes Tax Practitioners Board (TPB) legal costs for 2018–19. Total TBP external legal services expenditure was $410,671.
Total internal legal services expenditure for TPB was $2,551,184.(b) External expenditure in this table excludes GST.(c) This figure represents the current year’s costs recovered ($8,431,040), minus certain accrued costs which were reversed ($4,463,675)
as not recoverable as at 30 June 2019.(d) Excludes costs awarded against the ATO, costs for settlements, expenditure on compensation, and legal costs attributable to the
ATO’s test case program.(e) ATO internal legal officers manage tax litigation (under Part IVC of the Taxation Administration Act 1953), debt litigation, general legal
advice and freedom of information. This amount consists of the cost of labour and expenses for those activities. Some ATO employees perform functions with some characteristics of legal work (for example, preparation of writs, statutory demands and bankruptcy notices) and provide interpretative advice on complex areas of tax and superannuation law. These activities are not undertaken by legal officers and are therefore not included in this amount.notices) and provide interpretative advice on complex areas of tax and superannuation law. These activities are not undertaken by legal officers and are therefore not included in this amount.

06 Commissioner of Taxation annual report 2018–19
172
TABLE 6.10 Number and value of briefs to counsel, 2018–19(a)
Type of brief NumberValue
$
Direct briefs to male senior counsel 198 2,665,254
Direct briefs to female senior counsel 75 1,055,985
Indirect briefs to male senior counsel 252 4,837,834
Indirect briefs to female senior counsel 110 2,419,339
Total senior 635 10,978,413
Direct briefs to male junior counsel 112 1,019,773
Direct briefs to female junior counsel 80 565,998
Indirect briefs to male junior counsel 134 2,496,357
Indirect briefs to female junior counsel 85 1,028,610
Total junior 411 5,110,738
Total 1,046 16,089,151
NOTE(a) ‘Direct’ briefs cover counsel briefed directly by the ATO and who work with our in-house litigators and/or business areas.
‘Indirect’ briefs are counsel briefed by the ATO’s external legal providers acting on behalf of the ATO.
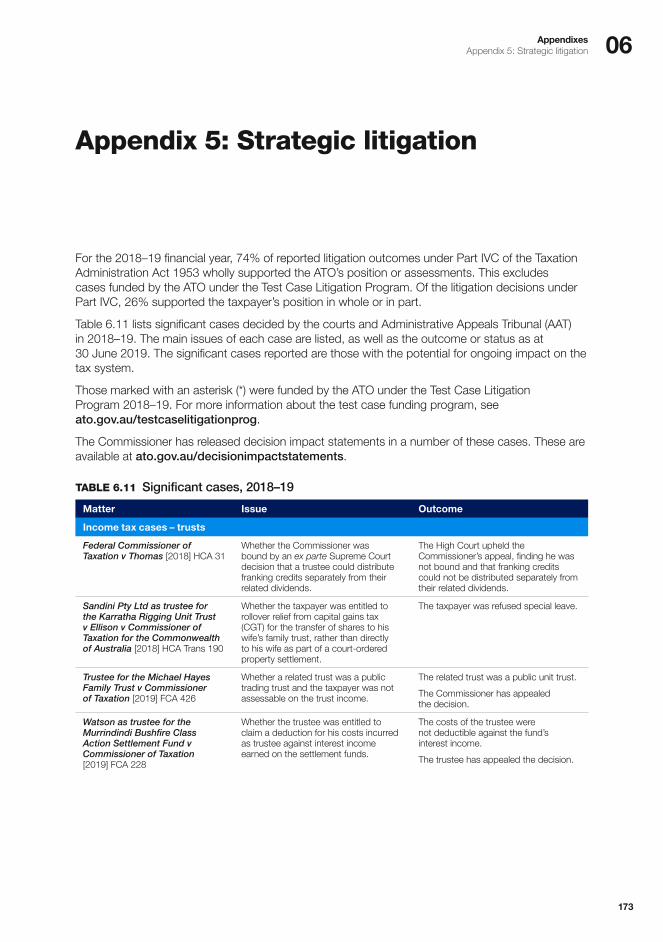
06AppendixesAppendix 5: Strategic litigation
173
Appendix 5: Strategic litigation
For the 2018–19 financial year, 74% of reported litigation outcomes under Part IVC of the Taxation Administration Act 1953 wholly supported the ATO’s position or assessments. This excludes cases funded by the ATO under the Test Case Litigation Program. Of the litigation decisions under Part IVC, 26% supported the taxpayer’s position in whole or in part.
Table 6.11 lists significant cases decided by the courts and Administrative Appeals Tribunal (AAT) in 2018–19. The main issues of each case are listed, as well as the outcome or status as at 30 June 2019. The significant cases reported are those with the potential for ongoing impact on the tax system.
Those marked with an asterisk (*) were funded by the ATO under the Test Case Litigation Program 2018–19. For more information about the test case funding program, see ato.gov.au/testcaselitigationprog.
The Commissioner has released decision impact statements in a number of these cases. These are available at ato.gov.au/decisionimpactstatements.
TABLE 6.11 Significant cases, 2018–19
Matter Issue Outcome
Income tax cases – trusts
Federal Commissioner of Taxation v Thomas [2018] HCA 31
Whether the Commissioner was bound by an ex parte Supreme Court decision that a trustee could distribute franking credits separately from their related dividends.
The High Court upheld the Commissioner’s appeal, finding he was not bound and that franking credits could not be distributed separately from their related dividends.
Sandini Pty Ltd as trustee for the Karratha Rigging Unit Trust v Ellison v Commissioner of Taxation for the Commonwealth of Australia [2018] HCA Trans 190
Whether the taxpayer was entitled to rollover relief from capital gains tax (CGT) for the transfer of shares to his wife’s family trust, rather than directly to his wife as part of a court-ordered property settlement.
The taxpayer was refused special leave.
Trustee for the Michael Hayes Family Trust v Commissioner of Taxation [2019] FCA 426
Whether a related trust was a public trading trust and the taxpayer was not assessable on the trust income.
The related trust was a public unit trust.
The Commissioner has appealed the decision.
Watson as trustee for the Murrindindi Bushfire Class Action Settlement Fund v Commissioner of Taxation [2019] FCA 228
Whether the trustee was entitled to claim a deduction for his costs incurred as trustee against interest income earned on the settlement funds.
The costs of the trustee were not deductible against the fund’s interest income.
The trustee has appealed the decision.

06 Commissioner of Taxation annual report 2018–19
174
TABLE 6.11 Significant cases, 2018–19 continued
Matter Issue Outcome
Income tax cases – other
Commissioner of Taxation v BHP Billiton Ltd [2019] FCAFC 4
Whether the taxpayer was sufficiently influenced by associates and was liable to pay additional tax on tainted sales income under the controlled foreign corporation (CFC) rules.
The Full Court upheld the Commissioner’s appeal, finding the taxpayer was an associate and was sufficiently influenced such that it was subject to the CFC rules.
The High Court has granted BHP special leave to appeal the decision.
Commissioner of Taxation v Resource Capital Fund IV LP [2019] FCAFC 51
Whether it is the partnerships, or the partners individually, who are assessable for gains made on Australian share trading by Cayman Islands partnerships, and the application of tax treaty benefits to those gains.
The Full Court found that the taxpayers were assessable individually and were entitled to relief from tax under the double-tax treaty with the USA.
The taxpayers have applied for special leave to appeal the decision.
*Commissioner of Taxation v Sharpcan Pty Ltd [2018] FCAFC 163
Whether the taxpayer’s expenditure to purchase gaming machine entitlements is deductible as a revenue rather than capital expense.
The Full Court found that the expenses were deductible on revenue account.
The Commissioner has been granted special leave to appeal the decision.
EE&C Pty Ltd as trustee for the Tarcisio Cremasco Family Trust and Commissioner of Taxation [2018] AATA 4093
Whether the taxpayer was able to ‘reopen’ a settlement deed years later by lodging objections for the years that were the subject of the settlement.
The taxpayer waived any right it might otherwise have had to object to the relevant assessments by entering the settlement.
The taxpayer has appealed the decision.
Eichmann and Commissioner of Taxation [2019] AATA 162
Whether land used in storing business assets was an active asset enlivening CGT concessions.
The tribunal held the land was an active asset.
The Commissioner has appealed the decision.
*Harding v Commissioner of Taxation [2019] FCAFC 29
Whether the taxpayer was not a resident of Australia as living in temporary accommodation in Bahrain constituted a ‘permanent place of abode’ under the domicile test.
Place of abode refers to a country, not a taxpayer’s accommodation arrangements. The taxpayer was not a resident of Australia as Bahrain was his permanent place of abode.
The Commissioner has applied for special leave to appeal the decision.
Mingos v Commissioner of Taxation [2019] FCA 834
Whether the main residence exemption from CGT is available for a property held in a trust.
The taxpayer was not entitled to the exemption.
The taxpayer has appealed the decision.
Satyam Computer Services Limits v Commissioner of Taxation [2018] FCAFC 172
Whether payments received by the applicant from its Australian clients are assessable, where they are royalties for the purposes of the tax treaty, but not under Australian domestic tax law.
The Full Court found the payments were Australian sourced and assessable income.
The taxpayer has been refused special leave to appeal the decision.
Victoria Power Networks Pty Ltd v Commissioner of Taxation [2019] FCA 77
Whether the taxpayer was assessable on customer contributions towards power connections, and on the construction value of transferred assets.
The Federal Court upheld the Commissioner’s decision.
The taxpayer has appealed the decision.

06AppendixesAppendix 5: Strategic litigation
175
TABLE 6.11 Significant cases, 2018–19 continued
Matter Issue Outcome
Taxation administration cases
Aussiegolfa Pty Ltd (Trustee) v Commissioner of Taxation [2018] FCAFC 122
Whether a property purchased by a self-managed super fund through a managed investment scheme was an in-house asset.
The Full Federal Court found the investment breached the in-house asset rule but not the sole purpose test.
BlueScope Steel (AIS) Pty Ltd v The Australian Workers’ Union [2019] FCAFC 84
The Commissioner intervened in this proceeding on the issue of the meaning of ‘ordinary times earnings’ for superannuation purposes, which is expressed in Superannuation Guarantee Ruling SGR 2009/2.
The Full Court agreed with the Commissioner’s construction of ‘ordinary times earnings’.
Commissioner of Taxation v ACN 154 520 199 Pty Ltd (in liq) (formerly EBS & Associates Pty Ltd) [2018] FCA 1140
Whether the Tribunal was able to direct that the Commissioner produce copies of his internal legal advices in relation to the taxpayer.
The Federal Court found it was not open to the Tribunal to direct the Commissioner to produce his legal advices.
*Commissioner of Taxation v Tomaras [2018] HCA 62
Whether, in matrimonial property proceedings, the Family Court has the power under section 90AE of the Family Law Act 1975 to order that one spouse be substituted as taxpayer for the tax liability of the other spouse.
The High Court allowed the appeal, finding the Family Court could make an order under section 90AE for a tax liability, but said it would only seldom, if ever, be appropriate for such an order to be made.
*Comptroller General of Customs v Zappia [2018] HCA 54
Whether an employed manager of a bonded warehouse is liable to a penalty for a failure to safely keep dutiable goods in his possession or control.
The High Court found an employed manager can be liable to the penalty.
Deputy Commissioner of Taxation v Buzadzic [2019] VSC 141
Whether the conclusive evidence provisions prevent a Supreme Court from looking behind an assessment in recovery proceedings.
The Supreme Court of Victoria declined to grant summary judgment on the basis that it was a matter for trial whether the court was entitled to look behind the assessment, despite the reliance on conclusive evidence.
The Commissioner has appealed the decision.
Fyna Projects Pty Ltd v Deputy Commissioner of Taxation [2018] FCA 2041
Whether failure to comply with a garnishee notice gives rise to a tax-related liability which can be the subject of a further garnishee notice.
The Federal Court found that the pecuniary penalty for non-compliance with a garnishee notice is not itself a tax-related liability that can ground a further garnishee notice.
Iannuzzi v Commissioner of Taxation [2019] FCAFC 39
Whether Mr Iannuzzi, a liquidator, should have leave to appeal the interlocutory decision that the Commissioner could use documents obtained through information gathering powers in its action for an inquiry into the conduct of the liquidator.
The Full Court refused to grant leave to appeal.
Linfox Australia Pty Ltd and Commissioner of Taxation [2019] AATA 222
Whether fuel used to run cabin air conditioning and to travel on toll roads is fuel used for ‘travelling on a public road’ for fuel tax purposes; and if so, whether Linfox was out of time to apply for fuel tax credits.
The Administrative Appeals Tribunal found that the fuel was used for travelling on a public road, but found that if Linfox had succeeded it would not have been out of time to apply for a fuel tax credit.
Linfox has appealed the decision, and the Commissioner has filed a notice of contention on the time limit issue.

06 Commissioner of Taxation annual report 2018–19
176
TABLE 6.11 Significant cases, 2018–19 continued
Matter Issue Outcome
Pintarich v Commissioner of Taxation [2018] HCASL 322
Whether the taxpayer should be granted special leave to argue that a payment arrangement letter constituted a deemed decision to remit general interest charges.
The taxpayer was refused special leave.
*Racing Queensland Board v Commissioner of Taxation [2019] FCA 509
Whether the Board is liable to pay superannuation guarantee shortfalls relating to riding fees paid to jockeys who rode in its races.
The Federal Court found that the Board is not liable to pay superannuation for the jockeys.
The Commissioner has appealed the decision.
*Scone Race Club Ltd v Commissioner of Taxation [2019] FCA 976
Whether the Club is liable to pay superannuation guarantee shortfalls relating to riding fees paid to jockeys who rode in its races.
The Federal Court found that the club is not liable to pay superannuation for the jockeys.
The Commissioner has appealed the decision.
The Bell Group Limited v Australian Securities and Investments Commission (No 2) [2018] FCA 1970
Whether deregistered companies should be retrospectively reinstated to enable them to form part of a tax consolidated group so related entities could obtain a tax benefit.
The Federal Court ordered the companies be retrospectively reinstated.
The Commissioner has appealed the decision.
Travelex Limited v Commissioner of Taxation [2018] FCA 1051
Whether delayed refund interest is payable from the date of the original or amended activity statement.
Interest is payable from the original activity statement lodgment, as there is no legislative entitlement to amend an activity statement.
The Commissioner has appealed the decision.

06AppendixesAppendix 6: Debt management
177
Appendix 6: Debt management
The following tables show statistics around debt holdings and debt not pursued.
Small businesses continue to account for the majority of collectable debt and are a key focus of our payment and debt strategies. We recognise that small businesses may occasionally experience short-term cash flow issues that prevent them paying on time. To assist, we offer payment plans tailored to their individual circumstances. In 2018–19 we granted over 800,000 payment plans to small businesses to help them get back on track.
TABLE 6.12 Value of debt holdings by client experience, 2016–17 to 2018–19(a)
Activity 2016–17 2017–18 2018–19
Value of debt holdings:
� Individuals — collectable debt $2.3b $2.7b $2.9b — debt subject to objection or appeal $0.3b $0.2b $0.2b — insolvency debt $0.5b $0.4b $0.4b
� Small business — collectable debt $13.9b $15.1b $16.5b — debt subject to objection or appeal $1.8b $1.0b $1.4b — insolvency debt $4.0b $3.7b $3.9b
� Privately owned and wealthy groups — collectable debt $3.8b $5.0b $5.6b — debt subject to objection or appeal $1.2b $3.0b $3.4b — insolvency debt $2.4b $2.6b $2.8b
� Public and multinational businesses — collectable debt $0.7b $0.7b $1.1b — debt subject to objection or appeal $4.7b $5.5b $6.3b — insolvency debt $0.3b $0.3b $0.4b
� Not-for-profit organisations — collectable debt $0.1b $0.1b $0.2b — debt subject to objection or appeal $0.0b $0.0b $0.0b — insolvency debt $0.0b $0.0b $0.0b
� Self-managed super funds — collectable debt $0.1b $0.1b $0.2b — debt subject to objection or appeal $0.1b $0.1b $0.0b — insolvency debt $0.0b $0.0b $0.0b
� Superannuation funds — collectable debt $0.0b $0.1b $0.1b — debt subject to objection or appeal $0.0b $0.0b $0.0b — insolvency debt $0.0b $0.0b $0.0b
NOTE(a) The sum of collectable debt, debt subject to objection, review or appeal under Part IVC of the Taxation Administration Act 1953 (TAA)
and insolvency debt in this table will vary from the ‘value of debt holdings by main revenue type’ table as only the main revenue types are included there.

06 Commissioner of Taxation annual report 2018–19
178
The proportion of debt accounted for by activity statement debt, income tax debt and superannuation guarantee charge debt is reasonably consistent over time.
TABLE 6.13 Value of debt holdings by main revenue type, 2016–17 to 2018–19(a)
Activity 2016–17 2017–18 2018–19
Value of debt holdings:
� Activity statement — collectable debt $11.3b $12.3b $14.3b — debt subject to objection or appeal $0.6b $0.8b $0.9b — insolvency debt $4.3b $4.1b $4.2b
� Income tax — collectable debt $8.8b $10.3b $10.8b — debt subject to objection or appeal $7.3b $8.6b $10.0b — insolvency debt $2.2b $2.0b $2.3b
� Superannuation guarantee charge — collectable debt $0.7b $0.9b $1.1b — debt subject to objection or appeal $0.0b $0.1b $0.1b — insolvency debt $0.7b $0.9b $1.0b
NOTE(a) The sum of collectable debt, debt subject to objection, review or appeal under Part IVC of the Taxation Administration Act 1953 (TAA)
and insolvency debt in this table will vary from the ‘value of debt holdings by client experience’ table as only the main revenue types are included here.
Determining that some debts are either uneconomical to pursue or irrecoverable at law helps ensure that we are focusing our collection activities on the right debts.
TABLE 6.14 Debt not pursued, 2016–17 to 2018–19(a)
Activity 2016–17 2017–18 2018–19
Value of debt: � uneconomical to pursue $1.4b $1.1b $1.4b � irrecoverable at law $2.5b $3.7b $2.8b
Ratio of debt uneconomical to pursue to ATO net cash collections 0.4% 0.3% 0.3%
NOTE(a) If a decision is made to not pursue a debt on the basis that it is uneconomical to do so, the debt can be pursued at a future time.
A debt that is irrecoverable at law is effectively extinguished.

06AppendixesAppendix 7: Compensation statistics
179
Appendix 7: Compensation statistics
The information below only relates to compensation under the Commonwealth’s Scheme for Compensation for Detriment caused by Defective Administration.
Under the Commonwealth’s Scheme for Compensation for Detriment caused by Defective Administration, compensation may be paid to an individual, company or other organisation that has experienced detriment as a result of our defective actions or inaction.
Payments under the scheme are discretionary. The information below provides details of claims made under the scheme in 2018–19.
Compensation claimsWe have internal service targets for processing compensation claims. In 2018–19, we aimed to process initial claims within 56 days. Some claims and internal reviews take longer to investigate; in those cases, we negotiate a time frame with applicants.
In 2018–19, we registered 182 compensation cases and finalised 167, with 79 resulting in compensation being offered. In one matter, 219 separate payments were made.
TABLE 6.15 Completion time frames of compensation claims, 2018–19
Claims 56 daysNegotiated time frame
Total within time
Number of claims 74 80 154
Compensation paymentsThe total amount of compensation payments made in 2018–19 was $2,271,135. The median payment was $193 and the average was $7,496.
While these statistics have been compiled from a number of data sources, all possible care has been taken to ensure consistency.

06 Commissioner of Taxation annual report 2018–19
180
Appendix 8: Service commitments and activities
The ATO reports on a range of service commitments and provides information about our activities that deliver outcomes for the community. Our annual results are provided in the following tables.
Service commitmentsOur service commitments are designed to assure the ATO and the community that the services we provide are of a consistent and high standard. Many of our commitments have targets, which are meaningful to our clients and challenge us to deliver the best possible service.
We regularly report on our service commitments. These are available at ato.gov.au.
We did not meet all of our targets, where applicable, for all service commitments in place at 30 June 2019.
TABLE 6.16 Commitments to service – Timely, 2017–18 and 2018–19
TargetAchieved 2017–18
Achieved 2018–19
Service commitment % % Indicator % Indicator
General calls over the tax time period, as at 31 October
– A total of 2,516,258 calls were answered, 133,816 abandoned (5% of calls offered) and 56,292 calls were blocked in 2018–19
answered within 5 minutes
80 83 87
Tax practitioner calls over the tax time period, as at 31 October – A total of 522,973 calls were answered,
9,687 abandoned (2% of calls offered) and zero calls were blocked in 2018–19
answered within 2 minutes
90 91 92
Electronic taxpayer requests finalised in 15 business days
90 92 92
Private rulings finalised in 28 calendar days of receiving all necessary information
80 88 88
Superannuation guarantee employee notifications
finalised within 4 months
60 68 51 X
Superannuation guarantee employee notifications
finalised within 9 months
90 99 99
Electronic tax returns and activity statements(a)
finalised in 12 business days
94 – – 99
Electronic amendments finalised in 20 business days
90 97 96

06AppendixesAppendix 8: Service commitments and activities
181
TABLE 6.16 Commitments to service – Timely, 2017–18 and 2018–19 continued
TargetAchieved 2017–18
Achieved 2018–19
Service commitment % % Indicator % Indicator
Paper tax returns, activity statements and amendments
finalised in 50 business days
80 – – 97
Australian residents’ ABR registrations finalised in 20 business days
93 99 99
Electronic Commissioner of Taxation registrations
finalised in 20 business days
93 94 96
Complaints received resolved in 15 business days or within the date negotiated with the client
85 90 88
= met X = not met– = Commitment is new, has not previously been reported in the annual report for the given years, or has not been reported using the same methodology.
NOTE(a) Target applies to current-year tax returns only.
TABLE 6.17 Commitments to service – Keep me informed, 2017–18 and 2018–19
TargetAchieved 2017–18
Achieved 2018–19
Service commitment % % Indicator % Indicator
Electronic tax returns(a)
(individuals not in business)inform if unable to finalise within 30 calendar days of receipt
100 100 100
Private rulings contact within 14 calendar days if request will take more than 28 calendar days to resolve
80 92 93
Superannuation guarantee employee notifications
notification commenced within 28 days of receipt
99 100 100
= met X = not met
NOTE(a) For 2017–18 and 2018–19, only successful notifications for tax agent clients are included.

06 Commissioner of Taxation annual report 2018–19
182
ActivitiesWe undertake a range of activities to support the delivery of the tax and superannuation systems. Outputs include information assistance services, processing and assurance activities, along with internal services for our staff.
TABLE 6.18 Activities and outputs – Information and assistance services, 2016–17 to 2018–19(a)
Activity 2016–17 2017–18 2018–19
Number of non-digital, inbound customer service interactions 11,652,688 11,004,282 9,996,161
Number provided of: � interpretative guidance products 45,000 55,048 51,584 � private rulings 7,300 6,459 5,285
Perceptions that the process was fair in(b): � disputes 56% 54% 49%
— individuals – – 49% — business – – 50%
� audits, advice or private rulings 66% 62% — individuals – – 61% — business – – 65%
Perceptions that the final decision was fair in: � disputes – – 57%
— individuals – – 57% — business – – 57%
� audits, advice or private rulings – – 62% — individuals – – 61% — business – – 64%
– = New, not previously reported in the annual report for the given years, or not previously reported using the same methodology.
NOTES(a) Some items reported for 2018–19 (such as Proportion of tax returns lodged electronically) relate to the 2017–18 tax year.(b) Survey methodology changes were implemented in 2017–18, with presented results reflecting outcomes for part of the 2017–18
financial year. Caution should be exercised in comparing trends across years.
TABLE 6.19 Activities and outputs – Obligations and entitlements processing, 2016–17 to 2018–19(a)
Activity 2016–17 2017–18 2018–19
Number of registrations processed 1.7m 1.8m 1.9m
Number of returns, statements and forms processed 97.9m 105.9m 334.0m
Proportion of taxpayers who lodge: � income tax returns 88.5% 88.8% 88.8% � activity statements 88.2% 88.9% 88.6%
Proportion of tax returns lodged electronically 96.3% 97.0% 97.3%
Number of payments processed 25.2m 27.0m 29.7m
Proportion of payments made and received through electronic channels
97.5% 98.2% 98.6%
NOTE(a) Some items reported for 2018–19 (such as Proportion of tax returns lodged electronically) relate to the 2017–18 tax year.

06AppendixesAppendix 8: Service commitments and activities
183
TABLE 6.20 Activities and outputs – Revenue assurance, 2016–17 to 2018–19(a)
Activity 2016–17 2017–18 2018–19
Number of refunds issued 13.0m 13.4m 13.6m
Number of compliance activities undertaken 3.1m 3.4m 4.3m
Number of international information exchanges(b)
� incoming 517 463 393 � outgoing 427 243 243
Value of tax collected: � gross $458.4b $498.9b $533.1b � net $359.3b $396.6b $426.0b
Value of refunds paid $99.1b $102.3b $107.2b
Value of compliance liabilities as a result of compliance audits, reviews and other checks: � raised $15.6b $16.9b $15.3b � collected $10.2b $11.8b $10.5b
Value of penalties and interest collected $3.6b $2.8b $2.2b
NOTES(a) Some items reported for 2018–19 (such as Proportion of tax returns lodged electronically) relate to the 2017–18 tax year.(b) Figures do not include automatic exchanges of information under agreements such as Country by Country reporting, Common
Reporting Standard and the Foreign Account Tax Compliance Act (FACTA). They do include spontaneous exchange of rulings.
TABLE 6.21 Activities and outputs – Securing retirement income, 2016–17 to 2018–19(a)
Activity 2016–17 2017–18 2018–19
Number of lost superannuation accounts(b) 628,658 579,722 674,190
Number of ATO-held superannuation accounts(c) 5.7m 5.7m 5.4m
Proportion of member contribution statements lodged on time(d) 98.9% 97% 97.1%
Number of excess contributions determinations issued(e) 80,384 84,453 197,578
Number of Division 293 tax assessments issued(f) 139,562 144,761 233,030
Proportion of excess contributions issued within 6 months of ATO receiving all relevant information
97.2% 99.4% 99.98%
Proportion of self-managed superannuation funds (SMSFs) with contraventions reported by approved SMSF auditors compared to the total number of SMSFs
1.4%(g) 1.5%(h) Less than 2%(i)
Value of lost superannuation accounts $14.1b $13.5b $16.5b
Value of ATO-held superannuation accounts(c) $3.8b $4.1b $4.0b
Value of excess contributions determinations issued $632.8m $734.6m $1.9b
Value of Division 293 tax assessments issued $512.0m $530.6m $730.7m
Proportion of super guarantee compliance casework consisting of ATO-initiated work
– – 40%
– = New, not previously reported in the annual report for the given years, or not previously reported using the same methodology.
NOTES(a) Some items reported for 2018–19 (such as Proportion of tax returns lodged electronically) relate to the 2017–18 tax year.(b) For 2018–19 funds transitioned their lost member reporting to event based reporting improving the accuracy and timeliness
of lost member account reporting. (c) ATO-held super accounts include unclaimed super money and Superannuation Holding Accounts special account.(d) Of those member contribution statements lodged by large APRA-regulated funds.(e) The increase reflects the lowering of the contributions caps on 1 July 2017. Determinations issued in the 2018–19 year primarily
relate to the 2017–18 year. (f) The increase reflects the lowering of the threshold for Division 293 tax from $300,000 to $250,000 on 1 July 2017.
Division 293 assessments issued in the 2018–19 financial year primarily relate to the 2017–18 year.(g) Relates to the contraventions reported for 2014–15 as at June 2017.(h) Relates to the contraventions reported for 2015–16 as at June 2018.(i) Relates to the contraventions reported for 2016–17 as at June 2019.
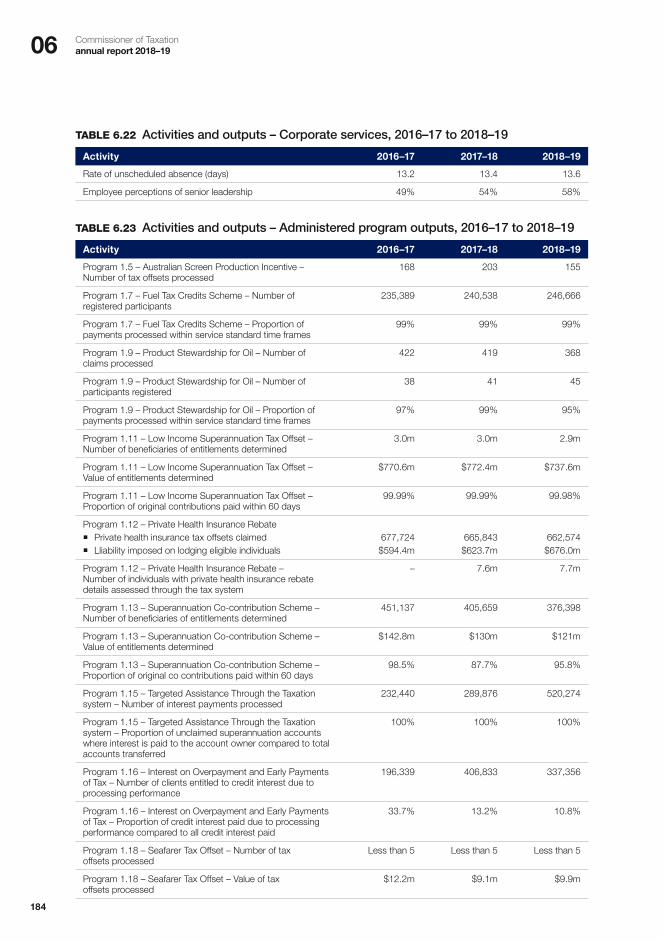
06 Commissioner of Taxation annual report 2018–19
184
TABLE 6.22 Activities and outputs – Corporate services, 2016–17 to 2018–19
Activity 2016–17 2017–18 2018–19
Rate of unscheduled absence (days) 13.2 13.4 13.6
Employee perceptions of senior leadership 49% 54% 58%
TABLE 6.23 Activities and outputs – Administered program outputs, 2016–17 to 2018–19
Activity 2016–17 2017–18 2018–19
Program 1.5 – Australian Screen Production Incentive – Number of tax offsets processed
168 203 155
Program 1.7 – Fuel Tax Credits Scheme – Number of registered participants
235,389 240,538 246,666
Program 1.7 – Fuel Tax Credits Scheme – Proportion of payments processed within service standard time frames
99% 99% 99%
Program 1.9 – Product Stewardship for Oil – Number of claims processed
422 419 368
Program 1.9 – Product Stewardship for Oil – Number of participants registered
38 41 45
Program 1.9 – Product Stewardship for Oil – Proportion of payments processed within service standard time frames
97% 99% 95%
Program 1.11 – Low Income Superannuation Tax Offset – Number of beneficiaries of entitlements determined
3.0m 3.0m 2.9m
Program 1.11 – Low Income Superannuation Tax Offset – Value of entitlements determined
$770.6m $772.4m $737.6m
Program 1.11 – Low Income Superannuation Tax Offset – Proportion of original contributions paid within 60 days
99.99% 99.99% 99.98%
Program 1.12 – Private Health Insurance Rebate � Private health insurance tax offsets claimed 677,724 665,843 662,574 � Lliability imposed on lodging eligible individuals $594.4m $623.7m $676.0m
Program 1.12 – Private Health Insurance Rebate – Number of individuals with private health insurance rebate details assessed through the tax system
– 7.6m 7.7m
Program 1.13 – Superannuation Co-contribution Scheme – Number of beneficiaries of entitlements determined
451,137 405,659 376,398
Program 1.13 – Superannuation Co-contribution Scheme – Value of entitlements determined
$142.8m $130m $121m
Program 1.13 – Superannuation Co-contribution Scheme – Proportion of original co contributions paid within 60 days
98.5% 87.7% 95.8%
Program 1.15 – Targeted Assistance Through the Taxation system – Number of interest payments processed
232,440 289,876 520,274
Program 1.15 – Targeted Assistance Through the Taxation system – Proportion of unclaimed superannuation accounts where interest is paid to the account owner compared to total accounts transferred
100% 100% 100%
Program 1.16 – Interest on Overpayment and Early Payments of Tax – Number of clients entitled to credit interest due to processing performance
196,339 406,833 337,356
Program 1.16 – Interest on Overpayment and Early Payments of Tax – Proportion of credit interest paid due to processing performance compared to all credit interest paid
33.7% 13.2% 10.8%
Program 1.18 – Seafarer Tax Offset – Number of tax offsets processed
Less than 5 Less than 5 Less than 5
Program 1.18 – Seafarer Tax Offset – Value of tax offsets processed
$12.2m $9.1m $9.9m

06AppendixesAppendix 9: Advertising, direct mail, media placement and market research
185
Appendix 9: Advertising, direct mail, media placement and market research
Advertising campaignsDuring 2018–19, the ATO conducted the advertising campaigns listed below. Further information on these advertising campaigns is available at ato.gov.au and in reports on Australian Government advertising prepared by the Department of Finance, available at finance.gov.au.
� Aggressive tax planning advertising campaign � Drought assistance advertising campaign � Extending the taxable payments reporting system advertising campaign � Government procurement advertising campaign � GST and BAS lodgment advertising campaign � GST and property development obligations advertising campaign � GST on property transactions advertising campaign � Identity protection advertising campaign � Illegal early release of super advertising campaign � Illicit tobacco advertising campaign � Income contingent loans advertising campaign � Is an SMSF right for you? advertising campaign � Lost super advertising campaign � Mobile strike teams advertising � Norfolk Island advertising � Overseas HELP/TSL debtors advertising campaign � Phoenix advertising campaign � Pop-up office advertising � Recruitment advertising � Re-engaging sub-contractors advertising campaign � Removing tax deductibility advertising campaign � SBS tax talk advertising campaign � Tax, Super + You competition advertising campaign � Vision Australia advertising campaign
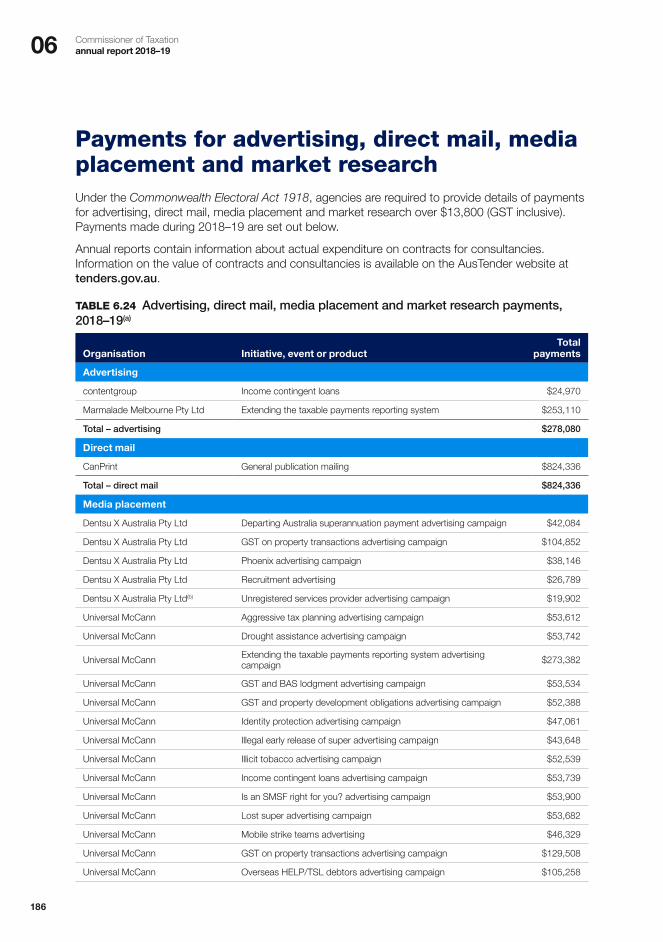
06 Commissioner of Taxation annual report 2018–19
186
Payments for advertising, direct mail, media placement and market researchUnder the Commonwealth Electoral Act 1918, agencies are required to provide details of payments for advertising, direct mail, media placement and market research over $13,800 (GST inclusive). Payments made during 2018–19 are set out below.
Annual reports contain information about actual expenditure on contracts for consultancies. Information on the value of contracts and consultancies is available on the AusTender website at tenders.gov.au.
TABLE 6.24 Advertising, direct mail, media placement and market research payments, 2018–19(a)
Organisation Initiative, event or productTotal
payments
Advertising
contentgroup Income contingent loans $24,970
Marmalade Melbourne Pty Ltd Extending the taxable payments reporting system $253,110
Total – advertising $278,080
Direct mail
CanPrint General publication mailing $824,336
Total – direct mail $824,336
Media placement
Dentsu X Australia Pty Ltd Departing Australia superannuation payment advertising campaign $42,084
Dentsu X Australia Pty Ltd GST on property transactions advertising campaign $104,852
Dentsu X Australia Pty Ltd Phoenix advertising campaign $38,146
Dentsu X Australia Pty Ltd Recruitment advertising $26,789
Dentsu X Australia Pty Ltd(b) Unregistered services provider advertising campaign $19,902
Universal McCann Aggressive tax planning advertising campaign $53,612
Universal McCann Drought assistance advertising campaign $53,742
Universal McCann Extending the taxable payments reporting system advertising campaign $273,382
Universal McCann GST and BAS lodgment advertising campaign $53,534
Universal McCann GST and property development obligations advertising campaign $52,388
Universal McCann Identity protection advertising campaign $47,061
Universal McCann Illegal early release of super advertising campaign $43,648
Universal McCann Illicit tobacco advertising campaign $52,539
Universal McCann Income contingent loans advertising campaign $53,739
Universal McCann Is an SMSF right for you? advertising campaign $53,900
Universal McCann Lost super advertising campaign $53,682
Universal McCann Mobile strike teams advertising $46,329
Universal McCann GST on property transactions advertising campaign $129,508
Universal McCann Overseas HELP/TSL debtors advertising campaign $105,258

06AppendixesAppendix 9: Advertising, direct mail, media placement and market research
187
TABLE 6.24 Advertising, direct mail, media placement and market research payments, 2018–19(a) continued
Organisation Initiative, event or productTotal
payments
Universal McCann Phoenix advertising campaign $109,521
Universal McCann Pop-up office advertising $25,859
Universal McCann Recruitment advertising $91,322
Universal McCann Re-engaging sub-contractors advertising campaign $53,899
Universal McCann Removing tax deductibility advertising campaign $42,600
Universal McCann Tax, super + you competition advertising campaign $39,999
Total – media placement $1,667,295
Market research
Bastion Latitude Extending the taxable payments reporting system $184,525
Bastion Latitude Information disadvantaged audience needs $225,885
Colmar Brunton Pty Ltd Small business black economy measurement framework $40,821
EY Sweeney Small business and superannuation research services $62,865
EY Sweeney Single Touch Payroll benchmarking and tracking $68,272
GFK Australia Pty Ltd(b) Tax Practitioners Board Online forms user research $153,318
Hall & Partners Pty Ltd Extending the taxable payments reporting system $66,427
Millward Brown Australia ATO Corporate Perceptions Survey $95,458
Orima Research Pty Ltd ATO Culture Pulse 2018–19 $33,700
Orima Research Pty Ltd Measuring community perceptions $313,194
Parisfirst Partners User research of tax time experience $74,400
Snapcracker research and strategy Single Touch Payroll concept testing $78,595
Taylor Nelson Sofres Pty Ltd GST voluntary compliance phase 8 $28,600
Taylor Nelson Sofres Pty Ltd Super guarantee research $99,550
Taylor Nelson Sofres Pty Ltd Youth education benchmarking research $88,000
Whereto Research Based Consulting
Client Experience Survey Suite data analysis and annual report $31,141
Total – market research $1,644,751
NOTES(a) For the purposes of section 311A of the Commonwealth Electoral Act 1918, the ATO does not undertake polling activity.(b) Relates to work undertaken on behalf of Tax Practitioners Board.
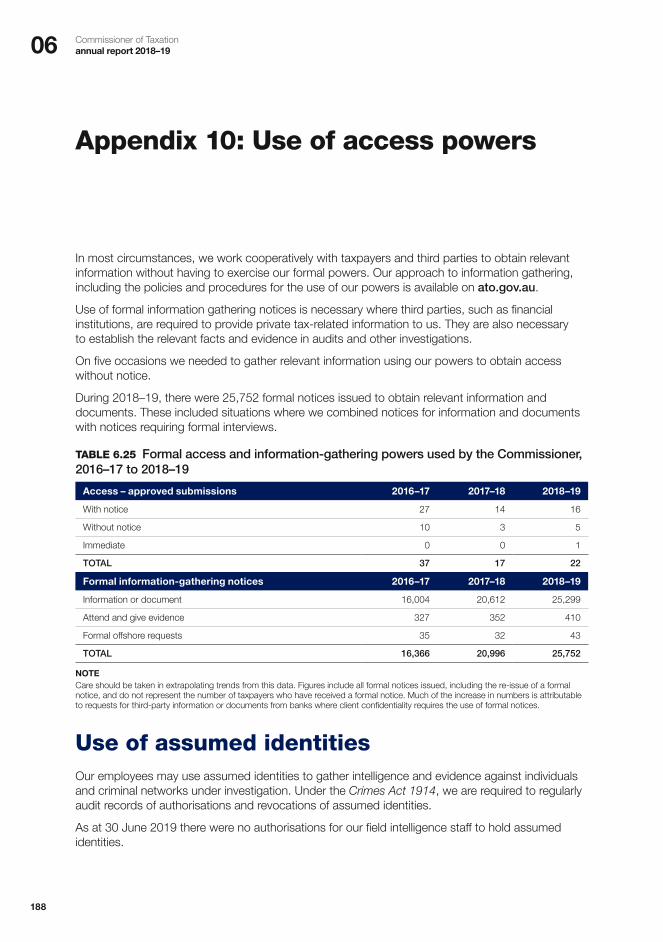
06 Commissioner of Taxation annual report 2018–19
188
Appendix 10: Use of access powers
In most circumstances, we work cooperatively with taxpayers and third parties to obtain relevant information without having to exercise our formal powers. Our approach to information gathering, including the policies and procedures for the use of our powers is available on ato.gov.au.
Use of formal information gathering notices is necessary where third parties, such as financial institutions, are required to provide private tax-related information to us. They are also necessary to establish the relevant facts and evidence in audits and other investigations.
On five occasions we needed to gather relevant information using our powers to obtain access without notice.
During 2018–19, there were 25,752 formal notices issued to obtain relevant information and documents. These included situations where we combined notices for information and documents with notices requiring formal interviews.
TABLE 6.25 Formal access and information-gathering powers used by the Commissioner, 2016–17 to 2018–19
Access – approved submissions 2016–17 2017–18 2018–19
With notice 27 14 16
Without notice 10 3 5
Immediate 0 0 1
TOTAL 37 17 22
Formal information-gathering notices 2016–17 2017–18 2018–19
Information or document 16,004 20,612 25,299
Attend and give evidence 327 352 410
Formal offshore requests 35 32 43
TOTAL 16,366 20,996 25,752
NOTECare should be taken in extrapolating trends from this data. Figures include all formal notices issued, including the re-issue of a formal notice, and do not represent the number of taxpayers who have received a formal notice. Much of the increase in numbers is attributable to requests for third-party information or documents from banks where client confidentiality requires the use of formal notices.
Use of assumed identitiesOur employees may use assumed identities to gather intelligence and evidence against individuals and criminal networks under investigation. Under the Crimes Act 1914, we are required to regularly audit records of authorisations and revocations of assumed identities.
As at 30 June 2019 there were no authorisations for our field intelligence staff to hold assumed identities.
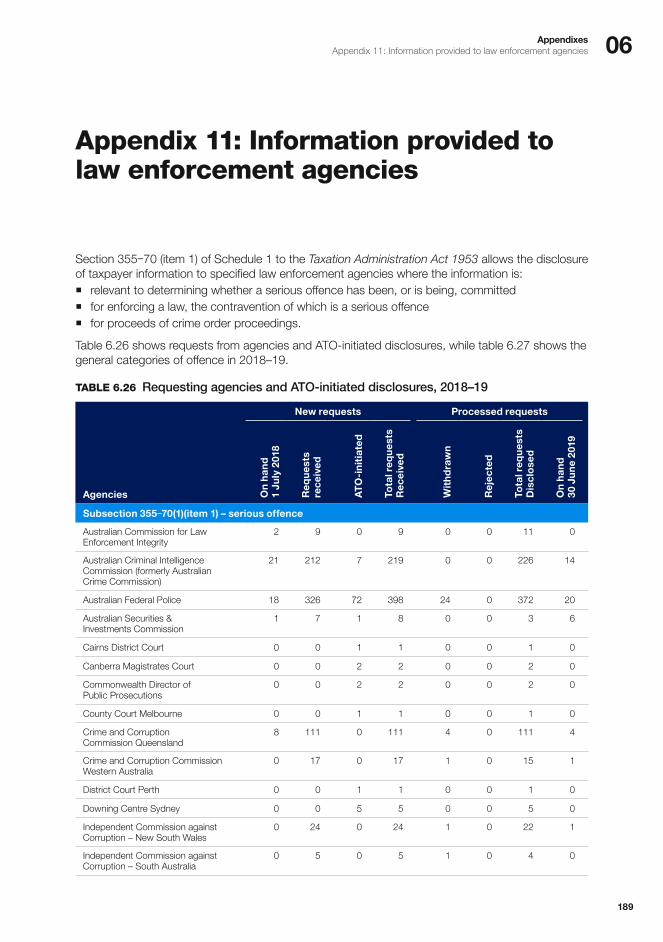
06AppendixesAppendix 11: Information provided to law enforcement agencies
189
Appendix 11: Information provided to law enforcement agencies
Section 355‑70 (item 1) of Schedule 1 to the Taxation Administration Act 1953 allows the disclosure of taxpayer information to specified law enforcement agencies where the information is: � relevant to determining whether a serious offence has been, or is being, committed � for enforcing a law, the contravention of which is a serious offence � for proceeds of crime order proceedings.
Table 6.26 shows requests from agencies and ATO-initiated disclosures, while table 6.27 shows the general categories of offence in 2018–19.
TABLE 6.26 Requesting agencies and ATO-initiated disclosures, 2018–19
New requests Processed requests
Agencies On
han
d
1 Ju
ly 2
018
Req
ues
ts
rece
ived
ATO
-in
itia
ted
Tota
l req
ues
ts
Rec
eive
d
Wit
hd
raw
n
Rej
ecte
d
Tota
l req
ues
ts
Dis
clo
sed
On
han
d
30 J
un
e 20
19
Subsection 355‑70(1)(item 1) – serious offence
Australian Commission for Law Enforcement Integrity
2 9 0 9 0 0 11 0
Australian Criminal Intelligence Commission (formerly Australian Crime Commission)
21 212 7 219 0 0 226 14
Australian Federal Police 18 326 72 398 24 0 372 20
Australian Securities & Investments Commission
1 7 1 8 0 0 3 6
Cairns District Court 0 0 1 1 0 0 1 0
Canberra Magistrates Court 0 0 2 2 0 0 2 0
Commonwealth Director of Public Prosecutions
0 0 2 2 0 0 2 0
County Court Melbourne 0 0 1 1 0 0 1 0
Crime and Corruption Commission Queensland
8 111 0 111 4 0 111 4
Crime and Corruption Commission Western Australia
0 17 0 17 1 0 15 1
District Court Perth 0 0 1 1 0 0 1 0
Downing Centre Sydney 0 0 5 5 0 0 5 0
Independent Commission against Corruption – New South Wales
0 24 0 24 1 0 22 1
Independent Commission against Corruption – South Australia
0 5 0 5 1 0 4 0
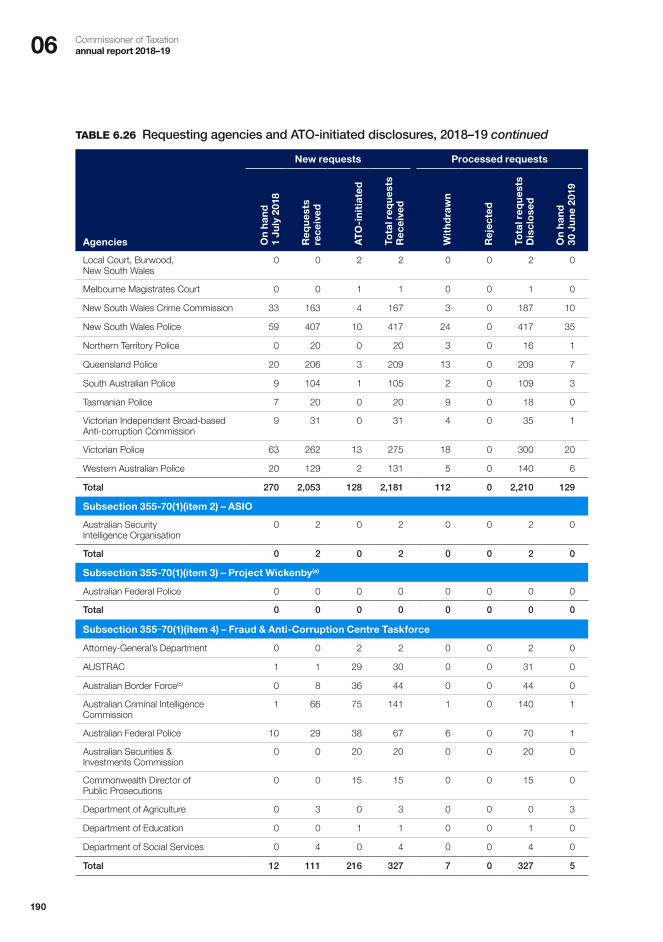
06 Commissioner of Taxation annual report 2018–19
190
TABLE 6.26 Requesting agencies and ATO-initiated disclosures, 2018–19 continued
New requests Processed requests
Agencies On
han
d
1 Ju
ly 2
018
Req
ues
ts
rece
ived
ATO
-in
itia
ted
Tota
l req
ues
ts
Rec
eive
d
Wit
hd
raw
n
Rej
ecte
d
Tota
l req
ues
ts
Dis
clo
sed
On
han
d
30 J
un
e 20
19
Local Court, Burwood, New South Wales
0 0 2 2 0 0 2 0
Melbourne Magistrates Court 0 0 1 1 0 0 1 0
New South Wales Crime Commission 33 163 4 167 3 0 187 10
New South Wales Police 59 407 10 417 24 0 417 35
Northern Territory Police 0 20 0 20 3 0 16 1
Queensland Police 20 206 3 209 13 0 209 7
South Australian Police 9 104 1 105 2 0 109 3
Tasmanian Police 7 20 0 20 9 0 18 0
Victorian Independent Broad-based Anti-corruption Commission
9 31 0 31 4 0 35 1
Victorian Police 63 262 13 275 18 0 300 20
Western Australian Police 20 129 2 131 5 0 140 6
Total 270 2,053 128 2,181 112 0 2,210 129
Subsection 355-70(1)(item 2) – ASIO
Australian Security Intelligence Organisation
0 2 0 2 0 0 2 0
Total 0 2 0 2 0 0 2 0
Subsection 355-70(1)(item 3) – Project Wickenby(a)
Australian Federal Police 0 0 0 0 0 0 0 0
Total 0 0 0 0 0 0 0 0
Subsection 355‑70(1)(item 4) – Fraud & Anti-Corruption Centre Taskforce
Attorney-General’s Department 0 0 2 2 0 0 2 0
AUSTRAC 1 1 29 30 0 0 31 0
Australian Border Force(b) 0 8 36 44 0 0 44 0
Australian Criminal Intelligence Commission
1 66 75 141 1 0 140 1
Australian Federal Police 10 29 38 67 6 0 70 1
Australian Securities & Investments Commission
0 0 20 20 0 0 20 0
Commonwealth Director of Public Prosecutions
0 0 15 15 0 0 15 0
Department of Agriculture 0 3 0 3 0 0 0 3
Department of Education 0 0 1 1 0 0 1 0
Department of Social Services 0 4 0 4 0 0 4 0
Total 12 111 216 327 7 0 327 5

06AppendixesAppendix 11: Information provided to law enforcement agencies
191
TABLE 6.26 Requesting agencies and ATO-initiated disclosures, 2018–19 continued
New requests Processed requests
Agencies On
han
d
1 Ju
ly 2
018
Req
ues
ts
rece
ived
ATO
-in
itia
ted
Tota
l req
ues
ts
Rec
eive
d
Wit
hd
raw
n
Rej
ecte
d
Tota
l req
ues
ts
Dis
clo
sed
On
han
d
30 J
un
e 20
19
Subsection 355‑70(1)(item 4) – Fusion Centre Taskforce
Australian Criminal Intelligence Commission
1 0 13 13 0 0 14 0
Total 1 0 13 13 0 0 14 0
Subsection 355-70(1)(item 4) – National Anti-Gang Taskforce
Australian Criminal Intelligence Commission
1 191 3 194 0 0 195 0
Australian Federal Police 13 903 40 943 3 0 950 3
Australian Gangs Intelligence Coordination Centre
0 0 3 3 0 0 3 0
Victorian Police 0 0 1 1 0 0 1 0
Total 14 1,094 47 1,141 3 0 1,149 3
Subsection 355-70(1)(item 4) – Phoenix Taskforce
AUSTRAC 1 1 53 54 0 0 55 0
Australian Border Force(b) 1 1 42 43 0 0 43 1
Australian Building and Construction Commission
0 0 32 32 0 0 32 0
Australian Competition and Consumer Commission
0 0 32 32 0 0 32 0
Australian Criminal Intelligence Commission
5 3 55 58 0 0 63 0
Australian Federal Police 0 0 8 8 0 0 8 0
Australian Finance Security Authority 0 0 39 39 0 0 39 0
Australian Securities Investments Commission
4 8 132 140 0 0 142 2
Clean Energy Regulator 0 0 32 32 0 0 32 0
Commissioner of State Revenue Office – VIC
0 0 1 1 0 0 1 0
Consumer Affairs Victoria 0 0 27 27 0 0 27 0
Department of Agriculture & Water Resources
0 0 1 1 0 0 1 0
Department of Environment 0 0 27 27 0 0 27 0
Department of Home Affairs 0 1 40 41 0 0 41 0
Department of Jobs and Small Business
3 2 73 75 0 0 77 1
Department of Treasury and Finance 0 0 2 2 0 0 2 0
Fair Work Ombudsman 1 1 45 46 0 0 46 1
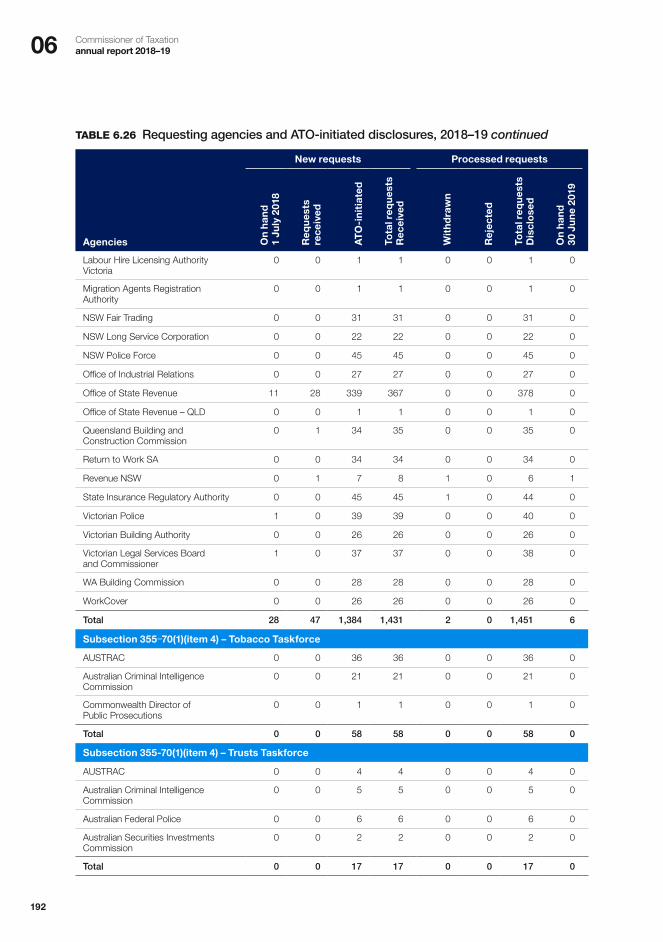
06 Commissioner of Taxation annual report 2018–19
192
TABLE 6.26 Requesting agencies and ATO-initiated disclosures, 2018–19 continued
New requests Processed requests
Agencies On
han
d
1 Ju
ly 2
018
Req
ues
ts
rece
ived
ATO
-in
itia
ted
Tota
l req
ues
ts
Rec
eive
d
Wit
hd
raw
n
Rej
ecte
d
Tota
l req
ues
ts
Dis
clo
sed
On
han
d
30 J
un
e 20
19
Labour Hire Licensing Authority Victoria
0 0 1 1 0 0 1 0
Migration Agents Registration Authority
0 0 1 1 0 0 1 0
NSW Fair Trading 0 0 31 31 0 0 31 0
NSW Long Service Corporation 0 0 22 22 0 0 22 0
NSW Police Force 0 0 45 45 0 0 45 0
Office of Industrial Relations 0 0 27 27 0 0 27 0
Office of State Revenue 11 28 339 367 0 0 378 0
Office of State Revenue – QLD 0 0 1 1 0 0 1 0
Queensland Building and Construction Commission
0 1 34 35 0 0 35 0
Return to Work SA 0 0 34 34 0 0 34 0
Revenue NSW 0 1 7 8 1 0 6 1
State Insurance Regulatory Authority 0 0 45 45 1 0 44 0
Victorian Police 1 0 39 39 0 0 40 0
Victorian Building Authority 0 0 26 26 0 0 26 0
Victorian Legal Services Board and Commissioner
1 0 37 37 0 0 38 0
WA Building Commission 0 0 28 28 0 0 28 0
WorkCover 0 0 26 26 0 0 26 0
Total 28 47 1,384 1,431 2 0 1,451 6
Subsection 355‑70(1)(item 4) – Tobacco Taskforce
AUSTRAC 0 0 36 36 0 0 36 0
Australian Criminal Intelligence Commission
0 0 21 21 0 0 21 0
Commonwealth Director of Public Prosecutions
0 0 1 1 0 0 1 0
Total 0 0 58 58 0 0 58 0
Subsection 355-70(1)(item 4) – Trusts Taskforce
AUSTRAC 0 0 4 4 0 0 4 0
Australian Criminal Intelligence Commission
0 0 5 5 0 0 5 0
Australian Federal Police 0 0 6 6 0 0 6 0
Australian Securities Investments Commission
0 0 2 2 0 0 2 0
Total 0 0 17 17 0 0 17 0
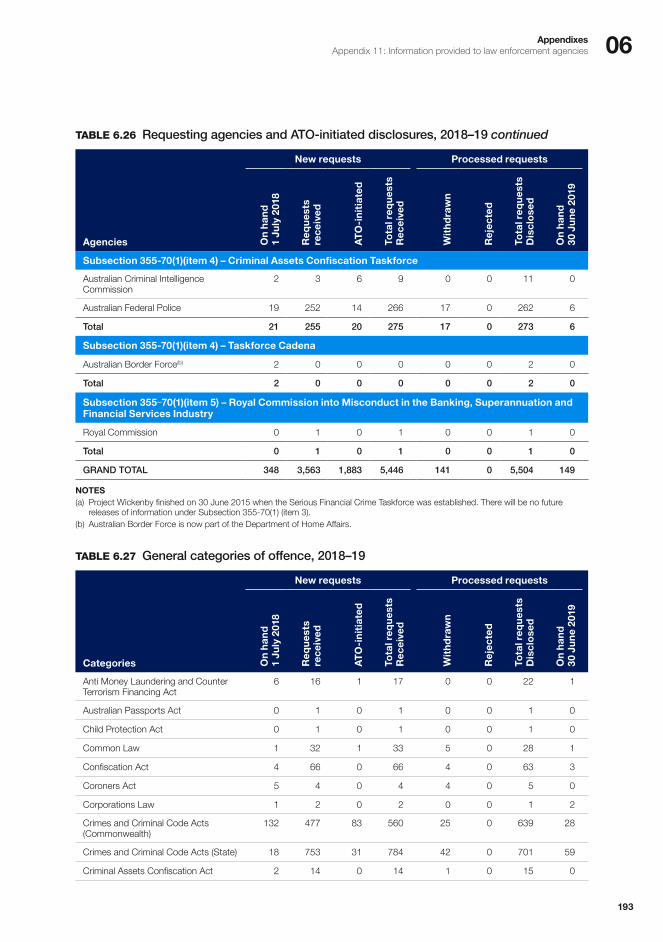
06AppendixesAppendix 11: Information provided to law enforcement agencies
193
TABLE 6.26 Requesting agencies and ATO-initiated disclosures, 2018–19 continued
New requests Processed requests
Agencies On
han
d
1 Ju
ly 2
018
Req
ues
ts
rece
ived
ATO
-in
itia
ted
Tota
l req
ues
ts
Rec
eive
d
Wit
hd
raw
n
Rej
ecte
d
Tota
l req
ues
ts
Dis
clo
sed
On
han
d
30 J
un
e 20
19
Subsection 355-70(1)(item 4) – Criminal Assets Confiscation Taskforce
Australian Criminal Intelligence Commission
2 3 6 9 0 0 11 0
Australian Federal Police 19 252 14 266 17 0 262 6
Total 21 255 20 275 17 0 273 6
Subsection 355-70(1)(item 4) – Taskforce Cadena
Australian Border Force(b) 2 0 0 0 0 0 2 0
Total 2 0 0 0 0 0 2 0
Subsection 355‑70(1)(item 5) – Royal Commission into Misconduct in the Banking, Superannuation and Financial Services Industry
Royal Commission 0 1 0 1 0 0 1 0
Total 0 1 0 1 0 0 1 0
GRAND TOTAL 348 3,563 1,883 5,446 141 0 5,504 149
NOTES(a) Project Wickenby finished on 30 June 2015 when the Serious Financial Crime Taskforce was established. There will be no future
releases of information under Subsection 355-70(1) (item 3).(b) Australian Border Force is now part of the Department of Home Affairs.
TABLE 6.27 General categories of offence, 2018–19
New requests Processed requests
Categories On
han
d
1 Ju
ly 2
018
Req
ues
ts
rece
ived
ATO
-in
itia
ted
Tota
l req
ues
ts
Rec
eive
d
Wit
hd
raw
n
Rej
ecte
d
Tota
l req
ues
ts
Dis
clo
sed
On
han
d
30 J
un
e 20
19
Anti Money Laundering and Counter Terrorism Financing Act
6 16 1 17 0 0 22 1
Australian Passports Act 0 1 0 1 0 0 1 0
Child Protection Act 0 1 0 1 0 0 1 0
Common Law 1 32 1 33 5 0 28 1
Confiscation Act 4 66 0 66 4 0 63 3
Coroners Act 5 4 0 4 4 0 5 0
Corporations Law 1 2 0 2 0 0 1 2
Crimes and Criminal Code Acts (Commonwealth)
132 477 83 560 25 0 639 28
Crimes and Criminal Code Acts (State) 18 753 31 784 42 0 701 59
Criminal Assets Confiscation Act 2 14 0 14 1 0 15 0

06 Commissioner of Taxation annual report 2018–19
194
TABLE 6.27 General categories of offence, 2018–19 continued
New requests Processed requests
Categories On
han
d
1 Ju
ly 2
018
Req
ues
ts
rece
ived
ATO
init
iate
d
Tota
l req
ues
ts
Rec
eive
d
Wit
hd
raw
n
Rej
ecte
d
Tota
l req
ues
ts
Dis
clo
sed
On
han
d
30 J
un
e 20
19
Criminal Assets Recovery Act 28 135 0 135 1 0 152 10
Criminal Code Compilation Act 0 15 0 15 1 0 14 0
Criminal Law Consolidations Act 6 27 0 27 2 0 30 1
Criminal Proceeds Confiscation Act 8 62 0 62 3 0 65 2
Criminal Property Confiscation Act 4 24 0 24 2 0 25 1
Customs Act (Importation) 1 7 0 7 0 0 8 0
Drugs Misuse and Trafficking Act 18 255 7 262 11 0 256 13
Drugs Poisons and Controlled Substances Act
22 134 0 134 7 0 144 5
Excise Act 0 0 1 1 0 0 1 0
Firearms Act 0 4 0 4 0 0 3 1
Income Tax Assessment Act 1 0 1 1 0 0 2 0
Local Government Act 0 1 0 1 0 0 1 0
Migration Act 1 4 0 4 0 0 4 1
National Consumer Credit Protection Act 0 1 0 1 0 0 1 0
Proceeds of Crime Acts (Commonwealth) 7 0 0 0 0 0 7 0
Proceeds of Crime Acts (State) 4 10 1 11 3 0 11 1
Sex Work Act (Vic.) 1 3 0 3 0 0 4 0
Summary Offences Act (SA) 0 3 0 3 0 0 3 0
Taxation Administration Act 0 1 2 3 1 0 2 0
Trade Marks Act 0 1 0 1 0 0 1 0
Total 270 2,053 128 2,181 112 0 2,210 129
For information disclosed to authorised law enforcement agency officers under section 70-40 of the Tax Agent Services Act 2009, see the TPB’s annual report at tpb.gov.au.
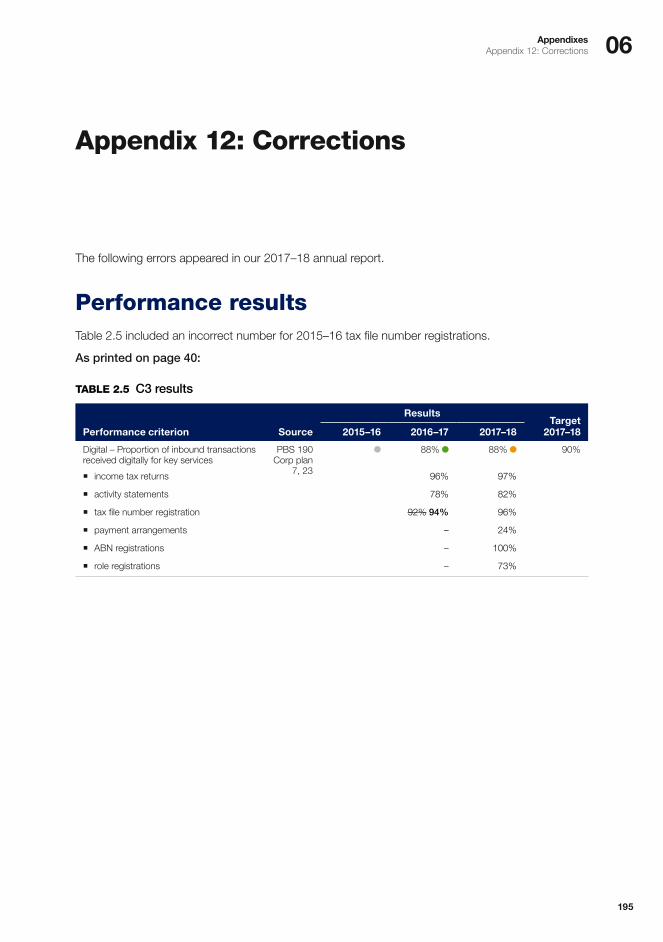
06AppendixesAppendix 12: Corrections
195
Appendix 12: Corrections
The following errors appeared in our 2017–18 annual report.
Performance resultsTable 2.5 included an incorrect number for 2015–16 tax file number registrations.
As printed on page 40:
TABLE 2.5 C3 results
ResultsTarget
2017–18Performance criterion Source 2015–16 2016–17 2017–18
Digital – Proportion of inbound transactions received digitally for key services
PBS 190 Corp plan
7, 23
88% 88% 90%
� income tax returns 96% 97%
� activity statements 78% 82%
� tax file number registration 92% 94% 96%
� payment arrangements – 24%
� ABN registrations – 100%
� role registrations – 73%

06 Commissioner of Taxation annual report 2018–19
196
DiversityThe percentage of mature age staff in Table 4.7 was based on all ATO staff rather than ongoing staff only.
As printed on page 169:
TABLE 4.7 Ongoing employees who identify as belonging to diversity groups, at 30 June 2018(a)
Group PercentageChange from
2016–17
Aboriginal and Torres Strait Islander people 2.1 0.1
With disability 3.0 0
Culturally and linguistically diverse (CALD) 21.5 –0.1
Lesbian, gay, bisexual, trans/transgender and intersex (LGBTI+)(b) 4.0 1.0
Mature age(c) 35.536.6
0.21.2
NOTES(a) Information on gender equality (the sixth diversity group) is provided in table 4.3.(b) LGBTI+ results obtained from the 2018 Australian Public Service Employee Census.(c) The number of mature age employees (50 years and older) is based on data we hold, rather than by asking staff to self-identify
as mature age.
Workplace agreementsTable 4.16 did not include non-SES employees under the Enterprise Agreement who are not employed with an individual flexibility arrangement.
As printed on page 175:
TABLE 4.16 Employment arrangement of SES and non-SES employees
Arrangement SES Non-SES Total
Enterprise Agreement (1) 0 020,112
020,112
Enterprise Agreement (2) 0 0 0
Individual flexibility arrangements 0 15 15
Australian workplace agreements 0 0 0
Common law contracts 0 0 0
Determinations under subsection 24(1) of the Public Service Act 1999 223 0 223
TOTAL 223 1520,127
23820,350

06AppendixesAppendix 12: Corrections
197
Dispute managementTable 5.3 included the number of cases lodged instead of the number of disputed litigation cases resolved.
As printed on page 183:
TABLE 5.3 Past disputes, 2015–16, to 2017–18
Cases 2015–16 2016–17 2017–18
Number of disputed cases resolved:
� objections(a)(b) 26,690 24,490 24,350
� settlements 1,350 648 673
� litigations 481486
456437
478326
� independent reviews 8 12 16
NOTES(a) Objection figures are cases completed.(b) The consistent flow of objections is partly attributable to a continuing increase in taxpayers objecting to their own self-assessments
rather than objecting to adjustments from ATO audit activity.
This correction also applies to the results shown in table 5.11 on page 226 of the 2016–17 Commissioner of Taxation annual report and the table shown on page 134 of the 2015–16 Commissioner of Taxation annual report.
Service commitmentsTable 5.14 included incorrect numbers of general and tax practitioner calls.
As printed on page 194:
TABLE 5.14 Commitments to service – Timely, 2016–17 and 2017–18
Target2016–17
Achieved2017–18
Achieved
Service commitment % % Indicator % Indicator
General calls – includes 6,321,331 5,937,641 calls answered, 383,608 (6%) of calls abandoned; and 538,377 calls were blocked in 2017–18
answered within 5 minutes
na 90 na 81 na
Tax practitioner calls – includes 1,456,044 1,398,026 calls answered; 30,145 abandoned (2% of calls offered) and zero calls were blocked in 2017–18
answered within 2 minutes
na 91 na 91 na

06 Commissioner of Taxation annual report 2018–19
198
Reference material
List of tablesTable 2.1 Performance results, 2016–17 to 2018–19 26
Table 2.2 ABR results, 2016–17 to 2018–19 39
Table 2.3 Administered payments 2016–17 to 2018–19 42
Table 2.4 Programs 1.5 to 1.13 and 1.15 to 1.18 Administered programs performance 43
Table 2.5 Program 1.14 Superannuation Guarantee Scheme 46
Table 3.1 ATO net tax cash collections, 2016–17 to 2018–19 48
Table 3.2 Expected revenue – Variation between Budget forecast and actual net collections in 2018–19 49
Table 3.3 Amount refunded, 2016–17 to 2018–19 49
Table 3.4 Net tax gap estimates – Transaction-based taxes, 2013–14 to 2018–19 51
Table 3.5 Net tax gap estimates – Income-based taxes, 2013–14 to 2018–19 51
Table 3.6 Net gap estimates – Programs we administer, 2013–14 to 2018–19 52
Table 3.7 Compliance income tax plans and results, 2016–17 to 2018–19 55
Table 3.8 Compliance GST plans and results, 2016–17 to 2018–19 56
Table 3.9 Penalties and interest, 2016–17 to 2018–19 57
Table 3.10 Working holiday maker tax returns processed, 2016–17 to 2018–19 57
Table 4.1 Details of the Accountable Authority, 2018–19 60
Table 4.2 Employees, by level and employment type, at 30 June 2019 71
Table 4.3 Employees, by level and employment type, at 30 June 2018 71
Table 4.4 Ongoing employees, by level and gender, at 30 June 2019 72
Table 4.5 Ongoing employees, by level and gender, at 30 June 2018 73
Table 4.6 Non-ongoing employees, by level and gender, at 30 June 2019 74
Table 4.7 Non-ongoing employees, by level and gender, at 30 June 2018 74
Table 4.8 Ongoing employees belonging to diversity groups, at 30 June 2019 75
Table 4.9 Indigenous employees, by employment type, at 30 June 2018 and 30 June 2019 75
Table 4.10 Employees, by job family, at 30 June 2018 and 30 June 2019 76
Table 4.11 Employees, by business area, at 30 June 2019 77
Table 4.12 Total employees, by location and employment type, at 30 June 2018 and 30 June 2019 79
Table 4.13 Ongoing employees, by location and gender, at 30 June 2019 80
Table 4.14 Ongoing employees, by location and gender, at 30 June 2018 81
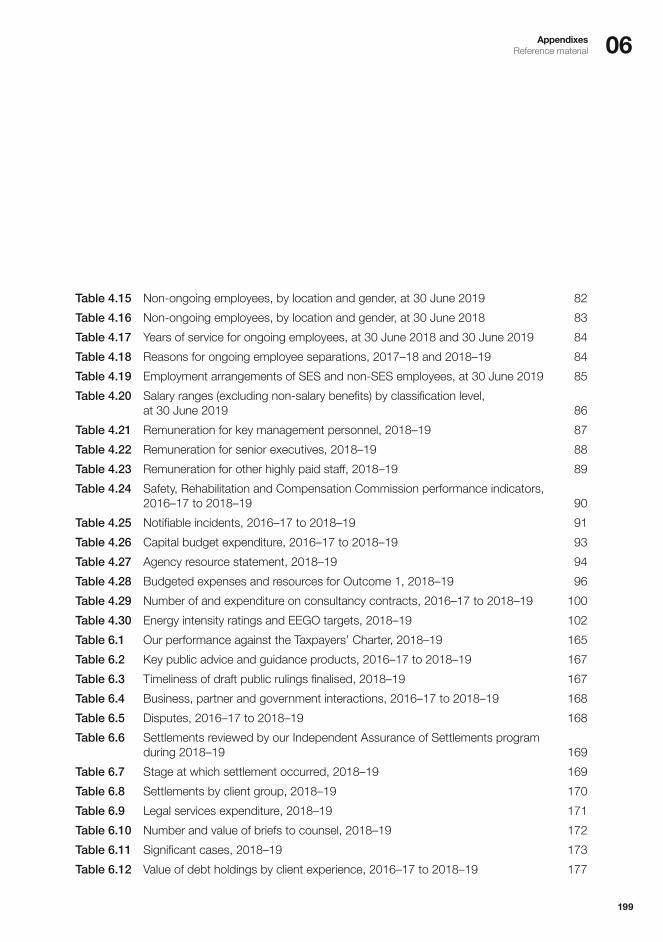
06AppendixesReference material
199
Table 4.15 Non-ongoing employees, by location and gender, at 30 June 2019 82
Table 4.16 Non-ongoing employees, by location and gender, at 30 June 2018 83
Table 4.17 Years of service for ongoing employees, at 30 June 2018 and 30 June 2019 84
Table 4.18 Reasons for ongoing employee separations, 2017–18 and 2018–19 84
Table 4.19 Employment arrangements of SES and non-SES employees, at 30 June 2019 85
Table 4.20 Salary ranges (excluding non-salary benefits) by classification level, at 30 June 2019 86
Table 4.21 Remuneration for key management personnel, 2018–19 87
Table 4.22 Remuneration for senior executives, 2018–19 88
Table 4.23 Remuneration for other highly paid staff, 2018–19 89
Table 4.24 Safety, Rehabilitation and Compensation Commission performance indicators, 2016–17 to 2018–19 90
Table 4.25 Notifiable incidents, 2016–17 to 2018–19 91
Table 4.26 Capital budget expenditure, 2016–17 to 2018–19 93
Table 4.27 Agency resource statement, 2018–19 94
Table 4.28 Budgeted expenses and resources for Outcome 1, 2018–19 96
Table 4.29 Number of and expenditure on consultancy contracts, 2016–17 to 2018–19 100
Table 4.30 Energy intensity ratings and EEGO targets, 2018–19 102
Table 6.1 Our performance against the Taxpayers’ Charter, 2018–19 165
Table 6.2 Key public advice and guidance products, 2016–17 to 2018–19 167
Table 6.3 Timeliness of draft public rulings finalised, 2018–19 167
Table 6.4 Business, partner and government interactions, 2016–17 to 2018–19 168
Table 6.5 Disputes, 2016–17 to 2018–19 168
Table 6.6 Settlements reviewed by our Independent Assurance of Settlements program during 2018–19 169
Table 6.7 Stage at which settlement occurred, 2018–19 169
Table 6.8 Settlements by client group, 2018–19 170
Table 6.9 Legal services expenditure, 2018–19 171
Table 6.10 Number and value of briefs to counsel, 2018–19 172
Table 6.11 Significant cases, 2018–19 173
Table 6.12 Value of debt holdings by client experience, 2016–17 to 2018–19 177
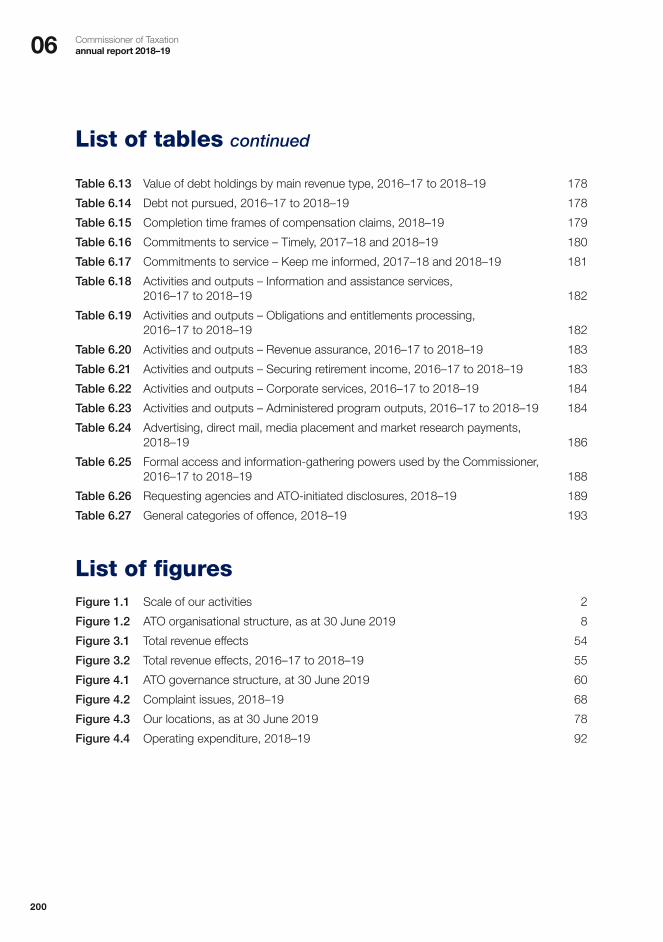
06 Commissioner of Taxation annual report 2018–19
200
List of tables continued
Table 6.13 Value of debt holdings by main revenue type, 2016–17 to 2018–19 178
Table 6.14 Debt not pursued, 2016–17 to 2018–19 178
Table 6.15 Completion time frames of compensation claims, 2018–19 179
Table 6.16 Commitments to service – Timely, 2017–18 and 2018–19 180
Table 6.17 Commitments to service – Keep me informed, 2017–18 and 2018–19 181
Table 6.18 Activities and outputs – Information and assistance services, 2016–17 to 2018–19 182
Table 6.19 Activities and outputs – Obligations and entitlements processing, 2016–17 to 2018–19 182
Table 6.20 Activities and outputs – Revenue assurance, 2016–17 to 2018–19 183
Table 6.21 Activities and outputs – Securing retirement income, 2016–17 to 2018–19 183
Table 6.22 Activities and outputs – Corporate services, 2016–17 to 2018–19 184
Table 6.23 Activities and outputs – Administered program outputs, 2016–17 to 2018–19 184
Table 6.24 Advertising, direct mail, media placement and market research payments, 2018–19 186
Table 6.25 Formal access and information-gathering powers used by the Commissioner, 2016–17 to 2018–19 188
Table 6.26 Requesting agencies and ATO-initiated disclosures, 2018–19 189
Table 6.27 General categories of offence, 2018–19 193
List of figuresFigure 1.1 Scale of our activities 2
Figure 1.2 ATO organisational structure, as at 30 June 2019 8
Figure 3.1 Total revenue effects 54
Figure 3.2 Total revenue effects, 2016–17 to 2018–19 55
Figure 4.1 ATO governance structure, at 30 June 2019 60
Figure 4.2 Complaint issues, 2018–19 68
Figure 4.3 Our locations, as at 30 June 2019 78
Figure 4.4 Operating expenditure, 2018–19 92

06AppendixesReference material
201
Glossary
ABN Lookup The public view of the Australian Business Register (ABR). It provides access to publicly available information supplied by businesses when they register for an Australian business number (ABN).
ABR Connect Provides access to multiple government agency registers via a single business register, the ABR. It reduces the number of registers businesses need to access each time they update information.
ABR Explorer An online reporting and analytical tool that makes using ABR data easy.
application programming interface (API)
A set of routines, communication protocols and tools for building software applications.
ATO app A digital application that allows taxpayers (individuals, small business owners, SMSFs and trustees) to conduct their tax and superannuation affairs from a mobile device. The ATO app can be downloaded onto a smart phone or tablet.
ATO online services
A range of tax and superannuation services available from our website, including lodging tax returns and activity statements and keeping track of super. Individuals, soles traders, businesses, tax agents, BAS agents and non-residents can register and log in at ato.gov.au.
audit yield The additional tax liabilities identified and collected through audit activities. It also includes interest and penalties.
AUSkey A single electronic identifier for businesses to access online government services with participating government agencies. AUSkey will be replaced by myGovID and Relationship Authorisation Manager (RAM) in 2020.
black economy Economic activity not declared, which may be a result of attempts to avoid tax obligations. Also known as the ‘cash economy’ or ‘non-observed economy’.
collectable debt Debt that is not subject to objection or appeal or to some form of insolvency administration.
Country-by-Country reporting (CbC)
One of a range of international measures aimed at combating tax avoidance, through more comprehensive exchanges of information between agencies. Certain types of significant global entities are required to report on international related-party dealings, revenues, profits and taxes paid, by jurisdiction.
departing Australia superannuation payment (DASP)
The payment of a superannuation balance for an eligible temporary resident leaving Australia.
digital service provider (DSP)
Anyone who develops and delivers digital services to the community, including software developers, gateway providers, third-party providers, system implementers and clearing houses.
Dispute Assist An ATO service designed to help unrepresented individuals and small businesses through the dispute process.
e-invoicing A form of electronic billing. It enables exchange of the invoice document between a supplier and buyer in an integrated electronic format.
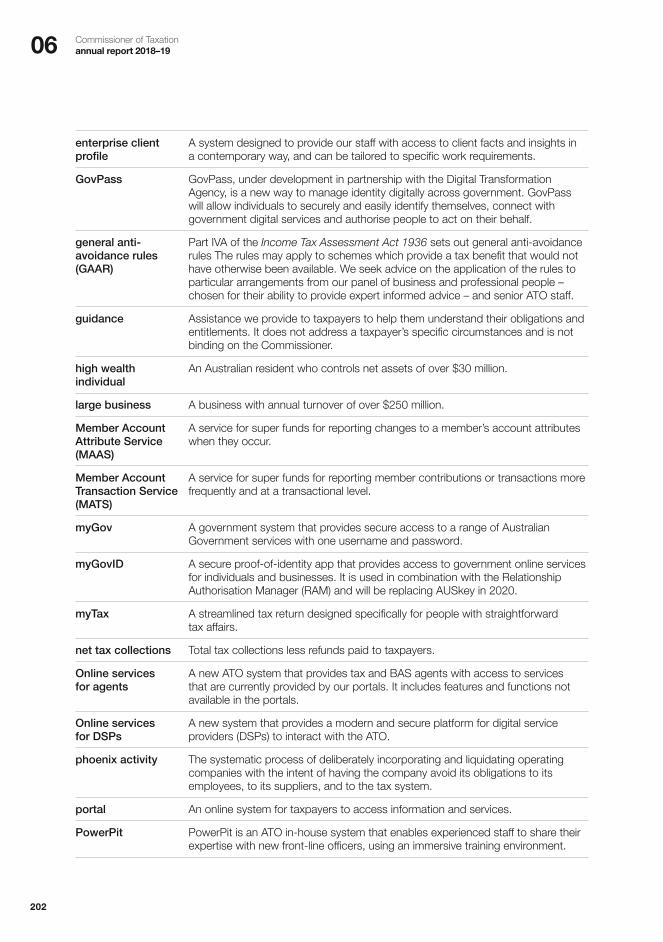
06 Commissioner of Taxation annual report 2018–19
202
enterprise client profile
A system designed to provide our staff with access to client facts and insights in a contemporary way, and can be tailored to specific work requirements.
GovPass GovPass, under development in partnership with the Digital Transformation Agency, is a new way to manage identity digitally across government. GovPass will allow individuals to securely and easily identify themselves, connect with government digital services and authorise people to act on their behalf.
general anti-avoidance rules (GAAR)
Part IVA of the Income Tax Assessment Act 1936 sets out general anti-avoidance rules The rules may apply to schemes which provide a tax benefit that would not have otherwise been available. We seek advice on the application of the rules to particular arrangements from our panel of business and professional people – chosen for their ability to provide expert informed advice – and senior ATO staff.
guidance Assistance we provide to taxpayers to help them understand their obligations and entitlements. It does not address a taxpayer’s specific circumstances and is not binding on the Commissioner.
high wealth individual
An Australian resident who controls net assets of over $30 million.
large business A business with annual turnover of over $250 million.
Member Account Attribute Service (MAAS)
A service for super funds for reporting changes to a member’s account attributes when they occur.
Member Account Transaction Service (MATS)
A service for super funds for reporting member contributions or transactions more frequently and at a transactional level.
myGov A government system that provides secure access to a range of Australian Government services with one username and password.
myGovID A secure proof-of-identity app that provides access to government online services for individuals and businesses. It is used in combination with the Relationship Authorisation Manager (RAM) and will be replacing AUSkey in 2020.
myTax A streamlined tax return designed specifically for people with straightforward tax affairs.
net tax collections Total tax collections less refunds paid to taxpayers.
Online services for agents
A new ATO system that provides tax and BAS agents with access to services that are currently provided by our portals. It includes features and functions not available in the portals.
Online services for DSPs
A new system that provides a modern and secure platform for digital service providers (DSPs) to interact with the ATO.
phoenix activity The systematic process of deliberately incorporating and liquidating operating companies with the intent of having the company avoid its obligations to its employees, to its suppliers, and to the tax system.
portal An online system for taxpayers to access information and services.
PowerPit PowerPit is an ATO in-house system that enables experienced staff to share their expertise with new front-line officers, using an immersive training environment.
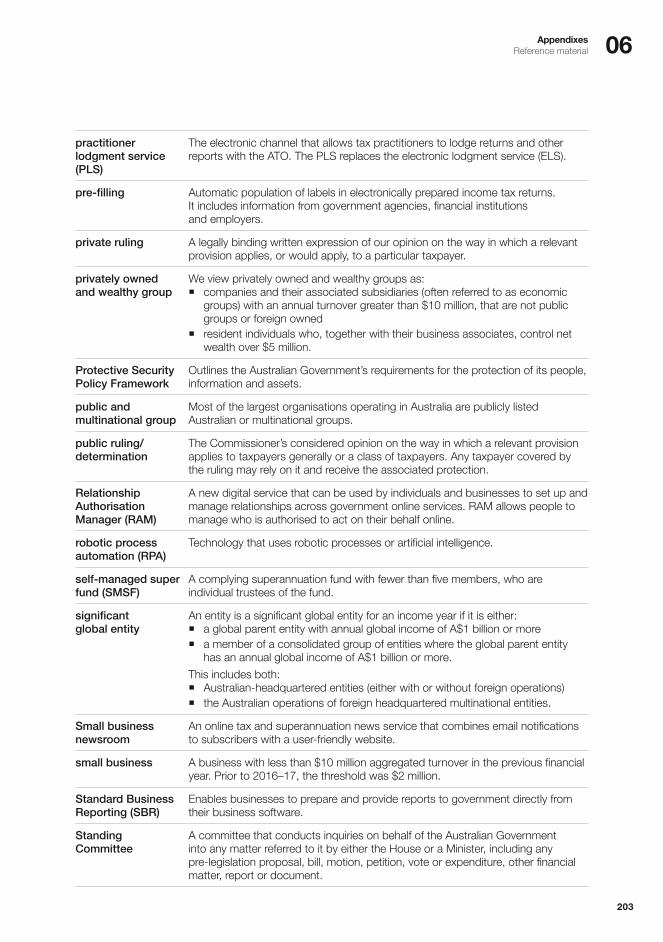
06AppendixesReference material
203
practitioner lodgment service (PLS)
The electronic channel that allows tax practitioners to lodge returns and other reports with the ATO. The PLS replaces the electronic lodgment service (ELS).
pre-filling Automatic population of labels in electronically prepared income tax returns. It includes information from government agencies, financial institutions and employers.
private ruling A legally binding written expression of our opinion on the way in which a relevant provision applies, or would apply, to a particular taxpayer.
privately owned and wealthy group
We view privately owned and wealthy groups as: � companies and their associated subsidiaries (often referred to as economic
groups) with an annual turnover greater than $10 million, that are not public groups or foreign owned
� resident individuals who, together with their business associates, control net wealth over $5 million.
Protective Security Policy Framework
Outlines the Australian Government’s requirements for the protection of its people, information and assets.
public and multinational group
Most of the largest organisations operating in Australia are publicly listed Australian or multinational groups.
public ruling/determination
The Commissioner’s considered opinion on the way in which a relevant provision applies to taxpayers generally or a class of taxpayers. Any taxpayer covered by the ruling may rely on it and receive the associated protection.
Relationship Authorisation Manager (RAM)
A new digital service that can be used by individuals and businesses to set up and manage relationships across government online services. RAM allows people to manage who is authorised to act on their behalf online.
robotic process automation (RPA)
Technology that uses robotic processes or artificial intelligence.
self-managed super fund (SMSF)
A complying superannuation fund with fewer than five members, who are individual trustees of the fund.
significant global entity
An entity is a significant global entity for an income year if it is either: � a global parent entity with annual global income of A$1 billion or more � a member of a consolidated group of entities where the global parent entity
has an annual global income of A$1 billion or more.
This includes both: � Australian-headquartered entities (either with or without foreign operations) � the Australian operations of foreign headquartered multinational entities.
Small business newsroom
An online tax and superannuation news service that combines email notifications to subscribers with a user-friendly website.
small business A business with less than $10 million aggregated turnover in the previous financial year. Prior to 2016–17, the threshold was $2 million.
Standard Business Reporting (SBR)
Enables businesses to prepare and provide reports to government directly from their business software.
Standing Committee
A committee that conducts inquiries on behalf of the Australian Government into any matter referred to it by either the House or a Minister, including any pre-legislation proposal, bill, motion, petition, vote or expenditure, other financial matter, report or document.

06 Commissioner of Taxation annual report 2018–19
204
super guarantee Super guarantee refers to the minimum level of superannuation contributions an employer must make for eligible employees.
super guarantee charge statement
An employer that does not make super guarantee contributions for an eligible employee within the required period must lodge a super guarantee charge statement with the ATO.
Super Fund Lookup Provides access to publicly available information about super funds that have an ABN. It includes funds regulated by the ATO and the Australian Prudential Regulation Authority (APRA).
tax assured An estimate of the proportion of tax reported that we are highly confident is correct.
tax gap An estimate of the difference between the amounts the ATO collects and what we would have collected if every taxpayer was fully compliant with tax law.
Taxable payments annual report (TPAR)
Some businesses and government entities need to report the total payments they make to contractors each year on a taxable payments annual report (or TPAR).
Test Case Litigation Program
Provides financial assistance to taxpayers who are litigating matters that will clarify the tax and superannuation laws we administer. By developing legal precedent, we seek to ensure we are providing the community with clear principles on how to apply the law.
total revenue effects
An estimate of the additional tax revenue resulting from our client engagement activities. It is a combination of audit yield and wider revenue effects.
Towards 2024 Reflects our ongoing commitment to transformation. Building on the gains of our reinvention program, the ATO corporate plan 2018–19 contains the next steps on the journey to achieving our 2024 aspirations. Our aim is to build trust and confidence in the tax and superannuation systems and to create a streamlined, integrated and data-driven future.
transfers Administered expenses incurred by the ATO, including superannuation guarantee, super co-contributions, and personal and business benefits and subsidies.
wider revenue effects
An estimate of the additional tax revenue arising from our broader suite of activities, which we can defensibly measure and that is not already captured by audit yield.

06AppendixesReference material
205
AbbreviationsAAT Administrative Appeals Tribunal
ABN Australian business number
ABR Australian Business Register
ABS Australian Bureau of Statistics
ACNC Australian Charities and Not-for-profits Commission
ANAO Australian National Audit Office
API application programming interface
APRA Australian Prudential Regulation Authority
APS Australian Public Service
APSC Australian Public Service Commission
ASIC Australian Securities and Investments Commission
ATO Australian Taxation Office
AUSTRAC Australian Transaction Reports and Analysis Centre
AASB Australian Accounting Standards Board
APRA Australian Prudential Regulation Authority
BAS business activity statement
CGT capital gains tax
CALD culturally and linguistically diverse
DASP departing Australia superannuation payments
DIN Director Identification Number
DSP digital service provider
DTA Digital Transformation Agency
EEGO Energy Efficiency in Government Operations
EL executive level
FACTA Foreign Account Tax Compliance Act
FBT fringe benefits tax
FCA Federal Court of Australia
FOI Act Freedom of Information Act 1982
FRCGW foreign resident capital gains withholding
GAAR general anti-avoidance rules
GIC general interest charge
GST goods and services tax
HELP Higher Education Loan Program
ICT information and communication technology
IGTO Inspector-General of Taxation and Taxation Ombudsman
IPS Information Publication Scheme
IT information technology
JITSIC Joint International Taskforce on Shared Intelligence and Collaboration
LGBTI lesbian, gay, bisexual, transgender and intersex people
NABERS National Australian Built Environment Rating System
OAIC Office of the Australian Information Commissioner
OECD Organisation for Economic Co-operation and Development
PAYG pay as you go
PBS Portfolio Budget Statements
PGPA Act Public Governance, Performance and Accountability Act 2013
PLS practitioner lodgment service
PSPF Protective Security Policy Framework
RAM Relationship Authorisation Manager
RPA robotic process automation
SBR Standard Business Reporting
SES senior executive service
SFSS Student Financial Supplement Scheme
SMS short message service
SMSF self-managed super fund
STP Single Touch Payroll
TAA Tax Administration Act 1953
TASA Tax Agent Services Act 2009
TFN tax file number
TPB Tax Practitioners Board
WHS Act Work Health and Safety Act 2011
06 Commissioner of Taxation annual report 2018–19
206
Key resourcesOur key resources for 2018–19 include: � ABN Lookup � Australian Charities Not-for-profits Commission annual report � ATO app � ATO careers � ATO community � ATO corporate plan � ATO Gender Equality Action Plan 2017–19 � Australian Business Register � Australian tax gaps – overview � Business bulletins newsroom � Diversity and inclusion plan 2017–19 � Drought help � Financial difficulties and serious hardship � Help with paying � Live chat � Lodge online – myTax � myDeductions � myGov sign in � Not-for-profit newsroom � Our service commitments � Single Touch Payroll � Small business assist � Small business newsroom � Small Business Superannuation Clearing House � Super Fund Lookup � Supporting your small business � SuperStream � Tax Practitioners Board annual report � Tax professionals newsroom
For more information on these products, plans, tools and services, visit ato.gov.au.

06AppendixesReference material
207
Compliance indexIt is mandatory to provide a list of requirements.
Reference Description Requirement Page
17AD(g) Letter of transmittal
17AI A copy of the letter of transmittal signed and dated by accountable authority on date final text approved, with statement that the report has been prepared in accordance with section 46 of the Act and any enabling legislation that specifies additional requirements in relation to the annual report.
Mandatory v
17AD(h) Aids to access
17AJ(a) Table of contents. Mandatory vi–vii
17AJ(b) Alphabetical index. Mandatory 211–217
17AJ(c) Glossary of abbreviations and acronyms. Mandatory 201–204
17AJ(d) List of requirements. Mandatory 207–210
17AJ(e) Details of contact officer. Mandatory Inside front cover
17AJ(f) Entity’s website address. Mandatory Inside front cover
17AJ(g) Electronic address of report. Mandatory Inside front cover
17AD(a) Review by accountable authority
17AD(a) A review by the accountable authority of the entity. Mandatory ii–iiv
17AD(b) Overview of the entity
17AE(1)(a)(i) A description of the role and functions of the entity. Mandatory 2
17AE(1)(a)(ii) A description of the organisational structure of the entity. Mandatory 8
17AE(1)(a)(iii) A description of the outcomes and programmes administered by the entity.
Mandatory 3–4
17AE(1)(a)(iv) A description of the purposes of the entity as included in corporate plan. Mandatory 10, 36–37, 41–42
17AE(1)(aa)(i) Name of the accountable authority or each member of the accountable authority
Mandatory 60
17AE(1)(aa)(ii) Position title of the accountable authority or each member of the accountable authority
Mandatory 60
17AE(1)(aa)(iii) Period as the accountable authority or member of the accountable authority within the reporting period
Mandatory 60
17AE(1)(b) An outline of the structure of the portfolio of the entity. Portfolio departments – mandatory
na
17AE(2) Where the outcomes and programs administered by the entity differ from any Portfolio Budget Statement, Portfolio Additional Estimates Statement or other portfolio estimates statement that was prepared for the entity for the period, include details of variation and reasons for change.
If applicable, Mandatory
na
17AD(c) Report on the Performance of the entity
Annual performance Statements
17AD(c)(i); 16F Annual performance statement in accordance with paragraph 39(1)(b) of the Act and section 16F of the Rule.
Mandatory 9–46
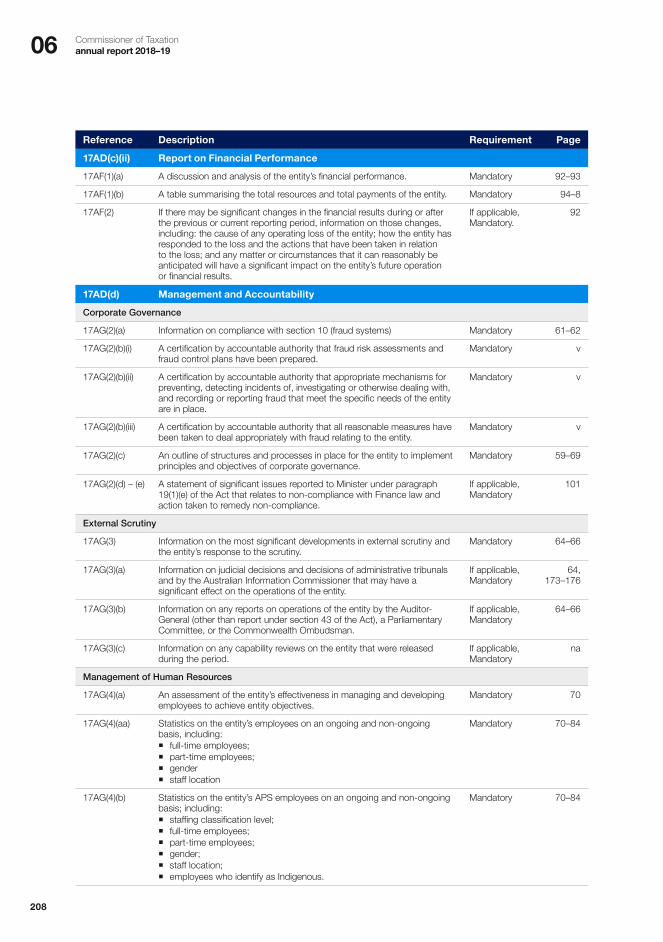
06 Commissioner of Taxation annual report 2018–19
208
Reference Description Requirement Page
17AD(c)(ii) Report on Financial Performance
17AF(1)(a) A discussion and analysis of the entity’s financial performance. Mandatory 92–93
17AF(1)(b) A table summarising the total resources and total payments of the entity. Mandatory 94–8
17AF(2) If there may be significant changes in the financial results during or after the previous or current reporting period, information on those changes, including: the cause of any operating loss of the entity; how the entity has responded to the loss and the actions that have been taken in relation to the loss; and any matter or circumstances that it can reasonably be anticipated will have a significant impact on the entity’s future operation or financial results.
If applicable, Mandatory.
92
17AD(d) Management and Accountability
Corporate Governance
17AG(2)(a) Information on compliance with section 10 (fraud systems) Mandatory 61–62
17AG(2)(b)(i) A certification by accountable authority that fraud risk assessments and fraud control plans have been prepared.
Mandatory v
17AG(2)(b)(ii) A certification by accountable authority that appropriate mechanisms for preventing, detecting incidents of, investigating or otherwise dealing with, and recording or reporting fraud that meet the specific needs of the entity are in place.
Mandatory v
17AG(2)(b)(iii) A certification by accountable authority that all reasonable measures have been taken to deal appropriately with fraud relating to the entity.
Mandatory v
17AG(2)(c) An outline of structures and processes in place for the entity to implement principles and objectives of corporate governance.
Mandatory 59–69
17AG(2)(d) – (e) A statement of significant issues reported to Minister under paragraph 19(1)(e) of the Act that relates to non-compliance with Finance law and action taken to remedy non-compliance.
If applicable, Mandatory
101
External Scrutiny
17AG(3) Information on the most significant developments in external scrutiny and the entity’s response to the scrutiny.
Mandatory 64–66
17AG(3)(a) Information on judicial decisions and decisions of administrative tribunals and by the Australian Information Commissioner that may have a significant effect on the operations of the entity.
If applicable, Mandatory
64, 173–176
17AG(3)(b) Information on any reports on operations of the entity by the Auditor-General (other than report under section 43 of the Act), a Parliamentary Committee, or the Commonwealth Ombudsman.
If applicable, Mandatory
64–66
17AG(3)(c) Information on any capability reviews on the entity that were released during the period.
If applicable, Mandatory
na
Management of Human Resources
17AG(4)(a) An assessment of the entity’s effectiveness in managing and developing employees to achieve entity objectives.
Mandatory 70
17AG(4)(aa) Statistics on the entity’s employees on an ongoing and non-ongoing basis, including: � full-time employees; � part-time employees; � gender � staff location
Mandatory 70–84
17AG(4)(b) Statistics on the entity’s APS employees on an ongoing and non-ongoing basis; including: � staffing classification level; � full-time employees; � part-time employees; � gender; � staff location; � employees who identify as Indigenous.
Mandatory 70–84
06AppendixesReference material
209
Reference Description Requirement Page
17AG(4)(c) Information on any enterprise agreements, individual flexibility arrangements, Australian workplace agreements, common law contracts and determinations under subsection 24(1) of the Public Service Act 1999.
Mandatory 85
17AG(4)(c)(i) Information on the number of SES and non-SES employees covered by agreements etc identified in paragraph 17AG(4)(c).
Mandatory 85
17AG(4)(c)(ii) The salary ranges available for APS employees by classification level. Mandatory 86
17AG(4)(c)(iii) A description of non-salary benefits provided to employees. Mandatory 89–90
17AG(4)(d)(i) Information on the number of employees at each classification level who received performance pay.
If applicable, Mandatory
86–87
17AG(4)(d)(ii) Information on aggregate amounts of performance pay at each classification level.
If applicable, Mandatory
na
17AG(4)(d)(iii) Information on the average amount of performance payment, and range of such payments, at each classification level.
If applicable, Mandatory
na
17AG(4)(d)(iv) Information on aggregate amount of performance payments. If applicable, Mandatory
na
Assets Management
17AG(5) An assessment of effectiveness of assets management where asset management is a significant part of the entity’s activities
If applicable, mandatory
99
Purchasing
17AG(6) An assessment of entity performance against the Commonwealth Procurement Rules.
Mandatory 99
Consultants
17AG(7)(a) A summary statement detailing the number of new contracts engaging consultants entered into during the period; the total actual expenditure on all new consultancy contracts entered into during the period (inclusive of GST); the number of ongoing consultancy contracts that were entered into during a previous reporting period; and the total actual expenditure in the reporting year on the ongoing consultancy contracts (inclusive of GST).
Mandatory 99
17AG(7)(b) A statement that “During [reporting period], [specified number] new consultancy contracts were entered into involving total actual expenditure of $[specified million]. In addition, [specified number] ongoing consultancy contracts were active during the period, involving total actual expenditure of $[specified million]”.
Mandatory 99
17AG(7)(c) A summary of the policies and procedures for selecting and engaging consultants and the main categories of purposes for which consultants were selected and engaged.
Mandatory 99–100
17AG(7)(d) A statement that “Annual reports contain information about actual expenditure on contracts for consultancies. Information on the value of contracts and consultancies is available on the AusTender website.”
Mandatory 100
Australian National Audit Office Access Clauses
17AG(8) If an entity entered into a contract with a value of more than $100 000 (inclusive of GST) and the contract did not provide the Auditor-General with access to the contractor’s premises, the report must include the name of the contractor, purpose and value of the contract, and the reason why a clause allowing access was not included in the contract.
If applicable, Mandatory
na
Exempt contracts
17AG(9) If an entity entered into a contract or there is a standing offer with a value greater than $10 000 (inclusive of GST) which has been exempted from being published in AusTender because it would disclose exempt matters under the FOI Act, the annual report must include a statement that the contract or standing offer has been exempted, and the value of the contract or standing offer, to the extent that doing so does not disclose the exempt matters.
If applicable, Mandatory
na

06 Commissioner of Taxation annual report 2018–19
210
Reference Description Requirement Page
Small business
17AG(10)(a) A statement that “[Name of entity] supports small business participation in the Commonwealth Government procurement market. Small and Medium Enterprises (SME) and Small Enterprise participation statistics are available on the Department of Finance’s website.”
Mandatory 100–101
17AG(10)(b) An outline of the ways in which the procurement practices of the entity support small and medium enterprises.
Mandatory 100–101
17AG(10)(c) If the entity is considered by the Department administered by the Finance Minister as material in nature—a statement that “[Name of entity] recognises the importance of ensuring that small businesses are paid on time. The results of the Survey of Australian Government Payments to Small Business are available on the Treasury’s website.”
If applicable, Mandatory
101
Financial Statements
17AD(e) Inclusion of the annual financial statements in accordance with subsection 43(4) of the Act.
Mandatory 104–162
Executive Remuneration
17AD(da) Information about executive remuneration in accordance with Subdivision C of Division 3A of Part 2-3 of the Rule.
Mandatory 87–89
17AD(f) Other Mandatory Information
17AH(1)(a)(i) If the entity conducted advertising campaigns, a statement that “During [reporting period], the [name of entity] conducted the following advertising campaigns: [name of advertising campaigns undertaken]. Further information on those advertising campaigns is available at [address of entity’s website] and in the reports on Australian Government advertising prepared by the Department of Finance. Those reports are available on the Department of Finance’s website.”
If applicable, Mandatory
185
17AH(1)(a)(ii) If the entity did not conduct advertising campaigns, a statement to that effect.
If applicable, Mandatory
na
17AH(1)(b) A statement that “Information on grants awarded by [name of entity] during [reporting period] is available at [address of entity’s website].”
If applicable, Mandatory
101
17AH(1)(c) Outline of mechanisms of disability reporting, including reference to website for further information.
Mandatory 66–67
17AH(1)(d) Website reference to where the entity’s Information Publication Scheme statement pursuant to Part II of FOI Act can be found.
Mandatory 66
17AH(1)(e) Correction of material errors in previous annual report If applicable, mandatory
195–197
17AH(2) Information required by other legislation Mandatory 68–69, 101–102, 189–194

06AppendixesReference material
211
Alphabetical index
AA New Tax System (Australian Business Number)
Act 1999, 37ABN see Australian business numberABN Lookup, 39Aboriginal and Torres Strait Islander people
ATO employees, 27, 33, 75, 196businesses, 14, 100helpline, 15Indigenous procurement policy, 101
ABR see Australian Business RegisterABR Agency Connect, 39ABR Connect, 39ABR Explorer, 39access powers, 188accommodation providers, 20accountability, 67–69Accountable Authority, v, 2
details of, 60statement by, 9
activity statements see business activity statementadministered programs, 42–46
outputs, 184performance overview, 42–43performance results, 43–46
administered cash flow statement, 123administered schedule of assets and liabilities,
120–121administered schedule of comprehensive income,
117–119administered reconciliation schedule, 122Administrative Appeals Tribunal, 15, 64, 173administrative practices, 99–102advertising, 185–187advice and guidance, 15, 167–168agency programs, 3alternative dispute resolution, 15annual report, corrections to, 195–197application programming interfaces, 16APS Employee Census, 32, 33, 75, 196artificial intelligence, use of, 20, 21asset management, 99assumed identities, use of, 188assurance, 11–12, 15, 52, 62, 169, 183ATO see Australian Taxation OfficeATO Corporate Plan 2018–19, 10, 19, 25, 37, 39,
43, 62ATO Executive, 5–7, 60ATO Online, 12, 22Audit and Risk Committee, 18, 60, 62–63audit yield, 30, 54–55Auditor-General, 64audits, 50, 64, 168, 182–183, 188AusTender, 100, 186Australian Bureau of Statistics (ABS), 29Australian business number (ABN), 14, 22, 32, 37, 38Australian Business Register (ABR), 2–3, 37–40
Australian Business Software Industry Association, 17Australian Charities and Not-for-profits Commission,
2, 3, 41, 63, 103Australian Federal Police, 61
see also law enforcement agenciesAustralian Information Commissioner, 64Australian National Audit Office, 64, 93, 166
audit of financial statements, 104–107Australian Public Service (APS), 85
Employee Census, 32–33, 75, 196Statistical Bulletin, 66
Australian Public Service Commission (APSC), 32–33, 66
Australian Screen Production Incentive, 4, 42–43, 96, 145–146, 184
Australian Securities and Investments Commission (ASIC), 12, 38
registration, 29Australian Taxation Office (ATO)
administered programs, 4, 42–46, 194tax gap estimates, 52agency programs, 3budget, 13, 28, 34–35, 92–93, 96–98Budget Statements, 25, 39, 43Business Portal, 22corporate plan, 10, 19, 25, 37, 39, 43, 62diversity and inclusion plan, 67, 75enterprise agreement, 70, 85Executive, 5–7, 60, 62, 87locations, 78–83organisational structure, 8performance against Taxpayers’ Charter,
165–166performance report, 10–46property portfolio, 78, energy efficiency, 102purpose, 10, 25, 36, 37, 41, 42role and responsibilities, 2vision, 1
automation, uses of, iv, 20–21
BBad and Doubtful Debts program, 4, 44, 97BAS see business activity statementBAS agents, 2, 16–17, 24, 36, 165 see also
tax agentsblack economy, ii, 11, 38, 48, 62Black Economy Procurement Connected Policy, 24Black Economy Taskforce, 15, 20, 38, 62Budget, 13, 38, 42, 47Budget Statements (ATO), 25, 39, 43business activity statement
agents, 2, 16–17, 24, 36, 165change to online, 17, 22complaints, 68cost of preparing, 31–32refunds, 49voluntary disclosures, 56
06 Commissioner of Taxation annual report 2018–19
212
Ccampaigns, 185capability framework, 18, 70carers in ATO workforce, 91cash collections, 11, 48, 54–56cash economy see black economycasual employees see workforce, non-ongoing
employeescash flow statements, 115–116, 123charity fundraising, 65Chief Internal Auditor, 62Chief Risk Officer, 62cleaners, exploitation of, 65Client and Community Confidence survey, 165clients
improvements for, iv, 14–17, 22–24, 168objections by, 15survey of, 165 with multiple accounts, 23
Commissioner of Taxation, 60as accountable authority, 5, 60exercise of remedial power, 69responsibilities, 2, 37, 164
Common Reporting Standard, 16Commonwealth Disability Strategy, 66Commonwealth Fraud Control Framework, 61Commonwealth grants rules and guidelines 2017,
101Commonwealth Ombudsman, 66Commonwealth Procurement Rules, 99, 102Commonwealth Property Management Framework,
78Commonwealth Risk Management Policy, 62community confidence, ii, 11, 26, 28, 165companies
administrative costs, 40large, 11multinational, 2, 11–12, 16, 52, 65not-for-profit, 2, 3, 41, 170, 177refunds, 49small see small businesses
compensationaccounting policy, 160claims, 142Compensation for Detriment caused by
Defective Administration (CDDA), 142, 179complaints, 46, 65–68, 166, 181compliance activities
audit yield, 30, 54–56integrated approach, 12legislation, 13policy development, 13superannuation system, 12tax gaps, 50–52
computer hardware update, 19conflict of interest, 61consultancies, 99–100, 186contracting, 100corporate governance, 59–102
structures, 60
corporate services, 184Council of Financial Regulators, 13Council on Federal Financial Relations, 93crime, 11, 62, 189–190, 193, 194culturally and linguistically diverse see diversity,
workforceculture, iv, 18, 27, 32–33, 63, 70customs duties, 51cyber security, 17, 22
Ddata acquisition and quality program, 20Data Transfer Facility, 39debt management, 177–178decision impact statements, 173departing Australia superannuation payments (DASP),
32Department of Finance, 101, 102, 185Digital Communication and Identity Services, 39digital identity, 22, 100digital service providers
partnerships with, 17partner perceptions, 32
digital services, 22ATO online, 12, 22availability for clients, 34client experience, 14e-invoicing, 38Online services for agents, iii, 17, 22, 165Online services for DSPs, iiiproportion of inbound transactions, 32reliability for clients, 34take-up rates, 32
Digital Transformation Agency, 38direct mail, payments for, 186–187Director Identification Number, 38disability see also carers
ATO employees with, 75reporting, 66–67
disclosuresto law enforcement agencies, 68, 189–193to ministers, 68of protected information, 69voluntary, 56
Dispute Assist service, 15dispute management, 15, 16, 168–170, 197diversity, workforce, 75, 196Diversity and inclusion plan 2017–19, 67, 75downsizer superannuation contributions, iiDrought Community Outreach Program, 14
Ee-invoicing, 38, 40ecologically sustainable development, 102Employee Census, 33employees see workforceEnergy Efficiency in Government Operations, 102enterprise agreement, 70, 85, 90enterprise client profile, 19, 20Enterprise Risk Management Committee, 60

06AppendixesReference material
213
environmental performance, 102excise
collections, 47, 48compliance activities, 56duty, 11, 47refunds, 49tax assured, 52tax gap, 51
expatriates, 29external scrutiny, 64–66
FFarm management deposits scheme audit, 64farmers, support for, 14finance law, compliance with, 101Financial Action Task Force, 62financial performance, 92–102
administrative practices, 99–102agency resource statement, 94–98capital budget, 93GST administration, 93operating expense budget, 92
financial statements, 103–162first home super saver scheme, iiforeign investors, 65Forum on Tax Administration, 16fraud management, 22, 61–63, 66freedom of information, 66Freedom of Information Act 1982 (FOI Act), 64, 66fringe benefits tax, 13, 48–49, 90fuel excise
tax gap, 51fuel tax compliance activities, 56Fuel Tax Credits Scheme, 4, 42, 43, 56, 96, 102, 118,
145–146, 176, 184 tax gap, 52
Future of the tax profession, 66
Ggarnishee notices, 66General Anti-Avoidance Rules Panel, 15general interest charge statement, 24Global Forum on Value Added Tax and GST, 16goods and services tax (GST), 51, 56
administration of, 2, 3, 93collections, 47–49fraud, 62received, 115, 119, 132refunds, 66tax gap, 51
governance see corporate governanceGovPass, iiigrants, 101greenhouse gas emissions, 102GST see goods and services tax
Hhealth and safety, occupational, 90, 91, 160high-risk industries, clients in, 15higher education loan program (HELP), 34, 48, 92,
122, 150human resources see workforce
IIllicit Tobacco Taskforce, 11, 62Improving Our Staff Experience hub, 19incidents
work health and safety, 91income tax
cash collections, 55pre-filled returns, iii, 27, 33–34, 165refunds, ii, iii, 14, 16, 23, 49
Income Tax (Managed Investment Trust Withholding Tax) Amendment Bill 2018, 65
Income Tax Rates Amendment (Sovereign Entities) Bill 2018, 65
Independent Assurance of Settlements program, 15, 169
Independent Review for Small Business program pilot, 15
Indigenous Australiansin ATO workforce, 27, 33, 75, businesses, 14, 100helpline, 15procurement policy, 101
individualsadvice and guidance for, 15number of, 2refunds, 49registered, 29superannuation, 12, 46support for, iitax assured, 52tax collections, 47–49tax gap, ii, 11, 51tax returns (see income tax)
information and assistance services, 182information-gathering powers, 188Information Publication Scheme, 66injuries at work, 90, 91Inspector-General of Taxation Act 2003, 65Inspector-General of Taxation and Taxation
Ombudsman (IGTO), 61, 65–66reports, 66
Integrity Adviser, 18Interest on Overpayments and Early Payments of Tax,
4, 97, 118, 120, 184interest penalties, 57Intergovernmental Agreement on Federal Financial
Relations, 93international collaboration, 11, 16, 62

06 Commissioner of Taxation annual report 2018–19
214
JJ5 Alliance, 62Joint Chiefs of Global Tax Enforcement, 62judicial reviews, 64Judiciary Amendment (Commonwealth Model Litigant
Obligations) Bill 2017, 65Junior Minerals Exploration Incentive, 4, 42, 43, 96,
145–146justified trust program, 11–12, 52–53
Kkey management personnel, 87, 143
Llaw enforcement agencies, disclosures to, 68,
189–94legal matters, complex, 15legal services expenditure, 171–172legislation see specific Actsletter of transmittal, vLGBTI+ Inclusion Awards, 75liabilities
compliance, 54audit yield, 54
litigation, strategic, 12, 173–176locations, 78–83Low Income Superannuation Tax Offset, 4, 42, 44,
97, 145–146, 184
Mmachine learning, 21Management of small business tax debt audit, 64market research, payments for, 186–187mature age employees, 75, 196media placement, payments for, 186–187Member Account Attribute Service (MAAS), ii, 12, 45Member Account Transaction Service (MATS), ii, 12,
45ministers, 1
disclosures to, 68Modernising Business Registry Program, 38Multilateral Convention to Implement Tax Treaty
Related Measures to Prevent Base Erosion and Profit Shifting, 16
multinational businesses, 11–12, 16, 52, 65, 170, 177myGovID app, 22myTax, iii
NNational Australian Built Environment Rating System,
102National Disability Network, 67National Disability Strategy 2010–20, 66National Rental Affordability Scheme, 4, 42, 43, 96,
145–146National Tax Clinics, 15nearest neighbour approach, 21New to business essentials service, 15
New ZealandInland Revenue, 16Ministry of Business Innovation & Employment,
38non-salary benefits, 89–90not-for-profit organisations, 2, 3, 170, 177notifiable incidents, 91
Oobjections by clients, 15, 166, 168, 177–178obligations and entitlements processing, 182offence, categories of, 193–194Office of the Australian Information Commissioner, 64older employees see workforce, mature ageOmbudsman, Australian Small Business and Family
Enterprise, 15Ombudsman, Commonwealth, 66Ombudsman, Taxation, 15, 65, 166online services see digital servicesOnline services for agents, iii, 17, 22, 165Online services for DSPs, iiiopen and transparent operations, 64–67operating expense budget, 34, 92Organisation for Economic Co-operation and
Development (OECD), 16, 62organisational culture see culture, organisationalorganised crime see crimeother highly paid staff, 88–89overpayments, interest on, 43–44
PPan-European Public Procurement On-Line
framework, 38Panama papers, 16paper correspondence, reduction of, 24Paradise papers, 16parenting see carersparliamentary committees, 64–65pay as you go (PAYG) withholding, 30, 57
tax gap, 52penalties, 57performance audits, 64performance report, 10–46
Accountable Authority statement, 9results, 25–35, 195
petroleum resource rent tax, 51phoenix activity, 62, 64Phoenix Taskforce, 11, 62police see law enforcement agenciespolicy development, 13PowerPit, 19practitioner lodgment service, 16Private Health Insurance Rebate, 4, 42, 44, 97,
145–146, 184private rulings, 180, 181, 182procurement, 6, 24, 38, 99–101Product Stewardship for Oil, 4, 42, 43, 94, 97, 102,
145–146, 184protected information, disclosure of, 69
06AppendixesReference material
215
Protective Security Policy Framework, 34public advice and guidance, 15, 167–168Public Advice and Guidance Panel, 15Public Governance, Performance and Accountability
Act 2013 (PGPA Act), 1, 2, 9, 60–63, 88, 99, 101, 103
Public Interest Disclosure Act 2013, 66public interest disclosures, 66public rulings, 167purchasing see procurement
RReach Out Indigenous Business Support program, 14RecruitAbility scheme, 67refunds, ii, iii, 14, 16, 23, 49, 66, 183registrations, company and individual, 27, 29, 181,
182Relationship Authorisation Manager, 22remuneration, 85–90Remuneration tribunal, 86research, contributions to, 13Research and Development Tax Incentive, 4, 44, 97,
145–146resident, definition of, 29Resource Committee, 60resource rent taxes, 48, 49, 51resource statement, 94–95retirement income see superannuationrevenue assurance, 183revenue collection, 47–49
expected, 49net, 48
revenue effects, 54–57good and services tax, 56income tax, 55indirect taxes, 56penalties and interest, 57total, 54–55voluntary disclosures, 56
ride-sharing providers, 20risk management, 61–63robotic process automation, 21Royal Commission into banking misconduct, 15
SSafety, Rehabilitation and Compensation
Commission, 90salaries see remunerationsalary packaging, 90salary ranges, 86, 88–89Seafarer Tax Offset, 4, 42, 44, 98, 145secondments, 31, 70, 75
security policy, 22, 28, 34Security, Integrity and Fraud Awareness week, 18Security, privacy and fraud, 61Security and Business Continuity Management
Committee, 60self-managed superannuation funds, 2, 12, 177, 183Senate Estimates, 65
senior executive service, 18, 27, 33, 85, 88–89 196 Serious Financial Crime Taskforce, 11, 62 193service commitments, 180–181, 197SES Disability Champions, 67settlements, 15, 126, 150 168–170, 71, 197, 199
by client group, 170single client account, 23Single Touch Payroll, iii, 14, 20, 187Small Business Newsroom service, 15Small Business Taxation Division (AAT), 15small businesses
debt, 177procurement from, 100–101staff visiting, 20support for, 14–15tax debt, 64
Small Superannuation Accounts Act 1995, 94, staff see workforceStandard Business Reporting (SBR), 37–8State of the Service report, 66strategic litigation, 12, 173–176strategic objectives
client, 14–17, 26–27, 31–32financial, 24, 28, 34–35government, 11–15, 26, 28–31operational, 20–23, 27–28, 33–34workforce, 18–19, 27, 32–33
strategic procurement, 24Strategy and Integration Committee, 60statement of changes in equity, 113–114statement of comprehensive income, 109–110statement of financial position, 111–112Super Fund Lookup, 12Superannuation, 183
compliance activities, 12, 46, 183support of system, 12, 13
Superannuation Co-contribution Scheme, 4, 42, 97, 145–146, 184
superannuation fundscontraventions, 183debt, 177perceptions of ATO, 32settlements, 170tax collections, 47–49tax compliance, 11tax gap, 51
Superannuation Guarantee (Administration) Act 1992, 64, 158
Superannuation guaranteedebt, 177, 178Scheme, 4, 46, 97tax gap, 46
surveys, 18, 19, 165–166, 168, 182

06 Commissioner of Taxation annual report 2018–19
216
TTargeted Assistance through the Taxation System,
4, 44, 45, 97, 184Taskforces, ii, 11, 15, 20, 38, 62, 171, 190–193tax administration, reporting on, 68tax agent services
changes to, 16–17Tax Agent Services Act 2009, v, 36, tax agents
changes to services, 16–17IGTO report, 66online access on behalf of clients, 22perceptions of ATO, 32regulation of, 36returns compared with similar clients, 21services for, 14
tax assured, 52–53Tax Avoidance Taskforce, ii, 11, 171tax collection see revenue collectiontax evasion, 62tax file number (TFN), 7, 27, 29, 48, 195tax gaps, ii, 11, 26, 30, 50, 53
corporations, 51estimates, 50–52fuel tax credits, 52income-based taxes, 51individuals, 11, 51pay as you go withholding, 52petroleum resource rent tax, 51as proportion of revenue, 30small business, 51superannuation funds, 51superannuation guarantee, 52transaction-based taxes, 51
tax havens, 16Tax Integrity Centre, 62Taxable Payments Reporting System, 53Tax Practitioners Board, v, 2, 3, 36, 63, 96, 103, 171tax professionals see tax agentstax returns see income taxtax revenue see revenue effectstax system
crime in, 62health of, 50–53
Tax Time 2018, 14taxable payment annual report (TPAR) lodgments,
27, 32Taxation Administration Act 1953, 67, 68, 171, 173,
189taxpayers
complaints, 67, 68obligations, 67rights, 67
Taxpayers’ Charter, 67, 165–166technology see computer hardware; digital servicesTest Case Litigation Panel, 12tobacco
duty – tax gap, 51illicit, 11, 62
Torres Strait Islanders see Aboriginal and Torres Strait Islander people
total revenue effects see revenue effectsTowards 2024 plan, iitraining, workforce, 18, 19, 34, 59, 61, 75Treasury
Portfolio Budget Statements (PBS), 25, 41, 43secondment program, 31relationship with, 13, 31
Treasury Laws Amendment ... Bill 2018, 65Treasury Laws Amendment (Protecting Your
Superannuation Package) Bill 2018, 65
Uunauthorised access, 61
VVET FEE-HELP debts, 34, 92voiceprint matching, 22voluntary disclosures, 46, 56
Wwilling participation, ii, 10, 25, 50, 54, 56, 64wine equalisation tax
tax gap, 51work health and safety, 90–91, 99investigations, 91work redesign, 24work-related expenses, ii, 15, 62workforce
by business area, 77digital experience, 33disability, 67diversity, 75, 196employee engagement, 32–33employment arrangements, 85–90Indigenous, 33, 75locations, 78–83management, 70–91mature age, 75, 196non-salary benefits, 89–90notifiable safety incidents, 91remuneration, 85–89retention and separation, 84statistics, 70–84training, 18, 19
Workforce Strategy 2024, 18working holiday maker framework, 57workplace
agreements, 85, 196diversity, 67, 91

