annual report 2018/19 - johnkeellstea.com keells plc annual report 2018-19.pdfjohn keells plc annual...
TRANSCRIPT

A N N U A L R E P O R T 2 0 1 8 / 1 9
John Keells PLC

THERE’S NO DENYING IT.
2018/19 WAS A DIFFICULT YEAR FOR
YOUR COMPANY….
BUT AS AN ORGANISATION
COMMITTED
TO SERVING ITS STAKEHOLDERS WITH VALUE, WE HAVE OVERCOME OUR OBSTACLES WITH RESILIENCE AND
STRENGTH.

2John Keells PLC Annual Report 2018/19
WE’RE MEETING
OUR CHALLENGES…

3 HEAD ON
Last year was a complex one, and your Company faced myriad challenges at several levels. These are discussed in detail further in this report, together with our business strategies for enhancing our processes and structures as we continue to plan for greater strength and stability in the years ahead.
Even as we head into the unknown, we’re pleased to report that John Keells PLC has performed well in a competitive environment. Today, your Company has faced the challenges with courage, resilience and strength, sustaining our performance and staying our course. This is why we are confident that even in times of adversity, we will find opportunities to expand, thrive and shine.
John Keells PLCWe’re meeting challenges. Head on.
John Keells PLC is your alliance to success through our core business in Tea and Rubber Broking, including the Warehousing of these produce. Our pre-eminent position as one of Sri Lanka’s leading Tea and Rubber broker with a large state-of-the-art warehousing complex is a catalyst for our effective leverage to the future.
4John Keells PLC Annual Report 2018/19
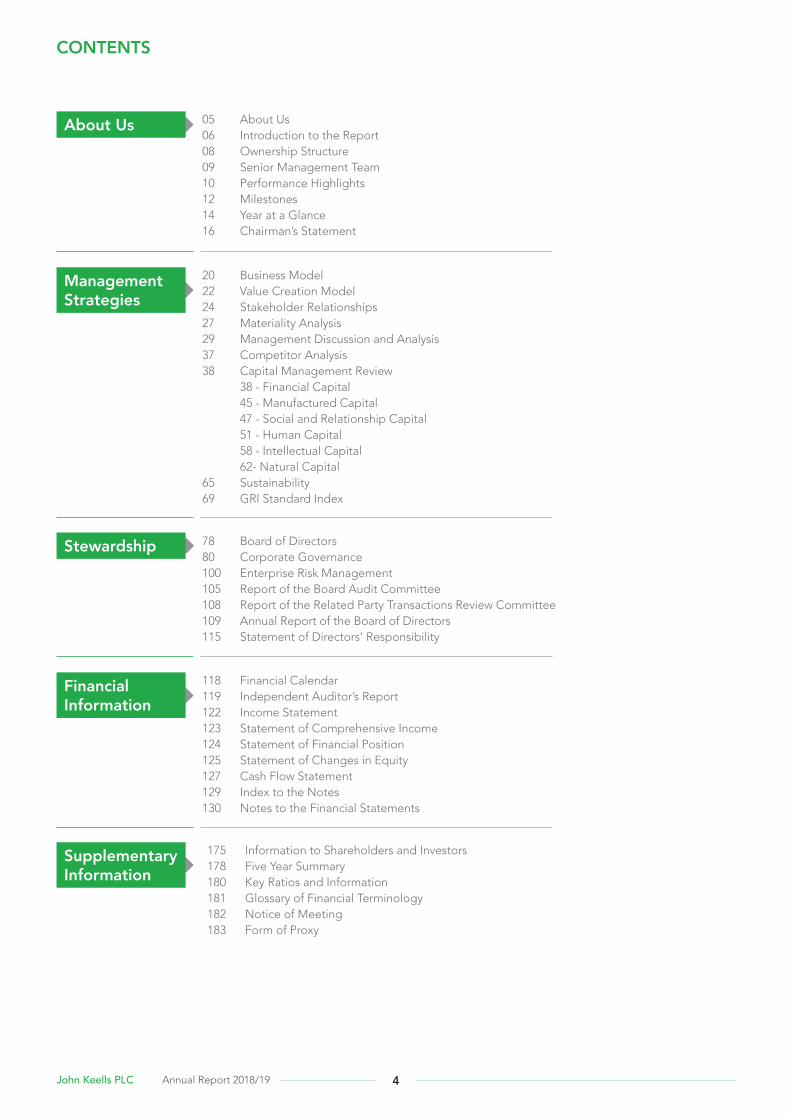
CONTENTS
About Us
ManagementStrategies
Stewardship
Supplementary Information
175 Information to Shareholders and Investors 178 Five Year Summary 180 Key Ratios and Information 181 Glossary of Financial Terminology 182 Notice of Meeting 183 Form of Proxy
Financial Information
118 Financial Calendar 119 Independent Auditor’s Report 122 Income Statement 123 Statement of Comprehensive Income 124 Statement of Financial Position 125 Statement of Changes in Equity 127 Cash Flow Statement 129 Index to the Notes 130 Notes to the Financial Statements
05 About Us06 Introduction to the Report 08 Ownership Structure 09 Senior Management Team 10 Performance Highlights 12 Milestones 14 Year at a Glance16 Chairman’s Statement
20 Business Model 22 Value Creation Model 24 Stakeholder Relationships27 Materiality Analysis 29 Management Discussion and Analysis37 Competitor Analysis 38 Capital Management Review 38 - Financial Capital 45 - Manufactured Capital 47 - Social and Relationship Capital 51 - Human Capital 58 - Intellectual Capital 62- Natural Capital 65 Sustainability69 GRI Standard Index
78 Board of Directors 80 Corporate Governance 100 Enterprise Risk Management 105 Report of the Board Audit Committee108 Report of the Related Party Transactions Review Committee109 Annual Report of the Board of Directors 115 Statement of Directors’ Responsibility
5 HEAD ON
ABOUT US
VisionTo be internationally recognised as the best Produce Broker in the world.
MissionTo retain the pre-eminent position as Sri Lanka’s leading Tea and Rubber broker; To uphold the traditions and ethics of the Tea and Rubber trades; To ensure superior customer service through a dedicated and motivated workforce.
ValuesWe are committed to the highest level of integrity and ethical conduct in all our business activities. We will look towards exceeding shareholder and customer expectations by achieving excellence in all areas of operations. We recognise the right of every individual to be treated with fairness, dignity and respect and assist our employees to improve their skills and reward their accomplishments. We will focus on corporate social responsibility and look to protect and safeguard the environment.
John Keells PLC
For over 149 years, John Keells PLC has been a corporate benchmark of quality, brand excellence and good governance. Our long heritage and sound values have led to our becoming the paradigm that others follow. That is why this report analyses the Head On - strategies that lie behind the triple bottom line results presented in these pages, in order to offer our stakeholders a clear view of where they stand in relation to their Company.
We know that relentless self-assessment is the first step towards an environment of excellence and that is what we have demonstrated in this Annual Report. The pages that follow describe an excellent performance across a range of indicators that will ensure our strength both now and into the years ahead. You will also drive deep into the way we operate, When confronted with various challenges Head on by adopting numerous Strategies to overcome and maintain our long term vision.
INTRODUCTION TO THE REPORT
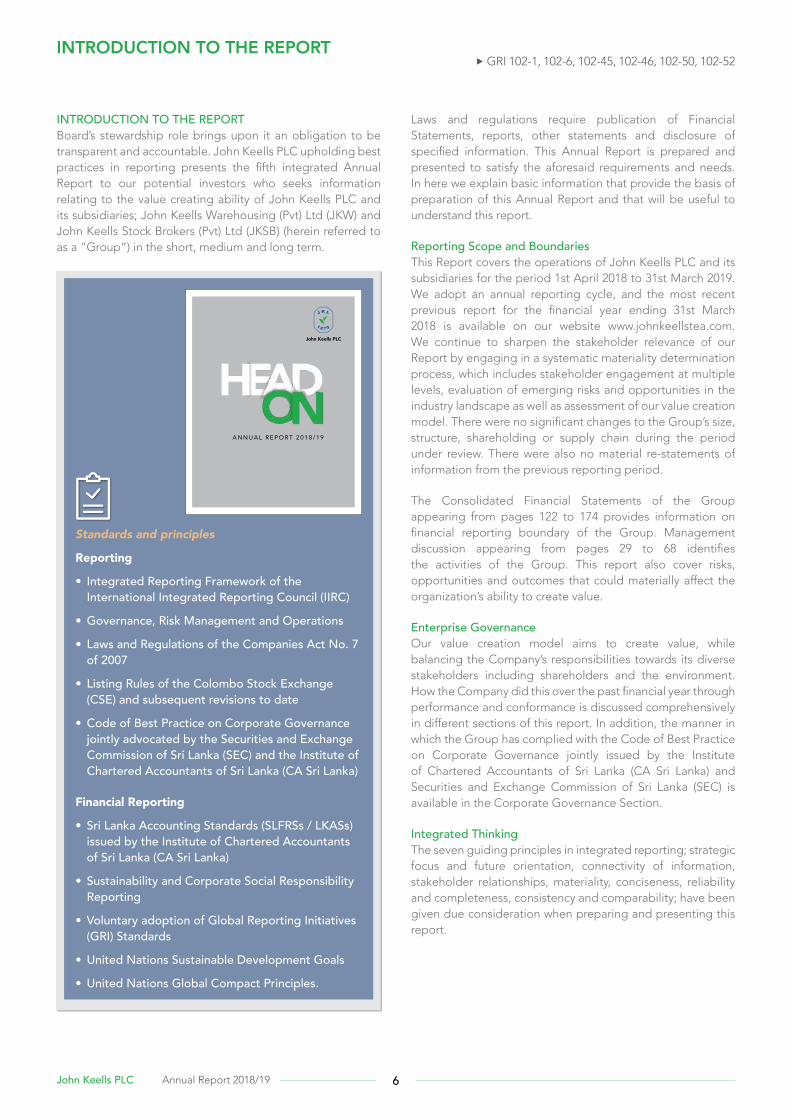
INTRODUCTION TO THE REPORTBoard’s stewardship role brings upon it an obligation to be transparent and accountable. John Keells PLC upholding best practices in reporting presents the fifth integrated Annual Report to our potential investors who seeks information relating to the value creating ability of John Keells PLC and its subsidiaries; John Keells Warehousing (Pvt) Ltd (JKW) and John Keells Stock Brokers (Pvt) Ltd (JKSB) (herein referred to as a “Group”) in the short, medium and long term.
A N N U A L R E P O RT 2 0 1 8 / 1 9
John Keells PLC
Standards and principles
Reporting
• Integrated Reporting Framework of the International Integrated Reporting Council (IIRC)
• Governance, Risk Management and Operations
• Laws and Regulations of the Companies Act No. 7 of 2007
• Listing Rules of the Colombo Stock Exchange (CSE) and subsequent revisions to date
• Code of Best Practice on Corporate Governance jointly advocated by the Securities and Exchange Commission of Sri Lanka (SEC) and the Institute of Chartered Accountants of Sri Lanka (CA Sri Lanka)
Financial Reporting
• Sri Lanka Accounting Standards (SLFRSs / LKASs) issued by the Institute of Chartered Accountants of Sri Lanka (CA Sri Lanka)
• Sustainability and Corporate Social Responsibility Reporting
• Voluntary adoption of Global Reporting Initiatives (GRI) Standards
• United Nations Sustainable Development Goals
• United Nations Global Compact Principles.
Laws and regulations require publication of Financial Statements, reports, other statements and disclosure of specified information. This Annual Report is prepared and presented to satisfy the aforesaid requirements and needs. In here we explain basic information that provide the basis of preparation of this Annual Report and that will be useful to understand this report.
Reporting Scope and BoundariesThis Report covers the operations of John Keells PLC and its subsidiaries for the period 1st April 2018 to 31st March 2019. We adopt an annual reporting cycle, and the most recent previous report for the financial year ending 31st March 2018 is available on our website www.johnkeellstea.com. We continue to sharpen the stakeholder relevance of our Report by engaging in a systematic materiality determination process, which includes stakeholder engagement at multiple levels, evaluation of emerging risks and opportunities in the industry landscape as well as assessment of our value creation model. There were no significant changes to the Group’s size, structure, shareholding or supply chain during the period under review. There were also no material re-statements of information from the previous reporting period.
The Consolidated Financial Statements of the Group appearing from pages 122 to 174 provides information on financial reporting boundary of the Group. Management discussion appearing from pages 29 to 68 identifies the activities of the Group. This report also cover risks, opportunities and outcomes that could materially affect the organization’s ability to create value.
Enterprise Governance Our value creation model aims to create value, while balancing the Company’s responsibilities towards its diverse stakeholders including shareholders and the environment. How the Company did this over the past financial year through performance and conformance is discussed comprehensively in different sections of this report. In addition, the manner in which the Group has complied with the Code of Best Practice on Corporate Governance jointly issued by the Institute of Chartered Accountants of Sri Lanka (CA Sri Lanka) and Securities and Exchange Commission of Sri Lanka (SEC) is available in the Corporate Governance Section.
Integrated ThinkingThe seven guiding principles in integrated reporting; strategic focus and future orientation, connectivity of information, stakeholder relationships, materiality, conciseness, reliability and completeness, consistency and comparability; have been given due consideration when preparing and presenting this report.
GRI 102-1, 102-6, 102-45, 102-46, 102-50, 102-52
6John Keells PLC Annual Report 2018/19
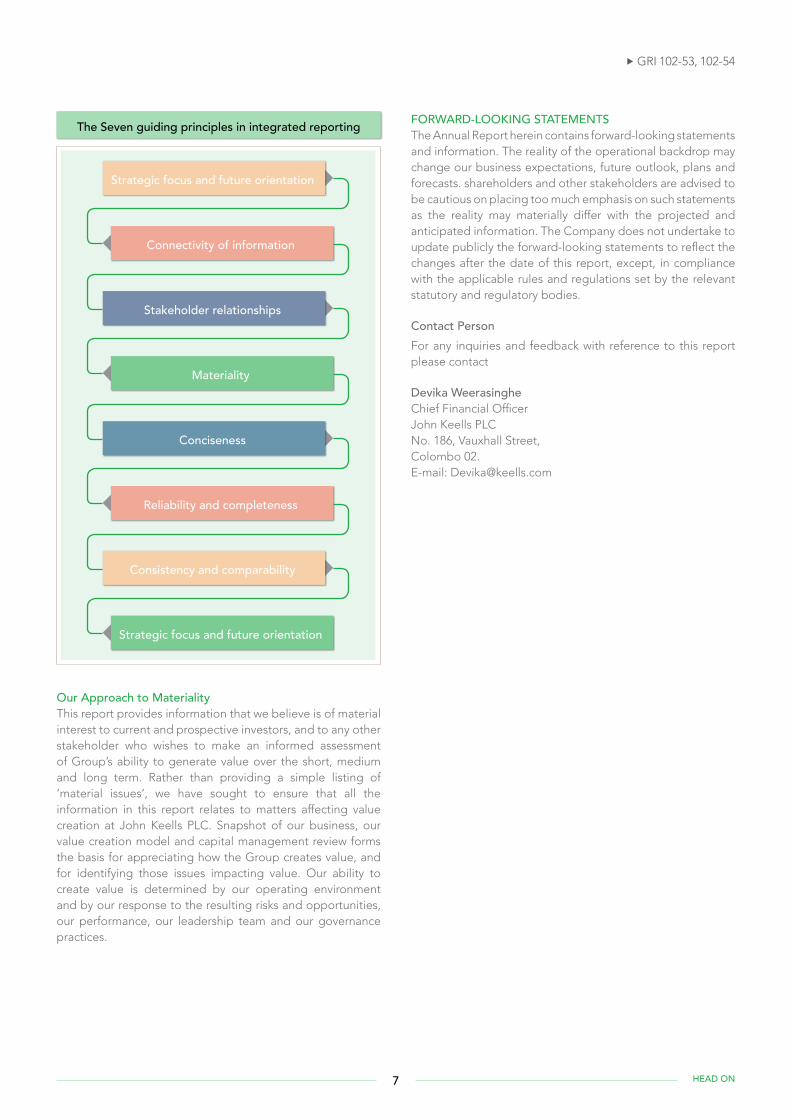
Our Approach to MaterialityThis report provides information that we believe is of material interest to current and prospective investors, and to any other stakeholder who wishes to make an informed assessment of Group’s ability to generate value over the short, medium and long term. Rather than providing a simple listing of ‘material issues’, we have sought to ensure that all the information in this report relates to matters affecting value creation at John Keells PLC. Snapshot of our business, our value creation model and capital management review forms the basis for appreciating how the Group creates value, and for identifying those issues impacting value. Our ability to create value is determined by our operating environment and by our response to the resulting risks and opportunities, our performance, our leadership team and our governance practices.
FORWARD-LOOKING STATEMENTSThe Annual Report herein contains forward-looking statements and information. The reality of the operational backdrop may change our business expectations, future outlook, plans and forecasts. shareholders and other stakeholders are advised to be cautious on placing too much emphasis on such statements as the reality may materially differ with the projected and anticipated information. The Company does not undertake to update publicly the forward-looking statements to reflect the changes after the date of this report, except, in compliance with the applicable rules and regulations set by the relevant statutory and regulatory bodies.
Contact PersonFor any inquiries and feedback with reference to this report please contact
Devika Weerasinghe Chief Financial OfficerJohn Keells PLCNo. 186, Vauxhall Street,Colombo 02.E-mail: [email protected]
GRI 102-53, 102-54
Strategic focus and future orientation
Consistency and comparability
Stakeholder relationships
Conciseness
Connectivity of information
Reliability and completeness
Strategic focus and future orientation
Materiality
The Seven guiding principles in integrated reporting
7 HEAD ON
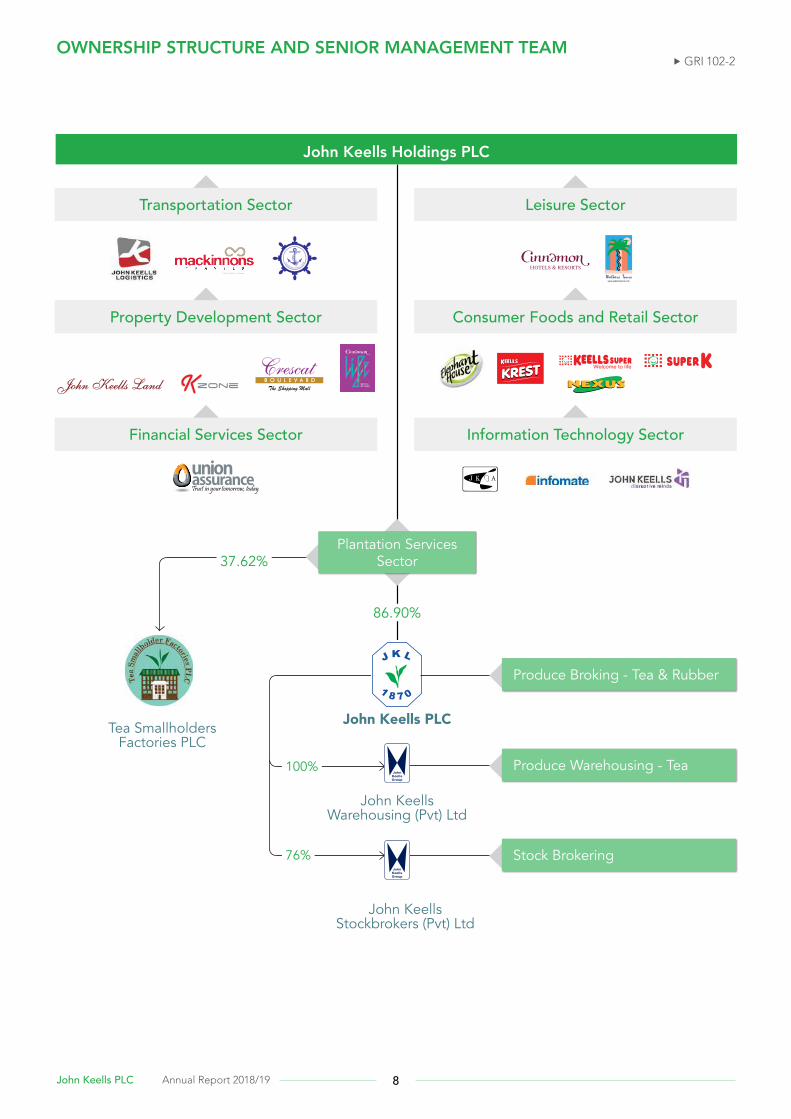
OWNERSHIP STRUCTURE AND SENIOR MANAGEMENT TEAM GRI 102-2
Tea Smallholders Factories PLC
86.90%
37.62%
John Keells Warehousing (Pvt) Ltd
John Keells Stockbrokers (Pvt) Ltd
John Keells Holdings PLC
Transportation Sector
Financial Services Sector Information Technology Sector
Leisure Sector
Consumer Foods and Retail Sector
KRESTKREST
Property Development Sector
Plantation Services Sector
John Keells PLC
Produce Broking - Tea & Rubber
Produce Warehousing - Tea
Stock Brokering
100%
76%
8John Keells PLC Annual Report 2018/19
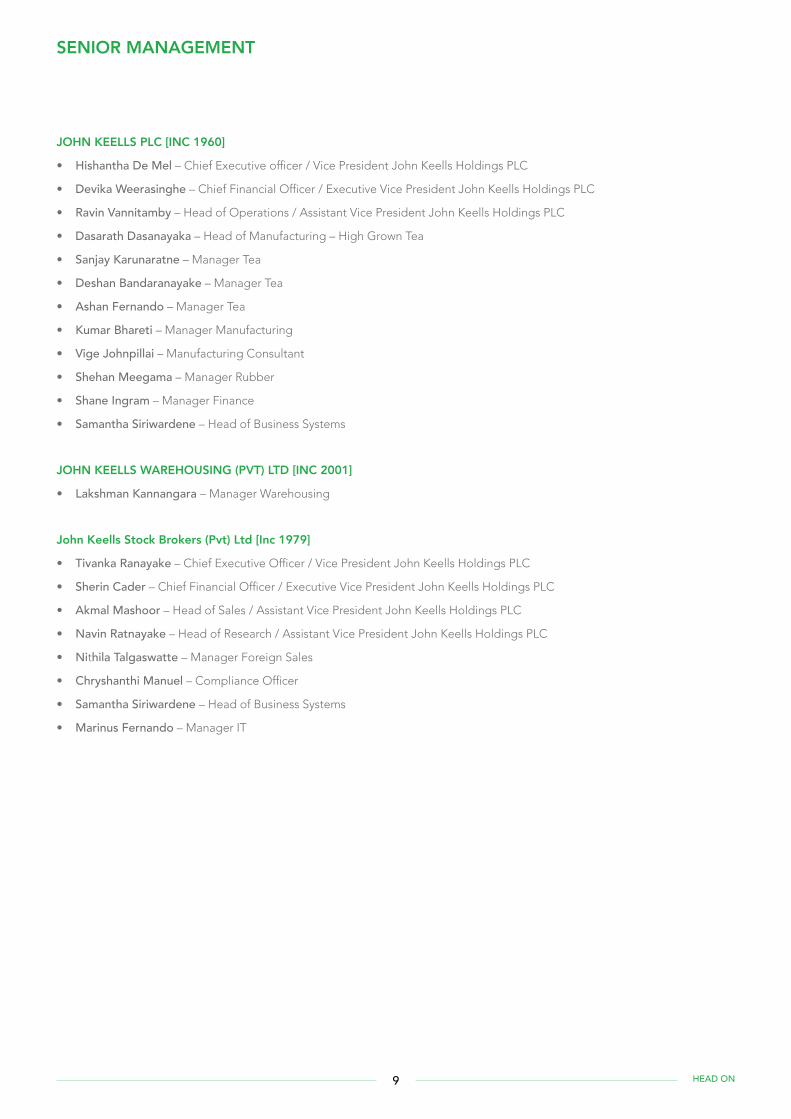
SENIOR MANAGEMENT
JOHN KEELLS PLC [INC 1960]
• Hishantha De Mel – Chief Executive officer / Vice President John Keells Holdings PLC
• Devika Weerasinghe – Chief Financial Officer / Executive Vice President John Keells Holdings PLC
• Ravin Vannitamby – Head of Operations / Assistant Vice President John Keells Holdings PLC
• Dasarath Dasanayaka – Head of Manufacturing – High Grown Tea
• Sanjay Karunaratne – Manager Tea
• Deshan Bandaranayake – Manager Tea
• Ashan Fernando – Manager Tea
• Kumar Bhareti – Manager Manufacturing
• Vige Johnpillai – Manufacturing Consultant
• Shehan Meegama – Manager Rubber
• Shane Ingram – Manager Finance
• Samantha Siriwardene – Head of Business Systems
JOHN KEELLS WAREHOUSING (PVT) LTD [INC 2001]
• Lakshman Kannangara – Manager Warehousing
John Keells Stock Brokers (Pvt) Ltd [Inc 1979]
• Tivanka Ranayake – Chief Executive Officer / Vice President John Keells Holdings PLC
• Sherin Cader – Chief Financial Officer / Executive Vice President John Keells Holdings PLC
• Akmal Mashoor – Head of Sales / Assistant Vice President John Keells Holdings PLC
• Navin Ratnayake – Head of Research / Assistant Vice President John Keells Holdings PLC
• Nithila Talgaswatte – Manager Foreign Sales
• Chryshanthi Manuel – Compliance Officer
• Samantha Siriwardene – Head of Business Systems
• Marinus Fernando – Manager IT
9 HEAD ON
10John Keells PLC Annual Report 2018/19
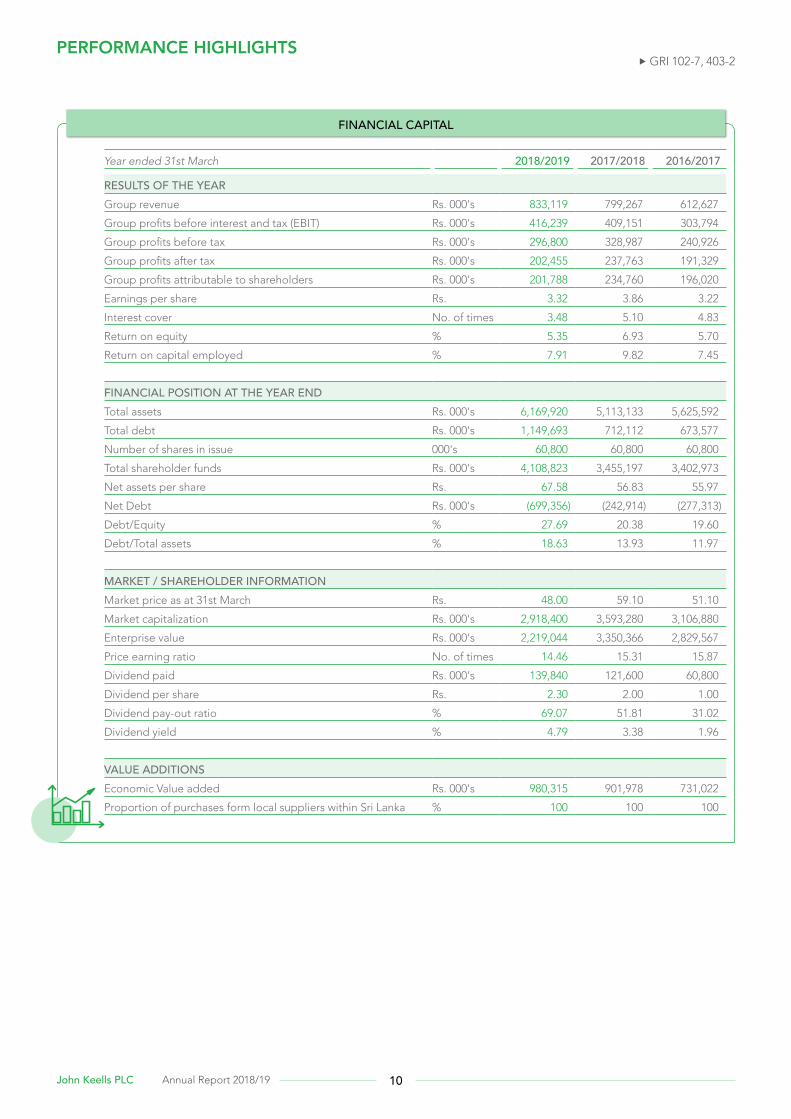
PERFORMANCE HIGHLIGHTS
Year ended 31st March 2018/2019 2017/2018 2016/2017
RESULTS OF THE YEARGroup revenue Rs. 000's 833,119 799,267 612,627
Group profits before interest and tax (EBIT) Rs. 000's 416,239 409,151 303,794
Group profits before tax Rs. 000's 296,800 328,987 240,926
Group profits after tax Rs. 000's 202,455 237,763 191,329
Group profits attributable to shareholders Rs. 000's 201,788 234,760 196,020
Earnings per share Rs. 3.32 3.86 3.22
Interest cover No. of times 3.48 5.10 4.83
Return on equity % 5.35 6.93 5.70
Return on capital employed % 7.91 9.82 7.45
FINANCIAL POSITION AT THE YEAR ENDTotal assets Rs. 000's 6,169,920 5,113,133 5,625,592
Total debt Rs. 000's 1,149,693 712,112 673,577
Number of shares in issue 000's 60,800 60,800 60,800
Total shareholder funds Rs. 000's 4,108,823 3,455,197 3,402,973
Net assets per share Rs. 67.58 56.83 55.97
Net Debt Rs. 000's (699,356) (242,914) (277,313)
Debt/Equity % 27.69 20.38 19.60
Debt/Total assets % 18.63 13.93 11.97
MARKET / SHAREHOLDER INFORMATIONMarket price as at 31st March Rs. 48.00 59.10 51.10
Market capitalization Rs. 000's 2,918,400 3,593,280 3,106,880
Enterprise value Rs. 000's 2,219,044 3,350,366 2,829,567
Price earning ratio No. of times 14.46 15.31 15.87
Dividend paid Rs. 000's 139,840 121,600 60,800
Dividend per share Rs. 2.30 2.00 1.00
Dividend pay-out ratio % 69.07 51.81 31.02
Dividend yield % 4.79 3.38 1.96
VALUE ADDITIONSEconomic Value added Rs. 000's 980,315 901,978 731,022
Proportion of purchases form local suppliers within Sri Lanka % 100 100 100
FINANCIAL CAPITAL
GRI 102-7, 403-2
11 HEAD ON
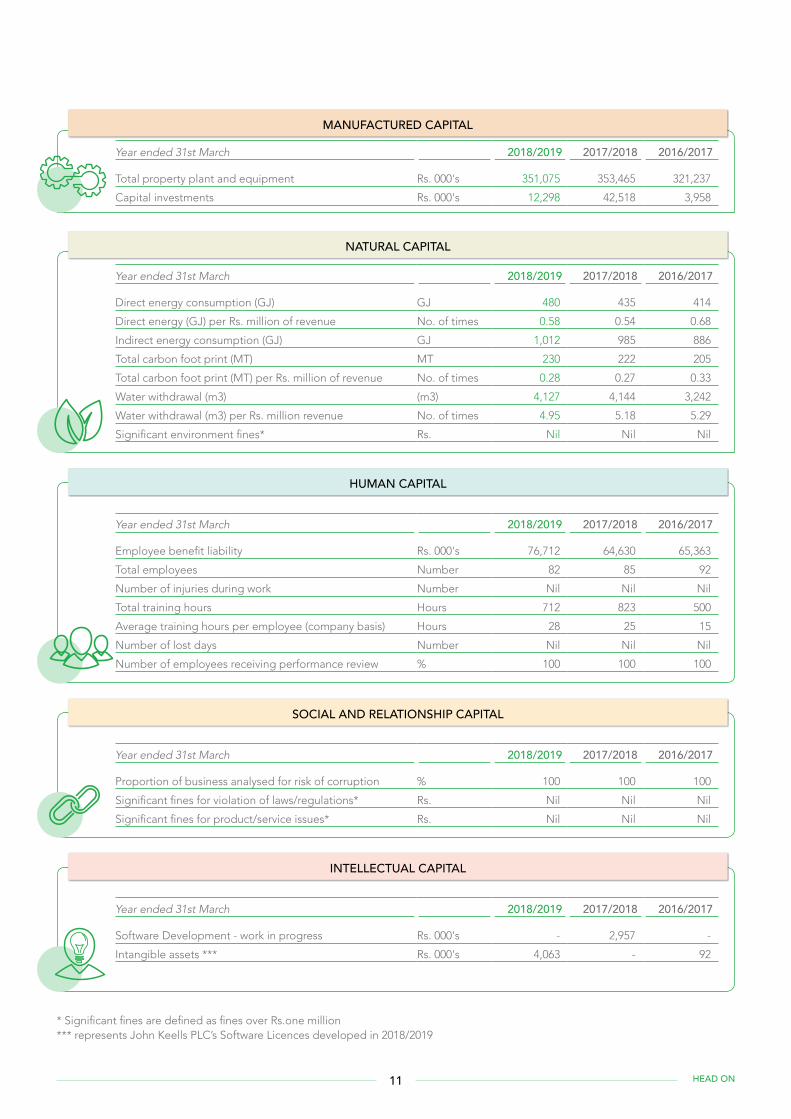
Year ended 31st March 2018/2019 2017/2018 2016/2017
Total property plant and equipment Rs. 000's 351,075 353,465 321,237
Capital investments Rs. 000's 12,298 42,518 3,958
MANUFACTURED CAPITAL
Year ended 31st March 2018/2019 2017/2018 2016/2017
Direct energy consumption (GJ) GJ 480 435 414
Direct energy (GJ) per Rs. million of revenue No. of times 0.58 0.54 0.68
Indirect energy consumption (GJ) GJ 1,012 985 886
Total carbon foot print (MT) MT 230 222 205
Total carbon foot print (MT) per Rs. million of revenue No. of times 0.28 0.27 0.33
Water withdrawal (m3) (m3) 4,127 4,144 3,242
Water withdrawal (m3) per Rs. million revenue No. of times 4.95 5.18 5.29
Significant environment fines* Rs. Nil Nil Nil
NATURAL CAPITAL
Year ended 31st March 2018/2019 2017/2018 2016/2017
Employee benefit liability Rs. 000's 76,712 64,630 65,363
Total employees Number 82 85 92
Number of injuries during work Number Nil Nil Nil
Total training hours Hours 712 823 500
Average training hours per employee (company basis) Hours 28 25 15
Number of lost days Number Nil Nil Nil
Number of employees receiving performance review % 100 100 100
HUMAN CAPITAL
Year ended 31st March 2018/2019 2017/2018 2016/2017
Proportion of business analysed for risk of corruption % 100 100 100
Significant fines for violation of laws/regulations* Rs. Nil Nil Nil
Significant fines for product/service issues* Rs. Nil Nil Nil
SOCIAL AND RELATIONSHIP CAPITAL
Year ended 31st March 2018/2019 2017/2018 2016/2017
Software Development - work in progress Rs. 000's - 2,957 -
Intangible assets *** Rs. 000's 4,063 - 92
INTELLECTUAL CAPITAL
* Significant fines are defined as fines over Rs.one million *** represents John Keells PLC’s Software Licences developed in 2018/2019
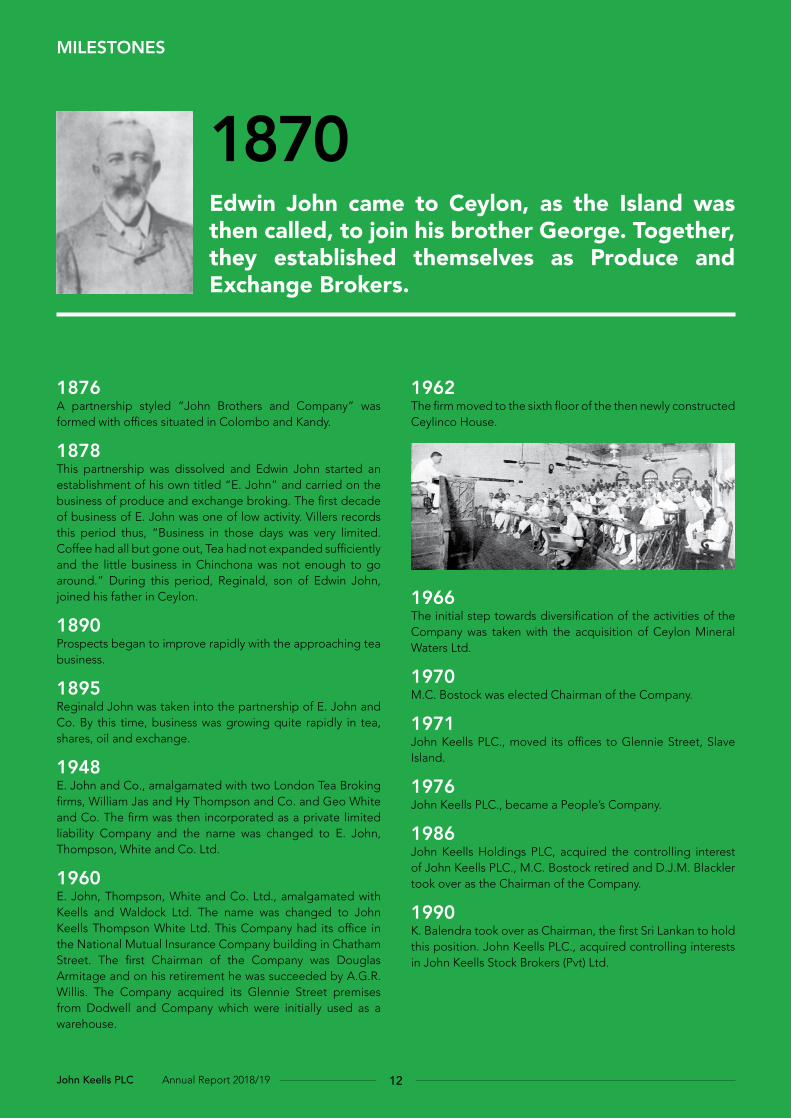
1876 A partnership styled “John Brothers and Company” was formed with offices situated in Colombo and Kandy.
1878This partnership was dissolved and Edwin John started an establishment of his own titled “E. John” and carried on the business of produce and exchange broking. The first decade of business of E. John was one of low activity. Villers records this period thus, “Business in those days was very limited. Coffee had all but gone out, Tea had not expanded sufficiently and the little business in Chinchona was not enough to go around.” During this period, Reginald, son of Edwin John, joined his father in Ceylon.
1890Prospects began to improve rapidly with the approaching tea business.
1895Reginald John was taken into the partnership of E. John and Co. By this time, business was growing quite rapidly in tea, shares, oil and exchange.
1948E. John and Co., amalgamated with two London Tea Broking firms, William Jas and Hy Thompson and Co. and Geo White and Co. The firm was then incorporated as a private limited liability Company and the name was changed to E. John, Thompson, White and Co. Ltd.
1960E. John, Thompson, White and Co. Ltd., amalgamated with Keells and Waldock Ltd. The name was changed to John Keells Thompson White Ltd. This Company had its office in the National Mutual Insurance Company building in Chatham Street. The first Chairman of the Company was Douglas Armitage and on his retirement he was succeeded by A.G.R. Willis. The Company acquired its Glennie Street premises from Dodwell and Company which were initially used as a warehouse.
1962The firm moved to the sixth floor of the then newly constructed Ceylinco House.
1966The initial step towards diversification of the activities of the Company was taken with the acquisition of Ceylon Mineral Waters Ltd.
1970M.C. Bostock was elected Chairman of the Company.
1971John Keells PLC., moved its offices to Glennie Street, Slave Island.
1976John Keells PLC., became a People’s Company.
1986John Keells Holdings PLC, acquired the controlling interest of John Keells PLC., M.C. Bostock retired and D.J.M. Blackler took over as the Chairman of the Company.
1990K. Balendra took over as Chairman, the first Sri Lankan to hold this position. John Keells PLC., acquired controlling interests in John Keells Stock Brokers (Pvt) Ltd.
MILESTONES
1870Edwin John came to Ceylon, as the Island was then called, to join his brother George. Together, they established themselves as Produce and Exchange Brokers.
12John Keells PLC Annual Report 2018/19
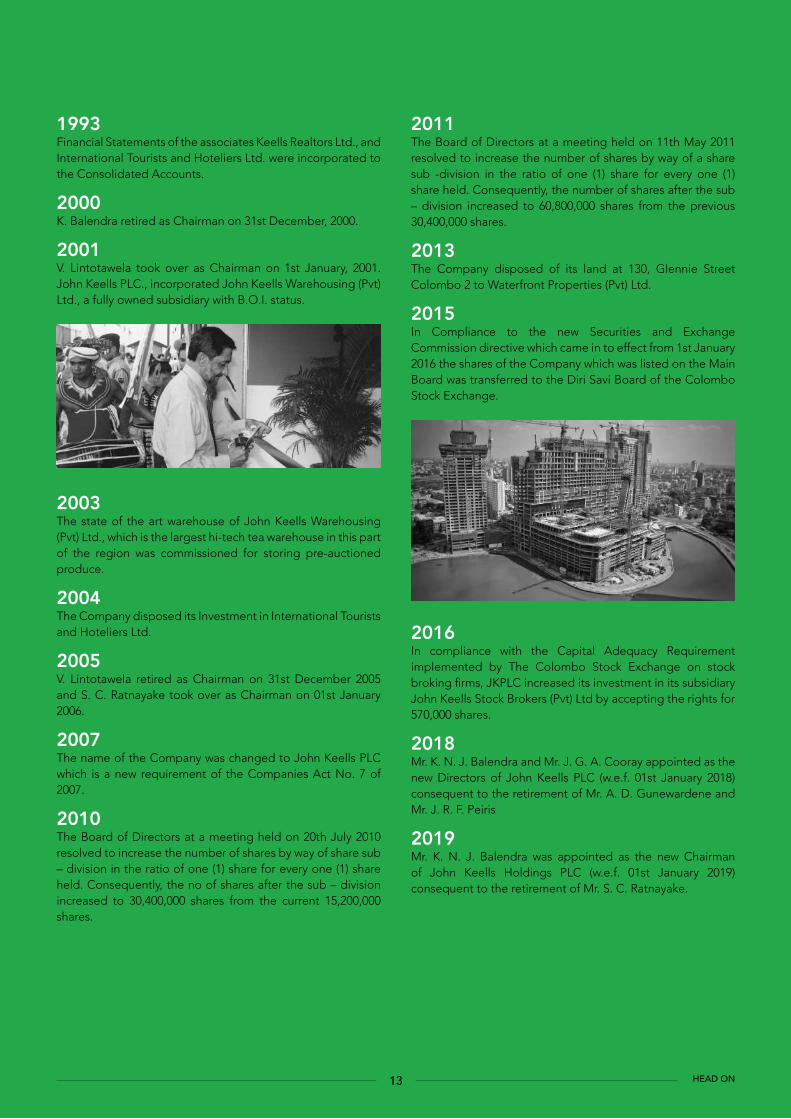
1993Financial Statements of the associates Keells Realtors Ltd., and International Tourists and Hoteliers Ltd. were incorporated to the Consolidated Accounts.
2000K. Balendra retired as Chairman on 31st December, 2000.
2001 V. Lintotawela took over as Chairman on 1st January, 2001. John Keells PLC., incorporated John Keells Warehousing (Pvt) Ltd., a fully owned subsidiary with B.O.I. status.
2003The state of the art warehouse of John Keells Warehousing (Pvt) Ltd., which is the largest hi-tech tea warehouse in this part of the region was commissioned for storing pre-auctioned produce.
2004The Company disposed its Investment in International Tourists and Hoteliers Ltd.
2005V. Lintotawela retired as Chairman on 31st December 2005 and S. C. Ratnayake took over as Chairman on 01st January 2006.
2007The name of the Company was changed to John Keells PLC which is a new requirement of the Companies Act No. 7 of 2007.
2010 The Board of Directors at a meeting held on 20th July 2010 resolved to increase the number of shares by way of share sub – division in the ratio of one (1) share for every one (1) share held. Consequently, the no of shares after the sub – division increased to 30,400,000 shares from the current 15,200,000 shares.
2011The Board of Directors at a meeting held on 11th May 2011 resolved to increase the number of shares by way of a share sub -division in the ratio of one (1) share for every one (1) share held. Consequently, the number of shares after the sub – division increased to 60,800,000 shares from the previous 30,400,000 shares.
2013The Company disposed of its land at 130, Glennie Street Colombo 2 to Waterfront Properties (Pvt) Ltd.
2015In Compliance to the new Securities and Exchange Commission directive which came in to effect from 1st January 2016 the shares of the Company which was listed on the Main Board was transferred to the Diri Savi Board of the Colombo Stock Exchange.
2016 In compliance with the Capital Adequacy Requirement implemented by The Colombo Stock Exchange on stock broking firms, JKPLC increased its investment in its subsidiary John Keells Stock Brokers (Pvt) Ltd by accepting the rights for 570,000 shares.
2018 Mr. K. N. J. Balendra and Mr. J. G. A. Cooray appointed as the new Directors of John Keells PLC (w.e.f. 01st January 2018) consequent to the retirement of Mr. A. D. Gunewardene and Mr. J. R. F. Peiris
2019 Mr. K. N. J. Balendra was appointed as the new Chairman of John Keells Holdings PLC (w.e.f. 01st January 2019) consequent to the retirement of Mr. S. C. Ratnayake.
13 HEAD ON
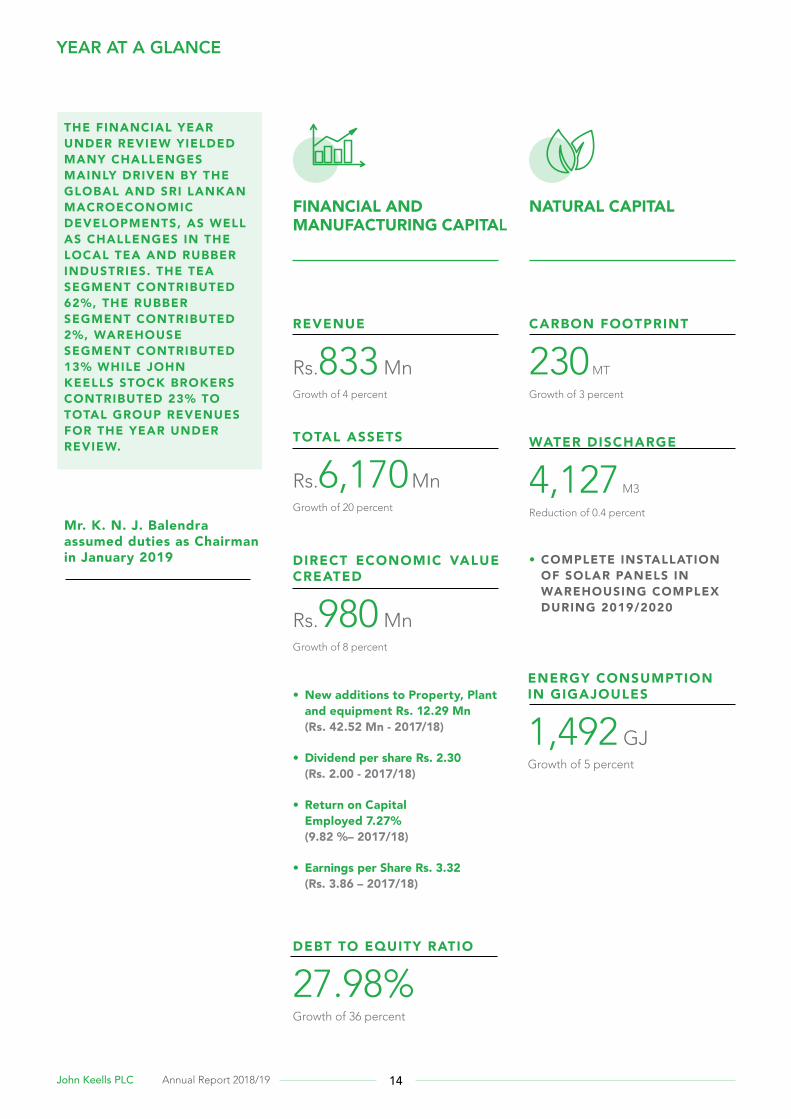
YEAR AT A GLANCE
THE FINANCIAL YEAR UNDER REVIEW YIELDED MANY CHALLENGES MAINLY DRIVEN BY THE GLOBAL AND SRI LANKAN MACROECONOMIC DEVELOPMENTS, AS WELL AS CHALLENGES IN THE LOCAL TEA AND RUBBER INDUSTRIES. THE TEA SEGMENT CONTRIBUTED 62%, THE RUBBER SEGMENT CONTRIBUTED 2%, WAREHOUSE SEGMENT CONTRIBUTED 13% WHILE JOHN KEELLS STOCK BROKERS CONTRIBUTED 23% TO TOTAL GROUP REVENUES FOR THE YEAR UNDER REVIEW.
FINANCIAL AND MANUFACTURING CAPITAL
NATURAL CAPITAL
• New additions to Property, Plant and equipment Rs. 12.29 Mn (Rs. 42.52 Mn - 2017/18)
• Dividend per share Rs. 2.30 (Rs. 2.00 - 2017/18)
• Return on Capital Employed 7.27% (9.82 %– 2017/18)
• Earnings per Share Rs. 3.32 (Rs. 3.86 – 2017/18)
Mr. K. N. J. Balendra assumed duties as Chairman in January 2019
WATER DISCHARGE
4,127 M3
Reduction of 0.4 percent
CARBON FOOTPRINT
230 MT
Growth of 3 percent
• COMPLETE INSTALLATION OF SOLAR PANELS IN WAREHOUSING COMPLEX DURING 2019/2020
REVENUE
Rs.833 MnGrowth of 4 percent
TOTAL ASSETS
Rs.6,170 MnGrowth of 20 percent
DIRECT ECONOMIC VALUE CREATED
Rs.980 MnGrowth of 8 percent
ENERGY CONSUMPTION IN GIGAJOULES
1,492 GJGrowth of 5 percent
DEBT TO EQUITY RATIO
27.98% Growth of 36 percent
14John Keells PLC Annual Report 2018/19
HUMAN CAPITAL SOCIAL AND RELATIONSHIP CAPITAL
INTELLECTUAL CAPITAL
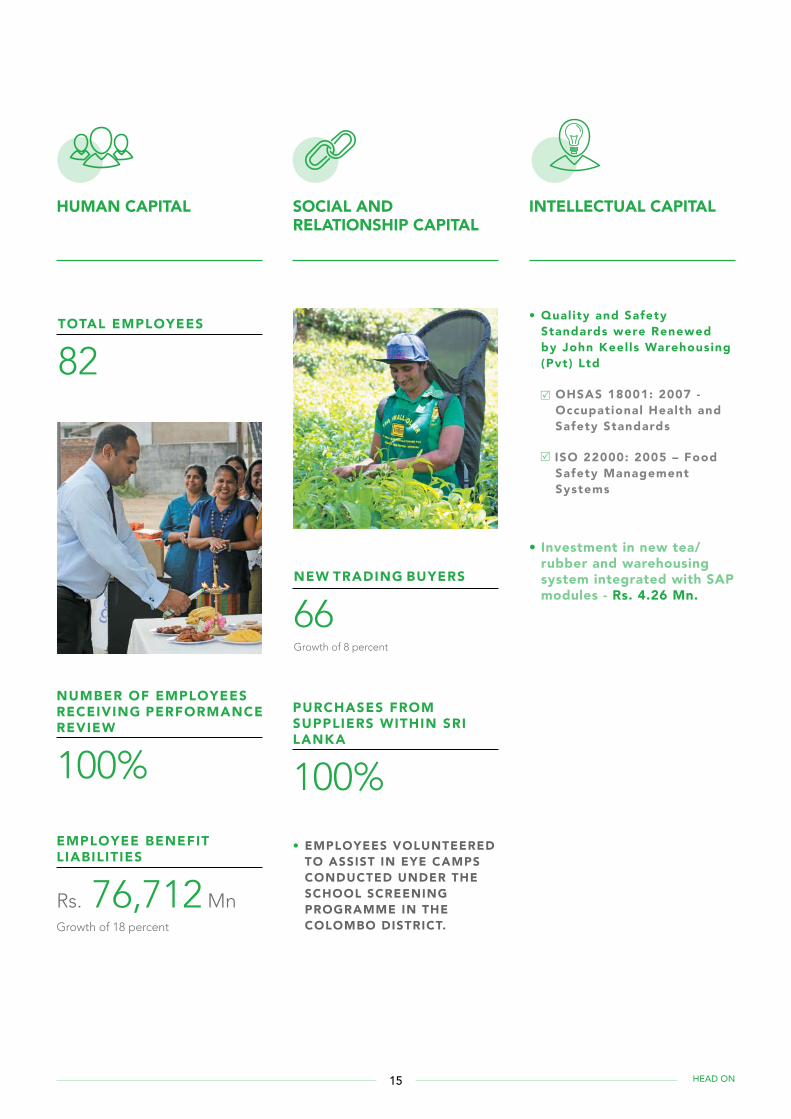
TOTAL EMPLOYEES
82
• EMPLOYEES VOLUNTEERED TO ASSIST IN EYE CAMPS CONDUCTED UNDER THE SCHOOL SCREENING PROGRAMME IN THE COLOMBO DISTRICT.
• Quality and Safety Standards were Renewed by John Keells Warehousing (Pvt) Ltd
OHSAS 18001: 2007 - Occupational Health and Safety Standards
ISO 22000: 2005 – Food Safety Management Systems
• Investment in new tea/rubber and warehousing system integrated with SAP modules - Rs. 4.26 Mn.
NEW TRADING BUYERS
66Growth of 8 percent
PURCHASES FROM SUPPLIERS WITHIN SRI LANKA
100%
NUMBER OF EMPLOYEES RECEIVING PERFORMANCE REVIEW
100%
EMPLOYEE BENEFIT LIABILITIES
Rs. 76,712 MnGrowth of 18 percent
15 HEAD ON
CHAIRMAN’S STATEMENT
I am pleased to present to you the Annual Report and Financial Statements of John Keells PLC (JKPLC) for the financial year ended 31st March 2019. All our lines of business encountered a challenging operating environment during the financial year under review, which stemmed from developments in the global and local macro environment as well as challenges specific to the local tea and rubber industries.
As you are aware, we experienced multiple terror attacks across the country on Easter Sunday, which resulted in the loss of many lives, including staff members and guests at Cinnamon Grand Colombo, a hotel property of the John Keells Group. It is with deep regret that we mourn the lives of all lost due to this incident, while wishing the injured and those affected a speedy recovery.
While we note that the security situation has been brought under control it is important that the country deals with this situation with resilience as we move forward to restore stability and growth in our country. While there will be impacts on the economy in the short term, particularly to the tourism industry, and while it may be premature to assess the medium to long term impacts on the economy, we believe that the macroeconomic fundamentals will be able to withstand and overcome these incidents. As such we do not expect a significant negative impact on the outlook of our business at this juncture of time.
MACRO ECONOMIC OVERVIEWThe Sri Lankan economy recorded slower than anticipated growth of 3.2 per cent for 2018. While a recovery was seen in agricultural activities, a contraction in the industrial sector stemming primarily from a decline in construction activities led to the slowdown in GDP growth. A prudent approach adopted in relation to monetary policy by the CBSL resulted in headline inflation remaining low during the year with the CCPI (2013 base) averaging at 4.3 percent compared to 6.6 percent recorded in 2017.
On the external front, Sri Lanka’s trade deficit widened during 2018 on account of increased import expenditure. This was induced by higher fuel, personal vehicle and gold imports and led to an offsetting of the improvement in the export performance. Export earnings grew by 4.7 percent to US$ 11.9 billion by end-2018, largely supported by the restoration of the GSP+ facility and conducive external trade policies. A significant improvement in tourism earnings was observed during the year 2018 with tourist arrivals increasing by 10.3 percent to record the highest annual tourist arrivals during a year. Workers’ remittances continued to moderate in 2018, owing to geopolitical uncertainties in the Middle Eastern region along with a shift in labour migration patterns. As a result, workers’ remittances reduced by 2.1 percent amounting to US$ 7 billion as at end 2018. Despite this, Sri Lanka’s balance of payments deteriorated in 2018, recording a deficit of US$ 1.1 billion from the US$ 2.1 billion surplus recorded in the previous year, contributing towards a depreciation of the rupee by 16.4 percent against the US Dollar in 2018. This was due to the significant increase of the current account deficit,
EXPECTED TO BE
MORE PROMISINGFOR THE TEA INDUSTRY WITH THE
IMPLEMENTATION OF ROBUST AGRICULTURAL
P R A C T I C E S A N D A M O R E C O N D U C I V EOPERATING ENVIRONMENT.
M r. K . N . J . B a l e n d r a
T H E Y E A R A H E A D I S
GRI 102-12, 102-14
16John Keells PLC Annual Report 2018/19
due to the rise in import expenditure in the vehicle, fuel and gold categories, and was exacerbated by the outflows faced in the government securities market and the Colombo Stock Exchange (CSE), particularly during the second half of the year.
THE TEA SEGMENTA significant development which affected the Tea industry during the year under review was the economic instability and devaluation of currencies of key tea importing markets such as Turkey, Russia and Iran which caused lower than anticipated demand and a fall in tea export earnings for the Country. In addition, the fluctuating global oil prices had a cascading effect on tea volumes exported by the Country to OPEC nations, a key market for Ceylon tea, whose purchasing power decreased resulting in either reduced orders or lower order quantities. These factors affected overall Ceylon tea prices which declined during the year under review to Rs. 570.55 per kilogram from Rs. 623.64 per kilogram in the previous financial year. Further, the sanctions imposed by the United States on Iran and the strained relationships with Turkey and Russia disrupted operating conditions resulting in delayed payments to exporters, and an overall decline in demand from these countries.
Development from global competitors which affected the local tea industry and the Group’s performance stemmed from the increased volumes produced by competing nations and in particular, Kenya. This resulted in a fall in tea prices in competing markets, leading to reduced demand for Ceylon tea in the world market.
In addition, the ban of Glyphosate in 2015 led to improper substitutes being used as herbicides by the industry which negatively affected the tea bushes resulting in an impact on the Maximum Residue Level (MRL) of tea. As a result, Japan and the European Union rejected Ceylon tea shipments during 2018 due to MRLs not meeting their predetermined standards. This caused further pressure on the industry in terms of reputation and cost, as exporters were impacted by returned shipments and non-shipment of orders where MRLs did not meet the required standards. These substitute herbicides also resulted in retarding the growth of the tea bushes which together with adverse weather conditions resulted in lower quantities of tea being produced in Sri Lanka. The adverse impacts of a decline in total tea production to 303.94 million kilograms in 2018 compared to 307.72 million kilograms in 2017 was compounded by the increased production costs faced by the industry amidst a reduction in tea prices. In addition, a few partner factories were forced to operate below capacity while several faced closure due to the volume reduction in the availability of green leaf, negatively affecting Company performance during the year under review.
A 15-day strike by the plantation workers regarding wage increases resulted in lost production days contributing toward a decline in the quantity and quality of tea available for processing in the last quarter of 2018.
THE RUBBER SEGMENTThe key developments which affected business operations at the Rubber segment was the reduction in global rubber prices and the cascading effects of the sanctions imposed by the United States on China, a key importer of rubber from Sri Lanka, which resulted in lower volume and value of exports. Production volumes declined by 0.60 percent to 82.6 million kilograms in 2018 compared to 2017. The added quantity of rubber Latex available for sale further reduced local prices to Rs. 313.21 per kilogram compared to the previous year’s Rs. 347.97per kilogram
THE WAREHOUSE SEGMENTThe Group’s Warehouse segment implemented a new strategy to increase capacity utilisation during the year under review. A key initiative under this new strategic direction was the storage of tea products of competing brokers which resulted in the achievement of business growth. The warehouse segment of the Group achieved an 85 percent capacity utilisation during most of the year compared to 65 to 70 percent recorded in previous years, resulting in a significantly better performance by the segment during the year.
THE STOCK BROKING SEGMENTActivity on the Colombo Stock Exchange was subdued with the economic environment driving the main segments of local retail, High Net Worth Individuals and foreign and local institutional investors to take a cautious approach.
Foreign participation throughout the year was high although this was driven by net outflows from the market which was also seen in the domestic fixed income securities market. The broader All Share Index declined by 14.2 percent over the financial year while the S&P20 index declined by 25.0 percent. Daily average turnover for the financial year 2018/2019 recorded Rs. 697.6 million compared to Rs. 1,035.6 million in the financial year 2017/2018. Net foreign outflows for the year under review recorded over Rs. 26 billion. The CSE market capitalization as at 31st March 2019 was Rs. 2,606 billion as compared to Rs. 3,033 billion as at 31st March 2018.
THE SRI LANKAN ECONOMY RECORDED SLOWER THAN ANTICIPATED GROWTH OF 3.2 PER CENT FOR 2018.
17 HEAD ON
PERFORMANCE OF THE GROUPThe Group performance during the year was supported mainly by the growth in the warehousing business segment. The tea and rubber segments also continued to support growth albeit at a lower contribution than experienced in the previous year. The Group recorded a consolidated revenue of Rs. 833 million for the year under review compared to Rs. 799 million in the previous financial year, achieving an overall growth of 4.24 percent. John Keells Stock Brokers (Pvt) Ltd recorded a modest performance with lower activity levels at the Colombo Stock Exchange, resulting in a lower contribution of 23 percent to total Group revenues for the year under review. Revenue contribution from the Tea, Rubber and Warehouse segments amounted to 62 percent, 2 percent and 13 percent respectively, for the year under review.
The increases in direct and indirect costs incurred by the Group during the year under review as a result of the challenging external operating environment resulted in a decline in Group profits. Thus, the Profit After Tax (PAT) recorded for the year under review was Rs. 202 million a 15 percent decline compared to Rs. 238 million recorded in the previous financial year.
FUTURE OUTLOOKThe emphasis in the ensuing financial year will be to consolidate business growth in the Tea and Rubber segments with focus on sustaining the existing customer base, while continuing the growth momentum experienced in the Warehousing segment.
The Group will further focus on sharing global industry best practices with partner production facilities to improve product quality and enhance process efficiencies thereby enhancing reputation and demand to enable optimal production capacity utilisation. This will also open new business opportunities for the Group in the medium term.
The increased focus by the tea industry regulator on imposing controls on tea factories and encouraging ethical and good manufacturing practices aligned to world and ISO standards is welcomed as this will help enhance the brand equity of Ceylon Tea and increase the global demand for same.
The year ahead is expected to be more promising for the tea industry with the implementation of robust agricultural practices and a more conducive operating environment.
As part of the John Keells Holdings PLC Group, we ensure that all regulatory requirements of operating a business are considered while subscribing to many voluntary standards of business conduct and sustainability with a view to building a sustainable business for the long term while creating value to all stakeholders.
ACKNOWLEDGMENTI welcome Mr J R Gunaratne who was appointed to the Board during the year and place on record my sincere appreciation to Mr S C Ratnayake and Mr V A A Perera who retired on 31st December 2018, for their valuable contribution during their tenure and wish them the very best. I take this opportunity to thank the JKPLC team for their efforts in facing a challenging year with resilience and strength. I also thank my colleagues on the Board for their continuing guidance.
K. N. J. BalendraChairman24th May 2019
CHAIRMAN’S STATEMENT
18John Keells PLC Annual Report 2018/19
STRATEGIES20 Business Model 22 Value Creation Model 24 Stakeholder Relationships27 Materiality Analysis 29 Management Discussion and Analysis37 Competitor Analysis 38 Capital Management Review 38 - Financial Capital 45 - Manufactured Capital 47 - Social and Relationship Capital 51 - Human Capital 58 - Intellectual Capital 62- Natural Capital 65 Sustainability69 GRI Standard Index
BUSINESS MODEL
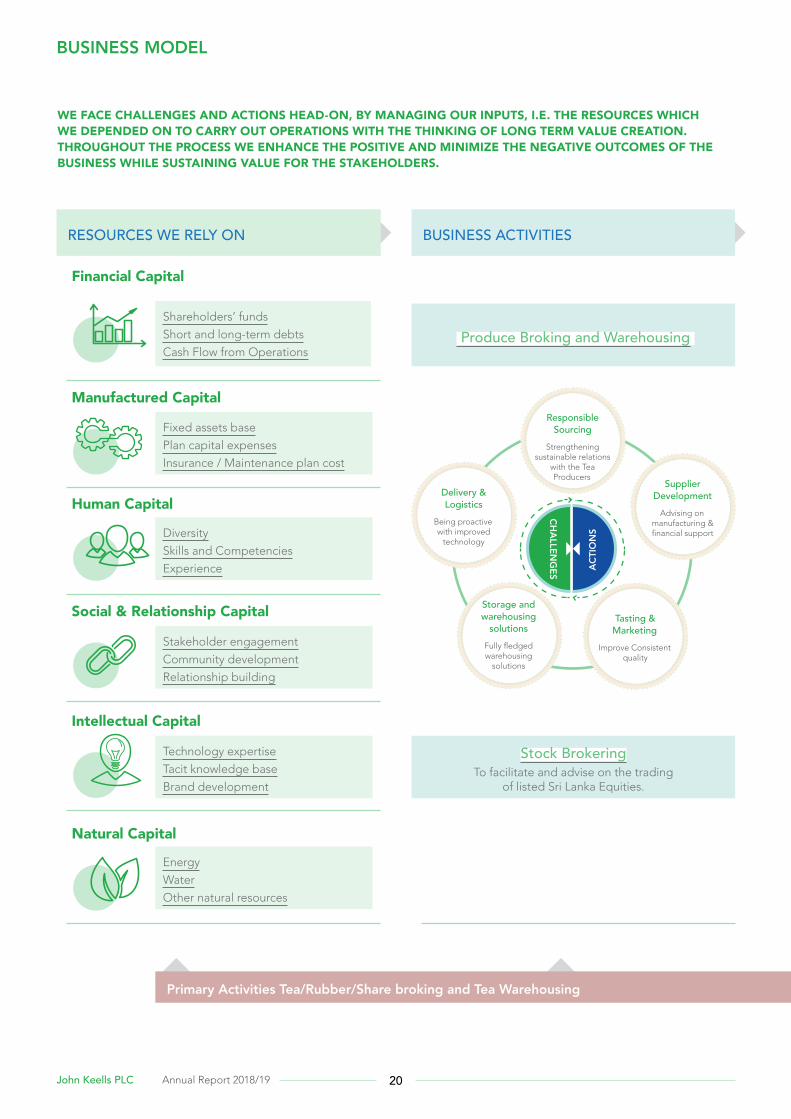
RESOURCES WE RELY ON BUSINESS ACTIVITIES
Financial Capital
Manufactured Capital
Human Capital
Social & Relationship Capital
Intellectual Capital
Natural Capital
Shareholders’ fundsShort and long-term debts Cash Flow from Operations
Fixed assets base Plan capital expenses Insurance / Maintenance plan cost
DiversitySkills and Competencies Experience
Stakeholder engagement Community development Relationship building
Technology expertise Tacit knowledge base Brand development
EnergyWaterOther natural resources
Primary Activities Tea/Rubber/Share broking and Tea Warehousing
Produce Broking and Warehousing
Stock BrokeringTo facilitate and advise on the trading
of listed Sri Lanka Equities.
CHA
LLENG
ES ACT
ION
S
Delivery & Logistics
Being proactive with improved
technology
Responsible Sourcing
Strengthening sustainable relations
with the Tea Producers
Supplier Development
Advising on manufacturing & financial support
Tasting & Marketing
Improve Consistent quality
Storage and warehousing
solutionsFully fledged warehousing
solutions
WE FACE CHALLENGES AND ACTIONS HEAD-ON, BY MANAGING OUR INPUTS, I.E. THE RESOURCES WHICH WE DEPENDED ON TO CARRY OUT OPERATIONS WITH THE THINKING OF LONG TERM VALUE CREATION. THROUGHOUT THE PROCESS WE ENHANCE THE POSITIVE AND MINIMIZE THE NEGATIVE OUTCOMES OF THE BUSINESS WHILE SUSTAINING VALUE FOR THE STAKEHOLDERS.
20John Keells PLC Annual Report 2018/19
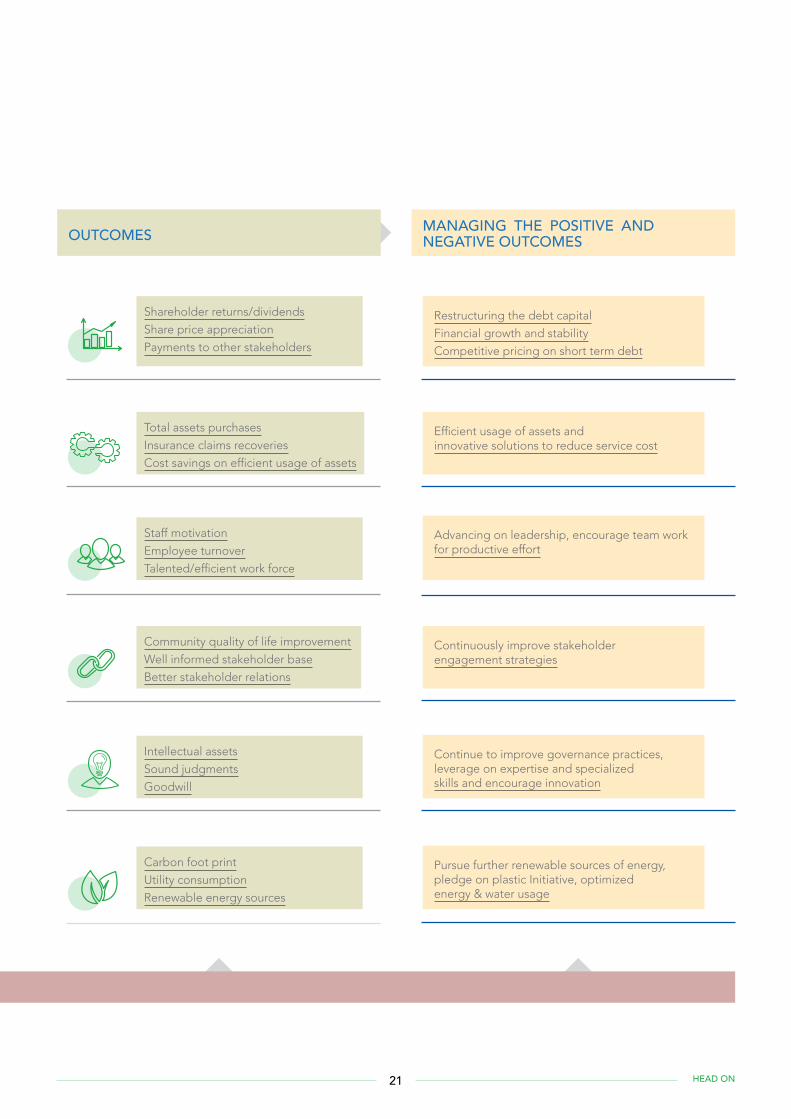
OUTCOMES MANAGING THE POSITIVE AND NEGATIVE OUTCOMES
Shareholder returns/dividends Share price appreciation Payments to other stakeholders
Total assets purchases Insurance claims recoveries Cost savings on efficient usage of assets
Staff motivationEmployee turnover Talented/efficient work force
Community quality of life improvementWell informed stakeholder base Better stakeholder relations
Intellectual assets Sound judgments Goodwill
Carbon foot print Utility consumptionRenewable energy sources
Restructuring the debt capitalFinancial growth and stability Competitive pricing on short term debt
Efficient usage of assets and innovative solutions to reduce service cost
Advancing on leadership, encourage team work for productive effort
Continuously improve stakeholder engagement strategies
Continue to improve governance practices, leverage on expertise and specialized skills and encourage innovation
Pursue further renewable sources of energy, pledge on plastic Initiative, optimized energy & water usage
Primary Activities Tea/Rubber/Share broking and Tea Warehousing
21 HEAD ON
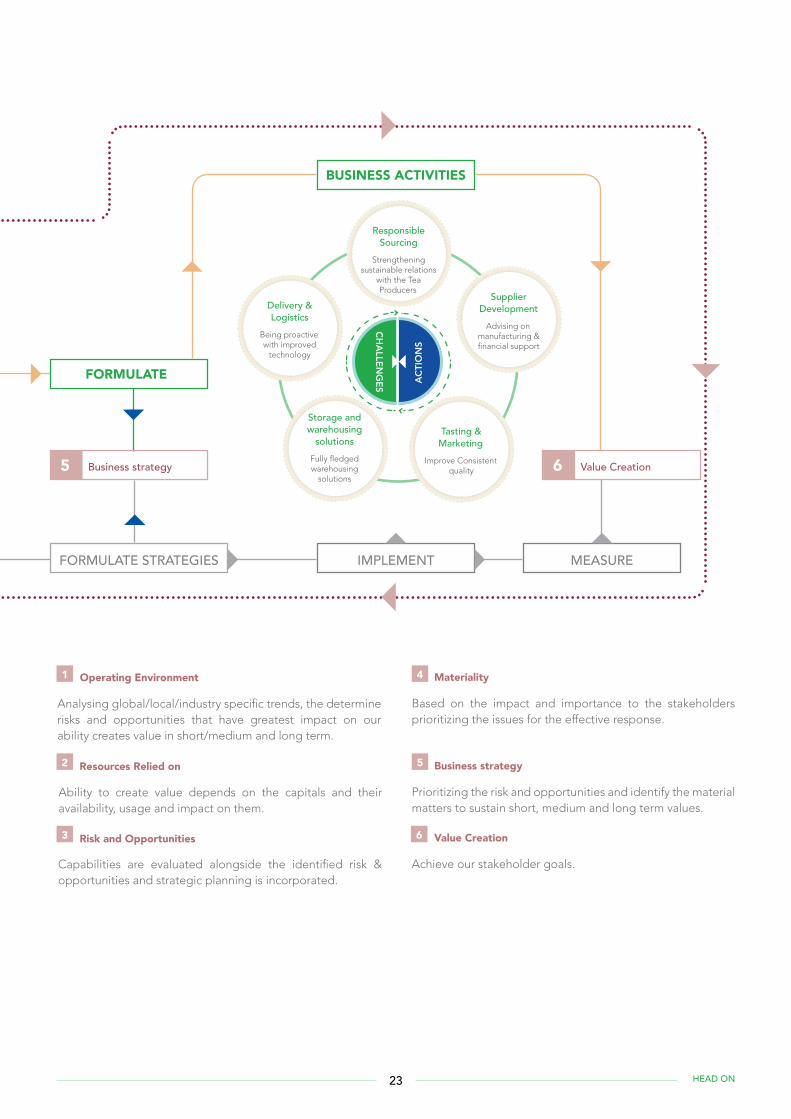
VALUE CREATION MODEL
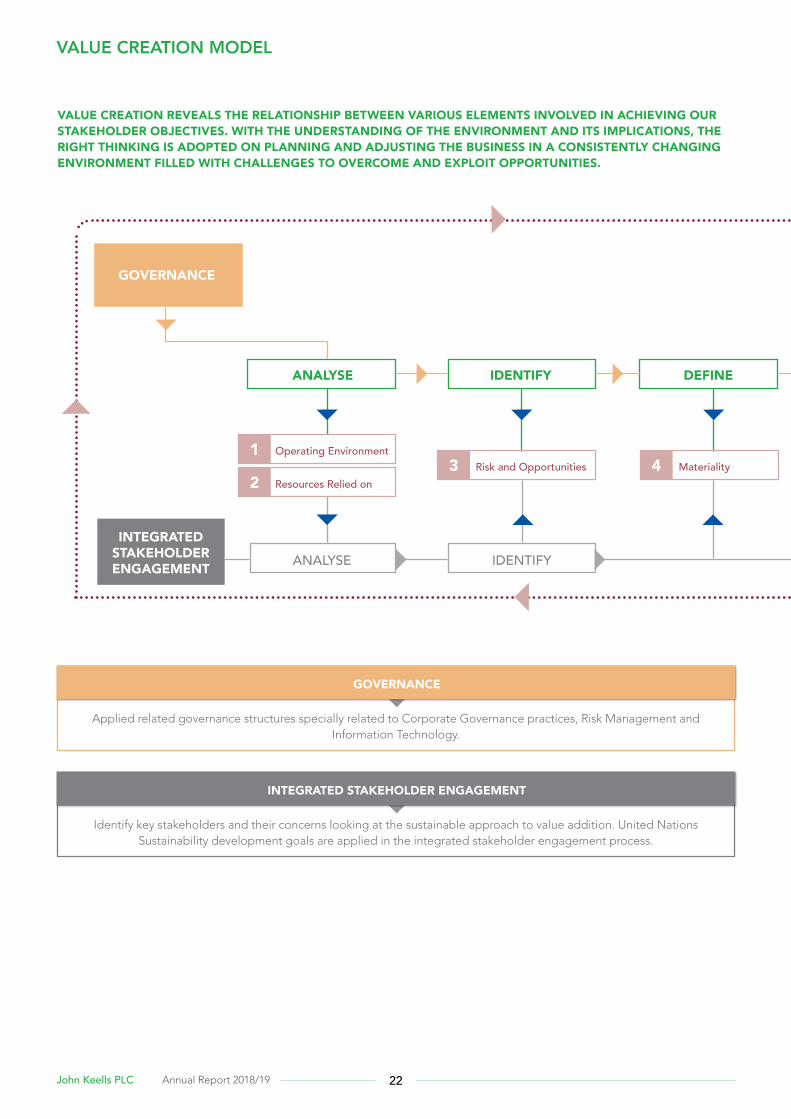
ANALYSE
Operating Environment
Resources Relied onRisk and Opportunities Materiality
ANALYSE
IDENTIFY
IDENTIFY
DEFINE
GOVERNANCE
INTEGRATED STAKEHOLDER ENGAGEMENT
13 4
2
Applied related governance structures specially related to Corporate Governance practices, Risk Management and Information Technology.
GOVERNANCE
Identify key stakeholders and their concerns looking at the sustainable approach to value addition. United Nations Sustainability development goals are applied in the integrated stakeholder engagement process.
INTEGRATED STAKEHOLDER ENGAGEMENT
VALUE CREATION REVEALS THE RELATIONSHIP BETWEEN VARIOUS ELEMENTS INVOLVED IN ACHIEVING OUR STAKEHOLDER OBJECTIVES. WITH THE UNDERSTANDING OF THE ENVIRONMENT AND ITS IMPLICATIONS, THE RIGHT THINKING IS ADOPTED ON PLANNING AND ADJUSTING THE BUSINESS IN A CONSISTENTLY CHANGING ENVIRONMENT FILLED WITH CHALLENGES TO OVERCOME AND EXPLOIT OPPORTUNITIES.
22John Keells PLC Annual Report 2018/19
Business strategy Value Creation
IMPLEMENT MEASUREFORMULATE STRATEGIES
FORMULATE
BUSINESS ACTIVITIES
5 6
Operating Environment
Risk and Opportunities
Business strategyResources Relied on
Materiality
Value Creation
Analysing global/local/industry specific trends, the determine risks and opportunities that have greatest impact on our ability creates value in short/medium and long term.
Capabilities are evaluated alongside the identified risk & opportunities and strategic planning is incorporated.
Prioritizing the risk and opportunities and identify the material matters to sustain short, medium and long term values.
Ability to create value depends on the capitals and their availability, usage and impact on them.
Based on the impact and importance to the stakeholders prioritizing the issues for the effective response.
Achieve our stakeholder goals.
1 4
2 5
3 6
CHA
LLENG
ES ACT
ION
S
Delivery & Logistics
Being proactive with improved
technology
Responsible Sourcing
Strengthening sustainable relations
with the Tea Producers
Supplier Development
Advising on manufacturing & financial support
Tasting & Marketing
Improve Consistent quality
Storage and warehousing
solutionsFully fledged warehousing
solutions
23 HEAD ON
STAKEHOLDER RELATIONSHIPS
Stakeholders Focus on Head on with
Customers • Better service
• Value for money
• Product responsibility
• Attitude of employees
• Adopting latest technology
• Building long term sustainable relationships
• Create customer value individually and as a group
Employees • Attractive remuneration
• Opportunities for development
• Career development
• Safety in the Woking environment
• Investment in employee training and development
• Development of transparent and competitive remuneration structure
Communities • Employment creation
• Involvement of community development projects
• Environmental preservation
• Compliance with mandatory and voluntary regulations and guidelines
• Partnering with John Keells Foundations and other institutes to engage and satisfy other regulatory requirements
Shareholders/ Providers of Capital
• Sustainable returns
• Corporate governance
• Ethical business practices
• Strategic long-term outlook
• Respond to macroeconomic conditions
• Adopting sustainable and effective relationships
• Developing flexible processes and policies
Suppliers • Consistence/ improvement in demand
• Knowledge sharing
• Fair pricing
• Continuous relationships
• Building long term sustainable relationships
• Effective management of risks
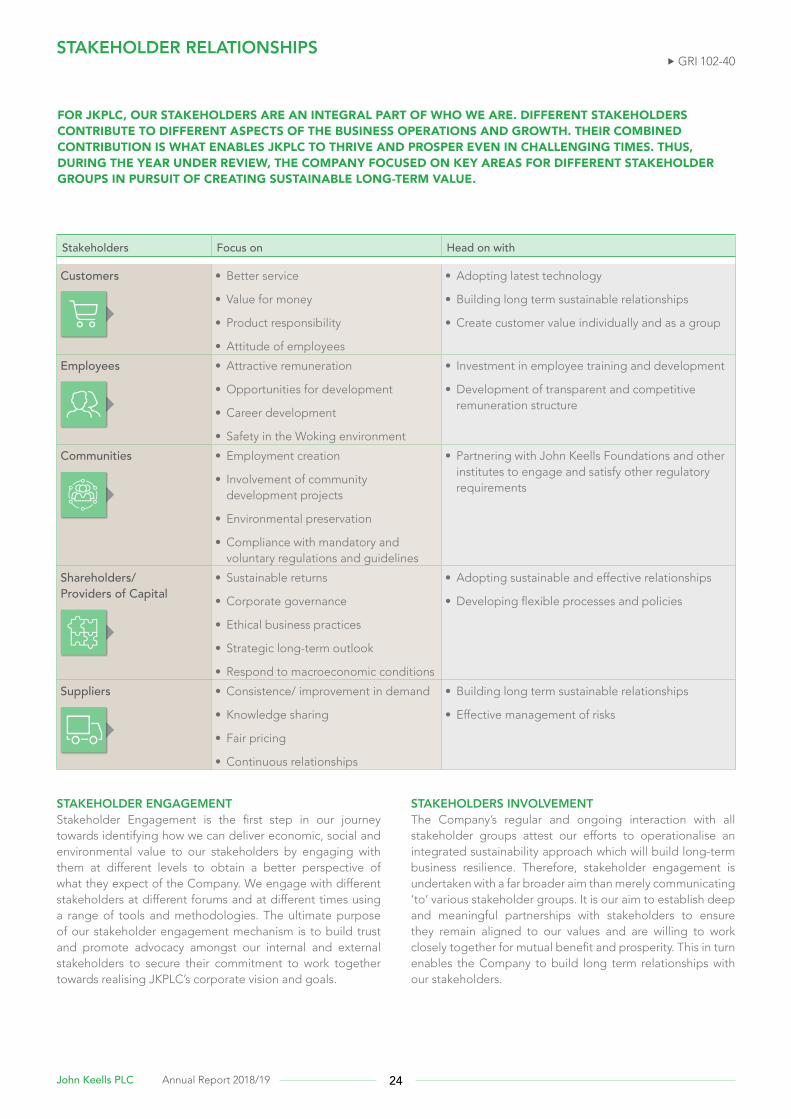
STAKEHOLDER ENGAGEMENTStakeholder Engagement is the first step in our journey towards identifying how we can deliver economic, social and environmental value to our stakeholders by engaging with them at different levels to obtain a better perspective of what they expect of the Company. We engage with different stakeholders at different forums and at different times using a range of tools and methodologies. The ultimate purpose of our stakeholder engagement mechanism is to build trust and promote advocacy amongst our internal and external stakeholders to secure their commitment to work together towards realising JKPLC’s corporate vision and goals.
STAKEHOLDERS INVOLVEMENTThe Company’s regular and ongoing interaction with all stakeholder groups attest our efforts to operationalise an integrated sustainability approach which will build long-term business resilience. Therefore, stakeholder engagement is undertaken with a far broader aim than merely communicating ‘to’ various stakeholder groups. It is our aim to establish deep and meaningful partnerships with stakeholders to ensure they remain aligned to our values and are willing to work closely together for mutual benefit and prosperity. This in turn enables the Company to build long term relationships with our stakeholders.
FOR JKPLC, OUR STAKEHOLDERS ARE AN INTEGRAL PART OF WHO WE ARE. DIFFERENT STAKEHOLDERS CONTRIBUTE TO DIFFERENT ASPECTS OF THE BUSINESS OPERATIONS AND GROWTH. THEIR COMBINED CONTRIBUTION IS WHAT ENABLES JKPLC TO THRIVE AND PROSPER EVEN IN CHALLENGING TIMES. THUS, DURING THE YEAR UNDER REVIEW, THE COMPANY FOCUSED ON KEY AREAS FOR DIFFERENT STAKEHOLDER GROUPS IN PURSUIT OF CREATING SUSTAINABLE LONG-TERM VALUE.
GRI 102-40
24John Keells PLC Annual Report 2018/19
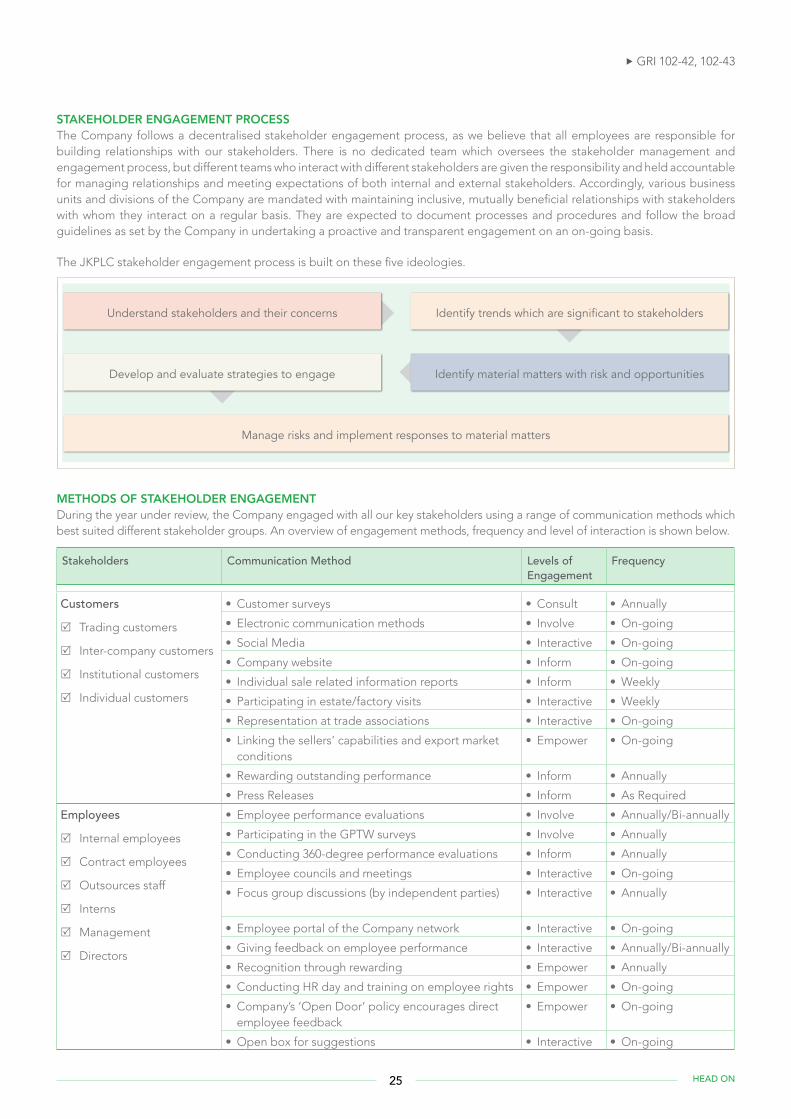
STAKEHOLDER ENGAGEMENT PROCESSThe Company follows a decentralised stakeholder engagement process, as we believe that all employees are responsible for building relationships with our stakeholders. There is no dedicated team which oversees the stakeholder management and engagement process, but different teams who interact with different stakeholders are given the responsibility and held accountable for managing relationships and meeting expectations of both internal and external stakeholders. Accordingly, various business units and divisions of the Company are mandated with maintaining inclusive, mutually beneficial relationships with stakeholders with whom they interact on a regular basis. They are expected to document processes and procedures and follow the broad guidelines as set by the Company in undertaking a proactive and transparent engagement on an on-going basis.
The JKPLC stakeholder engagement process is built on these five ideologies.
Understand stakeholders and their concerns
Identify material matters with risk and opportunities
Identify trends which are significant to stakeholders
Develop and evaluate strategies to engage
Manage risks and implement responses to material matters
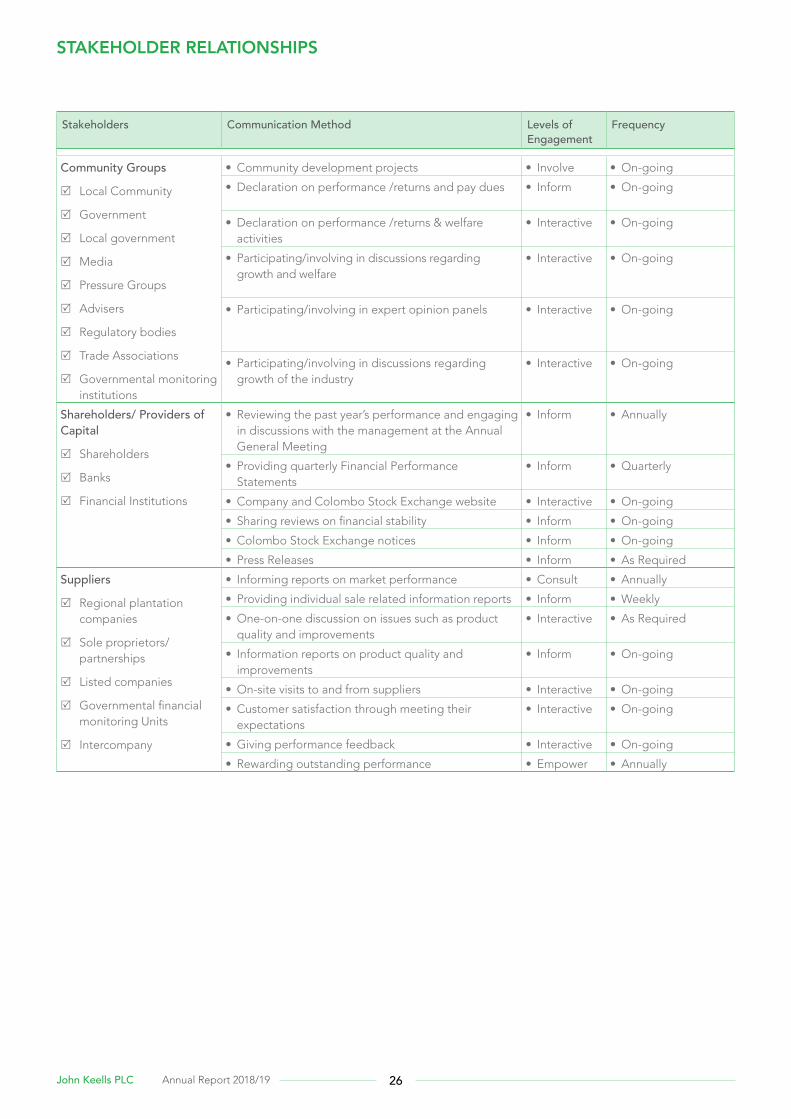
METHODS OF STAKEHOLDER ENGAGEMENTDuring the year under review, the Company engaged with all our key stakeholders using a range of communication methods which best suited different stakeholder groups. An overview of engagement methods, frequency and level of interaction is shown below.
Stakeholders Communication Method Levels of Engagement
Frequency
Customers
5 Trading customers
5 Inter-company customers
5 Institutional customers
5 Individual customers
• Customer surveys • Consult • Annually
• Electronic communication methods • Involve • On-going
• Social Media • Interactive • On-going
• Company website • Inform • On-going
• Individual sale related information reports • Inform • Weekly
• Participating in estate/factory visits • Interactive • Weekly
• Representation at trade associations • Interactive • On-going
• Linking the sellers’ capabilities and export market conditions
• Empower • On-going
• Rewarding outstanding performance • Inform • Annually
• Press Releases • Inform • As Required
Employees
5 Internal employees
5 Contract employees
5 Outsources staff
5 Interns
5 Management
5 Directors
• Employee performance evaluations • Involve • Annually/Bi-annually
• Participating in the GPTW surveys • Involve • Annually
• Conducting 360-degree performance evaluations • Inform • Annually
• Employee councils and meetings • Interactive • On-going
• Focus group discussions (by independent parties) • Interactive • Annually
• Employee portal of the Company network • Interactive • On-going
• Giving feedback on employee performance • Interactive • Annually/Bi-annually
• Recognition through rewarding • Empower • Annually
• Conducting HR day and training on employee rights • Empower • On-going
• Company’s ‘Open Door’ policy encourages direct employee feedback
• Empower • On-going
• Open box for suggestions • Interactive • On-going
GRI 102-42, 102-43
25 HEAD ON
Stakeholders Communication Method Levels of Engagement
Frequency
Community Groups
5 Local Community
5 Government
5 Local government
5 Media
5 Pressure Groups
5 Advisers
5 Regulatory bodies
5 Trade Associations
5 Governmental monitoring institutions
• Community development projects • Involve • On-going
• Declaration on performance /returns and pay dues • Inform • On-going
• Declaration on performance /returns & welfare activities
• Interactive • On-going
• Participating/involving in discussions regarding growth and welfare
• Interactive • On-going
• Participating/involving in expert opinion panels • Interactive • On-going
• Participating/involving in discussions regarding growth of the industry
• Interactive • On-going
Shareholders/ Providers of Capital
5 Shareholders
5 Banks
5 Financial Institutions
• Reviewing the past year’s performance and engaging in discussions with the management at the Annual General Meeting
• Inform • Annually
• Providing quarterly Financial Performance Statements
• Inform • Quarterly
• Company and Colombo Stock Exchange website • Interactive • On-going
• Sharing reviews on financial stability • Inform • On-going
• Colombo Stock Exchange notices • Inform • On-going
• Press Releases • Inform • As Required
Suppliers
5 Regional plantation companies
5 Sole proprietors/ partnerships
5 Listed companies
5 Governmental financial monitoring Units
5 Intercompany
• Informing reports on market performance • Consult • Annually
• Providing individual sale related information reports • Inform • Weekly
• One-on-one discussion on issues such as product quality and improvements
• Interactive • As Required
• Information reports on product quality and improvements
• Inform • On-going
• On-site visits to and from suppliers • Interactive • On-going
• Customer satisfaction through meeting their expectations
• Interactive • On-going
• Giving performance feedback • Interactive • On-going
• Rewarding outstanding performance • Empower • Annually
STAKEHOLDER RELATIONSHIPS
26John Keells PLC Annual Report 2018/19
MATERIALITY ANALYSIS
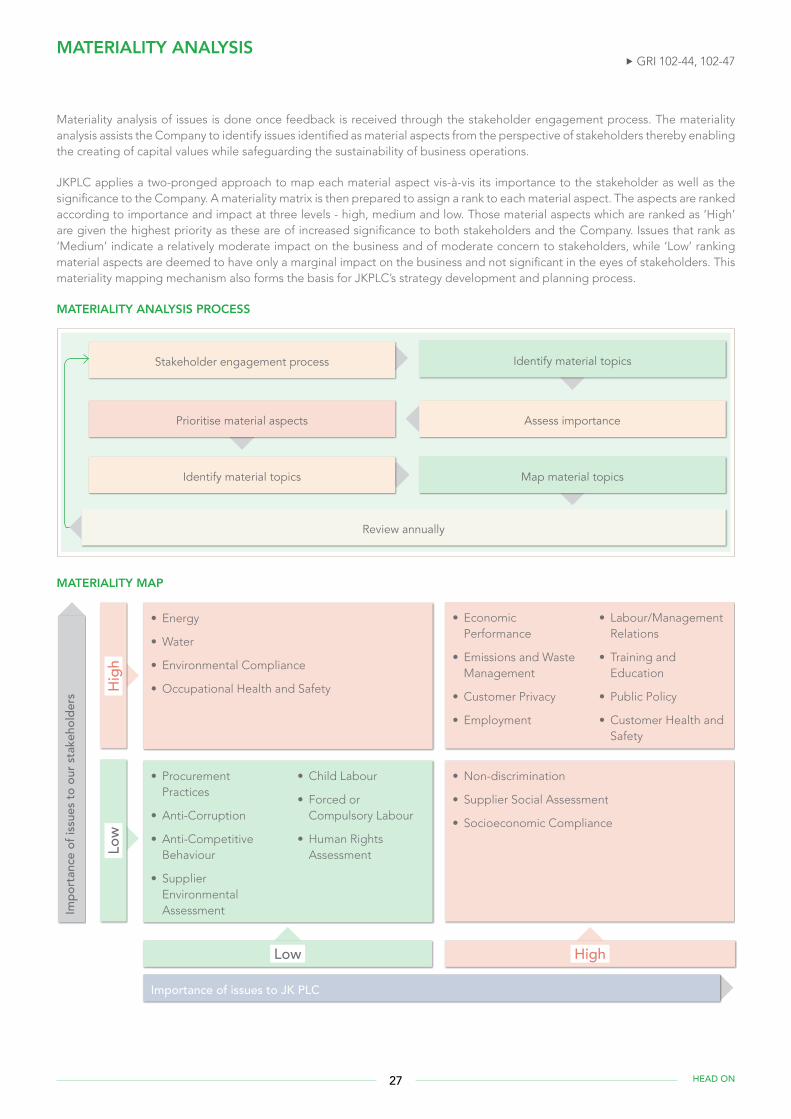
Materiality analysis of issues is done once feedback is received through the stakeholder engagement process. The materiality analysis assists the Company to identify issues identified as material aspects from the perspective of stakeholders thereby enabling the creating of capital values while safeguarding the sustainability of business operations.
JKPLC applies a two-pronged approach to map each material aspect vis-à-vis its importance to the stakeholder as well as the significance to the Company. A materiality matrix is then prepared to assign a rank to each material aspect. The aspects are ranked according to importance and impact at three levels - high, medium and low. Those material aspects which are ranked as ‘High’ are given the highest priority as these are of increased significance to both stakeholders and the Company. Issues that rank as ‘Medium’ indicate a relatively moderate impact on the business and of moderate concern to stakeholders, while ‘Low’ ranking material aspects are deemed to have only a marginal impact on the business and not significant in the eyes of stakeholders. This materiality mapping mechanism also forms the basis for JKPLC’s strategy development and planning process.
MATERIALITY ANALYSIS PROCESS
MATERIALITY MAP
• Energy
• Water
• Environmental Compliance
• Occupational Health and Safety
• Procurement Practices
• Anti-Corruption
• Anti-Competitive Behaviour
• Supplier Environmental Assessment
• Child Labour
• Forced or Compulsory Labour
• Human Rights Assessment
• Economic Performance
• Emissions and Waste Management
• Customer Privacy
• Employment
• Labour/Management Relations
• Training and Education
• Public Policy
• Customer Health and Safety
• Non-discrimination
• Supplier Social Assessment
• Socioeconomic Compliance
Low
Low
Hig
h
High
Identify material topics
Assess importancePrioritise material aspects
Identify material topics Map material topics
Review annually
Stakeholder engagement process
Importance of issues to JK PLC
Impo
rtan
ce o
f iss
ues
to o
ur s
take
hold
ers
GRI 102-44, 102-47
27 HEAD ON

Material topics and corresponding principles as per GRI Standard guidelines
GRI Standard No Material topic Boundary Impact to Company Impact to Community
Economic
201 Economic Performance Internal High High
204 Procurement Practices Internal Low Low 205 Anti-corruption Internal Low Low
206 Anti-competitive Behaviour Internal Low Low
Environmental 302 Energy Internal Medium Medium303 Water Internal Medium Medium305 Emissions Internal Medium Medium306 Effluents and Waste Environment Medium Medium307 Environmental Compliance Environment Medium Medium308 Supplier Environmental Assessment Suppliers Low LowSocial 401 Employment Internal High High
402 Labour/Management Relations Internal High High
403 Occupational Health and Safety Internal High Low404 Training and Education Internal High High
406 Non-discrimination Internal High Low408 Child Labour Internal Low Low
409 Forced or Compulsory Labour Internal Low Low
412 Human Rights Assessment Internal Low Low
414 Supplier Social Assessment Suppliers Low Medium
415 Public Policy Internal/ Government High High
419 Socioeconomic Compliance Community Medium High
MATERIALITY ANALYSIS
28John Keells PLC Annual Report 2018/19
MANAGEMENT DISCUSSION AND ANALYSIS
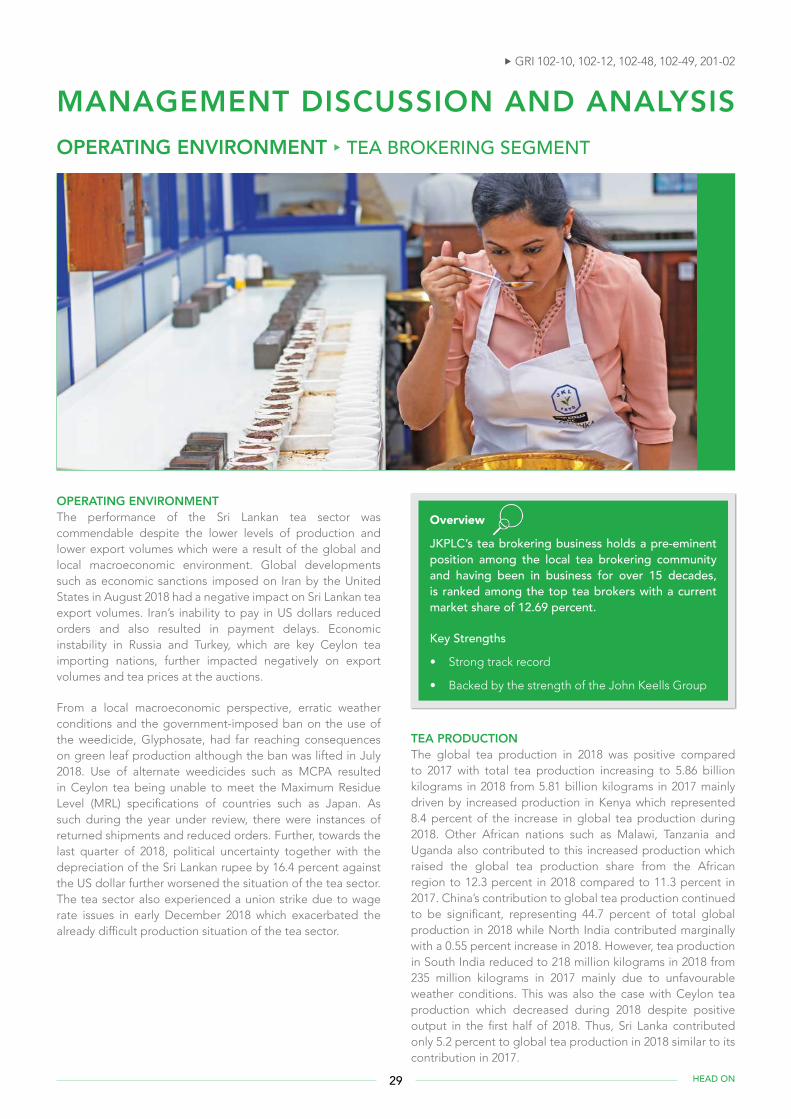
OPERATING ENVIRONMENT The performance of the Sri Lankan tea sector was commendable despite the lower levels of production and lower export volumes which were a result of the global and local macroeconomic environment. Global developments such as economic sanctions imposed on Iran by the United States in August 2018 had a negative impact on Sri Lankan tea export volumes. Iran’s inability to pay in US dollars reduced orders and also resulted in payment delays. Economic instability in Russia and Turkey, which are key Ceylon tea importing nations, further impacted negatively on export volumes and tea prices at the auctions.
From a local macroeconomic perspective, erratic weather conditions and the government-imposed ban on the use of the weedicide, Glyphosate, had far reaching consequences on green leaf production although the ban was lifted in July 2018. Use of alternate weedicides such as MCPA resulted in Ceylon tea being unable to meet the Maximum Residue Level (MRL) specifications of countries such as Japan. As such during the year under review, there were instances of returned shipments and reduced orders. Further, towards the last quarter of 2018, political uncertainty together with the depreciation of the Sri Lankan rupee by 16.4 percent against the US dollar further worsened the situation of the tea sector. The tea sector also experienced a union strike due to wage rate issues in early December 2018 which exacerbated the already difficult production situation of the tea sector.
TEA PRODUCTION The global tea production in 2018 was positive compared to 2017 with total tea production increasing to 5.86 billion kilograms in 2018 from 5.81 billion kilograms in 2017 mainly driven by increased production in Kenya which represented 8.4 percent of the increase in global tea production during 2018. Other African nations such as Malawi, Tanzania and Uganda also contributed to this increased production which raised the global tea production share from the African region to 12.3 percent in 2018 compared to 11.3 percent in 2017. China’s contribution to global tea production continued to be significant, representing 44.7 percent of total global production in 2018 while North India contributed marginally with a 0.55 percent increase in 2018. However, tea production in South India reduced to 218 million kilograms in 2018 from 235 million kilograms in 2017 mainly due to unfavourable weather conditions. This was also the case with Ceylon tea production which decreased during 2018 despite positive output in the first half of 2018. Thus, Sri Lanka contributed only 5.2 percent to global tea production in 2018 similar to its contribution in 2017.
Overview
JKPLC’s tea brokering business holds a pre-eminent position among the local tea brokering community and having been in business for over 15 decades, is ranked among the top tea brokers with a current market share of 12.69 percent.
Key Strengths
• Strong track record
• Backed by the strength of the John Keells Group
OPERATING ENVIRONMENT TEA BROKERING SEGMENT
GRI 102-10, 102-12, 102-48, 102-49, 201-02
29 HEAD ON
The reversal in fortunes for Sri Lanka’s total tea production which declined to 303.94 Mn kilograms in 2018 from 307.72 Mn kilograms in 2017 was mainly attributed to adverse weather patterns and the worker wage strike in the last quarter of 2018. The worst impact was on the low-grown elevation which decreased by 2.75 percent to 192 million kilograms in 2018 from 197.42 million kilograms in 2017. However, the high-grown elevation production marginally increased by 0.25 percent to 64.8 million kilograms from 64.64 million kilograms in 2017, while the medium-grown elevation increased by 3 percent to 47 million kilograms from 45.7 million kilograms in 2017. From a category perspective, the decline in production stemmed from ‘Orthodox’ and ‘Green Tea’ categories which reduced by 1.22 percent in 2018, while ‘Crush-Tear-Curl’ (CTC) varieties of black teas recorded an increase of 9.63 percent from 21.8 million kilograms in 2017 to 23.9 million kilograms in 2018, the highest ever volume recorded.
National Averages - Tea
0
150
300
450
600
750
2018/19 2017/18 2016/17 2015/16 2014/15
National Production - Mn Kgs.
National Average Price - Rs / Kg
National Average Price - US $ / Kg
US $ / KgRs / Kg
0
1
2
3
4
5
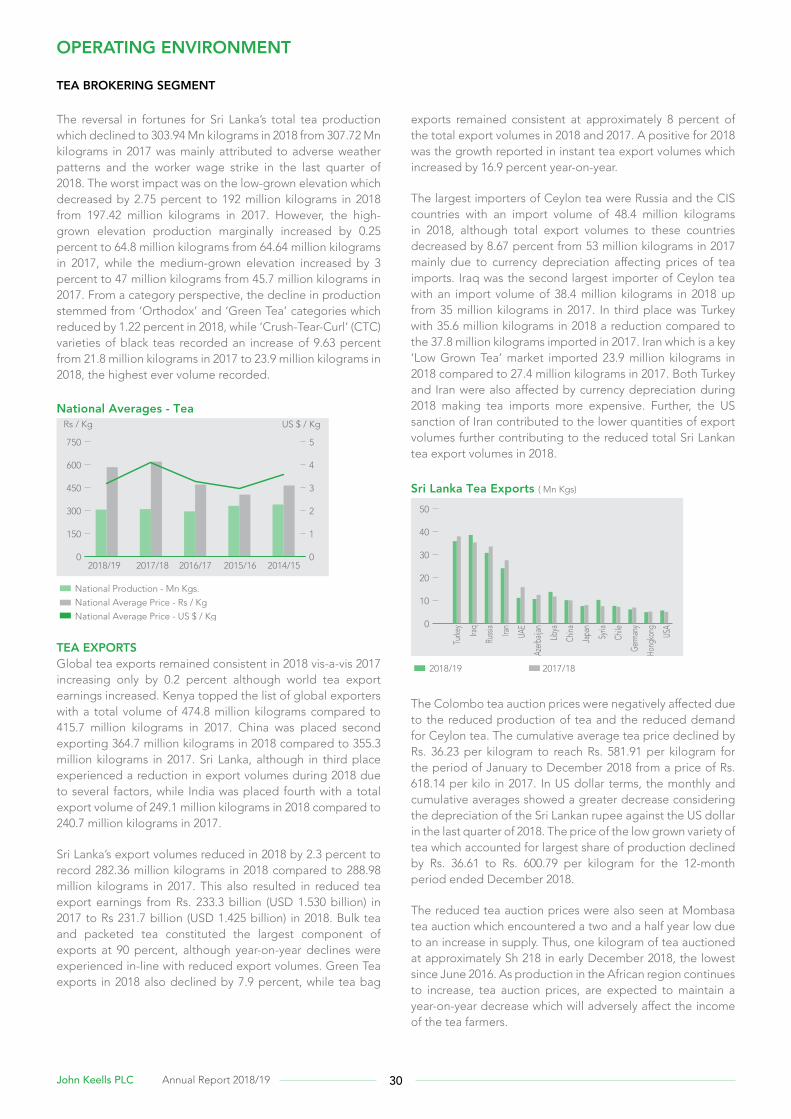
TEA EXPORTSGlobal tea exports remained consistent in 2018 vis-a-vis 2017 increasing only by 0.2 percent although world tea export earnings increased. Kenya topped the list of global exporters with a total volume of 474.8 million kilograms compared to 415.7 million kilograms in 2017. China was placed second exporting 364.7 million kilograms in 2018 compared to 355.3 million kilograms in 2017. Sri Lanka, although in third place experienced a reduction in export volumes during 2018 due to several factors, while India was placed fourth with a total export volume of 249.1 million kilograms in 2018 compared to 240.7 million kilograms in 2017.
Sri Lanka’s export volumes reduced in 2018 by 2.3 percent to record 282.36 million kilograms in 2018 compared to 288.98 million kilograms in 2017. This also resulted in reduced tea export earnings from Rs. 233.3 billion (USD 1.530 billion) in 2017 to Rs 231.7 billion (USD 1.425 billion) in 2018. Bulk tea and packeted tea constituted the largest component of exports at 90 percent, although year-on-year declines were experienced in-line with reduced export volumes. Green Tea exports in 2018 also declined by 7.9 percent, while tea bag
exports remained consistent at approximately 8 percent of the total export volumes in 2018 and 2017. A positive for 2018 was the growth reported in instant tea export volumes which increased by 16.9 percent year-on-year.
The largest importers of Ceylon tea were Russia and the CIS countries with an import volume of 48.4 million kilograms in 2018, although total export volumes to these countries decreased by 8.67 percent from 53 million kilograms in 2017 mainly due to currency depreciation affecting prices of tea imports. Iraq was the second largest importer of Ceylon tea with an import volume of 38.4 million kilograms in 2018 up from 35 million kilograms in 2017. In third place was Turkey with 35.6 million kilograms in 2018 a reduction compared to the 37.8 million kilograms imported in 2017. Iran which is a key ‘Low Grown Tea’ market imported 23.9 million kilograms in 2018 compared to 27.4 million kilograms in 2017. Both Turkey and Iran were also affected by currency depreciation during 2018 making tea imports more expensive. Further, the US sanction of Iran contributed to the lower quantities of export volumes further contributing to the reduced total Sri Lankan tea export volumes in 2018.
Sri Lanka Tea Exports ( Mn Kgs)
0
10
20
30
40
50
Turke
y
Iraq
Russ
ia
Iran
UAE
Azer
baija
n
Libya
China
Japa
n
Syria
Chile
Germ
any
Hong
kong USA
2018/19 2017/18
The Colombo tea auction prices were negatively affected due to the reduced production of tea and the reduced demand for Ceylon tea. The cumulative average tea price declined by Rs. 36.23 per kilogram to reach Rs. 581.91 per kilogram for the period of January to December 2018 from a price of Rs. 618.14 per kilo in 2017. In US dollar terms, the monthly and cumulative averages showed a greater decrease considering the depreciation of the Sri Lankan rupee against the US dollar in the last quarter of 2018. The price of the low grown variety of tea which accounted for largest share of production declined by Rs. 36.61 to Rs. 600.79 per kilogram for the 12-month period ended December 2018.
The reduced tea auction prices were also seen at Mombasa tea auction which encountered a two and a half year low due to an increase in supply. Thus, one kilogram of tea auctioned at approximately Sh 218 in early December 2018, the lowest since June 2016. As production in the African region continues to increase, tea auction prices, are expected to maintain a year-on-year decrease which will adversely affect the income of the tea farmers.
OPERATING ENVIRONMENT
TEA BROKERING SEGMENT
30John Keells PLC Annual Report 2018/19
In contrast, the Indian auction centres realised price increases of approximately 4.07 percent to INR 138.20 until November 2018 compared to the same period in 2017. This increase is mainly attributed to the North Indian auctions, where the average price per kilogram of tea increased to approximately INR 149.96 in 2018 compared to the INR 143.96 achieved in 2017. The South Indian auctions also realised increased average price per kilogram of tea to INR 100.68 in 2018 compared to INR 96.93 in 2017.
Category 2018 2017
Qty (Mn kg) FOB (Rs./Kg) Value (Rs. Mn) Qty (Mn kg) FOB (Rs./Kg) Value (Rs. Mn)
Bulk 164.22 722.90 118,715 169.4 725.25 122,825
Packets 85.43 805.18 68,785 86.51 792.79 68,583
Tea Bags 17.28 1,473.11 25,454 17.81 1,382.51 24,619
Instant Tea 2.48 1,319.49 3,272 2.12 1,250.83 2,651
Green Tea 2.37 1,698.62 4,026 2.40 1,538.90 3,697
Sub Total 271.78 810.41 220,252 278.24 799.35 222,375
Re-Exports 10.59 1,086.20 11,499 10.79 1,016.08 10,963
Total 282.37 820.75 231,751 289.03 807.44 233,338
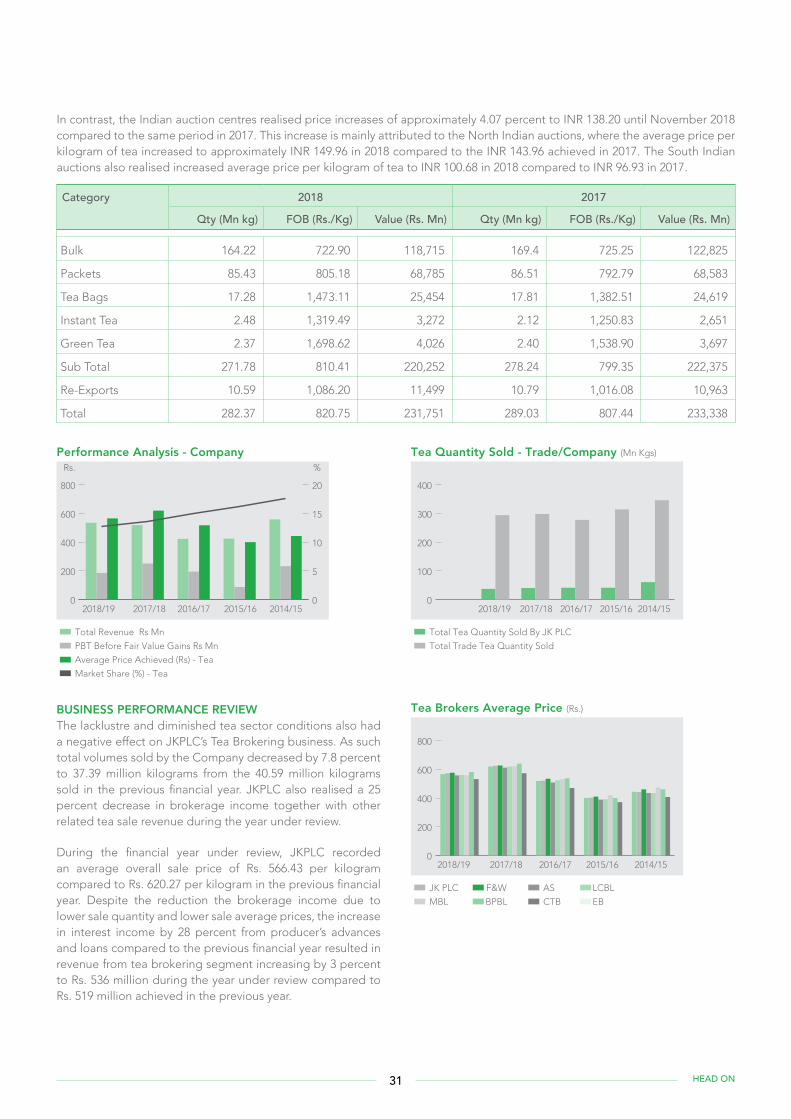
BUSINESS PERFORMANCE REVIEWThe lacklustre and diminished tea sector conditions also had a negative effect on JKPLC’s Tea Brokering business. As such total volumes sold by the Company decreased by 7.8 percent to 37.39 million kilograms from the 40.59 million kilograms sold in the previous financial year. JKPLC also realised a 25 percent decrease in brokerage income together with other related tea sale revenue during the year under review.
During the financial year under review, JKPLC recorded an average overall sale price of Rs. 566.43 per kilogram compared to Rs. 620.27 per kilogram in the previous financial year. Despite the reduction the brokerage income due to lower sale quantity and lower sale average prices, the increase in interest income by 28 percent from producer’s advances and loans compared to the previous financial year resulted in revenue from tea brokering segment increasing by 3 percent to Rs. 536 million during the year under review compared to Rs. 519 million achieved in the previous year.
Performance Analysis - Company
0
200
400
600
800
2018/19 2017/18 2016/17 2015/16 2014/15
Total Revenue Rs Mn
PBT Before Fair Value Gains Rs Mn
Average Price Achieved (Rs) - Tea
Market Share (%) - Tea
%Rs.
0
5
10
15
20
Tea Quantity Sold - Trade/Company (Mn Kgs)
0
100
200
300
400
2018/19 2017/18 2016/17 2015/16 2014/15
Total Tea Quantity Sold By JK PLC
Total Trade Tea Quantity Sold
Tea Brokers Average Price (Rs.)
0
200
400
600
800
2018/19 2017/18 2016/17 2015/16 2014/15
JK PLC F&W AS LCBL
MBL BPBL CTB EB
31 HEAD ON
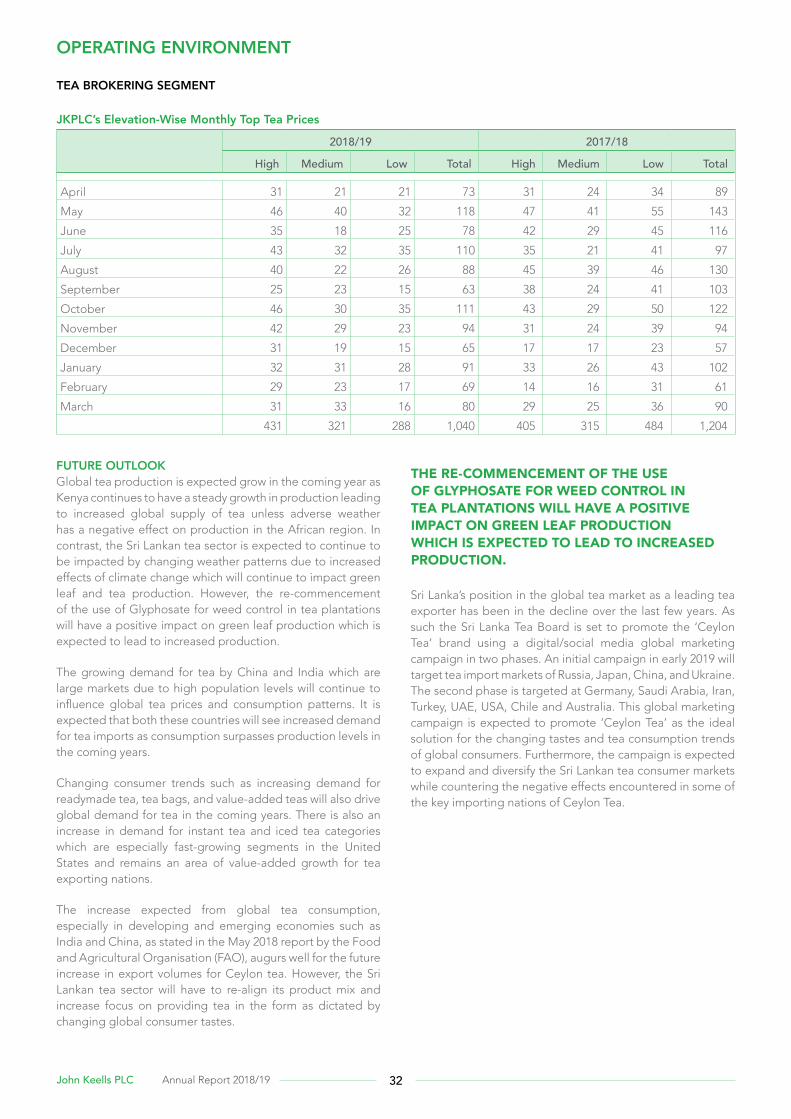
JKPLC’s Elevation-Wise Monthly Top Tea Prices
2018/19 2017/18
High Medium Low Total High Medium Low Total
April 31 21 21 73 31 24 34 89
May 46 40 32 118 47 41 55 143
June 35 18 25 78 42 29 45 116
July 43 32 35 110 35 21 41 97
August 40 22 26 88 45 39 46 130
September 25 23 15 63 38 24 41 103
October 46 30 35 111 43 29 50 122
November 42 29 23 94 31 24 39 94
December 31 19 15 65 17 17 23 57
January 32 31 28 91 33 26 43 102
February 29 23 17 69 14 16 31 61
March 31 33 16 80 29 25 36 90
431 321 288 1,040 405 315 484 1,204
FUTURE OUTLOOKGlobal tea production is expected grow in the coming year as Kenya continues to have a steady growth in production leading to increased global supply of tea unless adverse weather has a negative effect on production in the African region. In contrast, the Sri Lankan tea sector is expected to continue to be impacted by changing weather patterns due to increased effects of climate change which will continue to impact green leaf and tea production. However, the re-commencement of the use of Glyphosate for weed control in tea plantations will have a positive impact on green leaf production which is expected to lead to increased production.
The growing demand for tea by China and India which are large markets due to high population levels will continue to influence global tea prices and consumption patterns. It is expected that both these countries will see increased demand for tea imports as consumption surpasses production levels in the coming years.
Changing consumer trends such as increasing demand for readymade tea, tea bags, and value-added teas will also drive global demand for tea in the coming years. There is also an increase in demand for instant tea and iced tea categories which are especially fast-growing segments in the United States and remains an area of value-added growth for tea exporting nations.
The increase expected from global tea consumption, especially in developing and emerging economies such as India and China, as stated in the May 2018 report by the Food and Agricultural Organisation (FAO), augurs well for the future increase in export volumes for Ceylon tea. However, the Sri Lankan tea sector will have to re-align its product mix and increase focus on providing tea in the form as dictated by changing global consumer tastes.
Sri Lanka’s position in the global tea market as a leading tea exporter has been in the decline over the last few years. As such the Sri Lanka Tea Board is set to promote the ‘Ceylon Tea’ brand using a digital/social media global marketing campaign in two phases. An initial campaign in early 2019 will target tea import markets of Russia, Japan, China, and Ukraine. The second phase is targeted at Germany, Saudi Arabia, Iran, Turkey, UAE, USA, Chile and Australia. This global marketing campaign is expected to promote ‘Ceylon Tea’ as the ideal solution for the changing tastes and tea consumption trends of global consumers. Furthermore, the campaign is expected to expand and diversify the Sri Lankan tea consumer markets while countering the negative effects encountered in some of the key importing nations of Ceylon Tea.
OPERATING ENVIRONMENT
TEA BROKERING SEGMENT
THE RE-COMMENCEMENT OF THE USE OF GLYPHOSATE FOR WEED CONTROL IN TEA PLANTATIONS WILL HAVE A POSITIVE IMPACT ON GREEN LEAF PRODUCTION WHICH IS EXPECTED TO LEAD TO INCREASED PRODUCTION.
32John Keells PLC Annual Report 2018/19

OPERATING ENVIRONMENTTotal world production of rubber increased by 2 percent to 29.1 million tonnes in 2018 compared to 28.6 million tonnes in 2017. This was also matched by world consumption of rubber which increased by 1.9 percent to 29.2 million tonnes in 2018 from 28.4 million tonnes in 2017. However, the increase in global imports were marginal, realising only a 0.4 percent increase to 23.0 million tonnes in 2018 compared to 22.9 million tonnes in 2017.
The continuous rain in rubber growing areas in Sri Lanka resulted in a loss of tapping days in rubber plantations resulting in a significant decline in the rubber yield. Thus, the average rubber yield was 770 kilograms per hectare in 2018 compared to 809 kilograms per hectare in 2017.
Export Volume - Rubber (Kg ‘000’)
0
3,500
7,000
10,500
14,000
2018 2017 2016 2015 2014
Sheet Crepe Other
This in turn resulted in a decline in rubber production by 0.6 percent to 82.6 million kilogrammes, compared to 2017. Sheet rubber production, which is the largest component of total rubber production, decreased by 0.5 percent to 41.3 million kilogrammes, while crepe rubber production marginally increased by 26.2 percent to 14.5 million kilogrammes. Production of centrifuged latex and other rubber categories also declined by 11.1 percent to 26.8 million kilogrammes during 2018.
Sri Lanka's Rubber Production(Mn Kgs /Cultivation 000'Ha)
0
30
60
90
120
150
2018/19 2017/18 2016/17 2015/16 2014/15
Production Volume - Mn KgsCultivation Area - 000's Hectares
Average rubber prices reduced during 2018 compared to 2017, with the average price of Ribbed Smoked Sheet Number 1 (RSS1) registering a significant decrease of 8.2 percent to Rs. 309.9 per kilogramme during 2018. The average price of latex crepe rubber decreased by 8.5 percent to Rs. 321.70 per kilogramme at the Colombo Rubber Auction. This price reduction is aligned to the lower rubber prices in the world market, while the stagnant situation of the export market is also attributed to the low production of rubber in Sri Lanka.
OPERATING ENVIRONMENT RUBBER BROKERING SEGMENT
33 HEAD ON
Rubber remains Sri Lanka’s third largest foreign exchange earner, accounting for 0.3 percent of the country’s export earnings in 2018. Rubber exports accounted for a little over Rs. 5 billion in export earnings in 2018 compared to Rs. 5.9 billion in 2017, while rubber products accounted for Rs. 142.3 billion in export earnings in 2018 an increase of 4.8 percent compared to the earnings Rs. 127.4 billion earned in 2017 . The strong competitive advantage in several niche export markets, mainly certain grades of latex crepe and sole crepe rubber had achieved with regards to quality of the natural rubber and distinctive competencies of the local industry helped propel demand and sustain export earning for rubber products.
BUSINESS PERFORMANCE REVIEWThe rubber sales volumes of JKPLC increased marginally to 3.67 million kilograms in the financial year under review compared to 3.59 million kilograms in the previous financial year. However, the revenue generated by the rubber broking segment was below expectations, decreasing by 25 percent to Rs. 8.90 million in the financial year under review compared Rs. 11.83 million achieved in the previous financial year. This drop was mainly due to the decrease in global rubber prices due to excess supply as well as the reduced rubber yield caused by the adverse weather conditions which prevailed mainly in the first half of 2018. Thus, JKPLC recorded only an average auction price of Rs. 226.74 per kilogram in the financial year under review compared to Rs. 316.87 per kilogram in the previous financial year. Consequently, the rubber market share of JKPLC decreased by 1.82 percent recording 30.01 percent in the financial year under review.
As a leading rubber broker in Sri Lanka, JKPLC was able to manage the challenging operating environment during the financial year under review. The Company’s long-term relationships with rubber suppliers and customers and the strength of the Parent Company’s brand name contributed in overcoming the diverse challenges.
FUTURE OUTLOOKThere appears to be considerable optimism that the local natural Rubber industry will make a full recovery in the year ahead, as the imminent increase in Crude oil prices is likely to push up the price of synthetic rubber. Consequently, the demand for natural rubber is expected to grow in the coming months as China and other major consuming countries are expected to begin limiting synthetic rubber imports and instead opt to source natural rubber for their end products.
OPERATING ENVIRONMENT
RUBBER BROKERING SEGMENT
AS A LEADING RUBBER BROKER IN SRI LANKA, JKPLC WAS ABLE TO MANAGE THE CHALLENGING OPERATING ENVIRONMENT IN THE FINANCIAL YEAR UNDER REVIEW
34John Keells PLC Annual Report 2018/19
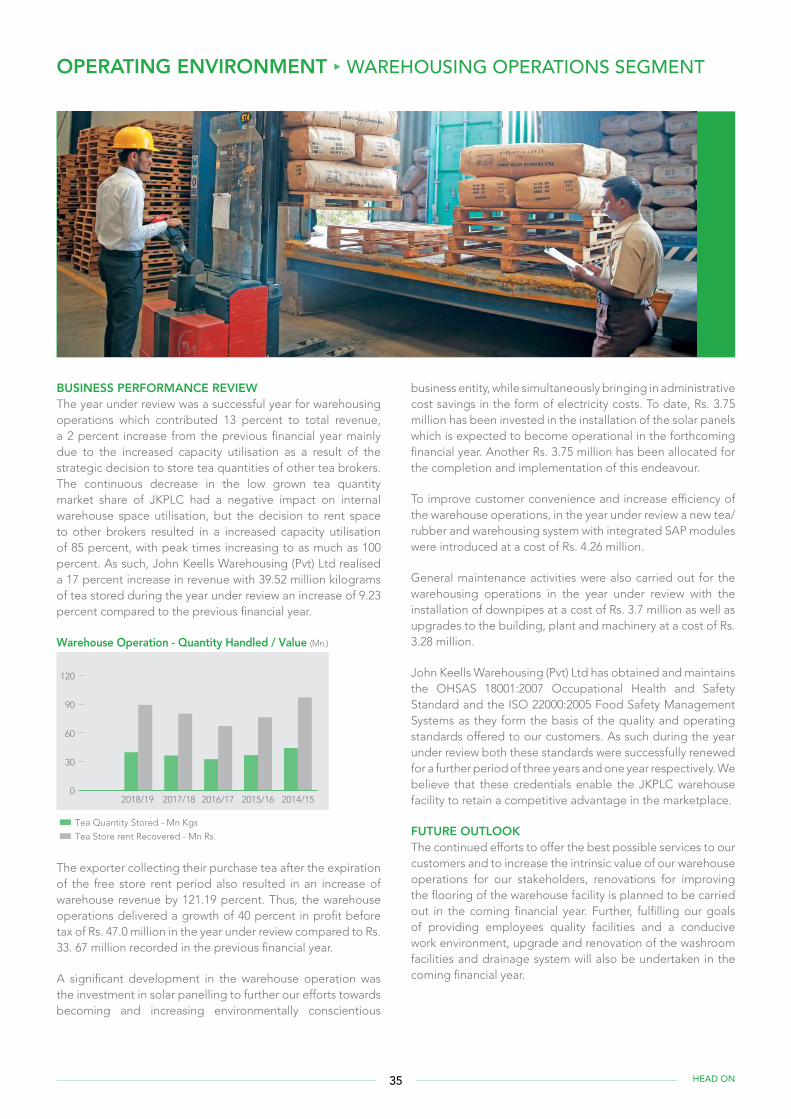
BUSINESS PERFORMANCE REVIEWThe year under review was a successful year for warehousing operations which contributed 13 percent to total revenue, a 2 percent increase from the previous financial year mainly due to the increased capacity utilisation as a result of the strategic decision to store tea quantities of other tea brokers. The continuous decrease in the low grown tea quantity market share of JKPLC had a negative impact on internal warehouse space utilisation, but the decision to rent space to other brokers resulted in a increased capacity utilisation of 85 percent, with peak times increasing to as much as 100 percent. As such, John Keells Warehousing (Pvt) Ltd realised a 17 percent increase in revenue with 39.52 million kilograms of tea stored during the year under review an increase of 9.23 percent compared to the previous financial year.
Warehouse Operation - Quantity Handled / Value (Mn.)
0
30
60
90
120
2018/19 2017/18 2016/17 2015/16 2014/15
Tea Quantity Stored - Mn Kgs
Tea Store rent Recovered - Mn Rs.
The exporter collecting their purchase tea after the expiration of the free store rent period also resulted in an increase of warehouse revenue by 121.19 percent. Thus, the warehouse operations delivered a growth of 40 percent in profit before tax of Rs. 47.0 million in the year under review compared to Rs. 33. 67 million recorded in the previous financial year.
A significant development in the warehouse operation was the investment in solar panelling to further our efforts towards becoming and increasing environmentally conscientious
business entity, while simultaneously bringing in administrative cost savings in the form of electricity costs. To date, Rs. 3.75 million has been invested in the installation of the solar panels which is expected to become operational in the forthcoming financial year. Another Rs. 3.75 million has been allocated for the completion and implementation of this endeavour.
To improve customer convenience and increase efficiency of the warehouse operations, in the year under review a new tea/rubber and warehousing system with integrated SAP modules were introduced at a cost of Rs. 4.26 million.
General maintenance activities were also carried out for the warehousing operations in the year under review with the installation of downpipes at a cost of Rs. 3.7 million as well as upgrades to the building, plant and machinery at a cost of Rs. 3.28 million.
John Keells Warehousing (Pvt) Ltd has obtained and maintains the OHSAS 18001:2007 Occupational Health and Safety Standard and the ISO 22000:2005 Food Safety Management Systems as they form the basis of the quality and operating standards offered to our customers. As such during the year under review both these standards were successfully renewed for a further period of three years and one year respectively. We believe that these credentials enable the JKPLC warehouse facility to retain a competitive advantage in the marketplace.
FUTURE OUTLOOKThe continued efforts to offer the best possible services to our customers and to increase the intrinsic value of our warehouse operations for our stakeholders, renovations for improving the flooring of the warehouse facility is planned to be carried out in the coming financial year. Further, fulfilling our goals of providing employees quality facilities and a conducive work environment, upgrade and renovation of the washroom facilities and drainage system will also be undertaken in the coming financial year.
OPERATING ENVIRONMENT WAREHOUSING OPERATIONS SEGMENT
35 HEAD ON
OPERATING ENVIRONMENTActivity on the Colombo Stock Exchange was subdued with the main segments of local retail, High Net Worth Individuals and foreign and local institutional investors remaining cautious.
Foreign participation throughout the year was high, although this was driven by net outflows from the market which was also seen in the domestic fixed income securities market. The broader All Share Index declined by 14.2 percent over the financial year while the more sensitive S&P20 index declined by 25.0 percent. Daily average turnover for the financial year 2018/2019 came to Rs.697.6m as compared to Rs.1,035.6m in financial year 2017/2018. Net foreign outflows for the year in review came to over Rs.26 billion.
Key challenges faced by the Sri Lankan stock market is its relatively small market size compared to other markets in the region and globally, the lower liquidity, and the higher transaction costs.
BUSINESS PERFORMANCE REVIEWThe subdued trading conditions of the Colombo Stock Exchange (CSE) which prevailed during the year under review resulted in John Keells Stock Brokers (Pvt) Ltd, recording a year-on-year increase in revenue of 1 percent compared to the growth of 66 percent in the previous financial year. Thus, the revenue generated was Rs. 194 million in the year under review compared to Rs. 193 million in the previous financial year. However, the stock broking was the second highest contributor to total revenue during the year under review with 23 percent .
FUTURE OUTLOOKEquity market outlook continues to be muted amid the existing macroeconomic conditions.
OPERATING ENVIRONMENT STOCK BROKERING SEGMENT
36John Keells PLC Annual Report 2018/19
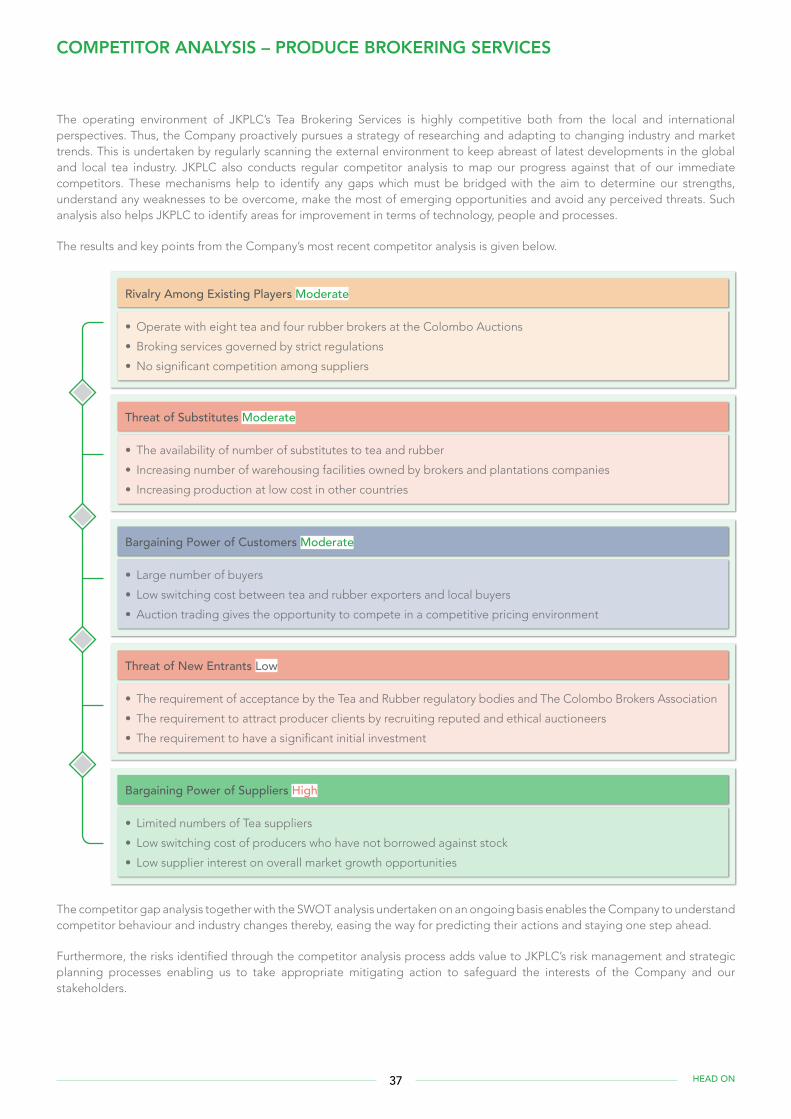
COMPETITOR ANALYSIS – PRODUCE BROKERING SERVICES
The operating environment of JKPLC’s Tea Brokering Services is highly competitive both from the local and international perspectives. Thus, the Company proactively pursues a strategy of researching and adapting to changing industry and market trends. This is undertaken by regularly scanning the external environment to keep abreast of latest developments in the global and local tea industry. JKPLC also conducts regular competitor analysis to map our progress against that of our immediate competitors. These mechanisms help to identify any gaps which must be bridged with the aim to determine our strengths, understand any weaknesses to be overcome, make the most of emerging opportunities and avoid any perceived threats. Such analysis also helps JKPLC to identify areas for improvement in terms of technology, people and processes.
The results and key points from the Company’s most recent competitor analysis is given below.
The competitor gap analysis together with the SWOT analysis undertaken on an ongoing basis enables the Company to understand competitor behaviour and industry changes thereby, easing the way for predicting their actions and staying one step ahead.
Furthermore, the risks identified through the competitor analysis process adds value to JKPLC’s risk management and strategic planning processes enabling us to take appropriate mitigating action to safeguard the interests of the Company and our stakeholders.
• Limited numbers of Tea suppliers
• Low switching cost of producers who have not borrowed against stock
• Low supplier interest on overall market growth opportunities
Bargaining Power of Suppliers High
Rivalry Among Existing Players Moderate
• The availability of number of substitutes to tea and rubber
• Increasing number of warehousing facilities owned by brokers and plantations companies
• Increasing production at low cost in other countries
Threat of Substitutes Moderate
• The requirement of acceptance by the Tea and Rubber regulatory bodies and The Colombo Brokers Association
• The requirement to attract producer clients by recruiting reputed and ethical auctioneers
• The requirement to have a significant initial investment
Threat of New Entrants Low
• Large number of buyers
• Low switching cost between tea and rubber exporters and local buyers
• Auction trading gives the opportunity to compete in a competitive pricing environment
Bargaining Power of Customers Moderate
• Operate with eight tea and four rubber brokers at the Colombo Auctions
• Broking services governed by strict regulations
• No significant competition among suppliers
37 HEAD ON
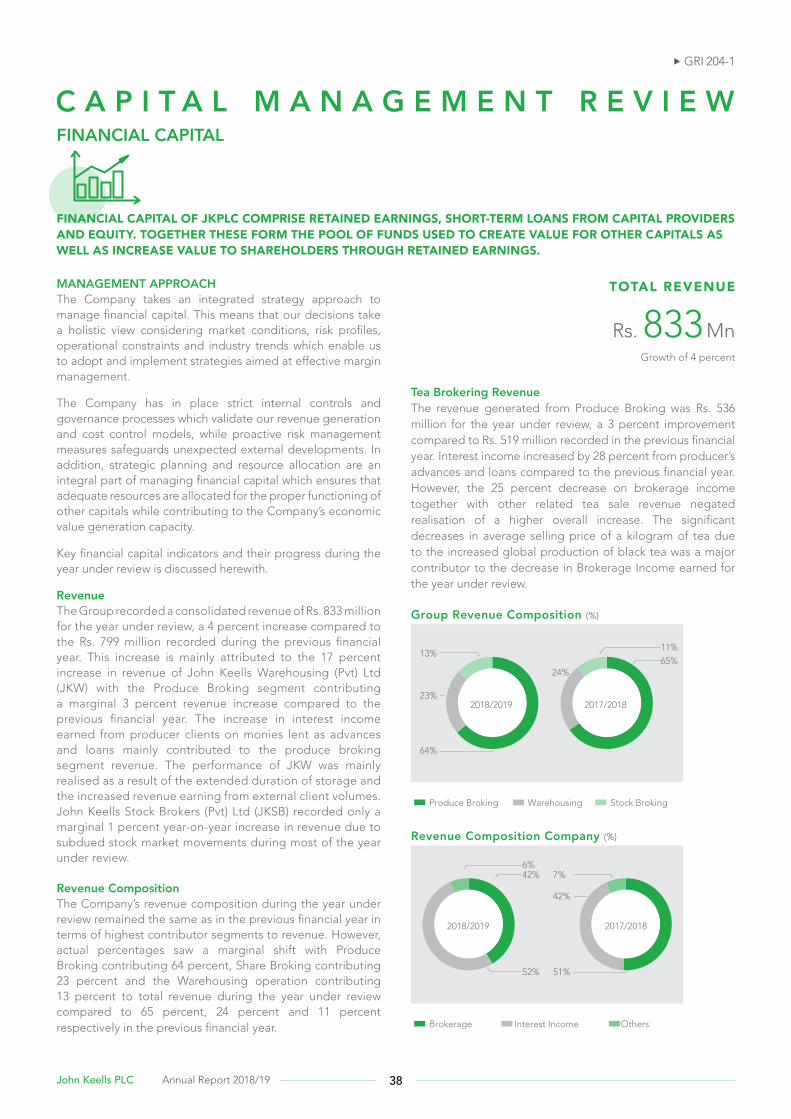
MANAGEMENT APPROACH The Company takes an integrated strategy approach to manage financial capital. This means that our decisions take a holistic view considering market conditions, risk profiles, operational constraints and industry trends which enable us to adopt and implement strategies aimed at effective margin management.
The Company has in place strict internal controls and governance processes which validate our revenue generation and cost control models, while proactive risk management measures safeguards unexpected external developments. In addition, strategic planning and resource allocation are an integral part of managing financial capital which ensures that adequate resources are allocated for the proper functioning of other capitals while contributing to the Company’s economic value generation capacity.
Key financial capital indicators and their progress during the year under review is discussed herewith.
RevenueThe Group recorded a consolidated revenue of Rs. 833 million for the year under review, a 4 percent increase compared to the Rs. 799 million recorded during the previous financial year. This increase is mainly attributed to the 17 percent increase in revenue of John Keells Warehousing (Pvt) Ltd (JKW) with the Produce Broking segment contributing a marginal 3 percent revenue increase compared to the previous financial year. The increase in interest income earned from producer clients on monies lent as advances and loans mainly contributed to the produce broking segment revenue. The performance of JKW was mainly realised as a result of the extended duration of storage and the increased revenue earning from external client volumes. John Keells Stock Brokers (Pvt) Ltd (JKSB) recorded only a marginal 1 percent year-on-year increase in revenue due to subdued stock market movements during most of the year under review.
Revenue CompositionThe Company’s revenue composition during the year under review remained the same as in the previous financial year in terms of highest contributor segments to revenue. However, actual percentages saw a marginal shift with Produce Broking contributing 64 percent, Share Broking contributing 23 percent and the Warehousing operation contributing 13 percent to total revenue during the year under review compared to 65 percent, 24 percent and 11 percent respectively in the previous financial year.
Tea Brokering RevenueThe revenue generated from Produce Broking was Rs. 536 million for the year under review, a 3 percent improvement compared to Rs. 519 million recorded in the previous financial year. Interest income increased by 28 percent from producer’s advances and loans compared to the previous financial year. However, the 25 percent decrease on brokerage income together with other related tea sale revenue negated realisation of a higher overall increase. The significant decreases in average selling price of a kilogram of tea due to the increased global production of black tea was a major contributor to the decrease in Brokerage Income earned for the year under review.
42%6%
52%
7%
42%
51%
Brokerage Interest Income Others
Revenue Composition Company (%)
2018/2019 2017/2018
Produce Broking Warehousing Stock Broking
Group Revenue Composition (%)
65%11%
24%
13%
23%
64%
2018/2019 2017/2018
TOTAL REVENUE
Rs. 833 MnGrowth of 4 percent
FINANCIAL CAPITAL
FINANCIAL CAPITAL OF JKPLC COMPRISE RETAINED EARNINGS, SHORT-TERM LOANS FROM CAPITAL PROVIDERS AND EQUITY. TOGETHER THESE FORM THE POOL OF FUNDS USED TO CREATE VALUE FOR OTHER CAPITALS AS WELL AS INCREASE VALUE TO SHAREHOLDERS THROUGH RETAINED EARNINGS.
C A P I T A L M A N A G E M E N T R E V I E W GRI 204-1
38John Keells PLC Annual Report 2018/19
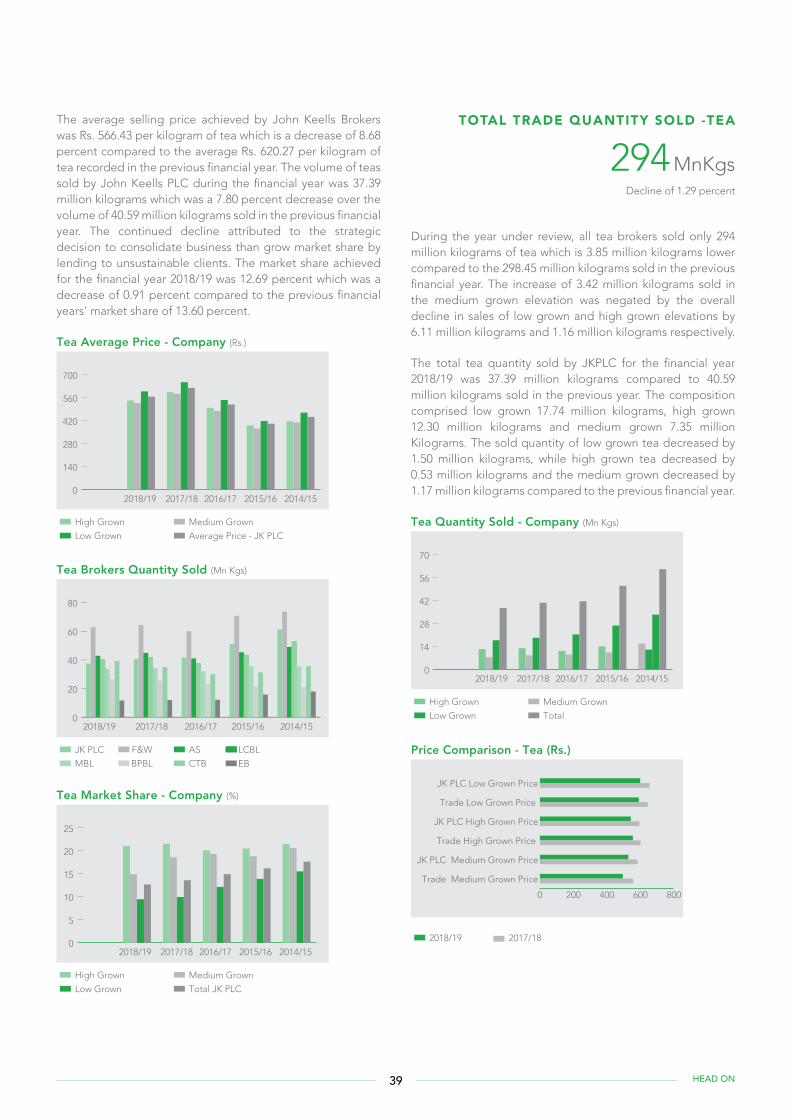
The average selling price achieved by John Keells Brokers was Rs. 566.43 per kilogram of tea which is a decrease of 8.68 percent compared to the average Rs. 620.27 per kilogram of tea recorded in the previous financial year. The volume of teas sold by John Keells PLC during the financial year was 37.39 million kilograms which was a 7.80 percent decrease over the volume of 40.59 million kilograms sold in the previous financial year. The continued decline attributed to the strategic decision to consolidate business than grow market share by lending to unsustainable clients. The market share achieved for the financial year 2018/19 was 12.69 percent which was a decrease of 0.91 percent compared to the previous financial years’ market share of 13.60 percent.
Tea Market Share - Company (%)
0
5
10
15
20
25
High Grown Medium Grown
Low Grown Total JK PLC
2018/19 2017/18 2016/17 2015/16 2014/15
Tea Brokers Quantity Sold (Mn Kgs)
0
20
40
60
80
2018/19 2017/18 2016/17 2015/16 2014/15
JK PLC F&W AS LCBL
MBL BPBL CTB EB
Tea Average Price - Company (Rs.)
0
140
280
420
560
700
2018/19 2017/18 2016/17 2015/16 2014/15
High Grown Medium Grown
Low Grown Average Price - JK PLC
During the year under review, all tea brokers sold only 294 million kilograms of tea which is 3.85 million kilograms lower compared to the 298.45 million kilograms sold in the previous financial year. The increase of 3.42 million kilograms sold in the medium grown elevation was negated by the overall decline in sales of low grown and high grown elevations by 6.11 million kilograms and 1.16 million kilograms respectively.
The total tea quantity sold by JKPLC for the financial year 2018/19 was 37.39 million kilograms compared to 40.59 million kilograms sold in the previous year. The composition comprised low grown 17.74 million kilograms, high grown 12.30 million kilograms and medium grown 7.35 million Kilograms. The sold quantity of low grown tea decreased by 1.50 million kilograms, while high grown tea decreased by 0.53 million kilograms and the medium grown decreased by 1.17 million kilograms compared to the previous financial year.
Price Comparison - Tea (Rs.)
0 200 400 600 800
2018/19 2017/18
JK PLC Low Grown Price
Trade Low Grown Price
JK PLC High Grown Price
Trade High Grown Price
JK PLC Medium Grown Price
Trade Medium Grown Price
Tea Quantity Sold - Company (Mn Kgs)
0
14
28
42
56
70
High Grown Medium Grown
Low Grown Total
2018/19 2017/18 2016/17 2015/16 2014/15
TOTAL TRADE QUANTITY SOLD -TEA
294 MnKgsDecline of 1.29 percent
39 HEAD ON
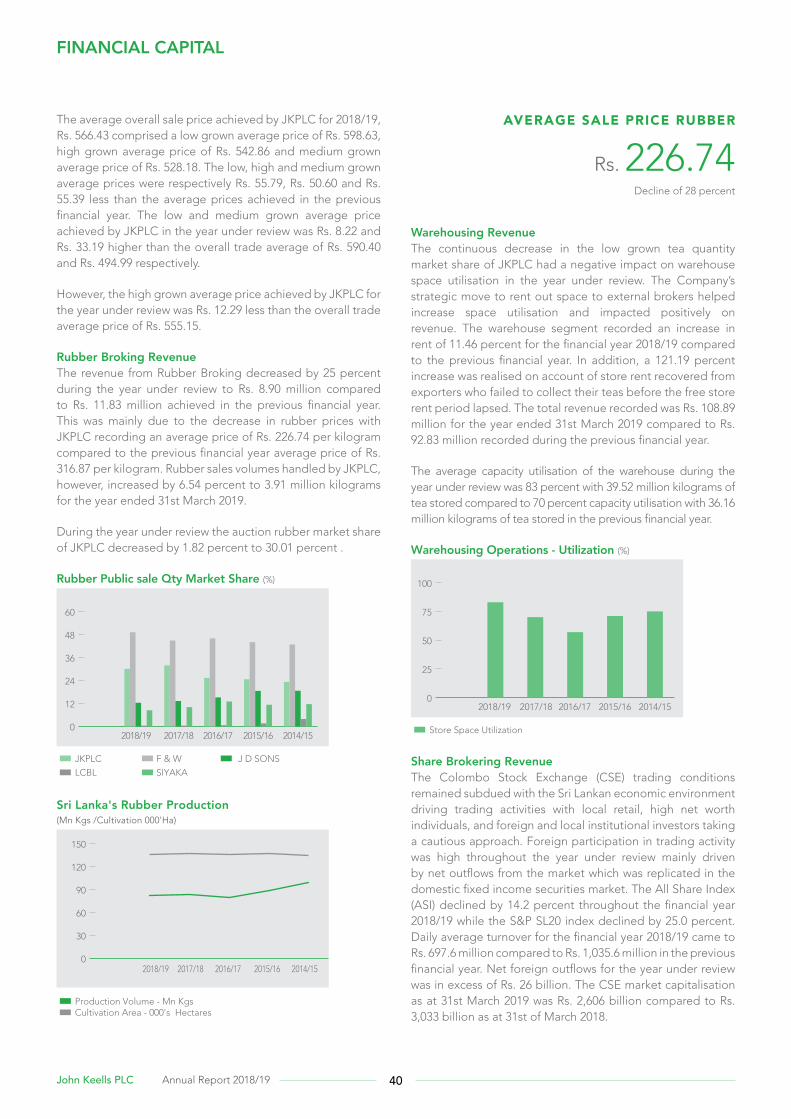
The average overall sale price achieved by JKPLC for 2018/19, Rs. 566.43 comprised a low grown average price of Rs. 598.63, high grown average price of Rs. 542.86 and medium grown average price of Rs. 528.18. The low, high and medium grown average prices were respectively Rs. 55.79, Rs. 50.60 and Rs. 55.39 less than the average prices achieved in the previous financial year. The low and medium grown average price achieved by JKPLC in the year under review was Rs. 8.22 and Rs. 33.19 higher than the overall trade average of Rs. 590.40 and Rs. 494.99 respectively.
However, the high grown average price achieved by JKPLC for the year under review was Rs. 12.29 less than the overall trade average price of Rs. 555.15.
Rubber Broking RevenueThe revenue from Rubber Broking decreased by 25 percent during the year under review to Rs. 8.90 million compared to Rs. 11.83 million achieved in the previous financial year. This was mainly due to the decrease in rubber prices with JKPLC recording an average price of Rs. 226.74 per kilogram compared to the previous financial year average price of Rs. 316.87 per kilogram. Rubber sales volumes handled by JKPLC, however, increased by 6.54 percent to 3.91 million kilograms for the year ended 31st March 2019.
During the year under review the auction rubber market share of JKPLC decreased by 1.82 percent to 30.01 percent .
Rubber Public sale Qty Market Share (%)
0
12
24
36
48
60
2018/19 2017/18 2016/17 2015/16 2014/15
JKPLC F & W J D SONS
LCBL SIYAKA
Sri Lanka's Rubber Production(Mn Kgs /Cultivation 000'Ha)
0
30
60
90
120
150
2018/19 2017/18 2016/17 2015/16 2014/15
Production Volume - Mn KgsCultivation Area - 000's Hectares
Warehousing RevenueThe continuous decrease in the low grown tea quantity market share of JKPLC had a negative impact on warehouse space utilisation in the year under review. The Company’s strategic move to rent out space to external brokers helped increase space utilisation and impacted positively on revenue. The warehouse segment recorded an increase in rent of 11.46 percent for the financial year 2018/19 compared to the previous financial year. In addition, a 121.19 percent increase was realised on account of store rent recovered from exporters who failed to collect their teas before the free store rent period lapsed. The total revenue recorded was Rs. 108.89 million for the year ended 31st March 2019 compared to Rs. 92.83 million recorded during the previous financial year.
The average capacity utilisation of the warehouse during the year under review was 83 percent with 39.52 million kilograms of tea stored compared to 70 percent capacity utilisation with 36.16 million kilograms of tea stored in the previous financial year.
Warehousing Operations - Utilization (%)
0
25
50
75
100
2018/19 2017/18 2016/17 2015/16 2014/15
Store Space Utilization
Share Brokering RevenueThe Colombo Stock Exchange (CSE) trading conditions remained subdued with the Sri Lankan economic environment driving trading activities with local retail, high net worth individuals, and foreign and local institutional investors taking a cautious approach. Foreign participation in trading activity was high throughout the year under review mainly driven by net outflows from the market which was replicated in the domestic fixed income securities market. The All Share Index (ASI) declined by 14.2 percent throughout the financial year 2018/19 while the S&P SL20 index declined by 25.0 percent. Daily average turnover for the financial year 2018/19 came to Rs. 697.6 million compared to Rs. 1,035.6 million in the previous financial year. Net foreign outflows for the year under review was in excess of Rs. 26 billion. The CSE market capitalisation as at 31st March 2019 was Rs. 2,606 billion compared to Rs. 3,033 billion as at 31st of March 2018.
FINANCIAL CAPITAL
AVERAGE SALE PRICE RUBBER
Rs. 226.74Decline of 28 percent
40John Keells PLC Annual Report 2018/19
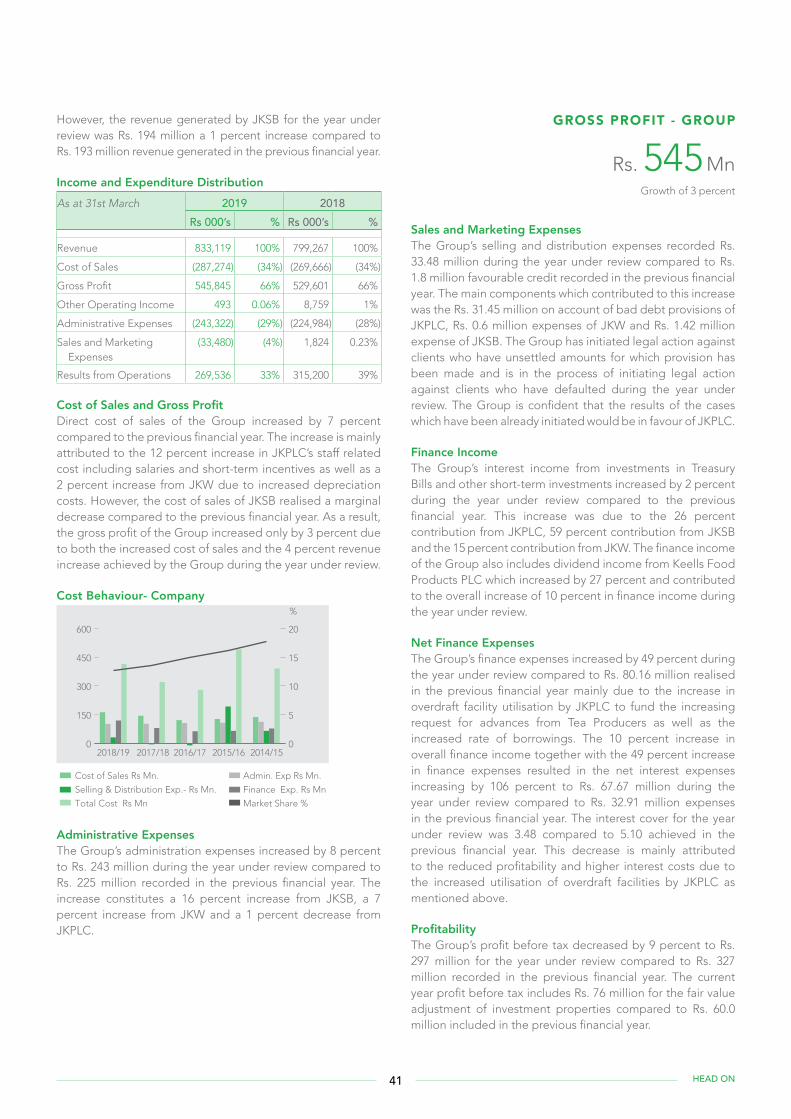
However, the revenue generated by JKSB for the year under review was Rs. 194 million a 1 percent increase compared to Rs. 193 million revenue generated in the previous financial year.
Income and Expenditure DistributionAs at 31st March 2019 2018
Rs 000’s % Rs 000’s %
Revenue 833,119 100% 799,267 100%
Cost of Sales (287,274) (34%) (269,666) (34%)
Gross Profit 545,845 66% 529,601 66%
Other Operating Income 493 0.06% 8,759 1%
Administrative Expenses (243,322) (29%) (224,984) (28%)
Sales and Marketing Expenses
(33,480) (4%) 1,824 0.23%
Results from Operations 269,536 33% 315,200 39%
Cost of Sales and Gross ProfitDirect cost of sales of the Group increased by 7 percent compared to the previous financial year. The increase is mainly attributed to the 12 percent increase in JKPLC’s staff related cost including salaries and short-term incentives as well as a 2 percent increase from JKW due to increased depreciation costs. However, the cost of sales of JKSB realised a marginal decrease compared to the previous financial year. As a result, the gross profit of the Group increased only by 3 percent due to both the increased cost of sales and the 4 percent revenue increase achieved by the Group during the year under review.
Cost Behaviour- Company
0
150
300
450
600
2018/19 2017/18 2016/17 2015/16 2014/15
Cost of Sales Rs Mn. Admin. Exp Rs Mn.
Selling & Distribution Exp.- Rs Mn. Finance Exp. Rs Mn
Total Cost Rs Mn Market Share %
%
0
5
10
15
20
Administrative ExpensesThe Group’s administration expenses increased by 8 percent to Rs. 243 million during the year under review compared to Rs. 225 million recorded in the previous financial year. The increase constitutes a 16 percent increase from JKSB, a 7 percent increase from JKW and a 1 percent decrease from JKPLC.
Sales and Marketing Expenses The Group’s selling and distribution expenses recorded Rs. 33.48 million during the year under review compared to Rs. 1.8 million favourable credit recorded in the previous financial year. The main components which contributed to this increase was the Rs. 31.45 million on account of bad debt provisions of JKPLC, Rs. 0.6 million expenses of JKW and Rs. 1.42 million expense of JKSB. The Group has initiated legal action against clients who have unsettled amounts for which provision has been made and is in the process of initiating legal action against clients who have defaulted during the year under review. The Group is confident that the results of the cases which have been already initiated would be in favour of JKPLC.
Finance IncomeThe Group’s interest income from investments in Treasury Bills and other short-term investments increased by 2 percent during the year under review compared to the previous financial year. This increase was due to the 26 percent contribution from JKPLC, 59 percent contribution from JKSB and the 15 percent contribution from JKW. The finance income of the Group also includes dividend income from Keells Food Products PLC which increased by 27 percent and contributed to the overall increase of 10 percent in finance income during the year under review.
Net Finance Expenses The Group’s finance expenses increased by 49 percent during the year under review compared to Rs. 80.16 million realised in the previous financial year mainly due to the increase in overdraft facility utilisation by JKPLC to fund the increasing request for advances from Tea Producers as well as the increased rate of borrowings. The 10 percent increase in overall finance income together with the 49 percent increase in finance expenses resulted in the net interest expenses increasing by 106 percent to Rs. 67.67 million during the year under review compared to Rs. 32.91 million expenses in the previous financial year. The interest cover for the year under review was 3.48 compared to 5.10 achieved in the previous financial year. This decrease is mainly attributed to the reduced profitability and higher interest costs due to the increased utilisation of overdraft facilities by JKPLC as mentioned above.
ProfitabilityThe Group’s profit before tax decreased by 9 percent to Rs. 297 million for the year under review compared to Rs. 327 million recorded in the previous financial year. The current year profit before tax includes Rs. 76 million for the fair value adjustment of investment properties compared to Rs. 60.0 million included in the previous financial year.
GROSS PROFIT - GROUP
Rs. 545 MnGrowth of 3 percent
41 HEAD ON
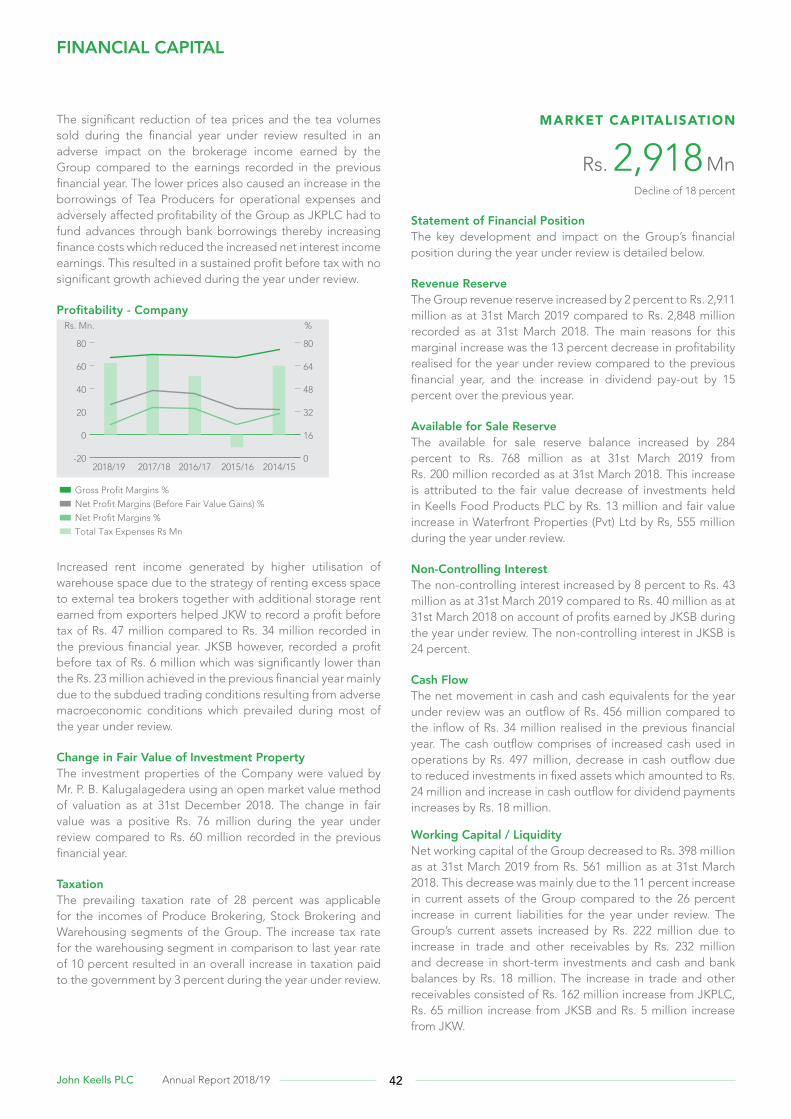
The significant reduction of tea prices and the tea volumes sold during the financial year under review resulted in an adverse impact on the brokerage income earned by the Group compared to the earnings recorded in the previous financial year. The lower prices also caused an increase in the borrowings of Tea Producers for operational expenses and adversely affected profitability of the Group as JKPLC had to fund advances through bank borrowings thereby increasing finance costs which reduced the increased net interest income earnings. This resulted in a sustained profit before tax with no significant growth achieved during the year under review.
Profitability - Company
-20
0
20
40
60
80
2018/19 2017/18 2016/17 2015/16 2014/15
Gross Profit Margins %
Net Profit Margins (Before Fair Value Gains) %
Net Profit Margins %
Total Tax Expenses Rs Mn
%Rs. Mn.
0
16
32
48
64
80
Increased rent income generated by higher utilisation of warehouse space due to the strategy of renting excess space to external tea brokers together with additional storage rent earned from exporters helped JKW to record a profit before tax of Rs. 47 million compared to Rs. 34 million recorded in the previous financial year. JKSB however, recorded a profit before tax of Rs. 6 million which was significantly lower than the Rs. 23 million achieved in the previous financial year mainly due to the subdued trading conditions resulting from adverse macroeconomic conditions which prevailed during most of the year under review.
Change in Fair Value of Investment PropertyThe investment properties of the Company were valued by Mr. P. B. Kalugalagedera using an open market value method of valuation as at 31st December 2018. The change in fair value was a positive Rs. 76 million during the year under review compared to Rs. 60 million recorded in the previous financial year.
TaxationThe prevailing taxation rate of 28 percent was applicable for the incomes of Produce Brokering, Stock Brokering and Warehousing segments of the Group. The increase tax rate for the warehousing segment in comparison to last year rate of 10 percent resulted in an overall increase in taxation paid to the government by 3 percent during the year under review.
Statement of Financial PositionThe key development and impact on the Group’s financial position during the year under review is detailed below.
Revenue ReserveThe Group revenue reserve increased by 2 percent to Rs. 2,911 million as at 31st March 2019 compared to Rs. 2,848 million recorded as at 31st March 2018. The main reasons for this marginal increase was the 13 percent decrease in profitability realised for the year under review compared to the previous financial year, and the increase in dividend pay-out by 15 percent over the previous year.
Available for Sale ReserveThe available for sale reserve balance increased by 284 percent to Rs. 768 million as at 31st March 2019 from Rs. 200 million recorded as at 31st March 2018. This increase is attributed to the fair value decrease of investments held in Keells Food Products PLC by Rs. 13 million and fair value increase in Waterfront Properties (Pvt) Ltd by Rs, 555 million during the year under review.
Non-Controlling InterestThe non-controlling interest increased by 8 percent to Rs. 43 million as at 31st March 2019 compared to Rs. 40 million as at 31st March 2018 on account of profits earned by JKSB during the year under review. The non-controlling interest in JKSB is 24 percent.
Cash Flow The net movement in cash and cash equivalents for the year under review was an outflow of Rs. 456 million compared to the inflow of Rs. 34 million realised in the previous financial year. The cash outflow comprises of increased cash used in operations by Rs. 497 million, decrease in cash outflow due to reduced investments in fixed assets which amounted to Rs. 24 million and increase in cash outflow for dividend payments increases by Rs. 18 million.
Working Capital / LiquidityNet working capital of the Group decreased to Rs. 398 million as at 31st March 2019 from Rs. 561 million as at 31st March 2018. This decrease was mainly due to the 11 percent increase in current assets of the Group compared to the 26 percent increase in current liabilities for the year under review. The Group’s current assets increased by Rs. 222 million due to increase in trade and other receivables by Rs. 232 million and decrease in short-term investments and cash and bank balances by Rs. 18 million. The increase in trade and other receivables consisted of Rs. 162 million increase from JKPLC, Rs. 65 million increase from JKSB and Rs. 5 million increase from JKW.
FINANCIAL CAPITAL
MARKET CAPITALISATION
Rs. 2,918 MnDecline of 18 percent
42John Keells PLC Annual Report 2018/19
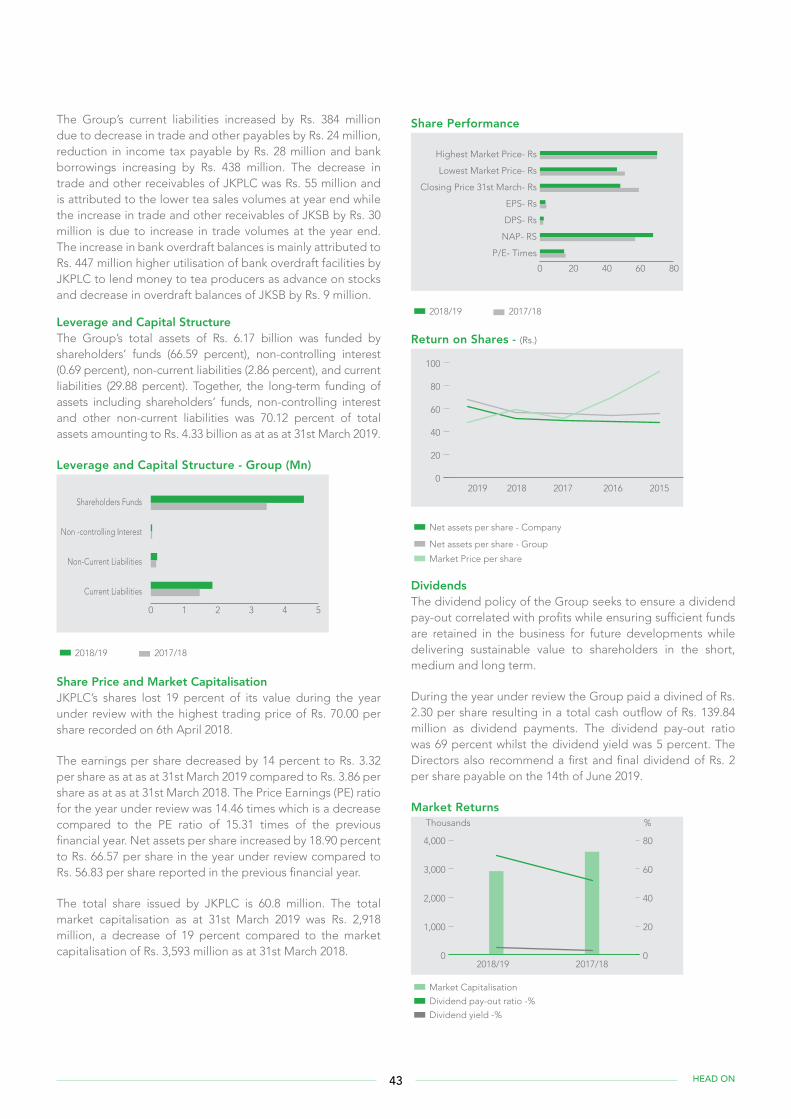
The Group’s current liabilities increased by Rs. 384 million due to decrease in trade and other payables by Rs. 24 million, reduction in income tax payable by Rs. 28 million and bank borrowings increasing by Rs. 438 million. The decrease in trade and other receivables of JKPLC was Rs. 55 million and is attributed to the lower tea sales volumes at year end while the increase in trade and other receivables of JKSB by Rs. 30 million is due to increase in trade volumes at the year end. The increase in bank overdraft balances is mainly attributed to Rs. 447 million higher utilisation of bank overdraft facilities by JKPLC to lend money to tea producers as advance on stocks and decrease in overdraft balances of JKSB by Rs. 9 million.
Leverage and Capital StructureThe Group’s total assets of Rs. 6.17 billion was funded by shareholders’ funds (66.59 percent), non-controlling interest (0.69 percent), non-current liabilities (2.86 percent), and current liabilities (29.88 percent). Together, the long-term funding of assets including shareholders’ funds, non-controlling interest and other non-current liabilities was 70.12 percent of total assets amounting to Rs. 4.33 billion as at as at 31st March 2019.
Leverage and Capital Structure - Group (Mn)
0 1 2 3 4 5
2018/19 2017/18
Shareholders Funds
Non -controlling Interest
Non-Current Liabilities
Current Liabilities
Share Price and Market CapitalisationJKPLC’s shares lost 19 percent of its value during the year under review with the highest trading price of Rs. 70.00 per share recorded on 6th April 2018.
The earnings per share decreased by 14 percent to Rs. 3.32 per share as at as at 31st March 2019 compared to Rs. 3.86 per share as at as at 31st March 2018. The Price Earnings (PE) ratio for the year under review was 14.46 times which is a decrease compared to the PE ratio of 15.31 times of the previous financial year. Net assets per share increased by 18.90 percent to Rs. 66.57 per share in the year under review compared to Rs. 56.83 per share reported in the previous financial year.
The total share issued by JKPLC is 60.8 million. The total market capitalisation as at 31st March 2019 was Rs. 2,918 million, a decrease of 19 percent compared to the market capitalisation of Rs. 3,593 million as at 31st March 2018.
Return on Shares - (Rs.)
0
20
40
60
80
100
2019 2018 2017 2016 2015
Net assets per share - Company
Net assets per share - Group
Market Price per share
Share Performance
0 20 40 60 80
2018/19 2017/18
Highest Market Price- Rs
Lowest Market Price- Rs
Closing Price 31st March- Rs
EPS- Rs
DPS- Rs
NAP- RS
P/E- Times
DividendsThe dividend policy of the Group seeks to ensure a dividend pay-out correlated with profits while ensuring sufficient funds are retained in the business for future developments while delivering sustainable value to shareholders in the short, medium and long term.
During the year under review the Group paid a divined of Rs. 2.30 per share resulting in a total cash outflow of Rs. 139.84 million as dividend payments. The dividend pay-out ratio was 69 percent whilst the dividend yield was 5 percent. The Directors also recommend a first and final dividend of Rs. 2 per share payable on the 14th of June 2019.
Market Returns
0
1,000
2,000
3,000
4,000
2018/19 2017/18
Market Capitalisation
Dividend pay-out ratio -%
Dividend yield -%
%Thousands
0
20
40
60
80
43 HEAD ON
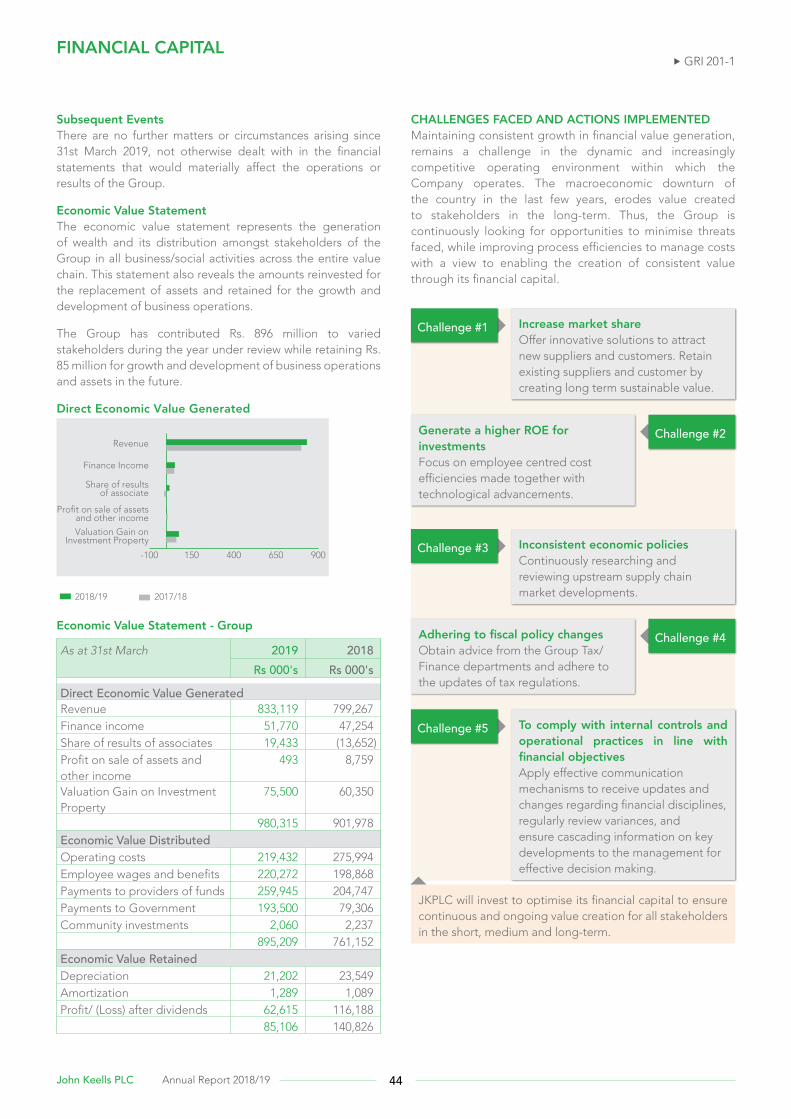
Subsequent EventsThere are no further matters or circumstances arising since 31st March 2019, not otherwise dealt with in the financial statements that would materially affect the operations or results of the Group.
Economic Value StatementThe economic value statement represents the generation of wealth and its distribution amongst stakeholders of the Group in all business/social activities across the entire value chain. This statement also reveals the amounts reinvested for the replacement of assets and retained for the growth and development of business operations.
The Group has contributed Rs. 896 million to varied stakeholders during the year under review while retaining Rs. 85 million for growth and development of business operations and assets in the future.
Direct Economic Value Generated
-100 150 400 650 900
2018/19 2017/18
Revenue
Finance Income
Share of resultsof associate
Profit on sale of assetsand other income
Valuation Gain onInvestment Property
Economic Value Statement - Group
As at 31st March 2019 2018 Rs 000's Rs 000's
Direct Economic Value GeneratedRevenue 833,119 799,267Finance income 51,770 47,254Share of results of associates 19,433 (13,652)Profit on sale of assets and other income
493 8,759
Valuation Gain on Investment Property
75,500 60,350
980,315 901,978Economic Value Distributed Operating costs 219,432 275,994Employee wages and benefits 220,272 198,868 Payments to providers of funds 259,945 204,747Payments to Government 193,500 79,306Community investments 2,060 2,237 895,209 761,152Economic Value RetainedDepreciation 21,202 23,549Amortization 1,289 1,089Profit/ (Loss) after dividends 62,615 116,188 85,106 140,826
Increase market share Offer innovative solutions to attract new suppliers and customers. Retain existing suppliers and customer by creating long term sustainable value.
Challenge #1
Inconsistent economic policies Continuously researching and reviewing upstream supply chain market developments.
Challenge #3
To comply with internal controls and operational practices in line with financial objectives Apply effective communication mechanisms to receive updates and changes regarding financial disciplines, regularly review variances, and ensure cascading information on key developments to the management for effective decision making.
Challenge #5
Generate a higher ROE for investments Focus on employee centred cost efficiencies made together with technological advancements.
Challenge #2
Adhering to fiscal policy changes Obtain advice from the Group Tax/Finance departments and adhere to the updates of tax regulations.
Challenge #4
JKPLC will invest to optimise its financial capital to ensure continuous and ongoing value creation for all stakeholders in the short, medium and long-term.
FINANCIAL CAPITAL
CHALLENGES FACED AND ACTIONS IMPLEMENTED Maintaining consistent growth in financial value generation, remains a challenge in the dynamic and increasingly competitive operating environment within which the Company operates. The macroeconomic downturn of the country in the last few years, erodes value created to stakeholders in the long-term. Thus, the Group is continuously looking for opportunities to minimise threats faced, while improving process efficiencies to manage costs with a view to enabling the creation of consistent value through its financial capital.
GRI 201-1
44John Keells PLC Annual Report 2018/19

MANUFACTURED CAPITAL
MANAGEMENT APPROACH To ensure our manufactured capital continues to add value to business operations and create value for our stakeholders, the Company continuously invests in maintaining and upgrading existing manufactured capital assets. This is undertaken by having in-house personnel to oversee maintenance of warehouse premises and related equipment as well as office equipment. The Company has also entered into maintenance contracts for regular upkeep as relevant to ensure the effective utilisation of physical assets.
As part of our efforts to continue to deliver on our business strategy and goals, the Company also makes new investments in manufactured capital as and when required to increase warehouse capacity, improve process efficiencies and enable employees to work in an automated environment of convenience. Furthermore, as a conscientious entity concerned with minimising our impact on the natural environment, JKPLC also researched and searches for new and innovative technology which will enable the Company to steadily reduce the environmental impact of our business and remain compliant with regulations across our markets.
INVESTMENTS IN MANUFACTURED CAPITAL A key investment during the year under review was the installation of solar panelling for the warehouse operations which is expected to bring in saving and create value to natural capital in the medium to long term. The Company invested Rs. 3.75 million in this endeavour during the year under review and a further investment of Rs. 3.75 million is expected in the coming financial year when the project is planned for completion and implementation. In addition, another Rs. 12.29 million was invested in the purchase of manufactured capital while the maintenance of manufactured capital assets was Rs. 3.58 million during the year under review.
Investments in capital assets (Rs. Mn.)
0
10
20
30
40
50
2018/19 2017/18 2016/17 2015/16 2014/15
Maintenance cost on property (Rs. Mn.)
0
1
2
3
4
5
2018/19 2017/18 2016/17 2015/16 2014/15
As part of the Company’s measures for safeguarding our tangible assets base, JKPLC procures comprehensive insurance coverage which are reviewed regularly by insurance providers to reflect current and ongoing developments and revaluations to ensure a sustainable method in assets utilisation and the risk associated with owning these assets.
Insurance cost on property (Rs. Mn.)
0.00
0.75
1.50
2.25
3.00
2018/19 2017/18 2016/17 2015/16 2014/15
INVESTMENT CAPITAL
Rs.12.29 Mn
NET BOOK VALUE OF ASSETS
Rs. 351.07 Mn
JKPLC’S MANUFACTURED CAPITAL IS COMPRISED OF THE 125,000 SQUARE FOOT WAREHOUSE COMPLEX AND RELATED MOVING EQUIPMENT USED IN THE DAY-TO-DAY WAREHOUSE OPERATIONS, WHICH ENHANCES VALUE OF THE BUSINESS OPERATIONS. IN ADDITION, OFFICE EQUIPMENT, FURNITURE AND FITTINGS, AND VEHICLES USED TO CONDUCT BUSINESS ACTIVITIES ARE ALSO A PART OF THE COMPANY’S MANUFACTURED CAPITAL.
45 HEAD ON
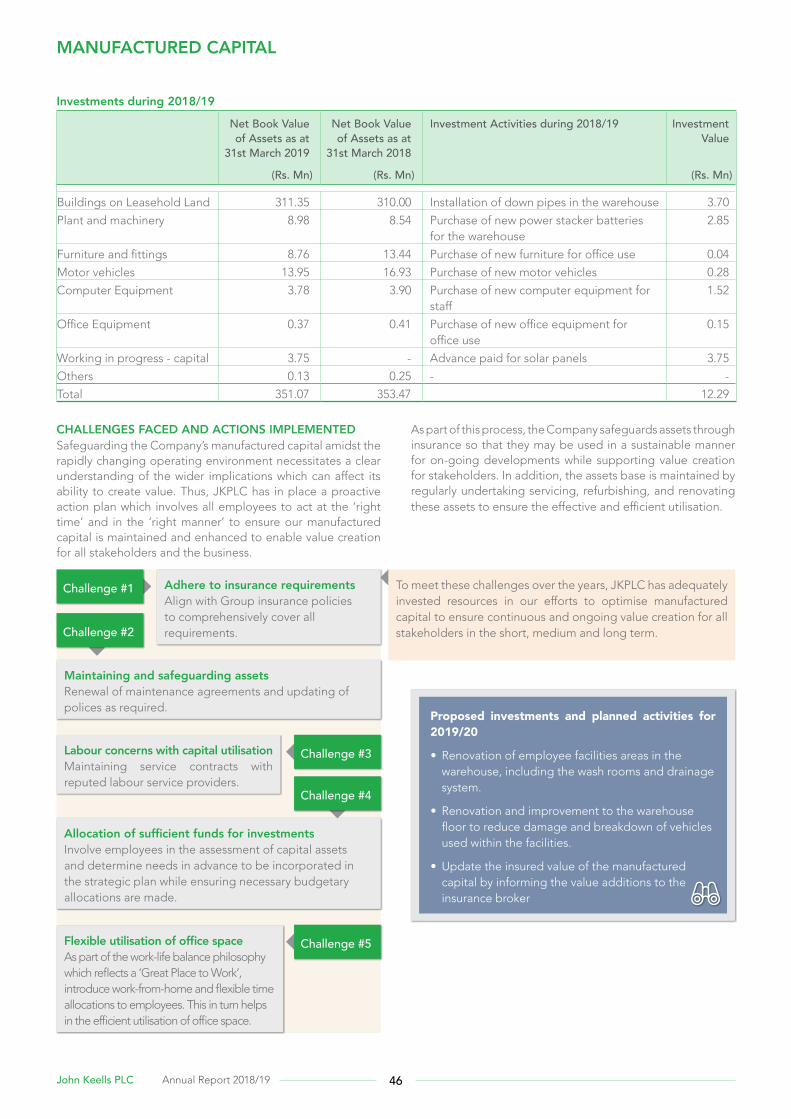
Investments during 2018/19
Net Book Valueof Assets as at
31st March 2019
Net Book Valueof Assets as at
31st March 2018
Investment Activities during 2018/19 Investment Value
(Rs. Mn) (Rs. Mn) (Rs. Mn)
Buildings on Leasehold Land 311.35 310.00 Installation of down pipes in the warehouse 3.70
Plant and machinery 8.98 8.54 Purchase of new power stacker batteries for the warehouse
2.85
Furniture and fittings 8.76 13.44 Purchase of new furniture for office use 0.04
Motor vehicles 13.95 16.93 Purchase of new motor vehicles 0.28
Computer Equipment 3.78 3.90 Purchase of new computer equipment for staff
1.52
Office Equipment 0.37 0.41 Purchase of new office equipment for office use
0.15
Working in progress - capital 3.75 - Advance paid for solar panels 3.75
Others 0.13 0.25 - -
Total 351.07 353.47 12.29
CHALLENGES FACED AND ACTIONS IMPLEMENTED Safeguarding the Company’s manufactured capital amidst the rapidly changing operating environment necessitates a clear understanding of the wider implications which can affect its ability to create value. Thus, JKPLC has in place a proactive action plan which involves all employees to act at the ‘right time’ and in the ‘right manner’ to ensure our manufactured capital is maintained and enhanced to enable value creation for all stakeholders and the business.
Adhere to insurance requirements Align with Group insurance policies to comprehensively cover all requirements.
Challenge #1
Labour concerns with capital utilisationMaintaining service contracts with reputed labour service providers.
Challenge #3
Challenge #5Flexible utilisation of office space As part of the work-life balance philosophy which reflects a ‘Great Place to Work’, introduce work-from-home and flexible time allocations to employees. This in turn helps in the efficient utilisation of office space.
Maintaining and safeguarding assets Renewal of maintenance agreements and updating of polices as required.
Challenge #2
Allocation of sufficient funds for investments Involve employees in the assessment of capital assets and determine needs in advance to be incorporated in the strategic plan while ensuring necessary budgetary allocations are made.
Challenge #4
As part of this process, the Company safeguards assets through insurance so that they may be used in a sustainable manner for on-going developments while supporting value creation for stakeholders. In addition, the assets base is maintained by regularly undertaking servicing, refurbishing, and renovating these assets to ensure the effective and efficient utilisation.
Proposed investments and planned activities for 2019/20
• Renovation of employee facilities areas in the warehouse, including the wash rooms and drainage system.
• Renovation and improvement to the warehouse floor to reduce damage and breakdown of vehicles used within the facilities.
• Update the insured value of the manufactured capital by informing the value additions to the insurance broker
To meet these challenges over the years, JKPLC has adequately invested resources in our efforts to optimise manufactured capital to ensure continuous and ongoing value creation for all stakeholders in the short, medium and long term.
MANUFACTURED CAPITAL
46John Keells PLC Annual Report 2018/19
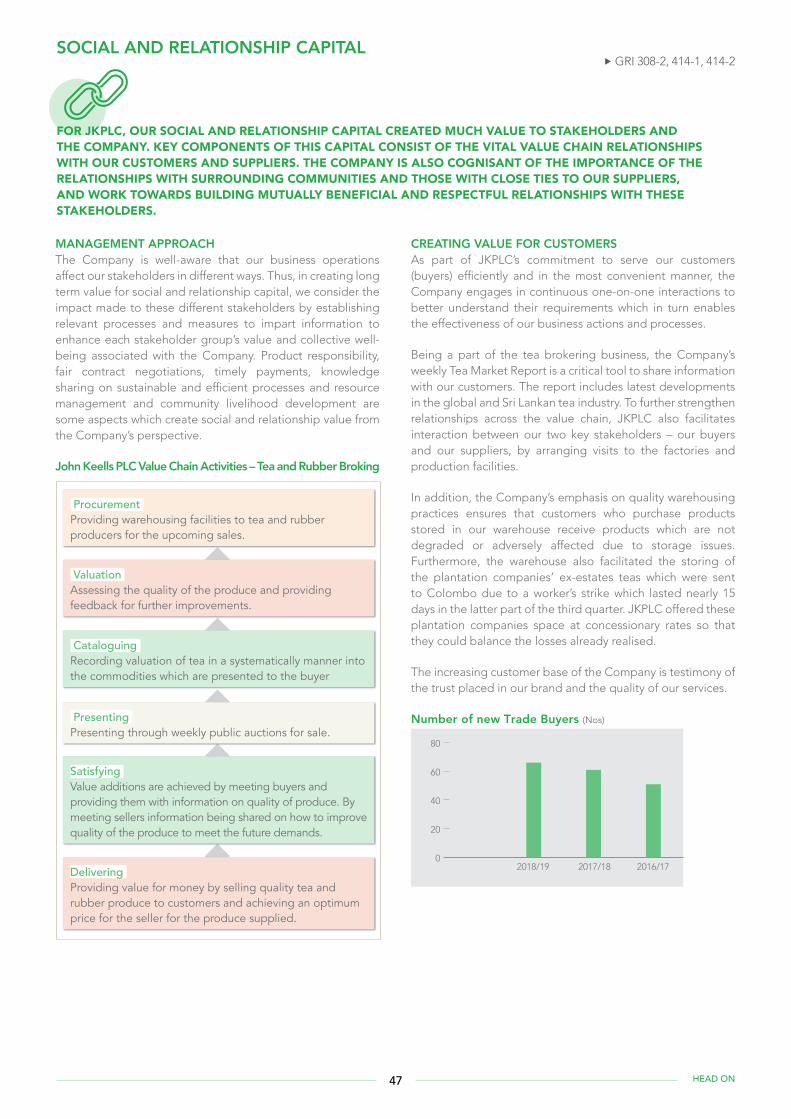
SOCIAL AND RELATIONSHIP CAPITAL
MANAGEMENT APPROACHThe Company is well-aware that our business operations affect our stakeholders in different ways. Thus, in creating long term value for social and relationship capital, we consider the impact made to these different stakeholders by establishing relevant processes and measures to impart information to enhance each stakeholder group’s value and collective well-being associated with the Company. Product responsibility, fair contract negotiations, timely payments, knowledge sharing on sustainable and efficient processes and resource management and community livelihood development are some aspects which create social and relationship value from the Company’s perspective.
John Keells PLC Value Chain Activities – Tea and Rubber Broking
Procurement Providing warehousing facilities to tea and rubber producers for the upcoming sales.
Valuation Assessing the quality of the produce and providing feedback for further improvements.
Cataloguing Recording valuation of tea in a systematically manner into the commodities which are presented to the buyer
Presenting Presenting through weekly public auctions for sale.
Satisfying Value additions are achieved by meeting buyers and providing them with information on quality of produce. By meeting sellers information being shared on how to improve quality of the produce to meet the future demands.
Delivering Providing value for money by selling quality tea and rubber produce to customers and achieving an optimum price for the seller for the produce supplied.
CREATING VALUE FOR CUSTOMERS As part of JKPLC’s commitment to serve our customers (buyers) efficiently and in the most convenient manner, the Company engages in continuous one-on-one interactions to better understand their requirements which in turn enables the effectiveness of our business actions and processes.
Being a part of the tea brokering business, the Company’s weekly Tea Market Report is a critical tool to share information with our customers. The report includes latest developments in the global and Sri Lankan tea industry. To further strengthen relationships across the value chain, JKPLC also facilitates interaction between our two key stakeholders – our buyers and our suppliers, by arranging visits to the factories and production facilities.
In addition, the Company’s emphasis on quality warehousing practices ensures that customers who purchase products stored in our warehouse receive products which are not degraded or adversely affected due to storage issues. Furthermore, the warehouse also facilitated the storing of the plantation companies’ ex-estates teas which were sent to Colombo due to a worker’s strike which lasted nearly 15 days in the latter part of the third quarter. JKPLC offered these plantation companies space at concessionary rates so that they could balance the losses already realised.
The increasing customer base of the Company is testimony of the trust placed in our brand and the quality of our services.
Number of new Trade Buyers (Nos)
0
20
40
60
80
2018/19 2017/18 2016/17
FOR JKPLC, OUR SOCIAL AND RELATIONSHIP CAPITAL CREATED MUCH VALUE TO STAKEHOLDERS AND THE COMPANY. KEY COMPONENTS OF THIS CAPITAL CONSIST OF THE VITAL VALUE CHAIN RELATIONSHIPS WITH OUR CUSTOMERS AND SUPPLIERS. THE COMPANY IS ALSO COGNISANT OF THE IMPORTANCE OF THE RELATIONSHIPS WITH SURROUNDING COMMUNITIES AND THOSE WITH CLOSE TIES TO OUR SUPPLIERS, AND WORK TOWARDS BUILDING MUTUALLY BENEFICIAL AND RESPECTFUL RELATIONSHIPS WITH THESE STAKEHOLDERS.
GRI 308-2, 414-1, 414-2
47 HEAD ON

Value Creating Activities for Customers in 2018/19
• Encouraged and facilitated the use of the new IT platform, electronic document delivery to exporters/buyers which enabled them to collect their tea purchases from the warehouse in a time efficient manner.
• Extension of the system to facilitate the process of keying in payments received from customers for their purchases directly to the system in real-time, thereby increasing the efficiency of finalising bank reconciliations in SAP system.
• Supplier factory visits together with customers to observe the production process, determine quality standards and share knowledge on best practices.
The Company’s top-ranking suppliers and customers work with JKPLC to enable and partner with us to pursue mutual growth in a sustainable manner.
Top Ten Suppliers (Tea Brokering)
Top Ten Customers (Tea Brokering)
Tea Smallholder Factories PLC Akbar Brothers Ltd
Hapugastanne Plantations PLC
Unilever Lipton Ceylon Ltd
Hatton Plantations Limited Uniworld Teas (Pvt) Ltd
Pussellawa Plantations Limited Anverally & Sons Ltd
Bogawantalawa Tea Estates PLC
Vintage Teas (Pvt) Ltd
Mr. K.D.S.R. Upasena Inter Tea (Private) Ltd
Agarapatana Plantations Ltd Watawala Tea Ceylon Ltd
Kotagala Plantations PLC Van Rees Ceylon Limited
Elpitiya Plantations PLC Empire Teas
Talawakelle Tea Estates PLC Imperial Teas (Pvt) Ltd
CREATING VALUE FOR SUPPLIERSOur tea and rubber suppliers are the critical link in our value chain as the success of JKPLC’s business depends heavily on reliable and sustainable supply chain partners. As such the Company remains fully committed to work towards building trust with our suppliers and offering increasingly comprehensive supplier integration within the Company’s business operations through a range of value-added services. As such, over the years, JKPLC has built processes and systems which enable us to provide financial assistance to factory owners (suppliers) to manage their working capital requirements and pursue extension plans, sharing of knowledge and best practices, sharing of latest industry developments and challenges, and one-to-one interaction with our customers for greater understanding of their needs.
In addition, the Company’s emphasis on efficient warehousing practices and quality standards ensures that suppliers’ produce is stored in optimal conditions without affecting quality, thereby increasing their ability to obtain higher prices at the marketplace.
Number of new Trade Sellers (Nos)
0
5
10
15
20
2018/19 2017/18 2016/17
Continuous quality checks by the Tea smallholders factory PLC staff.
Tea smallholders factory PLC the largest supplier of John Keells PLC advising on how to improve quality of the production by using latest manufacturing technology.
SOCIAL AND RELATIONSHIP CAPITAL
48John Keells PLC Annual Report 2018/19

Supply Chain – Commodity Broking Segment
Tea / Rubber Small holders
Private Tea/Rubber Factory Owners/
Managing Agent of Tea/Rubber Factories
Regional Plantation Companies
Corporative Societies/ Trusts
Partnerships / Agents of Estates
Commodity Brokers
Warehouses – Brokers/Plantation Company/Third party logistic providers
Buyers – Exporters/Local Purchases
Final Consumer
Value Creating Activities for Suppliers in 2018/19
• Continued to share pre-catalogue and post-sale (market reports, valuation reports, muster reports, etc.) information with suppliers in real time.
• Advised and facilitated producers to overcome issues of returned tea orders by exporters due to not meeting certain international standards as a result of the alternate weedicide usage post the ban of glyphosate.
• Suppliers were given free or discounted warehousing space to bring down ex estate tea during anticipated labour unrest.
• Conducted tea tasting days for the different elevational regions.
• Participating in discussions related to wage increase and other challenges faced by producers to promote the industry organised by the Colombo Brokers Association.
• Continued to facilitate manufacturing advisors and auctioneers to make regular factory visits to disseminate advice and recommend necessary quality and productivity improvements.
CREATING VALUE FOR THE COMMUNITYBeing a responsible and conscientious business organisation, JKPLC practices good corporate citizenship by assisting and developing communities which surround our business operations and those of our suppliers. Focus areas include health and well-being and the improvement of living standards.
Community activities are generally carried out with the support of our employees who are encouraged to volunteer their time in organising and participating at these programmes.
In addition, the Company makes an annual contribution to the John Keells Foundation through which all Group corporate social responsibility activities are carried out.
John Keells PLC Staff volunteered to conduct Eye Camps in schools neighbouring to colombo.
John Keells PLC Staff advising tea smallholders on tea replanting methods.
GRI 102-9
49 HEAD ON
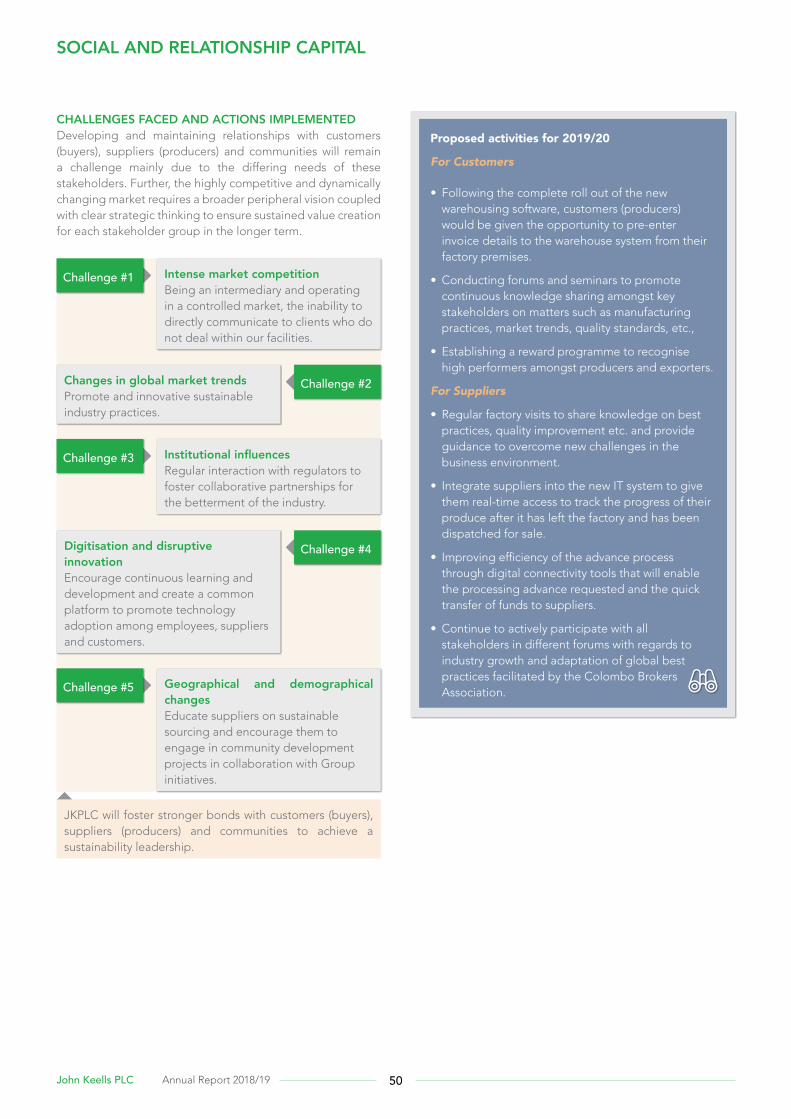
Proposed activities for 2019/20
For Customers
• Following the complete roll out of the new warehousing software, customers (producers) would be given the opportunity to pre-enter invoice details to the warehouse system from their factory premises.
• Conducting forums and seminars to promote continuous knowledge sharing amongst key stakeholders on matters such as manufacturing practices, market trends, quality standards, etc.,
• Establishing a reward programme to recognise high performers amongst producers and exporters.
For Suppliers
• Regular factory visits to share knowledge on best practices, quality improvement etc. and provide guidance to overcome new challenges in the business environment.
• Integrate suppliers into the new IT system to give them real-time access to track the progress of their produce after it has left the factory and has been dispatched for sale.
• Improving efficiency of the advance process through digital connectivity tools that will enable the processing advance requested and the quick transfer of funds to suppliers.
• Continue to actively participate with all stakeholders in different forums with regards to industry growth and adaptation of global best practices facilitated by the Colombo Brokers Association.
CHALLENGES FACED AND ACTIONS IMPLEMENTED Developing and maintaining relationships with customers (buyers), suppliers (producers) and communities will remain a challenge mainly due to the differing needs of these stakeholders. Further, the highly competitive and dynamically changing market requires a broader peripheral vision coupled with clear strategic thinking to ensure sustained value creation for each stakeholder group in the longer term.
Intense market competition Being an intermediary and operating in a controlled market, the inability to directly communicate to clients who do not deal within our facilities.
Challenge #1
Institutional influences Regular interaction with regulators to foster collaborative partnerships for the betterment of the industry.
Challenge #3
Geographical and demographical changes Educate suppliers on sustainable sourcing and encourage them to engage in community development projects in collaboration with Group initiatives.
Challenge #5
Changes in global market trendsPromote and innovative sustainable industry practices.
Challenge #2
Digitisation and disruptive innovation Encourage continuous learning and development and create a common platform to promote technology adoption among employees, suppliers and customers.
Challenge #4
JKPLC will foster stronger bonds with customers (buyers), suppliers (producers) and communities to achieve a sustainability leadership.
SOCIAL AND RELATIONSHIP CAPITAL
50John Keells PLC Annual Report 2018/19
HUMAN CAPITAL
MANAGEMENT APPROACHIn consideration of the importance of our employees, the main objective of the Company’s human capital development strategy is to create a mutually beneficial relationship between individual employee needs and the Company’s goals. As such, we aim to attract and retain the right people, with the right experience and attitude, and in the right place. The Company also ensures that our employees receive the right compensation and opportunities for professional advancement and career growth. This is how JKPLC creates a winning match between people and the Company. To assist us to achieve this aim, the Company is committed to the following fundamental principles which drive our approach to managing our human resources.
1. Maintaining equality and diversity at every stage of the employment process including recruitment, selection, evaluation, promotion and training and development of all employees.
2. Ensuring remuneration and benefits offered to employees are competitive, in line with industry standards and comply with the statutory labour laws of the country.
3. Evaluating the performance of all employees and their capacity for progress within the Company, thereby enabling to identify the training needs whilst highlighting employees’ potential for career progression within JKPLC.
4. Providing adequate training and development to ensure employees acquire the skills and competencies needed to optimise their capacity, knowledge and know-how.
• The Company’s investment in training seeks to correspond to the requirements identified through the performance appraisals aligning employees with the John Keells Holdings (JKH) Group behavioural competencies framework (referred to as roof competencies). The Company nominates staff for training to meet required competencies at their current job level and to develop them towards achieving their career aspirations.
• Diverse training programmes (classroom, e-learning, bite-sized and blended) are made available to meet the required competency levels of all employees. The Company works with both internal/external trainers to customise the programmes, keeping at the forefront the development needs of our employees, in order to meet their expectations.
Commitment to Human Rights
Fundamental to our Human Capital strategy is the commitment to uphold Human Rights.
JKPLC respects international principles of human rights including those expressed in the UN Declaration of Human Rights. As such the Company does not tolerate child labour, forced labour, physical punishment or abuse. We recognise lawful employee rights of free association and collective bargaining and remain committed to comply with all applicable labour laws. Further, we are committed to providing a safe and healthy work environment and in doing so strive to emulate globally accepted best practices for safety in the workplace.
5. Creating a communicative and open culture to enable employees to give and receive feedback and freely communicate with colleagues, supervisors, and senior managers.
6. Striving to recognise leadership qualities in employees and inspire them to reach for even greater heights.
7. Providing opportunities for employee engagement and team building by encouraging employees to participate in team sports, organising annual activities such as staff excursions, annual group sports events, etc., and inspiring employees to volunteer for CSR activities.
8. Ensuring employees benefit from a proper work-life balance by giving access to all employees to use the flexible working hours policy, work-from-home policy, and paternity leave.
9. Strictly implementing an equal opportunity principle to include people representing both genders; multiple social, religious and ethnic backgrounds and age groups.
10. Strictly implementing a policy of not allowing child labour.
EMPLOYEES OF JKPLC ARE AN INTEGRAL PART OF BUSINESS PROSPERITY. THEY WORK TIRELESSLY TO ENSURE THAT THE BUSINESS STRATEGIES, GOALS AND OBJECTIVES ARE ACHIEVED WHILST KEY PERSONNEL INTERACT WITH THE EXTERNAL STAKEHOLDERS OF THE COMPANY. AS SUCH, THE COMPANY CONSIDERS THE SKILLS, TALENT, AND PRODUCTIVITY OF OUR EMPLOYEES AS AN ENABLER FOR SUCCESS IN ACHIEVING OUR CORPORATE VISION.
GRI 102-41, 401-3, 408-1, 409-1, 412-2
51 HEAD ON
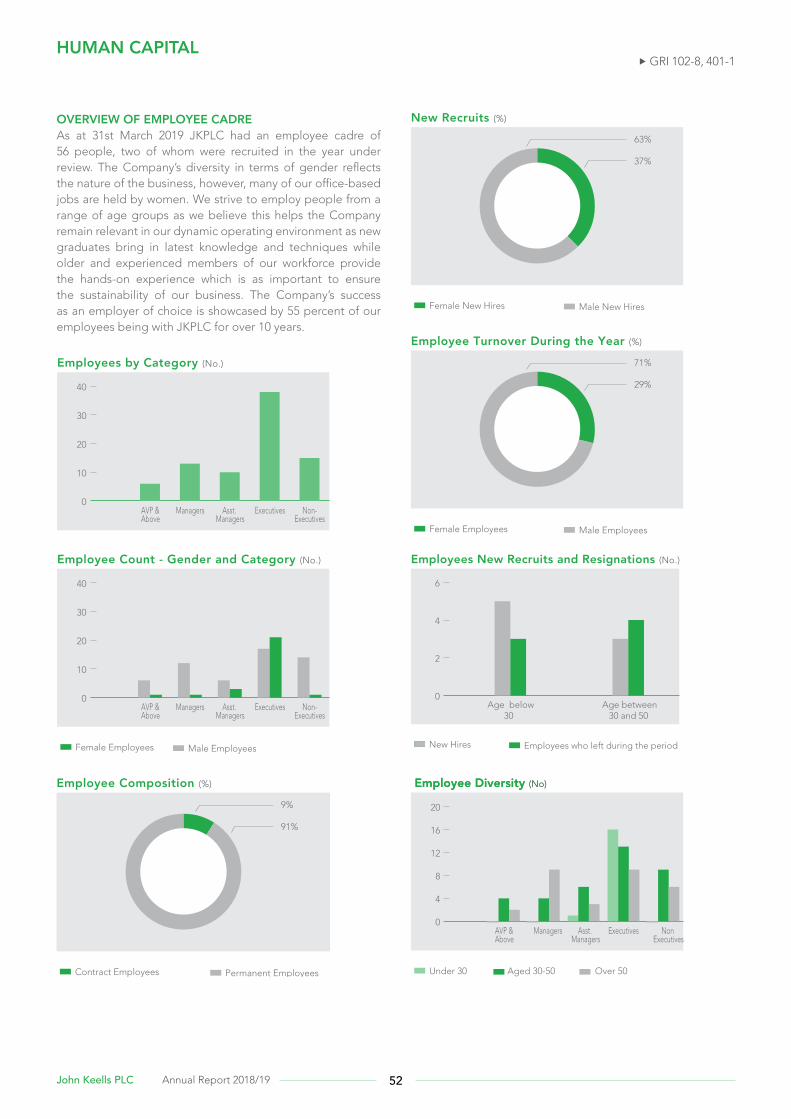
OVERVIEW OF EMPLOYEE CADREAs at 31st March 2019 JKPLC had an employee cadre of 56 people, two of whom were recruited in the year under review. The Company’s diversity in terms of gender reflects the nature of the business, however, many of our office-based jobs are held by women. We strive to employ people from a range of age groups as we believe this helps the Company remain relevant in our dynamic operating environment as new graduates bring in latest knowledge and techniques while older and experienced members of our workforce provide the hands-on experience which is as important to ensure the sustainability of our business. The Company’s success as an employer of choice is showcased by 55 percent of our employees being with JKPLC for over 10 years.
91%
9%
Contract Employees Permanent Employees
Employee Composition (%)
Employee Count - Gender and Category (No.)
0
10
20
30
40
AVP & Managers Asst. Executives Non-Above Managers Executives
Female Employees Male Employees
Employees by Category (No.)
0
10
20
30
40
AVP & Managers Asst. Executives Non-Above Managers Executives
37%
63%
Female New Hires Male New Hires
New Recruits (%)
Employee Diversity (No) Employee Diversity (No)
0
4
8
12
16
20
AVP & Managers Asst. Executives Non Above Managers Executives
Under 30 Aged 30-50 Over 50
29%
71%
Female Employees Male Employees
Employee Turnover During the Year (%)
Employees New Recruits and Resignations (No.)
0
2
4
6
Age below Age between 30 30 and 50
New Hires Employees who left during the period
HUMAN CAPITAL GRI 102-8, 401-1
52John Keells PLC Annual Report 2018/19
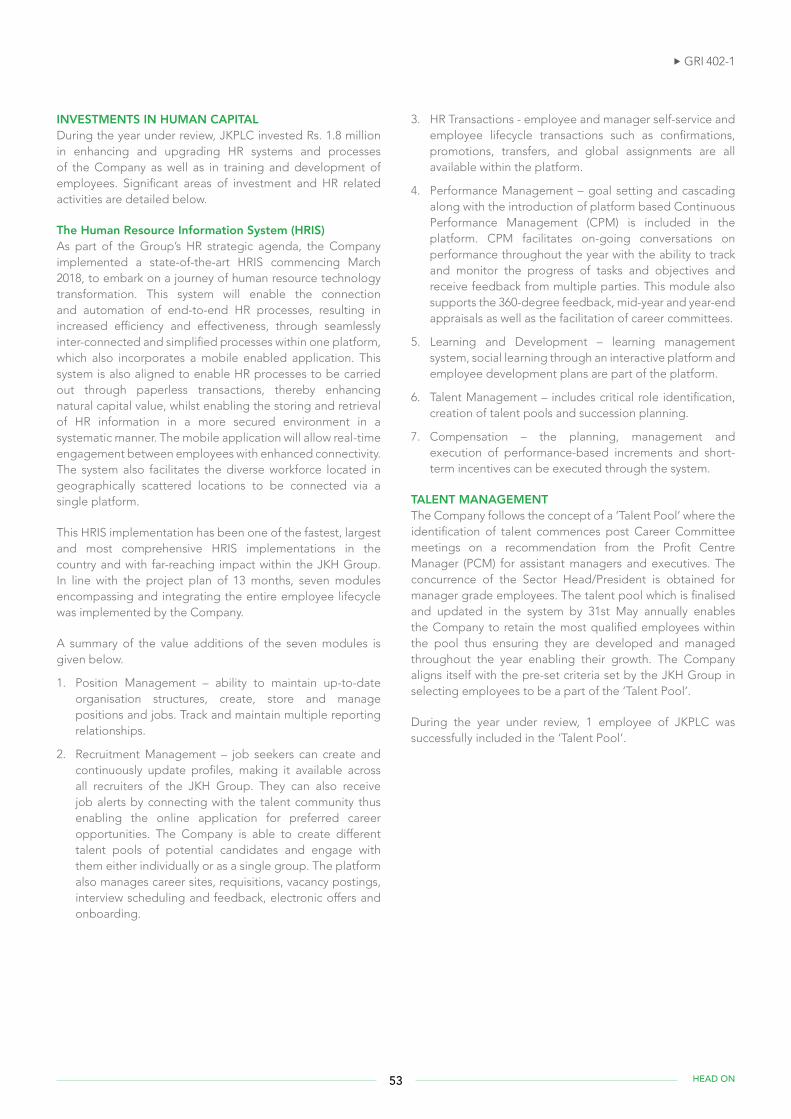
INVESTMENTS IN HUMAN CAPITALDuring the year under review, JKPLC invested Rs. 1.8 million in enhancing and upgrading HR systems and processes of the Company as well as in training and development of employees. Significant areas of investment and HR related activities are detailed below.
The Human Resource Information System (HRIS)As part of the Group’s HR strategic agenda, the Company implemented a state-of-the-art HRIS commencing March 2018, to embark on a journey of human resource technology transformation. This system will enable the connection and automation of end-to-end HR processes, resulting in increased efficiency and effectiveness, through seamlessly inter-connected and simplified processes within one platform, which also incorporates a mobile enabled application. This system is also aligned to enable HR processes to be carried out through paperless transactions, thereby enhancing natural capital value, whilst enabling the storing and retrieval of HR information in a more secured environment in a systematic manner. The mobile application will allow real-time engagement between employees with enhanced connectivity. The system also facilitates the diverse workforce located in geographically scattered locations to be connected via a single platform.
This HRIS implementation has been one of the fastest, largest and most comprehensive HRIS implementations in the country and with far-reaching impact within the JKH Group. In line with the project plan of 13 months, seven modules encompassing and integrating the entire employee lifecycle was implemented by the Company.
A summary of the value additions of the seven modules is given below.
1. Position Management – ability to maintain up-to-date organisation structures, create, store and manage positions and jobs. Track and maintain multiple reporting relationships.
2. Recruitment Management – job seekers can create and continuously update profiles, making it available across all recruiters of the JKH Group. They can also receive job alerts by connecting with the talent community thus enabling the online application for preferred career opportunities. The Company is able to create different talent pools of potential candidates and engage with them either individually or as a single group. The platform also manages career sites, requisitions, vacancy postings, interview scheduling and feedback, electronic offers and onboarding.
3. HR Transactions - employee and manager self-service and employee lifecycle transactions such as confirmations, promotions, transfers, and global assignments are all available within the platform.
4. Performance Management – goal setting and cascading along with the introduction of platform based Continuous Performance Management (CPM) is included in the platform. CPM facilitates on-going conversations on performance throughout the year with the ability to track and monitor the progress of tasks and objectives and receive feedback from multiple parties. This module also supports the 360-degree feedback, mid-year and year-end appraisals as well as the facilitation of career committees.
5. Learning and Development – learning management system, social learning through an interactive platform and employee development plans are part of the platform.
6. Talent Management – includes critical role identification, creation of talent pools and succession planning.
7. Compensation – the planning, management and execution of performance-based increments and short-term incentives can be executed through the system.
TALENT MANAGEMENTThe Company follows the concept of a ‘Talent Pool’ where the identification of talent commences post Career Committee meetings on a recommendation from the Profit Centre Manager (PCM) for assistant managers and executives. The concurrence of the Sector Head/President is obtained for manager grade employees. The talent pool which is finalised and updated in the system by 31st May annually enables the Company to retain the most qualified employees within the pool thus ensuring they are developed and managed throughout the year enabling their growth. The Company aligns itself with the pre-set criteria set by the JKH Group in selecting employees to be a part of the ‘Talent Pool’.
During the year under review, 1 employee of JKPLC was successfully included in the ‘Talent Pool’.
GRI 402-1
53 HEAD ON
Performance Appraisal Process of JKPLC
JKPLC follows best practices as laid down by JKH Group for the performance appraisal process of our employees.
Step 1: Once the strategy sessions are completed and annual plans for the financial year are finalised by the GEC, the Company sets SMARTS objectives for employees from executive level upwards using the Hoshin Kanri Methodology, which is based on the Balanced Score Card. This is generally completed ahead of the given financial year (by end March).
Step 2: Once the self and supervisor appraisals relating to the previous financial year are completed by end April, the performance appraisals of each member are taken up at a Career Committee meeting attended by the Management Committee and an independent third-party observer to finalise Performance Ratings. The annual increment of an employee and the short-term incentives are based on this rating. Additionally, for Executives, Assistant Managers and Managers, a scientifically developed, excel based tool is used to carry out the JKH Group ‘Roof Competency Assessment’ covering seven roof competencies. The competency assessment tool also serves as a fair and focused way of identifying training needs. Meanwhile for Managers, the rating is attached to their performance and that of their respective Business Units and goes on to impact their STI’s. All managers are also subjected to a 3600-evaluation process which helps to ascertain the views of the employees within the immediate work circle, a strictly confidential process. The results of the 3600 survey are first discussed at the Career Committee and the employee apprised. It is also used as a development tool to motivate and address possible areas for improvement.
Step 3: Each employee is given feedback on their performance rating by June. Employees dissatisfied with their rating can directly appeal to the President of HR.
Step 4: Training needs of employees are finalised at the Career Committee Meeting and the training requirement is addressed by Centre HR and Sector HR, to ensure all needs are met during the financial year.
Step 5: Preparatory mid-year career discussions introduced in the last financial year is done in September, at the GMC level ahead of the mid-year performance review discussions. The objective of this discussion is for the top management to be actively involved in identifying talent and developing the leadership pipeline.
Step 6: A mid-year review (during October) is undertaken to give employees feedback regarding their progress to help reassess the objectives if needed, whilst aligning the necessary training.
Step 7: The annual final performance appraisal takes place in May.
Competency Assessment Tool
During the year under review, the Company focused on developing a tool to assist our employees with the identification of competency gaps, and in deciding on the appropriate development options to bridge such gaps to further enhance the performance assessment process. This tool was implemented and successfully used by several employees.
HUMAN CAPITAL GRI 404-3
54John Keells PLC Annual Report 2018/19
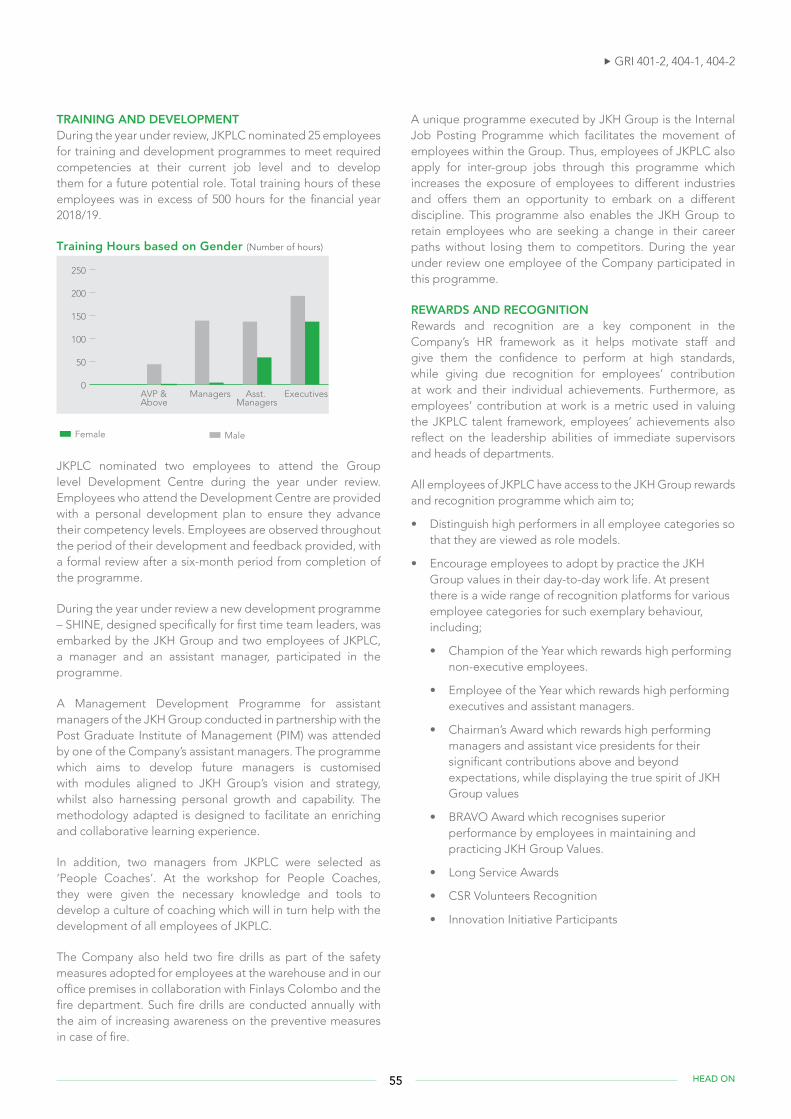
TRAINING AND DEVELOPMENTDuring the year under review, JKPLC nominated 25 employees for training and development programmes to meet required competencies at their current job level and to develop them for a future potential role. Total training hours of these employees was in excess of 500 hours for the financial year 2018/19.
Training Hours based on Gender (Number of hours)
0
50
100
150
200
250
AVP & Managers Asst. ExecutivesAbove Managers
Female Male
JKPLC nominated two employees to attend the Group level Development Centre during the year under review. Employees who attend the Development Centre are provided with a personal development plan to ensure they advance their competency levels. Employees are observed throughout the period of their development and feedback provided, with a formal review after a six-month period from completion of the programme.
During the year under review a new development programme – SHINE, designed specifically for first time team leaders, was embarked by the JKH Group and two employees of JKPLC, a manager and an assistant manager, participated in the programme.
A Management Development Programme for assistant managers of the JKH Group conducted in partnership with the Post Graduate Institute of Management (PIM) was attended by one of the Company’s assistant managers. The programme which aims to develop future managers is customised with modules aligned to JKH Group’s vision and strategy, whilst also harnessing personal growth and capability. The methodology adapted is designed to facilitate an enriching and collaborative learning experience.
In addition, two managers from JKPLC were selected as ‘People Coaches’. At the workshop for People Coaches, they were given the necessary knowledge and tools to develop a culture of coaching which will in turn help with the development of all employees of JKPLC.
The Company also held two fire drills as part of the safety measures adopted for employees at the warehouse and in our office premises in collaboration with Finlays Colombo and the fire department. Such fire drills are conducted annually with the aim of increasing awareness on the preventive measures in case of fire.
A unique programme executed by JKH Group is the Internal Job Posting Programme which facilitates the movement of employees within the Group. Thus, employees of JKPLC also apply for inter-group jobs through this programme which increases the exposure of employees to different industries and offers them an opportunity to embark on a different discipline. This programme also enables the JKH Group to retain employees who are seeking a change in their career paths without losing them to competitors. During the year under review one employee of the Company participated in this programme.
REWARDS AND RECOGNITION Rewards and recognition are a key component in the Company’s HR framework as it helps motivate staff and give them the confidence to perform at high standards, while giving due recognition for employees’ contribution at work and their individual achievements. Furthermore, as employees’ contribution at work is a metric used in valuing the JKPLC talent framework, employees’ achievements also reflect on the leadership abilities of immediate supervisors and heads of departments.
All employees of JKPLC have access to the JKH Group rewards and recognition programme which aim to;
• Distinguish high performers in all employee categories so that they are viewed as role models.
• Encourage employees to adopt by practice the JKH Group values in their day-to-day work life. At present there is a wide range of recognition platforms for various employee categories for such exemplary behaviour, including;
• Champion of the Year which rewards high performing non-executive employees.
• Employee of the Year which rewards high performing executives and assistant managers.
• Chairman’s Award which rewards high performing managers and assistant vice presidents for their significant contributions above and beyond expectations, while displaying the true spirit of JKH Group values
• BRAVO Award which recognises superior performance by employees in maintaining and practicing JKH Group Values.
• Long Service Awards
• CSR Volunteers Recognition
• Innovation Initiative Participants
GRI 401-2, 404-1, 404-2
55 HEAD ON
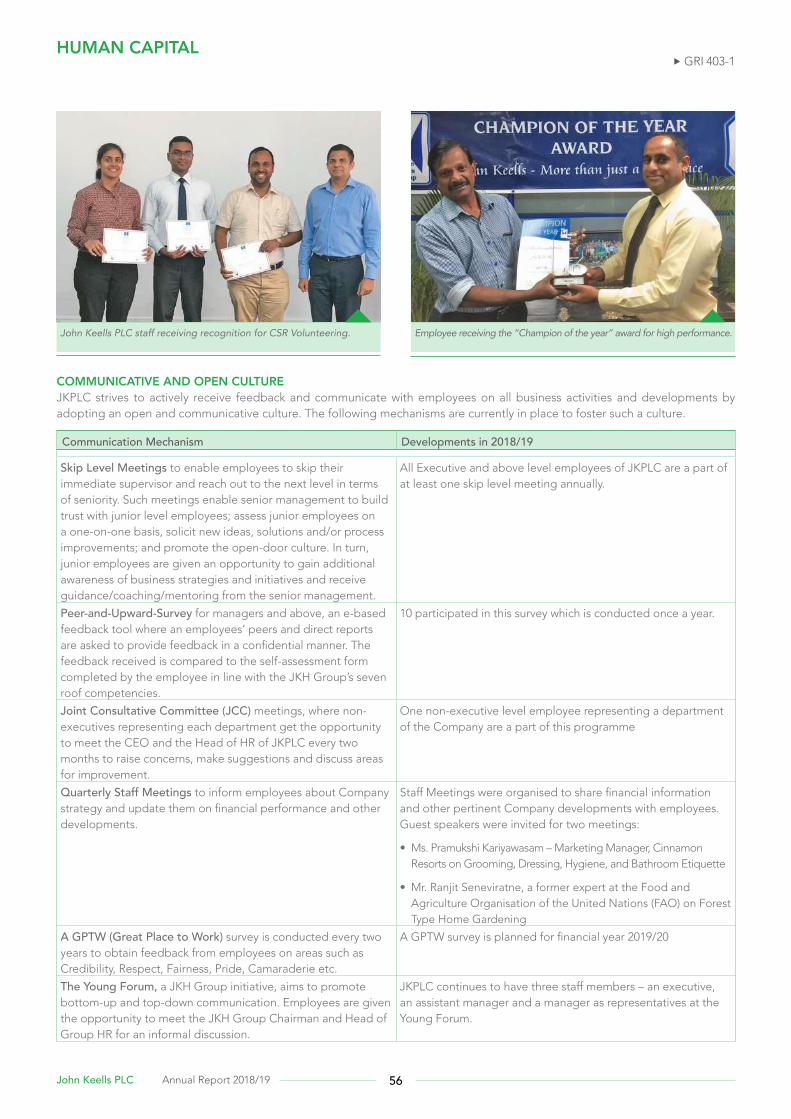
COMMUNICATIVE AND OPEN CULTUREJKPLC strives to actively receive feedback and communicate with employees on all business activities and developments by adopting an open and communicative culture. The following mechanisms are currently in place to foster such a culture.
Communication Mechanism Developments in 2018/19
Skip Level Meetings to enable employees to skip their immediate supervisor and reach out to the next level in terms of seniority. Such meetings enable senior management to build trust with junior level employees; assess junior employees on a one-on-one basis, solicit new ideas, solutions and/or process improvements; and promote the open-door culture. In turn, junior employees are given an opportunity to gain additional awareness of business strategies and initiatives and receive guidance/coaching/mentoring from the senior management.
All Executive and above level employees of JKPLC are a part of at least one skip level meeting annually.
Peer-and-Upward-Survey for managers and above, an e-based feedback tool where an employees’ peers and direct reports are asked to provide feedback in a confidential manner. The feedback received is compared to the self-assessment form completed by the employee in line with the JKH Group’s seven roof competencies.
10 participated in this survey which is conducted once a year.
Joint Consultative Committee (JCC) meetings, where non-executives representing each department get the opportunity to meet the CEO and the Head of HR of JKPLC every two months to raise concerns, make suggestions and discuss areas for improvement.
One non-executive level employee representing a department of the Company are a part of this programme
Quarterly Staff Meetings to inform employees about Company strategy and update them on financial performance and other developments.
Staff Meetings were organised to share financial information and other pertinent Company developments with employees. Guest speakers were invited for two meetings:
• Ms. Pramukshi Kariyawasam – Marketing Manager, Cinnamon Resorts on Grooming, Dressing, Hygiene, and Bathroom Etiquette
• Mr. Ranjit Seneviratne, a former expert at the Food and Agriculture Organisation of the United Nations (FAO) on Forest Type Home Gardening
A GPTW (Great Place to Work) survey is conducted every two years to obtain feedback from employees on areas such as Credibility, Respect, Fairness, Pride, Camaraderie etc.
A GPTW survey is planned for financial year 2019/20
The Young Forum, a JKH Group initiative, aims to promote bottom-up and top-down communication. Employees are given the opportunity to meet the JKH Group Chairman and Head of Group HR for an informal discussion.
JKPLC continues to have three staff members – an executive, an assistant manager and a manager as representatives at the Young Forum.
HUMAN CAPITAL GRI 403-1
Employee receiving the “Champion of the year” award for high performance.John Keells PLC staff receiving recognition for CSR Volunteering.
56John Keells PLC Annual Report 2018/19
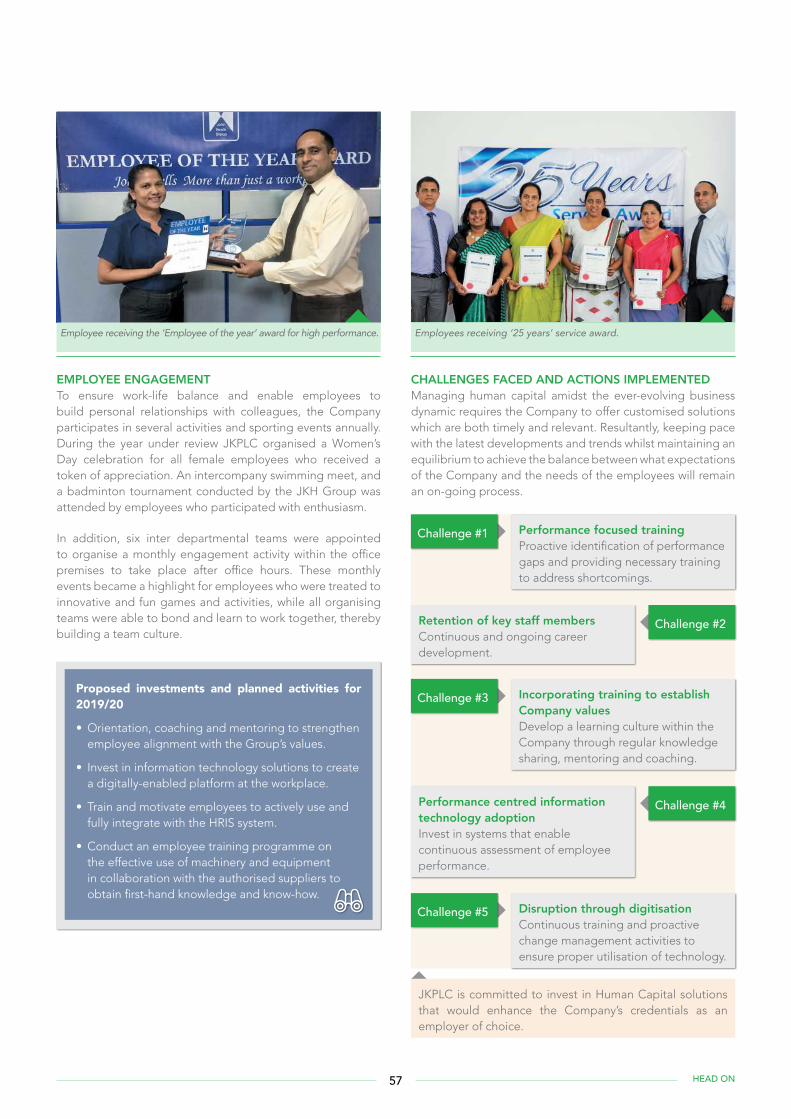
EMPLOYEE ENGAGEMENTTo ensure work-life balance and enable employees to build personal relationships with colleagues, the Company participates in several activities and sporting events annually. During the year under review JKPLC organised a Women’s Day celebration for all female employees who received a token of appreciation. An intercompany swimming meet, and a badminton tournament conducted by the JKH Group was attended by employees who participated with enthusiasm.
In addition, six inter departmental teams were appointed to organise a monthly engagement activity within the office premises to take place after office hours. These monthly events became a highlight for employees who were treated to innovative and fun games and activities, while all organising teams were able to bond and learn to work together, thereby building a team culture.
Proposed investments and planned activities for 2019/20
• Orientation, coaching and mentoring to strengthen employee alignment with the Group’s values.
• Invest in information technology solutions to create a digitally-enabled platform at the workplace.
• Train and motivate employees to actively use and fully integrate with the HRIS system.
• Conduct an employee training programme on the effective use of machinery and equipment in collaboration with the authorised suppliers to obtain first-hand knowledge and know-how.
Performance focused training Proactive identification of performance gaps and providing necessary training to address shortcomings.
Challenge #1
Incorporating training to establish Company values Develop a learning culture within the Company through regular knowledge sharing, mentoring and coaching.
Challenge #3
Disruption through digitisation Continuous training and proactive change management activities to ensure proper utilisation of technology.
Challenge #5
Retention of key staff membersContinuous and ongoing career development.
Challenge #2
Performance centred information technology adoption Invest in systems that enable continuous assessment of employee performance.
Challenge #4
JKPLC is committed to invest in Human Capital solutions that would enhance the Company’s credentials as an employer of choice.
CHALLENGES FACED AND ACTIONS IMPLEMENTED Managing human capital amidst the ever-evolving business dynamic requires the Company to offer customised solutions which are both timely and relevant. Resultantly, keeping pace with the latest developments and trends whilst maintaining an equilibrium to achieve the balance between what expectations of the Company and the needs of the employees will remain an on-going process.
Employee receiving the ‘Employee of the year’ award for high performance. Employees receiving ‘25 years’ service award.
57 HEAD ON
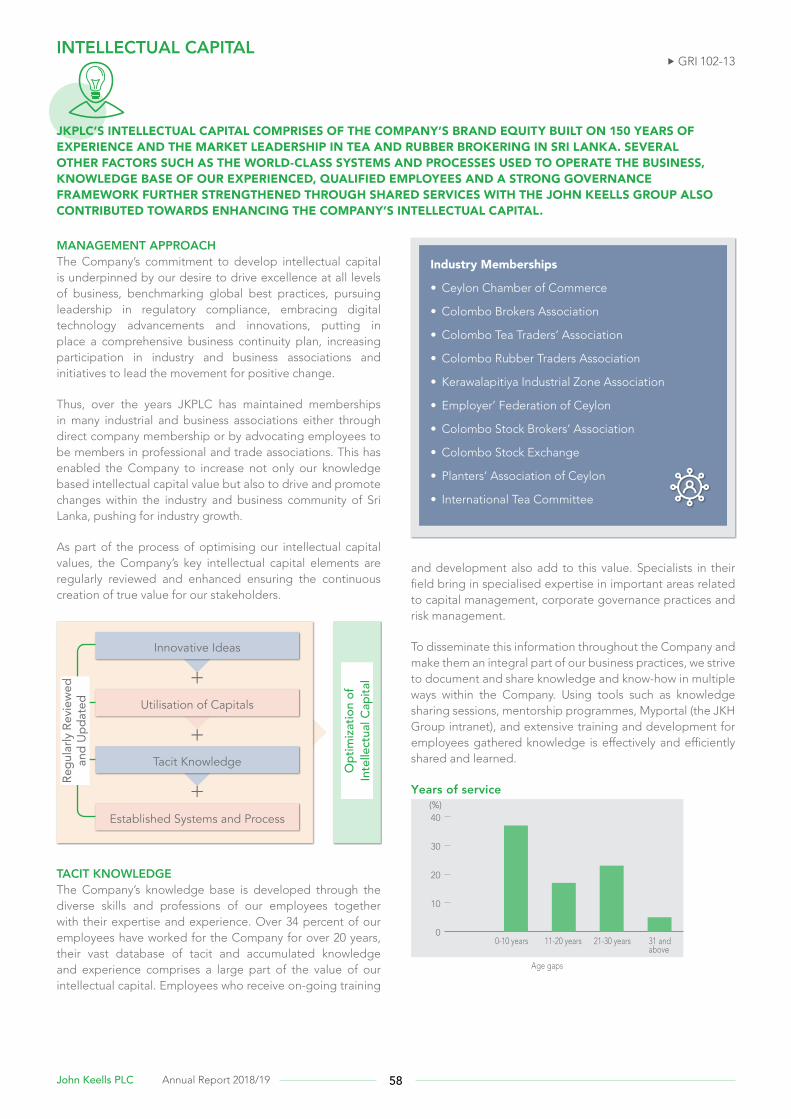
MANAGEMENT APPROACHThe Company’s commitment to develop intellectual capital is underpinned by our desire to drive excellence at all levels of business, benchmarking global best practices, pursuing leadership in regulatory compliance, embracing digital technology advancements and innovations, putting in place a comprehensive business continuity plan, increasing participation in industry and business associations and initiatives to lead the movement for positive change.
Thus, over the years JKPLC has maintained memberships in many industrial and business associations either through direct company membership or by advocating employees to be members in professional and trade associations. This has enabled the Company to increase not only our knowledge based intellectual capital value but also to drive and promote changes within the industry and business community of Sri Lanka, pushing for industry growth.
As part of the process of optimising our intellectual capital values, the Company’s key intellectual capital elements are regularly reviewed and enhanced ensuring the continuous creation of true value for our stakeholders.
Industry Memberships
• Ceylon Chamber of Commerce
• Colombo Brokers Association
• Colombo Tea Traders’ Association
• Colombo Rubber Traders Association
• Kerawalapitiya Industrial Zone Association
• Employer’ Federation of Ceylon
• Colombo Stock Brokers’ Association
• Colombo Stock Exchange
• Planters’ Association of Ceylon
• International Tea Committee
Innovative Ideas
Utilisation of Capitals
Tacit Knowledge
Established Systems and Process
Regu
larly
Rev
iew
ed
and
Upda
ted
Opt
imiza
tion
of
Inte
llect
ual C
apita
l
TACIT KNOWLEDGE The Company’s knowledge base is developed through the diverse skills and professions of our employees together with their expertise and experience. Over 34 percent of our employees have worked for the Company for over 20 years, their vast database of tacit and accumulated knowledge and experience comprises a large part of the value of our intellectual capital. Employees who receive on-going training
and development also add to this value. Specialists in their field bring in specialised expertise in important areas related to capital management, corporate governance practices and risk management.
To disseminate this information throughout the Company and make them an integral part of our business practices, we strive to document and share knowledge and know-how in multiple ways within the Company. Using tools such as knowledge sharing sessions, mentorship programmes, Myportal (the JKH Group intranet), and extensive training and development for employees gathered knowledge is effectively and efficiently shared and learned.
Years of service
0
10
20
30
40
0-10 years 11-20 years 21-30 years 31 and above
Age gaps
(%)
INTELLECTUAL CAPITAL
JKPLC’S INTELLECTUAL CAPITAL COMPRISES OF THE COMPANY’S BRAND EQUITY BUILT ON 150 YEARS OF EXPERIENCE AND THE MARKET LEADERSHIP IN TEA AND RUBBER BROKERING IN SRI LANKA. SEVERAL OTHER FACTORS SUCH AS THE WORLD-CLASS SYSTEMS AND PROCESSES USED TO OPERATE THE BUSINESS, KNOWLEDGE BASE OF OUR EXPERIENCED, QUALIFIED EMPLOYEES AND A STRONG GOVERNANCE FRAMEWORK FURTHER STRENGTHENED THROUGH SHARED SERVICES WITH THE JOHN KEELLS GROUP ALSO CONTRIBUTED TOWARDS ENHANCING THE COMPANY’S INTELLECTUAL CAPITAL.
GRI 102-13
58John Keells PLC Annual Report 2018/19
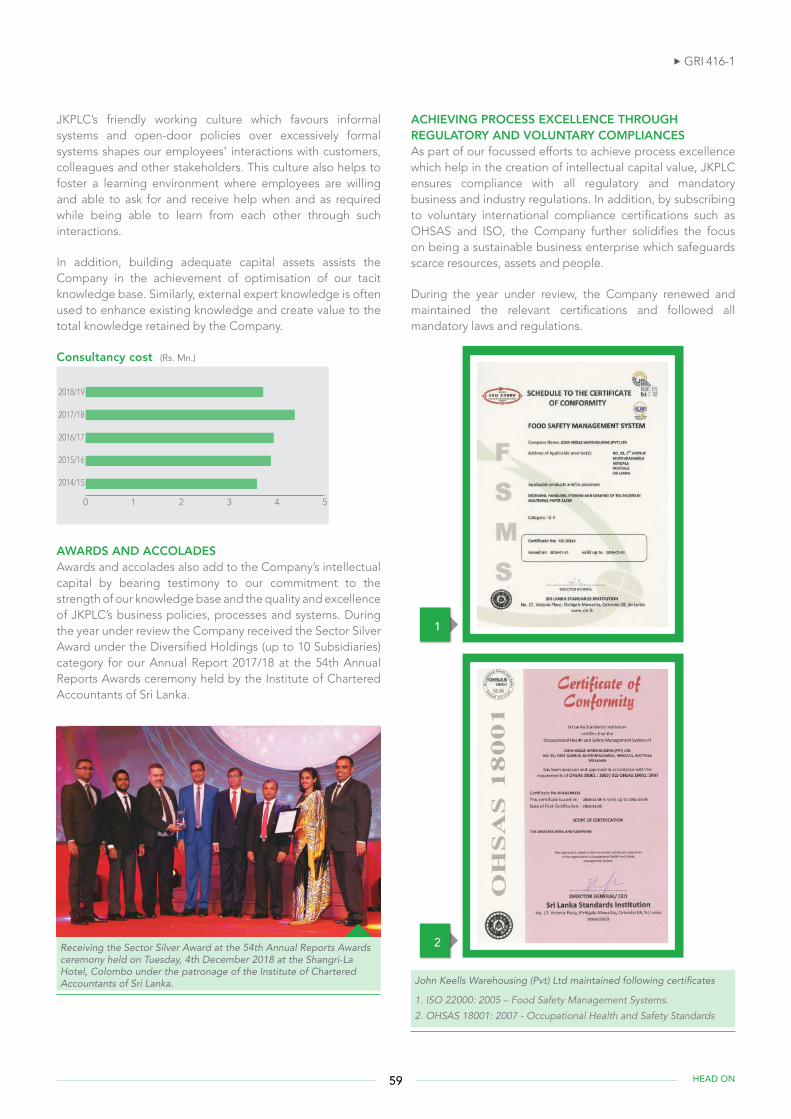
JKPLC’s friendly working culture which favours informal systems and open-door policies over excessively formal systems shapes our employees’ interactions with customers, colleagues and other stakeholders. This culture also helps to foster a learning environment where employees are willing and able to ask for and receive help when and as required while being able to learn from each other through such interactions.
In addition, building adequate capital assets assists the Company in the achievement of optimisation of our tacit knowledge base. Similarly, external expert knowledge is often used to enhance existing knowledge and create value to the total knowledge retained by the Company.
Consultancy cost (Rs. Mn.)
0 1 2 3 4 5
2018/19
2017/18
2016/17
2015/16
2014/15
AWARDS AND ACCOLADESAwards and accolades also add to the Company’s intellectual capital by bearing testimony to our commitment to the strength of our knowledge base and the quality and excellence of JKPLC’s business policies, processes and systems. During the year under review the Company received the Sector Silver Award under the Diversified Holdings (up to 10 Subsidiaries) category for our Annual Report 2017/18 at the 54th Annual Reports Awards ceremony held by the Institute of Chartered Accountants of Sri Lanka.
Receiving the Sector Silver Award at the 54th Annual Reports Awards ceremony held on Tuesday, 4th December 2018 at the Shangri-La Hotel, Colombo under the patronage of the Institute of Chartered Accountants of Sri Lanka.
ACHIEVING PROCESS EXCELLENCE THROUGH REGULATORY AND VOLUNTARY COMPLIANCESAs part of our focussed efforts to achieve process excellence which help in the creation of intellectual capital value, JKPLC ensures compliance with all regulatory and mandatory business and industry regulations. In addition, by subscribing to voluntary international compliance certifications such as OHSAS and ISO, the Company further solidifies the focus on being a sustainable business enterprise which safeguards scarce resources, assets and people.
During the year under review, the Company renewed and maintained the relevant certifications and followed all mandatory laws and regulations.
1
2
John Keells Warehousing (Pvt) Ltd maintained following certificates
1. ISO 22000: 2005 – Food Safety Management Systems.
2. OHSAS 18001: 2007 - Occupational Health and Safety Standards
GRI 416-1
59 HEAD ON

Initiatives Activity
Implementation of global standards
OHSAS 18001: 2007 - Occupational Health and Safety Standards – John Keells Warehousing (Pvt) Ltd (Certification period: 05.11.2018 – 04.11.2021)
Maintained/ Renewed
ISO 22000: 2005 – Food Safety Management Systems – John Keells Warehousing (Pvt) Ltd (Certification period: 31.07.2018 – 30.07.2019)
Maintained/ Renewed
Business Continuity Planning
Business Continuity Plan - JKPLC Updated on 17th October 2018
Adoption of Technology New Tea/Rubber and warehousing system with Integrated SAP modules
Invested Rs. 4.26 Mn
Adoption of “Forestpin”, a forensic analytics tool with embedded artificial intelligence technology to facilitate real time outlier alerts for vendor payments, claims payments, etc.
Ongoing
Group wide “John Keells Tax Portal” for transparent reporting of corporate tax processors
Intangible Assets (net book value) (Rs. Mn.)
0.0
0.9
1.8
2.7
3.6
4.5
2018/19 2017/18 2016/17 2015/16 2014/15
CHALLENGES FACED AND ACTIONS IMPLEMENTED The Company faces several challenges when developing intellectual capital value. The most critical is to secure the commitment of employees and to ensure they always remain properly aligned to the Company’s thinking. We believe that employee commitment is critical to achieve industry leadership, build our brand image and to adopt latest technology.
Equally important is the continuous and ongoing interaction with regulators, which will ensure JKPLC to be updated with the latest developments and changes in the compliance framework.
Changing market trends and consumer tastes and needs, also requires the Company to build solid relationships with marketing and research-based organisations who can provide us with key insights to ensure that the Company remains focused and sustainable in the long term.
Building our brand value Adhering to Group values and being innovative to meet market requirements.
Challenge #1
Government institutional influences Comply with all regulatory requirements by promoting a compliance culture within the Company.
Challenge #3
Disruption through digitisation Invest in learning & development for employees and promote the effective use of technology.
Challenge #5
Information security threatDevelop systems in line with Group values and educating the importance of IT security to all employees.
Challenge #2
Institutional influences Regular interaction with regulators to foster collaborative partnerships for the betterment of the industry.
Challenge #4
JKPLC continuously enhances intellectual capital through targeted efforts enabling the Company to sustain its growth momentum in the long-term.
INTELLECTUAL CAPITAL
60John Keells PLC Annual Report 2018/19
Proposed investments and planned activities for 2019/20
• Review and obtain assurance of efficiency on the completed Tea/Rubber and warehousing system integration.
• Adaptation of ISO 14001 - Environmental Management System to John Keells Warehousing (Pvt) Ltd.
• Improvements to cyber security measures adopted by JKPLC.
• Employee training programmes carried out knowledge on cyber security.
• Encourage and review customers and suppliers use of the on-line platform for daily transactions.
• Implement a new online banking facility with added focus on information safety.
• Maintain the Group-wide tax return system for transparent reporting processors.
• Encourage sharing/documentation of implicit knowledge for the improvement of process.
• Work towards industry developments by collaborating partnerships with trade associations.
61 HEAD ON
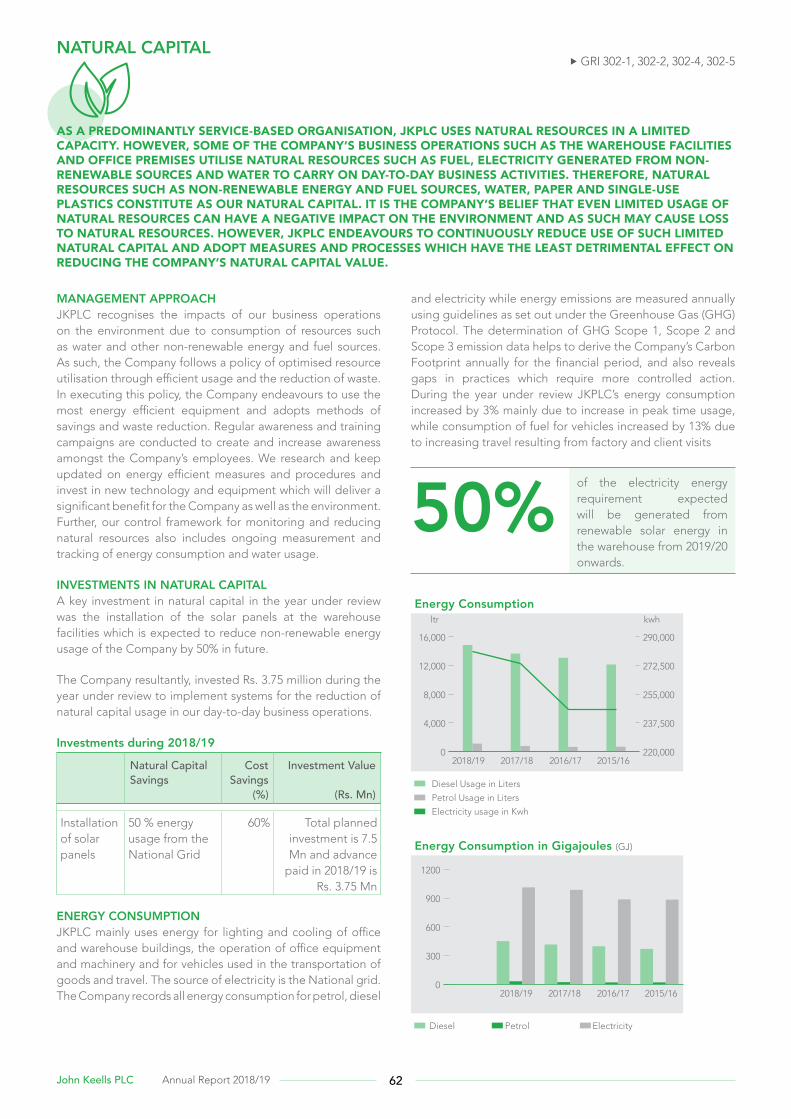
MANAGEMENT APPROACH JKPLC recognises the impacts of our business operations on the environment due to consumption of resources such as water and other non-renewable energy and fuel sources. As such, the Company follows a policy of optimised resource utilisation through efficient usage and the reduction of waste. In executing this policy, the Company endeavours to use the most energy efficient equipment and adopts methods of savings and waste reduction. Regular awareness and training campaigns are conducted to create and increase awareness amongst the Company’s employees. We research and keep updated on energy efficient measures and procedures and invest in new technology and equipment which will deliver a significant benefit for the Company as well as the environment. Further, our control framework for monitoring and reducing natural resources also includes ongoing measurement and tracking of energy consumption and water usage.
INVESTMENTS IN NATURAL CAPITALA key investment in natural capital in the year under review was the installation of the solar panels at the warehouse facilities which is expected to reduce non-renewable energy usage of the Company by 50% in future.
The Company resultantly, invested Rs. 3.75 million during the year under review to implement systems for the reduction of natural capital usage in our day-to-day business operations.
Investments during 2018/19
Natural Capital Savings
Cost Savings
(%)
Investment Value
(Rs. Mn)
Installation of solar panels
50 % energy usage from the National Grid
60% Total planned investment is 7.5 Mn and advance
paid in 2018/19 is Rs. 3.75 Mn
ENERGY CONSUMPTIONJKPLC mainly uses energy for lighting and cooling of office and warehouse buildings, the operation of office equipment and machinery and for vehicles used in the transportation of goods and travel. The source of electricity is the National grid. The Company records all energy consumption for petrol, diesel
and electricity while energy emissions are measured annually using guidelines as set out under the Greenhouse Gas (GHG) Protocol. The determination of GHG Scope 1, Scope 2 and Scope 3 emission data helps to derive the Company’s Carbon Footprint annually for the financial period, and also reveals gaps in practices which require more controlled action. During the year under review JKPLC’s energy consumption increased by 3% mainly due to increase in peak time usage, while consumption of fuel for vehicles increased by 13% due to increasing travel resulting from factory and client visits
of the electricity energy requirement expected will be generated from renewable solar energy in the warehouse from 2019/20 onwards.
50% Energy Consumption
0
4,000
8,000
12,000
16,000
2018/19 2017/18 2016/17 2015/16
Diesel Usage in Liters
Petrol Usage in Liters
Electricity usage in Kwh
ltr kwh
220,000
237,500
255,000
272,500
290,000
Energy Consumption in Gigajoules (GJ)
0
300
600
900
1200
2018/19 2017/18 2016/17 2015/16
Diesel Petrol Electricity
NATURAL CAPITAL
AS A PREDOMINANTLY SERVICE-BASED ORGANISATION, JKPLC USES NATURAL RESOURCES IN A LIMITED CAPACITY. HOWEVER, SOME OF THE COMPANY’S BUSINESS OPERATIONS SUCH AS THE WAREHOUSE FACILITIES AND OFFICE PREMISES UTILISE NATURAL RESOURCES SUCH AS FUEL, ELECTRICITY GENERATED FROM NON-RENEWABLE SOURCES AND WATER TO CARRY ON DAY-TO-DAY BUSINESS ACTIVITIES. THEREFORE, NATURAL RESOURCES SUCH AS NON-RENEWABLE ENERGY AND FUEL SOURCES, WATER, PAPER AND SINGLE-USE PLASTICS CONSTITUTE AS OUR NATURAL CAPITAL. IT IS THE COMPANY’S BELIEF THAT EVEN LIMITED USAGE OF NATURAL RESOURCES CAN HAVE A NEGATIVE IMPACT ON THE ENVIRONMENT AND AS SUCH MAY CAUSE LOSS TO NATURAL RESOURCES. HOWEVER, JKPLC ENDEAVOURS TO CONTINUOUSLY REDUCE USE OF SUCH LIMITED NATURAL CAPITAL AND ADOPT MEASURES AND PROCESSES WHICH HAVE THE LEAST DETRIMENTAL EFFECT ON REDUCING THE COMPANY’S NATURAL CAPITAL VALUE.
GRI 302-1, 302-2, 302-4, 302-5
62John Keells PLC Annual Report 2018/19
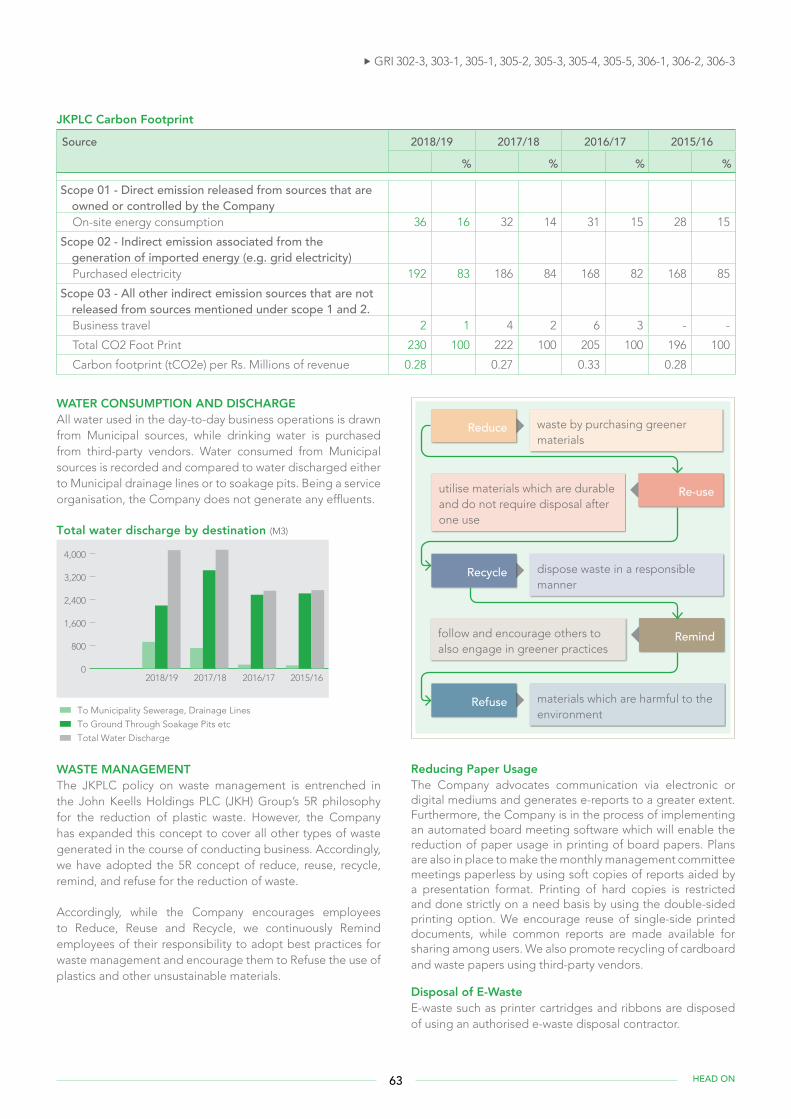
JKPLC Carbon Footprint
Source 2018/19 2017/18 2016/17 2015/16
% % % %
Scope 01 - Direct emission released from sources that are owned or controlled by the Company
On-site energy consumption 36 16 32 14 31 15 28 15
Scope 02 - Indirect emission associated from the generation of imported energy (e.g. grid electricity)
Purchased electricity 192 83 186 84 168 82 168 85
Scope 03 - All other indirect emission sources that are not released from sources mentioned under scope 1 and 2.
Business travel 2 1 4 2 6 3 - -
Total CO2 Foot Print 230 100 222 100 205 100 196 100
Carbon footprint (tCO2e) per Rs. Millions of revenue 0.28 0.27 0.33 0.28
WATER CONSUMPTION AND DISCHARGEAll water used in the day-to-day business operations is drawn from Municipal sources, while drinking water is purchased from third-party vendors. Water consumed from Municipal sources is recorded and compared to water discharged either to Municipal drainage lines or to soakage pits. Being a service organisation, the Company does not generate any effluents.
Total water discharge by destination (M3)
0
800
1,600
2,400
3,200
4,000
2018/19 2017/18 2016/17 2015/16
To Municipality Sewerage, Drainage Lines
To Ground Through Soakage Pits etc
Total Water Discharge
WASTE MANAGEMENTThe JKPLC policy on waste management is entrenched in the John Keells Holdings PLC (JKH) Group’s 5R philosophy for the reduction of plastic waste. However, the Company has expanded this concept to cover all other types of waste generated in the course of conducting business. Accordingly, we have adopted the 5R concept of reduce, reuse, recycle, remind, and refuse for the reduction of waste.
Accordingly, while the Company encourages employees to Reduce, Reuse and Recycle, we continuously Remind employees of their responsibility to adopt best practices for waste management and encourage them to Refuse the use of plastics and other unsustainable materials.
Reducing Paper Usage The Company advocates communication via electronic or digital mediums and generates e-reports to a greater extent. Furthermore, the Company is in the process of implementing an automated board meeting software which will enable the reduction of paper usage in printing of board papers. Plans are also in place to make the monthly management committee meetings paperless by using soft copies of reports aided by a presentation format. Printing of hard copies is restricted and done strictly on a need basis by using the double-sided printing option. We encourage reuse of single-side printed documents, while common reports are made available for sharing among users. We also promote recycling of cardboard and waste papers using third-party vendors.
Disposal of E-WasteE-waste such as printer cartridges and ribbons are disposed of using an authorised e-waste disposal contractor.
waste by purchasing greener materials
Reduce
dispose waste in a responsible manner
Recycle
materials which are harmful to the environment
Refuse
utilise materials which are durable and do not require disposal after one use
Re-use
follow and encourage others to also engage in greener practices
Remind
GRI 302-3, 303-1, 305-1, 305-2, 305-3, 305-4, 305-5, 306-1, 306-2, 306-3
63 HEAD ON
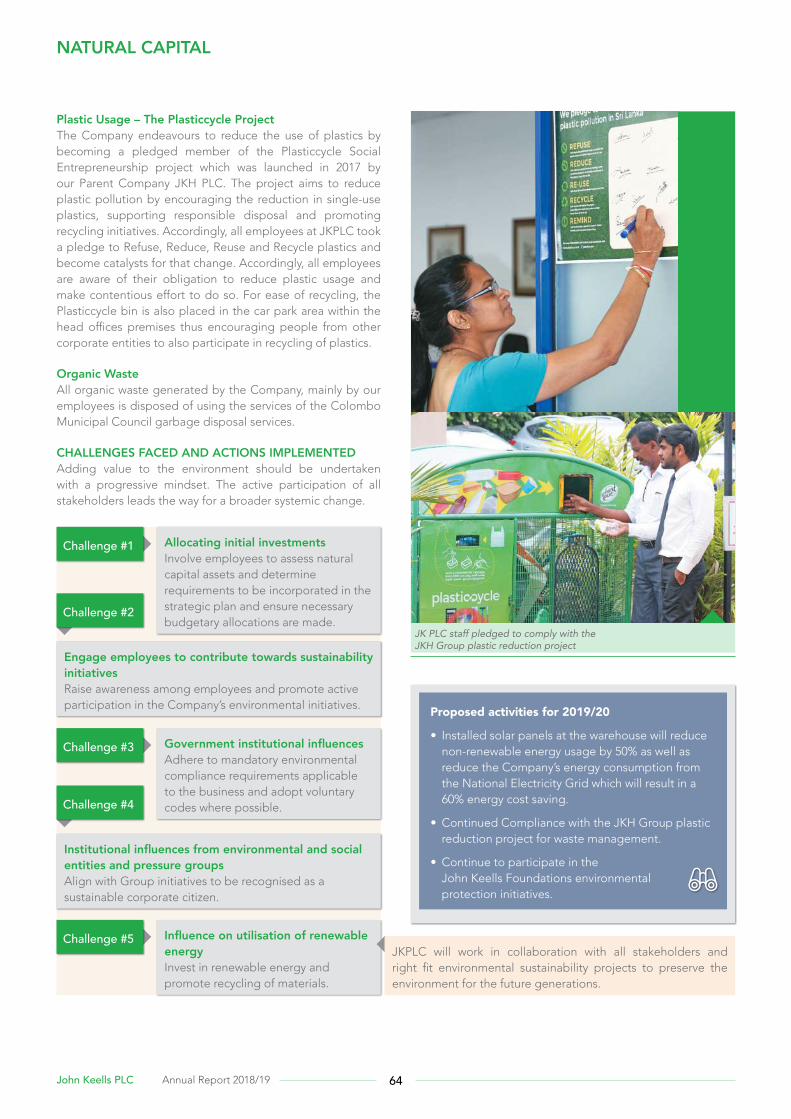
Plastic Usage – The Plasticcycle ProjectThe Company endeavours to reduce the use of plastics by becoming a pledged member of the Plasticcycle Social Entrepreneurship project which was launched in 2017 by our Parent Company JKH PLC. The project aims to reduce plastic pollution by encouraging the reduction in single-use plastics, supporting responsible disposal and promoting recycling initiatives. Accordingly, all employees at JKPLC took a pledge to Refuse, Reduce, Reuse and Recycle plastics and become catalysts for that change. Accordingly, all employees are aware of their obligation to reduce plastic usage and make contentious effort to do so. For ease of recycling, the Plasticcycle bin is also placed in the car park area within the head offices premises thus encouraging people from other corporate entities to also participate in recycling of plastics.
Organic WasteAll organic waste generated by the Company, mainly by our employees is disposed of using the services of the Colombo Municipal Council garbage disposal services.
CHALLENGES FACED AND ACTIONS IMPLEMENTED Adding value to the environment should be undertaken with a progressive mindset. The active participation of all stakeholders leads the way for a broader systemic change.
Allocating initial investments Involve employees to assess natural capital assets and determine requirements to be incorporated in the strategic plan and ensure necessary budgetary allocations are made.
Challenge #1
Government institutional influences Adhere to mandatory environmental compliance requirements applicable to the business and adopt voluntary codes where possible.
Challenge #3
Influence on utilisation of renewable energy Invest in renewable energy and promote recycling of materials.
Challenge #5
Engage employees to contribute towards sustainability initiativesRaise awareness among employees and promote active participation in the Company’s environmental initiatives.
Challenge #2
Challenge #4
Institutional influences from environmental and social entities and pressure groupsAlign with Group initiatives to be recognised as a sustainable corporate citizen.
JKPLC will work in collaboration with all stakeholders and right fit environmental sustainability projects to preserve the environment for the future generations.
Proposed activities for 2019/20
• Installed solar panels at the warehouse will reduce non-renewable energy usage by 50% as well as reduce the Company’s energy consumption from the National Electricity Grid which will result in a 60% energy cost saving.
• Continued Compliance with the JKH Group plastic reduction project for waste management.
• Continue to participate in the John Keells Foundations environmental protection initiatives.
NATURAL CAPITAL
JK PLC staff pledged to comply with the JKH Group plastic reduction project
64John Keells PLC Annual Report 2018/19
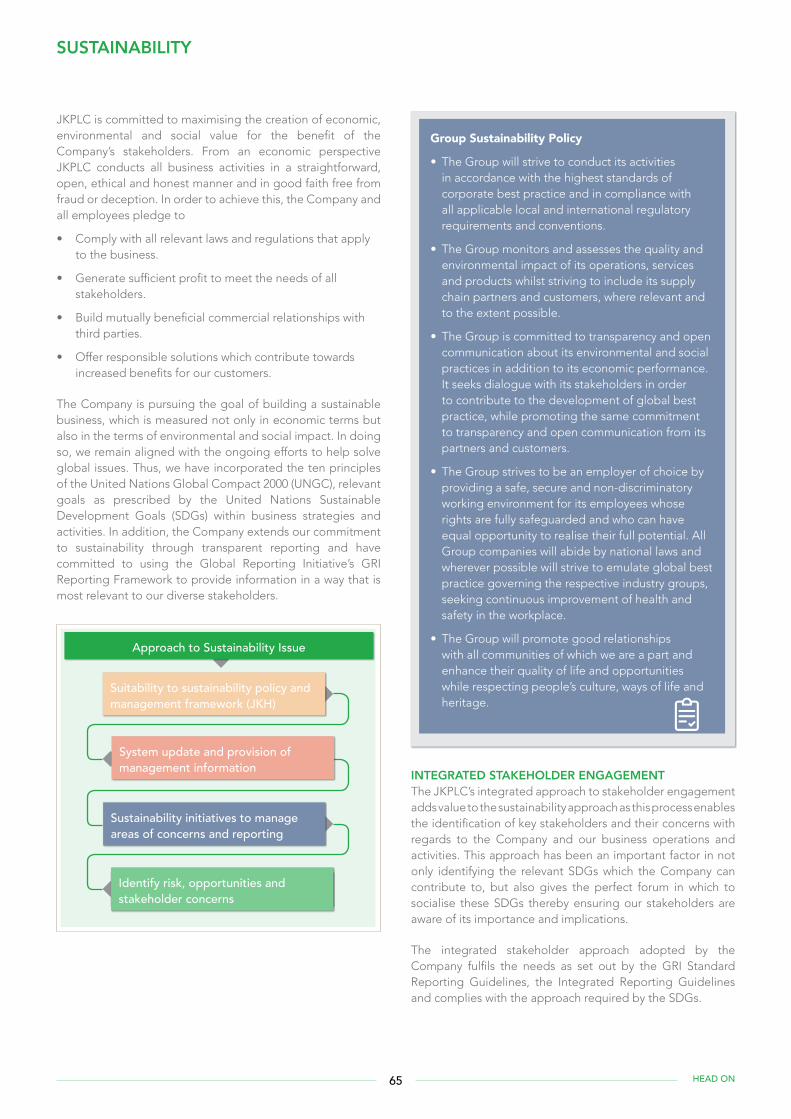
SUSTAINABILITY
JKPLC is committed to maximising the creation of economic, environmental and social value for the benefit of the Company’s stakeholders. From an economic perspective JKPLC conducts all business activities in a straightforward, open, ethical and honest manner and in good faith free from fraud or deception. In order to achieve this, the Company and all employees pledge to
• Comply with all relevant laws and regulations that apply to the business.
• Generate sufficient profit to meet the needs of all stakeholders.
• Build mutually beneficial commercial relationships with third parties.
• Offer responsible solutions which contribute towards increased benefits for our customers.
The Company is pursuing the goal of building a sustainable business, which is measured not only in economic terms but also in the terms of environmental and social impact. In doing so, we remain aligned with the ongoing efforts to help solve global issues. Thus, we have incorporated the ten principles of the United Nations Global Compact 2000 (UNGC), relevant goals as prescribed by the United Nations Sustainable Development Goals (SDGs) within business strategies and activities. In addition, the Company extends our commitment to sustainability through transparent reporting and have committed to using the Global Reporting Initiative’s GRI Reporting Framework to provide information in a way that is most relevant to our diverse stakeholders.
Suitability to sustainability policy and management framework (JKH)
Approach to Sustainability Issue
Sustainability initiatives to manage areas of concerns and reporting
Identify risk, opportunities and stakeholder concerns
System update and provision of management information
Group Sustainability Policy
• The Group will strive to conduct its activities in accordance with the highest standards of corporate best practice and in compliance with all applicable local and international regulatory requirements and conventions.
• The Group monitors and assesses the quality and environmental impact of its operations, services and products whilst striving to include its supply chain partners and customers, where relevant and to the extent possible.
• The Group is committed to transparency and open communication about its environmental and social practices in addition to its economic performance. It seeks dialogue with its stakeholders in order to contribute to the development of global best practice, while promoting the same commitment to transparency and open communication from its partners and customers.
• The Group strives to be an employer of choice by providing a safe, secure and non-discriminatory working environment for its employees whose rights are fully safeguarded and who can have equal opportunity to realise their full potential. All Group companies will abide by national laws and wherever possible will strive to emulate global best practice governing the respective industry groups, seeking continuous improvement of health and safety in the workplace.
• The Group will promote good relationships with all communities of which we are a part and enhance their quality of life and opportunities while respecting people’s culture, ways of life and heritage.
INTEGRATED STAKEHOLDER ENGAGEMENTThe JKPLC’s integrated approach to stakeholder engagement adds value to the sustainability approach as this process enables the identification of key stakeholders and their concerns with regards to the Company and our business operations and activities. This approach has been an important factor in not only identifying the relevant SDGs which the Company can contribute to, but also gives the perfect forum in which to socialise these SDGs thereby ensuring our stakeholders are aware of its importance and implications.
The integrated stakeholder approach adopted by the Company fulfils the needs as set out by the GRI Standard Reporting Guidelines, the Integrated Reporting Guidelines and complies with the approach required by the SDGs.
65 HEAD ON
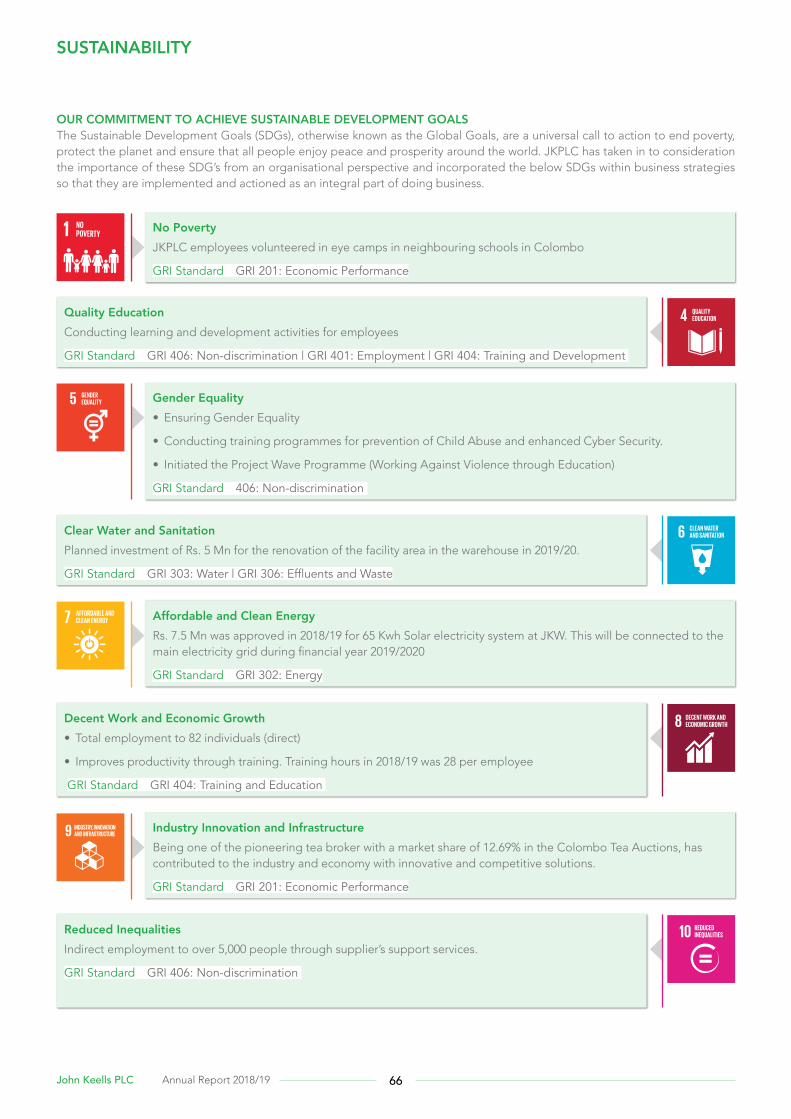
OUR COMMITMENT TO ACHIEVE SUSTAINABLE DEVELOPMENT GOALSThe Sustainable Development Goals (SDGs), otherwise known as the Global Goals, are a universal call to action to end poverty, protect the planet and ensure that all people enjoy peace and prosperity around the world. JKPLC has taken in to consideration the importance of these SDG’s from an organisational perspective and incorporated the below SDGs within business strategies so that they are implemented and actioned as an integral part of doing business.
SUSTAINABILITY
No Poverty JKPLC employees volunteered in eye camps in neighbouring schools in Colombo
GRI Standard GRI 201: Economic Performance
Quality Education Conducting learning and development activities for employees
GRI Standard GRI 406: Non-discrimination | GRI 401: Employment | GRI 404: Training and Development
Clear Water and Sanitation Planned investment of Rs. 5 Mn for the renovation of the facility area in the warehouse in 2019/20.
GRI Standard GRI 303: Water | GRI 306: Effluents and Waste
Gender Equality • Ensuring Gender Equality
• Conducting training programmes for prevention of Child Abuse and enhanced Cyber Security.
• Initiated the Project Wave Programme (Working Against Violence through Education)
GRI Standard 406: Non-discrimination
Affordable and Clean Energy Rs. 7.5 Mn was approved in 2018/19 for 65 Kwh Solar electricity system at JKW. This will be connected to the main electricity grid during financial year 2019/2020
GRI Standard GRI 302: Energy
Industry Innovation and Infrastructure Being one of the pioneering tea broker with a market share of 12.69% in the Colombo Tea Auctions, has contributed to the industry and economy with innovative and competitive solutions.
GRI Standard GRI 201: Economic Performance
Decent Work and Economic Growth • Total employment to 82 individuals (direct)
• Improves productivity through training. Training hours in 2018/19 was 28 per employee
GRI Standard GRI 404: Training and Education
Reduced Inequalities Indirect employment to over 5,000 people through supplier’s support services.
GRI Standard GRI 406: Non-discrimination
66John Keells PLC Annual Report 2018/19
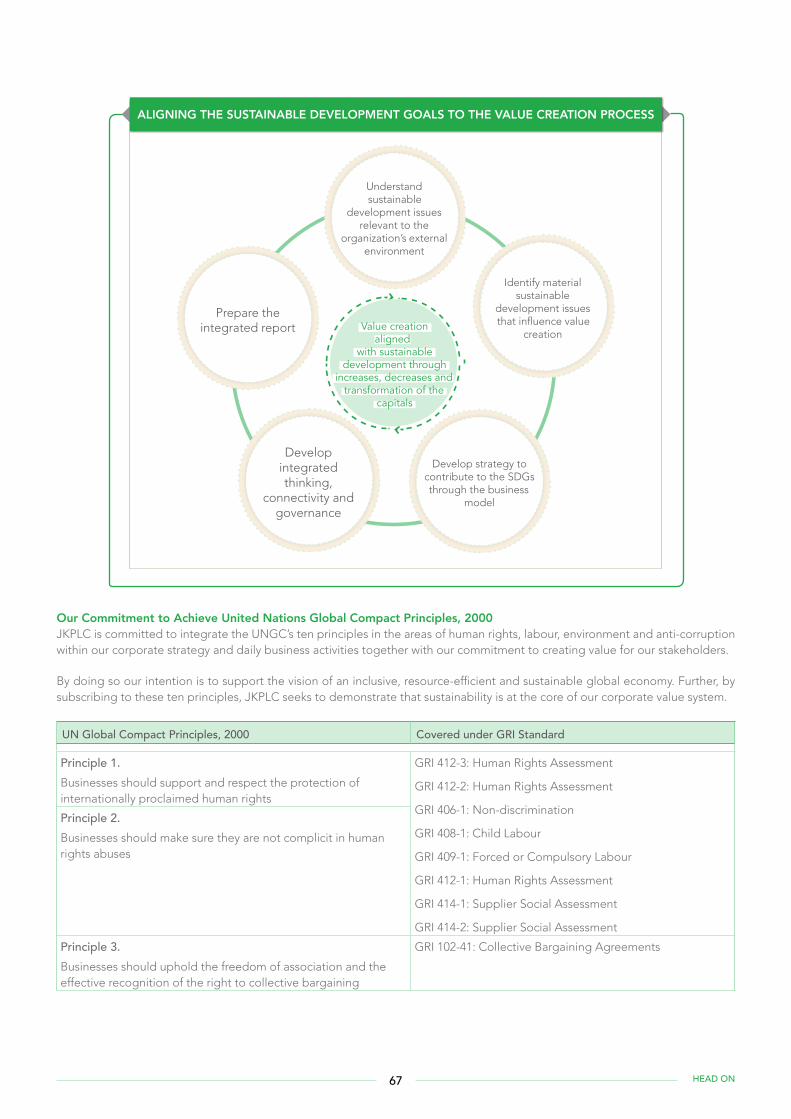
Our Commitment to Achieve United Nations Global Compact Principles, 2000JKPLC is committed to integrate the UNGC’s ten principles in the areas of human rights, labour, environment and anti-corruption within our corporate strategy and daily business activities together with our commitment to creating value for our stakeholders.
By doing so our intention is to support the vision of an inclusive, resource-efficient and sustainable global economy. Further, by subscribing to these ten principles, JKPLC seeks to demonstrate that sustainability is at the core of our corporate value system.
UN Global Compact Principles, 2000 Covered under GRI Standard
Principle 1. Businesses should support and respect the protection of internationally proclaimed human rights
GRI 412-3: Human Rights Assessment
GRI 412-2: Human Rights Assessment
GRI 406-1: Non-discrimination
GRI 408-1: Child Labour
GRI 409-1: Forced or Compulsory Labour
GRI 412-1: Human Rights Assessment
GRI 414-1: Supplier Social Assessment
GRI 414-2: Supplier Social Assessment
Principle 2. Businesses should make sure they are not complicit in human rights abuses
Principle 3. Businesses should uphold the freedom of association and the effective recognition of the right to collective bargaining
GRI 102-41: Collective Bargaining Agreements
Prepare the integrated report
Understand sustainable
development issues relevant to the
organization’s external environment
Identify material sustainable
development issues that influence value
creation
Develop strategy to contribute to the SDGs through the business
model
Develop integrated thinking,
connectivity and governance
Value creation aligned
with sustainable development through
increases, decreases and transformation of the
capitals
ALIGNING THE SUSTAINABLE DEVELOPMENT GOALS TO THE VALUE CREATION PROCESS
67 HEAD ON
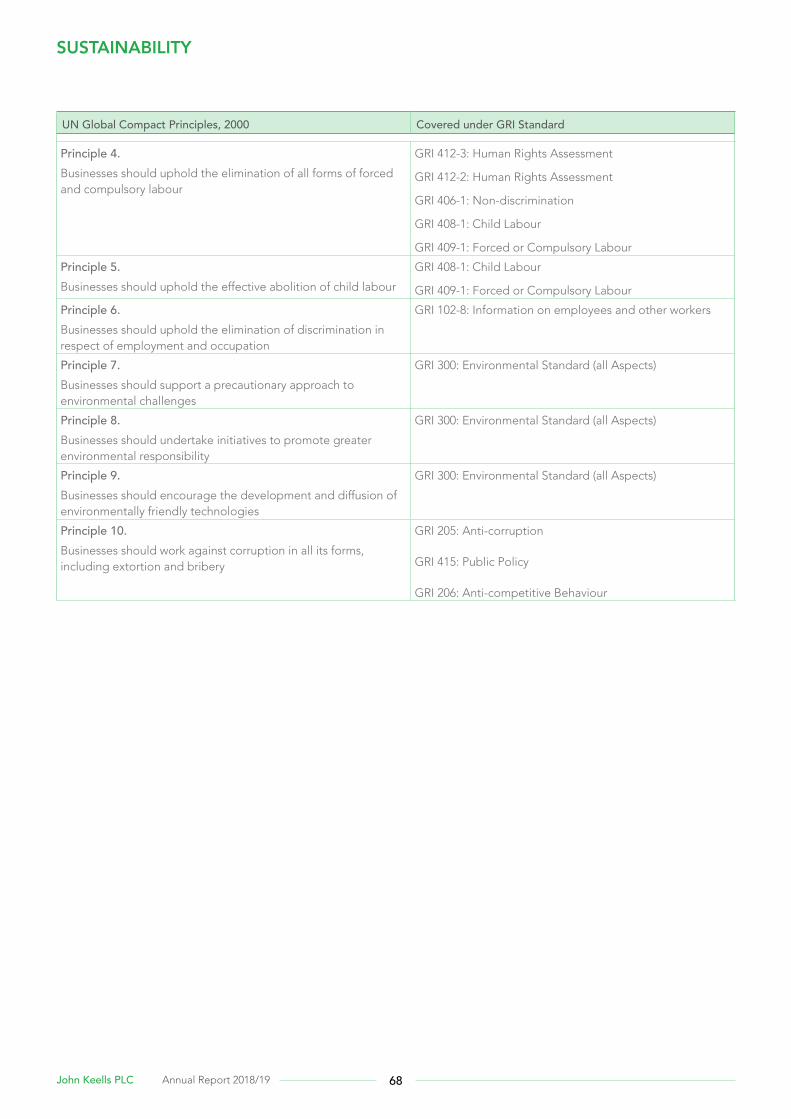
UN Global Compact Principles, 2000 Covered under GRI Standard
Principle 4. Businesses should uphold the elimination of all forms of forced and compulsory labour
GRI 412-3: Human Rights Assessment
GRI 412-2: Human Rights Assessment
GRI 406-1: Non-discrimination
GRI 408-1: Child Labour
GRI 409-1: Forced or Compulsory Labour
Principle 5.Businesses should uphold the effective abolition of child labour
GRI 408-1: Child Labour
GRI 409-1: Forced or Compulsory Labour
Principle 6. Businesses should uphold the elimination of discrimination in respect of employment and occupation
GRI 102-8: Information on employees and other workers
Principle 7. Businesses should support a precautionary approach to environmental challenges
GRI 300: Environmental Standard (all Aspects)
Principle 8. Businesses should undertake initiatives to promote greater environmental responsibility
GRI 300: Environmental Standard (all Aspects)
Principle 9. Businesses should encourage the development and diffusion of environmentally friendly technologies
GRI 300: Environmental Standard (all Aspects)
Principle 10. Businesses should work against corruption in all its forms, including extortion and bribery
GRI 205: Anti-corruption
GRI 415: Public Policy
GRI 206: Anti-competitive Behaviour
SUSTAINABILITY
68John Keells PLC Annual Report 2018/19
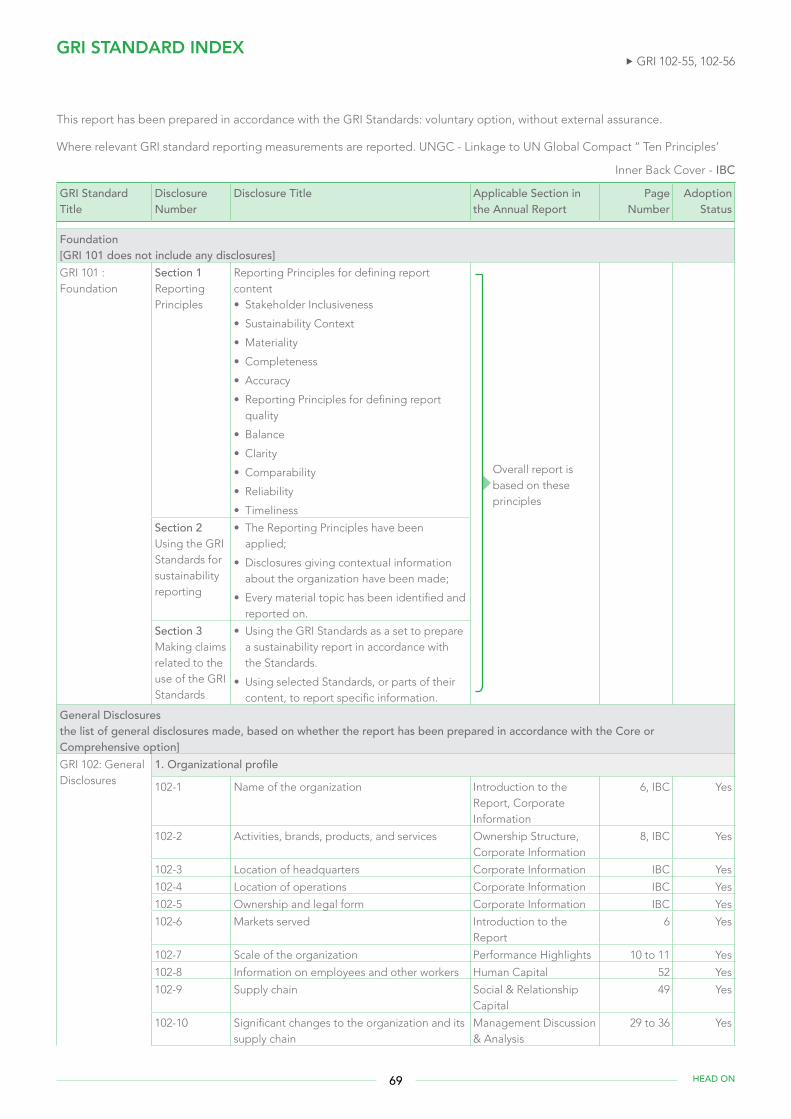
GRI STANDARD INDEX
This report has been prepared in accordance with the GRI Standards: voluntary option, without external assurance.
Where relevant GRI standard reporting measurements are reported. UNGC - Linkage to UN Global Compact ‘‘ Ten Principles’
GRI Standard Title
Disclosure Number
Disclosure Title Applicable Section in the Annual Report
Page Number
Adoption Status
Foundation [GRI 101 does not include any disclosures]GRI 101 : Foundation
Section 1Reporting Principles
Reporting Principles for defining report content • Stakeholder Inclusiveness
• Sustainability Context
• Materiality
• Completeness
• Accuracy
• Reporting Principles for defining report quality
• Balance
• Clarity
• Comparability
• Reliability
• Timeliness
Overall report is based on these principles
Section 2Using the GRI Standards for sustainability reporting
• The Reporting Principles have been applied;
• Disclosures giving contextual information about the organization have been made;
• Every material topic has been identified and reported on.
Section 3Making claims related to the use of the GRI Standards
• Using the GRI Standards as a set to prepare a sustainability report in accordance with the Standards.
• Using selected Standards, or parts of their content, to report specific information.
General Disclosuresthe list of general disclosures made, based on whether the report has been prepared in accordance with the Core or Comprehensive option]GRI 102: General Disclosures
1. Organizational profile
102-1 Name of the organization Introduction to the Report, Corporate Information
6, IBC Yes
102-2 Activities, brands, products, and services Ownership Structure, Corporate Information
8, IBC Yes
102-3 Location of headquarters Corporate Information IBC Yes
102-4 Location of operations Corporate Information IBC Yes
102-5 Ownership and legal form Corporate Information IBC Yes
102-6 Markets served Introduction to the Report
6 Yes
102-7 Scale of the organization Performance Highlights 10 to 11 Yes
102-8 Information on employees and other workers Human Capital 52 Yes
102-9 Supply chain Social & Relationship Capital
49 Yes
102-10 Significant changes to the organization and its supply chain
Management Discussion & Analysis
29 to 36 Yes
GRI 102-55, 102-56
Inner Back Cover - IBC
69 HEAD ON
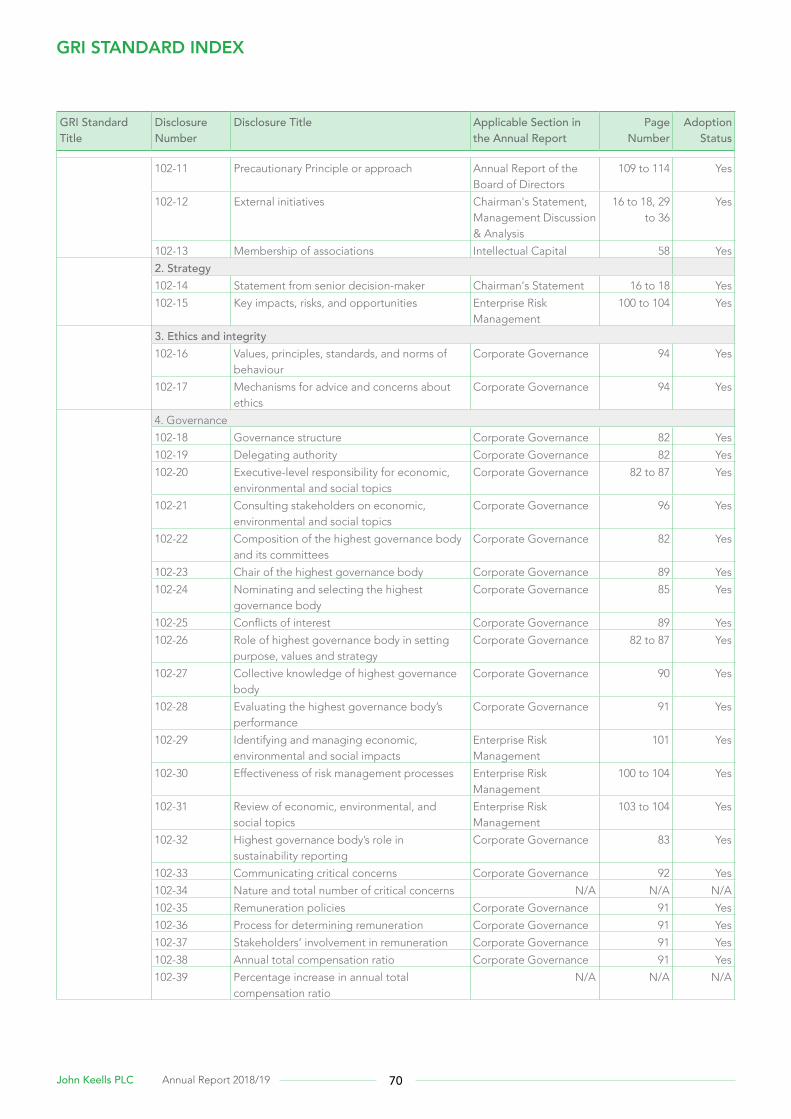
GRI Standard Title
Disclosure Number
Disclosure Title Applicable Section in the Annual Report
Page Number
Adoption Status
102-11 Precautionary Principle or approach Annual Report of the Board of Directors
109 to 114 Yes
102-12 External initiatives Chairman's Statement, Management Discussion & Analysis
16 to 18, 29 to 36
Yes
102-13 Membership of associations Intellectual Capital 58 Yes
2. Strategy 102-14 Statement from senior decision-maker Chairman's Statement 16 to 18 Yes
102-15 Key impacts, risks, and opportunities Enterprise Risk Management
100 to 104 Yes
3. Ethics and integrity 102-16 Values, principles, standards, and norms of
behaviour Corporate Governance 94 Yes
102-17 Mechanisms for advice and concerns about ethics
Corporate Governance 94 Yes
4. Governance
102-18 Governance structure Corporate Governance 82 Yes
102-19 Delegating authority Corporate Governance 82 Yes
102-20 Executive-level responsibility for economic, environmental and social topics
Corporate Governance 82 to 87 Yes
102-21 Consulting stakeholders on economic, environmental and social topics
Corporate Governance 96 Yes
102-22 Composition of the highest governance body and its committees
Corporate Governance 82 Yes
102-23 Chair of the highest governance body Corporate Governance 89 Yes
102-24 Nominating and selecting the highest governance body
Corporate Governance 85 Yes
102-25 Conflicts of interest Corporate Governance 89 Yes
102-26 Role of highest governance body in setting purpose, values and strategy
Corporate Governance 82 to 87 Yes
102-27 Collective knowledge of highest governance body
Corporate Governance 90 Yes
102-28 Evaluating the highest governance body’s performance
Corporate Governance 91 Yes
102-29 Identifying and managing economic, environmental and social impacts
Enterprise Risk Management
101 Yes
102-30 Effectiveness of risk management processes Enterprise Risk Management
100 to 104 Yes
102-31 Review of economic, environmental, and social topics
Enterprise Risk Management
103 to 104 Yes
102-32 Highest governance body’s role in sustainability reporting
Corporate Governance 83 Yes
102-33 Communicating critical concerns Corporate Governance 92 Yes
102-34 Nature and total number of critical concerns N/A N/A N/A
102-35 Remuneration policies Corporate Governance 91 Yes
102-36 Process for determining remuneration Corporate Governance 91 Yes
102-37 Stakeholders’ involvement in remuneration Corporate Governance 91 Yes
102-38 Annual total compensation ratio Corporate Governance 91 Yes
102-39 Percentage increase in annual total compensation ratio
N/A N/A N/A
GRI STANDARD INDEX
70John Keells PLC Annual Report 2018/19

GRI Standard Title
Disclosure Number
Disclosure Title Applicable Section in the Annual Report
Page Number
Adoption Status
5. Stakeholder engagement 102-40 List of stakeholder groups Stakeholder
Relationship24 to 46 Yes
102-41 Collective bargaining agreements Human Capital 51 to 54 Yes
102-42 Identifying and selecting stakeholders Stakeholder Relationship
24 to 26 Yes
102-43 Approach to stakeholder engagement Stakeholder Relationship
24 to 26 Yes
102-44 Key topics and concerns raised Materiality Analysis 27 to 28 Yes
6. Reporting practice102-45 Entities included in the consolidated financial
statements Introduction to the Report
6 to 7 Yes
102-46 Defining report content and topic Boundaries Introduction to the Report
6 to 7 Yes
102-47 List of material topics Materiality Analysis 27 to 28 Yes
102-48 Restatements of information Management Discussion & Analysis, Notes to Financial Statements
29 to 36, 130 to 174
Yes
102-49 Changes in reporting Management Discussion & Analysis, Notes to Financial Statements
29 to 36, 130 to 174
Yes
102-50 Reporting period Introduction to the Report
6 to 7 Yes
102-51 Date of most recent report Financial Calendar 118 Yes
102-52 Reporting cycle Introduction to the Report
6 to 7 Yes
102-53 Contact point for questions regarding the report
Introduction to the Report
6 to 7 Yes
102-54 Claims of reporting in accordance with the GRI Standards
Introduction to the Report
6 to 7 Yes
102-55 GRI content index GRI Standard Index 69 to 76 Yes
102-56 External assurance GRI Standard Index 69 to 76 Yes
Material topics[the list of material topics included in the report, as reported in Disclosure 102-47.]Economic PerformanceGRI 103Management Approach
103-1 Explanation of the material topic and its Boundary
103-2 The management approach and its components
103-3 Evaluation of the management approach
GRI 201Economic Performance
201-1 Direct economic value generated and distributed
Financial Capital 44 Yes
201-2 Financial implications and other risks and opportunities due to climate change
Management Discussion & Analysis
29 to 36 Yes
201-3 Defined benefit plan obligations and other retirement plans
Financial Statements 170 Yes
201-4 Financial assistance received from government N/A N/A N/A
71 HEAD ON
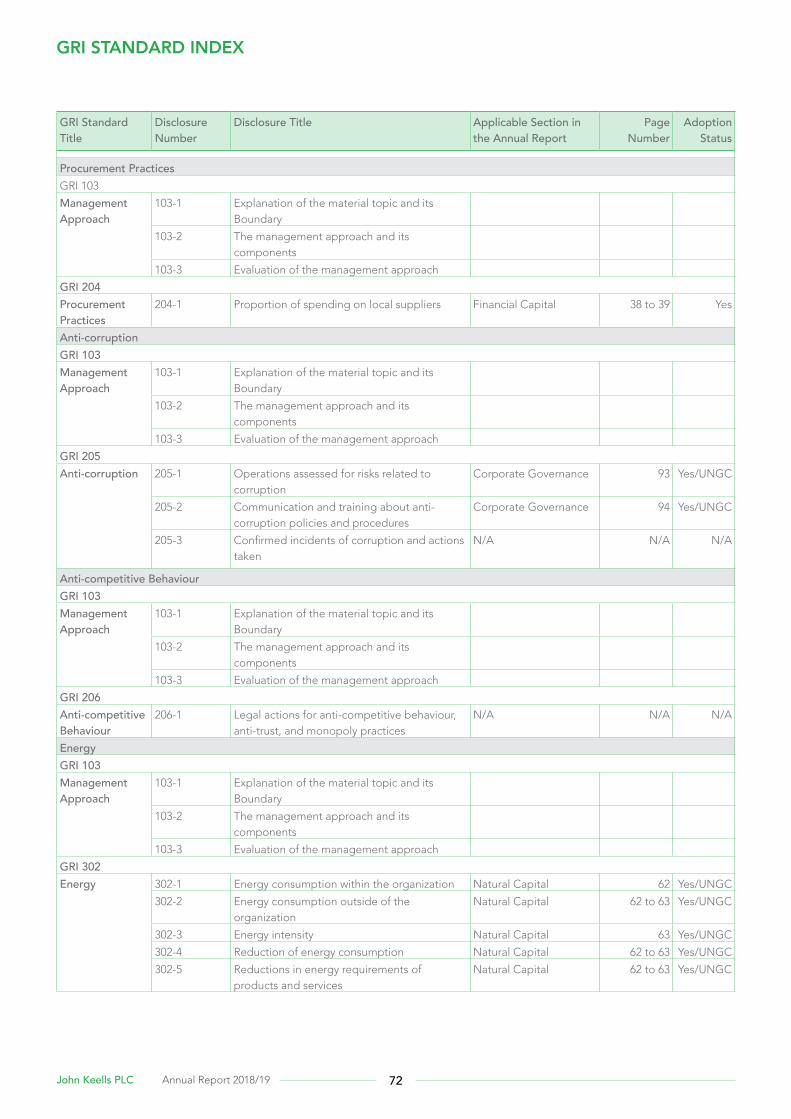
GRI Standard Title
Disclosure Number
Disclosure Title Applicable Section in the Annual Report
Page Number
Adoption Status
Procurement PracticesGRI 103
Management Approach
103-1 Explanation of the material topic and its Boundary
103-2 The management approach and its components
103-3 Evaluation of the management approach
GRI 204Procurement Practices
204-1 Proportion of spending on local suppliers Financial Capital 38 to 39 Yes
Anti-corruptionGRI 103Management Approach
103-1 Explanation of the material topic and its Boundary
103-2 The management approach and its components
103-3 Evaluation of the management approach
GRI 205Anti-corruption 205-1 Operations assessed for risks related to
corruptionCorporate Governance 93 Yes/UNGC
205-2 Communication and training about anti-corruption policies and procedures
Corporate Governance 94 Yes/UNGC
205-3 Confirmed incidents of corruption and actions taken
N/A N/A N/A
Anti-competitive BehaviourGRI 103Management Approach
103-1 Explanation of the material topic and its Boundary
103-2 The management approach and its components
103-3 Evaluation of the management approach
GRI 206Anti-competitive Behaviour
206-1 Legal actions for anti-competitive behaviour, anti-trust, and monopoly practices
N/A N/A N/A
EnergyGRI 103Management Approach
103-1 Explanation of the material topic and its Boundary
103-2 The management approach and its components
103-3 Evaluation of the management approach
GRI 302Energy 302-1 Energy consumption within the organization Natural Capital 62 Yes/UNGC
302-2 Energy consumption outside of the organization
Natural Capital 62 to 63 Yes/UNGC
302-3 Energy intensity Natural Capital 63 Yes/UNGC
302-4 Reduction of energy consumption Natural Capital 62 to 63 Yes/UNGC
302-5 Reductions in energy requirements of products and services
Natural Capital 62 to 63 Yes/UNGC
GRI STANDARD INDEX
72John Keells PLC Annual Report 2018/19

GRI Standard Title
Disclosure Number
Disclosure Title Applicable Section in the Annual Report
Page Number
Adoption Status
WaterGRI 103Management Approach
103-1 Explanation of the material topic and its Boundary
103-2 The management approach and its components
103-3 Evaluation of the management approach GRI 303Water 303-1 Water withdrawal by source Natural Capital 63 Yes/UNGC
303-2 Water sources significantly affected by withdrawal of water
N/A N/A N/A
303-3 Water recycled and reused N/A N/A N/AEmissionsGRI 103Management Approach
103-1 Explanation of the material topic and its Boundary
103-2 The management approach and its components
103-3 Evaluation of the management approach GRI 305Emissions 305-1 Direct (Scope 1) GHG emissions Natural Capital 63 Yes/UNGC
305-2 Energy indirect (Scope 2) GHG emissions Natural Capital 63 Yes/UNGC305-3 Other indirect (Scope 3) GHG emissions Natural Capital 63 Yes/UNGC305-4 GHG emissions intensity Natural Capital 63 Yes/UNGC305-5 Reduction of GHG emissions Natural Capital 63 Yes/UNGC305-6 Emissions of ozone-depleting substances
(ODS)N/A N/A N/A
305-7 Nitrogen oxides (NOX), sulfur oxides (SOX), and other significant air emissions
N/A N/A N/A
Effluents and WasteGRI 103Management Approach
103-1 Explanation of the material topic and its Boundary
103-2 The management approach and its components
103-3 Evaluation of the management approach GRI 306Effluents and Waste
306-1 Water discharge by quality and destination Natural Capital 63 Yes/UNGC
306-2 Waste by type and disposal method Natural Capital 63 to 64 Yes/UNGC306-3 Significant spills Natural Capital 63 Yes/UNGC306-4 Transport of hazardous waste N/A N/A N/A306-5 Water bodies affected by water discharges
and/or runoffN/A N/A N/A
Environmental ComplianceGRI 103Management Approach
103-1 Explanation of the material topic and its Boundary
103-2 The management approach and its components
103-3 Evaluation of the management approach GRI 307Environmental Compliance
307-1 Non-compliance with environmental laws and regulations
N/A N/A N/A
73 HEAD ON
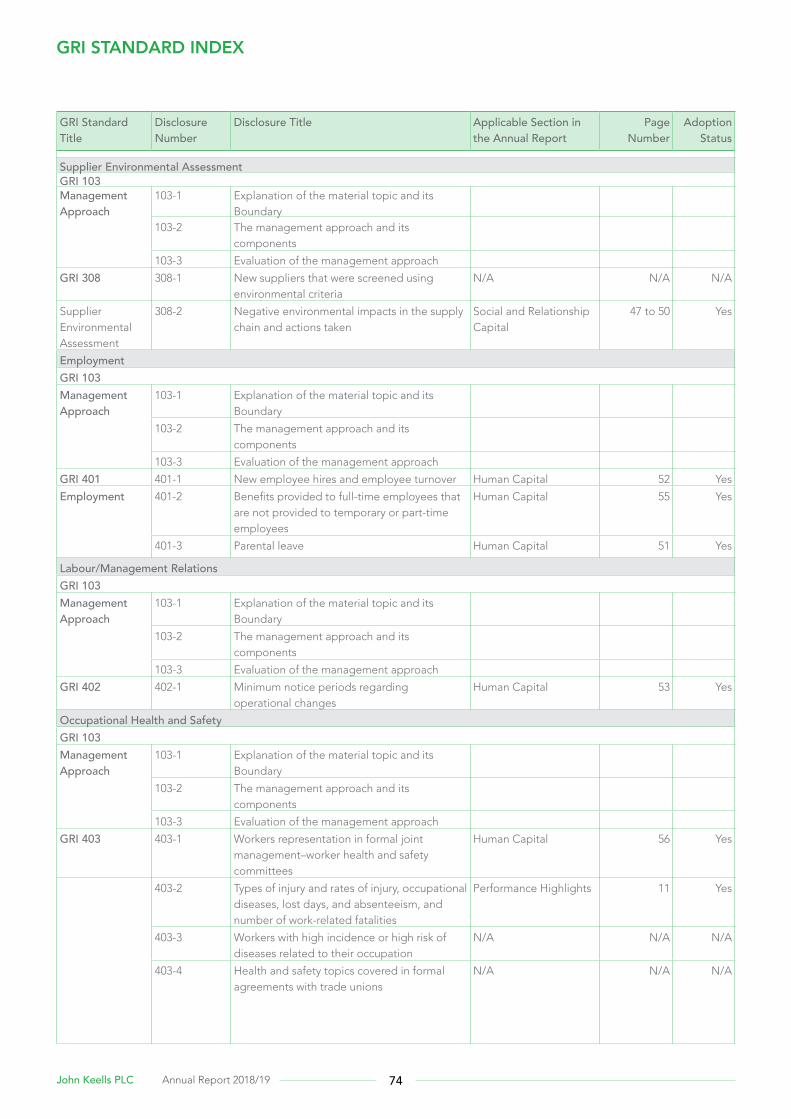
GRI Standard Title
Disclosure Number
Disclosure Title Applicable Section in the Annual Report
Page Number
Adoption Status
Supplier Environmental Assessment GRI 103Management Approach
103-1 Explanation of the material topic and its Boundary
103-2 The management approach and its components
103-3 Evaluation of the management approach
GRI 308 308-1 New suppliers that were screened using environmental criteria
N/A N/A N/A
Supplier Environmental Assessment
308-2 Negative environmental impacts in the supply chain and actions taken
Social and Relationship Capital
47 to 50 Yes
EmploymentGRI 103Management Approach
103-1 Explanation of the material topic and its Boundary
103-2 The management approach and its components
103-3 Evaluation of the management approach
GRI 401 401-1 New employee hires and employee turnover Human Capital 52 Yes
Employment 401-2 Benefits provided to full-time employees that are not provided to temporary or part-time employees
Human Capital 55 Yes
401-3 Parental leave Human Capital 51 Yes
Labour/Management RelationsGRI 103Management Approach
103-1 Explanation of the material topic and its Boundary
103-2 The management approach and its components
103-3 Evaluation of the management approach
GRI 402 402-1 Minimum notice periods regarding operational changes
Human Capital 53 Yes
Occupational Health and SafetyGRI 103Management Approach
103-1 Explanation of the material topic and its Boundary
103-2 The management approach and its components
103-3 Evaluation of the management approach
GRI 403 403-1 Workers representation in formal joint management–worker health and safety committees
Human Capital 56 Yes
403-2 Types of injury and rates of injury, occupational diseases, lost days, and absenteeism, and number of work-related fatalities
Performance Highlights 11 Yes
403-3 Workers with high incidence or high risk of diseases related to their occupation
N/A N/A N/A
403-4 Health and safety topics covered in formal agreements with trade unions
N/A N/A N/A
GRI STANDARD INDEX
74John Keells PLC Annual Report 2018/19
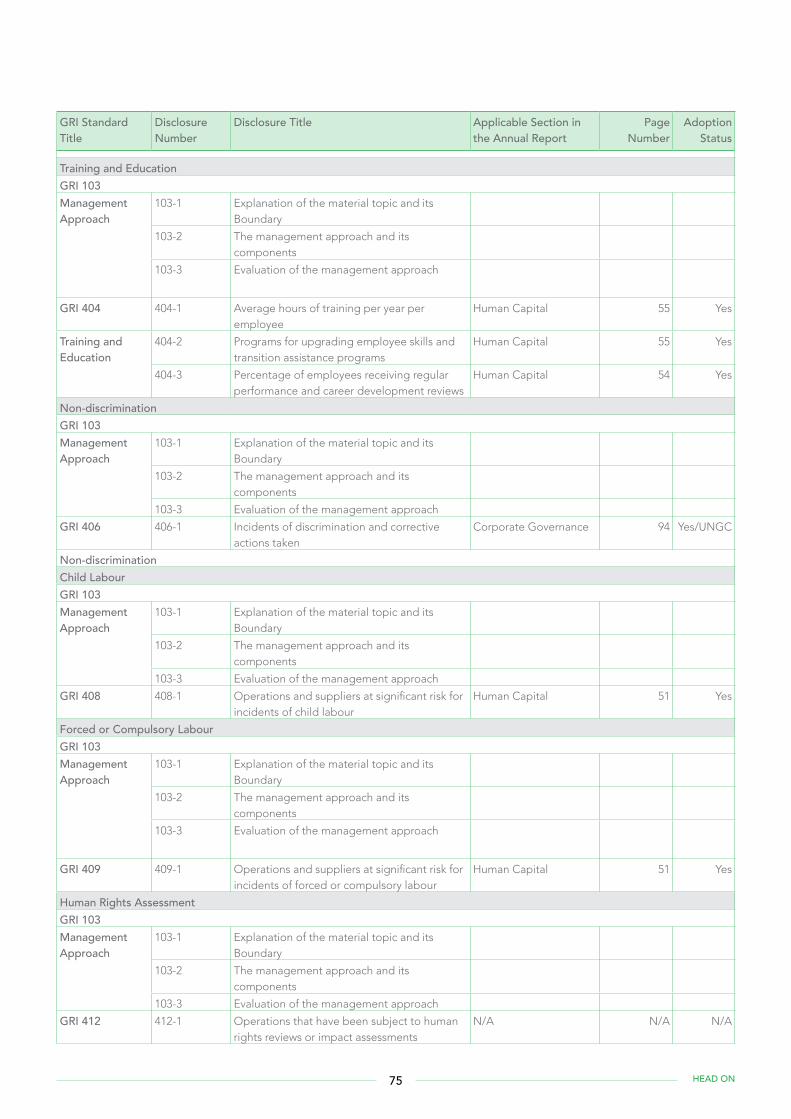
GRI Standard Title
Disclosure Number
Disclosure Title Applicable Section in the Annual Report
Page Number
Adoption Status
Training and EducationGRI 103Management Approach
103-1 Explanation of the material topic and its Boundary
103-2 The management approach and its components
103-3 Evaluation of the management approach
GRI 404 404-1 Average hours of training per year per employee
Human Capital 55 Yes
Training and Education
404-2 Programs for upgrading employee skills and transition assistance programs
Human Capital 55 Yes
404-3 Percentage of employees receiving regular performance and career development reviews
Human Capital 54 Yes
Non-discriminationGRI 103Management Approach
103-1 Explanation of the material topic and its Boundary
103-2 The management approach and its components
103-3 Evaluation of the management approach
GRI 406 406-1 Incidents of discrimination and corrective actions taken
Corporate Governance 94 Yes/UNGC
Non-discriminationChild LabourGRI 103Management Approach
103-1 Explanation of the material topic and its Boundary
103-2 The management approach and its components
103-3 Evaluation of the management approach
GRI 408 408-1 Operations and suppliers at significant risk for incidents of child labour
Human Capital 51 Yes
Forced or Compulsory LabourGRI 103Management Approach
103-1 Explanation of the material topic and its Boundary
103-2 The management approach and its components
103-3 Evaluation of the management approach
GRI 409 409-1 Operations and suppliers at significant risk for incidents of forced or compulsory labour
Human Capital 51 Yes
Human Rights AssessmentGRI 103Management Approach
103-1 Explanation of the material topic and its Boundary
103-2 The management approach and its components
103-3 Evaluation of the management approach
GRI 412 412-1 Operations that have been subject to human rights reviews or impact assessments
N/A N/A N/A
75 HEAD ON
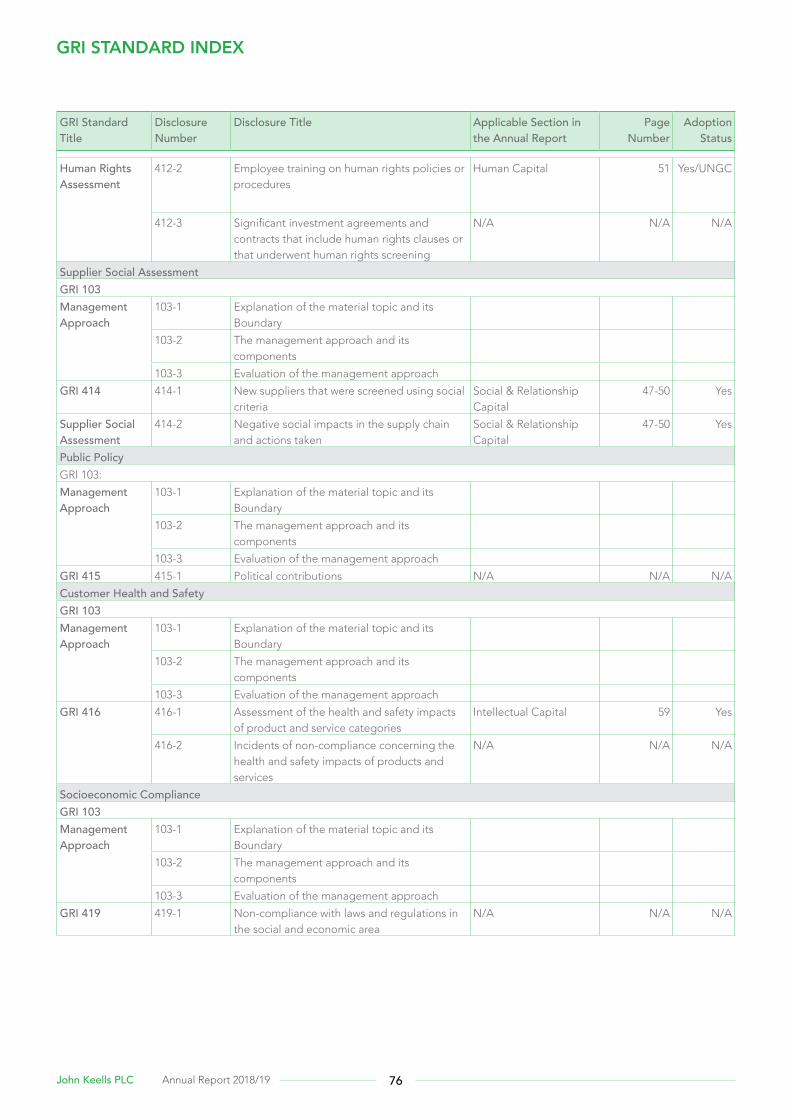
GRI Standard Title
Disclosure Number
Disclosure Title Applicable Section in the Annual Report
Page Number
Adoption Status
Human Rights Assessment
412-2 Employee training on human rights policies or procedures
Human Capital 51 Yes/UNGC
412-3 Significant investment agreements and contracts that include human rights clauses or that underwent human rights screening
N/A N/A N/A
Supplier Social Assessment GRI 103Management Approach
103-1 Explanation of the material topic and its Boundary
103-2 The management approach and its components
103-3 Evaluation of the management approach
GRI 414 414-1 New suppliers that were screened using social criteria
Social & Relationship Capital
47-50 Yes
Supplier Social Assessment
414-2 Negative social impacts in the supply chain and actions taken
Social & Relationship Capital
47-50 Yes
Public PolicyGRI 103:
Management Approach
103-1 Explanation of the material topic and its Boundary
103-2 The management approach and its components
103-3 Evaluation of the management approach
GRI 415 415-1 Political contributions N/A N/A N/A
Customer Health and SafetyGRI 103Management Approach
103-1 Explanation of the material topic and its Boundary
103-2 The management approach and its components
103-3 Evaluation of the management approach
GRI 416 416-1 Assessment of the health and safety impacts of product and service categories
Intellectual Capital 59 Yes
416-2 Incidents of non-compliance concerning the health and safety impacts of products and services
N/A N/A N/A
Socioeconomic Compliance GRI 103Management Approach
103-1 Explanation of the material topic and its Boundary
103-2 The management approach and its components
103-3 Evaluation of the management approach
GRI 419 419-1 Non-compliance with laws and regulations in the social and economic area
N/A N/A N/A
GRI STANDARD INDEX
76John Keells PLC Annual Report 2018/19

78 Board of Directors 80 Corporate Governance 100 Enterprise Risk Management 105 Report of the Board Audit
Committee108 Report of the Related Party
Transactions Review Committee109 Annual Report of the
Board of Directors 115 Statement of Directors’ Responsibility
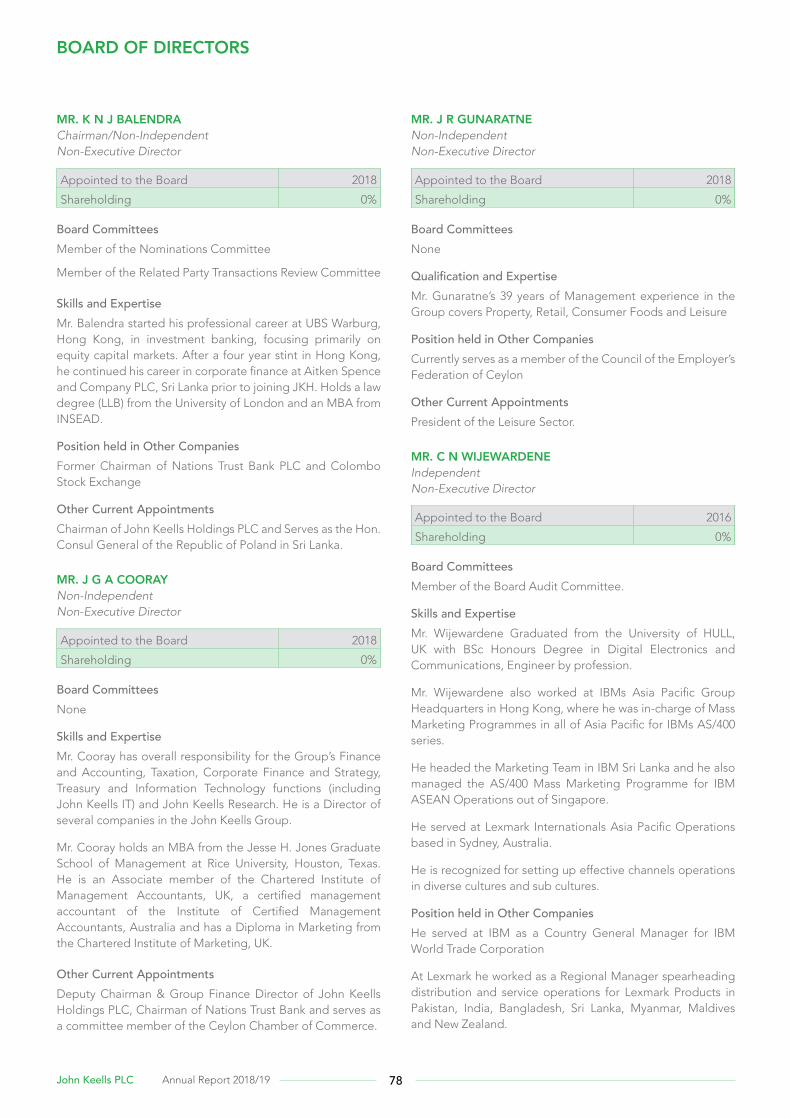
BOARD OF DIRECTORS
MR. K N J BALENDRAChairman/Non-Independent Non-Executive Director
Appointed to the Board 2018
Shareholding 0%
Board CommitteesMember of the Nominations Committee
Member of the Related Party Transactions Review Committee
Skills and ExpertiseMr. Balendra started his professional career at UBS Warburg, Hong Kong, in investment banking, focusing primarily on equity capital markets. After a four year stint in Hong Kong, he continued his career in corporate finance at Aitken Spence and Company PLC, Sri Lanka prior to joining JKH. Holds a law degree (LLB) from the University of London and an MBA from INSEAD.
Position held in Other Companies Former Chairman of Nations Trust Bank PLC and Colombo Stock Exchange
Other Current AppointmentsChairman of John Keells Holdings PLC and Serves as the Hon. Consul General of the Republic of Poland in Sri Lanka.
MR. J G A COORAYNon-Independent Non-Executive Director
Appointed to the Board 2018
Shareholding 0%
Board CommitteesNone
Skills and ExpertiseMr. Cooray has overall responsibility for the Group’s Finance and Accounting, Taxation, Corporate Finance and Strategy, Treasury and Information Technology functions (including John Keells IT) and John Keells Research. He is a Director of several companies in the John Keells Group.
Mr. Cooray holds an MBA from the Jesse H. Jones Graduate School of Management at Rice University, Houston, Texas. He is an Associate member of the Chartered Institute of Management Accountants, UK, a certified management accountant of the Institute of Certified Management Accountants, Australia and has a Diploma in Marketing from the Chartered Institute of Marketing, UK.
Other Current AppointmentsDeputy Chairman & Group Finance Director of John Keells Holdings PLC, Chairman of Nations Trust Bank and serves as a committee member of the Ceylon Chamber of Commerce.
MR. J R GUNARATNENon-Independent Non-Executive Director
Appointed to the Board 2018
Shareholding 0%
Board CommitteesNone
Qualification and ExpertiseMr. Gunaratne’s 39 years of Management experience in the Group covers Property, Retail, Consumer Foods and Leisure
Position held in Other Companies Currently serves as a member of the Council of the Employer’s Federation of Ceylon
Other Current AppointmentsPresident of the Leisure Sector.
MR. C N WIJEWARDENEIndependent Non-Executive Director
Appointed to the Board 2016
Shareholding 0%
Board CommitteesMember of the Board Audit Committee.
Skills and ExpertiseMr. Wijewardene Graduated from the University of HULL, UK with BSc Honours Degree in Digital Electronics and Communications, Engineer by profession.
Mr. Wijewardene also worked at IBMs Asia Pacific Group Headquarters in Hong Kong, where he was in-charge of Mass Marketing Programmes in all of Asia Pacific for IBMs AS/400 series.
He headed the Marketing Team in IBM Sri Lanka and he also managed the AS/400 Mass Marketing Programme for IBM ASEAN Operations out of Singapore.
He served at Lexmark Internationals Asia Pacific Operations based in Sydney, Australia.
He is recognized for setting up effective channels operations in diverse cultures and sub cultures.
Position held in Other Companies He served at IBM as a Country General Manager for IBM World Trade Corporation
At Lexmark he worked as a Regional Manager spearheading distribution and service operations for Lexmark Products in Pakistan, India, Bangladesh, Sri Lanka, Myanmar, Maldives and New Zealand.
78John Keells PLC Annual Report 2018/19
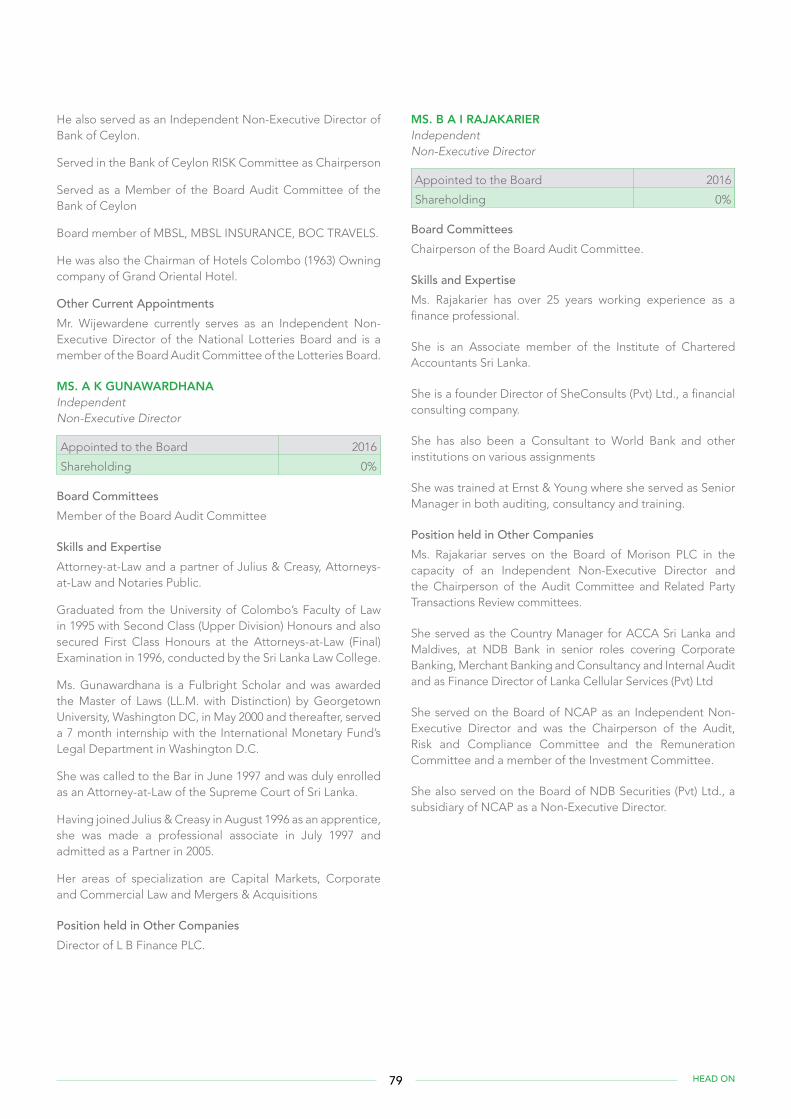
He also served as an Independent Non-Executive Director of Bank of Ceylon.
Served in the Bank of Ceylon RISK Committee as Chairperson
Served as a Member of the Board Audit Committee of the Bank of Ceylon
Board member of MBSL, MBSL INSURANCE, BOC TRAVELS.
He was also the Chairman of Hotels Colombo (1963) Owning company of Grand Oriental Hotel.
Other Current AppointmentsMr. Wijewardene currently serves as an Independent Non-Executive Director of the National Lotteries Board and is a member of the Board Audit Committee of the Lotteries Board.
MS. A K GUNAWARDHANAIndependent Non-Executive Director
Appointed to the Board 2016
Shareholding 0%
Board CommitteesMember of the Board Audit Committee
Skills and ExpertiseAttorney-at-Law and a partner of Julius & Creasy, Attorneys-at-Law and Notaries Public.
Graduated from the University of Colombo’s Faculty of Law in 1995 with Second Class (Upper Division) Honours and also secured First Class Honours at the Attorneys-at-Law (Final) Examination in 1996, conducted by the Sri Lanka Law College.
Ms. Gunawardhana is a Fulbright Scholar and was awarded the Master of Laws (LL.M. with Distinction) by Georgetown University, Washington DC, in May 2000 and thereafter, served a 7 month internship with the International Monetary Fund’s Legal Department in Washington D.C.
She was called to the Bar in June 1997 and was duly enrolled as an Attorney-at-Law of the Supreme Court of Sri Lanka.
Having joined Julius & Creasy in August 1996 as an apprentice, she was made a professional associate in July 1997 and admitted as a Partner in 2005.
Her areas of specialization are Capital Markets, Corporate and Commercial Law and Mergers & Acquisitions
Position held in Other Companies Director of L B Finance PLC.
MS. B A I RAJAKARIERIndependent Non-Executive Director
Appointed to the Board 2016
Shareholding 0%
Board CommitteesChairperson of the Board Audit Committee.
Skills and ExpertiseMs. Rajakarier has over 25 years working experience as a finance professional.
She is an Associate member of the Institute of Chartered Accountants Sri Lanka.
She is a founder Director of SheConsults (Pvt) Ltd., a financial consulting company.
She has also been a Consultant to World Bank and other institutions on various assignments
She was trained at Ernst & Young where she served as Senior Manager in both auditing, consultancy and training.
Position held in Other Companies Ms. Rajakariar serves on the Board of Morison PLC in the capacity of an Independent Non-Executive Director and the Chairperson of the Audit Committee and Related Party Transactions Review committees.
She served as the Country Manager for ACCA Sri Lanka and Maldives, at NDB Bank in senior roles covering Corporate Banking, Merchant Banking and Consultancy and Internal Audit and as Finance Director of Lanka Cellular Services (Pvt) Ltd
She served on the Board of NCAP as an Independent Non- Executive Director and was the Chairperson of the Audit, Risk and Compliance Committee and the Remuneration Committee and a member of the Investment Committee.
She also served on the Board of NDB Securities (Pvt) Ltd., a subsidiary of NCAP as a Non-Executive Director.
79 HEAD ON
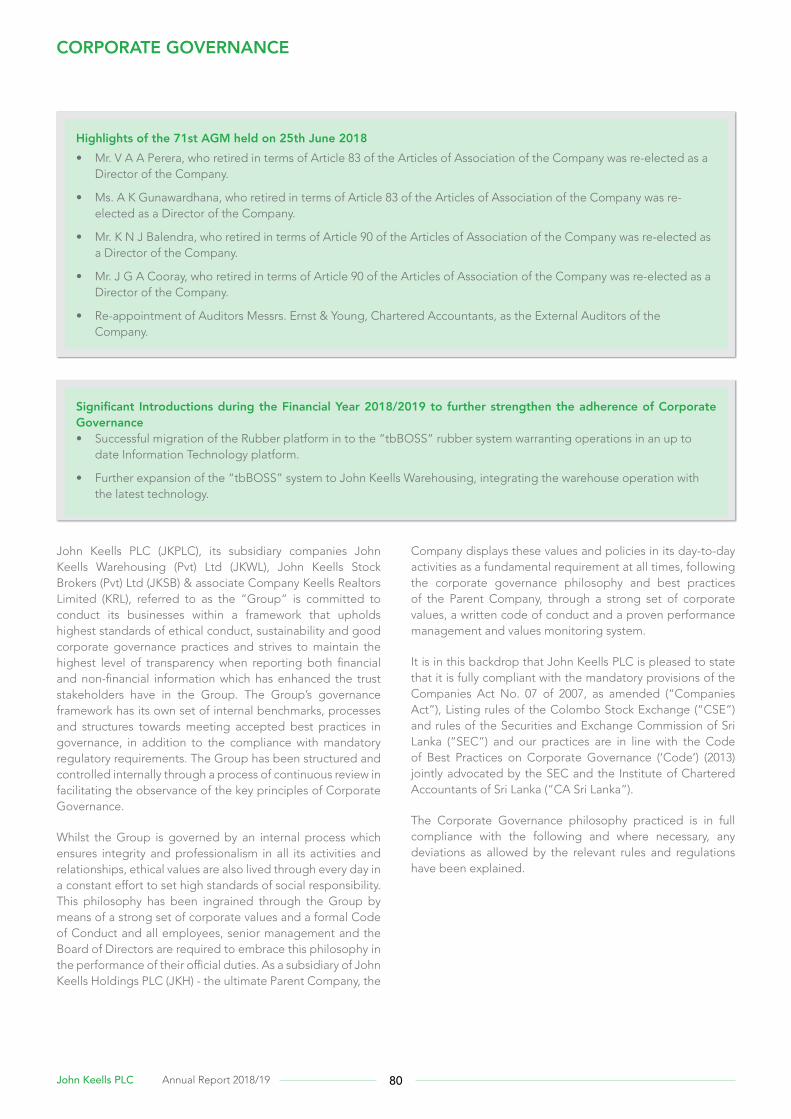
CORPORATE GOVERNANCE
John Keells PLC (JKPLC), its subsidiary companies John Keells Warehousing (Pvt) Ltd (JKWL), John Keells Stock Brokers (Pvt) Ltd (JKSB) & associate Company Keells Realtors Limited (KRL), referred to as the “Group” is committed to conduct its businesses within a framework that upholds highest standards of ethical conduct, sustainability and good corporate governance practices and strives to maintain the highest level of transparency when reporting both financial and non-financial information which has enhanced the trust stakeholders have in the Group. The Group’s governance framework has its own set of internal benchmarks, processes and structures towards meeting accepted best practices in governance, in addition to the compliance with mandatory regulatory requirements. The Group has been structured and controlled internally through a process of continuous review in facilitating the observance of the key principles of Corporate Governance.
Whilst the Group is governed by an internal process which ensures integrity and professionalism in all its activities and relationships, ethical values are also lived through every day in a constant effort to set high standards of social responsibility. This philosophy has been ingrained through the Group by means of a strong set of corporate values and a formal Code of Conduct and all employees, senior management and the Board of Directors are required to embrace this philosophy in the performance of their official duties. As a subsidiary of John Keells Holdings PLC (JKH) - the ultimate Parent Company, the
Company displays these values and policies in its day-to-day activities as a fundamental requirement at all times, following the corporate governance philosophy and best practices of the Parent Company, through a strong set of corporate values, a written code of conduct and a proven performance management and values monitoring system.
It is in this backdrop that John Keells PLC is pleased to state that it is fully compliant with the mandatory provisions of the Companies Act No. 07 of 2007, as amended (“Companies Act”), Listing rules of the Colombo Stock Exchange (“CSE”) and rules of the Securities and Exchange Commission of Sri Lanka (“SEC”) and our practices are in line with the Code of Best Practices on Corporate Governance (‘Code’) (2013) jointly advocated by the SEC and the Institute of Chartered Accountants of Sri Lanka (“CA Sri Lanka”).
The Corporate Governance philosophy practiced is in full compliance with the following and where necessary, any deviations as allowed by the relevant rules and regulations have been explained.
Significant Introductions during the Financial Year 2018/2019 to further strengthen the adherence of Corporate Governance • Successful migration of the Rubber platform in to the “tbBOSS” rubber system warranting operations in an up to
date Information Technology platform.
• Further expansion of the “tbBOSS” system to John Keells Warehousing, integrating the warehouse operation with the latest technology.
Highlights of the 71st AGM held on 25th June 2018 • Mr. V A A Perera, who retired in terms of Article 83 of the Articles of Association of the Company was re-elected as a
Director of the Company.
• Ms. A K Gunawardhana, who retired in terms of Article 83 of the Articles of Association of the Company was re-elected as a Director of the Company.
• Mr. K N J Balendra, who retired in terms of Article 90 of the Articles of Association of the Company was re-elected as a Director of the Company.
• Mr. J G A Cooray, who retired in terms of Article 90 of the Articles of Association of the Company was re-elected as a Director of the Company.
• Re-appointment of Auditors Messrs. Ernst & Young, Chartered Accountants, as the External Auditors of the Company.
80John Keells PLC Annual Report 2018/19
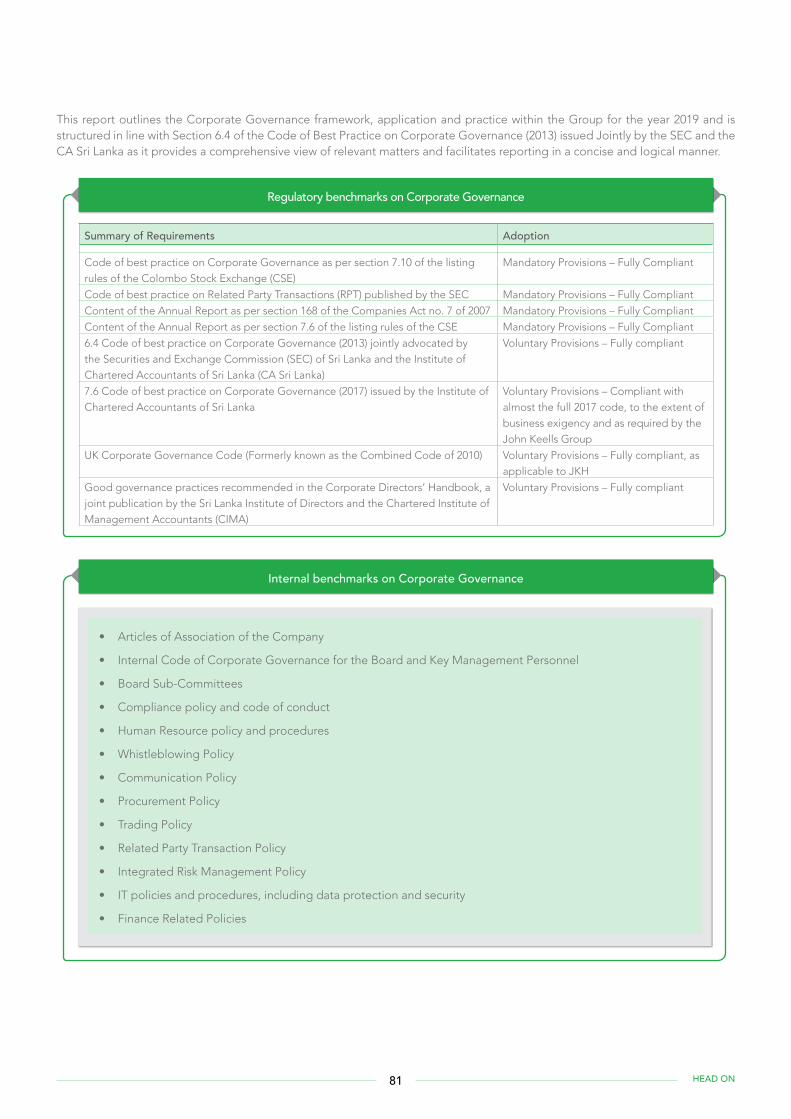
• Articles of Association of the Company
• Internal Code of Corporate Governance for the Board and Key Management Personnel
• Board Sub-Committees
• Compliance policy and code of conduct
• Human Resource policy and procedures
• Whistleblowing Policy
• Communication Policy
• Procurement Policy
• Trading Policy
• Related Party Transaction Policy
• Integrated Risk Management Policy
• IT policies and procedures, including data protection and security
• Finance Related Policies
Internal benchmarks on Corporate Governance
Regulatory benchmarks on Corporate Governance
Summary of Requirements Adoption
Code of best practice on Corporate Governance as per section 7.10 of the listing rules of the Colombo Stock Exchange (CSE)
Mandatory Provisions – Fully Compliant
Code of best practice on Related Party Transactions (RPT) published by the SEC Mandatory Provisions – Fully Compliant
Content of the Annual Report as per section 168 of the Companies Act no. 7 of 2007 Mandatory Provisions – Fully Compliant
Content of the Annual Report as per section 7.6 of the listing rules of the CSE Mandatory Provisions – Fully Compliant
6.4 Code of best practice on Corporate Governance (2013) jointly advocated by the Securities and Exchange Commission (SEC) of Sri Lanka and the Institute of Chartered Accountants of Sri Lanka (CA Sri Lanka)
Voluntary Provisions – Fully compliant
7.6 Code of best practice on Corporate Governance (2017) issued by the Institute of Chartered Accountants of Sri Lanka
Voluntary Provisions – Compliant with almost the full 2017 code, to the extent of business exigency and as required by the John Keells Group
UK Corporate Governance Code (Formerly known as the Combined Code of 2010) Voluntary Provisions – Fully compliant, as applicable to JKH
Good governance practices recommended in the Corporate Directors’ Handbook, a joint publication by the Sri Lanka Institute of Directors and the Chartered Institute of Management Accountants (CIMA)
Voluntary Provisions – Fully compliant
This report outlines the Corporate Governance framework, application and practice within the Group for the year 2019 and is structured in line with Section 6.4 of the Code of Best Practice on Corporate Governance (2013) issued Jointly by the SEC and the CA Sri Lanka as it provides a comprehensive view of relevant matters and facilitates reporting in a concise and logical manner.
81 HEAD ON
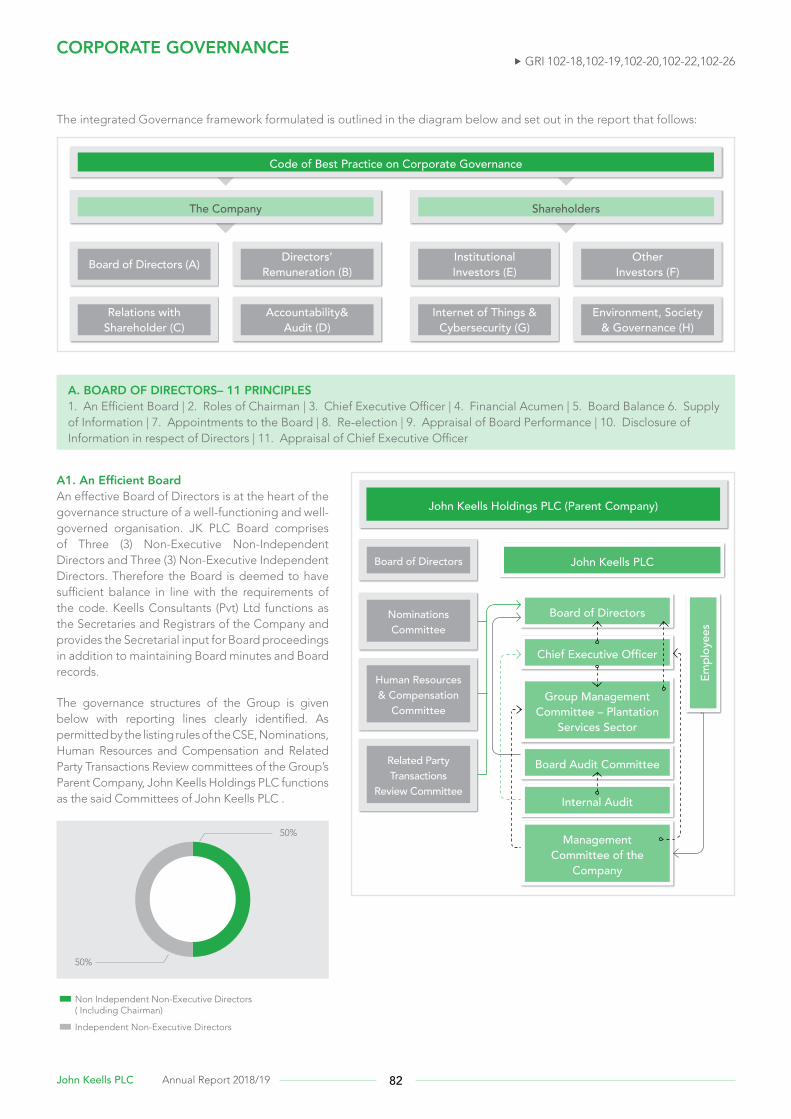
CORPORATE GOVERNANCE
A1. An Efficient Board An effective Board of Directors is at the heart of the governance structure of a well-functioning and well-governed organisation. JK PLC Board comprises of Three (3) Non-Executive Non-Independent Directors and Three (3) Non-Executive Independent Directors. Therefore the Board is deemed to have sufficient balance in line with the requirements of the code. Keells Consultants (Pvt) Ltd functions as the Secretaries and Registrars of the Company and provides the Secretarial input for Board proceedings in addition to maintaining Board minutes and Board records.
The governance structures of the Group is given below with reporting lines clearly identified. As permitted by the listing rules of the CSE, Nominations, Human Resources and Compensation and Related Party Transactions Review committees of the Group’s Parent Company, John Keells Holdings PLC functions as the said Committees of John Keells PLC .
50%
50%
Non Independent Non-Executive Directors( Including Chairman)
Independent Non-Executive Directors
The integrated Governance framework formulated is outlined in the diagram below and set out in the report that follows:
John Keells Holdings PLC (Parent Company)
Board of Directors
Chief Executive Officer
Internal Audit
Board Audit Committee
Management Committee of the
Company
Group Management Committee – Plantation
Services Sector
Empl
oyee
s
Nominations Committee
Human Resources & Compensation
Committee
Related Party Transactions
Review Committee
John Keells PLC
Board of Directors
A. BOARD OF DIRECTORS– 11 PRINCIPLES1. An Efficient Board | 2. Roles of Chairman | 3. Chief Executive Officer | 4. Financial Acumen | 5. Board Balance 6. Supply of Information | 7. Appointments to the Board | 8. Re-election | 9. Appraisal of Board Performance | 10. Disclosure of Information in respect of Directors | 11. Appraisal of Chief Executive Officer
Code of Best Practice on Corporate Governance
Board of Directors (A) Directors’ Remuneration (B)
Institutional Investors (E)
Other Investors (F)
Relations with Shareholder (C)
Accountability& Audit (D)
Internet of Things & Cybersecurity (G)
Environment, Society & Governance (H)
The Company Shareholders
GRI 102-18,102-19,102-20,102-22,102-26
82John Keells PLC Annual Report 2018/19
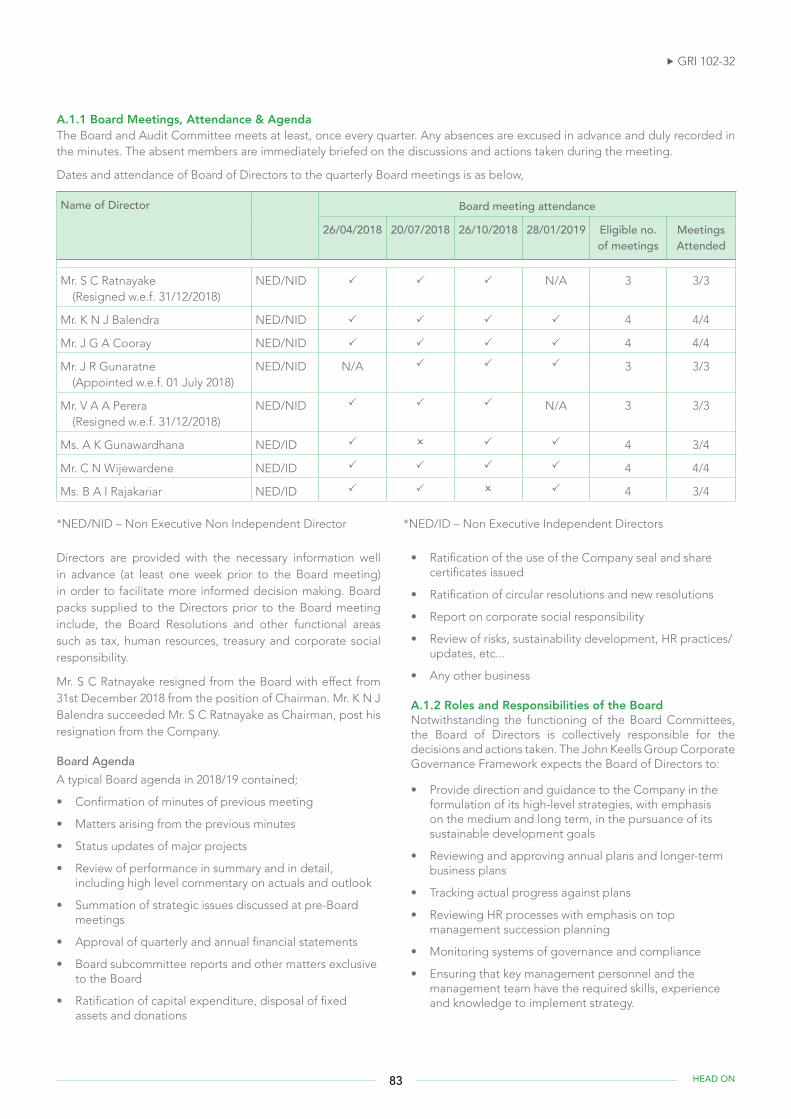
A.1.1 Board Meetings, Attendance & AgendaThe Board and Audit Committee meets at least, once every quarter. Any absences are excused in advance and duly recorded in the minutes. The absent members are immediately briefed on the discussions and actions taken during the meeting.
Dates and attendance of Board of Directors to the quarterly Board meetings is as below,
Name of Director Board meeting attendance
26/04/2018 20/07/2018 26/10/2018 28/01/2019 Eligible no. of meetings
Meetings Attended
Mr. S C Ratnayake (Resigned w.e.f. 31/12/2018)
NED/NID N/A 3 3/3
Mr. K N J Balendra NED/NID 4 4/4
Mr. J G A Cooray NED/NID 4 4/4
Mr. J R Gunaratne (Appointed w.e.f. 01 July 2018)
NED/NID N/A 3 3/3
Mr. V A A Perera (Resigned w.e.f. 31/12/2018)
NED/NID N/A 3 3/3
Ms. A K Gunawardhana NED/ID 4 3/4
Mr. C N Wijewardene NED/ID 4 4/4
Ms. B A I Rajakariar NED/ID 4 3/4
*NED/NID – Non Executive Non Independent Director *NED/ID – Non Executive Independent Directors
Directors are provided with the necessary information well in advance (at least one week prior to the Board meeting) in order to facilitate more informed decision making. Board packs supplied to the Directors prior to the Board meeting include, the Board Resolutions and other functional areas such as tax, human resources, treasury and corporate social responsibility.
Mr. S C Ratnayake resigned from the Board with effect from 31st December 2018 from the position of Chairman. Mr. K N J Balendra succeeded Mr. S C Ratnayake as Chairman, post his resignation from the Company.
Board AgendaA typical Board agenda in 2018/19 contained;
• Confirmation of minutes of previous meeting
• Matters arising from the previous minutes
• Status updates of major projects
• Review of performance in summary and in detail, including high level commentary on actuals and outlook
• Summation of strategic issues discussed at pre-Board meetings
• Approval of quarterly and annual financial statements
• Board subcommittee reports and other matters exclusive to the Board
• Ratification of capital expenditure, disposal of fixed assets and donations
• Ratification of the use of the Company seal and share certificates issued
• Ratification of circular resolutions and new resolutions
• Report on corporate social responsibility
• Review of risks, sustainability development, HR practices/updates, etc...
• Any other business
A.1.2 Roles and Responsibilities of the BoardNotwithstanding the functioning of the Board Committees, the Board of Directors is collectively responsible for the decisions and actions taken. The John Keells Group Corporate Governance Framework expects the Board of Directors to:
• Provide direction and guidance to the Company in the formulation of its high-level strategies, with emphasis on the medium and long term, in the pursuance of its sustainable development goals
• Reviewing and approving annual plans and longer-term business plans
• Tracking actual progress against plans
• Reviewing HR processes with emphasis on top management succession planning
• Monitoring systems of governance and compliance
• Ensuring that key management personnel and the management team have the required skills, experience and knowledge to implement strategy.
GRI 102-32
83 HEAD ON
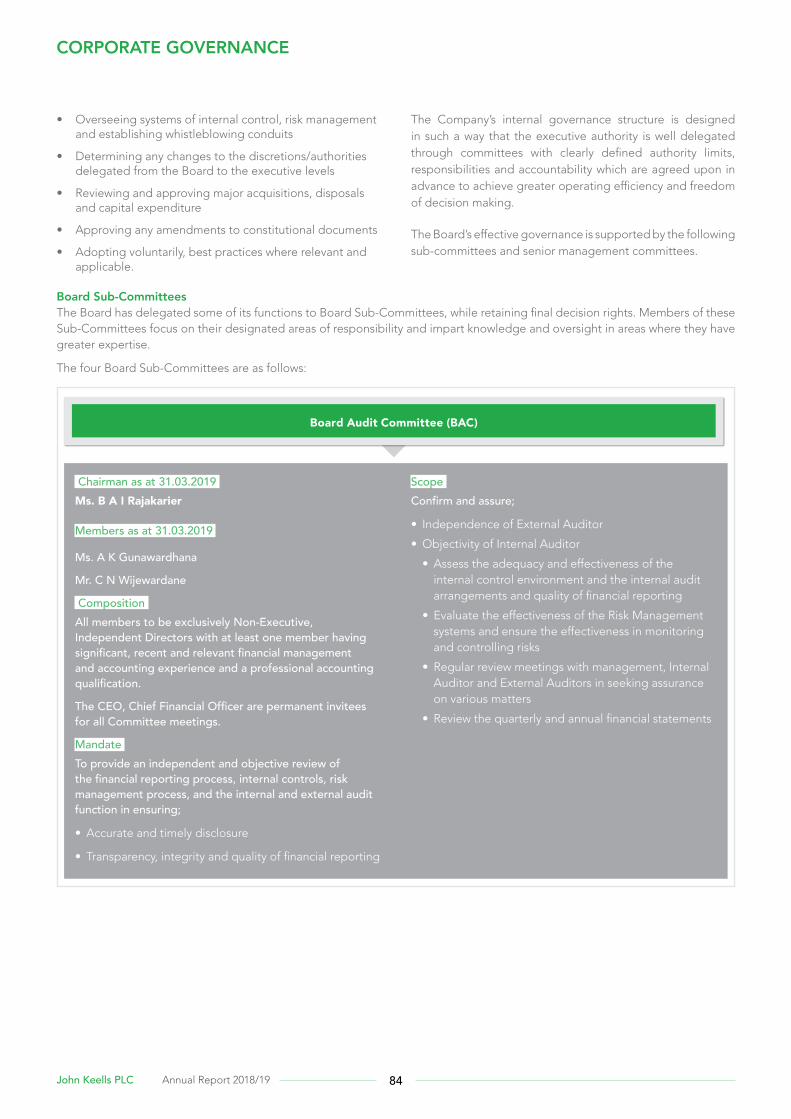
CORPORATE GOVERNANCE
• Overseeing systems of internal control, risk management and establishing whistleblowing conduits
• Determining any changes to the discretions/authorities delegated from the Board to the executive levels
• Reviewing and approving major acquisitions, disposals and capital expenditure
• Approving any amendments to constitutional documents
• Adopting voluntarily, best practices where relevant and applicable.
Board Sub-CommitteesThe Board has delegated some of its functions to Board Sub-Committees, while retaining final decision rights. Members of these Sub-Committees focus on their designated areas of responsibility and impart knowledge and oversight in areas where they have greater expertise.
The four Board Sub-Committees are as follows:
Board Audit Committee (BAC)
Chairman as at 31.03.2019 Ms. B A I Rajakarier
Members as at 31.03.2019
Ms. A K Gunawardhana
Mr. C N Wijewardane
Composition All members to be exclusively Non-Executive, Independent Directors with at least one member having significant, recent and relevant financial management and accounting experience and a professional accounting qualification.
The CEO, Chief Financial Officer are permanent invitees for all Committee meetings.
Mandate To provide an independent and objective review of the financial reporting process, internal controls, risk management process, and the internal and external audit function in ensuring;
• Accurate and timely disclosure
• Transparency, integrity and quality of financial reporting
Scope Confirm and assure;
• Independence of External Auditor
• Objectivity of Internal Auditor
• Assess the adequacy and effectiveness of the internal control environment and the internal audit arrangements and quality of financial reporting
• Evaluate the effectiveness of the Risk Management systems and ensure the effectiveness in monitoring and controlling risks
• Regular review meetings with management, Internal Auditor and External Auditors in seeking assurance on various matters
• Review the quarterly and annual financial statements
The Company’s internal governance structure is designed in such a way that the executive authority is well delegated through committees with clearly defined authority limits, responsibilities and accountability which are agreed upon in advance to achieve greater operating efficiency and freedom of decision making.
The Board’s effective governance is supported by the following sub-committees and senior management committees.
84John Keells PLC Annual Report 2018/19
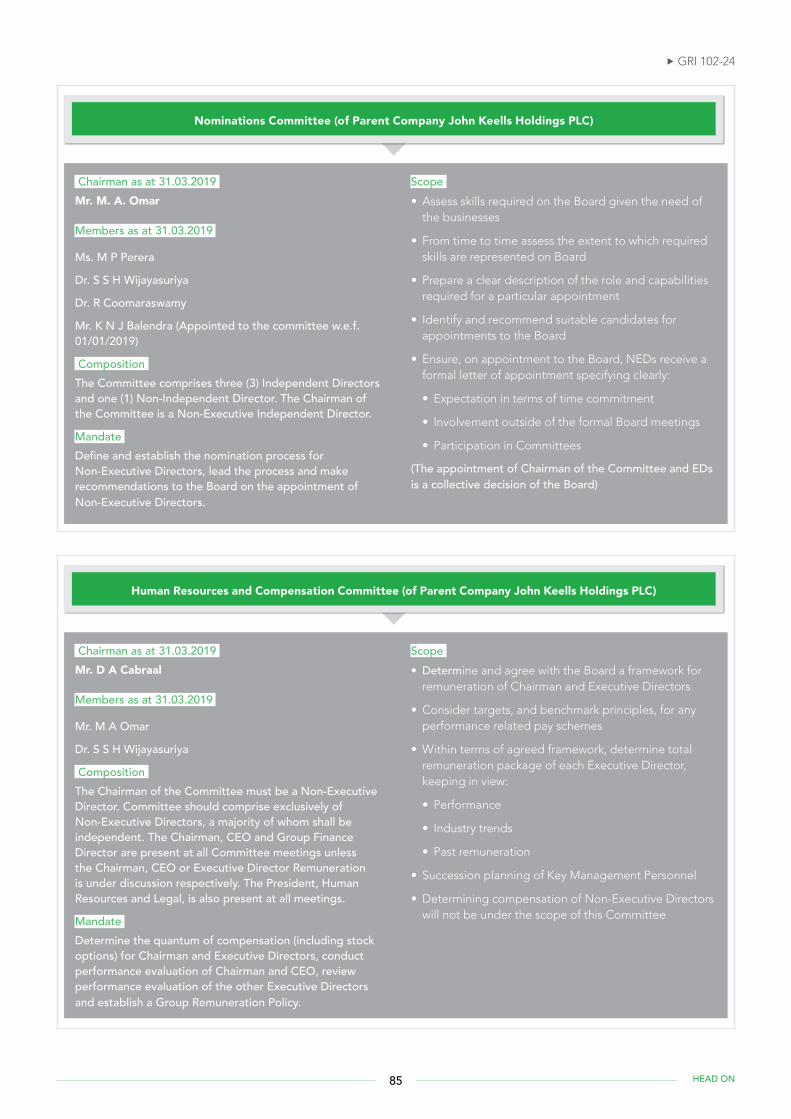
Nominations Committee (of Parent Company John Keells Holdings PLC)
Chairman as at 31.03.2019 Mr. M. A. Omar
Members as at 31.03.2019
Ms. M P Perera
Dr. S S H Wijayasuriya
Dr. R Coomaraswamy
Mr. K N J Balendra (Appointed to the committee w.e.f. 01/01/2019)
Composition The Committee comprises three (3) Independent Directors and one (1) Non-Independent Director. The Chairman of the Committee is a Non-Executive Independent Director.
Mandate Define and establish the nomination process for Non-Executive Directors, lead the process and make recommendations to the Board on the appointment of Non-Executive Directors.
Scope • Assess skills required on the Board given the need of the businesses
• From time to time assess the extent to which required skills are represented on Board
• Prepare a clear description of the role and capabilities required for a particular appointment
• Identify and recommend suitable candidates for appointments to the Board
• Ensure, on appointment to the Board, NEDs receive a formal letter of appointment specifying clearly:
• Expectation in terms of time commitment
• Involvement outside of the formal Board meetings
• Participation in Committees
(The appointment of Chairman of the Committee and EDs is a collective decision of the Board)
Human Resources and Compensation Committee (of Parent Company John Keells Holdings PLC)
Chairman as at 31.03.2019 Mr. D A Cabraal
Members as at 31.03.2019
Mr. M A Omar
Dr. S S H Wijayasuriya
Composition The Chairman of the Committee must be a Non-Executive Director. Committee should comprise exclusively of Non-Executive Directors, a majority of whom shall be independent. The Chairman, CEO and Group Finance Director are present at all Committee meetings unless the Chairman, CEO or Executive Director Remuneration is under discussion respectively. The President, Human Resources and Legal, is also present at all meetings.
Mandate Determine the quantum of compensation (including stock options) for Chairman and Executive Directors, conduct performance evaluation of Chairman and CEO, review performance evaluation of the other Executive Directors and establish a Group Remuneration Policy.
Scope • Determine and agree with the Board a framework for remuneration of Chairman and Executive Directors
• Consider targets, and benchmark principles, for any performance related pay schemes
• Within terms of agreed framework, determine total remuneration package of each Executive Director, keeping in view:
• Performance
• Industry trends
• Past remuneration
• Succession planning of Key Management Personnel
• Determining compensation of Non-Executive Directors will not be under the scope of this Committee
GRI 102-24
85 HEAD ON
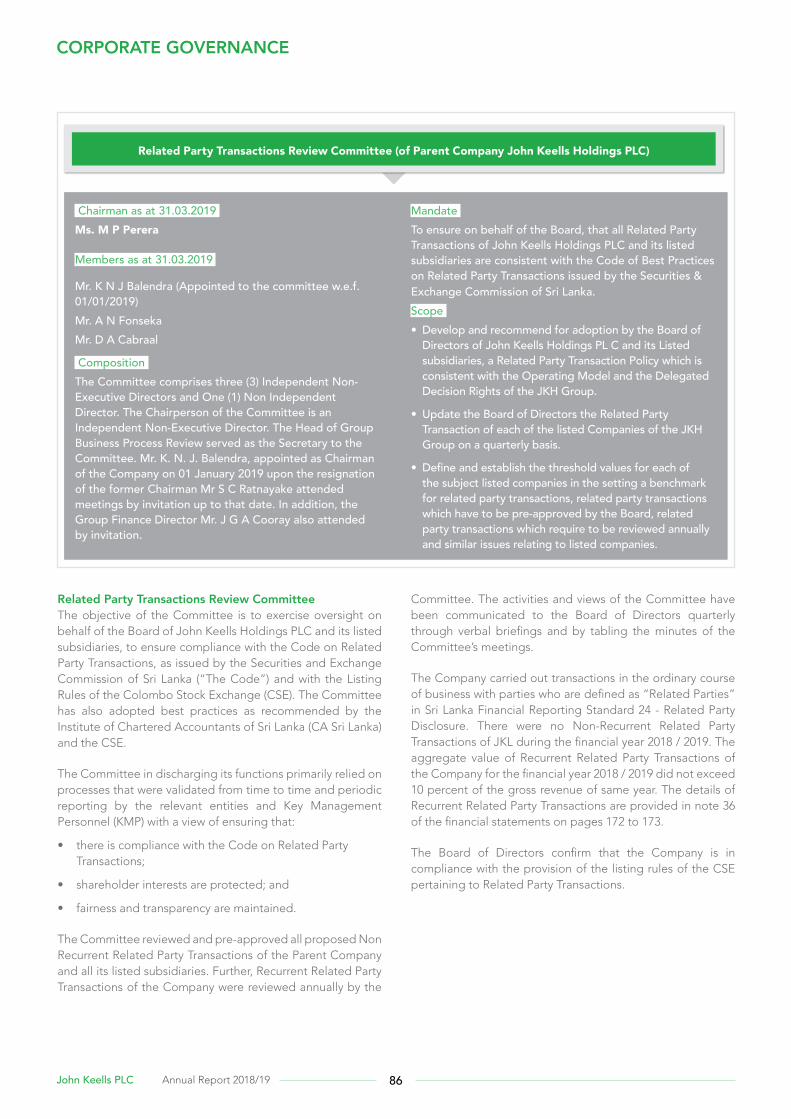
CORPORATE GOVERNANCE
Related Party Transactions Review Committee (of Parent Company John Keells Holdings PLC)
Chairman as at 31.03.2019 Ms. M P Perera
Members as at 31.03.2019
Mr. K N J Balendra (Appointed to the committee w.e.f. 01/01/2019) Mr. A N FonsekaMr. D A Cabraal
Composition The Committee comprises three (3) Independent Non-Executive Directors and One (1) Non Independent Director. The Chairperson of the Committee is an Independent Non-Executive Director. The Head of Group Business Process Review served as the Secretary to the Committee. Mr. K. N. J. Balendra, appointed as Chairman of the Company on 01 January 2019 upon the resignation of the former Chairman Mr S C Ratnayake attended meetings by invitation up to that date. In addition, the Group Finance Director Mr. J G A Cooray also attended by invitation.
Mandate To ensure on behalf of the Board, that all Related Party Transactions of John Keells Holdings PLC and its listed subsidiaries are consistent with the Code of Best Practices on Related Party Transactions issued by the Securities & Exchange Commission of Sri Lanka.Scope • Develop and recommend for adoption by the Board of Directors of John Keells Holdings PL C and its Listed subsidiaries, a Related Party Transaction Policy which is consistent with the Operating Model and the Delegated Decision Rights of the JKH Group.
• Update the Board of Directors the Related Party Transaction of each of the listed Companies of the JKH Group on a quarterly basis.
• Define and establish the threshold values for each of the subject listed companies in the setting a benchmark for related party transactions, related party transactions which have to be pre-approved by the Board, related party transactions which require to be reviewed annually and similar issues relating to listed companies.
Related Party Transactions Review CommitteeThe objective of the Committee is to exercise oversight on behalf of the Board of John Keells Holdings PLC and its listed subsidiaries, to ensure compliance with the Code on Related Party Transactions, as issued by the Securities and Exchange Commission of Sri Lanka (“The Code”) and with the Listing Rules of the Colombo Stock Exchange (CSE). The Committee has also adopted best practices as recommended by the Institute of Chartered Accountants of Sri Lanka (CA Sri Lanka) and the CSE.
The Committee in discharging its functions primarily relied on processes that were validated from time to time and periodic reporting by the relevant entities and Key Management Personnel (KMP) with a view of ensuring that:
• there is compliance with the Code on Related Party Transactions;
• shareholder interests are protected; and
• fairness and transparency are maintained.
The Committee reviewed and pre-approved all proposed Non Recurrent Related Party Transactions of the Parent Company and all its listed subsidiaries. Further, Recurrent Related Party Transactions of the Company were reviewed annually by the
Committee. The activities and views of the Committee have been communicated to the Board of Directors quarterly through verbal briefings and by tabling the minutes of the Committee’s meetings.
The Company carried out transactions in the ordinary course of business with parties who are defined as “Related Parties” in Sri Lanka Financial Reporting Standard 24 - Related Party Disclosure. There were no Non-Recurrent Related Party Transactions of JKL during the financial year 2018 / 2019. The aggregate value of Recurrent Related Party Transactions of the Company for the financial year 2018 / 2019 did not exceed 10 percent of the gross revenue of same year. The details of Recurrent Related Party Transactions are provided in note 36 of the financial statements on pages 172 to 173.
The Board of Directors confirm that the Company is in compliance with the provision of the listing rules of the CSE pertaining to Related Party Transactions.
86John Keells PLC Annual Report 2018/19
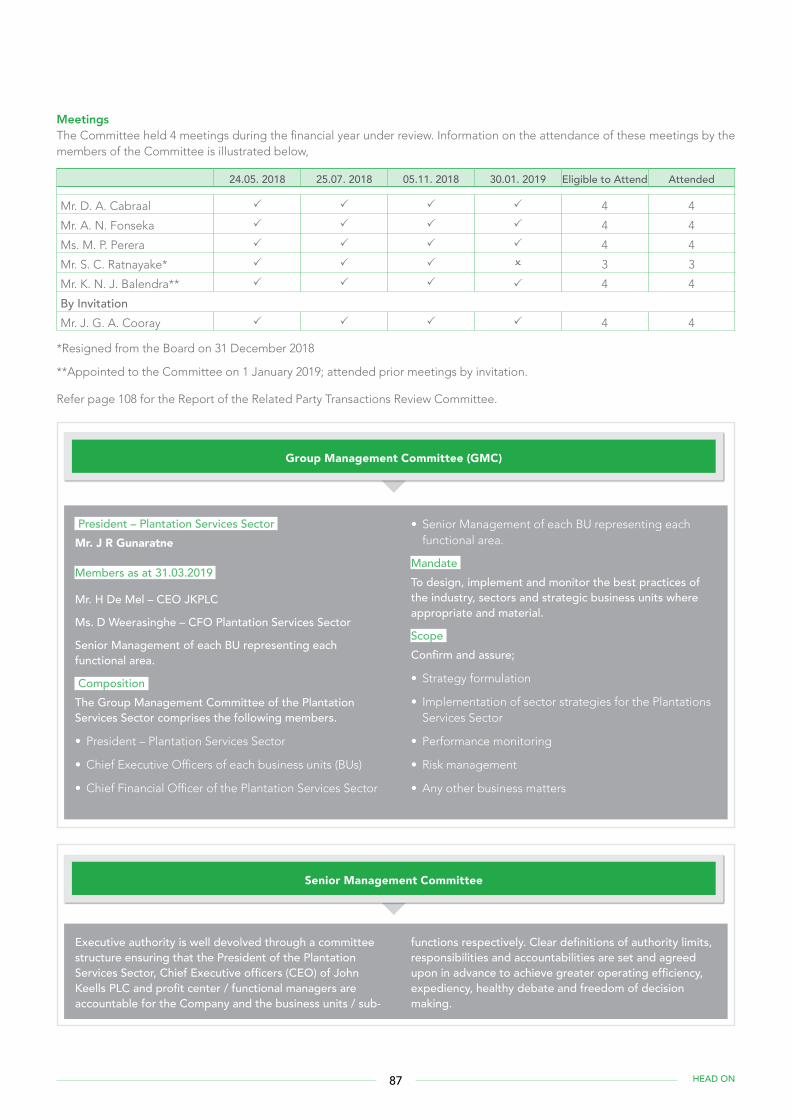
Group Management Committee (GMC)
President – Plantation Services Sector Mr. J R Gunaratne
Members as at 31.03.2019
Mr. H De Mel – CEO JKPLC
Ms. D Weerasinghe – CFO Plantation Services Sector
Senior Management of each BU representing each functional area.
Composition The Group Management Committee of the Plantation Services Sector comprises the following members.
• President – Plantation Services Sector
• Chief Executive Officers of each business units (BUs)
• Chief Financial Officer of the Plantation Services Sector
• Senior Management of each BU representing each functional area.
Mandate To design, implement and monitor the best practices of the industry, sectors and strategic business units where appropriate and material.
Scope Confirm and assure;
• Strategy formulation
• Implementation of sector strategies for the Plantations Services Sector
• Performance monitoring
• Risk management
• Any other business matters
Senior Management Committee
Executive authority is well devolved through a committee structure ensuring that the President of the Plantation Services Sector, Chief Executive officers (CEO) of John Keells PLC and profit center / functional managers are accountable for the Company and the business units / sub-
functions respectively. Clear definitions of authority limits, responsibilities and accountabilities are set and agreed upon in advance to achieve greater operating efficiency, expediency, healthy debate and freedom of decision making.
MeetingsThe Committee held 4 meetings during the financial year under review. Information on the attendance of these meetings by the members of the Committee is illustrated below,
24.05. 2018 25.07. 2018 05.11. 2018 30.01. 2019 Eligible to Attend Attended
Mr. D. A. Cabraal 4 4
Mr. A. N. Fonseka 4 4
Ms. M. P. Perera 4 4
Mr. S. C. Ratnayake* 3 3
Mr. K. N. J. Balendra** 4 4
By InvitationMr. J. G. A. Cooray 4 4
*Resigned from the Board on 31 December 2018
**Appointed to the Committee on 1 January 2019; attended prior meetings by invitation.
Refer page 108 for the Report of the Related Party Transactions Review Committee.
87 HEAD ON
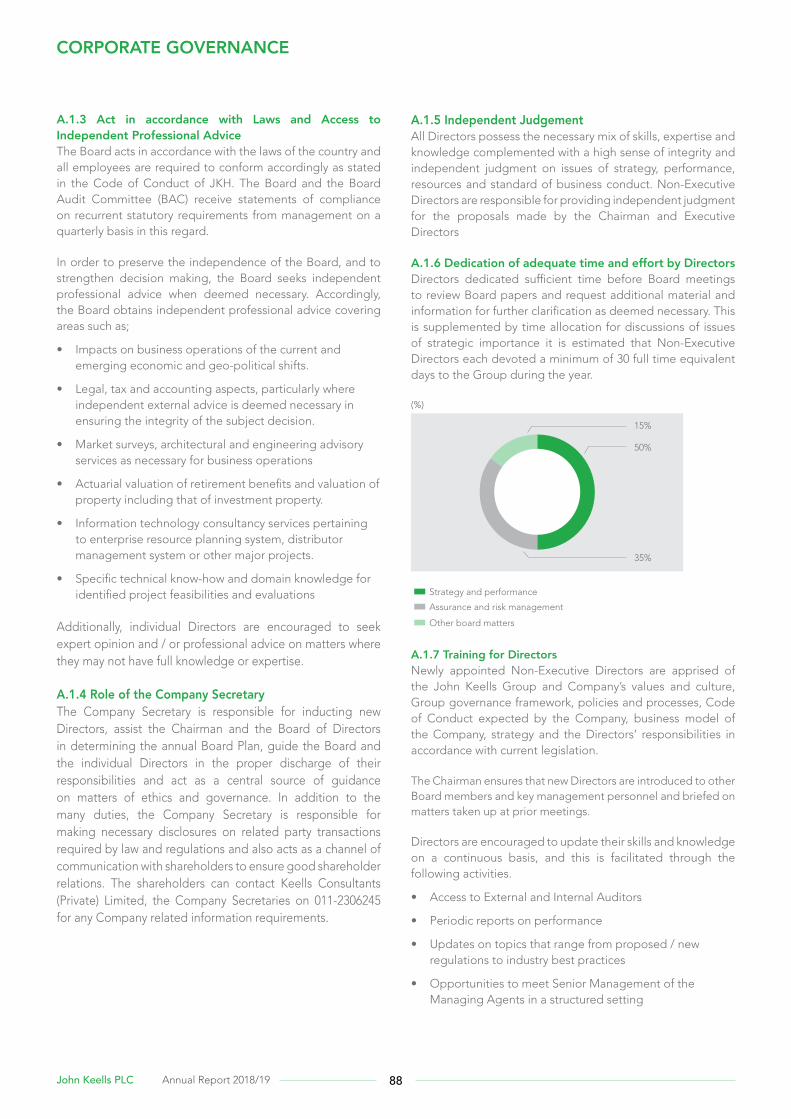
CORPORATE GOVERNANCE
A.1.3 Act in accordance with Laws and Access to Independent Professional AdviceThe Board acts in accordance with the laws of the country and all employees are required to conform accordingly as stated in the Code of Conduct of JKH. The Board and the Board Audit Committee (BAC) receive statements of compliance on recurrent statutory requirements from management on a quarterly basis in this regard.
In order to preserve the independence of the Board, and to strengthen decision making, the Board seeks independent professional advice when deemed necessary. Accordingly, the Board obtains independent professional advice covering areas such as;
• Impacts on business operations of the current and emerging economic and geo-political shifts.
• Legal, tax and accounting aspects, particularly where independent external advice is deemed necessary in ensuring the integrity of the subject decision.
• Market surveys, architectural and engineering advisory services as necessary for business operations
• Actuarial valuation of retirement benefits and valuation of property including that of investment property.
• Information technology consultancy services pertaining to enterprise resource planning system, distributor management system or other major projects.
• Specific technical know-how and domain knowledge for identified project feasibilities and evaluations
Additionally, individual Directors are encouraged to seek expert opinion and / or professional advice on matters where they may not have full knowledge or expertise.
A.1.4 Role of the Company SecretaryThe Company Secretary is responsible for inducting new Directors, assist the Chairman and the Board of Directors in determining the annual Board Plan, guide the Board and the individual Directors in the proper discharge of their responsibilities and act as a central source of guidance on matters of ethics and governance. In addition to the many duties, the Company Secretary is responsible for making necessary disclosures on related party transactions required by law and regulations and also acts as a channel of communication with shareholders to ensure good shareholder relations. The shareholders can contact Keells Consultants (Private) Limited, the Company Secretaries on 011-2306245 for any Company related information requirements.
A.1.5 Independent Judgement All Directors possess the necessary mix of skills, expertise and knowledge complemented with a high sense of integrity and independent judgment on issues of strategy, performance, resources and standard of business conduct. Non-Executive Directors are responsible for providing independent judgment for the proposals made by the Chairman and Executive Directors
A.1.6 Dedication of adequate time and effort by DirectorsDirectors dedicated sufficient time before Board meetings to review Board papers and request additional material and information for further clarification as deemed necessary. This is supplemented by time allocation for discussions of issues of strategic importance it is estimated that Non-Executive Directors each devoted a minimum of 30 full time equivalent days to the Group during the year.
50%
35%
15%
Strategy and performance
Assurance and risk management
Other board matters
(%)
A.1.7 Training for Directors Newly appointed Non-Executive Directors are apprised of the John Keells Group and Company’s values and culture, Group governance framework, policies and processes, Code of Conduct expected by the Company, business model of the Company, strategy and the Directors’ responsibilities in accordance with current legislation.
The Chairman ensures that new Directors are introduced to other Board members and key management personnel and briefed on matters taken up at prior meetings.
Directors are encouraged to update their skills and knowledge on a continuous basis, and this is facilitated through the following activities.
• Access to External and Internal Auditors
• Periodic reports on performance
• Updates on topics that range from proposed / new regulations to industry best practices
• Opportunities to meet Senior Management of the Managing Agents in a structured setting
88John Keells PLC Annual Report 2018/19
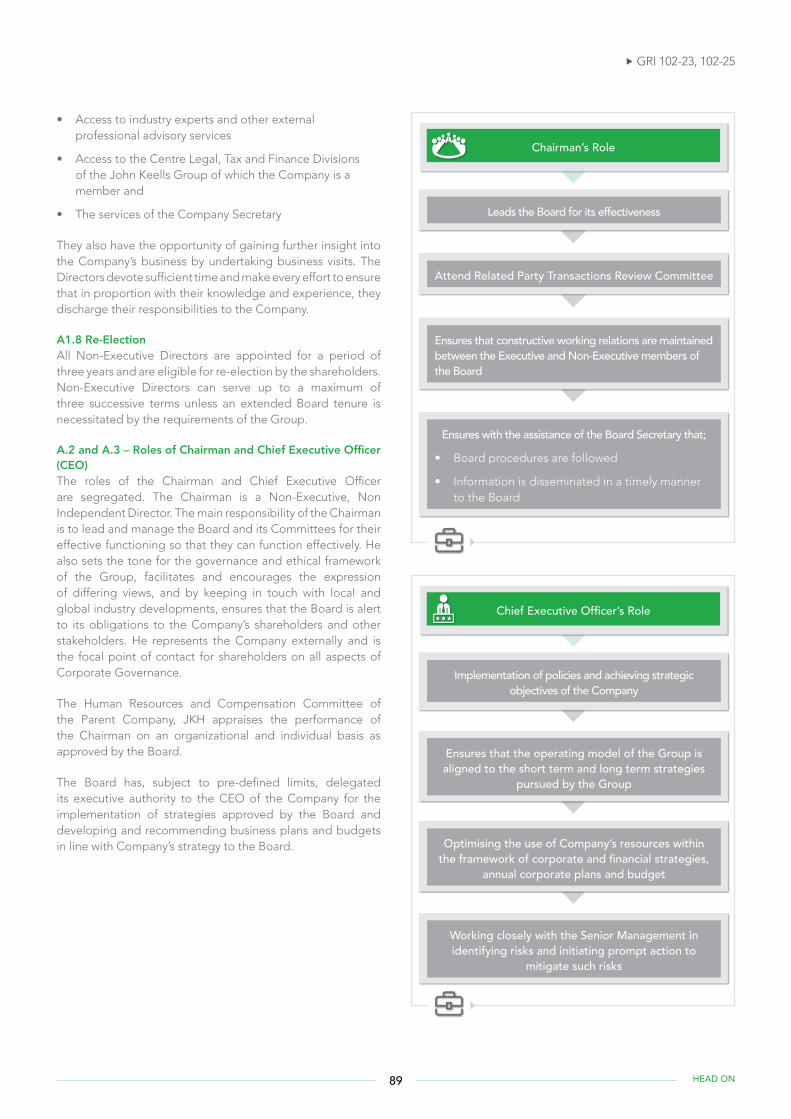
• Access to industry experts and other external professional advisory services
• Access to the Centre Legal, Tax and Finance Divisions of the John Keells Group of which the Company is a member and
• The services of the Company Secretary
They also have the opportunity of gaining further insight into the Company’s business by undertaking business visits. The Directors devote sufficient time and make every effort to ensure that in proportion with their knowledge and experience, they discharge their responsibilities to the Company.
A1.8 Re-ElectionAll Non-Executive Directors are appointed for a period of three years and are eligible for re-election by the shareholders. Non-Executive Directors can serve up to a maximum of three successive terms unless an extended Board tenure is necessitated by the requirements of the Group.
A.2 and A.3 – Roles of Chairman and Chief Executive Officer (CEO)The roles of the Chairman and Chief Executive Officer are segregated. The Chairman is a Non-Executive, Non Independent Director. The main responsibility of the Chairman is to lead and manage the Board and its Committees for their effective functioning so that they can function effectively. He also sets the tone for the governance and ethical framework of the Group, facilitates and encourages the expression of differing views, and by keeping in touch with local and global industry developments, ensures that the Board is alert to its obligations to the Company’s shareholders and other stakeholders. He represents the Company externally and is the focal point of contact for shareholders on all aspects of Corporate Governance.
The Human Resources and Compensation Committee of the Parent Company, JKH appraises the performance of the Chairman on an organizational and individual basis as approved by the Board.
The Board has, subject to pre-defined limits, delegated its executive authority to the CEO of the Company for the implementation of strategies approved by the Board and developing and recommending business plans and budgets in line with Company’s strategy to the Board.
Chairman’s Role
Leads the Board for its effectiveness
Attend Related Party Transactions Review Committee
Ensures that constructive working relations are maintained between the Executive and Non-Executive members of the Board
Ensures with the assistance of the Board Secretary that;
• Board procedures are followed
• Information is disseminated in a timely manner to the Board
Chief Executive Officer’s Role
Implementation of policies and achieving strategic objectives of the Company
Ensures that the operating model of the Group is aligned to the short term and long term strategies
pursued by the Group
Optimising the use of Company’s resources within the framework of corporate and financial strategies,
annual corporate plans and budget
Working closely with the Senior Management in identifying risks and initiating prompt action to
mitigate such risks
GRI 102-23, 102-25
89 HEAD ON

CORPORATE GOVERNANCE
A.4. Financial AcumenCollectively the Board has sufficient financial acumen as they are selected through a rigorous process. Additionally, the following Directors are members of professional accounting bodies and able to offer guidance on matters of finance drawing on their specialized knowledge on the subject of finance
• Mr. J G A Cooray
• Ms. B A I Rajakarier
A.5. Board BalanceThe entire Board comprises Three (3) Non-Executive Non Independent Directors including the Chairman and Three (3) Non Executive Independent Directors ensuring that there is sufficient balance on the Board. The Board is of the view that its present composition ensures a healthy balance between executive expediency and independent judgment. This is based on the following: -
• Collectively, the Non-Executive Directors possess proven business experience and expertise in their respective fields.
• The present composition of the Board represents an appropriate mix of skills and experience.
• The Independent Directors possess strong financial acumen and by virtue of their membership on external Boards, are able to assess the integrity of the Company’s financial reporting systems and internal controls, continually review, critique and suggest changes in keeping with best practice.
• The Board is also conscious of the need to progressively refresh its composition over time and notes the qualitative contribution of the Independent Directors to the governance of the Company.
The Directors at John Keells PLC who are profiled on page 78 and 79 of the annual report have a wide range of expertise as well as significant experience in commercial and financial activities enabling them to discharge their governance duties in an effective manner.
The Company is conscious of the need to maintain an appropriate mix of skills and experience in the Board through a regular review of its composition in ensuring that the skills representation is in sync with current and future needs.
Determining Independence of DirectorsEach Director holds continuous responsibility to determine whether he or she has a potential or actual conflict of interest arising from external associations, interests or personal relationships in material matters which are considered by the Board from time to time.
In accordance with the criteria for “Independence” specified by section 7.10.4 of the Listing Rules of the CSE and as identified by the Code (2013), the Board affirms that the aforesaid three Non-Executive Independent Directors satisfy the criteria for independence and have satisfied the requirements under clause 7.10.2 (b). All Three Non-executive Independent Directors of John Keells PLC have submitted signed declarations of their independence.
Name of Director/Capacity Shareholding
(i)
Management / Director
(ii)
Material Business
Relationship
(iii)
Employee of the
Company
(iv)
Family Member a Director or
CEO(v)
Continues Service for more than Nine years
(vi)
Non-Executive, Non Independent DirectorMr. S C Ratnayake(Resigned w.e.f. 31/12/2018) No Yes No No No N/A
Mr. K N J Balendra No Yes No No No N/A
Mr. J G A Cooray No Yes No No No N/A
Mr. V A A Perera (Resigned w.e.f. 31/12/2018) No Yes No No No N/A
Mr. J R Gunaratne (Appointed w.e.f. 01 July 2018)
No Yes No No No N/A
Non-Executive, Independent DirectorMs. A K Gunawardhana No No No No No No
Mr. C N Wijewardane No No No No No No
Ms. B A I Rakakarier No No No No No No
Definitionsi. Shareholding in the Company
ii. Director of a listed Company in which they are employed, or having a significant shareholding or have a material business relationship
iii. Income/Non cash benefits derived from the Company is equivalent to 20% of the director’s annual income
iv. Director is employed by the Company two years immediately preceding appointment
v. Immediate family member who is a director or General Manager
vi. Has served the Board for a continuous period exceeding 9 years
GRI 102-27
90John Keells PLC Annual Report 2018/19
A.6. Supply of InformationIn order to ensure robust discussion, informed deliberation and effective decision making, the Directors are provided access to;
• Information as necessary to carry out their duties and responsibilities effectively and efficiently
• Information updates from management on topics under review by the Board, new regulations and best practices as relevant to the Groups business.
• External and internal auditors
• Experts and other external professional services
• The services of the Company secretaries whose appointment and removal is the responsibility of the Board
• Periodic performance reports
• Senior Management under a structured arrangement
A.7 & A.8 Appointments to the Board & Re-electionAll Non-Executive Directors are appointed for a period of three years and are eligible for re-election by the shareholders subject to the age limit as per statutory provisions at the time of re-appointment. Further, Non-Executive Directors can serve up to a maximum of three successive terms unless an extended Board tenure is necessitated by the requirements of the Group. Casual vacancies are filled by the Board following the same rigorous process of selecting nominees.
At each Annual General Meeting (AGM) one third of the Directors, except the Chairman, retire by rotation on the basis prescribed in the Articles of Association of the Company and are eligible for re-election. The Directors who retire are those who have been longest in office since their appointment / re-appointment. In addition any new Director who was appointed to the Board during the year is required to stand for re-election at the next Annual General Meeting in terms of the Articles of Association of the Company.
Proposals for the re-appointment of Directors are set out in the Annual Report of the Board of Directors on pages 109 to 114 as well as in the Notice of Meeting on page 182 of this Report.
A.9. Appraisal of Board Performance The Board conducts Board performance appraisal annually. This is a formalized process of self-appraisal which enables each member to self-appraise on an anonymous basis, the performance of the Board, using a very detailed checklist / questionnaire, under the areas of
• Role clarity and effective discharge of responsibilities
• People mix and structures
• Systems and procedures
• Quality of participation
• Board image
The results are analysed to give the Board an indication of its effectiveness as well as areas that required addressing and / or strengthening. Despite the original anonymity of the remarks, the open and frank discussions that follow include some Directors identifying themselves as the person making the remark reflecting the openness of the Board.
A.10. Disclosure of Information in respect of DirectorsInformation specified in the Code with regards to Directors are disclosed within this Annual Report as follows:
1. Name, qualifications, expertise, material business interests and brief profiles on pages 78 and 79.
2. Membership of sub-committees and attendance at Board Meetings and Sub-Committee meetings on pages 84 to 87.
3. Related party transactions on pages 172 to 173.
A.11. Appraisal of Chief Executive OfficerThe annual appraisal of the Chief Executive Officer is carried out at a parent level and is based on a pre agreed performance criteria.
B. Directors Remuneration 1. Remuneration Procedures
2. The level of Makeup of Remuneration
3. Disclosure of Remuneration
Remuneration for Non Executive, Non Independent DirectorsThe remuneration of the Non-Executive, Non Independent Directors are determined in line with the remuneration policies of the Group. The remuneration policy is formulated to attract and retain high calibre executives and motivate them to develop and implement the business strategy in order to optimise long term shareholder value creation. The Group has adopted a remuneration policy designed to provide an appropriate balance between fixed remuneration and variable ‘risk’ reward which includes a fixed and variable element. The variable element is based on both individual performance and an organisational performance matrix which covers revenue and after tax profit.
In addition, a long term incentive in the form of employee share options (ESOP) in the stated capital of the ultimate Parent Company is granted based on actual performance. As prescribed by the Sri Lanka Accounting Standards (SLFRS / LKAS) all ESOPs of the respective employees are charged to the income statement of the relevant subsidiaries with effect from 01st July 2013 being the date of the first award after the introduction of the accounting standard.
Director’s fees applicable to NED/NIDs nominated by JKH are paid directly to the Parent Company. The aggregate of NEDs Remuneration for the year was Rs. 9.27 million and Rs. 6.9 million for Group and Company respectively.
GRI 102-28, 102-35, 102-36, 102-37, 102-38
91 HEAD ON
CORPORATE GOVERNANCE
Remuneration for Non-Executive, Independent DirectorsCompensation of Non-Executive, Independent Directors is determined with reference to fees paid to other NED/IDs of comparable companies and is adjusted where necessary. The fees received by NED/IDs are determined by the Board and reviewed annually. NED/IDs do not receive any performance/incentive payments and are not eligible to participate in any of the Group’s share option plans. The NED/IDs fees are not subject to time spent or defined by a maximum/minimum number of hours committed to the Group per annum, and hence are not subject to additional/lower fees for additional/lesser time devoted.
Compensation for Early TerminationIn the event of an early termination of a Director there are no compensation commitments other than for;
• Executive Director; as per employment contract like any other employee
• NEDs; Director Fees payable, if any, are payable in terms of his/her contract
C. Shareholder Relations 1. Constructive use of AGM and General Meetings
2. Communications with Shareholders
3. Major and Material Transactions
C.1 Constructive use of AGM and General MeetingsThe Company makes use of the AGMs constructively to enhance constructive relationship with the shareholders and towards the end of this procedures are followed;
• Notice of the AGM and related documents, are sent to shareholders along with the Annual Report within the specified period
• Summary of procedures governing voting at General Meetings are clearly communicated
• All the Directors are available to answer queries
• The Chairman ensures that the relevant Senior Managers are available at the AGM to answer specific queries
• Separate resolutions are proposed for each item
• Proxy votes are counted
C.2 Communications with ShareholdersThe Group has established several channels to ensure sound communication with the shareholders and the details are found in the relevant sections of this report
The Board of Directors, in conjunction with the Board Audit Committee (BAC), is responsible in ensuring the accuracy and timeliness of published information and in presenting an honest and balanced assessment of results in the quarterly and Annual Financial Statements.
All other material and price sensitive information about the Company is promptly communicated to the CSE, where the shares of the Company are listed, and such information is also released to the employees, press and shareholders.
C.3 Major and Material TransactionsShareholders are advised of any instance where the contemplated value of a transaction would be in excess of half of the net assets of the Company (Major transactions). There were no major transactions as defined under Section 185 of the Companies Act, during the year under review.
D. Accountability & Audit 1. Financial Reporting
2. Internal Control
3. Board Audit Committee (BAC)
4. Code of Business Conduct & Ethics
5. Corporate Governance Disclosures
D.1 Financial ReportingThe Board recognizes its responsibility to present a balanced and understandable assessment of the Group’s financial position, performance and prospects in accordance with the requirements of the Companies Act and the CSE Continuing Listing Requirements. The Financial Statements included in this Annual Report are prepared and presented in accordance with the Sri Lanka Accounting Standards. The Annual Report also conforms to the G4 standard on Sustainability Reporting published by the Global Reporting Initiative and the Integrated Reporting Framework published by the International Integrated Reporting Council.
The following specialized information requirements are also included in this Annual Report:
• The Annual Report of the Board of Directors on the Affairs of the Company given on pages 109 to 114 cover all areas of this section.
• The “Statement of Directors’ Responsibility” is given on page 115.
• The Directors’ Statement on Internal Controls is given on pages 105 to 107.
• The “Independent Auditors’ Report“ on pages 119 to 127 for the Auditors’ responsibility.
• The Management Discussion and Analysis on pages 29 to 68.
• Related Party Transitions on page 172 to 173.
D.2 Internal ControlThe Board has through the involvement of the Group Business Process Review (Group BPR) function of JKH, taken steps to obtain assurance that systems designed to safeguard the Company’s assets, maintain proper accounting records and provide of management information, are in place and
GRI 102-33
92John Keells PLC Annual Report 2018/19
are functioning according to expectations. The risk review programme covering the Internal Audit of the Company is outsourced.
Reports arising out of such audits, in the first instance considered and discussed at the Company level and after reviewed by the President.
An Executive Summary including appropriate management action prepared by the Group of BPR is forwarded to the relevant Board Audit Committee (BAC), through the Group Finance Director, on a quarterly basis. Further, the Board Audit Committees also assess the effectiveness of the risk review process and systems of internal control periodically.
The Internal Audit function of the Company is not outsourced to the External Auditor in a further attempt to ensure External auditor independence. The Auditors’ Report on the financial statements of the Company for the year under review is found in the Financial Information Section of the Annual Report.
The role of the Internal Auditor has transformed into a value adding function instead of a mere ‘policing’ function, where audit findings form an integral input in modifying and improving internal processes. Thereby, (Group BPR) division of JKH is a key contributor in achieving operational excellence and value addition of the Company.
Internal ComplianceA quarterly self-certification programme requires the President, of the Plantation Services Sector of JKH and the Chief Financial Officer of the Company to confirm compliance with statutory and other regulatory procedures, and also to identify any significant deviations from the expected norms. The President of the Plantation Services Sector of JKH and the CEO of the Company are required to confirm operational compliance with statutory and other regulations and key control procedures, and also identify any significant deviations from the expected norms.
Risk ReviewThe Group has adopted a wide Risk Management programme which focus on wider sustainability development, to identify, evaluate and manage significant risks and to stress-test various risk scenarios. The programme ensures that a multitude of risks, arising as a result of the Group’s operations, are effectively managed in creating and preserving shareholder and other stakeholder wealth.
The steps taken towards promoting the Integrated Risk Management process are:
• Integrating and aligning activities and processes related to planning, policies / procedures, culture, competency, financial management, monitoring and reporting with risk management.
• Supporting executives / managers in moving the organization forward in a cohesive integrated and aligned manner to improve performance, while operating effectively, efficiently, ethically and legally within the established limits for risk taking.
The risk management process would be elaborated under the Corporate Risk Management section of the Annual Report
D.3 Board Audit Committee (BAC)The Board Audit Committee (BAC) comprises solely of Non-Executive, Independent Directors and conforms to the requirements of the Listing Rules of the Colombo Stock Exchange (CSE). It is governed by a Charter, which inter alia, covers the reviewing of policies and procedures of internal control, business risk management, compliance with laws and Group policies and independent audit function.
The Committee is also responsible for the consideration and recommendation of the appointment of External Auditors, the maintenance of a professional relationship with them, reviewing the accounting principles, policies and practices adopted in the preparation of public financial information and examining all documents representing the final Financial Statements.
A quarterly self-certification program that requires the President of the Plantation Services Sector, CEO of JK PLC and JKSB, Head of Finance of JKSB and the Chief Financial Officer (CFO) to confirm compliance, on a quarterly basis, with statutory requirements and key control procedures and to identify any deviations from the set requirements. In addition the President of the Plantation Services Sector, CEO of JK PLC and JKSB and the Operational Heads of the different business units are also required to confirm operational compliance with statutory and other regulations and key control procedures, coupled with the identification of any deviations from the expected norms. These have significantly aided the committee in its efforts in ensuring correct financial reporting and effective internal control and risk management.
The Board Audit Committee had four (4) meetings during the year and attendance of the members are indicated in the Audit Committee Report on page 106.
The Non-Executive, Non-Independent Director, CEO of JKL and JKSB, the Chief Financial Officer, the Head of Finance and other operational heads are invited to the meetings of the Audit Committee. The detailed Audit Committee report including areas reviewed during the financial year 2018/19 is given on pages 105 to 107 of the Annual Report.
GRI 205-1
93 HEAD ON
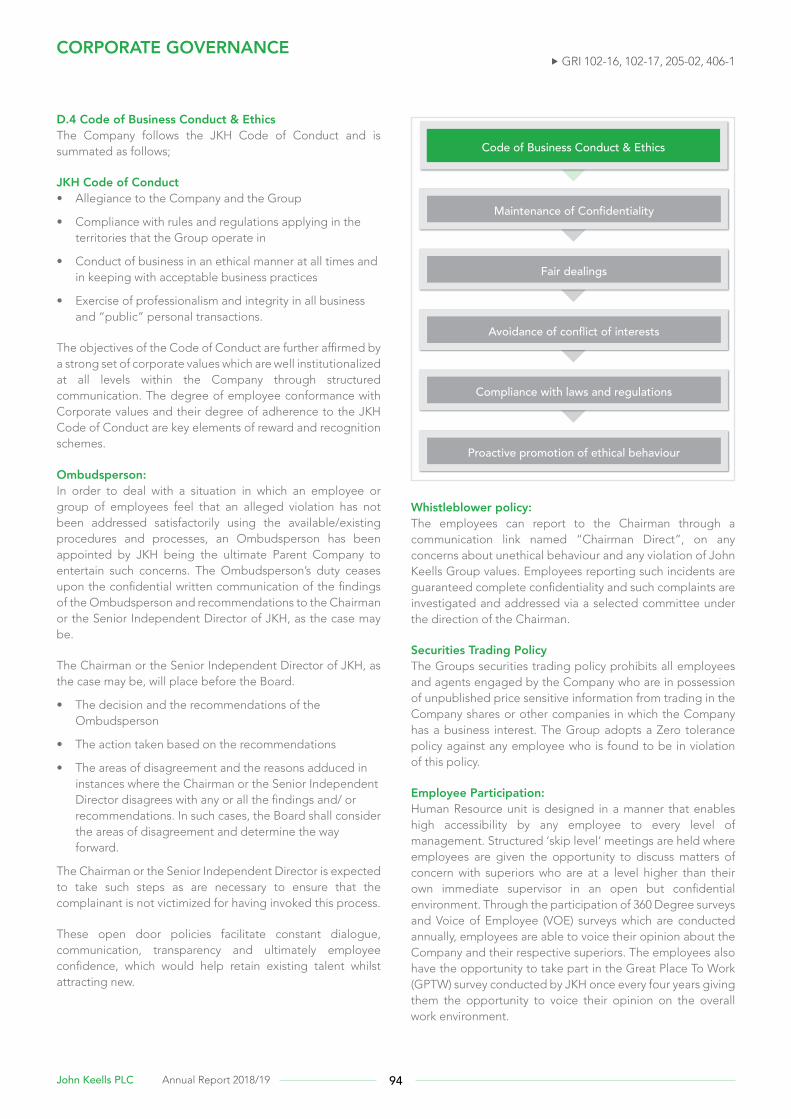
CORPORATE GOVERNANCE
D.4 Code of Business Conduct & EthicsThe Company follows the JKH Code of Conduct and is summated as follows;
JKH Code of Conduct • Allegiance to the Company and the Group
• Compliance with rules and regulations applying in the territories that the Group operate in
• Conduct of business in an ethical manner at all times and in keeping with acceptable business practices
• Exercise of professionalism and integrity in all business and “public” personal transactions.
The objectives of the Code of Conduct are further affirmed by a strong set of corporate values which are well institutionalized at all levels within the Company through structured communication. The degree of employee conformance with Corporate values and their degree of adherence to the JKH Code of Conduct are key elements of reward and recognition schemes.
Ombudsperson:In order to deal with a situation in which an employee or group of employees feel that an alleged violation has not been addressed satisfactorily using the available/existing procedures and processes, an Ombudsperson has been appointed by JKH being the ultimate Parent Company to entertain such concerns. The Ombudsperson’s duty ceases upon the confidential written communication of the findings of the Ombudsperson and recommendations to the Chairman or the Senior Independent Director of JKH, as the case may be.
The Chairman or the Senior Independent Director of JKH, as the case may be, will place before the Board.
• The decision and the recommendations of the Ombudsperson
• The action taken based on the recommendations
• The areas of disagreement and the reasons adduced in instances where the Chairman or the Senior Independent Director disagrees with any or all the findings and/ or recommendations. In such cases, the Board shall consider the areas of disagreement and determine the way forward.
The Chairman or the Senior Independent Director is expected to take such steps as are necessary to ensure that the complainant is not victimized for having invoked this process.
These open door policies facilitate constant dialogue, communication, transparency and ultimately employee confidence, which would help retain existing talent whilst attracting new.
Code of Business Conduct & Ethics
Maintenance of Confidentiality
Avoidance of conflict of interests
Fair dealings
Compliance with laws and regulations
Proactive promotion of ethical behaviour
Whistleblower policy:The employees can report to the Chairman through a communication link named “Chairman Direct”, on any concerns about unethical behaviour and any violation of John Keells Group values. Employees reporting such incidents are guaranteed complete confidentiality and such complaints are investigated and addressed via a selected committee under the direction of the Chairman.
Securities Trading PolicyThe Groups securities trading policy prohibits all employees and agents engaged by the Company who are in possession of unpublished price sensitive information from trading in the Company shares or other companies in which the Company has a business interest. The Group adopts a Zero tolerance policy against any employee who is found to be in violation of this policy.
Employee Participation:Human Resource unit is designed in a manner that enables high accessibility by any employee to every level of management. Structured ‘skip level’ meetings are held where employees are given the opportunity to discuss matters of concern with superiors who are at a level higher than their own immediate supervisor in an open but confidential environment. Through the participation of 360 Degree surveys and Voice of Employee (VOE) surveys which are conducted annually, employees are able to voice their opinion about the Company and their respective superiors. The employees also have the opportunity to take part in the Great Place To Work (GPTW) survey conducted by JKH once every four years giving them the opportunity to voice their opinion on the overall work environment.
GRI 102-16, 102-17, 205-02, 406-1
94John Keells PLC Annual Report 2018/19
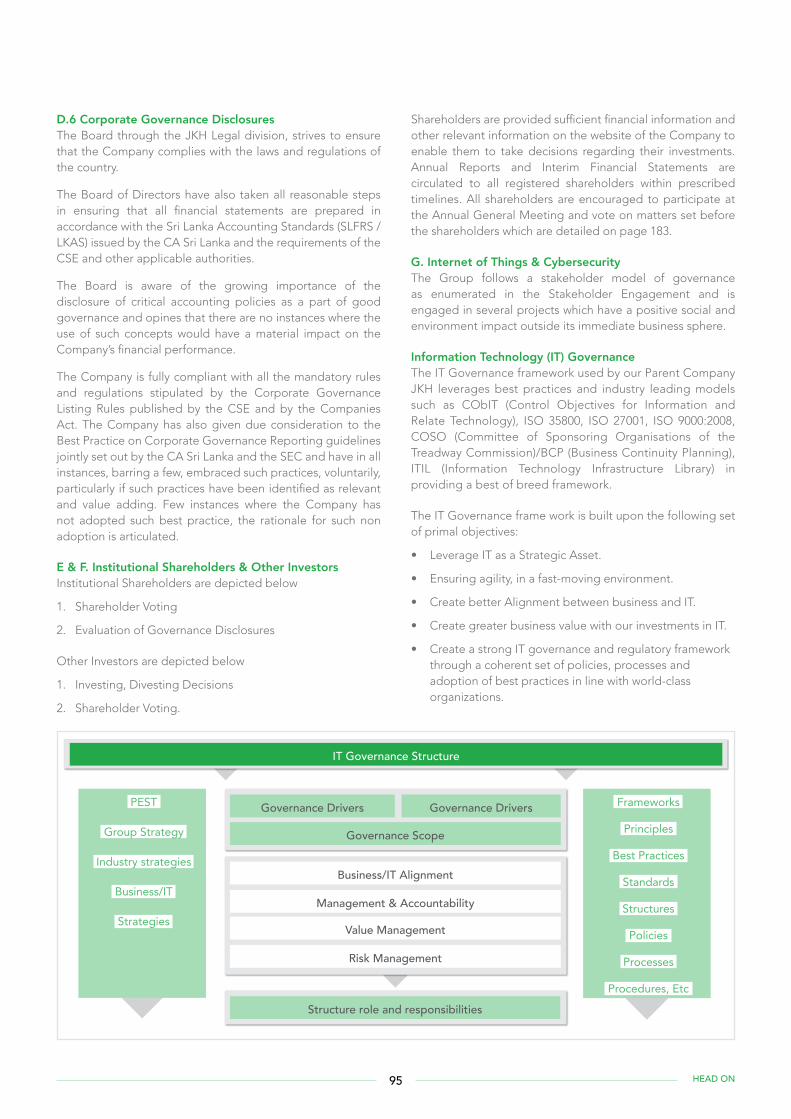
D.6 Corporate Governance DisclosuresThe Board through the JKH Legal division, strives to ensure that the Company complies with the laws and regulations of the country.
The Board of Directors have also taken all reasonable steps in ensuring that all financial statements are prepared in accordance with the Sri Lanka Accounting Standards (SLFRS / LKAS) issued by the CA Sri Lanka and the requirements of the CSE and other applicable authorities.
The Board is aware of the growing importance of the disclosure of critical accounting policies as a part of good governance and opines that there are no instances where the use of such concepts would have a material impact on the Company’s financial performance.
The Company is fully compliant with all the mandatory rules and regulations stipulated by the Corporate Governance Listing Rules published by the CSE and by the Companies Act. The Company has also given due consideration to the Best Practice on Corporate Governance Reporting guidelines jointly set out by the CA Sri Lanka and the SEC and have in all instances, barring a few, embraced such practices, voluntarily, particularly if such practices have been identified as relevant and value adding. Few instances where the Company has not adopted such best practice, the rationale for such non adoption is articulated.
E & F. Institutional Shareholders & Other Investors Institutional Shareholders are depicted below
1. Shareholder Voting
2. Evaluation of Governance Disclosures
Other Investors are depicted below
1. Investing, Divesting Decisions
2. Shareholder Voting.
Shareholders are provided sufficient financial information and other relevant information on the website of the Company to enable them to take decisions regarding their investments. Annual Reports and Interim Financial Statements are circulated to all registered shareholders within prescribed timelines. All shareholders are encouraged to participate at the Annual General Meeting and vote on matters set before the shareholders which are detailed on page 183.
G. Internet of Things & CybersecurityThe Group follows a stakeholder model of governance as enumerated in the Stakeholder Engagement and is engaged in several projects which have a positive social and environment impact outside its immediate business sphere.
Information Technology (IT) GovernanceThe IT Governance framework used by our Parent Company JKH leverages best practices and industry leading models such as CObIT (Control Objectives for Information and Relate Technology), ISO 35800, ISO 27001, ISO 9000:2008, COSO (Committee of Sponsoring Organisations of the Treadway Commission)/BCP (Business Continuity Planning), ITIL (Information Technology Infrastructure Library) in providing a best of breed framework.
The IT Governance frame work is built upon the following set of primal objectives:
• Leverage IT as a Strategic Asset.
• Ensuring agility, in a fast-moving environment.
• Create better Alignment between business and IT.
• Create greater business value with our investments in IT.
• Create a strong IT governance and regulatory framework through a coherent set of policies, processes and adoption of best practices in line with world-class organizations.
IT Governance Structure
Governance Drivers PEST
Group Strategy
Industry strategies
Business/IT
Strategies
Frameworks
Principles
Best Practices
Standards
Structures
Policies
Processes
Procedures, Etc
Governance Scope
Governance Drivers
Structure role and responsibilities
Management & Accountability
Risk Management
Business/IT Alignment
Value Management
95 HEAD ON
CORPORATE GOVERNANCE
Cyber Security Along with the organisation becoming more data driven, there is a significant increase in the organisation’s reliance on technology and Cyber security continues to be a regular item on the agenda of Risk Management and Audit Committees and is periodically discussed at the Board level. In such a backdrop, securing and protecting the Company’s most valuable assets becomes a priority. The Board accepts that the risk of a security breach needs to be continually managed, and that one needs to be well aware of where the vulnerabilities lie. During the year under review, the Company through the Parent Company’s IT division migrated identified software systems and processes to the cloud given its ability to make workflow more efficient and scalable. The cyber resilience programme was also revisited concurrently, with a revamped set of policies, procedures and methods put in place to cater to the evolving hybrid cloud environment and digitisation requirements of the Group, in order to strengthen the cyber security posture. Other initiatives also included the data classification and rights managements initiatives for data and two-factor authentication for employee.
H. Environment, Society and GovernanceTo ensure a sustainable business model, the Company has identified that it is a prerequisite to have an effective risk management model and a duly up-to-date business continuity plan. The Risk Report on pages 100 to 104 describes how risks and opportunities pertaining to ESG are recognized, managed, measured and reported.
The Company adopts an integrated approach which mitigates the environmental threats and improves best practices in Company’s engagements to fulfill the obligation towards the environment. Such best practices on emission management, water management, waste management and material Management are explained on Page 63 to 64.
The Company recognises that emphasis should not only be on maximising long term shareholder value, but it should also look after the rights and appropriate claims of many non-shareholder groups such as employees, consumers, clients, suppliers, lenders, environmentalists, host communities and governments. A detailed description of the Company’s CSR activities can be found on the Management Discussion and Analysis section of this Annual Report on pages 29 to 68.
Statement of compliance under Section 7.10 of the Rules of the Colombo Stock Exchange (CSE) on Corporate Governance (Mandatory provisions – Fully Complied)
Compliant Non-Compliant
Rule No.
Subject Applicable requirement Compliance Status
Applicable Section in the Annual Report
7.10 Compliance
a./b./c. Compliant with Corporate Governance Rules
• The Company is compliance with the Corporate Governance Rules and any deviations are explained where applicable
Corporate Governance
7.10.1 Non-Executive Directors
a./b./c. Non-Executive Directors (NED)
• 2 or at least 1/3 of the total number (whichever is higher) of Directors should be NEDs
Corporate Governance
7.10.2 Independent Directors
a. Independent Directors (ID)
• 2 or1/3 of NEDs, whichever is higher, should be independent
Corporate Governance
b. Independent Directors • Each NED should submit a signed and dated declaration of his/her independence or non-independence
Available with the Secretaries for review
7.10.3 Disclosures relating to Directors
a./b. Disclosure relating to Directors
• The Board shall annually determine the independence or otherwise of the NED
Corporate Governance
c. Disclosure relating to Directors
• A brief resume of each Director should be included in the Annual Report (AR) including the Director’s areas of expertise
Board of Directors (profile) section
d. Disclosure relating to Directors
• Provide a brief resume of new Directors appointed to the Board along with details
Board of Directors (profile) section
GRI 102-21
96John Keells PLC Annual Report 2018/19
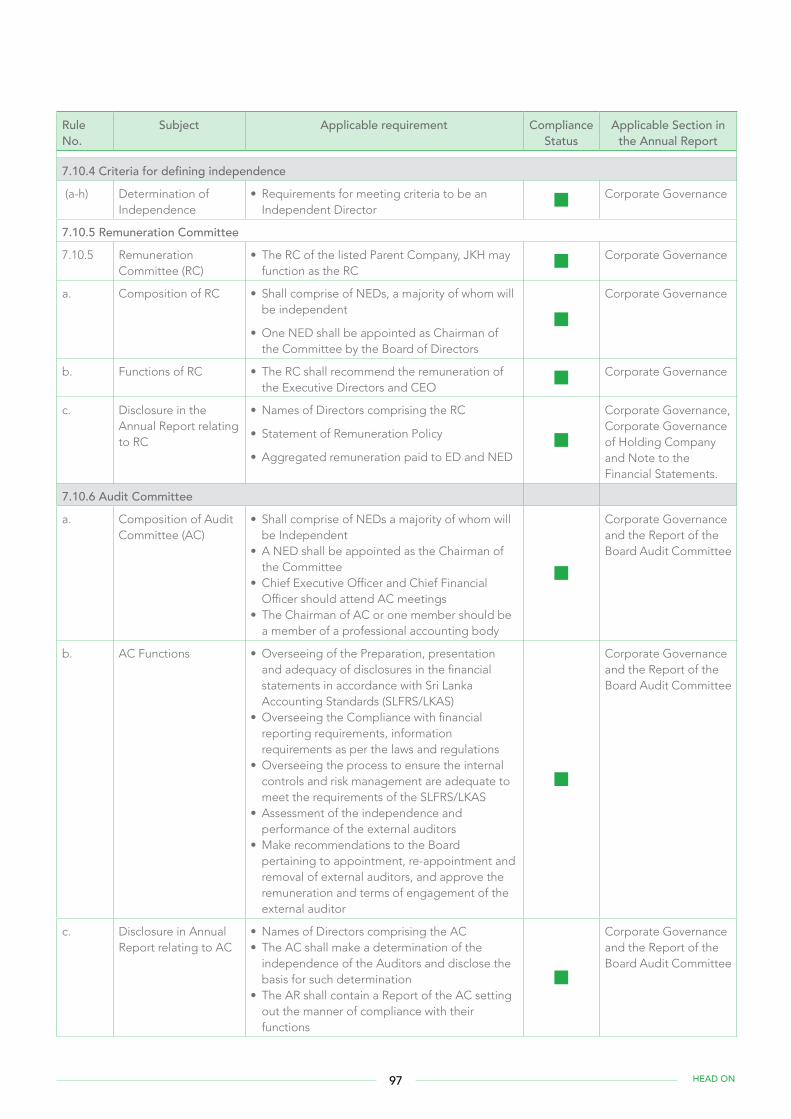
Rule No.
Subject Applicable requirement Compliance Status
Applicable Section in the Annual Report
7.10.4 Criteria for defining independence
(a-h) Determination of Independence
• Requirements for meeting criteria to be an Independent Director
Corporate Governance
7.10.5 Remuneration Committee
7.10.5 Remuneration Committee (RC)
• The RC of the listed Parent Company, JKH may function as the RC
Corporate Governance
a. Composition of RC • Shall comprise of NEDs, a majority of whom will be independent
• One NED shall be appointed as Chairman of the Committee by the Board of Directors
Corporate Governance
b. Functions of RC • The RC shall recommend the remuneration of the Executive Directors and CEO
Corporate Governance
c. Disclosure in the Annual Report relating to RC
• Names of Directors comprising the RC
• Statement of Remuneration Policy
• Aggregated remuneration paid to ED and NED
Corporate Governance, Corporate Governance of Holding Company and Note to the Financial Statements.
7.10.6 Audit Committee
a. Composition of Audit Committee (AC)
• Shall comprise of NEDs a majority of whom will be Independent
• A NED shall be appointed as the Chairman of the Committee
• Chief Executive Officer and Chief Financial Officer should attend AC meetings
• The Chairman of AC or one member should be a member of a professional accounting body
Corporate Governance and the Report of the Board Audit Committee
b. AC Functions • Overseeing of the Preparation, presentation and adequacy of disclosures in the financial statements in accordance with Sri Lanka Accounting Standards (SLFRS/LKAS)
• Overseeing the Compliance with financial reporting requirements, information requirements as per the laws and regulations
• Overseeing the process to ensure the internal controls and risk management are adequate to meet the requirements of the SLFRS/LKAS
• Assessment of the independence and performance of the external auditors
• Make recommendations to the Board pertaining to appointment, re-appointment and removal of external auditors, and approve the remuneration and terms of engagement of the external auditor
Corporate Governance and the Report of the Board Audit Committee
c. Disclosure in Annual Report relating to AC
• Names of Directors comprising the AC• The AC shall make a determination of the
independence of the Auditors and disclose the basis for such determination
• The AR shall contain a Report of the AC setting out the manner of compliance with their functions
Corporate Governance and the Report of the Board Audit Committee
97 HEAD ON
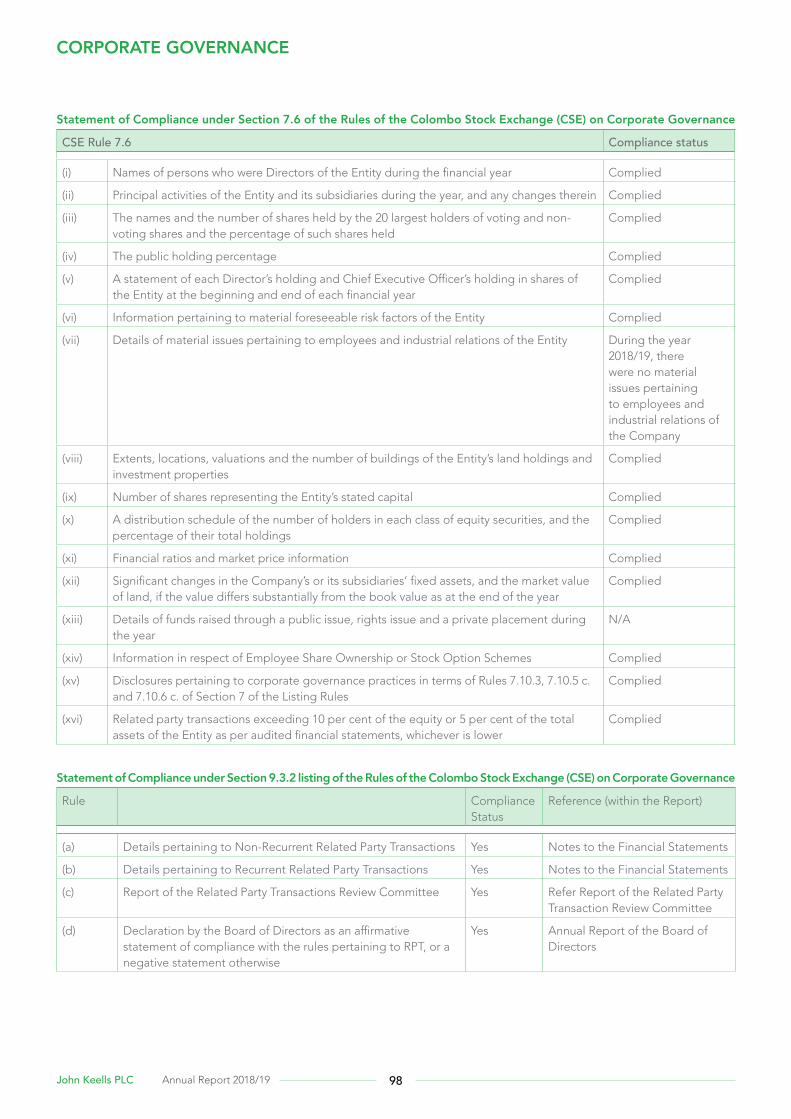
Statement of Compliance under Section 7.6 of the Rules of the Colombo Stock Exchange (CSE) on Corporate Governance
CSE Rule 7.6 Compliance status
(i) Names of persons who were Directors of the Entity during the financial year Complied
(ii) Principal activities of the Entity and its subsidiaries during the year, and any changes therein Complied
(iii) The names and the number of shares held by the 20 largest holders of voting and non-voting shares and the percentage of such shares held
Complied
(iv) The public holding percentage Complied
(v) A statement of each Director’s holding and Chief Executive Officer’s holding in shares of the Entity at the beginning and end of each financial year
Complied
(vi) Information pertaining to material foreseeable risk factors of the Entity Complied
(vii) Details of material issues pertaining to employees and industrial relations of the Entity During the year 2018/19, there were no material issues pertaining to employees and industrial relations of the Company
(viii) Extents, locations, valuations and the number of buildings of the Entity’s land holdings and investment properties
Complied
(ix) Number of shares representing the Entity’s stated capital Complied
(x) A distribution schedule of the number of holders in each class of equity securities, and the percentage of their total holdings
Complied
(xi) Financial ratios and market price information Complied
(xii) Significant changes in the Company’s or its subsidiaries’ fixed assets, and the market value of land, if the value differs substantially from the book value as at the end of the year
Complied
(xiii) Details of funds raised through a public issue, rights issue and a private placement during the year
N/A
(xiv) Information in respect of Employee Share Ownership or Stock Option Schemes Complied
(xv) Disclosures pertaining to corporate governance practices in terms of Rules 7.10.3, 7.10.5 c. and 7.10.6 c. of Section 7 of the Listing Rules
Complied
(xvi) Related party transactions exceeding 10 per cent of the equity or 5 per cent of the total assets of the Entity as per audited financial statements, whichever is lower
Complied
Statement of Compliance under Section 9.3.2 listing of the Rules of the Colombo Stock Exchange (CSE) on Corporate Governance
Rule Compliance Status
Reference (within the Report)
(a) Details pertaining to Non-Recurrent Related Party Transactions Yes Notes to the Financial Statements
(b) Details pertaining to Recurrent Related Party Transactions Yes Notes to the Financial Statements
(c) Report of the Related Party Transactions Review Committee Yes Refer Report of the Related Party Transaction Review Committee
(d) Declaration by the Board of Directors as an affirmative statement of compliance with the rules pertaining to RPT, or a negative statement otherwise
Yes Annual Report of the Board of Directors
CORPORATE GOVERNANCE
98John Keells PLC Annual Report 2018/19
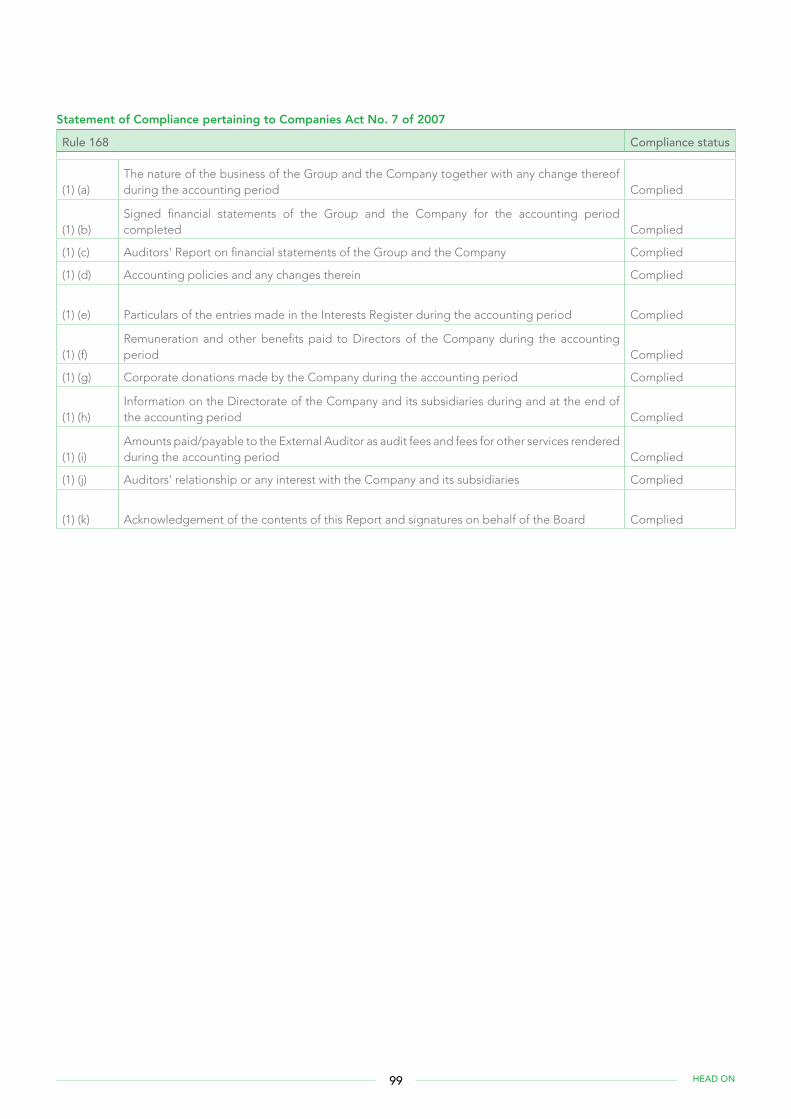
Statement of Compliance pertaining to Companies Act No. 7 of 2007
Rule 168 Compliance status
(1) (a)The nature of the business of the Group and the Company together with any change thereof during the accounting period Complied
(1) (b)Signed financial statements of the Group and the Company for the accounting period completed Complied
(1) (c) Auditors’ Report on financial statements of the Group and the Company Complied
(1) (d) Accounting policies and any changes therein Complied
(1) (e) Particulars of the entries made in the Interests Register during the accounting period Complied
(1) (f)Remuneration and other benefits paid to Directors of the Company during the accounting period Complied
(1) (g) Corporate donations made by the Company during the accounting period Complied
(1) (h)Information on the Directorate of the Company and its subsidiaries during and at the end of the accounting period Complied
(1) (i)Amounts paid/payable to the External Auditor as audit fees and fees for other services rendered during the accounting period Complied
(1) (j) Auditors’ relationship or any interest with the Company and its subsidiaries Complied
(1) (k) Acknowledgement of the contents of this Report and signatures on behalf of the Board Complied
99 HEAD ON
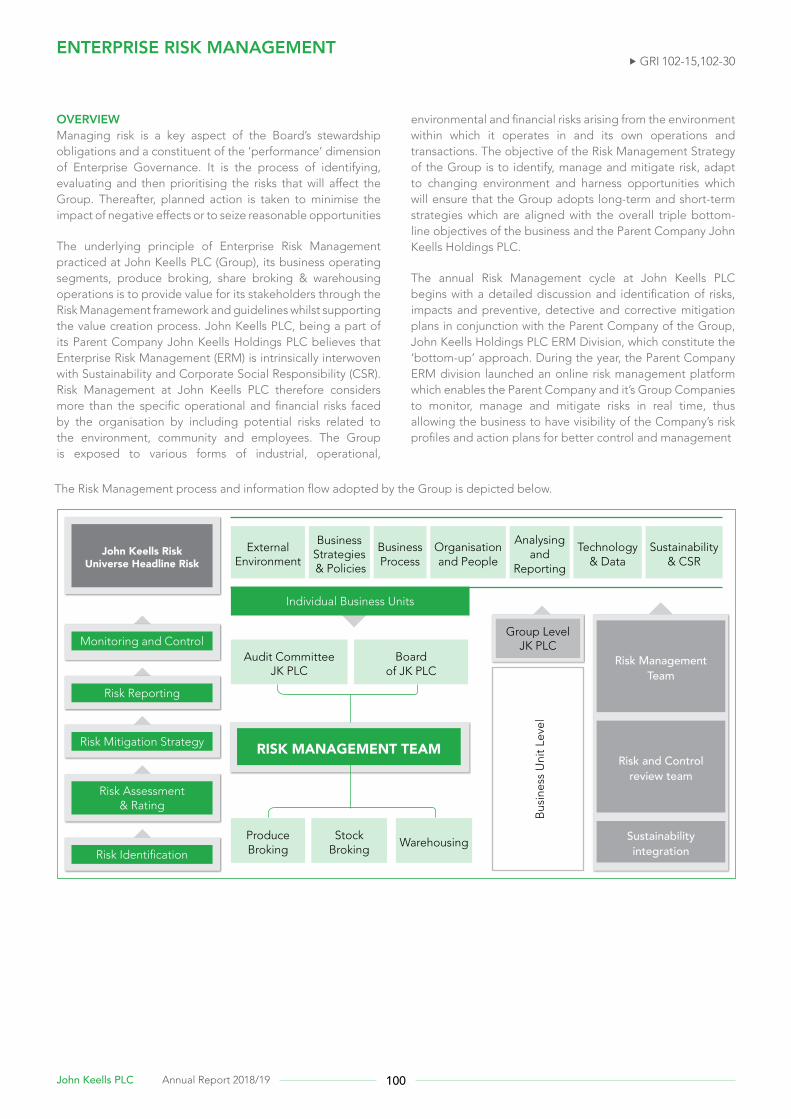
ENTERPRISE RISK MANAGEMENT
OVERVIEWManaging risk is a key aspect of the Board’s stewardship obligations and a constituent of the ‘performance’ dimension of Enterprise Governance. It is the process of identifying, evaluating and then prioritising the risks that will affect the Group. Thereafter, planned action is taken to minimise the impact of negative effects or to seize reasonable opportunities
The underlying principle of Enterprise Risk Management practiced at John Keells PLC (Group), its business operating segments, produce broking, share broking & warehousing operations is to provide value for its stakeholders through the Risk Management framework and guidelines whilst supporting the value creation process. John Keells PLC, being a part of its Parent Company John Keells Holdings PLC believes that Enterprise Risk Management (ERM) is intrinsically interwoven with Sustainability and Corporate Social Responsibility (CSR). Risk Management at John Keells PLC therefore considers more than the specific operational and financial risks faced by the organisation by including potential risks related to the environment, community and employees. The Group is exposed to various forms of industrial, operational,
environmental and financial risks arising from the environment within which it operates in and its own operations and transactions. The objective of the Risk Management Strategy of the Group is to identify, manage and mitigate risk, adapt to changing environment and harness opportunities which will ensure that the Group adopts long-term and short-term strategies which are aligned with the overall triple bottom-line objectives of the business and the Parent Company John Keells Holdings PLC.
The annual Risk Management cycle at John Keells PLC begins with a detailed discussion and identification of risks, impacts and preventive, detective and corrective mitigation plans in conjunction with the Parent Company of the Group, John Keells Holdings PLC ERM Division, which constitute the ‘bottom-up’ approach. During the year, the Parent Company ERM division launched an online risk management platform which enables the Parent Company and it’s Group Companies to monitor, manage and mitigate risks in real time, thus allowing the business to have visibility of the Company’s risk profiles and action plans for better control and management
The Risk Management process and information flow adopted by the Group is depicted below.
GRI 102-15,102-30
John Keells Risk Universe Headline Risk
RISK MANAGEMENT TEAM
Monitoring and ControlGroup Level
JK PLC
Risk Reporting
Risk Mitigation Strategy
Risk Assessment & Rating
Risk Identification
External Environment
Audit Committee JK PLC
Bus
ines
s U
nit L
evel
Board of JK PLC
Produce Broking
Stock Broking
Warehousing
Business Strategies & Policies
Business Process
Organisation and People
Analysing and
Reporting
Technology & Data
Sustainability & CSR
Risk Management Team
Risk and Control review team
Sustainability integration
Individual Business Units
100John Keells PLC Annual Report 2018/19
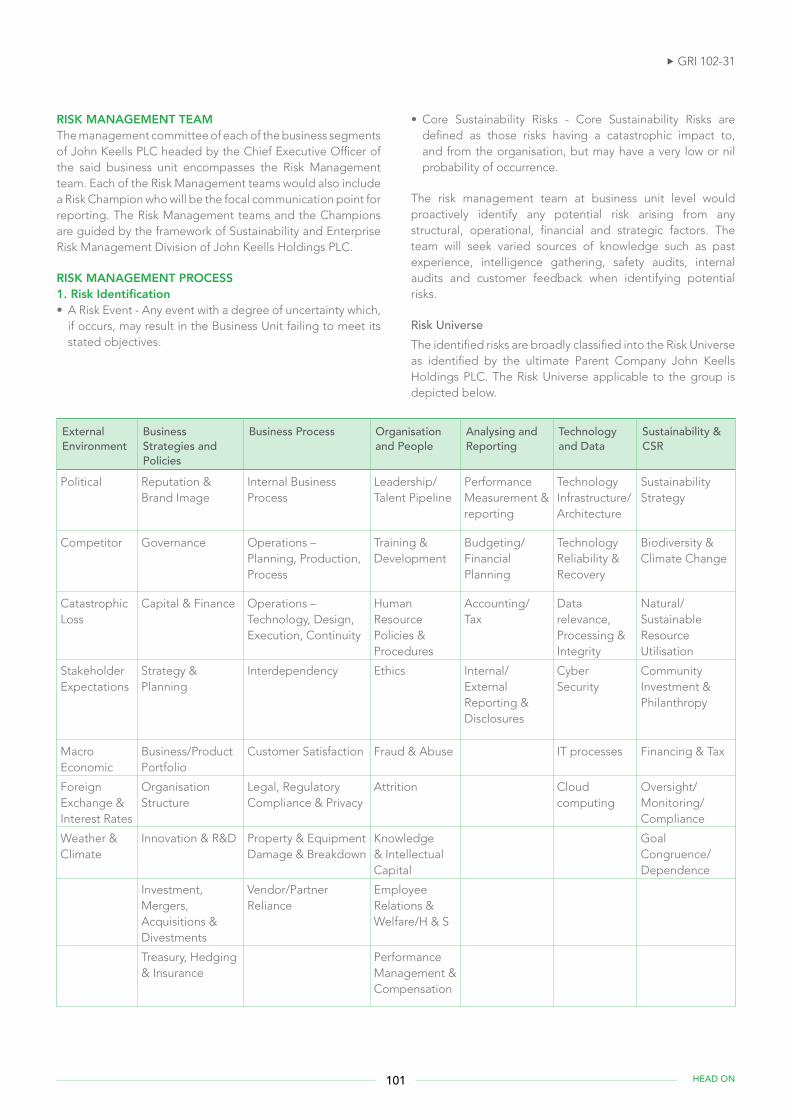
RISK MANAGEMENT TEAMThe management committee of each of the business segments of John Keells PLC headed by the Chief Executive Officer of the said business unit encompasses the Risk Management team. Each of the Risk Management teams would also include a Risk Champion who will be the focal communication point for reporting. The Risk Management teams and the Champions are guided by the framework of Sustainability and Enterprise Risk Management Division of John Keells Holdings PLC.
RISK MANAGEMENT PROCESS1. Risk Identification• A Risk Event - Any event with a degree of uncertainty which,
if occurs, may result in the Business Unit failing to meet its stated objectives.
• Core Sustainability Risks - Core Sustainability Risks are defined as those risks having a catastrophic impact to, and from the organisation, but may have a very low or nil probability of occurrence.
The risk management team at business unit level would proactively identify any potential risk arising from any structural, operational, financial and strategic factors. The team will seek varied sources of knowledge such as past experience, intelligence gathering, safety audits, internal audits and customer feedback when identifying potential risks.
Risk UniverseThe identified risks are broadly classified into the Risk Universe as identified by the ultimate Parent Company John Keells Holdings PLC. The Risk Universe applicable to the group is depicted below.
GRI 102-31
External Environment
Business Strategies and Policies
Business Process Organisation and People
Analysing and Reporting
Technology and Data
Sustainability & CSR
Political Reputation & Brand Image
Internal Business Process
Leadership/Talent Pipeline
Performance Measurement & reporting
Technology Infrastructure/ Architecture
Sustainability Strategy
Competitor Governance Operations – Planning, Production, Process
Training & Development
Budgeting/ Financial Planning
Technology Reliability & Recovery
Biodiversity & Climate Change
Catastrophic Loss
Capital & Finance Operations – Technology, Design, Execution, Continuity
Human Resource Policies & Procedures
Accounting/ Tax
Data relevance, Processing & Integrity
Natural/Sustainable Resource Utilisation
Stakeholder Expectations
Strategy & Planning
Interdependency Ethics Internal/ External Reporting & Disclosures
Cyber Security
Community Investment & Philanthropy
Macro Economic
Business/Product Portfolio
Customer Satisfaction Fraud & Abuse IT processes Financing & Tax
Foreign Exchange & Interest Rates
Organisation Structure
Legal, Regulatory Compliance & Privacy
Attrition Cloud computing
Oversight/Monitoring/Compliance
Weather & Climate
Innovation & R&D Property & Equipment Damage & Breakdown
Knowledge & Intellectual Capital
Goal Congruence/ Dependence
Investment, Mergers, Acquisitions & Divestments
Vendor/Partner Reliance
Employee Relations & Welfare/H & S
Treasury, Hedging & Insurance
Performance Management & Compensation
101 HEAD ON
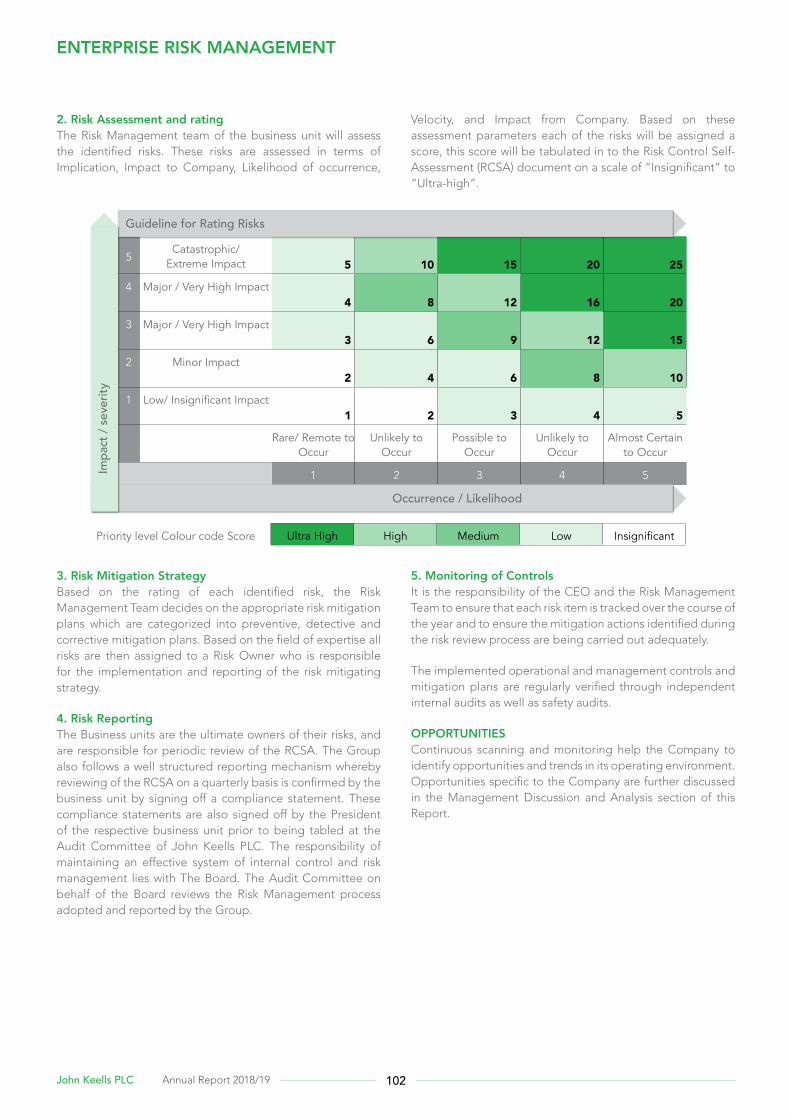
ENTERPRISE RISK MANAGEMENT
2. Risk Assessment and ratingThe Risk Management team of the business unit will assess the identified risks. These risks are assessed in terms of Implication, Impact to Company, Likelihood of occurrence,
Velocity, and Impact from Company. Based on these assessment parameters each of the risks will be assigned a score, this score will be tabulated in to the Risk Control Self-Assessment (RCSA) document on a scale of “Insignificant” to “Ultra-high”.
3. Risk Mitigation StrategyBased on the rating of each identified risk, the Risk Management Team decides on the appropriate risk mitigation plans which are categorized into preventive, detective and corrective mitigation plans. Based on the field of expertise all risks are then assigned to a Risk Owner who is responsible for the implementation and reporting of the risk mitigating strategy.
4. Risk ReportingThe Business units are the ultimate owners of their risks, and are responsible for periodic review of the RCSA. The Group also follows a well structured reporting mechanism whereby reviewing of the RCSA on a quarterly basis is confirmed by the business unit by signing off a compliance statement. These compliance statements are also signed off by the President of the respective business unit prior to being tabled at the Audit Committee of John Keells PLC. The responsibility of maintaining an effective system of internal control and risk management lies with The Board. The Audit Committee on behalf of the Board reviews the Risk Management process adopted and reported by the Group.
5. Monitoring of ControlsIt is the responsibility of the CEO and the Risk Management Team to ensure that each risk item is tracked over the course of the year and to ensure the mitigation actions identified during the risk review process are being carried out adequately.
The implemented operational and management controls and mitigation plans are regularly verified through independent internal audits as well as safety audits.
OPPORTUNITIESContinuous scanning and monitoring help the Company to identify opportunities and trends in its operating environment. Opportunities specific to the Company are further discussed in the Management Discussion and Analysis section of this Report.
5Catastrophic/
Extreme Impact 5 10 15 20 25
4 Major / Very High Impact4 8 12 16 20
3 Major / Very High Impact3 6 9 12 15
2 Minor Impact2 4 6 8 10
1 Low/ Insignificant Impact1 2 3 4 5
Rare/ Remote to Occur
Unlikely to Occur
Possible to Occur
Unlikely to Occur
Almost Certain to Occur
1 2 3 4 5
Occurrence / Likelihood
Guideline for Rating Risks
Impa
ct /
seve
rity
Priority level Colour code Score Ultra High High Medium Low Insignificant
102John Keells PLC Annual Report 2018/19
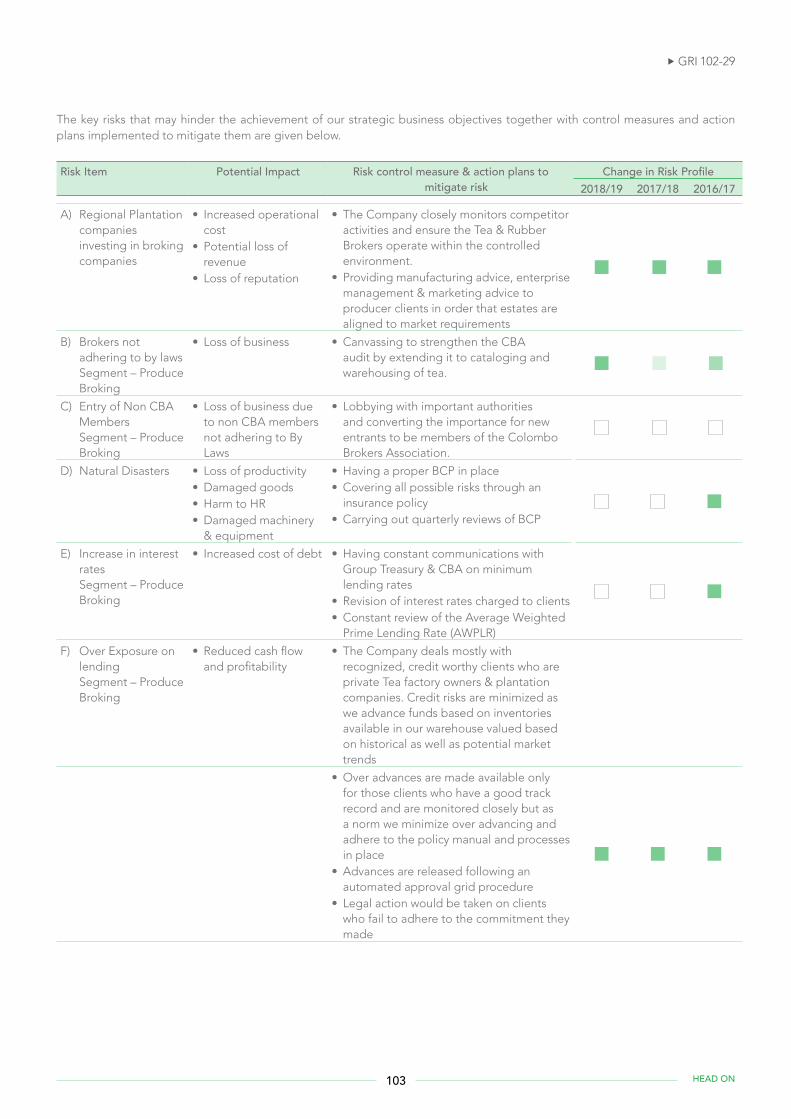
Risk Item Potential Impact Risk control measure & action plans to mitigate risk
Change in Risk Profile2018/19 2017/18 2016/17
A) Regional Plantation companies investing in broking companies
• Increased operational cost
• Potential loss of revenue
• Loss of reputation
• The Company closely monitors competitor activities and ensure the Tea & Rubber Brokers operate within the controlled environment.
• Providing manufacturing advice, enterprise management & marketing advice to producer clients in order that estates are aligned to market requirements
B) Brokers not adhering to by laws Segment – Produce Broking
• Loss of business • Canvassing to strengthen the CBA audit by extending it to cataloging and warehousing of tea.
C) Entry of Non CBA Members Segment – Produce Broking
• Loss of business due to non CBA members not adhering to By Laws
• Lobbying with important authorities and converting the importance for new entrants to be members of the Colombo Brokers Association.
D) Natural Disasters • Loss of productivity • Damaged goods • Harm to HR • Damaged machinery & equipment
• Having a proper BCP in place • Covering all possible risks through an insurance policy
• Carrying out quarterly reviews of BCP
E) Increase in interest rates Segment – Produce Broking
• Increased cost of debt • Having constant communications with Group Treasury & CBA on minimum lending rates
• Revision of interest rates charged to clients • Constant review of the Average Weighted Prime Lending Rate (AWPLR)
F) Over Exposure on lending Segment – Produce Broking
• Reduced cash flow and profitability
• The Company deals mostly with recognized, credit worthy clients who are private Tea factory owners & plantation companies. Credit risks are minimized as we advance funds based on inventories available in our warehouse valued based on historical as well as potential market trends
• Over advances are made available only for those clients who have a good track record and are monitored closely but as a norm we minimize over advancing and adhere to the policy manual and processes in place
• Advances are released following an automated approval grid procedure
• Legal action would be taken on clients who fail to adhere to the commitment they made
The key risks that may hinder the achievement of our strategic business objectives together with control measures and action plans implemented to mitigate them are given below.
GRI 102-29
103 HEAD ON
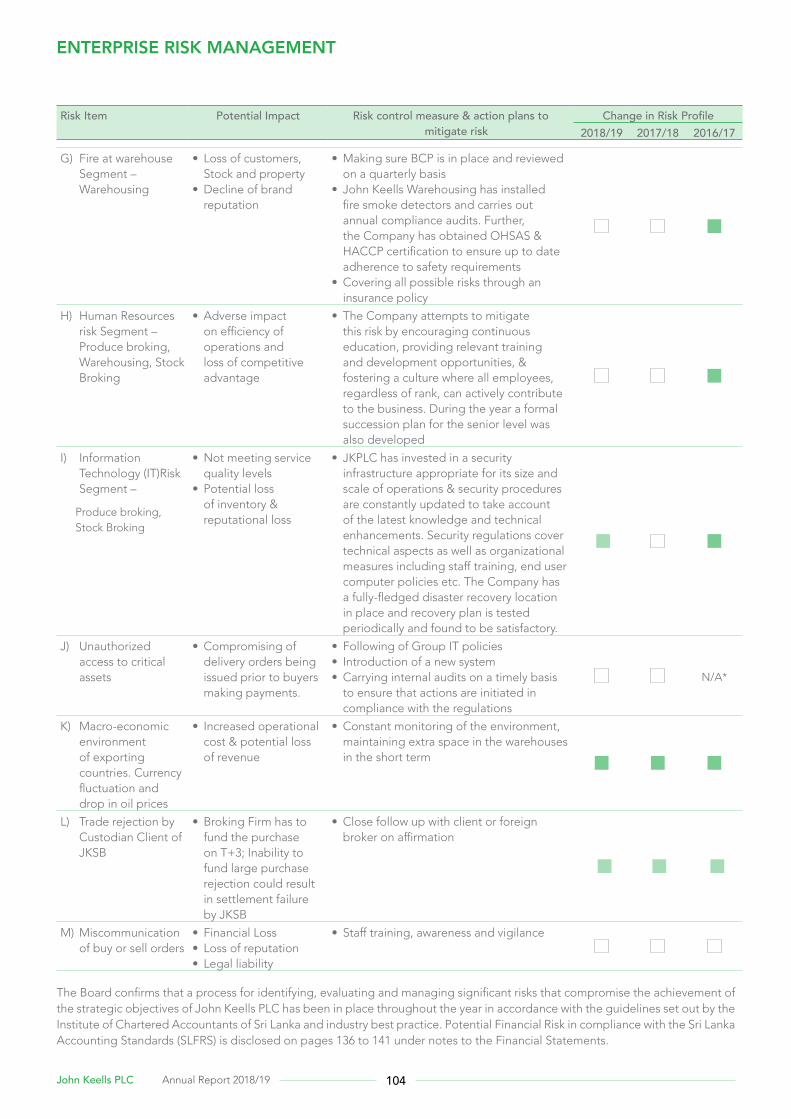
ENTERPRISE RISK MANAGEMENT
Risk Item Potential Impact Risk control measure & action plans to mitigate risk
Change in Risk Profile2018/19 2017/18 2016/17
G) Fire at warehouse Segment – Warehousing
• Loss of customers, Stock and property
• Decline of brand reputation
• Making sure BCP is in place and reviewed on a quarterly basis
• John Keells Warehousing has installed fire smoke detectors and carries out annual compliance audits. Further, the Company has obtained OHSAS & HACCP certification to ensure up to date adherence to safety requirements
• Covering all possible risks through an insurance policy
H) Human Resources risk Segment – Produce broking, Warehousing, Stock Broking
• Adverse impact on efficiency of operations and loss of competitive advantage
• The Company attempts to mitigate this risk by encouraging continuous education, providing relevant training and development opportunities, & fostering a culture where all employees, regardless of rank, can actively contribute to the business. During the year a formal succession plan for the senior level was also developed
I) Information Technology (IT)Risk Segment –
Produce broking, Stock Broking
• Not meeting service quality levels
• Potential loss of inventory & reputational loss
• JKPLC has invested in a security infrastructure appropriate for its size and scale of operations & security procedures are constantly updated to take account of the latest knowledge and technical enhancements. Security regulations cover technical aspects as well as organizational measures including staff training, end user computer policies etc. The Company has a fully-fledged disaster recovery location in place and recovery plan is tested periodically and found to be satisfactory.
J) Unauthorized access to critical assets
• Compromising of delivery orders being issued prior to buyers making payments.
• Following of Group IT policies • Introduction of a new system • Carrying internal audits on a timely basis to ensure that actions are initiated in compliance with the regulations
N/A*
K) Macro-economic environment of exporting countries. Currency fluctuation and drop in oil prices
• Increased operational cost & potential loss of revenue
• Constant monitoring of the environment, maintaining extra space in the warehouses in the short term
L) Trade rejection by Custodian Client of JKSB
• Broking Firm has to fund the purchase on T+3; Inability to fund large purchase rejection could result in settlement failure by JKSB
• Close follow up with client or foreign broker on affirmation
M) Miscommunication of buy or sell orders
• Financial Loss • Loss of reputation • Legal liability
• Staff training, awareness and vigilance
The Board confirms that a process for identifying, evaluating and managing significant risks that compromise the achievement of the strategic objectives of John Keells PLC has been in place throughout the year in accordance with the guidelines set out by the Institute of Chartered Accountants of Sri Lanka and industry best practice. Potential Financial Risk in compliance with the Sri Lanka Accounting Standards (SLFRS) is disclosed on pages 136 to 141 under notes to the Financial Statements.
104John Keells PLC Annual Report 2018/19

REPORT OF THE BOARD AUDIT COMMITTEE
INTRODUCTIONThis report focuses on the activities of the Board Audit Committee (Committee) for the year under review. The Committee assists the Board in exercising oversight in the areas of financial reporting, internal audit, internal controls, external audit and corporate risk. The Audit Committee Charter clearly defines the Terms of Reference of the Committee and the Committee conducts its proceedings in accordance with and pursuant to the Audit Committee Charter.
ROLE OF THE BOARD AUDIT COMMITTEEThe primary role of the Committee is to assist the Board in fulfilling its responsibilities with regard to;
• Ensuring the integrity of the financial statements of the Company in accordance with the Accounting Standards as defined by The Institute of Chartered Accountants of Sri Lanka, applicable local laws and regulations and the requirements of the Listing Rules of the Colombo Stock Exchange (CSE) to provide accurate, appropriate and timely information to management, regulatory authorities, shareholders and other stakeholders.
• Ensure that high standards of Corporate Governance are in place by adopting and adhering to policies and procedures of the Company.
• Ensure compliance with laws, regulations, policies of the Group and Company.
• Evaluate and review the independence of the External Auditors and outsourced Internal Auditors and follow up on their findings and recommendations.
• Ensure the efficiency, effectiveness and adequacy of the Company’s internal controls and risk management measures and processes to accept, avoid, transfer or mitigate current and unforeseen risks.
• Assess the Company’s ability to continue as a going concern in the foreseeable future.
COMPOSITION OF THE BOARD AUDIT COMMITTEE AND MEETINGSThe Board Audit Committee (Committee) of John Keells PLC is appointed by and accountable to the Board of Directors and is formally constituted as a Sub Committee of the Board of Directors and in accordance with the requirements of the Listing Rules of the CSE, the members of the Board Audit Committee comprised three Independent Non-Executive Directors for the financial year 2018/2019 whose detailed profiles are given on pages 78 to 79 of this report. The BAC is chaired by Ms. Aruni Rajakarier, Fellow member of the Institute of Chartered Accountants of Sri Lanka. The Chief Financial Officer of the Plantation Services Sector of the John Keells group serves as the Secretary to the Committee.
MEETING OF THE BOARD AUDIT COMMITTEEThe Committee convened four times during the financial year 2018 / 2019 and the attendance of the its members at these meetings is illustrated at the end of this report.
The Non-Independent Non Executive, Directors of John Keells PLC (JKPLC), Chief Executive Officer of JKPLC, Finance Manager of JKPLC, Chief Executive Officer of John Keells Stock Brokers (Pvt) Ltd (JKSB), Finance Manager of JKSB and Head of Group Business Process Review (Group BPR) of John Keells Holdings PLC attend the meetings of the Committee by invitation. The External Auditors, Outsourced Internal Auditors and other officials attend the meetings on a need basis.
FINANCIAL REPORTINGThe Committee has reviewed and assisted the Board in its oversight on the financial statements of the Company, to ensure the integrity of the financial statements prepared for disclosure and to evidence a true and fair view on the financial position and performance and to be in accordance with stipulated requirements of the Sri Lanka Accounting Standards.
The Committee is satisfied that all relevant matters have been considered in the preparation of the financial statements through discussion regarding the operations of the Company both during the financial year and its future outlook with the management.
The Committee continues to monitor compliance in accordance with the financial reporting standards of The Institute of Chartered Accountants of Sri Lanka, Companies Act No. 7 of 2007, The Sri Lanka Accounting and Auditing Standards and the Continuing Listing Rules of the Colombo Stock Exchange.
INTERNAL AUDIT AND CONTROL ASSESSMENTThe internal audit plan and scope of work were formulated in consultation with the Group BPR Division and the Outsourced Internal Auditors (BDO Partners), which was then approved by the Committee.
The main focus of the Internal Audit was to provide independent assurance on the overall system of internal controls, risk management and governance, by evaluating the adequacy and efficacy of internal controls, and compliance with laws, regulations and established policies and procedures of the Company.
During the year, the reports were presented to the Committee by the Outsourced Internal Auditors, which were reviewed and discussed along with the management and the Group BPR Division. Findings and recommendations of internal investigations have been given due attention and followed up for implementation.
105 HEAD ON
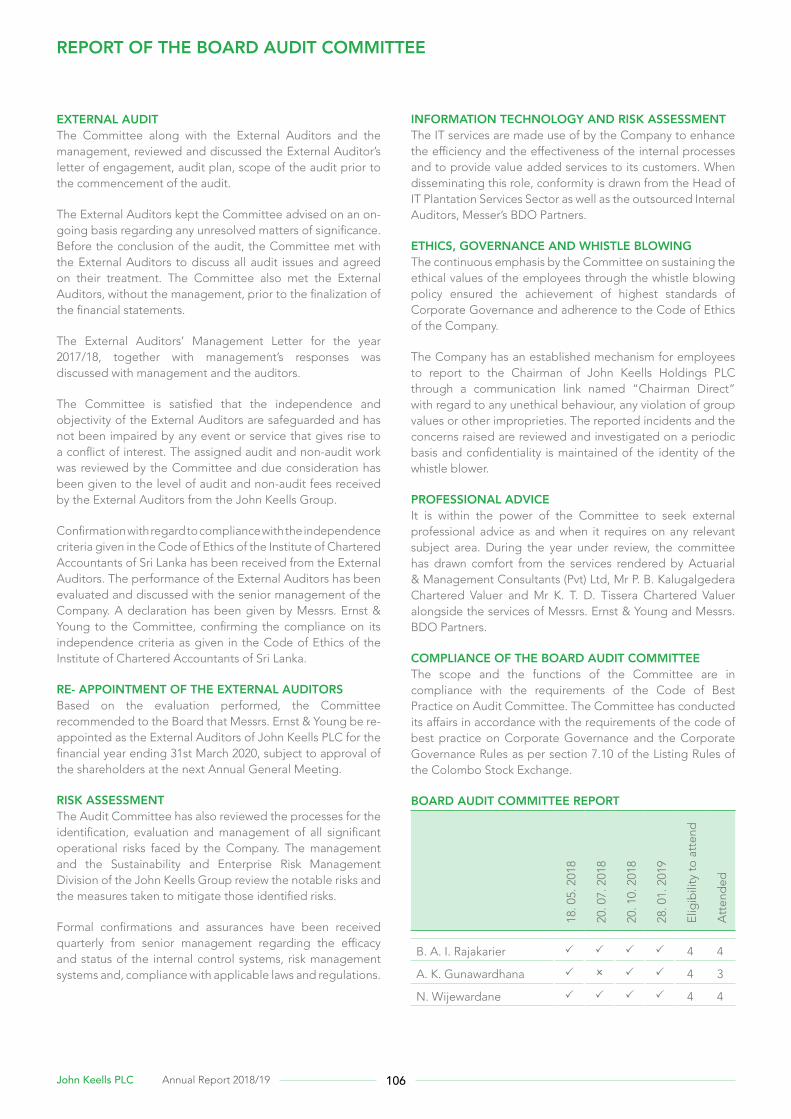
EXTERNAL AUDITThe Committee along with the External Auditors and the management, reviewed and discussed the External Auditor’s letter of engagement, audit plan, scope of the audit prior to the commencement of the audit.
The External Auditors kept the Committee advised on an on-going basis regarding any unresolved matters of significance. Before the conclusion of the audit, the Committee met with the External Auditors to discuss all audit issues and agreed on their treatment. The Committee also met the External Auditors, without the management, prior to the finalization of the financial statements.
The External Auditors’ Management Letter for the year 2017/18, together with management’s responses was discussed with management and the auditors.
The Committee is satisfied that the independence and objectivity of the External Auditors are safeguarded and has not been impaired by any event or service that gives rise to a conflict of interest. The assigned audit and non-audit work was reviewed by the Committee and due consideration has been given to the level of audit and non-audit fees received by the External Auditors from the John Keells Group.
Confirmation with regard to compliance with the independence criteria given in the Code of Ethics of the Institute of Chartered Accountants of Sri Lanka has been received from the External Auditors. The performance of the External Auditors has been evaluated and discussed with the senior management of the Company. A declaration has been given by Messrs. Ernst & Young to the Committee, confirming the compliance on its independence criteria as given in the Code of Ethics of the Institute of Chartered Accountants of Sri Lanka.
RE- APPOINTMENT OF THE EXTERNAL AUDITORSBased on the evaluation performed, the Committee recommended to the Board that Messrs. Ernst & Young be re-appointed as the External Auditors of John Keells PLC for the financial year ending 31st March 2020, subject to approval of the shareholders at the next Annual General Meeting.
RISK ASSESSMENTThe Audit Committee has also reviewed the processes for the identification, evaluation and management of all significant operational risks faced by the Company. The management and the Sustainability and Enterprise Risk Management Division of the John Keells Group review the notable risks and the measures taken to mitigate those identified risks.
Formal confirmations and assurances have been received quarterly from senior management regarding the efficacy and status of the internal control systems, risk management systems and, compliance with applicable laws and regulations.
INFORMATION TECHNOLOGY AND RISK ASSESSMENTThe IT services are made use of by the Company to enhance the efficiency and the effectiveness of the internal processes and to provide value added services to its customers. When disseminating this role, conformity is drawn from the Head of IT Plantation Services Sector as well as the outsourced Internal Auditors, Messer’s BDO Partners.
ETHICS, GOVERNANCE AND WHISTLE BLOWING The continuous emphasis by the Committee on sustaining the ethical values of the employees through the whistle blowing policy ensured the achievement of highest standards of Corporate Governance and adherence to the Code of Ethics of the Company.
The Company has an established mechanism for employees to report to the Chairman of John Keells Holdings PLC through a communication link named “Chairman Direct” with regard to any unethical behaviour, any violation of group values or other improprieties. The reported incidents and the concerns raised are reviewed and investigated on a periodic basis and confidentiality is maintained of the identity of the whistle blower.
PROFESSIONAL ADVICEIt is within the power of the Committee to seek external professional advice as and when it requires on any relevant subject area. During the year under review, the committee has drawn comfort from the services rendered by Actuarial & Management Consultants (Pvt) Ltd, Mr P. B. Kalugalgedera Chartered Valuer and Mr K. T. D. Tissera Chartered Valuer alongside the services of Messrs. Ernst & Young and Messrs. BDO Partners.
COMPLIANCE OF THE BOARD AUDIT COMMITTEEThe scope and the functions of the Committee are in compliance with the requirements of the Code of Best Practice on Audit Committee. The Committee has conducted its affairs in accordance with the requirements of the code of best practice on Corporate Governance and the Corporate Governance Rules as per section 7.10 of the Listing Rules of the Colombo Stock Exchange.
BOARD AUDIT COMMITTEE REPORT
18. 0
5. 2
018
20. 0
7. 2
018
20. 1
0. 2
018
28. 0
1. 2
019
Elig
ibili
ty t
o a
tten
d
Att
end
ed
B. A. I. Rajakarier 4 4
A. K. Gunawardhana 4 3
N. Wijewardane 4 4
REPORT OF THE BOARD AUDIT COMMITTEE
106John Keells PLC Annual Report 2018/19
EVALUATION OF THE BOARD AUDIT COMMITTEEAn evaluation of the effectiveness of the Committee was carried out by its members along with the Non-Independent Non-Executive Director of John Keells PLC President of the Plantation Services Sector, Chief Executive Officer (JK PLC), Chief Executive Officer (JKSB), Chief Financial Officer of the Plantation Services Sector, External Auditors and Internal Auditors. The evaluation carried out during the year is tabled at the meeting of the Committee and communicated to the Board of the Company.
CONCLUSIONBased on the reports submitted by the external auditors and the outsourced internal auditors of the Company, the assurances and certifications provided by the senior management, and the discussions with the management and the auditors both at formal meetings and informally, the Committee is of the view that the control environment within the Company is satisfactory and provides reasonable assurance that the financial position of the Company is adequately monitored
B A I RajakarierChairperson of the Board Audit Committee24th May 2019
107 HEAD ON

108John Keells PLC Annual Report 2018/19
REPORT OF THE RELATED PARTY TRANSACTIONS REVIEW COMMITTEE
The following Directors served as members of the Committee during the financial year:
Ms. M. P. Perera Mr. A. N. FonsekaMr. D. A. CabraalMr. K. N. J. Balendra (appointed on 1 January 2019)Mr. S. C. Ratnayake (retired on 31 December 2018)
In addition, the Group Finance Director Mr. Gihan Cooray, Former Group Financial Controller Mr. Suran Wijesinghe (resigned on 31 December 2018), and Group Financial Controller Mohan Thanthirige (appointed on 1 January 2019) attended meetings by invitation. The Head of Group Business Process Review, Mr. Hisham Nazeem, served as the Secretary to the Committee.
The objective of the Committee is to exercise oversight on behalf of the Board of John Keells Holdings PLC and its listed Subsidiaries, to ensure compliance with the Code on Related Party Transactions, as issued by the Securities and Exchange Commission of Sri Lanka (“The Code”) and with the Listing Rules of the Colombo Stock Exchange (CSE). The Committee has also adopted best practices as recommended by the Institute of Chartered Accountants of Sri Lanka and the CSE.
The Committee in discharging its functions primarily relied on processes that were validated from time to time and periodic reporting by the relevant entities and Key Management Personnel (KMP) with a view to ensuring that:
• there is compliance with the Code;
• shareholder interests are protected; and
• fairness and transparency are maintained.
The Committee reviewed and pre-approved all proposed non-recurrent RPTs of the parent, John Keells Holdings PLC, and all its listed subsidiaries, namely: John Keells PLC, Tea Smallholder Factories PLC, Asian Hotels and Properties PLC, Trans Asia Hotels PLC, John Keells Hotels PLC, Ceylon Cold Stores PLC, Keells Food Products PLC, and Union Assurance PLC. Further, recurrent RPTs were reviewed annually by the Committee. Other significant transactions of non-listed subsidiaries were presented to the Committee for information.
In addition to the Directors, all Presidents, Executive Vice Presidents, Chief Executive Officers, Chief Financial Officers and Financial Controllers of respective companies/sectors have been designated as KMPs in order to increase transparency and enhance good governance. Annual disclosures from all KMPs setting out any RPTs they were associated with, if any, were obtained and reviewed by the Committee.
The Committee held four meetings during the financial year. Information on the attendance at these meetings by the members of the Committee is given below.
The activities and views of the Committee have been communicated to the Board of Directors, quarterly, through verbal briefings, and by tabling the minutes of the Committee’s meetings.
M. P. Perera Chairperson of the Related Party Transactions Review CommitteeJohn Keells Holdings PLC
16th May 2019
109 HEAD ON
ANNUAL REPORT OF THE BOARD OF DIRECTORS
The Directors have pleasure in presenting the 72nd Annual Report of your Company together with the Audited Financial Statements of John Keells PLC (‘the Company’), and the Audited Consolidated Financial Statements of the Group for the year ended 31st March, 2019.
GENERALThe Company was incorporated on 01st April 1960 as a Public Limited Liability Company and the issued shares of the Company are listed on the Colombo Stock Exchange (CSE). Pursuant to the requirements of the Companies Act No. 7 of 2007 (Companies Act), the Company obtained a new Company registration No. PQ11 on 15th June 2007.
PRINCIPAL ACTIVITIESCompanyThe principal activities of the Company remain unchanged as produce broking.
SubsidiariesJohn Keells Stock Brokers (Private) Limited continues to provide stock broking services.
John Keells Warehousing (Private) Limited continues to provide warehousing facilities.
BUSINESS REVIEWA review of the Company and its subsidiaries (Group’s) performance during the financial year is given in the Chairman’s Statement and in the Management Discussion and Analysis. These reports form an integral part of the Directors Report and provide a fair review of the performance of the Group during the financial year ended 31st March 2019.
FINANCIAL STATEMENTSThe Financial Statements of the Company and the Group are set out on pages 122 to 174 of the Annual Report.
AUDITOR’S REPORTThe Auditor’s Report on the Financial Statements are given on pages 119 to 120 of the Annual Report.
SIGNIFICANT ACCOUNTING POLICIESThe Accounting Policies adopted in the preparation of the Financial Statements are given on pages 130 to 174 of the Annual Report.
GOING CONCERNThe Board of Directors is satisfied that the Company, its subsidiaries and associate, have adequate resources to continue its operations in the foreseeable future. Accordingly, the Financial Statements are prepared based on the “Going Concern Concept”.
STATED CAPITALThe total stated capital of the Company as at 31st March 2019 was Rs. 152 million (2018 - Rs. 152 million).
REVENUERevenue generated by the Company amounted to Rs. 536 million (2018 - Rs. 519 million), whilst Group revenue amounted to Rs. 833 million (2018 - Rs. 799 million). Contribution to Group revenue, from the different business segments is provided in Note 7.1 to the Financial Statements on page 135.
RESULTS AND APPROPRIATIONSThe profit after tax of the Company was Rs. 199 million (2018 - Rs.242 million) whilst the Group profit attributable to equity holders of the Parent Company for the year was Rs. 202 million (2018 - Rs. 235 million).
Results of the Company and of the Group are given in the Income Statement on page 122.
DIVIDENDOn 14th June 2018, a First and Final Dividend of Rs. 2.30 per share (2017 - Rs. 2.00) was paid for the financial year ended 31st March 2018 amounting to Rs. 139.84 million (2017 - Rs. 121.60 million).
Dividend per share has been computed based on the amount of dividends recognized as distributed to the equity holders during the period.
The Directors have recommended a First and Final Dividend of Rs. 2.00 per share for the year ended 31st March 2019 from the profits available for appropriation. In accordance with the Sri Lanka Accounting Standards, events after the Reporting Period, the proposed dividend has not been recognized as a liability as at 31st March 2019.
As required by Section 56 (2) of the Companies Act, the Board of Directors have, certified that the Company satisfies the solvency test in accordance with section 57 of the Companies Act, and have obtained a certificate from the Auditors, prior to approving the First and Final Dividend of Rs. 2.00 per share for this year. The First and Final Dividend will be paid on 14th June 2019 to those shareholders on the register as at 4th June 2019.
GRI 102-11
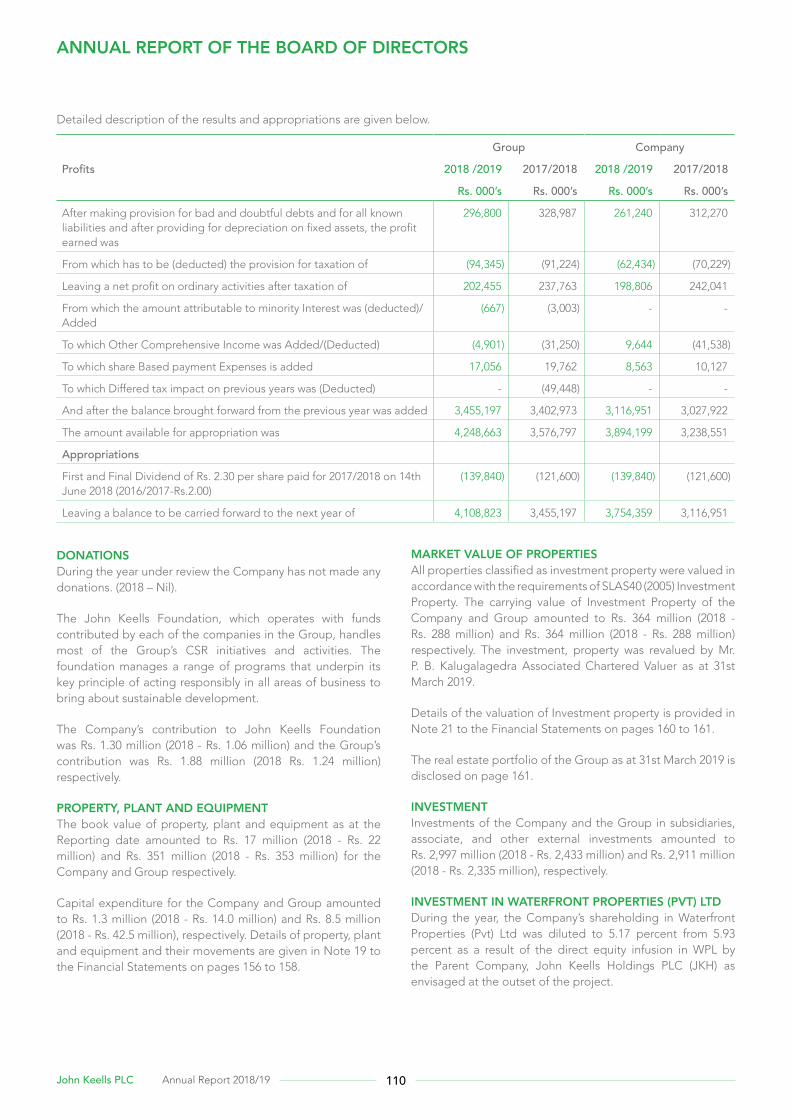
110John Keells PLC Annual Report 2018/19
Detailed description of the results and appropriations are given below.
MARKET VALUE OF PROPERTIESAll properties classified as investment property were valued in accordance with the requirements of SLAS40 (2005) Investment Property. The carrying value of Investment Property of the Company and Group amounted to Rs. 364 million (2018 - Rs. 288 million) and Rs. 364 million (2018 - Rs. 288 million) respectively. The investment, property was revalued by Mr. P. B. Kalugalagedra Associated Chartered Valuer as at 31st March 2019.
Details of the valuation of Investment property is provided in Note 21 to the Financial Statements on pages 160 to 161.
The real estate portfolio of the Group as at 31st March 2019 is disclosed on page 161.
INVESTMENTInvestments of the Company and the Group in subsidiaries, associate, and other external investments amounted to Rs. 2,997 million (2018 - Rs. 2,433 million) and Rs. 2,911 million (2018 - Rs. 2,335 million), respectively.
INVESTMENT IN WATERFRONT PROPERTIES (PVT) LTDDuring the year, the Company’s shareholding in Waterfront Properties (Pvt) Ltd was diluted to 5.17 percent from 5.93 percent as a result of the direct equity infusion in WPL by the Parent Company, John Keells Holdings PLC (JKH) as envisaged at the outset of the project.
ANNUAL REPORT OF THE BOARD OF DIRECTORS
Group Company
Profits 2018 /2019 2017/2018 2018 /2019 2017/2018
Rs. 000’s Rs. 000’s Rs. 000’s Rs. 000’s
After making provision for bad and doubtful debts and for all known liabilities and after providing for depreciation on fixed assets, the profit earned was
296,800 328,987 261,240 312,270
From which has to be (deducted) the provision for taxation of (94,345) (91,224) (62,434) (70,229)
Leaving a net profit on ordinary activities after taxation of 202,455 237,763 198,806 242,041
From which the amount attributable to minority Interest was (deducted)/ Added
(667) (3,003) - -
To which Other Comprehensive Income was Added/(Deducted) (4,901) (31,250) 9,644 (41,538)
To which share Based payment Expenses is added 17,056 19,762 8,563 10,127
To which Differed tax impact on previous years was (Deducted) - (49,448) - -
And after the balance brought forward from the previous year was added 3,455,197 3,402,973 3,116,951 3,027,922
The amount available for appropriation was 4,248,663 3,576,797 3,894,199 3,238,551
Appropriations
First and Final Dividend of Rs. 2.30 per share paid for 2017/2018 on 14th June 2018 (2016/2017-Rs.2.00)
(139,840) (121,600) (139,840) (121,600)
Leaving a balance to be carried forward to the next year of 4,108,823 3,455,197 3,754,359 3,116,951
DONATIONSDuring the year under review the Company has not made any donations. (2018 – Nil).
The John Keells Foundation, which operates with funds contributed by each of the companies in the Group, handles most of the Group’s CSR initiatives and activities. The foundation manages a range of programs that underpin its key principle of acting responsibly in all areas of business to bring about sustainable development.
The Company’s contribution to John Keells Foundation was Rs. 1.30 million (2018 - Rs. 1.06 million) and the Group’s contribution was Rs. 1.88 million (2018 Rs. 1.24 million) respectively.
PROPERTY, PLANT AND EQUIPMENTThe book value of property, plant and equipment as at the Reporting date amounted to Rs. 17 million (2018 - Rs. 22 million) and Rs. 351 million (2018 - Rs. 353 million) for the Company and Group respectively.
Capital expenditure for the Company and Group amounted to Rs. 1.3 million (2018 - Rs. 14.0 million) and Rs. 8.5 million (2018 - Rs. 42.5 million), respectively. Details of property, plant and equipment and their movements are given in Note 19 to the Financial Statements on pages 156 to 158.
111 HEAD ON
Detailed description of the long term investments held as at 31st March 2019, are given in Note 25 to the Financial statements on pages 164 to 165.
RESERVESTotal reserves as at 31st March 2019 of the Company and Group amounted to Rs. 3,602 million (2018 - Rs. 2,965 million) and Rs. 3,957 million (2018 - Rs. 3,303 million), respectively.
The movement and composition of the Capital and Revenue reserves is disclosed in the statement of Changes in equity on pages 125 to 126.
EVENTS OCCURRING AFTER THE REPORTING DATEThere have been no events subsequent to the Reporting date, which would have any material effect on the Company or on the Group other than those disclosed in Note 38 to the Financial Statements on page 174.
CONTINGENT LIABILITIES AND CAPITAL COMMITMENTSThere have been no commitments or Contingent liabilities other than those stated in Note 37 on page 174 of the Annual Report.
HUMAN RESOURCESThe number of persons employed by the Company and Group as at 31st March 2019 was 54 (2018 - 61) and 81 (2018 - 85), respectively.
The Group is committed to pursuing various HR initiatives that ensure the individual development of all our teams as well as facilitating the creation of value for themselves, the Company and all other stakeholders.
There were no material issues pertaining to employees and industrial relations in the year under review.
CORPORATE GOVERNANCECorporate Governance practices and principles with respect to the Management and operations of the Company is set out on pages 80 to 99 of this report. The Directors confirm that the Company is in compliance with the relevant rules on Corporate Governance contained in the listing rules of the CSE.
The Directors declare that:
a) The Company has not engaged in any activities, which contravene laws and regulations;
and
b) The Directors have declared all material interest in contracts involving the Company and refrained from voting on matters in which they were materially interested; and
c) The Company has made all endeavors to ensure the equitable treatment of shareholders; and
d) The business is a Going Concern with supporting assumptions or qualifications as necessary; and
e) The Directors have conducted a review of internal controls covering financial operational and compliance controls and risk management and have obtained a reasonable assurance of their effectiveness and successful adherence herewith.
RISK MANAGEMENT AND INTERNAL CONTROLThe Board confirms that there is an ongoing process for identifying, evaluating and managing any significant risks faced by the Group. Risk assessment and evaluation for each business unit, takes place as an integral part of the annual strategic planning cycle and the principle risks and mitigating actions in place are reviewed regularly by the Board and the audit Committee. The Board, through the involvement of the risk review and Control Division takes steps to gain assurance on the effectiveness of control systems in place. The audit Committee receives reports on the results of internal control reviews and the Head of the Group risk review and Control Department has direct access to the Chairman of the audit Committee.
AUDIT COMMITTEEThe following Independent Non-Executive, Directors of the Board served on the Audit Committee of the Company.
• Ms. B.A.I. Rajakarier – Chairperson
• Mr. C.N. Wijewardane
• Ms A.K. Gunawardhana
The report of the Audit Committee is given on pages 105 to 107 of the Annual Report.
HUMAN RESOURCES AND COMPENSATION COMMITTEEAs permitted by the listing rules of the CSE, the Human Resources and Compensation Committee of JKH, the Parent Company functions as the Human resources and Compensation Committee of the Company and subsidiaries. The Human Resources and Compensation Committee of JKH comprises of three independent Directors.
• Mr. D A Cabraal - Chairman
• Mr. M A Omar
• Dr. S.S.H.Wijayasuriya
The remuneration policy of the Company and its subsidiaries is detailed in the Corporate Governance report on page 91 of the Annual Report.
112John Keells PLC Annual Report 2018/19
NOMINATION COMMITTEEAs permitted by the listing rules of the CSE, the Nomination Committee of JKH, the Parent Company, functions as the Nomination Committee of the Company, The Committee comprises of four Independent Non-Executive Directors and one Non Independent Executive Director.
• Mr. M A Omar - Chairman
• Ms. M P Perera
• Dr. S S H.Wijayasuriya
• Mr. R Coomaraswamy (appointed to the Committee w.e.f. 6/11/2018)
• Mr. K N J Balendra (appointed to the Committee w.e.f. 01/01/2019)
• Mr. S C Ratnayake (resigned w.e.f. 31/12/2018)
RELATED PARTY TRANSACTION REVIEW COMMITTEEAs permitted by the listing rules of the CSE, the related Party Transaction review Committee of JKH, the Parent Company, functions as the related party Transaction review Committee of the Company. The Committee comprises of three Independent Non-Executive Directors and one Non Independent Executive Director.
• Ms. M P Perera – Chairperson
• Mr. A N Fonseka
• Mr. D A Cabraal
• Mr.K N J Balendra (appointed to the Committee w.e.f. 01/01/2019)
• Mr. S C Ratnayake (resigned w.e.f. 31/12/2018)
The Chairperson is an Independent Non – Executive Director of JKH.
STOCK MARKET INFORMATIONAn ordinary share of the Company was quoted on the Colombo stock Exchange at Rs. 48.00 as at 31st March 2019 (31st March 2018 - Rs. 59.10). Information relating to public holding, earnings, dividend, net assets, market value per share and share trading is given in Key Ratios and Information on page 180 and in the Shareholders Information section on pages 175 to 177.
The Company endeavors at all times to ensure equitable treatment to all shareholders.
SUBSTANTIAL SHAREHOLDINGSThe names of the twenty largest Shareholders, the number of shares held and the percentages held are given on page 176 of the Annual Report. The distribution schedule of the Shareholders and public holdings are disclosed on page 175 of the Annual Report.
ANNUAL REPORT OF THE BOARD OF DIRECTORS
DIRECTORATEAs at 31st March 2019 the Board of Directors of the Company consisted of six Directors with wide commercial, academic knowledge and experience. The Directors profile is given on pages 78 and 79 of the Annual Report.
The Board of Directors of the Company and its subsidiaries as at 31st March 2019 are listed below.
Name of the Director John Keells PLC John Keells Stock Brokers (Private) Limited
John Keells Warehousing (Private) Limited
Mr. K N J Balendra Chairman *** -
Mr. S.C. Ratnayake*
Mr. J. G. A. Cooray *** -
Mr. V. A. A. Perera** - -
Ms. B. A. I. Rajakarier - -
Mr. C. N. Wijewardane - -
Ms. A. K. Gunawardhana - -
Mr. J R Gunaratne -
Mr. S Rajendra (resigned w.e.f. 31/12/2018 - -
Mr. A D Pereria - -
Ms. R S Cader (appointed w.e.f. 01/01/2019) - -
Mr. K C Subasinghe (appointed w.e.f. 01/01/2019) - -
Mr. A Z Hashim(appointed w.e.f. 01/01/2019) - -
*Mr. S C Ratnayake resigned from the Board of Directors of the Company, John Keells Stock Brokers (Pvt) Ltd and John Keells Warehousing (Pvt) Ltd with effect from 31st December 2018.
** Mr. V A A Perera resigned from the Board of Directors of the Company with effect from 31st December 2018.
***Mr. K N J Balendra and Mr. J G A Cooray resigned from the Board of John Keells Stock Brokers (Pvt) Ltd with effect from 31st December 2018.
113 HEAD ON
Retirement of Directors by Rotation and Re-Election
In accordance with the Article 83 of the Article of Association of the Company
Mr. C N Wijewardene and Ms. B A I Rajakarier retire by rotation and being eligible, offer themselves for re-election.
In accordance with the Article 90 of the Article of Association of the Company Mr. J R Gunaratne retires by rotation and being eligible, offer himself for re-election.
DIRECTORS’ REMUNERATIONDetails of the remuneration and other benefits received by the Directors are set out in page 150 of the Financial Statements.
DIRECTORS’ AND CEO’S SHAREHOLDINGS
Name of Director
Number of shares
As at 31st March 2019
As at 31stMarch 2018
Mr. S C Ratnayake * Nil Nil
Mr. K N J Balendra-Chairman Nil Nil
Mr. J. G. A. Cooray Nil Nil
Mr. J R Gunaratne Nil Nil
Mr. V. A. A. Perera* Nil Nil
Ms. B. A. I. Rajakarier Nil Nil
Mr. C. N. Wijewardane Nil Nil
Ms. A. K. Gunawardhana Nil Nil
Mr. H. G. R. De Mel (CEO) Nil Nil
*Mr. S C Ratnayake & Mr. V A A Perera resigned from the Board of Directors with effect from 31st December 2018.
INTEREST REGISTERThe Company maintains an Interests Register as required by the Companies Act No. 7 of 2007 and entries have been made therein.
As both subsidiaries of the Company are private companies which have dispensed with the requirement to maintain an Interest Register, this Annual Report does not contain particulars of entries made in the Interests Registers of subsidiaries.
Particulars of Entries in the Interests Register
a) Interests In Contracts - The Directors have all made a General Disclosure to the Board of Directors as permitted by Section 192 (2) of the Companies Act No. 7 of 2007 and no additional interests have been disclosed by any Director.
b) There have been no disclosures of share dealings as at 31st March 2019.
c) Indemnities and Remuneration
Mr. J R Gunaratne was appointed as a Non-Executive Non – Independent Director of John Keells PLC from 01st July 2018 at the standard Non-Executive Fees recommended by the Human Resources and Compensation Committee of John Keells Holdings PLC, the holding Company of John Keells PLC, which fees are commensurate with the market complexities of the Company.
SUPPLIER POLICYThe Group applies an overall policy of agreeing and clearly communicating terms of payment as part of the commercial agreements negotiated with suppliers, and endeavors to pay for all items properly charged in accordance with these agreed terms. As at 31st March 2019 the trade and other payables of the Company and Group amounted Rs. 427 million (2018 - Rs. 483 million) and Rs. 667 million (2018 - Rs. 691 million) respectively.
ENVIRONMENTAL PROTECTIONThe Group complies with the relevant environmental laws, regulations and endeavors to comply with best practices applicable in the country of operation.
STATUTORY PAYMENTSThe Directors confirm that to the best of their knowledge, all taxes, duties and levies payable by the Company and its subsidiaries, all contributions, levies and taxes payable on behalf of, and in respect of the employees of the Company and its subsidiaries, and all other known statutory dues as were due and payable by the Company and its subsidiaries as at the Reporting date have been paid or, where relevant provided for, except as specified in Note 15 to the Financial statements on page 150, covering Contingent liabilities.
AUDITORSMessrs. Ernst & Young, Chartered Accountants, have intimated their willingness to continue as Auditors of the Company, and a resolution to re-appoint them as Auditor and authorising the Directors to fix their remuneration will be proposed at the Annual General Meeting.
The Audit Committee reviews the appointment of the Auditor, its effectiveness and its relationship with the Group, including the level of audit and non-audit fees paid to the Auditor.
Details of Audit fees are set out in Note 15 of the Financial Statements. The Auditors, do not have any relationship (other than that of an Auditor) with the Company or any of its subsidiaries.
Further details on the work of the Auditor and the Audit Committee are set out in the Audit Committee Report on pages 105 to 107.
114John Keells PLC Annual Report 2018/19
ANNUAL REPORTThe Board of Directors approved the Company and Consolidated Financial Statements on 24th May 2019. The appropriate number of copies of this report will be submitted to the Colombo stock Exchange and to the Sri Lanka Accounting and Auditing Standards Monitoring Board.
ANNUAL GENERAL MEETINGThe Annual General Meeting will be held at the John Keells Auditorium, No. 186 Vauxhall Street, Colombo 2, on Thursday 27th June, 2019 at 9.30 a.m. The notice of the Annual General Meeting appears on page 182.
This Annual Report is signed for and behalf of the Board of Directors
Chairman
Director
Keells Consultants (Private) Limited.Secretaries24th May 2019
ANNUAL REPORT OF THE BOARD OF DIRECTORS
115 HEAD ON
STATEMENT OF DIRECTORS’ RESPONSIBILITY
The responsibility of the Directors, in relation to the financial statements, is set out in the following statement. The responsibility of the Auditors, in relation to the financial statements prepared in accordance with the provisions of the Companies Act No. 07 of 2007, is set out in the Independent Auditors Report.
The financial statements comprise:
• Income Statement and Statement of Comprehensive Income of the Company and its subsidiaries, which present a true and fair view of the profit and loss of the Company and its subsidiaries for the financial year.
• Statement of Financial Position, which presents a true and fair view of the state of affairs of the Company and its subsidiaries as at the end of the financial year.
• Statement of Other Comprehensive Income
The Directors are required to confirm that the financial statements have been prepared:
• Using appropriate accounting policies which have been selected and applied in a consistent manner, and material departures, if any, have been disclosed and explained.
• Presented in accordance with the Sri Lanka Accounting Standards (SLFRS/LKAS); and that reasonable and prudent judgments and estimates have been made so that the form and substance of transactions are properly reflected.
• Provides the information required by and otherwise comply with the Companies Act and the Listing Rules of the Colombo Stock Exchange.
The Directors are also required to ensure that the Company has adequate resources to continue in operation to justify applying the going concern basis in preparing these financial statements.
Further, the Directors have a responsibility to ensure that the Company and its subsidiaries maintain sufficient accounting records to disclose, with reasonable accuracy the financial position of the Company and of the Group.
The Directors are also responsible for taking reasonable steps to safeguard the assets of the Company and of the Group and in this regard to give proper consideration to the establishment of appropriate internal control systems with a view to preventing and detecting fraud and other irregularities.
The Directors are required to prepare the financial statements and to provide the auditors with every opportunity to take whatever steps and undertake whatever inspections that may consider being appropriate to enable them to give their audit opinion.
Further, as required by Section 56(2) of the Companies Act No. 07 of 2007, the Board of Directors have confirmed that the Company, based on the information available, satisfies the solvency test immediately after the distribution, in accordance with Section 57 of the Companies Act No. 07 of 2007, and have obtained a certificate from the Auditors, prior to declaring a First and Final Dividend of Rs 2.00 per share for this year, to be paid on 14th June 2019.
The Directors are of the view that they have discharged their responsibilities as set out in this statement.
COMPLIANCE REPORTThe Directors confirm that to the best of their knowledge, all taxes, duties and levies payable by the Company and its subsidiaries, all contributions, levies and taxes payable on behalf of and in respect of the employees of the Company and its subsidiaries, and all other known statutory dues as were due and payable by the Company and its subsidiaries as at the reporting date have been paid, or where relevant provided for, except as specified in note 37 to the financial statements covering contingent liabilities.
By order of the Board
Keells Consultants (Pvt) Ltd.Secretaries24th May 2019

116John Keells PLC Annual Report 2018/19

117 HEAD ON
118 Financial Calendar 119 Independent Auditor’s Report 122 Income Statement 123 Statement of Comprehensive Income 124 Statement of Financial Position 125 Statement of Changes in Equity 127 Cash Flow Statement 129 Index to the Notes 130 Notes to the Financial Statements
118John Keells PLC Annual Report 2018/19
FINANCIAL CALENDAR
INTERIM FINANCIAL STATEMENTS PUBLISHED AS PER RULE
7.4 OF THE COLOMBO STOCK EXCHANGE
1st Quarter 20th July 2018
2nd Quarter 26th October 2018
3rd Quarter 28th January 2019
4th Quarter 24th May 2019
ANNUAL REPORTS
2018/19 (Fifth Integrated Annual Report) 24th May 2019
2017/18 (Fourth Integrated Annual Report) 28th May 2018
MEETINGS
72nd Annual General Meeting 27th June 2019
71st Annual General Meeting 25th June 2018
DIVIDENDS
First and Final dividend of Rs. 2.00 per share will be paid on 14th June 2019
GRI 102-51
119 HEAD ON
INDEPENDENT AUDITORS’ REPORT
INDEPENDENT AUDITORS’ REPORTTO THE SHAREHOLDERS OF JOHN KEELLS PLC Report on the audit of the Consolidated Financial Statements
Opinion We have audited the financial statements of John Keells PLC (“the Company”) and the consolidated financial statements of the Company and its subsidiaries (“the Group”), which comprise the statement of financial position as at 31 March 2019, and the statement of comprehensive income, statement of changes in equity and statement of cash flows for the year then ended, and notes to the financial statements, including a summary of significant accounting policies.
In our opinion, the accompanying financial statements of the Company and the Group give a true and fair view of the financial position of the Company and the Group as at 31 March 2019, and of their financial performance and cash flows for the year then ended in accordance with Sri Lanka Accounting Standards.
Basis for opinionWe conducted our audit in accordance with Sri Lanka Auditing Standards (SLAuSs). Our responsibilities under those standards are further described in the Auditor’s responsibilities for the audit of the financial statements section of our report.
We are independent of the Group in accordance with the Code of Ethics issued by CA Sri Lanka (Code of Ethics) and we have fulfilled our other ethical responsibilities in accordance with the Code of Ethics. We believe that the audit evidence we have obtained is sufficient and appropriate to provide a basis for our opinion.
Key audit mattersKey audit matters are those matters that, in our professional judgment, were of most significance in our audit of the financial statements of the current period. These matters were addressed in the context of our audit of the financial statements as a whole, and in forming our opinion thereon, and we do not provide a separate opinion on these matters. For each matter below, our description of how our audit addressed the matter is provided in that context.
We have fulfilled the responsibilities described in the Auditor’s responsibilities for the audit of the financial statements section of our report, including in relation to these matters. Accordingly, our audit included the performance of procedures designed to respond to our assessment of the risks of material misstatement of the financial statements. The results of our audit procedures, including the procedures performed to address the matters below, provide the basis for our audit opinion on the accompanying financial statements.
Key audit matter How our audit addressed the key audit matter
Impairment of Trade ReceivablesTrade Receivables include significant amounts due from Tea Sellers. The impairment of such Trade Debtors was a key audit matter as management judgment was involved in evaluating the credit risk of tea sellers with outstanding debts that continue to be impacted by certain macroeconomic challenges facing the tea industry and determining whether the related Trade Receivables should be impaired.
We obtained an understanding of the process for credit assessment and credit approval and the process for impairment assessment of Trade Receivables relating to Tea Sellers. We tested the operating effectiveness of relevant controls including the following:
3 Checked on a sample basis that credit assessment has been appropriately completed and authorization of credit has been in accordance with the Company’s standard operating procedures for granting credit to Tea Sellers
3 Read the related promissory notes where relevant for agreed terms
3 Assessed the appropriateness of provision for impairment based on the Expected Credit Loss (ECL) model specified in SLFRS 9 (“Financial Instruments”)
3 Evaluated the reasonability of the recoverable amounts of Trade Receivables collateralized by Tea Stocks by comparing the most recent trading prices as of reporting date.
We assessed the adequacy of the Company’s disclosures in notes 8.1, 8.1.1.3 and 27 to the financial statements regarding credit risk and impairment of trade receivables.
120John Keells PLC Annual Report 2018/19
Key audit matter How our audit addressed the key audit matter
Valuation of Investment PropertyAs at reporting date 31 March 2019, Investment Property carried at fair value amounted to Rs. 364 Mn. The fair value of such property was determined by external valuer engaged by the Group. The valuation of Investment Property was significant to our audit due to the use of significant estimates such as per perch price disclosed in notes 21 to the financial statements.
Our audit procedures focused on the valuations performed by external valuer engaged by the Group, and included the following;
Assessed the competency, capability and objectivity of the external valuer engaged by the Group
Read the professional valuer’s report and understood the key estimates made and the approach taken by the valuer in determining the valuation of each property
Engaged our internal specialised resources to assess the reasonability of the valuation technique and per perch price.
We have also assessed the adequacy of the disclosures made in note 21 to the financial statements relating to the valuation technique and estimates used by the professional valuer.
Valuation of unquoted financial assets classified as Fair Value through Other Comprehensive Income (FVOCI)The Company’s fair value through other comprehensive income consists of an unquoted equity investment in Waterfront Properties (Pvt) Ltd, which is fair valued at Rs. 2,493 Mn as at the reporting date. The fair value of this financial asset was derived based on an adjusted net assets basis, which was dependent on the fair value of the assets and liabilities held by Waterfront Properties (Pvt) Ltd.
We determined the valuation of the unquoted financial asset as a key audit matter due to the use of a valuation technique based on unobservable inputs as further disclosed in notes 9.3 and 25.2 to the financial statements.
Our audit procedures focused on the valuations performed by the management, and included the following;
We engaged our internal specialized resources to assist us in evaluating the appropriateness of the valuation technique and reasonability of assumptions used to fair value the unquoted equity investment by the management
We validated the key inputs such as extent of land, cost incurred to date for the construction of capital work in progress in the valuation.
We further evaluated disclosures in notes 9.3 and 25.2.
Other information included in the Group’s 2019 Annual ReportOther information consists of the information included in the Annual Report, other than the financial statements and our auditor’s report thereon. Management is responsible for the other information.
Our opinion on the financial statements does not cover the other information and we do not express any form of assurance conclusion thereon.
In connection with our audit of the financial statements, our responsibility is to read the other information and, in doing so, consider whether the other information is materially inconsistent with the financial statements or our knowledge obtained in the audit or otherwise appears to be materially misstated. If, based on the work we have performed, we conclude that there is a material misstatement of this other information, we are required to report that fact. We have nothing to report in this regard
Responsibilities of management and those charged with governance Management is responsible for the preparation of financial statements that give a true and fair view in accordance with Sri Lanka Accounting Standards, and for such internal control as management determines is necessary to enable the preparation of financial statements that are free from material misstatement, whether due to fraud or error.
In preparing the financial statements, management is responsible for assessing the Group’s ability to continue as a going concern, disclosing, as applicable, matters related to going concern and using the going concern basis of accounting unless management either intends to liquidate the Group or to cease operations, or has no realistic alternative but to do so.
Those charged with governance are responsible for overseeing the Company’s and the Group’s financial reporting process.
INDEPENDENT AUDITORS’ REPORT
121 HEAD ON
Auditor’s responsibilities for the audit of the financial statementsOur objectives are to obtain reasonable assurance about whether the financial statements as a whole are free from material misstatement, whether due to fraud or error, and to issue an auditor’s report that includes our opinion. Reasonable assurance is a high level of assurance, but is not a guarantee that an audit conducted in accordance with SLAuSs will always detect a material misstatement when it exists. Misstatements can arise from fraud or error and are considered material if, individually or in the aggregate, they could reasonably be expected to influence the economic decisions of users taken on the basis of these financial statements.
As part of an audit in accordance with SLAuSs, we exercise professional judgment and maintain professional skepticism throughout the audit. We also:
• Identify and assess the risks of material misstatement of the financial statements, whether due to fraud or error, design and perform audit procedures responsive to those risks, and obtain audit evidence that is sufficient and appropriate to provide a basis for our opinion. The risk of not detecting a material misstatement resulting from fraud is higher than for one resulting from error, as fraud may involve collusion, forgery, intentional omissions, misrepresentations, or the override of internal control.
• Obtain an understanding of internal control relevant to the audit in order to design audit procedures that are appropriate in the circumstances, but not for the purpose of expressing an opinion on the effectiveness of the internal controls of the Company and the Group.
• Evaluate the appropriateness of accounting policies used and the reasonableness of accounting estimates and related disclosures made by management.
• Conclude on the appropriateness of management’s use of the going concern basis of accounting and, based on the audit evidence obtained, whether a material uncertainty exists related to events or conditions that may cast significant doubt on the Group’s ability to continue as a going concern. If we conclude that a material uncertainty exists, we are required to draw attention in our auditor’s report to the related disclosures in the financial statements or, if such disclosures are inadequate, to modify our opinion. Our conclusions are based on the audit evidence obtained up to the date of our auditor’s report. However, future events or conditions may cause the Group to cease to continue as a going concern.
• Evaluate the overall presentation, structure and content of the financial statements, including the disclosures, and whether the financial statements represent the underlying
transactions and events in a manner that achieves fair presentation.
• Obtain sufficient appropriate audit evidence regarding the financial information of the entities or business activities within the Group to express an opinion on the consolidated financial statements. We are responsible for the direction, supervision and performance of the group audit. We remain solely responsible for our audit opinion.
We communicate with those charged with governance regarding, among other matters, the planned scope and timing of the audit and significant audit findings, including any significant deficiencies in internal control that we identify during our audit.
We also provide those charged with governance with a statement that we have complied with ethical requirements in accordance with the Code of Ethics regarding independence, and to communicate with them all relationships and other matters that may reasonably be thought to bear on our independence, and where applicable, related safeguards.
From the matters communicated with those charged with governance, we determine those matters that were of most significance in the audit of the financial statements of the current period and are therefore the key audit matters. We describe these matters in our auditor’s report unless law or regulation precludes public disclosure about the matter or when, in extremely rare circumstances, we determine that a matter should not be communicated in our report because the adverse consequences of doing so would reasonably be expected to outweigh the public interest benefits of such communication.
REPORT ON OTHER LEGAL AND REGULATORY REQUIREMENTSAs required by section 163 (2) of the Companies Act No. 07 of 2007, we have obtained all the information and explanations that were required for the audit and, as far as appears from our examination, proper accounting records have been kept by the Company.
CA Sri Lanka membership number of the engagement partner responsible for signing this independent auditor’s report is 2471.
24th May 2019Colombo
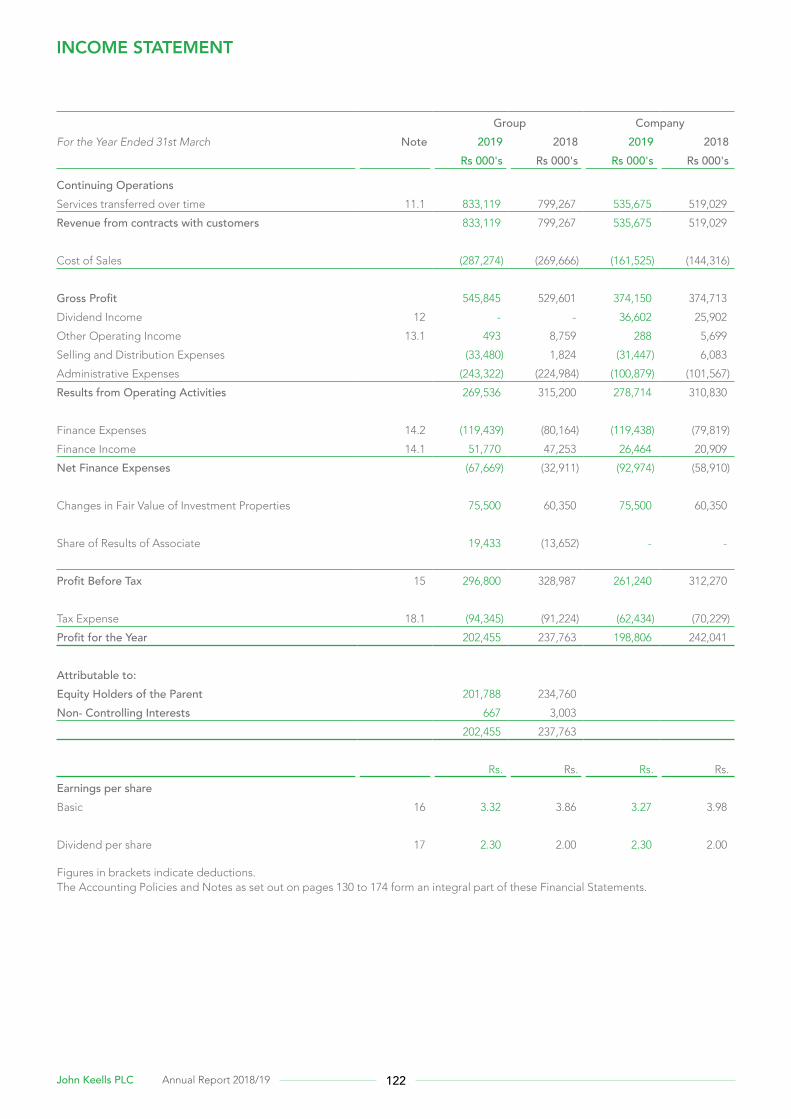
122John Keells PLC Annual Report 2018/19
INCOME STATEMENT
Group CompanyFor the Year Ended 31st March Note 2019 2018 2019 2018 Rs 000's Rs 000's Rs 000's Rs 000's
Continuing OperationsServices transferred over time 11.1 833,119 799,267 535,675 519,029
Revenue from contracts with customers 833,119 799,267 535,675 519,029
Cost of Sales (287,274) (269,666) (161,525) (144,316)
Gross Profit 545,845 529,601 374,150 374,713
Dividend Income 12 - - 36,602 25,902
Other Operating Income 13.1 493 8,759 288 5,699
Selling and Distribution Expenses (33,480) 1,824 (31,447) 6,083
Administrative Expenses (243,322) (224,984) (100,879) (101,567)
Results from Operating Activities 269,536 315,200 278,714 310,830
Finance Expenses 14.2 (119,439) (80,164) (119,438) (79,819)
Finance Income 14.1 51,770 47,253 26,464 20,909
Net Finance Expenses (67,669) (32,911) (92,974) (58,910)
Changes in Fair Value of Investment Properties 75,500 60,350 75,500 60,350
Share of Results of Associate 19,433 (13,652) - -
Profit Before Tax 15 296,800 328,987 261,240 312,270
Tax Expense 18.1 (94,345) (91,224) (62,434) (70,229)
Profit for the Year 202,455 237,763 198,806 242,041
Attributable to:Equity Holders of the Parent 201,788 234,760
Non- Controlling Interests 667 3,003
202,455 237,763
Rs. Rs. Rs. Rs.
Earnings per shareBasic 16 3.32 3.86 3.27 3.98
Dividend per share 17 2.30 2.00 2.30 2.00
Figures in brackets indicate deductions.The Accounting Policies and Notes as set out on pages 130 to 174 form an integral part of these Financial Statements.
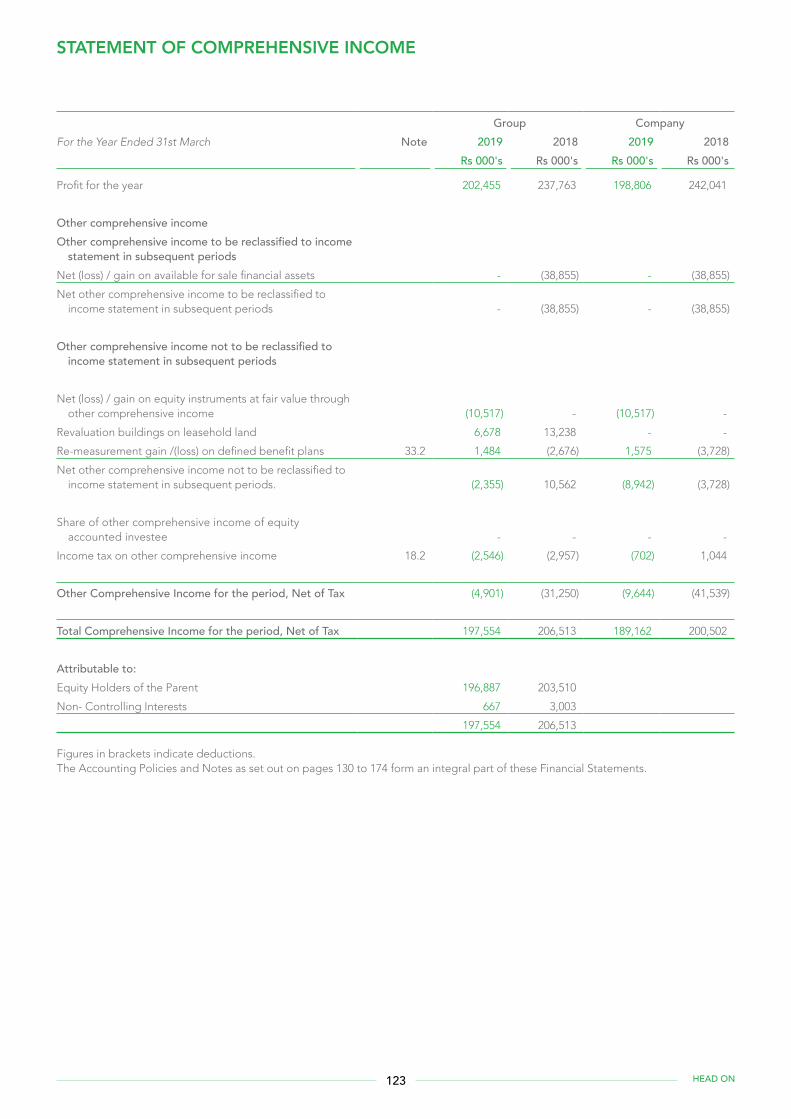
123 HEAD ON
STATEMENT OF COMPREHENSIVE INCOME
Group CompanyFor the Year Ended 31st March Note 2019 2018 2019 2018 Rs 000's Rs 000's Rs 000's Rs 000's
Profit for the year 202,455 237,763 198,806 242,041
Other comprehensive incomeOther comprehensive income to be reclassified to income
statement in subsequent periodsNet (loss) / gain on available for sale financial assets - (38,855) - (38,855)
Net other comprehensive income to be reclassified to income statement in subsequent periods - (38,855) - (38,855)
Other comprehensive income not to be reclassified to income statement in subsequent periods
Net (loss) / gain on equity instruments at fair value through other comprehensive income (10,517) - (10,517) -
Revaluation buildings on leasehold land 6,678 13,238 - -
Re-measurement gain /(loss) on defined benefit plans 33.2 1,484 (2,676) 1,575 (3,728)
Net other comprehensive income not to be reclassified to income statement in subsequent periods. (2,355) 10,562 (8,942) (3,728)
Share of other comprehensive income of equity accounted investee - - - -
Income tax on other comprehensive income 18.2 (2,546) (2,957) (702) 1,044
Other Comprehensive Income for the period, Net of Tax (4,901) (31,250) (9,644) (41,539)
Total Comprehensive Income for the period, Net of Tax 197,554 206,513 189,162 200,502
Attributable to:Equity Holders of the Parent 196,887 203,510
Non- Controlling Interests 667 3,003
197,554 206,513
Figures in brackets indicate deductions.The Accounting Policies and Notes as set out on pages 130 to 174 form an integral part of these Financial Statements.

124John Keells PLC Annual Report 2018/19
STATEMENT OF FINANCIAL POSITION
Group CompanyAs at 31st March Note 2019 2018 2019 2018 Rs 000's Rs 000's Rs 000's Rs 000's
ASSETSNon-Current AssetsProperty, Plant and Equipment 19.3 351,075 353,465 16,905 22,389 Lease Rentals Paid in Advance 20 35,846 36,935 - - Investment Property 21 363,600 288,100 363,600 288,100 Intangible Assets 22 4,063 - 4,063 - Investments in Subsidiaries 23 - - 158,570 158,570 Investments in Associate 24 96,132 84,700 24,000 24,000 Non-Current Financial Assets 25 3,053,240 2,303,411 3,028,288 2,294,642 Deferred Tax Assets 18.5 15,090 17,842 6,249 8,008 Other Non - Current Assets 9,367 8,925 3,237 7,278
3,928,413 3,093,378 3,604,912 2,802,987
Current Assets Inventories 26 1,103 661 778 470 Trade and Other Receivables 27 1,775,976 1,543,725 1,577,813 1,416,099 Amounts due from Related Parties 36.1 6,050 1,803 5,378 1,871 Income Tax Refunds 18.4 - 401 - - Other Current Assets 28 8,041 3,967 2,896 1,205 Short Term Investments 29 249,348 284,744 - - Cash in Hand and at Bank 30.1 200,989 184,454 178,349 153,394
2,241,507 2,019,755 1,765,214 1,573,039 Total Assets 6,169,920 5,113,133 5,370,126 4,376,026
EQUITY AND LIABILITIESEquity attributable to equity holders of the parent Stated Capital 31.1 152,000 152,000 152,000 152,000 Revenue Reserves 2,910,954 2,847,937 2,757,474 2,697,374 Other components of equity 31.2 1,045,869 455,260 844,885 267,577
4,108,823 3,455,197 3,754,359 3,116,951 Non-Controlling Interests 42,591 39,535 - - Total Equity 4,151,414 3,494,732 3,754,359 3,116,951
Non-Current LiabilitiesDeferred Tax Liabilities 18.6 98,693 95,088 - - Employee Benefit Liabilities 33.8 76,712 64,630 40,205 37,067
175,405 159,718 40,205 37,067 Current LiabilitiesTrade and Other Payables 34 667,387 691,233 427,412 483,038 Amounts due to Related Parties 36.2 6,123 3,552 8,634 3,761 Income Tax Liabilities 18.4 19,209 47,376 3,924 45,178 Other Current Liabilities 35 689 4,410 486 1,985 Bank Overdrafts 30.2 1,149,693 712,112 1,135,106 688,046
1,843,101 1,458,683 1,575,562 1,222,008 Total Equity and Liabilities 6,169,920 5,113,133 5,370,126 4,376,026
I certify that the financial statements have been prepared in compliance with the requirements of the Companies Act No. 7 of 2007.
Ms. K. D. WeerasingheChief Financial OfficerThe Board of Directors is responsible for the preparation and presentation of these Financial Statements.
Mr. K. N. J. Balendra Mr. J. G. A. Cooray Chairman Director
The Accounting Policies and Notes as set out on pages 130 to 174 form an integral part of these Financial Statements.24th May 2019
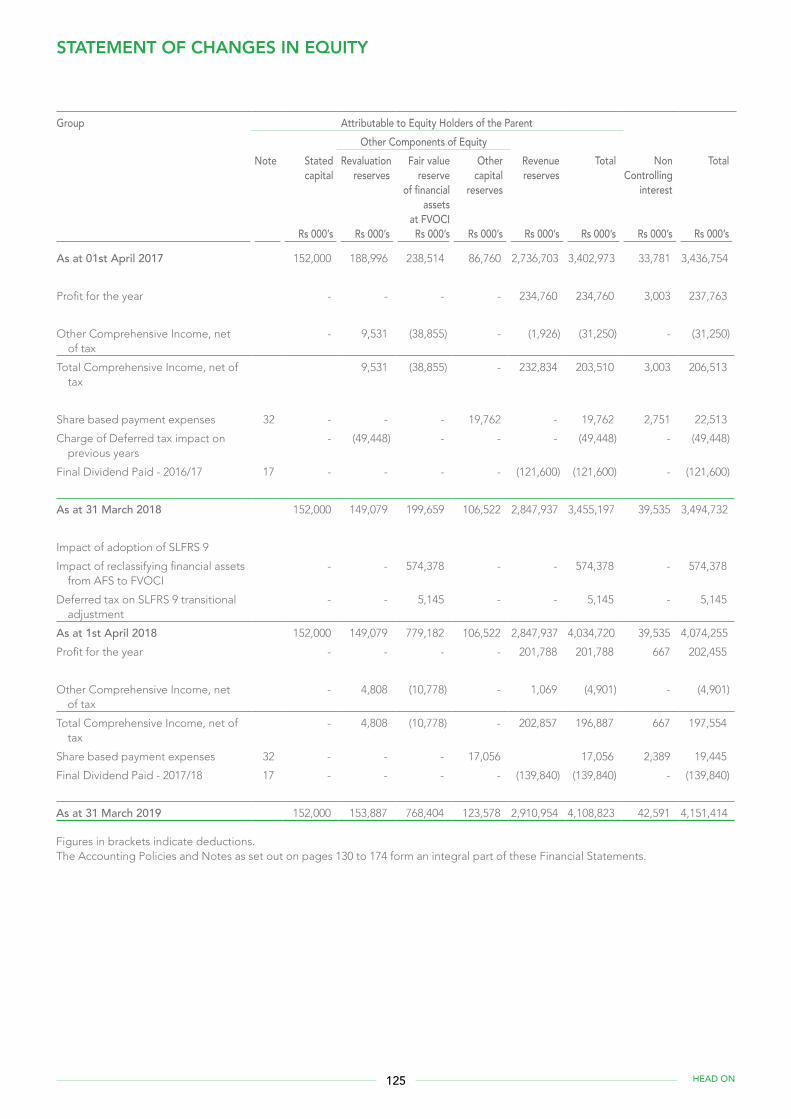
125 HEAD ON
STATEMENT OF CHANGES IN EQUITY
Group Attributable to Equity Holders of the ParentOther Components of Equity
Note Statedcapital
Rs 000’s
Revaluationreserves
Rs 000’s
Fair value reserve
of financial assets
at FVOCI Rs 000’s
Othercapital
reserves
Rs 000’s
Revenue reserves
Rs 000’s
Total
Rs 000’s
NonControlling
interest
Rs 000’s
Total
Rs 000’s
As at 01st April 2017 152,000 188,996 238,514 86,760 2,736,703 3,402,973 33,781 3,436,754
Profit for the year - - - - 234,760 234,760 3,003 237,763
Other Comprehensive Income, net of tax
- 9,531 (38,855) - (1,926) (31,250) - (31,250)
Total Comprehensive Income, net of tax
9,531 (38,855) - 232,834 203,510 3,003 206,513
Share based payment expenses 32 - - - 19,762 - 19,762 2,751 22,513
Charge of Deferred tax impact on previous years
- (49,448) - - - (49,448) - (49,448)
Final Dividend Paid - 2016/17 17 - - - - (121,600) (121,600) - (121,600)
As at 31 March 2018 152,000 149,079 199,659 106,522 2,847,937 3,455,197 39,535 3,494,732
Impact of adoption of SLFRS 9
Impact of reclassifying financial assets from AFS to FVOCI
- - 574,378 - - 574,378 - 574,378
Deferred tax on SLFRS 9 transitional adjustment
- - 5,145 - - 5,145 - 5,145
As at 1st April 2018 152,000 149,079 779,182 106,522 2,847,937 4,034,720 39,535 4,074,255
Profit for the year - - - - 201,788 201,788 667 202,455
Other Comprehensive Income, net of tax
- 4,808 (10,778) - 1,069 (4,901) - (4,901)
Total Comprehensive Income, net of tax
- 4,808 (10,778) - 202,857 196,887 667 197,554
Share based payment expenses 32 - - - 17,056 17,056 2,389 19,445
Final Dividend Paid - 2017/18 17 - - - - (139,840) (139,840) - (139,840)
As at 31 March 2019 152,000 153,887 768,404 123,578 2,910,954 4,108,823 42,591 4,151,414
Figures in brackets indicate deductions.The Accounting Policies and Notes as set out on pages 130 to 174 form an integral part of these Financial Statements.
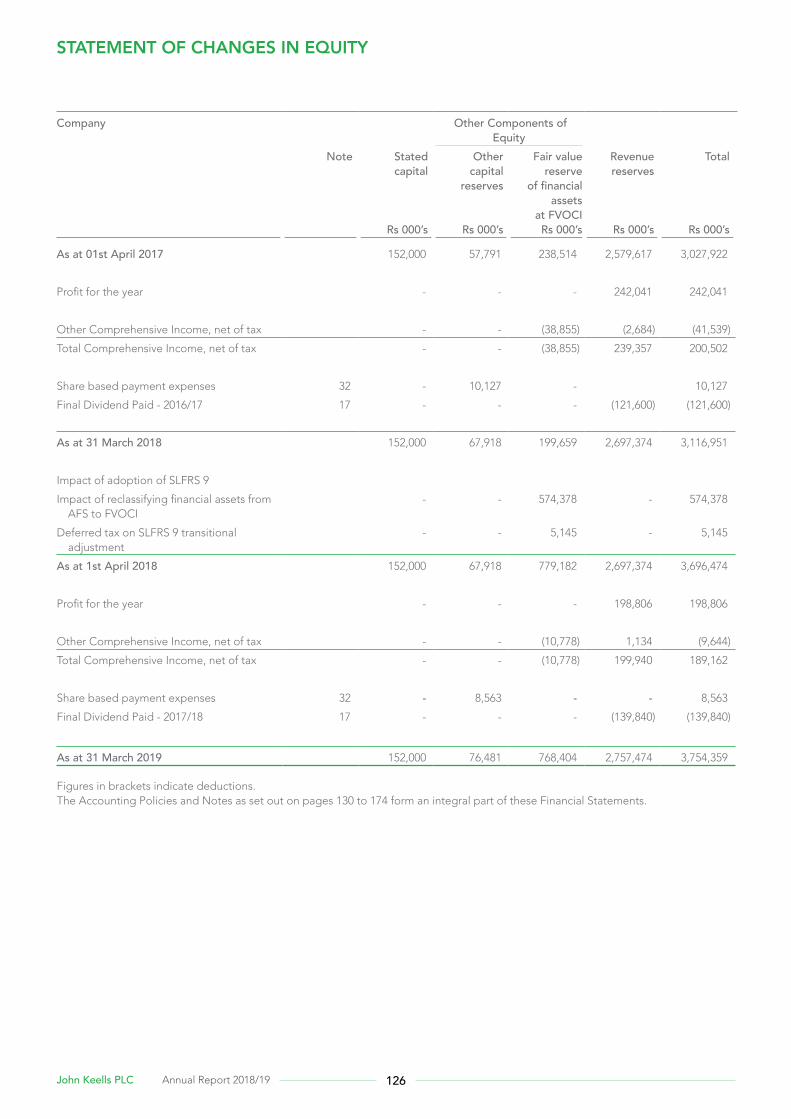
126John Keells PLC Annual Report 2018/19
STATEMENT OF CHANGES IN EQUITY
Company Other Components of Equity
Note Statedcapital
Rs 000’s
Othercapital
reserves
Rs 000’s
Fair value reserve
of financial assets
at FVOCI Rs 000’s
Revenue reserves
Rs 000’s
Total
Rs 000’s
As at 01st April 2017 152,000 57,791 238,514 2,579,617 3,027,922
Profit for the year - - - 242,041 242,041
Other Comprehensive Income, net of tax - - (38,855) (2,684) (41,539)
Total Comprehensive Income, net of tax - - (38,855) 239,357 200,502
Share based payment expenses 32 - 10,127 - 10,127
Final Dividend Paid - 2016/17 17 - - - (121,600) (121,600)
As at 31 March 2018 152,000 67,918 199,659 2,697,374 3,116,951
Impact of adoption of SLFRS 9
Impact of reclassifying financial assets from AFS to FVOCI
- - 574,378 - 574,378
Deferred tax on SLFRS 9 transitional adjustment
- - 5,145 - 5,145
As at 1st April 2018 152,000 67,918 779,182 2,697,374 3,696,474
Profit for the year - - - 198,806 198,806
Other Comprehensive Income, net of tax - - (10,778) 1,134 (9,644)
Total Comprehensive Income, net of tax - - (10,778) 199,940 189,162
Share based payment expenses 32 - 8,563 - - 8,563
Final Dividend Paid - 2017/18 17 - - - (139,840) (139,840)
As at 31 March 2019 152,000 76,481 768,404 2,757,474 3,754,359
Figures in brackets indicate deductions.The Accounting Policies and Notes as set out on pages 130 to 174 form an integral part of these Financial Statements.
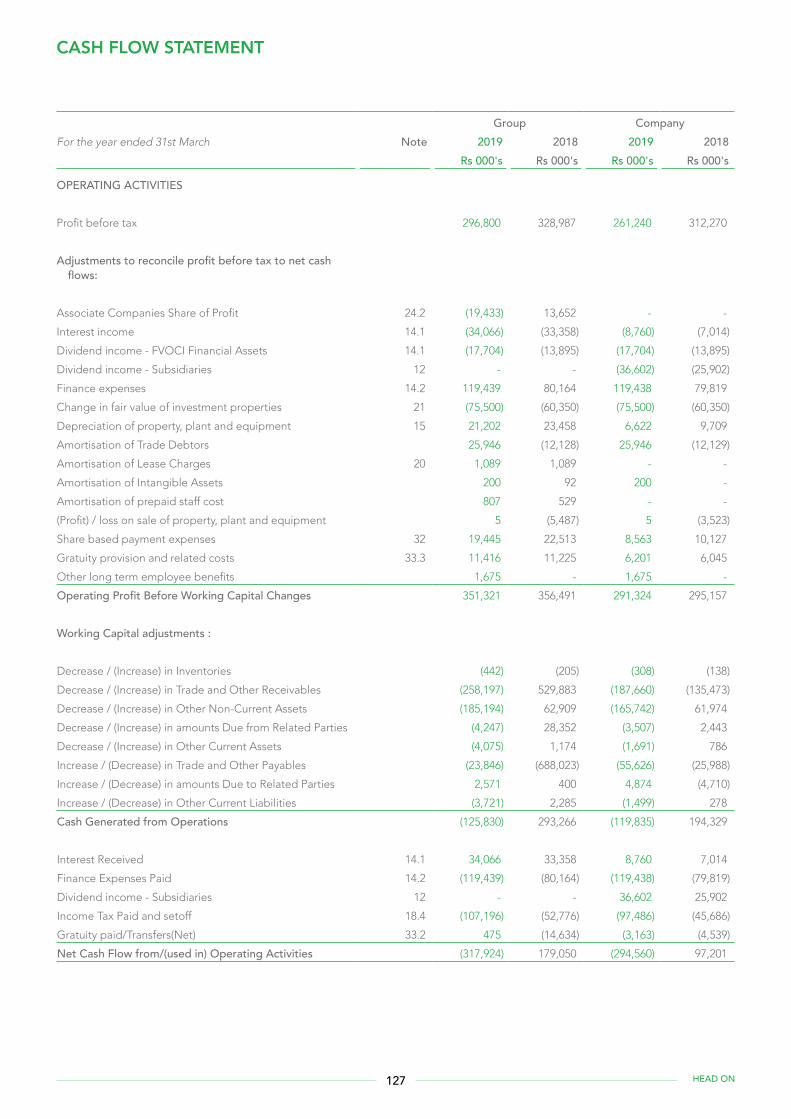
127 HEAD ON
CASH FLOW STATEMENT
Group CompanyFor the year ended 31st March Note 2019 2018 2019 2018 Rs 000's Rs 000's Rs 000's Rs 000's
OPERATING ACTIVITIES
Profit before tax 296,800 328,987 261,240 312,270
Adjustments to reconcile profit before tax to net cash flows:
Associate Companies Share of Profit 24.2 (19,433) 13,652 - -
Interest income 14.1 (34,066) (33,358) (8,760) (7,014)
Dividend income - FVOCI Financial Assets 14.1 (17,704) (13,895) (17,704) (13,895)
Dividend income - Subsidiaries 12 - - (36,602) (25,902)
Finance expenses 14.2 119,439 80,164 119,438 79,819
Change in fair value of investment properties 21 (75,500) (60,350) (75,500) (60,350)
Depreciation of property, plant and equipment 15 21,202 23,458 6,622 9,709
Amortisation of Trade Debtors 25,946 (12,128) 25,946 (12,129)
Amortisation of Lease Charges 20 1,089 1,089 - -
Amortisation of Intangible Assets 200 92 200 -
Amortisation of prepaid staff cost 807 529 - -
(Profit) / loss on sale of property, plant and equipment 5 (5,487) 5 (3,523)
Share based payment expenses 32 19,445 22,513 8,563 10,127
Gratuity provision and related costs 33.3 11,416 11,225 6,201 6,045
Other long term employee benefits 1,675 - 1,675 -
Operating Profit Before Working Capital Changes 351,321 356,491 291,324 295,157
Working Capital adjustments :
Decrease / (Increase) in Inventories (442) (205) (308) (138)
Decrease / (Increase) in Trade and Other Receivables (258,197) 529,883 (187,660) (135,473)
Decrease / (Increase) in Other Non-Current Assets (185,194) 62,909 (165,742) 61,974
Decrease / (Increase) in amounts Due from Related Parties (4,247) 28,352 (3,507) 2,443
Decrease / (Increase) in Other Current Assets (4,075) 1,174 (1,691) 786
Increase / (Decrease) in Trade and Other Payables (23,846) (688,023) (55,626) (25,988)
Increase / (Decrease) in amounts Due to Related Parties 2,571 400 4,874 (4,710)
Increase / (Decrease) in Other Current Liabilities (3,721) 2,285 (1,499) 278
Cash Generated from Operations (125,830) 293,266 (119,835) 194,329
Interest Received 14.1 34,066 33,358 8,760 7,014
Finance Expenses Paid 14.2 (119,439) (80,164) (119,438) (79,819)
Dividend income - Subsidiaries 12 - - 36,602 25,902
Income Tax Paid and setoff 18.4 (107,196) (52,776) (97,486) (45,686)
Gratuity paid/Transfers(Net) 33.2 475 (14,634) (3,163) (4,539)
Net Cash Flow from/(used in) Operating Activities (317,924) 179,050 (294,560) 97,201
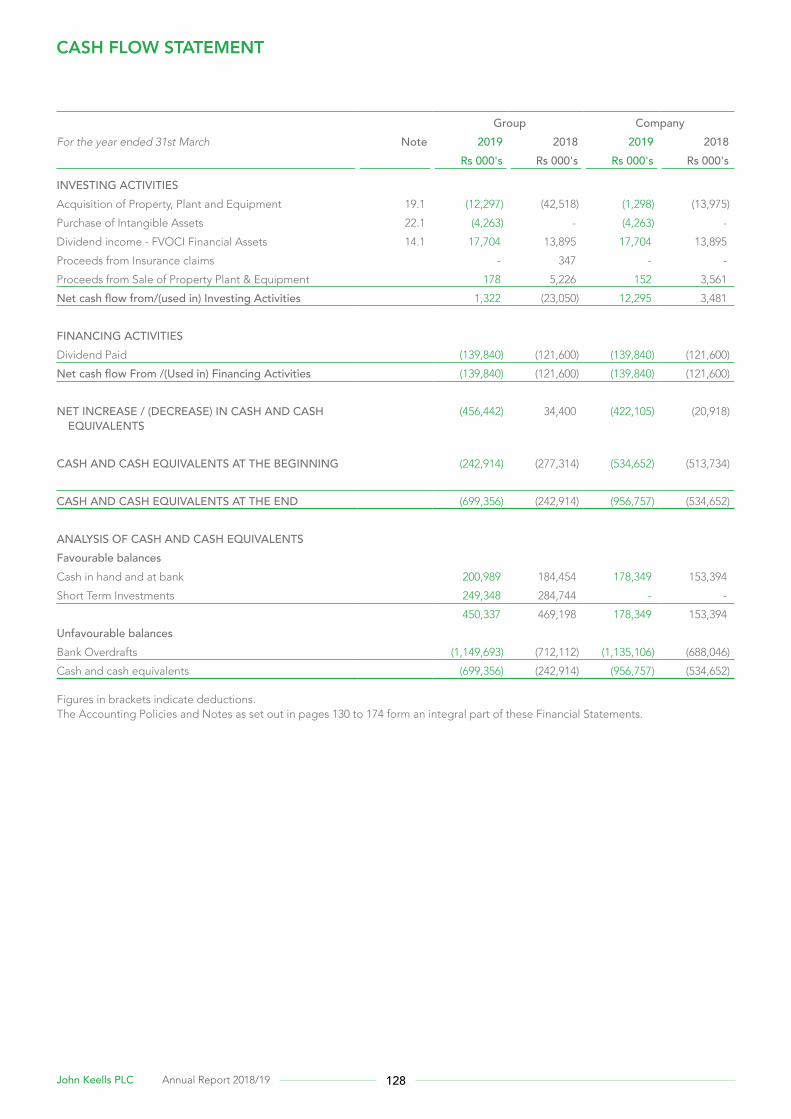
128John Keells PLC Annual Report 2018/19
CASH FLOW STATEMENT
Group CompanyFor the year ended 31st March Note 2019 2018 2019 2018 Rs 000's Rs 000's Rs 000's Rs 000's
INVESTING ACTIVITIESAcquisition of Property, Plant and Equipment 19.1 (12,297) (42,518) (1,298) (13,975)
Purchase of Intangible Assets 22.1 (4,263) - (4,263) -
Dividend income - FVOCI Financial Assets 14.1 17,704 13,895 17,704 13,895
Proceeds from Insurance claims - 347 - -
Proceeds from Sale of Property Plant & Equipment 178 5,226 152 3,561
Net cash flow from/(used in) Investing Activities 1,322 (23,050) 12,295 3,481
FINANCING ACTIVITIESDividend Paid (139,840) (121,600) (139,840) (121,600)
Net cash flow From /(Used in) Financing Activities (139,840) (121,600) (139,840) (121,600)
NET INCREASE / (DECREASE) IN CASH AND CASH EQUIVALENTS
(456,442) 34,400 (422,105) (20,918)
CASH AND CASH EQUIVALENTS AT THE BEGINNING (242,914) (277,314) (534,652) (513,734)
CASH AND CASH EQUIVALENTS AT THE END (699,356) (242,914) (956,757) (534,652)
ANALYSIS OF CASH AND CASH EQUIVALENTSFavourable balancesCash in hand and at bank 200,989 184,454 178,349 153,394
Short Term Investments 249,348 284,744 - -
450,337 469,198 178,349 153,394
Unfavourable balancesBank Overdrafts (1,149,693) (712,112) (1,135,106) (688,046)
Cash and cash equivalents (699,356) (242,914) (956,757) (534,652)
Figures in brackets indicate deductions.The Accounting Policies and Notes as set out in pages 130 to 174 form an integral part of these Financial Statements.
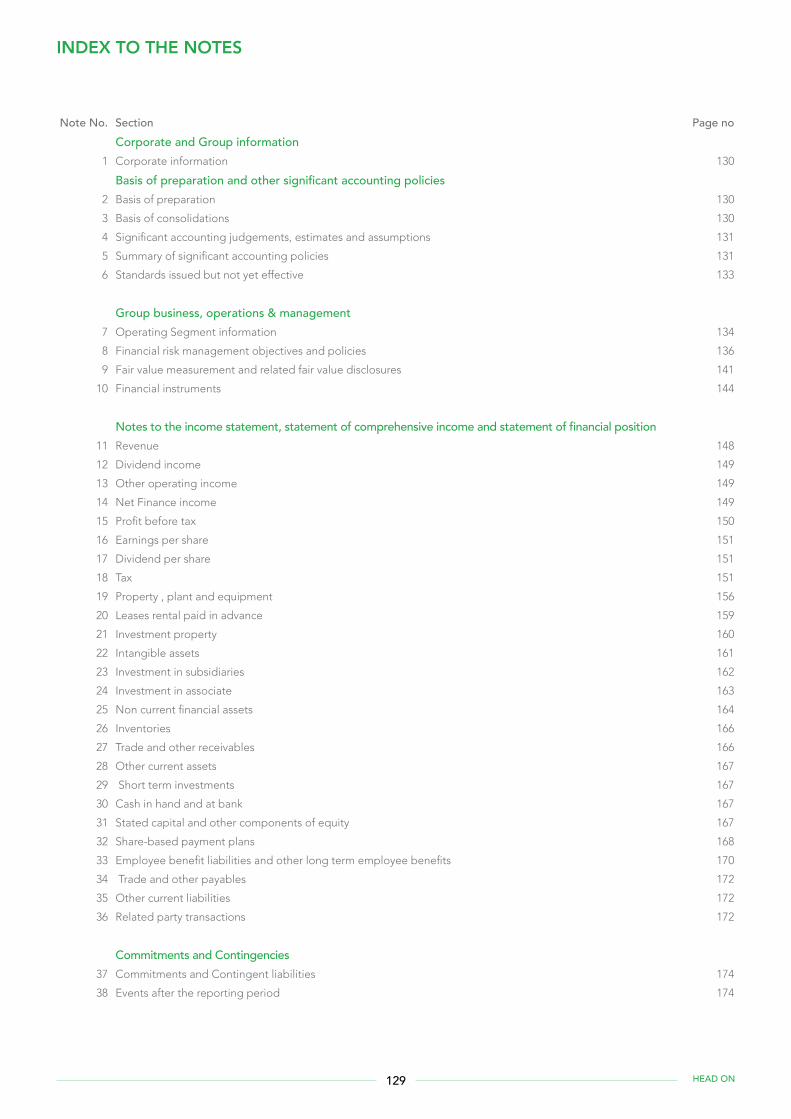
129 HEAD ON
INDEX TO THE NOTES
Note No. Section Page noCorporate and Group information
1 Corporate information 130
Basis of preparation and other significant accounting policies2 Basis of preparation 130
3 Basis of consolidations 130
4 Significant accounting judgements, estimates and assumptions 131
5 Summary of significant accounting policies 131
6 Standards issued but not yet effective 133
Group business, operations & management7 Operating Segment information 134
8 Financial risk management objectives and policies 136
9 Fair value measurement and related fair value disclosures 141
10 Financial instruments 144
Notes to the income statement, statement of comprehensive income and statement of financial position11 Revenue 148
12 Dividend income 149
13 Other operating income 149
14 Net Finance income 149
15 Profit before tax 150
16 Earnings per share 151
17 Dividend per share 151
18 Tax 151
19 Property , plant and equipment 156
20 Leases rental paid in advance 159
21 Investment property 160
22 Intangible assets 161
23 Investment in subsidiaries 162
24 Investment in associate 163
25 Non current financial assets 164
26 Inventories 166
27 Trade and other receivables 166
28 Other current assets 167
29 Short term investments 167
30 Cash in hand and at bank 167
31 Stated capital and other components of equity 167
32 Share-based payment plans 168
33 Employee benefit liabilities and other long term employee benefits 170
34 Trade and other payables 172
35 Other current liabilities 172
36 Related party transactions 172
Commitments and Contingencies 37 Commitments and Contingent liabilities 174
38 Events after the reporting period 174
NOTES TO THE FINANCIAL STATEMENTS
CORPORATE AND GROUP INFORMATION
1 CORPORATE INFORMATIONReporting EntityJohn Keells PLC is a public limited liability company incorporated and domiciled in Sri Lanka and listed on the Colombo Stock Exchange. The registered office of the Company is located at 117, Sir Chittampalam A Gardiner Mawatha, Colombo 02 and the principal place of business of the Company is located at 186, Vauxhall Street, Colombo 02.
Ordinary shares of the Company are listed on the Colombo Stock Exchange.
Consolidated financial statementsThe financial statements for the year ended 31 March 2019, comprise “the Company” referring to John Keells PLC. as the holding Company and “the Group” referring to the companies that have been consolidated therein.
Approval of Financial StatementsThe Financial statements for the year ended 31 March 2019 were authorized for issue by the Directors on 24th May 2019.
Principal Activities and Nature of OperationsHolding CompanyThe principal activities of the Group’s holding Company is Commodity broking.
Subsidiaries and AssociateThe companies within the Group and its business activities are disclosed in the Group Structure on page 8 of the Annual Report. There were no other significant changes in the nature of the principal activities of the Company and the Group during the financial year under review.
Parent Entity and Ultimate Parent EntityThe Company’s parent entity is John Keells Holdings PLC in the opinion of the Directors, which is incorporated in Sri Lanka.
Responsibility for Financial StatementsThe responsibility of the Directors in relation to the financial statements is set out in ‘The statement of director’s responsibility on Page 115 to in the Annual report.
Statement of complianceThe financial statements which comprise the statement of financial position, the statement of income, statement of comprehensive income, statement of changes in equity and the statement of cash flows, together with the accounting policies and notes (the “financial statements”) have been prepared in accordance with Sri Lanka Accounting Standards (SLFRS/LKAS) as issued by the Institute of Chartered Accountants of Sri Lanka (ICASL) and the requirement of the Companies Act No. 7 of 2007.
2 BASIS OF PREPARATIONBases of MeasurementThe Company’s financial statements have been prepared on an accrual basis and under the historical cost convention except for investment properties and available-for-sale financial assets designated at FVOCI that have been measured at fair value.
Presentation and Functional CurrencyThe consolidated financial statements are presented in Sri Lankan Rupees, the Group’s functional and presentation currency, which is the primary economic environment in which the Holding Company operates. Each entity in the Group uses the currency of the primary economic environment in which they operate as their functional currency.
All values are rounded to the nearest rupees thousand (Rs. ’000) except when otherwise indicated.
The significant accounting policies are discussed with relevant individual notes.
3 BASIS OF CONSOLIDATIONThe consolidated financial statements comprise the financial statements of the Group and its subsidiaries as at 31 March 2019. Control is achieved when the Group is exposed, or has rights, to variable returns from its involvement with the investee and has the ability to affect those returns through its power over the investee. Specifically, the Group controls an investee if, and only if, the Group has:
• Power over the investee (i.e., existing rights that give it the current ability to direct the relevant activities of the investee)
• Exposure, or rights, to variable returns from its involvement with the investee
• The ability to use its power over the investee to affect its returns
Generally, there is a presumption that a majority of voting rights result in control. To support this presumption and when the Group has less than a majority of the voting or similar rights of an investee, the Group considers all relevant facts and circumstances in assessing whether it has power over an investee, including:
• The contractual arrangement with the other vote holders of the investee
• Rights arising from other contractual arrangements
• The Group’s voting rights and potential voting right
The Group re-assesses whether or not it controls an investee if facts and circumstances indicate that there are changes to one or more of the three elements of control. Consolidation of a subsidiary begins when the Group obtains control over the subsidiary and ceases when the Group loses control of
130John Keells PLC Annual Report 2018/19
the subsidiary. Assets, liabilities, income and expenses of a subsidiary acquired or disposed of during the year are included in the consolidated financial statements from the date the Group gains control until the date the Group ceases to control the subsidiary.
Profit or loss and each component of other comprehensive income (OCI) are attributed to the equity holders of the parent of the Group and to the noncontrolling interests, even if this results in the non-controlling interests having a deficit balance. When necessary, adjustments are made to the financial statements of subsidiaries to bring their accounting policies into line with the Group’s accounting policies.
Loss of controlIf the Group loses control over a subsidiary, it derecognises the related assets (including goodwill), liabilities, noncontrolling interest and other components of equity while any resultant gain or loss is recognised in the income statement. Any investment retained is recognised at fair value.
The total profits and losses for the year of the Company and of its subsidiaries included in consolidation are shown in the consolidated income statement and consolidated statement of comprehensive income and all assets and liabilities of the Company and of its subsidiaries included in consolidation are shown in the consolidated statement of financial position.
Non-controlling interest (NCI)Non-controlling interest which represents the portion of profit or loss and net assets not held by the Group, are shown as a component of profit for the year in the consolidated income statement and statement of comprehensive income and as a component of equity in the consolidated statement of financial position, separately from equity attributable to the shareholders of the parent. The consolidated statement of cash flow includes the cash flows of the Company and its subsidiaries.
Transactions eliminated on consolidationAll intra-group assets, liabilities, equity, income, expenses and cash flows relating to transactions between members of the Group are eliminated in full on consolidation. A change in the ownership interest of a subsidiary, without a loss of control, is accounted for as an equity transaction.
4 SIGNIFICANT ACCOUNTING JUDGEMENT, ESTIMATES AND ASSUMPTIONSThe preparation of the financial statements of the Company require the management to make judgments, estimates and assumptions, which may affect the amounts of income, expenditure, assets, liabilities and the disclosure of contingent liabilities, at the end of the reporting period.
Uncertainty about these assumptions and estimates could result in outcomes that require a material adjustment to the carrying amount of assets or liabilities affected in future periods. In the process of applying the Company’s accounting policies, management has made various judgements. Those which management has assessed to have the most significant effect on the amounts recognised in the consolidated financial statements have been discussed in the individual notes of the related financial statement line items.
The key assumptions concerning the future and other key sources of estimation uncertainty at the reporting date, that have a significant risk of causing a material adjustment to the carrying amounts of assets and liabilities within the next financial year, are also described in the individual notes to the financial statements. The Group based its assumptions and estimates on parameters available when the financial statements were prepared. Existing circumstances and assumptions about future developments, however, may change due to market changes or circumstances arising that are beyond the control of the Group. Such changes are reflected in the assumptions when they occur.
The line items which have most significant effect on accounting, judgements, estimate and assumptions are as follows;
a) Valuation of property, plant and equipment and investment property.
b) Impairment of non-financial assets
c) Share based payments
d) Taxes
e) Employee benefit liability
f) Provision for expected credit losses of trade receivables
5 SUMMARY OF SIGNIFICANT ACCOUNTING POLICIESACCOUNTING POLICIESThe accounting policies adopted by the group are consistent with those used in the previous year other than the adoption of SLFRS 15 and SLFRS 9.
Changes in accounting standardsThe Group applied SLFRS 15 and SLFRS 9 for the first time. The nature and effect of the changes as a result of adoption of these new accounting standards are described below.
Several other amendments and interpretations apply for the first time in 2018/19 financial year, but do not have an impact on the consolidated financial statements of the Group. The Group has not early adopted any standards, interpretations or amendments that have been issued but are not yet effective.
SLFRS 15 Revenue from Contracts with CustomersSLFRS 15 supersedes LKAS 11 Construction Contracts, LKAS 18 Revenue and related interpretations and it applies, with
131 HEAD ON
limited exceptions, to all revenue arising from contracts with its customers. SLFRS 15 establishes a five-step model to account for revenue arising from contracts with customers and requires entities to exercise judgement, taking into consideration all of the relevant facts and circumstances when applying each step of the model to contracts with their customers. The standard requires entities to exercise judgement, taking into consideration all of the relevant facts and circumstances when applying each step of the model to contracts with their customers. The standard also specifies the accounting for the incremental costs of obtaining a contract and the costs directly related to fulfilling a contract. The Group adopted SLFRS 15 using the full retrospective method of adoption. Based on the assessment performed the Group concluded that SLFRS 15 does not have a material impact on Group’s consolidated financial statements.
SLFRS 9 Financial InstrumentsSLFRS 9 Financial Instruments replaces LKAS 39 Financial Instruments: Recognition and Measurement, bringing together all three aspects of the accounting for financial instruments: classification and measurement; impairment; and hedge accounting. With the exception of hedge accounting, which the Group applied prospectively, the Group has applied SLFRS 9 retrospectively, with the initial application date of 1 April 2018. The Group has taken an exception not to restate comparative information for prior periods with respect to classification and measurement requirements.
Comparative informationThe presentation and classification of the financial statements of the previous years have been amended, where relevant for better presentation and to be comparable with those of the current year.
5.1 Business combinations & goodwillAcquisitions of subsidiaries are accounted for using the acquisition method of accounting. The Group measures goodwill at the acquisition date as the fair value of the consideration transferred including the recognized amount of any non-controlling interests in the acquiree, less the net recognized amount (generally fair value) of the identifiable assets acquired and liabilities assumed, all measured as of the acquisition date. When the excess is negative, a bargain purchase gain is recognized immediately in the income statement.
The Group selects on a transaction-by transaction basis whether to measure non-controlling interests at fair value, or at their proportionate share of the recognized amount of the identifiable net assets, at the acquisition date. Transaction costs, other than those associated with the issue of debt or equity securities, that the Group incurs in connection with a business combination are expensed as incurred. When the Group acquires a business, it assesses the financial assets and liabilities assumed for appropriate classification and designation in accordance with the contractual terms,
economic circumstances and pertinent conditions as at the acquisition date. This includes the separation of embedded derivatives in host contracts by the acquiree.
If the business combination is achieved in stages, the acquisition date fair value of the acquirer’s previously held equity interest in the acquiree is remeasured to fair value at the acquisition date through profit or loss.
Any contingent consideration to be transferred by the acquirer will be recognized at fair value at the acquisition date. Contingent consideration which is deemed to be an asset or liability, which is a financial instrument and within the scope of LKAS 39, is measured at fair value with changes in fair value either in profit or loss or as a change to other comprehensive income. If the contingent consideration is classified as equity, it will not be remeasured. Subsequent settlement is accounted for within equity. In instances where the contingent consideration does not fall within the scope of LKAS 39, it is measured in accordance with the appropriate SLFRS/LKAS.
Goodwill is initially measured at cost being the excess of the consideration transferred over the Group’s net identifiable assets acquired and liabilities assumed. If this consideration is lower than the fair value of the net assets of the subsidiary acquired. The difference is recognized in the income statement.
After initial recognition, goodwill is measured at cost less any accumulated impairment losses. Goodwill is reviewed for impairment, annually or more frequently if events or changes in circumstances indicate that the carrying value maybe impaired. For the purpose of impairment testing, goodwill acquired in a business combination is, from the acquisition date, allocated to each of the Group’s cash generating units that are expected to benefit from the combination, irrespective of whether other assets or liabilities of the acquiree are assigned to those units.
Impairment is determined by assessing the recoverable amount of the cash generating unit to which the goodwill relates. Where the recoverable amount of the cash generating unit is less than the carrying amount, an impairment loss is recognized. The impairment loss is allocated first to reduce the carrying amount of any goodwill allocated to the unit and then to the other assets pro-rata to the carrying amount of each asset in the unit.
Goodwill and fair value adjustments arising on the acquisition of a foreign operation area treated as assets and liabilities of the foreign operation and translated at the closing rate.
Where goodwill forms part of a cash generating unit and part of the operation within that unit is disposed of, the goodwill associated with the operation disposed of is included in the carrying amount of the operation when determining the gain
NOTES TO THE FINANCIAL STATEMENTS
132John Keells PLC Annual Report 2018/19
or loss on disposal of the operation. Goodwill disposed in this circumstance is measured based on the relative values of the operation disposed of and the portion of the cash-generating unit retained.
Other significant accounting policies not covered with individual notes.
Following accounting policies which have been applied consistently by the Group, are considered to be significant but are not covered in any other sections.
5.2 Current versus non-current classificationThe Group presents assets and liabilities in statement of financial position based on current/non-current classification. An asset is current when it is:
* Expected to be realised or intended to be sold or consumed in the normal operating cycle
* Held primarily for the purpose of trading
* Expected to be realised within twelve months after the reporting period, or
* Cash or cash equivalent unless restricted from being exchange or used to settle a liability for at least twelve months after the reporting period
All other assets are classified as non-current
A liability is current when
* It is expected to be settled in the normal operating cycle
* It is held primarily for the purpose of trading
* It is due to be settled within twelve months after the reporting period, or
*There is no unconditional right to deter the settlement of the liability for at least twelve months after the reporting period
The Group classifies all other liabilities as non-current
Deferred tax assets and liabilities are classified as non current assets and liabilities.
6 STANDARDS ISSUED BUT NOT YET EFFECTIVEThe following SLFRS have been issued by the Institute of Chartered Accountants of Sri Lanka that have an effective date in the future and have not been applied in preparing these financial statements. Those SLFRS’s will have an effect on the accounting policies currently adopted by the Group and may have an impact on the future financial statements.
The Group intends to adopt these standards, if applicable, when they become effective.
Accounting Standard
Summary of the Requirements
Effective Date Possible Impact on Consolidated Financial Statements
SLFRS 16 - Leases
SLFRS 16 sets out the principles for the recognition, measurement, presentation and disclosure of leases and requires lessees to account for all leases under a single on-balance sheet model similar to the accounting for finance leases under LKAS 17. The objective is to ensure that lessees and lessors provide relevant information in a manner that faithfully represents those transactions. This information gives a basis for the users of financial statements to assess the effect that leases have on the financial position.
On or after 1 January 2019 (early adoption permitted)
The Group will apply the standard from its mandatory adoption date which financial reporting period starting from 1 April 2019. The Group intends to apply the simplified transition approach and will not restate comparative amounts for the year prior to first adoption. The standard will affect primarily the accounting for the Group’s operating leases and lease commitments. The Group will elect to apply the standard to contracts that were previously identified as leases applying LKAS 17 and IFRIC 4. The Group will elect to use the exemptions applicable to the standard on lease contracts for which the lease terms ends within 12 months as of the date of initial application, and lease contracts for which the underlying asset is of low value. The Group has rent agreements with several parties that the lease term ends within 12 months. Right-of-use assets for property leases will be measured on transition as if the new rules had always been applied. All other right-of-use assets will be measured at the amount of the lease liability on adoption (adjusted for any prepaid or accrued lease expenses).
The Company has performed a detailed impact assessment of SLFRS 16 as at the reporting date.
133 HEAD ON
Assets
Right-of-use assets 35,846
Lease rentals paid in advance (35,846)
Prepayments -
Liabilities -
Lease liabilities - Long term -
Deferred tax liabilities -
Lease liabilities - Short term -
Net impact on equity -
The Group expects that net profit after tax will have no impact for 2019/20 financial year as a result of adopting the new rules.
Operating cash flows and financing cash flows will have no impact. The Company’s activities as a lessor are not material and hence the Company does not expect any significant impact on the financial statements.
The following amendments and improvements are not expected to have a significant impact on the Group’s financial statements during the year ended 31st March 2019
• Presentation of Financial Statements & Accounting Policies and Changes in Accounting Estimates and Errors (Amendments to LKAS 1 & LKAS 8)
• IFRIC Interpretation 23 Uncertainty over Income Tax Treatment
• Sale or Contribution of Assets between an Investor and its Associate or Joint Venture (Amendments to SLFRS 10 and LKAS 28)
• Plan Amendment, Curtailment or Settlement (Amendments to LKAS 19)
7 OPERATING SEGMENT INFORMATIONAccounting PolicyThe Group internal organisation and management is structured based on individual services which are similar in nature and process and where the risk and returns are similar. The operating segments represent the Group’s business structure.
The activities of each of the operating businesses of the Group are detailed in the Group structure of the Annual report.
The Group’s operating business segments are as follows:
• Produce Broking - provision of tea and rubber broking services
• Warehousing - provision of warehousing of tea services
• Share Broking - provision of stock broking services
Segment information has been prepared in conformity with the accounting policies adopted for preparing and presenting the consolidated financial statements of the Group.
No operating segments have been aggregated to form the above reportable operating segments. An individual segment manger is determined for each operating segment and the results are regularly reviewed by the Board of Directors. The Board of Directors monitors the operating results of its business units separately for the purpose of making decisions about resource allocation and performance assessment. Segment performance is evaluated based on operating profit or loss which in certain respects, as explained in the operating segments information, is measured differently from operating profit or loss in the consolidated financial statements. Transfer prices between operating segments are carried out in the ordinary course of business. The Income taxes are managed on Group basis and are not allocated to operating segments
Transfer prices between operating segments are on an arm’s -length basis in a manner similar to transactions with third parties.
NOTES TO THE FINANCIAL STATEMENTS
134John Keells PLC Annual Report 2018/19
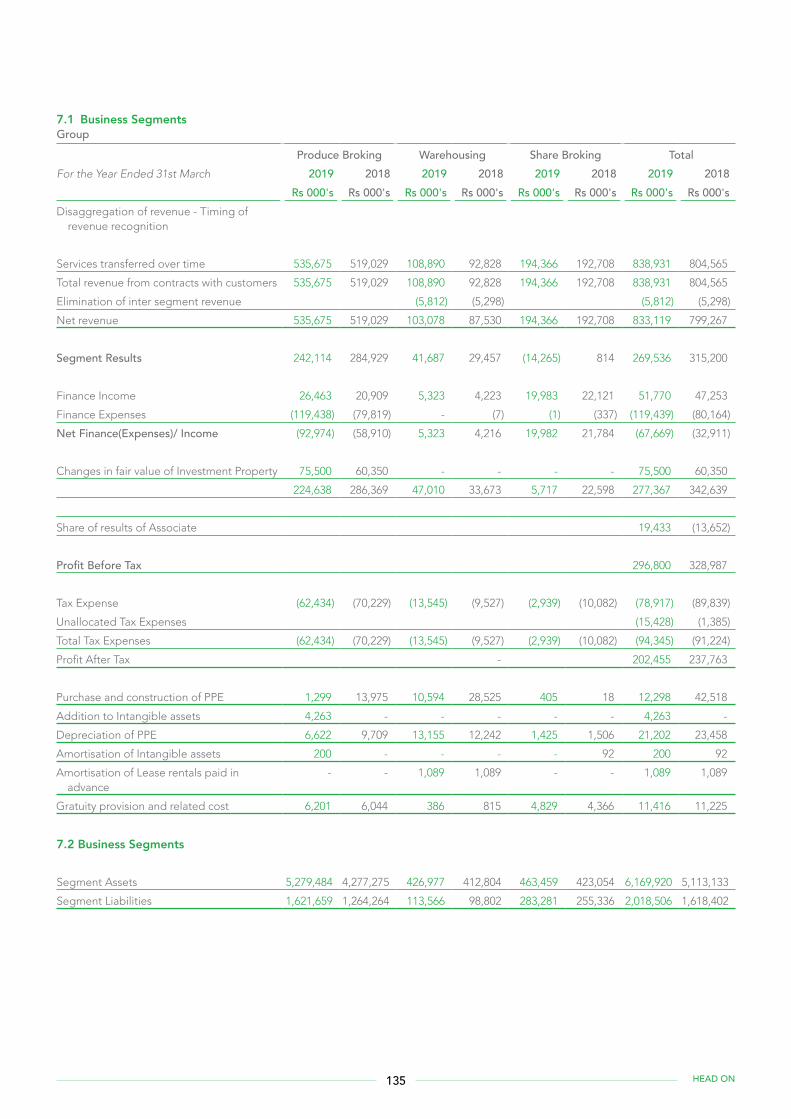
7.1 Business SegmentsGroup
Produce Broking Warehousing Share Broking TotalFor the Year Ended 31st March 2019 2018 2019 2018 2019 2018 2019 2018 Rs 000's Rs 000's Rs 000's Rs 000's Rs 000's Rs 000's Rs 000's Rs 000's Disaggregation of revenue - Timing of
revenue recognition
Services transferred over time 535,675 519,029 108,890 92,828 194,366 192,708 838,931 804,565
Total revenue from contracts with customers 535,675 519,029 108,890 92,828 194,366 192,708 838,931 804,565
Elimination of inter segment revenue (5,812) (5,298) (5,812) (5,298)
Net revenue 535,675 519,029 103,078 87,530 194,366 192,708 833,119 799,267
Segment Results 242,114 284,929 41,687 29,457 (14,265) 814 269,536 315,200
Finance Income 26,463 20,909 5,323 4,223 19,983 22,121 51,770 47,253
Finance Expenses (119,438) (79,819) - (7) (1) (337) (119,439) (80,164)
Net Finance(Expenses)/ Income (92,974) (58,910) 5,323 4,216 19,982 21,784 (67,669) (32,911)
Changes in fair value of Investment Property 75,500 60,350 - - - - 75,500 60,350
224,638 286,369 47,010 33,673 5,717 22,598 277,367 342,639
Share of results of Associate 19,433 (13,652)
Profit Before Tax 296,800 328,987
Tax Expense (62,434) (70,229) (13,545) (9,527) (2,939) (10,082) (78,917) (89,839)
Unallocated Tax Expenses (15,428) (1,385)
Total Tax Expenses (62,434) (70,229) (13,545) (9,527) (2,939) (10,082) (94,345) (91,224)
Profit After Tax - 202,455 237,763
Purchase and construction of PPE 1,299 13,975 10,594 28,525 405 18 12,298 42,518
Addition to Intangible assets 4,263 - - - - - 4,263 -
Depreciation of PPE 6,622 9,709 13,155 12,242 1,425 1,506 21,202 23,458
Amortisation of Intangible assets 200 - - - - 92 200 92
Amortisation of Lease rentals paid in advance
- - 1,089 1,089 - - 1,089 1,089
Gratuity provision and related cost 6,201 6,044 386 815 4,829 4,366 11,416 11,225
7.2 Business Segments
Segment Assets 5,279,484 4,277,275 426,977 412,804 463,459 423,054 6,169,920 5,113,133
Segment Liabilities 1,621,659 1,264,264 113,566 98,802 283,281 255,336 2,018,506 1,618,402
135 HEAD ON
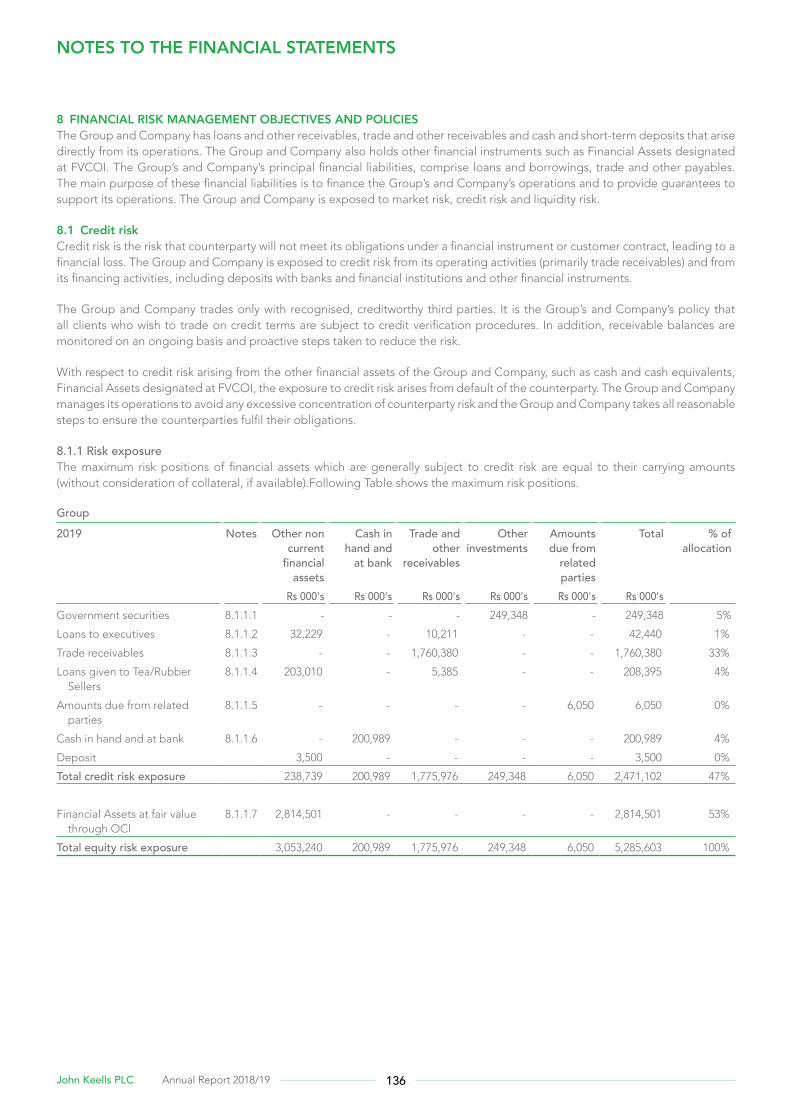
136John Keells PLC Annual Report 2018/19
8 FINANCIAL RISK MANAGEMENT OBJECTIVES AND POLICIESThe Group and Company has loans and other receivables, trade and other receivables and cash and short-term deposits that arise directly from its operations. The Group and Company also holds other financial instruments such as Financial Assets designated at FVCOI. The Group’s and Company’s principal financial liabilities, comprise loans and borrowings, trade and other payables. The main purpose of these financial liabilities is to finance the Group’s and Company’s operations and to provide guarantees to support its operations. The Group and Company is exposed to market risk, credit risk and liquidity risk.
8.1 Credit riskCredit risk is the risk that counterparty will not meet its obligations under a financial instrument or customer contract, leading to a financial loss. The Group and Company is exposed to credit risk from its operating activities (primarily trade receivables) and from its financing activities, including deposits with banks and financial institutions and other financial instruments.
The Group and Company trades only with recognised, creditworthy third parties. It is the Group’s and Company’s policy that all clients who wish to trade on credit terms are subject to credit verification procedures. In addition, receivable balances are monitored on an ongoing basis and proactive steps taken to reduce the risk.
With respect to credit risk arising from the other financial assets of the Group and Company, such as cash and cash equivalents, Financial Assets designated at FVCOI, the exposure to credit risk arises from default of the counterparty. The Group and Company manages its operations to avoid any excessive concentration of counterparty risk and the Group and Company takes all reasonable steps to ensure the counterparties fulfil their obligations.
8.1.1 Risk exposureThe maximum risk positions of financial assets which are generally subject to credit risk are equal to their carrying amounts (without consideration of collateral, if available).Following Table shows the maximum risk positions.
Group
2019 Notes Other non current
financial assets
Cash in hand and
at bank
Trade and other
receivables
Otherinvestments
Amounts due from
related parties
Total % of allocation
Rs 000's Rs 000's Rs 000's Rs 000's Rs 000's Rs 000's Government securities 8.1.1.1 - - - 249,348 - 249,348 5%
Loans to executives 8.1.1.2 32,229 - 10,211 - - 42,440 1%
Trade receivables 8.1.1.3 - - 1,760,380 - - 1,760,380 33%
Loans given to Tea/Rubber Sellers
8.1.1.4 203,010 - 5,385 - - 208,395 4%
Amounts due from related parties
8.1.1.5 - - - - 6,050 6,050 0%
Cash in hand and at bank 8.1.1.6 - 200,989 - - - 200,989 4%
Deposit 3,500 - - - - 3,500 0%
Total credit risk exposure 238,739 200,989 1,775,976 249,348 6,050 2,471,102 47%
Financial Assets at fair value through OCI
8.1.1.7 2,814,501 - - - - 2,814,501 53%
Total equity risk exposure 3,053,240 200,989 1,775,976 249,348 6,050 5,285,603 100%
NOTES TO THE FINANCIAL STATEMENTS
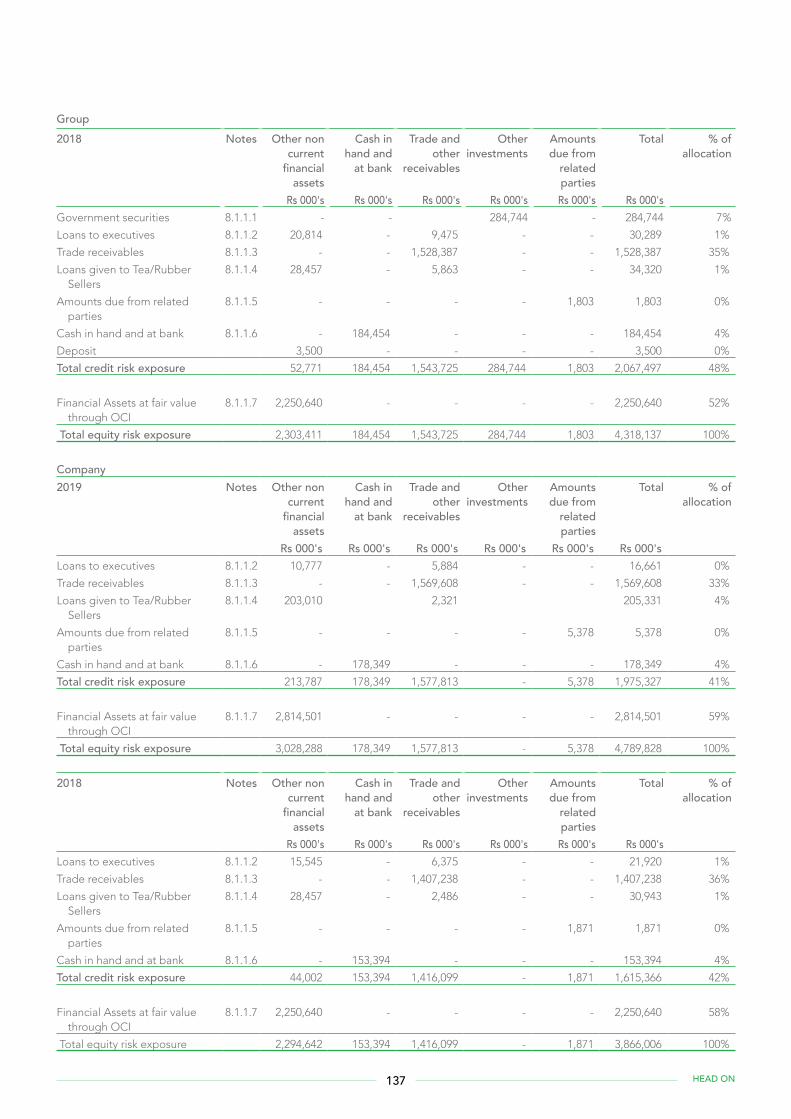
137 HEAD ON
Group2018 Notes Other non
current financial
assets
Cash in hand and
at bank
Trade and other
receivables
Otherinvestments
Amounts due from
related parties
Total % of allocation
Rs 000's Rs 000's Rs 000's Rs 000's Rs 000's Rs 000's Government securities 8.1.1.1 - - 284,744 - 284,744 7%
Loans to executives 8.1.1.2 20,814 - 9,475 - - 30,289 1%
Trade receivables 8.1.1.3 - - 1,528,387 - - 1,528,387 35%
Loans given to Tea/Rubber Sellers
8.1.1.4 28,457 - 5,863 - - 34,320 1%
Amounts due from related parties
8.1.1.5 - - - - 1,803 1,803 0%
Cash in hand and at bank 8.1.1.6 - 184,454 - - - 184,454 4%
Deposit 3,500 - - - - 3,500 0%
Total credit risk exposure 52,771 184,454 1,543,725 284,744 1,803 2,067,497 48%
Financial Assets at fair value through OCI
8.1.1.7 2,250,640 - - - - 2,250,640 52%
Total equity risk exposure 2,303,411 184,454 1,543,725 284,744 1,803 4,318,137 100%
Company2019 Notes Other non
current financial
assets
Cash in hand and
at bank
Trade and other
receivables
Otherinvestments
Amounts due from
related parties
Total % of allocation
Rs 000's Rs 000's Rs 000's Rs 000's Rs 000's Rs 000's Loans to executives 8.1.1.2 10,777 - 5,884 - - 16,661 0%
Trade receivables 8.1.1.3 - - 1,569,608 - - 1,569,608 33%
Loans given to Tea/Rubber Sellers
8.1.1.4 203,010 2,321 205,331 4%
Amounts due from related parties
8.1.1.5 - - - - 5,378 5,378 0%
Cash in hand and at bank 8.1.1.6 - 178,349 - - - 178,349 4%
Total credit risk exposure 213,787 178,349 1,577,813 - 5,378 1,975,327 41%
Financial Assets at fair value through OCI
8.1.1.7 2,814,501 - - - - 2,814,501 59%
Total equity risk exposure 3,028,288 178,349 1,577,813 - 5,378 4,789,828 100%
2018 Notes Other non current
financial assets
Cash in hand and
at bank
Trade and other
receivables
Otherinvestments
Amounts due from
related parties
Total % of allocation
Rs 000's Rs 000's Rs 000's Rs 000's Rs 000's Rs 000's Loans to executives 8.1.1.2 15,545 - 6,375 - - 21,920 1%
Trade receivables 8.1.1.3 - - 1,407,238 - - 1,407,238 36%
Loans given to Tea/Rubber Sellers
8.1.1.4 28,457 - 2,486 - - 30,943 1%
Amounts due from related parties
8.1.1.5 - - - - 1,871 1,871 0%
Cash in hand and at bank 8.1.1.6 - 153,394 - - - 153,394 4%
Total credit risk exposure 44,002 153,394 1,416,099 - 1,871 1,615,366 42%
Financial Assets at fair value through OCI
8.1.1.7 2,250,640 - - - - 2,250,640 58%
Total equity risk exposure 2,294,642 153,394 1,416,099 - 1,871 3,866,006 100%
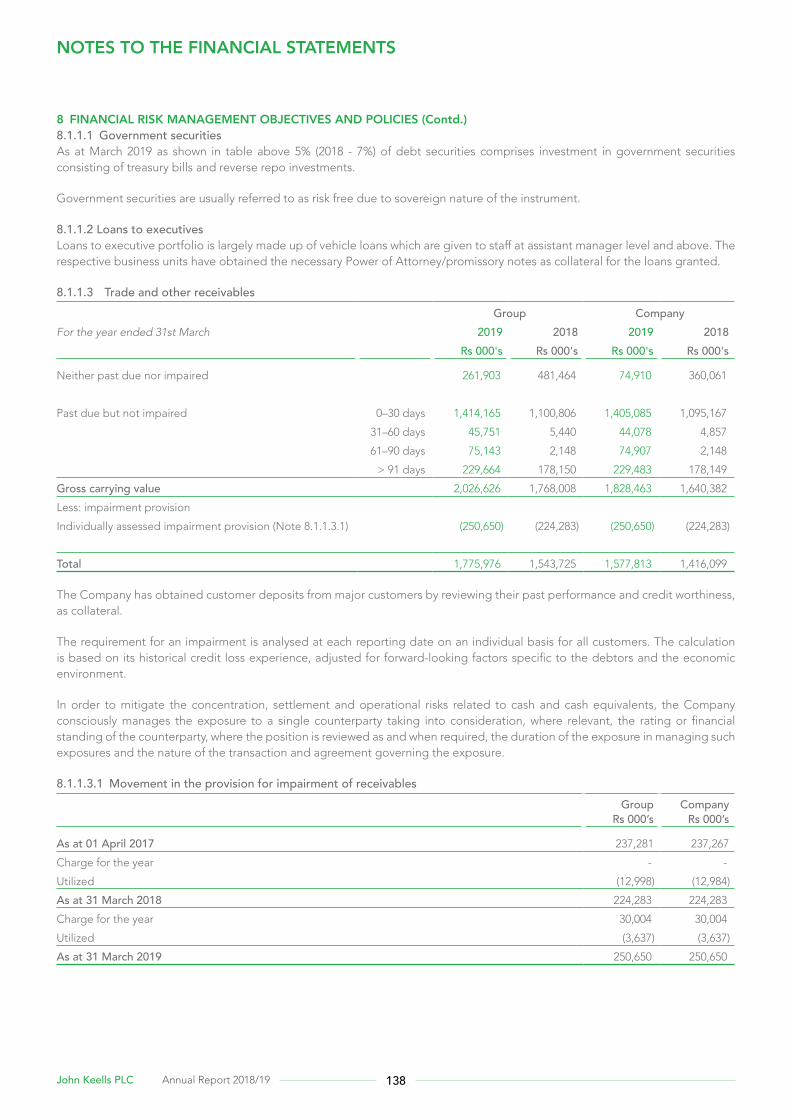
138John Keells PLC Annual Report 2018/19
8 FINANCIAL RISK MANAGEMENT OBJECTIVES AND POLICIES (Contd.)8.1.1.1 Government securitiesAs at March 2019 as shown in table above 5% (2018 - 7%) of debt securities comprises investment in government securities consisting of treasury bills and reverse repo investments.
Government securities are usually referred to as risk free due to sovereign nature of the instrument.
8.1.1.2 Loans to executivesLoans to executive portfolio is largely made up of vehicle loans which are given to staff at assistant manager level and above. The respective business units have obtained the necessary Power of Attorney/promissory notes as collateral for the loans granted.
8.1.1.3 Trade and other receivables Group Company
For the year ended 31st March 2019 2018 2019 2018 Rs 000's Rs 000's Rs 000's Rs 000's
Neither past due nor impaired 261,903 481,464 74,910 360,061
Past due but not impaired 0–30 days 1,414,165 1,100,806 1,405,085 1,095,167
31–60 days 45,751 5,440 44,078 4,857
61–90 days 75,143 2,148 74,907 2,148
> 91 days 229,664 178,150 229,483 178,149
Gross carrying value 2,026,626 1,768,008 1,828,463 1,640,382
Less: impairment provision
Individually assessed impairment provision (Note 8.1.1.3.1) (250,650) (224,283) (250,650) (224,283)
Total 1,775,976 1,543,725 1,577,813 1,416,099
The Company has obtained customer deposits from major customers by reviewing their past performance and credit worthiness, as collateral.
The requirement for an impairment is analysed at each reporting date on an individual basis for all customers. The calculation is based on its historical credit loss experience, adjusted for forward-looking factors specific to the debtors and the economic environment.
In order to mitigate the concentration, settlement and operational risks related to cash and cash equivalents, the Company consciously manages the exposure to a single counterparty taking into consideration, where relevant, the rating or financial standing of the counterparty, where the position is reviewed as and when required, the duration of the exposure in managing such exposures and the nature of the transaction and agreement governing the exposure.
8.1.1.3.1 Movement in the provision for impairment of receivablesGroup
Rs 000’sCompany
Rs 000’s
As at 01 April 2017 237,281 237,267
Charge for the year - -
Utilized (12,998) (12,984)
As at 31 March 2018 224,283 224,283
Charge for the year 30,004 30,004
Utilized (3,637) (3,637)
As at 31 March 2019 250,650 250,650
NOTES TO THE FINANCIAL STATEMENTS
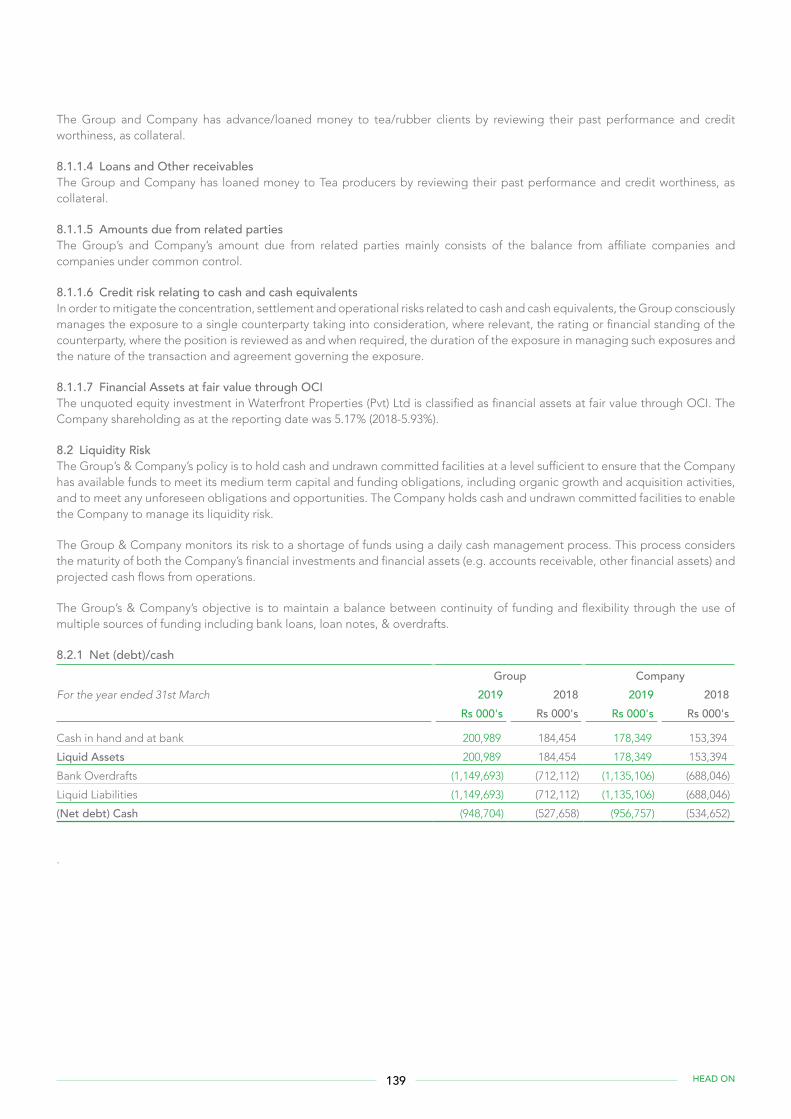
139 HEAD ON
The Group and Company has advance/loaned money to tea/rubber clients by reviewing their past performance and credit worthiness, as collateral.
8.1.1.4 Loans and Other receivablesThe Group and Company has loaned money to Tea producers by reviewing their past performance and credit worthiness, as collateral.
8.1.1.5 Amounts due from related partiesThe Group’s and Company’s amount due from related parties mainly consists of the balance from affiliate companies and companies under common control.
8.1.1.6 Credit risk relating to cash and cash equivalentsIn order to mitigate the concentration, settlement and operational risks related to cash and cash equivalents, the Group consciously manages the exposure to a single counterparty taking into consideration, where relevant, the rating or financial standing of the counterparty, where the position is reviewed as and when required, the duration of the exposure in managing such exposures and the nature of the transaction and agreement governing the exposure.
8.1.1.7 Financial Assets at fair value through OCIThe unquoted equity investment in Waterfront Properties (Pvt) Ltd is classified as financial assets at fair value through OCI. The Company shareholding as at the reporting date was 5.17% (2018-5.93%).
8.2 Liquidity RiskThe Group’s & Company’s policy is to hold cash and undrawn committed facilities at a level sufficient to ensure that the Company has available funds to meet its medium term capital and funding obligations, including organic growth and acquisition activities, and to meet any unforeseen obligations and opportunities. The Company holds cash and undrawn committed facilities to enable the Company to manage its liquidity risk.
The Group & Company monitors its risk to a shortage of funds using a daily cash management process. This process considers the maturity of both the Company’s financial investments and financial assets (e.g. accounts receivable, other financial assets) and projected cash flows from operations.
The Group’s & Company’s objective is to maintain a balance between continuity of funding and flexibility through the use of multiple sources of funding including bank loans, loan notes, & overdrafts.
8.2.1 Net (debt)/cash Group Company
For the year ended 31st March 2019 2018 2019 2018 Rs 000's Rs 000's Rs 000's Rs 000's
Cash in hand and at bank 200,989 184,454 178,349 153,394
Liquid Assets 200,989 184,454 178,349 153,394
Bank Overdrafts (1,149,693) (712,112) (1,135,106) (688,046)
Liquid Liabilities (1,149,693) (712,112) (1,135,106) (688,046)
(Net debt) Cash (948,704) (527,658) (956,757) (534,652)
.
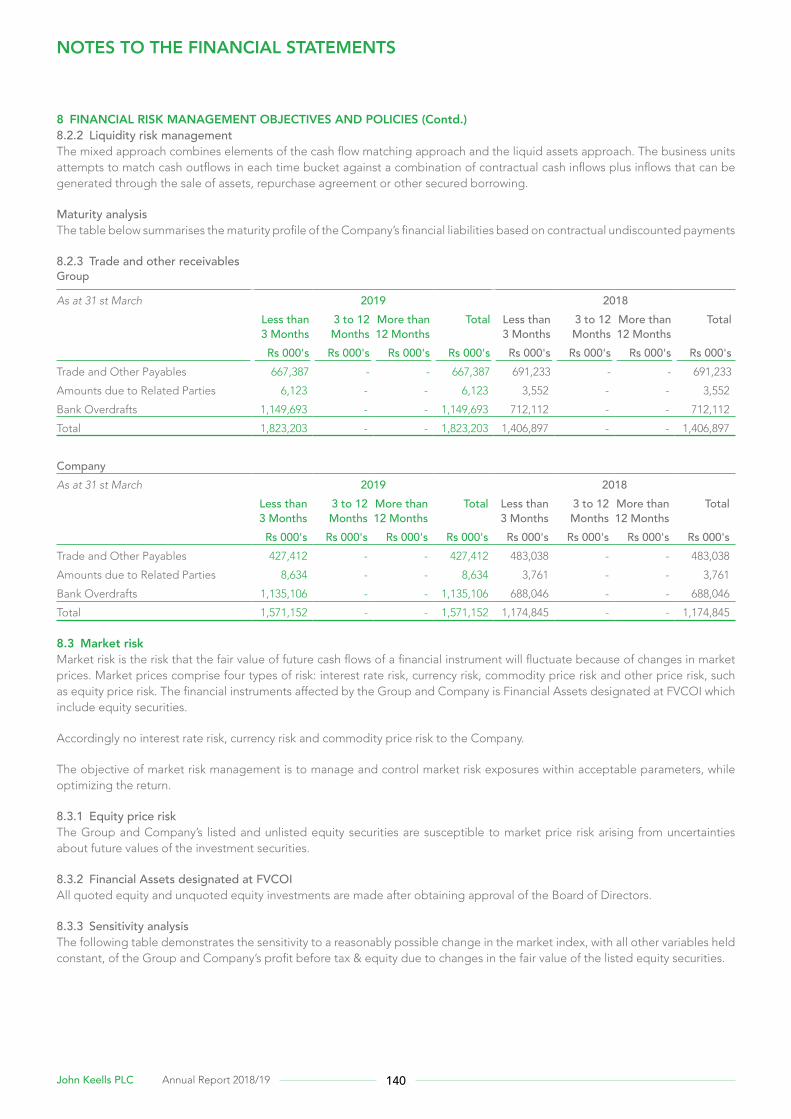
140John Keells PLC Annual Report 2018/19
8 FINANCIAL RISK MANAGEMENT OBJECTIVES AND POLICIES (Contd.)8.2.2 Liquidity risk managementThe mixed approach combines elements of the cash flow matching approach and the liquid assets approach. The business units attempts to match cash outflows in each time bucket against a combination of contractual cash inflows plus inflows that can be generated through the sale of assets, repurchase agreement or other secured borrowing.
Maturity analysisThe table below summarises the maturity profile of the Company’s financial liabilities based on contractual undiscounted payments
8.2.3 Trade and other receivablesGroup
As at 31 st March 2019 2018 Less than
3 Months3 to 12 Months
More than 12 Months
Total Less than 3 Months
3 to 12 Months
More than 12 Months
Total
Rs 000's Rs 000's Rs 000's Rs 000's Rs 000's Rs 000's Rs 000's Rs 000's Trade and Other Payables 667,387 - - 667,387 691,233 - - 691,233
Amounts due to Related Parties 6,123 - - 6,123 3,552 - - 3,552
Bank Overdrafts 1,149,693 - - 1,149,693 712,112 - - 712,112
Total 1,823,203 - - 1,823,203 1,406,897 - - 1,406,897
CompanyAs at 31 st March 2019 2018 Less than
3 Months3 to 12 Months
More than 12 Months
Total Less than 3 Months
3 to 12 Months
More than 12 Months
Total
Rs 000's Rs 000's Rs 000's Rs 000's Rs 000's Rs 000's Rs 000's Rs 000's Trade and Other Payables 427,412 - - 427,412 483,038 - - 483,038
Amounts due to Related Parties 8,634 - - 8,634 3,761 - - 3,761
Bank Overdrafts 1,135,106 - - 1,135,106 688,046 - - 688,046
Total 1,571,152 - - 1,571,152 1,174,845 - - 1,174,845
8.3 Market riskMarket risk is the risk that the fair value of future cash flows of a financial instrument will fluctuate because of changes in market prices. Market prices comprise four types of risk: interest rate risk, currency risk, commodity price risk and other price risk, such as equity price risk. The financial instruments affected by the Group and Company is Financial Assets designated at FVCOI which include equity securities.
Accordingly no interest rate risk, currency risk and commodity price risk to the Company.
The objective of market risk management is to manage and control market risk exposures within acceptable parameters, while optimizing the return.
8.3.1 Equity price riskThe Group and Company’s listed and unlisted equity securities are susceptible to market price risk arising from uncertainties about future values of the investment securities.
8.3.2 Financial Assets designated at FVCOIAll quoted equity and unquoted equity investments are made after obtaining approval of the Board of Directors.
8.3.3 Sensitivity analysisThe following table demonstrates the sensitivity to a reasonably possible change in the market index, with all other variables held constant, of the Group and Company’s profit before tax & equity due to changes in the fair value of the listed equity securities.
NOTES TO THE FINANCIAL STATEMENTS
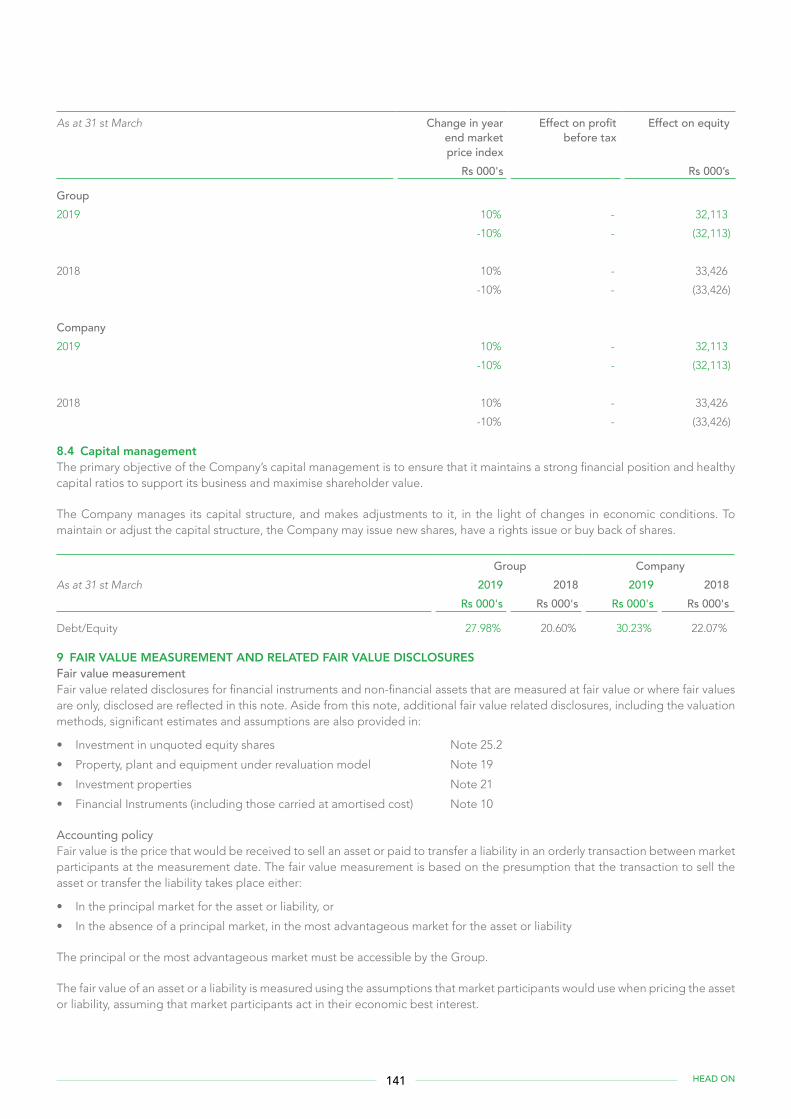
141 HEAD ON
As at 31 st March Change in year end market price index
Effect on profit before tax
Effect on equity
Rs 000's Rs 000’s
Group2019 10% - 32,113
-10% - (32,113)
2018 10% - 33,426
-10% - (33,426)
Company2019 10% - 32,113
-10% - (32,113)
2018 10% - 33,426
-10% - (33,426)
8.4 Capital managementThe primary objective of the Company’s capital management is to ensure that it maintains a strong financial position and healthy capital ratios to support its business and maximise shareholder value.
The Company manages its capital structure, and makes adjustments to it, in the light of changes in economic conditions. To maintain or adjust the capital structure, the Company may issue new shares, have a rights issue or buy back of shares.
Group CompanyAs at 31 st March 2019 2018 2019 2018 Rs 000's Rs 000's Rs 000's Rs 000's
Debt/Equity 27.98% 20.60% 30.23% 22.07%
9 FAIR VALUE MEASUREMENT AND RELATED FAIR VALUE DISCLOSURESFair value measurementFair value related disclosures for financial instruments and non-financial assets that are measured at fair value or where fair values are only, disclosed are reflected in this note. Aside from this note, additional fair value related disclosures, including the valuation methods, significant estimates and assumptions are also provided in:
• Investment in unquoted equity shares Note 25.2
• Property, plant and equipment under revaluation model Note 19
• Investment properties Note 21
• Financial Instruments (including those carried at amortised cost) Note 10
Accounting policyFair value is the price that would be received to sell an asset or paid to transfer a liability in an orderly transaction between market participants at the measurement date. The fair value measurement is based on the presumption that the transaction to sell the asset or transfer the liability takes place either:
• In the principal market for the asset or liability, or
• In the absence of a principal market, in the most advantageous market for the asset or liability
The principal or the most advantageous market must be accessible by the Group.
The fair value of an asset or a liability is measured using the assumptions that market participants would use when pricing the asset or liability, assuming that market participants act in their economic best interest.
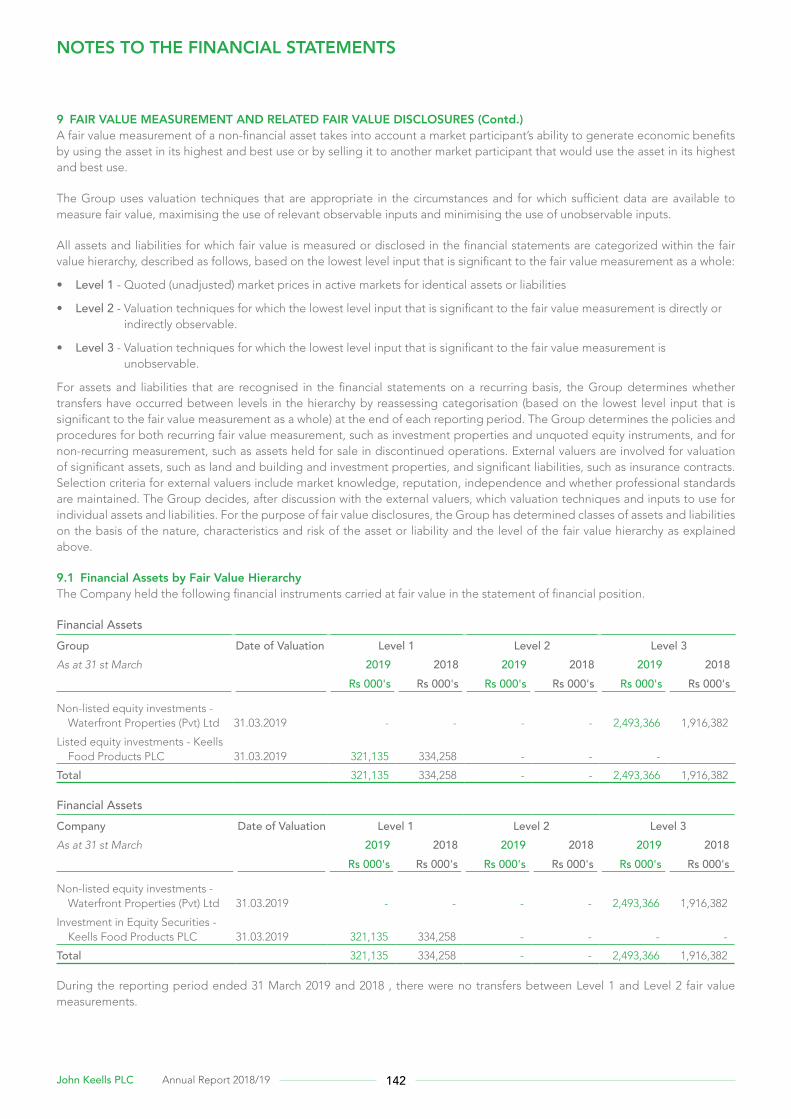
142John Keells PLC Annual Report 2018/19
9 FAIR VALUE MEASUREMENT AND RELATED FAIR VALUE DISCLOSURES (Contd.)A fair value measurement of a non-financial asset takes into account a market participant’s ability to generate economic benefits by using the asset in its highest and best use or by selling it to another market participant that would use the asset in its highest and best use.
The Group uses valuation techniques that are appropriate in the circumstances and for which sufficient data are available to measure fair value, maximising the use of relevant observable inputs and minimising the use of unobservable inputs.
All assets and liabilities for which fair value is measured or disclosed in the financial statements are categorized within the fair value hierarchy, described as follows, based on the lowest level input that is significant to the fair value measurement as a whole:
• Level 1 - Quoted (unadjusted) market prices in active markets for identical assets or liabilities
• Level 2 - Valuation techniques for which the lowest level input that is significant to the fair value measurement is directly or indirectly observable.
• Level 3 - Valuation techniques for which the lowest level input that is significant to the fair value measurement is unobservable.
For assets and liabilities that are recognised in the financial statements on a recurring basis, the Group determines whether transfers have occurred between levels in the hierarchy by reassessing categorisation (based on the lowest level input that is significant to the fair value measurement as a whole) at the end of each reporting period. The Group determines the policies and procedures for both recurring fair value measurement, such as investment properties and unquoted equity instruments, and for non-recurring measurement, such as assets held for sale in discontinued operations. External valuers are involved for valuation of significant assets, such as land and building and investment properties, and significant liabilities, such as insurance contracts. Selection criteria for external valuers include market knowledge, reputation, independence and whether professional standards are maintained. The Group decides, after discussion with the external valuers, which valuation techniques and inputs to use for individual assets and liabilities. For the purpose of fair value disclosures, the Group has determined classes of assets and liabilities on the basis of the nature, characteristics and risk of the asset or liability and the level of the fair value hierarchy as explained above.
9.1 Financial Assets by Fair Value HierarchyThe Company held the following financial instruments carried at fair value in the statement of financial position.
Financial AssetsGroup Date of Valuation Level 1 Level 2 Level 3As at 31 st March 2019 2018 2019 2018 2019 2018 Rs 000's Rs 000's Rs 000's Rs 000's Rs 000's Rs 000's
Non-listed equity investments - Waterfront Properties (Pvt) Ltd 31.03.2019 - - - - 2,493,366 1,916,382
Listed equity investments - Keells Food Products PLC 31.03.2019 321,135 334,258 - - -
Total 321,135 334,258 - - 2,493,366 1,916,382
Financial AssetsCompany Date of Valuation Level 1 Level 2 Level 3As at 31 st March 2019 2018 2019 2018 2019 2018 Rs 000's Rs 000's Rs 000's Rs 000's Rs 000's Rs 000's
Non-listed equity investments - Waterfront Properties (Pvt) Ltd 31.03.2019 - - - - 2,493,366 1,916,382
Investment in Equity Securities - Keells Food Products PLC 31.03.2019 321,135 334,258 - - - -
Total 321,135 334,258 - - 2,493,366 1,916,382
During the reporting period ended 31 March 2019 and 2018 , there were no transfers between Level 1 and Level 2 fair value measurements.
NOTES TO THE FINANCIAL STATEMENTS
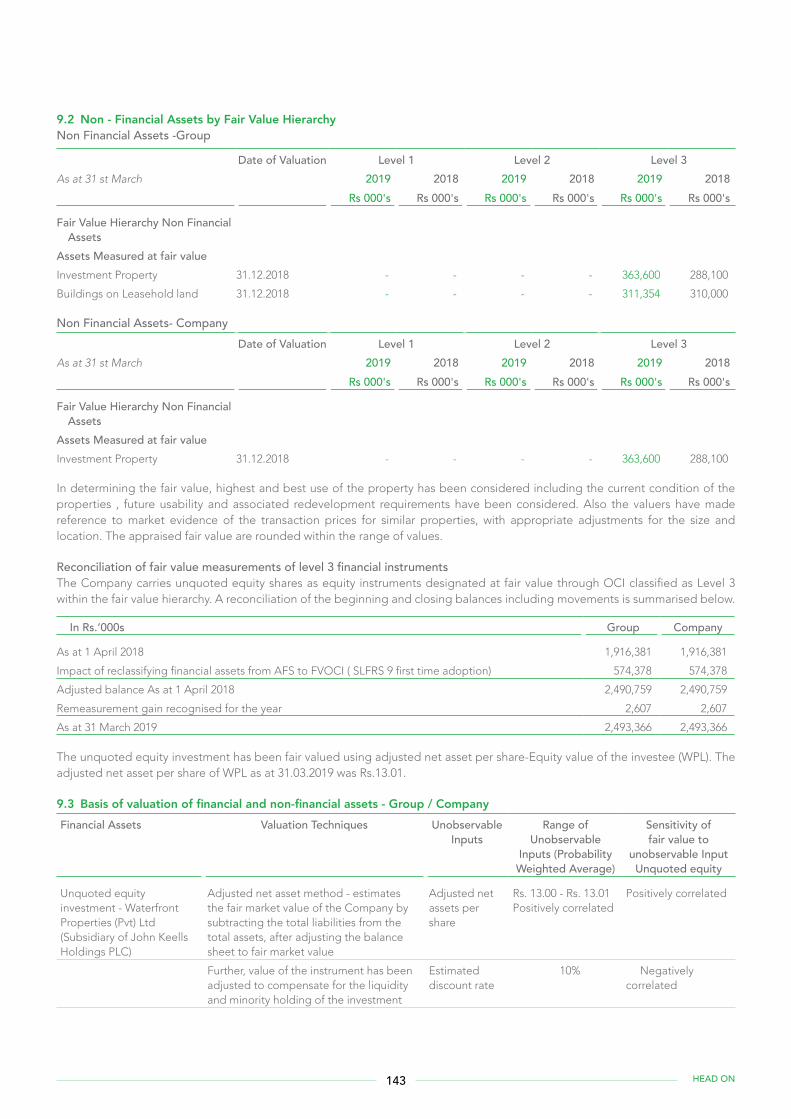
143 HEAD ON
9.2 Non - Financial Assets by Fair Value HierarchyNon Financial Assets -Group
Date of Valuation Level 1 Level 2 Level 3As at 31 st March 2019 2018 2019 2018 2019 2018 Rs 000's Rs 000's Rs 000's Rs 000's Rs 000's Rs 000's
Fair Value Hierarchy Non Financial Assets
Assets Measured at fair valueInvestment Property 31.12.2018 - - - - 363,600 288,100
Buildings on Leasehold land 31.12.2018 - - - - 311,354 310,000
Non Financial Assets- CompanyDate of Valuation Level 1 Level 2 Level 3
As at 31 st March 2019 2018 2019 2018 2019 2018 Rs 000's Rs 000's Rs 000's Rs 000's Rs 000's Rs 000's
Fair Value Hierarchy Non Financial Assets
Assets Measured at fair valueInvestment Property 31.12.2018 - - - - 363,600 288,100
In determining the fair value, highest and best use of the property has been considered including the current condition of the properties , future usability and associated redevelopment requirements have been considered. Also the valuers have made reference to market evidence of the transaction prices for similar properties, with appropriate adjustments for the size and location. The appraised fair value are rounded within the range of values.
Reconciliation of fair value measurements of level 3 financial instrumentsThe Company carries unquoted equity shares as equity instruments designated at fair value through OCI classified as Level 3 within the fair value hierarchy. A reconciliation of the beginning and closing balances including movements is summarised below.
In Rs.‘000s Group Company
As at 1 April 2018 1,916,381 1,916,381
Impact of reclassifying financial assets from AFS to FVOCI ( SLFRS 9 first time adoption) 574,378 574,378
Adjusted balance As at 1 April 2018 2,490,759 2,490,759
Remeasurement gain recognised for the year 2,607 2,607
As at 31 March 2019 2,493,366 2,493,366
The unquoted equity investment has been fair valued using adjusted net asset per share-Equity value of the investee (WPL). The adjusted net asset per share of WPL as at 31.03.2019 was Rs.13.01.
9.3 Basis of valuation of financial and non-financial assets - Group / CompanyFinancial Assets Valuation Techniques Unobservable
InputsRange of
Unobservable Inputs (Probability Weighted Average)
Sensitivity of fair value to
unobservable Input Unquoted equity
Unquoted equity investment - Waterfront Properties (Pvt) Ltd (Subsidiary of John Keells Holdings PLC)
Adjusted net asset method - estimates the fair market value of the Company by subtracting the total liabilities from the total assets, after adjusting the balance sheet to fair market value
Adjusted net assets per share
Rs. 13.00 - Rs. 13.01 Positively correlated
Positively correlated
Further, value of the instrument has been adjusted to compensate for the liquidity and minority holding of the investment
Estimated discount rate
10% Negatively correlated

144John Keells PLC Annual Report 2018/19
10 FINANCIAL INSTRUMENTSAccounting policyi) Financial instruments- Initial recognition and subsequent measurementFinancial assets within the scope of SLFRS 9 are classified as amortised cost, fair value through other comprehensive income (OCI), and fair value through profit or loss.
The classification of financial assets at initial recognition depends on the financial asset’s contractual cash flow characteristics and the Company’s business model for managing them. This assessment is referred to as the solely payments of principal and interest (SPPI) test and is performed at an instrument level. The business model determines whether cash flows will result from collecting contractual cash flows, selling the financial assets, or both. With the exception of trade receivables that do not contain a significant financing component or for which the Company has applied the practical expedient are measured at the transaction price.
At initial recognition, the group measures a financial asset at its fair value plus, in the case of a financial asset not at fair value through profit or loss (FVPL), transaction costs that are directly attributable to the acquisition of the financial asset. Transaction costs of financial assets carried at FVPL are expensed in profit or loss.
The Group’s financial assets include cash and short-term deposits, trade and other receivables, loans and other receivables, quoted and unquoted financial instruments and derivative financial instruments.
Subsequent measurementFor purposes of subsequent measurement, financial assets are classified in four categories
• Financial assets at amortised cost
• Financial assets at fair value through OCI with recycling of cumulative gains and losses
• Financial assets designated at fair value through OCI with no recycling of cumulative gains and losses upon derecognition
• Financial assets at fair value through profit or loss
Debt instrumentsFinancial assets at amortised costAssets that are held for collection of contractual cash flows where those cash flows represent SPPI are measured at amortised cost. The Group measures financial assets at amortised cost if both of the following conditions are met:
• The financial asset is held within a business model with the objective to hold financial assets in order to collect contractual cash flows And
• The contractual terms of the financial asset give rise on specified dates to cash flows that are SPPI on the principal amount outstanding
Financial assets at amortised cost are subsequently measured using the effective interest rate (EIR) method and are subject to impairment. Gains and losses are recognised in profit or loss when the asset is derecognised, modified or impaired.
Financial assets at fair value through OCIAssets that are held for collection of contractual cash flows and for selling the financial assets, where the assets’ cash flows represent SPPI, are measured at FVOCI. The Group measures debt instruments at fair value through OCI if both of the following conditions are met:
• The financial asset is held within a business model with the objective of both holding to collect contractual cash flows and selling And
• The contractual terms of the financial asset give rise on specified dates to cash flows that are SPPI on the principal amount outstanding
NOTES TO THE FINANCIAL STATEMENTS
145 HEAD ON
Movements in the carrying amount are taken through OCI, except for the recognition of impairment gains or losses, interest income and foreign exchange gains and losses which are recognised in profit or loss. When the financial asset is derecognised, the cumulative gain or loss previously recognized in OCI is reclassified from equity to profit or loss and recognized in other gains/(losses). Interest income from theses financial assets is included in finance income using the effective interest rate method. Foreign exchange gains and losses are presented in other gains/(losses) and impairment expenses are presented as separate line items in the income statement.
The Group does not have debt instruments at fair value trough OCI
Equity InstrumentsFinancial assets designated at fair value through OCIUpon initial recognition, the Group can elect to classify irrevocably its equity investments as equity instruments designated at fair value through OCI when they meet the definition of equity under SLFRS 9 Financial Instruments: Presentation and are not held for trading. The classification is determined on an instrument-by-instrument basis.
Gains and losses on these financial assets are never recycled to profit or loss. Dividends are recognised as other income in the statement of profit or loss when the right of payment has been established, except when the Company benefits from such proceeds as a recovery of part of the cost of the financial asset, in which case, such gains are recorded in OCI. Equity instruments designated at fair value through OCI are not subject to impairment assessment.
The Group does not have financial assets at fair value through profits or loss.
Financial assets - derecognitionFinancial assets are derecognised when the rights to receive cash flows from the financial assets have expired or have been transferred and the Group has transferred substantially all the risks and rewards of ownership.
Impairment of financial assetsFrom 1 April 2018, the Group assesses on a forward looking basis the expected credit losses associated with its debt instruments carried at amortised cost and FVOCI. The impairment methodology applied depends on whether there has been a significant increase in credit risk.
For trade receivables, the Group applies the simplified approach permitted by SLFRS 9, which requires expected lifetime losses to be recognised from initial recognition of the receivables. The Group has established a provision matrix that is based on its historical credit loss experience, adjusted for forward-looking factors specific to the debtors and the economic environment.
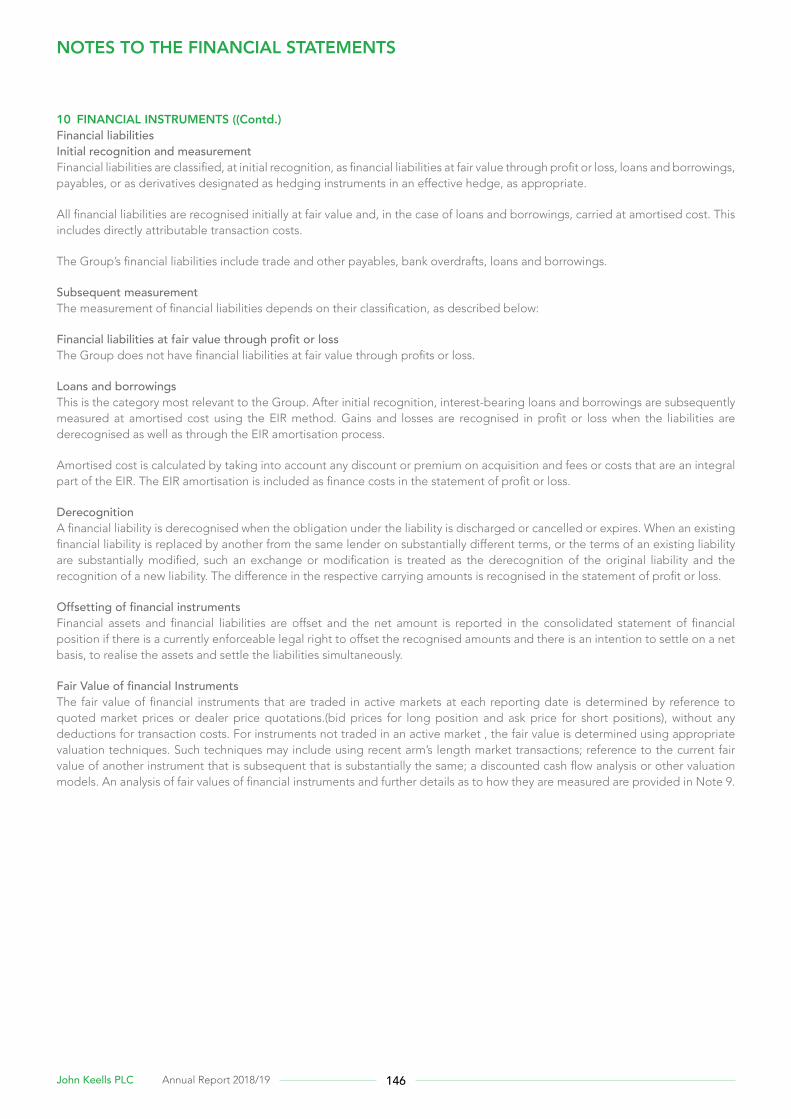
146John Keells PLC Annual Report 2018/19
10 FINANCIAL INSTRUMENTS ((Contd.)Financial liabilitiesInitial recognition and measurementFinancial liabilities are classified, at initial recognition, as financial liabilities at fair value through profit or loss, loans and borrowings, payables, or as derivatives designated as hedging instruments in an effective hedge, as appropriate.
All financial liabilities are recognised initially at fair value and, in the case of loans and borrowings, carried at amortised cost. This includes directly attributable transaction costs.
The Group’s financial liabilities include trade and other payables, bank overdrafts, loans and borrowings.
Subsequent measurementThe measurement of financial liabilities depends on their classification, as described below:
Financial liabilities at fair value through profit or lossThe Group does not have financial liabilities at fair value through profits or loss.
Loans and borrowingsThis is the category most relevant to the Group. After initial recognition, interest-bearing loans and borrowings are subsequently measured at amortised cost using the EIR method. Gains and losses are recognised in profit or loss when the liabilities are derecognised as well as through the EIR amortisation process.
Amortised cost is calculated by taking into account any discount or premium on acquisition and fees or costs that are an integral part of the EIR. The EIR amortisation is included as finance costs in the statement of profit or loss.
DerecognitionA financial liability is derecognised when the obligation under the liability is discharged or cancelled or expires. When an existing financial liability is replaced by another from the same lender on substantially different terms, or the terms of an existing liability are substantially modified, such an exchange or modification is treated as the derecognition of the original liability and the recognition of a new liability. The difference in the respective carrying amounts is recognised in the statement of profit or loss.
Offsetting of financial instrumentsFinancial assets and financial liabilities are offset and the net amount is reported in the consolidated statement of financial position if there is a currently enforceable legal right to offset the recognised amounts and there is an intention to settle on a net basis, to realise the assets and settle the liabilities simultaneously.
Fair Value of financial InstrumentsThe fair value of financial instruments that are traded in active markets at each reporting date is determined by reference to quoted market prices or dealer price quotations.(bid prices for long position and ask price for short positions), without any deductions for transaction costs. For instruments not traded in an active market , the fair value is determined using appropriate valuation techniques. Such techniques may include using recent arm’s length market transactions; reference to the current fair value of another instrument that is subsequent that is substantially the same; a discounted cash flow analysis or other valuation models. An analysis of fair values of financial instruments and further details as to how they are measured are provided in Note 9.
NOTES TO THE FINANCIAL STATEMENTS
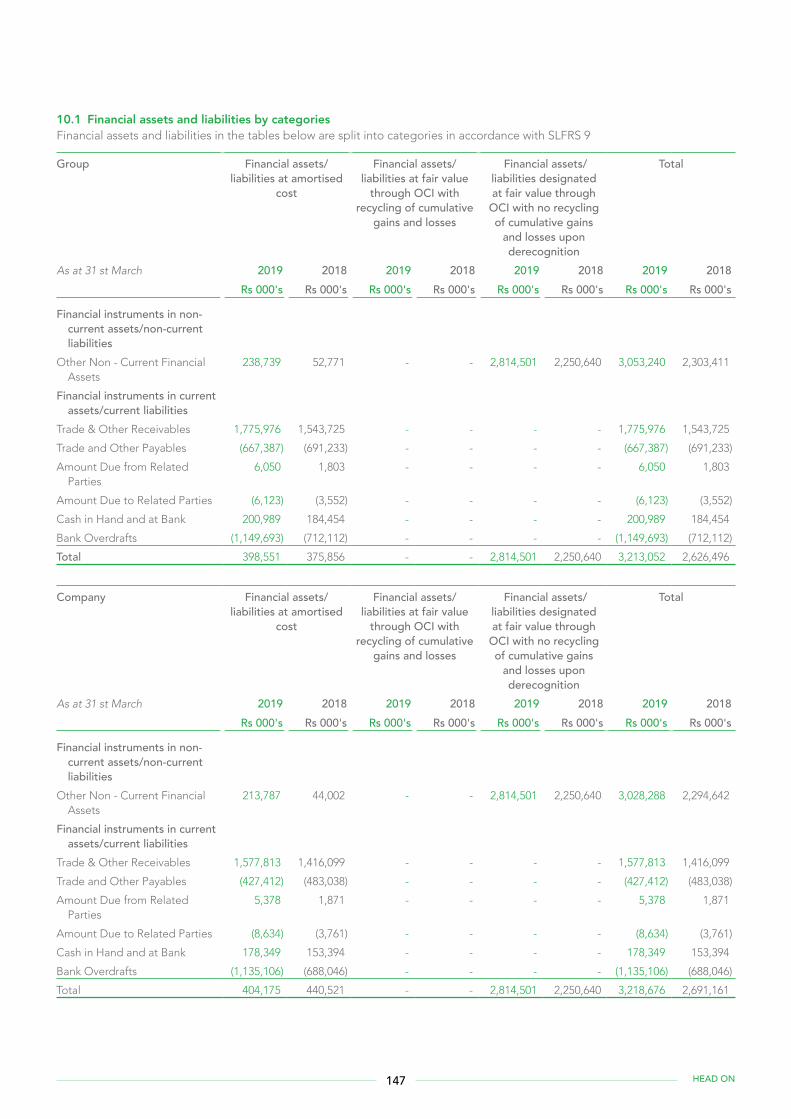
147 HEAD ON
10.1 Financial assets and liabilities by categoriesFinancial assets and liabilities in the tables below are split into categories in accordance with SLFRS 9
Group Financial assets/liabilities at amortised
cost
Financial assets/liabilities at fair value
through OCI with recycling of cumulative
gains and losses
Financial assets/liabilities designated at fair value through
OCI with no recycling of cumulative gains
and losses upon derecognition
Total
As at 31 st March 2019 2018 2019 2018 2019 2018 2019 2018 Rs 000's Rs 000's Rs 000's Rs 000's Rs 000's Rs 000's Rs 000's Rs 000's
Financial instruments in non-current assets/non-current liabilities
Other Non - Current Financial Assets
238,739 52,771 - - 2,814,501 2,250,640 3,053,240 2,303,411
Financial instruments in current assets/current liabilities
Trade & Other Receivables 1,775,976 1,543,725 - - - - 1,775,976 1,543,725
Trade and Other Payables (667,387) (691,233) - - - - (667,387) (691,233)
Amount Due from Related Parties
6,050 1,803 - - - - 6,050 1,803
Amount Due to Related Parties (6,123) (3,552) - - - - (6,123) (3,552)
Cash in Hand and at Bank 200,989 184,454 - - - - 200,989 184,454
Bank Overdrafts (1,149,693) (712,112) - - - - (1,149,693) (712,112)
Total 398,551 375,856 - - 2,814,501 2,250,640 3,213,052 2,626,496
Company Financial assets/liabilities at amortised
cost
Financial assets/liabilities at fair value
through OCI with recycling of cumulative
gains and losses
Financial assets/liabilities designated at fair value through
OCI with no recycling of cumulative gains
and losses upon derecognition
Total
As at 31 st March 2019 2018 2019 2018 2019 2018 2019 2018 Rs 000's Rs 000's Rs 000's Rs 000's Rs 000's Rs 000's Rs 000's Rs 000's
Financial instruments in non-current assets/non-current liabilities
Other Non - Current Financial Assets
213,787 44,002 - - 2,814,501 2,250,640 3,028,288 2,294,642
Financial instruments in current assets/current liabilities
Trade & Other Receivables 1,577,813 1,416,099 - - - - 1,577,813 1,416,099
Trade and Other Payables (427,412) (483,038) - - - - (427,412) (483,038)
Amount Due from Related Parties
5,378 1,871 - - - - 5,378 1,871
Amount Due to Related Parties (8,634) (3,761) - - - - (8,634) (3,761)
Cash in Hand and at Bank 178,349 153,394 - - - - 178,349 153,394
Bank Overdrafts (1,135,106) (688,046) - - - - (1,135,106) (688,046)
Total 404,175 440,521 - - 2,814,501 2,250,640 3,218,676 2,691,161
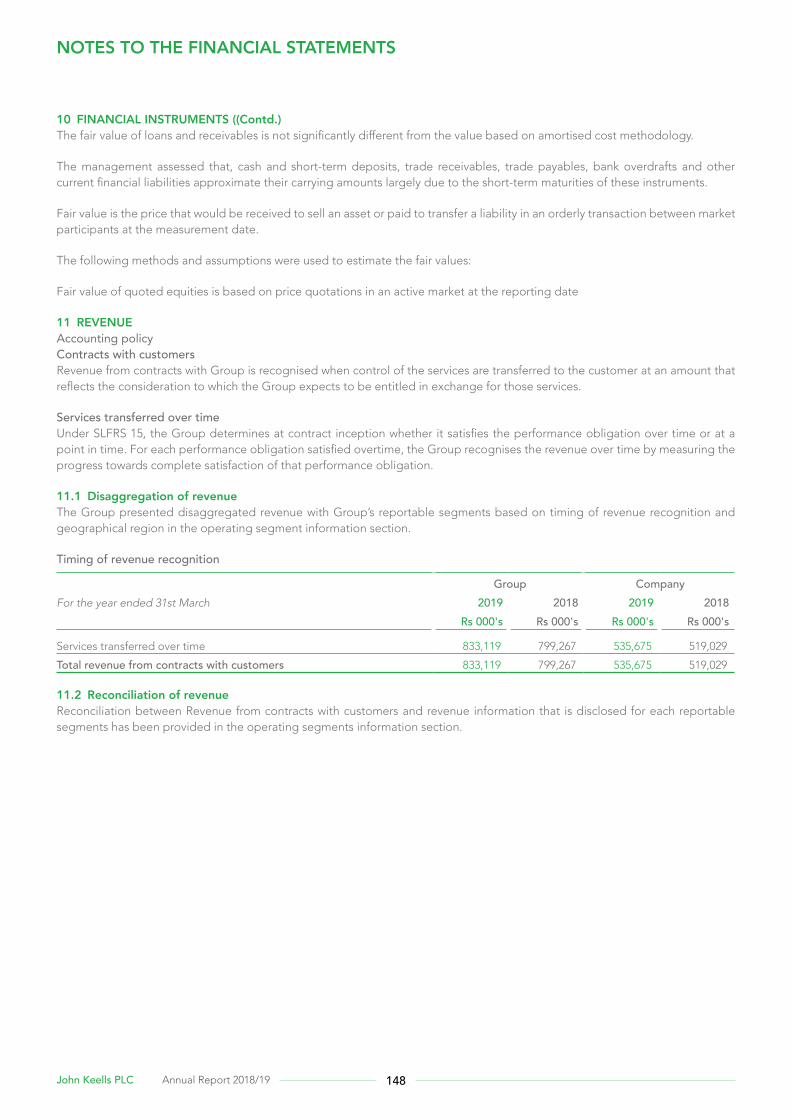
148John Keells PLC Annual Report 2018/19
10 FINANCIAL INSTRUMENTS ((Contd.)The fair value of loans and receivables is not significantly different from the value based on amortised cost methodology.
The management assessed that, cash and short-term deposits, trade receivables, trade payables, bank overdrafts and other current financial liabilities approximate their carrying amounts largely due to the short-term maturities of these instruments.
Fair value is the price that would be received to sell an asset or paid to transfer a liability in an orderly transaction between market participants at the measurement date.
The following methods and assumptions were used to estimate the fair values:
Fair value of quoted equities is based on price quotations in an active market at the reporting date
11 REVENUEAccounting policyContracts with customersRevenue from contracts with Group is recognised when control of the services are transferred to the customer at an amount that reflects the consideration to which the Group expects to be entitled in exchange for those services.
Services transferred over timeUnder SLFRS 15, the Group determines at contract inception whether it satisfies the performance obligation over time or at a point in time. For each performance obligation satisfied overtime, the Group recognises the revenue over time by measuring the progress towards complete satisfaction of that performance obligation.
11.1 Disaggregation of revenueThe Group presented disaggregated revenue with Group’s reportable segments based on timing of revenue recognition and geographical region in the operating segment information section.
Timing of revenue recognition
Group CompanyFor the year ended 31st March 2019 2018 2019 2018 Rs 000's Rs 000's Rs 000's Rs 000's
Services transferred over time 833,119 799,267 535,675 519,029
Total revenue from contracts with customers 833,119 799,267 535,675 519,029
11.2 Reconciliation of revenueReconciliation between Revenue from contracts with customers and revenue information that is disclosed for each reportable segments has been provided in the operating segments information section.
NOTES TO THE FINANCIAL STATEMENTS

149 HEAD ON
12 DIVIDEND INCOMEAccounting policyDividend income is recognised when the Company’s right to receive the payment is established.
Group CompanyFor the year ended 31st March 2019 2018 2019 2018 Rs 000's Rs 000's Rs 000's Rs 000's
Income from investments in related parties - - 36,602 25,902
- - 36,602 25,902
13 OTHER OPERATING INCOMEAccounting policyGains and lossesNet gains and losses of a revenue nature arising from the disposal of property, plant and equipment and other non-current assets, including investments, are accounted for in the income statement, after deducting from the proceeds on disposal, the carrying amount of such assets and the related selling expenses.
Gains and losses arising from activities incidental to the main revenue generating activities and those arising from a group of similar transactions, which are not material are aggregated, reported and presented on a net basis.
13.1 OTHER OPERATING INCOMEOther income is recognised on an accrual basis.
Group CompanyFor the year ended 31st March 2019 2018 2019 2018 Rs 000's Rs 000's Rs 000's Rs 000's
Sundry income 497 3,272 293 2,176
Net gain on disposal of Property, Plant and Equipment (5) 5,487 (5) 3,523
493 8,759 288 5,699
14 NET FINANCE INCOME /(EXPENSE)Finance IncomeAccounting PolicyFinance income comprises interest income on funds invested (including Fair Value reserve of financial assets at FVOCI), dividend income from financial investment designated on FVOCI, gains on the disposal of Fair Value reserve of financial assets at FVOCI, fair value gains on financial assets at fair value through profit or loss, gains on the remeasurement to fair value of any pre-existing interest in an acquire that are recognised in the income statement.
Finance ExpenseAccounting PolicyFinance expense comprise interest expense on borrowings, unwinding of the discount on provisions, losses on disposal of financial assets at FVOCI fair value losses on financial assets at fair value through profit or loss, impairment losses recognised on financial assets (other than trade receivables) that are recognised in the income statement.
Interest expense is recorded as it accrues using the effective interest rate (EIR), which is the rate that exactly discounts the estimated future cash payments through the expected life of the financial instrument or a shorter period, where appropriate, to the net carrying amount of the financial liability.
Borrowing costs directly attributable to the acquisition, construction or production of an asset that necessarily takes a substantial period of time to get ready for its intended use or sale are capitalised as part of the cost of the respective assets. All other borrowing costs are expensed in the period they occur. Borrowing costs consist of interest and other costs that the Company incurs in connection with the borrowing of funds.

150John Keells PLC Annual Report 2018/19
14 NET FINANCE INCOME /(EXPENSE) (Contd.) Group Company
For the year ended 31st March 2019 2018 2019 2018 Rs 000's Rs 000's Rs 000's Rs 000's
14.1 Finance IncomeInterest income 4,972 8,934 8,760 7,014
Dividend income on
Financial assets at fair value through OCI - Keells Food Products PLC 17,704 13,895 17,704 13,895
Financial assets at fair value through profit or loss 29,094 24,424 - -
Total finance income 51,770 47,253 26,464 20,909
14.2 Finance CostInterest expense on borrowings (119,439) (80,164) (119,438) (79,819)
Total finance cost (119,439) (80,164) (119,438) (79,819)
Net Finance Income (67,669) (32,911) (92,974) (58,910)
15 PROFIT BEFORE TAXAccounting PolicyExpenditure recognitionExpenses are recognised in the income statement on the basis of a direct association between the cost incurred and the earning of specific items of income. All expenditure incurred in the running of the business and in maintaining the property, plant and equipment in a state of efficiency has been charged to the income statement.
For the purpose of presentation of the income statement, the “function of expenses” method has been adopted, on the basis that it presents fairly the elements of the Group and Company performance.
Group CompanyFor the year ended 31st March 2019 2018 2019 2018 Rs 000's Rs 000's Rs 000's Rs 000's
PROFIT BEFORE TAXProfit before tax is stated after charging all expenses including the
following;Administration ExpensesRemuneration to Non Executive Directors 9,278 11,070 6,900 7,200
Audit Fees 2,137 2,036 1,157 1,102
Amortisation of lease rental paid in advance 1,089 1,089 - -
Personnel costs include
Defined Benefit Plan Cost 11,416 11,225 6,201 6,045
Defined Contribution Plan Cost - EPF and ETF 26,459 25,976 13,511 12,849
Other Staff Cost 241,351 229,197 111,942 97,483
Depreciation of Property, Plant and Equipment 21,202 23,458 6,622 9,709
Amortization of Intangible Assets 200 92 200 -
Other long term employee benefits cost 1,675 - 1,675 -
Donations 1,877 1,235 1,305 1,055
Selling and Distribution Expenses
Impairment / (Recoveries) of Trade Receivables 25,946 (12,128) 25,946 (12,129)
NOTES TO THE FINANCIAL STATEMENTS
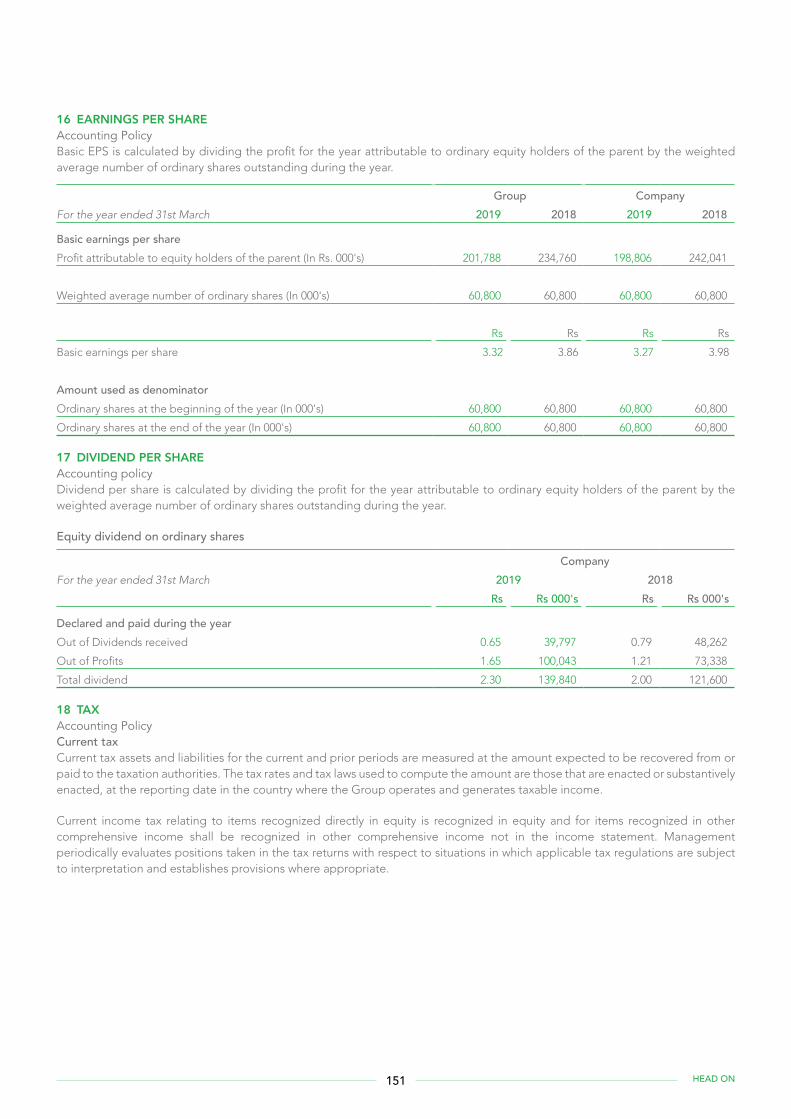
151 HEAD ON
16 EARNINGS PER SHAREAccounting PolicyBasic EPS is calculated by dividing the profit for the year attributable to ordinary equity holders of the parent by the weighted average number of ordinary shares outstanding during the year.
Group CompanyFor the year ended 31st March 2019 2018 2019 2018
Basic earnings per shareProfit attributable to equity holders of the parent (In Rs. 000's) 201,788 234,760 198,806 242,041
Weighted average number of ordinary shares (In 000's) 60,800 60,800 60,800 60,800
Rs Rs Rs Rs
Basic earnings per share 3.32 3.86 3.27 3.98
Amount used as denominatorOrdinary shares at the beginning of the year (In 000's) 60,800 60,800 60,800 60,800
Ordinary shares at the end of the year (In 000's) 60,800 60,800 60,800 60,800
17 DIVIDEND PER SHAREAccounting policyDividend per share is calculated by dividing the profit for the year attributable to ordinary equity holders of the parent by the weighted average number of ordinary shares outstanding during the year.
Equity dividend on ordinary shares
CompanyFor the year ended 31st March 2019 2018 Rs Rs 000's Rs Rs 000's
Declared and paid during the yearOut of Dividends received 0.65 39,797 0.79 48,262
Out of Profits 1.65 100,043 1.21 73,338
Total dividend 2.30 139,840 2.00 121,600
18 TAXAccounting PolicyCurrent taxCurrent tax assets and liabilities for the current and prior periods are measured at the amount expected to be recovered from or paid to the taxation authorities. The tax rates and tax laws used to compute the amount are those that are enacted or substantively enacted, at the reporting date in the country where the Group operates and generates taxable income.
Current income tax relating to items recognized directly in equity is recognized in equity and for items recognized in other comprehensive income shall be recognized in other comprehensive income not in the income statement. Management periodically evaluates positions taken in the tax returns with respect to situations in which applicable tax regulations are subject to interpretation and establishes provisions where appropriate.
152John Keells PLC Annual Report 2018/19
18 TAX (Contd.)Deferred taxDeferred tax is provided using the liability method on temporary differences at the reporting date between the tax bases of assets and liabilities and their carrying amounts for financial reporting purposes.
Deferred tax liabilities are recognized for all taxable temporary differences, except:
• Where the deferred tax liability arises from the initial recognition of goodwill or of an asset or liability in a transaction that is not a business combination and, at the time of the transaction, affects neither the accounting profit nor taxable profit or loss; and
• In respect of taxable temporary differences associated with investments in subsidiaries and associates, where the timing of the reversal of the temporary differences can be controlled and it is probable that the temporary differences will not reverse in the foreseeable future.
Current taxDeferred tax assets are recognized for all deductible temporary differences, and unused tax credits and tax losses carried forward, to the extent that it is probable that taxable profit will be available against which the deductible temporary differences and the unused tax credits and tax losses carried forward can be utilized except:
• Where the deferred income tax asset relating to the deductible temporary difference arises from the initial recognition of an asset or liability in a transaction that is not a business combination and, at the time of the transaction, affects neither the accounting profit nor taxable profit or loss; and
• In respect of deductible temporary differences associated with investments in subsidiaries and associates, deferred tax assets are recognized only to the extent that it is probable that the temporary differences will reverse in the foreseeable future and taxable profit will be available against which the temporary differences can be utilized.
The carrying amount of deferred tax assets is reviewed at each reporting date and reduced to the extent that it is no longer probable that sufficient taxable profit will be available to allow all or part of the deferred tax asset to be utilized. Unrecognised deferred tax assets are reassessed at each reporting date and are recognised to the extent that it has become probable that future taxable profit will allow the deferred tax asset to be recovered.
Deferred tax assets and liabilities are measured at tax rates that are expected to apply to the year when the asset is realised or liability is settled, based on the tax rates and tax laws that have been enacted or substantively enacted as at the reporting date.
Deferred tax relating to items recognised outside profit or loss is recognised outside profit or loss. Deferred tax items are recognised in correlation to the underlying transaction either in other comprehensive income or directly in equity.
Deferred tax assets and deferred tax liabilities are offset, if a legally enforceable right exists to set off current tax assets against current tax liabilities and when the deferred taxes relate to the same taxable entity and the same taxation authority.
Sales taxRevenues, expenses and assets are recognised net of the amount of sales tax except:
• Where the sales tax incurred on a purchase of assets or services is not recoverable from the taxation authority, in which case the sales tax is recognised as part of the cost of acquisition of the asset or as part of the expense item as applicable; and
• Receivables and payables that are stated with the amount of sales tax included.
The net amount of sales tax recoverable from, or payable to, the taxation authority is included as part of receivables or payables in the statement of financial position.
NOTES TO THE FINANCIAL STATEMENTS
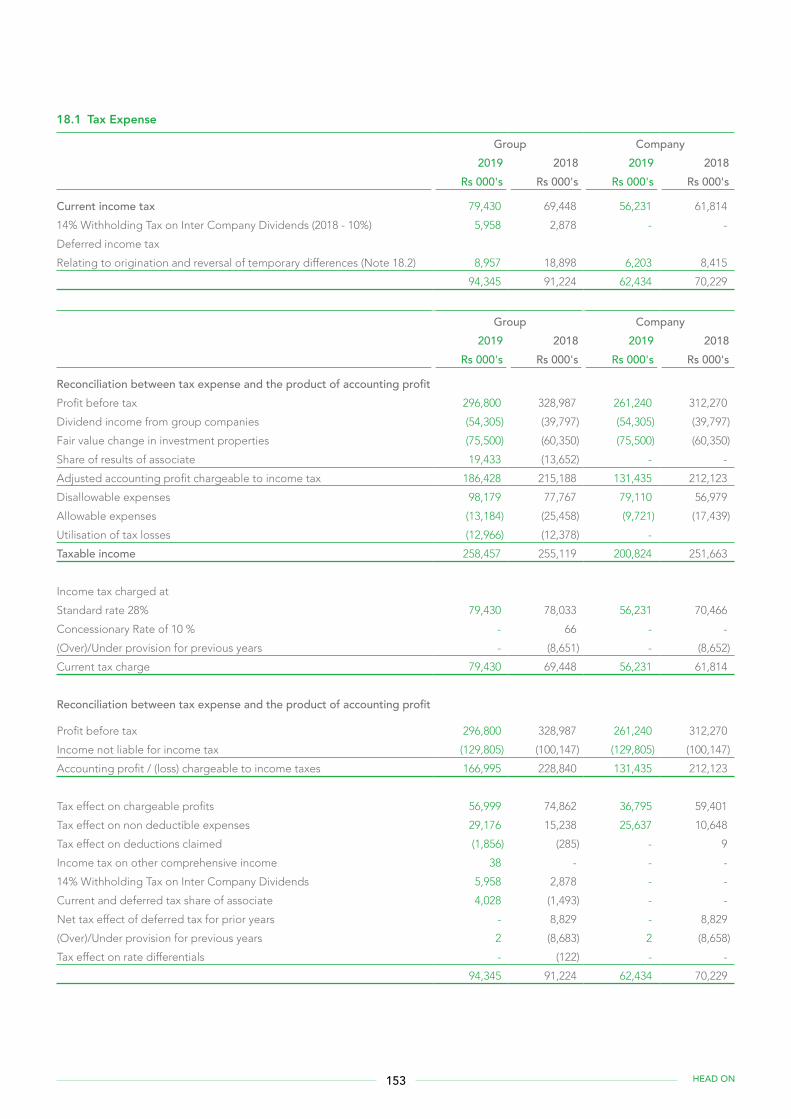
153 HEAD ON
18.1 Tax Expense
Group Company2019 2018 2019 2018
Rs 000's Rs 000's Rs 000's Rs 000's
Current income tax 79,430 69,448 56,231 61,814
14% Withholding Tax on Inter Company Dividends (2018 - 10%) 5,958 2,878 - -
Deferred income tax
Relating to origination and reversal of temporary differences (Note 18.2) 8,957 18,898 6,203 8,415
94,345 91,224 62,434 70,229
Group Company2019 2018 2019 2018
Rs 000's Rs 000's Rs 000's Rs 000's
Reconciliation between tax expense and the product of accounting profitProfit before tax 296,800 328,987 261,240 312,270
Dividend income from group companies (54,305) (39,797) (54,305) (39,797)
Fair value change in investment properties (75,500) (60,350) (75,500) (60,350)
Share of results of associate 19,433 (13,652) - -
Adjusted accounting profit chargeable to income tax 186,428 215,188 131,435 212,123
Disallowable expenses 98,179 77,767 79,110 56,979
Allowable expenses (13,184) (25,458) (9,721) (17,439)
Utilisation of tax losses (12,966) (12,378) -
Taxable income 258,457 255,119 200,824 251,663
Income tax charged at
Standard rate 28% 79,430 78,033 56,231 70,466
Concessionary Rate of 10 % - 66 - -
(Over)/Under provision for previous years - (8,651) - (8,652)
Current tax charge 79,430 69,448 56,231 61,814
Reconciliation between tax expense and the product of accounting profit
Profit before tax 296,800 328,987 261,240 312,270
Income not liable for income tax (129,805) (100,147) (129,805) (100,147)
Accounting profit / (loss) chargeable to income taxes 166,995 228,840 131,435 212,123
Tax effect on chargeable profits 56,999 74,862 36,795 59,401
Tax effect on non deductible expenses 29,176 15,238 25,637 10,648
Tax effect on deductions claimed (1,856) (285) - 9
Income tax on other comprehensive income 38 - - -
14% Withholding Tax on Inter Company Dividends 5,958 2,878 - -
Current and deferred tax share of associate 4,028 (1,493) - -
Net tax effect of deferred tax for prior years - 8,829 - 8,829
(Over)/Under provision for previous years 2 (8,683) 2 (8,658)
Tax effect on rate differentials - (122) - -
94,345 91,224 62,434 70,229
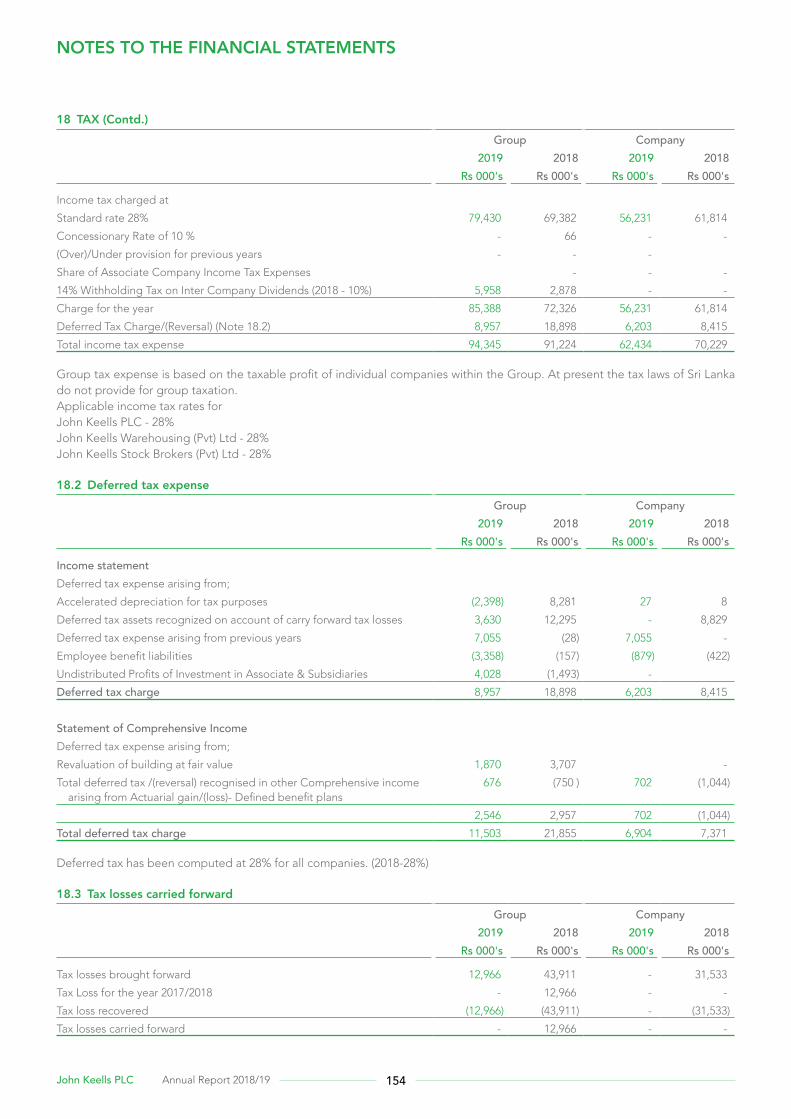
154John Keells PLC Annual Report 2018/19
18 TAX (Contd.) Group Company
2019 2018 2019 2018 Rs 000's Rs 000's Rs 000's Rs 000's
Income tax charged at
Standard rate 28% 79,430 69,382 56,231 61,814
Concessionary Rate of 10 % - 66 - -
(Over)/Under provision for previous years - - -
Share of Associate Company Income Tax Expenses - - -
14% Withholding Tax on Inter Company Dividends (2018 - 10%) 5,958 2,878 - -
Charge for the year 85,388 72,326 56,231 61,814
Deferred Tax Charge/(Reversal) (Note 18.2) 8,957 18,898 6,203 8,415
Total income tax expense 94,345 91,224 62,434 70,229
Group tax expense is based on the taxable profit of individual companies within the Group. At present the tax laws of Sri Lanka do not provide for group taxation.Applicable income tax rates for John Keells PLC - 28% John Keells Warehousing (Pvt) Ltd - 28%John Keells Stock Brokers (Pvt) Ltd - 28%
18.2 Deferred tax expense Group Company
2019 2018 2019 2018 Rs 000's Rs 000's Rs 000's Rs 000's
Income statement Deferred tax expense arising from;
Accelerated depreciation for tax purposes (2,398) 8,281 27 8
Deferred tax assets recognized on account of carry forward tax losses 3,630 12,295 - 8,829
Deferred tax expense arising from previous years 7,055 (28) 7,055 -
Employee benefit liabilities (3,358) (157) (879) (422)
Undistributed Profits of Investment in Associate & Subsidiaries 4,028 (1,493) -
Deferred tax charge 8,957 18,898 6,203 8,415
Statement of Comprehensive Income Deferred tax expense arising from;
Revaluation of building at fair value 1,870 3,707 -
Total deferred tax /(reversal) recognised in other Comprehensive income arising from Actuarial gain/(loss)- Defined benefit plans
676 (750 ) 702 (1,044)
2,546 2,957 702 (1,044)
Total deferred tax charge 11,503 21,855 6,904 7,371
Deferred tax has been computed at 28% for all companies. (2018-28%)
18.3 Tax losses carried forward Group Company
2019 2018 2019 2018 Rs 000's Rs 000's Rs 000's Rs 000's
Tax losses brought forward 12,966 43,911 - 31,533
Tax Loss for the year 2017/2018 - 12,966 - -
Tax loss recovered (12,966) (43,911) - (31,533)
Tax losses carried forward - 12,966 - -
NOTES TO THE FINANCIAL STATEMENTS
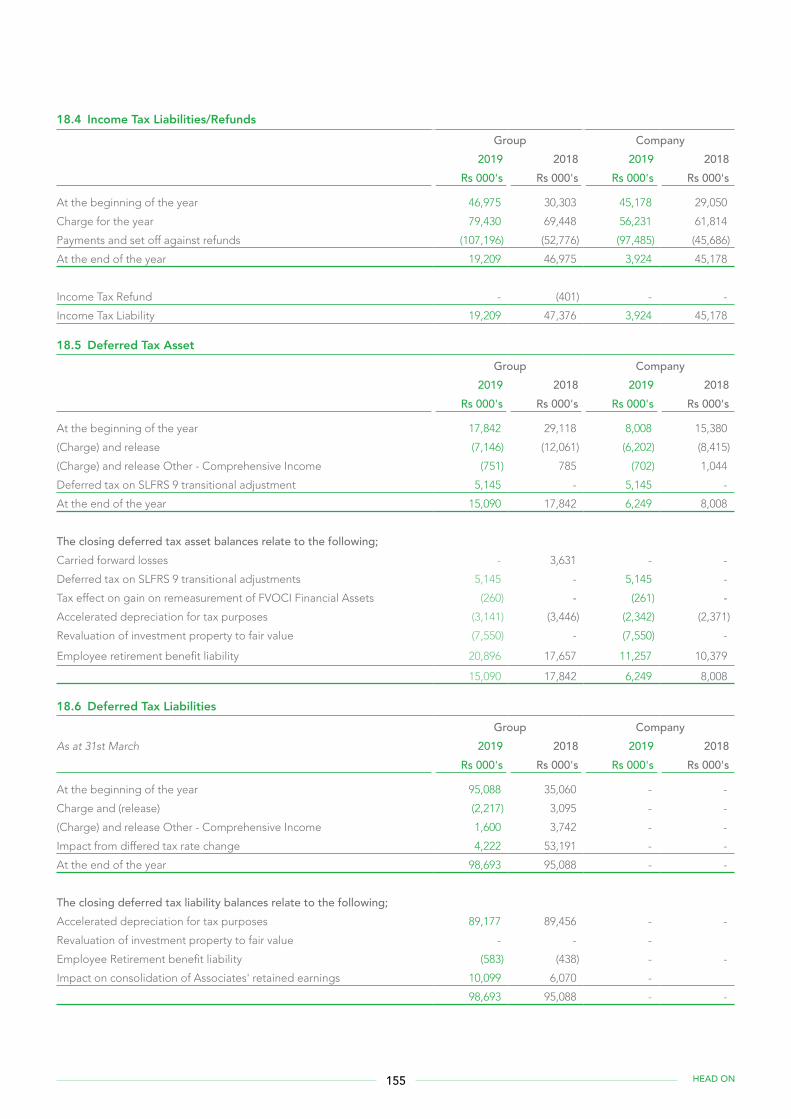
155 HEAD ON
18.4 Income Tax Liabilities/Refunds Group Company
2019 2018 2019 2018 Rs 000's Rs 000's Rs 000's Rs 000's
At the beginning of the year 46,975 30,303 45,178 29,050
Charge for the year 79,430 69,448 56,231 61,814
Payments and set off against refunds (107,196) (52,776) (97,485) (45,686)
At the end of the year 19,209 46,975 3,924 45,178
Income Tax Refund - (401) - -
Income Tax Liability 19,209 47,376 3,924 45,178
18.5 Deferred Tax Asset Group Company
2019 2018 2019 2018 Rs 000's Rs 000's Rs 000's Rs 000's
At the beginning of the year 17,842 29,118 8,008 15,380
(Charge) and release (7,146) (12,061) (6,202) (8,415)
(Charge) and release Other - Comprehensive Income (751) 785 (702) 1,044
Deferred tax on SLFRS 9 transitional adjustment 5,145 - 5,145 -
At the end of the year 15,090 17,842 6,249 8,008
The closing deferred tax asset balances relate to the following;Carried forward losses - 3,631 - -
Deferred tax on SLFRS 9 transitional adjustments 5,145 - 5,145 -
Tax effect on gain on remeasurement of FVOCI Financial Assets (260) - (261) -Accelerated depreciation for tax purposes (3,141) (3,446) (2,342) (2,371)
Revaluation of investment property to fair value (7,550) - (7,550) -
Employee retirement benefit liability 20,896 17,657 11,257 10,379
15,090 17,842 6,249 8,008
18.6 Deferred Tax Liabilities Group Company
As at 31st March 2019 2018 2019 2018 Rs 000's Rs 000's Rs 000's Rs 000's
At the beginning of the year 95,088 35,060 - -
Charge and (release) (2,217) 3,095 - -
(Charge) and release Other - Comprehensive Income 1,600 3,742 - -
Impact from differed tax rate change 4,222 53,191 - -
At the end of the year 98,693 95,088 - -
The closing deferred tax liability balances relate to the following; Accelerated depreciation for tax purposes 89,177 89,456 - -
Revaluation of investment property to fair value - - -
Employee Retirement benefit liability (583) (438) - -
Impact on consolidation of Associates' retained earnings 10,099 6,070 -
98,693 95,088 - -
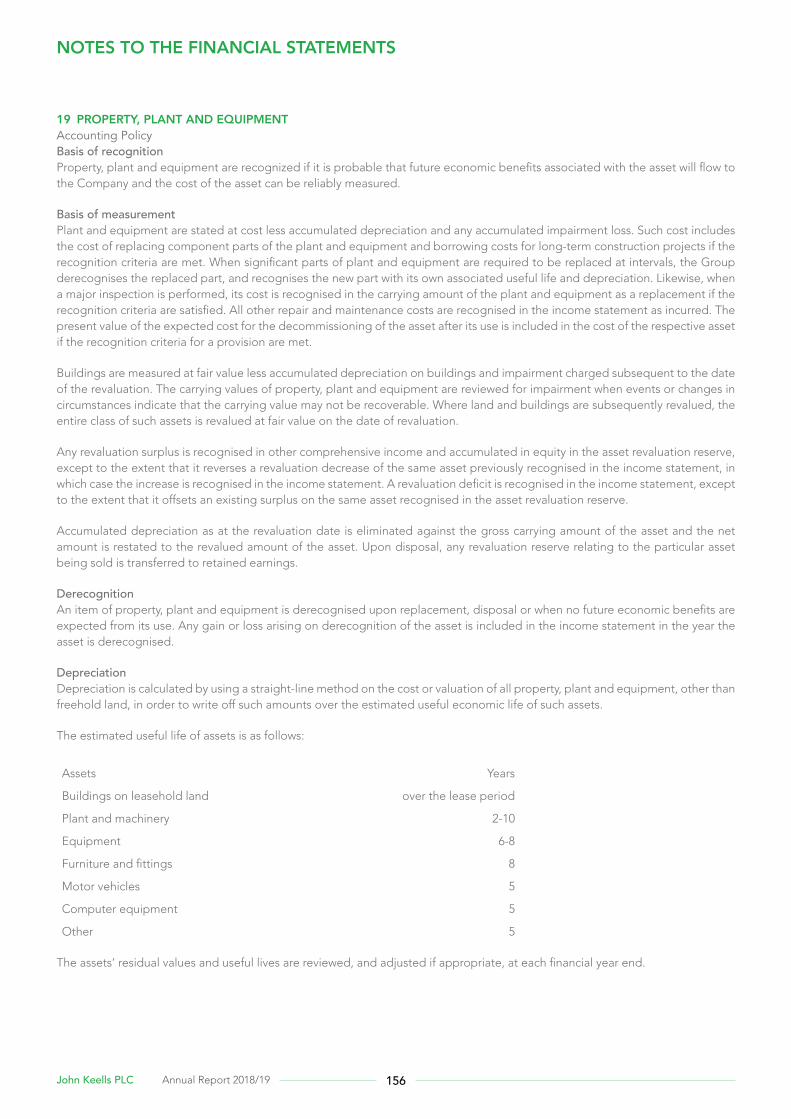
156John Keells PLC Annual Report 2018/19
19 PROPERTY, PLANT AND EQUIPMENTAccounting PolicyBasis of recognitionProperty, plant and equipment are recognized if it is probable that future economic benefits associated with the asset will flow to the Company and the cost of the asset can be reliably measured.
Basis of measurementPlant and equipment are stated at cost less accumulated depreciation and any accumulated impairment loss. Such cost includes the cost of replacing component parts of the plant and equipment and borrowing costs for long-term construction projects if the recognition criteria are met. When significant parts of plant and equipment are required to be replaced at intervals, the Group derecognises the replaced part, and recognises the new part with its own associated useful life and depreciation. Likewise, when a major inspection is performed, its cost is recognised in the carrying amount of the plant and equipment as a replacement if the recognition criteria are satisfied. All other repair and maintenance costs are recognised in the income statement as incurred. The present value of the expected cost for the decommissioning of the asset after its use is included in the cost of the respective asset if the recognition criteria for a provision are met.
Buildings are measured at fair value less accumulated depreciation on buildings and impairment charged subsequent to the date of the revaluation. The carrying values of property, plant and equipment are reviewed for impairment when events or changes in circumstances indicate that the carrying value may not be recoverable. Where land and buildings are subsequently revalued, the entire class of such assets is revalued at fair value on the date of revaluation.
Any revaluation surplus is recognised in other comprehensive income and accumulated in equity in the asset revaluation reserve, except to the extent that it reverses a revaluation decrease of the same asset previously recognised in the income statement, in which case the increase is recognised in the income statement. A revaluation deficit is recognised in the income statement, except to the extent that it offsets an existing surplus on the same asset recognised in the asset revaluation reserve.
Accumulated depreciation as at the revaluation date is eliminated against the gross carrying amount of the asset and the net amount is restated to the revalued amount of the asset. Upon disposal, any revaluation reserve relating to the particular asset being sold is transferred to retained earnings.
DerecognitionAn item of property, plant and equipment is derecognised upon replacement, disposal or when no future economic benefits are expected from its use. Any gain or loss arising on derecognition of the asset is included in the income statement in the year the asset is derecognised.
DepreciationDepreciation is calculated by using a straight-line method on the cost or valuation of all property, plant and equipment, other than freehold land, in order to write off such amounts over the estimated useful economic life of such assets.
The estimated useful life of assets is as follows:
Assets Years
Buildings on leasehold land over the lease period
Plant and machinery 2-10
Equipment 6-8
Furniture and fittings 8
Motor vehicles 5
Computer equipment 5
Other 5
The assets’ residual values and useful lives are reviewed, and adjusted if appropriate, at each financial year end.
NOTES TO THE FINANCIAL STATEMENTS
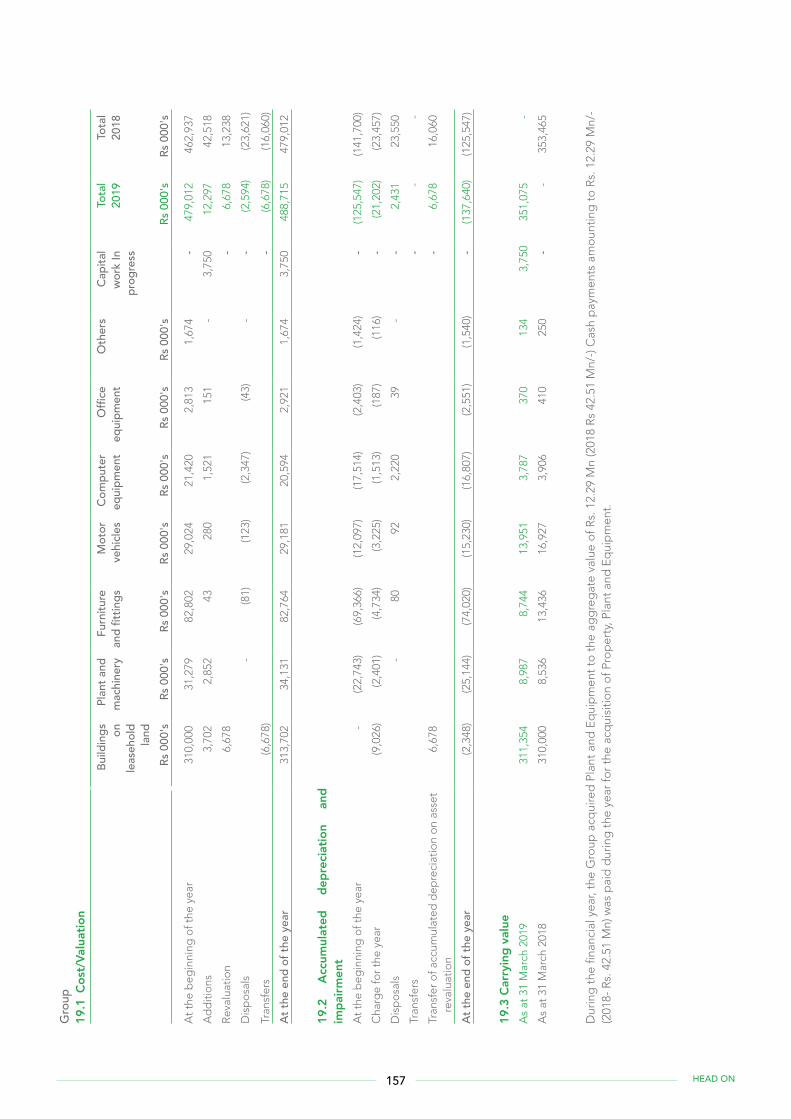
157 HEAD ON
Gro
up19
.1 C
ost/
Valu
atio
nBu
ildin
gs
onle
aseh
old
land
Pla
nt a
nd
mac
hine
ry
Fur
nitu
re
and
fitt
ings
M
otor
v
ehic
les
Com
pute
r e
quip
men
t O
ffice
e
quip
men
t O
ther
s C
apita
l w
ork
In
pro
gres
s
Tot
al20
19 T
otal
2018
R
s 00
0's
Rs
000'
s R
s 00
0's
Rs
000'
s R
s 00
0's
Rs
000'
s R
s 00
0's
Rs
000'
s R
s 00
0's
At t
he b
egin
ning
of t
he y
ear
310
,000
3
1,27
9 8
2,80
2 2
9,02
4 2
1,42
0 2
,813
1
,674
-
479
,012
4
62,9
37
Ad
diti
ons
3,7
02
2,8
52
43
280
1
,521
1
51
- 3
,750
1
2,29
7 4
2,51
8
Reva
luat
ion
6,6
78
- 6
,678
1
3,23
8
Dis
po
sals
- (8
1) (1
23)
(2,3
47)
(43)
-
- (2
,594
) (2
3,62
1)
Tran
sfer
s (6
,678
)-
(6,6
78)
(16,
060)
At th
e en
d of
the
year
313
,702
3
4,13
1 8
2,76
4 2
9,18
1 2
0,59
4 2
,921
1
,674
3
,750
4
88,7
15
479
,012
19.2
A
ccum
ulat
ed
depr
ecia
tion
and
impa
irmen
tA
t the
beg
inni
ng o
f the
yea
r -
(22,
743)
(69,
366)
(12,
097)
(17,
514)
(2,4
03)
(1,4
24)
- (1
25,5
47)
(141
,700
)
Cha
rge
for t
he y
ear
(9,0
26)
(2,4
01)
(4,7
34)
(3,2
25)
(1,5
13)
(187
) (1
16)
- (2
1,20
2) (2
3,45
7)
Dis
po
sals
- 8
0 9
2 2
,220
3
9 -
-
2,4
31
23,
550
Tran
sfer
s-
-
-
Tran
sfer
of a
ccum
ulat
ed d
epre
ciat
ion
on
asse
t re
valu
atio
n 6
,678
-
6,6
78
16,
060
At th
e en
d of
the
year
(2,3
48)
(25,
144)
(74,
020)
(15,
230)
(16,
807)
(2,5
51)
(1,5
40)
- (1
37,6
40)
(125
,547
)
19.3
Car
ryin
g va
lue
As
at 3
1 M
arch
201
9 3
11,3
54
8,9
87
8,7
44
13,
951
3,7
87
370
1
343,
750
351,
075
-
As
at 3
1 M
arch
201
8 3
10,0
00
8,5
36
13,
436
16,
927
3,9
06
410
2
50
- -
3
53,4
65
Dur
ing
the
fina
ncia
l yea
r, th
e G
roup
acq
uire
d P
lant
and
Eq
uip
men
t to
the
ag
gre
gat
e va
lue
of R
s. 1
2.29
Mn
(201
8 Rs
42.
51 M
n/-)
Cas
h p
aym
ents
am
oun
ting
to
Rs.
12.
29 M
n/-
(201
8- R
s. 4
2.51
Mn)
was
pai
d d
urin
g t
he y
ear f
or
the
acq
uisi
tion
of P
rop
erty
, Pla
nt a
nd E
qui
pm
ent.
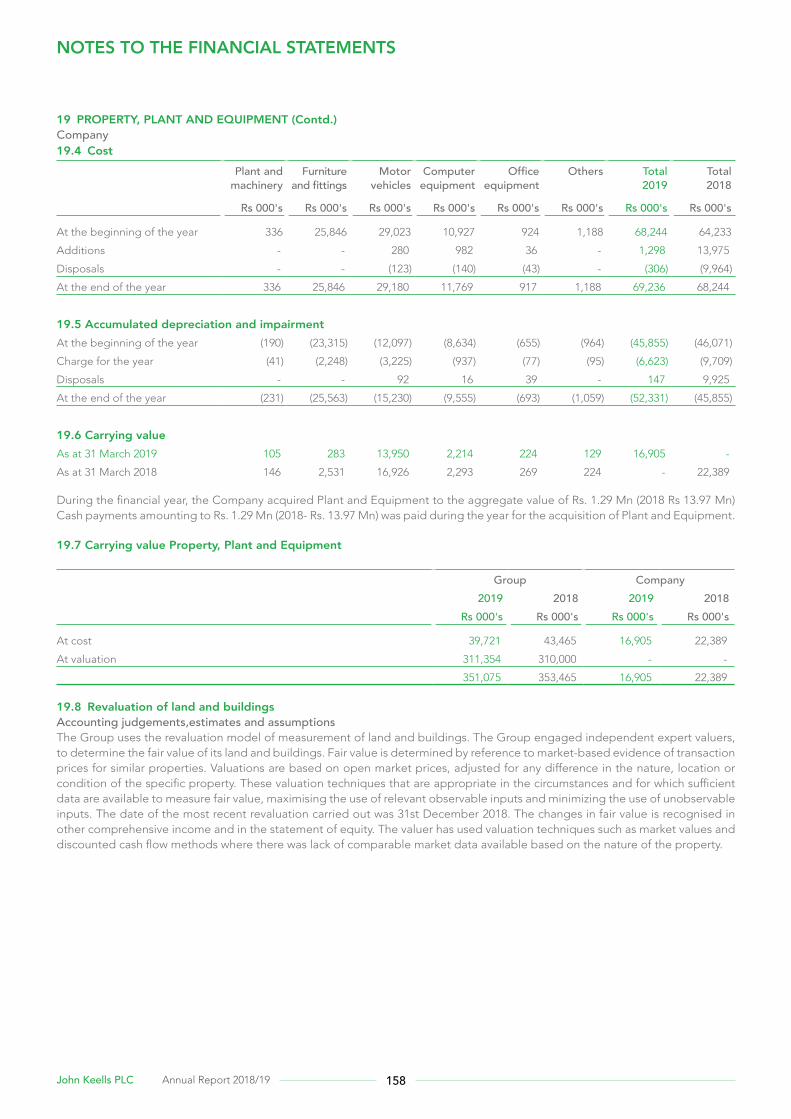
158John Keells PLC Annual Report 2018/19
19 PROPERTY, PLANT AND EQUIPMENT (Contd.)Company19.4 Cost
Plant and machinery
Furniture and fittings
Motor vehicles
Computer equipment
Office equipment
Others Total2019
Total2018
Rs 000's Rs 000's Rs 000's Rs 000's Rs 000's Rs 000's Rs 000's Rs 000's
At the beginning of the year 336 25,846 29,023 10,927 924 1,188 68,244 64,233
Additions - - 280 982 36 - 1,298 13,975
Disposals - - (123) (140) (43) - (306) (9,964)
At the end of the year 336 25,846 29,180 11,769 917 1,188 69,236 68,244
19.5 Accumulated depreciation and impairmentAt the beginning of the year (190) (23,315) (12,097) (8,634) (655) (964) (45,855) (46,071)
Charge for the year (41) (2,248) (3,225) (937) (77) (95) (6,623) (9,709)
Disposals - - 92 16 39 - 147 9,925
At the end of the year (231) (25,563) (15,230) (9,555) (693) (1,059) (52,331) (45,855)
19.6 Carrying valueAs at 31 March 2019 105 283 13,950 2,214 224 129 16,905 -
As at 31 March 2018 146 2,531 16,926 2,293 269 224 - 22,389
During the financial year, the Company acquired Plant and Equipment to the aggregate value of Rs. 1.29 Mn (2018 Rs 13.97 Mn) Cash payments amounting to Rs. 1.29 Mn (2018- Rs. 13.97 Mn) was paid during the year for the acquisition of Plant and Equipment.
19.7 Carrying value Property, Plant and Equipment
Group Company2019 2018 2019 2018
Rs 000's Rs 000's Rs 000's Rs 000's
At cost 39,721 43,465 16,905 22,389
At valuation 311,354 310,000 - -
351,075 353,465 16,905 22,389
19.8 Revaluation of land and buildingsAccounting judgements,estimates and assumptionsThe Group uses the revaluation model of measurement of land and buildings. The Group engaged independent expert valuers, to determine the fair value of its land and buildings. Fair value is determined by reference to market-based evidence of transaction prices for similar properties. Valuations are based on open market prices, adjusted for any difference in the nature, location or condition of the specific property. These valuation techniques that are appropriate in the circumstances and for which sufficient data are available to measure fair value, maximising the use of relevant observable inputs and minimizing the use of unobservable inputs. The date of the most recent revaluation carried out was 31st December 2018. The changes in fair value is recognised in other comprehensive income and in the statement of equity. The valuer has used valuation techniques such as market values and discounted cash flow methods where there was lack of comparable market data available based on the nature of the property.
NOTES TO THE FINANCIAL STATEMENTS
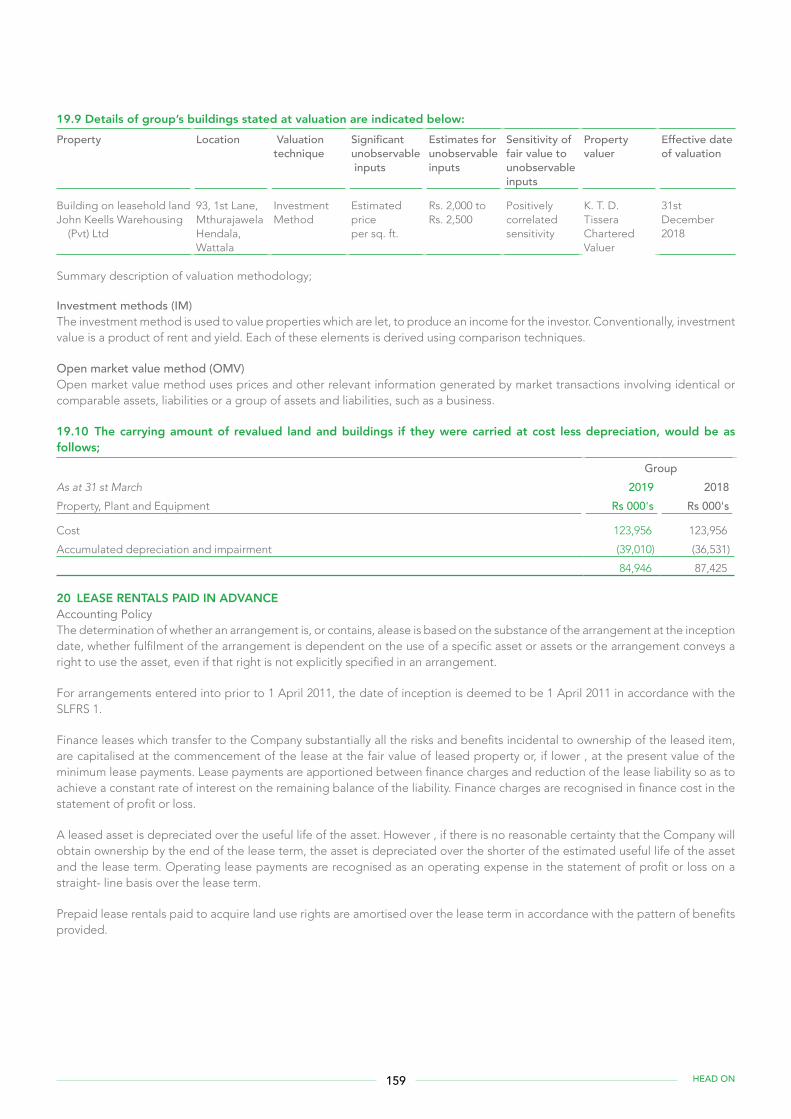
159 HEAD ON
19.9 Details of group’s buildings stated at valuation are indicated below:Property Location Valuation
techniqueSignificant unobservable inputs
Estimates for unobservable inputs
Sensitivity of fair value tounobservable inputs
Propertyvaluer
Effective dateof valuation
Building on leasehold landJohn Keells Warehousing
(Pvt) Ltd
93, 1st Lane, MthurajawelaHendala, Wattala
Investment Method
Estimated priceper sq. ft.
Rs. 2,000 to Rs. 2,500
Positively correlated sensitivity
K. T. D. TisseraChartered Valuer
31st December 2018
Summary description of valuation methodology;
Investment methods (IM)The investment method is used to value properties which are let, to produce an income for the investor. Conventionally, investment value is a product of rent and yield. Each of these elements is derived using comparison techniques.
Open market value method (OMV)Open market value method uses prices and other relevant information generated by market transactions involving identical or comparable assets, liabilities or a group of assets and liabilities, such as a business.
19.10 The carrying amount of revalued land and buildings if they were carried at cost less depreciation, would be as follows;
Group As at 31 st March 2019 2018Property, Plant and Equipment Rs 000's Rs 000's
Cost 123,956 123,956
Accumulated depreciation and impairment (39,010) (36,531)
84,946 87,425
20 LEASE RENTALS PAID IN ADVANCEAccounting PolicyThe determination of whether an arrangement is, or contains, alease is based on the substance of the arrangement at the inception date, whether fulfilment of the arrangement is dependent on the use of a specific asset or assets or the arrangement conveys a right to use the asset, even if that right is not explicitly specified in an arrangement.
For arrangements entered into prior to 1 April 2011, the date of inception is deemed to be 1 April 2011 in accordance with the SLFRS 1.
Finance leases which transfer to the Company substantially all the risks and benefits incidental to ownership of the leased item, are capitalised at the commencement of the lease at the fair value of leased property or, if lower , at the present value of the minimum lease payments. Lease payments are apportioned between finance charges and reduction of the lease liability so as to achieve a constant rate of interest on the remaining balance of the liability. Finance charges are recognised in finance cost in the statement of profit or loss.
A leased asset is depreciated over the useful life of the asset. However , if there is no reasonable certainty that the Company will obtain ownership by the end of the lease term, the asset is depreciated over the shorter of the estimated useful life of the asset and the lease term. Operating lease payments are recognised as an operating expense in the statement of profit or loss on a straight- line basis over the lease term.
Prepaid lease rentals paid to acquire land use rights are amortised over the lease term in accordance with the pattern of benefits provided.

160John Keells PLC Annual Report 2018/19
20 LEASE RENTALS PAID IN ADVANCE (Contd.)20.1 Summary
Group As at 31 st March 2019 2018
Rs 000's Rs 000's
At the beginning of the year 36,935 38,024
Amortisation for the year (1,089) (1,089)
At the end of the year 35,846 36,935
20.2 Amortisation of Leasehold Property Muthurajawela Land
To be amortised in 2020 1,089
To be amortised from 2021 -2023 4,356
To be amortised from 2024-2052 30,401
35,846
John Keells Warehousing (Pvt) Ltd has entered into a 50 year lease agreement with Sri Lanka Land Reclamation and Development Corporation to lease a land in Muthurajawela for a total lease rent of Rs 54,450,000/-.
21 INVESTMENT PROPERTIESAccounting PolicyInvestment properties are measured initially at cost, including transaction costs. The carrying value of an investment property includes the cost of replacing part of an existing investment property, at the time that cost is incurred if the recognition criteria are met, and excludes the costs of day-to-day servicing of the investment property. Subsequent to initial recognition, the investment properties are stated at fair value, which reflect market conditions at the reporting date.
Gains or losses arising from changes in fair value are included in the income statement in the year in which they arise. Fair values are evaluated at frequent intervals by an accredited external, independent valuer.
Investment properties are derecognised when disposed, or permanently withdrawn from use because no future economic benefits are expected. Any gains or losses on retirement or disposal are recognised in the income statement in the year of retirement or disposal.
Transfers are made to or from investment property only when there is a change in use. For a transfer from investment property to owner occupied property or inventory (WIP), the deemed cost for subsequent accounting is the fair value at the date of change in use. If owner occupied property becomes an investment property or inventory (WIP), the Company accounts for such property in accordance with the policy stated under property, plant and equipment up to the date of change in use.
Where Group companies occupy a significant portion of the investment property of a subsidiary, such investment properties are treated as property, plant and equipment in the consolidated financial statements, and accounted using Group accounting policy for property, plant and equipment.
Group CompanyAs at 31st March 2019 2018 2019 2018 Rs 000's Rs 000's Rs 000's Rs 000's
INVESTMENT PROPERTYAt the beginning of the year 288,100 227,750 288,100 227,750
Change in fair value during the year 75,500 60,350 75,500 60,350
At the end of the year 363,600 288,100 363,600 288,100
NOTES TO THE FINANCIAL STATEMENTS
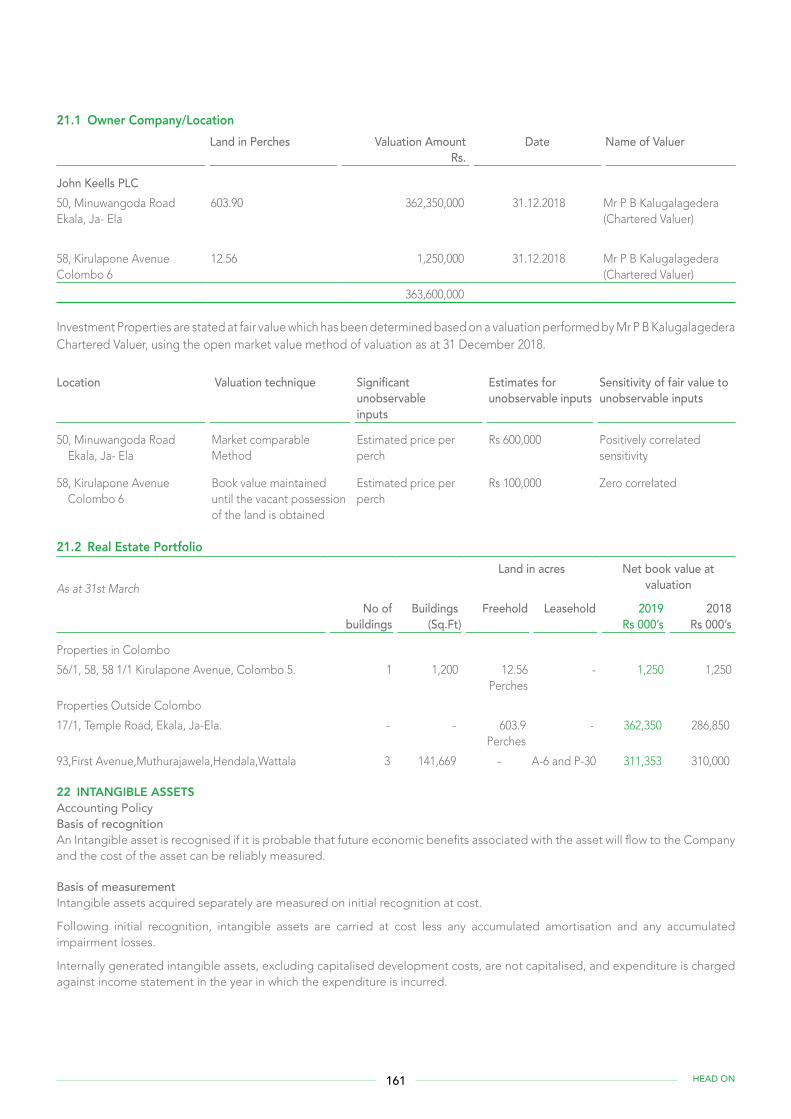
161 HEAD ON
21.1 Owner Company/LocationLand in Perches Valuation Amount
Rs. Date Name of Valuer
John Keells PLC50, Minuwangoda RoadEkala, Ja- Ela
603.90 362,350,000 31.12.2018 Mr P B Kalugalagedera(Chartered Valuer)
58, Kirulapone AvenueColombo 6
12.56 1,250,000 31.12.2018 Mr P B Kalugalagedera(Chartered Valuer)
363,600,000
Investment Properties are stated at fair value which has been determined based on a valuation performed by Mr P B Kalugalagedera Chartered Valuer, using the open market value method of valuation as at 31 December 2018.
Location Valuation technique Significant unobservableinputs
Estimates for unobservable inputs
Sensitivity of fair value tounobservable inputs
50, Minuwangoda Road Ekala, Ja- Ela
Market comparable Method
Estimated price per perch
Rs 600,000 Positively correlated sensitivity
58, Kirulapone Avenue Colombo 6
Book value maintained until the vacant possession of the land is obtained
Estimated price per perch
Rs 100,000 Zero correlated
21.2 Real Estate PortfolioLand in acres Net book value at
valuationAs at 31st March
No of buildings
Buildings(Sq.Ft)
Freehold Leasehold 2019Rs 000’s
2018Rs 000’s
Properties in Colombo
56/1, 58, 58 1/1 Kirulapone Avenue, Colombo 5. 1 1,200 12.56 Perches
- 1,250 1,250
Properties Outside Colombo
17/1, Temple Road, Ekala, Ja-Ela. - - 603.9 Perches
- 362,350 286,850
93,First Avenue,Muthurajawela,Hendala,Wattala 3 141,669 - A-6 and P-30 311,353 310,000
22 INTANGIBLE ASSETSAccounting PolicyBasis of recognitionAn Intangible asset is recognised if it is probable that future economic benefits associated with the asset will flow to the Company and the cost of the asset can be reliably measured.
Basis of measurementIntangible assets acquired separately are measured on initial recognition at cost.
Following initial recognition, intangible assets are carried at cost less any accumulated amortisation and any accumulated impairment losses.
Internally generated intangible assets, excluding capitalised development costs, are not capitalised, and expenditure is charged against income statement in the year in which the expenditure is incurred.

162John Keells PLC Annual Report 2018/19
22 INTANGIBLE ASSETS (Contd.)Useful economic lives, amortization and impairmentThe useful lives of intangible assets are assessed as either finite or indefinite lives. Intangible assets with finite lives are amortised over the useful economic life and assessed for impairment whenever there is an indication that the intangible asset may be impaired. The amortisation period and the amortisation method for an intangible asset with a finite useful life is reviewed at least at each financial year-end and such changes are treated as accounting estimates. The amortisation expense on intangible assets with finite lives is recognised in the income statement.
Intangible assets with indefinite useful lives are not amortized but tested for impairment annually, or more frequently when an indication of impairment exists either individually or at the cash-generating unit level. The useful life of an intangible asset with an indefinite life is reviewed annually to determine whether indefinite life assessment continues to be supportable. If not, the change in the useful life assessment from indefinite to finite is made on a prospective basis.
Software licenseSoftware license costs are recognised as an intangible asset and amortised over the period of expected future usage of related ERP systems (over three years).
Gains or losses arising from de recognition of an intangible asset are measured as the difference between the net disposal proceeds and the carrying amount of the asset and are recognised in the income statement when the asset is derecognised.
22.1 CostSoftware licenses
Group CompanyAs at 31st March 2019 2018 2019 2018 Rs 000's Rs 000's Rs 000's Rs 000's
At the beginning of the year 4,594 4,594 - -
Additions 4,263 - 4,263 -
Derecognition - -
At the end of the year 8,857 4,594 4,263 -
22.2 Accumulated amortisation and impairmentAt the beginning of the year (4,594) (4,502) - -
Amortisation (200) (92) (200) -
Derecognition - -
At the end of the year (4,794) (4,594) (200) -
22.3 Carrying valueAs at 31 March 2019 4,063 - 4,063 -
As at 31 March 2018 - - - -
23 INVESTMENTS IN SUBSIDIARIESAccounting PolicyInvestment in subsidiaries are initially recognised at cost in the financial statements of the Company. Any transaction cost relating to acquisition of investment in subsidiaries are immediately recognised in the income statement. Following initial recognition, investment in subsidiaries are carried at cost less any accumulated impairment losses. Income from these investments is recognized only to the extent of dividend received.
23.1 Carrying valueCompany
As at 31st March Note 2019 2018 Rs 000's Rs 000's
Investments in subsidiaries 23.2 158,570 158,570
Unquoted
158,570 158,570
NOTES TO THE FINANCIAL STATEMENTS
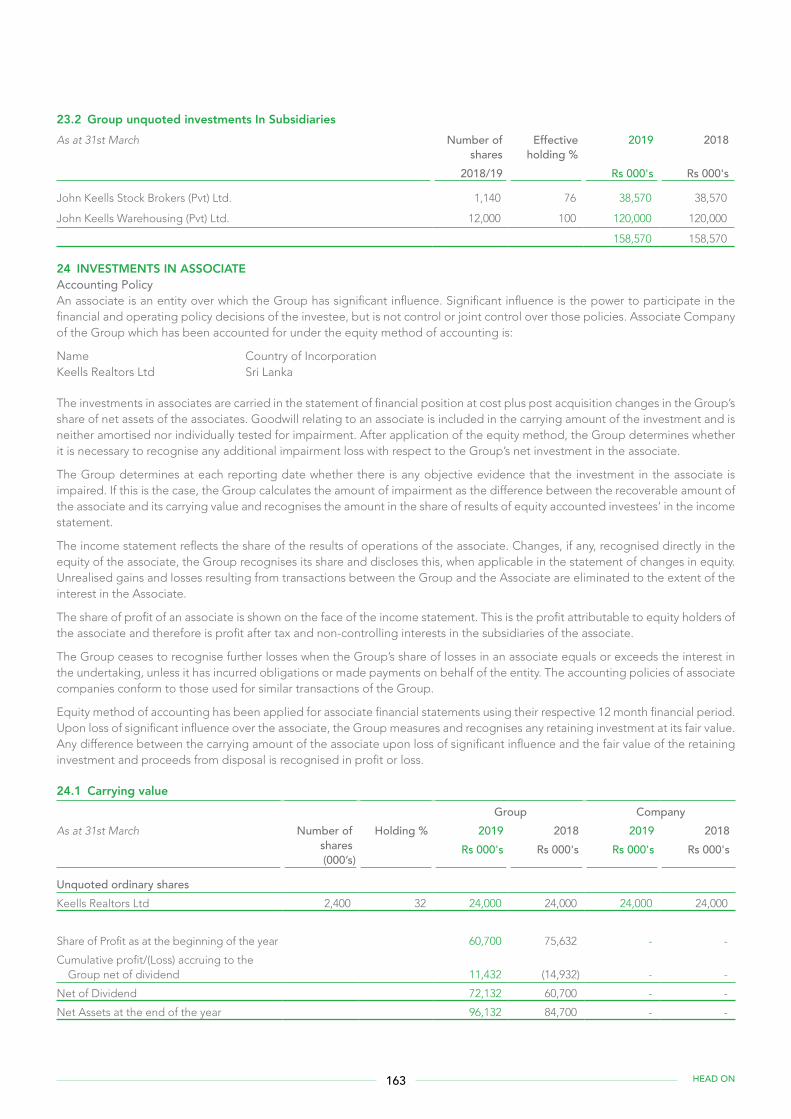
163 HEAD ON
23.2 Group unquoted investments In SubsidiariesAs at 31st March Number of
sharesEffective
holding %2019 2018
2018/19 Rs 000's Rs 000's
John Keells Stock Brokers (Pvt) Ltd. 1,140 76 38,570 38,570
John Keells Warehousing (Pvt) Ltd. 12,000 100 120,000 120,000
158,570 158,570
24 INVESTMENTS IN ASSOCIATEAccounting PolicyAn associate is an entity over which the Group has significant influence. Significant influence is the power to participate in the financial and operating policy decisions of the investee, but is not control or joint control over those policies. Associate Company of the Group which has been accounted for under the equity method of accounting is:
Name Country of IncorporationKeells Realtors Ltd Sri Lanka
The investments in associates are carried in the statement of financial position at cost plus post acquisition changes in the Group’s share of net assets of the associates. Goodwill relating to an associate is included in the carrying amount of the investment and is neither amortised nor individually tested for impairment. After application of the equity method, the Group determines whether it is necessary to recognise any additional impairment loss with respect to the Group’s net investment in the associate.
The Group determines at each reporting date whether there is any objective evidence that the investment in the associate is impaired. If this is the case, the Group calculates the amount of impairment as the difference between the recoverable amount of the associate and its carrying value and recognises the amount in the share of results of equity accounted investees’ in the income statement.
The income statement reflects the share of the results of operations of the associate. Changes, if any, recognised directly in the equity of the associate, the Group recognises its share and discloses this, when applicable in the statement of changes in equity. Unrealised gains and losses resulting from transactions between the Group and the Associate are eliminated to the extent of the interest in the Associate.
The share of profit of an associate is shown on the face of the income statement. This is the profit attributable to equity holders of the associate and therefore is profit after tax and non-controlling interests in the subsidiaries of the associate.
The Group ceases to recognise further losses when the Group’s share of losses in an associate equals or exceeds the interest in the undertaking, unless it has incurred obligations or made payments on behalf of the entity. The accounting policies of associate companies conform to those used for similar transactions of the Group.
Equity method of accounting has been applied for associate financial statements using their respective 12 month financial period. Upon loss of significant influence over the associate, the Group measures and recognises any retaining investment at its fair value. Any difference between the carrying amount of the associate upon loss of significant influence and the fair value of the retaining investment and proceeds from disposal is recognised in profit or loss.
24.1 Carrying value Group Company
As at 31st March Number ofshares(000’s)
Holding % 2019 2018 2019 2018 Rs 000's Rs 000's Rs 000's Rs 000's
Unquoted ordinary sharesKeells Realtors Ltd 2,400 32 24,000 24,000 24,000 24,000
Share of Profit as at the beginning of the year 60,700 75,632 - -
Cumulative profit/(Loss) accruing to the Group net of dividend 11,432 (14,932) - -
Net of Dividend 72,132 60,700 - -
Net Assets at the end of the year 96,132 84,700 - -
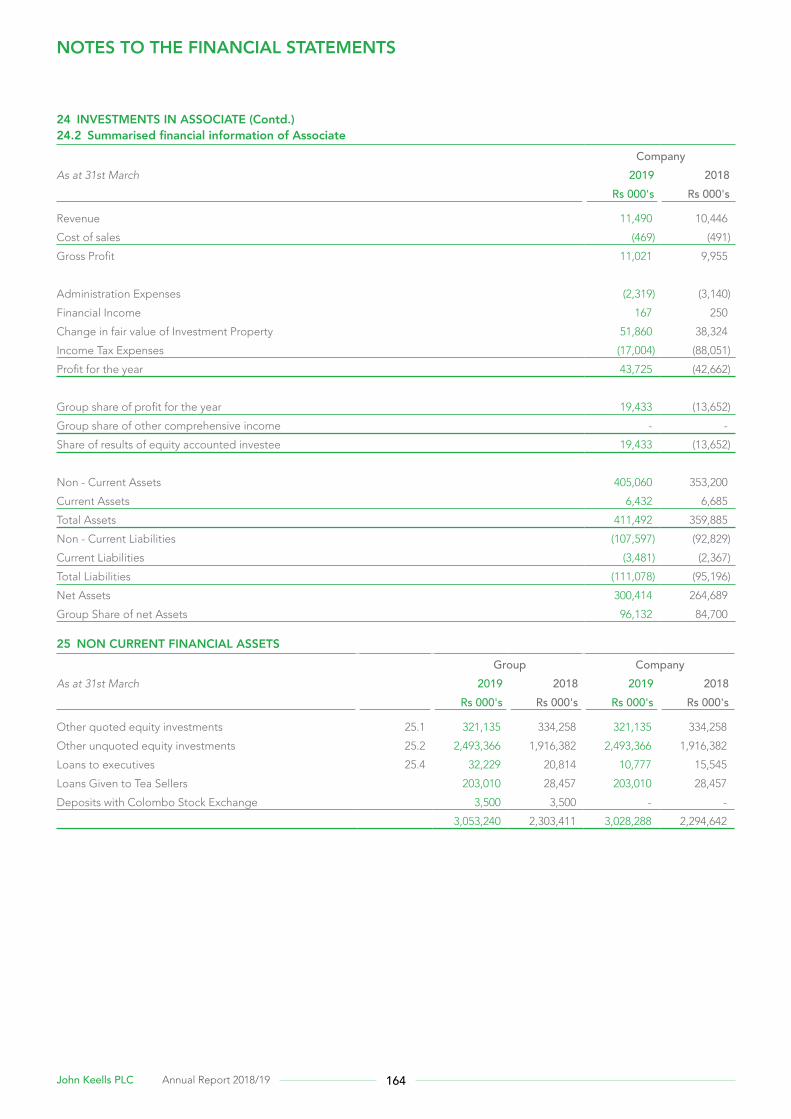
164John Keells PLC Annual Report 2018/19
24 INVESTMENTS IN ASSOCIATE (Contd.)24.2 Summarised financial information of Associate
CompanyAs at 31st March 2019 2018 Rs 000's Rs 000's
Revenue 11,490 10,446
Cost of sales (469) (491)
Gross Profit 11,021 9,955
Administration Expenses (2,319) (3,140)
Financial Income 167 250
Change in fair value of Investment Property 51,860 38,324
Income Tax Expenses (17,004) (88,051)
Profit for the year 43,725 (42,662)
Group share of profit for the year 19,433 (13,652)
Group share of other comprehensive income - -
Share of results of equity accounted investee 19,433 (13,652)
Non - Current Assets 405,060 353,200
Current Assets 6,432 6,685
Total Assets 411,492 359,885
Non - Current Liabilities (107,597) (92,829)
Current Liabilities (3,481) (2,367)
Total Liabilities (111,078) (95,196)
Net Assets 300,414 264,689
Group Share of net Assets 96,132 84,700
25 NON CURRENT FINANCIAL ASSETS Group Company
As at 31st March 2019 2018 2019 2018 Rs 000's Rs 000's Rs 000's Rs 000's
Other quoted equity investments 25.1 321,135 334,258 321,135 334,258
Other unquoted equity investments 25.2 2,493,366 1,916,382 2,493,366 1,916,382
Loans to executives 25.4 32,229 20,814 10,777 15,545
Loans Given to Tea Sellers 203,010 28,457 203,010 28,457
Deposits with Colombo Stock Exchange 3,500 3,500 - -
3,053,240 2,303,411 3,028,288 2,294,642
NOTES TO THE FINANCIAL STATEMENTS
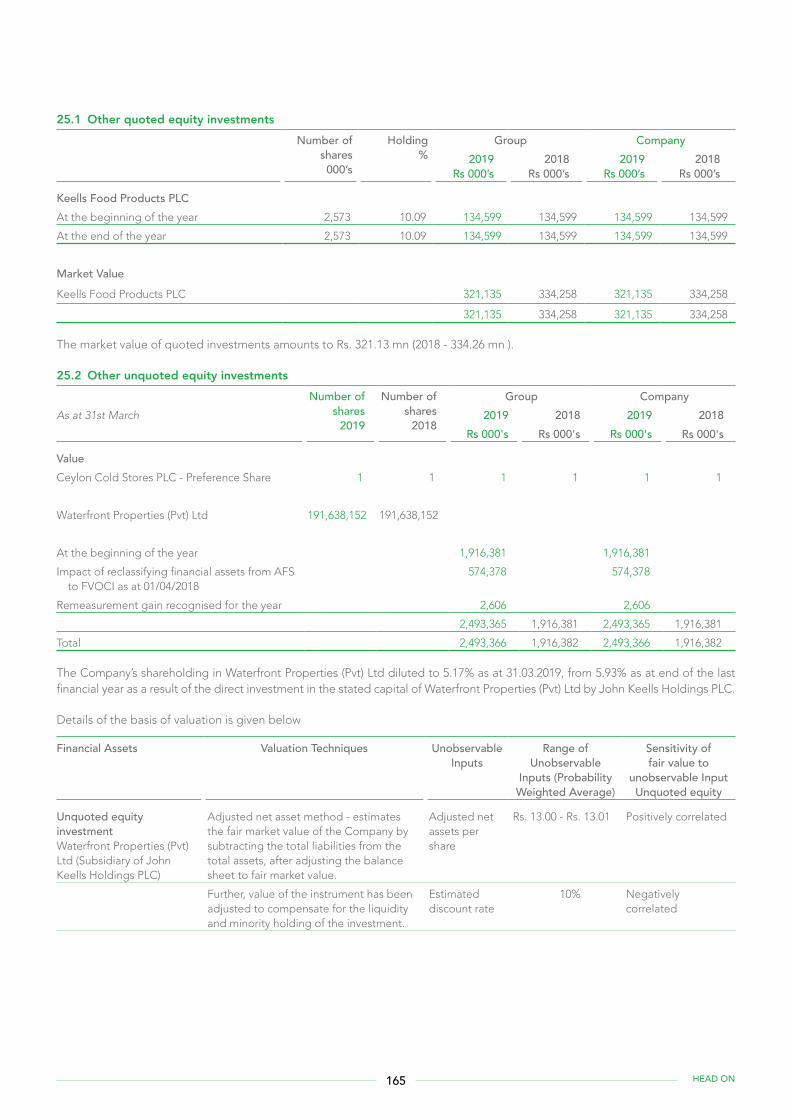
165 HEAD ON
25.1 Other quoted equity investments Number of
shares 000’s
Holding%
Group Company 2019
Rs 000’s2018
Rs 000’s2019
Rs 000’s2018
Rs 000’s
Keells Food Products PLCAt the beginning of the year 2,573 10.09 134,599 134,599 134,599 134,599
At the end of the year 2,573 10.09 134,599 134,599 134,599 134,599
Market Value
Keells Food Products PLC 321,135 334,258 321,135 334,258
321,135 334,258 321,135 334,258
The market value of quoted investments amounts to Rs. 321.13 mn (2018 - 334.26 mn ).
25.2 Other unquoted equity investmentsNumber of
shares2019
Number ofshares
2018
Group CompanyAs at 31st March 2019 2018 2019 2018 Rs 000's Rs 000's Rs 000's Rs 000's
ValueCeylon Cold Stores PLC - Preference Share 1 1 1 1 1 1
Waterfront Properties (Pvt) Ltd 191,638,152 191,638,152
At the beginning of the year 1,916,381 1,916,381
Impact of reclassifying financial assets from AFS to FVOCI as at 01/04/2018
574,378 574,378
Remeasurement gain recognised for the year 2,606 2,606
2,493,365 1,916,381 2,493,365 1,916,381
Total 2,493,366 1,916,382 2,493,366 1,916,382
The Company’s shareholding in Waterfront Properties (Pvt) Ltd diluted to 5.17% as at 31.03.2019, from 5.93% as at end of the last financial year as a result of the direct investment in the stated capital of Waterfront Properties (Pvt) Ltd by John Keells Holdings PLC.
Details of the basis of valuation is given below
Financial Assets Valuation Techniques Unobservable Inputs
Range of Unobservable
Inputs (Probability Weighted Average)
Sensitivity of fair value to
unobservable Input Unquoted equity
Unquoted equity investmentWaterfront Properties (Pvt) Ltd (Subsidiary of John Keells Holdings PLC)
Adjusted net asset method - estimates the fair market value of the Company by subtracting the total liabilities from the total assets, after adjusting the balance sheet to fair market value.
Adjusted net assets per share
Rs. 13.00 - Rs. 13.01 Positively correlated
Further, value of the instrument has been adjusted to compensate for the liquidity and minority holding of the investment.
Estimated discount rate
10% Negatively correlated
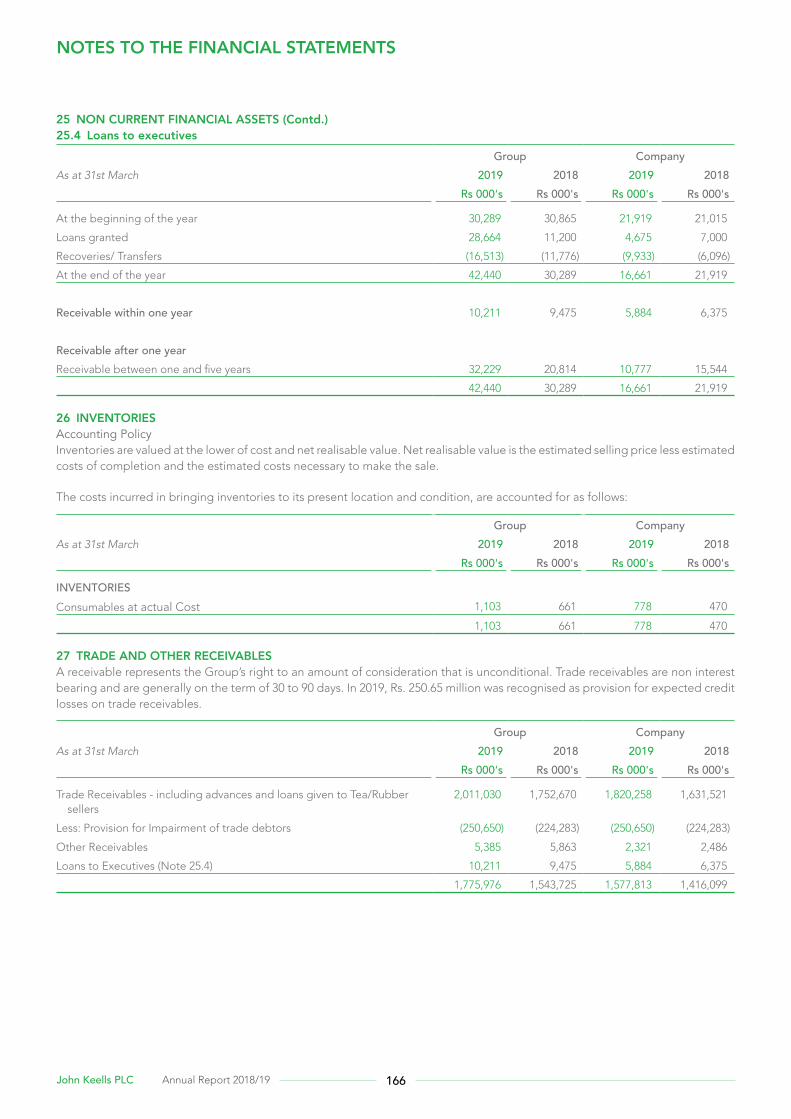
166John Keells PLC Annual Report 2018/19
25 NON CURRENT FINANCIAL ASSETS (Contd.)25.4 Loans to executives
Group CompanyAs at 31st March 2019 2018 2019 2018 Rs 000's Rs 000's Rs 000's Rs 000's
At the beginning of the year 30,289 30,865 21,919 21,015
Loans granted 28,664 11,200 4,675 7,000
Recoveries/ Transfers (16,513) (11,776) (9,933) (6,096)
At the end of the year 42,440 30,289 16,661 21,919
Receivable within one year 10,211 9,475 5,884 6,375
Receivable after one yearReceivable between one and five years 32,229 20,814 10,777 15,544
42,440 30,289 16,661 21,919
26 INVENTORIESAccounting PolicyInventories are valued at the lower of cost and net realisable value. Net realisable value is the estimated selling price less estimated costs of completion and the estimated costs necessary to make the sale.
The costs incurred in bringing inventories to its present location and condition, are accounted for as follows:
Group CompanyAs at 31st March 2019 2018 2019 2018 Rs 000's Rs 000's Rs 000's Rs 000's
INVENTORIESConsumables at actual Cost 1,103 661 778 470
1,103 661 778 470
27 TRADE AND OTHER RECEIVABLESA receivable represents the Group’s right to an amount of consideration that is unconditional. Trade receivables are non interest bearing and are generally on the term of 30 to 90 days. In 2019, Rs. 250.65 million was recognised as provision for expected credit losses on trade receivables.
Group CompanyAs at 31st March 2019 2018 2019 2018 Rs 000's Rs 000's Rs 000's Rs 000's
Trade Receivables - including advances and loans given to Tea/Rubber sellers
2,011,030 1,752,670 1,820,258 1,631,521
Less: Provision for Impairment of trade debtors (250,650) (224,283) (250,650) (224,283)
Other Receivables 5,385 5,863 2,321 2,486
Loans to Executives (Note 25.4) 10,211 9,475 5,884 6,375
1,775,976 1,543,725 1,577,813 1,416,099
NOTES TO THE FINANCIAL STATEMENTS
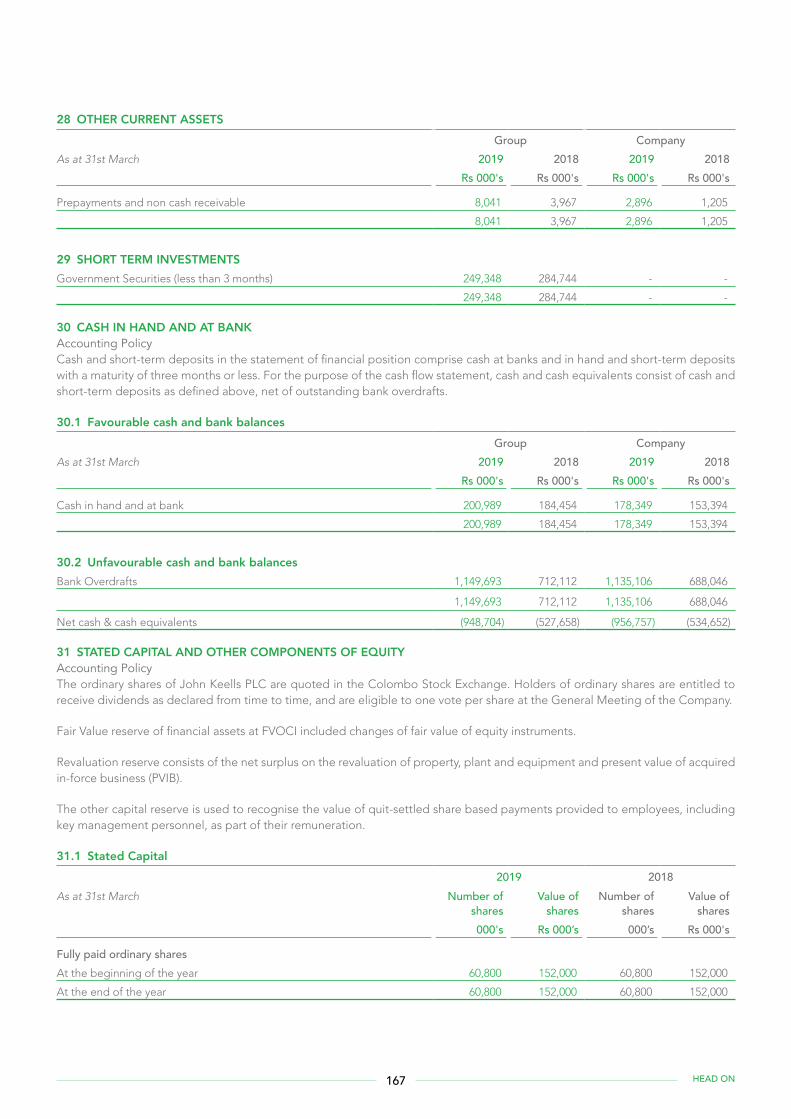
167 HEAD ON
28 OTHER CURRENT ASSETS Group Company
As at 31st March 2019 2018 2019 2018 Rs 000's Rs 000's Rs 000's Rs 000's
Prepayments and non cash receivable 8,041 3,967 2,896 1,205
8,041 3,967 2,896 1,205
29 SHORT TERM INVESTMENTSGovernment Securities (less than 3 months) 249,348 284,744 - -
249,348 284,744 - -
30 CASH IN HAND AND AT BANKAccounting PolicyCash and short-term deposits in the statement of financial position comprise cash at banks and in hand and short-term deposits with a maturity of three months or less. For the purpose of the cash flow statement, cash and cash equivalents consist of cash and short-term deposits as defined above, net of outstanding bank overdrafts.
30.1 Favourable cash and bank balances Group Company
As at 31st March 2019 2018 2019 2018 Rs 000's Rs 000's Rs 000's Rs 000's
Cash in hand and at bank 200,989 184,454 178,349 153,394
200,989 184,454 178,349 153,394
30.2 Unfavourable cash and bank balancesBank Overdrafts 1,149,693 712,112 1,135,106 688,046
1,149,693 712,112 1,135,106 688,046
Net cash & cash equivalents (948,704) (527,658) (956,757) (534,652)
31 STATED CAPITAL AND OTHER COMPONENTS OF EQUITYAccounting PolicyThe ordinary shares of John Keells PLC are quoted in the Colombo Stock Exchange. Holders of ordinary shares are entitled to receive dividends as declared from time to time, and are eligible to one vote per share at the General Meeting of the Company.
Fair Value reserve of financial assets at FVOCI included changes of fair value of equity instruments.
Revaluation reserve consists of the net surplus on the revaluation of property, plant and equipment and present value of acquired in-force business (PVIB).
The other capital reserve is used to recognise the value of quit-settled share based payments provided to employees, including key management personnel, as part of their remuneration.
31.1 Stated Capital2019 2018
As at 31st March Number ofshares
Value ofshares
Number ofshares
Value ofshares
000's Rs 000’s 000’s Rs 000's
Fully paid ordinary sharesAt the beginning of the year 60,800 152,000 60,800 152,000
At the end of the year 60,800 152,000 60,800 152,000
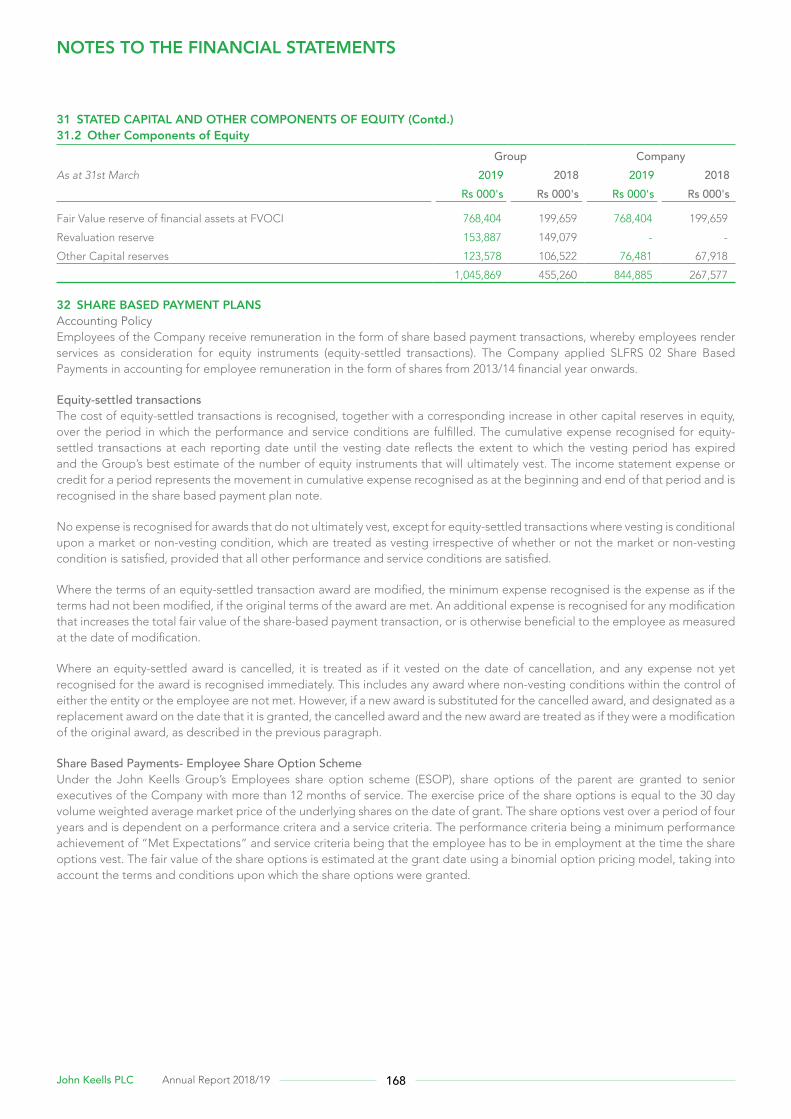
168John Keells PLC Annual Report 2018/19
31 STATED CAPITAL AND OTHER COMPONENTS OF EQUITY (Contd.)31.2 Other Components of Equity
Group CompanyAs at 31st March 2019 2018 2019 2018 Rs 000's Rs 000's Rs 000's Rs 000's
Fair Value reserve of financial assets at FVOCI 768,404 199,659 768,404 199,659
Revaluation reserve 153,887 149,079 - -
Other Capital reserves 123,578 106,522 76,481 67,918
1,045,869 455,260 844,885 267,577
32 SHARE BASED PAYMENT PLANSAccounting PolicyEmployees of the Company receive remuneration in the form of share based payment transactions, whereby employees render services as consideration for equity instruments (equity-settled transactions). The Company applied SLFRS 02 Share Based Payments in accounting for employee remuneration in the form of shares from 2013/14 financial year onwards.
Equity-settled transactionsThe cost of equity-settled transactions is recognised, together with a corresponding increase in other capital reserves in equity, over the period in which the performance and service conditions are fulfilled. The cumulative expense recognised for equity-settled transactions at each reporting date until the vesting date reflects the extent to which the vesting period has expired and the Group’s best estimate of the number of equity instruments that will ultimately vest. The income statement expense or credit for a period represents the movement in cumulative expense recognised as at the beginning and end of that period and is recognised in the share based payment plan note.
No expense is recognised for awards that do not ultimately vest, except for equity-settled transactions where vesting is conditional upon a market or non-vesting condition, which are treated as vesting irrespective of whether or not the market or non-vesting condition is satisfied, provided that all other performance and service conditions are satisfied.
Where the terms of an equity-settled transaction award are modified, the minimum expense recognised is the expense as if the terms had not been modified, if the original terms of the award are met. An additional expense is recognised for any modification that increases the total fair value of the share-based payment transaction, or is otherwise beneficial to the employee as measured at the date of modification.
Where an equity-settled award is cancelled, it is treated as if it vested on the date of cancellation, and any expense not yet recognised for the award is recognised immediately. This includes any award where non-vesting conditions within the control of either the entity or the employee are not met. However, if a new award is substituted for the cancelled award, and designated as a replacement award on the date that it is granted, the cancelled award and the new award are treated as if they were a modification of the original award, as described in the previous paragraph.
Share Based Payments- Employee Share Option SchemeUnder the John Keells Group’s Employees share option scheme (ESOP), share options of the parent are granted to senior executives of the Company with more than 12 months of service. The exercise price of the share options is equal to the 30 day volume weighted average market price of the underlying shares on the date of grant. The share options vest over a period of four years and is dependent on a performance critera and a service criteria. The performance criteria being a minimum performance achievement of “Met Expectations” and service criteria being that the employee has to be in employment at the time the share options vest. The fair value of the share options is estimated at the grant date using a binomial option pricing model, taking into account the terms and conditions upon which the share options were granted.
NOTES TO THE FINANCIAL STATEMENTS
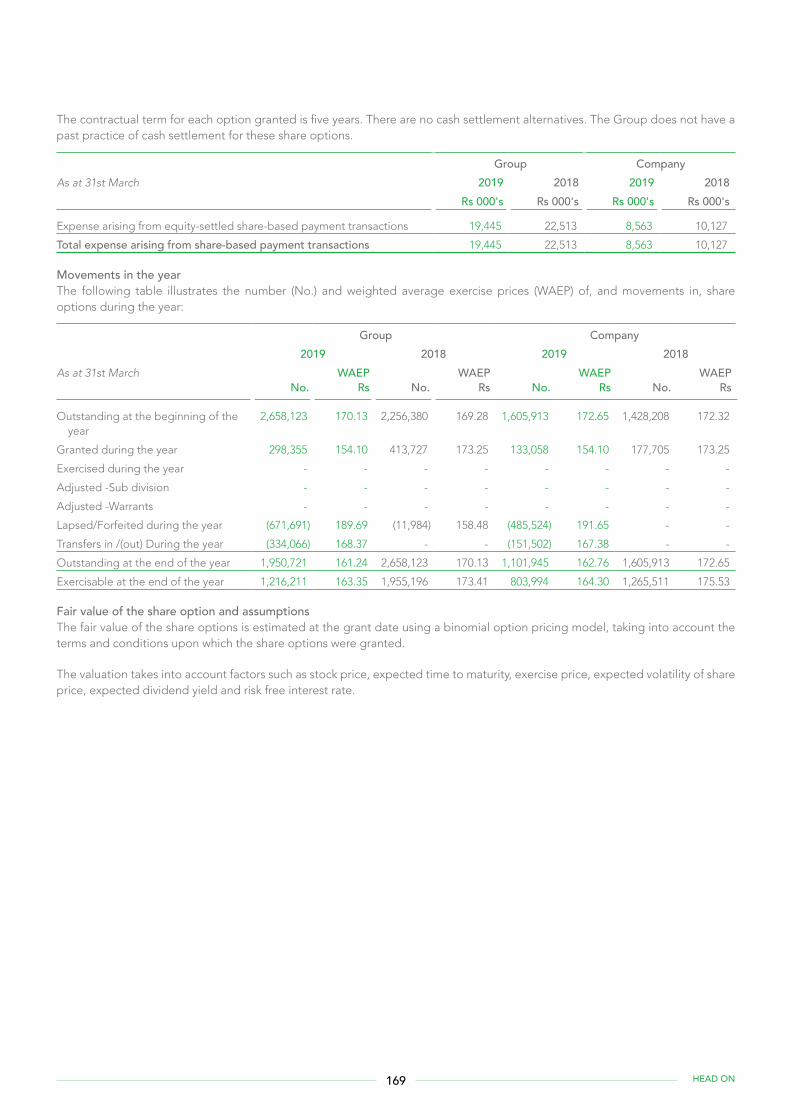
169 HEAD ON
The contractual term for each option granted is five years. There are no cash settlement alternatives. The Group does not have a past practice of cash settlement for these share options.
Group CompanyAs at 31st March 2019 2018 2019 2018 Rs 000's Rs 000's Rs 000's Rs 000's
Expense arising from equity-settled share-based payment transactions 19,445 22,513 8,563 10,127
Total expense arising from share-based payment transactions 19,445 22,513 8,563 10,127
Movements in the yearThe following table illustrates the number (No.) and weighted average exercise prices (WAEP) of, and movements in, share options during the year:
Group Company2019 2018 2019 2018
As at 31st MarchNo.
WAEPRs No.
WAEPRs No.
WAEPRs No.
WAEPRs
Outstanding at the beginning of the year
2,658,123 170.13 2,256,380 169.28 1,605,913 172.65 1,428,208 172.32
Granted during the year 298,355 154.10 413,727 173.25 133,058 154.10 177,705 173.25
Exercised during the year - - - - - - - -
Adjusted -Sub division - - - - - - - -
Adjusted -Warrants - - - - - - - -
Lapsed/Forfeited during the year (671,691) 189.69 (11,984) 158.48 (485,524) 191.65 - -
Transfers in /(out) During the year (334,066) 168.37 - - (151,502) 167.38 - -
Outstanding at the end of the year 1,950,721 161.24 2,658,123 170.13 1,101,945 162.76 1,605,913 172.65
Exercisable at the end of the year 1,216,211 163.35 1,955,196 173.41 803,994 164.30 1,265,511 175.53
Fair value of the share option and assumptionsThe fair value of the share options is estimated at the grant date using a binomial option pricing model, taking into account the terms and conditions upon which the share options were granted.
The valuation takes into account factors such as stock price, expected time to maturity, exercise price, expected volatility of share price, expected dividend yield and risk free interest rate.
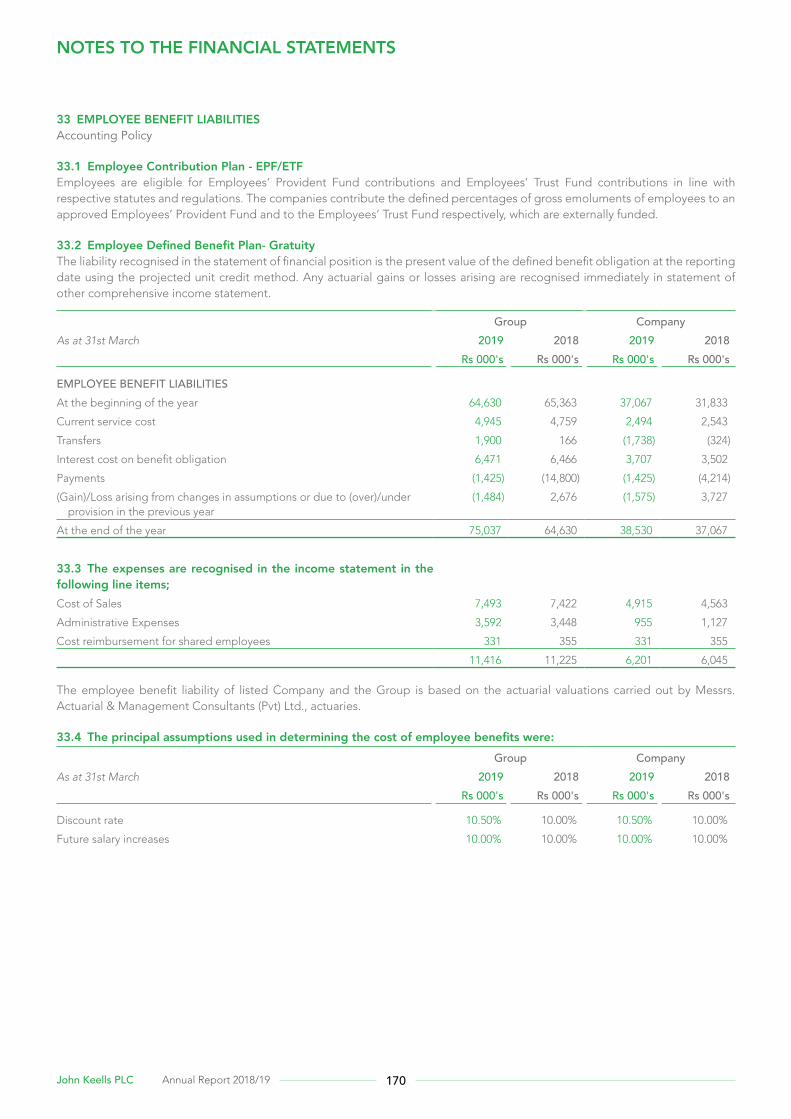
170John Keells PLC Annual Report 2018/19
33 EMPLOYEE BENEFIT LIABILITIESAccounting Policy
33.1 Employee Contribution Plan - EPF/ETFEmployees are eligible for Employees’ Provident Fund contributions and Employees’ Trust Fund contributions in line with respective statutes and regulations. The companies contribute the defined percentages of gross emoluments of employees to an approved Employees’ Provident Fund and to the Employees’ Trust Fund respectively, which are externally funded.
33.2 Employee Defined Benefit Plan- GratuityThe liability recognised in the statement of financial position is the present value of the defined benefit obligation at the reporting date using the projected unit credit method. Any actuarial gains or losses arising are recognised immediately in statement of other comprehensive income statement.
Group CompanyAs at 31st March 2019 2018 2019 2018 Rs 000's Rs 000's Rs 000's Rs 000's
EMPLOYEE BENEFIT LIABILITIESAt the beginning of the year 64,630 65,363 37,067 31,833
Current service cost 4,945 4,759 2,494 2,543
Transfers 1,900 166 (1,738) (324)
Interest cost on benefit obligation 6,471 6,466 3,707 3,502
Payments (1,425) (14,800) (1,425) (4,214)
(Gain)/Loss arising from changes in assumptions or due to (over)/under provision in the previous year
(1,484) 2,676 (1,575) 3,727
At the end of the year 75,037 64,630 38,530 37,067
33.3 The expenses are recognised in the income statement in the following line items;Cost of Sales 7,493 7,422 4,915 4,563
Administrative Expenses 3,592 3,448 955 1,127
Cost reimbursement for shared employees 331 355 331 355
11,416 11,225 6,201 6,045
The employee benefit liability of listed Company and the Group is based on the actuarial valuations carried out by Messrs. Actuarial & Management Consultants (Pvt) Ltd., actuaries.
33.4 The principal assumptions used in determining the cost of employee benefits were: Group Company
As at 31st March 2019 2018 2019 2018 Rs 000's Rs 000's Rs 000's Rs 000's
Discount rate 10.50% 10.00% 10.50% 10.00%
Future salary increases 10.00% 10.00% 10.00% 10.00%
NOTES TO THE FINANCIAL STATEMENTS
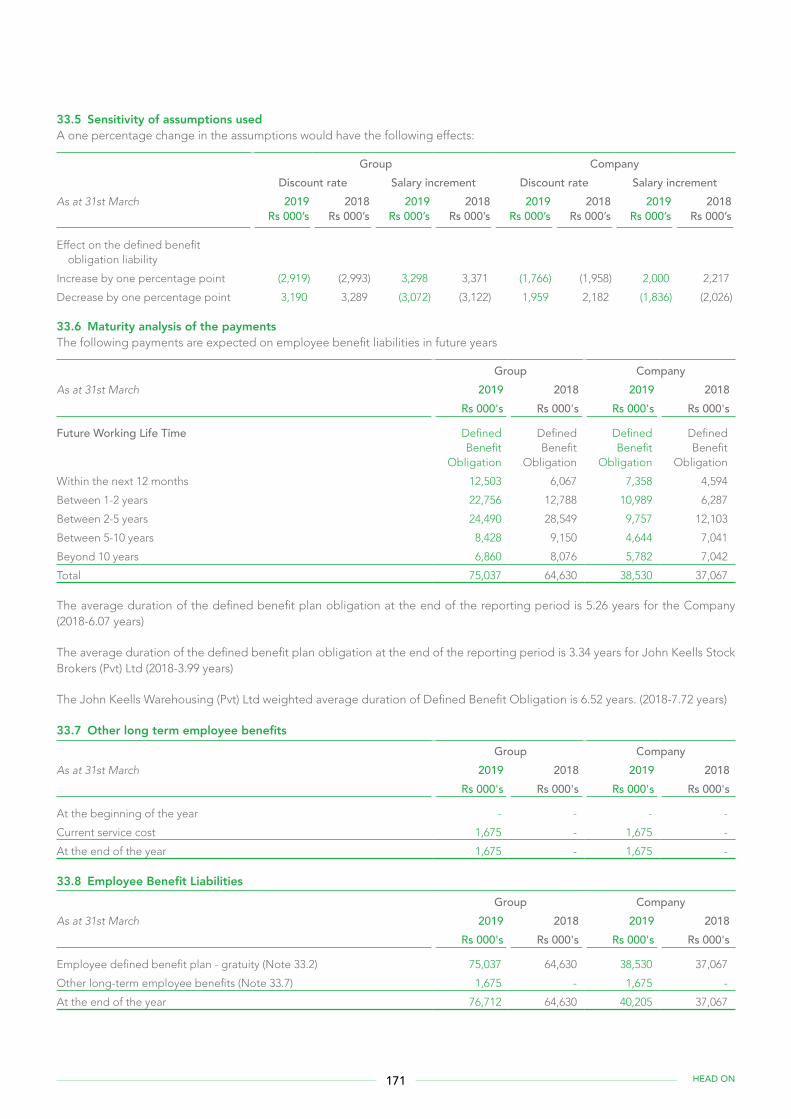
171 HEAD ON
33.5 Sensitivity of assumptions usedA one percentage change in the assumptions would have the following effects:
Group CompanyDiscount rate Salary increment Discount rate Salary increment
As at 31st March 2019Rs 000’s
2018Rs 000’s
2019Rs 000’s
2018Rs 000’s
2019Rs 000’s
2018Rs 000’s
2019Rs 000’s
2018Rs 000’s
Effect on the defined benefit obligation liability
Increase by one percentage point (2,919) (2,993) 3,298 3,371 (1,766) (1,958) 2,000 2,217
Decrease by one percentage point 3,190 3,289 (3,072) (3,122) 1,959 2,182 (1,836) (2,026)
33.6 Maturity analysis of the paymentsThe following payments are expected on employee benefit liabilities in future years
Group CompanyAs at 31st March 2019 2018 2019 2018 Rs 000's Rs 000's Rs 000's Rs 000's
Future Working Life Time Defined Benefit
Obligation
Defined Benefit
Obligation
Defined Benefit
Obligation
Defined Benefit
Obligation
Within the next 12 months 12,503 6,067 7,358 4,594
Between 1-2 years 22,756 12,788 10,989 6,287
Between 2-5 years 24,490 28,549 9,757 12,103
Between 5-10 years 8,428 9,150 4,644 7,041
Beyond 10 years 6,860 8,076 5,782 7,042
Total 75,037 64,630 38,530 37,067
The average duration of the defined benefit plan obligation at the end of the reporting period is 5.26 years for the Company (2018-6.07 years)
The average duration of the defined benefit plan obligation at the end of the reporting period is 3.34 years for John Keells Stock Brokers (Pvt) Ltd (2018-3.99 years)
The John Keells Warehousing (Pvt) Ltd weighted average duration of Defined Benefit Obligation is 6.52 years. (2018-7.72 years)
33.7 Other long term employee benefits Group Company
As at 31st March 2019 2018 2019 2018 Rs 000's Rs 000's Rs 000's Rs 000's
At the beginning of the year - - - -
Current service cost 1,675 - 1,675 -
At the end of the year 1,675 - 1,675 -
33.8 Employee Benefit Liabilities Group Company
As at 31st March 2019 2018 2019 2018 Rs 000's Rs 000's Rs 000's Rs 000's
Employee defined benefit plan - gratuity (Note 33.2) 75,037 64,630 38,530 37,067
Other long-term employee benefits (Note 33.7) 1,675 - 1,675 -
At the end of the year 76,712 64,630 40,205 37,067
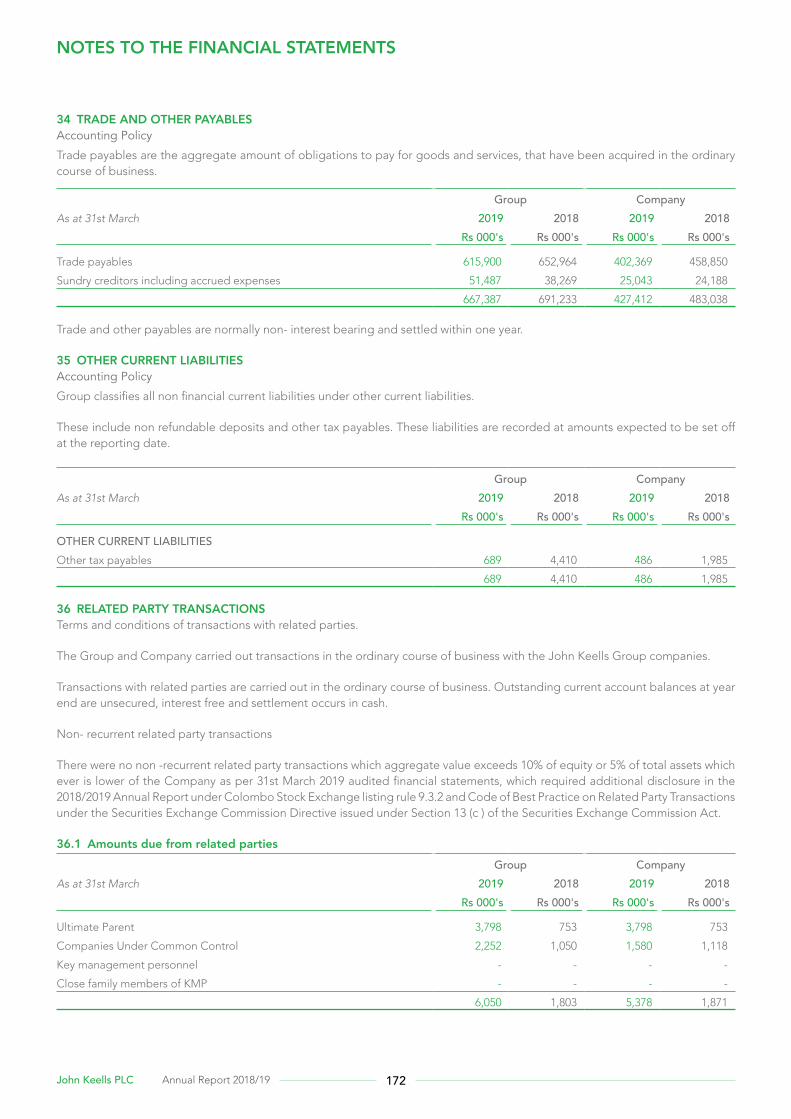
172John Keells PLC Annual Report 2018/19
34 TRADE AND OTHER PAYABLESAccounting Policy
Trade payables are the aggregate amount of obligations to pay for goods and services, that have been acquired in the ordinary course of business.
Group CompanyAs at 31st March 2019 2018 2019 2018 Rs 000's Rs 000's Rs 000's Rs 000's
Trade payables 615,900 652,964 402,369 458,850
Sundry creditors including accrued expenses 51,487 38,269 25,043 24,188
667,387 691,233 427,412 483,038
Trade and other payables are normally non- interest bearing and settled within one year.
35 OTHER CURRENT LIABILITIESAccounting Policy
Group classifies all non financial current liabilities under other current liabilities.
These include non refundable deposits and other tax payables. These liabilities are recorded at amounts expected to be set off at the reporting date.
Group CompanyAs at 31st March 2019 2018 2019 2018 Rs 000's Rs 000's Rs 000's Rs 000's
OTHER CURRENT LIABILITIESOther tax payables 689 4,410 486 1,985
689 4,410 486 1,985
36 RELATED PARTY TRANSACTIONSTerms and conditions of transactions with related parties.
The Group and Company carried out transactions in the ordinary course of business with the John Keells Group companies.
Transactions with related parties are carried out in the ordinary course of business. Outstanding current account balances at year end are unsecured, interest free and settlement occurs in cash.
Non- recurrent related party transactions
There were no non -recurrent related party transactions which aggregate value exceeds 10% of equity or 5% of total assets which ever is lower of the Company as per 31st March 2019 audited financial statements, which required additional disclosure in the 2018/2019 Annual Report under Colombo Stock Exchange listing rule 9.3.2 and Code of Best Practice on Related Party Transactions under the Securities Exchange Commission Directive issued under Section 13 (c ) of the Securities Exchange Commission Act.
36.1 Amounts due from related parties Group Company
As at 31st March 2019 2018 2019 2018 Rs 000's Rs 000's Rs 000's Rs 000's
Ultimate Parent 3,798 753 3,798 753
Companies Under Common Control 2,252 1,050 1,580 1,118
Key management personnel - - - -
Close family members of KMP - - - -
6,050 1,803 5,378 1,871
NOTES TO THE FINANCIAL STATEMENTS
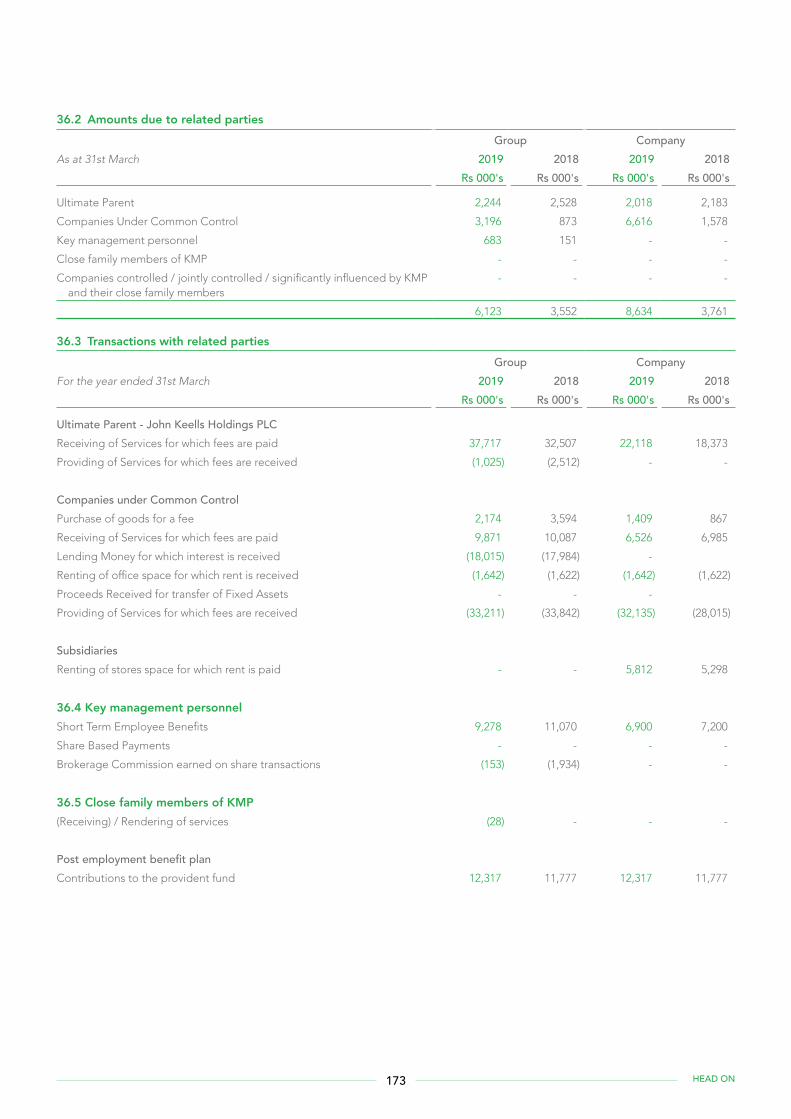
173 HEAD ON
36.2 Amounts due to related parties Group Company
As at 31st March 2019 2018 2019 2018 Rs 000's Rs 000's Rs 000's Rs 000's
Ultimate Parent 2,244 2,528 2,018 2,183
Companies Under Common Control 3,196 873 6,616 1,578
Key management personnel 683 151 - -
Close family members of KMP - - - -
Companies controlled / jointly controlled / significantly influenced by KMP and their close family members
- - - -
6,123 3,552 8,634 3,761
36.3 Transactions with related parties Group Company
For the year ended 31st March 2019 2018 2019 2018 Rs 000's Rs 000's Rs 000's Rs 000's
Ultimate Parent - John Keells Holdings PLCReceiving of Services for which fees are paid 37,717 32,507 22,118 18,373
Providing of Services for which fees are received (1,025) (2,512) - -
Companies under Common ControlPurchase of goods for a fee 2,174 3,594 1,409 867
Receiving of Services for which fees are paid 9,871 10,087 6,526 6,985
Lending Money for which interest is received (18,015) (17,984) -
Renting of office space for which rent is received (1,642) (1,622) (1,642) (1,622)
Proceeds Received for transfer of Fixed Assets - - -
Providing of Services for which fees are received (33,211) (33,842) (32,135) (28,015)
SubsidiariesRenting of stores space for which rent is paid - - 5,812 5,298
36.4 Key management personnelShort Term Employee Benefits 9,278 11,070 6,900 7,200
Share Based Payments - - - -
Brokerage Commission earned on share transactions (153) (1,934) - -
36.5 Close family members of KMP(Receiving) / Rendering of services (28) - - -
Post employment benefit planContributions to the provident fund 12,317 11,777 12,317 11,777
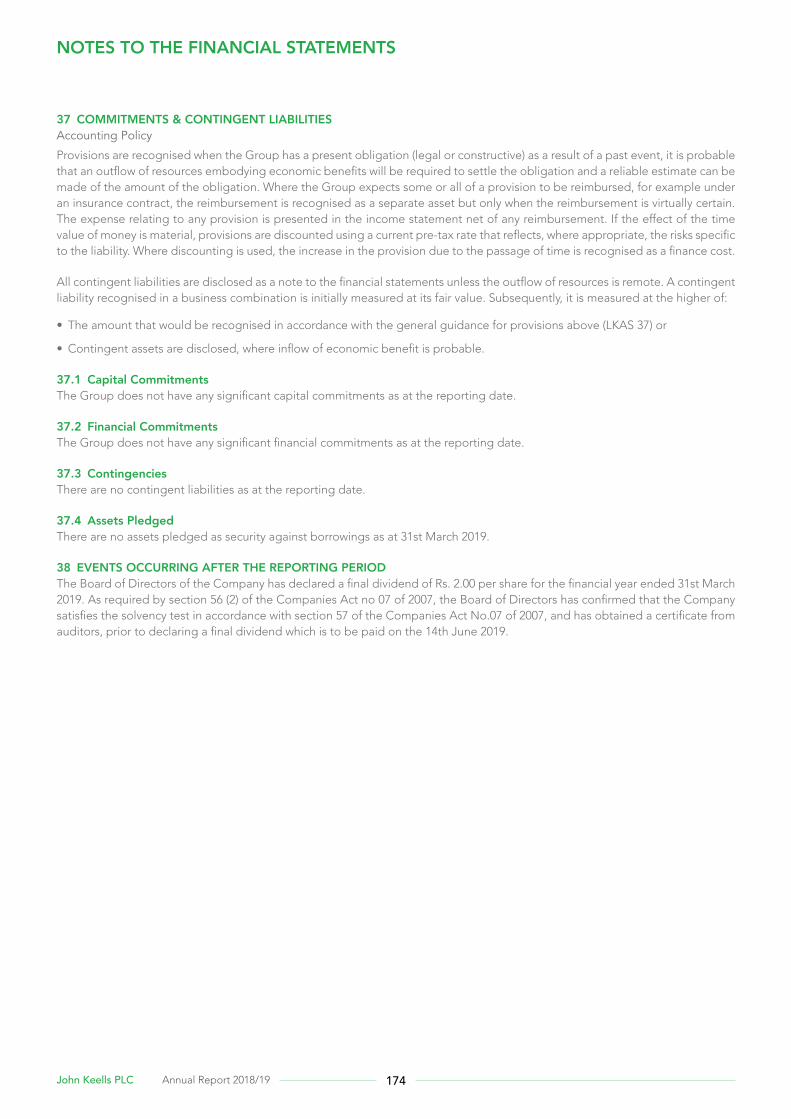
174John Keells PLC Annual Report 2018/19
37 COMMITMENTS & CONTINGENT LIABILITIESAccounting Policy
Provisions are recognised when the Group has a present obligation (legal or constructive) as a result of a past event, it is probable that an outflow of resources embodying economic benefits will be required to settle the obligation and a reliable estimate can be made of the amount of the obligation. Where the Group expects some or all of a provision to be reimbursed, for example under an insurance contract, the reimbursement is recognised as a separate asset but only when the reimbursement is virtually certain. The expense relating to any provision is presented in the income statement net of any reimbursement. If the effect of the time value of money is material, provisions are discounted using a current pre-tax rate that reflects, where appropriate, the risks specific to the liability. Where discounting is used, the increase in the provision due to the passage of time is recognised as a finance cost.
All contingent liabilities are disclosed as a note to the financial statements unless the outflow of resources is remote. A contingent liability recognised in a business combination is initially measured at its fair value. Subsequently, it is measured at the higher of:
• The amount that would be recognised in accordance with the general guidance for provisions above (LKAS 37) or
• Contingent assets are disclosed, where inflow of economic benefit is probable.
37.1 Capital CommitmentsThe Group does not have any significant capital commitments as at the reporting date.
37.2 Financial CommitmentsThe Group does not have any significant financial commitments as at the reporting date.
37.3 ContingenciesThere are no contingent liabilities as at the reporting date.
37.4 Assets PledgedThere are no assets pledged as security against borrowings as at 31st March 2019.
38 EVENTS OCCURRING AFTER THE REPORTING PERIODThe Board of Directors of the Company has declared a final dividend of Rs. 2.00 per share for the financial year ended 31st March 2019. As required by section 56 (2) of the Companies Act no 07 of 2007, the Board of Directors has confirmed that the Company satisfies the solvency test in accordance with section 57 of the Companies Act No.07 of 2007, and has obtained a certificate from auditors, prior to declaring a final dividend which is to be paid on the 14th June 2019.
NOTES TO THE FINANCIAL STATEMENTS
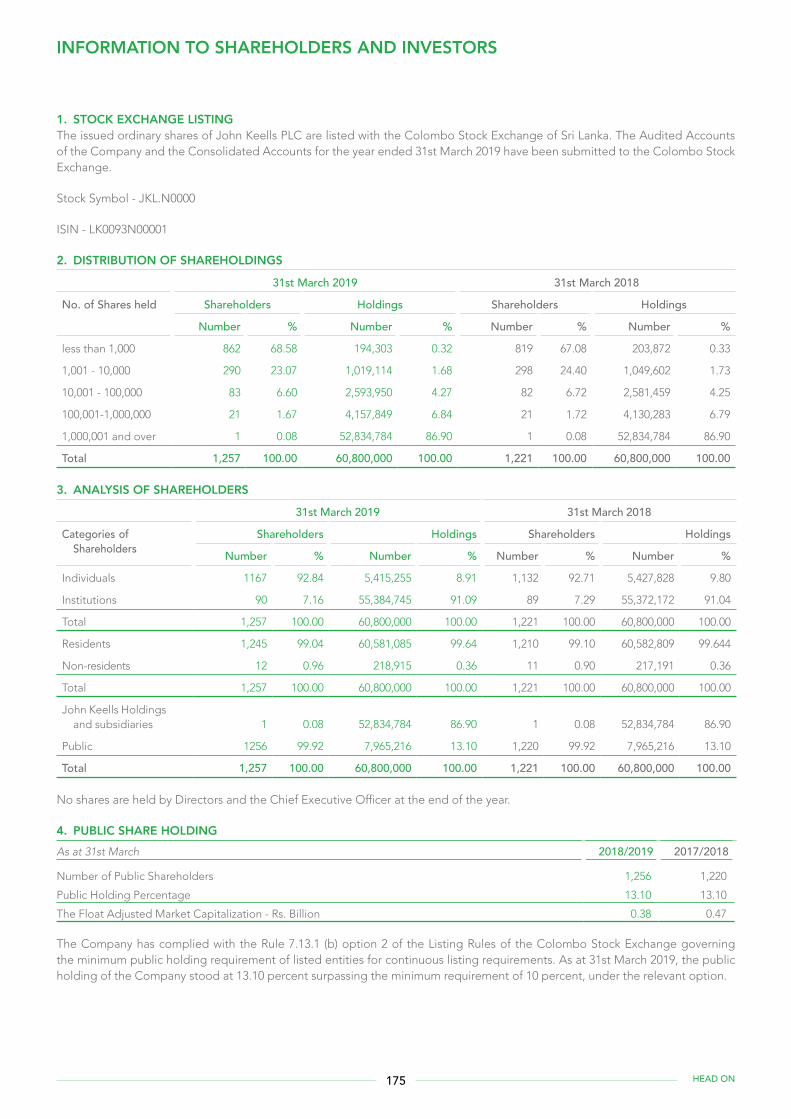
INFORMATION TO SHAREHOLDERS AND INVESTORS
1. STOCK EXCHANGE LISTINGThe issued ordinary shares of John Keells PLC are listed with the Colombo Stock Exchange of Sri Lanka. The Audited Accounts of the Company and the Consolidated Accounts for the year ended 31st March 2019 have been submitted to the Colombo Stock Exchange.
Stock Symbol - JKL.N0000
ISIN - LK0093N00001
2. DISTRIBUTION OF SHAREHOLDINGS
31st March 2019 31st March 2018
No. of Shares held Shareholders Holdings Shareholders Holdings
Number % Number % Number % Number %
less than 1,000 862 68.58 194,303 0.32 819 67.08 203,872 0.33
1,001 - 10,000 290 23.07 1,019,114 1.68 298 24.40 1,049,602 1.73
10,001 - 100,000 83 6.60 2,593,950 4.27 82 6.72 2,581,459 4.25
100,001-1,000,000 21 1.67 4,157,849 6.84 21 1.72 4,130,283 6.79
1,000,001 and over 1 0.08 52,834,784 86.90 1 0.08 52,834,784 86.90
Total 1,257 100.00 60,800,000 100.00 1,221 100.00 60,800,000 100.00
3. ANALYSIS OF SHAREHOLDERS
31st March 2019 31st March 2018
Categories of Shareholders
Shareholders Holdings Shareholders Holdings
Number % Number % Number % Number %
Individuals 1167 92.84 5,415,255 8.91 1,132 92.71 5,427,828 9.80
Institutions 90 7.16 55,384,745 91.09 89 7.29 55,372,172 91.04
Total 1,257 100.00 60,800,000 100.00 1,221 100.00 60,800,000 100.00
Residents 1,245 99.04 60,581,085 99.64 1,210 99.10 60,582,809 99.644
Non-residents 12 0.96 218,915 0.36 11 0.90 217,191 0.36
Total 1,257 100.00 60,800,000 100.00 1,221 100.00 60,800,000 100.00
John Keells Holdings and subsidiaries 1 0.08 52,834,784 86.90 1 0.08 52,834,784 86.90
Public 1256 99.92 7,965,216 13.10 1,220 99.92 7,965,216 13.10
Total 1,257 100.00 60,800,000 100.00 1,221 100.00 60,800,000 100.00
No shares are held by Directors and the Chief Executive Officer at the end of the year.
4. PUBLIC SHARE HOLDINGAs at 31st March 2018/2019 2017/2018
Number of Public Shareholders 1,256 1,220
Public Holding Percentage 13.10 13.10
The Float Adjusted Market Capitalization - Rs. Billion 0.38 0.47
The Company has complied with the Rule 7.13.1 (b) option 2 of the Listing Rules of the Colombo Stock Exchange governing the minimum public holding requirement of listed entities for continuous listing requirements. As at 31st March 2019, the public holding of the Company stood at 13.10 percent surpassing the minimum requirement of 10 percent, under the relevant option.
175 HEAD ON
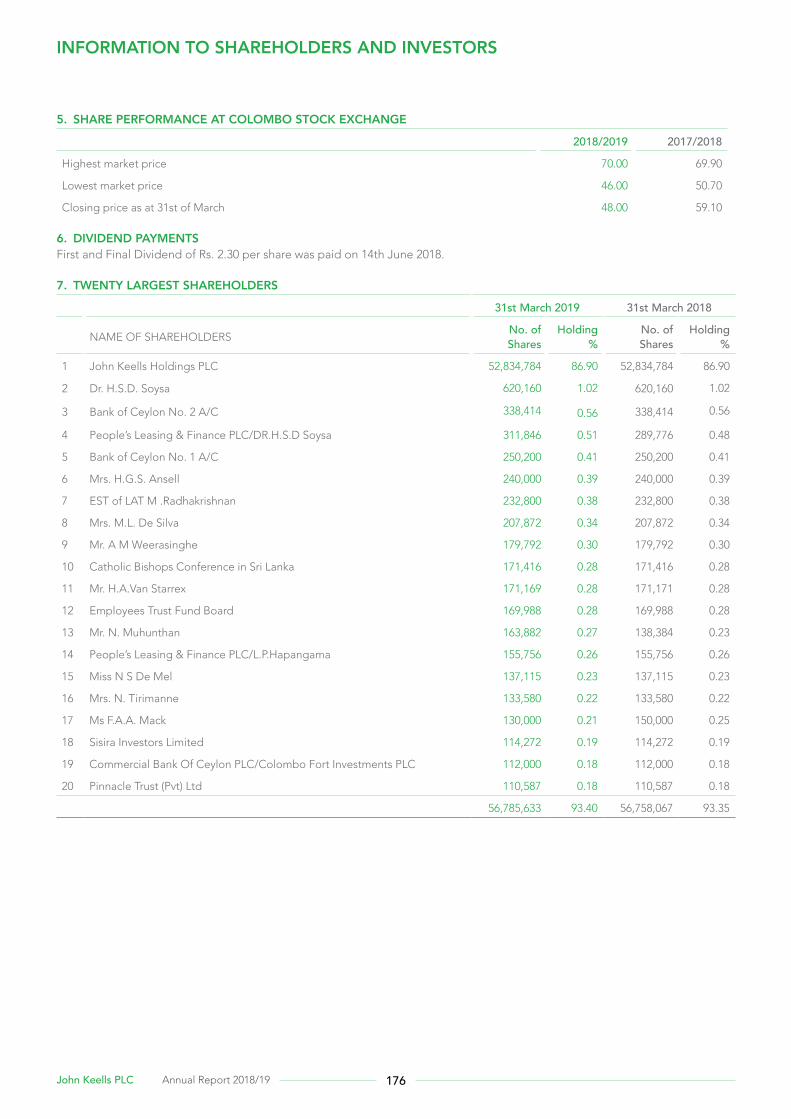
5. SHARE PERFORMANCE AT COLOMBO STOCK EXCHANGE
2018/2019 2017/2018
Highest market price 70.00 69.90
Lowest market price 46.00 50.70
Closing price as at 31st of March 48.00 59.10
6. DIVIDEND PAYMENTSFirst and Final Dividend of Rs. 2.30 per share was paid on 14th June 2018.
7. TWENTY LARGEST SHAREHOLDERS
31st March 2019 31st March 2018
NAME OF SHAREHOLDERSNo. of Shares
Holding %
No. of Shares
Holding %
1 John Keells Holdings PLC 52,834,784 86.90 52,834,784 86.90
2 Dr. H.S.D. Soysa 620,160 1.02 620,160 1.02
3 Bank of Ceylon No. 2 A/C 338,414 0.56 338,414 0.56
4 People’s Leasing & Finance PLC/DR.H.S.D Soysa 311,846 0.51 289,776 0.48
5 Bank of Ceylon No. 1 A/C 250,200 0.41 250,200 0.41
6 Mrs. H.G.S. Ansell 240,000 0.39 240,000 0.39
7 EST of LAT M .Radhakrishnan 232,800 0.38 232,800 0.38
8 Mrs. M.L. De Silva 207,872 0.34 207,872 0.34
9 Mr. A M Weerasinghe 179,792 0.30 179,792 0.30
10 Catholic Bishops Conference in Sri Lanka 171,416 0.28 171,416 0.28
11 Mr. H.A.Van Starrex 171,169 0.28 171,171 0.28
12 Employees Trust Fund Board 169,988 0.28 169,988 0.28
13 Mr. N. Muhunthan 163,882 0.27 138,384 0.23
14 People’s Leasing & Finance PLC/L.P.Hapangama 155,756 0.26 155,756 0.26
15 Miss N S De Mel 137,115 0.23 137,115 0.23
16 Mrs. N. Tirimanne 133,580 0.22 133,580 0.22
17 Ms F.A.A. Mack 130,000 0.21 150,000 0.25
18 Sisira Investors Limited 114,272 0.19 114,272 0.19
19 Commercial Bank Of Ceylon PLC/Colombo Fort Investments PLC 112,000 0.18 112,000 0.18
20 Pinnacle Trust (Pvt) Ltd 110,587 0.18 110,587 0.18
56,785,633 93.40 56,758,067 93.35
INFORMATION TO SHAREHOLDERS AND INVESTORS
176John Keells PLC Annual Report 2018/19
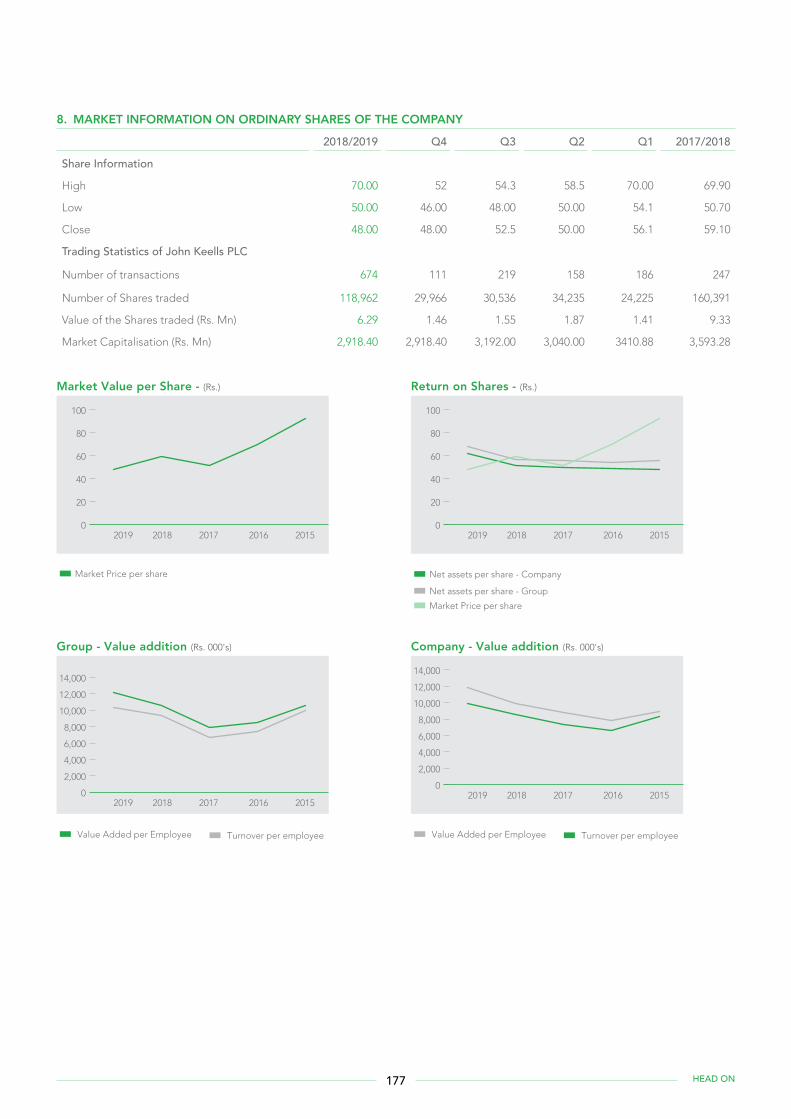
8. MARKET INFORMATION ON ORDINARY SHARES OF THE COMPANY
2018/2019 Q4 Q3 Q2 Q1 2017/2018
Share Information
High 70.00 52 54.3 58.5 70.00 69.90
Low 50.00 46.00 48.00 50.00 54.1 50.70
Close 48.00 48.00 52.5 50.00 56.1 59.10
Trading Statistics of John Keells PLC
Number of transactions 674 111 219 158 186 247
Number of Shares traded 118,962 29,966 30,536 34,235 24,225 160,391
Value of the Shares traded (Rs. Mn) 6.29 1.46 1.55 1.87 1.41 9.33
Market Capitalisation (Rs. Mn) 2,918.40 2,918.40 3,192.00 3,040.00 3410.88 3,593.28
Market Value per Share - (Rs.)
0
20
40
60
80
100
2019 2018 2017 2016 2015
Market Price per share
Return on Shares - (Rs.)
0
20
40
60
80
100
2019 2018 2017 2016 2015
Net assets per share - Company
Net assets per share - Group
Market Price per share
Group - Value addition (Rs. 000's)
0
2,000
4,000
6,000
8,000
10,000
12,000
14,000
2019 2018 2017 2016 2015
Value Added per Employee Turnover per employee
Company - Value addition (Rs. 000's)
0
2,000
4,000
6,000
8,000
10,000
12,000
14,000
2019 2018 2017 2016 2015
Value Added per Employee Turnover per employee
177 HEAD ON
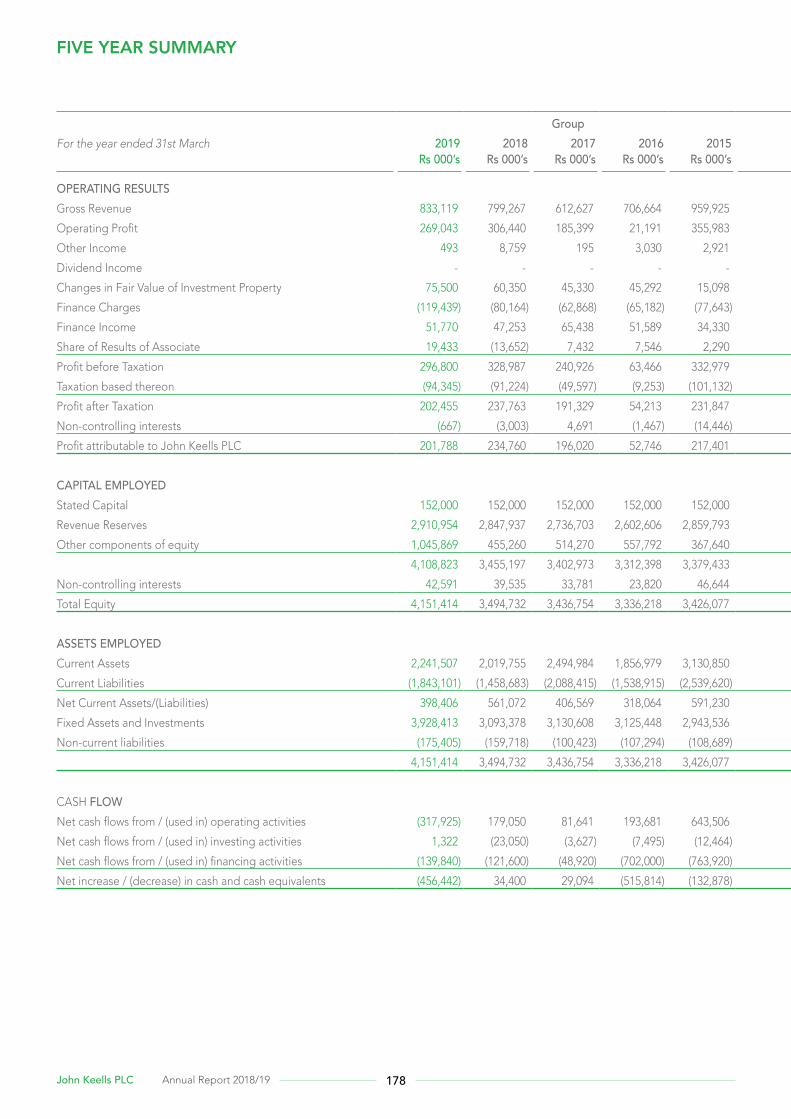
FIVE YEAR SUMMARY
Group CompanyFor the year ended 31st March 2019
Rs 000’s2018
Rs 000’s2017
Rs 000’s2016
Rs 000’s2015
Rs 000’s2019
Rs 000’s2018
Rs 000’s2017
Rs 000’s2016
Rs 000’s2015
Rs 000’s
OPERATING RESULTSGross Revenue 833,119 799,267 612,627 706,664 959,925 535,675 519,029 423,183 424,529 558,765
Operating Profit 269,043 306,440 185,399 21,191 355,983 241,824 279,229 207,315 (1,599) 244,812
Other Income 493 8,759 195 3,030 2,921 288 5,699 10 2 2,656
Dividend Income - - - - - 36,602 25,902 4,411 124,996 49,034
Changes in Fair Value of Investment Property 75,500 60,350 45,330 45,292 15,098 75,500 60,350 45,330 45,292 15,098
Finance Charges (119,439) (80,164) (62,868) (65,182) (77,643) (119,438) (79,819) (62,671) (64,979) (77,394)
Finance Income 51,770 47,253 65,438 51,589 34,330 26,464 20,909 45,530 29,652 14,109
Share of Results of Associate 19,433 (13,652) 7,432 7,546 2,290 - - - - -
Profit before Taxation 296,800 328,987 240,926 63,466 332,979 261,240 312,270 239,925 133,364 248,315
Taxation based thereon (94,345) (91,224) (49,597) (9,253) (101,132) (62,434) (70,229) (51,057) 10,943 (60,024)
Profit after Taxation 202,455 237,763 191,329 54,213 231,847 198,806 242,041 188,868 144,307 188,291
Non-controlling interests (667) (3,003) 4,691 (1,467) (14,446) - - - - -
Profit attributable to John Keells PLC 201,788 234,760 196,020 52,746 217,401 198,806 242,041 188,868 144,307 188,291
CAPITAL EMPLOYEDStated Capital 152,000 152,000 152,000 152,000 152,000 152,000 152,000 152,000 152,000 152,000
Revenue Reserves 2,910,954 2,847,937 2,736,703 2,602,606 2,859,793 2,757,474 2,697,374 2,579,617 2,452,151 2,610,820
Other components of equity 1,045,869 455,260 514,270 557,792 367,640 844,885 267,577 296,305 348,266 174,124
4,108,823 3,455,197 3,402,973 3,312,398 3,379,433 3,754,359 3,116,951 3,027,922 2,952,417 2,936,944
Non-controlling interests 42,591 39,535 33,781 23,820 46,644 - - - - -
Total Equity 4,151,414 3,494,732 3,436,754 3,336,218 3,426,077 3,754,359 3,116,951 3,027,922 2,952,417 2,936,944
ASSETS EMPLOYEDCurrent Assets 2,241,507 2,019,755 2,494,984 1,856,979 3,130,850 1,765,214 1,573,039 1,433,767 1,373,723 2,547,576
Current Liabilities (1,843,101) (1,458,683) (2,088,415) (1,538,915) (2,539,620) (1,575,562) (1,222,008) (1,220,621) (1,176,251) (2,198,427)
Net Current Assets/(Liabilities) 398,406 561,072 406,569 318,064 591,230 189,652 351,031 213,146 197,472 349,149
Fixed Assets and Investments 3,928,413 3,093,378 3,130,608 3,125,448 2,943,536 3,604,912 2,802,987 2,846,609 2,796,890 2,629,251
Non-current liabilities (175,405) (159,718) (100,423) (107,294) (108,689) (40,205) (37,067) (31,833) (41,945) (41,456)
4,151,414 3,494,732 3,436,754 3,336,218 3,426,077 3,754,359 3,116,951 3,027,922 2,952,417 2,936,944
CASH FLOWNet cash flows from / (used in) operating activities (317,925) 179,050 81,641 193,681 643,506 (294,559) 97,201 110,761 265,043 469,013
Net cash flows from / (used in) investing activities 1,322 (23,050) (3,627) (7,495) (12,464) 12,295 3,481 (1,303) 24,609 4,353
Net cash flows from / (used in) financing activities (139,840) (121,600) (48,920) (702,000) (763,920) (139,840) (121,600) (60,800) (678,000) (756,720)
Net increase / (decrease) in cash and cash equivalents (456,442) 34,400 29,094 (515,814) (132,878) (422,104) (20,918) 48,658 (388,348) (283,354)
178John Keells PLC Annual Report 2018/19
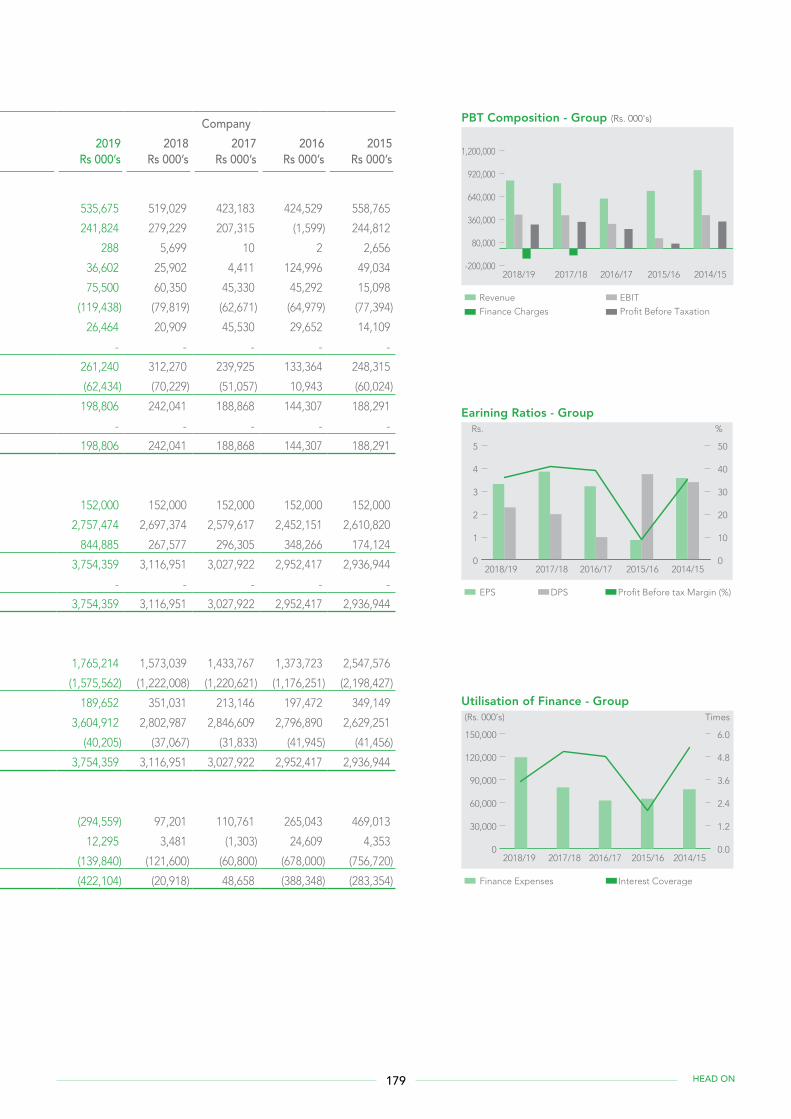
Group CompanyFor the year ended 31st March 2019
Rs 000’s2018
Rs 000’s2017
Rs 000’s2016
Rs 000’s2015
Rs 000’s2019
Rs 000’s2018
Rs 000’s2017
Rs 000’s2016
Rs 000’s2015
Rs 000’s
OPERATING RESULTSGross Revenue 833,119 799,267 612,627 706,664 959,925 535,675 519,029 423,183 424,529 558,765
Operating Profit 269,043 306,440 185,399 21,191 355,983 241,824 279,229 207,315 (1,599) 244,812
Other Income 493 8,759 195 3,030 2,921 288 5,699 10 2 2,656
Dividend Income - - - - - 36,602 25,902 4,411 124,996 49,034
Changes in Fair Value of Investment Property 75,500 60,350 45,330 45,292 15,098 75,500 60,350 45,330 45,292 15,098
Finance Charges (119,439) (80,164) (62,868) (65,182) (77,643) (119,438) (79,819) (62,671) (64,979) (77,394)
Finance Income 51,770 47,253 65,438 51,589 34,330 26,464 20,909 45,530 29,652 14,109
Share of Results of Associate 19,433 (13,652) 7,432 7,546 2,290 - - - - -
Profit before Taxation 296,800 328,987 240,926 63,466 332,979 261,240 312,270 239,925 133,364 248,315
Taxation based thereon (94,345) (91,224) (49,597) (9,253) (101,132) (62,434) (70,229) (51,057) 10,943 (60,024)
Profit after Taxation 202,455 237,763 191,329 54,213 231,847 198,806 242,041 188,868 144,307 188,291
Non-controlling interests (667) (3,003) 4,691 (1,467) (14,446) - - - - -
Profit attributable to John Keells PLC 201,788 234,760 196,020 52,746 217,401 198,806 242,041 188,868 144,307 188,291
CAPITAL EMPLOYEDStated Capital 152,000 152,000 152,000 152,000 152,000 152,000 152,000 152,000 152,000 152,000
Revenue Reserves 2,910,954 2,847,937 2,736,703 2,602,606 2,859,793 2,757,474 2,697,374 2,579,617 2,452,151 2,610,820
Other components of equity 1,045,869 455,260 514,270 557,792 367,640 844,885 267,577 296,305 348,266 174,124
4,108,823 3,455,197 3,402,973 3,312,398 3,379,433 3,754,359 3,116,951 3,027,922 2,952,417 2,936,944
Non-controlling interests 42,591 39,535 33,781 23,820 46,644 - - - - -
Total Equity 4,151,414 3,494,732 3,436,754 3,336,218 3,426,077 3,754,359 3,116,951 3,027,922 2,952,417 2,936,944
ASSETS EMPLOYEDCurrent Assets 2,241,507 2,019,755 2,494,984 1,856,979 3,130,850 1,765,214 1,573,039 1,433,767 1,373,723 2,547,576
Current Liabilities (1,843,101) (1,458,683) (2,088,415) (1,538,915) (2,539,620) (1,575,562) (1,222,008) (1,220,621) (1,176,251) (2,198,427)
Net Current Assets/(Liabilities) 398,406 561,072 406,569 318,064 591,230 189,652 351,031 213,146 197,472 349,149
Fixed Assets and Investments 3,928,413 3,093,378 3,130,608 3,125,448 2,943,536 3,604,912 2,802,987 2,846,609 2,796,890 2,629,251
Non-current liabilities (175,405) (159,718) (100,423) (107,294) (108,689) (40,205) (37,067) (31,833) (41,945) (41,456)
4,151,414 3,494,732 3,436,754 3,336,218 3,426,077 3,754,359 3,116,951 3,027,922 2,952,417 2,936,944
CASH FLOWNet cash flows from / (used in) operating activities (317,925) 179,050 81,641 193,681 643,506 (294,559) 97,201 110,761 265,043 469,013
Net cash flows from / (used in) investing activities 1,322 (23,050) (3,627) (7,495) (12,464) 12,295 3,481 (1,303) 24,609 4,353
Net cash flows from / (used in) financing activities (139,840) (121,600) (48,920) (702,000) (763,920) (139,840) (121,600) (60,800) (678,000) (756,720)
Net increase / (decrease) in cash and cash equivalents (456,442) 34,400 29,094 (515,814) (132,878) (422,104) (20,918) 48,658 (388,348) (283,354)
PBT Composition - Group (Rs. 000's)
-200,000
80,000
360,000
640,000
920,000
1,200,000
2018/19 2017/18 2016/17 2015/16 2014/15
Revenue EBIT
Finance Charges Profit Before Taxation
Earining Ratios - Group
0
1
2
3
4
5
2018/19 2017/18 2016/17 2015/16 2014/15
EPS DPS Profit Before tax Margin (%)
0
10
20
30
40
50
%Rs.
Utilisation of Finance - Group
0
30,000
60,000
90,000
120,000
150,000
2018/19 2017/18 2016/17 2015/16 2014/15
Finance Expenses Interest Coverage
0.0
1.2
2.4
3.6
4.8
Times(Rs. 000’s)
6.0
179 HEAD ON
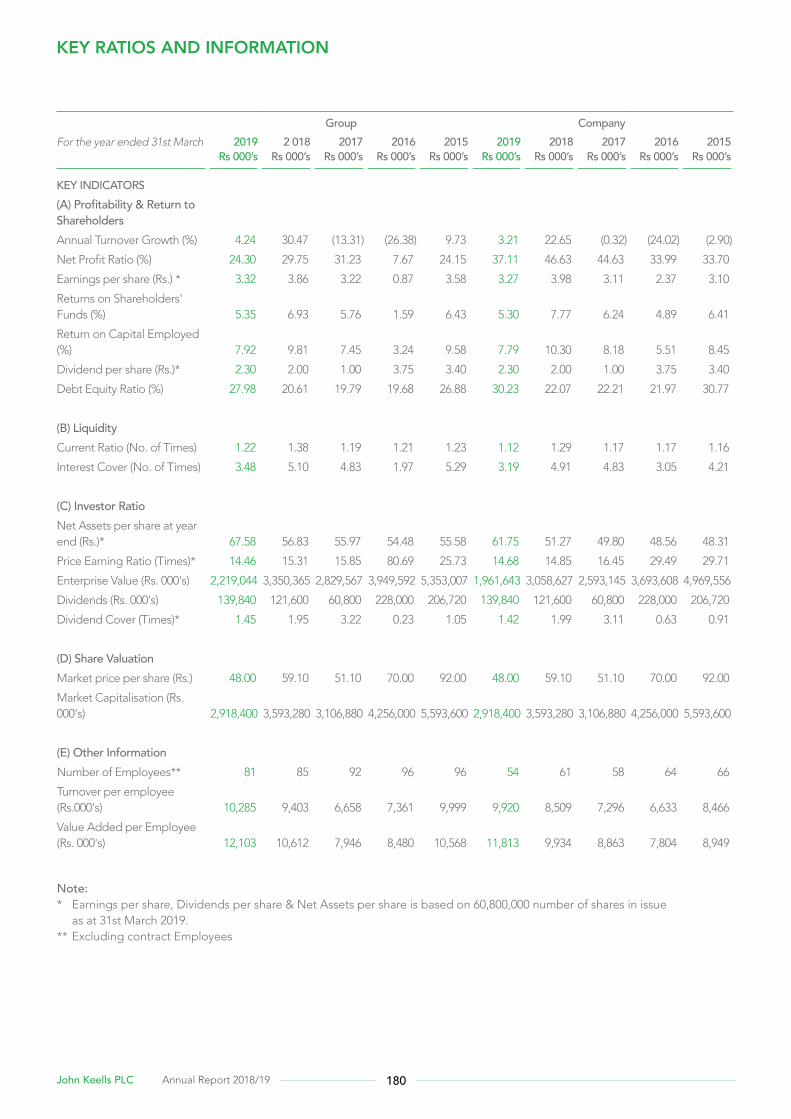
KEY RATIOS AND INFORMATION
Group CompanyFor the year ended 31st March 2019
Rs 000’s2 018
Rs 000’s2017
Rs 000’s2016
Rs 000’s2015
Rs 000’s2019
Rs 000’s2018
Rs 000’s2017
Rs 000’s2016
Rs 000’s2015
Rs 000’s
KEY INDICATORS(A) Profitability & Return to ShareholdersAnnual Turnover Growth (%) 4.24 30.47 (13.31) (26.38) 9.73 3.21 22.65 (0.32) (24.02) (2.90)
Net Profit Ratio (%) 24.30 29.75 31.23 7.67 24.15 37.11 46.63 44.63 33.99 33.70
Earnings per share (Rs.) * 3.32 3.86 3.22 0.87 3.58 3.27 3.98 3.11 2.37 3.10
Returns on Shareholders' Funds (%) 5.35 6.93 5.76 1.59 6.43 5.30 7.77 6.24 4.89 6.41
Return on Capital Employed (%) 7.92 9.81 7.45 3.24 9.58 7.79 10.30 8.18 5.51 8.45
Dividend per share (Rs.)* 2.30 2.00 1.00 3.75 3.40 2.30 2.00 1.00 3.75 3.40
Debt Equity Ratio (%) 27.98 20.61 19.79 19.68 26.88 30.23 22.07 22.21 21.97 30.77
(B) LiquidityCurrent Ratio (No. of Times) 1.22 1.38 1.19 1.21 1.23 1.12 1.29 1.17 1.17 1.16
Interest Cover (No. of Times) 3.48 5.10 4.83 1.97 5.29 3.19 4.91 4.83 3.05 4.21
(C) Investor RatioNet Assets per share at year end (Rs.)* 67.58 56.83 55.97 54.48 55.58 61.75 51.27 49.80 48.56 48.31
Price Earning Ratio (Times)* 14.46 15.31 15.85 80.69 25.73 14.68 14.85 16.45 29.49 29.71
Enterprise Value (Rs. 000's) 2,219,044 3,350,365 2,829,567 3,949,592 5,353,007 1,961,643 3,058,627 2,593,145 3,693,608 4,969,556
Dividends (Rs. 000's) 139,840 121,600 60,800 228,000 206,720 139,840 121,600 60,800 228,000 206,720
Dividend Cover (Times)* 1.45 1.95 3.22 0.23 1.05 1.42 1.99 3.11 0.63 0.91
(D) Share ValuationMarket price per share (Rs.) 48.00 59.10 51.10 70.00 92.00 48.00 59.10 51.10 70.00 92.00
Market Capitalisation (Rs. 000's) 2,918,400 3,593,280 3,106,880 4,256,000 5,593,600 2,918,400 3,593,280 3,106,880 4,256,000 5,593,600
(E) Other InformationNumber of Employees** 81 85 92 96 96 54 61 58 64 66
Turnover per employee (Rs.000's) 10,285 9,403 6,658 7,361 9,999 9,920 8,509 7,296 6,633 8,466
Value Added per Employee (Rs. 000's) 12,103 10,612 7,946 8,480 10,568 11,813 9,934 8,863 7,804 8,949
Note:* Earnings per share, Dividends per share & Net Assets per share is based on 60,800,000 number of shares in issue
as at 31st March 2019.** Excluding contract Employees
180John Keells PLC Annual Report 2018/19
GLOSSARY OF FINANCIAL TERMS
ACCRUAL BASISRecording Revenues and Expenses in the period in which they are earned or incurred regardless of whether cash is received or disbursed in that period.
CAPITAL EMPLOYEDShareholders’ Funds plus Debt
CONTINGENT LIABILITIESA condition or situation existing at the Balance Sheet date due to past events, where the financial effect is not recognised because:1. The obligation is crystallised by the occurrence or non
occurrence of one or more future events or,2. A probable outflow of economic resources is not expected
or,3. It is unable to be measured with sufficient reliability
CURRENT RATIOCurrent Assets over Current Liabilities
DEBT/EQUITY RATIODebt as a percentage of Shareholders Funds
DIVIDEND COVEREarnings per Share over Dividends per Share
DIVIDEND PAYOUT RATIODividend paid as a percentage of Company profits.
DIVIDEND YIELDDividends in number of shares in issue as a percentage of the share price at the end of the period.
EARNINGS PER SHARE (EPS)Profit after tax attributable to ordinary shareholding over weighted average numbers of shares in issue during the period
EARNINGS YIELDEarnings per Share as a percentage of Market price per Share end of the period.
EARNINGS BEFORE INTEREST AND TAX (EBIT)Earnings before interest and tax (includes other operating income)
EFFECTIVE RATE OF TAXATIONIncome Tax, including deferred tax over Profit before Tax
ENTERPRISE VALUE (EV)Market capitalisation plus net debt/(net cash).
INTEREST COVERProfit before Interest and Tax over Finance Expenses
MARKET CAPITALISATIONNumber of Shares in issue at the end of the period multiplied by the Market price at end of period
NET ASSETSTotal assets minus Current Liabilities minus Long Term Liabilities minus Minority Interest
NET ASSET PER SHARENet Assets, over number of Ordinary Shares in issue
NET DEBTTotal debt minus (cash plus short-term deposits).
NET TURNOVER PER EMPLOYEENet Turnover over average number of employees
PRICE EARNINGS RATIOMarket Price per Share over Earnings per Share
QUICK ASSET RATIOCash plus Short Term Investments plus Receivables, Dividend by Current Liabilities
QUICK RATIOCash plus Short Term Investments plus Receivables over Current Liabilities
RETURN ON ASSETSProfit after Tax over Average Total Assets
RETURN ON EQUITYProfit after Tax as a percentage of Average Shareholder’s Funds
RETURN ON CAPITAL EMPLOYEDEarnings before interest and tax as percentage of Capital Employed
SHAREHOLDERS FUNDSStated Capital plus other components of equity plus Revenue Reserves
TOTAL ASSETSFixed Assets plus Investments plus Non Current Assets plus Current Assets
TOTAL DEBTLong Term Loans plus Short Term Loans and Overdrafts
TOTAL EQUITYShareholders’ funds plus non-controlling interest
TOTAL VALUE ADDEDThe difference between revenue (including other income) and expenses, cost of materials and services purchased from external sources
WORKING CAPITALCapital required to finance the day-to-day operations, Current Assets minus Current Liabilities
181 HEAD ON
NOTICE OF MEETING
Notice is hereby given that the Seventy Second Annual General Meeting of John Keells PLC will be held on Thursday 27th June 2019 at 9.30 a.m. at the John Keells Auditorium, 186 Vauxhall Street, Colombo 02.
The business to be brought before the meeting will be:
• To read the Notice Convening the Meeting.
• To receive and consider the Annual Report and Financial Statements of the Company for the financial year ended 31st March 2019 with the Report of the Auditors thereon.
• To re-elect as Director, Mr. C N Wijewardene who retires in terms of Article 83 of the Articles of Association of the Company. A brief profile of Mr. C N Wijewardene is contained in the Board of Directors Section on page 78 of the Annual Report.
• To re-elect as Director, Ms. B A I Rajakarier who retires in terms of Article 83 of the Articles of Association of the Company. A brief profile of Ms. B A I Rajakarier is contained in the Board of Directors Section on page 79 of the Annual Report.
• To re-elect as Director, Mr. J R Gunaratne who retires in terms of Article 90 of the Articles of Association of the Company. A brief profile of Mr. J R Gunaratne is contained in the Board of Directors section on page 78 of the Annual Report.
• To re-appoint Auditors and to authorize the Directors to determine their remuneration.
• To consider any other business of which due notice has been given in terms of the relevant laws and regulations.
By order of the BoardJOHN KEELLS PLC
Keells Consultants (Private) LimitedSecretariesColombo24th May 2019
Notes:i. A member unable to attend is entitled to appoint a Proxy
to attend and vote in his/her place.
ii. A Proxy need not be a member of the Company.
iii. A member wishing to vote by Proxy at the Meeting may use the Proxy Form enclosed.
iv. In order to be valid, the completed Proxy Form must be lodged at the Registered Office of the Company not less than 48 hours before the meeting.
v. If a poll is demanded, a vote can be taken on a show of hands or by a poll. Each share is entitled to one vote. Votes can be cast in person, by proxy or corporate representatives. In the event an individual member and his proxy holder are both present at the meeting, only the member’s vote is counted. If the proxy holder’s appointor has indicated the manner of voting, only the appointor’s indication of the manner to vote will be used.
182John Keells PLC Annual Report 2018/19
FORM OF PROXY
I/We ............................................................................................................................................................................................................ of
............................................................................................................... being a member/members of John Keells PLC hereby appoint
.........................................................................................................................................................................................................................
of ..................................................................................................................................................................................... or, failing him/her
Mr. Krishan Niraj Jayasekara Balendra or, failing himMr. Joseph Gihan Adisha Cooray or, failing himMr. Jitendra Romesh Gunaratne or, failing himMs. Anandhiy Krisnajina Gunawardhana or, failing herMr. Charitha Nissanka Wijewardane or, failing himMs. Bodiyabaduge Arundathi Indira Rajakarier
as my/our proxy to represent me/us and vote on my/our behalf at the Seventy Second Annual General Meeting of the Company to be held on Thursday, 27th June 2019 at 9.30 a.m. and at any adjournment thereof, and at every poll which may be taken on consequence thereof.
I/We, the undersigned, hereby direct my/our proxy to vote for me/us and on my/our behalf on the specified Resolution as indicated by the letter “X” in the appropriate cage:
FOR AGAINST
i) To re-elect as Director, Mr. C N Wijewardene who retires in terms of Article 83 of the Article of Association of the Company.
ii) To re-elect as Director, Ms. B A I Rajakarier who retires in terms of Article 83 of the Article of Association of the Company.
iii) To re-elect as Director, Mr. J R Gunaratne who retires in terms of Article 90 of the Article of Association of the Company.
iv) To re-appoint Auditors and to authorize the Directors to determine their remuneration.
Signed this ……..………………….. day of …………………...Two Thousand and Nineteen.
Signature/s of Shareholder/s
NOTE: INSTRUCTIONS AS TO COMPLETION OF PROXY FORM ARE NOTED ON THE REVERSE.
183 HEAD ON

INSTRUCTIONS AS TO COMPLETION OF PROXY
1. Please perfect the Form of Proxy by filling in legibly your full name and address, signing in the space provided and filling in the date of signature.
2. The completed Form of Proxy should be deposited at the Company’s registered address at No. 117, Sir Chittampalam A. Gardiner Mawatha Colombo 2, not later than 48 hours before the time appointed for the holding of the Meeting.
3. If the Form of Proxy is signed by an Attorney, the relevant Power of Attorney should accompany the completed Form of Proxy for registration, if such Power of Attorney has not already been registered with the Company.
4. If the appointer is a Company or Corporation, the Form of Proxy should be executed under its Common Seal or by a duly authorised officer of the Company or Corporation in accordance with its Articles of Association or Constitution.
5. If this Form of Proxy is returned without any indication of how the person appointed as Proxy shall vote, then the Proxy shall exercise his/her discretion as to how he/she votes or, whether or not he/she abstains from voting
Please fill in the following details:
Name : ...................................................................................................................
Address : ...................................................................................................................
.....................................................................................................................
.....................................................................................................................
Jointly with : .....................................................................................................................
Share Folio No : .....................................................................................................................
184John Keells PLC Annual Report 2018/19
CORPORATE INFORMATIONNAME OF COMPANYJohn Keells PLC
COMPANY REGISTRATION NUMBERPQ 11
NAME OF SUBSIDIARIESJohn Keells Stock Brokers (Pvt) LimitedJohn Keells Warehousing (Pvt) Limited
NAME OF ASSOCIATE COMPANYKeells Realtors Limited
LEGAL FORMPublic Limited Liability Company listed on the Colombo Stock Exchange (Incorporated in Sri Lanka in 1960)
REGISTERED OFFICENo. 117, Sir Chittampalam A. Gardiner Mawatha, Colombo 2, Sri Lanka Tel : 0094 11 2306000 Fax : 0094 11 2342456 E-mail : [email protected]
BUSINESS ADDRESSNo. 186, Vauxhall Street, Colombo 2.
DIRECTORSMr. K. N. J. Balendra Mr. J. G. A. Cooray Mr. J. R. Gunaratne Ms. B. A. I. Rajakarier Mr. C. N. Wijewardane Ms. A. K. Gunawardhana
SECRETARIES & REGISTRARSKeells Consultants (Pvt) Limited No. 117, Sir Chittampalam A. Gardiner Mawatha, Colombo 2.
AUDITORSMessrs. Ernst & Young Chartered Accountants P.O. Box 101, Colombo.
PRINCIPAL BANKERS (in alphabetical Order)Bank of Ceylon Commercial Bank of Ceylon PLC Deutsche Bank DFCC Vardhana Bank Hatton National Bank Hongkong & Shanghai Banking Corporation Ltd. Nation’s Trust Bank National Development Bank PLC People’s Bank Sampath Bank PLC Seylan Bank PLC Standard Chartered Bank
Designed & produced by
Printed by Printage (Pvt) Ltd
CORPORATE INFORMATION GRI 102-01, 102-02, 102-03, 102-04, 102-05

John Keells PLCNo. 117, Sir Chittampalam A. Gardiner Mawatha,
Colombo 2, Sri Lanka.Tel: 0094 11 230 6000