annual report 2018 - lewa
TRANSCRIPT

Research and Monitoring
Annual Report 2018
Authors:
David W. Kimiti, Timothy Kaaria, Edwin Kisio, Ian Lemaiyan,
Saibala Gilisho, Francis Kobia, and Geoffrey Chege

ii
EXECUTIVE SUMMARY
This report provides a summary of the activities of the Research and Monitoring Department on
the Lewa-Borana Landscape (LBL) throughout 2018. The year received relatively good rainfall,
although the seasonal distribution was skewed, with the March-May season receiving above
average rainfall, and the October-December season receiving below average rains. The total
annual rainfall recorded across the Eastern side of the landscape was 638 ± 119 mm across the
different zones. This high standard deviation was an indicator of the high spatial variability of
rainfall received in the year, with some stations in the south like Subuiga receiving as much as
833mm in the year with other stations in the north like Fumbi camp received as little as 500
mm.
The rhino population on LBL increased to 97 black and 86 white following 10 and 6 births
respectively. This bumped up the growth rate for our black rhino population to 6.2% in the
2016-2018 average moving window up from 3.6% in the previous 3-year moving window. This
increased growth rate underscores the necessity of multi-year monitoring to inform appropriate
management interventions on the population. Abundant food resources as a result of high
rainfall in 2018 no doubt contributed to the significant reduction in natural mortalities, as well as
a reduction in intraspecific aggression. None of the animals targeted for body condition
monitoring were of concern throughout the year, negating the need for supplementary feeding.
In early 2018, an assessment of availability of Black rhino browse was carried out. The main
findings were that Acacia drepanolobium was selected preferentially for feeding and efforts to
increase its cover would be worthwhile. However, the study was conducted during a relatively
wet season, and needs to be replicated during the dry season to get a more complete picture of
existing seasonal dynamics.
The lion population remained steady despite some internal shifts, with males on the Western
portion of the landscape being supplanted in a pride take-over and their cubs killed. In total, 47
lions were recorded, comprising of 29 adults, 9 sub adults and 9 cubs. Nearly 70% of adults and
sub adults identified were females, suggesting a population with a high likelihood of continued
growth. The hormonal contraceptive implants under trial continued showing effectiveness, with
none of the three implanted females observed to have been mated or showing signs of pregnancy.
iii
The Spotted hyena population stood at 134 individuals, comprising of 84 adults, 40 sub adults
and 10 cubs. Livestock-wildlife conflict continued to be a problem in 2018, with significant
economic costs associated. However, partitioning of the root causes for this conflict identified
poor construction of livestock enclosures (bomas), poor herding strategies within the Ngare
Ndare Forest Reserve, and destruction of the predator proof fencing on the Ngare Ndare village
fence line as the main causes of these conflicts. Prey selectivity indices showed a continuation of
2017 trends, with giraffes, warthog and eland being strongly preferentially predated on, while
oryx and impala continued to be strongly avoided.
Buffalo continued to increase in number in 2018, both as a result of increased birth rates as well
as high infant survival rates. This was as a result of several factors, including abundant rainfall
(and subsequently increase in forage) as well as low predation rates due to the tendency of
Buffalo on the landscape to congregate into large herds. The upcoming research priority will be
to understand the factors leading to the recorded high increase in buffalo numbers whereas the
populations of most other bulk grazers have remained steady or decreased marginally across
similar time periods. 2018 also saw the Great Grevy’s rally, which estimated a total of 2,812 ±
163 Grevy’s zebra across northern Kenya. The survey identified the LBL as one of few places
where foal survival rates increased between 2016 and 2018. While survival rates for Grevy’s zebra
foals improved in 2018, those of hartebeest continued to dip, with nearly 60% of foals born in
the study period not surviving to year end. Efforts to transition the LBL Grevy’s zebra
identification platform to the new cloud-based stripe ID from WILDBOOK (formerly IBEIS)
continue, with current best estimates aiming for a mid-2019 launch. Due to these issues with the
IBEIS site-based server, the annual analysis of survival and recruitment rates of foals was
postponed to 2019.
Human-elephant conflicts continue to be a major challenge within the LBL and neighbouring
community farms particularly during the dry season. This pressure, however, was offset by
abundant rains received in the first half of the year, as well as translocation of seven fence
breaking elephants in Q1 2019. As the year progressed, crawling under the upgraded exclusion
zones fences, as opposed to breaking of fences, continued to be a key method of family groups
entering these zones. In an effort to mitigate these conflicts, the LBL has continued exploring

iv
new deterrent techniques in collaborations with partners including Big Life foundation and Save
the Elephant Bees and Elephants project. Trial use of gunny bags dipped in a mixture of ground
chili peppers and grease proved an effective deterrent against elephants, but raised questions
about their impact on other wildlife using those zones. As such, a decision was made to only
deploy them along the main boundary fence line adjacent to crop farms. In addition, 15
Langstroth beehives were set up during the October-December rainy season to initiate
colonization. These will be deployed in one breakage hotspot area in Q1 2018 on a pilot basis.
Abundant rains in 2018 meant there was a significant increase in species diversity and overall
grass biomass over 2017 levels. Species cover saw only modest increases as Lewa’s ecology
generally tends to favour consistently high vegetation cover due to the prevalence of resistant
Black cotton soils. The annual woody vegetation assessment underscored the continued
contribution of elephants and giraffes to suppression of woody vegetation structural growth, with
A. mellifera especially singled out for utilization in excess of its abundance. The NRTT-
Livestock to market programme continued through 2018, with an average of 580 cattle per
month on the Eastern side of the LBL. These low cattle numbers were primarily as a result of
good rains across the entire landscape, which meant pastoral communities were less willing to
sell their stock. Additionally, no community cattle were hosted on Lewa for supplementary or
emergency grazing in 2018.
Throughout 2018, the LBL Research and Monitoring team continued to develop the hydrology
programme, working with both the Southwest Research Institute (SwRI) based in San Antonio,
Texas, USA and the Centre for Training and integrated Research in ASAL Development
(CETRAD) based in Nanyuki, Kenya. A desktop survey identified a series of phases needed to
complete a comprehensive evaluation of the water resources within the LBL as well as the
surrounding landscape. Phase I will be an on-site field campaign to allow for reconnaissance
observations, collection of site-based data and samples, and identification of candidate locations
for a permanent network of environmental and hydrologic gauging stations. Installation of
instrumentation and development of the monitoring network will be done by CETRAD. While
funds are being sought to complete Phase I in its entirety, incremental changes will be made to

v
the weather monitoring systems, with analog rain gauges replaced with low-cost comprehensive
weather stations.
Finally, 2018 saw the LRD involved in the drafting of several technical reports and publications
that were published or ratified last year. These included the Black rhino action plan 2017-2021,
the Grevy’s zebra recovery and action plan 2017-2026, and two publications (Dupuis-
Desormeaux et al. 2018; Green et al. 2018) looking at wildlife use of fence gaps and corridors on
our landscape. Details of these publications are contained in the Appendix.
Implications for Management
• The White rhino population database needs to be transferred to an automated set up
similar to that developed for the Black rhino.
• The Black rhino browse availability and utilization assessment needs to be completed for
the dry season, to complement current wet season data.
• Contraceptive implants need to be replaced for the current test females, and more
breeding-age females added to the trial.
• GPS collars need to be deployed on hyena clans currently without working tracking
systems.
• Efforts to increase community awareness on appropriate construction of predator-proof
livestock enclosures need to be stepped up.
• Grazing partitioning between buffalo and other bulk grazers need to be understood as
part of an effort to identify causes for buffalo population increase and impact on the
ecosystem.
• Efforts to develop a new stripe ID system through the WILDBOOK cloud-based
platform need to be monitored closely. Concurrently, other alternative methods for stripe
ID matching need to be explored to provide data redundancy.
• Novel elephant deterrent methods should be piloted and tested for impact on other
wildlife, primarily use of chilli pepper gunny bags, pepper guns, thunder flashes, and
drones.

vi
• Replacement of manual rain gauges with automated weather stations is paramount for
ensuring data consistency and accuracy
• The Grassland Management Plan needs to be reviewed and updated following a
comprehensive rangeland assessment.
vii
TABLE OF CONTENTS
EXECUTIVE SUMMARY ........................................................................................................................ ii
1.0 INTRODUCTION ............................................................................................................................... 1
2.0 RHINO MONITORING ..................................................................................................................... 2
3.0 PREDATOR MONITORING .......................................................................................................... 12
4.0 UNGULATE MONITORING ......................................................................................................... 23
5.0 ELEPHANT MONITORING .......................................................................................................... 30
7.0 RANGELAND MANAGEMENT ................................................................................................... 36
8.0 HYDROLOGY ................................................................................................................................... 51
9.0 ACKNOWLEDGEMENTS .............................................................................................................. 55
10.0 REFERENCES ................................................................................................................................. 56
11.0 APPENDIX ....................................................................................................................................... 62

1
1.0 INTRODUCTION
The Lewa-Borana Landscape Research and Monitoring team had a busy 2018, not only continuing to collect monthly ecological monitoring data, but also seeking to explore novel research opportunities to further understand the baseline ecosystem dynamics driving wildlife interactions across the landscape. The year was relatively mixed in terms of rainfall, with the first six months receiving an abundance of rainfall, being the second highest for that same time period over the last 43 years. Rainfall was depressed for the second half of the year though, leading to only a slightly above average total annual rainfall of 638 ± 119 mm (Fig. 1.1).
Figure 1.1. Graph showing a) Monthly rainfall for 2016-2018, and b) annual rainfall for the last 43 years
The LBL Hydrology programme was further developed by incorporating CETRAD1 as an additional key collaborator. In collaboration with SwRI2, a research proposal for funding this work was completed in the year. In addition, research proposals to assess the feeding dynamics of black rhinos and evaluation of elephant demographics were developed. A Masters by Research student from the University of Southampton, UK completed the Black rhino feeding study. Short-term collaborations with University groups continued in the year, with a Princeton University mammalogy course providing critical information on past grazing and mowing impacts on sampled grasslands on LBL. Below we look at details for each thematic area.
1 Centre for Training and integrated Research in ASAL Development 2 Southwest Research Institute
2
2.0 RHINO MONITORING
Across Kenya, populations of both the Black and White rhino have continued to increase (KWS 2017). The LBL has played a pivotal role in this process. As at November 2018, there were 1,281 rhinos (758 Black and 523 White rhino) across Kenya (KWS Unpublished), 14% of which resided within the LBL.
The LBL Black rhino population experienced an increase in births, with several females calving in 2018. This had the immediate effect of increasing the population performance in the 2016-2018 average moving window (Fig. 2.1). This further illustrates the importance of using average moving windows to calculate growth rates, thereby accounting for coincidental spikes and dips in births as a result of annual fluctuations in factors such as rainfall patterns.
The observed decrease in vegetation browse, specifically the transformation from open woodlands to grasslands across the LBL (Giesen et al. 2017; LRD 2017), has led to a theoretical reduction in the Ecological Carrying Capacity (ECC) of Black rhinos from an estimate of 70 on the Lewa side in 2004 (KWS 2007) to 58 individuals estimated in 2016 (Wandera Unpublished). On the Borana side, the current ECC estimate is 65 (Wandera Unpublished) up from 53 Black rhinos in 2008 (KWS Unpublished). In relation to this, the lack of current knowledge regarding the availability of browse and resource utilisation by Black rhino necessitated the need for such a study. This was carried out from March to May 2018 by a University of Southampton MRes Wildlife Conservation student (Jackson 2018). The information generated by this research will be used to further inform the management of LBL on the availability and distribution of food types preferred by Black rhinos, mainly A. drepanolobium, as we design strategies of maintaining and improving their persistence. Further activities for the rhino monitoring programme are outlined below.
2.1 Black rhino population performance
With 10 births in 2018 (Table 2.1), the black rhino population on LBL increased from 87 to 97 individuals. This represented an overall annual biological growth rate of 6.2% in the 2016-2018 average moving window compared to an average annual rate of 3.6% in the 2015-2017 period (Fig. 2.1). On the Lewa side of the Landscape, the average annual biological growth rate went

3
up to 5.2% from <1% p.a. in the 2015-2017 moving window (Fig. 2.2). No mortalities were documented during the year.
Table 2.1: Black rhino births
Calf Name Dam Sire Date of birth Ren Suen Calf 1 Ren Suen Hoppy 10th Jan 2018 Sonia Calf 8 Sonia Ndoto 15th Apr 2018 Seneiya Calf 2 Seneiya Ibong 22nd Apr 2018 Zaria Calf 9 Zaria Muturi 14th May 2018 Wanjiku Calf 1 Wanjiku Folly 19th May 2018 Ndito Calf 8 Ndito Ibong 29th Jul 2018 Senewa Calf 1 Senewa Elvis 27th Aug 2018 Number 6 Calf 5 Number 6 Denny 21st Sep 2018 Winnie Calf 3 Winnie Elvis 8th Nov 2018 Samia Calf 6 Samia Ndoto 11th Nov 2018
Figure 2.1: Key Black rhino population metrics on the LBL, 2003-2018
0.0%2.0%4.0%6.0%8.0%
10.0%12.0%14.0%16.0%
03-0
5
04-0
6
05-0
7
06-0
8
07-0
9
08-1
0
09-1
1
10-1
2
11-1
3
12-1
4
13-1
5
14-1
6
15-1
7
16-1
8
% R
ate
Lewa-Borana Landscape Black Rhino population rates since 2003 (averages for each 3-year time period): underlying biological growth, actual achieved growth,
mortality and management removal rates
Overall Mortality Rate (all causes) Average Annual Management Removal rate
Average Annual Actual Growth Rate Average Annual Biological Growth Rate

4
Figure 2.2: Key Black rhino population rates on Lewa, 2003-2018
2.2 White rhino population performance
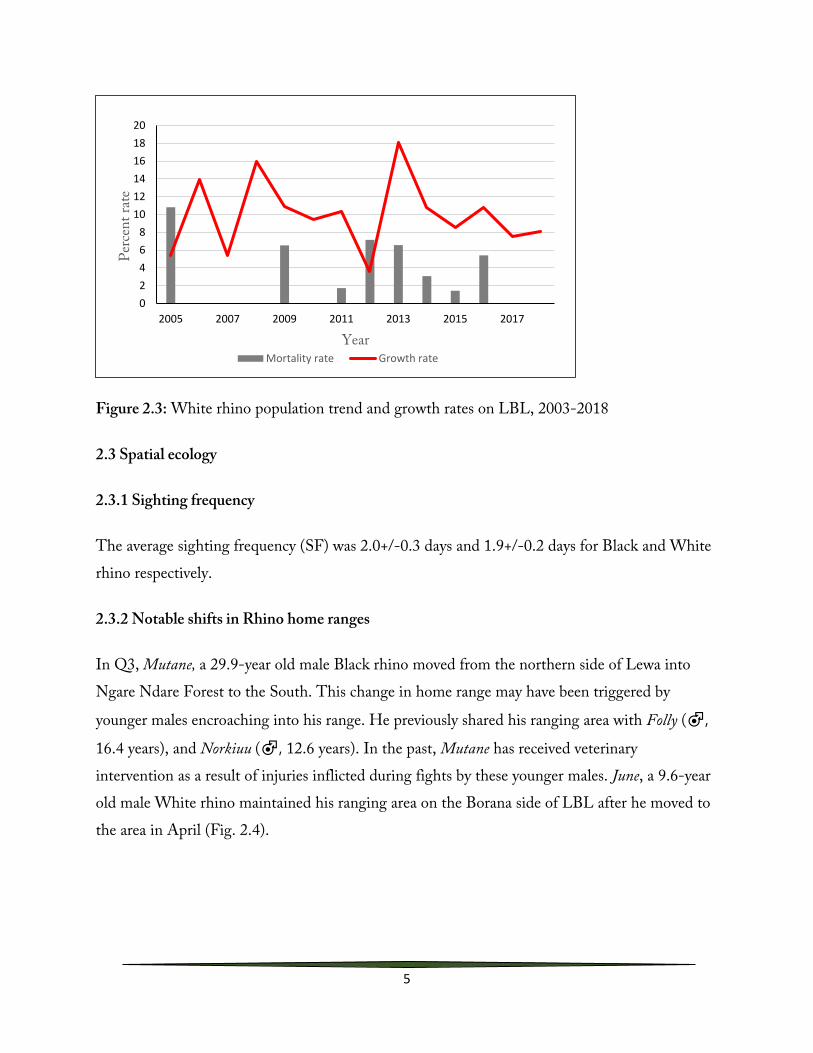
With 6 births, the population of White rhino increased from 80 to 86 individuals representing a 7%3 increase in 2018 (Fig. 2.3, Table 2.2). No mortalities were recorded. Since 2013, the white rhino population on the LBL has continued to increase steadily (Fig. 2.3). Overall, the reduction of mortalities as a result of both natural and human induced causes over this period has largely contributed to this increase.
Table 2.2: White rhino births
Calf Name Dam Sire Date of birth Ngura Calf 2 Ngura Owuan 16th Mar 2018 Rinta Calf 7 Rinta Samawati 10th Jun 2018 Natal Calf 10 Natal Owuan 25th Aug 2018 Lucille Calf 2 Lucille Owuan 19th Sep 2018 Tale Calf 5 Tale Ronnie 23rd Oct 2018 Tumbili Calf 11 Tumbili Imado 10th Nov 2018
3 The long-term performance of White rhino has not been analysed in a similar fashion as that of the Black rhino. This analysis is scheduled for 2019.
0.0%2.0%4.0%6.0%8.0%
10.0%12.0%14.0%16.0%
03-0
5
04-0
6
05-0
7
06-0
8
07-0
9
08-1
0
09-1
1
10-1
2
11-1
3
12-1
4
13-1
5
14-1
6
15-1
7
16-1
8
% R
ate
Lewa - Black Rhino population rates since 2003 (averages for each 3-year time period): underlying biological growth, actual achieved growth, mortality and
management removal rates
Overall Mortality Rate Average Annual Management Removal rate
Average Annual Actual Growth Rate Average Annual Biological Growth Rate
5
Figure 2.3: White rhino population trend and growth rates on LBL, 2003-2018
2.3 Spatial ecology
2.3.1 Sighting frequency
The average sighting frequency (SF) was 2.0+/-0.3 days and 1.9+/-0.2 days for Black and White rhino respectively.
2.3.2 Notable shifts in Rhino home ranges
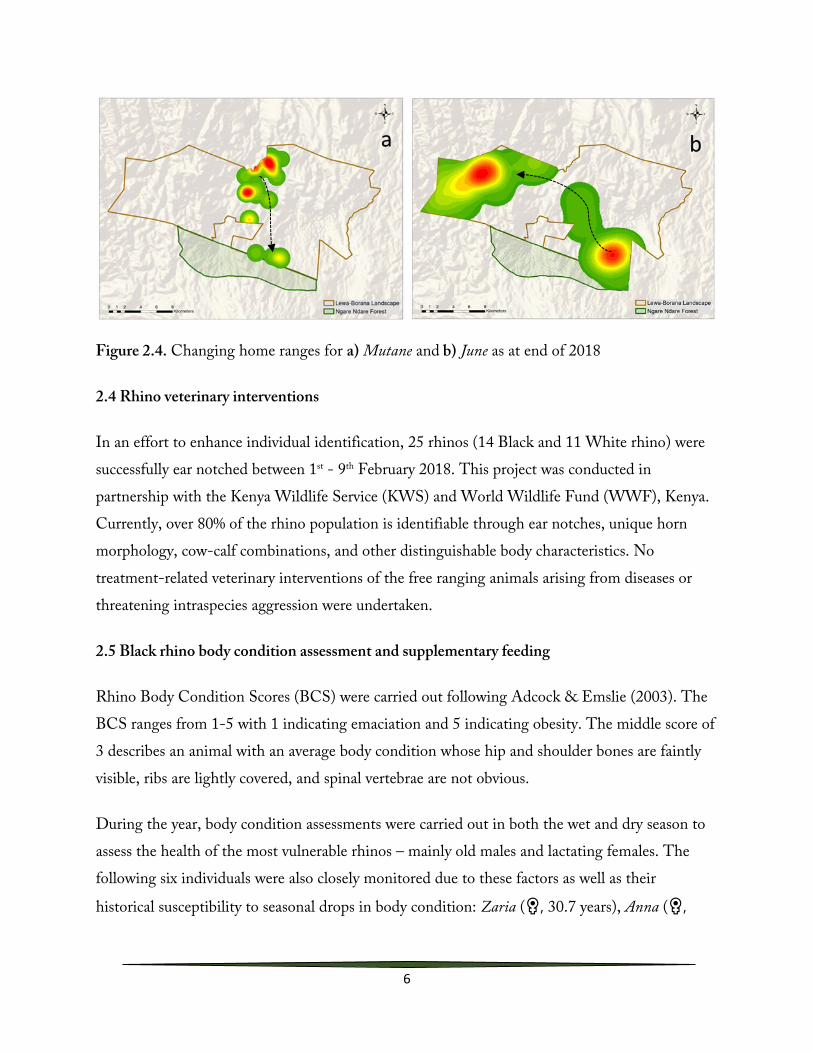
In Q3, Mutane, a 29.9-year old male Black rhino moved from the northern side of Lewa into Ngare Ndare Forest to the South. This change in home range may have been triggered by
younger males encroaching into his range. He previously shared his ranging area with Folly (♂,
16.4 years), and Norkiuu (♂, 12.6 years). In the past, Mutane has received veterinary intervention as a result of injuries inflicted during fights by these younger males. June, a 9.6-year old male White rhino maintained his ranging area on the Borana side of LBL after he moved to the area in April (Fig. 2.4).
02468
101214161820
2005 2007 2009 2011 2013 2015 2017
Perc
ent r
ate
YearMortality rate Growth rate
6
Figure 2.4. Changing home ranges for a) Mutane and b) June as at end of 2018
2.4 Rhino veterinary interventions
In an effort to enhance individual identification, 25 rhinos (14 Black and 11 White rhino) were successfully ear notched between 1st - 9th February 2018. This project was conducted in partnership with the Kenya Wildlife Service (KWS) and World Wildlife Fund (WWF), Kenya. Currently, over 80% of the rhino population is identifiable through ear notches, unique horn morphology, cow-calf combinations, and other distinguishable body characteristics. No treatment-related veterinary interventions of the free ranging animals arising from diseases or threatening intraspecies aggression were undertaken.
2.5 Black rhino body condition assessment and supplementary feeding
Rhino Body Condition Scores (BCS) were carried out following Adcock & Emslie (2003). The BCS ranges from 1-5 with 1 indicating emaciation and 5 indicating obesity. The middle score of 3 describes an animal with an average body condition whose hip and shoulder bones are faintly visible, ribs are lightly covered, and spinal vertebrae are not obvious.
During the year, body condition assessments were carried out in both the wet and dry season to assess the health of the most vulnerable rhinos – mainly old males and lactating females. The following six individuals were also closely monitored due to these factors as well as their
historical susceptibility to seasonal drops in body condition: Zaria (♀, 30.7 years), Anna (♀,

7
12.7 years), Zenetoi (♀, 12.9 years), Bahati (♀, 8.5 years) and Mutane (♂, 29.9 years). All individuals had an average score of ≥3.5 by the end of the year (Table 2.3).
Table 2.3: Rhino body condition score in 2018. All individuals apart from Mandela are Black rhinos
Rhino name Q1 Q2 Q3 Q4 Average
Zaria 3.0 3.5 3.0 3.5 3.5 Mutane 3.5 3.0 – 3.5 3.5 3.5 3.5 Anna 3.5 3.5 3.5 3.5 3.5 Zenetoi 3.0 3.0 3.0 – 3.5 3.0 -3.5 3.5 Bahati 3.5 3.0 3.0 3.5 3.5 Mandela 3.5 -4.0 3.5 – 4.0 4.0 4.0 4.0
The onset of rains in Q2 and Q4 resulted in the improvement of the body condition of the mentioned animals.
2.5 Black Rhino Feeding Study
In early 2018, a resource availability and utilisation study was carried out by an MRes student from Southampton University, UK (Jackson 2018). Browse availability (BA) and the utilisation of resources by black rhino were investigated. The main findings presented below were that overall BA did not differ significantly between Lewa and Borana portions of the Landscape.
However, the topographical differences between Lewa and Borana, notably the higher altitude of Borana and its steep slopes, mean that not all the vegetation is accessible to Black rhino. Regions of varying topographies can introduce uncertainty to estimates of ECC due to the inaccessibility of some areas (Young 1938; Giesen et al. 2017). This is especially relevant to black rhino that have been found to avoid areas that are steep and lacking pathways to access browse; thus, influencing which regions of the conservancies are utilised (Kotze & Zacharias 1993; Ganqa et al. 2005). Estimates that failed to consider topography and resource inaccessibility resulted in black rhino population growth rate declines of 6.1% per year in Eastern Shores and severe

8
vegetation degradation between 1962-1977 in the Addo Elephant National Park (Hall-Martin & Pentzhorn 1977; Hall-Martin et al.1982; Adcock 2001). Therefore, management must consider all the variables that may affect the ECC, including topography, competition, social interactions, fluctuations in precipitation and stochastic events like drought (Illius & O’Connor 1999; Adcock 2001).
BA in forest habitats was 18% higher than hills and 20% higher than plains. Across both conservancies, 54 of the palatable plant species were found in forest habitats, 57 in hills and rocky outcrops and 33 in plains. Plant diversity was highest in forests (H=3.255; D=0.944), followed by hills (H=3.199; D=0.936) and plains (H=2.312; D=0.812). BA can be extrapolated for LWC because meticulous vegetation studies have determined the coverage of each habitat-type on the reserve. However, inferences cannot be made as accurately for total BA on Borana, as the area of each habitat-type have not been calculated and thus, overall BA comparison between LWC and Borana has to be by necessity tentative.
An assessment of current management strategies (exclusion zones) revealed that Browse availability inside the zones was 22% higher than outside. BA did not differ between partial and total4 exclusion zones (Z=0.315, d.f.=13, P=0.759). However, sample size of total exclusion zones was limited to three (the number present on Lewa) and thus, statistical analysis had low power to detect any differences. Additionally, there was no correlation between Browse availability and the construction age of exclusion zones (Z=0.531, d.f.=11, P=0.607). This suggests that vegetation in exclusion zones rebounds relatively quickly and browse availability increases relatively quickly, within less than 10 years. Furthermore, excluding large herbivores reduces browsing pressure sufficiently enough that plants grow quickly and exceed heights of 2.0m (Smith & Goodman, 1987). Thus, the food resources may become inaccessible to black rhino who browse vegetation almost exclusively between 0.5-1.2m, and up to 2.0m (Adcock 2016).
Within the 36 plots that were sampled inside exclusion zones, there was no evidence of black rhino browsing or presence (i.e. dung/tracks). This study was conducted in the wet season when
4 The Total exclusion areas were Lewa Safari Camp, Lewa Wilderness, and Sirikoi short fence exclusion area

9
succulent forbs and herbs were abundantly present on the LBL. Black rhino may use exclusion zones as a dry-season resource when forbs are scarce, plant quality is low, and they are more reliant on woody vegetation (Rutina et al. 2005; Kassa et al. 2007). A habitat-use survey and a dry-season study would reveal usage rates of the exclusion zones.
This study was conducted during the wet season, when food plants (forbs, shrubs, trees) were abundant and diverse, offering a better representation of black rhino selectivity in comparison to resource availability on the LBL. Acacia drepanolobium and P. patens were the most palatable species to black rhino and were selected disproportionately to their availability. This study also revealed that black rhino selected for herbs and trees, but against shrubs. During observations, it was noted that black rhino were feeding low to the ground, corroborated by results that there was a significant difference in the consumption of plants below the height of 0.5m, in comparison to all other height classes. Selecting low-growing, succulent herbs appears to be a wet season adaptation for several herbivores, including black rhino, impala (Aepyceros melampus) and waterbuck (Kobus ellipsiprymnus). This is because plant variety, abundance of food plants and nutrient quality is higher, and the animals do not have to depend on woody vegetation as much (Rutina et al. 2005; Kassa et al. 2007; Landman et al. 2013).
Furthermore, selecting herbs may have evolved as a mechanism to avoid competition with other megaherbivores such as elephant. In the Addo Elephant National Park, elephant and Black rhino showed significant diet separation during the wet season, with black rhino consuming more forbs, and elephant diversifying to grass. However, the utilisation of these vegetation-types for both species declined during the dry season, when seasonally available plant forms declined, and both elephant and black rhino shifted their dietary intake to woody vegetation and shrubs (Landman et al. 2013).
Based on the conclusions of this study, the recommendations for future research on the LBL include (i) a vegetation survey on Borana Conservancy to determine the coverage of each habitat-type; (ii) a seasonal habitat-use study investigating the utilisation of exclusion zones by black rhino to provide information regarding the importance of the food resources inside; (iii) a comparative dry-season study to determine how Browse availability changes seasonally, and whether differences in food availability and quality causes the dietary composition of black rhino

10
to shift; (iv) the efficacy of the mutualistic relationship between A. drepanolobium and Crematogaster ants should be investigated on LWC. Elsewhere, ants have been shown to effectively reduce browsing by elephant; therefore, ant-acacia mutualisms play a crucial role in the stability and survival of trees in savannah ecosystems (Goheen & Palmer 2010). Given that elephant have significantly contributed to declines in A. drepanolobium cover on LWC, any issues with this symbiotic relationship should be identified.
2.7 Rhino Impact Investment Bond process
In 2018, the Lewa-Borana Landscape was selected to be one of the key Black rhino sanctuaries that will pilot a new model of rhino conservation funding. This framework, The Rhino Impact Investment bond, will be outcome based, where funding will be contingent upon the achievement of Key Performance Indicators (KPIs), which in this case will primarily be increased growth rates and ultimately higher Black rhino numbers. RII is an initiative of United for Wildlife, a partnership between seven of the world’s leading wildlife charities whose implementation is led by the Zoological Society of London (ZSL), Conservation Capital, and Conservation Alpha.
The LBL is currently undergoing an investment readiness phase, ensuring that security and monitoring protocols are enhanced to comprehensively auditable levels. This readiness process is projected to continue through to 2021, when the main RII funding period is scheduled to begin. A population management plan will be developed and implemented in partnership with KWS, with the two main strategies identified thus far being to implement an annual offtake and translocation plan to maintain growth rates and feed expanding national Black rhino range, and to continue experimenting with different methods of woody vegetation improvement.
2.8 Conclusions and recommendations
Most of the Rhino Monitoring objectives for 2018 were successfully completed. Notably, the rhino notching exercise carried out in Q1, the browse availability assessment in Q2 and the quarterly body condition assessments.
11
Looking forward, the browse availability study should ideally be repeated during a dry period to identify seasonal changes in preference and availability of browse across the landscape. Complementary to this, a habitat composition assessment should be carried out on Borana to quantify the relative proportions of the different habitat types therein.
The high number of rhino births recorded in 2018 continues to underscore the importance of assessing population growth rates in three-year windows, eliminating drastic peaks and troughs when analysing population trends. Nevertheless, close attention needs to be paid to changing inter-calving intervals for the black rhino, as this will continue providing crucial information about the social and ecological carrying capacity of the landscape.
Given the rich data provided by the Black rhino master dataset constructed in collaboration with Keryn Adcock, it will be imperative to create a similar dataset for the White rhino, as population changes will be easier to track and analyse accurately.
Black and white rhino body condition assessments should continue for timely interventions, especially coming off of sub-par rains in the latter half of the year and as possible dry conditions get worse. Related to this, an annual ranger refresher course should be implemented, especially for new recruits. This will reduce cases of mis-identification and improve accuracy of body condition scoring.

12
3.0 PREDATOR MONITORING
3.1 Introduction
Accurate data on wildlife numbers and dynamics underpins effective conservation measures. Continued monitoring is therefore necessary for assessing the efficacy of conservation initiatives. Although the LBL is home to large and small carnivores, our emphasis on monitoring has been mainly on the African lion and the Spotted hyena. This is mainly driven by their relative population sizes, their competitive dynamics and a concern about their numbers in the face of conflict with humans and endangered prey species. Large carnivores play a fundamental role in the tourism industry and are ecologically important. These dual functions make them a key functional group needing consistent research and monitoring.
3.2 Population performance
3.2.1 Lion Population
In 2018, we monitored a population of 47 lions (30 adults, 8 sub adults and 9 cubs) occurring in seven prides and two coalitions (Table 3.1). The lions were monitored using telemetry. We recorded data on the status, locations, movements, incidents of livestock depredation, predation, and collected their scat using cluster-point analysis. These data enabled us to determine the identities of lions using the whisker-spot method, association patterns, prey preferences, movement patterns and ranging areas. In addition, from the data gathered, as well as working with stakeholders in the contiguous landscape, we were able to determine areas prone to human-carnivore conflicts thus allowing us to intensify our monitoring in such areas.

13
Table 3.1: Lion population structure on LBL
Adult Sub adult Cubs
Total by pride/coalition
Male Female Male Female Male Female Unknown sex
Sarah's pride 1 5 2 1 0 0 0 9 Dalma's pride 1 2 0 0 0 0 0 3 Suzie 0 1 0 1 0 0 0 2 Laragai's pride 4 2 0 0 0 0 0 6 Bredymark's pride 0 2 0 0 1 0 1 4 Carissa's pride 0 2 0 3 0 0 0 5 Mole's pride 1 2 0 1 0 0 0 4 Harry's coalition 3 0 0 0 0 0 0 3 Njaa's pride 0 4 0 0 0 0 7 11
Total by Age 10 20 2 6 1 0 8 47
Contraception trial
As the contraceptive trial period draws to a close, the monitoring data collected clearly shows the effectiveness of the non-lethal implants. Throughout the monitoring period, none of the females targeted went into estrus, and no adverse effects on the behaviour, fitness, or social cohesion of the implanted animals was observed. The stabilizing effect this has had on the lion population is, however, temporary, as the implants are designed with a short-term lifespan, and several other females in the population have since attained sexual maturity. The overall population sex-ratio continues to be skewed towards females. This means that unless there is an external intervention, there will likely be a population spike within the next year. Our recommendation is that the contraceptive programme needs to be continued, with the next phase of interventions expanded to include more females. Additionally, research should continue into identifying and piloting more non-lethal contraception interventions, with the aim of providing the Lewa-Borana management and KWS a richer, more rigorous range of options for lion population control.

14
3.2.2 Hyena population The Spotted hyena population stood at 134 individuals (84 adults, 40 sub adults and 10 cubs) occurring in five clans (Table 3.2). Majority of these animals were not sexed because of the morphological similarities between male and female hyenas. Since this is a nocturnal species, we deployed camera traps to monitor their dynamics. Cameras were mounted on each of the clan’s communal dens, where photos obtained were used to identify individuals and estimate their population. In February 2018, we deployed GPS collars on three Spotted hyenas within the landscape to better understand their utilization and spatial patterns in and outside the landscape. Table 3.2: Population structure of the spotted hyena on LBL
Adults Sub adults Cubs
Clan name M F Unknown sex M F Unknown sex M F Unknown sex Total by clan
Borana 1 0 2 0 0 0 0 0 0 3 Charlie 2 3 16 2 0 16 0 0 0 39 Nala 3 3 28 0 0 11 0 0 7 52 Shamba 0 2 8 0 0 4 0 0 0 14 Utalii 2 5 9 0 0 7 0 0 3 26
Total by sex 8 13 63 2 0 38 0 0 10 134
Understanding the hyena demographics and feeding strategies in our landscape is as imperative as ever given the context of calf and foal survival of our endangered species. While we continue to collect information on scat analysis, we are looking to further understand these prey dynamics, especially the relative proportion of hunting versus scavenging in our hyena population. Additionally, we are exploring all possible interventions contained within the National predator control toolbox to slow down and possibly control the rapid increase of hyenas on our landscape. While this work will involve a significant amount of internal capacity, we are in communication with experts from the Mara Hyena Project through Dr. Kay Holenkamp looking towards setting up a comprehensive and dedicated medium-term hyena monitoring programme. Updates will continue to be provided as this initiative progresses.

15
3.3 Spatial ecology
3.3.1 Lion
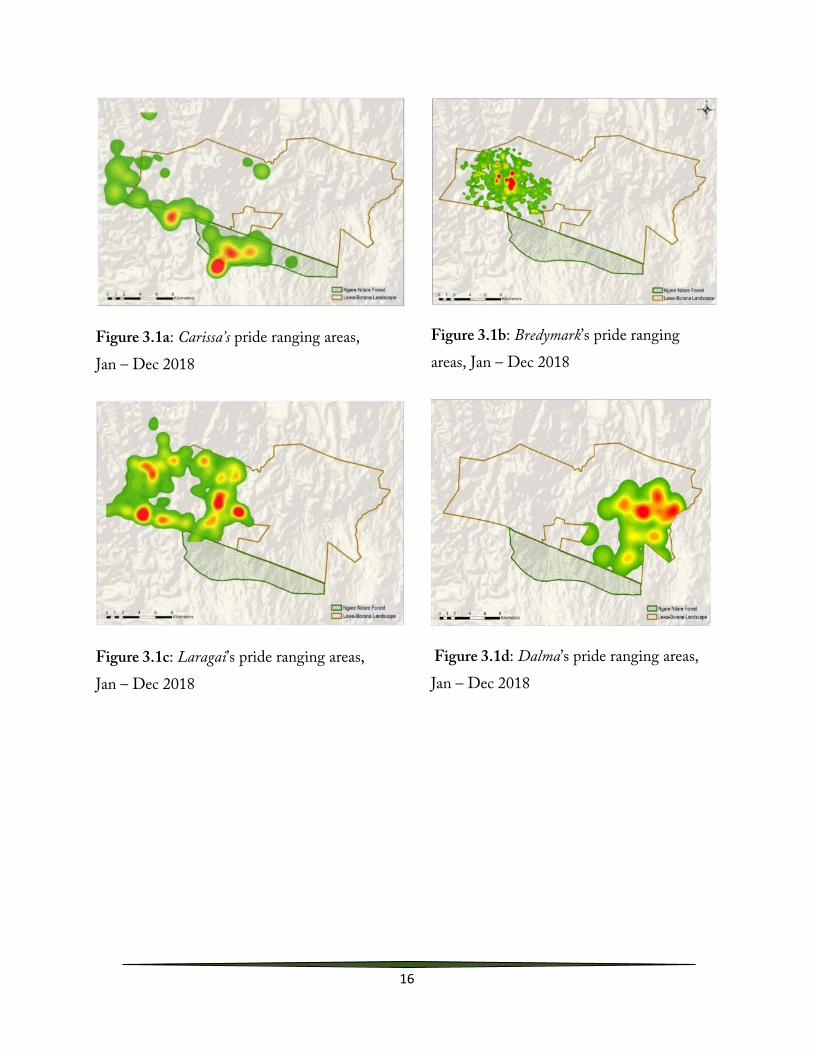
Pride territories were mapped from collar and sightings data using ArcMap 10.6.1. Harry’s coalition, comprising of three males; Harry, Dick and Esau, initially restricted their movement to the eastern side of the LBL. However, in the year, these males shifted their ranging area to the western side of the Landscape, an area that had primarily been utilized by another coalition known as Yas’s coalition of four males. Subsequently, members of Harry’s coalition were observed killing cubs and mating with females in the area, indicating pride take over. Males kill all small cubs when they first take over a pride (Bertram 1975; Pusey & Packer 1994) and thus prolonged residence is essential for successful reproduction. Lions are primarily nocturnal, and thus inter-coalition encounters were not directly observed. After this take over, Yas’s coalition was displaced out of LBL while Carissa’s pride, that has traditionally been utilizing the western side of the landscape shifted their home range into the Ngare Ndare Forest (Fig. 3.1)
Male lions form cooperative coalitions which compete against other coalitions for exclusive access to female groups (Bygott et al. 1979). Yas’s coalition has been resident on the landscape since 2014 before being displaced in 2018. These males managed to sire two sets of cubs of which only one individual had attained maturity before the takeover. This is mainly because competition between coalitions is intense, with only a small proportion of males ever gaining residence in a pride, and few coalitions are able to maintain residence long enough to rear even a single set of cubs.
All these male lion dynamics on the landscape explain why female prides with small cubs such as Carissa’s have established their core area in and around the Ngare Ndare Forest that is relatively male-free.
16
Figure 3.1a: Carissa’s pride ranging areas, Jan – Dec 2018
Figure 3.1b: Bredymark’s pride ranging areas, Jan – Dec 2018
Figure 3.1c: Laragai’s pride ranging areas, Jan – Dec 2018
Figure 3.1d: Dalma’s pride ranging areas, Jan – Dec 2018

17
Figure 3.1e: Suzie’s pride ranging areas, Jan – Dec 2018
Figure 3.1f: Sarah’s pride ranging areas, Jan – Dec 2018
Figure 3.1g: Harry’s coalition ranging areas, Jan – Dec 2018
18
3.5 Human-carnivore conflicts
The likelihood of human – carnivore conflict is determined by both human and carnivore behaviour. Human behaviour such as poor livestock husbandry can lead to conflicts. Proper construction of livestock enclosures (bomas) and the use of deterrents such as dogs, can lower the likelihood of livestock depredation (Ogada et al. 2003). Concurrently, the general ecology of carnivores, such as social status, habitat use and hunting strategies, may influence their predisposition to livestock depredation (Elliot et al. 2014; Loveridge et al. 2017).
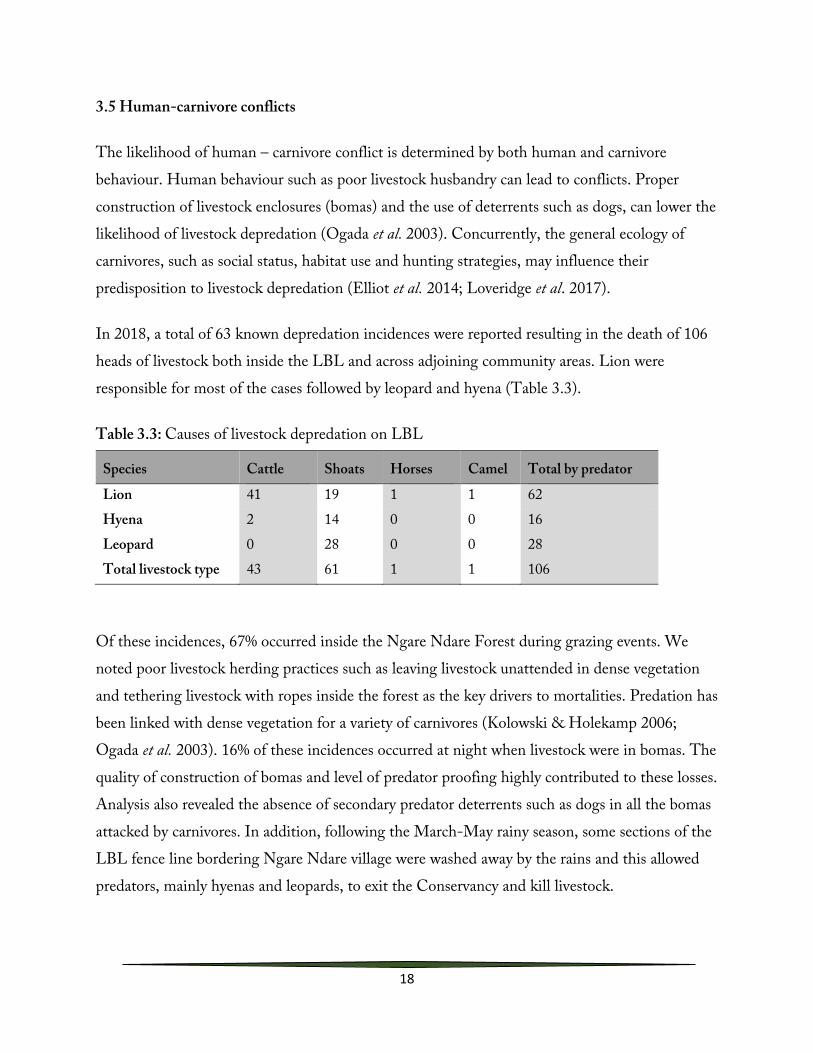
In 2018, a total of 63 known depredation incidences were reported resulting in the death of 106 heads of livestock both inside the LBL and across adjoining community areas. Lion were responsible for most of the cases followed by leopard and hyena (Table 3.3).
Table 3.3: Causes of livestock depredation on LBL
Species Cattle Shoats Horses Camel Total by predator
Lion 41 19 1 1 62 Hyena 2 14 0 0 16 Leopard 0 28 0 0 28 Total livestock type 43 61 1 1 106
Of these incidences, 67% occurred inside the Ngare Ndare Forest during grazing events. We noted poor livestock herding practices such as leaving livestock unattended in dense vegetation and tethering livestock with ropes inside the forest as the key drivers to mortalities. Predation has been linked with dense vegetation for a variety of carnivores (Kolowski & Holekamp 2006; Ogada et al. 2003). 16% of these incidences occurred at night when livestock were in bomas. The quality of construction of bomas and level of predator proofing highly contributed to these losses. Analysis also revealed the absence of secondary predator deterrents such as dogs in all the bomas attacked by carnivores. In addition, following the March-May rainy season, some sections of the LBL fence line bordering Ngare Ndare village were washed away by the rains and this allowed predators, mainly hyenas and leopards, to exit the Conservancy and kill livestock.

19
3.6 Wildlife mortality
We recorded a total of 133 wildlife mortality cases in 2018. These records were obtained through collaborative efforts from field rangers, tour guides, and kills sighted during daily lion monitoring of collared lions and hyenas. 95% of all the kills were as a result of predation while the rest were due to natural causes such as old age and diseases (Fig. 3.2).
Figure 3.2: Causes of wildlife mortality on LBL
Predation plays a pivotal role in shaping the behaviour of wildlife communities, not just through prey killed, but also through influencing the behaviour of prey species (Fischhoff et al. 2007; Prins & Iason 1989; Winnie et al. 2008). Additionally, predation influences prey density, spatial distribution, and habitat selection (Creel et al. 2005; Valeix et al. 2009). Nine prey species made up the bulk of lion kills as shown in Fig. 3.3.
0
20
40
60
80
100
Lion Cheetah Leopard Unknown
Perc
enta
ge o
f dea
ths
Cause of death

20
Figure 3.3: Number of mortalities per species on LBL.
3.7 Prey selectivity by lions
To assess prey preference and selectivity by lions, Jacobs Index (D) was used (Jacobs, 1974).
The index formula is;
D=(r-p)/(r+p-2rp)
Where r is the proportion of a particular species of all the kills; p is the proportional availability of that species in the population).
Jacob’s Index ranges between – 1 (highly avoided) and +1 (highly selected). Eland, Plains zebra and giraffe were taken according to their availability over the last five years. Grevy’s zebra and buffalo showed no selection while warthog showed a degree of selection across the five years (Table 3.4). On LBL, Buffalo occurs mainly in six herds with a minimum of 150 individuals per herd. Buffalo shows strong anti-predatory defense behaviour (Makacha & Schaller 1969), which makes them not to be selected.
0
10
20
30
40N
umbe
r of D
eath
s
21
Table3.4: Comparison of prey selectivity index from 2014 to 2018 Species 2014 2015 2016 2017 2018
Plains zebra 0.3 0.2 0.4 0.2 0.2 Grevy’s zebra 0.3 0.3 0.3 0.0 -0.1 Impala -0.7 -0.6 -0.1 -0.8 -1.0 Waterbuck 0.4 0.4 0.1 0.1 - 0.2 Eland 0.0 0.4 0.2 0.4 0.5 Beisa oryx 0.2 -0.6 -0.3 -0.6 -0.6 Warthog 0.7 0.7 -0.3 0.5 0.6 Giraffe 0.4 0.2 0.4 0.4 0.8 Buffalo -0.8 -0.5 -0.2 0.0 -0.2
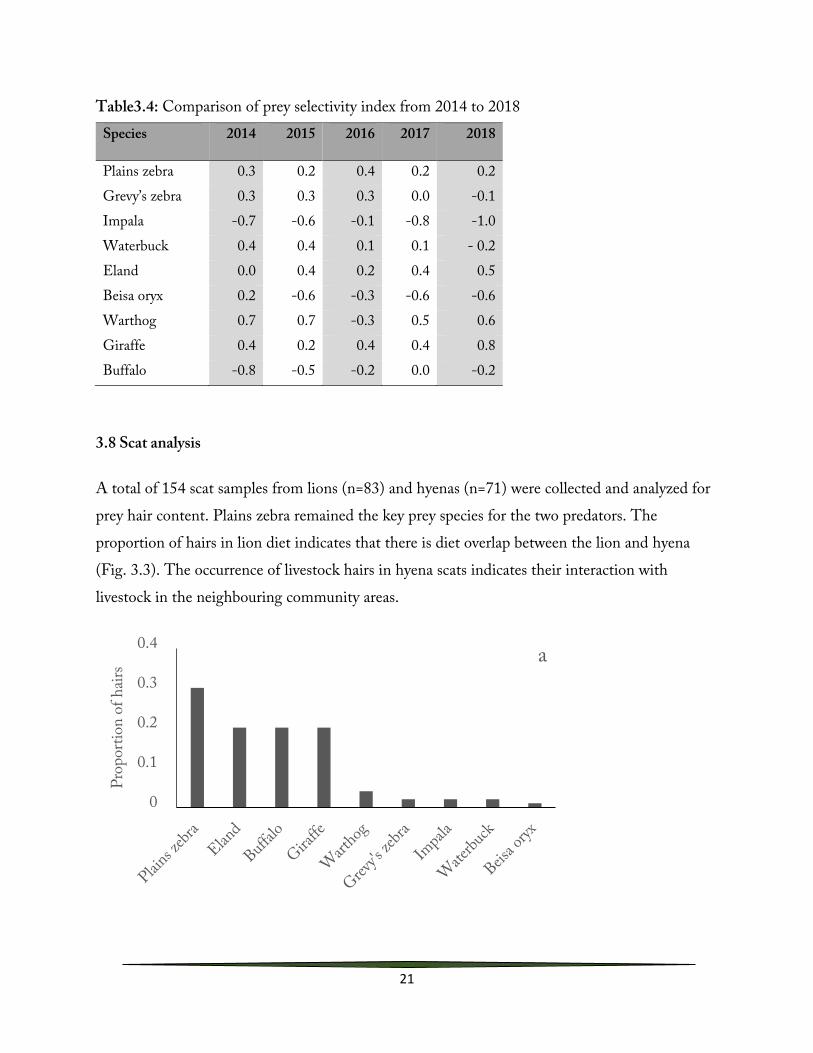
3.8 Scat analysis
A total of 154 scat samples from lions (n=83) and hyenas (n=71) were collected and analyzed for prey hair content. Plains zebra remained the key prey species for the two predators. The proportion of hairs in lion diet indicates that there is diet overlap between the lion and hyena (Fig. 3.3). The occurrence of livestock hairs in hyena scats indicates their interaction with livestock in the neighbouring community areas.
0
0.1
0.2
0.3
0.4
Prop
ortio
n of
hai
rs
a

22
Figure 3.3: Proportion of prey species hairs found in (a) lion and (b) hyena scat
3.9 Conclusions and recommendations
Our results show that the landscape features and livestock husbandry practices are important predictors of depredation. Livestock husbandry influenced livestock losses within individual bomas in the community areas, with weak bomas experiencing higher rates of depredation than strong bomas. We therefore recommend awareness be raised within the communities on how to construct stronger bomas which will deter predators.
While domestic dogs can be a deterrent to livestock depredation, they can be a reservoir for diseases such as canine distemper virus (CDV) and rabies which have caused massive die-offs of a variety of carnivores in the past. We recommend regular programs for vaccinating domestic dogs in the community lands. More livestock were lost to carnivores while they were out in the fields grazing than when they were in bomas. Sensitization to communities on the trade-offs of grazing in the forest would be a worthwhile endeavor. While improving grazing practices may very well limit livestock losses, we also recommend timely repairs of main boundary fences after damage by heavy rains to reinforce the discussed measures.
Given the current success of the Lion contraceptive programme, we recommend renewal of contraception on currently implanted females, as well as expansion of the programme to include a selection of sub-adult females currently poised for recruitment into the breeding age class.
0
0.1
0.2
0.3Pr
opor
tion
of h
airs b

23
4.0 UNGULATE MONITORING
4.1 Introduction
In arid and semi-arid environments, ungulates commonly experience changes in their dynamic due to significant seasonal, climatic and spatial variation in resources (Illius & O’Connor, 2000; Fryxell 1987; Sinclair 1975). Seasonal variability imposes forage growth cycles resulting in variations in food abundance and quality. Consequently, the cycles in resource availability affects animals’ body fat reserves (Illius & O’Connor, 2000, Fryxell 1987, Sinclair 1975).
The LBL, being an arid and semi-arid environment, climate and forage-mediated changes in population dynamics are likely to occur. We have therefore identified Grevy’s zebra (Equus grevyi), Plains zebra (Equus quagga), buffalo (Syncerus caffer), Beisa oryx (Oryx beisa), hartebeest (Alcelaphus buselaphus lelwel), giraffe (Giraffa camelopardalis), and eland (Taurotragus oryx) as representative indicator species. We monitored population dynamics of these species focusing on age-sex structure and body condition. These parameters assist in determining population stability and resilience. We also monitored the movement of wildlife through the migratory gaps linking eastern side of LBL with the contiguous conservancies by use of motion sensor camera traps.
The results and discussions of our ungulate monitoring are presented below. The years of comparison may vary from one monitoring activity to another based on when comprehensive and consistent monitoring was initiated.
4.2 Results
Buffaloes have attained the 30% infant and juveniles threshold for population growth throughout the period under review i.e. 2016-2018. Hartebeest attained this threshold in 2017 only. Grevy’s zebra and oryx show a positive change towards achieving this threshold. Giraffe recorded the lowest percent of juveniles and young of their total population (Fig. 4.1).
The growth potential for the ungulates ranged from medium to high (Fig. 4.2). This shows that the ungulate species should be able to recover in case of ecological disturbance since there are enough recruits to replace the reproductive class (Rubenstein et al. unpublished report).

24
The population of hartebeest in LBL is made up of approximately 60 individuals which is fairly low. From 2014, we followed a subset of hartebeest occurring on the Lewa side of LBL where we monitored the number of births and deaths. In this period, the population fluctuated from 12 to 27 individuals. We recorded a total of 29 births in the entire period. Out of these, 3 graduated to adulthood and 18 died while the rest are either calves or are sub adults (Fig. 4.3). The cause of death for the majority of these infants was unknown since they died at a very young age and it was difficult to locate them. One dead infant that we managed to record was diagnosed in the post mortem with theileriosis (tick-borne infection).
Figure 4.1: Proportion of young and juveniles for ungulate species monitored. The dotted black line indicates the 30% mark
Figure 4.2: Proportion of adult females per 1 adult male. The black dotted lines indicate levels of various growth potential, i.e, Low, Medium and High

25
Figure 4.3: Performance of hartebeest calves born on the Lewa side of LBL from 2014 to 2018
The Great Grevy’s Rally
In January 2018, private partners, Kenya Wildlife Service, academic and citizen scientists, and community members drove for two days through Grevy’s zebra and Reticulated giraffe range photographing the right side of these animals for unique identification using Image-Based Ecological Information System (IBEIS) software (Crall et al. 2013; Parham & Stewart 2016). Population estimates were then determined using Lincoln-Peterson Index as shown below;
N estimate = S1*S2/R;
CI = N estimate ±1.96 √ ((S12 * S2[S2 – R])/R2),
Where N is the number of individuals, S1 is the number of unique individuals sighted on day 1, S2 is the number of unique individuals sighted on day 2, R is the number of individuals re-sighted on day 2 that were also seen on day 1, and CI is the 95% confidence interval bounding the population size (N) estimate.
0
5
10
15
20
25
30
35
Births Deaths Graduates toadulthood
Number of calvesremaining
Num
ber

26
Results
The Grevy’s zebra national population rose from 2,350±93 to 2,812±163 between 2016 and 2018. This was partly attributed to increased effort of the survey in 2018 in areas that had previously been under-surveyed, primarily in Isiolo and Marsabit Counties. The Meru County population, which was largely made up of LBL’s animals, recorded less than 500 individuals. Laikipia recorded the highest number with slightly over 800 individuals (Rubenstein et al. unpublished report). The report also indicated that there was an increase in foal survival rates in Meru County (essentially Lewa) which was the only region to experience a positive trend between 2016 and 2018.
4.3 Assessment of Body Condition Scores (BCS) of selected ungulate species
Body Condition Scores of select species were conducted in 2018 following Ezenwa (2009). Values ranged from 1 to 5 with 1 being emaciated and 5 being obese. The quarterly BCS surveys recorded an average value above 3 from 2016 to date apart from Q3 of 2017 where a few species recorded scores of 2 and 3. The ungulate species in the landscape have remained resilient and have been able to recover quickly from forage disturbances mainly caused by rainfall inadequacy. The landscape health and productivity in LBL has mainly relied on rainfall and impact of planned livestock grazing, which together influences wildlife performance.
4.4 Wildlife movement through the migratory corridors
The loss of habitat and fragmentation are the main contributors to declines in biodiversity across different biomes (Noss, 2004). To protect conservation areas, an encompassing approach is required to manage natural ecosystems and ensure connectivity between remaining habitat. This will permit migration, interbreeding, and promote colonisation of new habitat by wildlife (Noss, 2004). In view of this, LBL has placed motion sensor cameras in various gaps along the established migratory corridors to monitor wildlife use of these linkages. The gaps are; Mount Kenya endpass, Mount Kenya underpass, and the Northern gap.

27
4.4.1 Mount Kenya endpass
A Chi-square test shows a significant increase in crossing events during the dry period compared to the wet period (χ2 = 414.516, df = 11, p = 0.000), figure 4.4a. Similar observation was made for the elephants (χ2 = 229.150, df = 11, p = 0.000), figure 4.4b.
4.4.2 Mount Kenya underpass
The dry period recorded the highest frequency of crossing events compared to the wet period (χ2 = 130.826, df = 11, p = 0.000), figure 4.5a. A similar trend was observed for the elephants (χ2 = 148.800, df = 11, p = 0.000), figure 4.5b.
4.4.3 Northern gap
We recorded more crossing events during the wet season than the dry period (χ2 = 3015.159, df = 11, p = 0.000), figure 4.6a. A similar observation was made involving elephants (χ2 = 1638.359, df = 11, p = 0.000), figure 4.6b.
Apart from the Northern gap which indicates more frequency in movements during the wet than the dry periods, other gaps indicate more frequency in movements during the dry periods. Studies have shown a strong relationship between rainfall/seasons and movement patterns of wildlife. Wildlife, particularly elephants, show more movements during the dry periods than the wet periods. They normally migrate to lower elevations during the wet periods and to higher elevations during the dry periods (Bohrer, Beck, Ngene, Skidmore, & Douglas-Hamilton, 2014). The high movements during the dry periods may be triggered by long distances separating foraging areas and water points especially in the northern rangelands.

28
Figure 4.3: Crossing events at Mt. Kenya endpass gap; a) Crossings for all wildlife, b) Crossings for elephants
Figure 4.4: Crossing events at Mt. Kenya underpass gap; a) Crossings for all wildlife, b) Crossings for elephants

29
Figure 4.5: Crossing events at Northern gap; a) Crossings for all wildlife, b) Crossings for elephants
4.4 Conclusion and Recommendation
The birth of 29 calves by the less than 20 adult hartebeests on the eastern side of LBL in five years indicates a well performing population in terms of reproduction. However, the death of 18 calves is of great concern. Measures geared towards protecting the calves should be considered if this population of hartebeest is to remain viable. The stabilization in Grevy’s zebra numbers underscores the effect predator dynamics have on the prey base, with pride perturbations and the contraceptive program possibly having an impact on predation of Grevy’s zebra foals. As such, plans to construct a breeding enclosure for Grevy’s zebra should be put on hold to allow for further assessment of the newly developing predator dynamics on the landscape.
The visual observation of increasing number of Grevy’s zebra foals need to be quantified using stripe identification software. Efforts to successfully debug and roll out the new Grevy’s zebra stripe ID platform on WILDBOOK are therefore of paramount importance. Concurrently, the Research Department will explore other methodologies currently being used across the landscape for stripe IDs.

30
5.0 ELEPHANT MONITORING
5.1 Introduction
Elephants are large herbivores that require large tracts of land for their survival. Because of their large body size, they have a huge impact on the environment. Elephant are well known to play an important ecological role through manipulation of vegetation structure and composition (Bohrer et al. 2014) particularly the woody vegetation. Elephants also are responsible for breaking fences, dam walls as well as destroying water piping (Thouless & Sakwa 1995). This is especially prevalent where cultivated land borders protected areas, leading to high levels of Human-Wildlife Conflict (HWC).
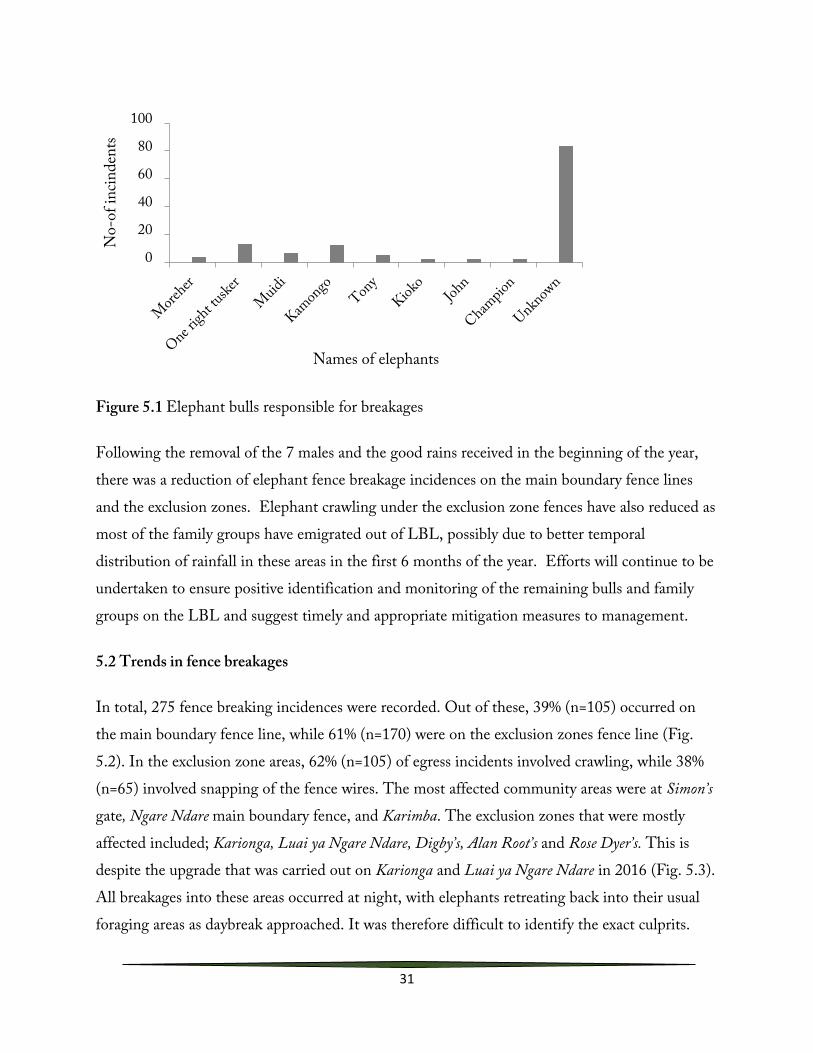
Elephant continued to pose a threat to exclusion zones and the main boundary fence lines within the LBL and the surrounding community areas. This necessitated the translocation of seven persistent fence breakers to Tsavo National Park in early March 2018. These males were: Mshauri, Bullet, Lekurende, Muindi, Saidimu, Kamaja, and Ethi bull. Despite the translocation intervention, there are still several fence-breaking bulls resident on the landscape, as well as elephants that have been newly recruited into the fence breaking routine. These bulls are One right Tusker, Champion, Melo, Kamongo and Moreher (Fig. 5.1). Daily monitoring of these bulls continued throughout 2018, and all pertinent information logged into the problem elephant database.
31
Figure 5.1 Elephant bulls responsible for breakages
Following the removal of the 7 males and the good rains received in the beginning of the year, there was a reduction of elephant fence breakage incidences on the main boundary fence lines and the exclusion zones. Elephant crawling under the exclusion zone fences have also reduced as most of the family groups have emigrated out of LBL, possibly due to better temporal distribution of rainfall in these areas in the first 6 months of the year. Efforts will continue to be undertaken to ensure positive identification and monitoring of the remaining bulls and family groups on the LBL and suggest timely and appropriate mitigation measures to management.
5.2 Trends in fence breakages
In total, 275 fence breaking incidences were recorded. Out of these, 39% (n=105) occurred on the main boundary fence line, while 61% (n=170) were on the exclusion zones fence line (Fig. 5.2). In the exclusion zone areas, 62% (n=105) of egress incidents involved crawling, while 38% (n=65) involved snapping of the fence wires. The most affected community areas were at Simon’s gate, Ngare Ndare main boundary fence, and Karimba. The exclusion zones that were mostly affected included; Karionga, Luai ya Ngare Ndare, Digby’s, Alan Root’s and Rose Dyer’s. This is despite the upgrade that was carried out on Karionga and Luai ya Ngare Ndare in 2016 (Fig. 5.3). All breakages into these areas occurred at night, with elephants retreating back into their usual foraging areas as daybreak approached. It was therefore difficult to identify the exact culprits.
0
20
40
60
80
100N
o-of
incin
dent
s
Names of elephants

32
Camera traps were then fixed along the breakage hotspot areas to ensure that we got photographs of the animal for identification. In addition, a rapid response team was deployed to these hotspot areas to deter the elephants before they broke the fence lines.
Figure 5.2. Heat map of elephants breakage incidences on LBL, 2018
Figure 5.3. Incidences of fence breakages across various locations
05
10152025303540
No-
of in
ciden
ces
Areas

33
There was a general reduction of elephant fence breakage incidences (Fig. 5.4) following the translocation of the seven male elephants. Most of the family groups recorded entering exclusion zones did so by crawling under the wires. Three bulls and five family groups in total were recorded crawling under the wires (Fig. 5.5).
Figure 5.4. Graph showing the comparison of the breakages before and after translocation of the seven bulls.
Figure 5.5 Graphs showing incidences of a) family groups and b) elephant bulls crawling under the exclusion zones wires.
0
50
100
150
200
Main boundary Exclusion zones Crawling incindences
No.
of i
ncid
ence
s
Areas
15 May 2017 - 15 March 2018 (Pre translocation)15 March 2018 - 15 December 2018 (Post translocation)
0
5
10
15
20
No-
of in
ciden
ts
Family groups (Matriarchs)
a
0
2
4
6
8
10
Tesh Livondo Obote
No
-of
incin
dent
s
Bulls
b

34
During the year, a joint Security and Conservation team visited Big Life Foundation on Mbirikani Group Ranch near Amboseli National Park to learn the methods they use to deter human-elephant conflict since their area of operation is similarly surrounded by agricultural parcels. As such, the Mbirikani area faces similar challenges with fence breaking and crop raiding elephants. Some of the methods observed being used to relative effect were; pepper guns, pepper-smeared gunny bags, and thunder flashes. All these deterrents proved relatively effective. However, different variables such as the location and temperament of elephant helped dictate which method was used in what situations, and whether or not to use a combination of deterrents.
As a follow-up to this exchange programme and to serve as an experimental pilot, we fixed some pepper-smeared gunny bags at the Karionga exclusion zone and at Moloi gate. The elephants were observed to avoid these areas once the gunny bags were deploying, demonstrating their effectiveness. However, one drawback to this method was that other wildlife also ended up avoiding these areas. Moving forward, we propose to fix these bags only on the main boundary fence line. We will also trial the use of pepper gun on LBL and thunder flashes on the community areas when the farms are relatively green and are unlikely to be at risk of sparking accidental fires.
The Save the Elephant Bees and Elephants project team visited LBL in Q3 2018 to familiarize themselves with the landscape and train LBL team on the basic use of the bees as a deterrent method. As a result of the visit, general plans were drawn up for deployment of a trial beehive fence on one of the main boundary fence breakage hotspot at Simon’s gate. Fifteen Langstroth bee hives were donated to Lewa by the STE team for this pilot. Ten catcher boxes have been deployed in one of community apiaries at Simon’s gate and five to Charlie’s farm to initiate colonization of the hives before deployment. Once the hives are colonized, they will be immediately deployed along the hotspots at Simon’s gate in Q1 2019 with assistance from the STE team.

35
5.3 Conclusions and recommendations
Human-elephant conflicts continue to be a major challenge within LBL and neighboring community farms particularly during the dry season. In an effort to mitigate these conflicts, LBL will continue to focus on fence integrity and development of new configuration, whilst at the same time exploring opportunities for collaboration with various partners, including Big Life foundation and the Save the Elephant Bees and Elephants project to trial new deterrent methods in 2019.
To respond to elephant conflicts in a timely fashion, there is need to establish an equipped Problem Animal Control (PAC) team in 2019 to deal with all wildlife causing human-wildlife conflict. Tusk trimming is another recognized mitigation technique. However, it has proven not to wholly deter the elephants from breaking the fences as some individuals whose tusks have been trimmed in the past have learned other new methods of breaking the fences using their trunks and stepping on the fencing poles.

36
7.0 RANGELAND MANAGEMENT
7.1 Grass assessment
The major objective of the annual grass assessment on the LBL is to estimate the biomass of grass and composition of herbaceous material in order to provide insight on the range condition and possible management interventions. The grass biomass (standing crop) was estimated using a disc pasture meter. This involves recording the mean settling height of an aluminium disc (Mass 1.5kg) dropped on the grass sward. This disc was dropped after every 1m along a 100m transect. The resultant mean height was converted to an estimate of biomass using a regression equation developed by Botha, 1999. Further to this, grass species composition was determined using a pin hit every 1m along the same 100m transect.
7.1.1 Results and discussion
Analysis was carried out on the 28 sampling points to determine grass biomass and cover and species diversity. General observations showed that there was a significant difference in grass biomass between years (F (7,201) = 7.261, p = 0.00001, Fig. 7.1). This was mainly attributed to the above average rainfall received at the beginning of the year. This was especially visible on blocks that had not been grazed during the year.
Figure 7.1: Comparison of the mean grass biomass on Lewa from 2011 to 2018
0100020003000400050006000
2011 2012 2013 2014 2015 2016 2017 2018
Gras
s bio
mas
s (Kg
/ha)
Year
37
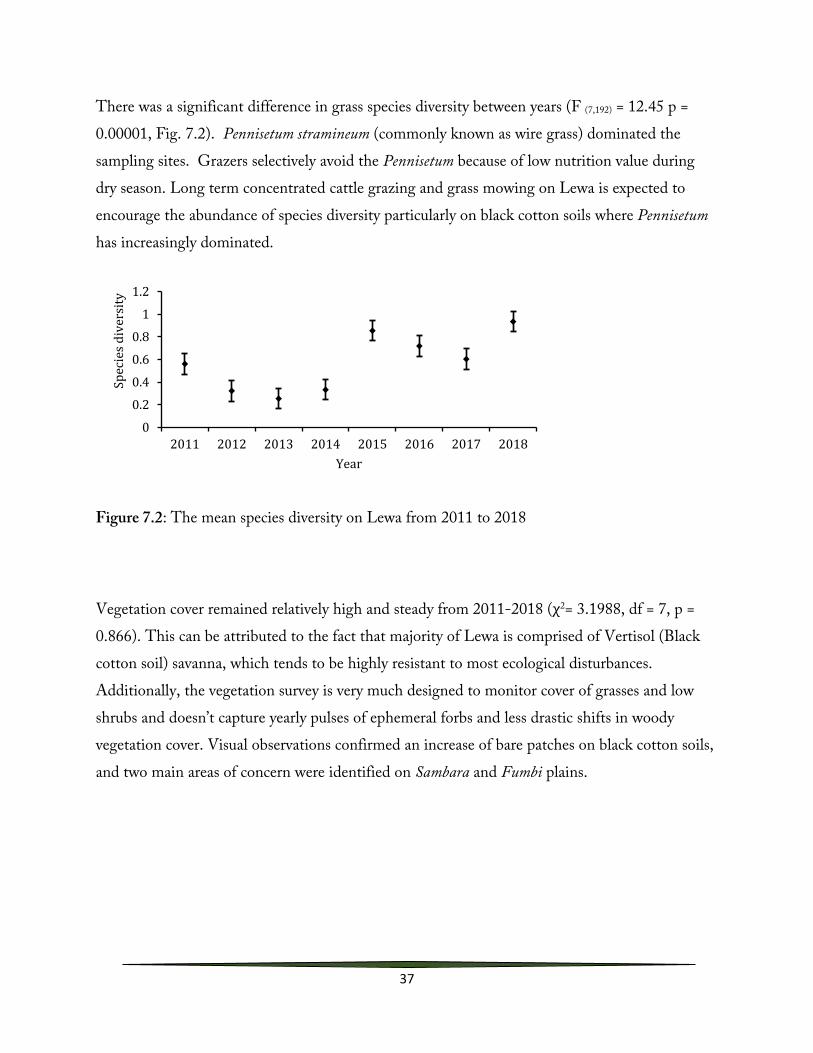
There was a significant difference in grass species diversity between years (F (7,192) = 12.45 p = 0.00001, Fig. 7.2). Pennisetum stramineum (commonly known as wire grass) dominated the sampling sites. Grazers selectively avoid the Pennisetum because of low nutrition value during dry season. Long term concentrated cattle grazing and grass mowing on Lewa is expected to encourage the abundance of species diversity particularly on black cotton soils where Pennisetum has increasingly dominated.
Figure 7.2: The mean species diversity on Lewa from 2011 to 2018
Vegetation cover remained relatively high and steady from 2011-2018 (χ2= 3.1988, df = 7, p = 0.866). This can be attributed to the fact that majority of Lewa is comprised of Vertisol (Black cotton soil) savanna, which tends to be highly resistant to most ecological disturbances. Additionally, the vegetation survey is very much designed to monitor cover of grasses and low shrubs and doesn’t capture yearly pulses of ephemeral forbs and less drastic shifts in woody vegetation cover. Visual observations confirmed an increase of bare patches on black cotton soils, and two main areas of concern were identified on Sambara and Fumbi plains.
0
0.2
0.4
0.6
0.8
1
1.2
2011 2012 2013 2014 2015 2016 2017 2018
Spec
ies d
iver
sity
Year

38
Figure 7.3: The mean species cover on Lewa from 2011 to 2018
7.3 NDVI assessment
In collaboration with partners, including the Regional Centre for Mapping of Resources for Development (RCMRD), the LBL has been working on a Rangeland monitoring tool, known as the Rangelands Decision Support tool (http://tools.rcmrd.org/rangelands/). This tool provides land managers with the ability to visualize vegetation changes via pre-analysed satellite imagery. The main image spatial analysis conducted is the Normalized Difference Vegetation Index (NDVI), which is a ratio between spectral reflectance measurements in the Red and Near-Infrared spectral regions, which allow identification of photosynthetically active vegetation in imagery.
We were able to acquire NDVI imagery for the wet season (Mar-April-May) as well as for October-November for both Lewa and Borana. Using these images, we also obtained image-based analysis in the form of the Vegetation Condition Index (VCI) for the same time frame (Fig. 7.5). The VCI compares the NDVI of the reporting period to the general natural variations in NDVI for each pixel, allowing land managers to distinguish between localized vegetation differences and normal variability for an area.
0
20
40
60
80
100
120
2011 2012 2013 2014 2015 2016 2017 2018
Perc
enta
ge c
over
Year

39
From these images, we were able to visually track the effects of the abundant rainfall in the first half of the year, translating to greenness indices close to the historical maximum (Fig. 7.4). Similarly, we were able to track the impact of the depressed rainfall first through October (Fig. 7.5) and then through November as conditions improved slightly (Fig. 7.6).
Figure 7.4. VCI images of Lewa and Borana showing deviations away from regular historical maxima and minima. Browner areas indicate areas approaching historical minimum, possibly indicating a reduction in productivity

40
Figure 7.5. VCI images of Lewa and Borana showing effects of depressed rainfall in October, leading to productivity below historical levels (brown areas)
Figure 7.6. VCI images of Lewa and Borana showing improvements in productivity after rainfall in November, with fewer light green and brown patches, mainly in Borana where rains were late

41
7.4 Woody vegetation
Vegetation changes over time due to changes in browsing pressure and unpredictable rainfall regimes. It is important to document these changes and be able to provide solutions to encourage the regeneration of the woody vegetation. Fixed-point photography and quantitative woody vegetation sampling was completed on 28 points covering the four management units. Two additional woody vegetation plots were established on the proposed extension of the Lewa headquarters exclusion zone and baseline data collected.
7.4.1 Results and discussion
Lippia javanica was the most abundant species in our plots, followed by Acacia mellifera and Euclea divinorum (Fig. 7.7). Nearly 90% of the woody species encountered were below 2m in height, consistent with growth suppression expected where elephants and giraffe are present in large numbers in a woodland savanna (Birkett, 2002). A. mellifera experienced the highest amount of browsing damage compared to the other species (Fig. 7.8). Majority of the damage observed was attributed to elephant and giraffe browsing, consistent with previous year’s findings (Fig. 7.9).

42
Figure 7.7. Number of individuals of the main woody species encountered in sampling plots
Figure 7.8. Number of damaged individuals encountered in sampling plots

43
Figure 7.9. Damage incidents attributed to different wildlife species
We delved further into this dataset to identify if any species were being utilized disproportionately to their abundance. Similar to the Jacob’s index for prey selectivity, Viljoen’s index compares utilization and availability, calculated as Percentage Utilization/ Percentage Availability, where:
A preference ratio higher than 1 represented a use higher than availability while conversely a ratio lower than 1 showed a use lower than availability.
Our findings indicated that A. mellifera was utilized preferentially compared to its abundance, while Lippia javanica and Euclea devinorum were avoided. We did not analyze most of the larger woody species as their abundance was too low to make reliable inferences.

44
Table 7.1. Comparison on total individuals and corresponding Viljoen’s (Preference) Index for a select number of species.
Species Total Individuals Viljoen's Index Lippia javanica 27 0.06 Acacia mellifera 20 1.29 Euclea divinorum 13 0.39 Grewia similis 12 1.72 Lycium spp. 6 1.72
7.5 Livestock grazing programme on Lewa
Using cattle as a tool to manage grassland is increasingly becoming a popular technique being adopted by landowners to enhance habitat. Lewa continues to offer grazing opportunity and quarantine ground to NRTT cattle while at the same time providing manure for fresh regrowth of plants, thereby providing a diversity of habitat for wildlife.
With a deluge of good rains received in Q2 2018 and successfully improved pasture in the neighbouring areas, the community members who heavily rely on the grass resources on the LBL during severe droughts, opted to graze livestock in their areas as there was less demand for the grass. Consequently, there were no community-owned cattle directly hosted on Lewa during the year.
By the end of Q4, an average of 580 head of NRTT cattle grazed each month on Lewa. A total of 1,000 head of cattle were moved to Ol Pejeta and El Karama Ranches following successful completion of the quarantine period on Lewa.
Cattle were bunched in a herd of 100 steers with one herder herding throughout the day and grazed in different blocks for a period determined by the Animal Grazing Days Available (ADAs) per area (Butterfield et al. 2006). The ADAs were adjusted accordingly to accommodate the challenges that arise as a result of variations in grass productivity throughout the year.

45
7.5.1 Grazing blocks
In 2018, livestock grazing covered a total of 9,190 acres representing 22% of the total area designated for grazing with an additional 3,355 acres projected to be grazed in Q1 2019 (Fig. 7.10). Moving forward, grazing of the cattle will continue to be determined as stipulated in the Lewa Grassland Management Plan for 2014, which is due for review and updating in early 2019.
Figure 7.10: Map of Lewa showing a.) grazed blocks in 2018 and b.) projected blocks to be grazed in Q1 2019
a b

46
7.6 Productivity and Restoration experiments
As part of ongoing efforts to shore up our understanding of the rangeland dynamics across the landscape, the Research and Monitoring team designed and implemented two restoration and productivity experiments in late 2018. While the results of these ongoing experiments are yet to be obtained, below, we present a brief synopsis and rationale for each.
7.6.1 Productivity and utilization experiment
Given the lack of clarity surrounding the ideal utilization and stubble height values for cattle (and wildlife) grazing on the landscape, we designed an experiment to ascertain the response of our major grass species (P. stramineum) to varying levels of biomass removal. Concurrently, this experiment was also designed to provide clarity on relative productivity of different blocks across the Conservancy. We set up 1x1m productivity cages in 9 different sites across Lewa, separating each into 50cmx50cm quadrants, and clipping grass to three different heights: 0, 15, and 30cm (Fig. 7.10). This first broad experiment will not only give us a ballpark idea for utilization ceilings for our different grazing areas, but also provide a basis for more in depth refined removal experiments. Results will continue being provided as seasons progress.
7.6.2 Bare ground prevalence experiment
As flagged in the LRD Annual Report for 2017, there has been concern over large bare patches now visible in certain areas on Lewa, almost exclusively on flat areas characterized by black cotton soils. Several cause and effect relationships have been suggested, although at the Conservation Committee meeting held in May 2018, it was also suggested that this was part of a natural cycle of vegetation pulses. To try and ascertain the reality, the LBL team brought on board a renowned ecologist, Prof. Truman Young of UC Davis who has studied black cotton soils in Laikipia for over 25 years. As the cause of the bare patches could not be immediately be ascertained, it was decided to set up a small-scale exclusion experiment to eliminate different possible causes, including wildlife impact at trail crossroads, long term grazing impacts, fire, and seed bank depletion.

47
Figure 7.10. Productivity cage deployed in the field.
Following Whisenant’s (1999) model for degradation and repair, the exclusions were set up to first ascertain whether the cause for the bare patches was simply overuse (Fig. 7.11 & 7.12). Within the exclusion zone, a nested experiment was also set up to look at the possible advantages of large-scale reseeding and mulching. These results will be an important first step in determining the drivers behind these patches. More data is still being collected, including on differences in microbial structure and soil properties and nutrient levels. Results will continue being provided as seasons progress.

48
Figure 7.11. A simplified graphic showing three different possible zones of degradation, and whether the thresholds to recovery require improved management, vegetation manipulation, or modification of the physical environment. Our experiment will allow us to identify where on the degradation spectrum these sites fall.
Figure 7.12. Exclusion experiment on Fumbi plain. Replicate is on Sambara plain

49
7.7 Rangeland Assessment and Grassland Management Plan Review
As part of our continuing efforts to ramp up and better inform Rangeland management on the LBL, some key interventions have been identified. As a precursor to our planned comprehensive Ecosystem assessment in 2020, we aim to conduct a Rangelands assessment in 2019. In collaboration with experts from Marwell Widllife, New Mexico State University, Mpala Research Centre, and ICRAF among others, we aim to collect in depth data on plant species composition, assemblages and associations across our landscape. We will also look at impacts of historical grazing, cultivation, and fire regimes, as well as identification of ecological sites, states, transitions, and shifts based on current and historical disturbances. We have already collected preliminary data on soil nutrient distribution from some sentinel sites, as well as grass nutrient distribution, primarily of Crude Protein and Crude Fibre. Further assessments and analyses will be identified as consultations continue.
Concurrently, while a Grassland management plan exists from 2014/2015, there have been significant operational and ecosystem changes since then that necessitate a review and update of this document. Informed by the Rangelands assessment, the Research and Monitoring team will, under the direction of the conservation committee, take lead on the design and commencement of the review process. With the Rangeland assessment scheduled for Q2 and Q3, the Grassland Management plan will be scheduled for completion by Q4 2019. This process will be inclusive and take into account both current and historical data in order to identify best practices of Rangeland management on the landscape. To inform both these interventions, we will produce a concise summary of past and current Rangeland interventions and research in Q2 2019.
7.8 Conclusion and recommendations
With good rains received in March-May, the pasture greatly recovered, thus reducing grazing pressure on LBL. Similarly, in preparedness for drought related challenges in the coming year, the LRD will continue to strengthen and enhance collaboration with the National Drought Management Authority (NDMA) to ensure a long-term strategy is put in place to mitigate emerging challenges and provide early warning grass and forage deficiencies on LBL and the surrounding community areas.

50
Repeat grazing after every growing season on areas with low species diversity should be encouraged for continuity of tangible results. However, bearing in mind that these are livestock to market cattle and are on Lewa for shorter period, this may not impact the rangeland to the extent of producing desired results. The LRD will continue collaboration with NRT- Trading to ensure appropriate numbers of cattle are maintained throughout the year on Lewa. With unpredictable weather pattern, grazing of community cattle on Lewa will be given consideration in 2019. Additionally, mowing trials will be extended in 2019.
The LBL Research team will take lead on implementation of a Rangeland assessment in mid-2019, and subsequently a review of the existing Grassland Management plan of 2014/2015 by end of 2019.

51
8.0 HYDROLOGY
Throughout 2018, the LBL Research and Monitoring team continued to develop the hydrology programme, working with both the Southwest Research Institute (SwRI) based in San Antonio, Texas, USA and CETRAD, based in Nanyuki, Kenya. CETRAD is a private-public Bilateral Institution between the Government of Kenya (through The Ministry of Water and Irrigation) and the Government of Swiss Confederation, through the Centre for Development and Environment of the University of Bern. The project proposed here will be implemented in close collaboration with CETRAD (Fig. 8.1). After consultation and an initial desktop survey early in 2018, a concept note was developed by SwRI for the next phases in the quantification of water resources on the LBL. Below, we present a summary of the next phases and the contents of the concept note.
SwRI identified a series of phases needed to complete a comprehensive evaluation of the water resources at the Conservancy. The phases are divided into individual tasks. Phase I will be a field campaign at the Conservancy to allow for reconnaissance observations, collection of on-site data and samples, and identification of candidate locations for a permanent network of environmental and hydrologic gauging stations. Installation of instrumentation and development of the monitoring network will be undertaken by CETRAD. A comprehensive database will be necessary to provide the basis for a conceptual model of water resources available to the Conservancy and local communities. Phase II will entail the analysis of the data and information acquired as part of the field campaign (Phase I). This information will form the basis for the required comprehensive databases.
Phase III will be a second field campaign to collect additional site data, if critical gaps in data are identified during Phase II. Phase IV will entail the development of a conceptual surface-water/groundwater model of the two watersheds that contain the Conservancy. Phase V will entail the development of a coupled surface-water/groundwater model of the two watersheds at the Conservancy and the quantitative assessment of the impact of land-management practices (i.e., pumping and irrigated farming) and climate change in terms of the impact of changes in precipitation on the water resources of the Conservancy. Development of these models will

52
enable quantitative assessment of the threats of land-management practices and climate changes to water resources at the Conservancy.
Figure 8.1. Map of the north slope of Mt. Kenya illustrating the two major watershed basins which include the Conservancy and locations of currently accessible monitoring data. Two sub- watersheds (purple and green outlines, 5DA and 5DB) encompass the Conservancy. Surface water (and likely the groundwater as well) within the Conservancy are sourced from the highest elevations of these watersheds and flow down gradient/downstream toward the Ewaso Ng’iro River. Locations of known CETRAD surface-water monitoring stations are illustrated with green triangles, and CETRAD precipitation stations are illustrated with yellow squares. SWAT precipitation data locations are illustrated with blue targets. Precipitation data from the East African Meteorological Department locations are illustrated with red targets. (SwRI)
53
Establishment of a permanent environmental and hydrologic data-collection network (Phase I) through collaboration with CETRAD is imperative to provide the Conservancy with the framework on which informed water-resource management decisions can be made. Irrespective of how Phases II through V are implemented, meaningful water-resource management is not possible in the absence of these critical data. Accordingly, establishment of a permanent environmental and hydrologic data collection network was strongly recommended by the SwRI team.
Next steps
The current next steps involve the collection of map data for the croplands up-gradient and to the south of the LBL. The land management practices in these croplands potentially have a profound impact on the recharge of the watershed that feeds the springs and wetlands on the LBL. Funding still continues to be sought to facilitate Phase I in its entirety, starting off with facilitating the SwRI team together with collaborators from the University of South Florida. The LBL Research and Monitoring team in the interim continues to work on completion of the sub-tasks for Phase I.
As part of upgrading the existing Hydromet system (hydrology and meteorology monitoring), we will acquire three low cost weather stations for testing and piloting in three locations across the rainfall gradient on LBL. These compact weather stations will allow collection of rainfall, temperature, wind speed, and air pressure, all important predictors of evapotranspiration (Fig. 8.2). These low-cost systems will complement the higher end systems required for Phase I and allow a wider coverage across the LBL and the immediate neighbouring areas. Details for the types and numbers of weather station and river gauging systems are included in the concept note for the project, available upon request courtesy of SwRI.

54
Figure 8.2. Recommended low cost weather stations for pilot testing, Ambient weather Solar Powered Wireless Station showing a) the general design of the station with 5 sensors and b) indoor console for automatic wireless download of data.

55
9.0 ACKNOWLEDGEMENTS
The Lewa Borana Landscape (LBL) Research and Monitoring Department would like to thank
all parties who worked with us in 2018. In particular, we acknowledge the management of Lewa
and Borana Conservancies, Lewa Canada, Lewa USA and Lewa UK for their continued
technical and financial support; Al Ain Zoo, UAE for their continuous financial support of
major wildlife monitoring programmes, and Zurich Zoo, Switzerland for their continued
programmatic and operations support. SwRI and CETRAD have been instrumental partners as
we seek to lay the foundation for our Hydrology programme. In addition, we acknowledge all the
other technical and financial support to Lewa and Borana to undertake our research and
monitoring programmes.

56
10.0 REFERENCES
Adcock, K. (2001). Black rhino carrying capacity and performance. In Emslie, R. (Ed.) Proceedings of a SADC Rhino Management Group (RMG) workshop on biological management to meet continental and national black rhino conservation goals.
Adcock, K., & Emslie, R.H., (2003). Monitoring African rhino: an AfRSG update of "Sandwith's" training course for field ranger, 5th edition: trainee's guide.
Adcock, K., (2016). Visual Assessment of Black Rhino Browse Availability. Version 3.1. International Union for Conservation of Nature.
Bertram, B. C. (1975). Social factors influencing reproduction in wild lions. Journal of Zoology, 177(4), 463-482.
Birkett, A. (2002). The impact of giraffe, rhino and elephant on the habitat of a black rhino sanctuary in Kenya. African Journal of Ecology, 40(3), 276-282.
Bohrer, G., Beck, P. S., Ngene, S. M., Skidmore, A. K., & Douglas-Hamilton, I. (2014). Elephant movement closely tracks precipitation-driven vegetation dynamics in a Kenyan forest-savanna landscape. In Movement Ecology (Vol. 2, p. 2). https://doi.org/10.1186/2051-3933-2-2
Botha, J.O. 1999. A resource management plan for the Lewa Wildlife Conservancy in the Meru District of the central Kenyan highlands. MSc (Wildlife Management) Thesis. University of Pretoria, Pretoria
Bygott, J. D., Bertram, B. C., & Hanby, J. P. (1979). Male lions in large coalitions gain reproductive advantages. Nature, 282(5741), 839.
Crall, J., Stewart, C., Berger-Wolf, T., Rubenstein, D. and Sundaresan, S. (2013) HotSpotter-Patterned Species Instance Recognition. Applications of Computer Vision (WACV): 230-237.

57
Creel S. Winnie J.Jr. Maxwell B. Hamlin K. Creel M. (2005). Elk alter habitat selection as an antipredator response to wolves. Ecology 86:3387–3397.
Elliot, N. B., Cushman, S. A., Macdonald, D. W., & Loveridge, A. J. (2014). The devil is in the dispersers: Predictions of landscape connectivity change with demography. Journal of Applied Ecology, 51, 1169–1178.https://doi.org/10.1111/1365- 2664.12282
Ezenwa, V. O., Jolles, A. E., & O’Brien, M. P. (2009). A reliable body condition scoring technique for estimating condition in African buffalo. African Journal of Ecology, 47(4), 476–481. https://doi.org/10.1111/j.1365-2028.2008.00960.x
Fischhoff I. R. Sundaresan S. R. Cordingley J. Rubenstein D. I. (2007). Habitat use and movements of plains zebra (Equus burchelli) in response to predation danger from lions. Behavioral Ecology 18:725–729.
Fryxell, J. M. (1987). Food limitation and demography of a migratory antelope, the white-eared kob. Oecologia, 72(1), 83-91.
Ganqa, N.M. Scogings, P.F. & Raats, J.G., (2005). Diet Selection and Forage Quality Factors Affecting woody plant selection by black rhinoceros in the Great Fish River Reserve, South Africa. South African Journal of Wildlife Research, vol 35(1):77-83
Giesen, W., Giesen, P., & Giesen, K., (2017). Lewa Wildlife Conservancy Habitat Changes 1962-2006. Lewa Wildlife Conservancy. Laikipia District, Kenya.
Goheen, J.R., & Palmer, T.M. (2010). Defensive Plant-Ants Stabilise Megaherbivore-Driven Landscape Change in an African Savanna. Current Biology, vol 20(19):1768-1772
Green, S. E., Davidson, Z., Kaaria, T., & Doncaster, C. P. (2018). Do wildlife corridors link or extend habitat? Insights from elephant use of a Kenyan wildlife corridor. African Journal of Ecology, 56(4), 860–871. https://doi.org/10.1111/aje.12541
Gusset, M., Swarner, M. J., Mponwane, L., Keletile, K., & McNutt, J. W. (2009). Human– wildlife conflict in northern Botswana: Livestock predation by Endangered African wild

58
dog Lycaon pictus and other carnivores. Oryx, 43, 67–72. https://doi.org/10.1017/S0030605308990475
Hall-Martin, A.J. & Pentzhorn, B.L. (1977). Behaviour and recruitment of translocated black rhinoceros Diceros bicornis. Koedoe, vol 21:147-162
Hall-Martin, A.J., Erasmus, T., & Botha, B.P. (1982). Seasonal variation of diet and faeces composition of black rhinoceros (Diceros bicronis L.) in the Addo Elephant National Park. Koedoe, vol 25:63-82
Illius, A. W., & O’Connor, T. G. (2000). Resource heterogeneity and ungulate population dynamics. Oikos, 89(2), 283–294. https://doi.org/10.1034/j.1600-0706.2000.890209.x
Illius, A.W. & O’Connor, T.G. (1999). On the relevance of non-equilibrium concepts to arid and semi-arid grazing systems. Ecological Applications, vol 9(3):798-813
Jackson., L. (2018). Browse Availability and Resource Utilisation by the Eastern Black Rhinoceros (Diceros bicornis michaeli) on two Wildlife Conservancies in Kenya. MRes thesis. Faculty of Natural and Environmental Sciences, University of Southampton, United Kingdom.
Jacobs, J. (1974). Quantitative measurement of food selection. Oecologia (Berl.) 14: 413– 417.
Kassa, B., Libois, R., Sinsin, B., (2007). Diet and food preference of the waterbuck (Kobus ellipsiprymus defassa) in the Pendjari National Park, Benin. African Journal of Ecology, vol 46:303-310
Kolowski, J. M., & Holekamp, K. E. (2006). Spatial, temporal, and physical characteristics of livestock depredations by large carnivores along a Kenyan reserve border. Biological Conservation, 128, 529–541. https://doi.org/10.1016/j.biocon.2005.10.021
Kotze, D.C., & Zacharias, P.J.K. (1993). Utilisation of woody browse and habitat by the Black rhino (Diceros bicornis) in Western Itala Game Reserve. African Journal of Range and Forage Science, vol 10:36-40.

59
KWS (2017). Black Rhino Action Plan 2017 – 2021 Sixth edition.
Landman, M., Schoeman, D.S., Kerley, G.I.H. (2013). Shift in Black Rhinoceros Diet in the Presences of Elephant: Evidence for Competition? PLoS ONE, vol 8(7):e69771
Legget, C. (2012). Lewa Wildlife Conservancy Grazing Planning Workshop.
Lembo, T., Hampson, K., Haydon, D. T., Craft, M., Dobson, A., Dushoff, J., Cleaveland, S.(2008). Exploring reservoir dynamics: A case study of rabies in the Serengeti ecosystem. Journal of Applied Ecology, 45, 1246–1257. https://doi.org/10.1111/jpe.2008.45.issue-4
Lima, S. L. & Dill, L. M. (1990). Behavioral decisions made under the risk of predation: a review and prospectus. Canadian Journal of Zoology, 68, 619e640
Loveridge, A. J., Valeix, M., Elliot, N. B., & Macdonald, D. W. (2017). The landscape of anthropogenic mortality: how African lions respond to spatial variation in risk. Journal of applied ecology, 54(3), 815-825.
LRD (2017). Lewa Research Department end of Year Report 2017
Makacha, S. & Schaller, G.B. (1969) Observations on lions in the Lake Manyara National Park, Tanzania. East African Wildlife Journal, 7, 99–103.
Marker, L. L., Dickman, A. J., & Macdonald, D. W. (2005). Perceived effectiveness of livestock-guarding dogs placed on Namibian farms.
Noss, R. (2004). Wildlife corridors. Natural Resource Management Advisory Series: NOTE 15, 43–68. https://doi.org/Export Date 19 June 2013
Ogada, M. O., Woodroffe, R., Oguge, N. O., & Frank, L. G. (2003). Limiting depredation by African carnivores: the role of livestock husbandry. Conservation biology, 17(6), 1521-1530.

60
Parham, J. and C. Stewart (2016). Detecting plains and Grevy's Zebras in the real world. IEEE Xplore: 2016, 1-9. DOI: 10.1109/WACVW.2016.7470122.
Prins H. H. T. Iason G. R. (1989). Dangerous lions and nonchalant buffalo. Behaviour 108:262–296.
Pusey, A. E., & Packer, C. (1994). Infanticide in lions: consequences and counterstrategies. Infanticide and parental care, 277-299.
Reilly, B. K., & Emslie, R. H. (1998). Power and precision of replicated helicopter surveys in mixed bushveld. Koedoe, 41(1), 47-56.
Rostro-Garcia, S., Tharchen, L., Abade, L., Astaras, C., Cushman, S. A., & Macdonald, D. W. (2016). Scale dependence of felid predation risk: Identifying predictors of livestock kills by tiger and leopard in Bhutan. https://doi.org/10.1007/s10980-015-0335-9
Rubenstein, D., Parham, J., Stewart, C., Berger-Wolf, T., Holmberg, J., Crall, J., Mackey, L., Funnel, S., Cockerill, K., Davidson, Z., Mate, L., Nzomo, C., Warungu, R., Martins, D., Ontita, V., Omulupi, J., Weston, J., Anyona, G., Chege, G., Kimiti, D., Tombak, K., Gersick, A. & Rubenstein,N. (2018). The State of Kenya’s Grevy’s Zebras and Reticulated Giraffes: Results of the Great Grevy’s Rally 2018, unpublished report.
Rutina, L.P., Moe, S.R. & Swenson, J.E. (2005). Elephant Loxodonta Africana driven woodland conversion to shrubland improves dry-season browse availability for imapalas Aepyceros melampus. Wildlife Biology, vol 11:207-213
Sih, A. (1987). Predators and prey lifestyles: an evolutionary and ecological overview. In: Predation: Direct and Indirect Impacts on Aquatic Communities (Ed. by C. W. Kerfoot & A. Sih), pp. 203e224. Hanover: University Press of New England.
Sinclair, A. R. E. (1975). The resource limitation of trophic levels in tropical grassland ecosystems. The Journal of Animal Ecology, 497-520.

61
Smith, T.M., & Goodman, P.S., (1987). Successional dynamics in an Acacia nilotica-Euclea divinorum savannah in southern Africa. Journal of Ecology, vol 75:603-610
Thouless, C. R., & Sakwa, J. (1995). Shocking elephants: fences and crop raiders in Laikipia District, Kenya. Biological conservation, 72(1), 99-107.
Valeix M.et al.. (2009). Behavioral adjustments of African herbivores to predation risk by lions: spatiotemporal variations influence habitat use. Ecology 90:23–30.
Whisenant, S. (1999). Repairing damaged wildlands: a process-orientated, landscape-scale approach (Vol. 1). Cambridge University Press.
Winnie J. A.Jr. Cross P. Getz W. (2008). Habitat quality and heterogeneity influence distribution and behavior in Africa7 buffalo (Syncerus caffer). Ecology 89:1457–1468.
Young, V.A. (1938). The Carrying Capacity of Big Game Range. The Journal of Wildlife Management, vol 2(3):131-134

62
11.0 APPENDIX
Publications in 2018 involving the Lewa-Borana Research and Monitoring Department:
Dupuis-desormeaux, M., Kaaria, T. N., Mwololo, M., Davidson, Z., & Macdonald, S. E. (2018). A ghost fence-gap: surprising wildlife usage of an obsolete fence crossing, 1–18. https://doi.org/10.7717/peerj.5950
Green, S. E., Davidson, Z., Kaaria, T., & Doncaster, C. P. (2018). Do wildlife corridors link or extend habitat? Insights from elephant use of a Kenyan wildlife corridor, (July), 860–871. https://doi.org/10.1111/aje.12541
KWS (2018). Kenya Black Rhino (Diceros bicornis michaeli) Action Plan 2017-2021. KWS, Nairobi.
KWS (2018). Recovery and action plan for Grevy’s zebra (Equus grevyi) in Kenya (2017-2026). KWS, Nairobi.