annual report 2018 - ecopackannual report 2018 2017 2018 2007 ecopack installed a complete bottle...
TRANSCRIPT

Annual Report 2018
Annual Report 2018
Head Office:19, Citivillas Near High Court Road, RawalpindiPABX: +92 51 5974098 & 99Fax: +92 51 5974097
Karachi OfficeSuit # 306, 3rd Floor, Clifton Diamond,Block-4, Clifton, KarachiPh: +92 21 35291051 & 52Fax: +92 21 35291053
Registered Office and Factory112-113, Phase V, Hattar Industrial Estate Hattar, District Haripur, Khyber PakhtunkhwaTel: +92 995 617720 &23, 617347Fax: +92 995 617074www.ecopack.com.pk

1
Annual Report 2018
Quality is our Forte´
2
Contents
Vision & Mission Statement 03Corporate Strategy 04Company Information 05Our Team 06Directors’ Profile 08Our History and Milestones 10Corporate Social Responsibility (CSR) 12Summary of Financials 13Business Performance 14Key Financial Numbers 15Horizontal Analysis - Statement of Financial Position 16Vertical Analysis - Statement of Financial Position 17Horizontal Analysis - Statement of Profit & Loss 18Vertical Analysis - Statement of Profit & Loss 19Notice of Annual General Meeting (AGM) 20Statement of Compliance with the Code of Corporate Governance 24Chairman's Review Report 26Directors’ Report 28Six years at a glance - Annexure “A” to the Directors’ Report 32Compliance with Code of Corporate Governance - Annexure “B” to the Directors’ Report 33Pattern of Shareholding- Annexure “C” to the Directors’ Report 35Auditors' Review Report 38Auditors' Report 40Statement of Financial Position 44Statement of Profit or Loss 45Statement of Comprehensive Income 46Statement of Changes in Equity 47Statement of Cash Flows 48Notes to the Financial Statements 49Proxy Form 80Jama Punji 81

3
Annual Report 2018
Vision & MissionTo systematically and cost effectively manufacture and supply consistently high quality products and services thus achieving customer satisfaction profitably, thereby ensuring the financial well being of the company and maximum returns to the shareholders.

4
Corporate StrategyRetain market share leadership through quality and price competitiveness while creating value as a low cost producer.

5
Annual Report 2018
Company Information
BOARD OF DIRECTORS Mr. Amar Zafar Khan ChairmanMr. Hussain Jamil Chief Executive OfficerMr. Shahid Jamil Non-Executive DirectorMr. Ali Jamil Non-Executive DirectorMr. Talat Mahmood Sadiq Non-Executive DirectorMr. Asad Ali Sheikh Non-Executive DirectorMs. Laila Jamil Non-Executive DirectorMr. Amjad Awan (Alternate Director of Mr. Talat Mahmood Sadiq)
AUDIT COMMITTEE
Mr. Asad Ali Sheikh Chairman Mr. Amar Zafar Khan Member Ms. Laila Jamil Member
HUMAN RESOURCE & REMUNERATION COMMITTEE
Mr. Amar Zafar Khan ChairmanMr. Hussain Jamil MemberMr. Asad Ali Sheikh Member Mr. Ali Jamil MemberMs. Laila Jamil Member
CHIEF FINANCIAL OFFICER & COMPANY SECRETARY
Mr. Muhammed Ali Adil
BANKERS
Habib Bank Limited The Bank of KhyberBank Al-Habib Limited Askari Bank LimitedJS Bank Limited Pak Oman Investment Company Limited
AUDITORS
Rahman Sarfaraz Rahim Iqbal Rafiq Chartered Accountants
SHARE REGISTRAR
M/s. THK Associates (Pvt.) Limited Ballotter, Share Registrar & Transfer Agent1st Floor, 40-C, Block-6, P.E.C.H.S., Karachi75400, Pakistan.
LEGAL ADVISOR
M/s. Ebrahim Hosain Advocate & Corporate Counsel
REGISTERED OFFICE AND FACTORY
112-113, Phase V, Hattar Industrial Estate, Hattar, District Haripur, Khyber Pakhtunkhwa Tel: (0995) 617720 & 23, 617347Fax: (0995) 617074, www.ecopack.com.pk

6
Our Team
Hussain JamilChief Executive Officer/Director
Mohammad Raza ChinoyChief Operating Officer
Zamir ul HasanDirector Commercial & Technical
Mohammad Ali AdilChief Financial Officer
Shahwaqar AhmedDGM HR, Supply Chain & Admin

7
Annual Report 2018
Manage the top line, your strategy, your people and your products, and the bottom line will follow(Steve Jobs)

8
Directors’ Profile
Hussain is the CEO of EcoPack Ltd and has over 45 years of business experience including running a private limited company in Karachi manufacturing flexible plastic packaging. He is the founder chairman and CEO of EcoPack since the company’s inception, and continues to strategically lead the company’s growth in key areas such as corporate relationship management, as well as new opportunities for product diversification in both domestic and regional markets. Prior to founding EcoPack, Hussain was a successful entrepreneur trading packaging materials such as cotton bags, polythene liners and jute bags, and later started a career in industrial manufacturer of packaging products. Hussain is an honours graduate from the University of Karachi.
Hussain JamilChief Executive Officer/Director
Amar Zafar KhanChairman of the
Board of Directors
Amar Zafar Khan is a qualified Chartered Accountant, with over 30 years of multifunctional experience at premier international financial institutions. His experience covers general management, directing turnarounds and developing new ventures/ businesses in commercial banking, investment banking, domestic and cross-border corporate finance and securities trading, including exposure to markets in Europe, the Middle East and Africa. He has rich experience & knowledge of a wide spectrum of financing solutions. He has served as the Chairman & CEO of “United Bank Limited” One of the largest banks in Pakistan.
Shahid Jamil qualified as a member of the Institute of Chartered Accountants from the UK in 1967 and became a member of the Institute in Pakistan in 1968. He then became an international banker working in Pakistan, Luxembourg, United Kingdom, Egypt & United Arab Emirates. His last position with a bank was as Executive Director at First International Bank Ltd., in Pakistan. As a non executive director on the board, he shares an international perspective and supports the internal audit role of KPMG at EcoPack Ltd. He also supports the company’s effort to achieve a cost effective turn around to become a profitable and sustainable business which maintains manufacturing employment in Khyber Pakhtunkhwa.
Shahid JamilNon-Executive Director
9
Annual Report 2018
Directors’ Profile
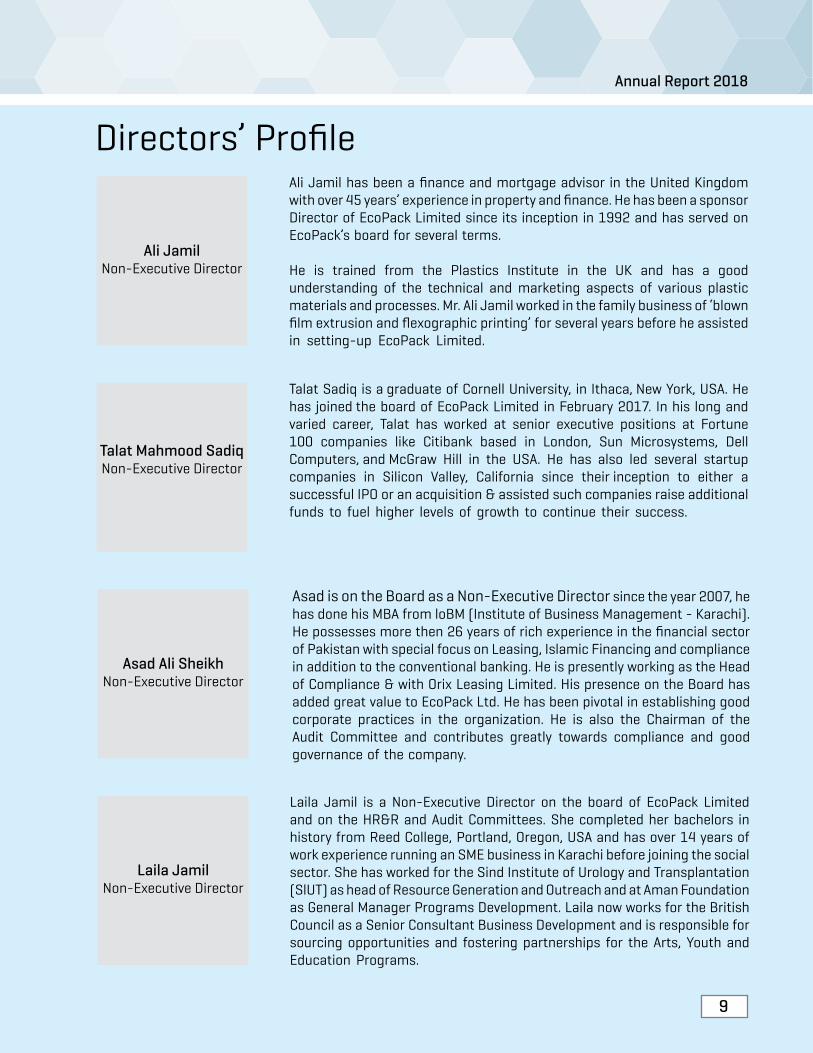
Laila Jamil is a Non-Executive Director on the board of EcoPack Limited and on the HR&R and Audit Committees. She completed her bachelors in history from Reed College, Portland, Oregon, USA and has over 14 years of work experience running an SME business in Karachi before joining the social sector. She has worked for the Sind Institute of Urology and Transplantation (SlUT) as head of Resource Generation and Outreach and at Aman Foundation as General Manager Programs Development. Laila now works for the British Council as a Senior Consultant Business Development and is responsible for sourcing opportunities and fostering partnerships for the Arts, Youth and Education Programs.
Laila JamilNon-Executive Director
Asad is on the Board as a Non-Executive Director since the year 2007, he has done his MBA from loBM (Institute of Business Management - Karachi). He possesses more then 26 years of rich experience in the financial sector of Pakistan with special focus on Leasing, Islamic Financing and compliance in addition to the conventional banking. He is presently working as the Head of Compliance & with Orix Leasing Limited. His presence on the Board has added great value to EcoPack Ltd. He has been pivotal in establishing good corporate practices in the organization. He is also the Chairman of the Audit Committee and contributes greatly towards compliance and good governance of the company.
Ali Jamil has been a finance and mortgage advisor in the United Kingdom with over 45 years’ experience in property and finance. He has been a sponsor Director of EcoPack Limited since its inception in 1992 and has served on EcoPack’s board for several terms. He is trained from the Plastics Institute in the UK and has a good understanding of the technical and marketing aspects of various plastic materials and processes. Mr. Ali Jamil worked in the family business of ‘blown film extrusion and flexographic printing’ for several years before he assisted in setting-up EcoPack Limited.
Talat Sadiq is a graduate of Cornell University, in Ithaca, New York, USA. He has joined the board of EcoPack Limited in February 2017. In his long and varied career, Talat has worked at senior executive positions at Fortune 100 companies like Citibank based in London, Sun Microsystems, Dell Computers, and McGraw Hill in the USA. He has also led several startup companies in Silicon Valley, California since their inception to either a successful IPO or an acquisition & assisted such companies raise additional funds to fuel higher levels of growth to continue their success.
Ali JamilNon-Executive Director
Talat Mahmood SadiqNon-Executive Director
Asad Ali Sheikh Non-Executive Director

10
EcoPack was converted
into a public limited
company
19921993
EcoPack started
commercial production
1994
EcoPack was successfully listed on the
Pakistan Stock
Exchange
1999
EcoPack sets up
its second factory for
blowing PET bottles in Karachi (Southern Pakistan) to meet growing
demand thus covering the
complete breadth of
the market.
2000
EcoPack introduced the first 1
piece bottles soft drink (CSD) PET bottles the
2-piece generic
base cup cylindrical
bottle
2005
EcoPack successfully introduced
the first single-serve 500 ml CSD bottle in the
Pakistani market.
Achieved ISO 9001
Certification
Our History & Milestones

11
Annual Report 2018
20172018
2007
EcoPack installed
a complete bottle
blowing line inside a
Multinational Beverage Plant in
Islamabad under a
"through-the-wall"
bottle supply arrangement
2010
Achieved the Coca Cola
Eurasia Africa approval for
the preforms
Started Export to
anti-podal Southern
Hemisphere markets like
Southern Africa
2013
Achieved ISO 22000
Certification
2008
Consolidated the
production units in
Hattar to cater to
the large population
region of the country.
Started export of
preforms to the regional
markets i.e. India,
Afghanistan and Central
Asia
Successful implementa-
tion of SAP
Ecopack made its biggest
expansion in Preform capacity,
increasing it by almost 90% annu-ally with the acquisition
of state-of-the-
art world renowned,
Husky Preform Injection systems.
Our History & Milestones
12
Corporate Social Responsibility (CSR)EcoPack received the Pakistan Centre for Philanthropy Award for donations in 2008-09
EcoPack regularly donates to renowned leading Pakistani Philanthropic organizations such as Sindh Institute of Urology and Transplantation, Layton Rahmatullah Benevolent Trust, Shaukat Khanum Memorial Cancer Hospital & Research Centre, The Kidney Center, Aman Foundation, The CItizens Foundation among others.
As part of its CSR strategy to give back to the community, EcoPack has embarked on a pilot program of skill development’ by hiring engineering graduates and diploma holders from nearby engineering colleges and universities to train them in various production departments of the company’s manufacturing processes. By doing so EcoPack retains the best by giving them permanent employment and releasing others as trained skilled resource. This program is expanding and building on its continual success.

13
Annual Report 2018
EcoPack LimitedSummary of Financials
2018 2017 2016 2015 2014 2013--------------------------------------Rupees in ‘000 ---------------------------------------
Share capital 301,573 287,212 229,770 229,770 229,770 229,770 Reserves 568,912 484,037 407,652 292,734 174,904 87,135Shareholders’ funds / Equity 870,485 771,249 637,422 522,504 404,674 316,905 Long term borrowings 369,296 154,196 247,379 323,094 125,032 184,732 Deferred liabilities 236,580 261,565 203,675 176,627 232,324 178,352 Property, plant & equipment 1,362,572 1,001,273 1,014,171 1,055,461 1,074,293 1,077,226 Long term assets 1,425,823 1,015,277 1,025,634 1,062,558 1,080,995 1,084,692 Current assets 999,833 690,979 671,674 618,037 579,853 535,663
Summary of Profit and LossSales 3,312,401 2,205,360 2,097,028 1,847,868 2,229,897 1,769,998 Gross profit 408,090 357,354 342,756 285,239 397,023 251,696 Operating profit 255,715 222,628 247,481 165,343 257,978 147,675 Profit / (loss) before tax 133,722 149,922 136,856 54,879 123,688 41,662 Profit / (loss) after tax 127,041 105,861 101,918 26,475 57,567 2,463 EBITDA 320,359 311,507 306,049 253,610 329,400 256,955
Summary of Cash FlowsNet cash flow from operating activities 51,395 234,016 134,986 (39,884) 155,843 51,143 Net cash flow from investing activities 509,546 (56,732) (81,927) (78,816) (61,911) (23,690)Net cash flow from financing activities 241,360 (76,401) (87,022) 174,946 (112,563) (87,347)Changes in cash & cash equivalents (216,791) 100,883 (33,963) 56,246 (18,631) (59,894)
Summary of Actual Production (Units)Preforms 387,500 283,402 270,975 194,997 209,002 180,070 Bottles 174,143 159,056 163,118 145,792 156,518 117,043

14
Business Performance
Sales Revenue - Year wise (Rs. in'000)
Gross profit and Net profit (Rs. in'000)
Earnings per share (Rs.)
4.50
4.00
3.50
3.00
2.50
2.00
1.50
1.00
0.50
0.00
2014 2015 2016 2017 2018
2014 2015 2016 2017 2018
3,500,000
3,000,000
2,500,000
2,000,000
1,500,000
1,000,000
500,000
0
450,00
400,000
350,000
250,000
200,000
150,000
100,000
50,000
-
20.00%18.00%16.00%14.00%12.00%10.00%8.00%6.00%4.00%2.00%0.00%

15
Annual Report 2018
Key Financial Numbers
Rs. 3.3Billion
Highest ever turnoverRs. 608
MillionContribution to
National Exchequer
Rs. 127Million Highest ever
Profit after Tax
Current Ratio
1.05:1
Rs. 507Million
Highest ever capital expenditure
Debt Equity Ratio
38:62

1616
Hor
izon
tal A
naly
sis
Stat
emen
t of fi
nanc
ial p
ositi
on
201
8 1
8 vs
17
201
7 1
7 vs
16
201
6 1
6 vs
15
201
5 1
5 vs
14
201
4 R
s. In
'000
%
R
s. In
'000
%
R
s. In
'000
%
R
s. In
'000
%
R
s. In
'000
AS
SETS
Non
-Cur
rent
Ass
ets
Prop
erty
, pla
nt a
nd e
quip
men
t 1
,362
,572
3
6.08
1
,001
,273
(1
.27)
1,0
14,1
71
(3.9
1) 1
,055
,461
(1
.75)
1,0
74,2
93
Secu
rity
depo
sits
55,
849
643
.46
7,5
12
23.
88
6,0
64
-
6,0
64
-
6,0
64
Inta
ngib
les
7,4
02
14.
02
6,4
92
20.
24
5,3
99
422
.65
1,0
33
61.
91
638
1
,425
,823
4
0.44
1
,015
,277
(1
.01)
1,0
25,6
34
(3.4
8) 1
,062
,558
(1
.71)
1,0
80,9
95
Curr
ent A
sset
sSt
ores
, spa
res
and
loos
e to
ols
58,
673
4.3
4 5
6,23
5 (9
.99)
62,
475
(17.
67)
75,
882
9.4
6 6
9,32
6 St
ock
in tr
ade
224
,659
(8
.92)
246
,650
2
.16
241
,424
1
9.05
2
02,7
85
18.
65
170
,913
Tr
ade
debt
s
454
,623
2
04.3
0 1
49,4
00
(5.6
3) 1
58,3
08
(26.
93)
216
,664
(2
.52)
222
,273
Sh
ort t
erm
inve
stm
ents
-
(100
.00)
3
6,00
0 1
00.0
0 -
-
-
-
-
Lo
ans
and
adva
nces
61,
510
14.
44
53,
748
7.7
4 4
9,88
7 8
4.82
2
6,99
2 (2
4.31
) 3
5,66
0 D
epos
its, p
repa
ymen
ts a
nd o
ther
rece
ivab
les
9,3
87
(44.
38)
16,
877
(49.
66)
33,
529
197
.45
11,
272
63.
55
6,8
92
Taxa
tion
- ne
t 1
11,2
48
1.9
4 1
09,1
27
64.
86
66,
193
42.
89
46,
324
120
.05
21,
052
Cash
and
ban
k ba
lanc
es 7
9,73
3 2
47.5
4 2
2,94
2 (6
1.67
) 5
9,85
8 5
7.03
3
8,11
8 (2
9.07
) 5
3,73
7 9
99,8
33
44.
70
690
,979
2
.87
671
,674
8
.68
618
,037
6
.59
579
,853
To
tal a
sset
s 2
,425
,656
4
2.16
1
,706
,256
0
.53
1,6
97,3
08
0.9
9 1
,680
,595
1
.19
1,6
60,8
48
EQU
ITY
AND
LIA
BILI
TIES
Equi
tyIs
sued
, sub
scrib
ed a
nd p
aid-
up c
apita
l 3
01,5
73
5.0
0 2
87,2
12
25.
00
229
,770
-
2
29,7
70
-
229
,770
Su
rplu
s on
reva
luat
ion
of p
rope
rty
and
plan
t 1
61,5
52
(8.1
5) 1
75,8
87
11.
39
157
,905
(3
.50)
163
,625
(8
.87)
179
,553
Ac
cum
ulat
ed p
rofit
407
,360
3
2.20
3
08,1
50
23.
38
249
,747
9
3.44
1
29,1
09
(2,8
77.1
3) (4
,649
) 8
70,4
85
12.
87
771
,249
2
1.00
6
37,4
22
21.
99
522
,504
2
9.12
4
04,6
74
Non
-Cur
rent
Lia
bilit
ies
Long
term
loan
s 6
0,74
6 (5
8.17
) 1
45,2
23
(40.
76)
245
,156
(2
3.41
) 3
20,0
91
166
.35
120
,175
Li
abili
ties
agai
nst a
sset
s su
bjec
t to
finan
ce le
ase
308
,550
3
,338
.65
8,9
73
303
.64
2,2
23
(25.
97)
3,0
03
(38.
17)
4,8
57
Def
erre
d lia
bilit
ies
236
,580
(9
.55)
261
,565
2
8.42
2
03,6
75
15.
31
176
,627
(2
3.97
) 2
32,3
24
605
,876
4
5.73
4
15,7
61
(7.8
2) 4
51,0
54
(9.7
4) 4
99,7
21
39.
84
357
,356
Cu
rren
t Lia
bilit
ies
Trad
e an
d ot
her p
ayab
les
297
,597
7
9.58
1
65,7
15
(9.5
8) 1
83,2
74
(32.
47)
271
,401
(3
3.50
) 4
08,1
19
Unc
laim
ed d
ivid
end
1,3
02
182
.43
461
-
4
61
-
461
-
4
61
Accr
ued
mar
k -
up 1
3,77
4 5
3.90
8
,950
5
7.38
5
,687
(5
0.52
) 1
1,49
4 (4
3.22
) 2
0,24
4 Sh
ort t
erm
bor
row
ings
479
,481
9
8.22
2
41,8
98
(29.
62)
343
,697
1
9.34
2
87,9
94
(19.
97)
359
,858
Cu
rren
t por
tion
of n
on-c
urre
nt li
abili
ties
157
,141
5
3.73
1
02,2
22
35.
01
75,
713
(12.
99)
87,
020
(20.
99)
110
,136
9
49,2
95
82.
82
519
,246
(1
4.71
) 6
08,8
32
(7.5
2) 6
58,3
70
(26.
75)
898
,818
2,4
25,6
56
42.
16
1,7
06,2
56
0.5
3 1
,697
,308
0
.99
1,6
80,5
95
1.1
9 1
,660
,848

17
Annual Report 2018
17
Annual Report 2018
201
8 2
017
201
6 2
015
201
4 R
s. In
‘000
%
R
s. In
‘000
%
R
s. In
‘000
%
R
s. In
‘000
%
R
s. In
‘000
%
AS
SETS
Non
-Cur
rent
Ass
ets
Prop
erty
, pla
nt a
nd e
quip
men
t 1
,362
,572
5
6.17
1
,001
,273
5
8.68
1
,014
,171
5
9.75
1
,055
,461
6
2.80
1
,074
,293
6
4.68
Se
curit
y de
posi
ts 5
5,84
9 2
.30
7,5
12
0.4
4 6
,064
0
.36
6,0
64
0.3
6 6
,064
0
.37
Inta
ngib
les
7,4
02
0.3
1 6
,492
0
.38
5,3
99
0.3
2 1
,033
0
.06
638
0
.04
1,4
25,8
23
58.
78
1,0
15,2
77
59.
50
1,0
25,6
34
60.
43
1,0
62,5
58
63.
23
1,0
80,9
95
65.
09
Curr
ent A
sset
sSt
ores
, spa
res
and
loos
e to
ols
58,
673
2.4
2 5
6,23
5 3
.30
62,
475
3.6
8 7
5,88
2 4
.52
69,
326
4.1
7 St
ock
in tr
ade
224
,659
9
.26
246
,650
1
4.46
2
41,4
24
14.
22
202
,785
1
2.07
1
70,9
13
10.
29
Trad
e de
bts
454
,623
1
8.74
1
49,4
00
8.7
6 1
58,3
08
9.3
3 2
16,6
64
12.
89
222
,273
1
3.38
Sh
ort t
erm
inve
stm
ents
-
-
36,
000
2.1
1 -
-
-
-
-
-
Lo
ans
and
adva
nces
61,
510
2.5
4 5
3,74
8 3
.15
49,
887
2.9
4 2
6,99
2 1
.61
35,
660
2.1
5 D
epos
its, p
repa
ymen
ts a
nd o
ther
rece
ivab
les
9,3
87
0.3
9 1
6,87
7 0
.99
33,
529
1.9
8 1
1,27
2 0
.67
6,8
92
0.4
1 Ta
xatio
n -
net
111
,248
4
.59
109
,127
6
.40
66,
193
3.9
0 4
6,32
4 2
.76
21,
052
1.2
7 Ca
sh a
nd b
ank
bala
nces
79,
733
3.2
9 2
2,94
2 1
.34
59,
858
3.5
3 3
8,11
8 2
.27
53,
737
3.2
4 9
99,8
33
41.
22
690
,979
4
0.50
6
71,6
74
39.
57
618
,037
3
6.77
5
79,8
53
34.
91
Tota
l ass
ets
2,4
25,6
56
100
.00
1,7
06,2
56
100
.00
1,6
97,3
08
100
.00
1,6
80,5
95
100
.00
1,6
60,8
48
100
.00
EQU
ITY
AND
LIA
BILI
TIES
Equi
tyIs
sued
, sub
scrib
ed a
nd p
aid-
up c
apita
l 3
01,5
73
12.
43
287
,212
1
6.83
2
29,7
70
13.
54
229
,770
1
3.67
2
29,7
70
13.
83
Surp
lus
on re
valu
atio
n of
pro
pert
y an
d pl
ant
161
,552
6
.66
175
,887
1
0.31
1
57,9
05
9.3
0 1
63,6
25
9.7
4 1
79,5
53
10.
81
Accu
mul
ated
pro
fit 4
07,3
60
16.
79
308
,150
1
8.06
2
49,7
47
14.
71
129
,109
7
.68
(4,6
49)
(0.2
8) 8
70,4
85
35.
89
771
,249
4
5.20
6
37,4
22
37.
55
522
,504
3
1.09
4
04,6
74
24.
36
Non
-Cur
rent
Lia
bilit
ies
Long
term
loan
s 6
0,74
6 2
.50
145
,223
8
.51
245
,156
1
4.44
3
20,0
91
19.
05
120
,175
7
.23
Liab
ilitie
s ag
ains
t ass
ets
subj
ect t
o fin
ance
le
ase
308
,550
1
2.72
8
,973
0
.53
2,2
23
0.1
3 3
,003
0
.18
4,8
57
0.2
9
Def
erre
d lia
bilit
ies
236
,580
9
.75
261
,565
1
5.33
2
03,6
75
12.
00
176
,627
1
0.51
2
32,3
24
13.
98
605
,876
2
4.98
4
15,7
61
24.
37
451
,054
2
6.57
4
99,7
21
29.
73
357
,356
2
1.51
Cu
rren
t Lia
bilit
ies
Trad
e an
d ot
her p
ayab
les
297
,597
1
2.27
1
65,7
15
9.7
1 1
83,2
74
10.
80
271
,401
1
6.15
4
08,5
80
24.
59
Unc
laim
ed d
ivid
end
1,3
02
0.0
5 4
61
0.0
3 4
61
0.0
3 4
61
0.0
3 4
61
0.0
3 Ac
crue
d m
ark
- up
13,
774
0.5
7 8
,950
0
.52
5,6
87
0.3
4 1
1,49
4 0
.68
20,
244
1.2
2 Sh
ort t
erm
bor
row
ings
479
,481
1
9.77
2
41,8
98
14.
18
343
,697
2
0.25
2
87,9
94
17.
14
359
,858
2
1.66
Cu
rren
t por
tion
of n
on-c
urre
nt li
abili
ties
157
,141
6
.48
102
,222
5
.99
75,
713
4.4
6 8
7,02
0 5
.18
110
,136
6
.63
949
,295
3
9.14
5
19,2
46
30.
43
608
,832
3
5.87
6
58,3
70
39.
17
899
,279
5
4.13
2,4
25,6
56
100
.00
1,7
06,2
56
100
.00
1,6
97,3
08
100
.00
1,6
80,5
95
100
.00
1,6
61,
309
100
.00
Vert
ical
Ana
lysi
s
Stat
emen
t of fi
nanc
ial p
ositi
on
1818
201
8 1
8 vs
17
201
7 1
7 vs
16
201
6 1
6 vs
15
201
5 1
5 vs
14
201
4
Rs.
In '0
00
%
Rs.
In '0
00
%
Rs.
In '0
00
%
Rs.
In '0
00
%
Rs.
In '0
00
Sale
s -
net
3,3
12,4
01
50.
20
2,2
05,3
60
5.1
7 2
,097
,028
1
3.48
1
,847
,868
(1
7.13
) 2
,229
,897
Cost
of s
ales
(2,9
04,3
11)
57.
16
(1,8
48,0
06)
5.3
4 (1
,754
,272
) 1
2.26
(1
,562
,629
) (1
4.74
) (1
,832
,874
)
Gros
s pr
ofit
408
,090
1
4.20
3
57,3
54
4.2
6 3
42,7
56
20.
16
285
,239
(2
8.16
) 3
97,0
23
Dis
trib
utio
n co
st (6
8,66
1) 7
.09
(64,
113)
89.
06
(33,
911)
(48.
89)
(66,
355)
(22.
37)
(85,
474)
Adm
inis
trat
ive
expe
nses
(83,
714)
18.
55
(70,
613)
15.
07
(61,
364)
14.
61
(53,
541)
(0.0
6) (5
3,57
1)
(152
,375
) 1
3.10
(1
34,7
26)
41.
41
(95,
275)
(20.
54)
(119
,896
) (1
3.77
) (1
39,0
45)
Profi
t fro
m o
pera
tions
255
,715
1
4.86
2
22,6
28
(10.
04)
247
,481
4
9.68
1
65,3
43
(35.
91)
257
,978
Othe
r inc
ome
- ne
t 3
9,80
0 5
.60
37,
691
110
.35
17,
918
17.
85
15,
204
(0.5
9) 1
5,29
5
Othe
r exp
ense
s (9
4,97
2) 6
9.31
(5
6,09
5) (4
.13)
(58,
509)
169
.86
(21,
681)
(39.
29)
(35,
712)
(55,
172)
199
.79
(18,
404)
(54.
66)
(40,
591)
526
.69
(6,4
77)
(68.
28)
(20,
417)
Fina
nce
cost
(66,
821)
23.
05
(54,
302)
(22.
46)
(70,
034)
(32.
65)
(103
,987
) (8
.68)
(113
,873
)
Profi
t bef
ore
taxa
tion
133
,722
(1
0.81
) 1
49,9
22
9.5
5 1
36,8
56
149
.38
54,
879
(55.
63)
123
,688
Taxa
tion
(6,6
81)
(84.
84)
(44,
061)
26.
11
(34,
938)
23.
00
(28,
404)
(57.
04)
(66,
121)
. .
Profi
t aft
er ta
xatio
n 1
27,0
41
20.
01
105
,861
3
.87
101
,918
2
84.9
6 2
6,47
5 (5
4.01
) 5
7,56
7
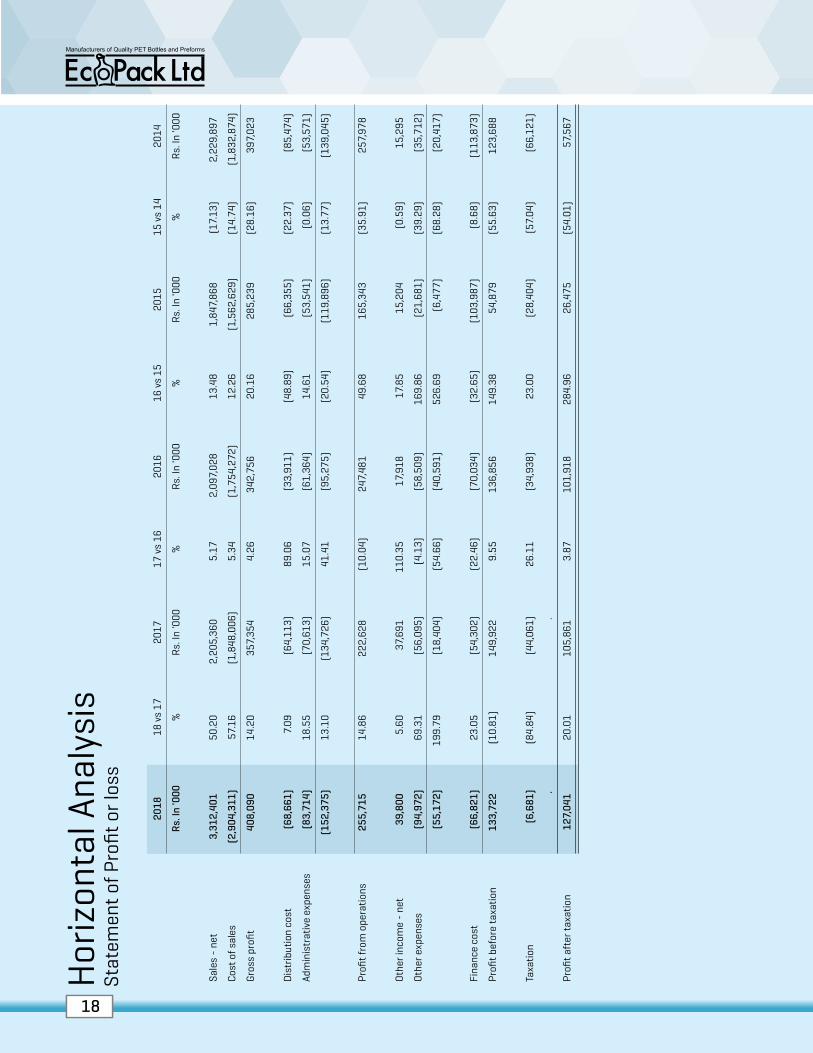
Hor
izon
tal A
naly
sis
Stat
emen
t of P
rofit
or l
oss
19
Annual Report 2018
19
Annual Report 2018
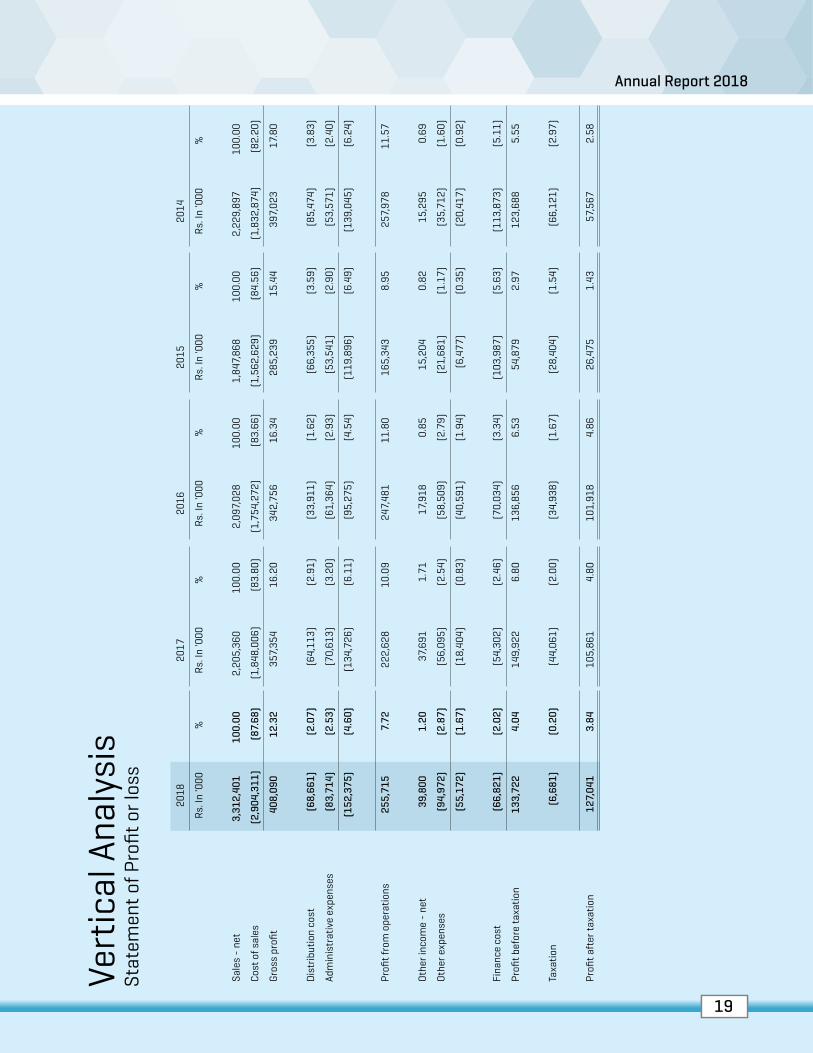
Vert
ical
Ana
lysi
s St
atem
ent o
f Pro
fit o
r los
s
201
8 2
017
201
6 2
015
201
4
Rs.
In '0
00
%
Rs.
In '0
00
%
Rs.
In '0
00
%
Rs.
In '0
00
%
Rs.
In '0
00
%
Sale
s -
net
3,3
12,4
01
100
.00
2,2
05,3
60
100
.00
2,0
97,0
28
100
.00
1,8
47,8
68
100
.00
2,2
29,8
97
100
.00
Cost
of s
ales
(2,9
04,3
11)
(87.
68)
(1,8
48,0
06)
(83.
80)
(1,7
54,2
72)
(83.
66)
(1,5
62,6
29)
(84.
56)
(1,8
32,8
74)
(82.
20)
Gros
s pr
ofit
408
,090
1
2.32
3
57,3
54
16.
20
342
,756
1
6.34
2
85,2
39
15.
44
397
,023
1
7.80
Dis
trib
utio
n co
st (6
8,66
1) (2
.07)
(64,
113)
(2.9
1) (3
3,91
1) (1
.62)
(66,
355)
(3.5
9) (8
5,47
4) (3
.83)
Adm
inis
trat
ive
expe
nses
(83,
714)
(2.5
3) (7
0,61
3) (3
.20)
(61,
364)
(2.9
3) (5
3,54
1) (2
.90)
(53,
571)
(2.4
0)
(152
,375
) (4
.60)
(134
,726
) (6
.11)
(95,
275)
(4.5
4) (1
19,8
96)
(6.4
9) (1
39,0
45)
(6.2
4)
Profi
t fro
m o
pera
tions
255
,715
7
.72
222
,628
1
0.09
2
47,4
81
11.
80
165
,343
8
.95
257
,978
1
1.57
Othe
r inc
ome
- ne
t 3
9,80
0 1
.20
37,
691
1.7
1 1
7,91
8 0
.85
15,
204
0.8
2 1
5,29
5 0
.69
Othe
r exp
ense
s (9
4,97
2) (2
.87)
(56,
095)
(2.5
4) (5
8,50
9) (2
.79)
(21,
681)
(1.1
7) (3
5,71
2) (1
.60)
(55,
172)
(1.6
7) (1
8,40
4) (0
.83)
(40,
591)
(1.9
4) (6
,477
) (0
.35)
(20,
417)
(0.9
2)
Fina
nce
cost
(66,
821)
(2.0
2) (5
4,30
2) (2
.46)
(70,
034)
(3.3
4) (1
03,9
87)
(5.6
3) (1
13,8
73)
(5.1
1)
Profi
t bef
ore
taxa
tion
133
,722
4
.04
149
,922
6
.80
136
,856
6
.53
54,
879
2.9
7 1
23,6
88
5.5
5
Taxa
tion
(6,6
81)
(0.2
0) (4
4,06
1) (2
.00)
(34,
938)
(1.6
7) (2
8,40
4) (1
.54)
(66,
121)
(2.9
7)
Profi
t aft
er ta
xatio
n 1
27,0
41
3.8
4 1
05,8
61
4.8
0 1
01,9
18
4.8
6 2
6,47
5 1
.43
57,
567
2.5
8
2020
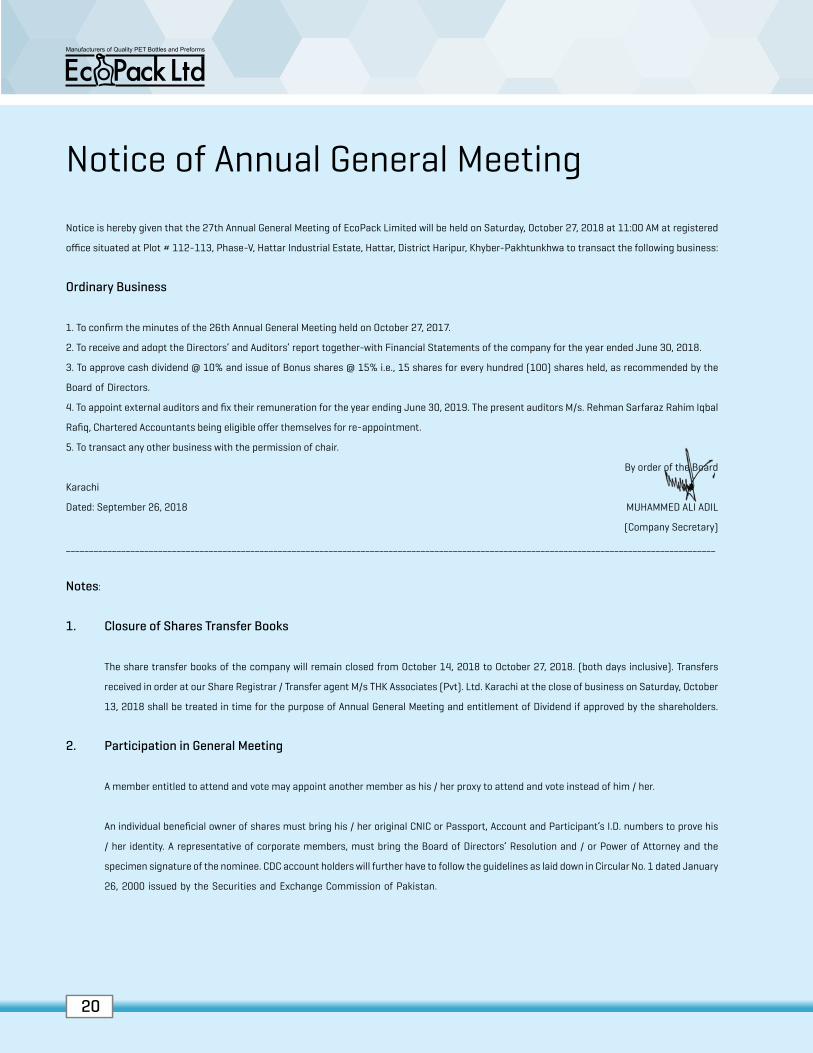
Notice of Annual General Meeting
Notice is hereby given that the 27th Annual General Meeting of EcoPack Limited will be held on Saturday, October 27, 2018 at 11:00 AM at registered
office situated at Plot # 112-113, Phase-V, Hattar Industrial Estate, Hattar, District Haripur, Khyber-Pakhtunkhwa to transact the following business:
Ordinary Business
1. To confirm the minutes of the 26th Annual General Meeting held on October 27, 2017.
2. To receive and adopt the Directors’ and Auditors’ report together-with Financial Statements of the company for the year ended June 30, 2018.
3. To approve cash dividend @ 10% and issue of Bonus shares @ 15% i.e., 15 shares for every hundred (100) shares held, as recommended by the
Board of Directors.
4. To appoint external auditors and fix their remuneration for the year ending June 30, 2019. The present auditors M/s. Rehman Sarfaraz Rahim Iqbal
Rafiq, Chartered Accountants being eligible offer themselves for re-appointment.
5. To transact any other business with the permission of chair.
By order of the Board
Karachi
Dated: September 26, 2018 MUHAMMED ALI ADIL
(Company Secretary)
_____________________________________________________________________________________________________________________________________________
Notes:
1. Closure of Shares Transfer Books
The share transfer books of the company will remain closed from October 14, 2018 to October 27, 2018. (both days inclusive). Transfers
received in order at our Share Registrar / Transfer agent M/s THK Associates (Pvt). Ltd. Karachi at the close of business on Saturday, October
13, 2018 shall be treated in time for the purpose of Annual General Meeting and entitlement of Dividend if approved by the shareholders.
2. Participation in General Meeting
A member entitled to attend and vote may appoint another member as his / her proxy to attend and vote instead of him / her.
An individual beneficial owner of shares must bring his / her original CNIC or Passport, Account and Participant’s I.D. numbers to prove his
/ her identity. A representative of corporate members, must bring the Board of Directors’ Resolution and / or Power of Attorney and the
specimen signature of the nominee. CDC account holders will further have to follow the guidelines as laid down in Circular No. 1 dated January
26, 2000 issued by the Securities and Exchange Commission of Pakistan.

21
Annual Report 2018
21
Annual Report 2018
3. For Appointing Proxies
The proxy form shall be witnessed by two persons whose names, addresses and CNIC numbers shall be mentioned on the form. Attested
copies of valid CNIC or the passport of the beneficial owners and the proxy shall be furnished with the proxy form.
Duly completed instrument of proxy, and the other authority under which it is signed, or a notarially certified copy thereof, must be lodged
with the Company Secretary at the Company’s Registered Office (Plot# 112-113 Phase 5, Industrial Estate Hattar) at least 48 hours before
the time of the Meeting.
4. Payment of Cash Dividend Electronically (Mandatory Requirement)
In accordance with the provisions of Section 242 of the Companies Act and Companies (Distribution of Dividends), Regulation 2017, a listed
company, is required to pay cash dividend to the shareholders ONLY through electronic mode directly into the bank account designated by
the entitled shareholders. In this regard, EcoPack Limited has already sent letters and Electronic Credit Mandate Forms to the shareholders
and issued various notices through publication in newspapers requesting the shareholders to comply with the requirement of providing their
International Bank Account Number (IBAN).
Those shareholders who have still not provided their IBAN are once again requested to fill in “Electronic Credit Mandate Form” as reproduced
below and send it duly signed along with a copy of valid CNIC to their respective CDC participant / CDC Investor account services (in case
of shareholding in Book Entry Form) or to the Company’s Share Registrar M/s THK Associates (Private) Limited, 1st Floor, 40-C, Block-6,
P.E.C.H.S, Karachi-75400 (in case of shareholding in Physical Form).
i. Shareholders Details
Name of the Shareholder(s)
Folio # /CDS Account No (s)
CNIC No (Copy attached)
Mobile / Landline No
ii. Shareholders’ Bank details
Title of Bank Account
International Bank Account Number (IBAN)
Bank’s Name
Branch’s Name and Address
In case of non-provision of IBAN, the Company will have to withhold the cash dividend according to SECP directives.
5. Withholding Tax on Dividend
I) The Government of Pakistan through Finance Act, 2014 had made certain amendments in section 150 of the Income Tax
Ordinance, 2001 whereby, different rates are prescribed for deduction of withholding tax on the amount of dividend paid by the
Companies. Now these rates as per the Finance Act 2018 are as under:

2222
a) For filers of income tax returns: 15%
b) For non-filers of income tax returns: 20%
To enable the Company to make tax deduction on the amount of cash dividend @ 15% instead of 20%, all the shareholders whose
names are not entered into the Active Tax Payer List (ATL) provided on the website of Federal Board of Revenue (FBR), despite
the fact that they are filers, are advised to make sure that their names are entered into ATL before the date for entitlement of
the cash dividend i.e. October 13, 2018; otherwise tax on their cash dividend will be deducted @ 20% instead of 15%.
II) For any query/problem/information, the investors may contact the Company and/ or the Share Registrar: The Manager,
Share Registrar Department, M/s THK Associates (Private) Limited, 1st Floor, 40-C, Block-6, P.E.C.H.S, Karachi-75400,
Telephone Number: (21) 111-000-322), email address: [email protected] and/ or The Manager Corporate Secretarial, Telephone
Number: 051-5974098 email address: [email protected]
III) The corporate shareholders having CDC accounts are required to have their National Tax Number (NTN) updated with their
respective participants, whereas, corporate physical shareholders should send a copy of their NTN certificate to the Company
or its Share Registrar i.e. Transfer Agent, M/s THK Associates (Private) Limited,. The shareholders while sending NTN or NTN
Certificates, as the case may be, must quote Company name and their respective folio numbers.
(IV) As per the clarification issued by FBR, withholding tax will be determined separately on “Filer/Non-Filer” status of principal
shareholder as well as joint-holder(s) based on their shareholding proportions. Therefore, all shareholders who hold shares
jointly are required to provide shareholding proportions of principal shareholder and joint-holder(s) in respect of shares held by
them to the Registrar and Share Transfer Agent in writing as follows:
Principal Shareholder Joint Shareholder(s)
Folio / CDCAccount No.
Total Shares Name and CNIC No.ShareholdingProportion(No. of Shares)
Name and CNIC No.ShareholdingProportion(No. of Shares)
6. Submission of the CNIC/NTN details (Mandatory)
In accordance with the notification of the Securities and Exchange Commission of Pakistan (SECP) vide SRO 779(1)/2011 dated August
18, 2011 and SRO 83(1)/2012 dated July 5, 2012, dividend warrants should bear CNIC number of the registered member or the authorized
person, except in case of minor(s) and corporate members Accordingly, Members who have not yet submitted copy of their valid CNIC or NTN
in case of corporate entities are requested to submit the same to the Company’s Shares Registrar. In case of non-compliance, the Company
may withhold dispatch of dividend warrants under intimation to Regulator till such time they provide the valid copy of their CNIC as per law.
7. Participation in the AGM vide Video-Link Facility
In pursuance of Section 132(2) of companies Act, 2017, the Company will provide the video link facility to those member(s) who hold
minimum 10% shareholding of the total paid-up capital and resident of city other than Hattar where Company’s Annual General Meeting is to
be placed, upon request. Such member(s) should submit request in writing to the Company at least five days before the date of the meeting.

23
Annual Report 2018
23
Annual Report 2018
In this regard, please fill the following form and submit to registered address of the Company 05 days before holding of the Annual General
Meeting (AGM). After receiving the request/demand of members having 10% or more shareholding in aggregate, the Company will intimate
members regarding venue of video conference facility at least three (3) days before the date of AGM along with complete information
necessary to enable them to access such facility:
“I/We/Messrs., _____________________________ of ____________________, being Member(s) of EcoPack Limited, holder of ______________
ordinary share(s) as per Folio #________ and / or CDC Participant ID & Sub-Account No. _______________, hereby, opt for video conference
facility at ________________________________ city.”
_________________________________
Signature of the Member(s)
(please affix company
stamp in case of corporate entity)
8. Change of Address
The members are also requested to notify change in their address, if any, to our Share Registrar / Transfer Agent, M/s THK Associates
(Private) Limited, 1st Floor, 40-C, Block-6, P.E.C.H.S, Karachi-75400.
2424
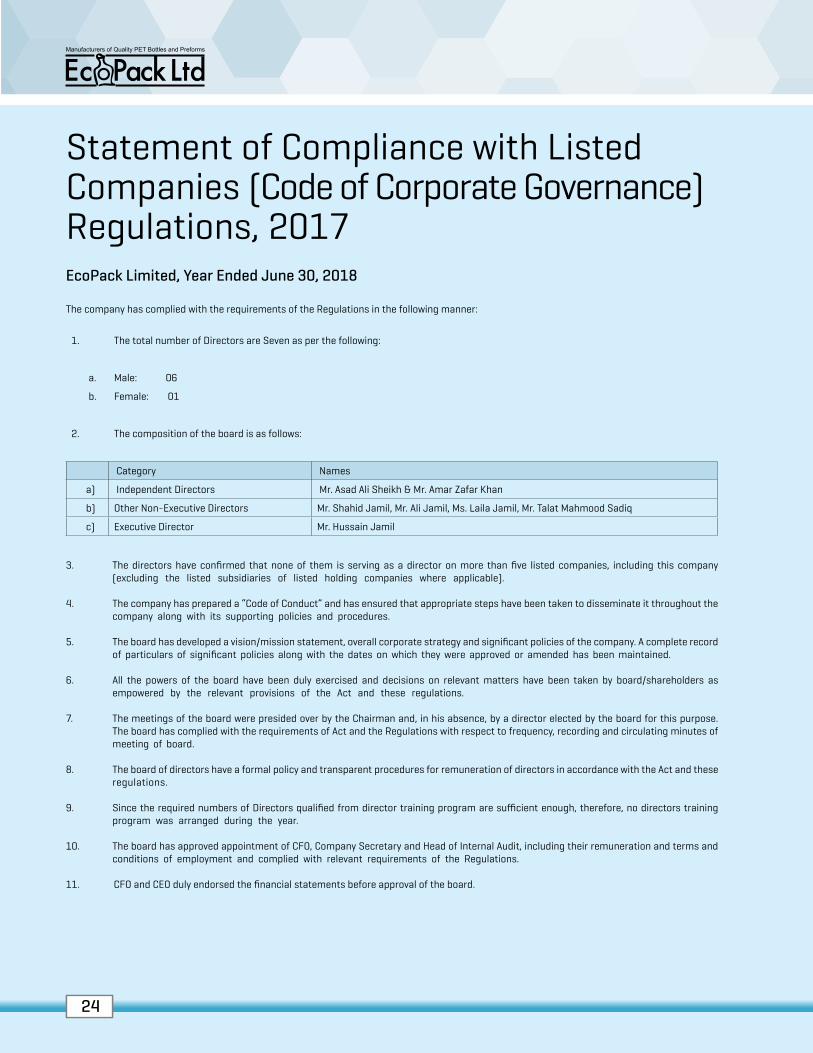
Statement of Compliance with Listed Companies (Code of Corporate Governance) Regulations, 2017EcoPack Limited, Year Ended June 30, 2018
The company has complied with the requirements of the Regulations in the following manner:
1. The total number of Directors are Seven as per the following:
a. Male: 06
b. Female: 01
2. The composition of the board is as follows:
Category Names
a) Independent Directors Mr. Asad Ali Sheikh & Mr. Amar Zafar Khan
b) Other Non-Executive Directors Mr. Shahid Jamil, Mr. Ali Jamil, Ms. Laila Jamil, Mr. Talat Mahmood Sadiq
c) Executive Director Mr. Hussain Jamil
3. The directors have confirmed that none of them is serving as a director on more than five listed companies, including this company (excluding the listed subsidiaries of listed holding companies where applicable).
4. The company has prepared a “Code of Conduct” and has ensured that appropriate steps have been taken to disseminate it throughout the company along with its supporting policies and procedures.
5. The board has developed a vision/mission statement, overall corporate strategy and significant policies of the company. A complete record of particulars of significant policies along with the dates on which they were approved or amended has been maintained.
6. All the powers of the board have been duly exercised and decisions on relevant matters have been taken by board/shareholders as empowered by the relevant provisions of the Act and these regulations.
7. The meetings of the board were presided over by the Chairman and, in his absence, by a director elected by the board for this purpose. The board has complied with the requirements of Act and the Regulations with respect to frequency, recording and circulating minutes of meeting of board.
8. The board of directors have a formal policy and transparent procedures for remuneration of directors in accordance with the Act and these regulations.
9. Since the required numbers of Directors qualified from director training program are sufficient enough, therefore, no directors training program was arranged during the year.
10. The board has approved appointment of CFO, Company Secretary and Head of Internal Audit, including their remuneration and terms and conditions of employment and complied with relevant requirements of the Regulations.
11. CFO and CEO duly endorsed the financial statements before approval of the board.
25
Annual Report 2018
25
Annual Report 2018
12. The board has formed committees comprising of members given below:
a) Audit Committee (03 Members)
Chairman: Mr. Asad Ali SheikhMembers: Mr. Amar Zafar Khan & Ms. Laila Jamil
b) HR and Remuneration Committee (05 Members)
Chairman: Mr. Amar Zafar KhanMembers: Mr. Hussain Jamil, Mr. Asad Ali Sheikh, Mr. Ali Jamil & Ms. Laila Jamil
13. The terms of reference of the aforesaid committees have been formed, documented and advised to the committee for compliance.
14. The frequency of meetings (quarterly) of the committee were as per following:
a) Audit Committee (04 Meetings)b) HR and Remuneration Committee (04 Meetings)
15. The board has set up effective internal audit functions which are considered suitably qualified and experienced for the purpose and are conversant with the policies and procedures of the company.
16. The statutory auditors of the company have confirmed that they have been given a satisfactory rating under the quality control review program of the ICAP and registered with Audit Oversight Board of Pakistan, that they or any of the partners of the firm, their spouses and minor children do not hold shares of the company and that the firm and all its partners are in compliance with International Federation of Accountants’ (IFAC) guidelines on code of ethics as adopted by the ICAP.
17. The statutory auditors or the persons associated with them have not been appointed to provide other services except in accordance with the Act, these regulations or any other regulatory requirement and the auditors have confirmed that they have observed IFAC guidelines in this regard.
18. We confirm that all other requirements of the Regulations have been complied with.
Karachi. AMAR ZAFAR KHANDated: September 26, 2018 CHAIRMAN
2626
CHAIRMAN’S REVIEW REPORTI am pleased to report that EcoPack Limited’s performance for the FY 2017-18 under the guidance of it’s Board of Directors and the policies and
controls executed by the company’s management have produced the best financial results hitherto seen in it’s 25 year history. The company’s Profit
after Tax has increased by 20% over the previous financial year as it achieved its record production and sales numbers ahead of the approved annual
Budget.
The company has procured the latest technologies and enhanced it’s production capacity for it’s intermediary product PET Preforms, used to make
PET bottles for packing beverages, bottled water, soft drinks & syrups, etc., for a wide range of customers spread all over the country. The investment
made in the outgoing financial year was in excess of PKR 450 million and was implemented cost effectively, in time to avoid the depreciation of the Pak
Rupee and meet the start of the high sales summer season in the last quarter before the financial year closed. This event has substantially enhanced
the standing and reputation of your company as a reliable and quality conscious vendor to the rapidly growing Beverage industry.
The Board of the company ably assisted by it’s sub-committees which meet regularly to assess and assure that the vision and mission of the
company are being implemented effectively according to the directives of the Board. The Board of Directors continually assess and evaluate their own
performance in line with the Code of Corporate Governance and the Companies Ordinance ensuring compliance with all regulations and rules. Efforts
to create an improved structure for regular and well planned meetings of the sub-committees for Audit and Human Resource & Remuneration (HR&R)
are being discussed to make such meetings purposeful and effective so that tasks and guidance provided to the management may be monitored and
measured effectively minimizing possible lapses and slippages in overall results.
I am happy to see that your company continues on an increasingly profitable path and remains a ‘vendor of choice’ for its customers across Pakistan,
bringing value to all its shareholders & stakeholders with merit and consistency.
I wish the company and it’s management every success in it’s endeavours in the years ahead.
Karachi Amar Zafar Khan
Dated: September 26, 2018 Chairman of the Board
EcoPack Limited

27
Annual Report 2018
27
Annual Report 2018
رئیچنیم یک اجزئہ روپرٹ
7182-81 ڈٹیم ے لا ی لا وزلےک تحت اوکی کیپ اہیمایک یک سیا ںویو اور رےھجم ہی اتبےت وہےئ اہنتی رسمت وہ ریہ ےہ ہک وبرڈ آف ڈارئرٹکیزیک راامنہیئ ںیم اور ینپمک
دصیف ااضہف وہا ےہ ویکہکن 71 ذگہتش لا ی لا ےک دوران ینپمک ےک عفن ںیم دعب از سکیٹےک دوران اینپ اکررکدیگ ےک ذرےعی سیچپ لاہل اترخی ںیم اشدنار لا ی اتنجئ احلص ےیک۔
ا۔ وھر اور رفوتخ ےک ادعادوامشر وکدیپاوا اس دوران اس لاالہن وظنمر دشہ ٹجب ےس ڑبھ رک راکیرڈ
وبںیلت TEP رسکن ، ریسپ وریغہ یک گنکیپ ےئلیکرشموابت، وبلت دنب سیین، لاٹف ڈسیاتسکن رھب ںیم ےلیھپ ریثک االاسقم اصرنیف ےک ےیلینپمک ے دجدی رتنی انکیٹولیج رخدی رک
ےس نیلم روےپ 051ریذگہتش لا ی لا ںیم یک اج ے وا ی رسلاہی اک۔ رپاڈٹک یک دیپاواری الصتیح ںیم ااضہف ایک اخمرپافیرزم یک TEPانب ے ےک ےیل اامعتس وہ ے وا ی اینپ
فدف وک وپرا رک ے ےک ےیل وم ر ہ زادئ یھت اور اےسسیاتسکین روےپیک دقر ںیم یمک ےس ےنچب اور لا ی لا ےک ااتتخم ےس لبق آرخی ہس لایہ ےک وممس رگلا ںیم زایدہ رفوتخ ےک
اس یک دبوتل آپ یک ینپمک یک لاھک ںیم ااضہف وہا اور آپ یک ینپمک زیتی ےس رتیق سییت رشموابت یک تعنص ےک ےیل اکی دھجمسار اور التگ ادناز ںیم ربوتق اامعتس ایک ایگ۔
اسحس و اقلب اامتعد اور ایعمری رفوتخ دننکہ ےک وطر لاےنم آیئ۔
اور نشم رپ ےی اباقدعیگ ےس االجس دقعنم رکیت رںیہ اتہک اس ارم وک ینیقی انبای اج ےکس ہک ینپمک ےک رظنہی ذیلی ایٹیمکو ینپمک یک ذیلی ویٹیمکو ے ینپمک ےک وبرڈوک ااعتن رفامہ یک۔
اینپ اکررکدیگ اک لسلسم ےک اضےطب ےک اطمقب اٹکیاکروپرٹی وگرسنن اور زینپمک وکڈ آف وبرڈ یک فداایت ےک اطمقب وم ر ادناز ںیم لمع ایک اج راہ ےہ۔ وبرڈ آف ڈارئرٹکیز
رپ ےط دشہ اباقدعہ االجوسو ےک ےیل اکی رتہب زئہ اتیل ےہ اور امتم وقادع و وضاطب یک لیمعت وک ینیقی انبات ےہ۔ آڈٹ اور ویہنم روسیرس و اعموہض اجت یک ذیلی ویٹیمکو یک رتہب وطر اج
اج ےکس اور اس رطح اہیمایک وک دی یئگ ذہم دارویو اور راامنہیئ یک رگناین وہ ےکس ر انبای ہک اےسی االجوسو وک ابینعم اور ومٔاظنم یک لیکشت ےک ےیل اکووشو وک زری ثحب الای ات
ر وطر رپ مک ےس مک ایک اج ےکس۔اورومجمیع اتنجئ ےک وصح ںیم ہنکمم وکاتویہو اور االغط وک ومٔ
اتسکن رھب ںیم اےنپ اصرنیف ےک ےیل "دنسپدیہ رفوتخ دننکہ"ریہ ےہ ، اس ںیم ہی دھکی رک وخش وہو ہک آپ یک ینپمک عفن آور راےتس رپ اانپ رفس اجری رےھک وہےئ ےہ اور سی
کیٹس وہڈلرز ےک ےیل دقر اک ابثع ینب۔ ارطح ہی اتیمہ اور لسلست ےک لاھت اس ےک صصح داران اور
ںیم ینپمک اور اس یک اہیمایک ےک ےیل آ ے واےل لاولو ںیم ایکن اکووشو ںیم اکایمیب ےک ےیل داعوگوہو۔
اخن رفظاعرم
رئیچنیم آف وبرڈ رکایچ
اوکی کیپ ڈٹیم 7181ربمتس 72

2828
Directors’ ReportThe Board of Directors of EcoPack Limited is pleased to present the Directors’ Report along with the annual financial statements of the company together with the Auditor’s Report for the year ended 30th June 2018:
OVERVIEW
Your company’s performance in the outgoing financial year is comprised of two distinct parts. The first half of the year was a period of relative macro-economic stability in the country, despite the ongoing political turmoil, as the Pak Rupee (PKR) parity with the US Dollar remained stable until December 2017. Thereafter the continual slide of the PKR by almost 16% against the USD was witnessed in the remaining period upto end June 2018. The second half of the financial year saw sharp increases in the prices of all import based items which were impacted by PKR devaluation such as petro-chemical derived raw materials, PET resin, POL products, machinery spare parts, truck-freight rates, electricity charges, etc. The increase in the SBP official inflation rate and rise in KIBOR and financial charges added to the growing economic uncertainty.
On the more positive side, your company did its biggest expansion in Preform capacity increasing it by almost 90% annually with the acquisition of state-of-the-art world renowned, Husky Preform Injection systems. This was cost efficiently done by adequately covering our forex risk and hence avoiding the adverse impact of the continuing PKR devaluation, resulting in substantial savings for the company. The implementation of the Preform expansion project was done ‘just in time’ to catch the peak summer sales in the last quarter of the financial year, thus achieving substantially higher production and sales YOY.
Operationally your company countered the challenge of rising costs and inflationary pressures by aggressively enhancing sales, both for Bottles and Preforms, at competitive pricing thereby reducing fixed costs due to higher production and capacity utilization. A timely and efficiently executed capacity expansion based on well considered rational commercial decisions by your management have helped in establishing your company as a reliable, quality conscious and widely preferred vendor to a rapidly growing Beverage industry.
SALES & FINANCIAL HIGHLIGHTS
Total sales value increased by 50% to Rs. 3.3 billion this year against Rs. 2.2 billion in the previous year, mainly due to growth in Preform sales revenue by 114% on account of expansion in Preforms production capacity in the last quarter. The topline revenue also increased due to the increase of the company’s basic raw material (PET Resin) price by nearly 40% as compared to the previous year. Bottle sales increased by 11% in unit terms, while Preforms sales increased by 63% in unit terms compared to last year. Gross profit increased this year by 14% to Rs. 408 million from Rs. 357 million in the prior year.
Financial charges increased by 23% from Rs. 54.3 million last year to Rs. 66.8 million this year – primarily due to the increase in financial costs on lease finance on account of expansion in production capacity of Preforms.
Profit before tax decreased by Rs. 16.2 million to Rs. 133.7 million from Rs. 149.9 million in the previous year due to impairment on fixed assets and stocks which have been recorded. Net profit after tax increased by Rs. 21.1 million this year to Rs. 127.0 million from Rs. 105.8 million last year – an increase of almost 20%.
Earnings per share (basic & diluted) increased from Rs. 3.51 to Rs. 4.21 per share which reflects a fairly consistent growth year on year.
FUTURE OUTLOOK
While the Beverage and Bottled Water industry has continued to grow strongly in the last 5 to 6 years, it has grown relentlessly in double digits YOY in PET bottles & Preforms due to the ongoing conversion from ‘returnable glass’ bottles to PET bottles (non-returnable convenience), aided by greater penetration into both the urban and rural markets. Increasing segmentation into smaller bottle sizes such as 300/350ml, 500ml and 1.0 litre bottles to target each consumer choice & segment specifically, has led to an exponential rise in the numerical volume of PET bottles in unit terms as the prime packaging of CSD and bottled drinking water in our fast growing market. Fruit juices and nectar/concentrate based drinks in PET bottles have hitherto faced a severe challenge by Tetra-brick/cartons as the prevailing popular packaging. However, PET bottles have recently made a serious foray in the premier consumption market of high-end juices marketed by MNC’s. This could well augur positive expansion in a new upmarket sector for PET bottles due to attractive visibility, better shelf positioning and merchandising prospects.
The advent of strong inflationary headwinds and macro-economic challenges across the board facing the industry, raise the spectre of a possible slowdown in the continuing robust rate of growth the industry has gotten used to. Higher cost of doing business and sharp increases in dollar based petro-chemical materials, raw & packing materials plus other production and sales inputs, will inevitably drive costs and retail prices upwards. A dilution of consumer purchasing power for a somewhat “elastic demand” for beverages could hit consumption adversely and possibly slow down the growth rate until incomes and savings catch up.
Your company’s management is alert to such an environment and related difficulties. It is gearing up to improve efficiencies all round and cut wastages wherever possible, to ensure the upward trajectory and direction of its production output and sales, which are the main drivers for delivering value and services consistently to it’s customers. In line with this effort, your company will regularly replace its old and obsolete machines (BMR) and add new cost & energy efficient production machines to expand and augment its capabilities, enabling it to remain in the fore-front as a preferred and value driven, lean and efficient vendor for its customers.

29
Annual Report 2018
29
Annual Report 2018
Product and customer diversification remain the focus of your company. Your company’s management is close to finalizing its business plan by adding a new range of bottles for packing of drinking water, edible oil and concentrate/ syrups for some of its existing as well as new customers. While the volumes of such bottles/containers is constantly increasing on a relatively small base, the sale potential and profitability are high. This expansion will also improve the seasonality of our sales and improve the cash-flows of your company during the off-season winter months.
RISKS
Inflationary pressures mentioned above, combined with the country’s external debt and trade imbalance, remain the major macro-economic challenges in the near to medium term for all manufacturing businesses in the country. Your company has secure Supply-Chain arrangements and support as the upstream industry for it’s main raw material, PET resin, is located in the country with adequate capacity to meet our local industry demand effectively.
Electricity supply countrywide has improved although unplanned outages and breakdowns in the ageing transmission lines and infrastructure could undo our endeavor to minimize our wastages and improve efficiencies wherever possible.
Company HR relations & morale remain positive as we embark on a high growth and profitable journey dovetailed to a buoyant and well organized Beverage industry readily poised to quench the thirst of a demographically young and consumption oriented population.
For & On Behalf of the Board of Directors
_______________ ______________________Asad Ali Sheikh Hussain Jamil Director Chief Executive Officer
KarachiSeptember 26, 2018

3030
ررٹی رپ � رشمPETزوردتس ااضہف وہا۔ دنہوسں ںی ے ُحج روولتں ےPETاپین ی اینبد گنکیپ ےننب ی وہج ے ٹ سن رر/کن کٹ ر ی وابت ےن ارٹا رِروولتں ںی ولھپں ے وجس اور ن
ک/اکرٹ
اس روولتں ےن امی انی ی ے امرٹیک رکدہ ایلع ایعمر ے وجس ی ھڑ تپھک وایل امرٹیک ںی زیت ے وفنذ ای۔ mEP نا ب ے زوردتس جنلیچ اک اسانم ای ویکہکن ہی اکی وبقمل اور راجئ گنکیپ ےہ۔ اتمہ
ںی تبثم وتعس اک ااکمن ےہ ویکہکن اس ے رپششکم ، رتہب اقمم اور اجترت ے ااکمانت ںیہ۔امرٹیک ے ےئن ےبعش ہنکمم روولتں ی PETے
ںی ہنکمم فیگتسہ ے رطخے وک منج ددا ےہ۔ اکروابر رکےن ی زدادہ التگ اور ڈارل ںی ر ےن یتعنص دیمان ی نار زیت راتفوپر تعنص وک ارفاد زر اور رکیمواانککم زجنلیچ ی دشت ے ےنلچ وایل وہا ے ارثات
ے التگ اور تمیق رفوتخ ںی ینیق رر رپ ااضہف وہرخدیورفوتخ ےیک ناےنو اےل کورٹولکیمیک رٹیملیم ، اخم امل اور گنکیپ رٹیمزلی اور درگی دیپاوار اور رفوتخ ے ولہپوں ںی زیت ے ااض ےف
ورفدمن اور تچب ںی دوابرہ ااض ےف کت اس ی رتیق فہتسہ وہ اگ۔رشموابت ی رخدیار ے ےلسلس ںی فرر ی ںت رخدی ںی یسک دقر دکچلار بلط ے ےیل یمک ے تپھک ورے رطےقی ے اتمرث وہ یتکس ےہ ا
یتکس ےہ۔
پ ے شیپ رظن ایسی رورلاحل وار اور ہیم ایتر ےہ۔ ااظتنہیم امتم وتہجں ںی اکررکدیگ وک رتہب نانےن اور ایضع وک ہنکمم دح کت روےنک ے ےیل ادقاامت رک ریہ ےہ ات ہک دیپافپ ی ینپمک ی ااظتناور � چپ
فپ ی ینپمک اینپ رپاین د ہ کک ںیہ۔اس وکےک ےدورانےیل اینب رفوتخ ی حطس وکاورپ نا ب رتیق دےنی وک ینیق ناندا ناےکس ویکہکن ہی دوونں فررنیف وک دقر اور لسلست ے اسھت دخامت ی رفایمہ ے
اوار ونیشمں وک اش ل رکے یگ سج ی وہج ے ینپمک اس اقلب وہ ےکس اور رفوسدہ ونیشمں وک اباقدعیگ ے اسھت دبتلی رکے یگ اور اینپ الصوتیحں ںی ااض ےف ے ےیل ومرث ہب التگ اور ومرث ہب وتاانیئ یئن دیپ
ہ اےنپ فررنیف ے ےیل اکی رتیحیج اور اقلب دقر اور ومرث رفوتخ ہدننہ ے رر رپ فص اول ںی رےہ۔یگ ہک و
ررٹی فپ ی ینپمک ی وتہج اک رمزک ونصماعت اور فررنیف ی ریثک ایتہجل ریہ۔ فپ ی ینپمک ی ااظتنہیم اےنپ وموجدہ اور ےئن فررنیف ے ےیلٹ سن /ریسپ ی گنکیپ ے ےیل ےنیپ ے اپینم ، وخردین لیت اور کن
رفوتخ اور عفن یکسج وہج ے ہکبج ایسی روولتں/ڈروں ے مجح ںی وھچےٹ اسزئ ے ےیل لسلسم ااضہف وہ راہ ےہم ، روولتں ی یئن ااسقم اش ل رکےن ے اکروابر وص ےب وک یمتح رورت دےنی ے رقبی ےہ۔
فےئ یگ۔رتہبفپ ی ینپمک ے شیک ولف ںی ے ونیہمں ے دوران رسام وممسِ اگ اور ف زیسن ے ااکمانت ھڑھ ےئگ ںیہ۔ اس وتعس ے امہر زیسلن رفوتخ ںی ااضہف وہ
رطخات
اانککم زجنلیچ ے رر رپ اسےنم اور کل ے ریبوین رقےض اور اجتریت دعم وتازن ےسیج اومر ل رک کل رھب ںی امتم دیپاوار اکروابروں ے ےیل وطس دمت امہ رتنی رکیمو ٔو ے داب زرذموکرہ ابال ارفاط
ےہ اور ہی ومرث رر رپ وموجداخرط وخاہ دقمار ںی PET Resin ے ےیل ااعتن ی ےہ۔ کل ںی فپ ی ینپمک ےن الپسیئ نیچ ے ااظتنامت ےیک ںیہ اور اپ رٹسمی تعنص وک اس ے اینبد اخم املفےئ۔
اقمیم تعنص ی بلط وک وپرا رکیتکس ےہ۔
ےن ی وکےک اتمرث وہ ریغ ےط دشہ دنبش اور رودیسہ رتالیسیت الونئں اور اظنم ںی رخاویبں ی وہج ے امہر ایضع وک مک ے مک رکےن اورہنکمم دح کت رتہب ال ناہکیئ کل رھب ںی وریق الپسیئ ںی رتہب فیئ ہچ
یتکس ےہ۔
اکی تخ اور ااہتنیئ مظن رشموابت ی تعنص ںی ںاہنں ےہ اور ہی تعنص ارغائاییئ رر رپ ینپمک ے ویہنم روسیرس اقلعتت اور وحہلص تبثم راہ ویکہکن مہ رتیق اور عفن ے اکی اےسی رفس رپ اگزمن ںیہ وج
رپزعم ےہ۔ےن ے ےیل اھجباور تپھک وایل فابد ی ایپس ونوجان
وراےئ اور اجنم ب رورڈ ف ڈارئرٹکیز
ادس یلع خیش نیسح لیمج ڈارئرٹکی فیچ ازگیوٹکی فرسیف
8305ربمتس 83

31
Annual Report 2018
31
Annual Report 2018
ڈارئرٹکیز روپرٹ
متخ وہےن واےل امیل اسل ےئلیک ینپمک ے اسالہن فڈٹ دشہ امایلیت الیصفتت اور فڈرٹی وک 8305وجن 03روپرٹ ے اسھت رٹکیزارئاہنتی رسمت ے اسھت ڈ ڈٹیم ے رورڈ ف ڈارئرٹکیز ی نا ب ےاوکی کیپ
روپرٹ شیپ ی نا ریہ ےہ۔
نازئہ
ے فاغز ےد وراےین رپ لمتش رکیمو اانککم ااکحتسم ارفارفت ے ابووجد لمتش ۔یھ۔ اسل ی یلہ ہامشیہ کل ںی نار ساییدوران فپ ی ینپمک ی اکررکدیگ دو وصحں رپ متخ وہےن واےل امیل اسل ے
دصیف یمک دےنھکی 03کت ی ہیقب دمت ے دوران ڈارل ی تبسن اپاتسکین روےپ ی دقر ںی رقتابی 8305۔ اس ے دعب وجن رےہرمیکی ڈارل ی رشح ابتدہل مکحتسمکت اپاتسکین روےپ اور ا 8304ریہ ویکہکن دربمس
م ، لال ے رر رپ کورٹومی ل س ے لصش دشہ ۔یھامیل اسل ی دورس ہامشیہ ے دوران امتم رت درفدم اایشء ی وتمیقں ںی زیت دےنھکی ںی فیئ سج ی وہج اپاتسکین روےپ ی دقر ںی یمک دعب ازاں ںی فیئ۔
ر اپرسٹم ، رٹک ے رکاویں ی رشحم ، یلجب ی PET Resinاخم املئ کنیب ے نار رکدہ رساکر ارفاط زر ی تمیق ے اسھت ٹیٹساتمیق وریغہ ںی ااضہف وہا۔ کورٹومیل فلئ رپاڈسٹکم ، � ے سپ
ےف ےن ھڑ یت وہیئ شاع ی ریغ ینیق رورلاحل ںی زدادہ رکدار ادا ای۔اور امایلیت ارخانات ںی ااض ROBIK اسھت
دصیف اسالہن ے اسحب ے ااضہف وہا اور اس ے اسھت اسھت داین 63 ی دیپاوار الصتیح ںی بس ے ھڑا ااضہف ای سج ے دعب اس ی اجنگشئ ںی رقتابی mroferPفپ ی ینپمک ےن اینپ تبثم تمس ںی
اس وپرے لمع وکزرابمدہل ے رطخات ے چب رک ااہتنیئ ومرث ہب التگ ادناز ںی رسااجنم ددا ایگ اور اس دوران لصش ےیک ےئگ۔ Husky Preform Injection Systemsاور اشاکہر ے وہشمر
م وصرپافیاپاتسکین روےپ ی دقر ںی دشدی یمک ے یفنم ارث ے اچبو رکےت وہےئ ینپمک ے ےیل اخرط وخاہ تچب ی یئگ۔ ی فرخ ہس امیہ ے دوران لمکم ای ایگ ات ہک امیل اسل ےب وک وروترم ے وتیی
ی ااہتنیئ دنلب وک ےنچنہپو ایل رفوتخ ے حطس وک وھچا نا ےکس اور اس رطح امنداں رر رپ دنلب رتنی دیپاوار دہ لصش ای ایگ۔ رگام وممسِ
اک اسانم ای اور اس رطح دنلب رتنی دیپاواراور اجنگشئ ٔور ارفاط زر ے دابھڑ یت وہیئ الوتگں او روولتں اور رپافیرزم دوونں ی اسماقبہن وتمیقں رپ نارلصہن رفوتخ ے ذرےعی اعفتیل ے احلظ ے فپ ی ینپمک ےن
و اچبر ے دعبوتمازن اکروابر ولصیفں ی اینبد رپ وروت اور ومرث ادناز ںی دیپاوار اجنگشئ ںی فپ ی ااظتنہیم ےن وخب وسچ ںی یمک الےن ںی اکایمیب لصش ی۔ ے اامعتسل ی دبوتل رقمرہ التگ
نانےن ںی دمد یل۔ حیج دشہ رفوتخ ہدننہ ے رر رپ اینپ اسھااضہف ای سج ی وہج ے فپ ی ینپمک وک رشموابت ی زیت ے وتعس اپےن وایل تعنص ںی ایعمر ے شاعےلم ںی اسحس اور وعیس امیپےن رپ رت
رفوتخ اور امایلت ے امہ ادعادوامشر
نیلب روےپ اھت اور اس ی اینبد وہج ذگہتش ہس امیہ ے دوران رپافیرزم ی دیپاوار اجنگشئ ںی ااض ےف ی وہج ے 2.2نیلب روےپ راہ وج ہک اسہقب اسل3.3دصیف ااض ےف ے اسھت 23ااسمل رفوتخ اک مجح
اٹپ النئ فدمن ںی یھباسہقب اسل ی تبسن دصیف ااض ےف ی وہج ے 40 ی تمیق ںی رقتابی PET Resinینپمک ے اینبد اخم امل ینعی دصیف ااضہف اھت۔ 001ے لصش فدمن ںی رپافیرم ی رفوتخ
نیلم رووپں ے اسھت 135دصیف ااضہف وہا۔ ااسمل ومجمیع انمعف ںی 30ذگہتش اسل ی تبسن ے روولتں ی رفوتخ ںی ایگرہ دصیف ااضہف وہا ہکبج رپافیرزم ی رفوتخ ںی ااضہف وہا۔ ااکویئں ے اسحب
نیلم روےپ اھت۔ 024دصیف ااضہف دےنھکی ںی فدا وج ہک ذگہتش اسل 01
ہف وہام ، اس ااض ےف ی اینبد وہج رپافیرزم ی دیپاوار اجنگشئ ںی دصیف ااض 80نیلم روےپ ے ارخانات ے اسھت 66.8نیلم روےپ ے امایلیت ارخانات ی تبسن ااسمل54.3ذگہتش اسل وہےن واےل
ااض ےف ے ےیل زیل انفسن ے امایلیت ارخانات ںی ااضہف اھت۔
اٹسک ںی انیلم روےپ راہ سج ی وہج ڈسکف ااثوثں اور 133.7نیلم رووپں ی یمک ے اسھت16.2نیلم روےپ ے لبق از سکیٹ عفن ی تبسن ااسمل لبق از سکیٹ عفن 149.9ذگہتش اسل وہےن واےل
OPemrrPomI دصیف ااضہف دےنھکی ںی فدا۔ 83نیلم روےپ راہ سج ے 127نیلم روےپ زدادہ وہ رک 21.1نیلم روےپ ے عفن ے 105.8دعب از سکیٹ اخصل عفن ذگہتش اسل وہےن واےل ااسملریہ۔
لسلسم رتیق ی اکعی وہیت ےہ۔ ہب اسل روےپ ریہ سج ے اسل4.21ے ھڑھ رکروےپ 3.51فدمین )Bmtrl D &rciIoB(یف صصح
لبقتسم ے ااکمانت
ریغ روولتں اور رپافیرزم ںی دورہے دنہوسں ںی ر ے mEPہکبج رشموابت اور رولت دنب اپین ی تعنص ےن ذگہتش اپچن ےھچ اسولں ے دوران اینپ زیترتیق اک رفس نار راھک وہا ےہم ، اس تعنص ےن
یل رٹیل 033 وپرا ارتےن ے ےیلرپ اوررہ ک م ے فرر ے ااخب روولتں ی نا ب یلقتنم ینب mEPوایسپ ےشیش ی روولتں ے اناقلب وایسپ اور اامعتسل ںی فاسن ِلبزوردتس رتیق ی ےہ سج ی وہج اق
دمد یل۔ اس ی وہج ے ااکویئں ے اسحب ے ی اسی ڈ اور رولت دنب ںی یت دوونں وقا ںں ںی ھڑے امیپےن رپ ب ہ نانےنرٹیل کت ے وھچےٹ اسزئوں ںی رفایمہ ی وہج ے اے رہش اور داہی 0 ے

3232
SIX YEARS AT A GLANCE ANNEXURE "A" TO THE DIRECTORS' REPORT
2018 2017 2016 2015 2014 2013
Assets employed:Property, plant and equipment 1,362,572 1,001,273 1,014,171 1,055,461 1,074,293 1,077,226 Intangibles and others 63,251 14,004 11,463 7,097 6,702 7,466 Current Assets 999,833 690,979 671,674 618,037 579,853 535,663
2,425,656 1,706,256 1,697,308 1,680,595 1,660,848 1,620,355
Assets financed by:Shareholders' equity includingrevaluation surplus 870,485 771,249 637,422 522,504 404,674 316,905 Long term finances 369,296 154,196 247,379 323,094 125,032 184,732 Deffered Liabilities 236,580 261,565 203,675 176,627 232,324 178,352 Short term finances 636,622 344,120 419,410 375,014 469,994 474,777 Other current liabilities 312,673 175,126 189,422 283,356 428,824 465,589
2,425,656 1,706,256 1,697,308 1,680,595 1,660,848 1,620,355
Profit & Loss:Sales 3,312,401 2,205,360 2,097,028 1,847,868 2,229,897 1,769,998 Cost of Sales 2,904,311 1,848,006 1,754,272 1,562,629 1,832,874 1,518,302 Gross Profit 408,090 357,354 342,756 285,239 397,023 251,696 Operating expenses 152,375 134,726 95,275 119,896 139,045 104,021 Operating profit 255,715 222,628 247,481 165,343 257,978 147,675 Net other income / expenses 55,172 18,404 40,591 6,477 20,417 10,756 Financial charges 66,821 54,302 70,034 103,987 113,873 116,769 Net profit / (loss) before taxation 133,722 149,922 136,856 54,879 123,688 41,662 Taxation 6,681 44,061 34,938 28,404 66,121 39,199 Net profit / (loss) after taxation 127,041 105,861 101,918 26,475 57,567 2,463
Other comprehensive income and Transactions with owners:Other comprehensive income 917 27,965 18,720 20,655 37,651 40,009 Bonus shares 15% 5% 25% - - - Dividend 10% 10% - - - -
Key Financial Ratios:Gross profit 12.32% 16.20% 16.34% 15.44% 17.80% 14.22%Operating profit 7.72% 10.09% 11.80% 8.95% 11.57% 8.95%Profit before tax to net sales 4.04% 6.80% 6.53% 2.97% 5.55% 2.35%Return on capital employed 14.36% 16.36% 15.51% 6.51% 23.57% 8.37%Inventory turnover (times) 12.32 7.57 7.90 8.36 11.16 9.72 Fixed assets turnover (times) 2.32 2.17 2.04 1.74 2.06 1.63 Debt equity ratio 38:62 25:75 34:66 35:65 20:80 28:72 Current ratio 1.05 1.33 1.10 0.94 0.64 0.57 Earnings per share 4.21 3.51 3.55 1.15 2.51 0.11
------- Rupees in ‘000’ -------

33
Annual Report 2018
33
Annual Report 2018
COMPLIANCE WITH CODE OF CORPORATE GOVERNANCEANNEXURE “B” TO THE DIRECTORS’ REPORT
STATEMENT OF DIRECTORS RESPONSIBILITIES
1. The financial statements prepared by the management present fairly its state of affairs, the results of its operations, cash-flows and changes in equity.
2. Proper books of accounts have been maintained.3. Appropriate accounting policies have been consistently applied in preparation of the financial statements and accounting estimates are based
on reasonable and prudent judgment.4. International financial reporting standards, as applicable in Pakistan have been followed in preparation of financial statements and any
departure there-from has been adequately disclosed and explained.5. The system of internal control is sound in design and has been effectively implemented and monitored.6. There are no significant doubts on company’s ability to continue as a going concern.7. There has been no departure from the best practice of corporate governance, as detailed in the listing regulations.
OTHER DISCLOSURES
1. Key operating and financial data for the last six years in summarized form has attached with the directors’ report as Annexure “A”.2. The Company has declared cash dividend @ 10% (2017 – 10%), however bonus shares @ 15% i.e.15 shares on every 100 shares held (2017 –
5%) for the year.3. There are no outstanding statutory payments on account of taxes, levies and charges except of normal and routine nature.4. The company maintains a funded provident fund scheme and a sum of Rs. 9.6 million is invested in various schemes duly approved by Govt of
Pakistan for Provident Fund investment. The Gratuity scheme is un-funded and no investment has been made for that.5. There is no any adverse impact on environment due to the business activity carried by the company.6. On account of “Corporate Social Responsibility” (CSR), donation during the year paid to various charitable organizations & hospitals, please
refer note No. 29.1 of the financial statements for the year ended June 30, 2018.7. During the year, 04 board of Directors, 04 Audit Committee & 04 HR & Remuneration Committee Meetings were held and the attendance of each
director is given below:
a) Board of Directors Meetings: -
Name of Directors No. of Meetings Attended
Mr. Amar Zafar Khan 04Mr. Hussain Jamil 04Mr. Shahid Jamil 01Mr. Ali Jamil 04Ms. Laila Jamil 04Mr. Asad Ali Sheikh 04Mr. Talat Mahmood Sadiq 01Mr. Amjad Awan (Alternate Director of Mr. Talat Mahmood Sadiq) 03Mr. Shahan Ali Jamil (Alternate Director of Mr. Shahid Jamil) 03
b) Audit Committee Meetings: -
Name of Members No. of Meetings Attended
Mr. Asad Ali Sheikh 04Ms. Laila Jamil 04Mr. Amar Zafar Khan 04

3434
c) Human Resource & Remuneration Committee Meetings: -
Name of Members No. of Meetings Attended
Mr. Amar Zafar Khan 01Mr. Hussain Jamil 04Mr. Asad Ali Sheikh 04Mr. Ali Jamil 04Ms. Laila Jamil 04
8. Trading of shares by Directors, Chief Financial Officer & Secretary of the Company during the year 2017-2018 is as under:
Name Designation No. of Shares Acquired / Sold
Mr. Amar Zafar Khan Director NilMr. Hussain Jamil Chief Executive Officer NilMr. Shahid Jamil Director Nil / (40,000)Mr. Ali Jamil Director NilMr. Asad Ali Sheikh Director NilMs. Laila Jamil Director NilMr. Talat Mahmood Sadiq Director NilMr. Amjad Awan (Alternate Director of Mr. Talat Sadiq) NilMr. Shahan Ali Jamil (Alternate Director of Mr. Shahid Jamil) NilMr. Muhammed Ali Adil Chief Financial Officer Nil
AUDITORS:
The present Auditors M/s. Rahman Sarfaraz Rahim Iqbal Rafiq, Chartered Accountants, retire and being eligible have offered themselves for re-appointment for the financial year 2018-19.
For & on behalf of the Board of Directors
ASAD ALI SHEIKH HUSSAIN JAMIL Director Chief Executive Officer
KarachiDated: September 26, 2018

35
Annual Report 2018
35
Annual Report 2018
PATTERN OF SHARE HOLDINGANNEXURE "C" TO THE DIRECTOR'S REPORT
Serial No No. Of Shareholding Shareholders Total Shares Held Percentage %
From To
AS AT JUNE 30,2018
1 419 1 100 14,581 0.05%
2 858 101 500 239,306 0.79%
3 319 501 1000 230,978 0.77%
4 716 1001 5000 1,476,018 4.89%
5 94 5001 10000 686,182 2.28%
6 38 10001 15000 456,667 1.51%
7 25 15001 20000 453,547 1.50%
8 19 20001 25000 428,317 1.42%
9 8 25001 30000 220,385 0.73%
10 5 30001 35000 165,043 0.55%
11 5 35001 40000 188,799 0.63%
12 3 40001 45000 129,540 0.43%
13 1 45001 50000 49,000 0.16%
14 3 50001 55000 157,581 0.52%
15 1 55001 60000 58,660 0.19%
16 1 60001 65000 62,850 0.21%
17 2 65001 70000 140,000 0.46%
18 1 70001 75000 70,257 0.23%
19 2 75001 80000 155,608 0.52%
20 1 80001 85000 84,298 0.28%
21 2 95001 100000 200,000 0.66%
22 1 100001 105000 105,000 0.35%
23 1 105001 110000 110,000 0.36%
24 1 115001 120000 119,328 0.40%
25 1 120001 125000 120,500 0.40%
26 1 130001 135000 134,813 0.45%
27 1 145001 150000 150,000 0.50%
28 1 230001 235000 230,827 0.77%
29 1 235001 240000 240,000 0.80%
30 1 245001 250000 250,000 0.83%
31 1 280001 285000 280,710 0.93%
32 1 360001 365000 362,521 1.20%
33 1 400001 405000 401,021 1.33%
34 1 535001 5400000 535,595 1.78%
35 1 905001 9100000 908,874 3.01%
36 1 1780001 1785000 1,784,033 5.92%
37 1 1855001 1860000 1,857,448 6.16%
38 1 2225001 2230000 2,227,374 7.39%
39 1 2460001 2465000 2,461,625 8.16%
40 1 2880001 2885000 2,880,625 9.55%
41 1 3890001 4500000 4,144,235 13.74%
42 1 4500001 5500000 5,185,125 17.19%
2544 Total Shares Held 30,157,271 100.00%

3636
Categories of Shareholders S.No Name
Number of Share Holders
Total Shares Held
Percentage
1 Associated Companies, undertaking and related parties NIL NIL 0.00%
2 Banks, Development Financial Institutions & Non
Banking Financial Institutions:-
National Development Fin.Corp.Investor 1 9,121 0.030%
National Bank of Pakistan 1 311 0.001%
Sub-Total: 2 9,432 0.031%
3 Directors, Chief Executive Officer, and their
Spouse and Minor Children:-
Mr. Hussain Jamil 1 5,185,125 17.194%
Mr. Shahid Jamil 1 942,199 3.124%
Mr. Ali Jamil 1 22,275 0.074%
Mr. Talat Mahmood Sadiq 1 500 0.002%
Mr. Amar Zafar Khan 1 647 0.002%
Mr. Asad Ali Sheikh 1 647 0.002%
Mr. Amjad Awan 1 647 0.002%
Ms. Laila Jamil 1 647 0.002%
Mrs. Deborah Jamil 1 6,736 0.022%
Sub-Total: 9 6,159,423 20.424%
4 Modarabas And Mutual Funds:-
Prudential Stock Fund Ltd. 2 150,192 0.498%
Modaraba Al-Mali 1 19,443 0.064%
CDC - Trustee NAFA Islamic Stock Fund 1 1,811 0.006%
Sub-Total: 4 171,446 0.569%
5 NIT AND ICP
M/S. Investment Corporation Of Pakistan 1 122 0.000%
Sub-Total: 1 122 0.000%
6 Foreign Investors:-
M/S Somers Nominee (Far East) Limited 1 8,089 0.027%
Sub-Total: 1 8,089 0.027%

37
Annual Report 2018
37
Annual Report 2018
S.No NameNumber of
Share HoldersTotal Shares
HeldPercentage
Categories of Shareholders
7 Others
Margalla Financial (Private) Limited 1 15,000 0.050%
Dr. Arslan Razaque Securities (Smc-Pvt) 1 1,393 0.005%
Akhai Securities (Private) Limited 1 648 0.002%
Fikree'S (Pvt) Ltd. 1 22,050 0.073%
Zillion Capital Securities (Pvt.) Ltd. 1 70,000 0.232%
Prudential Securities Limited 2 785 0.003%
M/S. Freedom Enterprises (Pvt) Ltd. 1 3,264 0.011%
Maple Leaf Capital Limited 1 1 0.000%
Muhammad Ahmed Nadeem Securities (Smc-Pvt) 1 653 0.002%
Federal Board Of Revenue 1 362,521 1.202%
S.A. Prosperity (Pvt.) Ltd. 1 49,000 0.162%
Aba Ali Habib Securities (Pvt) Ltd 1 2,000 0.007%
Mam Securities (Pvt) Limited 1 128 0.000%
Ghani Gases Employees Provident Fund 1 10,000 0.033%
Horizon Securities Limited - Mf 1 10,000 0.033%
Amanah Investments Limited 1 1,003 0.003%
Multiline Securities (Pvt) Limited - Mf 1 37,000 0.123%
Arif Habib Limited - Mf 1 10,000 0.033%
Sakarwala Capital Securities (Private) Limited - Mf 1 6,500 0.022%
Mra Securities Limited - Mf 1 9,000 0.030%
Dawood Equities Limited- Mf 1 5,000 0.017%
Market 786 (Private) Limited - Mf 1 240,000 0.796%
Y.S. Securities (Private) Limited 1 907 0.003%
Sub-Total: 24 856,853 2.841%
8 Individual
Local - Individuals 2,503 22,951,906 76.107%
Sub-Total: 2,503 22,951,906 76.107%
Grand Total: 2,544 30,157,271 100%
Share holding 5% or more voting interest
Hussain Jamil 1 5,185,125 17.194%
Ahsan Jamil 1 4,144,235 13.742%
Munaf Ibrahim 1 2,880,625 9.552%
Abdul Sameer 1 2,461,625 8.163%
Talat Iqbal 1 2,227,374 7.386%
Shahzad 1 1,857,448 6.159%
Hanif Khanani 1 1,784,033 5.916%
Total 7 20,540,465 68.111%

3838
INDEPENDENT AUDITOR’S REVIEW REPORTTO THE MEMBERS OF ECOPACK LIMITED
Review report on the statement of compliance contained in listed Companies (code of corporate governance) regulations, 2017
We have reviewed the enclosed Statement of Compliance with the Listed Companies (Code of Corporate Governance) Regulations, 2017 (the
Regulations) prepared by the Board of Directors of Ecopack Limited (the Company) for the year ended June 30, 2018 in accordance with the
requirements of regulation 40 of the Regulations.
The responsibility for compliance with the Regulations is that of the Board of Directors of the Company. Our responsibility is to review whether the
Statement of Compliance reflects the status of the Company’s compliance with the provisions of the Regulations and report if it does not and to
highlight any non-compliance with the requirements of the Regulations. A review is limited primarily to inquiries of the Company’s personnel and
review of various documents prepared by the Company to comply with the Regulations.
As a part of our audit of the financial statements we are required to obtain an understanding of the accounting and internal control systems sufficient
to plan the audit and develop an effective audit approach. We are not required to consider whether the Board of Directors’ statement on internal
control covers all risks and controls or to form an opinion on the effectiveness of such internal controls, the Company’s corporate governance
procedures and risks.
The Regulations require the Company to place before the Audit Committee, and upon recommendation of the Audit Committee, place before the
Board of Directors for their review and approval, its related party transactions and also ensure compliance with the requirements of section 208

39
Annual Report 2018
39
Annual Report 2018
of the Companies Act, 2017. We are only required and have ensured compliance of this requirement to the extent of the approval of the related
party transactions by the Board of Directors upon recommendation of the Audit Committee. We have not carried out procedures to assess and
determine the Company’s process for identification of related parties and that whether the related party transactions were undertaken at arm’s length
price or not.
Based on our review, nothing has come to our attention which causes us to believe that the Statement of Compliance does not appropriately reflect
the Company's compliance, in all material respects, with the requirements contained in the Regulations as applicable to the Company for the year
ended June 30, 2018.
Karachi Rahman Sarfaraz Rahim Iqbal RafiqDated: September 26, 2018 Chartered Accountants
4040
INDEPENDENT AUDITORS’ REPORT
To the members of EcoPack Limited
Report on the Audit of the Financial Statements
Opinion
We have audited the annexed financial statements of EcoPack Limited (the Company), which comprise the statement of financial position as at June 30, 2018, and the statement of profit or loss, the statement of comprehensive income, the statement of changes in equity, the statement of cash flows for the year then ended, and notes to the financial statements, including a summary of significant accounting policies and other explanatory information (‘the financial statements’), and we state that we have obtained all the information and explanations which, to the best of our knowledge and belief, were necessary for the purposes of the audit.
In our opinion and to the best of our information and according to the explanations given to us, the statement of financial position, statement of profit or loss, the statement of comprehensive income, the statement of changes in equity and the statement of cash flows together with the notes forming part thereof conform with the accounting and reporting standards as applicable in Pakistan and give the information required by the Companies Act, 2017 (XIX of 2017), in the manner so required and respectively give a true and fair view of the state of the Company’s affairs as at June 30, 2018 and of the profit or loss and other comprehensive income, the changes in equity and its cash flows for the year then ended.
Basis for Opinion
We conducted our audit in accordance with International Standards on Auditing (ISAs) as applicable in Pakistan. Our responsibilities under those standards are further described in the Auditor’s Responsibilities for the Audit of the Financial Statements section of our report. We are independent of the Company in accordance with the International Ethics Standards Board for Accountants’ Code of Ethics for Professional Accountants as adopted by the Institute of Chartered Accountants of Pakistan / Institute of Cost and Management Accountants (the Code) and we have fulfilled our other ethical responsibilities in accordance with the Code. We believe that the audit evidence we have obtained is sufficient and appropriate to provide a basis for our opinion.
Key Audit Matter(s)
Key audit matters are those matters that, in our professional judgment, were of most significance in our audit of the financial statements of the current period. These matters were addressed in the context of our audit of the financial statements as a whole, and in forming our opinion thereon, and we do not provide a separate opinion on these matters.
AUDITORS' REPORT TO THE MEMBERS

41
Annual Report 2018
41
Annual Report 2018
Following are the key audit matter(s):
S. No Key audit matter(s) How our audit addressed the key audit matter
01. Preparation of financial statements under Companies Act, 2017
As disclosed in note 2.1 and 44 to the accompanying financial statements, the Companies Act, 2017 (the Act) and fourth schedule to the Companies Act, 2017 became applicable for the first time for the preparation of the Company’s annual financial statements for the year ended 30 June 2018. Previously these financial statements used to be prepared as per the requirement of fourth schedule to the Companies Ordinance, 1984. The Act forms an integral part of the statutory financial reporting framework as applicable to the Company and amongst others, prescribes the nature and content of the disclosures in relation to various elements of the financial statements.In the case of the Company, specific additional disclosures and changes to the existing disclosures have been included in the financial statements as referred to in note 5 to the accompanying financial statements.The aforementioned changes and enhancements in the financial statements are considered important and a key audit matter because of the significance of the changes incorporated in the financial statements resulting from the transition to the new reporting requirements under the Act.
We reviewed the requirements of the Fourth schedule to the Act and carried out the following audit procedures to ensure that the financial statements were prepare in accordance with new requirements:
∫ As part of transition to new requirements, the management performed a gap analysis to identify additional requirements of disclosure for the current financial reporting framework. We reviewed the management’s process to identify the necessary amendments required in the Company’s financial statements;
∫ We evaluated the results of management’s analysis and key decisions taken in respect of the transition; and
∫ We assessed the adequacy and appropriateness of the additional disclosures made in the annexed financial statements based on the new requirements.
02. Implementation of (SAP) software
As disclosed in note 44, the Company replaced its current Enterprise Resource Planning Software (Sidat Hyder Financials) with new Enterprise Resource Planning Software named Systems Applications and Products (SAP) with effect from 01, Jan, 2018. The inherent risk and control risk in shifting data from old system to new system required assessment of the risk and controls of the new automated software as to whether these are appropriately designed and are also operating effectively.
We carried out the following audit procedure on the system to obtain reasonable assurance over the adequacy of the controls, and to address this significant risk.
∫ Initially we obtained an understanding of new management information system. We performed test on general IT controls around system access and controls over computer operations within specific application.
∫ We reviewed the methodology followed for transfer of data from old system to new system and also reviewed the resultant information produced by the new system as to its accuracy
∫ We performed test to check that on opening balances in new system matched / agreed with closing balances of old system.
Information Other than the Financial Statements and Auditor’s Report Thereon
Management is responsible for the other information. The other information comprises the information in the annual report including, in particular, the Chairman’s Review, Director’s Report, Financial and Business Highlights, Graphical Representation and Horizontal and Vertical Analysis of Financial Statements, but does not include the financial statements and our auditor’s report thereon.
Our opinion on the financial statements does not cover the other information and we do not express any form of assurance conclusion thereon.
In connection with our audit of the financial statements, our responsibility is to read the other information and, in doing so, consider whether the other information is materially inconsistent with the financial statements or our knowledge obtained in the audit or otherwise appears to be materially misstated. If, based on the work we have performed, we conclude that there is a material misstatement of this other information, we are required to report that fact. We have nothing to report in this regard.

4242
Responsibilities of Management and Board of Directors for the Financial Statements
Management is responsible for the preparation and fair presentation of the financial statements in accordance with the accounting and reporting standards as applicable in Pakistan and the requirements of Companies Act, 2017 (XIX of 2017) and for such internal control as management determines is necessary to enable the preparation of financial statements that are free from material misstatement, whether due to fraud or error.
In preparing the financial statements, management is responsible for assessing the Company’s ability to continue as a going concern, disclosing, as applicable, matters related to going concern and using the going concern basis of accounting unless management either intends to liquidate the Company or to cease operations, or has no realistic alternative but to do so.
Board of directors are responsible for overseeing the Company’s financial reporting process.
Auditor’s Responsibilities for the Audit of the Financial Statements
Our objectives are to obtain reasonable assurance about whether the financial statements as a whole are free from material misstatement, whether due to fraud or error, and to issue an auditor’s report that includes our opinion. Reasonable assurance is a high level of assurance, but is not a guarantee that an audit conducted in accordance with ISAs as applicable in Pakistan will always detect a material misstatement when it exists. Misstatements can arise from fraud or error and are considered material if, individually or in the aggregate, they could reasonably be expected to influence the economic decisions of users taken on the basis of these financial statements.
As part of an audit in accordance with ISAs as applicable in Pakistan, we exercise professional judgment and maintain professional scepticism throughout the audit. We also:
• Identify and assess the risks of material misstatement of the financial statements, whether due to fraud or error, design and perform audit procedures responsive to those risks, and obtain audit evidence that is sufficient and appropriate to provide a basis for our opinion. The risk of not detecting a material misstatement resulting from fraud is higher than for one resulting from error, as fraud may involve collusion, forgery, intentional omissions, misrepresentations, or the override of internal control.
• Obtain an understanding of internal control relevant to the audit in order to design audit procedures that are appropriate in the circumstances, but not for the purpose of expressing an opinion on the effectiveness of the Company’s internal control.
• Evaluate the appropriateness of accounting policies used and the reasonableness of accounting estimates and related disclosures made by management.
• Conclude on the appropriateness of management’s use of the going concern basis of accounting and, based on the audit evidence obtained, whether a material uncertainty exists related to events or conditions that may cast significant doubt on the Company’s ability to continue as a going concern. If we conclude that a material uncertainty exists, we are required to draw attention in our auditor’s report to the related disclosures in the financial statements or, if such disclosures are inadequate, to modify our opinion. Our conclusions are based on the audit evidence obtained up to the date of our auditor’s report. However, future events or conditions may cause the Company to cease to continue as a going concern.
• Evaluate the overall presentation, structure and content of the financial statements, including the disclosures, and whether the financial statements represent the underlying transactions and events in a manner that achieves fair presentation.
We communicate with the board of directors regarding, among other matters, the planned scope and timing of the audit and significant audit findings, including any significant deficiencies in internal control that we identify during our audit.
We also provide the board of directors with a statement that we have complied with relevant ethical requirements regarding independence, and to communicate with them all relationships and other matters that may reasonably be thought to bear on our independence, and where applicable, related safeguards.
From the matters communicated with the board of directors, we determine those matters that were of most significance in the audit of the financial statements of the current period and are therefore the key audit matters. We describe these matters in our auditor’s report unless law or regulation precludes public disclosure about the matter or when, in extremely rare circumstances, we determine that a matter should not be communicated in our report because the adverse consequences of doing so would reasonably be expected to outweigh the public interest benefits of such communication.
43
Annual Report 2018
43
Annual Report 2018
Report on Other Legal and Regulatory Requirements
Based on our audit, we further report that in our opinion:
a) proper books of account have been kept by the Company as required by the Companies Act, 2017 (XIX of 2017);
b) the statement of financial position, the statement of profit or loss, the statement of comprehensive income, the statement of changes in equity and the statement of cash flows together with the notes thereon have been drawn up in conformity with the Companies Act, 2017 (XIX of 2017) and are in agreement with the books of account and returns;
c) investments made, expenditure incurred and guarantees extended during the year were for the purpose of the Company’s business; and
d) zakat was deductible at source under the Zakat and Ushr Ordinance, 1980 (XVIII of 1980), was deducted by the company and deposited in the Central Zakat Fund established under section 7 of that Ordinance; and
The engagement partner on the audit resulting in this independent auditor’s report is Mr. Muhammad Rafiq Dosani.
Rahman Sarfaraz Rahim Iqbal RafiqChartered Accountants
KarachiDated: September 26, 2018

4444
Statement of Financial PositionAs at June 30, 2018
2018 2017 ASSETS Notes ------- Rupees in ‘000’ -------
Non-Current AssetsProperty, plant and equipment 6 1,362,572 1,001,273 Security deposits 7 55,849 7,512 Intangibles 8 7,402 6,492
1,425,823 1,015,277 Current AssetsStores, spares and loose tools 9 58,673 56,235 Stock in trade 10 224,659 246,650 Trade debts 11 454,623 149,400 Short term investments - 36,000 Loans and advances 12 61,510 53,748 Deposits, prepayments and other receivables 9,387 16,877 Taxation - net 111,248 109,127 Cash and bank balances 13 79,733 22,942
999,833 690,979 Total assets 2,425,656 1,706,256
EQUITY AND LIABILITIES
Share capital and reservesAuthorized capital50,000,000 (2017: 50,000,000) ordinaryshares of Rs.10/- each 500,000 500,000
Issued, subscribed and paid-up capital 14 301,573 287,212 Surplus on revaluation of property and plant 15 161,552 175,887 Accumulated profit 407,360 308,150
870,485 771,249 Non-Current LiabilitiesLong term loans 16 60,746 145,223 Liabilities against assets subject to finance lease 17 308,550 8,973 Deferred liabilities 18 236,580 261,565
605,876 415,761 Current LiabilitiesTrade and other payables 19 297,597 165,715 Unclaimed dividend 1,302 461 Accrued mark - up 20 13,774 8,950 Short term borrowings 21 479,481 241,898 Current portion of non-current liabilities 22 157,141 102,222
949,295 519,246 Contingencies and commitments 23
2,425,656 1,706,256
The annexed notes 1 to 46 form an integral part of these financial statements.
DIRECTOR CHIEF FINANCIAL OFFICER CHIEF EXECUTIVE OFFICER

45
Annual Report 2018
45
Annual Report 2018
Statement of Profit or lossFor the year ended June 30, 2018
2018 2017 Notes ----- Rupees in ‘000’ ------
Sales - net 24 3,312,401 2,205,360
Cost of sales 25 (2,904,311) (1,848,006)
Gross profit 408,090 357,354
Distribution cost 26 (68,661) (64,113)
Administrative expenses 27 (83,714) (70,613) (152,375) (134,726)
Profit from operations 255,715 222,628
Other income - net 28 39,800 37,691
Other expenses 29 (94,972) (56,095) (55,172) (18,404)
Finance cost 30 (66,821) (54,302)
Profit before taxation 133,722 149,922
Taxation 31 (6,681) (44,061)
Profit after taxation 127,041 105,861
---------- Rupees ----------
Earnings per share - basic and diluted 32 4.21 3.51
The annexed notes 1 to 46 form an integral part of these financial statements.
DIRECTOR CHIEF FINANCIAL OFFICER CHIEF EXECUTIVE OFFICER

4646
Statement of Comprehensive Income For the year ended June 30, 2018
Re-stated
2018 2017
Note -----Rupees in ‘000’ -----
Profit after taxation 127,041 105,861
Other comprehensive income
Items related to revaluation surplus
- Gain on revaluation of property and plant during the year - net of tax - 27,688
- Effect of revalued assets disposed off - net of tax (1,373) (92)
- Effect of change of tax rate related to deferred tax on
revaluation surplus 2,154 3,970
781 31,566
Items related to defined benefit obligation
- Remeasurements of defined benefit plan 18.1.4 192 (5,143)
- Deferred tax on remeasurements of defined benefit plan (56) 1,542
136 (3,601)
Total comprehensive income for the year 127,958 133,826
The annexed notes 1 to 46 form an integral part of these financial statements.
DIRECTOR CHIEF FINANCIAL OFFICER CHIEF EXECUTIVE OFFICER

47
Annual Report 2018
47
Annual Report 2018
Statement of Changes In Equity For the year ended June 30, 2018
Issued, subscribed
and paid-up capital
Revaluation reserve
Retained earnings
Total Equity
------------------------ (Rupees in ‘000’) --------------------
Balance as at July 01, 2016 229,770 - 249,747 479,517
Impact of change in accounting
policy (Note 5) - 157,905 - 157,905
Restated balance as at July 01, 2016 229,770 157,905 249,747 637,422
Total comprehensive income for the year
- Profit after taxation - - 105,861 105,861
- Other comprehensive income for the year - 31,566 (3,601) 27,965
- 31,566 102,260 133,826
Transfer of incremental depreciation to
retained earnings - (13,584) 13,584 -
Transaction with owners
- Issuance of bonus shares 57,442 - (57,442) -
Restated balance as at June 30, 2017 287,212 175,887 308,149 771,248
Total comprehensive income for the year
- Profit after taxation - - 127,041 127,041
- Other comprehensive income for the year - 781 136 897
- 781 127,177 127,938
Transfer of incremental depreciation to
retained earnings - (15,116) 15,116 -
Transaction with owners
- Issuance of bonus shares 14,361 - (14,361) -
- Final dividend @ 10% for the year ended 30 June 2017 - - (28,721) (28,721)
Balance as at June 30, 2018 301,573 161,552 407,360 870,485
The annexed notes 1 to 46 form an integral part of these financial statements.
DIRECTOR CHIEF FINANCIAL OFFICER CHIEF EXECUTIVE OFFICER

4848
Statement of Cash Flows For the year ended June 30, 2018
2018 2017 Notes ------ Rupees in ‘000’ -------
CASH FLOWS FROM OPERATING ACTIVITIESProfit before taxation 133,722 149,922
Adjustment for non-cash charges and other items:Depreciation and amortization 119,816 107,283 (Gain) on disposal of property, plant and equipment (554) (5,004)Provision for Workers’ Profits Participation Fund 7,285 8,139 Provision for Workers’ Welfare Fund 4,700 4,709 Fixed assets written off - 8,187 Other assets written off 5,188 -Provision for doubtful debts / doubtful debts written off (10,580) 7,338 Provision for impaired operating assets / capital work in progress 25,973 430 Provision for stock in trade 32,022 - Provision for gratuity 16,558 12,584 Finance cost 66,821 54,302
400,951 347,890 Working capital changes(Increase) / decrease in stores, spares and loose tools (2,438) 6,240 (Increase) in stock in trade (10,031) (5,226)(Increase) / decrease in trade debts (294,643) 1,570 (Increase) in loans and advances (7,762) (3,861)Decrease in deposits, prepayments and other receivables 7,490 16,652 Increase / (decrease) in trade and other payables 127,557 (12,230)
(179,827) 3,145 Cash generated from operations 221,124 351,035 Finance cost paid (61,218) (51,039)Gratuity paid (2,360) (1,229)Workers’ Profit Participation Fund paid (8,139) (7,436)Workers’ Welfare Fund paid (4,709) (4,418)Taxes paid (44,966) (51,449)Increase in security deposits (48,337) (1,448)Net cash generated from operating activities 51,395 234,016
CASH FLOWS FROM INVESTING ACTIVITIESPurchase of property, plant and equipment (507,184) (71,057)Proceeds from disposal of property, plant and equipment 753 5,816 Additions in intangible assets (3,115) (1,218)Net cash (used in) investing activities (509,546) (66,459)
CASH FLOWS FROM FINANCING ACTIVITIESLeases acquired during the year 366,397 9,727 Payments against lease obligations (3,466) (1,468)Dividend paid (27,880) - Repayment of long term loans (101,182) (74,933)Long term loans obtained 7,491 - Net cash (used in) financing activities 241,359 (66,674)Net increase / (decrease) in cash and cash equivalents (216,792) 100,883 Cash and cash equivalents at the beginning of the year (182,956) (283,839)
Cash and cash equivalents at the end of the year 33 (399,748) (182,956)
The annexed notes 1 to 46 form an integral part of these financial statements.
DIRECTOR CHIEF FINANCIAL OFFICER CHIEF EXECUTIVE OFFICER

49
Annual Report 2018
49
Annual Report 2018
Notes To The Financial Statements For the year ended June 30, 2018
1. STATUS AND NATURE OF BUSINESS
Ecopack Limited (the Company) is a limited liability Company incorporated in Pakistan and is listed on Pakistan Stock Exchange Limited. The registered office and manufacturing facility of the Company is located at Hattar Industrial Estate, Khyber Pakhtunkhwa. The principal business activity of the Company is manufacturing and sale of Polyethylene Terephthalate (PET) bottles and preforms for the market of Beverages and other liquid packaging industry.
Geographical location and address of business unit / plant:
Hattar Purpose
Plot - 112,113, Phase V, Hattar Industrial Estate, Hattar, KPK Registered office and factory
Rawalpindi Purpose
19, Citivillas Near High Court Road Head Office
Karachi Purpose
Suite # 306, 3rd Floor, Clifton Diamond, Block - 4, Clifton Administration Office
2. BASIS OF PREPARATION
2.1 Statement of compliance
These financial statements have been prepared in accordance with the accounting and reporting standards as applicable in Pakistan. The accounting and reporting standards comprise of:
- International Financial Reporting Standards (IFRS Standards) issued by the International Accounting Standards Board (IASB) as are notified under the Companies Act, 2017 (the Act), and
- provisions of and directives issued under the Companies Act, 2017.
- Where provisions of and directives issued under the Companies Act, 2017 differ from the IFRS Standards, the provisions of and directives issued under the Companies Act, 2017 have been followed.
2.2 Basis of measurement
These financial statements have been prepared under the historical cost convention except property, plant and machinery have been car-ried at revalued amount and certain employee retirement benefits carried at present value.
2.3 Functional and presentation currency
These financial statements are presented in Pakistan Rupees which is the functional and presentation currency of the Company.
2.4 Use of estimates and judgments
The preparation of financial statements in conformity with approved accounting standards, as applicable in Pakistan, requires management to make judgments, estimates and assumptions that affect the application of policies and the reported amounts of assets, liabilities, income and expenses.
5050
Notes To The Financial Statements For the year ended June 30, 2018
The estimates and associated assumptions are based on historical experience and various other factors that are believed to be reasonable under the circumstances, the results of which form the basis of making judgments about the carrying values of assets and liabilities that are not readily apparent from other sources. Actual results may differ from these estimates.
The estimates and underlying assumptions are reviewed on an ongoing basis. Revisions to accounting estimates are recognized in the period in which the estimate is revised if the revision affects only that period, or in the period of the revision and future periods if the revision affects both current and future periods. Areas where various assumptions and estimates are significant to the financial statements or where judgments were exercised in application of accounting policies are as follows:
Note
i) Useful life and residual values of property, plant and equipment 4.1
ii) Useful life and amortization of Intangible assets 4.2
iii) Provision for slow moving and obsolete store, spares and loose tools 4.3
iv) Provision for slow moving and obsolete stock in trade 4.4
v) Provision for doubtful debts 4.5
vi) Classification, recognition, measurement and derecognition of financial instruments 4.6
vii) Provision for staff retirement benefits 4.7
viii) Provision for taxation 4.8
3. STANDARDS, AMENDMENTS OR INTERPRETATIONS TO EXISTING STANDARD AND FORTHCOMING REQUIREMENTS:
3.1 New and amended standards and interpretations to published approved accounting standards that are effective in the current year
The following amendments to existing standards and interpretations have been published and are mandatory for accounting periods beginning on or after July 1, 2017 and are considered to be relevant to the Company’s financial statements:
IAS 7, 'Statement of cash flows' amendments introduce an additional disclosure that will enable users of financial statements to evaluate changes in liabilities arising from financing activities. The amendment is part of the IASB's disclosure initiative, which continues to explore how financial statement disclosure can be improved.
The Companies Act, 2017 (the Act) has also brought certain changes with regard to preparation and presentation of annual and interim financial statements of the Company. These changes also include change in respect of recognition criteria of revaluation surplus of property, plant and equipment as more fully explained in note 6, change in nomenclature of primary statements, etc.
Further, the disclosure requirements contained in the fourth schedule to the Act have been revised, resulting in the:
- elimination of duplicative disclosures with the IFRS disclosure requirements; and
- incorporation of significant additional disclosures.
3.2 New and amended standards and interpretations to published approved accounting standards that are not yet effective in the current year
The following International Financial Reporting Standards (IFRS Standards) as notified under the Companies Act, 2017 and the amendments and interpretations thereto will be effective for accounting periods beginning on or after the dates specified below:

51
Annual Report 2018
51
Annual Report 2018
Notes To The Financial Statements For the year ended June 30, 2018
- Classification and Measurement of Share-based Payment Transactions - amendments to IFRS 2 clarify the accounting for certain types of arrangements and are effective for annual periods beginning on or after 1 January 2018. The amendments cover three accounting areas (a) measurement of cash-settled share-based payments; (b) classification of share-based payments settled net of tax withholdings; and (c) accounting for a modification of a share-based payment from cash-settled to equity-settled. The new requirements could affect the classification and/or measurement of these arrangements and potentially the timing and amount of expense recognized for new and outstanding awards. The amendments are not likely to have an impact on the Company’s financial statements.
- Transfers of Investment Property (Amendments to IAS 40 ‘Investment Property’ -effective for annual periods beginning on or after 1 January 2018) clarifies that an entity shall transfer a property to, or from, investment property when, and only when there is a change in use. A change in use occurs when the property meets, or ceases to meet, the definition of investment property and there is evidence of the change in use. In isolation, a change in management's intentions for the use of a property does not provide evidence of a change in use. The amendments are not likely to have an impact on the Company’s financial statements.
- Annual Improvements to IFRSs 2014-2016 Cycle [Amendments to IAS 28 ‘Investments in Associates and Joint Ventures’] (effective for annual periods beginning on or after 1 January 2018) clarifies that a venture capital organization and other similar entities may elect to measure investments in associates and joint ventures at fair value through profit or loss, for each associate or joint venture separately at the time of initial recognition of investment. Furthermore, similar election is available to non-investment entity that has an interest in an associate or joint venture that is an investment entity, when applying the equity method, to retain the fair value measurement applied by that investment entity associate or joint venture to the investment entity associate's or joint venture's interests in subsidiaries. This election is made separately for each investment entity associate or joint venture. The amendments are not likely to have an impact on the Company’s financial statements.
- IFRIC 22 ‘Foreign Currency Transactions and Advance Consideration’ (effective for annual periods beginning on or after 1 January 2018) clarifies which date should be used for translation when a foreign currency transaction involves payment or receipt in advance of the item it relates to. The related item is translated using the exchange rate on the date the advance foreign currency is received or paid and the prepayment or deferred income is recognized. The date of the transaction for the purpose of determining the exchange rate to use on initial recognition of the related asset, expense or income (or part of it) would remain the date on which receipt of payment from advance consideration was recognized. If there are multiple payments or receipts in advance, the entity shall determine a date of the transaction for each payment or receipt of advance consideration. The application of interpretation is not likely to have an impact on the Company’s financial statements.
- IFRIC 23 ‘Uncertainty over Income Tax Treatments’ (effective for annual periods beginning on or after 1 January 2019) clarifies the accounting for income tax when there is uncertainty over income tax treatments under IAS 12. The interpretation requires the uncertainty over tax treatment be reflected in the measurement of current and deferred tax. The application of interpretation is not likely to have an impact on the Company’s financial statements.
- IFRS 15 ‘Revenue from Contracts with Customers’ (effective for annual periods beginning on or after 1 July 2018). IFRS 15 establishes a comprehensive framework for determining whether, how much and when revenue is recognized. It replaces existing revenue recognition guidance, including IAS 18 ‘Revenue’, IAS 11 ‘Construction Contracts’ and IFRIC 13 ‘Customer Loyalty Programmes’. The Company is currently in the process of analyzing the potential impact of changes required in its revenue recognition policies on adoption of the standard.
- IFRS 9 ‘Financial Instruments’ and amendment – Prepayment Features with Negative Compensation (effective for annual periods beginning on or after 1 July 2018 and 1 January 2019 respectively). IFRS 9 replaces the existing guidance in IAS 39 Financial Instruments: Recognition and Measurement. IFRS 9 includes revised guidance on the classification and measurement of financial instruments, a new expected credit loss model for calculating impairment on financial assets, and new general hedge accounting requirements. It also carries forward the guidance on recognition and derecognition of financial instruments from IAS 39. The Company is currently in the process of analyzing the potential impact of changes required in classification and measurement of financial instruments and the impact of expected loss model on adoption of the standard.
- IFRS 16 ‘Leases’ (effective for annual period beginning on or after 1 January 2019). IFRS 16 replaces existing leasing guidance, including IAS 17 ‘Leases’, IFRIC 4 ‘Determining whether an Arrangement contains a Lease’, SIC 15 ‘Operating Leases- Incentives’ and SIC-27 ‘Evaluating the Substance of Transactions Involving the Legal Form of a Lease’. IFRS 16 introduces a single, on-balance sheet lease accounting model for lessees. A lessee recognizes a right-of-use asset representing its right to use the underlying asset and a lease liability representing its obligation to make lease payments. There are recognition exemptions for short-term leases and leases of low-value items. Lessor accounting remains similar to the current standard i.e. lessors continue to classify leases as finance or operating leases. The Company is currently in the process of analyzing the potential impact of its lease arrangements that will result in recognition of right to use assets and liabilities on adoption of the standard.
5252
- Amendment to IAS 28 ‘Investments in Associates and Joint Ventures’ - Long Term Interests in Associates and Joint Ventures (effective for annual period beginning on or after 1 January 2019). The amendment will affect companies that finance such entities with preference shares or with loans for which repayment is not expected in the foreseeable future (referred to as long-term interests or ‘LTI’). The amendment and accompanying example state that LTI are in the scope of both IFRS 9 and IAS 28 and explain the annual sequence in which both standards are to be applied. The amendments are not likely to have an impact on the Company’s financial statements.
- Amendments to IAS 19 ‘Employee Benefits’- Plan Amendment, Curtailment or Settlement (effective for annual periods beginning on or after 1 January 2019). The amendments clarify that on amendment, curtailment or settlement of a defined benefit plan, a company now uses updated actuarial assumptions to determine its current service cost and net interest for the period; and the effect of the asset ceiling is disregarded when calculating the gain or loss on any settlement of the plan and is dealt with separately in other comprehensive income. The application of amendments is not likely to have an impact on the Company’s financial statements.
Annual Improvements to IFRS Standards 2015–2017 Cycle - the improvements address amendments to following approved accounting standards:
- IFRS 3 ''Business Combinations" and IFRS 11 "Joint Arrangement" - the amendment aims to clarify the accounting treatment when a company increases its interest in a joint operation that meets the definition of a business. A company remeasures its previously held interest in a joint operation when it obtains control of the business. A company does not remeasure its previously held interest in a joint operation when it obtains joint control of the business.
- IAS 12 "Income Taxes" - the amendment clarifies that all income tax consequences of dividends (including payments on financial instruments classified as equity) are recognized consistently with the transaction that generates the distributable profits.
- IAS 23 "Borrowing Costs" - the amendment clarifies that a company treats as part of general borrowings any borrowing originally made to develop an asset when the asset is ready for its intended use or sale.
The above amendments are effective for annual periods beginning on or after 1 January 2019 and are not likely to have an impact on the Company’s financial statements.
4. SUMMARY OF SIGNIFICANT ACCOUNTING POLICIES
The significant accounting policies adopted in the preparation of these financial statements are set out below. These policies have been consistently applied to all the years presented, unless otherwise stated.
4.1 Property, plant and equipment
Owned
These are stated at cost less accumulated depreciation and accumulated impairment loss, if any except for free hold land, factory building and plant and machinery which are stated at revalued amount less accumulated depreciation and accumulated loss, if any. Cost of an asset comprises acquisition and other costs which are directly attributable to the asset.
Capital work-in-progress is stated at cost less accumulated impairment losses, if any. All expenditures connected to the specific assets incurred during installation and construction period are carried under capital work-in-progress. These are transferred to specified assets as and when assets are available for use.
Notes To The Financial Statements For the year ended June 30, 2018

53
Annual Report 2018
53
Annual Report 2018
Any surplus arising on revaluation of plant and machinery is credited to the surplus on revaluation account. Revaluation is carried out with sufficient regularity to ensure that the carrying amount of assets does not differ materially from the fair value. To the extent of the incremental depreciation charged on the revalued assets, the related surplus on revaluation of plant and machinery (net of deferred taxation) is transferred directly to retained earning / unappropriated profit.
Subsequent costs are included in the asset's carrying amounts or recognized as a separate assets, as appropriate, only when it is probable that future economic benefits associated with the item will flow to the Company and the cost of the item can be measured reliably.
An item of property, plant and equipment is derecognized upon disposal or when no future economic benefits are expected from its use or disposal. Any gain or loss arising on derecognition of the asset (calculated as the difference between the net disposal proceeds and the carrying amount of the asset) is included in the statement of profit or loss in the year in which the asset is derecognized. The related balance of surplus on revaluation of such item, if any, is transferred directly to retained earnings (unappropriated profits).
Depreciation is charged to statement of profit or loss applying either straight line method or written down value method whereby the cost or revalued amount of an asset is written off over its useful life at the rates specified in note 5 to the financial statements. Depreciation on additions is charged from the time at which asset is available for use until asset is disposed off.
The assets' residual values, useful lives are reviewed, and adjusted if appropriate, at each financial year end. The Company's estimate of residual value of property and equipment as at June 30, 2018 did not require any adjustment as its impact is considered insignificant.
Leased
Assets subject to finance lease are initially recorded at the lower of the present value of minimum lease payments under the lease agreements and the fair value of the leased assets each determined at the inception of lease. Subsequent to initial recognition, the asset is stated at the amount determined at initial recognition less accumulated depreciation and impairment losses, if any.
Leased assets are depreciated on reducing balance method at the rates specified in note 6.1 to the financial statements as disclosed in the fixed asset schedule to the financial statements.
4.2 Intangible assets
Intangible assets are stated at cost less accumulated amortization and impairment losses, if any. Subsequent expenditure on capitalized intangible assets is capitalized only when it increases the future economic benefits embodied in the specific assets to which it relates. All other expenditure is expensed as incurred. Intangible assets are amortized using the straight line method over their estimated useful lives. The estimated useful life and amortization method are reviewed at the end of each annual reporting period, with the effect of any changes in estimate being accounted for on a prospective basis.
4.3 Stores, spares and loose tools
Stores, spares and loose tools excluding items in transit are valued at lower of average cost and net realizable value. Provision is made for slow moving and obsolete items. Items in transit are valued at cost comprising invoice values plus other charges incurred thereon accumulated to the date of statement of financial position.
Net realizable value signifies the estimated selling price in the ordinary course of business, less the estimated costs necessary to make the sale.
Provisions are made in the financial statements for obsolete and slow moving inventory based on management's best estimate regarding their future usability.
Notes To The Financial Statements For the year ended June 30, 2018

5454
4.4 Stock-in-trade
Raw materials and packing materials are valued at average cost and finished goods are valued at lower of average manufacturing cost and net realizable value. Raw material and packing material in transit are valued at invoice value plus other charges paid thereon.
Work-in-process is valued at average cost of raw materials including a proportionate of manufacturing overheads.
Finished goods are valued at average cost of raw materials and packing materials including a proportionate of manufacturing overheads.
Net realizable value signifies the estimated selling price in the ordinary course of business, less the estimated costs of completion and the estimated costs necessary to be incurred to make the sale.
Provisions are made in the financial statements for obsolete and slow moving inventory based on management's best estimate regarding there future usability.
4.5 Trade and other receivables
Trade and other receivables are carried at original invoice amount / cost, which is the fair value of the consideration to be received, less an estimate made for doubtful receivables which is determined based on management review of outstanding amounts and previous repayment pattern. Balance considered bad and irrevocable are written off.
4.6 Financial Instruments
4.6.1 Classification
The Company classifies its financial assets in the following categories: at fair value through profit or loss, held to maturity, loans and receivables, and available-for-sale. The classification depends on the purpose for which the financial assets were acquired. Management determines the classification of its financial assets at initial recognition.
a) At fair value through profit or loss
Financial assets at fair value through profit or loss are financial assets held for trading and financial assets designated upon initial recognition as at fair value through profit or loss. A financial asset is classified as held for trading if acquired principally for the purpose of selling in the short-term. Assets in this category are classified as current assets if expected to be settled within twelve months, otherwise, they are classified as non-current assets.
b) Loans and receivables
Loans and receivables are non-derivative financial assets with fixed or determinable payments that are not quoted in an active market. They are included in current assets, except for maturities longer than 12 months after the end of the reporting period. These are classified as non-current assets. The Company’s loans and receivables comprise 'trade debts', 'loans and advances', ‘deposits, prepayments and other receivables’ in the statement of financial position.
c) Held to maturity
Investments with a fixed maturity where the Company has the intent and ability to hold to maturity are classified as held to maturity investments. Held-to-maturity investments are carried at amortized cost using the effective interest rate method, less any impairment losses.
Notes To The Financial Statements For the year ended June 30, 2018

55
Annual Report 2018
55
Annual Report 2018
d) Available for sale
Available-for-sale financial assets are non-derivatives that are either designated in this category or not classified in any of the other categories. These are primarily those investments that are intended to be held for an undefined period of time or may be sold in response to the need for liquidity. They are included in non-current assets unless the investment matures or management intends to dispose off it within 12 months of the end of the reporting date.
4.6.2 Recognition, measurement and derecognition
"All financial assets are recognized at the time when the Company becomes a party to the contractual position of the instrument. Regular way purchases and sales of financial assets are recognized on the trade date – the date on which the Company commits to purchase or sell the asset. Financial assets are initially recognized at fair value plus transaction costs for all financial assets not carried at fair value through profit or loss. Financial assets carried at fair value through profit or loss are initially recognized at fair value and transaction costs are expensed to the profit or loss in the statement of comprehensive income. Financial assets are derecognized when the rights to receive cash flows from the investments have expired or have been transferred and the Company has transferred substantially all risks and rewards of ownership. Available-for-sale financial assets and financial assets at fair value through profit or loss are subsequently carried at fair value. Loans and receivables and held to maturity financial assets are carried at amortized cost using the effective interest method.
Gains or losses arising from changes in the fair value of the ‘financial assets at fair value through profit or loss’ category are recognized in the profit or loss in the statement of comprehensive income within ‘other income / expenses’ in the period in which they arise. Gains or losses on sale of investments at ‘fair value through profit or loss’ are recognized in the profit or loss in the statement of comprehensive income as ‘gains and losses from investment’.
Gains or losses from changes in fair value of monetary and non-monetary securities classified as available-for-sale are recognized in other comprehensive income. When investment classified as available-for-sale are sold or impaired, the accumulated fair value adjustments recognized in equity are taken to profit or loss in the statement of comprehensive income as ‘gains and losses from investment’. Interest on available-for-sale investment calculated using the effective interest method is recognized in the profit or loss in the statement of comprehensive income as part of ‘other income’.
Interest on available-for-sale investment calculated using the effective interest method is recognized in the statement of profit or loss as part of other income.
4.6.3 Impairment of financial assets
The Company assesses at each date of statement of financial position whether there is objective evidence that a financial asset or a group of financial assets is impaired. In the case of investments classified as available-for-sale, a significant or prolonged decline in the fair value of the security below its cost is considered as an indicator that the securities are impaired. If any such evidence exists for available-for-sale financial assets, the cumulative loss – measured as the difference between the acquisition cost and the current fair value, less any impairment loss on that financial asset previously recognized in equity is removed from equity and recognized in the profit or loss in the statement of comprehensive income. Impairment losses recognized in the profit or loss in the statement of comprehensive income on equity instruments classified as available-for-sale are not reversed. Impairment testing of trade debts and other receivables is carried out by the company on annual basis and the related impairment is recognized in the statement of profit or loss.
4.6.4 Financial liabilities
All financial liabilities are recognized at the time when the Company becomes a party to the contractual provisions of the instrument.
A financial liability is derecognized when the obligation under the liability is discharged or cancelled or expired. Where an existing financial liability is replaced by another from the same lender on substantially different terms, or the terms of an existing liability are substantially modified, such an exchange or modification is treated as a derecognition of the original liability and the recognition of a new liability, and the difference in respective carrying amounts is recognized in the profit or loss in the statement of comprehensive income.
Notes To The Financial Statements For the year ended June 30, 2018

5656
4.6.5 Offsetting of financial assets and financial liabilities
Financial assets and liabilities are offset and the net amount is reported in the financial statements only when there is a legally enforceable right to set off the recognized amount and the company intends either to settle on a net basis or to realize the assets and settle the liabilities simultaneously.
4.7 Staff Retirement Benefits
The main features of the schemes operated by the company for its employees are as follows:
4.7.1 Defined benefit plan
A defined benefit plan is post employment benefit plan other than a defined contribution plan. The company's net obligation in respect of defined benefit plan is calculated by estimating the amount of future benefit that employees have earned in return for their service in current and prior periods, that benefit is discounted to determine its present value. The calculation is performed annually by a qualified actuary using the projected unit credit method. The Gratuity scheme is unfunded and covers those permanent employees & management staff of the Company who have completed prescribed qualifying period of service. Provision is made annually to cover obligations under the scheme on the basis of actuarial valuation.
Past service cost is recognized immediately to the extent that the benefits are already vested. For non-vested benefits past service cost is amortized on the straight line basis over the average period until the amended benefits become vested.
All actuarial gains and losses arising on valuation are charged to other comprehensive income.
4.7.2 Defined contribution plan
A defined contribution plan is a post employment benefit plan under which the company pays fixed contribution into a separate entity and will have no legal and constructive obligation to pay further amounts. Obligation for contributions to defined contribution plans are recognized as an employee benefit expense in statement of profit or loss when they are due. The Company also operates an approved funded contributory provident fund for its permanent employees. Equal monthly contributions are made both by the Company and the employees at the rate of 5% per annum of the basic salary. Company's contributions are charged to statement of profit or loss.
4.8 Taxation
The tax expense for the year comprises current and deferred tax. Tax is recognized in the statement of profit or loss, except to the extent that it relates to items recognized outside profit or loss. In this case the tax is also recognized outside profit or loss.
Current
Current tax is the amount of tax payable on taxable income for the year, using tax rate enacted by or substantively enacted at the date of statement of financial position, and any adjustment to the tax payable in respect of previous year. Provision for current tax is based on higher of the taxable income at current rates of taxation in Pakistan after taking into account tax credits, rebates and exemptions available, if any or minimum tax u/s 113 of Income Tax Ordinance, 2001 after taking into account tax credits or Alternative corporate tax u/s 113C of Income Tax Ordinance, 2001. However, for income covered under final tax regime, taxation is based on applicable tax rates under such regime. The amount of unpaid income tax in respect of the current or prior periods is recognized as a liability. Any excess paid over what is due in respect of the current or prior periods is recognized as an asset.
Notes To The Financial Statements For the year ended June 30, 2018

57
Annual Report 2018
57
Annual Report 2018
Deferred
Deferred tax is recognized using the balance sheet method, providing for temporary differences, at the date of statement of financial position, between carrying amount and the tax base of assets and liabilities for financial reporting purposes.
Deferred tax liabilities are generally recognized for all taxable temporary differences and deferred tax assets are recognized for all deductible temporary differences and carry forward of unused tax losses and tax credits, to the extent that it is probable that future taxable profit will be available against which the deductible temporary differences and /or carry forward of unused tax losses or tax credits can be utilized.
The carrying amount of all deferred tax assets is reviewed at each date of statement of financial position and reduced to the extent that it is no longer probable that sufficient taxable profits will be available to allow all or part of the deferred tax assets to be utilized.
Deferred tax assets and liabilities are measured at the tax rates that are expected to apply to the period when the asset is realized or the liability is settled, based on tax rates (and tax laws) that have been enacted or substantively enacted at the date of statement of financial position.
4.9 Impairment of non-financial assets
Assets are reviewed for impairment whenever events or changes in circumstances indicate that the carrying amount of these assets may not be recoverable. Whenever the carrying amount of these assets exceed their recoverable amount, an impairment loss is recognized in the statement of profit or loss for the amount by which the asset’s carrying amount exceeds its recoverable amount. Reversal of impairment loss is restricted to the original cost of the asset.
4.10 Borrowing costs
Borrowings costs are recognized as an expense in the period in which they are incurred except, to the extent of borrowing costs that are directly attributable to the acquisition, construction or production of a qualifying asset. Such borrowing costs, if any, are capitalized as part of the cost of that asset.
4.11 Segment reporting
A segment is a distinguishable component of the Company that is engaged in providing related products or services (business segment), or in providing product or services within a particular economic environment (geographical segment), which is subject to risks and returns that are different from those of other segments. Segment information is presented in respect of the Company's business segments.
The Company's primary format for segment reporting is based on business segments. The business segments are determined based on the Company's management and internal reporting structure. Segment results and other information is provided on the basis of product and service. Theses categories are:
1) Injection : this represents manufacture and sale of Polyethylene Terephthalate (PET) preforms for beverage and non-beverage industry.
2) Blowing : this represents manufacture and sale of Polyethylene Terephthalate (PET) bottles for beverage and non-beverage industry.
4.12 Revenue recognition
Revenue is recognized to the extent that it is probable that the economic benefits will flow to the Company and the amount of revenue can be measured reliably. Revenue is measured at the fair value of the consideration received or receivable, net of any direct expenses. Revenue is recognized on the following basis:
Notes To The Financial Statements For the year ended June 30, 2018

5858
• Sales revenue is recognized on dispatch of goods to customers.
• Mark-up / interest income is recognized on a time proportion basis that takes into account the effective yield.
4.13 Foreign currency transactions and translation
Foreign currencies are translated into reporting currency at the rates of exchange prevailing on the date of transactions. Monetary assets and liabilities denominated in foreign currencies are translated into reporting currency equivalents using year-end spot foreign exchange rates. Non-monetary assets are translated using exchange rates that existed when the values were determined. Exchange differences on foreign currency translations are included in income currently.
4.14 Dividend
Dividend distribution to the Company's shareholders and appropriation to reserves are recognized as a liability in the financial statements in the period in which these are approved. Transfer between reserves made subsequent to the date of statement of financial position is considered as a non adjusting event and is recognized in the financial statements in the period in which such transfers are made.
4.15 Provisions
Provision is recognized when, as a result of past event, the company has a present legal or constructive obligation that can be estimated reliably and it is probable that an outflow of resources embodying economic benefits will be required to settle the obligation. Subsequently, provisions are reviewed at each date of statement of financial position and adjusted to reflect the current best estimate.
4.16 Related party transactions
All transactions involving related parties arising in the normal course of business are conducted at normal commercial rates except in extremely rare circumstances where, subject to the approval of the Board of Directors, it is in the interest of the Company to do so.
5. CHANGE IN ACCOUNTING POLICY
The specific provision / section in the repealed Companies Ordinance, 1984 relating to the surplus on revaluation of fixed assets has not been carried forward in the Companies Act, 2017. Previously, section 235 of the repealed Companies Ordinance, 1984 specified the accounting treatment and presentation of the surplus on revaluation of fixed assets, which was not in accordance with the IFRS requirements. Accordingly, in accordance with the requirements of International Accounting Standard (IAS) 16, Property, Plant and Equipment, surplus on revaluation of fixed assets would now be presented under equity.
Further, International Accounting Standard (IAS) 16 'Property, Plant and Equipment' requires that, if an amount equal to incremental depreciation on a revalued asset is transferred from revaluation surplus, such transfer is credited directly to retained earnings. However, contrary to this, the Company had been recognizing such transfers to equity through other comprehensive income instead of the same being credited directly to retained earnings. Therefore, in order to adopt the required presentation, the corresponding figures in the statement of comprehensive income have been re-presented that otherwise has no financial impact.
The correction of the above presentational impact has been accounted for retrospectively in accordance with the requirements of International Accounting Standard (IAS) 8 'Accounting Policies, Changes in Accounting Estimates and Errors' and corresponding figures have been restated. However, as these restatements have no effect on the balance sheet as at the beginning of the earliest period presented (i.e. as of July 01, 2016), the same has not been presented.
Notes To The Financial Statements For the year ended June 30, 2018

59
Annual Report 2018
59
Annual Report 2018
As noted above, the retrospective impact of the above presentational declassification has no effect on the statement of financial position as at 1 July 2016 and as at 30 June 2017. However, the change in the amount of statement of profit or loss and the statement of comprehensive income as of June 30, 2017 after the declassification is presented as below:
2017 2016
-------Rupees in '000' -------
Effect on statement of financial position
- Share capital and reserves
As previously reported 595,362 479,517
Effect of change in accounting policy 175,887 157,905
As restated 771,249 637,422
- Surplus on revaluation of property and plant
As previously reported 175,887 157,905
Effect of change in accounting policy (175,887) (157,905)
As restated - -
Effect on statement of comprehensive income
As previously reported 9,984
Effect of incremental depreciation (now transferred within equity) (13,584)
Effect of revaluation of property and plant during the year 27,688
Effect of disposal of revalued assets (92)
Effect of change of rate on deferred tax related to revaluation surplus 3,970
17,982
As restated 27,966
There was no cash flow impact as a result of the retrospective application of change in accounting policy.
2018 2017
------- Rupees in '000' ------
6. PROPERTY, PLANT AND EQUIPMENT
Operating fixed assets 6.1 1,346,684 989,248
Capital machines' spares (CWIP) 6.7 15,888 12,025
1,362,572 1,001,273
Notes To The Financial Statements For the year ended June 30, 2018

6060
6.1
PR
OP
ERTY
, PLA
NT
AND
EQ
UIP
MEN
T
Free
hold
la
nd
Fac
tory
bu
ildin
g an
d ro
ads
(Fre
hold
)
Pla
nt a
nd m
achi
nery
F
acto
ry
equi
pmen
t F
urni
ture
an
d fit
ting
s O
ffic
e eq
uipm
ent
Veh
icle
s T
otal
Ow
ned
Lea
sed
Ow
ned
Lea
sed
(not
e -
6.2)
-
----
----
----
----
----
----
----
----
----
----
----
----
Rup
ees
in ‘0
00
’ --
----
----
----
----
----
----
----
----
-
As a
t Jul
y 01
, 201
6Co
st a
nd re
valu
atio
n 7
,600
1
02,7
00
1,5
47,7
66
-
238
,831
5
,874
2
2,14
8 1
4,99
0 4
,655
1
,944
,564
Ac
cum
ulat
ed d
epre
ciat
ion
-
(34,
475)
(715
,259
) -
(1
66,5
56)
(4,0
06)
(12,
801)
(10,
508)
(1,8
73)
(945
,479
)N
et b
ook
valu
es 7
,600
6
8,22
5 8
32,5
07
-
72,
275
1,8
68
9,3
47
4,4
82
2,7
82
999
,085
For t
he y
ear J
une
30, 2
017
Addi
tions
dur
ing
the
year
-
4,2
00
7,5
47
-
48,
479
-
2,5
33
967
9
,962
7
3,68
8 Su
rplu
s on
Rev
alua
tion
16,
150
1,5
80
14,
903
-
-
-
-
-
-
32,
633
Dis
posa
ls /
writ
e off
s -
Cost
-
-
(4
0,11
9) -
(4
50)
-
(1,3
49)
(4,8
54)
-
(46,
772)
- Ac
cum
ulat
ed d
epre
ciat
ion
-
-
32,
096
-
343
-
1
,162
4
,172
-
3
7,77
3 -
-
(8
,023
) -
(1
07)
-
(187
) (6
82)
-
(8,9
99)
Dep
reci
atio
n fo
r the
yea
r - n
ote
6.3
-
(3,4
98)
(58,
607)
-
(40,
201)
(187
) (2
,009
) (9
88)
(1,6
69)
(107
,159
)N
et b
ook
valu
es 2
3,75
0 7
0,50
7 7
88,3
27
-
80,
446
1,6
81
9,6
84
3,7
79
11,
075
989
,248
As a
t Jun
e 30
, 201
7Co
st a
nd re
valu
atio
n 2
3,75
0 1
08,4
80
1,5
30,0
97
-
286
,860
5
,874
2
3,33
2 1
1,10
3 1
4,61
7 2
,004
,113
Ac
cum
ulat
ed d
epre
ciat
ion
-
(37,
973)
(741
,770
) -
(2
06,4
14)
(4,1
93)
(13,
648)
(7,3
24)
(3,5
42)
(1,0
14,8
65)
Net
boo
k va
lues
23,
750
70,
507
788
,327
-
8
0,44
6 1
,681
9
,684
3
,779
1
1,07
5 9
89,2
48
For t
he y
ear J
une
30, 2
018
Addi
tions
dur
ing
the
year
-
7,5
53
44,
931
411
,689
3
3,30
4 -
3
,040
2
36
3,4
88
504
,241
D
ispo
sals
/ w
rite
offs
/ im
pairm
ent
- Co
st
-
-
(107
,873
) -
(3
66)
(1,0
84)
(1,4
24)
(1,0
90)
-
(111
,837
)-
Accu
mul
ated
dep
reci
atio
n -
-
7
9,91
0 -
3
66
1,0
84
1,3
41
974
-
8
3,67
5 -
-
(2
7,96
3) -
-
-
(8
3) (1
16)
-
(28,
162)
Dep
reci
atio
n fo
r th
e ye
ar -
not
e 6.
3 -
(
3,6
61
) (
57,
58
2)
(6
,56
7)
(4
5,4
93
) (
16
8)
(1
,96
8)
(7
50
) (
2,4
54
) (
11
8,6
43
)N
et b
ook
valu
es 2
3,7
50
74
,39
9 7
47,
71
3 4
05
,12
2 6
8,2
57
1,5
13
10
,67
3 3
,14
9 1
2,1
09
1,3
46
,68
4
As a
t Ju
ne 3
0, 2
01
8C
ost
and
reva
luat
ion
23
,75
0 1
16
,03
3 1
,46
7,1
55
41
1,6
89
31
9,7
98
4,7
90
24
,94
8 1
0,2
49
18
,10
5 2
,39
6,5
17
Accu
mul
ated
dep
reci
atio
n -
(
41
,63
4)
(7
19
,44
2)
(6
,56
7)
(2
51
,54
1)
(3
,27
7)
(1
4,2
75
) (
7,1
00
) (
5,9
96
)(1
,049
,833
)N
et b
ook
valu
es 2
3,7
50
74
,39
9 7
47,
71
3 4
05
,12
2 6
8,2
57
1,5
13
10
,67
3 3
,14
9 1
2,1
09
1,3
46
,68
4
Rat
e of
dep
reci
atio
n -
5
%-1
0%
5
%-2
0%
8
% 1
0%
-40
%
10
% 1
0%
-33
%
20
%2
0%
Not
es T
o Th
e Fi
nanc
ial S
tate
men
ts
Fo
r the
yea
r end
ed J
une
30, 2
018

61
Annual Report 2018
61
Annual Report 2018
2018 2017
---- ----Rupees in ‘000’ ------
6.2 Detail of addition in plant & machinery leased:
Initial recognition - against lease liability 363,018 -
Subsequent addition - installation & commissioning cost 48,671 -
411,689 -
6.3 Depreciation charge has been allocated as follows:
Cost of sales 111,854 101,800
Administrative expenses 6,789 5,358
118,643 107,158
6.4 Last revaluation of the Company’s assets was carried out in 2016-17 by M/s K.G. Traders (Private) Limited, independent valuers, taking market value / depreciated replacement cost, as applicable, as a basis of valuation. The revaluation resulted in a net surplus of Rs. 32.63 million. The incremental values at the date of revaluation of the revalued operating property, plant and machinery are being depreciated over the remaining useful lives of these assets.
The forced sale value of the revalued plant and machinery, factory building and roads, and freehold land, at the date of revaluation was 638 million, 54.49 million and 19 million respectively.
6.5 Had there been no revaluation, the net carrying value of specific classes of operating fixed assets would have been as follows:
2018 2017
---- ----Rupees in ‘000’ ------
Freehold land 2,995 2,995
Factory building and roads 35,875 29,940
Plant and machinery 987,285 605,817
1,026,155 638,752
6.6 All operating fixed assets disposed off during the year had net book value less than Rs. 500,000 and all the disposals were made in accordance with the Company’s policy.
6.7 Capital machines’ spares
2018 2017
---- ----Rupees in ‘000’ ------
Gross Carrying Value 16,318 12,455
Provision for impairment (430) (430)
15,888 12,025
Notes To The Financial Statements For the year ended June 30, 2018

6262
6.8 Particulars of immovable property (i.e. land and building) in the name of the Company are as follows:
Location Usage of property Total area (sq ft)
Coveredarea (sq ft)
Plot -112,113, Phase V, Hattar Industrial Estate, Hattar, KPK.
Manufacturing facility 102,507 52,262
2018 2017 Notes ------Rupees in '000' -----
7. SECURITY DEPOSITS
Deposits 7.1 55,849 7,512
7.1 This includes deposit amount paid for lease arrangement as disclosed in note 17.2.
8. INTANGIBLES - ERP Software
CostOpening balance 6,959 5,741 Additions 3,115 1,218 Reclassification to fixed assets 43 (1,032) -
9,042 6,959 Accumulated AmortizationOpening balance (467) (342)For the year (1,173) (125)
(1,640) (467)Closing balance 7,402 6,492
Rates of Amortization 10% 10%
9. STORES, SPARES AND LOOSE TOOLS
Stores and spares 83,232 77,035 Loose tools 2,174 2,070
85,406 79,105 Provision against slow moving stores and spares (10,415) (10,415)Capital spares transferred to property, plant and equipment (16,318) (12,455)
58,673 56,235 10. STOCK IN TRADE
Raw material 62,229 105,515 Packing material 14,418 10,572 Work in process 132,514 63,558 Finished goods 51,048 70,533
260,209 250,178 Provision for obsolete stocks 10.1 (35,550) (3,528)
224,659 246,650 10.1 Provision for obsolete stocks
Balance at 1 July 3,528 3,528 Provision for the year 33,624 - Write off during the year (1,602) - Balance of 30 June 35,550 3,528
Notes To The Financial Statements For the year ended June 30, 2018
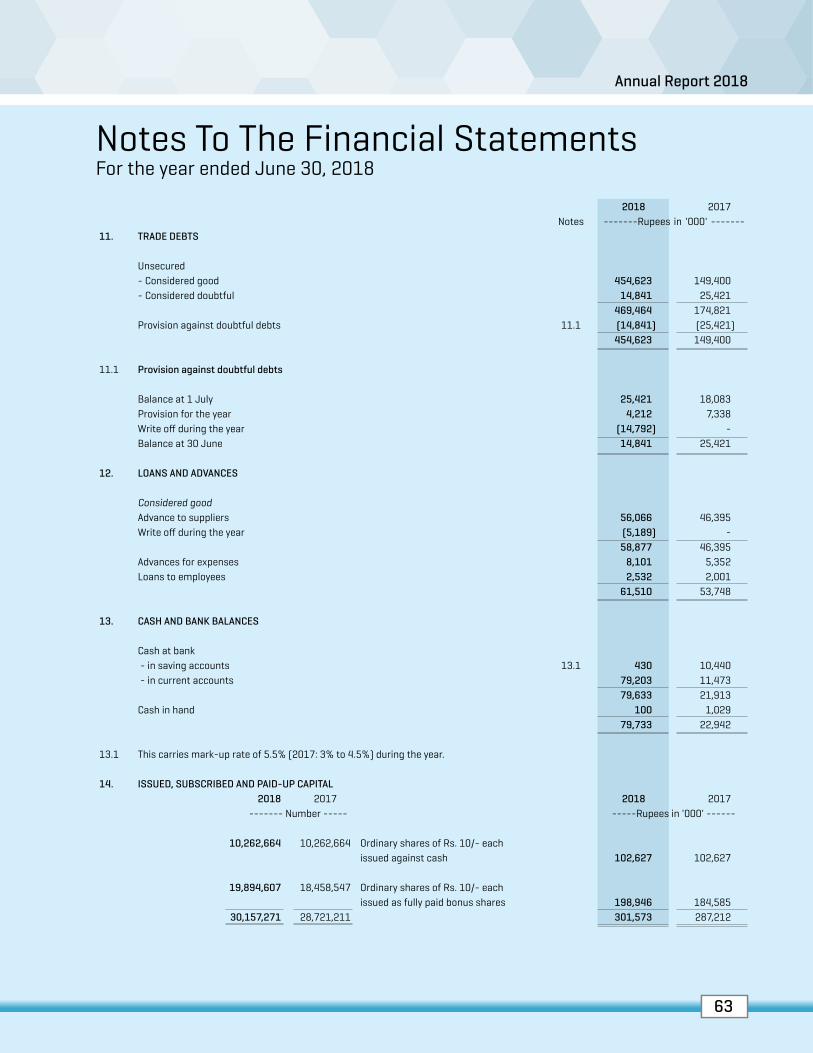
63
Annual Report 2018
63
Annual Report 2018
Notes To The Financial Statements For the year ended June 30, 2018
2018 2017 Notes -------Rupees in '000' -------
11. TRADE DEBTS
Unsecured- Considered good 454,623 149,400 - Considered doubtful 14,841 25,421
469,464 174,821 Provision against doubtful debts 11.1 (14,841) (25,421)
454,623 149,400
11.1 Provision against doubtful debts
Balance at 1 July 25,421 18,083 Provision for the year 4,212 7,338 Write off during the year (14,792) - Balance at 30 June 14,841 25,421
12. LOANS AND ADVANCES
Considered goodAdvance to suppliers 56,066 46,395 Write off during the year (5,189) -
58,877 46,395 Advances for expenses 8,101 5,352Loans to employees 2,532 2,001
61,510 53,748
13. CASH AND BANK BALANCES
Cash at bank - in saving accounts 13.1 430 10,440 - in current accounts 79,203 11,473
79,633 21,913 Cash in hand 100 1,029
79,733 22,942
13.1 This carries mark-up rate of 5.5% (2017: 3% to 4.5%) during the year.
14. ISSUED, SUBSCRIBED AND PAID-UP CAPITAL 2018 2017 2018 2017
------- Number ----- -----Rupees in '000' ------
10,262,664 10,262,664 Ordinary shares of Rs. 10/- eachissued against cash 102,627 102,627
19,894,607 18,458,547 Ordinary shares of Rs. 10/- eachissued as fully paid bonus shares 198,946 184,585
30,157,271 28,721,211 301,573 287,212

6464
Notes To The Financial Statements For the year ended June 30, 2018
2018 2017 14.1 Movement in Issued, subscribed and paid-up capital Notes -------Rupees in '000' -----
2018 2017 ------ Number ------
28,721,211 22,977,011 Balance at 1 July 287,212 229,770 1,436,060 5,744,200 Bonus shares issued during year 14,361 57,442
30,157,271 28,721,211 Balance at 30 June 301,573 287,212
15. SURPLUS ON REVALUATION OF PROPERTY, PLANT AND MACHINERY
On freehold land 15.1 23,750 23,750 On building / plant and machinery 15.2 137,802 152,137
161,552 175,887 15.1 On freehold land
Gross surplusBalance as at 01 July 23,750 7,600 Revaluation increase recognized during the year - 16,150
23,750 23,750 15.2 On building, plant and machinery
Gross surplusBalance as at 01 July 217,339 220,393 Less : Reversal due to disposal/ impairment of assets (1,990) (131)Revaluation increase recognized during the year - 16,483 Incremental depreciation transferred to retained earnings (21,290) (19,406)
194,059 217,339 Related deferred tax chargeBalance as at 01 July (65,202) (70,088)Deferred tax on revaluation surplus during the year - (4,945)Effect of change in tax rate 2,174 3,970 Deferred tax on fixed assets written off during the year 577 39 Deferred tax on incremental depreciation charged during the year 6,174 5,822
(56,277) (65,202) 137,802 152,137
16. LONG TERM LOANS
Loans from banking companies - SecuredAskari Bank Limited (TF II) 16.1 143,000 199,000 Allied Bank Limited (TF) - 30,600 JS Bank Limited (TF) 16.2 8,465 15,556
151,465 245,156 Less: current portion of long term loans (90,719) (99,933)
60,746 145,223
16.1 This represents restructuring of working capital finance into long term debt in 2015. It carries mark-up at 3 months KIBOR plus 1.75% p.a on quarterly basis. The loan is repayable in 5 years through 20 quarterly installments. The finance is secured by way of First Pari Passu charge of Rs. 450 million over all present and future fixed assets of the Company and personal guarantee of founder Director / sponsor of the Company.

65
Annual Report 2018
65
Annual Report 2018
Notes To The Financial Statements For the year ended June 30, 2018 16.2 This represents three years term loan obtained to retire one-off LC for the capital expenditure. It carries mark-up at 3 months KIBOR plus
2% p.a. payable in equal monthly installments of principal and quarterly installments of mark-up. It is secured by first pari passu charge over all present and future fixed assets of the Company amounting to Rs. 167 million.
2018 2017 Note ------Rupees in '000'-------
17. LIABILITIES AGAINST ASSETS SUBJECT TOFINANCE LEASE
Balance at 1 July 11,262 3,003 Leases obtained during the year 17.2 366,397 9,727 Payments made during the year (2,687) (1,468)
374,972 11,262 Less: Current portion shown under current liabilities (66,422) (2,289)
308,550 8,973
17.1 The future minimum lease payments and the period in which they become due are :
17.2 This represents machines acquired under finance lease agreements with Habib Bank Limited & Bank Of Khyber. Interest rate used as discounting factor ranges from 8.11% to 8.18% (2017: 8.54% to 9.12%) per annum. Taxes, repair, replacements and insurance are born by the Company. Under the terms of arrangement, the Company has an option to acquire leased assets at the end of respective lease terms and intends to exercise the option. There are no restrictions imposed on the Company under the term of leases.
2018 2017 18. DEFERRED LIABILITIES Note ------Rupees in '000'-------
Staff gratuity 18.1 106,325 92,319 Deferred taxation 18.2 130,255 169,246
236,580 261,565 18.1 Staff gratuity
18.1.1 The figures are based on actuarial valuation report for company's Employees' Gratuity Scheme carried out by Nauman Associates as on June 30, 2018.
2018 2017
Minimum lease payments
Present Value
Minimum lease payments
Present Value
---------------------- Rupees in '000' ------------------------
Upto one year 90,199 66,422 2,974 2,289
More than one year but less then five years 346,232 308,550 9,958 8,973
Total minimum lease payments 436,431 374,972 12,932 11,262
Less: Amount representing finance charges (61,459) - (1,670) -
Present value of minimum lease payments 374,972 374,972 11,262 11,262
Less: Current portion (66,422) (66,422) (2,289) (2,289)
308,550 308,550 8,973 8,973
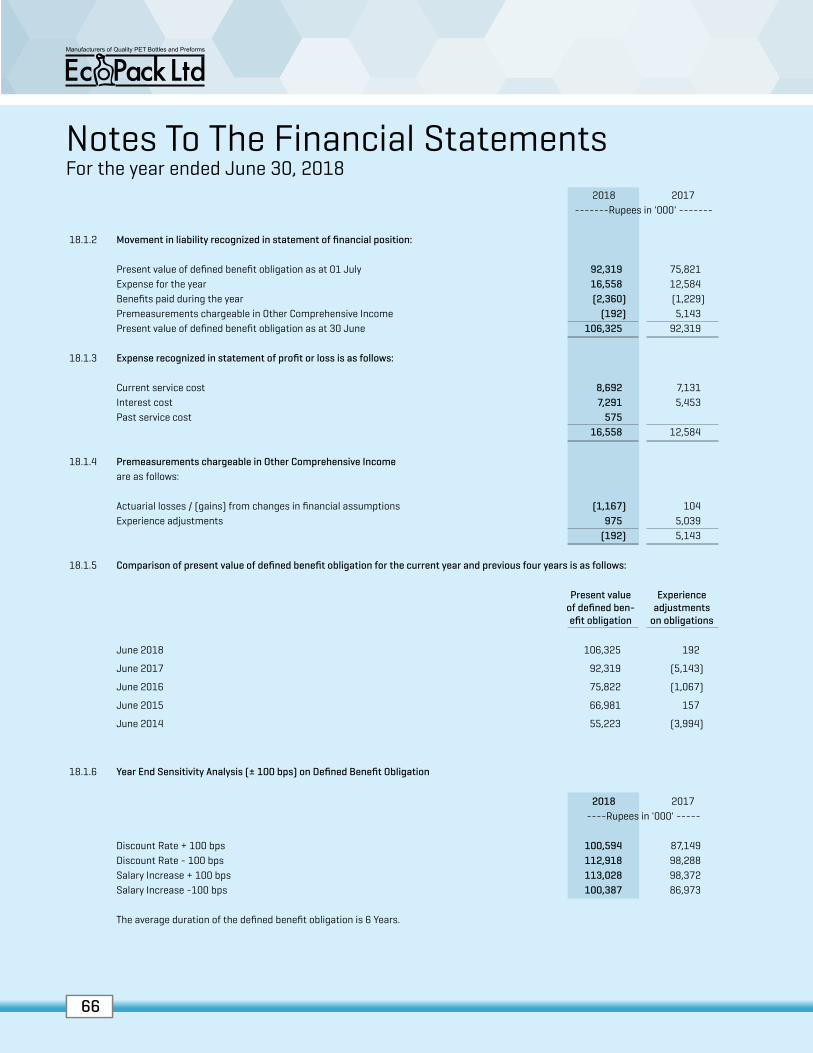
6666
2018 2017 -------Rupees in '000' -------
18.1.2 Movement in liability recognized in statement of financial position:
Present value of defined benefit obligation as at 01 July 92,319 75,821 Expense for the year 16,558 12,584 Benefits paid during the year (2,360) (1,229)Premeasurements chargeable in Other Comprehensive Income (192) 5,143 Present value of defined benefit obligation as at 30 June 106,325 92,319
18.1.3 Expense recognized in statement of profit or loss is as follows:
Current service cost 8,692 7,131 Interest cost 7,291 5,453 Past service cost 575
16,558 12,584
18.1.4 Premeasurements chargeable in Other Comprehensive Incomeare as follows:
Actuarial losses / (gains) from changes in financial assumptions (1,167) 104 Experience adjustments 975 5,039
(192) 5,143
18.1.5 Comparison of present value of defined benefit obligation for the current year and previous four years is as follows:
Present value of defined ben-efit obligation
Experience adjustments
on obligations
June 2018 106,325 192
June 2017 92,319 (5,143)
June 2016 75,822 (1,067)
June 2015 66,981 157
June 2014 55,223 (3,994)
18.1.6 Year End Sensitivity Analysis (± 100 bps) on Defined Benefit Obligation
2018 2017 ----Rupees in '000' -----
Discount Rate + 100 bps 100,594 87,149 Discount Rate - 100 bps 112,918 98,288 Salary Increase + 100 bps 113,028 98,372 Salary Increase -100 bps 100,387 86,973
The average duration of the defined benefit obligation is 6 Years.
Notes To The Financial Statements For the year ended June 30, 2018
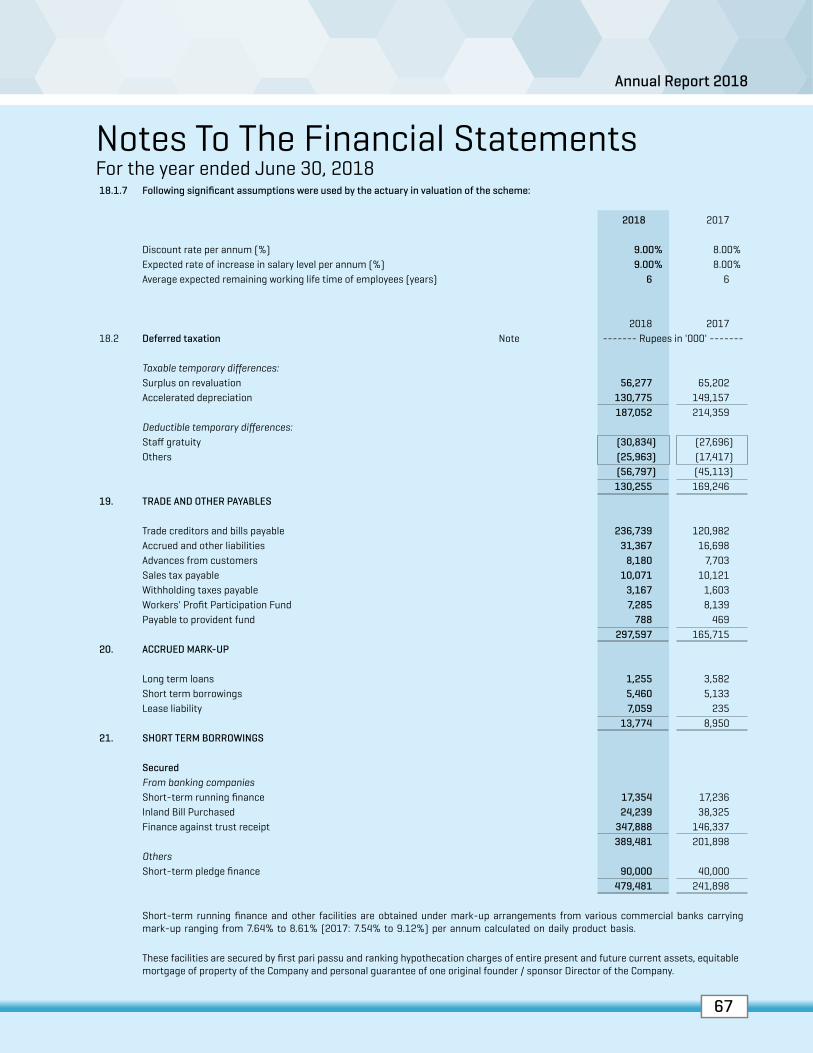
67
Annual Report 2018
67
Annual Report 2018
18.1.7 Following significant assumptions were used by the actuary in valuation of the scheme:
2018 2017
Discount rate per annum (%) 9.00% 8.00%Expected rate of increase in salary level per annum (%) 9.00% 8.00%Average expected remaining working life time of employees (years) 6 6
2018 2017 18.2 Deferred taxation Note ------- Rupees in '000' -------
Taxable temporary differences:Surplus on revaluation 56,277 65,202 Accelerated depreciation 130,775 149,157
187,052 214,359 Deductible temporary differences:Staff gratuity (30,834) (27,696)Others (25,963) (17,417)
(56,797) (45,113) 130,255 169,246
19. TRADE AND OTHER PAYABLES
Trade creditors and bills payable 236,739 120,982 Accrued and other liabilities 31,367 16,698 Advances from customers 8,180 7,703 Sales tax payable 10,071 10,121 Withholding taxes payable 3,167 1,603 Workers' Profit Participation Fund 7,285 8,139 Payable to provident fund 788 469
297,597 165,715 20. ACCRUED MARK-UP
Long term loans 1,255 3,582 Short term borrowings 5,460 5,133 Lease liability 7,059 235
13,774 8,950 21. SHORT TERM BORROWINGS
SecuredFrom banking companiesShort-term running finance 17,354 17,236 Inland Bill Purchased 24,239 38,325 Finance against trust receipt 347,888 146,337
389,481 201,898 OthersShort-term pledge finance 90,000 40,000
479,481 241,898
Short-term running finance and other facilities are obtained under mark-up arrangements from various commercial banks carrying mark-up ranging from 7.64% to 8.61% (2017: 7.54% to 9.12%) per annum calculated on daily product basis.
These facilities are secured by first pari passu and ranking hypothecation charges of entire present and future current assets, equitable mortgage of property of the Company and personal guarantee of one original founder / sponsor Director of the Company.
Notes To The Financial Statements For the year ended June 30, 2018

6868
2018 2017 22. CURRENT PORTION OF NON-CURRENT LIABILITIES Note -------Rupees in '000' -------
Long term loans 90,719 99,933 Liabilities against assets subject to finance lease 66,422 2,289
157,141 102,222
23. CONTINGENCIES AND COMMITMENTS
23.1 No contingencies existed at the date of statement of financial position (2017: Nil).
23.2 Inland letter of credits in respect of procurement of PET as of June 30, 2018 amounted to Rs. 141.85 million (2017: Nil).
2018 2017 24. SALES - NET Note -------Rupees in '000' -------
Gross sales 3,875,947 2,582,806 Sales tax and discounts (563,546) (377,446)
3,312,401 2,205,360
25. COST OF SALES
Raw material consumed 25.1 2,156,480 1,228,520 Packing material consumed 25.2 105,251 89,526 Store consumed 59,584 28,594 Salaries, wages and other benefits 25.3 186,698 155,062 Electricity, gas and water 241,769 179,359 Travelling and conveyance 15,216 13,456 Vehicle repair and maintenance 8,284 8,031 Rent, rate and taxes 28,832 22,548 Repair and maintenance 10,558 8,397 Insurance 4,778 3,920 Medical 5,167 4,303 Freight and other charges 8,660 5,888 Communication charges 1,905 1,635 Printing, postage and stationery 2,563 1,554 Lab testing 856 732 Fees and subscription 948 1,127 Entertainment 1,165 802 Staff welfare & support 3,085 2,736 Advertisement 44 114 Depreciation 111,854 101,800 Miscellaneous 85 201
2,953,782 1,858,305 Work-in-process - opening 63,558 46,824 Work-in-process - closing (132,514) (63,558)
(68,956) (16,734)Cost of goods manufactured 2,884,826 1,841,571 Finished goods - opening 70,533 76,968 Finished goods - closing (51,048) (70,533)
19,485 6,435 2,904,311 1,848,006
Notes To The Financial Statements For the year ended June 30, 2018
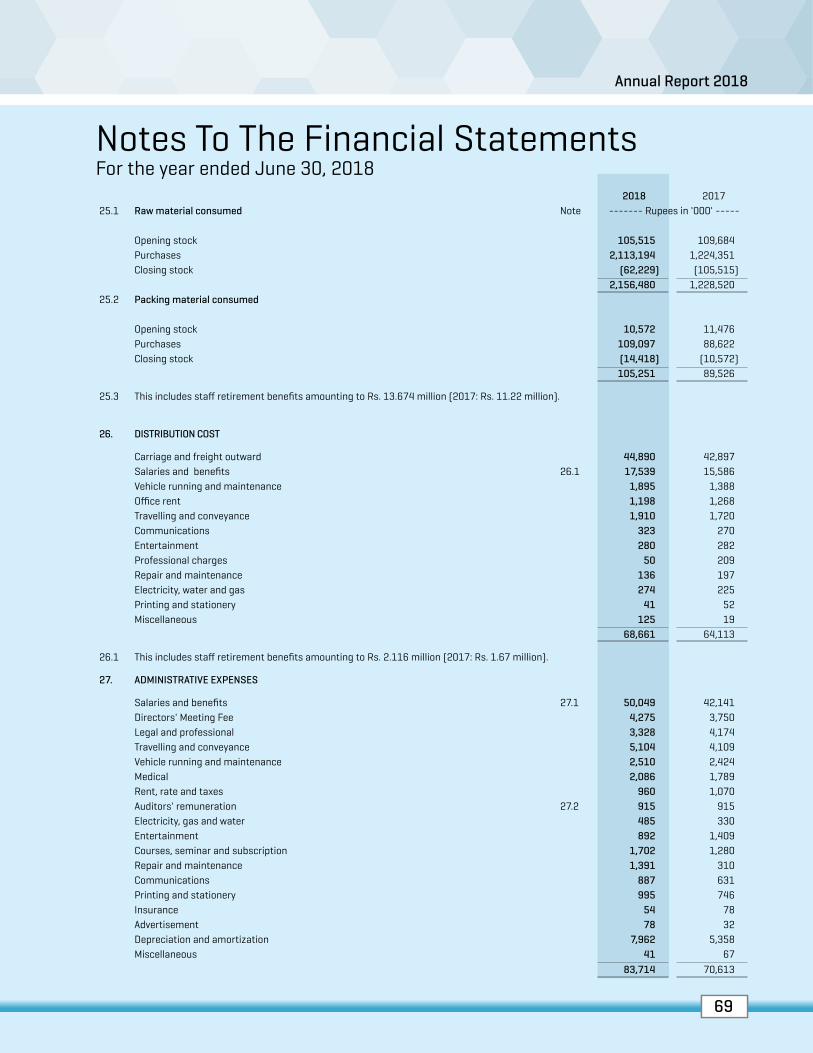
69
Annual Report 2018
69
Annual Report 2018
2018 2017 25.1 Raw material consumed Note ------- Rupees in '000' -----
Opening stock 105,515 109,684 Purchases 2,113,194 1,224,351 Closing stock (62,229) (105,515)
2,156,480 1,228,520 25.2 Packing material consumed
Opening stock 10,572 11,476 Purchases 109,097 88,622 Closing stock (14,418) (10,572)
105,251 89,526
25.3 This includes staff retirement benefits amounting to Rs. 13.674 million (2017: Rs. 11.22 million).
26. DISTRIBUTION COST
Carriage and freight outward 44,890 42,897 Salaries and benefits 26.1 17,539 15,586 Vehicle running and maintenance 1,895 1,388 Office rent 1,198 1,268 Travelling and conveyance 1,910 1,720 Communications 323 270 Entertainment 280 282 Professional charges 50 209 Repair and maintenance 136 197 Electricity, water and gas 274 225 Printing and stationery 41 52 Miscellaneous 125 19
68,661 64,113
26.1 This includes staff retirement benefits amounting to Rs. 2.116 million (2017: Rs. 1.67 million).
27. ADMINISTRATIVE EXPENSES
Salaries and benefits 27.1 50,049 42,141 Directors' Meeting Fee 4,275 3,750 Legal and professional 3,328 4,174 Travelling and conveyance 5,104 4,109 Vehicle running and maintenance 2,510 2,424 Medical 2,086 1,789 Rent, rate and taxes 960 1,070 Auditors' remuneration 27.2 915 915 Electricity, gas and water 485 330 Entertainment 892 1,409 Courses, seminar and subscription 1,702 1,280 Repair and maintenance 1,391 310 Communications 887 631 Printing and stationery 995 746 Insurance 54 78 Advertisement 78 32 Depreciation and amortization 7,962 5,358 Miscellaneous 41 67
83,714 70,613
Notes To The Financial Statements For the year ended June 30, 2018

7070
27.1 This includes staff retirement benefits amounting to Rs. 3.765 million (2017: Rs. 3.84 million).
2018 2017
27.2 Auditors' remuneration Note -------Rupees in '000' ------
Audit fee 600 600
Fee for half yearly review 230 230
Other advisory services 75 75
Out-of-pocket expense 10 10
915 915
28. OTHER INCOME - NET
Income from financial assets
Profit on bank deposits 1,852 600
Others
Freight income 95 -
Scrap sale 25,653 24,329
Net gain/(loss) on disposal of property, plant and equipment 554 5,004
Reversal of liabilities no longer required 2,121 -
Miscellaneous income 28.1 9,525 7,758
39,800 37,691
28.1 This includes a gain of Rs. 9.5 million on forward contracts to purchase foreign currency for import of plant and machinery.
2018 2017
29. OTHER EXPENSES Note -------Rupees in '000' ------
Workers' Welfare Fund 4,700 4,709
Workers' Profits' Participation Fund 7,285 8,139
Donation 29.1 864 646
Abnormal Loss 14,728 18,138
Provision for slow moving stock in trade 32,022 -
Provision for trade receivables 4,212 7,338
Other receivables written off 5,188 -
Impairment on operating assets /fixed assets written off 25,973 8,187
Impairment loss on spare parts - 8,938
94,972 56,095
29.1 Donation to a single party does not exceed Rs. 500,000 and none of the directors and their spouse have any interest in the donee's fund.
Notes To The Financial Statements For the year ended June 30, 2018
Provision for taxation
Tax assessed Excess / (shortage)
2017 63,584 64,493 (909)2016 26,446 27,140 (694)2015 3,103 3,118 (15)
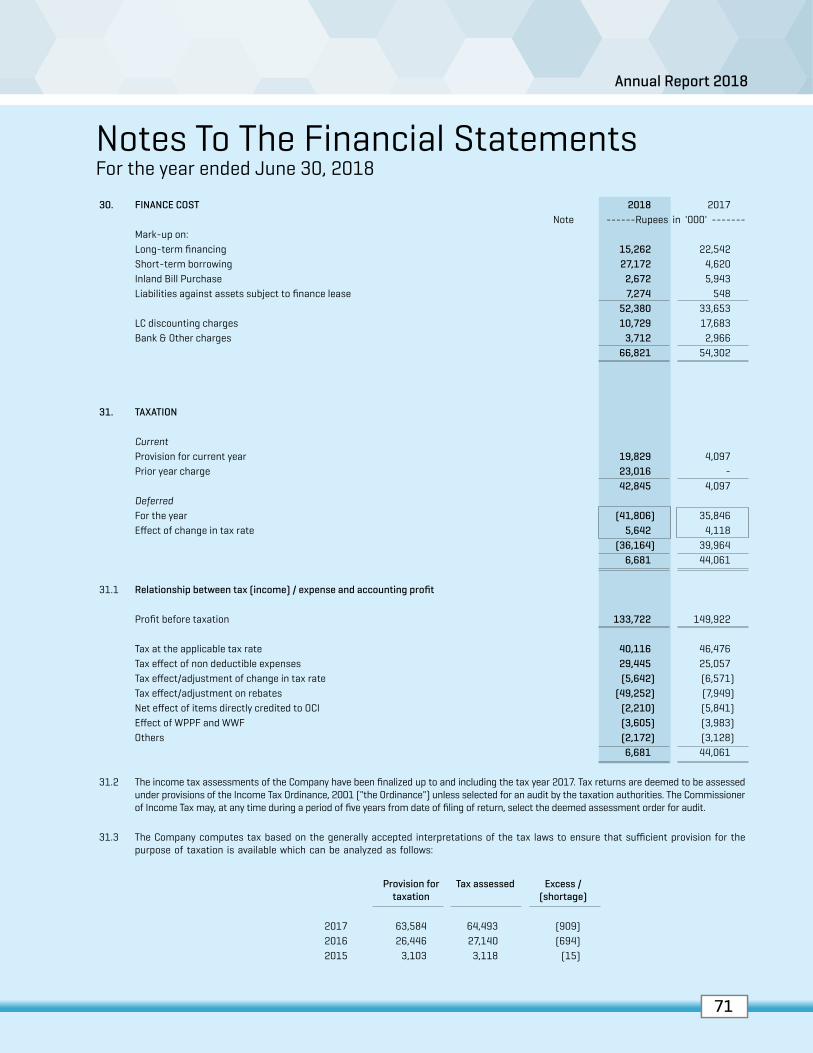
71
Annual Report 2018
71
Annual Report 2018
30. FINANCE COST 2018 2017 Note ------Rupees in '000' -------
Mark-up on:Long-term financing 15,262 22,542 Short-term borrowing 27,172 4,620 Inland Bill Purchase 2,672 5,943 Liabilities against assets subject to finance lease 7,274 548
52,380 33,653 LC discounting charges 10,729 17,683 Bank & Other charges 3,712 2,966
66,821 54,302
31. TAXATION
Current Provision for current year 19,829 4,097 Prior year charge 23,016 -
42,845 4,097 Deferred For the year (41,806) 35,846 Effect of change in tax rate 5,642 4,118
(36,164) 39,964 6,681 44,061
31.1 Relationship between tax (income) / expense and accounting profit
Profit before taxation 133,722 149,922
Tax at the applicable tax rate 40,116 46,476 Tax effect of non deductible expenses 29,445 25,057 Tax effect/adjustment of change in tax rate (5,642) (6,571)Tax effect/adjustment on rebates (49,252) (7,949)Net effect of items directly credited to OCI (2,210) (5,841)Effect of WPPF and WWF (3,605) (3,983)Others (2,172) (3,128)
6,681 44,061
31.2 The income tax assessments of the Company have been finalized up to and including the tax year 2017. Tax returns are deemed to be assessed under provisions of the Income Tax Ordinance, 2001 ("the Ordinance") unless selected for an audit by the taxation authorities. The Commissioner of Income Tax may, at any time during a period of five years from date of filing of return, select the deemed assessment order for audit.
31.3 The Company computes tax based on the generally accepted interpretations of the tax laws to ensure that sufficient provision for the purpose of taxation is available which can be analyzed as follows:
Notes To The Financial Statements For the year ended June 30, 2018
Provision for taxation
Tax assessed Excess / (shortage)
2017 63,584 64,493 (909)2016 26,446 27,140 (694)2015 3,103 3,118 (15)

7272
Notes To The Financial Statements For the year ended June 30, 2018 31.4 Section 5A of the Income Tax Ordinance, 2001 imposes tax at the rate of 7.5% of accounting profit before tax on every public company
other than a scheduled bank or modaraba, that derives profit for a tax year but does not distribute at least 40% of accounting profit either through cash dividend or issuance of bonus shares within six months of the end of said tax year.
In terms of section 5A in case the Company distributes cash dividend amounting to Rs. 50.8m or issues bonus shares of equivalent amount or both within six months of the close of the year it would not be liable to any tax under this section. The recognition of any liability in this respect as at financial year end is not considered necessary keeping in view the above, and liability if any in this respect would be recognized as of December 31, 2018 depending upon the dividend distributed out of profit for the year ended 30 June 2018.
2018 2017 32. EARNINGS PER SHARE - BASIC AND DILUTED Note -----Rupees in '000' -----
32.1 Basic
Profit after taxation (Rupees in '000') 127,040 105,861
Weighted average number of ordinary shares 30,157,311 30,157,311
Earnings per share - basic (Rupees) 4.21 3.51
32.2 The number of shares for the prior period has also been adjusted for the effect of bonus shares issued during the current year.
32.3 Diluted
There is no dilution effect on the basic earnings per share of the Company as the company has no convertible dilutive potential ordinary shares outstanding on June 30, 2018, which would have effect on the basic EPS if the option to convert would have been exercised.
2018 2017 33. CASH AND CASH EQUIVALENTS Note ------Rupees in '000' -------
Cash and bank balances 13 79,733 22,942 Short term investments - 36,000 Short term borrowings 21 (479,481) (241,898)
(399,748) (182,956)
34. REMUNERATION OF CHIEF EXECUTIVE, DIRECTORS AND EXECUTIVES
The aggregate amount charged in the accounts for remuneration, including certain benefits to directors, chief executive and executives of the company are as follows:
2018Chief Executive Directors Executives Total
----- Rupees in '000' -----
Managerial remuneration 16,242 - 30,839 47,080 House allowance and utilities 4,851 - 17,139 21,990 Servant allowance 980 - - 980 Telephone allowance 823 - - 823 Medical reimbursement - - 2,012 2,012 Directors' Meeting Fee - 4,275 - 4,275
22,896 4,275 49,990 77,160
Number of persons 1 6 20

73
Annual Report 2018
73
Annual Report 2018
2017Chief Executive Directors Executives Total
----- Rupees in '000' -----
Managerial remuneration 14,855 - 20,068 34,923 House allowance and utilities 3,486 - 11,045 14,531 Servant allowance 852 - - 852 Telephone allowance 716 - - 716 Medical reimbursement - - 1,296 1,296 Directors' Meeting Fee - 3,750 - 3,750
19,909 3,750 32,409 56,068
Number of persons 1 6 15
34.1 In addition to the above, the Directors, Chief Executive officer and some of the executives have been provided with free use of the Company maintained cars. Further, they are entitled to gratuity and provident fund in accordance with the Company's policy.
34.2 Comparative disclosure has been updated to comply with the requirements of changes in the fourth schedule to the Companies Act, 2017.
2018 2017 35. PROVIDENT FUND DISCLOSURES Note ------ Rupees in '000' -----
a) Disclosure with regards to Provident Fund
(i) Size of the Fund 11,355 16,531
(ii) Cost of Investment made 9,603 15,162
(iv) Fair value of Investments 10,795 16,062
(iii) Percentage of Investment made 95% 92%
b) Break-up of Investments is as under
Notes To The Financial Statements For the year ended June 30, 2018
2018 2017 Rs '000 Percent Rs '000 Percent
Mutual funds- NIT - 0% 1,203 7%- Meezan Mutual Fund 735 6% 1,901 12%- NAFA Fullerton Asset Man. (Money Market Fund) 1 0% 1,758 11%- NAFA Fullerton Asset Man. (Stock Fund) 263 2% 912 6%- NAFA Fullerton Asset Man. ( RIBA-Free Savings Fund) 1,163 10% - 0%- NAFA Fullerton Asset Man. ( Asset Allocation Fund ) 413 4% - 0%- NAFA Fullerton Asset Man. ( Islamic Asset Allocation Fund) 334 3% - 0%- NAFA Fullerton Asset Man. (Islamic Aggressive Income Fund) - 0% 1,111 7%- NAFA Fullerton Asset Man. (Islamic Stock Fund) - 0% 916 6%
2,909 26% 7,801 47%Banks deposits- Meezan Bank Limited Karachi - 0% 497 3%- Meezan Bank Limited Haripur 7,886 69% 7,764 47%
7,886 69% 8,261 50%Others 560 5% 469 3%
11,355 100% 16,531 100%
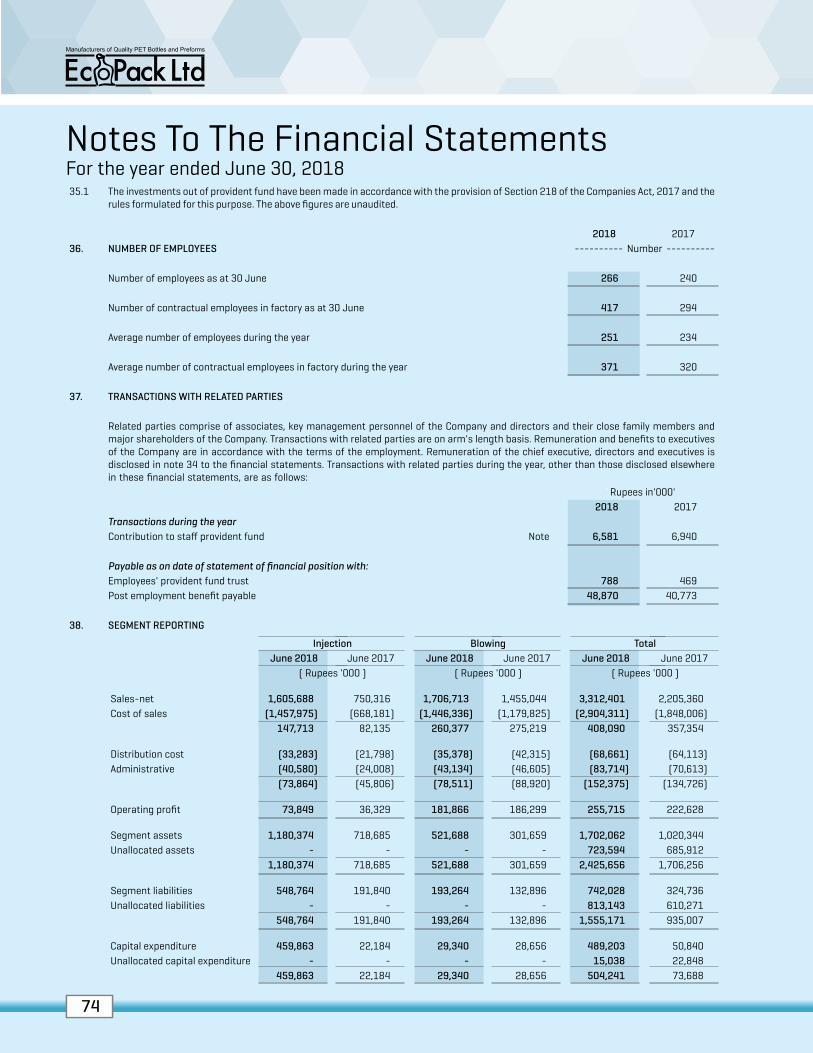
7474
35.1 The investments out of provident fund have been made in accordance with the provision of Section 218 of the Companies Act, 2017 and the rules formulated for this purpose. The above figures are unaudited.
2018 2017 36. NUMBER OF EMPLOYEES ---------- Number ----------
Number of employees as at 30 June 266 240
Number of contractual employees in factory as at 30 June 417 294
Average number of employees during the year 251 234
Average number of contractual employees in factory during the year 371 320
37. TRANSACTIONS WITH RELATED PARTIES
Related parties comprise of associates, key management personnel of the Company and directors and their close family members and major shareholders of the Company. Transactions with related parties are on arm's length basis. Remuneration and benefits to executives of the Company are in accordance with the terms of the employment. Remuneration of the chief executive, directors and executives is disclosed in note 34 to the financial statements. Transactions with related parties during the year, other than those disclosed elsewhere in these financial statements, are as follows:
Rupees in'000' 2018 2017
Transactions during the yearContribution to staff provident fund Note 6,581 6,940
Payable as on date of statement of financial position with:Employees' provident fund trust 788 469 Post employment benefit payable 48,870 40,773
38. SEGMENT REPORTING
Notes To The Financial Statements For the year ended June 30, 2018
Injection Blowing Total June 2018 June 2017 June 2018 June 2017 June 2018 June 2017
( Rupees '000 ) ( Rupees '000 ) ( Rupees '000 )
Sales-net 1,605,688 750,316 1,706,713 1,455,044 3,312,401 2,205,360 Cost of sales (1,457,975) (668,181) (1,446,336) (1,179,825) (2,904,311) (1,848,006)
147,713 82,135 260,377 275,219 408,090 357,354
Distribution cost (33,283) (21,798) (35,378) (42,315) (68,661) (64,113)Administrative (40,580) (24,008) (43,134) (46,605) (83,714) (70,613)
(73,864) (45,806) (78,511) (88,920) (152,375) (134,726)
Operating profit 73,849 36,329 181,866 186,299 255,715 222,628
Segment assets 1,180,374 718,685 521,688 301,659 1,702,062 1,020,344 Unallocated assets - - - - 723,594 685,912
1,180,374 718,685 521,688 301,659 2,425,656 1,706,256
Segment liabilities 548,764 191,840 193,264 132,896 742,028 324,736 Unallocated liabilities - - - - 813,143 610,271
548,764 191,840 193,264 132,896 1,555,171 935,007
Capital expenditure 459,863 22,184 29,340 28,656 489,203 50,840 Unallocated capital expenditure - - - - 15,038 22,848
459,863 22,184 29,340 28,656 504,241 73,688

75
Annual Report 2018
75
Annual Report 2018
Notes To The Financial Statements For the year ended June 30, 2018 38.1 Inter-segment transfer have been eliminated from totals.
38.2 Administrative expenses and distribution costs are allocated on the basis of the net sales value for each segment.
2018 2017 Note ------Rupees in '000' -------
39. FINANCIAL INSTRUMENTS
Financial instruments by category
Financial assets - loans and receivablesSecurity deposits 55,849 7,512 Trade debts 454,623 149,400 Loans and advances 2,532 2,001 Deposits and other receivables 4,100 16,877 Bank balances 79,633 21,913
596,737 197,703
Financial liabilities - at amortized costLong term loans 151,465 245,156 Liabilities against assets subject to finance lease 374,972 11,262 Trade and other payables 297,597 166,176 Accrued mark - up 13,774 8,950 Short term borrowings - secured 479,481 241,898
1,317,289 673,442
40. FINANCIAL RISK MANAGEMENT OBJECTIVES AND POLICIES
The Company's activities expose it to a variety of financial risks: capital risk, credit risk, liquidity risk and market risk (including foreign exchange or currency risk, interest / mark-up rate risk and price risk). The Company's overall risk management program focuses on the unpredictability of financial markets and seeks to minimize potential adverse effects on the financial performance. Overall, risks arising from the Company's financial assets and liabilities are limited. The Company consistently manages its exposure to financial risk without any material change from previous period in the manner described in notes below.
The Board of Directors has overall responsibility for the establishment and oversight of Company's risk management framework. All treasury related transactions are carried out within the parameters of these policies.
40.1 Credit risk
Credit risk is the risk which arises with a possibility that one party to a financial instrument will fail to discharge its obligation and cause the other party to incur a financial loss, without taking into account the fair value of any collateral. Concentration of credit risk arises when a number of financial instruments or contracts are entered into with the same party, or when counter parties are engaged in similar business activities, or activities in the same geographic region, or have similar economic features that would cause their ability to meet contractual obligations to be similarly affected by change in economics, political or other conditions. Concentration of credit risk indicates that relative sensitivity of the Company’s performance to development affecting a particular industry.
Credit risk arises from deposits with banks and long term deposits, trade debts, loans, investments and other receivables. The Company attempts to control credit risk by monitoring credit exposures and continually assessing the creditworthiness of counterparties. Company receives advances from customers against sales of goods and therefore its exposure to credit risk is limited. The Company monitors the credit quality of its financial assets with reference to historical performance of such assets and available external credit ratings.
The carrying amount of financial assets represents the maximum credit exposure. To manage exposure to credit risk, the Company applies credit limits to their customers. Cash is held only with banks with high quality credit worthiness.
The company's gross maximum exposure to credit risk at the date of statement of financial position is as follows:

7676
Notes To The Financial Statements For the year ended June 30, 2018
2018 2017 Note ------Rupees in '000' -----
Trade debts 469,464 174,821 Loans and advances 2,532 2,001 Deposits and other receivables 4,100 16,877 Bank balances 79,633 21,913
555,729 215,612 40.1.1 Impairment losses
The aging of trade debts at the reporting date was:
2018 2017Gross Value Impairment Gross Value Impairment
Rupees '000 Rupees '000
Not Past Due 301,970 - 100,700 - Past Due 1-60 Days 142,725 - 43,600 - Past due 61 Days to 1 Year 7,827 - 1,455 - More than 1-Year 16,942 14,841 29,066 25,421
469,464 14,841 174,821 25,421
2018Carrying Amount
Contractual cash flows
Twelve months or less
One to five years
---------- Rupees in '000' ----------
Long term loan 151,465 151,465 90,719 60,746 Finance Lease 374,972 374,972 66,422 308,550 Trade and other payables 297,597 297,597 297,597 - Short term borrowings 479,481 479,481 479,481 -
1,303,515 1,303,515 934,219 369,296 `
40.1.2 The credit quality of the Company's bank balances can be assessed with reference to external credit ratings as follows:
2018 2017 Credit rating Note ------Rupees in '000' -----
A1+ 64,931 20,706 A1 14,702 1,207
79,633 21,913 40.2 Liquidity risk
Liquidity risk is the risk that the Company will encounter difficulty in meeting its financial obligations as they fall due. Liquidity risk arises because of the possibility that the Company could be required to pay its liabilities earlier than expected or difficulty in raising funds to meet commitments associated with financial liabilities as they fall due. The Company’s approach to managing liquidity is to ensure, as far as possible, that it will always have sufficient liquidity to meet its liabilities when due, under both normal and stressed conditions, without incurring unacceptable losses or risking damage to the Company's reputation. The following are the contractual maturities of financial liabilities (including interest payments):

77
Annual Report 2018
77
Annual Report 2018
2018 2017
Average rates
Balance sheet rate
Average rates
Balance sheet rate
-------- Rupees -------- -------- Rupees --------
US Dollar 110.62 121.60 104.73 105.00
Contractual cash flows include interest related cash flows up to the year end. The future interest related cash flows depend on the interest rates applicable at that time and the extent of utilization of running finance facilities.
40.3 Market risk
Market risk is the risk that the value of the financial instrument may fluctuate as a result of changes in market interest rates or the market price due to a change in credit rating of the issuer or the instrument, change in market sentiments, speculative activities, supply and demand of securities and liquidity in the market. The Company is exposed to currency risk, interest rate risk and equity price risk.
a) Foreign exchange risk management
Foreign currency risk is the risk that the fair value of future cash flows of a financial instrument will fluctuate due to a change in a foreign exchange rate. It arise mainly where receivables and payables exist due to transactions in foreign currency. It mitigate its risk against foreign exchange rate by entering into hedging contract with Financial institution:
Exposure to foreign currency risk
The Company is exposed to currency risk on import of machinery and its parts that are denominated in a currency other than the respective functional currency of the Company. These transactions are denominated in US Dollars. At the reporting date all import payables were paid and the company has no exposure to foreign currency risk.
The following significant exchange rates applied during the year:
As the company has not any foreign currency payables at year end, hence any increase or decrease in exchange rate will not have any impact on company's financial statements.
Notes To The Financial Statements For the year ended June 30, 2018
2017Carrying Amount
Contractual cash flows
Twelve months or less
One to five years
---------- Rupees in '000' ----------
Long term loan 245,156 298,257 99,933 198,324 Finance Lease 11,262 12,932 2,289 10,643 Trade and other payables 166,176 166,176 166,176 - Short term borrowings 241,898 247,266 247,266 -
664,492 724,631 515,664 208,967

7878
b) Interest/ mark up rate risk
Interest rate risk is the risk that the fair value or future cash flows of a financial instrument will fluctuate because of changes in market interest rates. The Company is exposed to cash flow interest rate risk on its running finance arrangements which is repriced at a maximum period of 120 days.
All the borrowings of the company are variable rate borrowings, hence the company is not exposed to fair value risk on its borrowings.
During the year, if average KIBOR interest rate on borrowings had been 100 basis points higher / lower with all other variables held constant, profit after taxation for the year would have been higher / lower by Rs. 6.41 million (2017: higher / lower by Rs. 4.983 million) respectively, mainly as a result of higher / lower interest exposure on floating rate borrowing.
Cash flow sensitivity analysis for Variable rate instruments
The Company holds various variable rate financial instruments amounting to Rs. 1,006 million (2017: 498 million) exposing the Company to fair value interest rate risk. A change of 100 basis points as at June 30, 2018 would have increased profit after tax by Rs. 7.14 million (2017: 3.45 million).
Cash flow sensitivity analysis for Fixed rate instruments
The Company does not account for any fixed rate financial assets and liabilities at fair value through profit and loss. Therefore a change in interest rates at the reporting date would not affect profit and loss.
40.4 Fair value of financial instruments
‘Fair value’ is the price that would be received to sell an asset or paid to transfer a liability in an orderly transaction between market participants at the measurement date. Consequently, differences can arise between carrying values and the fair value estimates.
The carrying amounts of all financial assets and liabilities reflected in the financial statements approximate their fair values. The Company measures fair values using the following fair value hierarchy that reflects the significance of the inputs used in making the measurements:
Level 1: Fair value measurements using quoted prices (unadjusted) in active markets for identical assets or liabilities.
Level 2: Fair value measurements using inputs other than quoted prices included within Level 1 that are observable for the asset or liability, either directly or indirectly.
Level 3: Fair value measurements using inputs for the asset or liability that are not based on observable market data (i.e. unobservable inputs).
40.5 Capital risk management
The Company’s objectives when managing capital are to safeguard the Company’s ability to continue as a going concern in order to provide returns for shareholders and benefits for other stakeholders and to maintain an optimal capital structure.
In order to maintain or adjust the capital structure, the Company may adjust the amount of dividends paid to shareholders, return on capital to shareholders or issue new shares or sell assets to reduce debt.
Consistent with others in the industry, the Company manages its capital risk by monitoring its debt levels and liquid assets and keeping in view future investment requirements and expectation of the shareholders. Debt is calculated as total borrowings ('long term financing' and 'short term borrowings' as shown in the balance sheet). Total capital comprises shareholders’ equity and surplus on revaluation of fixed assets as shown on the face of the statement of financial position.
There were no changes to the Company’s approach to capital management during the year and the Company is not subject to externally imposed capital requirements.
Notes To The Financial Statements For the year ended June 30, 2018

79
Annual Report 2018
79
Annual Report 2018
2018 2017 41. PLANT CAPACITY AND ACTUAL PRODUCTION ------ Numbers in 000------
BlowingCapacity - no. of bottles 304,200 304,200 Production - no. of bottles 174,143 159,056 Utilization 57% 52%
InjectionCapacity - no. of preforms 41.1 796,733 415,733 Production - no. of preforms 387,500 283,402 Utilization 49% 68%
Injection - Proportionate effect of increased capacityCapacity - no. of preforms 510,983 415,733 Production - no. of preforms 387,500 283,402 Utilization 76% 68%
41.1 The production capacity of injection department is enhanced with 381 million units on annualized basis. However, the commercial production was started in last quarter of the financial year, therefore, its proportionate capacity enhancement is considered.
42. NON-ADJUSTING EVENT AFTER THE DATE OF STATEMENT OF FINANCIAL POSITION
The Board of Directors in its meeting held on September 26, 2018 has proposed a common stock dividend at the rate of 15% (2017: 5%) and cash dividend at the rate of 10% (2017: 10%) for the year ended June 30, 2018. These appropriations will be placed before share-holders for approval in the forthcoming Annual General Meeting and the effect thereof will be accounted for in the financial statements for the year ending June 30, 2019.
43. CORRESPONDING FIGURESCorresponding figures have been rearranged and reclassified, wherever necessary for the purposes of comparison and better presentation.
Reclassification from statement of Reclassification to statement of ---Rs in 000--- financial position financial position
Trade and other payable Unclaimed dividend 461 Intangibles Property, plant and equipment 1,032
44. SIGNIFICANT TRANSACTIONS AND EVENTS THAT AFFECTED THE COMPANY'S FINANCIAL POSITION AND PERFORMANCE- During the year the company installed two new injection moulding machines on lease arrangements to increase production capacity of preforms.
- Due to the applicability of Companies Act, 2017 certain disclosures of the financial statements have been presented in accordance with the fourth schedule notified by the Securities and Exchange Commission of Pakistan vide S.R.O 1169 date 7 November 2017.
- The company migrated its Enterprise Resource Planning (ERP) software from Sidat Hyder to SAP from 01 January 2018.
45. DATE OF AUTHORIZATION
These financial statements have been authorized for issue on September 26, 2018 by the Board of Directors of the Company.
46. GENERAL
Figures have been rounded off to the nearest thousand rupees.
Notes To The Financial Statements For the year ended June 30, 2018
DIRECTOR CHIEF FINANCIAL OFFICER CHIEF EXECUTIVE OFFICER

8080
Proxy FormThe Company SecretaryEcoPack LimitedPlot 112-113, Phase 5, IndustrialEstate Hattar, District HaripurKhyber Pakhtunkhwa
I / We __________________________________________________________________ of ___________________________________________________________________
being member (s) EcoPack Limited, and holder of Ordinary Share as per register Folio No __________________________ and / or CDC
Participant I.D. No. _______________________________________________ and Account / Sub-Account No. _______________________
do hereby appoint _________________________________________ of ___________________________________ as my / our proxy to
attend, speak and vote for me / us and on my / our behalf at the 27th Annual General Meeting of the Company to be held
on Saturday October 27, 2018 _____________________________________________________________________________________________________ and at any
adjournment thereof. As witness I / We set my / our hand (s) this _____________________________ day of _____________________ 2018 signed the said
proxy in the presence of:
Witnesses:
Note:
i. The Proxy Form in order to be valid must be deposited with the Company not later than 48 hours before the time of holding the meeting.ii. The proxy must be a member of the company.iii. CDC Shareholders and their Proxies must attached either an attested photocopy of their Computerized National Identity Card or Passport with the
proxy form.
Signature should agree with the specimen signature registered with
the Company)
1. Signature: _________________________________________________________
Name: _________________________________________________________
Address: _________________________________________________________
CNIC / NICOP
or
Passport No. _________________________________________________________
2. Signature: _________________________________________________________
Name: _________________________________________________________
Address: _________________________________________________________
CNIC / NICOP
or
Passport No. _________________________________________________________
Signature RevenueStamp
81
Annual Report 2018
81
Annual Report 2018