annual report 2017 - tamron.com · lenses rose slightly, and the surveillance camera market...
TRANSCRIPT

Annual Report 2017

0
1,000
2,000
3,000
4,000
0
2,000
4,000
6,000
8,000
0
20,000
40,000
60,000
80,000
Millions of Yen
Years ended December 31 201620142013
For the Year:
Net sales ¥ 59,903¥ 73,621¥ 68,452
Operating income 2,3616,0765,233
Operating income ratio 3.9%8.3%7.6%
Ordinary income 2,8556,2005,196
Ordinary income ratio 4.8%8.4%7.6%
Pro�t attributable to owners of parent 1,4823,8463,197
At Year-End:
Total assets ¥ 60,910¥ 69,906¥ 64,704
Net assets 47,32151,99547,087
Per Share Data (Yen):
Pro�t attributable to owners of parent ¥ 57.19¥ 140.14¥116.48
Shareholders’ equity 1,825.621,894.141,715.37
Cash dividends 55.0050.0050.00
Ratios:
Return on assets (ROA) 4.5%9.2%8.5%
Return on equity (ROE) 3.1%7.8%7.3%
Equity ratio 77.7%
2017
¥ 60,496
4,246
7.0%
4,100
6.8%
2,838
¥ 63,868
49,940
¥ 109.51
1,926.65
50.00
6.6%
5.8%
78.2%
2015
¥ 71,946
4,554
6.3%
5,140
7.1%
4,048
¥ 66,035
49,001
¥ 153.98
1,890.45
60.00
Price earnings ratio (PER) 33.917.021.9 22.114.6
7.6%
8.0%
74.2%74.4%72.8%
Notes: 1. ROA=Ordinary income/Total assets
2. ROE=Pro�t attributable to owners of parent/Total net assets
FINANCIAL HIGHLIGHTS
NET SALES
2013 2014 2015 2016 2013 2014 2015 2016 2013 2014 2015 20162017
OPERATING INCOME/(% NET SALES) PROFIT ATTRIBUTABLE TO OWNERS OF PARENT(% NET SALES)
2Annual Report 2017
2017 201700
3
6
9
12
0
3
6
9
12 (Millions of Yen) (Millions of Yen) (Millions of Yen) (%) (%)
CORPORATE PHILOSOPHY ……………………………………………………………… 1
FINANCIAL HIGHLIGHTS ………………………………………………………………… 2
MESSAGE FROM THE PRESIDENT & CEO …………………………………………… 3
MANAGEMENT POLICY…………………………………………………………………… 3
BUSINESS SEGMENT INFORMATION ………………………………………………… 5
FINANCIAL SITUATION …………………………………………………………………… 7
CORPORATE GOVERNANCE …………………………………………………………… 9
BUSINESS & OTHER RISKS…………………………………………………………………12
CONSOLIDATED BALANCE SHEETS ……………………………………………………13
CONSOLIDATED STATEMENTS OF INCOME/ CONSOLIDATED STATEMENTS OF COMPREHENSIVE INCOME………………15
CONSOLIDATED STATEMENTS OF CHANGES IN NET ASSETS…………………16
CONSOLIDATED STATEMENTS OF CASH FLOWS …………………………………17
NOTES TO CONSOLIDATED FINANCIAL STATEMENTS …………………………19
HISTORY ………………………………………………………………………………………21
COMPANY PROFILE/STOCK OVERVIEW………………………………………………23
GROUP NETWORK …………………………………………………………………………24
TABLE OF CONTENTS
Note: In the 2017 annual report, amounts of less than the unit indicated, for example, one million yen have been omitted.
Corporate Philosophy
With its �rm commitment to developing high-quality, innovative and tech-
nologically advanced products that satisfy customer needs, Tamron is
securing a leading position in the worldwide optical industry.
Our primary objective is to sustain strong corporate growth based on a
high level of customer satisfaction achieved by providing superior prod-
ucts at the right price, thus also contributing to the prosperity of our
shareholders and employees.
We at Tamron are advancing with our corporate philosophy
to guide our mission.
1 Tamron Co., Ltd.

President & CEOTamron Co., Ltd.
Shiro Ajisaka
MESSAGE FROM THE PRESIDENT & CEO
MANAGEMENT POLICY
We achieved a record high gross margin, increases in income and substantial pro�t in 2017.
I am pleased to provide an overview of our consolidated business results for the 71st term ( January 1, 2017 to December 31, 2017) as follows.Regarding market conditions in the current �scal year, although there was a decline in sales of the SLR type, sales of the non-�ex type increased substan-tially and the total of lenses for compact mirrorless system cameras turned positive compared to the previous year. Sales of interchangeable lenses also increased slightly. After peaking in 2012, sales of both cameras and lenses had been falling, but the fall came to an end. Sales of cameras with built-in lenses rose slightly, and the surveillance camera market achieved stable growth, while strong growth continued for the automotive camera market. Under these circumstances, in the current term, net sales came to 60.496 billion yen (up 1.0% compared to the previous year) mainly due to the posi-tive impact of the depreciation of the yen. The Company achieved a record high gross margin primarily thanks to effects of the launch of a new product, own-brand interchangeable lenses. Operating income stood at 4.246 billion yen (up 79.8% compared to the previous year), ordinary income came to 4.1 billion yen (up 43.6% compared to the previous year) and pro�t attributable to owners of parent was 2.838 billion yen (up 91.5% compared to the previ-ous year) because of a reduction in operating expenses. As a result, it was a year in which we saw an improvement in pro�tability with an increase in reve-nue and a substantial rise in pro�t.
Looking ahead at 2018, we are determined to achieve increases in revenue and pro�t for the second consecutive year by actively launching new prod-ucts, own-brand interchangeable lenses, and striving for sales expansion in growth areas such as surveillance cameras, FA, automotive cameras and drones.
Issues on Mid-to Long-Term Management
Agendas for Transformation
Mid-Term Management Plan
Reinforce Sales & Marketing
MANAGEMENT POLICY
3 Tamron Co., Ltd. 4Annual Report 2017
1. Accelerate the global expansion of the existing business, capture the demand of the emerging markets, improve pro�tability and strengthen the business foundation.
2. Increase and strengthen marketing activities, jointly create new values, including M&A, develop new "eyes for industry" and expand the business �elds.
3. Reduce the lead time from development to high-vol-ume production and construct the system for the timely input of new products.
4. Construct the global trilateral system for ef�cient production and promote increased productivity and cost reductions through automation, labor saving and manpower saving, among other means, with
the fourth industrial revolution in mind.
5. In addition to the development of component tech-nologies, especially the Company's core optical technologies, focus on research and development in new technical �elds, the joint creation of new values and other horizontal operations among multiple companies (including collaboration among government, industry and academia).
6. Strengthen corporate governance and increase capital ef�ciency.
7. Increase work-life balance and ensure a suitable work environment for all employees where all workers are satis�ed with their work.
Customer Values
Globalization of Sales, Production, & R&D
Re-Building of R&D Process
New Business Development
Corporate Management
<Basic policy by area>
Digital camera area(Mature market)
Do not assume significant sales growth, but prioritize improvement in profitability.
Maintain/secure competitiveness and broaden the client base for industries.
Business size expansion phase by aggressively adding resources ⇒ Secure a position in individual focus areas.
A phase for creating new business candidates including cooperation/M&A, etc. ⇒ Certain preparation eyeing full-scale sales growth in 2021 and beyond.
Surveillance/FA-related area(Stable growth market)
Focus area *Drone/Automotive Lenses(High growth market)
New area
2017 2020
¥60.5 billionNet Sales
¥4.2 billionOperating Income
7.0%(% Sales)
5.8%
¥72 billion
¥6.6 billion
9.2%
At least 9%ROE
We aim to achieve the medium-term management plan to 2020 as well as achieving innovative change themes.
The main points of the planIn 2020, we are aiming for a record pro�t for the �rst time in 10 years, with sales of ¥72 billion, an annual growth rate of 6% compared to 2017, and operating income of ¥6.6 billion, about 1.5 times that of 2017. The plan is to improve pro�tability and capital ef�ciency. Sales of ¥63 billion (up 4.1% compared to the prior year) and operating income of ¥4.8 billion (up 13.0% compared to the prior year) are planned for 2018, the �rst year of the plan. Re�ecting back on past medium-term management plans that we successively failed to achieve, we have decided to manage/assess the plan as a three-year �xed plan from now on, rather than in the conventional rolling fashion.
Approach by area ・Sales composition of the digital camera related area: 80% ⇒ down to the 60% level ・Sales of focus/new areas: Approx. ¥10 billion The plan is to improve the pro�tability of the core business, a mature market, maintain a competitive edge over stable growth industries and achieve sales growth in the areas of focus. The basic policy by area is as follows:
(unit: billion yen)
2017 2020
■ Digital camera area■ Surveillance/FA-related area■ Focus/new area
48.0
9.62.9
49.5
12.5
10.0

BUSINESS SEGMENT INFORMATION
5 Tamron Co., Ltd. 6
Main Products
Interchangeable lenses for 35mm/Digital SLR camerasInterchangeable lenses for mirrorless interchangeable lens cameras
Camcorder lensesDigital still camera lensesDrone lensesOptical device units
Surveillance camera lensesMachine vision/FA LensesAutomotive lenses
Business Segment Overview Net Sales Operating Income(Losses)/(% Net Sales)Composition of Sales
Photographic Products
Optical Components
Commercial/ Industrial-use Optics
Annual Report 2017
(Millions of Yen) (Millions of Yen) (%)
(Millions of Yen) (Millions of Yen) (%)
(Millions of Yen) (Millions of Yen) (%)
While revenue from OEM products fell, sales of and revenue from own-brand interchangeable lenses grew mainly in the U.S., China and Japan due to the effects of launching six new product models. Regarding the own-brand new products, the Company released the high-speed telephoto zoom lens SP70-200mm F/2.8 VC USD G2 (A025) in February, the ultra-wide-angle zoom lens 10-24 mm VC HLD (B023) in March, the ultra-telephoto all-in-one zoom lens 18-400 mm VC HLD (B028) in July, the high-speed standard zoom lens SP 24-70 mm F/2.8 VC USD G2 (A032) in August and the ultra-telephoto zoom lens 100-400 mm VC USD (A035) in November. The Company strove to release new products constantly throughout the year, thereby increasing demand and improving the profit ratio. Favorably received in Japan and overseas, a Company lens won the EISA award for the twelfth consecutive year as well. As a result, net sales for the Photographic Products business came to 45.292 billion yen (a decrease of 3.2% compared to the previous year). Operating income grew substantially to 5.818 billion yen (an increase of 44.2% compared to the previous year) thanks to the increase in revenue from the own-brand lens and the improvement of the profit ratio.
The substantial contraction of the compact digital camera lenses market continued. However, the Company also saw a rise in revenue from the market due to a sharp increase in sales volume because of a reactive increase due to the Kumamoto Earthquake in 2016. Moreover, the Company entered into a new field with the drone market, which the Company has been focusing on as a new business area, commencing product shipments in the second half of the year. As a result, net sales of the Optical Components business came to 3.375 billion yen (an increase of 43.2% compared to the previous year). Operating losses dropped to 24 million yen (operating profit in the previous year was 75 million yen) due to the initial cost and prior investments associated with the entry into a new business area.
Sales of surveillance camera lenses rose centered on highly value-added products for camera makers in advanced countries, although severe conditions remained in the competitive environment where the Company competes with overseas makers. In addition, revenue from automotive camera lenses grew against the backdrop of strong market growth and remained favorable. As a result, net sales for the Commercial/Industrial-use Optics business came to 11.827 billion yen (an increase of 10.1% compared to the previous year). Operating income came to 827 million yen (an increase of 12.9% compared to the previous year), posting double-digit revenue and operating profit.
74.9%
%5.6%
19.5%
2015 2016 20170
20,000
40,000
60,000
2015 2016 20170
2,000
4,000
6,000
2015 2016 20170
2,000
4,000
6,000
2015 2016 2017-100
0
100
200
300
2015 2016 20170
5,000
10,000
15,000
2015 2016 20170
500
1,000
1,500
0
5
10
15
-5
0
5
10
15
0
5
10
15

FINANCIAL SITUATION
7 Tamron Co., Ltd. 8
FINANCIAL SUMMARYCurrent assetsThe balance of current assets at the end of the con-solidated �scal year stood at 45.392 billion yen, up 3.802 billion yen compared to the level at the end of the previous consolidated �scal year. The result pri-marily re�ected increases in cash and deposits of 3.401 billion yen and in notes and accounts receiv-able-trade of 642 million yen.
Non-current assetsThe balance of non-current assets at the end of the consolidated �scal year stood at 18.476 billion yen, a decrease of 844 million yen compared to the level at the end of the previous �scal year. This was mainly because of a decl ine in property , p lant and equipment of 921 million yen.
Current liabilitiesThe balance of current liabilities at the end of the consolidated �scal year stood at 11.931 billion yen, up 543 million yen compared to the level at the end of the previous consolidated �scal year. This was mainly because of a decline in short-term borrowings o f 650 mi l l ion yen , an increase in accounts payable-trade of 607 mill ion yen and a rise in accrued expenses of 283 million yen.
Non-current liabilitiesThe balance of non-current liabilities at the end of the consolidated �scal year stood at 1.996 billion yen, down 204 million yen compared to the level at the end of the previous consolidated �scal year. This was chie�y because of a decrease in long-term borrowings of 268 million yen.
Net assetsThe net balance of assets at the end of the consolidated �scal year came to 49.940 billion yen, an increase of 2.618 billion yen compared to the level at the end of the previous consolidated �scal year. This mainly re�ected increases in retained earnings of 1.412 billion yen and in foreign currency translation adjustments of 738 million yen.
CASH FLOWSFor the consolidated �scal year, cash and cash equivalents at the end of the year increased 3.401 billion yen compared to the level at the end of the previous consolidated �scal year, to 19.431 billion yen.
The cash �ows resulting from different activities during the consolidated �scal year were as follows.
Cash �ows through operating activitiesIncome before income taxes and minority interests stood at 4.222 billion yen, depreciation expenses came to 3.562 billion yen, and the increase in notes and accounts payable-trade stood at 543 million yen. At the same t ime, the increases in accounts receivable-trade and inventory came to 367 million yen and 192 million yen, respectively. Because of these and other factors, cash �ows from operating activities resulted in income of 7.661 billion yen (compared to income of 6.537 billion yen for the previous consolidated �scal year).
Cash �ows through investing activitiesWith expenses of 2.390 billion yen for property, plant and equipment, etc., cash �ows from investing activities resulted in a disbursement of 2.174 billion yen (compared to 2.540 billion yen in the previous consolidated �scal year).
Cash �ows through �nancing activitiesThere was a disbursement of 766 million yen for the repayment of long-term borrowings and dividend payments of 1.427 billion yen. Because of these and other factors, cash �ows from �nancing activities resulted in a disbursement of 2.351 billion yen (compared to 1.524 billion yen in the previous consolidated �scal year).
CAPITAL INVESTMENTIn 2017, the Tamron Group made total capital investments of 2.425 billion yen (a decrease of 2.4% compared to the previous year) centered on investments in machining equipment at Tamron Optical (Foshan) Co., Ltd. and investments in metal molds related to new models in order to manufacture key components internally.
RESEARCH AND DEVELOPMENTRegarding the Tamron Group’s research and development activities, the Opto-Science R&D Center engages in R&D from a long-term perspective. The Optical Design & Engineering R&D Unit, the Core Technology & Engineering R&D Unit, the Integrated Core Technology R&D Unit and the Process Technology & Engineering Unit develop individual elementary technologies, which are the core technologies of optics, production engineering, and electronics. The engineering departments of the individual Business Units develop products. In 2017, R&D expenses were 4.111 billion yen (up 2.7% compared to the previous year).
DIVIDEND POLICYWe take R&D and capital investments, etc. into consideration to strengthen the management structure and develop new businesses from a long-term perspective. We also strive to achieve performance-based pro�t distribution by focusing on a continuous dividend with a payout ratio of some 35%, and continue stable pro�t distribution to our shareholders. That is our basic policy on dividends. For the term ended December, 2017, the total dividends for the year were 50 yen per share (a 25-yen interim dividend and a 25-yen year-end dividend), and the consolidated dividend payout ratio was 45.7%. For internal reserves, we are considering making an effective investment in core technology & engineering and capital investments to further reinforce cost competitiveness.
Annual Report 2017
0
2,000
4,000
6,000
■ CAPITAL INVESTMENT ■ DEPRECIATION
R&D EXPENSES/% NET SALESCAPITAL INVESTMENT/DEPRECIATION
TOTAL ASSETS NET ASSETS
2013 2014 2015 2016 2017 2013 2014 2015 2016 2017 2013 2014 2015 2016 2017 2013 2014 2015 2016 20170
20,000
40,000
60,000
80,000
0
20,000
40,000
60,000
80,000
0
2,000
4,000
6,000
0
3
6
9
R&D EXPENSES % NET SALES
(Millions of Yen) (Millions of Yen) (Millions of Yen) (Millions of Yen) (%)

CORPORATE GOVERNANCE
9 Tamron Co., Ltd. 10
of duties by Directors, by attending the Board of
Directors meetings and checking approval docu-
ments.
(3) Nomination Committee and Compensation Committee
To enhance the independence and objectivity of
Board of Directors functions concerning director ap-
pointment, dismissal and compensation, Tamron has
established a Nominating Committee and Compensa-
tion Committee. Each committee is chaired by an
external director, with a majority of its members
external of�cers (external directors and external audi-
tors).
(4) Management MeetingTamron has established management meetings
attended by directors and full-time corporate audi-
tors to discuss and consider issues related to man-
agement and the execution of duties, and to quickly
respond to the changing management environment.
1. Basic PolicyEver since the Company was �rst established, we at
Tamron have sought to forge good relationships with
all stakeholders, achieve sustainable growth and en-
hance corporate value in line with our management
philosophy. In support of those goals, we have ad-
opted the basic approach of ensuring fair and trans-
parent management practices while developing a
highly effective corporate governance system that
seeks to improve the speed and ef�ciency of deci-
sion making and business execution.
2. Corporate Governance System OverviewTamron is a company with corporate auditors and
includes a Board of Directors that functions as a
body to make important decisions and supervise the
execution of operations, as well as an Audit & Super-
visory Board as an auditing body that is independent
of the Board of Directors.
Tamron also appoints multiple independent exter-
nal directors possessing a wealth of knowledge,
expertise and independence and has set up a Nomi-
nating Committee and Compensation Committee as
advisory bodies to enhance supervisory functions. In
addition, by establishing a Management Meeting and
introducing an Executive Of�cer system, we have de-
veloped a framework for executing business matters
in a way that responds smoothly and quickly to
changes in the external environment.
To the Board of Directors, Tamron appoints 12
directors (two of whom are external directors) and 4
corporate auditors (three of whom are external audi-
tors).
(1) Board of DirectorsMeetings of the Board of Directors are held twice a
month, in principle, attended by all Directors and
Corporate Auditors, for reviewing the execution of
duties by the Directors and deciding on important
issues as set forth in the basic policy of the Company
and the Companies Act.
(2) Audit & Supervisory BoardMeeting once a month in principle, the Audit &
Supervisory Board audits the process of decision
making by the Board of Directors and the execution
General Meeting of Shareholders
Board of Auditors(Corporate Auditors and Coordination
Independent Auditors)Accounting Auditor
Board of Directors(Directors and External Directors)
President & CEO
Management Meeting
Each Department/Subsidiary
Internal Audit &Supervision Board
CSR Committee
NominationCommittee
CompensationCommittee
Compliance Committee
Election/Dismissal Election/Dismissal Election/Dismissal
Coordination
Coordination
Coordination
Internal Audit
Corporate Governance Structure
Annual Report 2017
POLICY AND PROCEDURES FOR NOMINATION OF DIRECTOR CANDIDATES AND CORPORATE AUDITOR CANDIDATESNomination policyThe Board o f D i rec to r s sha l l cons i s t o f an appropriate number of people of up to 15 persons, and the viability of the Board shall be secured in consideration of the diversity/balance that is able to cover the individual functions and individual bus iness divisions of the Company so that full
discussions/consideration and accurate and prompt decision-making will be undertaken and appropriate risk management as well as business execution will be made. ・Regardless of gender/nationality, etc., director candidates shall have extensive ability, knowledge, experience, results, dignity, and ethical standards. ・ In order to appropr iately re�ect extens ive experience, high-level expertise or insight in the management of the Company, the Company shall
Management (As of April 1, 2018)
Board of Directors
President & CEOShiro Ajisaka
Corporate Vice PresidentsShogo Sakuraba
Senior Managing Director
Masayuki Abo
Managing DirectorsHiroshi Kawanabe
Koji Masunari
Directors
Yasuki Kitazume
Hiroshi OtsukaShenghai Zhang
Yuichi Sato1
Harumi Katagiri 1
Audit & Supervisory Board Member
Full-Time Corporate AuditorsTsugio TsuchiyaTakayuki Namiki2
Corporate AuditorsTadahiro Tone2
Yasuhiko Nishimoto2
Notes: 1. Independent Director
2. Independent Corporate Auditor
Makoto Otani
Hideyuki Nonaka
Tomohide Okayasu
Takao Yamamoto
Yoshinori NaritaTsutomu TezukaChaitang HoJie ChenEmiko Ushida
Toshikuni Tateno
Masato NaraokaMikio KimuraNaoto ShigaShigehisa ArimaTakashi Sawao
CORPORATE GOVERNANCE BUSINESS & OTHER RISKS
The following section provides an overview of the issues related to the business results and �nancial position of the Group that may have a material effect on the decisions of investors. The forward-looking statements in this text repre-sent the judgment of management as of March 28, 2018.
1. Dependence on speci�c customersSales to Sony Corporation’s group companies and Nikon Corporation’s group companies comprise ap-proximately 24% and 11% of the Group’s sales, respectively (both �gures are for the �scal year ended December 31, 2017). As a result, changes in the strategies and policies and business relationships of these two companies may signi�cantly affect the Group’s business results.
2. New businessesIt is the Group’s policy to foster and expand new businesses. In the event that the Group decides to scale back or withdraw from a new business due to intensifying price competition, rapid technological innovation, drastic changes in market needs and so forth, the Group’s business results may be signi�cant-ly affected.
3. Dependence on speci�c suppliersThe Group procures raw materials, components, etc. from numerous external suppliers. For the procure-ment of glass materials, in particular, it relies on limit-ed supply sources. If these raw materials, components, etc. are not available in the quantity or price that the Group has planned for any reason, and the Group is unable to produce the products in the planned quantity, etc., it will fail to carry out its responsibility of delivery to customers, and this may signi�cantly affect its busi-ness results.4. Product defectsThe Group has developed advanced quality assur-ance systems. In the unlikely event of the occurrence of a defect in i ts products that may lead to large-scale product liability, the Group may incur sig-ni�cant expense or lose public con�dence, etc., any of which may signi�cantly affect its business results.
5. Intellectual property rightsThe Group undertakes investigations, negotiations and applications, and also takes other necessary steps to protect its rights related to intellectual prop-erty rights and avoid any related issues. In the event of a dispute over intellectual properties occurring be-tween the Group and a third party, the Group’s busi-ness results may be signi�cantly affected.
6. Laws and regulationsThe Group strives to comply with international and domestic laws and regulations, government permits, licenses, regulations and so forth that are relevant to the Group’s businesses. In the event of a violation of laws or regulations or the �ling of a suit due to unin-tended reasons, the Group’s business results may be signi�cantly affected.
7. Impairment lossIn cases where the market value of the Group’s assets declines signi�cantly or where the pro�tability of its business deteriorates, impairment loss will be recorded according to the accounting standards for impairment of assets, and this may signi�cantly affect the Group’s business results.
8. Effects of exchange rate �uctuationsThe Group conducts transactions with overseas sub-sidiaries in foreign currencies, and some of the trans-actions with international and domestic business partners in foreign currencies. Accordingly, �uctua-tions in exchange rates may signi�cantly affect the competitiveness of the Group’s products in overseas markets, its export pro�t, business results, etc.
9. Other risksIn addition to the above, if there arise unanticipated political or economic factors, changes in tax systems or tax rates that have adverse effects, or events of social turmoil, etc. due to acts of terrorism, wars, nat-ural disasters, contagious diseases or other factors in the countries or regions where the Group conducts business, this may signi�cantly affect the Group’s business results.
11 Tamron Co., Ltd. 12Annual Report 2017
have multiple independent director candidates who satisfy the standards set by the Company and can play the role of a supervisory and advisory function in its management from an independent standpoint in addition to the standards for independence speci�ed by the Tokyo Stock Exchange.・Corporate auditor candidates shall have a high leve l o f exper t i se and ins igh t in corpora te management, legal affairs, �nance and accounting. As for independent corporate auditors, the Company shall have multiple independent corporate auditor candidates who satisfy the standards set by the Company and can play the role of a supervisory and advisory function in its management from an independent standpoint in addition to the standards for independence speci�ed by the Tokyo Stock Exchange.
Procedures for nomination decision-making・Director candidates shall be determined by the Board of Directors after del iberat ion by the Nomination Committee with an independent director serving as the Chairman. ・Corporate auditor candidates shall be determined by the Board of Directors after obtaining approval from the Audit & Supervisory Board.
POLICY AND PROCEDURES FOR DETERMINING DIRECTORS’ REMUNERATIONThe Company shall review the remuneration system for directors, and the system shall consist of “base remuneration,” a �xed remuneration, “short-term incentive remuneration,” a bonus in accordance with the business performance for a single year, and “medium and long-term incentive remuneration,” a performance and stock-based remuneration. The revision of a bonus for directors was determined at the 71st Ordinary General Shareholders’ Meeting on March 28 , 2018 . Sepa ra te l y f rom th i s , t he introduction of performance and stock-based remuneration was resolved at the Meeting. “Base remuneration,” a �xed remuneration, and “short-term incentive remuneration,” a bonus in accordance with the business performance for a single year, shall be determined by the Board of D i r ec to r s t h rough t he de l i be ra t i on o f t he Compensation Committee with an independent director serving as the Chairman, considering the position, degree of contribution, industry standard or
standards of other companies of the same size, and performance, etc. of individuals within the range of a remuneration limit resolved at the General Meeting of Shareholders. The purpose of “medium and long-term incentive remuneration,” a performance and stock-based remuneration, is to clarify the link between business pe r fo rmance , s tock p r i ces , and d i r ec to r s ’ remuneration and further heighten awareness of contributing to the improvement of medium- and long-term business performance and the increase of corporate value. Regarding the system, the Trust established as a result of the monetary contribution made by the Company acquires the Company shares and delivers the Company shares to directors through the Trust based on points awarded in accordance with the position and performance pursuant to the share issuance rules speci�ed by the Board of Directors within the range of a remuneration limit resolved by the General Meeting of Shareholders. The directors shall be provided with the Company shares at the time of their retirement, in principle. Independent directors shall be paid the base remuneration only.
ANALYSIS/ASSESSMENT OF THE VIABILITY OF THE ENTIRE BOARD OF DIRECTORSThe Company conducts a survey of the directors and corporate auditors regarding the composition and operation of the Board of Directors to self-assess the viability of the overall Board of Directors. At present, discussions that contribute to the susta inable growth of the bus iness and the enhancement of corporate value are being held. As for the governance function, the supervision of business execution and audit independence are functioning effectively. We therefore acknowledge that the viability of the entire Board of Directors is generally and appropriately secured. Based on the survey results, the Company recognizes shared issues and strives to review the composition and size or frequency of the Board of Directors and the remuneration system. The Company shall continue the discussions and veri�cation based on the survey results and commit to further enhancing the viability of the Board of Directors.

CONSOLIDATED BALANCE SHEETS
Millions of Yen
As of December 31 2016 2017
Assets
Current assets
Cash and deposits ¥16,030
13,419
7,023
2,201
875
442
1,630
(32)
41,590
¥19,431
14,061
6,392
3,098
982
360
1,093
(28)
45,392
Notes and accounts receivable–trade
Finished goods
Work in process
Raw materials and supplies
Deferred tax assets
Other
Allowance for doubtful accounts
Total current assets
Non-current assets
Property, plant and equipment
Buildings and structures 13,200
(7,088)
6,112
19,195
(13,682)
5,513
19,289
(17,056)
2,232
1,012
668
15,539
787
2,303
340
437
(88)
2,993
19,320
¥60,910
13,295
(7,513)
5,781
19,385
(14,403)
4,982
20,186
(18,188)
1,998
961
894
14,618
704
2,811
115
267
(40)
3,153
18,476
¥63,868
Accumulated depreciation
Buildings and structures, net
Machinery, equipment and vehicles
Accumulated depreciation
Machinery, equipment and vehicles, net
Accumulated depreciation
Land
Construction in progress
Total property, plant and equipment
Intangible assets
Investments and other assets
Investment securities
Deferred tax assets
Other
Allowance for doubtful accounts
Total investments and other assets
Total non-current assets
Total assets
Millions of Yen
As of December 31 2016 2017
Liabilities
Current liabilities
Accounts payable–trade ¥3,068
3,327
2,826
371
1,794
11,388
¥3,675
2,676
3,109
629
1,839
11,931
736
1,403
60
2,200
13,589
468
1,298
230
1,996
13,928
6,923
7,432
30,114
(53)
44,416
6,923
7,432
31,527
(53)
45,829
498
2,475
(69)
2,905
47,321
¥60,910
846
3,214
49
4,110
49,940
¥63,868
Short-term loans payable
Accrued expenses
Income taxes payable
Other
Total current liabilities
Non-current liabilities
Long-term loans payable
Other
Total non-current liabilities
Total liabilities
Net assets
Shareholders’ equity
Capital stock
Capital surplus
Retained earnings
Treasury shares
Total shareholders’ equity
Accumulated other comprehensive income
Valuation difference on available-for-sale securities
Foreign currency translation adjustment
Remeasurements of de�ned bene�t plans
Total accumulated other comprehensive income
Total net assets
Total liabilities and net assets
13 Tamron Co., Ltd. 14Annual Report 2017

Millions of Yen
Years ended December 31 2016 2017 2016
2017
Net sales ¥59,90341,00118,901
1,17485329
4,261147
3,9466,126
16,5392,361
¥60,49639,89920,596
983753
(5)4,450
1314,0385,997
16,3504,246
Cost of sales
Selling, general and administrative expenses Advertising expenses Promotion expenses Provision of allowance for doubtful accounts Salaries and bonuses Technical research expenses Other Total selling, general and administrative expensesOperating incomeNon-operating income Interest income 34
613482038
206709
42—881569
2152,855
5845—1464
149332
42357361823
4784,100
Dividend income Foreign exchange gains Rent income Subsidy income Other Total non-operating incomeNon-operating expenses Interest expenses
Loss on retirement of non-current assetsForeign exchange losses
Loss on abandonment of inventories Other Total non-operating expensesOrdinary incomeExtraordinary income Surrender value of insurance —
—122122
Total extraordinary incomeExtraordinary losses
Impairment lossLoss on valuation of investment securities —
——
4,2221,276
1071,3832,838
¥2,838
7735
1132,742
987273
1,2601,482
¥1,482
Total extraordinary lossesPro�t before income taxesIncome taxes–currentIncome taxes–deferredTotal income taxesPlo�t Pro�t attributable to owners of parent
Millions of Yen
Years ended December 31 2016 2017Plo�t ¥1,482
52(1,784)
124(1,607)
(125)(125)
¥2,838
348738119
1,2054,044
4,044
Other comprehensive income Valuation difference on available-for-sale securities Foreign currency translation adjustment
Remeasurements of de�ned bene�t plans, net of tax Total other comprehensive incomeComprehensive income Comprehensive income attributable to owners of parent
CONSOLIDATED STATEMENTS OF INCOME CONSOLIDATED STATEMENTS OF CHANGES IN NET ASSETS
CONSOLIDATED STATEMENTS OF COMPREHENSIVE INCOME
15 Tamron Co., Ltd. 16Annual Report 2017
Millions of Yen
Shareholders’ equity
Year ended December 31
Capitalstock
Treasuryshares
Capital surplus
Retained earnings
Total shareholders’
equity
Balance at beginning of current period ¥6,923 ¥7,432 ¥30,187 ¥(53) ¥44,489Changes of items during period
Dividends of surplusPro�t attributable to owners of parentPurchase of treasury shares
(1,555) (1,555)
Net changes of items other than shareholders' equity
1,482 1,482
Total changes of items during period — — (72) —
——
—
——
—
(72)Balance at end of current period 6,923 7,432 30,114 (53) 44,416
Millions of YenAccumulated other comprehensive income
Year ended December 31
Valuationdifference onavailable-for-sale securities
Foreigncurrency
translationadjustment
Remeasurementsof de�ned bene�t
plans
Remeasurementsof de�ned bene�t
plans
Total accumulated
other comprehensive
income
Total net assets
Balance at beginning of current period ¥445 ¥4,260 ¥(194) ¥4,512 ¥49,001Changes of items during period
Dividends of surplus (1,555)
Pro�t attributable to owners of parentPurchase of treasury shares
1,482
Net changes of items other than shareholders' equity 52 (1,784) 124 (1,607) (1,607)Total changes of items during period 52 (1,784) 124 (1,607) (1,680)Balance at end of current period 498 2,475 (69) 2,905 47,321
Millions of Yen
Shareholders’ equity
Year ended December 31
Capitalstock
Treasuryshares
Capital surplus
Retained earnings
Total shareholders’
equity
Balance at beginning of current period ¥6,923 ¥7,432 ¥30,114 ¥(53) ¥44,416Changes of items during period Dividends of surplus
Pro�t attributable to owners of parentPurchase of treasury shares
(1,425) (1,425)
Net changes of items other than shareholders' equity
2,838 2,838
Total changes of items during period — — 1,412 1,412
———
(0) (0)
(0)
(0)—
Balance at end of current period 6,923 7,432 31,527 (53) 45,829
Millions of YenAccumulated other comprehensive income
Year ended December 31
Valuationdifference onavailable-for-sale securities
Foreigncurrency
translationadjustment
Total accumulated
other comprehensive
income
Total net assets
Balance at beginning of current period ¥498 ¥2,475 ¥(69) ¥2,905 ¥47,321Changes of items during period Dividends of surplus (1,425) Pro�t attributable to owners of parent
Purchase of treasury shares2,838
Net changes of items other than shareholders' equity 348 738 119 1,205 1,205Total changes of items during period 348 738 119 1,205 2,618Balance at end of current period 846 3,214 49 4,110 49,940

CONSOLIDATED STATEMENTS OF CASH FLOWS
17 Tamron Co., Ltd. 18
Annual Report 2017
Millions of Yen
Years ended December 31 2016 2017
Pro�t before income taxes ¥2,742
3,365
95
(96)
42
88
35
—
77
1,260
2,263
(1,331)
(787)
(193)
7,564
96
(43)
(1,079)
6,537
¥4,222
3,562
(64)
(104)
42
36
—
(122)
—
(367)
(192)
543
204
991
8,752
104
(42)
(1,153)
7,661
Depreciation
Increase (decrease) in net de�ned bene�t liability
Interest and dividends income
Interest expenses
Loss on retirement of property, plant and equipment
Impairment loss
Surrender value of insurance
Loss (gain) on valuation of investment securities
Decrease (increase) in notes and accounts receivable-trade
Decrease (increase) in inventories
Increase (decrease) in notes and accounts payable-trade
Increase (decrease) in accrued expenses
Other, net
Subtotal
Interest and dividends income received
Interest expenses paid
Income taxes paid
Net cash provided by (used in) operating activities
Purchases of property, plant and equipment (2,286)
(204)
(1)
—
(10)
13
(49)
(2,540)
(2,390)
(60)
(16)
260
(6)
13
26
(2,174)
Purchase of intangible assets
Purchase of investment securities
Proceeds from cancellation of insurance funds
Payments of loans receivable
Collection of loans receivable
Other, net
Net cash provided by (used in) investing activities
Net increase (decrease) in short-term loans payable 308
700
(977)
(1,554)
(1)
(1,524)
(635)
1,837
14,192
¥16,030
(372)
216
(766)
(1,427)
(1)
(2,351)
265
3,401
16,030
¥19,431
Proceeds from long-term loans payable
Repayment of long-term loans payable
Cash dividends paid
Other, net
Net cash provided by (used in) �nancing activities
Effect of exchange rate change on cash and cash equivalents
Net increase (decrease) in cash and cash equivalents
Cash and cash equivalents at beginning of period
Cash and cash equivalents at end of period
Cash �ows from operating activities
Cash �ows from investing activities
Cash �ows from �nancing activities

NOTES TO CONSOLIDATED FINANCIAL STATEMENTS
19 Tamron Co., Ltd. 20
2. Information by major customer Millions of Yen
Name of company Net sales Relevant segments
2016 2017
Nikon Corporation ¥9,585 ¥6,578 Photographic Products
Sony Global Manufacturing & Operations Corporation 7,439 9,403Photographic ProductsOptical ComponentsCommercial / Industrial-use Optics
RELATED INFORMATIONYear ended December 31, 2017 and 2016
1. Information by geographical area(1) Sales
Millions of Yen
Japan North America Europe Asia Other Total2016 ¥16,152 ¥7,759 ¥14,194 ¥20,301 ¥1,495 ¥59,9032017 ¥17,238 ¥8,897 ¥12,310 ¥20,496 ¥1,552 ¥60,496
Note: Sales are grouped by country or region, based on customer location.
IMPACT OF FOREIGN EXCHANGE RATE FLUCTUATIONS
2017 Millions of YenYen
Exchange Rate2016 2017 Net Sales Operating Income
Impact
Others - - +130 +60EUR 120.31 126.73 +520 +430USD 108.79 112.17 +1,000 +100
Total - - +1,650 +590(Impact on 2017 Actual performance)
Forecast 2018 Millions of YenYen
Exchange RateAssumption 2018 Net Sales Operating Income
Impact of ¥1 appreciation
EUR 130.00 (90) (80)USD 110.00 (300) (10)
(2) Property, plant and equipmentMillions of Yen
Japan North America Europe Asia Total2016 ¥7,172 ¥260 ¥277 ¥7,829 ¥15,5392017 ¥6,965 ¥243 ¥271 ¥7,137 ¥14,618
Annual Report 2017
SEGMENT INFORMATION1. Outline of reporting segments
reviewed by the Board of Directors to determine resource allocation and evaluate business performance. The Company
for its products and operates its business activities. Accordingly, Tamron has the following three reportable segments based on these business divisions that are categorized according to products: Photographic Products, Optical Components and Commercial/Industrial-use Optics. The “Photo-graphic Products” manufactures and sells Interchangeable lenses for SLR cameras. The “Optical Components” manufactures and sells Camcorder lenses, Digital still camera lenses, and Optical device units. The “Commercial/Industrial-use Optics” manufactures and sells Surveillance camera lenses and Automotive lenses.
2. Information on sales, income, assets, liabilities and other items by reporting segment for �scal 2017 and 2016
Millions of Yen
2017
Photographic products
Optical components
Total Consolidated
Net sales: Sales to external customers ¥45,292
-45,2925,818
36,5822,5781,733
¥3,375-
3,375(24)
2,472235308
¥11,827-
11,827827
8,708674349
¥60,496-
60,4966,622
47,7643,4882,391
¥ --
-(2,376)16,104
7333
¥60,496-
60,4964,246
63,8683,5622,425
Intersegment sales TotalOperating income (loss)AssetsDepreciationIncrease in tangible and intangible �xed assets
Notes:
Millions of Yen
2016
Photographic products
Optical components
Commercial/ Industrial use
opticsTotal Adjustment
Commercial/ Industrial use
opticsAdjustment
Consolidated(Note1) (Note2)
(Note1) (Note2)
Net sales: Sales to external customers ¥46,805
-46,8054,034
39,5672,497-
1,840
¥2,358-
2,35875
1,944167-91
¥10,739-
10,739733
8,600470-
526
¥59,903-
59,9034,843
50,1123,135-
2,458
¥ --
-(2,482)10,797
2293525
¥59,903-
59,9032,361
60,9103,365
352,484
Intersegment sales TotalOperating incomeAssetsDepreciationImpairment lossIncrease in tangible and intangible �xed assets
Notes:1.
1.
2. Segment pro�t is adjusted to operating pro�t of consolidated statements of income.
(1) Adjustment of segment pro�t totaled (2,482) million yen is due to unallocated operating expenses consisted principally of expenses related to general affairs, accounting and other departments of the Company.
(2) Adjustment to segment assets includes corporate level assets, which consist principally of surplus investment funds (cash and deposits) long-term investment funds (such as marketable securities), and non-segment speci�c.
(1) Adjustment of segment pro�t totaled (2,376) million yen is due to unallocated operating expenses consisted principally of expenses related to general affairs, accounting and other departments of the Company.
(2) Adjustment to segment assets includes corporate level assets, which consist principally of surplus investment funds (cash and deposits), long-term investment funds (such as marketable securities), and non-segment speci�c.
2. Segment pro�t or loss is adjusted to operating pro�t of consolidated statements of income.
3. Other
Millions of yen, excluding net income per share-basic
1Q 2Q 3QFor the year ended December 31, 2017
Net sales ¥11,4952631756.76
¥26,9121,265
91235.19
¥42,4332,4681,68364.94
¥60,4964,2222,838
109.51
Pro�t before income taxesPro�t attributable to owners of parentNet income per share-basic (yen)
Note: Amount per each quarter is accumulated amount.
Quarterly �nancial information for the year ended December 31, 2017
Yen
1Q 2Q 3Q 4QNet income per share-basic ¥6.76 ¥28.42 ¥29.75 ¥44.57
21 Tamron Co., Ltd. 22Annual Report 2017
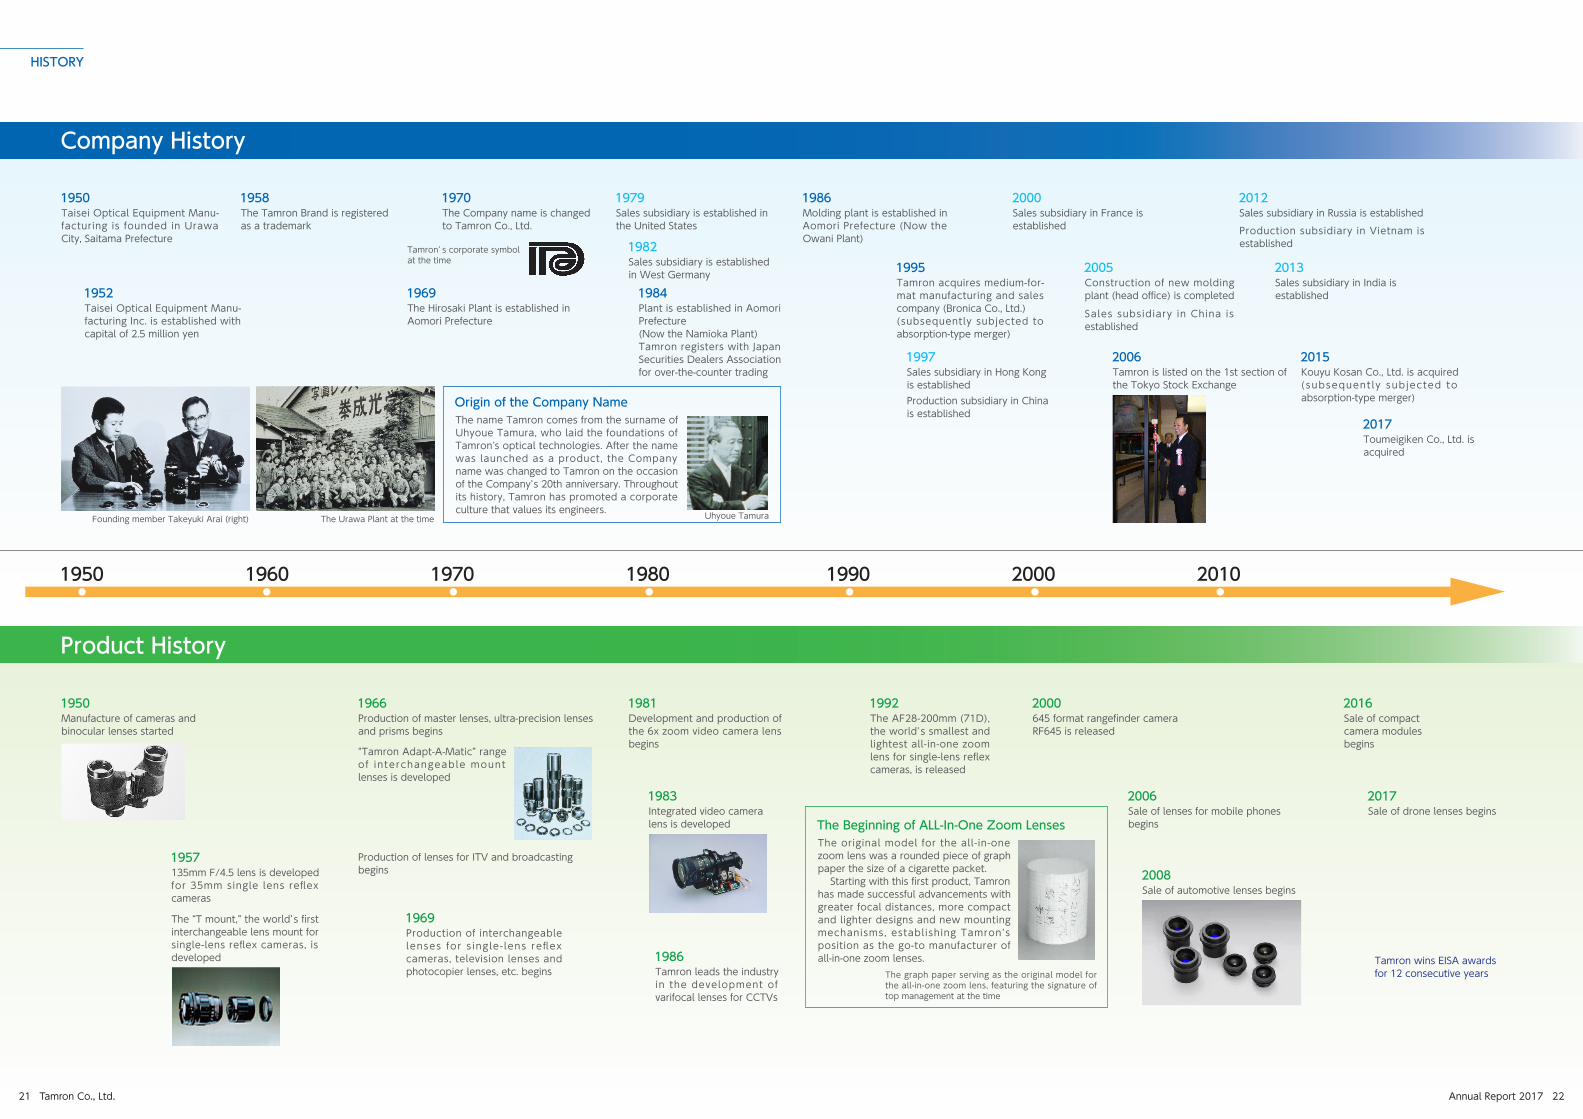
HISTORY
Company History
1950
Product History
Taisei Optical Equipment Manu-facturing is founded in Urawa City, Saitama Prefecture
1952Taisei Optical Equipment Manu-facturing Inc. is established with capital of 2.5 million yen
1950Manufacture of cameras and binocular lenses started
1966Production of master lenses, ultra-precision lenses and prisms begins
“Tamron Adapt-A-Matic” range of interchangeable mount lenses is developed
Production of lenses for ITV and broadcasting begins
1957135mm F/4.5 lens is developed for 35mm single lens re�ex cameras
The “T mount,” the world’s �rst interchangeable lens mount for single-lens re�ex cameras, is developed
1969Production of interchangeable lenses for s ingle- lens re�ex cameras, television lenses and photocopier lenses, etc. begins
1981Development and production of the 6x zoom video camera lens begins
1992The AF28-200mm (71D), the world’s smallest and lightest all-in-one zoom lens for single-lens re�ex cameras, is released
2000645 format range�nder cameraRF645 is released
2016Sale of compactcamera modulesbegins
1983Integrated video camera lens is developed
1986Tamron leads the industry in the development of varifocal lenses for CCTVs
2006Sale of lenses for mobile phones begins
2017Sale of drone lenses begins
Tamron wins EISA awards for 12 consecutive years
2008Sale of automotive lenses begins
1958The Tamron Brand is registered as a trademark
1970The Company name is changed to Tamron Co., Ltd.
1979Sales subsidiary is established in the United States
1986Molding plant is established in Aomori Prefecture (Now the Owani Plant)
2000Sales subsidiary in France is established
2012Sales subsidiary in Russia is established
Production subsidiary in Vietnam is established
1969The Hirosaki Plant is established in Aomori Prefecture
Tamron’ s corporate symbol at the time
1982Sales subsidiary is established in West Germany
1984Plant is established in Aomori Prefecture(Now the Namioka Plant)Tamron registers with Japan Securities Dealers Association for over-the-counter trading
1995Tamron acquires medium-for-mat manufacturing and sales company (Bronica Co., Ltd.)(subsequently subjected to absorption-type merger)
2005Construction of new molding plant (head of�ce) is completed
Sales subsidiary in China is established
1997Sales subsidiary in Hong Kong is established
Production subsidiary in China is established
2006Tamron is listed on the 1st section of the Tokyo Stock Exchange
2013Sales subsidiary in India is established
2015Kouyu Kosan Co., Ltd. is acquired (subsequent ly subjected to absorption-type merger)
2017Toumeigiken Co., Ltd. is acquired
Origin of the Company NameThe name Tamron comes from the surname of Uhyoue Tamura, who laid the foundations of Tamron’s optical technologies. After the name was launched as a product, the Company name was changed to Tamron on the occasion of the Company’s 20th anniversary. Throughout its history, Tamron has promoted a corporate culture that values its engineers.
The Beginning of ALL-In-One Zoom LensesThe original model for the all-in-one zoom lens was a rounded piece of graph paper the size of a cigarette packet. Starting with this �rst product, Tamronhas made successful advancements with greater focal distances, more compact and lighter designs and new mounting mechanisms, establishing Tamron’s position as the go-to manufacturer of all-in-one zoom lenses.
The graph paper serving as the original model for the all-in-one zoom lens, featuring the signature of top management at the time
Founding member Takeyuki Arai (right) The Urawa Plant at the time
1950 1960 1970 1980 1990 2000 2010
Uhyoue Tamura

COMPANY PROFILE
GROUP NETWORK
Tel:+81-48-684-9111Fax:+81-48-683-8289http://www.tamron.co.jp
Production Facilities
Hirosaki Plant3-2 Shimizu 3-chome, Hirosaki-shi, Aomori 036-8254, JAPAN
Namioka Plant64-1 Shimoshimada, Kitanakano, Namioka, Aomori-shi, Aomori 038-1325, JAPAN
Owani Plant31-1 Maeda, Hachimandate, Owani-machi, Minamitsugaru-gun, Aomori 038-0243, JAPAN
TAMRON OPTICAL (FOSHAN) CO., LTD.No. 76 West of Langbao Road, Changcheng District, Foshan, Guangdong, CHINA
TAMRON OPTICAL (VIETNAM) CO., LTD.Plot No. 69B&70A, Noi Bai IndustrialZone, Mai Dinh Commune, Soc SonDistrict, Hanoi, VIETNAM
Subsidiaries Overseas
TAMRON USA, INC.10 Austin Boulevard, Commack, NY 11725, USA
TAMRON Europe GmbH.Robert Bosch-Str. 9, 50769 Cologne, GERMANY
TAMRON France EURL.5, avenue Georges Bataille, F-60330 Le Plessis-Belleville, FRANCE
TAMRON INDUSTRIES (HONG KONG) LIMITEDUnit 908, 9/F, Elite Centre, 22 Hung To Road, Kwun Tong, Kowloon, Hong kong
TAMRON OPTICAL (SHANGHAI) CO., LTD.Room 1707, Ruijin Building, No. 205, Maoming South Road, Shanghai 200020, CHINA
Tamron (Russia) LLC.Unikon Business Center 2F No. 4, Plekhanova Street 4a, Moscow, 111123, Russian Federation
TAMRON INDIA PRIVATE LIMITED801, 8th Floor, Time Tower, M.G Road, Sector-28, Gurgaon-122002, Haryana, India
STOCK OVERVIEW
23 Tamron Co., Ltd.
Overview
Company Name:Tamron Co., Ltd.
(As of December 31, 2017)
(As of December 31, 2017)
Founded:November 1, 1950 Stock exchange:
First section, Tokyo Stock ExchangeIncorporated:October 27, 1952Head of�ce:1385 Hasunuma, Minuma-ku, Saitama-shi, Saitama 337-8556, JAPAN
Number of shares issued:25,950,000 sharesNumber of shares per unit:100 sharesNumber of shareholders:4,465 shareholdersBalance date:December 31Scheduled Annual Shareholders Meeting:MarchEligibility date for year-end dividend payments:December 31Eligibility date for interim dividend payments:June 30Transfer Agent:Sumitomo Mitsui Trust Bank, Limited
Top10 Shareholders
NameNoNumber of Shares
(Thousands) %
1 New Well Co., Ltd. 4,898 18.87
2 Sony Corporation 3,129 12.06
3 1,122 4.32
4Saitama Resona Bank Limited
24Annual Report 2017
792 3.05
5 NORTHERN TRUST CO. (AVFC) RE NVI01
The Master Trust Bank of Japan, Ltd. (trust account)
763 2.94
6
THE HONGKONG AND SHANGHAI BANKING CORPORATION LTD - HONG KONG PRIVATE BANKING DIVISION-CLIENT ACCOUNT
HAITONG INTERNATIONAL SECURITIES COMPANY LIMITED 700700 752 2.907
Japan Trustee Services Bank, Ltd. (trust account)
670 2.58
8
Nippon Life Insurance CompanyGOVERNMENT OF NORWAY
632 2.43
9 580 2.2310 562 2.16
Total 13,904 53.58Note:
Employees:1,067 (non-consolidated)4,640 (consolidated)
■ Individuals and Others
13.13%
■ Foreign Shareholders
27.55%
■ Other Corporation
23.27%
■ Securities Firm
1.11%
■ Financial Institution
34.94%
Note: Excluding odd lot.
The 3,129 thousand shares owned by Sony Corporation are �duciary assets trusted to Mizuho Trust & Banking Co., Ltd. In regard to the execution of voting rights and jus disposition of the shares, Sony Corporation reserves the right to instruct pursuant to the provisions of the trust contract between the two parties.
Composition of Shareholders