annual report 2016 - investor abir.investorab.com/files/press/investor/201703298696-1.pdf · list...
TRANSCRIPT

Annual report2016

Production: Investor and Addira. Photos: Mattias Bardå, Johan Lind and photos from Investor’s portfolio companies. Print: Åtta.45 Tryckeri AB, Sweden, 2017. Paper: Profimatt, 250 g/100 g.
Shareholder information
Calendar of events 2017• Interim Management Statement, January-March: April 24• Annual General Meeting: May 3• Interim Report, January-June: July 19• Interim Management Statement, January-September: October 27• Year-End Report: February 1, 2018
Information materialFinancial information about Investor can be accessed and ordered (information by sms, e-mail or printed annual report) on our website: www.investorab.com, or by calling +46 8 614 2131.
Printed annual reports are distributed to shareholders that have requested it. All new shareholders will receive a letter asking how they would like to receive information. Investor relationsMagnus Dalhammar: +46 8 614 [email protected] Group: +46 8 614 2131www.investorab.com
Annual General MeetingInvestor AB invites shareholders to participate in the Annual General Meeting on Wednesday, May 3, 2017, at 3:00 p.m. at the City Conference Centre, Barnhusgatan 12-14, in Stockholm.
Shareholders who would like to attend the Annual General Meeting must be recorded in the register of shareholders main-tained by Euroclear Sweden AB on Wednesday, April 26, 2017, and must notify the company of their intention to attend the Meeting no later than Wednesday, April 26, 2017.
Shareholders can give their notice of participation by:• registering on Investor AB’s website, www.investorab.com or• calling +46 8 611 2910, weekdays, between 9:00 a.m. and
5:00 p.m. CET or• writing to Investor AB, Annual General Meeting,
SE-103 32 Stockholm
Notice convening the Annual General Meeting and proxy forms are available on Investor’s website, www.investorab.com.
DIVIDEND
The Board of Directors proposes a dividend to the shareholders of SEK 11.00 per share for fiscal year 2016. Friday, May 5, 2017, has been proposed as the record date. If the proposal is approved by the Annual General Meeting, the dividend is expected to be distributed by Euroclear Sweden AB on Wednesday, May 10, 2017.
CONTENTS
Investor in brief .........................................................1
Letter from the Chairman .........................................2
Letter from the CEO ..................................................3
Financial development ..............................................4
Objective and operating priorities ..........................6
Active ownership .......................................................7
Sustainable business..................................................9
Listed Core Investments .......................................... 12
EQT ............................................................................ 16
Patricia Industries .................................................... 17
Investor’s employees ............................................... 21
The Investor share ...................................................22
Corporate Governance Report ...............................24
Board of Directors ...................................................30
Management Group................................................32
Proposed Disposition of Earnings ..........................33
List of contents of Financials ..................................34
Statements for the Group .......................................34
Notes for the Group ................................................38
Statements for the Parent Company .....................73
Notes for the Parent Company ..............................77
Auditor’s Report ......................................................84
Five-Year Summary ..................................................87
Definitions ................................................................88
Our legacy ................................................................89
The Annual Report for Investor AB (publ.) 556013-8298 consists of the Administration Report on pages 4-5, 9-11, 21-33 and the financial statements on pages 34-83.
The Annual Report is published in Swedish and English.
NORDIC ECOLABEL 3041 0001

INVESTOR 2016 1
Investor in brief
VisionAs a long-term owner, we actively sup-port the building and development of best-in-class companies.
Business conceptInvestor owns significant stakes in high-quality companies. Through the boards of directors, we work for continuous improvement of the performance of our companies. With our industrial experi-ence, broad network and financial strength, we strive to make and keep our companies best-in-class.
We always look at the opportunities and challenges facing each individual
company. Our cash flow allows us to financially support strategic initiatives in our companies, capture investment opportunities and provide our share-holders with a steadily rising dividend.
Objective and operating prioritiesWe are committed to generating an attractive long-term total return, exceed-ing the market cost of capital. Our long-term return requirement is the risk free interest rate plus an equity risk premium, in total 8-9 percent annually.
Our operating priorities are to grow our net asset value, operate efficiently and pay a steadily rising dividend.
Highlights 2016• Total Shareholder Return (TSR)
amounted to 13 percent. During the past 20 years, average annual TSR has been 12 percent.
• Within Listed Core Investments, SEK 1,011 m. was invested in Ericsson, SEK 353 m. in Wärtsilä and SEK 125 m. in Atlas Copco.
• Investor continued to invest in EQT. At year-end, Investor’s outstanding commitment to EQT funds amounted to SEK 13.7 bn.
• Patricia Industries acquired a new wholly-owned subsidiary, the Canadian-based medical technology company Laborie.
• Investor celebrated 100 years of being an active and long-term owner of high-quality companies.
Investor, founded by the Wallenberg family a hundred years ago, is a leading owner of high-
quality, international companies. We have a long-term investment perspective and support our
companies in their efforts to create sustainable value. Through board participation, industrial
experience, our network and financial strength, we strive to make our companies best-in-class.
Our business areas
LISTED CORE INVESTMENTS
EQT AB
EQT EQUITY
EQT MID MARKET
EQT INFRASTRUCTURE
EQT CREDIT
EQT VENTURES
248SEK bn.
78%of total assets
14SEK bn.
5%of total assets
55SEK bn.
17%of total assets
Financial Investments
INVESTOR 2016LET TER FROM THE CHA IRMAN 2
Letter from the ChairmanDear fellow Shareholders,
In 2016, we celebrated our 100th anniversary and continued to
execute on our strategy as an active owner of great companies.
In these times of economic and political uncertainty, I believe that
our model of long-term ownership, while being demanding in the
short term, serves us well in both time dimensions.
Being a supportive, yet demanding owner of our companies is our most important mission. At times of revolutionary tech-nology changes, such as digitalization and Artificial Intelligence, that have a dramatic impact on business models across indus-tries, it is imperative that our business model ensures that companies work relentlessly to strengthen their competi-tiveness and never compromise on inno-vation. Ultimately, cost-efficiency is a pre-requisite, but innovation is what really enables companies to bring new products and services to the market, satisfy their customers, grow market share and take a “leading” role in their respective indus-tries. This is the only way we can remain competitive.
Free trade and migration – important drivers of growth Coming from a small, export-dependent country, I am concerned that the principle of free trade may be endangered by the political currents sweeping across the Atlantic, with potentially vast implications for the global economy. We must never forget that free trade has boosted the world economy tremendously, to the benefit of consumers and producers alike, and has brought millions of people out of poverty. The same applies to migration, with talent and competence moving to where it can be the most productive, be it banking in London, software develop-ment in California or Stockholm, mining in Australia or fishing in Indonesia.
Awareness of inequality is rising in many parts of the world, fueling popu-lism. In my view, this is not caused by either free trade or migration, but rather by fast-changing technology leaving low-
skilled workers behind. Technology change can, or should, never be restricted. It should rather be embraced, as it always propels mankind forward. Still, it often comes at a significant short- to medium-term socioeconomic cost. I deeply miss a more constructive and open debate on how technology, and demo-graphics, affect society. This is perhaps particularly important for small, export-dependent economies such as Sweden.
I firmly believe that all of us in the business community have a responsibility to engage in these questions, also in order to combat the increasing lack of trust in political institutions, business, experts, and facts. Stability and trust are fundamental for enterprise. We need to raise the awareness that a well-function-ing business climate is the fundament for innovation, growth and ultimately, job creation. Business is never a special inter-est, it is an integral part of any prosperous society.
Long-term commitment to our companiesOne of Investor’s single most important tasks as an owner is to identify the next generation of leaders. The importance of having the right person at the right place at the right time cannot be overesti-mated. As my grandfather said: “No com-pany is so bad that it cannot be turned around by a good leader”. My view is that, as good as we are, we are fully dependent on the strength of the individ-uals that lead our companies. This is the reason why we continuously devote time and effort to nurture the current and next generation of executives and their teams.
Another important task is to evaluate efficient corporate structures. We always try to do what we believe is best for each individual company, and what would work in one company might not work in another. In ABB, we supported the deci-sion to retain the current structure, allow-ing the company to focus on its custom-ers and execution of the strategy. In Atlas Copco, we fully support the proposal made early 2017 to split the group into two focused, market-leading new com-panies, further enhancing future value creation.
During 2016, Investor continued to execute on its strategy, investing in Listed Core Investments, allocating capital to EQT and growing Patricia Industries. Net asset value growth and cash flow was strong. For 2016, the board proposes to increase the dividend to SEK 11 per share (10).
Entering our 101st year of operation, on behalf of the board I would like to thank Johan Forssell and his team for their professional and successful leader-ship. I would also like to thank everyone at Investor for their hard work and commitment.
Finally, I would particularly like to thank you, dear fellow Shareholders, for your continuous support. With a clearly defined strategy and long-term commit-ment, we will continue to focus on meet-ing the challenges of the future and gen-erating an attractive total return to you.
Jacob Wallenberg Chairman of the Board
INVESTOR 2016 LET TER FROM THE CEO 3
Letter from the CEO
2016 started with worries about the Chinese economy, pressuring the stock markets. However, since the latter part of last year, various leading indicators suggest some improvement of economic conditions. Meanwhile, the political land-scape is uncertain. How all of this will affect the world economy remains to be seen, but rather than hoping for the uncertainty to go away, all companies need to constantly improve their agility, focus on the customer and continue to invest for the future.
For Investor, celebrating our 100th anniversary, 2016 was successful. Our total shareholder return was 13 percent, and our cash flow was strong. Thanks to dividends from Listed Core Investments, net cash flow from EQT and distributions from companies within Patricia Industries, some SEK 13 bn. in total, we could invest in Listed Core Investments, acquire a new subsidiary, Laborie, and pay an increased dividend, with our leverage more or less unchanged at some 5 percent.
We continued to support the develop-ment of our companies by appointing new board members and through our board engagement. We also sharpened our focus on sustainability by implementing climate compensation at Investor and by integrat-ing sustainability into our value creation plans, the foundation of our active owner-ship work. Our view is clear: sustainability is never an obstacle, it is a prerequisite. Another area that is a top priority is the rapid technology change and its potential implications on our companies.
Listed Core InvestmentsThe total return for Listed Core Invest-ments was 14 percent, mainly driven by
Atlas Copco and ABB. Most companies improved efficiency and invested in growth.
During the first quarter, amid the worries about the Chinese economy, we invested SEK 125 m. in Atlas Copco, and mid-year, we invested SEK 353 m. in Wärtsilä. During the fourth quarter, after a profit warning and sharp share price decline, we invested SEK 1.0 bn. in Ericsson. It is crucial that Ericsson continues to improve efficiency and identifies strategic areas in which it can be a long-term win-ner. We believe that the new CEO Börje Ekholm and his team will be able to grad-ually realize Ericsson’s long-term potential.
In early 2017, Atlas Copco proposed a split of the group into one industrially focused company and one focusing on mining and civil engineering. We believe that this is a logical step which will create two focused market-leaders and further enhance future profitable growth. Assum-ing approval of the split at the 2018 Annual General Meeting, both companies will be listed core investments of Investor.
EQTThe value of our EQT investments grew by 10 percent in constant currency, and the net cash flow to Investor amounted to SEK 1.0 bn. Activity was high, with sev-eral new funds successfully closed. Given the attractive track record and return potential, we will continue to invest in EQT’s funds.
Patricia IndustriesPatricia Industries focuses on developing its existing companies, realizing its finan-cial investments, and finding new subsid-iaries in the Nordics and in North America.
Dear fellow Shareholders,
During 2016, our net asset value grew 13 percent. We continue
to support the development of our companies and many important
activities were initiated. Our cash flow was strong, enabling us to
make significant investments while keeping leverage unchanged.
Our focus on long-term value creation remains intact.
In 2016, it completed the SEK 5 bn. acqui-sition of Laborie, a Canadian market lead-ing medical technology company offering a strong platform for profitable growth.
The subsidiaries generally performed well, reporting organic sales growth between 5 and 17 percent, with overall good profitability. Several complementary acquisitions were made and actions to improve performance were implemented. Mölnlycke, the largest subsidiary, grew sales by 6 percent organically in constant currency, with profit and cash flow grow-ing double digit. The strong cash flow allowed for both growth investments and a EUR 300 m. distribution to Patricia Industries. Given the attractive return potential, continued growth remains the key priority for Mölnlycke.
Going forwardOur operating priorities to grow net asset value, operate efficiently and pay a steadily rising dividend, remains firm. We strive to be a strong owner of great com-panies, driving initiatives to help them stay or become best-in-class. We also focus on investing in the most attractive opportunities.
I would like to take this opportunity to thank my colleagues at Investor and in our companies. Their dedicated and pro-fessional work, in combination with our strong financial flexibility, makes me con-fident in our ability to create long-term value for you, dear Shareholders.
Johan ForssellPresident and Chief Executive Officer

INVESTOR 2016ADMIN ISTR AT ION REPORT – F inanc ia l deve lopment 4
Financial developmentAt year-end 2016, net asset value amounted to SEK 300.1 bn., an
increase of SEK 28.3 bn. during the year. With dividend added back,
the increase was 13 percent, compared to the SIXRX’s 10 percent.
Investor’s leverage was 5.3 percent.
0
50,000
100,000
150,000
200,000
250,000
300,000
350,000
NAV 2016
DividendGroup Wide
Patricia Industries
EQTListed Core Investments
NAV 2015
1) Including net financial items, repurchases of shares, equity effects and management costs.
1)
1) Inkl. finansnetto, återköp av egna aktier, påverkan på eget kapital och förvaltningskostnader.
0
50 000
100 000
150 000
200 000
250 000
300 000
350 000
Substans-värde2016
UtdelningKoncern-gemensamt
Patricia Industries
EQTNoterade Kärn-
investeringar
Substans-värde 2015
271 80130 936 300 077
1)
–1 449 –7 6351 986 4 438
271,80130,936 300,077–1,449 –7,635 1,986 4,438
Contribution to net asset value, SEK m.
Results The consolidated net profit amounted to SEK 33,665 m. (17,434). Management costs amounted to SEK 465 m. (483).
Net debt and leverageNet debt amounted to SEK 16,752 m. at year-end (15,892), corre-sponding to a leverage of 5.3 percent (5.5). Gross cash amounted to SEK 16,710 m., of which Patricia Industries SEK 14,389 m.
Our target leverage range is 5-10 percent over a business cycle. While leverage can fluctuate above and below the target level, it should not exceed 25 percent for any longer periods of time. Our leverage policy allows us to capture investment oppor-tunities in the market and support our companies.
Overview of net asset value
12/31 2016 12/31 2015
Owner- ship, %
(capital)SEK/
shareValue
SEK m.
Contribution to net asset
valueValue
SEK m.
Listed Core Investments
Atlas Copco 16.9 75 57,437 15,521 43,100ABB 10.5 58 44,592 10,671 35,424SEB 20.8 57 43,725 5,293 40,826AstraZeneca 4.1 34 25,732 –2,896 29,869Wärtsilä 17.7 19 14,257 1,208 13,077Nasdaq 11.7 15 11,842 2,610 9,423Sobi 39.6 15 11,480 –3,034 14,515Saab 30.0 15 11,181 2,809 8,535Electrolux 15.5 14 10,846 1,297 9,860Ericsson 5.9 14 10,378 –4,070 14,086Husqvarna 16.8 9 6,883 1,616 5,428
Total Listed Core Investments 325 248,354 30,9361) 224,143
EQT 18 13,996 1,9861) 13,021
Patricia IndustriesMölnlycke 99 28 21,067 3,944 20,050Laborie 97 6 4,928 271 –Aleris 100 5 3,940 58 3,869Permobil 94 5 3,923 140 3,963BraunAbility 95 4 3,136 366 2,781Vectura 100 3 2,161 365 1,795Grand Group 100 0 181 5 175
51 39,336 5,150 32,634
3 Scandinavia 40 7 5,446 619 5,611Financial Investments 13 10,024 –1,068 12,850
Total Patricia Industries excl. cash 72 54,806 4,4381) 51,095Total Patricia Industries incl. cash 69,195 65,711
Other assets & liabilities 0 –327 –9,0841,2) –565Total Assets excl. Patricia Industries’ cash 414 316 829 287,695Gross debt –33 461 –34,954Gross cash 16 710 19,062 Of which Patricia Industries 14 389 14,616Net debt –22 –16,752 –15,892Net Asset Value 393 300,077 28,276 271,801
1) Including management costs, of which Listed Core Investments SEK 89 m., EQT SEK 8 m., Patricia Industries SEK 263 m., and Groupwide SEK 105 m.
2) Including paid dividends of SEK 7,635 m.
Performance of the group in summary
SEK m. 2016 2015 2014 2013
Changes in value 22,057 8,538 41,960 37,031Dividends 8,351 7,821 7,228 6,052Other operating income 40 58 177 362Management costs –465 –483 –368 –359Other items 3,682 1,500 1,691 2,020Profit (+)/Loss (–) 33,665 17,434 50,688 45,106Non-controlling interest 0 –1 –32 59Dividends paid –7,635 –6,856 –6,089 –5,331Other effects on equity 2,246 262 979 885Total 28,276 10,838 45,546 40,719
The contribution to net asset value from the business areas during 2016 amounted to SEK 30,936 m. from Listed Core Investments (8,804), SEK 1,986 m. from EQT (3,995), and SEK 4,438 m. from Patricia Industries (4,855).

INVESTOR 2016 ADMIN ISTR AT ION REPORT – F inanc ia l deve lopment 5
The debt financing of the wholly-owned subsidiaries within Patricia Industries is ringfenced and hence not included in Investor’s net debt. Investor guarantees SEK 0.7 bn. of 3 Scandinavia’s external debt, which is not included in Investor’s net debt.
The average maturity of the debt, excluding the debt of the wholly-owned subsidiaries within Patricia Industries, was 10.0 years as of year-end (10.3).
SkuldsättningsgradMålnivå för skuldsättning, 5-10%
Maximal skuldsättningsgrad
%
−20
−10
0
10
20
30
2016201520142013201220112010200920082007
Leverage Leverage target range, 5-10%Maximum leverage
%
−20
−10
0
10
20
30
2016201520142013201220112010200920082007
Leverage
Parent companyResults after financial items were SEK 29,275 m. (8,360), mainly related to Listed Core Investments, which contributed with dividends of SEK 7,731 m. (7,182) and value changes of SEK 19,388 m. (–2,582). The Parent Company invested SEK 18,286 m. in financial assets (21,292), of which SEK 17,084 m. in group companies (15,677), and SEK 1,135 m. in Listed Core Investments (5,613). At year-end, shareholders’ equity amounted to SEK 250,404 m. (228,433).
Risk and uncertainty factors Risk management is an integral part of the board’s and manage-ment’s governance and follow-up of operations. The board is responsible for setting appropriate risk levels and establishing authorities and limits. The boards in the wholly-owned subsidiar-ies manage the risks in their respective businesses and decide on appropriate risk levels and limits. The following is a brief descrip-tion of the most significant risks and uncertainty factors affect-ing the Group and the Parent Company. For a more detailed description, see note 3, Risks and risk management, page 39.
Commercial risks
Commercial risks primarily consist of a high level of exposure to a particular industry or an individual portfolio company, as well as stock market volatility that impact our net asset value, limit investment potential or prevent divestments at a chosen time. The overall portfolio risk is mitigated by many investments active in several different industries and geographies. Commercial risks in the wholly-owned subsidiaries’ businesses are managed by continuous focus on agility and flexible business models, product development, customer needs, market analysis and cost efficiency, among other things.
Financial risks
The main financial risks are market risks, i.e. the risks associated with changes in the value of a financial instrument. For Investor, share price risk is clearly the largest financial risk. When it comes to fluctuations in exchange rates and interest rates, Investor partly uses hedging as one method of managing these risks.
Future developmentIn line with our strategy, we will continue to support the devel-opment of our companies, gradually increase our ownership in selected listed core investments, commit capital to EQT and add more subsidiaries within Patricia Industries. We will maintain cost discipline and we stay committed to our dividend policy with the goal to pay a steadily rising dividend over time.
Change in net debt
SEK m. 2016
Opening net debt –15,892
Listed Core InvestmentsDividends 8,307Investments, net of proceeds1) –1,488Total 6,818
EQTProceeds (divestitures, fee surplus and carry) 3,874Draw-downs (investments and management fees) –2,864Total 1,010
Patricia Industries
Proceeds 7,124
Investments –6,118Internal transfer to Investor –1,259Other2) 27Total –227
Investor GroupwideDividend paid –7,635Internal transfer from Patricia Industries 1,259Other3) –2,086Closing net debt –16,752
1) Including currency related effects on investments in foreign currency.2) Including currency related effects, net interest and management cost.3) Including revaluation of debt, net interest and management cost excluding Patricia Industries.
Net debt 12/31 2016
SEK m.Consolidated balance sheet
Deductions related to Patricia Industries
Investor’s net debt
Other financial investments 3,709 –91 3,618Short-term investments, cash and cash equivalents 16,344 –3,253 13,092Receivables included in net debt 2,402 – 2,402Loans –54,946 19,182 –35,764Provision for pensions –838 738 –99Total –33,329 16,577 –16,752

INVESTOR 2016OBJECT IVE AND OPER AT ING PR IOR IT I ES 6
Objective and operating prioritiesWe are committed to generating an attractive long-term total return, exceeding the
market cost of capital. Our long-term return requirement is the risk free interest rate
plus an equity risk premium, in total 8-9 percent annually. Our operating priorities are
to grow our net asset value, operate efficiently and pay a steadily rising dividend.
Average annual return
Management cost
Dividend
Management cost / Net asset value
Management cost
SEK m. % SEK m. %
0
100
200
300
400
500
600
700
2013201220111)201120100,0
0,1
0,2
0,3
0,4
0,5
0,6
1) Including restructuring cost of SEK 150 m.
Management cost / Net asset value Management cost
Förvaltningskostnader / Substansvärde
Förvaltningskostnader
Mkr %
0
100
200
300
400
500
600
700
2013201220111)201120100,0
0,1
0,2
0,3
0,4
0,5
0,6
1) Inklusive 150 Mkr i omstruktureringskostnader
0.7
0,7
0
100
200
300
400
500
201620151)2014201320120.0
0.1
0.2
0.3
0.4
0.5
2015201420132012
Mkr %
Förvaltningskostnader/Substansvärde Förvaltningskostnader1) Inklusive verksamheten i tidigare IGC, numera del av Patricia Industries
0
100
200
300
400
500
201620151)201420132012
1) Including the operations in former IGC, now part of Patricia Industries
0,0
0,1
0,2
0,3
0,4
0,5
Ordinarie utdelning, kr/aktie Extra utdelning, kr/aktieDirektavkastning, %, baserad på årets slutkurs
SEK/share
Ordinary dividend, SEK/share Extraordinary dividend, SEK/shareYield, %, based on share price at year-end
1) Proposed dividend
0123456789
1011
0123456789
1011
201620152014201320122011201020092008200701234567891011
161514131211100908071)
%
Kr/aktie
1) Föreslagen utdelning
0123456789
1011
0123456789
1011
201620152014201320122011201020092008200701234567891011
151514131211100908071)
%
%
Avkastningskrav 8-9%
Substansvärde inkl.återlagd utdelning Investor totalavkastning
SIXRX, totalavkastningsindex
0
5
10
15
20
25
30
20 år10 år5 år1 år
%
Return requirement 8-9 %
NAV incl. dividend added back Investor, total return
SIXRX, return index
0
5
10
15
20
25
30
20 years10 years5 years1 year
• Grow our net asset value To achieve attractive net asset value growth, we must own high-quality companies and be a good owner, supporting our companies to achieve profitable growth. We also need to allocate our capital successfully. 2016: Our net asset value amounted to SEK 300.1 bn. at year-end 2016 (271.8), an increase, with dividend added back, of 13 percent (7). The SIXRX total return index rose by 10 percent (10).
• Operate efficiently We maintain cost discipline to remain efficient and in order to maximize our operating cash flow. 2016: Management costs were SEK 465 m. (483), correspond-ing to 0.15 percent of our net asset value (0.18).
• Pay a steadily rising dividend Our dividend policy is to distribute a large percentage of the dividends received from the listed core investments, as well as to make a distribution from other net assets corresponding to a yield in line with the equity market. The goal is to pay a steadily rising dividend. 2016: The Board of Directors proposes a SEK 11.00 dividend per share (10.00). Based on this proposal, our dividend has increased by 13 percent annually over the past five years.

INVESTOR 2016 ACT IVE OWNERSH IP 7
Active ownership
We have a long-term investment perspective and support our companies in their efforts to create sustainable value. Our goal is to build strong and healthy, best-in-class companies. We aspire for all of our companies to perform better than their peers and to reach their full potential. However, our companies are diverse and therefore with different opportunities and challenges. Accord-ingly, we treat each company individually and independently.
Our model for active ownership is built on substantial owner-ship. We own significant minority stakes in our listed core invest-ments, and are often the largest shareholder, as it enables us to influence board composition and impact key strategic decisions. Our subsidiaries are owned by Patricia Industries, which offers management teams and boards co-ownership.
We work through the boardsOur objective is to create value through engagement and active ownership and we exercise our influence through the boards. We depend on the boards to ensure the building of strong and healthy companies for the long-term, while at the same time creating the needed urgency around short-term performance. It is imperative to have the best board possible in each company to build and actively support the development of best-in-class companies.
We believe in boards of limited size, which still allow for suffi-cient breadth of capabilities while ensuring high levels of individ-ual accountability. Our experience is that a well-functioning board is diverse in terms of age, gender and background. The board should include individuals with relevant industry, func-tional and geographic knowledge which is not too narrow or specific. Importantly, the board should have the experience necessary to support the company’s long-term ambitions.
Based on our experience, some areas are particularly impor-tant when composing high-performing boards: agenda setting
We are an active and long-term owner. Through substantial ownership
and board participation, we drive the initiatives that we believe will create
the most value for each individual company.
and time allocation, board dynamics, interaction with manage-ment, knowledge and capability building, and board evaluation.
The value added by the board is dependent on how well it carries out a set of key activities. We place particular emphasis on seven, largely forward-looking activities: strategic plan, CEO appointment, investments and M&A, performance management, corporate health including sustainability, talent management and management remuneration, and risk management and compliance.
Listed Core Investments
In our listed core investments, we often lead the nomination committees and utilize our network to find the best board candi-dates. We strive to have two board representatives, including the chairperson.
A clear division of responsibilities between the owners, boards and management teams in our listed core investments is important. The owners are responsible for ownership-related issues, for example the appointment of the board. The board appoints the CEO, approves the strategy and large investments, and monitors the performance of the company, while the CEO is responsible for executing the strategy.
Patricia Industries
The boards of Patricia Industries’ companies are typically com-posed of independent directors from our extensive network and employees from Patricia Industries, led by an independent non-executive chairperson.
Patricia Industries’ subsidiaries are wholly-owned, and as such, Patricia Industries and the respective boards have full responsibility to set the direction and follow-up on the perfor-mance in the companies.
We work with our companies to make them best-in-class
We have strong ownership positions, exercise our influence through the boards and develop and implement value creation plans
We act in the best interest of each company from an industrial and long-term perspective
We are long-term in vision, but relentlessly impatient in follow-up

INVESTOR 2016ACT IVE OWNERSH IP 8
What we invest inWe own companies within engineering, healthcare, financial services and technology; industries we understand well, and in which we can utilize our experience and network as well as our financial expertise.
We have a long-term investment horizon focusing on “buy-to-build”, with no exit strategy. Our base case is to develop our companies over time, as long as we see further value creation potential. Our business teams are responsible for regularly updating our view of the long-term fundamental values of our companies, serving as the starting point for our investment decisions. Our capital allocation focus is to invest through our existing wholly-owned subsidiaries within Patricia Industries and finding new ones. In addition, we will continue to strengthen our ownership in selected listed core investments, and invest in EQT’s funds. While not part of the strategy, if we arrive at the conclusion that a certain company no longer offers attractive potential, or that it would be better off with another main owner, we actively drive an exit process in order to find a better owner for the company and to maximize the value for our share-holders at the same time.
Long-term value-creating investments
We actively support all our companies in making long-term value-creating investments, which means that we are willing to sacrifice short-term profitability for longer-term value accretive investments. It is our firm belief that to become or remain best-in-class, companies must have the ability to invest in innovation, regardless of pressure from market or external forces. However, our long-term perspective is never an excuse for weak under-lying short-term performance.
Through our financial strength, we enable our companies to make the right investment decisions – at the right time. Access to capital, in combination with sound ownership and gover-nance, creates opportunities to invest for the long-term.
New investments
While we do not actively seek new investments within Listed Core Investments, we do not rule out additional investments should attractive opportunities arise. Patricia Industries con-stantly scouts the market for new companies to acquire. In addi-tion to the industries we are invested in, new investments can
be made in, for instance, infrastructure and business services. However, the main priority is to further develop and build the existing companies.
In any new investments, we look for certain characteristics; high-quality companies with strong market positions, flexible business models, strong corporate cultures, exposure to growth markets, strong cash flow, continuous focus on innovation and R&D, exposure to service and after-market sales and sustainable business models.
Value creation plansOur ownership work is mainly carried out by our business teams within Listed Core Investments and Patricia Industries. The busi-ness teams consist of our board representatives, investment managers and analysts.
The business teams invest significant time and resources in industry analysis and benchmarking of the portfolio companies’ performance versus peers. Based on our analysis and experience, we develop and constantly refine value creation plans for each company. These plans identify strategic key value drivers that we want the companies to focus on over the next 3-5 years in order to maximize long-term value and maintain or achieve best-in-class positions. While our ownership horizon is long-term, we believe in shorter-term plans to create clear focus on execution. The plans typically focus on the following main areas: opera-tional excellence, growth, capital structure, industrial structure and corporate health. During 2016, we had an increased focus on sustainability for our portfolio companies. For a description of our sustainability work as an owner, see page 10.
We communicate our value creation plan to each listed core investments’ board chairperson at least annually, and we encourage the chairperson to discuss the plan with the rest of the board. Patricia Industries has a continuous dialog with the wholly-owned subsidiaries’ management teams and boards.
Cash flow generationOver the past few years, we have established a strong cash flow generation through Patricia Industries’ wholly-owned subsidiar-ies. This cash flow, together with the dividend from our listed core investments, allows us to finance investments in both existing and new companies without divesting assets. It also allows us to pay a steadily rising dividend.
Ownership position
Value creation plan
Board composition
Continuous follow-up
Bench marking & fundamental analysis
Interaction with the company
Our model for active ownership

INVESTOR 2016 ADMIN ISTR AT ION REPORT – Sus ta inab le bus iness 9
Sustainable businessInvestor firmly believes that focus on sustainability is a prerequisite for creating long-term
value. Companies that are best-in-class when it comes to operating in a sustainable way,
will be able to provide superior products and services, and to recruit the best employees,
thereby outperforming competitors in the long-term.
Investor has a long tradition of being a responsible owner, company and employer. To maintain the right to exist in the long-term, companies need to work on managing their resources and focus on continuous improvement, as productivity is key to maintain a competitive advantage in a dynamic business environment.
Our sustainability work as company and employerAs a company, we continuously work to improve our social, environmental and economic impact. We aim to set a good example for our companies.
As an employer, we focus on providing a best-in-class working environment where respect for each individual and ethical behav-ior is key. This enables us to recruit and retain the best talents.
Guidelines and policies
We are fully committed to the highest standards of corporate governance and we support the UN Global Compact and the OECD guidelines for Multinational Enterprises. It is of the highest importance that we always comply with legislations and regulations.
Investor’s Board of Directors, in cooperation with the Management Group, has formulated an internal framework for how Investor should act as a responsible owner, company and employer. These topics are addressed in our Code of Conduct
and in our internal policies for Anti-Corruption, Sustainability and Whistleblowing. Investor’s Code of Conduct can be found on our website, www.investorab.com.
Every employee and other company representatives are expected to comply with our policies. In order to inform the organization about our internal rules, regular trainings are held and all documentation is available on Investor’s intranet. Investor’s internal regulations are monitored and updated when needed, at least annually.
Materiality assessment
During the fall 2016, Investor conducted an in-depth materiality assessment. Investor’s most significant sustainability issues were identified and prioritized via analyzes, ongoing dialogs and inter-views with our employees and external stakeholders.
Investor’s most relevant stakeholders are, among others, shareholders, portfolio companies, employees, partners, media and society as a whole, as they affect how well Investor perform from an economic, environmental and social perspective. The assessment is based on Investor’s investing activities and our impact as an owner is covered in the aspects of “Active owner-ship in sustainable business models” and “Indirect influence on sustainability related issues”.
The result from the assessment is used to further pinpoint our sustainability priorities and reporting going forward.
Medium High
Med
ium
Hig
h
Influence on Investors business success
Imp
ort
ance
to
sta
keh
old
ers
Priority High priority
Financial strength & long term return
Indirect economic influence
Business ethics
Indirect influence on sustainability related issues
Corporate governance
Equality & diversity
Transparency
Tax
Due diligence sustainability evaluation
Direct environmental impact, including climate change
Suppliers & advisors
Attract & keep talents /talent management
The matrix illustrates Investor’s main sustainability priorities and below is a description of our highest priorities.
• Financial strength and long-term return: Sustainable business to create long-term value.
• Business ethics: Ethical business conduct and prevention of unethical behavior, corruption and bribery.
• Indirect economic influence: Investor’s contribution to employment, growth, wealth, research, innovation and development.
• Active ownership in sustainable business models: As owners, we stress the importance of sustainable business models, customer benefit, processes and innovation in the portfolio companies.
• Corporate governance: Corporate governance matters, such as board independence, competence and compensation, are handled in an adequate and transparent manner.
• Indirect influence on sustainability related issues: As owners, we have an active dialog with the portfolio companies regarding the management of sustainability issues and risks, such as the impact on the climate and envi-ronment, health, safety, bribery and corruption, as well as human rights.
Active ownership in sustainable business models

INVESTOR 2016ADMIN ISTR AT ION REPORT – Sus ta inab le bus iness 10
Our sustainability work as an ownerDuring the year, Investor developed a more structured approach to sustainability as a long-term, responsible and active owner, as this is where we have the most impact. Our most important con-tribution is when our companies improve their competitiveness, by for example developing innovative products and services that reduce energy and water consumption, as well as improving waste management and human conditions.
We have high expectations on our companies’ sustainability efforts, guided by our sustainability guidelines and the company specific focus areas.
Investor’s sustainability guidelines
Investor’s sustainability guidelines describe our basic expectations which are applicable to all our companies. We expect them to;• act responsibly and in an ethical manner,• comply with local and national legislation in each country
of operation,• continuously improve social, environmental and economic
impact,• analyze risks, formulate objectives and to have adequate
processes to manage and monitor sustainability risks,• sign and adhere to the UN Global Compact and its ten
principles as well as the OECD guidelines for Multinational Enterprises,
• in an appropriate form, transparently report sustainability objectives, risks and progress,
• encourage and promote diversity in the organizations,
• have an active dialog with stake-holders such as suppliers and trading partners, and
• have a secure reporting channel (whistle blowing) in place.
Company specific focus areas
A sustainability section has been included in each of our listed core investments’ value creation plans, with an overview of the sustainability performance, our view and two to three company specific focus areas. All companies have different focus areas depending on the risks and opportunities that are relevant for their business. Examples of focus areas are continued focus on innovation, energy efficiency and diversity.
The company specific focus areas are presented annually to Investor’s Board of Directors, and we communicate the plan at least annually to the chairpersons and encourage him or her to discuss it with the rest of the board.
Continuous follow-up
Investor considers sustainability matters in all of our investing activities. Through the annual Investor sustainability question-naire, sent out to all portfolio companies for a self-assessment of their sustainability work, we follow-up and monitor our sus-tainability guidelines.
Our analysts support and monitor the development continu-ously and the company specific focus areas are monitored through the same process and principles as for the value creation plans as a whole, i.e. through our board work.
If a serious sustainability related issue occurs in one of our companies, the business team is
responsible for raising the matter internally within Investor and for
monitoring the steps the company takes to address the issue. The
business team is also respon-sible for reporting the pro-
cess and actions taken to relevant people within Investor. Investor’s board representatives are responsible to ensure that relevant actions are being made within the company.
REPORTING
Our sustainability work is included in our
Annual Report, on our website and in the
Communication of Progress (UN Global Compact).
COMPANY SPECIFIC FOCUS AREAS
Are included in the value creation plan for each listed
core investment and vary depending on each
company’s opportunities and challenges.
INVESTOR’S SUSTAINABILITY GUIDELINES
Describe our nine basic expectations, applicable to all our companies.
CONTINUOUS FOLLOW-UP
Through a sustainability questionnaire, we annually monitor our sustainability guidelines, and the company specific focus areas are monitored by our analysts on an
ongoing basis and reported annually to the Investor Board of Directors. We compile the companies’ sustainability
work in an internal index, to evaluate, monitor and develop our companies long-term.
Crea
te business opportunities
Reduce risks and costs
Long-term, responsible and
active owner

INVESTOR 2016 ADMIN ISTR AT ION REPORT – Sus ta inab le bus iness 11
HUMAN RIGHTS
Investor supports the UN Global Compact and its ten principles as well as the OECD guidelines on Multinational Enterprises. We also support and respect internationally proclaimed human rights.
Investor expects all our companies to continuously improve their work with human rights.
Actions in 2016 – examples from our companies• Mölnlycke has implemented a company-wide global trade policy which,
among others, includes the handling of trade restrictions and workers’ rights, and is formed in line with the UN Guiding principles on Human Rights. During 2016, the policy was implemented and 90 percent of the employees in the selected target groups have attended training. The implementation process will continue the coming year and include annual training, monitoring and audits, to ensure compliance with the policy.
• Permobil continued its work to make sure that the high standards included in the company’s Code of Conduct, are spread throughout the organization and that Permobil’s suppliers live up to the standards, for instance by ensuring that the supply agreements contain appropriate requirements regarding human rights, environmental, and working safety issues and business conduct.
• Sobi is actively working to increase access to rare disease treatment in developing countries, both through raising awareness as well as through bridging programs and humanitarian donations. By year end 2016, Sobi, in partnership with Bioverativ, had donated 203 million units of Elocta and Alprolix – enabling the treatment of 11,000 people in 40 countries by addressing 12,500 bleeds and almost 700 surgeries. The percentage of children who receive treatment trough the donation program in these countries has doubled.
LABOR
Investor shall ensure compliance with labor and employment laws, including working hours. Furthermore, the right to collec-tive bargaining is recognized at Investor. An employee no discrimination policy is included in Investor’s Code of Conduct. Violations connected to discrimination must be reported to the closest manager, HR or through our whistleblower system.
Investor expects all our companies to continuously improve labor and working conditions.
Actions in 2016 – examples from our companies• ABB arranged its third annual safety week under the theme ‘Living our
story safely’. Core modules included a Safety observation tour, Safety disciplines, and Communication for safety. In total, more than 160,000 employees attended 4,500 sessions during the week.
• Aleris’s conducted a “we-learning” (e-learning for groups) program during 2016, in order to increase the awareness of its ethical guidelines and pro-vide an understanding of how to interact in accordance with Aleris’ values, vision and business concept. The program clarifies the connection between the ethical guidelines and the employee’s everyday work. Overall, 5,200 answers were received and the feedback indicates that the program contributed to increased awareness.
• SEB introduced a global health index based on the questions in the employee survey Insight. This is the first global tool to measure the work-ing environment and health at both the divisional and national level. At group level, the index was 81 in 2016. Going forward, this will be an important tool to further identify health and work environment related changes and needs among employees in the organization.
ENVIRONMENT
Investor’s direct environmental impact is limited, but we actively strive to avoid increasing our carbon footprint. Investor carbon-offsets all flights, which corresponds to approximately 75 percent of Investor’s carbon footprint, and in accordance with the EU Energy Efficiency Directive and Swedish law, Investor and its con-solidated subsidiaries report and analyze energy use. The analyses will result in proposed actions to reduce energy usage further.
Investor expects all of its companies to continuously reduce the environmental impact and to encourage their stakeholders, such as suppliers and trading partners, to meet the same expec-tations.
Actions in 2016 – examples from our companies• Husqvarna has committed to reduce its greenhouse gas emissions intensity
by 10 percent across the company’s value chain by 2020 and the absolute greenhouse gas emissions will be reduced by 33 percent by 2035, both from a base year of 2015. The company also decided to allow an indepen-dent party to review the goals, and in December 2016 the goals were approved by the Science-Based Target Initiative.
• Vectura implemented a sustainability policy which states that new con-structions and redevelopment shall achieve set climate and environmental targets. For example, the share of renewable energy and renewable materials should be increased and digital solutions should be implemented to reduce climate impact.
• Wärtsilä 31 is recognized by Guinness World Records as the world’s most efficient 4-stroke diesel engine. It is the first of a new generation of medium speed engines, designed to set a new benchmark in efficiency and overall emissions performance. The launch of the Wärtsilä 31 introduces a 4-stroke engine having the best fuel economy of any engine in its class. At the same time, it maintains outstanding performance across the complete operating range. Its modular design enables a significant reduction in maintenance time and costs, thereby improving power availability and reducing the need for spare parts.
ANTI-CORRUPTION
It is of the highest importance that Investor and its companies adhere to and comply with all given legislations and regulations as well as setting a bar for how to act and behave in society – always with the highest ethics.
Investor expects all our companies to continuously improve their work against corruption and bribery.
Actions in 2016 – examples from our companies• Atlas Copco updated the Business Code of Practice training for white
collar employees and completed the training package for blue collar workers. The training describes the importance of the Business Code of Practice, how it is used and how to report violations of the code. It is a class-room training with interactive discussion about cases covering issues such as corruption, human rights, health and safety.
• BraunAbility was acquired by Investor in 2015 and since then, the sustain-ability focus within the company has increased. Among other things, an Anti-Corruption policy was approved by its Board of Directors, and train-ing and implementation will continue during the following year.
• Saab has revised and updated its internal regulations regarding gifts and representation, and sponsorship and social commitment. The company has also, alongside the regular training program, organized special training in anti-corruption for its Board of Directors and for the purchasing function.
Progress of Investor’s sustainability approach based on UN Global CompactFor more information regarding our companies’ sustainability work, please visit their websites.
INVESTOR 2016L ISTED CORE INVESTMENTS 12
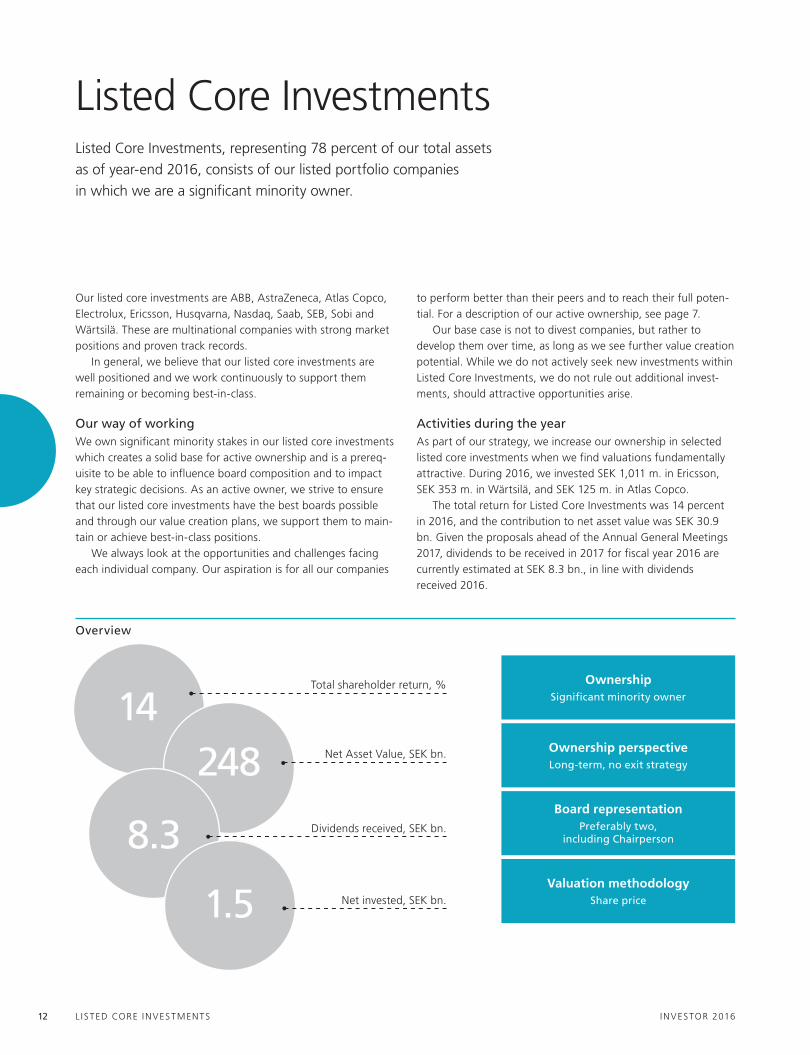
Listed Core InvestmentsListed Core Investments, representing 78 percent of our total assets
as of year-end 2016, consists of our listed portfolio companies
in which we are a significant minority owner.
Our listed core investments are ABB, AstraZeneca, Atlas Copco, Electrolux, Ericsson, Husqvarna, Nasdaq, Saab, SEB, Sobi and Wärtsilä. These are multinational companies with strong market positions and proven track records.
In general, we believe that our listed core investments are well positioned and we work continuously to support them remaining or becoming best-in-class.
Our way of workingWe own significant minority stakes in our listed core investments which creates a solid base for active ownership and is a prereq-uisite to be able to influence board composition and to impact key strategic decisions. As an active owner, we strive to ensure that our listed core investments have the best boards possible and through our value creation plans, we support them to main-tain or achieve best-in-class positions.
We always look at the opportunities and challenges facing each individual company. Our aspiration is for all our companies
to perform better than their peers and to reach their full poten-tial. For a description of our active ownership, see page 7.
Our base case is not to divest companies, but rather to develop them over time, as long as we see further value creation potential. While we do not actively seek new investments within Listed Core Investments, we do not rule out additional invest-ments, should attractive opportunities arise.
Activities during the yearAs part of our strategy, we increase our ownership in selected listed core investments when we find valuations fundamentally attractive. During 2016, we invested SEK 1,011 m. in Ericsson, SEK 353 m. in Wärtsilä, and SEK 125 m. in Atlas Copco.
The total return for Listed Core Investments was 14 percent in 2016, and the contribution to net asset value was SEK 30.9 bn. Given the proposals ahead of the Annual General Meetings 2017, dividends to be received in 2017 for fiscal year 2016 are currently estimated at SEK 8.3 bn., in line with dividends received 2016.
14248
8.3
1.5
OwnershipSignificant minority owner
Board representationPreferably two,
including Chairperson
Valuation methodologyShare price
Ownership perspectiveLong-term, no exit strategy
Total shareholder return, %
Net Asset Value, SEK bn.
Dividends received, SEK bn.
Net invested, SEK bn.
Overview
INVESTOR 2016 L ISTED CORE INVESTMENTS 13
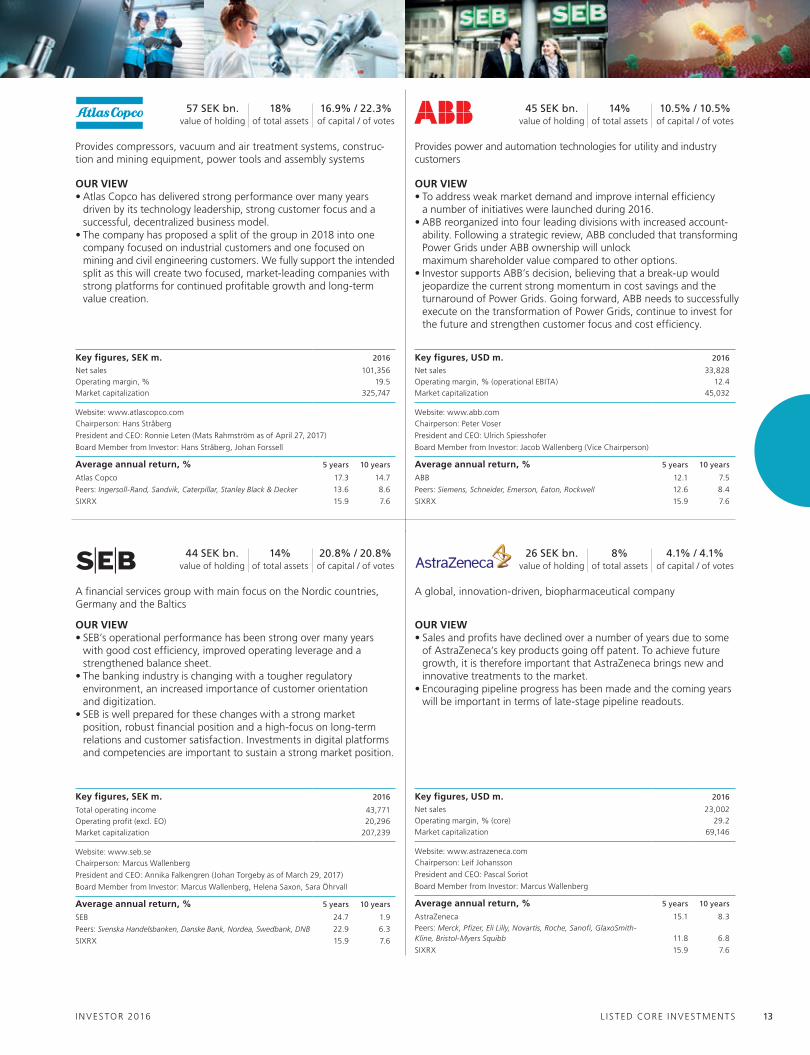
A financial services group with main focus on the Nordic countries, Germany and the Baltics
Key figures, SEK m. 2016
Net sales 101,356Operating margin, % 19.5Market capitalization 325,747
Website: www.atlascopco.comChairperson: Hans Stråberg
President and CEO: Ronnie Leten (Mats Rahmström as of April 27, 2017)
Board Member from Investor: Hans Stråberg, Johan Forssell
Average annual return, % 5 years 10 years
Atlas Copco 17.3 14.7
Peers: Ingersoll-Rand, Sandvik, Caterpillar, Stanley Black & Decker 13.6 8.6
SIXRX 15.9 7.6
Provides compressors, vacuum and air treatment systems, construc-tion and mining equipment, power tools and assembly systems
44 SEK bn. 14% 20.8% / 20.8%value of holding of total assets of capital / of votes
Key figures, SEK m. 2016
Total operating income 43,771Operating profit (excl. EO) 20,296Market capitalization 207,239
Website: www.seb.seChairperson: Marcus Wallenberg
President and CEO: Annika Falkengren (Johan Torgeby as of March 29, 2017)
Board Member from Investor: Marcus Wallenberg, Helena Saxon, Sara Öhrvall
Average annual return, % 5 years 10 years
SEB 24.7 1.9
Peers: Svenska Handelsbanken, Danske Bank, Nordea, Swedbank, DNB 22.9 6.3
SIXRX 15.9 7.6
Provides power and automation technologies for utility and industry customers
Key figures, USD m. 2016
Net sales 33,828Operating margin, % (operational EBITA) 12.4Market capitalization 45,032
Website: www.abb.comChairperson: Peter Voser
President and CEO: Ulrich Spiesshofer
Board Member from Investor: Jacob Wallenberg (Vice Chairperson)
Average annual return, % 5 years 10 years
ABB 12.1 7.5
Peers: Siemens, Schneider, Emerson, Eaton, Rockwell 12.6 8.4
SIXRX 15.9 7.6
Key figures, USD m. 2016
Net sales 23,002Operating margin, % (core) 29.2Market capitalization 69,146
Website: www.astrazeneca.comChairperson: Leif Johansson
President and CEO: Pascal Soriot
Board Member from Investor: Marcus Wallenberg
Average annual return, % 5 years 10 years
AstraZeneca 15.1 8.3Peers: Merck, Pfizer, Eli Lilly, Novartis, Roche, Sanofi, GlaxoSmith-Kline, Bristol-Myers Squibb 11.8 6.8
SIXRX 15.9 7.6
A global, innovation-driven, biopharma ceutical company
45 SEK bn. 14% 10.5% / 10.5%value of holding of total assets of capital / of votes
26 SEK bn. 8% 4.1% / 4.1%value of holding of total assets of capital / of votes
57 SEK bn. 18% 16.9% / 22.3%value of holding of total assets of capital / of votes
OUR VIEW• SEB’s operational performance has been strong over many years
with good cost efficiency, improved operating leverage and a strengthened balance sheet.
• The banking industry is changing with a tougher regulatory environment, an increased importance of customer orientation and digitization.
• SEB is well prepared for these changes with a strong market position, robust financial position and a high-focus on long-term relations and customer satisfaction. Investments in digital platforms and competencies are important to sustain a strong market position.
OUR VIEW• To address weak market demand and improve internal efficiency
a number of initiatives were launched during 2016. • ABB reorganized into four leading divisions with increased account-
ability. Following a strategic review, ABB concluded that transforming Power Grids under ABB ownership will unlock maximum shareholder value compared to other options.
• Investor supports ABB’s decision, believing that a break-up would jeopardize the current strong momentum in cost savings and the turnaround of Power Grids. Going forward, ABB needs to successfully execute on the transformation of Power Grids, continue to invest for the future and strengthen customer focus and cost efficiency.
OUR VIEW• Atlas Copco has delivered strong performance over many years
driven by its technology leadership, strong customer focus and a successful, decentralized business model.
• The company has proposed a split of the group in 2018 into one company focused on industrial customers and one focused on mining and civil engineering customers. We fully support the intended split as this will create two focused, market-leading companies with strong platforms for continued profitable growth and long-term value creation.
OUR VIEW• Sales and profits have declined over a number of years due to some
of AstraZeneca’s key products going off patent. To achieve future growth, it is therefore important that AstraZeneca brings new and innovative treatments to the market.
• Encouraging pipeline progress has been made and the coming years will be important in terms of late-stage pipeline readouts.

INVESTOR 2016L ISTED CORE INVESTMENTS 14
Key figures, SEK m. 2016
Net sales 5,204Operating margin, % (EBITA) 29.7Market capitalization 28,679
Website: www.sobi.seChairperson: Håkan Björklund
President and CEO: Geoffrey McDonough (up until July 1, 2017)
Board Member from Investor: Lennart Johansson, Helena Saxon
Average annual return, % 5 years 10 years
Sobi 47.8 7.9
Peers: Shire 16.4 16.6
SIXRX 15.9 7.6
A specialty healthcare company developing and delivering innovative therapies and services to treat rare diseases
Key figures, EUR m. 2016
Net sales 4,801Operating margin, % (excl. EO) 12.1Market capitalization 8,418
Website: www.wartsila.comChairperson: Mikael Lilius
President and CEO: Jaakko Eskola Board Member from Investor: Tom Johnstone, CBE, Johan Forssell (as of march 2, 2017)
Average annual return, % 5 years 10 years
Wärtsilä 17.2 12.7
Peers: Rolls-Royce, Alfa Laval 2.8 8.2
SIXRX 15.9 7.6
Provides complete lifecycle power solutions for the marine and energy markets
14 SEK bn. 5% 17.7% / 17.7%value of holding of total assets of capital / of votes
11 SEK bn. 4% 39.6% / 39.8%value of holding of total assets of capital / of votes
OUR VIEW• Sobi is an international specialty healthcare company focused on
rare diseases. The portfolio is focused on hemophilia, inflammation and genetic and metabolic diseases.
• 2016 was an important year for Sobi with the approvals and launches of its two hemophilia products, Elocta (Hemophilia A) and Alprolix (Hemophilia B), in Europe.
• Near term, building a strong and successful hemophilia franchise is key for the company.
OUR VIEW• Wärtsilä has delivered strong operational performance and share-
holder return despite tough end markets.• The company’s large aftermarket business provides earnings stability
in downturns and supports both marine and energy customers. • Wärtsilä’s leading global market positions and large emerging
market exposure provide an attractive platform for profitable growth.
Provides trading, exchange technology, information and public company services
12 SEK bn. 4% 11.7% / 11.7%1)
value of holding of total assets of capital / of votes
Key figures, USD m. 2016
Net sales 2,277Operating margin, % (non-GAAP) 46.3Market capitalization 11,181
Website: www.nasdaq.comChairperson: Robert Greifeld (as of January 1, 2017)
President and CEO: Adena Friedman (as of January 1, 2017)
Board Member from Investor: Börje Ekholm
Average annual return, % 5 years 10 years
Nasdaq 24.3 8.9
Peers: London Stock Exchange, Deutsche Boerse, Intercontinental Exchange 23.7 9.0
SIXRX 15.9 7.6
1) No single owner is allowed to vote for more than 5 percent at the AGM.
Provides products, services and solutions for military defense and civil security
Key figures, SEK m. 2016
Net sales 28,631Operating margin, % 6.3Market capitalization 36,231
Website: www.saab.comChairperson: Marcus Wallenberg
President and CEO: Håkan Buskhe
Board Member from Investor: Marcus Wallenberg, Johan Forssell, Lena Treschow Torell
Average annual return, % 5 years 10 years
Saab 22.3 7.7
Peers: BAE Systems, Leonardo, Thales 30.3 6.2
SIXRX 15.9 7.6
11 SEK bn. 4% 30.0% / 39.5%value of holding of total assets of capital / of votes
OUR VIEW• Nasdaq has a leading market position and a strong brand. It has
successfully strengthened its non-transactional business and thereby increased the share of recurring revenue and its resilience.
• We see expansion into new asset classes, geographies and adjacent businesses as some of the main drivers for continued value creation.
• Nasdaq’s strong cash flow supports continued growth initiatives as well as attractive shareholder cash distribution.
OUR VIEW• Saab provides state-of-the-art defense and civil security products
and is well positioned in niche markets globally.• In a rapidly changing world, Saab’s competitive edge is built on its
skills as a systems integrator and the ability of its engineers to challenge the technology frontier.
• Successful execution of the record-strong order book is imperative.

INVESTOR 2016 L ISTED CORE INVESTMENTS 15
Provides communications technology and services
10 SEK bn. 3% 5.9% / 21.8%value of holding of total assets of capital / of votes
Key figures, SEK m. 2016
Net sales 222,608Operating margin, % 2.8Market capitalization 174,758
Website: www.ericsson.comChairperson: Leif Johansson
President and CEO: Börje Ekholm (as of January 16, 2017)
Board Member from Investor: Jacob Wallenberg (Vice Chairperson)
Average annual return, % 5 years 10 years
Ericsson –1.8 –6.1
Peers: Nokia, ZTE Corporation 1.1 –1.2
SIXRX 15.9 7.6
OUR VIEW• Ericsson’s earnings growth and total shareholder return has been
weak in recent years, with a continued tough development in 2016.• In order to secure good performance going forward, Ericsson must
defend its strong market positions, ensure a competitive cost position and identify strategic areas in which it can be a long-term winner.
Key figures, SEK m. 2016
Net sales 121,093Operating margin, % 5.2Market capitalization 65,038
Website: www.electrolux.comChairperson: Ronnie Leten
President and CEO: Jonas Samuelsson
Board Member from Investor: Petra Hedengran
Average annual return, % 5 years 10 years
Electrolux 19.9 10.2
Peers: Whirlpool, Midea, Haier, Arcelik 27.1 19.7
SIXRX 15.9 7.6
Provides household appliances and appliances for professional use
11 SEK bn. 3% 15.5% / 30.0%value of holding of total assets of capital / of votes
OUR VIEW• Electrolux is one of the leading global appliance companies in an
industry impacted by digital transformation, a growing global middle class and industry consolidation.
• A strong focus on the consumer experience and new capabilities in digital are key in this environment.
• Electrolux is well positioned to improve its EBIT margin further, thereby establishing a strong platform for profitable growth.
Key figures, SEK m. 2016
Net sales 35,982Operating margin, % 8.9Market capitalization 40,596
Website: www.husqvarnagroup.comChairperson: Tom Johnstone, CBE
President and CEO: Kai Wärn
Board Member from Investor: Tom Johnstone, CBE, Magdalena Gerger, Daniel Nodhäll
Average annual return, % 5 years 10 years
Husqvarna 21.4 6.3
Peers: Toro, Emak, Briggs & Stratton 19.5 5.9
SIXRX 15.9 7.6
Provides outdoor power products, consumer watering products, cutting equipment and diamond tools
7 SEK bn. 2% 16.8% / 32.8%value of holding of total assets of capital / of votes
OUR VIEW• We have seen a significant improvement in operational performance
over the last years thanks to a clear focus on core brands, key profit pools and a strong focus on operational excellence.
• Husqvarna has world-leading market positions and strong brands making it well positioned for profitable growth.
• Profitability in the Husqvarna, Gardena and Construction divisions have been improved and focus is now shifting to profitable growth while near-term focus in the Consumer Brands division will continue to be on improving profitability.
−5,000
0
5,000
10,000
15,000
20,000
Husq
varn
a
Erics
son
Elec
trolu
x
Saab
Sobi
Nasd
aq
Wär
tsilä
Astra
Zene
ca
SEB
ABB
Atla
s Cop
co
−30
0
30
60
90
120
−5 000
0
5 000
10 000
15 000
20 000
Husq
varn
a
Erics
son
Elec
trolu
x
Saab
Sobi
Nasd
aq
Wär
tsilä
Astra
Zene
ca
SEB
ABB
Atla
s Cop
co
Net Asset Value contribution by company 2016, SEK m.
−30
−20
−10
0
10
20
30
40
Husq
varn
a
Erics
son
Elec
trolu
x
Saab
Sobi
Nasd
aq
Wär
tsilä
Astra
Zene
ca
SEB
ABB
Atla
s Cop
co
%
−30
0
30
60
90
120
NAV, SEK m TSR, %
Total Shareholder Return by company 2016, %

INVESTOR 2016EQT 16
IMPORTANT EVENTS 2016• In constant currency, the value change of Investor’s investments in
EQT was 10 percent. The reported value change was 15 percent.• Net cash flow to Investor amounted to SEK 1,010 m.
OUR VIEW• Our investments in EQT’s funds have proven very successful over
time and we will continue to invest in EQT’s funds going forward. • Although the cash flow is lumpy by nature, depending on whether
the funds are in an investment or exit phase, we expect that the EQT funds will continue to generate strong net cash flow over time.
Investor’s investments in EQT
SEK m.Fund size,
EUR m.Inves tor’s share, %
Investor’s remaining
commit-ment,
SEK m.
Reported value,
SEK m.
Terminated funds1) 1,633 – –Fully Invested funds2) 17,561 10-37 1,356 10,936EQT VII 6,817 5 2,246 1,103EQT Infrastructure II 1,938 8 595 876EQT Credit Fund II 845 10 328 655EQT Ventures3) 461 11 459 14EQT Mid Market U.S. 616 30 1,585 237EQT new funds 7,127 142EQT AB 19 33Total 29,871 13,697 13,996
1) EQT I, EQT II, EQT Denmark, EQT Finland, EQT Asia.2) EQT III, EQT IV, EQT V, EQT VI, EQT Expansion Capital I and II, EQT Greater China II,
EQT Infrastructure, EQT Credit Fund, EQT Opportunity, EQT Mid Market.3) Fund commitment excluding the EQT Ventures Co-investments Schemes and the EQT Ventures
Mentor Funds.
EQT is a world-class private equity company.
Our investments in its funds and our 19 percent
ownership in EQT AB represent 5 percent of
our assets as of year-end 2016. Over time, our
investments in EQT have generated strong returns,
and we will continue to invest in its funds.
EQT was founded in 1994, with Investor as one of its three founders. EQT operates in Europe, the U.S. and Asia within sev-eral different assets classes: equity, mid-market, infrastructure, credit and ventures. Since inception, EQT has raised approxi-mately EUR 35 bn. from more than 400 institutional investors and has invested more than EUR 22 bn. in around 170 compa-nies in a variety of industries and markets.
EQT has always focused on the industrial development of its companies, and the clear majority of the returns generated is attributable to operational improvements such as increased sales and efficiency gains. On average, portfolio companies have increased the number of employees by 9 percent, sales by 10 per-cent and earnings by 11 percent annually, during EQT’s ownership.
Investor and EQTAs a sponsor since inception, Investor has committed capital to the vast majority of the funds that EQT has raised, and today, Investor owns 19 percent of EQT AB, which allows us to receive carried interest and fee surplus on top of the returns received as a limited partner. This represents a significant enhancement of our total return from each respective fund over time.
−15
−5
5
15
25
35
2016201520142013201220112010−2,000
−600
800
2,200
3,600
5,000
16151413121110
Value change (constant currency), %
Net cash flow, SEK m.
00
% SEK m.
−15
−5
5
15
25
35
2016201520142013201220112010−2 000
−600
800
2 200
3 600
5 000
16151413121110
Värdeförändring (konstant valuta), %
Nettokassaflöde, Mkr
00
% Mkr
Net cash flow
EQT 14 SEK bn. 5% 5-37%value of holding of total assets share of funds
A private equity group with portfolio companies in Europe, Asia and the U.S.
14.01.0
2.0Ownership
19 percent of EQT AB
Valuation methodologyRecent transactions, multiples (unlisted), share price (listed)
Impact on Investor’s net asset value, SEK m. 2016 2015
Net asset value, beginning of the year 13,021 13,552Contribution to net asset value (value change) 1,986 3,995Draw-downs (investments and management fees) 2,864 1,590Proceeds to Investor (divestitures, fee surplus and carry) –3,874 –6,086
Net asset value, end of year 13,996 13,021
Website: www.eqt.seChairperson: Conni JonssonPresident and CEO (EQT AB): Thomas von KochBoard Members from Investor: Johan Forssell
Overview
Net Asset Value, SEK bn.
Net proceeds to Investor, SEK bn.
Contribution to Net Asset Value, SEK bn.

INVESTOR 2016 PATR ICIA INDUSTR IES 17
Overview
Patricia IndustriesPatricia Industries, representing 17 percent of our reported total assets
as of year-end 2016, consists of our wholly-owned subsidiaries,
partner-owned companies and financial investments.
Patricia Industries’ key focus is to invest in and develop wholly-owned companies in the Nordics and in North America. We oper-ate from offices in Stockholm, New York and Palo Alto, and have a separate Board of Directors.
We strive to develop strong companies that generate sustain-able profitable growth for years to come.
PortfolioOur wholly-owned subsidiaries are Aleris, BraunAbility, Laborie, Mölnlycke, Permobil, The Grand Group and Vectura. 3 Scandina-via was founded together with CK Hutchison Holdings (formerly Hutchison Whampoa) in 2000, and has been co-owned since. These companies have strong market positions and corporate cultures in industries with long-term growth potential.
Patricia Industries’ portfolio also includes Financial Invest-ments, stemming from our former venture capital arm, Investor Growth Capital. Our objective is to maximize the value and use realized proceeds for investments in existing and new subsidiar-ies. We are also evaluating if some holdings could become long-term investments.
554.7
4.4
OwnershipWholly-owned subsidiaries and
partner-owned companies
Board representation All board members appointed
by Patricia Industries
Valuation methodologyAcquisition method for subsidiaries and
various methods for other, see page 67 for more information
Ownership perspectiveLong-term, no exit strategy
Net Asset Value, SEK bn.
Net investment in Laborie, SEK bn.
Contribution to Net Asset Value, SEK bn.
www.patriciaindustries.com
Active ownershipPatricia Industries has full responsibility for managing the owner-ship in our wholly-owned subsidiaries. Our aim is to exceed 90 percent ownership, with management and the board of directors as co-owners, to ensure full alignment.
We rely on strong and independent boards to ensure that we are building strong and healthy companies for the long-term, while simultaneously creating the necessary urgency around short-term performance. For a description of our active owner-ship, see page 7.
We strive to be a great owner of our existing companies and to find attractive new companies to acquire.
Activities during the yearPatricia Industries acquired a new wholly-owned subsidiary, the Canadian medical technology company Laborie, and owns 97 percent of the company. In the other wholly-owned subsidiaries, several add-on acquisitions were made.
As part of our strategy, exits within Financial Investments, were made, realizing SEK 2.4 bn. to be used for investments in existing or new subsidiaries.

INVESTOR 2016PATR ICIA INDUSTR IES 18
Provides advanced products for treatment and prevention of wounds and single-use surgical solutions
IMPORTANT EVENTS 2016 • Organic growth was 6 percent in constant
currency. All regions continued to grow, with emerging markets showing the fastest pace.
• The EBITA margin increased to 27 percent, driven by increased volumes and improved product mix. Investments in additional growth continued.
• Wound Care continued to show good growth, primarily driven by Advanced Wound Care in the U.S.
• Surgical reported good growth, driven by ProcedurePakTM trays and Gloves, where Mölnlycke benefitted from the expected ban on powdered gloves that came into effect in January 2017.
• Mölnlycke acquired Sundance Solutions, a leading company developing innovative solutions for the safe positioning and turn-ing of patients to prevent pressure ulcers.
• Cash conversion remained strong, despite continued investments, mainly in the ProcedurePakTM trays assembly facility in the Czech Republic.
• Mölnlycke distributed EUR 300 m. to Patricia Industries, reflecting the company’s strong balance sheet and cash flow.
OUR VIEW• With its strong market positions and its
highly competitive product offering, Möln-lycke is well positioned to deliver strong growth, profitability and cash conversion.
• Continued focus on product innovation together with sales force expansion in exist-ing and new markets create a robust plat-form for continued profitable growth.
• We see continued opportunities for organic and inorganic growth both in existing and new geographies.
Key figures, EUR m. 2016 2015
Net sales 1,429 1,353EBITDA 428 374EBITDA, % 30 28EBITA 392 337EBITA, % 27 25Operating cash flow 346 313Net debt 909 855
website: www.molnlycke.comChairperson: Gunnar BrockPresident and CEO: Richard TwomeyBoard Members from Patricia Industries: Gunnar Brock, Christer Eriksson, Lennart Johansson (Deputy)
21 SEK bn. 7% 99.0% / 99.0%Reported value
of holdingof total assets
of capital / of votes
Provides innovative capital and consumables for the diagnosis and treatment of urologic and gastrointenstinal (GI) disorders
IMPORTANT EVENTS 2016 • Patricia Industries completed the acquisition
of Laborie, our second North American investment, during the third quarter, investing USD 650 m. in equity for a 97 percent ownership.
• Organic growth was 10 percent in constant currency, driven by strong performance globally.
• The reported EBITA margin was 17 percent, impacted by significant non-recurring costs, including transaction costs and administra-tive costs relating to the refinancing of the company. Adjusted for these non-recurring costs, the EBITA margin was 25 percent.
• Expansion into the diagnostic GI market continued, with solid commercial perfor-mance and progression of the GI pipeline.
• Significant investments were made in regu-latory and quality assurance functions, and several key recruitments were made.
• A USD 120 m. debt refinancing was completed, of which USD 100 m. was distributed to Patricia Industries.
OUR VIEW• Laborie is the market leader in urodynamic
testing and has a rapidly growing business in GI diagnostics.
• Both the urology and GI businesses are poised to grow organically and through acquisitions and benefit from multiple long-term growth drivers, including an aging population and higher awareness of pelvic floor disorders.
• There are also several promising urology and GI programs in the pipeline. Patricia Industries intends to increase the emphasis on internal research and development of innovative products.
5 SEK bn. 2% 97.0% / 97.0%Reported value
of holdingof total assets
of capital / of votes
Key figures, USD m. 2016 2015
Net sales 123 109EBITDA 23 20EBITDA, % 19 18EBITA 20 18EBITA, % 17 17Operating cash flow 10 26Net debt 67 190
website: www.laborie.comChairperson: Bo Jesper HansenPresident and CEO: Brian EllacottBoard Members from Patricia Industries: Abhijeet Lele, Yuriy Prilutskiy (Deputy)
Provides healthcare and care services in Scandinavia
IMPORTANT EVENTS 2016 • Organic growth was 7 percent in constant
currency, mainly driven by Care in Denmark and Norway.
• The EBITA margin decreased to 3 percent. The addition of Curato contributed to the EBITA margin, while weak performance within parts of Healthcare Sweden affected profitability negatively.
• Aleris acquired Hospitalet Valdemar in Zealand, Denmark, expanding the compa-ny’s reach to all health regions in the Danish market and adding strong capabilities with-in, for example, chronic pain treatment.
• Aleris acquired Curato, the Norwegian market leader in radiology, with annual sales of NOK 517 m. in 2015.
• Rickard Gustafson was appointed new Chairman of the Board and Alexander Wennergren Helm was appointed new CEO (effective February 2017).
• Two of Aleris’ hospitals were again selected top 4 in Dagens Medicin’s annual ranking of Sweden’s best hospitals. The ranking is based on a combination of quality, availability and financial stability.
OUR VIEW• Aleris aims to be an innovative, high-quality
care provider, offering a seamless care and healthcare journey for all its customers.
• With its broad product offering and strong market position, Aleris offers an attractive platform for growth in both new and exist-ing markets.
• We see additional potential for improving financial performance, while enhancing the customer’s quality of life by designing tailored care procedures.
Key figures, SEK m. 2016 2015
Net sales 9,896 8,540EBITDA 513 492EBITDA, % 5 6EBITA 306 323EBITA, % 3 4Operating cash flow 299 330Net debt 2,584 1,415
website: www.aleris.seChairperson: Rickard GustafsonPresident and CEO: Alexander Wennergren Helm (as of February 2017)Board Members from Patricia Industries: Christian Cederholm, Daniel Johansson (Deputy)
4 SEK bn. 1% 100% / 100%Reported value
of holdingof total assets
of capital / of votes

INVESTOR 2016 PATR ICIA INDUSTR IES 19
Provides advanced mobility and seating rehab solutions
IMPORTANT EVENTS 2016 • Organic growth was 6 percent in constant
currency. While the U.S. continued to grow, the European business contributed the most to growth during the year.
• The EBITA margin improved slightly to 17 percent, despite continued investments in sales.
• Permobil made several acquisitions, including iCare, a leading distributor of powered wheelchairs in France, Advanced Health Care, a leading distributor of advanced rehab technology in Canada, and Prairie Seating Corp, a U.S. based custom seating manufacturer. These acquisitions strengthen Permobil’s customer offering further. A partnership with BraunAbility within research and product development to improve the interface between wheel-chairs and wheelchair accessible vehicles was also announced.
• Operating cash flow improved compared to 2015. During the fourth quarter, Permobil distributed SEK 194 m. to Patricia Industries.
OUR VIEW• Permobil is a globally leading provider of
advanced mobility and seating rehab solu-tions, with a strong dedication to improve the quality of life for its users and healthcare outcomes.
• The company’s strong portfolio of brands, competitive product offering, innovation capabilities and leading market positions provide a strong base to capture additional growth, both in existing and new markets.
Key figures, SEK m. 2016 2015
Net sales 3,335 2,931EBITDA 682 547EBITDA, % 20 19EBITA 552 427EBITA, % 17 15Operating cash flow 687 331Net debt 2,501 2,395
website: www.permobil.comChairperson: Martin LundstedtPresident and CEO: Jon SintornBoard Members from Patricia Industries: Christian Cederholm, Thomas Kidane (Deputy)
4 SEK bn. 1% 94.0% / 90.0%Reported value
of holdingof total assets
of capital / of votes
Provides wheelchair accessible vehicles and wheelchair lifts
IMPORTANT EVENTS 2016 • Organic growth was 13 percent in constant
currency, primarily driven by strong demand for commercial wheelchair accessible vehicles (WAVs) and domestic lifts.
• The EBITA margin improved to 8 percent, despite significant investments in opera-tional improvements, growth initiatives and R&D.
• Plant operations continued to run smoothly with quality, productivity and safety metrics all showing significant improvement compared to 2015.
• The company presented a partnership with Permobil (see Permobil).
• Outside of North America, the company’s joint venture in EMEA continued to be challenged by weak market conditions.
OUR VIEW• BraunAbility is the U.S. market leader in
automobile mobility products for people with disabilities, with clear number one market positions within both Wheelchair Accessible Vehicles (WAV) and wheelchair lifts.
• The company has significant organic growth potential as its core WAV market is under-penetrated and benefits from sustainable demographic growth drivers.
• There are multiple opportunities to grow the business through acquisitions, product port-folio expansion and entry into new geogra-phies. In addition, there is substantial poten-tial to improve manufacturing efficiency.
Key figures, USD m. 2016 2015
Net sales 454 399EBITDA 40 30EBITDA, % 9 8EBITA 36 27EBITA, % 8 7Operating cash flow 38 26Net debt 59 75
website: www.braunability.comChairperson: Keith McLoughlinPresident and CEO: Nick GutweinBoard Members from Patricia Industries: Noah Walley, Yuriy Prilutskiy (Deputy)
3 SEK bn. 1% 95.0% / 95.0%Reported value
of holdingof total assets
of capital / of votes
Develops and manages real estate, focusing on Community Service, Hotel and Office
IMPORTANT EVENTS 2016 • Growth was 17 percent, mainly driven by
revenue-based rental income from Grand Hôtel, and newly established Aleris proper-ties.
• The adjusted EBITA margin improved signifi-cantly to 22 percent.
• The development of Aleris-related proper-ties continued with completion of the facilities in Solna and new projects were launched.
• In September, Vectura acquired a property in Søborg, Denmark, where Aleris provides healthcare services at the Hamlet Hospital. This marked Vectura’s first project outside of Sweden.
• Vectura strengthened its organization further with additional recruitments, and has built a strong platform for continued growth.
• The market value of Vectura’s real estate amounted to SEK 4,219 m. as of December 31, 2016 (3,306).
OUR VIEW• We see opportunity to create value in
Vectura by efficient real estate management and development.
• The company enables its customers to focus on its core business in well-adapted facilities, within Community Service, Hotel and Office.
• In a short period of time Vectura has devel-oped a pipeline of development projects, and is continuously investing in its organiza-tion to support accelerated growth.
Key figures, SEK m. 2016 2015
Net sales 184 158EBITDA 115 92EBITDA, % 62 58EBITA, adjusted 41 19EBITA, adjusted, % 22 12Operating cash flow –142 –28Net debt 1,456 1,105
website: www.vecturafastigheter.seChairperson: Lennart Johansson President and CEO: Susanne EkblomBoard Members from Patricia Industries: Lennart Johansson, Thomas Kidane (Deputy)
2 SEK bn. 1% 100% / 100%Reported value
of holdingof total assets
of capital / of votes
INVESTOR 2016PATR ICIA INDUSTR IES 20
The Grand Group offers Loding, Food & Bever-age as well as Conference & Banqueting, and consists of Scandinavia’s leading hotels Grand Hôtel and Lydmar Hotel
IMPORTANT EVENTS 2016 • Growth was 6 percent, mainly driven
by Lodging at both the Grand Hôtel and the Lydmar Hotel, although all segments contributed to growth.
• The EBITA margin improved slightly.• The Grand Group continued to invest in
its service offerings and completed the refurbishment of parts of the Grand Hôtel.
• Lydmar was ranked as the most popular hotel in Stockholm, reaching #1 on TripAdvisor.
OUR VIEW• The Grand Group has improved profitability
during the past years due to strong growth and cost control.
• Focus going forward remains on continued revenue growth and improvement of opera-tional excellence.
• The Grand Group has a solid platform for inorganic opportunities in the Nordics.
Key figures, SEK m. 2016 2015
Net sales 635 597EBITDA 51 41EBITDA, % 8 7EBITA 24 15EBITA, % 4 3Operating cash flow 1 16Net debt –89 –106
website: www.grandhotel.se and www.lydmar.comChairperson: Peter Wallenberg JrPresident and CEO: Pia DjupmarkBoard Members from Patricia Industries: Daniel Johansson, Jenny Haquinius Ashman (Deputy)
0.2 SEK bn. <1% 100% / 100%Reported value
of holdingof total assets
of capital / of votes
Provides mobile voice and broadband services in Sweden and Denmark
IMPORTANT EVENTS 2016 • Service revenue grew by 5 percent and the
subscriber base increased by 114,000, of which 52,000 in Sweden.
• The EBITDA margin remained unchanged at 27 percent.
• 3 Scandinavia acquired additional spectrum in both Sweden and Denmark, providing the foundation for maintaining a high- quality network with a growing subscriber base and increasing data usage.
• Johan Johansson was appointed new CEO of 3 Sweden, effective October 2016.
• Cash flow was strong, and SEK 1,936 m. was distributed to the owners, of which SEK 774 m. to Patricia Industries.
OUR VIEW• 3 Scandinavia has consistently grown by
capturing market share in Sweden and Denmark.
• The company always strives to put its customers first and invest in building and retaining its customer base.
• Investments in a high-quality network, including spectrum, remain a prerequisite for a sustainable customer proposition.
Key figures, SEK m. 2016 2015
Net sales 11,480 10,831Sweden, SEK m. 7,374 7,238Denmark, DKK m. 3,242 2,868EBITDA 3,063 2,916Sweden, SEK m. 2,255 2,149Denmark, DKK m. 633 612EBITDA, % 27 27Sweden 31 30Denmark 20 21Net debt 1,372 1,579Subscribers 3,304,000 3,190,000Sweden 2,068,000 2,016,000Denmark 1,236,000 1,174,000
website: www.tre.seChairperson: Canning FokPresident and CEO, Sweden: Johan JohanssonPresident and CEO, Denmark: Morten ChristiansenBoard Members from Patricia Industries: Christian Cederholm, Lennart Johansson
5 SEK bn. 2% 40.0% / 40.0%Reported value
of holdingof total assets
of capital / of votes
Financial Investments consists of investments in which the investment horizon has not yet been defined. Our objective is to maximize the value and use realized proceeds for investments in existing and new subsidiaries. We are also evaluating if some holdings could become long-term investments.
IMPORTANT EVENTS 2016• Investments amounted to SEK 611 m.
and divestments and distributions to SEK 2,368 m.
• Exits included Venda, Constant Contact, Liba, Nilörn, Transcend Medical, Yuan Chuan, Cayenne Medical, Galil Medical, CDG, Samsari, Kunskapsskolan and Aternity. The holdings in Active Biotech, Alligator Bioscience, Tobii, Corcept, Health-line and Spigit (Mindjet) were partially divested.
As of December 31, 2016, European, U.S. and Asian holdings represented 24, 46, and 30 percent of the total value of the Financial Investments. 48 percent of the net asset value of the Financial Investments is repre-sented by investments in publicly listed companies.
The five largest investments represented 53 percent of the total value of the Financial Investments.
10 SEK bn. 3%Reported
valueof total assets
Company Operations
Listed NSFOCUSProvides enterprise-level network security solutions and services in the Americas, Europe and Asia
Unlisted Madrague An equity long/short fund with European focus and active portfolio management driven by fundamental research combined with a top-down view
Listed TobiiProvides eye tracking, developing equipment and services used by more than 2,000 companies and 1,500 research institutions
Unlisted SpigitProvides enterprise software for crowdsourced innovation
Listed NewronA clinical-stage biopharmaceutical company discovering, developing and commercializing novel drugs to treat diseases of the Central Nervous System and pain
Financial Investments
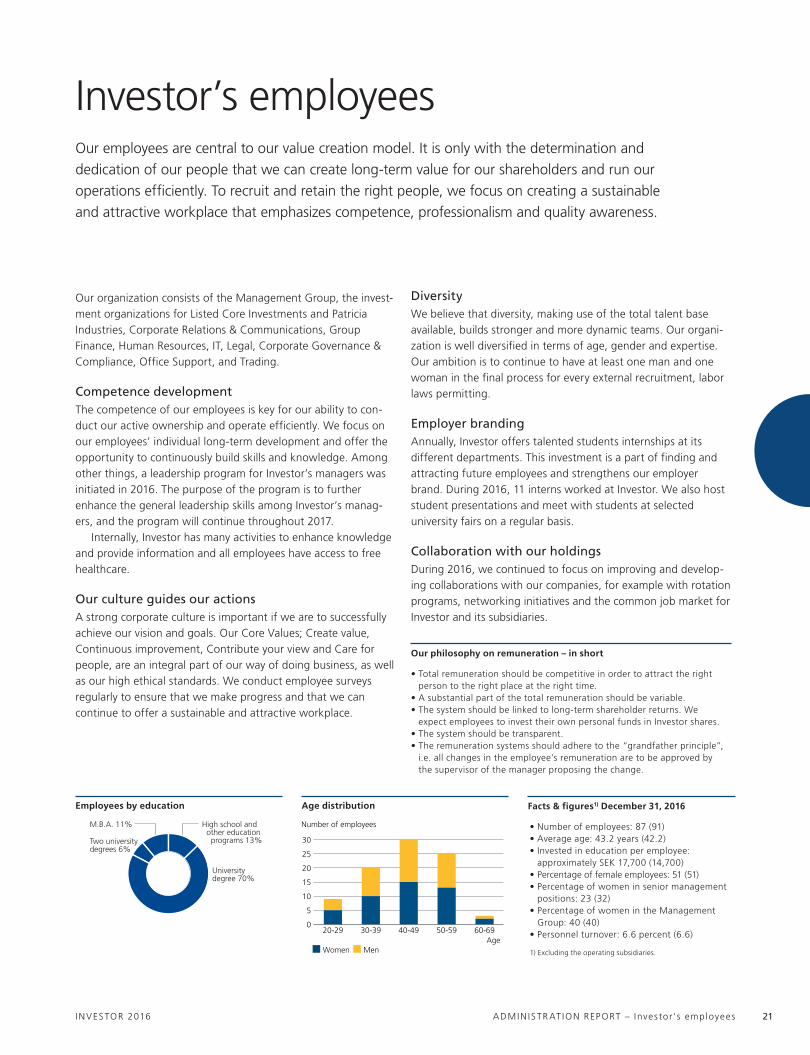
INVESTOR 2016 ADMIN ISTR AT ION REPORT – Inves tor 's employees 21
Investor’s employeesOur employees are central to our value creation model. It is only with the determination and
dedication of our people that we can create long-term value for our shareholders and run our
operations efficiently. To recruit and retain the right people, we focus on creating a sustainable
and attractive workplace that emphasizes competence, professionalism and quality awareness.
Age distribution
0
5
10
15
20
25
30
60-6950-5940-4930-3920-29
Number of employees
Age
MenWomen
0
5
10
15
20
25
30
60-6950-5940-4930-3920-29
Antal anställda
ÅlderMänKvinnor
0
5
10
15
20
25
30
60-6950-5940-4930-3920-29Age
Antal anställda
Kvinnor
0
5
10
15
20
25
30
60-6950-5940-4930-3920-29
MänÅlder
Employees by education
High school and other education programs 13%
University degree 70%
Two university degrees 6%
M.B.A. 11%
Gymnasie- och övrig utbildning 13%
Högskole- examen 70%
Dubbel högskole- examen 6%
M.B.A. 11%
Our philosophy on remuneration – in short
• Total remuneration should be competitive in order to attract the right person to the right place at the right time.
• A substantial part of the total remuneration should be variable.• The system should be linked to long-term shareholder returns. We
expect employees to invest their own personal funds in Investor shares.• The system should be transparent.• The remuneration systems should adhere to the “grandfather principle”,
i.e. all changes in the employee’s remuneration are to be approved by the supervisor of the manager proposing the change.
Facts & figures1) December 31, 2016
• Number of employees: 87 (91)• Average age: 43.2 years (42.2)• Invested in education per employee:
approximately SEK 17,700 (14,700)• Percentage of female employees: 51 (51)• Percentage of women in senior management
positions: 23 (32)• Percentage of women in the Management
Group: 40 (40)• Personnel turnover: 6.6 percent (6.6)
1) Excluding the operating subsidiaries.
Our organization consists of the Management Group, the invest-ment organizations for Listed Core Investments and Patricia Industries, Corporate Relations & Communications, Group Finance, Human Resources, IT, Legal, Corporate Governance & Compliance, Office Support, and Trading.
Competence developmentThe competence of our employees is key for our ability to con-duct our active ownership and operate efficiently. We focus on our employees’ individual long-term development and offer the opportunity to continuously build skills and knowledge. Among other things, a leadership program for Investor’s managers was initiated in 2016. The purpose of the program is to further enhance the general leadership skills among Investor’s manag-ers, and the program will continue throughout 2017.
Internally, Investor has many activities to enhance knowledge and provide information and all employees have access to free healthcare.
Our culture guides our actionsA strong corporate culture is important if we are to successfully achieve our vision and goals. Our Core Values; Create value, Continuous improvement, Contribute your view and Care for people, are an integral part of our way of doing business, as well as our high ethical standards. We conduct employee surveys regularly to ensure that we make progress and that we can continue to offer a sustainable and attractive workplace.
DiversityWe believe that diversity, making use of the total talent base available, builds stronger and more dynamic teams. Our organi-zation is well diversified in terms of age, gender and expertise. Our ambition is to continue to have at least one man and one woman in the final process for every external recruitment, labor laws permitting.
Employer brandingAnnually, Investor offers talented students internships at its different departments. This investment is a part of finding and attracting future employees and strengthens our employer brand. During 2016, 11 interns worked at Investor. We also host student presentations and meet with students at selected university fairs on a regular basis.
Collaboration with our holdingsDuring 2016, we continued to focus on improving and develop-ing collaborations with our companies, for example with rotation programs, networking initiatives and the common job market for Investor and its subsidiaries.
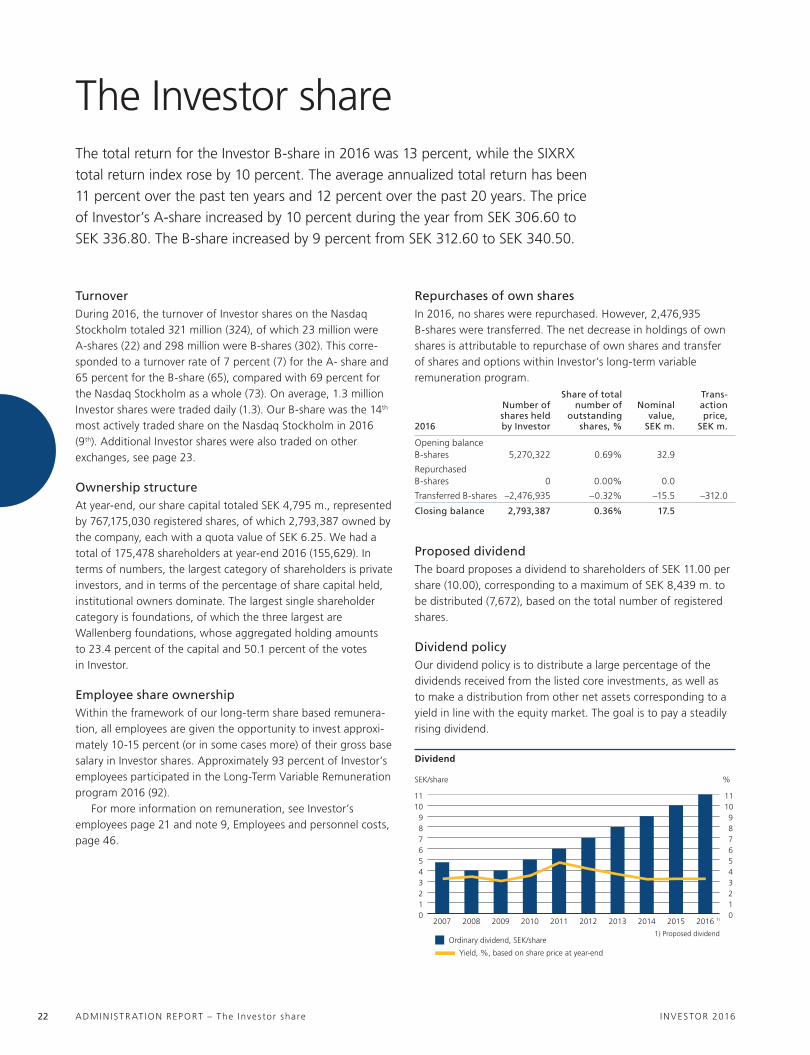
INVESTOR 2016ADMIN ISTR AT ION REPORT – The Inves tor share 22
The Investor share
TurnoverDuring 2016, the turnover of Investor shares on the Nasdaq Stockholm totaled 321 million (324), of which 23 million were A-shares (22) and 298 million were B-shares (302). This corre-sponded to a turnover rate of 7 percent (7) for the A- share and 65 percent for the B-share (65), compared with 69 percent for the Nasdaq Stockholm as a whole (73). On average, 1.3 million Investor shares were traded daily (1.3). Our B-share was the 14th most actively traded share on the Nasdaq Stockholm in 2016 (9th). Additional Investor shares were also traded on other exchanges, see page 23.
Ownership structureAt year-end, our share capital totaled SEK 4,795 m., represented by 767,175,030 registered shares, of which 2,793,387 owned by the company, each with a quota value of SEK 6.25. We had a total of 175,478 shareholders at year-end 2016 (155,629). In terms of numbers, the largest category of shareholders is private investors, and in terms of the percentage of share capital held, institutional owners dominate. The largest single shareholder category is foundations, of which the three largest are Wallenberg foundations, whose aggregated holding amounts to 23.4 percent of the capital and 50.1 percent of the votes in Investor.
Employee share ownershipWithin the framework of our long-term share based remunera-tion, all employees are given the opportunity to invest approxi-mately 10-15 percent (or in some cases more) of their gross base salary in Investor shares. Approximately 93 percent of Investor’s employees participated in the Long-Term Variable Remuneration program 2016 (92).
For more information on remuneration, see Investor’s employees page 21 and note 9, Employees and personnel costs, page 46.
The total return for the Investor B-share in 2016 was 13 percent, while the SIXRX
total return index rose by 10 percent. The average annualized total return has been
11 percent over the past ten years and 12 percent over the past 20 years. The price
of Investor’s A-share increased by 10 percent during the year from SEK 306.60 to
SEK 336.80. The B-share increased by 9 percent from SEK 312.60 to SEK 340.50.
Repurchases of own sharesIn 2016, no shares were repurchased. However, 2,476,935 B-shares were transferred. The net decrease in holdings of own shares is attributable to repurchase of own shares and transfer of shares and options within Investor’s long-term variable remuneration program.
2016
Number of shares held by Investor
Share of totalnumber of
outstanding shares, %
Nominal value,
SEK m.
Trans-action price,
SEK m.
Opening balance B-shares 5,270,322 0.69% 32.9
Repurchased B-shares 0 0.00% 0.0
Transferred B-shares –2,476,935 –0.32% –15.5 –312.0
Closing balance 2,793,387 0.36% 17.5
Proposed dividendThe board proposes a dividend to shareholders of SEK 11.00 per share (10.00), corresponding to a maximum of SEK 8,439 m. to be distributed (7,672), based on the total number of registered shares.
Dividend policyOur dividend policy is to distribute a large percentage of the dividends received from the listed core investments, as well as to make a distribution from other net assets corresponding to a yield in line with the equity market. The goal is to pay a steadily rising dividend.
Ordinarie utdelning, kr/aktie Extra utdelning, kr/aktieDirektavkastning, %, baserad på årets slutkurs
SEK/share
Ordinary dividend, SEK/share Extraordinary dividend, SEK/shareYield, %, based on share price at year-end
1) Proposed dividend
0123456789
1011
0123456789
1011
201620152014201320122011201020092008200701234567891011
161514131211100908071)
%
Kr/aktie
1) Föreslagen utdelning
0123456789
1011
0123456789
1011
201620152014201320122011201020092008200701234567891011
151514131211100908071)
%
Dividend
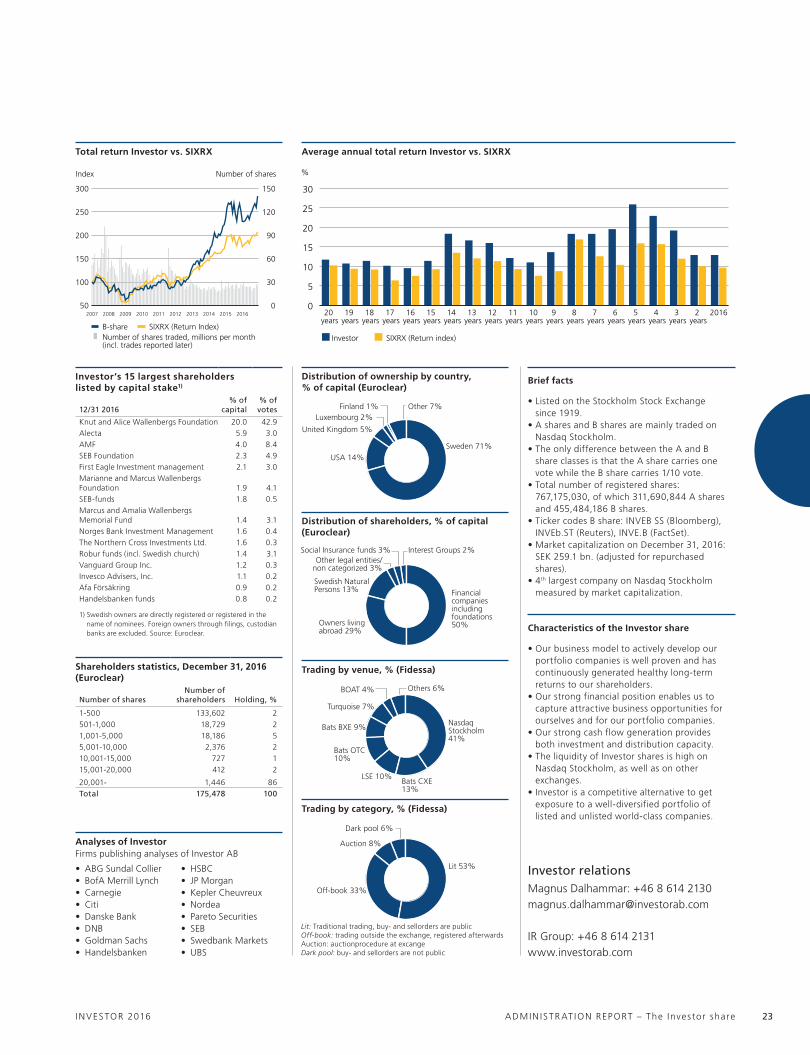
INVESTOR 2016 ADMIN ISTR AT ION REPORT – The Inves tor share 23
Luxembourg 2%
Sweden 71%USA 14%
Finland 1%
United Kingdom 5%
Other 7%
Luxemburg 2%
Sverige 71%USA 14%
Finland 1%
Storbritannien 5%
Övrigt 7%
Distribution of ownership by country, % of capital (Euroclear)
Shareholders statistics, December 31, 2016 (Euroclear)
Number of sharesNumber of
shareholders Holding, %
1-500 133,602 2501-1,000 18,729 21,001-5,000 18,186 55,001-10,000 2,376 210,001-15,000 727 115,001-20,000 412 2
20,001- 1,446 86Total 175,478 100
• ABG Sundal Collier• BofA Merrill Lynch• Carnegie• Citi• Danske Bank• DNB• Goldman Sachs• Handelsbanken
• HSBC• JP Morgan• Kepler Cheuvreux• Nordea• Pareto Securities• SEB• Swedbank Markets• UBS
Investor relationsMagnus Dalhammar: +46 8 614 [email protected]
IR Group: +46 8 614 2131 www.investorab.com
Investor’s 15 largest shareholders listed by capital stake1)
12/31 2016% of
capital% of votes
Knut and Alice Wallenbergs Foundation 20.0 42.9Alecta 5.9 3.0AMF 4.0 8.4SEB Foundation 2.3 4.9First Eagle Investment management 2.1 3.0Marianne and Marcus Wallenbergs Foundation 1.9 4.1SEB-funds 1.8 0.5Marcus and Amalia Wallenbergs Memorial Fund 1.4 3.1Norges Bank Investment Management 1.6 0.4The Northern Cross Investments Ltd. 1.6 0.3Robur funds (incl. Swedish church) 1.4 3.1Vanguard Group Inc. 1.2 0.3Invesco Advisers, Inc. 1.1 0.2Afa Försäkring 0.9 0.2Handelsbanken funds 0.8 0.2
1) Swedish owners are directly registered or registered in the name of nominees. Foreign owners through filings, custodian banks are excluded. Source: Euroclear.
Analyses of InvestorFirms publishing analyses of Investor AB
Characteristics of the Investor share
• Our business model to actively develop our portfolio companies is well proven and has continuously generated healthy long-term returns to our shareholders.
• Our strong financial position enables us to capture attractive business opportunities for ourselves and for our portfolio companies.
• Our strong cash flow generation provides both investment and distribution capacity.
• The liquidity of Investor shares is high on Nasdaq Stockholm, as well as on other exchanges.
• Investor is a competitive alternative to get exposure to a well-diversified portfolio of listed and unlisted world-class companies.
Social Insurance funds 3%
Financialcompaniesincluding foundations50%Owners living
abroad 29%
Other legal entities/non categorized 3%
Swedish Natural Persons 13%
Interest Groups 2%
Socialförsäkringsfonder 3%
Finansiellaföretag inklusive stiftelser50%Utlandsboende
ägare 29%
Övriga juridiska personer 3%
Svenska fysiskapersoner 13%
Intresseorganisationer 3%
Distribution of shareholders, % of capital (Euroclear)
Brief facts
• Listed on the Stockholm Stock Exchange since 1919.
• A shares and B shares are mainly traded on Nasdaq Stockholm.
• The only difference between the A and B share classes is that the A share carries one vote while the B share carries 1/10 vote.
• Total number of registered shares: 767,175,030, of which 311,690,844 A shares and 455,484,186 B shares.
• Ticker codes B share: INVEB SS (Bloomberg), INVEb.ST (Reuters), INVE.B (FactSet).
• Market capitalization on December 31, 2016: SEK 259.1 bn. (adjusted for repurchased shares).
• 4th largest company on Nasdaq Stockholm measured by market capitalization.
0
30
60
90
120
150
50
100
150
200
250
300
20162015201420132012201120102009200820070
30
60
90
120
150
50
100
150
200
250
300
2016201520142013201220112010200920082007
Index Number of shares
B-share SIXRX (Return Index)Number of shares traded, millions per month(incl. trades reported later)
Index Antal aktier
B-aktie SIXRX (Totalavkastningsindex)Omsatt antal aktier miljoner per månad (inkl. efteranmälda)
Total return Investor vs. SIXRX Average annual total return Investor vs. SIXRX
%
Investor SIXRX (Return index)
0
5
10
15
20
25
30
20162 years
3 years
4 years
5 years
6 years
7 years
8 years
9 years
10 years
11 years
12 years
13 years
14 years
15 years
16 years
17 years
18 years
19 years
20 years
%
Investor SIXRX (Return index)
0
5
10
15
20
25
30
20162 år3 år4 år5 år6 år7 år8 år9 år10 år11 år12 år13 år14 år15 år16 år17 år18 år19 år20 år
NasdaqStockholm41%
Bats CXE 13%
Others 6%
Turquoise 7%
BOAT 4%
LSE 10%
Bats OTC 10%
Bats BXE 9%
NasdaqStockholm41%
Bats CXE 13%
Övriga 6%
Turquoise 7%
BOAT 4%
LSE 10%
Bats OTC 10%
Bats BXE 9%
Trading by venue, % (Fidessa)
Social Insurance funds 2%
Financialcompanies46%
Owners living abroad 33%
Other legal entities/non categorized 4%
Swedish Natural Persons 12%
Interest Groups 3%
Lit 53%
Auction 8%
Off-book 33%
Dark pool 6%
Trading by category, % (Fidessa)
Lit: Traditional trading, buy- and sellorders are publicOff-book: trading outside the exchange, registered afterwards Auction: auctionprocedure at excangeDark pool: buy- and sellorders are not public
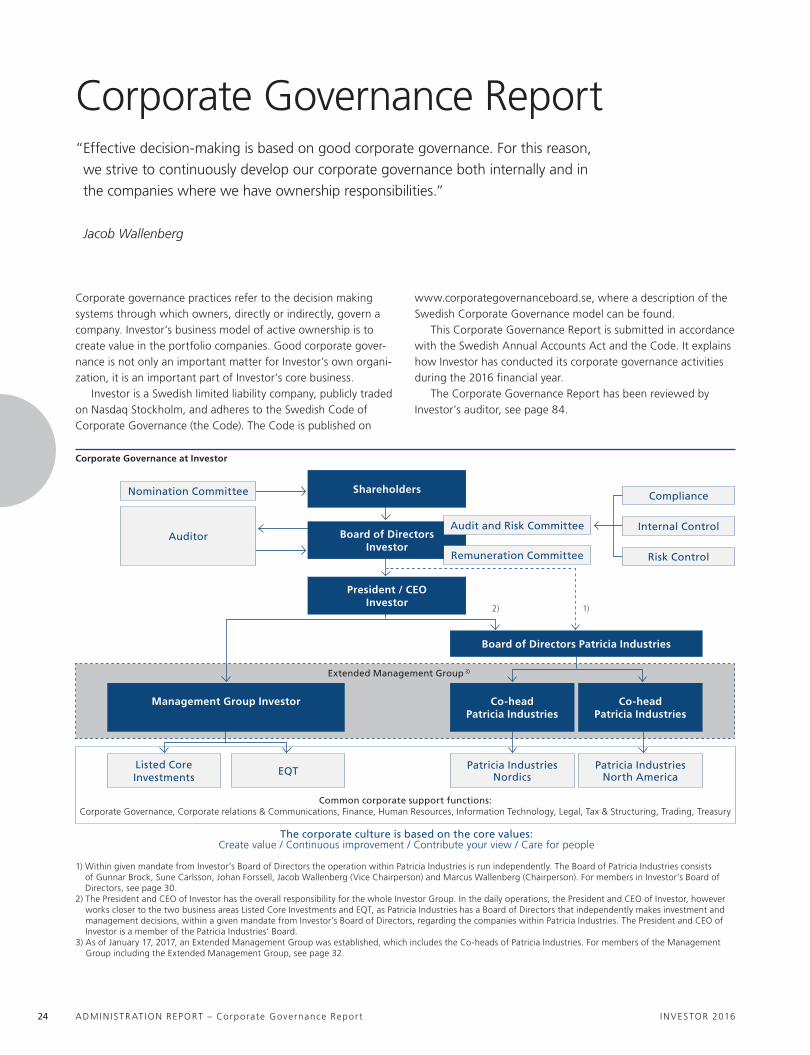
INVESTOR 2016ADMIN ISTR AT ION REPORT – Corporate Governance Repor t 24
Corporate governance practices refer to the decision making systems through which owners, directly or indirectly, govern a company. Investor’s business model of active ownership is to create value in the portfolio companies. Good corporate gover-nance is not only an important matter for Investor’s own organi-zation, it is an important part of Investor’s core business.
Investor is a Swedish limited liability company, publicly traded on Nasdaq Stockholm, and adheres to the Swedish Code of Corporate Governance (the Code). The Code is published on
Corporate Governance Report
www.corporategovernanceboard.se, where a description of the Swedish Corporate Governance model can be found.
This Corporate Governance Report is submitted in accordance with the Swedish Annual Accounts Act and the Code. It explains how Investor has conducted its corporate governance activities during the 2016 financial year.
The Corporate Governance Report has been reviewed by Investor’s auditor, see page 84.
“ Effective decision-making is based on good corporate governance. For this reason,
we strive to continuously develop our corporate governance both internally and in
the companies where we have ownership responsibilities.”
Jacob Wallenberg
Corporate Governance at Investor
The corporate culture is based on the core values:Create value / Continuous improvement / Contribute your view / Care for people
1) Within given mandate from Investor’s Board of Directors the operation within Patricia Industries is run independently. The Board of Patricia Industries consists of Gunnar Brock, Sune Carlsson, Johan Forssell, Jacob Wallenberg (Vice Chairperson) and Marcus Wallenberg (Chairperson). For members in Investor’s Board of Directors, see page 30.
2) The President and CEO of Investor has the overall responsibility for the whole Investor Group. In the daily operations, the President and CEO of Investor, however works closer to the two business areas Listed Core Investments and EQT, as Patricia Industries has a Board of Directors that independently makes investment and management decisions, within a given mandate from Investor’s Board of Directors, regarding the companies within Patricia Industries. The President and CEO of Investor is a member of the Patricia Industries’ Board.
3) As of January 17, 2017, an Extended Management Group was established, which includes the Co-heads of Patricia Industries. For members of the Management Group including the Extended Management Group, see page 32.
Common corporate support functions:Corporate Governance, Corporate relations & Communications, Finance, Human Resources, Information Technology, Legal, Tax & Structuring, Trading, Treasury
Auditor
Nomination Committee
Listed Core Investments
EQT Patricia Industries Nordics
Patricia Industries North America
Shareholders
Management Group Investor Co-head Patricia Industries
Co-head Patricia Industries
Board of Directors Patricia Industries
Board of Directors Investor
President / CEO Investor
Audit and Risk Committee Internal Control
Compliance
Remuneration Committee Risk Control
1)2)
Extended Management Group 3)

INVESTOR 2016 ADMIN ISTR AT ION REPORT – Corporate Governance Repor t 25
The members of the Nomination Committee for the AGM 2017:• Hans Wibom, Wallenberg Foundations, Chairperson of the
Nomination Committee• Anders Oscarsson, AMF• Lars Isacsson, SEB Foundation• Ramsay Brufer, Alecta• Jacob Wallenberg, Chairperson of the Board of Directors
The composition of the Nomination Committee meets the require-ments concerning the independence of the Nomination Committee.
The AGM documents related to the Nomination Committee are published on the website.
Auditor Pursuant to its Articles of Association, Investor must have one or two auditors, and no more than two deputies. A registered firm of auditors may be appointed as the company’s auditor. The audi-tor is appointed by the AGM for a mandate period of one year, as nothing further is stated in Investor’s Articles of Association.
At the 2016 AGM, the registered auditing company, Deloitte AB was re-elected as auditor for the period until the end of the 2017 AGM. Deloitte AB has been the auditor in charge since 2013. The Authorized Public Accountant Thomas Strömberg is since 2013 the auditor in charge for the audit.
For details on fees to auditors, see note 10, Auditor’s fees and expenses.
BoardThe Board of Directors is ultimately responsible for Investor’s organization and administration. Pursuant to the Articles of Association, the Board must consist of no less than three and no more than thirteen Directors, as well as no more than four depu-ties. Since the 2016 AGM, the Board has consisted of eleven members and no deputies. The CEO is the only Board member employed by the company. The number of female Board mem-bers are four and three Board members are not Swedish citizens.
The composition of Investor’s Board meets the requirements concerning the independence of Directors. Several of the Board members are Directors of Investor’s holdings and they receive remuneration from these companies. This consideration is not considered to entail a dependence of these members on Investor or its Management. Investor is an industrial holding company and works actively through the Boards of its holdings to identify and drive value-creating initiatives. The work of the Board of Directors in Investor’s holdings is the core of Investor’s active ownership model. For Investor, where a fundamental component is to have the right Board in each company, it is natural that Members of Investor’s Board of Directors and Management have Board assignments in Investor’s holdings.
A more detailed presentation of the Board is found on page 30 and on the website.
Annual General MeetingThe 2017 Annual General Meeting (AGM) of Investor will take place on May 3 at the City Conference Centre in Stockholm. Shareholders who would like to have a particular matter dis-cussed at the AGM should have submitted such request to the Nomination Committee before March 8 and to the company before March 15, 2017. Contact information is available on the company website.
Each Investor shareholder entitled to vote may vote for the entire number of the shares owned and represented by the shareholder without restrictions to the number of votes. A-shares are entitled to one vote and B-shares are entitled to 1/10 vote.
In addition to what follows from applicable law regarding shareholders’ right to participate at General Meetings, under Investor’s Articles of Association shareholders must (within the time stated in the convening notice) give notice of their attendance and notify the company of any intention to bring assistance.
The documents from the AGMs and the minutes recorded at the AGMs are published on the website.
SharesAt year-end 2016, Investor had 175,478 shareholders according to the register of shareholders maintained by Euroclear Sweden. Shareholdings in Investor representing at least one tenth of the votes of all shares in the company: Knut and Alice Wallenberg Foundation with 20.0 percent of the capital and 42.9 percent of the votes.
Since year 2000, the Board has requested and been granted a mandate by the AGM to repurchase and transfer Investor shares. The 2017 AGM is proposed to grant a corresponding authorization to the Board to repurchase and transfer Investor shares as was granted by the AGM 2016.
For more information about the Investor share and the largest shareholders, see page 22.
Nomination CommitteeAccording to the current instruction for the Nomination Commit-tee, the Committee shall consist of one representative from each of the four shareholders or groups of shareholders controlling the largest number of votes that desire to appoint a representa-tive and the Chairperson of the Board. The Nomination Commit-tee is obliged to perform its tasks according to the Code. For fur-ther information regarding instruction for the Nomination Committee, see the website.
Investor complied with the Code during 2016. Investor did neither deviate from the Nasdaq Stockholm Rule Book for Issuers nor from good stock market practice.

INVESTOR 2016ADMIN ISTR AT ION REPORT – Corporate Governance Repor t 26
Evaluation of the Board and CEO
Pursuant to the Rules of Procedure, the Chairperson of the Board initiates an annual evaluation of the performance of the Board. The objective of the evaluation is to provide insight into the Board members’ opinions about the performance of the Board and identify measures that could make the work of the Board more effective. A secondary objective is to form an overview of the areas the Board believes should be afforded greater scope and where additional expertise might be needed within the Board.
The 2016 evaluation was answered by each Board member. In addition, the Chairperson met with each Board member sepa-rately to discuss the work done by the Board during the year. The Board discussed the results of this year’s evaluation and the Chairperson of the Board reported them to the Nomination Committee.
Investor’s Board continuously evaluates the performance of the President by monitoring the development of the business in relation to the established objectives. A formal performance review is carried out once a year.
Work of the Board in 2016
During the year, the Board held 11 meetings (of which 2 per capsulam meetings). The Board members’ attendance is shown in the adjacent table. The secretary of the Board meetings was, with a few exceptions, General Counsel, Petra Hedengran. Prior
to each meeting, Board members were provided with written information on the issues that were to be discussed. Each Board meeting has included an item on the agenda during which Board members had the opportunity to discuss without representatives of the company’s Management being present.
The Board devoted considerable time to value creation plans in the portfolio companies, acquisition of shares in, inter alia, Atlas Copco, Wärtsilä and Ericsson, investments in EQT funds and other strategic matters.
The Board devoted time to both internal and external presen-tations of the financial markets. The Board discussed the devel-opment and the effects on industries, markets and individual companies, paying particularly close attention to Investor’s hold-ings and the long-term strategies of such holdings. The CEO of Saab presented the company. Furthermore, the Management for Patricia Industries held a presentation on the development of this business area and its portfolio companies including the key points in the value creation plans.
An important part of the Board’s work is the financial reports presented at every regular Board meeting, including those prior to the year-end, the interim report, and the interim management statements. The Board also receives regular reports on the com-pany’s financial position. Also, regular monthly reports about the companies within the business area Patricia Industries are reviewed. At regular Board meetings, reports are delivered on the ongoing operations in the business areas, together with in-
Attendance record and Board remuneration in 2016
Attendance record, Board and Committee meetings 2016 Board remuneration resolved by the AGM 2016, SEK t.
Member PositionBoard
meetings1)
Audit and Risk
CommitteeRemuneration
Committee1) Board fee2)
Audit and Risk
CommitteeRemuneration
Committee Total
Jacob Wallenberg Chairperson 9/9 6/6 7/7 2,400 170 160 2,730
Marcus Wallenberg Vice Chairperson 9/9 1,390 1,390
Josef Ackermann Member 9/9 640 640
Gunnar Brock Member 9/9 6/6 640 170 810
Johan Forssell Member 9/9
Magdalena Gerger Member 7/9 6/6 640 170 810
Tom Johnstone, CBE Member 9/9 7/7 640 80 720
Grace Reksten Skaugen Member 9/9 6/6 640 255 895
Hans Stråberg Member 9/9 640 640
Lena Treschow Torell Member 8/9 7/7 640 80 720
Sara Öhrvall Member 9/9 640 640
Total 8,910 765 320 9,995
1) Per capsulam not included.2) Non-employee Directors can choose to receive part of their Board remuneration (excluding Committee remuneration) in the form of synthetic shares.
For total value of the Board fee including synthetic shares and dividends at year-end, see note 9, Employees and personnel costs.

INVESTOR 2016 ADMIN ISTR AT ION REPORT – Corporate Governance Repor t 27
depth analyses and proposed actions regarding one or more of the company’s holdings. Succession planning is also evaluated yearly by the Board.
Committee work is an important task performed by the Board. For a description of the work conducted by the Commit-tees during 2016, see the adjacent table.
During the year, the company’s Management presented value creation plans for Listed Core Investments, including analyses of the holdings’ operations and development potential in the busi-ness areas where they are active. These analyses and their impli-cations were discussed and assessed by the Board with a focus on the individual companies as well as in the context of overall strategic discussions. The Board reviewed and approved these value creation plans for all listed core investments. The Board also discussed the overall strategy thoroughly at the yearly strategy review.
The Board regularly received and discussed reports on the composition of portfolios and developments within Patricia Industries and Investor’s involvement in EQT.
In addition to participating in meetings of the Audit and Risk Committee, the company’s auditor also attended a Board meet-ing during which Board members had the opportunity to pose questions to the auditor without representatives of the compa-ny’s Management being present.
Board Committees
In order to increase the efficiency of its work and enable a more detailed analysis of certain issues, the Board has formed Commit-tees. The Board Committees are the Audit and Risk Committee and the Remuneration Committee. The members of the Commit-tees are appointed for a maximum of one year at the statutory Board meeting. The Committee’s duties and decision making authorities are regulated in the annually approved Committee instructions.
The primary objective of the Committees is to provide prepara-tory and administrative support to the Board. The issues consid-ered at Committee meetings are recorded in minutes and reported at the next Board meeting. Representatives from the company’s specialist functions always participate in Committee meetings.
The Audit and Risk Committee is responsible for assuring the quality of the financial reporting and the efficiency in the internal control system. The Audit and Risk Committee also evaluates financial strategies, risk exposure and that the company’s compli-ance efforts are effective. The Audit and Risk Committee is the primary way in which the Board and the company’s auditor communicate with each other.
The responsibilities of the Remuneration Committee are, among other things, to monitor, evaluate and prepare guidelines for salary and other remuneration and to decide remuneration to the members of the Management Group, except for the President for whom the Board as a whole sets the remuneration.
Board Committees’ work 2016
Audit and Risk Committee Remuneration Committee
Members Grace Reksten Skaugen (Chairperson)Gunnar BrockMagdalena GergerJacob Wallenberg
Jacob Wallenberg (Chairperson)Tom Johnstone, CBE Lena Treschow Torell
Number of meetings 6 8 (of which 1 per capsulam)
Focus areas in 2016
• Analyzed each interim report, interim management statement and the year-end report for completeness and accuracy.
• Evaluated accounting and valuation principles. • Followed-up Audit reports.• Followed-up on the internal control in the financial reporting
process. • Evaluated risk for errors in the financial reporting and
followed-up recommendations on improvements. • Evaluated the auditor performance and presented to the
Nomination Committee.• Followed-up on limits, mandates and risk exposure. • Approved updates of Group policies.• Assessed the effect on Investor and specifically the Audit
and Risk Committee work, regarding new and coming regulations.
• Evaluated and approved remuneration structures for personnel and salary reviews for Management.
• Evaluated and assessed the President’s goals and terms and conditions for remuneration, which were then approved by the Board.
• Discussed strategic personnel and compensation related issues.
• Monitored and evaluated guidelines for salary and other remuneration including the long-term variable remuneration programs, both ongoing and those that have ended during the year.
• Monitored and evaluated the application of guidelines for salary and other remuneration that were approved by the AGM.
• Proposed to the Board to submit to the AGM 2017 long-term variable remuneration programs.

INVESTOR 2016ADMIN ISTR AT ION REPORT – Corporate Governance Repor t 28
The President and Management The Board appoints the President and approves the Instruction for the President. The President, Johan Forssell, is responsible for the day to day business of the company. The responsibilities include among other things ongoing investments and divest-ments, personnel, finance and accounting issues and regular contact with the company’s stakeholders, such as public authori-ties and the financial market. The President ensures that the Board is provided with the requisite material for making well-informed decisions.
For his support the President has appointed a Management Group consisting of Petra Hedengran, General Counsel and Head of Corporate Governance and Compliance, Daniel Nodhäll, Head of Listed Core Investments, Helena Saxon, CFO, and Stefan Stern, Head of Corporate Relations, Sustainability and Communi-cations. As of January 17, 2017, an Extended Management Group was established, which includes the Co-heads of Patricia Industries. For members of the Management Group including the Extended Management Group, see page 32.
Four to five times a year the Management Group holds meet-ings focused on the company’s strategy and risk assessment.
The Management Group regularly works with specific busi-ness transactions, follow-up on value creation plans, sustainabil-ity issues, the company’s financial flexibility and organization- and personnel related matters.
Control functionsThe Risk Control function is responsible for coordinating the internal reporting of Investor’s significant risks at the aggregate level. The Risk Control function reports to the Audit and Risk Committee.
The Compliance function supports Investor’s compliance with laws and regulations, and maintains internal regulatory systems and education to this end. The Compliance function reports to the Audit and Risk Committee.
The review function, Internal Control, provides objective support to the Board on matters relating to the internal control structure, partly by investigating major areas of risk and partly by performing reviews and follow-ups in selected areas. The Inter-nal Control function regularly provides reports on its work to the Audit and Risk Committee during the year.
Remuneration Remuneration to the Board
The total remuneration to the Board approved by the AGM 2016 was SEK 9,995 t. Since the 2008 AGM, it is possible for Board members to receive a portion of their remuneration in the form of synthetic shares. Information on specific remuneration is provided in the adjacent table and in note 9, Employees and personnel costs.
At the statutory Board meeting in May 2016, the Board adopted, as in 2011-2015, a policy stating that Board members, who do not already have such holdings, are expected to, over a five-year period, acquire an ownership in Investor shares (or a corresponding exposure to the Investor share, e.g. in the form of synthetic shares) with a market value equivalent to at least one year’s Board remuneration, before taxes, excluding remuneration for Committee work.
Remuneration to Management
The total remuneration for the President is determined by the Board. Remuneration issues concerning other members of the Management Group are decided by the Remuneration Commit-tee, after which the Board is informed.
Investor’s policy is for the Management Group to own shares in Investor corresponding to a market value of at least one year’s gross salary for the President and at least half of one year’s gross salary for the other members of the Management Group.
See note 9, Employees and personnel costs, and on the web-site, for the most recently approved guidelines on remuneration to senior executives and for a description on the long-term variable remuneration programs. See also the website for the information and evaluation that have to be reported according to the Code.
The Board of Directors’ proposal regarding guidelines for sal-ary and other remuneration for the President and other members of the Management Group to the AGM 2017 corresponds in substance with the guidelines for remuneration decided by the AGM 2016. The Management Group consists of the President Johan Forssell, Petra Hedengran, Daniel Nodhäll, Helena Saxon and Stefan Stern as well as the two additional members, Noah Walley and Christian Cederholm, who together with the other members form Investor’s Extended Management Group. Noah Walley and Christian Cederholm are Co-heads of Patricia Industries North America and Nordics respectively.
The Board of Directors’ proposal regarding long-term variable remuneration program to the AGM 2017 is substantially the same as the program decided by the AGM 2016. However, the Board of Directors also proposes to the AGM 2017 a new, separate program for employees within Patricia Industries.
INVESTOR 2016 ADMIN ISTR AT ION REPORT – Corporate Governance Repor t 29
Internal control over financial reportingThe description of the internal control over the financial report-ing is based on the framework set by the Committee of Sponsor-ing Organizations of the Treadway Commission (COSO).
Investor’s internal control over the financial reporting is focused primarily on ensuring efficient and reliable control of, and accounting for, purchases, sales and accurate evaluation of securities. Correct consolidation of the operating subsidiaries is also a priority.
The Board of each operating subsidiary is responsible for ensuring the efficiency of the subsidiary’s internal control structures, risk management and financial reporting. Patricia Industries’ Board representative provides this information to Patricia Industries’ Board, where analysis and follow-up take place. Patricia Industries’ Board ensures that Investor’s Board and Management receive information on any issues that could affect Investor’s business or financial reporting.
Control environment
The control environment is built around an organization with clear decision-making channels, powers and responsibilities that are defined by explicit instructions and a corporate culture based on shared values. It also requires each individual’s awareness of his/her role in maintaining effective internal control.
All of Investor’s business areas have policies, instructions and detailed process descriptions for the various phases of each busi-ness flow. These documents establish rules on responsibilities for specific tasks, mandates and powers and how validation is to be carried out. Accounting and reporting rules and routines are documented in Investor’s Financial Handbook. All governing documents are presented on the intranet for all employees. The documents are updated yearly or when needed. During 2016 the follow-up on the subsidiaries’ work with their steering documents continued.
Risk assessment
Risk assessment is conducted continuously in the day to day business at Investor. Annually the Finance department assesses risk for major errors in the financial report and sets action plans to reduce identified risks. Focus is placed on risks of material weaknesses for significant Income Statement and Balance Sheet items, which have a higher risk because of the complexity, or where there is a risk that the effects of potential weaknesses may become significant because of the high transaction values involved. Conclusions drawn from the risk assessments on risks for errors in the financial reporting are reported to and discussed with the Audit and Risk Committee.
Using the risk assessment as a starting point to ensure the reliability of the financial reporting, the Audit and Risk Commit-tee determines which of the identified risks should be prioritized by the Internal Control function. Suggestions for improvements
are identified and implemented on an ongoing basis. During 2016 the yearly risk assessment focused on information security, compliance risks and risks for errors in the financial reporting.
For a more detailed description of risks and other risk assess-ments, see note 3, Risks and Risk management.
Control activities
To ensure that the financial reporting gives a true and fair picture on each reporting date, every process incorporates a number of control activities. These involve all levels of the organization, from the Board and company Management to other employees.
Financial controls in the company include approval of business transactions, reconciliation with external counterparties, daily monitoring of risk exposure, daily account reconciliation, monthly custody reconciliation, performance monitoring and analytical monitoring of decisions. Investor’s financial reports are analyzed and validated by the company’s control function within Finance. Frequent analysis of the operating subsidiaries’ financial reports are also performed.
During 2016 the controls in the processes with Patricia Industries have been developed.
Information and communication
For the purpose of ensuring that the external information is correct, complete and timely, Investor’s Board has adopted a Communication policy. Within the company, there are also instructions regarding information security and how to communi-cate financial information between the Board, Management and other employees as well as from Patricia Industries to Investor.
During 2016 continued focus has been on improving the pro-cess of information flow between Patricia Industries and Investor. During the year, reporting processes from the new subsidiary Laborie have also been set.
Investor has an established process for whistleblowing, accessible for all employees. It can be used anonymously. Monitoring
Both the Board and the Management Group regularly follow-up on the effectiveness of the company’s internal controls to ensure the quality of processes for the financial reporting. Investor’s financial situation and strategy regarding the company’s financial position are discussed at every Board meeting and the Board is provided with detailed reports on the development of the busi-ness to this end. The Board reviews all interim reports before public release.
The Audit and Risk Committee plays an important role in ensur-ing and monitoring that control activities are in place for important areas of risk inherent in the processes for financial reporting and regularly reports the results from the committee work to the Board. The Audit and Risk Committee, Management Group and Internal Control function regularly follow-up reported deviations.
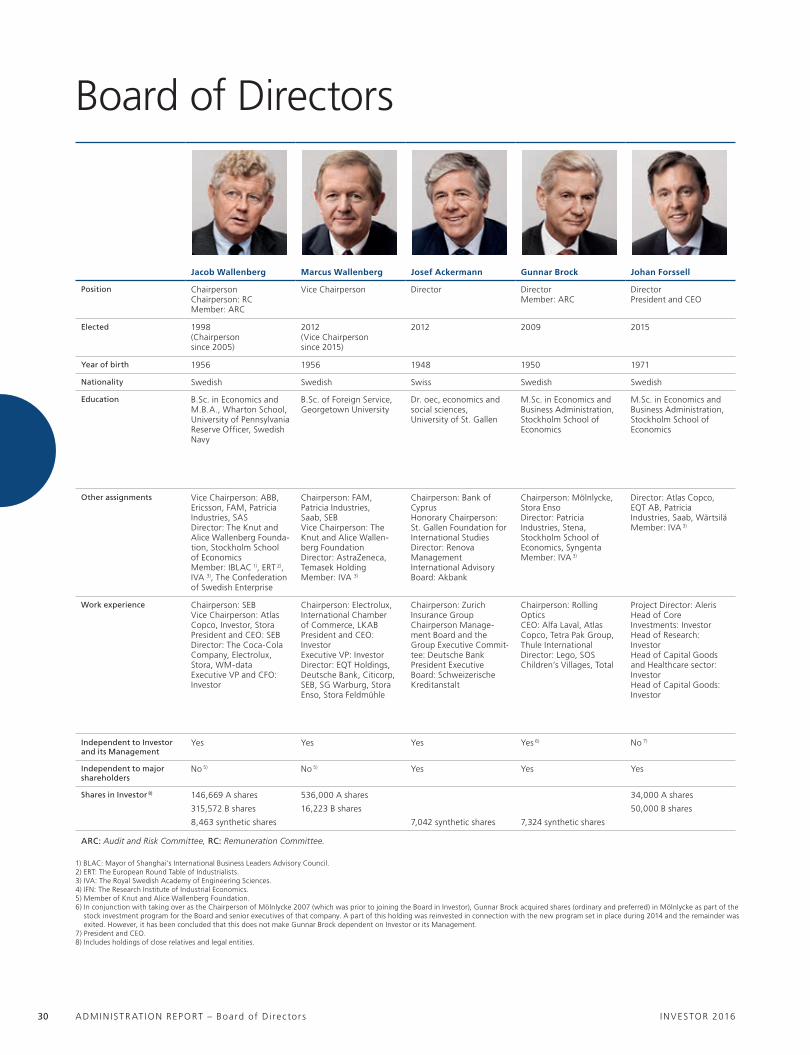
INVESTOR 2016ADMIN ISTR AT ION REPORT – Board of D i rec tor s 30
Jacob Wallenberg Marcus Wallenberg Josef Ackermann Gunnar Brock Johan Forssell
Position ChairpersonChairperson: RCMember: ARC
Vice Chairperson Director DirectorMember: ARC
DirectorPresident and CEO
Elected 1998 (Chairperson since 2005)
2012 (Vice Chairperson since 2015)
2012 2009 2015
Year of birth 1956 1956 1948 1950 1971
Nationality Swedish Swedish Swiss Swedish Swedish
Education B.Sc. in Economics and M.B.A., Wharton School, University of Pennsylvania Reserve Officer, Swedish Navy
B.Sc. of Foreign Service, Georgetown University
Dr. oec, economics and social sciences, University of St. Gallen
M.Sc. in Economics and Business Administration, Stockholm School of Economics
M.Sc. in Economics and Business Administration, Stockholm School of Economics
Other assignments Vice Chairperson: ABB, Ericsson, FAM, Patricia Industries, SASDirector: The Knut and Alice Wallenberg Founda-tion, Stockholm School of EconomicsMember: IBLAC 1), ERT 2), IVA 3), The Confederation of Swedish Enterprise
Chairperson: FAM, Patricia Industries, Saab, SEBVice Chairperson: The Knut and Alice Wallen-berg FoundationDirector: AstraZeneca,Temasek HoldingMember: IVA 3)
Chairperson: Bank of CyprusHonorary Chairperson:St. Gallen Foundation forInternational StudiesDirector: RenovaManagement International Advisory Board: Akbank
Chairperson: Mölnlycke, Stora EnsoDirector: Patricia Industries, Stena, Stockholm School of Economics, Syngenta Member: IVA 3)
Director: Atlas Copco, EQT AB, Patricia Industries, Saab, WärtsiläMember: IVA 3)
Work experience Chairperson: SEBVice Chairperson: Atlas Copco, Investor, StoraPresident and CEO: SEBDirector: The Coca-ColaCompany, Electrolux,Stora, WM-dataExecutive VP and CFO: Investor
Chairperson: Electrolux,International Chamber of Commerce, LKABPresident and CEO: InvestorExecutive VP: InvestorDirector: EQT Holdings, Deutsche Bank, Citicorp, SEB, SG Warburg, Stora Enso, Stora Feldmühle
Chairperson: Zurich Insurance GroupChairperson Manage-ment Board and the Group Executive Commit-tee: Deutsche BankPresident Executive Board: Schweizerische Kreditanstalt
Chairperson: Rolling OpticsCEO: Alfa Laval, Atlas Copco, Tetra Pak Group, Thule International Director: Lego, SOS Children’s Villages, Total
Project Director: AlerisHead of Core Investments: InvestorHead of Research: InvestorHead of Capital Goods and Healthcare sector: InvestorHead of Capital Goods: Investor
Independent to Investor and its Management
Yes Yes Yes Yes 6) No 7)
Independent to major shareholders
No 5) No 5) Yes Yes Yes
Shares in Investor 8) 146,669 A shares 536,000 A shares 34,000 A shares
315,572 B shares 16,223 B shares 50,000 B shares
8,463 synthetic shares 7,042 synthetic shares 7,324 synthetic shares
ARC: Audit and Risk Committee, RC: Remuneration Committee.
Board of Directors
1) BLAC: Mayor of Shanghai’s International Business Leaders Advisory Council. 2) ERT: The European Round Table of Industrialists. 3) IVA: The Royal Swedish Academy of Engineering Sciences. 4) IFN: The Research Institute of Industrial Economics.5) Member of Knut and Alice Wallenberg Foundation. 6) In conjunction with taking over as the Chairperson of Mölnlycke 2007 (which was prior to joining the Board in Investor), Gunnar Brock acquired shares (ordinary and preferred) in Mölnlycke as part of the
stock investment program for the Board and senior executives of that company. A part of this holding was reinvested in connection with the new program set in place during 2014 and the remainder was exited. However, it has been concluded that this does not make Gunnar Brock dependent on Investor or its Management.
7) President and CEO.8) Includes holdings of close relatives and legal entities.

INVESTOR 2016 ADMIN ISTR AT ION REPORT – Board of D i rec tor s 31
Magdalena Gerger Tom Johnstone, CBE Grace Reksten Skaugen Hans Stråberg Lena Treschow Torell Sara Öhrvall
DirectorMember: ARC
DirectorMember: RC
DirectorChairperson: ARC
Director DirectorMember: RC
Director
2014 2010 2006 2011 2007 2015
1964 1955 1953 1957 1946 1971
Swedish British Norwegian Swedish Swedish Swedish
M. Econ., and M.B.A., Stockholm School of EconomicsM.B.A. exchange, McGill University
M.A., University of GlasgowHonorary Doctorate in Business Administration, University of South Carolina Honorary Doctorate in Science, Cranfield University
M.B.A., BI Norwegian School of Management, Careers in Business Program, New York UniversityPh.D. and B.Sc., Laser Physics, Imperial College of Science and Technol-ogy, London University
M.Sc. in Engineering, Chalmers University Reserve Officer, Swedish Army
Ph.D., Physics, University of GothenburgDocent, Physics, Chalmers University
M.Sc. in International Business, Umeå University
President and CEO: SystembolagetDirector: Ahlsell, Husqvarna, IVA 3)
Member: IFN 4)
Chairperson: Combient, HusqvarnaDirector: Volvo Cars, WärtsiläMember: IVA 3)
Chairperson: Norwegian Institute of DirectorsDeputy Chairperson: OrklaDirector: Lundin Petroleum, Euronav
Chairperson: Atlas Copco, CTEK, Nikkarit, Roxtec Vice Chairperson: Orchid Director: Hedson, IVA 3) Mellbygård, N Holding, Stora Enso
Chairperson: Chalmers University Director: Saab, SKFMember: IVA 3)
Co-Founder and Senior Advisor: MindMill NetworkDirector: Bonnier News, Bonnier Books, Bisnode, SEBMember: Nobel Museum, Umeå University, Vinnova
Chairperson: IQ-initiativetDirector: IKEA (Ingka Holding), Svenska SpelVice President, responsible for Fresh Dairy, Marketing and Innovation: Arla FoodsManagement consultant: Futoria Category Director: Nestlé Marketing Director: ICI Paints, Procter & Gamble
President and CEO: SKFDirector: Electrolux, SKF, The Association of Swedish EngineeringExecutive Vice President: SKFPresident, AutomotiveDivision: SKF
Chairperson: Entra Eiendom, FerdDeputy Chairperson: StatoilDirector: Atlas Copco,Corporate Finance Enskilda Securities, Opera Software,Renewable Energy Corporation, Storebrand,Tandberg
President and CEO: ElectroluxDirector: The Confedera-tion of Swedish Enter-prise, The Association of Swedish Engineering IndustriesCOO: ElectroluxVarious positions within Electrolux
Chairperson: Euro-CASEChairperson and President: IVA 3)
Research Director: JointResearch Centre, European CommissionProfessor in Physics: Chalmers University, Uppsala UniversityDirector: Ericsson, Gambro, Getinge, Imego, IRECO, Micronic, ÅF
Chairperson: Newsmill, Workey, FeberDirector: Adlibris, Bonnier Publications, Dagens Industri, Lunarstorm, Mag+, SF Bio, TV4 Executive VP, R&D: BonnierDirector of Product Development: Volvo CarsPartner and CEO: Differ
Yes Yes Yes Yes Yes Yes
Yes Yes Yes Yes Yes Yes
2,000 A shares
4,441 B shares 8,300 B shares 2,500 B shares
3,383 synthetic shares 7,324 synthetic shares 7,324 synthetic shares 7,324 synthetic shares 2,147 synthetic shares
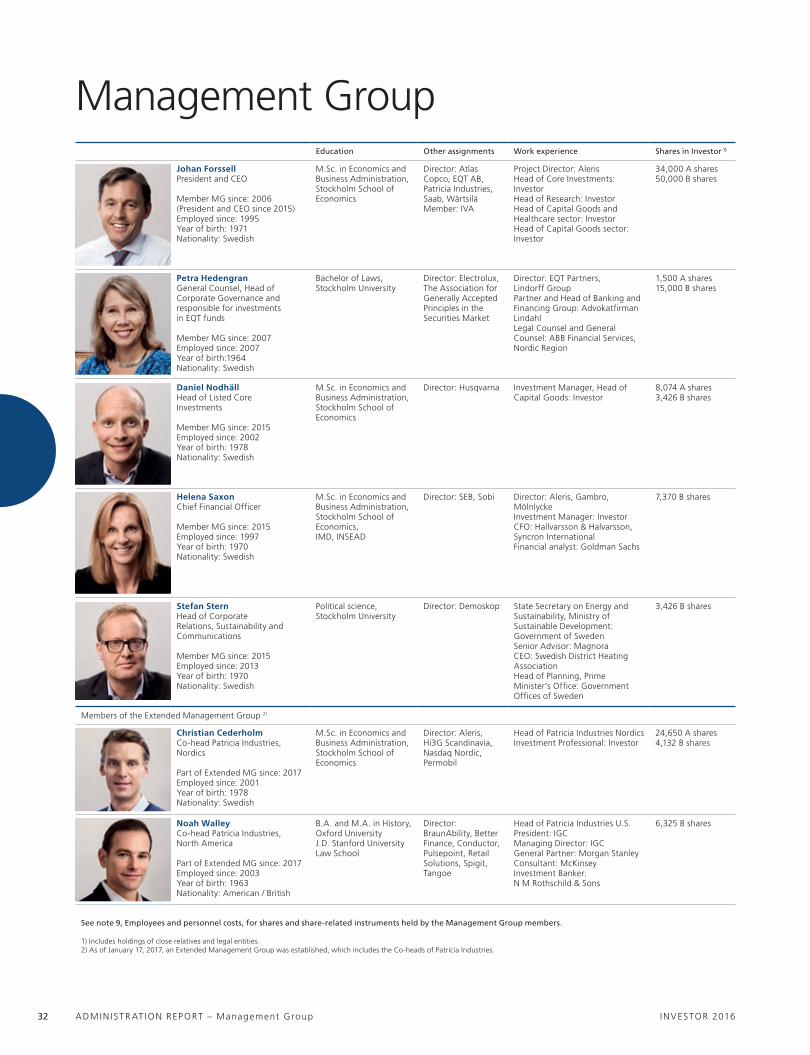
INVESTOR 2016ADMIN ISTR AT ION REPORT – Management Group 32
Management GroupEducation Other assignments Work experience Shares in Investor 1)
Johan ForssellPresident and CEO
Member MG since: 2006 (President and CEO since 2015)Employed since: 1995Year of birth: 1971Nationality: Swedish
M.Sc. in Economics and Business Administration, Stockholm School of Economics
Director: Atlas Copco, EQT AB, Patricia Industries, Saab, WärtsiläMember: IVA
Project Director: AlerisHead of Core Investments: InvestorHead of Research: InvestorHead of Capital Goods and Healthcare sector: InvestorHead of Capital Goods sector: Investor
34,000 A shares50,000 B shares
Petra Hedengran General Counsel, Head of Corporate Governance and responsible for investments in EQT funds
Member MG since: 2007Employed since: 2007Year of birth:1964Nationality: Swedish
Bachelor of Laws, Stockholm University
Director: Electrolux, The Association for Generally Accepted Principles in the Securities Market
Director: EQT Partners, Lindorff GroupPartner and Head of Banking and Financing Group: Advokatfirman LindahlLegal Counsel and General Counsel: ABB Financial Services, Nordic Region
1,500 A shares15,000 B shares
Daniel NodhällHead of Listed Core Investments
Member MG since: 2015 Employed since: 2002Year of birth: 1978Nationality: Swedish
M.Sc. in Economics and Business Administration, Stockholm School of Economics
Director: Husqvarna Investment Manager, Head of Capital Goods: Investor
8,074 A shares3,426 B shares
Helena SaxonChief Financial Officer
Member MG since: 2015 Employed since: 1997Year of birth: 1970Nationality: Swedish
M.Sc. in Economics and Business Administration, Stockholm School of Economics,IMD, INSEAD
Director: SEB, Sobi Director: Aleris, Gambro, MölnlyckeInvestment Manager: InvestorCFO: Hallvarsson & Halvarsson, Syncron InternationalFinancial analyst: Goldman Sachs
7,370 B shares
Stefan SternHead of Corporate Relations, Sustainability and Communications
Member MG since: 2015Employed since: 2013Year of birth: 1970Nationality: Swedish
Political science, Stockholm University
Director: Demoskop State Secretary on Energy and Sustainability, Ministry of Sustainable Development: Government of SwedenSenior Advisor: MagnoraCEO: Swedish District Heating AssociationHead of Planning, Prime Minister’s Office: Government Offices of Sweden
3,426 B shares
Members of the Extended Management Group 2)
Christian CederholmCo-head Patricia Industries, Nordics
Part of Extended MG since: 2017Employed since: 2001Year of birth: 1978Nationality: Swedish
M.Sc. in Economics and Business Administration, Stockholm School of Economics
Director: Aleris, Hi3G Scandinavia, Nasdaq Nordic, Permobil
Head of Patricia Industries Nordics Investment Professional: Investor
24,650 A shares4,132 B shares
Noah Walley Co-head Patricia Industries, North America
Part of Extended MG since: 2017Employed since: 2003Year of birth: 1963Nationality: American / British
B.A. and M.A. in History, Oxford UniversityJ.D. Stanford University Law School
Director: BraunAbility, Better Finance, Conductor, Pulsepoint, Retail Solutions, Spigit, Tangoe
Head of Patricia Industries U.S.President: IGCManaging Director: IGCGeneral Partner: Morgan Stanley Consultant: McKinsey Investment Banker: N M Rothschild & Sons
6,325 B shares
See note 9, Employees and personnel costs, for shares and share-related instruments held by the Management Group members.
1) Includes holdings of close relatives and legal entities.2) As of January 17, 2017, an Extended Management Group was established, which includes the Co-heads of Patricia Industries.

INVESTOR 2016 ADMIN ISTR AT ION REPORT – P roposed D ispos i t ion of Earn ings 33
Total available funds for distribution
Retained earnings 202,396,911,560
Net profit for the year 29,275,673,469
Total SEK 231,672,585,029
To be allocated as follows:
Dividend to shareholders, SEK 11.00 per share 8,438,925,3301)
Funds to be carried forward 223,233,659,699
Total SEK 231,672,585,029
The Board of Directors proposes that the unappropriated earnings in Investor AB:
Proposed Disposition of Earnings
The consolidated accounts and annual accounts have been pre-pared in accordance with the international accounting standards in Regulation (EC) No. 1606/2002 of the European Parliament and of the Council of July 19, 2002 on the application of international accounting standards and generally accepted accounting stan-dards in Sweden and give a true and fair view of the Group’s and Parent Company’s financial position and results of operations. The Administration Report for the Group and the Parent Company gives a true and fair view of the operations, position and results, and describes significant risks and uncertainty factors that the Parent Company and Group companies face. The annual accounts and the consolidated financial statements were approved for release by the Board of Directors and the President on March 23, 2017. The consolidated Income Statement and Balance Sheet, and the Income Statement and Balance Sheet of the Parent Company, will be presented for adoption by the Annual General Meeting on May 3, 2017.
The proposed dividend amounts to SEK 8,439 m. The Group’s equity attributable to the shareholders of the Parent Company was SEK 300,077 m. as of December 31, 2016, and unrestricted equity in the Parent Company was SEK 231,673 m. Unrestricted equity includes SEK 145,000 m. attributable to unrealized changes in value according to a valuation at fair value. With ref-erence to the above, and to other information that has come to the knowledge of the board, it is the opinion of the board that the proposed dividend is defendable with reference to the demands that the nature, scope and risks of Investor’s operations place on the size of the company’s and the Group’s equity, and the company’s and the Group’s consolidation needs, liquidity and position in general.
1) Calculated on the total number of registered shares. No dividend is paid for the Parent Company’s holding of own shares, whose exact number is determined on the record date for cash payment of the dividend. On December 31, 2016, the Parent Company’s holding of own shares totaled 2,793,387.
Stockholm, March 23, 2017
Jacob WallenbergChairperson
Marcus Wallenberg Josef Ackermann Gunnar Brock
Vice Chairperson Director Director
Tom Johnstone, CBE Magdalena Gerger Grace Reksten Skaugen Hans StråbergDirector Director Director Director
Lena Treschow Torell Sara Öhrvall Johan ForssellDirector Director President and
Chief Executive Officer
Our Audit Report was submitted on March 23, 2017
Deloitte AB
Thomas StrömbergAuthorized Public Accountant
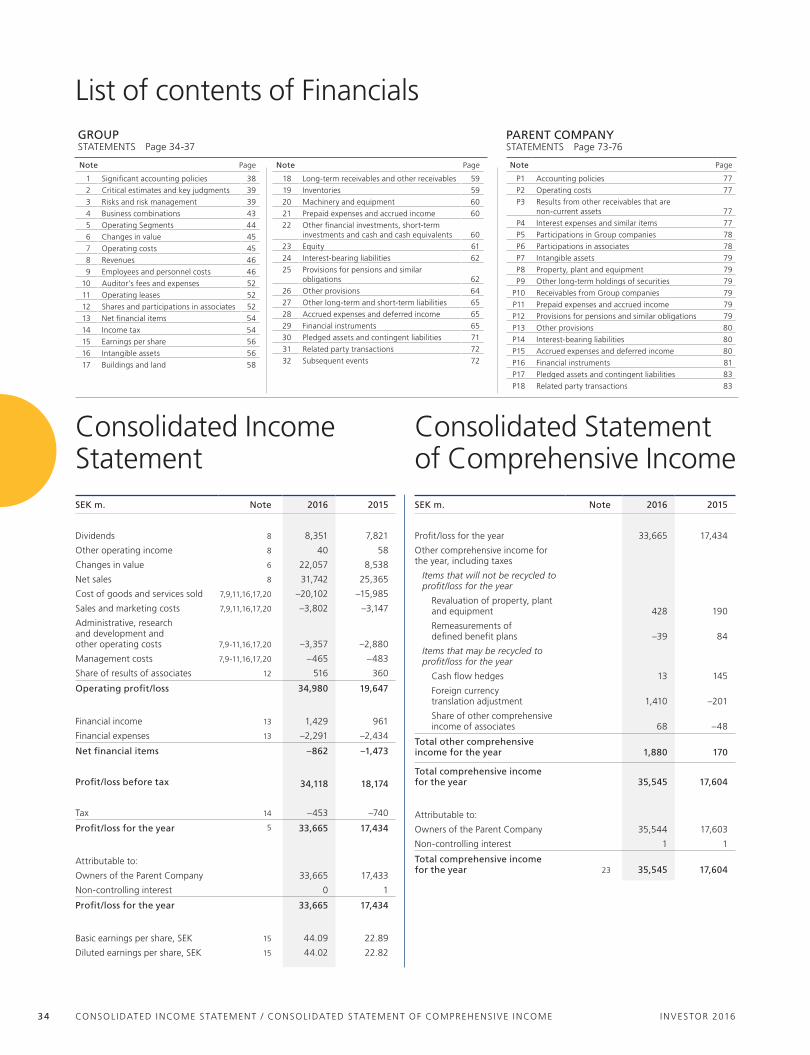
List of contents of Financials
Consolidated Income StatementSEK m. Note 2016 2015
Dividends 8 8,351 7,821
Other operating income 8 40 58
Changes in value 6 22,057 8,538
Net sales 8 31,742 25,365
Cost of goods and services sold 7,9,11,16,17,20 –20,102 –15,985
Sales and marketing costs 7,9,11,16,17,20 –3,802 –3,147
Administrative, research and development and other operating costs 7,9-11,16,17,20 –3,357 –2,880
Management costs 7,9-11,16,17,20 –465 –483
Share of results of associates 12 516 360
Operating profit/loss 34,980 19,647
Financial income 13 1,429 961
Financial expenses 13 –2,291 –2,434
Net financial items –862 –1,473
Profit/loss before tax 34,118 18,174
Tax 14 –453 –740
Profit/loss for the year 5 33,665 17,434
Attributable to:
Owners of the Parent Company 33,665 17,433
Non-controlling interest 0 1
Profit/loss for the year 33,665 17,434
Basic earnings per share, SEK 15 44.09 22.89
Diluted earnings per share, SEK 15 44.02 22.82
Consolidated Statement of Comprehensive IncomeSEK m. Note 2016 2015
Profit/loss for the year 33,665 17,434
Other comprehensive income for the year, including taxes
Items that will not be recycled to profit/loss for the year
Revaluation of property, plant and equipment 428 190
Remeasurements of defined benefit plans –39 84
Items that may be recycled to profit/loss for the year
Cash flow hedges 13 145
Foreign currency translation adjustment 1,410 –201
Share of other comprehensive income of associates 68 –48
Total other comprehensive income for the year 1,880 170
Total comprehensive income for the year 35,545 17,604
Attributable to:
Owners of the Parent Company 35,544 17,603
Non-controlling interest 1 1
Total comprehensive income for the year 23 35,545 17,604
Note Page
1 Significant accounting policies 38
2 Critical estimates and key judgments 39
3 Risks and risk management 39
4 Business combinations 43
5 Operating Segments 44
6 Changes in value 45
7 Operating costs 45
8 Revenues 46
9 Employees and personnel costs 46
10 Auditor’s fees and expenses 52
11 Operating leases 52
12 Shares and participations in associates 52
13 Net financial items 54
14 Income tax 54
15 Earnings per share 56
16 Intangible assets 56
17 Buildings and land 58
Note Page
18 Long-term receivables and other receivables 59
19 Inventories 59
20 Machinery and equipment 60
21 Prepaid expenses and accrued income 60
22 Other financial investments, short-term investments and cash and cash equivalents 60
23 Equity 61
24 Interest-bearing liabilities 62
25 Provisions for pensions and similar obligations 62
26 Other provisions 64
27 Other long-term and short-term liabilities 65
28 Accrued expenses and deferred income 65
29 Financial instruments 65
30 Pledged assets and contingent liabilities 71
31 Related party transactions 72
32 Subsequent events 72
PARENT COMPANYSTATEMENTS Page 73-76
Note Page
P1 Accounting policies 77
P2 Operating costs 77
P3 Results from other receivables that are non-current assets 77
P4 Interest expenses and similar items 77
P5 Participations in Group companies 78
P6 Participations in associates 78
P7 Intangible assets 79
P8 Property, plant and equipment 79
P9 Other long-term holdings of securities 79
P10 Receivables from Group companies 79
P11 Prepaid expenses and accrued income 79
P12 Provisions for pensions and similar obligations 79
P13 Other provisions 80
P14 Interest-bearing liabilities 80
P15 Accrued expenses and deferred income 80
P16 Financial instruments 81
P17 Pledged assets and contingent liabilities 83
P18 Related party transactions 83
GROUPSTATEMENTS Page 34-37
INVESTOR 2016CONSOL IDATED INCOME STATEMENT / CONSOL IDATED STATEMENT OF COMPREhENSIvE INCOME 34
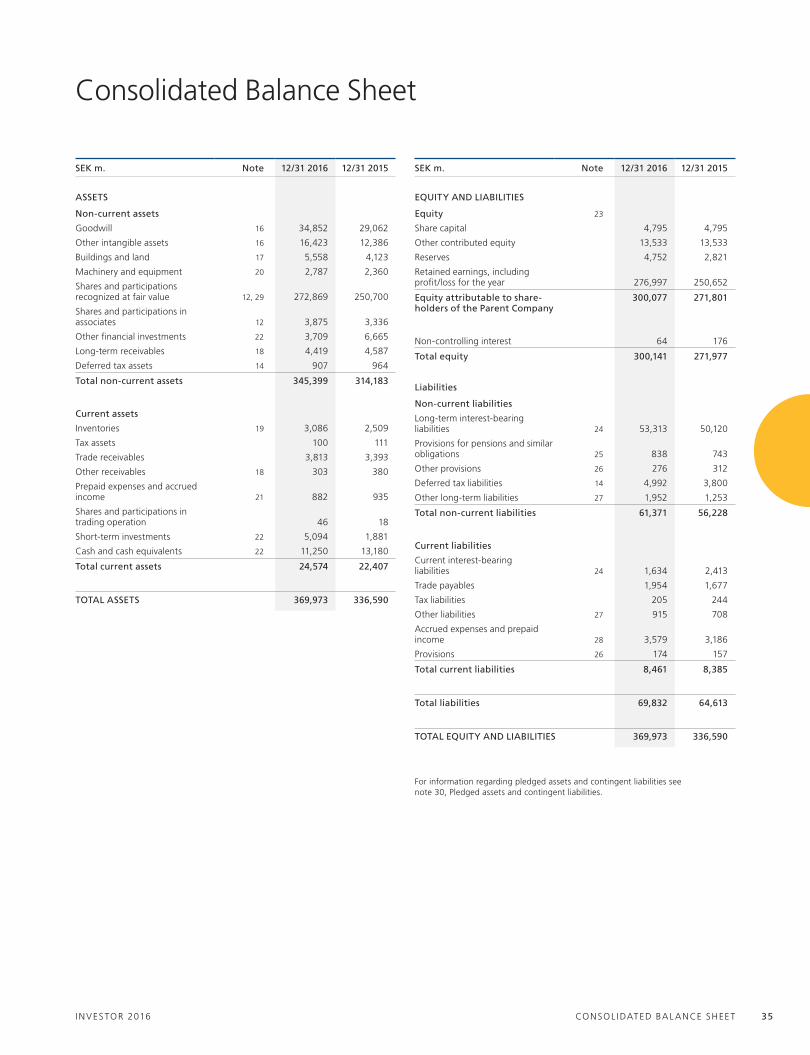
Consolidated Balance Sheet
SEK m. Note 12/31 2016 12/31 2015
ASSETS
Non-current assets
Goodwill 16 34,852 29,062
Other intangible assets 16 16,423 12,386
Buildings and land 17 5,558 4,123
Machinery and equipment 20 2,787 2,360
Shares and participations recognized at fair value 12, 29 272,869 250,700
Shares and participations in associates 12 3,875 3,336
Other financial investments 22 3,709 6,665
Long-term receivables 18 4,419 4,587
Deferred tax assets 14 907 964
Total non-current assets 345,399 314,183
Current assets
Inventories 19 3,086 2,509
Tax assets 100 111
Trade receivables 3,813 3,393
Other receivables 18 303 380
Prepaid expenses and accrued income 21 882 935
Shares and participations in trading operation 46 18
Short-term investments 22 5,094 1,881
Cash and cash equivalents 22 11,250 13,180
Total current assets 24,574 22,407
TOTAL ASSETS 369,973 336,590
SEK m. Note 12/31 2016 12/31 2015
EQUITY AND LIABILITIES
Equity 23
Share capital 4,795 4,795
Other contributed equity 13,533 13,533
Reserves 4,752 2,821
Retained earnings, including profit/loss for the year 276,997 250,652
Equity attributable to share-holders of the Parent Company
300,077 271,801
Non-controlling interest 64 176
Total equity 300,141 271,977
Liabilities
Non-current liabilities
Long-term interest-bearing liabilities 24 53,313 50,120
Provisions for pensions and similar obligations 25 838 743
Other provisions 26 276 312
Deferred tax liabilities 14 4,992 3,800
Other long-term liabilities 27 1,952 1,253
Total non-current liabilities 61,371 56,228
Current liabilities
Current interest-bearing liabilities 24 1,634 2,413
Trade payables 1,954 1,677
Tax liabilities 205 244
Other liabilities 27 915 708
Accrued expenses and prepaid income 28 3,579 3,186
Provisions 26 174 157
Total current liabilities 8,461 8,385
Total liabilities 69,832 64,613
TOTAL EQUITY AND LIABILITIES 369,973 336,590
For information regarding pledged assets and contingent liabilities see note 30, Pledged assets and contingent liabilities.
INVESTOR 2016 CONSOL IDATED BAL ANCE ShEET 35
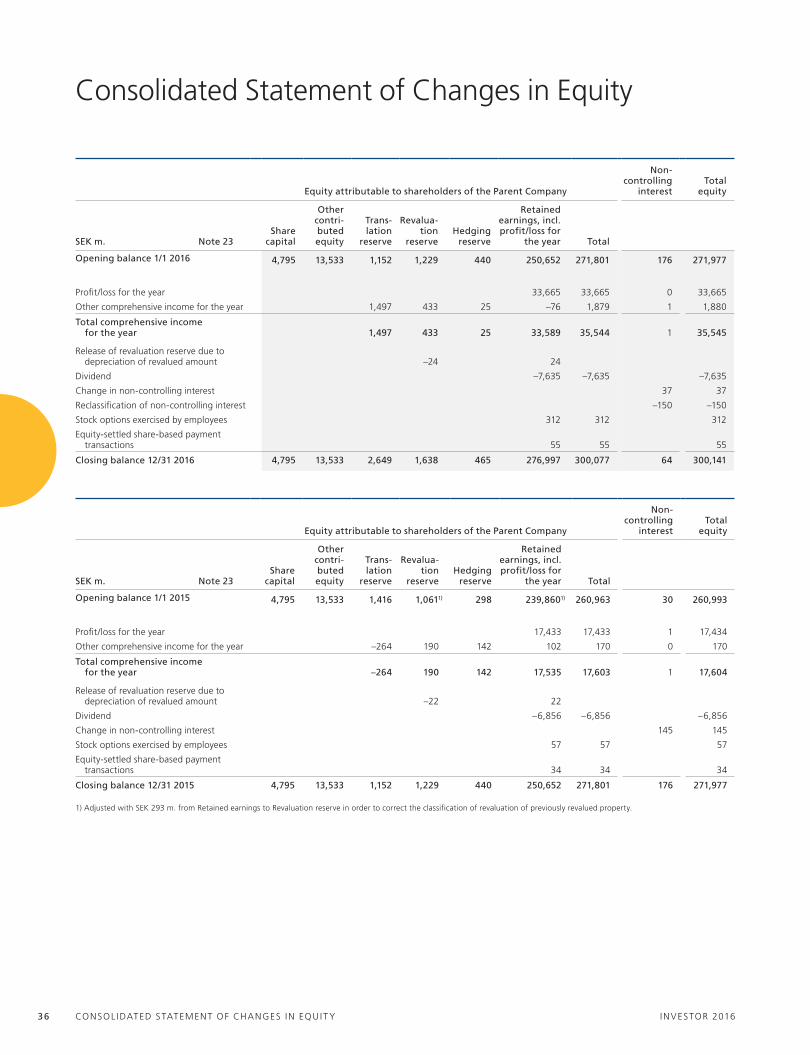
Consolidated Statement of Changes in Equity
Equity attributable to shareholders of the Parent Company
Non-controlling
interestTotal
equity
SEK m. Note 23Share
capital
Other contri-but ed equity
Trans-lation
reserve
Revalua-tion
reserveHedging
reserve
Retained earnings, incl. profit/loss for
the year Total
Opening balance 1/1 2016 4,795 13,533 1,152 1,229 440 250,652 271,801 176 271,977
Profit/loss for the year 33,665 33,665 0 33,665
Other comprehensive income for the year 1,497 433 25 –76 1,879 1 1,880
Total comprehensive income for the year 1,497 433 25 33,589 35,544 1 35,545
Release of revaluation reserve due to depreciation of revalued amount –24 24
Dividend –7,635 –7,635 –7,635
Change in non-controlling interest 37 37
Reclassification of non-controlling interest –150 –150
Stock options exercised by employees 312 312 312
Equity-settled share-based payment transactions 55 55 55
Closing balance 12/31 2016 4,795 13,533 2,649 1,638 465 276,997 300,077 64 300,141
Equity attributable to shareholders of the Parent Company
Non-controlling
interestTotal
equity
SEK m. Note 23Share
capital
Other contri-but ed equity
Trans-lation
reserve
Revalua-tion
reserveHedging
reserve
Retained earnings, incl. profit/loss for
the year Total
Opening balance 1/1 2015 4,795 13,533 1,416 1,0611) 298 239,8601) 260,963 30 260,993
Profit/loss for the year 17,433 17,433 1 17,434
Other comprehensive income for the year –264 190 142 102 170 0 170
Total comprehensive income for the year –264 190 142 17,535 17,603 1 17,604
Release of revaluation reserve due to depreciation of revalued amount –22 22
Dividend –6,856 –6,856 –6,856
Change in non-controlling interest 145 145
Stock options exercised by employees 57 57 57
Equity-settled share-based payment transactions 34 34 34
Closing balance 12/31 2015 4,795 13,533 1,152 1,229 440 250,652 271,801 176 271,977
1) Adjusted with SEK 293 m. from Retained earnings to Revaluation reserve in order to correct the classification of revaluation of previously revalued property.
INVESTOR 2016CONSOL IDATED STATEMENT OF ChANGES IN Equ IT y 36
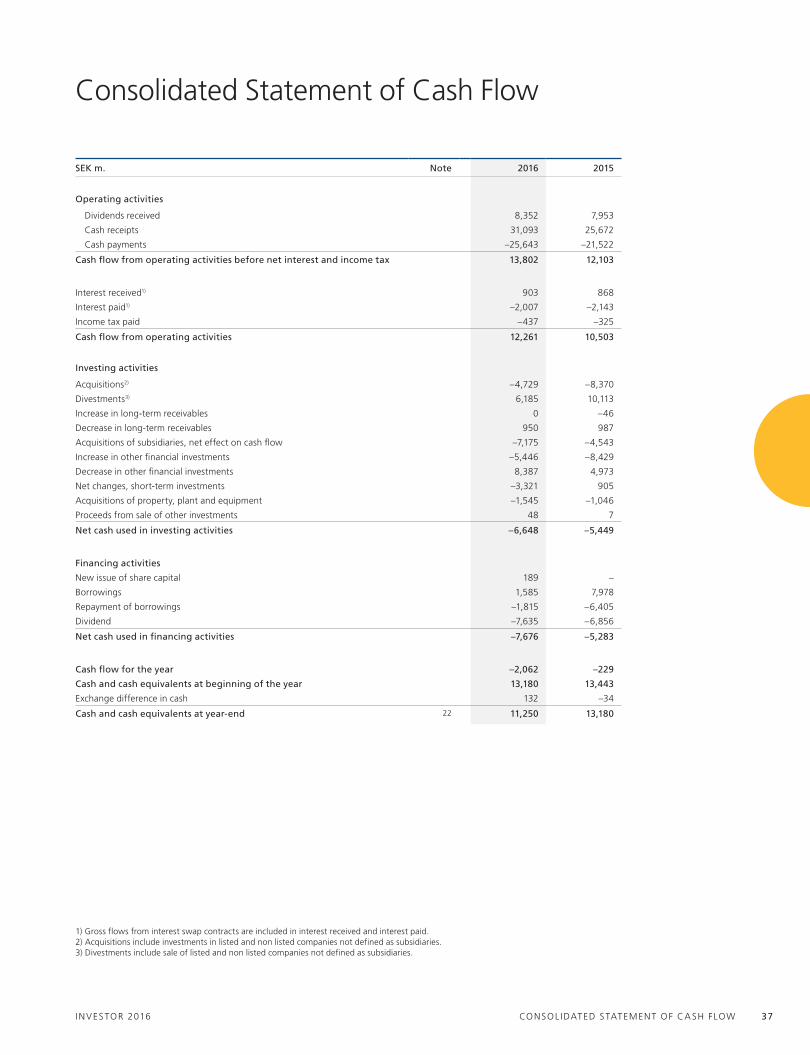
Consolidated Statement of Cash Flow
SEK m. Note 2016 2015
Operating activities
Dividends received 8,352 7,953
Cash receipts 31,093 25,672
Cash payments –25,643 –21,522
Cash flow from operating activities before net interest and income tax 13,802 12,103
Interest received1) 903 868
Interest paid1) –2,007 –2,143
Income tax paid –437 –325
Cash flow from operating activities 12,261 10,503
Investing activities
Acquisitions2) –4,729 –8,370
Divestments3) 6,185 10,113
Increase in long-term receivables 0 –46
Decrease in long-term receivables 950 987
Acquisitions of subsidiaries, net effect on cash flow –7,175 –4,543
Increase in other financial investments –5,446 –8,429
Decrease in other financial investments 8,387 4,973
Net changes, short-term investments –3,321 905
Acquisitions of property, plant and equipment –1,545 –1,046
Proceeds from sale of other investments 48 7
Net cash used in investing activities –6,648 –5,449
Financing activities
New issue of share capital 189 –
Borrowings 1,585 7,978
Repayment of borrowings –1,815 –6,405
Dividend –7,635 –6,856
Net cash used in financing activities –7,676 –5,283
Cash flow for the year –2,062 –229
Cash and cash equivalents at beginning of the year 13,180 13,443
Exchange difference in cash 132 –34
Cash and cash equivalents at year-end 22 11,250 13,180
1) Gross flows from interest swap contracts are included in interest received and interest paid.2) Acquisitions include investments in listed and non listed companies not defined as subsidiaries.3) Divestments include sale of listed and non listed companies not defined as subsidiaries.
INVESTOR 2016 CONSOL IDATED STATEMENT OF CASh FLOw 37

Notes to the consolidated financial statements
The most significant accounting policies applied in this annual report are presented in this note and, where applicable, in the following notes to the financial statements. Significant accounting policies for the Parent Company can be found on page 77.
Statement of complianceThe consolidated financial statements are prepared in accordance with the International Financial Reporting Standards (IFRS) as adopted by the European union. In addition the Swedish rules, RFR 1 Supplementary Accounting Poli-cies for Groups, was applied.
Basis of preparation for the Parent Company and consolidated financial statementsThe financial statements are presented in SEK, which is the functional currency of the Parent Company. All amounts, unless otherwise stated, are rounded to the nearest million (SEK m.). Due to rounding, numbers presented throughout these consolidated financial statements may not add up precisely to the totals provided and percentages may not precisely reflect the absolute figures.
The majority of the consolidated assets are financial assets and the majority of these as well as the majority of the property within the Group are measured at fair value. Other assets and liabilities are in essence measured at historical cost.
Non-current assets and non-current liabilities consist primarily of amounts that are expected to be settled more than 12 months from the Balance Sheet date. Other assets and liabilities are presented as current assets and current liabilities.
The accounting policies have been consistently applied to all periods pre-sented in the financial statements, unless otherwise noted. The accounting policies have also been consistently applied to the reporting and consolidation of the Parent Company, subsidiaries and associates.
Certain comparative figures have been reclassified in order to conform to the presentation of the current year’s financial statements. In cases where reclassifications pertains to significant amounts, special information has been provided.
Changes in accounting policiesThe following is a description of the revised accounting policies applied by the Group and Parent Company as of January 1, 2016. Other new or revised IFRSs and interpretations from the IFRS Interpretations Committee have had no material effect on the profit/loss, financial position or disclosures for the Group or Parent Company. New or amended standards that will come into effect in forthcoming years, have not been adopted early when preparing these financial statements.
Changes in accounting policies due to new or amended IFRSNew or revised IFRSs and interpretations from the IFRS Interpretations Committee, with effective date from January 1, 2016, have had no material effect on the accounting for the Group or Parent Company.
New IFRS regulations and interpretations to be applied in 2017 or laterThe new or revised standards described below will be applied from when application is mandatory. Earlier adoption is not planned.
IFRS 9 Financial Instruments will replace IAS 39 Financial Instruments Rec-ognition and Measurement: with mandatory effective date of January 1, 2018. IFRS 9 presents a model for classification and measurement of financial instru-ments, an expected loss model for the impairment of financial assets and significant changes to hedge accounting. The changes are not expected to have any substantial effects on amounts reported in the consolidated financial statements, since the majority of the Group’s financial assets are measured at fair value.
IFRS 15 Revenue from Contracts with Customers is a new standard for rev-enue that will replace all existing standards and interpretations about revenue. Revenue shall be recognized to depict the transfer of promised goods or ser-vices to customers in an amount that reflects the consideration to which the entity expects to be entitled in exchange for those goods or services. Manda-tory effective date is January 1, 2018. Investor is assessing the impact of the new standard. up to present the implementation projects that Investor works on indicates that the quantitative impact on the Group will not be substan-tial. Areas considered most impacted by the new Standard are classification and accrual of variable discounts. At initial application Investor will use the cumulative catch-up transition method. To date, Investor has not completed the quantitative assessment, but our preliminary analysis of the new principles indicates that the effects of the new standard will not be significant neither with regards to the amounts recognized as revenues nor the timing of when revenues are recognized.
IFRS 16 Leases is a new standard that concerns the accounting for rental and lease agreements for both lessors and lessees. Effective date is expected to be January 1, 2019, subject to Eu approval. Investor is assessing the impact of the new standard.
Other known changes to IFRS and IFRIC to be applied in the future are not expected to have any significant impact on the Group’s reporting.
Consolidation principlesThe consolidated financial statements comprise of the Parent Company, subsidiaries and associates.• Subsidiaries are companies over which Investor AB have control. when
determining if control is present, power and ability to affect the amount of returns are considered, but also de facto control. Subsidiaries are report-ed in accordance with the purchase method. For further information see note P5, Participations in Group companies.
• Associates are companies in which Investor has a significant influence, typically between 20 and 50 percent of the votes. Accounting for associates is dependent on how Investor controls and monitors the companies’ opera-tions. For further information see note 12, Shares and participations in associates.
Intra-group receivables, payables and transactions as well as gains arising from transactions with associates, that are consolidated using the equity method, are eliminated when preparing the consolidated financial statements.
Foreign currencyTranslation to functional currencyForeign currency transactions are translated at the exchange rate in existence on the date of the transaction. Assets and liabilities in foreign currency are translated at the exchange rate in existence on the balance sheet date, except for non-monetary assets and liabilities which are recognized at historical cost using the exchange rate in existence on the date of the transaction. Exchange differences arising on translation are recognized in the income statement with the exception of effects from cash-flow hedges, see Note 29, Financial Instru-ments.
Financial statements of foreign operationsAssets and liabilities of foreign operations, including goodwill and other consolidated surpluses/deficits are translated to SEK using the exchange rate in existence on the balance sheet date. Revenues and expenses in a foreign operation are translated to SEK using an average exchange rate that approxi-mates the exchange rates on the dates of the transactions. Translation differ-ences arising when translating foreign operations are recognized directly in other comprehensive income and are accumulated in the translation reserve, which is a separate component of equity.
The following symbols IS and BS show which amounts in the notes that can be found in the Income Statement or Balance Sheet.
Note 1. Significant accounting policies
INVESTOR 2016NOTES TO ThE CONSOL IDATED F INANCIAL STATEMENTS 38

In its business, the Investor group is exposed to commercial risks and financial risks such as share price risk, credit risk, liquidity and financing risk. Investor is also exposed to operational, political, legal and regulatory risks.
Investor’s most significant risk is the share price risk. There has been no significant change in the measurement and follow-up of risks compared with the preceding year.
RISK MANAGEMENTRisk management is part of the Board’s and management’s governance and follow-up of the business. At Investor, risk management is an integral part of the Group’s processes, meaning that control and responsibility for control is close to the business operations. Investor’s Board decides on risk levels, mandates and limits for the parent company and its business areas, while the Boards of the wholly-owned subsidiaries decide and follow up on policies that have been adapted to manage the risks in their respective businesses.
Investor’s Risk policy sets measurement and mandates for market risks for the short-term trading, excess liquidity and financing activities. The policy also outlines principles for foreign exchange risk management in connection with investments and cash flows in foreign currency, measurements and limits for credit risks and principles to minimize legal, regulatory and operational risks in the business.
The Board follows up frequently on limits and risk exposure to ensure the ability to reach business strategies and goals. The CEO is responsible for ensuring that the organization complies with the Risk policy and for the continuous management of all risks within the business. The Board’s and the Management’s support function for managing and identifying risks and activi-ties required, is the Risk Control Function.
Risk measurement is performed daily regarding the Treasury and Trading businesses and provided to the Management Group. The financial reports are compiled monthly and provided to the Management Group. Risk assessment is carried out yearly in the form of a self-evaluation and includes the establish-ment of action plans to mitigate identified risks. Risk assessment encompasses the entire organization and all of its processes. All types of risks are covered. Representatives from the Management Group, the investment organiza-tion, the support organization and the control functions together assess the risks. The assessment takes into consideration such things as systems, control activities and key individuals. when needed, action plans are implemented to minimize the probability and impact of identified risks. The identified risks are compiled in a company-wide risk map. Conclusions drawn from the risk assessments are reported to the Management Group and to the Board. The CEO and Management Group follow up on the implementation of action plans and report back to the Board. using each business area’s risk map as a starting point, the Audit and Risk Committee determines which of the identi-fied risks for the financial reporting should be prioritized by the Internal Con-trol function.
COMMERCIAL RISKSMaintaining long-term ownership in Listed Core Investments and the operat-ing subsidiaries and a flow of smaller investments and divestments involves commercial risks. These risks include, for instance, having a high exposure to a certain sector or an individual holding, changed market conditions for find-ing attractive investment candidates and barriers that arise and prevent exits from a holding at the chosen time. In order to manage its various commercial risks, Investor focuses on such factors as diversification of the company port-folio, process development and development of knowledge, experience and expertise.
Investor’s subsidiaries operate within the healthcare sector on different geographical markets for products and services. To remain competitive, all business units need to continuously develop innovative products and services that satisfy customer needs in a cost efficient way. New products, services and techniques developed and promoted by competitors can also affect the ability to achieve business plans and objectives. An important component of the subsidiaries’ strategies for growth is to make strategic acquisitions and enter strategic alliances that complement their current businesses. A subsidiary’s failure to identify appropriate targets for strategic acquisitions, or unsuccess-fully integrate its acquisitions, could have a negative impact on competitive-ness and profitability.
FINANCIAL RISKSThe main category of financial risks that the Investor Group is exposed to is market risks. These are primarily risks associated with fluctuations in share prices, as well as interest rate risks and foreign exchange rate risks.
Derivative instruments are used to manage financial risks. All derivative transactions are handled in accordance with established guidelines and limits stated in financial policies. The financial risks in the subsidiaries are managed by each subsidiary’s Treasury function.
Note 2. Critical estimates and key judgments
In order to close the books and prepare the financial statements in accordance with IFRS, management must make estimates and assumptions that affect the application of the accounting policies and the amounts recognized for assets, liabilities, income and expenses.
Estimates and judgments are based on historical experience, market infor-mation and assumptions that management considers to be reasonable based on the circumstances prevailing at the time. Changes in assumptions may result in adjustments to reported values and the actual outcome may differ from the estimates and judgments that were made.
Judgments in relation to the application of accounting policieswithin the scope of IFRS, there are some instances where management must either choose between accounting policies, or choose whether to apply a particular accounting policy, in order to provide a fair view of the Group’s activities. The development relating to accounting and the choice of policies are discussed in the Audit and Risk Committee.
Significant items for which a special judgment has been made in order to define the Group’s accounting policies are presented below.
Judgments See note
Participations in Group companies Control over investment or not Note P5
Participations in associates Fair value or equity method Note 12
Owner-occupied property Revaluation or cost model Note 17
Interest-bearing liabilities and related derivatives Application of hedge accounting Note 29
Important sources of uncertainty in estimatesThe most significant estimation uncertainties in relation to the preparation of the consolidated financial statements are presented below. Changes in assumptions may result in material effects on the financial statements and the actual outcome may differ from estimated values. For more detailed descrip-tions of the judgments and assumptions, please refer to the specific notes referenced below.
Estimates and assumptions See note
valuation of unlisted holdings
Appropriate valuation method, comparable companies, EBITDA multiples and sales multiples Note 29
valuation of interest-bearing liabilities and derivatives
yield curve for valuation of financial instruments for which trading is limited and duration is long-term Note 29
valuation of owner- occupied property
Comparable properties, long-term inflation rate, projected cash flows, real interest rate and risk premium Note 17
Impairment test of intangible assets
Projected cash-flows, growth rate, margins and discount factor Note 16
Reporting of deferred tax assets
Future possibilities to benefit from tax loss carry forwards Note 14
valuation of pension liabilities
Discount rate and future salary increase Note 25
Purchase Price Allocation valuation of acquired intangible assets Note 4
Note 3. Risks and risk management
INVESTOR 2016 NOTES TO ThE CONSOL IDATED F INANCIAL STATEMENTS 39

Market risksMarket risks refer to the risk of a change in value of a financial instrument because of changes in share prices, exchange rates or interest rates.
Share price riskInvestor’s most significant risk is share price risk. The majority of Investor’s share price risk exposure is concentrated to Listed Core Investments. At year-end 2016, Listed Core Investments accounted for 78 percent of total assets (78). For further information about Listed Core Investments, see pages 12-15. The companies and their share prices are analyzed and continuously moni-tored by Investor’s analysts. Thus, a large portion of share price exposure in a Listed Core Investment does not necessarily lead to any action. It is the long-term commitment that lays the groundwork for Investor’s strategic measures. Investor does not have defined goals for share price risks, as share prices are affected by short term fluctuations. The share price risk for Listed Core Investments is not hedged. If the market value of Listed Core Investments was to decline by 10 percent, the impact on income and equity would be SEK –24.8 bn. (–22.4).
The EqT fund investments are partly exposed to share price risk. EqT accounted for 5 percent of total assets (5) as per year-end 2016. Should the market value and the valuation parameters, in accordance with the guidelines of the International Private Equity and venture Capital Association, decline with 10 percent, the impact on the values of the EqT fund investments would be SEK –1.4 bn. (–1.3).
Patricia Industries including wholly-owned subsidiaries but excluding Patricia Industries’ cash, 3 Scandinavia and financial investments accounted for 17 percent of total assets (18). There is no share price risk associated with the wholly-owned subsidiaries. however, Patricia Industries’ listed financial investments face a share price risk. A 10 percent decline in share prices for the financial investments would imply a loss of –0.5 bn. for the financial invest-ments (–0.7).
Investor has a trading operation for the purpose of executing Listed Core Investments transactions and obtaining market information. The trading operation conducts short-term equity trading and deals in equity derivatives (primarily for hedging market risk in the portfolio). The market risk in this activity is measured and monitored in terms of cash delta. Limits on gross, net and maximum position size are measured as well as liquidity risk. At year-end 2016, the trading operation accounted for less than 0.5 percent of total assets (0.5). If the market value of the assets belonging to the trading operation were to decline by 10 percent, the impact on income and equity would be SEK –3 m. (–2).
Listed holdings in all business areasIf the market value of listed holdings in all business areas were to decline by 10 percent, the impact on income and equity would be SEK –25.3 bn. (–23.1), which equals 8.5 percent of Investor’s net asset value (8.5). Market risks asso-ciated with listed shares constitute the greatest risk for Investor.
Exchange rate riskCurrency exposure arises from cash flows in foreign currencies (transaction exposure), the translation of Balance Sheet items to foreign currencies (balance sheet exposure) and the translation of foreign subsidiaries’ Balance Sheets and Income Statements to the Groups accounting currency (translation exposure).
Balance sheet exposureSince the majority of Listed Core Investments are listed in SEK, there is a lim-ited direct exchange rate risk that affects Investor’s Balance Sheet. however, Investor is indirectly exposed to exchange rate risks in Listed Core Investments that are listed on foreign stock exchanges or that have foreign currency as their pricing currency. In addition, there are indirectly exchange rate risks since the majority of the companies in the Listed Core Investments business area are active in several markets. These risks have a direct impact on the company’s Balance Sheet and Income Statement, which indirectly affects valuation of the shares.
The wholly-owned subsidiaries are exposed to exchange rate risks in busi-ness and investments made in foreign companies. Also the EqT fund invest-ments are exposed to exchange rate risks.
There is no regular hedging of foreign currency since the investment hori-zon is more than three years and currency fluctuations are expected to equal out over time. This hedging policy is subject to continuous evaluation and deviations from the policy may be allowed if judged beneficial from a market economic perspective.
Exchange rate risks for investments in the trading operation are minimized through currency derivative contracts at the portfolio level.
Total currency exposure for the Investor Group is provided in the table below. If the SEK were to appreciate 10 percent against the EuR (holding all other factors constant), the impact on income and equity would be SEK –2.2 bn. (–2.0). If the SEK were to appreciate 10 percent against the uSD (hold-ing all other factors constant), the impact on income and equity would be SEK –3.1 bn. (–2.4).
Gross exposure in foreign currencies, SEK m.
Gross assets Gross liabilities
12/31 2016 12/31 2015 12/31 2016 12/31 2015
EuR 53,043 48,799 –36,109 –36,166uSD 37,995 28,617 –8,565 –5,691Other European and North American currencies 19,972 15,203 –11,044 –8,920Asian currencies 4,178 5,396 –2,735 –2,448
Total 115,187 98,016 –58,453 –53,226
Exchange rate risk in excess liquidity resulting from investments in foreign currency is managed through currency derivative contracts.
Exchange rate risk arising in connection with loans in foreign currency is managed by, among other things, exchanging the loans to SEK through cur-rency swap contracts. The objective is to minimize the exchange rate risk in excess liquidity and the debt portfolio. This strategy is applied if there is a high level of net exposure, having considered the holdings in foreign currency. The net exposure in foreign currencies after hedge is presented in the table below:
Net exposure in foreign currencies after hedge, SEK m. 12/31 2016 12/31 2015
EuR 21,819 19,645uSD 30,637 24,088Other European and North American currencies 16,381 13,696Asian currencies 3,895 4,939
Total 72,731 62,367
The net exposure increase in EuR is primarily explained by EqT investments and acquisition of wärtsilä shares. The increase in uSD net exposure relates mainly to the acquisition of Laborie and value increase in the Nasdaq hold-ing. The increased net exposure in other European currencies relates mainly to value increase in ABB. The decrease in Asian currencies relates to value change in Patricia Industries’ Asian holdings.
Currency exposure associated with transactionsInvestor AB’s guideline is, for future known cash flows in foreign currency exceeding the equivalent of SEK 50 m., to be hedged through forward exchange contracts, currency options or currency swaps.
Mölnlycke’s operational cash flows in foreign currency are estimated at the equivalent of EuR 446 m. (409), corresponding to SEK 4.2 bn. (3.8), for the next 12 months. For outstanding currency hedging as of December 31, 2016, an immediate 10 percent rise in the value of each currency against the EuR would impact net income by EuR 9.6 m. during the next 12 month period (6.4).
Permobil’s operational cash flows in foreign currency are estimated to SEK 1,184 m. for the coming 12 months (993). An immediate 10 percent rise in the value of each currency against the SEK would impact net income and equity for Permobil by SEK 96 m. the coming 12 months (99).
Currency exposure associated with net investments in foreign operationsCurrency exposure associated with investments made in independent foreign entities is considered as a translation risk and not an economic risk. The exposure arises when the foreign net investment is translated to SEK on the balance sheet date and it is recognized in the translation reserve under equity. Net investments are partly neutralized by loans in foreign currencies. Currency exposure due to net investments in foreign operations is normally not hedged.
The table below show the exposure, in main currencies, arising from net investments in foreign subsidiaries (in investment currency).
Currency exposure in equity 12/31 2016 12/31 2015
DKK m. 438 170EuR m. 3,610 3,673GBP m. 185 148NOK m. 701 615uSD m. 2,042 2,011
If the SEK were to appreciate by 10 percent this would decrease equity by SEK –5.9 bn. due to translation effects of currency exposure in net investments in foreign subsidiaries (–5.5).
Note 3. cont’d Risks and risk management
INVESTOR 2016NOTES TO ThE CONSOL IDATED F INANCIAL STATEMENTS 40

Because the wholly-owned subsidiaries are ring-fenced, a sensitivity analysis is also presented for the larger subsidiaries. For Mölnlycke, a one percent-age point increase in interest rates calculated on the Group’s net debt as of December 31, 2016, would impact income during the subsequent 12-month period by EuR –1.0 m. (–1.4).
For Aleris the interest rate risk exposure associated with liabilities amounts to SEK 2,856 m. (1,684). A parallel movement of the yield curve upwards by one percentage point would impact income and the equity by SEK –22 m. (–13).
For Permobil, the total interest rate risk exposure associated with liabilities amounts to SEK 2,916 m. (2,889) and a parallel movement of the yield curve upwards by one percentage point would impact the income statement and equity by SEK –29 m. (–29).
For Laborie the total interest rate risk exposure associated with liabilities amounts to uSD 120 m. A parallel movement of the yield curve upwards would impact the income statement and equity by uSD –1 m.
For BraunAbility the total interest rate risk exposure associated with liabili-ties amounts to uSD 104 m. (109). A parallel movement of the yield curve upwards would impact the income statement and equity by uSD –1 m. (–1).
Liquidity and financing riskLiquidity risk refers to the risk that a financial instrument cannot be divested without considerable extra costs, and to the risk that liquidity will not be avail-able to meet payment commitments.
Liquidity risks are reduced in Treasury operations by limiting the maturity of short-term cash investments up to two years and by always maintaining a higher than 1:1 ratio between cash and credit commitments/current liabilities. Liquid funds are invested in deposit markets and short-term interest-bearing securities with low risk and high liquidity. In other words, they are invested in a well-functioning second-hand market, allowing conversion to liquid funds when needed. Liquidity risk in the trading operations is restricted via limits established by the Board.
Financing risks are defined as the risk that financing can not be obtained, or can only be obtained at increased costs as a result of changed conditions in the capital market. To reduce the effect of refinancing risks, limits are set regarding average maturities for loans. In order to minimize financing risks, Treasury works actively to ensure financial preparedness by establishing loan and credit limits for both long-term and short-term borrowing. Financing risks are further reduced by allocating loan maturities evenly over time (please refer to the chart below) and by diversifying sources of capital. An important aspect, in this context, is the ambition to have a long borrowing profile. Fur-thermore, proactive liquidity-planning efforts also help limit both liquidity and financing risk.
Investor’s funding is primarily done through long-term loan programs in the Swedish and European capital markets. Investor has a European Medium Term Note Program (EMTN), which is a loan program intended for long-term financ-ing. The program is for EuR 5.0 bn. (SEK 47.8 bn.), of which EuR 3.1 bn. (SEK 30.1 bn.) has been utilized. For short-term financing, Investor has an uncom-mitted Swedish and a European Commercial Paper program (CP/ECP) for SEK 10.0 bn. and uSD 1.5 bn. (SEK 13.6 bn.), respectively. At year-end 2016 these facilities were unutilized.
Interest rate riskThe Group’s interest rate risk is primarily associated with long-term borrowings. In order to minimize the effects of interest rate fluctuations, limits and instruc-tions have been established for example regarding fixed interest rate periods.
Excess liquidity and debt portfolioInvestor AB’s Treasury manages interest rate risks, exchange rate risks, liquid-ity risks and financing risks associated with the administration of the excess liquidity portfolio and financing activities.
For excess liquidity exposed to interest rate risks, the goal is to limit interest rate risks while maximizing return within the established guidelines of the risk policy. high financial flexibility is also strived for in order to satisfy future liquid-ity needs. Investments are therefore made in interest-bearing securities of short duration and high liquidity. For further information, see note 22, Other financial investments, short-term investments and cash and cash equivalents. A one per-centage point parallel movement upward of the yield curve would reduce the value of the portfolio and affect the Income Statement by SEK –74 m. (–114).
On the liability side, Investor strives to manage interest rate risks by having an interest rate fixing tenor within the established limits and instructions of the Risk Policy. Fixed rates are established to provide flexibility to change the loan portfolio in step with investment activities and to minimize loan costs and volatility in the cash flow over time. A parallel movement of the yield curve downwards by one percentage point would increase the reported value of the hedged portion of loans by SEK 1.2 bn. (1.2). The amount is reduced to 0.2 bn. when hedging derivatives are included (0.2). The interest cost effect for the non-hedged loans would be SEK –2.0 bn. (–1.9), with a movement of the yield curve downwards with one percentage point.
Investor uses derivatives to hedge against interest rate risks (related to both fair value and cash flow fluctuations) in the debt portfolio. Some derivatives do not qualify for hedge accounting, but are still grouped together with loans since the intention of the derivative is to achieve the desired fixed-interest term for each loan. The subsidiaries Aleris and Permobil do not apply hedge accounting.
As per year-end the fair value hedge derivatives related to the hedged loans amounted accumulated to SEK 2,457 m. (1,837). Corresponding value change of the hedged loans at the same time was SEK –2,265 m. (–1,599). The total outstanding carrying amount of hedged loans, including fair value, was at year-end SEK 16,340 m. (17,955).
The effect of fair value hedges is recognized in the Income Statement. The remaining maturities of fair value hedges vary between 3 and 21 years. For further information on the maturity structure, see schedule, “Investor AB’s debt maturity profile”.
In the case of cash flow hedges, hedging instruments are valued on each balance sheet date and the change in value is recognized in other comprehen-sive income. The remaining maturities for cash flow hedges are below 1 year.
During the year, the impact of cash flow hedges on other comprehensive income was SEK 32 m. (13). with a parallel movement of the yield curve by one percentage point, the cash flow hedges effect on other comprehensive income would be SEK –4 m. (–19).
Note 3. cont’d Risks and risk management
SEK m.
Future cash flows from cash flow hedged transactions
20152016
–1 000
–800
–600
–400
–200
0
> 5 years2-5 years1-2 years6-12 months< 6 months
Mkr
Framtida kassaflöden från kassaflödessäkrade transaktioner
20152016
– 1 000
–800
–600
–400
–200
0
> 5 år2-5 år1-2 år6-12 månader< 6 månader
SEK m. Years
Investor AB’s debt maturity profile
0
1,000
2,000
3,000
4,000
5,000
6,000
7,000
Debt Maturity nominal values, SEK m. Average Debt Maturity, years
0
2
4
6
8
10
12
2037
2044
2036
2033
2023
2029
2022
2021
2019
2018
2017
2034
Mkr År
Förfallostruktur för Investor AB:s lån
0
1 000
2 000
3 000
4 000
5 000
6 000
7 000
Förfallostruktur, nominellt värde, Mkr Genomsnittligt förfall, år
0
2
4
6
8
10
12
2037
2044
2036
2033
2023
2029
2022
2021
2019
2018
2017
2034
INVESTOR 2016 NOTES TO ThE CONSOL IDATED F INANCIAL STATEMENTS 41

Investor renegotiated its committed syndicated bank loan facility of SEK 10.0 bn. in January 2017. This facility is available until 2022, with an option of another two years additional extension. This facility was unutilized at year-end. In contrast to an uncommitted credit facility, a committed loan program is a formalized commitment from the credit grantor. There are no financial covenants in any of Investor AB’s loan contracts, meaning that Investor does not have to meet special requirements with regard to key financial ratios for the loans it has obtained.
The wholly-owned subsidiaries ensure their financial preparedness by keep-ing credit facilities, should there be a need for additional working capital or minor acquisitions. As of December 31, 2016, Mölnlycke had a total credit facility of EuR 1,196 m. (1,195), of which EuR 1,001 m. was utilized (995). At the same time, Aleris had total credit facilities amounting to SEK 3,480 m. (2,091) of which SEK 2,782 m. (1,566) had been utilized. Also at year-end 2016, Permobil had total credit facilities of SEK 3,437 m. (2,983) of which 3,037 m. was used (2,889). vectura had a total credit facility of SEK 1,767 m. (1,284), of which none was used as per year-end (0). BraunAbility had a total credit facility of uSD 196 m. (175), of which uSD 123 m. was used (120). Laborie had at year-end a total credit facility of uSD 120 m. which was fully used. The terms of the credit facilities require the companies to meet a num-ber of key financial ratios. The subsidiaries fulfilled all financial ratios during 2016.
with an equity/assets ratio of 81 percent at year-end (81), Investor has considerable financial flexibility, since leverage is low and most assets are highly liquid.
The following table shows the Group’s contracted cash flow of loans including other financial payment commitments and derivatives.
12/31 2016 12/31 2015
Cash flow of financial liabilities and derivatives 1), SEK bn.
Loans and other financial debts
and commitments Derivatives
Loans and other financial debts
and commitments Derivatives
< 6 months –2.5 0.0 –5.1 0.06-12 months –1.7 0.0 –0.8 0.21-2 years –3.7 0.0 –3.2 0.32-5 years –12.0 –0.2 –13.3 0.8> 5 years –49.3 4.3 –46.2 2.8
1) Interest payments included.
For information on the Group’s excess liquidity and how it is invested, see note 22, Other financial investments, short-term investments and cash and cash equivalents.
Exposure from guarantees and other contingent liabilities also constitutes a liquidity risk. For such exposure as per December 31, 2016, see note 30, Pledged assets and contingent liabilities.
Credit riskCredit risk is the risk of a counterparty or issuer being unable to repay a liabil-ity to Investor. Investor is exposed to credit risks primarily through investments of excess liquidity in interest-bearing securities. Credit risks also arise as a result of positive market values in derivative instruments (mainly interest rate, currency swaps).
Investor applies a wide-ranging limit structure with regard to maturities, issuers and counterparties in order to limit credit risks on single counterpar-ties. with a view to further limiting credit risks in interest rate and currency swaps, and other derivative transactions, agreements are established with counterparties in accordance with the International Swaps and Derivatives Association, Inc. (ISDA), as well as netting agreements. Credit risk is moni-tored daily and the agreements with various counterparties are continuously analyzed.
The following table shows the credit risk exposure in interest-bearing secu-rities, by rating category, as of December 31, 2016.
InstrumentNominal
amount, SEK m.
Average remaining
maturity, months
Number of counter-
parties
Percentage of the credit risk
exposure
AAA 8,642 10.1 6 39AA 2,700 1.2 26 12A 8,303 0.1 39 37Lower than A 2,646 3.5 28 12
Total 22,291 4.5 99 100
The total credit risk exposure related to the fair value reported items at the end of 2016 amounted to SEK 22,291 m. (23,336). As of December 31, 2016, the credit risks resulting from positive market values for derivatives amounted to SEK 2,402 m. (1,909), which have been reported in the Balance Sheet.
The credit risk in the wholly-owned subsidiaries relates mainly to trade account receivables. Mölnlycke’s, Aleris’ and Permobil’s credit risks are lim-ited due to the fact that a significant portion of their customers are public hospitals /care institutions.
The maximum exposure related to commercial credit risk corresponds to the carrying amount of trade receivables.
The following table shows the aging of trade receivables and other short-term receivables within the Group.
12/31 2016 12/31 2015
Aging of receivables, SEK m.
Gross carrying amount
Impair-ment Net
Gross carrying amount
Impair-ment Net
Not past due 3,311 –2 3,309 3,031 0 3,031Past due 0-30 days 459 –2 457 394 0 394Past due 31-90 days 174 –12 162 162 –2 160Past due 91-180 days 97 –9 88 92 –4 88Past due 181-360 days 51 –9 41 71 –6 65More than 360 days 81 –23 58 68 –33 35
BS Total 4,173 –57 4,116 3,818 –45 3,773
Concentrations of credit risksConcentrations of risk are defined as individual positions or areas accounting for a significant portion of the total exposure to each area of risk. Because of the global nature of its business and sector diversification, the Group does not have any specific customers representing a significant portion of receivables.
The concentration of credit risk exposure related to fair value reported items, is presented in the adjacent table. The secured bonds issued by Swedish mortgage institutions have the primary rating category of AAA. The propor-tion of AAA-rated instruments accounted for 39 percent of the total credit risk portfolio’s nominal value (43).
SUSTAINABILITY RISKSInvestor is exposed to sustainability risks in all parts of its business operations. Sustainability risks imply that unethical or unsustainable behaviour leads to negative impact on Investor’s financial position and reputation. Sustainability risks within the Group are identified, analyzed and mitigated within the daily operations. Most of the risks are derived from operations in Investor’s holdings. when holdings operate in emerging markets, the holdings have an increased focus on sustainability related risks such as the risk of bribery and corruption. Investor has clear expectations that the holdings always act responsibly and ethically, and it is the responsibility of each holding and its management to analyze and take systematic action to reduce these risks.
OTHER RISKSThe Group is also exposed to political risks. To a large extent, spending on healthcare products and services is regulated by various governments. This applies to most markets around the world. Funds are made available or with-drawn from healthcare budgets due to different types of political decisions. In most of the major markets, pricing of products and services is controlled by decisions made by government authorities. Activities within health care com-panies are also heavily regulated. Examples of such laws are the health and Medical Service Act, the Social Services Act and environmental legislation.
There is a high awareness of legal and regulatory risks within the Investor Group. Risks associated with selling and operating healthcare services are dealt with by the different levels of management for each area of opera-tions. Continuous quality improvement is performed in accordance with ISO-standards.
Property risks, liability risks and interruption risks are covered by insurance policies. up to this date, very few incidents have occurred.
Follow-up on processes is performed on an ongoing basis to determine and strengthen appropriate control measures aimed at reducing operational risks.
Note 3. cont’d Risks and risk management
INVESTOR 2016NOTES TO ThE CONSOL IDATED F INANCIAL STATEMENTS 42
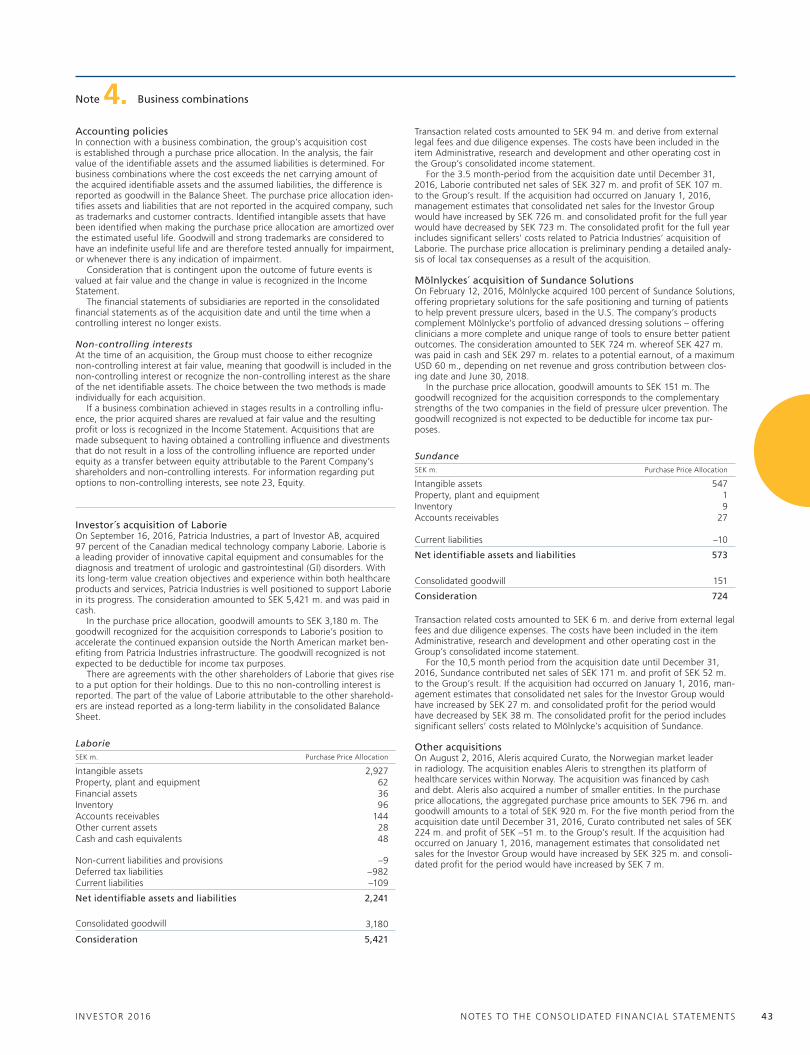
Transaction related costs amounted to SEK 94 m. and derive from external legal fees and due diligence expenses. The costs have been included in the item Administrative, research and development and other operating cost in the Group’s consolidated income statement.
For the 3.5 month-period from the acquisition date until December 31, 2016, Laborie contributed net sales of SEK 327 m. and profit of SEK 107 m. to the Group’s result. If the acquisition had occurred on January 1, 2016, management estimates that consolidated net sales for the Investor Group would have increased by SEK 726 m. and consolidated profit for the full year would have decreased by SEK 723 m. The consolidated profit for the full year includes significant sellers’ costs related to Patricia Industries’ acquisition of Laborie. The purchase price allocation is preliminary pending a detailed analy-sis of local tax consequenses as a result of the acquisition.
Mölnlyckes´ acquisition of Sundance SolutionsOn February 12, 2016, Mölnlycke acquired 100 percent of Sundance Solutions, offering proprietary solutions for the safe positioning and turning of patients to help prevent pressure ulcers, based in the u.S. The company’s products complement Mölnlycke’s portfolio of advanced dressing solutions – offering clinicians a more complete and unique range of tools to ensure better patient outcomes. The consideration amounted to SEK 724 m. whereof SEK 427 m. was paid in cash and SEK 297 m. relates to a potential earnout, of a maximum uSD 60 m., depending on net revenue and gross contribution between clos-ing date and June 30, 2018.
In the purchase price allocation, goodwill amounts to SEK 151 m. The goodwill recognized for the acquisition corresponds to the complementary strengths of the two companies in the field of pressure ulcer prevention. The goodwill recognized is not expected to be deductible for income tax pur-poses.
SundanceSEK m. Purchase Price Allocation
Intangible assets 547Property, plant and equipment 1Inventory 9Accounts receivables 27
Current liabilities –10
Net identifiable assets and liabilities 573
Consolidated goodwill 151
Consideration 724
Transaction related costs amounted to SEK 6 m. and derive from external legal fees and due diligence expenses. The costs have been included in the item Administrative, research and development and other operating cost in the Group’s consolidated income statement.
For the 10,5 month period from the acquisition date until December 31, 2016, Sundance contributed net sales of SEK 171 m. and profit of SEK 52 m. to the Group’s result. If the acquisition had occurred on January 1, 2016, man-agement estimates that consolidated net sales for the Investor Group would have increased by SEK 27 m. and consolidated profit for the period would have decreased by SEK 38 m. The consolidated profit for the period includes significant sellers’ costs related to Mölnlycke’s acquisition of Sundance.
Other acquisitionsOn August 2, 2016, Aleris acquired Curato, the Norwegian market leader in radiology. The acquisition enables Aleris to strengthen its platform of healthcare services within Norway. The acquisition was financed by cash and debt. Aleris also acquired a number of smaller entities. In the purchase price allocations, the aggregated purchase price amounts to SEK 796 m. and goodwill amounts to a total of SEK 920 m. For the five month period from the acquisition date until December 31, 2016, Curato contributed net sales of SEK 224 m. and profit of SEK –51 m. to the Group’s result. If the acquisition had occurred on January 1, 2016, management estimates that consolidated net sales for the Investor Group would have increased by SEK 325 m. and consoli-dated profit for the period would have increased by SEK 7 m.
Note 4. Business combinations
Accounting policiesIn connection with a business combination, the group’s acquisition cost is established through a purchase price allocation. In the analysis, the fair value of the identifiable assets and the assumed liabilities is determined. For business combinations where the cost exceeds the net carrying amount of the acquired identifiable assets and the assumed liabilities, the difference is reported as goodwill in the Balance Sheet. The purchase price allocation iden-tifies assets and liabilities that are not reported in the acquired company, such as trademarks and customer contracts. Identified intangible assets that have been identified when making the purchase price allocation are amortized over the estimated useful life. Goodwill and strong trademarks are considered to have an indefinite useful life and are therefore tested annually for impairment, or whenever there is any indication of impairment.
Consideration that is contingent upon the outcome of future events is valued at fair value and the change in value is recognized in the Income Statement.
The financial statements of subsidiaries are reported in the consolidated financial statements as of the acquisition date and until the time when a controlling interest no longer exists.
Non-controlling interestsAt the time of an acquisition, the Group must choose to either recognize non-controlling interest at fair value, meaning that goodwill is included in the non-controlling interest or recognize the non-controlling interest as the share of the net identifiable assets. The choice between the two methods is made individually for each acquisition.
If a business combination achieved in stages results in a controlling influ-ence, the prior acquired shares are revalued at fair value and the resulting profit or loss is recognized in the Income Statement. Acquisitions that are made subsequent to having obtained a controlling influence and divestments that do not result in a loss of the controlling influence are reported under equity as a transfer between equity attributable to the Parent Company’s shareholders and non-controlling interests. For information regarding put options to non-controlling interests, see note 23, Equity.
Investor´s acquisition of LaborieOn September 16, 2016, Patricia Industries, a part of Investor AB, acquired 97 percent of the Canadian medical technology company Laborie. Laborie is a leading provider of innovative capital equipment and consumables for the diagnosis and treatment of urologic and gastrointestinal (GI) disorders. with its long-term value creation objectives and experience within both healthcare products and services, Patricia Industries is well positioned to support Laborie in its progress. The consideration amounted to SEK 5,421 m. and was paid in cash.
In the purchase price allocation, goodwill amounts to SEK 3,180 m. The goodwill recognized for the acquisition corresponds to Laborie’s position to accelerate the continued expansion outside the North American market ben-efiting from Patricia Industries infrastructure. The goodwill recognized is not expected to be deductible for income tax purposes.
There are agreements with the other shareholders of Laborie that gives rise to a put option for their holdings. Due to this no non-controlling interest is reported. The part of the value of Laborie attributable to the other sharehold-ers are instead reported as a long-term liability in the consolidated Balance Sheet.
LaborieSEK m. Purchase Price Allocation
Intangible assets 2,927Property, plant and equipment 62Financial assets 36Inventory 96Accounts receivables 144Other current assets 28Cash and cash equivalents 48
Non-current liabilities and provisions –9Deferred tax liabilities –982Current liabilities –109
Net identifiable assets and liabilities 2,241
Consolidated goodwill 3,180
Consideration 5,421
INVESTOR 2016 NOTES TO ThE CONSOL IDATED F INANCIAL STATEMENTS 43
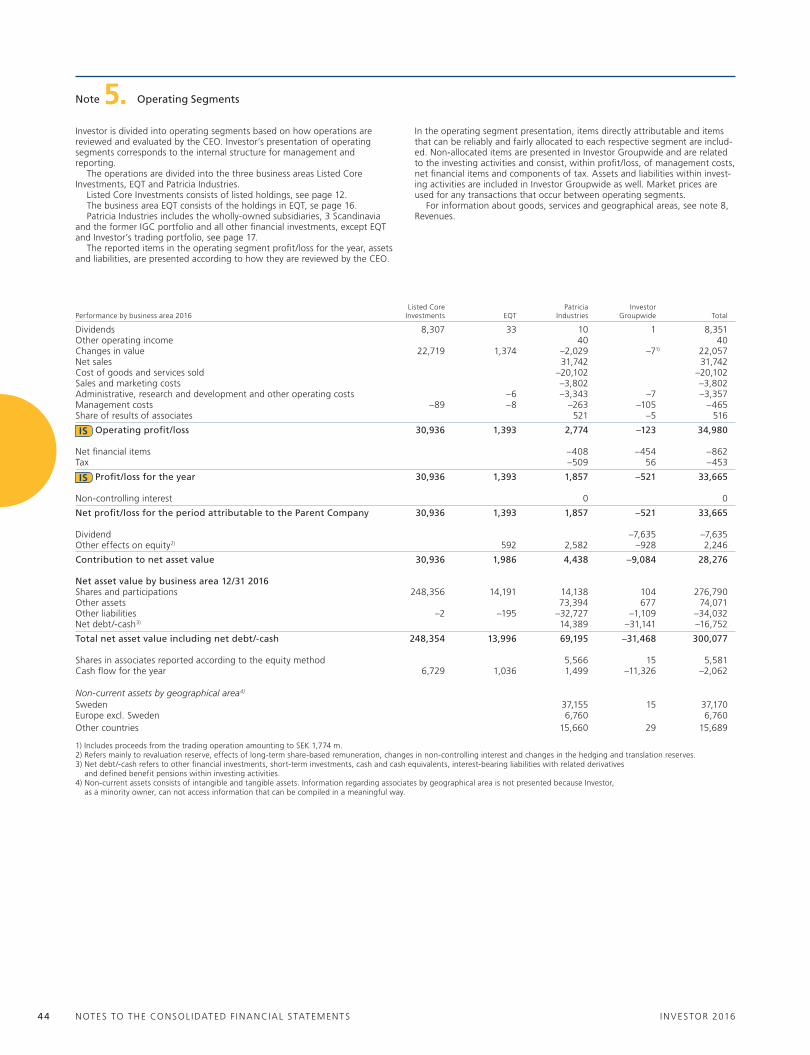
Investor is divided into operating segments based on how operations are reviewed and evaluated by the CEO. Investor’s presentation of operating segments corresponds to the internal structure for management and reporting.
The operations are divided into the three business areas Listed Core Investments, EqT and Patricia Industries.
Listed Core Investments consists of listed holdings, see page 12.The business area EqT consists of the holdings in EqT, se page 16.Patricia Industries includes the wholly-owned subsidiaries, 3 Scandinavia
and the former IGC portfolio and all other financial investments, except EqT and Investor’s trading portfolio, see page 17.
The reported items in the operating segment profit/loss for the year, assets and liabilities, are presented according to how they are reviewed by the CEO.
Note 5. Operating Segments
In the operating segment presentation, items directly attributable and items that can be reliably and fairly allocated to each respective segment are includ-ed. Non-allocated items are presented in Investor Groupwide and are related to the investing activities and consist, within profit/loss, of management costs, net financial items and components of tax. Assets and liabilities within invest-ing activities are included in Investor Groupwide as well. Market prices are used for any transactions that occur between operating segments.
For information about goods, services and geographical areas, see note 8, Revenues.
Performance by business area 2016Listed Core
Investments EqTPatricia
IndustriesInvestor
Groupwide Total
Dividends 8,307 33 10 1 8,351Other operating income 40 40Changes in value 22,719 1,374 –2,029 –71) 22,057Net sales 31,742 31,742Cost of goods and services sold –20,102 –20,102Sales and marketing costs –3,802 –3,802Administrative, research and development and other operating costs –6 –3,343 –7 –3,357Management costs –89 –8 –263 –105 –465Share of results of associates 521 –5 516
IS Operating profit/loss 30,936 1,393 2,774 –123 34,980 Net financial items –408 –454 –862Tax –509 56 –453
IS Profit/loss for the year 30,936 1,393 1,857 –521 33,665
Non-controlling interest 0 0
Net profit/loss for the period attributable to the Parent Company 30,936 1,393 1,857 –521 33,665
Dividend –7,635 –7,635Other effects on equity 2) 592 2,582 –928 2,246
Contribution to net asset value 30,936 1,986 4,438 –9,084 28,276
Net asset value by business area 12/31 2016Shares and participations 248,356 14,191 14,138 104 276,790Other assets 73,394 677 74,071Other liabilities –2 –195 –32,727 –1,109 –34,032Net debt/-cash 3) 14,389 –31,141 –16,752
Total net asset value including net debt/-cash 248,354 13,996 69,195 –31,468 300,077
Shares in associates reported according to the equity method 5,566 15 5,581Cash flow for the year 6,729 1,036 1,499 –11,326 –2,062
Non-current assets by geographical area 4)
Sweden 37,155 15 37,170Europe excl. Sweden 6,760 6,760Other countries 15,660 29 15,689
1) Includes proceeds from the trading operation amounting to SEK 1,774 m.2) Refers mainly to revaluation reserve, effects of long-term share-based remuneration, changes in non-controlling interest and changes in the hedging and translation reserves.3) Net debt/-cash refers to other financial investments, short-term investments, cash and cash equivalents, interest-bearing liabilities with related derivatives
and defined benefit pensions within investing activities.4) Non-current assets consists of intangible and tangible assets. Information regarding associates by geographical area is not presented because Investor,
as a minority owner, can not access information that can be compiled in a meaningful way.
INVESTOR 2016NOTES TO ThE CONSOL IDATED F INANCIAL STATEMENTS 4 4
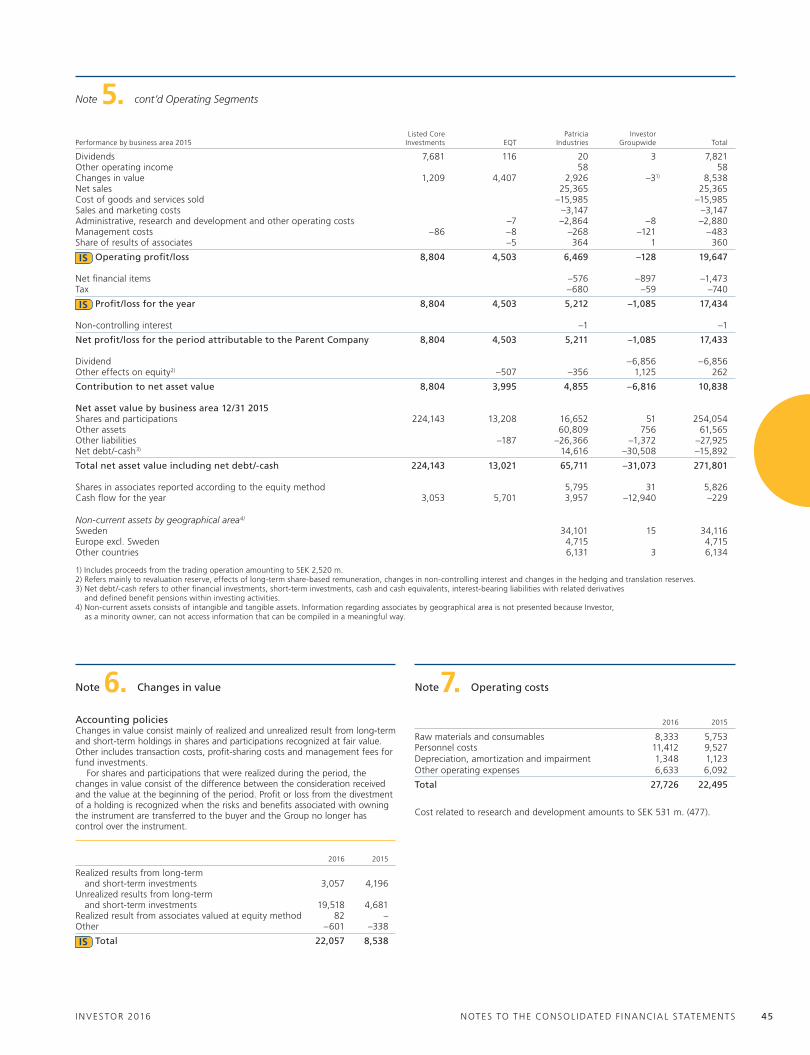
Note 5. cont’d Operating Segments
Note 7. Operating costs
2016 2015
Raw materials and consumables 8,333 5,753Personnel costs 11,412 9,527Depreciation, amortization and impairment 1,348 1,123Other operating expenses 6,633 6,092
Total 27,726 22,495
Cost related to research and development amounts to SEK 531 m. (477).
2016 2015
Realized results from long-term and short-term investments 3,057 4,196unrealized results from long-term and short-term investments 19,518 4,681Realized result from associates valued at equity method 82 –Other –601 –338
IS Total 22,057 8,538
Note 6. Changes in value
Accounting policiesChanges in value consist mainly of realized and unrealized result from long-term and short-term holdings in shares and participations recognized at fair value. Other includes transaction costs, profit-sharing costs and management fees for fund investments.
For shares and participations that were realized during the period, the changes in value consist of the difference between the consideration received and the value at the beginning of the period. Profit or loss from the divestment of a holding is recognized when the risks and benefits associated with owning the instrument are transferred to the buyer and the Group no longer has control over the instrument.
Performance by business area 2015Listed Core
Investments EqTPatricia
IndustriesInvestor
Groupwide Total
Dividends 7,681 116 20 3 7,821Other operating income 58 58Changes in value 1,209 4,407 2,926 –31) 8,538Net sales 25,365 25,365Cost of goods and services sold –15,985 –15,985Sales and marketing costs –3,147 –3,147Administrative, research and development and other operating costs –7 –2,864 –8 –2,880Management costs –86 –8 –268 –121 –483Share of results of associates –5 364 1 360
IS Operating profit/loss 8,804 4,503 6,469 –128 19,647 Net financial items –576 –897 –1,473Tax –680 –59 –740
IS Profit/loss for the year 8,804 4,503 5,212 –1,085 17,434
Non-controlling interest –1 –1
Net profit/loss for the period attributable to the Parent Company 8,804 4,503 5,211 –1,085 17,433
Dividend –6,856 –6,856Other effects on equity 2) –507 –356 1,125 262
Contribution to net asset value 8,804 3,995 4,855 –6,816 10,838
Net asset value by business area 12/31 2015Shares and participations 224,143 13,208 16,652 51 254,054Other assets 60,809 756 61,565Other liabilities –187 –26,366 –1,372 –27,925Net debt/-cash 3) 14,616 –30,508 –15,892
Total net asset value including net debt/-cash 224,143 13,021 65,711 –31,073 271,801
Shares in associates reported according to the equity method 5,795 31 5,826Cash flow for the year 3,053 5,701 3,957 –12,940 –229
Non-current assets by geographical area 4)
Sweden 34,101 15 34,116Europe excl. Sweden 4,715 4,715Other countries 6,131 3 6,134
1) Includes proceeds from the trading operation amounting to SEK 2,520 m.2) Refers mainly to revaluation reserve, effects of long-term share-based remuneration, changes in non-controlling interest and changes in the hedging and translation reserves.3) Net debt/-cash refers to other financial investments, short-term investments, cash and cash equivalents, interest-bearing liabilities with related derivatives
and defined benefit pensions within investing activities.4) Non-current assets consists of intangible and tangible assets. Information regarding associates by geographical area is not presented because Investor,
as a minority owner, can not access information that can be compiled in a meaningful way.
INVESTOR 2016 NOTES TO ThE CONSOL IDATED F INANCIAL STATEMENTS 45

Net sales
By category: 2016 2015
Sales of products 21,048 16,125Sales of services 10,504 9,077Other income 190 162
IS Total 31,742 25,365
By field of operation: 2016 2015
health care equipment 20,730 16,125health care services 10,360 8,621hotel 629 597Real estate 23 22
IS Total 31,742 25,365
By geographical market: 2016 2015
Sweden 6,421 6,082Scandinavia, excl. Sweden 5,936 4,684Europe, excl. Scandinavia 7,497 7,309u.S. 9,862 5,780North America, excl. u.S. 436 330South America 164 64Africa 248 188Australia 547 446Asia 631 482
IS Total 31,742 25,365
External revenues are presented on the basis where the customer is resident. Net sales are attributable to wholly-owned subsidiaries. No customer exceeds 10 percent of total net sales.
Accounting policiesRevenues included in operating profit are dividends, other operating income and net sales.
Dividends received are recognized when the right to receive payment has been established. Other operating income consists primarily of interest on shareholder loans to associates and it is calculated using the effective interest rate method.
Net salesRevenue from the sale of goods is recognized when the significant risks and rewards of ownership have been transferred to the buyer. Services provided as part of healthcare activities are sold via multi-year operating contracts and, in some cases, framework agreements. Revenue from services is recognized based on the stage of completion on balance sheet date. Completion is determined by an assessment of the work done, on the basis of performed examinations.
Revenue is not recognized if it is probable that economic benefits will not flow to the Group. No revenue is recognized if there is significant uncertainty regarding the payment, associated costs or the risk of returns. Neither is revenue recognized if the seller remains involved in day-to-day management activities that are typically associated with ownership. Revenue is recognized at the fair value of consideration received or expected to be received, less any discounts. Revenue shall be recognized when the amount of revenue can be measured reliably.
A provision is made for the risk of loss if the total directly attributable costs during the entire term of the contract are expected to exceed the total revenues, including indexation.
Note 8. Revenues Note 9. Employees and personnel costs
Accounting policiesAccounting policies on employee benefits such as short-term benefits, termination benefits and share-based payment transactions are presented below. Post-employment benefits are presented in note 25, Provisions for pensions and similar obligations.
Short-term benefitsShort-term employee benefits are measured on an undiscounted basis and are expensed as the related services are provided. A provision is made for the anticipated cost of variable cash salary and profit-sharing contracts when the Group has a current obligation to make such payments (because services have been provided by employees) and when the obligation can be reliably estimated.
Termination benefitsThe cost of termination benefits is recognized only if the company is demonstrably committed (without any realistic possibility of withdrawing the commitment) by a formal plan to prematurely terminate an employee’s employment.
Share-based payment transactionsInvestor AB has issued equity-settled stock option and share programs and cash-settled (synthetic) shares.
Accounting for equity-settled programsThe fair value of stock options and share programs issued is determined at the grant date in accordance with the Black & Scholes valuation model, taking into consideration the terms and conditions that are related to the share price.The value is recognized in the income statement as a personnel cost allocated over the vesting period with a corresponding increase in equity. The amount charged to the income statement is reversed in equity each time of the income statement charge. The recognized cost corresponds to the fair value of the estimated number of options and shares that are expected to vest. This cost is adjusted in subsequent periods to reflect the actual number of vested options and shares. however, no adjustment is made when options and shares expire only because share-price related conditions do not reach the level needed for the options to vest.
when equity-settled programs are exercised, shares are delivered to the employee. The delivered shares are treasury shares that are repurchased when needed. when exercised, the payment of the exercise price that was received from the employee is reported as an increase in equity.
Equity-settled programs issued to employees in Group companiesIn the Parent Company, the value of equity instruments, which is offered to employees of other companies belonging to the Group, is reported as a capital contribution to subsidiaries. The value of participations in subsidiaries increases simultaneously to the Parent Company’s reporting of an increase in equity. The costs related to employees in companies concerned are invoiced to the subsidiaries. The cash settlement of the invoices then neutralizes the increase of participations in subsidiaries.
Accounting for cash-settled programsCash-settled (synthetic) shares result in an obligation that is valued at fair value and recognized as an expense with a corresponding increase in liabili-ties. Initial fair value is calculated and the grant value is recognized over the vesting period as a personnel cost, which is similar to the recognition of equity -settled programs. however, cash settled programs are revalued at fair value every balance sheet date and at final settlement. All changes in the fair value as a result of changes in share price are recognized in the financial net with a corresponding change in liabilities.
when cash-settled programs are exercised, the liability to the holder of the synthetic shares is settled.
Accounting for social security attributable to share-based payment transactions Social security expenses attributable to share-based remuneration are recognized and amortized in accordance with the same policies as the costs for synthetic shares.
INVESTOR 2016NOTES TO ThE CONSOL IDATED F INANCIAL STATEMENTS 46

Note 9. cont’d Employees and personnel costs
Average number of employees in the Group
2016 2015
TotalOf which
women TotalOf which
women
Parent Company, Sweden 71 36 71 38Sweden, excl. Parent Company 6,295 4,797 6,023 4,611Europe excl. Sweden 6,616 4,680 5,337 3,644North- and South America 2,626 875 1,464 462Africa 6 4 – –Asia 3,593 2,562 3,663 2,758Australia 85 59 144 70
Total Group 19,292 13,011 16,702 11,583
Gender distribution in Boards and Senior management
2016 2015
Men women Men women
Gender distribution in percentBoard of the Parent Company 64 36 64 36Management Group of the Parent Company incl. the President 60 40 60 40Boards in the Group1) 70 30 71 29Management Groups in the Group 60 40 60 40
1) Based on all Group companies including small, internal companies with minor activity.
Guidelines for remuneration to members of the Management Group and other employees in Investing activitiesThe AGM 2016 decided on guidelines for salary and other remuneration for the President and other Members of the Management Group. The Board of Directors may, where particular grounds exist in the individual case, decide to deviate from the guidelines.
Investor strives to offer a total remuneration that is competitive and in line with market conditions, thereby enabling it to attract the right type of exper-tise to the company. The total remuneration should be based on factors such as position, performance and individual qualifications. The total remuneration for the Management Group shall consist of: basic salary, variable cash salary, long-term share-based remuneration, pension and other remuneration and benefits.
Basic salaryBasic salary is reviewed annually for all Investor employees. Basic salary constitutes the basis for calculating variable salary.
Variable cash salary Investor’s employees can have a portion of their salary as variable cash salary. The variable portion of salary differs between business areas. For the Presi-dent Johan Forssell, it amounts to a maximum of 30 percent of basic salary. For other employees, the maximum variable salary ranges between 0 and 80 percent of their basic salary, although for a very limited number of key per-sonnel, the variable portion of salary can be a maximum of 100 percent of their basic salary. The President may award additional variable salary to com-pany employees who he feels have made an exceptional contribution during the year. however, any such additional variable salary must be approved by Investor’s Remuneration Committee.
The established goals must also be reached in order to receive the variable salary. Goals are reviewed at the end of the year. The focus of the President’s goals for the year is determined through a dialog between the President and the Chairperson of the Board. The goals for the President are proposed by the Remuneration Committee and later approved by the Board. Goals for other employees are established by each employee’s manager.
Long-term share-based remuneration For long-term variable remuneration programs, it is the Board’s ambition to create a structure that results in employee commitment and is based on the long-term development of Investor. As a result, part of the remuneration to employees is related to the long-term performance of Investor and the Investor share, which exposes the employee to both increases and decreases of the share price. In 2006, a Stock Matching Plan was introduced for Investor employees, as well as a performance based share program for Senior Manage-ment. “Senior Management” is defined as the President, other members of the Management Group and a maximum of 20 other senior executives. The structure of the programs for 2007-2016 correspond in all material aspects to the program for 2006. The employee is required to invest his or her own funds, or commit shares, in order to participate in the program. For more details regarding the programs, see page 48-49.
PensionPension benefits consists of a premium based pension plan of which the ratio of pension provisions to fixed cash salary depends on the age of the executive. In respect of employees working abroad, pension benefits shall be adjustable in line with local pensions practice. The age of retirement for the President and other Members of the Management Group is 60 years.
Other remuneration and benefitsProfit-sharing program for the trading operation This program includes participants both from the trading organization and the investment organization. The participants in this program receive, in addition to their base salary, a variable salary equivalent to 20 percent of the trading function’s net result. The program includes a clawback principle by which 50 percent of the variable salary allotment is withheld for one year and will only be paid out in full if the trading result for that year is positive. In order to receive full allotment, two consecutive profitable years are thus required. Approximately 10-15 employees in total participate in the program.
Termination and severance payInvestor and Members of the Management Group may mutually terminate employment contracts subject to a six months´ notice. Fixed cash salary during the notice period and severance pay shall, for Members of the Management Group with employment contracts entered into after the Annual General Meeting 2010, in aggregate not exceed the fixed cash salary for two years. For members of the Management Group employed before the Annual Gen-eral Meeting of 2010 the contracts already entered into shall apply. For these Members a mutual termination period of six month applies and severance payment is maximized to two years of fixed cash salary.
Fees received for Board workInvestor allows Management Group members to keep any fees that they have received for work done on the Boards of the Company’s Listed Core Invest-ments. One reason for allowing this practice is that the employee assumes personal responsibility by having a Board position. Fees received for Board work are taken into account by Investor when determining the employee’s total remuneration.
Other benefits Investor offers Management Group members and other employees a variety of non-monetary benefits, including corporate health service, health insur-ance, subsidized lunches, employee fitness programs and the possibility to rent vacation homes. Managers and employees with young children are also offered in-home services in the form of cleaning and baby-sitting.
INVESTOR 2016 NOTES TO ThE CONSOL IDATED F INANCIAL STATEMENTS 47
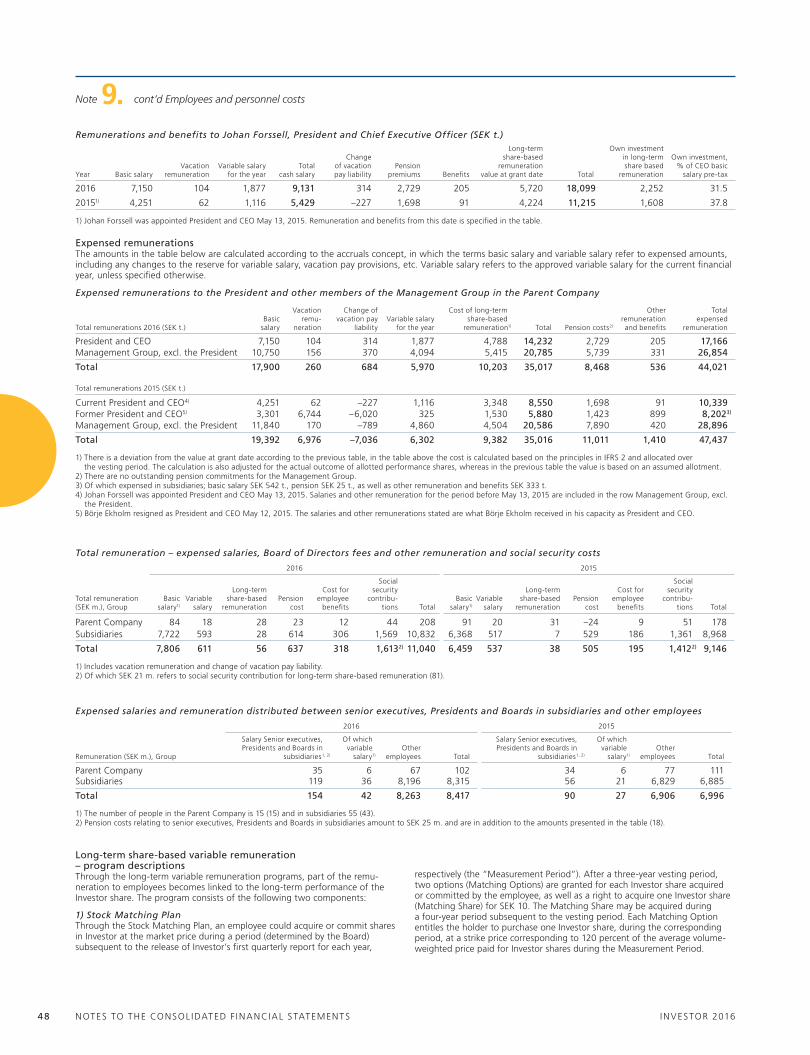
Note 9. cont’d Employees and personnel costs
Expensed remunerationsThe amounts in the table below are calculated according to the accruals concept, in which the terms basic salary and variable salary refer to expensed amounts, including any changes to the reserve for variable salary, vacation pay provisions, etc. variable salary refers to the approved variable salary for the current financial year, unless specified otherwise.
Expensed remunerations to the President and other members of the Management Group in the Parent Company
Total remunerations 2016 (SEK t.)Basic
salary
vacation remu-
neration
Change of vacation pay
liabilityvariable salary
for the year
Cost of long-term share-based
remuneration1) Total Pension costs2)
Other remuneration and benefits
Total expensed
remuneration
President and CEO 7,150 104 314 1,877 4,788 14,232 2,729 205 17,166Management Group, excl. the President 10,750 156 370 4,094 5,415 20,785 5,739 331 26,854
Total 17,900 260 684 5,970 10,203 35,017 8,468 536 44,021
Total remunerations 2015 (SEK t.)
Current President and CEO4) 4,251 62 –227 1,116 3,348 8,550 1,698 91 10,339Former President and CEO5) 3,301 6,744 –6,020 325 1,530 5,880 1,423 899 8,2023)
Management Group, excl. the President 11,840 170 –789 4,860 4,504 20,586 7,890 420 28,896
Total 19,392 6,976 –7,036 6,302 9,382 35,016 11,011 1,410 47,437
1) There is a deviation from the value at grant date according to the previous table, in the table above the cost is calculated based on the principles in IFRS 2 and allocated over the vesting period. The calculation is also adjusted for the actual outcome of allotted performance shares, whereas in the previous table the value is based on an assumed allotment.
2) There are no outstanding pension commitments for the Management Group.3) Of which expensed in subsidiaries; basic salary SEK 542 t., pension SEK 25 t., as well as other remuneration and benefits SEK 333 t.4) Johan Forssell was appointed President and CEO May 13, 2015. Salaries and other remuneration for the period before May 13, 2015 are included in the row Management Group, excl.
the President.5) Börje Ekholm resigned as President and CEO May 12, 2015. The salaries and other remunerations stated are what Börje Ekholm received in his capacity as President and CEO.
Total remuneration – expensed salaries, Board of Directors fees and other remuneration and social security costs
Total remuneration (SEK m.), Group
2016 2015
Basic salary1)
variable salary
Long-term share-based
remunerationPension
cost
Cost for employee
benefits
Social security
contribu-tions Total
Basic salary1)
variable salary
Long-term share-based
remunerationPension
cost
Cost for employee
benefits
Social security
contribu-tions Total
Parent Company 84 18 28 23 12 44 208 91 20 31 –24 9 51 178Subsidiaries 7,722 593 28 614 306 1,569 10,832 6,368 517 7 529 186 1,361 8,968
Total 7,806 611 56 637 318 1,6132) 11,040 6,459 537 38 505 195 1,4122) 9,146
1) Includes vacation remuneration and change of vacation pay liability.2) Of which SEK 21 m. refers to social security contribution for long-term share-based remuneration (81).
Expensed salaries and remuneration distributed between senior executives, Presidents and Boards in subsidiaries and other employees
2016 2015
Remuneration (SEK m.), Group
Salary Senior executives,Presidents and Boards in
subsidiaries 1, 2)
Of which variable
salary1)
Other employees Total
Salary Senior executives,Presidents and Boards in
subsidiaries 1, 2)
Of which variable
salary1)
Other employees Total
Parent Company 35 6 67 102 34 6 77 111Subsidiaries 119 36 8,196 8,315 56 21 6,829 6,885
Total 154 42 8,263 8,417 90 27 6,906 6,996
1) The number of people in the Parent Company is 15 (15) and in subsidiaries 55 (43).2) Pension costs relating to senior executives, Presidents and Boards in subsidiaries amount to SEK 25 m. and are in addition to the amounts presented in the table (18).
Long-term share-based variable remuneration – program descriptionsThrough the long-term variable remuneration programs, part of the remu-neration to employees becomes linked to the long-term performance of the Investor share. The program consists of the following two components:
1) Stock Matching Plan Through the Stock Matching Plan, an employee could acquire or commit shares in Investor at the market price during a period (determined by the Board) subsequent to the release of Investor’s first quarterly report for each year,
respectively (the “Measurement Period”). After a three-year vesting period, two options (Matching Options) are granted for each Investor share acquired or committed by the employee, as well as a right to acquire one Investor share (Matching Share) for SEK 10. The Matching Share may be acquired during a four-year period subsequent to the vesting period. Each Matching Option entitles the holder to purchase one Investor share, during the corresponding period, at a strike price corresponding to 120 percent of the average volume-weighted price paid for Investor shares during the Measurement Period.
Remunerations and benefits to Johan Forssell, President and Chief Executive Officer (SEK t.)
year Basic salaryvacation
remunerationvariable salary
for the yearTotal
cash salary
Change of vacation pay liability
Pension premiums Benefits
Long-term share-based
remuneration value at grant date Total
Own investment in long-term share based
remuneration
Own investment, % of CEO basic
salary pre-tax
2016 7,150 104 1,877 9,131 314 2,729 205 5,720 18,099 2,252 31.5
20151) 4,251 62 1,116 5,429 –227 1,698 91 4,224 11,215 1,608 37.8
1) Johan Forssell was appointed President and CEO May 13, 2015. Remuneration and benefits from this date is specified in the table.
INVESTOR 2016NOTES TO ThE CONSOL IDATED F INANCIAL STATEMENTS 4 8

Note 9. cont’d Employees and personnel costs
Summary of long-term share-based variable remuneration programs 2006-2016
Matching Shares 2006-2016
year issued
Number of Matching Shares
granted
Number at the beginning
of the yearAdjustment for dividend
Matching Shares for-
feited in 2016
Matching Shares exer-
cised in 2016
weighted aver-age share price
on exercise
Number of Matching Shares
at year-end
Theoreticalvalue 1),
SEK
Fair value 2),
SEK
Strike price,
SEK Maturity date
vesting period(years)3)
2016 49,948 – 374 49,5744) 246.40 274.01 10.00 12/31 2022 32015 37,671 37,671 1,395 531 38,5354) 293.33 326.18 10.00 12/31 2021 32014 55,451 54,171 2,012 426 572 290.26 55,1854) 219.51 244.29 10.00 12/31 2020 32013 72,378 69,748 1,619 30 35,429 294.08 35,908 167.90 187.33 10.00 12/31 2019 32012 120,160 79,793 1,477 45,379 294.68 35,891 109.60 122.17 10.00 12/31 2018 32011 88,959 42,275 732 30,477 299.61 12,530 127.15 141.66 10.00 12/31 2017 32010 124,543 33,810 146 33,956 292.02 – 114.91 128.33 10.00 12/31 20165) 32009 134,540 24,263 24,263 292.73 – 97.64 109.01 10.00 12/31 20155) 32007 70,194 11,603 11,603 292.73 – 150.91 168.48 10.00 12/31 20135) 32006 95,497 12,415 12,415 292.73 – 109.19 121.34 10.00 12/31 20125) 3
Total 849,341 365,749 7,381 1,361 194,094 227,623
1) The value of Matching Shares on the grant date was based on a theoretical value calculated in accordance with the Black & Scholes valuation model.2) The fair value on the grant date was calculated in accordance with IFRS 2, which was also used for calculating recognized value. See page 50 for specification of the basis of calculation.3) under certain circumstances, in conjunction with the end of employment, Matching Shares can be exercised before the end of the vesting period. Matching Shares that have already
vested must be exercised within 3 months from the end of employment if the employment lasted less than 4 years and 12 months if the holder has been employed longer.4) Matching Shares not available for exercise at year-end.5) The former President Börje Ekholm was entitled to exercise Matching Shares during the period from March 1, 2016 through February 28, 2017.
Other programs in subsidiariesParticipation/incentive programs in Investor Growth Capital (IGC)within IGC, selected senior staff and other senior executives were, to a cer-tain extent, allowed to make parallel investments with Investor, or else receive profit-sharing. For more information regarding the programs see note 31, Related party transactions.
Management Participation ProgramsBoard members and senior executives in unlisted investments, including Mölnlycke, Aleris, Permobil, BraunAbility and Laborie are offered the opportu-nity to invest in the companies through management participation programs. For more information regarding the programs see note 31, Related party transactions.
Remuneration to the Board of the Parent CompanyAt the 2016 Annual General Meeting (AGM), it was decided that Board remu-neration should total SEK 9,995 t., of which SEK 8,910 t. would be in the form of cash and synthetic shares and SEK 1,085 t. would be distributed as cash remuneration for committee work done by the Board of Directors.
Synthetic shares 2008-2016As of 2008, Board members may choose to receive a part of their gross remuneration, excluding committee fees, in synthetic shares. AGM’s decision regarding synthetic shares 2016 is essentially identical to the decision of the AGM 2015. In 2016, Board Members were entitled to receive 50 percent of the proposed remuneration before tax, excluding remuneration for commit-tee work, in the form of synthetic shares and 50 percent in cash (instead of receiving 100 percent of the remuneration in cash). A synthetic share carries the same economic rights as a class B Investor share, which means that the value of the Board of Director’s remuneration in synthetic shares, just like for class B shares, is dependent upon value fluctuations as well as the amount of dividends during the five-year period until 2021, when each synthetic share entitles the Board member to receive an amount corresponding to the share price, at the time, of a class B Investor share.
At the statutory meeting in May 2016 the Board approved, as in 2015, establishment of a policy pursuant to which members of the Board (who do not already have such holdings) are expected to, over a five-year period, acquire ownership in Investor shares (or a corresponding exposure to the Investor share, for example in synthetic shares) for a market value that is expected to correspond to at least one year’s remuneration for board work, before taxes and excluding remuneration for committee work.
The Director’s right to receive payment occurs after the publications of the year-end report and the three interim reports, respectively, during the fifth year following the general meeting which resolved on the allocation of the Synthetic Shares, with 25 percent of the allocated Synthetic Shares on each occasion. In case the Director resigns as Board Member prior to a payment date the Director has a right, within three months after the Director’s resig-nation, to request that the time of payment shall be brought forward, and instead shall occur, in relation to 25 percent of the total number of allocated Synthetic Shares, after the publications of each of the year-end report and the three interim reports, respectively, which are made during the year after the year when such request was received by the Company.
The President, other members of the Management Group and a maximum of 20 other senior executives (“Senior Management”) are obligated to invest at least 5 percent of their annual basic salary in Investor shares according to the Stock Matching Plan. Other employees are not obligated to invest, but they are still entitled to invest to the extent that the value of the allotted Match-ing Options and Matching Shares amounts to a maximum of either 10 or 15 percent of their basic salary. Senior Management has the right to invest to such an extent that the value of the allotted Matching Options and Matching Shares amounts to a maximum between 10 and 27 percent of their respective basic salary. In order to participate fully in the Stock Matching Plan for 2016, the President had to invest or commit approximately 31 percent of his basic salary in Investor shares. If the President, through the investment mentioned above, participates fully in the Stock Matching Plan, the theoretical value of the right to receive a Matching Share and two Matching Options per acquired share under the Stock Matching Plan is 27 percent of the basic salary.
2) Performance-Based Share Program, in which Senior Management participates in addition to the Stock Matching PlanSenior Management has, in addition to the Stock Matching Plan, the right (and obligation) to participate in a Performance-Based Share Program. under this program, which presumes participation in the Stock Matching Plan, Senior Management, after a three-year vesting period, has the right during four years to acquire additional Investor shares (“Performance Shares”) for a price that corresponds to, in 2016 year’s program, 50 percent of the price of the shares acquired by the employee (“Acquisition Price”). This right is conditional upon whether certain financial goals related to the total return of the Investor share are met during the vesting period. Total return is measured over a three-year qualification period. The average annual total return (including reinvested dividends) must exceed the interest on 10-year government bonds by more than 10 percentage points in order for Senior Management to be entitled to acquire the maximum number of Performance Shares that they were allotted. If the total return does not exceed the 10-year interest on government bonds by at least 2 percentage points, Senior Management is not entitled to acquire any shares. If the total return is between the 10-year interest on government bonds plus 2 percentage points and the 10-year interest on government bonds plus 10 percentage points, a proportional (linear) calculation of the number of shares that may be acquired is made. The total return is measured quarterly on running 12-month basis during the qualification period, where the total outcome is estimated as the average total return during the three-year period based on 9 measurement points.
Adjustment for dividendAt the time when Matching Shares and Performance Shares are acquired, employees are entitled to remuneration for dividends paid during the vesting period and up until the acquisition date. This is done so that the program will not be affected by dividends and to avoid the risk that a decision on dividends is affected by the long-term variable remuneration program.
Hedge contracts for employee stock option and share programsInvestor’s policy is to implement measures to minimize the effects on equity from the programs in the event of an increase in Investor’s share price. For programs implemented in 2006 and later, Investor has been repurchasing its own shares in order to guarantee delivery.
INVESTOR 2016 NOTES TO ThE CONSOL IDATED F INANCIAL STATEMENTS 49
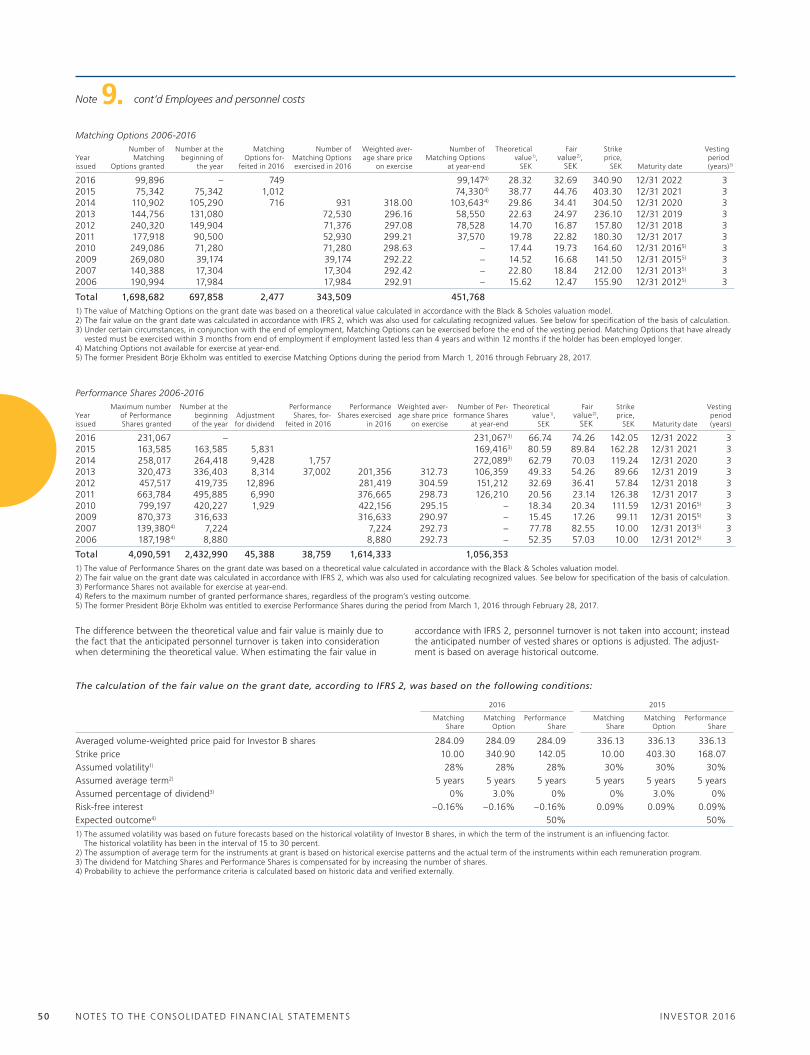
Note 9. cont’d Employees and personnel costs
Matching Options 2006-2016
year issued
Number of Matching
Options granted
Number at the beginning of
the year
Matching Options for-
feited in 2016
Number of Matching Options exercised in 2016
weighted aver-age share price
on exercise
Number ofMatching Options
at year-end
Theoreticalvalue 1),
SEK
Fair value 2),
SEK
Strike price,
SEK Maturity date
vesting period(years)3)
2016 99,896 – 749 99,1474) 28.32 32.69 340.90 12/31 2022 32015 75,342 75,342 1,012 74,3304) 38.77 44.76 403.30 12/31 2021 32014 110,902 105,290 716 931 318.00 103,6434) 29.86 34.41 304.50 12/31 2020 32013 144,756 131,080 72,530 296.16 58,550 22.63 24.97 236.10 12/31 2019 32012 240,320 149,904 71,376 297.08 78,528 14.70 16.87 157.80 12/31 2018 32011 177,918 90,500 52,930 299.21 37,570 19.78 22.82 180.30 12/31 2017 32010 249,086 71,280 71,280 298.63 – 17.44 19.73 164.60 12/31 20165) 32009 269,080 39,174 39,174 292.22 – 14.52 16.68 141.50 12/31 20155) 32007 140,388 17,304 17,304 292.42 – 22.80 18.84 212.00 12/31 20135) 32006 190,994 17,984 17,984 292.91 – 15.62 12.47 155.90 12/31 20125) 3
Total 1,698,682 697,858 2,477 343,509 451,7681) The value of Matching Options on the grant date was based on a theoretical value calculated in accordance with the Black & Scholes valuation model.2) The fair value on the grant date was calculated in accordance with IFRS 2, which was also used for calculating recognized values. See below for specification of the basis of calculation.3) under certain circumstances, in conjunction with the end of employment, Matching Options can be exercised before the end of the vesting period. Matching Options that have already
vested must be exercised within 3 months from end of employment if employment lasted less than 4 years and within 12 months if the holder has been employed longer.4) Matching Options not available for exercise at year-end.5) The former President Börje Ekholm was entitled to exercise Matching Options during the period from March 1, 2016 through February 28, 2017.
Performance Shares 2006-2016
year issued
Maximum number of Performance Shares granted
Number at the beginning
of the yearAdjustment for dividend
Performance Shares, for-
feited in 2016
Performance Shares exercised
in 2016
weighted aver-age share price
on exercise
Number of Per-formance Shares
at year-end
Theoreticalvalue 1),
SEK
Fair value 2),
SEK
Strike price,
SEK Maturity date
vesting period (years)
2016 231,067 – 231,0673) 66.74 74.26 142.05 12/31 2022 32015 163,585 163,585 5,831 169,4163) 80.59 89.84 162.28 12/31 2021 32014 258,017 264,418 9,428 1,757 272,0893) 62.79 70.03 119.24 12/31 2020 32013 320,473 336,403 8,314 37,002 201,356 312.73 106,359 49.33 54.26 89.66 12/31 2019 32012 457,517 419,735 12,896 281,419 304.59 151,212 32.69 36.41 57.84 12/31 2018 32011 663,784 495,885 6,990 376,665 298.73 126,210 20.56 23.14 126.38 12/31 2017 32010 799,197 420,227 1,929 422,156 295.15 – 18.34 20.34 111.59 12/31 20165) 32009 870,373 316,633 316,633 290.97 – 15.45 17.26 99.11 12/31 20155) 32007 139,3804) 7,224 7,224 292.73 – 77.78 82.55 10.00 12/31 20135) 32006 187,1984) 8,880 8,880 292.73 – 52.35 57.03 10.00 12/31 20125) 3
Total 4,090,591 2,432,990 45,388 38,759 1,614,333 1,056,3531) The value of Performance Shares on the grant date was based on a theoretical value calculated in accordance with the Black & Scholes valuation model. 2) The fair value on the grant date was calculated in accordance with IFRS 2, which was also used for calculating recognized values. See below for specification of the basis of calculation.3) Performance Shares not available for exercise at year-end. 4) Refers to the maximum number of granted performance shares, regardless of the program’s vesting outcome.5) The former President Börje Ekholm was entitled to exercise Performance Shares during the period from March 1, 2016 through February 28, 2017.
The calculation of the fair value on the grant date, according to IFRS 2, was based on the following conditions:
2016 2015
Matching Share
Matching Option
Performance Share
Matching Share
Matching Option
Performance Share
Averaged volume-weighted price paid for Investor B shares 284.09 284.09 284.09 336.13 336.13 336.13Strike price 10.00 340.90 142.05 10.00 403.30 168.07Assumed volatility1) 28% 28% 28% 30% 30% 30%Assumed average term2) 5 years 5 years 5 years 5 years 5 years 5 yearsAssumed percentage of dividend3) 0% 3.0% 0% 0% 3.0% 0%Risk-free interest –0.16% –0.16% –0.16% 0.09% 0.09% 0.09%Expected outcome4) 50% 50%
1) The assumed volatility was based on future forecasts based on the historical volatility of Investor B shares, in which the term of the instrument is an influencing factor. The historical volatility has been in the interval of 15 to 30 percent.
2) The assumption of average term for the instruments at grant is based on historical exercise patterns and the actual term of the instruments within each remuneration program. 3) The dividend for Matching Shares and Performance Shares is compensated for by increasing the number of shares. 4) Probability to achieve the performance criteria is calculated based on historic data and verified externally.
The difference between the theoretical value and fair value is mainly due to the fact that the anticipated personnel turnover is taken into consideration when determining the theoretical value. when estimating the fair value in
accordance with IFRS 2, personnel turnover is not taken into account; instead the anticipated number of vested shares or options is adjusted. The adjust-ment is based on average historical outcome.
INVESTOR 2016NOTES TO ThE CONSOL IDATED F INANCIAL STATEMENTS 50
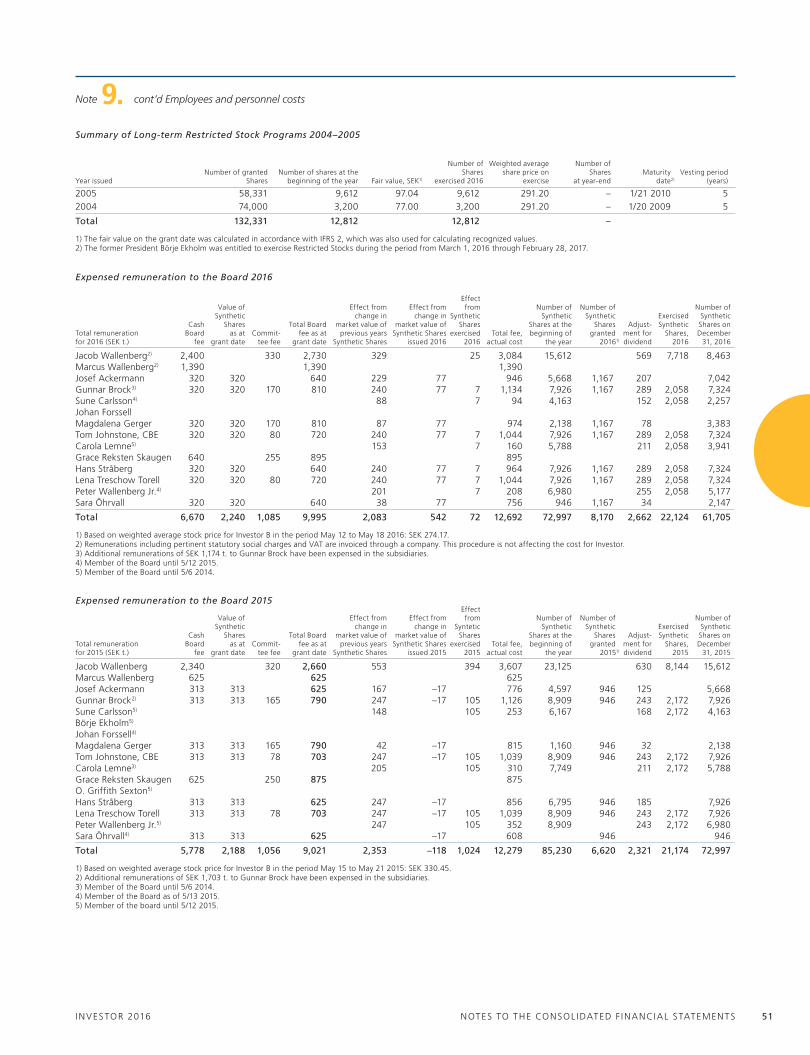
Note 9. cont’d Employees and personnel costs
Summary of Long-term Restricted Stock Programs 2004–2005
year issued Number of granted
SharesNumber of shares at the
beginning of the year Fair value, SEK1)
Number of Shares
exercised 2016
weighted average share price on
exercise
Number of Shares
at year-endMaturity
date2)
vesting period (years)
2005 58,331 9,612 97.04 9,612 291.20 – 1/21 2010 52004 74,000 3,200 77.00 3,200 291.20 – 1/20 2009 5
Total 132,331 12,812 12,812 –
1) The fair value on the grant date was calculated in accordance with IFRS 2, which was also used for calculating recognized values.2) The former President Börje Ekholm was entitled to exercise Restricted Stocks during the period from March 1, 2016 through February 28, 2017.
Expensed remuneration to the Board 2016
Total remuneration for 2016 (SEK t.)
Cash Board
fee
value of Synthetic
Shares as at
grant dateCommit-
tee fee
Total Board fee as at
grant date
Effect from change in
market value of previous years
Synthetic Shares
Effect from change in
market value of Synthetic Shares
issued 2016
Effect from
Synthetic Shares
exercised 2016
Total fee, actual cost
Number of Synthetic
Shares at the beginning of
the year
Number of Synthetic
Shares granted
20161)
Adjust-ment for dividend
Exercised Synthetic
Shares, 2016
Number of Synthetic Shares on December
31, 2016
Jacob wallenberg2) 2,400 330 2,730 329 25 3,084 15,612 569 7,718 8,463Marcus wallenberg2) 1,390 1,390 1,390Josef Ackermann 320 320 640 229 77 946 5,668 1,167 207 7,042Gunnar Brock3) 320 320 170 810 240 77 7 1,134 7,926 1,167 289 2,058 7,324Sune Carlsson4) 88 7 94 4,163 152 2,058 2,257Johan ForssellMagdalena Gerger 320 320 170 810 87 77 974 2,138 1,167 78 3,383Tom Johnstone, CBE 320 320 80 720 240 77 7 1,044 7,926 1,167 289 2,058 7,324Carola Lemne5) 153 7 160 5,788 211 2,058 3,941Grace Reksten Skaugen 640 255 895 895hans Stråberg 320 320 640 240 77 7 964 7,926 1,167 289 2,058 7,324Lena Treschow Torell 320 320 80 720 240 77 7 1,044 7,926 1,167 289 2,058 7,324Peter wallenberg Jr.4) 201 7 208 6,980 255 2,058 5,177Sara Öhrvall 320 320 640 38 77 756 946 1,167 34 2,147
Total 6,670 2,240 1,085 9,995 2,083 542 72 12,692 72,997 8,170 2,662 22,124 61,705
1) Based on weighted average stock price for Investor B in the period May 12 to May 18 2016: SEK 274.17.2) Remunerations including pertinent statutory social charges and vAT are invoiced through a company. This procedure is not affecting the cost for Investor.3) Additional remunerations of SEK 1,174 t. to Gunnar Brock have been expensed in the subsidiaries.4) Member of the Board until 5/12 2015.5) Member of the Board until 5/6 2014.
Expensed remuneration to the Board 2015
Total remuneration for 2015 (SEK t.)
Cash Board
fee
value of Synthetic
Shares as at
grant dateCommit-
tee fee
Total Board fee as at
grant date
Effect from change in
market value of previous years
Synthetic Shares
Effect from change in
market value of Synthetic Shares
issued 2015
Effect from
Syntetic Shares
exercised 2015
Total fee, actual cost
Number of Synthetic
Shares at the beginning of
the year
Number of Synthetic
Shares granted
20151)
Adjust-ment for dividend
Exercised Synthetic
Shares, 2015
Number of Synthetic Shares on December
31, 2015
Jacob wallenberg 2,340 320 2,660 553 394 3,607 23,125 630 8,144 15,612Marcus wallenberg 625 625 625Josef Ackermann 313 313 625 167 –17 776 4,597 946 125 5,668Gunnar Brock2) 313 313 165 790 247 –17 105 1,126 8,909 946 243 2,172 7,926Sune Carlsson5) 148 105 253 6,167 168 2,172 4,163Börje Ekholm5)
Johan Forssell4)
Magdalena Gerger 313 313 165 790 42 –17 815 1,160 946 32 2,138Tom Johnstone, CBE 313 313 78 703 247 –17 105 1,039 8,909 946 243 2,172 7,926Carola Lemne3) 205 105 310 7,749 211 2,172 5,788Grace Reksten Skaugen 625 250 875 875O. Griffith Sexton5)
hans Stråberg 313 313 625 247 –17 856 6,795 946 185 7,926Lena Treschow Torell 313 313 78 703 247 –17 105 1,039 8,909 946 243 2,172 7,926Peter wallenberg Jr.5) 247 105 352 8,909 243 2,172 6,980Sara Öhrvall4) 313 313 625 –17 608 946 946
Total 5,778 2,188 1,056 9,021 2,353 –118 1,024 12,279 85,230 6,620 2,321 21,174 72,997
1) Based on weighted average stock price for Investor B in the period May 15 to May 21 2015: SEK 330.45.2) Additional remunerations of SEK 1,703 t. to Gunnar Brock have been expensed in the subsidiaries.3) Member of the Board until 5/6 2014.4) Member of the Board as of 5/13 2015.5) Member of the board until 5/12 2015.
INVESTOR 2016 NOTES TO ThE CONSOL IDATED F INANCIAL STATEMENTS 51
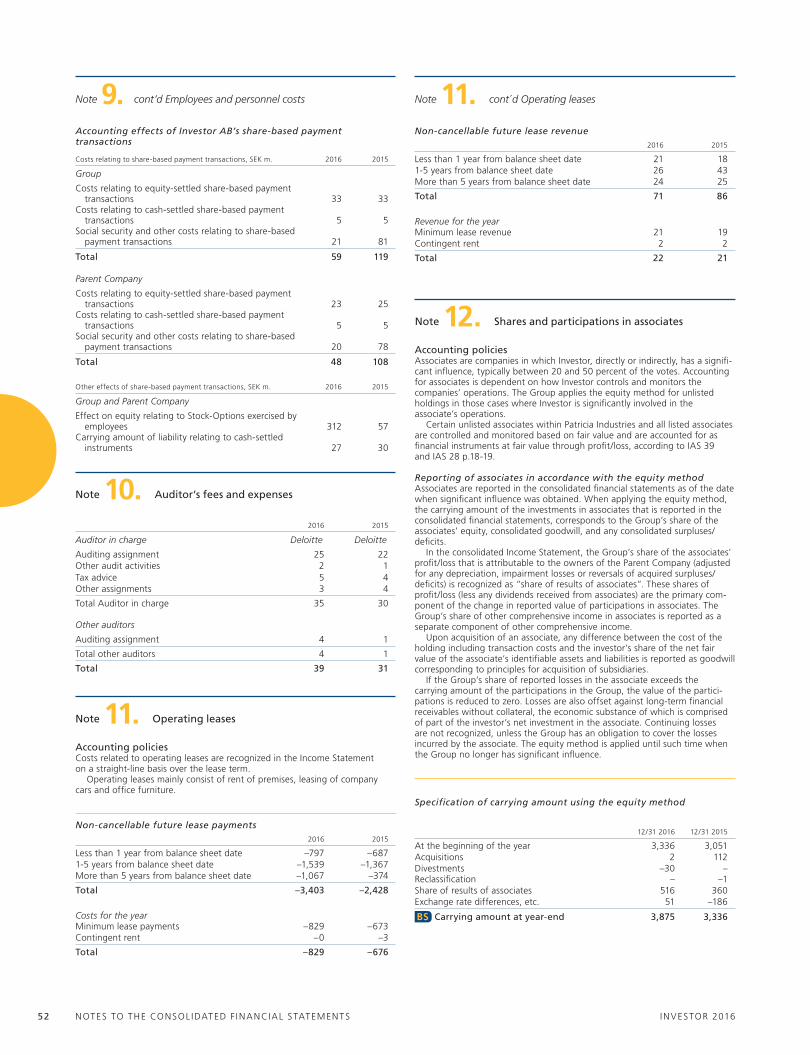
2016 2015
Auditor in charge Deloitte Deloitte
Auditing assignment 25 22Other audit activities 2 1Tax advice 5 4Other assignments 3 4
Total Auditor in charge 35 30
Other auditors
Auditing assignment 4 1
Total other auditors 4 1
Total 39 31
Note 11. Operating leases
Note 10. Auditor’s fees and expenses
Accounting policiesCosts related to operating leases are recognized in the Income Statement on a straight-line basis over the lease term.
Operating leases mainly consist of rent of premises, leasing of company cars and office furniture.
Non-cancellable future lease payments2016 2015
Less than 1 year from balance sheet date –797 –6871-5 years from balance sheet date –1,539 –1,367More than 5 years from balance sheet date –1,067 –374
Total –3,403 –2,428
Costs for the yearMinimum lease payments –829 –673Contingent rent –0 –3
Total –829 –676
Accounting policiesAssociates are companies in which Investor, directly or indirectly, has a signifi-cant influence, typically between 20 and 50 percent of the votes. Accounting for associates is dependent on how Investor controls and monitors the companies’ operations. The Group applies the equity method for unlisted holdings in those cases where Investor is significantly involved in the associate’s operations.
Certain unlisted associates within Patricia Industries and all listed associates are controlled and monitored based on fair value and are accounted for as financial instruments at fair value through profit/loss, according to IAS 39 and IAS 28 p.18-19.
Reporting of associates in accordance with the equity methodAssociates are reported in the consolidated financial statements as of the date when significant influence was obtained. when applying the equity method, the carrying amount of the investments in associates that is reported in the consolidated financial statements, corresponds to the Group’s share of the associates’ equity, consolidated goodwill, and any consolidated surpluses/deficits.
In the consolidated Income Statement, the Group’s share of the associates’ profit/loss that is attributable to the owners of the Parent Company (adjusted for any depreciation, impairment losses or reversals of acquired surpluses/ deficits) is recognized as “share of results of associates”. These shares of profit/loss (less any dividends received from associates) are the primary com-ponent of the change in reported value of participations in associates. The Group’s share of other comprehensive income in associates is reported as a separate component of other comprehensive income.
upon acquisition of an associate, any difference between the cost of the holding including transaction costs and the investor’s share of the net fair value of the associate’s identifiable assets and liabilities is reported as goodwill corresponding to principles for acquisition of subsidiaries.
If the Group’s share of reported losses in the associate exceeds the carrying amount of the participations in the Group, the value of the partici-pations is reduced to zero. Losses are also offset against long-term financial receivables without collateral, the economic substance of which is comprised of part of the investor’s net investment in the associate. Continuing losses are not recognized, unless the Group has an obligation to cover the losses incurred by the associate. The equity method is applied until such time when the Group no longer has significant influence.
Specification of carrying amount using the equity method
12/31 2016 12/31 2015
At the beginning of the year 3,336 3,051Acquisitions 2 112Divestments –30 –Reclassification – –1Share of results of associates 516 360Exchange rate differences, etc. 51 –186
BS Carrying amount at year-end 3,875 3,336
Note 12. Shares and participations in associates
Note 9. cont’d Employees and personnel costs
Accounting effects of Investor AB’s share-based payment transactions
Costs relating to share-based payment transactions, SEK m. 2016 2015
Group
Costs relating to equity-settled share-based payment transactions 33 33Costs relating to cash-settled share-based payment transactions 5 5Social security and other costs relating to share-based payment transactions 21 81
Total 59 119
Parent Company
Costs relating to equity-settled share-based payment transactions 23 25Costs relating to cash-settled share-based payment transactions 5 5Social security and other costs relating to share-based payment transactions 20 78
Total 48 108
Other effects of share-based payment transactions, SEK m. 2016 2015
Group and Parent Company
Effect on equity relating to Stock-Options exercised by employees 312 57Carrying amount of liability relating to cash-settled instruments 27 30
Non-cancellable future lease revenue2016 2015
Less than 1 year from balance sheet date 21 181-5 years from balance sheet date 26 43More than 5 years from balance sheet date 24 25
Total 71 86
Revenue for the yearMinimum lease revenue 21 19Contingent rent 2 2
Total 22 21
Note 11. cont´d Operating leases
INVESTOR 2016NOTES TO ThE CONSOL IDATED F INANCIAL STATEMENTS 52
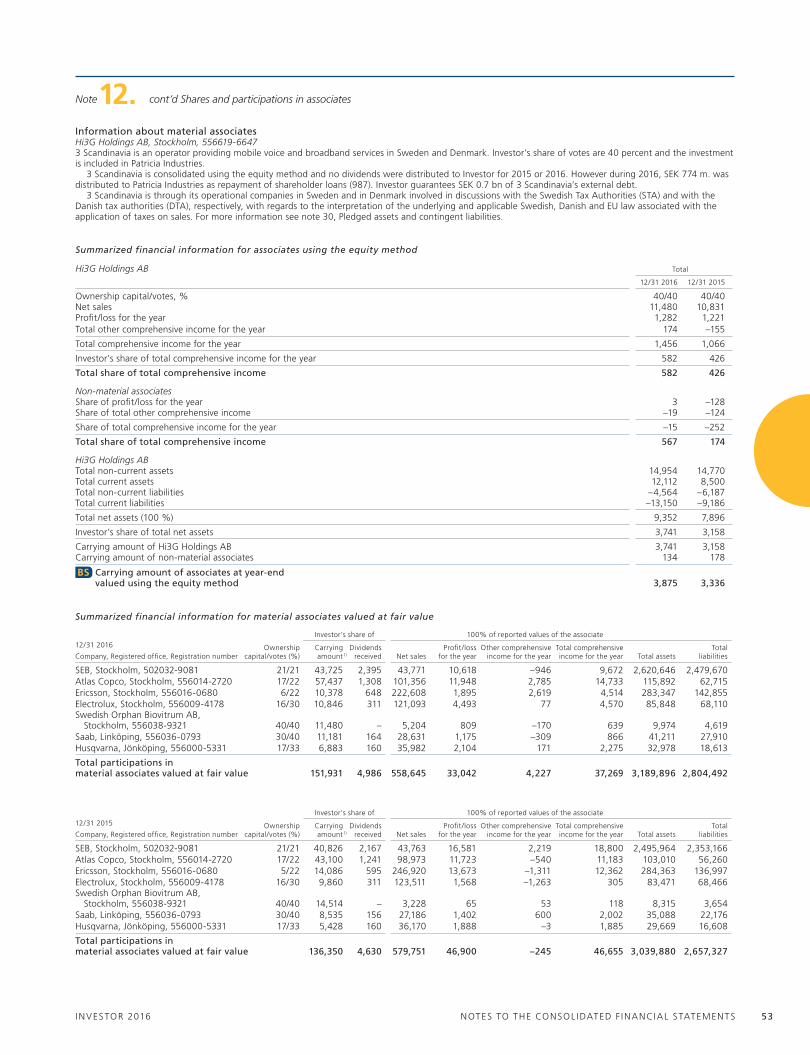
Summarized financial information for associates using the equity method
Hi3G Holdings AB Total
12/31 2016 12/31 2015
Ownership capital/votes, % 40/40 40/40Net sales 11,480 10,831Profit/loss for the year 1,282 1,221Total other comprehensive income for the year 174 –155
Total comprehensive income for the year 1,456 1,066
Investor’s share of total comprehensive income for the year 582 426
Total share of total comprehensive income 582 426
Non-material associatesShare of profit/loss for the year 3 –128Share of total other comprehensive income –19 –124
Share of total comprehensive income for the year –15 –252
Total share of total comprehensive income 567 174
Hi3G Holdings ABTotal non-current assets 14,954 14,770Total current assets 12,112 8,500Total non-current liabilities –4,564 –6,187Total current liabilities –13,150 –9,186
Total net assets (100 %) 9,352 7,896
Investor’s share of total net assets 3,741 3,158
Carrying amount of hi3G holdings AB 3,741 3,158Carrying amount of non-material associates 134 178
BS Carrying amount of associates at year-end valued using the equity method 3,875 3,336
Note 12. cont’d Shares and participations in associates
Summarized financial information for material associates valued at fair value
Investor’s share of 100% of reported values of the associate12/31 2016
Company, Registered office, Registration numberOwnership
capital/votes (%)Carryingamount 1)
Dividends received Net sales
Profit/loss for the year
Other comprehensive income for the year
Total comprehensive income for the year Total assets
Total liabilities
SEB, Stockholm, 502032-9081 21/21 43,725 2,395 43,771 10,618 –946 9,672 2,620,646 2,479,670Atlas Copco, Stockholm, 556014-2720 17/22 57,437 1,308 101,356 11,948 2,785 14,733 115,892 62,715Ericsson, Stockholm, 556016-0680 6/22 10,378 648 222,608 1,895 2,619 4,514 283,347 142,855Electrolux, Stockholm, 556009-4178 16/30 10,846 311 121,093 4,493 77 4,570 85,848 68,110Swedish Orphan Biovitrum AB, Stockholm, 556038-9321 40/40 11,480 – 5,204 809 –170 639 9,974 4,619Saab, Linköping, 556036-0793 30/40 11,181 164 28,631 1,175 –309 866 41,211 27,910husqvarna, Jönköping, 556000-5331 17/33 6,883 160 35,982 2,104 171 2,275 32,978 18,613
Total participations in material associates valued at fair value 151,931 4,986 558,645 33,042 4,227 37,269 3,189,896 2,804,492
Investor’s share of 100% of reported values of the associate12/31 2015
Company, Registered office, Registration numberOwnership
capital/votes (%)Carryingamount 1)
Dividends received Net sales
Profit/loss for the year
Other comprehensive income for the year
Total comprehensive income for the year Total assets
Total liabilities
SEB, Stockholm, 502032-9081 21/21 40,826 2,167 43,763 16,581 2,219 18,800 2,495,964 2,353,166Atlas Copco, Stockholm, 556014-2720 17/22 43,100 1,241 98,973 11,723 –540 11,183 103,010 56,260Ericsson, Stockholm, 556016-0680 5/22 14,086 595 246,920 13,673 –1,311 12,362 284,363 136,997Electrolux, Stockholm, 556009-4178 16/30 9,860 311 123,511 1,568 –1,263 305 83,471 68,466Swedish Orphan Biovitrum AB, Stockholm, 556038-9321 40/40 14,514 – 3,228 65 53 118 8,315 3,654Saab, Linköping, 556036-0793 30/40 8,535 156 27,186 1,402 600 2,002 35,088 22,176husqvarna, Jönköping, 556000-5331 17/33 5,428 160 36,170 1,888 –3 1,885 29,669 16,608
Total participations in material associates valued at fair value 136,350 4,630 579,751 46,900 –245 46,655 3,039,880 2,657,327
Information about material associatesHi3G Holdings AB, Stockholm, 556619-6647 3 Scandinavia is an operator providing mobile voice and broadband services in Sweden and Denmark. Investor’s share of votes are 40 percent and the investment is included in Patricia Industries.
3 Scandinavia is consolidated using the equity method and no dividends were distributed to Investor for 2015 or 2016. however during 2016, SEK 774 m. was distributed to Patricia Industries as repayment of shareholder loans (987). Investor guarantees SEK 0.7 bn of 3 Scandinavia’s external debt.
3 Scandinavia is through its operational companies in Sweden and in Denmark involved in discussions with the Swedish Tax Authorities (STA) and with the Danish tax authorities (DTA), respectively, with regards to the interpretation of the underlying and applicable Swedish, Danish and Eu law associated with the application of taxes on sales. For more information see note 30, Pledged assets and contingent liabilities.
INVESTOR 2016 NOTES TO ThE CONSOL IDATED F INANCIAL STATEMENTS 53

Information about the connection between tax expense for the period and reported income before tax
2016 (%) 2016 2015 (%) 2015
Reported loss/profit before taxes 34,118 18,174Tax according to applicable tax rate 22.0 –7,506 22.0 –3,998
Effect of other tax rates for foreign subsidiaries –0.1 46 –0.1 15Tax from previous years 0.0 –7 0.0 –4Tax effect of non-taxable income –28.4 9,700 –45.7 8,299Tax effect status as an industrial holding company1) –1.6 537 –2.6 472Tax effect non-deductible expenses 10.4 –3,560 29.1 –5,294Controlled Foreign Company taxation 0.0 –5 0.0 –16Standard interest on tax allocation reserve 0.0 0 0.0 0Tax effect of not recognized losses or temporary differences –0.3 96 –0.3 47Tax effect of recognized losses or temporary differences –0.9 318 –0.7 132Other 0.1 –42 0.2 –32
Current tax expense 1.2 –423 2.1 –379
Tax effect of recognition and derecognition of tax losses or temporary differences 0.5 –167 1.4 –248Tax effect of earlier not recognized losses or temporary differences 0.1 –31 0.7 –123Tax effect of changed tax rate –0.5 159 –0.2 34Tax effect impairment of goodwill 0.0 –2 0.0 –8Other 0.0 11 0.1 –16
Deferred tax expense 0.1 –30 2.0 –361
IS Reported tax expense 1.3 –453 4.1 –740
1) For tax purposes, industrial holding companies may deduct the dividend approved at the Annual General Meeting.
Note 13. Net financial items
Accounting policiesFinancial income and financial expenses consists mainly of interest, exchange rate differences on financial items and changes in the value of financial invest-ments, liabilities and derivatives used to finance operations.
Interest is calculated using the effective interest rate method. The effective interest rate is the rate that discounts estimated future payments or receipts throughout the expected life of the financial instrument to the net carrying amount of the financial asset or liability. Transaction costs, including issuing costs, are expensed at the same point in time that receivables or payables are measured at fair value through profit/loss. when valued at amortized cost, amortization takes place over the remaining life using the effective interest rate. Borrowing costs are recognized in profit/loss using the effective interest rate method except to the extent that they are directly attributable to the acquisition, construction or production of assets that take considerable time to prepare for their intended use or sale. In such cases, they are included in the acquisition cost of the asset. Costs related to unused credit facilities are recognized as interest and are amortized on a straight-line basis over the term of the facilities. Other financial items consist mainly of changes in the value of derivatives and loans that are subject to fair value hedging, and foreign currency result.
Other financial items consists of unrealized market value changes and real-ized results of financial items excluding interest. Net financial items include the changes in value attributable to long-term share-based remuneration SEK –15 m. (–73) and revaluations established with valuation techniques totaling SEK –11 m. (208). Liabilities accounted for as hedges have been revalued by SEK –371 m. (269) and the associated hedging instruments have been revalued by SEK 325 m. (–158). Derivatives included in cash flow hedges are not recognized in the Income Statement but have affected Other Comprehensive income by SEK 17 m. (184). For more information see note 29, Financial instruments.
2016 2015
Interest
Interest income 40 58Interest expense –1,470 –1,471
Total interest –1,430 –1,412
Other financial items
Changes in value, gains 25 218Changes in value, losses –36 –10Realized results from loans/swaps 16 –69Exchange gain 1,348 685Exchange loss –448 –685Other items –337 –200
Total other financial items 568 –61
IS Net financial items –862 –1,473
Income tax for the year in Other Comprehensive income
2016 2015
Current tax income/expense 10 –39
Total 10 –39
Note 14. Income tax
Accounting policiesThe amount reported as the Group’s total income tax for the year consists of current tax and deferred tax. Current tax is tax that must be paid or refunds that will be received for the current year and adjustments to current tax attributable to earlier periods. Deferred tax is based on the temporary differ-ences between the tax base of an asset or liability and its carrying amount. Temporary differences attributable to goodwill are not recognized. Further-more, temporary differences attributable to investments in subsidiaries or associates are not recognized unless they are expected to reverse within the foreseeable future. The valuation of deferred tax is based on the extent to which underlying assets and liabilities are expected to be realized or settled. Deferred tax is calculated using the tax rates and tax regulations that have been decided or announced at year-end. If the calculations result in a deferred tax asset, it will only be reported as such if it is probable that it will be realized.
Income taxes are reported in the Income Statement unless the underlying transaction is reported as part of Other Comprehensive income or as a component of equity. In such cases, the associated tax effect is also reported as part of Other Comprehensive income or as a component of equity.
Part of the difference between the effective tax rate and the Parent Company’s tax rate that occurs upon reconciliation is due to the fact that the Parent Company is taxed in accordance with the rules that apply to industrial holding companies.
For a description of matters relating to tax contingencies, see note 30, Pledged assets and contingent liabilities.
INVESTOR 2016NOTES TO ThE CONSOL IDATED F INANCIAL STATEMENTS 54

Note 14. cont’d Income tax
Deferred taxesDeferred taxes refer to the following assets and liabilities
12/31 2016 12/31 2015
Asset Liability Net Asset Liability Net
Intangible assets 41 –3,870 –3,829 44 –2,815 –2,771Property, plant and equipment 12 –750 –738 7 –568 –561Financial assets – –335 –335 – –472 –472Inventory 225 – 225 145 – 145Interest-bearing liabilities 6 –6 0 8 – 8Pension provisions 220 0 220 219 –11 208Provisions 15 –1 14 28 –1 27Losses carry-forward 373 –2 371 667 0 667Tax allocation reserves 2 –28 –26 0 –90 –90Other 108 –94 13 80 –77 3
Total deferred tax assets and liabilities 1,002 –5,087 –4,085 1,198 –4,034 –2,836
Net of deferred tax assets and liabilities1) –95 95 0 –234 234 0
BS Net deferred tax 907 –4,992 –4,085 964 –3,800 –2,836
1) Deferred tax assets and tax liabilities are offset if a legal right exists for this.
Change in deferred taxes related to temporary differences and losses carry-forward
12/31 2016Amount at the
beginning of the yearBusiness
combinationsRecognized in the Income Statement
Recognized in Other Comprehensive income
Amount at year-end
Intangible assets –2,771 –967 44 –135 –3,829Property, plant and equipment –561 –5 –43 –129 –738Financial assets –472 – 168 –31 –335Inventory 145 – 69 11 225Interest-bearing liabilities 8 –6 –2 0 0Pension provisions 208 –1 –2 15 220Provisions 27 1 –5 –9 14Losses carry-forward 667 2 –320 22 371Tax allocation reserves –90 – 64 – –26Other 3 0 –3 13 13
Total –2,836 –976 –30 –243 –4,085
12/31 2015Amount at the
beginning of the yearBusiness
combinationsRecognized in the Income Statement
Recognized in Other Comprehensive income
Amount at year-end
Intangible assets –2,817 –98 111 33 –2,771Property, plant and equipment –465 –60 –33 –3 –561Financial assets –200 0 –261 –11 –472Inventory 140 –10 11 3 145Interest-bearing liabilities 8 – 0 – 8Pension provisions 206 4 7 –9 208Provisions 27 –3 4 –1 27Losses carry-forward 744 93 –148 –22 667Tax allocation reserves –83 –1 –6 – –90Other 86 –4 –46 –36 3
Total –2,354 –79 –361 –46 –2,836
Unrecognized deferred tax assetsTaxes relating to deductible temporary differences for which deferred tax assets have not been recognized amounted to SEK 1,844 m. on December 31, 2016 (1,699). The amount refers to unrecognized losses carry-forward and does not include the Parent Company due to its status as an industrial holding company for tax purposes.
INVESTOR 2016 NOTES TO ThE CONSOL IDATED F INANCIAL STATEMENTS 55

Note 15. Earnings per share
Basic earnings per share
2016 2015
Profit/loss for the year attributable to the holders of ordinary shares in the Parent Company, SEK m. 33,665 17,433weighted average number of ordinary shares outstanding during the year, millions 763.5 761.8
IS Basic earnings per share, SEK 44.09 22.89
Change in the number of outstanding shares,
before dilution 2016 2015
Total number of outstanding shares at beginning of the year, millions 761.9 761.4Repurchase of own shares during the year, millions 0.0 0.0Sales own shares during the year, millions 2.5 0.5
Total number of outstanding shares at year-end, millions 764.4 761.9
Diluted earnings per share2016 2015
Profit for the year attributable to the holders of ordinary shares in the Parent Company, diluted, SEK m. 33,665 17,433
weighted average number of outstanding ordinary shares, millions 763.5 761.8
Effect of issued: Employee share and stock option programs, millions 1.3 2.1
Number of shares used for the calculation of diluted earnings per share, millions 764.8 763.8
IS Diluted earnings per share, SEK 44.02 22.82
Accounting policiesThe calculation of basic earnings per share is based on the profit/loss for the year attributable to shareholders of the Parent Company and on the weighted average number of shares outstanding during the year. when calculating diluted earnings per share, the average number of shares is adjusted to take into account the effects of dilutive potential ordinary shares, originating during the reported periods from stock option and share programs that have been offered to employees. Dilutions from stock option and share programs affect the number of shares and only occur when the strike price is less than the share price. The potential ordinary shares are not viewed as dilutive if they would result in better earnings per share after dilution, which occurs when net income is negative.
Note 16. Intangible assets
Accounting policiesIntangible assets, except for goodwill and trademarks with indefinite life, are reported at cost after a deduction for accumulated amortization or any impairment losses. Goodwill and the majority of the Groups trademarks have an indefinite life and are reported at cost after any impairment losses.
GoodwillGoodwill arises when the acquisition cost in a business combination exceeds the fair value of acquired assets and liabilities according to the purchase price allocation.
TrademarksTrademarks are valued as part of the fair value of businesses acquired from a third party. The trademark must have long-term value and it must be possible to sell it separately.
Capitalized development expenditureCosts attributable to the development of qualifying assets are capitalized as a component of the asset’s acquisition cost. An internally generated intangible asset is reported by the Group only if all of the following apply; it is possible to identify the asset that was created, it is both technically and financially feasible to complete the asset, there is both intent and ability to use the asset, it is likely that the asset will generate future economic benefits and it is possible to calculate the expenses in a reliable way. Amortization of the asset begins as soon as it is put into use. All other expenditure is immediately recognized in the Income Statement.
Proprietary technologyProprietary technology consists of assets such as patents and licenses and is valued as part of the fair value of acquired businesses.
Customer contracts and relationsCustomer contracts and relations are valued as part of the fair value of acquired businesses (less any amortization or impairment losses). The useful life of these assets are sometimes long, which reflects the long-term nature of the underlying business. Customer contracts and relations are based on the period of time over which net payments are expected to be received from the contract, as well as legal and financial factors.
SoftwareCosts for software intended for own administrative use are recognized as an asset in the Balance Sheet when the costs are expected to generate future economic benefits in the form of more efficient processes. Capitalized expen-diture for software is amortized from the date it became available for use.
AmortizationsAmortizations are made linearly over the asset’s estimated useful life. Goodwill and trademarks with an indefinite useful life are not amortized.
Estimated useful lives:Trademarks 8 yearsCapitalized development expenditure 3-8 yearsProprietary technology 5-20 yearsCustomer contracts and relations 3-30 yearsSoftware and other 3-5 years
ImpairmentThe recoverable amount of an asset is calculated whenever there is an indica-tion of impairment. The recoverable amount is calculated once per year or more often if there are any indications of impairment for goodwill, trademarks and other intangible assets with an indefinite useful life and intangible assets that are not yet available for use. The recoverable amount is the higher of the fair value less selling expenses and the value-in-use. when determining the value-in-use, future cash flows are discounted using a discount rate that takes into account the risk-free interest rate and risk associated with the specific asset. An impairment loss is recognized whenever the carrying amount of an asset exceeds its recoverable amount. The loss is reported in the Income Statement.
Instruments that are potentially dilutive in the future and changes after the balance sheet date Outstanding options and shares in long-term share-based programs are to be considered dilutive only if earnings per share was less after than before dilution. Some options are out of money due to a lower average share price (SEK 321.37) compared to exercise price and potential value per option to be expensed in accordance to IFRS 2. Finally there are Performance Shares for which performance terms and conditions are to be met before they can be dilutive. There have been no changes in the number of outstanding shares after the balance sheet date. See note 9, Employees and personnel costs, for exercise price and a description of performance terms and conditions.
INVESTOR 2016NOTES TO ThE CONSOL IDATED F INANCIAL STATEMENTS 56

12/31 2016 Goodwill Trademarks
Capitalized development expenditure
Proprietary technology
Customer contracts and
relationsSoftware
and other Total
Accumulated costsOpening balance 30,002 6,818 686 1,954 7,741 456 47,657Business combinations 4,222 162 1,150 1,537 872 7,943Internally generated intangible assets 52 8 60Acquisitions 96 12 37 145Disposals –2 –8 –10Reclassifications –44 14 1 –1 22 –8Exchange rate differences 1,611 282 4 150 421 79 2,546
At year-end 35,792 7,262 850 3,267 9,706 1,457 58,333
Accumulated amortization and impairment lossesOpening balance –940 –7 –216 –528 –4,242 –276 –6,209Disposals 8 8Impairment loss –8 –8Amortizations –10 –110 –172 –287 –91 –670Reclassifications 33 –8 25Exchange rate differences –1 –1 –28 –168 –5 –204
At year-end –940 –18 –335 –727 –4,664 –373 –7,058
BS Carrying amount at year-end 34,852 7,243 515 2,540 5,041 1,084 51,275
Allocation of amortization and impairment in Income StatementCosts of goods and services sold –0 –58 –16 –74Sales and marketing costs –106 –32 –0 –138Administrative, research and development and other operating costs –10 –110 –66 –196 –74 –456Management costs –1 –1
Total –10 –110 –172 –287 –91 –670
12/31 2015 Goodwill Trademarks
Capitalized development expenditure
Proprietary technology
Customer contracts and
relationsSoftware
and other Total
Accumulated costsOpening balance 28,357 6,708 595 1,997 6,456 404 44,517Business combinations 2,734 318 30 59 1,431 4,572Internally generated intangible assets 110 6 116Acquisitions 0 1 44 45Disposals –80 –54 –33 –6 –23 –196Reclassifications 5 23 28Exchange rate differences –1,009 –208 0 –69 –141 2 –1,425
At year-end 30,002 6,818 686 1,954 7,741 456 47,657
Accumulated amortization and impairment lossesOpening balance –940 0 –128 –438 –4,099 –227 –5,832Disposals 0 4 19 23Amortizations –6 –88 –112 –283 –68 –557Reclassifications –1 –1Exchange rate differences –1 0 18 140 1 158
At year-end –940 –7 –216 –528 –4,242 –276 –6,209
BS Carrying amount at year-end 29,062 6,811 470 1,426 3,499 180 41,448
Allocation of amortization and impairment in Income StatementCosts of goods and services sold 0 0 –120 –14 –134Sales and marketing costs –71 –30 0 –101Administrative, research and development and other operating costs –6 –88 –41 –133 –50 –318Management costs –4 –4
Total –6 –88 –112 –283 –68 –557
Note 16. cont’d Intangible assets
INVESTOR 2016 NOTES TO ThE CONSOL IDATED F INANCIAL STATEMENTS 57

Impairment testingGoodwill and other intangible assets with an indefinite useful life originating from acquisitions are divided between five cash-generating entities; Möln-lycke, Aleris, Permobil, BraunAbility and Laborie. Investor makes regular tests to determine that the carrying values of these assets do not exceed the value in use. The method for impairment testing is based on a discounted cash flow forecast to determine the value in use. various assumptions are used to suit the different companies and its business. The calculated value in use is then compared to the carrying amount.
Value in usevalue in use is calculated as Investors share of present value of future esti-mated cash flow generated from the subsidiaries. The estimate of future cash flows is based upon reasonable assumptions and best knowledge of the company and future economic conditions. The base for the estimate is an assumption of the future growth rate, budgets and forecasts. The chosen dis-count factor reflects specific risks that are assignable to the asset and market-able assessments of the time value of money. The base for calculation of the discount rate is the company’s weighted average cost of capital, where the assumption of the risk free interest rate, market risk premium, leverage, cost of debt and relevant tax rate are important components. The ambition is to use a discount rate which is not dependent on short term market sentiment, but instead reflects a long-term cost of capital corresponding to Investor’s long term investment horizon.
MölnlyckeImpairment testing of goodwill and trade names for Mölnlycke is based on a calculation of value in use in which assumptions of future growth and operat-ing margins are important components. The estimated value is based on the budget for 2017 and financial forecasts until year-end 2021. A growth rate of 1.8 percent has been used to extrapolate the cash flows for the years beyond 2021 (2.1), which is considered reasonable given the company’s historical growth, geographical positioning and industry fundamentals. Estimated cash flows have been discounted using a discount rate of 10.0 percent pre tax (10.1). No impairment requirement has been identified since the carrying value is lower than calculated value in use. The assessment is that no reasonably possible change in any key assumption will lead to a calculated recoverable amount that is lower than the carrying amount. Trademarks of SEK 5,195 m. is included in intangible assets (4,961). Mölnlycke’s trademarks, which have a long history, have an indefinite useful life as Mölnlycke has a strong posi-tion on all its core markets and will continue to actively use them, expecting continued growth with increased net profit margins. Consolidated goodwill attributable to Mölnlycke amounts to SEK 21,041 m. (19,938).
AlerisImpairment testing of goodwill for Aleris is based on a value in use calcula-tion in which assumptions of future growth rate and operating margins are important components. The estimated value in use is based on the budget for 2017 and financial forecasts until year-end 2021. A growth rate of 0.8 percent has been used to extrapolate the cash flows for the years beyond 2021 (1.6), which is based on the company’s historical growth and the sector’s long term growth drivers, such as demographics and lifestyle aspects. Estimated cash flows have been discounted using a discount rate of 10.1 percent pre tax (10.2). No impairment requirements has been identified since the carry-ing value is lower than calculated value in use. however, a sensitivity analysis with a one percentage point drop in operating margins indicate a calculated recoverable amount which is in line with the carrying amount. Consolidated goodwill attributable to Aleris amounts to SEK 5,904 m. (4,803).
PermobilImpairment testing of goodwill for Permobil is based on a calculation of value in use in which assumptions of future growth and operating margins are important components. The estimated value is based on the budget for 2017 and financial forecasts until year-end 2021. A growth rate of 1.2 percent has been used to extrapolate the cash flows for the years beyond 2021 (1.7), which is considered reasonable given the company’s historical growth, the market structure and industry fundamentals. Estimated cash flows have been discounted using a discount rate of 10.6 percent pre tax (10.6). No impairment requirement has been identified since the carrying value is lower than calculat-ed value in use. The assessment is that no reasonably possible change in any key assumption will lead to a calculated recoverable amount that is lower than the carrying amount. Consolidated goodwill attributable to Permobil amounts to SEK 3,084 m. (2,983).
Note 17. Buildings and land
Accounting policiesThe majority of owner-occupied property within the Group is reported according to the revaluation model less accumulated depreciation and revalu-ation adjustments. Industrial property is reported at cost less accumulated depreciation and any impairment losses.
Owner-occupied property has been categorized based on their characteristics:hotel property Revaluation modelCare property Revaluation modelOffice property Revaluation modelIndustrial property Cost model
Cost includes the original purchase price and directly attributable costs, including borrowing costs, required to bring the asset to working condition for its intended use. Property consist of parts with different useful lives (such as the framework, roof and basic installations), the parts are treated as separate components of property.
Subsequent expenditure is capitalized only if it is probable that future economic benefits associated with the asset will flow to the company and if the cost can be measured reliably. All other subsequent costs are expensed in the period they arise. Any undepreciated carrying amount of replaced compo-nents, or parts of components, are retired and expensed in connection with the exchange. Repairs are expensed as incurred.
Owner-occupied property is recognized according to the revaluation model less accumulated depreciation and revaluation adjustments. Property is revalued with sufficient regularity to ensure that the carrying amount does not differ materially from the amount established as fair value on the balance sheet date. when an asset’s carrying amount is increased as a result of a revaluation, the increase is reported in Other Comprehensive income and accumulated in a separate component of equity, called the Revaluation reserve. when an asset’s carrying amount is decreased as a result of a revaluation and there is a balance in the revaluation reserve attributable to the asset, the decrease in value is recognized in Other Comprehensive income and the amount in the revaluation reserve is also decreased. The difference between depreciation based on the revalued amount, and depreciation based on the original cost, is transferred from the revaluation reserve to retained earnings.
At the time of a revaluation the accumulated depreciation is recalculated in proportion to the change in the asset’s increased cost so that the carrying amount of the asset (the net of the adjusted cost and adjusted depreciation) after revaluation corresponds to the revalued amount. when an asset is divested, the value attributable to the asset in the revaluation reserve is transferred to retained earnings, without having any effect on profit/loss or Other Comprehensive income.
Note 16. cont’d Intangible assets Note 16. cont’d Intangible assets
BraunAbilityImpairment testing of goodwill for BraunAbility is based on a calculation of value in use in which assumptions of future growth and operating margins are important components. The estimated value is based on the budget for 2017 and financial forecasts until year-end 2021. A growth rate of 1.1 percent has been used to extrapolate the cash flows for the years beyond 2021 (2.2), which is considered reasonable given the company’s historical growth, the underlying market fundamentals and the company’s market position. Estimat-ed cash flows have been discounted using a discount rate of 11.7 percent pre tax (11.2). No impairment requirement has been identified since the carrying value is lower than calculated value in use. Consolidated goodwill attributable to BraunAbility amounts to SEK 1,458 m. (1,325).
Laborie Impairment testing of goodwill for newly acquired Laborie is based on a calculation of value in use in which assumptions of future growth and operat-ing margins are important components. The estimated value is based on the budget for 2017 and financial forecasts until year-end 2021. A growth rate of 2.2 percent has been used to extrapolate the cash flows for the years beyond 2021, which is considered reasonable given the company’s historical growth, the underlying market fundamentals and the company’s market position. Esti-mated cash flows have been discounted using a discount rate of 11.1 percent pre tax. No impairment requirement has been identified since the carrying value is lower than calculated value in use. Consolidated goodwill attributable to Laborie amounts to SEK 3,351 m.
INVESTOR 2016NOTES TO ThE CONSOL IDATED F INANCIAL STATEMENTS 58
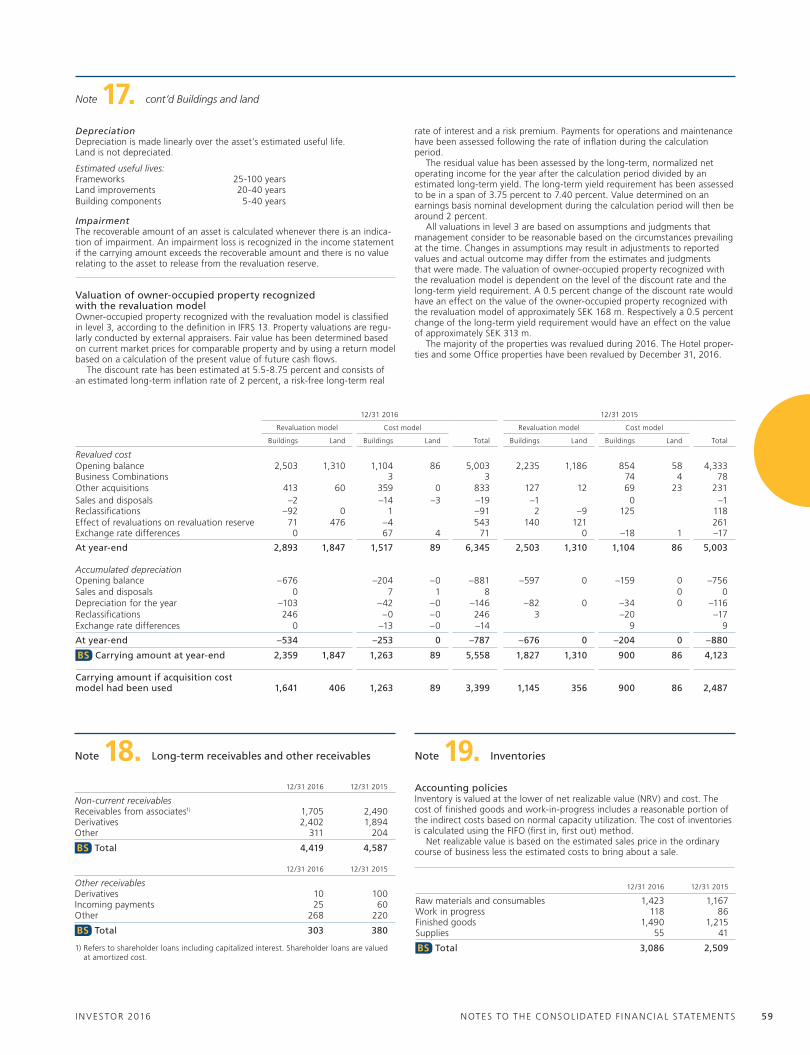
12/31 2016 12/31 2015
Revaluation model Cost model Revaluation model Cost model
Buildings Land Buildings Land Total Buildings Land Buildings Land Total
Revalued costOpening balance 2,503 1,310 1,104 86 5,003 2,235 1,186 854 58 4,333Business Combinations 3 3 74 4 78Other acquisitions 413 60 359 0 833 127 12 69 23 231Sales and disposals –2 –14 –3 –19 –1 0 –1Reclassifications –92 0 1 –91 2 –9 125 118Effect of revaluations on revaluation reserve 71 476 –4 543 140 121 261Exchange rate differences 0 67 4 71 0 –18 1 –17
At year-end 2,893 1,847 1,517 89 6,345 2,503 1,310 1,104 86 5,003
Accumulated depreciation Opening balance –676 –204 –0 –881 –597 0 –159 0 –756Sales and disposals 0 7 1 8 0 0Depreciation for the year –103 –42 –0 –146 –82 0 –34 0 –116Reclassifications 246 –0 –0 246 3 –20 –17Exchange rate differences 0 –13 –0 –14 9 9
At year-end –534 –253 0 –787 –676 0 –204 0 –880
BS Carrying amount at year-end 2,359 1,847 1,263 89 5,558 1,827 1,310 900 86 4,123
Carrying amount if acquisition cost model had been used 1,641 406 1,263 89 3,399 1,145 356 900 86 2,487
DepreciationDepreciation is made linearly over the asset’s estimated useful life. Land is not depreciated.
Estimated useful lives:Frameworks 25-100 yearsLand improvements 20-40 yearsBuilding components 5-40 years
ImpairmentThe recoverable amount of an asset is calculated whenever there is an indica-tion of impairment. An impairment loss is recognized in the income statement if the carrying amount exceeds the recoverable amount and there is no value relating to the asset to release from the revaluation reserve.
Valuation of owner-occupied property recognized with the revaluation modelOwner-occupied property recognized with the revaluation model is classified in level 3, according to the definition in IFRS 13. Property valuations are regu-larly conducted by external appraisers. Fair value has been determined based on current market prices for comparable property and by using a return model based on a calculation of the present value of future cash flows.
The discount rate has been estimated at 5.5-8.75 percent and consists of an estimated long-term inflation rate of 2 percent, a risk-free long-term real
Note 17. cont’d Buildings and land
rate of interest and a risk premium. Payments for operations and maintenance have been assessed following the rate of inflation during the calculation period.
The residual value has been assessed by the long-term, normalized net operating income for the year after the calculation period divided by an estimated long-term yield. The long-term yield requirement has been assessed to be in a span of 3.75 percent to 7.40 percent. value determined on an earnings basis nominal development during the calculation period will then be around 2 percent.
All valuations in level 3 are based on assumptions and judgments that management consider to be reasonable based on the circumstances prevailing at the time. Changes in assumptions may result in adjustments to reported values and actual outcome may differ from the estimates and judgments that were made. The valuation of owner-occupied property recognized with the revaluation model is dependent on the level of the discount rate and the long-term yield requirement. A 0.5 percent change of the discount rate would have an effect on the value of the owner-occupied property recognized with the revaluation model of approximately SEK 168 m. Respectively a 0.5 percent change of the long-term yield requirement would have an effect on the value of approximately SEK 313 m.
The majority of the properties was revalued during 2016. The hotel proper-ties and some Office properties have been revalued by December 31, 2016.
Note 18. Long-term receivables and other receivables
12/31 2016 12/31 2015
Non-current receivables Receivables from associates1) 1,705 2,490Derivatives 2,402 1,894Other 311 204
BS Total 4,419 4,587
12/31 2016 12/31 2015
Other receivablesDerivatives 10 100Incoming payments 25 60Other 268 220
BS Total 303 380
1) Refers to shareholder loans including capitalized interest. Shareholder loans are valued at amortized cost.
Note 19. Inventories
Accounting policiesInventory is valued at the lower of net realizable value (NRv) and cost. The cost of finished goods and work-in-progress includes a reasonable portion of the indirect costs based on normal capacity utilization. The cost of inventories is calculated using the FIFO (first in, first out) method.
Net realizable value is based on the estimated sales price in the ordinary course of business less the estimated costs to bring about a sale.
12/31 2016 12/31 2015
Raw materials and consumables 1,423 1,167work in progress 118 86Finished goods 1,490 1,215Supplies 55 41
BS Total 3,086 2,509
INVESTOR 2016 NOTES TO ThE CONSOL IDATED F INANCIAL STATEMENTS 59
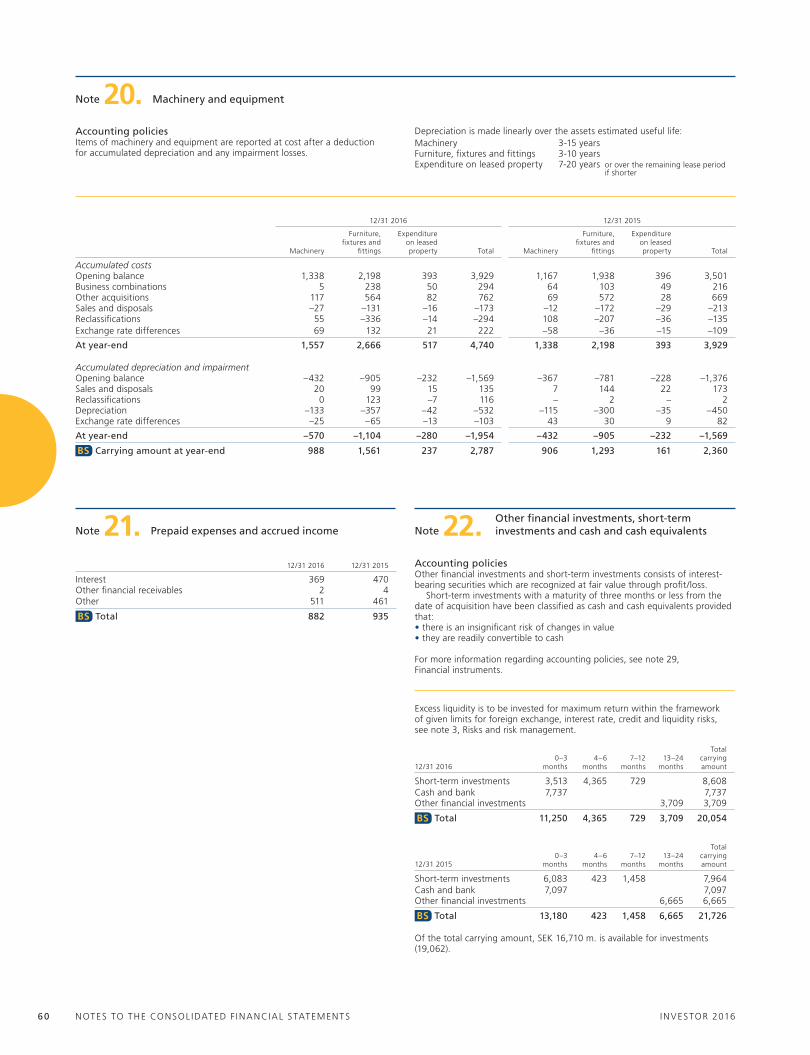
Accounting policiesItems of machinery and equipment are reported at cost after a deduction for accumulated depreciation and any impairment losses.
Note 20. Machinery and equipment
12/31 20160–3
months4–6
months7–12
months13–24
months
Total carrying amount
Short-term investments 3,513 4,365 729 8,608Cash and bank 7,737 7,737Other financial investments 3,709 3,709
BS Total 11,250 4,365 729 3,709 20,054
12/31 20150–3
months4–6
months7–12
months13–24
months
Total carrying amount
Short-term investments 6,083 423 1,458 7,964Cash and bank 7,097 7,097Other financial investments 6,665 6,665
BS Total 13,180 423 1,458 6,665 21,726
Of the total carrying amount, SEK 16,710 m. is available for investments (19,062).
Note 21. Prepaid expenses and accrued income
12/31 2016 12/31 2015
Interest 369 470Other financial receivables 2 4Other 511 461
BS Total 882 935
12/31 2016 12/31 2015
Machinery
Furniture, fixtures and
fittings
Expenditure on leased property Total Machinery
Furniture, fixtures and
fittings
Expenditure on leased property Total
Accumulated costsOpening balance 1,338 2,198 393 3,929 1,167 1,938 396 3,501Business combinations 5 238 50 294 64 103 49 216Other acquisitions 117 564 82 762 69 572 28 669Sales and disposals –27 –131 –16 –173 –12 –172 –29 –213Reclassifications 55 –336 –14 –294 108 –207 –36 –135Exchange rate differences 69 132 21 222 –58 –36 –15 –109
At year-end 1,557 2,666 517 4,740 1,338 2,198 393 3,929
Accumulated depreciation and impairmentOpening balance –432 –905 –232 –1,569 –367 –781 –228 –1,376Sales and disposals 20 99 15 135 7 144 22 173Reclassifications 0 123 –7 116 – 2 – 2Depreciation –133 –357 –42 –532 –115 –300 –35 –450Exchange rate differences –25 –65 –13 –103 43 30 9 82
At year-end –570 –1,104 –280 –1,954 –432 –905 –232 –1,569
BS Carrying amount at year-end 988 1,561 237 2,787 906 1,293 161 2,360
Accounting policiesOther financial investments and short-term investments consists of interest-bearing securities which are recognized at fair value through profit/loss.
Short-term investments with a maturity of three months or less from the date of acquisition have been classified as cash and cash equivalents provided that:• there is an insignificant risk of changes in value• they are readily convertible to cash
For more information regarding accounting policies, see note 29, Financial instruments.
Excess liquidity is to be invested for maximum return within the framework of given limits for foreign exchange, interest rate, credit and liquidity risks, see note 3, Risks and risk management.
Note 22. Other financial investments, short-term investments and cash and cash equivalents
Depreciation is made linearly over the assets estimated useful life:Machinery 3-15 yearsFurniture, fixtures and fittings 3-10 yearsExpenditure on leased property 7-20 years or over the remaining lease period
if shorter
INVESTOR 2016NOTES TO ThE CONSOL IDATED F INANCIAL STATEMENTS 60

Share capitalShare capital in the Parent Company.
Other contributed equityRefers to equity contributed by shareholders. It also includes premiums paid in connection with new stock issues.
Translation reserveThe translation reserve includes all foreign exchange differences arising on the translation of financial statements from foreign operations reported in a currency different from the reporting currency of the Group. The translation reserve also comprises exchange rate differences arising in conjunction with the translation of swap contracts reported as hedging instruments of a net investment in a foreign operation. Changes in translation reserve had no impact on reported tax.
Revaluation reserveThe revaluation reserve includes changes in value relating to owner-occupied property and related taxes.
Hedging reserveThe hedging reserve includes the effective component of the accumulated net change of fair value and related taxes, of an instrument used for a cash flow hedge, relating to hedging transactions not yet accounted for in the Profit/loss.
Note 23. Equity
Specification of reserves in equity 12/31 2016 12/31 2015
Translation reserveOpening balance 1,152 1,416Translation differences for the year, subsidiaries 1,410 –202Change for the year, associates 87 –62
2,649 1,152Revaluation reserveOpening balance 1,229 1,0611)
Revaluation of non-current assets for the year 531 244Tax relating to revaluations for the year –98 –54Release of revaluation reserve due to depreciation of revalued amount –24 –22
1,638 1,229Hedging reserveOpening balance 440 298Cash flow hedges: Change in fair value of cash flow hedges for the year –15 170 Recycled to Income Statement 32 12 Tax relating to changes in fair value of
cash flow hedges for the year 5 –38Change for the year, associates 3 –2
465 440Total reservesOpening balance 2,821 2,775Change in reserves for the year: Translation reserve 1,497 –264 Revaluation reserve 409 168 hedging reserve 25 142
Carrying amount at year-end 4,752 2,821
1) Adjusted with SEK 293 m. from Retained earnings to Revaluation reserve in order to correct the classification of revaluation of previously revalued property.
Repurchased shares included in retained earnings under equity, including profit/loss for the year
Amounts affecting equity, SEK m.Number of shares
2016 2015 2016 2015
Opening balance, repurchased own shares 5,270,322 5,796,960 –838 –895Sales/repurchases for the year –2,476,935 –526,638 3121) 571)
Balance at year-end, repurchased own shares 2,793,387 5,270,322 –526 –838
1) In connection with transfer of shares and options within Investors’ long-term variable remuneration program, the payment of strike price has had a positive effect on equity.
Repurchased sharesRepurchased shares include the cost of acquiring own shares held by the Parent Company. On December 31, 2016 the Group held 2,793,387 of its own shares (5,270,322). Repurchases of own shares are reported as a deduc-tion from equity. Cash proceeds from the sale of such equity instruments are reported as an increase in unrestricted equity. Any transaction costs are recognized directly under equity.
DividendThe Board of Directors proposes that the unappropriated earnings in Investor AB:
Total available funds for distribution (SEK m.):
Retained earnings 202,397Net profit for the year 29,275
Total 231,673
To be allocated as follows (SEK m.):
Dividend to shareholders, SEK 11.00 per share 8,4391)
Funds to be carried forward 223,234
Total 231,673
1) Calculated on the total number of registered shares.
For more information, see the Administration Report page 33. The dividend is subject to the approval of the Annual General Meeting on May 3, 2017.
The dividend for 2015 amounted to SEK 7,635 m. (SEK 10.00 per share) and the dividend for 2014 amounted to 6,856 m. (SEK 9.00 per share). Dividends paid out per share for 2015 and 2014 correspond to proposed dividend per share. Dividends are recognized as a liability as soon as the Annual General Meeting has approved the dividend for the year.
Capital managementIn order to be able to act upon business opportunities at any point in time, it is vital for Investor to maintain financial flexibility. The Group’s goal is to have leverage (net debt as a percentage of total assets) of 5-10 percent over an economic cycle. The ceiling for Investor’s leverage has been set at a maximum of 25 percent, which may only be exceeded on a short-term basis. Investor´s leverage at the beginning of the year was 5.5 percent and at the end of the year 5.3 percent. The change is mainly due to cash flows arising from divi-dends from Listed Core Investments, proceeds from EqT, divestments within Patricia Industries, the acquisition of Laborie and dividends paid to sharehold-ers. For more information, see the Administration Report page 4-5.
The Group’s total shareholder return objective (sum of the share price change and dividend) is to exceed the risk-free interest rate plus a risk pre-mium, i.e. 8-9 percent. The total shareholder return for 2016 was 13 percent.
Capital is defined as total recognized equity.
Equity 12/31 2016 12/31 2015
Attributable to shareholders of the Parent Company 300,077 271,801Attributable to non-controlling interest 64 176
BS Total 300,141 271,977
Non-controlling interestNon-controlling interest are presented in the equity separately from the equity attributable to the shareholders of the Parent Company. In the Consolidated Income Statement and Consolidated Statement of Comprehensive Income, the part attributable to the non-controlling interest are included and separately disclosed in conjunction with the statements.
For more information regarding non-controlling interests, see note P5, Participation in Group companies.
Put options to non-controlling interestsAgreements with non-controlling interests exists, that obliges Investor to purchase equity instruments in subsidiaries if the counterparty wants to divest them. The agreement, put option, is a contract to purchase the group’s own equity instruments and thus gives rise to a financial liability. The liability is included in Other long-term liabilities, see note 27, Other long-term and short-term liabilities. The obligation under the put option is valued at the estimated redemption amount at the time when the equity instrument can be put to Investor. The put option is valued at the proportionate value in relation to the fair value of the subsidiary. At remeasurement of the liability, the change of value is recognized in net financial items.
At initial recognition of the put option as a liability, equity is reduced by an amount corresponding to its fair value. Firstly equity attributable to the non-controlling interests are reduced and if this is insufficient in retained earnings attributable to shareholders of the Parent Company.
INVESTOR 2016 NOTES TO ThE CONSOL IDATED F INANCIAL STATEMENTS 61
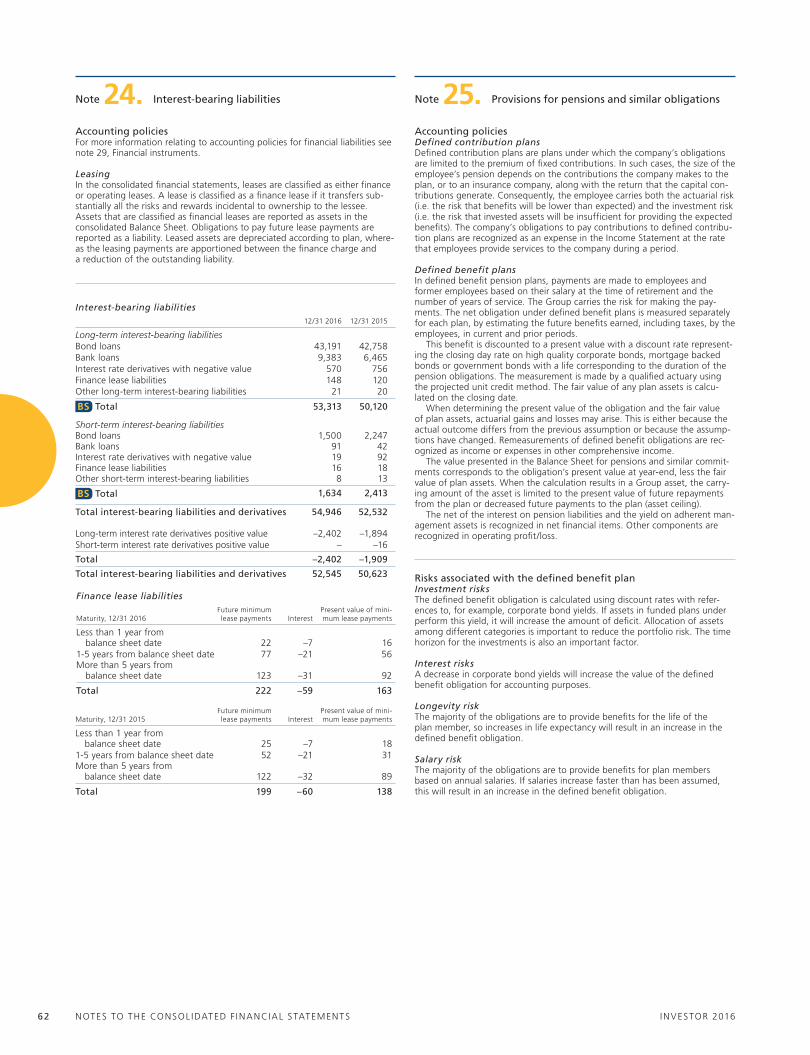
Note 24. Interest-bearing liabilities
Accounting policiesFor more information relating to accounting policies for financial liabilities see note 29, Financial instruments.
LeasingIn the consolidated financial statements, leases are classified as either finance or operating leases. A lease is classified as a finance lease if it transfers sub-stantially all the risks and rewards incidental to ownership to the lessee.Assets that are classified as financial leases are reported as assets in the consolidated Balance Sheet. Obligations to pay future lease payments are reported as a liability. Leased assets are depreciated according to plan, where-as the leasing payments are apportioned between the finance charge and a reduction of the outstanding liability.
Interest-bearing liabilities12/31 2016 12/31 2015
Long-term interest-bearing liabilitiesBond loans 43,191 42,758Bank loans 9,383 6,465Interest rate derivatives with negative value 570 756Finance lease liabilities 148 120Other long-term interest-bearing liabilities 21 20
BS Total 53,313 50,120
Short-term interest-bearing liabilitiesBond loans 1,500 2,247Bank loans 91 42Interest rate derivatives with negative value 19 92Finance lease liabilities 16 18Other short-term interest-bearing liabilities 8 13
BS Total 1,634 2,413
Total interest-bearing liabilities and derivatives 54,946 52,532
Long-term interest rate derivatives positive value –2,402 –1,894Short-term interest rate derivatives positive value – –16
Total –2,402 –1,909
Total interest-bearing liabilities and derivatives 52,545 50,623
Maturity, 12/31 2015Future minimum lease payments Interest
Present value of mini-mum lease payments
Less than 1 year from balance sheet date 25 –7 181-5 years from balance sheet date 52 –21 31More than 5 years from balance sheet date 122 –32 89
Total 199 –60 138
Accounting policiesDefined contribution plansDefined contribution plans are plans under which the company’s obligations are limited to the premium of fixed contributions. In such cases, the size of the employee’s pension depends on the contributions the company makes to the plan, or to an insurance company, along with the return that the capital con-tributions generate. Consequently, the employee carries both the actuarial risk (i.e. the risk that benefits will be lower than expected) and the investment risk (i.e. the risk that invested assets will be insufficient for providing the expected benefits). The company’s obligations to pay contributions to defined contribu-tion plans are recognized as an expense in the Income Statement at the rate that employees provide services to the company during a period.
Defined benefit plansIn defined benefit pension plans, payments are made to employees and former employees based on their salary at the time of retirement and the number of years of service. The Group carries the risk for making the pay-ments. The net obligation under defined benefit plans is measured separately for each plan, by estimating the future benefits earned, including taxes, by the employees, in current and prior periods.
This benefit is discounted to a present value with a discount rate represent-ing the closing day rate on high quality corporate bonds, mortgage backed bonds or government bonds with a life corresponding to the duration of the pension obligations. The measurement is made by a qualified actuary using the projected unit credit method. The fair value of any plan assets is calcu-lated on the closing date.
when determining the present value of the obligation and the fair value of plan assets, actuarial gains and losses may arise. This is either because the actual outcome differs from the previous assumption or because the assump-tions have changed. Remeasurements of defined benefit obligations are rec-ognized as income or expenses in other comprehensive income.
The value presented in the Balance Sheet for pensions and similar commit-ments corresponds to the obligation’s present value at year-end, less the fair value of plan assets. when the calculation results in a Group asset, the carry-ing amount of the asset is limited to the present value of future repayments from the plan or decreased future payments to the plan (asset ceiling).
The net of the interest on pension liabilities and the yield on adherent man-agement assets is recognized in net financial items. Other components are recognized in operating profit/loss.
Risks associated with the defined benefit planInvestment risksThe defined benefit obligation is calculated using discount rates with refer-ences to, for example, corporate bond yields. If assets in funded plans under perform this yield, it will increase the amount of deficit. Allocation of assets among different categories is important to reduce the portfolio risk. The time horizon for the investments is also an important factor.
Interest risksA decrease in corporate bond yields will increase the value of the defined benefit obligation for accounting purposes.
Longevity risk The majority of the obligations are to provide benefits for the life of the plan member, so increases in life expectancy will result in an increase in the defined benefit obligation.
Salary riskThe majority of the obligations are to provide benefits for plan members based on annual salaries. If salaries increase faster than has been assumed, this will result in an increase in the defined benefit obligation.
Finance lease liabilities
Maturity, 12/31 2016Future minimum lease payments Interest
Present value of mini-mum lease payments
Less than 1 year from balance sheet date 22 –7 161-5 years from balance sheet date 77 –21 56More than 5 years from balance sheet date 123 –31 92
Total 222 –59 163
Note 25. Provisions for pensions and similar obligations
INVESTOR 2016NOTES TO ThE CONSOL IDATED F INANCIAL STATEMENTS 62

Note 25. cont’d Provisions for pensions and similar obligations
Amounts recognized in Profit/loss and Other Comprehensive income for defined benefit plans
Components of defined benefit cost (gain –) 2016 2015
Current service cost 98 62Past service cost and gains/losses from settlements –4 –59Other values 1 2
Total operating cost 95 5
Net interest expense 27 20Exchange rate differences 8 –7Other values – –
Total financial cost 34 13
Components recognized in profit/loss 129 18
Remeasurement on the net defined benefit liability (gain –) 2016 2015
Return on plan assets (excl. amounts in interest income) –17 6Actuarial gains/losses, demographic assumptions –7 –80Actuarial gains/losses, financial assumptions 41 –26Actuarial gains/losses, experience adjustments 31 12
Components in Other Comprehensive income 49 –88
Provision for defined benefit plans
The amount included in the consolidated Balance Sheet arising from defined benefit plans 12/31 2016 12/31 2015
Present value of funded or partly funded obligations 817 711Present value of unfunded obligations 564 489
Total present value of defined benefit obligations 1,380 1,200
Fair value of plan assets –543 –457
NPV of obligations and fair value of plan assets 838 743
Restriction on asset ceiling recognized – –
BS Net liability arising from defined benefit obligations 838 743
Pension benefitsEmployees in Group companies have various kinds of pension benefits. These benefits are either defined contribution plans or defined benefit plans. In Sweden the total retirement benefit package is often a mixed solution with some parts being defined contribution pension plans and others being defined benefit pension plans. Salaried employees’ plans comprise of the defined ben-efit plan ITP and the additional defined contribution plan ITPK.
The ITP plan is secured with the insurance company Alecta. Since the information provided by Alecta is not sufficient to be able to account for as a defined benefit plan, the Alecta plan has been reported as a defined contribu-tion plan (multi-employer plan).
The ITP plan has contracts with a premium, where benefits continue unchanged until retirement. This means that premiums can not be changed to the policyholder‘s or the insured’s disadvantage.
The Group operates defined contribution plans in Sweden, Australia, Canada, the Czech Republic, Denmark, Finland, Malaysia and the uK. The plans imply that the Group obtains pension insurances or makes cash payments to foundations.
60 percent of the Group’s defined benefit plans exist in Sweden. Other defined benefit plans exist in the u.S., Belgium, Germany, the Netherlands, Thailand, Italy, Norway, France and Austria. The plans in Belgium, the u.S. and the Netherlands are funded. In Sweden and Norway there are funded and unfunded plans and the plans in other countries are unfunded.
Changes in the obligations for defined benefit plans recognized during the year 12/31 2016 12/31 2015
Defined benefit plan obligations, opening balance 1,200 1,467Current service cost 78 72Interest cost 33 30Remeasurement of defined benefit obligations Actuarial gains/losses, demographic assumptions –7 –80 Actuarial gains/losses, financial assumptions 41 –26 Actuarial gains/losses, experience adjustments 31 12Contributions to the plan from the employer –2 1Past service cost and gains/losses from curtailments –33 –59Liabilities extinguished on settlements –89 –221Liabilities assumed in a business combination 90 68Benefit paid –14 –21Other –7 –Exchange rate difference 58 –43
Obligations for defined benefit plans at year-end 1,380 1,200
Changes in fair value of plan assets during the year 12/31 2016 12/31 2015
Fair value of plan assets, opening balance 457 620Interest income 10 12Remeasurement of fair value plan assets Return on plan assets (excl. amounts in interest income) 17 –6Contributions from the employer 36 37Contributions from plan participants 4 5Assets distributed on settlements –80 –221Assets acquired in a business combination 68 51Exchange differences on foreign plans 27 –22Benefit paid –3 –10Other –3 –2Exchange rate difference 10 –7
Fair value of plan assets at year-end 543 457
The fair value of the plan asset at the end of the reporting period for each category are as follows 12/31 2016 12/31 2015
Cash and cash equivalents 26 18Equity investments 88 76Debt investments1) 226 205Properties 35 31Other values2) 167 127
Total fair value of plan assets 543 4571) The Majority of the debt investments represents of Swedish government bonds.2) Includes insurance contracts from countries where the liabilities are insured (the
Netherlands, Belgium and Norway). There are no split of the underlying assets available.
Changes in restriction asset ceiling in the current year 12/31 2016 12/31 2015
Restriction asset ceiling, opening balance – 6Interest net – 0Changes asset ceiling, OCI – –61)
Restriction asset ceiling at year-end – –1) The changes of asset ceiling in current year is netted out in OCI with the actuarial gain/
losses from the present value on the obligation and the Fv of the plan assets.
The Group estimates that SEK 57 m. will be paid to defined benefit plans during 2017.
INVESTOR 2016 NOTES TO ThE CONSOL IDATED F INANCIAL STATEMENTS 63

Note 25. cont’d Provisions for pensions and similar obligations Note 26. Other provisions
Accounting policiesThe Group reports a provision in the Balance Sheet when there is a formal or informal obligation as a result of a past event for which it is probable that an outflow of resources will be needed to settle the obligation and when a reliable estimate of the amount can be made.
A restructuring provision is recognized when the Group has a detailed, formal plan for the restructuring, and the restructuring plan has commenced or has been publicly announced.
For medical care and health care operations, a provision is made for the risk of loss if the total directly attributable costs during the entire term of the contract are expected to exceed the total revenues, including indexation. Provisions are reviewed at each balance sheet date.
12/31 2016 12/31 2015
Provisions expected to be paid after more than 12 monthsRestructuring reserve – 1Provision for social security contributions for LTvR 64 176Other 212 135
BS Total non-current other provisions 276 312
Provisions expected to be paid within 12 months Reserve related to business combinations – 30Restructuring reserve 41 37Provision for social security contributions for LTvR 0 0Other 133 90
BS Total current other provisions 174 157
Total other provisions 450 469
Provision for social security contributions for long-term share-based remuneration (LTVR)Investor operates LTvR programs which are offered to all employees. Provision is made for social security contributions connected to these programs. The provision will be used during the years 2017-2023.
OtherIn the category Other a provision of SEK 160 m. for potential additional com-pensation to be paid related to sold associated company is included. The pro-vision is expected to be settled in 2019 at the earliest. The remaining part of Other comprises mainly of provisions for guarantees, but also other provisions that have been considered immaterial to specify. These provisions intend to be settled with SEK 133 m. in 2017, SEK 14 m. in 2018 and SEK 38 m. in 2019.
12/31 2016
Reserve related to
business combinations
Restruc-turing
reserve
Social security
LTvR Other
Total other provi-sions
Opening balance 30 38 176 225 469Provisions for the year – 15 6 254 275Reversals for the year –30 –12 –118 –134 –294
Carrying amount at year-end – 41 64 345 450
12/31 2015
Opening balance 21 145 130 58 354Provisions for the year 10 36 47 209 302Reversals for the year –1 –143 –1 –42 –187
Carrying amount at year-end 30 38 176 225 469
Assumptions
Assumptions for defined benefit obligations 2016 Sweden Norway
Other (weighted average)
Discount rate 2.5 2.3 1.7Future salary growth 2.4 2.4 2.6Future pension growth 2.0-2.4 1.2-2.3 1.1Mortality assumptions used DuS14, PRI K2013, K2013BE Local mortality tables
Assumptions for defined benefit obligations 2015 Sweden Norway
Other (weighted average)
Discount rate 3.3 2.5 2.5Future salary growth 2.5 2.5 2.7Future pension growth 2.0-2.5 1.5-2.25 1.2Mortality assumptions used DuS14, PRI K2013, K2013BE Local mortality tables
Basis used to determine the discount rate The discount rate has been set separately for each country by reference to mar-ket rates on high quality corporate bonds with a duration and currency that is consistent with the duration and currency of the defined benefit obligation. This may involve interpolation of bond yield curves where there is no direct match for duration or the market is not deep for matching bond durations. The market for high quality Swedish and Norwegian mortgage backed bonds is considered to be deep and thereby fulfills the requirements of high quality corporate bonds according to IAS 19. Swedish and Norwegian mortgage backed bonds have therefore served as reference when determining the discount rate used for the calculation of the defined benefit obligations in Sweden and Norway. In coun-tries where there is no deep market for high quality corporate bonds, govern-ment bonds are used as a reference when determining the discount rate.
Maturity profile of the majority of the defined benefit obligation
Maturity profile 0-3 year 4-6 year 7-15 year Over 15 year Total
Cash flows 32 42 110 335 5191)
1) Based on 87 percent of the Groups total defined benifit obligation.
Multi-employer plansThe Swedish ITP plan is secured with the insurance company Alecta, which is a mutual life insurance company, owned by its customers, i.e. businesses and their employees. The company form means that any surplus in operations is returned to the customers and the insured population is responsible for any deficit. For the fiscal year the Investor Group did not have access to informa-tion that would make it possible to recognize it as a defined benefit plan. The ITP pension plan secured through insurance from Alecta is therefore recog-nized as a defined contribution plan. The premium for the defined benefit pension plan is calculated individually and depends on salary, pension already earned and expected remaining period of service. For 2017, the Investor Group expect to pay SEK 139 m. for premiums to Alecta (147). Alecta’s total premiums per year for defined benefit pensions is about SEK 15 bn (15).
A measure of the financial strength of a mutual insurance company is the collective funding ratio, which shows the relationship between the assets and the total insurance undertaking. The collective funding ratio is based on the market value of Alecta’s assets as a percentage of insurance obligations calcu-lated using Alecta’s actuarial assumptions, which do not conform to IAS 19. Alecta aims to have a collective funding ratio varying between 125 and 155 percent, with a target level of 140 percent. The assets that exceed the insur-ance undertaking are a surplus to policyholders’ behalf. Surplus can be used to increase future pensions, reduce future premiums or reimbursement for already-made premium payments. The collective funding ratio in Alecta was 149 percent December 31, 2016 (153).
Defined contribution plans
Defined contribution plans 2016 2015
Expenses for defined contribution plans 336 256
Sensitivity analysisvaluation of provision for pensions and similar obligations are estimates of present and future values. There are always uncertainty involved. Alternative assumptions will give different present values.
The sensitivity analysis below shows for example the impact of discount rate changes, from the current rate used.
Discount rate1 percent
increase1 percent decrease
Present value of defined benefit obligations 1,228 1,482Current service cost 32 58Interest expense 24 16
INVESTOR 2016NOTES TO ThE CONSOL IDATED F INANCIAL STATEMENTS 6 4

12/31 2016 12/31 2015
Interest 842 985Personnel-related expenses 1,780 1,340Other 958 861
BS Total 3,579 3,186
Note 28. Accrued expenses and deferred income
Note 27. Other long-term and short-term liabilities
12/31 2016 12/31 2015
Acquisition related liabilities 406 252Non controlling interest1) 1,296 755Other 250 246
BS Total other long-term liabilities 1,952 1,253
1) Fair value of issued put options over non-controlling interest.
Derivatives 8 118Shares on loan 13 –Incoming payments 9 49vAT 165 131Personnel-related 328 232Other 392 178
BS Total other current liabilities 915 708
Note 29. Financial instruments
Accounting policiesFinancial instruments recognized in the consolidated Balance Sheet include assets such as the following: shares and participations recognized at fair value, other financial investments, loan receivables, trade receivables, short-term investments, cash and cash equivalents, and derivatives. Liabilities recognized in the Balance Sheet include the following: loans, shares on loan, trade pay-ables and derivatives.
A financial asset or financial liability is recognized in the Balance Sheet when the Group becomes party to the instrument’s contractual terms.
Trade receivables and trade payables are recognized in the Balance Sheet when an invoice is sent or received.
A financial asset or part thereof is derecognized in the Balance Sheet when the rights in the agreement have been realized, upon maturity, or when the Group loses control over them. A financial liability or part thereof is derecognized in the Balance Sheet when the obligations in the contract have been fulfilled or no longer exist for some other reason.
A financial asset and liability are offset against one another and the net amount is reported in the Balance Sheet only when there is a legally enforce-able right and an intention to set off the recognized amounts.
A purchase or sale of financial assets is recognized on the trade date, which is the date that an entity commits itself to purchase or sell an asset.
Classification and measurementFinancial instruments are allocated to different categories. A financial instru-ment is classified upon initial recognition based on the purpose for which it was acquired. The classification determines how the financial instrument is measured after initial recognition, as described below.
Financial instruments belonging to the category, “Financial assets recog-nized at fair value through profit/loss”, are initially recognized at fair value (excluding transaction costs). Other financial instruments are initially recog-nized at cost, which corresponds to the instrument’s fair value (including transaction costs).
Cash and cash equivalents consists of cash and demand deposits in banks and similar institutions and short-term investments with a maturity of three months or less from the acquisition date, which are subject to an insignificant risk of changes in value.
Financial assetsFinancial assets at fair value through profit/lossThis category consists of two subcategories: financial assets that are initially placed in this category (via the fair value option) and held-for-trading financial assets. Financial assets in this category are continuously measured at fair value and value changes are reported in the Income Statement.
Financial assets recognized in accordance with the fair value optionThis category primarily includes short-term investments, other financial assets and shares/participations recognized at fair value. In this category, the Group has chosen, on initial recognition, to designate financial assets that are man-aged and measured on the basis of fair values, in accordance with the risk management and investment strategies.
Financial assets held for tradingShares and participations belonging to the trading operation are recognized as held-for-trading financial assets. The same applies to derivatives with a positive fair value (except for derivatives identified as effective hedging instruments).
Loans and receivablesLoans and receivables are financial assets with fixed or determinable payments that are not quoted in an active market. These assets are recognized at amortized cost. Trade receivables are recognized at net realizable value less any deductions for bad debts, which are assessed on an individual basis. Trade receivables are short term in nature, which is why they are reported at nominal amounts without any discounting.
Available-for-sale financial assetsTo the available-for-sale financial assets category, Investor has allocated a few financial assets that do not belong to any of the other categories.
INVESTOR 2016 NOTES TO ThE CONSOL IDATED F INANCIAL STATEMENTS 65
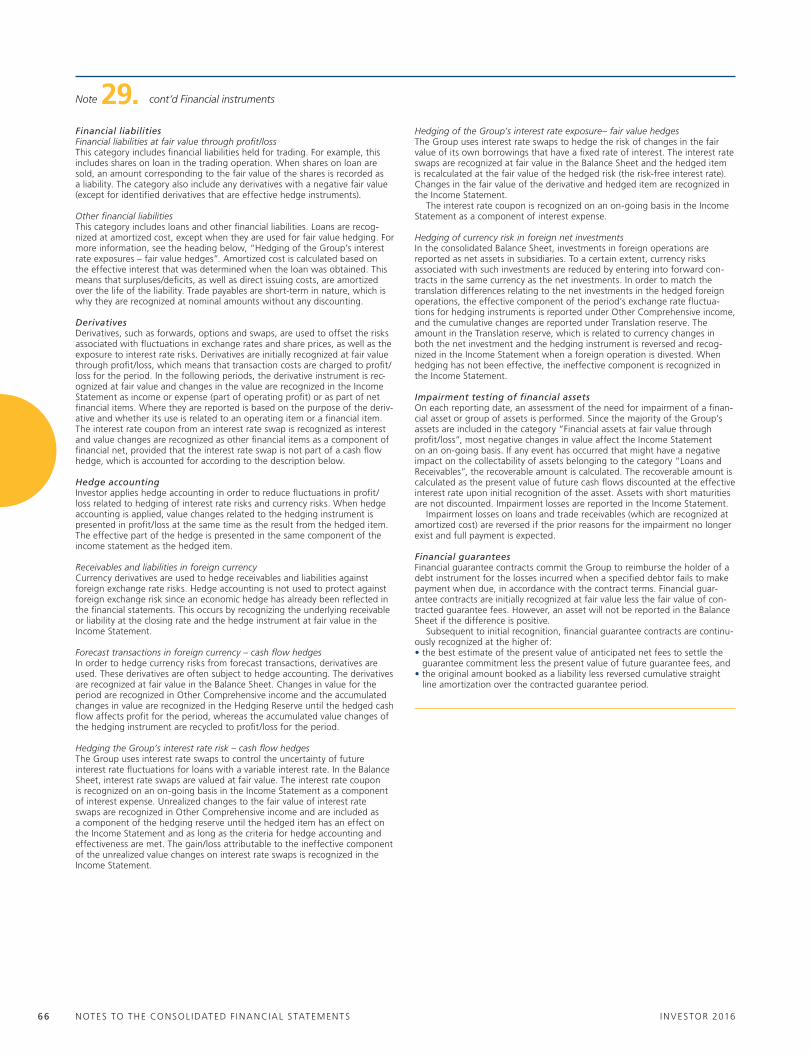
Note 29. cont’d Financial instruments
Financial liabilitiesFinancial liabilities at fair value through profit/lossThis category includes financial liabilities held for trading. For example, this includes shares on loan in the trading operation. when shares on loan are sold, an amount corresponding to the fair value of the shares is recorded as a liability. The category also include any derivatives with a negative fair value (except for identified derivatives that are effective hedge instruments).
Other financial liabilitiesThis category includes loans and other financial liabilities. Loans are recog-nized at amortized cost, except when they are used for fair value hedging. For more information, see the heading below, “hedging of the Group’s interest rate exposures – fair value hedges”. Amortized cost is calculated based on the effective interest that was determined when the loan was obtained. This means that surpluses/deficits, as well as direct issuing costs, are amortized over the life of the liability. Trade payables are short-term in nature, which is why they are recognized at nominal amounts without any discounting.
Derivatives Derivatives, such as forwards, options and swaps, are used to offset the risks associated with fluctuations in exchange rates and share prices, as well as the exposure to interest rate risks. Derivatives are initially recognized at fair value through profit/loss, which means that transaction costs are charged to profit/loss for the period. In the following periods, the derivative instrument is rec-ognized at fair value and changes in the value are recognized in the Income Statement as income or expense (part of operating profit) or as part of net financial items. where they are reported is based on the purpose of the deriv-ative and whether its use is related to an operating item or a financial item. The interest rate coupon from an interest rate swap is recognized as interest and value changes are recognized as other financial items as a component of financial net, provided that the interest rate swap is not part of a cash flow hedge, which is accounted for according to the description below.
Hedge accountingInvestor applies hedge accounting in order to reduce fluctuations in profit/loss related to hedging of interest rate risks and currency risks. when hedge accounting is applied, value changes related to the hedging instrument is presented in profit/loss at the same time as the result from the hedged item. The effective part of the hedge is presented in the same component of the income statement as the hedged item.
Receivables and liabilities in foreign currencyCurrency derivatives are used to hedge receivables and liabilities against foreign exchange rate risks. hedge accounting is not used to protect against foreign exchange risk since an economic hedge has already been reflected in the financial statements. This occurs by recognizing the underlying receivable or liability at the closing rate and the hedge instrument at fair value in the Income Statement.
Forecast transactions in foreign currency – cash flow hedgesIn order to hedge currency risks from forecast transactions, derivatives are used. These derivatives are often subject to hedge accounting. The derivatives are recognized at fair value in the Balance Sheet. Changes in value for the period are recognized in Other Comprehensive income and the accumulated changes in value are recognized in the hedging Reserve until the hedged cash flow affects profit for the period, whereas the accumulated value changes of the hedging instrument are recycled to profit/loss for the period.
Hedging the Group’s interest rate risk – cash flow hedgesThe Group uses interest rate swaps to control the uncertainty of future interest rate fluctuations for loans with a variable interest rate. In the Balance Sheet, interest rate swaps are valued at fair value. The interest rate coupon is recognized on an on-going basis in the Income Statement as a component of interest expense. unrealized changes to the fair value of interest rate swaps are recognized in Other Comprehensive income and are included as a component of the hedging reserve until the hedged item has an effect on the Income Statement and as long as the criteria for hedge accounting and effectiveness are met. The gain/loss attributable to the ineffective component of the unrealized value changes on interest rate swaps is recognized in the Income Statement.
Hedging of the Group’s interest rate exposure– fair value hedgesThe Group uses interest rate swaps to hedge the risk of changes in the fair value of its own borrowings that have a fixed rate of interest. The interest rate swaps are recognized at fair value in the Balance Sheet and the hedged item is recalculated at the fair value of the hedged risk (the risk-free interest rate). Changes in the fair value of the derivative and hedged item are recognized in the Income Statement.
The interest rate coupon is recognized on an on-going basis in the Income Statement as a component of interest expense.
Hedging of currency risk in foreign net investmentsIn the consolidated Balance Sheet, investments in foreign operations are reported as net assets in subsidiaries. To a certain extent, currency risks associated with such investments are reduced by entering into forward con-tracts in the same currency as the net investments. In order to match the translation differences relating to the net investments in the hedged foreign operations, the effective component of the period’s exchange rate fluctua-tions for hedging instruments is reported under Other Comprehensive income, and the cumulative changes are reported under Translation reserve. The amount in the Translation reserve, which is related to currency changes in both the net investment and the hedging instrument is reversed and recog-nized in the Income Statement when a foreign operation is divested. when hedging has not been effective, the ineffective component is recognized in the Income Statement.
Impairment testing of financial assetsOn each reporting date, an assessment of the need for impairment of a finan-cial asset or group of assets is performed. Since the majority of the Group’s assets are included in the category ”Financial assets at fair value through profit/loss”, most negative changes in value affect the Income Statement on an on-going basis. If any event has occurred that might have a negative impact on the collectability of assets belonging to the category ”Loans and Receivables”, the recoverable amount is calculated. The recoverable amount is calculated as the present value of future cash flows discounted at the effective interest rate upon initial recognition of the asset. Assets with short maturities are not discounted. Impairment losses are reported in the Income Statement.
Impairment losses on loans and trade receivables (which are recognized at amortized cost) are reversed if the prior reasons for the impairment no longer exist and full payment is expected.
Financial guaranteesFinancial guarantee contracts commit the Group to reimburse the holder of a debt instrument for the losses incurred when a specified debtor fails to make payment when due, in accordance with the contract terms. Financial guar-antee contracts are initially recognized at fair value less the fair value of con-tracted guarantee fees. however, an asset will not be reported in the Balance Sheet if the difference is positive.
Subsequent to initial recognition, financial guarantee contracts are continu-ously recognized at the higher of:• the best estimate of the present value of anticipated net fees to settle the
guarantee commitment less the present value of future guarantee fees, and • the original amount booked as a liability less reversed cumulative straight
line amortization over the contracted guarantee period.
INVESTOR 2016NOTES TO ThE CONSOL IDATED F INANCIAL STATEMENTS 66
Note 29. cont’d Financial instruments
Measurements of financial instruments at fair valueFollowing is a description of the methods and assumptions used to determine the fair value of financial assets and liabilities shown in this Annual Report. Changed conditions regarding the determination of fair value of financial instruments cause transfer between levels described below. Measurements of financial instruments in level 1Listed holdingsListed holdings are valued on the basis of their share price (bid price, if there is one quoted) on the balance sheet date.
Measurements of financial instruments in level 2Shares and participationsShares and participations in level 2 consist of holdings in listed shares for which the classes are not actively traded. The measurement of these shares is based on the market price for the most traded class of shares for the same holding.
DerivativesDerivatives in level 2 consist mainly of currency and interest rate swaps for which the valuation is based on discounted future cash flows according to the terms and conditions in the agreement and based on the market rate of interest for similar instruments with different durations.
Measurement of financial instruments in level 3Unlisted holdings and fund holdingsunlisted holdings are measured on the basis of the “International Private Equity and venture Capital valuation Guidelines”. For directly owned hold-ings (i.e. those owned directly by a company in the Investor Group), an overall evaluation is made to determine the measurement method that is appropri-ate for each specific holding. It is first taken into account whether a recent financing round or “arm’s length transaction” has been made. As a secondary measure, a valuation is made by applying relevant multiples to the holding’s key ratios (for example, EBITDA), derived from a relevant sample of compa-rable companies, with deduction for individually determined adjustments as a consequence of, for example, the size difference between the company being valued and the sample of comparable companies. In those cases when other measurement methods better reflect the fair value of a holding, this value is used.
Valuation techniques
Fair value Range
12/31 2016 12/31 2015 valuation technique Input 12/31 2016 12/31 2015
Shares and participations 19,367 19,406 Last round of financing N/A N/A N/AComparable companies EBITDA multiples N/A 2.1–7.8Comparable companies Sales multiples 1.5–3.6 0.9–5.3
Comparable transactions Sales multiples 0.4–5.7 1.4–5.7NAv N/A N/A N/A
Long-term receivables 1,948 1,640 Present value computation Market interest rate N/A N/ALong-term interest bearing liabilities 47 38 Present value computation Market interest rate N/A N/AOther long-term liabilities 1,624 1,194 Discounted cash flow N/A N/A
unlisted holdings in funds are measured at Investor’s share of the value that the fund manager reports for all unlisted fund holdings (Net Asset value) and is normally updated when a new valuation is received. If Investor’s assess-ment is that the fund manager’s valuation does not sufficiently take into account factors that affect the value of the underlying holdings, or if the valu-ation is considered to deviate considerably from IFRS principles, the value is adjusted.
when estimating the fair value market conditions, liquidity, financial condi-tion, purchase multiples paid in other comparable third-party transactions, the price of securities of other companies comparable to the portfolio company, and operating results and other financial data of the portfolio company are taken in consideration as applicable. Representatives from Investor’s manage-ment participate actively in the valuation process within Investor Growth Capi-tal (IGC) and evaluate the estimated fair values for holdings in IGC and the EqT funds in relation to their knowledge of the development of the portfolio companies and the market. Listed holdings in funds are measured in the same way as listed holdings, as described above.
DerivativesThe valuation of currency interest rate swaps with long duration and limited liquidity is based on discounted cash flows according to the terms and condi-tions of the agreement and based on an estimated market rate for similar instruments with diverse durations.
OptionsThe value of unlisted options is calculated in accordance with the Black & Scholes valuation model.
Fair value of assets and liabilities not measured at fair value in the Balance SheetInterest-bearing liabilitiesThe fair value would be classified in level 3 and is based on market prices and generally accepted methods, in which future cash flows have been discounted at the current interest rate, including Investor’s current credit rating, for the remaining life.
Loans, trade receivables and trade payablesThe carrying amounts of loans, trade receivables and trade payables are con-sidered to reflect their fair value.
All valuations in level 3 are based on assumptions and judgments that man-agement consider to be reasonable based on the circumstances prevailing at the time. Changes in assumptions may result in adjustments to reported values and the actual outcome may differ from the estimates and judgments that were made.
The unlisted part of Financial Investments portfolio companies, corresponds to 52 percent of the portfolio value (48). Part of the unlisted portfolio is val-ued based on comparable companies, and the value is dependent on the level
The table below indicates which valuation technique and which important unobservable input that has been used in order to estimate the carrying amounts of financial instruments in level 3. The inputs in the table below are not indicative of all the unobservable inputs that may have been used for an individual investment.
of the multiples. The multiple ranges provided in the note show the minimum and maximum value of the actual multiples applied in these valuations. A 10 percent change of the multiples would have an effect on the Financial Invest-ments portfolio value of approximately SEK 200 m. (200).
For the derivatives, a parallel shift of the interest rate curve upwards by one percentage point would affect the value positively by approximately SEK 1,100 m. (1,100).
INVESTOR 2016 NOTES TO ThE CONSOL IDATED F INANCIAL STATEMENTS 67

Note 29. cont’d Financial instruments
Financial assets and liabilities by valuation category
Financial assets and liabilities measured at fair value
through profit/loss
12/31 2016 Fair value optionheld for trading
Derivatives used in hedge
accountingLoans and
receivablesFinancial assets
available-for-sale Other financial
liabilitiesTotal carrying
amount Fair value
Financial assetsShares and participations recognized at fair value 272,863 5 2 272,869 272,869Other financial investments 3,656 53 3,709 3,709Long-term receivables 2,402 2,017 4,419 4,419Accrued interest income 371 371 371Trade receivables 3,813 3,813 3,813Other receivables 10 293 303 303Shares and participations in trading operation 46 46 46Short-term investments 5,094 5,094 5,094Cash and cash equivalents 11,250 11,250 11,250
Total 292,863 56 2,402 6,551 2 – 301,874 301,874
Financial liabilitiesLong-term interest-bearing liabilities 526 44 52,743 53,313 58,4641)
Other long-term liabilities 1,624 328 1,952 1,952Current interest-bearing liabilities 19 1,615 1,634 1,6431)
Trade payables 1,954 1,954 1,954Other current liabilities 21 894 915 915Accrued interest expenses 842 842 842
Total – 2,171 63 – – 58,375 60,609 65,770
Financial assets and liabilities measured at fair value
through profit/loss
12/31 2015 Fair value optionheld for trading
Derivatives used in hedge
accountingLoans and
receivablesFinancial assets
available-for-sale Other financial
liabilitiesTotal carrying
amount Fair value
Financial assetsShares and participations recognized at fair value 250,693 5 2 250,700 250,700Other financial investments 6,648 18 6,665 6,665Long-term receivables 1,894 2,694 4,587 4,587Accrued interest income 470 470 470Trade receivables 3,394 3,394 3,394Other receivables 18 82 280 380 380Shares and participations in trading operation 18 18 18Short-term investments 1,881 1,881 1,881Cash and cash equivalents 13,180 13,180 13,180
Total 272,401 36 1,976 6,860 2 – 281,274 281,274
Financial liabilitiesLong-term interest-bearing liabilities 545 211 49,363 50,120 52,6491)
Other long-term liabilities 1,194 59 1,253 1,253Current interest-bearing liabilities 17 75 2,320 2,413 2,4151)
Trade payables 1,677 1,677 1,677Other current liabilities 75 44 589 708 708Accrued interest expenses 986 986 986
Total – 1,831 330 – – 54,996 57,157 59,689
1) The Groups loans are valued at amortized cost. Fair value on loans are presented. For other assets and liabilities there are no differences between carrying amount and fair value.
INVESTOR 2016NOTES TO ThE CONSOL IDATED F INANCIAL STATEMENTS 68

Result from financial assets and liabilities by valuation category
Financial assets and liabilities measured at fair value through profit/loss
2016 Fair value option held for tradingDerivatives used in hedge accounting
Loans and receivables
Other financial liabilities Total
Operating profit/lossDividends 8,350 1 8,351Other operating income 40 40Changes in value, including currency 22,311 –6 22,305Cost of sales, distribution expenses 19 –2 17
Net financial itemsInterest 29 –118 417 15 –1,773 –1,430Changes in value 2 34 325 –373 –11Exchange rate differences –38 91 311 643 –106 900
Total 30,654 21 1,052 696 –2,251 30,172
Financial assets and liabilities measured at fair value through profit/loss
2015 Fair value option held for tradingDerivatives used in hedge accounting
Loans and receivables
Other financial liabilities Total
Operating profit/lossDividends 7,818 2 7,821Other operating income 58 58Changes in value, including currency 9,017 –3 9,013Cost of sales, distribution expenses –182 262 80
Net financial itemsInterest 40 –195 469 25 –1,752 –1,412Changes in value –10 106 –158 202 139Exchange rate differences –26 –76 –190 –659 952 0
Total 16,839 –348 120 –314 –598 15,699
Note 29. cont’d Financial instruments
Assets and liabilities measured at fair valueThe table below indicates how fair value is measured for the financial instruments recognized at fair value in the Balance Sheet. The financial instruments are categorized on three levels, depending on how the fair value is measured:
Level 1: According to quoted prices (unadjusted) in active markets for identical instrumentsLevel 2: According to directly or indirectly observable inputs that are not included in level 1 Level 3: According to inputs that are unobservable in the market
Financial assets and liabilities by level
12/31 2016 Level 1 Level 2 Level 3 Other1) Total
Financial assetsShares and participations recognized at fair value 251,164 2,332 19,367 6 272,869Other financial instruments 3,656 53 3,709Long-term receivables 454 1,948 2,017 4,419Other receivables 10 293 303Shares and participations in trading operation 46 46Short-term investments 5,094 5,094Cash and cash equivalents 11,250 11,250
Total 271,210 2,796 21,314 2,369 297,689
Financial liabilitiesLong-term interest-bearing liabilities 523 47 52,743 53,313Other long-term liabilities 1,624 328 1,952Short-term interest-bearing liabilities 19 1,615 1,634Other current liabilities 13 9 894 915
Total 13 551 1,671 55,579 57,813
1) To enable reconciliation with balance sheet items, financial instruments not valued at fair value as well as other assets and liabilities that are included within balance sheet items have been included within Other.
INVESTOR 2016 NOTES TO ThE CONSOL IDATED F INANCIAL STATEMENTS 69
Note 29. cont’d Financial instruments
The table below shows a reconciliation between opening and closing balance for the financial instruments recognized at fair value in the Balance Sheet derived from a valuation technique of unobservable input (level 3). No transfers have been made between level 1 and 2.
Changes of financial assets and liabilities in level 3
12/31 2016Shares and participations
recognized at fair valueLong-term receivables
Total financial assets
Long-term interest-bearing liabilities
Other long-term liabilities
Total financial liabilities
Opening balance 19,406 1,640 21,046 38 1,194 1,232Total gains or losses in profit/loss 1,121 308 1,429 9 219 228 in other comprehensive income 1,067 1,067 53 53Acquisitions 3,047 3,047 272 272Divestments –5,187 –5,187 –115 –115Transfers from level 3 –87 –87
Carrying amount at year-end 19,367 1,948 21,314 47 1,624 1,671
Total gains or losses for the period included in profit/loss for assets and liabilities held at the end of the period (unrealized results)
Changes in value –1,028 –1,028 0 0Net financial items 2 308 310 –9 –232 –239
Total –1,026 308 –718 –9 –232 –240
12/31 2015Shares and participations
recognized at fair valueLong-term receivables
Total financial assets
Long-term interest-bearing liabilities
Other long-term liabilities
Total financial liabilities
Opening balance 21,869 1,382 23,251 48 1,145 1,193Total gains or losses in profit/loss 3,856 258 4,114 –9 46 37 in other comprehensive income 399 399 –21 –21Acquisitions 2,143 2,143 24 24Divestments –7,826 –7,826Transfers to level 3 6 6Transfers from level 3 –1,0411) –1,041
Carrying amount at year-end 19,406 1,640 21,046 38 1,194 1,232
Total gains or losses for the period included in profit/loss for assets and liabilities held at the end of the period (unrealized results)
Changes in value 1,093 1,093 –3 –3Net financial items 258 258 9 –43 –34
Total 1,093 258 1,351 9 –46 –37
1) The reason for transfers from level 3 is listing of investments.
Financial assets and liabilities by level
12/31 2015 Level 1 Level 2 Level 3 Other1) Total
Financial assetsShares and participations recognized at fair value 229,262 2,025 19,406 7 250,700Other financial instruments 6,648 18 6,665Long-term receivables 254 1,640 2,694 4,587Other receivables 100 280 380Shares and participations in trading operation 18 18Short-term investments 1,881 1,881Cash and cash equivalents 13,180 13,180
Total 250,988 2,379 21,046 2,999 277,411
Financial liabilitiesLong-term interest-bearing liabilities 718 38 49,363 50,120Other long-term liabilities 1,194 59 1,253Short-term interest-bearing liabilities 92 2,321 2,413Other current liabilities 118 589 708
Total – 929 1,232 52,332 54,494
1) To enable reconciliation with balance sheet items, financial instruments not valued at fair value as well as other assets and liabilities that are included within balance sheet items have been included within Other.
INVESTOR 2016NOTES TO ThE CONSOL IDATED F INANCIAL STATEMENTS 70
Net amounts of financial assets and liabilities
No financial assets and liabilities have been set off in the Balance Sheet.
12/31 2016 12/31 2015
Financial assets Financial liabilities Financial assets Financial liabilities
Gross and net amount 2,562 581 2,109 929Not set off in the balance sheet –561 –561 –779 –779Cash collateral received/pledged – – – –
Net amounts 2,0011) 212) 1,3311) 1502)
1) Shares SEK 150 m. (116) and Derivatives SEK 1,864 m. (1,215).2) Derivatives SEK 21 m. (150) and Security lending SEK 13 m. (–).
Note 30. Pledged assets and contingent liabilities
Accounting policiesA contingent liability exists when there is a possible obligation depending on whether some uncertain future event occurs, or, when there is a present obligation, but payment is not probable or the amount cannot be measured reliably. A provision must be recognized if and only if a present obligation (legal or constructive) has arisen as a result of a past event (the obligating event), the payment is probable (more likely than not), and the amount can be estimated reliably.
Pledged assets 12/31 2016 12/31 2015
In the form of pledged securities for liabilities and provisionsReal estate mortgages 391 412Shares etc.1) 9,434 4,737
Other pledged and equivalent collateralReal estate mortgages 39 107
Total pledged assets 9,864 5,256
1) Pledged shares for loans in subsidiaries.
Contingent liabilities 12/31 2016 12/31 2015
Guarantee commitments to FPG/PRI 1 1Guarantees on behalf of associates 700 700Other contingent liabilities 2,372 1,197
Total contingent liabilities 3,073 1,898
Note 29. cont’d Financial instruments
Other contingent liabilities consist of warranties within the wholly-owned subsidiaries and appeals regarding deducted interest expenses. Three of Inves-tor AB’s subsidiaries have historically claimed deduction for certain interest expenses which has been denied by the tax authorities. Investor believe that these deductions have been claimed rightfully and no provision has therefore been made. If Investor would not be successful in claiming its right to these deductions it would lead to an additional tax expense of SEK 530 m. This amount is therefore reported as an other contingent liability.
The credit facilities within the wholly-owned subsidiaries are subject to financial covenants.
In addition, the Group’s share of contingent liabilities related to the associated companies amounts to SEK – m. (–). Although 3 Scandinavia is through its operational companies in Sweden and in Denmark involved in discussions with the Swedish Tax Authorities (STA) and with the Danish tax authorities (DTA), respectively, with regards to the interpretation of the under-lying and applicable Swedish, Danish and Eu law associated with the applica-tion of taxes on sales. These discussions have been ongoing for some time in both countries and a dispute arose in December 2016 in Sweden. 3 Sweden decided to challenge the STA’s decision in the administrative court. In Den-mark, discussions are still ongoing but a decision by Danish National Tax Board is expected during the course of q1 2017.
The assessment made by the management of 3 Scandinavia is that the pro-cess is in line with current legislation. Despite this, in order to adopt a prudent approach, a risk analysis has been produced and 3 Scandinavia has decided to record an accrual of SEK 500 m. on the balance sheet, representing around 29 percent of the overall uncertainty. This reflects the risk according to the Com-pany’s best estimate of the final financial position in this matter.
The Groups derivatives are covered by ISDA agreements. For repurchase agreements GMRA agreements exist and for securities lending there are GMSLA agreements. According to the agreements the holder has the right to set off the derivatives and keep securities when the counterparty does not fulfill its commitments.
INVESTOR 2016 NOTES TO ThE CONSOL IDATED F INANCIAL STATEMENTS 71
Note 32. Subsequent events
Investor to start providing supplementary information about unlisted holdings within Patricia IndustriesOn March 9, 2017, Investor announced its decision to start providing estimat-ed market values for the major wholly-owned subsidiaries and partner-owned investments within Patricia Industries as a supplement to the book values that are already reported. The decision is in line with our ambition to continuously improve the transparency in our external reporting and the supplementary information will increase the consistency between the valuation of Listed Core Investments and our unlisted holdings.
The estimated market values will be based on valuation multiples of rel-evant listed peers and indices. while these values might not necessarily reflect our view of the intrinsic values, they reflect how the market prices similar companies.
This change will start with the Interim Management Statement January – March 2017, to be released in April, 2017.
The following additional information about related parties is being provided in addition to what has been reported in other notes to the financial statements.
Relations with related parties with significant influenceThe wallenberg foundations have significant influence over Investor (in accordance with the definition in IAS 24 Related Party Disclosures). The larg-est of these foundations are the Knut and Alice wallenberg Foundation, the Marianne and Marcus wallenberg Foundation and the Marcus and Amalia wallenberg Memorial Fund.
Investor’s support functions provide a limited scope of services for FAM AB and Foundation Administration Management Sweden AB, which are owned by the wallenberg foundations. Transactions with these companies are priced according to market terms.
Companies with common board membersIn addition to the above-noted relations with related parties, there are a number of companies in which Investor and the company have common board members. Information has not been provided in this note because these situations are either not considered to involve influence of the type described in IAS 24, or the transactions refer to non material amounts.
Related party transactionsTransactions with related parties are priced according to market terms, for information about the Parent Company see note P18, Related party transactions.
With key personsSee note 9, Employees and personnel costs for information about salaries and other compensation, costs and commitments regarding pensions and similar benefits, and severance payment agreements for the board, President and other senior executives.
Investment programsParticipation/incentive programs IGCwithin Investor Growth Capital (IGC), selected senior staff and other senior executives have had the opportunity for a number of years to make parallel investments to some extent with Investor. The plans are designed in accor-dance with market practice in the venture capital market and are evaluated periodically against similar programs in Europe, the u.S. and Asia. Carried interest plans provide an economic incentive for managers and encourage per-sonal commitment to analysis and investment work since the result is directly connected to the financial performance of the business.
Carried interest plans are linked to realized growth in the value of holdings, after deduction for costs, seen as a portfolio. This means that when an invest-ment is realized with a profit, each parallel investor receives his or her share of the profit, after provisions for any unrealized declines in value or write-downs of other investments. The plans allow a maximum share of 16 percent that can be given to parallel investors, which is in line with practice in the venture capital market.
During the year, a total of SEK 35 m. was paid out from these programs (43). The provision (not paid out) on unrealized gains amounted to SEK 680 m. at year-end (1,000). Expensed amounts were reported in the item “Changes in value” in the Income Statement.
Due to the restructuring of IGC, a limited number of employees also partici-pate in a profit sharing program that is better adapted to reflect the decision to restructure IGC. This program is linked to the realized proceeds of holdings, where the share that can be credited to program participants is set with the holding’s market value taken into account.
Options agreement with Börje EkholmEricsson’s Board of Directors appointed Börje Ekholm as new CEO, effective January 16, 2017. In order to further align the CEO’s interests with the share-holders’, Investor has entered into an option agreement with Börje Ekholm. The option agreement was entered into on market terms and Investor has issued 1,000,000 call options in the Ericsson Class B share. Each option enti-tles the purchase of one Ericsson B share at a strike price of SEK 80 per share during one year after a seven-year period. The strike price will be adjusted if dividends deviate from market expectations at the time of entering the con-tract, in order to ensure that the option is dividend neutral. The valuation has been conducted, using the Black & Scholes model, by an independent third party. At year-end the liability of the option amounted to SEK 2 m. and is included in Other liabilities.
Management Participation ProgramsBoard members and senior executives in unlisted investments, including Möln-lycke, Laborie, Aleris, Permobil and BraunAbility are offered the opportunity to invest in the companies through management participation programs. The terms of the programs are based on market valuations and are designed to yield lower return to the participants than that of the owners if the invest-ment plan is not reached but higher return to the participants than that of the owners if the plan is exceeded.
Related party transactions
Associates Other related party
2016 2015 2016 2015
Sales of products/services 37 19 21) 21)
Purchase of products/services 11 4Financial expenses 89 259Financial income 168 5Dividends/redemptions 5,024 4,688Capital contributions – –Receivables 4,519 5,662Liabilities 3,714 2,365 2 – 1) wallenberg foundations
Note 31. Related party transactions Note 31. cont’d Related party transactions
INVESTOR 2016NOTES TO ThE CONSOL IDATED F INANCIAL STATEMENTS 72
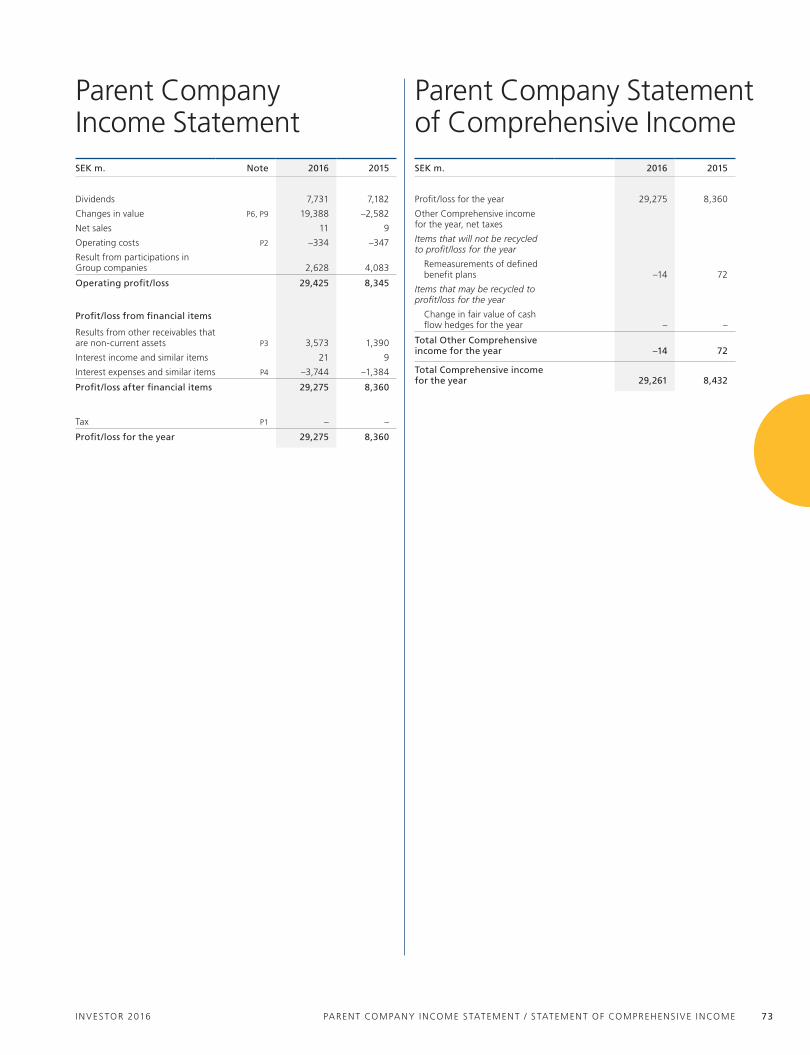
SEK m. 2016 2015
Profit/loss for the year 29,275 8,360
Other Comprehensive income for the year, net taxes
Items that will not be recycled to profit/loss for the year
Remeasurements of defined benefit plans –14 72
Items that may be recycled to profit/loss for the year
Change in fair value of cash flow hedges for the year – –
Total Other Comprehensive income for the year –14 72
Total Comprehensive income for the year 29,261 8,432
Parent Company Statement of Comprehensive Income
SEK m. Note 2016 2015
Dividends 7,731 7,182
Changes in value P6, P9 19,388 –2,582
Net sales 11 9
Operating costs P2 –334 –347
Result from participations in Group companies 2,628 4,083
Operating profit/loss 29,425 8,345
Profit/loss from financial items
Results from other receivables that are non-current assets P3 3,573 1,390
Interest income and similar items 21 9
Interest expenses and similar items P4 –3,744 –1,384
Profit/loss after financial items 29,275 8,360
Tax P1 – –
Profit/loss for the year 29,275 8,360
Parent Company Income Statement
INVESTOR 2016 PARENT COMPANy INCOME STATEMENT / STATEMENT OF COMPREhENSIvE INCOME 73

Parent Company Balance Sheet
SEK m. Note 12/31 2016 12/31 2015
ASSETS
Non-current assets
Intangible assets
Capitalized expenditure for software P7 3 2
Property, plant and equipment
Equipment P8 12 13
Financial assets
Participations in Group companies P5 53,797 56,967
Participations in associates P6 151,933 136,350
Other long-term holdings of securities P9 70,327 65,295
Receivables from Group companies P10 30,560 31,679
Total non-current assets 306,633 290,306
Current assets
Trade receivables 3 1
Receivables from Group companies 526 2,849
Receivables from associates 2 0
Tax assets 24 15
Other receivables 0 2
Prepaid expenses and accrued income P11 44 51
Cash and cash equivalents 0 0
Total current assets 599 2,918
TOTAL ASSETS 307,232 293,224
SEK m. Note 12/31 2016 12/31 2015
EQUITY AND LIABILITIES
Equity
Restricted equity
Share capital 4,795 4,795
Statutory reserve 13,935 13,935
Reserve for development expenditures 2 –
18,732 18,730
unrestricted equity
Accumulated profit/loss 202,397 201,343
Profit/loss for the year 29,275 8,360
231,673 209,703
Total equity 250,404 228,433
Provisions
Provisions for pensions and similar obligations P12 99 85
Other provisions P13 233 271
Total provisions 332 356
Non-current liabilities
Interest-bearing liabilities P14 31,231 31,500
Liabilities to Group companies 14,158 13,666
Total non-current liabilities 45,389 45,166
Current liabilities
Interest-bearing liabilities 1,500 2,229
Trade payables 12 13
Liabilities to Group companies 8,888 16,267
Liabilities to associates 0 0
Tax liabilities 1 –
Other liabilities 26 5
Accrued expenses and deferred income P15 680 755
Total current liabilities 11,107 19,269
TOTAL EQUITY AND LIABILITIES 307,232 293,224
For information regarding pledged assets and contingent liabilities see note P17, Pledged assets and contingent liabilities.
INVESTOR 2016PARENT COMPANy BAL ANCE ShEET 74

Parent Company Statement of Changes in Equity
Restricted equity Unrestricted equity Total equity
SEK m.Share
capitalStatutory
reserve
Reserve for devel-
opment expendi-
turesAccumulated
profit/lossProfit/loss
for the year
Opening balance 1/1 2016 4,795 13,935 – 209,703 228,433
Profit/loss for the year 29,275 29,275
Other Comprehensive income for the year –14 –14
Total Comprehensive income for the year –14 29,275 29,261
Dividend –7,635 –7,635
Stock options exercised by employees 312 312
Equity-settled share-based payment transactions 33 33
Reclassification 2 –2 –
Closing balance 12/31 2016 4,795 13,935 2 202,397 29,275 250,404
Restricted equity Unrestricted equity Total equity
SEK m.Share
capitalStatutory
reserve
Reserve for devel-
opment expendi-
turesAccumulated
profit/lossProfit/loss
for the year
Opening balance 1/1 2015 4,795 13,935 – 208,038 226,768
Profit/loss for the year 8,360 8,360
Other Comprehensive income for the year 72 72
Total Comprehensive income for the year 72 8,360 8,432
Dividend –6,856 –6,856
Stock options exercised by employees 57 57
Equity-settled share-based payment transactions 32 32
Closing balance 12/31 2015 4,795 13,935 – 201,343 8,360 228,433
Distribution of share capitalThe Parent Company’s share capital on December 31, 2016, as well as on December 31, 2015, consists of the following numbers of shares with a quota of SEK 6.25 per share.
Share in % of
Share class Number of shares Number of votes Capital votes
A 1 vote 311,690,844 311,690,844 40.6 87.2B 1/10 vote 455,484,186 45,548,418 59.4 12.8
Total 767,175,030 357,239,262 100.0 100.0
For information regarding repurchased own shares, see the Administration Report page 22.
DividendFor the Board of Director’s proposed Disposition of Earnings, see note 23, Equity.
INVESTOR 2016 PARENT COMPANy STATEMENT OF ChANGES IN Equ IT y 75

Parent Company Statement of Cash Flow
SEK m. 2016 2015
Operating activities
Dividends received 7,731 7,183
Cash payments to suppliers and employees –96 –323
Cash flow from operating activities before net interest and income tax 7,635 6,860
Interest received 1,987 1,831
Interest paid –1,707 –1,426
Income tax paid –11 –8
Cash flow from operating activities 7,904 7,257
Investing activities
Share portfolio
Acquisitions –1,211 –5,622
Divestments 65 2,494
Other items
Divestment of subsidiary 0 14,675
Capital contributions to/from subsidiaries 5,800 –13,948
Acquisitions of property, plant and equipment/intangible assets –3 –1
Net cash used in investing activities 4,652 –2,401
Financing activities
Repayment of borrowings –2,281 –
Change, intra-group balances –2,640 2,000
Dividends paid –7,635 –6,856
Net cash used in financing activities –12,556 –4,856
Cash flow for the year 0 0
Cash and cash equivalents at beginning of the year 0 0
Cash and cash equivalents at year-end 0 0
The Parent Company does not report cash and cash equivalents since liquidity needs are covered by funds in the joint bank account for the Group. These funds are reported as balances with the Group’s internal bank, AB Investor Group Finance.
INVESTOR 2016PARENT COMPANy STATEMENT OF CASh FLOw 76
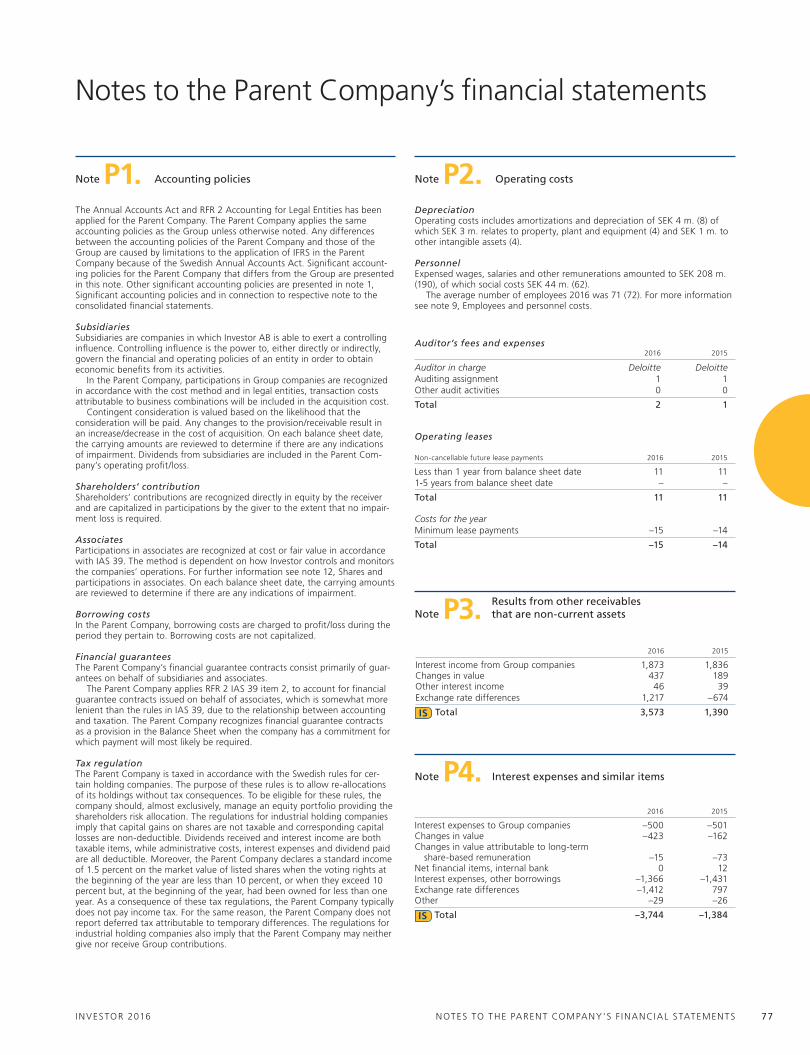
Note P1. Accounting policies
The Annual Accounts Act and RFR 2 Accounting for Legal Entities has been applied for the Parent Company. The Parent Company applies the same accounting policies as the Group unless otherwise noted. Any differences between the accounting policies of the Parent Company and those of the Group are caused by limitations to the application of IFRS in the Parent Company because of the Swedish Annual Accounts Act. Significant account-ing policies for the Parent Company that differs from the Group are presented in this note. Other significant accounting policies are presented in note 1, Significant accounting policies and in connection to respective note to the consolidated financial statements.
SubsidiariesSubsidiaries are companies in which Investor AB is able to exert a controlling influence. Controlling influence is the power to, either directly or indirectly, govern the financial and operating policies of an entity in order to obtain economic benefits from its activities.
In the Parent Company, participations in Group companies are recognized in accordance with the cost method and in legal entities, transaction costs attributable to business combinations will be included in the acquisition cost.
Contingent consideration is valued based on the likelihood that the consideration will be paid. Any changes to the provision/receivable result in an increase/decrease in the cost of acquisition. On each balance sheet date, the carrying amounts are reviewed to determine if there are any indications of impairment. Dividends from subsidiaries are included in the Parent Com-pany’s operating profit/loss.
Shareholders’ contributionShareholders’ contributions are recognized directly in equity by the receiver and are capitalized in participations by the giver to the extent that no impair-ment loss is required.
AssociatesParticipations in associates are recognized at cost or fair value in accordance with IAS 39. The method is dependent on how Investor controls and monitors the companies’ operations. For further information see note 12, Shares and participations in associates. On each balance sheet date, the carrying amounts are reviewed to determine if there are any indications of impairment.
Borrowing costsIn the Parent Company, borrowing costs are charged to profit/loss during the period they pertain to. Borrowing costs are not capitalized.
Financial guaranteesThe Parent Company’s financial guarantee contracts consist primarily of guar-antees on behalf of subsidiaries and associates.
The Parent Company applies RFR 2 IAS 39 item 2, to account for financial guarantee contracts issued on behalf of associates, which is somewhat more lenient than the rules in IAS 39, due to the relationship between accounting and taxation. The Parent Company recognizes financial guarantee contracts as a provision in the Balance Sheet when the company has a commitment for which payment will most likely be required.
Tax regulationThe Parent Company is taxed in accordance with the Swedish rules for cer-tain holding companies. The purpose of these rules is to allow re-allocations of its holdings without tax consequences. To be eligible for these rules, the company should, almost exclusively, manage an equity portfolio providing the shareholders risk allocation. The regulations for industrial holding companies imply that capital gains on shares are not taxable and corresponding capital losses are non-deductible. Dividends received and interest income are both taxable items, while administrative costs, interest expenses and dividend paid are all deductible. Moreover, the Parent Company declares a standard income of 1.5 percent on the market value of listed shares when the voting rights at the beginning of the year are less than 10 percent, or when they exceed 10 percent but, at the beginning of the year, had been owned for less than one year. As a consequence of these tax regulations, the Parent Company typically does not pay income tax. For the same reason, the Parent Company does not report deferred tax attributable to temporary differences. The regulations for industrial holding companies also imply that the Parent Company may neither give nor receive Group contributions.
Notes to the Parent Company’s financial statements
Operating leases
Non-cancellable future lease payments 2016 2015
Less than 1 year from balance sheet date 11 111-5 years from balance sheet date – –
Total 11 11
Costs for the yearMinimum lease payments –15 –14
Total –15 –14
Auditor’s fees and expenses2016 2015
Auditor in charge Deloitte DeloitteAuditing assignment 1 1Other audit activities 0 0
Total 2 1
DepreciationOperating costs includes amortizations and depreciation of SEK 4 m. (8) of which SEK 3 m. relates to property, plant and equipment (4) and SEK 1 m. to other intangible assets (4).
Personnel Expensed wages, salaries and other remunerations amounted to SEK 208 m. (190), of which social costs SEK 44 m. (62).
The average number of employees 2016 was 71 (72). For more information see note 9, Employees and personnel costs.
Note P3. Results from other receivables that are non-current assets
2016 2015
Interest income from Group companies 1,873 1,836Changes in value 437 189Other interest income 46 39Exchange rate differences 1,217 –674
IS Total 3,573 1,390
Note P4. Interest expenses and similar items
2016 2015
Interest expenses to Group companies –500 –501Changes in value –423 –162Changes in value attributable to long-term share-based remuneration –15 –73Net financial items, internal bank 0 12Interest expenses, other borrowings –1,366 –1,431Exchange rate differences –1,412 797Other –29 –26
IS Total –3,744 –1,384
Note P2. Operating costs
INVESTOR 2016 NOTES TO ThE PARENT COMPANy'S F INANCIAL STATEMENTS 77

Note P5. Participations in Group companies
Changes in participations in Group companies 12/31 2016 12/31 2015
Accumulated costsOpening balance 58,107 54,751Acquisitions and capital contributions 3,962 13,948Liquidation of Group company 2,619 –Divestments and repaid capital contributions –9,750 –10,592
At year-end 54,938 58,107
Accumulated impairment lossesOpening balance –1,140 –1,140Impairment losses – –
At year-end –1,140 –1,140
BS Carrying amount at year-end 53,797 56,967
Other material indirect holdings in subsidiaries
Ownership interest in %1)
Subsidiary, Registered office 12/31 2016 12/31 2015
Aleris Group AB, Stockholm 100.0 100.0Braun holdings Inc., Indiana 94.6 94.6Investor Growth Capital AB, Stockholm2) 100.0 100.0Investor Investment holding AB, Stockholm3) 100.0 100.0Laborie, Toronto 97.1 –Mölnlycke AB, Gothenburg 98.8 98.8Permobil holding AB, Timrå 87.6 87.6The Grand Group AB, Stockholm 100.0 100.0vectura Fastigheter AB, Stockholm 100.0 100.0
1) Refers to share of equity.2) holding company of Investor Growth Capital Inc.3) holding company of EqT.
The Investor Group consists of 6 wholly-owned subsidiaries to Investor AB, see table above, and a number of indirect holdings of which the material indirect holdings in subsidiaries are stated in the table above. In the subgroups Mölnlycke, Permobil, BraunAbility and Laborie non-controlling interests exists. None of these are considered material for Investor. Investor have assessed control over all subsidiaries due to the high ownership interest and Investor
AB having direct or indirect power of the companies and has the right and ability to affect the returns. Investor also continuously assess whether it con-trols companies with ownership interests below 50 percent. The assessment is based on whether Investor has the practical ability to direct relevant activities unilaterally either through the boards or the annual general meetings of the companies. No companies where de facto control exists have been identified.
Specification of the Parent Company’s direct holdings of participations in Group companies
Ownership interest in %1) Carrying amount
Subsidiary, Registered office, Registration number Number of participations 12/31 2016 12/31 2015 12/31 2016 12/31 2015
Investor holding AB, Stockholm, 556554-1538 1,000 100.0 100.0 13,793 21,293Patricia Industries AB, Stockholm, 556752-6057 100,000 100.0 100.0 23,239 19,639Invaw holding AB, Stockholm, 556904-1212 – – 100.0 – 9,880Invaw Invest AB, Stockholm, 556270-6308 10,000 100.0 – 12,099 –Patricia Industries II AB, Stockholm, 556619-6811 1,000 100.0 100.0 1,682 3,432Innax AB, Stockholm, 556619-6753 1,000 100.0 100.0 2,569 2,669AB Investor Group Finance, Stockholm, 556371-99872) 100,000 100.0 100.0 416 54
BS Carrying amount 53,797 56,967
1) Refers to share of equity, which also corresponds to the share of voting power.2) The Group’s internal bank.
Note P6. Participations in associates
Specification of participations in associates12/31 2016 12/31 2015
Investor’s share of Investor’s share of
Company, Registered office, Registration number Number of sharesOwnership
capital/votes (%)Carryingamount 1, 2) Equity3)
Profit/loss for the year 4)
Carryingamount 1, 2) Equity3)
Profit/loss for the year 4)
Listed Core Investments:SEB, Stockholm, 502032-9081 456,198,927 21/21 43,725 29,323 2,209 40,826 29,702 3,449Atlas Copco, Stockholm, 556014-2720 207,645,611 17/22 57,437 8,934 2,207 43,100 7,854 1,969Ericsson, Stockholm, 556016-0680 196,047,348 6/22 10,380 8,289 112 14,086 7,810 725Electrolux, Stockholm, 556009-4178 47,866,133 15/30 10,846 2,749 696 9,860 2,326 243Swedish Orphan Biovitrum, Stockholm, 556038-9321 107,594,165 40/40 11,480 2,120 253 14,514 1,845 47Saab, Linköping, 556036-0793 32,778,098 30/40 11,181 3,990 353 8,535 3,874 421husqvarna, Jönköping, 556000-5331 97,052,157 17/33 6,883 2,413 353 5,428 2,194 317
BS Total participations in associates 151,933 136,350
1) Carrying amount includes acquisition cost, additional investments and divestments for the period and value changes due to write-downs to correspond with the fair value of the investments valued at cost and fair value for participations in associates valued at fair value, respectively.
2) Carrying amount for associates valued at fair value, equals the quoted market price for the investment. 3) Equity refers to the ownership interest in the equity of a company including the equity component in untaxed reserves and after adjustments to Investor’s accounting policies.4) Profit/loss for the year refers to the share of the company’s results after tax including the equity component in the change for the year in untaxed reserves after adjustments
to Investor’s accounting policies.
INVESTOR 2016NOTES TO ThE PARENT COMPANy'S F INANCIAL STATEMENTS 78

For more information see note 25, Provision for pensions and similar obligations.
Note P11. Prepaid expenses and accrued income
12/31 2016 12/31 2015
Interest 34 31Other financial receivables 1 4Other 9 16
BS Total 44 51
Amounts recognized in Profit/loss for the year and Other Comprehensive income for defined benefit plans
Components of defined benefit cost (gain – ) 2016 2015
Past service cost and gains/losses from settlements – –55
Total operating cost – –55
Net interest expense 3 2
Total financial cost 3 2
Components recognized in profit or loss 3 –53
Remeasurement on the net defined benefit liability (gain –) 2016 2015
Actuarial gains/losses, demographic assumptions – –80Actuarial gains/losses, financial assumptions 10 –1Actuarial gains/losses, experience adjustments 4 10
Components in Other Comprehensive income 14 –71
Note P9. Other long-term holdings of securities
12/31 2016 12/31 2015
Opening balance 65,295 63,128Acquisitions 67 5,615Divestments –65 –1,253Revaluations disclosed in Income Statement 5,031 –2,195
BS Carrying amount at year-end 70,327 65,295
12/31 2016 12/31 2015
Opening balance 31,679 37,911New lending 1,023 1,729Divestments/due/redeemed –3,414 –4,988Reclassification – –2,281unrealized change in value 1,272 –692
BS Carrying amount at year-end 30,560 31,679
Note P10. Receivables from Group companies
Note P12. Provisions for pensions and similar obligations
Note P6. cont´d Participations in associates
Note P8. Property, plant and equipment
Equipment 12/31 2016 12/31 2015
Accumulated costsOpening balance 37 46Acquisitions 2 –Sales and disposals –2 –9
At year-end 37 37
Accumulated depreciation and impairmentOpening balance –24 –29Sales and disposals 2 9Depreciation for the year –3 –4
At year-end –25 –24
BS Carrying amount at year-end 12 13
Capitalized expenditure for software 12/31 2016 12/31 2015
Accumulated costsOpening balance 30 29Acquisitions 2 1
At year-end 32 30
Accumulated amortization and impairment lossesOpening balance –28 –24Amortizations –1 –4
At year-end –29 –28
BS Carrying amount at year-end 3 2
Allocation of amortizations in Income StatementOperating costs –1 –4
Total –1 –4
Note P7. Intangible assets
Specification of carrying amount for participations in associates valued at fair value
12/31 2016 12/31 2015
Opening balance 136,350 137,892Acquisitions 1,135 –Divestments – –1,241Revaluations disclosed in Income Statement 14,448 –301
Carrying amount at year-end 151,933 136,350
INVESTOR 2016 NOTES TO ThE PARENT COMPANy'S F INANCIAL STATEMENTS 79

Note P12. cont’d Provisions for pensions and similar obligations
Changes in the obligations for defined benefit plans during the year 12/31 2016 12/31 2015
Defined benefit plan obligations, opening balance 85 428Interest cost 3 2Remeasurement of defined benefit obligations Actuarial gains/losses, demographic assumptions – –80 Actuarial gains/losses, financial assumptions 10 –1 Actuarial gains/losses, experience adjustments 4 10Past service cost incl gains/losses on curtailments – –55Liabilities extinguished on settlements – –221Exchange difference on foreign plans 0 6Benefit paid –3 –5Other 0 1
Obligations for defined benefit plans at year-end 99 85
Changes in fair value of plan assets 12/31 2016 12/31 2015
Fair value of plan assets, opening balance – 221Assets distributed on settlements – –221
Fair value of plan assets at year-end – –
Changes in restriction asset ceiling in the current year 12/31 2016 12/31 2015
Restriction asset ceiling, opening balance – 6
Changes asset ceiling, OCI – –61)
Restriction asset ceiling at year-end – –
1) The changes of asset ceiling in current year is netted out in Other Comprehensive income with the actuarial gain/losses from the present value on the obligation and the Fv of the plan assets.
Assumptions
Assumptions for defined benefit obligations 12/31 2016 12/31 2015
Discount rate 2.4 3.3Future pension growth 2.0 2.0Mortality assumption used DuS14 DuS14
In the Parent Company Swedish mortgage backed bonds have been used as reference when determining the discount rate used for the calculation of the defined benefit obligation. The market for high quality Swedish mortgage backed bonds is considered to be deep and thereby fulfill the requirements of high quality corporate bonds according to IAS 19.
Defined contribution plans
Defined contribution plans 2016 2015
Expenses for defined contribution plans 23 –
Note P13. Other provisions
12/31 2016 12/31 2015
Provisions expected to be paid after more than 12 months
Provision for social security contributions for LTvR 9 171Other 160 80
Total non-current other provisions 169 251
Provisions expected to be paid within 12 months
Other 64 20
Total current provisions 64 20
BS Total other provisions 233 271
Provision for social security contributions for long-term share-based remuneration (LTVR)Investor operates LTvR programs which are offered to all employees. Provision is made for social security contributions connected to these programs. The provision will be used during the years 2017-2023.
OtherIn the category Other a provision of SEK 160 m. for potential additional compensation to be paid related to sold associated company is included. The provision is expected to be settled in 2019 at the earliest. Other provisions are considered immaterial to specify and intend to be settled with SEK 64 m. in 2017.
12/31 2016Social security
LTvR OtherTotal other provisions
Opening balance 171 100 271Provisions for the year –112 80 –32Reversals for the year – –6 –6
Carrying amount at year-end 59 174 233
12/31 2015
Opening balance 125 17 142Provisions for the year 46 86 132Reversals for the year – –3 –3
Carrying amount at year-end 171 100 271
Note P14. Interest-bearing liabilities
12/31 2016 12/31 2015
Interest-bearing liabilitiesLong-term interest-bearing liabilities 31,043 31,296Related interest rate derivatives with negative value 188 204
BS Total 31,231 31,500
12/31 2016 12/31 2015
Carrying amountsMaturity, 1–5 years from balance sheet date 5,429 5,688Maturity, more than 5 years from balance sheet date 25,802 25,812
BS Total 31,231 31,500
Note P15. Accrued expenses and deferred income
12/31 2016 12/31 2015
Interest 583 642Other financial receivables 35 56Other 62 57
BS Total 680 755
Provision for defined benefit plansThe amount included in the Balance Sheet arising from defined benefit plan 12/31 2016 12/31 2015
Present value of unfunded obligations 99 85
Total present value of defined benefit obligations 99 85
BS Net liability arising from defined benefit obligations 99 85
INVESTOR 2016NOTES TO ThE PARENT COMPANy'S F INANCIAL STATEMENTS 8 0

Note P16. Financial instruments
Financial assets and liabilities by valuation category
Financial assets and liabilities measured at fair value
through profit/loss
12/31 2016 Fair value option held for tradingDerivatives used in hedge accounting
Loans and receivables
Other assets and liabilities
Total carrying amount Fair value
Financial assetsOther long-term holdings of securities 70,327 70,327 70,327Participations in associates 151,933 151,933 151,933Receivables from Group companies (non-current) 912 29,648 30,560 30,560Accrued interest income 34 34 34Trade receivables 3 3 3Receivables from Group companies (current) 526 526 526Receivables from associates 2 2 2Other receivables 0 0 0
Total 222,260 – 912 30,212 – 253,385 253,385
Financial liabilitiesLoans (non-current) 188 31,043 31,231 38,5901)
Liabilities to Group companies (non-current) 1,876 12,282 14,158 14,158Loans (current) 1,500 1,500 1,5091)
Trade payables 12 12 12Liabilities to Group companies (current) 8,888 8,888 8,888Liabilities to associates (current) 0 0 0Accrued interest expenses 583 583 583Other liabilities 2 24 26 26
Total – 190 1,876 – 54,332 56,398 63,767
Financial assets and liabilities measured at fair value
through profit/loss
12/31 2015 Fair value option held for tradingDerivatives used in hedge accounting
Loans and receivables
Other assets and liabilities
Total carrying amount Fair value
Financial assetsOther long-term holdings of securities 65,295 65,295 65,295Participations in associates 136,350 136,350 136,350Receivables from Group companies (non-current) 423 31,256 31,679 31,679Accrued interest income 31 31 31Trade receivables 1 1 1Receivables from Group companies (current) 2,849 2,849 2,849Receivables from associates 0 0 0Other receivables 2 2 2
Total 201,645 – 423 34,139 – 236,207 236,207
Financial liabilitiesLoans (non-current) 204 31,296 31,500 38,6621)
Liabilities to Group companies (non-current) 1,384 12,282 13,666 13,666Loans (current) 2,229 2,229 2,2491)
Trade payables 13 13 13Liabilities to Group companies (current) 16,267 16,267 16,267Liabilities to associates (current) 0 0 0Accrued interest expenses 642 642 642Other liabilities 5 5 5
Total – 204 1,384 – 62,734 64,322 71,504
1) The Parent Company’s loans are valued at amortized cost, fair value on loans are presented in the table. For other assets and liabilities there are no differences between carrying amount and fair value.
Accounting policiesFor accounting policies see note 29, Financial instruments.
INVESTOR 2016 NOTES TO ThE PARENT COMPANy'S F INANCIAL STATEMENTS 81

Note P16. cont’d Financial instruments
Result from financial assets and liabilities by valuation category
Financial assets and liabilities measured at fair value through profit/loss
2016 Fair value option held for tradingDerivatives used in hedge accounting
Loans and receivables
Other financial liabilities Total
Operating profit/lossDividends 7,731 7,731Changes in value, including currency 19,389 –1 19,388
Net financial itemsInterest 14 –38 1,779 –1,722 33Changes in value –13 –3 200 –184 0Exchange rate differences 29 965 –1,189 –195
Total 27,120 29 –41 2,944 –3,096 26,956
2015 Fair value option held for tradingDerivatives used in hedge accounting
Loans and receivables
Other financial liabilities Total
Operating profit/lossDividends 7,182 7,182Changes in value, including currency –2,582 –2,582
Net financial itemsInterest 10 –40 1,733 –1,766 –63Changes in value –10 8 76 –119 –45Exchange rate differences –32 0 –794 949 123
Total 4,600 –32 –32 1,015 –936 4,615
Assets and liabilities measured at fair valueThe table below indicates how fair value is measured for the financial instruments recognized at fair value in the Balance Sheet. The financial instruments are categorized on three levels, depending on how the fair value is measured:Level 1: According to quoted prices (unadjusted) in active markets for identical instrumentsLevel 2: According to directly or indirectly observable inputs that are not included in level 1 Level 3: According to inputs that are unobservable in the market
Financial assets and liabilities by level
12/31 2016 Level 1 Level 2 Level 3 Other1) Total
Financial assets
Participations associates 149,601 2,332 151,933Receivables from Group companies (non-current) 912 29,648 30,560Other long-term holdings of securities 70,324 3 70,327
Total 219,925 2,332 915 29,648 252,820
Financial liabilities
Liabilities to Group companies (non-current) 1,876 12,282 14,158Interest-bearing liabilities (non-current) 188 31,043 31,231Other current liabilities 2 24 26
Total – 190 1,876 43,349 45,415
12/31 2015 Level 1 Level 2 Level 3 Other1) Total
Financial assets
Participations associates 134,325 2,025 136,350Receivables from Group companies (non-current) 423 31,256 31,679Other long-term holdings of securities 65,293 2 65,295
Total 199,618 2,025 425 31,256 233,324
Financial liabilities
Liabilities to Group companies (non-current) 1,384 12,282 13,666Interest-bearing liabilities (non-current) 204 31,296 31,500
Total – 204 1,384 43,578 45,166
1) To enable reconciliation with balance sheet items, financial instruments not valued at fair value as well as other assets and liabilities that are included within balance sheet items have been included within Other.
INVESTOR 2016NOTES TO ThE PARENT COMPANy'S F INANCIAL STATEMENTS 82
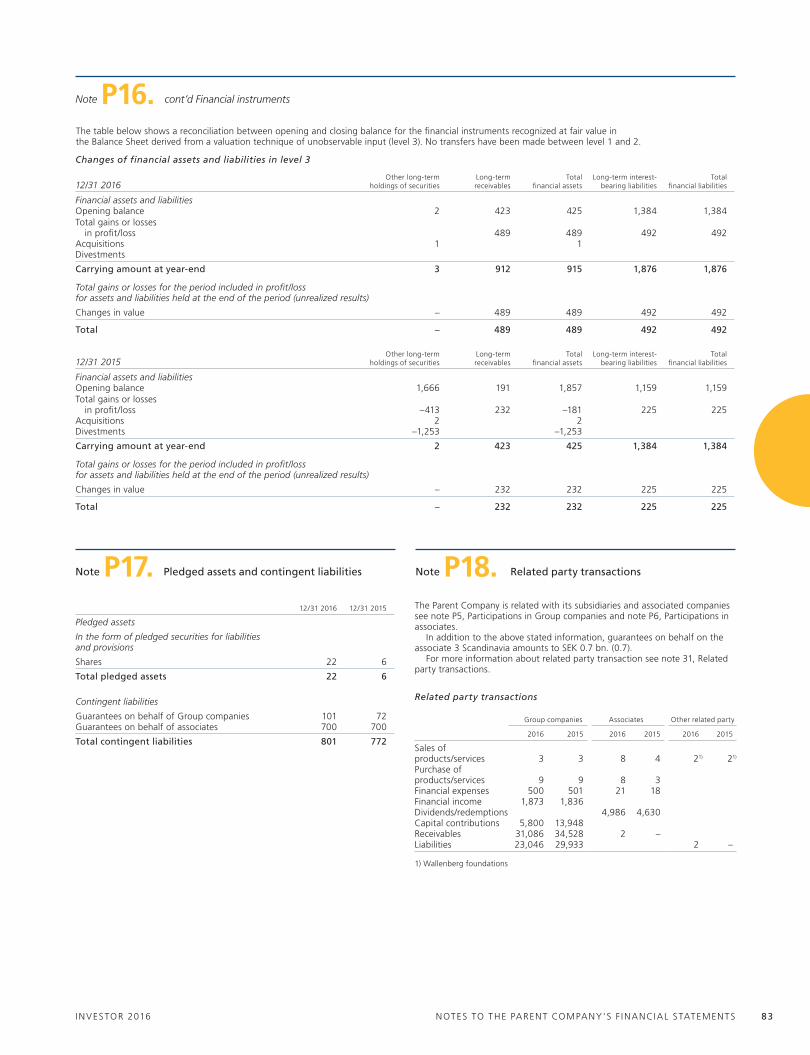
Note P16. cont’d Financial instruments
Changes of financial assets and liabilities in level 3
12/31 2016Other long-term
holdings of securitiesLong-term receivables
Total financial assets
Long-term interest-bearing liabilities
Total financial liabilities
Financial assets and liabilitiesOpening balance 2 423 425 1,384 1,384Total gains or losses in profit/loss 489 489 492 492Acquisitions 1 1Divestments
Carrying amount at year-end 3 912 915 1,876 1,876
Total gains or losses for the period included in profit/loss for assets and liabilities held at the end of the period (unrealized results)
Changes in value – 489 489 492 492
Total – 489 489 492 492
12/31 2015Other long-term
holdings of securitiesLong-term receivables
Total financial assets
Long-term interest-bearing liabilities
Total financial liabilities
Financial assets and liabilitiesOpening balance 1,666 191 1,857 1,159 1,159Total gains or losses in profit/loss –413 232 –181 225 225Acquisitions 2 2Divestments –1,253 –1,253
Carrying amount at year-end 2 423 425 1,384 1,384
Total gains or losses for the period included in profit/loss for assets and liabilities held at the end of the period (unrealized results)
Changes in value – 232 232 225 225
Total – 232 232 225 225
Note P17. Pledged assets and contingent liabilities
12/31 2016 12/31 2015
Pledged assets
In the form of pledged securities for liabilities and provisions
Shares 22 6
Total pledged assets 22 6
Contingent liabilities
Guarantees on behalf of Group companies 101 72Guarantees on behalf of associates 700 700
Total contingent liabilities 801 772
Note P18. Related party transactions
The table below shows a reconciliation between opening and closing balance for the financial instruments recognized at fair value in the Balance Sheet derived from a valuation technique of unobservable input (level 3). No transfers have been made between level 1 and 2.
Related party transactions
Group companies Associates Other related party
2016 2015 2016 2015 2016 2015
Sales of products/services 3 3 8 4 21) 21)
Purchase of products/services 9 9 8 3Financial expenses 500 501 21 18Financial income 1,873 1,836Dividends/redemptions 4,986 4,630Capital contributions 5,800 13,948Receivables 31,086 34,528 2 –Liabilities 23,046 29,933 2 – 1) wallenberg foundations
The Parent Company is related with its subsidiaries and associated companies see note P5, Participations in Group companies and note P6, Participations in associates.
In addition to the above stated information, guarantees on behalf on the associate 3 Scandinavia amounts to SEK 0.7 bn. (0.7).
For more information about related party transaction see note 31, Related party transactions.
INVESTOR 2016 NOTES TO ThE PARENT COMPANy'S F INANCIAL STATEMENTS 83

REPORT ON THE ANNUAL ACCOUNTS AND CONSOLIDATED ACCOUNTS
Opinions we have audited the annual accounts and consolidated accounts of Investor AB (publ) for the financial year January 1 – December 31, 2016 except for the corporate governance report on pages 24-32. The annual accounts and consolidated accounts of the company are included on pages 4-5, 9-11 and 21-83 in this document.
In our opinion, the annual accounts have been prepared in accor-dance with the Annual Accounts Act and present fairly, in all material respects, the financial position of parent company as of 31 December 2016 and its financial performance and cash flow for the year then ended in accordance with the Annual Accounts Act. The consoli-dated accounts have been prepared in accordance with the Annual Accounts Act and present fairly, in all material respects, the financial position of the group as of 31 December 2016 and their financial per-formance and cash flow for the year then ended in accordance with International Financial Reporting Standards (IFRS), as adopted by the Eu, and the Annual Accounts Act. Our opinions do not cover the cor-porate governance report on pages 24-32. The statutory administra-tion report is consistent with the other parts of the annual accounts and consolidated accounts.
we therefore recommend that the general annual meeting of shareholders adopts the income statement and balance sheet for the parent company and the group.
Basis for Opinionswe conducted our audit in accordance with International Standards on Auditing (ISA) and generally accepted auditing standards in Swe-den. Our responsibilities under those standards are further described in the Auditor’s Responsibilities section. we are independent of the parent company and the group in accordance with professional ethics for accountants in Sweden and have otherwise fulfilled our ethical responsibilities in accordance with these requirements.
we believe that the audit evidence we have obtained is sufficient and appropriate to provide a basis for our opinions.
Key Audit MattersKey audit matters of the audit are those matters that, in our profes-sional judgment, were of most significance in our audit of the annual accounts and consolidated accounts of the current period. These matters were addressed in the context of our audit of, and in forming our opinion thereon, the annual accounts and consolidated accounts as a whole, but we do not provide a separate opinion on these matters.
Governance over financial reportingwith Investor’s focus on high quality financial reporting combined with tighter reporting deadlines and more reporting units, a well-controlled financial reporting process is critical. wholly-owned sub-sidiaries and partner-owned investments within Patricia Industries are normally independent with separate internal control systems in place for their operating activities including financial reporting.
we focused our audit on the governance over financial reporting for several reasons. Firstly, it is important to ensure that the informa-tion reported by each entity is prepared in accordance with IFRS.
Secondly, with more tight reporting deadlines, changes to the timing and reporting structure, monitoring controls are critical to ensure high quality reporting. Thirdly, with Patricia Industries’ intention to continue to seek new investments with significant ownership it is important to have well established procedures to ensure timely and correct financial reporting.
Investor AB’s information regarding consolidation principles are included in Note 1 Significant accounting policies and Note 12 Shares and participation in associates on pages 38 and 52 respectively, pro-viding further explanation on the method for accounting for associ-ates.
Our audit procedures included, but were not limited to:• we obtained an understanding of Investor’s processes relating to
internal controls over financial reporting and tested key controls. • we evaluated internal controls in relation to critical IT-systems used
for financial reporting.• we assessed the company’s procedures relating to controls over
financial information reported from consolidated subsidiaries and associates reported under the equity method.
• we assessed unusual transactions, such as the accounting for the acquisition of Laborie, and the reporting thereof including assess-ment of application of new accounting rules and regulations and their compliance with IFRS.
Valuation of unlisted investmentsThe valuation process of unlisted investments requires estimates by management and is therefore more complex compared to the valua-tion of listed investments. Additionally, changes in the holding strat-egy for certain holdings and changes in ownership interests may have implications on the method for accounting and valuing these invest-ments. The total carrying value recognized at fair value amounted to SEK 19,367 million as of December 31, 2016.
Investor’s valuation policy is based on the International Private Equity and venture Capital valuation Guidelines. Inappropriate judge-ments made in the assessment of fair value, in particular, in respect of selection of valuation multiples could have a significant impact on the value of the unlisted investment.
we focused on the unlisted investments since the carrying value is material, the investment portfolio comprises a large number of unlisted securities and since the assessments made to arrive at the fair value is sensitive to judgements and estimates made.
Investor AB’s principles for accounting for unlisted investments are described in note 29 on page 67 and detailed disclosures regard-ing these investments are included in Note 29 Financial instruments on page 67-70, see detailed description in section Measurement of financial instruments in level 3.
Our audit procedures included, but were not limited to:• we obtained an understanding of the valuation process and key
controls in this process and tested key controls. • we agreed correct ownership percentages in Patricia Industries and
EqT funds and proper accounting for changes in such ownership. • we confirmed the reported valuations as of December 31, 2016 to
audited financial statements of the funds of EqT. • we tested that the methodology and consistency applied in
the valuation of the portfolio companies is in accordance with the International Private Equity and venture Capital valuation Guidelines.
Auditor’s ReportTo the annual general meeting of the shareholders of Investor AB (publ.)CORP. ID 556013-8298
INVESTOR 2016AuDITOR’S REPORT 8 4
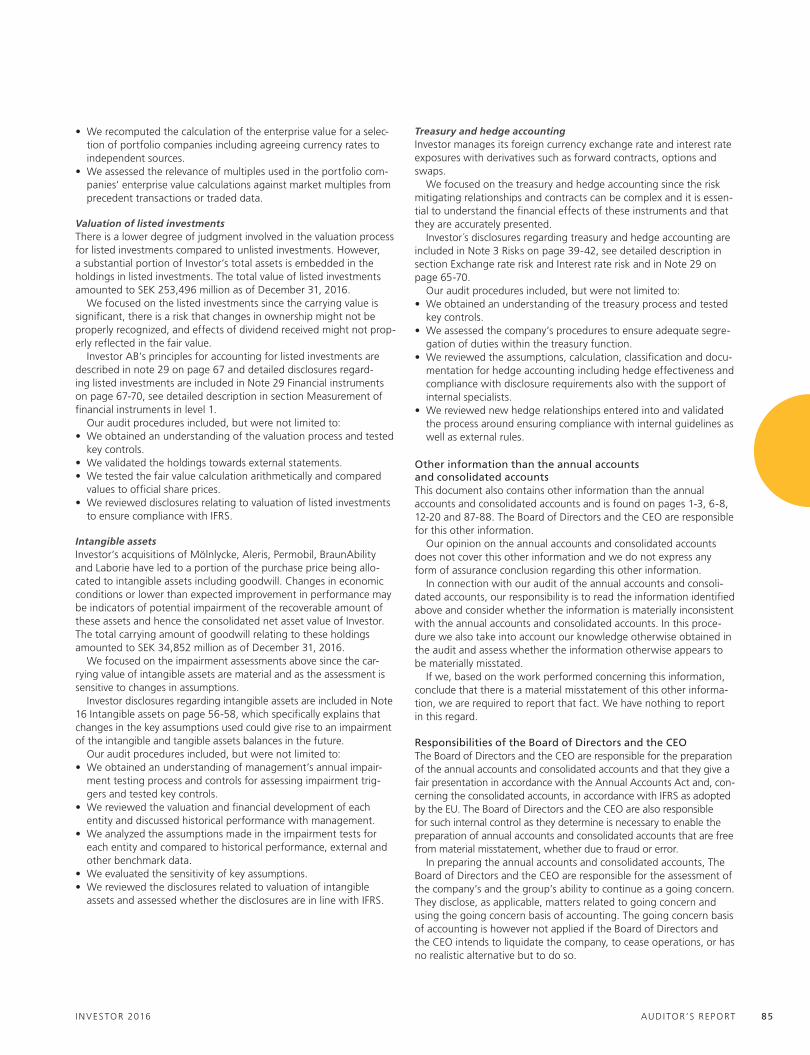
• we recomputed the calculation of the enterprise value for a selec-tion of portfolio companies including agreeing currency rates to independent sources.
• we assessed the relevance of multiples used in the portfolio com-panies’ enterprise value calculations against market multiples from precedent transactions or traded data.
Valuation of listed investmentsThere is a lower degree of judgment involved in the valuation process for listed investments compared to unlisted investments. however, a substantial portion of Investor’s total assets is embedded in the holdings in listed investments. The total value of listed investments amounted to SEK 253,496 million as of December 31, 2016.
we focused on the listed investments since the carrying value is significant, there is a risk that changes in ownership might not be properly recognized, and effects of dividend received might not prop-erly reflected in the fair value.
Investor AB’s principles for accounting for listed investments are described in note 29 on page 67 and detailed disclosures regard-ing listed investments are included in Note 29 Financial instruments on page 67-70, see detailed description in section Measurement of financial instruments in level 1.
Our audit procedures included, but were not limited to:• we obtained an understanding of the valuation process and tested
key controls. • we validated the holdings towards external statements.• we tested the fair value calculation arithmetically and compared
values to official share prices.• we reviewed disclosures relating to valuation of listed investments
to ensure compliance with IFRS.
Intangible assetsInvestor’s acquisitions of Mölnlycke, Aleris, Permobil, BraunAbility and Laborie have led to a portion of the purchase price being allo-cated to intangible assets including goodwill. Changes in economic conditions or lower than expected improvement in performance may be indicators of potential impairment of the recoverable amount of these assets and hence the consolidated net asset value of Investor. The total carrying amount of goodwill relating to these holdings amounted to SEK 34,852 million as of December 31, 2016.
we focused on the impairment assessments above since the car-rying value of intangible assets are material and as the assessment is sensitive to changes in assumptions.
Investor disclosures regarding intangible assets are included in Note 16 Intangible assets on page 56-58, which specifically explains that changes in the key assumptions used could give rise to an impairment of the intangible and tangible assets balances in the future.
Our audit procedures included, but were not limited to:• we obtained an understanding of management’s annual impair-
ment testing process and controls for assessing impairment trig-gers and tested key controls.
• we reviewed the valuation and financial development of each entity and discussed historical performance with management.
• we analyzed the assumptions made in the impairment tests for each entity and compared to historical performance, external and other benchmark data.
• we evaluated the sensitivity of key assumptions.• we reviewed the disclosures related to valuation of intangible
assets and assessed whether the disclosures are in line with IFRS.
Treasury and hedge accountingInvestor manages its foreign currency exchange rate and interest rate exposures with derivatives such as forward contracts, options and swaps.
we focused on the treasury and hedge accounting since the risk mitigating relationships and contracts can be complex and it is essen-tial to understand the financial effects of these instruments and that they are accurately presented.
Investor´s disclosures regarding treasury and hedge accounting are included in Note 3 Risks on page 39-42, see detailed description in section Exchange rate risk and Interest rate risk and in Note 29 on page 65-70.
Our audit procedures included, but were not limited to:• we obtained an understanding of the treasury process and tested
key controls. • we assessed the company’s procedures to ensure adequate segre-
gation of duties within the treasury function. • we reviewed the assumptions, calculation, classification and docu-
mentation for hedge accounting including hedge effectiveness and compliance with disclosure requirements also with the support of internal specialists.
• we reviewed new hedge relationships entered into and validated the process around ensuring compliance with internal guidelines as well as external rules.
Other information than the annual accounts and consolidated accountsThis document also contains other information than the annual accounts and consolidated accounts and is found on pages 1-3, 6-8, 12-20 and 87-88. The Board of Directors and the CEO are responsible for this other information.
Our opinion on the annual accounts and consolidated accounts does not cover this other information and we do not express any form of assurance conclusion regarding this other information.
In connection with our audit of the annual accounts and consoli-dated accounts, our responsibility is to read the information identified above and consider whether the information is materially inconsistent with the annual accounts and consolidated accounts. In this proce-dure we also take into account our knowledge otherwise obtained in the audit and assess whether the information otherwise appears to be materially misstated.
If we, based on the work performed concerning this information, conclude that there is a material misstatement of this other informa-tion, we are required to report that fact. we have nothing to report in this regard.
Responsibilities of the Board of Directors and the CEOThe Board of Directors and the CEO are responsible for the preparation of the annual accounts and consolidated accounts and that they give a fair presentation in accordance with the Annual Accounts Act and, con-cerning the consolidated accounts, in accordance with IFRS as adopted by the Eu. The Board of Directors and the CEO are also responsible for such internal control as they determine is necessary to enable the preparation of annual accounts and consolidated accounts that are free from material misstatement, whether due to fraud or error.
In preparing the annual accounts and consolidated accounts, The Board of Directors and the CEO are responsible for the assessment of the company’s and the group’s ability to continue as a going concern. They disclose, as applicable, matters related to going concern and using the going concern basis of accounting. The going concern basis of accounting is however not applied if the Board of Directors and the CEO intends to liquidate the company, to cease operations, or has no realistic alternative but to do so.
INVESTOR 2016 AuDITOR’S REPORT 85

The Audit Committee shall, without prejudice to the Board of Director’s responsibilities and tasks in general, among other things oversee the company’s financial reporting process.
Auditor’s responsibilityOur objectives are to obtain reasonable assurance about whether the annual accounts and consolidated accounts as a whole are free from material misstatement, whether due to fraud or error, and to issue an auditor’s report that includes our opinions. Reasonable assurance is a high level of assurance, but is not a guarantee that an audit conduct-ed in accordance with ISAs and generally accepted auditing standards in Sweden will always detect a material misstatement when it exists. Misstatements can arise from fraud or error and are considered material if, individually or in the aggregate, they could reasonably be expected to influence the economic decisions of users taken on the basis of these annual accounts and consolidated accounts.
A further description of our responsibility for the audit of the annual accounts and the consolidated accounts is available on the Supervisory Board of Public Accountants’ website: www.revisorsinspektionen.se/rn/showdocument/documents/rev_dok/revisors_ansvar.pdf. This description is part of the auditor´s report.
REPORT ON OTHER LEGAL AND REGULATORY REQUIREMENTSOpinionsIn addition to our audit of the annual accounts and consolidated accounts, we have also audited the administration of the Board of Directors and the CEO of Investor AB (publ) for the financial year 2016 and the proposed appropriations of the company’s profit or loss.
we recommend to the annual general meeting of shareholders that the profit to be appropriated in accordance with the proposal in the statutory administration report and that the members of the Board of Directors and the CEO be discharged from liability for the financial year.
Basis for Opinionswe conducted the audit in accordance with generally accepted audit-ing standards in Sweden. Our responsibilities under those standards are further described in the Auditor’s Responsibilities section. we are independent of the parent company and the group in accordance with professional ethics for accountants in Sweden and have other-wise fulfilled our ethical responsibilities in accordance with these requirements.
we believe that the audit evidence we have obtained is sufficient and appropriate to provide a basis for our opinions.
Responsibilities of the Board of Directors and the CEOThe Board of Directors is responsible for the proposal for appropria-tions of the company’s profit or loss. At the proposal of a dividend, this includes an assessment of whether the dividend is justifiable considering the requirements which the company’s and the group’s type of operations, size and risks place on the size of the parent com-pany’s and the group’s equity, consolidation requirements, liquidity and position in general.
The Board of Directors is responsible for the company’s organization and the administration of the company’s affairs. This includes among other things continuous assessment of the company’s and the group’s financial situation and ensuring that the company’s organization is designed so that the accounting, management of assets and the com-pany’s financial affairs otherwise are controlled in a reassuring manner. The CEO shall manage the ongoing administration according to the Board of Directors’ guidelines and instructions and among other mat-
ters take measures that are necessary to fulfill the company’s account-ing in accordance with law and handle the management of assets in a reassuring manner.
Auditor’s responsibilityOur objective concerning the audit of the administration, and thereby our opinion about discharge from liability, is to obtain audit evidence to assess with a reasonable degree of assurance whether any mem-ber of the Board of Directors or the CEO in any material respect:• has undertaken any action or been guilty of any omission which
can give rise to liability to the company, or• in any other way has acted in contravention of the Companies Act,
the Annual Accounts Act or the Articles of Association.Our objective concerning the audit of the proposed appropriations of the company’s profit or loss, and thereby our opinion about this, is to assess with reasonable degree of assurance whether the proposal is in accordance with the Companies Act.
Reasonable assurance is a high level of assurance, but is not a guar-antee that an audit conducted in accordance with generally accepted auditing standards in Sweden will always detect actions or omissions that can give rise to liability to the company, or that the proposed appropriations of the company’s profit or loss are not in accordance with the Companies Act.
A further description of our responsibility for the audit of the administration is available on the Supervisory Board of Public Accoun-tants’ website: www.revisorsinspektionen.se/rn/showdocument/documents/rev_dok/revisors_ansvar.pdf. This description is part of the auditor´s report.
The auditor’s examination of the corporate governance statementThe Board of Directors is responsible for that the corporate gover-nance statement on pages 24-32 has been prepared in accordance with the Annual Accounts Act.
Our examination of the corporate governance statement is con-ducted in accordance with FAR’s auditing standard Revu 16 The auditor’s examination of the corporate governance statement. This means that our examination of the corporate governance statement is different and substantially less in scope than an audit conducted in accordance with International Standards on Auditing and generally accepted auditing standards in Sweden. we believe that the examina-tion has provided us with sufficient basis for our opinions.
A corporate governance statement has been prepared. Disclosures, in accordance with chapter 6 section 6 the second paragraph points 2-6 of the Annual Accounts Act and chapter 7 section 31 the second paragraph the same law, are consistent with the other parts of the annual accounts and consolidated accounts and are in accordance with the Annual Accounts Act.
Stockholm, 23 March, 2017Deloitte AB
Thomas StrömbergAuthorized Public Accountant
INVESTOR 2016AuDITOR’S REPORT 86

INVESTOR 2016 F IVE-YEAR SUMMARY 87
Five-year summary
1) This business area reporting was implemented in 2011. 2) New business area reporting as of 2015.3) From July 1, 2011, invested includes a capital contribution from Investor to IGC of SEK 1,137 m. (2011) and SEK 750 m. (2012).
Divested includes dividends from IGC to Investor of SEK 674 m. (2011) and SEK 607 m. (2012).4) Pertains to class B shares.5) Based on the total number of registered shares.6) Proposed dividend of SEK 11.00/share.
Investor Group
Annual average growth
5 years, %
SEK m. 2012 2013 2014 2015 2016
Net asset value1) Net asset value2)
Core Investments Listed Core Investments 224,143 248,354 Listed 141,456 175,174 218,396 EQT 13,021 13,996 Subsidiaries 21,291 29,531 31,922 Patricia Industries 51,095 54,806Financial Investments 35,144 32,256 35,506 Other assets & liabilities –565 –327Other assets and liabilities –428 1,560 –29 Total assets 287,695 316,829Total assets 197,463 238,521 285,795 Net cash (+) / Net debt (–) –15,892 –16,752Net debt (–) /Net cash (+) –22,765 –23,104 –24,832 Of which Patricia Industries cash 14,616 14,389Net asset value 174,698 215,417 260,963 Net asset value 271,801 300,077Change in net asset value with dividend added back, % 15 26 24
Change in net asset value with dividend added back, % 7 13 17
Condensed Balance Sheet Condensed Balance SheetShares and participations 164,431 202,859 246,891 Shares and participations 254,054 276,790Other 65,214 64,291 76,596 Other 82,536 93,183Balance Sheet total 229,645 267,150 323,487 Balance Sheet total 336,590 369,973
Profit and loss Profit and lossProfit/loss for the year attributable to Parent Company shareholders 24,226 45,165 50,656
Profit/loss for the year attributable to Parent Company shareholders 17,433 33,665
Comprehensive income 23,857 46,161 52,657 Comprehensive income 17,604 35,545
Dividends DividendsDividends received 5,177 6,052 7,228 Dividends received 7,821 8,351 of which from Core Investments Listed 4,782 5,441 6,227 of which from Listed Core Investments 7,681 8,307 16
Contribution to NAV1) Contribution to NAV2)
Contribution to NAV, Core Investments Listed 23,312 38,433 41,311 Contribution to NAV, Listed Core Investments 8,804 30,936Total return, Core Investments Listed, % 20 27 24 Total return, Listed Core Investments, % 4 14Contribution to NAV, Core Investments Subsidiaries –194 668 2,386 Contribution to NAV, EQT 3,995 1,986Contribution to NAV, Financial Investments, Partner-owned 57 4,109 4,221 Contribution to NAV, Patricia Industries 4,855 4,438Contribution to NAV, IGC and EQT 305 3,788 6,543
Transactions Transactions2)
Investments, Core Investments Listed 2,762 719 8,233 Investments, Listed Core Investments 5,783 1,488Divestments & redemptions, Listed Core Investments – – 101 Divestments & redemptions, Listed Core Investments 1,241 –Investments, Core Investments Subsidiaries 3,386 7,558 1,121 Draw-downs, EQT 1,590 2,864Divestments, Core Investments Subsidiaries – – 1,197 Proceeds, EQT 6,086 3,874Investments, Partner-owned financial investments 376 15 3,011 Investments, Patricia Industries 4,176 6,127Divestments, Partner-owned financial investments 80 7,646 8,712 Divestments, Patricia Industries 2,896 2,360Investments, IGC and EQT 6) 2,0343) 1,914 2,389 Distributions to Patricia Industries 5,089 4,763Divestments, IGC and EQT 6) 4,0673) 5,005 5,737
Key figures per share Key figures per shareNet asset value, SEK 230 283 343 Net asset value, SEK 357 393Basic earnings, SEK 31.85 59.35 66.55 Basic earnings, SEK 22.89 44.09Diluted earnings, SEK 31.83 59.25 66.40 Diluted earnings, SEK 22.82 44.02Equity, SEK 230 284 343 Equity, SEK 357 393
Key ratios Key ratiosLeverage, % 12 10 9 Leverage, % 6 5Equity/assets ratio, % 76 81 81 Equity/assets ratio, % 81 81Return on equity, % 15 23 21 Return on equity, % 7 12Discount to reported net asset value, % 27 23 17 Discount to reported net asset value, % 13 14Management costs, % of net asset value 0.2 0.2 0.1 Management costs, % of net asset value 0.2 0.2
Share data Share dataTotal number of shares, million 767.2 767.2 767.2 Total number of shares, million 767.2 767.2Holding of own shares, million 6.2 6.3 5.8 Holding of own shares, million 5.3 2.8Share price on December 31, SEK 4) 170.0 221.3 284.7 Share price on December 31, SEK 4) 312.6 340.5 22Market capitalization on December 31 128,048 166,451 215,705 Market capitalization on December 31 236,301 259,119Dividend paid to Parent Company shareholders 5,331 6,089 6,856 Dividend paid to Parent Company shareholders 7,635 8,4395,6)
Dividend per share, SEK 7.00 8.00 9.00 Dividend per share, SEK 10.00 11.006) 13Dividend payout ratio, % 112 112 110 Dividend payout ratio, % 99 926)
Dividend yield, % 4.1 3.6 3.2 Dividend yield, % 3.2 3.26)
Total annual turnover rate, Investor shares, % 4) 78 62 58 Total annual turnover rate, Investor shares, % 4) 66 64Total return, Investor shares, %4) 38 35 33 Total return, Investor shares, %4) 13 13 26SIXRX (return index), % 16 28 16 SIXRX (return index), % 10 10 16OMXS30 index, % 12 21 10 OMXS30 index, % –1 5 9Foreign ownership, capital, % 33 34 34 Foreign ownership, capital, % 35 30
INVESTOR 2016DEF IN IT IONS 88
Definitions and Alternative Performance Measures
Basic earnings per shareProfit/loss for the year attributable to the Parent Company´s shareholders in relation to the weighted average number of shares outstanding.
Capital expendituresAcquisitions of tangible and intangible assets during the period.
Change in net asset valueChange in the carrying value of total assets less net debt for a period.
Contribution to net asset valueChanges in the carrying value of total assets less net debt (corresponds to the group´s change in equity attributable to shareholders of the Parent Company).
Diluted earnings per shareProfit/loss for the year attributable to the Parent Company´s shareholders, in relation to the weighted average number of shares outstanding after full conversion and adjusted for the effect of share-based payments.
Discount to net asset valueThe difference between net asset value and market capitalization as a percent-age of net asset value. If market capitalization is lower than net asset value, the share is traded at a discount. If market capitalization is higher, it is traded at a premium.
DistributionRepayment of shareholder loans.
Dividend yieldDividend per share in relation to share price at the balance sheet date.
Dividends payout ratioDividends paid in relation to dividends received from Listed Core Investments.
EBITEarnings before interest and taxes.
EBITAEarnings before interest, taxes and amortizations.
EBITA marginEarnings before interest, taxes and amortizations divided by sales (%).
EBITDAEarnings before interest, taxes, depreciations and amortizations.
Equity per shareShareholders´ equity as a percentage of the weighted average number of shares outstanding.
Equity/assets ratioShareholders´ equity as a percentage of the balance sheet total.
Gross cashThe sum of cash and cash equivalents, short-term investments and interest-bearing current and long-term receivables. Deductions are made for items related to subsidiaries within Patricia Industries.
Gross debtThe sum of interest-bearing current and long-term liabilities, including pension liabilities, less derivatives with positive value related to the loans. Deductions are made for items related to subsidiaries within Patricia Industries.
Industrial holding companyA company that offers shareholders the possibility to spread their risks and get attractive returns through long-term ownership of a well-distributed holdings of securities. Its shares are typically owned by a large number of individuals.
InvestmentsAcquisitions of financial assets.
Investments, net of proceedsAcquisitions of financial assets net of sales proceeds received.
Investor´s cash and readily available placementsThe sum of Gross cash.
LeverageNet debt/Net cash as a percentage of total assets.
Market cost of capitalDefined as the risk-free interest rate plus the market´s risk premium.
Multiple valuationA method for determining the fair value of a company by examining and com-paring the financial ratios of relevant peer groups.
Net asset value, SEK per shareEquity attributable to shareholders of the Parent Company in relation to the number of shares outstanding at the balance sheet date.
Net asset valueThe carrying value of total assets less net debt (corresponds to the group´s equity attributable to shareholders of the Parent Company).
Net cash flowNet invested capital and sales proceeds.
Net debt/Net cashInterest-bearing current and long-term liabilities, including pension liabilities, less cash and cash equivalents, short-term investments and interest-bearing current and long-term receivables. Deductions are made for items related to subsidiaries within Patricia Industries.
Operating cash flowCash flow from operating activities.
ProceedsCash payments obtained from sale of investments plus cash proceeds from distributions.
Reported valueNet asset value per investment.
Reported value changeThe sum of realized and unrealized result from long-term and short-term hold-ings in shares and participations, net of transaction costs, profit-sharing costs and management fees for fund investments.
Return on equityProfit/loss for the rolling 12 months as a percentage of average shareholders´ equity.
Risk premiumThe surplus yield above the risk-free interest rate that an investor requires to compensate for the higher risk in an investment in shares.
Risk-free interest rateThe interest earned on an investment in government bonds. In calculations, Investor has used SSVX 90 days.
SIX’s Return Index, SIXRXA Swedish all shares total return index calculated on share price change and reinvested dividends.
Total assets The net of all assets and liabilities not included in net debt.
Total returnThe sum of change in share price including reinvested dividend.
Turnover rateNumber of shares traded during the year as a percentage of the total number of shares outstanding.
Value, SEK per share Reported value in relation to the number of shares outstanding on the Balance Sheet date.
ALTERNATIVE PERFORMANCE MEASURESInvestor applies the Esma Guidelines on Alternative Performance Measures (APM). An APM is a financial measure of historical or future financial performance, financial position, or cash flows, other than a financial measure defined or specified in the applicable financial reporting framework. For Investor’s consolidated accounts, this typically means IFRS. APMs are disclosed when they complement performance measures defined by IFRS. The basis for disclosed APMs are that they are used by management to evaluate the financial performance and in so believed to give analysts and other stakeholders valuable information. Definitions of all APMs used are found below. Reconciliations to the financial statements for the APMs that are not directly identifiable from the financial state-ments and considered significant to specify, are disclosed on page 25 in the Year-End Report 2016 for Investor AB.
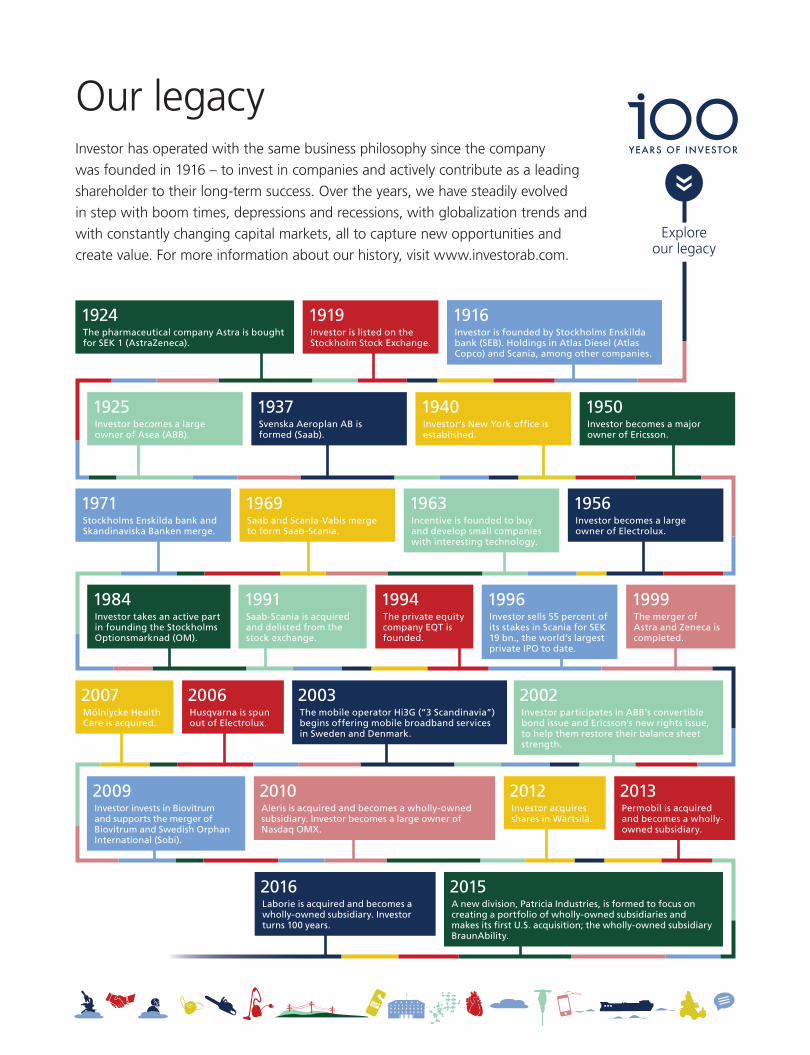
Explore our legacy
1991Saab-Scania is acquired and delisted from the stock exchange.
1994The private equity company EQT is founded.
2007Mölnlycke Health Care is acquired.
1996Investor sells 55 percent of its stakes in Scania for SEK 19 bn., the world’s largest private IPO to date.
1999The merger of Astra and Zeneca is completed.
2002Investor participates in ABB’s convertible bond issue and Ericsson’s new rights issue, to help them restore their balance sheet strength.
2003The mobile operator Hi3G (“3 Scandinavia”) begins offering mobile broadband services in Sweden and Denmark.
2006Husqvarna is spun out of Electrolux.
2010Aleris is acquired and becomes a wholly-owned subsidiary. Investor becomes a large owner of Nasdaq OMX.
2009Investor invests in Biovitrum and supports the merger of Biovitrum and Swedish Orphan International (Sobi).
2013Permobil is acquired and becomes a wholly-owned subsidiary.
2015 A new division, Patricia Industries, is formed to focus on creating a port folio of wholly-owned subsidiaries and makes its first U.S. acquisition; the wholly-owned subsidiary BraunAbility.
2016Laborie is acquired and becomes a wholly-owned subsidiary. Investor turns 100 years.
2012Investor acquires shares in Wärtsilä.
1916Investor is founded by Stockholms Enskilda bank (SEB). Holdings in Atlas Diesel (Atlas Copco) and Scania, among other companies.
1919Investor is listed on the Stockholm Stock Exchange.
1924The pharmaceutical company Astra is bought for SEK 1 (AstraZeneca).
1925Investor becomes a large owner of Asea (ABB).
1937Svenska Aeroplan AB is formed (Saab).
1940Investor’s New York office is established.
1950Investor becomes a major owner of Ericsson.
1956Investor becomes a large owner of Electrolux.
1963Incentive is founded to buy and develop small companies with interesting technology.
1969Saab and Scania-Vabis merge to form Saab-Scania.
1971Stockholms Enskilda bank and Skandinaviska Banken merge.
1984Investor takes an active part in founding the Stockholms Optionsmarknad (OM).
INVESTOR 2016 HISTORY 89
Definitions and Alternative Performance Measures Our legacyInvestor has operated with the same business philosophy since the company
was founded in 1916 – to invest in companies and actively contribute as a leading
shareholder to their long-term success. Over the years, we have steadily evolved
in step with boom times, depressions and recessions, with globalization trends and
with constantly changing capital markets, all to capture new opportunities and
create value. For more information about our history, visit www.investorab.com.

www.investorab.com
INVESTOR AB (PUBL)
SE-103 32 Stockholm
Sweden
Visiting address: Arsenalsgatan 8C
Phone: +46 8 614 2000
Fax: +46 8 614 2150
As a long-term owner, we actively support the building and development of best-in-class companies.