annual report 2016 for personal use only · new zealand, singapore, england, scotland, wales,...
TRANSCRIPT

Annual Report 2016
Premier In
vestmen
ts Limited
An
nu
al Rep
ort 2016
For
per
sona
l use
onl
y

Mark McInnesCEO Premier Retail
Solomon LewChairman
About this report
This report has been printed on Sovereign Silk and Sun Art Matt and are both elemental chlorine free.
Sovereign Silk is FSC certified derived from well-managed forests and controlled sources. Both stocks are manufactured by an ISO 14001 certified mill.
The printer is also ISO 9001 and ISO 14001 accredited.
These certifications specify the requirements for a quality and environmental management system.
Designed and produced by walterwakefield.com.au
For
per
sona
l use
onl
y
Annual Report 2016 1
Chairman’s Report
STRONG FINANCIAL PERFORMANCE
A prime objective of Premier is to deliver long term sustainable wealth creation to our shareholders. The strong FY16 results have, once again, delivered superior returns to our shareholders.
Premier reported net profit after tax of $103.9 million in FY16, up 17.9% on FY15. These results reflect: the contribution from Premier Retail (or The Just Group) which includes its seven retail brands that traded at year end through 1,111 stores and online; earnings from Premier’s 27.5% stake in electrical consumer products manufacturer Breville Group Limited (“Breville”); and interest earned on Premier’s significant cash balance.
Total sales for Premier Retail were up 10.9% to $1,049.2 million, breaking the $1 billion mark for the first time, a milestone which we were very pleased to surpass1.
Premier Retail’s underlying record earnings before interest and tax (“EBIT”) of $133.3 million was up 26.1% on FY15, with underlying net profit before tax increasing by 28.1% to $129.2 million. The strong trading result demonstrates the continued successful implementation of the Premier Retail Strategy to drive growth through Smiggle, Peter Alexander and our online offer while rejuvenating our core brands and controlling efficiencies2.
GROWTH INITIATIVES CONTINUE TO FIRE
Smiggle sales for FY16 were $188 million, up 41.8% for the year and 79% over two years. Smiggle now has stores in Australia, New Zealand, Singapore, England, Scotland, Wales, Malaysia and Hong Kong and is a truly unique international brand. In all of these countries, Smiggle is achieving growth in both total sales and like-for-like sales. During the year we opened 52 new Smiggle stores taking our total at financial year end to 239 stores.
Our strong trading results confirm the long term store rollout targets management has set for these countries and we continue to actively review opportunities in new markets. More than 50% of Smiggle’s revenue for the financial year was delivered by international stores, underscoring our decision to create a global business.
Peter Alexander achieved sales growth for the year of 20.4% to $169.1 million driven by innovative products, new product categories and campaigns that resonate with our customers. Peter Alexander opened 11 new stores during the year, including a flagship store in Queen Street Auckland and the brand’s first airport store in Brisbane.
In addition, Premier continued to invest in online capabilities, delivering 39.6% online sales growth for the year. We continue to significantly outperform the market and make significant investments in further enhancing our online capabilities, customer offering and customer engagement in order to reach our target of $100 million in annual online sales by 2020.
INVESTMENT IN CORE BUSINESSES
The Premier Retail team made targeted investments in refurbishments and new store formats during FY16 – opening 18 new stores; undertaking 33 store relocations and refurbishments; and a further 28 refurbishments in existing locations.
The team has continued to improve our products whilst maintaining a sound foreign exchange hedging position and enhancing our sourcing capabilities. Our team’s relentless focus on cost controls and improvements from our investment in our supply chain are also key factors in this regard.
The Directors of Premier Investments Limited (“Premier”) are pleased to submit to shareholders the Annual Report for the financial year ended 30 July 2016 (“FY16”) which has been another year of outstanding operational and financial success by your company.
1 Excluding sales to Jay Jays South African joint venture in FY15.
2 Group result in FY16 represents a 53 week period. Refer to page 29 of the Remuneration Report for a definition and reconciliation of Premier Retail underlying EBIT.
For
per
sona
l use
onl
y

2 Premier Investments Limited
Solomon Lew Chairman and Non-Executive Director
SECURE FINANCIAL POSITION
At the end of the year, Premier’s balance sheet reflects free cash on hand of $283.2 million plus its equity accounted investment in Breville at $213.4 million. The market value of Premier’s holding in Breville was $282.6 million at 30 July 2016.
Due to the continued strength of Premier’s balance sheet and the performance of Premier Retail, the Board has declared an increased final ordinary dividend of 25 cents per share fully franked (FY15: 21cps), bringing the total ordinary dividends for the year to 48 cents per share fully franked (FY15 ordinary: 42 cps).
Premier continues to use its strong balance sheet to fund the expansion of its growth brands, while still retaining the flexibility to pursue other opportunities that may arise in the future. We will, as always, be very careful with your money and only pursue investment that delivers strong value for you.
LEADERSHIP AND GOVERNANCE
These achievements show, yet again, that the Premier Retail team, led by Premier Retail CEO Mark McInnes, has the ability to deliver strong results in a difficult retail environment. The team remains focused on Premier Retail’s strategy to rejuvenate core brands, focus on efficiency, and drive the growth of Smiggle, Peter Alexander, and online.
During the year, our shareholders approved a new employment agreement for Mark McInnes, with performance incentives to be tested out to 2020. The Board is delighted that Mark has re-committed himself to a long term future with Premier and we look forward to his continued contribution. Over the past five years under Mark’s leadership, the Premier team has delivered significant returns for Premier shareholders.
In April 2016, your Board announced the appointment of Mr. Terry McCartney as an Independent Non-Executive Director. Terry is a former Managing Director of both Myer Grace Brothers and Kmart; and a seasoned advisor to investors in the retail sector, both in Australia and internationally. We are very pleased that Terry has accepted the invitation to join the Premier Board.
CREDIT TO OUR CUSTOMERS AND TEAM
On behalf of the Board, I also want to acknowledge our 7,000 dedicated employees who now span Australia, New Zealand, Singapore, England, Scotland, Wales, Malaysia and Hong Kong. This team delivers excellence every day.
Of course, our growth would not be possible without the strong support of our customers who continue to embrace our unique brands and designs. The Premier team will never take your support and your custom for granted. As we have expanded Smiggle into offshore markets one of the things we have most enjoyed is watching new customers embrace our products with the same enthusiasm we see here at home.
I would also like to thank my fellow directors for their contribution, service and counsel over the last year.
Finally, thank you to all our shareholders for your continued support and investment. We never forget that this is your company and we serve at your behest.
I encourage all shareholders to attend the annual general meeting on 2 December 2016 and look forward to your participation.
Chairman’s Report continued
For
per
sona
l use
onl
y

Annual Report 2016 3
Lindsay E. Fox ACNon-Executive Director
Sally HermanNon-Executive Director
Solomon LewChairman and Non-Executive Director
Terrence McCartney (Appointed 15 April 2016)Non-Executive Director
Timothy Antonie Non-Executive Director
The Directors
David M. CreanDeputy Chairman and Non-Executive Director
Gary H. Weiss LLM, J.S.D.Non-Executive Director
Mark McInnesExecutive Director
Henry D. Lanzer AM B. COM., LLB (Melb) Non-Executive Director
Michael R.I. McLeodNon-Executive Director
For
per
sona
l use
onl
y

4 Premier Investments Limited
Solomon Lew
Mr. Lew was appointed as Non-Executive Director and Chairman of Premier on 31 March 2008. Mr. Lew is a director of Century Plaza Investments Pty Ltd, the largest shareholder in Premier and was previously Chairman of Premier from 1987 to 1994.
Mr. Lew has over 50 years’ experience in the manufacture, wholesale and retailing of textiles, apparel and general merchandise, as well as property development. His success in the retail industry has been largely due to his ability to read fashion trends and interpret them for the Australasian market, in addition to his demonstrated ability in the timing of strategic investments.
Mr. Lew was a Director of Coles Myer Limited from 1985 to 2002, serving as Vice Chairman from 1989, Chairman from 1991 to 1995, Executive Chairman in 1995 and Vice Chairman in 1995 and 1996.
Mr. Lew is a member of the World Retail Hall of Fame and is the first Australian to be formally inducted.
He is also a former Board Member of the Reserve Bank of Australia and former Member of the Prime Minister’s Business Advisory Council.
Mr. Lew was the inaugural Chairman of the Mount Scopus Foundation (1987–2013) which supports the Mount Scopus College, one of Australia’s leading private colleges with 2000 students. He has also been the Chairman or a Director of a range of philanthropic organisations.
Dr. David M. Crean
Dr. Crean has been an Independent Non-Executive Director of Premier since December 2009, Deputy Chairman since July 2015 and is currently the Chairman of Premier’s Audit and Risk Committee (appointed August 2010).
Dr. Crean was Chairman of the Hydro Electric Corporation (Hydro Tasmania) from September 2004 until October 2014 and was also Chairman of the Business Risk Committee at Hydro Tasmania, member of the Audit Committee and Chairman of the Corporate Governance Committee.
Dr. Crean was State Treasurer of Tasmania from August 1998 to his retirement from the position in February 2004. He was also Minister for Employment from July 2002 to February 2004. He was a Member for Buckingham in the Legislative Council from 1992 to February 1999, and then for Elwick until May 2004. From 1989 to 1992 he was the member for Denison in the House of Assembly. From 1993 to 1998 he held Shadow Portfolios of State Development, Public Sector Management, Finance and Treasury.
Dr. Crean is also a Board member of the Linfox Foundation. Dr. Crean graduated from Monash University in 1976 with a Bachelor of Medicine and Bachelor of Surgery.
Timothy Antonie
Mr. Antonie was appointed to the Board of Directors on 1 December 2009. He holds a Bachelor of Economics degree from Monash University and qualified as a Chartered Accountant with Price Waterhouse. He has 20 years’ experience in investment banking and formerly held positions of Managing Director from 2004 to 2008 and Senior Adviser in 2009 at UBS Investment Banking, with particular focus on large scale mergers and acquisitions and capital raisings in the Australian retail, consumer,
media and entertainment sectors. Mr Antonie is also a Non-Executive Director of Village Roadshow Limited and Breville Group Limited and is a Principal of Stratford Advisory Group.
Lindsay E. Fox AC
Mr. Fox has extensive experience in all aspects of the transport, distribution and warehousing industries. He is the founder of the Linfox Group of Companies. Today, the Linfox Group operates one of the largest supply chain services businesses with operations in 10 countries. The Linfox Group employs over 23,000 people, operates 4.8 million square metres of warehouses and a fleet of more than 5,000 vehicles and carries out distribution operations for leading companies across the Asia-Pacific region. The Linfox Group includes operations in the areas of transport and logistics, airports, property development and cash management services.
Mr. Fox has extensive involvement in Australian and international circles and, apart from his business interests, is well recognised and active in sport and charity work.
In 2010, Victoria University admitted Mr. Fox to the degree of Doctor of the University honoris causa for his outstanding achievements in the transport industry, for his contribution to the community through his sustained efforts to reduce unemployment and his campaign against youth suicide.
In January 2008, Mr Fox was awarded a Companion of the Order of Australia (AC) for continued service to the transport and logistics industries, to business through the development and promotion of youth traineeships and to the community through a range of philanthropic endeavours.
He was awarded an Officer of the Order of Australia (AO) in 1992 for his contribution to the transport industry and the community and he received a Centenary Medal for services to the transport industry in 2001.
From September 1992 to December 1993, Mr. Fox together with Mr. Bill Kelty introduced a national campaign called ‘Work for Australia’. This campaign encouraged companies and local communities to generate jobs for the unemployed with the aid of government subsidies and programs. More than 60,000 jobs were pledged through their efforts and Mr. Fox and Mr. Kelty were awarded ‘Victorians of the Year’ by the Sunday Age.
Sally Herman
Sally Herman is an experienced Non-Executive Director in the fields of financial services, retail, manufacturing and property. She had a successful executive career spanning 25 years in financial services in both Australia and the US, transitioning in late 2010 to a full time career as a Non-Executive Director.
Prior to that, she had spent 16 years with the Westpac Group, running major business units in most operating divisions of the Group as well as heading up Corporate Affairs and Sustainability through the merger with St. George and the global financial crisis.
Ms. Herman sits on both listed and unlisted Boards, including Suncorp Group Limited (effective 6 October 2015), Breville Group Limited, ME Bank Limited (retired 5 October 2015) and Investec Property Limited. She was also a board member of FSA Group Limited (retired 28 November 2014). Ms. Herman is Chair of an independent girls’ school in Sydney and is on the Board of the
Chairman’s Report continued
For
per
sona
l use
onl
y
Annual Report 2016 5
Sydney Harbour Federation Trust. Ms. Herman holds a BA from the University of NSW and is a Graduate of the Australian Institute of Company Directors.
Henry D. Lanzer AM B.COM. LLB (Melb)
Henry Lanzer AM is Managing Partner of Arnold Bloch Leibler, a leading Australian commercial law firm. Henry has over 30 years’ experience in providing legal, corporate finance and strategic advice to some of Australia’s leading companies.
Mr. Lanzer is a Director of Just Group Limited, Thorney Opportunities Limited and the TarraWarra Museum of Art and also a Life Governor of the Mount Scopus College Council.
He is also Chairman of the Remuneration and Nomination Committee for Premier Investments Limited.
In June 2015, Henry was appointed as a Member of the Order of Australia.
Terrence L. McCartney
Mr. McCartney has had a long and successful career in retail. Mr. McCartney started at Boans Department Stores in Perth then moved to Grace Bros in Sydney. After the acquisition of Grace Bros by Myer, he relocated to the merged Department Stores Group in Melbourne within the merchandise & marketing department. His successful career within Coles Myer meant that Terry then moved to the Kmart discount department stores as Head of Merchandise & Marketing and then Managing Director. Following several years as Managing Director of Kmart Australia and New Zealand, Terry became Managing Director of Myer Grace Bros. For 5 years Terry lead year on year growth in profitability of Australia’s largest department store.
Terry’s experience spans the full spectrum of retailing, ranging from luxury goods in department stores to large mass merchandise discount operations. Terry has also been retained by large international accounting and legal firms as an expert witness in relation to Australian retail.
In addition to his extensive list of retail experience, he has also been an advisor to large Australian and international mining companies, prior to joining the Just Group Board in 2008. Terry lends his extensive retail and commercial expertise to the Just Group by serving on a number of committees, including the Property Committee and Internet Steering Committee of the Group, and through various store and site visits, both locally and overseas. He is also actively involved in seasonal and trading performance reviews for the Group.
Terry was appointed as a Director of Premier Investments Limited in April 2016.
Mark McInnes
Mr. McInnes is a career retailer with a long track record of success in every role he has occupied. Like many great retailers, Mark started his career from the shop floor as a company cadet for Grace Brothers. Mark has been directly responsible for some of Australia’s greatest retail success stories – including as a co-founder of the Officeworks concept which is today Australia’s largest office supply superstore.
Prior to joining Premier, Mark led David Jones to its most successful time as a public listed company. Mark spent 13 years at David Jones – 6 years as Merchandise & Marketing Director and
7 years as CEO. From 2003 to 2010, Mark as CEO and Executive Director of David Jones turned the company into a fashion and financial powerhouse, creating in excess of $2 billion of shareholder value.
Mark was appointed CEO of Premier Retail in April 2011, and has set about transforming the company to compete in an industry under great structural pressure. Premier Retail today has a clear path and a clear focus.
In December 2012, Mark was appointed as an Executive Director of Premier Investments Limited. Mark holds an MBA from the University of Melbourne.
Michael R.I. McLeod
Mr. McLeod is a former Executive Director of the Century Plaza Group and has been involved with the Group since 1996 as an advisor in the areas of corporate strategy, investment and public affairs. He has been a Non-Executive Director of Premier Investments Limited since 2002 and was a Non-Executive Director of Just Group Limited from 2007 to 2013. Past experience includes the Australian Board of an international funds manager, chief of staff to a Federal Cabinet Minister and statutory appointments including as a Commission Member of the National Occupational Health and Safety Commission.
He holds a Bachelor of Arts (First Class Honours and University Medal) from the University of New South Wales.
Dr. Gary H. Weiss LL.M, J.S.D.
Dr. Weiss holds the degrees of LL.B (Hons) and LL.M (with distinction) from Victoria University of Wellington, as well as a Doctor of Juridical Science (JSD) from Cornell University, New York. Dr. Weiss has extensive international business experience and has been involved in numerous cross-border mergers and acquisitions.
Dr. Weiss is Chairman of Ridley Corporation Limited, Executive Director of Ariadne Australia Limited, and a Director of Premier Investments Limited, Pro-Pac Packaging Limited, Tag Pacific Limited, Thorney Opportunities Limited, The Straits Trading Company Limited and Estia Health Limited. He was Chairman of Clearview Wealth Limited from July 2013 until May 2016 and of Coats Plc from 2003 until April 2012, and Executive Director of Guinness Peat Group Plc from 1990 to April 2011 and has held directorships of numerous companies, including Mercantile Investment Company Limited (retired 25 February 2015) Westfield Group, Tower Australia Limited, Australian Wealth Management Limited, Tyndall Australia Limited (Deputy Chairman), Joe White Maltings Limited (Chairman), CIC Limited, Whitlam Turnbull & Co Limited and Industrial Equity Limited.
He has authored numerous articles on a variety of legal and commercial topics.F
or p
erso
nal u
se o
nly

Management continued the rigorous implementation of the six key initiatives outlined in the 2011 Strategic Review.
Focus Area Status
1 Rejuvenate and reinvigorate all five core apparel brands.
Continued solid results were achieved in all five core brands in financial year 2016 (FY16). After trading during the second half of the financial year 2016 (2H16) was impacted by an unseasonably warm Autumn, the core apparel brands delivered a significant improvement in LFL and Total Sales across June and July as colder weather struck, leaving the business with a clean inventory position to commence FY17. The group continues to invest in upgrading its existing store network through targeted investment that delivers strong returns to shareholders.
2 Organisation-wide costefficiency program.
Costs of doing business continue to be well controlled whilst strategic investment in growth initiatives continue, including online, Peter Alexander and Smiggle international expansion. There was no store rent growth for established brands in FY16 despite inflationary pressures built into leases. Total store rent increased due to the ongoing growth of Peter Alexander in Australia and New Zealand and Smiggle globally. Salaries continued to be tightly controlled with improved labour productivity for the established brands. During the year, 12 loss making stores were closed, as part of an ongoing program to improve the portfolio profitability.
3 Two phase grossmargin expansion program.
Premier Retail’s gross margin expanded during the year despite the weaker AUD and highly competitive market. Strategies to offset the impact of the weaker AUD have been effectively implemented across all brands and markets. Direct sourcing initiatives continuing to deliver benefits from new suppliers and countries, which combined with our ongoing focus on markdown management is expected to support margin going forward.
4 Expand and grow theinternet business.
Total online sales for FY16 were up 39.6% – well ahead of market growth. The online channel remains extremely profitable. Investment is continuing in technology, people and marketing to deliver annual online sales of $100 million by 2020.
5 Grow Peter Alexander significantly.
Peter Alexander has over delivered on the three year strategic growth plan developed in 2013. Sales for FY16 were up 20.4% – bringing total sales growth over the last 3 years to 68%. 11 new stores were opened in FY16, including the brand’s first Airport Store and a new flagship store in Queen Street, Auckland, New Zealand. The brand sees further new store growth including 3 confirmed new stores in 1H17 and plans for 5–7 new stores per calendar year 2017, 2018 and 2019. Peter Alexander is an established destination during key gift giving times which remains a focus alongside delivering unique customer experiences every day in store and online.
6 Grow Smiggle significantly.
A record year for Smiggle, with global sales up 41.8% (up 79% over two years) and strong LFL growth in all countries (Australia, New Zealand, Singapore and United Kingdom). The Smiggle Asian expansion was successfully executed with 5 stores opened across Hong Kong and Malaysia and an established pipeline to continue the growth. There are robust plans in place to manage the continued UK store roll-out, delivering significant returns to shareholders. The company reaffirms the UK expansion plans to have 200 stores with annual sales of $200 million by 2019. The company also reaffirms the Hong Kong and Malaysian expansion plans to have 50 stores within 5 years.
Strategic Review Premier Retail
6 Premier Investments Limited
For
per
sona
l use
onl
y

Annual Report 2016 7
Brand Performance Premier Retail
Jacqui E delivered profit growth in FY16 under Karen Russell’s leadership. The focus on product excellence delivered a strong performance as a new fashion direction was introduced in 2H16 offering an on trend, modern look which was well received by customers. Supported by a strong brand campaign, led by our ambassador Tara Moss, the brand continues to build a destination for work wear.
Portmans, led by Paula Gorman, delivered an impressive full year result through a strong performance in summer apparel categories. The group continues to invest in ensuring our multi-channel capability is world class. The investment in Jess Hart as brand ambassador continues to deliver a strong brand campaign.
Jay Jays, under Linda Whitehead’s leadership, consolidated its market position in FY16 following significant growth in FY16. The brand’s new store format continues to be be well received. Ongoing focus on driving an increase in full price sales together with sourcing initiatives has delivered further brand profit growth in FY16.
Just Jeans, under Matthew McCormack’s leadership, continues to implement its “Anchored in Denim” strategy that has delivered strong denim growth over the year. A new store format was launched during the year with the opening of Mid City Sydney CBD, delivering improved customer experience and results ahead of expectations. Ash Hart was launched as the new brand ambassador in August 2015, and together with the Stenmark twins, is delivering a strong brand campaign.
Dotti, led by David Bull, delivered another strong result in a highly competitive market, opening 6 new stores in FY16. The brand has a world class digital platform. During the year a 60% increase in total fans on social media channels were driven through the Dotti influencer program. The first full year of a New Zealand dedicated website has traded ahead of plan since operations commenced.
Smiggle achieved exceptional sales growth of 41.8% in FY16, with more than 50% of global revenue generated outside Australia. John Cheston, Managing Director Smiggle, continues to lead a strong and focused management team growing a truly unique global brand. Smiggle’s Asian expansion was successfully executed with 5 stores opened across Hong Kong and Malaysia in 2H16, targeting to have a total of 10 stores trading before Christmas 2016. Smiggle UK continues to expand rapidly, with 40 new stores opened during FY16 for a total of 64 stores trading at the end of FY16, targeting to have 85-90 stores trading before Christmas 2016.
Peter Alexander delivered outstanding growth of 20.4% in FY16. Judy Coomber, Managing Director Peter Alexander and Peter Alexander, Creative Director have over delivered on the three year strategic growth plan developed in 2013. 11 new stores were opened during FY16, with a further 5-7 new stores planned to open in calendar year 2017, 2018 and 2019.
For
per
sona
l use
onl
y

8 Premier Investments Limited
Consistent online sales growth ahead of the market
Internet Performance Premier Retail
» Online sales up 39.6% in FY16 – well ahead of market growth of 8.0% for the 12 months ended July 2016
» Online channel delivers significantly higher profit margin than the Group average
» Strong performance from first full year trading from new international sites: Smiggle.co.uk for UK/Europe customers, fulfilled from UK Dotti.co.nz for New Zealand customers, fulfilled from NZ
» Australian sites continuing to deliver strong growth with all brands outperforming the market
» Investment continuing in technology, people and marketing to deliver annual online sales of $100 million by 2020
ONLINE SALES GROWTH FY16
+8.6%
FY14 FY15 FY16
+8.6% +8.0%
+30.5% +30.8%
+39.6%
0
5
10
15
20
25
30
35
40
Fashion Online Sales Growth
Premier Retail Online Sales Growth
Note: NAB Online Retail Sales Index – July 2016, published 31 August 2016.
Reported Australian online retail sales in the fashion category grew by 8.0% in the 12 months to July 2016
For
per
sona
l use
onl
y
Annual Report 2016 9
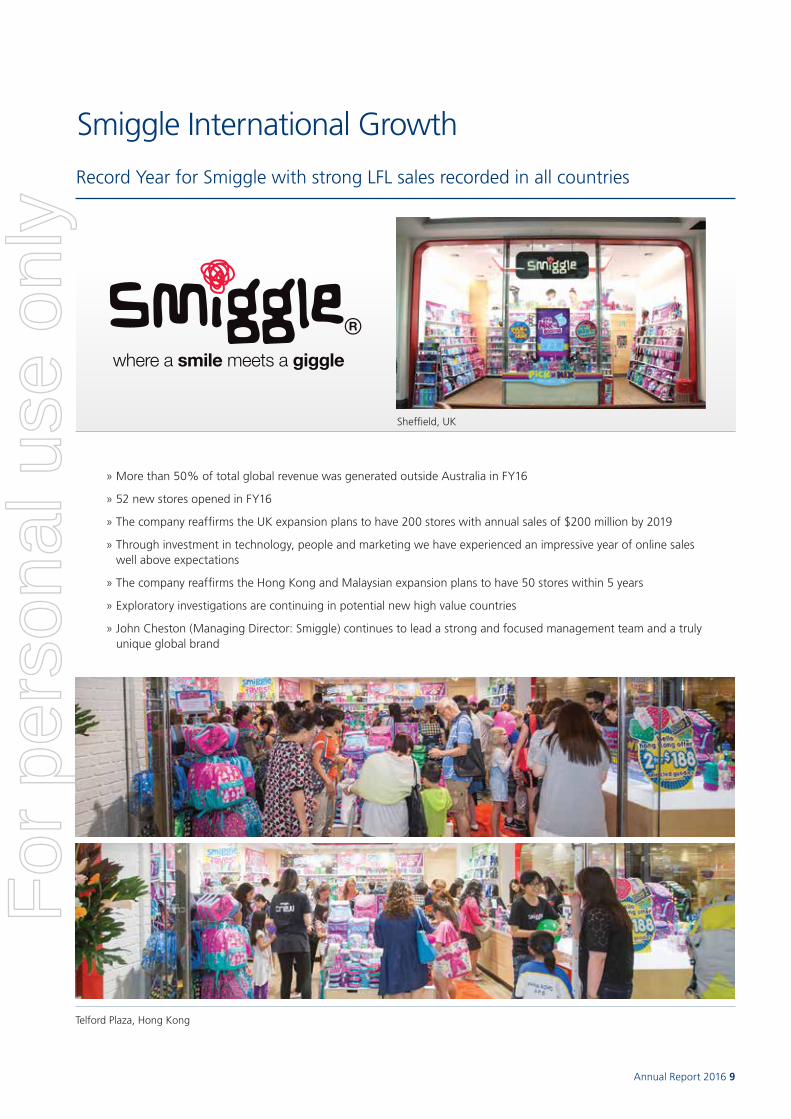
Smiggle International Growth
Record Year for Smiggle with strong LFL sales recorded in all countries
» More than 50% of total global revenue was generated outside Australia in FY16
» 52 new stores opened in FY16
» The company reaffirms the UK expansion plans to have 200 stores with annual sales of $200 million by 2019
» Through investment in technology, people and marketing we have experienced an impressive year of online sales well above expectations
» The company reaffirms the Hong Kong and Malaysian expansion plans to have 50 stores within 5 years
» Exploratory investigations are continuing in potential new high value countries
» John Cheston (Managing Director: Smiggle) continues to lead a strong and focused management team and a truly unique global brand
Telford Plaza, Hong Kong
Sheffield, UK
For
per
sona
l use
onl
y

10 Premier Investments Limited
Peter Alexander Growth
Sales for FY16 were up 20.4% - bringing total sales growth over the last 3 years to 68%
» 11 new stores opened
» 99 stores trading at year-end
» 3 new stores confirmed in 1H17: Greenwood Plaza, Macarthur Square and Noosa
» 4 stores confirmed to be refurbished and upsized in 1H17: Pacific Fair, Spencer Street, Chadstone and Warringah
» 5–7 new stores targeted per year in calendar years 2017, 2018 and 2019
» 3-5 store upgrades, upsizing or refurbishments targeted per year in calendar years 2017, 2018 and 2019
» Online sales continue to outperform the market
» New product initiatives continue including Plus Size and bed socks to be expanded in FY17
» Childrenswear expansion continues delivering significant growth
» Myer concessions well established and further department store growth being explored
Werribee, Australia
For
per
sona
l use
onl
y
Annual Report 2016 11
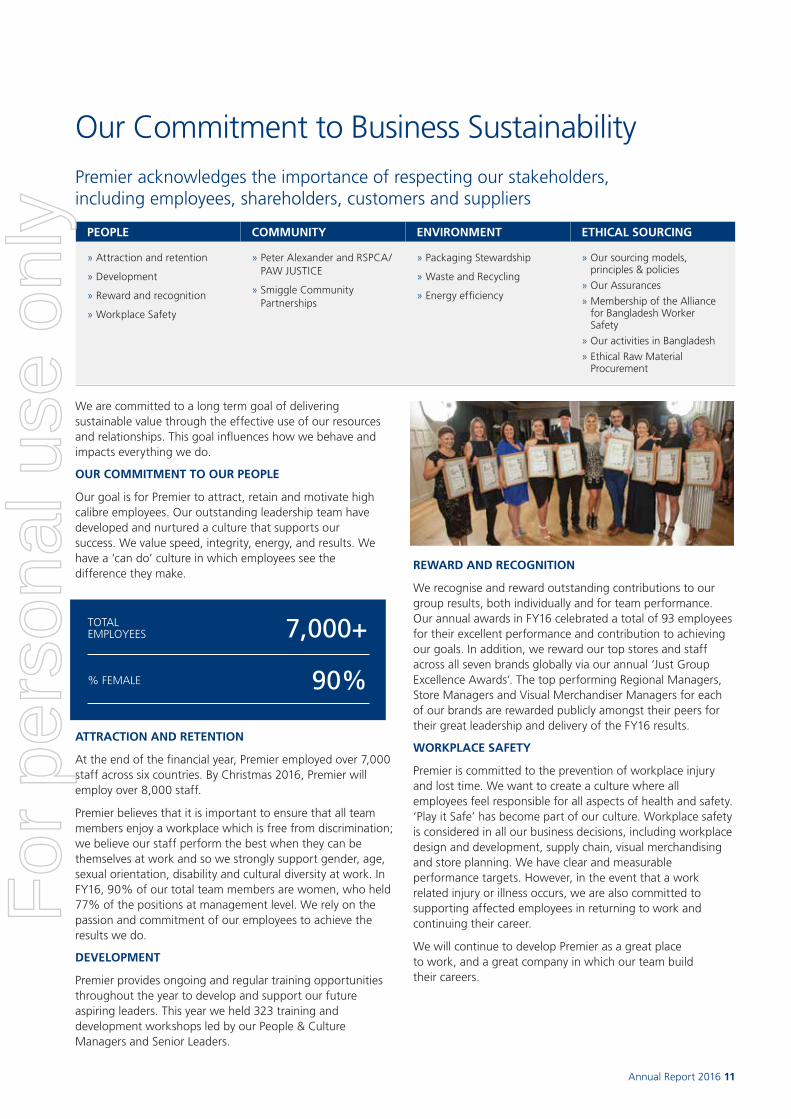
PEOPLE COMMUNITY ENVIRONMENT ETHICAL SOURCING
» Attraction and retention
» Development
» Reward and recognition
» Workplace Safety
» Peter Alexander and RSPCA/PAW JUSTICE
» Smiggle Community Partnerships
» Packaging Stewardship
» Waste and Recycling
» Energy efficiency
» Our sourcing models, principles & policies
» Our Assurances
» Membership of the Alliance for Bangladesh Worker Safety
» Our activities in Bangladesh
» Ethical Raw Material Procurement
We are committed to a long term goal of delivering sustainable value through the effective use of our resources and relationships. This goal influences how we behave and impacts everything we do.
OUR COMMITMENT TO OUR PEOPLE
Our goal is for Premier to attract, retain and motivate high calibre employees. Our outstanding leadership team have developed and nurtured a culture that supports our success. We value speed, integrity, energy, and results. We have a ‘can do’ culture in which employees see the difference they make.
ATTRACTION AND RETENTION
At the end of the financial year, Premier employed over 7,000 staff across six countries. By Christmas 2016, Premier will employ over 8,000 staff.
Premier believes that it is important to ensure that all team members enjoy a workplace which is free from discrimination; we believe our staff perform the best when they can be themselves at work and so we strongly support gender, age, sexual orientation, disability and cultural diversity at work. In FY16, 90% of our total team members are women, who held 77% of the positions at management level. We rely on the passion and commitment of our employees to achieve the results we do.
DEVELOPMENT
Premier provides ongoing and regular training opportunities throughout the year to develop and support our future aspiring leaders. This year we held 323 training and development workshops led by our People & Culture Managers and Senior Leaders.
REWARD AND RECOGNITION
We recognise and reward outstanding contributions to our group results, both individually and for team performance. Our annual awards in FY16 celebrated a total of 93 employees for their excellent performance and contribution to achieving our goals. In addition, we reward our top stores and staff across all seven brands globally via our annual ‘Just Group Excellence Awards’. The top performing Regional Managers, Store Managers and Visual Merchandiser Managers for each of our brands are rewarded publicly amongst their peers for their great leadership and delivery of the FY16 results.
WORKPLACE SAFETY
Premier is committed to the prevention of workplace injury and lost time. We want to create a culture where all employees feel responsible for all aspects of health and safety. ‘Play it Safe’ has become part of our culture. Workplace safety is considered in all our business decisions, including workplace design and development, supply chain, visual merchandising and store planning. We have clear and measurable performance targets. However, in the event that a work related injury or illness occurs, we are also committed to supporting affected employees in returning to work and continuing their career.
We will continue to develop Premier as a great place to work, and a great company in which our team build their careers.
Our Commitment to Business SustainabilityPremier acknowledges the importance of respecting our stakeholders, including employees, shareholders, customers and suppliers
TOTAL EMPLOYEES 7,000+
% FEMALE 90%
For
per
sona
l use
onl
y

12 Premier Investments Limited
Premier has a long history of philanthropic support, particularly with our Peter Alexander and Smiggle brands
PETER ALEXANDER AND PAW JUSTICE
In 2014, aligned with the growing presence of Peter Alexander in New Zealand, we partnered with the NZ animal charity Paw Justice, and over the last three years have raised close to $41,000.
Paw Justice works to stop violent animal abuse; and they have been instrumental in focusing the New Zealand public’s attention on the need for reform of animal welfare laws through youth education and advocacy for pets.
During the year Peter Alexander continued its commitment to the prevention of cruelty to animals. The involvement with the RSPCA in Australia and Paw Justice in New Zealand continues to be the key charity supported by the brand. Across the year there were a variety of items produced including playing cards, gift wrap and chocolates. 100% of all sales were donated to these charities. During the year we donated $88,000 to the RSPCA and $16,000 to Paw Justice.
SMIGGLE COMMUNITY PARTNERSHIPS
Premier and our Smiggle brand also support a number of children’s charities, organisations and educational programs. Plus, countless community fundraising initiatives both locally and abroad, for schools, sporting, and educational events. During the year we have donated over $100,000 in products.
PETER ALEXANDER AND THE RSPCA
As much as Peter Alexander has become famous for his pyjamas, he has also become known for his dogs, and is a huge supporter of animal welfare organisations. Peter Alexander has worked closely for the last 11 years with the RSPCA in Australia, and for the last three years with Paw Justice in New Zealand. Our work has included a variety of fundraising activities which raise awareness for animal charities.
Working with the RSPCA, Peter has raised over $548,000 contributing to RSPCA shelters, which care for more than 140,000 animals every year supporting rescue, rehabilitation and rehoming unwanted, stray and injured animals. Peter has been awarded the status of RSPCA Ambassador in recognition of his efforts.
Our Commitment to the Community
PETER HAS RAISED OVER
$589,000CONTRIBUTING TO RSPCA SHELTERS IN AUSTRALIA AND PAW JUSTICE IN NEW ZEALAND.
Peter Alexander with Butch on his right and Betty on his lap.
Peter Alexander with Butch on his left and Betty on his lap.
For
per
sona
l use
onl
y

Annual Report 2016 13
Our Commitment to the Environment
PACKAGING STEWARDSHIP
Premier is committed to managing and reducing the impact our business operations have on the environment. Premier is a signatory to the Australian Packaging Covenant, a voluntary agreement between government and industry which provides companies with the tools to be more involved in reducing their impact on the environment through sustainable packaging design, recycling and product stewardship. Premier has submitted a 5 year Action Plan outlining its objectives in relation to:
1 Optimising packaging to reduce environmental impacts;
2 Increasing the collection and recycling of packaging;
3 Commitment to product stewardship; and
4 Implementation of Sustainable Packaging Guidelines.
All plastic shopping bags used by the group are made using EPI technology designed to control and manage the lifetime of products made from the most common plastics to assist in the breakdown, degrade and subsequent biodegrade process.
WASTE AND RECYCLING
Premier has extensive recycling and sustainable practices across our network of Stores, Distribution Centres and Support Centre. Our Distribution Centres execute on-site recovery systems for recycling used packaging and follow Sustainable Packaging Guidelines. All carton packaging uses recycled content. Cartons are reused to facilitate the replenishment of stock, or where necessary waste packaging is compacted and collected for recycling. We have partnered with Orora, a signatory to the Australian Packaging Covenant, to collect and process in line with their recycling procedures. Orora’s recycling business specialises in paper and cardboard, among others, which is then used as the major input at their recycled paper mill, to produce 100% recycled paper.
Our Support Centre recycles all paper and has continued our co-mingled recycling program for glass and plastics on every floor in our entire building. All paper purchased for our Support Centre is accredited from The Forest Stewardship Council sources, an international network which promotes responsible management of the world’s forests. All necessary printing at our support centre is activated by personalised swipe access only to release print. This initiative has seen a significant reduction in waste paper printing, as it removes entirely non-collection of printouts. All weekly retail reporting, forms, reference and administrative material is stored and accessible via mobile technology.
Across our network of stores, reuse is always our first option. Specific initiatives relate to plastic hangers and carton packaging. In store, plastic hangers are first reused, and if there is an oversupply our supplier collects and repackages those hangers for reuse or to be fully recycled. Additionally, all cartons are reused to facilitate movement of stock between our stores. In the balance of instances we will utilise our shopping centre recycling facilities.
ENERGY EFFICIENCY
Premier recognises the importance of energy efficient, low environmental impact lighting systems and since 2012 have adhered to new improved lighting standards to efficiently manage our energy consumption in all of our stores. This has resulted in an investment to our store network and upgrade of 232 stores to LED lighting. This initiative has subsequently meant less heat, thereby reducing the overall heat load on our stores and reduced investment in cooling requirements. In addition this has led to a dramatic reduction in ongoing maintenance and light bulb replacement. This standard has been implemented for all new store fit-outs. Across our existing store network all expired bulbs are recycled and we are looking to complete a ‘like for like’ conventional to LED lamp replacement programme.
With the active participation of our employees, we believe that our focus on environmental issues will make our business more efficient, drive customer and employee connection, and have a positive impact in the communities in which we operate.
For
per
sona
l use
onl
y

14 Premier Investments Limited
Premier commits to the highest standards of ethical conduct and responsible product sourcing practices.
We support this commitment by our models for sourcing products, the principles that back-up those models, together with our policies and assurance program.
OUR SOURCING MODELS, PRINCIPLES & POLICIES
We share our customers’ full engagement in understanding where products come from, how products are made and the way that people who manufacture those products are treated.
With this in mind, we use the following sourcing models:
» direct sourcing from factories with whom we work in close partnership
» through Li & Fung, the world’s largest sourcing company for major retailers and brands around the world
In addition, we work with known established and trusted Australian importers.
We currently source products in the following countries: China, Australia, Bangladesh, Cambodia, Hong Kong, India, Indonesia, Sri Lanka, Taiwan, Thailand, Turkey and Vietnam.
SOURCE COUNTRIES (THE JUST GROUP, UNITS)
Our Ethical Sourcing and Supply Code (Code) supports our commitment to sourcing merchandise that is produced according to these principles, regardless of origin.
All suppliers must sign our supply terms and conditions, of which the Code is part, prior to any orders being placed. We will not do business with a supplier who does not comply with the Code.
Among other things, we note that our supply terms and the Code:
» requires compliance with all laws (and/or requires our suppliers to meet higher standards)
» insists on the free association of workers, including the right to collectively bargain and be represented
» requires labour to be voluntary, without workers being required to lodge deposits (eg. for recruitment fees etc.)
» prohibits forced labour (including child labour)
» insists on worker rights such as the right to work in safe, hygienic premises where working hours are not excessive
» requires the payment of the minimum national legal standards or local benchmark standards (whichever is higher), and, in relation to full time workers, sufficient to meet basic needs and to provide discretionary income
» prohibits unauthorised sub-contracting – meaning that we have a fully transparent relationship with our suppliers
» prohibits discrimination on the basis of personal attributes as well as union membership or political affiliations
ASSURANCES WHICH SUPPORT OUR SOURCING PRINCIPLES
Background checks. We conduct thorough and ongoing compliance activities of all suppliers directly and through Li & Fung and qualified audit firms.
Factory inspections. Senior management personally inspect all factories that manufacture for us. We continue factory visits throughout our relationship with our suppliers to ensure our principles are strictly adhered to.
BANGLADESH SOURCINGBackgroundBangladesh’s economic and social development relies on the expansion and strength of the garment sector, including through investment by international retailers. The garment industry comprises around 80% of all Bangladesh export earnings, is a significant contributor to GDP, and employs over 4 million workers, most of whom are women. Premier currently sources a portion of its Just Jeans and Jay Jays branded products in Bangladesh and we highlight our program in this country in the interest of full transparency.
In each case our model is supported by the following strict sourcing principles:
1. We comply with all laws in the countries we source from and operate.
2. We insist on workers’ legal rights – including worker empowerment and free association.
3. We have zero tolerance for child labour.
4. We have zero tolerance for bribery and corruption.
5. We have zero tolerance for animal cruelty.
Our Commitment to Ethical Sourcing
China 83%
Rest of the world 17%
For
per
sona
l use
onl
y

Annual Report 2016 15
MEMBERSHIP OF THE ALLIANCE FOR BANGLADESH WORKER SAFETY
Since 2013 we have been a proud signatory to the Alliance for Bangladesh Worker Safety. This is a legally binding five year commitment to work with some of the world’s largest apparel retailers including the following companies: Nordstrom, Gap, Target, Sears, J.C. Penney, Hudson’s Bay and Macy’s.
Together we have invested in worker safety, improved conditions and transparent reporting in a results oriented, measurable and verifiable way.
The Alliance’s achievements to date include:
» inspection of 100% of member factories (including all of our factories)
» publication on the Alliance website of all factory inspection results, along with corrective action plans for any factories requiring remediation (including all of our factories)
» in partnership with the International Finance Corporation, a $50 million low-cost long–term facility to assist factories to undertake remediation
» an anonymous worker helpline program in over 800 member factories, available to over 1.1 million workers (including all of our factories)
» Fire and safety training for 1.29 million workers in all member factories (including all of our factories). Plus following the Nepal Earthquake, the Alliance is now integrating earthquake preparedness into their training programs
Further, the Alliance for Bangladesh Worker Safety collaborates with all parties in the country – including the Bangladesh government, NGOs, factory workers and the Accord on Fire & Building Safety in Bangladesh. Both the Alliance and the Accord share common priorities, including a relentless focus on workers generally, as well as building integrity and safety – all supported by financial commitments and good governance.
All initiatives of the Alliance are publicly available at www.bangladeshworkersafety.org
OUR ACTIVITIES IN BANGLADESH
Our operational processes have included the establishment of our own office in Bangladesh, which we opened in March 2014. Our investment in on the ground infrastructure in Bangladesh, including employing staff at our sourcing office directly, supports our audit and compliance activities in that market with particular focus on social compliance and safety which includes: 1 Senior management personally inspect ALL factories
that manufacture for us prior to commencing
business. We continue factory visits throughout our relationship with our suppliers to ensure our principles are strictly adhered to. Our Code includes the ability for us to make unannounced visits in Bangladesh for the purposes of our audit and compliance activities.
2 Prior to placing orders with any factory, we also engage independent internationally recognised qualified assessment and audit firms to verify compliance with all local laws and safety conditions, in relation to labour and safety issues including fire and building integrity.
3 During manufacturing, our globally independent audit firm Intertek inspect all orders. To-date we have achieved a 100% inspection rate of all our orders in all of our factories.
4 In addition, if the factories are not member factories of either the Alliance or the Accord, then we will not conduct business with them. Factories must be inspected for compliance with Alliance safety standards before they can be approved by the Alliance for production.
As noted; the Alliance has conducted fire safety training at all factories we source from and all employed staff have received this training. We are fully engaged in this process with a committed and responsible work program in Bangladesh.
ETHICAL RAW MATERIAL PROCUREMENT
Our sourcing commitment is supported by the following initiatives relating to fibre procurement:
» Rabbit angora We confirm that we will not source products containing rabbit angora until we can be completely confident that the ethical standards of rabbit angora farming are assured and independently audited
» Cotton We will not source cotton harvested in Uzbekistan. We will maintain this position until the government of Uzbekistan ends the practice of forced child and adult labour in its cotton sector. To this end, we signed the Pledge against Child and Adult Forced Labour in Uzbek Cotton
» Azo Dyes We have voluntarily adopted the EU standard whereby we prohibit the manufacture and sale of goods which contain prohibited levels of the specific aromatic amines originating from a small number of azo dyes
» Sandblasted denim The harmful practice of ‘sandblasting’ denim with silica based powders has been discontinued in our business since 2011
For
per
sona
l use
onl
y

16 Premier Investments Limited
CODE OF CONDUCT
Premier acknowledges the importance of respecting our stakeholders, including team members, shareholders, customers and suppliers. We also know that by respecting and working with the communities in which we operate we can make an impact.
Our Code of Conduct outlines our legal, moral and ethical obligations which are underpinned by the behaviours we expect of all of our stakeholders.
The principles ensure that we:
» Foster a culture in which all stakeholders including customers, shareholders and fellow team members are treated with respect
» Comply with the law and Premier policies
» Protect company assets, information and reputation
» Provide a safe workplace for our team members and visitors
» Develop a culture where professional integrity and ethical behaviour is valued
As part of this focus, team members are regularly required to complete the Code of Conduct training. In addition, we have an advisory email and a confidential telephone service for all issues and complaints under this Code.
SHRINKAGE
Shrinkage is the loss of merchandise that can be attributed to product theft or through the administrative handling process. Premier has a shrinkage reduction strategy in place with processes and education aimed at reducing these losses. Premier delivered the sixth consecutive year of improved shrinkage results and we will continue to maintain this focus into the future.
Our Business
For
per
sona
l use
onl
y
Annual Report 2016 A
Premier Investments LimitedA.C.N. 006 727 966
Financial ReportFor the Period Commencing 26 July 2015 to 30 July 2016
For
per
sona
l use
onl
y

1 Premier Investments Limited
Directors’ Report 2
Auditor’s Independence Declaration 38
Statement of Comprehensive Income 39
Statement of Financial Position 40
Statement of Cash Flows 41
Statement of Changes In Equity 42
Notes to the Financial Statements 43
Directors’ Declaration 106
Independent Auditor’s Report to the Members of Premier Investments Limited 107
ASX Additional Information 109
Corporate Directory 111
Contents
DIRECTORS’ REPORT
2
The Board of Directors of Premier Investments Limited (A.B.N. 64 006 727 966) has pleasure in submitting its report in respect of the financial year ended 30 July 2016.
The Directors present their report together with the consolidated financial report of Premier Investments Limited (the “Company” or “Premier") and its controlled entities (the “Group”) for the 53 week period 26 July 2015 to 30 July 2016, together with the independent audit report to the members thereon.
DIRECTORS
The names and details of the Company’s Directors in office during the financial year and until the date of the report are as follows. Directors were in office for this entire period unless otherwise stated.
Solomon Lew Chairman and Non-Executive Director
Mr. Lew was appointed as Non-Executive Director and Chairman of Premier on 31 March 2008. Mr. Lew is a director of Century Plaza Investments Pty Ltd, the largest shareholder in Premier and was previously Chairman of Premier from 1987 to 1994.
Mr. Lew has over 50 years’ experience in the manufacture, wholesale and retailing of textiles, apparel and general merchandise, as well as property development. His success in the retail industry has been largely due to his ability to read fashion trends and interpret them for the Australasian market, in addition to his demonstrated ability in the timing of strategic investments.
Mr. Lew was a Director of Coles Myer Limited from 1985 to 2002, serving as Vice Chairman from 1989, Chairman from 1991 to 1995, Executive Chairman in 1995 and Vice Chairman in 1995 and 1996.
Mr. Lew is a member of the World Retail Hall of Fame and is the first Australian to be formally inducted.
He is also a former Board Member of the Reserve Bank of Australia and former Member of the Prime Minister’s Business Advisory Council.
Mr. Lew was the inaugural Chairman of the Mount Scopus Foundation (1987 – 2013) which supports the Mount Scopus College, one of Australia’s leading private colleges with 2000 students. He has also been the Chairman or a Director of a range of philanthropic organisations.
Dr. David M. Crean Deputy Chairman (appointed 25 July 2015) and Non-Executive Director
Dr. Crean has been an Independent Non-Executive Director of Premier since December 2009, Deputy Chairman since July 2015 and is currently the Chairman of Premier’s Audit and Risk Committee (appointed August 2010).
Dr. Crean was Chairman of the Hydro Electric Corporation (Hydro Tasmania) from September 2004 until October 2014 and was also Chairman of the Business Risk Committee at Hydro Tasmania, member of the Audit Committee and Chairman of the Corporate Governance Committee.
Dr. Crean was State Treasurer of Tasmania from August 1998 to his retirement from the position in February 2004. He was also Minister for Employment from July 2002 to February 2004. He was a Member for Buckingham in the Legislative Council from 1992 to February 1999, and then for Elwick until May 2004. From 1989 to 1992 he was the member for Denison in the House of Assembly. From 1993 to 1998 he held Shadow Portfolios of State Development, Public Sector Management, Finance and Treasury.
Dr. Crean is also a Board member of the Linfox Foundation. Dr. Crean graduated from Monash University in 1976 with a Bachelor of Medicine and Bachelor of Surgery.
For
per
sona
l use
onl
y
Annual Report 2016 2
DIRECTORS’ REPORT
2
The Board of Directors of Premier Investments Limited (A.B.N. 64 006 727 966) has pleasure in submitting its report in respect of the financial year ended 30 July 2016.
The Directors present their report together with the consolidated financial report of Premier Investments Limited (the “Company” or “Premier") and its controlled entities (the “Group”) for the 53 week period 26 July 2015 to 30 July 2016, together with the independent audit report to the members thereon.
DIRECTORS
The names and details of the Company’s Directors in office during the financial year and until the date of the report are as follows. Directors were in office for this entire period unless otherwise stated.
Solomon Lew Chairman and Non-Executive Director
Mr. Lew was appointed as Non-Executive Director and Chairman of Premier on 31 March 2008. Mr. Lew is a director of Century Plaza Investments Pty Ltd, the largest shareholder in Premier and was previously Chairman of Premier from 1987 to 1994.
Mr. Lew has over 50 years’ experience in the manufacture, wholesale and retailing of textiles, apparel and general merchandise, as well as property development. His success in the retail industry has been largely due to his ability to read fashion trends and interpret them for the Australasian market, in addition to his demonstrated ability in the timing of strategic investments.
Mr. Lew was a Director of Coles Myer Limited from 1985 to 2002, serving as Vice Chairman from 1989, Chairman from 1991 to 1995, Executive Chairman in 1995 and Vice Chairman in 1995 and 1996.
Mr. Lew is a member of the World Retail Hall of Fame and is the first Australian to be formally inducted.
He is also a former Board Member of the Reserve Bank of Australia and former Member of the Prime Minister’s Business Advisory Council.
Mr. Lew was the inaugural Chairman of the Mount Scopus Foundation (1987 – 2013) which supports the Mount Scopus College, one of Australia’s leading private colleges with 2000 students. He has also been the Chairman or a Director of a range of philanthropic organisations.
Dr. David M. Crean Deputy Chairman (appointed 25 July 2015) and Non-Executive Director
Dr. Crean has been an Independent Non-Executive Director of Premier since December 2009, Deputy Chairman since July 2015 and is currently the Chairman of Premier’s Audit and Risk Committee (appointed August 2010).
Dr. Crean was Chairman of the Hydro Electric Corporation (Hydro Tasmania) from September 2004 until October 2014 and was also Chairman of the Business Risk Committee at Hydro Tasmania, member of the Audit Committee and Chairman of the Corporate Governance Committee.
Dr. Crean was State Treasurer of Tasmania from August 1998 to his retirement from the position in February 2004. He was also Minister for Employment from July 2002 to February 2004. He was a Member for Buckingham in the Legislative Council from 1992 to February 1999, and then for Elwick until May 2004. From 1989 to 1992 he was the member for Denison in the House of Assembly. From 1993 to 1998 he held Shadow Portfolios of State Development, Public Sector Management, Finance and Treasury.
Dr. Crean is also a Board member of the Linfox Foundation. Dr. Crean graduated from Monash University in 1976 with a Bachelor of Medicine and Bachelor of Surgery.
For
per
sona
l use
onl
y

3 Premier Investments Limited
DIRECTORS’ REPORT (CONTINUED)
3
Mark McInnes Executive Director
Mr. McInnes is a career retailer with a long track record of success in every role he has occupied. Like many great retailers, Mark started his career from the shop floor as a company cadet for Grace Brothers. Mark has been directly responsible for some of Australia’s greatest retail success stories – including as a co-founder of the Officeworks concept which is today Australia’s largest office supply superstore.
Prior to joining Premier, Mark led David Jones to its most successful time as a public listed company. Mark spent 13 years at David Jones – 6 years as Merchandise & Marketing Director and 7 years as CEO. From 2003 to 2010, Mark as CEO and Executive Director of David Jones turned the company into a fashion and financial powerhouse, creating in excess of $2 billion of shareholder value.
Mark was appointed CEO of Premier Retail in April 2011, and has set about transforming the company to compete in an industry under great structural pressure. Premier Retail today has a clear path and a clear focus.
In December 2012, Mark was appointed as an Executive Director of Premier Investments Limited. Mark holds an MBA from the University of Melbourne.
Timothy Antonie Non-Executive Director and Lead Independent Director
Mr. Antonie was appointed to the Board of Directors on 1 December 2009. He holds a Bachelor of Economics degree from Monash University and qualified as a Chartered Accountant with Price Waterhouse. He has 20 years’ experience in investment banking and formerly held positions of Managing Director from 2004 to 2008 and Senior Adviser in 2009 at UBS Investment Banking, with particular focus on large scale mergers and acquisitions and capital raisings in the Australian retail, consumer, media and entertainment sectors. Mr Antonie is also a Non-Executive Director of Village Roadshow Limited and Breville Group Limited and is a Principal of Stratford Advisory Group.
Lindsay E. Fox AC Non-Executive Director
Mr. Fox has extensive experience in all aspects of the transport, distribution and warehousing industries. He is the founder of the Linfox Group of Companies. Today, the Linfox Group operates one of the largest supply chain services businesses with operations in 10 countries. The Linfox Group employs over 23,000 people, operates 4.8 million square metres of warehouses and a fleet of more than 5,000 vehicles and carries out distribution operations for leading companies across the Asia-Pacific region. The Linfox Group includes operations in the areas of transport and logistics, airports, property development and cash management services.
Mr. Fox has extensive involvement in Australian and international circles and, apart from his business interests, is well recognised and active in sport and charity work.
In 2010, Victoria University admitted Mr. Fox to the degree of Doctor of the University honoris causa for his outstanding achievements in the transport industry, for his contribution to the community through his sustained efforts to reduce unemployment and his campaign against youth suicide.
In January 2008, Mr Fox was awarded a Companion of the Order of Australia (AC) for continued service to the transport and logistics industries, to business through the development and promotion of youth traineeships and to the community through a range of philanthropic endeavours.
He was awarded an Officer of the Order of Australia (AO) in 1992 for his contribution to the transport industry and the community and he received a Centenary Medal for services to the transport industry in 2001.
From September 1992 to December 1993, Mr. Fox together with Mr. Bill Kelty introduced a national campaign called ‘Work for Australia’. This campaign encouraged companies and local communities to generate jobs for the unemployed with the aid of government subsidies and programs. More than 60,000 jobs were pledged through their efforts and Mr. Fox and Mr. Kelty were awarded ‘Victorians of the Year’ by the Sunday Age.
PREMIER INVESTMENTS LIMITED A.C.N. 006 727 966
FINANCIAL REPORT FOR THE PERIOD COMMENCING 26 JULY 2015 TO 30 JULY 2016
CONTENTS DIRECTORS’ REPORT 2
AUDITOR’S INDEPENDENCE DECLARATION 38
STATEMENT OF COMPREHENSIVE INCOME 39
STATEMENT OF FINANCIAL POSITION 40
STATEMENT OF CASH FLOWS 41
STATEMENT OF CHANGES IN EQUITY 42
NOTES TO THE FINANCIAL STATEMENTS 43
DIRECTORS’ DECLARATION 105
INDEPENDENT AUDIT REPORT TO THE MEMBERS OF PREMIER INVESTMENTS LIMITED 106
ASX ADDITIONAL INFORMATION 108
CORPORATE DIRECTORY 110
DIRECTORS’ REPORT (CONTINUED)
4
Sally Herman Non-Executive Director
Sally Herman is an experienced Non-Executive Director in the fields of financial services, retail, manufacturing and property. She had a successful executive career spanning 25 years in financial services in both Australia and the US, transitioning in late 2010 to a full time career as a Non-Executive Director.
Prior to that, she had spent 16 years with the Westpac Group, running major business units in most operating divisions of the Group as well as heading up Corporate Affairs and Sustainability through the merger with St. George and the global financial crisis.
Ms. Herman sits on both listed and unlisted Boards, including Suncorp Group Limited (effective 6 October 2015), Breville Group Limited, ME Bank Limited (retired 5 October 2015) and Investec Property Limited. She was also a board member of FSA Group Limited (retired 28 November 2014). Ms. Herman is Chair of an independent girls’ school in Sydney and is on the Board of the Sydney Harbour Federation Trust. Ms. Herman holds a BA from the University of NSW and is a Graduate of the Australian Institute of Company Directors.
Henry D. Lanzer AM B.COM. LLB (Melb) Non-Executive Director
Henry Lanzer AM is Managing Partner of Arnold Bloch Leibler, a leading Australian commercial law firm. Henry has over 30 years’ experience in providing legal, corporate finance and strategic advice to some of Australia’s leading companies.
Mr. Lanzer is a Director of Just Group Limited, Thorney Opportunities Limited and the TarraWarra Museum of Art and also a Life Governor of the Mount Scopus College Council.
He is also Chairman of the Remuneration and Nomination Committee for Premier Investments Limited.
In June 2015, Henry was appointed as a Member of the Order of Australia.
Terrence L. McCartney Non-Executive Director (Appointed 15 April 2016)
Mr. McCartney has had a long and successful career in retail. Mr. McCartney, started at Boans Department Stores in Perth then moved to Grace Bros in Sydney. After the acquisition of Grace Bros by Myer, he relocated to the merged Department Stores Group in Melbourne within the merchandise & marketing department. His successful career within Coles Myer meant that Terry then moved to the Kmart discount department stores as Head of Merchandise & Marketing and then Managing Director. Following several years as Managing Director of Kmart Australia and New Zealand, Terry became Managing Director of Myer Grace Bros. For 5 years Terry lead year on year growth in profitability of Australia’s largest department store.
Terry’s experience spans the full spectrum of retailing, ranging from luxury goods in department stores to large mass merchandise discount operations. Terry has also been retained by large international accounting and legal firms as an expert witness in relation to Australian retail.
In addition to his extensive list of retail experience, he has also been an advisor to large Australian and international mining companies, prior to joining the Just Group Board in 2008. Terry lends his extensive retail and commercial expertise to the Just Group by serving on a number of committees, including the Property Committee and Internet Steering Committee of the Group, and through various store and site visits, both locally and overseas. He is also actively involved in seasonal and trading performance reviews for the Group.
Terry was appointed as a Director of Premier Investments Limited in April 2016.
DIRECTORS’ REPORT (CONTINUED)
5
Michael R.I. McLeod Non-Executive Director
Mr. McLeod is a former Executive Director of the Century Plaza Group and has been involved with the Group since 1996 as an advisor in the areas of corporate strategy, investment and public affairs. He has been a Non-Executive Director of Premier Investments Limited since 2002 and was a Non-Executive Director of Just Group Limited from 2007 to 2013. Past experience includes the Australian Board of an international funds manager, chief of staff to a Federal Cabinet Minister and statutory appointments including as a Commission Member of the National Occupational Health and Safety Commission.
He holds a Bachelor of Arts (First Class Honours and University Medal) from the University of New South Wales.
Dr. Gary H. Weiss LL.M, J.S.D. Non-Executive Director
Dr. Weiss holds the degrees of LL.B (Hons) and LL.M (with distinction) from Victoria University of Wellington, as well as a Doctor of Juridical Science (JSD) from Cornell University, New York. Dr. Weiss has extensive international business experience and has been involved in numerous cross-border mergers and acquisitions.
Dr. Weiss is Chairman of Ridley Corporation Limited, Executive Director of Ariadne Australia Limited, and a Director of Premier Investments Limited, Pro-Pac Packaging Limited, Tag Pacific Limited, Thorney Opportunities Limited, The Straits Trading Company Limited and Estia Health Limited. He was Chairman of Clearview Wealth Limited from July 2013 until May 2016 and of Coats Plc from 2003 until April 2012, and Executive Director of Guinness Peat Group Plc from 1990 to April 2011 and has held directorships of numerous companies, including Mercantile Investment Company Limited (retired 25 February 2015) Westfield Group, Tower Australia Limited, Australian Wealth Management Limited, Tyndall Australia Limited (Deputy Chairman), Joe White Maltings Limited (Chairman), CIC Limited, Whitlam Turnbull & Co Limited and Industrial Equity Limited.
He has authored numerous articles on a variety of legal and commercial topics.
COMPANY SECRETARY
Kim F. Davis
Mr. Davis has been the Company Secretary of Premier Investments Limited for 22 years. Prior to holding this position, Mr Davis had 15 years’ experience within the accounting industry as a tax and financial advisor.
For
per
sona
l use
onl
y
Annual Report 2016 4
DIRECTORS’ REPORT (CONTINUED)
4
Sally Herman Non-Executive Director
Sally Herman is an experienced Non-Executive Director in the fields of financial services, retail, manufacturing and property. She had a successful executive career spanning 25 years in financial services in both Australia and the US, transitioning in late 2010 to a full time career as a Non-Executive Director.
Prior to that, she had spent 16 years with the Westpac Group, running major business units in most operating divisions of the Group as well as heading up Corporate Affairs and Sustainability through the merger with St. George and the global financial crisis.
Ms. Herman sits on both listed and unlisted Boards, including Suncorp Group Limited (effective 6 October 2015), Breville Group Limited, ME Bank Limited (retired 5 October 2015) and Investec Property Limited. She was also a board member of FSA Group Limited (retired 28 November 2014). Ms. Herman is Chair of an independent girls’ school in Sydney and is on the Board of the Sydney Harbour Federation Trust. Ms. Herman holds a BA from the University of NSW and is a Graduate of the Australian Institute of Company Directors.
Henry D. Lanzer AM B.COM. LLB (Melb) Non-Executive Director
Henry Lanzer AM is Managing Partner of Arnold Bloch Leibler, a leading Australian commercial law firm. Henry has over 30 years’ experience in providing legal, corporate finance and strategic advice to some of Australia’s leading companies.
Mr. Lanzer is a Director of Just Group Limited, Thorney Opportunities Limited and the TarraWarra Museum of Art and also a Life Governor of the Mount Scopus College Council.
He is also Chairman of the Remuneration and Nomination Committee for Premier Investments Limited.
In June 2015, Henry was appointed as a Member of the Order of Australia.
Terrence L. McCartney Non-Executive Director (Appointed 15 April 2016)
Mr. McCartney has had a long and successful career in retail. Mr. McCartney, started at Boans Department Stores in Perth then moved to Grace Bros in Sydney. After the acquisition of Grace Bros by Myer, he relocated to the merged Department Stores Group in Melbourne within the merchandise & marketing department. His successful career within Coles Myer meant that Terry then moved to the Kmart discount department stores as Head of Merchandise & Marketing and then Managing Director. Following several years as Managing Director of Kmart Australia and New Zealand, Terry became Managing Director of Myer Grace Bros. For 5 years Terry lead year on year growth in profitability of Australia’s largest department store.
Terry’s experience spans the full spectrum of retailing, ranging from luxury goods in department stores to large mass merchandise discount operations. Terry has also been retained by large international accounting and legal firms as an expert witness in relation to Australian retail.
In addition to his extensive list of retail experience, he has also been an advisor to large Australian and international mining companies, prior to joining the Just Group Board in 2008. Terry lends his extensive retail and commercial expertise to the Just Group by serving on a number of committees, including the Property Committee and Internet Steering Committee of the Group, and through various store and site visits, both locally and overseas. He is also actively involved in seasonal and trading performance reviews for the Group.
Terry was appointed as a Director of Premier Investments Limited in April 2016.
For
per
sona
l use
onl
y
5 Premier Investments Limited
DIRECTORS’ REPORT (CONTINUED)
5
Michael R.I. McLeod Non-Executive Director
Mr. McLeod is a former Executive Director of the Century Plaza Group and has been involved with the Group since 1996 as an advisor in the areas of corporate strategy, investment and public affairs. He has been a Non-Executive Director of Premier Investments Limited since 2002 and was a Non-Executive Director of Just Group Limited from 2007 to 2013. Past experience includes the Australian Board of an international funds manager, chief of staff to a Federal Cabinet Minister and statutory appointments including as a Commission Member of the National Occupational Health and Safety Commission.
He holds a Bachelor of Arts (First Class Honours and University Medal) from the University of New South Wales.
Dr. Gary H. Weiss LL.M, J.S.D. Non-Executive Director
Dr. Weiss holds the degrees of LL.B (Hons) and LL.M (with distinction) from Victoria University of Wellington, as well as a Doctor of Juridical Science (JSD) from Cornell University, New York. Dr. Weiss has extensive international business experience and has been involved in numerous cross-border mergers and acquisitions.
Dr. Weiss is Chairman of Ridley Corporation Limited, Executive Director of Ariadne Australia Limited, and a Director of Premier Investments Limited, Pro-Pac Packaging Limited, Tag Pacific Limited, Thorney Opportunities Limited, The Straits Trading Company Limited and Estia Health Limited. He was Chairman of Clearview Wealth Limited from July 2013 until May 2016 and of Coats Plc from 2003 until April 2012, and Executive Director of Guinness Peat Group Plc from 1990 to April 2011 and has held directorships of numerous companies, including Mercantile Investment Company Limited (retired 25 February 2015) Westfield Group, Tower Australia Limited, Australian Wealth Management Limited, Tyndall Australia Limited (Deputy Chairman), Joe White Maltings Limited (Chairman), CIC Limited, Whitlam Turnbull & Co Limited and Industrial Equity Limited.
He has authored numerous articles on a variety of legal and commercial topics.
COMPANY SECRETARY
Kim F. Davis
Mr. Davis has been the Company Secretary of Premier Investments Limited for 22 years. Prior to holding this position, Mr Davis had 15 years’ experience within the accounting industry as a tax and financial advisor.
DIRECTORS’ REPORT (CONTINUED)
6
PRINCIPAL ACTIVITIES
The consolidated entity operates a number of specialty retail fashion chains within the specialty retail fashion markets in Australia, New Zealand, Singapore, United Kingdom, as well as Malaysia and Hong Kong. The Group also has significant investments in listed securities and money market deposits.
DIVIDENDS CENTS $’000 Final Dividend recommended for 2016 25.00 39,291 Dividends paid in the year: Interim for the half-year ended 30 January 2016 23.00 36,129 Final for 2015 shown as recommended in the 2015 report 21.00 32,840
OPERATING AND FINANCIAL REVIEW
Group Overview:
Premier Investments Limited acquired a controlling interest in Just Group Limited (“Just Group”), a listed company on the Australian Securities Exchange in August 2008. Subsequent to the acquisition, Just Group delisted from the Australian Securities Exchange. Just Group is a leading speciality fashion retailer in Australia, New Zealand, Singapore and the United Kingdom. During the second half of the 2016 financial year, the Group opened its first Smiggle stores in Hong Kong and Malaysia. Just Group has a portfolio of well-recognised retail brands, consisting of Just Jeans, Jay Jays, Jacqui E, Portmans, Dotti, Peter Alexander and Smiggle. Currently, these seven unique brands are trading from more than 1,100 stores across six countries as well as online. Smiggle opened its first four stores in Hong Kong and one store in Malaysia during the year. Smiggle also expanded its store network in the United Kingdom by adding a further 40 stores to the UK network, bringing the total UK stores to 64 as at the end of the 2016 financial year.
The Group’s emphasis is on a range of brands that provide diversification through breadth of target demographic and sufficiently broad appeal to enable a national footprint. Over 90% of the product range is designed, sourced and sold under its own brands. There is a continuing investment in these brands to ensure they remain relevant to changing customer tastes and remain at the forefront of their respective target markets.
Group Operating Results:
The Group’s reported revenue from the sale of goods, total income and net profit after income tax for the 53 week period ended 30 July 2016 (2015: 52 week period ended 25 July 2015) are summarised below:
2016$’000
2015$’000 % CHANGE
Revenue from sale of goods 1,049,226 947,662 +10.72% Total interest income 7,888 9,828 -19.74% Total other income and revenue 1,847 4,379 -57.82% Total revenue and other income 1,058,961 961,869 +10.09% Net profit after income tax 103,874 88,102 +17.90%
For
per
sona
l use
onl
y

Annual Report 2016 6
DIRECTORS’ REPORT (CONTINUED)
6
PRINCIPAL ACTIVITIES
The consolidated entity operates a number of specialty retail fashion chains within the specialty retail fashion markets in Australia, New Zealand, Singapore, United Kingdom, as well as Malaysia and Hong Kong. The Group also has significant investments in listed securities and money market deposits.
DIVIDENDS CENTS $’000 Final Dividend recommended for 2016 25.00 39,291 Dividends paid in the year: Interim for the half-year ended 30 January 2016 23.00 36,129 Final for 2015 shown as recommended in the 2015 report 21.00 32,840
OPERATING AND FINANCIAL REVIEW
Group Overview:
Premier Investments Limited acquired a controlling interest in Just Group Limited (“Just Group”), a listed company on the Australian Securities Exchange in August 2008. Subsequent to the acquisition, Just Group delisted from the Australian Securities Exchange. Just Group is a leading speciality fashion retailer in Australia, New Zealand, Singapore and the United Kingdom. During the second half of the 2016 financial year, the Group opened its first Smiggle stores in Hong Kong and Malaysia. Just Group has a portfolio of well-recognised retail brands, consisting of Just Jeans, Jay Jays, Jacqui E, Portmans, Dotti, Peter Alexander and Smiggle. Currently, these seven unique brands are trading from more than 1,100 stores across six countries as well as online. Smiggle opened its first four stores in Hong Kong and one store in Malaysia during the year. Smiggle also expanded its store network in the United Kingdom by adding a further 40 stores to the UK network, bringing the total UK stores to 64 as at the end of the 2016 financial year.
The Group’s emphasis is on a range of brands that provide diversification through breadth of target demographic and sufficiently broad appeal to enable a national footprint. Over 90% of the product range is designed, sourced and sold under its own brands. There is a continuing investment in these brands to ensure they remain relevant to changing customer tastes and remain at the forefront of their respective target markets.
Group Operating Results:
The Group’s reported revenue from the sale of goods, total income and net profit after income tax for the 53 week period ended 30 July 2016 (2015: 52 week period ended 25 July 2015) are summarised below:
2016$’000
2015$’000 % CHANGE
Revenue from sale of goods 1,049,226 947,662 +10.72% Total interest income 7,888 9,828 -19.74% Total other income and revenue 1,847 4,379 -57.82% Total revenue and other income 1,058,961 961,869 +10.09% Net profit after income tax 103,874 88,102 +17.90%
For
per
sona
l use
onl
y

7 Premier Investments Limited
DIRECTORS’ REPORT (CONTINUED)
7
OPERATING AND FINANCIAL REVIEW (CONTINUED)
Group Operating Results (continued):
Retail Segment:
As Premier’s core business, Just Group was the key contributor to the Group’s operating results for the financial year. Key financial indicators for the retail segment for the 53 week period ended 30 July 2016 (2015: 52 week period ended 25 July 2015) are highlighted below:
RETAIL SEGMENT 2016$’000
2015 $’000 % CHANGE
Sale of goods 1,049,226 947,662 +10.72% Total segment income 1,051,241 952,191 +10.40% Segment net profit before income tax 126,207 98,958 +27.54% Capital expenditure 42,677 36,526
The Retail Segment contributed $126 million to the Group’s net profit before income tax, up 27.54% on the prior financial year. Growth in sales, combined with gross margin expansion and tight controls over the total cost of doing business contributed to the improvement in segment profit before income tax. The increase in profit before income tax is a reflection of the Group’s continued efforts to transform its core brands, the implementation of its organisation-wide cost efficiency program, as well as the focus on its growth initiatives, both locally and internationally.
PREMIER RETAIL TRANSFORMATION STRATEGY – OUR FOCUS ON GROWTH AND INVESTMENT
GROWTH CORE
Grow Smiggle significantly Gross margin expansion program
Grow Peter Alexander significantly Rejuvenation of core apparel brands
Expansion and growth of online businesses Organisation-wide cost efficiency program
The increase in sales is as a result of strong sales growth across all brands in the portfolio, with successful growth in both overseas and domestic markets. Premier Retail achieved annual sales of over $1 billion for the 53 weeks ended 30 July 2016, a new milestone for the Group. Online sales are up 39.6% on the prior year.
The Group continues to invest in new stores globally, and actively seeks to deliver sustainable sales growth through store upgrades and refurbishments. During the 2016 financial year, the Group opened a further 81 stores across all geographic segments, bringing the total global store network to over 1,100 stores.
During the 2016 financial year, the Group also expanded Smiggle’s Asian footprint by opening its first stores in Malaysia and Hong Kong.
DIRECTORS’ REPORT (CONTINUED)
8
OPERATING AND FINANCIAL REVIEW (CONTINUED)
Group Operating Results (continued):
Retail Segment (continued):
Retail segment sales per geographic segment is presented in the graph below:
Investment Segment:
The Group’s balance sheet remains strong, primarily due to the significant asset holding of the investment segment. As at 30 July 2016, the Group reflected its 27.5% shareholding in Breville Group Limited as an investment in associate, with an equity accounted value of $213.4 million. The fair value of the Group’s interest in Breville Group Limited as determined based on the quoted market price for the shares as at 30 July 2016 was $282.6 million.
GROUP PERFORMANCE
The Group is pleased to report that despite tough economic conditions, it continued to generate strong returns to shareholders. The dividends declared for the year reaffirm the confidence the Directors have in the future performance and underline Premier’s commitment to enhancing shareholder value through capital management and business investment.
2016 2015 2014 2013 2012
Closing share price at end of financial year $16.22 $13.43 $9.34 $7.68 $4.88
Basic earnings per share (cents) 66.3 56.5 47.0 112.4 44.0
Dividend paid per share (cents) 44.0 50.0 39.0 37.0 36.0
Return on equity (%) 7.8% 6.6% 5.6% 13.4% 5.5%
Net debt/equity ratio (%) (13.3%) (13.2%) (14.9%) (16.2%) (13.7%)
For
per
sona
l use
onl
y
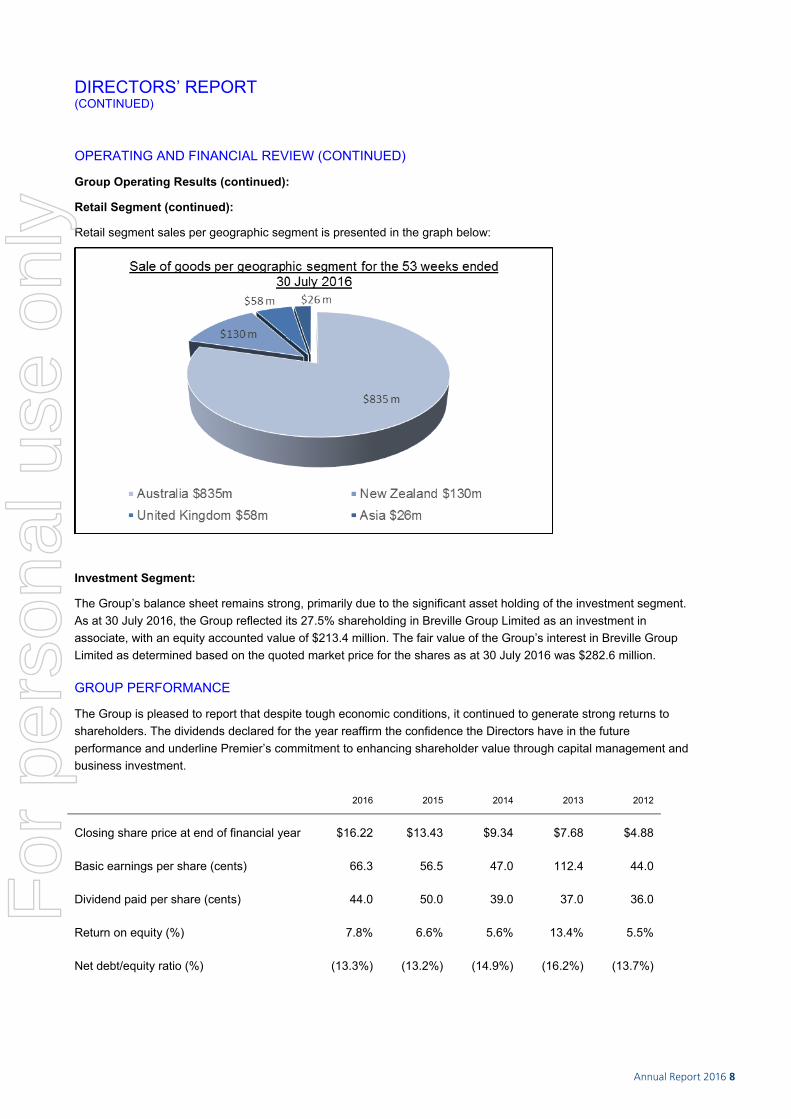
Annual Report 2016 8
DIRECTORS’ REPORT (CONTINUED)
8
OPERATING AND FINANCIAL REVIEW (CONTINUED)
Group Operating Results (continued):
Retail Segment (continued):
Retail segment sales per geographic segment is presented in the graph below:
Investment Segment:
The Group’s balance sheet remains strong, primarily due to the significant asset holding of the investment segment. As at 30 July 2016, the Group reflected its 27.5% shareholding in Breville Group Limited as an investment in associate, with an equity accounted value of $213.4 million. The fair value of the Group’s interest in Breville Group Limited as determined based on the quoted market price for the shares as at 30 July 2016 was $282.6 million.
GROUP PERFORMANCE
The Group is pleased to report that despite tough economic conditions, it continued to generate strong returns to shareholders. The dividends declared for the year reaffirm the confidence the Directors have in the future performance and underline Premier’s commitment to enhancing shareholder value through capital management and business investment.
2016 2015 2014 2013 2012
Closing share price at end of financial year $16.22 $13.43 $9.34 $7.68 $4.88
Basic earnings per share (cents) 66.3 56.5 47.0 112.4 44.0
Dividend paid per share (cents) 44.0 50.0 39.0 37.0 36.0
Return on equity (%) 7.8% 6.6% 5.6% 13.4% 5.5%
Net debt/equity ratio (%) (13.3%) (13.2%) (14.9%) (16.2%) (13.7%)
For
per
sona
l use
onl
y

9 Premier Investments Limited
DIRECTORS’ REPORT (CONTINUED)
5
Michael R.I. McLeod Non-Executive Director
Mr. McLeod is a former Executive Director of the Century Plaza Group and has been involved with the Group since 1996 as an advisor in the areas of corporate strategy, investment and public affairs. He has been a Non-Executive Director of Premier Investments Limited since 2002 and was a Non-Executive Director of Just Group Limited from 2007 to 2013. Past experience includes the Australian Board of an international funds manager, chief of staff to a Federal Cabinet Minister and statutory appointments including as a Commission Member of the National Occupational Health and Safety Commission.
He holds a Bachelor of Arts (First Class Honours and University Medal) from the University of New South Wales.
Dr. Gary H. Weiss LL.M, J.S.D. Non-Executive Director
Dr. Weiss holds the degrees of LL.B (Hons) and LL.M (with distinction) from Victoria University of Wellington, as well as a Doctor of Juridical Science (JSD) from Cornell University, New York. Dr. Weiss has extensive international business experience and has been involved in numerous cross-border mergers and acquisitions.
Dr. Weiss is Chairman of Ridley Corporation Limited, Executive Director of Ariadne Australia Limited, and a Director of Premier Investments Limited, Pro-Pac Packaging Limited, Tag Pacific Limited, Thorney Opportunities Limited, The Straits Trading Company Limited and Estia Health Limited. He was Chairman of Clearview Wealth Limited from July 2013 until May 2016 and of Coats Plc from 2003 until April 2012, and Executive Director of Guinness Peat Group Plc from 1990 to April 2011 and has held directorships of numerous companies, including Mercantile Investment Company Limited (retired 25 February 2015) Westfield Group, Tower Australia Limited, Australian Wealth Management Limited, Tyndall Australia Limited (Deputy Chairman), Joe White Maltings Limited (Chairman), CIC Limited, Whitlam Turnbull & Co Limited and Industrial Equity Limited.
He has authored numerous articles on a variety of legal and commercial topics.
COMPANY SECRETARY
Kim F. Davis
Mr. Davis has been the Company Secretary of Premier Investments Limited for 22 years. Prior to holding this position, Mr Davis had 15 years’ experience within the accounting industry as a tax and financial advisor.
DIRECTORS’ REPORT (CONTINUED)
9
SHARES ISSUED DURING THE FINANCIAL YEAR
A total of 784,386 shares (2015: 665,201) were issued during the year pursuant to the Group’s Performance Rights Plan.
SIGNIFICANT CHANGES IN THE STATE OF AFFAIRS
There have been no significant changes in the state of affairs of the Group during the financial year ended 30 July 2016.
SIGNIFICANT EVENTS AFTER THE REPORTING DATE
On 21 September 2016, the Directors of Premier Investments Limited declared a final dividend in respect of the 2016 financial year. The total amount of the dividend is $39,291,000 (2015: $32,840,000) which represents a fully franked dividend of 25 cents per share (2015: 21 cents per share). The dividend has not been provided for in the 30 July 2016 financial statements.
LIKELY DEVELOPMENTS AND EXPECTED RESULTS
Certain likely developments in the operations of the Group and the expected results of those operations in financial years subsequent to the period ended 30 July 2016 are referred to in the preceding operating and financial review. No additional information is included on the likely developments in the operations of the Group and the expected results of those operations as the Directors reasonably believe that the disclosure of such information would be likely to result in unreasonable prejudice to the Group if included in this report, and it has therefore been excluded in accordance with section 299(3) of the Corporations Act 2001.
ENVIRONMENTAL REGULATION AND PERFORMANCE
The Group’s operations are not subject to any significant environmental obligations or regulations.
SHARE OPTIONS
Unissued Shares:
As at the date of this report, there were 1,627,218 unissued performance rights (1,627,218 at the reporting date). Refer to the remuneration report for further details of the options outstanding.
Shares Issued as a Result of the Exercise of Options:
A total of 784,386 shares (2015: 665,201) were issued as a result of the exercise of options during the financial year and to the date of this report.
INDEMNIFICATION AND INSURANCE OF DIRECTORS AND OFFICERS
To the extent permitted by law, the company indemnifies every person who is or has been a director or officer of the company or of a wholly-owned subsidiary of the company against liability for damages awarded or judgments entered against them and legal defence costs and expenses, arising out of a wrongful act, incurred by that person whilst acting in their capacity as a director or officer provided there has been no admission, or judgment, award or other finding by a court, tribunal or arbitrator which establishes improper use of position, or committing of any criminal, dishonest, fraudulent or malicious act.
The officers include the Directors, as named earlier in this report, the Company Secretary and other officers, being the executive senior management team. Details of the nature of the liabilities covered or the amount of the premium paid in respect of the Directors, and Officers, liability insurance contracts are not disclosed as such disclosure is prohibited under the terms of the contracts.
DIRECTORS’ REPORT (CONTINUED)
5
Michael R.I. McLeod Non-Executive Director
Mr. McLeod is a former Executive Director of the Century Plaza Group and has been involved with the Group since 1996 as an advisor in the areas of corporate strategy, investment and public affairs. He has been a Non-Executive Director of Premier Investments Limited since 2002 and was a Non-Executive Director of Just Group Limited from 2007 to 2013. Past experience includes the Australian Board of an international funds manager, chief of staff to a Federal Cabinet Minister and statutory appointments including as a Commission Member of the National Occupational Health and Safety Commission.
He holds a Bachelor of Arts (First Class Honours and University Medal) from the University of New South Wales.
Dr. Gary H. Weiss LL.M, J.S.D. Non-Executive Director
Dr. Weiss holds the degrees of LL.B (Hons) and LL.M (with distinction) from Victoria University of Wellington, as well as a Doctor of Juridical Science (JSD) from Cornell University, New York. Dr. Weiss has extensive international business experience and has been involved in numerous cross-border mergers and acquisitions.
Dr. Weiss is Chairman of Ridley Corporation Limited, Executive Director of Ariadne Australia Limited, and a Director of Premier Investments Limited, Pro-Pac Packaging Limited, Tag Pacific Limited, Thorney Opportunities Limited, The Straits Trading Company Limited and Estia Health Limited. He was Chairman of Clearview Wealth Limited from July 2013 until May 2016 and of Coats Plc from 2003 until April 2012, and Executive Director of Guinness Peat Group Plc from 1990 to April 2011 and has held directorships of numerous companies, including Mercantile Investment Company Limited (retired 25 February 2015) Westfield Group, Tower Australia Limited, Australian Wealth Management Limited, Tyndall Australia Limited (Deputy Chairman), Joe White Maltings Limited (Chairman), CIC Limited, Whitlam Turnbull & Co Limited and Industrial Equity Limited.
He has authored numerous articles on a variety of legal and commercial topics.
COMPANY SECRETARY
Kim F. Davis
Mr. Davis has been the Company Secretary of Premier Investments Limited for 22 years. Prior to holding this position, Mr Davis had 15 years’ experience within the accounting industry as a tax and financial advisor.
DIRECTORS’ REPORT (CONTINUED)
10
INDEMNIFICATION OF AUDITORS
To the extent permitted by law, the company has agreed to indemnify its auditors, Ernst & Young, as part of the terms of its audit engagement agreement against claims by third parties arising from the audit (for an unspecified amount). No payment has been made to indemnify Ernst & Young during or since the financial year.
INTERESTS IN SHARES AND RIGHTS OF THE COMPANY
At the date of this report, the interests of the Directors in the shares and performance rights of the company were:
Mr. S. Lew 4,437,699 ordinary shares**
Mr. L.E. Fox 2,577,014 ordinary shares
Ms. S. Herman 8,000 ordinary shares
Mr. H.D. Lanzer 27,665 ordinary shares
Mr. M.R.I. McLeod 28,186 ordinary shares
Dr. G. H. Weiss 6,000 ordinary shares
Mr. M. McInnes 1,000,000 performance rights
**Mr. Lew is an associate of Century Plaza Investments Pty. Ltd. and Metrepark Pty. Ltd (Associated Entities). The Associated Entities, collectively, have a relevant interest in 59,804,731 shares in the company. However, Mr. Lew does not have a relevant interest in the shares of the company held by the Associated Entities.
DIRECTORS’ MEETINGS
The number of meetings of the Board of Directors during the financial year, and the number of meetings attended by each director were as follows:
BOARD MEETINGS AUDIT AND RISK COMMITTEE REMUNERATION AND NOMINATION COMMITTEE
DIRECTOR MEETINGS HELD WHILE A
DIRECTOR
NUMBER ATTENDED
MEETINGS ATTENDED AS COMMITTEE
MEMBER
NUMBER ATTENDED
MEETINGS ATTENDED AS COMMITTEE
MEMBER
NUMBER ATTENDED
Mr. S. Lew 8 8 - - 3 3
Mr. M. McInnes 8 6 - - - -
Mr. T. Antonie 8 8 4 4 - -
Dr. D. Crean 8 7 4 4 - -
Mr. L. E. Fox 8 7 - - - -
Ms. S. Herman 8 8 4 4 - -
Mr. H. D. Lanzer 8 8 - 3 3 3
Mr. T. L. McCartney 3 3 - 1 - -
Mr. M. R. I. McLeod 8 7 - - - -
Dr. G. H. Weiss 8 8 - - 3 3
ROUNDING
The company is a company of the kind specified in ASIC Corporations (Rounding in Financial/Directors’ Reports) Instrument 2016/191, dated 24 March 2016. In accordance with that ASIC instrument amounts in the financial statements and the Directors’ Report have been rounded to the nearest thousand dollars unless specifically stated to be otherwise.
AUDITOR INDEPENDENCE
The Directors received the declaration on page 38 from the auditor of Premier Investments Limited.
For
per
sona
l use
onl
y

Annual Report 2016 10
DIRECTORS’ REPORT (CONTINUED)
5
Michael R.I. McLeod Non-Executive Director
Mr. McLeod is a former Executive Director of the Century Plaza Group and has been involved with the Group since 1996 as an advisor in the areas of corporate strategy, investment and public affairs. He has been a Non-Executive Director of Premier Investments Limited since 2002 and was a Non-Executive Director of Just Group Limited from 2007 to 2013. Past experience includes the Australian Board of an international funds manager, chief of staff to a Federal Cabinet Minister and statutory appointments including as a Commission Member of the National Occupational Health and Safety Commission.
He holds a Bachelor of Arts (First Class Honours and University Medal) from the University of New South Wales.
Dr. Gary H. Weiss LL.M, J.S.D. Non-Executive Director
Dr. Weiss holds the degrees of LL.B (Hons) and LL.M (with distinction) from Victoria University of Wellington, as well as a Doctor of Juridical Science (JSD) from Cornell University, New York. Dr. Weiss has extensive international business experience and has been involved in numerous cross-border mergers and acquisitions.
Dr. Weiss is Chairman of Ridley Corporation Limited, Executive Director of Ariadne Australia Limited, and a Director of Premier Investments Limited, Pro-Pac Packaging Limited, Tag Pacific Limited, Thorney Opportunities Limited, The Straits Trading Company Limited and Estia Health Limited. He was Chairman of Clearview Wealth Limited from July 2013 until May 2016 and of Coats Plc from 2003 until April 2012, and Executive Director of Guinness Peat Group Plc from 1990 to April 2011 and has held directorships of numerous companies, including Mercantile Investment Company Limited (retired 25 February 2015) Westfield Group, Tower Australia Limited, Australian Wealth Management Limited, Tyndall Australia Limited (Deputy Chairman), Joe White Maltings Limited (Chairman), CIC Limited, Whitlam Turnbull & Co Limited and Industrial Equity Limited.
He has authored numerous articles on a variety of legal and commercial topics.
COMPANY SECRETARY
Kim F. Davis
Mr. Davis has been the Company Secretary of Premier Investments Limited for 22 years. Prior to holding this position, Mr Davis had 15 years’ experience within the accounting industry as a tax and financial advisor.
DIRECTORS’ REPORT (CONTINUED)
10
INDEMNIFICATION OF AUDITORS
To the extent permitted by law, the company has agreed to indemnify its auditors, Ernst & Young, as part of the terms of its audit engagement agreement against claims by third parties arising from the audit (for an unspecified amount). No payment has been made to indemnify Ernst & Young during or since the financial year.
INTERESTS IN SHARES AND RIGHTS OF THE COMPANY
At the date of this report, the interests of the Directors in the shares and performance rights of the company were:
Mr. S. Lew 4,437,699 ordinary shares**
Mr. L.E. Fox 2,577,014 ordinary shares
Ms. S. Herman 8,000 ordinary shares
Mr. H.D. Lanzer 27,665 ordinary shares
Mr. M.R.I. McLeod 28,186 ordinary shares
Dr. G. H. Weiss 6,000 ordinary shares
Mr. M. McInnes 1,000,000 performance rights
**Mr. Lew is an associate of Century Plaza Investments Pty. Ltd. and Metrepark Pty. Ltd (Associated Entities). The Associated Entities, collectively, have a relevant interest in 59,804,731 shares in the company. However, Mr. Lew does not have a relevant interest in the shares of the company held by the Associated Entities.
DIRECTORS’ MEETINGS
The number of meetings of the Board of Directors during the financial year, and the number of meetings attended by each director were as follows:
BOARD MEETINGS AUDIT AND RISK COMMITTEE REMUNERATION AND NOMINATION COMMITTEE
DIRECTOR MEETINGS HELD WHILE A
DIRECTOR
NUMBER ATTENDED
MEETINGS ATTENDED AS COMMITTEE
MEMBER
NUMBER ATTENDED
MEETINGS ATTENDED AS COMMITTEE
MEMBER
NUMBER ATTENDED
Mr. S. Lew 8 8 - - 3 3
Mr. M. McInnes 8 6 - - - -
Mr. T. Antonie 8 8 4 4 - -
Dr. D. Crean 8 7 4 4 - -
Mr. L. E. Fox 8 7 - - - -
Ms. S. Herman 8 8 4 4 - -
Mr. H. D. Lanzer 8 8 - 3 3 3
Mr. T. L. McCartney 3 3 - 1 - -
Mr. M. R. I. McLeod 8 7 - - - -
Dr. G. H. Weiss 8 8 - - 3 3
ROUNDING
The company is a company of the kind specified in ASIC Corporations (Rounding in Financial/Directors’ Reports) Instrument 2016/191, dated 24 March 2016. In accordance with that ASIC instrument amounts in the financial statements and the Directors’ Report have been rounded to the nearest thousand dollars unless specifically stated to be otherwise.
AUDITOR INDEPENDENCE
The Directors received the declaration on page 38 from the auditor of Premier Investments Limited.
For
per
sona
l use
onl
y

11 Premier Investments Limited
DIRECTORS’ REPORT (CONTINUED)
5
Michael R.I. McLeod Non-Executive Director
Mr. McLeod is a former Executive Director of the Century Plaza Group and has been involved with the Group since 1996 as an advisor in the areas of corporate strategy, investment and public affairs. He has been a Non-Executive Director of Premier Investments Limited since 2002 and was a Non-Executive Director of Just Group Limited from 2007 to 2013. Past experience includes the Australian Board of an international funds manager, chief of staff to a Federal Cabinet Minister and statutory appointments including as a Commission Member of the National Occupational Health and Safety Commission.
He holds a Bachelor of Arts (First Class Honours and University Medal) from the University of New South Wales.
Dr. Gary H. Weiss LL.M, J.S.D. Non-Executive Director
Dr. Weiss holds the degrees of LL.B (Hons) and LL.M (with distinction) from Victoria University of Wellington, as well as a Doctor of Juridical Science (JSD) from Cornell University, New York. Dr. Weiss has extensive international business experience and has been involved in numerous cross-border mergers and acquisitions.
Dr. Weiss is Chairman of Ridley Corporation Limited, Executive Director of Ariadne Australia Limited, and a Director of Premier Investments Limited, Pro-Pac Packaging Limited, Tag Pacific Limited, Thorney Opportunities Limited, The Straits Trading Company Limited and Estia Health Limited. He was Chairman of Clearview Wealth Limited from July 2013 until May 2016 and of Coats Plc from 2003 until April 2012, and Executive Director of Guinness Peat Group Plc from 1990 to April 2011 and has held directorships of numerous companies, including Mercantile Investment Company Limited (retired 25 February 2015) Westfield Group, Tower Australia Limited, Australian Wealth Management Limited, Tyndall Australia Limited (Deputy Chairman), Joe White Maltings Limited (Chairman), CIC Limited, Whitlam Turnbull & Co Limited and Industrial Equity Limited.
He has authored numerous articles on a variety of legal and commercial topics.
COMPANY SECRETARY
Kim F. Davis
Mr. Davis has been the Company Secretary of Premier Investments Limited for 22 years. Prior to holding this position, Mr Davis had 15 years’ experience within the accounting industry as a tax and financial advisor.
DIRECTORS’ REPORT (CONTINUED)
11
NON-AUDIT SERVICES
The Directors are satisfied that the provision of non-audit services is compatible with the general standard of independence for auditors imposed by the Corporations Act 2001. The nature and scope of each type of non-audit service provided means that independence was not compromised.
Details of non-audit services provided by the entity’s auditor, Ernst & Young, can be found in Note 25 of the Financial Report.
CORPORATE GOVERNANCE STATEMENT
To view Premier’s Corporate Governance Statement, please visit www.premierinvestments.com.au/about-us/board-policies.
DIRECTORS’ REPORT (CONTINUED) REMUNERATION REPORT
12
Dear Shareholders,
I am delighted to present our remuneration report for the year ended 30 July 2016. This year’s report has expanded disclosure to illustrate more explicitly the link between Premier’s performance and remuneration outcomes.
Premier has once again achieved very strong results from its main operating division and we are proud to deliver exceptional results to shareholders.
For FY16, Premier Retail achieved sales of over $1 billion for the first time and a record underlying Earnings before Interest and Taxation (“EBIT”)1 of $133.3 million, up 26.1% on FY15. The underlying EBIT for FY16 is up 104% on the $65.3 million achieved in FY11, the year Premier Retail’s CEO, Mr. Mark McInnes, was appointed to our Group. In the five years following Mr. McInnes’ appointment, the market capitalisation of Premier has increased by $1.6 billion, from $0.9 billion to $2.5 billion, and Premier shareholders have received a total of approximately $313 million in fully franked dividends.
Premier Investments Limited Total Shareholder Return (“TSR”) against the ASX200 Index from 4 April 2011 to 30 July 2016
Over the past five years, Premier shareholders have enjoyed some of the best returns of any listed company in the ASX200. These results are all the more impressive when compared to other listed discretionary retailers (many of whom have generated negative returns) and the marked changes in the retail landscape. The Board believes that the strong financial returns enjoyed by shareholders stem, in large part, from the strategic appointment of high calibre key management personnel.
Our Board is diverse and offers a depth of experience in the retail, financial, distribution and logistics, accounting, legal, international transaction and public policy sectors. Premier also has the distinct advantage of Chairman Mr. Solomon Lew’s 50 years of experience in the retail industry, and his ongoing shareholding which aligns his interests to the betterment of shareholders. Mr. Lew has always declined to accept remuneration in respect of his hands on involvement in the successful steering of the business.
1 Refer to page 29 of the Remuneration Report for a definition and reconciliation of underlying EBIT.
For
per
sona
l use
onl
y
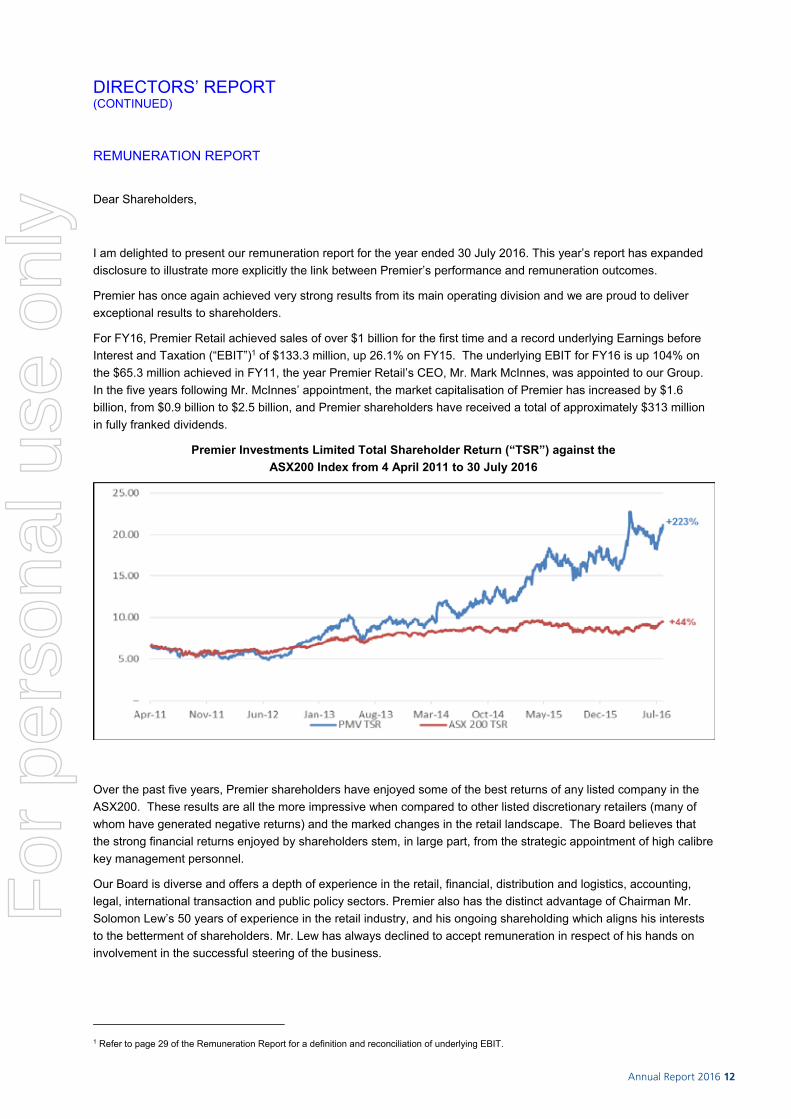
Annual Report 2016 12
DIRECTORS’ REPORT (CONTINUED) REMUNERATION REPORT
12
Dear Shareholders,
I am delighted to present our remuneration report for the year ended 30 July 2016. This year’s report has expanded disclosure to illustrate more explicitly the link between Premier’s performance and remuneration outcomes.
Premier has once again achieved very strong results from its main operating division and we are proud to deliver exceptional results to shareholders.
For FY16, Premier Retail achieved sales of over $1 billion for the first time and a record underlying Earnings before Interest and Taxation (“EBIT”)1 of $133.3 million, up 26.1% on FY15. The underlying EBIT for FY16 is up 104% on the $65.3 million achieved in FY11, the year Premier Retail’s CEO, Mr. Mark McInnes, was appointed to our Group. In the five years following Mr. McInnes’ appointment, the market capitalisation of Premier has increased by $1.6 billion, from $0.9 billion to $2.5 billion, and Premier shareholders have received a total of approximately $313 million in fully franked dividends.
Premier Investments Limited Total Shareholder Return (“TSR”) against the ASX200 Index from 4 April 2011 to 30 July 2016
Over the past five years, Premier shareholders have enjoyed some of the best returns of any listed company in the ASX200. These results are all the more impressive when compared to other listed discretionary retailers (many of whom have generated negative returns) and the marked changes in the retail landscape. The Board believes that the strong financial returns enjoyed by shareholders stem, in large part, from the strategic appointment of high calibre key management personnel.
Our Board is diverse and offers a depth of experience in the retail, financial, distribution and logistics, accounting, legal, international transaction and public policy sectors. Premier also has the distinct advantage of Chairman Mr. Solomon Lew’s 50 years of experience in the retail industry, and his ongoing shareholding which aligns his interests to the betterment of shareholders. Mr. Lew has always declined to accept remuneration in respect of his hands on involvement in the successful steering of the business.
1 Refer to page 29 of the Remuneration Report for a definition and reconciliation of underlying EBIT.
For
per
sona
l use
onl
y

13 Premier Investments Limited
DIRECTORS’ REPORT (CONTINUED) REMUNERATION REPORT (CONTINUED)
13
Details of our Board’s background and expertise is set out in our annual report. We are committed to maintaining an engaged and high performing Board and will look to increase the diversity of our members with future appointments, including an increased presence of female Board members to align with our high numbers of female executives.
In terms of our broader business, Premier has a number of very strong executives who work closely with Mr. McInnes to deliver exceptional results. This includes female leaders in four of our seven brands, in internet and marketing and in human resources. Overall, we employ a total of 7,000 employees and actively support our large numbers of female employees (comprising over 90% of our total workforce) to progress through the business. Further detail regarding staff composition is set out in our annual report.
Premier operates in the highly competitive retail segment. We are continuing to invest in growing and consolidating our key domestic business, whilst simultaneously expanding our foot print of retail stores overseas. By the end of this year, Premier Retail is on target to successfully and profitably operate approximately 120 stores across Singapore, England, Scotland, Wales, Hong Kong and Malaysia, representing 12% of Premier’s total portfolio. We expect this international presence to continue to grow.
As a result of this global reach, Premier’s success is dependent on competing for an international pool of talent who can bring with them innovative and forward thinking business strategies.
Following consultation with external remuneration experts, Premier has developed its remuneration strategy to entice, incentivise and develop executives who can deliver long term sustainable growth for shareholders.
On 26 April 2016, Mr. McInnes re-committed himself to the business by entering into a new employment agreement. As Mr. McInnes has indicated that he is committed to remaining in Melbourne for the foreseeable future, Premier authorised Mr. McInnes to sell 800,000 of his shares in order to fund the purchase and construction of a home in Melbourne. The new agreement also contained the first increase to Mr. McInnes’ fixed remuneration since his appointment in 2011, which reflected the outstanding increase in Premier’s market capitalisation referred to above.
Notwithstanding Premier’s exceptional results, the Board is conscious of the debate around Mr. McInnes’ re-engagement. Premier listened to these concerns and sought expert advice from Egan Associates to review Mr. McInnes’ remuneration arrangements. The report, which compared 19 similar sized international retail businesses, concluded that Mr. McInnes’ remuneration was both reasonable and reflective of the strong performance of Premier under his direction. In reaching this conclusion, the report noted that Premier’s performance over the past five years was well in excess of the 75th percentile, and yet Mr. McInnes’ remuneration remained between the median and 75th percentile of the comparison group.
Consistent with this year’s expanded disclosure, our remuneration report provides significant detail around Mr. McInnes’ employment arrangements.
In September 2016, the Remuneration and Nomination Committee (“Committee”) was re-constituted by the appointment to the Committee of Mr. Timothy Antonie and Mr. Terrence McCartney. The appointments were made in order to ensure that the Committee consisted of a majority Independent Directors.
Premier is looking forward to the challenges and opportunities presented by the new financial year and is confident that its remuneration strategy ensures that we have the people in place to deliver significant outperformance.
I hope that you will find this report informative.
Henry Lanzer AM
Chairman, Remuneration and Nomination Committee
DIRECTORS’ REPORT (CONTINUED) REMUNERATION REPORT (AUDITED)
14
This remuneration report for the 53 weeks ended 30 July 2016 outlines the remuneration arrangement of the Group in accordance with the requirements of the Corporations Act 2001 (Cth), as amended (the “Act”) and its regulations. This information has been audited as required by section 308 (3C) of the Act.
The remuneration report is presented under the following headings:
1. Introduction
2. Remuneration Governance
3. Executive remuneration arrangements:-
A. Remuneration principles and strategy
B. Approach to setting remuneration
C. Fixed remuneration objectives
D. Detail of incentive plans
4. Executive remuneration outcomes (including link to performance)
5. Remuneration of CEO Premier Retail, Mr. McInnes
6. Executive service agreements
7. Non-Executive Director remuneration arrangements
8. Remuneration of Key Management Personnel
9. Additional disclosures relating to Rights and Shares
10. Additional disclosure relating to transactions and balances with Key Management Personnel
1. INTRODUCTION
The remuneration report details the remuneration arrangement for Key Management Personnel (“KMP”) who are defined as those persons having authority and responsibility for planning, directing and controlling the major activities of the Group, directly or indirectly, including any director (whether executive or otherwise) of the Group.
The table below outlines the Group’s KMP during the 53 weeks ended 30 July 2016. Unless otherwise indicated, the individuals were KMP for the entire financial year.
KEY MANAGEMENT PERSONNEL
(i) Non-Executive Directors
Mr. S. Lew Chairman and Non-Executive Director
Dr. D. Crean Deputy Chairman and Non-Executive Director
Mr. T. Antonie Non-Executive Director and Lead Independent Director
Mr. L.E. Fox Non-Executive Director
Ms. S. Herman Non-Executive Director
Mr. H.D. Lanzer Non-Executive Director
Mr. T.L. McCartney Non-Executive Director (appointed: 15 April 2016)
Mr. M.R.I. McLeod Non-Executive Director
Dr. G.H. Weiss Non-Executive Director
For
per
sona
l use
onl
y
Annual Report 2016 14
DIRECTORS’ REPORT (CONTINUED) REMUNERATION REPORT (AUDITED)
14
This remuneration report for the 53 weeks ended 30 July 2016 outlines the remuneration arrangement of the Group in accordance with the requirements of the Corporations Act 2001 (Cth), as amended (the “Act”) and its regulations. This information has been audited as required by section 308 (3C) of the Act.
The remuneration report is presented under the following headings:
1. Introduction
2. Remuneration Governance
3. Executive remuneration arrangements:-
A. Remuneration principles and strategy
B. Approach to setting remuneration
C. Fixed remuneration objectives
D. Detail of incentive plans
4. Executive remuneration outcomes (including link to performance)
5. Remuneration of CEO Premier Retail, Mr. McInnes
6. Executive service agreements
7. Non-Executive Director remuneration arrangements
8. Remuneration of Key Management Personnel
9. Additional disclosures relating to Rights and Shares
10. Additional disclosure relating to transactions and balances with Key Management Personnel
1. INTRODUCTION
The remuneration report details the remuneration arrangement for Key Management Personnel (“KMP”) who are defined as those persons having authority and responsibility for planning, directing and controlling the major activities of the Group, directly or indirectly, including any director (whether executive or otherwise) of the Group.
The table below outlines the Group’s KMP during the 53 weeks ended 30 July 2016. Unless otherwise indicated, the individuals were KMP for the entire financial year.
KEY MANAGEMENT PERSONNEL
(i) Non-Executive Directors
Mr. S. Lew Chairman and Non-Executive Director
Dr. D. Crean Deputy Chairman and Non-Executive Director
Mr. T. Antonie Non-Executive Director and Lead Independent Director
Mr. L.E. Fox Non-Executive Director
Ms. S. Herman Non-Executive Director
Mr. H.D. Lanzer Non-Executive Director
Mr. T.L. McCartney Non-Executive Director (appointed: 15 April 2016)
Mr. M.R.I. McLeod Non-Executive Director
Dr. G.H. Weiss Non-Executive Director
For
per
sona
l use
onl
y

15 Premier Investments Limited
DIRECTORS’ REPORT (CONTINUED) REMUNERATION REPORT (AUDITED) (CONTINUED)
15
1. INTRODUCTION (CONTINUED)
KEY MANAGEMENT PERSONNEL (CONTINUED)
(ii) Executive Director
Mr. M. McInnes Executive Director and Chief Executive Officer Premier Retail
(iii) Executives
Mr. K.F. Davis Company Secretary
Mr. A. Gardner Chief Financial Officer, Just Group Limited (ceased: 23 February 2016)
Ms. C. Garnsey Core Brand Director, Just Group Limited
Ms. N. Peck Chief Financial Officer, Just Group Limited
Ms. Peck was a KMP from 6 January 2016 to 23 June 2016. In accordance with an order of the Supreme Court of Victoria dated 3 June 2016, Just Group Limited is required to provide Ms. Peck with her usual remuneration until the current litigation involving Ms. Peck is resolved.
Other than as noted above, there were no changes to the KMP after the reporting date and before the date the financial report was authorised for issue.
2. REMUNERATION GOVERNANCE
Remuneration and Nomination Committee
The Remuneration and Nomination Committee (“Committee”) of the Board of Directors of the Group (“Board”) comprises three Non-Executive Directors. The Committee has delegated decision-making authority for some matters related to the remuneration arrangements for KMP and is required to make recommendations to the Board on other matters.
Specifically, the Board approves the remuneration arrangements of the Chief Executive Officer Premier Retail (“CEO Premier Retail”) and other executives, including awards made under the short term incentive (“STI”) and long term incentive (“LTI”) plans, following recommendations from the Committee. The Board also sets the aggregate remuneration for Non-Executive Directors (which is subject to shareholder approval) and Non-Executive Director fee levels. The Committee approves, having regard to recommendations made by the CEO Premier Retail, the level of the Group STI pool.
The Committee meets regularly. The CEO Premier Retail attends certain Committee meetings by invitation, where management input is required. The CEO Premier Retail is not present during discussions relating to his own remuneration arrangements.
Further information relating to the Committee’s role, responsibilities and membership can be seen at www.premierinvestments.com.au.
Use of remuneration advisors
The Committee seeks, from time to time, external remuneration advice to ensure it is fully informed when making remuneration decisions. Remuneration advisors are engaged by, and report directly to, the Committee.
During the 2016 financial year, the Committee approved the engagement of Ernst & Young to provide advice on the Group remuneration strategy, and Egan Associates to review Mr. McInnes’ remuneration arrangements. Both the external experts and the Committee are satisfied that the advice received from each of the external experts is free from undue influence from the KMP to whom the remuneration report applies.
The Ernst & Young report was provided to the Committee as an input into decision making only. The Committee considered the report findings, along with other factors, in making its remuneration strategy decisions.
For
per
sona
l use
onl
y
Annual Report 2016 16
DIRECTORS’ REPORT (CONTINUED) REMUNERATION REPORT (AUDITED) (CONTINUED)
16
2. REMUNERATION GOVERNANCE (CONTINUED)
Use of remuneration advisors (continued)
The fee paid to Ernst & Young for the remuneration report findings was $47,895 excluding GST. The fee paid to Egan Associates for the remuneration review was $21,000, excluding GST.
3. EXECUTIVE REMUNERATION ARRANGEMENTS
3A. Remuneration principles and strategy
The Group’s executive remuneration strategy is designed to attract, motivate and retain high performing individuals, and align the interests of executives with shareholders.
The Group operates mainly in the retail industry, with significant revenues earned in its traditional markets of Australia and New Zealand. The retail industry in these markets has seen marked structural change over recent years, including a prevalence in the use of new and existing technology, an increase in international competitors and significant changes in general consumer sentiment.
Complementing its strong market position in Australia and New Zealand, the Group is steadily increasing its revenues from international markets including Singapore, England, Scotland, Wales, Hong Kong and Malaysia. The Group is committed to growing its existing international presence whilst also exploring expansion into new geographies.
The market for skilled and experienced executives in the retail industry has become increasingly competitive and international in nature. The Group’s strong domestic position, as well as global reach, provides exposure to an international pool of talent and access to a diverse range of strategies to respond to industry changes.
Given these structural changes and the growth of the Group’s international business, the Board believes it is both critical to the future success of the business, and in the best interest of shareholders, to attract, retain and develop the best possible executive team through the provision of competitive remuneration packages.
The Group’s strategic objective is to be recognised as a leader in the retail industry and build long term value for shareholders. It seeks to do this by:
Growing Smiggle significantly;
Growing Peter Alexander significantly;
Expansion and growth of online businesses;
Gross margin expansion;
Rejuvenation of core apparel brands; and
Organisation-wide cost efficiency program.
The Group is committed to ensuring that executive remuneration outcomes are explicitly linked to the overall performance and success of the Group. This section, and in particular the diagram on the following page, illustrates this link between the Group’s strategic objective and its executive remuneration strategies.
For
per
sona
l use
onl
y

17 Premier Investments Limited
DIRECTORS’ REPORT (CONTINUED) REMUNERATION REPORT (AUDITED) (CONTINUED)
17
3. EXECUTIVE REMUNERATION ARRANGEMENTS (CONTINUED)
3A. Remuneration principles and strategy (continued)
Group Objective
To be recognised as a leader in our industry and build long-term value for our shareholders
Remuneration strategy linkages to Group objective Align the interests of executives with shareholders
The remuneration framework incorporates “at-risk” components, through STI and LTI plans.
Performance is assessed against a suite of financial and non-financial measures relevant to the success of the Group and generate returns for shareholders.
Attract, motivate and retain high performing individuals
Remuneration is competitive as compared to companies of a similar size and complexity.
Longer-term remuneration frameworks and “at-risk” components encourage retention, development and a multi-year performance focus.
Component Vehicle Purpose Link to performance
Fixed remuneration
Comprises base salary, superannuation contributions and other benefits
To provide competitive fixed remuneration with reference to the applicable role, market and relevant executive’s experience.
Both the executive’s performance, and the performance of the Group, are considered during regular remuneration reviews.
STI Awarded in cash
Rewards executives for their contribution to achievement of Group and business unit annual outputs and performance outcomes.
Key financial metrics based primarily on Premier Retail’s underlying earnings before interest and taxation (“EBIT”) of each business unit, as well as a suite of other internal financial and non-financial measures.
LTI Awarded in performance rights
Rewards executives for their contribution to the creation of shareholder value over the long term.
Vesting of performance rights is dependent on both a positive total shareholder return (“TSR”) for the Group and testing against the Comparison Peer Group (defined on page 20).
Discretionary Bonus
Awarded in cash or performance rights
Rewards executives in exceptional circumstances linked to long term shareholder outcomes.
Granted at the discretion of the Board upon recommendation of the Committee in exceptional circumstances, and when in the best interests of the Group.
No discretionary bonuses were made during the 2016 or 2015 financial years.
DIRECTORS’ REPORT (CONTINUED) REMUNERATION REPORT (AUDITED) (CONTINUED)
18
3. EXECUTIVE REMUNERATION ARRANGEMENTS (CONTINUED)
3B. Approach to setting remuneration
For the financial year ended 30 July 2016, the executive remuneration framework comprised of fixed remuneration, STI and LTI, as outlined below. Details of Mr. McInnes’ remuneration are provided in section 5 of this report.
The Group aims to reward executives with a competitive level and mix of remuneration appropriate to their position and responsibilities, and linked to shareholder value creation.
3C. Fixed remuneration objectives
Fixed remuneration is reviewed by the Committee. The process consists of a review of the Group, applicable business unit and executive’s individual performance, relevant comparative remuneration (both externally and internally) and, where appropriate, external advice. The Committee has access to external advice independent of management.
3D. Detail of incentive plans
Short term incentive (STI)
The Group operates an annual STI program which is awarded subject to the attainment of clearly defined financial and non-financial Group and business unit measures.
Who participates? Executives who have served a minimum of nine months. How is STI delivered? Cash. What is the STI opportunity?
Executives have a STI opportunity of between 0% and 100% of their fixed remuneration.
What are the applicable financial performance measures?
STI payments awarded to each executive are explicitly aligned to the key value drivers of Premier Retail, such that rewards will only be payable when the following criteria has been met:
budgeted EBIT of Premier Retail has been achieved and an incentive pool has been created;
the executive receives a performance appraisal on target or above; the executive’s minimum performance outcomes have been achieved
(hurdle); and the executive’s key performance indicators (“KPIs”) have been met
(qualifiers).
The financial performance measures are chosen with reference to the strategic objective to promote both short term success and provide a framework for delivering long term value.
The hurdle criteria are designed to ensure STI outcomes are aligned to the creation of shareholder value. If the hurdles are not met, the STI is not payable.
The qualifier criteria aligns the individual activities and focus of the executive to shareholder value. Each executive is set multiple KPIs covering financial, non-financial, Group and business unit measures of performance. The KPIs are quantifiable and weighted according to their value.
The budgeted EBIT for each year is expected to incorporate growth on the previous year. As such, in a year in which STI payments are made, executives must exceed the actual result in the prior year to achieve an STI in the following year. This mechanism ensures the STI scheme continues to build shareholder returns over time.
For
per
sona
l use
onl
y
Annual Report 2016 18
DIRECTORS’ REPORT (CONTINUED) REMUNERATION REPORT (AUDITED) (CONTINUED)
18
3. EXECUTIVE REMUNERATION ARRANGEMENTS (CONTINUED)
3B. Approach to setting remuneration
For the financial year ended 30 July 2016, the executive remuneration framework comprised of fixed remuneration, STI and LTI, as outlined below. Details of Mr. McInnes’ remuneration are provided in section 5 of this report.
The Group aims to reward executives with a competitive level and mix of remuneration appropriate to their position and responsibilities, and linked to shareholder value creation.
3C. Fixed remuneration objectives
Fixed remuneration is reviewed by the Committee. The process consists of a review of the Group, applicable business unit and executive’s individual performance, relevant comparative remuneration (both externally and internally) and, where appropriate, external advice. The Committee has access to external advice independent of management.
3D. Detail of incentive plans
Short term incentive (STI)
The Group operates an annual STI program which is awarded subject to the attainment of clearly defined financial and non-financial Group and business unit measures.
Who participates? Executives who have served a minimum of nine months. How is STI delivered? Cash. What is the STI opportunity?
Executives have a STI opportunity of between 0% and 100% of their fixed remuneration.
What are the applicable financial performance measures?
STI payments awarded to each executive are explicitly aligned to the key value drivers of Premier Retail, such that rewards will only be payable when the following criteria has been met:
budgeted EBIT of Premier Retail has been achieved and an incentive pool has been created;
the executive receives a performance appraisal on target or above; the executive’s minimum performance outcomes have been achieved
(hurdle); and the executive’s key performance indicators (“KPIs”) have been met
(qualifiers).
The financial performance measures are chosen with reference to the strategic objective to promote both short term success and provide a framework for delivering long term value.
The hurdle criteria are designed to ensure STI outcomes are aligned to the creation of shareholder value. If the hurdles are not met, the STI is not payable.
The qualifier criteria aligns the individual activities and focus of the executive to shareholder value. Each executive is set multiple KPIs covering financial, non-financial, Group and business unit measures of performance. The KPIs are quantifiable and weighted according to their value.
The budgeted EBIT for each year is expected to incorporate growth on the previous year. As such, in a year in which STI payments are made, executives must exceed the actual result in the prior year to achieve an STI in the following year. This mechanism ensures the STI scheme continues to build shareholder returns over time.
For
per
sona
l use
onl
y
19 Premier Investments Limited
DIRECTORS’ REPORT (CONTINUED) REMUNERATION REPORT (AUDITED) (CONTINUED)
19
3. EXECUTIVE REMUNERATION ARRANGEMENTS (CONTINUED)
3D. Detail of incentive plans (continued)
Short-term incentive (STI) (continued)
What are the applicable non-financial performance measures?
The award of an STI is also dependent on the executive achieving individual aligned non-financial performance measures, such as:
retention of existing customers through outstanding customer service;
implementation of key growth initiatives;
demonstrated focus on a continuous improvement in safety performance; and
demonstrated focus on the growth and development of leadership and team talent to encourage leadership succession.
How is performance assessed?
After the end of the financial year, following consideration of the financial and non-financial performance measures, the Committee obtains input from the CEO Premier Retail in relation to the amount of STI to be paid to eligible executives.
The Committee then provides its recommendations to the Just Group Board for approval. The provision of any STI payments is subject to the sole discretion of the Chairman.
Long-term incentive (LTI)
The Group’s LTI plan seeks to create shareholder value over the long term by aligning executive remuneration with the Group’s strategic objective.
Generally, LTI performance rights are granted annually and are eligible to vest three years from the date of the grant, with the exception of rights awarded to Mr. Mark McInnes and Ms. Colette Garnsey.
The performance rights issued to Ms. Colette Garnsey on 18 April 2013 were issued to replace vesting performance rights that she was entitled to in her previous employment. The performance rights issued to Ms. Garnsey are eligible to vest in three tranches on 20 June 2015, 20 June 2016 and 20 June 2017.
During the 2015 financial year, the Group engaged the services of Ernst & Young to report on the LTI plan as compared to the market. Ernst & Young’s review considered the number of participants, allocation methodology, award vehicle, performance and vesting period, performance measures (including the possibility of an absolute test based on earnings), Comparison Peer Group (see definition on page 20) for TSR testing and re-testing.
Following consideration of shareholder outcomes, the structure of Premier Investments Limited and market segment, the Committee concluded that the TSR testing mechanism is still considered most appropriate, however made the following changes to the LTI plan for 2015 onwards:
allocation to be done on face value; and
the removal of re-testing.
DIRECTORS’ REPORT (CONTINUED) REMUNERATION REPORT (AUDITED) (CONTINUED)
20
3. EXECUTIVE REMUNERATION ARRANGEMENTS (CONTINUED)
3D. Detail of incentive plans (continued)
Long-term incentive (LTI) (continued)
Who participates? Executives. How is LTI delivered? Performance rights.
What were the performance measures for the 2015 and 2016 financial year?
LTI rights awarded to each executive are subject to a two stage performance test - an absolute and relative test - based on the Group’s TSR. Broadly, TSR is the percentage growth achieved from an investment in ordinary shares over the relevant testing period (assuming all dividends are reinvested).
The two stage performance measure approach ensures that the LTI plan operates as a key driver for performance whilst also providing an incentive to executives.
The absolute test requires the Group to achieve a positive TSR over the testing period. If the TSR is negative over the testing period, then the performance rights lapse.
If the TSR is positive over the testing period, the relative test is undertaken, which compares the Group’s TSR with the S&P/ASX200 Industrials, excluding overseas and resource companies (“Comparison Peer Group”). The Comparison Peer Group was chosen to reflect the Group’s competitors for both capital and talent.
The Group’s performance against the Comparison Peer Group measure is determined according to its ranking against the Comparison Peer Group over the performance period. The vesting schedule is as follows:
Target Conversion ratio of rights to shares available to vest under the TSR
performance condition Below 50th percentile 0% 50th percentile 25% Between 50th and 62.5th percentile Pro Rata 62.5th percentile 50% Between 62.5th and 75th percentile Pro Rata 75th percentile and above 100%
The absolute test was introduced to ensure that shareholders and executives are aligned in the goal of absolute wealth creation. The relative test was introduced to provide alignment between comparative shareholder return and reward for executives.
The Group considers the suitability of the above performance conditions on an annual basis.
How is performance assessed?
TSR performance is calculated by an independent external adviser at the end of each performance period.
Section 9 of this report, titled “Additional disclosures relating to rights and shares”, provides details of performance rights granted, vested, exercised and lapsed during the year.
For
per
sona
l use
onl
y
Annual Report 2016 20
DIRECTORS’ REPORT (CONTINUED) REMUNERATION REPORT (AUDITED) (CONTINUED)
20
3. EXECUTIVE REMUNERATION ARRANGEMENTS (CONTINUED)
3D. Detail of incentive plans (continued)
Long-term incentive (LTI) (continued)
Who participates? Executives. How is LTI delivered? Performance rights.
What were the performance measures for the 2015 and 2016 financial year?
LTI rights awarded to each executive are subject to a two stage performance test - an absolute and relative test - based on the Group’s TSR. Broadly, TSR is the percentage growth achieved from an investment in ordinary shares over the relevant testing period (assuming all dividends are reinvested).
The two stage performance measure approach ensures that the LTI plan operates as a key driver for performance whilst also providing an incentive to executives.
The absolute test requires the Group to achieve a positive TSR over the testing period. If the TSR is negative over the testing period, then the performance rights lapse.
If the TSR is positive over the testing period, the relative test is undertaken, which compares the Group’s TSR with the S&P/ASX200 Industrials, excluding overseas and resource companies (“Comparison Peer Group”). The Comparison Peer Group was chosen to reflect the Group’s competitors for both capital and talent.
The Group’s performance against the Comparison Peer Group measure is determined according to its ranking against the Comparison Peer Group over the performance period. The vesting schedule is as follows:
Target Conversion ratio of rights to shares available to vest under the TSR
performance condition Below 50th percentile 0% 50th percentile 25% Between 50th and 62.5th percentile Pro Rata 62.5th percentile 50% Between 62.5th and 75th percentile Pro Rata 75th percentile and above 100%
The absolute test was introduced to ensure that shareholders and executives are aligned in the goal of absolute wealth creation. The relative test was introduced to provide alignment between comparative shareholder return and reward for executives.
The Group considers the suitability of the above performance conditions on an annual basis.
How is performance assessed?
TSR performance is calculated by an independent external adviser at the end of each performance period.
Section 9 of this report, titled “Additional disclosures relating to rights and shares”, provides details of performance rights granted, vested, exercised and lapsed during the year.
For
per
sona
l use
onl
y

21 Premier Investments Limited
DIRECTORS’ REPORT (CONTINUED) REMUNERATION REPORT (AUDITED) (CONTINUED)
21
3. EXECUTIVE REMUNERATION ARRANGEMENTS (CONTINUED)
3D. Detail of incentive plans (continued)
Long-term incentive (LTI) (continued)
When does the LTI vest?
Generally, the performance rights will vest over a period of three years subject to meeting performance measures. The testing period for Ms. Garnsey is detailed on page 19 of this report.
The performance rights issued in the 2015 and 2016 financial years have no opportunity to re-test. The rights issued prior to the 2015 financial year are re-tested a year later if the TSR when first tested was between the 40th and 50th percentile.
How are grants treated on termination?
Generally, all outstanding unvested rights are forfeited upon an executive resigning from the Group.
May participants enter into hedging arrangements?
Executives are prohibited from entering into transactions to hedge or limit the economic risk of the securities allocated to them under the LTI scheme, either before vesting or after vesting while the securities are held subject to restriction. Executives are only able to hedge securities that have vested but continue to be subject to a trading restriction and a seven-year lock, with the prior consent of the Board.
No employees have any hedging arrangements in place.
Are there restrictions on disposals?
Once rights have been allocated, disposal of performance shares is subject to restrictions whereby Board approval is required to sell shares granted within seven years under the LTI plan.
Do participants receive distributions or dividends on unvested LTI grants?
Participants do not receive distributions or dividends on unvested LTI grants.
DIRECTORS’ REPORT (CONTINUED) REMUNERATION REPORT (AUDITED) (CONTINUED)
22
4. EXECUTIVE REMUNERATION OUTCOMES (INCLUDING LINK TO PERFORMANCE)
Group performance and its link to STI
STI payment outcomes are primarily driven by Premier Retail’s underlying EBIT growth. The following chart shows Premier Retail’s underlying EBIT for the six years since the appointment of Mr. McInnes as CEO Premier Retail.
Premier Retail Underlying EBIT
Note: The term underlying EBIT is not an IFRS defined term. Please refer to page 29 for a reconciliation between underlying EBIT and statutory reported operating profit before tax for the Retail Segment.
Performance compared to STI payments made during the financial years ended 30 July 2016 and 25 July 2015
STI payments to Ms. Garnsey
During the 2016 financial year, an STI payment of $300,000 was paid to Ms. Garnsey in line with the hurdles and qualifiers relating to her STI plan. This included the achievement of Premier Retail underlying EBIT and the achievement of hurdles and qualifiers for specific brands for the 2015 financial year.
During the 2015 financial year, an STI payment of $300,000 was paid to Ms. Garnsey in line with the hurdles and qualifiers relating to her STI plan. This included the achievement of Premier Retail underlying EBIT and the achievement of hurdles and qualifiers for specific brands for the 2014 financial year.
For
per
sona
l use
onl
y
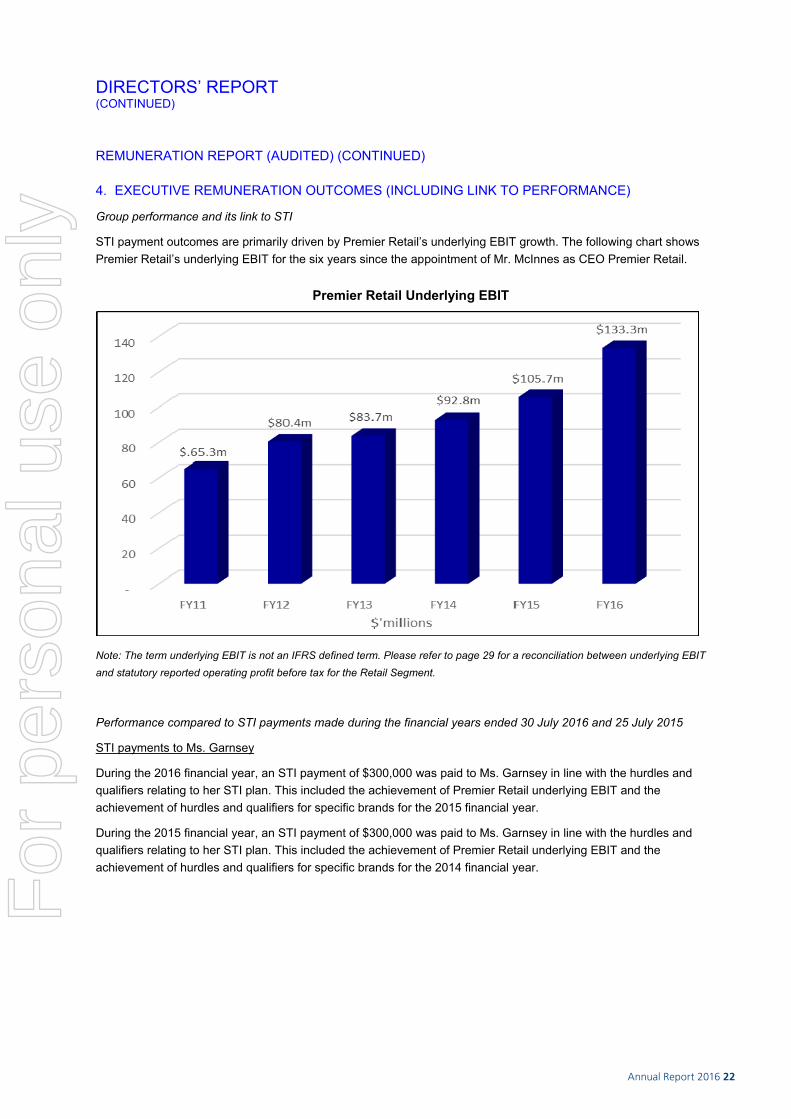
Annual Report 2016 22
DIRECTORS’ REPORT (CONTINUED) REMUNERATION REPORT (AUDITED) (CONTINUED)
22
4. EXECUTIVE REMUNERATION OUTCOMES (INCLUDING LINK TO PERFORMANCE)
Group performance and its link to STI
STI payment outcomes are primarily driven by Premier Retail’s underlying EBIT growth. The following chart shows Premier Retail’s underlying EBIT for the six years since the appointment of Mr. McInnes as CEO Premier Retail.
Premier Retail Underlying EBIT
Note: The term underlying EBIT is not an IFRS defined term. Please refer to page 29 for a reconciliation between underlying EBIT and statutory reported operating profit before tax for the Retail Segment.
Performance compared to STI payments made during the financial years ended 30 July 2016 and 25 July 2015
STI payments to Ms. Garnsey
During the 2016 financial year, an STI payment of $300,000 was paid to Ms. Garnsey in line with the hurdles and qualifiers relating to her STI plan. This included the achievement of Premier Retail underlying EBIT and the achievement of hurdles and qualifiers for specific brands for the 2015 financial year.
During the 2015 financial year, an STI payment of $300,000 was paid to Ms. Garnsey in line with the hurdles and qualifiers relating to her STI plan. This included the achievement of Premier Retail underlying EBIT and the achievement of hurdles and qualifiers for specific brands for the 2014 financial year.
For
per
sona
l use
onl
y

23 Premier Investments Limited
DIRECTORS’ REPORT (CONTINUED) REMUNERATION REPORT (AUDITED) (CONTINUED)
23
4. EXECUTIVE REMUNERATION OUTCOMES (INCLUDING LINK TO PERFORMANCE) (CONTINUED)
Group performance and its link to LTI
The performance measure which drives LTI vesting is dependent on an absolute test, being a positive Group TSR performance and a relative test, being a comparison against the Comparison Peer Group (see definition on page 20).
The table below illustrates the outcomes of the TSR testing performed during the 2015 and 2016 financial years in relation to KMP:
Testing Period
Share price at start of
testing period
Share price at end of testing period
Dividends
paid
TSR
percentage
TSR
percentile
Number of Performance
Rights tested for
KMP
24 Mar 2011 to 3 Apr 2014 $5.91 $9.84 $1.10 fully franked
95.3% 85th 600,000*
1 Oct 2011 to 30 Sept 2014 $5.20 $10.20 $1.12 fully franked
133.4% 85th 85,878
24 Mar 2011 to 3 Apr 2015 $5.91 $12.92 $1.50 fully franked
166.0% 89th 300,000*
19 Jun 2012 to 19 Jun 2015 $4.49 $13.29 $1.26 fully franked
241.8% 96th 80,000
1 Oct 2012 to 30 Sept 2015 $5.76 $12.85 $1.26 fully franked
155.3% 93rd 95,321
24 Mar 2011 to 3 Apr 2016 $5.91 $16.61 $2.01 fully franked
271.7% 95th 300,000*
19 Jun 2012 to 19 Jun 2016 $4.49 $14.69 $1.70 fully franked
287.2% 97th 80,000
* Relates to Mr. McInnes, refer to section 5 of this report.
The below chart shows the Premier share performance against the S&P/ASX200 Index, from 4 April 2011 to 30 July 2016:
Premier Investments Limited Total Shareholder Return (TSR) against the ASX200 Index from 4 April 2011 to 30 July 2016
For
per
sona
l use
onl
y

Annual Report 2016 24
DIRECTORS’ REPORT (CONTINUED) REMUNERATION REPORT (AUDITED) (CONTINUED)
23
4. EXECUTIVE REMUNERATION OUTCOMES (INCLUDING LINK TO PERFORMANCE) (CONTINUED)
Group performance and its link to LTI
The performance measure which drives LTI vesting is dependent on an absolute test, being a positive Group TSR performance and a relative test, being a comparison against the Comparison Peer Group (see definition on page 20).
The table below illustrates the outcomes of the TSR testing performed during the 2015 and 2016 financial years in relation to KMP:
Testing Period
Share price at start of
testing period
Share price at end of testing period
Dividends
paid
TSR
percentage
TSR
percentile
Number of Performance
Rights tested for
KMP
24 Mar 2011 to 3 Apr 2014 $5.91 $9.84 $1.10 fully franked
95.3% 85th 600,000*
1 Oct 2011 to 30 Sept 2014 $5.20 $10.20 $1.12 fully franked
133.4% 85th 85,878
24 Mar 2011 to 3 Apr 2015 $5.91 $12.92 $1.50 fully franked
166.0% 89th 300,000*
19 Jun 2012 to 19 Jun 2015 $4.49 $13.29 $1.26 fully franked
241.8% 96th 80,000
1 Oct 2012 to 30 Sept 2015 $5.76 $12.85 $1.26 fully franked
155.3% 93rd 95,321
24 Mar 2011 to 3 Apr 2016 $5.91 $16.61 $2.01 fully franked
271.7% 95th 300,000*
19 Jun 2012 to 19 Jun 2016 $4.49 $14.69 $1.70 fully franked
287.2% 97th 80,000
* Relates to Mr. McInnes, refer to section 5 of this report.
The below chart shows the Premier share performance against the S&P/ASX200 Index, from 4 April 2011 to 30 July 2016:
Premier Investments Limited Total Shareholder Return (TSR) against the ASX200 Index from 4 April 2011 to 30 July 2016
DIRECTORS’ REPORT (CONTINUED) REMUNERATION REPORT (AUDITED) (CONTINUED)
24
5. REMUNERATION OF CEO PREMIER RETAIL, MR. MCINNES
On 26 April 2016, Mr. McInnes re-committed himself to the Group by signing a new employment agreement.
Mr. McInnes’ fixed remuneration
Under Mr. McInnes’ new employment agreement, his annual fixed remuneration increased from $2,000,000 to $2,500,000, effective from the beginning of the 2016 financial year. This is Mr. McInnes’ first increase in fixed remuneration since joining the Group in 2011.
Mr McInnes’ notice period
Upon cessation of his employment, Mr. McInnes is entitled to 12 months’ notice (“Notice Period”) if he resigns, or is terminated by Premier for any reason other than for serious misconduct, or for conduct otherwise giving rise to an entitlement at law to summarily dismiss (“Terminated Without Cause”).
During the Notice Period, Premier may direct Mr. McInnes to continue in his role, perform no duties, reduced duties or alternative duties during the Notice Period, or elect to provide Mr. McInnes with payment in lieu of the Notice Period. The maximum amount of any payment in lieu of the Notice Period based on Mr. McInnes’ current fixed remuneration is $2,500,000 gross, less applicable tax.
If Mr. McInnes is terminated for serious misconduct or Premier is otherwise entitled at law to summarily dismiss Mr. McInnes (“Terminated for Cause”), Premier may terminate Mr. McInnes’ employment without providing a Notice Period.
Mr McInnes’ STI payments during the 2016 financial year
During the 2016 financial year, an STI payment of $2,000,000 was made to Mr. McInnes which primarily reflected the significant growth achieved in Premier Retail’s EBIT for the 2015 financial year.
The historical growth in Premier Retail’s underlying EBIT is detailed in the graph on page 22.
Mr McInnes’ STI arrangements under his new employment contract
Under his new employment agreement, Mr. McInnes is entitled to receive a STI if the applicable performance targets and conditions set out below are met.
Calculation of Mr. McInnes’ STI is based on growth of Premier Retail EBIT, as compared to the previous financial year (“Base Year”). The relevant performance targets and corresponding STI payment amounts are as follows:
EBIT growth less than 5% of Base Year No payment.
EBIT growth of 5% of Base Year $1,250,000.
EBIT growth between 5% and 10% of Base Year $1,250,000 plus a pro rata payment based on the % of the EBIT growth above 5%, up to a maximum of $2,500,000 for 10% EBIT growth.
EBIT growth of above 10% of Base Year If Mr. McInnes considers that any additional payment is warranted based on EBIT growth of above 10%, he may make a request for an additional payment to the Chairman of Premier. The Chairman may determine whether or not to make any such payment in his sole and absolute discretion within 30 days of receiving any such request.
The maximum payment that Mr. McInnes may receive under the current STI scheme is $2,500,000, unless the Chairman decides to make an additional payment in his absolute discretion to reward EBIT growth of above 10%.
For
per
sona
l use
onl
y
25 Premier Investments Limited
DIRECTORS’ REPORT (CONTINUED) REMUNERATION REPORT (AUDITED) (CONTINUED)
25
5. REMUNERATION OF CEO PREMIER RETAIL, MR. MCINNES (CONTINUED)
Mr McInnes’ STI arrangements under his new employment contract (continued)
The Chairman has absolute discretion to make an additional STI payment if Mr. McInnes would not otherwise be entitled to such a payment under the above table.
The amount that Mr. McInnes may receive under the STI scheme in connection with him ceasing employment (for reasons other than being Terminated for Cause) will depend on the financial year in which the Notice Period ends and will be calculated in accordance with the above table (on a pro rata basis for part of a financial year if the Notice Period ends part way through a financial year).
If Mr. McInnes resigns from his employment, or is Terminated Without Cause, he remains entitled to continue participating in the STI scheme until the end of the Notice Period.
This entitlement will not be impacted by any election by Premier to direct Mr. McInnes to continue in his role, to perform no duties, reduced duties or alternative duties during the Notice Period, or to provide Mr. McInnes with a payment in lieu of the Notice Period.
If Mr. McInnes’ employment is Terminated for Cause, he is not entitled to participate in the STI scheme for the financial year in which his employment ceases, or any following financial year.
Payment of an STI upon Mr. McInnes’ cessation of employment may be considered a termination benefit within the meaning of Part 2D.2 of the Act.
Mr McInnes’ LTI arrangements
Under Mr. McInnes’ new employment agreement, he became entitled to 1,000,000 performance rights split into four equal tranches. The performance rights were granted at no cost to Mr. McInnes and, conditional on the performance hurdles being met, the performance rights will be exercisable at no cost.
Shareholders approved the right of the Group to issue the 1,000,000 performance rights to Mr. McInnes at the 2015 Annual General Meeting of shareholders held on 27 November 2015. The rules pertaining to this grant were approved by shareholders at the Extraordinary General Meeting of shareholders held on 15 June 2016.
The performance rights granted will vest in four equal tranches subject to the achievement of both an absolute and relative TSR test. No value will be received by Mr. McInnes if the performance rights lapse prior to the vesting date.
Each tranche of performance rights will be tested against the TSR performance measure over different testing periods, as follows:
Tranche A – 4 April 2014 to 4 April 2017
Tranche B – 4 April 2014 to 4 April 2018
Tranche C – 4 April 2014 to 4 April 2019
Tranche D - 4 April 2014 to 4 April 2020
(each date being a “Vesting Date”).
The share price baseline for each tranche is $9.88, which was the volume weighted average share price (“VWAP”) of the ordinary shares on ASX for the five trading days prior to 4 April 2014. Premier’s TSR will be calculated based on the percentage growth achieved from the share price baseline of $9.88 to the share price on the relevant Vesting Date (calculated by the VWAP of the ordinary shares on ASX for the five trading days prior to the relevant Vesting Date).
The first stage absolute test requires that the TSR over the testing period is positive.
If the TSR is positive, the second stage relative test requires the TSR to be assessed against the relative performance of the Comparison Peer Group.
For
per
sona
l use
onl
y
Annual Report 2016 26
DIRECTORS’ REPORT (CONTINUED) REMUNERATION REPORT (AUDITED) (CONTINUED)
25
5. REMUNERATION OF CEO PREMIER RETAIL, MR. MCINNES (CONTINUED)
Mr McInnes’ STI arrangements under his new employment contract (continued)
The Chairman has absolute discretion to make an additional STI payment if Mr. McInnes would not otherwise be entitled to such a payment under the above table.
The amount that Mr. McInnes may receive under the STI scheme in connection with him ceasing employment (for reasons other than being Terminated for Cause) will depend on the financial year in which the Notice Period ends and will be calculated in accordance with the above table (on a pro rata basis for part of a financial year if the Notice Period ends part way through a financial year).
If Mr. McInnes resigns from his employment, or is Terminated Without Cause, he remains entitled to continue participating in the STI scheme until the end of the Notice Period.
This entitlement will not be impacted by any election by Premier to direct Mr. McInnes to continue in his role, to perform no duties, reduced duties or alternative duties during the Notice Period, or to provide Mr. McInnes with a payment in lieu of the Notice Period.
If Mr. McInnes’ employment is Terminated for Cause, he is not entitled to participate in the STI scheme for the financial year in which his employment ceases, or any following financial year.
Payment of an STI upon Mr. McInnes’ cessation of employment may be considered a termination benefit within the meaning of Part 2D.2 of the Act.
Mr McInnes’ LTI arrangements
Under Mr. McInnes’ new employment agreement, he became entitled to 1,000,000 performance rights split into four equal tranches. The performance rights were granted at no cost to Mr. McInnes and, conditional on the performance hurdles being met, the performance rights will be exercisable at no cost.
Shareholders approved the right of the Group to issue the 1,000,000 performance rights to Mr. McInnes at the 2015 Annual General Meeting of shareholders held on 27 November 2015. The rules pertaining to this grant were approved by shareholders at the Extraordinary General Meeting of shareholders held on 15 June 2016.
The performance rights granted will vest in four equal tranches subject to the achievement of both an absolute and relative TSR test. No value will be received by Mr. McInnes if the performance rights lapse prior to the vesting date.
Each tranche of performance rights will be tested against the TSR performance measure over different testing periods, as follows:
Tranche A – 4 April 2014 to 4 April 2017
Tranche B – 4 April 2014 to 4 April 2018
Tranche C – 4 April 2014 to 4 April 2019
Tranche D - 4 April 2014 to 4 April 2020
(each date being a “Vesting Date”).
The share price baseline for each tranche is $9.88, which was the volume weighted average share price (“VWAP”) of the ordinary shares on ASX for the five trading days prior to 4 April 2014. Premier’s TSR will be calculated based on the percentage growth achieved from the share price baseline of $9.88 to the share price on the relevant Vesting Date (calculated by the VWAP of the ordinary shares on ASX for the five trading days prior to the relevant Vesting Date).
The first stage absolute test requires that the TSR over the testing period is positive.
If the TSR is positive, the second stage relative test requires the TSR to be assessed against the relative performance of the Comparison Peer Group.
DIRECTORS’ REPORT (CONTINUED) REMUNERATION REPORT (AUDITED) (CONTINUED)
26
5. REMUNERATION OF CEO PREMIER RETAIL, MR. MCINNES (CONTINUED)
Mr McInnes’ LTI arrangements (continued)
The relative TSR performance targets and the corresponding vesting percentages are as follows:
Target Conversion ratio of performance rights to shares available to vest under the TSR performance condition:
Below the 50th percentile 0%
50th percentile 25%
Between 50th and 62.5th percentile Pro rata
62.5th percentile 50%
Between 62.5th and 75th percentile Pro rata
75th percentile and above 100%
Premier’s TSR and ranking within the Comparison Peer Group for each testing period will be assessed by an external independent advisor.
The performance rights under each tranche lapse if the applicable performance hurdles are not met (unless otherwise determined by the Board in its absolute discretion).
If in any year Mr. McInnes has satisfied all performance conditions, other than the TSR being positive, and would otherwise have been entitled to vesting of any performance rights, the Chairman may, in his sole and absolute discretion, elect to enable some or all of the applicable performance rights to vest if circumstances justify such an award.
If Mr. McInnes resigns, or is Terminated Without Cause (as defined on page 24), he will be entitled to continue to participate in the LTI plan until the end of his Notice Period, regardless of any election by Premier to direct Mr. McInnes to continue in his role, to perform no duties, reduced duties or alternative duties during the Notice Period, or to provide Mr. McInnes with a payment in lieu of the Notice Period.
If Mr. McInnes’ employment is Terminated for Cause (as defined on page 24), he is not entitled to participate in the LTI plan for the financial year in which his employment ceases, or any following financial year.
If Mr. McInnes resigns, or is Terminated Without Cause, and the final day of the Notice Period is within 14 days prior to a Vesting Date, Mr. McInnes remains entitled to have the performance rights tested against the TSR performance measure on the Vesting Date (“Special Vesting”).
The Special Vesting terms will be effective regardless of any election by Premier to direct Mr. McInnes to continue in his role, to perform no duties, reduced duties or alternative duties during the Notice Period, or to provide Mr. McInnes with a payment in lieu of the Notice Period.
Similar Special Vesting terms were contained in Mr. McInnes’ prior employment agreement in relation to the 2014 and 2015 Vesting Dates. Mr McInnes’ new employment agreement replicates this treatment in relation to each of the Vesting Dates.
Provision of an LTI upon Mr. McInnes’ cessation of employment may be considered a termination benefit within the meaning of Part 2D.2 of the Act.
For
per
sona
l use
onl
y

27 Premier Investments Limited
DIRECTORS’ REPORT (CONTINUED) REMUNERATION REPORT (AUDITED) (CONTINUED)
27
5. REMUNERATION OF CEO PREMIER RETAIL, MR. MCINNES (CONTINUED)
Mr McInnes’ post-employment restrictions
If Mr. McInnes resigns, or is Terminated Without Cause, Premier may elect to restrict Mr. McInnes from certain conduct in competition with Premier for a period of either 12 months or 24 months from the end of the Notice Period (“Post-employment Restrictions”).
If Premier elects to enforce the Post-employment Restrictions, it is required to provide Mr. McInnes with his total fixed remuneration during the relevant period (up to a maximum period of 24 months). If Premier elects to enforce the Post-employment Restrictions for 24 months, Mr. McInnes would receive a total of $5,000,000 gross, less applicable tax. If Premier elects to enforce the Post-employment Restrictions for 12 months, Mr. McInnes would receive a total of $2,500,000 gross, less applicable tax.
Premier’s ability to enforce the Post-employment Restrictions will not be impacted by any election by Premier to direct Mr. McInnes to continue in his role, perform no duties, reduced duties or alternative duties during the Notice Period, or to provide Mr. McInnes with a payment in lieu of the Notice Period.
If Mr. McInnes’ employment is Terminated for Cause, Premier may elect to enforce the Post-employment Restrictions from the date on which his employment is terminated (as no Notice Period will be provided).
The payments outlined above may be considered a termination benefit within the meaning of Part 2D.2 of the Act.
Termination benefits
The STI, LTI and Post-employment Restriction payments and benefits outlined above may be considered termination benefits within the meaning of Part 2D.2 of the Act.
At an Extraordinary General Meeting held on 15 June 2016, shareholders approved these potential termination benefits for the purposes of Part 2D.2 of the Act.
The performance rights issued to Mr McInnes on his appointment in April 2011
Mr. McInnes was issued 1,200,000 performance rights on his original appointment in April 2011. These performance rights were divided into 3 tranches and tested as follows:
April 2016 – A tranche of 300,000 performance rights were tested for the period 24 March 2011 to 3 April 2016. The TSR over this period was 271.7% placing Premier in the 95th percentile of the Comparison Peer Group. Details of this test are presented on page 23 of this report. The testing resulted in 100% of performance rights qualifying for vesting into 300,000 newly issued shares in April 2016.
April 2015 – A tranche of 300,000 performance rights were tested for the period 24 March 2011 to 3 April 2015. The TSR over this period was 166.0% placing Premier in the 89th percentile of the Comparison Peer Group. Details of this test are presented on page 23 of this report. The testing resulted in 100% of performance rights qualifying for vesting, however under Mr. McInnes’ employment agreement one third of this tranche was subject to an additional 12 month retention clause that was fulfilled in March 2016. Therefore, 200,000 of this tranche vested into 200,000 newly issued shares in April 2015 and 100,000 of this tranche vested into 100,000 newly issued shares in March 2016.
April 2014 - A tranche of 600,000 performance rights were tested for the period 24 March 2011 to 3 April 2014. The TSR over this period was 95.3% placing Premier in the 85th percentile of the Comparison Peer Group. The testing resulted in 100% of performance rights qualifying for vesting, however under Mr McInnes’ employment agreement one third of this tranche was subject to an additional 12 month retention clause that was fulfilled in March 2015. Therefore, 400,000 of this tranche vested into 400,000 newly issued shares in April 2014 and 200,000 of this tranche vested into 200,000 newly issued shares in March 2015.
For
per
sona
l use
onl
y
Annual Report 2016 28
DIRECTORS’ REPORT (CONTINUED) REMUNERATION REPORT (AUDITED) (CONTINUED)
27
5. REMUNERATION OF CEO PREMIER RETAIL, MR. MCINNES (CONTINUED)
Mr McInnes’ post-employment restrictions
If Mr. McInnes resigns, or is Terminated Without Cause, Premier may elect to restrict Mr. McInnes from certain conduct in competition with Premier for a period of either 12 months or 24 months from the end of the Notice Period (“Post-employment Restrictions”).
If Premier elects to enforce the Post-employment Restrictions, it is required to provide Mr. McInnes with his total fixed remuneration during the relevant period (up to a maximum period of 24 months). If Premier elects to enforce the Post-employment Restrictions for 24 months, Mr. McInnes would receive a total of $5,000,000 gross, less applicable tax. If Premier elects to enforce the Post-employment Restrictions for 12 months, Mr. McInnes would receive a total of $2,500,000 gross, less applicable tax.
Premier’s ability to enforce the Post-employment Restrictions will not be impacted by any election by Premier to direct Mr. McInnes to continue in his role, perform no duties, reduced duties or alternative duties during the Notice Period, or to provide Mr. McInnes with a payment in lieu of the Notice Period.
If Mr. McInnes’ employment is Terminated for Cause, Premier may elect to enforce the Post-employment Restrictions from the date on which his employment is terminated (as no Notice Period will be provided).
The payments outlined above may be considered a termination benefit within the meaning of Part 2D.2 of the Act.
Termination benefits
The STI, LTI and Post-employment Restriction payments and benefits outlined above may be considered termination benefits within the meaning of Part 2D.2 of the Act.
At an Extraordinary General Meeting held on 15 June 2016, shareholders approved these potential termination benefits for the purposes of Part 2D.2 of the Act.
The performance rights issued to Mr McInnes on his appointment in April 2011
Mr. McInnes was issued 1,200,000 performance rights on his original appointment in April 2011. These performance rights were divided into 3 tranches and tested as follows:
April 2016 – A tranche of 300,000 performance rights were tested for the period 24 March 2011 to 3 April 2016. The TSR over this period was 271.7% placing Premier in the 95th percentile of the Comparison Peer Group. Details of this test are presented on page 23 of this report. The testing resulted in 100% of performance rights qualifying for vesting into 300,000 newly issued shares in April 2016.
April 2015 – A tranche of 300,000 performance rights were tested for the period 24 March 2011 to 3 April 2015. The TSR over this period was 166.0% placing Premier in the 89th percentile of the Comparison Peer Group. Details of this test are presented on page 23 of this report. The testing resulted in 100% of performance rights qualifying for vesting, however under Mr. McInnes’ employment agreement one third of this tranche was subject to an additional 12 month retention clause that was fulfilled in March 2016. Therefore, 200,000 of this tranche vested into 200,000 newly issued shares in April 2015 and 100,000 of this tranche vested into 100,000 newly issued shares in March 2016.
April 2014 - A tranche of 600,000 performance rights were tested for the period 24 March 2011 to 3 April 2014. The TSR over this period was 95.3% placing Premier in the 85th percentile of the Comparison Peer Group. The testing resulted in 100% of performance rights qualifying for vesting, however under Mr McInnes’ employment agreement one third of this tranche was subject to an additional 12 month retention clause that was fulfilled in March 2015. Therefore, 400,000 of this tranche vested into 400,000 newly issued shares in April 2014 and 200,000 of this tranche vested into 200,000 newly issued shares in March 2015.
DIRECTORS’ REPORT (CONTINUED) REMUNERATION REPORT (AUDITED) (CONTINUED)
28
5. REMUNERATION OF CEO PREMIER RETAIL, MR. MCINNES (CONTINUED)
Mr McInnes’ STI payments during the 2015 financial year
During the 2015 financial year, two STI payments were made to Mr. McInnes. An STI payment of $1,100,000 was paid in relation to the growth achieved in Premier Retail EBIT for the 2013 financial year. Another STI payment of $2,000,000 was paid in relation to the growth achieved in Premier Retail EBIT for the 2014 financial year.
6. EXECUTIVE SERVICE AGREEMENTS
Remuneration and other terms of employment for KMP and other executives are formalised in written service agreements (with the exception of Mr. Davis, whose relevant terms of employment are set out below). Material provisions of the service agreements are set out below:
Termination benefits
Start date
Term of agreement
Review period
Notice period required from Premier
Premier initiated
Upon diminution of role
Notice period required from employee
Mr. McInnes
4 April 2011
Open Annual 12 months 12 months fixed rem. including notice
Nil 12 months fixed rem. including notice
Mr. Davis
17 Nov 1993
Open Annual 3 months Nil Nil 3 months
Mr. Gardner (ceased: 23 February 2016)
2 Jan 2007
Open Annual 12 months 12 months fixed rem. including notice
Nil 12 months
Ms. Peck
6 Jan 2016
Open Oct 2017
12 months 12 months fixed rem. Including notice
Nil 12 months
Ms. Garnsey
20 Sep 2012
Open Annual 12 months 12 months fixed rem. including notice
Nil 12 months
7. NON-EXECUTIVE DIRECTOR FEE ARRANGEMENTS
Determination of fees and maximum aggregate non-executive director remuneration
The Board seeks to set Non-Executive Director fees at a level which provides the Group with the ability to attract and retain Non-Executive Directors of the highest calibre, whilst incurring a cost which is acceptable to shareholders.
The Group’s constitution and the ASX listing rules specify that the Non-Executive Director maximum aggregate remuneration shall be determined from time to time by a general meeting. The most recent determination of this kind was at the 2008 Annual General Meeting held on 25 November 2008 when shareholders approved an aggregate remuneration of an amount not exceeding $1,000,000 per year.
For
per
sona
l use
onl
y

29 Premier Investments Limited
DIRECTORS’ REPORT (CONTINUED) REMUNERATION REPORT (AUDITED) (CONTINUED)
29
7. NON-EXECUTIVE DIRECTOR FEE ARRANGEMENTS (CONTINUED)
Determination of fees and maximum aggregate non-executive director remuneration (continued)
The Chairman of the Group, consistent with his past practice, has declined to accept any remuneration for his role as a director or for his role on any committees.
Fee policy
Non-Executive Director’s fees consist of base fees and committee fees. The payment of committee fees recognises the additional time commitment required by Non-Executive Directors who serve on Board committees.
Non-Executive Directors may be reimbursed for expenses reasonably incurred in attending to the Group’s affairs. Non-Executive Directors do not participate in any incentive programs. Premier has not established any schemes for retirement benefits for Non-Executive Directors (other than superannuation).
RECONCILIATION BETWEEN UNDERLYING PREMIER RETAIL EBIT AND REPORTED RETAIL SEGMENT RESULT
IFRS financial information is financial information that is presented in accordance with all relevant accounting standards. Non-IFRS information is financial information that is presented other than in accordance with all relevant accounting standards.
STI payments are paid based on Non-IFRS financial information. The table below reconciles the Non-IFRS financial term Premier Retail underlying EBIT to the Reported Retail Segment Result for each of the financial years:
2011 $’000
2012 $’000
2013 $’000
2014 $’000
2015 $’000
2016 $’000
Reported Retail Segment Operating Profit before Taxation 39,796 69,988 76,686 79,299 98,958
126,207
Add back: Interest expense 9,614 10,194 6,988 6,311 5,738 4,912
EBIT 49,410 80,182 83,674 85,610 104,696 131,119 Adjusted for:
Inter-segment adjustments 74 192 30 (482) (673) (167) One-off costs related to strategic review 15,771 - - - - - One-off Smiggle UK market entry expense - - - 3,193 - - One-off supply chain transformation expense - - - 4,482 - - One-off exit of South African Joint Venture - - - - 1,724 - One-off litigation expense - - - - - 2,345
Underlying Premier Retail EBIT 65,255 80,374 83,704 92,803 105,747 133,297 Underlying Premier Retail EBIT, expressed in $’ millions 65.3 80.4 83.7 92.8 105.7 133.3
For
per
sona
l use
onl
y

Annual Report 2016 30
DIR
ECTO
RS’
REP
OR
T (C
ON
TIN
UED
) R
EMU
NER
ATIO
N R
EPO
RT
(AU
DIT
ED) (
CO
NTI
NU
ED)
30
8. R
EMU
NER
ATIO
N O
F KE
Y M
ANAG
EMEN
T PE
RSO
NN
EL
Det
ails
of t
he n
atur
e an
d am
ount
of e
ach
elem
ent o
f com
pens
atio
n fo
r ser
vice
s fo
r key
man
agem
ent p
erso
nnel
of t
he G
roup
pai
d in
the
finan
cial
yea
r are
as
follo
ws:
Shor
t ter
m
Post
-em
ploy
men
t Sh
are
base
d
2016
Sala
ry/F
ee
C
ash
Non
-Mon
etar
y Be
nefit
s
Supe
rann
uatio
n O
ther
Pos
t-em
ploy
men
t Lo
ng-te
rm
ince
ntiv
es
To
tal
Perfo
rman
ce
rela
ted
$
$ $
$ $
$ $
%
Non
-exe
cutiv
e D
irect
ors
Mr.
S. L
ew
- -
- -
- -
- -
Mr.
T. A
nton
ie
114,
795
- -
5,20
5 -
- 12
0,00
0 -
Dr.
D. C
rean
14
6,11
9 -
- 13
,881
-
- 16
0,00
0 -
Mr.
L. E
. Fox
73
,059
-
- 6,
941
- -
80,0
00
- M
s. S
Her
man
91
,325
-
- 8,
675
- -
100,
000
- M
r. H
. D. L
anze
r1 80
,000
-
- -
- -
80,0
00
- M
r. T.
L. M
cCar
tney
11
3,33
3 -
- -
- -
113,
333
- M
r. M
. R. I
. McL
eod
91,3
24
- -
28,6
76
- -
120,
000
- D
r. G
. H. W
eiss
73
,059
-
- 6,
941
- -
80,0
00
- To
tal n
on-e
xecu
tive
Dire
ctor
s 78
3,01
4 -
- 70
,319
-
- 85
3,33
3
Exec
utiv
es
Mr.
M. M
cInn
es
2,47
0,00
0 2,
000,
0002
166,
136
30,0
00
- 1,
578,
708
6,24
4,84
4 57
.31
Mr.
K. F
. Dav
is
431,
216
- -
19,3
08
- -
450,
524
- M
r. A.
Gar
dner
3 40
3,23
3 -
29,5
14
14,5
60
100,
000
- 54
7,30
7 -
Ms.
C. G
arns
ey
964,
480
300,
0002
230,
257
35,5
45
- 71
,412
1,
601,
694
23.1
9 M
s. N
. Pec
k 23
7,16
2 50
,000
4 -
10,6
58
- -
297,
820
- To
tal e
xecu
tives
4,
506,
091
2,35
0,00
0 42
5,90
7 11
0,07
1 10
0,00
0 1 ,
650,
120
9,14
2,18
9
TOTA
L 20
16
5,28
9,10
5 2,
350,
000
425,
907
180,
390
100,
000
1,65
0,12
0 9,
995,
522
1 Mr.
Lanz
er’s
dire
ctor
’s fe
es w
ere
paid
to A
rnol
d Bl
och
Leib
ler
2 Ref
er to
pag
e 24
for f
urth
er in
form
atio
n re
latin
g to
the
STI p
aym
ent f
or M
r. M
cInn
es, a
nd to
pag
e 22
for i
nfor
mat
ion
rela
ting
to th
e ST
I pay
men
t for
Ms.
Gar
nsey
.
3 Mr.
Gar
dner
’s s
alar
y in
clud
es a
n am
ount
of $
104,
486
whi
ch re
pres
ents
acc
rued
unt
aken
leav
e en
title
men
ts o
n ce
ssat
ion.
On
cess
atio
n of
em
ploy
men
t, M
r. G
ardn
er w
as p
aid
$100
,000
in c
onsi
dera
tion
for c
erta
in
post
-em
ploy
men
t res
train
ts n
ot c
onta
ined
in h
is o
rigin
al c
ontra
ct.
4 M
s. P
eck
rece
ived
a $
50,0
00 s
ign-
on b
onus
on
com
men
cem
ent o
f em
ploy
men
t.
For
per
sona
l use
onl
y

31 Premier Investments Limited
DIR
ECTO
RS’
REP
OR
T (C
ON
TIN
UED
) R
EMU
NER
ATIO
N R
EPO
RT
(AU
DIT
ED) (
CO
NTI
NU
ED)
31
8. R
EMU
NER
ATIO
N O
F KE
Y M
ANAG
EMEN
T PE
RSO
NN
EL (C
ON
TIN
UED
)
Sh
ort t
erm
Po
st-e
mpl
oym
ent
Shar
e ba
sed
20
15
Sa
lary
/Fee
Cas
h N
on-M
onet
ary
Bene
fits
Su
pera
nnua
tion
Oth
er P
ost-
empl
oym
ent
Long
-term
in
cent
ives
Tota
l Pe
rform
ance
re
late
d
$ $
$ $
$ $
$ %
N
on-e
xecu
tive
Dire
ctor
s
M
r. S.
Lew
-
- -
- -
- -
- M
r. F.
W. J
ones
10
9,58
9 -
- 10
,411
-
- 12
0,00
0 -
Mr.
T. A
nton
ie
104,
795
- -
5,20
5 -
- 11
0,00
0 -
Dr.
D. C
rean
10
9,58
9 -
- 10
,411
-
- 12
0,00
0 -
Mr.
L. E
. Fox
73
,059
-
- 6,
941
- -
80,0
00
- M
s. S
Her
man
86
,758
-
- 8,
242
- -
95,0
00
- M
r. H
. D. L
anze
r1 80
,000
-
- -
- -
80,0
00
- M
r. M
. R. I
. McL
eod
88,0
89
- -
31,9
11
- -
120,
000
- D
r. G
. H. W
eiss
73
,059
-
- 6,
941
- -
80,0
00
- To
tal n
on-e
xecu
tive
Dire
ctor
s 72
4,93
8 -
- 80
,062
-
- 80
5,00
0
Exec
utiv
es
Mr.
M. M
cInn
es
1,97
0,00
0 3,
100,
0002
- 30
,000
-
314,
850
5,41
4,85
0 63
.06
Mr.
K. F
. Dav
is
421,
217
- -
18,7
83
- -
440,
000
- M
r. A.
Gar
dner
47
8,07
9 -
48,0
13
25,2
11
- 81
,069
63
2,37
2 12
.82
Ms.
C. G
arns
ey
898,
294
300,
0003
148,
339
35,0
39
- 13
4,30
1 1,
515,
973
28.6
5 To
tal e
xecu
tives
3,
767,
590
3,40
0,00
0 19
6,35
2 10
9,03
3 -
530,
220
8,00
3,19
5
TOTA
L 20
15
4,49
2,52
8 3,
400,
000
196,
352
189,
095
- 53
0,22
0 8,
808,
195
1 Mr.
Lanz
er’s
dire
ctor
’s fe
es w
ere
paid
to A
rnol
d Bl
och
Leib
ler
2 Ref
er to
pag
e 28
for f
urth
er in
form
atio
n re
latin
g to
the
STI p
aym
ents
for M
r. M
cInn
es
3 Ref
er to
pag
e 22
for f
urth
er in
form
atio
n re
latin
g to
the
STI p
aym
ent f
or M
s. G
arns
ey
For
per
sona
l use
onl
y

Annual Report 2016 32
DIR
ECTO
RS’
REP
OR
T (C
ON
TIN
UED
) R
EMU
NER
ATIO
N R
EPO
RT
(AU
DIT
ED) (
CO
NTI
NU
ED)
32
9. A
DD
ITIO
NAL
DIS
CLO
SUR
ES R
ELA T
ING
TO
RIG
HTS
AN
D S
HAR
ES
a)
R
ight
s aw
arde
d, v
este
d an
d la
psed
dur
ing
the
year
The
tabl
e be
low
dis
clos
es th
e nu
mbe
r of s
hare
righ
ts g
rant
ed to
key
man
agem
ent p
erso
nnel
as
rem
uner
atio
n fo
r the
fina
ncia
l yea
r end
ed 3
0 Ju
ly 2
016,
as
wel
l as
the
num
ber o
f rig
hts
vest
ed a
nd la
psed
dur
ing
the
year
:
Term
s an
d co
nditi
ons
R
ight
s ve
sted
and
laps
ed
durin
g th
e ye
ar
2016
Ye
ar
gran
ted
Rig
hts
awar
ded
durin
g th
e ye
ar
No.
G
rant
dat
e
Fa
ir va
lue
per r
ight
at
gran
t dat
e $
Ex
piry
dat
e
Fi
rst e
xerc
ise
date
Last
exe
rcis
e da
te
Rig
hts
vest
ed
durin
g th
e ye
ar
No.
Rig
hts
laps
ed
durin
g th
e ye
ar
No.
Key
man
agem
ent
pers
onne
l
Mr.
M. M
cInn
es
2016
1,
000,
000
26-A
pr-2
016
9.96
04
-Apr
-202
0 04
-Apr
-201
7 -
- -
20
11
- 10
-May
-201
1 -
- 04
-Apr
-201
4 -
400,
000
- M
r. A.
Gar
dner
20
13
- 12
-Apr
-201
3 -
- 1-
Oct
-201
5 -
95,3
21
- M
s. C
. Gar
nsey
20
13
- 18
-Apr
-201
3 -
- 20
-Jun
-201
5 -
80,0
00
-
For
per
sona
l use
onl
y
33 Premier Investments Limited
DIRECTORS’ REPORT (CONTINUED) REMUNERATION REPORT (AUDITED) (CONTINUED)
33
9. ADDITIONAL DISCLOSURES RELATING TO RIGHTS AND SHARES (CONTINUED)
b) Value of rights awarded, exercised and lapsed during the year
2016
Value of rights granted during the
year $
Value of rights exercised during the
year $
Value of rights lapsed during the
year $
Remuneration consisting of rights
for the year %
Key management personnel
Mr. M. McInnes 9,960,000 6,182,000 - 25.28 Mr. A. Gardner - 1,256,331 - - Ms. C. Garnsey - 1,120,000 - 4.46
There were no alterations to the terms and conditions of rights awarded as remuneration since their award date.
c) Shares issued on exercise of rights
2016
Shares issued No
Paid per share $
Unpaid per share $
Key management personnel
Mr. M. McInnes 400,000 - -
Mr. A. Gardner 95,321 - - Ms. C. Garnsey 80,000 - -
There were no alterations to the terms and conditions of rights awarded as remuneration since their award date.
For
per
sona
l use
onl
y
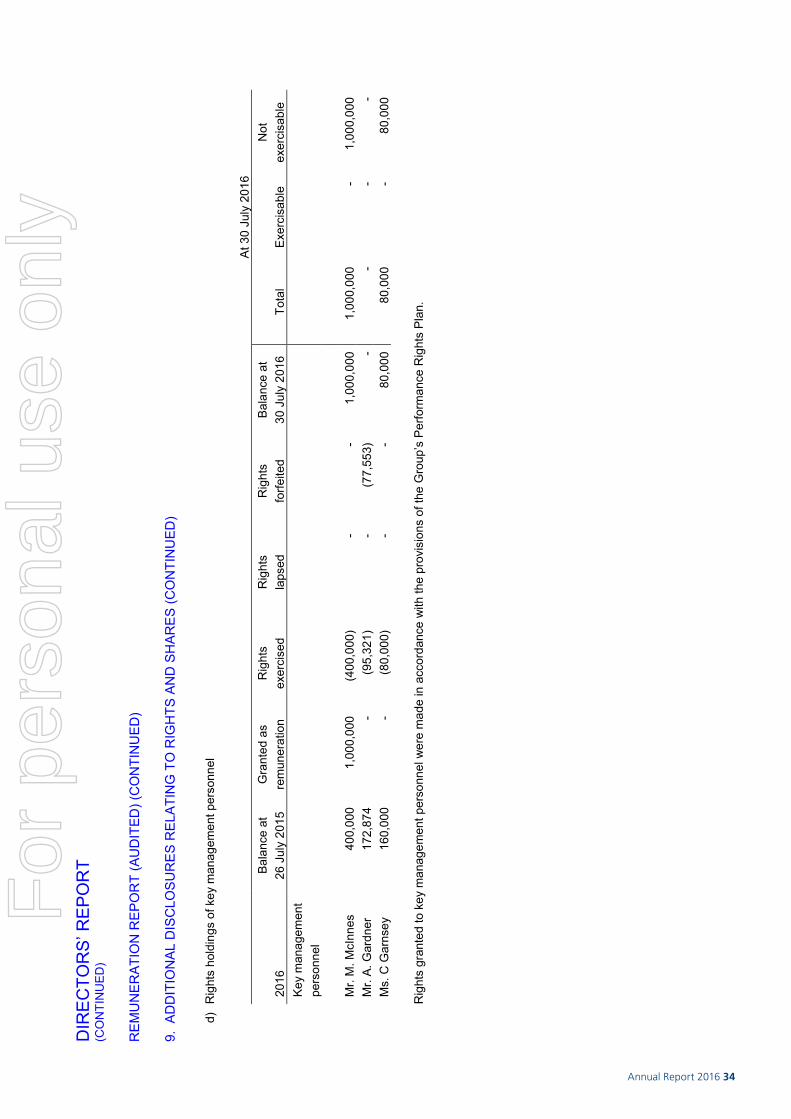
Annual Report 2016 34
DIR
ECTO
RS’
REP
OR
T (C
ON
TIN
UED
) R
EMU
NER
ATIO
N R
EPO
RT
(AU
DIT
ED) (
CO
NTI
NU
ED)
34
9. A
DD
ITIO
NAL
DIS
CLO
SUR
ES R
ELAT
I NG
TO
RIG
HTS
AN
D S
HAR
ES (C
ON
TIN
UED
)
d)
Rig
hts
hold
ings
of k
ey m
anag
emen
t per
sonn
el
At 3
0 Ju
ly 2
016
2016
Ba
lanc
e at
26
Jul
y 20
15
Gra
nted
as
rem
uner
atio
n R
ight
s ex
erci
sed
Rig
hts
la
psed
R
ight
s
forfe
ited
Bala
nce
at
30 J
uly
2016
Tota
l
Exer
cisa
ble
Not
ex
erci
sabl
e Ke
y m
anag
emen
t pe
rson
nel
Mr.
M. M
cInn
es
400,
000
1,00
0,00
0 (4
00,0
00)
- -
1,00
0,00
0 1,
000,
000
- 1,
000,
000
Mr.
A. G
ardn
er
172,
874
- (9
5,32
1)
- (7
7,55
3)
- -
- -
Ms.
C G
arns
ey
160,
000
- (8
0,00
0)
- -
80,0
00
80,0
00
- 80
,000
Rig
hts
gran
ted
to k
ey m
anag
emen
t per
sonn
el w
ere
mad
e in
acc
orda
nce
with
the
prov
isio
ns o
f the
Gro
up’s
Per
form
ance
Rig
hts
Plan
.
For
per
sona
l use
onl
y

35 Premier Investments Limited
DIRECTORS’ REPORT (CONTINUED) REMUNERATION REPORT (AUDITED) (CONTINUED)
35
9. ADDITIONAL DISCLOSURES RELATING TO RIGHTS AND SHARES (CONTINUED)
e) Number of Shares held in Premier Investments Limited
2016
BALANCE 26 JULY 2015
ORDINARY
SHARE PURCHASE ORDINARY
SHARES ACQUIRED
UNDER PERFORMANCE
RIGHTS PLAN ORDINARY
NET CHANGE - OTHER
ORDINARY
BALANCE 30 JULY 2016
ORDINARY
NON-EXECUTIVE DIRECTORS
Mr. S. Lew * 4,437,699 - - - 4,437,699 Mr. T. Antonie - - - - - Dr. D.M. Crean - - - - - Mr. L.E. Fox 2,577,014 - - - 2,577,014 Ms. S. Herman 8,000 - - - 8,000 Mr. H.D. Lanzer 27,665 - - - 27,665 Mr. T.L. McCartney - - - - - Mr. M.R.I. McLeod 28,186 - - - 28,186 Dr. G.H. Weiss 6,000 - - - 6,000 EXECUTIVES Mr. M. McInnes 400,000 - 400,000 (800,000) - Mr. K.F. Davis - - - - - Mr. A. Gardner ** 113,266 - 95,321 (208,587) - Ms. C. Garnsey 80,000 - 80,000 (40,000) 120,000 TOTAL 7,677,830 - 575,321 (1,048,587) 7,204,564
* Mr. Lew is an associate of Century Plaza Investments Pty. Ltd. and Metrepark Pty. Ltd (Associated Entities). The Associated Entities, collectively, have a relevant interest in 59,804,731 (2015: 59,804,731) shares in the company. However, Mr. Lew does not have a relevant interest in the shares in the company held by the Associated Entities.
** Mr. Gardner ceased being a KMP effective 23 February 2016.
10. ADDITIONAL DISCLOSURES RELATING TO TRANSACTIONS AND BALANCES WITH KEY MANAGEMENT PERSONNEL
a) Details and terms and conditions of other transactions and balances with key management personnel and their related parties
Mr. Lanzer is a partner of the legal firm Arnold Bloch Leibler. Group companies use the services of Arnold Bloch Leibler from time to time. Legal services totalling $1,905,871 (2015: $1,250,763), including Mr. Lanzer's Directors fees, GST and disbursements were invoiced by Arnold Bloch Leibler to the consolidated group, with $769,000 (2015: $101,748) remaining outstanding at year-end. The fees paid for these services were all at arm's length and on normal commercial terms.
For
per
sona
l use
onl
y

Annual Report 2016 36
DIRECTORS’ REPORT (CONTINUED) REMUNERATION REPORT (AUDITED) (CONTINUED)
35
9. ADDITIONAL DISCLOSURES RELATING TO RIGHTS AND SHARES (CONTINUED)
e) Number of Shares held in Premier Investments Limited
2016
BALANCE 26 JULY 2015
ORDINARY
SHARE PURCHASE ORDINARY
SHARES ACQUIRED
UNDER PERFORMANCE
RIGHTS PLAN ORDINARY
NET CHANGE - OTHER
ORDINARY
BALANCE 30 JULY 2016
ORDINARY
NON-EXECUTIVE DIRECTORS
Mr. S. Lew * 4,437,699 - - - 4,437,699 Mr. T. Antonie - - - - - Dr. D.M. Crean - - - - - Mr. L.E. Fox 2,577,014 - - - 2,577,014 Ms. S. Herman 8,000 - - - 8,000 Mr. H.D. Lanzer 27,665 - - - 27,665 Mr. T.L. McCartney - - - - - Mr. M.R.I. McLeod 28,186 - - - 28,186 Dr. G.H. Weiss 6,000 - - - 6,000 EXECUTIVES Mr. M. McInnes 400,000 - 400,000 (800,000) - Mr. K.F. Davis - - - - - Mr. A. Gardner ** 113,266 - 95,321 (208,587) - Ms. C. Garnsey 80,000 - 80,000 (40,000) 120,000 TOTAL 7,677,830 - 575,321 (1,048,587) 7,204,564
* Mr. Lew is an associate of Century Plaza Investments Pty. Ltd. and Metrepark Pty. Ltd (Associated Entities). The Associated Entities, collectively, have a relevant interest in 59,804,731 (2015: 59,804,731) shares in the company. However, Mr. Lew does not have a relevant interest in the shares in the company held by the Associated Entities.
** Mr. Gardner ceased being a KMP effective 23 February 2016.
10. ADDITIONAL DISCLOSURES RELATING TO TRANSACTIONS AND BALANCES WITH KEY MANAGEMENT PERSONNEL
a) Details and terms and conditions of other transactions and balances with key management personnel and their related parties
Mr. Lanzer is a partner of the legal firm Arnold Bloch Leibler. Group companies use the services of Arnold Bloch Leibler from time to time. Legal services totalling $1,905,871 (2015: $1,250,763), including Mr. Lanzer's Directors fees, GST and disbursements were invoiced by Arnold Bloch Leibler to the consolidated group, with $769,000 (2015: $101,748) remaining outstanding at year-end. The fees paid for these services were all at arm's length and on normal commercial terms.
DIRECTORS’ REPORT (CONTINUED) REMUNERATION REPORT (AUDITED) (CONTINUED)
36
10. ADDITIONAL DISCLOSURES RELATING TO TRANSACTIONS AND BALANCES WITH KEY MANAGEMENT PERSONNEL (CONTINUED)
a) Details and terms and conditions of other transactions and balances with key management personnel and their related parties (continued)
Mr. Lanzer is a director of Loch Awe Pty Ltd. During the year operating lease payments totalling $351,998 (2015: $393,774) including GST was paid to Loch Awe Pty Ltd. The payments were at arm’s length and on normal commercial terms.
Mr. Lew is a director of Voyager Distributing Company Pty Ltd and family companies associated with Mr. Lew have a controlling interest in Playcorp Pty Ltd and Sky Chain Trading Limited. During the year, purchases totalling $18,648,378 (2015: $18,831,141) including GST have been made by Group companies from Voyager Distributing Co. Pty Ltd, Playcorp Pty Ltd and Sky Chain Trading Limited, with $969,084 (2015: $1,232,020) remaining outstanding at year-end. The purchases were all at arm’s length and on normal commercial terms.
Mr. Lew is a director of Century Plaza Trading Pty. Ltd. The company and Century Plaza Trading Pty Ltd are parties to a Services Agreement to which Century Plaza Trading agrees to provide certain services to the company to the extent required and requested by the company. The company is required to reimburse Century Plaza Trading for costs it incurs in providing the company with the services under the Service Agreement. The company reimbursed a total of $382,123 (2015: $391,480) costs including GST incurred by Century Plaza Trading Pty Ltd.
Amounts recognised in the financial report at the reporting date in relation to other transactions:
i) Amounts included within Assets and Liabilities
2016$’000
Current Liabilities
Trade and other payables 1,738
1,738
ii) Amounts included within Profit or Loss
2016$’000
Expenses
Purchases/ Cost of goods sold 17,128
Operating lease rental expense 320
Legal fees 1,749
Other expenses 382
Total expenses 19,579
For
per
sona
l use
onl
y

37 Premier Investments Limited
DIRECTORS’ REPORT (CONTINUED)
37
AUDITOR INDEPENDENCE A copy of the Auditor’s Independence Declaration in relation to the audit for the financial year is provided on page 38 of this report. Signed in accordance with a resolution of the Board of Directors.
Solomon Lew Chairman 5 October 2016
8 Exhibition Street Melbourne VIC 3000 Australia GPO Box 67 Melbourne VIC 3001
Tel: +61 3 9288 8000 Fax: +61 3 8650 7777 ey.com/au
Auditor’s Independence Declaration to the Directors of Premier Investments Limited As lead auditor for the audit of Premier Investments Limited for the financial year ended 30 July 2016, I declare to the best of my knowledge and belief, there have been:
a) no contraventions of the auditor independence requirements of the Corporations Act 2001 in relation to the review; and
b) no contraventions of any applicable code of professional conduct in relation to the review. This declaration is in respect of Premier Investments Limited and the entities it controlled during the financial period.
Ernst & Young
Rob Perry Partner 5 October 2016
For
per
sona
l use
onl
y
Annual Report 2016 38
DIRECTORS’ REPORT (CONTINUED)
37
AUDITOR INDEPENDENCE A copy of the Auditor’s Independence Declaration in relation to the audit for the financial year is provided on page 38 of this report. Signed in accordance with a resolution of the Board of Directors.
Solomon Lew Chairman 5 October 2016
8 Exhibition Street Melbourne VIC 3000 Australia GPO Box 67 Melbourne VIC 3001
Tel: +61 3 9288 8000 Fax: +61 3 8650 7777 ey.com/au
Auditor’s Independence Declaration to the Directors of Premier Investments Limited As lead auditor for the audit of Premier Investments Limited for the financial year ended 30 July 2016, I declare to the best of my knowledge and belief, there have been:
a) no contraventions of the auditor independence requirements of the Corporations Act 2001 in relation to the review; and
b) no contraventions of any applicable code of professional conduct in relation to the review. This declaration is in respect of Premier Investments Limited and the entities it controlled during the financial period.
Ernst & Young
Rob Perry Partner 5 October 2016
A member firm of Ernst & Young Global Limited Liability limited by a scheme approved under Professional Standards Legislation
8 Exhibition Street Melbourne VIC 3000 Australia GPO Box 67 Melbourne VIC 3001
Tel: +61 3 9288 8000 Fax: +61 3 8650 7777 ey.com/au
Independent auditor's report to the members of Premier Investments Limited
Report on the financial report
We have audited the accompanying financial report of Premier Investments Limited, which comprises the consolidated statement of financial position as at 30 July 2016, the consolidated statement of comprehensive income, the consolidated statement of changes in equity and the consolidated statement of cash flows for the financial year then ended, notes comprising a summary of significant accounting policies and other explanatory information, and the directors' declaration of the consolidated entity comprising the company and the entities it controlled for the financial year ended or from time to time during the financial year.
Directors' responsibility for the financial report
The directors of the company are responsible for the preparation of the financial report that gives a true and fair view in accordance with Australian Accounting Standards and the Corporations Act 2001 and for such internal controls as the directors determine are necessary to enable the preparation of the financial report that is free from material misstatement, whether due to fraud or error. In Note 2 (b), the directors also state, in accordance with Accounting Standard AASB 101 Presentation of Financial Statements, that the financial statements comply with International Financial Reporting Standards.
Auditor's responsibility
Our responsibility is to express an opinion on the financial report based on our audit. We conducted our audit in accordance with Australian Auditing Standards. Those standards require that we comply with relevant ethical requirements relating to audit engagements and plan and perform the audit to obtain reasonable assurance about whether the financial report is free from material misstatement.
An audit involves performing procedures to obtain audit evidence about the amounts and disclosures in the financial report. The procedures selected depend on the auditor's judgment, including the assessment of the risks of material misstatement of the financial report, whether due to fraud or error. In making those risk assessments, the auditor considers internal controls relevant to the entity's preparation and fair presentation of the financial report in order to design audit procedures that are appropriate in the circumstances, but not for the purpose of expressing an opinion on the effectiveness of the entity's internal controls. An audit also includes evaluating the appropriateness of accounting policies used and the reasonableness of accounting estimates made by the directors, as well as evaluating the overall presentation of the financial report.
We believe that the audit evidence we have obtained is sufficient and appropriate to provide a basis for our audit opinion.
Independence
In conducting our audit we have complied with the independence requirements of the Corporations Act 2001. We have given to the directors of the company a written Auditor’s Independence Declaration, a copy of which is included in the directors’ report.
For
per
sona
l use
onl
y

39 Premier Investments Limited
STATEMENT OF COMPREHENSIVE INCOME FOR THE 53 WEEKS ENDED 30 JULY 2016 AND THE 52 WEEKS ENDED 25 JULY 2015
39
CONSOLIDATED
NOTES 2016 $’000
2015$’000
Continuing operations Revenue from sale of goods 4 1,049,226 947,662 Other revenue 4 8,228 10,230 Total revenue 1,057,454 957,892 Other income 4 1,507 3,977 Total revenue and other income 1,058,961 961,869 Changes in inventories of finished goods (378,946) (350,894) Employee expenses (268,997) (240,469) Operating lease rental expense 5 (204,707) (193,812) Depreciation, impairment and amortisation 5 (23,881) (22,677) Advertising and direct marketing (11,580) (12,879) Finance costs 5 (4,912) (5,738) Expense associated with disposal of asset held for sale 5 - (1,724)
Other expenses (36,647) (29,875)
Total expenses (929,670) (858,068)
Share of profit of associates 14 13,792 13,144
Profit from continuing operations before income tax 143,083 116,945 Income tax expense 6 (39,209) (28,843)
Net profit for the period attributable to owners 103,874 88,102
Other comprehensive income (loss) Items that may be reclassified subsequently to profit or loss Net (loss) gain on cash flow hedges 20 (44,983) 35,374 Foreign currency translation 20 (5,363) 1,418 Net movement in other comprehensive income of associates 20 (70) 2,728 Income tax on items of other comprehensive income 20 13,495 (10,612) Other comprehensive income (loss) for the period, net of tax (36,921) 28,908 TOTAL COMPREHENSIVE INCOME FOR THE PERIOD ATTRIBUTABLE TO THE OWNERS 66,953 117,010
Earnings per share for profit from continuing operations attributable to the ordinary equity holders of the parent:
- basic for profit for the year (cents per share) 31 66.27 56.49
- diluted for profit for the year (cents per share) 31 65.78 55.92 The accompanying notes form an integral part of this Statement of Comprehensive Income.
STATEMENT OF FINANCIAL POSITION AS AT 30 JULY 2016 AND 25 JULY 2015
40
CONSOLIDATED
NOTES
2016 $’000
2015 $’000
ASSETS Current assets Cash and cash equivalents 26 283,233 281,572 Trade and other receivables 8 16,461 14,341 Inventories 9 123,556 111,814 Other financial instruments 30 1,636 30,795 Other current assets 10 11,694 6,309 Asset classified as held for sale 11 - 1,000 Total current assets 436,580 445,831 Non-current assets Property, plant and equipment 12 139,237 123,537 Intangible assets 13 854,816 854,711 Deferred tax assets 6 18,858 13,476 Investments in associates 14 213,392 209,477 Other financial instruments 30 - 1,771 Total non-current assets 1,226,303 1,202,972 TOTAL ASSETS 1,662,883 1,648,803 LIABILITIES Current liabilities Trade and other payables 15 72,965 73,723 Interest-bearing liabilities 16 - 14 Other financial instruments 30 11,711 117 Income tax payable 31,953 31,781 Provisions 17 16,457 16,097 Other current liabilities 18 6,967 5,635 Total current liabilities 140,053 127,367 Non-current liabilities Interest-bearing liabilities 16 105,805 104,641 Deferred tax liabilities 6 57,311 64,285 Provisions 17 1,871 1,782 Other financial instruments 30 4,479 10 Other non-current liabilities 18 14,809 12,411 Total non-current liabilities 184,275 183,129 TOTAL LIABILITIES 324,328 310,496 NET ASSETS 1,338,555 1,338,307 EQUITY Contributed equity 19 608,615 608,615 Reserves 20 (2,434) 32,223 Retained earnings 21 732,374 697,469 TOTAL EQUITY 1,338,555 1,338,307
The accompanying notes form an integral part of this Statement of Financial Position.
STATEMENT OF COMPREHENSIVE INCOME FOR THE 53 WEEKS ENDED 30 JULY 2016 AND THE 52 WEEKS ENDED 25 JULY 2015
39
CONSOLIDATED
NOTES 2016 $’000
2015$’000
Continuing operations Revenue from sale of goods 4 1,049,226 947,662 Other revenue 4 8,228 10,230 Total revenue 1,057,454 957,892 Other income 4 1,507 3,977 Total revenue and other income 1,058,961 961,869 Changes in inventories of finished goods (378,946) (350,894) Employee expenses (268,997) (240,469) Operating lease rental expense 5 (204,707) (193,812) Depreciation, impairment and amortisation 5 (23,881) (22,677) Advertising and direct marketing (11,580) (12,879) Finance costs 5 (4,912) (5,738) Expense associated with disposal of asset held for sale 5 - (1,724)
Other expenses (36,647) (29,875)
Total expenses (929,670) (858,068)
Share of profit of associates 14 13,792 13,144
Profit from continuing operations before income tax 143,083 116,945 Income tax expense 6 (39,209) (28,843)
Net profit for the period attributable to owners 103,874 88,102
Other comprehensive income (loss) Items that may be reclassified subsequently to profit or loss Net (loss) gain on cash flow hedges 20 (44,983) 35,374 Foreign currency translation 20 (5,363) 1,418 Net movement in other comprehensive income of associates 20 (70) 2,728 Income tax on items of other comprehensive income 20 13,495 (10,612) Other comprehensive income (loss) for the period, net of tax (36,921) 28,908 TOTAL COMPREHENSIVE INCOME FOR THE PERIOD ATTRIBUTABLE TO THE OWNERS 66,953 117,010
Earnings per share for profit from continuing operations attributable to the ordinary equity holders of the parent:
- basic for profit for the year (cents per share) 31 66.27 56.49
- diluted for profit for the year (cents per share) 31 65.78 55.92 The accompanying notes form an integral part of this Statement of Comprehensive Income.
For
per
sona
l use
onl
y

Annual Report 2016 40
STATEMENT OF FINANCIAL POSITION AS AT 30 JULY 2016 AND 25 JULY 2015
40
CONSOLIDATED
NOTES
2016 $’000
2015 $’000
ASSETS Current assets Cash and cash equivalents 26 283,233 281,572 Trade and other receivables 8 16,461 14,341 Inventories 9 123,556 111,814 Other financial instruments 30 1,636 30,795 Other current assets 10 11,694 6,309 Asset classified as held for sale 11 - 1,000 Total current assets 436,580 445,831 Non-current assets Property, plant and equipment 12 139,237 123,537 Intangible assets 13 854,816 854,711 Deferred tax assets 6 18,858 13,476 Investments in associates 14 213,392 209,477 Other financial instruments 30 - 1,771 Total non-current assets 1,226,303 1,202,972 TOTAL ASSETS 1,662,883 1,648,803 LIABILITIES Current liabilities Trade and other payables 15 72,965 73,723 Interest-bearing liabilities 16 - 14 Other financial instruments 30 11,711 117 Income tax payable 31,953 31,781 Provisions 17 16,457 16,097 Other current liabilities 18 6,967 5,635 Total current liabilities 140,053 127,367 Non-current liabilities Interest-bearing liabilities 16 105,805 104,641 Deferred tax liabilities 6 57,311 64,285 Provisions 17 1,871 1,782 Other financial instruments 30 4,479 10 Other non-current liabilities 18 14,809 12,411 Total non-current liabilities 184,275 183,129 TOTAL LIABILITIES 324,328 310,496 NET ASSETS 1,338,555 1,338,307 EQUITY Contributed equity 19 608,615 608,615 Reserves 20 (2,434) 32,223 Retained earnings 21 732,374 697,469 TOTAL EQUITY 1,338,555 1,338,307
The accompanying notes form an integral part of this Statement of Financial Position.
STATEMENT OF COMPREHENSIVE INCOME FOR THE 53 WEEKS ENDED 30 JULY 2016 AND THE 52 WEEKS ENDED 25 JULY 2015
39
CONSOLIDATED
NOTES 2016 $’000
2015$’000
Continuing operations Revenue from sale of goods 4 1,049,226 947,662 Other revenue 4 8,228 10,230 Total revenue 1,057,454 957,892 Other income 4 1,507 3,977 Total revenue and other income 1,058,961 961,869 Changes in inventories of finished goods (378,946) (350,894) Employee expenses (268,997) (240,469) Operating lease rental expense 5 (204,707) (193,812) Depreciation, impairment and amortisation 5 (23,881) (22,677) Advertising and direct marketing (11,580) (12,879) Finance costs 5 (4,912) (5,738) Expense associated with disposal of asset held for sale 5 - (1,724)
Other expenses (36,647) (29,875)
Total expenses (929,670) (858,068)
Share of profit of associates 14 13,792 13,144
Profit from continuing operations before income tax 143,083 116,945 Income tax expense 6 (39,209) (28,843)
Net profit for the period attributable to owners 103,874 88,102
Other comprehensive income (loss) Items that may be reclassified subsequently to profit or loss Net (loss) gain on cash flow hedges 20 (44,983) 35,374 Foreign currency translation 20 (5,363) 1,418 Net movement in other comprehensive income of associates 20 (70) 2,728 Income tax on items of other comprehensive income 20 13,495 (10,612) Other comprehensive income (loss) for the period, net of tax (36,921) 28,908 TOTAL COMPREHENSIVE INCOME FOR THE PERIOD ATTRIBUTABLE TO THE OWNERS 66,953 117,010
Earnings per share for profit from continuing operations attributable to the ordinary equity holders of the parent:
- basic for profit for the year (cents per share) 31 66.27 56.49
- diluted for profit for the year (cents per share) 31 65.78 55.92 The accompanying notes form an integral part of this Statement of Comprehensive Income.
For
per
sona
l use
onl
y
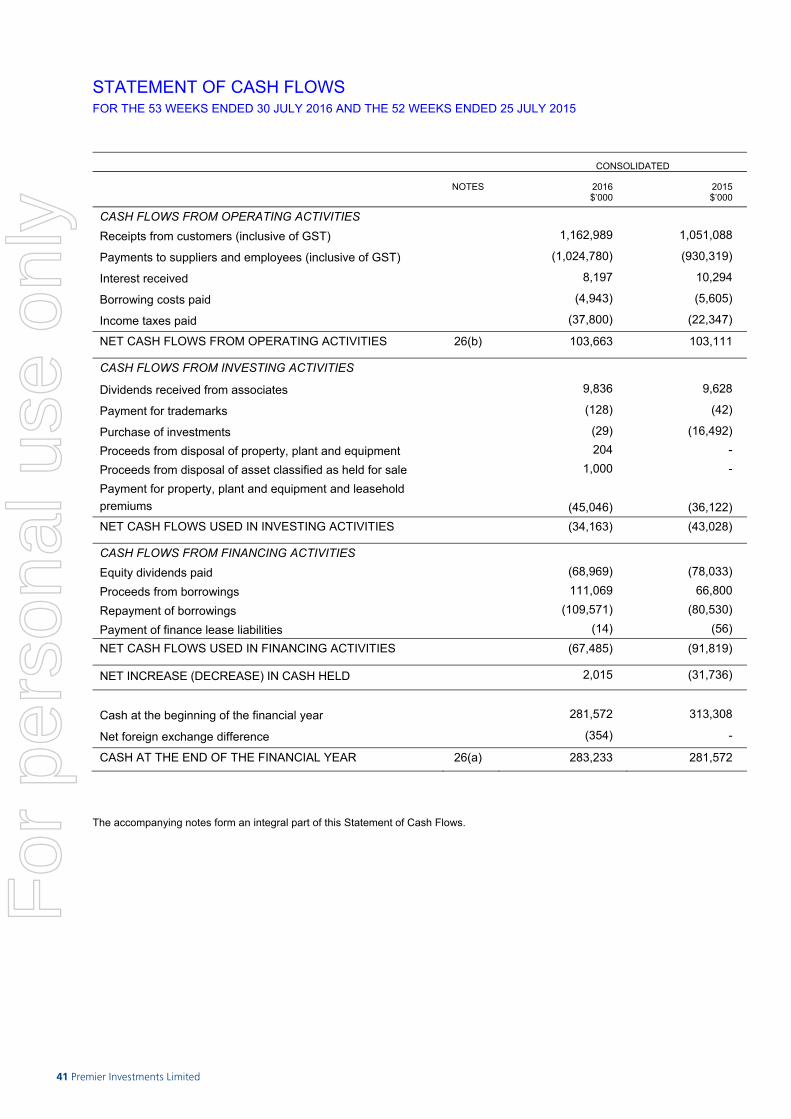
41 Premier Investments Limited
STATEMENT OF CASH FLOWS FOR THE 53 WEEKS ENDED 30 JULY 2016 AND THE 52 WEEKS ENDED 25 JULY 2015
41
CONSOLIDATED
NOTES 2016 $’000
2015 $’000
CASH FLOWS FROM OPERATING ACTIVITIES Receipts from customers (inclusive of GST) 1,162,989 1,051,088
Payments to suppliers and employees (inclusive of GST) (1,024,780) (930,319)
Interest received 8,197 10,294
Borrowing costs paid (4,943) (5,605)
Income taxes paid (37,800) (22,347)
NET CASH FLOWS FROM OPERATING ACTIVITIES 26(b) 103,663 103,111
CASH FLOWS FROM INVESTING ACTIVITIES
Dividends received from associates 9,836 9,628
Payment for trademarks (128) (42)
Purchase of investments (29) (16,492) Proceeds from disposal of property, plant and equipment 204 - Proceeds from disposal of asset classified as held for sale 1,000 - Payment for property, plant and equipment and leasehold premiums
(45,046)
(36,122)
NET CASH FLOWS USED IN INVESTING ACTIVITIES (34,163) (43,028)
CASH FLOWS FROM FINANCING ACTIVITIES Equity dividends paid (68,969) (78,033) Proceeds from borrowings 111,069 66,800 Repayment of borrowings (109,571) (80,530) Payment of finance lease liabilities (14) (56) NET CASH FLOWS USED IN FINANCING ACTIVITIES (67,485) (91,819)
NET INCREASE (DECREASE) IN CASH HELD 2,015 (31,736)
Cash at the beginning of the financial year 281,572 313,308
Net foreign exchange difference (354) -
CASH AT THE END OF THE FINANCIAL YEAR 26(a) 283,233 281,572
The accompanying notes form an integral part of this Statement of Cash Flows.
STATEMENT OF CHANGES IN EQUITY FOR THE 53 WEEKS ENDED 30 JULY 2016 AND THE 52 WEEKS ENDED 25 JULY 2015
42
CONSOLIDATED
CONTRIBUTED EQUITY
$’000
CAPITALPROFITS
RESERVE$’000
PERFORMANCERIGHTS
RESERVE$’000
CASH FLOWHEDGE
RESERVE$’000
FOREIGN CURRENCY
TRANSLATION RESERVE
$’000
RETAINED PROFITS
$’000
TOTAL$’000
At 26 July 2015 608,615 464 4,082 21,197 6,480 697,469 1,338,307
Net profit for the period - - - - - 103,874 103,874
Other comprehensive loss - - - (31,488) (5,433) - (36,921)
Total comprehensive income
for the period
-
-
-
(31,488)
(5,433)
103,874
66,953
Transactions with owners
in their capacity as owners:
Performance rights issued - - 2,264 - - - 2,264
Dividends paid - - - - - (68,969) (68,969)
Balance as at 30 July 2016 608,615 464 6,346 (10,291) 1,047 732,374 1,338,555
At 27 July 2014 608,615 464 3,281 (3,565) 2,334 687,400 1,298,529
Net profit for the period - - - - - 88,102 88,102
Other comprehensive income - - - 24,762 4,146 - 28,908
Total comprehensive income
for the period
-
-
-
24,762
4,146
88,102
117,010
Transactions with owners
in their capacity as owners:
Performance rights issued - - 801 - - - 801
Dividends paid - - - - - (78,033) (78,033)
Balance as at 25 July 2015 608,615 464 4,082 21,197 6,480 697,469 1,338,307
The accompanying notes form an integral part of this Statement of Changes in Equity
For
per
sona
l use
onl
y

Annual Report 2016 42
STATEMENT OF CHANGES IN EQUITY FOR THE 53 WEEKS ENDED 30 JULY 2016 AND THE 52 WEEKS ENDED 25 JULY 2015
CONSOLIDATED
CONTRIBUTED EQUITY
$’000
CAPITALPROFITS
RESERVE$’000
PERFORMANCERIGHTS
RESERVE$’000
CASH FLOWHEDGE
RESERVE$’000
FOREIGN CURRENCY
TRANSLATION RESERVE
$’000
RETAINEDPROFITS
$’000
TOTAL$’000
At 26 July 2015 608,615 464 4,082 21,197 6,480 697,469 1,338,307
Net profit for the period - - - - - 103,874 103,874
Other comprehensive loss - - - (31,488) (5,433) - (36,921)
Total comprehensive income
for the period - - - (31,488) (5,433) 103,874 66,953
Transactions with owners
in their capacity as owners:
Performance rights issued - - 2,264 - - - 2,264
Dividends paid - - - - - (68,969) (68,969)
Balance as at 30 July 2016 608,615 464 6,346 (10,291) 1,047 732,374 1,338,555
At 27 July 2014 608,615 464 3,281 (3,565) 2,334 687,400 1,298,529
Net profit for the period - - - - - 88,102 88,102
Other comprehensive income - - - 24,762 4,146 - 28,908
Total comprehensive income
for the period - - - 24,762 4,146 88,102 117,010
Transactions with owners
in their capacity as owners:
Performance rights issued - - 801 - - - 801
Dividends paid - - - - - (78,033) (78,033)
Balance as at 25 July 2015 608,615 464 4,082 21,197 6,480 697,469 1,338,307
The accompanying notes form an integral part of this Statement of Changes in Equity
For
per
sona
l use
onl
y
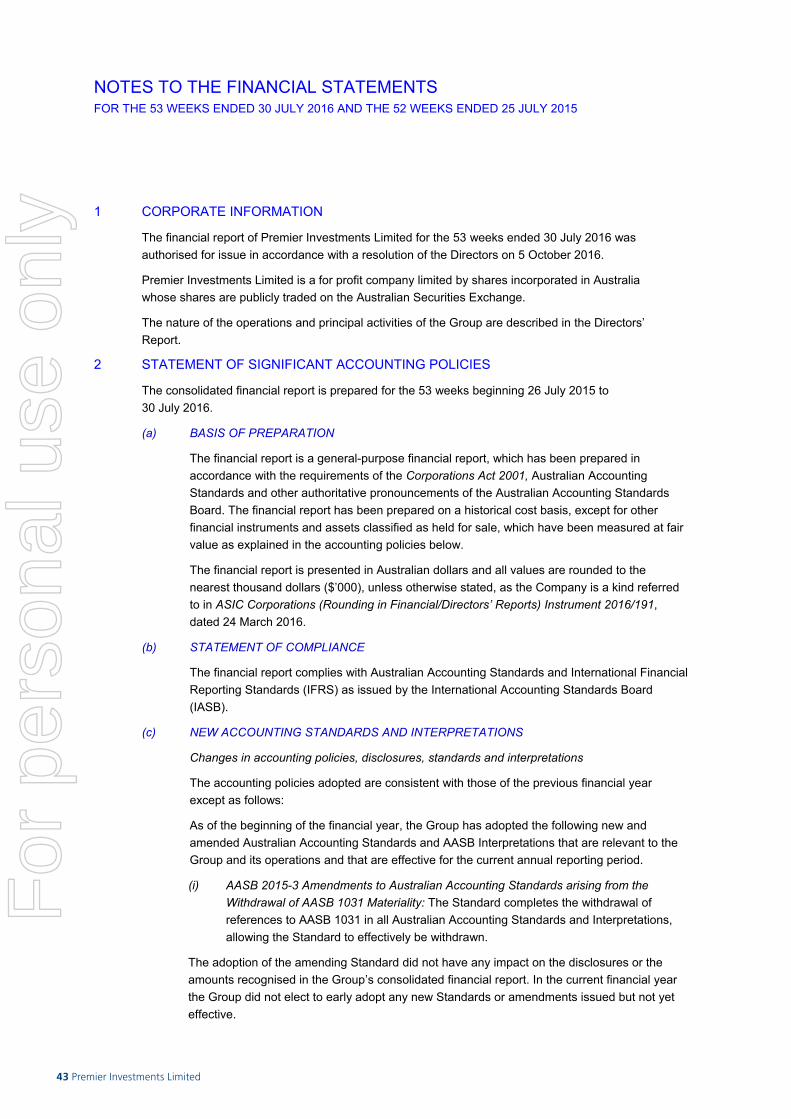
43 Premier Investments Limited
NOTES TO THE FINANCIAL STATEMENTS FOR THE 53 WEEKS ENDED 30 JULY 2016 AND THE 52 WEEKS ENDED 25 JULY 2015
43
1 CORPORATE INFORMATION
The financial report of Premier Investments Limited for the 53 weeks ended 30 July 2016 was authorised for issue in accordance with a resolution of the Directors on 5 October 2016.
Premier Investments Limited is a for profit company limited by shares incorporated in Australia whose shares are publicly traded on the Australian Securities Exchange.
The nature of the operations and principal activities of the Group are described in the Directors’ Report.
2 STATEMENT OF SIGNIFICANT ACCOUNTING POLICIES
The consolidated financial report is prepared for the 53 weeks beginning 26 July 2015 to 30 July 2016.
(a) BASIS OF PREPARATION
The financial report is a general-purpose financial report, which has been prepared in accordance with the requirements of the Corporations Act 2001, Australian Accounting Standards and other authoritative pronouncements of the Australian Accounting Standards Board. The financial report has been prepared on a historical cost basis, except for other financial instruments and assets classified as held for sale, which have been measured at fair value as explained in the accounting policies below.
The financial report is presented in Australian dollars and all values are rounded to the nearest thousand dollars ($’000), unless otherwise stated, as the Company is a kind referred to in ASIC Corporations (Rounding in Financial/Directors’ Reports) Instrument 2016/191, dated 24 March 2016.
(b) STATEMENT OF COMPLIANCE
The financial report complies with Australian Accounting Standards and International Financial Reporting Standards (IFRS) as issued by the International Accounting Standards Board (IASB).
(c) NEW ACCOUNTING STANDARDS AND INTERPRETATIONS
Changes in accounting policies, disclosures, standards and interpretations
The accounting policies adopted are consistent with those of the previous financial year except as follows:
As of the beginning of the financial year, the Group has adopted the following new and amended Australian Accounting Standards and AASB Interpretations that are relevant to the Group and its operations and that are effective for the current annual reporting period.
(i) AASB 2015-3 Amendments to Australian Accounting Standards arising from the Withdrawal of AASB 1031 Materiality: The Standard completes the withdrawal of references to AASB 1031 in all Australian Accounting Standards and Interpretations, allowing the Standard to effectively be withdrawn.
The adoption of the amending Standard did not have any impact on the disclosures or the amounts recognised in the Group’s consolidated financial report. In the current financial year the Group did not elect to early adopt any new Standards or amendments issued but not yet effective.
NOTES TO THE FINANCIAL STATEMENTS FOR THE 53 WEEKS ENDED 30 JULY 2016 AND THE 52 WEEKS ENDED 25 JULY 2015 (CONTINUED) 2 STATEMENT OF SIGNIFICANT ACCOUNTING POLICIES (CONTINUED)
44
(c) NEW ACCOUNTING STANDARDS AND INTERPRETATIONS (CONTINUED)
Accounting Standards and Interpretations issued but not yet effective
Recently issued or amended Australian Accounting Standards and Interpretations that have been identified as those which may be relevant to the Group in future reporting periods, but are not yet effective and have not been adopted by the Group for the reporting period ended 30 July 2016, are outlined in the table below:
Title
Summary Impact on the Group financial report
Effective Dates
AASB 2014-4 Clarification of Acceptable Methods of Depreciation and Amortisation
The standard amends AASB 116 Property, Plant and Equipment and AASB 138 Intangible Assets to provide additional guidance on how the depreciation or amortisation of property, plant and equipment and intangible assets should be calculated.
The Group does not expect the adoption of this Standard to have a material effect on the financial position and performance of the Group.
The standard applies to annual reporting periods beginning on or after 1 January 2016. The standard is expected to be initially applied by the group for the financial year beginning 31 July 2016.
AASB 15 Revenue from Contracts with Customers, AASB 2014-5 Amendments to Australian Accounting Standards arising from AASB 15, AASB 2015-8 Amendments to Australian Accounting Standards – effective date of AASB 15
AASB 15 outlines a single comprehensive model for entities to use in accounting for revenue arising from contracts with customers and replaces AASB 111 Construction Contracts, AASB 118 Revenue, and Interpretation 13 Customer Loyalty Programmes. The core principle of AASB 15 is that an entity recognises revenue to depict the transfer of promised goods or services to customers in an amount that reflects the consideration to which the entity expects to be entitled in exchange for those goods or services. AASB 2016-3 Amendments to Australian Accounting Standards – Clarifications to AASB 15 has been issued as a consequence of the issuance of International Financial Reporting Standards Clarifications to IFRS 15 Revenue from Contracts with Customers and clarifies some requirements and provides additional transitional relief for companies that are implementing the new Standard. The amendments do not change the underlying principles of the Standard, but rather clarify how those principles should be applied.
The new standard requires extensive disclosures, including disaggregation of total revenue and key judgements and estimates. The Group is in the process of evaluating the potential impact, if any, of the new standard on the Group.
The standard applies to annual reporting periods beginning on or after 1 January 2018. The standard is expected to be initially applied by the group for the financial year beginning 29 July 2018.
AASB 16 Leases
AASB 16 will replace AASB 117 Leases, Interpretation 4 Determining whether an Arrangement contains a Lease, Interpretation 115 Operating Leases – Incentives and Interpretation 127 Evaluating the Substance of Transactions Involving the Legal form of a Lease. The Standard will provide a comprehensive model for the identification of lease arrangements and their treatment in the financial statements of both lessees and lessors. The new Standard introduces three main changes: Enhanced guidance on identifying whether a contract
contains a lease; A completely new leases accounting model for lessees
that require lessees to recognise all leases on balance sheet, except short-term leases and leases of low value assets, and
Enhanced disclosures.
The new standard requires lessees to recognise all leases, except for short-term and low value leases, on balance sheet. The Group is in the process of evaluating the potential impact of the new standard on the Group.
The standard applies to annual reporting periods beginning on or after 1 January 2019. The standard is expected to be initially applied by the group for the financial year beginning 28 July 2019.
For
per
sona
l use
onl
y
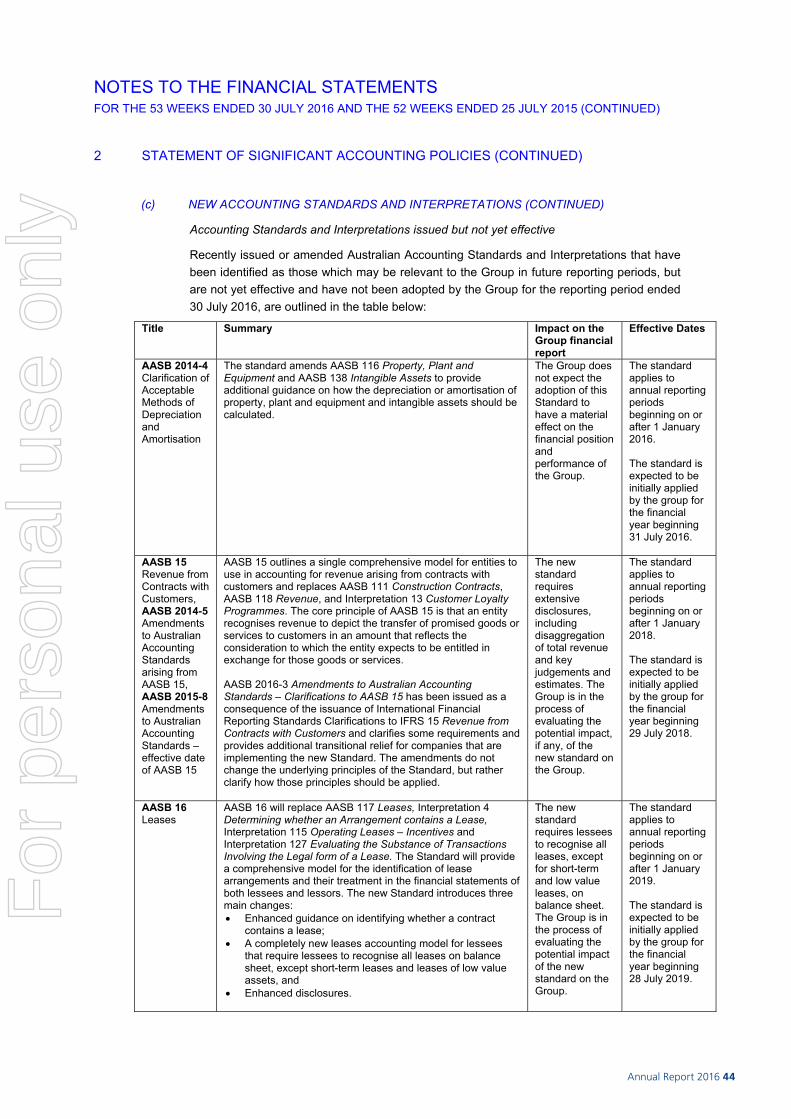
Annual Report 2016 44
NOTES TO THE FINANCIAL STATEMENTS FOR THE 53 WEEKS ENDED 30 JULY 2016 AND THE 52 WEEKS ENDED 25 JULY 2015 (CONTINUED) 2 STATEMENT OF SIGNIFICANT ACCOUNTING POLICIES (CONTINUED)
44
(c) NEW ACCOUNTING STANDARDS AND INTERPRETATIONS (CONTINUED)
Accounting Standards and Interpretations issued but not yet effective
Recently issued or amended Australian Accounting Standards and Interpretations that have been identified as those which may be relevant to the Group in future reporting periods, but are not yet effective and have not been adopted by the Group for the reporting period ended 30 July 2016, are outlined in the table below:
Title
Summary Impact on the Group financial report
Effective Dates
AASB 2014-4 Clarification of Acceptable Methods of Depreciation and Amortisation
The standard amends AASB 116 Property, Plant and Equipment and AASB 138 Intangible Assets to provide additional guidance on how the depreciation or amortisation of property, plant and equipment and intangible assets should be calculated.
The Group does not expect the adoption of this Standard to have a material effect on the financial position and performance of the Group.
The standard applies to annual reporting periods beginning on or after 1 January 2016. The standard is expected to be initially applied by the group for the financial year beginning 31 July 2016.
AASB 15 Revenue from Contracts with Customers, AASB 2014-5 Amendments to Australian Accounting Standards arising from AASB 15, AASB 2015-8 Amendments to Australian Accounting Standards – effective date of AASB 15
AASB 15 outlines a single comprehensive model for entities to use in accounting for revenue arising from contracts with customers and replaces AASB 111 Construction Contracts, AASB 118 Revenue, and Interpretation 13 Customer Loyalty Programmes. The core principle of AASB 15 is that an entity recognises revenue to depict the transfer of promised goods or services to customers in an amount that reflects the consideration to which the entity expects to be entitled in exchange for those goods or services. AASB 2016-3 Amendments to Australian Accounting Standards – Clarifications to AASB 15 has been issued as a consequence of the issuance of International Financial Reporting Standards Clarifications to IFRS 15 Revenue from Contracts with Customers and clarifies some requirements and provides additional transitional relief for companies that are implementing the new Standard. The amendments do not change the underlying principles of the Standard, but rather clarify how those principles should be applied.
The new standard requires extensive disclosures, including disaggregation of total revenue and key judgements and estimates. The Group is in the process of evaluating the potential impact, if any, of the new standard on the Group.
The standard applies to annual reporting periods beginning on or after 1 January 2018. The standard is expected to be initially applied by the group for the financial year beginning 29 July 2018.
AASB 16 Leases
AASB 16 will replace AASB 117 Leases, Interpretation 4 Determining whether an Arrangement contains a Lease, Interpretation 115 Operating Leases – Incentives and Interpretation 127 Evaluating the Substance of Transactions Involving the Legal form of a Lease. The Standard will provide a comprehensive model for the identification of lease arrangements and their treatment in the financial statements of both lessees and lessors. The new Standard introduces three main changes: Enhanced guidance on identifying whether a contract
contains a lease; A completely new leases accounting model for lessees
that require lessees to recognise all leases on balance sheet, except short-term leases and leases of low value assets, and
Enhanced disclosures.
The new standard requires lessees to recognise all leases, except for short-term and low value leases, on balance sheet. The Group is in the process of evaluating the potential impact of the new standard on the Group.
The standard applies to annual reporting periods beginning on or after 1 January 2019. The standard is expected to be initially applied by the group for the financial year beginning 28 July 2019.
For
per
sona
l use
onl
y
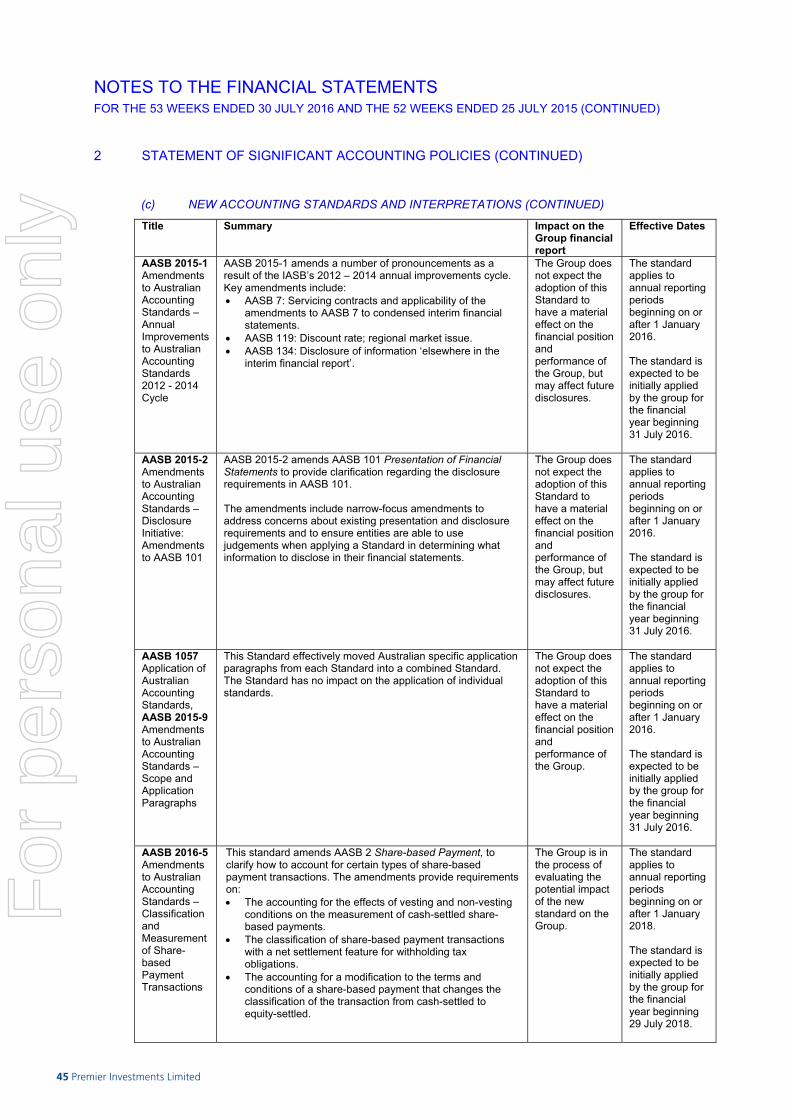
45 Premier Investments Limited
NOTES TO THE FINANCIAL STATEMENTS FOR THE 53 WEEKS ENDED 30 JULY 2016 AND THE 52 WEEKS ENDED 25 JULY 2015 (CONTINUED) 2 STATEMENT OF SIGNIFICANT ACCOUNTING POLICIES (CONTINUED)
45
(c) NEW ACCOUNTING STANDARDS AND INTERPRETATIONS (CONTINUED)
Title
Summary Impact on the Group financial report
Effective Dates
AASB 2015-1 Amendments to Australian Accounting Standards – Annual Improvements to Australian Accounting Standards 2012 - 2014 Cycle
AASB 2015-1 amends a number of pronouncements as a result of the IASB’s 2012 – 2014 annual improvements cycle. Key amendments include: AASB 7: Servicing contracts and applicability of the
amendments to AASB 7 to condensed interim financial statements.
AASB 119: Discount rate; regional market issue. AASB 134: Disclosure of information ‘elsewhere in the
interim financial report’.
The Group does not expect the adoption of this Standard to have a material effect on the financial position and performance of the Group, but may affect future disclosures.
The standard applies to annual reporting periods beginning on or after 1 January 2016. The standard is expected to be initially applied by the group for the financial year beginning 31 July 2016.
AASB 2015-2 Amendments to Australian Accounting Standards – Disclosure Initiative: Amendments to AASB 101
AASB 2015-2 amends AASB 101 Presentation of Financial Statements to provide clarification regarding the disclosure requirements in AASB 101. The amendments include narrow-focus amendments to address concerns about existing presentation and disclosure requirements and to ensure entities are able to use judgements when applying a Standard in determining what information to disclose in their financial statements.
The Group does not expect the adoption of this Standard to have a material effect on the financial position and performance of the Group, but may affect future disclosures.
The standard applies to annual reporting periods beginning on or after 1 January 2016. The standard is expected to be initially applied by the group for the financial year beginning 31 July 2016.
AASB 1057 Application of Australian Accounting Standards, AASB 2015-9 Amendments to Australian Accounting Standards – Scope and Application Paragraphs
This Standard effectively moved Australian specific application paragraphs from each Standard into a combined Standard. The Standard has no impact on the application of individual standards.
The Group does not expect the adoption of this Standard to have a material effect on the financial position and performance of the Group.
The standard applies to annual reporting periods beginning on or after 1 January 2016. The standard is expected to be initially applied by the group for the financial year beginning 31 July 2016.
AASB 2016-5 Amendments to Australian Accounting Standards – Classification and Measurement of Share-based Payment Transactions
This standard amends AASB 2 Share-based Payment, to clarify how to account for certain types of share-based payment transactions. The amendments provide requirements on: The accounting for the effects of vesting and non-vesting
conditions on the measurement of cash-settled share-based payments.
The classification of share-based payment transactions with a net settlement feature for withholding tax obligations.
The accounting for a modification to the terms and conditions of a share-based payment that changes the classification of the transaction from cash-settled to equity-settled.
The Group is in the process of evaluating the potential impact of the new standard on the Group.
The standard applies to annual reporting periods beginning on or after 1 January 2018. The standard is expected to be initially applied by the group for the financial year beginning 29 July 2018.
NOTES TO THE FINANCIAL STATEMENTS FOR THE 53 WEEKS ENDED 30 JULY 2016 AND THE 52 WEEKS ENDED 25 JULY 2015 (CONTINUED) 2 STATEMENT OF SIGNIFICANT ACCOUNTING POLICIES (CONTINUED)
46
(c) NEW ACCOUNTING STANDARDS AND INTERPRETATIONS (CONTINUED)
Title
Summary Impact on the Group financial report
Effective Dates
AASB 9 Financial Instruments
AASB 9 (Dec 2014) is a new principal standard which replaces AASB 139. This new version supersedes AASB 9 issued in December 2009 (as amended) and AASB 9 (issued in Dec 2010) and includes a model for classification and measurement, a single forward-looking ‘expected loss’ impairment model and a substantially-reformed approach to hedge accounting.
The final version of AASB 9 introduces a new expected-loss impairment model that will require more timely recognition of expected credit losses. Specifically, the new Standard requires entities to account for expected credit losses from when financial instruments are first recognised and to recognise full lifetime expected losses on a timelier basis. Amendments to AASB 9 (Dec 2009 and 2010 editions, as well as AASB 2013-9) issued in December 2013 included the new hedge accounting requirements, including changes to hedge effectiveness testing, treatment of hedge costs, risk components that can be hedged and disclosures. AASB 9 includes requirements for a simpler approach to classification and measurement of financial assets compared with the requirements of AASB 139. The main changes are described below: Financial assets that are debt instruments will be classified
based on 1) the objective of the entity’s business model for managing the financial assets; 2) the characteristics of the contractual cash flows.
Allows an irrevocable election on initial recognition to present gains and losses on investments in equity instruments that are not held for trading in other comprehensive income. Dividends in respect of these investments that are a return on investment can be recognised in profit or loss and there is no impairment or recycling on disposal of investment.
Financial assets can be designated and measured at fair value through profit and loss at initial recognition if doing so eliminates or significantly reduces the measurement or recognition inconsistency that would arise from measuring assets or liabilities, or recognising gains and losses on them, on different bases.
Where the fair value option is used for financial liabilities the change in fair value is to be accounted for as follows: The change attributable to changes in credit risk are
presented in other comprehensive income. The remaining change is presented in profit or loss.
AASB 9 also removes the volatility in profit or loss that was caused by changes in the credit risk of liabilities elected to be measured at fair value. The change in accounting means that gains caused by deterioration of an entity’s own credit risk on such liabilities are no longer recognised in profit or loss. Consequential amendments were also made to other standards as a result of AASB 9, introduced by AASB 2009-11 and superseded by AASB 2010-7, AASB 2010-10 and AASB 2014-1 – Part E. AASB 2014-7 incorporates the consequential amendments arising from the issuance of AASB 9 in December 2014.
The Group has not yet determined the potential effects of the standard. Retrospective application is generally required.
The standard applies to annual reporting periods beginning on or after 1 January 2018. The standard is expected to be initially applied by the group for the financial year beginning 29 July 2018.
For
per
sona
l use
onl
y
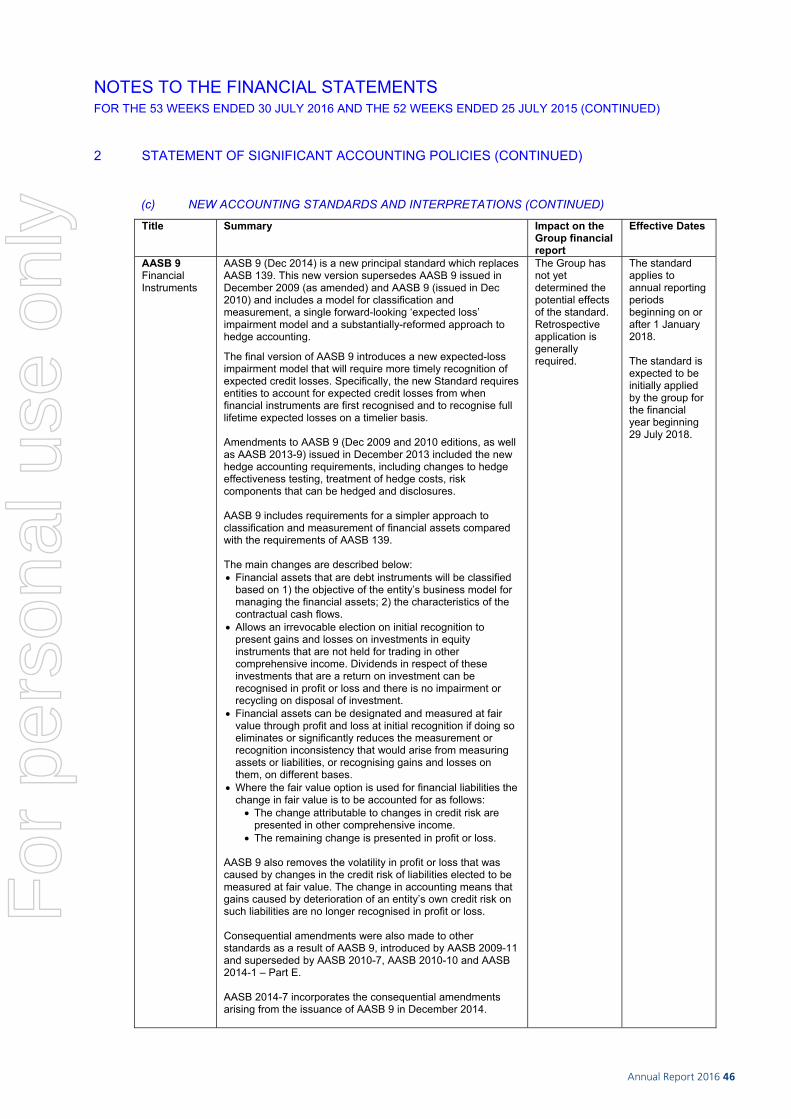
Annual Report 2016 46
NOTES TO THE FINANCIAL STATEMENTS FOR THE 53 WEEKS ENDED 30 JULY 2016 AND THE 52 WEEKS ENDED 25 JULY 2015 (CONTINUED) 2 STATEMENT OF SIGNIFICANT ACCOUNTING POLICIES (CONTINUED)
46
(c) NEW ACCOUNTING STANDARDS AND INTERPRETATIONS (CONTINUED)
Title
Summary Impact on the Group financial report
Effective Dates
AASB 9 Financial Instruments
AASB 9 (Dec 2014) is a new principal standard which replaces AASB 139. This new version supersedes AASB 9 issued in December 2009 (as amended) and AASB 9 (issued in Dec 2010) and includes a model for classification and measurement, a single forward-looking ‘expected loss’ impairment model and a substantially-reformed approach to hedge accounting.
The final version of AASB 9 introduces a new expected-loss impairment model that will require more timely recognition of expected credit losses. Specifically, the new Standard requires entities to account for expected credit losses from when financial instruments are first recognised and to recognise full lifetime expected losses on a timelier basis. Amendments to AASB 9 (Dec 2009 and 2010 editions, as well as AASB 2013-9) issued in December 2013 included the new hedge accounting requirements, including changes to hedge effectiveness testing, treatment of hedge costs, risk components that can be hedged and disclosures. AASB 9 includes requirements for a simpler approach to classification and measurement of financial assets compared with the requirements of AASB 139. The main changes are described below: Financial assets that are debt instruments will be classified
based on 1) the objective of the entity’s business model for managing the financial assets; 2) the characteristics of the contractual cash flows.
Allows an irrevocable election on initial recognition to present gains and losses on investments in equity instruments that are not held for trading in other comprehensive income. Dividends in respect of these investments that are a return on investment can be recognised in profit or loss and there is no impairment or recycling on disposal of investment.
Financial assets can be designated and measured at fair value through profit and loss at initial recognition if doing so eliminates or significantly reduces the measurement or recognition inconsistency that would arise from measuring assets or liabilities, or recognising gains and losses on them, on different bases.
Where the fair value option is used for financial liabilities the change in fair value is to be accounted for as follows: The change attributable to changes in credit risk are
presented in other comprehensive income. The remaining change is presented in profit or loss.
AASB 9 also removes the volatility in profit or loss that was caused by changes in the credit risk of liabilities elected to be measured at fair value. The change in accounting means that gains caused by deterioration of an entity’s own credit risk on such liabilities are no longer recognised in profit or loss. Consequential amendments were also made to other standards as a result of AASB 9, introduced by AASB 2009-11 and superseded by AASB 2010-7, AASB 2010-10 and AASB 2014-1 – Part E. AASB 2014-7 incorporates the consequential amendments arising from the issuance of AASB 9 in December 2014.
The Group has not yet determined the potential effects of the standard. Retrospective application is generally required.
The standard applies to annual reporting periods beginning on or after 1 January 2018. The standard is expected to be initially applied by the group for the financial year beginning 29 July 2018.
For
per
sona
l use
onl
y
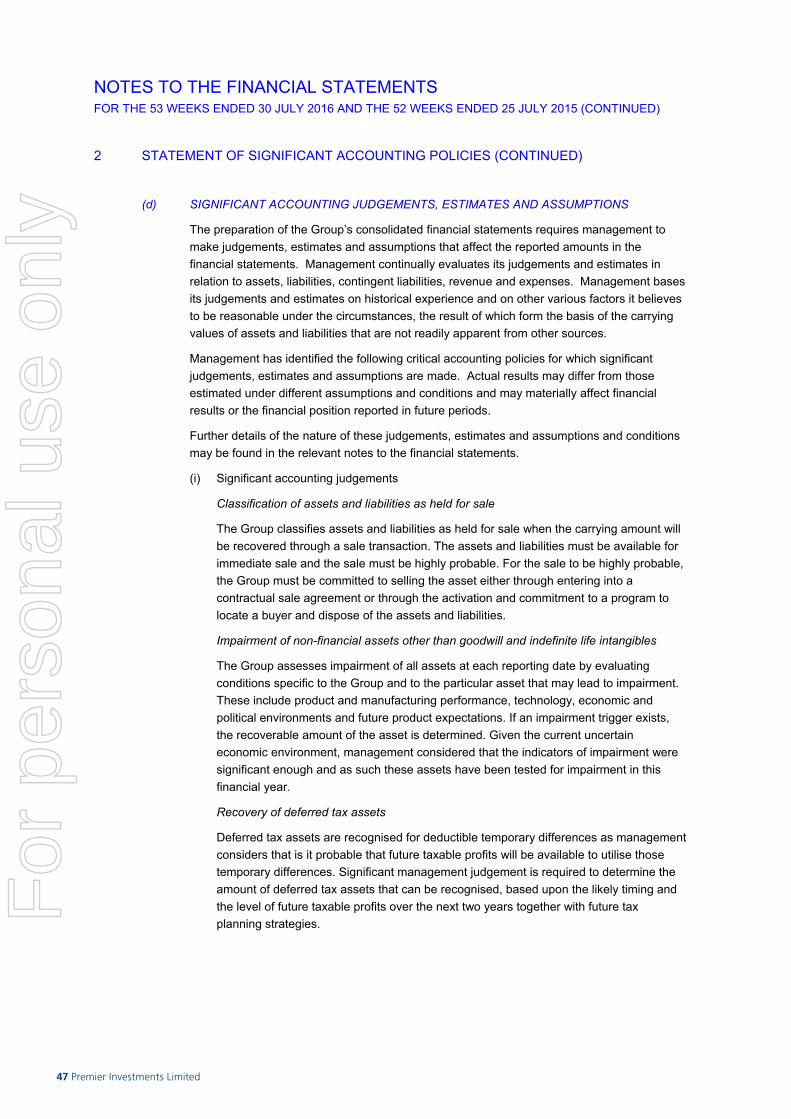
47 Premier Investments Limited
NOTES TO THE FINANCIAL STATEMENTS FOR THE 53 WEEKS ENDED 30 JULY 2016 AND THE 52 WEEKS ENDED 25 JULY 2015 (CONTINUED) 2 STATEMENT OF SIGNIFICANT ACCOUNTING POLICIES (CONTINUED)
47
(d) SIGNIFICANT ACCOUNTING JUDGEMENTS, ESTIMATES AND ASSUMPTIONS
The preparation of the Group’s consolidated financial statements requires management to make judgements, estimates and assumptions that affect the reported amounts in the financial statements. Management continually evaluates its judgements and estimates in relation to assets, liabilities, contingent liabilities, revenue and expenses. Management bases its judgements and estimates on historical experience and on other various factors it believes to be reasonable under the circumstances, the result of which form the basis of the carrying values of assets and liabilities that are not readily apparent from other sources.
Management has identified the following critical accounting policies for which significant judgements, estimates and assumptions are made. Actual results may differ from those estimated under different assumptions and conditions and may materially affect financial results or the financial position reported in future periods.
Further details of the nature of these judgements, estimates and assumptions and conditions may be found in the relevant notes to the financial statements.
(i) Significant accounting judgements
Classification of assets and liabilities as held for sale
The Group classifies assets and liabilities as held for sale when the carrying amount will be recovered through a sale transaction. The assets and liabilities must be available for immediate sale and the sale must be highly probable. For the sale to be highly probable, the Group must be committed to selling the asset either through entering into a contractual sale agreement or through the activation and commitment to a program to locate a buyer and dispose of the assets and liabilities.
Impairment of non-financial assets other than goodwill and indefinite life intangibles
The Group assesses impairment of all assets at each reporting date by evaluating conditions specific to the Group and to the particular asset that may lead to impairment. These include product and manufacturing performance, technology, economic and political environments and future product expectations. If an impairment trigger exists, the recoverable amount of the asset is determined. Given the current uncertain economic environment, management considered that the indicators of impairment were significant enough and as such these assets have been tested for impairment in this financial year.
Recovery of deferred tax assets
Deferred tax assets are recognised for deductible temporary differences as management considers that is it probable that future taxable profits will be available to utilise those temporary differences. Significant management judgement is required to determine the amount of deferred tax assets that can be recognised, based upon the likely timing and the level of future taxable profits over the next two years together with future tax planning strategies.
NOTES TO THE FINANCIAL STATEMENTS FOR THE 53 WEEKS ENDED 30 JULY 2016 AND THE 52 WEEKS ENDED 25 JULY 2015 (CONTINUED) 2 STATEMENT OF SIGNIFICANT ACCOUNTING POLICIES (CONTINUED)
48
(d) SIGNIFICANT ACCOUNTING JUDGEMENTS, ESTIMATES AND ASSUMPTIONS (CONTINUED)
(i) Significant accounting judgements (continued)
Taxation
The Group's accounting policy for taxation requires management's judgement as to the types of arrangements considered to be a tax on income in contrast to an operating cost. Judgement is also required in assessing whether deferred tax assets and certain deferred tax liabilities are recognised in the statement of financial position. Deferred tax assets, including those arising from un-recouped tax losses, capital losses and temporary differences, are recognised only where it is considered more likely than not that they will be recovered, which is dependent on the generation of sufficient future taxable profits. Deferred tax liabilities arising from temporary differences in investments, caused principally by retained earnings held in foreign tax jurisdictions, are recognised unless repatriation of retained earnings can be controlled and are not expected to occur in the foreseeable future.
Assumptions about the generation of future taxable profits and repatriation of retained earnings depend on management's estimates of future cash flows. These depend on estimates of future production and sales volumes, operating costs, restoration costs, capital expenditure, dividends and other capital management transactions. Judgements are also required about the application of income tax legislation.
These judgements and assumptions are subject to risk and uncertainty, hence there is a possibility that changes in circumstances will alter expectations, which may impact the amount of deferred tax assets and deferred tax liabilities recognised on the statement of financial position and the amount of other tax losses and temporary differences not yet recognised. In such circumstances, some or all of the carrying amounts of recognised deferred tax assets and liabilities may require adjustment, resulting in a corresponding credit or charge to profit or loss in the statement of comprehensive income.
(ii) Significant accounting estimates and assumptions
Estimated impairment of goodwill and intangibles with indefinite useful lives
The Group tests whether goodwill and intangibles with indefinite useful lives have suffered any impairment annually, in accordance with the accounting policies stated in note 2(n) and note 2(o). The recoverable amounts of cash-generating units have been determined based on value-in-use calculations. These calculations require the use of assumptions. Refer to note 13 for details of these assumptions and the potential impact of changes to the assumptions.
Share-based payment transactions
The Group measures the cost of equity-settled transactions with employees by reference to the fair value of the equity instruments at the date at which they are granted. The fair value is determined at grant date using an appropriate valuation model and taking into account the terms and conditions upon which the instruments were granted. The related valuation models and assumptions are detailed in note 28.
The accounting estimates and assumptions relating to equity-settled share-based payments would have no impact on the carrying amounts of assets and liabilities within the next annual reporting period but may impact expenses and equity.
For
per
sona
l use
onl
y

Annual Report 2016 48
NOTES TO THE FINANCIAL STATEMENTS FOR THE 53 WEEKS ENDED 30 JULY 2016 AND THE 52 WEEKS ENDED 25 JULY 2015 (CONTINUED) 2 STATEMENT OF SIGNIFICANT ACCOUNTING POLICIES (CONTINUED)
48
(d) SIGNIFICANT ACCOUNTING JUDGEMENTS, ESTIMATES AND ASSUMPTIONS (CONTINUED)
(i) Significant accounting judgements (continued)
Taxation
The Group's accounting policy for taxation requires management's judgement as to the types of arrangements considered to be a tax on income in contrast to an operating cost. Judgement is also required in assessing whether deferred tax assets and certain deferred tax liabilities are recognised in the statement of financial position. Deferred tax assets, including those arising from un-recouped tax losses, capital losses and temporary differences, are recognised only where it is considered more likely than not that they will be recovered, which is dependent on the generation of sufficient future taxable profits. Deferred tax liabilities arising from temporary differences in investments, caused principally by retained earnings held in foreign tax jurisdictions, are recognised unless repatriation of retained earnings can be controlled and are not expected to occur in the foreseeable future.
Assumptions about the generation of future taxable profits and repatriation of retained earnings depend on management's estimates of future cash flows. These depend on estimates of future production and sales volumes, operating costs, restoration costs, capital expenditure, dividends and other capital management transactions. Judgements are also required about the application of income tax legislation.
These judgements and assumptions are subject to risk and uncertainty, hence there is a possibility that changes in circumstances will alter expectations, which may impact the amount of deferred tax assets and deferred tax liabilities recognised on the statement of financial position and the amount of other tax losses and temporary differences not yet recognised. In such circumstances, some or all of the carrying amounts of recognised deferred tax assets and liabilities may require adjustment, resulting in a corresponding credit or charge to profit or loss in the statement of comprehensive income.
(ii) Significant accounting estimates and assumptions
Estimated impairment of goodwill and intangibles with indefinite useful lives
The Group tests whether goodwill and intangibles with indefinite useful lives have suffered any impairment annually, in accordance with the accounting policies stated in note 2(n) and note 2(o). The recoverable amounts of cash-generating units have been determined based on value-in-use calculations. These calculations require the use of assumptions. Refer to note 13 for details of these assumptions and the potential impact of changes to the assumptions.
Share-based payment transactions
The Group measures the cost of equity-settled transactions with employees by reference to the fair value of the equity instruments at the date at which they are granted. The fair value is determined at grant date using an appropriate valuation model and taking into account the terms and conditions upon which the instruments were granted. The related valuation models and assumptions are detailed in note 28.
The accounting estimates and assumptions relating to equity-settled share-based payments would have no impact on the carrying amounts of assets and liabilities within the next annual reporting period but may impact expenses and equity.
For
per
sona
l use
onl
y

49 Premier Investments Limited
NOTES TO THE FINANCIAL STATEMENTS FOR THE 53 WEEKS ENDED 30 JULY 2016 AND THE 52 WEEKS ENDED 25 JULY 2015 (CONTINUED) 2 STATEMENT OF SIGNIFICANT ACCOUNTING POLICIES (CONTINUED)
49
(d) SIGNIFICANT ACCOUNTING JUDGEMENTS, ESTIMATES AND ASSUMPTIONS (CONTINUED)
(ii) Significant accounting estimates and assumptions
Estimation of useful lives of assets
The estimation of the useful lives of assets has been based on historical experience as well as manufacturers' warranties (for plant and equipment), lease terms (for leased equipment) and turnover policies (for motor vehicles). In addition, the condition of the assets is assessed at least once per year and considered against the remaining useful life. Adjustments to useful lives are made when considered necessary.
Depreciation charges are included in note 5.
Estimated gift card redemption rates
The key assumption in measuring the liability for gift cards and vouchers is the expected redemption rates by customers. Expected redemption rates are reviewed annually, and adjustments are made to the expected redemption rates when considered necessary.
Fair value of financial instruments
Some of the Group’s assets and liabilities are measured at fair value for financial reporting purposes. In estimating the fair value of an asset or a liability, the Group uses market-observable data to the extent possible, but where this is not feasible, a degree of judgement is required in establishing fair values. The fair value disclosures are detailed in note 3.
(e) BASIS OF CONSOLIDATION
The consolidated financial statements are those of the consolidated entity, comprising Premier Investments Limited (the parent entity) and its subsidiaries ('the Group') as at the end of each financial year. Control is achieved when the Group is exposed, or has rights, to variable returns from its involvement with the investee and has the ability to affect those returns through its power over the investee. Specifically, the Group controls an investee if and only if the Group has:
- Power over the investee (i.e. existing rights that give it the current ability to direct the relevant activities of the investee);
- Exposure, or rights, to variable returns from its involvement with the investee, and
- The ability to use its power over the investee to affect its returns.
When the Group has less than a majority of the voting or similar rights of an investee, the Group considers all relevant facts and circumstances in assessing whether it has power over an investee, including:
- The contractual arrangement with the other vote holders of the investee;
- Rights arising from other contractual arrangements;
- The Group’s voting rights and potential voting rights.
NOTES TO THE FINANCIAL STATEMENTS FOR THE 53 WEEKS ENDED 30 JULY 2016 AND THE 52 WEEKS ENDED 25 JULY 2015 (CONTINUED) 2 STATEMENT OF SIGNIFICANT ACCOUNTING POLICIES (CONTINUED)
50
(e) BASIS OF CONSOLIDATION (CONTINUED)
The Group re-assesses whether or not it controls an investee if facts and circumstances indicate that there are changes to one or more of the three elements of control. Consolidation of a subsidiary begins when the Group obtains control over the subsidiary and ceases when the Group loses control of the subsidiary.
Assets, liabilities, income and expenses of a subsidiary acquired or disposed of during the year are included in the consolidated financial statements from the date the Group gains control until the date the Group ceases to control the subsidiary.
Profit or loss and each component of other comprehensive income are attributed to the equity holders of the parent of the Group and to the non-controlling interest, even if this results in the non-controlling interests having a deficit balance. When necessary, adjustments are made to the financial statements of subsidiaries to bring their accounting policies into line with the Group’s accounting policies. All intra-group assets and liabilities, equity, income, expenses and cash flows relating to transactions between members of the Group are eliminated in full on consolidation.
Investments in subsidiaries held by Premier Investments Limited are accounted for at cost in the separate financial statements of the parent entity less any impairment losses. Dividends received from subsidiaries are recorded as a component of other revenues in the separate income statement of the parent entity, and do not impact the recorded cost of the investment.
A change in ownership interest of a subsidiary, without a loss of control, is accounted for as an equity transaction. If the Group loses control over a subsidiary, it:
- De-recognises the assets (including goodwill) and liabilities of the subsidiary;
- De-recognises the carrying amount of any non-controlling interests;
- De-recognises the cumulative translation differences recorded in equity;
- Recognises the fair value of the consideration received and of any investment retained,
- Recognises the surplus or deficit in profit or loss;
- Reclassifies the parent’s share of components previously recognised in other comprehensive income to profit or loss or retained earnings, as appropriate, as would be required if the Group had directly disposed of the related assets or liabilities.
(f) INVESTMENT IN ASSOCIATES
An associate is an entity over which the Group has significant influence. Significant influence is the power to participate in the financial and operating policy decisions of the investee, but is not control or joint control over those policies.
The considerations made in determining significant influence are similar to those necessary to determine control over subsidiaries.
The Group’s investments in its associates are accounted for using the equity method of accounting in the consolidated financial statements.
For
per
sona
l use
onl
y
Annual Report 2016 50
NOTES TO THE FINANCIAL STATEMENTS FOR THE 53 WEEKS ENDED 30 JULY 2016 AND THE 52 WEEKS ENDED 25 JULY 2015 (CONTINUED) 2 STATEMENT OF SIGNIFICANT ACCOUNTING POLICIES (CONTINUED)
50
(e) BASIS OF CONSOLIDATION (CONTINUED)
The Group re-assesses whether or not it controls an investee if facts and circumstances indicate that there are changes to one or more of the three elements of control. Consolidation of a subsidiary begins when the Group obtains control over the subsidiary and ceases when the Group loses control of the subsidiary.
Assets, liabilities, income and expenses of a subsidiary acquired or disposed of during the year are included in the consolidated financial statements from the date the Group gains control until the date the Group ceases to control the subsidiary.
Profit or loss and each component of other comprehensive income are attributed to the equity holders of the parent of the Group and to the non-controlling interest, even if this results in the non-controlling interests having a deficit balance. When necessary, adjustments are made to the financial statements of subsidiaries to bring their accounting policies into line with the Group’s accounting policies. All intra-group assets and liabilities, equity, income, expenses and cash flows relating to transactions between members of the Group are eliminated in full on consolidation.
Investments in subsidiaries held by Premier Investments Limited are accounted for at cost in the separate financial statements of the parent entity less any impairment losses. Dividends received from subsidiaries are recorded as a component of other revenues in the separate income statement of the parent entity, and do not impact the recorded cost of the investment.
A change in ownership interest of a subsidiary, without a loss of control, is accounted for as an equity transaction. If the Group loses control over a subsidiary, it:
- De-recognises the assets (including goodwill) and liabilities of the subsidiary;
- De-recognises the carrying amount of any non-controlling interests;
- De-recognises the cumulative translation differences recorded in equity;
- Recognises the fair value of the consideration received and of any investment retained,
- Recognises the surplus or deficit in profit or loss;
- Reclassifies the parent’s share of components previously recognised in other comprehensive income to profit or loss or retained earnings, as appropriate, as would be required if the Group had directly disposed of the related assets or liabilities.
(f) INVESTMENT IN ASSOCIATES
An associate is an entity over which the Group has significant influence. Significant influence is the power to participate in the financial and operating policy decisions of the investee, but is not control or joint control over those policies.
The considerations made in determining significant influence are similar to those necessary to determine control over subsidiaries.
The Group’s investments in its associates are accounted for using the equity method of accounting in the consolidated financial statements.
For
per
sona
l use
onl
y

51 Premier Investments Limited
NOTES TO THE FINANCIAL STATEMENTS FOR THE 53 WEEKS ENDED 30 JULY 2016 AND THE 52 WEEKS ENDED 25 JULY 2015 (CONTINUED) 2 STATEMENT OF SIGNIFICANT ACCOUNTING POLICIES (CONTINUED)
51
(f) INVESTMENT IN ASSOCIATES (CONTINUED)
Under the equity method, investments in the associates are initially recognised at cost. The carrying amount of the investment is adjusted to recognise changes in the Group’s share of net assets of the associate since the acquisition date. Goodwill relating to an associate is included in the carrying amount of the investment and is not amortised. After application of the equity method, the Group determines whether it is necessary to recognise any impairment loss with respect to the Group’s net investment in the associate.
The Group’s share of profit or loss of an associate is recognised in the statement of comprehensive income and represents profit or loss after tax and non-controlling interest in the subsidiaries of the associate. When there has been a change recognised directly in the equity of the associate, the Group recognises its share of any change, when applicable, in the statement of changes in equity. Dividends receivable from the associate is recognised in the parent entity’s statement of comprehensive income, while in the consolidated financial statements they reduce the carrying amount of the investment.
When the Group’s share of losses in an associate equals or exceeds its interest in the associate, including any unsecured long-term receivables and loans, the Group does not recognise further losses, unless it has incurred obligations or made payments on behalf of the associate.
After application of the equity method, the Group determines whether it is necessary to recognise an impairment loss on its investment in associates. At each reporting period, the Group determines whether there is objective evidence that the investment in associate is impaired. If there is such evidence, the Group calculates the amount of impairment as the difference between the recoverable amount of the associate and its carrying value, then recognises the loss in the statement of comprehensive income.
Upon loss of significant influence over the associate, the Group measures and recognises any retained investment at its fair value. Any differences between the carrying amount of the associate upon loss of significant influence and the fair value of the retained investment and proceeds from disposal is recognised in profit or loss.
The reporting date of the associates are currently 30 June and the associates’ accounting policies materially conform to those used by the Group for like transactions and events in similar circumstances.
(g) BUSINESS COMBINATIONS
Business combinations are accounted for using the acquisition method. The consideration transferred in a business combination shall be measured at fair value, which shall be calculated as the sum of the acquisition-date fair values of the assets transferred by the acquirer, the liabilities incurred by the acquirer to former owners of the acquiree and the equity issued by the acquirer, and the amount of any non-controlling interest in the acquiree either at fair value or at the proportionate share of the acquiree’s identifiable net assets. Acquisition-related costs are expensed as incurred.
When the Group acquires a business, it assesses the financial assets and liabilities assumed for appropriate classification and designation in accordance with the contractual terms, economic conditions, the Group’s operating and accounting policies and other pertinent conditions as at the acquisition date. This includes the separation of embedded derivatives in host contracts by the acquiree.
NOTES TO THE FINANCIAL STATEMENTS FOR THE 53 WEEKS ENDED 30 JULY 2016 AND THE 52 WEEKS ENDED 25 JULY 2015 (CONTINUED) 2 STATEMENT OF SIGNIFICANT ACCOUNTING POLICIES (CONTINUED)
52
(g) BUSINESS COMBINATIONS (CONTINUED)
If the business combination is achieved in stages, the acquisition date fair value of the acquirer’s previously held equity interest in the acquiree is remeasured at fair value as at the acquisition date through profit or loss.
Any contingent consideration to be transferred by the acquirer will be recognised at fair value at the acquisition date. Subsequent changes to the fair value of the contingent consideration which is deemed to be an asset or liability will be recognised in accordance with AASB 139 either in profit or loss or in other comprehensive income. If the contingent consideration is to be classified as equity, it should not be remeasured until it is finally settled within equity.
(h) CURRENT VERSUS NON-CURRENT CLASSIFICATION
The Group presents assets and liabilities in the statement of financial position based on current/non-current classification. An asset is current when it is:
- Expected to be realised or intended to be sold in the normal operating cycle, or primarily held for the purpose of trading, or is expected to be realised within twelve months after the reporting period, or;
- Cash and cash equivalents unless restricted from being exchanged or used to settle a liability for at least twelve months after the reporting period.
All other assets are classified as non-current. A liability is current when it is:
- Expected to be settled in the normal operating cycle, or primarily held for the purpose of trading, or is due to be settled within twelve months after the reporting period, or;
- There is no unconditional right to defer the settlement of the liability for at least twelve months after the reporting period.
All other liabilities are classified as non-current. Deferred tax assets and liabilities are classified as non-current.
(i) OPERATING SEGMENTS
The Group determines and presents operating segments based on the information that is internally provided and used by the chief operating decision maker in assessing the performance of the entity and in determining the allocation of resources.
An operating segment is a component of the Group that engages in business activities from which it may earn revenues and incur expenses, including revenues and expenses that relate to transactions with any of the Group’s other components. All operating segments’ operating results are regularly reviewed by the chief operating decision maker to make decisions about resources to be allocated to the segment and assess its performance, and for which discreet financial information is available.
Segment results that are reported to the chief operating decision maker include items directly attributable to a segment as well as those that can be allocated on a reasonable basis. Unallocated items comprise mainly of corporate assets, head office expenses and income tax assets and liabilities.
Segment capital expenditure is the total cost incurred during the period to acquire property, plant and equipment, and intangible assets other than goodwill.
For
per
sona
l use
onl
y
Annual Report 2016 52
NOTES TO THE FINANCIAL STATEMENTS FOR THE 53 WEEKS ENDED 30 JULY 2016 AND THE 52 WEEKS ENDED 25 JULY 2015 (CONTINUED) 2 STATEMENT OF SIGNIFICANT ACCOUNTING POLICIES (CONTINUED)
52
(g) BUSINESS COMBINATIONS (CONTINUED)
If the business combination is achieved in stages, the acquisition date fair value of the acquirer’s previously held equity interest in the acquiree is remeasured at fair value as at the acquisition date through profit or loss.
Any contingent consideration to be transferred by the acquirer will be recognised at fair value at the acquisition date. Subsequent changes to the fair value of the contingent consideration which is deemed to be an asset or liability will be recognised in accordance with AASB 139 either in profit or loss or in other comprehensive income. If the contingent consideration is to be classified as equity, it should not be remeasured until it is finally settled within equity.
(h) CURRENT VERSUS NON-CURRENT CLASSIFICATION
The Group presents assets and liabilities in the statement of financial position based on current/non-current classification. An asset is current when it is:
- Expected to be realised or intended to be sold in the normal operating cycle, or primarily held for the purpose of trading, or is expected to be realised within twelve months after the reporting period, or;
- Cash and cash equivalents unless restricted from being exchanged or used to settle a liability for at least twelve months after the reporting period.
All other assets are classified as non-current. A liability is current when it is:
- Expected to be settled in the normal operating cycle, or primarily held for the purpose of trading, or is due to be settled within twelve months after the reporting period, or;
- There is no unconditional right to defer the settlement of the liability for at least twelve months after the reporting period.
All other liabilities are classified as non-current. Deferred tax assets and liabilities are classified as non-current.
(i) OPERATING SEGMENTS
The Group determines and presents operating segments based on the information that is internally provided and used by the chief operating decision maker in assessing the performance of the entity and in determining the allocation of resources.
An operating segment is a component of the Group that engages in business activities from which it may earn revenues and incur expenses, including revenues and expenses that relate to transactions with any of the Group’s other components. All operating segments’ operating results are regularly reviewed by the chief operating decision maker to make decisions about resources to be allocated to the segment and assess its performance, and for which discreet financial information is available.
Segment results that are reported to the chief operating decision maker include items directly attributable to a segment as well as those that can be allocated on a reasonable basis. Unallocated items comprise mainly of corporate assets, head office expenses and income tax assets and liabilities.
Segment capital expenditure is the total cost incurred during the period to acquire property, plant and equipment, and intangible assets other than goodwill.
For
per
sona
l use
onl
y

53 Premier Investments Limited
NOTES TO THE FINANCIAL STATEMENTS FOR THE 53 WEEKS ENDED 30 JULY 2016 AND THE 52 WEEKS ENDED 25 JULY 2015 (CONTINUED) 2 STATEMENT OF SIGNIFICANT ACCOUNTING POLICIES (CONTINUED)
53
(j) FOREIGN CURRENCY TRANSLATION
Items included in the financial statements of each of the Group’s entities are measured using the currency of the primary economic environment in which the entity operates (‘the functional currency’). Both the functional and presentation currency of Premier Investments Limited and its Australian subsidiaries is Australian dollars.
Transactions in foreign currencies are initially recorded in the functional currency by applying the exchange rates ruling at the date of the transaction. Monetary assets and liabilities denominated in foreign currencies are retranslated at the rate of exchange ruling at the reporting date. All exchange differences in the consolidated financial report are taken to profit or loss in the statement of comprehensive income.
As at the reporting date the assets and liabilities of the overseas subsidiary are translated into the presentation currency of Premier Investments Limited at the rate of exchange ruling at the reporting date and the statements of comprehensive incomes are translated at the weighted average exchange rates for the period.
Exchange variations resulting from the translation are recognised in the foreign currency translation reserve in equity.
(k) CASH AND CASH EQUIVALENTS
Cash and cash equivalents in the statement of financial position comprise cash on hand and in banks, money market investments readily convertible to cash within two working days and short-term deposits with an original maturity of three months or less that are readily convertible to known amounts of cash and which are subject to an insignificant risk of changes in value.
For the purposes of the statement of cash flows, cash and cash equivalents consist of cash and cash equivalents as defined above, net of outstanding bank overdrafts.
(l) INVENTORIES
Inventories are valued at the lower of cost and net realisable value.
Costs incurred in bringing each product to its present location and conditions are accounted for as follows:
- Raw materials - purchase cost on a first-in, first-out basis;
- Finished goods and work-in-progress - purchase cost plus a proportion of the purchasing department, freight, handling and warehouse costs incurred to deliver the goods to the point of sale.
Net realisable value is the estimated selling price in the ordinary course of business, less the estimated direct costs necessary to make the sale.
NOTES TO THE FINANCIAL STATEMENTS FOR THE 53 WEEKS ENDED 30 JULY 2016 AND THE 52 WEEKS ENDED 25 JULY 2015 (CONTINUED) 2 STATEMENT OF SIGNIFICANT ACCOUNTING POLICIES (CONTINUED)
54
(m) PROPERTY, PLANT AND EQUIPMENT
Property, Plant and equipment is stated at historical cost less accumulated depreciation and any accumulated impairment losses. Depreciation is calculated on a straight-line basis over the estimated useful life of the asset as follows:
- Buildings 40 years
- Store plant and equipment 3 to 10 years
- Leased plant and equipment 2 to 5 years
- Other plant and equipment 2 to 20 years
Freehold land is not depreciated.
The carrying values of property, plant and equipment are reviewed for impairment annually for events or changes in circumstances that may indicate the carrying value may not be recoverable. For an asset that does not generate largely independent cash inflows, the recoverable amount is determined for the cash-generating unit to which the asset belongs.
If an indication of impairment exists, and where the carrying values exceed the estimated recoverable amount, the assets or cash-generating units are written down to their recoverable amount.
The recoverable amount of property, plant and equipment is the greater of fair value less costs of disposal and value-in-use. In assessing value-in-use, the estimated future cash flows are discounted to their present value using a discount rate that reflects current market assessments of the time value of money and the risks specific to the assets.
(n) GOODWILL
Goodwill acquired in a business combination is initially measured at cost, being the excess of the cost of the business combination over the Group’s interest in the net fair value of the acquiree’s identifiable assets, liabilities and contingent liabilities. Following initial recognition, goodwill is measured at cost less any accumulated impairment losses.
Goodwill is reviewed for impairment annually or more frequently if events or changes in circumstances indicate that the carrying value may be impaired. For the purposes of assessing impairment, goodwill acquired in a business combination is, from the date of acquisition, allocated to each of the Group’s cash-generating units that are expected to benefit from the synergies of the combination. Impairment is determined by assessing the recoverable amount of the cash-generating unit to which the goodwill relates.
Where the recoverable amount of the cash-generating unit is less than the carrying amount, an impairment loss is recognised.
Impairment losses recognised for goodwill are not subsequently reversed.
For
per
sona
l use
onl
y

Annual Report 2016 54
NOTES TO THE FINANCIAL STATEMENTS FOR THE 53 WEEKS ENDED 30 JULY 2016 AND THE 52 WEEKS ENDED 25 JULY 2015 (CONTINUED) 2 STATEMENT OF SIGNIFICANT ACCOUNTING POLICIES (CONTINUED)
54
(m) PROPERTY, PLANT AND EQUIPMENT
Property, Plant and equipment is stated at historical cost less accumulated depreciation and any accumulated impairment losses. Depreciation is calculated on a straight-line basis over the estimated useful life of the asset as follows:
- Buildings 40 years
- Store plant and equipment 3 to 10 years
- Leased plant and equipment 2 to 5 years
- Other plant and equipment 2 to 20 years
Freehold land is not depreciated.
The carrying values of property, plant and equipment are reviewed for impairment annually for events or changes in circumstances that may indicate the carrying value may not be recoverable. For an asset that does not generate largely independent cash inflows, the recoverable amount is determined for the cash-generating unit to which the asset belongs.
If an indication of impairment exists, and where the carrying values exceed the estimated recoverable amount, the assets or cash-generating units are written down to their recoverable amount.
The recoverable amount of property, plant and equipment is the greater of fair value less costs of disposal and value-in-use. In assessing value-in-use, the estimated future cash flows are discounted to their present value using a discount rate that reflects current market assessments of the time value of money and the risks specific to the assets.
(n) GOODWILL
Goodwill acquired in a business combination is initially measured at cost, being the excess of the cost of the business combination over the Group’s interest in the net fair value of the acquiree’s identifiable assets, liabilities and contingent liabilities. Following initial recognition, goodwill is measured at cost less any accumulated impairment losses.
Goodwill is reviewed for impairment annually or more frequently if events or changes in circumstances indicate that the carrying value may be impaired. For the purposes of assessing impairment, goodwill acquired in a business combination is, from the date of acquisition, allocated to each of the Group’s cash-generating units that are expected to benefit from the synergies of the combination. Impairment is determined by assessing the recoverable amount of the cash-generating unit to which the goodwill relates.
Where the recoverable amount of the cash-generating unit is less than the carrying amount, an impairment loss is recognised.
Impairment losses recognised for goodwill are not subsequently reversed.
For
per
sona
l use
onl
y

55 Premier Investments Limited
NOTES TO THE FINANCIAL STATEMENTS FOR THE 53 WEEKS ENDED 30 JULY 2016 AND THE 52 WEEKS ENDED 25 JULY 2015 (CONTINUED) 2 STATEMENT OF SIGNIFICANT ACCOUNTING POLICIES (CONTINUED)
55
(o) INTANGIBLE ASSETS (excluding goodwill)
Intangible assets acquired separately or in a business combination are initially measured at cost. The cost of an intangible asset acquired in a business combination is its fair value as at the date of acquisition. Following initial recognition, intangible assets are carried at cost less any accumulated amortisation and any accumulated impairment losses.
The useful lives of intangible assets are assessed as either finite or indefinite.
Intangible assets are tested for impairment where an indicator of impairment exists, and in the case of intangibles with indefinite lives impairment is tested annually or where an indicator of impairment exists, either individually or at the cash-generating unit level.
Where the carrying amount of an intangible asset exceeds its recoverable amount, the asset is considered impaired and is written down to its recoverable amount. The recoverable amount is the asset’s value-in-use.
The recoverable amount is determined for an individual asset, unless the asset’s value-in-use cannot be estimated to be close to its fair value, less costs of disposal and it does not generate cash inflows that are largely independent of those from other assets or groups of assets, in which case, the recoverable amount is determined for the cash-generating unit to which the asset belongs.
In assessing value-in-use, the estimated future cash flows are discounted to their present value using a post-tax discount rate that reflects current market assessments of the time-value of money and the risks specific to the asset.
A summary of the policies applied to the Group’s intangible assets is as follows:
Brands Premiums paid on acquisition of
leaseholds
Trademarks & Licences
Useful life Indefinite Finite Indefinite
Method used Not amortised or
revalued Amortised over the term of the lease
Not amortised or revalued
Internally generated/acquired
Acquired Acquired Acquired
Impairment test/recoverable amount testing
Annually; for indicators of impairment
Amortisation method reviewed at each
financial year end; reviewed annually
for indicators of impairment
Annually; for indicators of impairment
NOTES TO THE FINANCIAL STATEMENTS FOR THE 53 WEEKS ENDED 30 JULY 2016 AND THE 52 WEEKS ENDED 25 JULY 2015 (CONTINUED) 2 STATEMENT OF SIGNIFICANT ACCOUNTING POLICIES (CONTINUED)
56
(p) OTHER FINANCIAL ASSETS
A financial instrument is any contract that gives rise to a financial asset of one entity and a financial liability or equity instrument of another entity.
All financial assets are recognised initially at fair value plus, in the case of financial assets not recorded at fair value through profit or loss, transaction costs that are attributable to the acquisition of the financial asset.
(i) Loans and Receivables
Loans and receivables are non-derivative financial assets with fixed or determinable payments that are not quoted in an active market. After initial measurement, such assets are recognised at cost and amortised using the effective interest method. Gains and losses are recognised in profit or loss when the loans and receivables are derecognised or impaired.
(ii) Financial assets at fair value through profit or loss
Financial assets at fair value through profit or loss include financial assets held for trading and financial assets designated upon initial recognition at fair value through profit or loss. Financial assets are classified as held for trading if they are acquired for the purpose of selling or repurchasing in the near term. Derivatives, including separated embedded derivatives are also classified as held for trading unless they are designated as effective hedging instruments as defined by AASB 139.
Financial assets at fair value through profit or loss are carried in the statement of financial position at fair value with net changes in fair value recognised in profit or loss.
(q) OTHER FINANCIAL LIABILITIES
All financial liabilities are recognised initially at fair value and, in the case of loans and borrowings and payables, net of directly attributable transaction costs.
(i) Trade and other payables
Liabilities for trade creditors and other amounts are recognised and carried at original invoice cost, which is the fair value of the consideration to be paid in the future for goods and services received whether or not billed to the consolidated entity.
Trade liabilities are normally settled on terms of between 7 and 90 days.
(ii) Loans and borrowings
All loans, borrowings and interest-bearing payables are initially recognised at the fair value of the consideration received net of issue costs associated with the borrowing.
After initial recognition, such items are subsequently measured at amortised cost using the effective interest method. Amortised cost is calculated by taking into account any issue costs, and any discount or premium on settlement.
Fees paid on the establishment of loan facilities are amortised over the life of the facility. On-going borrowing costs are expensed as incurred.
For
per
sona
l use
onl
y
Annual Report 2016 56
NOTES TO THE FINANCIAL STATEMENTS FOR THE 53 WEEKS ENDED 30 JULY 2016 AND THE 52 WEEKS ENDED 25 JULY 2015 (CONTINUED) 2 STATEMENT OF SIGNIFICANT ACCOUNTING POLICIES (CONTINUED)
56
(p) OTHER FINANCIAL ASSETS
A financial instrument is any contract that gives rise to a financial asset of one entity and a financial liability or equity instrument of another entity.
All financial assets are recognised initially at fair value plus, in the case of financial assets not recorded at fair value through profit or loss, transaction costs that are attributable to the acquisition of the financial asset.
(i) Loans and Receivables
Loans and receivables are non-derivative financial assets with fixed or determinable payments that are not quoted in an active market. After initial measurement, such assets are recognised at cost and amortised using the effective interest method. Gains and losses are recognised in profit or loss when the loans and receivables are derecognised or impaired.
(ii) Financial assets at fair value through profit or loss
Financial assets at fair value through profit or loss include financial assets held for trading and financial assets designated upon initial recognition at fair value through profit or loss. Financial assets are classified as held for trading if they are acquired for the purpose of selling or repurchasing in the near term. Derivatives, including separated embedded derivatives are also classified as held for trading unless they are designated as effective hedging instruments as defined by AASB 139.
Financial assets at fair value through profit or loss are carried in the statement of financial position at fair value with net changes in fair value recognised in profit or loss.
(q) OTHER FINANCIAL LIABILITIES
All financial liabilities are recognised initially at fair value and, in the case of loans and borrowings and payables, net of directly attributable transaction costs.
(i) Trade and other payables
Liabilities for trade creditors and other amounts are recognised and carried at original invoice cost, which is the fair value of the consideration to be paid in the future for goods and services received whether or not billed to the consolidated entity.
Trade liabilities are normally settled on terms of between 7 and 90 days.
(ii) Loans and borrowings
All loans, borrowings and interest-bearing payables are initially recognised at the fair value of the consideration received net of issue costs associated with the borrowing.
After initial recognition, such items are subsequently measured at amortised cost using the effective interest method. Amortised cost is calculated by taking into account any issue costs, and any discount or premium on settlement.
Fees paid on the establishment of loan facilities are amortised over the life of the facility. On-going borrowing costs are expensed as incurred.
For
per
sona
l use
onl
y

57 Premier Investments Limited
NOTES TO THE FINANCIAL STATEMENTS FOR THE 53 WEEKS ENDED 30 JULY 2016 AND THE 52 WEEKS ENDED 25 JULY 2015 (CONTINUED) 2 STATEMENT OF SIGNIFICANT ACCOUNTING POLICIES (CONTINUED)
57
(q) OTHER FINANCIAL LIABILITIES (CONTINUED)
(iii) Offsetting of financial instruments
Financial assets and financial liabilities are offset and the net amount is reported in the consolidated statement of financial position if there is a currently enforceable legal right to offset the recognised amounts and there is an intention to settle on a net basis, or to realise the assets and settle the liabilities simultaneously.
(r) DERIVATIVE FINANCIAL INSTRUMENTS AND HEDGING
The Group uses derivative financial instruments (including forward currency contracts and foreign exchange options) to hedge its risks associated with foreign currency fluctuations. Such derivative financial instruments are initially recognised at fair value on the date on which the derivative contract is entered into and are subsequently remeasured at fair value. Any derivative financial instruments acquired through business combinations are re-designated.
Derivatives are carried as financial assets when their fair value is positive and as financial liabilities when their fair value is negative. Any gains or losses arising from changes in the fair value of derivatives, except for those that qualify as cash flow hedges and are considered to be effective, are taken directly to profit or loss for the period.
Cash flow hedges
Cash flow hedges are hedges of the Group’s exposure to variability in cash flows that is attributable to a particular risk associated with a recognised asset or liability that is a firm commitment and that could affect the statement of comprehensive income. The Group’s cash flow hedges that meet the strict criteria for hedge accounting are accounted for by recognising the effective portion of the gain or loss on the hedging instrument directly in other comprehensive income and accumulated in the cash flow hedge reserve in equity, while the ineffective portion is recognised in profit or loss. Amounts taken to equity are reclassified out of equity and included in the measurement of the hedge transaction (finance costs or inventory purchases) when the forecast transaction occurs.
The Group tests each of the designated cash flow hedges for effectiveness on an ongoing basis both retrospectively and prospectively using the ratio offset method. If the testing falls within the 80% to 125% range, the hedge is considered to be highly effective and continues to be designated as a cash flow hedge.
At each reporting date, the Group measures ineffectiveness using the ratio offset method. For foreign currency cash flow hedges if the risk is over-hedged, the ineffective portion is taken immediately to other income/expense in the statement of comprehensive income.
If the forecast transaction is no longer expected to occur, amounts recognised in equity are reclassified to profit or loss in the statement of comprehensive income.
If the hedging instrument expires or is sold, terminated or exercised without replacement or rollover, or if its designation as a hedge is revoked (due to being ineffective), amounts previously recognised in equity remain in equity until the forecast transaction occurs.
NOTES TO THE FINANCIAL STATEMENTS FOR THE 53 WEEKS ENDED 30 JULY 2016 AND THE 52 WEEKS ENDED 25 JULY 2015 (CONTINUED) 2 STATEMENT OF SIGNIFICANT ACCOUNTING POLICIES (CONTINUED)
58
(s) BORROWING COSTS
Borrowing costs directly attributable to the acquisition, construction or production of an asset that necessarily takes a substantial period of time to get ready for its intended use are capitalised as part of the cost of the asset. All other borrowing costs are expensed in the period in which they occur. Borrowing costs consist of interest and other costs that an entity incurs in connection with the borrowing of the funds.
(t) LEASES
Finance leases, which transfer to the Group substantially all the risks and benefits incidental to ownership of the leased item, are capitalised at the inception of the lease at the fair value of the leased asset or, if lower, at the present value of the minimum lease payments.
Lease payments are apportioned between the finance charges and reduction of the lease liability so as to achieve a constant rate of interest on the remaining balance of the liability. Finance charges are recognised as an expense in profit or loss.
Capitalised leased assets are depreciated over the shorter of the estimated useful life of the asset and the lease term if there is no reasonable certainty that the Group will obtain ownership by the end of the lease term.
Operating lease payments are recognised as an expense in profit or loss on a straight-line basis over the lease term. Operating lease incentives are recognised as a liability when received and subsequently reduced by allocating lease payments between rental expense and reduction of the liability.
(u) PROVISIONS
Provisions are recognised when the Group has a present obligation (legal or constructive) as a result of a past event, it is probable that an outflow of resources embodying economic benefits will be required to settle the obligation and a reliable estimate can be made of the amount of the obligation.
If the effect of the time-value of money is material, provisions are determined by discounting the expected future cash flows at a pre-tax rate that reflects current market assessments of the time-value of money and, where appropriate, the risks specific to the liability. Where discounting is used, the increase in the provision due to the passage of time is recognised as a finance cost.
(v) ONEROUS LEASE PROVISIONS
A provision for onerous contracts is recognised when the expected benefits to be derived by the Group from the contract are lower than the unavoidable cost of meeting its obligations under the contract. The provision is measured at the present value of the lower of the expected cost of terminating the contract and the expected net unavoidable costs of continuing with the contract. Before a provision is established, the Group recognises any impairment loss on the assets associated with the contract.
For
per
sona
l use
onl
y

Annual Report 2016 58
NOTES TO THE FINANCIAL STATEMENTS FOR THE 53 WEEKS ENDED 30 JULY 2016 AND THE 52 WEEKS ENDED 25 JULY 2015 (CONTINUED) 2 STATEMENT OF SIGNIFICANT ACCOUNTING POLICIES (CONTINUED)
58
(s) BORROWING COSTS
Borrowing costs directly attributable to the acquisition, construction or production of an asset that necessarily takes a substantial period of time to get ready for its intended use are capitalised as part of the cost of the asset. All other borrowing costs are expensed in the period in which they occur. Borrowing costs consist of interest and other costs that an entity incurs in connection with the borrowing of the funds.
(t) LEASES
Finance leases, which transfer to the Group substantially all the risks and benefits incidental to ownership of the leased item, are capitalised at the inception of the lease at the fair value of the leased asset or, if lower, at the present value of the minimum lease payments.
Lease payments are apportioned between the finance charges and reduction of the lease liability so as to achieve a constant rate of interest on the remaining balance of the liability. Finance charges are recognised as an expense in profit or loss.
Capitalised leased assets are depreciated over the shorter of the estimated useful life of the asset and the lease term if there is no reasonable certainty that the Group will obtain ownership by the end of the lease term.
Operating lease payments are recognised as an expense in profit or loss on a straight-line basis over the lease term. Operating lease incentives are recognised as a liability when received and subsequently reduced by allocating lease payments between rental expense and reduction of the liability.
(u) PROVISIONS
Provisions are recognised when the Group has a present obligation (legal or constructive) as a result of a past event, it is probable that an outflow of resources embodying economic benefits will be required to settle the obligation and a reliable estimate can be made of the amount of the obligation.
If the effect of the time-value of money is material, provisions are determined by discounting the expected future cash flows at a pre-tax rate that reflects current market assessments of the time-value of money and, where appropriate, the risks specific to the liability. Where discounting is used, the increase in the provision due to the passage of time is recognised as a finance cost.
(v) ONEROUS LEASE PROVISIONS
A provision for onerous contracts is recognised when the expected benefits to be derived by the Group from the contract are lower than the unavoidable cost of meeting its obligations under the contract. The provision is measured at the present value of the lower of the expected cost of terminating the contract and the expected net unavoidable costs of continuing with the contract. Before a provision is established, the Group recognises any impairment loss on the assets associated with the contract.
For
per
sona
l use
onl
y

59 Premier Investments Limited
NOTES TO THE FINANCIAL STATEMENTS FOR THE 53 WEEKS ENDED 30 JULY 2016 AND THE 52 WEEKS ENDED 25 JULY 2015 (CONTINUED) 2 STATEMENT OF SIGNIFICANT ACCOUNTING POLICIES (CONTINUED)
59
(w) SUPPLY CHAIN TRANSFORMATION PROVISIONS
Restructuring provisions are only recognised when general recognition criteria for provisions are fulfilled. Additionally, the Group needs to follow a detailed formal plan about the business or part of the business concerned, the location and number of employees affected, a detailed estimate of the associated costs, and appropriate time line. The people affected have a valid expectation that the restructuring is being carried out or the implementation has been initiated already.
(x) EMPLOYEE BENEFITS
(i) Wages, salaries and current annual leave
The provisions for employee entitlements to wages, salaries and annual leave (which is expected to be settled wholly within 12 months of the reporting date) represent the amount which the Group has a present obligation to pay, resulting from employees’ services provided up to the reporting date. The provisions have been calculated at nominal amounts based on current wage and salary rates, and include related on-costs.
(ii) Long service leave and non-current annual leave
The liability for long service leave and non-current annual leave (which is not expected to be settled wholly within 12 months of the reporting date) is recognised in the provision for employee benefits and measured as the present value of expected future payments to be made in respect of services provided by employees up to the reporting date. Consideration is given to expected future wage and salary levels, experience of employee departures, and periods of service. Related on-costs have also been included in the liability.
Expected future payments are discounted using market yields at the reporting date on high quality corporate bonds with terms to maturity that match as closely as possible the estimated cash outflow.
(iii) Retirement benefit obligations
All employees of the Group are entitled to benefits from the Group’s superannuation plan on retirement, disability or death. The Group operates a defined contribution plan. Contributions to the plan are recognised as an expense as they become payable. Prepaid contributions are recognised as an asset to the extent that a cash refund or a reduction in the future payment is made available.
(y) DEFERRED LEASE INCENTIVES
Lease incentives are capitalised in the financial statements when received and credited to rent expense over the term of the store lease to which they relate.
(z) DEFERRED RENT
Operating lease expenses are recognised on a straight-line basis over the lease term, which includes the impact of annual fixed rate percentage increases.
NOTES TO THE FINANCIAL STATEMENTS FOR THE 53 WEEKS ENDED 30 JULY 2016 AND THE 52 WEEKS ENDED 25 JULY 2015 (CONTINUED) 2 STATEMENT OF SIGNIFICANT ACCOUNTING POLICIES (CONTINUED)
60
(aa) REVENUE RECOGNITION
Revenue is recognised and measured at the fair value of the consideration received or receivable to the extent it is probable that the economic benefits will flow to the Group and the revenue can be reliably measured. The following specific recognition criteria must also be met before revenue is recognised.
(i) Sale of goods
Revenue from the sale of goods is recognised when the significant risks and rewards of ownership of the goods have passed to the customer. Risks and rewards are considered passed to the customer at the point-of-sale in retail stores and at the time of delivery to catalogue and wholesale customers.
(ii) Interest revenue
Revenue is recognised as interest accrues using the effective interest method. This is a method of calculating the amortised cost of a financial asset and allocating the interest income over the relevant period using the effective interest rate, which is the rate that exactly discounts estimated future cash receipts through the expected life of the financial asset to the net carrying amount of the financial asset.
(iii) Dividends
Revenue is recognised when the Group’s right to receive the payment is established.
(iv) Lay-by sales
The Group has a history of most lay-by sales in retail stores being completed following receipt of an initial deposit. Therefore, the Group has elected to recognise revenue on lay-by sales upon receipt of a deposit.
(v) Gift cards
Revenue from the sale of gift cards is recognised upon redemption of the gift card, or when the card is no longer expected to be redeemed, based on analysis of historical non-redemption rates.
(bb) INCOME TAX
Current tax assets and liabilities for the current and prior periods are measured at the amount expected to be recovered from or paid to the taxation authorities based on the current period’s taxable income. The tax rates and tax laws used to compute the amount are those that are enacted or substantially enacted by the reporting date.
Current income tax relating to items recognised directly in equity is recognised in equity and not in profit or loss. Management periodically evaluates positions taken in the tax returns with respect to situations in which applicable tax regulations are subject to interpretation and establishes provisions where appropriate.
Deferred income tax is provided on all temporary differences at the reporting date between the tax bases of assets and liabilities and their carrying amounts for financial reporting purposes.
For
per
sona
l use
onl
y

Annual Report 2016 60
NOTES TO THE FINANCIAL STATEMENTS FOR THE 53 WEEKS ENDED 30 JULY 2016 AND THE 52 WEEKS ENDED 25 JULY 2015 (CONTINUED) 2 STATEMENT OF SIGNIFICANT ACCOUNTING POLICIES (CONTINUED)
60
(aa) REVENUE RECOGNITION
Revenue is recognised and measured at the fair value of the consideration received or receivable to the extent it is probable that the economic benefits will flow to the Group and the revenue can be reliably measured. The following specific recognition criteria must also be met before revenue is recognised.
(i) Sale of goods
Revenue from the sale of goods is recognised when the significant risks and rewards of ownership of the goods have passed to the customer. Risks and rewards are considered passed to the customer at the point-of-sale in retail stores and at the time of delivery to catalogue and wholesale customers.
(ii) Interest revenue
Revenue is recognised as interest accrues using the effective interest method. This is a method of calculating the amortised cost of a financial asset and allocating the interest income over the relevant period using the effective interest rate, which is the rate that exactly discounts estimated future cash receipts through the expected life of the financial asset to the net carrying amount of the financial asset.
(iii) Dividends
Revenue is recognised when the Group’s right to receive the payment is established.
(iv) Lay-by sales
The Group has a history of most lay-by sales in retail stores being completed following receipt of an initial deposit. Therefore, the Group has elected to recognise revenue on lay-by sales upon receipt of a deposit.
(v) Gift cards
Revenue from the sale of gift cards is recognised upon redemption of the gift card, or when the card is no longer expected to be redeemed, based on analysis of historical non-redemption rates.
(bb) INCOME TAX
Current tax assets and liabilities for the current and prior periods are measured at the amount expected to be recovered from or paid to the taxation authorities based on the current period’s taxable income. The tax rates and tax laws used to compute the amount are those that are enacted or substantially enacted by the reporting date.
Current income tax relating to items recognised directly in equity is recognised in equity and not in profit or loss. Management periodically evaluates positions taken in the tax returns with respect to situations in which applicable tax regulations are subject to interpretation and establishes provisions where appropriate.
Deferred income tax is provided on all temporary differences at the reporting date between the tax bases of assets and liabilities and their carrying amounts for financial reporting purposes.
For
per
sona
l use
onl
y
61 Premier Investments Limited
NOTES TO THE FINANCIAL STATEMENTS FOR THE 53 WEEKS ENDED 30 JULY 2016 AND THE 52 WEEKS ENDED 25 JULY 2015 (CONTINUED) 2 STATEMENT OF SIGNIFICANT ACCOUNTING POLICIES (CONTINUED)
61
(bb) INCOME TAX (CONTINUED)
Deferred income tax liabilities are recognised for all taxable temporary differences except:
- When the deferred income tax liability arises from the initial recognition of an asset or liability in a transaction that is not a business combination and, at the time of the transaction, affects neither the accounting profit nor taxable profit or loss; and
- When the taxable temporary difference is associated with investments in subsidiaries, associates and interests in joint ventures, and the timing of the reversal of the temporary differences can be controlled and it is probable that the temporary differences will not reverse in the foreseeable future.
Deferred income tax assets are recognised for all deductible temporary differences, carry-forward of unused tax credits and unused tax losses, to the extent that it is probable that taxable profit will be available against which the deductible temporary differences, and the carry-forward of unused tax credits and unused tax losses, can be utilised except:
- When the deferred income tax asset relating to the deductible temporary difference arises from the initial recognition of an asset or liability in a transaction that is not a business combination and, at the time of the transaction, affects neither the accounting profit nor taxable profit or loss; and
- Where the deductible temporary difference is associated with investments in subsidiaries, associates and interest in joint ventures, in which case a deferred tax asset is only recognised to the extent that it is probable that the temporary difference will reverse in the foreseeable future and taxable profit will be available against which the temporary difference can be utilised.
The carrying amount of deferred income tax assets is reviewed at each reporting date and reduced to the extent that it is no longer probable that sufficient taxable profit will be available to allow all or part of the deferred income tax asset to be utilised.
Unrecognised deferred income tax assets are reassessed at each reporting date and recognised to the extent that it has become probable that future taxable profit will allow the deferred tax asset to be recovered.
Deferred income tax assets and liabilities are measured at the tax rates that are expected to apply to the year when the asset is realised or the liability is settled, based on tax rates (and tax laws) that have been enacted or substantively enacted at the reporting date.
Deferred tax assets and deferred tax liabilities are offset only if a legally enforceable right exists to set off current tax assets against current tax liabilities and the deferred tax assets and liabilities relate to the same taxable entity and the same taxation authority.
Tax consolidation
Premier Investments Limited and its wholly owned Australian controlled entities have implemented a tax consolidation group. The head entity, Premier Investments Limited and the controlled entities continue to account for their own current and deferred tax amounts. The Group has applied the Group allocation approach to determining the appropriate amount of current taxes and deferred taxes to allocate to members of the tax consolidated group. The agreement provides for the allocation of income tax liabilities between the entities should the head entity default on its tax payment obligations. At reporting date the possibility of default is remote.
NOTES TO THE FINANCIAL STATEMENTS FOR THE 53 WEEKS ENDED 30 JULY 2016 AND THE 52 WEEKS ENDED 25 JULY 2015 (CONTINUED) 2 STATEMENT OF SIGNIFICANT ACCOUNTING POLICIES (CONTINUED)
62
(bb) INCOME TAX (CONTINUED)
In addition to its own current and deferred tax amounts, Premier Investments Limited also recognises the current tax liabilities (or assets) and the deferred tax assets arising from unused tax losses and unused tax credits assumed from controlled entities in the tax consolidated group.
Assets or liabilities arising under tax funding agreements with the tax consolidated entities are recognised as amounts receivable from or payable to other entities in the Group.
(cc) OTHER TAXES
Revenues, expenses and assets are recognised net of the amount of goods and services tax (GST) except:
- When the GST incurred on a purchase of goods and services is not recoverable from the taxation authority, in which case the GST is recognised as part of the cost of acquisition of the asset or as part of the expense item as applicable; and
- Receivables and payables are stated with the amount of GST included.
The net amount of GST recoverable from, or payable to, the taxation authority is included as part of receivables or payables in the statement of financial position.
Cash flows are included in the statement of cash flows on a gross basis and the GST component of cash flows arising from investing and financing activities, which is recoverable from, or payable to, the taxation authority, are classified as operating cash flows.
Commitments and contingencies are disclosed net of the amount of GST recoverable from, or payable to, the taxation authority.
(dd) CONTRIBUTED EQUITY
Ordinary shares are classified as equity. Incremental costs directly attributable to the issue of new shares or options are shown in equity as a deduction, net of tax, from the proceeds.
(ee) EARNINGS PER SHARE
Basic earnings per share are calculated as net profit attributable to members of the parent divided by the weighted average number of ordinary shares.
Diluted earnings per share is calculated as net profit attributable to members of the parent, adjusted for costs of servicing equity, the after tax effect of dividends and interest associated with dilutive potential ordinary shares that have been recognised as expenses, and other non-discretionary changes in revenue or expenses during the period that would result from the dilution of potential ordinary shares, divided by the weighted average number of ordinary shares and dilutive potential ordinary shares.
(ff) SHARE-BASED REMUNERATION SCHEMES
The Group provides benefits to its employees in the form of share-based payments, whereby employees render services in exchange for shares or rights over shares (equity-settled transactions). The plan in place to provide these benefits is a long-term incentive plan known as the performance rights plan (“PRP”).
For
per
sona
l use
onl
y

Annual Report 2016 62
NOTES TO THE FINANCIAL STATEMENTS FOR THE 53 WEEKS ENDED 30 JULY 2016 AND THE 52 WEEKS ENDED 25 JULY 2015 (CONTINUED) 2 STATEMENT OF SIGNIFICANT ACCOUNTING POLICIES (CONTINUED)
62
(bb) INCOME TAX (CONTINUED)
In addition to its own current and deferred tax amounts, Premier Investments Limited also recognises the current tax liabilities (or assets) and the deferred tax assets arising from unused tax losses and unused tax credits assumed from controlled entities in the tax consolidated group.
Assets or liabilities arising under tax funding agreements with the tax consolidated entities are recognised as amounts receivable from or payable to other entities in the Group.
(cc) OTHER TAXES
Revenues, expenses and assets are recognised net of the amount of goods and services tax (GST) except:
- When the GST incurred on a purchase of goods and services is not recoverable from the taxation authority, in which case the GST is recognised as part of the cost of acquisition of the asset or as part of the expense item as applicable; and
- Receivables and payables are stated with the amount of GST included.
The net amount of GST recoverable from, or payable to, the taxation authority is included as part of receivables or payables in the statement of financial position.
Cash flows are included in the statement of cash flows on a gross basis and the GST component of cash flows arising from investing and financing activities, which is recoverable from, or payable to, the taxation authority, are classified as operating cash flows.
Commitments and contingencies are disclosed net of the amount of GST recoverable from, or payable to, the taxation authority.
(dd) CONTRIBUTED EQUITY
Ordinary shares are classified as equity. Incremental costs directly attributable to the issue of new shares or options are shown in equity as a deduction, net of tax, from the proceeds.
(ee) EARNINGS PER SHARE
Basic earnings per share are calculated as net profit attributable to members of the parent divided by the weighted average number of ordinary shares.
Diluted earnings per share is calculated as net profit attributable to members of the parent, adjusted for costs of servicing equity, the after tax effect of dividends and interest associated with dilutive potential ordinary shares that have been recognised as expenses, and other non-discretionary changes in revenue or expenses during the period that would result from the dilution of potential ordinary shares, divided by the weighted average number of ordinary shares and dilutive potential ordinary shares.
(ff) SHARE-BASED REMUNERATION SCHEMES
The Group provides benefits to its employees in the form of share-based payments, whereby employees render services in exchange for shares or rights over shares (equity-settled transactions). The plan in place to provide these benefits is a long-term incentive plan known as the performance rights plan (“PRP”).
For
per
sona
l use
onl
y

63 Premier Investments Limited
NOTES TO THE FINANCIAL STATEMENTS FOR THE 53 WEEKS ENDED 30 JULY 2016 AND THE 52 WEEKS ENDED 25 JULY 2015 (CONTINUED) 2 STATEMENT OF SIGNIFICANT ACCOUNTING POLICIES (CONTINUED)
63
(ff) SHARE-BASED REMUNERATION SCHEMES (CONTINUED)
The cost of these equity-settled transactions with employees is measured by reference to the fair value of the equity instrument at the date at which they are granted.
The cost of equity-settled transactions is recognised in profit or loss, together with a corresponding increase in equity, over the period in which the performance and/or service conditions are fulfilled (the vesting period), ending on the date on which the relevant employees become fully entitled to the award (the vesting date).
At each subsequent reporting date until vesting, the cumulative charge to profit or loss in the statement of comprehensive income is the product of:
(i) The grant date fair value of the award;
(ii) The extent to which the vesting period has expired; and
(iii) The current best estimate of the number of awards that will vest as at the grant date.
The charge to profit and loss for the period is the cumulative amount as calculated above less the amounts already charged in previous periods. There is a corresponding entry to equity.
No expense is recognised for awards that do not ultimately vest, except for equity-settled transactions for which vesting is conditional upon a market or non-vesting condition. These are treated as vested, irrespective of whether or not the market or non-vesting condition is satisfied, provided that all other performance and service conditions are met.
(gg) COMPARATIVES
The current reporting period, 26 July 2015 to 30 July 2016, represents 53 weeks and the comparative reporting period is from 27 July 2014 to 25 July 2015 which represents 52 weeks. From time to time, management may change prior year comparatives to reflect classifications applied in the current year.
NOTES TO THE FINANCIAL STATEMENTS FOR THE 53 WEEKS ENDED 30 JULY 2016 AND THE 52 WEEKS ENDED 25 JULY 2015 (CONTINUED)
3 FINANCIAL RISK MANAGEMENT POLICIES AND OBJECTIVES
64
The Group’s principal financial instruments comprise cash and short-term deposits, derivative financial instruments, receivables, payables, bank overdraft and interest-bearing liabilities.
RISK EXPOSURES AND RESPONSES
The Group manages its exposure to key financial risks in accordance with Board-approved policies which are reviewed annually including liquidity risk, foreign currency risk, interest rate risk and credit risk. The objective of the policy is to support the delivery of the Group’s financial targets whilst protecting future financial security.
The Group uses different methods to measure and manage different types of risks to which it is exposed. These include, monitoring levels of exposure to interest rate and foreign exchange risk and assessment of market forecasts for interest rate and foreign exchange prices. Ageing analyses and monitoring of specific credit allowances are undertaken to manage credit risk. Liquidity risk is monitored through development of future cash flow forecast projections.
Details of the significant accounting policies and methods adopted, including the criteria for recognition, the basis of measurement and the basis on which income and expenses are recognised, in respect of each class of financial asset, financial liability and equity instrument are disclosed in note 2 of the financial statements.
Interest rate risk
The Group’s exposure to market interest rates relates primarily to its cash and cash equivalents that it holds and long term debt obligations.
At reporting date, the Group had the following mix of financial assets and liabilities exposed to variable interest rate risk that are not designated in cash flow hedges:
CONSOLIDATED
NOTES 2016$’000
2015$’000
Financial Assets
Cash 26 283,233 281,572
Other receivables 1,373 2,464
284,606 284,036
Financial Liabilities
Bank loans AUD 16 105,805 86,623
Bank loans (NZD 20.0 million) 16 - 18,018
105,805 104,641
Net Financial Assets 178,801 179,395
F
or p
erso
nal u
se o
nly
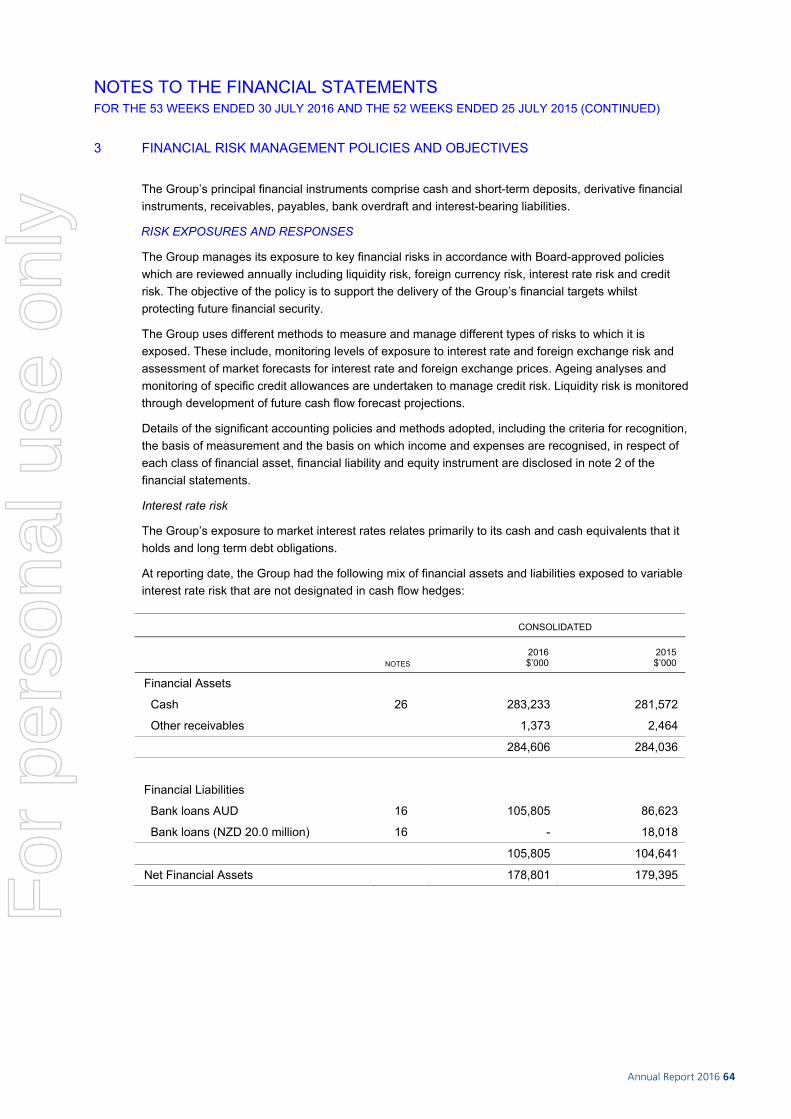
Annual Report 2016 64
NOTES TO THE FINANCIAL STATEMENTS FOR THE 53 WEEKS ENDED 30 JULY 2016 AND THE 52 WEEKS ENDED 25 JULY 2015 (CONTINUED)
3 FINANCIAL RISK MANAGEMENT POLICIES AND OBJECTIVES
64
The Group’s principal financial instruments comprise cash and short-term deposits, derivative financial instruments, receivables, payables, bank overdraft and interest-bearing liabilities.
RISK EXPOSURES AND RESPONSES
The Group manages its exposure to key financial risks in accordance with Board-approved policies which are reviewed annually including liquidity risk, foreign currency risk, interest rate risk and credit risk. The objective of the policy is to support the delivery of the Group’s financial targets whilst protecting future financial security.
The Group uses different methods to measure and manage different types of risks to which it is exposed. These include, monitoring levels of exposure to interest rate and foreign exchange risk and assessment of market forecasts for interest rate and foreign exchange prices. Ageing analyses and monitoring of specific credit allowances are undertaken to manage credit risk. Liquidity risk is monitored through development of future cash flow forecast projections.
Details of the significant accounting policies and methods adopted, including the criteria for recognition, the basis of measurement and the basis on which income and expenses are recognised, in respect of each class of financial asset, financial liability and equity instrument are disclosed in note 2 of the financial statements.
Interest rate risk
The Group’s exposure to market interest rates relates primarily to its cash and cash equivalents that it holds and long term debt obligations.
At reporting date, the Group had the following mix of financial assets and liabilities exposed to variable interest rate risk that are not designated in cash flow hedges:
CONSOLIDATED
NOTES 2016$’000
2015$’000
Financial Assets
Cash 26 283,233 281,572
Other receivables 1,373 2,464
284,606 284,036
Financial Liabilities
Bank loans AUD 16 105,805 86,623
Bank loans (NZD 20.0 million) 16 - 18,018
105,805 104,641
Net Financial Assets 178,801 179,395
F
or p
erso
nal u
se o
nly

65 Premier Investments Limited
NOTES TO THE FINANCIAL STATEMENTS FOR THE 53 WEEKS ENDED 30 JULY 2016 AND THE 52 WEEKS ENDED 25 JULY 2015 (CONTINUED)
3 FINANCIAL RISK MANAGEMENT POLICIES AND OBJECTIVES (CONTINUED)
65
RISK EXPOSURES AND RESPONSES (CONTINUED)
Interest rate risk (Continued)
Interest rate risk is the risk that the fair value or future cash flows of a financial instrument will fluctuate because of changes in market interest rates. The Group’s objective of managing interest rate risk is to minimise the Group’s exposure to fluctuations in interest rates that might impact its interest revenue, interest expense and cash flow. To manage this risk, the Group locks a portion of its cash and cash equivalents into term deposits. The maturity of term deposits is determined based on the Group’s cash flow forecast. The Group manages its interest rate risk relating to long-term debt obligations by having access to both fixed and variable rate debt which can be drawn down.
The Group has conducted a sensitivity analysis of the Group’s exposure to interest rate risk. The sensitivity analysis below has been determined based on the exposure to interest rates from financial instruments at the reporting date and the stipulated change taking place at the beginning of the financial year and being held constant throughout the reporting period, holding all other variables constant. A 100 (2015:100) basis point increase and decrease in Australian interest rates represents management's assessment of the possible change in interest rates. A positive number indicates an increase in profit after tax, whilst a negative number indicates a reduction in profit after tax.
POST-TAX PROFIT
HIGHER/(LOWER)
Judgements of reasonably possible movements: 2016$000
2015$000
CONSOLIDATED
+1.0% (100 basis points) 1,242 1,236
-1.0% (100 basis points) (1,242) (1,236)
The movement in profits are due to lower interest expense and interest income from variable rates and net cash balances.
Significant assumptions used in the interest rate sensitivity analysis include:
Reasonably possible movements in interest rates were determined based on the Group’s current credit rating and mix of debt in Australian and foreign countries, relationships with financial institutions, the level of debt that is expected to be renewed as well as a review of the last two years’ historical movements and economic forecasters’ expectations.
The net exposure at reporting date is representative of what the Group was and is expecting to be exposed to in the next twelve months.
Credit risk
The overwhelming majority of the Group’s sales are on cash or cash equivalent terms with settlement within 24 hours. As such, the Group’s exposure to credit risk is minimal. The Group trades only with recognised, creditworthy third parties. It is the Group’s policy that all customers who wish to trade on credit terms are subject to credit verification procedures. In addition, receivable balances are monitored on an ongoing basis with the result that the Group’s exposure to bad debts is not significant.
There are no significant concentrations of credit risk within the Group and financial instruments are spread amongst a number of financial institutions.
For
per
sona
l use
onl
y

Annual Report 2016 66
NOTES TO THE FINANCIAL STATEMENTS FOR THE 53 WEEKS ENDED 30 JULY 2016 AND THE 52 WEEKS ENDED 25 JULY 2015 (CONTINUED)
3 FINANCIAL RISK MANAGEMENT POLICIES AND OBJECTIVES (CONTINUED)
66
RISK EXPOSURES AND RESPONSES (CONTINUED)
Credit risk (Continued)
With respect to credit risk arising from the other financial assets of the Group, which comprise mainly cash and cash equivalents and certain derivative instruments, the Group’s exposure to credit risk arises from default of the counter party, with a maximum exposure equal to the carrying amount of these instruments. Since the Group trades only with recognised creditworthy third parties, there is no requirement for collateral by either party.
Credit risk for the Group also arises from financial guarantees that members of the Group act as guarantor. At 30 July 2016, the maximum exposure to credit risk of the Group is the amount guaranteed as disclosed in note 34.
Foreign operations
The Group has operations in New Zealand, Singapore and the United Kingdom. As a result, movements in the Australian Dollar and New Zealand Dollar (“AUD/NZD”) exchange rate, Australian Dollar and Singapore Dollar (“AUD/SGD”) exchange rate, and the Australian Dollar and Pound Sterling (“AUD/GBP”) exchange rate affect the Group’s statement of financial position and results from operations. From time to time the Group obtains New Zealand Dollar denominated financing facilities from a financial institution to provide a natural hedge of the Group’s exposure to movements in the AUD/NZD on translation of the New Zealand statement of financial position. In addition, the Group, on occasion, hedges its cash flow exposure to movements in the AUD/NZD. The Group, on occasion, hedges its cash flow exposure in movements in the AUD/SGD and AUD/GBP.
During the 2016 financial year, the Group commenced operations in Malaysia and Hong Kong. As a result, movement in the Australian Dollar and Malaysian Ringgit (“AUD/MYR”) exchange rate, as well as the Australian Dollar and Hong Kong Dollar (“AUD/HKD”) exchange rate may affect the Group’s statement of financial position and results from operations.
Foreign currency transactions
The Group has exposures to foreign currencies principally arising from purchases by operating entities in currencies other than the functional currency. Approximately 70% of the Group’s purchases are denominated in USD, which is not the functional currency of the Australian, New Zealand, Singapore, United Kingdom, Malaysia or Hong Kong operating entities.
The Group considers its exposure to USD arising from the purchases of inventory to be a long-term and ongoing exposure. In order to protect against exchange rate movements, the Group enters into forward exchange contracts to purchase US Dollars.
The Group’s foreign currency risk management policy provides guidelines for the term over which foreign currency hedging will be undertaken for part or all of the risk. This term cannot exceed two years. Factors taken into account include:
- the implied market volatility for the currency exposure being hedged and the cost of hedging, relative to long-term indicators;
- the level of the Australian Dollar, New Zealand Dollar, Singapore Dollar, Pound Sterling, Hong Kong Dollar and Malaysian Ringgit against the currency risk being hedged, relative to long-term indicators;
- the Group’s strategic decision-making horizon; and
- other factors considered relevant by the Board
For
per
sona
l use
onl
y
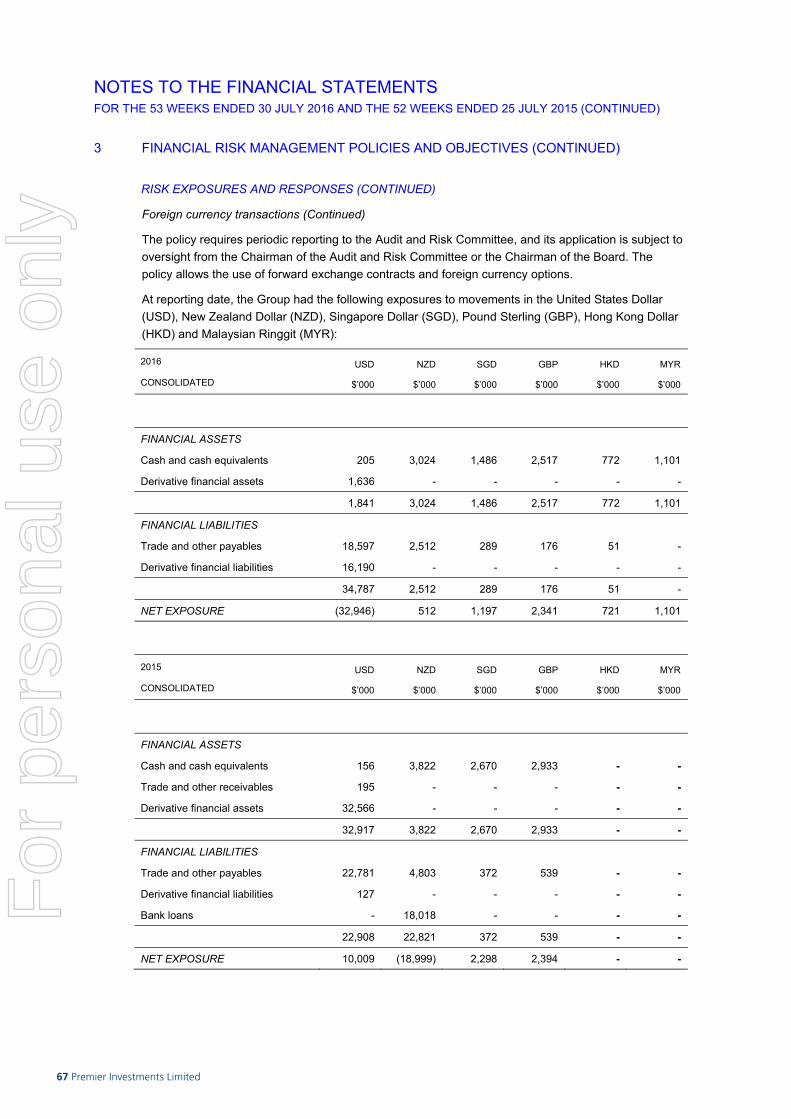
67 Premier Investments Limited
NOTES TO THE FINANCIAL STATEMENTS FOR THE 53 WEEKS ENDED 30 JULY 2016 AND THE 52 WEEKS ENDED 25 JULY 2015 (CONTINUED)
3 FINANCIAL RISK MANAGEMENT POLICIES AND OBJECTIVES (CONTINUED)
67
RISK EXPOSURES AND RESPONSES (CONTINUED)
Foreign currency transactions (Continued)
The policy requires periodic reporting to the Audit and Risk Committee, and its application is subject to oversight from the Chairman of the Audit and Risk Committee or the Chairman of the Board. The policy allows the use of forward exchange contracts and foreign currency options.
At reporting date, the Group had the following exposures to movements in the United States Dollar (USD), New Zealand Dollar (NZD), Singapore Dollar (SGD), Pound Sterling (GBP), Hong Kong Dollar (HKD) and Malaysian Ringgit (MYR):
2016
CONSOLIDATED
USD
$’000
NZD
$’000
SGD
$’000
GBP
$’000
HKD
$’000
MYR
$’000
FINANCIAL ASSETS
Cash and cash equivalents 205 3,024 1,486 2,517 772 1,101
Derivative financial assets 1,636 - - - - -
1,841 3,024 1,486 2,517 772 1,101
FINANCIAL LIABILITIES
Trade and other payables 18,597 2,512 289 176 51 -
Derivative financial liabilities 16,190 - - - - -
34,787 2,512 289 176 51 -
NET EXPOSURE (32,946) 512 1,197 2,341 721 1,101
2015
CONSOLIDATED
USD
$’000
NZD
$’000
SGD
$’000
GBP
$’000
HKD
$’000
MYR
$’000
FINANCIAL ASSETS
Cash and cash equivalents 156 3,822 2,670 2,933 - -
Trade and other receivables 195 - - - - -
Derivative financial assets 32,566 - - - - -
32,917 3,822 2,670 2,933 - -
FINANCIAL LIABILITIES
Trade and other payables 22,781 4,803 372 539 - -
Derivative financial liabilities 127 - - - - -
Bank loans - 18,018 - - - -
22,908 22,821 372 539 - -
NET EXPOSURE 10,009 (18,999) 2,298 2,394 - -
NOTES TO THE FINANCIAL STATEMENTS FOR THE 53 WEEKS ENDED 30 JULY 2016 AND THE 52 WEEKS ENDED 25 JULY 2015 (CONTINUED)
3 FINANCIAL RISK MANAGEMENT POLICIES AND OBJECTIVES (CONTINUED)
68
RISK EXPOSURES AND RESPONSES (CONTINUED)
Foreign currency transactions (Continued)
The Group has forward currency contracts designated as cash flow hedges that are subject to movements through equity and profit and loss respectively as foreign exchange rates move (refer to Note 30).
Foreign currency risk
The following sensitivity is based on the foreign exchange risk exposures in existence at the reporting date:
POST-TAX PROFIT
HIGHER/(LOWER)
OTHER COMPREHENSIVE INCOME
HIGHER/(LOWER)
Judgements of
reasonably possible
movements:
2016$000
2015$000
2016 $000
2015$000
CONSOLIDATED
AUD/USD + 2.5% (58) (311) (5,248) (4,023)
AUD/USD – 10.0% 326 1,318 29,991 16,997
AUD/NZD + 2.5% (12) 463 - -
AUD/NZD – 10.0% 57 (2,111) - -
AUD/ZAR + 2.5% - (34) - -
AUD/ZAR – 10.0% - 153 - -
AUD/SGD + 2.5% (29) (56) - -
AUD/SGD –10.0% 133 255 - -
AUD/GBP + 2.5% (57) (58) - -
AUD/GBP –10.0% 260 266 - -
AUD/HKD + 2.5% (18) - - -
AUD/HKD –10.0% 80 - - -
AUD/MYR + 2.5 (27) - - -
AUD/MYR –10.0% 122 - - -
Significant assumptions used in the foreign currency exposure sensitivity analysis include:
Reasonably possible movements in foreign exchange rates were determined based on a review of the last two years historical movements and economic forecasters’ expectations.
The net exposure at reporting date is representative of what the Group was and is expecting to be exposed to in the next twelve months from reporting date.
The effect on other comprehensive income is the effect on the cash flow hedge reserve, and/or the foreign currency translation reserve.
The sensitivity does not include financial instruments that are non-monetary items as these are not considered to give rise to currency risk.
For
per
sona
l use
onl
y

Annual Report 2016 68
NOTES TO THE FINANCIAL STATEMENTS FOR THE 53 WEEKS ENDED 30 JULY 2016 AND THE 52 WEEKS ENDED 25 JULY 2015 (CONTINUED)
3 FINANCIAL RISK MANAGEMENT POLICIES AND OBJECTIVES (CONTINUED)
68
RISK EXPOSURES AND RESPONSES (CONTINUED)
Foreign currency transactions (Continued)
The Group has forward currency contracts designated as cash flow hedges that are subject to movements through equity and profit and loss respectively as foreign exchange rates move (refer to Note 30).
Foreign currency risk
The following sensitivity is based on the foreign exchange risk exposures in existence at the reporting date:
POST-TAX PROFIT
HIGHER/(LOWER)
OTHER COMPREHENSIVE INCOME
HIGHER/(LOWER)
Judgements of
reasonably possible
movements:
2016$000
2015$000
2016 $000
2015$000
CONSOLIDATED
AUD/USD + 2.5% (58) (311) (5,248) (4,023)
AUD/USD – 10.0% 326 1,318 29,991 16,997
AUD/NZD + 2.5% (12) 463 - -
AUD/NZD – 10.0% 57 (2,111) - -
AUD/ZAR + 2.5% - (34) - -
AUD/ZAR – 10.0% - 153 - -
AUD/SGD + 2.5% (29) (56) - -
AUD/SGD –10.0% 133 255 - -
AUD/GBP + 2.5% (57) (58) - -
AUD/GBP –10.0% 260 266 - -
AUD/HKD + 2.5% (18) - - -
AUD/HKD –10.0% 80 - - -
AUD/MYR + 2.5 (27) - - -
AUD/MYR –10.0% 122 - - -
Significant assumptions used in the foreign currency exposure sensitivity analysis include:
Reasonably possible movements in foreign exchange rates were determined based on a review of the last two years historical movements and economic forecasters’ expectations.
The net exposure at reporting date is representative of what the Group was and is expecting to be exposed to in the next twelve months from reporting date.
The effect on other comprehensive income is the effect on the cash flow hedge reserve, and/or the foreign currency translation reserve.
The sensitivity does not include financial instruments that are non-monetary items as these are not considered to give rise to currency risk.
For
per
sona
l use
onl
y

69 Premier Investments Limited
NOTES TO THE FINANCIAL STATEMENTS FOR THE 53 WEEKS ENDED 30 JULY 2016 AND THE 52 WEEKS ENDED 25 JULY 2015 (CONTINUED)
3 FINANCIAL RISK MANAGEMENT POLICIES AND OBJECTIVES (CONTINUED)
69
RISK EXPOSURES AND RESPONSES (CONTINUED)
Liquidity risk
Liquidity risk refers to the risk of encountering difficulties in meeting obligations associated with financial liabilities. Liquidity risk management is associated with ensuring that there are sufficient funds available to meet financial commitments in a timely manner and planning for unforeseen events which may curtail cash flows and cause pressure on liquidity. The Group keeps its short, medium and long term funding requirements under constant review. Its policy is to have sufficient committed funds available to meet medium term requirements, with flexibility and headroom to make acquisitions for cash in the event an opportunity should arise.
The Group has, at reporting date, $30 million (2015: $35 million) cash held in deposit with 11am at call and the remaining $254 million (2015: $246 million) cash held in deposit with maturity terms ranging from 30 to 180 days. Hence management believe there is no significant exposure to liquidity risk at 30 July 2016 and 25 July 2015.
The Group aims to maintain a balance between continuity of funding and flexibility through the use of bank overdrafts, bank loans and finance leases with a variety of counterparties.
At reporting date, the remaining contractual maturities of the Group’s financial liabilities are:
2016
CONSOLIDATED
MATURITY < 6 MONTHS
$’000
MATURITY 6 – 12 MONTHS
$’000
MATURITY 12 – 24 MONTHS
$’000
MATURITY > 24 MONTHS
$’000
FINANCIAL LIABILITIES
Trade and other payables 72,965 - - -
Bank loans - - 86,805 19,000
Forward currency contracts 143,932 125,465 140,425 -
216,897 125,465 227,230 19,000
2015
CONSOLIDATED
MATURITY < 6 MONTHS
$’000
MATURITY 6 – 12 MONTHS
$’000
MATURITY 12 – 24 MONTHS
$’000
MATURITY > 24 MONTHS
$’000
FINANCIAL LIABILITIES
Trade and other payables 73,723 - - -
Bank loans - - - 105,018
Finance leases 14 - - -
Forward currency contracts 123,035 103,123 19,605 -
196,772 103,123 19,605 105,018
NOTES TO THE FINANCIAL STATEMENTS FOR THE 53 WEEKS ENDED 30 JULY 2016 AND THE 52 WEEKS ENDED 25 JULY 2015 (CONTINUED)
3 FINANCIAL RISK MANAGEMENT POLICIES AND OBJECTIVES (CONTINUED)
70
RISK EXPOSURES AND RESPONSES (CONTINUED)
Fair value of financial assets and liabilities
The Group measures financial instruments, such as derivatives and assets held for sale, at fair value at each reporting date. Fair value is the price that would be received to sell an asset or paid to transfer a liability in an orderly transaction between market participants at the measurement date. The fair value measurement is based on the presumption that the transaction to sell the asset or transfer the liability takes place in either the principal market for the asset or liability or, in the absence of a principal market, the most advantageous market for the asset or liability, which is accessible to the Group.
The fair value of an asset or liability is measured using the assumptions that market participants would use when pricing the asset or liability, assuming that market participants act in their economic best interest. The Group uses valuation techniques that are appropriate in the circumstances and for which sufficient data are available to measure fair value, maximising the use of relevant observable inputs and minimising the use of unobservable inputs.
The fair value of financial assets and financial liabilities is based on market prices (where a market exists) or using other widely accepted methods of valuation.
All assets and liabilities for which fair value is measured or disclosed in the financial statements are categorised within the fair value hierarchy, based on the lowest level input that is significant to the fair value measurement as a whole:
Level 1 – the fair value is calculated using quoted price in active markets.
Level 2 – the fair value is estimated using inputs other than quoted prices included in Level 1 that are observable for the asset or liability, either directly (as prices) or indirectly (derived from prices).
Level 3 – the fair value is estimated using inputs for the asset or liability that are not based on observable market data.
The following table provides the fair value measurement hierarchy of the Group’s financial assets and liabilities:
For
per
sona
l use
onl
y
Annual Report 2016 70
NOTES TO THE FINANCIAL STATEMENTS FOR THE 53 WEEKS ENDED 30 JULY 2016 AND THE 52 WEEKS ENDED 25 JULY 2015 (CONTINUED)
3 FINANCIAL RISK MANAGEMENT POLICIES AND OBJECTIVES (CONTINUED)
70
RISK EXPOSURES AND RESPONSES (CONTINUED)
Fair value of financial assets and liabilities
The Group measures financial instruments, such as derivatives and assets held for sale, at fair value at each reporting date. Fair value is the price that would be received to sell an asset or paid to transfer a liability in an orderly transaction between market participants at the measurement date. The fair value measurement is based on the presumption that the transaction to sell the asset or transfer the liability takes place in either the principal market for the asset or liability or, in the absence of a principal market, the most advantageous market for the asset or liability, which is accessible to the Group.
The fair value of an asset or liability is measured using the assumptions that market participants would use when pricing the asset or liability, assuming that market participants act in their economic best interest. The Group uses valuation techniques that are appropriate in the circumstances and for which sufficient data are available to measure fair value, maximising the use of relevant observable inputs and minimising the use of unobservable inputs.
The fair value of financial assets and financial liabilities is based on market prices (where a market exists) or using other widely accepted methods of valuation.
All assets and liabilities for which fair value is measured or disclosed in the financial statements are categorised within the fair value hierarchy, based on the lowest level input that is significant to the fair value measurement as a whole:
Level 1 – the fair value is calculated using quoted price in active markets.
Level 2 – the fair value is estimated using inputs other than quoted prices included in Level 1 that are observable for the asset or liability, either directly (as prices) or indirectly (derived from prices).
Level 3 – the fair value is estimated using inputs for the asset or liability that are not based on observable market data.
The following table provides the fair value measurement hierarchy of the Group’s financial assets and liabilities:
For
per
sona
l use
onl
y

71 Premier Investments Limited
NOTES TO THE FINANCIAL STATEMENTS FOR THE 53 WEEKS ENDED 30 JULY 2016 AND THE 52 WEEKS ENDED 25 JULY 2015 (CONTINUED)
3 FINANCIAL RISK MANAGEMENT POLICIES AND OBJECTIVES (CONTINUED)
71
RISK EXPOSURES AND RESPONSES (CONTINUED)
Fair value of financial assets and liabilities (continued)
CONSOLIDATED
FINANCIAL YEAR ENDED 30 JULY 2016 FINANCIAL YEAR ENDED 25 JULY 2015
QUOTED MARKET
PRICE
(LEVEL 1)
VALUATION TECHNIQUE –
MARKET OBSERVABLE
INPUTS (LEVEL 2)
VALUATION TECHNIQUE – NON MARKET OBSERVABLE
INPUTS (LEVEL 3)
TOTAL QUOTED MARKET
PRICE
(LEVEL 1)
VALUATION TECHNIQUE –
MARKET OBSERVABLE
INPUTS (LEVEL 2)
VALUATION TECHNIQUE – NON MARKET OBSERVABLE
INPUTS (LEVEL 3)
TOTAL
$’000 $’000 $’000 $’000 $’000 $’000 $’000 $’000
FINANCIAL ASSETS
Asset classified as held for sale
-
-
-
-
-
-
1,000
1,000
Foreign Exchange Contracts
-
1,636
-
1,636
-
32,566
-
32,566
- 1,636 - 1,636 - 32,566 1,000 33,566
FINANCIAL LIABILITIES
Foreign Exchange Contracts - 16,190 - 16,190 - 127 - 127
- 16,190 - 16,190 - 127 - 127
There have been no transfers between Level 1 and Level 2 during the financial year.
At 30 July 2016 and 25 July 2015 the fair values of cash and cash equivalents, short-term receivables and payables approximate their carrying values. The carrying value of interest bearing liabilities is considered to approximate the fair value, being the amount at which the liability could be settled in a current transaction between willing parties.
Foreign exchange contracts are initially recognised in the statement of financial position at fair value on the date which the contract is entered into, and subsequently remeasured to fair value. Accordingly, the carrying amounts of forward exchange contracts approximate their fair values at the reporting date.
Foreign exchange contracts are measured based on observable spot exchange rates, the yield curves of the respective currencies as well as the currency basis spread between the respective currencies.
NOTES TO THE FINANCIAL STATEMENTS FOR THE 53 WEEKS ENDED 30 JULY 2016 AND THE 52 WEEKS ENDED 25 JULY 2015 (CONTINUED)
72
CONSOLIDATED
2016 $’000
2015$’000
4 REVENUE AND OTHER INCOME
REVENUE
Revenue from sale of goods 1,049,226 945,706
Revenue from sale of goods to associate - 1,956
TOTAL REVENUE FROM SALE OF GOODS 1,049,226 947,662
OTHER REVENUE
Membership program fees 318 385
Other sundry revenue 22 17
INTEREST
Other persons 7,702 9,680
Associate 186 148
Total Interest 7,888 9,828
TOTAL OTHER REVENUE 8,228 10,230
TOTAL REVENUE 1,057,454 957,892
OTHER INCOME
Gain on ineffective cash flow hedges - 2,224
Royalty and licence fees
Other persons 63 99
Insurance proceeds - 159
Other 1,444 1,495
TOTAL OTHER INCOME 1,507 3,977
TOTAL REVENUE AND OTHER INCOME 1,058,961 961,869
For
per
sona
l use
onl
y
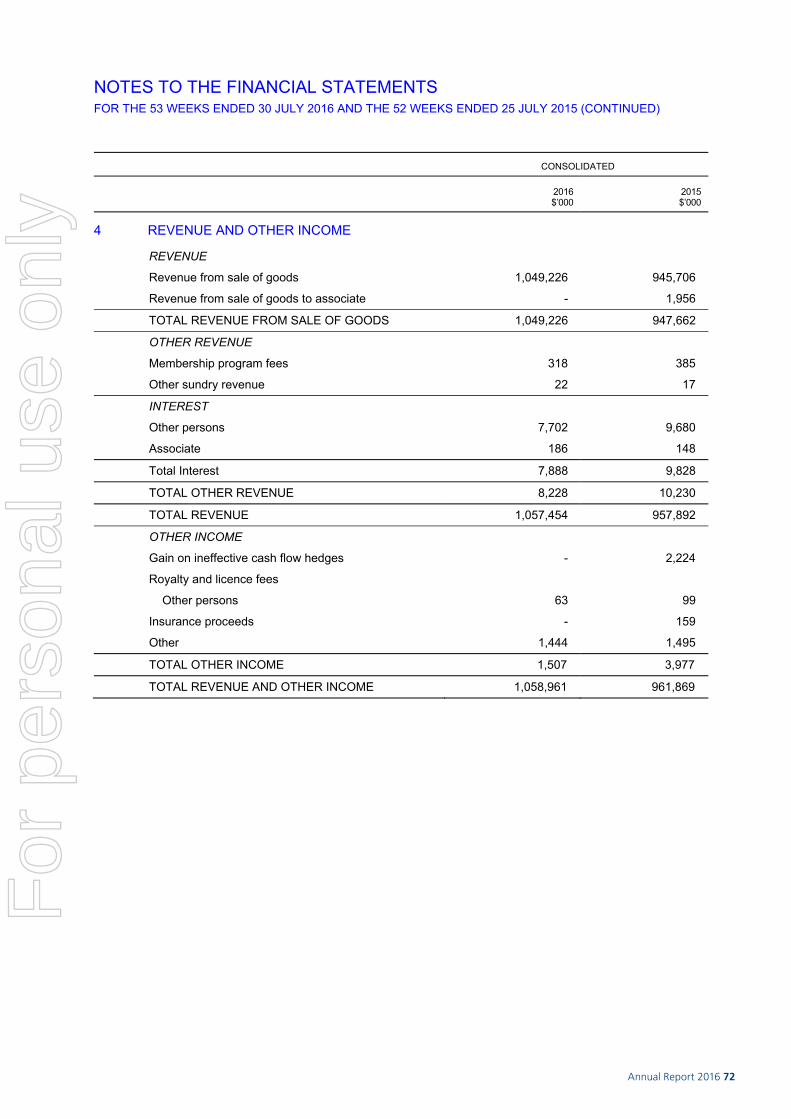
Annual Report 2016 72
NOTES TO THE FINANCIAL STATEMENTS FOR THE 53 WEEKS ENDED 30 JULY 2016 AND THE 52 WEEKS ENDED 25 JULY 2015 (CONTINUED)
72
CONSOLIDATED
2016 $’000
2015$’000
4 REVENUE AND OTHER INCOME
REVENUE
Revenue from sale of goods 1,049,226 945,706
Revenue from sale of goods to associate - 1,956
TOTAL REVENUE FROM SALE OF GOODS 1,049,226 947,662
OTHER REVENUE
Membership program fees 318 385
Other sundry revenue 22 17
INTEREST
Other persons 7,702 9,680
Associate 186 148
Total Interest 7,888 9,828
TOTAL OTHER REVENUE 8,228 10,230
TOTAL REVENUE 1,057,454 957,892
OTHER INCOME
Gain on ineffective cash flow hedges - 2,224
Royalty and licence fees
Other persons 63 99
Insurance proceeds - 159
Other 1,444 1,495
TOTAL OTHER INCOME 1,507 3,977
TOTAL REVENUE AND OTHER INCOME 1,058,961 961,869
For
per
sona
l use
onl
y

73 Premier Investments Limited
NOTES TO THE FINANCIAL STATEMENTS FOR THE 53 WEEKS ENDED 30 JULY 2016 AND THE 52 WEEKS ENDED 25 JULY 2015 (CONTINUED)
73
CONSOLIDATED
NOTES 2016 $’000
2015$’000
5 EXPENSES AND LOSSES
EXPENSES
DEPRECIATION AND IMPAIRMENT OF NON-CURRENT ASSETS
Depreciation of property, plant and equipment 12 23,842 21,797
Amortisation of property, plant and equipment under lease
12
12
47
Impairment of property, plant and equipment 12 - 771
TOTAL DEPRECIATION AND IMPAIRMENT OF NON-CURRENT ASSETS
23,854 22,615
AMORTISATION OF NON-CURRENT ASSETS
Amortisation of leasehold premiums 13 27 62
TOTAL DEPRECIATION, IMPAIRMENT AND AMORTISATION
23,881 22,677
FINANCE COSTS
Finance charges payable under finance leases 33 28
Interest on bank loans and overdraft 4,870 5,697
Provision for discount adjustment on onerous leases
9 13
TOTAL FINANCE COSTS 4,912 5,738
OPERATING LEASE EXPENSES Minimum lease payments – operating leases 169,511 163,543 Contingent rentals 35,196 30,269
TOTAL OPERATING LEASE EXPENSES 204,707 193,812
OTHER EXPENSES INCLUDE: Foreign exchange losses 191 73 Loss on ineffective cash flow hedges 2,010 - Net loss on disposal of property, plant and equipment
413
758
EXPENSE ASSOCIATED WITH DISPOSAL OF ASSET HELD FOR SALE In the 2015 financial year, the Group resolved to dispose of its 50% interest in a joint venture entity, Just Kor Fashion Group (Pty) Ltd, which was involved in retailing of the Jay Jays concept in South Africa. The commercial terms of the sale had been agreed as at year-end, with transfer of the consideration completed in August 2015. As a result of the disposal, the Group reclassified its investment in associate to an asset classified as held for sale in the 2015 financial year. The Group incurred an impairment loss of $765,000 in the 2015 financial year on revaluing its investment classified as held for sale at fair value. Other costs associated with the sale of the investment amounted to $959,000, and were expensed in 2015. Refer to note 11 for further information on the asset held for sale at the end of the previous year.
NOTES TO THE FINANCIAL STATEMENTS FOR THE 53 WEEKS ENDED 30 JULY 2016 AND THE 52 WEEKS ENDED 25 JULY 2015 (CONTINUED)
74
CONSOLIDATED
2016 $’000
2015$’000
6 INCOME TAX The major components of income tax expense are:
(a) INCOME TAX RECOGNISED IN PROFIT OR LOSS CURRENT INCOME TAX Current income tax charge 38,044 30,776 Adjustment in respect of current income tax of previous years
(90)
(1,031)
DEFERRED INCOME TAX Relating to origination and reversal of temporary differences
1,841
(1,057)
Adjustments in respect of current income tax of previous years
(450)
155
Difference in exchange rates (136) - INCOME TAX EXPENSE REPORTED IN THE STATEMENT OF COMPREHENSIVE INCOME
39,209
28,843
(b) STATEMENT OF CHANGES IN EQUITY Deferred income tax related to items charged (credited) directly to equity: Net deferred income tax on movements on cash-flow hedges (13,495) 10,612 INCOME TAX EXPENSE (BENEFIT) REPORTED IN EQUITY (13,495) 10,612
(c) NUMERICAL RECONCILIATION BETWEEN AGGREGATE TAX EXPENSE RECOGNISED IN THE STATEMENT OF COMPREHENSIVE INCOME AND TAX EXPENSE CALCULATED PER THE STATUTORY INCOME TAX RATE
A reconciliation between tax expense and the product of accounting profit before tax multiplied by the Group’s applicable income tax rate is as follows:
Accounting profit before income tax 143,083 116,945At the Parent Entity’s statutory income tax rate of 30% (2015: 30%)
42,925 35,084
Adjustment in respect of current income tax of previous years
(609) (1,031)
Effect of exchange rates (38) (337)
Expenditure not allowable for income tax purposes 751 43
Effect of different rates of tax on overseas income (1,641) (533)
Income not assessable for tax purposes (3,749) (3,849)
Other 1,570 (534)
AGGREGATE INCOME TAX EXPENSE 39,209 28,843
For
per
sona
l use
onl
y
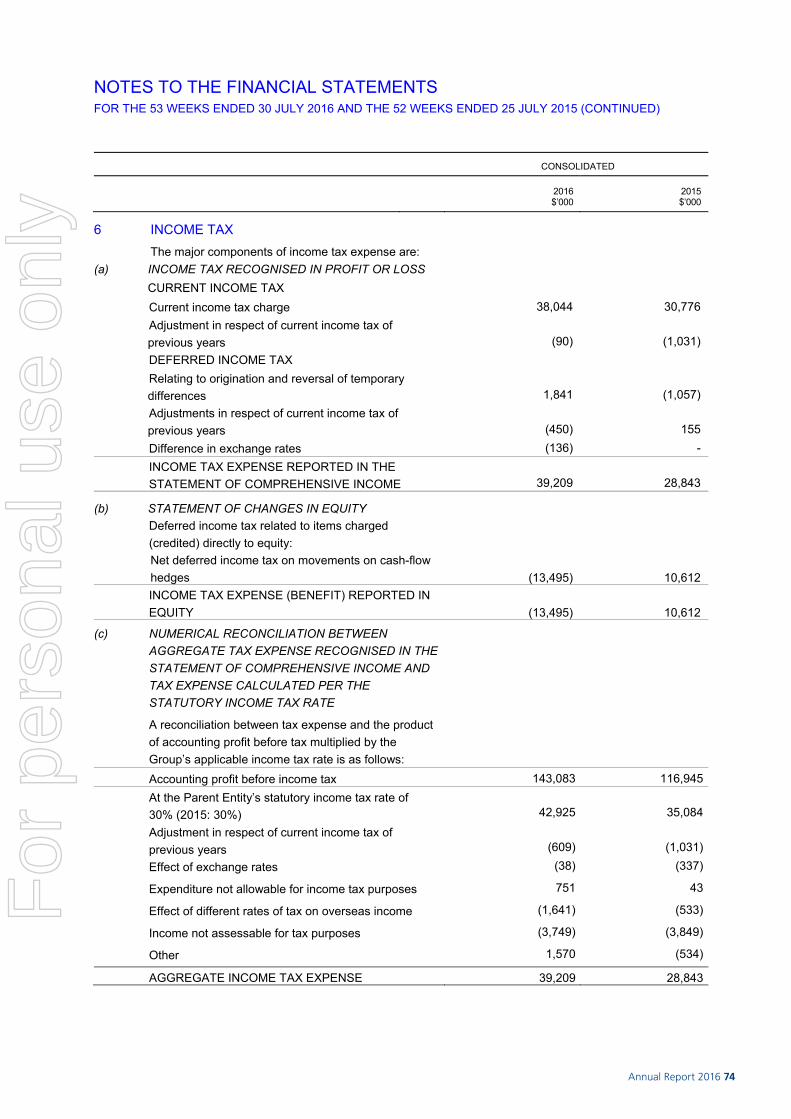
Annual Report 2016 74
NOTES TO THE FINANCIAL STATEMENTS FOR THE 53 WEEKS ENDED 30 JULY 2016 AND THE 52 WEEKS ENDED 25 JULY 2015 (CONTINUED)
74
CONSOLIDATED
2016 $’000
2015$’000
6 INCOME TAX The major components of income tax expense are:
(a) INCOME TAX RECOGNISED IN PROFIT OR LOSS CURRENT INCOME TAX Current income tax charge 38,044 30,776 Adjustment in respect of current income tax of previous years
(90)
(1,031)
DEFERRED INCOME TAX Relating to origination and reversal of temporary differences
1,841
(1,057)
Adjustments in respect of current income tax of previous years
(450)
155
Difference in exchange rates (136) - INCOME TAX EXPENSE REPORTED IN THE STATEMENT OF COMPREHENSIVE INCOME
39,209
28,843
(b) STATEMENT OF CHANGES IN EQUITY Deferred income tax related to items charged (credited) directly to equity: Net deferred income tax on movements on cash-flow hedges (13,495) 10,612 INCOME TAX EXPENSE (BENEFIT) REPORTED IN EQUITY (13,495) 10,612
(c) NUMERICAL RECONCILIATION BETWEEN AGGREGATE TAX EXPENSE RECOGNISED IN THE STATEMENT OF COMPREHENSIVE INCOME AND TAX EXPENSE CALCULATED PER THE STATUTORY INCOME TAX RATE
A reconciliation between tax expense and the product of accounting profit before tax multiplied by the Group’s applicable income tax rate is as follows:
Accounting profit before income tax 143,083 116,945At the Parent Entity’s statutory income tax rate of 30% (2015: 30%)
42,925 35,084
Adjustment in respect of current income tax of previous years
(609) (1,031)
Effect of exchange rates (38) (337)
Expenditure not allowable for income tax purposes 751 43
Effect of different rates of tax on overseas income (1,641) (533)
Income not assessable for tax purposes (3,749) (3,849)
Other 1,570 (534)
AGGREGATE INCOME TAX EXPENSE 39,209 28,843
For
per
sona
l use
onl
y

75 Premier Investments Limited
NOTES TO THE FINANCIAL STATEMENTS FOR THE 53 WEEKS ENDED 30 JULY 2016 AND THE 52 WEEKS ENDED 25 JULY 2015 (CONTINUED)
75
CONSOLIDATED
2016 $’000
2015$’000
6 INCOME TAX (CONTINUED)
(d) RECOGNISED DEFERRED TAX ASSETS AND LIABILITIES
DEFERRED TAX RELATES TO THE FOLLOWING:
Foreign currency balances (703) (5)
Potential capital gains tax on financial investments (47,892) (46,322)
Deferred gains and losses on foreign exchange contracts
4,367
(9,731)
Inventory provisions 70 13
Deferred income 6,431 5,100
Employee provisions 5,438 5,109
Other receivables and prepayments (1,019) (262)
Property, plant and equipment (6,032) (4,817)
Leased plant and equipment - (4)
Other 887 106
Lease liability - 4
NET DEFERRED TAX LIABILITIES (38,453) (50,809)
REFLECTED IN THE STATEMENT OF FINANCIAL POSITION AS FOLLOWS:
Deferred tax assets 18,858 13,476
Deferred tax liabilities (57,311) (64,285)
NET DEFERRED TAX LIABILITIES (38,453) (50,809)
7 DIVIDENDS PAID AND PROPOSED
RECOGNISED DIVIDEND AMOUNTS
Declared and paid during the year: Interim franked dividends for 2016: 23 cents per share (2015: 21 cents) 36,129 32,823 Special franked dividends for 2016: nil cents per share (2015: 9 cents) - 14,067
Final franked dividends for 2015: 21 cents per share (2014: 20 cents) 32,840 31,143
TOTAL DECLARED AND PAID DURING THE YEAR 68,969 78,033 UNRECOGNISED DIVIDEND AMOUNTS
Final franked dividend for 2016: 25 cents per share (2015: 21 cents) 39,291 32,840
NOTES TO THE FINANCIAL STATEMENTS FOR THE 53 WEEKS ENDED 30 JULY 2016 AND THE 52 WEEKS ENDED 25 JULY 2015 (CONTINUED)
76
CONSOLIDATED
2016 $’000
2015$’000
7 DIVIDENDS PAID AND PROPOSED (CONTINUED)
FRANKING CREDIT BALANCE
The amount of franking credits available for the subsequent financial year are:
- franking account balance as at the end of the financial year at 30% (2015: 30%)
198,813
193,190
- franking credits that will arise from the payment of income tax payable as at the end of the financial year
27,434
29,042- franking debits that will arise from the payment
of dividends as at the end of the financial year
(16,839)
(14,074)
TOTAL FRANKING CREDIT BALANCE 209,408 208,158
The tax rate at which paid dividends have been franked is 30% (2015: 30%). Dividends proposed will be franked at the rate of 30% (2015: 30%).
CONSOLIDATED
2016 $’000
2015$’000
8 TRADE AND OTHER RECEIVABLES
CURRENT
Sundry debtors 16,461 12,963 Associate - 1,378
CARRYING AMOUNT OF TRADE AND OTHER RECEIVABLES
16,461
14,341
(a) Impairment losses
Receivables are non-interest-bearing and are generally on 30 to 60 day terms. A provision for impairment loss is recognised where there is objective evidence that an individual receivable balance is impaired. No impairment loss has been recognised by the Group during the financial year ended 30 July 2016 (2015: $nil). During the year, no bad debt expense (2015: $nil) was recognised.
Other balances within trade and other receivables do not contain impaired assets and are not past due. It is expected that these other balances will be received when due.
(b) Related party receivables
For terms and conditions of related party receivables refer to Note 27.
(c) Fair value and credit risk
Due to the short-term nature of these receivables, their carrying value is considered to approximate their fair value.
(d) Foreign exchange and interest rate risk
Detail regarding foreign exchange and interest rate risk is disclosed in Note 3.
For
per
sona
l use
onl
y

Annual Report 2016 76
NOTES TO THE FINANCIAL STATEMENTS FOR THE 53 WEEKS ENDED 30 JULY 2016 AND THE 52 WEEKS ENDED 25 JULY 2015 (CONTINUED)
76
CONSOLIDATED
2016 $’000
2015$’000
7 DIVIDENDS PAID AND PROPOSED (CONTINUED)
FRANKING CREDIT BALANCE
The amount of franking credits available for the subsequent financial year are:
- franking account balance as at the end of the financial year at 30% (2015: 30%)
198,813
193,190
- franking credits that will arise from the payment of income tax payable as at the end of the financial year
27,434
29,042- franking debits that will arise from the payment
of dividends as at the end of the financial year
(16,839)
(14,074)
TOTAL FRANKING CREDIT BALANCE 209,408 208,158
The tax rate at which paid dividends have been franked is 30% (2015: 30%). Dividends proposed will be franked at the rate of 30% (2015: 30%).
CONSOLIDATED
2016 $’000
2015$’000
8 TRADE AND OTHER RECEIVABLES
CURRENT
Sundry debtors 16,461 12,963 Associate - 1,378
CARRYING AMOUNT OF TRADE AND OTHER RECEIVABLES
16,461
14,341
(a) Impairment losses
Receivables are non-interest-bearing and are generally on 30 to 60 day terms. A provision for impairment loss is recognised where there is objective evidence that an individual receivable balance is impaired. No impairment loss has been recognised by the Group during the financial year ended 30 July 2016 (2015: $nil). During the year, no bad debt expense (2015: $nil) was recognised.
Other balances within trade and other receivables do not contain impaired assets and are not past due. It is expected that these other balances will be received when due.
(b) Related party receivables
For terms and conditions of related party receivables refer to Note 27.
(c) Fair value and credit risk
Due to the short-term nature of these receivables, their carrying value is considered to approximate their fair value.
(d) Foreign exchange and interest rate risk
Detail regarding foreign exchange and interest rate risk is disclosed in Note 3.
For
per
sona
l use
onl
y

77 Premier Investments Limited
NOTES TO THE FINANCIAL STATEMENTS FOR THE 53 WEEKS ENDED 30 JULY 2016 AND THE 52 WEEKS ENDED 25 JULY 2015 (CONTINUED)
77
CONSOLIDATED
2016 $’000
2015$’000
9 INVENTORIES
The valuation policy adopted in respect of the following is set out in Note 2(l)
Finished goods 123,556 111,814 TOTAL INVENTORIES AT THE LOWER OF COST AND NET REALISABLE VALUE 123,556 111,814
10 OTHER ASSETS
CURRENT
Deposits and prepayments 11,694 6,309
TOTAL OTHER CURRENT ASSETS 11,694 6,309
11 ASSET CLASSIFIED AS HELD FOR SALE
Investment in Just Kor Fashion Group (Pty) Ltd - 1,000
TOTAL ASSETS HELD FOR SALE - 1,000
INVESTMENT IN JUST KOR FASHION GROUP (PTY) LTD
Just Jeans Group Pty Ltd, a subsidiary of Premier Investments Limited, had a 50% interest in a joint venture entity, Just Kor Fashion Group (Pty) Ltd, which was involved in retailing of the Jay Jays concept in South Africa. During the second half of the 2015 financial year, the Group resolved to dispose of its 50% interest in the joint venture entity. As a result of the disposal, the group ceased equity accounting for its investment in the joint venture and classified the fair value of the investment as an asset held for sale.
The commercial terms of the sale was agreed at the end of the 2015 financial year, with settlement of the fair value completed in August 2015.
As a result of the reclassification from investment in associate to asset held for sale, and the subsequent revaluing to fair value of the asset held for sale, an impairment loss of $765,000 was recognised in the 2015 financial year.
Refer to note 14 for further details of the amounts previously recognised as an investment in associate.
The investment in the joint venture formed part of the Retail Operating Segment in the financial statements. Refer to note 22, Operating Segments.
NOTES TO THE FINANCIAL STATEMENTS FOR THE 53 WEEKS ENDED 30 JULY 2016 AND THE 52 WEEKS ENDED 25 JULY 2015 (CONTINUED)
78
CONSOLIDATED
NOTES 2016 $’000
2015$’000
12 PROPERTY, PLANT AND EQUIPMENT
Land – at cost 3,203 3,203
Buildings – at cost 14,985 14,985 Less: accumulated depreciation and impairment (807) (432)
Total 14,178 14,553
Plant and equipment – at cost 242,121 213,916 Less: accumulated depreciation and impairment (122,084) (110,075) Total 120,037 103,841
Capitalised leased assets – at cost 343 343 Less: accumulated depreciation and impairment (343) (331)
Total - 12
Capital works in progress 1,819 1,928 TOTAL PROPERTY, PLANT AND EQUIPMENT 139,237 123,537 RECONCILIATIONS
Reconciliations of the carrying amounts for each class of property, plant and equipment are set out below:
Land
At beginning of the financial year 3,203 3,203
Net carrying amount at end of financial year 3,203 3,203
Buildings At beginning of the financial year 14,553 14,928
Depreciation 5 (375) (375)
Net carrying amount at end of financial year 14,178 14,553
Plant and equipment
At beginning of the financial year 103,841 90,838
Additions 40,858 34,598
Transfers from capital works in progress 1,928 -
Disposals (1,186) (857)
Exchange differences (1,937) 1,455
Impairment – plant and equipment 5 - (771)
Depreciation 5 (23,467) (21,422)
Net carrying amount at end of financial year 120,037 103,841
Leased plant and equipment
At beginning of the financial year 12 59
Amortisation 5 (12) (47)
Net carrying amount at end of financial year - 12
Capital works in progress At beginning of the financial year 1,928 -
Additions 1,819 1,928
Transfers to plant and equipment (1,928) -
Net carrying amount at end of financial year 1,819 1,928 TOTAL PROPERTY, PLANT AND EQUIPMENT 139,237 123,537
For
per
sona
l use
onl
y

Annual Report 2016 78
NOTES TO THE FINANCIAL STATEMENTS FOR THE 53 WEEKS ENDED 30 JULY 2016 AND THE 52 WEEKS ENDED 25 JULY 2015 (CONTINUED)
78
CONSOLIDATED
NOTES 2016 $’000
2015$’000
12 PROPERTY, PLANT AND EQUIPMENT
Land – at cost 3,203 3,203
Buildings – at cost 14,985 14,985 Less: accumulated depreciation and impairment (807) (432)
Total 14,178 14,553
Plant and equipment – at cost 242,121 213,916 Less: accumulated depreciation and impairment (122,084) (110,075) Total 120,037 103,841
Capitalised leased assets – at cost 343 343 Less: accumulated depreciation and impairment (343) (331)
Total - 12
Capital works in progress 1,819 1,928 TOTAL PROPERTY, PLANT AND EQUIPMENT 139,237 123,537 RECONCILIATIONS
Reconciliations of the carrying amounts for each class of property, plant and equipment are set out below:
Land
At beginning of the financial year 3,203 3,203
Net carrying amount at end of financial year 3,203 3,203
Buildings At beginning of the financial year 14,553 14,928
Depreciation 5 (375) (375)
Net carrying amount at end of financial year 14,178 14,553
Plant and equipment
At beginning of the financial year 103,841 90,838
Additions 40,858 34,598
Transfers from capital works in progress 1,928 -
Disposals (1,186) (857)
Exchange differences (1,937) 1,455
Impairment – plant and equipment 5 - (771)
Depreciation 5 (23,467) (21,422)
Net carrying amount at end of financial year 120,037 103,841
Leased plant and equipment
At beginning of the financial year 12 59
Amortisation 5 (12) (47)
Net carrying amount at end of financial year - 12
Capital works in progress At beginning of the financial year 1,928 -
Additions 1,819 1,928
Transfers to plant and equipment (1,928) -
Net carrying amount at end of financial year 1,819 1,928 TOTAL PROPERTY, PLANT AND EQUIPMENT 139,237 123,537
For
per
sona
l use
onl
y
79 Premier Investments Limited
NOTES TO THE FINANCIAL STATEMENTS FOR THE 53 WEEKS ENDED 30 JULY 2016 AND THE 52 WEEKS ENDED 25 JULY 2015 (CONTINUED)
79
12 PROPERTY, PLANT AND EQUIPMENT (CONTINUED) LAND AND BUILDINGS
The land and buildings with a combined carrying amount of $17,381,000 have been pledged to secure certain interest-bearing borrowings of the Group (refer to note 16).
IMPAIRMENT OF PROPERTY, PLANT AND EQUIPMENT
On an individual store basis, identified to be the cash-generating units (CGU) of the Group’s retail segment, the recoverable amount was estimated for certain items of plant and equipment. The recoverable amount estimation was based on a value–in-use calculation and was determined at the CGU level.
These calculations use cash flow projections based on financial budgets approved by management, covering a five year period. Cash flows beyond the five year period are extrapolated using the growth rate stated below. The growth rate does not exceed the long-term average growth rate for the business in which the CGU operates.
The post-tax discount rate applied to the cash flow projections is 10.5% (2015: 10.5%) and the cash flows beyond the five year period are extrapolated using a growth rate of 3% (2015: 3%). The discount rate used reflects management’s estimate of the time value of money and risks specific to each unit not already reflected in the cash flow. In determining the appropriate discount rate, regard has been given to the weighted average cost of capital for the retail segment.
When considering the recoverable amount, the net present value of cash flows has been compared to reasonable earnings multiples for comparable companies. An impairment review was conducted based on a store by store review. No impairment loss was recognised during the current financial year (2015: impairment loss recognised of $771,000).
NOTES TO THE FINANCIAL STATEMENTS FOR THE 53 WEEKS ENDED 30 JULY 2016 AND THE 52 WEEKS ENDED 25 JULY 2015 (CONTINUED)
80
13 INTANGIBLES
RECONCILIATION OF CARRYING AMOUNTS AT THE BEGINNING AND END OF THE PERIOD
CONSOLIDATED
GOODWILL
$’000
BRAND NAMES
$’000 TRADEMARK
$’000
LEASEHOLD PREMIUMS
$’000 TOTAL
$’000
YEAR ENDED 30 JULY 2016 As at 26 July 2015 net of accumulated amortisation and impairment 477,085 376,179 1,324 123 854,711Trademark registrations - - 128 - 128Amortisation - - - (27) (27)Exchange differences - - - 4 4As at 30 July 2016 net of accumulated amortisation and impairment 477,085 376,179 1,452 100 854,816
AS AT 30 JULY 2016 Cost (gross carrying amount) 477,085 376,179 1,452 989 855,705Accumulated amortisation and impairment - - - (889) (889)Net carrying amount 477,085 376,179 1,452 100 854,816 YEAR ENDED 25 JULY 2015 As at 27 July 2014 net of accumulated amortisation and impairment 477,085 376,179 1,282 26 854,572Additions - - - 158 158Trademark registrations - - 42 - 42Amortisation - - - (62) (62)Exchange differences - - - 1 1As at 25 July 2015 net of accumulated amortisation and impairment 477,085 376,179 1,324 123 854,711
AS AT 25 JULY 2015 Cost (gross carrying amount) 477,085 376,179 1,324 965 855,553Accumulated amortisation and impairment - - - (842) (842)Net carrying amount 477,085 376,179 1,324 123 854,711
GOODWILL AND BRAND NAMES
After initial recognition, goodwill and indefinite-life brand names acquired in a business combination are measured at cost less any accumulated impairment losses. Goodwill and brand names are not amortised but are subject to impairment testing on an annual basis or whenever there is an indication of impairment.
Brand names with a carrying value of approximately $376,179,000 are assessed as having an indefinite useful life. The indefinite-useful life reflects management’s intention to continue to operate these brands to generate net cash inflows into the foreseeable future.
For
per
sona
l use
onl
y

Annual Report 2016 80
NOTES TO THE FINANCIAL STATEMENTS FOR THE 53 WEEKS ENDED 30 JULY 2016 AND THE 52 WEEKS ENDED 25 JULY 2015 (CONTINUED)
80
13 INTANGIBLES
RECONCILIATION OF CARRYING AMOUNTS AT THE BEGINNING AND END OF THE PERIOD
CONSOLIDATED
GOODWILL
$’000
BRAND NAMES
$’000 TRADEMARK
$’000
LEASEHOLD PREMIUMS
$’000 TOTAL
$’000
YEAR ENDED 30 JULY 2016 As at 26 July 2015 net of accumulated amortisation and impairment 477,085 376,179 1,324 123 854,711Trademark registrations - - 128 - 128Amortisation - - - (27) (27)Exchange differences - - - 4 4As at 30 July 2016 net of accumulated amortisation and impairment 477,085 376,179 1,452 100 854,816
AS AT 30 JULY 2016 Cost (gross carrying amount) 477,085 376,179 1,452 989 855,705Accumulated amortisation and impairment - - - (889) (889)Net carrying amount 477,085 376,179 1,452 100 854,816 YEAR ENDED 25 JULY 2015 As at 27 July 2014 net of accumulated amortisation and impairment 477,085 376,179 1,282 26 854,572Additions - - - 158 158Trademark registrations - - 42 - 42Amortisation - - - (62) (62)Exchange differences - - - 1 1As at 25 July 2015 net of accumulated amortisation and impairment 477,085 376,179 1,324 123 854,711
AS AT 25 JULY 2015 Cost (gross carrying amount) 477,085 376,179 1,324 965 855,553Accumulated amortisation and impairment - - - (842) (842)Net carrying amount 477,085 376,179 1,324 123 854,711
GOODWILL AND BRAND NAMES
After initial recognition, goodwill and indefinite-life brand names acquired in a business combination are measured at cost less any accumulated impairment losses. Goodwill and brand names are not amortised but are subject to impairment testing on an annual basis or whenever there is an indication of impairment.
Brand names with a carrying value of approximately $376,179,000 are assessed as having an indefinite useful life. The indefinite-useful life reflects management’s intention to continue to operate these brands to generate net cash inflows into the foreseeable future.
For
per
sona
l use
onl
y

81 Premier Investments Limited
NOTES TO THE FINANCIAL STATEMENTS FOR THE 53 WEEKS ENDED 30 JULY 2016 AND THE 52 WEEKS ENDED 25 JULY 2015 (CONTINUED)
81
13 INTANGIBLES (CONTINUED)
IMPAIRMENT TESTING OF GOODWILL
Impairment of goodwill acquired in a business combination is determined by assessing the recoverable amount of the cash-generating units (CGU) to which it relates. When the recoverable amount of the CGU is less than the carrying amount, an impairment loss is recognised.
The key factors contributing to the goodwill relate to the synergies existing within the acquired business and also synergies expected to be achieved as a result of combining Just Group Limited with the rest of the Group. Accordingly, goodwill is assessed at a retail segment level.
The recoverable amount of the CGU has been determined based upon a value-in-use calculation, using cash flow projections as at July 2016 for a period of five years plus a terminal value. The cash flow projections are based on financial estimates approved by senior management and the Board for the 2017 financial year and are projected for a further four years based on estimated growth rates of 3.4% to 3.5% (2015: 3.4%). As part of the annual impairment test for goodwill, management assesses the reasonableness of growth rate assumptions by reviewing historical cash flow projections as well as future growth objectives.
Cash flows beyond the five year period are extrapolated using a growth rate of 3% (2015: 3%) which reflects the long-term growth expectation beyond the five year projection.
The post-tax discount rate applied to these cash flow projections is 10.1% (2015: 10.7%). The discount rate has been determined using the weighted average cost of capital which incorporates both the cost of debt and the cost of capital.
Management has considered the possible change in expected sales growth, forecast Earnings Before Interest, Tax and Amortisation (EBITA) and discount rates applied within the CGU to which goodwill relate, each of which have been subject to sensitivities. A reasonably possible adverse change in these key assumptions on which the recoverable amount is based would not cause the carrying amount of the CGU to exceed its recoverable amount.
IMPAIRMENT TESTING OF BRAND NAMES
Brand names acquired through business combinations have been allocated to the following CGU groups ($’000) as no individual brand name is considered significant:
Casual wear - $188,975
Women’s wear - $137,744
Non Apparel - $49,460
The recoverable amounts of brand names acquired in a business combination are determined on an individual brand basis based upon a value-in-use calculation. The value-in-use calculation has been determined based upon the relief from royalty method using cash flow projections as at July 2016 for a period of five years plus a terminal value. The cash flow projections are based on financial estimates approved by senior management and the Board for the 2017 financial year and are projected for a further four years based on estimated growth rates.
The extrapolated growth rates at which cash flows have been discounted for the individual brands within each of the CGU groups have been summarised in the table on the following page. Cash flows beyond the five year period are extrapolated using a growth rate of 3% (2015: 3%), which reflects the long-term growth expectation beyond the five year projection.
NOTES TO THE FINANCIAL STATEMENTS FOR THE 53 WEEKS ENDED 30 JULY 2016 AND THE 52 WEEKS ENDED 25 JULY 2015 (CONTINUED)
82
13 INTANGIBLES (CONTINUED)
IMPAIRMENT TESTING OF BRAND NAMES (CONTINUED)
The extrapolated growth rates at which cash flows have been projected or the individual brands within each of the CGU groups have been summarised below:
CGU AVERAGE GROWTH RATES APPLIED TO PROJECTED CASH FLOWS
TERMINAL VALUE GROWTH RATE
Casual wear 3.5% to 4% 3%
Women’s wear 3.5% to 5% 3%
Non Apparel 3% 3%
As part of the annual impairment test for brand names, management assesses the reasonableness of growth rate assumptions by reviewing historical cash flow projections as well as future growth objectives.
The post-tax discount rate applied to the cash flow projections for each of the three CGU groups is 9.0% (2015: 9.7%). The discount rate has been determined using the weighted average cost of capital which incorporates both the cost of debt and cost of capital.
Royalty rates have been determined for each brand within the CGU groups by considering the brand’s history and future expected performance. Factors such as the profitability of the brand, market share, brand recognition and general conditions in the industry have also been considered in determining an appropriate royalty rate for each brand. Consideration is also given to the industry norms relating to royalty rates by analysing market derived data for comparable brands and by considering the notional royalty payments as a percentage of the divisional earnings before interest and taxation generated by the division in which the Brand names are used. Net royalty rates applied across the three CGU groups range between 3.5% and 8.5% (2015: 3.5% and 8.5%).
Management has considered the possible change in expected sales growth, net royalty rates and discount rates applied to brands within the relevant CGU groups, each of which have been subjected to sensitivities. A reasonably possible adverse change in these key assumptions on which the recoverable amount is based would not cause the carrying amount of the CGU groups to exceed its recoverable amount.
For
per
sona
l use
onl
y

Annual Report 2016 82
NOTES TO THE FINANCIAL STATEMENTS FOR THE 53 WEEKS ENDED 30 JULY 2016 AND THE 52 WEEKS ENDED 25 JULY 2015 (CONTINUED)
82
13 INTANGIBLES (CONTINUED)
IMPAIRMENT TESTING OF BRAND NAMES (CONTINUED)
The extrapolated growth rates at which cash flows have been projected or the individual brands within each of the CGU groups have been summarised below:
CGU AVERAGE GROWTH RATES APPLIED TO PROJECTED CASH FLOWS
TERMINAL VALUE GROWTH RATE
Casual wear 3.5% to 4% 3%
Women’s wear 3.5% to 5% 3%
Non Apparel 3% 3%
As part of the annual impairment test for brand names, management assesses the reasonableness of growth rate assumptions by reviewing historical cash flow projections as well as future growth objectives.
The post-tax discount rate applied to the cash flow projections for each of the three CGU groups is 9.0% (2015: 9.7%). The discount rate has been determined using the weighted average cost of capital which incorporates both the cost of debt and cost of capital.
Royalty rates have been determined for each brand within the CGU groups by considering the brand’s history and future expected performance. Factors such as the profitability of the brand, market share, brand recognition and general conditions in the industry have also been considered in determining an appropriate royalty rate for each brand. Consideration is also given to the industry norms relating to royalty rates by analysing market derived data for comparable brands and by considering the notional royalty payments as a percentage of the divisional earnings before interest and taxation generated by the division in which the Brand names are used. Net royalty rates applied across the three CGU groups range between 3.5% and 8.5% (2015: 3.5% and 8.5%).
Management has considered the possible change in expected sales growth, net royalty rates and discount rates applied to brands within the relevant CGU groups, each of which have been subjected to sensitivities. A reasonably possible adverse change in these key assumptions on which the recoverable amount is based would not cause the carrying amount of the CGU groups to exceed its recoverable amount.
For
per
sona
l use
onl
y

83 Premier Investments Limited
NOTES TO THE FINANCIAL STATEMENTS FOR THE 53 WEEKS ENDED 30 JULY 2016 AND THE 52 WEEKS ENDED 25 JULY 2015 (CONTINUED)
83
CONSOLIDATED
NOTES 2016 $’000
2015$’000
14 INVESTMENTS IN ASSOCIATES
Movements in carrying amounts Carrying amount at the beginning of the financial year
209,477
188,418 Increase in investment in associate 29 16,492 Share of profit after income tax 13,792 13,144 Share of other comprehensive income (70) 2,728 Foreign currency translation of investment - 88 Dividends received (9,836) (9,628) Impairment loss on investment in associate 5 - (765) Transferred to asset classified as held for sale 11 - (1,000) Investments in associates 213,392 209,477
Just Kor Fashion Group (Pty) Ltd
Just Jeans Group Pty Ltd, a subsidiary of Premier Investments Limited, had a 50% interest in a joint venture entity, namely Just Kor Fashion Group (Pty) Ltd. Just Kor Fashion Group (Pty) Ltd a small proprietary company incorporated in South Africa, was involved in retailing of the Jay Jays concept in South Africa. Its functional currency was South African Rand.
During the second half of the 2015 financial year, the Group resolved to dispose of its 50% interest in the joint venture entity. As a result of the disposal, the Group ceased equity accounting for its investment in the joint venture and classified the fair value of the investment as an asset held for sale. The commercial terms of the sale was agreed at the end of the 2015 financial year, with transfer of the fair value completed in August 2015.
As a result of the reclassification from investment in associate to asset classified as held for sale and the subsequent revaluing to fair value, an impairment loss of $765,000 was recognised in the 2015 financial year. Prior to classifying the investment as held for sale, the Group’s share of the profit in its investment in the associate for the first half of the 2015 financial year was $311,850.
The following table illustrates summarised financial information relating to the Group’s investment in Just Kor Fashion Group (Pty) Ltd for the 2015 financial year:
EXTRACT OF THE ASSOCIATE’S STATEMENT OF COMPREHENSIVE INCOME
2016 $’000
26 WEEKS ENDED 26 JANUARY 2015
$’000
Revenue - 18,212 Profit after income tax - 624 Group’s share of profit after income tax - 312
NOTES TO THE FINANCIAL STATEMENTS FOR THE 53 WEEKS ENDED 30 JULY 2016 AND THE 52 WEEKS ENDED 25 JULY 2015 (CONTINUED)
84
14 INVESTMENTS IN ASSOCIATES (CONTINUED)
Breville Group Limited
As at 30 July 2016, Premier Investments Limited holds 27.5% (2015: 27.5%) of Breville Group Limited, a company incorporated in Australia whose shares are quoted on the Australian Securities Exchange. The principal activities of Breville Group Limited involves the innovation, development, marketing and distribution of small electrical appliances.
As at 30 July 2016, the fair value of the Group’s interest in Breville Group Limited as determined based on the quoted market price was $282,555,326 (2015: $228,873,056).
There were no impairment losses relating to the investment in associate and no capital commitments or other commitments relating to the associate. The Group’s share of the profit after tax in its investment in associate for the year was $13,792,283 (2015: $12,832,332).
The financial year end date of Breville Group Limited is 30 June. For the purpose of applying the equity method of accounting, the financial statements of Breville Group Limited for the year ended 30 June 2016 have been used.
The following table illustrates summarised financial information relating to the Group’s investment in Breville Group Limited:
EXTRACT OF THE ASSOCIATE’S STATEMENT OF FINANCIAL POSITION
30 JUNE 2016 $’000
30 JUNE 2015 $’000
Current assets 258,512 254,808 Non-current assets 111,455 106,464 Total assets 369,967 361,272 Current liabilities (108,204) (102,626) Non-current liabilities (15,758) (27,241) Total liabilities (123,962) (129,867) NET ASSETS 246,005 231,405 Group’s share of associate’s net assets 67,627 63,613
EXTRACT OF THE ASSOCIATE’S STATEMENT OF COMPREHENSIVE INCOME
30 JUNE 2016 $’000
30 JUNE 2015 $’000
Revenue 576,573 527,036 Profit after income tax 50,172 46,680 Other comprehensive (loss) income (255) 9,889 Group’s share of profit after income tax 13,792 12,832
For
per
sona
l use
onl
y

Annual Report 2016 84
NOTES TO THE FINANCIAL STATEMENTS FOR THE 53 WEEKS ENDED 30 JULY 2016 AND THE 52 WEEKS ENDED 25 JULY 2015 (CONTINUED)
84
14 INVESTMENTS IN ASSOCIATES (CONTINUED)
Breville Group Limited
As at 30 July 2016, Premier Investments Limited holds 27.5% (2015: 27.5%) of Breville Group Limited, a company incorporated in Australia whose shares are quoted on the Australian Securities Exchange. The principal activities of Breville Group Limited involves the innovation, development, marketing and distribution of small electrical appliances.
As at 30 July 2016, the fair value of the Group’s interest in Breville Group Limited as determined based on the quoted market price was $282,555,326 (2015: $228,873,056).
There were no impairment losses relating to the investment in associate and no capital commitments or other commitments relating to the associate. The Group’s share of the profit after tax in its investment in associate for the year was $13,792,283 (2015: $12,832,332).
The financial year end date of Breville Group Limited is 30 June. For the purpose of applying the equity method of accounting, the financial statements of Breville Group Limited for the year ended 30 June 2016 have been used.
The following table illustrates summarised financial information relating to the Group’s investment in Breville Group Limited:
EXTRACT OF THE ASSOCIATE’S STATEMENT OF FINANCIAL POSITION
30 JUNE 2016 $’000
30 JUNE 2015 $’000
Current assets 258,512 254,808 Non-current assets 111,455 106,464 Total assets 369,967 361,272 Current liabilities (108,204) (102,626) Non-current liabilities (15,758) (27,241) Total liabilities (123,962) (129,867) NET ASSETS 246,005 231,405 Group’s share of associate’s net assets 67,627 63,613
EXTRACT OF THE ASSOCIATE’S STATEMENT OF COMPREHENSIVE INCOME
30 JUNE 2016 $’000
30 JUNE 2015 $’000
Revenue 576,573 527,036 Profit after income tax 50,172 46,680 Other comprehensive (loss) income (255) 9,889 Group’s share of profit after income tax 13,792 12,832
For
per
sona
l use
onl
y

85 Premier Investments Limited
NOTES TO THE FINANCIAL STATEMENTS FOR THE 53 WEEKS ENDED 30 JULY 2016 AND THE 52 WEEKS ENDED 25 JULY 2015 (CONTINUED)
85
CONSOLIDATED
2016 $’000
2015$’000
15 TRADE AND OTHER PAYABLES
CURRENT
Trade creditors 31,632 38,162
Other creditors and accruals 41,333 35,561 TOTAL CURRENT 72,965 73,723
(a) Fair values
Due to the short-term nature of these payables, their carrying values approximate their fair values.
(b) Interest rate, foreign exchange rate and liquidity risk
Detail regarding interest rate, foreign exchange and liquidity risk is disclosed in Note 3.
CONSOLIDATED
NOTES 2016 $’000
2015$’000
16 INTEREST-BEARING LIABILITIES
CURRENT Lease liability 23 - 14 TOTAL CURRENT - 14
NON-CURRENT Bank loans* unsecured 86,805 67,623 Bank loans* unsecured (NZ$20.0 million) - 18,018 Bank loans ** secured 19,000 19,000
105,805 104,641 TOTAL NON-CURRENT 105,805 104,641
* Bank loans are subject to a negative pledge and cross guarantee within the Just Group Ltd group. Premier Investments Limited is not a participant or guarantor of the Just Group Ltd financing facilities.
** Premier Investments Limited obtained a bank borrowing amounting to $19 million. The borrowing is secured by a mortgage over the Land and Buildings, representing the National Distribution Centre in Truganina, Victoria. The borrowing is repayable in full at the end of 5 years, being January 2019.
(a) Fair values
The carrying values of the Group’s current and non-current borrowings approximate their fair values.
(b) Interest rate, foreign exchange rate and liquidity risk
Detail regarding interest rate, foreign exchange and liquidity risk is disclosed in Note 3.
(c) Defaults and breaches
During the current and prior years, there were no defaults or breaches on any of the loans.
NOTES TO THE FINANCIAL STATEMENTS FOR THE 53 WEEKS ENDED 30 JULY 2016 AND THE 52 WEEKS ENDED 25 JULY 2015 (CONTINUED)
86
CONSOLIDATED
2016 $’000
2015$’000
17 PROVISIONS
CURRENT Employee entitlements – Annual Leave 10,903 10,209 Employee entitlements – Long Service Leave 5,554 5,189 Supply chain transformation - 497 Onerous leases - 202 TOTAL CURRENT 16,457 16,097 NON-CURRENT Employee entitlements – Long Service Leave 1,871 1,782
MOVEMENTS IN PROVISIONS
Supply chain transformation
Opening balance 497 1,100
Utilised during the period (497) (603)
Closing balance - 497
Onerous leases
Opening balance 202 541
Charged to profit or loss - 36
Utilised during the period (202) (375)
Closing balance - 202
NATURE AND TIMING OF PROVISIONS
Supply chain transformation, onerous lease and employee entitlements provisions
Refer to note 2(u), 2(v), 2(w) and 2(x) for the relevant accounting policy and a discussion of significant estimations and assumptions applied in the measurement of these provisions.
CONSOLIDATED
2016 $’000
2015$’000
18 OTHER LIABILITIES
CURRENT
Deferred income 6,967 5,635 TOTAL CURRENT 6,967 5,635 NON-CURRENT
Deferred income 14,809 12,411 TOTAL NON-CURRENT 14,809 12,411
For
per
sona
l use
onl
y

Annual Report 2016 86
NOTES TO THE FINANCIAL STATEMENTS FOR THE 53 WEEKS ENDED 30 JULY 2016 AND THE 52 WEEKS ENDED 25 JULY 2015 (CONTINUED)
86
CONSOLIDATED
2016 $’000
2015$’000
17 PROVISIONS
CURRENT Employee entitlements – Annual Leave 10,903 10,209 Employee entitlements – Long Service Leave 5,554 5,189 Supply chain transformation - 497 Onerous leases - 202 TOTAL CURRENT 16,457 16,097 NON-CURRENT Employee entitlements – Long Service Leave 1,871 1,782
MOVEMENTS IN PROVISIONS
Supply chain transformation
Opening balance 497 1,100
Utilised during the period (497) (603)
Closing balance - 497
Onerous leases
Opening balance 202 541
Charged to profit or loss - 36
Utilised during the period (202) (375)
Closing balance - 202
NATURE AND TIMING OF PROVISIONS
Supply chain transformation, onerous lease and employee entitlements provisions
Refer to note 2(u), 2(v), 2(w) and 2(x) for the relevant accounting policy and a discussion of significant estimations and assumptions applied in the measurement of these provisions.
CONSOLIDATED
2016 $’000
2015$’000
18 OTHER LIABILITIES
CURRENT
Deferred income 6,967 5,635 TOTAL CURRENT 6,967 5,635 NON-CURRENT
Deferred income 14,809 12,411 TOTAL NON-CURRENT 14,809 12,411
For
per
sona
l use
onl
y

87 Premier Investments Limited
NOTES TO THE FINANCIAL STATEMENTS FOR THE 53 WEEKS ENDED 30 JULY 2016 AND THE 52 WEEKS ENDED 25 JULY 2015 (CONTINUED)
87
CONSOLIDATED
2016 $’000
2015$’000
19 CONTRIBUTED EQUITY
Ordinary shares 608,615 608,615
NO. (‘000)
$‘000
(a) MOVEMENTS IN SHARES ON ISSUE
Shares on issue 26 July 2015 156,380 608,615
Shares issued during the year (i) 784 -
Shares on issue at 30 July 2016 157,164 608,615
Shares on issue 27 July 2014 155,714 608,615
Shares issued during the year (i) 666 -
Shares on issue at 25 July 2015 156,380 608,615
Fully paid ordinary shares carry one vote per share and carry the rights to dividends.
(i) A total of 784,386 shares (2015: 665,201) were issued in relation to the performance rights plan.
(b) CAPITAL MANAGEMENT
The Group’s objective is to ensure the entity continues as a going concern as well as to maintain optimal returns to shareholders. The Group also aims to maintain a capital structure that ensures the lowest cost of capital available to the entity.
The capital structure of the Group consists of debt which includes borrowings as disclosed in Note 16, cash and cash equivalents as disclosed in Note 26 and equity attributable to the equity holders of the parent comprising of issued capital, reserves and retained profits as disclosed in Notes 19, 20 and 21 respectively.
The Group operates primarily through its two business segments, investments and retail. The investments segment is managed and operated through the parent company. The retail segment operates through subsidiaries established in their respective markets and maintains a central borrowing facility through a subsidiary, to meet the retail segment’s funding requirements and to enable the Group to find the optimal debt and equity balance.
The Group’s capital structure is reviewed on a periodic basis in the context of prevailing market conditions, and appropriate steps are taken to ensure the Group’s capital structure and capital management initiatives remain in line with the Board’s objectives.
The Group maintains that the dividend paid will represent at least 65% of net profit after tax.
(c) EXTERNALLY IMPOSED CAPITAL REQUIREMENTS
Just Group Ltd, a subsidiary of Premier Investments Limited, is subject to a number of financial undertakings as part of its financing facility agreement. These undertakings have been satisfied during the period.
The Group is not subject to any capital requirements imposed by regulators or other prudential authorities.
NOTES TO THE FINANCIAL STATEMENTS FOR THE 53 WEEKS ENDED 30 JULY 2016 AND THE 52 WEEKS ENDED 25 JULY 2015 (CONTINUED)
88
CONSOLIDATED
2016 $’000
2015$’000
20 RESERVES
RESERVES COMPRISE: Capital profits reserve (a) 464 464 Foreign currency translation reserve (b) 1,047 6,480 Cash flow hedge reserve (c) (10,291) 21,197 Performance rights reserve (d) 6,346 4,082
TOTAL RESERVES (2,434) 32,223
(a) CAPITAL PROFITS RESERVE (i) Nature and purpose of reserve
The capital profits reserve is used to accumulate realised capital profits. There were no movements through the capital profits reserve.
(b) FOREIGN CURRENCY TRANSLATION RESERVE (i) Nature and purpose of reserve This reserve is used to record exchange differences arising from the translation of the financial statements of foreign subsidiaries. (ii) Movements in the reserve
Opening balance 6,480 2,334
Foreign currency translation of overseas subsidiaries (5,363) 1,418
Net movement in associate entity’s reserves (70) 2,728
CLOSING BALANCE 1,047 6,480
(c) CASH FLOW HEDGE RESERVE
(i) Nature and purpose of reserve This reserve records the portion of the gain or loss on a hedging instrument in a cash flow hedge that is determined to be an effective hedge.
(ii) Movements in the reserve Opening balance 21,197 (3,565) Net (loss) gain on cash flow hedges (24,076) 19,251 Transferred to (from) statement of financial position/ profit or loss
(20,907)
16,123
Net deferred income tax movement on cash flow hedges 13,495 (10,612)
CLOSING BALANCE (10,291) 21,197
For
per
sona
l use
onl
y

Annual Report 2016 88
NOTES TO THE FINANCIAL STATEMENTS FOR THE 53 WEEKS ENDED 30 JULY 2016 AND THE 52 WEEKS ENDED 25 JULY 2015 (CONTINUED)
88
CONSOLIDATED
2016 $’000
2015$’000
20 RESERVES
RESERVES COMPRISE: Capital profits reserve (a) 464 464 Foreign currency translation reserve (b) 1,047 6,480 Cash flow hedge reserve (c) (10,291) 21,197 Performance rights reserve (d) 6,346 4,082
TOTAL RESERVES (2,434) 32,223
(a) CAPITAL PROFITS RESERVE (i) Nature and purpose of reserve
The capital profits reserve is used to accumulate realised capital profits. There were no movements through the capital profits reserve.
(b) FOREIGN CURRENCY TRANSLATION RESERVE (i) Nature and purpose of reserve This reserve is used to record exchange differences arising from the translation of the financial statements of foreign subsidiaries. (ii) Movements in the reserve
Opening balance 6,480 2,334
Foreign currency translation of overseas subsidiaries (5,363) 1,418
Net movement in associate entity’s reserves (70) 2,728
CLOSING BALANCE 1,047 6,480
(c) CASH FLOW HEDGE RESERVE
(i) Nature and purpose of reserve This reserve records the portion of the gain or loss on a hedging instrument in a cash flow hedge that is determined to be an effective hedge.
(ii) Movements in the reserve Opening balance 21,197 (3,565) Net (loss) gain on cash flow hedges (24,076) 19,251 Transferred to (from) statement of financial position/ profit or loss
(20,907)
16,123
Net deferred income tax movement on cash flow hedges 13,495 (10,612)
CLOSING BALANCE (10,291) 21,197
For
per
sona
l use
onl
y

89 Premier Investments Limited
NOTES TO THE FINANCIAL STATEMENTS FOR THE 53 WEEKS ENDED 30 JULY 2016 AND THE 52 WEEKS ENDED 25 JULY 2015 (CONTINUED)
89
CONSOLIDATED
2016 $’000
2015$’000
20 RESERVES (CONTINUED)
(d) PERFORMANCE RIGHTS RESERVE
(i) Nature and purpose of reserve This reserve is used to record the cumulative amortised value of performance rights issued to key senior employees net of the value of performance shares acquired under the performance rights plan.
(ii) Movements in the reserve Opening balance 4,082 3,281
Performance rights expense for the year 2,264 801 CLOSING BALANCE 6,346 4,082
21 RETAINED EARNINGS
Opening balance 697,469 687,400
Net profit for the period attributable to owners 103,874 88,102 Dividends paid (68,969) (78,033)
CLOSING BALANCE 732,374 697,469
NOTES TO THE FINANCIAL STATEMENTS FOR THE 53 WEEKS ENDED 30 JULY 2016 AND THE 52 WEEKS ENDED 25 JULY 2015 (CONTINUED)
90
22 OPERATING SEGMENTS
Identification of operating segments
The Group has identified its operating segments based on the internal reports that are reviewed and used by the chief operating decision maker in assessing the performance of the company and in determining the allocation of resources.
The operating segments are identified by management based on the nature of the business conducted. Discrete financial information about each of these operating businesses is reported to the chief operating decision maker on at least a monthly basis.
Types of products and services
Retail
The retail segment represents the financial performance of a number of speciality retail fashion chains.
Investment
The investments segment represents investments in securities for both long and short term gains, dividend income and interest.
Accounting policies
The accounting policies used by the Group in reporting segments internally are the same as those contained in note 2 to the accounts and in the prior periods.
Income tax expense
Income tax expense is calculated based on the segment operating net profit using the Group’s effective income tax rate.
It is the Group’s policy that if items of revenue and expense are not allocated to operating segments then any associated assets and liabilities are also not allocated to the segments. This is to avoid asymmetrical allocations within segments which management believe would be inconsistent.
The following table presents revenue and profit information for operating segments for the periods ended 30 July 2016 and 25 July 2015.
For
per
sona
l use
onl
y

Annual Report 2016 90
NOTES TO THE FINANCIAL STATEMENTS FOR THE 53 WEEKS ENDED 30 JULY 2016 AND THE 52 WEEKS ENDED 25 JULY 2015 (CONTINUED)
90
22 OPERATING SEGMENTS
Identification of operating segments
The Group has identified its operating segments based on the internal reports that are reviewed and used by the chief operating decision maker in assessing the performance of the company and in determining the allocation of resources.
The operating segments are identified by management based on the nature of the business conducted. Discrete financial information about each of these operating businesses is reported to the chief operating decision maker on at least a monthly basis.
Types of products and services
Retail
The retail segment represents the financial performance of a number of speciality retail fashion chains.
Investment
The investments segment represents investments in securities for both long and short term gains, dividend income and interest.
Accounting policies
The accounting policies used by the Group in reporting segments internally are the same as those contained in note 2 to the accounts and in the prior periods.
Income tax expense
Income tax expense is calculated based on the segment operating net profit using the Group’s effective income tax rate.
It is the Group’s policy that if items of revenue and expense are not allocated to operating segments then any associated assets and liabilities are also not allocated to the segments. This is to avoid asymmetrical allocations within segments which management believe would be inconsistent.
The following table presents revenue and profit information for operating segments for the periods ended 30 July 2016 and 25 July 2015.
For
per
sona
l use
onl
y

91 Premier Investments Limited
NOTES TO THE FINANCIAL STATEMENTS FOR THE 53 WEEKS ENDED 30 JULY 2016 AND THE 52 WEEKS ENDED 25 JULY 2015 (CONTINUED)
91
22 OPERATING SEGMENTS (CONTINUED)
(a) OPERATING SEGMENTS
RETAIL INVESTMENT ELIMINATION TOTAL
2016 $’000
2015$’000
2016$’000
2015$’000
2016$’000
2015 $’000
2016$’000
2015$’000
REVENUE
Sale of goods 1,049,226 947,662 - - - - 1,049,226 947,662
Interest revenue 186 390 7,702 9,438 - - 7,888 9,828
Other revenue 322 388 62,018 48,014 (62,000) (48,000) 340 402
Other income 1,507 3,751 - 226 - - 1,507 3,977
Total Segment Income 1,051,241 952,191 69,720 57,678 (62,000) (48,000) 1,058,961 961,869
Total income per the statement of comprehensive income
1,058,961 961,869
RESULTS
Depreciation and amortisation
23,881
21,906
-
-
-
-
23,881
21,906
Impairment of property plant and equipment
-
771
-
-
-
-
-
771
Interest expense 4,912 5,738 - - - - 4,912 5,738
Disposal of asset held for sale
-
1,724
-
-
-
-
-
1,724
Share of profit of associates
-
312
13,792
12,832
-
-
13,792
13,144
Segment profit before income tax expense
126,207
98,958
78,876
65,987
(62,000)
(48,000)
143,083
116,945
Income tax expense (39,209) (28,843)
Net profit after tax per the statement of comprehensive income
103,874 88,102
ASSETS AND LIABILITIES
Segment assets 446,874 442,900 1,283,894 1,278,659 (67,885) (72,756) 1,662,883 1,648,803
Segment liabilities 270,091 260,971 76,106 76,268 (21,869) (26,742) 324,328 310,496
Capital expenditure 42,677 36,526 - - - - 42,677 36,526
For
per
sona
l use
onl
y

Annual Report 2016 92
NO
TES
TO T
HE
FIN
ANC
IAL
STAT
EMEN
TS
FOR
TH
E 53
WEE
KS E
ND
ED 3
0 JU
LY 2
016
AND
TH
E 52
WEE
KS E
ND
ED 2
5 JU
LY 2
015
(CO
NTI
NU
ED)
92
22
OPE
RAT
ING
SEG
MEN
T (C
ON
TIN
UED
)
(b)
GE
OG
RA
PH
IC S
EG
ME
NTS
AUST
RAL
IA
N
EW Z
EALA
ND
ASIA
UN
ITED
KIN
GD
OM
TOTA
L
ELIM
INAT
ION
S
CO
NSO
LID
ATED
20
16
$’00
0 20
15
$’00
0 20
16
$’00
0 20
15
$’00
0 20
16
$’00
0 20
15
$’00
0 20
16
$’00
0 20
15
$’00
0 20
16
$’00
0 20
15
$’00
0 20
16
$’00
0 20
15
$’00
0 20
16
$’00
0 20
15
$’00
0
RE
VE
NU
E
Sale
of g
oods
83
4,93
2 78
4,80
2 13
0,15
8 12
2,17
0 26
,081
20
,893
58
,055
19
,797
1,
049,
226
947,
662
- -
1,04
9,22
6 94
7,66
2
Oth
er re
venu
e an
d
inco
me
60,4
55
13,5
29
8,42
6
664
-
-
13
14
68,8
94
14,2
07
(59,
159)
-
9,73
5
14,2
07
Segm
ent i
ncom
e
895,
387
798,
331
138,
584
122,
834
26,0
81
20,8
93
58,0
68
19,8
11
1,11
8,12
0 96
1,86
9 (5
9,15
9)
- 1,
058,
961
961,
869
Segm
ent n
on-c
urre
nt
asse
ts
1,23
8,70
1
1,23
3,12
2
10,0
33
8,00
6
4,14
2
2,81
6
25,3
72
13,3
68
1,27
8,24
8
1,25
7,31
2
(51,
945)
(54,
340)
1,22
6,30
3
1,20
2,97
2
Cap
ital e
xpen
ditu
re
19,8
37
25,9
54
3,70
2 2,
039
1,97
9 55
6 17
,159
7,
977
42,6
77
36,5
26
- -
42,6
77
36,5
26
For
per
sona
l use
onl
y
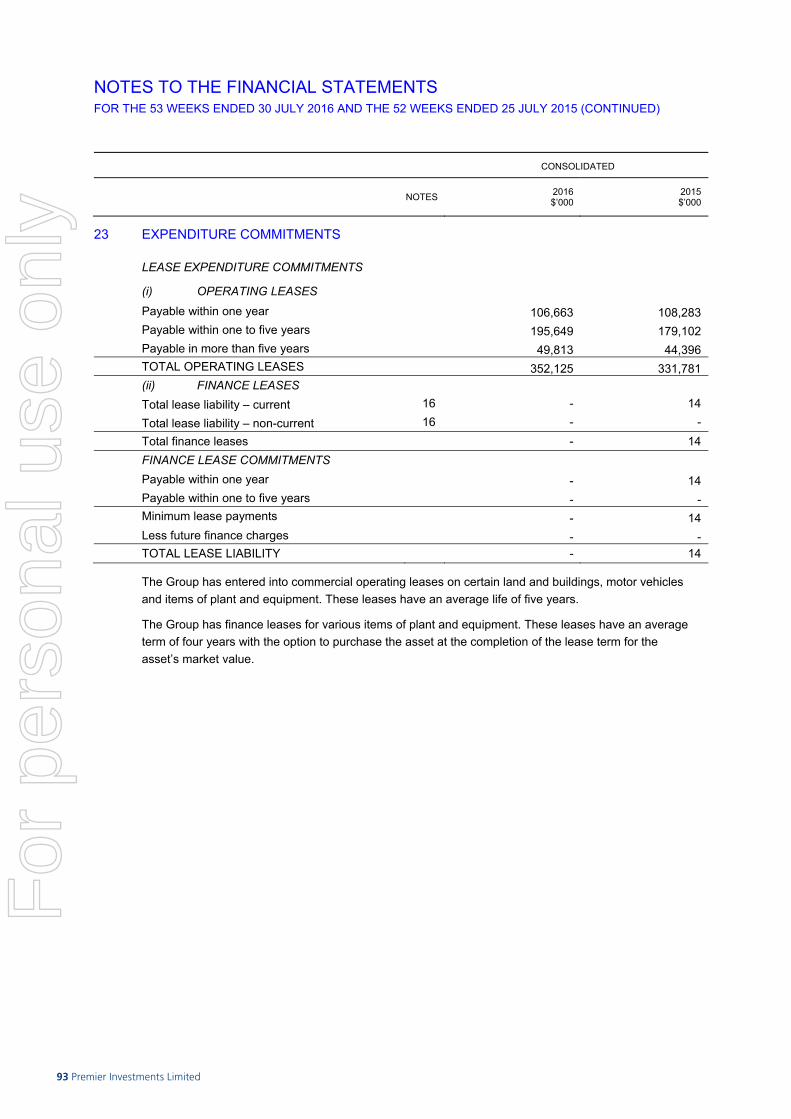
93 Premier Investments Limited
NOTES TO THE FINANCIAL STATEMENTS FOR THE 53 WEEKS ENDED 30 JULY 2016 AND THE 52 WEEKS ENDED 25 JULY 2015 (CONTINUED)
94
CONSOLIDATED
2016 $
2015$
24 KEY MANAGEMENT PERSONNEL
COMPENSATION FOR KEY MANAGEMENT PERSONNEL
Short-term employee benefits 8,065,012 8,088,880
Post-employment benefits 180,390 189,095
Other post-employment benefits 100,000 -
Share-based payments 1,650,120 530,220
TOTAL 9,995,522 8,808,195
Information regarding individual key management personnel compensation, shareholdings of key management personnel, as well as other transactions and balances with key management personnel and their related parties, as required by Regulation 2M.3.03 of the Corporations Regulations 2001 is provided in the Remuneration Report section of the Directors’ Report.
CONSOLIDATED
2016 $
2015$
25 AUDITOR’S REMUNERATION
The auditor of Premier Investments Limited is Ernst & Young. Amounts received, or due and receivable, by Ernst & Young (Australia) for:
- An audit or review of the financial report of the entity and any other entity in the consolidated group.
501,138
526,757 Other services in relation to the entity and any other entity in the consolidated group:
- Other non-audit services 76,125 76,600
Total – Other services 76,125 76,600
TOTAL AUDITOR’S REMUNERATION 577,263 603,357
NOTES TO THE FINANCIAL STATEMENTS FOR THE 53 WEEKS ENDED 30 JULY 2016 AND THE 52 WEEKS ENDED 25 JULY 2015 (CONTINUED)
93
CONSOLIDATED
NOTES 2016 $’000
2015$’000
23 EXPENDITURE COMMITMENTS
LEASE EXPENDITURE COMMITMENTS
(i) OPERATING LEASES Payable within one year 106,663 108,283 Payable within one to five years 195,649 179,102 Payable in more than five years 49,813 44,396 TOTAL OPERATING LEASES 352,125 331,781 (ii) FINANCE LEASES Total lease liability – current 16 - 14 Total lease liability – non-current 16 - - Total finance leases - 14 FINANCE LEASE COMMITMENTS Payable within one year - 14 Payable within one to five years - - Minimum lease payments - 14 Less future finance charges - - TOTAL LEASE LIABILITY - 14
The Group has entered into commercial operating leases on certain land and buildings, motor vehicles and items of plant and equipment. These leases have an average life of five years.
The Group has finance leases for various items of plant and equipment. These leases have an average term of four years with the option to purchase the asset at the completion of the lease term for the asset’s market value.
For
per
sona
l use
onl
y

Annual Report 2016 94
NOTES TO THE FINANCIAL STATEMENTS FOR THE 53 WEEKS ENDED 30 JULY 2016 AND THE 52 WEEKS ENDED 25 JULY 2015 (CONTINUED)
94
CONSOLIDATED
2016 $
2015$
24 KEY MANAGEMENT PERSONNEL
COMPENSATION FOR KEY MANAGEMENT PERSONNEL
Short-term employee benefits 8,065,012 8,088,880
Post-employment benefits 180,390 189,095
Other post-employment benefits 100,000 -
Share-based payments 1,650,120 530,220
TOTAL 9,995,522 8,808,195
Information regarding individual key management personnel compensation, shareholdings of key management personnel, as well as other transactions and balances with key management personnel and their related parties, as required by Regulation 2M.3.03 of the Corporations Regulations 2001 is provided in the Remuneration Report section of the Directors’ Report.
CONSOLIDATED
2016 $
2015$
25 AUDITOR’S REMUNERATION
The auditor of Premier Investments Limited is Ernst & Young. Amounts received, or due and receivable, by Ernst & Young (Australia) for:
- An audit or review of the financial report of the entity and any other entity in the consolidated group.
501,138
526,757 Other services in relation to the entity and any other entity in the consolidated group:
- Other non-audit services 76,125 76,600
Total – Other services 76,125 76,600
TOTAL AUDITOR’S REMUNERATION 577,263 603,357
For
per
sona
l use
onl
y
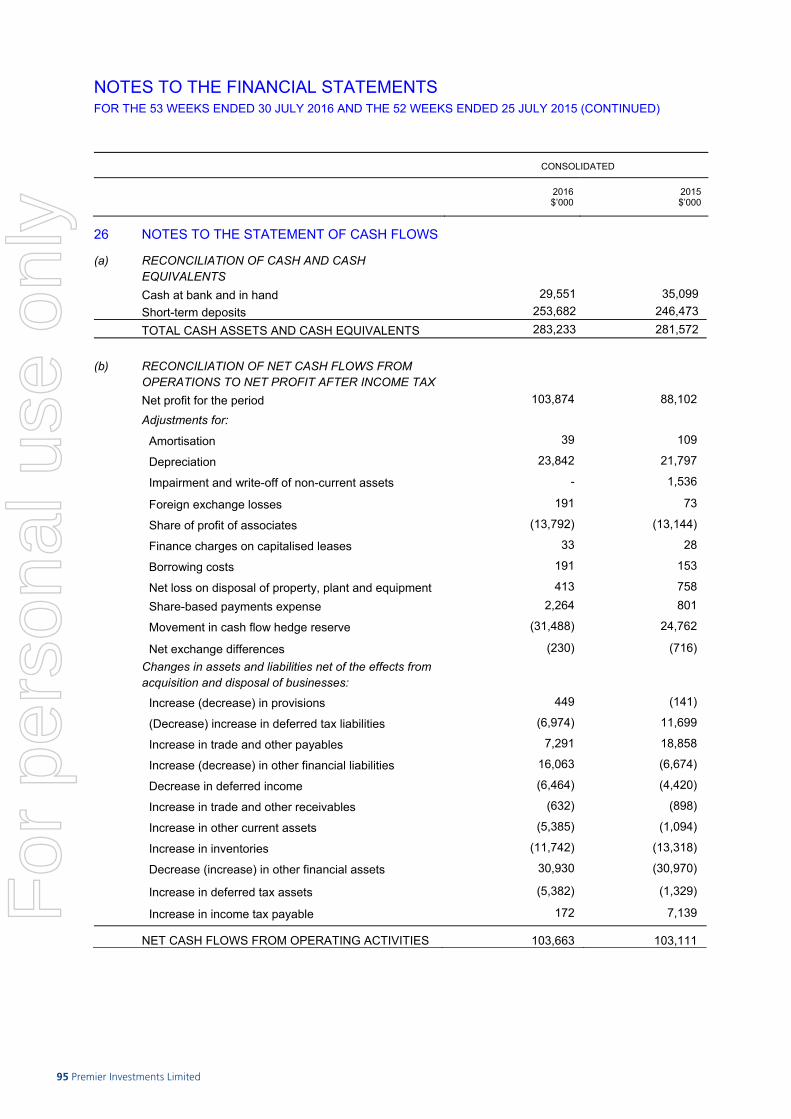
95 Premier Investments Limited
NOTES TO THE FINANCIAL STATEMENTS FOR THE 53 WEEKS ENDED 30 JULY 2016 AND THE 52 WEEKS ENDED 25 JULY 2015 (CONTINUED)
95
CONSOLIDATED
2016 $’000
2015$’000
26 NOTES TO THE STATEMENT OF CASH FLOWS
(a) RECONCILIATION OF CASH AND CASH EQUIVALENTS
Cash at bank and in hand 29,551 35,099 Short-term deposits 253,682 246,473 TOTAL CASH ASSETS AND CASH EQUIVALENTS 283,233 281,572
(b) RECONCILIATION OF NET CASH FLOWS FROM OPERATIONS TO NET PROFIT AFTER INCOME TAX Net profit for the period 103,874 88,102
Adjustments for:
Amortisation 39 109
Depreciation 23,842 21,797
Impairment and write-off of non-current assets - 1,536
Foreign exchange losses 191 73
Share of profit of associates (13,792) (13,144)
Finance charges on capitalised leases 33 28
Borrowing costs 191 153
Net loss on disposal of property, plant and equipment 413 758 Share-based payments expense 2,264 801
Movement in cash flow hedge reserve (31,488) 24,762
Net exchange differences (230) (716) Changes in assets and liabilities net of the effects from acquisition and disposal of businesses:
Increase (decrease) in provisions 449 (141)
(Decrease) increase in deferred tax liabilities (6,974) 11,699
Increase in trade and other payables 7,291 18,858
Increase (decrease) in other financial liabilities 16,063 (6,674)
Decrease in deferred income (6,464) (4,420)
Increase in trade and other receivables (632) (898)
Increase in other current assets (5,385) (1,094)
Increase in inventories (11,742) (13,318)
Decrease (increase) in other financial assets 30,930 (30,970)
Increase in deferred tax assets (5,382) (1,329)
Increase in income tax payable 172 7,139
NET CASH FLOWS FROM OPERATING ACTIVITIES 103,663 103,111
NOTES TO THE FINANCIAL STATEMENTS FOR THE 53 WEEKS ENDED 30 JULY 2016 AND THE 52 WEEKS ENDED 25 JULY 2015 (CONTINUED)
96
CONSOLIDATED
2016 $’000
2015$’000
26 NOTES TO THE STATEMENT OF CASH FLOWS
(CONTINUED)
(c) FINANCE FACILITIES Working capital and bank overdraft facility Used - -
Unused 11,800 11,800 11,800 11,800
Finance facility Used 106,000 105,018 Unused 53,000 53,982
159,000 159,000 Bank guarantee facility Used 51 188 Unused 149 12
200 200 Interchangeable facility Used 5,156 3,899 Unused 2,844 4,101 8,000 8,000 Leasing facility Used - 14 Unused - -
- 14 Total facilities Used 111,207 109,119 Unused 67,793 69,895 TOTAL 179,000 179,014
For
per
sona
l use
onl
y

Annual Report 2016 96
NOTES TO THE FINANCIAL STATEMENTS FOR THE 53 WEEKS ENDED 30 JULY 2016 AND THE 52 WEEKS ENDED 25 JULY 2015 (CONTINUED)
96
CONSOLIDATED
2016 $’000
2015$’000
26 NOTES TO THE STATEMENT OF CASH FLOWS
(CONTINUED)
(c) FINANCE FACILITIES Working capital and bank overdraft facility Used - -
Unused 11,800 11,800 11,800 11,800
Finance facility Used 106,000 105,018 Unused 53,000 53,982
159,000 159,000 Bank guarantee facility Used 51 188 Unused 149 12
200 200 Interchangeable facility Used 5,156 3,899 Unused 2,844 4,101 8,000 8,000 Leasing facility Used - 14 Unused - -
- 14 Total facilities Used 111,207 109,119 Unused 67,793 69,895 TOTAL 179,000 179,014
For
per
sona
l use
onl
y
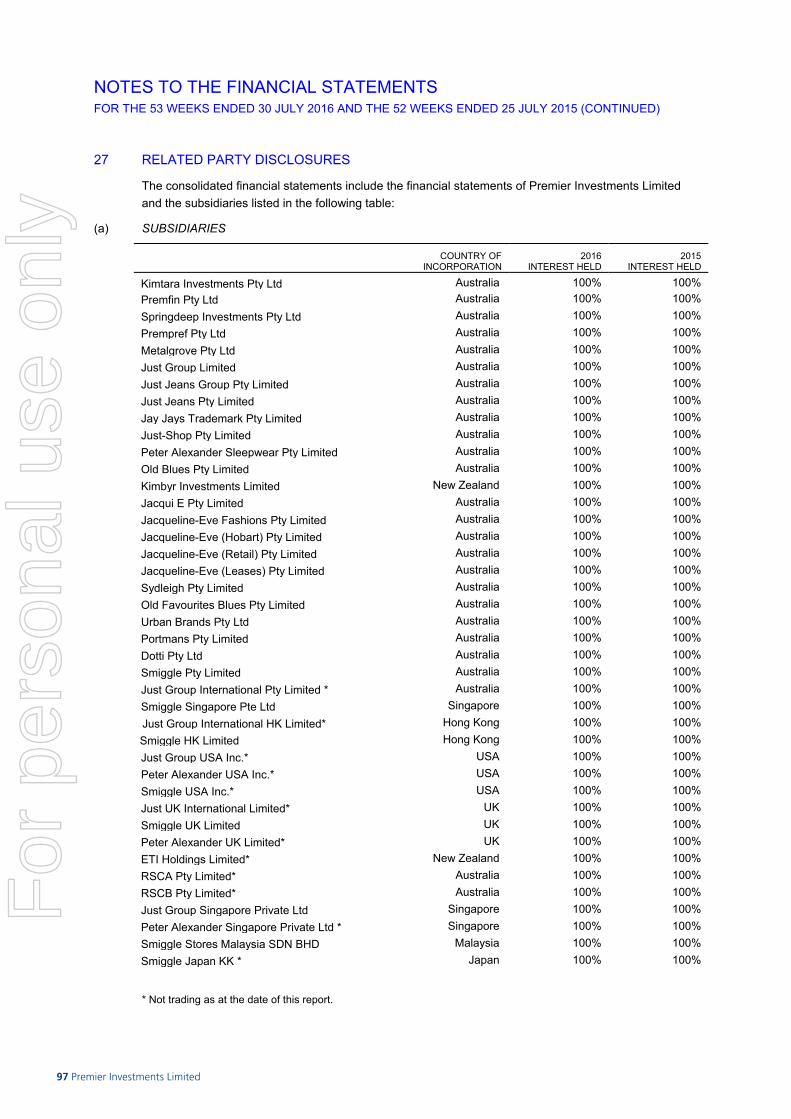
97 Premier Investments Limited
NOTES TO THE FINANCIAL STATEMENTS FOR THE 53 WEEKS ENDED 30 JULY 2016 AND THE 52 WEEKS ENDED 25 JULY 2015 (CONTINUED)
97
27 RELATED PARTY DISCLOSURES
The consolidated financial statements include the financial statements of Premier Investments Limited and the subsidiaries listed in the following table:
(a) SUBSIDIARIES
COUNTRY OF
INCORPORATION 2016
INTEREST HELD 2015
INTEREST HELD
Kimtara Investments Pty Ltd Australia 100% 100% Premfin Pty Ltd Australia 100% 100% Springdeep Investments Pty Ltd Australia 100% 100% Prempref Pty Ltd Australia 100% 100% Metalgrove Pty Ltd Australia 100% 100% Just Group Limited Australia 100% 100% Just Jeans Group Pty Limited Australia 100% 100% Just Jeans Pty Limited Australia 100% 100% Jay Jays Trademark Pty Limited Australia 100% 100% Just-Shop Pty Limited Australia 100% 100% Peter Alexander Sleepwear Pty Limited Australia 100% 100% Old Blues Pty Limited Australia 100% 100% Kimbyr Investments Limited New Zealand 100% 100% Jacqui E Pty Limited Australia 100% 100% Jacqueline-Eve Fashions Pty Limited Australia 100% 100% Jacqueline-Eve (Hobart) Pty Limited Australia 100% 100% Jacqueline-Eve (Retail) Pty Limited Australia 100% 100% Jacqueline-Eve (Leases) Pty Limited Australia 100% 100% Sydleigh Pty Limited Australia 100% 100% Old Favourites Blues Pty Limited Australia 100% 100% Urban Brands Pty Ltd Australia 100% 100% Portmans Pty Limited Australia 100% 100% Dotti Pty Ltd Australia 100% 100% Smiggle Pty Limited Australia 100% 100% Just Group International Pty Limited * Australia 100% 100% Smiggle Singapore Pte Ltd Singapore 100% 100% Just Group International HK Limited* Hong Kong 100% 100% Smiggle HK Limited Hong Kong 100% 100% Just Group USA Inc.* USA 100% 100% Peter Alexander USA Inc.* USA 100% 100% Smiggle USA Inc.* USA 100% 100% Just UK International Limited* UK 100% 100% Smiggle UK Limited UK 100% 100% Peter Alexander UK Limited* UK 100% 100% ETI Holdings Limited* New Zealand 100% 100% RSCA Pty Limited* Australia 100% 100% RSCB Pty Limited* Australia 100% 100% Just Group Singapore Private Ltd Singapore 100% 100% Peter Alexander Singapore Private Ltd * Singapore 100% 100% Smiggle Stores Malaysia SDN BHD Malaysia 100% 100% Smiggle Japan KK * Japan 100% 100%
* Not trading as at the date of this report.
NOTES TO THE FINANCIAL STATEMENTS FOR THE 53 WEEKS ENDED 30 JULY 2016 AND THE 52 WEEKS ENDED 25 JULY 2015 (CONTINUED)
98
27 RELATED PARTY DISCLOSURES (CONTINUED)
(b) GROUP TRANSACTIONS WITH ASSOCIATES
During the 2015 financial year, the Group had a 50% interest in Just Kor Fashion Group (Pty) Ltd. The Group disposed of its interest in Just Kor Fashion Group (Pty) Ltd in August 2015.
(i) Sale of inventory in the amount of $ nil (2015: $1,956,022).
(ii) Management fee charged for services provided in the amount of $ nil (2015: $83,501).
(iii) Information regarding outstanding balances with the associate at the end of the 2015 financial year is disclosed in Note 8. The loan was denominated in South African Rand. Interest was charged at a commercial rate and was payable monthly. Interest earned on the loan in 2015 is disclosed in Note 4.
(iv) Refer to Note 11 for information regarding the disposal of the 50% interest in Just Kor Fashion Group (Pty) Ltd subsequent to the 2015 financial year-end.
(c) KEY MANAGEMENT PERSONNEL
Details relating to remuneration paid to key management personnel are included in Note 24.
(d) TERMS AND CONDITIONS
Outstanding balances at year-end are unsecured, interest free and settlement occurs in cash with the exception of the loan provided to the associate as disclosed above.
(e) ULTIMATE PARENT
Premier Investments Limited is the ultimate parent entity.
For
per
sona
l use
onl
y
Annual Report 2016 98
NOTES TO THE FINANCIAL STATEMENTS FOR THE 53 WEEKS ENDED 30 JULY 2016 AND THE 52 WEEKS ENDED 25 JULY 2015 (CONTINUED)
98
27 RELATED PARTY DISCLOSURES (CONTINUED)
(b) GROUP TRANSACTIONS WITH ASSOCIATES
During the 2015 financial year, the Group had a 50% interest in Just Kor Fashion Group (Pty) Ltd. The Group disposed of its interest in Just Kor Fashion Group (Pty) Ltd in August 2015.
(i) Sale of inventory in the amount of $ nil (2015: $1,956,022).
(ii) Management fee charged for services provided in the amount of $ nil (2015: $83,501).
(iii) Information regarding outstanding balances with the associate at the end of the 2015 financial year is disclosed in Note 8. The loan was denominated in South African Rand. Interest was charged at a commercial rate and was payable monthly. Interest earned on the loan in 2015 is disclosed in Note 4.
(iv) Refer to Note 11 for information regarding the disposal of the 50% interest in Just Kor Fashion Group (Pty) Ltd subsequent to the 2015 financial year-end.
(c) KEY MANAGEMENT PERSONNEL
Details relating to remuneration paid to key management personnel are included in Note 24.
(d) TERMS AND CONDITIONS
Outstanding balances at year-end are unsecured, interest free and settlement occurs in cash with the exception of the loan provided to the associate as disclosed above.
(e) ULTIMATE PARENT
Premier Investments Limited is the ultimate parent entity.
For
per
sona
l use
onl
y

99 Premier Investments Limited
NOTES TO THE FINANCIAL STATEMENTS FOR THE 53 WEEKS ENDED 30 JULY 2016 AND THE 52 WEEKS ENDED 25 JULY 2015 (CONTINUED)
99
28 SHARE-BASED PAYMENT PLANS
(a) RECOGNISED SHARE-BASED PAYMENT EXPENSES
The expense recognised for employee services received during the year is shown in the table below:
CONSOLIDATED
2016 $’000
2015$’000
Total expense arising from equity-settled share-based payment transactions 2,264 801
(b) TYPE OF SHARE-BASED PAYMENT PLAN
Performance rights
The Company grants performance rights to executives, thus ensuring that the executives who are most directly able to influence the Group’s performance are appropriately aligned with the interests of shareholders.
A performance right is a right to acquire one fully paid ordinary share of the Company after meeting a three or four year performance period, provided specific performance hurdles are met. The number of performance rights to vest is determined by a vesting schedule based on the performance of the Company. These performance hurdles have been discussed in the Remuneration Report on pages 15 to 36.
The fair value of the performance rights has been calculated as at the respective grant dates using an appropriate valuation technique. The valuation model applied, being either the Black Sholes European option pricing model for performance rights granted prior to the end of the 2015 financial year, or the Monte-Carlo simulation pricing model for performance rights granted as of the 2016 financial year, is dependent on the assumptions underlying the performance rights granted to ensure these are appropriately factored into the determination of fair value.
In determining the share-based payments expense for the period, the number of instruments expected to vest has been adjusted to reflect the number of executives expected to remain with the Group until the end of the performance period, as well as the probability of not meeting the Total Shareholder Return (“TSR”) performance hurdles.
The following share-based payment arrangements were in existence during the current and prior reporting periods:
NUMBER GRANT DATE FAIR VALUE AT
GRANT DATE
Granted on 10 May 2011 1,200,000 10/05/2011 $3.00 Granted on 25 May 2012 185,201 25/05/2012 $2.62 Granted on 12 April 2013 304,386 12/04/2013 $2.88 Granted on 18 April 2013 240,000 18/04/2013 $4.20 Granted on 11 December 2013 319,493 11/12/2013 $4.28 Granted on 22 June 2015 169,365 22/06/2015 $10.34 Granted on 22 June 2015 12,266 22/06/2015 $8.56 Granted on 24 February 2016 123,647 24/02/2016 $12.89 Granted on 26 April 2016 1,000,000 26/04/2016 $9.96
NOTES TO THE FINANCIAL STATEMENTS FOR THE 53 WEEKS ENDED 30 JULY 2016 AND THE 52 WEEKS ENDED 25 JULY 2015 (CONTINUED)
100
28 SHARE-BASED PAYMENT PLANS (CONTINUED)
(b) TYPE OF SHARE-BASED PAYMENT PLAN (CONTINUED)
The following table shows the factors which were considered in determining the fair value of the performance rights in existence during the current and prior reporting period:
GRANT DATE SHARE ISSUE PRICE OPTION LIFE
DIVIDEND YIELD
VOLATILITY RISK-FREE RATE FAIR VALUE
10/05/2011 $6.00 4-5 years 5% 40% 5.10% $3.00 25/05/2012 $5.24 3.4 years 5% 40% 2.39% $2.62 12/04/2013 $5.77 3.5 years 5% 40% 2.81% $2.88 18/04/2013 $8.40 4.2 years 5% 40% 2.71% $4.20 11/12/2013 $8.56 3.8 years 5% 40% 2.98% $4.28 22/06/2015 $10.34 2.3 years 5% 40% 1.95% $10.34 22/06/2015 $8.56 2.3 years 5% 40% 1.95% $8.56 24/02/2016 $12.89 2.6 years 5% 40% 1.75% $12.89 26/04/2016 $9.88 3-6 years 5.5% 30% 2.06% $9.96
(c) SUMMARY OF RIGHTS GRANTED UNDER PERFORMANCE RIGHTS PLANS
The following table illustrates the number (No.) and weighted average exercise prices (WAEP) of, and movements in, performance rights issued during the year:
2016No.
2016WAEP
2015 No.
2015WAEP
Balance at beginning of the year 1,365,510 - 1,849,080 -
Granted during the year 1,123,647 - 181,631 -
Forfeited during the year (77,553) - - -
Exercised during the year (i) (784,386) - (665,201) -
Expired during the year - - - -
Balance at the end of the year 1,627,218 - 1,365,510 -
(i) The weighted average share price at the date of exercise of rights exercised during the year was $15.01 (2015: $12.36).
Since the end of the financial year and up to the date of this report, no performance rights have been exercised, no performance rights have been issued, no performance rights have been forfeited and no performance rights have expired.
(d) WEIGHTED AVERAGE FAIR VALUE
The weighted average fair value of performance rights granted during the year was $10.28 (2015: $10.22).
29 DEED OF CROSS GUARANTEE
Pursuant to Class Order 98/1418, relief has been granted to certain wholly-owned subsidiaries in the Australian Group from the Corporations law requirements for preparation, audit and lodgement of financial reports.
As a condition of the class order, Just Group Limited, a subsidiary of Premier Investments Limited, and each of the controlled entities of Just Group Limited entered into a Deed of Cross Guarantee as at 25 June 2009. Premier Investments Limited is not a party to the Deed of Cross Guarantee.
For
per
sona
l use
onl
y
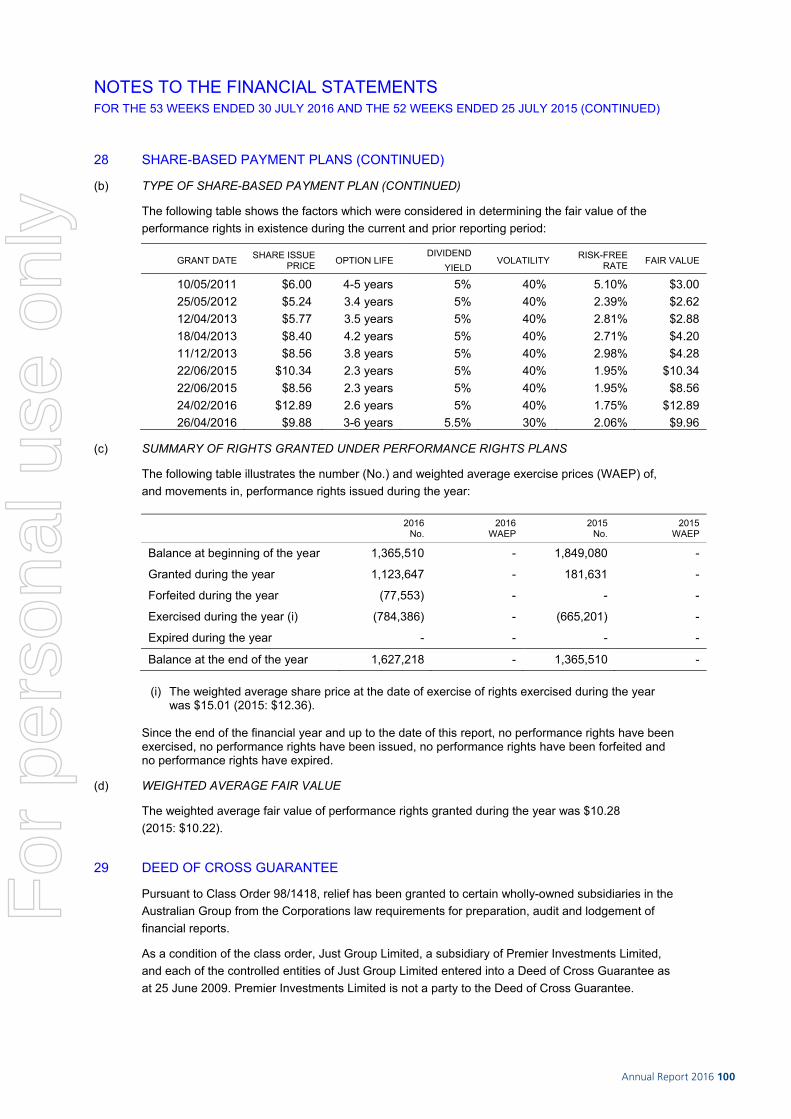
Annual Report 2016 100
NOTES TO THE FINANCIAL STATEMENTS FOR THE 53 WEEKS ENDED 30 JULY 2016 AND THE 52 WEEKS ENDED 25 JULY 2015 (CONTINUED)
100
28 SHARE-BASED PAYMENT PLANS (CONTINUED)
(b) TYPE OF SHARE-BASED PAYMENT PLAN (CONTINUED)
The following table shows the factors which were considered in determining the fair value of the performance rights in existence during the current and prior reporting period:
GRANT DATE SHARE ISSUE PRICE OPTION LIFE
DIVIDEND YIELD
VOLATILITY RISK-FREE RATE FAIR VALUE
10/05/2011 $6.00 4-5 years 5% 40% 5.10% $3.00 25/05/2012 $5.24 3.4 years 5% 40% 2.39% $2.62 12/04/2013 $5.77 3.5 years 5% 40% 2.81% $2.88 18/04/2013 $8.40 4.2 years 5% 40% 2.71% $4.20 11/12/2013 $8.56 3.8 years 5% 40% 2.98% $4.28 22/06/2015 $10.34 2.3 years 5% 40% 1.95% $10.34 22/06/2015 $8.56 2.3 years 5% 40% 1.95% $8.56 24/02/2016 $12.89 2.6 years 5% 40% 1.75% $12.89 26/04/2016 $9.88 3-6 years 5.5% 30% 2.06% $9.96
(c) SUMMARY OF RIGHTS GRANTED UNDER PERFORMANCE RIGHTS PLANS
The following table illustrates the number (No.) and weighted average exercise prices (WAEP) of, and movements in, performance rights issued during the year:
2016No.
2016WAEP
2015 No.
2015WAEP
Balance at beginning of the year 1,365,510 - 1,849,080 -
Granted during the year 1,123,647 - 181,631 -
Forfeited during the year (77,553) - - -
Exercised during the year (i) (784,386) - (665,201) -
Expired during the year - - - -
Balance at the end of the year 1,627,218 - 1,365,510 -
(i) The weighted average share price at the date of exercise of rights exercised during the year was $15.01 (2015: $12.36).
Since the end of the financial year and up to the date of this report, no performance rights have been exercised, no performance rights have been issued, no performance rights have been forfeited and no performance rights have expired.
(d) WEIGHTED AVERAGE FAIR VALUE
The weighted average fair value of performance rights granted during the year was $10.28 (2015: $10.22).
29 DEED OF CROSS GUARANTEE
Pursuant to Class Order 98/1418, relief has been granted to certain wholly-owned subsidiaries in the Australian Group from the Corporations law requirements for preparation, audit and lodgement of financial reports.
As a condition of the class order, Just Group Limited, a subsidiary of Premier Investments Limited, and each of the controlled entities of Just Group Limited entered into a Deed of Cross Guarantee as at 25 June 2009. Premier Investments Limited is not a party to the Deed of Cross Guarantee.
For
per
sona
l use
onl
y

101 Premier Investments Limited
NOTES TO THE FINANCIAL STATEMENTS FOR THE 53 WEEKS ENDED 30 JULY 2016 AND THE 52 WEEKS ENDED 25 JULY 2015 (CONTINUED)
101
CONSOLIDATED
2016 $’000
2015$’000
30 OTHER FINANCIAL INSTRUMENTS
CURRENT ASSETS Derivatives designated as hedging instruments
Forward currency contracts – cash flow hedges 1,636 30,795
1,636 30,795
NON -CURRENT ASSETS
Derivatives designated as hedging instruments
Forward currency contracts – cash flow hedges - 1,771
- 1,771
CURRENT LIABILITIES
Derivatives designated as hedging instruments
Forward currency contracts – cash flow hedges 11,711 117
11,711 117
NON -CURRENT LIABILITIES
Derivatives designated as hedging instruments
Forward currency contracts – cash flow hedges 4,479 10
4,479 10
(a) INSTRUMENTS USED BY THE GROUP
Derivative financial instruments are used by the Group in the normal course of business in order to hedge exposure to fluctuations in foreign exchange rates in accordance with the Group’s financial risk management policies.
(i) Forward currency contracts – cash flow hedges
The majority of the Group’s inventory purchases are denominated in US Dollars. In order to protect against exchange rates movements, the Group has entered into forward exchange contracts to purchase US Dollars.
These contracts are hedging highly probable forecasted purchases and they are timed to mature when payments are scheduled to be made.
The cash flows are expected to occur between one to twenty four months from 30 July 2016 and the profit and loss within cost of sales will be affected over the next couple of years as the inventory is sold.
NOTES TO THE FINANCIAL STATEMENTS FOR THE 53 WEEKS ENDED 30 JULY 2016 AND THE 52 WEEKS ENDED 25 JULY 2015 (CONTINUED)
102
30 OTHER FINANCIAL INSTRUMENTS (CONTINUED)
(a) INSTRUMENTS USED BY THE GROUP (CONTINUED)
(i) Forward currency contracts – cash flow hedges (continued)
At reporting date, the details of the outstanding contracts are:
CONSOLIDATED
2016$’000
2015$’000
2016
2015
Buy USD / Sell AUD NOTIONAL AMOUNTS $AUD AVERAGE EXCHANGE RATE
Maturity < 6 months 111,917 77,145 0.7268 0.8774
Maturity 6 – 12 months 98,282 93,879 0.7170 0.8089
Maturity 12 – 24 months 115,482 10,146 0.7231 0.7885
Buy USD / Sell NZD NOTIONAL AMOUNTS $NZD AVERAGE EXCHANGE RATE
Maturity < 6 months 21,399 15,652 0.6502 0.8206
Maturity 6 – 12 months 21,060 - 0.6502 -
Maturity 12 – 24 months 22,623 - 0.6586 -
Buy USD / Sell GBP NOTIONAL AMOUNTS £GBP AVERAGE EXCHANGE RATE
Maturity < 6 months 5,011 1,737 1.4493 1.5313
Maturity 6 – 12 months 4,791 1,134 1.3554 1.5059
Maturity 12 – 24 months 5,339 167 1.3299 1.5067
Buy AUD / Sell NZD NOTIONAL AMOUNTS $NZD AVERAGE EXCHANGE RATE
Maturity < 6 months 4,400 4,114 1.0897 1.0494
Maturity 6 – 12 months 2,635 3,178 1.0937 1.0561
Maturity 12 – 24 months - - - -
Buy USD / Sell SGD NOTIONAL AMOUNTS $SGD AVERAGE EXCHANGE RATE
Maturity < 6 months 3,591 3,239 0.7199 0.7407
Maturity 6 – 12 months 2,512 1,626 0.7167 0.7385
Maturity 12 – 24 months - - - -
The forward currency contracts are considered to be highly effective hedges as they are matched against forecast inventory purchases and any gain or loss on the contracts attributable to the hedge risk is taken directly to equity.
When the cash flows occur, the Group adjusts the initial measurement of the component recognised in the statement of financial position by the related amount deferred in equity.
For
per
sona
l use
onl
y

Annual Report 2016 102
NOTES TO THE FINANCIAL STATEMENTS FOR THE 53 WEEKS ENDED 30 JULY 2016 AND THE 52 WEEKS ENDED 25 JULY 2015 (CONTINUED)
102
30 OTHER FINANCIAL INSTRUMENTS (CONTINUED)
(a) INSTRUMENTS USED BY THE GROUP (CONTINUED)
(i) Forward currency contracts – cash flow hedges (continued)
At reporting date, the details of the outstanding contracts are:
CONSOLIDATED
2016$’000
2015$’000
2016
2015
Buy USD / Sell AUD NOTIONAL AMOUNTS $AUD AVERAGE EXCHANGE RATE
Maturity < 6 months 111,917 77,145 0.7268 0.8774
Maturity 6 – 12 months 98,282 93,879 0.7170 0.8089
Maturity 12 – 24 months 115,482 10,146 0.7231 0.7885
Buy USD / Sell NZD NOTIONAL AMOUNTS $NZD AVERAGE EXCHANGE RATE
Maturity < 6 months 21,399 15,652 0.6502 0.8206
Maturity 6 – 12 months 21,060 - 0.6502 -
Maturity 12 – 24 months 22,623 - 0.6586 -
Buy USD / Sell GBP NOTIONAL AMOUNTS £GBP AVERAGE EXCHANGE RATE
Maturity < 6 months 5,011 1,737 1.4493 1.5313
Maturity 6 – 12 months 4,791 1,134 1.3554 1.5059
Maturity 12 – 24 months 5,339 167 1.3299 1.5067
Buy AUD / Sell NZD NOTIONAL AMOUNTS $NZD AVERAGE EXCHANGE RATE
Maturity < 6 months 4,400 4,114 1.0897 1.0494
Maturity 6 – 12 months 2,635 3,178 1.0937 1.0561
Maturity 12 – 24 months - - - -
Buy USD / Sell SGD NOTIONAL AMOUNTS $SGD AVERAGE EXCHANGE RATE
Maturity < 6 months 3,591 3,239 0.7199 0.7407
Maturity 6 – 12 months 2,512 1,626 0.7167 0.7385
Maturity 12 – 24 months - - - -
The forward currency contracts are considered to be highly effective hedges as they are matched against forecast inventory purchases and any gain or loss on the contracts attributable to the hedge risk is taken directly to equity.
When the cash flows occur, the Group adjusts the initial measurement of the component recognised in the statement of financial position by the related amount deferred in equity.
For
per
sona
l use
onl
y

103 Premier Investments Limited
NOTES TO THE FINANCIAL STATEMENTS FOR THE 53 WEEKS ENDED 30 JULY 2016 AND THE 52 WEEKS ENDED 25 JULY 2015 (CONTINUED)
103
30 OTHER FINANCIAL INSTRUMENTS (CONTINUED)
(b) INTEREST RATE RISK
Information regarding interest rate exposure is set out in Note 3.
(c) CREDIT RISK
Information regarding credit risk exposure is set out in Note 3.
CONSOLIDATED
2016 $’000
2015$’000
31 EARNINGS PER SHARE
The following reflects the income and share data used in the calculation of basic and diluted earnings per share:
Net profit for the period 103,874 88,102 NUMBER OF
SHARES ‘000
NUMBER OFSHARES
‘000
Weighted average number of ordinary shares used in calculating:
- basic earnings per share 156,733 155,967
- diluted earnings per share 157,918 157,564
There have been no other conversions to, calls of, or subscriptions for ordinary shares or issues of potential ordinary shares since the reporting date and before the completion of this financial report.
32 PARENT ENTITY INFORMATION
The accounting policies of the parent entity, which have been applied in determining the financial information shown below, are the same as those applied in the consolidated financial statements. Refer to note 2 for a summary of the significant accounting policies of the Group.
The individual financial statements for the parent entity show the following aggregate amounts:
2016 $’000
2015$’000
(a) Summary financial information
Statement of financial position
Current assets 294,124 289,109
Total assets 1,369,030 1,360,484
Current liabilities 28,201 29,920
Total liabilities 95,106 95,420
NOTES TO THE FINANCIAL STATEMENTS FOR THE 53 WEEKS ENDED 30 JULY 2016 AND THE 52 WEEKS ENDED 25 JULY 2015 (CONTINUED)
104
32 PARENT ENTITY INFORMATION (CONTINUED)
2016 $’000
2015$’000
(a) Summary financial information (continued)
Shareholders’ equity
Issued capital 608,615 608,615
Reserves
- Foreign currency translation reserve 2,982 3,052
- Performance rights reserve 6,346 4,082
Retained earnings 655,982 649,315
Net profit for the period 75,636 64,629
Total comprehensive income (loss) for the period, net of tax
(70)
2,719
(b) Guarantees entered into by the parent entity
The parent entity has provided financial guarantees in respect of bank overdrafts and loans of subsidiaries amounting to $nil (2015: $nil).
The parent entity has also given unsecured guarantees in respect of:
(i) Finance leases of subsidiaries amounting to $nil (2015: $nil).
(ii) The bank overdraft of a subsidiary amounting to $nil (2015: $nil).
(c) Contingent liabilities of the parent entity
The parent entity did not have any contingent liabilities as at 30 July 2016 or 25 July 2015.
(d) Contractual commitments for the acquisition of property, plant or equipment
The parent entity did not have any contractual commitments to purchase property, plant and equipment as at 30 July 2016 or 25 July 2015.
33 EVENTS AFTER THE REPORTING DATE
On 21 September 2016, the Directors of Premier Investments Limited declared a final dividend in respect of the 2016 financial year. The total amount of the dividend is $39,291,000 (2015: $32,840,000) which represents a fully franked dividend of 25 cents per share (2015: 21 cents per share).
34 CONTINGENT LIABILITIES
The Group has bank guarantees totalling $5,206,702 (2015: $4,087,246).
NOTES TO THE FINANCIAL STATEMENTS FOR THE 53 WEEKS ENDED 30 JULY 2016 AND THE 52 WEEKS ENDED 25 JULY 2015 (CONTINUED)
103
30 OTHER FINANCIAL INSTRUMENTS (CONTINUED)
(b) INTEREST RATE RISK
Information regarding interest rate exposure is set out in Note 3.
(c) CREDIT RISK
Information regarding credit risk exposure is set out in Note 3.
CONSOLIDATED
2016 $’000
2015$’000
31 EARNINGS PER SHARE
The following reflects the income and share data used in the calculation of basic and diluted earnings per share:
Net profit for the period 103,874 88,102 NUMBER OF
SHARES ‘000
NUMBER OFSHARES
‘000
Weighted average number of ordinary shares used in calculating:
- basic earnings per share 156,733 155,967
- diluted earnings per share 157,918 157,564
There have been no other conversions to, calls of, or subscriptions for ordinary shares or issues of potential ordinary shares since the reporting date and before the completion of this financial report.
32 PARENT ENTITY INFORMATION
The accounting policies of the parent entity, which have been applied in determining the financial information shown below, are the same as those applied in the consolidated financial statements. Refer to note 2 for a summary of the significant accounting policies of the Group.
The individual financial statements for the parent entity show the following aggregate amounts:
2016 $’000
2015$’000
(a) Summary financial information
Statement of financial position
Current assets 294,124 289,109
Total assets 1,369,030 1,360,484
Current liabilities 28,201 29,920
Total liabilities 95,106 95,420
For
per
sona
l use
onl
y

Annual Report 2016 104
NOTES TO THE FINANCIAL STATEMENTS FOR THE 53 WEEKS ENDED 30 JULY 2016 AND THE 52 WEEKS ENDED 25 JULY 2015 (CONTINUED)
104
32 PARENT ENTITY INFORMATION (CONTINUED)
2016 $’000
2015$’000
(a) Summary financial information (continued)
Shareholders’ equity
Issued capital 608,615 608,615
Reserves
- Foreign currency translation reserve 2,982 3,052
- Performance rights reserve 6,346 4,082
Retained earnings 655,982 649,315
Net profit for the period 75,636 64,629
Total comprehensive income (loss) for the period, net of tax
(70)
2,719
(b) Guarantees entered into by the parent entity
The parent entity has provided financial guarantees in respect of bank overdrafts and loans of subsidiaries amounting to $nil (2015: $nil).
The parent entity has also given unsecured guarantees in respect of:
(i) Finance leases of subsidiaries amounting to $nil (2015: $nil).
(ii) The bank overdraft of a subsidiary amounting to $nil (2015: $nil).
(c) Contingent liabilities of the parent entity
The parent entity did not have any contingent liabilities as at 30 July 2016 or 25 July 2015.
(d) Contractual commitments for the acquisition of property, plant or equipment
The parent entity did not have any contractual commitments to purchase property, plant and equipment as at 30 July 2016 or 25 July 2015.
33 EVENTS AFTER THE REPORTING DATE
On 21 September 2016, the Directors of Premier Investments Limited declared a final dividend in respect of the 2016 financial year. The total amount of the dividend is $39,291,000 (2015: $32,840,000) which represents a fully franked dividend of 25 cents per share (2015: 21 cents per share).
34 CONTINGENT LIABILITIES
The Group has bank guarantees totalling $5,206,702 (2015: $4,087,246).
NOTES TO THE FINANCIAL STATEMENTS FOR THE 53 WEEKS ENDED 30 JULY 2016 AND THE 52 WEEKS ENDED 25 JULY 2015 (CONTINUED)
103
30 OTHER FINANCIAL INSTRUMENTS (CONTINUED)
(b) INTEREST RATE RISK
Information regarding interest rate exposure is set out in Note 3.
(c) CREDIT RISK
Information regarding credit risk exposure is set out in Note 3.
CONSOLIDATED
2016 $’000
2015$’000
31 EARNINGS PER SHARE
The following reflects the income and share data used in the calculation of basic and diluted earnings per share:
Net profit for the period 103,874 88,102 NUMBER OF
SHARES ‘000
NUMBER OFSHARES
‘000
Weighted average number of ordinary shares used in calculating:
- basic earnings per share 156,733 155,967
- diluted earnings per share 157,918 157,564
There have been no other conversions to, calls of, or subscriptions for ordinary shares or issues of potential ordinary shares since the reporting date and before the completion of this financial report.
32 PARENT ENTITY INFORMATION
The accounting policies of the parent entity, which have been applied in determining the financial information shown below, are the same as those applied in the consolidated financial statements. Refer to note 2 for a summary of the significant accounting policies of the Group.
The individual financial statements for the parent entity show the following aggregate amounts:
2016 $’000
2015$’000
(a) Summary financial information
Statement of financial position
Current assets 294,124 289,109
Total assets 1,369,030 1,360,484
Current liabilities 28,201 29,920
Total liabilities 95,106 95,420
For
per
sona
l use
onl
y

105 Premier Investments Limited
DIRECTORS’ DECLARATION
105
In accordance with a resolution of the Directors of Premier Investments Limited, I state that:
In the opinion of the Directors: (a) the financial statements and notes of Premier Investments Limited for the financial year ended
30 July 2016 are in accordance with the Corporations Act 2001, including: (i) complying with Accounting Standards, the Corporations Regulations 2001 and other
mandatory professional reporting requirements, and
(ii) giving a true and fair view of the consolidated entity’s financial position as at 30 July 2016 and of its performance for the financial year ended on that date, and
(b) there are reasonable grounds to believe that the Company will be able to pay its debts as and when they become due and payable.
(c) in the opinion of the directors, as at the date of this declaration, there are reasonable grounds to believe that the members of the Closed Group will be able to meet any obligations or liabilities to which they are or may become subject, by virtue of the Deed of Cross Guarantee.
Note 2(b) confirms that the financial statements also comply with International Financial Reporting Standards as issued by the International Accounting Standards Board. The Directors have been given the declaration by the Chief Financial Officer required by section 295A of the Corporations Act 2001 for the financial year ended 30 July 2016. On behalf of the Board
Solomon Lew Chairman
5 October 2016
NOTES TO THE FINANCIAL STATEMENTS FOR THE 53 WEEKS ENDED 30 JULY 2016 AND THE 52 WEEKS ENDED 25 JULY 2015 (CONTINUED)
104
32 PARENT ENTITY INFORMATION (CONTINUED)
2016 $’000
2015$’000
(a) Summary financial information (continued)
Shareholders’ equity
Issued capital 608,615 608,615
Reserves
- Foreign currency translation reserve 2,982 3,052
- Performance rights reserve 6,346 4,082
Retained earnings 655,982 649,315
Net profit for the period 75,636 64,629
Total comprehensive income (loss) for the period, net of tax
(70)
2,719
(b) Guarantees entered into by the parent entity
The parent entity has provided financial guarantees in respect of bank overdrafts and loans of subsidiaries amounting to $nil (2015: $nil).
The parent entity has also given unsecured guarantees in respect of:
(i) Finance leases of subsidiaries amounting to $nil (2015: $nil).
(ii) The bank overdraft of a subsidiary amounting to $nil (2015: $nil).
(c) Contingent liabilities of the parent entity
The parent entity did not have any contingent liabilities as at 30 July 2016 or 25 July 2015.
(d) Contractual commitments for the acquisition of property, plant or equipment
The parent entity did not have any contractual commitments to purchase property, plant and equipment as at 30 July 2016 or 25 July 2015.
33 EVENTS AFTER THE REPORTING DATE
On 21 September 2016, the Directors of Premier Investments Limited declared a final dividend in respect of the 2016 financial year. The total amount of the dividend is $39,291,000 (2015: $32,840,000) which represents a fully franked dividend of 25 cents per share (2015: 21 cents per share).
34 CONTINGENT LIABILITIES
The Group has bank guarantees totalling $5,206,702 (2015: $4,087,246).
NOTES TO THE FINANCIAL STATEMENTS FOR THE 53 WEEKS ENDED 30 JULY 2016 AND THE 52 WEEKS ENDED 25 JULY 2015 (CONTINUED)
104
32 PARENT ENTITY INFORMATION (CONTINUED)
2016 $’000
2015$’000
(a) Summary financial information (continued)
Shareholders’ equity
Issued capital 608,615 608,615
Reserves
- Foreign currency translation reserve 2,982 3,052
- Performance rights reserve 6,346 4,082
Retained earnings 655,982 649,315
Net profit for the period 75,636 64,629
Total comprehensive income (loss) for the period, net of tax
(70)
2,719
(b) Guarantees entered into by the parent entity
The parent entity has provided financial guarantees in respect of bank overdrafts and loans of subsidiaries amounting to $nil (2015: $nil).
The parent entity has also given unsecured guarantees in respect of:
(i) Finance leases of subsidiaries amounting to $nil (2015: $nil).
(ii) The bank overdraft of a subsidiary amounting to $nil (2015: $nil).
(c) Contingent liabilities of the parent entity
The parent entity did not have any contingent liabilities as at 30 July 2016 or 25 July 2015.
(d) Contractual commitments for the acquisition of property, plant or equipment
The parent entity did not have any contractual commitments to purchase property, plant and equipment as at 30 July 2016 or 25 July 2015.
33 EVENTS AFTER THE REPORTING DATE
On 21 September 2016, the Directors of Premier Investments Limited declared a final dividend in respect of the 2016 financial year. The total amount of the dividend is $39,291,000 (2015: $32,840,000) which represents a fully franked dividend of 25 cents per share (2015: 21 cents per share).
34 CONTINGENT LIABILITIES
The Group has bank guarantees totalling $5,206,702 (2015: $4,087,246).
For
per
sona
l use
onl
y
Annual Report 2016 106
DIRECTORS’ DECLARATION
105
In accordance with a resolution of the Directors of Premier Investments Limited, I state that:
In the opinion of the Directors: (a) the financial statements and notes of Premier Investments Limited for the financial year ended
30 July 2016 are in accordance with the Corporations Act 2001, including: (i) complying with Accounting Standards, the Corporations Regulations 2001 and other
mandatory professional reporting requirements, and
(ii) giving a true and fair view of the consolidated entity’s financial position as at 30 July 2016 and of its performance for the financial year ended on that date, and
(b) there are reasonable grounds to believe that the Company will be able to pay its debts as and when they become due and payable.
(c) in the opinion of the directors, as at the date of this declaration, there are reasonable grounds to believe that the members of the Closed Group will be able to meet any obligations or liabilities to which they are or may become subject, by virtue of the Deed of Cross Guarantee.
Note 2(b) confirms that the financial statements also comply with International Financial Reporting Standards as issued by the International Accounting Standards Board. The Directors have been given the declaration by the Chief Financial Officer required by section 295A of the Corporations Act 2001 for the financial year ended 30 July 2016. On behalf of the Board
Solomon Lew Chairman
5 October 2016
For
per
sona
l use
onl
y

107 Premier Investments LimitedA member firm of Ernst & Young Global Limited Liability limited by a scheme approved under Professional Standards Legislation
8 Exhibition Street Melbourne VIC 3000 Australia GPO Box 67 Melbourne VIC 3001
Tel: +61 3 9288 8000 Fax: +61 3 8650 7777 ey.com/au
Independent auditor's report to the members of Premier Investments Limited
Report on the financial report
We have audited the accompanying financial report of Premier Investments Limited, which comprises the consolidated statement of financial position as at 30 July 2016, the consolidated statement of comprehensive income, the consolidated statement of changes in equity and the consolidated statement of cash flows for the financial year then ended, notes comprising a summary of significant accounting policies and other explanatory information, and the directors' declaration of the consolidated entity comprising the company and the entities it controlled for the financial year ended or from time to time during the financial year.
Directors' responsibility for the financial report
The directors of the company are responsible for the preparation of the financial report that gives a true and fair view in accordance with Australian Accounting Standards and the Corporations Act 2001 and for such internal controls as the directors determine are necessary to enable the preparation of the financial report that is free from material misstatement, whether due to fraud or error. In Note 2 (b), the directors also state, in accordance with Accounting Standard AASB 101 Presentation of Financial Statements, that the financial statements comply with International Financial Reporting Standards.
Auditor's responsibility
Our responsibility is to express an opinion on the financial report based on our audit. We conducted our audit in accordance with Australian Auditing Standards. Those standards require that we comply with relevant ethical requirements relating to audit engagements and plan and perform the audit to obtain reasonable assurance about whether the financial report is free from material misstatement.
An audit involves performing procedures to obtain audit evidence about the amounts and disclosures in the financial report. The procedures selected depend on the auditor's judgment, including the assessment of the risks of material misstatement of the financial report, whether due to fraud or error. In making those risk assessments, the auditor considers internal controls relevant to the entity's preparation and fair presentation of the financial report in order to design audit procedures that are appropriate in the circumstances, but not for the purpose of expressing an opinion on the effectiveness of the entity's internal controls. An audit also includes evaluating the appropriateness of accounting policies used and the reasonableness of accounting estimates made by the directors, as well as evaluating the overall presentation of the financial report.
We believe that the audit evidence we have obtained is sufficient and appropriate to provide a basis for our audit opinion.
Independence
In conducting our audit we have complied with the independence requirements of the Corporations Act 2001. We have given to the directors of the company a written Auditor’s Independence Declaration, a copy of which is included in the directors’ report.
A member firm of Ernst & Young Global Limited Liability limited by a scheme approved under Professional Standards Legislation
8 Exhibition Street Melbourne VIC 3000 Australia GPO Box 67 Melbourne VIC 3001
Tel: +61 3 9288 8000 Fax: +61 3 8650 7777 ey.com/au
Independent auditor's report to the members of Premier Investments Limited
Report on the financial report
We have audited the accompanying financial report of Premier Investments Limited, which comprises the consolidated statement of financial position as at 30 July 2016, the consolidated statement of comprehensive income, the consolidated statement of changes in equity and the consolidated statement of cash flows for the financial year then ended, notes comprising a summary of significant accounting policies and other explanatory information, and the directors' declaration of the consolidated entity comprising the company and the entities it controlled for the financial year ended or from time to time during the financial year.
Directors' responsibility for the financial report
The directors of the company are responsible for the preparation of the financial report that gives a true and fair view in accordance with Australian Accounting Standards and the Corporations Act 2001 and for such internal controls as the directors determine are necessary to enable the preparation of the financial report that is free from material misstatement, whether due to fraud or error. In Note 2 (b), the directors also state, in accordance with Accounting Standard AASB 101 Presentation of Financial Statements, that the financial statements comply with International Financial Reporting Standards.
Auditor's responsibility
Our responsibility is to express an opinion on the financial report based on our audit. We conducted our audit in accordance with Australian Auditing Standards. Those standards require that we comply with relevant ethical requirements relating to audit engagements and plan and perform the audit to obtain reasonable assurance about whether the financial report is free from material misstatement.
An audit involves performing procedures to obtain audit evidence about the amounts and disclosures in the financial report. The procedures selected depend on the auditor's judgment, including the assessment of the risks of material misstatement of the financial report, whether due to fraud or error. In making those risk assessments, the auditor considers internal controls relevant to the entity's preparation and fair presentation of the financial report in order to design audit procedures that are appropriate in the circumstances, but not for the purpose of expressing an opinion on the effectiveness of the entity's internal controls. An audit also includes evaluating the appropriateness of accounting policies used and the reasonableness of accounting estimates made by the directors, as well as evaluating the overall presentation of the financial report.
We believe that the audit evidence we have obtained is sufficient and appropriate to provide a basis for our audit opinion.
Independence
In conducting our audit we have complied with the independence requirements of the Corporations Act 2001. We have given to the directors of the company a written Auditor’s Independence Declaration, a copy of which is included in the directors’ report.
For
per
sona
l use
onl
y

Annual Report 2016 108A member firm of Ernst & Young Global Limited Liability limited by a scheme approved under Professional Standards Legislation
Opinion
In our opinion:
a. the financial report of Premier Investments Limited is in accordance with the Corporations Act 2001, including:
i giving a true and fair view of the consolidated entity's financial position as at 30 July 2016 and of its performance for the financial year ended on that date; and
ii complying with Australian Accounting Standards and the Corporations Regulations 2001; and
b. the financial report also complies with International Financial Reporting Standards as disclosed in Note 2 (b).
Report on the remuneration report
We have audited the Remuneration Report included in the directors' report for the financial year ended 30 July 2016. The directors of the company are responsible for the preparation and presentation of the Remuneration Report in accordance with section 300A of the Corporations Act 2001. Our responsibility is to express an opinion on the Remuneration Report, based on our audit conducted in accordance with Australian Auditing Standards.
Opinion
In our opinion, the Remuneration Report of Premier Investments Limited for the financial year ended 30 July 2016, complies with section 300A of the Corporations Act 2001.
Ernst & Young
Rob Perry Partner Melbourne 5 October 2016
A member firm of Ernst & Young Global Limited Liability limited by a scheme approved under Professional Standards Legislation
8 Exhibition Street Melbourne VIC 3000 Australia GPO Box 67 Melbourne VIC 3001
Tel: +61 3 9288 8000 Fax: +61 3 8650 7777 ey.com/au
Independent auditor's report to the members of Premier Investments Limited
Report on the financial report
We have audited the accompanying financial report of Premier Investments Limited, which comprises the consolidated statement of financial position as at 30 July 2016, the consolidated statement of comprehensive income, the consolidated statement of changes in equity and the consolidated statement of cash flows for the financial year then ended, notes comprising a summary of significant accounting policies and other explanatory information, and the directors' declaration of the consolidated entity comprising the company and the entities it controlled for the financial year ended or from time to time during the financial year.
Directors' responsibility for the financial report
The directors of the company are responsible for the preparation of the financial report that gives a true and fair view in accordance with Australian Accounting Standards and the Corporations Act 2001 and for such internal controls as the directors determine are necessary to enable the preparation of the financial report that is free from material misstatement, whether due to fraud or error. In Note 2 (b), the directors also state, in accordance with Accounting Standard AASB 101 Presentation of Financial Statements, that the financial statements comply with International Financial Reporting Standards.
Auditor's responsibility
Our responsibility is to express an opinion on the financial report based on our audit. We conducted our audit in accordance with Australian Auditing Standards. Those standards require that we comply with relevant ethical requirements relating to audit engagements and plan and perform the audit to obtain reasonable assurance about whether the financial report is free from material misstatement.
An audit involves performing procedures to obtain audit evidence about the amounts and disclosures in the financial report. The procedures selected depend on the auditor's judgment, including the assessment of the risks of material misstatement of the financial report, whether due to fraud or error. In making those risk assessments, the auditor considers internal controls relevant to the entity's preparation and fair presentation of the financial report in order to design audit procedures that are appropriate in the circumstances, but not for the purpose of expressing an opinion on the effectiveness of the entity's internal controls. An audit also includes evaluating the appropriateness of accounting policies used and the reasonableness of accounting estimates made by the directors, as well as evaluating the overall presentation of the financial report.
We believe that the audit evidence we have obtained is sufficient and appropriate to provide a basis for our audit opinion.
Independence
In conducting our audit we have complied with the independence requirements of the Corporations Act 2001. We have given to the directors of the company a written Auditor’s Independence Declaration, a copy of which is included in the directors’ report.
For
per
sona
l use
onl
y
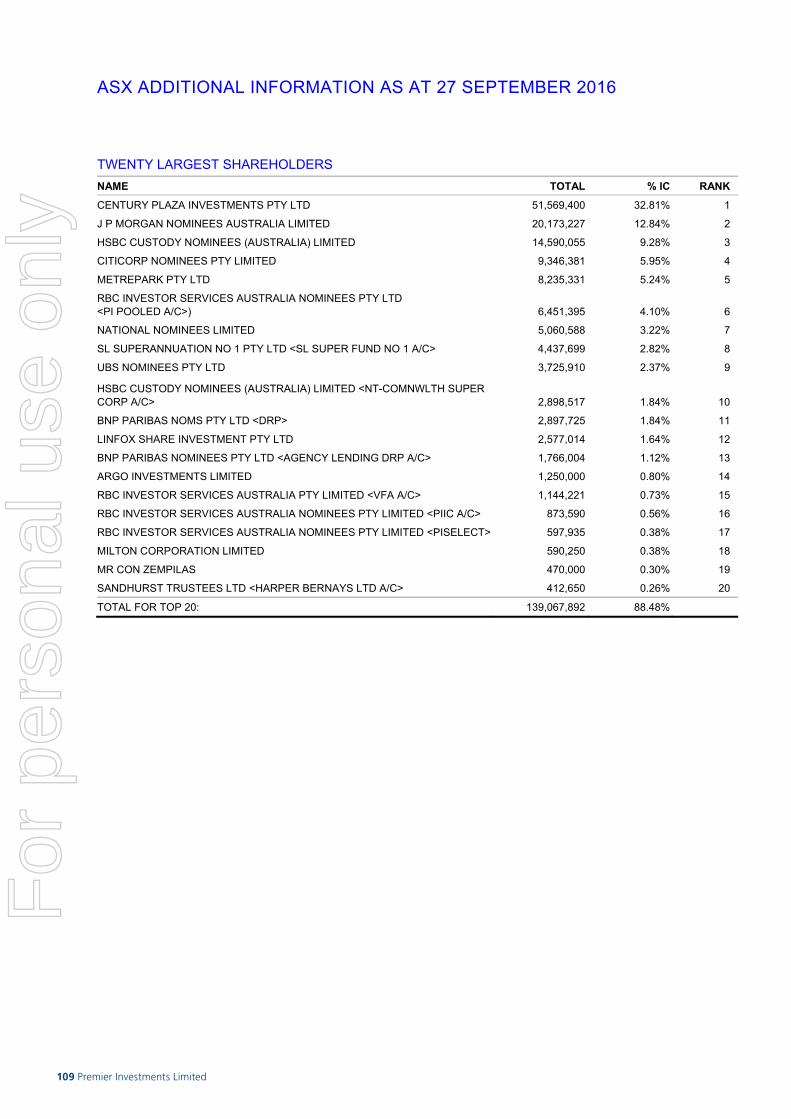
109 Premier Investments Limited
ASX ADDITIONAL INFORMATION AS AT 27 SEPTEMBER 2016
TWENTY LARGEST SHAREHOLDERS NAME TOTAL % IC RANK CENTURY PLAZA INVESTMENTS PTY LTD 51,569,400 32.81% 1
J P MORGAN NOMINEES AUSTRALIA LIMITED 20,173,227 12.84% 2
HSBC CUSTODY NOMINEES (AUSTRALIA) LIMITED 14,590,055 9.28% 3
CITICORP NOMINEES PTY LIMITED 9,346,381 5.95% 4
METREPARK PTY LTD 8,235,331 5.24% 5
RBC INVESTOR SERVICES AUSTRALIA NOMINEES PTY LTD <PI POOLED A/C>) 6,451,395 4.10% 6
NATIONAL NOMINEES LIMITED 5,060,588 3.22% 7
SL SUPERANNUATION NO 1 PTY LTD <SL SUPER FUND NO 1 A/C> 4,437,699 2.82% 8
UBS NOMINEES PTY LTD 3,725,910 2.37% 9
HSBC CUSTODY NOMINEES (AUSTRALIA) LIMITED <NT-COMNWLTH SUPER CORP A/C>
2,898,517 1.84% 10
BNP PARIBAS NOMS PTY LTD <DRP> 2,897,725 1.84% 11
LINFOX SHARE INVESTMENT PTY LTD 2,577,014 1.64% 12
BNP PARIBAS NOMINEES PTY LTD <AGENCY LENDING DRP A/C> 1,766,004 1.12% 13
ARGO INVESTMENTS LIMITED 1,250,000 0.80% 14
RBC INVESTOR SERVICES AUSTRALIA PTY LIMITED <VFA A/C> 1,144,221 0.73% 15
RBC INVESTOR SERVICES AUSTRALIA NOMINEES PTY LIMITED <PIIC A/C> 873,590 0.56% 16
RBC INVESTOR SERVICES AUSTRALIA NOMINEES PTY LIMITED <PISELECT> 597,935 0.38% 17
MILTON CORPORATION LIMITED 590,250 0.38% 18
MR CON ZEMPILAS 470,000 0.30% 19
SANDHURST TRUSTEES LTD <HARPER BERNAYS LTD A/C> 412,650 0.26% 20
TOTAL FOR TOP 20: 139,067,892 88.48%
For
per
sona
l use
onl
y
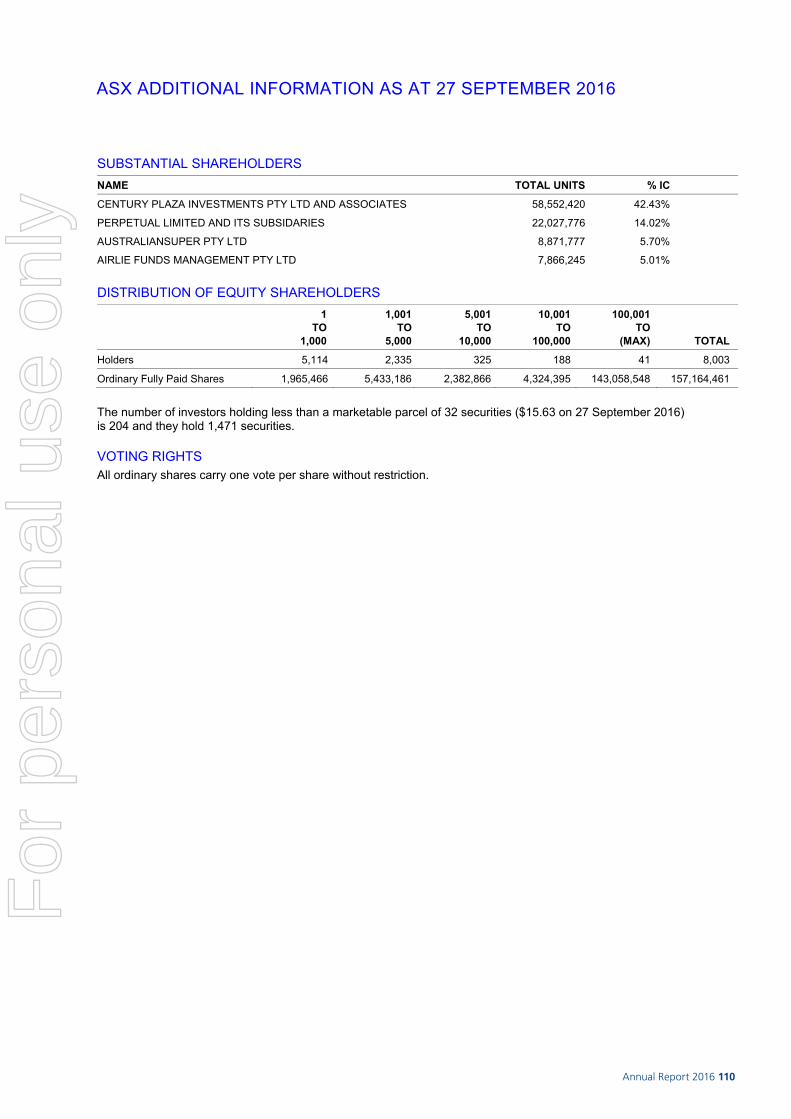
Annual Report 2016 110
ASX ADDITIONAL INFORMATION AS AT 27 SEPTEMBER 2016
TWENTY LARGEST SHAREHOLDERS NAME TOTAL % IC RANK CENTURY PLAZA INVESTMENTS PTY LTD 51,569,400 32.81% 1
J P MORGAN NOMINEES AUSTRALIA LIMITED 20,173,227 12.84% 2
HSBC CUSTODY NOMINEES (AUSTRALIA) LIMITED 14,590,055 9.28% 3
CITICORP NOMINEES PTY LIMITED 9,346,381 5.95% 4
METREPARK PTY LTD 8,235,331 5.24% 5
RBC INVESTOR SERVICES AUSTRALIA NOMINEES PTY LTD <PI POOLED A/C>) 6,451,395 4.10% 6
NATIONAL NOMINEES LIMITED 5,060,588 3.22% 7
SL SUPERANNUATION NO 1 PTY LTD <SL SUPER FUND NO 1 A/C> 4,437,699 2.82% 8
UBS NOMINEES PTY LTD 3,725,910 2.37% 9
HSBC CUSTODY NOMINEES (AUSTRALIA) LIMITED <NT-COMNWLTH SUPER CORP A/C>
2,898,517 1.84% 10
BNP PARIBAS NOMS PTY LTD <DRP> 2,897,725 1.84% 11
LINFOX SHARE INVESTMENT PTY LTD 2,577,014 1.64% 12
BNP PARIBAS NOMINEES PTY LTD <AGENCY LENDING DRP A/C> 1,766,004 1.12% 13
ARGO INVESTMENTS LIMITED 1,250,000 0.80% 14
RBC INVESTOR SERVICES AUSTRALIA PTY LIMITED <VFA A/C> 1,144,221 0.73% 15
RBC INVESTOR SERVICES AUSTRALIA NOMINEES PTY LIMITED <PIIC A/C> 873,590 0.56% 16
RBC INVESTOR SERVICES AUSTRALIA NOMINEES PTY LIMITED <PISELECT> 597,935 0.38% 17
MILTON CORPORATION LIMITED 590,250 0.38% 18
MR CON ZEMPILAS 470,000 0.30% 19
SANDHURST TRUSTEES LTD <HARPER BERNAYS LTD A/C> 412,650 0.26% 20
TOTAL FOR TOP 20: 139,067,892 88.48%
ASX ADDITIONAL INFORMATION AS AT 27 SEPTEMBER 2016
SUBSTANTIAL SHAREHOLDERS NAME TOTAL UNITS % IC CENTURY PLAZA INVESTMENTS PTY LTD AND ASSOCIATES 58,552,420 42.43%
PERPETUAL LIMITED AND ITS SUBSIDARIES 22,027,776 14.02%
AUSTRALIANSUPER PTY LTD 8,871,777 5.70%
AIRLIE FUNDS MANAGEMENT PTY LTD 7,866,245 5.01%
DISTRIBUTION OF EQUITY SHAREHOLDERS
1 TO
1,000
1,001TO
5,000
5,001TO
10,000
10,001TO
100,000
100,001 TO
(MAX) TOTAL Holders 5,114 2,335 325 188 41 8,003
Ordinary Fully Paid Shares 1,965,466 5,433,186 2,382,866 4,324,395 143,058,548 157,164,461 The number of investors holding less than a marketable parcel of 32 securities ($15.63 on 27 September 2016) is 204 and they hold 1,471 securities.
VOTING RIGHTS All ordinary shares carry one vote per share without restriction.
For
per
sona
l use
onl
y

111 Premier Investments Limited
CORPORATE DIRECTORY
A.C.N. 006 727 966 DIRECTORS Solomon Lew (Chairman) Dr. David M. Crean (Deputy Chairman) Timothy Antonie (Lead Independent Director) Lindsay E. Fox Sally Herman Henry D. Lanzer Terrence L. McCartney Mark McInnes Michael R.I. McLeod Dr. Gary H. Weiss COMPANY SECRETARY Kim Davis REGISTERED OFFICE Level 53 101 Collins Street Melbourne Victoria 3000 Telephone (03) 9650 6500 Facsimile (03) 9654 6665 WEBSITE
www.premierinvestments.com.au EMAIL
AUDITOR Ernst & Young 8 Exhibition Street Melbourne Victoria 3000 SHARE REGISTER AND SHAREHOLDER ENQUIRIES Computershare Investor Services Pty Limited Yarra Falls 452 Johnston Street Abbotsford Victoria 3067 Telephone (03) 9415 5000 LAWYERS Arnold Bloch Leibler Level 21 333 Collins Street Melbourne Victoria 3000 Telephone (03) 9229 9999
For
per
sona
l use
onl
y

Mark McInnesCEO Premier Retail
Solomon LewChairman
About this report
This report has been printed on Sovereign Silk and Sun Art Matt and are both elemental chlorine free.
Sovereign Silk is FSC certified derived from well-managed forests and controlled sources. Both stocks are manufactured by an ISO 14001 certified mill.
The printer is also ISO 9001 and ISO 14001 accredited.
These certifications specify the requirements for a quality and environmental management system.
Designed and produced by walterwakefield.com.au
For
per
sona
l use
onl
y

Annual Report 2016
Premier In
vestmen
ts Limited
An
nu
al Rep
ort 2016
For
per
sona
l use
onl
y