annual report 2016 - ab-inbev.com · income statement as of the fourth quarter 2016. completion of...
TRANSCRIPT
1
Annual Report 2016

2
Financial Report
Management report
Anheuser-Busch InBev is a publicly traded company (Euronext: ABI) based in Leuven, Belgium, with secondary listings on the Mexico
(MEXBOL: ANB) and South Africa (JSE: ANH) stock exchanges and with American Depositary Receipts on the New York Stock
Exchange (NYSE: BUD). Our Dream is to bring people together for a better world. Beer, the original social network, has been bringing
people together for thousands of years. We are committed to building great brands that stand the test of time and to brewing the best
beers using the finest natural ingredients. Our diverse portfolio of well over 500 beer brands includes global brands Budweiser®,
Corona® and Stella Artois®; multi-country brands Beck’s®, Castle®, Castle Lite®, Hoegaarden® and Leffe®; and local champions
such as Aguila®, Antarctica®, Bud Light®, Brahma®, Cass®, Chernigivske®, Cristal®, Harbin®, Jupiler®, Klinskoye®, Michelob
Ultra®, Modelo Especial®, Quilmes®, Victoria®, Sedrin®, Sibirskaya Korona® and Skol®. Our brewing heritage dates back more than
600 years, spanning continents and generations. From our European roots at the Den Hoorn brewery in Leuven, Belgium. To the
pioneering spirit of the Anheuser & Co brewery in St. Louis, US. To the creation of the Castle Brewery in South Africa during the
Johannesburg gold rush. To Bohemia, the first brewery in Brazil. Geographically diversified with a balanced exposure to developed and
developing markets, we leverage the collective strengths of approximately 200 000 employees based in more than 50 countries
worldwide. For 2016, AB InBev’s reported revenue was 45.5 billion US dollar (excluding joint ventures and associates).
The following management report should be read in conjunction with Anheuser-Busch InBev’s audited consolidated financial statements.
In the rest of this document we refer to Anheuser-Busch InBev as “AB InBev” or “the company”.
RECENT EVENTS
COMPLETION OF COMBINATION WITH SABMILLER
On 10 October 2016, AB InBev announced the completion of the Belgian Merger and the successful completion of the business
combination with SABMiller.
The combined company has operations in virtually every major beer market and an expanded portfolio that includes global, multi-
country and local brands, providing more choices for consumers around the world. Customers will benefit from a broad distribution
network and strong brand-building expertise. The company will also continue to develop its business in partnership with its suppliers as
it continues brewing the best beers using the best ingredients.
Following the combinations with SABMiller, AB InBev benefits from a geographically diversified platform, with a stronger presence in
key emerging regions with attractive growth prospects, such as Africa and Latin America. The growth opportunities in these developing
markets complement the stability and strength of the company’s strong existing presence in developed markets.
As a result of the Belgian merger, which was the final step in completion of the combination, the former AB InBev merged into
Newbelco, and Newbelco has become the holding company for the combined former AB InBev and SABMiller groups. All assets and
liabilities of the former AB InBev have been transferred to Newbelco, and Newbelco has automatically been substituted for the former
AB InBev in all its rights and obligations by operation of Belgian law. Newbelco has been renamed Anheuser-Busch InBev, and the
former AB InBev has been dissolved by operation of Belgian law.
The shares in the former AB InBev were delisted from Euronext Brussels, the Bolsa Mexicana de Valores and the Johannesburg Stock
Exchange. The new ordinary shares were admitted to listing and trading on Euronext Brussels, the Johannesburg Stock Exchange and
the Bolsa Mexicana de Valores at the opening of business in each market on 11 October 2016. In addition, ADSs trading on the New
York Stock Exchange, each of which used to represent one ordinary share of the former AB InBev, now each represent one new
ordinary share, effective as of the opening of business in New York on 11 October 2016.
The share capital of AB InBev now amounts to 1 238 608 344 euro. It is represented by 2 019 241 973 shares without nominal value, of
which 85 540 392 are held in treasury by AB InBev and its subsidiaries as at 31 December 2016. All shares are new ordinary shares,
except for 325 999 817 restricted shares.
Following the combination, AB InBev is consolidating SABMiller and reporting the results of the retained SABMiller operations in its
income statement as of the fourth quarter 2016.
COMPLETION OF PERONI, GROLSCH AND MEANTIME DISPOSAL
On 11 October 2016, AB InBev announced the completion of the divestiture of SABMiller’s interest in the Peroni, Grolsch and
Meantime brand families and associated businesses in Italy, the Netherlands, the UK and internationally (excluding certain rights in the
US) (the “PGM Business”) to Asahi Group Holdings, Ltd (“Asahi”). The transaction valued the PGM Business at 2.5 billion euro on a
debt free/cash free basis, and was originally announced on 10 February 2016.
COMPLETION OF CR SNOW DISPOSAL
On 11 October 2016, AB InBev announced the completion of the divestiture of SABMiller’s equity interest in China Resources Snow
Breweries Limited (“CR Snow”) to China Resources Beer (Holdings) Company Limited (“CRB”). The total consideration of the
transaction was 1.6 billion US dollar before tax, and was originally announced on 2 March 2016. CRB has acquired SABMiller’s 49%
equity interest in the share capital of CR Snow and CR Snow has upon completion become a wholly owned subsidiary of CRB.

3
COMPLETION OF MILLERCOORS DISPOSAL
On 11 October 2016, AB InBev announced the completion of the divestiture of SABMiller’s interest in MillerCoors LLC
(“MillerCoors”), a joint venture in the U.S. and Puerto Rico between Molson Coors and SABMiller. The total transaction was valued at
12 billion US dollar before tax, and was originally announced on 11 November 2015.
Under the terms of the Molson Coors Purchase Agreement, Molson Coors has acquired SABMiller’s 50% voting interest and 58%
economic interest in MillerCoors. MillerCoors became a wholly owned subsidiary of Molson Coors, and Molson Coors has full control
of the operations and resulting economic benefits of MillerCoors.
Under the terms of the Molson Coors purchase agreement, Molson Coors has acquired full ownership of the Miller brand portfolio
outside of the U.S. and perpetual licenses to the U.S. rights to all of the brands currently in the MillerCoors portfolio for the U.S. market,
including import brands such as Peroni and Pilsner Urquell. The sale also includes the global Miller brand, currently sold in over 50
countries (including Australia, Argentina, Canada, Colombia, Ecuador, Mexico, Panama, Russia, South Africa and the United
Kingdom), as well as related trademarks and other intellectual property rights.
ANHEUSER-BUSCH INBEV TO SELL FORMER SABMILLER’S CENTRAL AND EASTERN EUROPEAN BUSINESS TO ASAHI
On 13 December 2016, AB InBev announced that it has entered into a binding agreement with Asahi to sell the businesses formerly
owned by SABMiller Limited in Poland, the Czech Republic, Slovakia, Hungary and Romania (the “CEE Business”) for an agreed
enterprise value of 7.3 billion euro, subject to customary adjustments.
In connection with the combination with SABMiller, AB InBev made commitments to the European Commission (“EC”) to sell the CEE
Business. The sale is conditional upon EC regulatory approval. The disposal process is being carried out under the supervision of Mazars
LLP in their role as EC monitoring trustee. Closing is expected to take place in the first half of 2017. The results of the CEE Business
are presented in these financials statements as “Results from discontinued operations”.
ANHEUSER-BUSCH INBEV TO SELL ITS INTERESTS IN DISTELL GROUP LIMITED TO THE PUBLIC INVESTMENT
CORPORATION
On 15 December 2016, AB InBev entered into a binding agreement to sell its entire indirect shareholding in Distell Group Limited
(“Distell”) to the Public Investment Corporation (SOC) Limited, acting on behalf of the Government Employees Pension Fund (“Distell
Sale”). The stake comprises 58 674 000 ordinary shares or approximately 26.4% of Distell’s issued share capital (“the Distell
Shareholding”). As part of its ruling to approve the business combination with SABMiller, the South African Competition Tribunal
required AB InBev to dispose of the Distell Shareholding. Remgro Limited and Capevin Holdings Limited, who hold pre-emptive rights
in relation to the Distell Shareholding, confirmed that they will not exercise their pre-emptive rights triggered by the Sale. The Distell
Sale remains subject to the approval of the South African competition authorities.
ANHEUSER-BUSCH INBEV STATEMENT ON DISPOSAL OF COCA-COLA BEVERAGES AFRICA
On 11 October 2016, AB InBev was notified by The Coca-Cola Company of its intention to acquire AB InBev’s stake in Coca-Cola
Beverages Africa (“CCBA”). On 21 December 2016, The Coca-Cola Company and the company have reached an agreement regarding
the transition of AB InBev’s 54.5% equity stake in CCBA for 3.15 billion US dollar, after customary adjustments. CCBA includes the
Coca-Cola bottling operations in South Africa, Namibia, Kenya, Uganda, Tanzania, Ethiopia, Mozambique, Ghana, Mayotte and
Comoros. In addition, the companies have reached an agreement in principle for The Coca-Cola Company to acquire the company’s
interest in bottling operations in Zambia, Zimbabwe, Botswana, Swaziland, Lesotho, El Salvador and Honduras for an undisclosed
amount. The transactions are subject to the relevant regulatory and minority approvals and are expected to close by the end of 2017.
REFERENCE BASE FOLLOWING THE COMBINATION WITH SABMILLER
Given the transformational nature of the transaction with SABMiller and to facilitate the understanding of AB InBev’s underlying
performance, AB InBev has updated its 2015 segment reporting for purposes of result announcement and internal review by senior
management. This presentation (further referred to as the “2015 Reference base”) includes, for comparative purposes, the SABMiller
results as from the fourth quarter 2015.
The company’s six geographic regions: North America, Latin America West, Latin America North, Latin America South, EMEA and
Asia Pacific, plus its Global Export and Holding Companies comprise the company’s seven segments for financial reporting purposes.
The former SABMiller geographies were included in the existing six regions of AB InBev: Colombia, Peru, Ecuador, Honduras and El
Salvador are reported together with Mexico as Latin America West, Panama is reported within Latin America North, Africa is reported
together with Europe as EMEA, and Australia, India and Vietnam are reported within Asia Pacific. Exports to countries in which AB
InBev has operations following the combination with SABMiller, were allocated to the respective regions in the 2015 Reference Base
and 2016 segment reporting.
The company continues to report the results of Global Export and Holding Companies which include the company’s global
headquarters, the export businesses which have not been allocated to the regions, and the interim supply agreement with Constellation
Brands, Inc..
The 2015 Reference Base and 2016 segment reporting exclude the results of the SABMiller business sold since the combination was
completed, including the joint venture stakes in MillerCoors and CR Snow, and the sale of the Peroni, Grolsch and Meantime brands and
associated businesses in Italy, the Netherlands, the UK and internationally. The 2015 Reference Base and 2016 segment reporting also
exclude the results of the CEE Business and the stake in Distell. The results of the CEE Business will be reported as “Results from
discontinued operations” and the results of Distell will be reported as share of results of associates until the respective sales are
completed.

4
Selected financial figures
To facilitate the understanding of AB InBev’s underlying performance, the comments in this management report, unless otherwise
indicated, are based on organic and normalized numbers. “Organic” means the financials are analyzed eliminating the impact of
changes in currencies on translation of foreign operations, and scopes. Scopes represent the impact of acquisitions and divestitures,
the start-up or termination of activities or the transfer of activities between segments, curtailment gains and losses and year-over-
year changes in accounting estimates and other assumptions that management does not consider part of the underlying performance
of the business.
To facilitate the understanding of AB InBev’s underlying performance the company is presenting in this management report the
2015 consolidated volumes and results up to Normalized EBIT on a 2015 Reference base and as such these financials are included
in the organic growth calculation. The 2015 Reference base includes, for comparative purposes, the results of SABMiller business
as if the combination had taken place at the beginning of the fourth quarter 2015.
The tables in this management report provide the segment information per region for the period ended 31 December 2016 and 2015
in the format up to Normalized EBIT level that is used by management to monitor performance. The differences between the 2015
Reference base and the 2015 income statement as Reported represent the effect of the combination with SABMiller. The profit,
cash flow and balance sheet are presented as Reported in 2015.
Whenever used in this report, the term “normalized” refers to performance measures (EBITDA, EBIT, Profit, EPS, effective tax
rate) before non-recurring items and discontinued operations. Non-recurring items are either income or expenses which do not
occur regularly as part of the normal activities of the company. They are presented separately because they are important for the
understanding of the underlying sustainable performance of the company due to their size or nature. Normalized measures are
additional measures used by management, and should not replace the measures determined in accordance with IFRS as an indicator
of the company’s performance, but rather should be used in conjunction with the most directly comparable IFRS measures. The
results of the CEE Business are presented in these financials statements as “Results from discontinued operations”.
The tables below set out the components of AB InBev’s operating income and operating expenses, as well as the key cash flow
figures.
Million US dollar 2016 %
2015
Reported %
2015
Reference
base %
Revenue1 .......................................................................... 45 517 100% 43 604 100% 46 928 100%
Cost of sales ....................................................................... (17 803) 39% (17 137) 39% (18 344) 39%
Gross profit ...................................................................... 27 715 61% 26 467 61% 28 584 61%
SG&A ................................................................................. (15 171) 33% (13 732) 31% (14 776) 31%
Other operating income/(expenses) ....................................... 732 2% 1 032 2% 1 074 2%
Normalized profit from operations (Normalized EBIT) ..... 13 276 29% 13 768 32% 14 882 32%
Non-recurring items ............................................................. (394) - 136 -
Profit from operations (EBIT) ........................................... 12 882 28% 13 904 32%
Depreciation, amortization and impairment ....................... 3 477 8% 3 153 7% 3 341 7%
Normalized EBITDA ............................................................ 16 753 37% 16 839 39% 18 145 39%
EBITDA ............................................................................... 16 360 36% 17 057 39%
Normalized profit attributable to equity holders of AB
InBev ............................................................................... 4 853 11% 8 513 20%
Profit from continuing operations attributable to equity
holders of AB InBev ............................................................ 1 193 3% 8 273 19%
Profit attributable to equity holders of AB InBev .............. 1 241 3% 8 273 19%
1 Turnover less excise taxes. In many jurisdictions, excise taxes make up a large proportion of the cost of beer charged to the company’s customers.

5
Million US dollar 2016 2015
Operating activities
Profit ..................................................................................................................................... 2 769 9 867
Interest, taxes and non-cash items included in profit ................................................................... 13 572 6 859
Cash flow from operating activities before changes in working capital and use of
provisions ............................................................................................................................. 16 341 16 726
Change in working capital......................................................................................................... 173 1 786 Pension contributions and use of provisions ................................................................................ (470) (449)
Interest and taxes (paid)/received ............................................................................................. (5 977) (3 964)
Dividends received .................................................................................................................. 43 22
Cash flow from operating activities ...................................................................................... 10 110 14 121
Investing activities
Net capex ............................................................................................................................... (4 768) (4 337)
Acquisition of SABMiller, net of cash acquired ............................................................................. (65 166) -
Proceeds from SABMiller transaction-related divestitures .............................................................. 16 342 -
Acquisition and sale of other subsidiaries, net of cash acquired/disposed of .................................... (792) (918)
Proceeds from the sale/(acquisition) of investment in short-term debt securities ............................. (5 583) 169 Net of tax proceeds from the sale of assets held for sale .............................................................. 146 397
Other ..................................................................................................................................... (256) (241)
Cash flow from investing activities ....................................................................................... (60 077) (4 930)
Financing activities
Dividends paid ........................................................................................................................ (8 450) (7 966)
Net (payments on)/proceeds from borrowings ............................................................................ 62 675 457
Net proceeds from the issue of share capital ............................................................................... - 5
Share buyback ........................................................................................................................ - (1 000)
Other (including net finance (cost)/income other than interest) ..................................................... (3 494) (777)
Cash flow from financing activities ....................................................................................... 50 731 (9 281)
Net increase/(decrease) in cash and cash equivalents ........................................................ 764 (90)

6
Financial performance
Given the transformational nature of the combination with SABMiller, the company has updated its fourth quarter 2015 segment
reporting for purposes of results announcements and internal review by senior management. This presentation includes, for
comparative purposes, the results of SABMiller as if the combination had taken place at the beginning of the fourth quarter 2015.
AB InBev will continue to present its results under the existing six regions. With effect from the fourth quarter 2016, these regions
will also include the former SABMiller geographies. Colombia, Peru, Ecuador, Honduras and El Salvador will be reported together
with Mexico as Latin America West, Panama will be reported within Latin America North, Africa will be reported together with
Europe as EMEA, and Australia, India and Vietnam will be reported within Asia Pacific. This external reporting presentation has
no impact on the operational management and organizational structure within AB InBev which was announced on 4 August 2016.
The six regions are: North America, Latin America West, Latin America North, Latin America South, EMEA and Asia Pacific.
For further information on the basis under which the Reference Base was prepared, please refer to section Adjusted segment
information within this Management Report.
The tables in this management report provide the segment information per region for the period ended 31 December 2016 and 2015
in the format down to Normalized EBIT level that is used by management to monitor performance. To facilitate the understanding
of AB InBev’s underlying performance the company is presenting in this management report the 2015 consolidated volumes and
results down to Normalized EBIT on a 2015 Reference base and as such these financials are included in the organic growth
calculation.
The profit, cash flow and balance sheet are presented as Reported in 2015.
The tables below provide a summary of the performance of AB InBev (in million US dollar, except volumes in thousand
hectoliters) and the related comments are based on organic numbers.
AB INBEV WORLDWIDE
2015
Reference base Scope
Currency
translation
Organic
growth 2016
Organic
growth %
Volumes (thousand hectoliters) ....... 502 246 8 118 (10 121) 500 242 (2.0)% Revenue ..................................... 46 928 337 (2 852) 1 104 45 517 2.4%
Cost of sales ................................. (18 344) (99) 954 (314) (17 803) (1.8)%
Gross profit ................................ 28 584 238 (1 898) 790 27 715 2.8%
SG&A ........................................... (14 776) (302) 988 (1 080) (15 171) (7.3)%
Other operating income/(expenses) . 1 074 (153) (59) (129) 732 (13.9)%
Normalized EBIT ........................... 14 882 (217) (970) (419) 13 276 (2.9)%
Normalized EBITDA .................... 18 145 (184) (1 199) (9) 16 753 (0.1)%
Normalized EBITDA margin ............. 38.7% 36.8% (92) bps
In 2016, AB InBev normalized EBITDA decreased marginally, down 0.1%, held back by very weak result in Brazil in the second
half of the year. Normalized EBITDA margin contracted by 92 bps to 36.8%.
Consolidated volumes declined by 2.0%, with own beer volumes down 1.4% and non-beer volumes down 6.2%.
Consolidated revenue grew 2.4% to 45 517m US dollar, with revenue per hectoliter increasing 4.5%. On a constant geographic
basis (i.e. eliminating the impact of faster growth in countries with lower revenue per hectoliter), revenue per hectoliter increased
4.1%. Combined revenues of the company’s three global brands, Budweiser, Stella Artois and Corona, grew by 6.5%. Budweiser
grew global revenues by 2.8%. Stella Artois and Corona also performed well in 2016 with global revenues growth of 6.3% and
14.3%, respectively.
Consolidated Cost of Sales (CoS) increased 1.8%, or 4.6% on a per hectoliter basis. On a constant geographic basis, CoS per
hectoliter increased 4.4%.
VOLUMES
The table below summarizes the volume evolution per region and the related comments are based on organic numbers. Volumes
include not only brands that AB InBev owns or licenses, but also third party brands that the company brews as a subcontractor and
third party products that it sells through AB InBev’s distribution network, particularly in Europe. Volumes sold by the Global
Export business, which includes the company’s global headquarters and the export businesses which have not been allocated to the
company’s regions, are shown separately.
Thousand hectoliters
2015
Reference base Scope
Organic
growth 2016
Organic
growth %
North America ............................................ 118 151 671 (1 932) 116 890 (1.6)%
Latin America West ..................................... 61 096 (1 087) 3 609 63 618 6.0% Latin America North .................................... 124 106 1 210 (7 304) 118 012 (5.9)%
Latin America South ................................... 34 009 41 (1 893) 32 158 (5.6)%
EMEA ........................................................ 69 158 7 859 (1 670) 75 348 (2.4)%
Asia Pacific ................................................ 93 203 153 (1 079) 92 278 (1.2)%
Global Export and Holding Companies ........... 2 522 (730) 147 1 940 8.2%
AB InBev Worldwide ............................... 502 246 8 118 (10 121) 500 242 (2.0)%
North America total volumes decreased 1.6%. The company estimates that the United States industry beer sales-to-retailers
adjusted for the number of selling days declined by 1.0% in 2016. On the same basis, the company estimates that its shipment
volumes in the United States and its beer sales-to-retailers adjusted for the number of selling days declined by 1.7% and 2.0%,
respectively. The company estimates that its total market share, based on beer sales-to-retailers adjusted for the number of selling

7
days, declined by approximately 50 bps during 2016 compared to 2015, which is a 15 bps trend improvement compared to 2015.
Bud Light sales-to-retailers adjusted for the number of selling days were down by mid-single digits and the company estimates that
the brand’s share of total market was down 50 bps, with some share loss in the premium light segment. Budweiser sales-to-retailers
adjusted for the number of selling days declined by mid-single digits in the full year, with an estimated total market share loss of 25
bps. The company’s portfolio of Above Premium brands continued to outperform the market, with sales-to-retailers adjusted for the
number of selling days up by mid-single digits, leading to a gain of approximately 45 bps of total market share, based on the
company’s estimate. The strongest performances came from Michelob Ultra and Stella Artois.
The company estimates Canada grew share marginally in the fourth quarter 2016, despite industry weakness, largely due to the
success of the company’s global brands as well as Bud Light, which was the fastest growing brand in Canada.
Latin America West total volumes increased 6.0%, driven by another solid year in Mexico, with strong volume growth following
increased investment behind the company’s core brands and further expansion in the North, as well as benefitting from a favorable
macroeconomic environment. The company estimates that its beer market share was up approximately 20 bps in 2016.
In Colombia, the company’s beer volumes contracted in the fourth quarter 2016 as the business cycled a demanding prior year
comparable. The company estimates that during the fourth quarter 2016 the beer category gained 100 bps share of alcohol. Peru
volumes were roughly flat, with continued growth of the company’s share of alcohol and premiumization initiatives. Ecuador’s
volumes remained under pressure following a recession exacerbated by an earthquake in April 2016 as well as the subsequent tax
increases resulting in price adjustments.
Latin America South total volumes decreased 5.6% in 2016 and beer volumes were down 2.0% driven by consumption
contraction in Argentina due to structural reforms implemented in the country coupled with high inflation.
Latin America North total volumes declined 5.9%. In Brazil, volume performance remained under pressure due to a challenging
consumer environment, with declining real disposable income and the rising unemployment rate reaching its highest level since
1995. The company estimates that beer industry volumes declined by approximately 5.3% in 2016, and that the company’s market
share declined by 120 bps to 66.3%, based on Nielsen data.
EMEA total volumes decreased 2.4% and own beer volumes decreased 1.1% in 2016. In South Africa, beer volumes declined by
5% as a result of macroeconomic weakness and the company’s mainstream portfolio being under pressure due to a reduced price
gap to higher ABV products, while the company’s premium brands Castle Lite and Flying Fish delivered solid volume growth.
Nigeria continues to experience double-digit volume growth on the back of increased capacity and further market penetration.
Tanzania posted low single digit total volumes decline in the fourth quarter due to pressure on consumers’ disposable incomes and
as it cycles difficult comparables. Total volumes in Mozambique grew by low single digits in the fourth quarter 2016 as the
company grew market share, despite a difficult macroeconomic situation. In Zambia, an economic slowdown and lower consumer
disposable income resulted in a double digit volume decline in the fourth quarter 2016, despite improvements in the company’s
market share.
Western Europe total volumes grew by low single digits in 2016, driven by market share gains in the majority of the company’s
markets, while Eastern Europe total volumes declined by high single digits in 2016 mainly due to industry weakness and share loss,
following price increases mainly on value segment brands in Russia.
Asia Pacific total volumes decreased 1.2%. In China, the company continues to see industry weakness with estimated total industry
volumes declining by approximately 3.8% in 2016, while the company’s volumes contracted by only 1.2%. This resulted in
approximately 45 bps of share gain on the back of the company’s strategy to pursue long term growth in the most profitable core
plus, premium and super premium segments due to growing number of urban middle class and affluent class consumer households.
The combined volumes of the company’s core plus, premium and super premium brands now account for over 55% of the
company’s total China volumes.
In Australia, the company took over distribution rights for Budweiser, Stella Artois, and Corona, and other premium brands as part
of the combination with SABMiller and became the market leader in the country, especially as Corona is the largest premium
imported brand. Despite a soft fourth quarter 2016, the company estimates it gained share in the country in 2016.

8
OPERATING ACTIVITIES BY REGIONS
The tables below provide a summary of the performance of each region (in million US dollar, except volumes in thousand
hectoliters) and the related comments are based on organic numbers.
AB INBEV WORLDWIDE
2015
Reference base Scope
Currency
translation
Organic
growth 2016
Organic
growth %
Volumes (thousand hectoliters) ....... 502 246 8 118 - (10 121) 500 242 (2.0)%
Revenue ..................................... 46 928 337 (2 852) 1 104 45 517 2.4%
Cost of sales ................................. (18 344) (99) 954 (314) (17 803) (1.8)%
Gross profit ................................ 28 584 238 (1 898) 790 27 715 2.8%
SG&A ........................................... (14 776) (302) 988 (1 080) (15 171) (7.3)% Other operating income/(expenses) . 1 074 (153) (59) (129) 732 (13.9)%
Normalized EBIT ........................... 14 882 (217) (970) (419) 13 276 (2.9)%
Normalized EBITDA .................... 18 145 (184) (1 199) (9) 16 753 (0.1)%
Normalized EBITDA margin ............. 38.7% 36.8% (92) bps
NORTH AMERICA
2015
Reference base Scope
Currency
translation
Organic
growth 2016
Organic
growth %
Volumes (thousand hectoliters) ....... 118 151 671 - (1 932) 116 890 (1.6)%
Revenue ..................................... 15 603 143 (66) 18 15 698 0.1%
Cost of sales ................................. (6 122) (50) 16 298 (5 858) 4.9%
Gross profit ................................ 9 481 94 (50) 316 9 841 3.3%
SG&A ........................................... (4 113) (108) 24 (241) (4 438) (5.9)%
Other operating income/(expenses) . 50 (15) - 4 39 9.2% Normalized EBIT ........................... 5 418 (30) (26) 78 5 441 1.5%
Normalized EBITDA .................... 6 172 (19) (28) 125 6 250 2.0%
Normalized EBITDA margin ............. 39.6% 39.8% 76 bps
LATIN AMERICA WEST
2015
Reference base Scope
Currency
translation
Organic
growth 2016
Organic
growth %
Volumes (thousand hectoliters) ....... 61 096 (1 087) - 3 609 63 618 6.0%
Revenue ..................................... 5 396 (55) (648) 494 5 188 9.3%
Cost of sales ................................. (1 486) 21 182 (188) (1 470) (13.0)%
Gross profit ................................ 3 912 (34) (466) 306 3 718 7.9%
SG&A ........................................... (1 898) 44 236 (187) (1 805) (10.1)%
Other operating income/(expenses) . 241 (159) (11) 4 75 4.7%
Normalized EBIT ........................... 2 256 (149) (241) 123 1 988 5.8%
Normalized EBITDA .................... 2 680 (153) (294) 143 2 376 5.6% Normalized EBITDA margin ............. 49.7% 45.8% (160) bps
LATIN AMERICA NORTH 2015
Reference base Scope Currency
translation Organic growth 2016
Organic growth %
Volumes (thousand hectoliters) ....... 124 105 1 210 - (7 304) 118 012 (5.9)%
Revenue ..................................... 9 156 159 (493) (362) 8 461 (3.9)%
Cost of sales ................................. (3 059) (85) 179 (205) (3 169) (6.6)%
Gross profit ................................ 6 098 74 (314) (567) 5 291 (9.2)%
SG&A ........................................... (2 626) (34) 156 (113) (2 618) (4.3)%
Other operating income/(expenses) . 561 2 (22) (214) 328 (38.1)%
Normalized EBIT ........................... 4 032 42 (180) (893) 3 001 (22.0)%
Normalized EBITDA .................... 4 727 42 (224) (794) 3 751 (16.7)%
Normalized EBITDA margin ............. 51.6% 44.3% (686) bps
LATIN AMERICA SOUTH
2015
Reference base Scope
Currency
translation
Organic
growth 2016
Organic
growth %
Volumes (thousand hectoliters) ........ 34 009 41 - (1 893) 32 158 (5.6)% Revenue ...................................... 3 331 5 (1 051) 565 2 850 16.9%
Cost of sales .................................. (1 148) (3) 312 (88) (927) (7.6)%
Gross profit ................................. 2 184 2 (739) 477 1 923 21.8%
SG&A ............................................ (780) 1 291 (216) (704) (27.8)%
Other operating income/(expenses) .. 7 - (12) 25 20 -
Normalized EBIT ............................ 1 411 3 (460) 286 1 240 20.2%
Normalized EBITDA ..................... 1 592 3 (537) 372 1 431 23.4%
Normalized EBITDA margin .............. 47.8% 50.2% 263 bps
EMEA
2015
Reference base Scope
Currency
translation
Organic
growth 2016
Organic
growth %
Volumes (thousand hectoliters) ....... 69 158 7 859 - (1 670) 75 348 (2.4)%
Revenue ..................................... 5 638 420 (286) 237 6 010 4.2% Cost of sales ................................. (2 348) (281) 126 (86) (2 590) (3.7)%
Gross profit ................................ 3 290 140 (160) 151 3 421 4.6%
SG&A ........................................... (2 017) (100) 95 (140) (2 163) (6.9)%
Other operating income/(expenses) . 30 8 (1) 7 44 16.8%
Normalized EBIT ........................... 1 305 48 (67) 17 1 302 1.3%
Normalized EBITDA .................... 1 723 71 (85) 65 1 774 3.7%
Normalized EBITDA margin ............. 30.6% 29.5% (14) bps

9
ASIA PACIFIC
2015
Reference base Scope
Currency
translation
Organic
growth 2016
Organic
growth %
Volumes (thousand hectoliters) ....... 93 203 153 - (1 079) 92 278 (1.2)%
Revenue ..................................... 6 220 8 (245) 92 6 074 1.5%
Cost of sales ................................. (2 993) 6 127 6 (2 855) 0.2%
Gross profit ................................ 3 226 14 (118) 98 3 220 3.0%
SG&A ........................................... (2 380) (23) 103 (62) (2 364) (2.6)%
Other operating income/(expenses) . 148 (3) (6) (8) 131 (5.6)% Normalized EBIT ........................... 994 (12) (22) 28 981 2.8%
Normalized EBITDA .................... 1 625 (12) (55) 87 1 645 5.4%
Normalized EBITDA margin ............. 26.1% 27.1% 99 bps
GLOBAL EXPORT AND HOLDING
COMPANIES
2015
Reference base Scope
Currency
translation
Organic
growth 2016
Organic
growth %
Volumes (thousand hectoliters) ....... 2 522 (730) - 147 1 940 8.2%
Revenue ..................................... 1 582 (343) (63) 60 1 237 5.4%
Cost of sales ................................. (1 190) 292 12 (51) (935) (6.1)%
Gross profit ................................ 393 (50) (51) 9 302 3.2%
SG&A ........................................... (961) (82) 83 (121) (1 080) (12.2)%
Other operating income/(expenses) . 34 14 (6) 54 96 -
Normalized EBIT ........................... (534) (118) 26 (57) (683) (8.5)% Normalized EBITDA .................... (373) (115) 24 (9) (474) (1.7)%
REVENUE
Consolidated revenue grew 2.4% to 45 517m US dollar with revenue per hectoliter increasing 4.5%. On a constant geographic basis
(i.e. eliminating the impact of faster growth in countries with lower revenue per hectoliter), revenue per hectoliter increased 4.1%,
driven by the company’s premiumization and revenue management initiatives, offset in part by the weak net revenue per hectoliter
in Brazil, as anticipated due to cycling a though prior year. Combined revenues of the company’s three global brands, Budweiser,
Stella Artois and Corona, grew by 6.5%. Budweiser grew global revenues by 2.8%. Stella Artois and Corona also performed well in
2016 with global revenues growth of 6.3% and 14.3%, respectively.
COST OF SALES
Cost of Sales (CoS) increased by 1.8%, and by 4.6% on a per hectoliter basis. This increase was driven primarily by unfavorable
foreign exchange transactional impacts, and product mix. On a constant geographic basis, CoS per hectoliter increased by 4.4%.
OPERATING EXPENSES
Total operating expenses increased 8.8% in 2016:
Selling, General & Administrative Expenses (SG&A) increased by 7.3% in 2016 with increased support behind the long
term growth of the company’s brands, innovations and sales activations. The increased investments included further support
for the growth of the company’s global brands and premiumization initiatives.
Other operating income declined 13.9% in 2016, due to lower government grants in China and Brazil.
NORMALIZED PROFIT FROM OPERATIONS BEFORE DEPRECIATION AND AMORTIZATION (NORMALIZED EBITDA)
Normalized EBITDA decreased by 7.7% in nominal terms and decreased 0.1% organically to 16 753m US dollar, with an EBITDA
margin of 36.8%, and an organic decline of 92 bps.
North America EBITDA increased 2.0% to 6 250m US dollar, with a margin enhancement of 76 bps to 39.8%, driven by solid
financial performance in the US.
Latin America West EBITDA grew by 5.6% to 2 376m US dollar, with a margin contraction of 160 bps to 45.8%, driven by
strong top-line performance in Mexico, which was partly offset by incremental investment behind the company’s brands and
unfavorable foreign exchange transactional hedges affecting cost of sales. In Colombia, EBITDA margin contracted due to the
adverse impact of foreign exchange rates on the company’s imported commodities, adverse packaging mix, and the timing of
certain marketing investments.
Latin America North EBITDA was down 16.7% to 3 751m US dollar, with margin contraction of 686 bps to 44.3%, driven by
a weak top line performance and accentuated by the unfavorable foreign exchange transactional impact on cost of sales.
Latin America South EBITDA increased 23.4% to 1 431m US dollar, with margin expansion of 263 bps to 50.2% as a result
of the company’s cost management initiatives.
EMEA EBITDA increased 3.7% to 1 774m US dollar, with margin contraction of 14 bps to 29.5%. South Africa EBITDA
declined, despite a sizable price increase, due to the impact of currency and commodity headwinds.
Asia Pacific EBITDA increased 5.4% to 1 645m US dollar, with a margin expansion of 99 bps to 27.1%. EBITDA growth in
China for the year was fueled by top line growth combined with favorable commodity prices.
Global Export and Holding Companies reported EBITDA of (474)m US dollar in 2016 (2015: (373)m US dollar).
Differences in normalized EBITDA margins by region are due to a number of factors such as different routes to market, share of
returnable packaging in the region’s sales and premium product mix.

10
RECONCILIATION BETWEEN NORMALIZED EBITDA AND PROFIT ATTRIBUTABLE TO EQUITY HOLDERS
Normalized EBITDA and EBIT are measures utilized by AB InBev to demonstrate the company’s underlying performance.
Normalized EBITDA is calculated excluding profit from discontinued operations and the following effects from profit from
continuing operations attributable to equity holders of AB InBev: (i) Non-controlling interest, (ii) Income tax expense, (iii) Share of
results of associates, (iv) Net finance cost, (v) Non-recurring net finance cost, (vi) Non-recurring items above EBIT (including non-
recurring impairment) and (vii) Depreciation, amortization and impairment.
Normalized EBITDA and EBIT are not accounting measures under IFRS accounting and should not be considered as an alternative
to Profit from continuing operations attributable to equity holders as a measure of operational performance or as an alternative to
cash flow as a measure of liquidity. Normalized EBITDA and EBIT do not have a standard calculation method and AB InBev’s
definition of normalized EBITDA and EBIT may not be comparable to that of other companies.
Million US dollar Notes 2016
2015
Reported
Profit attributable to equity holders of AB InBev ................................................ 1 241 8 273
Non-controlling interest .......................................................................................... 1 528 1 594
Profit .................................................................................................................. 2 769 9 867
Profit from discontinued operations .......................................................................... (48) -
Profit from continuing operations ...................................................................... 2 721 9 867
Income tax expense .............................................................................................. 12 1 613 2 594
Share of result of associates and joint ventures ........................................................ (16) (10)
Non-recurring net finance cost/(income) .................................................................. 11 3 356 214
Net finance cost .................................................................................................... 11 5 208 1 239 Non-recurring items above EBIT (including non-recurring impairment) ......................... 8 394 (136)
Normalized EBIT................................................................................................. 13 276 13 768
Depreciation, amortization and impairment (excluding non-recurring impairment) ......... 3 477 3 071
Normalized EBITDA ............................................................................................ 16 753 16 839
Non-recurring items are either income or expenses which do not occur regularly as part of the normal activities of the company.
They are presented separately because they are important for the understanding of the underlying sustainable performance of the
company due to their size or nature. Details on the nature of the non-recurring items are disclosed in Note 8 Non-recurring items.
IMPACT OF FOREIGN CURRENCIES
Foreign currency exchange rates have a significant impact on AB InBev’s financial statements. The following table sets forth the
percentage of revenue realized by currency for the years ended 31 December 2016 and 2015:
2016
2015
Reference base
US dollar ............................................................................................................................ 33.1% 32.4%
Brazilian real ...................................................................................................................... 15.8% 17.2% Mexican peso ...................................................................................................................... 9.3% 10.3%
Chinese yuan ...................................................................................................................... 8.9% 8.9%
Euro .................................................................................................................................. 6.6% 5.7%
Canadian dollar ................................................................................................................... 4.1% 3.8%
Argentinean peso ................................................................................................................ 3.5% 4.5%
South Korean won ............................................................................................................... 2.9% 2.8%
South African rand .............................................................................................................. 2.7% 2.0%
Pound sterling ..................................................................................................................... 1.8% 1.9%
Colombian peso .................................................................................................................. 1.4% 1.2%
Other ................................................................................................................................. 9.9% 9.3%
The following table sets forth the percentage of normalized EBITDA realized by currency for the periods ended 31 December 2016
and 2015:
2016
2015
Reference base
US dollar ............................................................................................................................ 34.1% 29.7%
Brazilian real ...................................................................................................................... 19.1% 23.9% Mexican peso ...................................................................................................................... 10.8% 12.4%
Chinese yuan ...................................................................................................................... 5.6% 5.3%
Argentinean peso ................................................................................................................ 4.6% 5.0%
Canadian dollar ................................................................................................................... 4.2% 3.9%
Euro .................................................................................................................................. 3.6% 3.1%
South Korean won ............................................................................................................... 2.7% 2.4%
South African rand .............................................................................................................. 2.1% 2.0%
Pound sterling ..................................................................................................................... 1.2% 1.3%
Colombian peso .................................................................................................................. 1.8% 1.7%
Other ................................................................................................................................. 10.2% 9.3%
In 2016, the fluctuation of the foreign currency rates had a negative translation impact of (2 852)m US dollar on AB InBev’s
revenue (2015: negative impact of (5 957)m US dollar), of (1 199)m US dollar on its normalized EBITDA (2015: negative impact
of (2 639)m US dollar) and of (970)m US dollar on its normalized EBIT (2015: negative impact of (2 190)m US dollar).

11
AB InBev’s profit (after tax) has been negatively affected by the fluctuation of foreign currencies for (649)m US dollar (2015:
negative impact of (1 492)m US dollar), while the negative translation impact on its EPS (profit attributable to equity holders of
AB InBev) was (505)m US dollar or (0.27) US dollar per share (2015: negative impact of (1 109)m US dollar or (0.68) US dollar
per share).
The impact of the fluctuation of the foreign currencies on AB InBev’s net debt amounted to (349)m US dollar (decrease of net debt)
in 2016, as compared to an impact of (1 100)m US dollar (decrease of net debt) in 2015. The impact of the fluctuation of the
foreign currencies on the equity attributable to the equity holders of AB InBev amounted to (3 265)m US dollar (decrease of
equity), as compared to an impact of (6 157)m US dollar (decrease of equity) in 2015 on a reported basis.
PROFIT
Normalized profit attributable to equity holders of AB InBev was 4 853m US dollar (normalized EPS 2.83 US dollar) in 2016,
compared to 8 513m US dollar (normalized EPS 5.20 US dollar) in 2015 (see Note 23 Changes in equity and earnings per share for
more details). Profit attributable to equity holders of AB InBev for 2016 was 1 241m US dollar, compared to 8 273m US dollar for
2015 and includes the following impacts:
Net finance costs (excluding non-recurring net finance items): 5 208m US dollar in 2016 compared to
1 239m US dollar in 2015. This increase was driven primarily by the additional net interest expenses resulting from the
bond issuances in the first quarter 2016 related to the funding of the SABMiller combination. Other financial results
include a negative mark-to-market adjustment of 384m US dollar in 2016, linked to the hedging of the company’s share-
based payment programs, compared to a gain of 844m US dollar in 2015.
Non-recurring net finance income/(cost): (3 356)m US dollar in 2016 compared to (214) m US dollar in 2015. Non-
recurring net finance costs in 2016 include a negative mark-to-market adjustment of 2 693m US dollar, related to the
portion of the FX hedging of the purchase price of the combination with SABMiller that did not qualify for hedge
accounting under IFRS rules. The 2016 result also includes mark-to-market losses on derivative instruments entered into
to hedge the deferred share instrument issued in a transaction related to the combination with Grupo Modelo, and
derivative instruments entered into to hedge part of the restricted shares issued in relation to the combination with
SABMiller. Furthermore, the 2016 non-recurring net finance costs include commitment fees for the 2015 committed
senior acquisition facilities, as well as costs linked to the early redemption of SABMiller bonds.
Income tax expense: 1 613m US dollar with an effective tax rate of 37.4% for 2016 compares with 2 594m US dollar with
an effective tax rate of 20.8% in 2015. The increase in the effective tax rate is mainly due to the unfavorable impact on
profit before tax of the negative mark-to-market adjustments related to the hedging of the purchase price of the
combination with SABMiller. The normalized effective tax rate was 20.9% in 2016 compared to 19.1% in 2015.
Profit attributable to non-controlling interest: 1 528m US dollar in 2016, a decrease from 1 594m US dollar in 2015.
Profit from discontinued operations relates to the results of the Central and Eastern Europe business as the disposal had
not closed at the end of the reporting period.

12
Liquidity position and capital resources
CASH FLOWS
Million US dollar 2016 2015
Cash flow from operating activities ............................................................................................ 10 110 14 121
Cash flow from investing activities ............................................................................................. (60 077) (4 930)
Cash flow from financing activities ............................................................................................. 50 731 (9 281)
Net increase/(decrease) in cash and cash equivalents ........................................................ 764 (90)
Cash flows from operating activities
Million US dollar 2016 2015
Profit ..................................................................................................................................... 2 769 9 867
Interest, taxes and non-cash items included in profit ................................................................... 13 572 6 859
Cash flow from operating activities before changes in working capital and use of
provisions ............................................................................................................................. 16 341 16 726
Change in working capital......................................................................................................... 173 1 786
Pension contributions and use of provisions ................................................................................ (470) (449)
Interest and taxes (paid)/received ............................................................................................. (5 977) (3 964)
Dividends received .................................................................................................................. 43 22
Cash flow from operating activities ...................................................................................... 10 110 14 121
AB InBev’s cash flow from operating activities reached 10 110m US dollar in 2016 compared to 14 121m US dollar in 2015. The
decline is mainly explained unfavorable foreign exchange translational impacts, higher taxes and interest paid and a difficult
comparable on working capital due to lower trade payables as a result of reduced production volumes in Brazil.
Cash flow from investing activities
Million US dollar 2016 2015
Net capex ............................................................................................................................... (4 768) (4 337)
Acquisition of SABMiller, net of cash acquired ............................................................................. (65 166) -
Proceeds from SABM transaction-related divestitures ................................................................... 16 342 -
Acquisition and sale of subsidiaries, net of cash acquired/disposed of............................................. (792) (918)
Proceeds from the sale/(acquisition) of investment in short-term debt securities ............................. (5 583) 169
Net of tax proceeds from the sale of assets held for sale .............................................................. 146 397
Other ..................................................................................................................................... (256) (241)
Cash flow from investing activities ....................................................................................... (60 077) (4 930)
Net cash used in investing activities was 60 077m US dollar in 2016 as compared to 4 930m US dollar in 2015. Cash flow from
investing activities is mainly impacted by the payment associated with the combination with SABMiller net of the cash acquired
and the proceeds from the announced divestitures.
AB InBev’s net capital expenditures amounted to 4 768m US dollar in 2016 and 4 337m US dollar in 2015. Out of the total 2016
capital expenditures approximately 50% was used to improve the company’s production facilities while 34% was used for logistics
and commercial investments and 16% was used for improving administrative capabilities and purchase of hardware and software.
Cash flow from financing activities
Million US dollar 2016 2015
Dividends paid ........................................................................................................................ (8 450) (7 966)
Net (payments on)/proceeds from borrowings ............................................................................ 62 675 457
Net proceeds from the issue of share capital ............................................................................... - 5
Share buyback ........................................................................................................................ - (1 000)
Other (including net finance (cost)/income other than interest) ..................................................... (3 494) (777)
Cash flow from financing activities ....................................................................................... 50 731 (9 281)
The cash inflow from AB InBev’s financing activities amounted to 50 731m US dollar in 2016, as compared to a cash outflow of
9 281m US dollar in 2015. The cash inflow from financing activities in 2016 reflects the funding of the combination with
SABMiller.
In connection with the combination with SABMiller, AB InBev entered into a 75.0 billion US dollar Committed Senior Facilities
agreement dated 28 October 2015 (“2015 Senior Facilities Agreement”). The new financing consisted of a 10.0 billion US dollar
Disposal Bridge Facility, a 15.0 billion US dollar Cash/DCM Bridge Facility A, a 15.0 billion US dollar Cash/DCM Bridge Facility
B, a 25.0 billion US dollar Term Facility A, and a 10.0 billion US dollar Term Facility B. On 27 January 2016, AB InBev
announced that it had cancelled 42.5 billion US dollar of its 75.0 billion US dollar 2015 Senior Agreement Facilities following
approximately 47 billion US dollar of capital markets issuances in January 2016. On 4 April 2016, AB InBev announced that it had
voluntarily cancelled a further 12.5 billion US dollar following the 13.25 billion euro debt capital market issuances in March 2016
under its EMTN program. On 6 October 2016, the company drew down 8.0 billion US dollar under the Term Facility B and 10.0
billion US dollar under the Disposal Bridge Facility to finance the combination with SABMiller and announced that it had chosen
to make an additional voluntary cancellation of 2.0 billion US dollar of the Term Facility B. On 20 October 2016, the company
fully repaid and cancelled the Disposal Bridge Facility. See also Note 24 Interest-bearing loans and borrowings.

13
AB InBev’s cash, cash equivalents and short-term investments in debt securities less bank overdrafts as of 31 December 2016
amounted to 14 054m US dollar. As of 31 December 2016, the company had total liquidity of 23 054m US dollar, which consisted
of 9 billion US dollar available under committed long-term credit facilities and 14 054m US dollar of cash, cash equivalents and
short-term investments in debt securities less bank overdrafts. Although the company may borrow such amounts to meet its
liquidity needs, the company principally relies on cash flows from operating activities to fund the company’s continuing operation.
CAPITAL RESOURCES AND EQUITY
AB InBev’s net debt increased to 108.0 billion US dollar as of 31 December 2016, from 42.2 billion US dollar as of 31 December
2015.
Net debt is defined as non-current and current interest-bearing loans and borrowings and bank overdrafts minus debt securities and
cash and cash equivalents. Net debt is a financial performance indicator that is used by AB InBev’s management to highlight
changes in the company’s overall liquidity position. The company believes that net debt is meaningful for investors as it is one of
the primary measures AB InBev’s management uses when evaluating its progress towards deleveraging.
Apart from operating results net of capital expenditures, the net debt is mainly impacted by the payment associated with the
combination with SABMiller net of the cash acquired and the proceeds from the announced divestitures completed at 31 December
2016 (48.8 billion US dollar), the SABMiller debt assumed as part of the combination (11.9 billion US dollar), the settlement of the
portion of the derivatives hedging the SABMiller purchase consideration that did not qualify as hedge accounting (4.5 billion US
dollar), dividend payments to shareholders of AB InBev and Ambev (8.5 billion US dollar), the payment of interests and taxes (6.0
billion US dollar) and the impact of changes in foreign exchange rates (0.3 billion US dollar decrease of net debt).
Net debt to normalized EBITDA increased from 2.51x on a reported basis for the 12-month period ending 31 December 2015 to
5.50x on an amended basis for the 12-month period ending 31 December 2016, incorporating the Reference base EBITDA of the
combined group from 1 January 2016 until December 2016. The net debt to EBITDA calculation excludes any EBITDA from the
Central and Eastern Europe business and the stake in Distell. The results of CCBA are included as of July 2016 and will continue to
be reported throughout AB InBev’s ownership of its stake in CCBA.
Consolidated equity attributable to equity holders of AB InBev as at 31 December 2016 was 71 339m US dollar, compared to
42 137m US dollar as at 31 December 2015. The increase in equity is mainly related to the combination with SABMiller. The
equity attributable to equity holders was negatively impacted by the mark-to-market adjustments related to the hedging of the
purchase price of the combination with SABMiller for the portion of the hedge that did not qualify for hedge accounting under
IFRS rules. Following the combination with SABMiller, (12.3) billion US dollar negative mark-to-market adjustment related to
such hedging and other non-derivative items were recognized cumulatively over 2015 and 2016, of which (7.4) billion US dollar
qualified for hedge accounting and was, accordingly, reclassified from equity and allocated as part of the consideration paid.
Furthermore, the combined effect of the weakening of mainly the closing rates of the Argentinean peso, the Australian dollar, the
Chinese yuan, the Colombian peso, the euro, the Mexican peso, the pound sterling and the South Korean won and the strengthening
of mainly the closing rates of the Brazilian real, the Canadian dollar, the Peruvian nuevo sol, the Russian ruble and the South
African rand resulted in a foreign exchange translation adjustment of (3 265)m US dollar. Further details on equity movements can
be found in the consolidated statement of changes in equity.
Further details on interest-bearing loans and borrowings, repayment schedules and liquidity risk, are disclosed in Note 24
Interest-bearing loans and borrowings and Note 29 Risks arising from financial instruments.
As of 31 December 2016, the company’s credit rating from Standard & Poor’s was A- for long-term obligations and A-2 for short-
term obligations, with a stable outlook, and the company’s credit rating from Moody’s Investors Service was A3 for long-term
obligations and P-2 for short-term obligations, with a stable outlook.
Research and development
Given its focus on innovation, AB InBev places a high value on research and development. In 2016, AB InBev spent
244m US dollar in research and development (2015: 207m US dollar). Part of this was spent in the area of market research, but the
majority is related to innovation in the areas of process optimization and product development.
Research and development in product innovation covers liquid, packaging and draft innovation. Product innovation consists of
breakthrough innovation, incremental innovation and renovation. The main goal for the innovation process is to provide consumers
with better products and experiences. This implies launching new liquid, new packaging and new draught products that deliver
better performance both for the consumer and in terms of top-line results, by increasing AB InBev's competitiveness in the relevant
markets. With consumers comparing products and experiences offered across very different drink categories and the offering of
beverages increasing, AB InBev's research and development efforts also require an understanding of the strengths and weaknesses
of other beverage categories, spotting opportunities for beer and developing consumer solutions (products) that better address
consumer need and deliver better experience. This requires understanding consumer emotions and expectations. Sensory
experience, premiumization, convenience, sustainability and design are all central to AB InBev's research and development efforts.
Research and development in process optimization is primarily aimed at quality improvement, capacity increase (plant
debottlenecking and addressing volume issues, while minimizing capital expenditure) and improving efficiency. Newly developed
processes, materials and/or equipment are documented in best practices and shared across business regions. Current projects range
from malting to bottling of finished products.
Knowledge management and learning is also an integral part of research and development. AB InBev seeks to continuously
increase its knowledge through collaborations with universities and other industries.
AB InBev's research and development team is briefed annually on the company's and the business regions' priorities and approves
concepts which are subsequently prioritized for development. The research & development teams invest in both short and long-term

14
strategic projects for future growth, with the launch time depending on complexity and prioritization. Launch time usually falls
within the next calendar year.
The Global Innovation and Technology Center (“GITeC”), located in Leuven, accommodates the Packaging, Product, Process
Development teams and facilities such as Labs, Experimental Brewery and the European Central Lab, which also includes Sensory
Analysis. In addition to GITeC, AB InBev also has Product, Packaging and Process development teams located in each of the AB
InBev geographic regions focusing on the short-term needs of such regions.
Risks and uncertainties
Under the explicit understanding that this is not an exhaustive list, AB InBev’s major risk factors and uncertainties are listed below.
There may be additional risks which AB InBev is unaware of. There may also be risks AB InBev now believes to be immaterial,
but which could turn out to have a material adverse effect. Moreover, if and to the extent that any of the risks described below
materialize, they may occur in combination with other risks which would compound the adverse effect of such risks. The sequence
in which the risk factors are presented below is not indicative of their likelihood of occurrence or of the potential magnitude of their
financial consequence.
RISKS RELATING TO AB INBEV AND THE BEER AND BEVERAGE INDUSTRY
AB InBev relies on the reputation of its brands and its success depends on its ability to maintain and enhance the image and
reputation of its existing products and to develop a favorable image and reputation for new products. An event, or series of events,
that materially damages the reputation of one or more of AB InBev's brands could have an adverse effect on the value of that brand
and subsequent revenues from that brand or business. Further, any restrictions on the permissible advertising style, media and
messages used may constrain AB InBev’s brand building potential and thus reduce the value of its brands and related revenues.
AB InBev may not be able to protect its current and future brands and products and defend its intellectual property rights, including
trademarks, patents, domain names, trade secrets and know-how, which could have a material adverse effect on its business, results
of operations, cash flows or financial condition, and in particular, on AB InBev’s ability to develop its business.
Certain of AB InBev's operations depend on independent distributors' or wholesalers’ efforts to sell AB InBev's products and there
can be no assurance that such distributors will not give priority to AB InBev's competitors. Further, any inability of AB InBev to
replace unproductive or inefficient distributors or any limitations imposed on AB InBev to purchase or own any interest in
distributors or wholesalers as a result of contractual restrictions, regulatory changes, changes in legislation or the interpretations of
legislation by regulators or courts could adversely impact AB InBev's business, results of operations and financial condition.
Changes in the availability or price of raw materials, commodities, energy and water could have an adverse effect on AB InBev's
results of operations to the extent that AB InBev fails to adequately manage the risks inherent in such volatility, including if
AB InBev’s hedging and derivative arrangements do not effectively or completely hedge changes in commodity prices.
AB InBev relies on key third parties, including key suppliers, for a range of raw materials for its beer, alcoholic beverages and soft
drinks, and for packaging material. The termination of or a material change to arrangements with certain key suppliers or the
failure of a key supplier to meet its contractual obligations could have a material impact on AB InBev's production, distribution and
sale of beer, alcoholic beverages and soft drinks and have a material adverse effect on AB InBev's business, results of operations,
cash flows or financial condition. Certain of AB InBev’s subsidiaries may purchase nearly all their key packaging materials from
sole suppliers under multi-year contracts. The loss of or temporary discontinuity of supply from any of these suppliers without
sufficient time to develop an alternative source could cause AB InBev to spend increased amounts on supplies in the future. In
addition, a number of key brand names are both licensed to third-party brewers and used by companies over which AB InBev does
not have control. Although AB InBev monitors brewing quality to ensure its high standards, to the extent that one of these key
brand names or joint ventures, companies in which AB InBev does not own a controlling interest and/or AB InBev’s licensees are
subject to negative publicity, it could have a material adverse effect on AB InBev’s business, results of operations, cash flows or
financial condition.
Competition in its various markets and increased purchasing power of players in AB InBev’s distribution channels could cause
AB InBev to reduce prices of its products, increase capital investment, increase marketing and other expenditures or prevent
AB InBev from increasing prices to recover higher costs and thereby cause AB InBev to reduce margins or lose market share. Any
of the foregoing could have a material adverse effect on AB InBev's business, financial condition and results of operations. Also,
innovation faces inherent risks, and the new products AB InBev introduces may not be successful, while competitors may be able to
respond more quickly to the emerging trends, such as the increasing consumer preference for “craft beers” produced by smaller
microbreweries.
The continued consolidation of retailers in markets in which AB InBev operates could result in reduced profitability for the beer
industry as a whole and indirectly adversely affect AB InBev’s financial results.
AB InBev could incur significant costs as a result of compliance with, and/or violations of or liabilities under, various regulations
that govern AB InBev's operations or the operations of its licensed third parties. Also, public concern about beer, alcoholic
beverages and soft drink consumption and any resulting restrictions may cause the social acceptability of beer, alcoholic beverages
and soft drinks to decline significantly and consumption trends to shift away from these products, which would have a material
adverse effect on AB InBev’s business, financial condition and results of operations.
AB InBev's operations are subject to environmental regulations, which could expose it to significant compliance costs and litigation
relating to environmental issues.
Antitrust and competition laws and changes in such laws or in the interpretation and enforcement thereof, as well as being subject
to regulatory scrutiny, could affect AB InBev's business or the businesses of its subsidiaries.

15
In recent years, there has been increased public and political attention directed at the alcoholic beverage and food and soft drinks
industries, as a result of health care concerns related to the harmful use of alcohol (including drunk driving, drinking while pregnant
and excessive, abusive and underage drinking) and to health concerns such as diabetes and obesity related to the overconsumption
of food and soft drinks. Negative publicity regarding AB InBev's products and brands, publication of studies indicating a significant
risk in using AB InBev’s products or changes in consumer perceptions in relation to AB InBev’s products generally could
adversely affect the sale and consumption of AB InBev’s products and could harm its business, results of operations, cash flows or
financial condition. Concerns over alcohol abuse and underage drinking have also caused governments, including those in
Argentina, Brazil, Spain, Russia, the United Kingdom, South Africa, Australia and the United States, to consider measures such as
increased taxation, implementation of minimum alcohol pricing regimes or other changes to the regulatory framework governing
our marketing and other commercial practices.
Demand for AB InBev's products may be adversely affected by changes in consumer preferences and tastes. Consumer preferences
and tastes can change in unpredictable ways. Failure by AB InBev to anticipate or respond adequately to changes in consumer
preferences and tastes or to developments in new forms of media and marketing could adversely impact AB InBev's business,
results of operations and financial condition.
The beer and beverage industry may be subject to adverse changes in taxation, which makes up a large proportion of the cost of
beer charged to consumers in many jurisdictions. Increases in excise and other indirect taxes applicable to AB InBev’s products
tend to adversely affect AB InBev’s revenue or margins, both by reducing overall consumption and by encouraging consumers to
switch to other categories of beverages. Minimum pricing is another form of fiscal regulation that can affect AB InBev’s
profitability. Furthermore, AB InBev may be subject to increased taxation on its operations by national, local or foreign authorities,
to higher corporate income tax rates or to new or modified taxation regulations and requirements. For example, the work being
carried out by the Organisation for Economic Co-operation and Development on base erosion and profit shifting or initiatives at the
European Union level (including the anti-tax-avoidance directive adopted by the Council of the European Union on 12 July 2016)
as a response to increasing globalization of trade and business operations could result in changes in tax treaties, the introduction of
new legislation, updates to existing legislation, or changes to regulatory interpretations of existing legislation, any of which could
impose additional taxes on businesses. An increase in excise taxes or other taxes could adversely affect the financial results of
AB InBev as well as its results of operations.
Seasonal consumption cycles and adverse weather conditions in the markets in which AB InBev operates may result in fluctuations
in demand for AB InBev's products and therefore may have an adverse impact on AB InBev's business, results of operations and
financial condition.
Climate change, or legal, regulatory or market measures to address climate change, could have a long-term, material adverse impact
on AB InBev’s business and results of operations. Further, water scarcity or poor water quality may affect AB InBev by increasing
production costs and capacity constraints, which could adversely affect AB InBev’s business and results of operations.
Additionally, AB InBev’s inability to meet its compliance obligations under EU emissions trading regulations may also have an
adverse impact on AB InBev’s business and results of operations.
A substantial portion of AB InBev’s operations are carried out in developing European, African, Asian and Latin American
markets. AB InBev’s operations and equity investments in these markets are subject to the customary risks of operating in
developing countries, which include, amongst others, political instability or insurrection, external interference, changes in
government policy, political and economic changes, changes in the relations between the countries, actions of governmental
authorities affecting trade and foreign investment, regulations on repatriation of funds, interpretation and application of local laws
and regulations, enforceability of intellectual property and contract rights, local labor conditions and regulations, potential political
and economic uncertainty, application of exchange controls, nationalization or expropriation, crime and lack of law enforcement as
well as financial risks, which include risk of liquidity, inflation, devaluation, price volatility, currency convertibility and country
default. Moreover, the economies of developing countries are often affected by changes in other developing market countries, and,
accordingly, adverse changes in developing markets elsewhere in the world could have a negative impact on the markets in which
we operate. Such developing market risks could adversely impact AB InBev’s business, results of operations and financial
condition.
Economic and political events in Argentina may adversely affect the company’s Argentinean operations. The political instability,
fluctuations in the economy, governmental actions concerning the economy of Argentina, the devaluation of the Argentine peso,
inflation and deteriorating macroeconomic conditions in Argentina could have, and may continue to have, a material adverse effect
on AB InBev’s Latin America South operations, financial condition and results. During recent years, the Argentine government has
increased its direct intervention in the Argentinean economy, including its establishment of currency controls in an effort to
strengthen the value of the Argentine peso. However, on 16 December 2015, the Argentine government announced that it was
lifting these currency controls, which led to a 26.5% devaluation against the U.S. dollar on 17 December 2015 and may lead to
further unpredictable consequences for the value of the Argentine peso, including possible further devaluation. If the economic or
political situation in Argentina further deteriorates, AB InBev’s Latin America South operations may be subject to additional
restrictions under new Argentinean foreign exchange, export repatriation or expropriation regimes that could adversely affect AB
InBev’s liquidity and operations, and its ability to access funds from Argentina.
Political events in Ukraine and related sanctions adopted by the European Union and the United States targeting Russia and Crimea
may adversely affect AB InBev’s (or its partnerships’) operations in Ukraine, Russia and elsewhere in the region. AB InBev owns
and operates beer production facilities in Ukraine and Russia. Continued political instability, civil strife, deteriorating
macroeconomic conditions, the devaluation of the Russian ruble, the devaluation of the Ukrainian hryvnia and actual or threatened
military action in the region could have a material adverse effect on AB InBev’s operations in the region and on the results of
operations of AB InBev’s EMEA segment, and may result in impairment charges on goodwill or other intangible assets.
If any of AB InBev’s products is defective or found to contain contaminants, AB InBev may be subject to product recalls or other
liabilities. Although AB InBev maintains insurance policies against certain product liability (but not product recall) risks, it may not
be able to enforce its rights in respect of these policies and any amounts it recovers may not be sufficient to offset any damage it
may suffer, which could adversely impact its business, reputation, prospects, results of operations and financial condition.

16
AB InBev may not be able to obtain the necessary funding for its future capital or refinancing needs and may face financial risks
due to its level of debt and uncertain market conditions. AB InBev may be required to raise additional funds for AB InBev’s future
capital needs or refinance its current indebtedness through public or private financing, strategic relationships or other arrangements
and there can be no assurance that the funding, if needed, will be available on attractive terms, or at all. AB InBev has incurred
substantial indebtedness by entering into several senior credit facilities and accessing the bond markets from time to time based on
its financial needs, including as a result of the acquisition of SABMiller. The portion of AB InBev’s consolidated balance sheet
represented by debt will remain significantly higher as compared to its historical position. AB InBev’s increased level of debt could
have significant adverse consequences on AB InBev, including (i) increasing its vulnerability to general adverse economic and
industry conditions, (ii) limiting its flexibility in planning for, or reacting to, changes in its business and the industry in which
AB InBev operates; (iii) impairing its ability to obtain additional financing in the future and limiting its ability to fund future
working capital and capital expenditures, to engage in future acquisitions or development activities or to otherwise realize the value
of its assets and opportunities fully, (iv) requiring AB InBev to issue additional equity (potentially under unfavorable market
conditions), and (v) placing AB InBev at a competitive disadvantage compared to its competitors that have less debt. AB InBev's
ability to repay and renegotiate its outstanding indebtedness will be dependent upon market conditions. Unfavorable conditions,
including significant price volatility and liquidity disruptions in the global credit markets in recent years, as well as downward
pressure on credit capacity for certain issuers without regard to those issuers’ underlying financial strength, could increase costs
beyond what is currently anticipated. Such costs could have a material adverse impact on AB InBev’s cash flows, results of
operations or both. Further, AB InBev may restrict the amount of dividends it will pay as a result of AB InBev’s level of debt and
its strategy to give priority to deleveraging. Also, a credit rating downgrade could have a material adverse effect on AB InBev’s
ability to finance its ongoing operations or to refinance its existing indebtedness. In addition, a failure of AB InBev to refinance all
or a substantial amount of its debt obligations when they become due, or more generally a failure to raise additional equity capital
or debt financing or to realize proceeds from asset sales when needed, would have a material adverse effect on its financial
condition and results of operations.
AB InBev’s results could be negatively affected by increasing interest rates. Although AB InBev enters into interest rate swap
agreements to manage its interest rate risk and also enters into cross-currency interest rate swap agreements to manage both its
foreign currency risk and interest-rate risk on interest-bearing financial liabilities, there can be no assurance that such instruments
will be successful in reducing the risks inherent in exposures to interest rate fluctuations.
AB InBev’s results of operations are affected by fluctuations in exchange rates. Any change in exchange rates between
AB InBev’s operating companies’ functional currencies and the US dollar will affect its consolidated income statement and balance
sheet when the results of those operating companies are translated into US dollar for reporting purposes as translational exposures
are not hedged. Also, there can be no assurance that the policies in place to manage commodity price and transactional foreign
currency risks to protect AB InBev’s exposure will be able to successfully hedge against the effects of such foreign exchange
exposure, especially over the long-term. Further, the use of financial instruments to mitigate currency risk and any other efforts
taken to better match the effective currencies of AB InBev’s liabilities to its cash flows could result in increased costs.
AB InBev’s ordinary shares currently trade on Euronext Brussels in euros, the Johannesburg Stock Exchange in South African
rand, the Mexican Stock Exchange in Mexican pesos and its ordinary shares represented by American Depositary Shares (the
“ADSs”) trade on the New York Stock Exchange in U.S. dollars. Fluctuations in the exchange rates between the euro, the South
African rand, the Mexican peso and the U.S. dollar may result in temporary differences between the value of AB InBev’s ordinary
shares trading in different currencies, and between its ordinary shares and its ADSs, which may result in heavy trading by investors
seeking to exploit such differences.
The ability of AB InBev’s subsidiaries to distribute cash upstream may be subject to various conditions and limitations. The
inability to obtain sufficient cash flows from its domestic and foreign subsidiaries and affiliated companies could adversely impact
AB InBev’s ability to pay dividends and otherwise negatively impact its business, results of operations and financial condition.
Failure to generate significant cost savings and margin improvement through initiatives for improving operational efficiencies
could adversely affect AB InBev’s profitability and AB InBev’s ability to achieve its financial goals. A number of AB InBev’s
subsidiaries are in the process of executing a major cost saving and efficiency program and AB InBev is pursuing a number of
initiatives to improve operational efficiency. If AB InBev fails for any reason to successfully complete these measures and
programs as planned or to derive the expected benefits from these measures and programs, there is a risk of increased costs
associated with these efforts, delays in benefit realization, disruption to the business, reputational damage or a reduced competitive
advantage in the medium term.
AB InBev reached a settlement with the U.S. Department of Justice in relation to the combination with Grupo Modelo, which
included a three-year transition services agreement to ensure the smooth transition of the operation of the Piedras Negras brewery
as well as certain distribution guarantees for Constellation Brands, Inc. in the fifty states of the United States, the District of
Columbia and Guam. AB InBev’s compliance with its obligations under the settlement agreement is monitored by the U.S.
Department of Justice and the Monitoring Trustee appointed by them. Were AB InBev to fail to fulfill its obligations under the
settlement, whether intentionally or inadvertently, AB InBev could be subject to monetary fines.
AB InBev entered into a consent decree with the U.S. Department of Justice in relation to the combination with SABMiller,
pursuant to which AB InBev’s subsidiary, Anheuser-Busch Companies, LLC, agreed not to acquire control of a distributor if doing
so would result in more than 10% of its annual volume being distributed through distributorships controlled by AB InBev in the
U.S. AB InBev’s compliance with its obligations under the settlement agreement is monitored by the U.S. Department of Justice
and the Monitoring Trustee appointed by them. Were AB InBev to fail to fulfill its obligations under the consent decree, whether
intentionally or inadvertently, AB InBev could be subject to monetary fines.
If the business of AB InBev does not develop as expected, impairment charges on goodwill or other intangible assets may be
incurred in the future which could be significant and which could have an adverse effect on AB InBev's results of operations and
financial condition.
Although AB InBev’s operations in Cuba are quantitatively immaterial, its overall business reputation may suffer or it may face
additional regulatory scrutiny as a result of Cuba being a target of US economic and trade sanctions. If investors decide to liquidate
or otherwise divest their investments in companies that have operations of any magnitude in Cuba, the market in and value of AB
17
InBev’s securities could be adversely impacted. In addition, US legislation known as the “Helms-Burton Act” authorizes private
lawsuits for damages against anyone who traffics in property confiscated without compensation by the Government of Cuba from
persons who at the time were, or have since become, nationals of the United States. Although this section of the Helms-Burton Act
is currently suspended, claims accrue notwithstanding the suspension and may be asserted if the suspension is discontinued. AB
InBev has received notice of a claim purporting to be made under the Helms-Burton Act. AB InBev is currently unable to express a
view as to the validity of such claims, or as to the standing of the claimants to pursue them.
AB InBev may not be able to recruit or retain key personnel and successfully manage them, which could disrupt AB InBev’s
business and have an unfavorable material effect on AB InBev’s financial position, its income from operations and its competitive
position.
Further, AB InBev may be exposed to labor strikes, disputes and work stoppages or slowdowns, within its operations or those of its
suppliers, or an interruption or shortage of raw materials for any other reason that could lead to a negative impact on AB InBev’s
costs, earnings, financial condition, production level and ability to operate its business. AB InBev’s production may also be affected
by work stoppages or slowdowns that affect its suppliers, distributors and retail delivery/logistics providers as a result of disputes
under existing collective labor agreements with labor unions, in connection with negotiations of new collective labor agreements, as
a result of supplier financial distress or for other reasons. A work stoppage or slowdown at AB InBev’s facilities could interrupt the
transport of raw materials from its suppliers or the transport of its products to its customers. Such disruptions could put a strain on
AB InBev’s relationships with suppliers and clients and may have lasting effects on its business even after the disputes with its
labor force have been resolved, including as a result of negative publicity.
AB InBev relies on information technology systems to process, transmit, and store electronic information. Although AB InBev
takes various actions to prevent cyber-attacks and to minimize potential technology disruptions, such disruptions could impact AB
InBev’s business. For example, if outside parties gained access to AB InBev’s confidential data or strategic information and
appropriated such information or made such information public, this could harm AB InBev’s reputation or its competitive
advantage. In addition, the information systems of AB InBev and SABMiller are subject to integration. Any failure of integration
could have a material adverse effect on AB InBev. More generally, technology disruptions could have a material adverse effect on
AB InBev’s business, results of operations, cash flows or financial condition.
The size of AB InBev, contractual limitations it is subject to and its position in the markets in which it operates may decrease its
ability to successfully carry out further acquisitions and business integrations. AB InBev cannot enter into further transactions
unless it can identify suitable candidates and agree on the terms with them. The size of AB InBev and its position in the markets in
which it operates may make it harder to identify suitable candidates, including because it may be harder for AB InBev to obtain
regulatory approval for future transactions. If appropriate opportunities do become available, AB InBev may seek to acquire or
invest in other businesses; however, any future acquisition may pose regulatory, anti-trust and other risks.
AB InBev’s business and operating results could be negatively impacted by social, technical, natural, physical or other disasters.
Although AB InBev maintains insurance policies to cover various risks, it also uses self-insurance for most of its insurable risks.
Should an uninsured loss or a loss in excess of insured limits occur, this could adversely impact AB InBev’s business, results of
operations and financial condition.
AB InBev is exposed to the risk of a global recession or a recession in one or more of its key markets, and to credit and capital
market volatility and economic financial crisis, which could result in lower revenue and reduced profit, as beer consumption in
many of the jurisdictions in which AB InBev operates is closely linked to general economic conditions and changes in disposable
income. A continuation or worsening of the levels of market disruption and volatility seen in the recent past could have an adverse
effect on AB InBev’s ability to access capital, on its business, results of operations and financial condition, and on the market price
of its shares and American Depositary Shares.
AB InBev operates its business and markets its products in certain countries that, as a result of political and economic instability, a
lack of well-developed legal systems and potentially corrupt business environments, present it with political, economic and
operational risks. Although AB InBev is committed to conducting business in a legal and ethical manner in compliance with local
and international statutory requirements and standards applicable to its business, there is a risk that the employees or representatives
of AB InBev’s subsidiaries, affiliates, associates, joint ventures/operations or other business interests may take actions that violate
applicable laws and regulations that generally prohibit the making of improper payments to foreign government officials for the
purpose of obtaining or keeping business, including laws relating to the 1997 OECD Convention on Combating Bribery of Foreign
Public Officials in International Business Transactions such as the U.S. Foreign Corrupt Practices Act and the U.K. Bribery Act.
The audit report included in AB InBev’s annual report is prepared by an auditor who is not inspected by the US Public Company
Accounting Oversight Board (PCAOB). This lack of PCAOB inspections in Belgium prevents the PCAOB from regularly
evaluating audits and quality control procedures of any auditors operating in Belgium, including AB InBev’s auditors. As a result,
US and other investors may be deprived of the benefits of PCAOB inspections.
AB InBev is now, and may in the future be, a party to legal proceedings and claims, including collective suits (class actions), and
significant damages may be asserted against it. Given the inherent uncertainty of litigation, it is possible that AB InBev might incur
liabilities as a consequence of the proceedings and claims brought against it, including those that are not currently believed by it to
be reasonably possible, which could have a material adverse effect on AB InBev’s business, results of operations, cash flows or
financial position. Important contingencies are disclosed in Note 32 Contingencies of the consolidated financial statements.
RISKS ARISING FROM THE RECENT COMBINATION WITH SABMILLER
The Combination has been subject to the review and authorization of various regulatory authorities which have imposed (and may
impose) conditions with which AB InBev is required to comply.. AB InBev has agreed to divestitures and other commitments in
order to obtain regulatory approvals, and such commitments may have an adverse effect on its business, results of operations,
financial condition and prospects. These or any conditions, remedies or changes also could have the effect of reducing the
anticipated benefits of the combination with SABMiller, reducing the price AB InBev is able to obtain for such divestitures or

18
imposing additional costs on or limiting AB InBev’s revenues, any of which might have a material adverse effect on AB InBev.
Any non-compliance with the commitments may result in fines or other adverse consequences to AB InBev.
We may not be able to complete all planned or other restructuring or divestitures in connection with the Combination. The
uncertainty regarding the effect of the Combination and any related divestitures could cause disruptions to AB InBev’s business.
These uncertainties may materially and adversely affect AB InBev’s businesses and its operations and could cause customers,
distributors, other business partners and other parties that have business relationships with AB InBev to defer the consummation of
other transactions or other decisions concerning AB InBev’s business, or to seek to change existing business relationships with
these companies. Moreover, AB InBev will have to address issues inherent in the management of a greater number of employees in
some very diverse geographic areas. Therefore, it is not certain that AB InBev will be able to attract or retain its key employees and
successfully manage them, which could disrupt its business and have an unfavorable material effect on its financial position, its
income from operations and on its competitive position.
AB InBev may not be able to successfully complete the integration of the SABMiller business or fully realize the anticipated
benefits and synergies of the combination with SABMiller, and any such benefits and synergies will be offset by the significant
transaction fees and other costs AB InBev incurred in connection with the Combination. The integration process involves inherent
costs and uncertainties, which uncertainties are exacerbated because SABMiller was active in new or developing markets in which
AB InBev did not have significant operations. Additionally, the Tax Matters Agreement AB InBev has entered into with Altria
Group Inc. imposes some limits on the ability of the Combined Group to effect some group reorganizations, which may limit its
capacity to integrate SABMiller’s operations.
As a result of the Combination, AB InBev recognized a significant amount of incremental goodwill on its balance sheet. If the
integration of the businesses meets with unexpected difficulties, or if the business of AB InBev does not develop as expected,
impairment charges may be incurred in the future that could be significant and that could have an adverse effect on its results of
operations and financial condition.
RISKS ARISING FROM FINANCIAL INSTRUMENTS
Note 29 of the 2016 consolidated financial statements on Risks arising from financial instruments contains detailed information on
the company’s exposures to financial risks and its risk management policies.
Events after the balance sheet date
Please refer to Note 35 Events after the balance sheet date of the consolidated financial statements.
Corporate governance
For information with respect to Corporate Governance, please refer to the Corporate Governance section, which forms an integral
part of AB InBev's annual report.

19
Adjusted segment information
Given the transformational nature of the combination with SABMiller, the company has updated its 2015 and 2016 segment
reporting for purposes of results announcements and internal review by senior management. This presentation includes, for
comparative purposes, the results of AB InBev for 4Q15, 1Q16, 2Q16 and 3Q16, as if the combination with SABMiller had taken
place at the beginning of 4Q15.
For external reporting purposes, AB InBev will continue to present its results under the existing six regions. However, with effect
from 4Q16, these regions will also include the former SABMiller geographies. Colombia, Peru, Ecuador, Honduras and El Salvador
will be reported together with Mexico as Latin America West, Panama will be reported within Latin America North, Africa will be
reported together with Europe as EMEA, and Australia, India and Vietnam will be reported within APAC. This external reporting
presentation has no impact on the operational management and organizational structure within AB InBev which was announced on
4 August 2016.
The six regions are: North America, Latin America West, Latin America North, Latin America South, EMEA and Asia Pacific.
The company will also continue to report the results of Global Export and Holding Companies which include the company’s global
headquarters, the export businesses which have not been allocated to the regions, and the interim supply agreement with
Constellation Brands, Inc. The company’s six geographic regions plus its Global Export and Holding Companies will comprise the
company’s seven segments for all financial reporting purposes.
The Reference Base has been prepared on the following basis:
The Reference Base excludes the results of those business sold since the combination was completed, including the joint
venture stakes in MillerCoors and CR Snow, and the sale of the Peroni, Grolsch and Meantime brands and associated
businesses in Italy, the Netherlands, the UK and internationally.
The Reference Base excludes the results of the Central and Eastern Europe business and the stake in Distell. Binding sale
agreements have been announced for these businesses but the transactions have not yet closed. The results of the Central
and Eastern Europe business will be reported as “Results from discontinued operations” until the sale is completed. The
results of Distell will be reported as share of results of associates, and accordingly, excluded from normalized EBIT and
EBITDA.
Exports to countries in which AB InBev has operations following the combination, were allocated to the respective
regions in the Reference Base.
On 21 December 2016, The Coca-Cola Company and AB InBev announced that they had reached agreement regarding
the transition of AB InBev’s 54.5% equity stake in CCBA. For the purposes of the Reference Base, the results of CCBA
are included in “EMEA” and will continue to be reported within that region throughout AB InBev’s ownership of its
stake in CCBA.
AB INBEV WORLDWIDE
4Q 2015
Reference base
1Q 2016
Reference base
2Q 2016
Reference base
3Q 2016
Reference base
9M 2016
Reference base
Volumes ................................................. 156 353 142 845 150 652 162 944 456 441
Revenue ............................................... 14 047 12 073 13 453 14 210 39 736
Cost of sales ........................................... (5 238) (4 803) (5 262) (5 698) (15 764)
Gross profit .......................................... 8 809 7 270 8 192 8 511 23 973
SG&A ..................................................... (4 518) (3 960) (4 614) (4 716) (13 291)
Other operating income/(expenses) ........... 362 208 284 200 692
Normalized EBIT ..................................... 4 653 3 517 3 862 3 995 11 374
Normalized EBITDA .............................. 5 619 4 490 4 856 5 039 14 385
Normalized EBITDA margin ....................... 40.0% 37.2% 36.1% 35.5% 36.2%
NORTH AMERICA
4Q 2015
Reference base
1Q 2016
Reference base
2Q 2016
Reference base
3Q 2016
Reference base
9M 2016
Reference base
Volumes ................................................. 27 317 26 913 31 526 31 912 90 351
Revenue ............................................... 3 644 3 532 4 263 4 287 12 082
Cost of sales ........................................... (1 449) (1 358) (1 544) (1 579) (4 481)
Gross profit .......................................... 2 195 2 175 2 717 2 709 7 601
SG&A ..................................................... (1 017) (992) (1 208) (1 183) (3 383)
Other operating income/(expenses) ........... 25 11 20 10 41
Normalized EBIT ..................................... 1 203 1 194 1 529 1 536 4 259
Normalized EBITDA .............................. 1 400 1 384 1 732 1 741 4 857
Normalized EBITDA margin ....................... 38.4% 39.2% 40.6% 40.6% 40.2%

20
LATIN AMERICA WEST
4Q 2015
Reference base
1Q 2016
Reference base
2Q 2016
Reference base
3Q 2016
Reference base
9M 2016
Reference base
Volumes ................................................. 28 675 25 672 26 862 27 152 79 686
Revenue ............................................... 2 355 1 974 2 149 2 161 6 284
Cost of sales ........................................... (639) (576) (623) (642) (1 841)
Gross profit .......................................... 1 717 1 398 1 527 1 518 4 443
SG&A ..................................................... (762) (676) (738) (705) (2 119)
Other operating income/(expenses) ........... 71 38 40 22 100
Normalized EBIT ..................................... 1 026 760 829 835 2 424
Normalized EBITDA .............................. 1 184 915 988 991 2 894
Normalized EBITDA margin ....................... 50.3% 46.4% 46.0% 45.9% 46.1%
LATIN AMERICA NORTH
4Q 2015
Reference base
1Q 2016
Reference base
2Q 2016
Reference base
3Q 2016
Reference base
9M 2016
Reference base
Volumes ................................................. 35 940 29 713 27 209 28 947 85 869
Revenue ............................................... 2 547 1 900 1 920 2 081 5 901
Cost of sales ........................................... (757) (652) (734) (881) (2 267)
Gross profit .......................................... 1 791 1 248 1 187 1 198 3 634
SG&A ..................................................... (602) (586) (636) (715) (1 938)
Other operating income/(expenses) ........... 163 100 92 95 286
Normalized EBIT ..................................... 1 350 763 641 579 1 983
Normalized EBITDA .............................. 1 510 931 830 782 2 543
Normalized EBITDA margin ....................... 59.3% 49.0% 43.2% 37.6% 43.1%
LATIN AMERICA SOUTH
4Q 2015
Reference base
1Q 2016
Reference base
2Q 2016
Reference base
3Q 2016
Reference base
9M 2016
Reference base
Volumes ................................................. 10 065 8 820 5 999 7 478 22 297
Revenue ............................................... 1 046 727 504 677 1 908
Cost of sales ........................................... (317) (229) (185) (225) (639)
Gross profit .......................................... 731 498 319 451 1 268
SG&A ..................................................... (228) (174) (149) (173) (495)
Other operating income/(expenses) ........... 7 2 - 7 10
Normalized EBIT ..................................... 509 326 170 287 784
Normalized EBITDA .............................. 557 366 218 332 917
Normalized EBITDA margin ....................... 53.3% 50.4% 43.3% 49.1% 48.1%
EMEA
4Q 2015
Reference base
1Q 2016
Reference base
2Q 2016
Reference base
3Q 2016
Reference base
9M 2016
Reference base
Volumes ................................................. 34 554 27 965 29 754 35 898 93 617
Revenue ............................................... 2 505 1 885 2 257 2 648 6 789
Cost of sales ........................................... (1 061) (877) (970) (1 213) (3 061)
Gross profit .......................................... 1 443 1 007 1 286 1 435 3 729
SG&A ..................................................... (783) (643) (783) (857) (2 283)
Other operating income/(expenses) ........... 15 (7) 14 8 14
Normalized EBIT ..................................... 675 357 517 586 1 460
Normalized EBITDA .............................. 841 521 688 778 1 987
Normalized EBITDA margin ....................... 33.6% 27.7% 30.5% 29.4% 29.3%
ASIA PACIFIC
4Q 2015
Reference base
1Q 2016
Reference base
2Q 2016
Reference base
3Q 2016
Reference base
9M 2016
Reference base
Volumes ................................................. 19 071 23 262 28 900 31 103 83 265
Revenue ............................................... 1 603 1 699 1 959 2 107 5 765
Cost of sales ........................................... (757) (825) (861) (911) (2 597)
Gross profit .......................................... 846 873 1 098 1 196 3 168
SG&A ..................................................... (706) (572) (710) (747) (2 029)
Other operating income/(expenses) ........... 54 33 94 41 167
Normalized EBIT ..................................... 193 334 482 490 1 306
Normalized EBITDA .............................. 379 533 648 668 1 849
Normalized EBITDA margin ....................... 23.6% 31.4% 33.1% 31.7% 32.1%
GLOBAL EXPORT AND HOLDING
COMPANIES
4Q 2015
Reference base
1Q 2016
Reference base
2Q 2016
Reference base
3Q 2016
Reference base
9M 2016
Reference base
Volumes ................................................. 729 502 400 455 1 357
Revenue ............................................... 346 357 401 249 1 006
Cost of sales ........................................... (260) (287) (344) (246) (877)
Gross profit .......................................... 86 70 57 2 129
SG&A ..................................................... (417) (319) (386) (338) (1 043)
Other operating income/(expenses) ........... 27 32 24 18 73
Normalized EBIT ..................................... (304) (218) (306) (317) (841)
Normalized EBITDA .............................. (252) (161) (246) (256) (663)

21
Statement of the Board of Directors
The Board of Directors of AB InBev SA/NV certifies, on behalf and for the account of the company, that, to their knowledge, (a)
the financial statements which have been prepared in accordance with International Financial Reporting Standards give a true and
fair view of the assets, liabilities, financial position and profit or loss of the company and the entities included in the consolidation
as a whole and (b) the management report includes a fair review of the development and performance of the business and the
position of the company and the entities included in the consolidation as a whole, together with a description of the principal risks
and uncertainties they face.

22
Independent auditors’ report

23

24
Consolidated financial statements
Consolidated income statement
For the year ended 31 December Million US dollar, except earnings per shares in US dollar Notes 2016 2015
Revenue ...................................................................................................... 45 517 43 604
Cost of sales .................................................................................................. (17 803) (17 137)
Gross profit ................................................................................................. 27 715 26 467
Distribution expenses...................................................................................... (4 543) (4 259)
Sales and marketing expenses ......................................................................... (7 745) (6 913)
Administrative expenses.................................................................................. (2 883) (2 560)
Other operating income/(expenses) .................................................................. 7 732 1 032
Profit from operations before non-recurring items ...................................... 13 276 13 768
Restructuring ................................................................................................ 8 (323) (171)
Business and asset disposal ............................................................................. 8 377 524
Acquisition costs business combinations ............................................................ 8 (448) (55)
Impairment of assets ...................................................................................... 8 - (82)
Judicial settlement .......................................................................................... 8 - (80)
Profit from operations ................................................................................ 12 882 13 904
Finance cost .................................................................................................. 11 (5 860) (2 417)
Finance income .............................................................................................. 11 652 1 178
Non-recurring net finance income/(cost) ........................................................... 8 (3 356) (214)
Net finance income/(cost) .......................................................................... (8 564) (1 453)
Share of result of associates and joint ventures ................................................. 16 10
Profit before tax .......................................................................................... 4 334 12 461
Income tax expense ....................................................................................... 12 (1 613) (2 594)
Profit from continuing operations ............................................................... 2 721 9 867
Profit from discontinued operations ................................................................... 22 48 -
Profit of the year ......................................................................................... 2 769 9 867
Profit from continuing operations attributable to:
Equity holders of AB InBev ...................................................................... 1 193 8 273
Non-controlling interest ........................................................................... 1 528 1 594
Profit of the year attributable to:
Equity holders of AB InBev ...................................................................... 1 241 8 273
Non-controlling interest ........................................................................... 1 528 1 594
Basic earnings per share ................................................................................. 23 0.72 5.05
Diluted earnings per share ............................................................................... 23 0.71 4.96
Basic earnings per share from continuing operations ........................................... 23 0.69 5.05
Diluted earnings per share from continuing operations ........................................ 23 0.68 4.96
Basic earnings per share before non-recurring items and discontinued operations1 . 23 2.83 5.20
Diluted earnings per share before non-recurring items and discontinued
operations2 ....................................................................................................
23 2.77 5.10
The accompanying notes are an integral part of these consolidated financial statements.
1 Basic earnings per share and diluted earnings per share before non-recurring items are not defined metrics in IFRS. Refer to Note 23 Changes in equity and earnings
per share for more details.

25
Consolidated statement of comprehensive income
For the year ended 31 December
Million US dollar
2016
2015
Profit ............................................................................................................................. 2 769 9 867
Other comprehensive income: Items that will not be reclassified to profit or loss:
Re-measurements of post-employment benefits ................................................................... (226) 45
(226) 45
Other comprehensive income: Items that may be reclassified subsequently to profit
or loss:
Exchange differences on translation of foreign operations ................................................... (2 918) (6 898)
Foreign exchange contracts recognized in equity in relation to the SABMiller combination ....... (7 099) (1 738)
Foreign exchange contracts reclassified from equity in relation to the SABMiller combination .. 8 837 -
Effective portion of changes in fair value of net investment hedges ...................................... (161) (201)
Cash flow hedges recognized in equity ............................................................................. 110 281
Cash flow hedges reclassified from equity to profit or loss .................................................. (3) (240)
(1 234) (8 796)
Other comprehensive income, net of tax ....................................................................... (1 460) (8 751)
Total comprehensive income ......................................................................................... 1 309 1 116
Attributable to:
Equity holders of AB InBev ........................................................................................... (275) 389
Non-controlling interest ............................................................................................... 1 584 727
The accompanying notes are an integral part of these consolidated financial statements.

26
Consolidated statement of financial position
The accompanying notes are an integral part of these consolidated financial statements.
As at
Million US dollar Notes
31 December
2016
31 December
2015
ASSETS
Non-current assets
Property, plant and equipment ............................................................................................. 13 27 522 18 952
Goodwill ............................................................................................................................ 14 136 533 65 061
Intangible assets ................................................................................................................ 15 44 568 29 677
Investments in associates and joint ventures ......................................................................... 16 4 324 212
Investment securities ......................................................................................................... 17 82 48
Deferred tax assets ............................................................................................................ 18 1 261 1 181 Employee benefits .............................................................................................................. 25 10 2
Derivatives ........................................................................................................................ 29H 146 295
Trade and other receivables ................................................................................................. 20 874 913
215 320 116 341
Current assets
Investment securities ......................................................................................................... 17 5 659 55
Inventories ........................................................................................................................ 19 3 913 2 862
Income tax receivables ....................................................................................................... 1 112 687
Derivatives ........................................................................................................................ 29H 971 3 268
Trade and other receivables ................................................................................................. 20 6 391 4 451 Cash and cash equivalents................................................................................................... 21 8 579 6 923
Assets classified as held for sale ........................................................................................... 22 16 439 48
43 061 18 294
Total assets ..................................................................................................................... 258 381 134 635
EQUITY AND LIABILITIES
Equity
Issued capital .................................................................................................................... 23 1 736 1 736
Share premium .................................................................................................................. 17 620 17 620
Reserves ........................................................................................................................... 23 769 (13 168) Retained earnings .............................................................................................................. 28 214 35 949
Equity attributable to equity holders of AB InBev ........................................................... 71 339 42 137
Non-controlling interests ................................................................................................ 33 10 086 3 582
81 425 45 719
Non-current liabilities
Interest-bearing loans and borrowings .................................................................................. 24 113 941 43 541
Employee benefits .............................................................................................................. 25 3 014 2 725
Deferred tax liabilities ......................................................................................................... 18 16 678 11 961
Derivatives ........................................................................................................................ 29H 471 315
Trade and other payables .................................................................................................... 28 1 328 1 241
Provisions .......................................................................................................................... 27 1 409 677
136 841 60 460
Current liabilities
Bank overdrafts ................................................................................................................. 21 184 13
Interest-bearing loans and borrowings .................................................................................. 24 8 618 5 912
Income tax payables ........................................................................................................... 3 922 669
Derivatives ........................................................................................................................ 29H 1 263 3 980
Trade and other payables .................................................................................................... 28 23 086 17 662
Provisions .......................................................................................................................... 27 869 220
Liabilities associated with assets held for sale ........................................................................ 22 2 174 -
40 116 28 456
Total equity and liabilities ............................................................................................... 258 381 134 635

27
Consolidated statement of changes in equity Attributable to equity holders of AB InBev
Million US dollar
Issued capital
Share premium
Treasury shares
Share-
based
payment reserves
Other
comprehensive
income reserves1
Deferred
share instrument
Retained earnings
Total
Non-
controlling interest Total equity
As per 1 January 2015 .............................................. 1 736 17 620 (819) 1 080 (6 226) 1 407 35 174 49 972 4 285 54 257
Profit ......................................................................... - - - - - - 8 273 8 273 1 594 9 867
Other comprehensive income
Exchange differences on translation of foreign
operations (gains/(losses)) ........................................ - - - - (6 157) - - (6 157) (942) (7 099)
Foreign exchange contracts recognized in equity in
relation to the SABMiller combination .......................... - - - - (1 738) - - (1 738) - (1 738)
Cash flow hedges ..................................................... - - - - (36) - - (36) 77 41
Re-measurements of post-employment benefits ........... - - - - 47 - - 47 (2) 45 Total comprehensive income ..................................... - - - - (7 884) - 8 273 389 727 1 116
Dividends .................................................................... - - - - - (103) (7 191) (7 294) (1 305) (8 559)
Treasury shares ........................................................... - - (807) - - - - (807) - (807)
Share-based payments ................................................. - - - 184 - - - 184 20 204
Scope and other changes .............................................. - - - - - - (307) (307) (145) (452)
As per 31 December 2015 ......................................... 1 736 17 620 (1 626) 1 264 (14 110) 1 304 35 949 42 137 3 582 45 719
Attributable to equity holders of AB InBev
Million US dollar
Issued
capital
Share
premium
Treasury
shares Reserves
Share-
based
payment
reserves
Other
comprehensive
income
reserves1
Deferred
share
instrument
Retained
earnings
Total
Non-
controlling
interest Total equity
As per 1 January 2016 .............................................. 1 736 17 620 (1 626) - 1 264 (14 110) 1 304 35 949 42 137 3 582 45 719
Profit ......................................................................... - - - - - - - 1 241 1 241 1 528 2 769
Other comprehensive income - - - - - - - - - - -
Exchange differences on translation of foreign
operations (gains/(losses)) ........................................ - - - - - (3 265) - - (3 265) 186 (3 079)
Foreign exchange contracts recognized in equity in relation to the SABMiller combination .......................... - - - - - (7 099) - - (7 099) - (7 099)
Foreign exchange contracts reclassified from equity
in relation to the SABMiller combination ...................... - - - - - 8 837 - - 8 837 - 8 837
Cash flow hedges ..................................................... - - - - - 223 - - 223 (116) 107
Re-measurements of post-employment benefits ........... - - - - - (212) - - (212) (14) (226)
Total comprehensive income ..................................... - - - - - (1 516) - 1 241 (275) 1 584 1 309
Issuance of restricted shares for SABMiller ordinary
shares ....................................................................... 9 528 27 244 - - - - - - 36 772 - 36 772
Transfer to reserves1 ................................................... (9 528) (27 244) (8 953) 45 726 - - - - - - -
Acquisitions through business combinations2 .................. - - - - - - - - - 6 201 6 201 Dividends ................................................................... - - - - - - (92) (7 041) (7 133) (1 347) (8 480)
Treasury shares ........................................................... - - 174 - - - - (124) 50 - 50
Share-based payments ................................................. - - - - 173 - - - 173 7 180
Scope and other changes3 ............................................. - - 1 425 - - - - (1 812) (386) 59 (327)
As per 31 December 2016 ......................................... 1 736 17 620 (8 980) 45 726 1 437 (15 626) 1 212 28 214 71 339 10 086 81 425
1 See Note 23 Changes in equity and earnings per share. 2 See Note 6 Acquisitions and disposals. 3 During 2016, the company reclassified the results of treasury shares of 1 452m US dollar to retained earnings.

28
Consolidated cash flow statement
For the year ended 31 December
Million US dollar Notes 2016 2015
OPERATING ACTIVITIES
Profit ................................................................................................................... 2 769 9 867
Depreciation, amortization and impairment .............................................................. 10 3 477 3 153
Impairment losses on receivables, inventories and other assets .................................. 110 64
Additions/(reversals) in provisions and employee benefits ......................................... 293 324
Net finance cost/(income) ...................................................................................... 11 8 564 1 453
Loss/(gain) on sale of property, plant and equipment and intangible assets ................. (4) (189)
Loss/(gain) on sale of subsidiaries, associates and assets held for sale ........................ (410) (362)
Equity-settled share-based payment expense ........................................................... 26 231 221
Income tax expense .............................................................................................. 12 1 613 2 594
Other non-cash items included in profit ................................................................... (286) (389)
Share of result of associates and joint ventures ........................................................ (16) (10)
Cash flow from operating activities before changes in working capital and
use of provisions ...............................................................................................
16 341 16 726
Decrease/(increase) in trade and other receivables ................................................... (714) (138)
Decrease/(increase) in inventories .......................................................................... (364) (424)
Increase/(decrease) in trade and other payables ...................................................... 1 251 2 348
Pension contributions and use of provisions ............................................................. (470) (449)
Cash generated from operations ........................................................................ 16 044 18 063
Interest paid ........................................................................................................ (3 279) (1 943)
Interest received .................................................................................................. 558 334
Dividends received ................................................................................................ 43 22
Income tax paid ................................................................................................... (3 256) (2 355)
CASH FLOW FROM OPERATING ACTIVITIES ....................................................... 10 110 14 121
INVESTING ACTIVITIES
Proceeds from sale of property, plant and equipment and of intangible assets .............. 211 412
Sale of subsidiaries, net of cash disposed of ............................................................. 6 653 72
Acquisition of SABMiller, net of cash acquired ........................................................... 6 (65 166) -
Proceeds from SABMiller transaction-related divestitures ........................................... 6 16 342 -
Acquisition of other subsidiaries, net of cash acquired ............................................... 6 (1 445) (990)
Acquisition of property, plant and equipment and of intangible assets ......................... 13/15 (4 979) (4 749)
Net of tax proceeds from the sale of assets held for sale ............................................ 146 397
Net proceeds from sale/(acquisition) of investment in short-term debt securities .......... 17 (5 583) 169
Net proceeds from sale/(acquisition) of other assets ................................................. (27) (195)
Net repayments/(payments) of loans granted .......................................................... (229) (46)
CASH FLOW FROM INVESTING ACTIVITIES ....................................................... (60 077) (4 930)
FINANCING ACTIVITIES
Purchase of non-controlling interest ........................................................................ 23 (10) (296)
Net proceeds from the issue of share capital ............................................................ 23 - 5
Proceeds from borrowings ...................................................................................... 86 292 16 237
Payments on borrowings ........................................................................................ (23 617) (15 780)
Cash net finance (cost)/income other than interests .................................................. (3 484) (481)
Share buyback ..................................................................................................... - (1 000)
Dividends paid ...................................................................................................... (8 450) (7 966)
CASH FLOW FROM FINANCING ACTIVITIES ....................................................... 50 731 ( 9 281)
Net increase/(decrease) in cash and cash equivalents ...................................... 764 (90)
Cash and cash equivalents less bank overdrafts at beginning of year .......................... 6 910 8 316
Effect of exchange rate fluctuations ........................................................................ 721 (1 316)
Cash and cash equivalents less bank overdrafts at end of period ...................... 21 8 395 6 910
The accompanying notes are an integral part of these consolidated financial statements.

29
Notes to the consolidated financial statements
Note
Corporate information ............................................................................................................................................... 1
Statement of compliance ........................................................................................................................................... 2
Summary of significant accounting policies .................................................................................................................. 3
Use of estimates and judgments ................................................................................................................................. 4
Segment reporting .................................................................................................................................................... 5
Acquisitions and disposals of subsidiaries ..................................................................................................................... 6
Other operating income/(expenses) ............................................................................................................................ 7
Non-recurring items .................................................................................................................................................. 8
Payroll and related benefits ........................................................................................................................................ 9
Additional information on operating expenses by nature ................................................................................................ 10
Finance cost and income ............................................................................................................................................ 11
Income taxes ........................................................................................................................................................... 12
Property, plant and equipment ................................................................................................................................... 13
Goodwill .................................................................................................................................................................. 14
Intangible assets ...................................................................................................................................................... 15
Investment in associates ........................................................................................................................................... 16
Investment securities ................................................................................................................................................ 17
Deferred tax assets and liabilities ............................................................................................................................... 18
Inventories .............................................................................................................................................................. 19
Trade and other receivables ....................................................................................................................................... 20
Cash and cash equivalents ......................................................................................................................................... 21
Assets classified as held for sale and discontinued operations ........................................................................................ 22
Changes in equity and earnings per share .................................................................................................................... 23
Interest-bearing loans and borrowings ........................................................................................................................ 24
Employee benefits .................................................................................................................................................... 25
Share-based payments .............................................................................................................................................. 26
Provisions ................................................................................................................................................................ 27
Trade and other payables .......................................................................................................................................... 28
Risks arising from financial instruments ....................................................................................................................... 29
Operating leases ....................................................................................................................................................... 30
Collateral and contractual commitments for the acquisition of property, plant and equipment, loans to customers and other.. 31
Contingencies ........................................................................................................................................................... 32
Non-controlling interests ............................................................................................................................................ 33
Related parties ......................................................................................................................................................... 34
Events after the balance sheet date ............................................................................................................................ 35
AB InBev companies ................................................................................................................................................. 36

30
1. CORPORATE INFORMATION
On 10 October 2016, AB InBev announced the completion of the Belgian merger and the successful completion of the business
combination with SABMiller.
As a result of the Belgian merger, the former AB InBev has merged into Newbelco, and Newbelco has become the holding company
for the combined former AB InBev and SABMiller groups. All assets and liabilities of the former AB InBev have been transferred to
Newbelco, and Newbelco has automatically been substituted for the former AB InBev in all its rights and obligations by operation of
Belgian law. Newbelco has been renamed Anheuser-Busch InBev, and the former AB InBev has been dissolved by operation of
Belgian law.
The shares in the former AB InBev were delisted from Euronext Brussels, the Bolsa Mexicana de Valores and the Johannesburg
Stock Exchange. The new ordinary shares were admitted to listing and trading on Euronext Brussels, the Johannesburg Stock
Exchange and the Bolsa Mexicana de Valores at the opening of business in each market on 11 October 2016. In addition, ADSs
trading on the New York Stock Exchange, each of which used to represent one ordinary share of the former AB InBev, now each
represent one new ordinary share, effective as of the opening of business in New York on 11 October 2016.
The share capital of AB InBev now amounts to 1 238 608 344 euro. It is represented by 2 019 241 973 shares without nominal value,
of which 85 540 392 are held in treasury by AB InBev and its subsidiaries. All shares are new ordinary shares, except for 325 999
817 restricted shares.
Following the combination, AB InBev is consolidating SABMiller and reporting the results of the retained SABMiller operations in
its income statement as of the fourth quarter 2016.
Anheuser-Busch InBev is a publicly traded company (Euronext: ABI) based in Leuven, Belgium, with secondary listings on the
Mexico (MEXBOL: ANB) and South Africa (JSE: ANH) stock exchanges and with American Depositary Receipts on the New York
Stock Exchange (NYSE: BUD). Our Dream is to bring people together for a better world. Beer, the original social network, has been
bringing people together for thousands of years. We are committed to building great brands that stand the test of time and to brewing
the best beers using the finest natural ingredients. Our diverse portfolio of well over 500 beer brands includes global brands
Budweiser®, Corona® and Stella Artois®; multi-country brands Beck’s®, Castle®, Castle Lite®, Hoegaarden® and Leffe®; and
local champions such as Aguila®, Antarctica®, Bud Light®, Brahma®, Cass®, Chernigivske®, Cristal®, Harbin®, Jupiler®,
Klinskoye®, Michelob Ultra®, Modelo Especial®, Quilmes®, Victoria®, Sedrin®, Sibirskaya Korona® and Skol®. Our brewing
heritage dates back more than 600 years, spanning continents and generations. From our European roots at the Den Hoorn brewery in
Leuven, Belgium. To the pioneering spirit of the Anheuser & Co brewery in St. Louis, US. To the creation of the Castle Brewery in
South Africa during the Johannesburg gold rush. To Bohemia, the first brewery in Brazil. Geographically diversified with a balanced
exposure to developed and developing markets, we leverage the collective strengths of approximately 200 000 employees based in
more than 50 countries worldwide. For 2016, AB InBev’s reported revenue was 45.5 billion US dollar (excluding joint ventures and
associates).
The consolidated financial statements of the company for the year ended 31 December 2016 comprise the company and its
subsidiaries (together referred to as “AB InBev” or the “company”) and the company’s interest in associates, joint ventures and
operations.
The financial statements were authorized for issue by the Board of Directors on 1 March 2017.
2. STATEMENT OF COMPLIANCE
The consolidated financial statements are prepared in accordance with International Financial Reporting Standards as issued by the
International Accounting Standards Board (“IASB”) and in conformity with IFRS as adopted by the European Union up to
31 December 2016 (collectively “IFRS”). AB InBev did not early apply any new IFRS requirements that were not yet effective in
2016 and did not apply any European carve-outs from IFRS.
3. SUMMARY OF SIGNIFICANT ACCOUNTING POLICIES
The accounting policies set out below have been applied consistently to all periods presented in these consolidated financial
statements by the company and its subsidiaries.
(A) BASIS OF PREPARATION AND MEASUREMENT
Depending on the applicable IFRS requirements, the measurement basis used in preparing the financial statements is cost, net
realizable value, fair value or recoverable amount. Whenever IFRS provides an option between cost and another measurement basis
(e.g. systematic re-measurement), the cost approach is applied.
(B) FUNCTIONAL AND PRESENTATION CURRENCY
Unless otherwise specified, all financial information included in these financial statements have been stated in US dollar and has
been rounded to the nearest million. As from 2009, following the combination with Anheuser-Bush, the company changed the
presentation currency of the consolidated financial statements from the euro to the US dollar to provide greater alignment of the
presentation currency with AB InBev’s most significant operating currency and underlying financial performance. The functional
currency of the parent company is the euro.

31
(C) USE OF ESTIMATES AND JUDGMENTS
The preparation of financial statements in conformity with IFRS requires management to make judgments, estimates and
assumptions that affect the application of policies and reported amounts of assets and liabilities, income and expenses. The estimates
and associated assumptions are based on historical experience and various other factors that are believed to be reasonable under the
circumstances, the results of which form the basis of making the judgments about carrying values of assets and liabilities that are not
readily apparent from other sources. Actual results may differ from these estimates.
The estimates and underlying assumptions are reviewed on an ongoing basis. Revisions to accounting estimates are recognized in the
period in which the estimate is revised if the revision affects only that period or in the period of the revision and future periods if the
revision affects both current and future periods.
(D) PRINCIPLES OF CONSOLIDATION
Subsidiaries are those entities controlled by AB InBev. AB InBev controls an entity when it is exposed to, or has rights to, variable
returns from its involvement with the entity and has the ability to affect those returns through its power over the entity. In assessing
control, potential voting rights are taken into account. Control is presumed to exist where AB InBev owns, directly or indirectly,
more than one half of the voting rights (which does not always equate to economic ownership), unless it can be demonstrated that
such ownership does not constitute control. The financial statements of subsidiaries are included in the consolidated financial
statements from the date that control commences until the date that control ceases. Total comprehensive income of subsidiaries is
attributed to the owners of the company and to the non-controlling interests even if this results in the non-controlling interests having
a deficit balance.
Associates are undertakings in which AB InBev has significant influence over the financial and operating policies, but which it does
not control. This is generally evidenced by ownership of between 20% and 50% of the voting rights. A joint venture is an
arrangement in which AB InBev has joint control, whereby AB InBev has rights to the net assets of the arrangement, rather than
rights to its assets and obligations for its liabilities. Associates and joint ventures are accounted for by the equity method of
accounting, from the date that significant influence or joint control commences until the date that significant influence or joint control
ceases. When AB InBev’s share of losses exceeds the carrying amount of the associate or joint venture, the carrying amount is
reduced to nil and recognition of further losses is discontinued except to the extent that AB InBev has incurred legal or constructive
obligations on behalf of the associate or joint venture.
Joint operations arise when AB InBev has rights to the assets and obligations to the liabilities of a joint arrangement. AB InBev
accounts for its share of the assets, liabilities, revenues and expenses as from the moment joint operation commences until the date
that joint operation ceases.
The financial statements of the company’s subsidiaries, joint ventures, joint operations and associates are prepared for the same
reporting year as the parent company, using consistent accounting policies. In exceptional cases when the financial statements of a
subsidiary, joint venture, joint operation or associate are prepared as of a different date from that of AB InBev, adjustments are made
for the effects of significant transactions or events that occur between that date and the date of AB InBev's financial statements. In
such cases, the difference between the end of the reporting period of these subsidiaries, joint ventures, joint operations or
associates from AB InBev's reporting period is no more than three months. Results from the company’s associate Anadolu Efes are
reported on a three month lag.
Transactions with non-controlling interests are treated as transactions with equity owners of the company. For purchases from non-
controlling interests, the difference between any consideration paid and the relevant share acquired of the carrying value of net assets
of the subsidiary is recorded in equity. Gains or losses on disposals to non-controlling interests are also recorded in equity where
there is no loss of control.
All intercompany transactions, balances and unrealized gains and losses on transactions between group companies have been
eliminated. Unrealized gains arising from transactions with joint ventures, joint operations and associates are eliminated to the extent
of AB InBev’s interest in the entity. Unrealized losses are eliminated in the same way as unrealized gains, but only to the extent that
there is no evidence of impairment.
A listing of the company’s most important subsidiaries, joint ventures, joint operations and associates is set out in Note 36 AB InBev
companies.
(E) SUMMARY OF CHANGES IN ACCOUNTING POLICIES
A number of new standards, amendment to standards and new interpretations became mandatory for the first time for the financial
year beginning 1 January 2016, and have not been listed in these consolidated financial statements because of either their non-
applicability to or their immateriality to AB InBev’s consolidated financial statements.
(F) FOREIGN CURRENCIES
FOREIGN CURRENCY TRANSACTIONS
Foreign currency transactions are accounted for at exchange rates prevailing at the date of the transactions. Monetary assets and
liabilities denominated in foreign currencies are translated at the balance sheet date rate. Gains and losses resulting from the
settlement of foreign currency transactions and from the translation of monetary assets and liabilities denominated in foreign
currencies are recognized in the income statement. Non-monetary assets and liabilities denominated in foreign currencies are
translated at the foreign exchange rate prevailing at the date of the transaction. Non-monetary assets and liabilities denominated in
foreign currencies that are stated at fair value are translated to US dollar at foreign exchange rates ruling at the dates the fair value
was determined.

32
TRANSLATION OF THE RESULTS AND FINANCIAL POSITION OF FOREIGN OPERATIONS
Assets and liabilities of foreign operations are translated to US dollar at foreign exchange rates prevailing at the balance sheet date.
Income statements of foreign operations, excluding foreign entities in hyperinflationary economies, are translated to US dollar at
exchange rates for the year approximating the foreign exchange rates prevailing at the dates of the transactions. The components of
shareholders’ equity are translated at historical rates. Exchange differences arising from the translation of shareholders’ equity to
US dollar at period-end exchange rates are taken to other comprehensive income (translation reserves).
In hyperinflationary economies, re-measurement of the local currency denominated non-monetary assets, liabilities, income
statement accounts as well as equity accounts is made by applying a general price index. These re-measured accounts are used for
conversion into US dollar at the closing exchange rate. AB InBev did not have material operations in hyperinflationary economies in
2016 and 2015.
EXCHANGE RATES
The most important exchange rates that have been used in preparing the financial statements are:
Closing rate Average rate
1 US dollar equals: 2016 2015 2016 2015
Argentinean peso ............................................. 15.850116 13.004955 14.762591 9.101728
Australian dollar .............................................. 1.384689 - 1.3440978 -
Brazilian real ................................................... 3.259106 3.904803 3.474928 3.259601
Canadian dollar ............................................... 1.345983 1.388446 1.318844 1.270237
Colombian peso ............................................... 3 002.14 3 145.64 2 986.89 2 792.222
Chinese yuan .................................................. 6.944520 6.485535 6.607635 6.256495
Euro............................................................... 0.948677 0.918527 0.902821 0.899096
Mexican peso............. ..................................... 20.663842 17.206357 18.464107 15.730837
Pound sterling ................................................. 0.812238 0.674152 0.737400 0.653179
Peruvian nuevo sol ........................................... 3.352820 3.413342 3.394121 3.135481 Russian ruble .................................................. 60.657097 72.881615 66.905365 59.186097
South Korean won............. .............................. 1 203.90 1 176.09 1 154.50 1 129.52
South African rand............. .............................. 13.714953 - 14.0166901 -
Turkish lira ..................................................... 3.516940 - 3.50148 -
Ukrainian hryvnia ............................................ 27.190513 24.000600 25.408674 21.493019
(G) INTANGIBLE ASSETS
RESEARCH AND DEVELOPMENT
Expenditure on research activities, undertaken with the prospect of gaining new scientific or technical knowledge and understanding,
is recognized in the income statement as an expense as incurred.
Expenditure on development activities, whereby research findings are applied to a plan or design for the production of new or
substantially improved products and processes, is capitalized if the product or process is technically and commercially feasible,
future economic benefits are probable and the company has sufficient resources to complete development. The expenditure
capitalized includes the cost of materials, direct labor and an appropriate proportion of overheads. Other development expenditure is
recognized in the income statement as an expense as incurred. Capitalized development expenditure is stated at cost less accumulated
amortization (see below) and impairment losses (refer to accounting policy P).
Amortization related to research and development intangible assets is included within the cost of sales if production related and in
sales and marketing if related to commercial activities.
Borrowing costs directly attributable to the acquisition, construction or production of qualifying assets are capitalized as part of the
cost of such assets.
SUPPLY AND DISTRIBUTION RIGHTS
A supply right is the right for AB InBev to supply a customer and the commitment by the customer to purchase from AB InBev. A
distribution right is the right to sell specified products in a certain territory.
Acquired distribution rights are measured initially at cost or fair value when obtained through a business combination.
Amortization related to supply and distribution rights is included within sales and marketing expenses.
BRANDS
If part of the consideration paid in a business combination relates to trademarks, trade names, formulas, recipes or technological
expertise these intangible assets are considered as a group of complementary assets that is referred to as a brand for which one fair
value is determined. Expenditure on internally generated brands is expensed as incurred.
SOFTWARE
Purchased software is measured at cost less accumulated amortization. Expenditure on internally developed software is capitalized
when the expenditure qualifies as development activities; otherwise, it is recognized in the income statement when incurred.
Amortization related to software is included in cost of sales, distribution expenses, sales and marketing expenses or administrative
expenses based on the activity the software supports.
OTHER INTANGIBLE ASSETS
Other intangible assets, acquired by the company, are recognized at cost less accumulated amortization and impairment losses.
Other intangible assets also include multi-year sponsorship rights acquired by the company. These are initially recognized at the
present value of the future payments and subsequently measured at cost less accumulated amortization and impairment losses.

33
SUBSEQUENT EXPENDITURE
Subsequent expenditure on capitalized intangible assets is capitalized only when it increases the future economic benefits embodied
in the specific asset to which it relates. All other expenditures are expensed as incurred.
AMORTIZATION
Intangible assets with a finite life are amortized using the straight-line method over their estimated useful lives. Licenses, brewing,
supply and distribution rights are amortized over the period in which the rights exist. Brands are considered to have an indefinite life
unless plans exist to discontinue the brand. Discontinuance of a brand can be either through sale or termination of marketing support.
When AB InBev purchases distribution rights for its own products the life of these rights is considered indefinite, unless the company
has a plan to discontinue the related brand or distribution. Software and capitalized development costs related to technology are
amortized over 3 to 5 years.
Brands are deemed intangible assets with indefinite useful lives and, therefore, are not amortized but tested for impairment on an
annual basis (refer to accounting policy P).
GAINS AND LOSSES ON SALE
Net gains on sale of intangible assets are presented in the income statement as other operating income. Net losses on sale are
included as other operating expenses. Net gains and losses are recognized in the income statement when the significant risks and
rewards of ownership have been transferred to the buyer, recovery of the consideration is probable, the associated costs can be
estimated reliably, and there is no continuing managerial involvement with the intangible assets.
(H) BUSINESS COMBINATIONS
The company applies the acquisition method of accounting to account for acquisitions of businesses. The cost of an acquisition is
measured as the aggregate of the fair values at the date of exchange of the assets given, liabilities incurred and equity instruments
issued. Identifiable assets, liabilities and contingent liabilities acquired or assumed are measured separately at their fair value as of
the acquisition date. The excess of the cost of the acquisition over the company’s interest in the fair value of the identifiable net
assets acquired is recorded as goodwill.
The allocation of fair values to the identifiable assets acquired and liabilities assumed is based on various assumptions requiring
management judgment.
Acquisition-related costs are expensed as incurred.
If the business combination is achieved in stages, the acquisition date carrying value of AB InBev’s previously held interest in the
acquiree is re-measured to fair value at the acquisition date; any gains or losses arising from such re-measurement are recognized in
profit or loss.
(I) GOODWILL
Goodwill is determined as the excess of the consideration paid over AB InBev’s interest in the net fair value of the identifiable assets,
liabilities and contingent liabilities of the acquired subsidiary, jointly controlled entity or associate recognized at the date of
acquisition. All business combinations are accounted for by applying the purchase method.
In conformity with IFRS 3 Business Combinations, goodwill is stated at cost and not amortized but tested for impairment on an
annual basis and whenever there is an indicator that the cash generating unit to which goodwill has been allocated, may be impaired
(refer to accounting policy P).
Goodwill is expressed in the currency of the subsidiary or jointly controlled entity to which it relates and is translated to US dollar
using the year-end exchange rate.
In respect of associates and joint ventures, the carrying amount of goodwill is included in the carrying amount of the investment in
the associate.
If AB InBev’s interest in the net fair value of the identifiable assets, liabilities and contingent liabilities recognized exceeds the cost
of the business combination such excess is recognized immediately in the income statement as required by IFRS 3 Business
Combinations.
Expenditure on internally generated goodwill is expensed as incurred.
(J) PROPERTY, PLANT AND EQUIPMENT
Property, plant and equipment is measured at cost less accumulated depreciation and impairment losses (refer to accounting policy
P). Cost includes the purchase price and any costs directly attributable to bringing the asset to the location and condition necessary
for it to be capable of operating in the manner intended by management (e.g. nonrefundable tax and transport cost). The cost of a
self-constructed asset is determined using the same principles as for an acquired asset. The depreciation methods, residual value, as
well as the useful lives are reassessed and adjusted if appropriate, annually.
Borrowing costs directly attributable to the acquisition, construction or production of qualifying assets are capitalized as part of the
cost of such assets.
SUBSEQUENT EXPENDITURE
The company recognizes in the carrying amount of an item of property, plant and equipment the cost of replacing part of such an
item when that cost is incurred if it is probable that the future economic benefits embodied with the item will flow to the company
and the cost of the item can be measured reliably. All other costs are expensed as incurred.

34
DEPRECIATION
The depreciable amount is the cost of an asset less its residual value. Residual values, if not insignificant, are reassessed annually.
Depreciation is calculated from the date the asset is available for use, using the straight-line method over the estimated useful lives of
the assets.
The estimated useful lives are defined in terms of the asset’s expected utility to the company and can vary from one geographical
area to another. On average the estimated useful lives are as follows:
Industrial buildings – other real estate properties ................................................................................................ 20 - 50 years
Production plant and equipment:
Production equipment ................................................................................................................................. 10 - 15 years
Storage, packaging and handling equipment.................................................................................................. 5 - 7 years
Returnable packaging:
Kegs ......................................................................................................................................................... 2 - 10 years
Crates ...................................................................................................................................................... 2 - 10 years Bottles ...................................................................................................................................................... 2 - 5 years
Point of sale furniture and equipment ................................................................................................................. 5 years
Vehicles .......................................................................................................................................................... 5 years
Information processing equipment ..................................................................................................................... 3 - 5 years
Where parts of an item of property, plant and equipment have different useful lives, they are accounted for as separate items of
property, plant and equipment.
Land is not depreciated as it is deemed to have an indefinite life.
GAINS AND LOSSES ON SALE
Net gains on sale of items of property, plant and equipment are presented in the income statement as other operating income. Net
losses on sale are presented as other operating expenses. Net gains and losses are recognized in the income statement when the
significant risks and rewards of ownership have been transferred to the buyer, recovery of the consideration is probable, the
associated costs can be estimated reliably, and there is no continuing managerial involvement with the property, plant and equipment.
(K) ACCOUNTING FOR LEASES
Leases of property, plant and equipment where the company assumes substantially all the risks and rewards of ownership are
classified as finance leases. Finance leases are recognized as assets and liabilities (interest-bearing loans and borrowings) at amounts
equal to the lower of the fair value of the leased property and the present value of the minimum lease payments at inception of the
lease. Depreciation and impairment testing for depreciable leased assets is the same as for depreciable assets that are owned (refer to
accounting policies J and P).
Lease payments are apportioned between the outstanding liability and finance charges so as to achieve a constant periodic rate of
interest on the remaining balance of the liability.
Leases of assets under which all the risks and rewards of ownership are substantially retained by the lessor are classified as operating
leases. Payments made under operating leases are charged to the income statement on a straight-line basis over the term of the lease.
When an operating lease is terminated before the lease period has expired, any payment required to be made to the lessor by way of
penalty is recognized as an expense in the period in which termination takes place.
(L) INVESTMENTS
All investments are accounted for at trade date.
INVESTMENTS IN EQUITY SECURITIES
Investments in equity securities are undertakings in which AB InBev does not have significant influence or control. This is generally
evidenced by ownership of less than 20% of the voting rights. Such investments are designated as available-for-sale financial assets
which are at initial recognition measured at fair value unless the fair value cannot be reliably determined in which case they are
measured at cost. Subsequent changes in fair value, except those related to impairment losses which are recognized in the income
statement, are recognized directly in other comprehensive income.
On disposal of an investment, the cumulative gain or loss previously recognized directly in other comprehensive income is
recognized in profit or loss.
INVESTMENTS IN DEBT SECURITIES
Investments in debt securities classified as trading or as being available-for-sale are carried at fair value, with any resulting gain or
loss respectively recognized in the income statement or directly in other comprehensive income. Fair value of these investments is
determined as the quoted bid price at the balance sheet date. Impairment charges and foreign exchange gains and losses are
recognized in the income statement.
Investments in debt securities classified as held to maturity are measured at amortized cost.
In general, investments in debt securities with maturities of more than three months when acquired and remaining maturities of less
than one year are classified as short-term investments. Investments with maturities beyond one year may be classified as short-term
based on their highly liquid nature and because such marketable securities represent the investment of cash that is available for
current operations.

35
OTHER INVESTMENTS
Other investments held by the company are classified as available-for-sale and are carried at fair value, with any resulting gain or loss
recognized directly in other comprehensive income. Impairment charges are recognized in the income statement.
(M) INVENTORIES
Inventories are valued at the lower of cost and net realizable value. Cost includes expenditure incurred in acquiring the inventories
and bringing them to their existing location and condition. The weighted average method is used in assigning the cost of inventories.
The cost of finished products and work in progress comprises raw materials, other production materials, direct labor, other direct cost
and an allocation of fixed and variable overhead based on normal operating capacity. Net realizable value is the estimated selling
price in the ordinary course of business, less the estimated completion and selling costs.
Inventories are written down on a case-by-case basis if the anticipated net realizable value declines below the carrying amount of the
inventories. The calculation of the net realizable value takes into consideration specific characteristics of each inventory category,
such as expiration date, remaining shelf life, slow-moving indicators, amongst others.
(N) TRADE AND OTHER RECEIVABLES
Trade and other receivables are carried at amortized cost less impairment losses. An estimate of impairment losses for doubtful
receivables is made based on a review of all outstanding amounts at the balance sheet date.
An allowance for impairment of trade and other receivables is established if the collection of a receivable becomes doubtful. Such
receivable becomes doubtful when there is objective evidence that the company will not be able to collect all amounts due according
to the original terms of the receivables. Significant financial difficulties of the debtor, probability that the debtor will enter into
bankruptcy or financial reorganization, and default or delinquency in payments are considered indicators that the receivable is
impaired. The amount of the allowance is the difference between the asset’s carrying amount and the present value of the estimated
future cash flows. An impairment loss is recognized in the income statement, as are subsequent recoveries of previous impairments.
(O) CASH AND CASH EQUIVALENTS
Cash and cash equivalents include all cash balances and short-term highly liquid investments with a maturity of three months or less
from the date of acquisition that are readily convertible into cash. They are stated at face value, which approximates their fair value.
In the cash flow statement, cash and cash equivalents are presented net of bank overdrafts.
(P) IMPAIRMENT
The carrying amounts of financial assets, property, plant and equipment, goodwill and intangible assets are reviewed at each balance
sheet date to determine whether there is any indication of impairment. If any such indication exists, the asset’s recoverable amount is
estimated. In addition, goodwill, intangible assets that are not yet available for use and intangibles with an indefinite useful life are
tested for impairment annually at the business unit level (that is a country or group of countries managed as a group below a
reporting region). An impairment loss is recognized whenever the carrying amount of an asset or the related cash-generating unit
exceeds its recoverable amount. Impairment losses are recognized in the income statement.
CALCULATION OF RECOVERABLE AMOUNT
The recoverable amount of the company’s investments in unquoted debt securities is calculated as the present value of expected
future cash flows, discounted at the debt securities’ original effective interest rate. For equity investments classified as available for
sale and quoted debt securities the recoverable amount is their fair value.
The recoverable amount of other assets is determined as the higher of their fair value less costs to sell and value in use. For an asset
that does not generate largely independent cash inflows, the recoverable amount is determined for the cash-generating unit to which
the asset belongs. The recoverable amount of the cash generating units to which the goodwill and the intangible assets with
indefinite useful life belong is based on discounted future cash flows using a discount rate that reflects current market assessments of
the time value of money and the risks specific to the asset. These calculations are corroborated by valuation multiples, quoted share
prices for publicly traded subsidiaries or other available fair value indicators.
Impairment losses recognized in respect of cash-generating units are allocated first to reduce the carrying amount of any goodwill
allocated to the units and then to reduce the carrying amount of the other assets in the unit on a pro rata basis.
REVERSAL OF IMPAIRMENT LOSSES
Non-financial assets other than goodwill and equity investments classified as available for sale that suffered an impairment are
reviewed for possible reversal of the impairment at each reporting date. An impairment loss is reversed only to the extent that the
asset’s carrying amount does not exceed the carrying amount that would have been determined, net of depreciation or amortization, if
no impairment loss had been recognized.
(Q) SHARE CAPITAL
REPURCHASE OF SHARE CAPITAL
When AB InBev buys back its own shares, the amount of the consideration paid, including directly attributable costs, is recognized
as a deduction from equity under treasury shares.

36
DIVIDENDS
Dividends are recognized in the consolidated financial statements on the date that the dividends are declared unless minimum
statutory dividends are required by local legislation or the bylaws of the company’s subsidiaries. In such instances, statutory
minimum dividends are recognized as a liability.
SHARE ISSUANCE COSTS
Incremental costs directly attributable to the issue of new shares or options are shown in equity as a deduction, net of tax, from the
proceeds.
(R) PROVISIONS
Provisions are recognized when (i) the company has a present legal or constructive obligation as a result of past events, (ii) it is
probable that an outflow of resources embodying economic benefits will be required to settle the obligation, and (iii) a reliable
estimate of the amount of the obligation can be made. Provisions are determined by discounting the expected future cash flows at a
pre-tax rate that reflects current market assessments of the time value of money and, where appropriate, the risks specific to the
liability.
RESTRUCTURING
A provision for restructuring is recognized when the company has approved a detailed and formal restructuring plan, and the
restructuring has either commenced or has been announced publicly. Costs relating to the ongoing activities of the company are not
provided for. The provision includes the benefit commitments in connection with early retirement and redundancy schemes.
ONEROUS CONTRACTS
A provision for onerous contracts is recognized when the expected benefits to be derived by the company from a contract are lower
than the unavoidable cost of meeting its obligations under the contract. Such provision is measured at the present value of the lower
of the expected cost of terminating the contract and the expected net cost of continuing with the contract.
DISPUTES AND LITIGATIONS
A provision for disputes and litigation is recognized when it is more likely than not that the company will be required to make future
payments as a result of past events, such items may include but are not limited to, several claims, suits and actions relating to antitrust
laws, violations of distribution and license agreements, environmental matters, employment related disputes, claims from tax
authorities, and alcohol industry litigation matters.
(S) EMPLOYEE BENEFITS
POST-EMPLOYMENT BENEFITS
Post-employment benefits include pensions, post-employment life insurance and post-employment medical benefits. The company
operates a number of defined benefit and defined contribution plans throughout the world, the assets of which are generally held in
separate trustee-managed funds. The pension plans are generally funded by payments from employees and the company, and, for
defined benefit plans taking account of the recommendations of independent actuaries. AB InBev maintains funded and unfunded
pension plans.
a) Defined contribution plans
Contributions to defined contribution plans are recognized as an expense in the income statement when incurred. A defined
contribution plan is a pension plan under which AB InBev pays fixed contributions into a fund. AB InBev has no legal or
constructive obligations to pay further contributions if the fund does not hold sufficient assets to pay all employees the benefits
relating to employee service in the current and prior periods.
b) Defined benefit plans
A defined benefit plan is a pension plan that is not a defined contribution plan. Typically defined benefit plans define an amount of
pension benefit that an employee will receive on retirement, usually dependent on one or more factors such as age, years of service
and compensation. For defined benefit plans, the pension expenses are assessed separately for each plan using the projected unit
credit method. The projected unit credit method considers each period of service as giving rise to an additional unit of benefit
entitlement. Under this method, the cost of providing pensions is charged to the income statement so as to spread the regular cost
over the service lives of employees in accordance with the advice of qualified actuaries who carry out a full valuation of the plans at
least every three years. The amounts charged to the income statement include current service cost, net interest cost (income), past
service costs and the effect of any curtailments or settlements. Past service costs are recognized at the earlier of when the
amendment / curtailment occurs or when the company recognizes related restructuring or termination costs. The pension obligations
recognized in the balance sheet are measured at the present value of the estimated future cash outflows using interest rates based on
high quality corporate bond yields, which have terms to maturity approximating the terms of the related liability, less the fair value of
any plan assets. Re-measurements, comprising of actuarial gains and losses, the effect of the asset ceiling (excluding net interest)
and the return on plan assets (excluding net interest) are recognized in full in the period in which they occur in the statement of
comprehensive income. Re-measurements are not reclassified to profit or loss in subsequent periods.
Where the calculated amount of a defined benefit liability is negative (an asset), AB InBev recognizes such pension asset to the
extent that economic benefits are available to AB InBev either from refunds or reductions in future contributions.
OTHER POST-EMPLOYMENT OBLIGATIONS
Some AB InBev companies provide post-employment medical benefits to their retirees. The entitlement to these benefits is usually
based on the employee remaining in service up to retirement age. The expected costs of these benefits are accrued over the period of
employment, using an accounting methodology similar to that for defined benefit pension plans.

37
TERMINATION BENEFITS
Termination benefits are recognized as an expense at the earlier when the company is demonstrably committed, without realistic
possibility of withdrawal, to a formal detailed plan to terminate employment before the normal retirement date and when the
company recognizes costs for a restructuring. Termination benefits for voluntary redundancies are recognized if the company has
made an offer encouraging voluntary redundancy, it is probable that the offer will be accepted, and the number of acceptances can be
estimated reliably.
BONUSES
Bonuses received by company employees and management are based on pre-defined company and individual target achievement.
The estimated amount of the bonus is recognized as an expense in the period the bonus is earned. To the extent that bonuses are
settled in shares of the company, they are accounted for as share-based payments.
(T) SHARE-BASED PAYMENTS
Different share and share option programs allow company senior management and members of the board to acquire shares of the
company and some of its affiliates. The fair value of the share options is estimated at grant date, using an option pricing model that is
most appropriate for the respective option. Based on the expected number of options that will vest, the fair value of the options
granted is expensed over the vesting period. When the options are exercised, equity is increased by the amount of the proceeds
received.
Equity-settled share-based payment transactions with parties other than employees are measured at the fair value of the goods or
services received, except where that fair value cannot be estimated reliably, in which case they are measured at the fair value of the
equity instruments granted, measured at the date the company obtains the goods or the counterparty renders the service.
(U) INTEREST-BEARING LOANS AND BORROWINGS
Interest-bearing loans and borrowings are recognized initially at fair value, less attributable transaction costs. Subsequent to initial
recognition, interest-bearing loans and borrowings are stated at amortized cost with any difference between the initial amount and the
maturity amount being recognized in the income statement (in accretion expense) over the expected life of the instrument on an
effective interest rate basis.
(V) TRADE AND OTHER PAYABLES
Trade and other payables are recognized initially at fair value and subsequently measured at amortized cost using the effective
interest method.
(W) INCOME TAX
Income tax on the profit for the year comprises current and deferred tax. Income tax is recognized in the income statement except to
the extent that it relates to items recognized directly in equity, in which case the tax effect is also recognized directly in equity.
Current tax is the expected tax payable on the taxable income for the year, using tax rates enacted, or substantively enacted, at the
balance sheet date, and any adjustment to tax payable in respect of previous years.
In accordance with IAS 12 Income Taxes deferred taxes are provided using the so-called balance sheet liability method. This means
that, for all taxable and deductible differences between the tax bases of assets and liabilities and their carrying amounts in the balance
sheet a deferred tax liability or asset is recognized. Under this method a provision for deferred taxes is also made for differences
between the fair values of assets and liabilities acquired in a business combination and their tax base. IAS 12 prescribes that no
deferred taxes are recognized i) on initial recognition of goodwill, ii) at the initial recognition of assets or liabilities in a transaction
that is not a business combination and affects neither accounting nor taxable profit and iii) on differences relating to investments in
subsidiaries to the extent that they will probably not reverse in the foreseeable future and to the extent that the company is able to
control the timing of the reversal. The amount of deferred tax provided is based on the expected manner of realization or settlement
of the carrying amount of assets and liabilities, using currently or substantively enacted tax rates.
Deferred tax assets and liabilities are offset if there is a legally enforceable right to offset current tax liabilities and assets, and they
relate to income taxes levied by the same tax authority on the same taxable entity, or on different taxable entities which intend either
to settle current tax liabilities and assets on a net basis, or to realize the assets and settle the liabilities simultaneously.
The company recognizes deferred tax assets, including assets arising from losses carried forward, to the extent that future probable
taxable profit will be available against which the deferred tax asset can be utilized. A deferred tax asset is reduced to the extent that
it is no longer probable that the related tax benefit will be realized.
Tax claims are recorded within provisions on the balance sheet (refer to accounting policy R).
(X) INCOME RECOGNITION
Income is recognized when it is probable that the economic benefits associated with the transaction will flow to the company and the
income can be measured reliably.
GOODS SOLD
In relation to the sale of beverages and packaging, revenue is recognized when the significant risks and rewards of ownership have
been transferred to the buyer, and no significant uncertainties remain regarding recovery of the consideration due, associated costs or
the possible return of goods, and there is no continuing management involvement with the goods. Revenue from the sale of goods is
measured at the fair value of the consideration received or receivable, net of returns and allowances, trade discounts, volume rebates,
discounts for cash payments and excise taxes.

38
RENTAL AND ROYALTY INCOME
Rental income is recognized under other operating income on a straight-line basis over the term of the lease. Royalties arising from
the use by others of the company’s resources are recognized in other operating income on an accrual basis in accordance with the
substance of the relevant agreement.
GOVERNMENT GRANTS
A government grant is recognized in the balance sheet initially as deferred income when there is reasonable assurance that it will be
received and that the company will comply with the conditions attached to it. Grants that compensate the company for expenses
incurred are recognized as other operating income on a systematic basis in the same periods in which the expenses are incurred.
Grants that compensate the company for the acquisition of an asset are presented by deducting them from the acquisition cost of the
related asset in accordance with IAS 20 Accounting for Government Grants and Disclosure of Government Assistance.
FINANCE INCOME
Finance income comprises interest received or receivable on funds invested, dividend income, foreign exchange gains, losses on
currency hedging instruments offsetting currency gains, gains on hedging instruments that are not part of a hedge accounting
relationship, gains on financial assets classified as trading as well as any gains from hedge ineffectiveness (refer to accounting policy
Z).
Interest income is recognized as it accrues (taking into account the effective yield on the asset) unless collectability is in doubt.
DIVIDEND INCOME
Dividend income is recognized in the income statement on the date that the dividend is declared.
(Y) EXPENSES
FINANCE COSTS
Finance costs comprise interest payable on borrowings, calculated using the effective interest rate method, foreign exchange losses,
gains on currency hedging instruments offsetting currency losses, results on interest rate hedging instruments, losses on hedging
instruments that are not part of a hedge accounting relationship, losses on financial assets classified as trading, impairment losses on
available-for-sale financial assets as well as any losses from hedge ineffectiveness (refer to accounting policy Z).
All interest costs incurred in connection with borrowings or financial transactions are expensed as incurred as part of finance costs.
Any difference between the initial amount and the maturity amount of interest bearing loans and borrowings, such as transaction
costs and fair value adjustments, are recognized in the income statement (in accretion expense) over the expected life of the
instrument on an effective interest rate basis (refer to accounting policy U). The interest expense component of finance lease
payments is also recognized in the income statement using the effective interest rate method.
RESEARCH AND DEVELOPMENT, ADVERTISING AND PROMOTIONAL COSTS AND SYSTEMS DEVELOPMENT COSTS
Research, advertising and promotional costs are expensed in the year in which these costs are incurred. Development costs and
systems development costs are expensed in the year in which these costs are incurred if they do not meet the criteria for capitalization
(refer to accounting policy G).
PURCHASING, RECEIVING AND WAREHOUSING COSTS
Purchasing and receiving costs are included in the cost of sales, as well as the costs of storing and moving raw materials and
packaging materials. The costs of storing finished products at the brewery as well as costs incurred for subsequent storage in
distribution centers are included within distribution expenses.
(Z) DERIVATIVE FINANCIAL INSTRUMENTS
AB InBev uses derivative financial instruments to mitigate the transactional impact of foreign currencies, interest rates, equity prices
and commodity prices on the company’s performance. AB InBev’s financial risk management policy prohibits the use of derivative
financial instruments for trading purposes and the company does therefore not hold or issue any such instruments for such purposes.
Derivative financial instruments that are economic hedges but that do not meet the strict IAS 39 Financial Instruments: Recognition
and Measurement hedge accounting rules, however, are accounted for as financial assets or liabilities at fair value through profit or
loss.
Derivative financial instruments are recognized initially at fair value. Fair value is the price that would be received to sell an asset or
paid to transfer a liability in an orderly transaction between market participants at the measurement date. The fair value of derivative
financial instruments is either the quoted market price or is calculated using pricing models taking into account current market rates.
These pricing models also take into account the current creditworthiness of the counterparties.
Subsequent to initial recognition, derivative financial instruments are re-measured to their fair value at balance sheet date. Depending
on whether cash flow or net investment hedge accounting is applied or not, any gain or loss is either recognized directly in other
comprehensive income or in the income statement.
Cash flow, fair value or net investment hedge accounting is applied to all hedges that qualify for hedge accounting when the required
hedge documentation is in place and when the hedge relation is determined to be effective.
CASH FLOW HEDGE ACCOUNTING
When a derivative financial instrument hedges the variability in cash flows of a recognized asset or liability, the foreign currency risk
of a firm commitment or a highly probable forecasted transaction, the effective part of any resulting gain or loss on the derivative
financial instrument is recognized directly in other comprehensive income (hedging reserves). When the firm commitment in foreign
currency or the forecasted transaction results in the recognition of a non-financial asset or a non-financial liability, the cumulative
gain or loss is removed from other comprehensive income and included in the initial measurement of the asset or liability. When the

39
hedge relates to financial assets or liabilities, the cumulative gain or loss on the hedging instrument is reclassified from other
comprehensive income into the income statement in the same period during which the hedged risk affects the income statement (e.g.
when the variable interest expense is recognized). The ineffective part of any gain or loss is recognized immediately in the income
statement.
When a hedging instrument or hedge relationship is terminated but the hedged transaction is still expected to occur, the cumulative
gain or loss (at that point) remains in equity and is reclassified in accordance with the above policy when the hedged transaction
occurs. If the hedged transaction is no longer probable, the cumulative gain or loss recognized in other comprehensive income is
reclassified into the income statement immediately.
FAIR VALUE HEDGE ACCOUNTING
When a derivative financial instrument hedges the variability in fair value of a recognized asset or liability, any resulting gain or loss
on the hedging instrument is recognized in the income statement. The hedged item is also stated at fair value in respect of the risk
being hedged, with any gain or loss being recognized in the income statement.
NET INVESTMENT HEDGE ACCOUNTING
When a foreign currency liability hedges a net investment in a foreign operation, exchange differences arising on the translation of
the liability to the functional currency are recognized directly in other comprehensive income (translation reserves).
When a derivative financial instrument hedges a net investment in a foreign operation, the portion of the gain or the loss on the
hedging instrument that is determined to be an effective hedge is recognized directly in other comprehensive income (translation
reserves), while the ineffective portion is reported in the income statement.
Investments in equity instruments or derivatives linked to and to be settled by delivery of an equity instrument are stated at cost when
such equity instrument does not have a quoted market price in an active market and for which other methods of reasonably estimating
fair value are clearly inappropriate or unworkable.
OFFSETTING DERIVATIVE ASSETS WITH DERIVATIVE LIABILITIES
A derivative asset and a derivative liability shall be offset and the net amount presented in the statement of financial position when,
and only when, the company has a currently legally enforceable right to set off the recognized amounts; and intends either to settle on
a net basis, or to realize the asset and settle the liability simultaneously.
(AA) SEGMENT REPORTING
Operating segments are components of the company’s business activities about which separate financial information is available that
is evaluated regularly by senior management.
AB InBev’s operating segment reporting format is geographical because the company’s risks and rates of return are affected
predominantly by the fact that AB InBev operates in different geographical areas. The company’s management structure and internal
reporting system to the Board of Directors is set up accordingly. The company has nine operating segments.
Given the transformational nature of the combination with SABMiller, the company has updated its segment reporting in order to add
the former SABMiller geographies into the previous AB InBev geographies. Colombia, Peru, Ecuador, Honduras and El Salvador
will be reported together with Mexico as Latin America West, Panama will be reported within Latin America North, Africa will be
reported together with Europe as EMEA, and Australia, India and Vietnam will be reported within APAC.
The company’s six geographic regions: North America, Latin America West, Latin America North, Latin America South, EMEA and
Asia Pacific, plus its Global Export and Holding Companies comprise the company’s seven reportable segments for financial
reporting purposes.
The aggregation criteria applied are based on similarities in the economic indicators (e.g. margins) that have been assessed in
determining that the aggregated operating segments share similar economic characteristics, as prescribed in IFRS 8. Furthermore
management assessed additional factors such as management’s views on the optimal number of reporting segments, the continuation
of the previous AB InBev geographies, peer comparison (e.g. APAC and EMEA being a commonly reported regions amongst the
company’s peers), as well management’s view on the optimal balance between practical and more granular information.
The results of Global Export and Holding Companies, which includes the company’s global headquarters, the export businesses in
countries in which AB InBev has no operations, and the interim supply agreement with Constellation Brands, Inc., are reported
separately. The company six geographic regions plus the Global Export and Holding Companies will comprise the company’s seven
reportable segments for all financial reporting purposes.
Segment capital expenditure is the total cost incurred during the period to acquire property, plant and equipment, and intangible
assets other than goodwill.
(BB) NON-RECURRING ITEMS
Non-recurring items are those that in management’s judgment need to be disclosed by virtue of their size or incidence. Such items
are disclosed on the face of the consolidated income statement or separately disclosed in the notes to the financial statements.
Transactions which may give rise to non-recurring items are principally restructuring activities, impairments, gains or losses on
disposal of investments and the effect of the accelerated repayment of certain debt facilities.
(CC) DISCONTINUED OPERATIONS AND NON-CURRENT ASSETS HELD FOR SALE
A discontinued operation is a component of the company that either has been disposed of or is classified as held for sale and
represents a separate major line of business or geographical area of operations and is part of a single coordinated plan to dispose of or
is a subsidiary acquired exclusively with a view to resale.

40
AB InBev classifies a non-current asset (or disposal group) as held for sale if its carrying amount will be recovered principally
through a sale transaction rather than through continuing use if all of the conditions of IFRS 5 are met. A disposal group is defined as
a group of assets to be disposed of, by sale or otherwise, together as a group in a single transaction, and liabilities directly associated
with those assets that will be transferred. Immediately before classification as held for sale, the company measures the carrying
amount of the asset (or all the assets and liabilities in the disposal group) in accordance with applicable IFRS. Then, on initial
classification as held for sale, non-current assets and disposal groups are recognized at the lower of carrying amount and fair value
less costs to sell. Impairment losses on initial classification as held for sale are included in profit or loss. The same applies to gains
and losses on subsequent re-measurement. Non-current assets classified as held for sale are no longer depreciated or amortized.
(DD) RECENTLY ISSUED IFRS
To the extent that new IFRS requirements are expected to be applicable in the future, they have been listed hereafter. For the year
ended 31 December 2016 they have not been applied in preparing these consolidated financial statements.
The following standards, amendments and interpretations have been issued recently, but are not yet effective:
IFRS 9 Financial Instruments (effective from annual periods beginning on or after 1 January 2018) is the standard issued as part of
a wider project to replace IAS 39. IFRS 9 introduces a logical approach for the classification of financial assets, which is driven by
cash flow characteristics and the business model in which an asset is held; defines a new expected-loss impairment model that will
require more timely recognition of expected credit losses; and introduces a substantially-reformed model for hedge accounting, with
enhanced disclosures about risk management activity. The new hedge accounting model represents a significant overhaul of hedge
accounting that aligns the accounting treatment with risk management activities. IFRS 9 also removes the volatility in profit or loss
that was caused by changes in the credit risk of liabilities elected to be measured at fair value.
IFRS 15 Revenue from Contracts with Customers (effective from annual periods beginning on or after 1 January 2018). The core
principle of the new standard is for companies to recognize revenue to depict the transfer of goods or services to customers in
amounts that reflect the consideration (that is, payment) to which the company expects to be entitled in exchange for those goods or
services. The new standard will also result in enhanced disclosures about revenue, provide guidance for transactions that were not
previously addressed comprehensively (for example, service revenue and contract modifications) and improve guidance for multiple-
element arrangements.
IFRS 16 Leases (effective from annual periods beginning on or after 1 January 2019, not yet endorsed by the European Union)
replaces the existing lease accounting requirements and represents a significant change in the accounting and reporting of leases that
were previously classified as operating leases, with more assets and liabilities to be reported on the balance sheet and a different
recognition of lease costs.
The company is in process of assessing the full impact of the above standards and, apart from changes in the presentation of
operating leases in the balance sheet, does not expect material impacts in the consolidated income statement.
Other Standards, Interpretations and Amendments to Standards
A number of other amendments to standards are effective for annual periods beginning after 1 January 2016, and have not been listed
above because of either their non-applicability to or their immateriality to AB InBev’s consolidated financial statements.
4. USE OF ESTIMATES AND JUDGMENTS
The preparation of financial statements in conformity with IFRS requires management to make judgments, estimates and
assumptions that affect the application of policies and reported amounts of assets and liabilities, income and expenses. The estimates
and associated assumptions are based on historical experience and various other factors that are believed to be reasonable under the
circumstances, the results of which form the basis of making the judgments about carrying values of assets and liabilities that are not
readily apparent from other sources. Actual results may differ from these estimates.
The estimates and underlying assumptions are reviewed on an ongoing basis. Revisions to accounting estimates are recognized in the
period in which the estimate is revised if the revision affects only that period or in the period of the revision and future periods if the
revision affects both current and future periods.
Although each of its significant accounting policies reflects judgments, assessments or estimates, AB InBev believes that the
following accounting policies reflect the most critical judgments, estimates and assumptions that are important to its business
operations and the understanding of its results: business combinations, intangible assets, goodwill, impairment, provisions, share-
based payments, employee benefits and accounting for current and deferred tax.
The fair values of acquired identifiable intangibles are based on an assessment of future cash flows. Impairment analyses of goodwill
and indefinite-lived intangible assets are performed annually and whenever a triggering event has occurred, in order to determine
whether the carrying value exceeds the recoverable amount. These calculations are based on estimates of future cash flows.
The company uses its judgment to select a variety of methods including the discounted cash flow method and option valuation
models and makes assumptions about the fair value of financial instruments that are mainly based on market conditions existing at
each balance sheet date.
Actuarial assumptions are established to anticipate future events and are used in calculating pension and other long-term employee
benefit expense and liability. These factors include assumptions with respect to interest rates, rates of increase in health care costs,
rates of future compensation increases, turnover rates, and life expectancy.
The company is subject to income tax in numerous jurisdictions. Significant judgment is required in determining the worldwide
provision for income tax. There are some transactions and calculations for which the ultimate tax determination is uncertain. Some
subsidiaries within the group are involved in tax audits and local enquiries usually in relation to prior years. Investigations and
negotiations with local tax authorities are ongoing in various jurisdictions at the balance sheet date and, by their nature, these can

41
take considerable time to conclude. In assessing the amount of any income tax provisions to be recognized in the financial
statements, estimation is made of the expected successful settlement of these matters. Estimates of interest and penalties on tax
liabilities are also recorded. Where the final outcome of these matters is different from the amounts that were initially recorded, such
differences will impact the current and deferred income tax assets and liabilities in the period such determination is made.
Judgments made by management in the application of IFRS that have a significant effect on the financial statements and estimates
with a significant risk of material adjustment in the next year are further discussed in the relevant notes hereafter.
In preparing these consolidated financial statements, the significant judgments made by management in applying the company’s
accounting policies and the key sources of estimating uncertainty mainly related to the valuation of the individual assets acquired and
liabilities assumed as part of the allocation of the SABMiller purchase price. The company is in the process of finalizing the
allocation of the purchase price to the individual assets acquired and liabilities assumed in compliance with IFRS 3. Following the
AB InBev and SABMiller combination, AB InBev is fully consolidating SABMiller in the AB InBev consolidated financial
statements as of the fourth quarter 2016. Detail is provided in Note 6 Acquisitions and disposals of Subsidiaries of these consolidated
financial statements.

5. SEGMENT REPORTING
Segment information is presented by geographical segments, consistent with the information that is available and evaluated regularly by the chief operating decision maker. AB InBev operates its business through
seven business segments. Regional and operating company management is responsible for managing performance, underlying risks, and effectiveness of operations. Internally, AB InBev’s management uses
performance indicators such as normalized profit from operations (normalized EBIT) and normalized EBITDA as measures of segment performance and to make decisions regarding allocation of resources. These
measures are reconciled to segment profit in the tables presented (figures may not add up due to rounding).
The company’s six geographic regions: North America, Latin America West, Latin America North, Latin America South, EMEA and Asia Pacific, plus its Global Export and Holding Companies comprise the
company’s seven reportable segments for financial reporting purposes.
Given the transformational nature of the transaction with SABMiller, that closed on 10 October 2016, and to facilitate the understanding of AB InBev’s underlying performance, AB InBev has updated its 2015
segment reporting for purposes of result announcement and internal review by management. This presentation (further referred to as the “2015 Reference base”) includes, for comparative purposes, the SABMiller
results as from the fourth quarter 2015. The tables below provide the segment information per segment for the twelve-month period ended 31 December 2015 and 2016 in the format that is used by management to
monitor performance. The former SABMiller geographies: Colombia, Peru, Ecuador, Honduras and El Salvador are reported together with Mexico as Latin America West, Panama is reported within Latin America
North, Africa is reported together with Europe as EMEA, and Australia, India and Vietnam are reported within Asia Pacific. Exports to countries in which AB InBev has operations following the combination, were
allocated to the respective regions in the 2015 Reference Base.
The 2015 Reference Base and 2016 segment reporting exclude the results of the SABMiller businesses sold since the combination was completed, including the joint venture stakes in MillerCoors and CR Snow, and
the sale of the Peroni, Grolsch and Meantime brands and associated businesses in Italy, the Netherlands, the UK and internationally. The 2015 Reference Base and 2016 segment reporting also exclude the results of
the Central and Eastern Europe business and the stake in Distell. The results of the Central and Eastern Europe business will be reported as “Results from discontinued operations” until the sale is completed. The
results of Distell will be reported as share of results of associates, and accordingly, are excluded from normalized EBIT and EBITDA.
The differences between the 2015 Reference base and the 2015 audited income statement as Reported represent the effect of the combination with SABMiller.
All figures in the tables below are stated in million US dollar, except volume (million hls) and Normalized EBITDA margin (in %).
SEGMENT REPORTING (REFERENCE BASE)
North America
Latin America
West
Latin America
North
Latin America
South EMEA Asia Pacific
Global Export and
holding companies Effect of acquisition Consolidated
2016
2015
Reference
base 2016
2015
Reference
base 2016
2015
Reference
base 2016
2015
Reference
base 2016
2015
Reference
base 2016
2015
Reference
base 2016
2015
Reference
base 2016
2015
Bridge to
Reported 2016
2015
Reported
Volumes ............................... 117 118 64 61 118 124 32 34 75 69 92 93 2 3 - (45) 500 457
Revenue .............................. 15 698 15 603 5 188 5 396 8 461 9 156 2 850 3 331 6 010 5 638 6 074 6 220 1 237 1 582 - (3 322) 45 517 43 604
Normalized EBITDA ............. 6 250 6 172 2 376 2 680 3 751 4 727 1 431 1 592 1 774 1 723 1 645 1 625 (474) (373) - (1 307) 16 753 16 839 Normalized EBITDA margin % 39.8% 39.6% 45.8% 49.7% 44.3% 51.6% 50.2% 47.8% 29.5% 30.6% 27.1% 26.1% 36.8% 38.6%
Depreciation, amortization and
impairment ........................... (809) (754) (388) (423) (750) (695) (191) (181) (473) (419) (658) (631) (210) (159) - 191 (3 477) (3 071)
Normalized profit from
operations (EBIT) ................ 5 441 5 418 1 988 2 256 3 001 4 032 1 240 1 411 1 302 1 305 987 994 (683) (534) - (1 115) 13 276 13 768

43
SEGMENT REPORTING (2015 REPORTED)
North America Latin America
West Latin America
North Latin America
South EMEA Asia Pacific Global Export and holding companies Consolidated
2016 20151 2016 20151 2016 20151 2016 20151 2016 20151 2016 20151 2016 20151 2016 20151
Volume .............................. 117 118 64 44 118 123 32 34 75 46 92 90 2 3 500 457
Revenue ............................ 15 698 15 603 5 188 4 079 8 461 9 096 2 850 3 331 6 010 4 128 6 074 5 784 1 237 1 582 45 517 43 604
Normalized EBITDA ........... 6 250 6 172 2 376 2 002 3 751 4 709 1 431 1 593 1 774 1 142 1 639 1 444 (474) (225) 16 753 16 839
Normalized EBITDA margin % 39.8% 39.6% 45.8% 49.1% 44.3% 51.8% 50.2% 47.8% 29.6% 27.7% 27.1% 25.0% - 36.8% 38.6%
Depreciation, amortization and impairment ................... (809) (754) (388) (350) (750) (689) (191) (182) (473) (342) (658) (606) (210) (148) (3 477) (3 071)
Normalized profit from
operations (EBIT) .............. 5 441 5 418 1 988 1 652 3 001 4 020 1 240 1 411 1 302 800 987 838 (683) (373) 13 276 13 768
Non-recurring items (refer
Note 8) ............................... (29) 102 252 29 (20) (84) (12) (11) (118) 70 (84) 90 (383) (61) (394) 136
Profit from operations (EBIT) ............................... 5 412 5 520 2 240 1 681 2 981 3 937 1 228 1 400 1 184 870 903 928 (1 066) (434) 12 882 13 904
Net finance income/(cost) ...... (8 564) (1 453)
Share of results of associates . 16 10
Income tax expense ............. (1 613) (2 594)
Profit from continuing
operations ......................... 2 721 9 867 Discontinued operations ........ 48 -
Profit/(loss) ...................... 2 769 9 867
Segment assets (non-
current)2 ............................. 62 467 61 870 71 041 21 749 13 614 11 357 2 357 2 301 41 975 4 316 21 436 12 761 2 430 1 987 215 320 116 341
Gross capex ........................ 895 1 112 710 515 709 1 056 389 488 1 001 466 837 1 166 379 225 4 919 5 028
FTE3 ................................... 19 314 16 844 51 418 32 201 40 416 39 359 9 571 9 615 43 456 11 749 39 213 40 101 3 245 2 454 206 633 152 321
For the period ended 31 December 2016, net revenue from the beer business amounted to 41 421m US dollar (2015: 40 595m US dollar) while the net revenue from the non-beer business (soft drinks and other
business) accounted for 4 096m US dollar (2015: 3 009m US dollar). On the same basis, net revenue from external customers attributable to AB InBev’s country of domicile (Belgium) represented 687m US dollar
(2015: 690m US dollar) and non-current assets located in the country of domicile represented 1 440m US dollar (2015: 1 169m US dollar).
1 2015 as Reported, adjusted to reflect the effects of SABMiller Combination on the AB InBev’s historical segmental information. 2 The increase in the non-current segment assets is mainly related to the intangible assets and goodwill recognized following the combination with SABMiller. See also Note 6 – Acquisition and disposal of subsidiaries. 3 Includes FTE from SABMiller retained operations at year end 2016 per AB InBev’s definition in the glossary. This definition is different than the one formerly applied by SABMiller.

44
6. ACQUISITIONS AND DISPOSALS OF SUBSIDIARIES
The table below summarizes the impact of acquisitions and disposals on the Statement of financial position and cash flows of
AB InBev for 31 December 2016 and 2015:
Million US dollar
2016
Acquisitions
2015
Acquisitions
2016
Disposal
2015
Disposal
Non-current assets Property, plant and equipment ..................................................................... 9 346 121 (115) (51)
Intangible assets ........................................................................................ 20 719 270 - (19)
Investments in associates ............................................................................ 4 448 - - -
Investment securities .................................................................................. 21
Deferred tax assets..................................................................................... 183 - - -
Employee benefits ...................................................................................... 3 - - -
Derivatives ................................................................................................ 579 - - -
Trade and other receivables ......................................................................... 59 - - -
Current assets Inventories ................................................................................................ 1 018 20 (17) (1)
Income tax receivable ................................................................................. 189 - - -
Derivatives ................................................................................................ 60 - - -
Trade and other receivables ......................................................................... 1 285 40 (4) -
Cash and cash equivalents ........................................................................... 1 455 14 (75) -
Assets held for sale ..................................................................................... 24 805 - - 1
Non-current liabilities
Interest-bearing loans and borrowings .......................................................... (9 130) (7) - - Employee benefits ...................................................................................... (196) - - 1
Deferred tax liabilities ................................................................................. (5 812) (7) 6 -
Derivatives ................................................................................................ (24) - - -
Trade and other payables ............................................................................ (140) (45) 10 -
Provisions .................................................................................................. (688) - - (3)
Current liabilities
Bank overdraft ........................................................................................... (212) - - -
Interest-bearing loans and borrowings .......................................................... (2 852) (3) - -
Income tax payable .................................................................................... (4 310) - - - Derivatives ................................................................................................ (156) - - -
Trade and other payables ............................................................................ (3 598) (12) 41 -
Provisions .................................................................................................. (847) - - -
Net identifiable assets and liabilities ....................................................... 36 205 391 (156) (72)
Non-controlling interest .......................................................................... (6 214) - - -
Goodwill on acquisitions and goodwill disposed of ........................................... 74 886 288 (187) -
Loss/(gain) on disposal ............................................................................... - - (406) (21)
Prior year payments.................................................................................... (143) - - -
Consideration to be paid .............................................................................. (365) (25) - -
Net cash paid on prior years acquisitions ....................................................... 34 485 (5) -
Consideration paid/(received) ................................................................ 104 403 1 139 (754) (93)
Cash (acquired)/ disposed of ....................................................................... (1 243) (14) 75 -
Converted to restricted shares .................................................................... (36 772) - - -
Net cash outflow / (inflow) ..................................................................... 66 388 1 125 (679) (93)
2016 ACQUISITIONS
The following transactions took place in 2016:
COMBINATION WITH SABMILLER
On 11 November 2015, the boards of AB InBev and SABMiller plc (“SABMiller”) announced that they had reached an agreement
on the terms of the proposed business combination between SABMiller and AB InBev (the “Combination”).
The Combination was implemented through a series of steps and completed on the 10th of October. During the final step of the
proposed structure, Anheuser Busch InBev SA/NV, the holding of the AB InBev group, merged into Newbelco SA/NV (Newbelco),
which was formed for the purpose of effecting the Combination, so that following completion of the Combination, Newbelco
became the new holding company for the combined AB InBev and SABMiller group. Newbelco has been renamed Anheuser-Busch
InBev SA/NV.
Under the terms of the Combination, each SABMiller shareholder was entitled to elect to receive 45.00 pounds sterling in cash in
respect of each SABMiller share (subject to the terms and conditions of the Combination). The Combination also included a partial
share alternative (the “Partial Share Alternative”), under which SABMiller shareholders could elect to receive 4.6588 pounds
sterling in cash and 0.483969 restricted shares in respect of each SABMiller share in lieu of the full cash consideration to which they
would otherwise be entitled under the Combination (subject to scaling back in accordance with the terms of the Partial Share
Alternative and the other terms and conditions of the Combination).

45
The Partial Share Alternative was limited to a maximum of 326,000,000 restricted shares and 3.1 billion pounds sterling in cash,
Altria Inc. and Bevco Ltd. which held in aggregate approximately 40% of the ordinary share capital of SABMiller, had given
irrevocable undertakings to AB InBev to elect for the Partial Share Alternative in respect of their entire beneficial holdings in
SABMiller.
On 6 October 2016, Newbelco issued 163 276 737 100 ordinary shares (“Initial Newbelco Shares”) to SABMiller shareholders
through a capital increase of 85 531m euro equivalent to 75.4 billion pound sterling, as consideration for 1 632 767 371 ordinary
shares of SABMiller pursuant to a UK law court-sanctioned scheme of arrangement (the “UK Scheme”). Following completion of
the tender offer, AB InBev acquired 102 890 758 014 Initial Newbelco Shares tendered into the Belgian offer. Based on the terms of
the UK Scheme, all Initial Newbelco Shares not tendered to AB InBev in the context of the Belgian offer (i.e. 60 385 979 086 Initial
Newbelco Shares) were reclassified into 325 999 817 restricted shares, in accordance with the mechanism by which any Initial
Newbelco Shares that were retained after closing of the Belgian offer were automatically reclassified and consolidated.
The restricted shares are unlisted, not admitted to trading on any stock exchange, and are subject to, among other things, restrictions
on transfer until converted into new ordinary shares. Subject to limited exceptions, the restricted shares will only be convertible at
the election of the holder into new ordinary shares on a one-for-one basis with effect from the fifth anniversary of completion of the
Combination. From completion of the Combination, such restricted shares rank equally with the new ordinary shares with respect to
dividends and voting rights. Following completion of the combination, AB InBev acquired 105 246 SABMiller shares from option
holders that had not exercised their option rights prior to the completion of the combination for a total consideration of 5m euro.
Following this transaction AB InBev owns 100 % of the SABMiller shares.
The SABMiller purchase consideration is calculated as follows:
(i) The restricted share valuation is based on the valuation of the Newbelco shares that were not tendered into the Belgian offer and
has regard to the AB InBev share price of the day of the closing of the SABMiller transaction, adjusted for the specificities of
the restricted shares in line with fair value measurement rules under IFRS.
(ii) During 2015 and 2016, AB InBev entered into derivative foreign exchange forward contracts, as well as other non-derivative
items also documented in a hedge accounting relationship, in order to economically hedge against exposure to changes in the US
dollar exchange rate for the cash component of the purchase consideration in pound sterling and South African rand. Although
these derivatives and non-derivative items were considered to be economic hedges, only a portion of such derivatives could
qualify for hedge accounting under IFRS rules. Since inception of the derivative contracts in 2015 and upon the completion of
the combination with SABMiller, 12.3 billion US dollar negative mark-to-market adjustment related to such hedging were
recognized cumulatively over 2015 and 2016, of which 7.4 billion US dollar qualified for hedge accounting and was,
accordingly, allocated as part of the consideration paid. The settlement of the portion of the derivatives that did not qualify as
hedge accounting was classified as cash flow from financing activities in the consolidated cash flow statement.
On 10 October 2016, AB InBev announced completion of the Belgian merger and the successful completion of the business
combination with SABMiller.
As a result of the Belgian merger, the former Anheuser-Busch InBev SA/NV (the “former AB InBev”) has merged into Newbelco
SA/NV (“Newbelco”), and Newbelco has become the holding company for the combined former AB InBev and SABMiller groups.
All assets and liabilities of the former AB InBev have been transferred to Newbelco, and Newbelco has automatically been
substituted for the former AB InBev in all its rights and obligations by operation of Belgian law. Newbelco has been renamed
Anheuser-Busch InBev SA/NV, and the former AB InBev has been dissolved by operation of Belgian law.
The shares in the former AB InBev were delisted from Euronext Brussels, the Bolsa Mexicana de Valores and the Johannesburg
Stock Exchange. The new ordinary shares were admitted to listing and trading on Euronext Brussels, the Johannesburg Stock
Exchange and the Bolsa Mexicana de Valores at the opening of business in each market on 11 October 2016. In addition, ADSs
trading on the New York Stock Exchange, each of which used to represent one ordinary share of the former AB InBev, now each
represent one new ordinary share, effective as of the opening of business in New York on 11 October 2016.
The share capital of AB InBev now amounts to 1 238 608 344 euro. It is represented by 2 019 241 973 shares without nominal
value, of which 85 540 392 are held in treasury by AB InBev and its subsidiaries. All shares are new ordinary shares, except for
325 999 817 restricted shares.
Newbelco number
of shares
Newbelco
valuation in
million pound
sterling
Newbelco
valuation in
million euro
Tender offer (cash consideration) ................................................................. 102 890 758 014 46 301 52 522
Converted to restricted shares ..................................................................... 60 385 979 086 29 099 33 009 (i)
163 276 737 100 75 400 85 531
Total equity value at offer in million euro .............................................................................................. 85 531
Purchase from option holders .............................................................................................................. 5
Total equity value in million euro ................................................................................................... 85 536
Total equity value in million US dollar ............................................................................................ 95 288
Foreign exchange hedges and other .................................................................................................... 7 848 (ii)
Purchase consideration .................................................................................................................. 103 136
Add: fair market value of total debt assumed ........................................................................................ 11 870
Less: total cash acquired .................................................................................................................... (1 198)
Gross purchase consideration ......................................................................................................... 113 808

46
AB InBev financed the cash consideration of the transaction with 18.0 billion US dollar drawn down under the 75.0 billion US
dollar Committed Senior Acquisition Facilities agreement dated 28 October 2015, together with excess liquidity resulting from the
issuance of bonds in 2016. See Note 24 Interest bearing loans and borrowings.
The transaction costs incurred in connection with the transaction, which include transaction taxes, advisory, legal, audit, valuation
and other fees and costs, amounted to approximately USD 1.0 billion. In addition AB InBev incurred approximately USD 0.7 billion
of costs in connection with the transaction-related financing arrangements.
In accordance with IFRS, the merger between the former AB InBev into Newbelco is considered for accounting purposes as a
reverse acquisition, operation by which Newbelco legally absorbed assets and liabilities of former AB InBev. As a consequence, the
legal acquirer (Newbelco) is considered as the accounting acquiree and the legal acquiree (former AB InBev) is considered the
accounting acquirer. Therefore, the consolidated financial statements represent the continuation of the financial statements of former
AB InBev. The assets and liabilities of former AB InBev remained recognized at their pre-combination carrying amounts. The
identified assets, liabilities and non-controlling interests of SABMiller are recognized in accordance with IFRS 3 Business
Combinations and have only been provisionally determined at the end of the reporting period.
The provisional allocation of the purchase price included in the balance sheet and detailed in the table below is based on the current
best estimates of AB InBev’s management with input from independent third parties. The completion of the purchase price
allocation may result in further adjustment to the carrying value of SABMiller’s recorded assets, liabilities and non-controlling
interests and the determination of any residual amount that will be allocated to goodwill.
The following table presents the provisional allocation of purchase price to the SABMiller business:
Million US dollar
Provisional fair
values
Non-current assets
Property, plant and equipment .................................................... 9 060
Intangible assets ....................................................................... 20 040
Investment in associates ............................................................ 4 386
Investment securities ................................................................. 21
Deferred tax assets.................................................................... 179 Derivatives ............................................................................... 579
Trade and other receivables ........................................................ 59
Current assets
Inventories ............................................................................... 977
Income tax receivable ................................................................ 189
Derivatives ............................................................................... 60
Trade and other receivables ........................................................ 1 257
Cash and cash equivalents .......................................................... 1 410
Assets held for sale .................................................................... 24 805
Non-current liabilities
Interest-bearing loans and borrowings ......................................... (9 021)
Employee benefits ..................................................................... (195)
Deferred tax liabilities ................................................................ (5 801)
Derivatives ............................................................................... (24)
Trade and other payables ........................................................... (146)
Provisions ................................................................................. (688)
Current liabilities
Bank overdraft .......................................................................... (212)
Interest-bearing loans and borrowings ......................................... (2 849)
Income tax payable ................................................................... (4 310)
Derivatives ............................................................................... (156)
Trade and other payables ........................................................... (3 520)
Provisions ................................................................................. (847)
Net identified assets and liabilities ......................................... 35 253
Non-controlling interests ........................................................ (6 200)
Goodwill on acquisition .......................................................... 74 083
Purchase consideration .......................................................... 103 136
The transaction resulted in 74.1 billion US dollar of goodwill provisionally allocated primarily to the businesses in Colombia,
Ecuador, Peru, Australia, South Africa and other African, Asia Pacific and Latin American countries. The factors that contributed to
the recognition of goodwill include the acquisition of an assembled workforce and the premiums paid for cost synergies expected to
be achieved in SABMiller. Management's assessment of the future economic benefits supporting recognition of this goodwill is in
part based on expected savings through the implementation of AB InBev best practices such as, among others, a zero based
budgeting program and initiatives that are expected to bring greater efficiency and standardization, generate cost savings and
maximize purchasing power. Goodwill also arises due to the recognition of deferred tax liabilities in relation to the preliminary fair
value adjustments on acquired intangible assets for which the amortization does not qualify as a tax deductible expense. None of the
goodwill recognized is deductible for tax purposes.

47
The valuation of the property, plant and equipment, intangible assets, investment in associates, interest bearing loans and
borrowings, employee benefits, other assets and liabilities and non-controlling interests are based on the current best estimates of
AB InBev’s management, with input from independent third parties.
The majority of the intangible asset valuation relates to brands with indefinite life, valued for a total amount of 19.9 billion US
dollar. The valuation of the brands with indefinite life is based on a series of factors, including the brand history, the operating plan
and the countries in which the brands are sold. The fair value of brands was estimated by applying a combination of known
valuation methodologies, such as the royalty relief and excess earnings valuation approaches.
The intangibles with an indefinite life mainly include the Castle and Carling brand families in Africa, the Aguila and Poker brand
families in Colombia, the Cristal and Pilsner brand families in Ecuador, and the Carlton brand family in Australia.
A deferred tax liability has been accrued on the fair value adjustments considering tax rates expected to apply to the period when the
assets are realized or liabilities are settled, based on enacted tax rates in the relevant tax jurisdictions.
Assets held for sale were recognized in relation to the divestiture of SABMiller’s interests in the MillerCoors LLC joint venture and
certain of SABMiller's portfolio of Miller brands outside of the U.S. to Molson Coors Brewing company; the divestiture of
SABMiller’s European premium brands to Asahi Group Holdings, Ltd and the divestiture of SABMiller’s interest in China
Resources Snow Breweries Ltd. to China Resources Beer (Holdings) Co. Ltd. These divestments were completed on 11 October
2016.
Assets held for sale were also recognized in relation to the agreement to sell SABMiller’s assets in Central and Eastern Europe
(Hungary, Romania, the Czech Republic, Slovakia and Poland) to Asahi and the agreement to divest SABMiller’s interests in Distell
Group Limited in South Africa to the Public Investment Corporation (SOC) Limited. By 31 December 2016, these disposals had not
closed. In addition, the company has announced its agreement to transfer SABMiller’s Panamanian business to its Brazilian-listed
subsidiary Ambev S.A. (“Ambev”) in exchange for Ambev’s businesses in Colombia, Peru and Ecuador, to allow Ambev to initiate
operations in Panama through the established SABMiller business and further expand its businesses in Central America; however,
no effect has been given to such asset exchange within the provisional allocation of the purchase price as all businesses will remain
within the Combined Group.
Non-controlling interests recognized at acquisition date were measured by the reference to their fair values and amounted to
6.2 billion US dollar. The fair value of non-controlling interests were estimated by applying primarily a market-based multiple
valuation and assumed adjustments because of lack of control or lack of marketability that market participants would consider when
estimating the fair value of non-controlling interests in SABMiller’s owned businesses. The Market Approach analyzes market
conditions and transactions comparable to the subject asset being valued, and estimates the fair value where reliable and available
data on guideline transactions can be found.
Following the completion date of the transaction, SABMiller contributed 3.8 billion US dollar to the revenue and
0.7 billion US dollar to the profit of AB InBev. If the acquisition date had been 1 January 2016 it is estimated that AB InBev’s
combined revenue and profit from operations would have been higher by 8.4 billion US dollar, and 2.2 billion US dollar
respectively. The combined data includes certain purchase accounting adjustments such as the estimated changes in depreciations
and amortization expenses on acquired tangible and intangible assets. However, the combined results do not include any anticipated
cost savings or other effects of the planned integration of SABMiller. Accordingly, such amounts are not necessarily indicative of
the results if the combination had occurred on 1 January 2016 or that may result in the future.
OTHER ACQUISITIONS AND DISPOSALS
2016 ACQUISITIONS
During 2016, AB InBev completed the acquisition of the Canadian rights to a range of primarily spirit-based beers and ciders from
Mark Anthony Group. In a separate transaction, Mark Anthony Group agreed to sell certain non-U.S. and non-Canadian trademark
rights and other intellectual property to one of the company’s subsidiaries. The aggregate purchase price of such acquisitions was
approximately 413m US dollar. Mark Anthony Group retains full ownership of its U.S. business, as well as the Canadian wine,
spirits and beer import and distribution business.
2015 ACQUISITIONS
During 2015, AB InBev performed a mandatory tender offer and purchased all outstanding Grupo Modelo’s shares held by third
parties for a total consideration of 483m US dollar. Following the tender offer, Modelo became a wholly owned subsidiary of AB
InBev and Modelo was delisted.
The company undertook a series of additional acquisitions and disposals during 2015 and 2016, with no significant impact in the
company’s consolidated financial statements.

48
7. OTHER OPERATING INCOME/(EXPENSES)
Million US dollar 2016 2015
Government grants .......................................................................................... 432 668
License income ................................................................................................ 65 73
Net (additions to)/reversals of provisions ........................................................... (50) (31)
Net gain on disposal of property, plant and equipment, intangible assets and assets
held for sale .................................................................................................... 37 20
Net rental and other operating income ............................................................... 248 302
732 1 032
Research expenses as incurred.......................................................................... 244 207
The government grants relate primarily to fiscal incentives given by certain Brazilian states and Chinese provinces, based on the
company’s operations and developments in those regions.
In 2016, the company expensed 244m US dollar in research, compared to 207m US dollar in 2015. Part of this was expensed in the
area of market research, but the majority is related to innovation in the areas of process optimization especially as it pertains to
capacity, new product developments and packaging initiatives.
8. NON-RECURRING ITEMS
IAS 1 Presentation of financial statements requires material items of income and expense to be disclosed separately. Non-recurring
items are items, which in management’s judgment, need to be disclosed by virtue of their size or incidence in order for the user to
obtain a proper understanding of the financial information. The company considers these items to be of significance in nature, and
accordingly, management has excluded these from their segment measure of performance as noted in Note 5 Segment Reporting.
The non-recurring items included in the income statement are as follows:
Million US dollar 2016 2015
Restructuring ................................................................................................... (323) (171)
Acquisition costs business combinations .............................................................. (448) (55)
Business and asset disposal ............................................................................... 377 524
Impairment of assets ........................................................................................ - (82)
Judicial settlement ............................................................................................ - (80)
Impact on profit from operations .................................................................. (394) 136
Non-recurring net finance income/(cost) ............................................................. (3 356) (214)
Non-recurring taxes .......................................................................................... 77 (201)
Non-recurring non-controlling interest ................................................................. 13 39
Net impact on profit attributable to equity holders of AB InBev .................... (3 659) (240)
The non-recurring restructuring charges for 2016 total (323)m US dollar. These charges primarily relate to the integration of
SABMiller and to organizational alignments in EMEA, Asia Pacific and Latin America West. These changes aim to eliminate
overlap or duplicated processes, taking into account the right match of employee profiles with the new organizational requirements.
These one-time expenses, as a result of the series of decisions, provide the company with a lower cost base in addition to a stronger
focus on AB InBev’s core activities, quicker decision making and improvements to efficiency, service and quality.
Acquisition costs of business combinations amount to (448)m US dollar by the end of December 2016, primarily related to costs
incurred in relation to the combination with SABMiller.
Business and asset disposals resulted in a net gain of 377m US dollar as per 31 December 2016, mainly attributable to the proceeds
from the sale of the company’s brewery plant located in Obregón, Sonora, México to Constellation Brands, Inc.
The non-recurring restructuring charges for 2015 total (171)m US dollar. These charges primarily relate to the integration of Grupo
Modelo and to organizational alignments in North America and EMEA.
Business and asset disposals resulted in a net gain of 524m US dollar as per 31 December 2015, which consists primarily of gains on
property sales, and compensation for the termination agreements with Crown imports for the distribution of Grupo Modelo products
thought the company’s wholly owned distributors in the US, and with Monster for the distribution of its brands through the
Anheuser-Busch distribution system.
The company incurred non-recurring net finance cost of (3 356)m US dollar for the period ended 31 December 2016 (31 December
2015: (214)m US dollar cost) - see Note 11 Finance cost and income.
All the above amounts are before income taxes. The non-recurring items as of 31 December 2016 decreased income taxes by 77m
US dollar (31 December 2015: (201)m US dollar increase of income taxes).
Non-controlling interest on the non-recurring items amounts to 13m US dollar for period ended 31 December 2016 (31 December
2015: 39m US dollar).

49
9. PAYROLL AND RELATED BENEFITS
Million US dollar 2016 2015
Wages and salaries .......................................................................................... (4 404) (3 706)
Social security contributions ............................................................................. (647) (633)
Other personnel cost ........................................................................................ (580) (648)
Pension expense for defined benefit plans........................................................... (194) (212)
Share-based payment expense ......................................................................... (228) (225)
Contributions to defined contribution plans ......................................................... (77) (90)
(6 130) (5 514)
Number of full time equivalents (FTE) at year-end .............................................. 206 633 152 321
The number of full time equivalents can be split as follows:
2016 2015
AB InBev NV (parent company) ......................................................................... 225 191
Other subsidiaries ............................................................................................ 206 408 152 130
206 633 152 321
The 2016 increase in payroll and related benefits and FTEs is mainly due to the business combination with SABMiller. See also
Note 6 – Acquisition and disposal of subsidiaries.
10. ADDITIONAL INFORMATION ON OPERATING EXPENSES BY NATURE
Depreciation, amortization and impairment charges are included in the following line items of the 2016 income statement:
Million US dollar
Depreciation and
impairment of property,
plant and equipment
Amortization and
impairment of intangible
assets Impairment of goodwill
Cost of sales ...................................................... 2 292 21 -
Distribution expenses .......................................... 143 1 -
Sales and marketing expenses ............................. 363 208 -
Administrative expenses ...................................... 222 218 -
Other operating expenses .................................... 2 1 -
3 025 452 -
Depreciation, amortization and impairment charges were included in the following line items of the 2015 income statement:
Million US dollar
Depreciation and
impairment of property,
plant and equipment
Amortization and
impairment of intangible
assets Impairment of goodwill
Cost of sales ...................................................... 2 122 17 -
Distribution expenses .......................................... 122 1 -
Sales and marketing expenses ............................. 285 173 -
Administrative expenses ...................................... 170 177 -
Other operating expenses .................................... 4 - -
Non-recurring items ............................................ 12 32 38
2 715 400 38
The depreciation, amortization and impairment of property, plant and equipment included a full-cost reallocation of 9m US dollar in
2016 from the aggregate depreciation, amortization and impairment expense to cost of goods sold (2015: 3m US dollar).
The 2016 increase in depreciation, amortization and impairment charges is mainly due to the business combination with SABMiller.
See also Note 6 Acquisition and disposal of subsidiaries.

50
11. FINANCE COST AND INCOME
RECOGNIZED IN PROFIT OR LOSS
FINANCE COSTS
Million US dollar 2016 2015
Interest expense ................................................................................................................. (4 092) (1 833)
Capitalization of borrowing costs ........................................................................................... 12 28
Net interest on net defined benefit liabilities .......................................................................... (113) (118)
Accretion expense ............................................................................................................... (648) (326)
Net foreign exchange losses (net of the effect of foreign exchange derivative instruments)........... (21) -
Net losses on hedging instruments that are not part of a hedge accounting relationship ............... (797) -
Tax on financial transactions ................................................................................................. (70) (61)
Other financial costs, including bank fees ............................................................................... (131) (107)
(5 860) (2 417)
Non-recurring finance cost .................................................................................................... (3 522) (725)
(9 382) (3 142)
Finance costs, excluding non-recurring items, increased by 3 443m US dollar from prior year driven by higher interest expense,
mainly as a result of the issuance of bonds in January and March 2016 in connection with the funding of the combination with
SABMiller, as well as higher accretion expenses and net losses on hedging instruments that are not part of a hedge accounting
relationship.
Mark-to-market result on certain derivatives related to the hedging of share-based payment programs reached net losses of 384m US
dollar in 2016 (31 December 2015: 844m US dollar income).
Borrowing costs capitalized relate to the capitalization of interest expenses directly attributable to the acquisition and construction of
qualifying assets mainly in Brazil and China. Interest is capitalized at a borrowing rate ranging from 4% to 8%.
In the light of the combination with SABMiller, AB InBev recognized non-recurring expenses of 3 522m US dollar, of which:
- 2 693m US dollar negative mark-to-market adjustments as a result of derivative foreign exchange forward contracts entered
into in order to economically hedge against exposure to changes in the US dollar exchange rate for the cash component of the
purchase consideration of SABMiller in pound sterling and South African rand, for which a portion of the hedges could not
qualify for hedge accounting – see also Note 29 Risks arising from financial instruments;
- 306m US dollar related to accelerated accretion expenses associated to the 2015 Senior Facilities Agreement, as well as
commitment fees and other fees. The accelerated accretion follows the cancellation of 42.5, 12.5 and 2.0 billion US dollar
commitments available under the 2015 Senior Facilities Agreement in January, April and October 2016, respectively. See also
Note 24 Interest-bearing loans and borrowings;
- 304m US dollar resulting from mark-to-market adjustments on derivative instruments entered into to hedge the deferred share
instrument issued in a transaction related to the combination with Grupo Modelo (31 December 2015: 511m US dollar income).
By 31 December 2016, 100% of the deferred share instrument had been hedged at an average price of approximately 68 euro
per share. See also Note 23 Changes in equity and earnings per share;
- 127m US dollar exceptional finance cost resulting from mark-to-market adjustments on derivative instruments entered into to
hedge the shares issued in relation to the combination with SABMiller – see also Note 29 Risks arising from financial
instrument;
- 92m US dollar mainly related to the early redemption of SABMiller bonds – see also Note 24 Interest-bearing loans and
borrowings.
Interest expense is presented net of the effect of interest rate derivative instruments hedging AB InBev’s interest rate risk – see also
Note 29 Risks arising from financial instruments.
FINANCE INCOME Million US dollar 2016 2015
Interest income ................................................................................................................. 561 339
Net foreign exchange gains (net of the effect of foreign exchange derivative instruments) .......... - 378
Net gains on hedging instruments that are not part of a hedge accounting relationship .............. - 399
Other financial income ........................................................................................................ 91 62 652 1 178
Non-recurring finance income .............................................................................................. 166 511 818 1 689
Finance income, excluding non-recurring items, decreased by 526m US dollar mainly as a result of net foreign exchange gains in
2015. Interest income for the period ended 31 December 2016 is positively impacted by the income on the excess liquidity following
the issuance of bonds in the first quarter of 2016 that were mainly invested in US Treasury Bills pending the closing of the
SABMiller acquisition.
Non-recurring net finance income for the period ended 31 December 2016 includes 166m US dollar positive mark-to-market
adjustments as a results of derivatives entered into in order to convert the 13.25 billion euro bond issuance on 29 March 2016, into
US dollar – see also Note 24 Interest-bearing loans and borrowings.
No interest income was recognized on impaired financial assets.
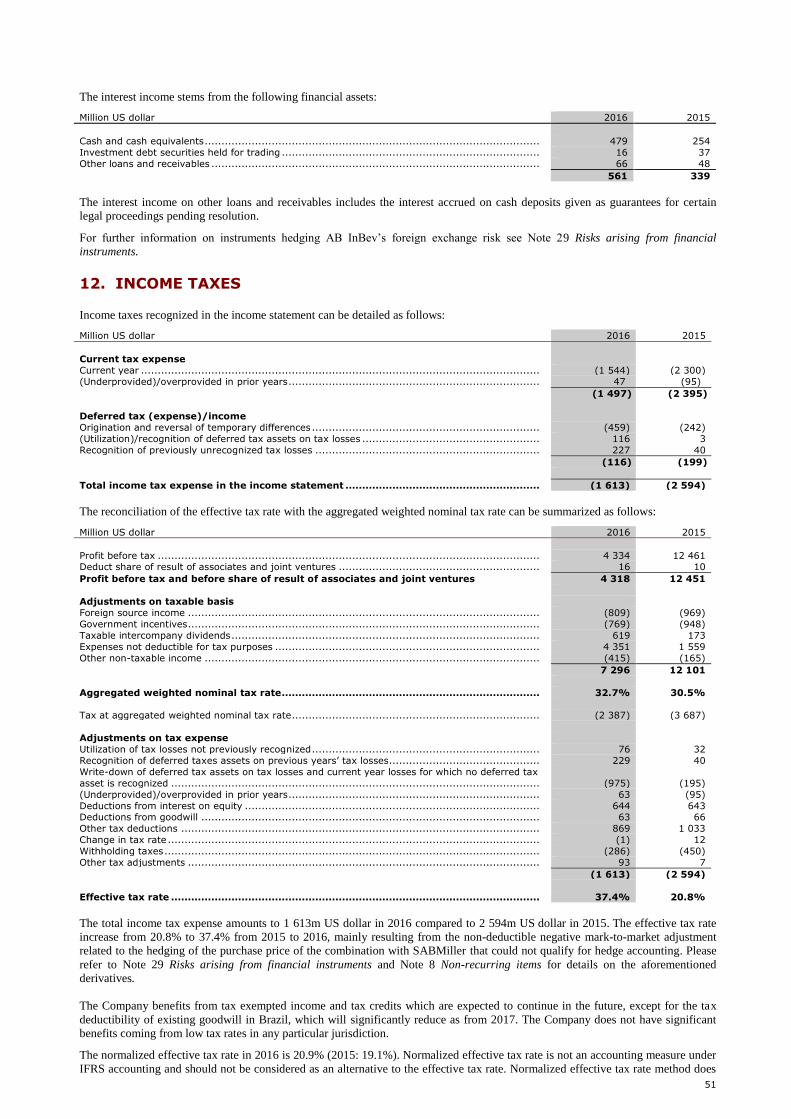
51
The interest income stems from the following financial assets:
Million US dollar 2016 2015
Cash and cash equivalents .................................................................................................... 479 254
Investment debt securities held for trading ............................................................................. 16 37
Other loans and receivables .................................................................................................. 66 48
561 339
The interest income on other loans and receivables includes the interest accrued on cash deposits given as guarantees for certain
legal proceedings pending resolution.
For further information on instruments hedging AB InBev’s foreign exchange risk see Note 29 Risks arising from financial
instruments.
12. INCOME TAXES
Income taxes recognized in the income statement can be detailed as follows:
Million US dollar 2016 2015
Current tax expense
Current year ....................................................................................................................... (1 544) (2 300)
(Underprovided)/overprovided in prior years ........................................................................... 47 (95)
(1 497) (2 395)
Deferred tax (expense)/income
Origination and reversal of temporary differences .................................................................... (459) (242)
(Utilization)/recognition of deferred tax assets on tax losses ..................................................... 116 3
Recognition of previously unrecognized tax losses ................................................................... 227 40
(116) (199)
Total income tax expense in the income statement .......................................................... (1 613) (2 594)
The reconciliation of the effective tax rate with the aggregated weighted nominal tax rate can be summarized as follows:
Million US dollar 2016 2015
Profit before tax .................................................................................................................. 4 334 12 461 Deduct share of result of associates and joint ventures ............................................................ 16 10
Profit before tax and before share of result of associates and joint ventures 4 318 12 451
Adjustments on taxable basis
Foreign source income ......................................................................................................... (809) (969)
Government incentives ......................................................................................................... (769) (948)
Taxable intercompany dividends ............................................................................................ 619 173
Expenses not deductible for tax purposes ............................................................................... 4 351 1 559
Other non-taxable income .................................................................................................... (415) (165)
7 296 12 101
Aggregated weighted nominal tax rate............................................................................. 32.7% 30.5%
Tax at aggregated weighted nominal tax rate .......................................................................... (2 387) (3 687)
Adjustments on tax expense
Utilization of tax losses not previously recognized .................................................................... 76 32
Recognition of deferred taxes assets on previous years’ tax losses............................................. 229 40
Write-down of deferred tax assets on tax losses and current year losses for which no deferred tax
asset is recognized .............................................................................................................. (975) (195)
(Underprovided)/overprovided in prior years ........................................................................... 63 (95)
Deductions from interest on equity ........................................................................................ 644 643 Deductions from goodwill ..................................................................................................... 63 66
Other tax deductions ........................................................................................................... 869 1 033
Change in tax rate ............................................................................................................... (1) 12
Withholding taxes ................................................................................................................ (286) (450)
Other tax adjustments ......................................................................................................... 93 7
(1 613) (2 594)
Effective tax rate .............................................................................................................. 37.4% 20.8%
The total income tax expense amounts to 1 613m US dollar in 2016 compared to 2 594m US dollar in 2015. The effective tax rate
increase from 20.8% to 37.4% from 2015 to 2016, mainly resulting from the non-deductible negative mark-to-market adjustment
related to the hedging of the purchase price of the combination with SABMiller that could not qualify for hedge accounting. Please
refer to Note 29 Risks arising from financial instruments and Note 8 Non-recurring items for details on the aforementioned
derivatives.
The Company benefits from tax exempted income and tax credits which are expected to continue in the future, except for the tax
deductibility of existing goodwill in Brazil, which will significantly reduce as from 2017. The Company does not have significant
benefits coming from low tax rates in any particular jurisdiction.
The normalized effective tax rate in 2016 is 20.9% (2015: 19.1%). Normalized effective tax rate is not an accounting measure under
IFRS accounting and should not be considered as an alternative to the effective tax rate. Normalized effective tax rate method does

52
not have a standard calculation method and AB InBev’s definition of normalized effective rate may not be comparable to other
companies.
Income taxes were directly recognized in other comprehensive income as follows:
Million US dollar 2016 2015
Income tax (losses)/gains Re-measurements of post-employment benefits .................................................. 54 (37)
Cash flow and net investment hedges ................................................................ (258) 930
(204) 893
13. PROPERTY, PLANT AND EQUIPMENT
2016 2015
Million US dollar
Land and
buildings
Plant and
equipment,
fixtures and
fittings
Under
construction Total Total
Acquisition cost
Balance at end of previous year1 .......... 9 239 24 157 1 933 35 329 37 485 Effect of movements in foreign exchange ... (40) (33) (83) (156) (5 047)
Acquisitions ............................................ 212 1 592 2 591 4 395 4 276
Acquisitions through business
combinations .......................................... 3 261 5 373 713 9 346 121
Disposals ................................................ (159) (1 523) (1) (1 683) (1 206)
Disposals through the sale of subsidiaries ... (39) (48) (2) (88) (184)
Transfer (to)/from other asset categories
and other movements2 ............................. 10 1 093 (2 590) (1 487) (116)
Balance at end of the period ................. 12 483 30 611 2 561 45 655 35 329
Depreciation and impairment losses Balance at end of previous year1 .......... (2 745) (13 632) - (16 377) (17 222)
Effect of movements in foreign exchange ... (53) (137) - (190) 2 386
Depreciation ........................................... (399) (2 587) - (2 986) (2 670)
Disposals ................................................ 117 1 314 - 1 431 1 011
Disposals through the sale of subsidiaries ... 9 (36) - (27) 133
Impairment losses ................................... - (38) (1) (39) (48)
Transfer to/(from) other asset categories
and other movements2 ............................. 7 49 1 56 33
Balance at end of the period ................. (3 065) (15 068) - (18 132) (16 377)
Carrying amount
at 31 December 2015 .......................... 6 494 10 525 1 933 18 952 18 952
at 31 December 2016 ........................... 9 418 15 543 2 561 27 522 -
The carrying amount of property, plant and equipment subject to restrictions on title amounts to 19m US dollar (2015: 21m US
dollar).
Contractual commitments to purchase property, plant and equipment amounted to 816m US dollar as at 31 December 2016
compared to 750m US dollar as at 31 December 2015.
AB InBev’s net capital expenditures in the statement of cash flow amounted to 4 768m US dollar in 2016 and 4 337m US dollar in
2015. Out of the total 2016 capital expenditures approximately 50% was used to improve the company’s production facilities while
34% was used for logistics and commercial investments and 16% was used for improving administrative capabilities and purchase
of hardware and software.
LEASED ASSETS
The company leases land and buildings as well as equipment under a number of finance lease agreements. The carrying amount as at
31 December 2016 of leased land and buildings was 302m US dollar (31 December 2015: 141m US dollar).
1 Reclassified to conform to the 2016 presentation. 2 The transfer (to)/from other asset categories and other movements mainly relates to transfers from assets under construction to their respective asset categories, to
contributions of assets to pension plans and to the separate presentation in the balance sheet of property, plant and equipment held for sale in accordance with IFRS 5 Non-
current assets held for sale and discontinued operations. See also Note 22 Assets classified as held for sale and discountinued operations.

53
14. GOODWILL
Million US dollar 2016 2015
Acquisition cost Balance at end of previous year....................................................................... 65 099 70 765
Effect of movements in foreign exchange .............................................................. (2 222) (5 956)
Purchases of non-controlling interest .................................................................... - 2
Disposals through the sale of subsidiaries .............................................................. (187) -
Acquisitions through business combinations ........................................................... 74 886 288
Reclassified as held for sale1 ................................................................................ (1 008) -
Balance at end of the period ............................................................................ 136 566 65 099
Impairment losses
Balance at end of previous year....................................................................... (38) (7)
Impairment losses .............................................................................................. - (38) Effect of movements in foreign exchange and other movements ............................... 4 7
Balance at end of the period ............................................................................ (34) (38)
Carrying amount
at 31 December 2015 ...................................................................................... 65 061 65 061
at 31 December 2016 ..................................................................................... 136 533 -
Current year acquisitions through business combinations primarily reflect the business combination with SABMiller. This
transaction resulted in the recognition of goodwill of 74 083m US dollar. The other business combinations that took place in 2016
resulted in goodwill recognition of 803m US dollar – see also Note 6 Acquisitions and disposals of subsidiaries.
The carrying amount of goodwill was allocated to the different business unit levels as follows:
Million US dollar
Business unit 2016 2015
SABMiller ........................................................................................................... 73 736 -
USA .................................................................................................................. 33 056 32 831
Mexico .............................................................................................................. 12 035 14 630
Brazil ................................................................................................................ 5 531 4 613
South Korea....................................................................................................... 3 652 3 739 China ................................................................................................................ 2 710 2 901
Canada ............................................................................................................. 1 892 1 583
Dominican Republic ............................................................................................ 1 029 1 024
Other countries .................................................................................................. 3 899 3 470
Reclassified as held for sale1 ................................................................................ (1 008) -
136 533 65 061
The allocation of the purchase price related to the SABMiller combination has been only provisionally determined at the end of the
reporting period. The completion of the purchase price allocation may result in further adjustment to the carrying value of
SABMiller’s recorded assets, liabilities and non-controlling interests and the determination of any residual amount that will be
allocated to goodwill. The preliminary allocation of goodwill to different business units is demonstrated below:
Million US dollar
Business unit 2016
Colombia ........................................................................................................... 19 143
Ecuador ............................................................................................................. 5 998
Peru.................................................................................................................. 12 153
Australia ............................................................................................................ 5 692 South Africa ....................................................................................................... 17 896
Other African countries ....................................................................................... 6 422
Other Latin American countries ............................................................................ 5 423
Reclassified as held for sale ................................................................................. 1 008
73 736
The company expects to complete the initial allocation of goodwill to the business units during 2017, as permitted by IFRS 3
Business combinations and IAS 36 Impairment of assets.
AB InBev completed its annual impairment test for goodwill for the business units that are not linked to the SABMiller
combination and concluded that, based on the assumptions described below, no impairment charge was warranted.
The company cannot predict whether an event that triggers impairment will occur, when it will occur or how it will affect the asset
values reported. AB InBev believes that all of its estimates are reasonable: they are consistent with the internal reporting and reflect
management’s best estimates. However, inherent uncertainties exist that management may not be able to control. During its
valuation, the company ran sensitivity analysis for key assumptions including the weighted average cost of capital and the terminal
growth rate, in particular for the valuations of the US, Brazil and Mexico, countries that show the highest goodwill, as well as for
Russia due to macroeconomic conditions. While a change in the estimates used could have a material impact on the calculation of
the fair values and trigger an impairment charge, the company, based on the sensitivity analysis performed is not aware of any
reasonably possible change in a key assumption used that would cause a business unit’s carrying amount to materially exceed its
recoverable amount.
1 See also Note 22 Assets classified as held for sale and discountinued operations.

54
Goodwill impairment testing relies on a number of critical judgments, estimates and assumptions. Goodwill, which accounted for
approximately 53% of AB InBev's total assets as at 31 December 2016, is tested for impairment at the business unit level (that is
one level below the reporting segments). The business unit level is the lowest level at which goodwill is monitored for internal
management purposes. Except in cases where the initial allocation of goodwill has not been concluded by the end of the initial
reporting period following the business combination, goodwill is allocated as from the acquisition date to each of AB InBev’s
business units that are expected to benefit from the synergies of the combination whenever a business combination occurs.
AB InBev’s impairment testing methodology is in accordance with IAS 36, in which fair-value-less-cost-to-sell and value in use
approaches are taken into consideration. This consists in applying a discounted free cash flow approach based on acquisition
valuation models for its major business units and the business units showing a high invested capital to EBITDA multiple, and
valuation multiples for its other business units.
The key judgments, estimates and assumptions used in the discounted free cash flow calculations are generally as follows:
The first year of the model is based on management's best estimate of the free cash flow outlook for the current year;
In the second to fourth year of the model, free cash flows are based on AB InBev's strategic plan as approved by key
management. AB InBev's strategic plan is prepared per business unit and is based on external sources in respect of
macro-economic assumptions, industry, inflation and foreign exchange rates, past experience and identified initiatives in
terms of market share, revenue, variable and fixed cost, capital expenditure and working capital assumptions;
For the subsequent six years of the model, data from the strategic plan is extrapolated generally using simplified
assumptions such as constant volumes and variable cost per hectoliter and fixed cost linked to inflation, as obtained from
external sources;
Cash flows after the first ten-year period are extrapolated generally using expected annual long-term consumer price
indices (CPI), based on external sources, in order to calculate the terminal value, considering sensitivities on this metric.
For the three main cash generating units, the terminal growth rate applied ranged between 0.0% and 2.3% for the US;
0.0% and 3.3% for Brazil and 0.0% and 2.6% for Mexico;
Projections are made in the functional currency of the business unit and discounted at the unit's weighted average cost of
capital (WACC), considering sensitivities on this metric. The WACC ranged primarily between 7% and 14% in US dollar
nominal terms for goodwill impairment testing conducted for 2016. For the three main cash generating units, the WACC
applied in US dollar nominal terms ranged between 6% and 8% for the US, 9% and 11% for Brazil, and 8% and 10% for
Mexico.
Cost to sell is assumed to reach 2% of the entity value based on historical precedents.
The above calculations are corroborated by valuation multiples, quoted share prices for publicly-traded subsidiaries or other
available fair value indicators (i.e. recent market transactions from peers).
The initial allocation of goodwill to the business units acquired through the SABMiller combination was not concluded by 31
December 2016. Management assessed whether there would be any triggering event or indicator that could lead to an impairment of
the goodwill acquired through the SABMiller combination and concluded that there were no indicators of impairment of goodwill.
Although AB InBev believes that its judgments, assumptions and estimates are appropriate, actual results may differ from these
estimates under different assumptions or market or macro-economic conditions.

55
15. INTANGIBLE ASSETS
2016 2015
Million US dollar Brands
Commercial
intangibles Software Other Total Total
Acquisition cost
Balance at end of previous year............... 27 426 2 227 1 399 667 31 719 31 880
Effect of movements in foreign exchange ...... (791) 54 (38) (31) (805) (1 267)
Acquisitions through business combinations ... 15 422 5 076 161 64 20 723 270
Acquisitions and expenditures ...................... 23 265 140 135 563 1 018
Disposals through the sales of subsidiaries .... - - - - - (20)
Disposals ........................................... ....... (4) (114) (22) (21) (161) (108)
Transfer (to)/from other asset categories and
other movements1 ...................................... - (4 794) 232 (508) (5 070) (54)
Balance at end of period .......................... 42 077 2 715 1 872 306 46 969 31 719
Amortization and impairment losses
Balance at end of previous year .............. (32) (954) (987) (69) (2 042) (1 957)
Effect of movements in foreign exchange ...... - (1) 33 3 34 238
Amortization .............................................. - (186) (220) (39) (446) (368)
Impairment losses ...................................... - (2) - (1) (3) (32)
Disposals through the sales of subsidiaries .... - - - - - 2
Disposals ........................................... ...... - 111 19 12 142 77
Transfer to/(from) other asset categories and
other movements1 ...................................... - (91) 4 1 (86) (2)
Balance at end of period .......................... (32) (1 124) (1 151) (94) (2 401) (2 042)
Carrying value
at 31 December 2015 ............................. 27 394 1 273 412 598 29 677 29 677
at 31 December 2016 ............................. 42 045 1 591 720 212 44 568 -
Current year acquisitions through business combinations primarily reflect the combination with SABMiller which resulted in the
recognition of brands and commercial intangibles with an indefinite life of 19 879m US dollar, mainly including the Castle and
Carling brand families in Africa, the Aguila and Poker brand families in Colombia, the Cristal and Pilsner brand families in
Ecuador, and the Carlton brand family in Australia. Additionally, 161m US dollar was recognized as intangible assets with a finite
life, primarily consisting of software and distribution agreements. See also Note 6 Acquisitions and disposals of subsidiaries.
AB InBev is the owner of some of the world’s most valuable brands in the beer industry. As a result, brands and certain distribution
rights are expected to generate positive cash flows for as long as the company owns the brands and distribution rights. Given AB
InBev’s more than 600-year history, brands and certain distribution rights have been assigned indefinite lives.
Acquisitions and expenditures of commercial intangibles mainly represent supply and distribution rights, exclusive multi-year
sponsorship rights and other commercial intangibles.
Intangible assets with indefinite useful lives are comprised primarily of brands and certain distribution rights that AB InBev
purchases for its own products, and are tested for impairment during the fourth quarter of the year or whenever a triggering event
has occurred. As of 31 December 2016, the carrying amount of the intangible assets amounted to 44 568m US dollar
(31 December 2015: 29 677m US dollar) of which 42 272m US dollar was assigned an indefinite useful life (31 December 2015:
27 722m US dollar) and 2 296m US dollar a finite life (31 December 2015: 1 955m US dollar).
The carrying amount of intangible assets with indefinite useful lives was allocated to the different countries as follows:
Million US dollar
Country 2016 20152
USA ..................................................................................................................... 21 570 21 484
Colombia .............................................................................................................. 3 803 -
South Africa .......................................................................................................... 3 518 -
Mexico ................................................................................................................. 2 920 3 503
Peru..................................................................................................................... 2 731 -
Australia ............................................................................................................... 2 373 -
South Korea.......................................................................................................... 938 960
Ecuador ................................................................................................................ 604 - China ................................................................................................................... 373 399
Dominican Republic ............................................................................................... 366 598
Other African countries .......................................................................................... 1 364 -
Other countries ..................................................................................................... 1 712 778
42 272 27 722
Intangible assets with indefinite useful lives have been tested for impairment using the same methodology and assumptions as
disclosed in Note 14 Goodwill. Based on the assumptions described in that note, AB InBev concluded that no impairment charge is
warranted. While a change in the estimates used could have a material impact on the calculation of the fair values and trigger an
1 See also Note 22 Assets classified as held for sale and discountinued operations. 2 Reclassified to conform to the 2016 presentation

56
impairment charge, the company is not aware of any reasonable possible change in a key assumption used that would cause a
business unit’s carrying amount to materially exceed its recoverable amount.
16. INVESTMENTS IN ASSOCIATES
Following the combination with SABMiller, AB InBev recognized interests in associates with a fair value at acquisition date of 4.4
billion US dollar. Main associates contributing to such fair value adjustments are Castel and Anadolu Efes.
A reconciliation of the summarized financial information to the carrying amount of the company’s interests in material associates is
as follows:
2016
Million US dollar Castel1 Efes
Balance at 1 January ............................................................................................................ - -
Combination with SABMiller ................................................................................................... 2 932 895
Share of results of associates ................................................................................................. 18 (27)
Effect of movements in foreign exchange ................................................................................ (158) (119)
Balance at 31 December .................................................................................................... 2 793 750
Summarized financial information of the company’s material associates is as follows:
2016
Million US dollar Castel1 Efes
Current assets ..................................................................................................................... 3 970 1 058
Non-current assets ............................................................................................................... 2 900 4 668
Current liabilities .................................................................................................................. 1 391 561
Non-current liabilities ............................................................................................................ 547 1 570
Non-controlling interests ....................................................................................................... 762 1 464
Net assets ........................................................................................................................... 4 170 2 131
Revenue .............................................................................................................................. 1 236 659
Profit (loss) from continuing operations ................................................................................... 42 (111)
Other comprehensive income (loss) ........................................................................................ (108) 75
Total comprehensive income (loss) ......................................................................................... (66) (35)
Reconciliation of the above summarized financial information to the carrying amount of the interest in Castel and Efes recognized in
the consolidated financial statements is as follows:
2016
Million US dollar Castel1 Efes
Net assets of the associate .................................................................................................... 4 170 2 131
Interest in associates (%) ..................................................................................................... 20-40 24
Interest in associate ............................................................................................................. 939 511
Goodwill .............................................................................................................................. 1 854 239
Carrying amount of investment in associates ........................................................................... 2 793 750
During 2016, associates that are not individually material contributed to 47m US dollar to the results of investment in associates.
In 2015, there were no significant investments in associates.
Additional information related to the significant associates is presented in Note 36 AB InBev Companies.
17. INVESTMENT SECURITIES
Million US dollar 2016 2015
Non-current investments
Investments in unquoted companies – available for sale..................................... 58 31 Debt securities held to maturity ...................................................................... 24 17
82 48
Current investments
Debt securities held for trading ....................................................................... 5 659 55
5 659 55
As of 31 December 2016, current debt securities of 5 659m US dollar mainly represented investments in Euro denominated T-Bills.
The company’s investments in such short-term debt securities are primarily to facilitate liquidity and for capital preservation.
1 Brasseries Internationales Holding Ltd, Société des Brasseries et Glacières Internationales SA, Algerienne de Bavaroise Spa, BIH Brasseries Internationales Holding
(Angola) Ltd, Marocaine d'Investissements et de Services SA, Skikda Bottling Company SARL, Société de Boissons de I'Ouest Algerien SARL, and Société des
Nouvelles Brasseries together make up Castel's African beverage operations. Details of individual ownership percentages are included in Note 36 AB InBev companies.

57
The securities available for sale consist of investments in unquoted companies and are measured at cost as their fair value cannot be
reliably determined.
18. DEFERRED TAX ASSETS AND LIABILITIES
The amount of deferred tax assets and liabilities by type of temporary difference can be detailed as follows:
2016
Million US dollar Assets Liabilities Net
Property, plant and equipment ........................................................................ 533 (4 017) (3 484)
Intangible assets ........................................................................................... 200 (14 863) (14 663)
Inventories ................................................................................................... 145 (95) 50
Trade and other receivables ............................................................................ 74 (59) 15
Interest-bearing loans and borrowings ............................................................. 322 (456) (134)
Employee benefits ......................................................................................... 704 (22) 682
Provisions ..................................................................................................... 578 (234) 344
Derivatives ................................................................................................... 42 (30) 12
Other items .................................................................................................. 147 (1 119) (972)
Loss carry forwards ....................................................................................... 1 278 - 1 278
Reclassified as held for sale ............................................................................ (4) 1 459 1 455
Gross deferred tax assets/(liabilities) ........................................................ 4 019 (19 436) (15 417)
Netting by taxable entity ............................................................................ (2 758) 2 758 -
Net deferred tax assets/(liabilities) ........................................................... 1 261 (16 678) (15 417)
2015
Million US dollar Assets Liabilities Net
Property, plant and equipment ........................................................................ 514 (2 482) (1 968)
Intangible assets ........................................................................................... 221 (9 709) (9 488)
Inventories ................................................................................................... 103 (97) 6
Trade and other receivables ............................................................................ 91 (59) 32
Interest-bearing loans and borrowings ............................................................. 569 (403) 166
Employee benefits ......................................................................................... 751 (28) 723
Provisions ..................................................................................................... 337 (36) 301
Derivatives ................................................................................................... 92 (47) 45
Other items .................................................................................................. 151 (997) (846)
Loss carry forwards ....................................................................................... 249 - 249
Gross deferred tax assets/(liabilities) ........................................................ 3 078 (13 858) (10 780)
Netting by taxable entity ............................................................................ (1 897) 1 897 -
Net deferred tax assets/(liabilities) ........................................................... 1 181 (11 961) (10 780)
The change in net deferred taxes recorded in the consolidated statement of financial position can be detailed as follows:
Million US dollar 2016 2015
Balance at 1 January ....................................................................................................... (10 780) (11 643)
Recognized in profit or loss ................................................................................................... (116) (199)
Recognized in other comprehensive income ............................................................................ (204) 893
Acquisitions through business combinations ............................................................................ (5 623) (7)
Reclassified as held for sale .................................................................................................. 1 455 -
Other movements and effect of changes in foreign exchange rates ............................................ (149) 176
Balance at 31 December ................................................................................................... (15 417) (10 780)
Net deferred tax assets and liabilities increased from prior year mainly due to deferred tax liabilities associated with the combination
with SABMiller.
Most of the temporary differences are related to the fair value adjustment on intangible assets with indefinite useful lives and
property, plant and equipment acquired through business combinations. The realization of such temporary differences is unlikely to
revert within 12 months.
On 31 December 2016, a deferred tax liability of 121m US dollar (2015: 235m US dollar) relating to investment in subsidiaries has
not been recognized because management believes that this liability will not be incurred in the foreseeable future.
Tax losses carried forward and deductible temporary differences on which no deferred tax asset is recognized amount to
4 499m US dollar (2015: 2 766m US dollar). 858m US dollar of these tax losses and deductible temporary differences do not have
an expiration date, 51m US dollar, 95m US dollar and 165m US dollar expire within respectively 1, 2 and 3 years, while
3 330m US dollar have an expiration date of more than 3 years. Deferred tax assets have not been recognized on these items
because it is not probable that future taxable profits will be available against which these tax losses and deductible temporary

58
differences can be utilized and the company has no tax planning strategy currently in place to utilize these tax losses and deductible
temporary differences.
19. INVENTORIES
Million US dollar 2016 2015
Prepayments .................................................................................................................... 90 103
Raw materials and consumables ......................................................................................... 2 143 1 539
Work in progress .............................................................................................................. 391 294 Finished goods ................................................................................................................. 1 166 819
Goods purchased for resale ................................................................................................ 124 107
3 913 2 862
Inventories other than work in progress
Inventories stated at net realizable value ............................................................................ 42 46
Carrying amount of inventories subject to collateral .............................................................. - -
The cost of inventories recognized as an expense in 2016 amounts to 17 803m US dollar, included in cost of sales (2015:
17 137m US dollar).
Impairment losses on inventories recognized in 2016 amount to 70m US dollar (2015: 21m US dollar).
20. TRADE AND OTHER RECEIVABLES
NON-CURRENT TRADE AND OTHER RECEIVABLES
Million US dollar 2016 2015
Cash deposits for guarantees ............................................................................................... 200 187
Loans to customers............................................................................................................. 15 37
Deferred collection on disposals............................................................................................ 11 25
Tax receivable, other than income tax ................................................................................... 105 86
Trade and other receivables ................................................................................................. 543 578
874 913
For the nature of cash deposits for guarantees see Note 31 Collateral and contractual commitments for the acquisition of property,
plant and equipment, loans to customers and other.
CURRENT TRADE AND OTHER RECEIVABLES
Million US dollar 2016 2015
Trade receivables and accrued income ................................................................................. 4 562 3 241
Interest receivable ............................................................................................................. 10 21
Tax receivable, other than income tax .................................................................................. 572 353
Loans to customers............................................................................................................ 85 57
Prepaid expenses .............................................................................................................. 316 465
Other receivables .............................................................................................................. 846 314
6 391 4 451
The fair value of trade and other receivables equals their carrying amounts as the impact of discounting is not significant.
The ageing of the current trade receivables and accrued income, interest receivable, other receivables and current and non-current
loans to customers can be detailed as follows for 2016 and 2015 respectively:
Net carrying
amount as of
December 31,
2016
Of which:
neither
impaired nor
past due on
the reporting
date
Of which not impaired as of the reporting date and past
due
Less than
30 days
Between 30
and 59 days
Between 60
and 89 days
More than
90 days
Trade receivables and accrued income . 4 562 4 201 189 64 37 70
Loans to customers............................ 100 96 - 2 2 -
Interest receivable ............................. 10 10 - - - -
Other receivables .............................. 846 721 42 21 6 56
5 518 5 028 231 87 45 126

59
Net carrying
amount as of
December 31,
2015
Of which:
neither
impaired nor
past due on
the reporting
date
Of which not impaired as of the reporting date and past
due
Less than
30 days
Between 30
and 59 days
Between 60
and 89 days
More than
90 days
Trade receivables and accrued income . 3 241 3 105 110 13 13 -
Loans to customers............................ 94 88 3 2 1 -
Interest receivable ............................. 21 21 - - - -
Other receivables .............................. 314 314 - - - -
3 670 3 528 113 15 14 -
In accordance with IFRS 7 Financial Instruments: Disclosures, the above analysis of the age of financial assets that are past due as
at the reporting date but not impaired also includes non-current loans to customers. Past due amounts were not impaired when
collection is still considered likely, for instance because the amounts can be recovered from the tax authorities or AB InBev has
sufficient collateral. Impairment losses on trade and other receivables recognized in 2016 amount to 40m US dollar (2015: 44m US
dollar).
AB InBev’s exposure to credit, currency and interest rate risks is disclosed in Note 29 Risks arising from financial instruments.
21. CASH AND CASH EQUIVALENTS
Million US dollar 2016 2015
Short-term bank deposits .......................................................................... 3 231 4 462
Treasury Bills .......................................................................................... 250 -
Cash and bank accounts ............................................................................ 5 098 2 461
Cash and cash equivalents..................................................................... 8 579 6 923
Bank overdrafts ..................................................................................... (184) (13)
8 395 6 910
The cash outstanding per 31 December 2016 includes restricted cash for an amount of 2m US dollar (2015: 5m US dollar). This
restricted cash refers to outstanding consideration payable to former Anheuser-Busch who did not yet claim the proceeds from the
2008 combination.
22. ASSETS CLASSIFIED AS HELD FOR SALE AND DISCONTINUED OPERATIONS
Million US dollar 2016 2015
Balance at the end of previous year ...................................................... 48 101
Combination with SABMiller ....................................................................... 24 805 -
Proceeds from SABMiller transaction-related divestitures .............................. (16 342) -
Reclassified to assets held for sale in the period .......................................... 7 959 148
Disposals through sales of subsidiaries ........................................................ (28) (189)
Effect of movements in foreign exchange ................................................... (51) (12)
Other movements ..................................................................................... 48 -
Balance at the end of year ..................................................................... 16 439 48
Assets held for sale through the Combination with SABMiller were recognized in relation to the divestiture of SABMiller’s interests
in the MillerCoors LLC joint venture and certain of SABMiller's portfolio of Miller brands outside of the U.S. to Molson Coors
Brewing company; the divestiture of SABMiller’s European premium brands to Asahi Group Holdings, Ltd and the divestiture of
SABMiller’s interest in China Resources Snow Breweries Ltd. to China Resources Beer (Holdings) Co. Ltd. These divestments
were completed on 11 October 2016. See also Note 6 – Acquisitions and disposals of Subsidiaries.
Assets held for sale through the Combination with SABMiller were also recognized in relation to the agreement to sell SABMiller’s
assets in Central and Eastern Europe (Hungary, Romania, the Czech Republic, Slovakia and Poland) to Asahi; and the agreement to
divest SABMiller’s interests in Distell Group Limited in South Africa to the Public Investment Corporation (SOC) Limited. By 31
December 2016, these disposals had not closed. See also Note 6 – Acquisitions and disposals of Subsidiaries
Amounts reclassified to assets held for sale in the period mainly related to the agreement reached in December 2016, between The
Coca-Cola Company and the company regarding the transition of the company’s 54.5% equity stake in CCBA for 3.15 billion US
dollar, after customary adjustments. CCBA includes the Coca-Cola bottling operations in South Africa, Namibia, Kenya, Uganda,
Tanzania, Ethiopia, Mozambique, Ghana, Mayotte and Comoros.
As discussed in Note 6 – Acquisition and disposal of subsidiaries, the company is in the process of finalizing the allocation of the
purchase price to individual assets acquired and liabilities assumed in compliance with IFRS 3. Accordingly, on a provisional basis,
the major classes of assets and liabilities of CCBA at the end of the reporting period, gross of non-controlling interests, are as
follows:

60
Million US dollar CCBA
Intangible assets and goodwill ................................................................... 6 032
Property, plant and equipment .................................................................. 1 301
Other assets ........................................................................................... 584
Assets classified as held for sale ........................................................... 7 917
Trade payables ........................................................................................ 558
Deferred tax liabilities ............................................................................... 1 459
Other liabilities ........................................................................................ 157
Liabilities associated with assets held for sale ..................................... 2 174
Net assets classified as held for sale .................................................... 5 743
In addition, the companies have reached an agreement in principle for The Coca-Cola Company to acquire the companies’s interest
in bottling operations in Zambia, Zimbabwe, Botswana, Swaziland, Lesotho, El Salvador and Honduras for an undisclosed amount.
The transactions are subject to the relevant regulatory and minority approvals and are expected to close by the end of 2017.
The results of the Central and Easter European businesses acquired through the SABMiller combination exclusively with a view to
resale, qualify as discontinued operations and have been presented as such in these consolidated financial statements.
The condensed income statement and cash flows of the Central and Easter European business are as follows:
Million US dollar 2016
Revenue ................................................................................................. 388
Profit from operations .............................................................................. 58
Profit from discontinued operations ...................................................... 48
Operating cash inflows/(outflows) .............................................................. 48
23. CHANGES IN EQUITY AND EARNINGS PER SHARE
COMBINATION WITH SABMILLER
The Combination was implemented through a series of steps and completed on the 10th of October. During the final step of the
proposed structure, the former Anheuser-Busch InBev SA/NV (the “former AB InBev”) has merged into Newbelco SA/NV
(“Newbelco”), and Newbelco has become the holding company for the combined former AB InBev and SABMiller groups. All
assets and liabilities of the former AB InBev have been transferred to Newbelco, and Newbelco has automatically been substituted
for the former AB InBev in all its rights and obligations by operation of Belgian law. Newbelco has been renamed Anheuser-Busch
InBev SA/NV, and the former AB InBev has been dissolved by operation of Belgian law.
The combination resulted in a series of equity reorganizations:
On 6 October 2016, Newbelco issued 163 276 737 100 ordinary shares (“Initial Newbelco Shares”) to SABMiller
shareholders through a capital increase of 85 531m euro represented by 8 553m euro capital (9 528 m US dollar) and
76 978m euro share premium (85 754m US dollar), as consideration for 1 632 767 371 ordinary shares of SABMiller
pursuant to a UK law court-sanctioned scheme of arrangement (the “UK Scheme”).
Following completion of the tender offer, AB InBev acquired 102 890 758 014 Initial Newbelco Shares tendered into the
Belgian offer equivalent to 555 466 167 new ordinary shares considering the consolidation factor of 185.233168056448
defined in the UK Scheme.
Based on the terms of the UK Scheme, all Initial Newbelco Shares not tendered to AB InBev in the context of the Belgian
offer (i.e. 60 385 979 086 Initial Newbelco Shares) were reclassified into 325 999 817 restricted shares, in accordance
with the mechanism by which any Initial Newbelco Shares that were retained after closing of the Belgian offer were
automatically reclassified and consolidated.
After the Belgian offer and, upon completion of the Belgian merger, all shares acquired by AB InBev in the Belgian offer
were cancelled except for the equivalent of 85 000 000 of new ordinary shares, which were retained by Newbelco and held
as treasury after completion of the Belgian Merger, as decided by the general meeting of Newbelco in the notarial deed
approving the merger of former AB InBev into Newbelco and in accordance with the Belgian Companies Code. As a
result of the merger the share premium was reduced by 52 522m euro (58 510m US dollar) against undistributable
reserves, 44 485m euro (49 556m US dollar) of such reserves were cancelled upon cancellation of the shares acquired by
AB InBev in the Belgian offer, and 8 037m euro (8 953m US dollar) undistributable reserves remained outstanding against
the 85 000 000 treasury shares in accordance with Belgian Companies Code.
Upon the merger, the capital and share premium of Newbelco were further reorganized. Newbelco’s share capital was
reduced by 8 553m euro (9 528m US dollar) and its issue premium account was reduced by 24 456m euro (27 244m USD)
to create distributable reserves of 33 009m euro (36 772m US dollar) as decided by the general meeting of Newbelco in
the notarial deed approving the merger of former AB InBev into Newbelco and in accordance with the Belgian Companies
Code. Each such step became effective simultaneously with the merger of former AB InBev into Newbelco upon
completion of the SABMiller transaction.
As discussed in Note 6 – Acquisition and disposal of subsidiaries, in accordance with IFRS, the merger between the former AB
InBev into Newbelco is considered for accounting purposes as a reverse acquisition, operation by which Newbelco legally absorbed

61
assets and liabilities of former AB InBev. As a consequence, the legal acquirer (Newbelco) is the accounting acquiree and the legal
acquiree (former AB InBev) is the accounting acquirer.
IFRS 3 requires that the comparative equity structure of the accounting acquirer (former AB InBev) be restated using the exchange
ratio established in the acquisition agreement to reflect the number of shares of the legal parent issued in the reverse acquisition. As
the exchange ratio resulting from the Belgian Merger represented one new ordinary share issued to the AB InBev shareholders in
exchange for one former AB InBev Share, without any cash compensation, no restatement of comparative figures was deemed
needed.
STATEMENT OF CAPITAL
The tables below summarize the changes in issued capital and treasury shares during the year:
FORMER AB INBEV –PRE MERGER
Issued capital
Million shares Million US dollar
At the end of the previous year and pre-merger ............................... 1 608 1 736
1 608 1 736
ISSUED CAPITAL – IMPACT MERGER
Issued capital
Million shares Million US dollar
6 October capital increase ............................................................. 881 9 528
Cancellation of acquired shares ...................................................... (470) -
Share for share exchange former AB InBev 1 608 1 736
Transfer to reserves ...................................................................... - (9 528)
2 019 1 736
Of which:
Ordinary shares 1 693
Restricted shares 326
TREASURY SHARES
Treasury shares
Result on the use of
treasury shares1
Million shares Million US dollar Million US dollar
At the end of the previous year ...................................................... 1.9 (202) (1 424)
Treasury shares as a result of the Belgian Merger ............................. 85.0 (8 953) -
Other changes during the period .................................................... (1.4) 175 (28)
85.5 (8 980) (1 452)
As at 31 December 2016, the share capital of AB InBev amounts to 1 238 608 344.12 euro (1 736 billion US dollar). It is
represented by 2 019 241 973 shares without nominal value, of which 85 540 392 are held in treasury by AB InBev and its
subsidiaries. All shares are new ordinary shares following the completion of the Belgian Merger, except for 325 999 817 Restricted
Shares. As at 31 December 2016, there is no authorized, un-issued capital.
The treasury shares held by the company are reported in equity in Treasury shares.
The holders of ordinary and restricted shares are entitled to receive dividends as declared from time to time and are entitled to one
vote per share at meetings of the company. In respect of the company’s shares that are held by AB InBev, rights are suspended.
The restricted shares are unlisted, not admitted to trading on any stock exchange, and are subject to, among other things, restrictions
on transfer until converted into new ordinary shares. The restricted shares will be convertible at the election of the holder into new
ordinary shares on a one-for-one basis with effect from the fifth anniversary of completion of the Combination. From completion of
the Combination, such restricted shares will rank equally with the new ordinary shares with respect to dividends and voting rights.
The shareholders’ structure based on the notifications made to the company pursuant to the Belgian Law of 02 May 2007 on the
disclosure of significant shareholdings in listed companies is included in the Corporate Governance section of AB InBev’s annual
report.
CHANGES IN OWNERSHIP INTERESTS
In compliance with IFRS 10, the acquisition of additional shares in a subsidiary is accounted for as an equity transaction with
owners.
During 2016, AB InBev purchased non-controlling interests in subsidiaries for a total consideration of 10m US dollar. As the related
subsidiaries were already fully consolidated, the purchases did not impact AB InBev’s profit, but reduced the non-controlling
interests and thus impacted the profit attributable to equity holders of AB InBev.
REPORT ACCORDING TO ARTICLE 624 OF THE BELGIAN COMPANIES CODE - PURCHASE OF OWN SHARES
During the year ended 31 December 2015, AB InBev bought back 8 200 090 shares for a total amount of 1 billion US dollar,
corresponding to 0.41% of the total shares outstanding. The shares acquired were mainly used to fulfill the company’s various share
delivery commitments under the stock ownership plan.
1 During 2016, the company reclassified the results of treasury shares to retained earnings

62
During 2016, the company proceeded with the following sale transactions:
194 132 shares were granted to executives of the group according to the company’s executive remuneration policy;
1 139 599 shares were sold, as a result of the exercise of options granted to employees of the group.
At the end of the period, the group owned 85 540 392 own shares of which 85 000 000 were held directly by AB InBev.
The par value of the shares is 0.61 euro. As a consequence, the shares that were sold during the year 2016 represent 862 374 US
dollar (818 114 euro) of the subscribed capital and the shares that the company still owned at the end of 2016 represent 54 959 956
US dollar (52 139 224 euro) of the subscribed capital.
DIVIDENDS
On 27 October 2016, an interim dividend of 1.60 euro per share or 3 091m euro was approved by the Board of Directors. This
interim dividend was paid out on 17 November 2016. On 1 March 2017, in addition to the interim dividend paid on 17 November
2016, a dividend of 2.00 euro per share or 3 856m euro was proposed by the Board of Directors, reflecting a total dividend payment
for 2016 fiscal year of 3.60 euro per share or 6 947m euro.
On 29 October 2015, an interim dividend of 1.60 euro per share or 2 570m euro was approved by the Board of Directors. This
interim dividend was paid out on 16 November 2015. On 27 April 2016, in addition to the interim dividend paid on 16 November
2015, a dividend of 2.00 euro per share or approximately 3 206m euro was approved at the shareholders meeting, reflecting a total
dividend payment for 2015 fiscal year of 3.60 euro per share or 5 776m euro. The dividend was paid out on 3 May 2016.
TRANSLATION RESERVES
The translation reserves comprise all foreign currency exchange differences arising from the translation of the financial statements
of foreign operations. The translation reserves also comprise the portion of the gain or loss on the foreign currency liabilities and on
the derivative financial instruments determined to be effective net investment hedges in conformity with IAS 39 Financial
Instruments: Recognition and Measurement hedge accounting rules.
HEDGING RESERVES
The hedging reserves comprise the effective portion of the cumulative net change in the fair value of cash flow hedges to the extent
the hedged risk has not yet impacted profit or loss – see also Note 29 Risks arising from financial instruments.
TRANSFERS FROM SUBSIDIARIES
The amount of dividends payable to AB InBev by its operating subsidiaries is subject to, among other restrictions, general
limitations imposed by the corporate laws, capital transfer restrictions and exchange control restrictions of the respective
jurisdictions where those subsidiaries are organized and operate. Capital transfer restrictions are also common in certain emerging
market countries, and may affect AB InBev’s flexibility in implementing a capital structure it believes to be efficient. As at 31
December 2016, the restrictions above mentioned were not deemed significant on the company’s ability to access or use the assets
or settle the liabilities of the its operating subsidiaries.
Dividends paid to AB InBev by certain of its subsidiaries are also subject to withholding taxes. Withholding tax, if applicable,
generally does not exceed 15%.
DEFERRED SHARE INSTRUMENT
In a transaction related to the combination with Grupo Modelo, selected Grupo Modelo shareholders committed, upon tender of
their Grupo Modelo shares, to acquire 23 076 923 AB InBev shares to be delivered within 5 years for a consideration of
approximately 1.5 billion US dollar. The consideration was paid on 5 June 2013. Pending the delivery of the AB InBev shares, AB
InBev will pay a coupon on each undelivered AB InBev share, so that the Deferred Share Instrument holders are compensated on an
after tax basis, for dividends they would have received had the AB InBev shares been delivered to them prior to the record date for
such dividend.
The deferred share instrument is classified as an equity instrument, in line with IAS 32, as the number of shares and consideration
received are fixed. The coupon to compensate for the dividend equivalent is reported through equity. On 3 May 2016, the company
paid a coupon of 2.00 euro per share or approximately 51m US dollar. On 17 November 2016, the company paid a coupon of 1.60
euro per share or approximately 41m US dollar.
STOCK LENDING
In order to fulfil AB InBev’s commitments under various outstanding stock option plans, AB InBev entered into stock lending
arrangements for up to 15 million of its own ordinary shares. As of 31 December 2016, the outstanding balance of loaned securities
amounted to 15 million, of which 13 million were used to fulfil stock option plan commitments. AB InBev shall pay any dividend
equivalent, after tax in respect of the loaned securities. This payment will be reported through equity as dividend.

63
OTHER COMPREHENSIVE INCOME RESERVES
The changes in the other comprehensive income reserves are as follows:
Million US dollar
Translation
reserves
Hedging
reserves
Post-employment
benefits
Total OCI
reserves
As per 1 January 2016 ............................................... (11 493) (1 217) (1 400) (14 110)
Other comprehensive income
Exchange differences on translation of foreign
operations (gains/(losses)) ......................................... (3 265) - - (3 265)
Foreign exchange contracts recognized in equity in
relation to the SABMiller combination .......................... - (7 099) - (7 099)
Foreign exchange contracts reclassified from equity
in relation to the SABMiller combination ....................... - 8 837 - 8 837 Cash flow hedges ...................................................... - 223 - 223
Re-measurements of post-employment benefits ........... - (212) (212)
Total comprehensive income ..................................... (3 265) 1 961 (212) (1 516)
As per 31 December 2016 ......................................... (14 758) 744 (1 612) (15 626)
Million US dollar
Translation
reserves
Hedging
reserves
Post-employment
benefits
Total OCI
reserves
As per 1 January 2015 ............................................... (5 336) 557 (1 447) (6 226)
Other comprehensive income
Exchange differences on translation of foreign
operations (gains/(losses)) ......................................... (6 157) - - (6 157)
Foreign exchange contracts recognized in equity in
relation to the SABMiller combination .......................... - (1 738) - (1 738)
Cash flow hedges ...................................................... - (36) - (36)
Re-measurements of post-employment benefits ........... - - 47 47
Total comprehensive income ..................................... (6 157) (1 774) 47 (7 884)
As per 31 December 2015 ......................................... (11 493) (1 217) (1 400) (14 110)
EARNINGS PER SHARE
The calculation of basic earnings per share is based on the profit attributable to equity holders of AB InBev of 1 241m US dollar (31
December 2015: 8 273m US dollar) and a weighted average number of ordinary and restricted shares outstanding (including
deferred share instruments and stock lending) per end of the period, calculated as follows:
Million shares 2016 2015
Issued ordinary shares at 1 January, net of treasury shares .................................................... 1 606 1 607
Effect of restricted share issuance – SABMiller combination .................................................... 94 -
Effect of shares issued and share buyback programs .............................................................. (20) (2)
Effect of stock lending ........................................................................................................ 12 10
Effect of undelivered shares under the deferred share instrument ............................................ 23 23
Weighted average number of ordinary and restricted shares at 31 December ............... 1 717 1 638
The calculation of diluted earnings per share is based on the profit attributable to equity holders of AB InBev of 1 241m US dollar
(31 December 2015: 8 273m US dollar) and a weighted average number of ordinary and restricted shares (diluted) outstanding
(including deferred share instruments and stock lending) per end of the period, calculated as follows:
Million shares 2016 2015
Weighted average number of ordinary and restricted shares at 31 December ........................... 1 717 1 638
Effect of share options, warrants and restricted stock units ..................................................... 38 30
Weighted average number of ordinary and restricted shares (diluted) at 31 December . 1 755 1 668
The calculation of earnings per share before non-recurring items and discontinued operations is based on the profit from continuing
operations attributable to equity holders of AB InBev. A reconciliation of profit before non-recurring items and discontinued
operations, attributable to equity holders of AB InBev to profit attributable to equity holders of AB InBev is calculated as follows:
Million US dollar 2016 2015
Profit before non-recurring items and discontinued operations, attributable to equity holders of
AB InBev .......................................................................................................................... 4 853 8 513
Non-recurring items, after taxes, attributable to equity holders of AB InBev (refer to Note 8) ... (304) (26)
Non-recurring finance income/(cost), after taxes, attributable to equity holders of AB InBev (refer
to Note 8)......................................................................................................................... (3 356) (214)
Profit from discontinued operations (refer to Note 22) ............................................................ 48 -
Profit attributable to equity holders of AB InBev ............................................................ 1 241 8 273

64
The table below sets out the EPS calculation:
Million US dollar 2016 2015
Profit attributable to equity holders of AB InBev .................................................................... 1 241 8 273
Weighted average number of ordinary and restricted shares ................................................... 1 717 1 638
Basic EPS from continuing and discontinued operations................................................. 0.72 5.05
Profit from continuing operations attributable to equity holders of AB InBev ............................. 1 193 8 273
Weighted average number of ordinary and restricted shares ................................................... 1 717 1 638
Basic EPS from continuing operations ............................................................................ 0.69 5.05
Profit from continuing operations before non-recurring items, attributable to equity holders of
AB InBev .......................................................................................................................... 4 853 8 513
Weighted average number of ordinary and restricted shares ................................................... 1 717 1 638
EPS from continuing operations before non-recurring items .......................................... 2.83 5.20
Profit attributable to equity holders of AB InBev .................................................................... 1 241 8 273
Weighted average number of ordinary and restricted shares (diluted) ...................................... 1 755 1 668
Diluted EPS from continuing and discontinued operations.............................................. 0.71 4.96
Profit from continuing operations attributable to equity holders of AB InBev ............................. 1 193 8 273
Weighted average number of ordinary and restricted shares (diluted) ...................................... 1 755 1 668
Diluted EPS from continuing operations ......................................................................... 0.68 4.96
Profit from continuing operations before non-recurring items, attributable to equity holders of
AB InBev .......................................................................................................................... 4 853 8 513
Weighted average number of ordinary and restricted shares (diluted) ...................................... 1 755 1 668
Diluted EPS from continuing operations before non-recurring items ............................. 2.77 5.10
The average market value of the company’s shares for purposes of calculating the dilutive effect of share options and restricted stock
units was based on quoted market prices for the period that the options and restricted stock units were outstanding. 5m share options
were anti-dilutive and not included in the calculation of the dilutive effect as at 31 December 2016.
24. INTEREST-BEARING LOANS AND BORROWINGS
This note provides information about the company’s interest-bearing loans and borrowings. For more information about the
company’s exposure to interest rate and foreign exposure currency risk - refer to Note 29 Risks arising from financial instruments.
NON-CURRENT LIABILITIES
Million US dollar 2016 2015
Secured bank loans ............................................................................................ 210 175
Unsecured bank loans ......................................................................................... 8 266 89
Unsecured bond issues ........................................................................................ 105 146 43 112
Unsecured other loans ........................................................................................ 111 43 Finance lease liabilities ........................................................................................ 208 122
113 941 43 541
CURRENT LIABILITIES Million US dollar 2016 2015
Secured bank loans ............................................................................................ 652 102
Commercial papers ............................................................................................. 2 053 2 087
Unsecured bank loans ......................................................................................... 1 396 1 380
Unsecured bond issues ........................................................................................ 4 481 2 330
Unsecured other loans ........................................................................................ 10 9
Finance lease liabilities ........................................................................................ 26 4
8 618 5 912
The current and non-current interest-bearing loans and borrowings amount to 122.6 billion US dollar as of 31 December 2016,
compared to 49.5 billion US dollar as of 31 December 2015. Out of the 122.6 billion US dollar as of 31 December 2016, 12.2 billion
US dollar represents the fair market value of the total SABMiller debt assumed.
Commercial papers amount to 2.1 billion US dollar as of 31 December 2016 and include programs in US dollar and euro with a total
authorized issuance up to 3.0 billion US dollar and 1.0 billion euro, respectively.

65
During 2016, AB InBev completed the issuance of the following series of bonds:
Issue date
Aggregate
principal amount
(in millions) Currency Interest rate Maturity date
25 January 2016 4 000 US dollar 1.900% 1 February 2019
25 January 2016 7 500 US dollar 2.650% 1 February 2021
25 January 2016 6 000 US dollar 3.300% 1 February 2023
25 January 2016 11 000 US dollar 3.650% 1 February 2026
25 January 2016 6 000 US dollar 4.700% 1 February 2036 25 January 2016 11 000 US dollar 4.900% 1 February 2046
25 January 2016 500 US dollar 3M LIBOR + 126 bps 1 February 2021
29 January 2016 1 470 US dollar 4.915% 29 January 2046
29 March 2016 1 750 Euro 0.625% 17 March 2020
29 March 2016 2 000 Euro 0.875% 17 March 2022
29 March 2016 2 500 Euro 1.500% 17 March 2025
29 March 2016 3 000 Euro 2.000% 17 March 2028
29 March 2016 2 750 Euro 2.750% 17 March 2036
29 March 2016 1 250 Euro 3M EURIBOR + 75 bps 17 March 2020
Substantially all of the net proceeds of the offering was used to fund a portion of the purchase price for the combination with
SABMiller and related transactions. The remainder of the net proceeds was used for general corporate purposes. The excess liquidity
resulting from these bonds was mainly invested in US Treasury Bills pending the closing of the combination.
In connection with the combination with SABMiller, AB InBev entered into a 75.0 billion US dollar Committed Senior Acquisition
Facilities agreement dated 28 October 2015 to fund the cash consideration of the transaction. The new financing consisted of a 10.0
billion US dollar Disposal Bridge Facility, a 15.0 billion US dollar Cash/DCM Bridge Facility A, a 15.0 billion US dollar
Cash/DCM Bridge Facility B, a 25.0 billion US dollar Term Facility A, and a 10.0 billion US dollar Term Facility B, (“2015 Senior
Facilities Agreement”).
On 27 January 2016, AB InBev announced that it had cancelled 42.5 billion US dollar of the 75.0 billion US dollar Committed
Senior Acquisition Facilities. Upon receipt of the net proceeds of the January 46 billion US dollar offering, the company was
required to cancel the Bridge to Cash / DCM Facilities A & B totaling 30 billion US dollar. Additionally, the company chose to
make a voluntary cancellation of 12.5 billion US dollar of the Term Facility A as permitted under the terms of the 2015 Senior
Facilities. On 4 April 2016, AB InBev announced that it had chosen to make an additional voluntary cancellation of the remaining
12.5 billion US dollar of the Term Facility A.
On 6 October 2016, the company drew down 8.0 billion US dollar under the Term Facility B and 10.0 billion US dollar under the
Disposal Bridge Facility to finance the acquisition of SABMiller and announced that it had chosen to make an additional voluntary
cancellation of 2.0 billion US dollar of the Term Facility B. On 20 October 2016, the company fully repaid the Disposal Bridge
Facility, following completion of the disposals of SABMiller’s interests in MillerCoors and the global Miller brand, SABMiller's
interest in China Resources Snow Breweries and part of SABMiller’s European business – see also Note 6 – Acquisitions and
disposals of Subsidiaries.
A summation of the Facilities, related cancellations and drawdowns as of 31 December 2016 is presented below:
Facility Term
Applicable
Margin (bps)
Original
Amount (billion
US dollar)
2016
Cancellation (billion
US dollar)
2016
Drawdown (billion
US dollar)
Repayment (billion
US dollar)
Outstanding
Balance (billion
US dollar)
Term Facility A 3 Years LIBOR + 110 25.0 (25.0) - - -
Term Facility B 5 Years LIBOR + 125 10.0 (2.0) (8.0) - (8.0)
Disposal Bridge Facility 1 Year LIBOR + 100 10.0 - (10.0) 10.0 -
Bridge to Cash / DCM Facility A 1 Year LIBOR + 100 15.0 (15.0) - - -
Bridge to Cash / DCM Facility B 2 Years LIBOR + 100 15.0 (15.0) - - -
75.0 (57.0) (18.0) 10.0 (8.0)
The facilities bear interest rate calculated at LIBOR for a period equal to the length of the interest period plus an applicable margin.
The margins on each facility are determined based on ratings assigned by rating agencies to AB InBev long-term debt. For Term
Facility B, the margin ranges between 1.00% per annum and 1.45% per annum.
Customary commitment fees were payable on any undrawn but available funds under the 2015 Senior Facilities Agreement. These
fees are recorded as exceptional finance cost – see also Note 8 Non-recurring items.
As at 31 December 2016, there are no amounts drawn down under the 9.0 billion US dollar 2010 Senior Facilities.
Furthermore, in 2016, AB InBev completed the following early redemptions, exchange offers and credit facilities cancellation:
On 9 December 2016, the company and its wholly-owned subsidiaries, Anheuser-Busch InBev Finance Inc. and
Anheuser-Busch North American Holding Corporation (formerly SABMiller Holdings Inc.), exercised their respective
options to redeem in full the entire outstanding principal amount of certain series of notes, consisting of 1.2 billion US
dollar aggregate principal amount of fixed rate notes due 2017 bearing interest at an annual rate of 1.125%; 2.0 billion US
dollar aggregate principal amount of fixed rate notes due 2017 bearing interest at an annual rate of 2.45% and; 0.6 billion
euro aggregate principal amount of fixed rate notes due 2017 bearing interest at an annual rate of 8.625%.
In November 2016, the company cancelled 3.5 billion US dollar committed syndicated revolving credit facilities assumed
as part of the SABMiller combination, that were available for general corporate purposes.
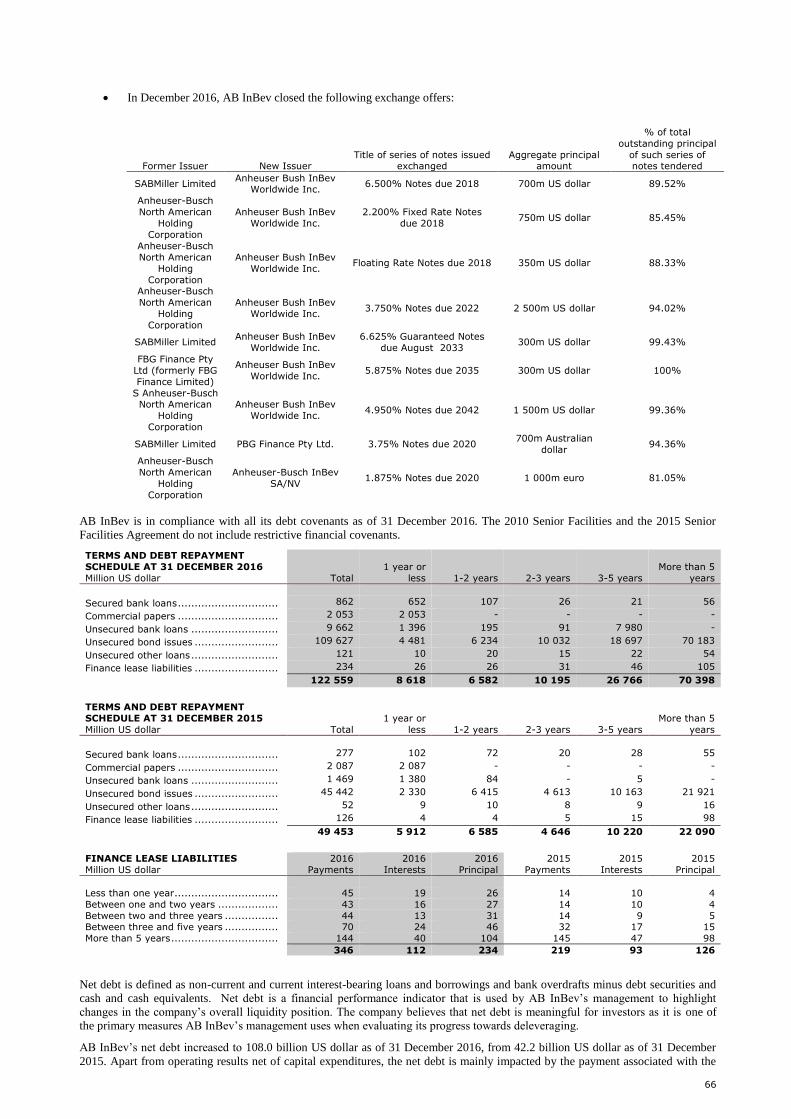
66
In December 2016, AB InBev closed the following exchange offers:
Former Issuer New Issuer Title of series of notes issued
exchanged Aggregate principal
amount
% of total
outstanding principal
of such series of notes tendered
SABMiller Limited Anheuser Bush InBev
Worldwide Inc. 6.500% Notes due 2018 700m US dollar 89.52%
Anheuser-Busch
North American
Holding
Corporation
Anheuser Bush InBev
Worldwide Inc.
2.200% Fixed Rate Notes
due 2018 750m US dollar 85.45%
Anheuser-Busch
North American
Holding
Corporation
Anheuser Bush InBev
Worldwide Inc. Floating Rate Notes due 2018 350m US dollar 88.33%
Anheuser-Busch
North American
Holding
Corporation
Anheuser Bush InBev
Worldwide Inc. 3.750% Notes due 2022 2 500m US dollar 94.02%
SABMiller Limited Anheuser Bush InBev
Worldwide Inc.
6.625% Guaranteed Notes
due August 2033 300m US dollar 99.43%
FBG Finance Pty
Ltd (formerly FBG
Finance Limited)
Anheuser Bush InBev
Worldwide Inc. 5.875% Notes due 2035 300m US dollar 100%
S Anheuser-Busch North American
Holding
Corporation
Anheuser Bush InBev
Worldwide Inc. 4.950% Notes due 2042 1 500m US dollar 99.36%
SABMiller Limited PBG Finance Pty Ltd. 3.75% Notes due 2020 700m Australian
dollar 94.36%
Anheuser-Busch
North American
Holding
Corporation
Anheuser-Busch InBev
SA/NV 1.875% Notes due 2020 1 000m euro 81.05%
AB InBev is in compliance with all its debt covenants as of 31 December 2016. The 2010 Senior Facilities and the 2015 Senior
Facilities Agreement do not include restrictive financial covenants.
TERMS AND DEBT REPAYMENT
SCHEDULE AT 31 DECEMBER 2016
Million US dollar Total
1 year or
less 1-2 years 2-3 years 3-5 years
More than 5
years
Secured bank loans .............................. 862 652 107 26 21 56
Commercial papers .............................. 2 053 2 053 - - - -
Unsecured bank loans .......................... 9 662 1 396 195 91 7 980 -
Unsecured bond issues ......................... 109 627 4 481 6 234 10 032 18 697 70 183
Unsecured other loans .......................... 121 10 20 15 22 54
Finance lease liabilities ......................... 234 26 26 31 46 105
122 559 8 618 6 582 10 195 26 766 70 398
TERMS AND DEBT REPAYMENT
SCHEDULE AT 31 DECEMBER 2015
Million US dollar Total
1 year or
less 1-2 years 2-3 years 3-5 years
More than 5
years
Secured bank loans .............................. 277 102 72 20 28 55
Commercial papers .............................. 2 087 2 087 - - - -
Unsecured bank loans .......................... 1 469 1 380 84 - 5 -
Unsecured bond issues ......................... 45 442 2 330 6 415 4 613 10 163 21 921
Unsecured other loans .......................... 52 9 10 8 9 16
Finance lease liabilities ......................... 126 4 4 5 15 98
49 453 5 912 6 585 4 646 10 220 22 090
FINANCE LEASE LIABILITIES
Million US dollar
2016
Payments
2016
Interests
2016
Principal
2015
Payments
2015
Interests
2015
Principal
Less than one year............................... 45 19 26 14 10 4
Between one and two years .................. 43 16 27 14 10 4
Between two and three years ................ 44 13 31 14 9 5 Between three and five years ................ 70 24 46 32 17 15
More than 5 years ................................ 144 40 104 145 47 98
346 112 234 219 93 126
Net debt is defined as non-current and current interest-bearing loans and borrowings and bank overdrafts minus debt securities and
cash and cash equivalents. Net debt is a financial performance indicator that is used by AB InBev’s management to highlight
changes in the company’s overall liquidity position. The company believes that net debt is meaningful for investors as it is one of
the primary measures AB InBev’s management uses when evaluating its progress towards deleveraging.
AB InBev’s net debt increased to 108.0 billion US dollar as of 31 December 2016, from 42.2 billion US dollar as of 31 December
2015. Apart from operating results net of capital expenditures, the net debt is mainly impacted by the payment associated with the

67
combination with SABMiller net of the cash acquired and the proceeds from the announced divestitures completed at 31 December
2016 (48.8 billion US dollar), the SABMiller debt assumed as part of the combination (11.9 billion US dollar), the settlement of the
portion of the derivatives hedging the SABMiller purchase consideration that did not qualify as hedge accounting (4.5 billion US
dollar), dividend payments to shareholders of AB InBev and Ambev (8.5 billion US dollar), the payment of interests and taxes (6.0
billion US dollar) and the impact of changes in foreign exchange rates (0.3 billion US dollar decrease of net debt).
The following table provides a reconciliation of AB InBev’s net debt as at 31 December:
Million US dollar 2016 2015
Non-current interest-bearing loans and borrowings ..................................................... 113 941 43 541 Current interest-bearing loans and borrowings ........................................................... 8 618 5 912
122 559 49 453
Bank overdrafts ...................................................................................................... 184 13
Cash and cash equivalents ....................................................................................... (8 579) (6 923)
Interest bearing loans granted and other deposits (included within Trade and other
receivables) ........................................................................................................... (528) (286)
Debt securities (included within Investment securities) ............................................... (5 683) (72)
Net debt .............................................................................................................. 107 953 42 185
25. EMPLOYEE BENEFITS
AB InBev sponsors various post-employment benefit plans worldwide. These include pension plans, both defined contribution
plans, and defined benefit plans, and other post-employment benefits. In accordance with IAS 19 Employee Benefits post-
employment benefit plans are classified as either defined contribution plans or defined benefit plans.
DEFINED CONTRIBUTION PLANS
For defined contribution plans, AB InBev pays contributions to publicly or privately administered pension funds or insurance
contracts. Once the contributions have been paid, the group has no further payment obligation. The regular contributions constitute
an expense for the year in which they are due. For 2016, contributions paid into defined contribution plans for the company
amounted to 77m US dollar compared to 90m US dollar for 2015.
DEFINED BENEFIT PLANS
During 2016, the company contributed to 101 defined benefit plans, of which 69 are retirement or leaving service plans, 25 are
medical cost plans and 7 other long-term employee benefit plans. Most plans provide retirement and leaving service benefits related
to pay and years of service. The Australian, Barbadian, Belgian, Brazilian, Canadian, Dominican Republic, Dutch, Mexican,
Panamean, South Korean, South African, UK and US plans are partially funded. When plans are funded, the assets are held in
legally separate funds set up in accordance with applicable legal requirements and common practice in each country. The medical
cost plans in Barbados, Brazil, Canada, Colombia, South Africa and US provide medical benefits to employees and their families
after retirement. Many of the defined benefit plans are closed to new entrants.
The present value of funded obligations includes a 210m US dollar liability related to two medical plans in Brazil, for which the
benefits are provided through the Fundação Antonio Helena Zerrenner (“FAHZ”). The FAHZ is a legally distinct entity which
provides medical, dental, educational and social assistance to current and retired employees of Ambev. On 31 December 2016, the
actuarial liabilities related to the benefits provided by the FAHZ are fully offset by an equivalent amount of assets existing in the
fund. The net liability recognized in the balance sheet is nil.
The employee benefit net liability amounts to 3 004m US dollar as of 31 December 2016 compared to 2 723m US dollar as of 31
December 2015. In 2016, the fair value of the plan assets increased by 102m US dollar and the defined benefit obligations increased
by 358m US dollar. The increase in the employee benefit net liability is mainly driven by decreases in discount rates partially offset
by positive asset returns. The combination with SABMiller is also impacting the employee benefit net liability (see Note 6
Acquisitions and disposals).

68
The company’s net liability for post-employment and long-term employee benefit plans comprises the following at 31 December:
Million US dollar
2016 2015
Present value of funded obligations ..................................................................................... (7 044) (6 905)
Fair value of plan assets .................................................................................................... 5 177 5 075
Present value of net obligations for funded plans .......................................................... (1 867) (1 830)
Present value of unfunded obligations ................................................................................. (908) (689)
Present value of net obligations .................................................................................... (2 775) (2 519)
Unrecognized asset ........................................................................................................... (168) (137)
Net liability .................................................................................................................... (2 943) (2 656)
Other long term employee benefits ..................................................................................... (73) (67)
Reclassified as held for sale ............................................................................................... 12 -
Total employee benefits ................................................................................................ (3 004) (2 723)
Employee benefits amounts in the balance sheet:
Liabilities ......................................................................................................................... (3 014) (2 725)
Assets ............................................................................................................................. 10 2
Net liability .................................................................................................................... (3 004) (2 723)
The changes in the present value of the defined benefit obligations are as follows:
Million US dollar 2016 2015
Defined benefit obligation at 1 January ......................................................................... (7 594) (8 585)
Current service costs ........................................................................................................ (73) (81)
Interest cost .................................................................................................................... (347) (354)
Past service gain/(cost) ..................................................................................................... 8 8
Settlements ..................................................................................................................... 174 3
Benefits paid .................................................................................................................... 482 517
Contribution by plan participants ........................................................................................ (4) (4)
Acquisition and disposal through business combination ......................................................... (260) -
Actuarial gains/(losses) – demographic assumptions ............................................................. (1) 4
Actuarial gains/(losses) – financial assumptions ................................................................... (607) 283
Experience adjustments .................................................................................................... 37 14
Exchange differences ........................................................................................................ 256 606
Transfers and other movements ......................................................................................... (23) (5)
Defined benefit obligation at 31 December .................................................................... (7 952) (7 594)
As at the last valuation date, the present value of the defined benefit obligation was comprised of approximately
1.9 billion US dollar relating to active employees, 1.5 billion US dollar relating to deferred members and 4.6 billion US dollar
relating to members in retirement.
The changes in the fair value of plan assets are as follows:
Million US dollar 2016 2015
Fair value of plan assets at 1 January............................................................................ 5 075 5 773
Interest income ................................................................................................................ 249 253
Administration costs ......................................................................................................... (24) (20)
Return on plan assets exceeding interest income .................................................................. 297 (211)
Contributions by AB InBev ................................................................................................. 302 275
Contributions by plan participants ....................................................................................... 4 4
Benefits paid net of administration costs ............................................................................. (478) (517)
Acquisition through business combination ............................................................................ 68 -
Assets distributed on settlements ....................................................................................... (164) -
Exchange differences ........................................................................................................ (155) (482)
Transfers and other movements ......................................................................................... 3 -
Fair value of plan assets at 31 December ...................................................................... 5 177 5 075
Actual return on plans assets amounted to a gain of 546m US dollar in 2016 compared to a gain of 42m US dollar in 2015. The
increase is mainly driven by higher than expected market returns particularly in Brazil, the UK and the United States.
Acquisitions through business combinations mainly refer to defined benefit plans in Colombia and South Africa following the
combination with SABMiller. See also Note 6 – Acquisition and disposal of subsidiaries.

69
The changes in the unrecognized asset are as follows:
Million US dollar 2016 2015
Irrecoverable surplus impact at 1 January .................................................................... (137) (171)
Interest expense .............................................................................................................. (17) (15)
Changes excluding amounts included in interest expense ..................................................... (14) 49
Irrecoverable surplus impact at 31 December ............................................................... (168) (137)
The expense recognized in the income statement with regard to defined benefit plans can be detailed as follows:
Million US dollar 2016 2015
Current service costs ........................................................................................................ (73) (81)
Administration costs ......................................................................................................... (24) (20)
Past service cost .............................................................................................................. 8 8
(Losses)/gains on settlements or curtailments ..................................................................... 10 (2)
Profit from operations ................................................................................................... (79) (95)
Net finance cost ............................................................................................................... (115) (116)
Total employee benefit expense .................................................................................... (194) (211)
The employee benefit expense is included in the following line items of the income statement:
Million US dollar 2016 2015
Cost of sales .................................................................................................................... (59) (64)
Distribution expenses ........................................................................................................ (9) (8)
Sales and marketing expenses ........................................................................................... (13) (14)
Administrative expenses .................................................................................................... (15) (17)
Other operating (expense)/income ..................................................................................... 10 6
Non-recurring items .......................................................................................................... 7 2
Net finance cost ............................................................................................................... (115) (116)
(194) (211)
Weighted average assumptions used in computing the benefit obligations of the company’s significant plans at the balance sheet
date are as follows:
2016
United
States Canada Mexico Brazil
United
Kingdom AB InBev
Discount rate ................................................... 4.2% 3.9% 7.8% 10.5% 2.7% 4.4%
Price inflation ................................................... 2.5% 2.0% 3.5% 4.5% 3.4% 2.8%
Future salary increases ..................................... - 1.0% 4.8% 5.8% - 3.5%
Future pension increases ................................... - 2.0% 3.5% 4.5% 3.1% 2.8%
Medical cost trend rate ...................................... 7.0%-5.0% 4.5% - 8.2% - 7.2%-6.5%
Life expectation for a 65 year old male ................ 85 86 82 85 87 86
Life expectation for a 65 year old female ............. 88 89 85 88 89 88
2015
United
States Canada Mexico Brazil
United
Kingdom AB InBev
Discount rate ................................................... 4.4% 4.1% 7.0% 12.1% 4.0% 4.6%
Price inflation ................................................... 2.5% 2.0% 3.5% 4.5% 3.2% 2.7%
Future salary increases ..................................... 2.0% 1.0% 4.8% 5.8% - 3.6%
Future pension increases ................................... - 2.0% 3.5% 4.5% 2.9% 2.7%
Medical cost trend rate ...................................... 6.2%-5.0% 4.5% - 8.2% - 6.6%-5.9%
Life expectation for a 65 year old male ................ 85 86 82 85 87 85
Life expectation for a 65 year old female ............. 88 89 85 88 89 88
Through its defined benefit pension plans and post-employment medical plans, the company is exposed to a number of risks, the
most significant are detailed below:
ASSET VOLATILITY
The plan liabilities are calculated using a discount rate set with reference to high quality corporate yields; if plan assets
underperform this yield, the company’s net defined benefit obligation may increase. Most of the company’s funded plans hold a
significant proportion of equities, which are expected to outperform corporate bonds in the long-term while providing volatility and
risk in the short-term. As the plans mature, the company usually reduces the level of investment risk by investing more in assets that
better match the liabilities.
CHANGES IN BOND YIELDS
A decrease in corporate bond yields will increase plan liabilities, although this will be partially offset by an increase in the value of
the plans’ bond holdings.

70
INFLATION RISK
Some of the company’s pension obligations, mainly in the UK, are linked to inflation, and higher inflation will lead to higher
liabilities. The majority of the plan’s assets are either unaffected by or loosely correlated with inflation, meaning that an increase in
inflation could potentially increase the company’s net benefit obligation.
LIFE EXPECTANCY
The majority of the plans’ obligations are to provide benefits for the life of the member, so increases in life expectancy will result in
an increase in the plans’ liabilities.
INVESTMENT STRATEGY
In case of funded plans, the company ensures that the investment positions are managed within an asset-liability matching (ALM)
framework that has been developed to achieve long-term investments that are in line with the obligations under the pension
schemes. Within this framework, the company’s ALM objective is to match assets to the pension obligations by investing in long-
term fixed interest securities with maturities that match the benefit payments as they fall due and in the appropriate currency. The
company actively monitors how the duration and the expected yield of the investments are matching the expected cash outflows
arising from the pension obligation. In 2015, the company has started the implementation of a new pension de-risking strategy to
reduce the risk profile of certain plans by reducing gradually the current exposure to equities and shifting those assets to fixed
income securities.
The weighted average duration of the defined benefit obligation is 14.0 years (2015: 14.4 years).
The sensitivity of the defined benefit obligation to changes in the weighted principal assumptions is:
Million US dollar 2016
Change in
assumption
Increase in
assumption
Decrease in
assumption
Discount rate ............................................................................... 0.5% (505) 549
Future salary increase ................................................................... 0.5% 24 (22)
Medical cost trend rate .................................................................. 1% 44 (38)
Longevity .................................................................................... One year 230 (227)
Sensitivities are what is reasonably possible changes in assumptions and they are calculated using the same approach as was used to
determine the defined benefit obligation. Therefore, the above information is not necessarily a reasonable representation of future
results.
The above are purely hypothetical changes in individual assumptions holding all other assumptions constant: economic conditions
and changes therein will often affect multiple assumptions at the same time and the effects of changes in key assumptions are not
linear.
The fair value of plan assets at 31 December consists of the following:
2016 2015
Quoted Unquoted Total Quoted Unquoted Total
Government bonds ....................................................... 30% - 30% 26% - 26%
Corporate bonds ........................................................... 38% - 38% 31% - 31%
Equity instruments ....................................................... 22% - 22% 29% - 29%
Property ...................................................................... - 3% 3% - 3% 3%
Insurance contracts and others ...................................... 6% 1% 7% 10% 1% 11%
96% 4% 100% 96% 4% 100%
AB InBev expects to contribute approximately 251m US dollar for its funded defined benefit plans and 80m US dollar in benefit
payments to its unfunded defined benefit plans and post-retirement medical plans in 2017.
26. SHARE-BASED PAYMENTS1
Different share and share option programs allow company senior management and members of the board of directors to receive or
acquire shares of AB InBev or Ambev. AB InBev has three primary share-based compensation plans, the share-based compensation
plan (“Share-Based Compensation Plan”), established in 2006 and amended as from 2010, the long-term incentive warrant plan
(“LTI Warrant Plan”), established in 1999 and replaced by a long-term incentive stock option plan for directors (“LTI Stock Option
Plan Directors”) in 2014, and the long-term incentive stock-option plan for executives (“LTI Stock Option Plan Executives”),
established in 2009. For all option plans, the fair value of share-based payment compensation is estimated at grant date, using a
binomial Hull model, modified to reflect the IFRS 2 Share-based Payment requirement that assumptions about forfeiture before the
end of the vesting period cannot impact the fair value of the option. All the company share-based payment plans are equity-settled.
Share-based payment transactions resulted in a total expense of 228m US dollar for the year 2016 (including the variable
compensation expense settled in shares), as compared to 225m US dollar for the year 2015.
AB INBEV SHARE-BASED PAYMENT PROGRAMS
Share-Based Compensation Plan
As from 1 January 2010, the structure of the Share-Based Compensation Plan for certain executives, including the executive board
of management and other senior management in the general headquarters, has been modified. From 1 January 2011, the new plan
1 Amounts have been converted to US dollar at the average rate of the period, unless otherwise indicated.
71
structure applies to all other senior management. Under this plan, the executive board of management and other senior employees
will receive their bonus in cash but have the choice to invest some or all of the value of their bonus in AB InBev shares with a five-
year vesting period, referred to as bonus shares. Such voluntary investment leads to a 10% discount to the market price of the
shares. The company will also match such voluntary investment by granting three matching shares for each bonus share voluntarily
invested in, up to a limited total percentage of each participant’s bonus. The percentage of the variable compensation that is entitled
to get matching shares varies depending on the position of the executive. The matching is based on the gross amount of the variable
compensation invested. The discount shares and matching shares are granted in the form of restricted stock units which have a five-
year vesting period. Additionally, the holders of the restricted stock units may be entitled to receive from AB InBev additional
restricted stock units equal to the dividends declared since the restricted stock units were granted.
During 2016, AB InBev issued 0.7m of matching restricted stock units in relation to bonus granted to company employees and
management. These matching restricted stock units are valued at the share price at the day of grant representing a fair value of
approximately 85m US dollar and cliff vest after five years. During 2015, AB InBev issued 0.4m of matching restricted stock units
in relation to the 2014 bonus and 0.1m matching restricted stock units in relation to a 2015 bonus granted to company employees
and management, with a fair value of approximately 54m US dollar.
LTI Stock Option Plan for Directors
Before 2014, the company issued regularly warrants, or rights to subscribe for newly issued shares under the LTI Warrant Plan for
the benefit of directors and, until 2006, for the benefit of members of the executive board of management and other senior
employees. LTI warrants were subject to a vesting period ranging from one to three years. Forfeiture of a warrant occurs in certain
circumstances when the holder leaves the company’s employment.
Since 2007, members of the executive board of management and other employees are no longer eligible to receive warrants under
the LTI Warrant Plan, but instead receive a portion of their compensation in the form of shares and options granted under the Share-
Based Compensation Plan and the LTI Stock Option Plan Executives.
Since 2014, directors are no longer eligible to receive warrants under the LTI Warrant Plan. Instead, on 30 April 2014, the annual
shareholders meeting decided to replace the LTI Warrant Plan by a LTI Stock Option plan for directors. As a result, grants for
directors now consist of LTI stock options instead of LTI warrants (i.e. the right to purchase existing shares instead of the right to
subscribe to newly issued shares). Grants are made annually at the company’s shareholders meeting on a discretionary basis upon
recommendation of the Remuneration Committee. The LTI stock options have an exercise price that is set equal to the market price
at the time of the granting, a maximum lifetime of 10 years and an exercise period that starts after 5 years. The LTI stock options
cliff vest after 5 years. Unvested options are subject to specific forfeiture provisions in the event that the directorship is not renewed
upon the expiry of its term or is terminated in the course of its term, both due to a breach of duty by the director.
AB InBev granted 0.2m stock options to members of the board of directors during 2016 representing a fair value of approximately
5m US dollar (2015: 0.2m stock options with a fair value of approximately 5m US dollar).
Furthermore, at the annual shareholders meeting of 30 April 2014, all outstanding LTI warrants granted under the company’s LTI
Warrant Plan were converted into LTI stock options, i.e. the right to purchase existing ordinary shares of Anheuser-Busch InBev
SA/NV instead of the right to subscribe to newly issued shares. All other terms and conditions of the existing grants under the LTI
Warrant Plan remain unchanged.
LTI Stock Option Plan Executives
As from 1 July 2009, senior employees are eligible for an annual long-term incentive to be paid out in LTI stock options (or, in
future, similar share-based instruments), depending on management’s assessment of the employee’s performance and future
potential.
In December 2016 AB InBev issued 4.6m LTI stock options with an estimated fair value of 83m US dollar, whereby 1.3m options
relate to American Depositary Shares (ADSs) and 3.3m options to AB InBev shares. In December 2015 AB InBev issued 4.7m LTI
stock options with an estimated fair value of 117m US dollar, whereby 1.1m options relate to American Depositary Shares (ADSs)
and 3.6m options to AB InBev shares.
Exceptional incentive stock options
On 15 December 2016, approximately 13.2 million options were granted to a selected group of approximately 300 members of the
senior management of the company considering the significant contribution that these employees can make to the success of the
company and the achievement of integration benefits. Each option gives the grantee the right to purchase one existing AB InBev
share. The exercise price of the options is 97.99 Euro which corresponds to the closing share price on the day preceding the grant
date. The options granted have an estimated fair value of 228m US dollar.
The options have a duration of 10 years from grant and vest on 01 January 2022. The options only become exercisable provided a
performance test is met.
No stock options were granted to members of the Executive Board of Management.
On 15 December 2016, approximately 1.3 million options were granted to employees of SABMiller. The grant results from the
commitment that AB InBev has made under the terms of the combination with SABMiller, that it would, for at least one year,
preserve the terms and conditions for employment of all employees that remain with the SABMiller Group. Each option gives the
grantee the right to purchase one existing AB InBev share. The exercise price of the options is 97.99 Euro which corresponds to the
closing share price on the day preceding the grant date. The options granted have an estimated fair value of 29m US dollar.
The options have a duration of 10 years as from granting and vest after 3 years. Specific forfeiture rules apply if the employee leaves
the company before the vesting date.

72
Performance related incentive plan for Disruptive Growth Function
In 2016 the company implemented a new performance related incentive plan which will substitute the long-term incentive stock
option plan for executives of the Disruptive Growth Function. This function was created in 2015 to accelerate new business
development opportunities, focusing on initiatives in e-commerce, mobile, craft and branded experiences such as brew pubs.
During 2016, approximately 2.4 million performance units were granted to senior management of the Disruptive Growth Function.
Out of these, approximately 0.5 million performance units were granted to a member of the Executive Board of Management. The
value of the performance units will depend on the return of the Disruptive Growth business area.
The units vest after 5 years provided a performance test is met. Specific forfeiture rules apply in case the executive leaves the
company.
Other Grants
AB InBev has in place three specific long-term restricted stock unit programs.
One program allows for the offer of restricted stock units to certain employees in certain specific circumstances, whereby grants are
made at the discretion of the CEO, e.g. to compensate for assignments of expatriates in countries with difficult living conditions.
The restricted stock units vest after five years and in case of termination of service before the vesting date, special forfeiture rules
apply. In 2016, 0.4m restricted stock units with an estimated fair value of 40m US dollar were granted under this program to a
selected number of employees (2015: 0.1m restricted stock units with an estimated fair value of 15m US dollar).
A second program allows for the exceptional offer of restricted stock units to certain employees at the discretion of the
Remuneration Committee of AB InBev as a long-term retention incentive for key employees of the company. Employees eligible to
receive a grant under this program receive two series of restricted stock units, the first half of the restricted stock units vesting after
five years, the second half after ten years. In case of termination of service before the vesting date, special forfeiture rules apply. In
2016, 0.2m restricted stock units with an estimated fair value of 18m US dollar were granted under this program to a selected
number of employees (2015: 0.2m restricted stock units with an estimated fair value of 26m US dollar).
A third program allows certain employees to purchase company shares at a discount aimed as a long-term retention incentive for (i)
high-potential employees of the company, who are at a mid-manager level (“People bet share purchase program”) or (ii) for newly
hired employees. The voluntary investment in company shares leads to the grant of an amount of matching stock options which vest
after 5 years. In case of termination before the vesting date, special forfeiture rules apply. In 2016, employees purchased shares
under this program for the equivalent of 0.5m US dollar (2015: equivalent of 0.8m US dollar).
In order to maintain consistency of benefits granted to executives and to encourage international mobility of executives, an options
exchange program can be executed whereby unvested options are exchanged against restricted shares that remain locked-up until 5
years after the end of the initial vesting period. In 2015 and 2016, no unvested options were exchanged against restricted shares. As
a variant to this program, the Remuneration Committee has approved the early release of the vesting conditions of 0.2m unvested
options. The shares that result from the exercise of the options must remain locked-up until 31 December 2023. Furthermore, certain
options granted have been modified whereby the dividend protected feature of these options have been cancelled and compensated
by the issuance of new additional options. In 2016, 0.2m new options where issued, representing the economic value of the dividend
protection feature. In 2015 no new options were issued. The Remuneration Committee has also approved the early release of vesting
conditions of 0.1m unvested options and 0.1m unvested restricted stock units. The shares that result from the exercise of the options
or the accelerated vesting of restricted stock units must remain locked-up until the end of the initial vesting period.
As the vesting period for these stock options and restricted stock units was changed, an accelerated expense of 0.7m US dollar was
recorded as a result of the modification.
The weighted average fair value of the options and assumptions used in applying the AB InBev option pricing model for the 2016
grants of awards described above are as follows:
Amounts in US dollar unless otherwise indicated1 2016 2015 2014
Fair value of options and warrants granted ....................................... 17.40 21.78 20.70
Share price ................................................................................... 103.77 125.29 113.29
Exercise price ............................................................................... 103.77 125.29 113.29
Expected volatility ......................................................................... 24% 24% 24%
Expected dividends ........................................................................ 3.00% 3.00% 3.00%
Risk-free interest rate .................................................................... 0.54% 0.82% 1.23%
Expected volatility is based on historical volatility calculated using 3032 days of historical data. In the determination of the
expected volatility, AB InBev is excluding the volatility measured during the period 15 July 2008 until 30 April 2009, in view of the
extreme market conditions experienced during that period. The binomial Hull model assumes that all employees would immediately
exercise their options if the AB InBev share price is 2.5 times above the exercise price. As a result, no single expected option life
applies.
1 Amounts have been converted to US dollar at the closing rate of the respective period.

73
The total number of outstanding AB InBev options and warrants developed as follows:
Million options and warrants 2016 2015 2014
Options and warrants outstanding at 1 January .................................. 47.6 45.6 52.5
Options and warrants issued during the year ..................................... 20.4 9.7 4.5
Options and warrants exercised during the year ................................. (2.2) (6.6) (10.0)
Options and warrants forfeited during the year................................... (0.9) (1.1) (1.4)
Options and warrants outstanding at the end of December ......... 64.9 47.6 45.6
The range of exercise prices of the outstanding options and warrants is between 10.32 euro (10.88 US dollar)1 and 121.95 euro
(128.55 US dollar) while the weighted average remaining contractual life is 7.46 years.
Of the 64.9m outstanding options and warrants 9.9m are vested at 31 December 2016.
The weighted average exercise price of the AB InBev options and warrants is as follows:
Amounts in US dollar1 2016 2015 2014
Options and warrants outstanding at 1 January ................................. 64.50 51.35 45.38
Granted during the year ................................................................ 104.71 126.67 113.29
Exercised during the year ............................................................... 32.45 32.47 24.40
Forfeited during the year ................................................................ 88.68 54.88 45.75
Outstanding at the end of December ................................................ 76.25 64.50 51.35
Exercisable at the end of December ................................................. 40.62 37.15 36.21
For share options and warrants exercised during 2016, the weighted average share price at the date of exercise was 109.32 euro
(115.23 US dollar).
The total number of outstanding AB InBev restricted stock units developed as follows:
Million restricted stock units 2016 2015 2014
Restricted stock units outstanding at 1 January .................................. 5.6 5.8 4.7
Restricted stock units issued during the year ..................................... 1.4 1.0 1.3
Restricted stock units exercised during the year ................................. (1.1) (1.0) -
Restricted stock units forfeited during the year................................... (0.1) (0.2) (0.2)
Restricted stock units outstanding at the end of December ......... 5.8 5.6 5.8
AMBEV SHARE-BASED PAYMENT PROGRAMS
Since 2005, Ambev has had a plan which is substantially similar to the Share-based compensation plan under which bonuses granted
to company employees and management are partially settled in shares. Under the Share-based compensation plan, Ambev issued
7.3m restricted stock units in 2016 with an estimated fair value of 38.5m US dollar (2015: 2.7m restricted stock units with an
estimated fair value of 15m US dollar).
As from 2010, senior employees are eligible for an annual long-term incentive to be paid out in Ambev LTI stock options (or, in
future, similar share-based instruments), depending on management’s assessment of the employee’s performance and future
potential. In 2016, Ambev granted 24.8m LTI stock options with an estimated fair value of 44.3m US dollar (2015: 16.5m LTI
stock options with an estimated fair value of 40m US dollar).
The weighted fair value of the options and assumptions used in applying a binomial option pricing model for the 2016 Ambev
grants are as follows:
Amounts in US dollar unless otherwise indicated1 2016 2015 2014
Fair value of options granted ...................................................... 1.90 2.01 1.96
Share price .............................................................................. 5.27 4.72 6.00
Exercise price .......................................................................... 5.27 4.72 6.00
Expected volatility .................................................................... 27% 27% 32%
Expected dividends ................................................................... 0.00% - 5.00% 0.00% - 5.00% 0.00% - 5.00%
Risk-free interest rate ............................................................... 12.40% 15.90% 2.20% - 12.40%
The total number of outstanding Ambev options developed as follows:
Million options 2016 2015 2014
Options outstanding at 1 January ............................................... 121.8 126.1 147.7
Options issued during the year ................................................... 24.8 16.6 17.0
Options exercised during the year .............................................. (11.6) (20.0) (34.8)
Options forfeited during the year ................................................ (3.7) (1.0) (3.8)
Options outstanding at the end of December ......................... 131.3 121.7 126.1
The range of exercise prices of the outstanding options is between 0.02 Brazilian real (0.00 US dollar) and 28.32 Brazilian real (8.69
US dollar) while the weighted average remaining contractual life is 5.96 years.
1 Amounts have been converted to US dollar at the closing rate of the respective period.

74
Of the 131.2m outstanding options 52.8m options are vested at 31 December 2016.
The weighted average exercise price of the Ambev options is as follows:
Amounts in US dollar1 2016 2015 2014
Options outstanding at 1 January ............................................... 3.17 3.79 2.69
Granted during the year ............................................................ 5.27 4.72 6.03
Exercised during the year .......................................................... 0.77 1.29 1.45
Forfeited during the year ........................................................... 3.94 5.21 4.25
Outstanding at the end of December ........................................... 4.26 3.17 3.79
Exercisable at the end of December ............................................ 1.12 0.84 1.11
For share options exercised during 2016, the weighted average share price at the date of exercise was 18.41 Brazilian real (5.65
US dollar).
The total number of outstanding Ambev restricted stock units developed as follows:
Million restricted stock units 2016 2015 2014
Restricted stock units outstanding at 1 January ............................ 19.1 17.5 15.6
Restricted stock units issued during the year ............................... 7.3 2.7 5.2
Restricted stock units exercised during the year ........................... (6.1) (0.8) (2.3)
Restricted stock units forfeited during the year............................. (1.0) (0.3) (1.0)
Restricted stock units outstanding at the end of December ... 19.3 19.1 17.5
Additionally, as a means of creating a long term incentive (wealth incentive) for certain senior employees and members of
management considered as having “high potential,” share appreciation rights in the form of phantom stocks have been granted to
those employees, pursuant to which the beneficiary shall receive two separate lots – Lot A and Lot B – subject to lockup periods of
five and ten years, respectively.
During 2016, a limited number of Ambev shareholders who are part of the senior management of AB InBev were given the
opportunity to exchange Ambev shares against a total of 0.3m AB InBev shares (0.3m AB InBev shares in 2015) at a discount of
16.7% provided that they stay in service for another five years. The fair value of this transaction amounts to approximately 5m US
dollar (6m US dollar in 2015) and is expensed over the five years’ service period. The fair values of the Ambev and AB InBev
shares were determined based on the market price.
27. PROVISIONS
Million US dollar Restructuring Disputes Other Total
Balance at 1 January 2016 ............................................................. 157 733 7 897
Effect of changes in foreign exchange rates .......................................... (9) 9 (3) (3)
Acquisitions through business combinations .......................................... 216 703 616 1 535
Provisions made ................................................................................ 100 483 17 600
Provisions used ................................................................................. (228) (274) (6) (508)
Provisions reversed ............................................................................ (3) (63) (27) (93)
Other movements .............................................................................. (1) 1 (150) (150)
Balance at 31 December 2016 ........................................................ 232 1 592 454 2 278
The restructuring provisions are primarily explained by the organizational alignments - see also Note 8 Non-recurring items.
Provisions for disputes mainly relate to various disputed direct and indirect taxes and to claims from former employees.
The provisions are expected to be settled within the following time windows:
Million US dollar Total < 1 year 1-2 years 2-5 years > 5 years
Restructuring ......................................................... 232 149 9 70 4
Disputes
Income and indirect taxes .......................................... 1 178 514 499 32 133
Labor ....................................................................... 161 67 14 53 26
Commercial .............................................................. 50 27 15 5 3
Other disputes .......................................................... 204 7 91 102 4
1 592 615 619 192 166
Other provisions ..................................................... 454 76 27 24 327
Total provisions 2 278 841 655 286 497
AB InBev is subject to the greenhouse gas emission allowance trading scheme in force in the European Union and a similar scheme
in Korea. Acquired emission allowances are recognized at cost as intangible assets. To the extent that it is expected that the number
of allowances needed to settle the CO2 emissions exceeds the number of emission allowances owned, a provision is recognized.
Such provision is measured at the estimated amount of the expenditure required to settle the obligation. At 31 December 2016, the
emission allowances owned fully covered the expected CO2 emissions. As such no provision needed to be recognized.

75
28. TRADE AND OTHER PAYABLES
NON-CURRENT TRADE AND OTHER PAYABLES
Million US dollar 2016 20151
Indirect taxes payable ............................................................................................ 159 186
Trade payables ...................................................................................................... 465 484
Deferred consideration on acquisitions ..................................................................... 379 329
Other payables ...................................................................................................... 325 242
1 328 1 241
CURRENT TRADE AND OTHER PAYABLES
Million US dollar 2016 20151
Trade payables and accrued expenses ...................................................................... 14 071 11 616
Payroll and social security payables ......................................................................... 1 027 924
Indirect taxes payable ............................................................................................ 2 750 1 610
Interest payable .................................................................................................... 1 797 817
Consigned packaging ............................................................................................. 974 680
Dividends payable ................................................................................................. 447 239
Deferred income .................................................................................................... 52 49
Deferred consideration on acquisitions ..................................................................... 1 640 1 474
Other payables ...................................................................................................... 327 253
23 086 17 662
Deferred consideration on acquisitions is mainly comprised of 1.5 billion US dollar for the put option included in the 2012
shareholders’ agreement between Ambev and E. León Jimenes S.A. (“ELJ”), which may result in Ambev acquiring additional Class
B shares of Cervecería Nacional Dominicana S.A. (“CND”). The put option granted to ELJ is exercisable since 2013. The valuation
of this option is based on the EBITDA of the consolidated operations in Dominican Republic.
29. RISKS ARISING FROM FINANCIAL INSTRUMENTS
AB InBev’s activities expose it to a variety of financial risks: market risk (including currency risk, fair value interest rate risk, cash
flow interest risk, commodity risk and equity risk), credit risk and liquidity risk. The company analyses each of these risks
individually as well as on an interconnected basis, and defines strategies to manage the economic impact on the company’s
performance in line with its financial risk management policy.
Some of the company’s risk management strategies include the usage of derivatives. The main derivative instruments used are
foreign currency rate agreements, exchange traded foreign currency futures and options, interest rate swaps and forwards, cross
currency interest rate swaps (“CCIRS”), exchange traded interest rate futures, commodity swaps, exchange traded commodity
futures and equity swaps. AB InBev’s policy prohibits the use of derivatives in the context of speculative trading.
The following table provides an overview of the derivative financial instruments outstanding at year-end by maturity bucket. The
amounts included in this table are the notional amounts.
2016 2015
Million US dollar
< 1
year
1-2
years
2-3
years
3-5
years
> 5
years
< 1
year
1-2
years
2-3
years
3-5
years
> 5
years
Foreign currency
Forward exchange contracts
SABMiller combination .................. - - - - - 68 860 - - - -
Other forward exchange contracts . 22 396 96 - - - 10 481 - 508 803 -
Foreign currency futures............... 610 - - - - 1 568 100 - - -
Interest rate
Interest rate swaps ...................... 1 292 1 075 2 250 784 3 630 - 77 - 3 000 74
Cross currency interest rate swaps 1 553 785 1 796 460 1 134 - 1 604 777 1 803 1 560
Interest rate futures .................... - - 46 77 - - 13 - 109 -
Other interest rate derivatives - - - - 565 - - - - 565
Commodities
Aluminum swaps ......................... 1 211 31 - - - 1 509 172 - - -
Other commodity derivatives ........ 1 124 189 - - - 1 227 82 - - -
Equity
Equity derivatives ........................ 10 087 235 - - - 5 985 - - - -
1 Reclassified to conform to the 2016 presentation.

76
A. FOREIGN CURRENCY RISK
AB InBev incurs foreign currency risk on borrowings, investments, (forecasted) sales, (forecasted) purchases, royalties, dividends,
licenses, management fees and interest expense/income whenever they are denominated in a currency other than the functional
currency of the subsidiary. The main derivative financial instruments used to manage foreign currency risk are foreign currency rate
agreements, exchange traded foreign currency futures and cross currency interest rate swaps.
FOREIGN EXCHANGE RISK ON THE COMBINATION WITH SABMILLER
During 2015 and 2016, AB InBev entered into derivative foreign exchange forward contracts, as well as other non-derivative items
also documented in a hedge accounting relationship, in order to economically hedge against exposure to changes in the US dollar
exchange rate for the cash component of the purchase consideration in pound sterling and South African rand. Although these
derivatives and non-derivative items were considered to be economic hedges, only a portion of such derivatives could qualify for
hedge accounting under IFRS rules. Since inception of the derivative contracts in 2015 and upon the completion of the combination
with SABMiller, 12.3 billion US dollar negative mark-to-market adjustment related to such hedging were recognized cumulatively
over 2015 and 2016, of which 7.4 billion US dollar qualified for hedge accounting and was, accordingly, allocated as part of the
consideration paid.
The portion that did not qualify for hedge accounting was reported as an exceptional finance cost in the profit and loss account in
2016 - see Note 11 Finance cost and income. Furthermore, the settlement of the derivatives that did not qualify for hedge accounting
is classified as cash flow from financing activities in the consolidated cash flow statement.
FOREIGN EXCHANGE RISK ON OPERATING ACTIVITIES
As far as foreign currency risk on firm commitments and forecasted transactions is concerned, AB InBev’s policy is to hedge
operational transactions which are reasonably expected to occur (e.g. cost of goods sold and selling, general & administrative
expenses) within the forecast period determined in the financial risk management policy. Operational transactions that are certain
are hedged without any limitation in time. Non-operational transactions (such as acquisitions and disposals of subsidiaries) are
hedged as soon as they are certain.
The table below provides an indication of the company’s main net foreign currency positions as regards firm commitments and
forecasted transactions for the most important currency pairs. The open positions are the result of the application of AB InBev’s
risk management policy. Positive amounts indicate that the company is long (net future cash inflows) in the first currency of the
currency pair while negative amounts indicate that the company is short (net future cash outflows) in the first currency of the
currency pair. The second currency of the currency pairs listed is the functional currency of the related subsidiary.
31 December 2016 31 December 20151
Total Total Open Total Total Open
Million US dollar exposure hedges position exposure hedges position
Euro/Canadian dollar ......................................... (52) 52 - (56) 56 -
Euro/Mexican peso ............................................ (159) 197 38 - - -
Euro/South African rand ..................................... (64) 64 - - - -
Euro/South Korean won ..................................... (63) 55 (8) (57) 27 (30)
Euro/Pound sterling ........................................... (33) 146 113 (52) 184 132
Euro/Russian ruble ............................................ (64) 93 29 (74) 109 35
Euro/Ukrainian hryvnia....................................... (60) - (60) (68) - (68)
Euro/US dollar .................................................. (924) 483 (441) (420) 152 (268)
Pound sterling/US dollar ..................................... (492) 162 (330) - - -
US dollar/Argentinean peso ................................ (219) 219 - (459) 459 -
US dollar/Australian dollar .................................. (171) 73 (98) - - -
US dollar/Bolivian boliviano ................................ (59) 59 - (62) 62 -
US dollar/Brazilian real ....................................... (1 102) 1 102 - (1 419) 1 419 -
US dollar/Canadian dollar ................................... (347) 347 - (321) 321 -
US dollar/Chilean peso ....................................... (255) 255 - (152) 152 -
US dollar/Chinese yuan ...................................... (248) 228 (20) (135) 121 (14)
US dollar/Colombian peso ................................... (202) 187 (15) (10) 10 -
US dollar/Euro .................................................. (115) 68 (47) (197) 301 104
US dollar/Honduran lempira ................................ (172) - (172) - - -
US dollar/Mexican peso ...................................... (952) 1 065 113 (1 234) 1 933 699
US dollar/Nigerian naira ..................................... (87) - (87) - - -
US dollar/Paraguayan guarani ............................. (136) 136 - (96) 96 -
US dollar/Peruvian nuevo sol .............................. (196) 123 (73) (5) 5 -
US dollar/Russian ruble ...................................... (71) 91 20 (78) 115 37
US dollar/South African rand ............................... (95) 95 - - - -
US dollar/South Korean won ............................... (48) 112 64 (35) 84 49
US dollar/Tanzanian shilling ................................ (85) 14 (71) - - -
US dollar/Ukrainian hryvnia ................................ (22) - (22) (46) - (46)
US dollar/Uruguayan peso .................................. (44) 44 - (52) 52 -
US dollar/Zambian kwacha ................................. (89) - (89) - - -
Others ............................................................. (459) 142 (317) (173) 160 (13)
The US dollar/Mexican peso open long position in 2015 is mainly related to US dollar cash held in Mexico.
Further analysis on the impact of open currency exposures is performed in the Currency Sensitivity Analysis below.
1 Reclassified to conform to the 2016 presentation.

77
In conformity with IAS 39 hedge accounting rules, these hedges of firm commitments and highly probable forecasted transactions
denominated in foreign currency are designated as cash flow hedges.
FOREIGN EXCHANGE RISK ON NET INVESTMENTS IN FOREIGN OPERATIONS
AB InBev enters into hedging activities to mitigate exposures related to its investments in foreign operations. These strategies are
designated as net investment hedges and include both derivative and non-derivative financial instruments.
As of 31 December 2016, designated derivative and non-derivative financial instruments in a net investment hedge relationship
amount to 15 583m US dollar equivalent (11 193m US dollar in 2015) in Holding companies and approximately 1 497m US dollar
equivalent (1 460m US dollar in 2015) at Ambev level. Those derivatives and non-derivatives are used to hedge foreign operations
with functional currencies mainly denominated in Canadian dollar, Dominican peso, euro, Mexican peso, pound sterling, South
Korean won and US dollar.
FOREIGN EXCHANGE RISK ON FOREIGN CURRENCY DENOMINATED DEBT
It is AB InBev’s policy to have the debt in the subsidiaries as much as possible linked to the functional currency of the subsidiary.
To the extent this is not the case, hedging is put in place unless the cost to hedge outweighs the benefits. Interest rate decisions and
currency mix of debt and cash are decided on a global basis and take into consideration the holistic risk management approach.
A description of the foreign currency risk hedging related to the debt instruments issued in a currency other than the functional
currency of the subsidiary is further detailed in the Interest Rate Risk section below.
CURRENCY SENSITIVITY ANALYSIS
Currency transactional risk
Most of AB InBev’s non-derivative monetary financial instruments are either denominated in the functional currency of the
subsidiary or are converted into the functional currency through the use of derivatives. However, the company can have open
positions in certain countries for which hedging can be limited as the illiquidity of the local foreign exchange market prevents the
company from hedging at a reasonable cost. The transactional foreign currency risk mainly arises from open positions in Australian
dollar, Chinese yuan, Colombian peso, Honduran lempira, Nigerian naira, Mexican peso, Peruvian nuevo sol, pound sterling,
Russian ruble, South Korean won, Tanzanian shilling, Ukrainian hryvnia and Zambian kwacha against the US dollar and the euro.
AB InBev estimated the reasonably possible change of exchange rate, on the basis of the average volatility on the open currency
pairs, as follows:
2016
Closing rate
31 December 2016
Possible
closing rate1
Volatility
of rates in %
Euro/Mexican peso ........................................... 21.78 18.12 - 25.45 16.83%
Euro/Pound sterling .......................................... 0.86 0.76 - 0.96 11.63%
Euro/Russian ruble ........................................... 63.94 51.45 - 76.43 19.53%
Euro/Ukrainian hryvnia...................................... 28.66 24.85 - 32.47 13.30%
Euro/US dollar ................................................. 1.05 0.97 - 1.14 8.09%
Pound sterling/US dollar .................................... 1.23 1.06 - 1.40 13.99%
US dollar/Australian dollar ................................. 1.38 1.23 - 1.54 11.22%
US dollar/Chinese yuan ..................................... 6.94 6.57 - 7.32 5.45%
US dollar/Colombian peso .................................. 3 002.14 2 449.43 - 3 554.86 18.41%
US dollar/Euro ................................................. 0.95 0.87 - 1.03 8.09%
US dollar/Honduran lempira ............................... 23.49 23.36 - 23.63 0.57%
US dollar/Mexican peso ..................................... 20.66 17.20 - 24.13 16.76%
US dollar/Nigerian naira .................................... 315.28 192.49 - 438.07 38.95%
US dollar/Peruvian nuevo sol ............................. 3.35 3.11 - 3.60 7.29%
US dollar/Russian ruble ..................................... 60.66 48.77 - 72.55 19.60%
US dollar/South Korean won .............................. 1 203.90 1 039.01 – 1 368.80 13.70%
US dollar/Tanzanian shilling ............................... 2 180.87 2 151.10 – 2 210.64 1.37%
US dollar/Ukrainian hryvnia ............................... 27.19 24.27 - 30.11 10.74%
US dollar/Zambian kwacha ................................ 9.94 8.06 - 11.82 18.91%
2015
Closing rate
31 December 2015
Possible
closing rate2
Volatility
of rates in %
Pound sterling/Euro .......................................... 1.36 1.23 - 1.50 9.73%
Euro/Czech koruna ........................................... 27.02 26.21 - 27.83 2.99%
Euro/Russian ruble ........................................... 79.35 58.04 - 100.66 26.86%
Euro/Ukrainian hryvnia...................................... 26.13 10.51 - 41.75 59.79%
US dollar/Euro ................................................. 0.92 0.81 - 1.03 12.13%
US dollar/Mexican peso ..................................... 17.21 15.38 - 19.04 10.63%
US dollar/Pound sterling .................................... 0.67 0.62 - 0.73 8.34%
US dollar/Russian ruble ..................................... 72.88 54.75 - 91.01 24.88%
US dollar/Ukrainian hryvnia .............................. 24.00 8.88 - 39.12 63.01%
1 Sensitivity analysis is assessed based on the yearly volatility using daily observable market data during 250 days at 31 December 2016. 2 Sensitivity analysis is assessed based on the yearly volatility using daily observable market data during 250 days at 31 December 2015.

78
Had the Australian dollar, Chinese yuan, Colombian peso, Honduran lempira, Nigerian naira, Mexican peso, Peruvian nuevo sol,
pound sterling, Russian ruble, South Korean won, Tanzanian shilling, Ukrainian hryvnia and Zambian kwacha
weakened/strengthened during 2016 by the above estimated changes against the euro or the US dollar, with all other variables held
constant, the 2016 impact on consolidated profit before taxes would have been approximately 112m US dollar (71m US dollar in
2015) higher/lower.
Additionally, the AB InBev sensitivity analysis1 to the foreign exchange rates on its total derivatives positions as of 31 December
2016, shows a positive/negative pre-tax impact on equity reserves of 774m US dollar (895m US dollar in 2015).
NET FOREIGN EXCHANGE RESULTS
Foreign exchange results recognized on unhedged and hedged exposures and from the related hedging derivative instruments can be
summarized per type of hedging relationship as follows:
Million US dollar 2016 2015
Cash flow hedges - hedged items ................................................................................... 98 61
Cash flow hedges - hedging instruments (reclassified from equity) ..................................... (151) (11)
Economic hedges - hedged items not part of a hedge accounting relationship ...................... 9 (347)
Economic hedges - hedging instruments not part of a hedge accounting relationship ............ (45) 352 Other results - not hedged ............................................................................................ 68 323
(21) 378
B. INTEREST RATE RISK
The company applies a dynamic interest rate hedging approach whereby the target mix between fixed and floating rate debt is
reviewed periodically. The purpose of AB InBev’s policy is to achieve an optimal balance between cost of funding and volatility of
financial results, while taking into account market conditions as well as AB InBev’s overall business strategy.
FAIR VALUE HEDGE
Pound sterling bond hedges (foreign currency risk + interest rate risk on borrowings in pound sterling)
In June 2009, the company issued a pound sterling bond for an equivalent of 750m pound sterling. This bond bears interest at
6.50% with maturity in June 2017.
The company entered into several pound sterling fixed/euro floating cross currency interest rate swaps to manage and reduce the
impact of changes in the pound sterling exchange rate and interest rate on this bond.
These derivative instruments have been designated in a fair value hedge accounting relationship.
US dollar fixed rate bond hedges (interest rate risk on borrowings in US dollar)
The company entered into several US dollar fixed/floating interest rate swaps to manage and reduce the impact of changes in the US
dollar interest rates on the fair value of certain fixed rate bonds with an aggregate principal amount of 5.5 billion US dollar.
These derivative instruments have been designated in a fair value hedge accounting relationship.
Ambev bond hedges (interest rate risk on borrowings in Brazilian real)
In July 2007 Ambev issued a Brazilian real bond (“Bond 17”), which bears interest at 9.5% and is repayable semi-annually with
final maturity date in July 2017.
Ambev entered into a fixed/floating interest rate swap to hedge the interest rate risk on such bond. These derivative instruments have
been designated in a fair value hedge accounting relationship.
CASH FLOW HEDGE
Canadian dollar bond hedges (foreign currency risk + interest rate risk on borrowings in Canadian dollar)
In January 2013, the company issued a series of notes in an aggregated principal amount of 1.2 billion Canadian dollar. These bonds
bear interest at 2.375% with maturity in January 2018 and 3.375% with maturity in January 2023.
The company entered into several Canadian dollar fixed/US dollar fixed cross currency interest rate swaps to manage and reduce the
impact of changes in the Canadian dollar exchange rate and interest rate on these bonds.
These derivative instruments have been designated in a cash flow hedge accounting relationship.
Pound sterling bond hedges (foreign currency risk + interest rate risk on borrowings in pound sterling)
In September 2013, the company issued a pound sterling bond for an equivalent of 500m pound sterling. This bond bears interest at
4.00% per year with maturity in September 2025.
The company entered into several pound sterling fixed/euro fixed cross currency interest rate swaps to manage and reduce the
impact of changes in the pound sterling exchange rate and interest rate on this bond.
These derivative instruments have been designated in a cash flow hedge accounting relationship.
ECONOMIC HEDGE
Marketable debt security hedges (interest rate risk on Brazilian real)
During 2016 and 2015, Ambev invested in highly liquid Brazilian real denominated government debt securities.
1 Sensitivity analysis is assessed based on the yearly volatility using daily observable market data during 250 days at 31 December 2016.

79
The company also entered into interest rate future contacts in order to offset the Brazilian real interest rate exposure of such
government bonds. Since both instruments are measured at fair value with changes recorded into profit or loss, no hedge accounting
designation was done.
INTEREST RATE SENSITIVITY ANALYSIS
In respect of interest-bearing financial liabilities, the table below indicates their effective interest rates at balance sheet date as well
as the split per currency in which the debt is denominated.
31 December 2016 Before hedging After hedging
Interest-bearing financial liabilities
Million US dollar
Effective
interest rate Amount
Effective
interest rate Amount
Floating rate
Brazilian real ................................ 9.76% 205 12.62% 729
Canadian dollar ............................ 1.55% 386 1.55% 386
Euro ........................................... 0.20% 3 037 0.12% 4 046
South African rand ........................ 8.30% 446 8.30% 446
US dollar ..................................... 1.82% 10 187 2.33% 18 002
Other .......................................... 18.75% 352 18.75% 352
14 613 23 961
Fixed rate
Australian dollar ........................... 3.85% 520 3.85% 520
Brazilian real ................................ 6.67% 375 6.20% 258
Canadian dollar ............................ 2.93% 886 2.89% 554
Euro ........................................... 0.26% 23 991 1.86% 26 396
Peruvian nuevo sol ....................... 5.88% 119 5.88% 119
Pound sterling .............................. 6.80% 2 212 9.75% 594
South Korean won ........................ - - 2.50% 1 000
US dollar ..................................... 4.06% 79 615 4.15% 68 928
Other .......................................... 11.41% 412 11.41% 412
108 130 98 782
31 December 2015 Before hedging After hedging
Interest-bearing financial liabilities
Million US dollar
Effective
interest rate Amount
Effective
interest rate Amount
Floating rate
Brazilian real ................................ 9.41% 270 11.19% 355
Euro ........................................... 0.09% 2 934 1.41% 3 975
US dollar ..................................... 1.12% 584 1.20% 1 787
Other .......................................... 6.10% 6 6.10% 6
3 795 6 124
Fixed rate
Brazilian real ................................ 7.13% 282 8.22% 237
Canadian dollar ............................ 3.14% 1 290 3.22% 968
Dominican peso ............................ 9.52% 101 9.52% 101
Euro ........................................... 2.47% 11 363 2.31% 13 893
Pound sterling .............................. 6.54% 2 686 8.67% 912
South Korean won ........................ - - 2.44% 1 000
US dollar ..................................... 4.21% 29 935 4.37% 26 216
Other .......................................... 3.60% 14 3.60% 14
45 671 43 342
At 31 December 2016, the total carrying amount of the floating and fixed rate interest-bearing financial liabilities before hedging
listed above includes bank overdrafts of 184m US dollar.
As disclosed in the above table, 23 961m US dollar or 19.52% of the company’s interest bearing financial liabilities bear a variable
interest rate. The company estimated that the reasonably possible change of the market interest rates applicable to its floating rate
debt after hedging is as follows:
2016
Interest rate
31 December 20161
Possible
interest rate2
Volatility
of rates in %
Brazilian real ........................................... 13.20% 12.88% - 13.53% 2.46%
Canadian dollar ....................................... 0.95% 0.87% - 1.02% 7.83%
Euro ...................................................... - - 11.84%
South African rand ................................... 7.36% 6.95% - 7.77% 5.55%
US dollar ................................................ 1.00% 0.89% - 1.11% 11.08%
1 Applicable 3-month InterBank Offered Rates as of 31 December 2016 and as of 31 December 2015. 2 Sensitivity analysis is assessed based on the yearly volatility using daily observable market data during 250 days at 31 December 2016 and at December 2015. For the
Brazilian real floating rate debt, the estimated market interest rate is composed of the InterBank Deposit Certificate (‘CDI’) and the Long-Term Interest Rate (‘TJLP’).
With regard to other market interest rates, the company’s analysis is based on the 3-month InterBank Offered Rates applicable for the currencies concerned (e.g.
EURIBOR 3M, LIBOR 3M).

80
2015
Interest rate
31 December 20151
Possible
interest rate2
Volatility
of rates in %
Brazilian real ........................................... 13.64% 12.48% - 14.8% 8.52%
Euro ...................................................... - 0.15% -0% 211.93%
US dollar ................................................ 0.61% 0.5% - 0.73% 18.83%
When AB InBev applies the reasonably possible increase/decrease in the market interest rates mentioned above on its floating rate
debt at 31 December 2016, with all other variables held constant, 2016 interest expense would have been 23m US dollar
higher/lower (2015: 5m US dollar). This effect would be more than offset by 53m US dollar higher/lower interest income on
AB InBev’s interest-bearing financial assets (2015: 50m US dollar).
INTEREST EXPENSE
Interest expense recognized on unhedged and hedged financial liabilities and the net interest expense from the related hedging
derivative instruments can be summarized per type of hedging relationship as follows:
Million US dollar 2016 2015
Financial liabilities measured at amortized cost – not hedged ....................................... (4 119) (2 005) Fair value hedges – hedged items ............................................................................. (73) (87)
Fair value hedges – hedging instruments ................................................................... 42 50
Cash flow hedges – hedged items ............................................................................. (24) (31)
Cash flow hedges – hedging instruments (reclassified from equity) .............................. 16 24
Net investment hedges - hedging instruments (interest component) ............................ 34 152
Economic hedges - hedged items not part of a hedge accounting relationship ................ 8 8
Economic hedges - hedging instruments not part of a hedge accounting relationship ...... 24 56
(4 092) (1 833)
C. COMMODITY PRICE RISK
The commodity markets have experienced and are expected to continue to experience price fluctuations. AB InBev therefore uses
both fixed price purchasing contracts and commodity derivatives to minimize exposure to commodity price volatility. The company
has important exposures to the following commodities: aluminum, barley, coal, corn grits, corn syrup, corrugated board, diesel, fuel
oil, glass, hops, labels, malt, natural gas, orange juice, plastics, rice, steel and wheat. As of 31 December 2016, the company has the
following commodity derivatives outstanding (in notional amounts): aluminum swaps for 1 242m US dollar (2015: 1 681m US
dollar), natural gas and energy derivatives for 189m US dollar (2015: 216m US dollar), exchange traded sugar futures for 93m US
dollar (2015: 92m US dollar), corn swaps for 179m US dollar (2015: 272m US dollar), exchange traded wheat futures for 557m US
dollar (2015: 484m US dollar), rice swaps for 190m US dollar (2015: 138m US dollar) and plastic derivatives for 105m US dollar
(2015: 107m US dollar). These hedges are designated in a cash flow hedge accounting relationship.
COMMODITY PRICE SENSITIVITY ANALYSIS
The impact of changes in the commodity prices for AB InBev’s derivative exposures would have caused an immaterial impact on
2016 profits as most of the company’s commodity derivatives are designated in a hedge accounting relationship.
The table below shows the estimated impact that changes in the price of the commodities, for which AB InBev held material
derivative exposures at 31 December 2016, would have on the equity reserves.
2016
Volatility of
prices in %1
Pre-tax impact on equity
Million US dollar Prices increase Prices decrease
Aluminum .............................................................................. 15.80% 196 (196)
Sugar .................................................................................... 32.63% 30 (30)
Wheat ................................................................................... 26.43% 147 (147)
Energy .................................................................................. 28.60% 54 (54)
Rice ...................................................................................... 26.38% 50 (50)
Corn ..................................................................................... 24.30% 44 (44)
Plastic ................................................................................... 18.62% 20 (20)
1 Sensitivity analysis is assessed based on the yearly volatility using daily observable market data during 250 days at 31 December 2016.
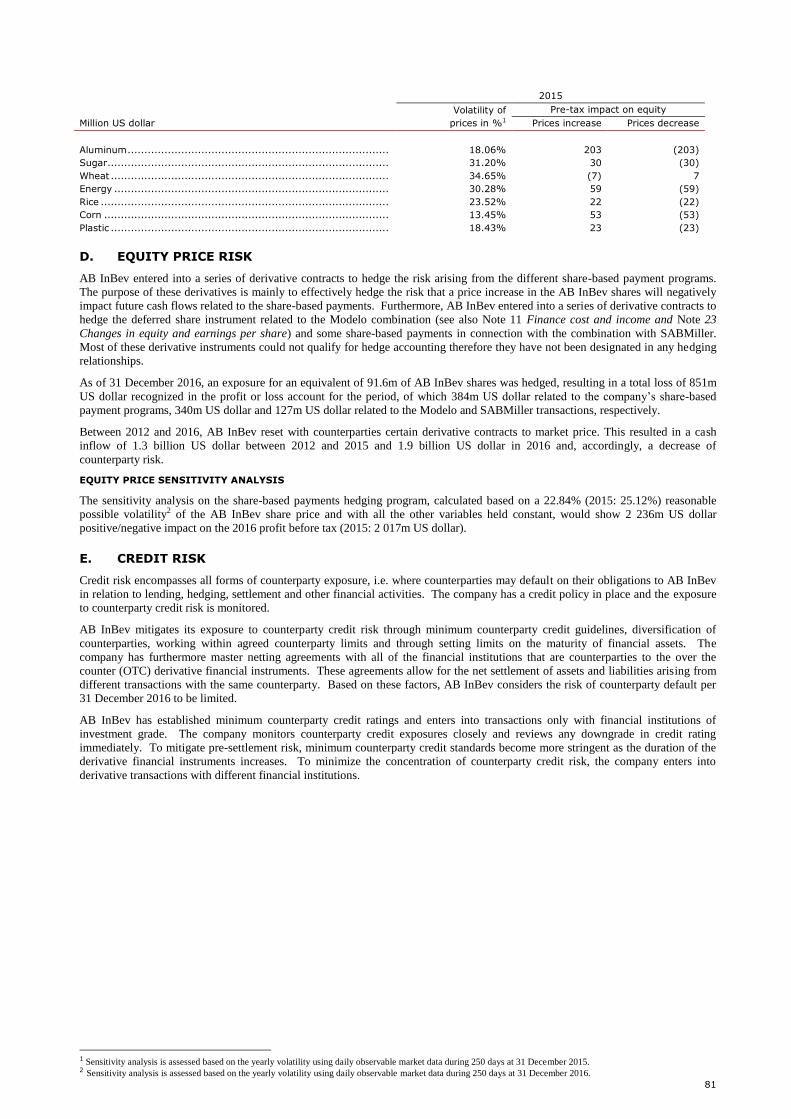
81
2015
Volatility of
prices in %1
Pre-tax impact on equity
Million US dollar Prices increase Prices decrease
Aluminum .............................................................................. 18.06% 203 (203)
Sugar .................................................................................... 31.20% 30 (30)
Wheat ................................................................................... 34.65% (7) 7
Energy .................................................................................. 30.28% 59 (59)
Rice ...................................................................................... 23.52% 22 (22)
Corn ..................................................................................... 13.45% 53 (53)
Plastic ................................................................................... 18.43% 23 (23)
D. EQUITY PRICE RISK
AB InBev entered into a series of derivative contracts to hedge the risk arising from the different share-based payment programs.
The purpose of these derivatives is mainly to effectively hedge the risk that a price increase in the AB InBev shares will negatively
impact future cash flows related to the share-based payments. Furthermore, AB InBev entered into a series of derivative contracts to
hedge the deferred share instrument related to the Modelo combination (see also Note 11 Finance cost and income and Note 23
Changes in equity and earnings per share) and some share-based payments in connection with the combination with SABMiller.
Most of these derivative instruments could not qualify for hedge accounting therefore they have not been designated in any hedging
relationships.
As of 31 December 2016, an exposure for an equivalent of 91.6m of AB InBev shares was hedged, resulting in a total loss of 851m
US dollar recognized in the profit or loss account for the period, of which 384m US dollar related to the company’s share-based
payment programs, 340m US dollar and 127m US dollar related to the Modelo and SABMiller transactions, respectively.
Between 2012 and 2016, AB InBev reset with counterparties certain derivative contracts to market price. This resulted in a cash
inflow of 1.3 billion US dollar between 2012 and 2015 and 1.9 billion US dollar in 2016 and, accordingly, a decrease of
counterparty risk.
EQUITY PRICE SENSITIVITY ANALYSIS
The sensitivity analysis on the share-based payments hedging program, calculated based on a 22.84% (2015: 25.12%) reasonable
possible volatility2 of the AB InBev share price and with all the other variables held constant, would show 2 236m US dollar
positive/negative impact on the 2016 profit before tax (2015: 2 017m US dollar).
E. CREDIT RISK
Credit risk encompasses all forms of counterparty exposure, i.e. where counterparties may default on their obligations to AB InBev
in relation to lending, hedging, settlement and other financial activities. The company has a credit policy in place and the exposure
to counterparty credit risk is monitored.
AB InBev mitigates its exposure to counterparty credit risk through minimum counterparty credit guidelines, diversification of
counterparties, working within agreed counterparty limits and through setting limits on the maturity of financial assets. The
company has furthermore master netting agreements with all of the financial institutions that are counterparties to the over the
counter (OTC) derivative financial instruments. These agreements allow for the net settlement of assets and liabilities arising from
different transactions with the same counterparty. Based on these factors, AB InBev considers the risk of counterparty default per
31 December 2016 to be limited.
AB InBev has established minimum counterparty credit ratings and enters into transactions only with financial institutions of
investment grade. The company monitors counterparty credit exposures closely and reviews any downgrade in credit rating
immediately. To mitigate pre-settlement risk, minimum counterparty credit standards become more stringent as the duration of the
derivative financial instruments increases. To minimize the concentration of counterparty credit risk, the company enters into
derivative transactions with different financial institutions.
1 Sensitivity analysis is assessed based on the yearly volatility using daily observable market data during 250 days at 31 December 2015. 2 Sensitivity analysis is assessed based on the yearly volatility using daily observable market data during 250 days at 31 December 2016.

82
EXPOSURE TO CREDIT RISK
The carrying amount of financial assets represents the maximum credit exposure of the company. The carrying amount is presented
net of the impairment losses recognized. The maximum exposure to credit risk at the reporting date was:
2016 2015
Million US dollar Gross Impairment
Net carrying
amount Gross1 Impairment
Net carrying
amount2
Debt securities held for trading .............. 5 659 - 5 659 55 - 55
Available for sale .................................. 65 (7) 58 40 (9) 31
Held to maturity ................................... 24 - 24 17 - 17
Trade receivables ................................. 4 399 (202) 4 197 3 244 (230) 3 014
Cash deposits for guarantees ................. 200 - 200 187 - 187
Loans to customers............................... 100 - 100 94 - 94
Other receivables ................................. 2 818 (109) 2 709 1 975 (99) 1 876
Derivatives .......................................... 1 117 - 1 117 3 563 - 3 563
Cash and cash equivalents ..................... 8 579 - 8 579 6 923 - 6 923
22 961 (318) 22 643 16 098 (338) 15 760
There was no significant concentration of credit risks with any single counterparty per 31 December 2016 and no single customer
represented more than 10% of the total revenue of the group in 2016.
IMPAIRMENT LOSSES
The allowance for impairment recognized during the period per classes of financial assets was as follows:
2016
Million US dollar
Available for
sale
Trade
receivables
Loans to
customers
Other
receivables Total
Balance at 1 January........................ (9) (230) - (99) (338)
Impairment losses ........................... - (43) - - (43)
Derecognition ................................. - 69 - 2 71
Currency translation and other .......... 2 2 - (12) (8)
Balance at 31 December ............... (7) (202) - (109) (318)
2015
Million US dollar
Available for
sale
Trade
receivables
Loans to
customers
Other
receivables Total
Balance at 1 January........................ (11) (260) (30) (128) (429)
Impairment losses ........................... - (41) - (16) (57)
Derecognition ................................. - 20 30 22 72
Currency translation and other .......... 2 51 - 23 76
Balance at 31 December ............... (9) (230) - (99) (338)
F. LIQUIDITY RISK
AB InBev’s primary sources of cash flow have historically been cash flows from operating activities, the issuance of debt, bank
borrowings and the issuance of equity securities. AB InBev’s material cash requirements have included the following:
Debt service;
Capital expenditures;
Investments in companies;
Increases in ownership of AB InBev’s subsidiaries or companies in which it holds equity investments;
Share buyback programs; and
Payments of dividends and interest on shareholders’ equity.
The company believes that cash flows from operating activities, available cash and cash equivalent and short term investments,
along with the derivative instruments and access to borrowing facilities, will be sufficient to fund capital expenditures, financial
instrument liabilities and dividend payments going forward. It is the intention of the company to continue to reduce its financial
indebtedness through a combination of strong operating cash flow generation and continued refinancing.
The following are the nominal contractual maturities of non-derivative financial liabilities including interest payments and
derivative financial assets and liabilities:
1 Reclassified to conform to the 2016 presentation.

83
2016
Million US dollar
Carrying
amount1
Contractual
cash flows
Less than
1 year 1-2 years 2-3 years 3-5 years
More than
5 years
Non-derivative financial liabilities
Secured bank loans ......................... (862) (937) (676) (116) (33) (32) (80)
Commercial papers .......................... (2 053) (2 054) (2 054) - - - -
Unsecured bank loans ...................... (9 662) (11 057) (1 618) (535) (365) (8 535) (4)
Unsecured bond issues ..................... (109 627) (162 300) (7 284) (10 262) (13 713) (25 383) (105 658)
Unsecured other loans ..................... (122) (279) (27) (41) (33) (41) (137)
Finance lease liabilities ..................... (234) (346) (44) (42) (44) (70) (146)
Bank overdraft ................................ (184) (184) (184) - - - -
Trade and other payables ................. (24 879) (25 398) (23 717) (449) (209) (331) (692)
(147 623) (202 555) (35 604) (11 445) (14 397) (34 392) (106 717)
Derivative financial
assets/(liabilities)
Interest rate derivatives ................... (267) (269) 5 3 (13) (35) (229)
Foreign exchange derivatives ............ 47 42 44 (2) - - -
Cross currency interest rate swaps .... (32) (58) 22 (97) - 55 (38)
Commodity derivatives ..................... 125 117 107 10 - - -
Equity derivatives ............................ (490) (499) (499) - - - -
(617) (667) (321) (86) (13) 20 (267)
Of which: directly related to cash flow
hedges ........................................... 28 6 176 (112) (2) - (56)
2015
Million US dollar
Carrying
amount
Contractual
cash flows
Less than
1 year 1-2 years
2-3
years 3-5 years
More than
5 years
Non-derivative financial liabilities
Secured bank loans ......................... (277) (340) (115) (81) (27) (39) (78)
Commercial papers .......................... (2 087) (2 089) (2 089) - - - -
Unsecured bank loans ...................... (1 469) (1 740) (1 446) (216) (56) (22) -
Unsecured bond issues ..................... (45 442) (63 694) (3 434) (8 036) (6 209) (12 546) (33 469)
Unsecured other loans ..................... (52) (114) (15) (16) (14) (15) (54)
Finance lease liabilities ..................... (126) (218) (13) (14) (14) (32) (145)
Bank overdraft ................................ (13) (13) (13) - - - -
Trade and other payables ................. (18 816) (19 082) (17 616) (454) (184) (392) (436)
(68 282) (87 290) (24 741) (8 817) (6 504) (13 046) (34 182)
Derivative financial
assets/(liabilities)
Interest rate derivatives ................... (99) (100) 18 (8) (15) (13) (82)
Foreign exchange derivatives ............ (3 022) (3 088) (3 072) 2 (12) (6) -
Cross currency interest rate swaps .... 167 175 57 182 (73) (81) 90
Commodity derivatives ..................... (246) (247) (250) 3 - - -
Equity derivatives ............................ 2 468 2 469 2 469 - - - -
(732) (791) (778) 179 (100) (100) 8
Of which: directly related to cash flow
hedges ........................................... (1 187) (1 269) (1 238) 45 (105) 13 16
G. CAPITAL MANAGEMENT
AB InBev is continuously optimizing its capital structure targeting to maximize shareholder value while keeping the desired
financial flexibility to execute the strategic projects. AB InBev’s capital structure policy and framework aims to optimize
shareholder value through cash flow distribution to the company from its subsidiaries, while maintaining an investment-grade rating
and minimizing investments with returns below AB InBev’s weighted average cost of capital. Besides the statutory minimum
equity funding requirements that apply to the company’s subsidiaries in the different countries, AB InBev is not subject to any
externally imposed capital requirements. When analyzing AB InBev’s capital structure the company uses the same debt/equity
classifications as applied in the company’s IFRS reporting.
H. FAIR VALUE
Fair value is the price that would be received to sell an asset or paid to transfer a liability in an orderly transaction between market
participants at the measurement date. In conformity with IAS 39 all derivatives are recognized at fair value in the balance sheet.
The fair value of derivative financial instruments is either the quoted market price or is calculated using pricing models taking into
account current market rates.
1 “Carrying amount” refers to net book value as recognized in the balance sheet at each reporting date.
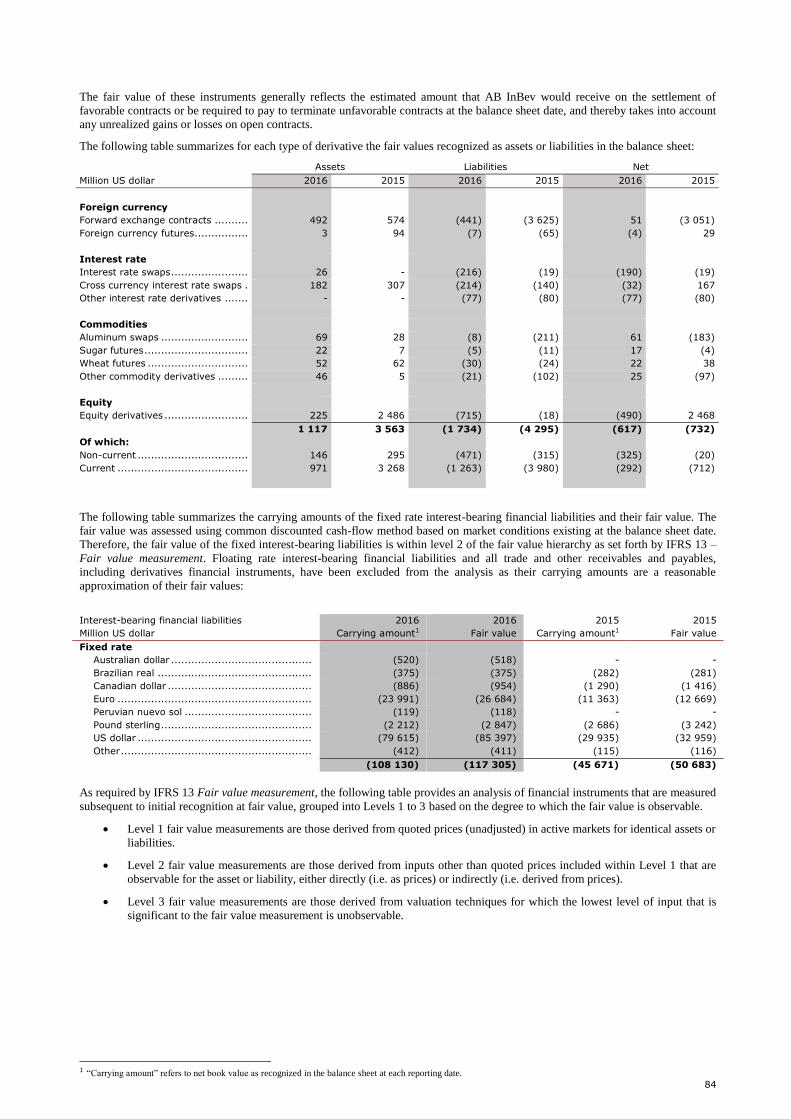
84
The fair value of these instruments generally reflects the estimated amount that AB InBev would receive on the settlement of
favorable contracts or be required to pay to terminate unfavorable contracts at the balance sheet date, and thereby takes into account
any unrealized gains or losses on open contracts.
The following table summarizes for each type of derivative the fair values recognized as assets or liabilities in the balance sheet:
Assets Liabilities Net
Million US dollar 2016 2015 2016 2015 2016 2015
Foreign currency
Forward exchange contracts .......... 492 574 (441) (3 625) 51 (3 051)
Foreign currency futures................ 3 94 (7) (65) (4) 29
Interest rate
Interest rate swaps ....................... 26 - (216) (19) (190) (19)
Cross currency interest rate swaps . 182 307 (214) (140) (32) 167
Other interest rate derivatives ....... - - (77) (80) (77) (80)
Commodities
Aluminum swaps .......................... 69 28 (8) (211) 61 (183)
Sugar futures ............................... 22 7 (5) (11) 17 (4)
Wheat futures .............................. 52 62 (30) (24) 22 38
Other commodity derivatives ......... 46 5 (21) (102) 25 (97)
Equity
Equity derivatives ......................... 225 2 486 (715) (18) (490) 2 468
1 117 3 563 (1 734) (4 295) (617) (732)
Of which:
Non-current ................................. 146 295 (471) (315) (325) (20)
Current ....................................... 971 3 268 (1 263) (3 980) (292) (712)
The following table summarizes the carrying amounts of the fixed rate interest-bearing financial liabilities and their fair value. The
fair value was assessed using common discounted cash-flow method based on market conditions existing at the balance sheet date.
Therefore, the fair value of the fixed interest-bearing liabilities is within level 2 of the fair value hierarchy as set forth by IFRS 13 –
Fair value measurement. Floating rate interest-bearing financial liabilities and all trade and other receivables and payables,
including derivatives financial instruments, have been excluded from the analysis as their carrying amounts are a reasonable
approximation of their fair values:
Interest-bearing financial liabilities
Million US dollar
2016
Carrying amount1
2016
Fair value
2015
Carrying amount1
2015
Fair value
Fixed rate
Australian dollar .......................................... (520) (518) - -
Brazilian real .............................................. (375) (375) (282) (281)
Canadian dollar ........................................... (886) (954) (1 290) (1 416)
Euro .......................................................... (23 991) (26 684) (11 363) (12 669)
Peruvian nuevo sol ...................................... (119) (118) - -
Pound sterling ............................................. (2 212) (2 847) (2 686) (3 242)
US dollar .................................................... (79 615) (85 397) (29 935) (32 959)
Other ......................................................... (412) (411) (115) (116)
(108 130) (117 305) (45 671) (50 683)
As required by IFRS 13 Fair value measurement, the following table provides an analysis of financial instruments that are measured
subsequent to initial recognition at fair value, grouped into Levels 1 to 3 based on the degree to which the fair value is observable.
Level 1 fair value measurements are those derived from quoted prices (unadjusted) in active markets for identical assets or
liabilities.
Level 2 fair value measurements are those derived from inputs other than quoted prices included within Level 1 that are
observable for the asset or liability, either directly (i.e. as prices) or indirectly (i.e. derived from prices).
Level 3 fair value measurements are those derived from valuation techniques for which the lowest level of input that is
significant to the fair value measurement is unobservable.
1 “Carrying amount” refers to net book value as recognized in the balance sheet at each reporting date.

85
Fair value hierarchy 2016
Million US dollar
Quoted (unadjusted)
prices - level 1
Observable market
inputs - level 2
Unobservable market
inputs - level 3
Financial Assets
Held for trading (non-derivatives) ............................................... 5 659 - -
Derivatives at fair value through profit and loss ............................ 1 338 -
Derivatives in a cash flow hedge relationship ............................... 30 549 -
Derivatives in a fair value hedge relationship ............................... - 54 -
Derivatives in a net investment hedge relationship ....................... - 145 -
5 690 1 086 -
Financial Liabilities
Non-derivatives recognized at fair value ...................................... - 1 485 -
Deferred consideration on acquisitions at fair value....................... - - 1 826
Derivatives at fair value through profit and loss ............................ 3 818 -
Derivatives in a cash flow hedge relationship ............................... 27 524 -
Derivatives in a fair value hedge relationship ............................... - 354 -
Derivatives in a net investment hedge relationship ....................... - 8 -
30 3 189 1 826
Fair value hierarchy 2015
Million US dollar
Quoted (unadjusted)
prices - level 1
Observable market
inputs - level 2
Unobservable market
inputs - level 3
Financial Assets
Held for trading (non-derivatives) ............................................... 55 - -
Derivatives at fair value through profit and loss ............................ 41 2 712 -
Derivatives in a cash flow hedge relationship ............................... 47 404 -
Derivatives in a fair value hedge relationship ............................... - 180 -
Derivatives in a net investment hedge relationship ....................... 16 163 -
159 3 459 -
Financial Liabilities
Deferred consideration on acquisitions at fair value ...................... - - 1 449
Derivatives at fair value through profit and loss ............................ 36 1 819 -
Derivatives in a cash flow hedge relationship ............................... 35 1 603 -
Derivatives in a fair value hedge relationship ............................... - 117 -
Derivatives in a net investment hedge relationship ....................... 19 666 -
90 4 205 1 449
DERIVATIVE INSTRUMENTS
The fair value of exchange traded derivatives (e.g. exchange traded foreign currency futures) is determined by reference to the
official prices published by the respective exchanges (e.g. the New York Board of Trade). The fair value of over-the-counter
derivatives is determined by commonly used valuation techniques. These are based on market inputs from reliable financial
information providers.
NON-DERIVATIVE FINANCIAL LIABILITIES
As part of the 2012 shareholders agreement between Ambev and E. León Jimenes S.A., following the acquisition of Cervecería
Nacional Dominicana S.A. (“CND”), a put and call option is in place which may result in Ambev acquiring additional shares in
CND. As of 31 December 2016, the put option was valued 1 497m US dollar (2015: 1 424m US dollar) and recognized as a deferred
consideration on acquisitions at fair value in “level 3” category above. The variance is mainly explained by accretion and foreign
exchange expenses as well as fair value gains. No value was allocated to the call option. The fair value of such deferred
consideration is calculated based on commonly-used valuation techniques (i.e. net present value of future principal and interest cash
flows discounted at market rate). These are based on market inputs from reliable financial information providers. As the put option
may be exercised in the short-term, a portion of the liability is presented as a current liability.
Fair values determined by reference to prices provided by reliable financial information providers are periodically checked for
consistency against other pricing sources.
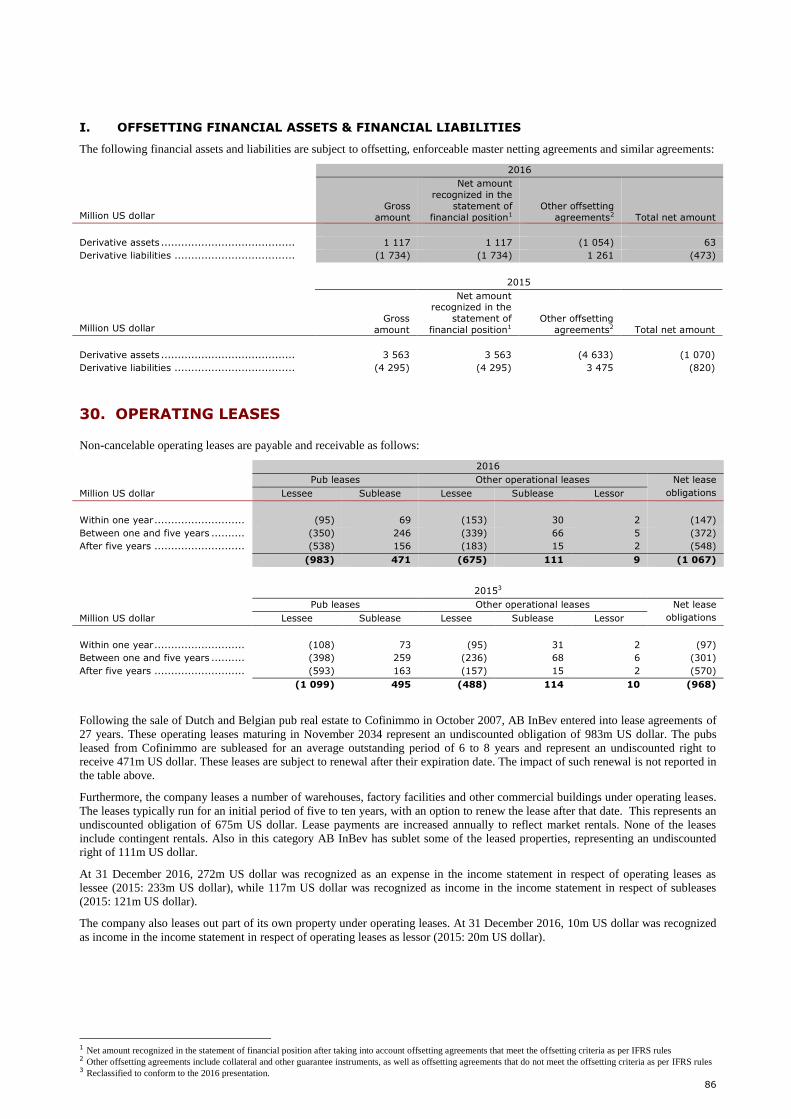
86
I. OFFSETTING FINANCIAL ASSETS & FINANCIAL LIABILITIES
The following financial assets and liabilities are subject to offsetting, enforceable master netting agreements and similar agreements:
2016
Million US dollar Gross
amount
Net amount
recognized in the
statement of
financial position1
Other offsetting
agreements2 Total net amount
Derivative assets ........................................ 1 117 1 117 (1 054) 63
Derivative liabilities .................................... (1 734) (1 734) 1 261 (473)
2015
Million US dollar Gross
amount
Net amount recognized in the
statement of
financial position1
Other offsetting
agreements2 Total net amount
Derivative assets ........................................ 3 563 3 563 (4 633) (1 070)
Derivative liabilities .................................... (4 295) (4 295) 3 475 (820)
30. OPERATING LEASES
Non-cancelable operating leases are payable and receivable as follows:
2016
Pub leases Other operational leases Net lease
obligations Million US dollar Lessee Sublease Lessee Sublease Lessor
Within one year ........................... (95) 69 (153) 30 2 (147)
Between one and five years .......... (350) 246 (339) 66 5 (372)
After five years ........................... (538) 156 (183) 15 2 (548)
(983) 471 (675) 111 9 (1 067)
20153
Pub leases Other operational leases Net lease
obligations Million US dollar Lessee Sublease Lessee Sublease Lessor
Within one year ........................... (108) 73 (95) 31 2 (97)
Between one and five years .......... (398) 259 (236) 68 6 (301)
After five years ........................... (593) 163 (157) 15 2 (570)
(1 099) 495 (488) 114 10 (968)
Following the sale of Dutch and Belgian pub real estate to Cofinimmo in October 2007, AB InBev entered into lease agreements of
27 years. These operating leases maturing in November 2034 represent an undiscounted obligation of 983m US dollar. The pubs
leased from Cofinimmo are subleased for an average outstanding period of 6 to 8 years and represent an undiscounted right to
receive 471m US dollar. These leases are subject to renewal after their expiration date. The impact of such renewal is not reported in
the table above.
Furthermore, the company leases a number of warehouses, factory facilities and other commercial buildings under operating leases.
The leases typically run for an initial period of five to ten years, with an option to renew the lease after that date. This represents an
undiscounted obligation of 675m US dollar. Lease payments are increased annually to reflect market rentals. None of the leases
include contingent rentals. Also in this category AB InBev has sublet some of the leased properties, representing an undiscounted
right of 111m US dollar.
At 31 December 2016, 272m US dollar was recognized as an expense in the income statement in respect of operating leases as
lessee (2015: 233m US dollar), while 117m US dollar was recognized as income in the income statement in respect of subleases
(2015: 121m US dollar).
The company also leases out part of its own property under operating leases. At 31 December 2016, 10m US dollar was recognized
as income in the income statement in respect of operating leases as lessor (2015: 20m US dollar).
1 Net amount recognized in the statement of financial position after taking into account offsetting agreements that meet the offsetting criteria as per IFRS rules 2 Other offsetting agreements include collateral and other guarantee instruments, as well as offsetting agreements that do not meet the offsetting criteria as per IFRS rules 3 Reclassified to conform to the 2016 presentation.

87
31. COLLATERAL AND CONTRACTUAL COMMITMENTS FOR THE ACQUISITION OF PROPERTY, PLANT AND EQUIPMENT, LOANS TO CUSTOMERS AND
OTHER
Million US dollar 2016 2015
Collateral given for own liabilities .................................................................................... 490 562
Collateral and financial guarantees received for own receivables and loans to customers ........ 228 194
Contractual commitments to purchase property, plant and equipment ................................. 817 750
Contractual commitments to acquire loans to customers .................................................... 11 14
Other commitments ....................................................................................................... 1 768 1 713
The collateral given for own liabilities of 490m US dollar at 31 December 2016 contains 173m US dollar cash guarantees. Such
cash deposits are a customary feature associated with litigations in Brazil: in accordance with Brazilian laws and regulations a
company may or must (depending on the circumstances) place a deposit with a bank designated by the court or provide other
security such as collateral on property, plant and equipment. With regard to judicial cases, AB InBev has made the appropriate
provisions in accordance with IAS 37 Provisions, Contingent Liabilities and Contingent Assets – see also Note 27 Provisions. In
the company’s balance sheet the cash guarantees are presented as part of other receivables – see Note 20 Trade and other
receivables. The remaining part of collateral given for own liabilities (317m US dollar) contains collateral on AB InBev’s property
in favor of the excise tax authorities, the amount of which is determined by the level of the monthly excise taxes due, inventory
levels and transportation risk, and collateral on its property, plant and equipment with regard to outstanding loans. To the extent that
AB InBev would not respect its obligations under the related outstanding contracts or would lose the pending judicial cases, the
collateralized assets would be used to settle AB InBev’s obligations.
To keep AB InBev's credit risk with regard to receivables and loans to customers as low as possible collateral and other credit
enhancements were obtained for a total amount of 228m US dollar at 31 December 2016. Collateral is held on both real estate and
debt securities while financial guarantees are obtained from banks and other third parties.
AB InBev has entered into commitments to purchase property, plant and equipment for an amount of 816m US dollar at 31
December 2016.
In a limited number of countries AB InBev has committed itself to acquire loans to customers from banks at their notional amount if
the customers do not respect their reimbursement commitments towards the banks. The total outstanding amount of such loans is
11m US dollar at 31 December 2016
As at 31 December 2016, the following commitments existed with respect to the combination with Grupo Modelo and the
SABMiller combination:
In a transaction related to the combination of AB InBev and Grupo Modelo select Grupo Modelo shareholders committed,
upon tender of their Grupo Modelo shares, to acquire 23 076 923 AB InBev shares to be delivered within 5 years for
consideration of approximately 1.5 billion US dollar. The consideration was paid on 5 June 2013. Pending the delivery of
the AB InBev shares, AB InBev will pay a coupon on each undelivered AB InBev share, so that the Deferred Share
Instrument holders are compensated on an after tax basis, for dividends they would have received had the AB InBev
shares been delivered to them prior to the record date for such dividend.
On 7 June 2013, in a transaction related to the combination of AB InBev and Grupo Modelo, AB InBev and Constellation
have entered into a three-year transition services agreement by virtue of which Grupo Modelo or its affiliates agreed to
provide certain transition services to Constellation to ensure a smooth operational transition of the Piedras Negras
brewery. AB InBev and Constellation have also entered into a temporary supply agreement for an initial three-year term,
whereby Constellation can purchase inventory from Grupo Modelo or its affiliates under a specified pricing until the
Piedras Negras brewery business acquires the necessary capacity to fulfill 100 percent of the US demand.
On 13 December 2016, AB InBev announced that it has entered into a binding agreement with Asahi to sell the businesses
formerly owned by SABMiller in Poland, the Czech Republic, Slovakia, Hungary and Romania (the “CEE Business”) for
an agreed enterprise value of 7.3 billion euro, subject to customary adjustments. In connection with its business
combination with SABMiller Limited AB InBev made commitments to the European Commission (“EC”) to sell the CEE
Business. The sale is conditional upon EC regulatory approval. The disposal process is being carried out under the
supervision of Mazars LLP in their role as EC monitoring trustee. Closing is expected to take place in the first half of
2017.
On 15 December 2016, AB InBev entered into a binding agreement to sell its entire indirect shareholding in Distell Group
Limited (“Distell”) to the Public Investment Corporation (SOC) Limited, acting on behalf of the Government Employees
Pension Fund (“Distell Sale”). The stake comprises 58,674,000 ordinary shares or approximately 26.4% of Distell’s issued
share capital (“the Distell Shareholding”). As part of its ruling to approve the business combination with SABMiller, the
South African Competition Tribunal required AB InBev to dispose of the Distell Shareholding. Remgro Limited and
Capevin Holdings Limited, who hold pre-emptive rights in relation to the Distell Shareholding, had confirmed that they
will not exercise their pre-emptive rights triggered by the Sale. The Distell Sale remains subject to the approval of the
South African competition authorities.
As at 31 December 2016, the following M&A related commitments existed:
As part of the 2012 shareholders agreement between Ambev and E. León Jimenes S.A., following the acquisition of Cervecería
Nacional Dominicana S.A. (“CND”), a put and call option is in place which may result in Ambev acquiring additional shares in
CND. As of 31 December 2016, the put option was valued 1 497m US dollar (2015: 1 424m US dollar) and recognized as a deferred
consideration on acquisitions at fair value in “level 3” category above. See also note 29 Risks arising from financial instruments.

88
On 23 July 2015 AB InBev entered into a subscription agreement for private placement of shares of Guangzhou Zhujiang Brewery
Co., Ltd (“Zhujiang Brewery”), investing no less than 1.6 billion RMB (approximately 258m US dollar) to increase its holdings in
Zhujiang Brewery to 29.99%, subject to various regulatory approvals. This additional investment allows the company to further
deepen the strategic partnership with Zhujiang Brewery which started in the early 1980s.
On 11 October 2016, AB InBev was notified by The Coca-Cola Company of its intention to acquire AB InBev’s stake in Coca-Cola
Beverages Africa (“CCBA”). On 21 December 2016, The Coca-Cola Company and the company have reached an agreement
regarding the transition of AB InBev’s 54.5% equity stake in CCBA for 3.15 billion US dollar, after customary adjustments. CCBA
includes the Coca-Cola bottling operations in South Africa, Namibia, Kenya, Uganda, Tanzania, Ethiopia, Mozambique, Ghana,
Mayotte and Comoros. In addition, the companies have reached an agreement in principle for The Coca-Cola Company to acquire
the companies’s interest in bottling operations in Zambia, Zimbabwe, Botswana, Swaziland, Lesotho, El Salvador and Honduras for
an undisclosed amount. The transactions are subject to the relevant regulatory and minority approvals and are expected to close by
the end of 2017.
In December 2016, the company entered into an agreement with Keurig Green Mountain, Inc. to establish a joint venture for
conducting research and development of an in-home alcohol drink system, focusing on the US and Canadian markets. The
transaction includes the contribution of intellectual property and manufacturing assets from Keurig Green Mountain, Inc. Pursuant
to the terms of the joint venture agreement, the company will own 70% of the voting and economic interest in the joint venture and
Keurig Green Mountain, Inc. will own 30% and has certain minority protection rights. The transaction is expected to close in the
first half of 2017.
Other commitments amount to 1 768m US dollar at 31 December 2016 and mainly cover guarantees given to pension funds, rental
and other guarantees.
In order to fulfil AB InBev’s commitments under various outstanding stock option plans, AB InBev entered into stock lending
arrangements for up to 15 million of its own ordinary shares. AB InBev shall pay any dividend equivalent, after tax in respect of the
loaned securities. This payment will be reported through equity as dividend. As of 31 December 2016,
13 million loaned securities were used to fulfil stock option plan commitments.
32. CONTINGENCIES1
The company has contingencies for which, in the opinion of management and its legal counsel, the risk of loss is possible but not
probable and therefore no provisions have been recorded. Due to their nature, such legal proceedings and tax matters involve
inherent uncertainties including, but not limited to, court rulings, negotiations between affected parties and governmental actions,
and as a consequence AB InBev management cannot at this stage estimate the likely timing of resolution of these matters. The most
significant contingencies are discussed below.
AMBEV TAX MATTERS
As of 31 December 2016, AB InBev’s material tax proceedings related to Ambev and its subsidiaries. Estimates of amounts of
possible loss are as follows:
Million US dollar 31 December 2016 31 December 2015
Income tax and social contribution ................................................. 8 878 4 189
Value-added and excise taxes ........................................................ 4 924 2 658
Other taxes ................................................................................. 605 220
14 407 7 067
The most significant tax proceedings of Ambev are discussed below.
INCOME TAX AND SOCIAL CONTRIBUTION
During 2005, certain subsidiaries of Ambev received a number of assessments from Brazilian federal tax authorities relating to
profits of its foreign subsidiaries. In December 2008, the Administrative Court decided on one of the tax assessments relating to
earnings of Ambev’s foreign subsidiaries. This decision was partially favorable to Ambev, and in connection with the remaining
part, Ambev filed an appeal to the Upper House of the Administrative Court and is awaiting its decision. With respect to another tax
assessment relating to foreign profits, the Administrative Court rendered a decision favorable to Ambev in September 2011. In
December 2013 and 2016, Ambev received other tax assessments related to profits of its foreign subsidiaries. As of 31 December
2016, Ambev management estimates the exposure of approximately 4.9 billion Brazilian real (1.5 billion US dollar) as a possible
risk, and accordingly has not recorded a provision for such amount, and approximately 42 million Brazilian real (13m US dollar) as
a probable loss.
In December 2011, Ambev received a tax assessment related to the goodwill amortization resulting from the InBev Holding Brasil
S.A. merger with Ambev. In November 2014 the Lower Administrative Court concluded the judgment. The decision was partly
favorable, Ambev was notified in August 2015 and presented a motion to clarify the decision to the Administrative Court. This
motion was admitted in September 2016 and Ambev waits for the clarified decision. In June 2016, Ambev received a new tax
assessment charging the remaining value of the goodwill amortization and filed a defense. Ambev has not recorded any provisions
for this matter, and management estimates possible losses in relation to this assessment to be approximately 7.8 billion Brazilian real
(2.4 billion US dollar) as of 31 December 2016. In the event Ambev is required to pay these amounts, AB InBev will reimburse the
amount proportional to the benefit received by AB InBev pursuant to the merger protocol, as well as the related costs.
1 Amounts have been converted to US dollar at the closing rate of the respective period.

89
In October 2013, Ambev also received a tax assessment related to the goodwill amortization resulting from the merger of Beverage
Associates Holding Limited (“BAH”) into Ambev. Ambev filed a defense in November 2013. In December 2014, Ambev filed an
appeal against the unfavorable first level administrative decision published in November 2014. Ambev management estimates the
amount of possible losses in relation to this assessment to be approximately 1.5 billion Brazilian real (0.5 billion US dollar) as of 31
December 2016. Ambev has not recorded any provision in connection therewith.
Ambev and certain of its subsidiaries received a number of assessments from Brazilian federal tax authorities relating to the offset of
tax loss carry forward arising in the context of business combinations. In February 2016, the Upper House of the Administrative Tax
Court concluded the judgment of two tax assessments on this matter. In both cases the decision was unfavorable. Ambev filed a
judicial proceeding. In September 2016, Ambev received a favorable first level decision in one of the judicial claims. Ambev
management estimates the total exposures of possible losses in relation to these assessments to be approximately 0.5 billion
Brazilian real (0.2 billion US dollar) as of 31 December 2016.
In December 2014, Ambev received a tax assessment from the Brazilian Federal Tax Authorities related to the disallowance of
alleged non-deductible expenses and the deduction of certain losses mainly associated to financial investments and loans. In July
2016, Ambev was notified of the unfavorable first level administrative decision and filed an appeal to the Upper Administrative
Court at the legal term. In December 2015, Ambev also received a new tax assessment related to the same matter. Ambev presented
a defense and awaits the first level administrative decision. In December 2016, Ambev received a new tax assessment related to the
same matter, regarding the period of 2011, 2012 and 2013. Ambev presented a defense and awaits the first level administrative
decision. Ambev management estimates the amount of possible losses in relation to those assessments to be approximately 5.6
billion Brazilian real (1.7 billion US dollar) as of 31 December 2016. Ambev has not recorded any provision in connection with this
assessment.
During 2014 and the first quarter of 2015, Ambev received tax assessments from the Brazilian Federal Tax Authorities related to the
disallowance of deductions associated with alleged unproven taxes paid abroad, for which the decision from the Upper House of the
Administrative Court is still pending. As of 31 December 2016, Ambev management estimates the exposure of approximately 2.8
billion Brazilian real (0.9 billion US dollar) as a possible risk, and accordingly has not recorded a provision for such amount, and
approximately 194 million Brazilian real (60 million US dollar) as a probable loss.
In April 2016, Arosuco (a subsidiary of Ambev) received a tax assessment regarding the use of “presumed profit” method for the
calculation of income tax and the social contribution on net profit instead of the “real profit” method. Arosuco filed a defense and
awaits the first level administrative decision. Arosuco management estimates the amount of possible losses in relation to this
assessment to be approximately 0.6 billion Brazilian real (0.2 billion US dollar) as of 31 December 2016. Arosuco has not recorded
any provision in connection therewith. In December 2016, CRBS (also a subsidiary of Ambev) received a tax assessment regarding
the same matter. CRBS filed a defense and awaits the first level administrative decision. CRBS management estimates the amount
of possible losses in relation to this assessment to be approximately 3.6 billion Brazilian real (1.1 billion US dollar) as of 31
December 2016.
ICMS VALUE ADDED TAX, IPI EXCISE TAX AND TAXES ON NET SALES
In Brazil, goods manufactured within the Manaus Free Trade Zone intended for remittance elsewhere in Brazil are exempt from IPI
excise tax. Ambev’s subsidiaries have been registering IPI excise tax presumed credits upon the acquisition of exempted inputs
manufactured therein. Since 2009, Ambev has been receiving a number of tax assessments from the Brazilian Federal Tax
Authorities relating to the disallowance of such presumed credits and other IPI credits, which are under discussion before the
Brazilian Supreme Court. Ambev management estimates the possible losses related to these assessments to be approximately
2.0 billion Brazilian real (0.6 billion US dollar) as of 31 December 2016. Ambev has not recorded any provision in connection
therewith.
Over the years, Ambev has received tax assessments from the Brazilian Federal Tax Authorities charging federal taxes considered
unduly offset with the disallowed IPI excise tax credits which are under discussion in the above mentioned proceedings. Ambev is
challenging those charges before Courts. Ambev management estimates the possible losses related to these assessments to be
approximately 0.7 billion Brazilian real (0.2 billion US dollar) as of 31 December 2016. Ambev has not recorded any provision in
connection therewith.
In 2014 and 2015, Ambev received tax assessments from the Brazilian Federal Tax Authorities relating to IPI excise tax, supposedly
due over remittances of manufactured goods to other related factories, for which the decision from the Upper House of the
Administrative Court is still pending. Ambev management estimates the possible losses related to these assessments to be
approximately 1.5 billion Brazilian real (0.5 billion US dollar) as of 31 December 2016. Ambev has not recorded any provision in
connection therewith.
Ambev is currently challenging tax assessments from the States of São Paulo, Rio de Janeiro, Minas Gerais and other States, which
question the legality of tax credits arising from existing tax incentives granted to Ambev by other States. Ambev management
estimates the possible losses related to these assessments to be approximately 1.8 billion Brazilian real (0.6 billion US dollar) as of
31 December 2016. Ambev has not recorded any provision in connection therewith.
Ambev has been party to legal proceedings with the State of Rio de Janeiro where it was challenging such State’s attempt to assess
ICMS with respect to unconditional discounts granted by Ambev from January 1996 to February 1998. In 2015, these proceedings
were before the Superior Court of Justice and the Brazilian Supreme Court. In 2013, 2014 and 2015, Ambev received similar tax
assessments issued by the States of Pará and Piauí relating to the same issue, which are currently under discussion. In October 2015
and January 2016, Ambev paid the amounts related to the State of Rio de Janeiro’s proceedings in an incentive tax program under
which discounts were granted, in the total amount of approximately 0.3 billion Brazilian real (0.1 billion US dollar). After the above
mentioned payments, Ambev management estimates the possible losses involved in these proceedings to be approximately 0.6
billion Brazilian real (0.2 billion US dollar) as of 31 December 2016. Ambev has not recorded any provision in connection
therewith.

90
Over the years, Ambev has received tax assessments relating to supposed ICMS differences considered due when the price of the
products sold by the company reaches levels close to or above the price table basis established by States, cases in which the tax
authorities understand that the calculation basis should be based on a value-added percentage over the actual prices and not the table
price. Ambev is currently challenging those charges before Courts. In August 2016, Ambev received a new assessment, issued by
the State of Minas Gerais, in the amount of 1.4 billion Brazilian real (0.4 billion US dollar). In the fourth quarter of 2016, Ambev
received other assessments related to the same issue, with lower values. Ambev management estimates the total possible losses
related to this issue to be approximately 4.5 billion Brazilian real (1.4 billion US dollar) as of 31 December 2016. Ambev has
recorded provisions in the total amount of 1.7 million Brazilian real (0.5 million US dollar) in relation to the proceedings for which
it considers the chances of loss to be probable, considering specific procedural issues.
SOCIAL CONTRIBUTIONS
In December 2015, Ambev received a tax assessment issued by the Brazilian federal tax authorities, relating to amounts allegedly
due under Integration Program / Social Security Financing Levy (PIS/COFINS) over bonus products granted to its customers in the
first quarter of 2011. In 2016, Ambev received new assessments related to the same issue, for the subsequent periods. Ambev
management estimates the possible losses related to these assessments to be approximately 1.45 billion Brazilian real (0.5 billion US
dollar) as of 31 December 2016. Ambev filed defenses against these assessments and currently awaits judgment. No related
provision has been made.
OTHER TAX MATTERS
During 2014, Anheuser-Busch InBev Worldwide Inc. received a net proposed tax assessment from the United States federal tax
authorities (IRS) of 0.3 billion US dollar predominantly involving certain inter-company transactions, related to tax returns for the
years 2008 and 2009. In November 2015, the IRS issued an additional proposed tax assessment of 0.1 billion US dollar for tax years
2010 and 2011. Anheuser-Busch InBev Worldwide Inc. has filed protests with the IRS for the 2008 to 2011 tax years and intends to
vigorously defend its position.
In February 2015, the European Commission opened an in-depth state aid investigation into the Belgian excess profit ruling system.
On 11 January 2016, the European Commission adopted a negative decision finding that the Belgian excess profit ruling system
constitutes an aid scheme incompatible with the internal market and ordering Belgium to recover the incompatible aid from a
number of aid beneficiaries. The Belgian authorities have contacted the companies that have benefitted from the system and have
advised each company of the amount of incompatible aid that is potentially subject to recovery. The European Commission decision
was appealed to the European Union’s General Court by Belgium on 22 March 2016 and by AB InBev on 12 July 2016. The appeals
do not suspend the recovery process, and AB InBev cannot at this stage estimate the outcome of such legal proceedings. Based on
the estimated exposure related to the excess profit ruling applicable to AB InBev, the different elements referred to above, as well as
the possibility that taxes paid abroad and non-recognised tax loss carryforwards could eventually partly or fully offset amounts
subject to recovery, if any, AB InBev has not recorded any provisions in connection therewith as of 31 December 2016.
WARRANTS
Certain holders of warrants issued by Ambev in 1996 for exercise in 2003 proposed lawsuits to subscribe correspondent shares for
an amount lower than Ambev considers as established upon the warrant issuance. In case Ambev loses the totality of these lawsuits,
the issuance of 172,831,574 shares would be necessary. Ambev would receive in consideration funds that are materially lower than
the current market value. This could result in a dilution of about 1% to all Ambev shareholders. Furthermore, the holders of these
warrants are claiming that they should receive the dividends relative to these shares since 2003, approximately 0.8 billion Brazilian
real (0.2 billion US dollar) in addition to legal fees. Ambev disputes these claims and intends to continue to vigorously defend its
case.
ANTITRUST MATTERS
In August 2011, the German Federal Cartel Office (Bundeskartellamt) launched an investigation against several breweries and
retailers in Germany in connection with an allegation of anticompetitive vertical price maintenance by breweries vis-à-vis their
trading partners in Germany. The Bundeskartellamt eventually concluded these proceedings in December 2016 after it had issued
fines against a number of retailers. Due to AB InBev's cooperation with the Bundeskartellamt, AB InBev received full immunity
from fines, which was confirmed by letter on 13 December 2016.
On 12 December 2014, a lawsuit was commenced in the Ontario Superior Court of Justice against the Liquor Control Board of
Ontario, Brewers Retail Inc. (known as The Beer Store or “TBS”) and the owners of Brewers Retail Inc. (Molson Coors Canada,
Sleeman Breweries Ltd. and Labatt Breweries of Canada LP). The lawsuit was brought in Canada pursuant to the Ontario Class
Proceedings Act, and sought, among other things: (i) to obtain a declaration that the defendants conspired with each other to allocate
markets for the supply of beer sold in Ontario since 1 June 2000; (ii) to obtain a declaration that Brewers Retail Inc. and the owners
of Brewers Retail Inc. conspired to fix, increase and/or maintain prices charged to Ontario licensees (on-trade) for beer and the fees
charged by TBS to other competitive brewers who wished to sell their products through TBS and (iii) damages for unjust
enrichment. As part of this third allegation, the plaintiffs allege illegal trade practices by the owners of Brewers Retail Inc. They are
seeking damages not exceeding 1.4 billion Canadian dollar (1.0 billion US dollar), as well as, punitive, exemplary and aggravated
damages of 5 million Canadian dollar (4m US dollar) and changes/repeals of the affected legislation. Ambev has not recorded any
provision in connection therewith.
On 30 June 2016, the European Commission announced an investigation into alleged abuse of a dominant position by AB InBev
through certain practices aimed at restricting trade from other EU countries to Belgium. The fact that an investigation has been
initiated does not mean that the European Commission has concluded that there is an infringement. AB InBev is fully cooperating
with the investigation. It is not possible to indicate how long the investigation will take or what the outcome will be and no

91
provision has been made in connection therewith. There is no connection between this investigation and the combination with
SABMiller.
2009 DISPOSITIONS PENSION LITIGATION
On 1 December 2009, AB InBev and several of its related companies were sued in Federal Court in the Eastern District of Missouri
in a lawsuit styled Richard F. Angevine v. AB InBev, et al. The plaintiff sought to represent a class of certain employees of Busch
Entertainment Corporation, which was divested on 1 December 2009, and the four Metal Container Corporation plants which were
divested on 1 October 2009. He also sought to represent certain employees of any other subsidiary of Anheuser-Busch Companies,
Inc. (ABC) which were divested on 1 October 2009. The lawsuit contained claims that the class was entitled to enhanced retirement
benefits under sections 4.3 and 19.11(f) of the Anheuser-Busch Companies' Salaried Employees' Pension Plan (the "Plan").
Specifically, plaintiff alleged that the divestitures resulted in his "involuntary termination" from "ABC and its operating division and
subsidiaries" within three years after the 18 November 2008 ABC/InBev merger, which allegedly triggered the enhanced benefits
under the Plan. The lawsuit claimed that by failing to provide the class members with these enhanced benefits, AB InBev, et al.
breached their fiduciary duties under ERISA. The complaint sought punitive damages and attorneys' fees. On 16 July 2010, the
Court ruled that the claims for breach of fiduciary duty and punitive damages were not proper. The Court also found that Angevine
did not exhaust his administrative remedies, which was required before filing a lawsuit. Angevine filed an appeal of this ruling with
the Eighth Circuit Court of Appeals. On 22 July 2011, the Court of Appeals affirmed the decision of the lower court. No further
appeals were filed.
On 15 September 2010, AB InBev and several of its related companies were sued in Federal Court for the Southern District of Ohio
in a lawsuit entitled Rusby Adams et al. v. AB InBev et al. This lawsuit was filed by four employees of Metal Container
Corporation’s facilities (“MCC”) in Columbus, Ohio, Gainesville, Florida, and Ft. Atkinson, Wisconsin that were divested on
1 October 2009. Similar to the Angevine lawsuit, these plaintiffs sought to represent a class of participants of the Anheuser-Busch
Companies’ Inc. Salaried Employees’ Pension Plan (the “Plan”) who had been employed by subsidiaries of Anheuser-Busch
Companies, Inc. that had been divested during the period of 18 November 2008 and 17 November 2011. The plaintiffs also alleged
claims similar to the Angevine lawsuit: (1) that they were entitled to benefits under section 19.11(f) of the Plan; and (2) that the
denial of benefits was a breach of fiduciary duty. AB InBev believed that it had defenses to these claims, and filed a motion to
dismiss. On 25 April 2011, the Court dismissed the breach of fiduciary duty claims, and the only remaining claim was for benefits
under section 19.11(f). On 28 March 2012, the Court certified that the case could proceed as a class action comprised of former
employees of the divested MCC operations. On 9 January 2013, the Court granted AB InBev’s motion for Judgment on the
Administrative Record. The plaintiffs appealed this decision on 5 February 2013. On 11 July 2014, the Court of Appeals for the 6th
Circuit reversed the lower court and remanded the case for judgment against AB InBev. On 16 September 2014, AB InBev’s Motion
for Rehearing En Banc was denied. A Final Order and Judgment was then entered by the District Court on 24 December 2014,
which ordered the Plan to provide the enhanced pension benefit under Section 19.11(f) to members of the certified class. The
company believes that the total amount of the enhanced pension benefit is approximately 8m US dollar. Plaintiffs’ counsel has
received approximately 1m US dollar in legal fees.
On 10 January 2012, a class action complaint asserting claims very similar to those asserted in the Angevine lawsuit was filed in
Federal Court for the Eastern District of Missouri, styled Nancy Anderson et al. v. Anheuser-Busch Companies Pension Plan et al.
Unlike the Angevine case, however, the plaintiff in this matter alleges complete exhaustion of all administrative remedies. The
company filed a motion to dismiss on 9 October 2012. This was still pending when the Court allowed the complaint to be amended
on 19 November 2012 to name four new plaintiffs. AB InBev filed a motion to dismiss on 17 December 2012. While this motion
was pending, on 11 March 2013 the Court consolidated the case with the Knowlton case (see below) which had been transferred
from California to Missouri.
On 10 October 2012, another class action complaint was filed against Anheuser-Busch Companies, LLC, Anheuser-Busch
Companies Pension Plan, Anheuser-Busch Companies Pension Plan Appeals Committee and the Anheuser-Busch Companies
Pension Plans Administrative Committee by Brian Knowlton, an employee of the divested Busch Entertainment Corporation
(“BEC”). This complaint, filed in Federal Court in the Southern District of California, was amended on 12 October 2012. Like the
other lawsuits, it claims that the employees of any divested assets were entitled to enhanced retirement benefits under section
19.11(f) of the Plan. However, it specifically excludes the divested Metal Container Corporation facilities that have been included in
the Adams class action. On 6 November 2012, the plaintiffs filed a motion asking the court to move the Anderson case to California
to join it with the Knowlton case for discovery. The company filed a motion to dismiss/motion to transfer the case to Missouri on 12
November 2012, which was granted on 30 January 2013. As outlined above, on 11 March 2013, the Knowlton case was then
consolidated in Missouri with the Anderson case. On 19 April 2013 a consolidated complaint was filed, and a Motion to Dismiss
was filed by the company on 10 May 2013. On 30 October 2013, the court dismissed the breach of fiduciary claims, and an answer
was filed on 13 November 2013. On 19 November 2013, plaintiffs amended one count of the consolidated complaint. On 16 May
2014, the Court granted class certification. The class consists of divested BEC employees. On 10 November 2014, Plaintiffs filed a
Motion for Judgment on the Pleadings based on the decision by the Sixth Circuit Court of Appeals in the Adams case. On 8 July
2015, the Court issued an order of partial judgment on the pleadings, holding that the employees of BEC were entitled to enhanced
retirement benefits under the Plan. The 8 July 2015 order, however, was not a final, appealable order. On 21 August 2015, the
company filed a motion seeking entry of a final, appealable order, as well as a stay pending appeal, both of which were granted on 9
October 2015. The company subsequently appealed. That appeal remains pending. The company believes that the total amount of
the enhanced pension benefit at issue in this case is approximately 68m US dollar.

92
33. NON-CONTROLLING INTERESTS
As of 31 December 2016 and 2015, material non-controlling interests related to AB InBev’s 62% ownership of Ambev, a Brazilian
listed subsidiary of AB InBev. The tables below provide summarized information of Ambev’s audited consolidated financial
statements as of as of 31 December 2016 and 2015, in accordance with International Financial Reporting Standards.
Summarized financial information of the company’s material non-controlling interest is as follows:
Million US dollar 2016 2015
Summarized balance sheet information
Current assets ..................................................................................................................... 7 329 7 251
Non-current assets ............................................................................................................... 18 396 15 843
Current liabilities .................................................................................................................. 8 829 7 719
Non-current liabilities ............................................................................................................ 2 582 2 484
Equity attributable to equity holders ....................................................................................... 13 754 12 378
Non-controlling interests ....................................................................................................... 560 513
Summarized income statement and comprehensive income information
Revenue .............................................................................................................................. 13 123 14 333
Net income .......................................................................................................................... 3 765 3 951
Attributable to:
Equity holders ..................................................................................................................... 3 611 3 812
Non-controlling interests ....................................................................................................... 155 140
Net income .......................................................................................................................... 3 765 3 951
Other comprehensive income ................................................................................................. (1 534) 1 244
Total comprehensive income .................................................................................................. 2 231 5 195
Attributable to:
Equity holders ..................................................................................................................... 2 190 4 935
Non-controlling interests ....................................................................................................... 41 260
Summarized cash flow information
Cash flow from operating activities ......................................................................................... 3 552 7 234
Cash flow from investing activities .......................................................................................... (1 697) (1 840)
Cash flow from financing activities .......................................................................................... (3 351) (4 702)
Net increase/(decrease) in cash and cash equivalents ............................................................... (1 496) 692
Dividends paid by Ambev to non-controlling interests (i.e. to entities outside the AB InBev Group) amounted to 1.2 billion US
dollar and 1.3 billion US dollar for 2016 and 2015, respectively.
34. RELATED PARTIES
TRANSACTIONS WITH DIRECTORS AND EXECUTIVE BOARD MANAGEMENT MEMBERS (KEY MANAGEMENT PERSONNEL)
In addition to short-term employee benefits (primarily salaries) AB InBev’s executive board management members are entitled to
post-employment benefits. In particular, members of the executive board of management participate in the pension plan of their
respective country – see also Note 25 Employee Benefits. Finally, key management personnel are eligible for the company’s share
option; restricted stock and/or share swap program (refer Note 26 Share-based Payments). Total directors and executive board
management compensation included in the income statement can be detailed as follows:
2016 2015
Million US dollar Directors
Executive board
management Directors
Executive board
management
Short-term employee benefits .................. 2 18 3 25
Post-employment benefits ....................... - - - 2
Other long-term employee benefits .......... - - - -
Share-based payments ........................... 3 64 2 65
5 82 5 91
Directors’ compensation consists mainly of directors’ fees.
During 2016, AB InBev entered into the following transactions:
The acquisition, through Grupo Modelo and its subsidiaries, of information technology and infrastructure services for a
consideration of approximately 1m US dollar from a company in which one of the company’s Board Member had
significant influence as of 31 December 2016.
The acquisition, through its subsidiary Bavaria S.A., of logistical services and natural gas, as well as the lease of office
space for an aggregated consideration of 1.3m US dollar from companies in which one of the company’s Board Member

93
had a significant influence as of 31 December 2016. The outstanding balance of these transactions as of 31 December
2016 amounts to 0.3m US dollar.
With the exception of the abovementioned transactions, key management personnel were not engaged in any transactions with AB
InBev and did not have any significant outstanding balances with the company.
JOINTLY CONTROLLED ENTITIES
Significant interests in joint ventures include three entities in Brazil, one in Mexico and two in Canada. None of these joint ventures
are material to the company. Aggregate amounts of AB InBev’s interest are as follows:
Million US dollar 2016 2015
Non-current assets ............................................................................................................... 11 2
Current assets ..................................................................................................................... 5 5
Non-current liabilities ............................................................................................................ 9 2
Current liabilities .................................................................................................................. 6 5
Result from operations .......................................................................................................... (6) (1)
Profit attributable to equity holders of AB InBev ....................................................................... (7) -
TRANSACTIONS WITH ASSOCIATES
Significant interests in associates are shown in note 16 Investments in associates. AB InBev’s transactions with associates were as
follows:
Million US dollar 2016 2015
Gross profit ......................................................................................................................... (47) (77)
Current assets ..................................................................................................................... (8) 2
Current liabilities .................................................................................................................. 20 25
TRANSACTIONS WITH PENSION PLANS
AB InBev’s transactions with pension plans mainly comprise 12m US dollar other income from pension plans in US.
35. EVENTS AFTER THE BALANCE SHEET DATE
None.

94
36. AB INBEV COMPANIES
Listed below are the most important AB InBev companies. A complete list of the company’s investments is available at AB InBev
NV, Brouwerijplein 1, B-3000 Leuven, Belgium.
LIST OF MOST IMPORTANT FULLY CONSOLIDATED COMPANIES1
NAME AND REGISTERED OFFICE OF FULLY CONSOLIDATED COMPANIES
% OF ECONOMIC
INTEREST AS AT
31 DECEMBER 2016
ARGENTINA
CERVECERIA Y MALTERIA QUILMES SAICA y G - Charcas 5160 - C1425BOF - Buenos Aires 61.95
AUSTRALIA
FOSTER'S GROUP PTY LTD - Southbank Boulevard 77 - 3006 Southbank - Victoria 100.00
CUB PTY LTD - Southbank Boulevard 77 - 3006 Southbank - Victoria 100.00
FBG FINANCE PTY LTD - Southbank Boulevard 77 - 3006 Southbank - Victoria 100.00
FBG TREASURY (AUST) PTY LTD - Southbank Boulevard 77 - 3006 Southbank - Victoria 100.00
BELGIUM
AB INBEV N.V. – Grote Markt 1 - 1000 – Brussel Consolidating Company
BRASSERIE DE L'ABBAYE DE LEFFE S.A. - Place de l'Abbaye 1 - 5500 - Dinant 98.54
BROUWERIJ VAN HOEGAARDEN N.V. - Stoopkensstraat 46 - 3320 - Hoegaarden 100.00
COBREW N.V. - Brouwerijplein 1 - 3000 – Leuven 100.00
INBEV BELGIUM S.P.R.L. - Industrielaan 21 - 1070 – Brussel 100.00
BOTSWANA
KGALAGADI BREWERIES (PTY) LTD - Plot 20768, Broadhurst industrial estate - Gaborone2 31.00
BOLIVIA
CERVECERIA BOLIVIANA NACIONAL S.A. - Av. Montes 400 and Chuquisaca No. 121, Zona Challapampa - La
Paz 61.95
BRAZIL
AMBEV S.A. - Rua Dr Renato Paes de Barros, 1017, 3° andar, Itaim Bibi - CEP 04530-001 - São Paulo 61.95
CANADA
LABATT BREWING COMPANY LIMITED - 207 Queen's Quay West, Suite 299 - M5J 1A7 - Toronto 61.95
CHILE
CERVECERIA CHILE S.A. - Av. Presidente Eduardo Frei Montalva 9600 - 8700000 - Quilicura 61.95
CHINA
ANHEUSER-BUSCH INBEV (CHINA) SALES CO LTD. - Shangshou, Qin Duan Kou, Hanyang Area - 430051 -
Wuhan City, Hubei Province
100.00
ANHEUSER-BUSCH INBEV (WUHAN) BREWERY CO. LTD. - Shangshou, Qin Duan Kou, Hanyang Area -
430051 - Wuhan City, Hubei Province
97.06
ANHEUSER-BUSCH INBEV (FOSHAN) BREWERY CO. LTD. - 1 Budweiser Avenue, Southwest St., Sanshui
District - 528132 - Foshan City, Guangdong
100.00
ANHEUSER-BUSCH INBEV HARBIN BREWERY CO. LTD. - 9 HaPi Road Pingfang District - 150066 - Harbin
City, Heilongijang Province
100.00
ANHEUSER-BUSCH INBEV (TANGSHAN) BREWERY CO. LTD. - 18, Yingbin Road - 063300 - Tangshan City,
Hebei Province
100.00
ANHEUSER-BUSCH INBEV SEDRIN BREWERY CO. LTD. - 660 Gong Ye Road, Hanjiang District - 351111 -
Putian City, Fujian Province
100.00
ANHEUSER-BUSCH INBEV SEDRIN (ZHANGZHOU) BREWERY CO. LTD. - Lantian Economic District - 363005
- Zhangzhou City, Fujian Province
100.00
ANHEUSER-BUSCH INBEV (TAIZHOU) BREWERY CO. LTD. - 159 Qi Xia East Road, Chengguan Town, Tiantai
County - 317200 - Taizhou Cithy, Zhejiang Province
100.00
NANCHANG ASIA BREWERY CO. LTD. - 183 West Sandian Road, Qing Yun Pu District - Nanchang City,
Jiangxi Province
100.00
SIPING GINSBER DRAFT BEER CO. LTD. - Xianmaquan, Tiedong Area - Siping City, Jilin Province 100.00
ANHEUSER-BUSCH INBEV BIG BOSS (JIANGSU) BREWERY CO. LTD. - 666 Zhaoxia Road - Nantong City,
Jiangsu Province
100.00
ANHEUSER-BUSCH INBEV (SICHUAN) BREWERY CO. LTD. - No. 1, AB InBev Avenue, Cheng Nan Industry
Park, Economic Development Area - 641300 - Ziyang City, Sichuan Province
100.00
ANHEUSER-BUSCH INBEV (HENAN) BREWERY CO. LTD. - No. 1 Budweiser Avenue, Industry Park,
Tangzhuang Town - 453100 - Weihui City, Henan Province
100.00
INBEV JINLONGQUAN (HUBEI) BREWERY CO. LTD. - 89 Jin Long Quan Avenue - Jingmen City, Hubei
Province
60.00
ANHEUSER-BUSCH INBEV (SUQIAN) BREWERY CO. LTD. - No 1 Qujiang Road, Suyu Industry Park - Suqian
City, Jiangsu Province
100.00
1 Excludes companies classified as held for sale 2 The group’s shares entitle the holder to twice the voting rights

95
NAME AND REGISTERED OFFICE OF FULLY CONSOLIDATED COMPANIES
% OF ECONOMIC
INTEREST AS AT
31 DECEMBER 2016
COLOMBIA
BOGOTA BEER COMPANY BBC S.A.S. - Avenida Carrera 24 85A-47 - Bogota 97.22
BAVARIA SA - Carrera 53A 127–35 - Cundinamarca - 111111 Bogota 99.00
AMBEV COLOMBIA S.A.S. - Calle 90 12-28 Piso 2 – Bogota 97.22
CZECH REPUBLIC
PIVOVAR SAMSON A.S. - V parku 2326/18, Chodov, 148 00 Praha 4 100.00
DOMINICAN REPUBLIC
CERVECERIA NACIONAL DOMINICANA S.A. - Autopista 30 de Mayo Km 61/2, Distrito Nacional - A.P. 1086 -
Santo Domingo1 34.07
ECUADOR
COMPAÑIA CERVECERA AMBEV ECUADOR S.A. - Km 14.5 Via a Daule S/N y Av. Las Iguanas, Guayaquil 97.22
CERVECERÍA NACIONAL (CN) SA - Via a daule km 16,5 y calle cobre s/n – Guayaquil, Guayas 95.60
EL SALVADOR
INDUSTRIAS LA CONSTANCIA, SA DE CV - 526 Av. Independencia, San Salvador 100.00
FRANCE
AB INBEV FRANCE S.A.S. - Immeuble Crystal, 38, Place Vauban - C.P. 59110 - La Madeleine 100.00
GERMANY
BRAUEREI BECK GmbH & CO. KG - Am Deich 18/19 - 28199 - Bremen 100.00
BRAUEREI DIEBELS GmbH & CO.KG - Brauerei-Diebels-Strasse 1 - 47661 - Issum 100.00
HAAKE-BECK AG - Am Deich 18/19 - 28199 - Bremen 99.96
HASSERÖDER BRAUEREI GmbH - Auerhahnring 1 - 38855 - Wernigerode 100.00
ANHEUSER-BUSCH INBEV GERMANY HOLDING GmbH - Am Deich 18/19 - 28199 - Bremen 100.00
SPATEN - FRANZISKANER - BRÄU GmbH - Marsstrasse 46 + 48 - 80335 - München 100.00
ANHEUSER-BUSCH INBEV Deutschland GmbH & Co KG - Am Deich 18/19 - 28199 - Bremen 100.00
LOEWENBRAEU AG - Nymphenburger Str. 7 - 80335 - München 100.00
GHANA
ACCRA BREWERY LTD - Farra Avenue 20 1st Floor, Pkf Building, P.O. Box Gp1219 - Accra 59.84
GRAND DUCHY OF LUXEMBOURG
BRASSERIE DE LUXEMBOURG MOUSEL - DIEKIRCH - 1, Rue de la Brasserie - L-9214 - Diekirch 95.82
HONDURAS
CERVECERÍA HONDUREÑA, SA DE CV - Blvd. Del Norte, Carretera Salida a Puerto Cortes - San Pedro Sula,
Cortes 99.00
INDIA
CROWN BEERS INDIA LIMITED - #8-2-684/A, Road No. 12 - Banjara Hills, Hyderabad 500034 - Andhra
Pradesh 100.00
SABMILLER BREWERIES PRIVATE LTD - M99, MIDC, Aurangabad - 431136 Waluj 100.00
ITALY
ANHEUSER-BUSCH INBEV ITALIA SPA - Piazza Buffoni 3, 21013 Gallarate 100.00
MEXICO
GRUPO MODELO S. DE R.L. DE C.V.- Javier Barros Sierra 555 Piso 3 - Zedec Ed Plaza Santa Fe Alvaro
Obregon - 01210 Mexico City, Distrito Federal 100.00
MOZAMBIQUE
CERVEJAS DE MOÇAMBIQUE SA - Rua do Jardim 1329 - Maputo2 49.10
THE NETHERLANDS
INBEV NEDERLAND N.V. - Ceresstraat 1 - 4811 CA - Breda 100.00
INTERBREW INTERNATIONAL B.V. - Ceresstraat 1 - 4811 CA - Breda 100.00
SABMILLER AFRICA BV - Ceresstraat 1, 4811 CA - Breda 62.00
SABMILLER BOTSWANA BV - Ceresstraat 1, 4811 CA - Breda 62.00
NIGERIA
INTAFACT BEVERAGES LTD - SABMiller Drive Niger Bridge Industrial Layout Onitsha - Anambra2 37.50
INTERNATIONAL BREWERIES PLC - Lawrence Omole Way, Omi Osoro Road, Imo Ilesha, Osun State2 36.00
1 55% owned by Ambev S.A 2 The company is consolidated due to the group’s majority shareholdings and ability to control the operations

96
NAME AND REGISTERED OFFICE OF FULLY CONSOLIDATED COMPANIES
% OF ECONOMIC
INTEREST AS AT
31 DECEMBER 2016
PANAMA
CERVECERÍA NACIONAL HOLDING SA - Costa del Este Business Park, torre Oeste Piso 2 - Ciudad de
Panama
60.00
PARAGUAY
CERVECERIA PARAGUAYA S.A. - Ruta Villeta km 30 N 3045 - 2660 - Ypané 61.95
PERU
COMPANIA CERVECERA AMBEV PERU S.A.C. - Av. Los Laureles Mza. A Lt. 4 del Centro Poblado Menor Santa
Maria de Huachipa - Lurigancho (Chosica) - Lima 15 97.22
UNIÓN DE CERVECERÍAS PERUANAS BACKUS Y JOHNSTON SAA - 3986 Av. Nicolas Ayllon, Ate, Lima 3 93.48
RUSSIA
OAO SUN INBEV - 28 Moscovskaya Street, Moscow region - 141600 - Klin 99.95
SOUTH AFRICA
SABSA HOLDINGS LTD - 2 Jan Smuts Avenue, Gauteng - Johannesburg 100.00
THE SOUTH AFRICAN BREWERIES (PTY) LTD - 65 Park Lane, Gauteng - Johannesburg 100.00
SOUTH KOREA
ORIENTAL BREWERY CO., LTD - 151, Hyeondogongdan-ro, Seowon-gu Cheongju-si, Chungcheongbuk-do 100.00
SWITZERLAND
SABMILLER PROCUREMENT GMBH - Turmstrasse 26 - 6300 Zug 100.00
TANZANIA
TANZANIA BREWERIES LTD - Plot No 79, Block AA, Uhuru Street, Mchikichini, Ilala District, Dar es Salaam1 36.00
UGANDA
NILE BREWERIES LTD - Plot M90 Yusuf Lule Roa, Njeru, Jinja - Eastern Uganda 61.76
UKRAINE
SUN INBEV UKRAINE PJSC - 30-V Fizkultury Str., BC "Faringeit" 4th floor - 3068 - Kiev 98.29
UNITED KINGDOM
AB INBEV UK LTD - Porter Tun House, 500 Capability Green - LU1 3LS - Luton 100.00
PIONEER BREWING COMPANY LTD - Porter Tun House, 500 Capability Green - LU1 3LS - Luton 100.00
SABMILLER LIMITED – AB InBev House, Church Street West, Woking, Surrey, GU21 6HT 100.00
SABMILLER HOLDINGS LTD - AB InBev House, Church Street West, Woking, Surrey, GU21 6HT 100.00
SABMILLER INTERNATIONAL BRANDS LTD - AB InBev House, Church Street West, Woking, Surrey, GU21
6HT 100.00
UNITED STATES
ANHEUSER-BUSCH COMPANIES, LLC. - One Busch Place - St. Louis, MO 63118 100.00
ANHEUSER-BUSCH INTERNATIONAL, INC. - One Busch Place - St. Louis, MO 63118 100.00
ANHEUSER-BUSCH PACKAGING GROUP, INC. - One Busch Place - St. Louis, MO 63118 100.00
ANHEUSER-BUSCH, LLC – One Busch Place, St. Louis, MO. 63118 100.00
METAL CONTAINER CORPORATION, INC. – One Busch Place, St. Louis, MO. 63118 100.00
Anheuser-Busch North American Holding Corporation 100.00
URUGUAY
CERVECERIA Y MALTERIA PAYSANDU S.A. - Cesar Cortinas, 2037 - C.P. 11500 - Montevideo 61.95
VIETNAM
ANHEUSER-BUSCH INBEV VIETNAM BREWERY COMPANY LIMITED/No.2 VSIP II-A, Street no. 28, Vietnam -
Singapore II-A Industrial Park, Tan Uyen District, Binh Duong Province 100.00
ZAMBIA
ZAMBIAN BREWERIES PLC - Mungwi Road, Plot Number 6438, Lusaka 54.00
1 The company is consolidated due to the group’s majority shareholdings and ability to control the operations

97
LIST OF MOST IMPORTANT ASSOCIATES AND JOINT VENTURES
NAME AND REGISTERED OFFICE OF ASSOCIATES AND JOINT VENTURES
% OF ECONOMIC
INTEREST AS AT
31 DECEMBER 2016
FRANCE
SOCIÉTÉ DES BRASSERIES ET GLACIÈRES INTERNATIONALES SA - 30 AV George V, 75008, Paris 20.00
GIBRALTAR
BIH BRASSERIES INTERNATIONALES HOLDING LTD - CC Building, 10th Floor, Main Street 20.00
BIH BRASSERIES INTERNATIONALES HOLDING (ANGOLA) LTD - Suite 10/3, International Commercial
Centre, 2A Main Street 27.00
TURKEY
ANADOLU EFES BIRACΙLΙK VE MALT SANAYII AS - Bahçelievler Mahallesi, Sehit Ibrahim Koparir Caddesi No.
4, Bahçelievler Istanbul 24.00
ZIMBABWE
DELTA CORPORATION LTD - Sable house, P.O. Box BW 343, Northridge Close, Borrowdale, Harare 25.00

98
Information to our shareholders
EARNINGS, DIVIDENDS, SHARE AND SHARE PRICE
2016 2015 2014 2013 2012
Cash flow from operating activities (US dollar per share) ....................... 5.89 8.62 8.66 8.53 8.29
Normalized earnings per share (US dollar per share) ............................ 2.83 5.20 5.43 4.91 4.50
Dividend (euro per share) .................................................................. 3.60 3.60 3.00 2.05 1.70
Share price high (euro per share) ....................................................... 119.60 124.20 94.89 79.60 71.05
Share price low (euro per share) ........................................................ 92.13 87.73 69.14 63.44 46.10
Year-end share price (euro per share) ................................................. 100.55 114.40 93.86 77.26 65.74
Weighted average number of ordinary and restricted shares (million
shares) ........................................................................................... 1 717 1 638 1 634 1 617 1 600
Diluted weighted average number of ordinary and restricted shares
(million shares) ................................................................................ 1 755 1 668 1 665 1 650 1 628
Volume of shares traded (million shares) ............................................. 445 449 397 423 486

99
INFORMATION ON THE AUDITORS’ ASSIGNMENTS AND RELATED FEES
AB InBev’s Statutory auditor is Deloitte Bedrijfsrevisoren BV CVBA – Réviseurs d’Entreprises SC SCRL, represented by Joel
Brehmen, engagement partner.
Base fees for auditing the annual financial statements of AB InBev and its subsidiaries are determined by the shareholders meeting
after review and approval by the company’s Audit Committee and Board of Directors.
Fees for 20161 in relation to services provided by Deloitte Bedrijfsrevisoren BV CVBA – Réviseurs d’Entreprises SC SCRL
amounted to 5 238k US dollar (20152: 3 133k US dollar), which was composed of audit services for the annual financial statements
of 1 168k US dollar (2015: 1 522k US dollar), tax services of 2 809k US dollar (2015: 41k US dollar), audit related services of 1
261k US dollar (2015: 1 567k US dollar) and other services of 0k US dollar (2015: 3k US dollar). Audit related services mainly
relate to services incurred in connection with rights and bonds issuance, interim dividends and reports issued in connection to the
SABMiller combination. Tax services mainly relate to services incurred in connection with expat services, all of which have been
pre-approved by the company’s Audit Committee.
Fees for 2016 in relation to services provided by other offices in the Deloitte Touche Tohmatsu network amounted to 10 677k US
dollar (2015: 8 838k US dollar), which was composed of audit services for the annual financial statements of 6 282k US dollar
(2015: 5 417k US dollar), tax services of 3 853k US dollar (2015: 2 623k US dollar), audit related services of 541k US dollar (2015:
597k US dollar) and other services of 0k US dollar (2015: 201k US dollar), all of which have been pre-approved by the company’s
Audit Committee.
FINANCIAL CALENDAR
Publication of 2016 results ................................................................................ 02 March 2017
Annual report 2016 available on www.ab-inbev.com ............................................ 02 March 2017
General shareholders meeting ........................................................................... 26 April 2017
Dividend: ex-coupon date ................................................................................. 2 May 2017
Publication of first quarter results ...................................................................... 4 May 2017
Publication of half year results .......................................................................... 27 July 2017
Publication of third quarter results ..................................................................... 26 October 2017
INVESTOR RELATIONS CONTACT
Media Investors
Marianne Amssoms Henry Rudd
Tel: +1-212-573-9281 Tel: +1-212-503-1892
E-mail: [email protected] E-mail: [email protected]
Kathleen Van Boxelaer Lauren Abbott
Tel: + 32-16-27-68-23 Tel: +1-212-573-9287
E-mail: [email protected] E-mail: [email protected]
Mariusz Jamka
Tel: +32-16-27-68-88
E-mail: [email protected]
1 2016 fees do not include audit and other fees of SABMiller companies which are audited by PricewaterhouseCoopers LLP. 2 AB InBev’s statutory auditor in 2015 was PricewaterhouseCoopers Bedrijfsrevisoren cvba.

100
Excerpt from the AB InBev NV separate (non-consolidated)
financial statements prepared in accordance with Belgian
GAAP
On 11 November 2015, the boards of the former Anheuser-Busch InBev SA/NV (the “former AB InBev”) and SABMiller plc
announced that they had reached an agreement on the terms of the proposed business combination between SABMiller plc and AB
InBev (the “Combination”).
The Combination was implemented through a series of steps and completed on the 10th of October 2016. Pursuant to the final step
of the Combination, the former AB InBev has merged into Newbelco SA/NV (“Newbelco”), with Newbelco being the surviving
company. As a result of the merger, Newbelco has become the holding company for the combined former AB InBev and SABMiller
groups and the former AB InBev was dissolved. All assets and liabilities of the former AB InBev have been transferred to
Newbelco, and Newbelco has automatically been substituted for the former AB InBev in all its rights and obligations by operation
of Belgian law. Immediately following the merger, Newbelco has been renamed Anheuser-Busch InBev SA/NV (hereinafter “AB
InBev NV”).
The following information is extracted from the separate Belgian GAAP financial statements of AB InBev NV, the new holding
company and surviving entity following the merger on 10 October 2016. AB InBev NV, previously named Newbelco NV/SA, was
incorporated on 3 March 2016. These Belgian GAAP financials cover the period from 3 March 2016 to 31 December 2016.
The following information is also extracted from the separate Belgian GAAP financials of the former AB InBev that merged into
Newbelco and that was dissolved upon completion of the merger on 10 October 2016. These Belgian GAAP financials cover the
period from 1 January 2016 to 10 October 2016.
These separate financial statements, together with the management report of the Board of Directors to the general assembly of
shareholders as well as the auditor’s report, will be filed with the National Bank of Belgium within the legally foreseen time limits.
These documents are also available on request from: AB InBev NV, Brouwerijplein 1, 3000 Leuven.
It should be noted that only the consolidated financial statements as set forth above present a true and fair view of the financial
position and performance of the AB InBev group.
Since AB InBev NV (and before that former AB InBev) is essentially a holding company, which recognizes its investments at cost
in its non-consolidated financial statements, these separate financial statements present no more than a limited view of the financial
position of AB InBev NV. For this reason, the Board of Directors deemed it appropriate to publish only an abbreviated version of
the non-consolidated balance sheet and income statement prepared in accordance with Belgian GAAP as at and for the year ended
31 December 2016.
The statutory auditor has confirmed that his audit procedures are substantially complete and that the abbreviated non-consolidated
balance sheet and income statement of AB InBev NV prepared in accordance with Belgian GAAP for the year ended 31 December
2016 and of former AB InBev prepared in accordance with Belgian GAAP for the period ending 10 October 2016 are consistent, in
all material respects, with the accounts from which they have been derived.
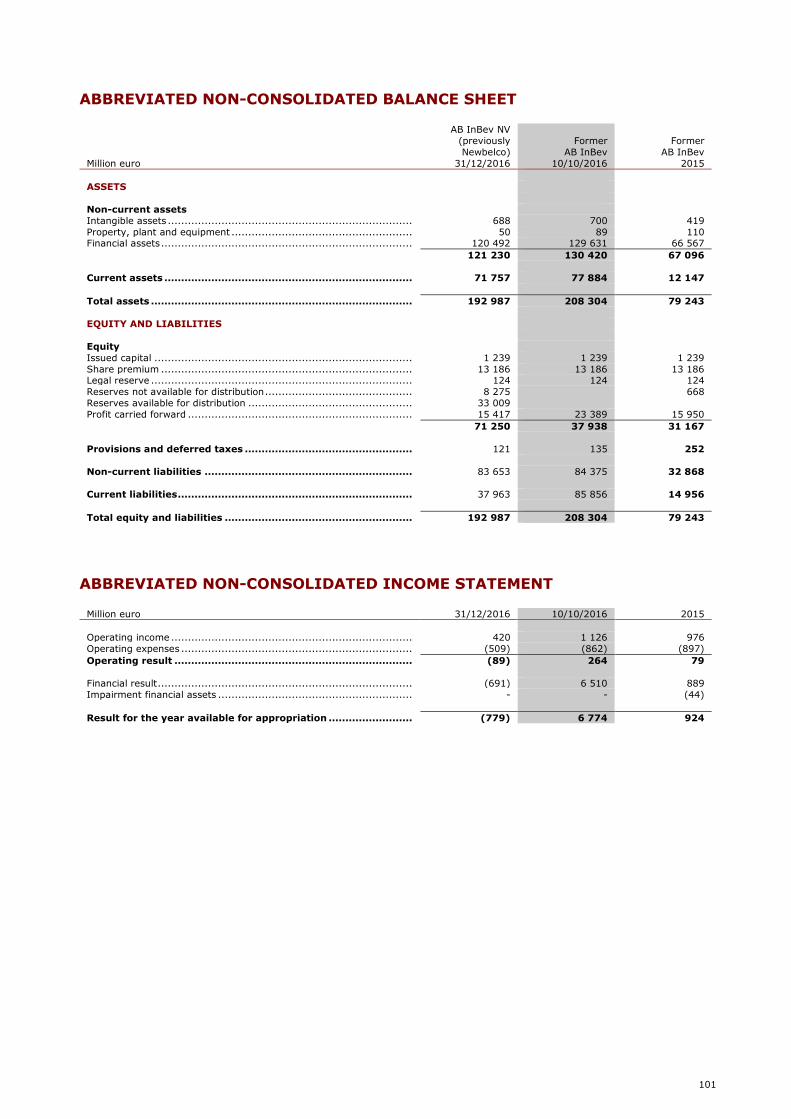
101
ABBREVIATED NON-CONSOLIDATED BALANCE SHEET
Million euro
AB InBev NV
(previously
Newbelco)
31/12/2016
Former
AB InBev
10/10/2016
Former
AB InBev
2015
ASSETS
Non-current assets
Intangible assets ......................................................................... 688 700 419
Property, plant and equipment ...................................................... 50 89 110 Financial assets ........................................................................... 120 492 129 631 66 567
121 230 130 420 67 096
Current assets .......................................................................... 71 757 77 884 12 147
Total assets .............................................................................. 192 987 208 304 79 243
EQUITY AND LIABILITIES
Equity
Issued capital ............................................................................. 1 239 1 239 1 239
Share premium ........................................................................... 13 186 13 186 13 186 Legal reserve .............................................................................. 124 124 124
Reserves not available for distribution ............................................ 8 275 668
Reserves available for distribution ................................................. 33 009
Profit carried forward ................................................................... 15 417 23 389 15 950
71 250 37 938 31 167
Provisions and deferred taxes .................................................. 121 135 252
Non-current liabilities .............................................................. 83 653 84 375 32 868
Current liabilities ...................................................................... 37 963 85 856 14 956
Total equity and liabilities ........................................................ 192 987 208 304 79 243
ABBREVIATED NON-CONSOLIDATED INCOME STATEMENT
Million euro 31/12/2016 10/10/2016 2015
Operating income ........................................................................ 420 1 126 976
Operating expenses ..................................................................... (509) (862) (897)
Operating result ....................................................................... (89) 264 79
Financial result ............................................................................ (691) 6 510 889
Impairment financial assets .......................................................... - - (44)
Result for the year available for appropriation ......................... (779) 6 774 924

102
Glossary
AGGREGATED WEIGHTED NOMINAL TAX RATE
The aggregated weighted nominal tax rate is based on the statutory corporate income tax rates applicable in the various countries.
COPEC
Colombia, Peru and Ecuador.
DILUTED EPS
Profit attributable to equity holders of AB InBev divided by the fully diluted weighted average number of ordinary and restricted
shares.
DILUTED WEIGHTED AVERAGE NUMBER OF ORDINARY AND RESTRICTED SHARES
Weighted average number of ordinary and restricted shares, adjusted by the effect of share options on issue.
EBIT
Profit from operations.
EBITDA
Profit from operations plus depreciation, amortization and impairment.
EMEA
Europe and Africa.
EPS
Profit attributable to equity holders of AB InBev divided by the weighted average number of ordinary and restricted shares.
FTE’S
Full-time employees on a permanent or temporary basis, excluding outsourced personnel.
INVESTED CAPITAL
Includes property, plant and equipment, goodwill and intangible assets, investments in associates and equity securities, working
capital, provisions, employee benefits and deferred taxes.
MARKETING EXPENSES
Include all costs relating to the support and promotion of the brands. They include among others operating costs (payroll, office
costs, etc.) of the marketing department, advertising costs (agency costs, media costs, etc.), sponsoring and events, and surveys and
market research.
NET CAPEX
Acquisitions of property, plant and equipment and of intangible assets, minus proceeds from sale.
NET DEBT
Non-current and current interest-bearing loans and borrowings and bank overdrafts, minus debt securities and cash and cash
equivalents.
NON-RECURRING ITEMS
Items of income or expense which do not occur regularly as part of the normal activities of the company.
NORMALIZED
The term “normalized” refers to performance measures (EBITDA, EBIT, Profit, EPS, effective tax rate) before non-recurring items
and profit from discontinued operations. Non-recurring items are items of income or expense which do not occur regularly as part of
the normal activities of the company and which warrant separate disclosure because they are important for the understanding of the
underlying results of the company due to their size or nature. AB InBev believes that the communication and explanation of
normalized measures is essential for readers of its financial statements to understand fully the sustainable performance of the
company. Normalized measures are additional measures used by management and should not replace the measures determined in
accordance with IFRS as an indicator of the company’s performance.
NORMALIZED DILUTED EPS
Diluted EPS adjusted for non-recurring items and profit from discontinued operations.
NORMALIZED EBIT
Profit from operations adjusted for non-recurring items.
NORMALIZED EBITDA
Profit from operations adjusted for non-recurring items, plus depreciation, amortization and impairment.
NORMALIZED EFFECTIVE TAX RATE
Effective tax rate adjusted for non-recurring items.
NORMALIZED EPS
EPS adjusted for non-recurring items and profit from discontinued operations.
NORMALIZED PROFIT
Profit adjusted for non-recurring items and profit from discontinued operations.
NORMALIZED PROFIT FROM OPERATIONS
Profit from operations adjusted for non-recurring items.
PAY OUT RATIO
Gross dividend per share multiplied by the estimated number of ordinary shares outstanding at the dividend record date, divided by
normalized profit attributable to equity holders of AB InBev.

103
RE-MEASUREMENTS OF POST-EMPLOYEE BENEFITS
Comprised of actuarial gains and losses, the effect of the asset ceiling (excluding net interest) and the return on plan assets
(excluding net interest).
REVENUE
Gross revenue less excise taxes and discounts.
SALES EXPENSES
Include all costs relating to the selling of the products. They include among others the operating costs (payroll, office costs, etc.) of
the sales department and the sales force.
SG&A
Sales, marketing, distribution and administrative expenses
SCOPE
Financials are analyzed eliminating the impact of changes in currencies on translation of foreign operations, and scopes. A scope
represents the impact of acquisitions and divestitures, the start-up or termination of activities or the transfer of activities between
segments, curtailment gains and losses and year-over-year changes in accounting estimates and other assumptions that management
does not consider as part of the underlying performance of the business.
WEIGHTED AVERAGE NUMBER OF ORDINARY AND RESTRICTED SHARES
Number of shares outstanding at the beginning of the period, adjusted by the number of shares cancelled, repurchased or issued
during the period multiplied by a time-weighing factor.
WORKING CAPITAL
Includes inventories, trade and other receivables and trade and other payables, both current and non-current.