annual report 2016-2017 - rura · rura annual report, 2016 - 2017 iii contents rura’s vision,...
TRANSCRIPT
RURA Annual Report, 2016 - 2017 i
ANNUAL REPORT 2016-2017
www.rura.rw

RURA Annual Report, 2016 - 2017ii
RURA Annual Report, 2016 - 2017 i
OUR VISION
OUR MISSION
OUR VALUES
OUR MOTO
A point of reference in public utilities regulation that inspires development and confidence
To build an environment that promotes fair competition and quality of public utility services in a
transparent, independent and reliable manner
• Independency• Accountability• Transparency• Firmness
Inspiring development
VISION, MISSION & CORE VALUES

RURA Annual Report, 2016 - 2017ii

RURA Annual Report, 2016 - 2017 iii
CONTENTS
RURA’S VISION, MISSION AND CORE VALUES i
LIST OF FIGURES vi
LIST OF TABLES vii
ABBREVIATIONS viii
ACKNOWLEDGMENT x
THE REGULATORY BOARD xi
FOREWORD xii
EXECUTIVE SUMMARY xiii
1. INTRODUCTION 1
1.1. Rwanda in Context 1
1.2. RURA’s Operational Framework 1
1.3. Mission and Powers 1
1.4. Corporate Governance 2
1.5. Senior Management Team 7
2. CORPORATE PERFORMANCE REVIEW 9
2.1. Workforce 9
2.2. Knowledge Transfer 11
2.3. Corporate Social Responsibility 11
2.4. Public Relations and International Cooperation 11
2.5. Financial Performance Review 13
2.6. UAF Financial Performance Review 14
3. ICT SECTOR 16
3.1. Sector Profile 16
3.2. Legal and Regulatory Framework 16
3.3. Licensing 17
3.4. Market Performance and Statistics 22
3.5. Management Of ICT Resources 27
3.6. Monitoring and Enforcement 29
3.7. Consumer Protection 31
3.8. Universal Access 33
3.9. Outstanding Issues 34

RURA Annual Report, 2016 - 2017iv
4. ENERGY SECTOR 36
4.1. Sector Profile 36
4.2. Legal and Regulatory Framework 36
4.3. Licensing 37
4.4. Market Performance 40
4.5. Inspection and Monitoring 45
4.6. Consumer Protection 48
4.7. Outstanding Issues 48
5. WATER AND SANITATION SECTOR 51
5.1. Sector Profile 51
5.2. Legal and Regulatory Framework 51
5.3. Licensing 52
5.4. Market Performance 54
5.5. Monitoring 56
5.6. Consumer Protection 59
5.7. Outstanding Issues 59
6. TRANSPORT REGULATION 61
6.1. Sector Profile 61
6.2. Legal and Regulatory Framework 61
6.3. Licensing 61
6.4. Market Performance 62
6.5. Monitoring and Enforcement 65
6.6. Consumer Protection 69
6.7. Oustanding Issues 69
7. CONCLUSIONS AND WAY FORWARD 71
8. ANNEXES 72

RURA Annual Report, 2016 - 2017 v
LIST OF FIGURES
Figure 1: Percentages of staff members by gender 9
Figure 2: Distribution of RURA staff per qualifications 9
Figure 3: Distribution of RURA staff by age (2016-2017) 10
Figure 4: The signing of MOU between RURA and ARPTC 13
Figure 5: Trends of the Mobile Telephone Subscriptions from December 2009 to June 2017 23
Figure 6: Trends of fixed telephone subscribers for the period 2009-June 2017 23
Figure 7: Evolution of Mobile Telephone Subscribers Market Share per Operator 24
Figure 8: Development of Internet subscribers for the period 2009-June 2017 26
Figure 9: International Internet bandwidth in Mbps 26
Figure 10: Number of Complaints in ICT sector 32
Figure 11: Gishoma Peat to power plant 41
Figure 12: Nasho Solar Power plant 41
Figure 13: Installed generation capacity mix (MW) 41
Figure 14: Energy Generation Mix (MWh) 41
Figure 15: Trend of on-grid connected customers 42
Figure 16: Institutional Biogas Plant 43
Figure 17: Medical gases facility –CHUB Hospital 43
Figure 18: Fuel Depot – E.R.P- Kabuye 44
Figure 19: LPG Storage & Filling Plant – 44
Figure 20: Trend in essence and gasoil pump prices (Frw/liter) 45
Figure 21: Trend in Jet A1 Price (US$/liter) 45
Figure 22: Energy related complaints 48
Figure 23: Number of licensed operators in sanitation service provision 54
Figure 24: Volume of water produced and supplied by WASAC Ltd 55
Figure 25: Trend in increase of customer connections in urban areas 55
Figure 26 : Trend in Non-Revenue Water over 6 years 56
Figure 27: Ongoing construction works at Nzove 56
Figure 28: Completed LV-WATSAN project at Mpanga 56
Figure 29: Completed LV-WATSAN project at Nyagatare 56
Figure 30: Newly constructed plant at Nkombo 56
Figure 31: Compressor for waste collection and transportation 58
Figure 32: Provincial workshops on water supply and sanitation service provision in Western Province. 58
Figure33: Motorcycle Fleet Distribution by Provinces and the City of Kigali 64

RURA Annual Report, 2016 - 2017vi
Figure 34: Boats per Lake 64
Figure 35: South-West corridor operators faults 65
Figure 36: North-West corridor operators faults 66
Figure 37: Eastern Corridor operators’ faults 66
Figure 38: City of Kigali operators’ faults 67
Figure 39: Speed governor launch 68
Figure 40: Official Launch of DVCMS 68

RURA Annual Report, 2016 - 2017 vii
LIST OF TABLES
Table 1: Strategic Area of Training 11Table 2: Performance report table 14Table 3: Financial Performance in Frw /Universal Access Fund 14Table 4: Licensed Network and Service Providers as of June 2017 17Table 5: Licensed Postal and Courier operators 18Table 6: The list of television broadcasters and Digital Studio permit holders, as of June 2017 19Table 7: List of registered FM radio broadcasters between July 2016 – June 2017 20Table 8: Print media organs that have permit, as of June 2017. 20Table 9: Online media (Radio/TV) 21Table 10: Online newspaper authorized, as of June 2017 22Table 11: Number of Mobile and Fixed Telephone Service Subscribers per Telecom Operators of June 2017 22Table 12: Mobile telephone network coverage as of June 2017 per type of technology and per operator 24Table 13: Fixed Voice Telephone Tariff Trend in FRW 25Table 14: Mobile Voice tariff in FRW 25Table 15: Interconnection glide path 25Table 16: Mobile Money Services 27Table 17: Summary of the Licenses issued and revoked in Different Services 27Table 18: New Registrars in 2016-2017 financial year 28Table 19: Voice service 29Table 20: Data services 30Table 21: Comparison of the traffic for 2015/2016 vs 2016/2017 30Table 22: Annual aggregate RINEX traffic as of June 2017 30Table 23: Fiber Optic Installation Authorization 31Table 24: Electricity generation Licensed operators 38Table 25: List of licensed Operators for Petrol Service Stations, (July, 2016-June,2017) 39Table 26: List of Licensed LPG Operators 39Table 27: Licensed Operator –LPG Plant installation 40Table 28: List of Temporary Authorizations for Road Tankers (2016-2017) 40Table 29: Electricity tariff 43Table 30: Energy related complaints 48Table 31: End user rural water tariffs 51Table 32: List of Licensed Operators in water Supply sub sector 52Table 33: Water and sanitation complaints 59Table 34: Newly licensees in transport per category as of June 2017 62Table 35: Trend in licensed operators 62Table 36: Trend in operator’s fleets 63Table 37: Faults committed in public transport by corridor in 2016-2017 65Table 38: Transport related complaints 69

RURA Annual Report, 2016 - 2017viii
ABBREVIATIONS
ARPTC: Autorité de Régulation, de la Poste et des Télécommunications du Congo
CcTLD: Country Code Top Level Domain
CoK: City of Kigali
DOA: Digital Object Architecture
DRC: Democratic Republic of Congo
DVCMS: Drivers Vocational Cards Management System
EAG: Expert Advisory Group
EDPRS: Economic Development and Poverty Reduction Strategy
EUCL: Energy Utility Corporation Limited
FM: Frequency Modulation
FRW: Rwandan Francs
FTR: Fixed Termination Rates
GDP: Gross Domestic Product
GSM: Global System for Mobile communications
HV: High Voltage
ICT: Information Communication Technology
IGTVS: International Gateway Traffic Verification System
ISP: Internet Service Provider
IT: Information Technology
LKMP: Lake Kivu Monitoring Program
LPG: Liquefied Petroleum Gas
LTD: Limited
LTE: Long Term Evolution
MIFOTRA: Ministre de la Fonction Publique et du Travail
MINAGRI: Ministry of Agriculture
MINEDUC: Ministry of Education
MoU: Memorandum of Understanding

RURA Annual Report, 2016 - 2017 ix
MP: Management Prescriptions
MTN: Mobile Telecommunication Network
MTR: Mobile Termination Rates
MV: Medium Voltage
MW: Megawatt
MYICT: Ministry of Youth and Information Communication Technology
NCC: Network Color Codes
NCPD: Support to National Council of Persons with Disabilities
PM: Prime Minister
QoS: Quality of Services
RDB: Rwanda Development Board
REG: Rwanda Energy Group
RFTC: Rwanda Federation Transport Cooperative
RICTA: Rwanda Information and Communication Technology Association
RINEX Rwanda Internet Network Exchange
RNP: Rwanda National Police
RRA: Rwanda Revenue Authority
RURA: Rwanda Utilities Regulatory Authority
SDG: Sustainable Development Goals
SMS: Short Message Service
SP: Societe Petrolire
SRMM: Scarce Resources Management and Monitoring
TC: Transport Cooperatives
TV: Television
UAF: Universal Access Fund
VSAT: Very Small Aperture Terminal
WASAC: Water and Sanitation Corporation
WASH: Water, Sanitation and Hygiene
WTD: World Telecommunication Development Conference
WTP: Water Treatment Plants

RURA Annual Report, 2016 - 2017x
RURA Annual Report, 2015 - 2016 vii
THE REGULATORY BOARD MEMBERS
Standing (Left to right):Mr. Eugene Kazige - Vice - Chairperson, Mrs. Mbabazi Judith - Member,Maj. Patrick Nyirishema - Ag. Director General - Member, Dr. Etienne Ntagwirumugara - Member,
Seated (Left to right):Mrs. Liliane Mupende - Member, Eng. Coletha U. RUHAMYA - Chairperson,Mrs. Fortune Mukandoli - Member
ACKNOWLEDGMENT
The Rwanda Utilities Regulatory Authority acknowledges and appreciates the hard work that went into developing this Annual Report. The Authority wishes to thank the following individuals for their dedication, commitment and professionalism in developing this Report.
Ms. Beata Mukangabo – Chairperson
Mrs. Jackline F. Mupenzi
Mr. Norbert Kamana
Mrs. Violaine Akimana
Mr. Amani David Rugamba
Mrs. Scovia Umulisa
Mr. Vincent Museminali
Mrs. Yvonne Umutoni
Mr. Alexis Mutware
Mrs. Chantal Gakima
Mrs. Elizabeth Nahimana
Mr. Oscar Ugirashebuja
Mrs. Carine Manirakiza
Mr. Aaron Nagiramungu
Mr. Egidius Mbarara

RURA Annual Report, 2016 - 2017 xi
RURA Annual Report, 2015 - 2016 vii
THE REGULATORY BOARD MEMBERS
Standing (Left to right):Mr. Eugene Kazige - Vice - Chairperson, Mrs. Mbabazi Judith - Member,Maj. Patrick Nyirishema - Ag. Director General - Member, Dr. Etienne Ntagwirumugara - Member,
Seated (Left to right):Mrs. Liliane Mupende - Member, Eng. Coletha U. RUHAMYA - Chairperson,Mrs. Fortune Mukandoli - Member
Standing (Left to right):Mr. Eugene Kazige - Vice - Chairperson, Mrs. Mbabazi Judith - Member,Maj. Patrick Nyirishema - Director General - Member, Dr. Etienne Ntagwirumugara -Member,
Seated (Left to right):Mrs. Liliane Mupende - Member, Eng. Coletha U. RUHAMYA - Chairperson,Mrs. Fortune Mukandoli - Member
THE REGULATORY BOARD

RURA Annual Report, 2016 - 2017xii
Dear partners,
On behalf of the Regulatory Board, Management and entire staff of the Rwanda Utilities Regulatory Authority (RURA), I would like to present to you the annual report for the year ended June 2017 and thank you for your continuous support!
It is my hope that you will enjoy reading this annual report and will find it useful and informative.
FOREWORD
“Our main aim is to ensure that regulation works effectively, and is in the interest the public”
This past year has seen particularly important achievements in all sectors where different regulations were put in place, licenses issued, enforcement actions taken against non-compliant operators and consumer complaint handling was at its best.
RURA continues to strive to put in place other important instruments that shall assist the authority in advancing its strategic goals. We believe that this shall significantly benefit service providers and consumers in particular as well as augment sector contribution to the development of the country at large.
The Authority understands that to promote the lives of fellow citizens, we must go further than regulate public utilities, hence during the year under review, we financially supported the Unit Club, Pro-femme Twese Hamwe and the Gisozi Genocide Memorial Site under our Corporate Social Responsibility plan.
I would like to acknowledge the Board, Management and entire staff of RURA for their continued vigilance in delivering high quality service and protecting consumers in the regulated sectors regardless of some outstanding issues.
We are ready to continue partnerships with all our stakeholders to enhance regulation as we protect the utility users/consumers and service providers while laying groundwork for future developments.
Once again thank you, enjoy the report, share opinions and looking forward to yet another fruitful year 2017/18 as our main aim indeed remains, to “ensure that regulation works effectively, and is in the interest of the public”
Thank You!
Eng. Coletha U. RUHAMYA Chairperson of the Regulatory Board

RURA Annual Report, 2016 - 2017 xiii
The year 2016/17 marks a period in which the Authority took significant steps to implement its mandate and management concentrated its efforts in developing operational documents which exist in the form of sector guidelines and regulations. Primarily, these documents were developed to guide stakeholders on pertinent matters in the regulated sectors.
The Authority achieved a number of milestones with regard to corporate related matters to enhance the corporate governance, improve staff welfare and contribute to national socio-economic development efforts.
EXECUTIVE SUMMARY
It is in this regard that RURA reviewed strategic plan 2017-2020 and other internal rules and regulations including RURA Staff Statutes and Internal Rules and Regulations. In the same vein, RURA adopted a number of policies including Recruitment Policy, Remuneration Policy and Internship Policy. Other important achieved milestone is the start-up of the Construction works of RURA Twin Tower.
The Authority was cognizant that as the sectors advance, it is imperative to operate more efficiently as a regulator. In that regard, the Authority focused on enforcement of its established legal and regulatory framework and with the implementation of organization structure, the new staff were recruited and some important decisions were taken as it pertained to human resource development, enforcement and public education to build capacity and improve the effectiveness as a regulator.
There was also focus on increasing its visibility through various initiatives designed to educate the public on the Authority’s mandate for example a countrywide tour and media coverage of the meetings with motorcyclists where their problems were discussed and solved on spot.
With regard to Regional and International Cooperation, the Authority through its staff members and management also participated in a number of regional and international activities hosted by EACO, AFUR, CTO, ITU and other partners.
As RURA aspires to become a point of reference in the regulation of public utilities, a number of Regulatory bodies find it relevant to come and learn from RURA’s experience through study visits. It is within this context that RURA hosted visiting delegations from regulatory institutions in different regulated sectors. In Energy, Water and Sanitation Sectors, RURA received delegates from Zanzibar and Kenya while in ICT sector, RURA received delegates from Benin, Cameroun and Nigeria and a memorandum of understanding (MoU) was signed between RURA and Democratic Republic of Congo Telecommunications Regulator (ARPTC).

RURA Annual Report, 2016 - 2017xiv
In the ICT Sector, some regulatory instruments were put in place so as to promote the use of ICTs. Those include Regulations on Satellite Networks Filing, Regulation governing broadcasting services in Rwanda and Regulations on Promotion by Telecommunication Operators.
Other important achievements in the ICT Sector include high increase of the use of electronic transaction through mobile money with an increase of 99.08% of mobile money transactions compared to the previous year as well as an increase of 19% and 6% respectively for Internet and mobile penetration.
Through Universal Access Fund, RURA funded a number of important projects implemented through its partners. Those include the connection of one hundred and twenty-seven (127) schools in rural areas through 4G LTE. This initiative aims at promoting the quality of education in the country, increasing ICT penetration in rural and underserved areas, and increasing the use of Internet in schools and their neighbourhood.
In Energy Sector the reliability of electricity network has significantly improved due to reinforcement of the grid that led to substantial reduction of outages and power supply rationing as a result of increase in power supply with an adequate reserve margin.
RURA and its stakeholders strived to improve the grid reliability and increase electricity generation to meet present and future power demand, through attraction of both private and public sector investments.
In the Gas and Downstream Petroleum sub-sector, different projects were initiated on Methane Gas exploration in Lake Kivu and related projects are ongoing with increasing private investments in the petroleum supply chains and storage infrastructures, all aimed at promoting a sound management of
Gas and Downstream Petroleum industry. Also, various projects on Biogas were implemented countrywide as fuel for cooking and lighting at institutional.
Under Water and Sanitation Sub-Sector, regulations governing cleaning services provision, regulations on liquid waste collection and transportation and regulations on hazardous waste management are the ones newly adopted by RURA. Whereas regulations on decentralized wastewater treatment systems were reviewed together with regulations on cleaning services provision.
The annual water production increased from 43,558,705 m3 to 47,709,233 m3 representing 9.5% increase while water supplied has increased from 40,275,536 m3 to 44,213,124 m3 and the number of connected customers increased by 9% from 175,646 to 191,684 compared to the previous year.
The Transport Sector is a significant segment of Rwanda’s economy due to its strategic role in boosting socio-economic development experienced evolutions in terms of the increase in number of licensed operators and the increase in terms of number of vehicles used. According to transport regulations, only individual authorizations still issued in transportation of goods and waterways, for other sub-sectors, operators have to work in cooperatives or companies.
Concentrated effort was also placed on enforcing the Presidential Order no 25/01 of 25/02/2015 to speed limitation for public and commercial transport vehicles, in collaboration with Police, Mininfra, and Rwanda Standard Board conducted inspections and approved speed governor gadgets of the qualified companies.
In the same vein of enhancing professionalism in the sector, training of 880 public transport drivers was conducted

RURA Annual Report, 2016 - 2017 xv
on different aspects, including professional behavior, customer care and first aid. Also, the Drivers Vocational Cards Management System (DVCMS) was officially launched and 714 drivers’ vocational cards were issued in order to facilitate monitoring of public transport drivers.
Finally, I would like to take this opportunity on behalf of the Management and Staff, to convey our sincere gratitude to the Regulatory Board for their continued
support and guidance.
We also thank the Ministries in charge of regulated sectors and all stakeholders for their cordial cooperation accorded to the Authority throughout the year.
Thank You!
Patrick NYIRISHEMAMajDirector General
RURA Annual Report, 2016 - 2017xvi
INTRODUCTION

RURA Annual Report, 2016 - 2017 1
1. INTRODUCTION
1.1. RWANDA IN CONTEXT
Rwanda is a landlocked country with a surface area of 26,338 km2, a population of about 11.5 million (NISR, 2012) and GDP per capita of U$ 720 as of 2016.
The Vision 2020 and the Economic Development and Poverty Reduction Strategy [EDPRS II] 2013-2018 set the target to achieve a GDP per capita of USD 1,240 by 2020 at an annual growth rate of 11.5%. With a very high tele-density, lower GDP per capita and agrarian economy, the role of the Regulatory Authority in the much-needed transformational development is both crucial and strategic in promoting industry and service sectors.
1.2. RURA’S OPERATIONAL FRAMEWORK
RURA was initially created by the Law N° 39/2001 of 13th September 2001 as multi-sector regulatory agency with the mission to regulate certain public Utilities. This Law was repealed and replaced by Law Nº 09/2013 of 01/03/2013 establishing Rwanda Utilities Regulatory Authority (RURA) and determining its mission, powers, organization and functioning.
This Law gives RURA the mandate to regulate:
1. Telecommunications, information technology, broadcasting and converging electronic technologies including the internet and any other audio-visual information and communication technology;
2. Postal services;3. Renewable and non-renewable energy, industrial gases, pipelines and
storage facilities;4. Water;5. Sanitation;6. Transport of persons and goods; and7. Other public utilities, if deemed necessary.
RURA has a legal personality, financial and administrative autonomy in the fulfilment of its mandate. The Authority plays a pivotal role between the policy maker, licensed service providers and consumers. It reports to the Office of the Prime Minister and coordinates with line ministries responsible for each regulated sector in executing its functions.
1.3. MISSION AND POWERS
The Law Nº 09/2013 of 01/03/2013 gives the Authority the following mission:
to set up necessary guidelines in order to implement laws and regulations in force;
to ensure compliance by public utilities with the provisions of laws and regulations governing the regulated sectors in an objective, transparent and non-discriminatory manner;

RURA Annual Report, 2016 - 20172
to ensure the continuity of service delivery by the licensed or authorized service providers and the preservation of public interest;
to protect users’ and operators’ interests by taking measures likely to guarantee effective, sound and fair competition in the regulated sectors within the framework of applicable laws and regulations;
to protect and promote consumers’ interests;to promote the availability, accessibility and affordability of regulated services
to all consumers including low income, rural and disadvantaged consumers;to promote efficient development of regulated sectors in accordance with
Government economic and financial policy;to promote and enhance general knowledge, sensitization and awareness of
the regulated sectorsto issue permits, authorizations and licenses required for regulated sectors, in
accordance with the relevant laws and regulations;to monitor and ensure compliance by regulated network or service providers
in line with their licenses, permits and concession obligations;to ensure fair competition in all regulated sectors.
For public interest and consumers’ protection in particular, and in order to effectively fulfil its mandate, RURA has been vested by the Law with the following powers:
1º to carry out investigations including inspections at service delivery sites of the regulated service providers in the purpose of ensuring compliance with their obligations;2º to impose administrative sanctions in case of a violation of this Law and other Laws and regulations governing regulated sectors;3 º to settle and facilitate the settlement of disputes related to regulated services;4º to issue directives to the regulated service provider whose license to operate has been cancelled, suspended, modified or revoked, and appoint an administrator5º to regulate tariffs and charges6º to obtain information7º Judicial police power and RURA’s representation before courts subject to approval by the Minister of Justice.
1.4. CORPORATE GOVERNANCE
1.4.1. REGULATORY BOARD
The Regulatory Board is by virtue of the law the supreme management and decision making organ of RURA. The Regulatory Board consists of seven (7) members including the Director General who equally serves as a rapporteur.
1.4.1.1. RESPONSIBILITIES OF THE REGULATORY BOARD
The responsibilities of the Regulatory Board as outlined in the law establishing RURA include:
a) To participate in developing RURA general policy and monitor its implementation;
b) To determine the general vision of RURA and ensure its implementation;

RURA Annual Report, 2016 - 2017 3
c) To approve RURA’s annual budget and action plan;d) To approve annual financial statements for the previous financial year;e) To adopt the staff statutes, their emoluments, their wage structure, the internal
rules and the organizational structure of RURA;f ) To determine the job descriptions of RURA employees, set related terms
and conditions of employment and appoint staff members based on the recommendation of the Director General;
g) To evaluate the performance of RURA based on its action plan and budget;h) To decide on receiving, buying, giving away or selling movable or immovable
property and on the use of RURA’s property;i) To approve the annual activity report of RURA before its submission to the
supervisory authority.
1.4.1.2. POWERS OF THE REGULATORY BOARD
The powers of the Regulatory Board include among others:
1) To set up the general regulations and directives in accordance with the laws in force;
2) To determine at any time tariffs, charges related to networks interconnection or infrastructure shared by public utilities provider
3) To take any decision pertaining to the regulation of public utilities, particularly any decision relating to the granting, suspension and withdrawal of a license, authorization or permit;
4) To take administrative sanctions in case of violation of legal and regulatory provisions or violation of the contents of permits, licenses, authorization and other directives;
5) To take decisions on any disputes referred to it;6) To conciliate parties in dispute upon request.
1.4.1.3. REGULATORY BOARD COMMITTEES
In order to effectively perform its responsibilities, the Regulatory Board formed the following committees entrusted with analysing in depth all issues of the Authority before any decision is taken:
Audit and Risk Committee consisting of 4 members;
Human Resource Committee consisting of 3 members;
Technical Committee consisting of 3 members.
1.4.1.4. REGULATORY BOARD MEETINGS
The ordinary meetings of the Regulatory Board are held every month and the extra ordinary meetings are held when deemed necessary. During the period under review, the Regulatory Board held Nine (9) ordinary Board meetings and Two (2) extra-ordinary meetings.

RURA Annual Report, 2016 - 20174
Audit and Risk Committee held three (3) meetings during the period under review mainly to ensure that the Authority’s risk management, governance and internal control processes are operating effectively and monitor and review the effectiveness of the internal audit function.
Human Resource Committee held three (3) meetings during the period under review mainly to review the human resource issues affecting the Authority.
The Regulatory Board heard different briefings on the performance of operators in all sectors, took decisions and resolutions on the same. The followings are key resolutions/decisions taken during the period under review per Department:
A. ICT REGULATION
In the ICT related matters, the Regulatory Board of RURA took important decisions including among others:
(i) The issuance of an enforcement notice to MTN Rwanda Ltd
(ii) Approval of a temporary authorization to KTRN Ltd to provide retail internet service provision in buses and for service continuity, this is still valid until December 2017
(iii) Approval of Addendum 1 to the License No RURA/2013/0130 for KT Rwanda Network
(iv) Approval of the regulations for satellite networks filing in Rwanda
(v) Held a hearing on MTN Compliance issues
(vi) Imposition of administrative sanctions to MTN Ltd for non-compliance.
B. MEDIA AND CONSUMER AFFAIRS
In Media and Consumer related affairs, following regulations were approved by the Regulatory Board:
(i) Regulations Governing Broadcasting Services in Rwanda; (ii) Regulations on Promotion by Telecommunication Operators.
C. ENERGY, WATER AND SANITATION REGULATION
In the Energy Sector, the Regulatory Board of RURA:i. Approved the Electricity Generation License for Rwaza Hydropower LTD ii. Approved the Electricity Generation License for Prime Energy Limitediii. Approved the End User Electricity Tariffsi. Approved the Electricity Generation Licences for the following companies:
a. Rwanda Energy UK & Africa Energy Servicesb. Novel Energyc. Energie Nyaruguru (ENNY) Limitedd. REFAD Rwandae. Rubagabaga Hydro Power Ltdf. SPV NYIRAHINDWE HPP LTD

RURA Annual Report, 2016 - 2017 5
In Water and Sanitation Sector, the Regulatory Board:
i. Approved the water services provision license from WASAC Ltdii. Approved the regulations governing cleaning services provision in Rwandaiii. Approved the Electricity Generation License for REPRO Limitediv. Approved Rural Water Tariffsv. Approved the Regulations on decentralized wastewater treatment systems
vi. Approved the Regulations on liquid waste collection and transportationvii. Approved the Regulations governing hazardous waste management in
Rwanda
D. TRANSPORT REGULATION
In Transport Sector, the Regulatory Board:i. Appreciated the updates on changes in fares for the Bugesera Region
and Town Service routes emanating from Nyanza Taxi Park
ii. Heard a briefing on the performance of Kigali Bus Service Ltd
iii. Appointed an Administrator for the Kigali Bus Service Ltd
E. CORPORATE AFFAIRS
In corporate related matters, the Regulatory Board:i. Approved the implementation of the Horizontal Promotionii. Suspended some staff members due to gross misconductiii. Approved the RURA Staff Statutes, Recruitment Policy, Internal Rules and
Regulations and the Remuneration policyiv. Approved a report from the recruitment committee on new recruited
staffv. Approved the RURA annual report for the financial year 2015-16
vi. Noted the financial statements 2015-16 to be submitted to the Office of the Auditor General of State Finances
vii. Approved the asset disposal valuation reportviii. Approved the proposed adjustment on the organisational structure of RURAix. Appointed the RURA Spokesperson and Head of Media and Consumer
Affairs x. Approved the Regulations on promotions by telecommunications operatorsxi. Reviewed the RURA budget for the fiscal year 2016-2017xii. Approved the RURA Internship Policyxiii. Approved an amended annual Regulatory Fee based on a percentage of
the turnover from each regulated servicexiv. Approved the guidelines on consumer protection and consumer handling
proceduresxv. Approved a proposal on a Masters Program in Regulatory Economics and
Competition Policyxvi. Approved recruited staff in the Economic Regulation Unit and Transport

RURA Annual Report, 2016 - 20176
Departments xvii. Approved a leave of absence for a non-specified period for 4 staff xviii. Approved the RURA Strategic Plan 2017/2020;xix. Approved the Action Plan and Budget for 2017/18
1.4.2. THE MANAGEMENT
The Director General of RURA is entrusted with executive powers. He coordinates and directs daily activities of the institution and is answerable to the Regulatory Board on how its decisions are implemented. The Director General is assisted by Seven Heads of Departments heading respectively:
i. Information and Communications Technology Regulation;
ii. Media and Consumer Affairs;
iii. Innovation and Cybersecurity;
iv. Transport Regulation;
v. Energy, Water & Sanitation Regulation;
vi. Legal and Economic Regulation;
vii. Corporate Services.
In addition to the Heads of Departments, there is one Division Manager heading Universal Access and Service Fund.
The Director General, Heads of Departments and Division Manager constitute the Senior Management of RURA. The entire organizational structure is in Annex 1.
1.4.3. ACCOUNTABILITY
The Prime Minister’s Office is the supervising organ of RURA. The Prime Minister’s Order No 89/03 of 11/09/2014 has determined modalities of which Ministries in charge of regulated sectors shall coordinate activities with RURA in the implementation of their respective mandates.
RURA submits an annual activity report to the Prime Minister’s Office and provides copies to the Parliament, both chambers, Ministry in charge of finance and Ministries in charge of regulated services within three (3) months after the close of the budget year.
RURA finances are audited by the Auditor General of the State finances at the end of the budget year and whenever considered necessary.
RURA has also internal control systems that help the organization to achieve its goals in effective, efficient and transparent manner.

RURA Annual Report, 2016 - 2017 7
1.5. SENIOR MANAGEMENT TEAM
Maj. Patrick NYIRISHEMADirector General
Ms. Beata MUKANGABOHead of Department Legal &
Economic Regulation/Ag. Head of Corporate
Services Department
Mr. Anthony KULAMBA Head of Media Regulation
& Consumer Affairs Department
Mr. Charles SEMAPONDOAg. Head of Innovation & Cybresecurity Department
Eng. Emmanuel Asaba KATABARWA
Head of Transport Regulation Department
Eng. Alfred BYIGERO Head of Energy, Water
& Sanitation Department
Mr. Protais KANYANKOREAg. Head of ICT
Regulation Department

RURA Annual Report, 2016 - 20178
CORPORATE PERFORMANCE REVIEW

RURA Annual Report, 2016 - 2017 9
2. CORPORATE PERFORMANCE REVIEW
2.1. WORKFORCEThe regulated sectors are growing rapidly and Authority is under pressure to meet the increasing demand hence realigning its workforce with nature of the work through recruitment.
The number of RURA staff by June 2017 increased from One Hundred and Twenty (120) to One Hundred Forty-Five (145) including 2 on determined contract. The percentage of male and female counts 69.7% and 30.3% respectively.
Figure 1: Percentages of staff members by gender
As shown in the figure below, 0.69% of staff holds PhD, 3.4% holds diplomas, 40.31% holds master’s degree and 55.6% holds bachelor’s degree.
Figure 2: Distribution of RURA staff per qualifications
On the other side, the statistics on age show that the majority of RURA staff is between 36 and 45 as illustrated in the following figure.
0.69%
40.31%
55.60%
3.40%
Distribution of Staff Per Qualification
PhD Masters Degrees Diplomas

RURA Annual Report, 2016 - 201710
Figure 3: Distribution of RURA staff by age (2016-2017)
From the graph above, the composition of RURA staff by age groups are as follows; 35% are between 25 and 35 years, 55% are between 36 and 45 years and 10% are 46 and above
2.1.1. KEY ACHIEVEMENTS
During the year under review, the Authority achieved a number of milestones with regard to corporate related matters including among others:
1- Review of RURA Staff Statutes and Internal Rules and Regulations;
2- Adoption of Recruitment Policy, Remuneration Policy and Internship Policy;
3- Start of the Construction works of RURA Twin Tower;
4- Recruitment of thirty-five (35) new staff;
5- Labor Day celebration and awarding best employee of the year;
6- HeForShe awareness campaign and signing of petition by RURA staff.
7- Adoption of reviewed Strategic Plan 2017-2020
Furthermore, the Authority has adjusted its organizational structure with the creation of new department responsible for media regulation, public relation and consumer affairs.
2.1.2. TRAINING AND DEVELOPMENT
RURA regularly develops the capacity of its staff to meet the needs of a continually changing regulatory environment. It is in this regard that RURA invested in the development of its staff by providing them with opportunities in short and long term trainings and study visits.

RURA Annual Report, 2016 - 2017 11
The table below represents the strategic areas of training Programmes conducted:
Table 1: Strategic Area of Training
TYPE OF TRAININGSECTOR
LONG TERMSTRAINING
SHORT TERMS & IN-HOUSE TRAINING
STUDY TOUR, CONFERENCE & ATTACHMENTCOMPLETED ONGOING
DG OFFICE 2 2
CORPORATE 1 8 1
ICT 2 2 5
TRANSPORT 4 2
MEDIA & CONSUMER AFFAIRS 2
ENERGY, WATER & SANITATION 4 5 2
LEGAL & ECONOMIC REGULATION 4 1 5 2
TOTAL 7 19 22 6
2.2. KNOWLEDGE TRANSFER
In Water and Sanitation Sector, RURA provided trainings to different operators among others, cleaning companies and solid waste collectors. This exercise aimed at equipping them with the basic knowledge of how to prepare financial reports normally submitted to RURA.
On the side of internship, thirty-nine (39) students both professionals and academic from different higher learning institutions were provided with internship opportunities in RURA.
2.3. CORPORATE SOCIAL RESPONSIBILITY
As a way of enhancing the corporate social responsibility, RURA actively participated in 23rd Commemoration of Genocide against Tutsi. In that line, RURA organized sessions on the theme of the year and visited Gisozi Genocide Memorial where Frw 10,000,000 was donated to this site to support its educational programs.
The Authority also contributed to Unit Club Project of constructing hostels for Genocide widows in Mukura Sector, Huye District in Southern Province. The hostels were officially inaugurated by the First Lady on 29th June 2017 to accommodate 100 elderly women (Incike) who lost husbands and children during the 1994 Genocide against the Tutsi.
In addition to this RURA contributed to the construction of centre of Excellency for women leadership by PRO-FEMMES TWESE HAMWE.
2.4. PUBLIC RELATIONS AND INTERNATIONAL COOPERATION
RURA has enhanced its corporate image through different programs. Some important achievement including among others:
• Participation in MIFOTRA-organized Africa Public Service Day event held at Kigali Convention Center from 21 to 23 June 2017 in which RURA received an award as First Runner up in the category of best pavilion and exhibition booth;

RURA Annual Report, 2016 - 201712
• Increased media coverage of RURA activities such as Rwanda’s seven years’ achievements in the regulated sectors published in The New Times, Imvaho Nshya, Igihe.com and The Link Magazine contributed to enhanced visibility of the institution;
• Countrywide tour and media coverage of the meetings with motorcyclists, in which their problems were discussed and solved on spot.
With regard to Regional and International Cooperation, RURA successful organised the Preparatory meeting of World Telecommunication Development Conference (WTD -17/ITU) held at Marriot Hotel Kigali from 5 to 8 December 2016;
Further, RURA hosted visiting delegations from regulatory institutions:
• In Energy, Water and Sanitation Sectors, RURA received delegates from Zanzibar and Kenya benchmarking on Energy, Water and Sanitation Sectors where delegates visited Nzove, SP Petroleum depot and Rwamagana Solar Power Station and Ubumwe cleaning services.
• In ICT sector, RURA received delegates from Benin, Cameroun and Nigeria who visited RURA IGTVS, RDB, MYICT & Irembo, SMMS towers on Mont Kigali and MYICT.
In addition, Memorandum of Understanding (MoU) was signed between RURA and Democratic Republic of Congo Telecommunications Regulatory Authority, Autorité de Régulation, de la Poste et des Télécommunications du Congo (ARPTC) in May 2017. The purpose of the mentioned MoU is to eliminate future cross-border interference by establishing coordination procedures and facilitating communication and collaboration between two countries.

RURA Annual Report, 2016 - 2017 13
Figure 4: The signing of MOU between RURA and ARPTC
2.5. FINANCIAL PERFORMANCE REVIEW
RURA embarked in aggressive awareness campaigns on financial reporting and operators were trained operators on how to report. These efforts coupled with regular inspections and audit of some operators resulted in a significant increase of revenues in all sectors.
RURA revenues in the financial year 2016/17 reached FRW 19,322,249,123 from FRW 9,868,741,428 recorded in the year 2015/16, representing an increase of 95,6% compared to the previous year. This tremendous increase is also due to the fines charged to defaulting operators including the 7.03 billion to MTN which contributed significantly to

RURA Annual Report, 2016 - 201714
the increment in revenues.
The total amount related to operating expenses was 7,538,884,426 FRW and increased by 14.8% compared to the previous financial year due to the expansion of regulatory activities in all sectors especially those related to the awareness campaigns, sensitization of operators and enforcement of regulations.
Table 2: Performance report table
Sectors Revenues( Rwf) Variation(Rwf)2015/16(Audited)
2016/17(Not audited)
ICT 7,807,096,674 9,112,989,735 1,305,893,061
Energy, Water and Sanitation 321,375,742 520,219,686 198,843,944
Transport 1,501,826,408 2,658,905,758 1,157,079,350
Others 238,442,604 7,030,000,000 6,791,557,396
Total Revenues 9,868,741,428 19,322,115,179 9,453,373,751Total expenditure 7,105,879,055 15,541,249,123 8,435,370,068
The high increase of the expenditure is mainly justified by the big budget allocated to capital expenditure was 8,002,364,697 FRW mainly composed of payments for the construction of RURA Headquarters, costs related to the supervision of the construction and acquisition of other non-current assets.
As way forward, financial operations are being automated for more efficiency in revenue collection and reporting.
2.6. UAF FINANCIAL PERFORMANCE REVIEW
The revenues for the Universal Access Fund decreased mainly due to the fall of the annual turnover from some operators and the late submission of financial statements by others.
Regarding the Universal Access Fund (UAF), an amount of 2,666,165,180 Frw was collected from annual contribution by Telecom Operators representing a decrease of 9.5% compared to the previous financial year.
On expenditure side, the total amount of operating expenditures is 3,369,632,511Rwf and it increased by 33% compared to the previous financial year and the increase was due to the big number of Projects financed by UAF.
Table 3: Financial Performance in Frw /Universal Access Fund
2015/2016 2016/2017 VariationTotal Revenues 2,947,496,897 2,666,165,180 (281,331,717)
Total expenditure 2,531,900,929 3,369,632,511 837,731,582
N.B: The above mentioned financial figures are subject to audit confirmation

RURA Annual Report, 2016 - 2017 15
ICT

RURA Annual Report, 2016 - 201716
3. ICT SECTOR
3.1. SECTOR PROFILEThe Rwanda market for Information and Communication Technologies is characterised by a high evolution and demand for services across the socio-economic spread of the country. Enhancement in the use of ICT requires proper regulatory framework to create an environment that promotes public confidence and ensure stability, transparency, competition, investment, innovation, and growth in the ICT sector. RURA’s mandate, among other things, in the ICT sector is to license, monitor and enforce license obligations, manage scarce resources, advise policy makers on ICT, postal and media related issues and represent Rwanda in international organizations on issues pertaining to ICT.
The Rwandan market in telecommunications is composed by three main telecom operators, six Internet Service Providers (ISPs), one Wholesale Network Service provider, two Network facility providers and fourteen Retailers Internet Service Providers by June 2017.
As a result of a conducive Legal and Regulatory Framework in place, the ICT sector continues to experience a significant growth. Indeed, during the period under review, the mobile telephone subscription decreased from 8,932,108 to 8,368,432 meaning 6% of decrease. The financial year ended with a mobile penetration of 73%.
Internet service subscription increased from 3,665,072 to 4,375,033 representing an increase of 19%. This increase is mainly attributed to the use of mobile internet segment backed by the use of smart devices.
New Termination Rates glide path was set for fixed, Mobile and SMSs using a costing model, Mobile telephone, fixed termination rates fell from 20Rwf to 15Rwf for Mobile and 6Rwf for fixed telephones in 2017. Competition in Telecommunication has brought about price wars in the market and operators have started bundling their services, where one can buy a voice pack and be given free SMS, and internet packs, in addition to this it has been evidenced that calling packs have become so popular to mobile telephone users.
The Broadcasting sub-sector has also witnessed a considerable development with a growing number of televisions broadcasters where six permits were issued to build digital television studio during the year under review.
3.2. LEGAL AND REGULATORY FRAMEWORK
The ICT sector is mainly governed by the Law N°24/2016 of 18/06/2016. In a bid to implement this law, secondary legislations are under development and the following regulations were adopted:
- Regulations on Satellite Networks Filing (No 003/R/SRMM-ICT/RURA/2017 of 31/06/2016);
- Regulation governing broadcasting services in Rwanda (N°004/R/MR-MCA/RURA/2017 of 30/06/2017);
- Regulations on Promotion by Telecommunication Operators (N° 001/R/CA-MCA/RURA/016 of 26/07/2016).

RURA Annual Report, 2016 - 2017 17
3.3. LICENSING
3.3.1. TELECOMMUNICATION AND INTERNET SERVICE PROVISION
The Table below illustrates the licensed Telecom Operators, Internet Service Providers, Wholesale Network Service provider, Network Facility providers and Retailer Internet Service Providers.
Table 4: Licensed Network and Service Providers as of June 2017
Operators Licensed From(Year) Description
MTN Rwanda Ltd 2006Telecom OperatorsTIGO Rwanda Ltd 2008
AIRTEL Rwanda Ltd 2011
Liquid Telecom Ltd 2014
Internet Service ProvidersISPA Ltd 20064G Networks Ltd 2009BSC Ltd 2010AXIOM 2014KT Rwanda Networks 2013 Wholesale Network Service Provider
GMAX 2014
Retailer Internet Service Providers
Intercom Technologies 2014Telecom Network Solution Provider 2014
4NetAfrica Ltd 2014Piramie Inc 2014ECOORPONE 2014WireCell LTD 2014Twinning in Corporation 2015Simba Supermarket 2015TRUCONNECT Ltd 2015POPCONN Ltd 2015SUKU NSA Ltd 2015BK Telecom Ltd 2015ISCO Limited 2015Universal Links Group 2015Zoomnet Ltd 2016Fastnet Ltd 2016CBNET Ltd 2016Smart Broadband Ltd 2016
IHS Rwanda Ltd 2014Network Facility Providers
Fibernet Telecom Ltd 2015
VANU 2017 Provisional Licence

RURA Annual Report, 2016 - 201718
3.3.2. POSTAL AND COURIER SERVICE PROVISION
In postal sector, RURA grants Public Postal Operator, International courier, Regional courier, Domestic courier, International in-bound courier and Intra-city courier Licenses.
The following table illustrates the number of licensed postal and courier operators, as of June 2017.
Table 5: Licensed Postal and Courier operators
No LICENSED POSTAL AND COURIER OPERATORS
1 PANORAMA Ltd
2 DOVE Forwarding and Supply Company Ltd
3 SHAFT Ltd
4 DHL Express
5 PAN AFRICA EXPRESS TRANSPORT LTD (Licensee of FedEx)
6 STELLA Express Ltd
7 SKYNET WORLDWIDE EXPRESS LTD
8 SOTRA TOUR & TRAVEL AGENCY Ltd
9 I&T INVESTMENT & SUPPLY COMPANY Ltd
10 NATIONAL POST OFFICE
11 SOFAST Ltd
12 HORIZONTAL Ltd
13 KIGALI COACH TOURS & TRAVEL Ltd
14 UKINE Ltd
15 EAGLE NET LTD
16 ALPHA EXPRESS COMPANY LTD
17 EXCEL TRAVEL & TOURS AGENCY LTD
18 ISCO INTERSEC SECURITY
19 KIGALI SAFARI EXPRESS
20 MODERN COAST EXPRESS UGANDA LTD
21 OMEGA LTD
22 VURUNGA COURIER EXPRESS LTD
23 MATUNDA EXPRESS LTD
24 COMMON ROCK LTD
25 FAST RWANDA COURIER LTD
3.3.3. BROADCASTING
3.3.3.1. TV BROADCASTING
During 2016 – 2017 fiscal year, six (6) permits to build adequate digital television studios were issued to the following media organs: ISANGO STAR TV, ADECCO, BRISK AFRICA Ltd, REEDEMED GOSPEL CHURCH and RIF Ltd.

RURA Annual Report, 2016 - 2017 19
Table 6: The list of television broadcasters and Digital Studio permit holders, as of June 2017
S/N Name of the applicant Name of TV channel
Current status
Building TV studio On air
1 Tele 10 Rwanda TV 10 √
2 Royal TV Ltd ROYAL TV
3 Beat Entertainment FAMILY TV √
4 Contact TV CONTACT TV √
5 TV1 Rwanda Ltd TV 1 √
6 ECONET MEDIA LIMITED KFS √
7 AUTHENTIC RADIO LTD AUTHENTIC TV √
8 BIG CONCEPT MANAGEMENT LTD BTN TV √
9 ISHEMA MEDIA INCORPORATION Ltd ISHEMA TV √
10 Spark Media Ltd CLOUDS TV √
11 Goodrich Life Care CO.LTD GOODRICH TV √
12 TV& Radio Flash Limited FLASH TV √
13 Isango Stars Limited ISANGO STAR TV √
14 Green Media Ltd SUPER TV √
15 Digital Media Professionals Ltd DMP TV √
16 Light House Ltd LIGHT HOUSE TV √
17 National holdings Ltd KTV √
18 Capital TV Rwanda Ltd CAPITAL TV √
19 Broadway Communications Ltd MAX TV √
20 Mak media Limited MAK MEDIA TV √
21 SPARK MEDIA LIMITED SPARK TV √
22 SHUNGU RWANDA LTD TV PLUS √
23 SANA GEB TV INTERNATIONAL SANA TV √
24 VICTORY TV Ltd VICTORY TV √
25 ADECCO IZUBA TV √
26 BRISK AFRICA Ltd LALA TV √
27 RWANDA IMAGES FILMS LIMITED LCN TV √
28 REEDEMED GOSPEL CHURCH TV7 Miracle √

RURA Annual Report, 2016 - 201720
3.3.3.2. FM RADIO BROADCASTERS
The table below illustrates FM Radio Broadcasters registered to operate during 2016 – 2017 financial year.
Table 7: List of registered FM radio broadcasters between July 2016 – June 2017
Applicant name StatusAssigned Frequency (MHz)
Transmitter locationNew Existing
Hobe Rwanda Ltd New licensee 93.1 - Jari
Top 5Sai Ltd New licensee 88.8 - Mugogo
Radio Maria Rwanda Existing licensee 96.4
Byumba97.3 Jari88.6 Huye99.8 Karongi99.4 Rusizi
Radio 10 Existing licensee
99.0 Nyarupfubire102.9 Kinanira
87.6 Jari93.6 Rubavu
KT radio Existing licensee
101.1 Mugogo103.3 Karongi
96.7 Jari107.9 Huye102.0 Nyarupfubire
Isango Star Existing licensee105.5 Mugogo106.5 Kinanira
91.5 Jari
3.3.4. PRINT MEDIA
During 2016 – 2017 fiscal year, RURA licensed two print media organs: (Business Mag LTD and Exposure Ltd). The following table shows print media organs, by June 2017.
Table 8: Print media organs that have permit, as of June 2017.
S/N Company Name of print media Permit Number Date of Issue
1 Ihema Media Group Ltd Ihema RURA/PM/001/2013 19/11/2013
2 Ishya n’Ihirwe Ltd Ishya n’Ihirwe RURA/PM/002/2013 13/11/2013
3 Mont Jali News Company Ltd Mont Jali News RURA/PM/003/2013 13/11/2013
4 Watoto smile Ltd Watoto smile RURA/PM/004/2013 28/11/2013
5 Umuryango Company Ltd Umuryango RURA/PM/005/2013 28/11/2013
6 Ijwi rya bose publications Ltd Ijwi rya bose RURA/PM/007/2014 4/02/2014
7 Pax Ltd Pax newspaper RURA/PM/006/2014 4/02/2014
8 Umuhuza media Ltd Umuhuza newspaper RURA/PM/008/2014 28/03/2014
9 Glance Media Ltd The Diva magazine RURA/PM/009/2014 5/4/2014
10 Twiga Media Corporate Ltd Panorama newspaper RURA/PM/010/2014 6/8/2014
11 Nation Holdings Rwanda Rwanda Today Newspaper RURA/PM/011/2014 30/10/2014

RURA Annual Report, 2016 - 2017 21
12 Journal Imena Ltd Imena newspaper RURA/PM/012/2014 30/10/2014
13 Ubuto n’ubukuru channels media group Ltd
Angels ubuto n’ubukuru newspaper RURA/PM/013/2014 16/12/2014
14 Igisabo Media Ltd Igisabo newspaper RURA/PM/014/2014 16/12/2014
15 Kampemu Ltd Urungano magazine RURA/PM/015/2014 16/12/2014
16 Hi Rwanda for you Ltd Rwanda for you magazine RURA/PM/016/2014 16/12/2014
17 Focus media Ltd The Rwanda Focus RURA/PM/017/2014 17/12/2014
18 Gorilla Entertainment Group Ltd Gorilla24 Ad magazine RURA/PM/018/2015 27/02/2015
19 BUTUYU MEDIA HOUSE LTD Butuyu Newspaper RURA/PM/018/2014 23/12/2014
20 Link Cube Ltd Yambi Magazine RURA/PM/019/2015 15/04/2015
21 Construction Rwanda Magazine Ltd Construction Magazine RURA/PM/021/2015 15/04/2015
22 The Service Mag Ltd The Service Mag Magazine RURA/PM/022/2015 18/05/2015
23 Intambwe Newspaper Ltd Intambwe newspaper RURA/PM/023/2015 18/05/2015
24 Umuyenzi media group Ltd Umuyenzi newspaper 024/PM/PMT/MP-CMR/RURA/016 06/01/2016
25 Master Hand Company Ltd Novella newspaper 025/PM/PMT/MP-CMR/RURA/016 19/01/2016
26 The Business Mag Ltd The Business Mag 026/PM/PMT/MCA/RURA/017 20/02/2017
27 Exposure Ltd Exposure Magazine 027/PM/PMT/MCA/RURA/2017 20/02/2017
3.3.5. ONLINE MEDIA
During the year under review, RURA authorised one online radio/TV (Umuseke IT Ltd) and three online newspapers (Zari Media Ltd, Aquila Group Ltd and Agasaro Publishing Ltd) to operating in Rwanda. Below tables illustrate Internet Radios/TVs and online newspaper authorized to operate in Rwanda, as of June 2017.
Table 9: Online media (Radio/TV)
S/N Company Name of Internet Radio/TV Authorization Number Date of Issue
1 UMURYANGO COMPANY LIMITED UMURYANGO TV RURA/ICT/MEDIA/02/2014 18/02/2014
2 HOLY MULTIMEDIA PRODUCTION LTD www.africalive.rbm.tv - 27/08/2012
3 UMURYANGO COMPANY LIMITED UMURYANGO RADIO RURA/ICT/MEDIA/01/2014 6/12/2013
4 HOLY MULTI MEDIA PRODUCTION LTD
HOLY MULTI MEDIA PRODUCTION TV 2800/ARR/DG/012 27/08/2013
5 INYARWANDA LTD INYARWANDA TV RURA/ICT/MEDIA/03/2014 26/06/2014
6 IGIHE LTD IGIHE.TV RURA/ICT/MEDIA/04/2015 01/06/2015
7 17ART Ltd Radio5rw.com RURA/ICT/MEDIA/02/2015 19/11/2015
8 UMURASHI Ltd Umurashi TV 005/OM/P-AUT/MP-CMR/015 05/12/2015
9 Umuseke IT Ltd U FM 003/OM/P-AUT/MRD-DG/016 08/13/2016

RURA Annual Report, 2016 - 201722
Table 10: Online newspaper authorized, as of June 2017
S/N Company Name of websites Authorization Number Date of Issue
1 UMURYANGO COMPANY LIMITED www.umuryango.com RURA/ICT/MEDIA/01/2014 20/06/2014
2 KUMUGARAGARO LTD Kumugaragaro.com RURA/ICT/MEDIA/02/2014 25/07/2014
3 NONAHA LTD Nonaha.com RURA/ICT/MEDIA/04/2015 28/01/2015
4 IBYISHIMO BYACU LTD Ibyishimo.com RURA/ICT/MEDIA/08/2015 15/07/2015
5 INTYOZA LTD Intyoza.com RURA/ICT/MEDIA/11/2015 06/07/2015
6 IBARUWA TECH AND MEDIA LTD Ibaruwa.com RURA/ICT/MEDIA/07/2015 15/05/2015
7 DEMESO LTD Isange.com RURA/ICT/MEDIA/06/2015 15/07/2015
8 GORILLA ENTERTAINMENT GROUP LTD gorilla24news.com RURA/ICT/MEDIA/09/2015 15/07/2015
9 IGIHE LTD Igihe.com RURA/ICT/MEDIA/10/2015 01/06/2015
10 BWIZA MEDIA Ltd www.bwiza.com RURA/ICT/MEDIA/12/2015 19/11/2015
11 GUSENGA INFO Ltd www.gusenga.org No 013/OM/P-PMT/MP-CMR/RURA/015 21/12/2015
12 UMUYENZI MEDIA GROUP Ltd www.umuyenzi.com No 014/OM/P-PMT/MP-CMR/
RURA/015 10/12/2015
13 TOUCH RWANDA Ltd www.touchrwanda.com No 016/OM/P-PMT/MP-CMR/RURA/016 25/01/2016
14 INFOTIME Ltd www.rwandasport.com No 015/OM/P-PMT/MP-CMR/RURA/016 25/01/2016
15 ZARI MEDIA Ltd, www.muhabura.rw - 25/02/2017
16 AQUILA GROUP Ltd www.aquilatimes.com - 25/02/2017
17 AGASARO PUBLISHING Ltd www.agasaro.com - 25/02/2017
3.4. MARKET PERFORMANCE AND STATISTICS
3.4.1. MOBILE AND FIXED TELEPHONE SERVICES
3.4.1.1. MOBILE AND FIXED SUBSCRIPTION
The following table illustrates number of mobile and fixed telephone service subscribers per telecom operator.
Table 11: Number of Mobile and Fixed Telephone Service Subscribers per Telecom Operators of June 2017
Operators Name Active Subscribers Fixed Tele density
Mobile Tele density
General Tele density
Mobile Active subscribers
Fixed Telephony
0.06 73 73.06
MTN Rwanda Ltd 3,520,315 1,906
TIGO Rwanda Ltd 3,262,099 4,214Airtel Rwanda Ltd 1,586,018 11Liquid Telecom Ltd N/A 829Total 8,368,432 6,960
Source: RURA operators’ returns

RURA Annual Report, 2016 - 2017 23
Mobile telephony industry witnessed a decline. MTN subscribers declined due to their activity of cleaning up their database, being the operator with the biggest market it impacted the total mobile telephone by 6.3 % down from 8,932,108 to 8,368,432 and the penetration rate from 72.9 % to 73 %.
Source: RURA operators’ returns
Figure 5: Trends of the Mobile Telephone Subscriptions from December 2009 to June 2017
This financial year marked an increase in fixed telephone subscribers from 6,664 subscribers recorded at the end of June 2016 to 6,960 reported as of June 2017. This increase is attributed to two operators (Airtel and Tigo) that started offering fixed phones service.
Source: RURA operators’ returns
Figure 6: Trends of fixed telephone subscribers for the period 2009-June 2017
33,451
39,664 38,801
44,363 45,338 46,921 46,465
6,664
6,960
-
5,000
10,000
15,000
20,000
25,000
30,000
35,000
40,000
45,000
50,000
2 0 0 9 2 0 1 0 2 0 1 1 2 0 1 2 2 0 1 3 J U N - 1 4 J U N - 1 5 J U N - 1 6 J U N - 1 7
RURA Annual Report, 2016 - 201724
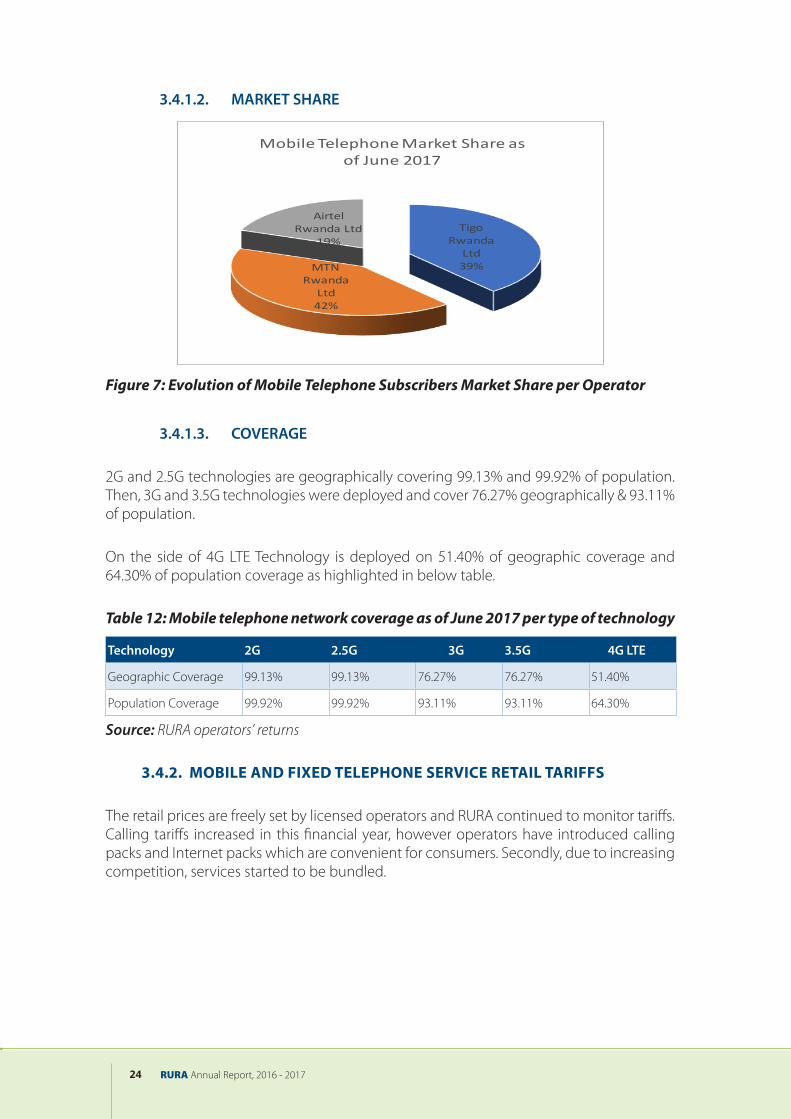
3.4.1.2. MARKET SHARE
Figure 7: Evolution of Mobile Telephone Subscribers Market Share per Operator
3.4.1.3. COVERAGE
2G and 2.5G technologies are geographically covering 99.13% and 99.92% of population. Then, 3G and 3.5G technologies were deployed and cover 76.27% geographically & 93.11% of population.
On the side of 4G LTE Technology is deployed on 51.40% of geographic coverage and 64.30% of population coverage as highlighted in below table.
Table 12: Mobile telephone network coverage as of June 2017 per type of technology
Technology 2G 2.5G 3G 3.5G 4G LTE
Geographic Coverage 99.13% 99.13% 76.27% 76.27% 51.40%
Population Coverage 99.92% 99.92% 93.11% 93.11% 64.30%
Source: RURA operators’ returns
3.4.2. MOBILE AND FIXED TELEPHONE SERVICE RETAIL TARIFFS
The retail prices are freely set by licensed operators and RURA continued to monitor tariffs. Calling tariffs increased in this financial year, however operators have introduced calling packs and Internet packs which are convenient for consumers. Secondly, due to increasing competition, services started to be bundled.
Tigo Rwanda
Ltd 39%MTN
Rwanda Ltd 42%
Airtel Rwanda Ltd
19%
Mobile Telephone Market Share as of June 2017

RURA Annual Report, 2016 - 2017 25
Table 13: Fixed Voice Telephone Tariff Trend in FRW
MTN Rwanda Ltd
LiquidTelecom Ltd
TigoRwanda Ltd
Airtel Rwanda Ltd
Jun-15 Jun-16 Jun-17 Jun-15 Jun-16 Jun-17 Jun-17 Jun-17
On net Tariff 30 37 45 30 37 20 40 46
Off net Tariff 90 37 39 90 37 60 40 60
Regional Tariff 140 70 70 140 70 135 60 70
Table 14: Mobile Voice tariff in FRW
On Net Tariff Jun-15 Jun-16 Jun-17 Jun-15 Jun-16 Jun-17 Jun-15 Jun-16 Jun-17
Pre-paid46 37 45 34 35 40 28 32 30
Post-Paid
Off Net Tariff
Pre-paid60 37 39 60 35 40 62 32 30
Post-Paid
Regional and International
Kenya 60 70 70 68 60 70 59 60 70
Uganda 60 70 70 60 60 70 59 60 70
Burundi 398 538 165 165 169 169
South Sudan 70 70 70 69 70 60 70
USA/Canada/ China /India/ Belgium
49.8 51 51 40 40 35 31.5 31.5 51
3.4.3. NEW INTERCONNECTION RATE
RURA in collaboration with Marpij consultants reviewed interconnections rates of Mobile, Fixed and SMS and the new glide path is highlighted in the table here under. These new rates will be applied starting from September 2017 and ends in 2019 and thereafter another review shall be done.
Table 15: Interconnection glide path
Sep-17 2018 2019
Mobile Termination Rates(MTR) 15 10 5
Fixed Termination Rates(FTR) 6 4 3
SMS 5 2 1
RURA Annual Report, 2016 - 201726
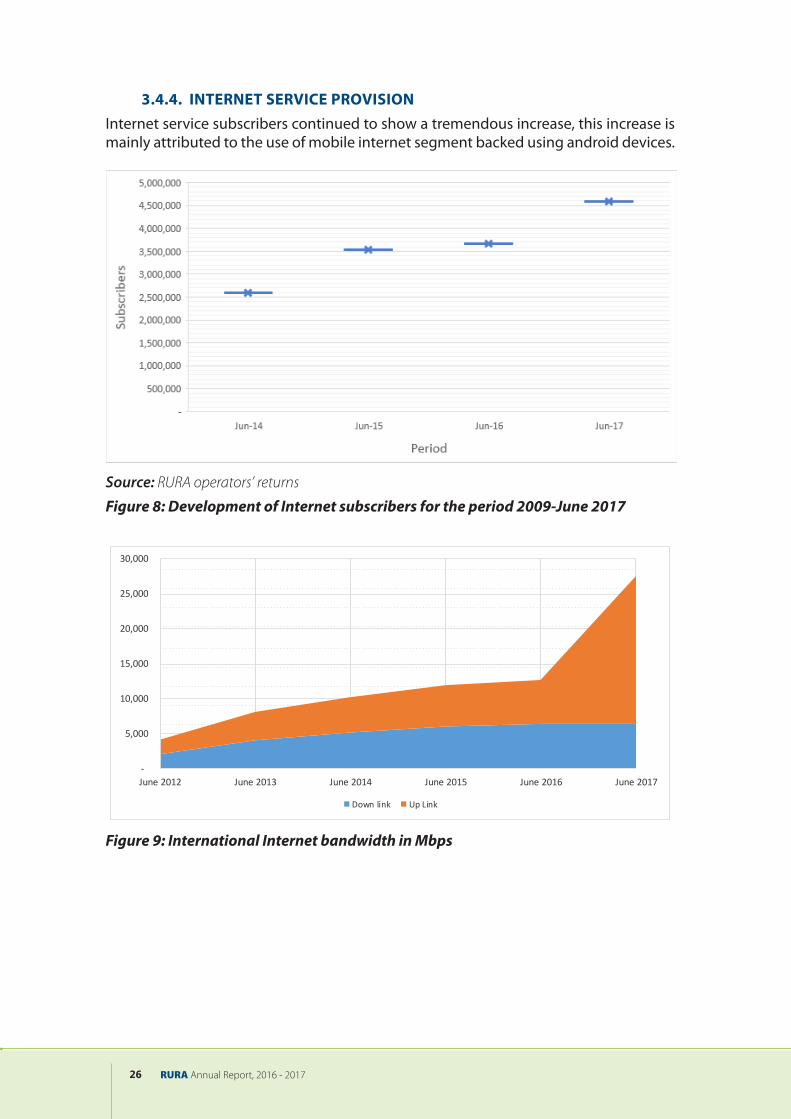
3.4.4. INTERNET SERVICE PROVISIONInternet service subscribers continued to show a tremendous increase, this increase is mainly attributed to the use of mobile internet segment backed using android devices.
Source: RURA operators’ returns
Figure 8: Development of Internet subscribers for the period 2009-June 2017
Figure 9: International Internet bandwidth in Mbps
-
5,000
10,000
15,000
20,000
25,000
30,000
June 2012 June 2013 June 2014 June 2015 June 2016 June 2017
Down link Up Link
RURA Annual Report, 2016 - 2017 27
3.4.5. MOBILE MONEY SERVICES
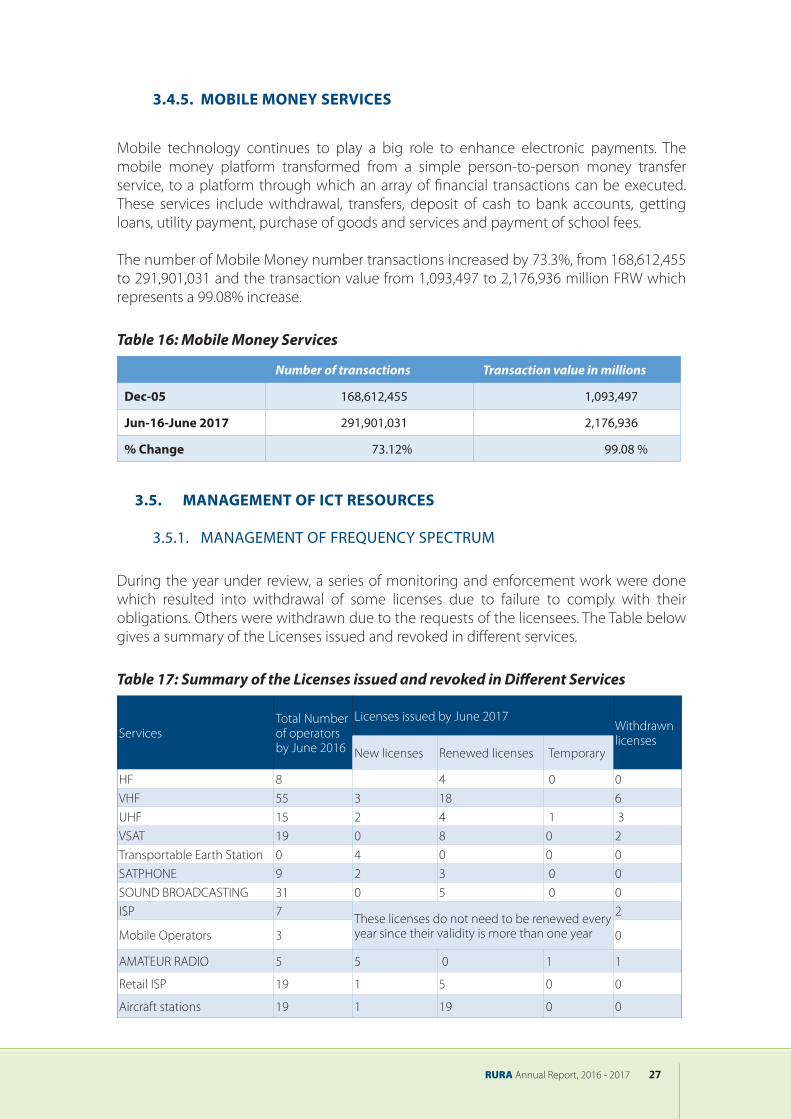
Mobile technology continues to play a big role to enhance electronic payments. The mobile money platform transformed from a simple person-to-person money transfer service, to a platform through which an array of financial transactions can be executed. These services include withdrawal, transfers, deposit of cash to bank accounts, getting loans, utility payment, purchase of goods and services and payment of school fees.
The number of Mobile Money number transactions increased by 73.3%, from 168,612,455 to 291,901,031 and the transaction value from 1,093,497 to 2,176,936 million FRW which represents a 99.08% increase.
Table 16: Mobile Money Services
Number of transactions Transaction value in millions
Dec-05 168,612,455 1,093,497
Jun-16-June 2017 291,901,031 2,176,936
% Change 73.12% 99.08 %
3.5. MANAGEMENT OF ICT RESOURCES
3.5.1. MANAGEMENT OF FREQUENCY SPECTRUM
During the year under review, a series of monitoring and enforcement work were done which resulted into withdrawal of some licenses due to failure to comply with their obligations. Others were withdrawn due to the requests of the licensees. The Table below gives a summary of the Licenses issued and revoked in different services.
Table 17: Summary of the Licenses issued and revoked in Different Services
ServicesTotal Number of operators by June 2016
Licenses issued by June 2017Withdrawn licenses
New licenses Renewed licenses Temporary
HF 8 4 0 0
VHF 55 3 18 6
UHF 15 2 4 1 3
VSAT 19 0 8 0 2
Transportable Earth Station 0 4 0 0 0
SATPHONE 9 2 3 0 0
SOUND BROADCASTING 31 0 5 0 0ISP 7 These licenses do not need to be renewed every
year since their validity is more than one year
2
Mobile Operators 3 0
AMATEUR RADIO 5 5 0 1 1
Retail ISP 19 1 5 0 0
Aircraft stations 19 1 19 0 0

RURA Annual Report, 2016 - 201728
3.5.2. MANAGEMENT OF TELECOM NUMBERING RESOURCES
During 2016-2017 financial year, ninety-two (92) new short codes were assigned to both government and private institutions while forty-five (45) institutions renewed their short codes. Three (3) new International Signaling Point codes (ISPC) were also assigned to MTN. On the other side, three (3) short codes were suspended following the request of the holders. In addition, following activities were also done during this financial year:
3.5.2.1. IMPLEMENTATION OF NETWORK COLOR CODE (NCC)
In order to avoid interference and forced roaming in GSM band between operators on Rwanda – DRC border, RURA and ARPTC (DRC Regulator) signed an agreement to implement different NCCs on Rwanda – DRC border on all sites on the border along their respective countries.
During the year under review, Telecom operators from both countries implemented color codes as per the agreement, thus Rwanda is using 6 as network color code while DRC is using network color code from 0 to 2.
3.5.2.2. CAMPAIGN ON SIM CARD MANAGEMENT
RURA conducted the SIM Card management campaign countrywide in order to minimize communication related crimes/frauds. The population was educated on how to verify and deregister the telephone numbers that are registered on their identity cards. As a result, the population managed to deregister non-operational telephone numbers and those registered unknowingly.
3.5.3. MANAGEMENT OF INTERNET RESOURCES
RURA continued to support Rwanda Information and Communication Technology Association (RICTA) for managing Country Code Top Level Domain (ccTLD). Six (6) new registrars were registered during the period under review, as highlighted in the table below.
Table 18: New Registrars in 2016-2017 financial year
REGISTRY REGISTRARS
RICTA
The click
Amitabha Technology
Axioms
Yego host
IT net
Spider IT
Further, registered domain names increased from 2,508 as of June 2016 to 2,953 as of June 2017 which represents an increase of 17.8 %.

RURA Annual Report, 2016 - 2017 29
3.6. MONITORING AND ENFORCEMENT
3.6.1. FREQUENCY SPECTRUM MONITORING
During the period 2016-2017, RURA conducted countrywide measurements of Electromagnetic radiations and one (1) site was found non-compliant with ICNRP1998 guideline. All operators on that site were instructed to reduce BTS power up to the acceptable value according to the aforementioned guideline.
A number of interferences reported inside the country were successfully handled and resolved. RURA received and resolved five interferences inside the country. In order to resolve cross-border interferences reported on Rwanda - DRC border, a Memorandum of understanding (MoU) between RURA and Democratic Republic of Congo Telecommunications Regulator (ARPTC) in May 2017.
3.6.2. QUALITY OF SERVICE MONITORING
RURA conducted countrywide measurement campaign for evaluating end-to-end service quality from consumers’ perspective on 2G/3G/4G voice and data services. Further, this exercise benchmarked the competitive positioning of the four Telecom Operators, namely MTN Rwanda, TIGO Rwanda, AIRTEL Rwanda and KT Rwanda Networks.
This exercise analysed also measurement results, pointed out QoS issues found in mobile networks of operators and recommended some needed QoS adjustments by Telecom operators licensed in Rwanda.
The assessed quality of service parameters are illustrated in the following tables:
Table 19: Voice service
Quality of service parameters
MTN TIGO AIRTEL
2G 2G/3G2G/3G/4G (CSFB1)
2G 2G/3G2G/3G/4G (CSFB)
2G 2G/3G
Call setup success rate (CSSR):≥95% 97.7 85.5 95.2 95.7 92.9 96.2 93.9 95.0
Call setup time (CST): ≤ 9 sec in ≥ 95% of cases 97.0 90.0 63.9 98.1 97.6 89.5 98.7 92.1
Speech Quality (MOS): ≥92% of cases ≥3 85.1 71.4 _ 37.4 56.8 _ 44.0 47.4
3G quality Ec/No (average) _ -10.2 _ _ -9.4 _ _ -9.5

RURA Annual Report, 2016 - 201730
Table 20: Data services
Quality of service parametersMTN TIGO AIRTEL KTRN
2G/3G 4G 2G/3G 4G 2G/3G 4G
Application Throughput Downlink (Mbits/s)
Maximum 21.9 90.9 19.7 122.0 29.1 102.6
Average 1.6 9.1 1.3 10.2 1.9 10.2
Round Trip Time (ms) Median 375.0 55.0 230.0 51.0 299.0 52.0
LTE Coverage RSRP in dBm (Average)
LTE 800 MHz _ -86.8 _ - 85.1 _ -87.4
LTE 1800 MHz _ -83.8 _ -85.2 _ -83.3
LTE Quality RSRQ in dB (average)
LTE 800 MHz _ -11.9 _ -11.9 _ -11.9
LTE 1800 MHz _ -9.7 _ -9.7 _ -9.8
3.6.3. INTERNATIONAL GATEWAY TRAFFIC VERIFICATION SYSTEM
The International Gateway Traffic Verification System (IGTVS) allows collection of real time accurate statistics and helps in detection of illegal call termination.
Both incoming and outgoing registered a decrease with International Incoming Traffic decreasing by 10.75 % while the outgoing traffic decreased by 11.64%. National Off-net traffic registered a significant growth of 14.56 % during this period under review while it was decreasing during the preceding year.
Table 21: Comparison of the traffic for 2015/2016 vs 2016/2017
PERIODINTERNATIONAL INCOMING TRAFFIC (Minutes)
INTERNATIONAL OUTGOING TRAFFIC (Minutes)
NATIONAL OFF-NET TRAFFIC (Minutes)
TOTAL AVERAGE TOTAL AVERAGE TOTAL AVERAGE
2015-2016 108,575,172.65 9,047,931.05 190,697,752.00 15,891,479.00 162,487,089.00 13,540,591.00
2016-2017 96,907,231.00 8,075,602.58 168,505,749.00 14,042,145.75 186,144,941.00 15,512,078.42
INCREMENT -10.75% -10.75% -11.64% -11.64% 14.56% 14.56%
3.6.4. MONITORING OF RWANDA INTERNET EXCHANGE POINT
As shown in table below, the traffic at the Rwanda Internet Exchange Point increased during the year under review. The statistics show that the traffic at Rwanda exchange point almost doubled over the last two years.
Table 22: Annual aggregate RINEX traffic as of June 2017
Direction
ISP/CSP/Route Server Name
31 December 2015 30 June 2017
Average Maximum Average Maximum
Inbound 560.76 Mbps 862.46 Mbps 1.41 Gbps 1.65 Gbps
Outbound 550.96 Mbps 797.60 Mbps 1.20 Gbps 1.41 Gbps

RURA Annual Report, 2016 - 2017 31
3.6.5. TELECOM INFRASTRUCTURE INSPECTION AND INSTALLATION AUTHORIZATION
RURA issued 20 tower sites to IHS, during 2016 – 2017 financial year, in accordance with ICT law and Guidelines for “Site and Sharing of Telecommunication Base Station Infrastructure”. On the side of Fiber Optic, RURA issued authorizations based on “Guidelines for Fiber Optic Cables Underground Installation”, as illustrated in the table below:
Table 23: Fiber Optic Installation AuthorizationOperators/ISPs Sites AuthorizedKT Rwanda Networks 25Liquid Telecom Rwanda 69MTN Rwanda 3
3.6.6. TYPE APPROVAL
During the year under review, RURA issued two thousand (2,000) type approvals which include two hundred (200) type approvals for mobile phones/ tablets and one thousand eight hundred (1,800) type approvals of other electronic communication equipment.
3.7. CONSUMER PROTECTION
The regulatory accountability involves regulators to have appropriate procedures to channel consumer complaints, educate consumers regarding their rights and obligations, put in place legal and regulatory tools in regard with consumer protection and protection of consumers in case of market failures.
It is in this regard that during the year under review, various programs related to the promotion and protection of consumer rights were executed as described in the following subsections.
3.7.1. CONSUMER EDUCATION
As the main program in consumer protection is consumer education, various approaches and strategies were used to educate consumers in the ICT sector. Eighty-four (84) workshops on consumer rights and obligations were conducted in different districts of Rwanda namely Nyagatare, Kayonza, Rulindo, Gakenke, Rubavu, Musanze, Nyabihu and Karongi districts.
In the ICT sector, TV and radio emissions on different topics were conducted. They mainly talked about SIM card registration and deregistration, how mobile money fraud can happen and how consumers can keep safe the money on their mobile phone and other kind of information stored on it by keeping confidential their PIN numbers. They were also educated on misleading calls from fraudsters who want to steal their money and on what to check before purchasing ICT equipment especially phones and computers to avoid counterfeit products.

RURA Annual Report, 2016 - 201732
3.7.2. COMPLAINTS HANDLING
The received complaints in the ICT sector were mainly related to quality of service, billing, fraud in mobile money, unsolicited SMS, misleading information in some promotions and customer care service centers of Telecom Operators were not handling properly consumer queries. The most recurrent issue was billing for data packages / bundles, where consumers complained that they have lost their money and operators denied their responsibility.
During the year under review, RURA received three hundred thirty-five (335) complaints, and among them two hundred (200) were resolved. The low number of solved complaints was due to complexity of technologies used in the ICT sector and lack of evidence from consumers as sometimes consumers are not able to explain properly their complaints. However, in order to address the lack of evidence issues, RURA continues to educate consumers and request Telecom operators to do the same on every service that they do provide to consumers.
The graph below illustrates the number of complaints received in 2016 – 2017 financial year.
Figure 10: Number of Complaints in ICT sector
3.7.3. TELECOM OPERATORS’ PROMOTIONS
During the year under review, RURA approved regulations about promotions offered by Telecom Operators. The purpose of those regulations was mainly to establish a regulatory framework for telecommunication operators so as to promote services or products in a fair and competitive manner in the ICT sector in Rwanda. In accordance with those regulations, thirty (30) Applications for promotions from all Telecom Operators (MTN, TIGO and Airtel) were received and analyzed. Among the thirty (30) applications, only one (1) application was rejected for not complying with the aforementioned RURA regulations.
RURA Annual Report, 2016 - 2017 33
3.8. UNIVERSAL ACCESS
The Government of Rwanda (GoR) established the Universal Access Fund (UAF) to ensure availability and affordability of ICT services in the country. The fund is financed by licensed operators who contribute 2% of their annual turnover. The Regulatory Board has the mandate to manage this fund in a way that favours the spread and take-up of ICTs in designated remote and under-served areas of the country. Projects under Universal Access complement and integrate the overall Smart Rwanda Master plan.
In this financial year, the following projects were funded:
a) Rwanda website hosting Most of the Rwandan websites are hosted outside the country and this makes the accessibility of that content very expensive to the viewers, and yet it is local content. Through UAF, RURA funded RICTA in order to implement “Rwanda website hosting project”. The objective of this project is to promote local content hosting in Rwanda.
b) Connecting schools in rural and underserved areas RURA through UAF supported MINEDUC in connecting one hundred and twenty-seven (127) schools in rural areas through 4G LTE. This initiative aims at promoting the quality of education in the country, increasing ICT penetration in rural and underserved areas, and increasing the use of Internet in schools and their neighbourhood.
c) Subsidizing “Bandwidth Acquisition to Rural Communities”In this project, a number of schools, hospitals, administration offices and army sites are connected to Internet provided by New Artel and now BSC Ltd1 under the UAF subsidy scheme. This was done by subsidizing bandwidth using VSAT Technology to the rural communities where fibre network is not yet operational.
1 New Artel was merged with BSC and became BSC Ltd in May 2017
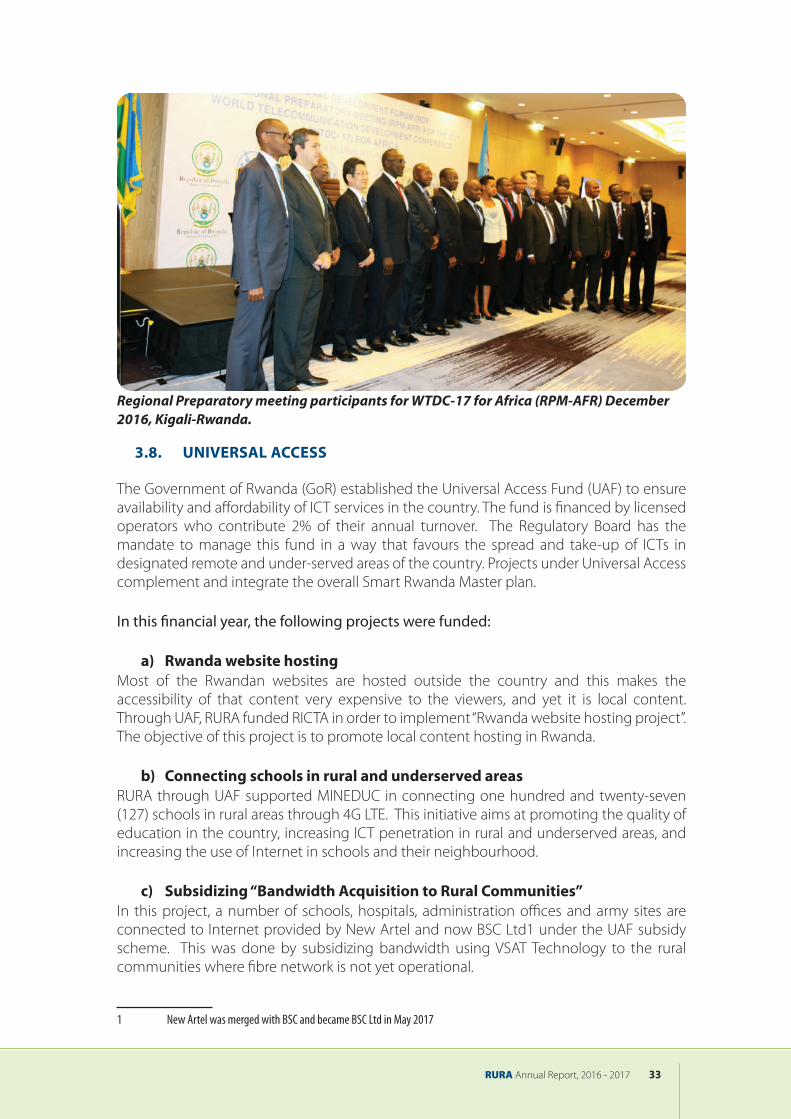
Regional Preparatory meeting participants for WTDC-17 for Africa (RPM-AFR) December 2016, Kigali-Rwanda.

RURA Annual Report, 2016 - 201734
d) Support to National Council of Persons with Disabilities (NCPD) Within the framework of digital inclusion, RURA and NCPD entered into an agreement (MoU) to establish five (5) ICT training centres, one in each province of Rwanda. This initiative aims at making improvements in the lives of persons with disabilities, allowing them to enhance their social, cultural, political and economic integration in the Rwandan and global society.
e) Implementation of Broadband Network ProjectRURA in collaboration with ITU started the implementation of Broadband Wireless Network Project to provide Wi-Fi to some public institutions like schools, hospitals and health centres as well as local government offices in remote areas. Accordingly, two pilot Base Stations were deployed respectively in Rwamagana and Rulindo Districts with a total of eight (8) Customer Premise Equipment for both sites.
f) Digital Object Architecture (DOA)A multi-primary administrator (MPA)2 agreement was signed between the alliance of RURA, Smart Africa and DONA3 Foundation on 19th October, 2016 to become a unique MPA in East Africa.
Furthermore, the alliance received:- Top-level prefix (25 for Rwanda) - Global Handle Registry (GHR): 0.GHR/25 for administration and 0.GHR for
replication. - Site address: 196.12.152.20
This initiative is in line with Smart Africa Manifesto. The main objective of that agreement is to acquire the digital object architecture (DOA)4.
In addition, RURA signed MoU for implementing the “ICT Enabled Information Systems for Agricultural Development in Rural Communities” project. This project aims at increasing the agricultural production through envisioning the use of ICT to enhance food security in Rwanda. It is in this line that RURA through UAF supported the implementation of Smart Rwanda Master Plan under its pillar of Smart Agriculture. MoU on this initiative was signed between RURA and MINAGRI.
3.9. OUTSTANDING ISSUES
Lack of some secondary legislation of law governing information and communication technologies;
Lack of monitoring equipment, tools to collect data on media content quality;Absence of Prime Minister’s Order specifying RURA mission in regards to media;Law and regulatory gaps due to rapid technology development. RURA is required
to adapt quickly its rules and regulations to the changing ICT technology and market development.
2 MPA: is an organization that is assigned with top level prefix (25 for Rwanda) from which it can allocate sub prefixes and collectively with other MPAs and DONA foundation
3 DONA Foundation: Swiss organization that provides management and software development 4 DOA: a system of information management that promotes interoperability across information systems.

RURA Annual Report, 2016 - 2017 35
ENERGY
RURA Annual Report, 2016 - 201736
4. ENERGY SECTOR
4.1. SECTOR PROFILE
The Energy Sector is a critical sector that catalyses broader economic growth and contributes significantly to facilitating the achievements of the country’s ambitious social economic transformation agenda. RURA’s mandate in the energy sector is to regulate four sub-sectors namely Electricity, Renewable energy, Gas and Downstream Petroleum so as to ensure sufficient, reliable, affordable and sustainable energy supply. Regulatory activities performed by the Regulatory Authority in the Energy Sector include, among other things, licensing, tariff setting and compliance monitoring of operations and regulated infrastructure to ensure quality and reliability of services.
During the year under review, the energy sector recorded significant growth. RURA and its stakeholders in the Electricity Industry strived to improve the grid reliability and increase electricity generation to meet present and future power demand, through attraction of both private and public sector investments. In the Gas and Downstream Petroleum sub-sector, Rwanda initiated different projects on Methane Gas exploration in Lake Kivu and the country continues to rely on importation of petroleum products including Liquefied Petroleum Gas (LPG) whereby related projects are ongoing with increasing private investments in the petroleum supply chains and storage infrastructures, all aimed at promoting a sound management of Gas and Downstream Petroleum industry. Also, various projects on Biogas were implemented countrywide as fuel for cooking and lighting at institutional (schools, prisons) and domestic levels.
Over the past few years, tremendous achievements were made in the Electricity Supply Industry. The reliability of electricity network has significantly improved due to reinforcement of the grid that led to substantial reduction of outages and power supply rationing no longer exists as a result of increase in power supply with an adequate reserve margin. The electricity access rate tripled to reach about 35% (of which 28% on-grid and 7% off-grid) while the total installed generation capacity increased to reach 208MW as of June 2017. The private investors contribution went from being non-existent to above 50% currently due to the sound policy and regulatory framework that was put in place to attract the private sector.
4.2. LEGAL AND REGULATORY FRAMEWORK
4.2.1. ELECTRICITY AND RENEWABLE ENERGY SUB-SECTORS
During the last few years, RURA’s focus in the electricity sub-sector was to put in place a robust legal and regulatory framework to govern the regulation of electricity and renewable energy activities in order to properly regulate these two important sub-sectors.
The Law No 21/2011 of 23/06/2011 governing electricity in Rwanda is the main legal instrument regulating the sector. In line with this law, a number of regulations and guidelines

RURA Annual Report, 2016 - 2017 37
were adopted by the Regulatory Board such as the Electricity Licensing Regulations, the Electricity Quality of Service Regulations, the Simplified Regulatory framework for off-grid systems, the Rwanda Grid Code, Solar Water Heating Regulations, etc.
The enforcement of these regulations has been the main focus during the year under review and it is expected to remain as the top priority during the next five years.
4.2.2. GAS AND DOWNSTREAM PETROLEUM
4.2.2.1. LAKE KIVU METHANE GAS
With the existing “Management Prescriptions / MPs” for lake Kivu monitoring and in order to exercise its regulatory powers in respect to methane gas extraction, RURA convened consultative meetings with key stakeholders namely MININFRA, RNRA (Rwanda Natural Resources Authority) and LKMP (Lake Kivu Monitoring Program) to discuss the long-pending enactment of Gas law and reporting system for Lake Kivu Gas Extraction Facilities.
4.2.2.2. DOWNSTREAM PETROLEUM
RURA was given the mandate to regulate all petroleum trade operation related activities in Rwanda by the Prime Minister’s Order N° 131/03 of 10/05/2016. In addition to the regulations that have been so far developed namely regulations on aboveground petroleum storage facilities, regulations on petrol service stations and Liquefied Petroleum Gas (LPG) regulations, RURA embarked on the development of other missing regulations such as petroleum transportation and fuel marking and quality control regulations in order to fully operationalize the Petroleum law and the above mentioned Prime Minister Order.
In the same vein, stakeholders’ consultation and validation meetings involving both public and private entities were organized to discuss on revised LPG and Petrol Service Stations Regulations.
4.3. LICENSING
4.3.1. ELECTRICITY AND RENEWABLE SUB-SECTORS
The Regulatory Authority approved 15 electricity generation licenses among which 7 were existing power plants that were previously owned by the Government but were later on privatized and are currently owned by private operators since October 2015.

RURA Annual Report, 2016 - 201738
Table 24: Electricity generation Licensed operators
SN Licensee Project Capacity ( MW) Duration
1 REPRO Ltd Mutobo 0.2 25 years
2 Rwaza Hydro Power Ltd Rwaza-Muko 2.6 25 years
3 REFAD Rwanda Ltd Rukarara V 5 25 years
4 Novel Energy Ltd Gaseke 0.5 25 years
5 Energie Nyaruguru Ltd Mazimeru 0.5 6 years
6 Rubagabaga HPP Ltd Rubagabaga 0.28 25 years
7 SPV Nyirahindwe Ltd Nyirahindwe I 0.9 25 years
8 SPV Nyirahindwe Ltd Nyirahindwe I 0.38 25 years
9 Energy UK & Africa Energy Services Janja 0.2 25 years
10 Energicotel Ltd Keya 2.2 25 years
11 Energicotel Ltd Nkora 0.68 25 years
12 Energicotel Ltd Cyimbili 0.3 25 years
13 Energicotel Ltd Nyamyotsi I 0.1 25 years
14 Energicotel Ltd Nyamyotsi II 0.1 25 years
15 SoEnergy Rwanda Ltd Thermal power plants 30 5 years
Furthermore, the Regulatory Authority issued one (1) provisional electricity generation license to Nyirantaruko Hydropower Ltd to develop the Nyirantaruko hydro power project (1.263 MW) located in Nyamasheke District, Western province.
With regard to electrical installations, a third round of registration was carried out during the months of January and February 2017 whereby 41 applicants applied for different classes of electrical installations permits. Among the 41 applicants, 27 passed the exams for at least one class of permit. As of June 2017, 25 electrical installations Permits were issued to successful applicants and the process is still ongoing whereby permits are issued to successful applicants after paying the required fee.
4.3.2. GAS & DOWSTREAM PETROLEUM
Field visits were conducted countrywide upon different requests from operators seeking installation licenses to construct petrol service stations. The list of Licensed Petrol Station Service Developers is in Annex 2. During the year under review, 12 projects were licensed as described in the table below.
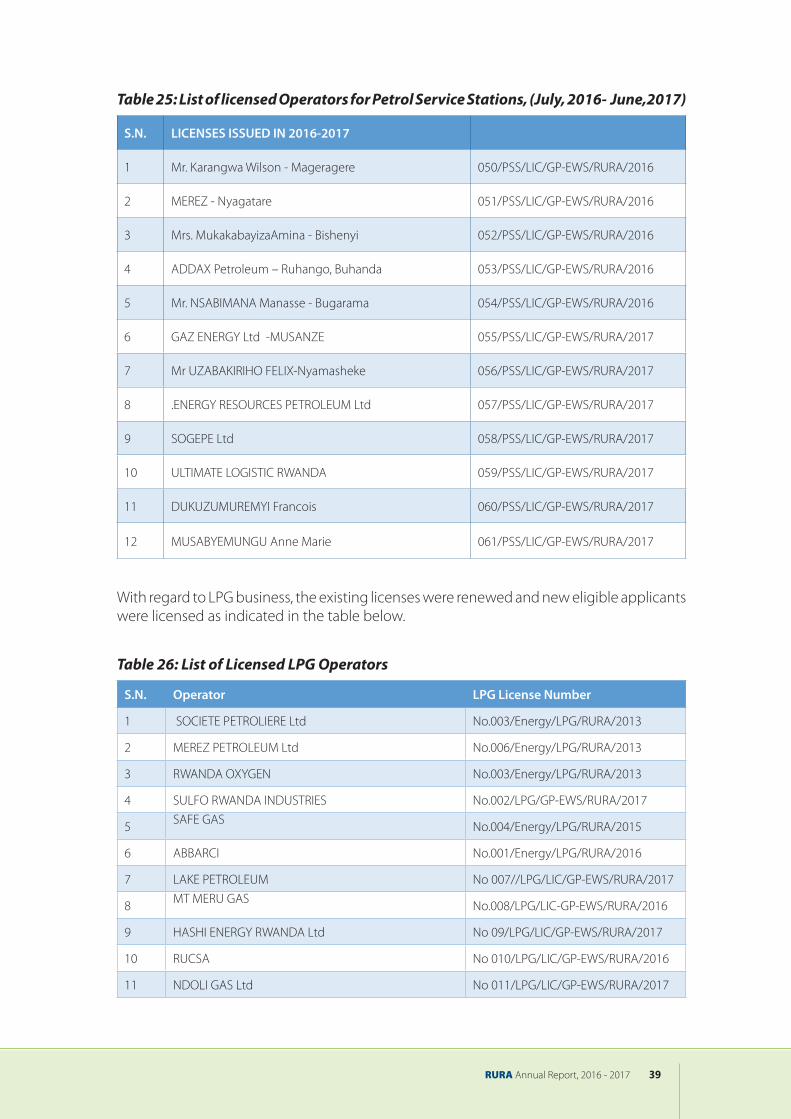
RURA Annual Report, 2016 - 2017 39
Table 25: List of licensed Operators for Petrol Service Stations, (July, 2016- June,2017)
S.N. LICENSES ISSUED IN 2016-2017
1 Mr. Karangwa Wilson - Mageragere 050/PSS/LIC/GP-EWS/RURA/2016
2 MEREZ - Nyagatare 051/PSS/LIC/GP-EWS/RURA/2016
3 Mrs. MukakabayizaAmina - Bishenyi 052/PSS/LIC/GP-EWS/RURA/2016
4 ADDAX Petroleum – Ruhango, Buhanda 053/PSS/LIC/GP-EWS/RURA/2016
5 Mr. NSABIMANA Manasse - Bugarama 054/PSS/LIC/GP-EWS/RURA/2016
6 GAZ ENERGY Ltd -MUSANZE 055/PSS/LIC/GP-EWS/RURA/2017
7 Mr UZABAKIRIHO FELIX-Nyamasheke 056/PSS/LIC/GP-EWS/RURA/2017
8 .ENERGY RESOURCES PETROLEUM Ltd 057/PSS/LIC/GP-EWS/RURA/2017
9 SOGEPE Ltd 058/PSS/LIC/GP-EWS/RURA/2017
10 ULTIMATE LOGISTIC RWANDA 059/PSS/LIC/GP-EWS/RURA/2017
11 DUKUZUMUREMYI Francois 060/PSS/LIC/GP-EWS/RURA/2017
12 MUSABYEMUNGU Anne Marie 061/PSS/LIC/GP-EWS/RURA/2017
With regard to LPG business, the existing licenses were renewed and new eligible applicants were licensed as indicated in the table below.
Table 26: List of Licensed LPG Operators
S.N. Operator LPG License Number
1 SOCIETE PETROLIERE Ltd No.003/Energy/LPG/RURA/2013
2 MEREZ PETROLEUM Ltd No.006/Energy/LPG/RURA/2013
3 RWANDA OXYGEN No.003/Energy/LPG/RURA/2013
4 SULFO RWANDA INDUSTRIES No.002/LPG/GP-EWS/RURA/2017
5 SAFE GAS No.004/Energy/LPG/RURA/2015
6 ABBARCI No.001/Energy/LPG/RURA/2016
7 LAKE PETROLEUM No 007//LPG/LIC/GP-EWS/RURA/2017
8 MT MERU GAS No.008/LPG/LIC-GP-EWS/RURA/2016
9 HASHI ENERGY RWANDA Ltd No 09/LPG/LIC/GP-EWS/RURA/2017
10 RUCSA No 010/LPG/LIC/GP-EWS/RURA/2016
11 NDOLI GAS Ltd No 011/LPG/LIC/GP-EWS/RURA/2017

RURA Annual Report, 2016 - 201740
Table 27: Licensed Operator –LPG Plant installation
S.N. Operator LPG License Number
1 LAKE PETROLEUM RWANDA Ltd No.001/LPG PLANT/LIC/GP-EWS/RURA/2017
RURA granted temporary authorizations to road tankers that had applied for petroleum transportation licenses while waiting for the approval of regulations on petroleum transportation.
Table 28: List of Temporary Authorizations for Road Tankers (2016-2017)
SN Name of operator Number of trucks & Trailers
1 GAKIRE George 1
2 PETROCOM Ltd 8
3 GASARABWE Alphonse 6
4 MUKASAFARI and SONS Ltd 1
5 NADIS CARGO Group 1
6 General Motors and Transportation Array(GMT)represented by Nyandwi Rachid 1
7 Mr. NKUSI Evariste 1
4.4. MARKET PERFORMANCE
4.4.1. ELECTRICITY & RENEWABLE ENERGY SUB-SECTORS
4.4.1.1. ELECTRICITY SUPPLY INDUSTRY
Rwanda’s Electricity Supply Industry is still dominated by the Energy Utility Corporation Limited (EUCL), which is a vertically integrated state owned company. EUCL operates 45% of the total installed generation capacity and has a monopoly over transmission, distribution and supply of electricity to customers connected to the main-grid. Currently, 14 Independent Power Producers (IPPs) generate and sell bulk electricity to EUCL under long or short term Power Purchase Agreements (PPAs).
During the year under review, the electricity installed generation capacity increased from 190 MW in June 2016 to 208.3 MW as of June 2017 (including imported power from Rusizi I & II in DRC). The 10% increase is due to the commissioning of 3 power plants namely Gishoma Peat-to-Power (15 MW), Nasho Solar Power (3.3 MW) that was constructed with the support of the Howard Buffet Foundation and Gaseke (0.5 MW) Micro Hydro power plants.

RURA Annual Report, 2016 - 2017 41
The country’s power generation mix has a total installed capacity made of 40% hydro, 25% thermal (heavy fuel/diesel oil), 14% methane gas, 6% solar, with the 8% balance coming from imports (Fig.13). The share of renewable energy in electricity generation mix currently accounts for 61.5% of the total installed capacity.
A total electrical energy of 712,123 MWh was generated and supplied to the national grid with hydro dominating the energy mix with 39%, followed by Methane Gas with 28% and Solar with 18% (Fig. 14). There was an increase of 11% in the total energy generated as compared to the previous year’s figures. The total demand peaked at about 125MW in May 2017 which represents a 5% increase compared to the year 2015/16.
4.4.1.2. ACCESS TO ELECTRICITY
The year 2016 has seen a turnaround in the Government’s approach toward increasing access to electricity with the adoption of the Rural Electrification Strategy in June 2016. Off-grid supply through Solar Home systems is rapidly expanding access to electricity in rural areas at a comparatively low cost. Also, a number of new mini/micro grid systems are being initiated in addition to the 80 micro-grids already operational in the country. With regard
Figure 11: Gishoma Peat to power plant Figure 12: Nasho Solar Power plant
Figure 13: Installed generation capacity mix (MW)
Figure 14: Energy Generation Mix (MWh)

RURA Annual Report, 2016 - 201742
to electricity on-grid connections, the total number of customers increased from 590,000 at end of June 2016 to 669,698 as of June 2017, representing an increase of 13.5%. The period under review also recorded a total of about 130,000 Solar Home Systems installed throughout the country. Over the same period, the national grid was extended by 335,5 km of High Voltage (HV) transmission lines (220kV and 110kV) and 2,617 km of Medium Voltage (MV) distribution lines (30kV and 15kV).
Figure 15: Trend of on-grid connected customers
4.4.1.3. ENERGY EFFICIENCY
During the year under review, 214 new Solar Water Heaters were installed through the Solar Rwanda Program, making the total number of systems installed over 2,000 since the beginning of the program in 2011. The main target of the programme is to reduce the demand on the network and eventually reduce the required investments for new generation plants as well as the maintenance costs of the existing transmission and distribution networks.
Regarding grid losses, a number of projects aiming at reducing the network losses are being implemented by the Utility (REG/EUCL) with the support of Development Partners such as World Bank, European Union and JICA. Currently, the total losses account for 21%, representing a reduction of 1% as compared to June 2016.
4.4.1.4. ELECTRICITY TARIFF REVIEW
As part of the Rwandan Electricity Supply Industry reforms and in a bid to ensure that the newly created Energy Utility Corporation Limited (EUCL) is able to sustain its operations and improve service provision to the Rwandan population, RURA embarked on the review of the electricity tariff in the year 2016. The tariff was reviewed in line with the Government policy to make the tariff for industries more competitive in the region and to make the tariff affordable to low income households by introducing a lifeline (social) tariff. The new electricity tariffs shown in the table below were approved by the Regulatory Board in December 2016 and became effective on 1st January 2017.

RURA Annual Report, 2016 - 2017 43
Table 29: Electricity tariff
Customer Category Customer Class Energy Charge
(Frw/kWh)Max. Demand Charge (Frw/kVA/Month)
Fixed Charge (Frw/month)
Residential 0-15 kWh 89 - -
15-50 kWh 182 - -
>50 kWh 189 - -Non-residential 0-100 kWh 189 - -
>100 kWh 192 - -Industries Small Industries 126 - -
Medium Industries 90 Peak 10,469.55 3,125
Off-peak 5,588.41
Shoulder 1,891.54Large Industries 83 Peak 7,184.44 3,125
Off-peak 4,004.16
Shoulder 1,085.86
4.4.2. GAS AND DOWNSTREAM PETROLEUM
4.4.2.1. BIOGAS AND INDUSTRIAL GASES
Biogas projects are being implemented countrywide through construction and installation of Biogas Plants (institutional and domestic types). These plants generate gas used for cooking and lighting purposes. A total of 86 institutional biogas plants are installed at schools and prisons whereas 10,093 domestic biogas plants serve the households. Industrial gases are also part of gases used in the medical domain such as Oxygen, and in the manufacturing industry such as acetylene used in welding. Apart from imported gases, two companies namely RWANDA OXYGEN and KALISIMBI also produce industrial and medical gases used in Rwanda. In addition, medical gases production facilities were installed in different Hospitals countrywide.
Figure 16: Institutional Biogas Plant Figure 17: Medical gases facility –CHUB
Hospital
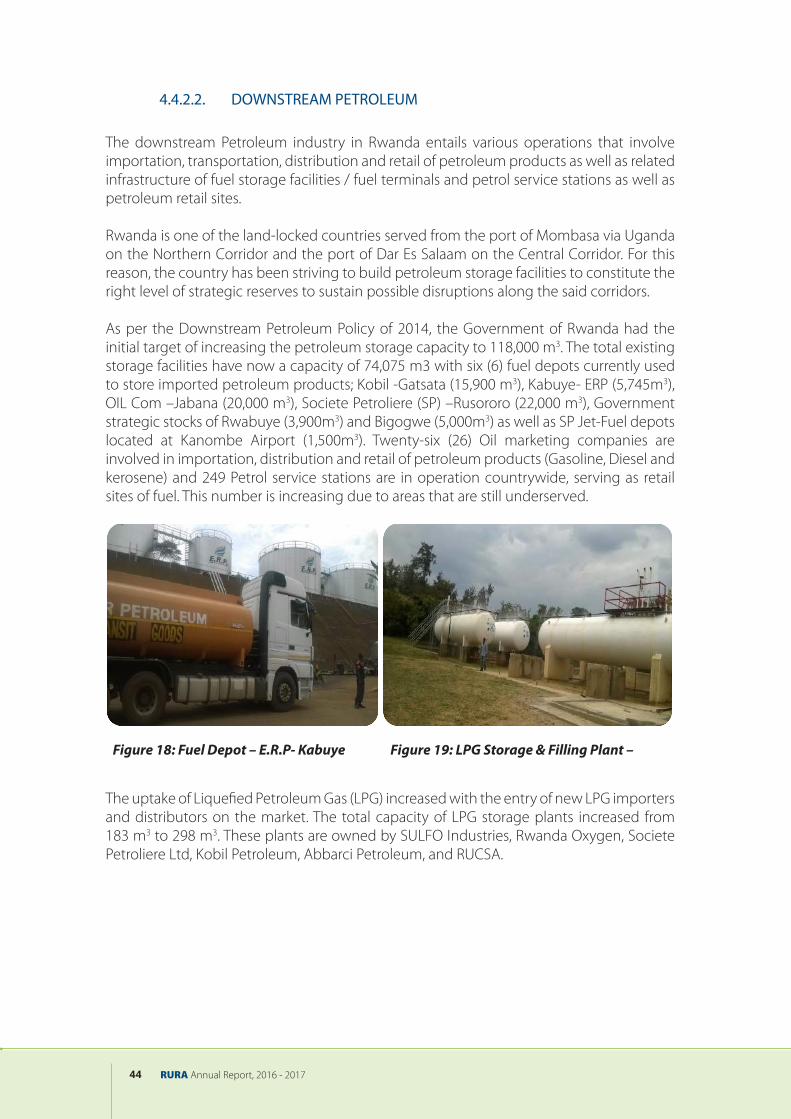
RURA Annual Report, 2016 - 201744
4.4.2.2. DOWNSTREAM PETROLEUM
The downstream Petroleum industry in Rwanda entails various operations that involve importation, transportation, distribution and retail of petroleum products as well as related infrastructure of fuel storage facilities / fuel terminals and petrol service stations as well as petroleum retail sites.
Rwanda is one of the land-locked countries served from the port of Mombasa via Uganda on the Northern Corridor and the port of Dar Es Salaam on the Central Corridor. For this reason, the country has been striving to build petroleum storage facilities to constitute the right level of strategic reserves to sustain possible disruptions along the said corridors.
As per the Downstream Petroleum Policy of 2014, the Government of Rwanda had the initial target of increasing the petroleum storage capacity to 118,000 m3. The total existing storage facilities have now a capacity of 74,075 m3 with six (6) fuel depots currently used to store imported petroleum products; Kobil -Gatsata (15,900 m3), Kabuye- ERP (5,745m3), OIL Com –Jabana (20,000 m3), Societe Petroliere (SP) –Rusororo (22,000 m3), Government strategic stocks of Rwabuye (3,900m3) and Bigogwe (5,000m3) as well as SP Jet-Fuel depots located at Kanombe Airport (1,500m3). Twenty-six (26) Oil marketing companies are involved in importation, distribution and retail of petroleum products (Gasoline, Diesel and kerosene) and 249 Petrol service stations are in operation countrywide, serving as retail sites of fuel. This number is increasing due to areas that are still underserved.
Figure 18: Fuel Depot – E.R.P- Kabuye Figure 19: LPG Storage & Filling Plant –
The uptake of Liquefied Petroleum Gas (LPG) increased with the entry of new LPG importers and distributors on the market. The total capacity of LPG storage plants increased from 183 m3 to 298 m3. These plants are owned by SULFO Industries, Rwanda Oxygen, Societe Petroliere Ltd, Kobil Petroleum, Abbarci Petroleum, and RUCSA.
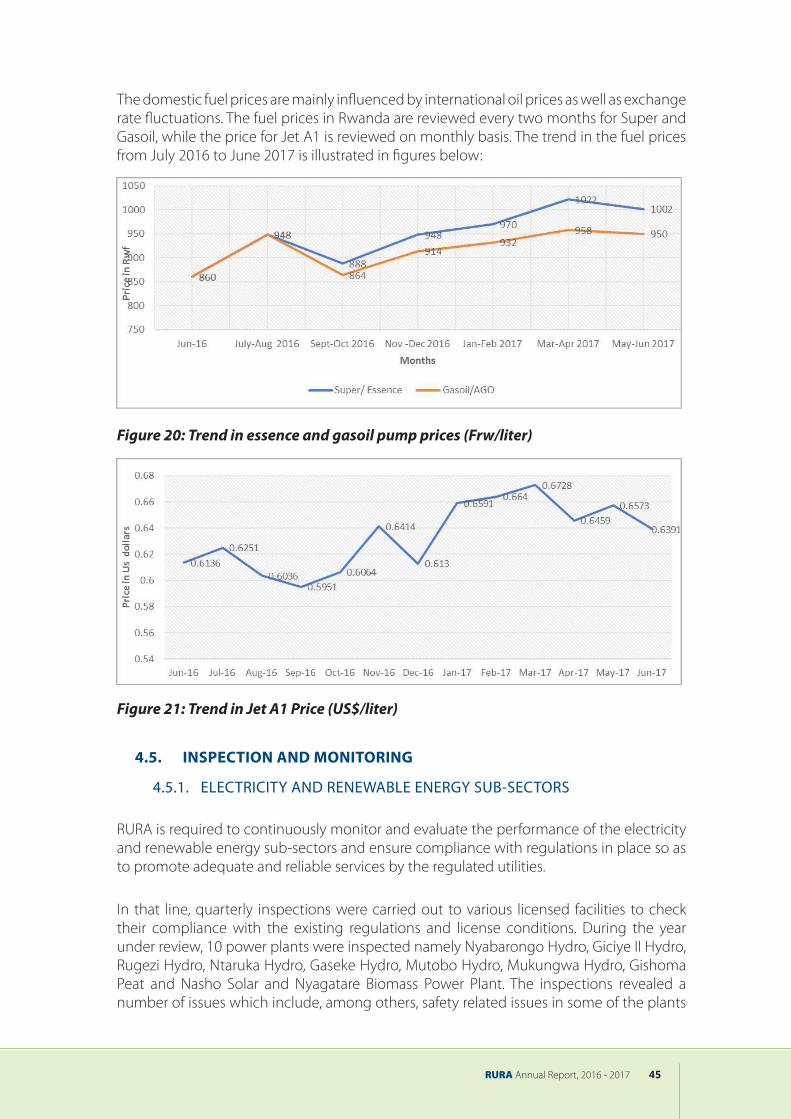
RURA Annual Report, 2016 - 2017 45
The domestic fuel prices are mainly influenced by international oil prices as well as exchange rate fluctuations. The fuel prices in Rwanda are reviewed every two months for Super and Gasoil, while the price for Jet A1 is reviewed on monthly basis. The trend in the fuel prices from July 2016 to June 2017 is illustrated in figures below:
Figure 20: Trend in essence and gasoil pump prices (Frw/liter)
Figure 21: Trend in Jet A1 Price (US$/liter)
4.5. INSPECTION AND MONITORING
4.5.1. ELECTRICITY AND RENEWABLE ENERGY SUB-SECTORS
RURA is required to continuously monitor and evaluate the performance of the electricity and renewable energy sub-sectors and ensure compliance with regulations in place so as to promote adequate and reliable services by the regulated utilities.
In that line, quarterly inspections were carried out to various licensed facilities to check their compliance with the existing regulations and license conditions. During the year under review, 10 power plants were inspected namely Nyabarongo Hydro, Giciye II Hydro, Rugezi Hydro, Ntaruka Hydro, Gaseke Hydro, Mutobo Hydro, Mukungwa Hydro, Gishoma Peat and Nasho Solar and Nyagatare Biomass Power Plant. The inspections revealed a number of issues which include, among others, safety related issues in some of the plants

RURA Annual Report, 2016 - 201746
while others were found operating without licenses issued by RURA. The concerned plants owners were requested to rectify the identified issues that were found non-compliant with the regulations in place.
Furthermore, site inspections were carried out to both on-grid and off-grid connected customers as well to EUCL branches to check the quality of services being delivered by service providers.These inspections were conducted in 9 districts, namely Gicumbi, Gakenke, Musanze, Nyagatare, Nyabihu, Karongi, Bugesera, Ngoma, Kayonza and Nyagatare. Also, the network performance (power plants production, network peak values, consumption statistics, lake levels, blackouts, accidents, losses) was assessed on quarterly basis and recommendations shared with EUCL for improvement of their performance. Generally, it was found that there were no longer planned load shedding on the electricity network as the supply is able to meet the total demand. However, the number of unplanned power outages is still considerable mainly due to very old power distribution infrastructure throughout the country. A number of projects related to grid reinforcement and rehabilitation are being implemented countrywide to ensure reliable supply of electricity in the near future.
RURA also conducted a survey on Solar Rwanda Program. This program was initiated by the Government of Rwanda to promote efficient use of electricity through Solar Water Heaters installations. The survey aimed at assessing the overall implementation of the program and understanding the challenges faced by both clients and suppliers of the systems. The survey revealed a number of issues which include, among others, the following:
• Low water pressure and shortage of water in some areas which hinders the performance of the systems;
• Delay of payment to the suppliers of the systems by REG/EDCL; • Public awareness of the program is still low as many potential customers of the
systems are not aware of the benefits of this program.
Recommendations on how to address the challenges reported in the survey were eventually transmitted to EDCL that is in charge of managing the program.
4.5.2. GAS AND DOWNSTREAM PETROLEUM SUB-SECTORS
4.5.2.1. LAKE KIVU METHANE GAS AND INDUSTRIAL GASES
Field inspections were carried out to evaluate the progress of on-site construction works of methane gas extraction and assess the status of operational gas extraction plants. The inspections revealed that operators such as KivuWatt had difficulties to comply with some requirements of the Management Prescriptions (MPs), especially parameters related to proper management of the gas resources. As a way forward, the following strategies have been recommended to address the issues identified:
• Engage the Expert Advisory Group (EAG) being recruited by the Energy Development Corporation Limited (EDCL) through Lake Kivu Monitoring Program (LKMP) to advise the Government of Rwanda on various matters related to Lake Kivu;
• Concessions should be granted based on quantities of gas to be extracted and not only in terms of power production capacity. This will motivate operators/

RURA Annual Report, 2016 - 2017 47
concessionaires to manage the gas resources more efficiently;• Adoption of the Management Prescriptions through enforceable regulations;
Besides, two inspections were implemented on biogas systems in all 30 districts where around 900 bio-digesters countrywide were visited. Common challenges found during the inspections include:
• Lack of feedstock by some beneficiary of biogas program mainly due to the fact that some beneficiaries sell their cows;
• Abandonment of uncompleted bio digesters by contractors hired by REG;• Lack of maintenance service after the guarantee period;• Insufficient water mainly in dry season in some regions of the country.
The following were recommended as a way forward to address the above mentioned challenges:
• Trainings on biogas plant operations and maintenance should be provided to officers in charge of biogas at districts and sectors level as well as to beneficiaries of biogas systems;
• Biogas plants should be installed to premises that meets the minimum requirements such as access to water and having sufficient feedstock to be used in biogas plant;
• Awareness on the benefits of the biogas systems need to be raised as biogas is a clean and affordable energy and provides good quality fertilizer used in agriculture needs;
4.5.2.2. DOWNSTREAM PETROLEUM
With the support of a consultant, RURA conducted an exercise of mapping all petrol service stations countrywide. The exercise came up with a database of all geographical data and technical information related to petrol service stations’ facilities as well as their operation process. A computer based application was developed to facilitate RURA to not only assess and monitor the location of petrol stations but also to propose plots for petrol station projects. During this exercise, a total of 276 petrol service stations were found in the country among which 249 were operating. The 249 PSS were classified as follows:
• First Category (9): The Petrol Stations in this category comply with most of important regulations but need to do some technical upgrade and risk mitigation.
• Second Category (209): These Petrol Stations do not comply with the most important regulations provisions, but can do significant upgrades and comply after a significant investment like acquiring a neighbor plot to adapt their plot size or relocate its installations intersecting with protected areas.
• Third category (31): These Petrol Stations do not and cannot comply with regulations because their current location and parcel boundaries are completely inside prohibited areas.
The exercise also came up with strategies and plans for phasing out substandard petrol service. The proposed strategies are currently being discussed with all involved stakeholders for further inputs before they get implemented.
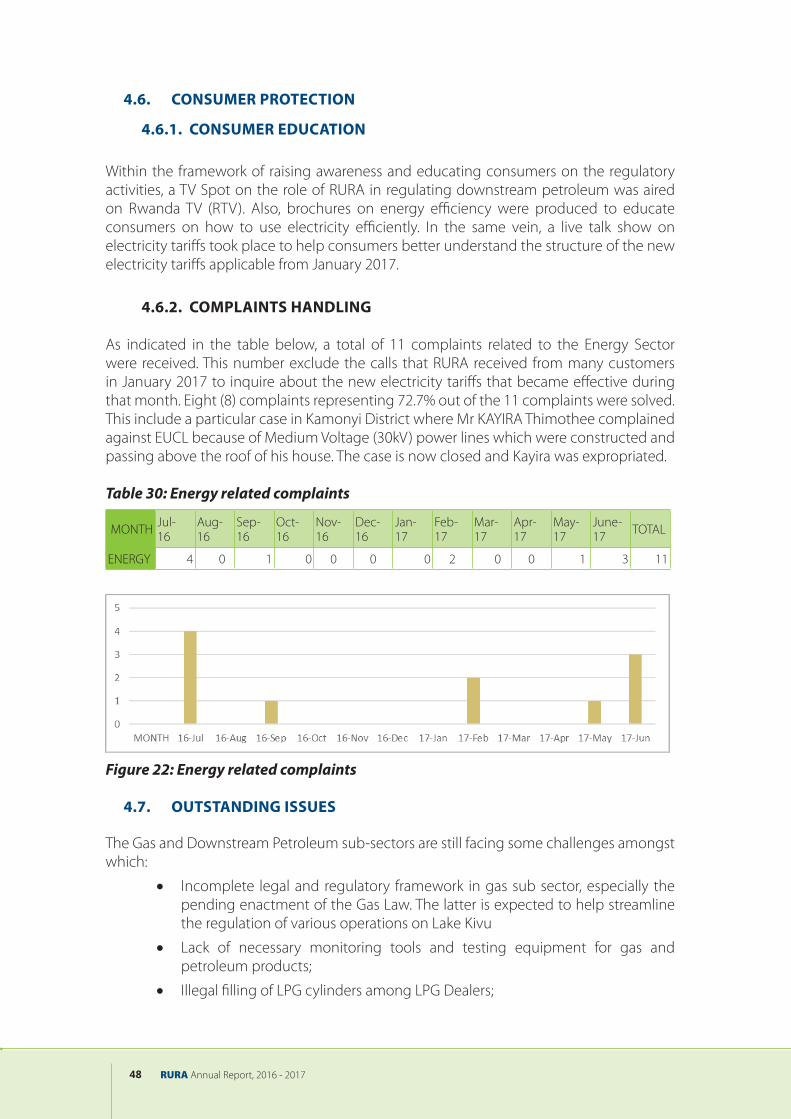
RURA Annual Report, 2016 - 201748
4.6. CONSUMER PROTECTION
4.6.1. CONSUMER EDUCATION
Within the framework of raising awareness and educating consumers on the regulatory activities, a TV Spot on the role of RURA in regulating downstream petroleum was aired on Rwanda TV (RTV). Also, brochures on energy efficiency were produced to educate consumers on how to use electricity efficiently. In the same vein, a live talk show on electricity tariffs took place to help consumers better understand the structure of the new electricity tariffs applicable from January 2017.
4.6.2. COMPLAINTS HANDLING
As indicated in the table below, a total of 11 complaints related to the Energy Sector were received. This number exclude the calls that RURA received from many customers in January 2017 to inquire about the new electricity tariffs that became effective during that month. Eight (8) complaints representing 72.7% out of the 11 complaints were solved. This include a particular case in Kamonyi District where Mr KAYIRA Thimothee complained against EUCL because of Medium Voltage (30kV) power lines which were constructed and passing above the roof of his house. The case is now closed and Kayira was expropriated.
Table 30: Energy related complaints
MONTH Jul-16
Aug-16
Sep-16
Oct-16
Nov-16
Dec-16
Jan-17
Feb-17
Mar-17
Apr-17
May-17
June-17 TOTAL
ENERGY 4 0 1 0 0 0 0 2 0 0 1 3 11
Figure 22: Energy related complaints
4.7. OUTSTANDING ISSUES
The Gas and Downstream Petroleum sub-sectors are still facing some challenges amongst which:
• Incomplete legal and regulatory framework in gas sub sector, especially the pending enactment of the Gas Law. The latter is expected to help streamline the regulation of various operations on Lake Kivu
• Lack of necessary monitoring tools and testing equipment for gas and petroleum products;
• Illegal filling of LPG cylinders among LPG Dealers;

RURA Annual Report, 2016 - 2017 49
• Insufficient collaboration framework with GoR institutions such as RRA in the provision of updated information and statistics relating to the Gas and Downstream Petroleum sub-sectors;
The mitigation measures that have been put in place to address the above mentioned issues include:
• Drafting the missing regulations to operationalize the petroleum law and review of the existing regulations in the alignment with the sector development and realities of the market;
• Signing an MOU with RRA for ease of information sharing, especially with regard to data on petroleum products trade;
• Signing an MOU with RSB for ease of tracking of fuel quality control; especially with regard to fuel marking and monitoring of fuel adulteration and dumping;
• Speeding up enactment of the gas law from which to devise regulations related to the methane gas extraction operations.

RURA Annual Report, 2016 - 201750
WATER & SANITATION

RURA Annual Report, 2016 - 2017 51
5. WATER AND SANITATION SECTOR
5.1. SECTOR PROFILE
Access to improved drinking water and appropriate sanitation services is a basic right that every citizen must have and this has been recognized globally in Sustainable Development Goals (SDGs) with the target to achieve universal access to safe drinking water and sanitation for all by 2030. Rwanda has made tremendous effort to achieve adequate water and sanitation services to all citizens and has set the target to attain 100% service coverage in water supply and sanitation sector by 2020.
During the period under review, water sub-sector has realized some improvements. In urban and peri-urban areas, the sole water service provider (WASAC Ltd) was licensed, water production has increased by 9.5% and the number of customers by 9%. However, the Non-Revenue Water has increased by 3% as compared to the previous year.
On the other hand, in rural water supply, the number of licensed operators was increased from 1 to 35, water tariffs were set, the number of Districts with water boards has increased from 10 to 27, the number of Districts with clustered water supply systems was increased from 13 to 23 and 19 Districts have so far recruited the WASH Officers in comparison with 15 recorded during previous year.
In sanitation sub sector, thirty-eight (38) new licenses were issued and eighteen (18) were renewed in cleaning services. Two (2) new licenses were issued in solid waste collection and transportation, one (1) license was issued in waste recycling and one (1) license was granted in installation of wastewater treatment systems.
5.2. LEGAL AND REGULATORY FRAMEWORK
RURA actively contributed in the development of separate national water supply and sanitation policies and strategies which were approved in December 2016. Also, rural water tariffs for end users were approved by the Regulatory Board on 13th December 2016. The following table illustrates rural water tariffs for different water systems.
Table 31: End user rural water tariffs
Water System
TARIFFS VAT EXCLUSIVE TARIFFS VAT INCLUSIVE
Tariff FRw/m3 Tariff FRw/Jerrican Tariff
FRw/m3 Tariff FRw/Jerrican
Gravity 287 7 338 8
Electricity pumping 731 17 863 20
Diesel pumping 921 21 1,087 25
Turbo 689 16 814 19
Complex system 597 14 704 16
WATER & SANITATION

RURA Annual Report, 2016 - 201752
In sanitation, the following sanitation regulations were reviewed and approved by the Regulatory Board:
• Regulations on cleaning service provision; • Regulations on decentralized wastewater treatment systems.
In addition, Regulations on liquid waste collection and transportation were drafted and approved in November 2016.
5.3. LICENSING
5.3.1. WATER SUB SECTOR
Following the approval of Regulations on water supply service provision and intensive awareness workshops with service providers and local authorities, licensing water service providers recorded a significant improvement. Thirty-five (35) licenses were issued including one (1) utility license granted to WASAC Ltd and 34 water supply infrastructure management licenses granted to rural water operators. This makes a total of thirty-six (36) licensed operators in water service provision as indicated in the following table.
Table 32: List of Licensed Operators in water Supply sub sector
S.N Licensee Address License numberProvince Service areaI. URBAN WATER SUPPLY (Water Utility- WU)
1. WASAC LTD Country wide
Urban and Peri-urban areas
001/ WU/LIC/WAT-EWS/RURA/2016
II. RURAL WATER SUPPLY
A. Water Supply Infrastructure Management-WSIM
1 COWBE South Nyaruguru 001/ WSIM/LIC/WAT-EWS/RURA/2016
2 CFGAE North Gakenke 002/ WSIM/LIC/WAT-EWS/RURA/2016
3 SEEGH Ltd South Kamonyi 003/WSIM/LIC/WAT-EWS/RURA/2016
4 PAAK KAM North Gicumbi 004/ WSIM/LIC/WAT-EWS/RURA/2016
5 COFO North Gicumbi 005/ WSIM/LIC/WAT-EWS/RURA/2016
6 Ndundimana JMV South Nyamagabe 006/ WSIM/LIC/WAT-EWS/RURA/2016
7 AGEOH West Nyamasheke 007/ WSIM/LIC/WAT-EWS/RURA/2016
8 AGEOH North Rulindo 008/ WSIM/LIC/WAT-EWS/RURA/2016
9 AGEOH West Rutsiro 009/ WSIM/LIC/WAT-EWS/RURA/2016
10 COPEREMA East Kirehe 010/ WSIM/LIC/WAT-EWS/RURA/2016
11 REDEC LTD South Huye 011/ WSIM/LIC/WAT-EWS/RURA/2016
12 REDEC LTD North Musanze 012/ WSIM/LIC/WAT-EWS/RURA/2016
13 ENTRAGREPCO North Gicumbi 013/ WSIM/LIC/WAT-EWS/RURA/2016
14 EDEPRES South Gisagara 014/WSIM/LIC/WAT-EWS/RURA/2016

RURA Annual Report, 2016 - 2017 53
15 EGIPRES LTD South Gisagara 015/WSIM/LIC/WAT-EWS/RURA/2016
16
REGIE ASSOCIATIVES DES USAGERS DES POINTS D’EAU GASABO LTD
City of Kigali Gasabo 016/ WSIM/LIC/WAT-EWS/RURA/2016
17 AYATEKE STAR East Kirehe 017/ WSIM/LIC/WAT-EWS/RURA/2016
18 AYATEKE STAR East Kayonza 018/ WSIM/LIC/WAT-EWS/RURA/2016
19 AYATEKE STAR South Nyaruguru 019/ WSIM/LIC/WAT-EWS/RURA/2016
20 AQUAVIRUNGA LTD West Nyabihu 020/ WSIM/LIC/WAT-EWS/RURA/2016
21 AQUAVIRUNGA LTD North Musanze 021/ WSIM/LIC/WAT-EWS/RURA/2016
22 SOCOTRIM South Kamonyi 022/ WSIM/LIC/WAT-EWS/RURA/2016
23 COOPERATIVE COOGEPO East Kirehe 023/WSIM/LIC/WAT-EWS/RURA/2016
24 S.T.E.F LTD South Huye 024/WSIM/LIC/WAT-EWS/RURA/2016
25 REGEP North Burera 025/WSIM/LIC/WAT-EWS/RURA/2016
26 AQUARWANDA South Kamonyi 026/WSIM/LIC/WAT-EWS/RURA/2016
27 UBUZIMA BWIZA MKM East Rwamagana 027/WSIM/LIC/WAT-EWS/RURA/2016
28 RUSAWACO-URUBOGOBOGO West Rutsiro 028/WSIM/LIC/WAT-EWS/RURA/2016
29 WATRESCO East Ngoma 029/WSIM/LIC/WAT-EWS/RURA/2017
30 KOPERATIVE ICUNGA AMAZI (KIA) West Karongi 030/WSIM/LIC/WAT-EWS/RURA/2017
31KOPERATIVE MAZI SOKO Y’UBUZIMA KARONGI
West Karongi 031/WSIM/LIC/WAT-EWS/RURA/2017
32MPANGA URUBOGOBOGO COMPANY Ltd
Eastern Kirehe 032/WSIM/LIC/WAT-EWS/2017
33 VISION WORK COMPANY Ltd Eastern Kirehe 033/WSIM/LIC/WAT-EWS/2017
34 NEEP COMPANY Ltd North Gakenke 034/ WSIM/LIC/WATEWS/RURA/2017
B. Management of Complex Water Supply Infrastructure-MCWSI
1 AQUAVIRUNGA West Rubavu 001/MCWSI/LIC/WAT-EWS/RURA/2016
5.3.2. SANITATION SUB SECTOR
During the financial year 2016-2017, two (2) new operators were licensed for solid waste collection and transportation and one (1) license was issued for waste recycling. This makes a total of twenty-four (24) licensed operators for solid waste collection and transportation and two (2) licensed operators for waste recycling. (The table in Annex 3 is the list of licensed operators in solid waste collection and transportation).
In cleaning service provision, thirty-eight (38) new operators were granted the licenses while eighteen (18) expired licenses were renewed. The total number of operators with valid licenses for cleaning service provision is one hundred ninety-five (195) by June 2017.

RURA Annual Report, 2016 - 201754
The number of licensed cleaning service providers dropped down from 208 in 2015/2016 to 195 in 2016/2017 due to the fact that some operators did not renew their licenses and others indicated that they stopped the business of cleaning service provision.
In liquid waste management, one (1) operator was licensed for the installation of decentralized wastewater treatment systems (DWwTS) making a total of two licensed operators in this sub-sector. The chart below summarizes the number of licensed operators in sanitation services provision.
Figure 23: Number of licensed operators in sanitation provision
5.4. MARKET PERFORMANCE
In this financial year, improvements were recorded mainly in water production whereby WASAC LTD completed the construction of 4 water treatment plants namely Mpanga (5,000 m3/day), Muhazi (2,800 m3/day) and Nyagatare (2,400 m3/day) under LV-WATSAN (Lake Victoria Water and Sanitation) project and Nkombo water treatment plant with a production capacity of 720 m3/day.
This has led to the annual production of 47,709,233 m3/year representing 9.5% increase in comparison to the records of previous year (43,558,705 m3 /year). On the other hand, water supplied has increased from 40,275,536 m3 to 44,213,124 m3.
sector. The chart below summarizes the number of licensed operators in sanitation services provision. (More details in annex….)
Figure 1: Number of licensed operators in sanitation service provision
3. MARKET PERFORMANCE
In this financial year, improvements were recorded mainly in water production whereby WASAC LTD completed the construction of 4 water treatment plants namely Mpanga (5,000 m3/day), Muhazi (2,800 m3/day) and Nyagatare (2,400 m3/day) under LV-WATSAN (Lake Victoria Water and Sanitation) project and Nkombo water treatment plant with a production capacity of 720 m3/day. This has led to the annual production of 47,709,233 m3/year representing 9.5% increase in comparison to the records of previous year (43,558,705 m3 /year). On the other hand, water supplied has increased from 40,275,536 m3 to 44,213,124 m3. The figure below shows the trend in water production and supply in urban areas over the last 5 years.

RURA Annual Report, 2016 - 2017 55
The figure below shows the trend in water production and supply in urban areas over the last 5 years.
Figure 24:Volume of water produced and supplied by WASAC Ltd
The number of customers has also increased compared to the previous year. As shown in the figure below, the number of connected customers increased by 9% from 175,646 (2015-2016) to 191,684 (2016-2017).
Figure 25: Trend in increase of customer connections in urban areas
Despite the above improvement, poor performance was noted in terms of Non-Revenue Water. As show in the figure 26. Non-Revenue Water has increased by 3% from 35.5% recorded in previous year to 38.3%. The high level of Non-Revenue Water is attributed to the poor maintenance of water infrastructure as well as old networks that lead to leakage in the distribution network as well as the commercial losses.

RURA Annual Report, 2016 - 201756
Figure 26 : Trend in Non-Revenue Water over 6 years
5.5. MONITORING
Monitoring is part of RURA mandate to ensure effective provision of regulated services. Audits and inspections are conducted to licensed operators in order to assess their performance and compliance with regulations.
5.5.1. WATER SUB SECTOR
In the financial year 2016-2017, audits and inspections were conducted to all Water Treatment Plants (19) and Branches (20) under WASAC Ltd management.
These inspections revealed that most water treatment plants (WTPs) are well operated and branches are well managed. Major improvement was specifically noted in water production, number of customers as well as the collection efficiency.
Figure 27: Ongoing construction works at Nzove
Figure 28: Completed LV-WATSAN project at Mpanga
Figure 29: Completed LV-WATSAN project at Nyagatare
Figure 30: Newly constructed plant at Nkombo

RURA Annual Report, 2016 - 2017 57
In rural areas, audits and inspections were conducted to twenty-eight (28) licensed operators over the course of 2016-2017 and the following improvement was noted:
• Number of Districts with clustered water supply systems has increased from 13 to 23;
• Establishment of District water boards was done in all Districts;• Number of Districts with WASH Officers has slightly increased from 15 to 18.
5.5.2. SANITATION SUB SECTOR5.5.2.1. CLEANING SERVICES
In cleaning service provision, audits and inspections were conducted to 28 operators in the City of Kigali in a bid to monitor the compliance with regulations and license conditions. The following were the findings:
• The visited operators provide adequate cleaning equipment, materials and products as per the signed contracts with their clients;
• All workers possess medical insurances predominantly “Mutuelle de santé” for easy access to medical care;
• Records keeping has seen a slight improvement whereby some operators availed all their working documents during audits and inspections;
• More than 80% of licensed cleaning service providers submitted their annual reports.
Efforts are however still needed in the provision of full package of personal protective equipment to workers and proper handling and storage of cleaning products. It was also noted that some operators delayed to renew their licenses and found themselves working with expired licenses.
5.5.2.2. SOLID WASTE MANAGEMENT
In the City of Kigali, audits and inspections were carried out on twelve licensed operators in the City of Kigali and three operators in Provinces.
Also waste disposal sites were visited in the following Districts: Rwamagana, Kayonza, Ngoma,Nyagatare Gakenke, Musanze, Rubavu, Karongi, Kamonyi, Muhanga, Ruhango Nyanza and Huye as well as Nduba landfill located in the City of Kigali. The following are the key findings:
• The visited operators have contracts for waste collection and transportation with their clients at an average of 90%;
• There are plans and schedules for waste collection and transportation and the frequency of once a week is respected by most operators making a collection efficiency of 79%;
• There has been improvement in waste hauling trucks: some operators possess appropriate trucks (compressors) for waste collection and transportation, the number required by the regulations is respected however some operators still have to cover their trucks;

RURA Annual Report, 2016 - 201758
• Waste pickers still have to be provided with full package of safety gadgets;• Waste sorting at source is still lagging behind at a rate of 39% on average.
Figure 31: Compressor for waste collection and transportation
Regarding waste disposal sites, audits and inspections revealed that Kayonza, Nyagatare, Nyanza and Huye Districts have already completed the construction of landfills.
5.5.3. SERVICE PROVIDERS EDUCATION
During the period under review, workshops were conducted in all 4 Provinces and the City of Kigali with the aim to sensitize Local Authorities and operators in water and sanitation operators on the regulations governing the provision of water and sanitation services and encourage them to comply with these regulations.
Figure 32: Provincial workshops on water supply and sanitation service provision in Western Province.

RURA Annual Report, 2016 - 2017 59
5.6. CONSUMER PROTECTION
During the financial year 2016/2017, RURA received a total number of 99 complaints in water and sanitation as shown by the table below:
Table 33: Water and sanitation complaints
Sub sector Jul-16
Aug-16
Sep-16
Oct-16
Nov-16
Dec-16
Jan-17
Feb-17
Mar-17
Apr-17
May-17
June-17 TOTAL
WAT 0 3 0 0 0 3 6 5 0 1 4 10 32
SAN 0 0 0 1 0 2 33 18 0 0 6 7 67
Most complaints in water subsector were related to water shortage where some neighborhoods in the City of Kigali could not get water for a significant period of time. To solve the problem, RURA monitored the implementation of weekly water rationing program as provided by WASAC Ltd to ensure that every customer gets water at least three times a week. In the worst cases, the meeting between customers, RURA and WASAC Ltd representatives would be convened to discuss and address the issue.
In sanitation subsector, the complaints received were related to the frequency of waste collection from the households. According to the regulations on solid waste collection and transportation, waste should be collected once a week however it was observed that some operators do not respect this set frequency. All received complaints were handled to the satisfaction of the customers.
5.7. OUTSTANDING ISSUES
Sector challenges recorded within the year under review consist of the following:
- Lack of professional operators in rural water supply;- No proper treatment facilities for solid and liquid waste especially in the City
of Kigali;- High Non- Revenue Water recorded for the urban water utility;- Imbalance between water supply and demand in urban areas;- Lack of budget for the rehabilitation of old and non-functional rural water
supply systems;- Lack of sufficient treatment facilities and laboratories to perform water quality
analyses.

RURA Annual Report, 2016 - 201760
TRANSPORTREGULATION

RURA Annual Report, 2016 - 2017 61
6. TRANSPORT REGULATION
6.1. SECTOR PROFILE
The transport sector is a significant segment of Rwanda’s economy due to its strategic role in boosting socio-economic development.
The law No. 09/13 of 01/03/2013 gives RURA the mandate to regulate transport services namely road and inland waterways transport of goods and persons.
RURA ensures that transport services are available and reliable throughout the Country to meet, in transparency, current and future demands. It also ensures that service providers comply with laws and regulations in force.
The period under review experienced notable achievements. These include increase of 103% licensed taxi cab operators fleet, 15% of driving schools and the number of rental vehicles increased by 31% from 369 to 483 compared to the previous financial year. Three (3) new motorcycle cooperatives were also licensed as a result of awareness campaigns and enforcement.
6.2. LEGAL AND REGULATORY FRAMEWORK
The transport Sector is regulated in line with the following:
• Public Transport Policy and Strategy for Rwanda;
• Presidential Order N° 25/01 of 25/02/2015 Modifying and Complementing Presidential Decree N° 85/01 of 02/09/2002 Regulating General Traffic Police and Road Traffic as Modified and Complemented to Date;
• Code of Conduct for Boat Drivers of Public Passenger and Cargo Boats in the Republic of Rwanda;
• Passengers Road Transport Regulations N°007/TRANS/RT/RURA/2015 of 01/06/2015
• Code of Conduct of Public Road Transport Drivers in Rwanda;
• Board Decision No 13/TR-RURA/2009 of 4 September 2009 Regarding the Functioning of Driving Schools in Rwanda.
6.3. LICENSING
Transport sector, in this year experienced evolutions in terms of the increase in number of licensed operators and the increase in terms of number of vehicles used. According to transport regulations only individual authorizations still hold in transportation of goods and waterways. For other sub-sectors operators have to work in cooperatives or companies.
TRANSPORTREGULATION

RURA Annual Report, 2016 - 201762
Table 34: Newly licensees in transport per category as of June 2017
CATEGORY Number of Newly licensed operators
Total Number of Operators
Transport of goods 2 25
Transportation of persons local 1 47
Transportation of persons Cross- border 1 6
Motorcycles cooperatives 3 146
Car rental operators 2 30
Driving schools 12 91
Taxi cab 12 53
Freight forwarders 1 14
In addition to the above in transport of goods, 7,106 authorizations were issued to individual operators.
6.4. MARKET PERFORMANCE
6.4.1. TARIFF STRUCTURE
RURA has the obligation to set tariffs for taxi cabs and transport of person’s fares. During this financial year, fuel price the main cost parameter in transport service costing did not go beyond the pre-set margin of variation, consequently, transport fares were not reviewed.
6.4.2. TREND IN TRANSPORT SECTOR
The following table shows the trend in licensed operators.
Table 35: Trend in licensed operators
CATEGORY 2015-2016 2016-2017 Change (%)
Transport of goods 23 25 9%
Transportation of persons local 46 47 2%
Transportation of persons Cross- border 8 6 -25%
Motorcycles cooperatives 143 146 2%
Car rental operators 30 30 0%
Driving schools 79 91 15%
Taxi cab 41 53 29%
Freight forwarders 13 14 8%
In transport of goods, 2 new licenses were issued to 2 companies namely Sugira Ltd and Ubumwe Transport Gahanga Ltd. The table of all licensed transport of goods operators is in Annex 4.
In transportation of persons sub sectors, there are two types of licenses issued namely local and cross boarders’ licenses. In this financial year, one operator was licensed which is Alfa Ltd. However, the same year marked a decrease in the number of licensed cross-border operators from 8 in June 2016 to 6 operators as of June 2017. This decrease is attributed

RURA Annual Report, 2016 - 2017 63
to failure of some operators to meet regulations regarding required fleet capacity. Despite the decrease in the number of operators, their fleet increased from 66 by June 2016 to 76 in this year. The list of Passengers Bus Transport Operators is in Annex 5.
Three (3) new motorcycles cooperatives were licensed, this increased the number of authorized Motorcycles by 13.2% from 27,646 as of June 2016 to 31,296 as of June 2017 operating under 146 cooperatives. See the list of Licensed Motorcycles Operators in Annex 6.
The number of licensed car rental operators remained the same as only two operators entered in the market replacing two other operators that didn’t renew their licenses. The number of vehicles increased by 31% from 369 in the preceding financial year to 483 in the year 2016-2017. See Licensed Car Rental Companies/Cooperatives in Annex 7.
Driving schools fleet increased by 7.7% from 804 to 866 in 2016-2017. This increment is backed by increased number of driving schools from 79 recorded in 2015-2016 to 91 in this financial year. The table of all licensed driving schools is in Annex 8.
During the year under review, twelve (12) new taxi cab were licensed leading to a total number of fifty-three (53) companies/cooperatives. The already existing Companies and Cooperatives increased their fleet size by 103% from 632 in 2015-2016 to 1,285 in 2016-2017. This is due to enforcement measures and new operators joining the sub sector. See Licensed Taxi Cabs in annex 9.
In freight forwarders sub sector, one (1) new company called Platinum Ltd was licensed. Thirteen operators renewed their license during this financial year which lead to a total number of 14 licensed freight forwarders operators in Rwanda.
6.4.3. TREND IN FLEET OF LICENSED OPERATORS IN TRANSPORT SECTOR
The table below shows the trend in operators’ fleets in transport sector:
Table 36: Trend in operator’s fleets
CATEGORY 2015-2016 2016-2017 Change (%)
Transport of goods 470 478 2%
Transportation of persons local 3,297 3,974 21%
Transportation of persons Cross- border 66 76 15%
Motorcycles cooperatives 27,646 31,296 13%
Car rental operators 369 483 31%
Driving schools 804 866 8%
Taxi cab 632 1,285 103%
From the above table, it is observed that the operators’ fleets increased in all categories ranging from 2% in transport of goods to 103% in taxi cab.

RURA Annual Report, 2016 - 201764
Figure33: Motorcycle Fleet Distribution by Provinces and the City of Kigali
As indicated in the above figure, the City of Kigali has highest number of motorcycles with a fleet of 13,546 motorcycles, followed by the Eastern Province that has 7,332. Southern Province has 4,514 and Western Province 4,130. The Northern Province has the least fleet of 1,774 motorcycles.
6.4.4. WATERWAY BOATS DISTRIBUTION
The chart below summarizes the number of boats authorized during this financial year, Kivu Lake has many boats compared to other lakes.
Figure 34: Boats per Lake
146
18 169 5 2 2
0
20
40
60
80
100
120
140
160
Kivu Mugesera Muhazi Burera Ruhondo Sake Cyohoha
Num
ber
of B
oats
Lakes

RURA Annual Report, 2016 - 2017 65
6.5. MONITORING AND ENFORCEMENT
6.5.1. ENFORCEMENT IN PUBLIC TRANSPORT
RURA ensures that all public transport operators comply with the regulations, license obligations and other applicable laws. In this context field inspections are always organized and sanctions are given to non-compliant operators.
During this financial year the following faults were recorded in public transport;
Table 37: Faults committed in public transport by corridor in 2016-2017
No Faults South-West
North-West
Eastern
City of Kigali Total
Driving Without Required Document (D.W.R.D) 116 83 91 130 420
Violating Route (V.R) 20 21 19 143 203
Failure To Use E-Ticketing(F.U.E.T) 58 62 42 1 163
Without Uniform (W-Uniform)2 24 37 29 31 121
Loading at unappropriated place LO.P.P 6 16 7 83 112
Bus overloading (Bus .Overl.) 12 22 9 26 69
Failure to issue ticket (F.T.I.T) 5 5 16 0 26Failure to observe the set cleanliness and customer service delivery (F.T.O.T.clean Delivery) 0 4 4 15 23
Use of bus without a valid license (U.B.V.L) 10 7 0 2 19
Failure to operate (F.T.O) 4 0 5 3 12
Refusal to avail document at the demand R.A.D.D 2 1 3 0 6
Failure to operate to time table (F.T.O.time) 0 1 0 3 4
Failure to charge correct fare( F.T.C.F) 0 0 1 0 1Failure to observe set bus service operating hours (F.T.O.S.B. 0 0 0 1 1
Total 257 259 226 438 1,180
The most repetitive faults are driving without required document (DWRD) and violating route and which were committed especially in City of Kigali (CoK), South West corridor. The use of E-ticketing was not respected in upcountry than in CoK.
The chart below classifies operators by faults committed in South-West Corridor operators.
Figure 35: South-West corridor operators faults
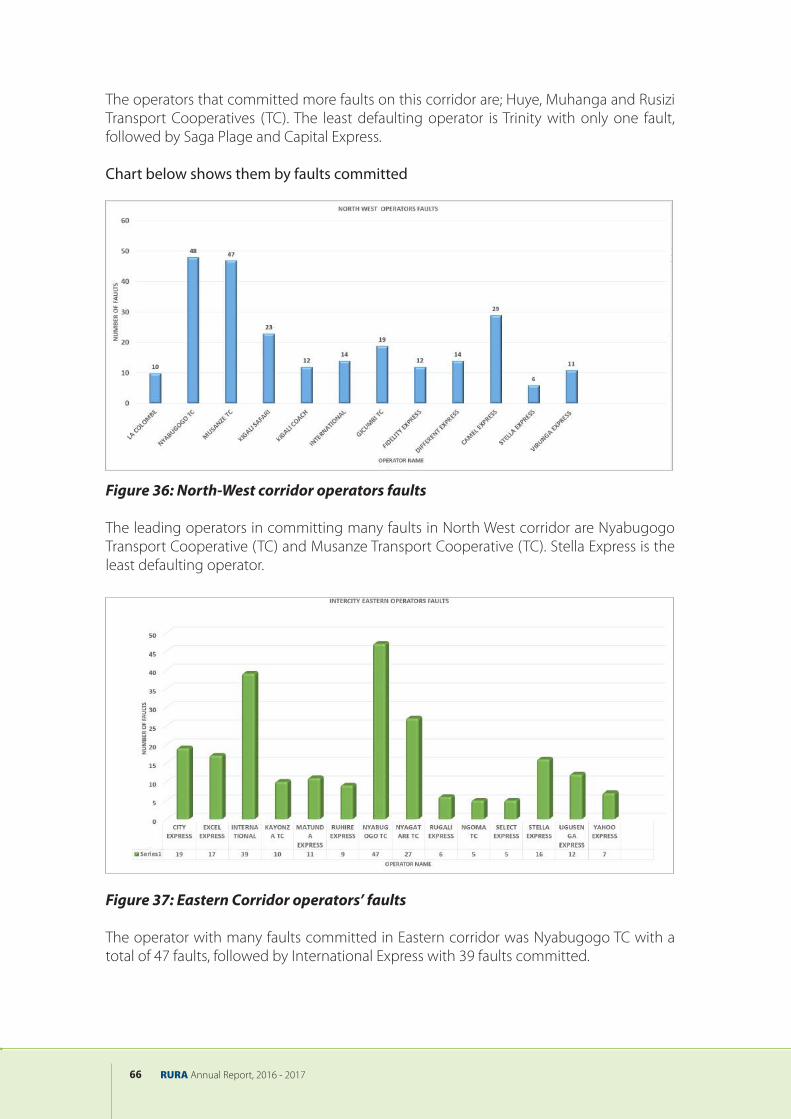
RURA Annual Report, 2016 - 201766
The operators that committed more faults on this corridor are; Huye, Muhanga and Rusizi Transport Cooperatives (TC). The least defaulting operator is Trinity with only one fault, followed by Saga Plage and Capital Express.
Chart below shows them by faults committed
Figure 36: North-West corridor operators faults
The leading operators in committing many faults in North West corridor are Nyabugogo Transport Cooperative (TC) and Musanze Transport Cooperative (TC). Stella Express is the least defaulting operator.
Figure 37: Eastern Corridor operators’ faults
The operator with many faults committed in Eastern corridor was Nyabugogo TC with a total of 47 faults, followed by International Express with 39 faults committed.

RURA Annual Report, 2016 - 2017 67
In the City of Kigali, RFTC registered more faults as illustrated in the figure below:
Figure 38: City of Kigali operators’ faults
The operator leading in City of Kigali in committing many faults is Rwanda Federation Transport Cooperative (RFTC) operating two cooperatives in City of Kigali namely City Center Transport Cooperative and Remera transport Cooperative with a total of 413 committed faults.
6.5.2. SPEED GOVERNORS IN PUBLIC AND GOODS TRANSPORT VEHICLES
In accordance to speed limitation for public and commercial transport vehicles as provided by the Presidential Order no 25/01 of 25/02/2015, RURA in collaboration with Police, Mininfra, and Rwanda Standard Board conducted inspections and approved speed governor5 gadgets of the following companies:
• Beno Car Limited, • Akagera Business Group ltd, • Jendie Automobiles ltd, • Mala n.e.c ltd, • Pascal Technology ltd • Paymatic Ltd • Sator Rwanda Ltd
5 Speed governor: is high-tech device that limits vehicles to a set maximum speed and has the capacity to trim down the speed every time the vehicle attempts to exceed the set maximum velocity. The set maximum speed in Rwanda is 60 kilometers per hour.

RURA Annual Report, 2016 - 201768
Figure 39: Speed governor launch
6.5.3. TRAINING OF DRIVERS AND DRIVERS VOCATION CARDS
To ensure professionalism, training of 880 public transport drivers was conducted on different aspects, including professional behavior, customer care and first aid. In the same vein, 714 drivers’ vocational cards were issued in order to facilitate monitoring of public transport drivers. The Drivers Vocational Cards Management System (DVCMS) was officially launched on 1st June 2017 in Nyabugogo Bus Terminal by the Minister of Youth and ICT.
.
Figure 40: Official Launch of DVCMS

RURA Annual Report, 2016 - 2017 69
6.6. CONSUMER PROTECTION
6.6.1. CONSUMER EDUCATION
In public transport, passengers were educated on their rights and obligations and one consumer forum talking about public transport was organized and it took place.
6.6.2. COMPLAINT HANDLING
For the transport sector, 1002 complaints were received. Lodging a complaint in transport is easier than in ICT sector because of the nature of complaints and this is may be the cause of receiving many complaints that any other sector.
Table 38: Transport related complaints
MONTH Jul-16
Aug-16
Sep-16
Oct-16
Nov-16
Dec-16
Jan-17
Feb-17
Mar-17
Apr-17
May-17
June-17 TOTAL
TRANSP 101 135 5 80 49 156 143 63 42 43 40 145 1002
Many complaints were related to the departure time which is no more respected by almost all companies and cooperatives. We also received complaints related to delays in issuing motorcycle’s transport authorisations but the issue is now solved after the awareness campaign on the issue took place. In this sector, 850 complaints representing 84.8% were resolved and we continue to educate drivers so that they can change their behaviour.
6.7. OUSTANDING ISSUES
The faced challenges in the transport sector are the following:
Some vehicles operate without licenses which leads to unfairness in the market;
The use of taxi meter did not reach the desired objective because taxi cab operators and consumers have not adopted the culture of using taxi meter;
Taxi meter suppliers are still few compared to the demand which delayed the installation in taxi cabs vehicles;
Lack of transport sector law.
To address the challenges mentioned above, RURA will focus on the following:
Put more effort in monitoring and enforcing public transport rules and regulations;
Conduct public awareness campaigns on the use of taxi meter;Integrate operators’ E-ticketing systems into RURA transport E-ticketing
monitoring system.

RURA Annual Report, 2016 - 201770
CONCLUSIONS & WAY FORWARD

RURA Annual Report, 2016 - 2017 71
7. CONCLUSIONS AND WAY FORWARD
This report paves away different achievements recorded in the financial year 2016-2017. As detailed in the same, many more projects have been accomplished despite some few that had constraints which hindered the full accomplishment.
The ICT sector continues to expand considerably in various aspects driving a positive socio-economic impact on the welfare of the entire community. As detailed in the report, Internet service subscription registered an increase of 19%. The competition brought about more innovative ideas and facilities to end-users. Following the enactment of the new ICT Law in June 2016, the Regulatory Authority has and continues to put in place a new regulatory framework to ensure effective implementation of the ICT law and to facilitate new entrants in the market.
The Energy sector has also registered an increase 10% in electricity installed generation capacity and it reached 208.3 MW from 190 MW registered in the previous year. In the same line, the access to electricity has increased where electricity on-grid connections alone has increased by 13.5%. Other important achievements include the new electricity end user tariffs approved during the year under review which gave special consideration to some categories of customers by introducing a lifeline tariff for low income households and by giving to industrial customers’ tariffs which are much more competitive.
The mapping of all petrol stations countrywide marks another important milestone in the regulation of downstream petroleum industry.
In Water and Sanitation sector, some improvements have also been registered such as the increase in water production by 9.5% and the number of customers by 9%. However, this sector is still facing a lot of challenges like imbalance between water supply and demand in urban areas, high Non-Revenue Water mainly due to old networks, lack of clear plan and means to rehabilitate the old and non-functional rural water supply systems etc. To address these, heavy investments in water and sanitation are still needed.
The Transport has recorded tremendous achievements during the year under review. Awareness campaign and enforcement mechanisms have boosted the transport sector in terms of compliance and revenues generation in the financial year. Licensed Taxi cabs recorded an increase of 103% due to extensive inspections conducted by the Authority. Regular monitoring operations provided responses to frequent noted issues and basically addressed them on time. Furthermore, the E-ticketing system has made the operators much more compliant. For this to be effective and consistent, there is a plan to integrate it with RURA monitoring Systems. The introduced system of Speed governor in Public and good transport marked positive impact in accident reduction and other incidents usually caused by over speeding.
As a way forward, measures and means are to be put in place to the well performance in the next financial year. The crucial steps in will include among other: to complete the legal and regulatory frameworks by putting in place all required regulatory tools/instruments to enable effective environment; to closely monitor the service delivered to consumers; to improve the corporate image through different programmes.
The Authority will also ensure the effective implementation of the revised RURA Strategic-Plan 2017-2020, by aligning its activities with its strategic objectives.
For effective regulation, RURA will continue to engage various actors from all regulated sectors and all national, regional and international stakeholders.

RURA Annual Report, 2016 - 201772
AN
NEX
1: R
UR
A O
RGA
NIS
ATIO
NA
L ST
RUC
TURE
8. ANNEXES

RURA Annual Report, 2016 - 2017 73RURA Annual Report, 2015 - 2016 78
AN
NEX
1: R
URA
ORG
AN
ISAT
ION
AL
STR
UCT
URE
OFF
ICE
OF
PM
REG
ULA
TORY
BOA
RD
DIR
ECTO
R G
ENER
AL
- Eco
nom
ic A
naly
st (1
)- A
dviso
r (1)
- Adv
isor/
RB (1
)- A
dmin
istra
tiveA
ssist
ant (
1)
- Chi
ef In
tern
al A
udito
r (1)
- Int
erna
l Aud
itor (
4)
MED
IA R
EGU
LATI
ON
DIV
ISIO
N M
AN
AGER
(SPO
KESP
ERSO
N)
- AA
/DM
(1)
- Med
ia L
icen
sing
& C
ompl
ianc
e O
ffice
r (1)
- Med
ia M
onito
ring
Offi
cers
(3)
- Ext
erna
l Rel
ation
s &
Ser
vice
Del
iver
y O
ffice
r (2)
- Soc
ial M
edia
Offi
cer (
1)- W
ebsit
e Co
nten
t Mgt
Offi
cer (
1)
HO
D/I
CT R
EG. (
1)- A
A/H
OD
(1)
- Lic
ensin
g &
Com
plia
nce
Off.
(1)
- Dir
ICT
SRM
M (1
)- S
pect
rum
Pla
nnin
g
Offi
cer (
1)- R
adio
com
mun
icati
on
Lice
nsin
g O
ffice
r (1)
- ICT
Sca
rce
Reso
urce
s
Mon
itorin
g O
ffice
rs (3
)- I
CT S
carc
e Re
sour
ces
Num
berin
g O
ffice
r (2)
- Dir
ICT
Std,
QoS
and
Post
al R
eg. (
1)- F
ixed
and
Mob
ile
Net
wor
ks O
ffice
r (3)
- Bro
adca
sting
Offi
cer(1
)- T
ype
appr
oval
Off.
(1)
- Tow
ers
& fi
ber O
ff (1
)- E
-was
te M
gt O
ffice
r (1)
- Pos
tal R
egul
ation
Offi
cer (
2)
- HO
D/E
WAT
SAN
REG
. (1)
- AA
/HO
D (1
)- L
ic. &
Com
plia
nce
Off
(1)
- Tar
iff M
onito
ring
and
M
arke
t Ana
lysis
Offi
cer (
1)
- DIR
/ELE
CTRI
CITY
& R
E
REG
.(1)
- Pro
ject
s M
onito
ring
Off.
(1)
- Tec
hnic
al c
ompl
ianc
e &
m
onito
ring
Off.
(2)
- Pow
er D
istr
ibuti
on &
QoS
Off.
(1)
- R
E&EE
offi
cer (
1)
- DIR
/Gas
& D
owns
trea
m
Pet
role
um R
EG. (
1)- M
etha
ne &
Indu
stria
l Gas
es o
ff. (1
)- D
owns
trea
m P
etro
leum
M
onito
ring
Offi
cers
(4)
- LPG
Offi
cer(1
)
- DIR
/WAT
SAN
REG
. (1)
- Wat
er s
uppl
y m
onito
ring
Offi
cer(3
) - W
aste
wat
er tr
eatm
ent a
nd
cle
anin
g se
rvic
es O
ffice
r (1)
- Sol
id w
aste
col
lecti
on &
t
rans
port
ation
Offi
cer (
1)
- HO
D/L
EGA
L, C
ON
SUM
ER &
ECO
NO
MIC
REG
.
AFF
AIR
S (1
)- A
A/H
OD
(1)
- D/L
EGA
L SE
RVIC
E &
EN
FORC
EMEN
T (1
)- L
egal
Dra
ftin
g O
ffice
r (3)
- Tra
nsla
tor (
2)- C
orpo
rate
Leg
al S
ervi
ces
Off.
(1)
- Enf
orce
men
t O
ffice
r (2)
- DIR
/ECO
NO
MIC
REG
ULA
TIO
N
- Offi
cer i
n ch
arge
of
tar
iff (4
)- S
tatis
ticia
n (1
)- B
usin
ess
Plan
ana
lysis
Offi
cer (
2)- R
IA O
ffice
rs (2
)
- DIR
/ CO
NSU
MER
AFF
AIR
S- C
onsu
mer
Affa
irs O
ffice
r (6)
- HO
D/T
RAN
SPO
RTRE
G.(1
)- A
A/H
OD
(1)
- DIR
/TPT
QoS
Co
mpl
ianc
e (1
)- I
nspe
ctor
s (9
)
- DIR
/TPT
PL
AN
NIN
G &
LICE
NSI
NG
(1)
- Tra
nspo
rt P
lann
ing
& D
evel
opm
ent (
4)- L
icen
se is
suan
ce
office
r (8)
- HO
D/I
NN
OVA
TIO
N
&
CYB
ERSE
CURI
TY (1
)- A
A/H
OD
(1)
- UA
F D
IVIS
ION
MA
NAG
ER(1
)- B
ig D
ata
Ana
lyst
(2)
- Em
ergi
ng C
omm
unic
ation
s
Tech
nolo
gy A
naly
st (3
)- A
pplic
ation
syst
ems
anal
yst (
2)- I
nfra
stru
ctur
e D
ev O
ffice
r (1)
- Con
tent
Dev
el O
ffice
r (1)
- Pro
ject
Man
ager
(1)
- Int
erne
t gov
erna
nce
Offi
cer (
1)
- D/T
ECH
N
DEV
PT &
SER
VIC
E (1
)- M
onito
ring
Offi
cer (
5)- M
aint
enan
ce a
nd s
uppo
rt O
ff. (2
)- S
yste
m D
vpt O
ffice
r (2)
- Cyb
erse
curit
y O
ffice
rs (2
)- I
CT a
pplic
ation
Reg
. Offi
cer (
2)
- D/I
S (1
)- S
yste
m A
dmin
istra
tor (
1)- D
atab
ase
deve
lope
r/ A
dmin
. (1)
- N
etw
ork
Engi
neer
(1)
- IT
Mai
nten
ance
& S
upp
Off.
(1)
- Sys
tem
Ana
lyst
(2)
- Ele
ctro
-mec
hani
cal
tec
hnic
ian
(1)
- Hel
pdes
k te
chni
cian
(1)
HO
D/C
ORP
ORA
TE
SERV
ICES
(1)
- AA
/HO
D (1
)- M
&E
Offi
cer (
1)
- DIR
/PLA
NN
ING
&
PRO
CURE
MEN
T (1
)- P
lann
ing
& C
orpo
rate
Str
ateg
y O
ff. (2
)- P
rocu
rem
ent O
ff.(3
)
- DIR
/HR
& A
DM
(1)
- HR
Offi
cer (
1)- C
aree
r Dev
elop
men
t &
Tra
inin
g O
ff. (1
)- R
emun
erati
on O
ff. (1
) - L
ogisti
c O
ffice
r (2)
- Sto
reke
eper
(1)
- Cen
tral
Sec
reta
riat
(2)
- Cus
tom
er C
are
(2)
- Lib
raria
n (1
)- S
ec. &
Fle
et M
gt O
ff (1
)- D
river
s (7
) - M
esse
nger
s (2)
DIR
/FIN
AN
CE U
NIT
(1)
- Cas
hier
(1)
- Rev
enue
Ass
uran
ce O
ffice
r (4)
- Chi
ef A
ccou
ntan
t (1)
- Acc
ount
ants
(4)
RURA
Org
anisa
tiona
l Str
uctu
reA
NN
EX 1
: RU
RA O
RGA
NIS
ATIO
NA
L S
TRU
CTU
RE
AN
NEX
1: R
UR
A O
RGA
NIS
ATIO
NA
L ST
RUC
TURE

RURA Annual Report, 2016 - 201774
ANNEX 2: LIST OF LICENSED PETROL SERVICE STATION DEVELOPERS
SN Operator/ applicant name
License number SN Operator / applicant name
License number
1 Mr. KABALISA Gaspard -Kayonza
026/PSS/RURA/2015 7 Mr. GASARABWE Alphonse (Gas Oil)–Poids Lourd
032/PSS/LIC/GP-EWS/RURA/2015
2 Mr.NDAGIJIMANA Emmanuel- Nyamata
027/PSS/LIC/GP-EWS/RURA/2015 8 Mr. NDAGIMANA Francois
– Kabeza033/PSS/LIC/GP-EWS/RURA/2015
3LAKE PETROLEUM RWANDA Ltd -Rwamagana
028/PSS/LIC/GP-EWS/RURA/2015 9 ADDAX PETROLEUM Ltd
–Gatsibo034/PSS/LIC/GP-EWS/RURA/2015
4LAKE PETROLEUM RWANDA Ltd - Kayonza
029/PSS/LIC/GP-EWS/RURA/2015 10
MOUNT MERU RWANDA PETROLEUM Ltd-Rwamagana
035/PSS/LIC/GP-EWS/RURA/2015
5ESCALE GROUP Ltd - Kayonza 030/PSS/LIC/GP-EWS/
RURA/2015 11 HOME STATION –Rwamagana
036/PSS/LIC/GP-EWS/RURA/2015
6 Mr. RURANGANGABO Paulin - Kicukiro
031/PSS/LIC/GP-EWS/RURA/2015 12 NDAGIJIMANA Athanase -
Kamonyi037/PSS/LIC/GP-EWS/RURA/2015
13 HOME STATION - Kibeho
038/PSS/LIC/GP-EWS/RURA/2015 19 SOPEFANI Itd – Musanze 045/PSS/LIC/GP-
EWS/RURA/2015
14 Mr. BIDERI Vincent –Kicukiro - Gahanga
039/PSS/LIC/GP-EWS/RURA/2015 20 Mrs. KAMARADE
NumutakoAbineImmy044/PSS/LIC/GP-EWS/RURA/2015
15Station Dicsentre - Rubavu
040/PSS/LIC/GP-EWS/RURA/2015 21 Mr. NTIRUSHWAMABOKO
Concorde – Nyamata
046/PSS/LIC/GP-EWS/RURA/2015
16 Mr. MURANGIRA Philippe - Rusumo
041/PSS/LIC/GP-EWS/RURA/2015 22 ADDAX Petroleum Ltd –
Muhura047/PSS/LIC/GP-EWS/RURA/2015
17 MT MERU Petroleum Rwanda -Kayonza
042/PSS/LIC/GP-EWS/RURA/2015 23 SIGEPE Ltd - Rulindo 048/PSS/LIC/GP-
EWS/RURA/2015
18 Lake Petroleum Ltd -Musanze
043/PSS/LIC/GP-EWS/RURA/2015 24 ADDAX Petroleum Ltd –
Byangabo049/PSS/LIC/GP-EWS/RURA/2015
ANNEX 3: ThE LIST OF LICENSED OPERATORS IN SOLID WASTE COLLECTION
No Operator Province Operation areaOperators with first category license3
1 ISUKU KINYINYA City of Kigali Kinyinya Sector (Gasabo District)
2 REAL ENVIRONMENTAL PROTECTORS
City of Kigali Kagarama Sector (Kicukiro District)
3 UMURIMO MWIZA LTD City of Kigali Air Port, Inyange Industries, Bralirwa (Kicukiro District)
4 UBUMWE CLEANING SERVICES
City of Kigali Kicukiro, Gatenga, Niboye and Gikondo Sectors (Kicukiro District)
5 COPED City of Kigali Nyarugenge, Kacyiru and RemeraSectors(Nyarugenge and Gasabo Districts)
6 AGRUNI LTD City of Kigali Nyarugunga, Kanombe, Kimihurura, Rwezamenyo, Kimironko, Nyamirambo, Gatsata, Kigali, Jali, Rusororo,Bumbogo&Ndera Sectors (Gasabo, Kicukiro, &NyarugengeDistrict)
7 BAHEZA GENERAL SERVICES LTD
City of Kigali Kigarama Sector (Kicukiro District)
8 COCEN City of Kigali Nyakabanda and Kimisagara Sectors (Nyarugenge District)
9 ACAPE Western Province
Rubavu District
10 INZIRA NZIZA SERVICES COMPANY LTD
City of Kigali Muhima Sector(Nyarugenge District)

RURA Annual Report, 2016 - 2017 75
11 CESCO COMPANY City of Kigali Masaka sector (Kicukiro District)
12 INDATWA GITEGA COOPERATIVE City of Kigali Gitega, Gisozi&Jabana Sectors (Nyarugenge District)
13 NEW LIFE NT &MVK LTD City of Kigali Commercial areas (Nyarugenge District)
14 KEEN KLEENERS LIMITED City of Kigali Some institutions and commercial entities
Operators with second category license4
1 MZI Ltd Northern Province
Musanze District
2 GEBUR MULTI-BUSINESS LTD
Northern Province Gicumbi District
3 KOPIBO Western Province Rubavu District
4 Develop our families Western Province Rubavu District
Operators with third category license5
1 G.A.P.M Northern Province
Gicumbi District
2 BUSMED Ltd Western Province Rubavu District
3 Guma General Services and Suppliers Ltd Eastern Nyagatare District
4 RITM Ltd Northern -
ANNEX 4: LICENSED TRANSPORT GOOD OPERATORS
N0 COOPERATIVES/COMPANIES NUMBER OF VEHICLES 2016- 2017
HUYE TRANSPORT COOPERATIVE 55
COOPERATIVE DES TRANSPORTEURS DE MARCHANDISES DE RUBAVU 22
COOPERATIVE DES TRANSPORTEURS ET DE SOLIDARITE DE MAHOKO 11
COOPERATIVE DES TRANSPORTEURS DES MARCHANDISES DE GISENYI 73
COOPERATIVE DES TRANSPORTEURS DE MARCHANDISES DE KAVUMU 41
UMOJA WA MADEREVA 16
COCTRAMAVK 41
COOPERATIVE DES TAXISMAN VOITURE RUSIZI-BUGARAMA 16
NYAMPINGA DRIVERS 13
RWABUKUMMBA J.P TRASNPORT LTD 10
STIPPAG-RWANDA LTD 3
TOP SERVICES ENTERPRISE LTD 8
KAURWA LTD 16
NTIVUGURUZWA BUSINESS COMPANY LTD 2
BUSINESS & TRANSPORT TRADING COMPANY LTD 16
SOFT SERVICE 7
KHALFAN TRANSPORTERS LTD 9
ISANO PICK UP AND TRUCK DRIVERS COOPERATIVE KICUKIRO 9
GLEVOL CO LTD 5
KAMO AND SONS 17
UBUMWE TRANSPORT GAHANGA 6
SUGIRA LTD 4
EAST AFRICAN COOPERATIVE OF TRANSPORTS 59
GORILLA MOTORS LTD 2
SOCIETE RWANDAISE DE DISTRIBUTION ET SERVICE 5
TOTAL NUMBER OF VEHICLES 478

RURA Annual Report, 2016 - 201776
ANNEX 5: PASSENGER BUS TRANSPORT OPERATORS
No COMPANIES NAME VEHICLES FLEET 2015-2016
VEHICLES FLEET 2016-2017
1 Camel Tours And Travel Agency 20 212 Capital Express 18 233 City Center T/Cooperative 408 3704 City Express 48 515 Different Express 6 206 Excel Tours &Travel Agency 56 547 Fidelity Express 10 238 Gicumbi T/Cooperative 77 809 Horizon Express 66 8210 Huye T/Cooperative 141 17611 Impala Express 23 1712 International Express 100 8713 Kayonza T/Cooperative 90 9014 Kigali Bus Services 118 15315 Kigali Coach Travel Agency 29 4116 Kigali Safari Express 21 3017 Kivu Belt Express 8 2418 La Colombe Express 27 4119 Matunda Express 27 2720 Muhanga T/Cooperative 148 15821 Musanze T/Cooperative 213 30222 Ngoma T/Cooperative 116 13723 Nyabugogo T/Cooperative 343 41224 Nyagatare T/Cooperative 147 15425 Omega Express 30 3826 Remera T/Cooperative 318 38227 Royal Express 94 10628 Rubavu T/Cooperative 98 16729 Rugali Travel Agency 43 5530 Ruhire Express 21 2631 Rusizi T/Cooperative 122 14432 Rwinyana Express 11 -33 Select Express 28 2634 Stella Express 57 5635 Tripartite Tours 11 1936 Ugusenga Express 42 4737 Virunga Express 50 5338 Volcano Express Ltd 77 9039 Yahoo Car Express Ltd 35 3340 Volcano Ltd (Crossboarder) 1241 Students Safety Bus Ltd (School Bus) 1342 Modern Coast Exp.Uganda (Crossboarder) 343 Trinity Transporters & Distributors Co. Ltd(Crossboarder) 1744 Jakobu Entreprises Ltd(Crossboarder) 3145 Volcano Ltd (School Bus) 7 2046 Mash Bus Services Limited(Crossboarder) 347 Alpha Express 3948 Rwanda School And Students Transport Cooperative (School Bus) 58 3304 4011

RURA Annual Report, 2016 - 2017 77
ANNEX 6: LIST OF MOTORCYCLES COMPANIES OR COOPERATIVES
S/N MOTOCYLES COMPANIES OR COOPERATIVESNUMBER OF MOTOS 2016-2017
1 COOPERATIVE DES MOTARDS RUSIZI (COMORU) 2952 KOPERATIVE TERIMBERE MOTARD RUSIZI (KOTEMORU) 2053 COOPERATIVE DES MOTARDS DE GIHUNDWE RUSIZI (COMOGIRU) 2414 COOPERATIVE DES MOTARDS DE MASHYUZA-RUSIZI (COMOMARU) 1205 COOPEWRATIVE DE TRANSPORET AU MOYEN DE MOTO- KAMEMBE 1306 COOPERATIVE DES MOTARDS DE NYAMASHEKE 957 COOPERATIVE DES TRANSPORTEURS A MOTOS DE NYAMASHEKE (COTRAMONYA) 2278 COOPERATIVE DES TAXIMEN MOTOS NYAMASHEKE-RUHARAMBUGA (COTAMONYA) 579 COTEMO COOPERATIVE TERIMBERE TAXI MOTOS NGORORERO 16110 COOPERATIVE DE TAXIS MOTOS DE KABATWA-NYABIHU 12611 AMAJYAMBERE IWACU (KAMIGI) 16312 COOPERATIVE DE CHAUFFEURS DE TAXIS MOTOS DE L’OUEST (COCTMO) 14613 COOPERATIVE POUR LE TRANSPORT DES PERSONNES A MOTO (COTRAPMO) 27914 COOPERATIVE DE TAXI MOTARDS RUBAVU 4715 KOPERATIVE UMURAVA RUBAVU 7016 KOPERATIVE AGUKA MOTARDS RUBAVU 8617 KWISUNGANA NO KUGOBOKA ABAJYAMBERE 5818 COOPERATIVE DE TAXI MOTO ENTRAIDONS-NOUS DE RUBAVU 11319 MOTO TRANSPORT COOPERATIVE 33420 COOPERATIVE URUMURI MOTARD GISENYI 12221 COOPERATIVE DES CHAUFFEURS TAXI MOTO DE KABARI 14422 COOPERATIVE DES TAXIMEN-MOTO DE BUSASAMANA 4723 COOPERATIVE DE TRANSPORT AU MOYEN DE MOTO DE KARONGI 14924 COOPERATIVE DE TRANSPORT AU MOYEN DE TAXI MOTO KARONGI 23425 KOPERATIVE TAXIMEN MOTOS TERIMBERE KARONGI (KOTAMOTEKA) 16626 COPERATIVE DE TAXI-MOTO DE GAKERI/RUTSIRO 14027 COOPERATIVE DES TAXIMEN-MOTOS DE RUTSIRO-ICYIZERE 11828 COTAMORU TWITEZIMBERE/RUTSIRO 5729 KARENGE TAXI MOTO COOPERATIVE 10330 COOPERATIVE DE DE MOTARDS DE GAHENGERI 14131 COOPERATIVE UBUMWE MOTARD-KIGABIRO 15332 COOPERATIVE TAXIMEN MOTO KIGABIRO 7933 COOPERATIVE TUZAMURANE GAHINI 2434 COOP.DE TAXIMEN MOTOS DE RUKIRA 14535 COOPERATIVE TWIHUTE KARAMBI 14536 COOPERATIVE DUTABARANE RUKARA 16137 COOPERATIVE DE TAXI MOTO DE MUKARANGE 19838 COOP.DES TAXIMEN MOTO DE RWINKWAVU DUFATANYE 14739 COOPDE TAXI MOTO DE KABARONDO 15340 MUKARANGE MOTORCYCLE COOPERATIVE TURAHIRIWE 21741 COOP.DE TAXI MOTO DE KIREHE TWITEZIMBERE 25242 COTAMORU INGOBOKABAGENZI RUSOZI 13143 KOTMN/NYARUBUYE 10644 MOTOS COOPERATIVE .AS GENERAL BENEFIT 11845 COOPERATIVE .TAXIS MOTO NGOMA 34846 COOPERATIVE DE TAXI MOTO DE REMERA 114247 COOP.DES TAXI MOTO DE SAKE 123

RURA Annual Report, 2016 - 201778
48 LE PROFESSIONNEL NGOMA 17249 COOP.DES MOTARS DE GATSIBO/COMOGA 35850 CO.TA.MO-KIRAMURUZI 18351 COOP TAXIS MOTOS DE RUGARAMA/GATSIBO 14952 COOP.DE TRANSPORT AU MOYEN DE TAXIS MOTO 6253 COOPERATIVE DES TAXIS MOTOS DE NDATEMWA-GATSIBO 9054 COMORWI-RWIMBOGO 12955 COTAMOGI IMBARAGA 21356 COOPERATIVE DES MOTARDS DE GITOKI 15457 COOPERATIVE DES TAXI MOTO DE BUGESERA 17958 COOPERATIVE DES TAXIMEN MOTO ICYEREKEZO RUHUHA 7159 COOPERATIVE DES TAXIMEN MOTO INTEGO RILIMA 9760 KARANGAZI RAPID MOTORCYCLIST COOPERATIVE. 19261 COOP.TAXIMOTO INTIGANDA NYAGATARE 19062 NGEGENE MOTORIST TRANSPORTERS COOP. 11963 KOPERATIVE KUNDUMURIMO MOTAR TABAGWE 8264 COOP.DES JEUNES MOTARDS DE KARAMA 8965 KOPERATIVE MOTARI NYAGATARE 9366 KUNDUMULIMO MOTAR COOPERATIVE 8667 SAFE TAXI MOTO COOPERATIVE NYAGATARE 9968 KOPERATIVE MOTARI RWIMIYAGA 11669 SAFE TAXI MOTOR COOPERATIVE MUSHERI 6570 COOPERATIVE DES MOTARDSDE RYABEGA 8371 INTASUMBWA 15972 KOPERATIVE DUKORER HAMWE MATIMBA 3773 SAFE TAXI MOTO RWIMIYAGA 7174 COOPERATIVE Y’ABAMOTARI MIMULI DUTERIMBERE (COAMIDU) 10875 COOPERATIVE DES CHAUFFEURS DE TAXIS MOTOS DE KAMONYI (COOCTAMOKA) 27776 KAMONYI MOTORCYCLE TRANSPORTER’S COOPERATIVE(KAMOTRACO) 28477 COOPERATIVE DE TAXIS MOTOS DE MUHANGA SUD 172
78 COOPERATIVE DE TRANSPORT DES VELOS MOTEURS DE MUHANGA (COOTRAVEMOMU) 651
79 UNITY MOTOCYCLISTS COOPERATIVE (UMC) 6480 COOPERATIVE DE TAXIS MOTO DE BYIMANA (COOTAMOB) 5681 COTAMORU TEBUKA 9782 COTRAPAMARU 12783 KOPERATIVE INKERAKUBARUTA BWERAMANA 6984 COOPERATIVE DES TAXIS MOTO DE KINAZI 6785 COOPERATIVE TAXI MOTO BUHANDA KINIHIRA (COTAMOBUKI) 13386 COOPERATIVE DE TAXI MOTO DE NYAMAGABE 14887 COOPERATIVE DES MOTARDS DE NYAMAGABE (COOMONYA) 10988 COOPERATIVE DE TRANSPORTEUR DE TOUT GENRE NYAMAGABE (COTRANYA) 16089 COOPERATIVE INTAMBWE MOTARD (CIM/HUHE) 605
90 COOPERATIVE DE TRANSPORTEURS DE TAXI MOTO EN DISTRICT DE HUYE (COTTAMOHU) 688
91 MOTORBIKE DRIVERS COOPERATIVE NYANZA (MODRICONYA) 21292 COOPERATIVE DE TAXI MOTO DE BUSORO 7793 COOPERATIVE DES TAXIMEN MOTO NYANZA 10994 KOPERATIVE IMENA TAIXI MOTO NYANZA 10995 COOPERATIVE DUFASHE ABAGENZI (KODUAGI) 24296 KOPERATIVE TERIMBERE TAXI MOTO NYARUGURU 5897 COOPERATIVE DES MOTARDS DE CYAMUTARA (COMOCYA) 148

RURA Annual Report, 2016 - 2017 79
98 COOPERATIVE DES CHAUFFREURS DE TAXI-MOTOS BASE (COOCTAMOB) 13299 COOPERATIVE DES TAXIMEN MOTO DE MURAMBI 48100 COOPERATIVE DES TAXIMEN MOTO DE GAKENKE (COOPTAMOGA) 52
101 COOPERATIVE DE TRANSPORT DE PERSONNES AU MOYEN DE MOTO DE MUSANZE (COOTRAMO) 213
102 COOPERATIVE DES TAXIS MOTOS DU NORD(COOTAMONO-UBUMWE) 566103 COVATRAMO-MUSANZE 69104 COOPERATIVE DES PROPRIETAIRES DE TAXI MOTOS DE GICUMBI CPTMG 229105 COOPERATIVE DE TRANSPORT AU MOYEN DE MINI MOTO DE GICUMBI 147106 COOPERATIVE DE SERVICE DE TRANSPORT AU MOYEN DE MOTOS 170
107 COOPERATIVE DE TRANSPORTEURS DES TAXIS MOTO NYARUGENGE (COTRATAMONYA) 365
108 COOPERATIVE DE TAXIS MOTO DE GITIKINYONI (COTAMOGI CYINYONI) 286109 COOPERATIVE DES TAXIS MOTOS ZONE NYABUGOGO (COTAMONYA) 518110 KORANUMUCYO MOTARI/KABUGURU II 320111 COTRAMO ICYIZERE COOPERATIVE KIMISAGARA 161112 MUHIMA COOPERATIVE OF MOTORCYCLISTS 408113 COOPERATIVE KORA NDEBE MOTARD 325114 KOPERATIVE TWIYUBAKE MOTARD 426115 KORA TAXI MOTO NYARUGENGE COOPERATIVE 162116 NYARUGENGE MOTARD COOPERATIVE 497117 IMBARAGA MOTARD MUHIMA 337118 IBAKWE MOTARD NYARUGENGE 299119 COOPERATIVE DE TRANSPORT ICYEREKEZO 184120 MBAHAFI COOPERATIVE 579121 COOPERATIVE DE TRANSPORTEURS TAXI MOTO KABUGA (COTAMOKA) 250122 KACYIRU COOPERATIVE FOR DEVELOPMENT OF MOTORCYCLIST (KCDM) 338123 JABANA COOPERATIVE FOR DEVELOPMENT OF MOTORCYCLIST EJO HEZA 317124 GASABO MOTOCYCLISTS COOPERATIVE OF REMERA 454125 GASABO MOTOCYCLIST SERVICES COOPERATIVE (GMTSC) 892126 COOPERATIVE DUFATANYE MOTARD GASABO 141127 GATSATA COOPERATIVE OF MOTORCYCLISTS 163128 KOPERATIVE KORA WIGIRE MOTARI (KOKOWIMO) 356129 GASABO EAST COOPERATIVE MOTO 758130 COOPERATIVE TAXI MOTO DE RUSORORO 266131 COOPERATIVE TAXI MOTO DE JABANA 110132 GASABO CENTER MOTORCYCLISTS COOPETRATIVE 366133 KINYINYA MOTORCYCLITS COOPERATIVE 449134 COOPERATIVE TERIMBERE MOTARD 167135 GISOZI COOPERATIVE FOR VISION MOTOCYCLIST 624136 COOPERATIVE DES TAXIS MOTOS DE MULINDI (COOTAMOMU) 245
137 COOPERATIVE OF PROFESSIONAL MOTORIST FOR TRANSPORTATION KAGARAMA (COOPROMOTRAKI) 193
138 COOPERATIVE UBUMWE TAXI MOTO GATENGA 370139 ABAHUZA COOPERATIVE 752140 COTAMOGI GIKONDO 396141 NYARUGUNGA MOTARD COOPERATIVE 143142 COOPERATIVE DE TAXI MOTO DE KICUKIRO/COTAMOTOKI 154143 COOPERATIVE DE TRANSPORT UMUSEKE MWIZA 237144 SUN CITY TAXI MOTO COOPERATIVE 106145 COOPERATIVE KUNDUMURIMO TABA 205146 COOPERATIVE TUBANEHAFI 227MOTORCYLES TOTAL NUMBER 31296
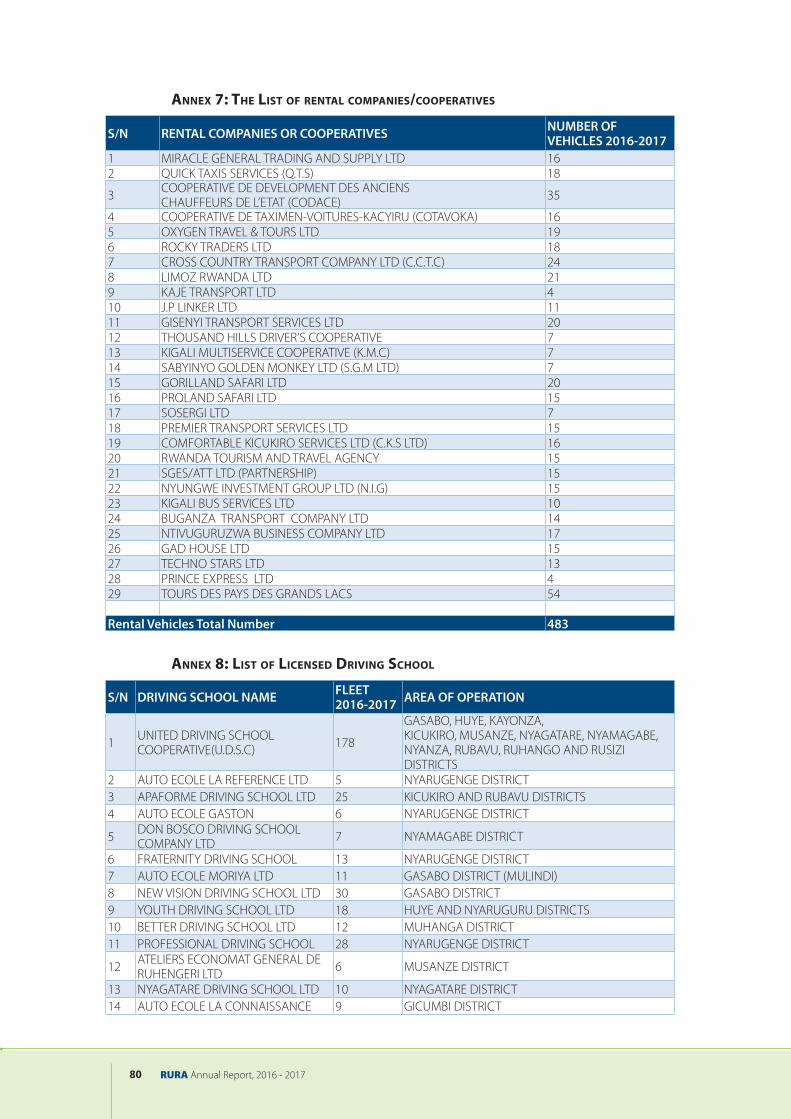
RURA Annual Report, 2016 - 201780
ANNEX 7: ThE LIST OF RENTAL COMPANIES/COOPERATIVES
S/N RENTAL COMPANIES OR COOPERATIVES NUMBER OF VEHICLES 2016-2017
1 MIRACLE GENERAL TRADING AND SUPPLY LTD 162 QUICK TAXIS SERVICES (Q.T.S) 18
3 COOPERATIVE DE DEVELOPMENT DES ANCIENS CHAUFFEURS DE L’ETAT (CODACE) 35
4 COOPERATIVE DE TAXIMEN-VOITURES-KACYIRU (COTAVOKA) 165 OXYGEN TRAVEL & TOURS LTD 196 ROCKY TRADERS LTD 187 CROSS COUNTRY TRANSPORT COMPANY LTD (C.C.T.C) 248 LIMOZ RWANDA LTD 219 KAJE TRANSPORT LTD 410 J.P LINKER LTD 1111 GISENYI TRANSPORT SERVICES LTD 2012 THOUSAND HILLS DRIVER’S COOPERATIVE 713 KIGALI MULTISERVICE COOPERATIVE (K.M.C) 714 SABYINYO GOLDEN MONKEY LTD (S.G.M LTD) 715 GORILLAND SAFARI LTD 2016 PROLAND SAFARI LTD 1517 SOSERGI LTD 718 PREMIER TRANSPORT SERVICES LTD 1519 COMFORTABLE KICUKIRO SERVICES LTD (C.K.S LTD) 1620 RWANDA TOURISM AND TRAVEL AGENCY 1521 SGES/ATT LTD (PARTNERSHIP) 1522 NYUNGWE INVESTMENT GROUP LTD (N.I.G) 1523 KIGALI BUS SERVICES LTD 1024 BUGANZA TRANSPORT COMPANY LTD 1425 NTIVUGURUZWA BUSINESS COMPANY LTD 1726 GAD HOUSE LTD 1527 TECHNO STARS LTD 1328 PRINCE EXPRESS LTD 429 TOURS DES PAYS DES GRANDS LACS 5430 HORSE TOURISM AND TRAVEL AGENCY LTD 15Rental Vehicles Total Number 483
ANNEX 8: LIST OF LICENSED DRIVING SChOOL
S/N DRIVING SCHOOL NAME FLEET 2016-2017 AREA OF OPERATION
1 UNITED DRIVING SCHOOL COOPERATIVE(U.D.S.C) 178
GASABO, HUYE, KAYONZA, KICUKIRO, MUSANZE, NYAGATARE, NYAMAGABE, NYANZA, RUBAVU, RUHANGO AND RUSIZI DISTRICTS
2 AUTO ECOLE LA REFERENCE LTD 5 NYARUGENGE DISTRICT3 APAFORME DRIVING SCHOOL LTD 25 KICUKIRO AND RUBAVU DISTRICTS4 AUTO ECOLE GASTON 6 NYARUGENGE DISTRICT
5 DON BOSCO DRIVING SCHOOL COMPANY LTD 7 NYAMAGABE DISTRICT
6 FRATERNITY DRIVING SCHOOL 13 NYARUGENGE DISTRICT7 AUTO ECOLE MORIYA LTD 11 GASABO DISTRICT (MULINDI)8 NEW VISION DRIVING SCHOOL LTD 30 GASABO DISTRICT 9 YOUTH DRIVING SCHOOL LTD 18 HUYE AND NYARUGURU DISTRICTS10 BETTER DRIVING SCHOOL LTD 12 MUHANGA DISTRICT11 PROFESSIONAL DRIVING SCHOOL 28 NYARUGENGE DISTRICT
12 ATELIERS ECONOMAT GENERAL DE RUHENGERI LTD 6 MUSANZE DISTRICT
13 NYAGATARE DRIVING SCHOOL LTD 10 NYAGATARE DISTRICT14 AUTO ECOLE LA CONNAISSANCE 9 GICUMBI DISTRICT
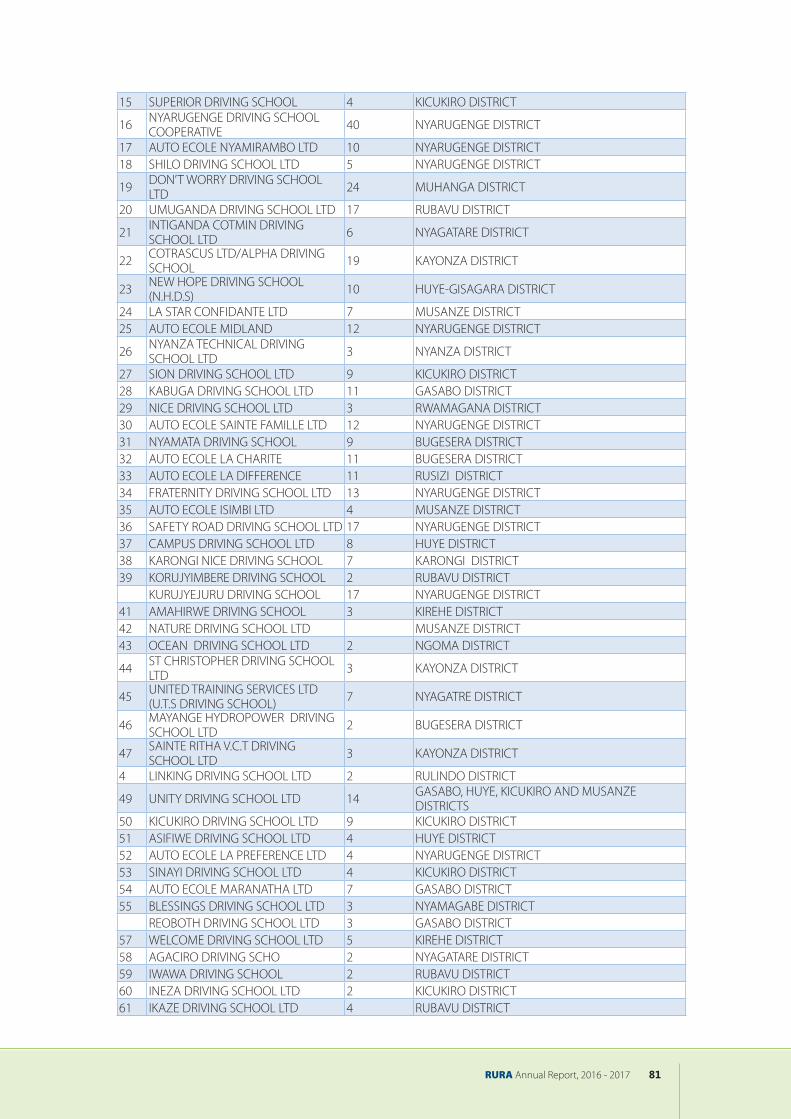
RURA Annual Report, 2016 - 2017 81
15 SUPERIOR DRIVING SCHOOL 4 KICUKIRO DISTRICT
16 NYARUGENGE DRIVING SCHOOL COOPERATIVE 40 NYARUGENGE DISTRICT
17 AUTO ECOLE NYAMIRAMBO LTD 10 NYARUGENGE DISTRICT18 SHILO DRIVING SCHOOL LTD 5 NYARUGENGE DISTRICT
19 DON’T WORRY DRIVING SCHOOL LTD 24 MUHANGA DISTRICT
20 UMUGANDA DRIVING SCHOOL LTD 17 RUBAVU DISTRICT
21 INTIGANDA COTMIN DRIVING SCHOOL LTD 6 NYAGATARE DISTRICT
22 COTRASCUS LTD/ALPHA DRIVING SCHOOL 19 KAYONZA DISTRICT
23 NEW HOPE DRIVING SCHOOL (N.H.D.S) 10 HUYE-GISAGARA DISTRICT
24 LA STAR CONFIDANTE LTD 7 MUSANZE DISTRICT25 AUTO ECOLE MIDLAND 12 NYARUGENGE DISTRICT
26 NYANZA TECHNICAL DRIVING SCHOOL LTD 3 NYANZA DISTRICT
27 SION DRIVING SCHOOL LTD 9 KICUKIRO DISTRICT28 KABUGA DRIVING SCHOOL LTD 11 GASABO DISTRICT29 NICE DRIVING SCHOOL LTD 3 RWAMAGANA DISTRICT30 AUTO ECOLE SAINTE FAMILLE LTD 12 NYARUGENGE DISTRICT31 NYAMATA DRIVING SCHOOL 9 BUGESERA DISTRICT 32 AUTO ECOLE LA CHARITE 11 BUGESERA DISTRICT 33 AUTO ECOLE LA DIFFERENCE 11 RUSIZI DISTRICT 34 FRATERNITY DRIVING SCHOOL LTD 13 NYARUGENGE DISTRICT35 AUTO ECOLE ISIMBI LTD 4 MUSANZE DISTRICT36 SAFETY ROAD DRIVING SCHOOL LTD 17 NYARUGENGE DISTRICT37 CAMPUS DRIVING SCHOOL LTD 8 HUYE DISTRICT38 KARONGI NICE DRIVING SCHOOL 7 KARONGI DISTRICT39 KORUJYIMBERE DRIVING SCHOOL 2 RUBAVU DISTRICT40 KURUJYEJURU DRIVING SCHOOL 17 NYARUGENGE DISTRICT41 AMAHIRWE DRIVING SCHOOL 3 KIREHE DISTRICT42 NATURE DRIVING SCHOOL LTD 3 MUSANZE DISTRICT43 OCEAN DRIVING SCHOOL LTD 2 NGOMA DISTRICT
44 ST CHRISTOPHER DRIVING SCHOOL LTD 3 KAYONZA DISTRICT
45 UNITED TRAINING SERVICES LTD (U.T.S DRIVING SCHOOL) 7 NYAGATRE DISTRICT
46 MAYANGE HYDROPOWER DRIVING SCHOOL LTD 2 BUGESERA DISTRICT
47 SAINTE RITHA V.C.T DRIVING SCHOOL LTD 3 KAYONZA DISTRICT
48 LINKING DRIVING SCHOOL LTD 2 RULINDO DISTRICT
49 UNITY DRIVING SCHOOL LTD 14 GASABO, HUYE, KICUKIRO AND MUSANZE DISTRICTS
50 KICUKIRO DRIVING SCHOOL LTD 9 KICUKIRO DISTRICT51 ASIFIWE DRIVING SCHOOL LTD 4 HUYE DISTRICT52 AUTO ECOLE LA PREFERENCE LTD 4 NYARUGENGE DISTRICT53 SINAYI DRIVING SCHOOL LTD 4 KICUKIRO DISTRICT54 AUTO ECOLE MARANATHA LTD 7 GASABO DISTRICT55 BLESSINGS DRIVING SCHOOL LTD 3 NYAMAGABE DISTRICT56 REOBOTH DRIVING SCHOOL LTD 3 GASABO DISTRICT57 WELCOME DRIVING SCHOOL LTD 5 KIREHE DISTRICT58 AGACIRO DRIVING SCHOOL LTD 2 NYAGATARE DISTRICT 59 IWAWA DRIVING SCHOOL 2 RUBAVU DISTRICT60 INEZA DRIVING SCHOOL LTD 2 KICUKIRO DISTRICT 61 IKAZE DRIVING SCHOOL LTD 4 RUBAVU DISTRICT

RURA Annual Report, 2016 - 201782
62 MODERN DRIVING SCHOOL LTD 4 RUSIZI DISTRICT
63 RIGHT CHOICE DRIVING SCHOOL LTD 2 KAMONYI DISTRICT
64 NEW PLAN DRIVING SCHOOL LTD 7 GASABO DISTRICT65 COOTELRU-VTC RUHANGO 3 RUHANGO DISTRICT66 ZION DRIVING SCHOOL LTD 16 GASABO, MUHANGA AND MUSANZE DISTRICTS67 NEW RIGHT DRIVING SCHOOL LTD 4 NYARUGENGE DISTRICT68 KARIBU DRIVING SCHOOL LTD 2 RUBAVU DISTRICT69 IMANZI DRIVING SCHOOL LTD 3 RWAMAGANA DISTRICT70 HERO DRIVING SCHOOL LTD 2 GATSIBO DISTRICT71 SINAPI DRIVING SCHOOL LTD 4 KICUKIRO DISTRICT72 RELIANCE DRIVING SCHOOL LTD 2 KAMONYI DISTRICT73 UMUCO DRIVING SCHOOL LTD 3 RUBAVU DISTRICT74 NEW DREAM DRIVING SCHOOL LTD 5 GASABO DISTRICT 75 FRANCIS DRIVING SCHOOL LTD 4 GASABO DISTRICT76 INTEGO DRIVING SCHOOL LTD 2 NGOMA DISTRICT77 WINNERS DRIVING SCHOOL LTD 4 KICUKIRO DISTRICT 78 EXPERT DRIVING SCHOOL LTD 5 GASABO DISTRICT 79 STAR DRIVING SCHOOL LTD 2 NGOMA DISTRICT80 RUSIZI DRIVING SCHOOL LTD 6 RUSIZI DISTRICT
81 NYARUTARAMA DRIVING SCHOOL LTD 4 GASABO DISTRICT
82 HIRWA DRIVING SCHOOL LTD 5 RUBAVU DISTRICT
83 NDIZEYE KARANGAZI DRIVING SCHOOL LTD 2 NYAGATARE DISTRICT
84 KAMONYI DRIVING SCHOOL LTD 2 KAMONYI DISTRICT85 AKAGERA DRIVING SCHOOL LTD 5 NYAGATARE DISTRICT86 ALPHONSE DRIVING SCHOOL LTD 2 NYAGATARE DISTRICT87 BICON DRIVING SCHOOL LTD 5 NYAGATARE DISTRICT
88 BLESS MOUNT DRIVING SCHOOL LTD 2 GICUMBI DISTRICT
89 SIBO DRIVING SCHOOL LTD 11 NYARUGENGE DISTRICT
90 INTERNATIONAL DRIVING SCHOOL & ASSOCIATION LTD 6 NYARUGENGE DISTRICT
91 OMEGA DRIVING SCHOOL LTD 5 GATSIBO DISTRICT
ANNEX 9: LIST OF LICENSED TAXICABS S/N COMPANIES OR COOPERATIVES OPERATION AREA NUMBER OF
VEHICLES 2016-20171 COOPERATIVE DE DEVELOPEMENT DES ANCIENS
CHAUFFEUR DE L’ETAT (CODACE) NYARUGENGE DISTRICT 33
2 COOPERATIVE POUR TAXI VOITURE DE KIGALI(CO.T.V.K)
NYARUGENGE DISTRICT 21
3 COOPERATIVE DES TAXIMANS DE L’HOTEL AMAHORO (COTAHAMA)
GASABO DISTRICT 19
4 COOPERATIVE DES TAXIMEN VOITURE DE NYABUGOGO (COTAVONYA)
NYARUGENGE DISTRICT 54
5 KIGALI TAXI VOITURE COOPERATIVE (K.T.V CO) GASABO DISTRICT 316 COOPERATIVE EJO HEZA HACU GASABO DISTRICT 127 COOPERATIVE KISIMENTI TAXIMEN-VOITURES
(COKITA)GASABO DISTRICT 20
8 AIRPORT TAXI DRIVERS OF KIGALI (A.T.A.K) GASABO DISTRICT 609 COOPERATIVE DE TAXI VOITURE DE KICUKIRO
(COCTAKI)KICUKIRO DISTRICT 21
10 ROCKY TRADERS LTD NYARUGENGE DISTRICT 711 GROLY COACH LTD GASABO DISTRICT 3812 CONDOR SPECIAL TAXI COMPANY LTD NYARUGENGE DISTRICT 18

RURA Annual Report, 2016 - 2017 83
13 HOLLY AUTO TRAVEL AGENCY LTD NYARUGENGE DISTRICT 2514 COOPERATIVE DE TRANSPORT PAR TAXIS
VOITURES DE GISENYI (COTTAVOGI)RUBAVU DISTRICT 42
15 COOP. DES CHAUFFEURS DE TAXI-VOITURES DE L’OUEST (COCTVO-GI)
RUBAVU DISTRICT 34
16 COOPERATIVE DE TAXIS VOITURES DE LA CAPITALE (COTAVOC)
NYARUGENGE DISTRICT 17
17 COOPERATIVE DE TAXIMEN VOITURE DE GACURIRO (COTAVOGA)
GASABO DISTRICT 26
18 COOPERATIVE TAXI VOITURES GARE REMERA (COTAVOGAR)
GASABO DISTRICT 28
19 BLISS TOUR COMPANY LTD GASABO DISTRICT 720 MUHI TRANSPORT COMPANY LTD NYARUGENGE DISTRICT 1721 BELEVA COMPANY LTD NYARUGENGE DISTRICT 722 COOP.TUNYARUKE MUSANZE DE TAXI VOITURES MUSANZE DISTRICT 2623 COOPERATIVE DES TAXIMENS DE L’HOTEL CHEZ
LANDO (COTHOLA)GASABO DISTRICT 16
24 QUALITY VALUE TRANSPORT COMPANY LTD ( Q.V.T.C LTD)
KICUKIRO DISTRICT 42
25 COOPERATIVE DES TAXI VOITURES DU STADE AMAHORO (C.T.V.S)
GASABO DISTRICT 7
26 COOP.DES TAXIMEN- VOITURES DE L’HOPITAL LA CROIX DU SUD
GASABO DISTRICT 7
27 COOPERATIVE LAICO UMUBANO GASABO GASABO DISTRICT 2628 TWIGIRE TAXI SERVICE COOPERATIVE (T.T.S.C) GASABO DISTRICT 3329 WOMEN TRANSPORT COMPANY LTD NYARUGENGE DISTRICT 1630 COOPERATIVE DES TAXISMAN VOITURE RUSIZI-
BUGARAMA(C.T.V.R.B) RUSIZI DISTRICT 86
31 COOPERATIVE DES TAXIMEN VOITURES DE KIBAGABAGA(COTAVOKI)
GASABO DISTRICT 20
32 HUYE TAXI TRANSPORT COOPERATIVE (H.T.T.C) HUYE DISTRICT 2833 COOPERATIVE INTASHYA NYAMASHEKE DISTRICT 4534 NYARUTARAMA TAXI COOPERATIVE (N.T.C) GASABO DISTRICT 2235 COMPANY DE TAXMEN DE GIKONDO LTD KICUKIRO DISTRICT 1736 COOPERATIVE DE TAXIMEN VOITURES
MUHIMA(COTAVOMU) NYARUGENGE DISTRICT 21
37 NYAMIRAMBO TAXI SERVICE LTD NYARUGENGE DISTRICT 2238 COOPERATIVE DES TAXIMEN ROI FAYSAL GASABO DISTRICT 2339 COOPERATIVE DE CHAUFFEURS DE TAXI VOITURES
DE RUSIZI (COOCHATAVORU)RUSIZI DISTRICT 27
40 NYABUGOGO SMALL TAXI DRIVER COOPERATIVE (NYASTADRICO)
NYARUGENGE DISTRICT 30
41 AMAREMBO CITY TAX SERVICE LTD (A.C.T.S) NYARUGENGE DISTRICT 2042 COSMOS TAXI SERVICE LTD NYARUGENGE DISTRICT 1943 ATAVO TRANSPORT COMPANY NYARUGENGE DISTRICT 1944 INTAGANZWA COOPERATIVE OF TRANSPORT NYARUGENGE DISTRICT 1645 KIMIRONKO UNITED TAXI COOPERATIVE (K.U.T.C) GASABO DISTRICT 2646 COOPERATIVE DE TAXI VOITURE HOPITAL
MILITAIREKICUKIRO DISTRICT 18
47 COOP. DE LA VISION DE TRANSPORT DU ROND POINT (COEVITRA)
NYARUGENGE DISTRICT 7
48 TAXI TOWN SERVICE CENTER COOPERATIVE (T.T.S.C.C)
NYARUGENGE DISTRICT 18
49 TAXI SERVICES COMPANY LTD (TASE COMPANY LTD)
NYARUGENGE DISTRICT 18
50 INTEGO TRANSPORT COMPANY LTD NYARUGENGE DISTRICT 1751 JYAMBERE TRANSPORT 2000 COMPANY LTD NYARUGENGE DISTRICT 1952 COOPERATIVE DES TAXIMEN-VOITURES DE
GISHOMA- RUSIZIRUSIZI DISTRICT 14
53 KICUKIRO TAXI VOITURE COOPERATIVE KICUKIRO DISTRICT 23Taxi Cabs Total Number 1285

RURA Annual Report, 2016 - 201784 RURA Annual Report, 2016 - 201784
RURAANNUAL REPORT
2016-2017

RURA Annual Report, 2016 - 2017 85

RURA Annual Report, 2016 - 201786
Kiyovu-Rue BigogweKN 6 Av 11P.O. Box: 7289, KIGALI-RWANDA
Tel: (250) 252 584 562Fax: (250) 252 584 563Hotline: 3988Website: www.rura.rwEmail: [email protected]
RWANDAUTILITIES REGULATORYAUTHORITY