annual report 2015 - netia · 3 operating costs and capital expenditures for petrotelfully...
TRANSCRIPT

ANNUAL REPORT 2015
inwestor.netia.pl 2
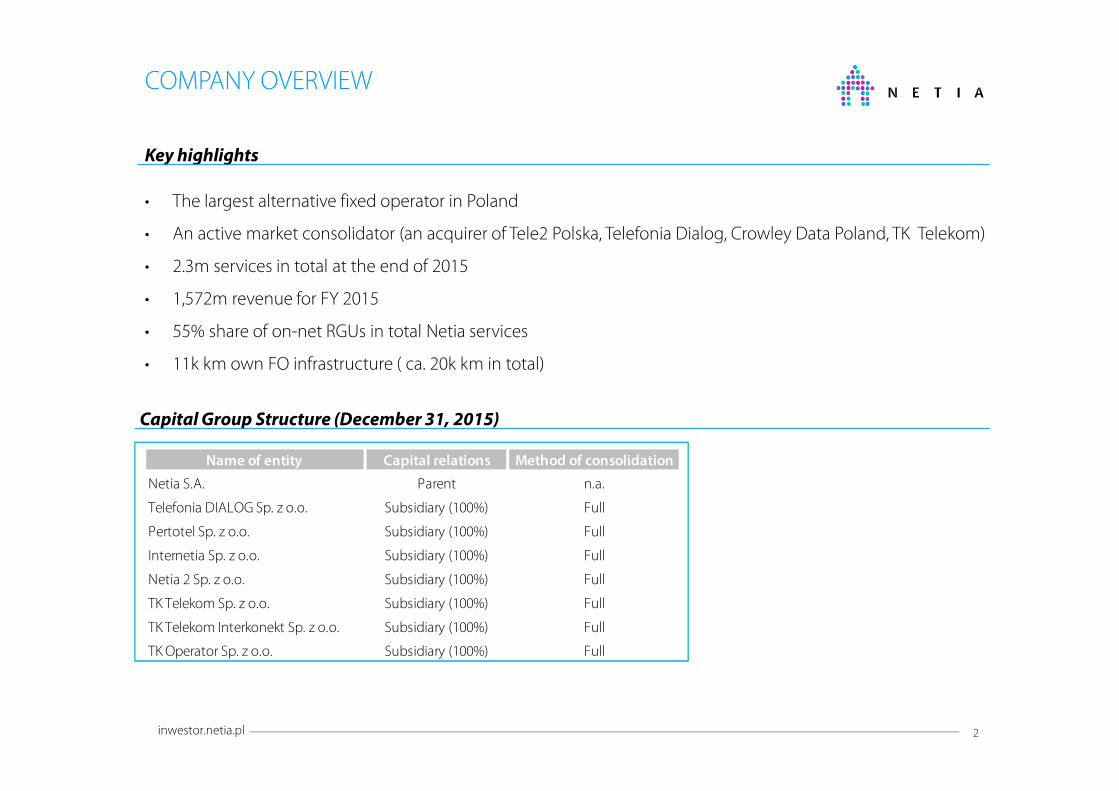
COMPANY OVERVIEW
Capital Group Structure (December 31, 2015)
Key highlights
• The largest alternative fixed operator in Poland
• An active market consolidator (an acquirer of Tele2 Polska, Telefonia Dialog, Crowley Data Poland, TK Telekom)
• 2.3m services in total at the end of 2015
• 1,572m revenue for FY 2015
• 55% share of on-net RGUs in total Netia services
• 11k km own FO infrastructure ( ca. 20k km in total)
Name of entity Capital relations Method of consolidation
Netia S.A. Parent n.a.
Telefonia DIALOG Sp. z o.o. Subsidiary (100%) Full
Pertotel Sp. z o.o. Subsidiary (100%) Full
Internetia Sp. z o.o. Subsidiary (100%) Full
Netia 2 Sp. z o.o. Subsidiary (100%) Full
TK Telekom Sp. z o.o. Subsidiary (100%) Full
TK Telekom Interkonekt Sp. z o.o. Subsidiary (100%) Full
TK Operator Sp. z o.o. Subsidiary (100%) Full
3inwestor.netia.pl
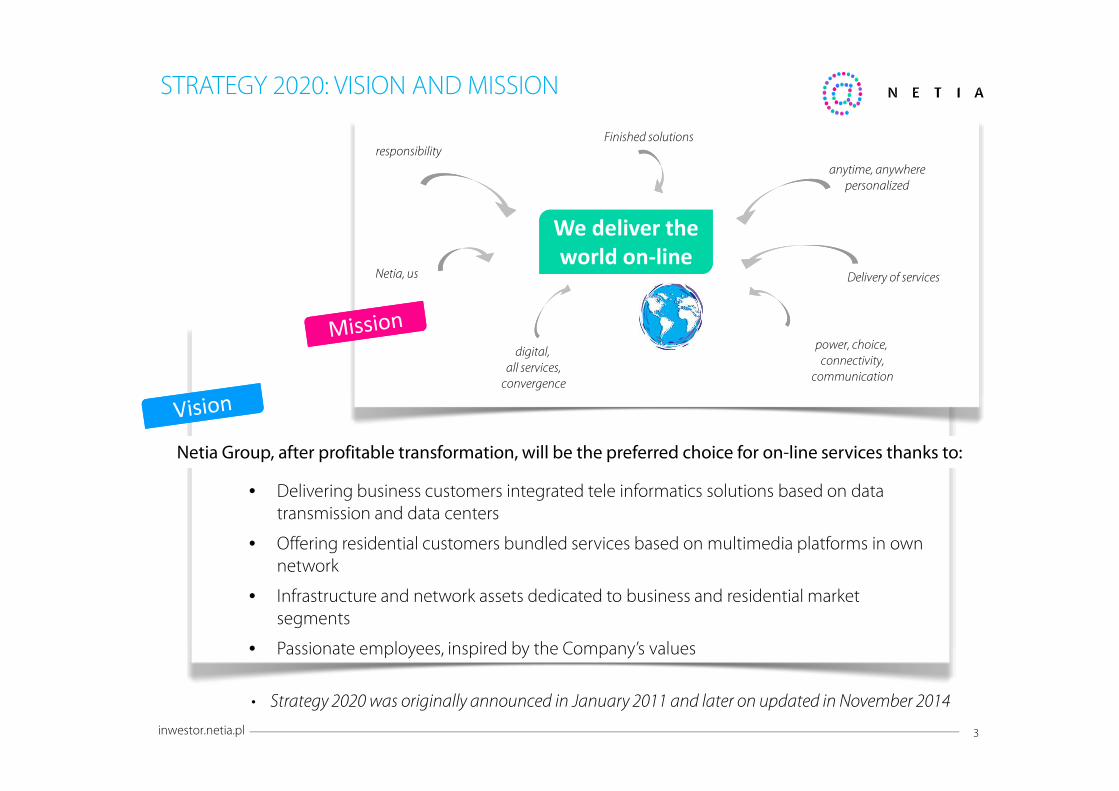
STRATEGY 2020: VISION AND MISSION
responsibilityFinished solutions
anytime, anywhere
personalized
Delivery of services
power, choice,
connectivity,
communication
digital,
all services,
convergence
Netia Group, after profitable transformation, will be the preferred choice for on-line services thanks to:
• Delivering business customers integrated tele informatics solutions based on data transmission and data centers
• Offering residential customers bundled services based on multimedia platforms in own network
• Infrastructure and network assets dedicated to business and residential market segments
• Passionate employees, inspired by the Company’s values
Netia, us
We deliver the
world on-line
We deliver the
world on-line
• Strategy 2020 was originally announced in January 2011 and later on updated in November 2014

4inwestor.netia.pl
FIBER OPTIC INFRASTRUCTURE
11k km own FO infrastructure ( ca. 20k km in total)

inwestor.netia.pl 5
Shareholders (last updateMarch 21, 2016)
Historical financial data
SHAREHOLDERS AND HISTORICAL FINANCIAL DATA
On October 8, 2014 Netia received a notification from the SISU Capital Master Fund Ltd. that it holds 35,427,077 Netia sharesrepresenting 10.18% of Netia's share capital and 10.18% of total number of votes at its shareholders meeting.
2012 2013 2014 2015
Revenue (PLNm) 2,121 1,876 1,674 1,572
Adjusted EBITDA (PLNm) 591 551 493 457
Adjusted EBITDA (%) 28% 29% 30% 29%
EBITDA (PLNm) 461 533 581 449
EBIT (PLNm) 109 93 157 28
Capital investment (PLNm) 279 280 232 225
Broadband services (k) 875 849 790 756
Voice services (k) 1,644 1,489 1,331 1,253
Total services (k) 2,688 2,526 2,305 2,254
Number of shares % Capital % VotesMennica Polska 55.293.375 15.88% 15.88%
SISU Capital Ltd 1 44.336.534 12.73% 12.73%
FIP Fundusz Inwestycyjny Zamknięty
Aktywów Niepublicznych69.760.101 20.04% 20.04%
Nationale Nederlanden OFE 33.273.518 9.56% 9.56%
Aviva OFE 20.243.646 5.81% 5.81%
PZU OFE "Z?ota Jesień" 34.908.344 10.02% 10.02%
Free float WSE 90.417.937 25.96% 25.96%

inwestor.netia.pl 6
MANAGEMENT
Management Board
Tomasz SzopaChief Executive Officer
Cezary ChałupaHead of B2B Unit
Executive Management Team
Joanna WcisłoHead of B2C Unit
Jacek WiśniewskiHead of Technology
Katarzyna SzwarcHead of Legal Affairs
Paweł ŻyteckiStrategic Projects Director
Anna RoszewskaHead of Human Resources
Katarzyna IwućChief Financial Officer

inwestor.netia.pl 7
INVESTMENT PROGRAM RELATED TO NETIA`S ACCESS NETWORK
~ 56% NGA > 30 Mbps ~ 100% NGA >= 100 Mbps
• Investment of PLN 417m during 2016-2020
• +1.66 additional homes passed in a range of NGA >=100 Mbps network
• Elimination of technological limitations – consistent offer across entire access network
('000) Total < 30 Mbps < 100 Mbps >= 100 Mbps
Copper 1408 753 655 0
FTTB - ETTH 592 350 0 242
FTTH - PON 165 0 0 165
CATV 385 0 0 385
Total 2550 1103 655 792
1573
385
2550
Netia today After modernization
> = 100 Mbps
PSTN only
592
In March, 2016 the Supervisory Board approved a new investment program aimed at upgradingNetia’s access network to NGA standard >= 100Mbps. The program will be executed from 2016 to2020 and the total cost will amount to ~PLN 417m

inwestor.netia.pl 8
Revenue
KEY FINANCIAL FIGURES (PLNm)
Adjusted EBITDA
OpFCF1 Capital Investments
1674 1572
2014 2015
493 457
2014 2015
277240
2014 2015
232 225
2014 2015
1 Adjusted OpFCF = Adjusted EBITDA less Capex excluding integration capex, capitalised interests from the bank loan, investments related to
the Netia Lite project and non-current asset received in non-cash transaction (comparatives restated); Capex = investments in tangible and intangible fixed assets
inwestor.netia.pl 9
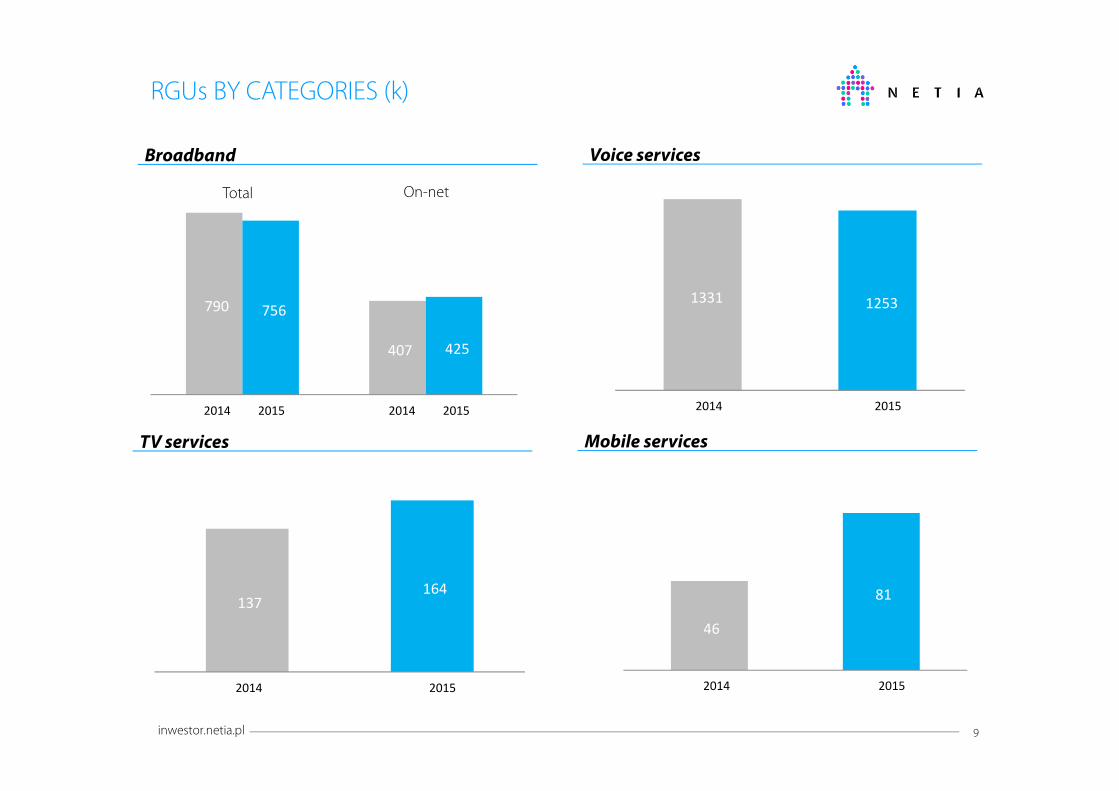
Broadband
RGUs BY CATEGORIES (k)
Voice services
TV services Mobile services
790
407
756
425
2014 2015 2014 2015
Total On-net
1331 1253
2014 2015
137164
2014 2015
46
81
2014 2015
inwestor.netia.pl 10
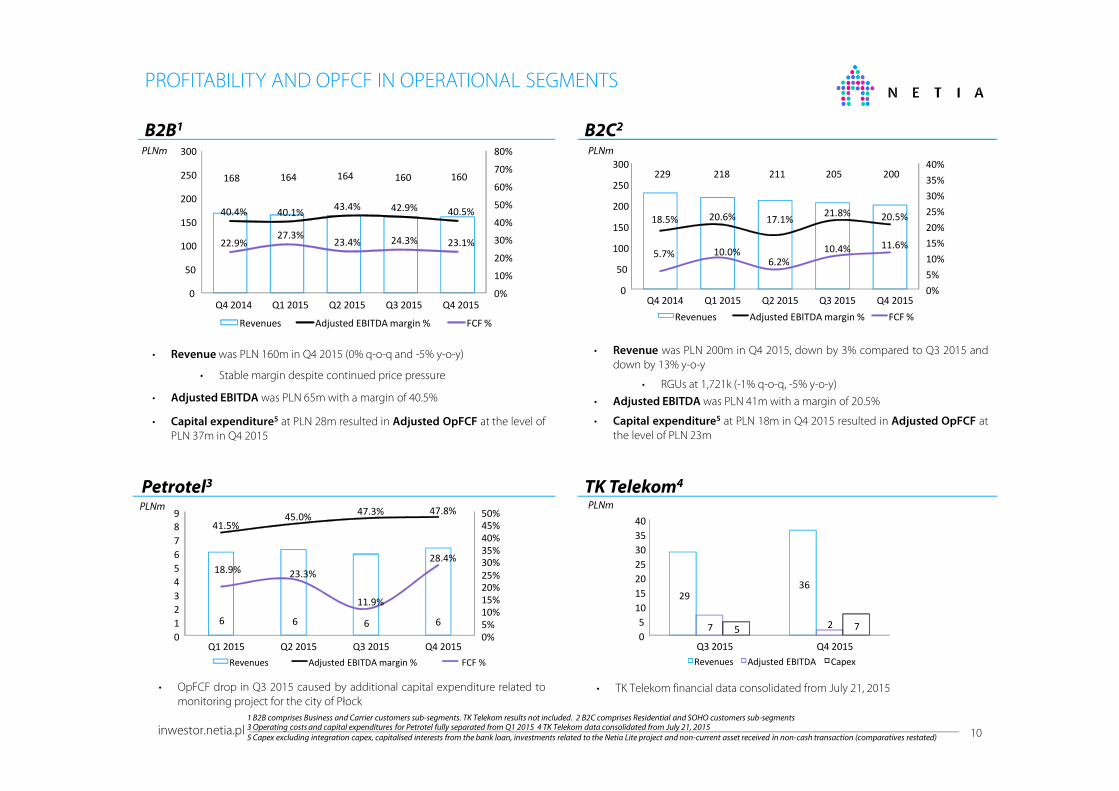
PROFITABILITY AND OPFCF IN OPERATIONAL SEGMENTS
B2C2
1 B2B comprises Business and Carrier customers sub-segments. TK Telekom results not included. 2 B2C comprises Residential and SOHO customers sub-segments3 Operating costs and capital expenditures for Petrotel fully separated from Q1 2015 4 TK Telekom data consolidated from July 21, 2015
5 Capex excluding integration capex, capitalised interests from the bank loan, investments related to the Netia Lite project and non-current asset received in non-cash transaction (comparatives restated)
B2B1
• Revenue was PLN 200m in Q4 2015, down by 3% compared to Q3 2015 anddown by 13% y-o-y
• RGUs at 1,721k (-1% q-o-q, -5% y-o-y)
• Adjusted EBITDA was PLN 41m with a margin of 20.5%
• Capital expenditure5 at PLN 18m in Q4 2015 resulted in Adjusted OpFCF atthe level of PLN 23m
• Revenue was PLN 160m in Q4 2015 (0% q-o-q and -5% y-o-y)
• Stable margin despite continued price pressure
• Adjusted EBITDA was PLN 65m with a margin of 40.5%
• Capital expenditure5 at PLN 28m resulted in Adjusted OpFCF at the level ofPLN 37m in Q4 2015
PLNmPLNm
Petrotel3
• OpFCF drop in Q3 2015 caused by additional capital expenditure related tomonitoring project for the city of Płock
PLNm
TK Telekom4
PLNm
• TK Telekom financial data consolidated from July 21, 2015
2936
7 25 7
0
5
10
15
20
25
30
35
40
Q3 2015 Q4 2015
Revenues Adjusted EBITDA Capex
6 6 6 6
41.5%45.0%
47.3% 47.8%
18.9% 23.3%
11.9%
28.4%
0%
5%
10%
15%
20%
25%
30%
35%
40%
45%
50%
0
1
2
3
4
5
6
7
8
9
Q1 2015 Q2 2015 Q3 2015 Q4 2015
Revenues Adjusted EBITDA margin % FCF %
229 218 211 205 200
18.5% 20.6% 17.1%21.8% 20.5%
5.7% 10.0%6.2%
10.4% 11.6%
0%
5%
10%
15%
20%
25%
30%
35%
40%
0
50
100
150
200
250
300
Q4 2014 Q1 2015 Q2 2015 Q3 2015 Q4 2015
Revenues Adjusted EBITDA margin % FCF %
168 164 164 160 160
40.4% 40.1%43.4% 42.9% 40.5%
22.9%27.3%
23.4% 24.3% 23.1%
0%
10%
20%
30%
40%
50%
60%
70%
80%
0
50
100
150
200
250
300
Q4 2014 Q1 2015 Q2 2015 Q3 2015 Q4 2015
Revenues Adjusted EBITDA margin % FCF %

inwestor.netia.pl 11
ADJUSTED B2B EBITDA BRIDGE FOR FY 2015
• ARPU decline related mainly to a visible price pressure in voice services
• Lower fixed and variable costs reflect a number of optimization initiatives introduced by the Company during2014 and 2015 within Netia Lite program
Actual
2014
vs
2015
Comments
Increase in Adjusted EBITDA Decrease in Adjusted EBITDA
PLNm
8
1721
8
Adjusted EBITDA
2014
RGU revenue
change
ARPU revenue
change
IC and Other Service cost
change
RGU Acquisition
cost
Variable cost A&P cost Fixed costs Adjusted EBITDA
2015
270
2 5 93 17
5
2110
270
50
100
150
200
250
300
inwestor.netia.pl 12
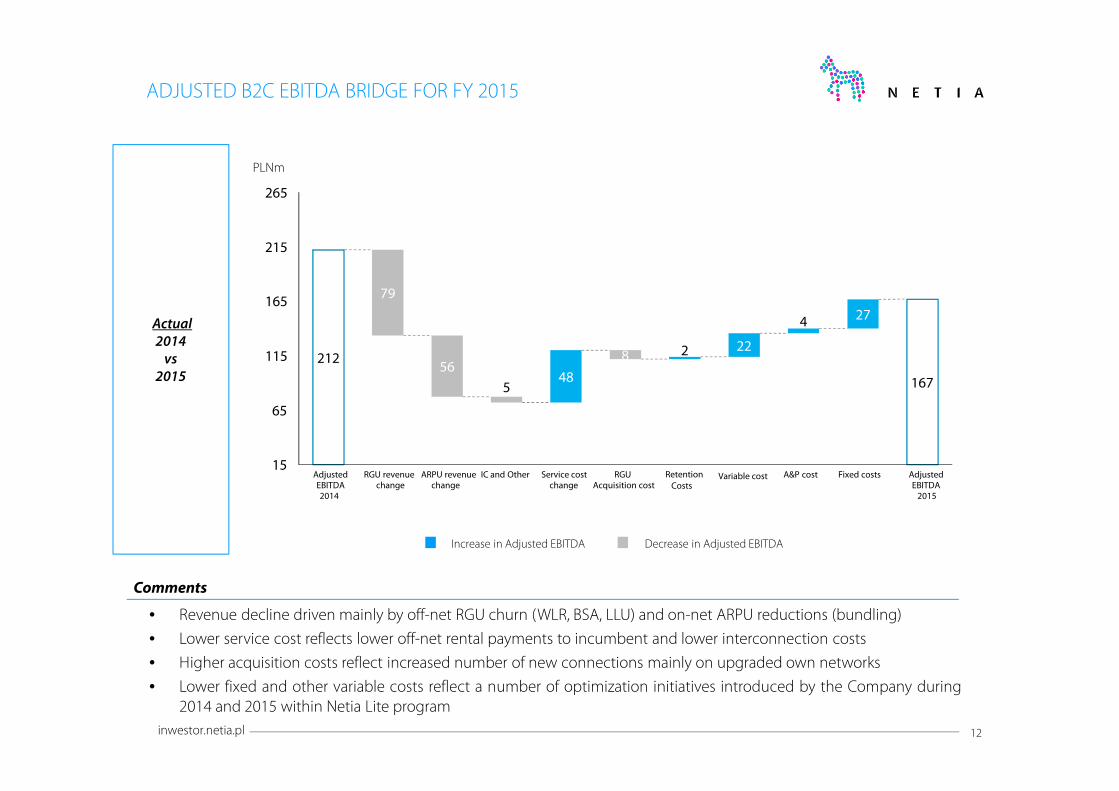
ADJUSTED B2C EBITDA BRIDGE FOR FY 2015
Actual
2014
vs
2015
Comments
PLNm
• Revenue decline driven mainly by off-net RGU churn (WLR, BSA, LLU) and on-net ARPU reductions (bundling)
• Lower service cost reflects lower off-net rental payments to incumbent and lower interconnection costs
• Higher acquisition costs reflect increased number of new connections mainly on upgraded own networks
• Lower fixed and other variable costs reflect a number of optimization initiatives introduced by the Company during2014 and 2015 within Netia Lite program
Increase in Adjusted EBITDA Decrease in Adjusted EBITDA
66
428
AdjustedEBITDA2014
RGU revenuechange
ARPU revenuechange
IC and Other Service costchange
RGUAcquisition cost
Retention
CostsVariable cost A&P cost Fixed costs Adjusted
EBITDA2015
212
16748
2 22
4 27
79
56
5
8
15
65
115
165
215
265
13inwestor.netia.pl
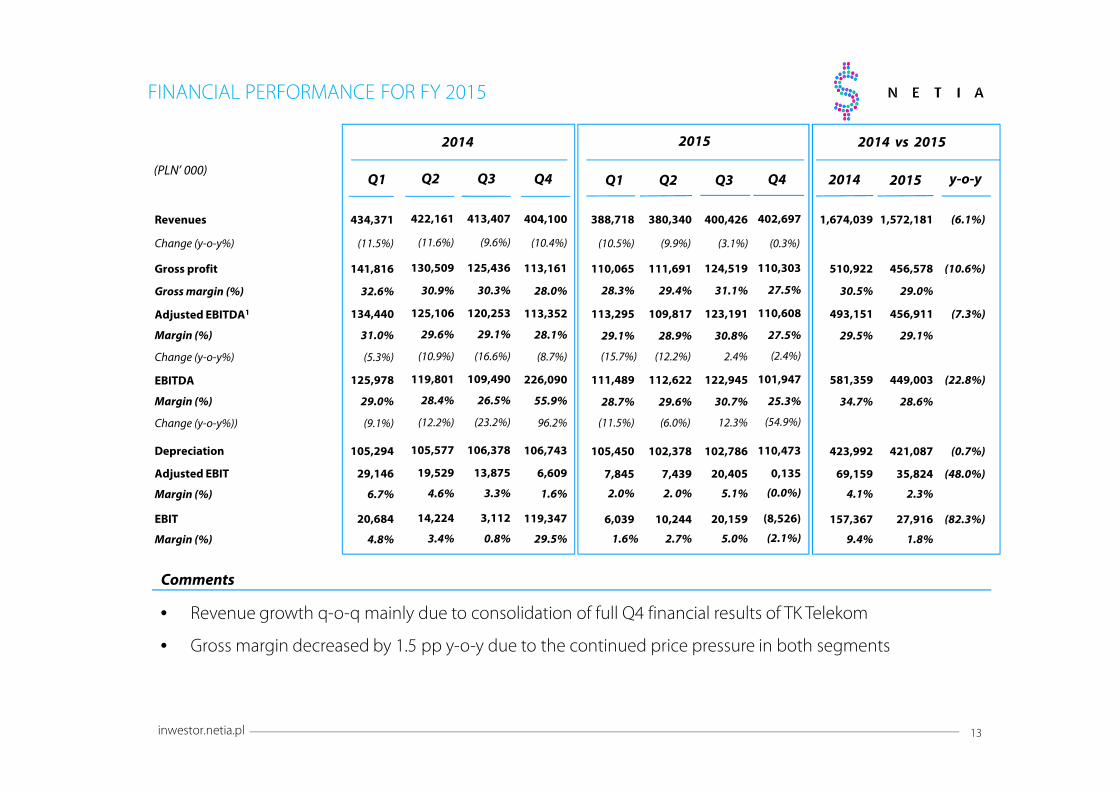
FINANCIAL PERFORMANCE FOR FY 2015
• Revenue growth q-o-q mainly due to consolidation of full Q4 financial results of TK Telekom
• Gross margin decreased by 1.5 pp y-o-y due to the continued price pressure in both segments
Comments
Revenues
Adjusted EBITDA1
Margin (%)
(PLN’ 000)
Gross profit
Change (y-o-y%)
Change (y-o-y%)
Gross margin (%)
Adjusted EBIT
Margin (%)
2014
Q1
434,371
31.0%
141,816
(11.5%)
(5.3%)
32.6%
29,146
6.7%
Q3
134,440
Q2
422,161
29.6%
130,509
(11.6%)
(10.9%)
30.9%
19,529
4.6%
125,106
2015
Q3
413,407
29.1%
125,436
(9.6%)
(16.6%)
30.3%
13,875
3.3%
120,253
Q4
404,100
28.1%
113,161
(10.4%)
(8.7%)
28.0%
6,609
1.6%
113,352
Depreciation 105,294 105,577 106,378 106,743
EBITDA
Margin (%)
Change (y-o-y%))
29.0%
(9.1%)
125,978
28.4%
(12.2%)
119,801
26.5%
(23.2%)
109,490
55.9%
96.2%
226,090
EBIT
Margin (%)
20,684
4.8%
14,224
3.4%
Q2
380,340
28.9%
111,691
29.4%
7,439
2. 0%
109,817
102,378
29.6%
112,622
10,244
2.7%
3,112
0.8%
119,347
29.5%
2014 vs 2015
2014
1,674,039
29.5%
510,922
30.5%
69,159
4.1%
y-o-y
(6.1%)
(7.3%)
(10.6%)
(48.0%)
493,151
2015
1,572,181
29.1%
456,578
29.0%
35,824
2.3%
456,911
423,992 (0.7%)421,087
34.7%
(22.8%)581,359
28.6%
449,003
157,367
9.4%
(82.3%)27,916
1.8%
Q1
388,718
29.1%
110,065
28.3%
7,845
2.0%
113,295
105,450
28.7%
111,489
6,039
1.6%
(10.5%) (9.9%)
(15.7%) (12.2%)
(11.5%) (6.0%)
400,426
30.8%
124,519
31.1%
20,405
5.1%
123,191
102,786
30.7%
122,945
20,159
5.0%
2.4%
(3.1%)
12.3%
Q4
402,697
27.5%
110,303
27.5%
0,135
(0.0%)
110,608
110,473
25.3%
101,947
(8,526)
(2.1%)
(2.4%)
(54.9%)
(0.3%)
inwestor.netia.pl 14
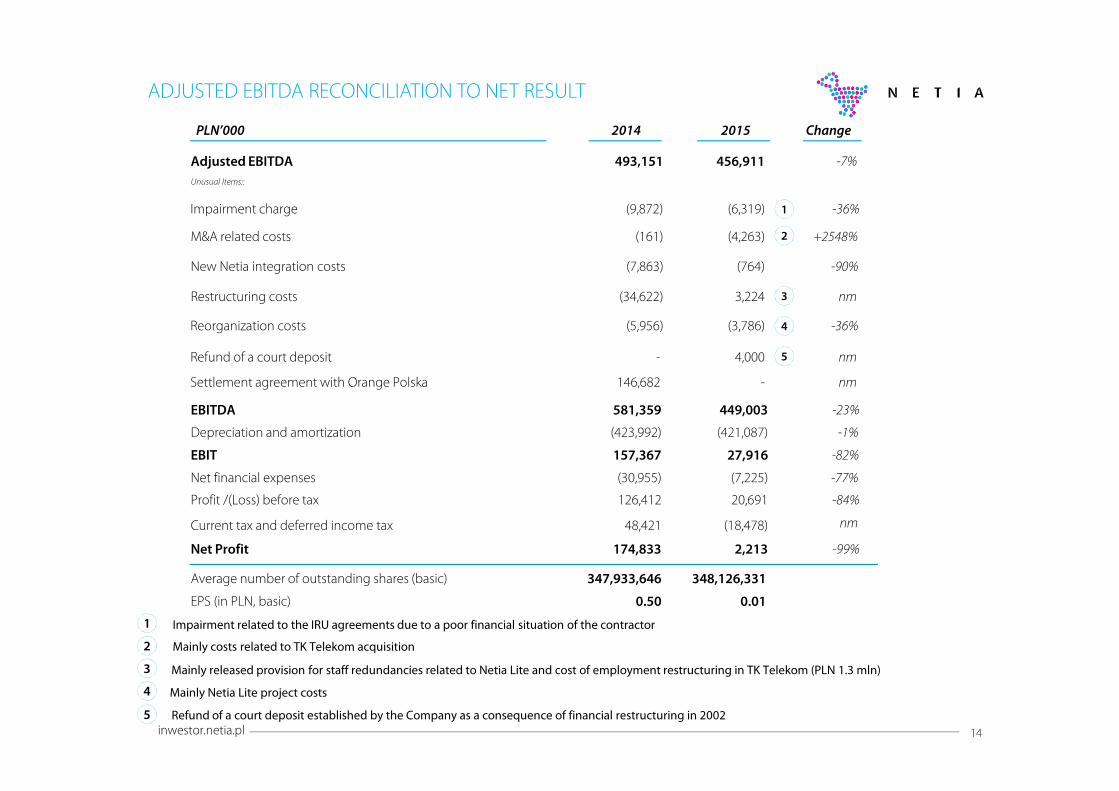
ADJUSTED EBITDA RECONCILIATION TO NET RESULT
2015
348,126,331347,933,646Average number of outstanding shares (basic)
0.010.50EPS (in PLN, basic)
2,213174,833Net Profit -99%
(7,225)(30,955)Net financial expenses -77%
27,916157,367EBIT -82%
(421,087)(423,992)Depreciation and amortization -1%
449,003581,359EBITDA -23%
456,911493,151Adjusted EBITDA -7%
Unusual Items::
(161)M&A related costs +2548%
(34,622)Restructuring costs nm
126,412Profit /(Loss) before tax -84%20,691
(18,478)Current tax and deferred income tax nm48,421
PLN’000 2014 Change
(764)(7,863)New Netia integration costs -90%
3,224
1
2
Reorganization costs
Refund of a court deposit
(5,956)
-
(3,786)
4,000
-36%
nm
3
1
Refund of a court deposit established by the Company as a consequence of financial restructuring in 2002
Impairment related to the IRU agreements due to a poor financial situation of the contractor
(4,263)
Mainly released provision for staff redundancies related to Netia Lite and cost of employment restructuring in TK Telekom (PLN 1.3 mln)
2
(9,872)Impairment charge -36%
Mainly costs related to TK Telekom acquisition
3
4
5
5
Settlement agreement with Orange Polska 146,682 - nm
(6,319)
4
Mainly Netia Lite project costs
inwestor.netia.pl 15
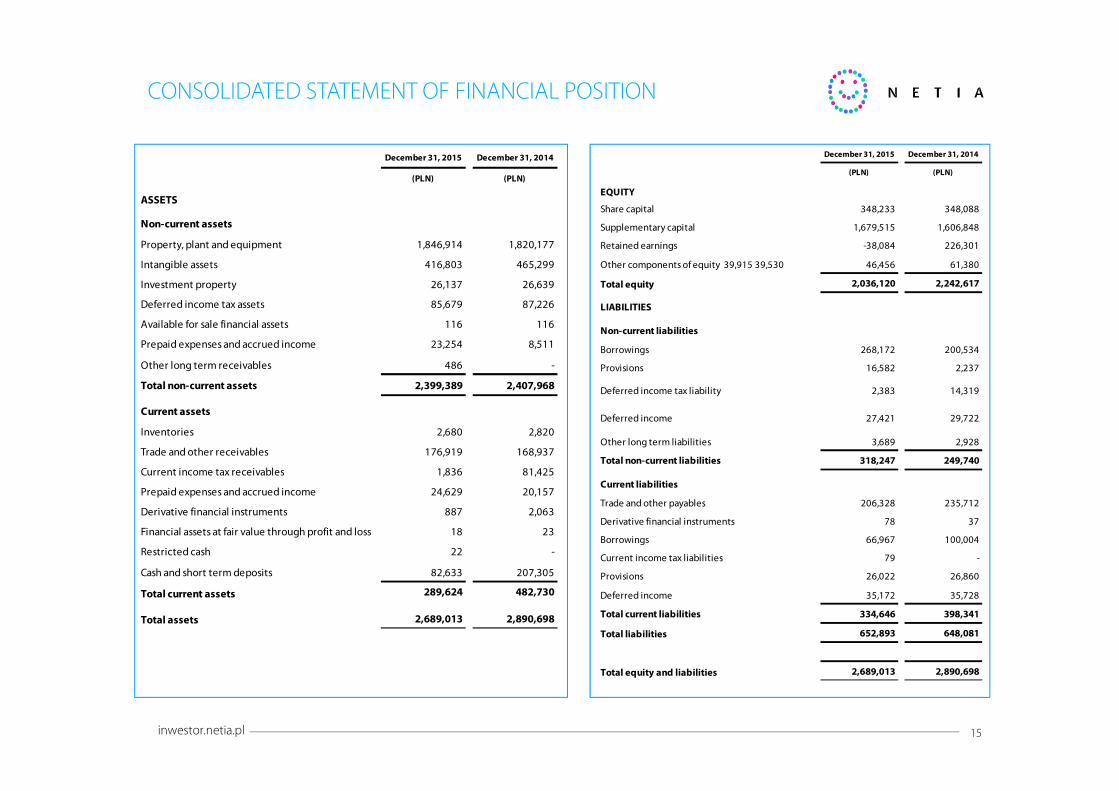
CONSOLIDATED STATEMENT OF FINANCIAL POSITION
December 31, 2015 December 31, 2014
(PLN) (PLN)
ASSETS
Non-current assets
Property, plant and equipment 1,846,914 1,820,177
Intangible assets 416,803 465,299
Investment property 26,137 26,639
Deferred income tax assets 85,679 87,226
Available for sale financial assets 116 116
Prepaid expenses and accrued income 23,254 8,511
Other long term receivables 486 -
Total non-current assets 2,399,389 2,407,968
Current assets
Inventories 2,680 2,820
Trade and other receivables 176,919 168,937
Current income tax receivables 1,836 81,425
Prepaid expenses and accrued income 24,629 20,157
Derivative financial instruments 887 2,063
Financial assets at fair value through profit and loss 18 23
Restricted cash 22 -
Cash and short term deposits 82,633 207,305
Total current assets 289,624 482,730
Total assets 2,689,013 2,890,698
December 31, 2015 December 31, 2014
(PLN) (PLN)
EQUITY
Share capital 348,233 348,088
Supplementary capital 1,679,515 1,606,848
Retained earnings -38,084 226,301
Other components of equity 39,915 39,530 46,456 61,380
Total equity 2,036,120 2,242,617
LIABILITIES
Non-current liabilities
Borrowings 268,172 200,534
Provisions 16,582 2,237
Deferred income tax liability 2,383 14,319
Deferred income 27,421 29,722
Other long term liabilities 3,689 2,928
Total non-current liabilities 318,247 249,740
Current liabilities
Trade and other payables 206,328 235,712
Derivative financial instruments 78 37
Borrowings 66,967 100,004
Current income tax liabilities 79 -
Provisions 26,022 26,860
Deferred income 35,172 35,728
Total current liabilities 334,646 398,341
Total liabilities 652,893 648,081
Total equity and liabilities 2,689,013 2,890,698

inwestor.netia.pl 16
CONSOLIDATED INCOME STATEMENT
Year ended
December 31, 2015
Year ended
December 31, 2014
CONSOLIDATED INCOME STATEMENT (PLN) (PLN)
Revenue 1,572,181 1,674,039
Cost of sales -1,115,603 -1,163,117
Gross profit 456,578 510,922
Selling and distribution costs -295,307 -308,984
General and administration costs -145,703 -200,621
Other income 17,349 168,496
Other expenses -10,456 -11,300
Other gains / (losses), net 5,455 -1,146
Operating profit 27,916 157,367
Finance income 3,441 4,627
Finance costs -10,666 -35,582
Profit before income tax 20,691 126,412
Income tax benefit / (charge) -18,478 48,421
Profit 2,213 174,833
Earnings per share (expressed in PLN per share)
- basic 0.01 0.50
- diluted 0.01 0.50
inwestor.netia.pl 17
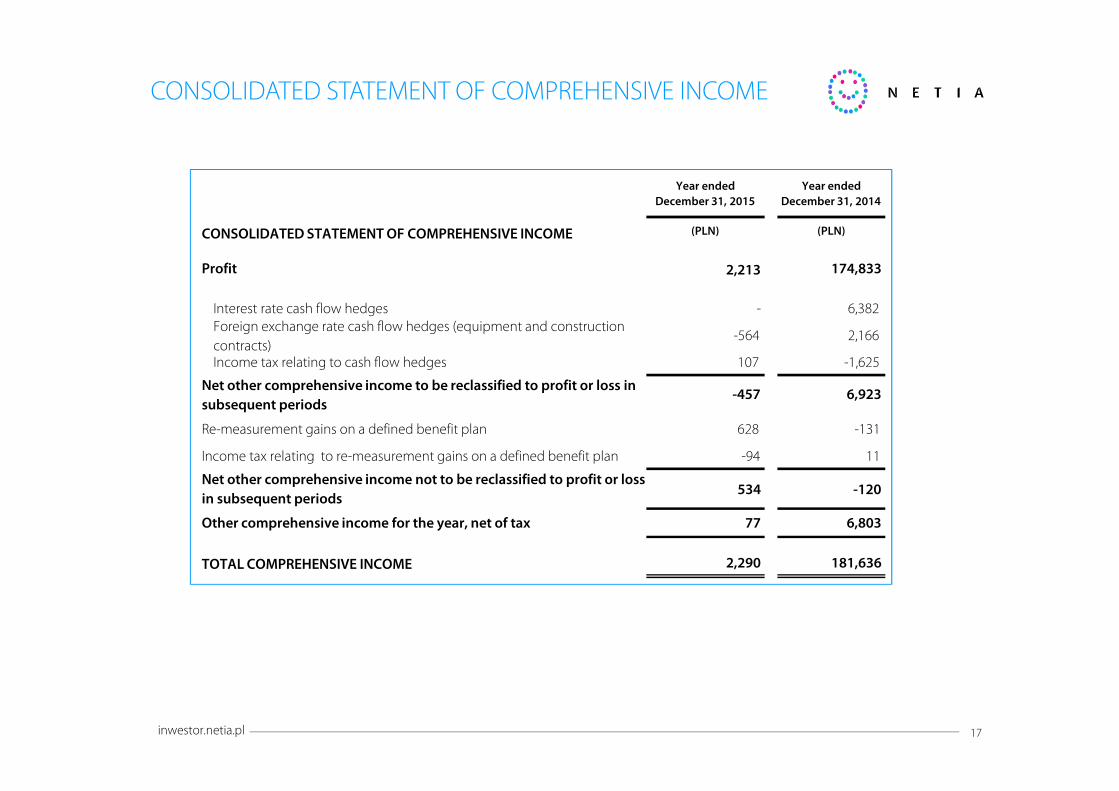
CONSOLIDATED STATEMENT OF COMPREHENSIVE INCOME
Year ended December 31, 2015
Year ended December 31, 2014
CONSOLIDATED STATEMENT OF COMPREHENSIVE INCOME (PLN) (PLN)
Profit 2,213 174,833
Interest rate cash flow hedges - 6,382Foreign exchange rate cash flow hedges (equipment and construction
contracts) -564 2,166
Income tax relating to cash flow hedges 107 -1,625
Net other comprehensive income to be reclassified to profit or loss in subsequent periods
-457 6,923
Re-measurement gains on a defined benefit plan 628 -131
Income tax relating to re-measurement gains on a defined benefit plan -94 11
Net other comprehensive income not to be reclassified to profit or loss in subsequent periods
534 -120
Other comprehensive income for the year, net of tax 77 6,803
TOTAL COMPREHENSIVE INCOME 2,290 181,636
18inwestor.netia.pl
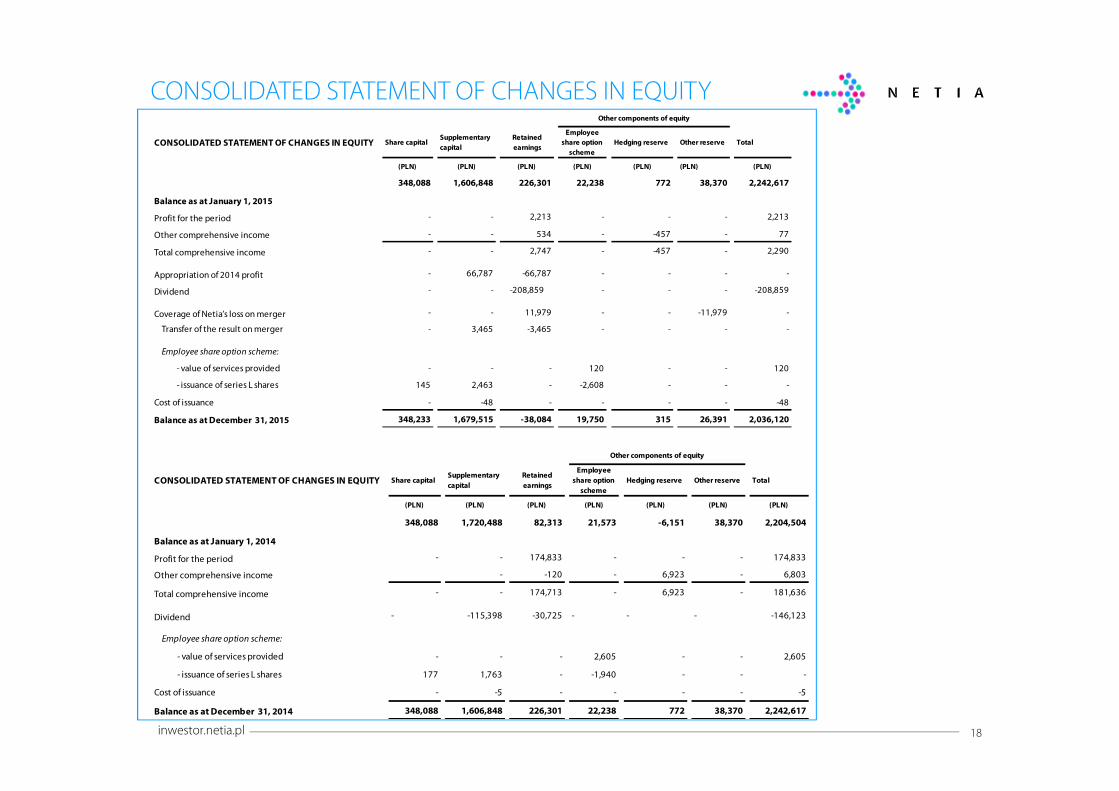
CONSOLIDATED STATEMENT OF CHANGES IN EQUITY
CONSOLIDATED STATEMENT OF CHANGES IN EQUITY Share capitalSupplementary
capital
Retained
earnings
Employee
share option
scheme
Hedging reserve Other reserve Total
(PLN) (PLN) (PLN) (PLN) (PLN) (PLN) (PLN)
348,088 1,606,848 226,301 22,238 772 38,370 2,242,617
Balance as at January 1, 2015
Profit for the period - - 2,213 - - - 2,213
Other comprehensive income - - 534 - -457 - 77
Total comprehensive income - - 2,747 - -457 - 2,290
Appropriation of 2014 profit - 66,787 -66,787 - - - -
Dividend - - -208,859 - - - -208,859
Coverage of Netia’s loss on merger - - 11,979 - - -11,979 -
Transfer of the result on merger - 3,465 -3,465 - - - -
Employee share option scheme:
- value of services provided - - - 120 - - 120
- issuance of series L shares 145 2,463 - -2,608 - - -
Cost of issuance - -48 - - - - -48
Balance as at December 31, 2015 348,233 1,679,515 -38,084 19,750 315 26,391 2,036,120
Other components of equity
CONSOLIDATED STATEMENT OF CHANGES IN EQUITY Share capitalSupplementary
capital
Retained
earnings
Employee
share option
scheme
Hedging reserve Other reserve Total
(PLN) (PLN) (PLN) (PLN) (PLN) (PLN) (PLN)
348,088 1,720,488 82,313 21,573 -6,151 38,370 2,204,504
Balance as at January 1, 2014
Profit for the period - - 174,833 - - - 174,833
Other comprehensive income - -120 - 6,923 - 6,803
Total comprehensive income - - 174,713 - 6,923 - 181,636
Dividend - -115,398 -30,725 - - - -146,123
Employee share option scheme:
- value of services provided - - - 2,605 - - 2,605
- issuance of series L shares 177 1,763 - -1,940 - - -
Cost of issuance - -5 - - - - -5
Balance as at December 31, 2014 348,088 1,606,848 226,301 22,238 772 38,370 2,242,617
Other components of equity

19inwestor.netia.pl
CONSOLIDATED STATEMENT OF CASHFLOWS
CONSOLIDATED STATEMENT OF CASH FLOWS Year ended
December
31, 2015
Year ended
December
31, 2014
(PLN) (PLN)
Cash flows from operating activities:
Profit 2,213 174,833
Adjustments for:
Depreciation and amortization 421,087 423,992
Impairment charges for specific individual assets 8,493 11,300
Deferred income tax charge 12,372 233
Interest expense and fees charged on bank loans Interest expense accrued
on credit facility 9,442 35,311
Other interest charged 52 138
Share-based compensation 120 -476
Fair value (gains)/ losses on financial assets / liabilities Fair value gains /
(losses) on financial assets / liabilities 5 2
Fair value (gains)/ losses on derivative financial instruments 652 -2,148
Foreign exchange (gains)/ losses -47 -131
Loss on disposal of fixed assets 6,546 4,027
Gain on sale of subsidiary - -286
Changes in working capital 36,093 -23,399
Net cash provided by operating activities 497,028 623,396
Cash flows from investing activities:
Purchase of fixed assets and computer software -237,498 -245,719
Proceeds from sale of fixed assets 478 996
Acquisition of shares in subsidiaries, net of cash acquired -201,330 -
Sale of subsidiary, net of cash - 322
Net cash used in investing activities -438,350 -244,401
Cash flows from financing activities:
Government grants received 2,181 1,157
Proceeds from borrowings 400,000 350,000
Dividend paid -208,859 -146,123
Finance lease payments -633 -581
Loan payments -366,667 -440,000
Payments of interests, fees and interest rate swap settlements relating to
bank loans -9,419 -29,630
Net cash used in financing activities -183,397 -265,177
Net change in cash and cash equivalents -124,719 113,818
Exchange losses on cash and cash equivalents 47 131
Cash and cash equivalents at beginning of period 207,305 93,356
Cash and cash equivalents at end of period 82,633 207,305
inwestor.netia.pl 20
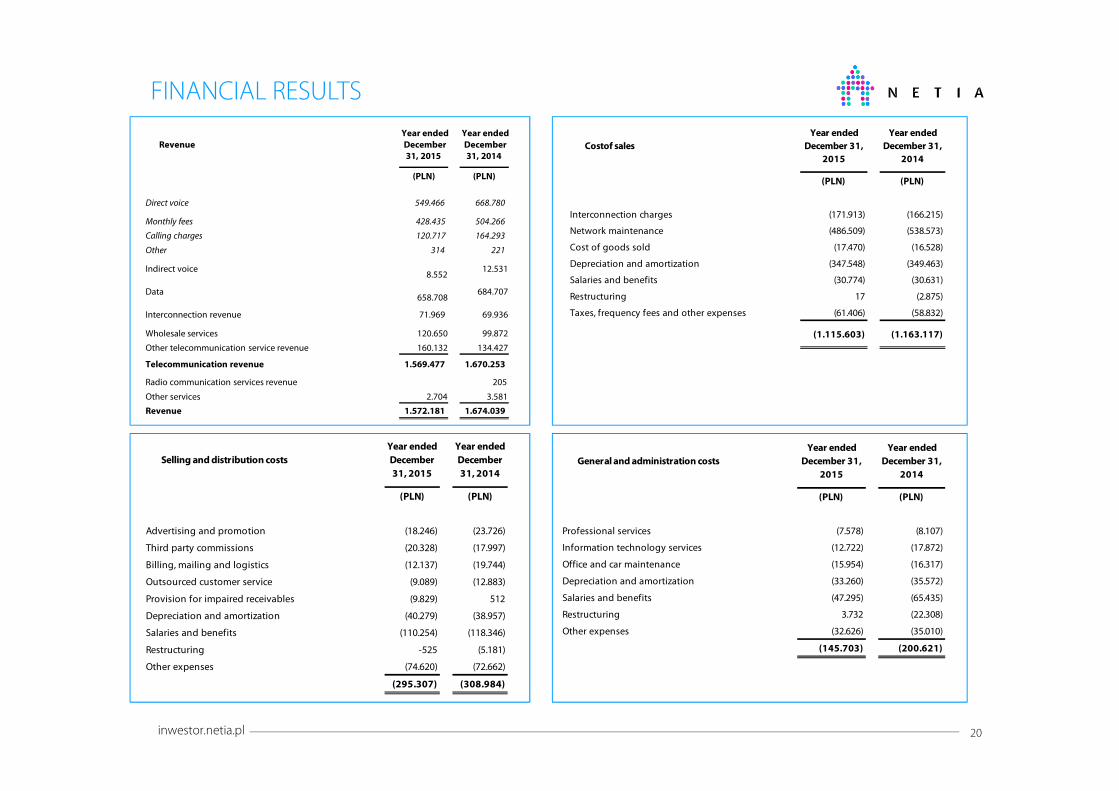
FINANCIAL RESULTS
Selling and distribution costs
Year ended
December
31, 2015
Year ended
December
31, 2014
(PLN) (PLN)
Advertising and promotion (18.246) (23.726)
Third party commissions (20.328) (17.997)
Billing, mailing and logistics (12.137) (19.744)
Outsourced customer service (9.089) (12.883)
Provision for impaired receivables (9.829) 512
Depreciation and amortization (40.279) (38.957)
Salaries and benefits (110.254) (118.346)
Restructuring -525 (5.181)
Other expenses (74.620) (72.662)
(295.307) (308.984)
Costof sales
Year ended
December 31,
2015
Year ended
December 31,
2014
(PLN) (PLN)
Interconnection charges (171.913) (166.215)
Network maintenance (486.509) (538.573)
Cost of goods sold (17.470) (16.528)
Depreciation and amortization (347.548) (349.463)
Salaries and benefits (30.774) (30.631)
Restructuring 17 (2.875)
Taxes, frequency fees and other expenses (61.406) (58.832)
(1.115.603) (1.163.117)
Revenue
Year ended
December
31, 2015
Year ended
December
31, 2014
(PLN) (PLN)
Direct voice 549.466 668.780
Monthly fees 428.435 504.266
Calling charges 120.717 164.293
Other 314 221
Indirect voice 8.552
12.531
Data 658.708
684.707
Interconnection revenue 71.969 69.936
Wholesale services 120.650 99.872
Other telecommunication service revenue 160.132 134.427
Telecommunication revenue 1.569.477 1.670.253
Radio communication services revenue 205
Other services 2.704 3.581
Revenue 1.572.181 1.674.039
General and administration costs
Year ended
December 31,
2015
Year ended
December 31,
2014
(PLN) (PLN)
Professional services (7.578) (8.107)
Information technology services (12.722) (17.872)
Office and car maintenance (15.954) (16.317)
Depreciation and amortization (33.260) (35.572)
Salaries and benefits (47.295) (65.435)
Restructuring 3.732 (22.308)
Other expenses (32.626) (35.010)
(145.703) (200.621)
inwestor.netia.pl 21
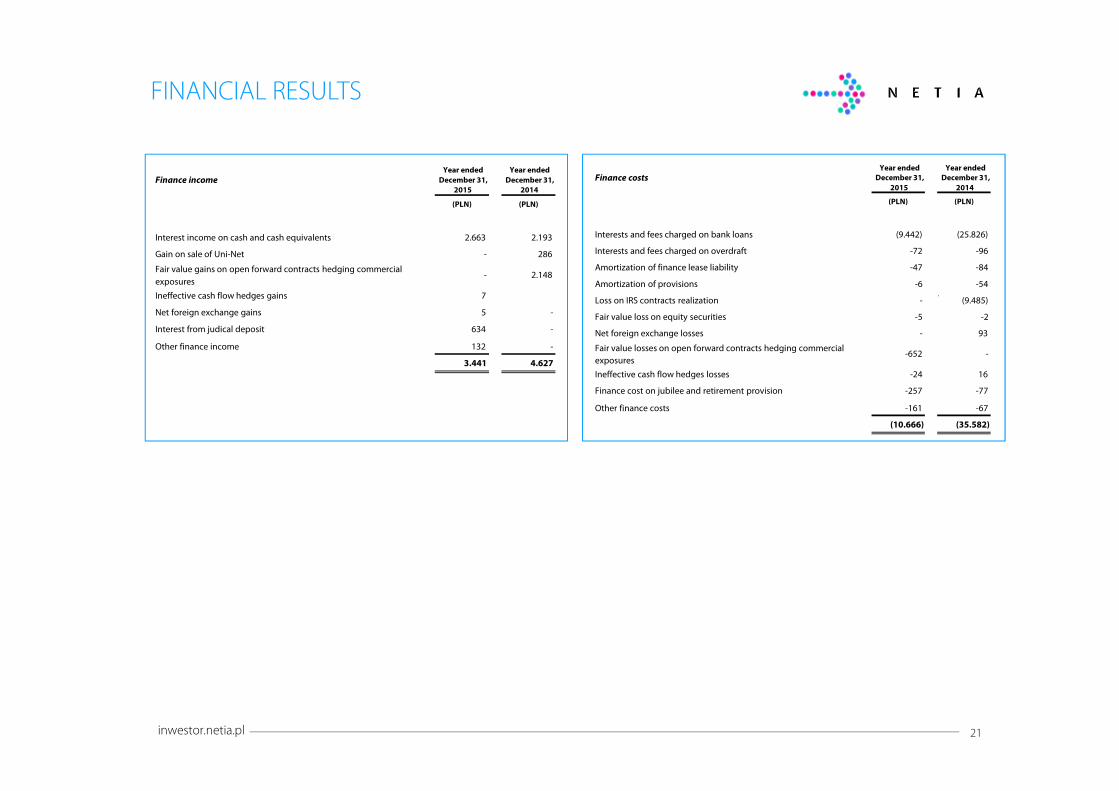
FINANCIAL RESULTS
Finance incomeYear ended
December 31,
2015
Year ended
December 31,
2014
(PLN) (PLN)
Interest income on cash and cash equivalents 2.663 2.193
Gain on sale of Uni-Net - 286
Fair value gains on open forward contracts hedging commercial
exposures- 2.148
Ineffective cash flow hedges gains 7
Net foreign exchange gains 5 -
Interest from judical deposit 634 -
Other finance income 132 -
3.441 4.627
Finance costsYear ended
December 31,
2015
Year ended
December 31,
2014
(PLN) (PLN)
Interests and fees charged on bank loans (9.442) (25.826)
Interests and fees charged on overdraft -72 -96
Amortization of finance lease liability -47 -84
Amortization of provisions -6 -54
Loss on IRS contracts realization - (9.485)
Fair value loss on equity securities -5 -2
Net foreign exchange losses - 93
Fair value losses on open forward contracts hedging commercial
exposures-652 -
Ineffective cash flow hedges losses -24 16
Finance cost on jubilee and retirement provision -257 -77
Other finance costs -161 -67
(10.666) (35.582)

22inwestor.netia.pl
OPERATING SEGMENTS
B2C B2B TK Telekom*Total reportable
segmentsUnallocated Total
(PLN) (PLN) (PLN) (PLN) (PLN) (PLN)
Year ended December 31, 2015
Revenue from external customers 834,139 648,565 64,948 1,547,652 24,529 1,572,181
Adjusted EBITDA 166,707 270,461 8,609 445,777 11,134 456,911
Restructuring costs 2,865 1,669 -1,324 3,210 14 3,224
Integration costs -120 -581 -63 -764 - -764
Return of judicial deposit 2,000 2,000 - 4,000 - 4,000
Reorganization costs -2,829 -957 - -3,786 - -3,786
Impairment loss -3,383 -2,936 - -6,319 - -6,319
Expenses incurred on mergers and acquisitions -64 -4,199 - -4,263 - -4,263
EBITDA 165,176 265,457 7,222 437,855 11,148 449,003
Depreciation and Amortization -137,490 -257,735 -17,656 -412,881 -8,206 -421,087
Operating profit 27,686 7,722 -10,434 24,974 2,942 27,916
Finance income/ (costs), net - - - - -7,225 -7,225
Income tax charge - - - - -18,478 -18,478
Profit / (Loss) 27,686 7,722 -10,434 24,974 -22,761 2,213
Capital expenditure 89,052 117,747 11,944 218,743 6,037 224,780
Adjusted EBIDTA less capital expenditure 77,655 152,714 -3,335 227,034 5,096 232,130
* Data relate to the period from acquisition July 21, till December 31,
2015

23inwestor.netia.pl
OPERATING SEGMENTS
B2C B2BTotal reportable
segmentsUnallocated Total
(PLN) (PLN) (PLN) (PLN) (PLN)
Year ended December 31, 2014*
Revenue from external customers 974,333 672,894 1,647,227 26,812 1,674,039
Adjusted EBITDA 212,131 269,942 482,073 11,078 493,151
Expenses incurred on mergers and acquisitions -100 -61 -161 - -161
Integration costs -5,252 -2,611 -7,863 - -7,863
Restructuring costs -17,234 -17,234 -34,468 -154 -34,622
Impairment loss -4,936 -4,936 -9,872 - -9,872
Settlement with Orange Polska SA 73,341 73,341 146,682 - 146,682
“Netia Lite” project -2,048 -1,052 -3,100 - -3,100
Reorganization costs -1,766 -1,090 -2,856 - -2,856
EBITDA 254,136 316,299 570,435 10,924 581,359
Depreciation and Amortization -144,995 -271,074 -416,069 -7,923 -423,992
Operating profit 109,141 45,225 154,366 3,001 157,367
Finance income/ (costs), net - - - -30,955 -30,955
Income tax charge - - - 48,421 48,421
Profit / (Loss) 109,141 45,225 154,366 20,467 174,833
Capital expenditure 109,110 99,212 208,322 23,530 231,852
Adjusted EBIDTA less capital expenditure 103,021 170,729 273,750 -12,451 261,299
* The comparative segment information was adjusted to reflect the functional reorganization in relation to cost allocation. As a result, as compared to previously reported, EBITDA for
the year ended December 31, 2014 in B2C and B2B segments deceased by PLN 34,232 and PLN 28,228, respectively and revenue from external customers for the year ended
December 31, 2014 in B2C and B2B segments changed PLN 18,871 and PLN (18,871), respectively.
24inwestor.netia.pl
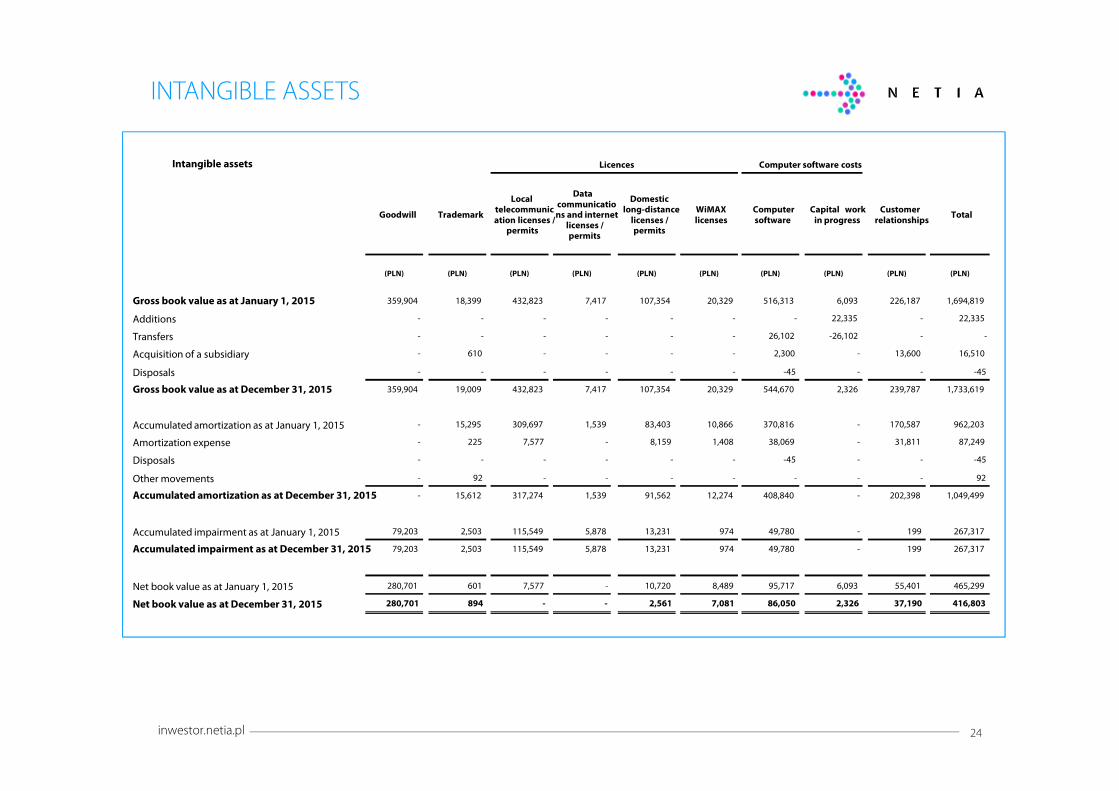
INTANGIBLE ASSETS
Intangible assets
(PLN) (PLN) (PLN) (PLN) (PLN) (PLN) (PLN) (PLN) (PLN) (PLN)
Gross book value as at January 1, 2015 359,904 18,399 432,823 7,417 107,354 20,329 516,313 6,093 226,187 1,694,819
Additions - - - - - - - 22,335 - 22,335
Transfers - - - - - - 26,102 -26,102 - -
Acquisition of a subsidiary - 610 - - - - 2,300 - 13,600 16,510
Disposals - - - - - - -45 - - -45
Gross book value as at December 31, 2015 359,904 19,009 432,823 7,417 107,354 20,329 544,670 2,326 239,787 1,733,619
Accumulated amortization as at January 1, 2015 - 15,295 309,697 1,539 83,403 10,866 370,816 - 170,587 962,203
Amortization expense - 225 7,577 - 8,159 1,408 38,069 - 31,811 87,249
Disposals - - - - - - -45 - - -45
Other movements - 92 - - - - - - - 92
Accumulated amortization as at December 31, 2015 - 15,612 317,274 1,539 91,562 12,274 408,840 - 202,398 1,049,499
Accumulated impairment as at January 1, 2015 79,203 2,503 115,549 5,878 13,231 974 49,780 - 199 267,317
Accumulated impairment as at December 31, 2015 79,203 2,503 115,549 5,878 13,231 974 49,780 - 199 267,317
Net book value as at January 1, 2015 280,701 601 7,577 - 10,720 8,489 95,717 6,093 55,401 465,299
Net book value as at December 31, 2015 280,701 894 - - 2,561 7,081 86,050 2,326 37,190 416,803
Local telecommunication licenses /
permits
Total
Domestic long-distance
licenses / permits
WiMAX licenses
Computer software
Customer relationships
Goodwill Trademark
Licences Computer software costs
Capital work in progress
Data communications and internet
licenses / permits

25inwestor.netia.pl
INTANGIBLE ASSETS
Intangible assets
(PLN) (PLN) (PLN) (PLN) (PLN) (PLN) (PLN) (PLN) (PLN) (PLN)
Gross book value as at January 1, 2014 359,904 18,310 432,823 7,417 107,354 20,329 476,482 14,844 226,233 1,663,696
Additions - - - - - - 208 34,097 - 34,305
Transfers - 89 - - - - 42,759 -42,848 - -
Sale of Uni-Net - - - - - - -412 - - -412
Disposals - - - - - - -2,721 - -46 -2,767
Other movements - - - - - - -3 - - -3
Gross book value as at December 31, 2014 359,904 18,399 432,823 7,417 107,354 20,329 516,313 6,093 226,187 1,694,819
Accumulated amortization as at January 1, 2014 - 13,483 291,051 1,539 76,052 9,456 335,762 - 140,375 867,718
Amortization expense - 1,812 18,646 - 7,351 1,410 37,936 - 30,258 97,413
Sale of Uni-Net - - - - - - -404 - - -404
Disposals - - - - - - -2,477 - -46 -2,523
Other movements - - - - - - -1 - - -1
Accumulated amortization as at December 31, 2014 - 15,295 309,697 1,539 83,403 10,866 370,816 - 170,587 962,203
Accumulated impairment as at January 1, 2014 79,203 - 115,549 5,878 13,231 974 42,604 - 199 257,638
Impairment charge for specific assets* - 2,503 - - - - 7,369 - - 9,872
Sale of Uni-Net - - - - - - -5 - - -5
Disposals - - - - - - -188 - - -188
Accumulated impairment as at December 31, 2014 79,203 2,503 115,549 5,878 13,231 974 49,780 - 199 267,317
Net book value as at January 1, 2014 280,701 4,827 26,223 - 18,071 9,899 98,116 14,844 85,659 538,340
Net book value as at December 31, 2014 280,701 601 7,577 - 10,720 8,489 95,717 6,093 55,401 465,299
Total
Licences Computer software costs
Goodwill Trademark
Customer
relationship
s
Local
telecommun
ication
licenses /
permits
Domestic
long-
distance
licenses /
permits
WiMAX
licenses
Data
communicat
ions and
internet
licenses /
Computer
software
Capital
work in
progress
inwestor.netia.pl 26
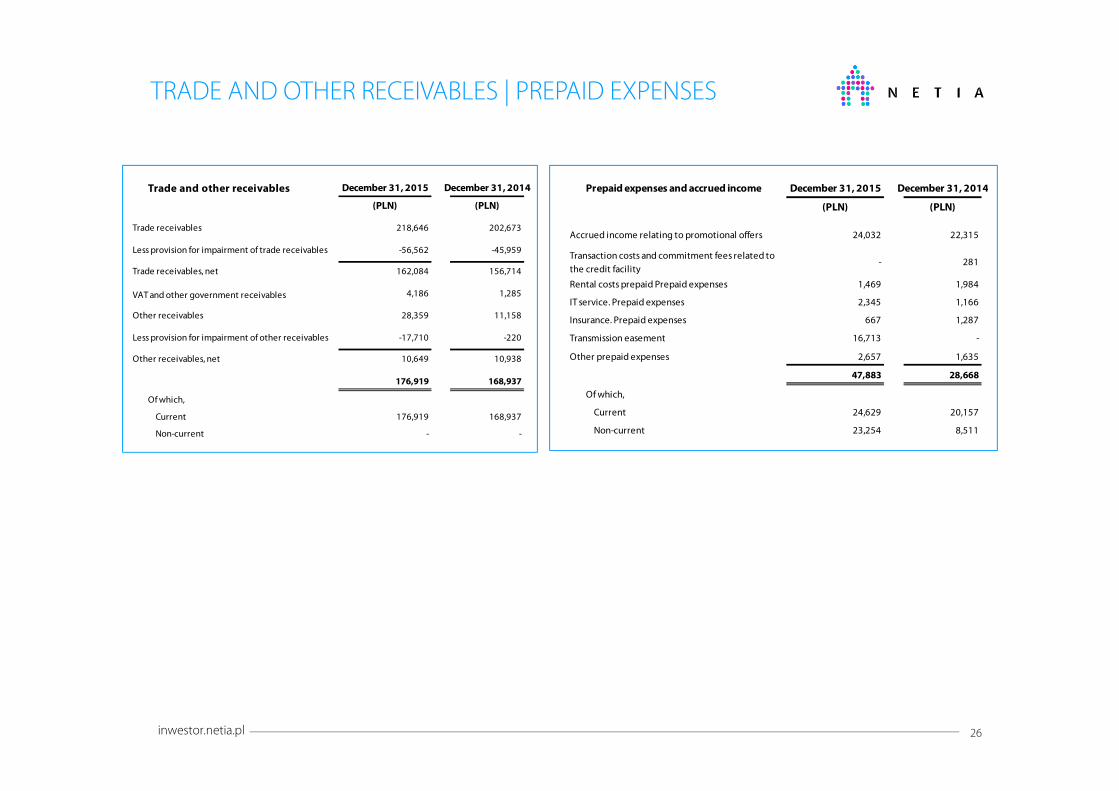
TRADE AND OTHER RECEIVABLES | PREPAID EXPENSES
Trade and other receivables December 31, 2015 December 31, 2014
(PLN) (PLN)
Trade receivables 218,646 202,673
Less provision for impairment of trade receivables -56,562 -45,959
Trade receivables, net 162,084 156,714
VAT and other government receivables 4,186 1,285
Other receivables 28,359 11,158
Less provision for impairment of other receivables -17,710 -220
Other receivables, net 10,649 10,938
176,919 168,937
Of which,
Current 176,919 168,937
Non-current - -
Prepaid expenses and accrued income December 31, 2015 December 31, 2014
(PLN) (PLN)
Accrued income relating to promotional offers 24,032 22,315
Transaction costs and commitment fees related to
the credit facility- 281
Rental costs prepaid Prepaid expenses 1,469 1,984
IT service. Prepaid expenses 2,345 1,166
Insurance. Prepaid expenses 667 1,287
Transmission easement 16,713 -
Other prepaid expenses 2,657 1,635
47,883 28,668
Of which,
Current 24,629 20,157
Non-current 23,254 8,511
27inwestor.netia.pl
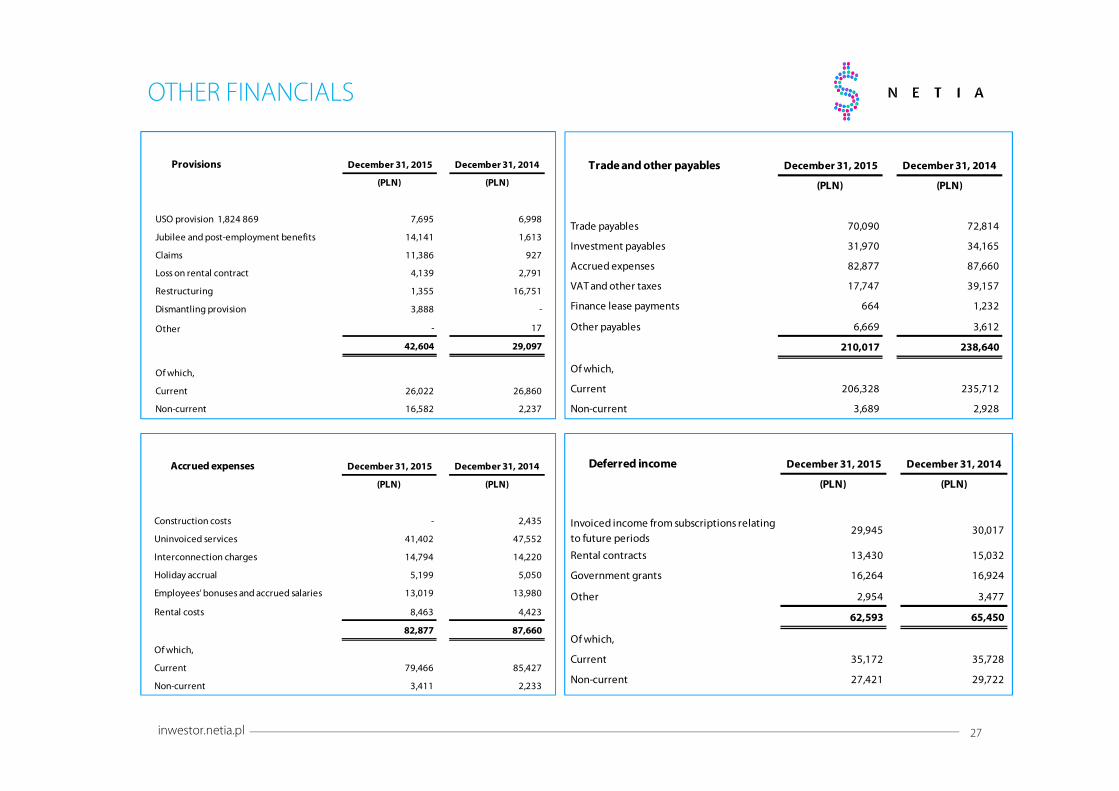
OTHER FINANCIALS
Provisions December 31, 2015 December 31, 2014
(PLN) (PLN)
USO provision 1,824 869 7,695 6,998
Jubilee and post-employment benefits 14,141 1,613
Claims 11,386 927
Loss on rental contract 4,139 2,791
Restructuring 1,355 16,751
Dismantling provision 3,888 -
Other - 17
42,604 29,097
Of which,
Current 26,022 26,860
Non-current 16,582 2,237
Trade and other payables December 31, 2015 December 31, 2014
(PLN) (PLN)
Trade payables 70,090 72,814
Investment payables 31,970 34,165
Accrued expenses 82,877 87,660
VAT and other taxes 17,747 39,157
Finance lease payments 664 1,232
Other payables 6,669 3,612
210,017 238,640
Of which,
Current 206,328 235,712
Non-current 3,689 2,928
Accrued expenses December 31, 2015 December 31, 2014
(PLN) (PLN)
Construction costs - 2,435
Uninvoiced services 41,402 47,552
Interconnection charges 14,794 14,220
Holiday accrual 5,199 5,050
Employees‘ bonuses and accrued salaries 13,019 13,980
Rental costs 8,463 4,423
82,877 87,660
Of which,
Current 79,466 85,427
Non-current 3,411 2,233
Deferred income December 31, 2015 December 31, 2014
(PLN) (PLN)
Invoiced income from subscriptions relating
to future periods 29,945 30,017
Rental contracts 13,430 15,032
Government grants 16,264 16,924
Other 2,954 3,477
62,593 65,450
Of which,
Current 35,172 35,728
Non-current 27,421 29,722
28inwestor.netia.pl
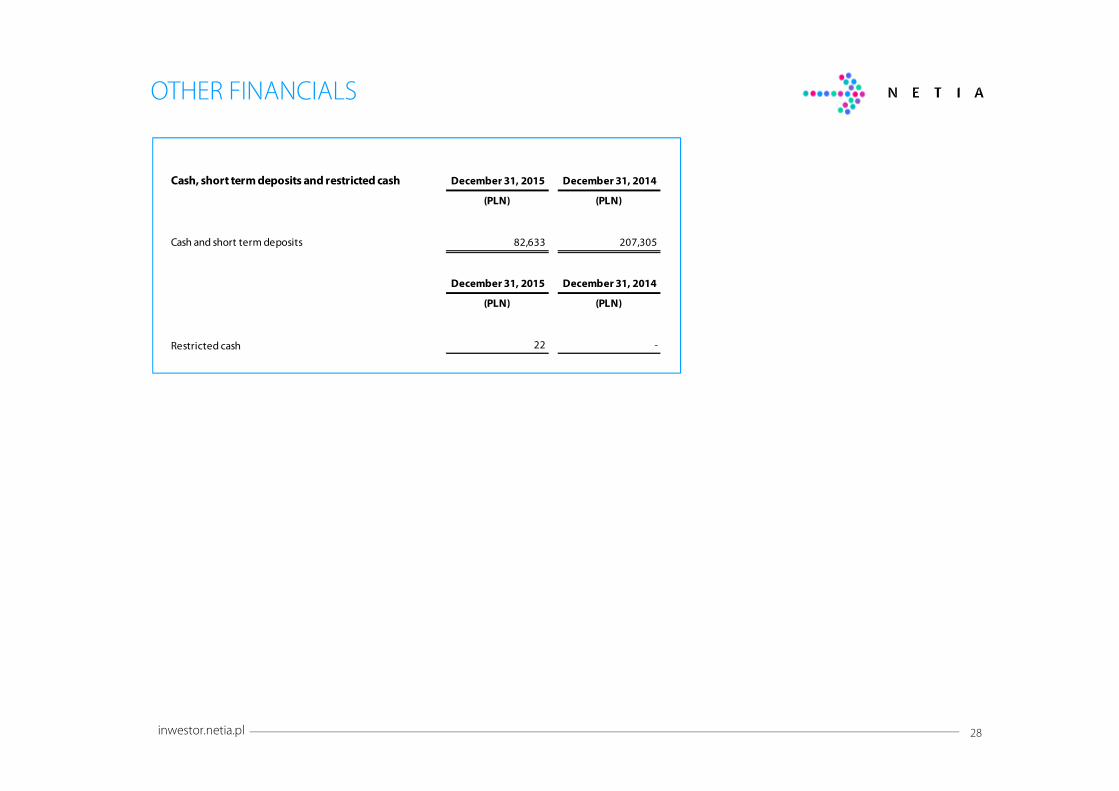
OTHER FINANCIALS
Cash, short term deposits and restricted cash December 31, 2015 December 31, 2014
(PLN) (PLN)
Cash and short term deposits 82,633 207,305
December 31, 2015 December 31, 2014
(PLN) (PLN)
Restricted cash 22 -

inwestor.netia.pl 29
Disclaimer
Some of the information included in this material contains forward-looking statements. Readers are cautioned that any such forward-looking statements are not
guarantees of future performance and involve risks and uncertainties, and that actual results may differ materially from those in the forward-looking statements as
a result of various factors. For a more detailed description of these risks and factors, please see Netia's most recent financial report and press release. Netia
undertakes no obligation to publicly update or revise any forward-looking statements.

inwestor.netia.pl 30