annual report 2014 - infomedia · service (saas) infrastructure optimisation. aside from helping...
TRANSCRIPT

Annual Report 2014

TABLE OF CONTENTS
TABLE OF CONTENTS
© 2014 Infomedia Ltd. All rights reserved worldwide. This document may not be
reproduced in whole or in part without the express written permission of Infomedia Ltd.
RESULTS AT A GLANCE 1
CHAIRMAN’S REPORT 3
CEO REPORT 5
CFO REPORT 8
AMERICAS REPORT 10
EMEA REPORT 12
ASIA PACIFIC REPORT 14
CONNECTED VEHICLES: TECHNOLOGY DRIVES THE NEW AGE OF THE AUTOMOBILE 16
DIRECTORS 19
DIRECTORS’ REPORT 20
AUDITOR’S INDEPENDENCE DECLARATION 30
STATEMENT OF PROFIT & LOSS AND OTHER COMPREHENSIVE INCOME 31
STATEMENT OF FINANCIAL POSITION 32
STATEMENT OF CASH FLOWS 33
STATEMENT OF CHANGES IN EQUITY 34
NOTES TO THE FINANCIAL STATEMENTS 35
DIRECTORS’ DECLARATION 62
INDEPENDENT AUDIT REPORT 63
CORPORATE GOVERNANCE 65
ADDITIONAL INFORMATION 70
CORPORATE DIRECTORY 71
SUPERSERVICE.COM

1SUPERSERVICE.COM
Sales Revenue
EBITDA Dividends per Share
Net Profi t After Tax (NPAT)
Key Figures
AUD
$m
AUD
¢
AUD
$m
AUD
$m
Financial Year 2010 2011 2012 2013 2014
Sales Revenue ($m) 45.3 44.1 45.7 48.7 57.1
NPAT ($m) 11.3 10.0 8.5 10.1 12.3
EBITDA ($m) 18.2 18.8 17.7 20.1 24.6
DPS (¢) 2.40 2.40 2.40 2.82 3.78
RESULTS AT A GLANCE

Helping our automotive partners sell billions of dollars in parts and service every year.
BY THE NUMBERS
SOLUTIONS CUSTOMERS
75,838y pMonthly SubscriptionsMonthly Subscripti
150,000Daily Users
Countries
BY THE N
Countries
186
5 Office
Locations
14Customer Suppport tomer Suppp
Languages
31Solution Solution
Languages24/7
Global Global
Operations
4 tomer SuupportCust
ters Cent
39 Automaker brands use
Infomedia’s solutions in
their dealerships.
Meeting the needs for a smarter, more professional approach by OEMs and dealerships.
Data license agreementsData license agreements
OEMs
Parts and service selling systemsParts and service selling systems
OEM DEALERSHIPS
Trade parts and technical publicationsTrade parts and technical publications
INDEPENDENT REPAIRERS
POS data solutionsPOS data solutions
OIL COMPANIES
LEADERS IN PARTS & SERVICE SELLING SYSTEMS FOR 25 YEARS.
(Sydney, Melbourne, Shanghai,
Detroit, Cambridge)
(Australia, Japan,
UK, USA)
We are constantly innovatinng toWe are constantly innovatitinng tostay ahead of customer nneeds.
p y, y y Transparerency, reliability and accessibilityarare the keysys to our cutting edge solutions.
LUBRICANTS
PARTS
SERVICE
LULULUUUBRBRBRBRICICICANANANANTSTSTSTLUBRICANTS
PPPAPAPAPARTRTRRRTTSSSPARTS
SSSESESERVRVRVICICI EEEESSS RV CSERVICE
1990 2001 20092003 2011 2013199999909090 20200000001 2000000003 20200000009 2010 20001111 20200013131313
Elecctrtronic Parts
CCatalogues
Precision n SService
QuQuoting
Wholesale Parts
e-Commerce
Real-timee
Customer Survey
Elecctrtrononiic Vehicle
Inspections
Digital SeServrvice
History
Online Servicee
Appointments
2020001101010

3SUPERSERVICE.COM
CHAIRMAN’S LETTER
Dear fellow shareholders,
I am pleased to report
that during FY2014 your
Company continued to
achieve positive results.
Infomedia increased
sales to $57.1 million, an
improvement of 17.4%
over the prior fi nancial year, and net profi t after tax
rose to $12.3 million, a 22% growth over FY2013. Your
Directors declared a fully franked fi nal dividend of 1.89
cents per share, bringing the total dividend for FY2014
to 3.78 cents, an increase of 34% over the previous
fi nancial year.
These key results were supported by a focus on advancing
our next generation product development, continuing
improvements in productivity and expanding the acceptance
of our Superservice product suite.
I would like to take this opportunity to thank the entire
Infomedia team for their eff orts in delivering these solid results.
I write to you as Non-Executive Chairman following the
decision of Infomedia’s founder, Richard Graham, to step
down from his role as Executive Chairman in February 2014.
Richard remained on the Board as a Non-Executive Director
during the reporting period.
During the fi rst half of FY2014, the Company delivered
strong fi nancial results under Richard’s tenure as Executive
Chairman. Infomedia continues to follow the strategy he
established, based on the seminal research he commissioned
into the future of Aftersales to 2020. An edited version of this
research is available on our website at superservice.com.
The Board appointed Andrew Pattinson, formerly the Director
of Global Solutions and Systems, as CEO in September
2013. During his 25 year career with Infomedia, Andrew has
developed a deep understanding of Infomedia’s business
as well as the leadership, industry knowledge and product
development credentials to take the Company forward. He
is also a member of the Board of Directors. You will fi nd
Andrew’s fi rst report as CEO on the following pages.
In November 2013, the Board announced the appointment
of Clyde McConaghy as a Non-Executive Director. Clyde also
chairs the Audit and Risk Committee. Clyde fi lled a casual
vacancy on the Board and in accordance with our constitution,
will off er himself for election at the Annual General Meeting in
October 2014.
This year the Board has undertaken a review of the Executive
remuneration structure with the intent of ensuring we retain
our best talent and optimise the performance of the business.
The structure will be described in more detail in the notice to
shareholders of the 2014 Annual General Meeting.
As to the outlook, the opportunities in the automotive
Aftersales market are substantial. As you will read later in
this Report, the ever-increasing connectivity of devices, the
“Internet of Things”, continues to empower consumers as
never before. Added to this is the transformational eff ect of
the exponentially increasing collection and storage of data,
the potential of which is known as Big Data. As the digital
world evolves, Big Data will provide the edge in customer
service and retention for those who can understand and
harness it.
Here, Infomedia is well positioned. Digital value will continue
to rise as we become a hyper-connected world. Infomedia’s
investment in cloud technology provides us with the
speed and capability to capitalise on these developments.
This, combined with the depth of our knowledge and
understanding of the Aftersales market, off ers opportunities
to create new business and build competitive advantage.
Against this backdrop, we will continue to invest in our
technology research and development to ensure our products
deliver a strong platform for growth. Infomedia’s model of
recurring revenue through subscriptions remains unchanged
and continues to deliver a sound fi nancial basis for creating
shareholder value.
In closing, the Board is confi dent in Infomedia’s ability to
deliver long term, sustainable growth and remain at the
forefront of innovation in our sector. I trust you will fi nd this
Annual Report of interest and on behalf of the Board, I invite
you to attend the Annual General Meeting at our head offi ce
in Frenchs Forest, Sydney, on October 30. I look forward to
welcoming you there.
Frances Hernon
Chairman
Sydney, 21 August 2014

4 SUPERSERVICE.COM
“The opportunities in
the automotive Aftersales
market are substantial.”
CHAIRMAN’S LETTER

5SUPERSERVICE.COM
It is a pleasure to be
delivering my fi rst
Annual Report as CEO
of Infomedia. During
FY2014, your Company
continued to grow revenue,
product development and
infrastructure optimisation.
You can be proud of the Infomedia teams throughout
the organisation as they worked on our longstanding
Company goal of contributing to our customers’ success
and creating shareholder value.
We move ahead in good fi nancial health and with optimism
about our ability to continue on this growth trajectory. I believe
the Company has a unique and focused culture that has
served us well in the past, and we will continue to nurture and
improve this over the coming years. The underlying positive
momentum of our business has translated into signifi cant
market capitalisation growth during the 2014 fi nancial year.
The strong performance and renewed recognition from the
investor community is affi rmation that our vision and tactical
strategy is on track.
Later in the report you will learn more about our global
achievements and activities during the 2014 fi nancial year
from our regional leaders. I am delighted with the strong
operational performance in all regions and look forward to
further success as we develop new market opportunities.
Continued Growth
CEO REPORT
Our Superservice fi xed operations platform is attracting a
lot of interest from dealerships and OEM customers around
the globe. Dealer pilots that had been conducted in Europe
for Superservice products are now turning into revenue; KIA
France and KIA Spain dealership networks are examples to
run such pilots. We expect this will be the start of a growing
product uptake as pilot programs that are running in all of our
sales regions (The Americas, Europe, Middle East and Africa,
and Asia Pacifi c) start moving into commercial releases.
Auto PartsBridge (APB) is also gaining traction in North
America. During the year we conducted a product roll out for
KIA Canada, as well as signing agreements to release versions
of the application for Hyundai Canada and Chrysler USA.
Furthermore, we entered into discussions to expand the APB
product line outside of the North America region.
Microcat subscriptions continued to achieve organic growth,
particularly in the Asia Pacifi c region where growth from China in
particular provides a platform for more opportunity in the future.
Product Innovation
Infomedia has always stood for leading product innovation.
This year was no diff erent as our teams continued our
legacy of delivering cutting edge and aff ordable innovation,
founded in a deep knowledge of the commercial and
operational pressures dealership staff face. The combination
of technology know-how and domain expertise has allowed
us to release industry leading features and back-end
optimisations for our Microcat and Superservice platforms
that add value to all stakeholders.
Infomedia has released many industry fi rsts in its 25 year
history and this year I can report we have added to that list.
During the year we included photo and video capability
to our Superservice Triage vehicle health check system.
This new genre of inspection system sophistication
provides a customer experience beyond expectation. Visual
evidence of repair recommendations empowers Service
Advisors to engage the customer in the quotation process.
It leads to a transparent service experience for the
customer, increased sales conversions for the dealer,
and improved prospects for customer retention within
the automaker brand.
In our Microcat solutions, we released next generation
illustration handling. This example of product innovation
provides signifi cantly more detail and scale to the parts
images, and also handles the images with the same speed
and display performance as the historically available lower
resolution images.
In another industry fi rst, our subject matter expertise and
international language handling skills were put to good use to
release augmented automaker data to vastly improve search
performance and useability of parts information.
I am pleased to report that during the year, our overall
subscription equivalents grew to a total of 75,838. During
the 2014 fi nancial year we also increased the global footprint
of daily users to 150,000 for the fi rst time. The growth was
experienced in all regions, supported by organic and new
customer acquisitions. We continued to maintain good
relationships with OEMs, signing 14 new or renewed data
licence agreements during the year. The high number of
renewals is testimony to our ability to keep innovating to
meet the evolving needs of dealership fi xed operations
departments globally.

“During the 2014 fi nancial year
we also increased the global
footprint of daily users to
150,000 for the fi rst time. ”
6 SUPERSERVICE.COM
CEO REPORT

7SUPERSERVICE.COM
Continued IT Investment
Our Research and Development activities continue to lead the
industry curve to support product evolution and Software as a
Service (SaaS) infrastructure optimisation. Aside from helping
our customers to achieve outstanding performance metrics, our
innovative cloud solutions have received recognition and praise
from IT industry leaders in the global hosting environment.
In harmony with our Development teams, the IT group are
building new capabilities for the business. These are focused
on creating a faster and more stable online experience for
our customers and a lower impact, more cost eff ective
infrastructure for the business.
An example of the benefi t to customers is our Active/Active/
Active (AAA) hosting solution that went into production this
year. This advanced hosting environment ensures that a
cluster of servers in 3 diff erent geographic locations is always
up to date with the most current information for every user
accessing the system. In the event of an outage in one
region, the user’s account is seamlessly pointed to another
region, where their most up to date information is already
maintained. Whilst hosting in multiple regions is a common
practice, having the systems and infrastructure to maintain
all regions in a fully up to date state is class leading and
becoming a key market diff erentiator.
Within the business, the investment in the new hosting
environment has led to a reduction in the amount of
resource required to maintain and manage the hosted
environment. Whilst the Company continues to increase
the number of hosted applications by the month, the team
required to produce, test and deploy each product release
remains stable.
Era of Smart Mobility – Connected Vehicles
The automotive and wider press seems to be full of stories
of automakers working hard to introduce diff erentiated
products and experiences. The advent of new technology has
enabled the development of the so called ‘connected vehicle’
– vehicles that are connected via the internet to other devices.
Using sensors and cloud technology, they can transmit and
receive vehicle data to and from other devices including smart
phones and tablets. This topic was partly covered in our
Aftersales 2020 whitepaper last year, and recently this new
trend has accelerated.
Connected vehicles off er new and exciting opportunities for
automakers to personalise the ownership experience. They
also present potential for third parties to develop value add
services such as predictive maintenance, risk minimised
routing, parking information, internet radio, pay per use
insurance and other new connected features and experiences.
Infomedia is well placed to take advantage of new industry
drivers and trends, and our leading edge cloud technology will
be a key enabler to capture new market opportunities. Later
in this report you can read more about the coming era of
connected vehicles and the role that cloud computing will play
to make that happen.
Conclusion
In closing, I want to assure you that your Company is in
a healthy position. Our business model is sound and our
market knowledge and capacity for continued innovation
are strong.
There were some signifi cant advancements made during
FY2014 and looking to the future, we will continue to
work towards contributing to our customers’ success,
whilst continuing our own business expansion and adding
shareholder value.
Thank you for your ongoing support of your Company, and I
hope to see you in person at our Annual General Meeting later
in the year.
Andrew PattinsonChief Executive Offi cer
CEO REPORT
8 SUPERSERVICE.COM
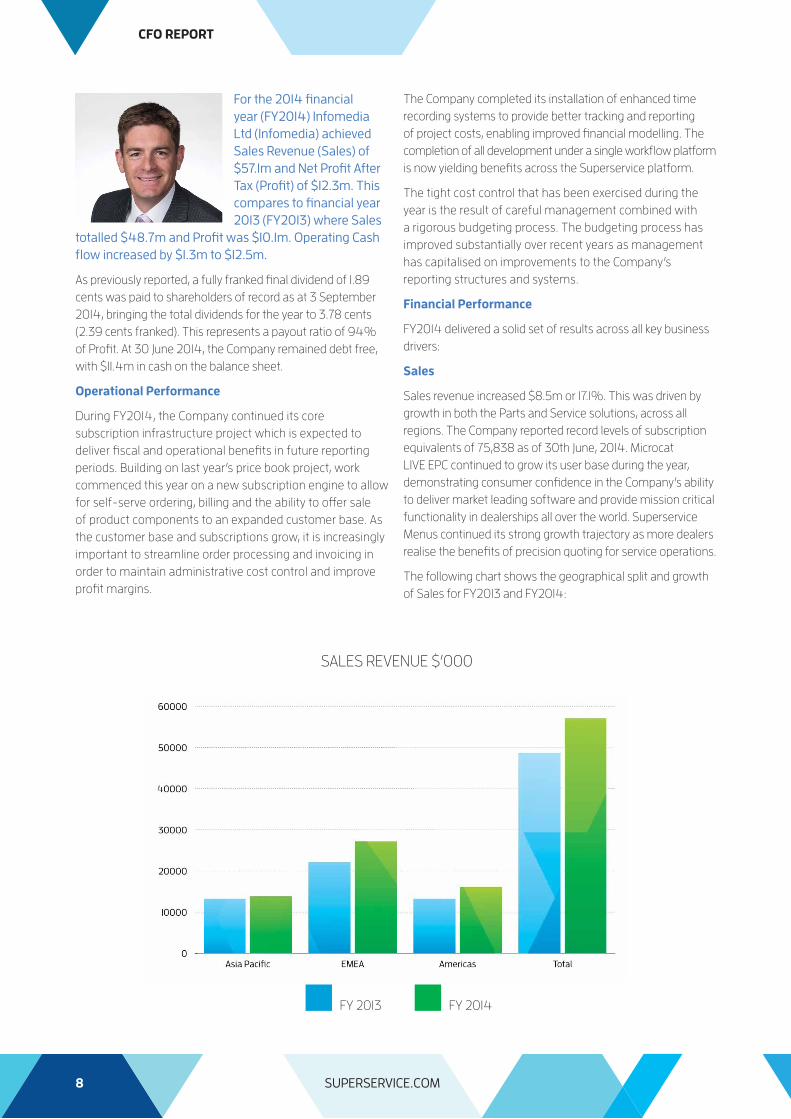
For the 2014 fi nancial
year (FY2014) Infomedia
Ltd (Infomedia) achieved
Sales Revenue (Sales) of
$57.1m and Net Profi t After
Tax (Profi t) of $12.3m. This
compares to fi nancial year
2013 (FY2013) where Sales
totalled $48.7m and Profi t was $10.1m. Operating Cash
fl ow increased by $1.3m to $12.5m.
As previously reported, a fully franked fi nal dividend of 1.89
cents was paid to shareholders of record as at 3 September
2014, bringing the total dividends for the year to 3.78 cents
(2.39 cents franked). This represents a payout ratio of 94%
of Profi t. At 30 June 2014, the Company remained debt free,
with $11.4m in cash on the balance sheet.
Operational Performance
During FY2014, the Company continued its core
subscription infrastructure project which is expected to
deliver fi scal and operational benefi ts in future reporting
periods. Building on last year’s price book project, work
commenced this year on a new subscription engine to allow
for self-serve ordering, billing and the ability to off er sale
of product components to an expanded customer base. As
the customer base and subscriptions grow, it is increasingly
important to streamline order processing and invoicing in
order to maintain administrative cost control and improve
profi t margins.
The Company completed its installation of enhanced time
recording systems to provide better tracking and reporting
of project costs, enabling improved fi nancial modelling. The
completion of all development under a single workfl ow platform
is now yielding benefi ts across the Superservice platform.
The tight cost control that has been exercised during the
year is the result of careful management combined with
a rigorous budgeting process. The budgeting process has
improved substantially over recent years as management
has capitalised on improvements to the Company’s
reporting structures and systems.
Financial Performance
FY2014 delivered a solid set of results across all key business
drivers:
Sales
Sales revenue increased $8.5m or 17.1%. This was driven by
growth in both the Parts and Service solutions, across all
regions. The Company reported record levels of subscription
equivalents of 75,838 as of 30th June, 2014. Microcat
LIVE EPC continued to grow its user base during the year,
demonstrating consumer confi dence in the Company’s ability
to deliver market leading software and provide mission critical
functionality in dealerships all over the world. Superservice
Menus continued its strong growth trajectory as more dealers
realise the benefi ts of precision quoting for service operations.
The following chart shows the geographical split and growth
of Sales for FY2013 and FY2014:
SALES REVENUE $’000
FY 2013 FY 2014
CFO REPORT

9SUPERSERVICE.COM
Operational Costs
Operational costs showed a small increase compared to the
prior year. Investment in Sales and Marketing was the primary
reason for the increase as the company sought to capitalise
on increasing sales opportunities. The Company maintained
tight cost control and took advantage of its leveraged
software business model. This is especially pleasing to see
given the increase in frequency of product releases. This is
testament to the constant focus on improving infrastructure
and processes over recent years. These improvements will
enable the Company to grow whilst maintaining a fi rm hold
on margins.
Research & Development
We maintained our investment in R&D as we continued
to work on further enhancing and integrating the new
Superservice suite. DMS integration was a key theme during
FY2014 as the industry continued to require IT systems to
communicate more easily. The Company is committed to
ensuring it remains a key integration partner in the industry
and this will continue to be one of the drivers of the future
R&D spend.
Foreign Exchange
The average Australian dollar spot rates versus the USD
and EUR through FY2014 were lower than FY2013. This
contributed to a positive variance in profi t compared to the
prior year. The Company was hedged at rates higher than the
spot rates and thus achieved a hedging loss of $2.6m during
the year. Despite this, the net FX impact relative to FY2013
was $1.4m. Based on current FX rates and the hedging in
place for FY2015, the Company is anticipating a relatively
neutral FX impact from hedging activity.
Overall, the Company’s NPAT increased 22% or $2.2m to
$12.3m.
The Year Ahead
Looking forward, the Company anticipates further
subscription and sales revenue growth from both Parts
and Service solutions. The Company expects a measured
increase in operational costs to support the product and
sales expansion; however, cost management will remain a
core focus. We expect to maintain our investment in R&D.
Given the Company’s foreign exchange hedging, it is likely
that the relative FX impact will be neutral or positive for the
year compared with FY2014 although the exact quantum is
diffi cult to predict. Accordingly, the Company has provided
guidance that it expects FY2015 NPAT to exceed $14.5m.
Jonathan PollardChief Financial Offi cer
CFO REPORT

10 SUPERSERVICE.COM
AMERICAS REPORT
I’m pleased to have this
opportunity to discuss the
prospective landscape and
success experienced across
the Americas during the
last fi nancial year. It’s been
a year where our products
have fl ourished and we
have had revenue growth across all of our product
lines. It has also been a year where we’ve executed
a key component of our business growth strategy by
establishing and growing our third party relationships
with integration, training and reseller agreements.
Where APB has extended parts sales beyond the dealership
to the collision community, this past year we took that
further to provide parts sales to the consumer, in this case
to forklift truck service and repair technicians. In late 2013,
we introduced a Microcat order manager solution to trade
customers of Toyota Materials Handling in the US. The trade
consumers now have the benefi t of having access to details
only found in an Electronic Parts Catalogue (EPC) for part
look up, illustration and then electronic ordering. It has greatly
enhanced the accuracy of repairs and decreased the time a
truck is out of service awaiting parts.
The new Chrysler Microcat EPC was also introduced with an
expanded data set and integration over the initial launch.
Chrysler dealerships now have access, and the parts selling
capability that comes with it, to all of their MOPAR (second
line) parts; this is not provided in competitor off erings.
Most importantly, is the growth of our Superservice suite
of solutions. Superservice for Hyundai America will be
introduced in FY2015, following the Chrysler, General Motors,
Toyota, Jaguar, Hyundai Canada and Land Rover solutions
that were launched throughout the fi scal year. Superservice
is a key growth engine in support of FY2015 projections, not
only in the United States, but also with targeted expansions
within Canada and South America.
Looking ahead, we move forward with a strong pipeline, and
a product portfolio with unique competitive diff erentiation.
We continue to grow our Americas team to cope with
growing business needs, and we’re committed to building
on the hard work of recent years to deliver on our regional
growth strategy.
Karen Blunden
CEO IFM Americas
Since the time of last year’s report, we have launched our
wholesale solution Microcat Auto PartsBridge (APB) to
KIA and Hyundai Canada dealerships, and their body shop
customers. Their distributors, their dealerships and their
partner body shops are experiencing the similar levels of
success as Honda, with increased parts sales, improved
repair times and greater customer satisfaction as a result of
expanded genuine part utilisation. APB subscriptions have
continued to grow in the US, with Chrysler APB set to be
released later this year.

“It’s been a year where our
products have fl ourished and
we have had revenue growth
across all of our product lines.”
11SUPERSERVICE.COM
AMERICAS REPORT
Financial Year 2014 has
been a positive year for
Infomedia in Europe,
Middle East and Africa
(EMEA) as dealerships
and automakers continue
to emerge further from
the fi nancial crisis that
has impacted the Automotive sector in recent years.
Although some of the Southern European markets
such as Portugal and Greece continue to experience
diffi culties, the northern markets such as Germany,
France and the Nordics are largely completely recovered
and back to pre-recession new car sales numbers.
This improvement in new car sales has been matched by
renewed investment in Aftersales, with manufacturers
looking to support their dealerships with updated systems
and processes. This has led to a signifi cant interest in the
Superservice suite of products, as well as an eagerness to
move away from legacy technologies.
To that end, our customers in the region have been
transitioning to the Microcat LIVE platform and we are seeing
dealerships benefi t from instant parts pricing updates, and
the improved functionality and fl exibility of being fully online
without the need to install a disc, as they have done historically.
In the service area, we are seeing strong traction with some of
our newer products such as Superservice Connect, our online
service booking off ering. In 2014, KIA Spain was the fi rst
market to deploy Superservice Connect to their dealership
network. With seamless integration to Superservice Menus
data as a strong competitive diff erentiator to everything
else in this market, we have a number of European markets
looking to adopt the solution in 2015.
Advances in the Superservice Triage platform such as the
addition of photo and video capture are also benefi tting
dealerships in a number of franchises across the region. The
ability for customers to see images and videos of the work
required on their vehicle and instantly authorise from the
comfort of their home or workplace is further reinforcing the
Superservice commitment of Accuracy, Certainty and Trust.
This promise has driven strong interest in both Superservice
Triage and Superservice Menus, with a number of full market
launches anticipated in FY2015.
A key part of our EMEA growth strategy has been our tighter
integration with Dealer Management Systems (DMS). With
such a diverse range of systems in use throughout Europe,
we have invested in a dedicated integration team to work with
DMS partners to enable seamless transfer of data between
the Superservice suite of applications and the DMS. We are
already beginning to reap the dividends from this investment
as it further strengthens our position in the market, whilst
providing tangible productivity benefi ts to our customers.
As we look to the future, we are excited about furthering our
partnerships with our existing automaker customers, and
anticipate building some new OEM relationships as well.
The integrated nature of the Superservice suite and our
commitment to providing leading edge sales tools to our
dealership and OEM partners puts us in a strong position for
the years ahead in this region.
Jason Thorpe
Managing Director, IFM Europe
12 SUPERSERVICE.COM
EMEA REPORT
IFM UK Head Offi ce

“We are seeing dealerships benefi t
from instant parts pricing updates,
and the improved functionality and
fl exibility of being fully online... ”
13SUPERSERVICE.COM
EMEA REPORT

14 SUPERSERVICE.COM
not only at automaker level, but also from larger dealership
groups who want to automate their inspection selling process
and improve the customer experience. Service customer
retention continues to be a big focus for all automakers in
the region, and Infomedia’s Superservice suite is seen as a
complementary technology solution to pair with customer
retention programs being deployed by automakers.
In addition to improved customer experience, early adopters
of Superservice Triage in Australia are reporting excellent
ROI metrics. Dealerships are reporting signifi cant growth in
labour, parts and tyre sales, with some dealerships increasing
workshop effi ciency to 100% within one month of using the
system. We’re using this information from our early adopters
as key reference sites to support our future sales and
marketing campaigns.
Our CRM team have worked to strengthen our partnerships
with automakers and distributors during FY2014, across
a number of our product solutions. With Microcat EPC, we
extended agreements with both Ford Asia Pacifi c and Honda
Australia. We also renewed Superservice Menus agreements
with Toyota New Zealand and Honda Australia.
There has also been growth in the lubricant
recommendations business, with more oil company
subscriptions being added during the year. We welcomed
six new oil companies as customers from Australia and
New Zealand, and we expect more oil companies to
subscribe to our leading edge lubricant data solution in the
coming year.
Going forward, I’m confi dent that our innovative solutions will
underpin our growth in the Asia Pacifi c region. We are in good
shape to capture new opportunities and expand Superservice
product introductions to new customers in the region. Our
new business pipeline is strong, and with 25 years of goodwill
in the Asia Pacifi c market, we will be working to add value
to our customers’ businesses whilst looking to expand the
business as well.
Michael RoachDirector Asia Pacifi c & Global Marketing
This year in the Asia Pacifi c
region, we have continued
to make progress in
achieving organic sales
growth and also developing
our new business pipeline.
Characterised by a mix of
growth and mature markets,
the Asia Pacifi c region has unique qualities that present
many challenges and opportunities. New car sales have
continued to grow across the region, and the increased
focus on fi xed operations is now prevalent amongst most
tier one and tier two automakers. The parts and service
business is not only seen as a strong revenue source, but
also a way to foster brand engagement and loyalty.
ASIA PACIFIC REPORT
While the big three OEMs in Australia, Ford, Holden and
Toyota, have announced the end of manufacturing in the
country, their dealership networks remain strong and demand
for our parts and service solutions remains solid. In other
larger markets such as China and India, we are seeing new
dealerships opening up every month. This is driving organic
growth of our Microcat solutions, in particular for Ford and
Land Rover.
Our recent market development work for Superservice Triage
is also starting to yield results. We are seeing growing interest

15SUPERSERVICE.COM
ASIA PACIFIC REPORT

16 SUPERSERVICE.COM
CONNECTED VEHICLES
TECHNOLOGY DRIVES THE NEW AGE OF THE AUTOMOBILE
With 25 years of
experience in the
aftersales technology
business, Infomedia
has seen a considerable
evolution both in the
automotive industry itself
and in the way dealerships
do business. These changes have been driven in
large part by advances in technology and customer
expectations, and are increasing exponentially. In
last year’s report we discussed our Aftersales 2020
industry research that reviews the future of dealership
parts and service business. In the past year we have
seen the industry move closer to making aspects of
the 2020 vision a reality.
As mentioned in the Chairman’s and CEO’s reports, one of
the most signifi cant technological innovations that will drive
change in the automotive industry is the ‘connected vehicle’
— intelligent, sensor-enabled vehicle, able to communicate
with other devices and applications via the internet. The
connected vehicle will play an integral role in a new digital
paradigm where information collection is autonomous,
mobile and real-time.
Today’s sophisticated digital consumers are demanding
transformative value experiences from their connected
devices. Likewise, connected drivers will expect an enhanced
ownership experience beyond just basic transportation. As
the vehicle moves away from being an industrial product
to becoming a digital one, its core activities will expand to
increase the value propositions for drivers and passengers.
Automakers and dealerships are fast adapting to successfully
operate in this new era. Connected vehicles will enable
automakers to capture real-time vehicle performance and
driver behaviour data, as well as consumer preferences. In
the future, the challenge for software creators like Infomedia
will be to turn the explosion in available data – often referred
to as “Big Data” - into actionable insights to build aftersales
solutions that predict and personalise the customer
experience both online and at the dealership. Infomedia’s
agility, creativity and focus on innovation means we are well
positioned to meet this challenge.
A New Automobile: Connected Vehicles
Cloud technology is enabling integrated vehicle sensors to
transmit data-at-rest and data-in-motion to automakers,
dealerships and third party technology providers. All major
automakers are expected to deploy connected vehicle
systems in their next generation vehicles. Today, some new
Hybrid models already generate over 20GB of data per
hour1. This real-time streaming information can be used to
predict vehicle issues before safety or vehicle performance
is compromised. Dealership technicians can analyse real-
time vehicle status information and perform remote vehicle
diagnosis – providing opportunity to strengthen customer
relationships and improve service retention within the brand.
Automakers and dealerships will be able to use insights to
develop a better understanding of service requirements,
environmental information, driver behavior and preferences.
This vast amount of data will also be used by automakers to
feed into future product planning and sales campaigns.
As the industry moves from off ering basic transportation to
off ering smart mobility, consumers will benefi t from new
and creative ‘connected experiences’ powered by cloud
computing. It is expected that 25% of automakers will
monetise connected vehicles by 20172, allowing development
of third party apps that use vehicle data to provide connected
value services. Using geospatial analytics, connected vehicle
apps will suggest detours to drivers located in traffi c, and
communicate with infrastructure managers to help them
better regulate traffi c in congested areas. The idea of ‘pay-
as-you-drive’ insurance is already available in some North
American markets today, governed by driving patterns and
location data received from the vehicle sensors. With the
advent of vehicle to home integration, in-vehicle payments,
internet radio, risk-minimised routing and other location-
based services, the automotive industry will move to a multi-
product service industry.
Connected vehicles will empower automakers to transition
from focusing on their product to focusing on their customers’
experience, and dealerships will be presented with huge
opportunities to drive increased revenue growth and loyalty.
They will have a greater understanding of their customers and
use predictive analytics to track maintenance issues, demand
for service and facilitate personalised communication.
Dealerships will be able to present transparent aftersales
off ers to their customers at times when they are most
receptive. To achieve this, they will need next-generation
aftersales technology that converts vehicle and customer
data into actionable insights for CRM purposes.

GEO-LOCATION TRACKING
INFOTAINMENT APPS
VEHICLE STATUS DATA
ONBOARD DIAGNOSTICS
360° CAMERA SYSTEM
SAFETY SENSORS
VEHICLE TO MOBILE DEVICE
VEHICLE TO VEHICLE
VEHICLE TO INFRASTRUCTURE
VEHICLE TO 3RD PARTY eSERVICE
VEHICLE TO DEALER/OEM
VEHICLE TO HOME
1.
2.
3.
4.
Geo Location Advertising
Pay as you Drive Insurance
Traffic Management
Big Data
INFOTAINME
VEHICLE ST
17SUPERSERVICE.COM
CONNECTED VEHICLES

18 SUPERSERVICE.COM
Big Data, Big Potential
Connected vehicles will generate a vast amount of raw data
(Big Data) from each vehicle on the road. For automakers and
dealerships, capturing, organising and mining this data so
that it can provide useful information will be one of the big
challenges and opportunities in the years ahead. Data such
as service reminders, error codes, odometer readings, engine
status, braking performance, environmental conditions and
parts wear status will help automakers and dealerships
anticipate the customer service experience and optimise the
supply chain.
become more prevalent, our customer-facing applications
will have the capacity to use new data streams in diff erent
and creative ways – helping our dealership customers
transform their retail aftersales business.
Investment in the Cloud
Cloud computing will be one of the greatest enablers of
change – it will facilitate the aggregation and organisation of
large amounts of vehicle and customer data, and will be the
crucial delivery mechanism for many of the new and exciting
features and experiences that are set to become a ubiquitous
part of the fi xed operations businesses. Anticipating the
role that cloud computing will play in the future, Infomedia
has transitioned our solution services to the cloud. The
transition was a three-year project that has resulted in a cloud
infrastructure that is fi rst among the competition in terms of
scalability, reliability and global performance.
Infomedia’s cloud computing capabilities are designed to
fl ex and expand to meet the needs of the future. We have
ensured that we have robust capabilities to support our cloud
infrastructure. We have developed leading edge IP for hosting,
deploying, managing and optimising our cloud assets, ready
for the challenges and opportunities ahead.
Leading Innovation
Our industry is on the verge of an exciting new age for the
automobile. In the future, cloud computing, Big Data and
digital lifestyle convergence will reshape our notions of what a
vehicle can do and the role that automobiles play in our lives.
Infomedia has invaluable automotive domain knowledge
thanks to 25 years of experience building software systems
for fi xed operations. And, as a software company with a
culture based on agility and constant innovation, we are
poised to help our global customers maximise the economic
potential of this new era of connected vehicles.
Our dealer solutions are accessible, aff ordable and
dependable, leading the industry with data-driven innovation
and intuitive cloud applications. We remain committed to
generating value for all Infomedia stakeholders by maximising
the value of these assets, as well as building new assets to
drive future business.
Peter PetrovskiDirector of Marketing
1 ZDNet.com 2 Gartner Research
Big Data is already eff ectively used by Amazon and other
online retailers to anticipate their customers’ needs, increase
selling power and maximise the retail experience. In the
automotive industry, the use of telematics has provided
some basic data benefi ts in the area of safety, security and
infotainment; however, current data platforms are proprietary
and closed to third party technology providers. The data
mined through telematics has also not off ered the interactive
experiences that digital consumers demand. The coming
era in smart mobility will utilise open data platforms. Vehicle
owners will be able to integrate their car to their devices (and
lifestyle) via value-add applications and services, much in the
way they use apps on their smart phones today.
At Infomedia, we are building Big Data into our innovation
pipeline. We have a strong understanding of automaker data
structures and data management systems and we have built
dedicated cloud technology to store, manage and value-add
automaker parts and service data. As connected vehicles
CONNECTED VEHICLES

19SUPERSERVICE.COM
Directors were in offi ce from the beginning of the fi nancial
year until the date of this report, unless otherwise stated. The
names and details of the Directors of the Company in offi ce
during the fi nancial year and until the date of this report are:
Andrew Pattinson*Chief Executive Offi cer and Executive Director
Andrew Pattinson is a 25-year veteran of the Company,
having held several senior positions including Director of the
Company between the period of October 2001 and October
2004. He joined the Company in 1988 and was appointed
as COO in 1994, and in 2000 became General Manager of
its fi rst corporate acquisition, Melbourne based Datateck
Publishing Pty Ltd. There, he orchestrated the successful
business integration and oversaw its evolution to become the
Company’s second development centre and the eventual home
of Superservice Menus. In 2004, Mr Pattinson established and
became Managing Director of Infomedia’s UK based European
subsidiary. He returned to Australia in 2009 as Director of the
Company’s Global Solutions and Systems division.
Mr Pattinson was appointed CEO and elected to the Board on
27 September 2013.
Clyde McConaghy^ Non-Executive Director
(Chairman of Audit, Risk & Governance Committee)
Clyde McConaghy was appointed to the Infomedia Board
of Directors on 1 November 2013. Mr McConaghy has in
excess of 15 years’ experience as a senior international
Board Director and Executive of publicly listed and private
companies. Having lived in Germany, China, the UK and
Australia, his experience encompasses both multinational
and early stage companies, in the technology, media and
publishing, and venture capital sectors. He held a number of
senior positions within BMW Australia. He was a director at
The Economist Intelligence Unit in London and a founding
director of World Markets Research Centre Plc (LSX:WMRC),
both including Automotive industry analysis divisions. He is
also currently a director of Integrated Research Ltd (ASX:IRI)
and Serko (NZX:SKO). He is also Managing Director of Optima
Boards, a board advisory fi rm for companies and non-for-
profi t entities worldwide.
Mr McConaghy is Chairman of the Audit, Risk and
Governance Committee, and his current term will expire at
the close of the 2014 Annual General Meeting.
Frances Hernon**Non-Executive Chairman
Frances Hernon was appointed Chairman on 19 February 2014.
Ms Hernon has extensive experience in media, publishing,
marketing and technology and during her executive career she
developed broad commercial experience across a wide range
of companies.
Ms Hernon serves the Board as Lead Non-Executive Director
for all matters that formerly fell within the ambit of the
Remuneration & Nomination Committee. Ms Hernon has
served as a Non-Executive Director on Infomedia’s Board
since 19 June 2000.
She was last re-elected to the Board in October 2013.
Myer HerszbergNon-Executive Director
Myer Herszberg has been a Director of Infomedia since 1992.
Mr Herszberg has extensive consumer electronics experience
and was active in bringing home computers to Australia in the
early 1980s, as well as many other leading edge electronic
products. He also has extensive experience in the commercial
property market, and is active in a number of community
service organisations.
Mr Herszberg was last re-elected to the Board in October 2012.
Richard GrahamNon-Executive Director
Mr Richard Graham has held senior management positions in
the American and Australian computer industry since 1977. In
1988, Mr Graham co-founded the Company and served as the
Chairman and Managing Director/CEO of Infomedia from its
establishment until he retired as CEO in December 2004. He
continued his role as Chairman from 2004 until August 2010.
In August 2010, Mr Graham returned to the Company in an
operational role as Executive Chairman, until Mr Pattinson’s
appointment as CEO in September 2013. Mr Graham retired
from his role as Executive Chairman in February 2014, but
remains on the Board as a Non-Executive Director.
He was last re-elected to the Board in October 2008.
*On 27 September 2013 Richard Graham became Non-Executive Chairman.
Andrew Pattinson was made Chief Executive Offi cer and appointed to the Board.
** On 19 February 2014 Frances Hernon was appointed Non-Executive Chairman
^Appointed 1 November 2013
DIRECTORS
Clyde McConaghy Frances Hernon Myer Herszberg Richard GrahamAndrew Pattinson
20 SUPERSERVICE.COM
DIRECTORS’ REPORT
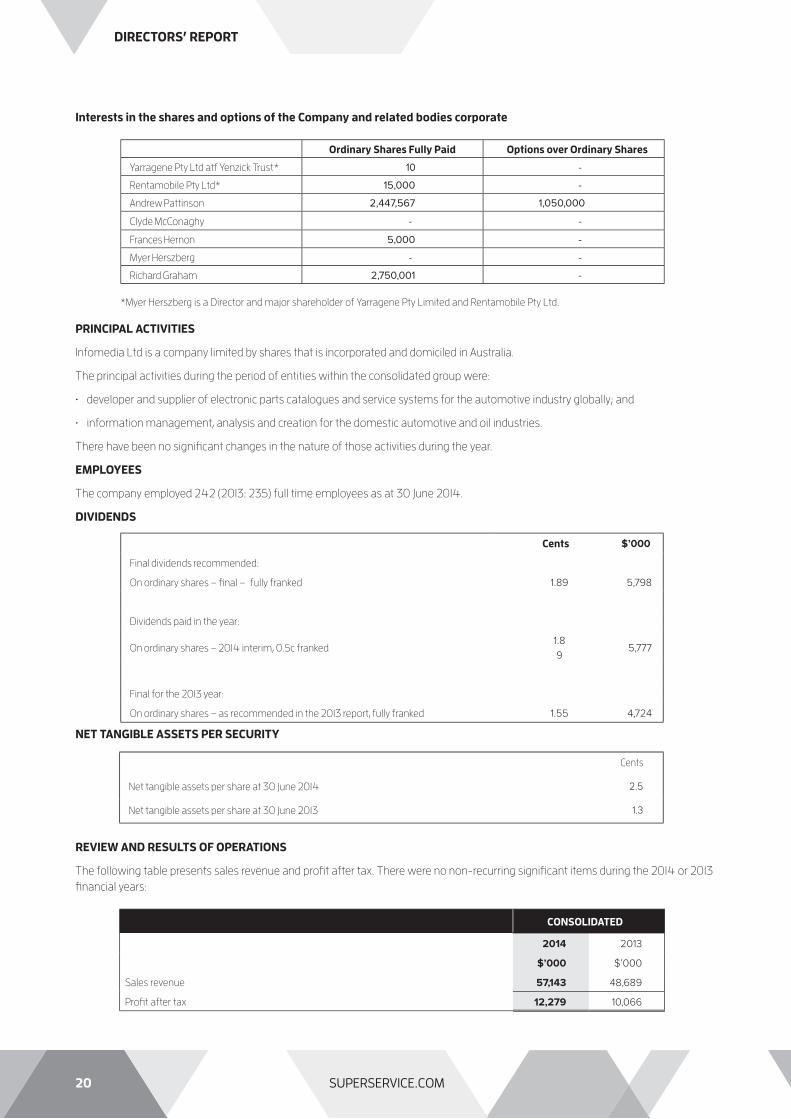
Interests in the shares and options of the Company and related bodies corporate
PRINCIPAL ACTIVITIES
Infomedia Ltd is a company limited by shares that is incorporated and domiciled in Australia.
The principal activities during the period of entities within the consolidated group were:
• developer and supplier of electronic parts catalogues and service systems for the automotive industry globally; and
• information management, analysis and creation for the domestic automotive and oil industries.
There have been no signifi cant changes in the nature of those activities during the year.
EMPLOYEES
The company employed 242 (2013: 235) full time employees as at 30 June 2014.
DIVIDENDS
NET TANGIBLE ASSETS PER SECURITY
REVIEW AND RESULTS OF OPERATIONS
The following table presents sales revenue and profi t after tax. There were no non-recurring signifi cant items during the 2014 or 2013
fi nancial years:
Ordinary Shares Fully Paid Options over Ordinary Shares
Yarragene Pty Ltd atf Yenzick Trust* 10 -
Rentamobile Pty Ltd* 15,000 -
Andrew Pattinson 2,447,567 1,050,000
Clyde McConaghy - -
Frances Hernon 5,000 -
Myer Herszberg - -
Richard Graham 2,750,001 -
*Myer Herszberg is a Director and major shareholder of Yarragene Pty Limited and Rentamobile Pty Ltd.
Cents $’000
Final dividends recommended:
On ordinary shares – fi nal – fully franked 1.89 5,798
Dividends paid in the year:
On ordinary shares – 2014 interim, 0.5c franked1.8
95,777
Final for the 2013 year:
On ordinary shares – as recommended in the 2013 report, fully franked 1.55 4,724
Cents
Net tangible assets per share at 30 June 2014 2.5
Net tangible assets per share at 30 June 2013 1.3
CONSOLIDATED
2014 2013
$’000 $’000
Sales revenue 57,143 48,689
Profi t after tax 12,279 10,066

21SUPERSERVICE.COM
DIRECTORS’ REPORT
REVIEW AND RESULTS OF OPERATIONS (CONTINUED)
The results for the year ending 30 June 2014 show that the Company’s Net Profi t After Tax (NPAT) grew by 22.0% to $12.3m and Sales
revenues grew by 17.4% to $57.1m.
The Company’s NPAT exceeded previously advised guidance by $0.3m. The achievement of NPAT beyond guidance is attributed to
sales growth combined with tight cost control and a small benefi t from a weaker Australian dollar compared with that used for guidance.
The increase in Sales Revenue was driven by growth in all major product lines. Electronic Parts Catalogue Solutions (EPC) revenue
grew $6.6m, Superservice revenue grew $2.2m and other revenue reduced $0.4m.
Subscription Equivalents increased to an all-time high of 75,838 with Superservice products increasing 9.2% to 18,274 subscriptions,
and EPC subscriptions by 1.5% to 57,564.
In constant currency terms, sales revenue rose by $2.9m and operating costs increased $1.1m. Foreign currency translations favourably
aff ected constant currency EBITDA over the prior year by $2.0m. Consequently, the Company achieved an EBITDA (excluding
capitalisation of research and development) of $16.5m, an increase of $3.8m (30.0%).
The Company saw increased capitalisation and amortisation during the year and a higher tax expense. Overall, NPAT increased $2.2m
or 22.0% to $12.3m.
Cash fl ows from operations increased $1.2m to $12.5m due to the higher profi t.
The Company is debt free and had $11.4m of cash as at 30 June 2014.
The Board has declared a fully franked fi nal dividend payment of 1.89 cents per share. This, together with the interim dividend of
1.89 cents (franked to 0.5 cents), results in a total dividend of 3.78 cents for the full year which is 34% higher than the prior year and
represents a payout ratio of 94% of NPAT.
The record date to determine entitlements to the dividend distribution is 3 September 2014 and the date on which the dividend is
payable is 17 September 2014.
With regards to FY2015, the Company advises that it expects both constant currency and reported AUD growth. Accordingly, the
Company provides guidance that it expects NPAT to exceed $14.5 million in FY2015 driven by increasing sales.
SIGNIFICANT CHANGES IN THE STATE OF AFFAIRS
There has been no signifi cant change in the state of aff airs of the Company since the last Directors’ Report.
MATTERS SUBSEQUENT TO THE END OF THE FINANCIAL YEAR
There has been no matter or circumstance that has arisen since the end of the fi nancial year that has signifi cantly aff ected the
operations of the Company, the results of those operations, or the state of aff airs of the Company.
LIKELY DEVELOPMENTS AND EXPECTED RESULTS
In the year ahead the Company expects to continue to release its internet-based products. The company expects to continue
increasing Superservice™ revenue.
ENVIRONMENTAL REGULATION AND PERFORMANCE
The Company is not subject to any particular or signifi cant environmental regulation under a law of the Commonwealth of Australia or
of a State or Territory.
SHARE OPTIONS
Unissued shares
At the date of this report, there were 4,630,000 unissued ordinary shares under options. Refer to Note 19 of the fi nancial statements
for further details of the options outstanding.
Shares issued as a result of the exercise of options.
There were 3,190,000 shares issued as a result of the exercise of options during the year. Since the end of the fi nancial year there
have been no options exercised.
INDEMNIFICATION AND INSURANCE OF DIRECTORS AND OFFICERS
During the year the Company paid a premium in relation to insuring Directors and other offi cers against liability incurred in their
capacity as a Director or offi cer of the Company. The insurance contract specifi cally prohibits the disclosure of the nature of the policy
and amount of premium paid.

22 SUPERSERVICE.COM
REMUNERATION REPORT – AUDITED
This remuneration report outlines the Director and Executive remuneration arrangements of the Company and the Group in
accordance with the requirements of the Corporations Act 2001 and its regulations. For the purposes of this report, Key Management
Personnel (KMP) of the Group are defi ned as those persons having authority and responsibility for planning, directing and controlling
the major activities of the Company and the Group, directly or indirectly, including any Director (whether Executive or otherwise) of the
parent company.
Details of Key Management Personnel
(i) Directors
Clyde McConaghy^ Non-Executive Director
Frances Hernon** Non-Executive Chairman
Myer Herszberg Non-Executive Director
Richard Graham* Non-Executive Director
(ii) Executives
Andrew Pattinson* Chief Executive Offi cer and Executive Director
Jonathan Pollard Chief Financial Offi cer
Karen Blunden CEO IFM Americas
Michael Roach General Manager Asia Pacifi c
Nick Georges Company Secretary and Legal Counsel
*On 27 September 2013 Richard Graham became Non-Executive Chairman. Andrew Pattinson was made Chief Executive Offi cer and appointed to the Board.
** On 19 February 2014 Frances Hernon was appointed Non-Executive Chairman
^Appointed 1 November 2013
Compensation Philosophy
The performance of the Company depends upon the quality of its Directors and Executives. To prosper, the Company must attract,
motivate and retain highly skilled Directors and Executives. To this end, the Company embodies the following principles in its
compensation framework:
• Provide competitive rewards to attract high calibre executives;
• Link executive rewards to shareholder value; and
• Establish appropriate performance hurdles in relation to variable executive compensation.
Remuneration Decisions
This year your Directors decided to review Infomedia’s approach to Senior Executive remuneration. Previously, Ms. Hernon, in her
capacity as lead director for all matters that formerly fell within the former Remuneration & Nomination Committee of the Board of
Directors was responsible for recommending to the Board the Company’s remuneration and compensation policy arrangements
for all Key Management Personnel (KMP). Ms. Hernon, together with the Non-Executive members of the Board, assessed the
appropriateness of the nature and amount of these emoluments on a periodic basis by reference to relevant employment market
conditions with the overall objective of ensuring maximum stakeholder benefi t from the retention of a high quality Board and
Executive team.
Whilst the Board considers the Company’s current approach to senior executive remuneration to be in the interests of shareholders
and its appropriateness is refl ected in the results of the Company, Ms. Hernon as Chairman, with the assistance of external advisors, is
leading a Board review with the aim of providing recommendations to the Board prior to the Company’s next Annual General Meeting.
Compensation Structure
For the reporting year, Infomedia’s approach was in accordance with best practice corporate governance recommendations,
to maintain the structure of Non-Executive Director and senior executive compensation as separate and distinct.
DIRECTORS’ REPORT
23SUPERSERVICE.COM
REMUNERATION REPORT (CONTINUED) - AUDITED
Non-Executive Director Compensation
Objective
The Board seeks to set aggregate compensation at a level which provides the Company with the ability to attract and retain Directors
of appropriate calibre, whilst incurring a cost which is acceptable to shareholders.
Structure
The Constitution and the ASX Listing Rules specify that the aggregate compensation of Non-Executive Directors shall be determined
from time to time by a general meeting. An amount not exceeding the amount determined is then available between the Directors
as appropriate (for the year ended 30 June 2014) Non-Executive Directors’ compensation totalled $297,593 (2013: $153,335). The
increase was due to an increase in the number of Directors. The latest determination was at the Annual General Meeting held on 30
October 2002 when shareholders approved a maximum aggregate compensation of $450,000 per year.
The Board has historically considered the advice from external consultants as well as the fees paid to Non-Executive Directors of
comparable companies when undertaking a review process. During the current review it was found that the Non-Executive Director
remuneration was below the median compensation for Directors of companies of similar size and complexity. Consequently, a salary
increase of 5% was approved for each Director. This was the fi rst salary increase since 2007 for Non-Executive Directors..
Senior Executive and Executive Director Compensation Objective
The Company aims to reward executives with a level and mix of compensation commensurate with their position and responsibilities
within the Company and so as to:
• reward executives for Company and individual performance against targets set by reference to appropriate benchmarks;
• align the interests of executives with those of shareholders;
• link reward with the strategic goals and performance of the Company; and
• ensure total compensation is competitive by market standards.
The Company’s policy is to pay at the median level for roles as measured against the Mercer data and/or market data to determine the
salary levels.
Structure
In determining the level and make-up of executive compensation, the Company engages an external consultant from time to time to
provide independent advice but more typically conducts its own market salary review of similar companies to determining the level
and make-up of executive compensation.
Compensation consists of the following key elements: Fixed Compensation;
Variable Compensation - Short Term Incentive (STI); and
Variable Compensation - Long Term Incentive (LTI)
The actual proportion of fi xed compensation and variable compensation (potential short term and long term incentives) is established
for KMP (excluding the CEO and Non-Executive Directors) by the CEO in conjunction with the lead director (Ms. Hernon) for all
remuneration matters, and in the case of the CEO, by the Chairman of the Board. Other executive salaries are determined by the CEO
with reference to market conditions.
For new CEO, Andrew Pattinson, the “at risk” component of his base salary is 19%. His KPIs include various measures relating to the
Company’s general performance as well as fi nancial targets. Andrew’s base salary is $310,458 plus superannuation.
Fixed Compensation
Objective
The level of fi xed compensation is set so as to provide a base level of compensation which is both appropriate to the position and
is competitive in the market. Fixed compensation is reviewed periodically by the CEO in conjunction with the Chairman for the KMP
excluding the CEO where the Chairman has access to external advice independent of management. All other executive positions are
reviewed periodically by the CEO or Chairman.
DIRECTORS’ REPORT
24 SUPERSERVICE.COM
REMUNERATION REPORT (CONTINUED) - AUDITED
Structure
Executives are given the opportunity to receive their fi xed (primary) compensation in a variety of forms including cash or other
designated employee expenditure such as motor vehicles. It is intended that the manner of payment chosen will be optimal for the
recipient without creating undue cost for the Company.
Variable Compensation – Short Term Incentive (STI) Objective
The objective of STI compensation is to link the achievement of both individual performance and Company performance with the
compensation received by the executive.
Structure
The structure of STI compensation is a cash bonus dependent upon a combination of individual performance objectives and
Company objectives being met. This refl ects the Company wide practice of ‘Performance Planning & Review’ (PPR) procedures.
Individual performance objectives centre on key focus areas which are very specifi c to the organisation and its operations. Company
objectives include achieving budgetary targets that are set at the commencement of the fi nancial year (adjusted where necessary
for currency fl uctuations). In FY2014 all fi nancial targets were exceeded and, therefore, KMP will receive at least 60% of their STI
compensation. The STIs for FY2014 represent an amount equivalent to 19% of the KMP’s base salary.
REMUNERATION REPORT (CONTINUED) - AUDITED
These performance conditions were chosen, in the case of individual performance objectives, to promote and maintain the individual’s
focus on their own contribution to the Company’s strategic objectives through individual achievement in key result areas (KRAs) which
include, for example, ‘leadership’, ‘decision making’, ‘results’ and ‘risk management’. In the case of Company objectives, budgetary
performance conditions were chosen to promote and maintain a collaborative, Company wide focus on the achievement of those targets.
In assessing whether an individual performance condition has been satisfi ed, pre-agreed key performance indicators (KPIs) are
used. In assessing whether Company objectives have been satisfi ed, Board level pre-determined budgetary targets are used. These
methods have been chosen to create clear and measurable performance targets.
Variable Compensation – Long Term Incentive (LTI)
Objective
The objective of the LTI plan is to reward executives in a manner which aligns this element of compensation with the creation of
shareholder wealth. As such LTI grants are made to executives who are able to infl uence the generation of shareholder wealth and
thus have a direct impact on the Company’s performance against the relevant long term performance hurdle.
Structure
The structure of LTI compensation is in the form of share options pursuant to the Company’s employee option plans.
Options granted to employees vest subject to the following hurdles:
1. Time: the options vest in three equal tranches over three years post the date of grant;
2. Share price appreciation: the traded share price of the Company must increase by 10% year on year over the exercise price of
the options; and
3. Service: the option holders must remain in the employment of the Company at any relevant vesting date. Employees who depart
the Company automatically forfeit any unexercised options.
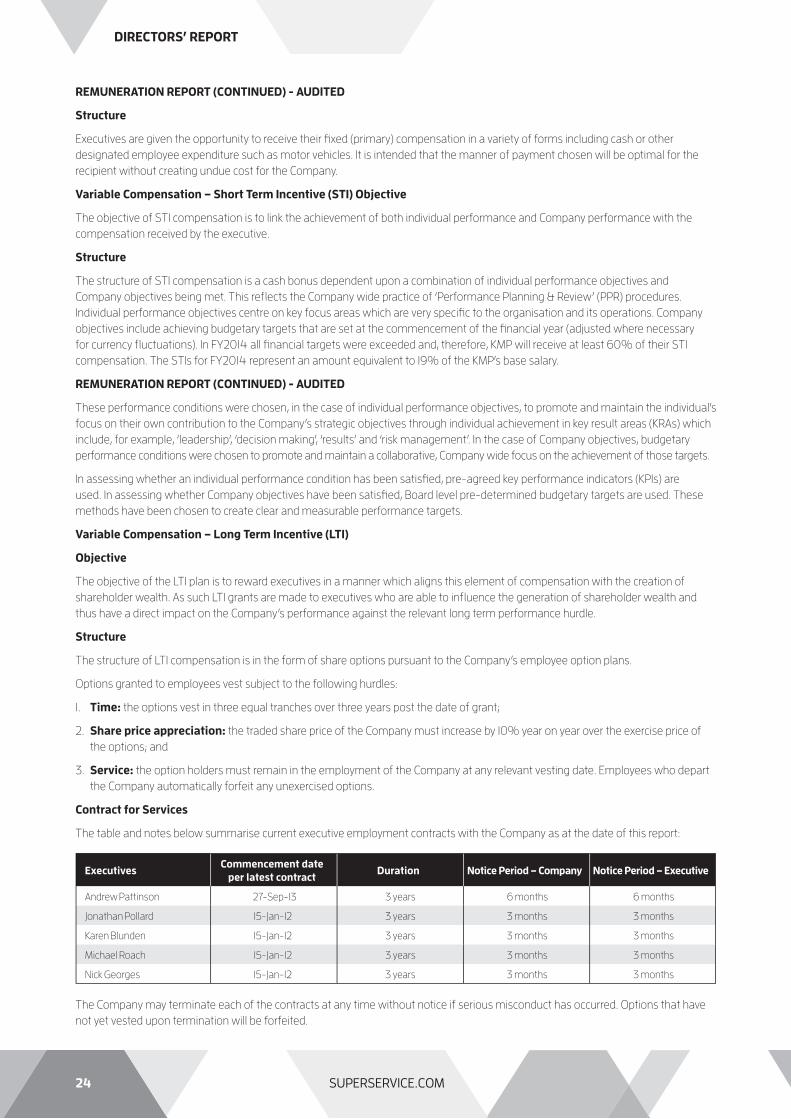
Contract for Services
The table and notes below summarise current executive employment contracts with the Company as at the date of this report:
ExecutivesCommencement date
per latest contractDuration Notice Period – Company Notice Period – Executive
Andrew Pattinson 27-Sep-13 3 years 6 months 6 months
Jonathan Pollard 15-Jan-12 3 years 3 months 3 months
Karen Blunden 15-Jan-12 3 years 3 months 3 months
Michael Roach 15-Jan-12 3 years 3 months 3 months
Nick Georges 15-Jan-12 3 years 3 months 3 months
The Company may terminate each of the contracts at any time without notice if serious misconduct has occurred. Options that have
not yet vested upon termination will be forfeited.
DIRECTORS’ REPORT

25SUPERSERVICE.COM
REMUNERATION REPORT (CONTINUED) - AUDITED
Key Management Personnel for the year ended 30 June 2014 and 30 June 2013 is set out below. The amounts are based on
individual contracts with each person. The proportion of remuneration that is based on performance is dependent on their individual
achievement of KPI’s
Short-TermPost
EmploymentShare Based
PaymentsLong Service
leaveTotal
Percentage Performance
Related
Percentage Attributable to Options
2014 Financial Year: Salary & Fees BonusNon
Monetary Benefi ts
Superannuation Options
$ $ $ $ $ $ $ % %
Directors:
Clyde McConaghy^ 44,846 - - 4,148 - - 48,994 - -
Frances Hernon1 76,587 - - 7,084 - - 83,671 - -
Myer Herszberg 56,300 - - 5,208 - - 61,508 - -
Richard Graham1 94,664 - - 8,756 - - 103,420 - -
Executives:
Andrew Pattinson1 310,813 58,987 - 28,750 65,895 5,174 469,619 13% 14%
Jonathan Pollard 249,076 47,270 - 23,040 4,262 3,732 327,380 14% 1%
Karen Blunden 290,029 52,650 1,091 - 4,262 - 348,032 15% 1%
Michael Roach 225,659 42,826 - 20,873 4,262 3,757 297,377 14% 1%
Nick Georges 215,014 40,806 - 19,937 4,262 3,579 283,598 14% 2%
Total 1,562,988 242,539 1,091 117,796 82,943 16,242 2,023,599
Short-TermPost
EmploymentShare Based
PaymentsLong Service
leaveTotal
Percentage Performance
Related
Percentage Attributable to Options
2013 Financial Year: Salary & Fees Bonus
Non
Monetary
Benefi ts
Superannuation Options
$ $ $ $ $ $ $ % %
Frances Hernon 56,250 - - 5,062 - - 61,312 - -
Geoff Henderson* 28,125 - - 2,531 - - 30,656 - -
Myer Herszberg 56,300 - - 5,067 - - 61,367 - -
Richard Graham 115,000 - - 10,350 - - 125,350 - -
Executives:
Andrew Pattinson 292,000 55,480 - 26,280 10,061 4,867 388,688 14% 3%
Jonathan Pollard 234,000 44,460 - 21,060 10,061 3,120 312,701 14% 3%
Karen Blunden 256,056 44,890 968 - 10,061 - 311,975 14% 3%
Michael Roach 212,000 40,280 - 19,080 10,061 3,533 284,954 14% 4%
Nick Georges 202,000 38,380 - 18,227 10,061 3,367 272,035 14% 4%
Total 1,451,731 223,490 968 107,657 50,305 14,887 1,849,038
*Resigned 3rd January 2013
^Appointed 1 November 2013
1 On 27 September 2013 Richard Graham resigned as Non-Executive Chairman. Andrew Pattinson was made Chief Executive Offi cer and appointed to the
Board. On 19 February 2014 Frances Hernon was appointed Non-Executive Chairman.
Bonuses were paid at a rate of 100% of maximum bonus potential (2013: 100%)
DIRECTORS’ REPORT

26 SUPERSERVICE.COM
Terms and Conditions for each Grant Vested Exercised
ExecutivesOptions
Issued No.Grant date
Fair value per option
at grant date ($)
Exercise price per
option ($)
Expiry date
No. % No. %
Andrew Pattinson 450,000 15/1/2012 0.050 0.190 14/3/2015 300,000 66.7% 150,000 50.0%
Andrew Pattinson 750,000 27/9/2013 0.110 0.565 31/10/2016 - 0.0% - 0.0%
Jonathan Pollard 450,000 15/1/2012 0.050 0.190 14/3/2015 300,000 66.7% 300,000 100.0%
Karen Blunden 450,000 15/1/2012 0.050 0.190 14/3/2015 300,000 66.7% 300,000 100.0%
Michael Roach 450,000 15/1/2012 0.050 0.190 14/3/2015 300,000 66.7% 300,000 100.0%
Nick Georges 450,000 15/1/2012 0.050 0.190 14/3/2015 300,000 66.7% 300,000 100.0%
Total 3,000,000 1,500,000 50.0% 1,350,000 90.0%
Terms and Conditions for each Grant Vested Exercised
ExecutivesOptions
Issued No.Grant date
Fair value per option
at grant date ($)
Exercise price per
option ($)
Expiry date
No. % No. %
Andrew Pattinson 450,000 15/1/2012 0.050 0.190 14/3/2015 300,000 33.3% - 0.0%
Jonathan Pollard 450,000 15/1/2012 0.050 0.190 14/3/2015 300,000 33.3% - 0.0%
Karen Blunden 450,000 15/1/2012 0.050 0.190 14/3/2015 300,000 33.3% 150,000 100.0%
Michael Roach 450,000 15/1/2012 0.050 0.190 14/3/2015 300,000 33.3% - 0.0%
Nick Georges 450,000 15/1/2012 0.050 0.190 14/3/2015 300,000 33.3% 150,000 100.0%
Total 2,250,000 750,000 33.0% 300,000 40.0%
REMUNERATION REPORT (CONTINUED) - AUDITED
Option holdings of Key Management Personnel (Consolidated)
REMUNERATION REPORT (CONTINUED) - AUDITED
Shareholdings of Key Management Personnel - Number of shares held in Infomedia Ltd
2014 Financial Year:
Balance at beginning of period
Granted as compensation
Options exercised
ExpiredBalance at end
of periodVested at 30 June 2014
Executives 1 July 2013 30 June 2014 Not exercisable Exercisable
Andrew Pattinson 450,000 750,000 (150,000) - 1,050,000 900,000 150,000
Jonathan Pollard 450,000 - (300,000) - 150,000 150,000 -
Karen Blunden 300,000 - (150,000) - 150,000 150,000 -
Michael Roach 450,000 - (300,000) - 150,000 150,000 -
Nick Georges 300,000 - (150,000) - 150,000 150,000 -
Total 1,950,000 750,000 (1,050,000) - 1,650,000 1,500,000 150,000
2013 Financial Year:
Balance at beginning of period
Granted as compensation
Options exercised
ExpiredBalance at end
of periodVested at 30 June 2014
Executives 1 July 2012 30 June 2013 Not exercisable Exercisable
Andrew Pattinson 450,000 - - - 450,000 300,000 150,000
Jonathan Pollard 450,000 - - - 450,000 300,000 150,000
Karen Blunden 450,000 - (150,000) - 300,000 300,000 -
Michael Roach 450,000 - - - 450,000 300,000 150,000
Nick Georges 450,000 - (150,000) - 300,000 300,000 -
Total 2,250,000 750,000 (1,050,000) - 1,950,000 1,500,000 450,000
DIRECTORS’ REPORT

27SUPERSERVICE.COM
REMUNERATION REPORT (CONTINUED) - AUDITED
Shareholdings of Key Management Personnel - Number of shares held in Infomedia Ltd
2014 Financial Year:Balance
30 June 2013Granted as
compensationOn exercise of options
Net change otherBalance 30 June
2014
Directors
Clyde McConaghy^ - - - - -
Frances Hernon 5,000 - - - 5,000
Myer Herszberg 23,436,599 - - (23,421,589) 15,010
Richard Graham 103,390,901 - - (100,640,900) 2,750,001
Executives
Andrew Pattinson 2,447,567 - 150,000 (150,000) 2,447,567
Jonathan Pollard 1,996 - 300,000 (200,000) 101,996
Karen Blunden 150,000 - 150,000 - 300,000
Michael Roach 18,721 - 300,000 (300,000) 18,721
Nick Georges 153,000 - 150,000 (303,000) -
Total 129,603,784 - 1,050,000 (125,015,489) 5,638,295
2013 Financial Year:Balance
30 June 2012Granted as
compensationOn exercise of options
Net change otherBalance 30 June
2013
Directors
Frances Hernon 5,000 - - - 5,000
Geoff Henderson* - - - - -
Myer Herszberg 23,436,599 - - - 23,436,599
Richard Graham 103,390,901 - - - 103,390,901
Executives
Andrew Pattinson 2,447,567 - - - 2,447,567
Jonathan Pollard 1,996 - - - 1,996
Karen Blunden - - 150,000 - 150,000
Michael Roach 18,721 - - - 18,721
Nick Georges 24,421 - 150,000 (21,421) 153,000
Total 129,325,205 - 1,050,000 (21,421) 129,603,784
*Resigned 3/01/13
^Appointed 1 November 2013
All equity transactions with key management personnel other than those arising from the exercise of compensation options and compensation shares
have been entered into under terms and conditions no more favourable than those the entity would have adopted if dealing at arm’s length.
Loans to Key Management Personnel There were no loans at the beginning or the end of the reporting period to key management personnel. No loans were made available during the
reporting period to key management personnel.
DIRECTORS’ REPORT
28 SUPERSERVICE.COM
REMUNERATION REPORT (CONTINUED) - AUDITED
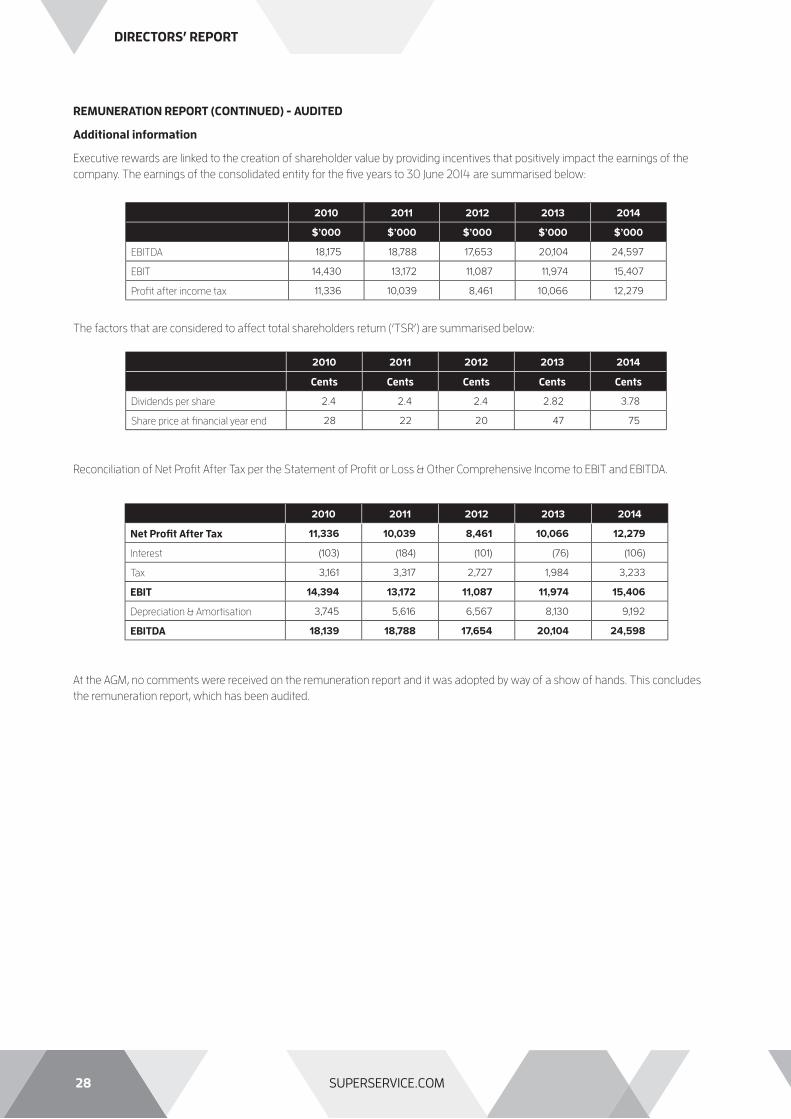
Additional information
Executive rewards are linked to the creation of shareholder value by providing incentives that positively impact the earnings of the
company. The earnings of the consolidated entity for the fi ve years to 30 June 2014 are summarised below:
The factors that are considered to aff ect total shareholders return (‘TSR’) are summarised below:
Reconciliation of Net Profi t After Tax per the Statement of Profi t or Loss & Other Comprehensive Income to EBIT and EBITDA.
At the AGM, no comments were received on the remuneration report and it was adopted by way of a show of hands. This concludes
the remuneration report, which has been audited.
2010 2011 2012 2013 2014
$’000 $’000 $’000 $’000 $’000
EBITDA 18,175 18,788 17,653 20,104 24,597
EBIT 14,430 13,172 11,087 11,974 15,407
Profi t after income tax 11,336 10,039 8,461 10,066 12,279
2010 2011 2012 2013 2014
Cents Cents Cents Cents Cents
Dividends per share 2.4 2.4 2.4 2.82 3.78
Share price at fi nancial year end 28 22 20 47 75
2010 2011 2012 2013 2014
Net Profi t After Tax 11,336 10,039 8,461 10,066 12,279
Interest (103) (184) (101) (76) (106)
Tax 3,161 3,317 2,727 1,984 3,233
EBIT 14,394 13,172 11,087 11,974 15,406
Depreciation & Amortisation 3,745 5,616 6,567 8,130 9,192
EBITDA 18,139 18,788 17,654 20,104 24,598
DIRECTORS’ REPORT
29SUPERSERVICE.COM
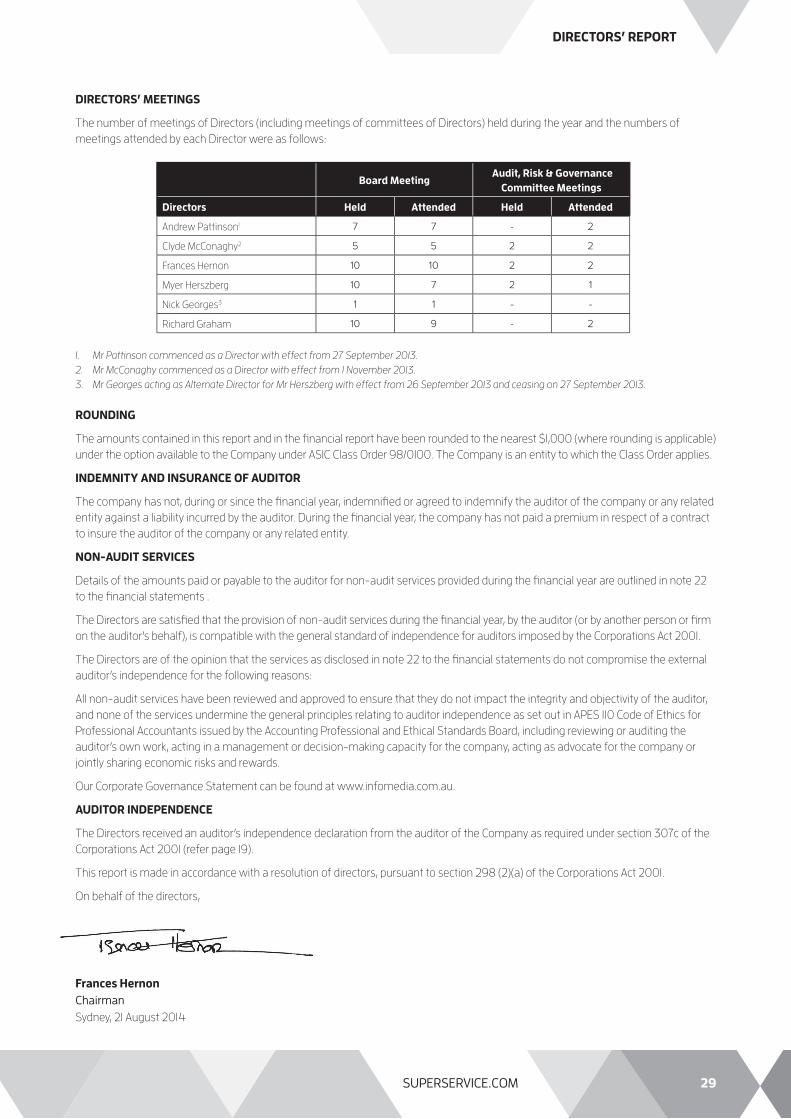
DIRECTORS’ MEETINGS
The number of meetings of Directors (including meetings of committees of Directors) held during the year and the numbers of
meetings attended by each Director were as follows:
Board Meeting Audit, Risk & Governance
Committee Meetings
Directors Held Attended Held Attended
Andrew Pattinson1 7 7 - 2
Clyde McConaghy2 5 5 2 2
Frances Hernon 10 10 2 2
Myer Herszberg 10 7 2 1
Nick Georges3 1 1 - -
Richard Graham 10 9 - 2
1. Mr Pattinson commenced as a Director with effect from 27 September 2013.
2. Mr McConaghy commenced as a Director with effect from 1 November 2013.
3. Mr Georges acting as Alternate Director for Mr Herszberg with effect from 26 September 2013 and ceasing on 27 September 2013.
ROUNDING
The amounts contained in this report and in the fi nancial report have been rounded to the nearest $1,000 (where rounding is applicable)
under the option available to the Company under ASIC Class Order 98/0100. The Company is an entity to which the Class Order applies.
INDEMNITY AND INSURANCE OF AUDITOR
The company has not, during or since the fi nancial year, indemnifi ed or agreed to indemnify the auditor of the company or any related
entity against a liability incurred by the auditor. During the fi nancial year, the company has not paid a premium in respect of a contract
to insure the auditor of the company or any related entity.
NON-AUDIT SERVICES
Details of the amounts paid or payable to the auditor for non-audit services provided during the fi nancial year are outlined in note 22
to the fi nancial statements .
The Directors are satisfi ed that the provision of non-audit services during the fi nancial year, by the auditor (or by another person or fi rm
on the auditor’s behalf), is compatible with the general standard of independence for auditors imposed by the Corporations Act 2001.
The Directors are of the opinion that the services as disclosed in note 22 to the fi nancial statements do not compromise the external
auditor’s independence for the following reasons:
All non-audit services have been reviewed and approved to ensure that they do not impact the integrity and objectivity of the auditor,
and none of the services undermine the general principles relating to auditor independence as set out in APES 110 Code of Ethics for
Professional Accountants issued by the Accounting Professional and Ethical Standards Board, including reviewing or auditing the
auditor’s own work, acting in a management or decision-making capacity for the company, acting as advocate for the company or
jointly sharing economic risks and rewards.
Our Corporate Governance Statement can be found at www.infomedia.com.au.
AUDITOR INDEPENDENCE
The Directors received an auditor’s independence declaration from the auditor of the Company as required under section 307c of the
Corporations Act 2001 (refer page 19).
This report is made in accordance with a resolution of directors, pursuant to section 298 (2)(a) of the Corporations Act 2001.
On behalf of the directors,
Frances Hernon
Chairman
Sydney, 21 August 2014
DIRECTORS’ REPORT


31SUPERSERVICE.COM
STATEMENT OF PROFITOR LOSS AND OTHER
COMPREHENSIVE INCOME
YEAR ENDED 30 June 2014 Notes CONSOLIDATED
2014 2013
$’000 $’000
Sales revenue 57,143 48,689
Expenditure
Research and development expenses 3 (13,778) (12,362)
Sales and marketing expenses (14,677) (12,631)
General and administration expenses (11,780) (11,868)
Total expenditure (40,235) (36,861)
Other income and expenses
Finance income 106 76
Currency exchange gains/(losses) (1,502) 146
Profi t before income tax 15,512 12,050
Income tax expense 4 (3,233) (1,984)
Profi t for the year 12,279 10,066
Other comprehensive income
Items that may be subsequently reclassifi ed to profi t or loss
Foreign currency translation diff erences for foreign operations 132 854
Eff ective cashfl ow hedges gain/(losses) recognised in equity 1,079 (1,240)
Other comprehensive income for the period, net of tax 1,211 (386)
Total comprehensive income for the period 13,490 9,680
Basic earnings per share (cents per share) 4.02 3.32
Diluted earnings per share (cents per share) 4.00 3.29
Dividends per share - ordinary (cents per share) 6 3.78 2.82
1The presentation of Statement of Profi t or Loss & Other Comprehensive Income has been revised during the year and the comparative amounts
restated. See note 2 (aa) for further details.
The above Statement of Profi t or Loss & Other Comprehensive Income should be read in conjunction with the attached notes.

32 SUPERSERVICE.COM
STATEMENT OFFINANCIAL POSITION
As at 30 June 2014 Notes CONSOLIDATED
2014 2013
CURRENT ASSETS $’000 $’000
Cash and cash equivalents 17(b) 11,410 9,299
Trade and other receivables 7 6,162 5,304
Inventories 8 - 1
Prepayments 926 1,214
Derivatives 26 460 -
TOTAL CURRENT ASSETS 18,958 15,818
NON-CURRENT ASSETS
Property, plant and equipment 9 1,269 1,438
Intangible assets and goodwill 10 34,322 34,359
TOTAL NON-CURRENT ASSETS 35,591 35,797
TOTAL ASSETS 54,549 51,615
CURRENT LIABILITIES
Trade and other payables 12 2,601 2,634
Derivatives 26 - 2,193
Provisions 13 2,339 2,039
Income tax payable 1,149 611
Deferred revenue 14 477 668
TOTAL CURRENT LIABILITIES 6,566 8,145
NON-CURRENT LIABILITIES
Provisions 15 498 448
Deferred tax liabilities 4 5,496 4,854
TOTAL NON-CURRENT LIABILITIES 5,994 5,302
TOTAL LIABILITIES 12,560 13,447
NET ASSETS 41,989 38,168
EQUITY
Contributed equity 16 11,476 10,855
Reserves 16 1,569 147
Retained profi ts 28,944 27,166
TOTAL EQUITY 41,989 38,168
The above Statement of Financial Position should be read in conjunction with the attached notes.

33SUPERSERVICE.COM
STATEMENT OF CASH FLOWS
YEAR ENDED 30 June 2014 Notes CONSOLIDATED
2014 2013
$’000 $’000
CASH FLOWS FROM OPERATING ACTIVITIES
Receipts from customers 55,085 50,179
Payments to suppliers and employees (40,213) (37,063)
Interest received 106 76
Income tax paid (2,485) (1,944)
NET CASH FLOWS FROM OPERATING ACTIVITIES 17(a) 12,493 11,248
CASH FLOWS FROM INVESTING ACTIVITIES
Acquisition of property, plant and equipment (502) (642)
NET CASH FLOWS USED IN INVESTING ACTIVITIES (502) (642)
CASH FLOWS FROM FINANCING ACTIVITIES
Proceeds from issue of share options 16 621 57
Dividends paid on ordinary shares 6 (10,501) (8,010)
NET CASH FLOWS USED IN FINANCING ACTIVITIES (9,880) (7,953)
NET INCREASE IN CASH HELD 2,111 2,653
Add opening cash brought forward 9,299 6,646
CLOSING CASH CARRIED FORWARD 17(b) 11,410 9,299
The above Statement of Cash Flows should be read in conjunction with the attached notes.
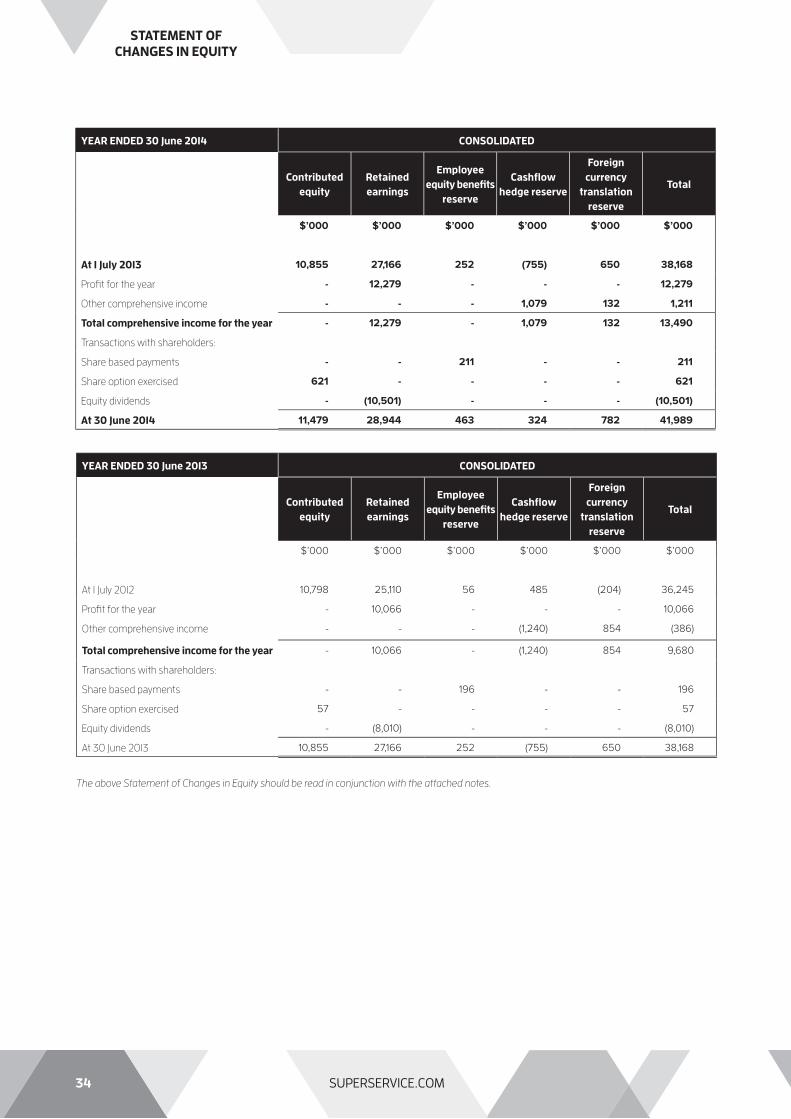
34 SUPERSERVICE.COM
STATEMENT OFCHANGES IN EQUITY
YEAR ENDED 30 June 2014 CONSOLIDATED
Contributed equity
Retained earnings
Employee equity benefi ts
reserve
Cashfl ow hedge reserve
Foreign currency
translation reserve
Total
$’000 $’000 $’000 $’000 $’000 $’000
At 1 July 2013 10,855 27,166 252 (755) 650 38,168
Profi t for the year - 12,279 - - - 12,279
Other comprehensive income - - - 1,079 132 1,211
Total comprehensive income for the year - 12,279 - 1,079 132 13,490
Transactions with shareholders:
Share based payments - - 211 - - 211
Share option exercised 621 - - - - 621
Equity dividends - (10,501) - - - (10,501)
At 30 June 2014 11,479 28,944 463 324 782 41,989
YEAR ENDED 30 June 2013 CONSOLIDATED
Contributed equity
Retained earnings
Employee equity benefi ts
reserve
Cashfl ow hedge reserve
Foreign currency
translation reserve
Total
$’000 $’000 $’000 $’000 $’000 $’000
At 1 July 2012 10,798 25,110 56 485 (204) 36,245
Profi t for the year - 10,066 - - - 10,066
Other comprehensive income - - - (1,240) 854 (386)
Total comprehensive income for the year - 10,066 - (1,240) 854 9,680
Transactions with shareholders:
Share based payments - - 196 - - 196
Share option exercised 57 - - - - 57
Equity dividends - (8,010) - - - (8,010)
At 30 June 2013 10,855 27,166 252 (755) 650 38,168
The above Statement of Changes in Equity should be read in conjunction with the attached notes.
35SUPERSERVICE.COM
NOTES TO THEFINANCIAL STATEMENTS
30 June 2014
1. CORPORATE INFORMATION
The fi nancial report of Infomedia Ltd for the year ended 30 June 2014 was authorised for issue in accordance with a resolution of the
Directors on 21 August 2014.
Infomedia Ltd is a company limited by shares incorporated and domiciled in Australia whose shares are publicly traded on the
Australian stock exchange (ASX:IFM). The nature of the operations and principal activities of the Company are described in the
Directors’ Report.
2. SUMMARY OF SIGNIFICANT ACCOUNTING POLICIES
a) Basis of preparation
The fi nancial report is a general-purpose fi nancial report, which has been prepared in accordance with the requirements of the
Corporations Act 2001 and Australian Accounting Standards and Interpretations as appropriate for profi t oriented entities. The fi nancial
report has also been prepared on an historical cost basis, except for derivative fi nancial instruments that have been measured at fair value.
b) Statement of compliance
This fi nancial report complies with Australian Accounting Standards as issued by the Australian Accounting Standards Board. This
fi nancial report also complies with the International Financial Reporting Standards (IFRS) as issued by the International Accounting
Standards Board.
New, revised or amending Accounting Standards and Interpretations adopted
The consolidated entity has adopted all of the new, revised or amending Accounting Standards and Interpretations issued by the
Australian Accounting Standards Board (‘AASB’) that are mandatory for the current reporting period.
Any new, revised or amending Accounting Standards or Interpretations that are not yet mandatory have not been early adopted.
Any signifi cant impact on the accounting policies of the consolidated entity from the adoption of these Accounting Standards and
Interpretations are disclosed below. The adoption of these Accounting Standards and Interpretations did not have any signifi cant
impact on the fi nancial performance or position of the consolidated entity.
New Accounting Standards and Interpretations not yet mandatory or early adopted.
Australian Accounting Standards and Interpretations that have recently been issued or amended but are not yet mandatory, have
not been early adopted by the consolidated entity for the annual reporting period ended 30 June 2014. The consolidated entity’s
assessment of the impact of these new or amended Accounting Standards and Interpretations, most relevant to the consolidated
entity, are set out below.
AASB 9 Financial Instruments and its consequential amendments
This standard and its consequential amendments are applicable to annual reporting periods beginning on or after 1 January 2017 and
completes phases I and III of the IASB’s project to replace IAS 39 (AASB 139) ‘Financial Instruments: Recognition and Measurement’.
This standard introduces new classifi cation and measurement models for fi nancial assets, using a single approach to determine
whether a fi nancial asset is measured at amortised cost or fair value. The accounting for fi nancial liabilities continues to be classifi ed
and measured in accordance with AASB 139, with one exception, being that the portion of a change of fair value relating to the entity’s
own credit risk is to be presented in other comprehensive income unless it would create an accounting mismatch. Chapter 6 ‘Hedge
Accounting’ supersedes the general hedge accounting requirements in AASB 139 and provides a new simpler approach to hedge
accounting that is intended to more closely align with risk management activities undertaken by entities when hedging fi nancial
and non-fi nancial risks. The consolidated entity will adopt this standard and the amendments from 1 July 2017 but the impact of its
adoption is yet to be assessed by the consolidated entity.
c) Basis of consolidation
The consolidated fi nancial statements comprise the fi nancial statements of Infomedia Ltd (the ‘Company’) and its subsidiaries (‘the
Group’). The fi nancial statements of subsidiaries are prepared for the same reporting period as the parent company, using consistent
accounting policies. Adjustments are made to bring into line any dissimilar accounting policies that may exist. All intercompany
balances and transactions, including unrealised profi ts arising from intra-group transactions, have been eliminated in full. Unrealised
losses are eliminated unless costs cannot be recovered. Subsidiaries are consolidated from the date on which control is transferred
to the Company and cease to be consolidated from the date on which control is transferred out of the Company. Where there is loss
of control of a subsidiary, the consolidated fi nancial statements include the results for the part of the reporting period during which
Infomedia Ltd has control.

36 SUPERSERVICE.COM
30 June 2014
2. SUMMARY OF SIGNIFICANT ACCOUNTING POLICIES (CONTINUED)
d) Signifi cant accounting judgments, estimates and assumptions.
Signifi cant accounting estimates and assumptions
The carrying amounts of certain assets and liabilities are often determined based on estimates and assumptions of future events. The
key estimates and assumptions that have a signifi cant risk of causing a material adjustment to the carrying amounts of certain assets
and liabilities within the next annual reporting period are:
• Impairment of goodwill
The Company determines whether goodwill is impaired at least on an annual basis. This requires an estimation of the recoverable
amount of the cash generating units to which the goodwill and intangibles with indefi nite useful lives are allocated. The assumptions
used in this estimation of recoverable amount and the carrying amount of goodwill and Intangibles with indefi nite useful lives are
discussed in Note 11.
• Share-based payment transactions
The Company measures the cost of equity-settled transactions with employees by reference to the fair value of the equity
instruments at the date at which they are granted. The fair value is determined by an external valuer using a binomial model, using the
assumptions detailed in Note 19.
• Research & development
Development costs are only capitalised by the Group when it is assessed that the technical feasibility of completing the intangible
asset is valid so that the asset will be available for use or sale and that the asset is expected to generate future economic benefi t.
Refer to note 2(k) for further discussion.
e) Foreign currency translation
Translation of foreign currency transactions
Transactions in foreign currencies of the Company are converted to local currency at the rate of exchange ruling at the date of the
transaction.
Amounts payable to and by the Company that are outstanding at the balance date and are denominated in foreign currencies have
been converted to local currency using rates of exchange ruling at the end of the reporting period.
All currency exchange diff erences in the consolidated fi nancial report are taken to the Statement of Profi t or Loss & Other
Comprehensive Income.
Translation of fi nancial reports of overseas operations
Both the functional and presentation currency of Infomedia Ltd is Australian dollars (A$).
Non-monetary items that are measured in terms of historical cost in a foreign currency are translated using the exchange rate as at
the date of the initial transaction.
The functional currency of the overseas subsidiaries is as follows:
IFM Europe Ltd Great British Pounds (GBP)
IFM Germany GmbH Euros (EUR)
IFM North America Inc United States Dollars (USD)
Diff erent Aspect Software Ltd Great British Pounds (GBP)
As at the reporting date the assets and liabilities of these overseas subsidiaries are translated into the presentation currency of
Infomedia Ltd at the rate of exchange ruling at the balance sheet date and the income statements are translated at the weighted
average exchange rates for the period. The exchange diff erences arising on the retranslation are taken directly to a separate
component of equity.
f) Cash and cash equivalents
Cash on hand and in banks and short-term deposits are stated at nominal values. For the purposes of the Statement of Cash Flows,
cash includes cash on hand and in banks, and money market investments readily convertible to cash within three months, net of
outstanding bank overdrafts.
NOTES TO THEFINANCIAL STATEMENTS

37SUPERSERVICE.COM
30 June 2014
2. SUMMARY OF SIGNIFICANT ACCOUNTING POLICIES (CONTINUED)
g) Trade and other receivables
Trade receivables, which generally have 30-60 day terms, are recognised and carried at original invoice amount less an allowance for
any uncollectible amounts. An allowance for doubtful debts is made when there is objective evidence that the Company will not be
able to collect the debts. Bad debts are written off when identifi ed.
h) Investments and other fi nancial assets
Financial assets in the scope of AASB 139 Financial Instruments: Recognition and Measurement are classifi ed as either fi nancial
assets at fair value through profi t or loss, loans and receivables, held-to-maturity investments, or available-for-sale investments,
as appropriate. For the Company the relevant categories are listed below:
Loans and receivables
Loans and receivables are non-derivative fi nancial assets with fi xed or determinable payments that are not quoted in an active
market. Such assets are carried at amortised cost using the eff ective interest method. Gains and losses are recognised in profi t or loss
when the loans and receivables are derecognised or impaired, as well as through the amortisation process.
Investments in Subsidiaries
Investments in subsidiaries are recorded at cost.
i) Inventories
Inventories are valued at the lower of cost and net realisable value.
Costs incurred in bringing each product to its present location and condition are accounted for as follows:
• Raw materials – purchase cost on a fi rst-in-fi rst-out basis
j) Goodwill
Goodwill acquired in a business combination is initially measured at cost being the excess of the cost of the business combination
over the Company’s interest in the net fair value of the acquiree’s identifi able assets, liabilities and contingent liabilities. Following initial
recognition, goodwill is measured at cost less any accumulated impairment losses.
Goodwill is reviewed for impairment annually or more frequently if events or changes in circumstances indicate that the carrying value
may be impaired.
For the purpose of impairment testing, goodwill acquired in a business combination is, from the acquisition date, allocated to each
of the Company’s cash-generating units, or groups of cash generating units, that are expected to benefi t from the synergies of the
combination, irrespective of whether other assets or liabilities of the Company are assigned to those units or groups of units.
Each unit or group of units to which the goodwill is so allocated:
• represents the lowest level within the Company at which the goodwill is monitored for internal management purposes; and
• is not larger than a segment based on either the Company’s primary or the Company’s secondary reporting format determined in
accordance with AASB 8 Operating Segments
Impairment is determined by assessing the recoverable amount of the cash-generating unit (group of cash-generating units), to
which the goodwill relates. When the recoverable amount of the cash-generating unit (group of cash-generating units) is less than the
carrying amount, an impairment loss is recognised. When goodwill forms part of a cash-generating unit (group of cash-generating
units) and an operation within that unit is disposed of, the goodwill associated with the operation disposed of is included in the
carrying amount of the operation when determining the gain or loss on disposal of the operation. Goodwill disposed of in this manner
is measured based on the relative values of the operation disposed of and the portion of the cash generating unit retained.
Impairment losses recognised for goodwill are not subsequently reversed.
k) Intangible assets
Intangible assets acquired separately or in a business combination are initially measured at cost. The cost of an intangible asset
acquired in a business combination is its fair value as at the date of acquisition. Following initial recognition, intangible assets are
carried at cost less any accumulated amortisation and any accumulated impairment losses. Internally generated intangible assets,
excluding capitalised development costs, are not capitalised and expenditure is charged against profi ts in the year in which the
expenditure is incurred.
NOTES TO THEFINANCIAL STATEMENTS
38 SUPERSERVICE.COM
30 June 2014
2. SUMMARY OF SIGNIFICANT ACCOUNTING POLICIES (CONTINUED)
k) Intangible assets (continued)
Research costs are expensed as incurred. Development costs are capitalised and an intangible asset for development expenditure
on an internal project is recognised only when the Company can demonstrate the technical feasibility of completing the intangible
asset so that it will be available for use or sale, its intention to complete and its ability to use or sell the asset, how the asset will
generate future economic benefi ts, the availability of resources to complete the development and the ability to measure reliably
the expenditure attributable to the intangible asset during its development. Following the initial recognition of the development
expenditure, the cost model is applied requiring the asset to be carried at cost less any accumulated amortisation and accumulated
impairment losses. Any expenditure so capitalised is amortised over the period of expected benefi ts from the related project
commencing from the commercial release of the project.
The carrying value of an intangible asset arising from development expenditure is tested for impairment annually when the asset
is not yet available for use or more frequently when an indication of impairment arises during the reporting period. Gains or losses
arising from de-recognition of an intangible asset are measured as the diff erence between the net disposal proceeds and the carrying
amount of the asset and are recognised in profi t or loss when the asset is derecognised.
The useful lives of intangible assets are assessed to be either fi nite or indefi nite. Intangible assets with fi nite lives are amortised
over the useful life and assessed for impairment whenever there is an indication that the intangible asset may be impaired. The
amortisation period and the amortisation method for an intangible asset with a fi nite useful life is reviewed at least at each fi nancial
year-end. Changes in the expected useful life or the expected pattern of consumption of future economic benefi ts embodied in the
asset are accounted for by changing the amortisation period or method, as appropriate, which is a change in accounting estimate.
The amortisation expense on intangible assets with fi nite lives is recognised in profi t or loss in the expense category consistent with
the function of the intangible asset.
Intangible assets with indefi nite useful lives are tested for impairment annually either individually or at the cash-generating unit level.
Such intangibles are not amortised. The useful life of an intangible asset with an indefi nite life is reviewed each reporting period
to determine whether indefi nite life assessment continues to be supportable. If not, the change in the useful life assessment from
indefi nite to fi nite is accounted for as a change in an accounting estimate and is thus accounted for on a prospective basis.
l) Impairment of assets
The Company assesses at each reporting date whether there is an indication that an asset may be impaired. If any such indication
exists, or when annual impairment testing for an asset is required, the Company makes an estimate of the asset’s recoverable
amount. An asset’s recoverable amount is the higher of its fair value less costs to sell and its value in use and is determined for an
individual asset, unless the asset does not generate cash infl ows that are largely independent of those from other assets or groups of
assets and the asset’s value in use cannot be estimated to be close to its fair value. In such cases the asset is tested for impairment
as part of the cash generating unit to which it belongs. When the carrying amount of an asset or cash-generating unit exceeds its
recoverable amount, the asset or cash-generating unit is considered impaired and is written down to its recoverable amount.
In assessing value in use, the estimated future cash fl ows are discounted to their present value using a pre-tax discount rate that
refl ects current market assessments of the time value of money and the risks specifi c to the asset. Impairment losses relating to
continuing operations are recognised in those expense categories consistent with the function of the impaired asset unless the asset
is carried at revalued amount (in which case the impairment loss is treated as a revaluation decrease).
An assessment is also made at each reporting date as to whether there is any indication that previously recognised impairment losses
may no longer exist or may have decreased. If such indication exists, the recoverable amount is estimated. A previously recognised
impairment loss is reversed (with the exception of goodwill) only if there has been a change in the estimates used to determine the
asset’s recoverable amount since the last impairment loss was recognised. If that is the case the carrying amount of the asset is
increased to its recoverable amount. That increased amount cannot exceed the carrying amount that would have been determined,
net of depreciation, had no impairment loss been recognised for the asset in prior years. Such reversal is recognised in profi t or loss
unless the asset is carried at revalued amount, in which case the reversal is treated as a revaluation increase. After such a reversal
the depreciation charge is adjusted in future periods to allocate the asset’s revised carrying amount, less any residual value, on a
systematic basis over its remaining useful life.
NOTES TO THEFINANCIAL STATEMENTS

39SUPERSERVICE.COM
30 June 2014
2. SUMMARY OF SIGNIFICANT ACCOUNTING POLICIES (CONTINUED)
m) Property, plant and equipment
Property, plant and equipment is stated at cost less accumulated depreciation and any accumulated impairment losses. Land and
buildings are measured at cost less accumulated depreciation on buildings and less any impairment losses recognised. Depreciation is
calculated on a straight-line basis over the estimated useful life of the assets as follows:
Major depreciation periods are: 2014 2013
Leasehold improvements: 5 to 20 years 5 to 20 years
Other plant and equipment: 3 to 15 years 3 to 15 years
The assets’ residual values, useful lives and amortisation methods are reviewed, and adjusted if appropriate, at each fi nancial year end.
An item of property, plant and equipment is derecognised upon disposal or when no further future economic benefi ts are expected
from its use or disposal.
Any gain or loss arising on derecognition of the asset (calculated as the diff erence between the net disposal proceeds and the carrying
amount of the asset) is included in profi t or loss in the year the asset is derecognised.
n) Leases
Operating lease payments are recognised as an expense in the Statement of Profi t or Loss and Other Comprehensive Income on a
straight-line basis over the lease term. Lease incentives are recognised in the statement of Profi t or Loss and Other Comprehensive
Income as an integral part of the total lease expense.
o) Trade and other payables
Trade payables and other payables are carried at amortised cost and represent liabilities for goods and services provided to the
Company prior to the end of the fi nancial year that are unpaid and arise when the Company becomes obliged to make future
payments in respect of the purchase of these goods and services.
p) Provisions
Provisions are recognised when the Company has a present obligation (legal or constructive) as a result of a past event, it is probable
that an outfl ow of resources embodying economic benefi ts will be required to settle the obligation and a reliable estimate can be
made of the amount of the obligation.
Where discounting is used, the increase in the provision due to the passage of time is recognised as a borrowing cost.
q) Deferred revenue
Certain contracts allow annual subscriptions to be invoiced in advance. The components of revenue relating to the subscription period
beyond balance date are recorded as a liability.
r) Contributed equity
Ordinary shares are classifi ed as equity. Incremental costs directly attributable to the issue of new shares or options are shown in
equity as a deduction, net of tax, from the proceeds.
s) Revenue recognition
Revenue is recognised to the extent that it is probable that the economic benefi ts will fl ow to the entity and the revenue can be reliably
measured. The following specifi c recognition criteria must also be met before revenue is recognised:
Subscriptions
Subscription revenue is recognised when the copyright article has passed to the buyer with related support revenue being recognised
over the service period. Where the copyright article and related support revenue are inseparable then the revenue is recognised over
the service period.
Interest
Interest is recognised using the eff ective interest method.
NOTES TO THEFINANCIAL STATEMENTS

40 SUPERSERVICE.COM
30 June 2014
2. SUMMARY OF SIGNIFICANT ACCOUNTING POLICIES (CONTINUED)
t) Derivative fi nancial instruments and hedging
Derivatives are carried as assets when their fair value is positive and as liabilities when their fair value is negative. Derivative fi nancial
instruments are measured at fair value.
Any gains or losses arising from changes in the fair value of derivatives, except for those that qualify as cash fl ow hedges, are taken
directly to profi t or loss for the year.
The fair value of forward currency contracts are calculated by reference to current forward exchange rates for contacts with similar
maturity profi les.
For the purpose of hedge accounting, hedges are classifi ed as cash fl ow hedges when they hedge the exposure to variability in
cash fl ows that is attributable either to a particular risk associated with a recognised asset or liability or to a highly probable forecast
transaction. Infomedia Ltd currently has cash fl ow hedges attributable to highly probable future foreign currency sales.
Cash fl ow hedges
Cash fl ow hedges are hedges of the Group’s exposure to variability in cash fl ows that is attributable to a particular risk associated
with anticipated future sales that could aff ect profi t or loss. The eff ective portion of the gain or loss on the hedging instrument is
recognised directly in equity, while the ineff ective portion is recognised in profi t or loss.
Amounts taken to equity are transferred out of equity and included in the measurement of the hedged transaction when the
forecast transaction occurs. The Group tests each of the designated cash fl ow hedges for eff ectiveness on a monthly basis both
retrospectively and prospectively using the “matched terms” principle.
At each balance date, hedge eff ectiveness is measured in the fi rst instance by determining whether there have been any changes to
these “matched terms”. When there have been no changes to these “matched terms”, the hedge is considered to be highly eff ective.
Where there has been a change to these terms, eff ectiveness is measured using the hypothetical derivative method.
The parent entity (Infomedia Ltd) sells software to its customers and uses its subsidiary companies (i.e. IFM North America Inc and
IFM Europe Ltd) to act as billing agents and provide sales and support services. Sales are denominated in USD and Euros. The Group
hedges foreign exchange exposure on sales (net of sales and support service costs) as this exposure aff ects consolidated profi t when
the sale is made to the external customer.
u) Income tax
Current tax assets and liabilities for the current and prior periods are measured at the amount expected to be recovered from or
paid to the taxation authorities. The tax rates and tax laws used to compute the amount are those that are enacted or substantively
enacted by the balance sheet date.
Deferred income tax is provided on all temporary diff erences at the balance sheet date between the tax bases of assets and
liabilities and their carrying amounts for fi nancial reporting purposes.
Deferred income tax liabilities are recognised for all taxable temporary diff erences except:
• when the deferred income tax liability arises from the initial recognition of goodwill or of an asset or liability in a transaction that is
not a business combination and that, at the time of the transaction, aff ects neither the accounting profi t nor taxable profi t or loss; or
• when the taxable temporary diff erence is associated with investments in subsidiaries, associates or interests in joint ventures, and
the timing of the reversal of the temporary diff erence can be controlled and it is probable that the temporary diff erence will not
reverse in the foreseeable future.
Deferred income tax assets are recognised for all deductible temporary diff erences, carry-forward of unused tax assets and unused
tax losses, to the extent that it is probable that taxable profi t will be available against which the deductible temporary diff erences and
the carry-forward of unused tax credits and unused tax losses can be utilised, except:
• when the deferred income tax asset relating to the deductible temporary diff erence arises from the initial recognition of an asset
or liability in a transaction that is not a business combination and, at the time of the transaction, aff ects neither the accounting
profi t nor taxable profi t or loss; or
• when the deductible temporary diff erence is associated with investments in subsidiaries, associates or interests in joint ventures, in
which case a deferred tax asset is only recognised to the extent that it is probable that the temporary diff erence will reverse in the
foreseeable future and taxable profi t will be available against which the temporary diff erence can be utilised.
NOTES TO THEFINANCIAL STATEMENTS

41SUPERSERVICE.COM
30 June 2014
2. SUMMARY OF SIGNIFICANT ACCOUNTING POLICIES (CONTINUED)
u) Income tax (continued)
Deferred income tax assets and liabilities are measured at the tax rates that are expected to apply to the year when the asset is
realised or the liability is settled, based on tax rates (and tax laws) that have been enacted or substantively enacted at the balance
sheet date.
Income taxes relating to items recognised directly in equity are recognised in equity and not in profi t or loss.
Deferred tax assets and deferred tax liabilities are off set only if a legally enforceable right exists to set off current tax assets against
current tax liabilities and the deferred tax assets and liabilities relate to the same taxable entity and the same taxation authority.
The tax consolidated current tax liability and other deferred tax assets are required to be allocated to the members of the tax
consolidated group in accordance with Interpretation 1052 – Tax Consolidation Accounting. The group uses a group allocation method
for this purpose where the allocated current tax payable, deferred tax assets and other tax credits for each member of the tax
consolidated group is determined as if the company is a stand-alone taxpayer but modifi ed as necessary to recognise membership
of a tax consolidated group. Recognition of amounts allocated to members of the tax consolidated group has regard to the tax
consolidated groups future tax profi ts.
v) Other taxes
Revenues, expenses and assets are recognised net of the amount of Goods and Services Tax (“GST”) except:
• when the GST incurred on a purchase of goods and services is not recoverable from the taxation authority, in which case the GST is
recognised as part of the cost of acquisition of the asset or as part of the expense item as applicable; and
• receivables and payables, which are stated with the amount of GST included.
• The net amount of GST recoverable from, or payable to, the taxation authority is included as part of receivables or payables in the
Statement of Financial Position.
The net amount of GST recoverable from, or payable to, the taxation authority is included as part of receivables or payables in the
Statement of Financial Position.
Cash fl ows are included in the Statement of Cash Flows on a gross basis.
Commitments and contingencies are disclosed net of the amount of GST recoverable from, or payable to, the taxation authority.
w) Employee leave benefi ts
(i) Wages, salaries and annual leave
Liabilities for wages and salaries, including non-monetary benefi ts, and annual leave expected to be settled within 12 months of
the reporting date are recognised in other payables and current provisions respectively in respect of employees’ services up to the
reporting date. They are measured at the amounts expected to be paid when the liabilities are settled. Liabilities for non-accumulating
sick leave are recognised when the leave is taken and are measured at the rates paid or payable.
(ii) Long service leave
The liability for long service leave is recognised in the provision for employee benefi ts and measured as the present value of expected
future payments to be made in respect of services provided by employees up to the reporting date. Consideration is given to expected
future wage and salary levels, experience of employee departures, and period of service. Expected future payments are discounted
using market yields at the reporting date on national government bonds with terms to maturity and currencies that match, as closely
as possible, the estimated future cashfl ows.
(iii) Post employment and termination benefi ts
A Superannuation expense at 9.25% of salaries is recognised on a straight line basis. Termination benefi ts are recognised at the point
of being incurred where relevant.
x) Share-based payment transactions
The Company provides benefi ts to employees in the form of share-based payment transactions, whereby employees render services
in exchange for shares or options over shares (‘equity-settled transactions’).
There are currently two plans in place to provide these benefi ts:
(i) the Employee Share Plan (ESP), and
(ii) the Employee Option Plan (EOP).
NOTES TO THEFINANCIAL STATEMENTS

42 SUPERSERVICE.COM
30 June 2014
2. SUMMARY OF SIGNIFICANT ACCOUNTING POLICIES (CONTINUED)
x) Share-based payment transactions (continued)
The cost of these equity-settled transactions with employees is measured by reference to the fair value at the date at which they are
granted. The fair value is determined by an external valuer using a binomial model. In valuing equity-settled transactions, no account is
taken of any performance conditions, other than conditions linked to the price of the shares of Infomedia Ltd (‘market conditions’). The cost
of equity-settled transactions is recognised, together with a corresponding increase in equity, over the period in which the performance
conditions are fulfi lled, ending on the date on which the relevant employees become fully entitled to the option (‘vesting date’).
The cumulative expense recognised for equity-settled transactions at each reporting date until vesting date refl ects (i) the extent to
which the vesting period has expired and (ii) the number of options that, in the opinion of the Directors of the Company, will ultimately
vest. This opinion is formed based on the best available information at balance date. No adjustment is made for the likelihood of
market performance conditions being met as the eff ect of these conditions is included in the determination of fair value at grant
date. Where the terms of an equity-settled option are modifi ed, as a minimum an expense is recognised as if the terms had not
been modifi ed. In addition, an expense is recognised for any increase in the value of the transaction as a result of the modifi cation, as
measured at the date of modifi cation.
Where an equity-settled option is cancelled, it is treated as if it had vested on the date of cancellation, and any expense not yet
recognised for the option is recognised immediately. However, if a new option is substituted for the cancelled option, and designated
as a replacement option on the date that it is granted, the cancelled and new option are treated as if they were a modifi cation of the
original option, as described in the previous paragraph.
The dilutive eff ect, if any, of outstanding options is refl ected as additional share dilution in the computation of diluted earnings per share.
y) Earnings per share
Basic earnings per share is determined by dividing the profi t attributed to members of the parent after related income tax expense by
the weighted average number of ordinary shares outstanding during the fi nancial year.
Diluted earnings per share is calculated as net profi t attributable to members, adjusted for:
• cost of servicing equity (other than dividends);
• the after tax eff ect of dividends and interest associated with dilutive potential ordinary shares that have been recognised as expenses; and
• other non-discretionary changes in revenue or expenses during the period that would result from the dilution of potential ordinary shares;
divided by the weighted average number of ordinary shares and dilutive potential ordinary shares, adjusted for any bonus element.
z) Business combinations
The acquisition method of accounting is used to account for business combinations regardless of whether equity instruments or other
assets are acquired.
The consideration transferred is the sum of the acquisition-date fair values of the assets transferred, equity instruments issued or
liabilities incurred by the acquirer to former owners of the acquiree and the amount of any non-controlling interest in the acquiree. For
each business combination, the non-controlling interest in the acquiree is measured at either fair value or at the proportionate share
of the acquiree’s identifi able net assets. All acquisition costs are expensed as incurred to profi t or loss.
On the acquisition of a business, the consolidated entity assesses the fi nancial assets acquired and liabilities assumed for appropriate
classifi cation and designation in accordance with the contractual terms, economic conditions, the consolidated entity’s operating or
accounting policies and other pertinent conditions in existence at the acquisition-date.
Where the business combination is achieved in stages, the consolidated entity remeasures its previously held equity interest in the
acquiree at the acquisition-date fair value and the diff erence between the fair value and the previous carrying amount is recognised in
profi t or loss.
Contingent consideration to be transferred by the acquirer is recognised at the acquisition-date fair value. Subsequent changes in the
fair value of contingent consideration classifi ed as an asset or liability is recognised in profi t or loss. Contingent consideration classifi ed
as equity is not remeasured and its subsequent settlement is accounted for within equity.
The diff erence between the acquisition-date fair value of assets acquired, liabilities assumed and any non-controlling interest in
the acquiree and the fair value of the consideration transferred and the fair value of any pre-existing investment in the acquiree is
recognised as goodwill. If the consideration transferred and the pre-existing fair value is less than the fair value of the identifi able net
assets acquired, being a bargain purchase to the acquirer, the diff erence is recognised as a gain directly in profi t or loss by the acquirer
on the acquisition-date, but only after a reassessment of the identifi cation and measurement of the net assets acquired, the non-
controlling interest in the acquiree, if any, the consideration transferred and the acquirer’s previously held equity interest in the acquirer.
NOTES TO THEFINANCIAL STATEMENTS

43SUPERSERVICE.COM
30 June 2014
2. SUMMARY OF SIGNIFICANT ACCOUNTING POLICIES (CONTINUED)
z) Business combinations
Business combinations are initially accounted for on a provisional basis. The acquirer retrospectively adjusts the provisional amounts
recognised and also recognises additional assets or liabilities during the measurement period, based on new information obtained
about the facts and circumstances that existed at the acquisition-date. The measurement period ends on either the earlier of (i) 12
months from the date of the acquisition or (ii) when the acquirer receives all the information possible to determine fair value.
aa) Restatement of comparatives
Over recent years the Company has invested signifi cant resources in changing the way customers use its software by migrating users
from physical DVD discs and applications installed on end user infrastructure (Disc based), to products accessible online via internet
browsers (Software as a Service or ‘SaaS’).
As customers increasingly migrate to the online ‘SaaS’ versions, the Company has seen a change to the nature of its business in
certain areas. In accordance with the provisions of AASB101 Presentation of Financial Statements which requires classifi cation of items
of income and expense on the most reliable and relevant basis, the Company has now adopted a functional approach to presenting
its Statement of Profi t or Loss and Other Comprehensive Income showing Research & Development expenses, Sales & Marketing
expenses and General & Administrative expenses which it believes gives readers a more intuitive view of the Company’s activities.
The approach adopted by the Company for creation and maintenance of the Software as a Service products has led to the lack of
distinction between ‘Direct Wages’ and ‘Employee benefi ts expense (Salary and wages). These costs are now included within the
three functional areas of expense listed above. Consequently ‘Cost of Sales’ is no longer presented.
Reconciliation of cost of sales and employee benefi t expense to Sales & Marketing, General & Administrative and Research &
Development expense due to the change in presentation of the Statement of Profi t or Loss and Other Comprehensive Income.
2013
$’000
Cost of sales
Direct wages 12,032
Other 7,267
Total cost of sales 19,299
Reported as:
Sales & Marketing expense 11,207
General & Administrative expense 3,517
Research & Development expense 4,575
Total Direct wages 19,299
NOTES TO THEFINANCIAL STATEMENTS

44 SUPERSERVICE.COM
3. EXPENSES
4. INCOME TAX
Notes CONSOLIDATED
2014 2013
$’000 $’000
(i) Research & development costs
Total research & development costs incurred during the period 13,771 12,601
Amortisation of deferred development costs 8,113 7,178
Less: development costs capitalised (8,106) (7,417)
Net research and development costs expensed 13,778 12,362
Profi t before income tax from continuing operations includes the following specifi c expenses:
Notes CONSOLIDATED
2014 2013
$’000 $’000
Depreciation 662 593
Amortisation 8,530 7,537
Minimum lease payments for rental expense 1,359 1,208
Superannuation expense 1,443 1,328
Share based payment expense 211 196
Employee benefi ts expense 24,828 22,743
Notes CONSOLIDATED
2014 2013
$’000 $’000
The major components of income tax expense are:
(a) Income statement
Current income tax
Current income tax charge 3,128 2,404
Adjustments in respect of current income tax of previous years. (68) (711)
Deferred income tax
Relating to origination and reversal of temporary diff erences 173 291
Income tax expense reported in the income statement 3,233 1,984
(b) Disclosure of tax eff ects relating to each component of other comprehensive income
Movement in cash fl ow hedges 469 (542)
469 (542)
A reconciliation between tax expense and the product of accounting profi t before income tax
multiplied by the Company’s applicable income tax rate is as follows:
Accounting profi t before income tax 15,512 12,050
At the Company’s statutory income tax rate of 30% (2013: 30%) 4,653 3,615
Adjustments in respect of income tax of previous years (151) (487)
Additional research and development deduction (1,345) (1,214)
Expenditure not allowable for income tax purposes 76 70
Income tax expense for the year 3,233 1,984
NOTES TO THEFINANCIAL STATEMENTS

45SUPERSERVICE.COM
4. INCOME TAX (CONTINUED)
NotesSTATEMENT OF
FINANCIAL POSITIONSTATEMENT OF PROFIT OR LOSS
& OTHER COMPREHENSIVE INCOME
2014 2013 2014 2013
$’000 $’000 $’000 $’000
Deferred income tax
Deferred income tax at 30 June relates to the following:
CONSOLIDATED
Deferred tax liabilities
Derivatives (138) 658 327 (324)
Deferred development costs (6,380) (6,382) (2) 72
Gross deferred income tax liabilities (6,518) (5,724)
CONSOLIDATED
Deferred tax assets
Provisions 872 679 (193) 408
Other payables 40 50 10 17
Currency exchange 110 141 31 118
Gross deferred income tax assets 1,022 870
Deferred tax income/ (expense) 173 291
Net deferred income tax liabilities (5,496) (4,854)
5. EARNINGS PER SHARE
Basic earnings per share amounts are calculated by dividing net profi t for the year attributable to ordinary equity holders of the parent
by the weighted average number of ordinary shares outstanding during the year.
Diluted earnings per share amounts are calculated by dividing the net profi t attributable to ordinary shareholders by the weighted
average number of ordinary shares outstanding during the year (adjusted for the eff ects of dilutive options). The following refl ects the
income and share data used in the total operations basic and diluted earnings per share computations:
CONSOLIDATED
2014 2013
$’000 $’000
Net profi t attributable to equity holders from continuing operations 12,279 10,066
Number of shares
Number of
shares
Weighted average number of ordinary shares for basic earnings per share 305,173,135 303,382,350
Eff ect of dilution:
Share options 2,003,292 2,801,407
Adjusted weighted average number of ordinary shares for diluted earnings per share 307,176,427 306,183,757
Diluted EPS (cents) 4.00 3.29
NOTES TO THEFINANCIAL STATEMENTS

46 SUPERSERVICE.COM
6. DIVIDEND PROPOSED OR PAID
7. TRADE AND OTHER RECEIVABLES (CURRENT)
Trade receivables are non-interest bearing and are generally on 30-60 day terms. A provision for impairment loss is recognised when
there is objective evidence that an individual trade receivable is impaired. An impairment loss of $53,000 (2013: $76,000 loss) has
been recognised by the group in the current year. These amounts have been included in the General & Administration expenses item.
The amount of the allowance/impairment loss is recognised as the diff erence between the carrying amount of the debtor and the
estimated future cash fl ows expected to be received from the relevant debtors.
At 30 June the aging analysis of trade receivables is as follows:
If fully franked, the tax rate on dividends is 30% (2013: 30%).
* Not impaired (NI)
Considered impaired (CI)
All trade receivables over 60 days are considered past due.
Notes CONSOLIDATED
2014 2013
$’000 $’000
(a) Dividends paid during the year:
Interim dividend - 1.89 cents, 0.5c franked
(2013: 1.27 cents, 0.5 cents franked) per share
5,777 3,855
Prior year fi nal dividend - 1.55 cents fully franked
(2013: 1.37 cents fully franked) per share
4,724 4,155
Total dividends paid during the year 10,501 8,010
(b) Dividends proposed and not recognised as a liability:
Final dividend - 1.89 cents per share fully franked.
(2013: 1.55 cents per share, fully franked) 5,798 4,713
(c) Franking credit balance:
The amount of franking credits available for the subsequent fi nancial year are:
Franking account balance as at the end of the fi nancial year 10 217
Franking credits/(debits) that will arise from the payment/(receipt) of income tax payable/
(receivable) as at the end of the fi nancial year
1,133 656
1,143 873
Notes CONSOLIDATED
2014 2013
$’000 $’000
Trade debtors 6,218 5,459
Allowance for impairment loss (a) (188) (224)
6,030 5,235
Other debtors 132 69
6,162 5,304
Notes CONSOLIDATED
2014 2013
$’000 $’000
At 1 July 224 210
Charge/(release) for the year 53 76
Foreign exchange translation 4 10
Amounts written off (93) (72)
At 30 June 188 224
Total 0-60 days NI* 0-60 days CI* 61-120 days NI* 61-120 days CI* 121+ days NI* 121+ days CI*
2014 Consolidated ($’000) 6,218 4,547 21 959 31 524 136
2013 Consolidated ($’000) 5,459 4,795 30 296 43 144 151
NOTES TO THEFINANCIAL STATEMENTS

47SUPERSERVICE.COM
8. INVENTORY
9. PROPERTY, PLANT & EQUIPMENT
Notes CONSOLIDATED
2014 2013
$’000 $’000
Raw materials
At cost - 1
Total inventories at the lower of cost and net realisable value - 1
Notes CONSOLIDATED
2014 2013
$’000 $’000
(a) Leasehold improvements 491 481
At cost (426) (413)
Accumulated amortisation 65 68
Offi ce equipment
At cost 8,893 8,455
Accumulated depreciation (7,836) (7,300)
1,057 1,155
Furniture and fi ttings
At cost 436 446
Accumulated depreciation (329) (287)
107 159
Plant and equipment
At cost 3,331 3,301
Accumulated depreciation (3,291) (3,245)
40 56
Total property, plant and equipment
At cost 13,151 12,683
Accumulated depreciation and amortisation (11,882) (11,245)
Total carrying amount 1,269 1,438
NOTES TO THEFINANCIAL STATEMENTS

48 SUPERSERVICE.COM
9. PROPERTY, PLANT & EQUIPMENT (CONTINUED)
Notes CONSOLIDATED
2014 2013
$’000 $’000
(b) Reconciliation of property, plant and equipment carrying values
Leasehold Improvements
Carrying amount - opening balance 68 27
Additions 30 46
Disposals - -
Depreciation (33) (5)
Carrying amount - closing balance 65 68
Offi ce equipment
Carrying amount - opening balance 1,155 1,087
Additions 439 544
Disposals -
Depreciation (536) (476)
Carrying amount - closing balance 1,057 1,155
Furniture and fi ttings
Carrying amount - opening balance 159 162
Additions 3 38
Disposals (8) -
Depreciation (47) (41)
Carrying amount - closing balance 107 159
Plant and equipment
Carrying amount - opening balance 56 113
Additions 30 14
Depreciation (46) (71)
Carrying amount - closing balance 40 56
Total property, plant and equipment
Carrying amount - opening balance 1,438 1,389
Additions 502 642
Disposals (9) -
Depreciation (662) (593)
Carrying amount - closing balance 1,269 1,438
NOTES TO THEFINANCIAL STATEMENTS

49SUPERSERVICE.COM
10. INTANGIBLE ASSETS AND GOODWILL
CONSOLIDATED
Development costs1
Intellectual Property2
Other Intangibles2
Goodwill2 Total
$’000 $’000 $’000 $’000 $’000
At 1 July 2013
Cost (gross carrying amount) 47,729 3,167 1,167 12,008 64,071
Accumulated amortisation (26,458) (2,825) (429) - (29,712)
Net carrying amount 21,271 342 738 12,008 34,359
Year ended 30 June 2014
At 1 July 2013, net of accumulated amortisation and impairment 21,271 342 738 12,008 34,359
Purchase from wholly owned subsidiary - - - - -
Additions 8,106 - - - 8,106
Revaluation on cost - 54 101 300 455
Amortisation (8,113) (168) (249) - (8,530)
Revaluation on amortisation - (28) (40) - (68)
At 30 June 2014, net of accumulated amortisation and impairment 21,264 200 550 12,308 34,322
At 30 June 2014
Cost (gross carrying amount) 55,835 3,221 1,268 12,308 72,632
Accumulated amortisation (34,571) (3,021) (718) - (38,310)
Net carrying amount 21,264 200 550 12,308 34,322
1. Internally generated
2. Purchased as part of business/territory acquisition
Development costs that meet the recognition criteria as an intangible asset have been capitalised at cost. This intangible asset
has been assessed as having a fi nite life and is amortised using the straight-line method over a period not exceeding four years
commencing from the commercial release of the project. If an impairment indication arises, the recoverable amount is estimated and
an impairment loss is recognised to the extent that the recoverable amount is lower than the carrying amount.
Intellectual property includes intangible assets acquired through business or territory acquisition and relates primarily to copyright and
software code over key products. Intellectual property is amortised over its useful life being 3 years.
CONSOLIDATED
Development costs1
Intellectual Property2
Other Intangibles2
Goodwill2 Total
$’000 $’000 $’000 $’000 $’000
At 1 July 2012
Cost (gross carrying amount) 40,312 3,115 1,071 11,723 56,221
Accumulated amortisation (19,280) (2,656) (179) - (22,115)
Net carrying amount 21,032 459 892 11,723 34,106
Year ended 30 June 2013
At 1 July 2012, net of accumulated amortisation and impairment 21,032 459 892 11,723 34,106
Additions 7,417 - - - 7,417
Foreign exchange movements - 28 60 285 373
Amortisation (7,178) (145) (214) - (7,537)
At 30 June 2013, net of accumulated amortisation and impairment 21,271 342 738 12,008 34,359
At 30 June 2013
Cost (gross carrying amount) 47,729 3,167 1,167 12,008 64,071
Accumulated amortisation (26,458) (2,825) (429) - (29,712)
Net carrying amount 21,271 342 738 12,008 34,359
NOTES TO THEFINANCIAL STATEMENTS

50 SUPERSERVICE.COM
30 June 2014
11. IMPAIRMENT TESTING OF GOODWILL
Goodwill acquired through business combinations or territory acquisition has been allocated to four individual cash generating units,
each of which is a reportable segment (refer note 24) for impairment testing as follows:
• Asia Pacifi c;
• Europe, Middle East & Africa;
• North America; and
• Latin and South America
The recoverable amount of each cash generating unit has been determined based on a value in use calculation using cash fl ow
projections as at 30 June 2014 based on fi nancial budgets approved by The Board for the 2015 fi nancial year extrapolated for a fi ve
year period on the basis of 5% growth together with a terminal value. The NPV of this calculation was $109,404,000.
The discount rate applied to cash fl ow projections is 14% (2013: 14%). The discount rate refl ects management estimate of the time
value of money and the rates specifi c to each unit.
Carrying amount of goodwill allocated to each of the cash generating units is as follows:
CONSOLIDATED Asia Pacifi cEurope, Middle
East & AfricaNorth America
Latin and South America
Total
$’000 $’000 $’000 $’000 $’000
Carrying amount of goodwill 2013 2,725 5,727 2,701 855 12,008
Foreign exchange movement 68 143 67 22 300
Carrying amount of goodwill 2014 2,793 5,870 2,768 877 12,308
Key assumptions used in value in use calculations:
The following describes each key assumption on which management has based its cash fl ow projections when determining the value
in use of its cash generating units:
• The Company will continue to have access to the data supply from automakers over the budgeted period;
• The Company will not experience any substantial adverse movements in currency exchange rates;
• The Company’s research and development program will ensure that the current suite of products remain leading edge;
• The Company is able to maintain its current gross margins;
• The discount rates estimated by management are refl ective of the time value of money; and
• Management has used an AUD/USD exchange rate of $0.93 and an AUD/EUR exchange rate of $0.66 in its cash fl ow projections.
Sensitivity to changes in assumptions:
Growth rate assumptions –Management notes if negative growth rates are applied to revenues, by 5% over the fi ve year period,
this still yields a recoverable amount to be above its carrying amount.
Discount rate assumptions – Management recognises that the time value of money may vary from what they have estimated.
Management notes that applying a discount rate of double the current rate still yields the recoverable amount to be above its
carrying amount.
Foreign exchange rate assumptions – Management notes that applying an AUD/USD exchange rate of $1.20 and an AUD/EUR
exchange rate of $0.85 still yields the recoverable amount to be above its carrying amount.
NOTES TO THEFINANCIAL STATEMENTS
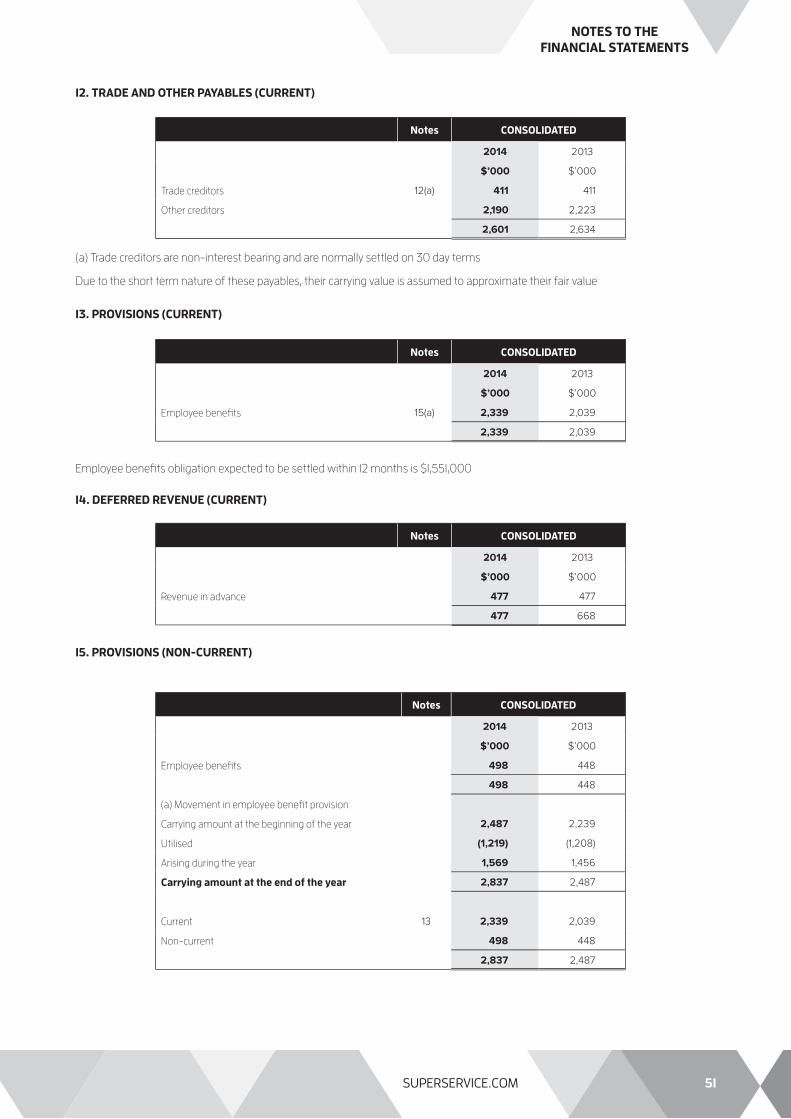
51SUPERSERVICE.COM
12. TRADE AND OTHER PAYABLES (CURRENT)
13. PROVISIONS (CURRENT)
15. PROVISIONS (NON-CURRENT)
(a) Trade creditors are non-interest bearing and are normally settled on 30 day terms
Due to the short term nature of these payables, their carrying value is assumed to approximate their fair value
Employee benefi ts obligation expected to be settled within 12 months is $1,551,000
14. DEFERRED REVENUE (CURRENT)
Notes CONSOLIDATED
2014 2013
$’000 $’000
Trade creditors 12(a) 411 411
Other creditors 2,190 2,223
2,601 2,634
Notes CONSOLIDATED
2014 2013
$’000 $’000
Employee benefi ts 15(a) 2,339 2,039
2,339 2,039
Notes CONSOLIDATED
2014 2013
$’000 $’000
Revenue in advance 477 477
477 668
Notes CONSOLIDATED
2014 2013
$’000 $’000
Employee benefi ts 498 448
498 448
(a) Movement in employee benefi t provision
Carrying amount at the beginning of the year 2,487 2,239
Utilised (1,219) (1,208)
Arising during the year 1,569 1,456
Carrying amount at the end of the year 2,837 2,487
Current 13 2,339 2,039
Non-current 498 448
2,837 2,487
NOTES TO THEFINANCIAL STATEMENTS
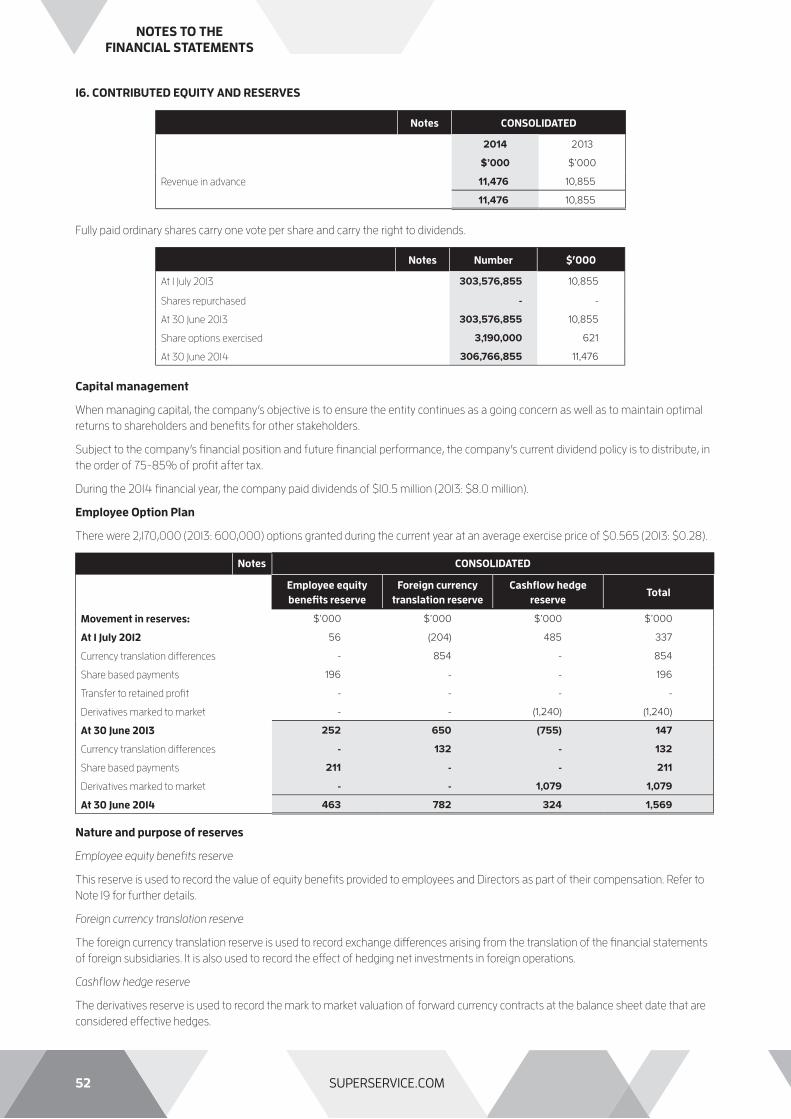
52 SUPERSERVICE.COM
16. CONTRIBUTED EQUITY AND RESERVES
Notes CONSOLIDATED
2014 2013
$’000 $’000
Revenue in advance 11,476 10,855
11,476 10,855
Fully paid ordinary shares carry one vote per share and carry the right to dividends.
Capital management
When managing capital, the company’s objective is to ensure the entity continues as a going concern as well as to maintain optimal
returns to shareholders and benefi ts for other stakeholders.
Subject to the company’s fi nancial position and future fi nancial performance, the company’s current dividend policy is to distribute, in
the order of 75-85% of profi t after tax.
During the 2014 fi nancial year, the company paid dividends of $10.5 million (2013: $8.0 million).
Employee Option Plan
There were 2,170,000 (2013: 600,000) options granted during the current year at an average exercise price of $0.565 (2013: $0.28).
Nature and purpose of reserves
Employee equity benefi ts reserve
This reserve is used to record the value of equity benefi ts provided to employees and Directors as part of their compensation. Refer to
Note 19 for further details.
Foreign currency translation reserve
The foreign currency translation reserve is used to record exchange diff erences arising from the translation of the fi nancial statements
of foreign subsidiaries. It is also used to record the eff ect of hedging net investments in foreign operations.
Cashfl ow hedge reserve
The derivatives reserve is used to record the mark to market valuation of forward currency contracts at the balance sheet date that are
considered eff ective hedges.
Movement in ordinary shares on issue: Notes Number $’000
At 1 July 2013 303,576,855 10,855
Shares repurchased - -
At 30 June 2013 303,576,855 10,855
Share options exercised 3,190,000 621
At 30 June 2014 306,766,855 11,476
Notes CONSOLIDATED
Employee equity benefi ts reserve
Foreign currency translation reserve
Cashfl ow hedge reserve
Total
Movement in reserves: $’000 $’000 $’000 $’000
At 1 July 2012 56 (204) 485 337
Currency translation diff erences - 854 - 854
Share based payments 196 - - 196
Transfer to retained profi t - - - -
Derivatives marked to market - - (1,240) (1,240)
At 30 June 2013 252 650 (755) 147
Currency translation diff erences - 132 - 132
Share based payments 211 - - 211
Derivatives marked to market - - 1,079 1,079
At 30 June 2014 463 782 324 1,569
NOTES TO THEFINANCIAL STATEMENTS

53SUPERSERVICE.COM
17. STATEMENT OF CASH FLOWS
18. COMMITMENTS & CONTINGENCIES
Notes CONSOLIDATED
2014 2013
$’000 $’000
(a) Reconciliation of profi t after tax to the net cash fl ows from operations
Profi t from ordinary activities after income tax expense 12,279 10,066
Depreciation of non-current assets 662 593
Amortisation of non-current assets 8,530 7,537
Share based payment 211 196
Ineff ective (gains)/loss on hedgeing instruments (1,112) 1,112
Disposal of property, plant, and equipment 7 -
Changes in assets and liabilities
(Increase)/decrease in trade and other debtors (687) (430)
(Increase)/decrease in inventories 1 6
(Increase)/decrease in prepayments 129 (199)
(Increase)/decrease in deferred development costs (8,106) (7,417)
(Increase)/decrease in intangible assets (387) (373)
Increase/(decrease) in trade and other creditors 126 (267)
Increase/(decrease) in allowance for doubtful debts (37) 15
Increase/(decrease) in provision for employee entitlements 350 250
Increase/(decrease) in income tax payable 538 (224)
Increase/(decrease) in deferred income tax liability 179 279
Increase/(decrease) in revenue in advance (190) 104
Net cash fl ow from operating activities 12,493 11,248
(b) Reconciliation of cash
Cash balance comprises:
-Cash at bank 6,017 4,877
-Cash on deposit 5,393 4,422
11,410 9,299
Notes CONSOLIDATED
2014 2013
$’000 $’000
(a) Lease expenditure commitments
Operating leases (non-cancellable):
Minimum lease payments
- not later than one year 1,268 1,290
- later than one year and not later than fi ve years 1,990 3,264
- later than fi ve years - -
- aggregate operating lease expenditure contracted for at balance date 3,258 4,554
Operating lease commitments are for offi ce accommodation both in Australia and abroad.
(b) Performance Bank Guarantee
Infomedia Ltd has a performance bank guarantee to a maximum value of $508,000 (2013: $508,000) relating to the lease
commitments of its corporate headquarters
NOTES TO THEFINANCIAL STATEMENTS

54 SUPERSERVICE.COM
19. SHARE BASED PAYMENT PLANS
Employee Option Plan
The Employee Option Plan entitles the Company to off er ‘eligible employees’ options to subscribe for shares in the Company. Options
will be granted at a nil issue price unless otherwise determined by the Directors of the Company and each Option enables the holder to
subscribe for one Share. The exercise price for the Options granted will be as specifi ed on the option certifi cate or, if not specifi ed, the
volume weighted average price for Shares of the Company for the fi ve days trading immediately before the day on which the options
were granted. The Options may be exercised in accordance with the date determined by the Board, which must be within four years of
the option being granted.
Information with respect to the number of options granted under the employee share incentive scheme is as follows:
(a) Options held at the beginning of the year:
The following table summarises information about options held by employees at 1 July 2013
(b) Options granted during the year:
The following table summarises information about options granted during the year.
(c) Options forfeited during the year:
The following table summarises information about options granted during the year.
(d) Options exercised during the year:
The following table summarises information about options granted during the year.
Notes 2014 2013
Number of optionsWeighted average
exercise priceNumber of options
Weighted average exercise price
Balance at beginning of year 19(a) 5,850,000 $0.200 5,670,000 $0.190
- granted 19(b) 2,170,000 $0.565 600,000 $0.280
- expired 19(c) (200,000) $0.190 (120,000) $0.280
- exercised 19(d) (3,190,000) $0.230 (300,000) $0.190
Balance at end of year 19(e) 4,630,000 $0.370 5,850,000 $0.200
Number of options Grant date Earliest vesting date Expiry dateWeighted average
exercise price
1,950,000 15/1/2012 15/1/2012 14/3/2015 $0.190
3,420,000 30/5/2012 30/5/2012 30/5/2012 $0.190
480,000 12/3/2013 15/1/2012 1/2/2016 $0.280
Number of options Grant date Earliest vesting date Expiry dateWeighted average
exercise price
1,050,000 15/1/2012 15/1/2013 14/3/2015 $0.190
1,980,000 30/5/2012 30/5/2013 30/5/2012 $0.190
160,000 12/3/2013 15/1/2014 1/2/2016 $0.280
Number of options Grant date Earliest vesting date Expiry dateWeighted average
exercise price
750,000 27/9/2013 27/9/2014 31/10/2016 $0.565
1,420,000 16/12/2013 15/12/2014 31/12/2016 $0.565
Number of options Grant date Earliest vesting date Expiry dateWeighted average
exercise price
120,000 30/5/2012 30/5/2013 30/5/2016 $0.190
80,000 12/3/2013 15/1/2014 1/2/2016 $0.280
NOTES TO THEFINANCIAL STATEMENTS

55SUPERSERVICE.COM
19. SHARE BASED PAYMENT PLANS (CONTINUED)
(e) Options held at the end of the year
20. PENSIONS AND OTHER POST-EMPLOYMENT PLANS
Superannuation Commitments
Contributions are made by the Company in accordance with the relevant statutory requirements. Contributions by the Company for
the year ending 30 June 2014 were 9.25% (2013 : 9.00%) of employee’s wages and salaries which are legally enforceable in Australia.
The superannuation plans provide accumulation benefi ts.
21. KEY MANAGEMENT PERSONNEL DISCLOSURES
Compensation of Key Management Personnel
(f) Options held at the end of the year
The weighted average fair value of options granted during the year was $0.295 (2013: $0.21).
The fair value of the equity-settled options granted under the option plan is estimated as at the grant date using a binomial model
taking into account the term and conditions upon which the options were granted.
The following table lists the inputs to the model used for the year
The expense recognised for employee services received during the year is shown in the table below
Number of options Grant date Earliest vesting date Expiry dateWeighted average
exercise price
900,000 15/01/2012 15/01/2013 14/03/2015 $0.190
1,320,000 30/05/2012 30/05/2013 30/05/2015 $0.190
240,000 12/03/2013 15/01/2014 1/02/2016 $0.280
750,000 27/09/2013 27/09/2014 31/10/2016 $0.565
1,420,000 16/12/2013 15/12/2014 31/12/2016 $0.565
Granted 15/01/2012
Granted 30/05/2012
Granted 12/03/2013
Granted 27/09/2013
Granted 16/12/2013
Dividend yield (%) 10.00% 10.00% 4.33% 3.87% 4.98%
Expected volatility (%) 41% 39% 42% 42% 42%
Risk free rate (%) 3.95% 3.08% 3.22% 3.09% 3.17%
Option exercise price $0.190 $0.190 $0.280 $0.565 $0.565
Weighted average share price at grant date $0.190 $0.190 $0.280 $0.565 $0.565
Notes CONSOLIDATED
2014 2013
$’000 $’000
Expense arising from equity-settled share-based payment 211 196
CONSOLIDATED
2014 2013
$’000 $’000
Short-Term 1,806,618 1,676,189
Post Employment 117,796 107,657
Other Long-Term 16,242 14,887
Share-based Payments 82,943 50,305
2,023,599 1,849,038
NOTES TO THEFINANCIAL STATEMENTS
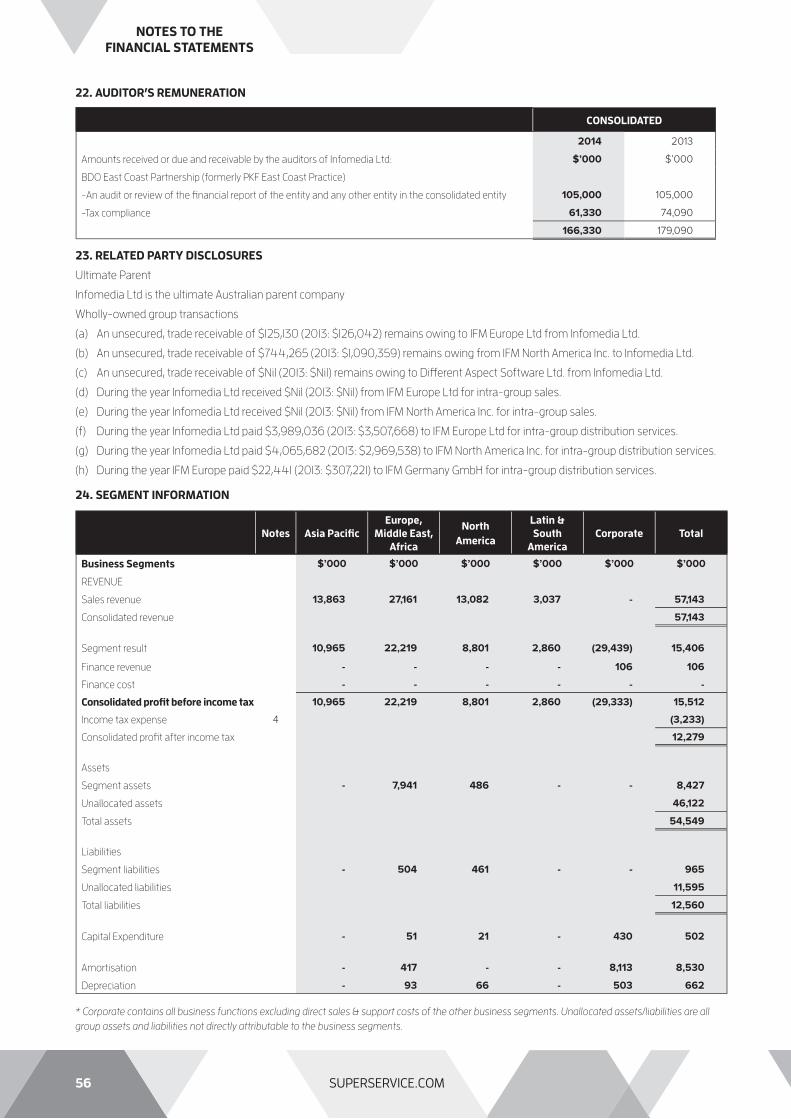
56 SUPERSERVICE.COM
CONSOLIDATED
2014 2013
Amounts received or due and receivable by the auditors of Infomedia Ltd: $’000 $’000
BDO East Coast Partnership (formerly PKF East Coast Practice)
-An audit or review of the fi nancial report of the entity and any other entity in the consolidated entity 105,000 105,000
-Tax compliance 61,330 74,090
166,330 179,090
22. AUDITOR’S REMUNERATION
23. RELATED PARTY DISCLOSURES
Ultimate Parent
Infomedia Ltd is the ultimate Australian parent company
Wholly-owned group transactions
(a) An unsecured, trade receivable of $125,130 (2013: $126,042) remains owing to IFM Europe Ltd from Infomedia Ltd.
(b) An unsecured, trade receivable of $744,265 (2013: $1,090,359) remains owing from IFM North America Inc. to Infomedia Ltd.
(c) An unsecured, trade receivable of $Nil (2013: $Nil) remains owing to Diff erent Aspect Software Ltd. from Infomedia Ltd.
(d) During the year Infomedia Ltd received $Nil (2013: $Nil) from IFM Europe Ltd for intra-group sales.
(e) During the year Infomedia Ltd received $Nil (2013: $Nil) from IFM North America Inc. for intra-group sales.
(f) During the year Infomedia Ltd paid $3,989,036 (2013: $3,507,668) to IFM Europe Ltd for intra-group distribution services.
(g) During the year Infomedia Ltd paid $4,065,682 (2013: $2,969,538) to IFM North America Inc. for intra-group distribution services.
(h) During the year IFM Europe paid $22,441 (2013: $307,221) to IFM Germany GmbH for intra-group distribution services.
24. SEGMENT INFORMATION
Notes Asia Pacifi cEurope,
Middle East, Africa
North America
Latin & South
AmericaCorporate Total
Business Segments $’000 $’000 $’000 $’000 $’000 $’000
REVENUE
Sales revenue 13,863 27,161 13,082 3,037 - 57,143
Consolidated revenue 57,143
Segment result 10,965 22,219 8,801 2,860 (29,439) 15,406
Finance revenue - - - - 106 106
Finance cost - - - - - -
Consolidated profi t before income tax 10,965 22,219 8,801 2,860 (29,333) 15,512
Income tax expense 4 (3,233)
Consolidated profi t after income tax 12,279
Assets
Segment assets - 7,941 486 - - 8,427
Unallocated assets 46,122
Total assets 54,549
Liabilities
Segment liabilities - 504 461 - - 965
Unallocated liabilities 11,595
Total liabilities 12,560
Capital Expenditure - 51 21 - 430 502
Amortisation - 417 - - 8,113 8,530
Depreciation - 93 66 - 503 662
* Corporate contains all business functions excluding direct sales & support costs of the other business segments. Unallocated assets/liabilities are all
group assets and liabilities not directly attributable to the business segments.
NOTES TO THEFINANCIAL STATEMENTS

57SUPERSERVICE.COM
24. SEGMENT INFORMATION (CONTINUED)
Notes Asia Pacifi cEurope,
Middle East, Africa
North America
Latin & South
AmericaCorporate Total
Business Segments $’000 $’000 $’000 $’000 $’000 $’000
REVENUE
Sales revenue 13,275 22,184 10,555 2,675 - 48,689
Consolidated revenue 48,689
Segment result 10,610 18,086 7,943 2,190 (26,855) 11,974
Finance revenue - - - - 76 76
Finance cost - - - - - -
Consolidated profi t before income tax 10,610 18,086 7,943 2,190 (26,779) 12,050
Income tax expense 4 (1,984)
Consolidated profi t after income tax 10,066
Assets
Segment assets - 7,927 359 - - 8,286
Unallocated assets 43,329
Total assets 51,615
Liabilities
Segment liabilities - 625 505 - - 1,130
Unallocated liabilities 12,317
Total liabilities 13,447
Capital Expenditure - 22 16 - 604 642
Amortisation - 359 - - 7,178 7,537
Depreciation - 36 73 - 484 593
* Corporate contains all business functions excluding direct sales & support costs of the other business segments. Unallocated assets/liabilities are all
group assets and liabilities not directly attributable to the business segments.
Identifi cation of reportable segments
The group has identifi ed its operating segments based on the internal reports that are reviewed and used by the Board of Directors
(the chief operating decision makers) in assessing performance and in determining the allocation of resources. The operating
segments are identifi ed by management based on the region in which the product is sold. Discrete fi nancial information about each
of these operating businesses is reported to the Board of Directors regularly. The reportable segments are based on aggregated
operating segments determined by the similarity of the products produced and sold as these are the sources of the Group’s major
risks and have the most eff ect of the rates of return.
Accounting policies and inter-segment transactions
The accounting policies used by the Group in reporting segments internally are the same as those contained in note 2 to the accounts
and in the prior period.
The group accounting policies for segments are applied to the respective segments up to the segment result level.
Major customers
The Group has many customers to which it provides products. There is no signifi cant reliance on any single customer.
NOTES TO THEFINANCIAL STATEMENTS
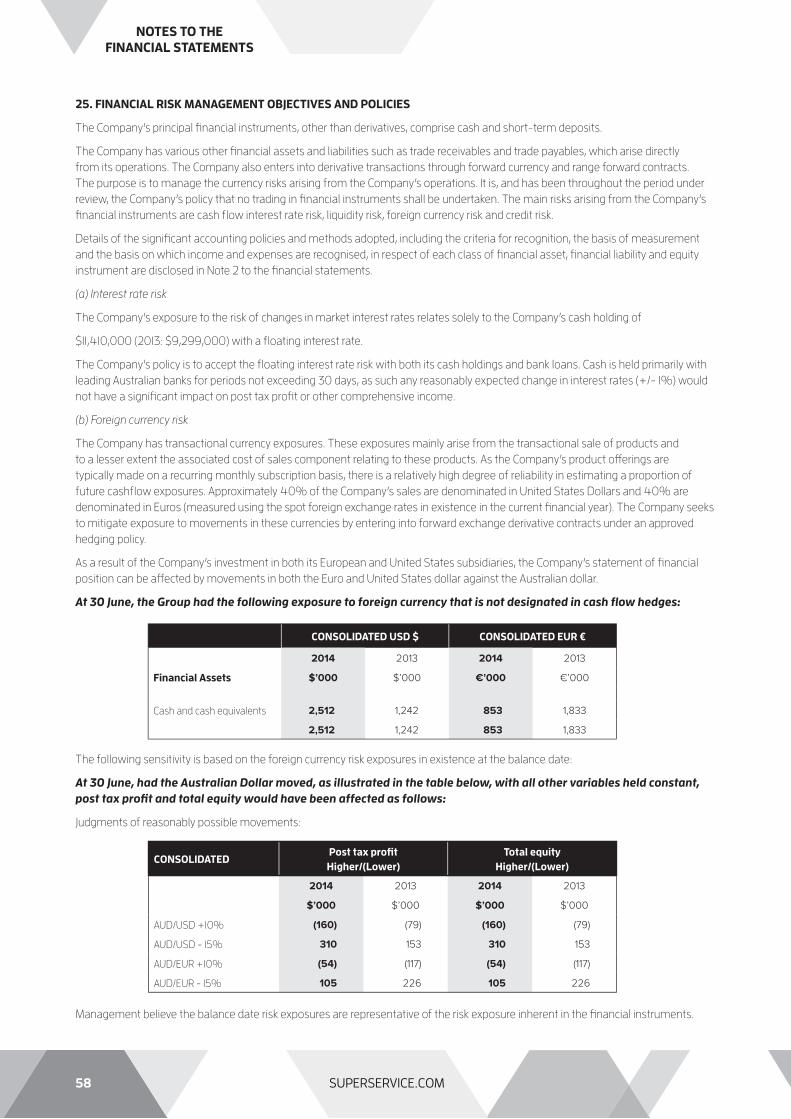
58 SUPERSERVICE.COM
25. FINANCIAL RISK MANAGEMENT OBJECTIVES AND POLICIES
The Company’s principal fi nancial instruments, other than derivatives, comprise cash and short-term deposits.
The Company has various other fi nancial assets and liabilities such as trade receivables and trade payables, which arise directly
from its operations. The Company also enters into derivative transactions through forward currency and range forward contracts.
The purpose is to manage the currency risks arising from the Company’s operations. It is, and has been throughout the period under
review, the Company’s policy that no trading in fi nancial instruments shall be undertaken. The main risks arising from the Company’s
fi nancial instruments are cash fl ow interest rate risk, liquidity risk, foreign currency risk and credit risk.
Details of the signifi cant accounting policies and methods adopted, including the criteria for recognition, the basis of measurement
and the basis on which income and expenses are recognised, in respect of each class of fi nancial asset, fi nancial liability and equity
instrument are disclosed in Note 2 to the fi nancial statements.
(a) Interest rate risk
The Company’s exposure to the risk of changes in market interest rates relates solely to the Company’s cash holding of
$11,410,000 (2013: $9,299,000) with a fl oating interest rate.
The Company’s policy is to accept the fl oating interest rate risk with both its cash holdings and bank loans. Cash is held primarily with
leading Australian banks for periods not exceeding 30 days, as such any reasonably expected change in interest rates (+/- 1%) would
not have a signifi cant impact on post tax profi t or other comprehensive income.
(b) Foreign currency risk
The Company has transactional currency exposures. These exposures mainly arise from the transactional sale of products and
to a lesser extent the associated cost of sales component relating to these products. As the Company’s product off erings are
typically made on a recurring monthly subscription basis, there is a relatively high degree of reliability in estimating a proportion of
future cashfl ow exposures. Approximately 40% of the Company’s sales are denominated in United States Dollars and 40% are
denominated in Euros (measured using the spot foreign exchange rates in existence in the current fi nancial year). The Company seeks
to mitigate exposure to movements in these currencies by entering into forward exchange derivative contracts under an approved
hedging policy.
As a result of the Company’s investment in both its European and United States subsidiaries, the Company’s statement of fi nancial
position can be aff ected by movements in both the Euro and United States dollar against the Australian dollar.
At 30 June, the Group had the following exposure to foreign currency that is not designated in cash fl ow hedges:
CONSOLIDATED USD $ CONSOLIDATED EUR €
2014 2013 2014 2013
Financial Assets $’000 $’000 €’000 €’000
Cash and cash equivalents 2,512 1,242 853 1,833
2,512 1,242 853 1,833
The following sensitivity is based on the foreign currency risk exposures in existence at the balance date:
At 30 June, had the Australian Dollar moved, as illustrated in the table below, with all other variables held constant, post tax profi t and total equity would have been affected as follows:
Judgments of reasonably possible movements:
Management believe the balance date risk exposures are representative of the risk exposure inherent in the fi nancial instruments.
CONSOLIDATEDPost tax profi t
Higher/(Lower)Total equity
Higher/(Lower)
2014 2013 2014 2013
$’000 $’000 $’000 $’000
AUD/USD +10% (160) (79) (160) (79)
AUD/USD - 15% 310 153 310 153
AUD/EUR +10% (54) (117) (54) (117)
AUD/EUR - 15% 105 226 105 226
NOTES TO THEFINANCIAL STATEMENTS

59SUPERSERVICE.COM
25. FINANCIAL RISK MANAGEMENT OBJECTIVES AND POLICIES (CONTINED)
(c) Credit risk
The Company’s credit risk with regard to accounts receivables is spread broadly across three automotive groups - manufacturers,
distributors and dealerships. Receivable balances are monitored on an ongoing basis with the result that the Company’s exposure to
bad debts is not signifi cant. As the products typically have a monthly life cycle and are priced on a relatively low subscription price, the
concentration of credit risk is typically low with automotive manufacturers being the exception.
With respect to credit risk arising from the other fi nancial assets of the Company, which comprise cash and cash equivalents, and
certain derivative instruments, the Company’s exposure to credit risk arises from default of the counter party, with a maximum
exposure equal to the carrying amount of these instruments.
Since the Company trades only with recognised third parties, collateral is not requested nor is it the Group’s policy to securitise its trade
and other receivables.
(d) Price risk
There are no items on the statement of fi nancial position as at 30 June 2014 that are subject price risk.
(e) Liquidity risk
The Company’s exposure to liquidity risk is minimal given the relative strength of the statement of fi nancial position and cash fl ows
from operations.
Given the nature of the Company’s operations and no borrowings, the Company does not have fi xed or contracted payments at
balance date other than with respect of its cash fl ow hedges which are disclosed below. Consequently the remaining contractual
maturity of the group entity’s fi nancial liabilities is as stated in the statement of fi nancial position and is less than 60 days. Deferred
revenue requires no cash outfl ow.
Liquidity and Interest rate risk
The following table sets out the carrying amount, by maturity, of the fi nancial instruments exposed to interest rate or liquidity risk:
CONSOLIDATED
30 June 2014 Less than one year Two to fi ve years Greater than fi ve years Weighted average
eff ective interest rate
Floating rate $’000 $’000 $’000 %
Cash and cash equivalents 11,410 - - 1.4
Trade and other receivables 6,162 - - -
Trade and other payables (2,601) - - -
CONSOLIDATED
30 June 2013 Less than one year Two to fi ve years Greater than fi ve years Weighted average
eff ective interest rate
Floating rate $’000 $’000 $’000 %
Cash and cash equivalents 9,299 - - 1.5
Trade and other receivables 5,304 - - -
Trade and other payables (2,634) - - -
Interest on cash and cash equivalents classifi ed as fl oating rate is repriced at intervals of less than one year. Interest on fi nancial
instruments classifi ed as fi xed rate is fi xed until maturity of the instrument. The other fi nancial instruments of the Group that are not
included in the above tables are non-interest bearing and are therefore not subject to interest rate risk.
(f) Fair value
Derivative instruments use valuation techniques other than quoted prices in active markets with only observable market inputs for the
asset or liability , either directly (as prices) or indirectly (derived from prices)to determine the fair value of foreign exchange contracts.
NOTES TO THEFINANCIAL STATEMENTS
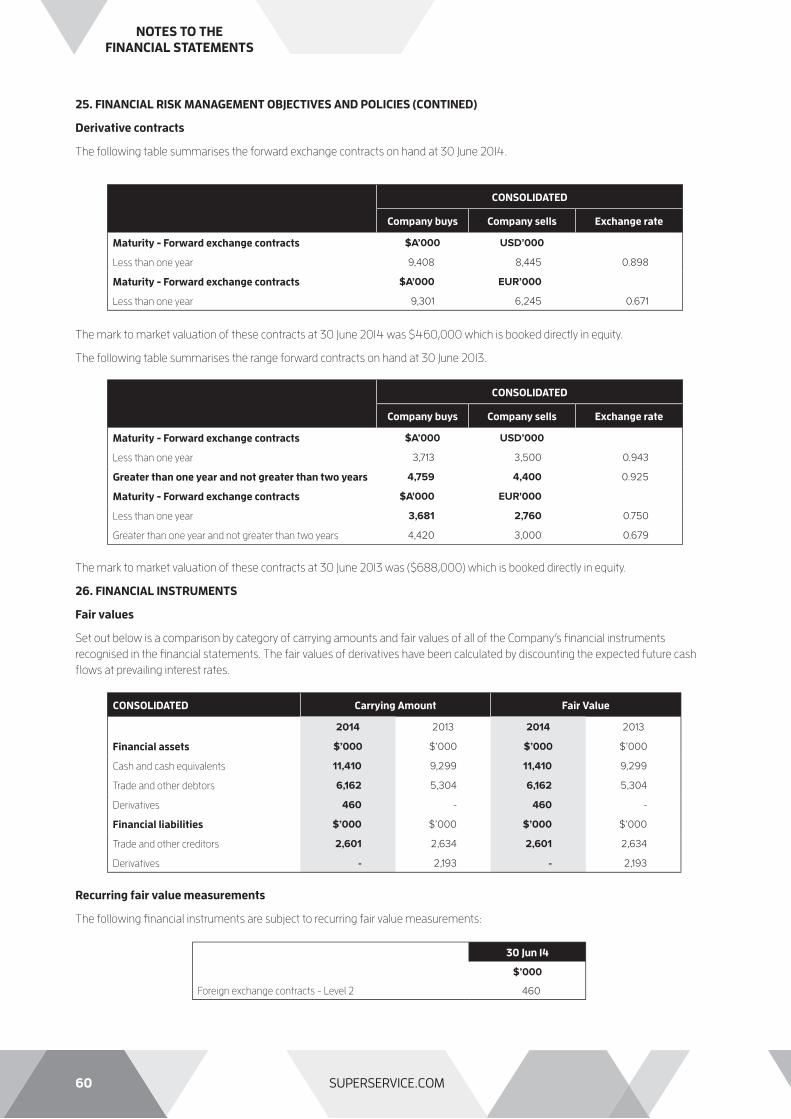
60 SUPERSERVICE.COM
25. FINANCIAL RISK MANAGEMENT OBJECTIVES AND POLICIES (CONTINED)
Derivative contracts
The following table summarises the forward exchange contracts on hand at 30 June 2014.
The mark to market valuation of these contracts at 30 June 2014 was $460,000 which is booked directly in equity.
The following table summarises the range forward contracts on hand at 30 June 2013.
The mark to market valuation of these contracts at 30 June 2013 was ($688,000) which is booked directly in equity.
26. FINANCIAL INSTRUMENTS
Fair values
Set out below is a comparison by category of carrying amounts and fair values of all of the Company’s fi nancial instruments
recognised in the fi nancial statements. The fair values of derivatives have been calculated by discounting the expected future cash
fl ows at prevailing interest rates.
Recurring fair value measurements
The following fi nancial instruments are subject to recurring fair value measurements:
CONSOLIDATED
Company buys Company sells Exchange rate
Maturity - Forward exchange contracts $A’000 USD’000
Less than one year 9,408 8,445 0.898
Maturity - Forward exchange contracts $A’000 EUR’000
Less than one year 9,301 6,245 0.671
CONSOLIDATED
Company buys Company sells Exchange rate
Maturity - Forward exchange contracts $A’000 USD’000
Less than one year 3,713 3,500 0.943
Greater than one year and not greater than two years 4,759 4,400 0.925
Maturity - Forward exchange contracts $A'000 EUR'000
Less than one year 3,681 2,760 0.750
Greater than one year and not greater than two years 4,420 3,000 0.679
CONSOLIDATED Carrying Amount Fair Value
2014 2013 2014 2013
Financial assets $’000 $’000 $’000 $’000
Cash and cash equivalents 11,410 9,299 11,410 9,299
Trade and other debtors 6,162 5,304 6,162 5,304
Derivatives 460 - 460 -
Financial liabilities $’000 $’000 $’000 $’000
Trade and other creditors 2,601 2,634 2,601 2,634
Derivatives - 2,193 - 2,193
Foreign exchange contracts - Level 2
30 Jun 14
$’000
460
NOTES TO THEFINANCIAL STATEMENTS

61SUPERSERVICE.COM
26. FINANCIAL INSTRUMENTS (CONTINUED)
Fair value hierarchy
AASB 13 Fair Value Measurement requires disclosure of fair value measurements by level in the fair value measurement hierarchy as follows:
- Level 1 - the instrument has quoted prices (unadjusted) in active markets for identical assets or liabilities
- Level 2 - a valuation technique is used using inputs other than quoted prices within level 1 that are observable for the fi nancial
instrument, either directly (i.e. as prices), or indirectly (i.e. derived from prices)
- Level 3 - a valuation technique is used using inputs that are not observable based on observable market data (unobservable inputs).
Transfers
During the year ended 30 June 2014, there were no transfers of available-for-sale equity securities or derivatives between levels 1 and
2 of the fair value hierarchy. There were also no transfers into or out of level 3 during the period.
Valuation techniques used to derive level 2 fair values
Derivative instruments use valuation techniques other than quoted prices in active markets with only observable market inputs for the
asset or liability, either directly (as prices) or indirectly (derived from prices) to determine the fair value of foreign exchange contracts.
Fair values of fi nancial instruments not measured at fair value
Due to their short-term nature, the carrying amounts of cash and cash equivalents, current receivables and current trade and other
payables is assumed to approximate their fair value.
27. PARENT ENTITY INFORMATION
PARENT ENTITY
2014 2013
$’000 $’000
Current assets 14,362 11,596
Total assets 51,125 48,332
Current liabilities 5,673 7,075
Total liabilities 11,596 12,317
Contributed equity 11,476 10,856
Retained earnings 27,268 25,663
Employee equity benefi t reserve 463 252
Cashfl ow hedge reserve 322 (756)
Total shareholders’ equity 39,529 36,015
Profi t or loss of the parent entity 12,106 10,054
Total comprehensive income of the parent entity 13,185 8,812
28. INTERESTS IN CONTROLLED ENTITIES
Name Country of incorporationPercentage of equity interest held by the Company (directly or indirectly)
Parent entity
2014 2013 2014 2013
% % $ $
IFM Europe Ltd
-Ordinary shares United Kingdom 100 100 247 247
Diff erent Aspect Software Ltd**
-Ordinary shares United Kingdom 100 100 4,719 4,719
IFM North America Inc
-Ordinary shares United States of America 100 100 1 1
IFM Germany GmbH*
-Ordinary shares Germany 100 100 - -
* Investment is held by IFM Europe Ltd.
** Entity was purchased on 2 September 2011
NOTES TO THEFINANCIAL STATEMENTS

62 SUPERSERVICE.COM
Directors’ Declaration
In accordance with a resolution of the directors of Infomedia Limited, I state that: In the opinion of the directors:
(a) the fi nancial statements and notes of the consolidated entity are in accordance with the Corporations Act 2001, including:
(i) giving a true and fair view of the consolidated entity’s fi nancial position as at 30 June 2014 and of their performance for the
year ended on that date; and
(ii) complying with Accounting Standards and the Corporations Regulations 2001; and
(b) the fi nancial statements and notes also comply with International Financial Reporting Standards as disclosed in note 2b
(c) there are reasonable grounds to believe that the consolidated entity will be able to pay its debts as and when they become due
and payable.
(d) this declaration has been made after receiving the declarations required to be made to the Directors in accordance with section
295A of the Corporations Act 2001 for the fi nancial year ending 30 June 2014.
On behalf of the Board
Frances Hernon
Chairman
Sydney, 21 August 2014
DIRECTOR’SDECLARATION


65SUPERSERVICE.COM
INFOMEDIA LTD
CORPORATE GOVERNANCE STATEMENT FY2014
OVERVIEW
Infomedia’s adoption of ‘best practice’ Corporate Governance Principles
Infomedia strives to ensure an acceptable level of compliance with the voluntary governance principles set out in the ‘Corporate
Governance Principles and Recommendations 2nd Edition with 2010 Amendments‘ published by the Australian Stock Exchange’s
(ASX) Corporate Governance Committee (CGC) (the ASX Principles).
Infomedia endeavours to meet the ASX Principles in a manner consistent with the resources, size and operational scope of the
Company. Where Infomedia is non-compliant with particular elements of the voluntary framework, the Company embraces the “If not,
why not?” principle, and provides explanatory materials relating to those compliance discrepancies.
ASX - Corporate Governance Principles
CORPORATE GOVERNANCE
ASXCORPORATE
GOVERNANCEPRINCIPLES
PRINCIPLE 1Lay solid
foundations for
management
and oversight PRINCIPLE 2
Structure the
Board to
add value
PRINCIPLE 3
Promote ethical
and responsible
decision making
PRINCIPLE 4
Safeguard integrity
in financial
reportingPRINCIPLE 5
Make timely
and balanced
disclosures
PRINCIPLE 6
Respect the rights
of shareholders
PRINCIPLE 7
Recognise and
manage risk
PRINCIPLE 8
Remunerate fairly
and responsibly
The ASX Principles provide a standard platform from which Infomedia implements and maintains a range of charters, policies and
procedures applicable to the Company (the Policies). Infomedia’s Policies seek to instil and entrench the values, standards and
behaviours required to ensure transparency, effi cient resource allocation and protection of stakeholder interests. Further information
about the Policies is available at http://www.infomedia.com.au/our-company/investors/145-corporate-governance
CORPORATE GOVERNANCE STATEMENT
1. PARTIAL NON-COMPLIANCE WITH THE ASX PRINCIPLES –“IF NOT, WHY NOT?”
As a voluntary set of guidelines, compliance with the ASX Principles is not mandatory.
In order to encourage participation, and in recognition of the fact that the resources and operating environments vary between
participants, the ASX Principles provide organisations with the fl exibility to comply in full or in part. This fl exibility is tempered by the
adoption of the “If not, why not?” principle, encouraging the Company to provide reasons for non-compliance with particular parts of
the ASX Principles.
Whilst Infomedia strives to meet the ASX Principles, it does so in a manner consistent with the resources available to it, and within the
context of its operating environment.
During FY2014, Infomedia was non-compliant with several of the ASX Principles. The following sections contain commentary on
the areas of both compliance and non-compliance, and provide relevant commentary in accordance with the “If not, why not?”
framework.

66 SUPERSERVICE.COM
CORPORATE GOVERNANCE
2. THE BOARD, SUB-COMMITTEES AND SENIOR MANAGEMENT
2.1 Composition and structure of the Board
The composition and size of Board has been primarily shaped by Infomedia’s Constitution. Relevantly, the Constitution provides that:
(a) the Company must maintain a minimum of three and a maximum of fi ve directors;
(b) one third of the Directors, and any other Director not in such one third who has held offi ce for three years or more, other than the
Chief Executive Offi cer (CEO), must retire by rotation each year. If eligible, retiring directors may off er themselves for re-election.
Careful consideration is given to the contribution each director is able to make both individually and collectively. There is strong
emphasis on promoting, among other attributes, an appropriate mix of complementary skills, independence, expertise, business
knowledge and executive and non-executive participation.
As noted in the Directors’ Report, on 27 September 2013, Mr Richard Graham became Non-Executive Chairman and Mr Andrew Pattinson
was appointed CEO and Director. In the same year Mr Clyde McConaghy was appointed as Non-Executive Director, eff ective from 1
November 2013. Following the appointment of Mr Pattinson and Mr McConaghy, the Board is comprised of fi ve Directors. The details of
each Director’s name, terms of offi ce, meeting attendance records, skills experience and expertise, appear in the Directors’ Report.
2.2 Independence of the Chair
On 19 February 2014 Ms Frances Hernon was appointed independent Non-Executive Chairman of the Board. Prior to her appointment
Mr Graham was Executive Chairman and his independence was compromised owing to:
(a) he being the Company’s largest shareholder until 28 August 2013; and
(b) eff ectively occupying the role of both CEO and Chairman.
For the reasons outlined above, the Company did not comply with the following principles for part of FY2014:
(a) ASX Principle 2.2 - The chair should be an independent Director; and
(b) ASX Principle 2.3 - The roles of the chair and the chief executive offi cer should not be exercised by the same individual.
2.3 Independence of the Board
ASX Principle 2.1 calls for the majority of the Board to be independent, Non-Executive Directors.
For the fi rst half of FY2014, the Board was comprised of four Non-Executive Directors in the form of Ms Hernon, Mr Clyde McConaghy,
Mr Graham and Mr Myer Herszberg.
Whilst Ms Hernon and Mr McConaghy meet the criteria for independence, Mr Herszberg’s independence was technically compromised
by his standing as a substantial shareholder of the Company for the relevant period prior to his selling down of his shares on 30
August 2013. Accordingly, the Company only partially complied with ASX Principle 2.1.
The independence of the Board is subject to continual evaluation. Ultimately, however, the Board accepts that its members remain
in offi ce upon the vote of the Company’s shareholders and that they may elect members to the Board regardless of their standing,
independent or otherwise.
2.4 Establishment of nomination and remuneration committees
The ASX Principles recommend that the Board should establish:
(a) a nominations committee for the examination of selection, recruitment and succession practices of the Company (ASX Principle 2.4); and
(b) a remuneration committee to focus on remuneration policies (ASX Principle 8.1).
The Board has assumed responsibility for remuneration and nomination since July 2007.
Given the relative size and resources available to the Company, the Board is of the view that neither a nominations nor a remuneration
committee would add any signifi cant corporate governance value for the following reasons:
(a) given the size and structure of the Board, there is little effi ciency to be derived from sub-committees other than the Audit, Risk &
Governance Committee (Audit Committee);
(b) ultimate responsibility for nominations and remuneration rests with the Board whether or not a nomination or remuneration
sub-committee is established;
(c) the Board has processes in place to raise issues relating to nomination and remuneration in the form of regular reporting by
senior management (including detailed reports from the Human Resources Manager) on such matters; and
(d) the Company maintains a formal policy for the nomination and induction of Directors (Director Nomination and Induction Policy),
a summary of which is available on Infomedia’s website.

67SUPERSERVICE.COM
2.5 Board charter and responsibilities
A formal charter documenting the appropriate division between the responsibilities of the Board and management has been in place
since July 2004. The Charter mandates the Board’s focus on the following key matters:
(a) developing the Company’s overall objectives;
(b) developing and mandating strategies to achieve Company objectives;
(c) setting overall policy framework within which the business of the Company is conducted; and
(d) ensuring that the Company operates with integrity and in accordance with good management and governance practices.
A summary of the Charter of the Board is available on the Company’s website.
2.6 Audit, Risk & Governance Committee
Please refer to section 3.1 below for a report on the activities of the Audit Committee.
3. ETHICAL BUSINESS CONDUCT
3.1 Infomedia’s Code of Conduct
Since its inception, Infomedia has placed emphasis on personal integrity, mutual respect and ethical business practices as core values
(Core Values). The Company’s dedication to these Core Values was formalised by the introduction of a formal Code of Conduct in
2004. The Code was further refi ned under the guidance of the Corporate Governance Committee during FY2006 to:
(a) strengthen formal resolution strategies for intra-organisational disputes; and
(b) provide clearer reporting guidelines with regard to compliance mechanisms.
The Infomedia Code of Conduct strengthens the Company’s commitment to the Core Values by articulating and formally entrenching
positive cultural values within the Company, and by providing guidance on dealings with various stakeholders. A summary of the Code
of Conduct is available on the Company’s website.
3.2 Workplace Diversity
The Company has historically dedicated itself to principles of equality and diversity within the workplace, and remains committed to
that goal. The Company has consistently achieved annual accreditation from the Department of Equal Opportunity for Women in the
Workplace (EOWA) for over a decade.
Given the relative size and resourcing of the Company, it did not maintain formal measurable objectives or policies relating to diversity
during the reporting period, therefore placing it outside of technical compliance with ASX Principles 3.2 and 3.3.
In accordance with ASX Principle 3.4, the following proportional split of Australian based employees was recorded as at 31 May 2014:
Category Females Males Total
Directors 1 (33%) 2 (66%) 3
Key Management Personnel 1 (20%) 4 (80%) 5
Employees 34 (18.4%) 157 (81.6%) 191
4. FINANCIAL REPORTING, AUDIT, GOVERNANCE AND RISK MANAGEMENT
4.1 The Audit, Risk & Governance Committee
Infomedia has maintained an Audit Committee in various forms since its IPO in August 2000. The last Audit Committee continued to
meet throughout the fi rst half of FY2014, however, its functions were temporarily incorporated by the full Board upon the resignation
of Mr Henderson, the then Chairman of the Committee, on 3 January 2013. The Audit Committee was re-established upon the
appointment on 1 November 2013 of Mr McConaghy.
The composition of the current Audit Committee meets all of the requirements contained in ASX Principle 4.2 on the basis that it:
(a) consists only of Non-Executive directors;
(b) consists of a majority of independent directors;
(c) is chaired by an independent chair, who is not the chair of the board; and
(d) has at least three members.
The objectives of the Committee are clearly defi ned within the Company’s Audit Committee Charter. A summary of the Audit
Committee Charter is available via the Company’s website.
CORPORATE GOVERNANCE

68 SUPERSERVICE.COM
4.2 Independent auditors
The Board acknowledges the importance of external auditor independence and the rotation of not only responsible audit partners but
also audit fi rms. The appointment of BDO as auditors during FY2012, after many years of commendable service from the Company’s
previous auditors, Ernst & Young, represents a commitment towards this objective. Additionally, the Committee has formalised
procedures for the rotation of responsible audit partners from BDO on a regular basis.
4.3 Financial reporting obligations
The Company’s fi nancial reporting obligations for FY2014 were fulfi lled in accordance with applicable legal and accounting
requirements. For further information, please refer to the fi nancial statements and notes contained in the Directors’ Report and the
Independent Audit Report.
Having acted in accordance with the revised Risk Management Plan and Policy, the CEO and the Chief Financial Offi cer (CFO) have
provided the Board with the necessary certifi cations required pursuant to the Corporations Act 2001 (Cth) and the ASX Principles.
4.4 Risk Management
Upon the recommendation of the Audit Committee, the Board adopted a revised Risk Management Plan and Policy (Risk Policy) during
FY2014. The revised plans promotes the establishment and implementation of a more eff ective and appropriate risk management
framework for the Company.
The Risk Policy allocates oversight responsibility to the Board and the Audit Committee, whilst the establishment of risk management
procedures, compliance and control rests with the CEO, CFO and senior executives and, at a daily operating level, with departmental
managers, line managers and individuals as part of regular business conduct.
A summary of the Company’s Risk Policy is available on the Company’s website.
5. MARKET DISCLOSURE & SHAREHOLDER RIGHTS
5.1 Market disclosure
During FY2004, the Board adopted a Market Disclosure Policy, developed in accordance with the ASX Principles. Internal reviews of
the Market Disclosure Policy indicate that both the continuous and periodic reporting obligations imposed under the ASX Listing Rules,
and the Company’s internal procedures, are well understood by senior management.
Infomedia remains committed to providing relevant, timely and accurate information to the market regarding fi nancial information,
performance, ownership and governance. A summary of the Market Disclosure Policy can be found on the Company’s website.
5.2 Communicating with shareholders
Through a series of initiatives, Infomedia continues to demonstrate its commitment to promoting eff ective communication with all
shareholders. The Company continues to develop its online content delivery for shareholders via the Company website where the
following documents are located:
• this Corporate Governance Statement;
• summaries of the various corporate governance charters, policies and guidelines;
• annual, and half yearly reports;
• a synopsis of the Infomedia business model;
• media releases, achievements, share price information;
• relevant notices relating to members’ meetings; and
• the Company’s July 2000 Prospectus.
Infomedia has considered and adopted, as appropriate to its circumstances, the various methods of electronic communications
contemplated by the ASX Principles.
5.3 Shareholder participation
Shareholder participation at general meetings is always encouraged. As usual, Infomedia’s independent auditor, BDO, will be present
during the 2014 Annual General Meeting, and will be available to answer shareholder questions at that time.
CORPORATE GOVERNANCE

69SUPERSERVICE.COM
6. EXECUTIVE & NON-EXECUTIVE REMUNERATION
6.1 Infomedia’s remuneration and performance review policies
Upon recommendation of the then Remuneration and Nomination Committee, the Board adopted a Remuneration and Performance
Evaluation Policy (Remuneration Policy) for Directors and senior executives in July 2004.
The Remuneration Policy outlines the criteria for assessing the performance of the Board as a whole, the Directors as individuals, the
Chairman of the Board and the senior executives. Further, it aims to provide a framework for structuring total remuneration that:
(a) facilitates both the short and long term growth and success of the Company;
(b) implements a mixture of fi xed, performance and equity based incentives;
(c) is competitive with the market place; and
(d) which is demonstrably linked to the Company’s overall performance.
The Company also has two equity based incentive plans:
(a) an Employee Option Plan, applicable to certain eligible employees, including senior executives and executive Directors; and
(b) an Employee Share Plan, applicable to all permanent employees of one or more years of service, including senior executives but
excluding both executive and Non-Executive Directors.
These plans were established prior to Infomedia’s listing in August 2000 in accordance with both the Corporations Act and the ASX
Listing Rules and were disclosed in the 14 July 2000 prospectus. In June 2005, the Board resolved to suspend the Employee Share
Plan indefi nitely.
Further details of senior executive remuneration is included in the Remuneration Report.
6.2 Remuneration dichotomy – Executive versus Non-Executive
The Remuneration Policy (refer paragraph 6.1 above) was formulated with regard to the best practice measures contained in the
commentary to Principle 8 of the ASX Principles.
The range of remuneration incentives available* to Executive and Non-Executive Directors and staff is summarised in the table below:
CORPORATE GOVERNANCE
Components of Executive Director Remuneration*
Components of Non-Executive Director Remuneration*
Components of Senior Executive and Staff Remuneration*
• Directors’ fees
• Statutory Superannuation contributions
• Incentive payments
• Share options and/or Performance Rights
• Retirement benefi ts
• Directors’ fees
• Statutory Superannuation contributions
• Salary
• Statutory Superannuation contributions
• Bonuses
• Share options and/or Performance Rights
• Commissions
* Note – the listed incentives for each category is optional and at the discretion of the Board. Differing combinations of remuneration and incentives are offered
on a case by case basis.

70 SUPERSERVICE.COM
Infomedia Ltd – Fully Paid Ordinary Shares
Top 20 Holdings as at 04-09-2014
Holder Name Balance at 04-09-2014 %
1 NATIONAL NOMINEES LIMITED 40,256,422 13.115
2 HSBC CUSTODY NOMINEES (AUSTRALIA) LIMITED 38,871,436 12.664
3 J P MORGAN NOMINEES AUSTRALIA LIMITED 28,191,722 9.184
4 CITICORP NOMINEES PTY LIMITED 17,498,005 5.701
5 BNP PARIBAS NOMS PTY LTD <DRP> 14,458,854 4.710
6 RBC INVESTOR SERVICES AUSTRALIA NOMINEES PTY LIMITED <BKCUST A/C> 12,905,584 4.204
7 RBC INVESTOR SERVICES AUSTRALIA NOMINEES PTY LIMITED <PI POOLED A/C> 12,794,480 4.168
8 CITICORP NOMINEES PTY LIMITED <COLONIAL FIRST STATE INV A/C> 5,315,568 1.732
9 MR RICHARD DAVID GRAHAM 4,043,001 1.317
10 BNP PARIBAS NOMS (NZ) LTD <DRP> 2,452,500 0.799
11 MR ANDREW PATTINSON 2,447,567 0.797
12 PERSHING AUSTRALIA NOMINEES PTY LTD <ACCORDIUS A/C> 1,714,061 0.558
13 MR PETER ALEXANDER BROWN 1,350,000 0.440
14 SANDHURST TRUSTEES LTD <TBF SMALL CAP VAL GRWTH A/C> 1,310,701 0.427
15 BRISPOT NOMINEES PTY LTD <HOUSE HEAD NOMINEE NO 1 A/C> 1,264,894 0.412
16 UBS NOMINEES PTY LTD 1,210,255 0.394
17 MORGAN STANLEY AUSTRALIA SECURITIES (NOMINEE) PTY LIMITED <NO 1 ACCOUNT> 1,015,394 0.331
18 HSBC CUSTODY NOMINEES (AUSTRALIA) LIMITED-GSCO ECA 896,402 0.292
19 SPANDOU INVESTMENTS PTY LTD 850,000 0.277
20 AUST EXECUTOR TRUSTEES LTD <FLANNERY FOUNDATION> 826,113 0.269
189,672,959 61.791
Total IC 306,954,355
ADDITIONAL INFORMATION
Infomedia Ltd – Analysis of Holdings as at 04-09-2014
Security ClassesFully Paid Ordinary Shares
Holdings Ranges Holders Total Units %
1-1,000 488 364,668 0.119
1,001-5,000 2,129 6,760,135 2.202
5,001-10,000 1,391 11,499,747 3.746
10,001-100,000 2,269 68,035,864 22.165
100,001-9,999,999,999 173 220,293,941 71.768
Totals 6,450 306,954,355 100.000
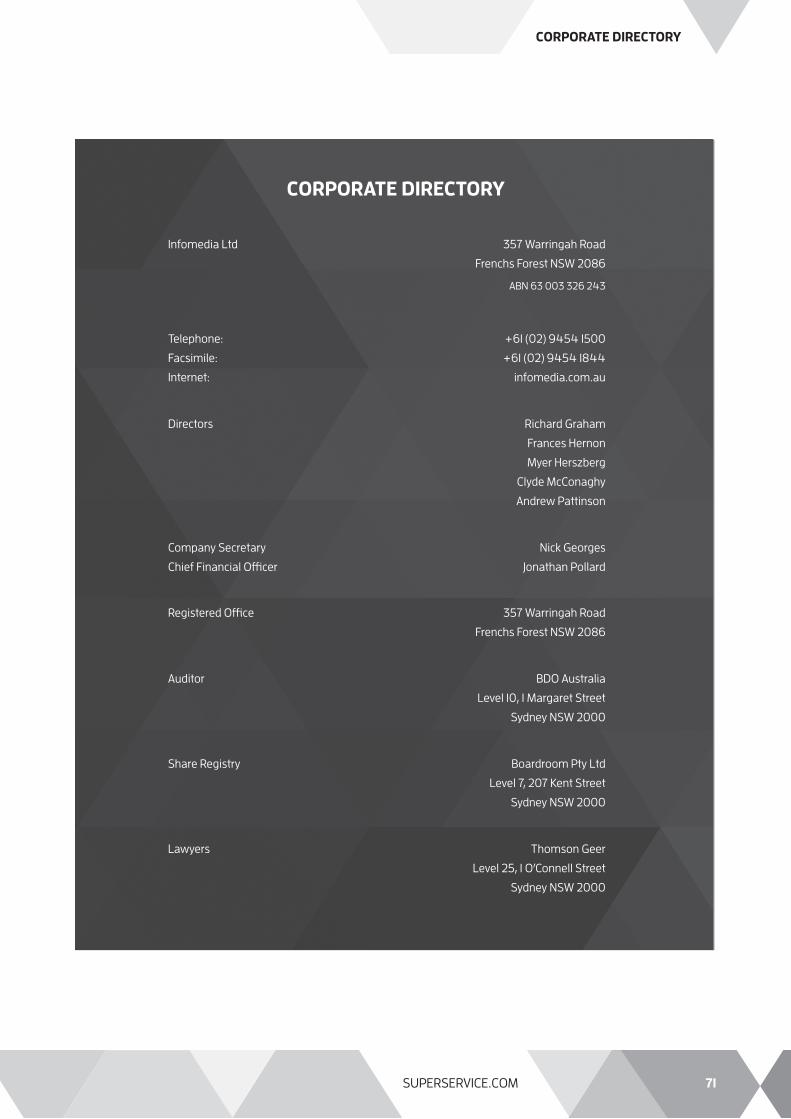
71SUPERSERVICE.COM
Infomedia Ltd 357 Warringah Road
Frenchs Forest NSW 2086
ABN 63 003 326 243
Telephone: +61 (02) 9454 1500
Facsimile: +61 (02) 9454 1844
Internet: infomedia.com.au
Directors Richard Graham
Frances Hernon
Myer Herszberg
Clyde McConaghy
Andrew Pattinson
Company Secretary Nick Georges
Chief Financial Offi cer Jonathan Pollard
Registered Offi ce 357 Warringah Road
Frenchs Forest NSW 2086
Auditor BDO Australia
Level 10, 1 Margaret Street
Sydney NSW 2000
Share Registry Boardroom Pty Ltd
Level 7, 207 Kent Street
Sydney NSW 2000
Lawyers Thomson Geer
Level 25, 1 O’Connell Street
Sydney NSW 2000
CORPORATE DIRECTORY
CORPORATE DIRECTORY

72 SUPERSERVICE.COM
NOTES

www.twitter.com/infomedialtd
www.linkedin.com/company/infomedia-ltd
http://www.superservice.com/counterview
www.youtube.com/superservicesolution
