annual report 2014 - eksportfinans · 8 eksportfinans annual report 2014 tone lunde bakker (born...
TRANSCRIPT

annual report
2014

2 e k s p o r t f i n a n s a n n u a l r e p o r t 2 0 1 4

c o n t e n t 3
Key figures 4President and CEO: Sound and stable 5About Eksportfinans 6Board of directors 8Management 9Annual report 2014 11
Financial statements
STATEMENT OF COMPREHENSIVE INCOME 20
BALANCE SHEET 21
STATEMENT OF CHANGES IN EQUITY 22
CASH FLOW STATEMENT 23
Notes1 GENERAL INFORMATION 24
2 SUMMARY OF SIGNIFICANT ACCOUNTING POLICIES 24
3 CRITICAL ACCOUNTING ESTIMATES AND JUDGMENTS 28
4 FAIR VALUE OF FINANCIAL INSTRUMENTS 29
5 NET GAINS/(LOSSES) ON FINANCIAL
INSTRUMENTS AT FAIR VALUE 38
6 LEASES 39
7 OTHER INCOME 39
8 EMPLOYEE RETIREMENT PLAN 39
9 SALARIES AND OTHER ADMINISTRATIVE EXPENSES 42
10 OTHER EXPENSES 42
11 INCOME TAXES 43
12 FINANCIAL DERIVATIVES 45
13 LOANS DUE FROM CREDIT
INSTITUTIONS AND CUSTOMERS 47
14 INTANGIBLE ASSETS 49
15 PROPERTY, EQUIPMENT AND INVESTMENT PROPERTY 50
16 OTHER ASSETS 51
17 BORROWINGS THROUGH THE ISSUE OF SECURITIES 51
18 LOANS TO ELECTED OFFICERS 52
19 PROVISIONS 52
20 INTRAGROUP ACCOUNTS 52
21 OTHER LIABILITIES 53
22 SUBORDINATED DEBT 53
23 CAPITAL CONTRIBUTION SECURITIES 53
24 SHAREHOLDERS 54
25 RESERVES WITHIN EQUITY 54
26 CAPITAL MANAGEMENT 55
27 CASH AND CASH EQUIVALENTS 56
28 FINANCIAL RISK MANAGEMENT 57
29 CREDIT RISK 57
30 MARKET RISK 62
31 LIQUIDITY RISK 66
32 FINANCIAL INSTRUMENTS SUBJECT
TO NET SETTLEMENTS 70
33 SEGMENT INFORMATION 71
34 RELATED PARTIES 73
35 REMUNERATION 73
36 NUMBER OF EMPLOYEES 76
37 CONTINGENCIES 76
38 REGULATORY FRAMEWORK 76
39 EVENTS AFTER BALANCE SHEET DATE 77
Declaration 77Auditor's report 78Statement by the control committee 80 Statement by the council of representatives 80Statement of policy on corporate government 81Corporate governance 82Remuneration policy 86Elected officers 88Financial analysis 90
contenteksportfinans annual report 2014

4 e k s p o r t f i n a n s a n n u a l r e p o r t 2 0 1 4
2010 2011 2012 2013 2014
key figures
net income after taxes (NOK BILLIONS) lending (NOK BILLIONS)
composition of assets (NOK BILLIONS)
■ Net income after taxes■ Profit for the period excluding unrealized gains/(losses)
on financial instruments at fair value
■ New lending■ Total lending
■ Liquidity investments ■ Municipal lending ■ Export lending
■ New bond debt■ Total bond debt
bond debt (NOK BILLIONS)
35
30
25
20
15
10
5
0
-5
-10
-15
-202010 2011 2012 2013 2014
150
120
90
60
30
02010 2011 2012 2013 2014
200
180
160
140
120
100
80
60
40
20
0
200
180
160
140
120
100
80
60
40
20
02010 2011 2012 2013 2014
return on equity (PERCENT)
capital adequacy (PERCENT)
Return on equity after taxesRisk free rate after taxesReturn on equity after taxes excluding unrealized gains/(losses) on financial instruments at fair value
Capital adequacyCore capital adequacy
200 %
150 %
100 %
50 %
0 %
-50 %
-100 %2010 2011 2012 2013 2014
40 %
35 %
30 %
25 %
20 %
15 %
10 %
5 %
0 %2010 2011 2012 2013 2014*
* New capital regulations (CRD IV)
7
6
5
4
3
2
1
0
Net income after taxes Profit for the period

2014 was a good year for Eksportfinans. Among the highlights were the verdict in favour of Eksportfinans in the lawsuit filed by an investor in the Japanese Samurai bond, and the rating upgrade to invest-ment grade (BBB -) with positive outlook by Standard & Poor’s.
Eksportfinans continued to deliver stable operations and positive results, leaving the company with a solid capital base at year-end. This makes the company more robust to adverse fluctuations in the capital markets and adds to its abil-ity and strong commitment to honor all its obligations to all stakeholders. Net in-terest income was lower in 2014 than the
year before due to lower level of interest generating assets and reduced margins on investments.
The change of chief executive officer in 2014 does not represent any change to the company’s strategy to actively manage its existing portfolios of assets, liabilities and other commitments in order to retain company value.
Eksportfinans values the high level of confidence from its business partners in 2014 and looks forward to continuing the good co-operation in 2015. Also crucial to the success of 2014 was the high quality work and strong dedication of our staff and management which we bring with us into 2015.
i n t r o d u c t i o n 5
sound and stable
«eksportfinans continued to deliver stable operations and positive results, leaving the company with a solid capital base at year-end.»
introduction by president and ceo, geir bergvoll

6 e k s p o r t f i n a n s a n n u a l r e p o r t 2 0 1 4
about eksportfinans
eksportfinans’ current strategy and business model are to actively manage the considerable existing portfolios of loans and bond debt as well as other assets, liabilities and commitments. The company is owned by banks operating in Norway and the Nor-wegian government and employs approxi-mately 50 highly qualified professionals.
The complex nature of Eksportfinans’ business and the size of its balance sheet require a professional and skilled staff. Combined with domestic and international regulations for financial institutions, this requires advanced technology, risk man-agement and processes to ensure quality in all aspects of business operations.
Important areas of operations include: •Leadership, human resources and
administration •Loan administration•Back office •Liquidity management •Risk management•Client and investor relations•Corporate communications•Business control•Accounting and reporting • Information technology•Legal and compliance
Eksportfinans’ main stakeholders are:
investorsEksportfinans’ debt securities are held by a wide range of private and institutional investors throughout Europe, Asia, the Middle East and North America. international capital marketsEksportfinans is active in several areas of the capital markets, including currency and interest rate risk management, depos-its and short and long term investments.
ownersThe company is owned by 24 banks operat-ing in Norway (85 percent) and the Norwe-gian government (15 percent). There have been no material changes in the ownership structure in the last decade. See note 24 to the accompanying financial statements for a detailed overview of shareholders.
the norwegian governmentThrough the Ministry of Trade, Industry and Fisheries, the Norwegian state owns 15 percent of the shares in Eksportfinans. From 1978 to 2011, Eksportfinans managed the Norwegian government-supported export financing scheme under the OECD Consensus arrangement on behalf of the government. Eksportfinans’ existing port-folio of these so-called CIRR loans is man-aged actively by the company until final redemption of the loans.
During the 1980’s and 90’s Eksportfi-
nans also offered so-called mixed credits to finance Norwegian export contracts to developing countries in close coopera-tion with the Norwegian Development Aid Agency, NORAD.
customersEksportfinans’ customers are Norwegian exporters and their clients in other coun-tries, Norwegian companies with interna-tional business activities, the Norwegian municipal sector as well as companies within renewable energy, environmental protection and infrastructure. Substan-tially all loans are secured by, or granted to, highly rated banks and the public sector.
giekThe Norwegian Guarantee Institute for Export Credits (GIEK) secures political and commercial risks on loans provided by Eksportfinans or other lenders, and is a vital partner for Eksportfinans.
commercial guarantorsHighly rated commercial banks provide guarantees for parts of the lenders’ obliga-tions on many of Eksportfinans’ loans.
employeesEksportfinans is a highly skilled organiza-tion and human capital is one of its primary resources. Several measures are in place to retain and develop the organization’s ex-pertise.
since its establishment on March 2, 1962, eksportfinans has financed norwegian export contracts from exporters throughout norway to clients all over the world. the company has also provided funding to the municipal sector, and has a substantial liquidity portfolio.

a b o u t e k s p o r t f i n a n s 7

8 e k s p o r t f i n a n s a n n u a l r e p o r t 2 0 1 4
Tone Lunde Bakker(born 1962) is a board member and member of the audit committee and the risk committee. She is country manager for Danske Bank in Norway, and has management experience from Danske Bank, SEB and Nordea. Ms. Lunde Bakker holds a business degree from Arizona State University, USA, and is an authorized financial analyst from the Norwegian School of Economics and Busi-ness Administration (NHH) in Bergen.
Rune Helgeland(born 1968) is a board member, elected by and among the employees of Eksportfinans. He is also an observer in the remuneration commit-tee. Mr. Helgeland joined Eksportfinans in 2001 as application manager. He has international experience from the financial software vendors SunGard and SimCorp and holds a bachelor in economics and an MBA in finance from Drexel University in Pennsylvania, USA.
Sigurd CarlSen(born 1959) is chair person of the board and the remuneration committee. He is chief risk officer in Nordea Bank Norge ASA and has held various leading positions within Nordea since he was first employed by the bank in 1986. Mr. Carlsen has a business degree from BI Nor-wegian Business School in Oslo, and holds an Executive Master of International Management from Thunderbird School of Global Manage-ment (then the American Graduate School of International Management) in Arizona, USA.
Christian Berg(born 1969) is deputy chair person of the board and member of the remuneration committee. He is senior partner of HitecVision AS. Until January 2012, he was president and CEO of Hafslund ASA. Prior to this, he was CFO of the company from 2001, after serving as manager of group financial investments. He has previ-ous experience from PwC and the investment company Brothers AS. Mr. Berg holds an MBA from the Norwegian School of Economics and Business Administration (NHH) in Bergen.
Bjørn Berg (born 1957) is a board member and head of both the audit committee and the risk commit-tee. He is chief investment officer in DNB Bank ASA and previously had management respon-sibility for the bank’s ownership in Eksportfi-nans. He has held various senior positions in finance since 1986, and previously worked as an auditor. Mr. Berg holds an MBA from the University of Wisconsin and a CPA from the Norwegian School of Economics and Business Administration (NHH) in Bergen.
Marianne Heien Blystad(born 1958) is a board member and member of the audit committee and the risk committee. She is an attorney-at-law with the law firm Ro Sommernes. She has a wide experience from in-ternational banking, with Citibank and Eksport-finans ASA, from maritime industries both in the US and Norway with the company Blystad Shipping and Trading and as an investor in the commercial real estate market in Norway. She has served on a wide range of boards in Nor-way. Ms. Blystad holds a business degree from BI Norwegian Business School in Oslo and a law degree from the University of Oslo.
board of directorsat deceMber 31, 2014

m a n a g e m e n t 9
managementat deceMber 31, 2014
Geir BerGvoll(born 1952) is president and CEO. Prior to the appointment in November 2014, he was chair-man of the board of directors of Eksportfinans since 2008. Mr. Bergvoll was head of merg-ers and acquisitions in DNB Bank ASA in Oslo from 2007 to 2014 and head of distribution in DnBNOR Asset Management between 2005 and 2007. Prior to this, he has held several mana-gerial positions within the bank. He started in DNB (then Sparebanken NOR) in 1990, follow-ing a period as General Manager of ABC-Bank. Mr. Bergvoll holds a degree in economics (Cand. Oecon.) from the University of Oslo.
Jens O. Feiring (born 1946) is executive vice president and gen-eral counsel. He has a law degree from the Uni-versity of Oslo and has worked in Eksportfinans since 1974. Mr. Feiring has previously held the position as EVP and director of the legal depart-ment in the company from 1981 to September 2011 and returned to the position in February 2012.
Christian Grøm(born 1958) is executive vice president and di-rector of risk management. He joined Eksportfi-nans in 2009 from DNB, where he had worked since 1990. He has additional work experience from the management consulting company IKO Strategi and Elkem. Mr. Grøm holds a business degree from the Norwegian School of Economics and Business Administration (NHH) in Bergen.
geir ove olsen(born 1966) is executive vice president and CFO. Mr. Olsen joined Eksportfinans in 2008 from the position of CFO of Toyota Kreditbank Gmbh, Norway, a position he had held since 1997. He has previous work experience from Dyno Indus-trier, Skattekontoret for storbedrifter and Puget Sound Bank in Seattle, USA. Mr. Olsen holds an MBA from Pacific Lutheran University in Ta-coma, USA.
elise lindbæk(born 1964) is executive vice president and director of staff. She was head of communica-tions from 2003 to 2008, and has held different positions within Eksportfinans since 1991. She has previous work experience from Nordea. Ms. Lindbæk has a business degree from the Nor-wegian School of Economics and Business Ad-ministration (NHH) in Bergen and an Executive Master of Management degree from BI Norwe-gian Business School in Oslo.
martine mills hagen(born 1968) is executive vice president and director of funding & lending. She joined Ek-sportfinans in 2005 and was head of funding from 2007 to 2012. She has been with Kom-munalbanken, Bankers Trust International (Lon-don) and Tokai Bank Europe (London). Ms. Mills Hagen has an MA in Economics & Politics from the University of Glasgow and an Executive MBA from ESCP Europe in Paris and BI Norwe-gian Business School in Oslo.

10 e k s p o r t f i n a n s a n n u a l r e p o r t 2 0 1 4

b o a r d o f d i r e c t o r s r e p o r t 11
eksportfinans actively manages a con-siderable portfolio of loans to the Norwe-gian export industry, foreign buyers of Nor-wegian capital goods and the Norwegian municipal sector. Substantially all loans are secured by guarantees from either GIEK (The Norwegian Guarantee Institute for Ex-port Credits) and/or highly rated banks. The company also actively manages its portfolio of international securities. Eksportfinans’ business is funded by equity as well as debt issued in the international capital markets.
The company was established in 1962 and is located in Oslo. Owners include 24 commercial and savings banks which oper-ate in Norway (85 percent ownership), as well as the Kingdom of Norway (15 percent ownership). Eiendomsselskapet Dronning Mauds gate 15 AS is a fully owned subsidiary of Eksportfinans founded in 2013 for the sole purpose of owning and managing the of-fice building formerly accounted for directly in Eksportfinans’ balance sheet.
Eksportfinans’ current strategy, es-tablished in 2012, is to actively manage the existing portfolios of assets, liabilities and other commitments. Eksportfinans gener-ated positive financial results from these portfolios in 2014, although a lower level of interest generating assets combined with reduced margins on investments, led to a reduction of net interest income in 2014 compared to 2013.
Profit excluding unrealized gains and losses and excluding realized losses hedged by the Portfolio Hedge Agreement (“PHA”) was reduced in 2014 compared to 2013, due to lower net interest income and high pen-sion expenses in 2014, as well as the high income booked in 2013 due to an Icelandic High Court ruling in Eksportfinans’ favor.
resultsnet interest incomeNet interest income was NOK 461 million for 2014, compared to NOK 697 million for 2013. The main reason for the decrease was the lower level of interest generating assets combined with reduced margins on investments. The net return on average as-sets and liabilities was 0.36 percent for 2014, 0.10 percentage points lower than for 2013.
net other operating incomeNet other operating income was negative NOK 6,060 million for 2014 compared to negative NOK 7,377 million for 2013. The main reason for this change was the large fluctuation in the market prices of Eksport-finans’ own debt. These prices fell substan-tially following the rating downgrades after November 18, 2011, and have since recov-ered, leading to unrealized losses (reversal of unrealized gains) for the company.
For 2014, the unrealized loss on Eksportfinans’ own debt amounted to NOK 9,313 million compared to unrealized losses of NOK 13,881 million for 2013 (see note 5 to the accompanying financial statements). Net of derivatives, this amount was an un-realized loss of NOK 6,023 million in 2014 (whereof around NOK 6.0 billion is due to credit spread effects) compared to a loss of NOK 7,708 million, net of derivatives, for 2013 (see note 30.4 to the accompanying financial statements).
The unrealized gain on Eksportfinans’ own debt accumulated in the balance sheet, net of derivatives, was NOK 2,310 million at December 31, 2014 (whereof around NOK 2.3 billion is due to credit spread ef-fects), compared to NOK 8,334 million at December 31, 2013. These unrealized gains
annual report 2014board of directors

12 e k s p o r t f i n a n s a n n u a l r e p o r t 2 0 1 4
will be reversed as unrealized losses in fu-ture periods. Capital adequacy will not be impacted by this in any material way, as changes in fair value of own debt caused by movements in credit spreads do not have an impact on total regulatory capital.
total operating expensesTotal operating expenses amounted to NOK 180 million for 2014, an increase of NOK 15 million from 2013. Aside from high litigation expenses which are not expected to continue, the underlying level of oper-ating expenses remained stable. The key ratio of net operating expenses in relation to average assets was 0.18 percent for 2014, compared to 0.12 percent for 2013. The rea-son for this increase was, in addition to the litigation expenses mentioned above, the lower level of average assets in 2014.
profit for the year Total comprehensive income in 2014 was negative NOK 4,315 million, compared to negative NOK 4,850 million in 2013. The negative figures were primarily due to the reversal of previously unrealized gains on Eksportfinans’ own debt. Consequently, return on equity was negative 43.5 percent in 2014, compared to negative 33.4 percent in 2013.
The table above shows the calculation of the non-IFRS measure of profit exclud-ing unrealized gains and losses on financial
instruments and excluding realized losses hedged by the PHA, and the corresponding return on equity. This calculation may be of interest to investors because it allows assessment of the performance of the un-derlying business operations without the volatility caused by fair value fluctuations; in particular the unrealized gains and loss-es on Eksportfinans’ own debt.
Profit excluding unrealized gains and losses and excluding realized losses hedged by the PHA amounted to NOK 130 million in 2014. This was a decrease of NOK 436 million compared to 2013. The main rea-sons for this decrease are the reduced net interest income, the high income booked in the fourth quarter of 2013 due to an Icelandic High Court ruling in Eksportfi-nans’ favor, combined with high pension expenses in 2014. The latter is mainly due to reduced discount rates on pension obli-gations, shown in “Other Comprehensive Income” in the Condensed statement of comprehensive income (see also note 8 to the accompanying financial statements).
balance sheetTotal assets amounted to NOK 85.6 billion at December 31, 2014, compared to NOK 100.8 billion at December 31, 2013.
Total loans amounted to NOK 39.2 bil-lion at the end of 2014, compared to NOK 58.6 billion at the end of 2013. The reduction was mainly due to limitations on new lend-
ing since November 18, 2011 and repayments on the current loan and debt portfolios.
export lendingEksportfinans actively manages a consid-erable portfolio of export loans. There were no disbursements of new loans in 2014. Total outstanding amount of loans qualifying for the government-supported export financing scheme was NOK 26.4 billion at December 31, 2014, compared to 33.7 billion at December 31, 2013. These fig-ures include both lending at market terms and lending at terms decided under the government-supported scheme. Eksport-finans’ total outstanding export related loans were NOK 36.1 billion at year-end 2014 compared to NOK 51.6 billion at year-end 2013.
Eksportfinans continued its close co-operation with GIEK, its owner banks and other banks that support Norwegian indus-try and commerce during 2014. These rela-tionships remain central in the adminis-tration and management of Eksportfinans’ outstanding loan portfolio.
local government lendingEksportfinans’ total involvement in local government lending was NOK 3.0 billion at year-end 2014 compared to NOK 6.9 billion at year-end 2013. This reduction was in line with expectations.
non-ifrs profit for the period the year
(nok Millions) 2014 2013
Comprehensive income for the period in accordance with IFRS (4,315) (4,850)
Net unrealized losses/(gains) 6,017 7,354
Unrealized gains/(losses) related to Iceland 1) (7) 276
Realized losses/(gains) hedged by the Portfolio Hedge Agreement (PHA) 2) 0 0
Tax effect of the items above (1,566) (2,214)
non-ifrs profit for the period excluding unrealized gains/(losses) on financial instruments and excluding realized losses/(gains) hedged by the pha 130 566
Return on equity based on profit for the period excluding unrealized gains/(losses) on financial instruments and excluding realized losses/(gains) hedged by the PHA 3) 1.8% 8.0%
1) Reversal of previously recognized loss (at exchange rates applicable at reporting date).
2) Securities have been sold with realized gains/losses. These gains and losses are covered by the PHA, and will be settled according to that agreement. Eksportfinans therefore believes it is useful for investors to present this non-IFRS profit figure with such gains/losses excluded due to the economic arrangements under, and the accounting impacts of, the PHA.
3) Return on equity: Profit for the period/average equity adjusted for proposed not distributed dividends.

b o a r d o f d i r e c t o r s r e p o r t 13
securitiesEksportfinans’ total securities portfolio consists of two sub-portfolios. One has been subject to a Portfolio Hedge Agree-ment (“PHA”) with Eksportfinans’ share-holders since February 29, 2008 (the “PHA portfolio”). The other is maintained for liquidity purposes (the “liquidity reserve portfolio”). The total securities portfolio was NOK 28.0 billion at December 31, 2014, compared to NOK 26.5 billion at December 31, 2013.
The fair value of the PHA portfolio was NOK 6.9 billion at December 31, 2014, compared to NOK 7.5 billion at year-end 2013. Management expects the main por-tion of the portfolio to be held to maturity. See note 12 to the accompanying financial statements for further information about the PHA. The fair value of the liquidity reserve portfolio was NOK 21.1 billion at December 31, 2014, compared to NOK 18.9 billion at December 31, 2013.
fundingOutstanding bond debt was NOK 66.4 bil-lion at year-end 2014. The corresponding figure at year-end 2013 was NOK 75.8 bil-lion. The main reason for this decrease was maturing debt.
As foreseen, Eksportfinans did not have the need to seek new funding from the markets during 2014. The company has a robust infrastructure in place to manage
its funding portfolio going forward. The table on page 14 shows estimated cumula-tive liquidity based on estimated maturity of debt, loans and investments.
capital The capital ratio was 24.4 percent at year-end 2014, compared to 38.1 percent at year-end 2013. The core capital ratio was 24.3 percent at year-end 2014, compared to 36.8 percent at year-end 2013. These decreases in the capital ratios were due to the new capital regulations reflecting CRD IV, implemented by the Norwegian FSA as of September 30, 2014. The company’s es-timate of its core capital ratio at December 31, 2014 according to the capital regulations prior to the implementation of CRD IV was 45 percent. The reasons for the decrease un-der the CRD IV regulations are changed risk weights on financial institutions, affecting mainly Eksportfinans’ bank guaranteed loans and securities, as well as the CVA (Credit Valuation Adjustment) charge on financial derivatives.
The board has decided not to propose a dividend for 2014.
risk management Eksportfinans’ business model is based on a conservative risk profile.
Risk and capital are managed through a framework of principles, organizational structures as well as measurement and
monitoring processes that are closely aligned with the activities of the business areas. Particular focus on liquidity risk, business risk and operational risk is im-portant going forward.
obJectives and strategies for risk managementThe following form the approach to risk and capital management in Eksportfinans:•Themanagementteamprovidesoverall
risk and capital management supervision. The board regularly monitors the risk and capital profile, which it revises at a mini-mum on an annual basis.
•Eksportfinans manages market, credit,operational, concentration, liquidity, busi-ness, legal and reputational risks as well as capital allocation in a coordinated manner.
categories of riskliquidity riskEksportfinans manages liquidity risk pri-marily through its sizeable liquidity reserve portfolio, by matching maturities of assets and liabilities, and by stress testing cash flows. Liquidity management aims to en-sure adequate excess liquidity at all times. Liquidity and new placements are aligned closely to future maturities of liabilities. The company has a committed liquidity facility of USD 1 billion in place with its owner banks in order to ensure access to additional liquidity if needed.
■ Share capital■ Reserves
■ Bond debt■ Risk capital■ Other liabilities
capital sources AT DECEMBER 31, 2014 (NOK billions)
■ Liquidity■ Government supported loans■ Commercial loans■ Other receivables and fixed assets
total assets AT DECEMBER 31, 2014 (NOK billions)
shareholders equityAT DECEMBER 31
(NOK billions)
40
35
30
25
20
15
10
5
02010 2011 2012 2013 2014
14 e k s p o r t f i n a n s a n n u a l r e p o r t 2 0 1 4
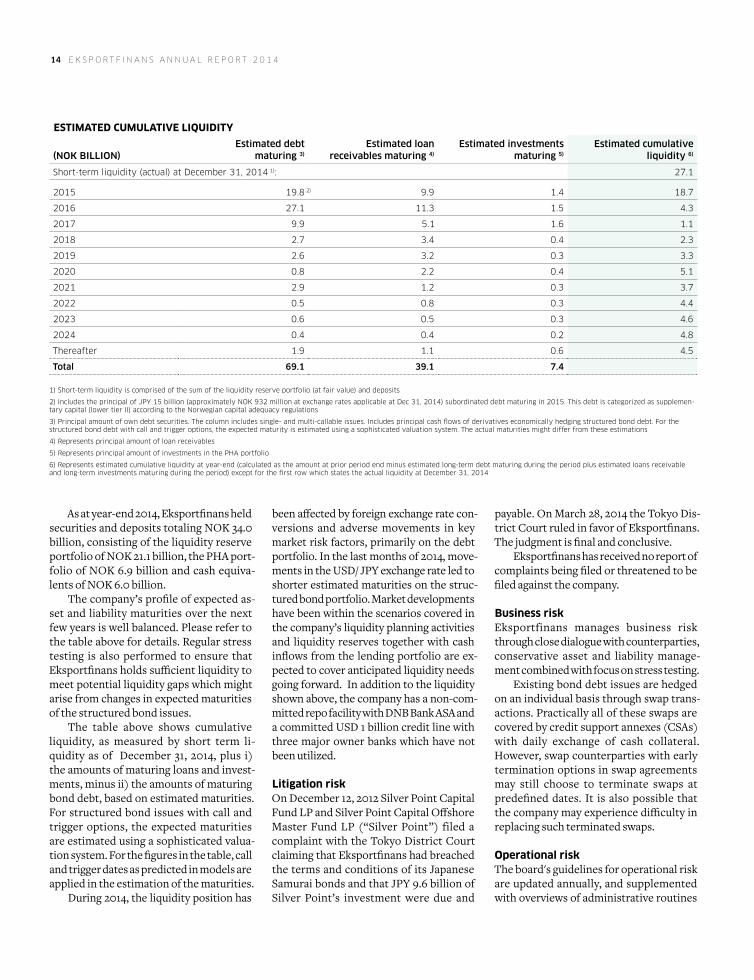
As at year-end 2014, Eksportfinans held securities and deposits totaling NOK 34.0 billion, consisting of the liquidity reserve portfolio of NOK 21.1 billion, the PHA port-folio of NOK 6.9 billion and cash equiva-lents of NOK 6.0 billion.
The company’s profile of expected as-set and liability maturities over the next few years is well balanced. Please refer to the table above for details. Regular stress testing is also performed to ensure that Eksportfinans holds sufficient liquidity to meet potential liquidity gaps which might arise from changes in expected maturities of the structured bond issues.
The table above shows cumulative liquidity, as measured by short term li-quidity as of December 31, 2014, plus i) the amounts of maturing loans and invest-ments, minus ii) the amounts of maturing bond debt, based on estimated maturities. For structured bond issues with call and trigger options, the expected maturities are estimated using a sophisticated valua-tion system. For the figures in the table, call and trigger dates as predicted in models are applied in the estimation of the maturities.
During 2014, the liquidity position has
been affected by foreign exchange rate con-versions and adverse movements in key market risk factors, primarily on the debt portfolio. In the last months of 2014, move-ments in the USD/ JPY exchange rate led to shorter estimated maturities on the struc-tured bond portfolio. Market developments have been within the scenarios covered in the company’s liquidity planning activities and liquidity reserves together with cash inflows from the lending portfolio are ex-pected to cover anticipated liquidity needs going forward. In addition to the liquidity shown above, the company has a non-com-mitted repo facility with DNB Bank ASA and a committed USD 1 billion credit line with three major owner banks which have not been utilized.
litigation riskOn December 12, 2012 Silver Point Capital Fund LP and Silver Point Capital Offshore Master Fund LP (“Silver Point”) filed a complaint with the Tokyo District Court claiming that Eksportfinans had breached the terms and conditions of its Japanese Samurai bonds and that JPY 9.6 billion of Silver Point’s investment were due and
payable. On March 28, 2014 the Tokyo Dis-trict Court ruled in favor of Eksportfinans. The judgment is final and conclusive.
Eksportfinans has received no report of complaints being filed or threatened to be filed against the company.
business riskEksportfinans manages business risk through close dialogue with counterparties, conservative asset and liability manage-ment combined with focus on stress testing.
Existing bond debt issues are hedged on an individual basis through swap trans-actions. Practically all of these swaps are covered by credit support annexes (CSAs) with daily exchange of cash collateral. However, swap counterparties with early termination options in swap agreements may still choose to terminate swaps at predefined dates. It is also possible that the company may experience difficulty in replacing such terminated swaps.
operational riskThe board's guidelines for operational risk are updated annually, and supplemented with overviews of administrative routines
estimated cumulative liquidity
(nok billion)estimated debt
maturing 3)
estimated loan receivables maturing 4)
estimated investments maturing 5)
estimated cumulative liquidity 6)
Short-term liquidity (actual) at December 31, 2014 1): 27.1
2015 19.8 9.9 1.4 18.7
2016 27.1 11.3 1.5 4.3
2017 9.9 5.1 1.6 1.1
2018 2.7 3.4 0.4 2.3
2019 2.6 3.2 0.3 3.3
2020 0.8 2.2 0.4 5.1
2021 2.9 1.2 0.3 3.7
2022 0.5 0.8 0.3 4.4
2023 0.6 0.5 0.3 4.6
2024 0.4 0.4 0.2 4.8
Thereafter 1.9 1.1 0.6 4.5
total 69.1 39.1 7.4
1) Short-term liquidity is comprised of the sum of the liquidity reserve portfolio (at fair value) and deposits
2) Includes the principal of JPY 15 billion (approximately NOK 932 million at exchange rates applicable at Dec 31, 2014) subordinated debt maturing in 2015. This debt is categorized as supplemen-tary capital (lower tier II) according to the Norwegian capital adequacy regulations
3) Principal amount of own debt securities. The column includes single- and multi-callable issues. Includes principal cash flows of derivatives economically hedging structured bond debt. For the structured bond debt with call and trigger options, the expected maturity is estimated using a sophisticated valuation system. The actual maturities might differ from these estimations
4) Represents principal amount of loan receivables
5) Represents principal amount of investments in the PHA portfolio
6) Represents estimated cumulative liquidity at year-end (calculated as the amount at prior period end minus estimated long-term debt maturing during the period plus estimated loans receivable and long-term investments maturing during the period) except for the first row which states the actual liquidity at December 31, 2014
2)

b o a r d o f d i r e c t o r s r e p o r t 15
and management systems. Throughout 2014 the company has
maintained a stable and robust organiza-tion and Eksportfinans’ operations have developed according to plan. The com-pany's operational risk guidelines regard-ing routines, policies and procedures have been developed further to maintain high quality also in the future.
In all fair value estimations and risk control processes, there is a clearly defined separation of responsibility between the business units and the control and follow-up units. These processes are subject to audit on a regular basis.
market riskDuring 2014 credit spreads on the compa-ny’s own debt decreased gradually. These spreads constitute an important input to the calculation of fair value under the IFRS accounting principles. A significant part of the unrealized gain caused by the substan-tial increase in fair value of the company’s own debt in 2011 has been reversed since then due to the tightening of credit spreads and the approach to maturity of the indi-vidual debt transactions.
Credit spreads in the lending portfo-lio remained relatively stable throughout 2014. Other market risks for the company were currency and interest rate risk. These were controlled through daily monitor-ing of defined limits. The interest rate and currency exposures are presented in note 30.2 and 30.3 to the accompanying financial statements.
Interest rate risk, foreign exchange risk and liquidity risk on outstanding lending and borrowing under the government-sup-ported export financing scheme managed by Eksportfinans, are still fully covered through the agreement with the Norwegian Ministry of Trade, Industry and Fisheries.
credit riskEksportfinans’ credit policy requires coun-terparties to be of high credit quality. The limited credit risk is generated through exposure to supra nationals, financial in-stitutions and countries within the EU and OECD area. The counterparties either have high ratings or the exposure is covered by governmental guarantee programs.
The main credit risks going forward
are reduced creditworthiness and default of counterparties. Nearly all loans have double default protection through both a debtor and a guarantor. The separate PHA agreement hedges the credit risk in the PHA portfolio (see the section “Securities” above). The liquidity reserve portfolio is managed within conservative credit limits. Credit risk from derivatives is managed through daily exchange of collateral for practically all transactions.
ratingIn 2014 Standard & Poor’s and Moody’s changed Eksportfinans’ outlook to posi-tive and stable accordingly. On December 5, 2014, Standard & Poor’s also upgraded its credit rating of Eksportfinans to BBB -.
At year-end 2014, the company's for-eign currency credit ratings were as fol-lows: •BBB-/A-3 with positive outlook from
Standard and Poor’s •Ba3/Not Prime fromMoody’s Investor
Services. Long term ratings are on stable outlook.
The company gave notice to Moody's Investor Services at year-end 2014 that it no longer required their rating.
regulatory risk management and controlAs required by the Norwegian capital ad-equacy regulation, the company´s overall risk strategy, assessments of the capital adequacy as well as controls and routines for managing the types of risk that Eksport-finans faces (market risk, credit risk and operational risk), is available on the com-pany’s website (www.eksportfinans.no).
In August 2014, Eksportfinans filed its annual ICAAP (Internal Capital Adequacy Assessment Process) report with the Nor-wegian Financial Supervisory Authority.
regulatory frameworkAs of December 31, 2014, one of Eksportfi-nans' loans has an exemption from the reg-ulations regarding maximum exposures to one single client until the loan has reached the regulatory level through scheduled re-payments of principal.
New capital regulations reflecting the EU’s Capital Requirements Directive IV were implemented in Norway as of Sep-
tember 30, 2014. After the implementa-tion the capital ratios decreased due to changed risk weights on financial institu-tions and the credit valuation adjustment (CVA) charge on derivatives, but are still well above regulatory requirements.
elected officersThe board of directors of Eksportfinans consists of six members in all, of which at December 31, 2014, three were representa-tives from the shareholder banks, in addi-tion to two representatives from Norwe-gian industry. An employee representative also holds a place on the board.
Chairman of the board, Geir Bergvoll, took up the position as new president and CEO of the company from November 1, 2014. Concurrently, former deputy chair-man of the board, Sigurd Carlsen, was ap-pointed new chairman of the board and Christian Berg was appointed new deputy chairman. Furthermore, Bjørn Berg from DNB Bank ASA was appointed new member of the board of directors of Eksportfinans from the same date.
Eksportfinans is in compliance with the Norwegian legal regulations requiring that the board should consist of at least 40 percent men and 40 percent women elected by the shareholders. The board of directors is presented on page 8.
The board held seven ordinary and eight extraordinary meetings in 2014, in addition to a strategy seminar.
The board of directors has formed three subcommittees in accordance with prevailing regulations:
(i) The audit committee consists of three members. Sigurd Carlsen acted as chair of the committee until November 1, 2014 when Bjørn Berg took over this posi-tion. Tone Lunde Bakker and Marianne Heien Blystad are members. During 2014, the committee had four ordinary meetings and one extraordinary meeting.
(ii) The risk committee consists of three members. Currently the members of the audit committee (see above) also serve as members of the risk committee.
(iii) The remuneration committee consists of two members and one observer. Geir Bergvoll acted as chair of the commit-tee until November 1, 2014 when Sigurd Carlsen took over this position. Christian

16 e k s p o r t f i n a n s a n n u a l r e p o r t 2 0 1 4
Berg joined the committee as member in 2014. Rune Helgeland serves as an observer. During 2014 the committee had three ordi-nary meetings.
For an overview of Eksportfinans’ elect-ed officers see page 88.
According to Sections 5-6 (3), (4) and 6-16a of the Public Limited Liability Com-pany Act, the board of directors shall dis-close its guidelines for remuneration to the general executive management. In addition, the board shall report on its guidelines for remuneration to the management team for the preceding financial year and the implementation thereof. The amounts are reported in note 35 to the accompanying fi-nancial statements, and the policy is avail-able in a separate article on page 86.
corporate governance Eksportfinans aims to ensure a high stan-dard of corporate governance and to be in compliance with relevant laws, regula-tions and ethical standards at all times. The shareholders elect independent and well-qualified board members to safeguard these values. The company complies with the Norwegian code of practice for corporate governance (NUES) to the extent possible, and with section 3-3b of the Norwegian ac-counting act. The report on corporate gov-ernance is available in a separate article on page 82, and the statement of policy on cor-porate governance is presented on page 81.
the organiZation The complex nature of Eksportfinans' business and the size of its balance sheet require a highly skilled organization. Thus, a key priority is to secure the necessary ex-pertise and skills to maintain a solid foun-dation for Eksportfinans' operations going forward. Several measures are in place to retain and develop the organization’s ex-pertise and there is a close dialog between management, the employees and their rep-resentatives on this matter. Eksportfinans has two cooperation committees between top management and the employees, which both submit an annual report on their ac-tivities to the board.
The institution is committed to diversi-ty, for example with regards to composition of age and gender, education and ethnic background. At the end of 2014, the gender
distribution was 48 percent women and 52 percent men and employees from several nations were represented in the organiza-tion. In management positions 40 percent were women at the end of 2014, compared to 50 percent at the end of 2013. The head-quarters are situated in Oslo.
Short-term absence in 2014 was 0.8 percent compared to 0.6 percent in 2013. Total absence in 2014 due to illness was 3.5 percent, compared to 4.2 percent in 2013. There were no reports of accidents result-ing in personal injury in 2014.
President and CEO Gisele Marchand left the executive management team and Eksportfinans with effect from November 1, 2014 and her successor, Geir Bergvoll, took up the position from the same date. For a complete presentation of the company’s management, see page 9.
corporate responsibility Eksportfinans has implemented the re-porting requirements on social corporate responsibility in accordance with the Ac-counting Act, section 3-3c. The company’s activities do not have any direct mate-rial consequences on the external environ-ment or any direct social impact. However, projects financed by the company may have such adverse affects. Eksportfinans therefore has an awareness of environ-mental and social issues as well as corrup-tion. Extensive guidelines are incorporated into the company’s social responsibility policy which is approved by the board and published on the company website (www.eksportfinans.no) and on its intranet.
The policy covers a broad range of social responsibility considerations and comprises ethical guidelines, environmen-tal and social requirements for projects financed by Eksportfinans, required anti-corruptions measures in projects financed by Eksportfinans, measures against money laundering as well as reporting require-ments. As part of the company’s environ-mental requirements Eksportfinans is obliged to adhere to the OECD Common Approaches on the Environment and Of-ficially Supported Export Credits, which also gives specific directions on how the re-quirements should be implemented in the company’s lending operations. In addition the board has decided upon an environ-
mental poster which provides guidelines for practical application of environmental considerations in the company’s activities. As a result of these efforts, Eksportfinans is not aware of violations of human or social rights, or breaches of environmental re-quirements, in any of its projects or opera-tions in 2014 or historically.
Eksportfinans has also implemented anti-corruption guidelines which are in ac-cordance with the OECD Action Statement on Bribery and Officially Supported Export Credits. Consequently, Eksportfinans has not been associated with any company known to have been involved in corrup-tion in 2014, or historically. Furthermore, Eksportfinans’ instructions on measures against money laundering have been imple-mented to prevent involuntarily involve-ment in criminal acts and the financing of terrorism. An important application of these guidelines is the know-your-custom-er principle, which implies, inter alia, thor-ough documentation of the identity of all clients, agents and other parties involved in lending projects.
Finally, Eksportfinans has established its own whistleblowing routine which is easily accessible on the company’s intranet. The routine encourages and explains how employees should promptly report any violations of the company’s guidelines, applicable laws and regulations or other causes of concern. There has been no such reporting in 2014 or historically. The social responsibility policy, including all appen-dices, is subject to the company’s regular compliance reporting. Eksportfinans does not anticipate any major amendments to its current guidelines, efforts or reporting within this field in the foreseeable future.
statements In conformity with Section 3-3 of the Nor-wegian Accounting Act, the board confirms the going concern assumption forming the basis for the preparation of the annual ac-counts. As the basis for this assumption the board has considered the annual financial statements for 2014 as well as the liquid-ity situation and cash flow forecast of the company, as described in the “Liquidity risk” section of this report.
In compliance with section 3-3b of the Norwegian Accounting Act and the Norwe-

b o a r d o f d i r e c t o r s r e p o r t 17
Marianne Heien Blystad Rune Helgeland
Tone Lunde Bakker Bjørn Berg
Sigurd CarlsenChair person
Christian BergDeputy chair person
gian code of practice for corporate gover-nance, the board submits the company’s principles and practice for corporate gov-ernance to Eksportfinans’ ordinary annual general assembly. The policy statement is presented on page 81 of this report.
According to Section 5-5 of the Securi-ties Trading Act the board of directors and the president and CEO shall jointly give a statement that the financial report repre-sents a complete and final report on the financial position of the company. The dec-laration is provided separately on page 77.
future prospects The board expects the balance sheet to re-duce further in 2015 due to maturing debt. Along with expected reduced margins on investments this is expected to contribute to a reduction in the company’s income in 2015 and beyond. Furthermore, accumu-lated unrealized gains due to price fluc-tuations of Eksportfinans’ own debt after November 18, 2011, will continue to be re-versed as unrealized losses in the future. As of December 31, 2014, the cumulative unre-alized gain on Eksportfinans’ own debt, net of derivatives, is NOK 2,310 million.
Eksportfinans will continue to pursue its strategy of actively managing its loan portfolio and other assets and liabilities going forward. The company enters 2015 with a solid capital base and adequate liquidity reserves. Developments in the international capital markets will be fol-lowed closely with special attention to key risk factors in order to assess and mitigate adverse impacts on the company’s balance sheet and liquidity.
Oslo, February 13, 2015EKSPORTFINANS ASA The board of directors

18 e k s p o r t f i n a n s a n n u a l r e p o r t 2 0 1 4

a n n u a l a c c o u n t s 19
annual accountsas of deceMber 2014

20 e k s p o r t f i n a n s a n n u a l r e p o r t 2 0 1 4
statement of comprehensive incomeparent company group
2014 2013 (nok thousands) 2014 2013 notes
175,884 290,135 Interest and related income on loans due from credit institutions 175,987 290,139
1,804,859 2,542,775 Interest and related income on loans due from customers 1,804,859 2,542,775
264,465 235,814 Interest and related income on securities 264,465 235,814
15,332 31,885 Other interest and related income 15,332 31,885
2,260,540 3,100,609 total interest and related income 2,260,643 3,100,613
1,781,907 2,389,482Interest and related expenses on commercial paper and bond debt 1,781,907 2,389,482
2,882 3,608 Interest and related expenses on subordinated debt 2,882 3,608
0 960 Interest and related expenses on capital contribution securities 0 960
15,098 9,608 Other interest and related expenses 15,103 9,608
1,799,887 2,403,658 total interest and related expenses 1,799,892 2,403,658
460,653 696,951 net interest income 460,751 696,955
82 77 Commissions and income related to banking services 82 77
2,357 2,496 Commissions and expenses related to banking services 2,357 2,496
(6,069,425) (7,379,137) Net losses on financial instruments at fair value (6,069,425) (7,379,137) 5, 30.4
298 145,246 Other income 12,064 4,821 7
(6,071,402) (7,236,310) net other operating incoMe (6,059,636) (7,376,735)
(5,610,749) (6,539,359) total operating incoMe (5,598,885) (6,679,780)
153,525 137,475 Salaries and other administrative expenses 154,235 137,550 9
4,413 13,357 Depreciation 15,865 17,703 14,15
15,346 11,553 Other expenses 10,352 9,452 10
173,284 162,385 total operating eXpenses 180,452 164,705
(5,784,033) (6,701,744) pre-taX operating profit/(loss) (5,779,337) (6,844,485)
(1,572,890) (1,956,668) Tax benefit (1,505,808) (1,995,208) 11
(4,211,143) (4,745,076) profit/(loss) for the year (4,273,529) (4,849,277)
(41,023) (882) Other comprehensive income *) (41,023) (882)
(4,252,166) (4,745,958) total comprehensive income (4,314,552) (4,850,159)
(4,359,588) (5,420,380) Allocated to/(from) reserve for unrealized gains (4,305,947) (5,364,215) 25
148,445 674,422 Allocated to/(from) other equity 32,418 514,056
(4,211,143) (4,745,958) total allocations (4,273,529) (4,850,159)
*) Items that will not be reclassified to profit or loss.
The accompanying notes are an integral part of the financial statements.

a n n u a l a c c o u n t s 21
balance sheetparent company group
dec. 31, 2014 dec. 31, 2013 (nok thousands) dec. 31, 2014 dec. 31, 2013 note
assets
12,367,805 17,702,019 Loans due from credit institutions 1) 12,370,388 17,704,012 13
33,371,816 47,362,902 Loans due from customers 2) 33,371,816 47,362,902 13
27,991,395 26,462,302 Securities 27,991,395 26,462,302 29.5
7,070,531 5,499,731 Financial derivatives 7,070,531 5,499,731 12
337,831 337,831 Investments in group companies 0 0
3,575 5,417 Intangible assets 3,575 5,417 14
7,138 8,873 Property, equipment and investment property 217,194 213,227 15
4,620,339 3,560,419 Other assets 4,604,261 3,545,159 16
85,770,430 100,939,494 total assets 85,629,160 100,792,750
liabilities
66,412,958 75,842,547 Bond debt 3) 66,412,958 75,842,547 17
5,128,629 5,145,290 Financial derivatives 5,128,629 5,145,290 12
372,215 0 Taxes payable 372,119 0 11
201,628 2,162,661 Deferred tax liabilities 229,484 2,124,120 11
4,601,941 4,611,486 Other liabilities 4,599,499 4,607,485 21
161,459 96,971 Provisions 161,459 96,971 8, 19
964,978 901,750 Subordinated debt 964,978 901,750 22
77,843,808 88,760,705 total liabilities 77,869,126 88,718,163
shareholders' equity
2,771,097 2,771,097 Share capital 2,771,097 2,771,097 24
933,222 5,292,810 Reserve for unrealized gains 1,043,028 5,348,974 25
4,222,303 4,114,882 Other equity 3,945,909 3,954,516
7,926,622 12,178,789 total shareholders' equity 7,760,034 12,074,587
85,770,430 100,939,494total liabilities and shareholders' equity 85,629,160 100,792,750
1) Of NOK 12,370,388 thousand at December 31, 2014, NOK 12,180,893 thousand is measured at fair value through profit or loss and NOK 189,495 thousand is measured at amortized cost. Of NOK 17,704,012 thousand at December 31, 2013, NOK 17,496,576 thousand is measured at fair value through profit or loss and NOK 207,436 thousand is measured at amortized cost.
2) Of NOK 33,371,816 thousand at December 31, 2014, NOK 15,206,829 thousand is measured at fair value through profit or loss and NOK 18,164,987 thousand is measured at amortized cost. Of NOK 47,362,902 thousand at December 31, 2013, NOK 25,390,064 thousand is measured at fair value through profit or loss and NOK 21,972,838 thousand is measured at amortized cost.
3) Of NOK 66,412,958 thousand at December 31, 2014, NOK 47,837,947 thousand is measured at fair value through profit or loss and NOK 18,575,011 thousand is measured at amortized cost. Of NOK 75,842,547 thousand at December 31, 2013, NOK 53,264,264 thousand is measured at fair value through profit or loss and NOK 22,578,283 thousand is measured at amortized cost.
The accompanying notes are an integral part of the financial statements.
Sigurd CarlsenChair person
Christian BergDeputy chair person
Tone Lunde Bakker Bjørn Berg Marianne Heien Blystad Rune Helgeland

22 e k s p o r t f i n a n s a n n u a l r e p o r t 2 0 1 4
statement of changes in equity
parent company
(nok thousands) share capital 1)
share premium reserve 1)
reserve unrealized gains 1) other equity total equity
eQuity as at January 1, 2013 2,771,097 176,597 10,713,189 3,263,863 16,924,745
Share premium reserve 2) 0 (176,597) 0 176,597 0
Actuarial gains /(loss) and other comprehensive income 0 0 0 (882 (882)
Total comprehensive income for the period 0 0 (5,420,379) 675,304 (4,745,076)
equity as at december 31, 2013 2,771,097 0 5,292,810 4,114,882 12,178,789
eQuity as at January 1, 2014 2,771,097 0 5,292,810 4,114,882 12,178,789
Actuarial gains/(loss) and other comprehensive income 0 0 0 (41,023) (41,023)
Total comprehensive income for the period 0 0 (4,359,588) 148,445 (4,211,143)
equity as at december 31, 2014 2,771,097 0 933,222 4,222,303 7,926,622
group
(nok thousands) share capital 1)
share premium reserve 1)
reserve unrealized gains 1) other equity total equity
eQuity as at January 1, 2013 2,771,097 176,597 10,713,189 3,263,863 16,924,745
Share premium reserve 2) 0 (176,597) 0 176,597 0
Actuarial gains /(loss) and other comprehensive income 0 0 0 (882) (882)
Total comprehensive income for the period 0 0 (5,364,215) 514,938 (4,849,277)
equity as at december 31, 2013 2,771,097 0 5,348,974 3,954,516 12,074,587
eQuity as at January 1, 2014 2,771,097 0 5,348,974 3,954,516 12,074,587
Actuarial gains/(loss) and other comprehensive income 0 0 0 (41,023) (41,023)
Total comprehensive income for the period 0 0 (4,305,947) 32,418 (4,273,529)
equity as at december 31, 2014 2,771,097 0 1,043,028 3,945,909 7,760,034
1) Restricted equity that cannot be paid out to the the owners without a resolution to reduce the share capital in accordance with the Public Limited Companies Act under Norwegian law. For further information, see note 25.
2) As per July 1, 2013 the Public Limited Companies Act under Norwegian Law states that share premium reserve no longer is to be classified as restricted equity that cannot be paid out to owners without a shareholder resolution to reduce the share capital.
The accompanying notes are an integral part of the financial statements.

a n n u a l a c c o u n t s 23
cash flow statement
parent company group
2014 2013 (nok thousands) 2014 2013 notes
(5,784,033) (6,701,744) Pre-tax operating profit/(loss) (5,779,337) (6,844,485)
provided by operating activities:
(169,452) (61,846) Accrual of contribution from the Norwegian government (169,452) (61,846)
6,016,988 7,354,358 Unrealized losses/(gains) on financial instruments at fair value 6,016,988 7,354,358 5
4,413 13,357 Depreciation 15,865 17,704 14, 15
23,438,207 33,247,243 Principal collected on loans 23,438,207 33,247,243
(22,774,520) (27,506,083) Purchase of financial investments (trading) (22,774,520) (27,506,083)
22,713,113 44,752,040 Proceeds from sale or redemption of financial investments (trading) 22,713,113 44,752,040
336,929 322,402 Contribution paid by the Norwegian government 336,929 322,402
0 (318,377) Taxes paid (786) (318,377)
changes in:
95,926 491,292 Accrued interest receivable 95,926 491,292
(730,313) 2,964,064 Other receivables (729,488) 2,980,124
(911,944) (4,738,075) Accrued liabilities (910,386) (4,742,877)
22,235,314 49,818,631 net cash floW froM operating activities 22,253,059 49,691,495
1,009,975 3,165,914 Proceeds from sale or redemption of financial investments 1,009,975 3,165,914
0 (337,831) Investment in group companies 0 0
7,197,272 1,111,653 Net cashflow from financial derivatives 7,197,272 1,111,653
(1,339) (18,391) Purchases of property and equipment and intangible assets (18,494) (24,010) 14, 15
416 207,040 Proceeds from sales of property and equipment 416 3,958
8,206,324 4,128,385 net cash floW froM investing activities 8,189,169 4,257,515
2,163 (5,030,828) Change in debt to credit institutions 2,163 (5,030,828)
(31,808,681) (52,169,648) Principal payments on bond debt (31,808,681) (52,169,648)
0 (502,650) Repayment of subordinated debt 0 (502,650)
(31,806,518) (57,703,126) net cash floW froM financing activities (31,806,518) (57,703,126)
(1,364,880) (3,756,110) net change in cash and cash eQuivalents (1,364,290) (3,754,116)
6,251,712 9,265,361 Cash and cash equivalents as at beginning of period 6,253,706 9,265,361 27
1,123,894 742,461 Effect of exchange rates on cash and cash equivalents 1,123,894 742,461
6,010,726 6,251,712 cash and cash eQuivalents at end of period 6,013,310 6,253,706 27
The accompanying notes are an integral part of the financial statements.

24 e k s p o r t f i n a n s a n n u a l r e p o r t 2 0 1 4
1 general inforMationEksportfinans ASA manages a portfolio of both government supported and market-based export credits.
Eksportfinans ASA is a limited liability company. Eksportfinans ASA is in-corporated and domiciled in Norway. The address of the head office is Dronning Mauds gate 15, P.O. Box 1601 Vika, N-0119 Oslo, Norway. In the second half of 2013, Eksportfinans ASA founded Eiendomsselskapet Dronning Mauds gate 15 AS for the sole purpose of owning and managing the office building formerly accounted for directly in Eksportfinans’ bal-ance sheet. Eiendomsselskapet Dronning Mauds gate 15 AS is owned 100 percent by Eksportfinans.
In these financial statements the terms ‘Eksportfinans ASA’, ‘company’ and ‘Eksportfinans’ are used for the parent company Eksportfinans ASA. The term ‘EDM 15’ is used for the subsidiary Eiendomsselskapet Dronning Maudsgate 15 AS. The term ‘group’ refers to the parent company and the subsidiary as a financial group.
The fiscal year of the company runs from January 1 to December 31.
These financial statements have been approved for issue by the Board of Directors on February 13, 2015.
2 suMMary of significant accounting policiesThe principal accounting policies applied in the preparation of these finan-cial statements are set out below. These policies have been consistently applied to all the years presented, unless otherwise stated.
2.1 basis of preparation These financial statements have been prepared in line with accounting regu-lations and legislation in Norway. The Norwegian Accounting Act requires the group to prepare the financial statements in accordance with Interna-tional Financial Reporting Standards (IFRS) as adopted by the European Union (EU). This set of standards is not necessarily identical with IFRS as issued by the International Accounting Standards Board (IASB). Mainly, these differences are related to the timing of endorsement by the EU, but there are also material differences in specific standards (e.g. the ’carve outs‘ in IAS 39). The Norwegian Accounting Act also requires some disclosure in addition to the disclosure required by IFRS. These are related to remuneration, and are included in these financial statements. The financial statements have been prepared under the historical cost convention, as modified by the re-valuation of financial assets and liabilities held at fair value through profit and loss, and as modified by the revaluation made for certain assets when implementing IFRS.
ifrss and ifrics adopted by the the company and the group in 2014IFRS 10, ‘Consolidated financial statements’ builds on existing principles by identifying the concept of control as the determining factor in whether an entity should be included within the consolidated financial statements of the parent company. The standard provides additional guidance to assist in
the determination of control where this is difficult to assess. The standard was endorsed by the EU for accounting periods beginning on or after Janu-ary 1, 2014. The amendments did not have an impact on the group.
IFRS 11, ‘Joint arrangements’focuses on the rights and obligations of the parties to the arrangements rather than its legal form. There are two types of joint arrangements; joint operations and joint ventures. Joint operations arise where the investors have rights to the assets and obligations for the liabilities of an arrangement. A joint operator accounts of its share of the assets, liabilities, revenue and expenses. Joint ventures arise where the investors have rights to the net assets of the arrangement; joint ventures are accounted for under the equity method. Proportional consolidation of joint arrangements is no longer permitted. The standard was endorsed by the EU for accounting periods beginning on or after January 1, 2014. The amendments did not have an impact on the group.
IFRS 12, ‘Disclosures of interests in other entities’ includes the disclosure requirements for all forms of interests in other entities, including joint arrangements, associates, structured entities and other off balance sheet vehicles. The standard was endorsed by the EU for accounting periods be-ginning on or after January 1, 2014. The amendments did not have an impact on the group.
new and amended standards (ifrss) and interpretations (ifrics) issued but not effective for the financial year beginning January 1, 2014, and not early adopted by the company and the groupIFRS 9, ‘Financial instruments’, addresses the classification, measurement and recognition of financial assets and financial liabilities. The complete version of IFRS 9 was issued in July 2014. It replaces the guidance in IAS 39 that relates to the classification and measurement of financial instru-ments. IFRS 9 retains but simplifies the mixed measurement model and establishes three primary measurement categories for financial assets: am-ortised cost, fair value through OCI and fair value though P&L. The basis of classicication depends on the entity’s business model and the contractual cash flow characteristics of the financial asset. Investments in equity in-struments are required to be measured at fair value through profit or loss with the irrevocable option at inception to present changes in fair value in OCI not recycling. There is now a new expected credit losses model that replaces the incurred loss impairment model used in IAS 39. For financial liabilities there were no changes to classification and measurement except for the recognition of changes in own credit risk in other comprehensive income, for liabilities designated at fair value through profit or loss. IFRS 9 relaxes the requirements for hedge effectiveness by replacing the bright line hadge effectiveness tests. It requires an economic relationship be-tween the hedged item and hedging instrument and for the ‘hedged ratio’ to be the same as the one management actually use for risk management purposes. Contemporaneous documentation is still required but is different to that currently prepared under IAS 39. The standard is effective for ac-counting periods beginning on or after January 1, 2018. Early adoption is permitted. The group is yet to assess IFRS 9’s full impact.
notesto annual report 2014

n o t e s 25
IFRS 15, ‘Revenue from contracts with customers’ deals with revenue rec-ognition and establishes principles for reporting useful information to users of financial statements about the nature, amount, timing and uncertainty of revenue and cash flows arising from an entity’s contracts with custom-ers. Revenue is recognized when a customer obtains control of a good or service and thus has the ability to direct the use and obtain the benefits from the good or service. The standard replaces IAS 18 ‘Revenue’ and IAS 11 ‘Construction contracts’ and related interpretations. The standard is ef-fective for annual periods beginning on or after January 1, 2017 and earlier application is permitted. The group is yet to assess the impact of IFRS 15.
There are no other IFRSs or IFRIC interpretations that are not yet effective that would be expected to have a material impact on the group.
2.2 foreign currency translationItems included in the financial statements are measured using the currency of the primary economic environment in which the group operates, i.e. the functional currency. Norwegian kroner (NOK) serve as both the functional and presentational currency for the company and its subsidiary.
On initial recognition, foreign currency transactions are recorded applying the spot exchange rate at the date of recognition. At the balance sheet date, foreign currency monetary items are translated using the closing rate. Unrealized gains and losses on foreign currency translations are recorded in the statement of comprehensive income. This is not applied for items related to the Parliamentary Bill No. 108 (1977-78), (referred to as the 108 Agreement), as foreign currency risks are covered by the 108 Agreement. The 108 Agreement has been established to provide exporters of capital goods financing on terms that are in accordance with OECD (Organization for Economic Co-operation and Development) regulations related to the Consensus Agreement for export financing (the CIRR scheme). Exchange rate differences on transactions under the 108 Agreement are booked to a settlement account with the government on the balance sheet. See the further description of the 108 Agreement in notes 2.5.1, 2.5.3 and 12.
2.3 recognition and derecognition of financial assets and liabilitiesSecurities are accounted for at settlement date. However, the change in fair value from trade date to settlement date is recorded in earnings. All other financial instruments are accounted for at the date that Eksportfinans be-comes contractually obliged to the agreement. Financial instruments are derecognized when the contractual rights to receive, or the contractual ob-ligations to pay, cash flows expire or when substantially all the risks and rewards of the instrument are transferred.
2.4 revenue recognitionInterest income from financial instruments measured at amortized cost is recognized in the statement of comprehensive income using the effective interest method. Interest income from financial instruments measured at fair value through profit or loss is recognized in the statement of compre-hensive income as it accrues.
All interest income and interest expense is classified to net interest income. This includes interest related to financial assets and financial liabilities measured at fair value through profit or loss.
Guarantees issued are recognized initially on the balance sheet at fair val-ue. The fees that the company receives over the life of the guarantee are amortized to income on a straight-line basis over the period of the obliga-tion in the line item ’Commissions and income related to banking services‘.
2.5 financial instruments 2.5.1 financial instruments used and classification in portfoliosThe company’s balance sheet consists to a great extent of financial instru-ments. The accounting policies related to these assets and liabilities are therefore critical for an understanding of the financial statements. Financial instruments are classified into the following categories:• Financial assets or financial liabilities at fair value through profit or loss• Loans and receivables (measured at amortized cost)• Other financial liabilities (measured at amortized cost)
Financial assets or financial liabilities at fair value through profit or loss are financial instruments either classified as held for trading, or upon initial recognition designated as at fair value through profit or loss (the fair value option). Financial instruments held for trading include securities acquired principally for the purpose of being sold in the short term, and financial derivatives used to manage market risk. Financial instruments designated upon initial recognition as at fair value through profit or loss consist of lending, liquidity placements, including deposits and securities, borrowings and cash collateral related to swaps.
Loans and receivables measured at amortized cost consist of loans covered by an agreement with the authorities pursuant to Coverage of interest and exchange rate risk for borrowing, lending and liquidity is provided under the 108 Agreement. The company enters into derivative contracts on be-half of the 108 Agreement to reduce the market risk. See further descrip-tion in note 2.5.3.
Other financial liabilities, measured at amortized cost, consist of debt re-lated to the 108 Agreement.
2.5.2 measurement 2.5.2.1 initial measurement Financial instruments are measured at fair value on the date of recognition, see note 2.3. 2.5.2.2 subsequent measurementmeasurement at fair value through profit or loss Fair value is the amount for which an asset could be exchanged or a li-ability settled between knowledgeable, willing parties in an arm’s length transaction.

26 e k s p o r t f i n a n s a n n u a l r e p o r t 2 0 1 4
The company has elected the fair value option for the main portion of its financial instruments, with two exceptions. Firstly, lending, borrowing and liquidity under the government supported 108 Agreement are measured at amortized cost. Secondly, instruments for which fair value measurement is a requirement and are therefore not subject to the fair value option. The latter applies for financial assets and liabilities held for trading and all financial derivatives, which are required to be measured at fair value.
The fair value option is applied when this results in the most relevant in-formation under the options available for measurement of financial instru-ments and when alternative principles of measurement result in greater accounting mismatches. The most important cause of accounting mismatch is the requirement to measure all financial derivatives at fair value. Finan-cial derivatives are used in economic hedges of the market risk of specific assets and liabilities. To obtain a more symmetrical measurement, the un-derlying economically hedged transactions, as well as transactions at float-ing rate that are not subject to individual hedges, have to be measured at fair value. This is obtained through the application of the fair value option for these financial instruments.
At the time of adoption of IFRS (January 1, 2007) management had ana-lyzed different measurement combinations of hedge accounting, amortized cost and fair value under different market scenarios. All combinations would have led to high income volatility, and none of the analyzed combi-nations showed a systematically lower volatility under all market scenar-ios. An asymmetric measurement model gives rise to volatility that is dif-ficult to analyze and communicate. The performed analyses indicated that applying the fair value option for the majority of its financial instruments (apart from the exceptions described above) would result in less volatility, thus the most relevant information, ex ante. The company therefore was of the opinion that the financial instruments satisfied the conditions in IAS 39 for applying the fair value option.
The fair values of quoted investments are based on current bid prices. If the market for a financial asset is not active (and for unlisted securities), the company establishes fair value by using valuation techniques. These include the use of recent arm’s length transactions, reference to other in-struments that are substantially the same, expected discounted cash flow analysis, and option pricing models making maximum use of market inputs and relying as little as possible on entity-specific inputs. See note 4 for a description of fair value measurement.
measurement at amortized cost Lending, borrowing and liquidity at amortized cost are measured using the effective interest method. The effective interest method provides the principles of calculating the amortized cost of a financial asset or financial liability, and of allocating the interest income or interest expense over the relevant period. The effective interest rate is the rate that exactly discounts estimated future cash payments or receipts through the expected life of the financial instrument or, when appropriate, a shorter period to the net carrying amount of the financial asset or financial liability.
impairments of financial assets At each balance sheet date the company assesses whether there is any objective evidence that a financial asset, or group of financial assets, meas-ured at amortized cost is impaired. If any such evidence exists, the amount of the impairment loss is measured as the difference between the carrying amount of the financial asset and the present value of estimated future cash flows discounted at the original effective rate or the current effective rate of return for a financial asset with variable interest rate.
2.5.3 presentation in the balance sheet and statement of comprehensive income general Interest accrued but not paid or received and adjustments to fair value are presented in the balance sheet in the same line item as the underlying as-set or liability to which the interest relates.
lending Loans are recorded, dependent on the counterparty, either in the line item ’Loans due from credit institutions’ or in the line item ’Loans due from customers‘ in the balance sheet, regardless of measurement principles ap-plied. The company has acquired certain loan agreements from banks for which the bank provides a repayment guarantee, therefore retaining the credit risk of the loans. These loans are classified as loans due from credit institutions.
Interest income on instruments classified as lending is included in the line item ’Net interest income‘ using the effective interest method, irrespective of measurement principle. The method is described in the section on am-ortized cost in note 2.5.2.2. Fees are recognized as income or expense at the transaction date when applying fair value, and as interest income using the effective interest method when applying amortized cost measurement.
Changes in the value of loans measured at fair value are included in the line item ’Net gains/(losses) on financial instruments at fair value‘ in the statement of comprehensive income, except for interest income which is recorded in net interest income.
the 108 agreement The 108 Agreement provides coverage of interest rate and exchange rate risk for qualifying lending, borrowing and liquidity. The aim of the 108 Agreement is to provide a fixed Norwegian krone based margin on qualify-ing OECD loans by compensating for re-pricing or foreign currency mis-match between the lending and the funding. The 108 Agreement entails the debiting or crediting of settlement accounts continuously throughout the year for realized payment differences related to lending and borrowing. The net amount to be refunded by the government is included in the line item ’Other assets‘ in the balance sheet.
Lending, borrowing and liquidity under the 108 Agreement are included in the relevant balance sheet items together with transactions not cov-ered by the 108 Agreement. Interest income and interest expenses are recorded in the statement of comprehensive income using the effective interest method based on the rates agreed upon under the 108 Agreement. Fees are recognized as interest income using the effective interest method when applying amortized cost.
A decrease in the value at the balance sheet date based on objective evi-dence of impairment for loans valued at amortized cost is reflected in the line item ’Impairment charges on loans at amortized cost‘ in the statement of comprehensive income.
Certain components of the 108 Agreement, which compensate the com-pany for gains and losses on certain lending and borrowing transactions covered by the Agreement due to changes in interest and foreign exchange rates, are defined as embedded financial derivatives. Separate measure-ment at fair value for these derivatives has the potential to result in con-siderable increases in the company’s income volatility. See note 12 for additional information.
securities Interest bearing securities, consisting of commercial paper and bonds, are included in the line item ’Securities‘ in the balance sheet. The line item ’Se-curities‘ consists of securities covered by the Portfolio Hedge Agreement (as described below) and the Liquidity Reserve Portfolio (as described in note 31.1).
Interest income on securities is included in the line item ’Net interest in-come‘ using the effective interest method. The method is described in the section on amortized cost in note 2.5.2.2.
Realized gains or losses from the sale of securities, and changes in fair value of securities, are included in the line item ’Net gains/(losses) on finan-cial instruments at fair value‘ in the statement of comprehensive income.

n o t e s 27
derivatives The fair value of derivative contracts is reported in the balance sheet in separate asset and liability line items depending on the fair value of each contract. The net fair value of each derivative contract determines if it is classified as an asset or as a liability at the reporting date. The embedded derivatives in the 108 Agreement are bifurcated out from the host contract and recognized in the balance sheet as an asset or a liability depending on the net fair value of the derivatives at the reporting date.
Interest, and the interest effect on economic hedging instruments, is clas-sified as interest income or expense in the statement of comprehensive income. Changes in fair value are recorded in the line item ’Net gains/(losses) on financial instruments at fair value‘. See note 30.4 for the impact of this economic hedging. portfolio hedge agreementIn March 2008 the company entered into an agreement with a majority of the shareholders. The shareholders guaranteed against any further market value decline relative to the fair value as of end of February 2008 in the securities portfolio for an amount up to NOK 5 billion. This agreement is referred to as the Portfolio Hedge Agreement (PHA). The agreement meets the definitions of a financial derivative contract and is measured at fair value. Changes in fair value are recorded in the line item ’Net gains/(losses) on financial instruments at fair value‘ in the statement of comprehensive income. See note 12 for a description of the agreement.
borrowings through the issue of securities All borrowings are measured at fair value with the exception of borrowings under the 108 Agreement, which are measured at amortized cost. Changes in value of borrowings measured at fair value are included in the line item ‘Net gains/(losses) on financial instruments at fair value‘ in the statement of comprehensive income, except for interest expense which is recorded in net interest income using the nominal interest
reacquired debt Reacquired debt is deducted from the same line item in which the initial issue was recorded. The reduction is made with the carrying value. For debt not covered by the 108 Agreement, there is no effect in the statement of comprehensive income from the reacquisition (apart from transaction costs), as the debt is already measured at fair value.
2.6 intangible assetsThe company’s intangible assets include both internally generated and acquired software systems. All have finite useful lives as the economic benefit of these assets is assessed to be time-limited. Identifiable costs for internally developed software controlled by the company are capitalized as intangible assets when it is probable that economic benefits will exceed development expenses and if it is expected to have a useful life of more than three years.
Direct expenses are materials and salaries to employees directly involved in the projects, and are capitalized. Expenses related to maintenance of software and IT systems are recognized in the statement of comprehensive income as they occur. Capitalized software recorded in the balance sheet is depreciated on a straight-line basis over the asset’s useful life.
See note 14 for further information.
2.7 property and equipmentProperty and equipment are carried at historical cost less depreciation. Cost includes expenses directly related to the acquisition of the asset. Sub-sequent expenses are capitalized together with the relevant asset if it is probable that future economic benefits associated with the expenses will flow to the group. Expenses for repairs and maintenance are recognized in the statement of comprehensive income as they occur. Depreciation is recorded on a straight-line basis over the asset’s useful life.
Depreciation rates are applied to the asset’s deemed cost, as recognized at
transition to IFRS, for buildings, and to the asset’s historical cost for other equipment. Land and art are not depreciated.
An asset is derecognized when risks and rewards are transferred to an-other party.
See note 15 for further information.
2.8 investment propertyPart of the building owned by the group can be sold separately and is leased out to various tenants. Investment property constitutes approxi-mately 38 percent of the property. The cost model is applied for invest-ment property. After initial recognition investment property is thus ac-counted for in the same way as property classified under property and equipment, and depreciation is recorded on a straight-line basis over the property’s remaining life.
See notes 7, 10 and 15 for further information related to investment property.
2.9 impairment of non-financial assetsWhen there are indications that an intangible asset, a piece of property or equipment, or an investment property may be impaired, its recoverable amount is estimated for that individual asset. The recoverable amount is the higher of an asset’s fair value less cost to sell, and the asset’s value in use. If the recoverable amount is lower than the carrying amount, the carrying amount of the asset is reduced to its recoverable amount. The impairment loss is recognized in the statement of comprehensive income.
2.10 dividend Dividend from Eksportfinans to its owners is recognized in the year in which the dividend is formally approved by the Council of Representatives, and not in the fiscal year to which the dividend is related.
2.11 pension commitmentspension plansThe company has a set of employee retirement plans, consisting of both defined benefit plans and defined contribution plans, reflecting national practices and conditions. The plans are generally covered by pension schemes funded and managed through life insurance companies, deter-mined by periodic actuarial calculations.
Pension schemes of the company define an amount of pension benefit that an employee will receive on retirement, dependent on several factors, such as age, years of service and compensation.
The company is required to establish an occupational pension scheme in accordance with the Norwegian law on required occupational pension (‘lov om obligatorisk tjenestepensjon‘). The company’s pension scheme meets the requirements of that law.
pension costsThe pension calculations are carried out in accordance with IAS 19.
The pension expenses in the statement of comprehensive income are based on assumptions determined at the start of the period while the liability is based on assumptions at the end of the period (i.e. the balance sheet date). Pension expenses are included in the line item ’Salaries and other adminis-trative expenses‘ in the statement of comprehensive income.
Obligations for defined contribution pension plans are recognized as an expense as the employee renders services to the entity and the contribu-tion payable in exchange for that service becomes due.
The liability recognized in the balance sheet in respect of defined benefit pension plans is the present value of the defined benefit obligation at the balance sheet date less the fair value of the plan assets.

28 e k s p o r t f i n a n s a n n u a l r e p o r t 2 0 1 4
The defined benefit obligation is calculated annually by independent actu-aries using the projected unit credit method. The calculation is based on as-sumptions related to discount rate, future salary adjustments, pension and other payments from the national insurance fund, future return on plan assets and actuarial assumptions on mortality and voluntary resignation.
The present value of the defined benefit obligation is determined by dis-counting the estimated future cash outflows using interest rates on high quality corporate bonds are used as an estimate for the discount rate, ad-justed for differences in the payment structure and the average maturity of the pension liability.
Return on plan assets is calculated at the beginning of the period based on the discount rate.
Actuarial gains and losses arising from experience adjustments and chang-es in actuarial assumptions of the value of plan assets or of the defined benefit obligation are recognized in the statement of comprehensive in-come.
Social security tax related to the pension commitments is calculated based on the net pension obligation for each pension scheme at the end of the year.
Pension liabilities are classified under the line item ‘Provisions’, and pre-paid pension cost is classified under the line item ‘Other assets’ in the balance sheet.
See notes 8 for further information.
2.12 income taxesThe tax expense in the statement of comprehensive income consists of both current payable tax and changes in deferred tax. Current payable tax is based on taxable operating profit for the year. Change in deferred tax is based on temporary differences between accounting profit and taxable profit.
Deferred taxes in the balance sheet are calculated on the basis of tempo-rary differences. Temporary differences are differences between the re-corded value of an asset or liability and the taxable value of the asset or liability. Deferred taxes are calculated based on tax rates and tax rules that are effective at the date of the balance sheet. The most significant tempo-rary differences refer to unrealized gains and losses on financial instru-ments, non deductible pension expenses and depreciation of investment property and property and equipment.
Taxable and deductible temporary differences which are, or can be, re-versed within the same period are offset. Deferred tax is recorded in the balance sheet as a liability (or asset).
Deferred tax assets are recorded in the balance sheet to the extent that it is probable that future taxable income will be available against which they can be utilized.
See note 11 for further information.
2.13 provisionsA provision is a liability of uncertain timing and amount that is recognized when the group has a present legal or constructive obligation as a result of a past event and when it is probable that an outflow of resources embody-ing economic benefits will be required to settle the obligation. The amount recognized is measured at the present value expected to be required to settle the obligation at the balance sheet date, taking into account risks and uncertainties surrounding the provision. The amount is only recognized if it can be estimated reliably.
See notes 8 and 19 for further information.
2.14 leasesThe group acts as lessor in operating lease contracts. Lease income is recognized in the statement of comprehensive income on a straight-line basis over the lease term. Assets subject to lease are recog-nized in the balance sheet according to the nature of those assets.
See note 6 and 7 for further information.
2.15 cash equivalentsCash equivalents are defined as bank deposits with maturity of less than three months from the date of acquisition. Change in other bank deposits are included in the line items ’Purchase of financial investments‘and ‘Pro-ceeds from sale or redemption of financial investments’ in the cash flow statement.
See note 27 for further information.
2.16 financial guaranteesFinancial guarantee contracts are initially recognized at fair value. After initial recognition, financial guarantee contracts are measured at the higher of the amount determined in accordance with IAS 37 and the amount ini-tially recognized less, when appropriate, cumulative amortization recog-nized in accordance with IAS 18. Refer to note 31.3 for further information.
3 critical accounting estiMates and JudgMentsThe preparation of financial statements in conformity with IFRS requires management to use judgment in making estimates and assumptions that affect reported amounts of assets and liabilities, the reported amounts of income and expense and the disclosure of contingent assets and liabilities. The following accounting estimates, which are based on relevant informa-tion available at the end of each period, include inherent risks and un-certainties related to judgments and assumptions made by management. We consider the following accounting estimates to be critical in applying our accounting policies due to the existence of uncertainty at the time the estimate is made, the likelihood of changes in estimates from period to period and the potential impact that these estimates can have on the financial statements.
Estimates and judgments are continually evaluated and based on historical experience and other factors, including expectations of future events that are believed to be reasonable under the circumstances. We believe that the applied assumptions are the most likely, although actual events may differ from these. Consequently, our estimates could prove inaccurate, and the group may be exposed to changes to earnings that could be material.
3.1 fair value of financial instrumentsEksportfinans uses quoted prices where available, valuation techniques and theoretical models using market information. These estimates are cali-brated against economic models and any observed transaction prices. Es-timated market values of derivatives under Credit Support Annexes (“CSA agreements”) are also reconciled daily with counterparties valuations (see "Note 29.2 Risk limit control and mitigation policies" for a brief description of CSA agreements). Since Eksportfinans has adopted the fair value option for the majority of its financial assets and liabilities, market changes or changes to assumptions or estimated levels can significantly impact the fair value of an instrument as reported and have a significant impact on the statement of comprehensive income. The subjectivity of these assumptions is reduced by using observable market inputs in the valuations, such as a quoted price or rate, by using multiple models for valuation purposes, and by obtaining price and rate information from multiple sources.
In particular the multi-notch downgrade of Eksportfinans from Moody's and Standard and Poor's in November 2011 lead to significant reductions in the market value of the company's own debt. The company used quoted prices of traded debt both before and after the downgrade since IFRS re-quires actual traded prices to be used if such quotes exist. The rating effect on the company's significant liabilities overshadowed all other market fluc-tuation effects for 2011 and the unrealized gain for the year was several

n o t e s 29
times higher than ever recorded for any year before in the history of the company. During 2014, the credit spreads on the company’s own debt have gradually decreased and a significant part of the unrealized gain in 2011 has been reversed.
Generally critical accounting estimates and judgment are those related to fair value measurement of financial instruments using significant unob-servable inputs. Unobservable inputs are most significant for structured bond debt, the swaps used to economically hedge the structured bond debt and export loans. For structured debt and related swap contracts, the most important assumptions that impact the estimate of fair value are the spread assumptions and the models chosen for the Monte Carlo simula-tions performed in order to be able to project expected coupon and maturi-ty dates. The simulations performed to project coupons and maturities are based on market data such as volatilities and correlations. However, there is in general little market data available to corroborate the simulations per-formed. Spread assumptions are to a large extent based on internal data.
Further information on fair value measurement techniques and assump-tions are disclosed in note 4.
4 fair value of financial instruMents 4.1 methodologyThe fair values of financial instruments are determined either with refer-ence to a price quoted in an active market for that instrument, or by using a valuation technique.
Prices quoted in active markets are prices readily and regularly available from exchanges, brokers (executable broker quotes), market makers and pricing vendors (actual trades), and those prices represent actual and regu-larly occurring market transactions on an arm’s length basis.
An active market is one in which transactions, for the financial asset or financial liability being valued, occur with sufficient frequency and volume to provide pricing information on an ongoing basis. A market is considered to be non-active when there are few transactions, the prices are not cur-rent, price quotations vary substantially either over time or among market makers, or little information is released publicly for the financial asset or financial liability. Pricing transparency is affected by a number of different factors, such as type of financial instrument, whether the instrument is new to the market, characteristics specific to the transaction, and general market conditions.
The degree of judgment used in the measurement of fair value of financial instruments is generally higher with a lower level of pricing transparency, and vice versa. Financial instruments with quoted prices in active markets generally have higher transparency of prices, and less judgment is needed when determining fair value. Conversely, instruments traded in non-active markets, or that do not have quoted prices, have lower transparency of prices, and fair values are estimated through valuation models or other pricing techniques that require a higher degree of judgment.
The methodologies used for estimating the fair values using valuation models calculate the expected cash flows under the terms of each specific contract, and then discount these back to present values using appropri-ate discount curves. The expected cash flows for each contract are either determined directly by reference to actual cash flows implicit in observ-able market prices, or through modeling cash flows by using appropriate financial market pricing models. The valuation techniques make maximum use of market inputs, and rely as little as possible on entity-specific inputs. These techniques use observable market prices and rates as inputs, includ-ing interest rate yield curves for substantially the full term of the asset or liability, equity and commodity prices, option volatilities and currency rates. In certain cases, the valuation techniques incorporate unobservable inputs. See description of fair value measurement of each class of financial instruments below for extent of unobservable inputs used. The fair value measurement generally incorporates appropriate credit spreads obtained from the market.
For financial instruments a significant share of prices are obtained from the market. Although the prices generally are not binding or directly trad-able, they are observable in the market. As such, the company primarily has financial instruments for which prices are quoted in active markets, or financial instruments for which credit spreads or other model inputs are observable in the market, and the models used to price them are transpar-ent. Most of the portfolios consist of financial instruments for which the fair value is calculated using valuation models or index proxies judged to be sufficiently close to the securities proxied. The company has developed an understanding of the information used by third party pricing sources to describe the estimated prices or model inputs. The information obtained from third party pricing sources was evaluated and relied upon based on the degree of market transactions supporting the price indications and the firmness of the price indications. In these instances, management’s judg-ment was that this third party information was a reasonable indication of the financial instrument’s fair value.
In general, the company goes through the following process to establish fair value for each financial instrument:
• First, the company seeks to identify current quoted prices in an active market for the financial instrument.
• If there are no current quoted prices, the company seeks to identify recent transactions for the same instrument.
• If there are no recently quoted prices for the same instrument, the com-pany seeks to identify current or recently quoted prices or transactions for another instrument that is substantially the same.
• If there are no quoted prices for essentially equal instruments, the company seeks to identify appropriate market-quoted rates (e.g. yield curves, volatilities and currency rates) to be used as inputs into a valu-ation technique.
• In certain instances, it is necessary for the company to use unobservable inputs into the valuation technique. These inputs are to the fullest extent possible based on other observable prices or rates identified during the above mentioned steps.
See below for a discussion on how fair value is established for each class of financial assets and liabilities:
loans due from credit institutions or customers: The fair values of loans due from credit institutions or customers are de-termined using a discounted cash flow model, incorporating appropriate market yield curves and credit spreads. These debt instruments are not actively traded and consequently, these instruments do not have observ-able market prices subsequent to loan origination.
For guaranteed loans, interest rate curves are obtained from market sources, and credit spreads are based on initial spreads at the time of loan origination. The initial spread is usually not adjusted because these loans are fully guaranteed by a bank or the Norwegian Guarantee Institute for Export Credits (GIEK). Most of Eksportfinans’ non-government guarantors are currently well rated (A- or above) Norwegian banks and international banks with solid financial position. An increase in the credit risk of the debtor will, as a result of the guarantee, in most cases not lead to more than an insignificant increase of the combined credit risk. This is reflected in market rates so for example a loan made to a debtor guaranteed by a specific bank has a considerably lower spread than a direct loan made to the same bank. Eksportfinans therefore believes it would be reasonable to assume, in the absence of evidence to the contrary, that no changes have taken place in the spread that existed at the date the loan was made. The company does make reasonable efforts to determine whether there is evidence that there has been such a change in spread. Credit ratings of all guarantors are monitored on an ongoing basis. Spreads are adjusted upon significant changes in rating for the guarantor since origination date, as the company considers this as evidence of widening of spreads. Further, the company analyses the development of initial margins over time. This data shows that initial margins obtained for new guaranteed loans have not been functions of time, not even during the financially turbulent times

30 e k s p o r t f i n a n s a n n u a l r e p o r t 2 0 1 4
in 2007-2009. Credit spreads for guaranteed loans given by the company, have consequently not increased with the significant general credit spread increase during the period. The spreads applied to fair value measurement of export loans are unobservable in the market.
For direct loans to Norwegian savings banks, interest rate curves and credit spreads are based on observable market data. The credit spread curves obtained from the market are from widely published reports from mar-ket participants on indicative spreads for identical or similar loans. The spreads are published in the market shortly after month end, but do not represent offers, or solicitations of offers, to purchase or sell financial in-struments. To ensure that the information can be used for fair value meas-urement purposes, Eksportfinans performs an assessment of the evalua-tions, calculations, opinions and recommendations of the publications. The spreads come partly from trading screens quoting actual trades, and partly from matrix pricing and interpolations including judgments by the distribu-tors. Eksportfinans has assessed their interpolation methodologies, matrix pricing algorithms and models to be adequate and of sufficient quality.
For the remaining municipal portfolio after the sale of former municipality lender company Kommunekreditt, interest rate curves and credit spreads are based on observable market data. The credit spreads used in the model are supported by quotes obtained from three different price providers. For loans guaranteed by municipalities, the same methodology is used as for guaranteed export lending.
Eksportfinans has entered into agreements with its Norwegian shareholder banks or unaffiliated banks active in financing Norwegian exports to pur-chase specific loans. The purchases of these loans are based on normal commercial terms, and the loans acquired are of the type extended by Eksportfinans in the normal course of its business. The company places an initial deposit with the selling bank, which is used as consideration for the purchase of the relevant loans. Each loan purchased is supported by a guarantee provided by the selling bank. In consideration for the guarantee, the company pays the selling bank a fee spread over the life of the loan by way of a swap transaction, under which the difference between the interest received on the loan and the interest receivable from the selling bank with respect to the deposit amount is paid to the selling bank. The net effect of these transactions is that Eksportfinans receives a specified, individually negotiated return comparable to that received on its other commercial loans.
All credit spread adjustments of initial spreads are individually assessed for reasonableness relative to appropriate credit spread development over time, spreads for similar guarantors, and spreads on new similar loans or guarantees.
The following table shows the unrealized loss of each category of loans by increasing the credit spread by 1 basis point as well as the percentage of total lending portfolio.
The spreads applied for fair value measurement of the combined total
lending portfolio are in the range from -4 basis point to 150 basis points as of year-end 2014 (from -4 basis points to 204 basis points as of year-end 2013). For the combined total lending portfolio over the past two years credit spreads have changed less than 1 basis point per month in 95 per-cent of the time. As of year-end 2014 a spread widening of 1 basis point would give an estimated loss of NOK 6 million. As of the end of 2013 a 95 percent confidence interval was 2 basis points representing NOK 20 million.
securities:Fair value of Eksportfinans’ portfolio of securities is partially established using valuation techniques and partially using prices quoted in active mar-kets. Eksportfinans aims to maximize the use of observable inputs, and minimize the use of unobservable inputs, when estimating fair value. The valuation techniques used by Eksportfinans are index based models us-ing publicly available market data as inputs, such as index levels, stock prices and bond credit spreads. Whenever available, the company obtains quoted prices in active markets for fixed maturity securities at the bal-ance sheet date. Market price data is generally obtained from exchange or dealer markets.The quotes may come from securities with similar attributes, from a matrix pricing methodology, or from internal valuation models utilizing different methodologies. These methodologies consider such factors as the issuer’s industry, the security’s rating and tenor, its coupon rate and type, its posi-tion in the capital structure of the issuer, yield curves, credit curves, pre-payment rates and other relevant factors. Eksportfinans retrieved prices and credit spread quotes from nine different market makers and pricing vendors. Among the nine different quote providers, the major price pro-vider (Bloomberg) covered 91 percent (80 percent as of December 31. 2013). Eksportfinans has established various controls to ensure the rea-sonableness of received quotes such as reconciling with other securities of similar currency, maturity, country or issuer and reconciling with actual trade data from Bloomberg. The company also investigates large variations amongst different price providers. For all quoted prices the median quote was used.
For the remaining, one security had such short time to maturity that par value was used. Par value was also used on two government related secu-rities (all rated AAA and expected maturity in 2015). Eksportfinans holds two securities originally in the PHA portfolio issued by the defaulted Wash-ington Mutual (now non-existent). These securities were priced using re-covery rates retrieved from Bloomberg.
financial derivatives:Currency and interest rate swaps are valued using a valuation model tech-nique incorporating appropriate credit spreads obtained from the market, as well as other observable market inputs, such as interest rate levels and market volatilities. Structured swaps mirroring the embedded derivatives in structured debt issues are modeled as described for structured bond debt. All swaps are governed by ISDA agreements with cash collateral an-nexes, and movement of cash collateral will offset credit spread changes. Non-performance risk is included in the fair value of the financial deriva-tive portfolio assets and liabilities. Both Eksportfinans and the counterpar-
parent company/group december 31, 2014 december 31, 2013
december 31, 2014 december 31, 2013
(nok million and percentage) sensitivity (1 bp) percentage sensitivity (1 bp) percentage
Direct loans (0.8) 5 % (1.0) 15 %
Loans to municipalities (0.9) 11 % (1.9) 11 %
Collaboration loans (0.4) 21 % (0.8) 12 %
Guaranteed loans (3.3) 63 % (5.8) 62 %
total loans 100 % 100 %

n o t e s 31
ty’s credit risk at the time of trade of a swap will be reflected in the initial terms and conditions. The company only enters into derivatives with high-ly rated counterparties. The Credit Support Annexes (CSAs) enables calls for collateral for both parties based on rating dependent parameters such as threshold and minimum independent amounts. The company’s valuation of swaps uses mid levels of interest rate curve bid-ask spreads.
bond debt:Structured bond debt consists of bond issues where the coupon rate, cur-rency, maturity date and notional amount may vary with market condi-tions. For instance, the maturity will vary as a significant part of the struc-tured bond debt has call and trigger features depending on the passage of time and/or market levels.
Eksportfinans’ structured issues currently consist of eight main structure types:
• The coupon is paid in a different currency than the currency for which the coupon is calculated and the bond might have Bermudan options embedded. Bonds with this coupon type are priced using a Hull-White one-factor model if there is only one currency and an N-currency model coupled with a Black and Scholes model in cases of several currencies.
• The coupon is based on the minimum of two FX’s (JPY/USD and AUD/JPY for a majority of our issues). We use Black and Scholes to model the foreign exchange rates and a Hull-White one factor model to treat the interest rate curves.
• Fixed rate securities with Bermudan options. These are modeled using Black and Scholes framework.
• The coupon has digital attributes. For example if the FX rate is above a given strike level, the coupon paid will be high, if the FX is below the strike, the coupon paid will be low. These coupon structures are modeled by an N-currency model.
• The coupon is inversely linked to the London Interbank Offer Rate (LI-BOR). The coupon structure is normally of the type “FixedRate-multiplier x Libor”. Here we use a Hull-White model for the interest rate and if the issue contains more than one currency, we use the N-factor model.
• The coupon depends on the difference between two interest rates, for example ’2 year swap minus 10 year swap‘. This difference is multiplied with a factor, and both one and two currencies can be involved. For one-currency issues a Hull-White model is used for the two interest rates. For two-currency issues a Black and Scholes model put together with an N-currency model is used.
• The coupon is based on the performance of single equities, equity bas-kets or indexes. These issues are priced based on a Black and Scholes model if the underlying is in the same currency as the notional. The im-plied volatility derived from suitable traded options is used as volatility input and expected future dividends are based on market expectations. If the underlying is in a different currency than the notional we use a quanto-model to factor in the currency effect.
• The coupon is paid only if the issuer calls the issue. For such structures (like callable zeros) the call option is normally Bermudan and contains only one currency. Eksportfinans price it using a Hull-White one-factor model.
Structured bond debt (and their corresponding swaps, see section on fi-nancial derivatives above) are mostly valued using the company’s valu-ation system based on different, well known valuation models, such as Black and Scholes and Hull-White, as appropriate for the different types of structures. All models use observable market data. Market data such as volatilities, correlations, and spreads for constant maturity swaps are imported (unadjusted) directly from widely used data systems like Reuters
and Bloomberg. All models are calibrated to produce the transaction price at day one and consequently there are no day one profits calculated using Eksportfinans’ methodology. Which model and which structure setup are determined by the redemption structure, the number of FX, equities or in-dexes constituting the underlying and whether the coupon is accumulated or not as time passes.
The market data used is observable market input. This input is used to project both cash flows and maturity dates of the structured debt. This is to a large degree done by Monte Carlo simulations.
The fair values established using the valuation models above are further supported by two sources of information. The values are assessed for rea-sonableness against values for the same instruments received from the counterparty in the transaction. Eksportfinans buys back structured debt from time to time, and the fair values established are assessed for reasona-bleness against buy back transaction prices for similar debt.
Changes in credit spread are considered in the valuation of structured bond debt. There is a very limited market for trading in Eksportfinans’ structured debt. Since the multi-notch downgrade of Eksportfinans in November 2011 the company does not anticipate issuing new debt. Prior to the downgrade the most current issue spread for corresponding issues was used to value the structured bonds. After the downgrade there are no new issues of structured debt and instead the company uses spreads on non-structured debt for the outstanding structured issues.
Fair value of other bond debt is established using a valuation model tech-nique based on discounted cash flows, incorporating appropriate inter-est rate curves and credit spreads obtained from the market. The credit spreads are derived from current spreads on Eksportfinans’ USD bench-marks quoted by Bloomberg. Only spreads supported by actual trades close to year-end are used. Quoted spreads are also used for benchmark issues that are not quoted on Bloomberg. From the spread quotes obtained, a yield curve is derived by using an interpolation methodology. These are similar instruments, and the quoted prices cover the range of maturities in the benchmark debt portfolio.
In order to assess the reasonableness of the quotes used, spreads are also benchmarked against broker quotes obtained from four different dealers in Eksportfinans’ benchmark program.
The following table shows the unrealized gain of each category of bond debt by increasing the credit spread by 1 basis point:
parent company/group dec 31, 2014 dec 31, 2013
december 31, 2014 december 31, 2013
(nok million) sensitivity (1 bp) sensitivity (1 bp)
Unstructured bond debt 9.0 13.0
Structured bond debt 7.0 20.0
The spreads applied for fair value measurement of bond debt are in the range from 132 basis points to 169 basis points as of year-end 2014 (from 200 basis points to 272 basis points as of year-end 2013).
subordinated debt:Fair value of subordinated bond debt is established using a valuation mod-el technique based on discounted cash flows, incorporating appropriate interest rate curves and credit spreads obtained from market participants. These are the same credit spreads as quoted for our traded non-structured debt of same maturity and currency. For quotes received in the form of credit spreads, appropriate net present value calculations derive the fair value of the security, using the quoted credit spread relative to the cor-responding curve. The company considers the spread and price quotes ob-tained as unobservable input to the valuation.

32 e k s p o r t f i n a n s a n n u a l r e p o r t 2 0 1 4
Increasing the spreads applied in fair value measurement by 10 basis points would decrease the value of subordinated debt as of year-end 2014 by approximately NOK 0.9 million (NOK 1.8 million as of year-end 2013). The spread applied for fair value measurement of the subordinated debt is 132 basis points as of year-end 2014, resulting in a price of 103.56. As of year-end 2013 the spread applied for fair value measurement of the subordinated debt was 244 basis points, resulting in a price of 103.80.
4.2 fair value hierarchyIFRS 13 specifies a hierarchy of valuation techniques based on whether the inputs to those valuation techniques are observable or unobservable. Observable inputs reflect market data obtained from independent sources that is visible to other parties in the market; unobservable inputs reflect the company’s market assumptions, specific methodologies and model choices. These two types of input have created a hierarchy that gives the highest priority to unadjusted quoted prices in active markets for identical assets or liabilities (level 1 measurements) and the lowest priority to unob-servable inputs (level 3 measurements). The three levels of the fair value hierarchy are described below:
level 1:Securities for which unadjusted quoted prices in active markets that are accessible at the measurement date for identical, unrestricted assets or liabilities. level 2:Securities with inputs other than quoted prices included within level 1 that are observable for the asset or liability, either directly (i.e. as prices) or indirectly (i.e. derived from prices) are classified as level 2.
level 3:Securities with inputs that are both significant to fair value and unobserv-able.
This hierarchy requires the use of observable market data when available. The company considers relevant and observable market prices in its valu-ations where possible.
The assessments of which level each transaction falls into is a dynamic process.
Loans and receivables that do not trade frequently or in sufficient volumes to be classified in level 1 but where nothing but observable market data (such as interest rate levels and published spread indices) and well known discounting methods are used are classified as level 2. Loans and receiva-bles where credit spreads at a reporting date is a function of initial over the counter negotiated spreads and subjective adjustments to input such as rating changes are classified as level 3. Demand deposits in Norwegian and foreign bank accounts are classified as level 1. Short term deposits are classified as level 2 due to their contractual periods.
Securities consist of bonds in our liquidity portfolios which are classified as level 2 as they are valued using index mappings or adjusted market prices such as the median of several quotes not necessarily public obtainable.
Financial derivatives are either normal interest rate- or currency swaps classified in level 2 as standard discounting of observable inputs is used in the valuation, or structured swaps classified as level 3 where unobservable inputs such as correlations and volatilities are used in model valuations.
The below tables set forth Eksportfinans trading assets and liabilities and other financial assets and liabilities accounted for at fair value under the fair value option. Assets and liabilities are classified in their entirety based on the lowest level of input that is significant to the fair value measure-ment. Other assets are collateral paid to swap counterparties (as specified in note 29.2) and are classified as level 2.
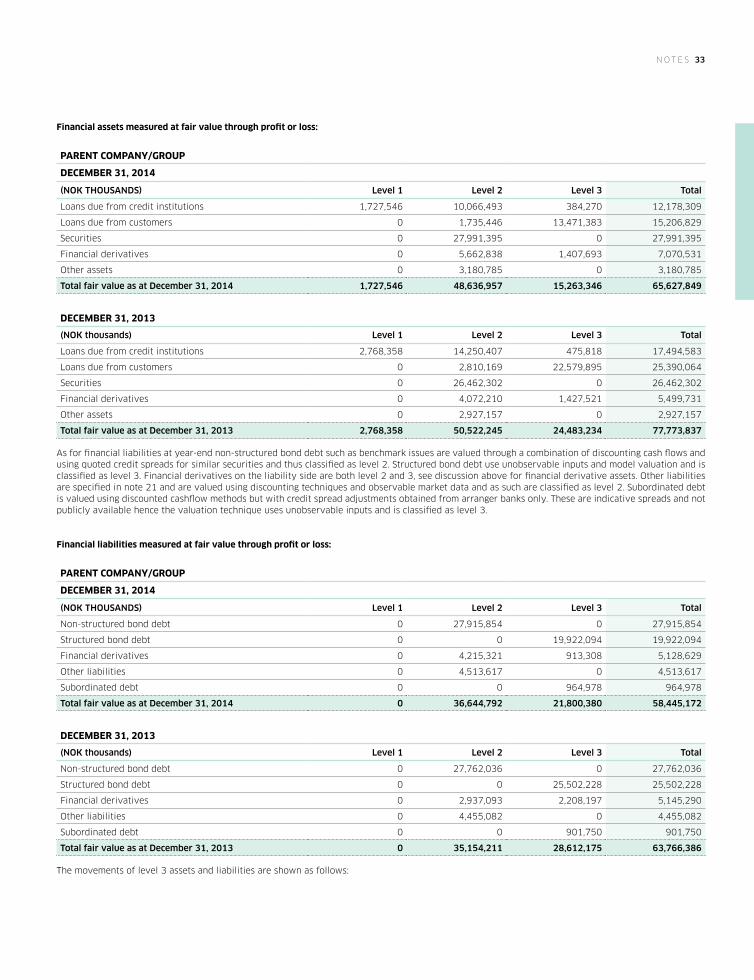
n o t e s 33
financial assets measured at fair value through profit or loss:
parent company/group
december 31, 2014
(nok thousands) level 1 level 2 level 3 total
Loans due from credit institutions 1,727,546 10,066,493 384,270 12,178,309
Loans due from customers 0 1,735,446 13,471,383 15,206,829
Securities 0 27,991,395 0 27,991,395
Financial derivatives 0 5,662,838 1,407,693 7,070,531
Other assets 0 3,180,785 0 3,180,785
total fair value as at december 31, 2014 1,727,546 48,636,957 15,263,346 65,627,849
december 31, 2013
(nok thousands) level 1 level 2 level 3 total
Loans due from credit institutions 2,768,358 14,250,407 475,818 17,494,583
Loans due from customers 0 2,810,169 22,579,895 25,390,064
Securities 0 26,462,302 0 26,462,302
Financial derivatives 0 4,072,210 1,427,521 5,499,731
Other assets 0 2,927,157 0 2,927,157
total fair value as at december 31, 2013 2,768,358 50,522,245 24,483,234 77,773,837
As for financial liabilities at year-end non-structured bond debt such as benchmark issues are valued through a combination of discounting cash flows and using quoted credit spreads for similar securities and thus classified as level 2. Structured bond debt use unobservable inputs and model valuation and is classified as level 3. Financial derivatives on the liability side are both level 2 and 3, see discussion above for financial derivative assets. Other liabilities are specified in note 21 and are valued using discounting techniques and observable market data and as such are classified as level 2. Subordinated debt is valued using discounted cashflow methods but with credit spread adjustments obtained from arranger banks only. These are indicative spreads and not publicly available hence the valuation technique uses unobservable inputs and is classified as level 3.
financial liabilities measured at fair value through profit or loss:
parent company/group
december 31, 2014
(nok thousands) level 1 level 2 level 3 total
Non-structured bond debt 0 27,915,854 0 27,915,854
Structured bond debt 0 0 19,922,094 19,922,094
Financial derivatives 0 4,215,321 913,308 5,128,629
Other liabilities 0 4,513,617 0 4,513,617
Subordinated debt 0 0 964,978 964,978
total fair value as at december 31, 2014 0 36,644,792 21,800,380 58,445,172
december 31, 2013
(nok thousands) level 1 level 2 level 3 total
Non-structured bond debt 0 27,762,036 0 27,762,036
Structured bond debt 0 0 25,502,228 25,502,228
Financial derivatives 0 2,937,093 2,208,197 5,145,290
Other liabilities 0 4,455,082 0 4,455,082
Subordinated debt 0 0 901,750 901,750
total fair value as at december 31, 2013 0 35,154,211 28,612,175 63,766,386
The movements of level 3 assets and liabilities are shown as follows:

34 e k s p o r t f i n a n s a n n u a l r e p o r t 2 0 1 4
financial assets measured at fair value through profit or loss based on level 3 inputs:
parent company/group (nok thousands)
loans and receivables due from
credit institutions
loans and receivables due from customers
financial derivatives total
opening balance January 1, 2014 475,818 22,579,895 1,427,521 24,483,234
Total gains or losses *) 69,490 2,584,414 412,351 3,066,255
Issues 0 0 0 0
Settlements (161,038) (11,692,926) (432,179) (12,286,143)
Transfers into level 3 0 0 0 0
Transfers out of level 3 0 0 0 0
closing balance december 31, 2014 384,270 13,471,383 1,407,693 15,263,346
Total gains or losses *) for the period in profit or loss for assets held at the end of the reporting period 69,490 2,584,414 1,253,059 3,906,963
opening balance January 1, 2013 525,542 39,372,552 4,541,863 44,439,957
Total gains or losses *) 29,750 1,100,159 (1,205,896) (75,986)
Issues 0 0 0 0
Settlements (79,474) (17,892,816) (1,908,446) (19,880,737)
Transfers into level 3 0 0 0 0
Transfers out of level 3 0 0 0 0
closing balance december 31, 2013 475,818 22,579,895 1,427,521 24,483,234
Total gains or losses *) for the period in profit or loss for assets held at the end of the reporting period 29,750 1,100,159 (526,973) 602,936
*) Presented under the line item ‘Net gains/(losses) on financial instruments at fair value’ in the statement of comprehensive income.

n o t e s 35
financial liabilities measured at fair value through profit or loss based on level 3 inputs:
parent company/group (nok thousands) bond debt
financial derivatives
subordinated debt
capital contribution securities total
opening balance January 1, 2014 25,502,228 2,208,197 901,750 0 28,612,175
Total gains or losses *) **) 8,211,629 (850,483) 63,228 0 7,424,374
Issues 0 0 0 0 0
Settlements (13,791,763) (444,406) 0 0 (14,236,169)
Transfers into Level 3 0 0 0 0 0
Transfers out of Level 3 0 0 0 0 0
closing balance december 31, 2014 19,922,094 913,308 964,978 0 21,800,380
Total gains or losses *) **) for the period in profit or loss for liabili-ties outstanding at the end of the reporting period. 7,272,599 (179,475) 63,228 7,156,352
opening balance January 1, 2013 42,275,265 5,126,980 990,327 449,790 48,842,362
Total gains or losses *) **) 11,878,753 (1,537,484) (88,577) 0 10,252,692
Issues 0 0 0 0 0
Settlements (28,651,790) (1,381,299) 0 (449,790) (30,482,879)
Transfers into Level 3 0 0 0 0 0
Transfers out of Level 3 0 0 0 0 0
closing balance december 31, 2013 25,502,228 2,208,197 901,750 0 28,612,175
Total gains or losses *) **) for the period in profit or loss for liabili-ties outstanding at the end of the reporting period. 6,740,757 (858,559) (88,577) 0 5,793,621
*) Presented under the line item ‘Net gains/(losses) on financial instruments at fair value’ in the statement of comprehensive income.
**) For liabilities, positive figures are represented as losses and negative figures are represented as gains.

36 e k s p o r t f i n a n s a n n u a l r e p o r t 2 0 1 4
4.3 measurement categoriesThe classes of financial instrument fall into the following measurement categories (carrying amounts in NOK thousands):
parent company 2014 2013
financial assets fvo 1) hft 2) l&r 3) total fvo 1) hft 2) l&r 3) total
Loans due from credit institutions 12,178,309 0 189,496 12,367,805 17,494,583 0 207,436 17,702,019
Loans due from customers 15,206,829 0 18,164,987 33,371,816 25,390,064 0 21,972,838 47,362,902
Securities 1,699,089 26,292,306 0 27,991,395 2,377,543 24,084,759 0 26,462,302
Financial derivatives 0 7,070,531 0 7,070,531 0 5,499,731 0 5,499,731
Other assets 3,180,785 0 1,439,554 4,620,339 2,927,157 0 633,262 3,560,419
total 32,265,012 33,362,837 19,794,037 85,421,886 48,189,347 29,584,490 22,813,536 100,587,373
financial liabilities fvo 1) hft 2) olb 4) total fvo 1) hft 2) olb 4) total
Non-strucured bond debt 27,915,854 0 18,575,010 46,490,864 27,762,036 0 22,578,283 50,340,319
Structured bond debt 19,922,094 0 0 19,922,094 25,502,228 0 0 25,502,228
Financial derivatives 0 5,128,629 0 5,128,629 0 5,145,290 0 5,145,290
Other liabilities 4,513,617 0 88,324 4,601,941 4,455,082 0 156,405 4,611,487
Subordinated debt 964,978 0 0 964,978 901,750 0 0 901,750
total 53,316,543 5,128,629 18,663,334 77,108,506 58,621,096 5,145,290 22,734,688 86,501,074
group 2014 2013
financial assets fvo 1) hft 2) l&r 3) total fvo 1) hft 2) l&r 3) total
Loans due from credit institutions 12,178,309 0 192,080 12,370,389 17,494,583 0 209,430 17,704,013
Loans due from customers 15,206,829 0 18,164,987 33,371,816 25,390,064 0 21,972,838 47,362,902
Securities 1,699,089 26,292,306 0 27,991,395 2,377,543 24,084,759 0 26,462,302
Financial derivatives 7,070,531 0 7,070,531 0 5,499,731 0 5,499,731
Other assets 3,180,785 0 1,423,476 4,604,261 2,927,157 0 618,002 3,545,159
total 32,265,012 33,362,837 19,780,543 85,408,392 48,189,347 29,584,490 22,800,270 100,574,107
financial liabilities fvo 1) hft 2) olb 4) total fvo 1) hft 2) olb 4) total
Non-strucured bond debt 27,915,855 0 18,575,010 46,490,865 27,762,036 0 22,578,283 50,340,319
Structured bond debt 19,922,093 0 0 19,922,093 25,502,228 0 0 25,502,228
Financial derivatives 0 5,128,629 0 5,128,629 0 5,145,290 0 5,145,290
Other liabilities 4,513,617 0 85,882 4,599,499 4,455,082 0 152,403 4,607,485
Subordinated debt 964,978 0 0 964,978 901,750 0 0 901,750
total 53,316,543 5,128,629 18,660,892 77,106,064 58,621,096 5,145,290 22,730,686 86,497,072
1) FVO: Financial instrument at fair value through profit or loss - designated at initial recognition (fair value option)
2) HFT: Financial instrument at fair value through profit or loss - held for trading
3) L&R: Financial instrument at amortized cost - loans and receivables
4) OLB: Financial instrument at amortized cost - other liabilities

n o t e s 37
4.4 fair value of financial assets and liabilitiesThe following table presents the financial assets and liabilities, with the fair value and carrying value (book value) of each class of financial instrument:
parent company
(nok thousands) december 31, 2014 december 31, 2013
fair value carrying value fair value carrying value
assets
Loans due from credit institutions 12,311,857 12,367,805 17,681,657 17,702,019
Loans due from customers 36,447,805 33,371,816 50,958,657 47,362,902
Securities 27,991,395 27,991,395 26,462,302 26,462,302
Financial derivatives 7,070,531 7,070,531 5,499,731 5,499,731
Other assets 4,620,339 4,620,339 3,560,419 3,560,419
liabilities
Non-structured bond debt 48,879,447 46,490,864 53,032,408 50,340,319
Structured bond debt 19,922,094 19,922,094 25,502,228 25,502,228
Financial derivatives 5,128,629 5,128,629 5,157,290 5,157,290
Other liabilities 4,606,863 4,601,941 4,617,648 4,611,486
Subordinated debt 964,978 964,978 901,750 901,750
group
(nok thousands) december 31, 2014 december 31, 2013
fair value carrying value fair value carrying value
assets
Loans due from credit institutions 12,314,440 12,370,388 17,683,650 17,704,012
Loans due from customers 36,447,805 33,371,816 50,958,657 47,362,902
Securities 27,991,395 27,991,395 26,462,302 26,462,302
Financial derivatives 7,070,531 7,070,531 5,499,731 5,499,731
Other assets 4,604,261 4,604,261 3,545,159 3,545,159
liabilities
Non-structured bond debt 48,879,447 46,490,864 53,032,408 50,340,319
Structured bond debt 19,922,094 19,922,094 25,502,228 25,502,228
Financial derivatives 5,128,629 5,128,629 5,157,290 5,157,290
Other liabilities 4,604,421 4,599,499 4,613,647 4,607,485
Subordinated debt 964,978 964,978 901,750 901,750

38 e k s p o r t f i n a n s a n n u a l r e p o r t 2 0 1 4
5 net gains/(losses) on financial instruMents at fair valueNet realized and unrealized gains/(losses) on financial instruments at fair value:
parent company/group
(nok thousands) 2014 2013
Securities 1) 14,223 41,543
Financial derivatives (62,648) (117,001)
Other financial instruments at fair value 5) (4,012) 50,679
net realized gains/(losses) (52,437) (24,779)
Loans due from credit institutions 6) (18,398) 315,268
Loans due from customers 12,851 (36,869)
Securities 2) 416,303 196,975
Financial derivatives 3) 2,879,963 6,057,501
Bond debt 4) (9,312,756) (13,845,017)
Subordinated debt and capital contribution securities 4) (103) (35,588)
Other financial instruments at fair value 5,152 (6,628)
net unrealized gains/(losses) (6,016,988) (7,354,358)
net realiZed and unrealiZed gains/(losses) (6,069,425) (7,379,137)
1) Net realized gains/(losses) on securities:
parent company/group
(nok thousands) 2014 2013
Securities held for trading 14,223 17,784
Securities designated as at fair value at initial recognition 0 23,759
total 14,223 41,543
2) Net unrealized gains/(losses) on securities:
(nok thousands) 2014 2013
Securities held for trading 442,034 208,585
Securities designated as at fair value at initial recognition (25,731) (11,610)
total 416,303 196,975
3) The Portfolio Hedge Agreement entered into in March 2008, further described in note 12 of this report, is included with a loss of NOK 382 million in 2014 and a loss of NOK 295 million in 2013.
4) In 2014, Eksportfinans had an unrealized loss of NOK 9,313 million (loss of NOK 13,881 million in 2013) on its own debt.
5) Realized gains related to the Glitnir trial is included with NOK 17 million as of December 31, 2013.
6) Reversed previous unrealized loss related to the Glitnir trial, is included with a gain of NOK 264 million as of December 31, 2013.
See note 30.4 for a presentation of the above tables through the eyes of management.

n o t e s 39
6 leasesEksportfinans’ subsidiary EDM 15 leases parts of its office building to unrelated parties under operating lease contracts, with lease terms generally be-tween five and ten years. The future minimum lease payments receivable under non-cancelable operating leases in the aggregate and for each of the following periods is shown in the table below:
group
(nok thousands) dec. 31, 2014 dec. 31, 2013
Up to and including one year 14,522 11,726
From 1 year up to and including 3 years 12,865 15,000
From 3 years up to and including 5 years 10,341 9,201
After 5 years *) 17,433 20,800
total payMents receivable 55,161 56,727
*) Beginning July 1, 2013 Electromagnetic Geoservice is leasing part of the office building, with a 10 year lease contract.
7 other incoMe
parent company group
2014 2013 (nok thousands) 2014 2013
0 968 Rental income 12,192 6,590
0 1,206 Rental income investment property 0 1,206
426 178 Services to subsidiary *) 0 0
0 145,869 Net income on sale of building to subsidiary 0 0
(128) (2,975) Other income /(expenses) **) (128) (2,975)
298 145,246 total 12,064 4,821
*) The income from the subsidiary relates to management services from August 1 to December 31, 2013.
**) 2013 amount relates to impairment on technical equipment.
8 eMployee retireMent planUntil 2011, Eksportfinans had a defined benefit occupational scheme for all employees in the form of a pension scheme. As of December 31, 2011 this defined benefit occupational scheme was closed and replaced by a defined contribution plan.
The company has also had a contractual pension agreement (CPA) scheme that has entitled staff to benefits from the age of 62 until they are eligible for a National Insurance pension upon reaching the age of 67. The terminated CPA scheme has been replaced by a new multi-employer scheme entering into force as of January 1, 2011. This plan is considered to be a multi-employer defined benefit plan, but is accounted for as a defined contribution plan until reliable and sufficient information is available for the company to recognize its proportional share of pension cost, pension liabilities and pension assets.
the actuarial calculations are based on the following assumptions:
parent company/group
expenses commitments
2014 2013 (percent) dec. 31, 2014 dec. 31, 2013
4,00 3,80 Discount rate 2,30 4,00
4,00 3,80 Expected return on plan assets 2,30 4,00
3,75 3,50 Future salary increases 3,20 3,75
3,50 3,25 Future basic amount increase 3,00 3,50
2,25 2,25 Future pension increases 2,25 2,25
K2013BE K2013BE Demographic assumption about mortality rate *) K2013BE K2013BE
*) Statistical assumptions about mortality, as officially calculated in 2005 and 2013.

40 e k s p o r t f i n a n s a n n u a l r e p o r t 2 0 1 4
the pension expenses consist of the following components:
parent company/group
(nok thousands) 2014 2013
Current service cost 9,390 8,506
Interest cost 2,425 2,357
Social security tax 918 272
total pension eXpenses 12,733 11,135
the amounts in the balance sheet are determined as follows:
parent company/group
(nok thousands) dec. 31, 2014 dec. 31, 2013
Present value of funded obligations 173,236 121,607
Fair value of plan assets 98,673 88,497
underfunded/(funded) status of funded obligations 74,563 33,110
Present value of unfunded obligations 62,157 42,349
underfunded/(funded) status of all obligations 136,720 75,459
net pension liability 136,720 75,459
Pension liabilities in the balance sheet 136,720 75,459
net pension liability 136,720 75,459
Social security tax included 16,709 9,376
the movement in the defined benefit obligation over the year is as follows:
parent company/group
(nok thousands) 2014 2013
Beginning of year 163,956 163,975
Current service cost, excluding social security taxes 9,390 8,506
Interest cost 5,995 5,670
Actuarial losses/(gains) 60,721 882
Social security tax 631 (689)
Benefits paid (5,300) (8,713)
Curtailments 0 (5,675)
obligation at and of year 235,393 163,956
Curtailments are mainly related to reduction of members in the pension plan. The contributions expected to be paid to the company’s pension schemes in 2015 is NOK 5 million.

n o t e s 41
the movement in the fair value of plan assets of the year is as follows:
parent company/group
(nok thousands) 2014 2013
Beginning of year 88,497 84,032
Interest income 3,457 3,190
Actuarial gains/(losses) 4,524 3,054
Curtailment 113 122
Employer contributions 6,099 5,417
Benefits paid (4,017) (7,318)
assets at end of year 98,673 88,497
a quantitative sensitivity analysis for significant assumptions as at december 31, 2014 is as shown below:
parent company/group(nok thousands)
assumption discount ratefuture salary
increasesfuture pension cost
increase
sensitivity level1 %
increase1 %
decrease1 %
increase1 %
decrease1 %
increase1 %
decrease
Impact on the net defined benefit obligation 192,471 292,752 258,283 215,181 274,693 203,716
Estimated change net pension cost 2016 9,782 17,678 15,573 10,944 15,732 10,990
Estimated change service cost 2016 6,767 11,666 10,515 7,328 10,324 7,599
plan assets are invested as follows (according to regulatory guidelines established for life insurance companies):
parent company/group(percent) dec. 31, 2014* dec. 31, 2013
Equity securities 11 9
Debt securities 71 76
Property 14 14
Other assets 3 2
total plan assets 100 100
parent company/group(percent) 2014 2013
Actual return on plan assets 4.1 5.3
*Figures as per September 30, 2014, due to lack of figures from life insurance company.

42 e k s p o r t f i n a n s a n n u a l r e p o r t 2 0 1 4
historical development of the pension liabilities:
parent company/group december 31,
(nok thousands) 2014 2013 2012 2011 2010
Present value of defined benefit obligations 235,393 163,956 164,189 314,159 222,177
Fair value of plan assets 98,673 88,497 82,461 129,655 116,513
Pension plan deficit/(surplus) 136,720 75,459 81,728 184,504 105,664
net recorded pension liability/(asset) 136,720 75,459 81,728 184,504 76,859
Actuarial losses/(gains) for the year related to obligations 61,359 4,167 (38,486) 78,161 16,795
Actuarial gains/(losses) for the year related to assets 4,524 3,054 0 166 1,573
9 salaries and other adMinistrative eXpenses
parent company group
2014 2013 (nok thousands) 2014 2013
84,883 75,495 Salaries, pension expenses and social security 84,883 75,495
68,642 61,980 Administrative expenses 69,352 62,055
153,525 137,475 total 154,235 137,550
10 other eXpenses
parent company group
2014 2013 (nok thousands) 2014 2013
2,891 3,590 Building service 6,081 4,987
0 60 Building service investment property 0 60
12,455 7,903 Other expenses 4,271 4,405
15,346 11,553 total 10,352 9,452

n o t e s 43
11 incoMe taXes
taxes payable:
parent company group
2014 2013 (nok thousands) 2014 2013
(5,784,033) (6,701,743) Pre-tax operating profit/(loss) (5,779,279) (6,844,486)
520 328 Permanent differences 520 328
7,164,887 6,595,391 Change in temporary differences 7,162,725 6,489,652
1,381,374 (106,024) taxable income 1,383,966 (354,506)
372,971 0 Current taxes 373,671 0
(26,514) (28,627) Change in last year's tax provision 39,284 (95,717)
15,173 341 Other current tax adjustments 15,157 341
(1,934,520) (1,928,382) Change in deferred taxes (1,933,920) (1,899,832)
(1,572,890) (1,956,668) total income taxes in income statement (1,505,808) (1,995,208)
372,971 0 Current taxes in statement of income 373,671 0
(756) (748) Withholding tax already paid (756) (748)
0 748 Other effects (796) 748
372,215 0 taxes payable in balance sheet 372,119 0
deferred tax liabilities / deferred tax assets:
parent company group
2014 2013 (nok thousands) 2014 2013
2,162,661 4,120,655 Deferred tax/(deferred tax assets) beginning of year 2,142,120 4,120,655
(26,514) 0 Deferred tax/(deferred tax assets) beginning of year adjustment 39,284 0
814 (104,581) Excess book value over tax depreciation 772 1,158
(3,449) 277,769 Accounts receivables (3,449) 277,769
1,587,667 6,933,821 Mark-to-market adjustments financial instruments 1,587,667 6,933,821
(61,260) (8,973) Employee retirement plan (61,261) (8,973)
(9,313,060) (13,890,403) Debt at fair value (9,312,971) (13,890,403)
208,068 0 Deficit that can be carried forward 210,273 0
416,303 196,976 Securities 416,303 196,976
(7,164,917) (6,595,391) change in tax-increasing temporary differences (7,162,666) (6,489,652)
201,628 2,162,661 deferred tax/(deferred tax assets) end of year 229,484 2,142,120

44 e k s p o r t f i n a n s a n n u a l r e p o r t 2 0 1 4
temporary differences:
parent company group
dec. 31, 2014 dec. 31, 2013 (nok thousands) dec. 31, 2014 dec. 31, 2013
(1,181) (2,185) Excess book value over tax depreciation 101,996 103,554
410 3,860 Accounts receivables 410 3,860
948,335 (639,332) Mark-to-market adjustments financial instruments 948,335 (639,332)
(136,720) (75,459) Employee retirement plan (136,720) (75,459)
575,721 9,888,751 Debt at fair value 575,751 9,888,752
(639,800) (1,056,103) Securities (639,800) (1,056,103)
746,765 8,119,532 total tax-increasing temporary differences 849,972 8,225,272
201,628 2,162,661 tax on temporary differences 229,484 2,124,120
reconciliation of income taxes:
parent company group
2014 2013 (nok thousands) 2014 2013
(5,784,033) (6,701,743) Pre-tax operating profit/(loss) from continuing operations (5,779,279) (6,844,486)
(1,561,689) (1,876,488) tax calculated at a 28 % nominal tax rate (1,560,405) (1,916,456)
Tax effect of:
0 (80,520) - Change in tax rate for deferred taxes to 27 % 0 (78,708)
140 (92) - Permanent differences 140 (92)
15,173 (238) - Actuarial losses according to IAS19R 15,173 (238)
(26,514) 670 - Other items 39,284 286
(11,201) (80,180) total tax effects 54,597 (78,752)
(1,572,890) (1,956,668) taxes / (tax income) in the income statement (1,505,808) (1,995,208)
27.2 % 29.2 % Effective tax rate of taxes in the income statement 26.1 % 29.2 %
(0.2 %) (2.2 %) Tax effect from reconciliation items above 0.9 % (2.2 %)
27.0 % 27.0 % Tax rate after reconciliation 27.0 % 27.0 %
27.0 % 27.0 % Applicable tax rate 27.0 % 27.0 %
0.0 % 0.0 % difference 0.0 % 0.0 %
27 % 27 % Applied tax rate 27 % 27 %

n o t e s 45
12 financial derivativesFinancial derivatives are used in the risk management of the company’s financial activities with the purpose of obtaining economic hedging. The risk ele-ments of derivatives related to the issue of securities in the international capital markets (embedded derivatives) are covered through economic hedging transactions. Financial derivatives are also used to provide the company’s borrowers with the required foreign currency, interest rate terms and financing structure, and to cover the interest and exchange rate risk related to financial investments. In addition, derivatives can be used to a limited extent in the trading portfolio.
The credit risk related to existing agreements is considered to be low, as all parties involved are major Norwegian and international financial institutions. All derivative transactions are traded under ISDA (International Swaps and Derivatives Association) agreements. For the majority of the derivative coun-terparties Eksportfinans has entered into credit support annexes (CSAs) represented as annexes in the ISDA agreements. These CSAs enable Eksportfinans to call for collateral if the derivative exposure exceeds set limits. The same strict requirements and monitoring procedures in force for loan guarantees also apply to the company’s counterparties under agreements related to financial derivatives. The risk of non-performance is considered in the estimates of fair value of derivative assets and liabilities.
Eksportfinans has active CSA agreements with 30 different counterparties as of December 31, 2014. As of December 31, 2014, 90 percent of the CSA's have daily collateral exchange, around the same as of December 31, 2013. Eksportfinans accepts only cash as collateral. As of December 31, 2014, 99 percent of total number of derivative transactions and 95 percent of total derivative exposures are covered under CSA agreements, which is about the same as of December 31, 2013.
The following overview of financial derivatives shows the nominal gross amounts and the fair value of the agreements involved:
parent company/group
(nok thousands) dec. 31, 2014 dec. 31, 2013
notional value fair value notional value fair value
Interest rate derivatives 78,690,876 817,128 88,297,335 1,235,529
Currency rate derivatives 20,564,289 905,083 31,515,380 (343,662)
Interest and currency rate derivatives 49,475,634 1,126,428 64,460,946 116,540
Equity derivatives 1,406,623 55,130 7,785,381 (43,701)
Portfolio Hedge Agreement 5,000,000 (1,038,381) 5,000,000 (462,533)
108 derivatives 16,502,716 30,721 21,389,471 16,287
Other financial derivatives 232,062 45,793 205,462 (164,018)
total 171,872,200 1,941,902 218,653,975 354,441
Financial derivatives assets 7,070,531 5,499,731
Financial derivatives liabilities 5,128,629 5,145,290
net derivatives 1,941,902 354,441
The notional is defined as the principal amount of the agreement at year-end.
interest rate derivatives cover: • Interest rate swaps – agreements to swap the nominal interest rates payable within a certain period.
• Forward rate agreements (FRAs) – agreements that fix the rate of interest to a nominal amount for a future period.
• Agreements that set floating rates of interest based on the future level of interest rates. These agreements include both interest rate options (caps, collars, floors) and interest rate conditions based on agreed formulas in which the future floating rate of interest is a variable.
currency rate derivatives cover: • Forward purchases/sales agreements – agreements to purchase or sell a certain amount of foreign currency at a future date at an agreed exchange
rate in relation to another currency.
• Short-term currency swap agreements (FX swaps) – agreements to swap given amounts of foreign currency for a defined period at a pre-determined exchange rate.
combined interest rate and foreign exchange rate derivatives cover: • Interest and foreign currency swaps – long-term agreements to swap both interest rates and the amount of foreign currency for a fixed period.
• Interest and foreign exchange swaps combined with other interest and foreign currency derivatives include the following:
• Agreements which set floating rates of interest based on the future level of interest rates. This covers both interest rate options (caps, collars, floors) and interest rate conditions based on agreed formulas in which the floating rate of interest is a variable.
• Foreign currency options – agreements that offer the right – but no obligation – to sell or buy a certain nominal amount at a pre-determined rate.
• Agreements based on a future foreign exchange rate. The terms of the agreement are set on the basis of a pre-determined agreed-upon future exchange rate level.
• Call or put options – agreements that give the right to cancel the agreement before its maturity date, or to extend the agreement.

46 e k s p o r t f i n a n s a n n u a l r e p o r t 2 0 1 4
equity derivatives cover: • Interest and foreign currency swaps combined with agreements that
relate to the future price level of individual stocks or stock indexes in relation to a pre-determined agreed-upon level.
• Interest and foreign currency swaps combined with stock options – agree-ments that offer the right – but no obligation – to sell or purchase a defined number of shares at a pre-determined, agreed-upon price.
portfolio hedge agreement (pha): • The background for introducing a Portfolio Hedge Agreement (PHA) back
in March 2008 was to mitigate the market risk in the company’s invest-ment portfolio. Unrealized losses in this portfolio significantly reduced the company’s capital base. Continuing volatility in capital markets in general and risk for further deterioration of the company’s capital base led to discussions on how to hedge the market risk in this portfolio. The company was at the time of the opinion that the unrealized losses would reverse and that hedging in the market (e.g. through Credit Default Swaps) would be very expensive. By creating a tailor-made derivative with the majority of the owners that would offset market risk for the company and at the same time give the owners all potential upside was seen as an optimal solution.
• The negotiated PHA agreement indemnifies the company’s former invest-ment portfolio (now denoted the PHA portfolio) from losses from both market risk and credit risk. The indemnification covered further losses up to NOK 5 billion, as gains or losses from inception of the agreement and until the last security matures is at the risk of the guarantor syndicate. The NOK 5 billion limit of the guarantee is in fact a put option for the syndicate in that their potential losses are capped at NOK 5 billion while they have all the potential upside. The company pays a monthly fee of NOK 5 million for the guarantee. The market value of the PHA agree-ment hence consists of three parts: the market value fluctuations of the underlying portfolio, the value of the put option, the net present value of the remaining monthly fees. The portfolio market value component of the PHA agreement offsets the changes in market value of the portfolio in the statement of financial position.
• After considering the economic hedging impact of the PHA agreement, the company is exposed to credit risk through the risk of potential de-faults among syndicate members and both credit risk and market risk if the NOK 5 billion cap is reached. The default risk of syndicate members is monitored daily as part of the company’s exposure monitoring. The probability of the PHA agreement reaching the cap of the indemnifica-tion is currently negligible. Since inception of the agreement this prob-ability has had a maximum of approximately 0.5 percent in November 2008 where around NOK 2.7 billion of the NOK 5 billion was utilized. Currently, Eksportfinans owe NOK 848 million to the guarantors. Further-more, the portfolio is currently smaller due to maturities (no additional investments are done in the portfolio) further reducing the probability of reaching the cap.
108 agreement derivatives: • The 108 Agreement is a government supported arrangement to facilitate
lending to companies involved in the Norwegian export industry. It pro-vides coverage of interest rate risk and foreign exchange risk for qualifying lending, borrowing and liquidity. The aim of the Agreement is to provide a fixed Norwegian krone based margin on qualifying OECD loans by com-pensating for interest rates and foreign currency differences between the
lending and the funding. Settlement accounts are utilized to keep track of differences between actual amounts of lending and borrowing rates and the margin stipulated by the agreement. The net amount of settlement to be refunded by the government is included in the line item ”Other assets” in the statement of financial position.
• Certain components of the 108 Agreement which compensate the com-pany for gains and losses on certain lending and borrowing transactions covered by the 108 Agreement due to differences in interest rates and foreign exchange rates, meet the definition of financial derivatives in IAS 39. The following summarizes the accounting treatment for the different features of the 108 Agreement:
• The Government subsidies provided to the company are treated as government grants in accordance with IAS 20. Government grants are recognized in income over the periods necessary to match them with the related costs which they are intended to compensate, on a systematic basis.
• Those grants relating to the variable rate borrowing meet the defini-tion of a derivative in accordance with IAS 39. On day 1, the deriva-tive will be recorded on the balance sheet at fair value. The corre-sponding entry will be posted to 'deferred revenue' in accordance with the treatment for government grants noted above. On subsequent measurements of the derivative, the changes in its fair value is re-corded in the income statement.
• Those grants relating to fixed rate borrowings and loans and denomi-nated in NOK currency, do not meet the definition of a derivative in accordance with IAS 39.
• Grants denominated in a foreign currency meet the definition of a derivative in accordance with IAS 39. The foreign currency component would not be separated from the entire agreement contract. Therefore the valuation of the derivative would include the foreign currency component plus the fixed margin relating to the fixed rate loans and borrowings. Similar to the treatment described in the second bullet point above, the initial gain would be deferred and the subsequent changes in the fair value of the derivative would be recognized in the income statement.
• The embedded derivatives in the 108 Agreement are recognized in the balance sheet as an asset or a liability depending on the net fair value of the derivatives at the reporting date.
other financial derivatives cover: • Interest and foreign currency swaps combined with agreements that
provide the option to receive physical securities (such as U.S. Treasury bonds) in exchange for the nominal amount of the agreement.
• Credit linked swaps – interest rate swaps combined with agreements where both maturity date and final payments are linked to a specific credit in the form of one or several bonds.
• Commodity derivatives – interest and foreign currency swaps combined with agreements which relate to the future price level of a commodity or commodity index in relation to a pre-determined agreed price.
• The financial derivatives as described above are used in the risk manage-ment of the company with the purpose of obtaining economic hedging. For a quantitative analysis of the impact of these economic hedging relationships, see note 29.4.

n o t e s 47
13 loans due froM credit institutions and custoMersloans due from credit institutions:
group
(nok thousands) dec. 31, 2014 dec. 31, 2013
Cash equivalents 1) 6,013,310 6,253,706
Other bank deposits and claims on banks 172,644 (228,466)
Loans to other credit institutions, nominal amount 2) 6,267,975 11,765,218
Accrued interest on loans and unamortized premium/discount on purchased loans (15,872) (5,803)
Adjustment to fair value on loans (67,669) (80,643)
total 12,370,388 17,704,012
1) Cash equivalents are defined as bank deposits with maturity of less than 3 months.
2) The company has acquired certain loan agreements from banks for which the bank provides a repayment guarantee, therefore retaining the credit risk of the loans. Under IFRS these loans classify as loans to credit institutions.
loans due from customers:
parent company/group
(nok thousands) dec. 31, 2014 dec. 31, 2013
Loans due from customers, nominal amount 32,906,310 46,802,540
Accrued interest on loans and unamortised premium/discount on purchased loans 397,774 474,231
Adjustment to fair value on loans 67,732 86,131
total 33,371,816 47,362,902
total loans:Nominal amounts related to loans due from credit institutions and customers, respectively, from the two previous tables are included in the following analysis.
parent company/group
(nok thousands) dec. 31, 2014 dec. 31, 2013
Loans due from other credit institutions 6,267,975 11,765,218
Loans due from customers 32,906,310 46,802,540
total noMinal aMount 39,174,285 58,567,758
See note 2.5.2.2 for a description of which loans are measured at amortized cost and which are measured as at fair value through profit or loss.
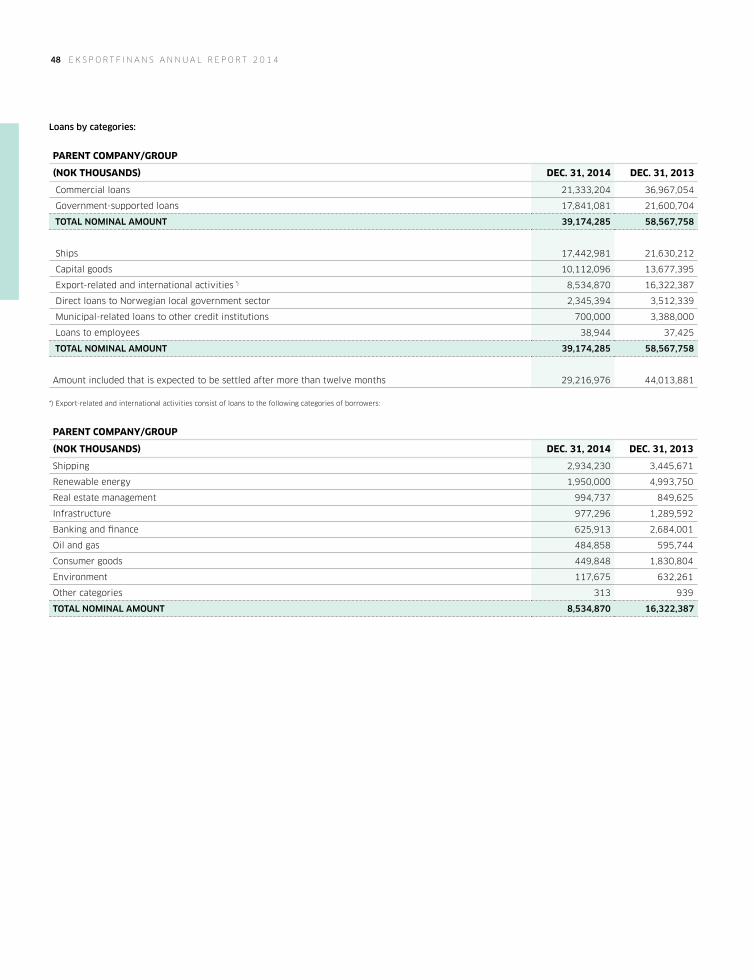
48 e k s p o r t f i n a n s a n n u a l r e p o r t 2 0 1 4
loans by categories:
parent company/group
(nok thousands) dec. 31, 2014 dec. 31, 2013
Commercial loans 21,333,204 36,967,054
Government-supported loans 17,841,081 21,600,704
total noMinal aMount 39,174,285 58,567,758
Ships 17,442,981 21,630,212
Capital goods 10,112,096 13,677,395
Export-related and international activities *) 8,534,870 16,322,387
Direct loans to Norwegian local government sector 2,345,394 3,512,339
Municipal-related loans to other credit institutions 700,000 3,388,000
Loans to employees 38,944 37,425
total noMinal aMount 39,174,285 58,567,758
Amount included that is expected to be settled after more than twelve months 29,216,976 44,013,881
*) Export-related and international activities consist of loans to the following categories of borrowers:
parent company/group
(nok thousands) dec. 31, 2014 dec. 31, 2013
Shipping 2,934,230 3,445,671
Renewable energy 1,950,000 4,993,750
Real estate management 994,737 849,625
Infrastructure 977,296 1,289,592
Banking and finance 625,913 2,684,001
Oil and gas 484,858 595,744
Consumer goods 449,848 1,830,804
Environment 117,675 632,261
Other categories 313 939
total noMinal aMount 8,534,870 16,322,387

n o t e s 49
14 intangible assetsThe company’s intangible assets consist mainly of software systems.
parent company/group
(nok thousands)
Book value at January 1, 2014 5,417
Additions during the year 390
Disposals during the year 68
Impairment 0
Depreciation during the year 2,164
book value at december 31, 2014 3,575
Cost at December 31, 2014 86,561
Total accumulated depreciation at December 31, 2014 82,986
book value at december 31, 2014 3,575
Book value at January 1, 2013 9,281
Additions during the year 861
Impairment 0
Depreciation during the year 4,725
book value at december 31, 2013 5,417
Cost at December 31, 2013 86,239
Total accumulated depreciation at December 31, 2013 80,822
book value at december 31, 2013 5,417
Useful life 5-7 years
Depreciation rates 14-20 %
Depreciation of intangible assets is included in the line item 'Depreciation' in the statement of comprehensive income.

50 e k s p o r t f i n a n s a n n u a l r e p o r t 2 0 1 4
15 property, eQuipMent and investMent property
parent company group
equiment
buildings and land at
own useinvestment
property total (nok thousands) equipment
buildings and land at
own use investment
property total
8,873 0 0 8,873 Book value at January 1, 2014 8,873 131,271 73,083 213,227
949 0 0 949 Additions during the year 2,316 9,788 5,999 18,103
435 0 0 435 Disposals during the year 435 0 0 435
0 0 0 0Impairment / (reversal of impairment) 0 0 0 0
2,249 0 0 2,249 Depreciation during the year 2,386 7,015 4,300 13,701
7,138 0 0 7,138 book value at december 31, 2014 8,368 134,044 74,782 217,194
96,098 0 0 96,098 Cost at December 31, 2014 97,465 181,994 104,210 383,669
88,960 0 0 88,960Total accumulated depreciation at December 31, 2014 89,097 47,950 29,428 166,475
7,138 0 0 7,138 book value at december 31, 2014 8,368 134,044 74,782 217,194
10,815 126,190 70,010 207,015 Book value at January 1, 2013 10,815 126,190 70,010 207,015
1,994 9,632 5,903 17,529 Additions during the year 1,994 13,116 8,038 23,148
1,073 1,789 1,096 3,958 Disposals during the year 1,073 1,789 1,096 3,958
0 (25) 25 0Impairment / (reversal of impairment) 0 (25) 25 0
2,863 3,576 2,192 8,631 Depreciation during the year 2,863 6,271 3,844 12,978
0 130,482 72,600 203,082Disposals during the year: sale to subsidiary August 1, 2013 0 0 0 0
8,873 0 0 8,873 book value at december 31, 2013 8,873 131,271 73,083 213,227
95,584 0 0 95,584 Cost at December 31, 2013 95,584 172,206 98,211 366,001
86,711 0 0 86,711Total accumulated depreciation at December 31, 2013 86,711 40,935 25,128 152,774
8,873 0 0 8,873 book value at december 31, 2013 8,873 131,271 73,083 213,227
3-7 years 4-67 years 4-67 years Useful life 3-7 years 4-67 years 4-67 years
14-33 % 1.5-25 % 1.5-25 % Depreciation rates 14-33 % 1.5-25 % 1.5-25 %
Book value for property, equipment and investment property in the parent company and in the group equals cost less accumulated depreciation. Fair value of the investment property at the balance sheet date is estimated to approximately NOK 160 million. This is based on estimates prepared by a qualified, independent real estate appraiser as of January 20, 2015. The fair value is calculated based on the discounted cash flow method. The fair value of the investment property is calculated using unobservable inputs and is therefore placed in Level 3 in the fair value hierarchy.
Income and expenses related to the investment property are specified in note 7 and 10 respectively.

n o t e s 51
16 other assets
parent company group
dec. 31, 2014 dec. 31, 2013 (nok thousands) dec. 31, 2014 dec. 31, 2013
182,279 474,096 Settlement account 108 Agreement 182,279 474,096
3,180,785 2,927,157 Cash collateral 3,180,785 2,927,157
1,114,980 0 Collateral deposit *) 1,114,980 0
142,295 159,166 Other 126,217 143,906
4,620,339 3,560,419 total 4,604,261 3,545,159 *) The Collateral deposit relates to a USD 150 million deposit of collateral for the benefit of Citibank N.A. to cover Eksportfinans’ day to day settlement activity. This amount ca be adjusted up or down depending on settlement activity of Eksportfinans. The deposit shall stay in place while any secured obligations are in place. Citibank is entitled to at any time without prior notice to Eksport-finans to set-off or transfer all or part of the Deposit in or towards satisfaction of all or any part of the secured obligations.
17 borroWings through the issue of securitiesAs a result of the November 18, 2011 decision, the company has found that the need for new funding in the capital markets is limited, and that the trans-actions in the existing funding portfolio will be repaid at maturity.
Until November 18, 2011 Eksportfinans’ long term funding strategy had been to be a frequent and diversified issuer in terms of markets and investors. The company had been funding itself through the issuance of bond debt and commercial paper in the international capital markets. Bond debt was primar-ily issued off the company’s Euro Medium Term Note Programme as well as its US Medium Term Note Program. Commercial paper was issued using the company’s US Commercial Paper Program as well as its Euro Commercial Paper Program.
In its outstanding debt portfolio the company has public benchmark bonds (primarily in USD) as well as smaller medium term notes / private placements. Public benchmark bonds are driven by the company and are designed to manage the company’s liquidity position in terms of size and maturity. Medium term notes / private placements are generally issued on an investor reverse enquiry basis and tend to be smaller and shorter in maturity by nature and in a number of currencies. These bonds range from being plain vanilla to having a structured coupon and / or redemption amount. The type of structure is dictated by the investor and can be issued by the company providing it meets with internal approval and risk systems. All funding transactions have been arranged by dealers from the company’s debt issuance programs; the company does not arrange any of its own bond issues and does not discuss terms directly with investors on specific transactions.
All bond debt issuance is swapped back into Libor in one of the company’s base currencies; US Dollar, Euro or Norwegian Kroner. The company does not take market views through its bond debt issuance and hedges itself against market risk on a trade by trade basis.
The company ’s debt issuance is dictated by demand on the lending side of the business. No funding was raised in the capital markets in 2014 or 2013.
Commercial paper can be used for bridge financing as and when required.
outstanding amounts and interest rates related to bond debt and commercial paper debt:
parent comany/group
(nok thousands) 2014 2013
Amount outstanding at year-end 66,412,958 75,842,547
Maximum amount oustanding 80,495,894 113,071,716
Average amount outstanding 73,269,103 89,699,065
average interest rate 1.95 % 2.57 %
structure composition of bond debt and commercial paper debt:
parent comany/group
(nok thousands) 2014 2013
Non-structured 47,688,782 51,529,910
Equity linked 1,110,203 7,041,911
Foreign exchange linked 13,704,783 12,325,851
Commodity linked 19,825 11,594
Other structures 3,889,365 4,933,281
total 66,412,958 75,842,547

52 e k s p o r t f i n a n s a n n u a l r e p o r t 2 0 1 4
18 loans to elected officersNo loans have been provided to any elected officers, except for loans to the employees’ representatives, which are included in loans to employees in note 13.
To companies in which Eksportfinans’ board members, members of control committee or chairman of the council of representatives are board members, no loans were provided as of December 31, 2014 and as of December 31, 2013.
Bank deposits are not defined as loans. These loans are granted as loans at ordinary terms to customers.
19 provisions
parent comany/group
(nok thousands) dec. 31, 2014 dec. 31, 2013
Pensions 136,720 76,043
Salaries and social security 24,739 20,928
total 161,459 96,971
20 intragroup accountsOperating income received from companies that were subsidiaries at the end of the year, are included in the statement of comprehensive income for the parent company, under the following line items:
(nok thousands) dec. 31, 2014 dec. 31, 2013
Income related to the sale of property, equipment and investment property to Eiendomsselskapet DM15. 0 145,869
Other income 426 178
Other expenses 8,185 3,498
total (7,759) 142,549
Transactions with companies that were subsidiaries at the end of the year, are included in the following line items in the balance sheet of the parent company:
(nok thousands) dec. 31, 2014 dec. 31, 2013
Intragroup receivables due from Eiendomsselskapet DM15 16,315 18,649
Outstanding liabilities related to leases 2,692 8,303
total 13,623 10,346

n o t e s 53
21 other liabilities
parent company
dec 31, 2014 dec 31, 2013 (nok thousands) dec 31, 2014 dec 31, 2013
43,990 46,965 Grants to mixed credits 43,990 46,965
4,508,349 4,450,264 Cash collateral 4,508,349 4,450,264
49,602 114,257 Other short-term liabilities 47,160 110,256
4,601,941 4,611,486 total 4,599,499 4,607,485
22 subordinated debt
parent company/group
(nok thousands) dec 31, 2014 dec 31, 2013
JPY 15 billion, 4.80%, due 2015 964,978 901,750
total 964,978 901,750
The conditions comply with the requirements of The Financial Supervisory Authority of Norway (the NFSA) for additional capital.
23 capital contribution securitiesIn January 2013 Eksportfinans, in accordance with market practice, exercised its right to call the company’s Capital Contribution Securities of GBP 50 mil-lion. The securities were repaid at face value (NOK 430 million) on February 19, 2013.

54 e k s p o r t f i n a n s a n n u a l r e p o r t 2 0 1 4
24 shareholdersAt the end of 2014, Eksportfinans ASA had a share capital of NOK 2,771,097 thousand, divided into 263,914 authorized shares of nominal value NOK 10,500. All shares are fully paid.
dec. 31, 2014 dec. 31, 2013
number of shares ownership percentage number of shares
ownership percentage
DNB Bank ASA 105,557 40.00 105,557 40.00
Nordea Bank Norge ASA 61,246 23.21 61,246 23.21
The Norwegian State, the Ministry of Trade, Industry and Fisheries 39,587 15.00 39,587 15.00
Danske Bank A/S 21,348 8.09 21,348 8.09
Sparebanken Øst 12,787 4.84 12,787 4.84
Sparebanken Sør 4,026 1.52 3,497 1.32
Sparebanken Møre 3,551 1.35 3,551 1.35
Sparebanken 1 Hedmark 3,499 1.33 3,499 1.33
Sparebanken Sogn og Fjordane 3,478 1.31 3,478 1.31
Sparebanken Vest 2,638 1.00 2,638 1.00
SpareBank 1 SMN (Midt-Norge) 1,857 0.70 1,857 0.70
Voss Veksel og Landmandsbank ASA 1,050 0.40 1,050 0.40
Fana Sparebank 943 0.36 943 0.36
Handelsbanken 563 0.21 563 0.21
Helgeland Sparebank 377 0.14 377 0.14
SpareBank 1 Ringerike Hadeland 329 0.13 329 0.13
SpareBank 1 Søre Sunnmøre 296 0.11 296 0.11
SpareBank 1 Modum 188 0.07 188 0.07
SpareBank 1 Buskerud-Vestfold 188 0.07 188 0.07
SpareBank 1 Nøtterøy-Tønsberg 174 0.06 174 0.06
Haugesund Sparebank 94 0.04 94 0.04
BNP Paribas, Oslo Branch 83 0.03 83 0.03
SpareBank 1 Østfold Akershus 38 0.02 38 0.02
Skudenes & Aakra Sparebank 17 0.01 17 0.01
Sparebanken Pluss 0 0 529 0.20
total 263,914 100 263,914 100 There exists only one class of shares. One share represents one vote. There exists no regulatory or other restriction on any shareholder to exercise their voting rights.
A shareholder agreement exists between the major (that is those with an ownership percentage of over 20 percent) and some of the minor shareholders, whereby they have given eachother the priority to acquire any shares the others may sell in Eksportfinans ASA. The shareholder agreement comprises 71 percent of the shares.
25 reserves Within eQuityThe reserve for unrealized gains is a requirement by Norwegian legislation. Allocations to this reserve are to be made in the company accounts for, with a few exceptions, positive differences between carrying value and amortized cost of financial assets and liabilities measured at fair value. Reserves are also made for the difference between fair value of buildings and land (measured at fair value at the transition to IFRS) as of January 1, 2006, and the value as of December 31, 2005 under the previous GAAP. The latter difference is reduced each year with depreciation of the revaluation amount.
As per July 1, 2013 the Public Limited Companies Act under Norwegian Law states that the share premium reserve no longer is to be classified as re-stricted equity that cannot be paid out to owners without a shareholder resolution to reduce capital.
The reserve for unrealized gains represents restricted equity that cannot be distributed as dividend.

n o t e s 55
26 capital ManageMentThe primary objectives of the company’s capital management are to have a sound capital base and to ensure compliance with externally imposed capital requirements, in order to support its business and to provide returns for shareholders and benefits for other stakeholders.
Capital adequacy is calculated in accordance with the CRD IV regulations in force from the Financial Supervisory Authority of Norway. These regulations were implemented as of September 30, 2014. The company has adopted the standardized approach to capital requirements. The CRD IV regulations decreases the company’s capital ratio, due to changed risk weights on financial institutions, affecting mainly Eksportfinans’ bank guaranteed loans and securities, as well as the CVA (Credit Valuation Adjustment) charge on financial derivatives.
Capital adequacy is currently above the internally set risk capital level. Through the ICAAP-process, the board has decided that the company should aim for a risk capital level of about NOK 5.6 billion, including NOK 1.8 billion to cover large exposure regulations, future economic downturns and possible future capital regulations. Dividends are determined with the aim to ensure an adequate level of capital for Eksportfinans as well as a satisfactory return for the shareholders. Norwegian FSA expects Eksportfinans not to distribute any equity based on the 2014 financial statements. Based on this, the board proposed on February 13, 2015, not to pay any dividend related to the fiscal year 2014.
During the past year, Eksportfinans has complied with all its statutory capital requirements.
risk capital:
parent company
(nok thousands and as percentage of risk-weighted assets and off-balance sheet items) dec. 31, 2014 dec. 31, 2013
Share capital 2,771,097 2,771,097
Reserve for unrealized gains 933,222 5,292,810
Other equity 4,222,303 4,114,882
total equity 7,926,622 12,178,789
Deductions 1,712,233 5,970,232
total core capital 6,214,389 25.0 % 6,208,557 38.0 %
Subordinated debt 0 173,754
additional capital 0 0.0 % 173,754 1.0 %
total risk capital 6,214,389 25.0 % 6,382,311 39.0 %
risk-weighted balance sheet and off-balance:
parent company
(nok thousands) dec. 31, 2014 dec. 31, 2013
book value Weighted value book value Weighted value
Loans due from credit institutions 12,367,805 4,329,964 17,702,019 3,540,404
Loans due from customers 33,371,816 8,838,634 47,362,902 5,923,608
Securities 27,991,395 3,974,046 26,462,302 3,287,312
of which held for trading 26,292,306 3,398,796 24,084,759 2,885,603
Financial derivatives 7,070,531 2,843,018 5,499,731 736,902
Other assets 4,968,883 943,496 3,912,540 75,671
total assets on balance sheet 85,770,430 20,929,158 100,939,494 13,563,898
Off-balance sheet items 70,435 22,664
Operational risk 1,927,493 2,403,177
Foreign currency exchange risk 546,243 362,463
CVA 1,419,238 0
total risk-Weighted value 24,892,566 16,352,202

56 e k s p o r t f i n a n s a n n u a l r e p o r t 2 0 1 4
risk capital:
group
(nok thousands and as percentage of risk-weighted assets and off-balance sheet items) dec. 31, 2014 dec. 31, 2013
Share capital 2,771,097 2,771,097
Reserve for unrealized gains 1,043,028 5,348,974
Other equity 3,945,909 3,954,516
total equity 7,760,034 12,074,587
Deductions 1,785,987 6,043,986
Additions 13,051 9,675
total core capital 5,987,098 24.3 % 6,040,276 36.8 %
Subordinated debt 0 173,754
Additions 36,878 46,097
additional capital 36,878 0.1 % 219,851 1.3 %
total risk capital 6,023,976 24.4 % 6,260,127 38.1 %
risk-weighted balance sheet and off-balance:
group
(nok thousands) dec. 31, 2014 dec. 31, 2013
book value Weighted value book value Weighted value
Loans due from credit institutions 12,370,388 4,330,480 17,704,012 3,540,802
Loans due from customers 33,371,816 8,838,634 47,362,902 5,923,608
Securities 27,991,395 3,974,046 26,462,302 3,287,312
of which held for trading 26,292,306 3,398,796 24,084,759 2,885,603
Financial derivatives 7,070,531 2,843,018 5,499,731 736,902
Other assets 4,822,030 807,609 3,763,803 227,074
total assets on balance sheet 85,626,160 20,793,787 100,792,750 13,715,700
Off-balance sheet items 70,435 22,664
Operational risk 1,847,144 2,315,413
Foreign currency exchange risk 546,243 362,463
CVA 1,419,238 0
total risk-Weighted value 24,676,846 16,416,240
27 cash and cash eQuivalentsFor the purposes of the cash flow statement, cash and cash equivalents comprise the following balances with less than three months maturity from the date of acquisition:
parent company group
dec. 31,2014 dec. 31, 2013 (nok thousands) dec. 31, 2014 dec. 31, 2013
549,569 684,555 Balances with Norwegian banks 552,153 686,549
1,175,922 2,081,276 Balances with foreign banks 1,175,922 2,081,276
4,285,235 3,485,881 Bank deposits with maturity less than three months 4,285,235 3,485,881
6,010,726 6,251,712 total cash and cash eQuivalents 6,013,310 6,253,706
The amounts are included in the balance sheet line item ‘Loans due from credit institutions’.

n o t e s 57
28 financial risk ManageMentAfter the Government’s announcement to assume responsibility for the state-supported export financing scheme, Eksportfinans will manage its consid-erable portfolio of outstanding loans until maturity and does not currently anticipate engaging in new lending or funding activities, except for already granted loan commitments of NOK 261 million. A new state-owned and state-funded entity granting new loans was set up on July 1, 2012.
risk management structureEksportfinans seeks to monitor and control risk exposure through a variety of separate but complementary financial, credit, operational, compliance and legal reporting systems. In addition, a number of committees are responsible for monitoring risk exposures and have general oversight of the company’s risk management process as described further below. The Board of Directors ("the Board") has developed guidelines for loans to the export lending indus-try, liquidity management, funding, interest rate exposure, currency risk exposure, liquidity risk and credit exposure for the company.
organiZationThe Director of Risk Management reports directly to the company’s CEO. Risk Management has responsibility for conducting company-wide compliance with risk management policies, procedures and guidelines such as counterparty credit quality and risk limits, as well as risk pricing, asset and liability projections, sensitivity analysis and mark to market calculations for external reporting.
The team responsible for the day-to-day management of market risk is referred to as the internal bank which reports directly to the CFO and is independ-ent of the Risk Management Group overseeing risk. The internal bank has the operative responsibility of the main hedging activities in the market as well as controlling the liquidity by monitoring short term borrowing programs, asset-liability gaps, maturity gaps, market conditions and market projections. In addition to the day to day work of the Risk Management Group the company has five risk committees.
committees overseeing risk:• The Group of Managing Directors • The Credit Committee• The Asset and Liability Committee• The Product Approval Committee• The Investment Committee
29 credit riskCredit risk represents the loss that Eksportfinans would incur if one or several counterparties or issuers of securities or other instruments that the com-pany holds, fail to perform under their contractual obligations to Eksportfinans, or upon a deterioration of credit quality of the third parties whose securi-ties or other instruments, including over-the counter (OTC) derivatives Eksportfinans holds.
Credit risk arises from lending transactions, financial investments and derivative transactions. Most export loans are fully credit enhanced, normally with guarantees from financial institutions or governments.
Eksportfinans relies on domicile country as well as credit ratings and analyses from the major rating agencies (Fitch Ratings, Moody’s Investor Services and Standard & Poor’s) to monitor the credit quality of all guarantors and credit counterparties in the financial investments and derivatives portfolios. If a counterpart has no rating from any of the three international agencies, the company uses internal ratings published by the company’s main owner bank for some counterparties. These “shadow ratings” are well known and widely used in the market by other institutions. Reports are provided regularly to senior management and the Board. Eksportfinans does not perform extensive analyses of the creditworthiness of its borrowers, but instead relies on guarantees and other forms of support for the loans.
The following table presents loans by type of security/exposure:
parent company/group
(percent) dec. 31, 2014 dec. 31, 2013
Government guarantees 33.5 30.7
Loans to and guarantees from Norwegian local authorities 1.9 2.5
public sector borrowers/guarantors 35.4 33.2
Guarantees from Norwegian banks 50.7 50.6
Loans to Norwegian banks 2.8 9.5
Guarantees from foreign banks 11.1 6.7
Other 0.0 0.0
total 100.0 100.0
total nominal amount in nok thousands (from note 13) 39,174,285 58,567,758 All guarantees obtained from banks to support Eksportfinans’ loans are unconditional and irrevocable, whereas government guarantees from the Norwe-gian Guarantee Institute for Export Credits (GIEK) are given subject to certain conditions and limitations, as discussed below.
Guarantees issued by GIEK and banks, generally cover principal, interest and, in most cases, interest on payments past due and expenses.
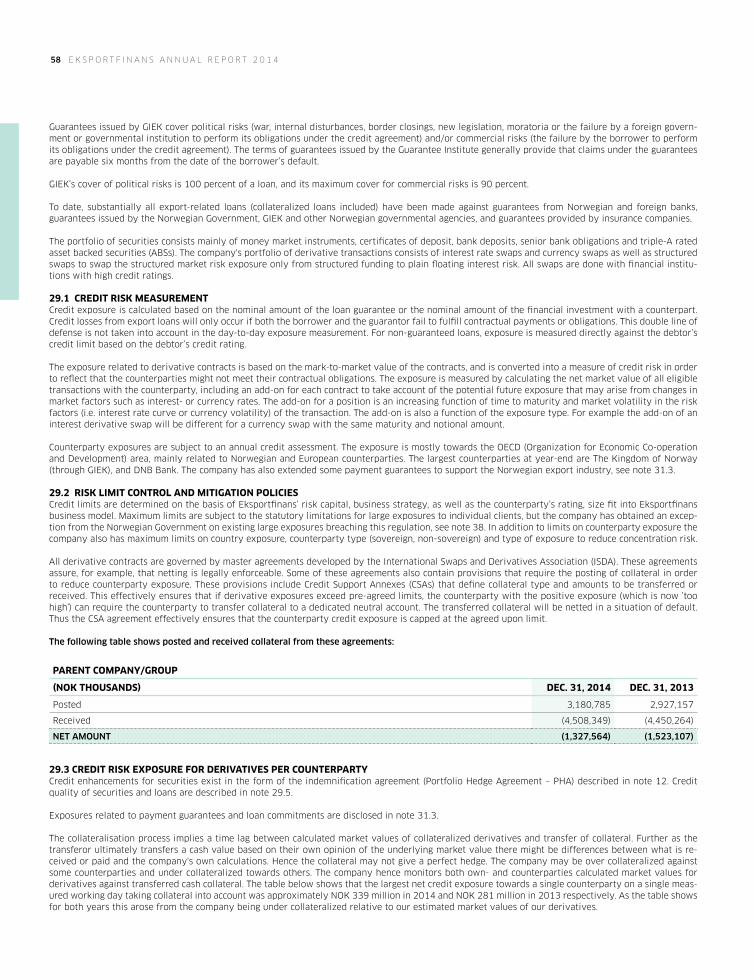
58 e k s p o r t f i n a n s a n n u a l r e p o r t 2 0 1 4
Guarantees issued by GIEK cover political risks (war, internal disturbances, border closings, new legislation, moratoria or the failure by a foreign govern-ment or governmental institution to perform its obligations under the credit agreement) and/or commercial risks (the failure by the borrower to perform its obligations under the credit agreement). The terms of guarantees issued by the Guarantee Institute generally provide that claims under the guarantees are payable six months from the date of the borrower’s default.
GIEK’s cover of political risks is 100 percent of a loan, and its maximum cover for commercial risks is 90 percent.
To date, substantially all export-related loans (collateralized loans included) have been made against guarantees from Norwegian and foreign banks, guarantees issued by the Norwegian Government, GIEK and other Norwegian governmental agencies, and guarantees provided by insurance companies.
The portfolio of securities consists mainly of money market instruments, certificates of deposit, bank deposits, senior bank obligations and triple-A rated asset backed securities (ABSs). The company's portfolio of derivative transactions consists of interest rate swaps and currency swaps as well as structured swaps to swap the structured market risk exposure only from structured funding to plain floating interest risk. All swaps are done with financial institu-tions with high credit ratings.
29.1 credit risk measurementCredit exposure is calculated based on the nominal amount of the loan guarantee or the nominal amount of the financial investment with a counterpart. Credit losses from export loans will only occur if both the borrower and the guarantor fail to fulfill contractual payments or obligations. This double line of defense is not taken into account in the day-to-day exposure measurement. For non-guaranteed loans, exposure is measured directly against the debtor’s credit limit based on the debtor’s credit rating.
The exposure related to derivative contracts is based on the mark-to-market value of the contracts, and is converted into a measure of credit risk in order to reflect that the counterparties might not meet their contractual obligations. The exposure is measured by calculating the net market value of all eligible transactions with the counterparty, including an add-on for each contract to take account of the potential future exposure that may arise from changes in market factors such as interest- or currency rates. The add-on for a position is an increasing function of time to maturity and market volatility in the risk factors (i.e. interest rate curve or currency volatility) of the transaction. The add-on is also a function of the exposure type. For example the add-on of an interest derivative swap will be different for a currency swap with the same maturity and notional amount.
Counterparty exposures are subject to an annual credit assessment. The exposure is mostly towards the OECD (Organization for Economic Co-operation and Development) area, mainly related to Norwegian and European counterparties. The largest counterparties at year-end are The Kingdom of Norway (through GIEK), and DNB Bank. The company has also extended some payment guarantees to support the Norwegian export industry, see note 31.3.
29.2 risk limit control and mitigation policiesCredit limits are determined on the basis of Eksportfinans’ risk capital, business strategy, as well as the counterparty’s rating, size fit into Eksportfinans business model. Maximum limits are subject to the statutory limitations for large exposures to individual clients, but the company has obtained an excep-tion from the Norwegian Government on existing large exposures breaching this regulation, see note 38. In addition to limits on counterparty exposure the company also has maximum limits on country exposure, counterparty type (sovereign, non-sovereign) and type of exposure to reduce concentration risk.
All derivative contracts are governed by master agreements developed by the International Swaps and Derivatives Association (ISDA). These agreements assure, for example, that netting is legally enforceable. Some of these agreements also contain provisions that require the posting of collateral in order to reduce counterparty exposure. These provisions include Credit Support Annexes (CSAs) that define collateral type and amounts to be transferred or received. This effectively ensures that if derivative exposures exceed pre-agreed limits, the counterparty with the positive exposure (which is now ’too high‘) can require the counterparty to transfer collateral to a dedicated neutral account. The transferred collateral will be netted in a situation of default. Thus the CSA agreement effectively ensures that the counterparty credit exposure is capped at the agreed upon limit.
the following table shows posted and received collateral from these agreements:
parent company/group
(nok thousands) dec. 31, 2014 dec. 31, 2013
Posted 3,180,785 2,927,157
Received (4,508,349) (4,450,264)
net aMount (1,327,564) (1,523,107)
29.3 credit risk exposure for derivatives per counterpartyCredit enhancements for securities exist in the form of the indemnification agreement (Portfolio Hedge Agreement – PHA) described in note 12. Credit quality of securities and loans are described in note 29.5.
Exposures related to payment guarantees and loan commitments are disclosed in note 31.3.
The collateralisation process implies a time lag between calculated market values of collateralized derivatives and transfer of collateral. Further as the transferor ultimately transfers a cash value based on their own opinion of the underlying market value there might be differences between what is re-ceived or paid and the company's own calculations. Hence the collateral may not give a perfect hedge. The company may be over collateralized against some counterparties and under collateralized towards others. The company hence monitors both own- and counterparties calculated market values for derivatives against transferred cash collateral. The table below shows that the largest net credit exposure towards a single counterparty on a single meas-ured working day taking collateral into account was approximately NOK 339 million in 2014 and NOK 281 million in 2013 respectively. As the table shows for both years this arose from the company being under collateralized relative to our estimated market values of our derivatives.

n o t e s 59
largest single counterparty credit exposure from derivatives after collateral:
parent company/group
(nok thousands) 2014 2013
Date of max net exposure Oct 31th Aug 31st
MTM of derivatives 254,802 (496,295)
Posted(-) / Received(+) collateral (84,404) (777,500)
net eXposure 339,205 281,205
Max 10d VaR at 95% confidence level 317,948 683,046
If a counterpart should disagree with our calculated demands or defaults future collateral transfers may cease. Eksportfinans estimates it will take a maxi-mum of 10 days to replace a single counterparty derivative exposure such as in the Lehman case in 2008. Eksportfinans therefore also estimates a 95% significant adverse derivative evolution over ten days for each counterpart. While the net exposure line shows the actual worst recorded credit exposure the 10d VaR number shows the forecasted additional worst case given collateralization suddenly stops. The company estimates that by 95% certainty the loss from derivative value fluctuations after a collateral exchange cease before replacement is less than approximately NOK 318 million at year-end 2014.
29.4 loans past due or impaireddue from credit institutions:
parent company/group
(nok thousands) dec. 31, 2014 dec. 31, 2013
Interest and principal instalment 1-30 days past due 0 0
Not matured principal on loans with payments 1-30 days past due 0 0
Interest and principal instalment 31-90 days past due 0 0
Not matured principal on loans with payments 31-90 days past due 0 0
Interest and principal instalment more than 90 days past due *) 101,068 93,754
Not matured principal on loans with payments more than 90 days past due 0 0
total loans that are past due 101,068 93,754
Relevant collateral or guarantees received 0 0
fair vaule adjustment on loans past due 65,694 57,846
impairments on loans measured at amortized cost 0 0 *) NOK 101,068 thousand as of December 31, 2014 and NOK 93,754 thousands as of December 31, 2013 relates to direct exposure towards Icelandic banks, and are as of the balance sheet date not considered guaranteed in a satisfactory manner. The fair value of these loans recognized in the balance sheet was NOK 35,374 thousand as of December 31, 2014 and NOK 35,908 thousands as of December 2013. The change in fair value in the period is reflected in the line item ‘Net gains/losses on financial instruments at fair value‘. Apart from the fair value adjustments already recognized in the statement of comprehensive income, related to the exposure towards the Icelandic banks discussed above, the company considers all other receivables to be secured in a satisfactory manner. For these transactions, amounting to NOK 439,998 thousands, the Norwegian Government, through the Guarantee Institute for Export Credit (GIEK), guarantees approximately 94 percent of the amounts in default. The remaining 6 percent are guaranteed by private banks, most of them operating in Norway. Claims have already been submitted in accordance with the guarantees.

60 e k s p o r t f i n a n s a n n u a l r e p o r t 2 0 1 4
due from customers:
parent company/group
(nok thousands) dec. 31, 2014 dec. 31, 2013
Interest and principal instalment 1-30 days past due 0 1,577
Not matured principal on loans with payments 1-30 days past due 0 0
Interest and principal instalment 31-90 days past due 0 17,743
Not matured principal on loans with payments 31-90 days past due 0 105,621
Interest and principal instalment more than 90 days past due *) 111,308 18,508
Not matured principal on loans with payments more than 90 days past due *) 328,690 86,068
total loans that are past due 439,998 229,517
Relevant collateral or guarantees received 439,998 229,517
fair vaule adjustment on loans past due 0 0
impairments on loans measured at amortized cost 0 0
*) The increase in not matured principal and interest on loans with payments more than 90 days past due is primarily caused by one newly defaulted loan.
29.5 credit quality of securities and loanscredit quality of securitiesThe tables below show the credit quality of debt securities, treasury bills and equivalents by rating agency designation, based on Standard & Poor’s, or their equivalent, credit rating of the issuers (securities and repurchase receivable in the balance sheet):
parent company/group
(nok thousands) december 31, 2014
treasury bills or equivalent trading securities *) other securities total amount total in %
AAA 344,776 9,679,194 0 10,023,970 36 %
AA+ to AA- 827,294 4,675,419 0 5,502,713 20 %
A+ to A- 0 7,407,186 726,385 8,133,571 29 %
Lower than A- 0 2,447,472 815,677 3,263,149 12 %
No international rating 0 910,951 157,041 1,067,992 4 %
total 1,172,070 25,120,222 1,699,103 27,991,395 100 %
parent company/group
(nok thousands) december 31, 2013
treasury bills or equivalent trading securities *) other securities total amount total in %
AAA 1,695,733 8,678,337 0 10,374,070 39 %
AA+ to AA- 837,936 4,174,664 0 5,012,600 19 %
A+ to A- 0 4,816,960 156,638 4,973,598 19 %
Lower than A- 0 2,755,482 2,081,738 4,837,220 18 %
No international rating 0 1,125,645 139,169 1,264,814 5 %
total 2,533,669 21,551,088 2,377,545 26,462,302 100 % *) Trading securities is not the same as the company’s trading portfolio, as the trading portfolio may include treasury bills or other equivalents. Other securities consist mostly of investment-grade debt. Trading securities without international rating are issued by Norwegian savings banks. Trading securities with rating lower than A- and other securities with lower rating than A-/no interna-tional rating are all included in the PHA agreement.
Securities that are expected to be settled after more than twelve months from the balance sheet date amount to NOK 12,495 million as of December 31, 2014 (NOK 12,347 million as of December 31, 2013).

n o t e s 61
credit quality of loans:
parent company / group
(nok thousands) december 31, 2014
export lending exposure
Municipal lending exposure other exposure 1) total amount total in %
AAA 12,308,089 781,110 0 13,089,199 29 %
AA+ to AA- 2,405,056 1,101,794 1,113,183 4,620,033 10 %
A+ to A- 21,437,175 1,021,166 4,901,295 27,359,635 60 %
Lower than A- 2) 433,872 0 0 433,872 1 %
No international rating 3) 53,747 144,192 38,944 236,883 1 %
total 36,637,938 3,048,262 6,053,421 45,739,621 100 %
1) Includes depo and employee loans.
2) Consist of NOK 250 508 HSH Nordbank(BBB-) exposure, NOK 137 983 Danmarks skibskreditt (BBB) NOK 43 892 Unicredit (BBB), NOK 1 385 Bank of India (BBB-) NOK 103 Royal Bank of Scotland (BBB+)
3) Of the NOK 236 883 with "No international rating" NOK 197 939 is related to Norwegian Banks with shadowrating: A- 10 %, BBB+ 90%
parent company / group
(nok thousands) december 31, 2013
export lending exposure
Municipal lending exposure other exposure 1) total amount total in %
AAA 18,022,448 1,389,244 0 19,411,692 30 %
AA+ to AA- 1,923,727 1,550,740 1,508,131 4,982,598 8 %
A+ to A- 26,946,827 3,313,547 4,747,123 35,007,497 54 %
Lower than A- 2) 3,444,568 0 0 3,444,568 5 %
No international rating 3) 1,508,000 675,135 37,425 2,220,560 3 %
total 51,845,569 6,928,667 6,292,679 65,066,915 100 %
1) Includes depo and employee loans.
2) Consist of NOK 2,708,032 Danske Bank Guarantees (BBB+), NOK 458,017 HSH Nordbank(BBB) exposure, NOK 150,211 Danmarks skibskreditt (BBB), NOK 126,182 i DVB Bank(BBB+)
3) Of the NOK 1,508,000 with "No international rating" NOK 1,414,742 is related to Norwegian Savings Bank with shadowrating: A- 55 %, BBB+ 35 %, BBB 9 %
29.6 concentration of credit riskCredit risk concentration may arise from trading, investing and financing activities, and may be affected by economic, industrial or political factors. While Eksportfinans is exposed to many different counterparties and industries the firm executes a high volume of transactions with counterparties in the financial services industry, such as brokers, dealers, commercial banks and institutional clients. This results in a credit concentration with respect to the financial industry.
A significant part of the company’s business consists of lending to the maritime sector, such as rig and ship building financing. Loans to this sector are fully guaranteed by banks or GIEK.
In the ordinary course of business, Eksportfinans may be subject to a concentration of credit risk to any particular bank guarantor or bond issuer.

62 e k s p o r t f i n a n s a n n u a l r e p o r t 2 0 1 4
29.7 effects from credit spread changesThe amount of change, during the period and cumulatively, in the fair value that is attributable to changes in the credit risk of the financial assets and liabilities, is determined by multiplying the sensitivity of the instrument to credit spreads by the change in credit spread since inception. The credit sensitivity is calculated in the main trading system by altering discount curves by one basis point. The credit spread sensitivity is increasing in time to maturity. Credit spreads are obtained from the market, see note 4, and the instrument sensitivities are estimated based on observable market data input.
loans as at fair value through profit and loss:
parent company/group
(nok thousands) dec. 31, 2014 dec. 31, 2013
Maximum exposure to credit risk of loans and receivables 27,385,138 42,884,647
Change during the period in fair value of loans and receivables attributable to changes in credit spread 63,501 147,539
Accumulated change in fair value of loans and receivables attributable to changes in credit spread 102,056 38,555
financial liabilities as at fair value through profit and loss:
parent company/group
(nok thousands) dec. 31, 2014 dec. 31, 2013
Amount contractually required to pay at maturity 53,215,659 65,613,340
Accrued interest (218) 20,007
Adjustments to fair value 5,230,149 (1,868,390)
carrying amount of the financial liabilities at fair value 58,445,590 63,764,957
Change during the period in fair value of financial liabilities attributable to changes in credit spread 5,978,276 7,756,248
Accumulated change in fair value of financial liabilities attributable to changes in credit spread (2,305,800) (8,284,077)
The credit spread effects are related to the fair value of the asset or liability in the balance sheet. A negative figure in the liabilities table therefore means that the credit spread effect reduces the value of the liability, consequently making a positive effect in the statement of comprehensive income.
30 Market riskMarket risk is the risk of loss due to an adverse move in the market value of an asset, a liability or a derivative contract. For Eksportfinans the market value of the net positions will primarily depend on general interest rates, specific interest rates (credit spreads) and exchange rates. General interest rate risk such as a movement in the USD Libor rate is controlled daily by set limits. Specific interest rate risk, credit spread risk, is the main component of market risk. Specific interest rate risk on own debt had after the multi-notch downgrade become by far the most significant component of market risk in company IFRS results. The PHA agreement was established to hedge the market risk in the PHA portfolio. Besides the PHA agreement the company does not hedge credit spreads on a perfect basis however credit spread risks is on portfolio basis limited by stop loss limits and covenants on guarantor rating.
The 108 Agreement with the Norwegian Ministry of Trade and Industry (referred to as the Ministry) regulates Eksportfinans’ financing of export con-tracts according to regulations set by the OECD. Interest and exchange rate exposures related to lending, funding and investments of liquidity under this agreement are adequately economically hedged with derivatives. Any residual cost or profit arising from the non-perfect hedges will be accounted to the Ministry.
30.1 market risk measurement techniquesFinancial instruments account for the bulk of the company’s assets and liabilities. Eksportfinans measures market risk by currency exposure and interest rate sensitivity.
Currency exposure towards a particular currency is measured as the net of assets and liabilities for the currency, plus the basis currency bought spot or forward with settlement in NOK minus basis currency sold spot or forward settling in NOK, adjusted for the value of any option positions.
Eksportfinans’ exposure to interest rate risk is measured according to the price value of a basis point method. This measurement quantifies the change in the fair value of assets and liabilities that would result from a one basis point change in interest rates or a one basis point widening of credit spreads. Basis point value shows the change in value of the portfolio from a 0.01 percent (i.e. 1/100 of 1 percent) change in the underlying interest yield curves.
30.2 foreign exchange riskCurrency exposure arises from future margins only. All notionals are currency hedged. Each instrument is swapped to Eksportfinans’ three main business currencies EUR, USD and NOK and net exposure in EUR and USD is further hedged by foreign exchange forward. The Board has approved this currency risk and strategy, and at the present time Eksportfinans can have aggregate net positions in foreign currencies according to limits set by the Board.

n o t e s 63
the tables below set forth a summary of eksportfinans’ total exposure to currencies other than nok:
parent company/group
(nok thousands)balance sheet assets/
(liabilities) derivatives net position *)
amount of net position covered by 108
agreement items
december 31, 2014
CAD 363,743 (361,259) 2,484 1,388
JPY (19,319,769) 19,320,127 358 242
SEK 38,597 (38,388) 209 0
EUR 9,158,173 (9,115,603) 42,570 40,120
DKK 3,966,823 (3,966,567) 256 239
USD (10,641,058) 11,136,463 495,405 498,069
Other currencies (6,972,704) 6,974,706 2,002 4,523
total (23,406,195) 23,949,479 543,284 544,581
parent company/group
(nok thousands)balance sheet assets/
(liabilities) derivatives net position *)
amount of net position covered by 108
agreement items
december 31, 2013
CAD 226,383 (223,772) 2,611 1,632
JPY (28,527,447) 28,527,858 411 226
SEK 379,511 (378,880) 631 0
EUR 12,160,750 (12,136,717) 24,033 33,917
DKK 4,528,264 (4,529,395) (1,131) 222
USD (17,299,441) 17,630,318 330,877 325,263
Other currencies (10,472,583) 10,461,850 (10,733) 4,282
total (39,004,563) 39,351,262 346,699 365,542
*) Net position includes amounts covered by the 108 Agreement.
Eksportfinans has set currency risk limits and does currency hedging according to these. The set currency limits exclude currency exposure from subsi-dized lending (the 108 Agreement), as the Government assumes this risk. The below tables show currency exposure through 2013 and 2014, including peaks, and excluding the exposure from subsidized lending and for liabilities in contracts covering leases and maintenance. These exposures constitute what we define as our currency exposure, and as described do not equal the above tables for total currency positions.
currency exposure:
parent company/group
(nok thousands) eur usd other currencies total
as of december 31, 2014 2,908 (3,037) 3,103 2,974
Maximum through 2014 *) 4,900 (1,251) 5,971 9,620
Minimum through 2014 *) (7,195) (8,909) 3,082 (13,022)
Average through 2014 2,149 (4,514) 4,149 1,784
as of december 31, 2013 (8,853) 5,764 (10,762) (13,851)
Maximum through 2013 *) 15,420 13,609 2,798 31,827
Minimum through 2013 *) (8,853) (141,036) (10,762) (160,651)
Average through 2013 (914) (12,472) (954) (14,340)
As of December 31, 2012 (2,138) (596) 15,000 12,266
*) The maximum and minimum exposures in general do not occur on the same date for different currencies.

64 e k s p o r t f i n a n s a n n u a l r e p o r t 2 0 1 4
The above table does not include foreign currency commitments because the currency exposure first comes to effect at disbursement. At that time any currency/interest rate exposure will be hedged.
The profit and loss effect on Eksportfinans’ balance sheet as of December 31, 2014 due to an adverse change of 10 percent in foreign currency exchange rates is estimated to be NOK 0.9 million compared to NOK 2.5 million as of December 31, 2013. Annualized fluctuation in EURNOK and USDNOK based on 95 percent confidence interval of daily changes through 2014 are 14 percent and 12.5 percent respectively, compared to 14 percent and 18 percent through 2013.
30.3 interest rate riskEksportfinans’ guidelines with respect to interest rate risk include limits on interest rate exposure for market-based activities.
Interest rate risk is managed by a separate risk management function and reported regularly to the Group of Managing Directors and to the Board. The Board sets the permitted level of interest rate exposure.
The table below displays a summary of the change in fair values resulting from a shift in yield curves of 1 basis point. The interest rate exposure as of December 31, 2014 is negative NOK 19,000. Since Eksportfinans swaps all fixed rate instruments to floating rate, the interest rate exposure mainly arises from interest rate fixings occurring on different dates. Interest rate maturities between the selected interest rate points are given estimated values allocat-ed to the selected interest rate points. However, actual interest rate exposure may be different since the estimates do not account for covariance between the selected interest points. The below table shows interest rate risk of exposure with up to one year of maturity as this is the subportfolio that is daily hedged. Earlier annual reports have shown all exposure also for exposure without strict limits and hedging routines and are hence not directly comparable.
Interest rate exposure from a 1 basis point shift of interest rate curves:
parent company/group
(nok thousands) nok eur usd other currencies total
as of december 31, 2014 (37) (5) 23 0 (19)
Maximum through 2014*) 93 9 115 28 146
Minimum through 2014*) (78) (42) (27) (26) (62)
Average through 2014 8 (6) 15 0 17
as of december 31, 2013 (39) 0 (17) 16 (40)
Maximum through 2013*) 117 49 16 30 93
Minimum through 2013*) (90) (67) (56) (1) (125)
Average through 2013 2 (14) (23) 5 (30)
As of December 31, 2012 (59) (14) (33) (2) (108)
*) The maximum and minimum exposure in general does not occur on the same date for different currencies.
Eksportfinans considers changes of interest rates of 6 basis points over a period equal to the expected maximum time before the company will be able to hedge exposure to be reasonably possible as of December 31, 2014 (5 basis points as of December 31, 2013). The effect on profit and loss from such changes in interest rates is shown below:
parent company/group
(nok thousands) nok eur usd other currencies total
as of december 31, 2014 (637) (132) 296 0 (76)
As of December 31, 2013 (782) (4) (291) 64 (161)
credit spread riskChanges in credit spreads in the market are defined as market risk and not credit risk, which is defined to include default probability only. Isolated for the securities portfolio (PHA portfolio + liquidity reserve portfolio) a potential increase in credit spreads of one basis point will reduce the fair value by NOK 5 million as of December 31, 2014, compared to NOK 4 million as of December 31, 2013.

n o t e s 65
30.4 effects from economic hedgingNote 5 specifies the net realized and unrealized gains/ (losses) on financial instruments, showing separately the effects from financial derivatives. When presented to the company’s management, this presentation is made with the various financial instruments shown after netting with related economic hedges, as derivatives are used in economic hedges of the market risk of specific assets and liabilities.
net realized and unrealized gains/(losses) on financial instruments at fair value, netted with the related economic hedges:
parent company/group
(nok thousands) 2014 2013
Securities 1) (48,426) (42,288)
Other financial instruments at fair value 1) 5) (4,008) 17,510
net realized gains/(losses) (52,434) (24,778)
Loans and receivables 1) 6) (30,326) 384,640
Securities 1) 17,098 (73,072)
Bond debt 1) 2) 3) (5,991,560) (7,631,704)
Subordinated debt and capital contribution securities 1) 2) 3) (31,788) (76,156)
Other financial instruments at fair value 1) 5,151 (6,629)
net unrealized gains/(losses) (6,031,425) (7,402,921)
Financial derivatives related to 108 Agreement 4) 14,434 48,562
net realiZed and unrealiZed gains/(losses) (6,069,425) (7,379,137)
net realized and unrealized gains/ (losses) on securities:
parent company/group
(nok thousands) 2014 2013
Net realized gains/(losses) on securities 1) (48,426) (42,288)
Net unrealized gains/(losses) on securities 1) 17,098 (73,072)
total (31,328) (115,360)
Securities not hedged by PHA 1) 24,960 707
Securities hedged by PHA 1) 326,071 179,396
Portfolio Hedge Agreement (PHA) (382,359) (295,463)
total (31,328) (115,360)
1) Including financial derivatives with purpose of economic hedging
2) Accumulated net gain on own debt is NOK 2,310 million as of December 31, 2014, compared to NOK 8,334 million as of December 31, 2013.
3) In the year of 2014, Eksportfinans had an unrealized loss of NOK 6,023 million (loss of NOK 7,708 million in 2013) on its own debt, net of derivatives.
4) Derivatives related to components of the 108 Agreement. The 108 Agreement is accounted for at amortized cost, hence these derivatives are not included in the effects related to financial instruments at fair value.
5) Realized gains related to the Glitnir trial is included with NOK 17 million as of December 31, 2013.
6) Reversed previous unrealized loss related to the Glitnir trial, is included with a gain of NOK 264 million as of December 31, 2013
See note 12 for a description of the Portfolio Hedge Agreement (PHA).
Interest, and the interest effect on economic hedging instruments, is classified as interest income or expense in the statement of comprehensive income. Changes in fair value are recorded in the line item ’Net gains/(losses) on financial instruments at fair value‘. For the years ended December 31, 2014 and 2013, the company recorded NOK 2,297 million and NOK 3,144 million, respectively, of interest income on loans due from credit institutions, loans due from customers and securities and NOK 2,954 million and NOK 4,365 million, respectively, of interest expense on commercial paper and bond debt, subordinated debt and capital contribution securities. In the same periods the company recorded NOK negative 37 million and NOK negative 34 million, respectively, of interest income on economic hedging instruments and NOK negative 1,154 million and NOK negative 1,962 million, respectively, of inter-est expense on economic hedging instruments.

66 e k s p o r t f i n a n s a n n u a l r e p o r t 2 0 1 4
31 liQuidity riskLiquidity risk is the risk that an entity will encounter difficulty in meeting obligations associated with financial liabilities that are settled by delivering cash or another financial asset.
Liquidity risk can arise from call and trigger features in the structured funding portfolio that have unknown maturity dates, constituting approximately 22 percent of the company’s total funding (securities issued) at year-end. Liquidity risk can also arise from prepayment options in asset backed securities. As of year-end 2014 the asset backed securities portfolio makes up approximately 75 percent (68 percent as of year-end 2013) of the liquidity portfolio that is covered by the Portfolio Hedge Agreement (PHA), whereas the PHA portfolio is 8 percent (7 percent as of year-end 2013) of total assets.
31.1 liquidity risk management processThe risk associated with insufficient access to liquidity was until mid November 2011 managed by operating several diversified short-term and long-term borrowing programs that provided access to the funding markets. In addition, Eksportfinans holds a securities portfolio that consists of a liquidity reserve portfolio and the PHA portfolio.
Following the government’ decision to establish a new state owned entity to manage the export financing schemes on 18th November 2011, the funding programs have not been used. The securities portfolios however remain, and as of December 31, 2014 the liquidity reserve portfolio and the PHA portfolio had market values of NOK 21.1 billion and NOK 6.9 billion respectively, a change from NOK 18.8 billion and NOK 7.6 billion as of December 31, 2013. In addition to liquid securities the company also held cash and cash equivalent assets totaling NOK 6.0 billion as of end of 2014 compared to NOK 6.3 billion as of end of 2013. Total liquidity reserves were NOK 32.3 billion as of December 31, 2014 (NOK 31.1 billion as of December 31, 2013).
The primary purpose of the liquidity reserve portfolio was to be a liquidity buffer when funding could not be secured according to plan. It continues to be used to absorb fluctuations in the cash flow due to prepayment of assets, or as a buffer for liabilities maturing early due to structured funding calls/triggers being excercised. The liquidity reserve portfolio is invested in assets that can easily be converted to cash. The conversion to cash may happen through sale in the secondary market, through a repo-line or through repayment of principal. The PHA portfolio is likely to be held to maturity as a consequence of the Portfolio Hedge Agreement.
Until mid November 2011, the company had monitored the liquidity capacity and the need for refinancing over the next 12 months under both normal and stressed conditions. Focus then was to diversify funding from several markets and to cover the maturities on the liability side by new borrowings. Monitoring expected time to maturity for assets and liabilities as well as the difference between the financing need and the liquidity capacity gave the company a good indication of the liquidity risk. Eksportfinans monitored symmetrical maturity profiles on the asset and liability side and controlled refi-nancing risk by limiting short-term borrowing
Since mid November 2011, the company continues to monitor 12 month liquidity capacity and the maturity of assets and liabilities. As we are currently not funding in the markets, the main instrument for securing sufficient liquidity at all times is now the liquidity portfolio. The liquidity portfolio is shorter and more liquid than before to be more prepared to manage liquidity risk. Part of the companys existing funding has maturity dates linked to call and trigger options. Liquidity risk is controlled through active management and frequent assets / liabilities meetings where liquidity under different stress conditions is analysed. Eksportfinans follows the liquidity risk against defined limits and has contingency plans that take effect if needed.
31.2 maturity analysisMaturity analysis of financial liabilities based on contractual maturities (including off-balance sheet items):
(nok thousands)
up to and including 1 month
from 1 month up to and i ncluding
3 months
from 3 months up to and including
1 year
from 1 year up to and including
5 years over 5 years
december 31, 2014
Non-structured bond debt 26,738 153,464 12,513,525 34,342,990 2,564,277
Structured bond debt 1,574,819 6,266,206 8,988,384 1,905,910 2,041,237
Cash collateral 3,181,000 0 0 0 0
Subordinated loans 0 0 976,511 0 0
Derivatives net settled 78,769 83,562 423,697 1,833,551 378,957
Derivatives gross settled 1) 952,921 1,769,210 6,777,982 3,693,415 148,147
Financial guarantees (off-balance sheet) 88,738 0 0 0 0
Loan commitments (off-balance sheet) 0 261,000 0 0 0
total 5,902,984 8,533,442 29,680,099 41,775,867 5,132,619
1) Including only cash flows from the paying leg of derivatives, cash flows from the receiving leg of derivatives are shown below:
Derivatives gross settled 879,711 1,729,755 5,658,450 2,689,970 132,763

n o t e s 67
cash flows from derivatives on the asset side are shown below:
Derivatives net settled (net cash inflow) 15,119 84,976 1,111,447 1,121,967 540,446
Derivatives gross settled (paying leg) 5,986,286 11,098,265 19,397,297 17,326,680 3,309,289
Derivatives gross settled (receiving leg) 6,438,300 11,389,358 20,307,129 19,067,115 3,427,786
(nok thousands)
up to and including 1 month
from 1 month up to and i ncluding
3 months
from 3 months up to and including
1 year
from 1 year up to and including
5 years over 5 years
december 31, 2013
Non-structured bond debt 24,485 3,050,791 10,613,559 37,861,863 4,082,600
Structured bond debt 7,967,368 7,293,588 14,902,717 2,646,879 2,108,818
Cash collateral 2,927,000 0 0 0 0
Subordinated loans 0 0 41,701 910,471 0
Derivatives net settled 104,655 107,341 456,728 2,354,424 850,895
Derivatives gross settled 1) 11,192,969 12,590,437 22,119,417 11,647,728 152,700
Financial guarantees (off-balance sheet) 72,628 0 0 0 0
Loan commitments (off-balance sheet) 0 200,000 5,000 0 0
total 22,289,104 23,242,158 48,139,122 55,421,364 7,195,014
1) Including only cash flows from the paying leg of derivatives, cash flows from the receiving leg of derivatives are shown below
Derivatives gross settled 11,034,062 12,791,144 22,137,812 10,691,941 162,961
cash flows from derivatives on the asset side are shown below:
Derivatives net settled (net cash inflow) 12,565 67,509 1,197,807 1,850,772 478,564
Derivatives gross settled (paying leg) 9,732,131 3,822,847 9,883,727 15,016,552 4,987,302
Derivatives gross settled (receiving leg) 10,338,086 4,380,117 10,561,393 16,303,164 5,535,940
The figures in the above table include principal and interest payable at nominal value, i.e. undiscounted cash flows. Interest payable is based on the market conditions at the balance sheet date. First possible call dates and trigger dates, according to the contracts, are applied in the classification of the maturities. Maturity of cash collateral depends on the development of fair value of derivatives, and is in the table applied to the first time bucket.
The company manages its liquidity risk, inter alia, by monitoring the difference between expected maturities of its assets and liabilities.

68 e k s p o r t f i n a n s a n n u a l r e p o r t 2 0 1 4
Maturity analysis of financial assets and liabilities based on expected maturities:
parent company/group
(nok thousands)
up to and including 1 month
from 1 month up to and i ncluding 3 months
from 3 months up to and including
1 year
from 1 year up to and including
5 years over 5 years
december 31, 2014
assets
Loans and receivables due from credit institutions 5,142,836 12,513 1,068,198 2,672,120 253,559
Loans and receivables due from customers 305,099 441,270 3,536,083 16,176,608 19,289,342
Securities 492,788 1,704,080 11,440,855 10,845,029 2,601,563
Derivatives net settled 15,119 84,976 1,111,354 1,157,607 540,446
Derivatives gross settled (paying leg) (5,183,649) (8,859,016) (17,462,868) (20,947,571) (4,623,178)
Derivatives gross settled (receiving leg) 5,622,243 9,166,950 18,399,813 22,738,409 4,853,446
Cash collateral 0 4,508,000 0 0 0
total assets 6,394,434 7,058,774 18,093,436 32,642,201 22,915,177
liabilities
Structured bond debt 26,738 153,464 12,513,525 34,342,990 2,564,277
Commercial paper debt 388,394 785,778 5,530,285 9,156,408 5,110,777
Derivatives net settled 78,769 83,562 411,502 1,820,780 383,919
Derivatives gross settled (paying leg) 559,652 95,963 5,746,316 5,099,132 1,802,438
Derivatives gross settled (receiving leg) (559,798) (92,299) (4,663,948) (4,020,329) (1,776,644)
Cash collateral 0 3,181,000 0 0 0
Subordinated loans 0 0 976,511 0 0
total liabilities 493,755 4,207,468 20,514,191 46,398,981 8,084,769

n o t e s 69
parent company/group
(nok thousands)
up to and including 1
month
from 1 month up to and including 3 months
from 3 months up to and including
1 year
from 1 year up to and including
5 years over 5 years
december 31, 2013
assets
Loans and receivables due from credit institutions 3,496,973 14,202 61,622 5,027,305 331,958
Loans and receivables due from customers 741,857 3,562,670 5,756,290 24,420,252 26,397,239
Securities 27,820 1,926,203 14,767,454 6,820,994 4,448,522
Derivatives net settled 12,565 67,509 1,195,308 2,236,292 1,435,144
Derivatives gross settled (paying leg) (7,397,436) (2,693,654) (8,811,712) (16,253,292) (8,230,321)
Derivatives gross settled (receiving leg) 7,583,813 3,118,706 9,331,833 17,702,359 9,316,734
Cash collateral 0 4,450,000 0 0 0
total assets 4,465,592 10,445,636 22,300,794 39,953,911 33,699,277
liabilities
Non-structured bond debt 24,485 3,050,791 10,613,559 37,861,863 4,082,600
Structured bond debt 657,561 233,932 7,256,201 7,326,018 22,046,269
Derivatives net settled 104,655 107,341 435,793 2,105,602 79,897
Derivatives gross settled (paying leg) 7,608,397 8,681,860 18,573,225 12,938,291 9,701,045
Derivatives gross settled (receiving leg) (7,386,460) (8,473,869) (18,086,485) (11,919,197) (11,048,377)
Cash collateral 0 2,927,000 0 0 0
Subordinated loans 0 0 41,701 910,471 0
total liabilities 1,008,638 6,527,055 18,833,994 49,223,049 24,861,433
The figures in the above table include principal and interest payable (receivable) at nominal value. For the figures in the above table, call and trigger dates as estimated in models are applied in the classification of the maturities. For some issues with call and trigger optionalities, the expected maturity is estimated using a sophisticated valuation system.
31.3 off-balance sheet itemspayment guarantees In addition to the lending activity, the company issued (until November 18, 2011) financial guarantees to support the Norwegian export industry. The beneficiary is normally a foreign buyer of Norwegian export products (goods and services etc.) or a foreign investor. Eksportfinans will make payment to the buyer/investor if the exporter does not fulfill its payment obligations. In each and every case Eksportfinans will have recourse to prime Norwegian or international banks with full payment indemnification. The maturity of the guarantees corresponds to the maturity of the underlying loans being covered by the guarantee.
parent company/group
(nok thousands) dec. 31, 2014 dec. 31, 2013
Notional amount of financial guarantees 88,738 72,628
loan commitmentsIn the normal course of the company’s lending business there were until November 18, 2011 outstanding commitments to extend credit that are not reflected in the accompanying financial statements. The following table shows the undrawn loan commitments at the reporting date, based on signed loan agreements.
parent company/group
(nok thousands) dec. 31, 2014 dec. 31, 2013
Loan commitments 260,658 203,449

70 e k s p o r t f i n a n s a n n u a l r e p o r t 2 0 1 4
32 financial instruMents subJect to net settleMentsAll derivative contracts are governed by master agreements developed by the International Swaps and Derivatives Association (ISDA). These agreements assure, for example, that netting is legally enforceable. Some of these agreements also contain provisions that require the posting of collateral in order to reduce counterparty exposure. These provisions include Credit Support Annexes (CSAs) that define collateral type and amounts to be transferred or received. This effectively ensures that if derivative exposures exceed pre-agreed limits, the counterparty with the positive exposure (which is now ’too high‘) can require the counterparty to transfer collateral to a dedicated neutral account. The transferred collateral will be netted in a situation of default. Thus the CSA agreement effectively ensures that the counterparty credit exposure is capped at the agreed upon limit.
The following table presents the financial instruments subject to net settlements:
parent company/group amounts not presented net
parent company/group
(nok thousands)financial
instruments
financial instruments
that are set off
financial instruments on
balance sheetfinancial
instrumentsfinancial collateral net amount
december 31, 2014
Derivatives assets 7,070,531 0 7,070,531 (1,473,751) (4,024,238) 1,572,542
Derivatives liabilities (5,128,629) 0 (5,128,629) 439,441 2,119,704 (2,569,484)
total 1,941,902 0 1,941,902 (1,034,310) (1,904,534) (996,942)
parent company/group amounts not presented net
(nok thousands)financial
instruments
financial instruments
that are set off
financial instruments on
balance sheetfinancial
instrumentsfinancial collateral net amount
december 31, 2013
Derivatives assets 5,499,731 0 5,499,731 (788,578) (2,770,020) 1,941,133
Derivatives liabilities (5,145,290) 0 (5,145,290) 1,559,738 2,216,507 (1,369,045)
total liabilities 354,441 0 354,441 771,160 (553,513) 572,088

n o t e s 71
33 segMent inforMationThe company is divided into three business areas, export lending, municipal lending and securities. After the sale of Kommunekreditt, municipal lending consists of loans directly to municipalities and municipal-related loans to savings banks that were purchased from Kommunekreditt in connection with the sale of the subsidiary. The company also has a treasury department, responsible for the company’s funding. Income and expenses related to treasury are divided between the three business areas.
The segment information is in line with management reporting.
group
(nok thousands) export lending Municipal lending securities
2014 2013 2014 2013 2014 2013
net interest income 1) 311,441 446,420 45,108 61,520 104,201 189,015
Commissions and income related to banking services 2) 82 77 0 0 0 0
Commissions and expenses related to banking services 2) 0 0 0 0 0 0
Net gains/(losses) on financial instruments at fair value 3) (11,178) 300,438 0 0 (45,777) (42,288)
Income/expenses divided by volume 4) (26,487) (3,546) (2,956) (458) (19,543) (1,701)
net other operating income (37,583) 296,969 (2,956) (458) (65,321) (43,989)
total net income 273,858 743,389 42,152 61,062 38,880 145,026
total operating expenses 84,368 87,445 5,927 6,211 90,157 71,049
pre-tax operating profit/(loss) 189,490 655,944 36,225 54,851 (51,277) 73,977
Taxes 48,795 182,575 9,328 15,267 (13,204) 20,591
non-ifrs profit for the period from continuing operations excluding unrealized gains/(losses) on financial instruments at fair value 140,695 473,369 26,897 39,584 (38,072) 53,386
1) Net interest income includes interest income directly attributable to the segments based on Eksportfinans’ internal pricing model. The treasury department obtains interest on Eksportfinans’ equity and in addition the positive or negative result (margin) based on the difference between the internal interest income from the segments and the actual external funding cost. Net interest income in the treasury department is allocated to the reportable segments based on volume for the margin, and risk weighted volume for the interest on equity.
2) Income/(expenses) directly attributable to each segment.
3) For Export lending the figures are related to unrealized gains/(losses) on the Icelandic bank exposure. In this context, the fair value adjustments on the Icelandic bank exposure have been treated as realized, as they are not expected to be reversed towards maturity, as other unrealized gains and losses. For Securities the figures are related to realized gains/(losses) on financial instruments.
4) Income/expenses, other than interest, in the treasury department have been allocated to the business areas by volume. These are items included in net other operating income in the income statement.
reconciliation of segment profit measure to total comprehensive income:
group
(nok thousands) 2014 2013
Export lending 140,695 473,369
Municipal lending 26,897 39,584
Securities (38,072) 53,386
non-ifrs profit/(loss) for the period from continuing operations excluding unrealized gains/(losses) on financial instruments at fair value 129,520 566,339
Net unrealized gains/(losses) on financial instruments at fair value (6,016,988) (7,354,359)
Unrealized losses/(gains) related to the Icelandic bank exposure included above 1) 7,017 (276,124)
Tax effect of the items above 1,565,899 2,213,985
total comprehensive income (4,314,552) (4,850,159)
1) Reversal of previously recognized loss (at exchange rates applicable at December 31, 2014 and December 31, 2013). This amount is included in the line item ‘Net unrealized gains/(losses) on financial instruments at fair value’, and adjusted for because the company believes this loss will materialize.

72 e k s p o r t f i n a n s a n n u a l r e p o r t 2 0 1 4
segment assets:
group
(nok thousands) 2014 2013
Export lending 36,092,520 51,633,599
Municipal lending 3,045,394 6,900,339
Securities 28,533,130 27,442,236
Unallocated assets 17,958,116 14,816,576
total assets 85,629,160 100,792,750
geographical segmentsThe geographical segments are based on the location of the company's customers. For property, equipment and intangible assets, the carrying amount is allocated based on the location of the asset. Norway is the home country of the company and is also its main geographical segment.
group
(nok thousands) total interest and related income total assets investments *)
2014
Norway 1,455,490 39,036,412 18,494
Other European countries 408,246 33,282,862 0
The Americas 107,922 6,530,267 0
Other countries 288,882 6,779,619 0
total 2,260,540 85,629,160 18,494
2013
Norway 1,979,817 50,427,764 24,009
Other European countries 529,931 31,710,725 0
The Americas 79,835 7,032,760 0
Other countries 511,030 11,621,501 0
total 3,100,613 100,792,750 24,009
*) Investments made during the year in property, plant, equipment, and intangible assets.

n o t e s 73
34 related partiesThe group’s two largest shareholders are considered to be related parties.
group
(nok thousands) acquired loans 1) deposits 2)
guarantees issued 3)
guarantees recieved 4) repo facility 5)
portfolio hedge agreement 6)
Balance January 1, 2014 4,732,230 312,337 72,628 16,622,127 0 (295,496)
Change of balance January 1, 2014 7) 0 0 0 1,454,803 0 0
Change in the period (420,742) 241,042 16,110 (3,583,239) 0 (246,517)
balance december 31, 2014 4,311,488 553,379 88,738 14,493,691 0 (542,013)
Balance January 1, 2013 5,684,676 980,545 87,252 20,823,581 4,475,869 (142,214)
Change in the period (952,446) (668,208) (14,624) (4,201,454) (4,475,869) (153,282)
balance december 31, 2013 4,732,230 312,337 72,628 16,622,127 0 (295,496)
1) The company acquired loans from banks. The loans were part of the company’s ordinary lending activity, as they were extended to the export industry. Since the selling banks provided a guarantee for the loans, not substantially all of the risk and rewards were transferred to the company, thus the loans are classified as loans due from credit institutions in the balance sheet. 2) Deposits made by the company. 3) Guarantees issued by the company to support the Norwegian export industry. See note 31.3. 4) Guarantees related to the loans described in footnote 1 provided to the company from the related parties. 5) Non-committed Repo facility with DNB Bank ASA. Under this framework agreement, Eksportfinans can transact in an unlimited amount of eligible securities with DNB Bank ASA as the counter party, but neither party is committed to do so. The Agreement has no expiration date. As of January 1, 2013, EUR 600 million has been drawn with a Repurchase Date of February 26, 2015, but with the option to terminate the drawn down tranche in whole on specified termination dates (weekly). The tranche was terminated on September 11, 2013. 6) The Portfolio Hedge Agreement is described in note 12. The balances show the related parties’ share of the fair value of the contract as of the balance sheet date. 7) Balance at January 1, 2014, has been changed in 2014, due to internal corrections.
In addition to the transactions reflected in the above table, Eksportfinans’ three major owner banks have extended a committed liquidity facility of USD 1 billion to the company, an Eksportfinans initiated reduction from a former USD 2 billion agreement. The facility has a twelve month maturity with the possibility of extension, and was most recently renewed for another year in the second quarter of 2014. Eksportfinans has not utilized this credit facility.
All transactions with related parties are made on market terms.
35 reMuneration
auditor's remuneration:
parent company/group
(nok thousands) 2014 2013
Audit services 1,627 2,141
Audit fees related to SEC filing in USA 1,456 1,487
total audit services 3,083 3,628
Audit related services *) 0 0
All other 311 261
total 3,394 3,889
*) Audit related services include attestations related to funding transactions.

74 e k s p o r t f i n a n s a n n u a l r e p o r t 2 0 1 4
remuneration to the Management group:
parent company/group
(nok thousands) salaryincentive
scheme paidstay on
bonus paid 3)
other taxable benefits pension cost total loans 2)
2014
Marchand, Gisèle 4) 3,104 329 293 207 2,593 6,526 0
Bergvoll, Geir 1) 5) 581 0 0 30 0 611 0
Hagen, Martine Mills 1,664 0 435 177 462 2,738 0
Grøm, Christian 1,482 58 394 178 472 2,584 0
Olsen, Geir Ove 1,335 76 354 199 391 2,355 0
Lindbæk, Elise 1,314 80 348 199 278 2,219 759
Feiring, Jens O. 982 40 175 173 0 1,370 2,275
total 10,462 583 1,999 1,163 4,196 18,403 3,034
1) The President and CEO has a severance package covering salary for 12 months in the event that the employment is terminated by the company within 31. December 2017. The agreed retirement age is 67 years and the President is member of the company’s defined contribution pension scheme. 2) The loans have the same terms as other loans to employees. 3) The Stay on bonus program was established in 2012. 4) For the period January 1, to November 30, 2014. 5) For the period November 1, to December 31, 2014.
parent company/group
(nok thousands) salaryincentive
scheme paidstay on
bonus paid 3)
other taxable benefits pension cost total loans 2)
2013
Marchand, Gisèle 1) 2,701 182 1,985 223 2,546 7,637 0
Hagen, Martine Mills 1,485 0 616 177 392 2,670 0
Grøm, Christian 1,364 58 659 178 471 2,730 0
Olsen, Geir Ove 1,215 76 764 189 365 2,609 0
Lindbæk, Elise 1,201 80 757 197 257 2,492 809
Feiring, Jens O. 775 40 579 169 0 1,563 2,379
total 8,741 436 5,360 1,133 4,031 19,701 3,188
1) The President and CEO had a severance package covering salary for 18 months in the event that the employment is terminated by the company. The agreed retirement age is 62 years with 70 percent of salary. 2) The loans have the same terms as other loans to employees. 3) The Stay on bonus program was established in 2012.
Members of the Management Group have individual agreements on pensionable age upon reaching the age of 62-65 years with 70 percent of salaries and are also members of the ordinary pension scheme.

n o t e s 75
remuneration to board of directors and audit committee:
parent company/group
(nok thousands) 2014 2013
board of directors
audit committe
remuneration committe 1) total
board of directors
audit committe
remuneration committe 1) total
Bergvoll, Geir 375 0 16 391 268 0 16 284
Carlsen, Sigurd 304 56 0 360 132 18 0 150
Bakker, Tone Lunde 266 45 0 311 161 43 0 204
Hollingsæter, Bodil 266 45 0 311 161 43 0 204
Aker, Live Haukvik 266 20 11 297 161 59 0 220
Blystad, Marianne H. 266 30 5 301 161 0 16 177
Berg, Christian 266 0 11 277 161 0 5 166
Rune Helgeland 2) 200 0 0 200 0 0 0 0
Østbø, Tor 3) 67 0 0 67 161 0 0 161
Steen, Carl Erik 0 0 0 0 66 0 5 71
total 2,276 196 43 2,515 1,432 163 42 1,637
1) The Remuneration Committe was established in December 2010. The first remuneration paid was in 2012. 2) In addition to ordinary salary amounting to NOK 1,502 thousand in 2014. 3) In addition to ordinary salary amounting to NOK 1,245 thousand in 2013 and NOK 1,214 thousand in 2013.
remuneration to council of representatives:
parent company/group
(nok thousands) 2014 2013
Alhaug, Frode 61 59
Riise, Sandra 31 30
Krokeide, Elisabeth 26 25
Vik, Torbjørn 26 25
Nordli, Peder 26 25
Kapstad, Petter 26 25
Sture, Eldbjørg 26 19
Tostrup, Trond 20 19
Guttelvik, Ottar B. 20 19
Møller, Marius Juul 20 25
Mellem, Irene N. 13 11
Bergskaug, Geir 13 25
Hongseth, Unni Karlsen 8 19
Lundevik, Gro Elisabeth 7 25
Pedersen, Jørn 1 25
Arntsen, Ingelise 1 19
Eidesvik, Toril 1 19
Heiberg, Richard 1 6
Johnsen, Laila 0 8
total 327 428

76 e k s p o r t f i n a n s a n n u a l r e p o r t 2 0 1 4
remuneration to control committee:
parent company/group
(nok thousands) 2014 2013
Kapstad, Petter 110 107
Sture, Eldbjørg 72 70
Guttelvik, Ottar B. 72 70
Møller, Marius Juul 72 70
total 326 317
remuneration to election committee:
parent company/group
(nok thousands) 2014 2013
Alhaug, Frode 19 25
Utvik, Knut J. 4 11
Teksum, Leif 4 11
Bratheim, Ingrid 4 4
Carlsen, Sigurd 0 7
total 30 58
36 nuMber of eMployees
parent company/group dec. 31,2014 dec. 31,2013
Number of employees 48 53
Number of man-years 48 51
37 contingencies the contingencies are:a) Because of the bankruptcy of Lehman Brothers, certain swap contracts were settled and replaced by new swap contracts with other counterparties. At the time of the bankruptcy, Eksportfinans had swap contracts with three different legal entities in the Lehman Brothers group. Payments related to the settlement of these swaps were calculated and paid by Eksportfinans in 2008. The valuation of the settlement amount has been contested by two of the Lehman Brothers legal entities. A final settlement was reached with one of the entities in 2011, and for a second entity in the third quarter of 2012. The final settlement amount for these two entities has been paid. The third Lehman Brothers entity has, to date, not contested the original valuation.
b) Post November 2011 Eksportfinans is no longer making new loans pursuant to the 108 Agreement. The Norwegian Ministry of Trade and Fisheries and Eksportfinans are discussing whether historical procedures and practices followed prior to November 2011 with respect to loans pursuant to the 108 Agreement that are prepaid after November 2011 should be changed or not. There can be no assurances of what the outcome of these discussions, or any other applicable procedure for settlement, will be. An assessment of what impact, if any, these discussions may have on our accounts is postponed until an effective settlement, and subsequently no provisions have been made.
38 regulatory fraMeWork With effect from January 1, 2011, new regulations concerning calculation of exposures to one single client were introduced. The single most important change was that risk weighting for exposures to banks was discontinued. The maximum allowed exposure, equaling 25 percent of the institutions own funds, applies under the new provisions. Under the previous rules for calculating and reporting large exposures Eksportfinans risk weighted engagements with borrowers that were secured by on demand guarantees with 20 percent. Eksportfinans reported exposures to borrowers up to the maximum 25 percent and excess exposures, if any, were reported as exposures towards the guaranteeing bank. That meant that maximum exposure to a single cli-ent (borrower and guaranteeing bank) equaled NOK 7.1 billion. The new provisions for large exposures equal the prevailing provisions applicable in the European Union (Directive 2006/48/EU) and entail that the maximum exposure to borrower and guaranteeing banks are approximately NOK 1.4 billion. Eksportfinans was granted a transitional period ending December 31, 2011, which later was extended by one year until December 31, 2012, during which it could use the 2010 reporting standards for large exposures. On February 13, 2012, the Norwegian FSA granted the company a new temporary exemp-tion for the five lending transactions currently expecting to exceed 1.4 billion at December 31, 2012. The temporary exemption is specific to each loan and runs until the lending transactions are scheduled to get within the regulatory limit due to ordinary repayments of principal, which is in the period December 31, 2014 – December 31, 2016. At December 31, 2014 there is only one loan relevant under under the temporary exemtion.

n o t e s 77
39 events after balance sheet date In 2013 the Icelandic Supreme Court confirmed that Eksportfinans had a first priority claim against Glitnir Banki HF. Since then, in accordance with ex-change controls applied by the Icelandic central bank, an amount of ISK 2 billion has been frozen in an escrow account in Iceland. On February 10, 2015, Eksportfinans participated in an auction administered by the Icelandic central bank for exchanging said ISK to EUR. The auction exchange rate was set at 200. This will give an estimated profit of around NOK 30 million in the 2015 accounts.
declarationby board of directors and president and ceo
The annual financial results for 2014 are, according to the best of our knowledge, prepared in accordance with existing accounting standards and in all material respects fairly present the assets and liabilities, financial condition, results of operation and cash flows of the company as of, and for, the period presented in this report, and; the annual report gives a fair coverage of the development, results and position of the company, together with a description of the most significant risk factors and uncertainties that the company is faced with.
Oslo, February 13, 2015
Sigurd CarlsenChair person
Christian BergDeputy chair person
Tone Lunde Bakker
Bjørn Berg
Geir BergvollPresident and CEO
Marianne Heien Blystad Rune Helgeland

78 e k s p o r t f i n a n s a n n u a l r e p o r t 2 0 1 4
auditor's report

i n t r o d u c t i o n 79a u d i t o r ' s r e p o r t 79

80 e k s p o r t f i n a n s a n n u a l r e p o r t 2 0 1 4
extract of the 2014 report from the control committeeThe control committee has executed the tasks which are imposed in accordance with instructions for the control committee.
In connection with the end of the fiscal year 2014, the control com-mittee has reviewed the board of directors’ report, the financial statements and the auditor’s report for Eksportfinans ASA.
The committee finds that the board’s assessment of the financial position of Eksportfinans and the group is adequate, and recom-mends that the board’s report and the financial statements are adopted as the company’s accounts for 2014.
Oslo, March 12, 2015
Marius Juul Møller
Eldbjørg StureDeputy Chairperson
Petter KapstadChairperson
Frode AlhaugChairperson
statement to the general assemblyEksportfinans’ financial statements for 2014, along with the board of directors’ report, the auditor’s report and the report by the control committee have been submitted to the council of representatives.
The council of representatives recommends to the general as-sembly that the board of directors’ proposed statements of in-come and balance sheet are adopted as the company’s accounts for 2014.
Furthermore, the council of representatives recommends that the board of directors’ proposal for the disposal of profits and payment of dividends are adopted.
Oslo, March 18, 2015
statement statementby the control coMMittee by the council of representatives
Ottar Brage Guttelvik

s t at e m e n t s 81
This statement is presented at Eksportfinans’ ordinary annual gen-eral assembly on April 16, 2015, and gives an account of the com-pany’s relevant principles and practice.
Eksportfinans’ shares are not listed on a stock exchange or another regulated marketplace, thus the following items under section 3-3b of the Norwegian accounting act are relevant:
4. A description of the main elements in the company’s internal control and risk management systems linked to the accounts reporting process:
This information is included under section 10 of the separate ar-ticle on corporate governance on page 82 of this annual report.
7. Regulations in the articles of association regarding the appointment and replacement of directors:
This information is available in paragraph 5 of the company’s arti-cles of association: “The board of directors is elected by the council of representatives. One member and one alternate member of the board are elected by and among the employees. The board of direc-tors shall have a minimum of six, and a maximum of eight members. Board members are elected for a term of one year each.”
The articles of association are available on www.eksportfinans.no.
8. Regulations in the articles of association or powers of attorney that allow the board to make decisions regarding repurchase or issue of the enterprise’s own shares or equity certificates:
The board has no authorization to make decisions regarding repur-chase or issue of Eksportfinans’ own shares.
eksportfinans’ board of directors seeks to ensure that the company is compliant with the require-ments of section 3-3b of the norwegian accounting act and the norwegian code of practice for corporate governance at all times.
statementof policy on corporate governance

82 e k s p o r t f i n a n s a n n u a l r e p o r t 2 0 1 4
in accordance with the board’s objectives, Eksportfinans adheres to the Norwegian code of practice for corporate governance (NUES) last updated on October 30, 2014, to the extent possible. Below is a descrip-tion of how Eksportfinans has adapted to the different areas of corporate governance as defined in the code of practice, based on the “comply or explain principle”. For more information on the Norwegian code of practice see www.nues.no.
Rules regarding corporate governance of financial institutions operating in Norway are to a large extent laid down in national legislation. In addition, Eksport-finans is subject to the international regu-lations that apply to issuers of bonds in a number of jurisdictions, including the Sar-banes Oxley Act in the United States, see www.soxlaw.com.
1. implementation and reporting of corporate governanceBusiness activities in 2014 were governed on the company’s established ethical guidelines, the policy for social responsibil-ity and the corporate values (commercial, responsible and innovative). The ethical guidelines and policy for social responsibil-ity were revised in 2014 and are published on the company’s website (www.eksport-finans.no).
The ethical guidelines apply to all employees, and comprise the handling of issues such as legal compliance, conflicts of interest, relationships with clients and suppliers, confidentiality, the duty to pro-vide correct and timely information, me-dia statements, securities trading, insider trading and other relevant issues related to private finances. Material breaches of the
ethical guidelines may result in termina-tion of employment.
The policy for social responsibility in-cludes guidelines for the practical applica-tion of environmental considerations and anti-corruption measures in Eksportfinans’ activities. The policy confirms, among other things, that Eksportfinans will com-ply with international environmental stan-dards in accordance with the OECD’s rec-ommendations regarding projects that are financed through export credits. Eksportfi-nans also adheres to the reporting require-ments for members of the OECD’s export financing group (www.oecd.org).
In the board’s opinion, Eksportfinans has implemented sound corporate gover-nance in accordance with the Norwegian code of practice.
2. businessAccording to its articles of association, Eksportfinans’ objective is to conduct fi-nancing operations to, among others, the export sector. In addition, operations may include financing as approved or requested by Norwegian authorities and the munici-pal sector. The financing should be in ac-cordance with the license and articles of association, applicable Norwegian law, in addition to decisions by and guidelines from the board. The articles of association also provide for the operation of the com-pany.
In the annual report, Eksportfinans gives information on its objectives, busi-ness model and principle strategies.
Annual strategy processes form the ba-sis for the strategic plan for the company on a rolling 2 – 3 year basis. The current strategy is to actively manage the company
based on the extensive existing portfolio of assets, liabilities and other commitments, with the overall objective of preserving company value.
Clear guidelines for line responsibili-ties have been drawn up for the business areas.
The board is of the opinion that the ar-ticles of association provide a good frame-work for strategic planning and business development. The articles of association are available on www.eksportfinans.no.
3. equity and dividends The board regularly reviews the equity situ-ation of Eksportfinans in relation to profit-ability, risk profile and business develop-ment. The target core capital adequacy ratio and other relevant key figures are published in the company’s Pillar 3 reporting on its website.
The board proposes dividends to the annual general meeting based on the eq-uity situation of the institution and other relevant factors for the period ahead. Divi-dends are determined with the aim of en-suring an adequate level of profitability and solidity for Eksportfinans as well as a satis-factory return for the shareholders.
4. equal treatment of share-holders and transactions with close associatesEksportfinans’ shares are not listed on a stock exchange. The company has one class of shares, where each share counts for one vote.
The articles of association do not in-clude any provision entitling the board of directors to make a decision to buy back or issue Eksportfinans’ shares on behalf of
corporate governance

c o r p o r at e g o v e r n a n c e 83
the company, nor is there any other written authorization granting the board this right.
Eksportfinans has a number of ongoing business transactions with its owner banks, which can be characterized as closely re-lated parties. Material transactions with related parties are listed in note 34 to the accompanying financial statements. All transactions are of a business nature, and conducted at market terms. It is the board’s assessment that the recommendation in the Norwegian code of practice to evalu-ate the value of this type of transactions is not required because it falls under activi-ties that can be characterized as ongoing business.
Eksportfinans does not have guidelines requiring board members and executive management to report to the board if they, directly or indirectly, have a special inter-est in an agreement entered into by the company. However, the company’s ethi-cal guidelines, applicable to management specifically, state that conflicts of interest shall be avoided, and that each employee is obliged to inform their immediate superior as soon as they become aware that an im-partiality conflict might arise. Furthermore, board members are subject to the statutory impartiality and insider considerations in-corporated into Norwegian law.
5. freely negotiable sharesThe Norwegian code of practice states that shares, in principle, should be freely nego-tiable. Eksportfinans is not complying with this recommendation due to the following:• Paragraph2ofthearticlesofassociation
states that only banks and the Norwe-gian state can own shares in Eksportfi-nans. The board does not have authority
to approve share transfers.• Ashareholderagreementexistsbetween
the major and some of the minor share-holders, giving them mutual rights of first refusal in the event that any one of them desires to dispose of its shares in the company.
• Norwegianlawrequiresthattheauthori-ties shall be notified about transactions regarding the acquisition of over 10, 20, 30 or 50 percent of the shares of a finan-cial institution.
6. general meetingsIn accordance with the articles of asso-ciation, the annual general meeting is held before the end of April each year, and is led by the chairperson of the council of repre-sentatives.
The notification and documents are sent to the shareholders no later than two weeks before the meeting. Due to the limit-ed number of shareholders, Eksportfinans has decided against announcing general meetings on its website.
Shareholders may issue proxies to third-parties. As the shareholders are commercial banks, savings banks and the government, the company has deemed it unnecessary to post procedures for set-ting forth proposals to the general meeting or how to set up proxies on the corporate website.
7. nomination committeeAs specified in the articles of association, Eksportfinans has an independent nomina-tion committee that nominates candidates to the board, the council of representatives and the control committee. The nomina-tion committee also suggests changes in
remuneration to the different committees. The committee is led by the chairperson of the council of representatives. In addi-tion, it consists of representatives from the three largest shareholders including the Norwegian state.
In accordance with the Act on Financ-ing Activities and Financial Institutions of 1988 and the articles of association, the council of representatives elects the board of directors based on recommendations by the nomination committee. The nomi-nation committee also recommends the chairperson and a deputy chairperson among the board members.
The council of representatives and the control committee are elected by the annu-al general meeting, based on recommenda-tions from the nomination committee. The nomination committee also recommends who should be chairperson and deputy chairperson of these committees.
In its work the nomination commit-tee emphasizes the mutual interests of the shareholders. It shares its grounds for the different nominations with the annual gen-eral meeting and the council of represen-tatives following a thorough assessment of Eksportfinans’ need for expertise, capacity and diversity.
8. corporate assembly and board of directors: composition and independenceFinancial institutions have a council of representatives instead of a corporate as-sembly. The council of representatives of Eksportfinans is elected by the general meeting based on recommendations made by the nomination committee. The mem-bers include shareholder representatives

84 e k s p o r t f i n a n s a n n u a l r e p o r t 2 0 1 4
as well as other interested parties. One representative and one alternate member are elected by and among the employees.
In accordance with paragraph five of the articles of association, the board of directors is elected by the council of representatives. One member and one al-ternate member of the board are elected by and among the employees. The board of directors shall have a minimum of six, and a maximum of eight members. Board members are elected for a term of one year. The nomination committee recommends new members to the board. The articles of association do not contain any further pro-visions specifically regulating the nomina-tion and replacement of board members.
At December 31, 2014 the board had three members from owner banks, two independent members and one member elected among the employees.
Eksportfinans complies with the Nor-wegian regulation implying that board members elected by the shareholders should consist of at least 40 percent men and 40 percent women. The board mem-bers’ independence and competence are discussed in the nomination committee and in the board itself. Each board mem-ber’s background is listed in the annual report on page 8 and in the 20-F reporting, available on the corporate website.
The control committee reviews the board’s decisions and deliberations, and ensures that they comply with Norwe-gian legislation and other relevant regu-lations. The external auditor attends the meetings of the control committee. The board’s chairperson and the chairperson of the audit committee have annual meet-ings with the control committee to ensure good communication between the differ-ent bodies.
Clear distinction of roles and respon-sibilities between the different corporate bodies of the institution has been estab-lished in the articles of association, direc-tives, guidelines and reporting systems. Eksportfinans’ elected officers are shown on page 88. Guidelines have been estab-lished in order to handle potential conflicts of interest between board members, execu-tive decision makers and the organization.
9. the work of the board of directorsThe board has established a set of instruc-tions with respect to its undertakings and procedures, and has an annual plan for its work. The board has also issued an in-struction for the president and CEO, and for all major areas of operation. The board resolves strategies and the budget, and re-ceives monthly reports on developments in relation to budgets, plans and risk manage-ment.
In 2014, the board has held seven or-dinary meetings, and also a one-day strat-egy seminar in September. In addition, the board has held eight extraordinary meet-ings. The participation rate at the regular board meetings in 2014 was close to 100 percent.
Eksportfinans has an audit committee consisting of three board members, two of which were shareholder representatives at December 31, 2014. In December 2013 Eksportfinans also established a risk com-mittee, in accordance with new legislation, with the same members as of the audit committee.
Both the audit committee and the risk committee normally have predefined meetings four to five times a year. The pur-pose, tasks and functions of the commit-tees comply with Norwegian and interna-tional regulations and standards. Among other things, the audit committee reviews and discusses all financial reports with the external auditors before the accounts are presented to the board. The risk commit-tee inter alia supervises internal control and risk management in co-operation with the internal auditor. Both committees have meetings with external and internal audi-tors to ensure that the audits are indepen-dent and effective. Auditors participate in the meetings of the committees on a regu-lar basis. In 2014 both committees held four meetings, with a participation rate of close to 100 percent.
The remuneration committee consists of two members of the board, appointed for one year periods. In addition, the employ-ee's representative on the board meets as an observer. The committee ensures that Eksportfinans at any given time practices guidelines and frameworks for a compen-sation scheme that will apply to the whole
company in general and for certain speci-fied categories of employees including, in particular, the management. The remuner-ation committee has held three meetings in 2014, with 100 percent participation rate.
The board evaluates its competence and performance annually, whereupon a report is issued to the nomination com-mittee.
10. risk management and internal controlRisk management is a key element of Eksportfinans’ operations. Eksportfinans’ board has set a comprehensive risk policy for all major risk areas, including detailed risk limits. The board also approves the company’s ICAAP (Internal Capital Ad-equacy Assessment Process) on an annual basis, stating the capital requirement for the ongoing business according to Basel II. As a registered borrower in the USA, Eksportfinans is subject to section 404 of the Sarbanes Oxley Act. Hereunder the institution must perform a thorough iden-tification of key earnings and risk areas, the operational processes and controls of these processes, documentation and re-porting. Eksportfinans also complies with Norwegian internal control regulations (internkontrollforskriften). The board re-ceives monthly reports including the sta-tus of all major risk areas, in addition to a comprehensive quarterly risk report. This forms the basis for board discussions on risk management.
The risk committee, the audit commit-tee and the control committee take special interest in the management of different risk factors. Predefined risk related issues regularly appear on the agenda of these committee meetings.
Eksportfinans’ internal auditor, EY, en-sures that risk analysis are conducted and that the activities are conducted in accor-dance with external regulations, approved strategies and guidelines. The internal au-dit is an integrated part of the management and planning process.
The internal auditor conducts a risk workshop with the executive management team on an annual basis, during which the risk factors perceived as most important are identified and discussed. The workshop leads to an action plan with regards to the

c o r p o r at e g o v e r n a n c e 85
handling of major risk factors. The results of the workshop are reported to the audit committee and the board, before also being assessed by the control committee.
Eksportfinans’ financial reporting is led by the chief financial officer and in-cludes guidelines for monthly, quarterly and annual reporting on the basis of in-ternal and external requirements and risk assessments related to financial reporting. The financial reporting is ensured to be in line with prevailing legislation, accounting standards and current accounting princi-ples. A number of control measures have been prepared in connection with the final-ization of such information, including gen-eral assessments of reasonableness, prob-ability tests and detailed reconciliation controls. These measures are also subject to section 404 of the Sarbanes Oxley Act.
The audit committee reviews all finan-cial reporting from Eksportfinans. After the quarterly accounts and proposed an-nual accounts for Eksportfinans have been reviewed by the audit committee, they are considered by the board of directors. The annual accounts are approved at the annual general meeting.
11. remuneration to the board of directorsIn accordance with the articles of associa-tion, remuneration to the different elected officers is proposed by the nomination committee based on an assessment of responsibility, expertise and allocated time. On this basis the fees are set by the annual general meeting for all elected of-ficers except the board. The council of representatives sets the fees for the board members, including sub-committees. The remuneration is independent of results, and does not include any form of options or bonuses. Details on the remuneration to board members are found in note 35 to the accompanying financial statements.
12. remuneration of executive personnelThe board determines the remuneration for the president and CEO, and sets the limits for compensation to other executive personnel. In accordance with Norwegian legislation, the board has set guidelines for the remuneration of executive personnel.
These are reviewed annually and presented to the annual general meeting. Eksportfi-nans does not have remuneration schemes based on the share value of the company. For a more detailed description of the re-muneration policy, see page 86 of the an-nual report or the corporate website.
13. information and communicationThe board has set guidelines to ensure rele-vant, up-to-date and identical information to shareholders, financial investors and other actors in the international capital markets. The market is updated through the annual registration of Form 20-F with the Securities and Exchange Commission in the USA, as well as annual reports and interim reports published on the corpo-rate website according to a predefined fi-nancial calendar. In 2014 the company also arranged three investor calls in connection with announcements of the quarterly re-ports. Eksportfinans provides the market with comprehensive analytical material in connection with submission of the ac-counts. The information is made available concurrently to Oslo Stock Exchange and all stock exchanges on which the compa-ny’s debt instruments are listed, as well as on the corporate website.
Eksportfinans does not have set guide-lines for communicating with sharehold-ers other than through the general meet-ings. However, financial information and other corporate information such as press releases are forwarded to the shareholders at release.
14. take-overEksportfinans has not defined guiding prin-ciples on how it will react in the case of a take-over bid situation. However, the limit-ed number of shareholders, the limitation in the articles of association on ownership eli-gibility and the agreement between certain shareholders providing for mutual rights of first refusal in the event that any one or more of them desires to dispose of its shares in the company, will help ensure equal treatment of shareholders and timely and relevant in-formation if such a situation should occur.
15. auditorEksportfinans has an independent exter-nal audit, conducted by auditors who act according to the recommendations set out in the Norwegian code of practice for cor-porate governance. Also, the internal audit is conducted by an independent auditor.
The external auditor is present at rel-evant audit committee, control committee and board meetings whenever financial results are handled. The board and audit committee have separate annual meetings with the auditors without participation of the administration.
Guidelines have been drawn up for the relationship with the external auditor. This includes limitations on the type of additional services that can be performed, and approval of fees. The annual general meeting elects the external auditors and approves their remuneration.

86 e k s p o r t f i n a n s a n n u a l r e p o r t 2 0 1 4
the enclosed declaration for the deter-mination of salary and other remuneration to the management will be presented to the ordinary general meeting by the board of di-rectors for an advisory vote pursuant to sec-tions 5-6(3) and (4) and 6-16a of the Norwe-gian Public Limited Liability Companies Act. Eksportfinans’ remuneration policy reflects applicable regulations from the Norwegian Ministry of Finance regarding remunera-tion in the financial sector dated December 1, 2010, as amended on December 20, 2010 and on August 22, 2014, and supplemented by a circular memo issued by the Norwegian FSA (Finanstilsynet) on February 21, 2011. The policy also reflects the guidelines for employment conditions for leaders in gov-ernment entities and companies (Report to the Storting no 27 (2013-2014)).
In November 2011 the Norwegian gov-ernment terminated the agreement with Eksportfinans for the issuing and manage-ment of new export credits on its behalf. Following this, stay-on fees have been used as a tool to ensure a competent staff to man-age Eksportfinans’ substantial and complex portfolio of loans, funding, derivatives and liquidity placements. In 2014, variable pay has only been given in connection with de-ferred payments of variable pay granted to executives in 2011 and 2013.
persons comprised by the policyEksportfinans has an established remunera-tion policy for all employees. The policy includes special rules applicable to execu-tive management, employees with special responsibility for the company’s risk ex-posure and other employees and elected officers with similar compensation, as well as employees involved in control activities. In Eksportfinans the management team includes the president and CEO and other executives reporting to the CEO. The policy
applies to all new agreements of employ-ment in general.
decision-making processThe board of directors has established a remuneration subcommittee consisting of two members and an observer, appointed for one year periods. The committee en-sures that Eksportfinans at any given time practices guidelines and frameworks for a compensation scheme that will apply to the whole company in general and for certain specified categories of employees, includ-ing the management, in particular.
The board of directors is responsible for adopting the elements to be included in the executive management’s compensa-tion plans and guidelines for the determi-nation of the actual annual compensation (the amount of the various elements of the plan). The board also sets the annual com-pensation for the president and CEO.
remuneration to executive managementgeneral points
In this policy, compensation plan means a pay package that may include the following elements: fixed and/or variable pay, stay-on fees, benefits in kind, a pension plan and severance pay.
To ensure access to qualified execu-tives, the management’s compensation plans shall be competitive and on a par with the remuneration applicable for positions in the owner banks with which it would be natural to compare the company’s manage-ment positions.
The management’s compensation plans shall not unfavorably affect the com-pany or damage its reputation. The board of directors shall assess each element of the compensation plan jointly, as a whole. The board of directors shall receive an overview
of the aggregate value of the agreed remu-neration of the executive management on an annual basis. Members of the executive management shall not receive any special remuneration for board appointments in Eksportfinans’ subsidiaries. Agreements on remuneration entered into before these guidelines came into force shall be upheld.
components
fixed salary
The main element of the company’s com-pensation plan shall be the fixed salary.
options and share programs
As long as the ownership provisions in the company’s current articles of association are not amended, share options or share programs shall not be used in any form as an element of the management’s compen-sation plans.
stay-on fees
Eksportfinans offers stay-on fees to all em-ployees, excluding the president and CEO, in order to maintain a skilled and profes-sional staff going forward, given the com-pany’s current business model. The annual stay-on fee may in certain cases exceed six months fixed pay.
variable pay
Since 2012, variable pay has only been used to a very limited degree, as one of the ele-ments of the executives’ compensation plans. When granted, the following prin-ciples shall apply:•There must be a clear connection
between the targets on which the vari-able pay is based and the company’s objectives.
•Variable pay must be based on objec-tive, definable and measurable criteria. The criteria shall be based on circum-
remuneration policy

r e m u n e r at i o n p o l i c y 87
stances the executive may influence.•Several target criteria shall be used and
all shall be relevant.•The variable pay element must be
transparent and easy to understand. When giving an account of the plan, an essential objective must be to clarify the anticipated and maximum pay-ment of each executive.
•The plan shall be limited in time.•Total variable pay in one year shall nor-
mally not exceed six months’ fixed pay.
pension plan
Pension benefits for executive manage-ment shall be based on the pension ben-efits of other employees. At the same time the benefits shall be on a par with the ben-efits of positions in the owner banks with which it would be natural to compare the company’s executive positions.
The board of directors shall receive an overview of the total costs of the pen-sion plan before any agreement is signed. Any commitments the company under-takes through the management’s pension scheme shall, to the extent practicable and reasonable within the framework of cur-rent laws and regulations, be covered by entering into a pension insurance agree-ment with a life insurance company.
The retirement age for the current president and CEO, who joined the com-pany on November 1, 2014, is set at 67 years. For members of the executive management recruited prior to June 2012, the retirement age is set at 65 years. For members who joined the executive management after June 2012, the retirement age is set at 67 years.
Eksportfinans’ pension plan for all em-ployees hired after January 1, 2012 is a de-fined contribution scheme, in line with the pension plans of its largest owner banks. Em-ployees who were employed by the company
on December 31, 2011 could choose to remain in the existing defined benefit scheme, or be-come part of the new defined contribution scheme at their own discretion.
severance pay
Where a member of the company’s execu-tive management has previously agreed to waive the provisions relating to employ-ment protection rights in the Working En-vironment Act, an agreement may be made on severance pay. Severance pay shall not normally be used in case of voluntary resig-nation. The severance pay scheme shall be adjusted to the results obtained over time, and ensure that failure to obtain agreed re-sults is not a basis for severance pay.
The severance pay shall not exceed twelve months’ fixed pay in addition to any pay during the period of notice. Sever-ance pay may also contain other financial benefits and benefits in kind. In case of appointment to a new position elsewhere, severance pay shall be reduced by a pro-portionate amount, calculated on the basis of the new annual income. Such reduction may only be made after expiry of the ordi-nary period of notice for the position.
In connection with workforce reduc-tion processes, severance pay may be agreed in case of voluntary resignation, and the above-mentioned upper limit of twelve months’ fixed pay may be exceeded. This applies if the calculation of the executive’s severance pay is made pursuant to the rules applying to the severance pay of other em-ployees. A reduction in severance pay men-tioned in this paragraph shall only be made if required under the internal general rules regarding severance pay in connection with a workforce reduction process.
Severance pay may be withheld if the terms for summary dismissal are present.
benefits in kind
The nature and value of benefits in kind shall be on a par with what is customary in the owner banks with which it would be natural to compare the company’s execu-tive positions.
remuneration to employees with risk exposure responsibilitiesThe regulations regarding variable pay to executive management mentioned above shall also apply to employees with special responsibility for the company’s risk ex-posure and to other employees or elected officers with similar compensation.
remuneration to employees involved in control activitiesRemuneration to employees involved in control activities shall be independent of the results in the business area they con-trol. The regulations regarding variable pay to executive management mentioned above shall also apply to employees in-volved in control activities.
remuneration to elected officersThe regulations regarding variable pay to executive management mentioned above shall also apply to elected officers.
declaration for 2014The board confirms that the declaration for the determination of salary and other remuneration approved in April 2014 has been followed in 2014. In 2014, there has been one change in the personnel com-prised by this policy since president and CEO Gisele Marchand left Eksportfinans in November, 2014. The new president and CEO, Geir Bergvoll, who joined the company on November 1, 2014, receives compensation in accordance with this re-muneration policy.

88 e k s p o r t f i n a n s a n n u a l r e p o r t 2 0 1 4
board of directors
sigurd carlsenChairperson Nordea Bank Norge ASA, Oslo
christian bergDeputy chairperson HitecVision AS, Oslo
bjørn berg DNB Bank ASA, Oslo
tone lunde bakker Danske Bank, Oslo
Marianne heien blystad Ro Sommernes Law, Oslo
rune helgeland *) Eksportfinans ASA, Oslo
audit committee
bjørn berg Chairperson DNB Bank ASA, Oslo
tone lunde bakker Danske Bank, Oslo
Marianne heien blystad Ro Sommernes Law, Oslo
risk committee
bjørn berg Chairperson DNB Bank ASA, Oslo
tone lunde bakker Danske Bank, Oslo
Marianne heien blystad Ro Sommernes Law, Oslo
remuneration committee
sigurd carlsenChairperson Nordea Bank Norge ASA, Oslo
christian berg HitecVision AS, Oslo
rune helgeland *) Eksportfinans ASA, Oslo
control committee
petter kapstad Chairperson Statoil ASA, Oslo
eldbjørg sture Deputy chairperson DNB Markets, Oslo
Marius Juul Møller Rica Eiendom Holding, Oslo
ottar brage guttelvik Deputy member Møre og Romsdal Fylkeskommune, Molde
nomination committee
frode alhaug Chairperson Hamar
ingrid bratheim Nordea Bank Norge ASA, Oslo
bjørn erik næss DNB Bank ASA, Oslo
knut J. utvik
Ministry of Trade, Industry and Fisheries, Oslo
council of representatives
frode alhaugChairperson Hamar
sandra riise Deputy chairperson
Norges Autoriserte Regnskapsføreres Forening, Oslo
geir bergskaug Sparebanken Sør, Kristiansand
ottar brage guttelvik Møre og Romsdal Fylkeskommune, Molde
petter kapstad Statoil ASA, Oslo
elisabeth krokeide Eidsiva Vekst AS, Gjøvik
gro elisabeth lundevik Nordea Bank Norge ASA, Oslo
Marius Juul Møller Rica Eiendom Holding, Oslo
eldbjørg sture DNB Markets, Oslo
trond tostrup Sparebanken Øst, Drammen
torbjørn vik Bank 1 Oslo, Oslo
peder nordli *) Eksportfinans ASA, Oslo
irene n. Mellem *) Deputy member Eksportfinans ASA, Oslo
*) Representative of the employees
elected officersat deceMber 31, 2014

e l e c t e d o f f i c e r s 89

90 e k s p o r t f i n a n s a n n u a l r e p o r t 2 0 1 4
financial analysis
group
(nok Millions) 2014 2013 2012 2011 2010
stateMents of incoMe
Net interest income 461 697 1,244 1,550 1,419
Commissions and income related to banking services 0 0 0 1 2
Commissions and expenses related to banking services 2 2 3 6 7
Total gains/(losses) on financial instruments at fair value and foreign currencies (6,069) (7,379) (25,816) 40,373 (603)
Other income 12 5 60 16 7
Total operating expenses 180 165 144 213 195
Impairment charges on loans 0 0 0 0 0
Pre-tax-operating profit/(loss) (5,779) (6,844) (24,659) 41,721 623
Taxes (1,506) (1,995) (6,903) 11,682 175
profit/(loss) for the year (4,274) (4,849) (17,756) 30,039 448
Proft/(loss) for the year from discontinued operations, net of taxes 0 0 0 0 0
Other comprehensive income (41) (1) 38 0 0
comprehensive income for the period (4,315) (4,850) (17,717) 30,039 448
Profit for the year excluding unrealized gains/ (losses) on financial instruments at fair value 5) 130 566 867 945 859
balance sheet
Loans and receivables due from credit institutions 12,370 17,704 26,410 40,340 43,014
Loans and receivables due from customers 33,372 47,363 71,879 96,541 85,095
Securities 27,991 26,462 41,785 51,909 67,921
Other assets 11,896 9,264 17,332 25,139 19,519
total assets 85,629 100,793 157,406 213,929 215,549
Deposits by credit institutions 0 0 4,476 1 48
Commercial paper and bond debt 66,413 75,843 112,543 141,489 186,402
Other liabilities 10,491 11,974 22,009 36,358 21,887
Subordinated debt/capital contribution securities 965 902 1,440 1,387 2,056
Shareholders' equity 7,760 12,075 16,938 34,694 5,156
total liabilities and shareholders' eQuity 85,629 100,793 157,406 213,929 215,549

f i n a n c i a l a n a l y s i s 91
group
(nok Millions) 2014 2013 2012 2011 2010
key figures
Return on equity after taxes 1) (43.5 %) (33.4 %) (68.8 %) 150.8 % 8.5 %
Return on equity before taxes 1) (58.3 %) (47.2 %) (95.5 %) 209.4 % 11.8 %
Net return on average assets and liabilities 0.36 % 0.46 % 0.66 % 0.71 % 0.59 %
Return on assets 2) 0.49 % 0.54 % 0.67 % 0.72 % 0.64 %
Net operating expenses/average assets 3) 0.18 % 0.12 % 0.05 % 0.09 % 0.09 %
Allocation to/(from) other equity 32 514 933 746 781
Total loans outstanding 4) 39,174 58,568 87,509 121,807 123,412
New loans 0 0 923 33,685 33,654
New bond debt 0 0 0 51,552 72,231
Capital adequacy 24.4 % 38.1 % 28.0 % 19.4 % 17.6 %
Public sector borrowers/guarantors 35.4 % 33.2 % 40.0 % 40.1 % 34.5 %
Return on equity (excluding unrealized gains/(losses) on financial instruments at fair value) after taxes 5) 1.8 % 8.0 % 13.6 % 17.2 % 17.7 %
Number of employees 48 53 55 98 98
definitions:1) Return on equity: Profit for the period/average equity.2) Return on assets: Net interest income including provisions/average assets.3) Net operating expenses/average assets: Net operating expenses (administrative and operating expenses + depreciation - other income)/average assets.4) Total loans outstanding: Consists of Loans due from customers and part of Loans due from credit institutions in the balance sheet. Accrued interest and unrealized gains/(losses) are not included.5) Profit the year excluding unrealized gains/(losses) on financial instruments at fair value for the company is calculated below:
group
(nok Millions) 2014 2013
comprehensive income for the period in accordance with ifrs (4,315) (4,850)
Net unrealized losses/(gains) on financial instruments at fair value 6,017 7,354
Unrealized losses related to Icelandic banks that are included above 1) (7) 276
Realized losses hedged by the Portfolio Hedge Agreement 2) 0 0
Tax-effect of the items above (1,566) (2,214)
non-gaap profit for the period excluding unrealized gains/(losses) on financial instruments at fair value 130 566
Return on equity based on profit for the period excluding unrealized gains/(losses) on financial instruments at fair value 3) 1.8 % 8.0 %
See note 5 to the accompanying financial statements.
1) Reversal of previously recognized loss (at exchange rates applicable at reporting date).
2) Securities have been sold with a realized gain or loss. These gains or losses are covered by the PHA, and will be settled according to that agreement. Eksportfinans therefore believes it is useful for investors to present this non-IFRS profit figure with such losses excluded due to the economic arrangements under, and the accounting impacts of, the PHA.
3) Return on equity: Profit for the period/average equity adjusted for proposed not distributed dividends.

92 e k s p o r t f i n a n s a n n u a l r e p o r t 2 0 1 4
Design
: RED
INK
eksportfinans asaDronning Mauds gate 15
P.O. Box 1601 VikaNO-0119 Oslo, Norway
Phone: +47 22 01 22 01Fax: +47 22 01 22 02
www.eksportfinans.no