annual report 2013 - suntory · annual report 2013 suntory b everage & food limited 01...
TRANSCRIPT
Annual Report 2013
Annual Report 2013
SuntoRy BeveRAge & Food Limited
01
Forward-Looking Statements
In Harmony with People and Nature
Contents
The Suntory Group’s corporate philosophy is “In
Harmony with People and Nature.” These words
express our core beliefs and ongoing objectives.
We develop a rich experience of life based on real
needs, in harmony with people and their natural
surroundings. Through our corporate initiatives,
Suntory strives to maintain a sustainable global
environment and contribute to a truly prosperous
society. Guided by this philosophy, as responsible
corporate citizens, the Suntory Group aspires to
provide the highest quality products and services
for the improvement of life around the world.
• This annual report is aimed at providing financial, management and other information on Suntory Beverage & Food Limited (SBF) and its subsidiaries and affiliate companies (the Group).
• Though SBF has relied upon and assumed the accuracy and completeness of third party information available to it in preparing this annual report, including data prepared by Euromonitor International Limited, Inryou Souken, and INTAGE Inc., SBF has not independently verified such information and makes no representations as to the actual accuracy or completeness of such information. Therefore, the information should not be relied upon in making, or refraining from making, any investment decision. The information in this annual report is subject to change without prior notice. Statements contained herein that relate to future operating performance or strategic objectives are forward-looking statements. Forward-looking statements are based on judgments made by SBF’s management based on information currently available. These forward-looking statements are subject to various risks and uncertainties, and actual business results may vary substantially.
• This annual report is not a securities report based on the Financial Instruments Exchange Act of Japan, and does not necessarily contain all the information required in making investment decisions regarding the securities of SBF.
About us . . . . . . . . . . . . . . . . . . . . . . . . . . . . . . . . . . 02We Are a Soft Drink Company with a Globally Integrated Platform in Key Regions . . . . . . . . . . . . . . . . . . . . 02
Our Innovative Products Have Led Robust Organic Growth Outperforming the Japanese Market . . . . . . . . . . . . . 04
Established Strong Position through Marketing and R&D Expertise . . . . . . . . . . . . . . . . . . . . . . . . . . . . . . . . . . . . 06
Strong Track Record of Acquisitions to Accelerate Global Business Expansion . . . . . . . . . . . . . . . . . . . . . . . . . . . 10
Leveraging Our Strengths and Robust Overseas Business Platform to Deliver Deliciousness Worldwide . . . . . . . . . . . . . 12
Brand Portfolio . . . . . . . . . . . . . . . . . . . . . . . . . . . . . 14
Performance Highlights . . . . . . . . . . . . . . . . . . . . . . . 16
President’s Message . . . . . . . . . . . . . . . . . . . . . . . . . 18
Strategy in 2014 . . . . . . . . . . . . . . . . . . . . . . . . . . . . 24
CSR Approach and Initiatives . . . . . . . . . . . . . . . . . . 30
Corporate Governance . . . . . . . . . . . . . . . . . . . . . . . 40
Board of Directors and Audit & Supervisory Board Members . . . . . . . . . . . . 46
Financial Section . . . . . . . . . . . . . . . . . . . . . . . . . . . . 47
Corporate Overview . . . . . . . . . . . . . . . . . . . . . . . . . 88
Stock Overview . . . . . . . . . . . . . . . . . . . . . . . . . . . . . 89
BOSS Iyemon Suntory Oolong Tea
Suntory Tennensui
Pepsi Orangina GREEN DAKARA
V Just Juice
Orangina Schweppes Oasis Lucozade Ribena
Mountain DewMirai MYTEA Oolong Tea
TEA+Oolong Tea
BRAND’ SEssence ofChicken
Americas
Oceania
Asia
Japan
Europe
Okky JellyDrink
Pepsi
64%14%
12%
as
7%
JapanEurope
Asia
Americ
Oceania
3%
Japan
54%Europe
23%
Asia
10%
Americas
8%Oceania
5%
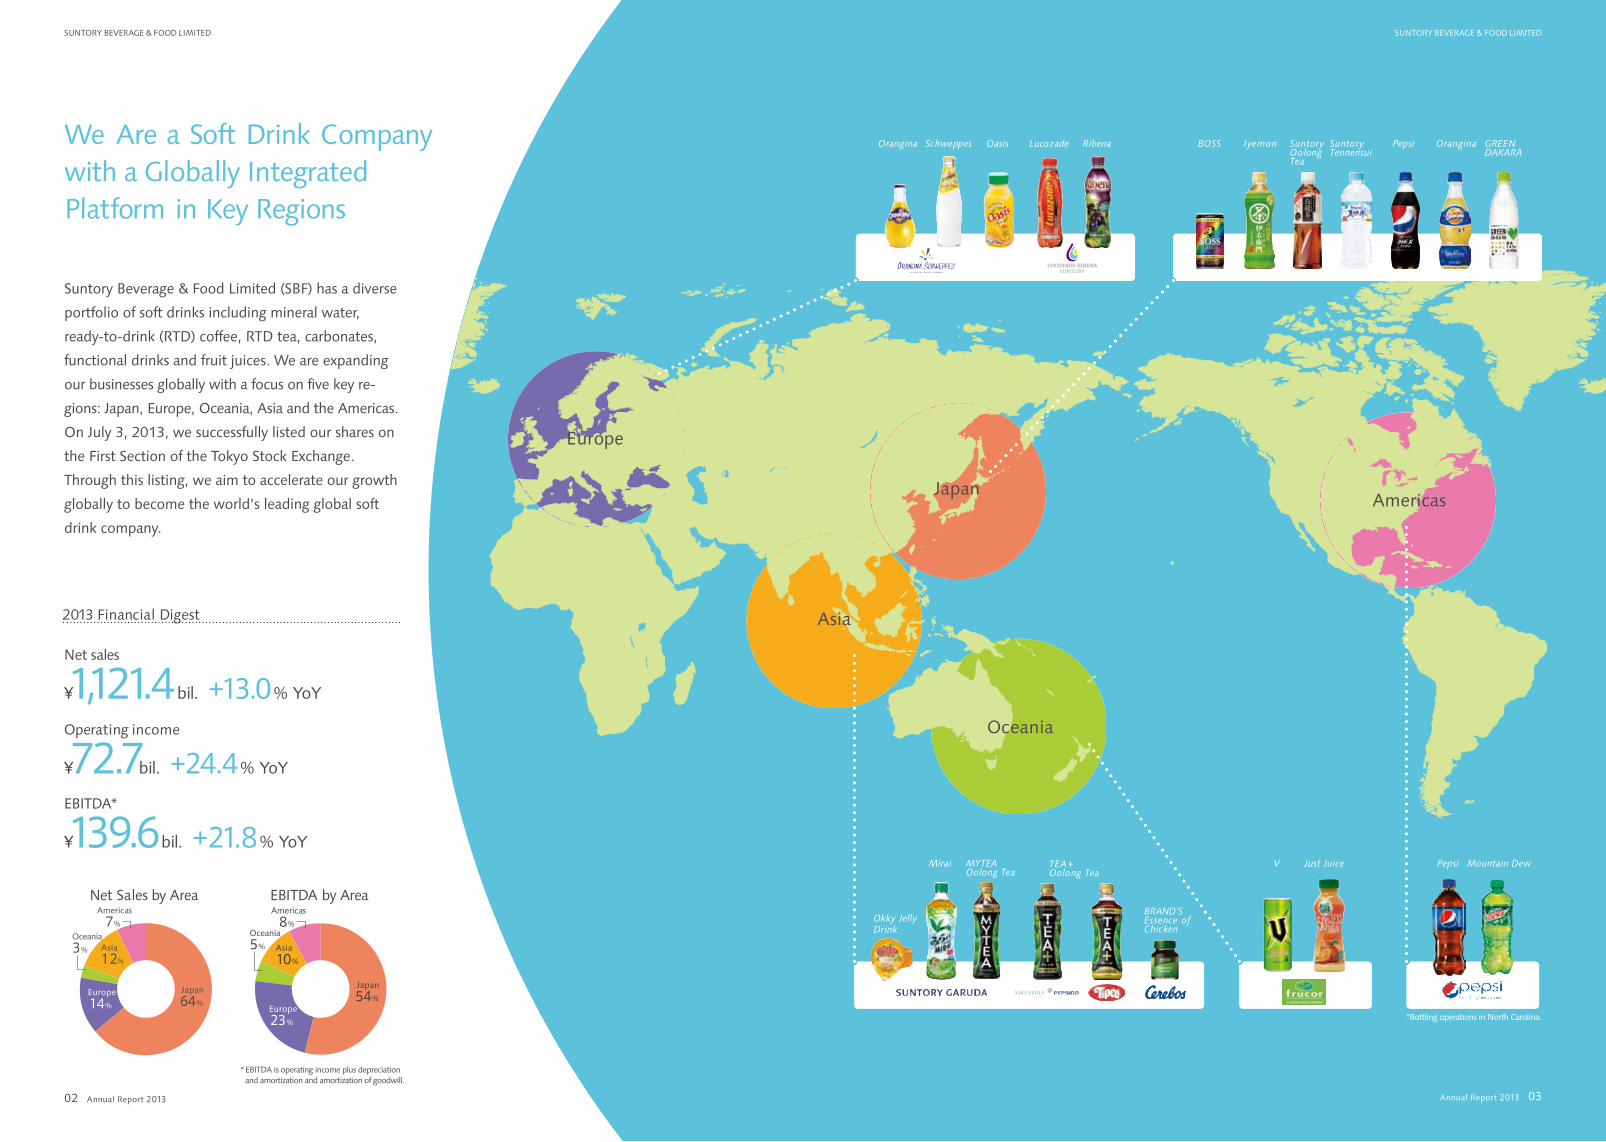
Net Sales by Area EBITDA by Area
* EBITDA is operating income plus depreciation and amortization and amortization of goodwill.
Annual Report 2013
SuntoRy BeveRAge & Food Limited
03Annual Report 2013
SuntoRy BeveRAge & Food Limited
02
We Are a Soft Drink Company with a Globally Integrated Platform in Key Regions
2013 Financial Digest
Net sales
¥1,121.4bil. +13.0% YoY
Operating income
¥72.7bil. +24.4% YoY
EBITDA*
¥139.6bil. +21.8% YoY
* Bottling operations in North Carolina.
Suntory Beverage & Food Limited (SBF) has a diverse
portfolio of soft drinks including mineral water,
ready-to-drink (RTD) coffee, RTD tea, carbonates,
functional drinks and fruit juices. We are expanding
our businesses globally with a focus on five key re-
gions: Japan, Europe, Oceania, Asia and the Americas.
On July 3, 2013, we successfully listed our shares on
the First Section of the Tokyo Stock Exchange.
Through this listing, we aim to accelerate our growth
globally to become the world’s leading global soft
drink company.
0
50
100
150
200
250
300
350
400
450
500
(million cases)
201320122011
2010200920082007
200620052004
200320022001
2000
1999
1998
199719961995
1994
199319921991
Suntory Oolong Tea
Suntory BOSS C.C.Lemon Iyemon Pepsi NEX ZERO Suntory BlackOolong Tea
Oranginanatchan! GREENDAKARATennensui
Annual Report 2013 Annual Report 2013
SuntoRy BeveRAge & Food Limited SuntoRy BeveRAge & Food Limited
0504
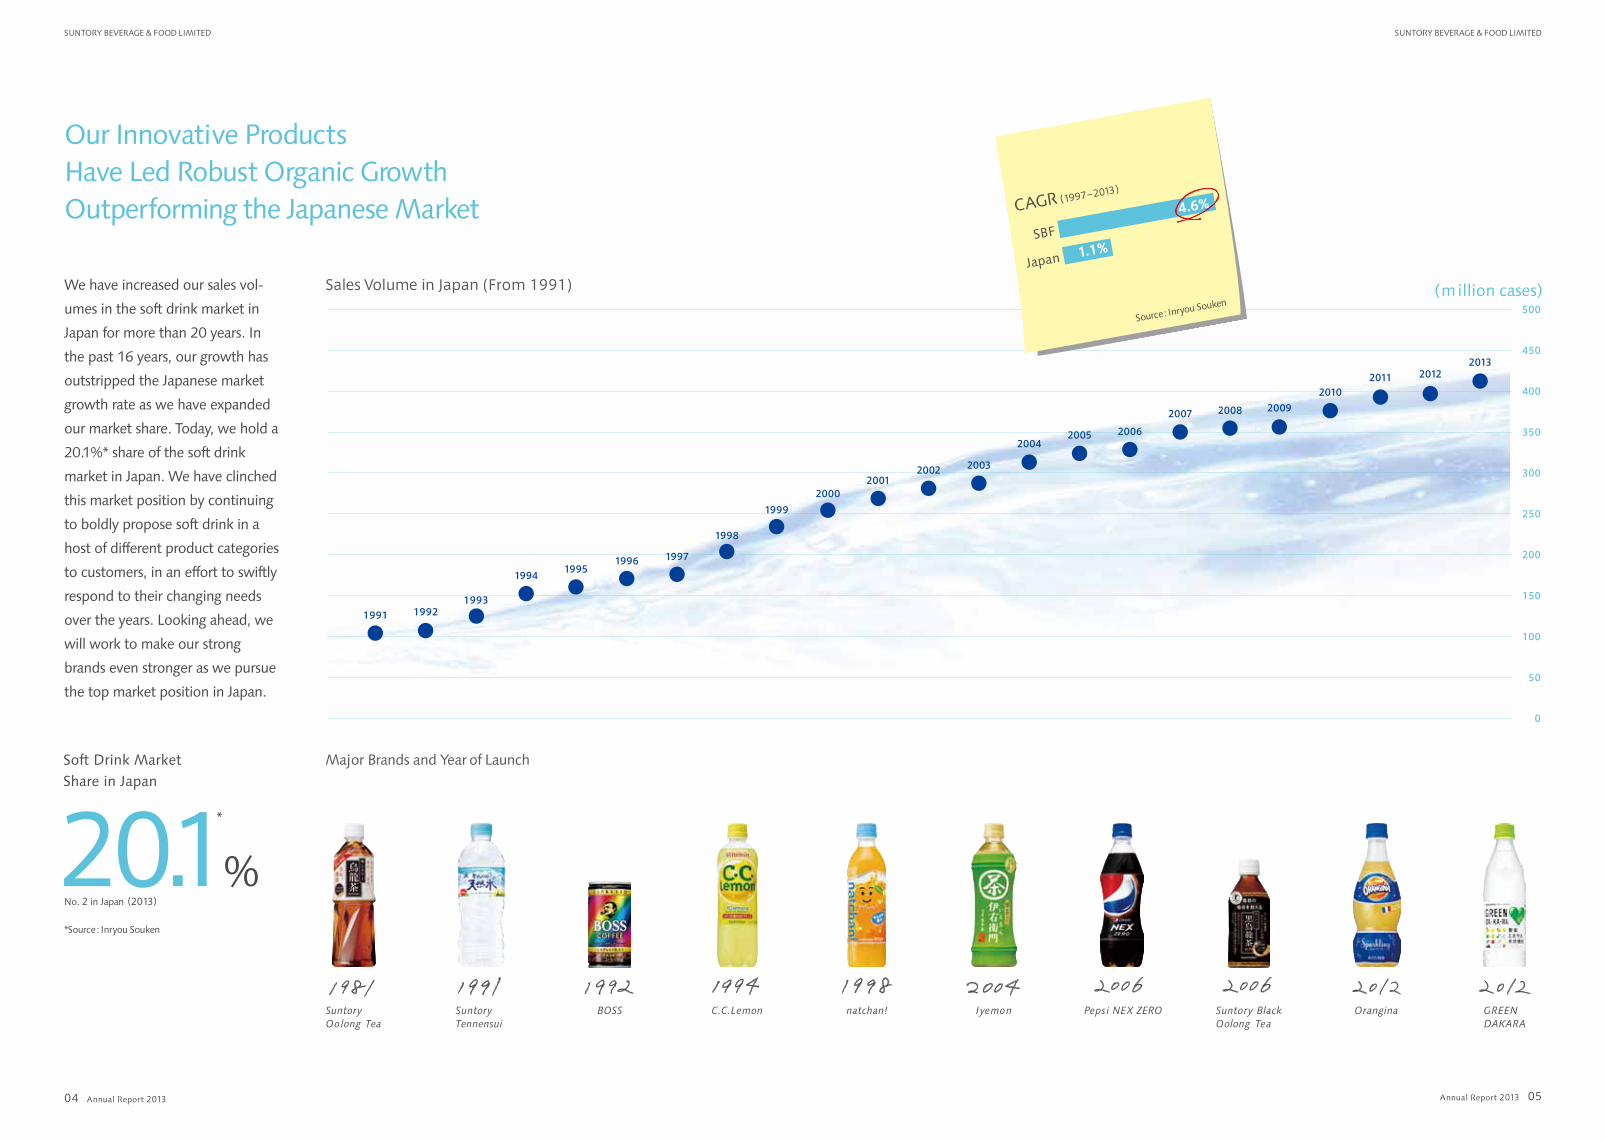
Sales Volume in Japan (From 1991)
Source: Inryou Souken
CAGR(1997–2013)
SBF
Japan
4.6%
1.1%
*Source: Inryou Souken
We have increased our sales vol-
umes in the soft drink market in
Japan for more than 20 years. In
the past 16 years, our growth has
outstripped the Japanese market
growth rate as we have expanded
our market share. Today, we hold a
20.1%* share of the soft drink
market in Japan. We have clinched
this market position by continuing
to boldly propose soft drink in a
host of different product categories
to customers, in an effort to swiftly
respond to their changing needs
over the years. Looking ahead, we
will work to make our strong
brands even stronger as we pursue
the top market position in Japan.
Major Brands and Year of Launch
No. 2 in Japan (2013)
Soft Drink Market Share in Japan
20.1*
%
Our Innovative ProductsHave Led Robust Organic GrowthOutperforming the Japanese Market
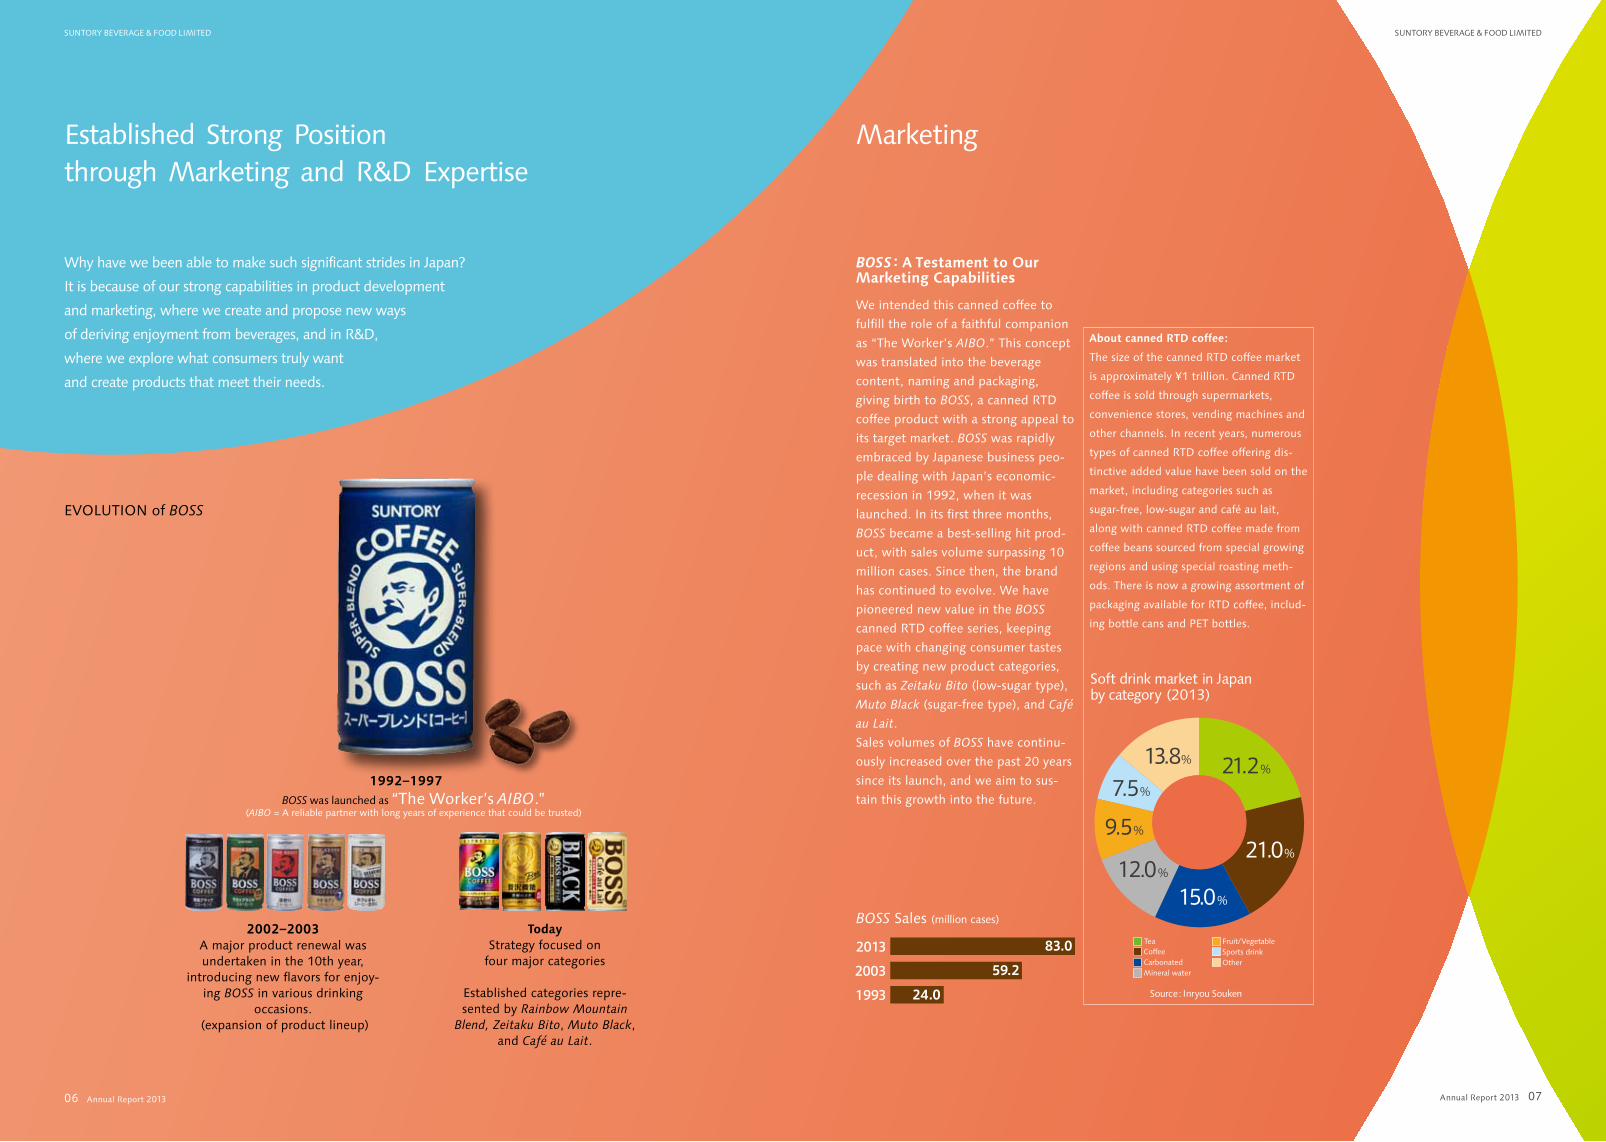
2002–2003A major product renewal was undertaken in the 10th year,
introducing new flavors for enjoy-ing BOSS in various drinking
occasions. (expansion of product lineup)
TodayStrategy focused on
four major categories
Established categories repre-sented by Rainbow Mountain
Blend, Zeitaku Bito, Muto Black, and Café au Lait.
EVOLUTION of BOSS
1992–1997BOSS was launched as “The Worker’s AIBO.”
(AIBO = A reliable partner with long years of experience that could be trusted)
13.8% 21.2%
21.0%
15.0%
9.5%
7.5%
12.0%
CoffeeCarbonatedMineral water
Tea Fruit/VegetableSports drinkOther
Annual Report 2013
SuntoRy BeveRAge & Food Limited
07Annual Report 2013
SuntoRy BeveRAge & Food Limited
06
Established Strong Position through Marketing and R&D Expertise
BOSS : A Testament to Our Marketing Capabilities
We intended this canned coffee to
fulfill the role of a faithful companion
as “The Worker’s AIBO.” This concept
was translated into the beverage
content, naming and packaging,
giving birth to BOSS, a canned RTD
coffee product with a strong appeal to
its target market. BOSS was rapidly
embraced by Japanese business peo-
ple dealing with Japan’s economic-
recession in 1992, when it was
launched. In its first three months,
BOSS became a best-selling hit prod-
uct, with sales volume surpassing 10
million cases. Since then, the brand
has continued to evolve. We have
pioneered new value in the BOSS
canned RTD coffee series, keeping
pace with changing consumer tastes
by creating new product categories,
such as Zeitaku Bito (low-sugar type),
Muto Black (sugar-free type), and Café
au Lait.
Sales volumes of BOSS have continu-
ously increased over the past 20 years
since its launch, and we aim to sus-
tain this growth into the future.
Why have we been able to make such significant strides in Japan?
It is because of our strong capabilities in product development
and marketing, where we create and propose new ways
of deriving enjoyment from beverages, and in R&D,
where we explore what consumers truly want
and create products that meet their needs.
Soft drink market in Japan by category (2013)
About canned RTD coffee:
The size of the canned RTD coffee market
is approximately ¥1 trillion. Canned RTD
coffee is sold through supermarkets,
convenience stores, vending machines and
other channels. In recent years, numerous
types of canned RTD coffee offering dis-
tinctive added value have been sold on the
market, including categories such as
sugar-free, low-sugar and café au lait,
along with canned RTD coffee made from
coffee beans sourced from special growing
regions and using special roasting meth-
ods. There is now a growing assortment of
packaging available for RTD coffee, includ-
ing bottle cans and PET bottles.
2013
2003
1993
83.0
59.2
24.0 Source: Inryou Souken
BOSS Sales (million cases)
Marketing
Annual Report 2013 Annual Report 2013
SuntoRy BeveRAge & Food Limited SuntoRy BeveRAge & Food Limited
0908
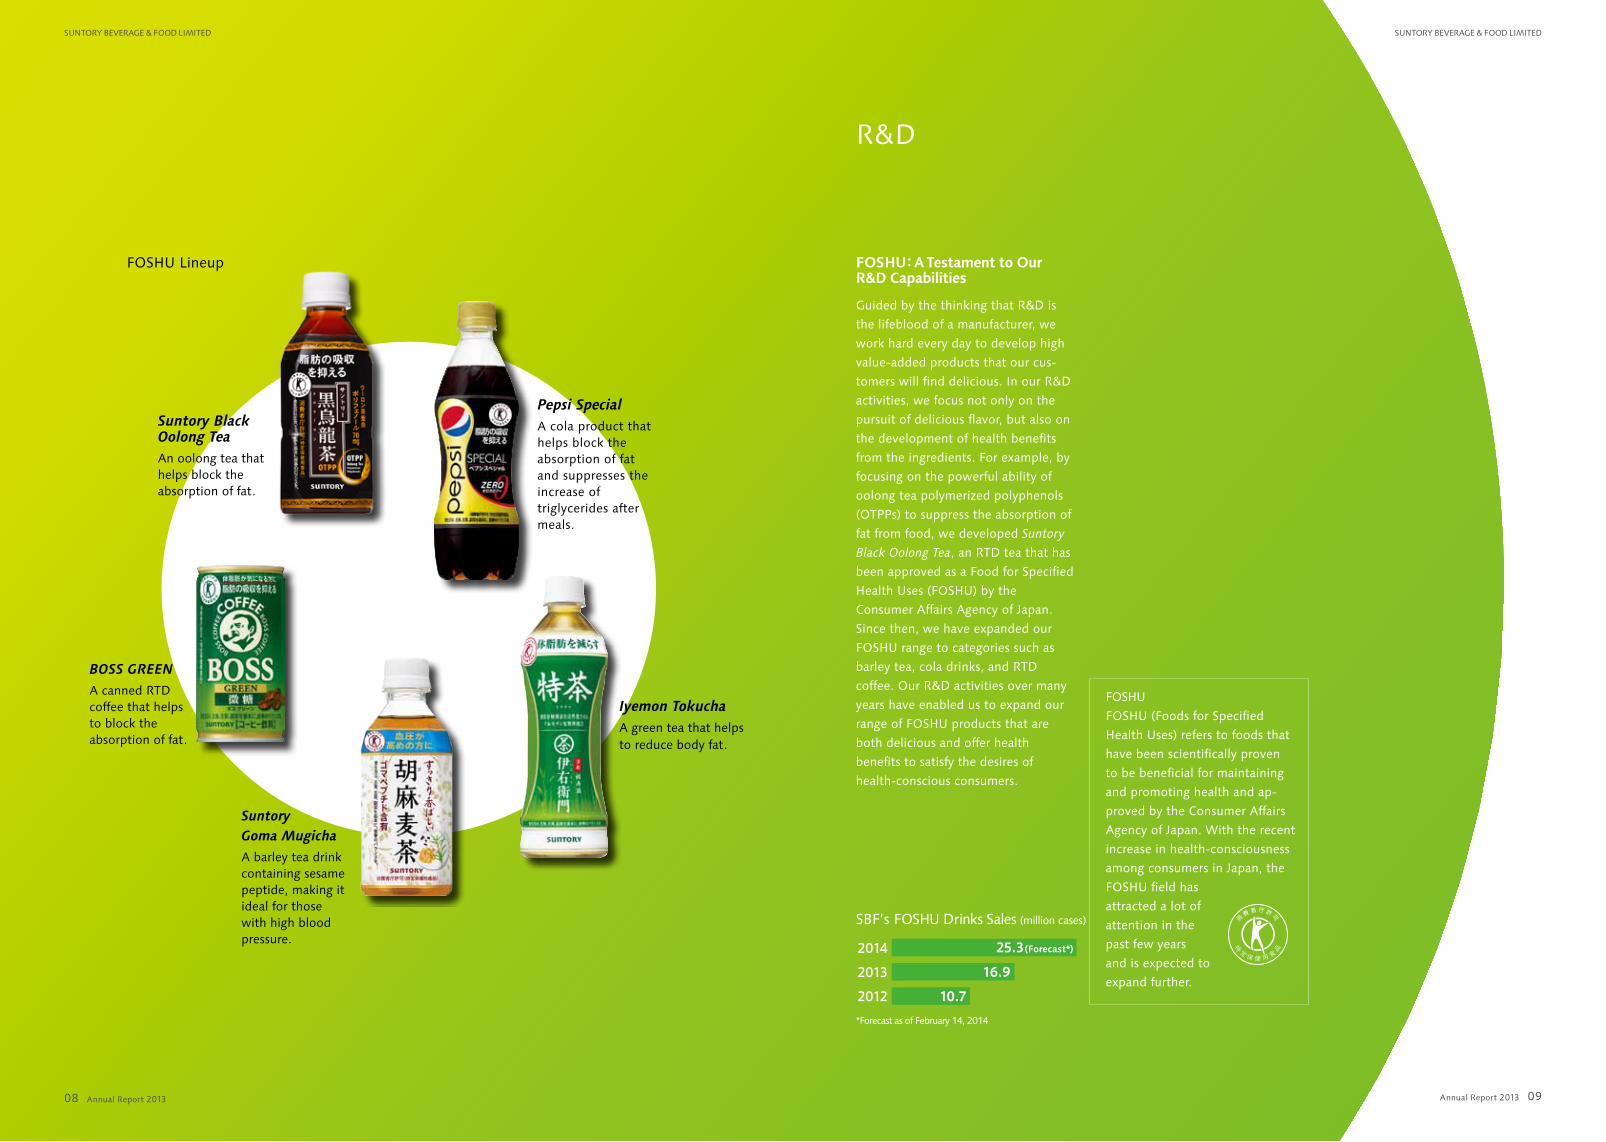
FOSHU: A Testament to Our R&D Capabilities
Guided by the thinking that R&D is
the lifeblood of a manufacturer, we
work hard every day to develop high
value-added products that our cus-
tomers will find delicious. In our R&D
activities, we focus not only on the
pursuit of delicious flavor, but also on
the development of health benefits
from the ingredients. For example, by
focusing on the powerful ability of
oolong tea polymerized polyphenols
(OTPPs) to suppress the absorption of
fat from food, we developed Suntory
Black Oolong Tea, an RTD tea that has
been approved as a Food for Specified
Health Uses (FOSHU) by the
Consumer Affairs Agency of Japan.
Since then, we have expanded our
FOSHU range to categories such as
barley tea, cola drinks, and RTD
coffee. Our R&D activities over many
years have enabled us to expand our
range of FOSHU products that are
both delicious and offer health
benefits to satisfy the desires of
health-conscious consumers.
SBF’s FOSHU Drinks Sales (million cases)
*Forecast as of February 14, 2014
2014
2013
2012
25.3(Forecast*)
16.9
10.7
FOSHU
FOSHU (Foods for Specified
Health Uses) refers to foods that
have been scientifically proven
to be beneficial for maintaining
and promoting health and ap-
proved by the Consumer Affairs
Agency of Japan. With the recent
increase in health-consciousness
among consumers in Japan, the
FOSHU field has
attracted a lot of
attention in the
past few years
and is expected to
expand further.
Suntory Black Oolong TeaAn oolong tea thathelps block theabsorption of fat.
Suntory Goma MugichaA barley tea drinkcontaining sesamepeptide, making itideal for thosewith high bloodpressure.
Iyemon TokuchaA green tea that helpsto reduce body fat.
BOSS GREENA canned RTDcoffee that helpsto block theabsorption of fat.
Pepsi SpecialA cola product thathelps block theabsorption of fatand suppresses theincrease oftriglycerides aftermeals.
FOSHU Lineup
R&D
Annual Report 2013 Annual Report 2013
SuntoRy BeveRAge & Food Limited SuntoRy BeveRAge & Food Limited
1110
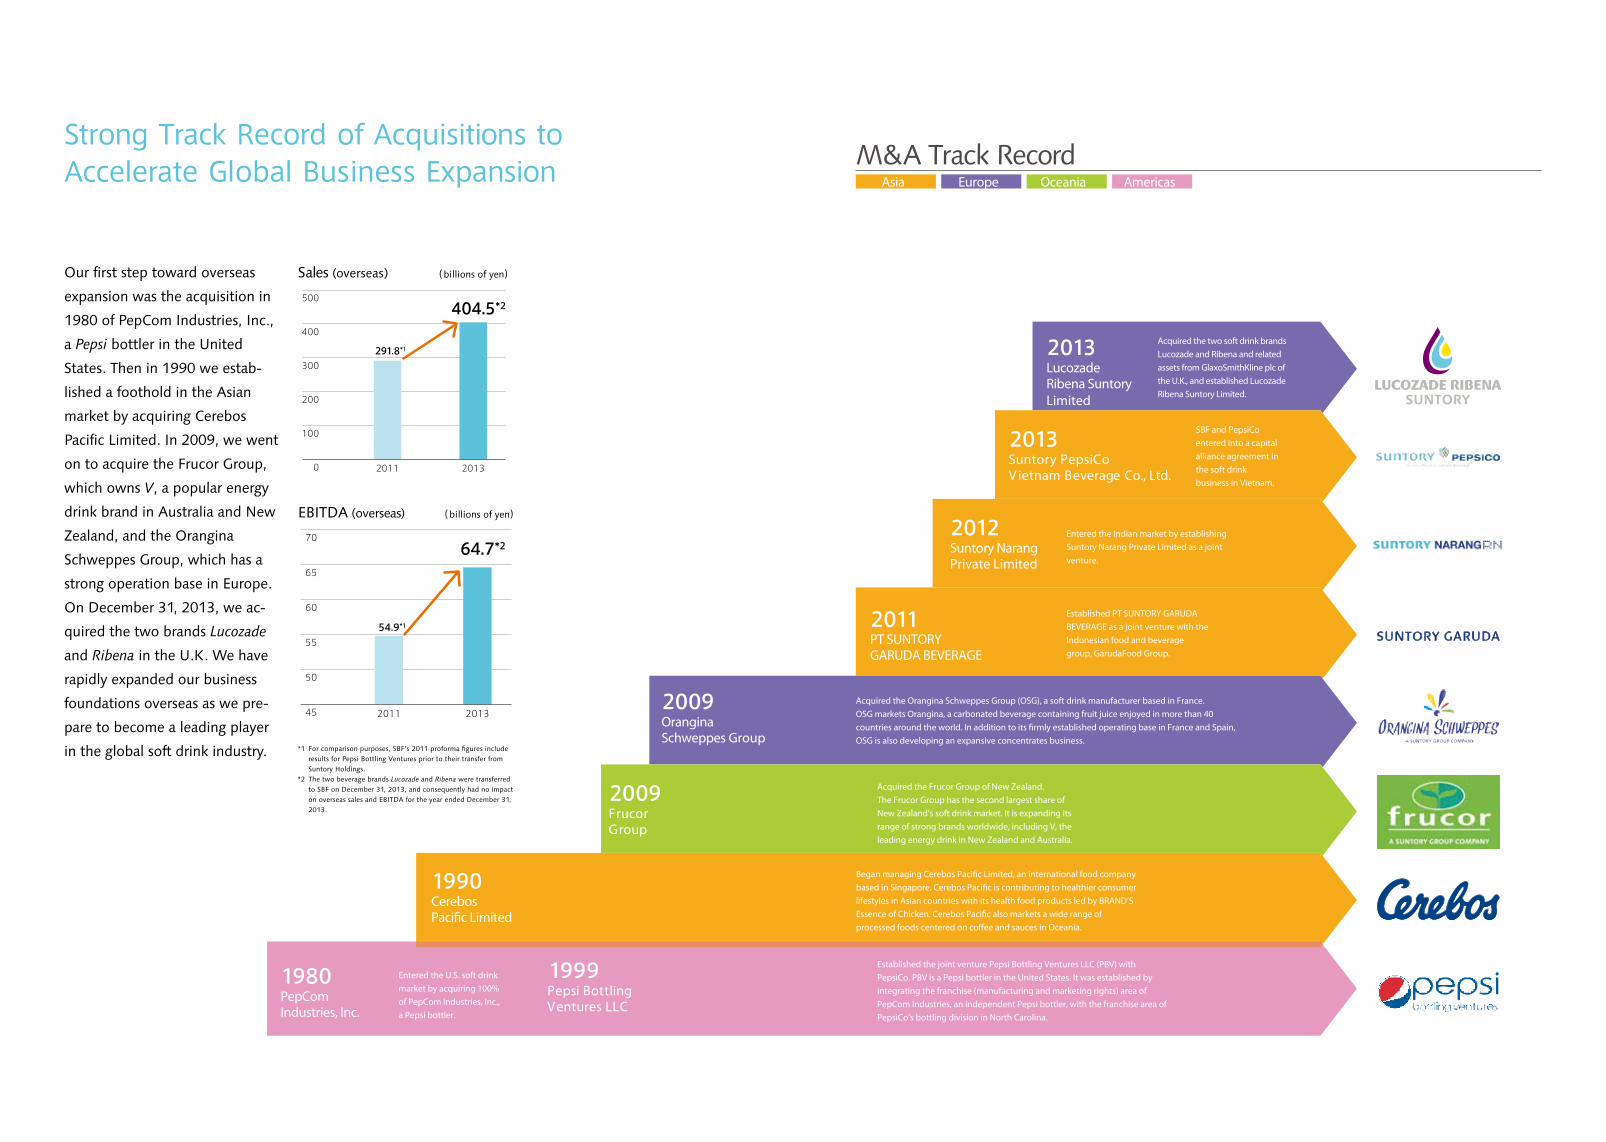
Asia Europe Oceania Americas
Lucozade Ribena Suntory Limited
2013 Acquired the two soft drink brands Lucozade and Ribena and related assets from GlaxoSmithKline plc of the U.K., and established Lucozade Ribena Suntory Limited.
Suntory PepsiCoV ietnam Beverage Co., Ltd.
2013SBF and PepsiCo entered into a capital alliance agreement in the soft drink business in Vietnam.
Suntory Narang Private Limited
2012 Entered the Indian market by establishing Suntory Narang Private Limited as a joint venture.
PT SUNTORYGARUDA BEVERAGE
2011 Established PT SUNTORY GARUDA BEVERAGE as a joint venture with the Indonesian food and beverage group, GarudaFood Group.
OranginaSchweppes Group
2009 Acquired the Orangina Schweppes Group (OSG), a soft drink manufacturer based in France. OSG markets Orangina, a carbonated beverage containing fruit juice enjoyed in more than 40 countries around the world. In addition to its �rmly established operating base in France and Spain, OSG is also developing an expansive concentrates business.
FrucorGroup
2009 Acquired the Frucor Group of New Zealand.The Frucor Group has the second largest share of New Zealand’s soft drink market. It is expanding its range of strong brands worldwide, including V, the leading energy drink in New Zealand and Australia.
Cerebos Paci�c Limited
1990 Began managing Cerebos Paci�c Limited, an international food company based in Singapore. Cerebos Paci�c is contributing to healthier consumer lifestyles in Asian countries with its health food products led by BRAND’S Essence of Chicken. Cerebos Paci�c also markets a wide range of processed foods centered on co�ee and sauces in Oceania.
PepComIndustries, Inc.
1980 Entered the U.S. soft drinkmarket by acquiring 100%of PepCom Industries, Inc.,a Pepsi bottler.
Pepsi BottlingVentures LLC
1999 Established the joint venture Pepsi Bottling Ventures LLC (PBV) with PepsiCo. PBV is a Pepsi bottler in the United States. It was established by integrating the franchise (manufacturing and marketing rights) area of PepCom Industries, an independent Pepsi bottler, with the franchise area of PepsiCo’s bottling division in North Carolina.
Strong Track Record of Acquisitions to Accelerate Global Business Expansion M&A Track Record
Sales (overseas)
EBITDA (overseas)
20132011
404.5*2
291.8*1
0
100
200
300
400
500
20132011
64.7*2
54.9*1
45
50
55
60
65
70
*1 For comparison purposes, SBF’s 2011 proforma figures include results for Pepsi Bottling Ventures prior to their transfer from Suntory Holdings.
*2 The two beverage brands Lucozade and Ribena were transferred to SBF on December 31, 2013, and consequently had no impact on overseas sales and EBITDA for the year ended December 31, 2013.
Our first step toward overseas
expansion was the acquisition in
1980 of PepCom Industries, Inc.,
a Pepsi bottler in the United
States. Then in 1990 we estab-
lished a foothold in the Asian
market by acquiring Cerebos
Pacific Limited. In 2009, we went
on to acquire the Frucor Group,
which owns V, a popular energy
drink brand in Australia and New
Zealand, and the Orangina
Schweppes Group, which has a
strong operation base in Europe.
On December 31, 2013, we ac-
quired the two brands Lucozade
and Ribena in the U.K. We have
rapidly expanded our business
foundations overseas as we pre-
pare to become a leading player
in the global soft drink industry.
(billions of yen)
(billions of yen)
Annual Report 2013 Annual Report 2013
SuntoRy BeveRAge & Food Limited SuntoRy BeveRAge & Food Limited
1312
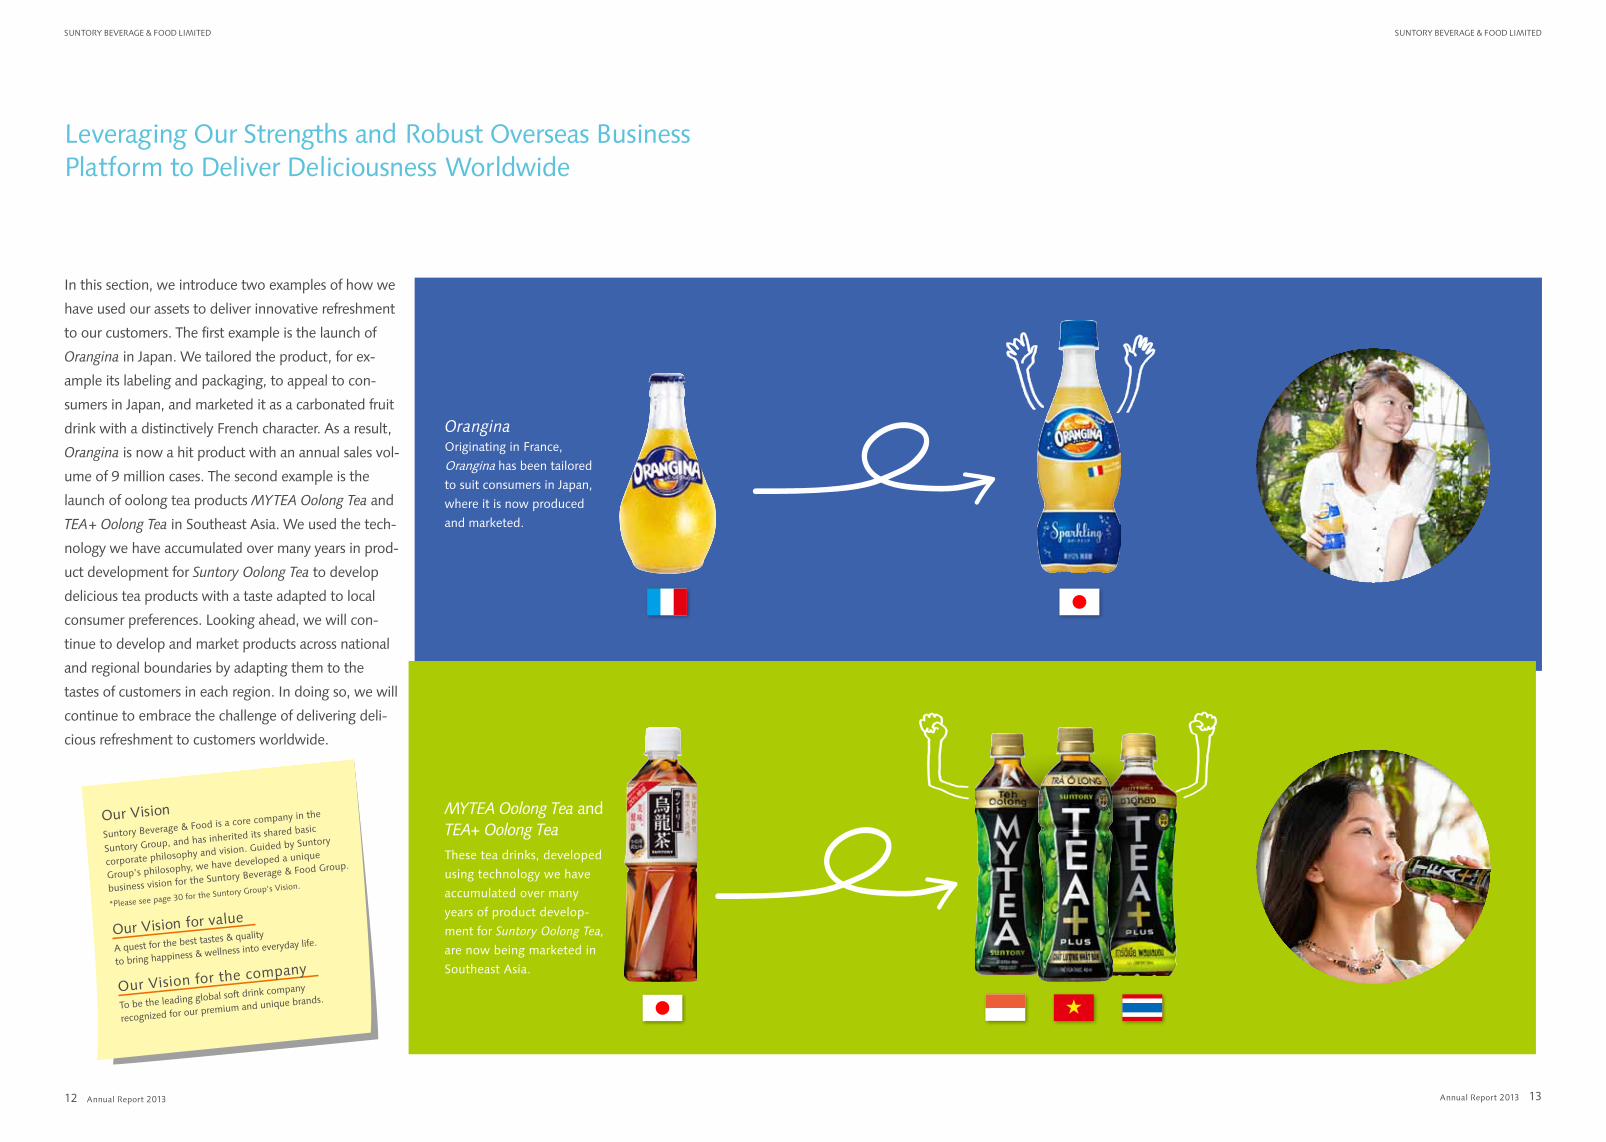
In this section, we introduce two examples of how we
have used our assets to deliver innovative refreshment
to our customers. The first example is the launch of
Orangina in Japan. We tailored the product, for ex-
ample its labeling and packaging, to appeal to con-
sumers in Japan, and marketed it as a carbonated fruit
drink with a distinctively French character. As a result,
Orangina is now a hit product with an annual sales vol-
ume of 9 million cases. The second example is the
launch of oolong tea products MYTEA Oolong Tea and
TEA + Oolong Tea in Southeast Asia. We used the tech-
nology we have accumulated over many years in prod-
uct development for Suntory Oolong Tea to develop
delicious tea products with a taste adapted to local
consumer preferences. Looking ahead, we will con-
tinue to develop and market products across national
and regional boundaries by adapting them to the
tastes of customers in each region. In doing so, we will
continue to embrace the challenge of delivering deli-
cious refreshment to customers worldwide.
OranginaOriginating in France,
Orangina has been tailored
to suit consumers in Japan,
where it is now produced
and marketed.
MYTEA Oolong Tea and TEA+ Oolong Tea These tea drinks, developed
using technology we have
accumulated over many
years of product develop-
ment for Suntory Oolong Tea,
are now being marketed in
Southeast Asia.
Our Vision
Suntory Beverage & Food is a core company in the
Suntory Group, and has inherited its shared basic
corporate philosophy and vision. Guided by Suntory
Group’s philosophy, we have developed a unique
business vision for the Suntory Beverage & Food Group.
*Please see page 30 for the Suntory Group’s Vision.
Our Vision for value
A quest for the best tastes & quality
to bring happiness & wellness into everyday life.
Our Vision for the company
To be the leading global soft drink company
recognized for our premium and unique brands.
Leveraging Our Strengths and Robust Overseas Business Platform to Deliver Deliciousness Worldwide
Europe
Europe
Oceania
Oceania
Asia
Americas
Japan
A gr
een
tea
that
use
s 100
% Ja
pane
se te
a le
aves
,
care
fully
sele
cted
by a
“cha
sho”
(mas
ter t
ea b
lend
er)
from
the
pres
tigio
us K
yoto
tea
com
pany
Fuk
ujue
n to
brin
g ou
t the
gen
uine
mel
low
flav
or o
f sto
ne-g
roun
d
mat
cha
tea
for a
ll to
enj
oy.
Iyem
on
An oolong tea tailored to suit the tastes of Japanese
consumers, w
ith a tea blend based on Wuyi rock tea
leaves, from w
hich oolong tea traces its origins.Suntory O
olong Tea
An RTD coffee that has been enjoyed for more than 20 years as “The Worker’s AIBO.”
BOSS
A drink m
ade u
sing p
opular heal
th food in
gredien
ts
such as se
aweed
and blac
k sesa
me to provid
e
effect
ive ev
eryday
rehydrat
ion.
GREEN DAKARA
An oolong tea FOSHU that helps to
block the absorption of fat.
Suntory Black Oolong Tea
ema
ses
gnin
iatn
oc
UHS
OF a
et y
elrab
Apeptide, m
aking it ideal for those with high
blood pressure.
Suntory Gom
a Mugicha
A P
epsi
FOSH
U p
rodu
ct th
at h
elps
to b
lock
the
abso
rptio
n of
fat.
Peps
i Spe
cial
A green tea FO
SHU
that helps to reduce body fat. Iyem
on Tokucha
A R
TD c
offe
e FO
SHU
that
help
s to
blo
ck th
e ab
sorp
tion
of fa
t.
BOSS
GRE
EN
A mineral w
ater sourced from
crystal-clear groundwater from
the great
outdoors of the Minam
i-Alps, Aso and Okudaisen.
Suntory Tennensui
A fruit juice drink that offers consumers the
delicious taste of fresh, juicy fruit.
natchan!A cr
isp sp
arklin
g lem
on fla
vored
drink
with
a
vitam
in C
cont
ent e
quiva
lent t
o 50 l
emon
s (50
0 ml).
C.C.
Lemon
A s
park
ling
frui
t drin
k fr
om F
ranc
e w
ith a
dist
inct
ive
refr
eshi
ng o
rang
e fla
vor a
nd n
atur
al
bitt
erne
ss. (
Prod
uced
by
SBF
in Ja
pan)
Ora
ngin
a
A ze
ro-c
alor
ie d
rink
that
offe
rs th
e fu
ll-bo
died
tast
e an
d ch
arac
teris
tic c
risp
afte
rtast
e of
a c
ola.
Peps
i NEX
ZER
O
•RTD tea •RTD coffee •Functional drink •Health supplement Mineral water •Fruit juice •Carbonate •Cola drink •Jelly drink •Energy drink •FOSHU
Energy drinks marketed in New Zealand and Australia, notable for its use of natural guarana seed extract.
V
A fr
uit a
nd v
eget
able
juic
e br
and
offe
ring
a w
ide
rang
e of
flav
ors
cent
ered
on
trop
ical
frui
ts.
Just
Jui
ce
An
ener
gy d
rink
that
com
man
ds t
he t
op
sale
s sh
are*
of U
.K. e
nerg
y dr
inks
.
Luco
zade
Ene
rgy
A functional drink that commands the top sales
share* of the U.K. sports drink market.
Lucozade Sport
A b
lack
curr
ant (
cass
is) f
lavo
red
fruit
juic
e th
at
was
orig
inal
ly la
unch
ed in
193
8.
Ribe
na
A natural fruit juice w
ith no artificial
colors or preservatives.O
asis
A s
park
ling
oran
ge fr
uit d
rink
mar
kete
d in
mor
e th
an 4
0 countries
around the world.
Ora
ngin
a
A carbonated soft drink available in a m
ultitude
of flavors.
Schweppes
A gree
n te
a dev
elope
d us
ing J
apan
ese
tech
nolo
gies t
o su
it lo
cal t
aste
s.
Mira
i
An oolong tea designed using know-how
developed for Suntory Oolong Tea w
ith unique
flavors to suit Indonesian taste preferences.
MYTEA O
olong Tea
A refreshing flavored tea available in fresh fruit flavors such as apple, mango and guava.
Mountea
Suntory brand RTD coffee beverage characterized by a strong sweetness and satisfying taste.
De'Koffie
A jelly drink in a cup packaging, available in a full range of fruit flavors.
Okky Jelly DrinkAn all natural health food supplement that is made from extracts of fine quality chicken in an easily digestible form.
BRAND’S Essence of Chicken
A brand of health foods made from bird’s nests, containing ingredients that help maintain youthful skin.
BRAND’S Bird’s Nest
A range of 100% fruit/vegetable juices
marketed in Thailand.
TipCo Brand Juices
An energy drink packed w
ith nutrients such
as taurine and B vitamins, recom
mended
on busy days or before intensive sports activities.Sting
A citrus flavored soft drink notable for providing
a refreshing jolt and being easy to gulp down.
Mountain D
ew
An ic
onic
col
a dr
ink
know
n fo
r its
spar
klin
g
effe
rves
cenc
e an
d its
smoo
th, r
efre
shin
g ch
arac
ter.
Peps
i
An oolong tea created using the know-
how developed for Suntory Oolong Tea.
Marketed in Vietnam
and Thailand.
TEA+ Oolong Tea
•
*Source: Euromonitor, 2013CY, Off-trade Volume
*Bottling operations in North Carolina.
Annual Report 2013 Annual Report 2013
SuntoRy BeveRAge & Food Limited SuntoRy BeveRAge & Food Limited
1514
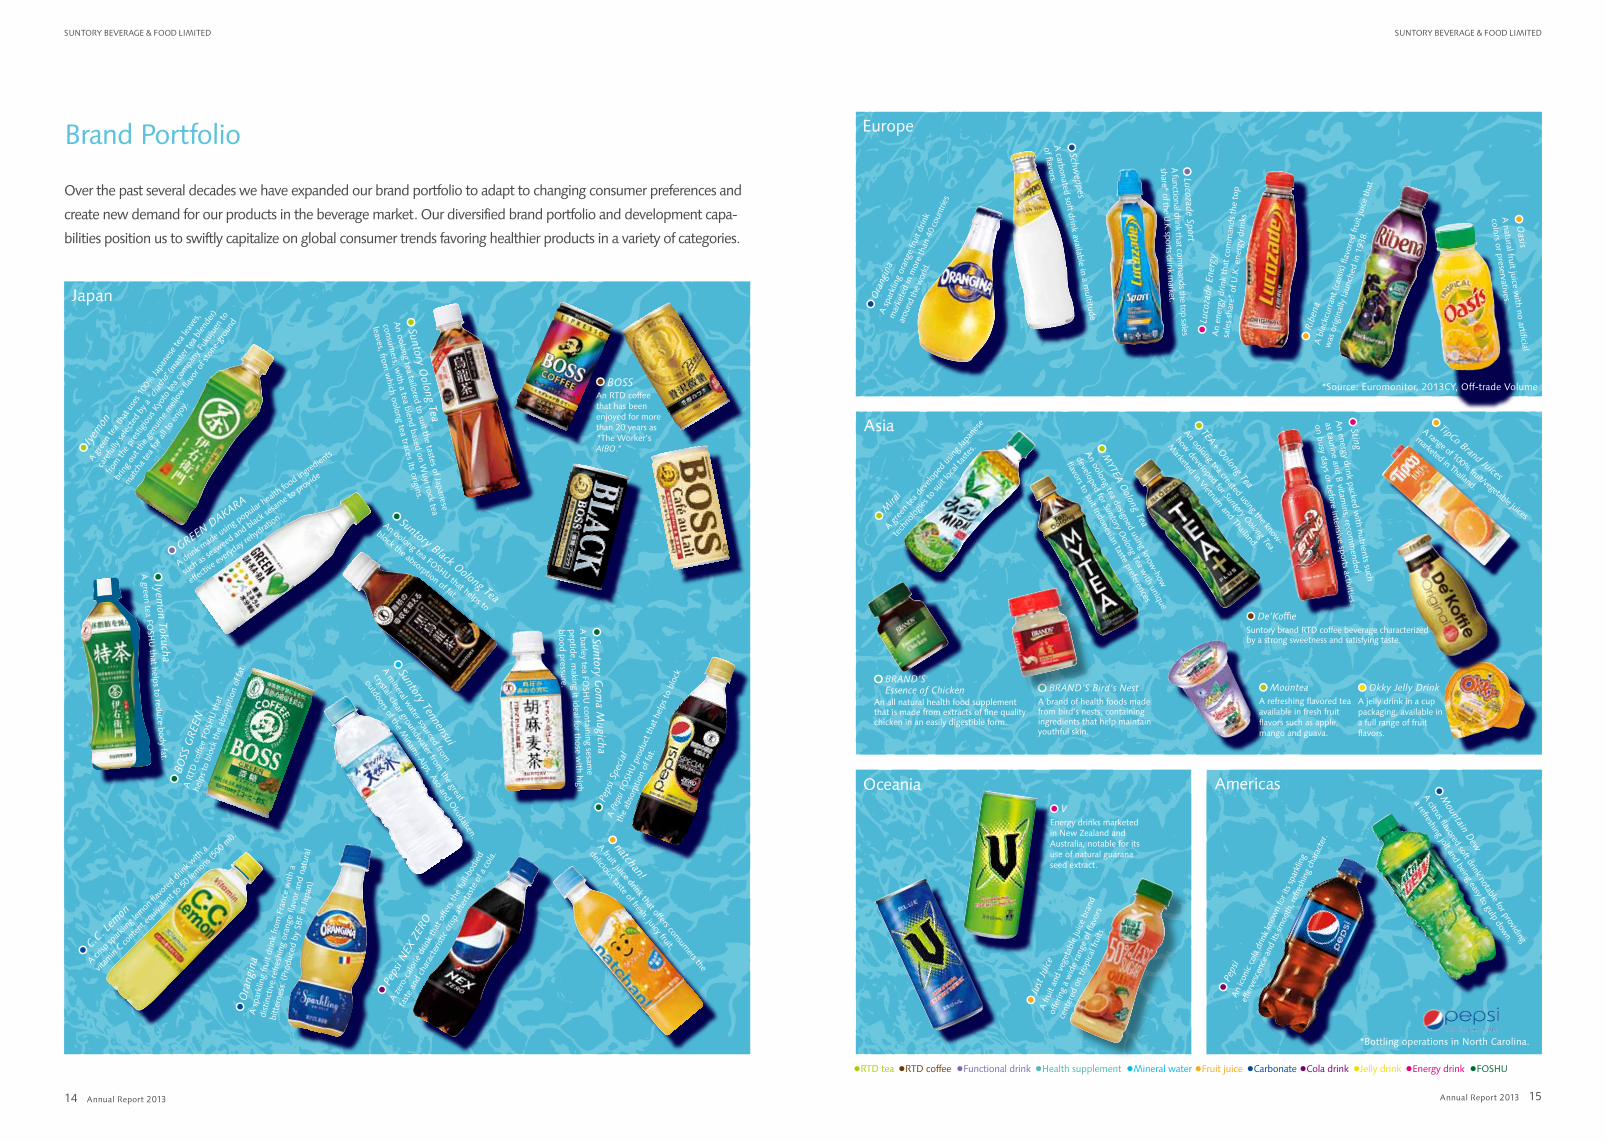
Brand Portfolio
Over the past several decades we have expanded our brand portfolio to adapt to changing consumer preferences and
create new demand for our products in the beverage market. Our diversified brand portfolio and development capa-
bilities position us to swiftly capitalize on global consumer trends favoring healthier products in a variety of categories.
Annual Report 2013 Annual Report 2013
SuntoRy BeveRAge & Food Limited SuntoRy BeveRAge & Food Limited
1716
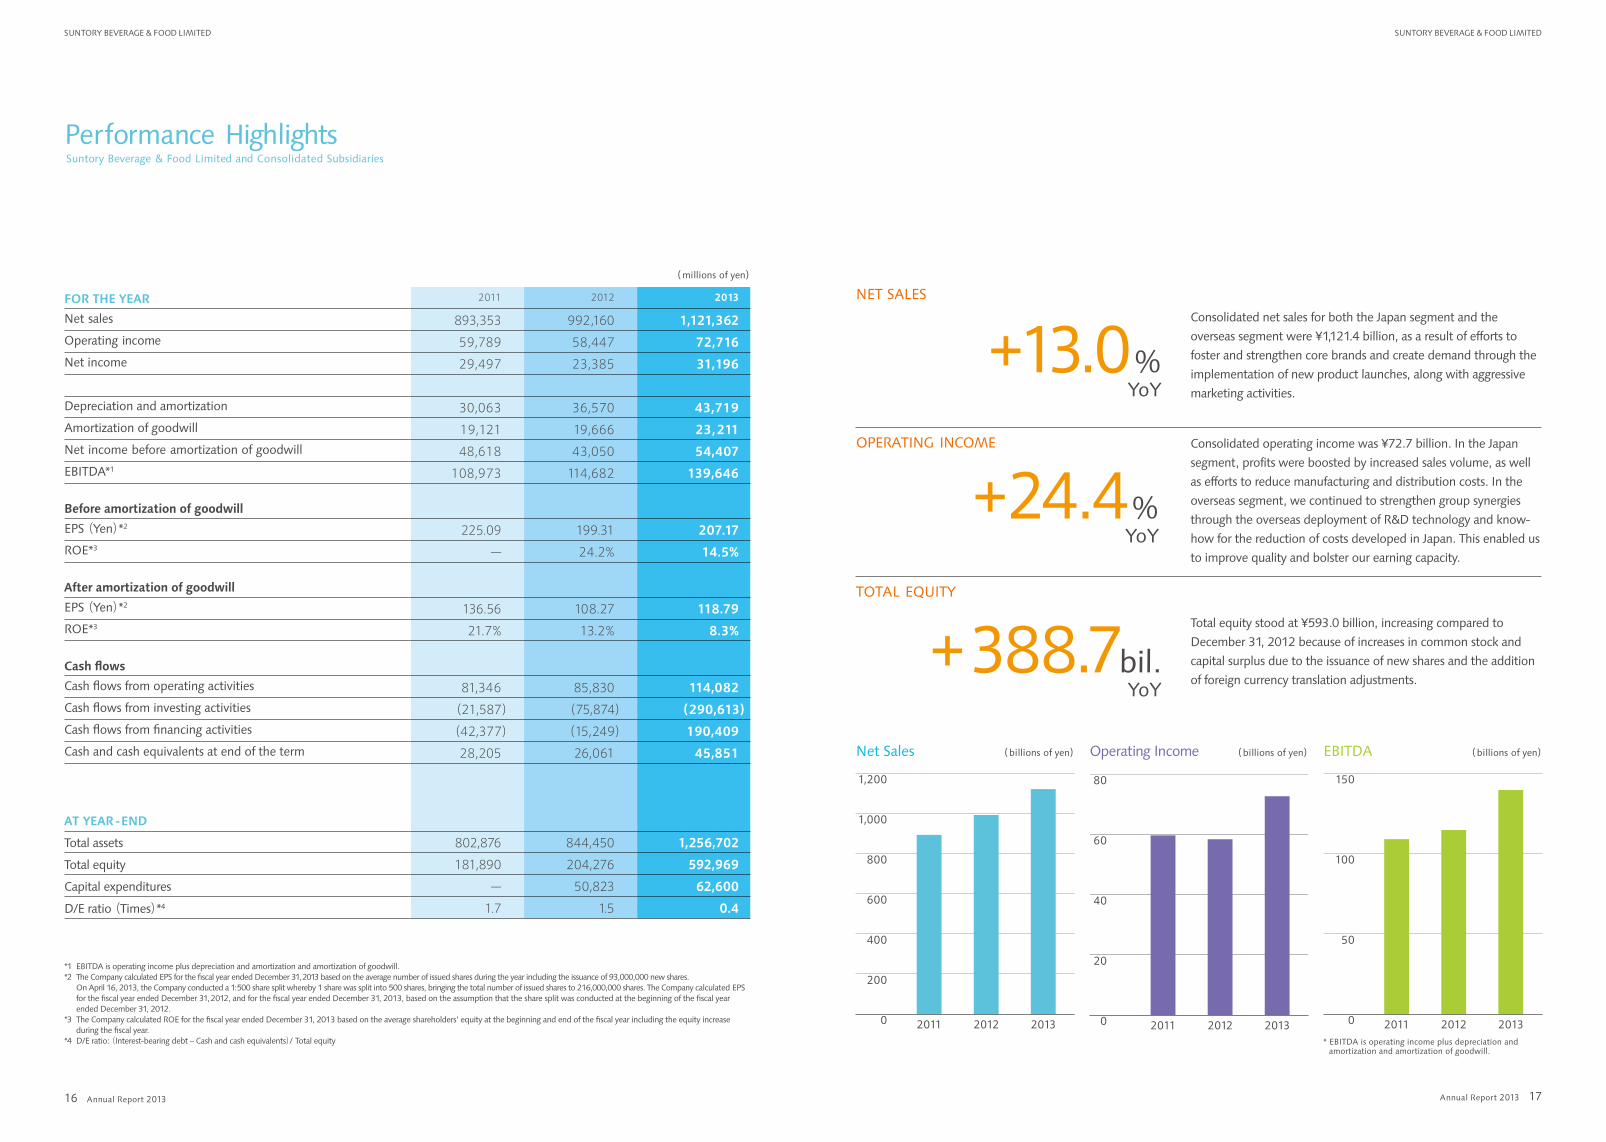
Consolidated net sales for both the Japan segment and the
overseas segment were ¥1,121.4 billion, as a result of efforts to
foster and strengthen core brands and create demand through the
implementation of new product launches, along with aggressive
marketing activities.
Consolidated operating income was ¥72.7 billion. In the Japan
segment, profits were boosted by increased sales volume, as well
as efforts to reduce manufacturing and distribution costs. In the
overseas segment, we continued to strengthen group synergies
through the overseas deployment of R&D technology and know-
how for the reduction of costs developed in Japan. This enabled us
to improve quality and bolster our earning capacity.
Total equity stood at ¥593.0 billion, increasing compared to
December 31, 2012 because of increases in common stock and
capital surplus due to the issuance of new shares and the addition
of foreign currency translation adjustments.
+13.0%
YoY
+24.4%
YoY
+388.7bil.
YoY
Suntory Beverage & Food Limited and Consolidated Subsidiaries
(millions of yen)
FOR THE YEAR 2011 2012 2013
Net sales 893,353 992,160 1,121,362Operating income 59,789 58,447 72,716Net income 29,497 23,385 31,196
Depreciation and amortization 30,063 36,570 43,719Amortization of goodwill 19,121 19,666 23,211Net income before amortization of goodwill 48,618 43,050 54,407EBITDA*1 108,973 114,682 139,646
Before amortization of goodwill
EPS (Yen)*2 225.09 199.31 207.17ROE*3 — 24.2% 14.5%
After amortization of goodwill
EPS (Yen)*2 136.56 108.27 118.79ROE*3 21.7% 13.2% 8.3%
Cash flows
Cash flows from operating activities 81,346 85,830 114,082Cash flows from investing activities (21,587) (75,874) (290,613)Cash flows from financing activities (42,377) (15,249) 190,409Cash and cash equivalents at end of the term 28,205 26,061 45,851
AT YEAR-EnD
Total assets 802,876 844,450 1,256,702
Total equity 181,890 204,276 592,969
Capital expenditures — 50,823 62,600
D/E ratio (Times)*4 1.7 1.5 0.4
*1 EBITDA is operating income plus depreciation and amortization and amortization of goodwill.*2 The Company calculated EPS for the fiscal year ended December 31, 2013 based on the average number of issued shares during the year including the issuance of 93,000,000 new shares. On April 16, 2013, the Company conducted a 1:500 share split whereby 1 share was split into 500 shares, bringing the total number of issued shares to 216,000,000 shares. The Company calculated EPS
for the fiscal year ended December 31, 2012, and for the fiscal year ended December 31, 2013, based on the assumption that the share split was conducted at the beginning of the fiscal year ended December 31, 2012.
*3 The Company calculated ROE for the fiscal year ended December 31, 2013 based on the average shareholders’ equity at the beginning and end of the fiscal year including the equity increase during the fiscal year.
*4 D/E ratio: (Interest-bearing debt – Cash and cash equivalents)/ Total equity
2013201220110
200
400
600
800
1,000
1,200
2013201220110
20
40
60
80
2013201220110
50
100
150
Net Sales (billions of yen)
NET SALES
OPERATING INCOME
TOTAL EQUITY
Operating Income (billions of yen) EBITDA (billions of yen)
* EBITDA is operating income plus depreciation and amortization and amortization of goodwill.
Performance Highlights
Annual Report 2013 Annual Report 2013
SuntoRy BeveRAge & Food Limited SuntoRy BeveRAge & Food Limited
1918
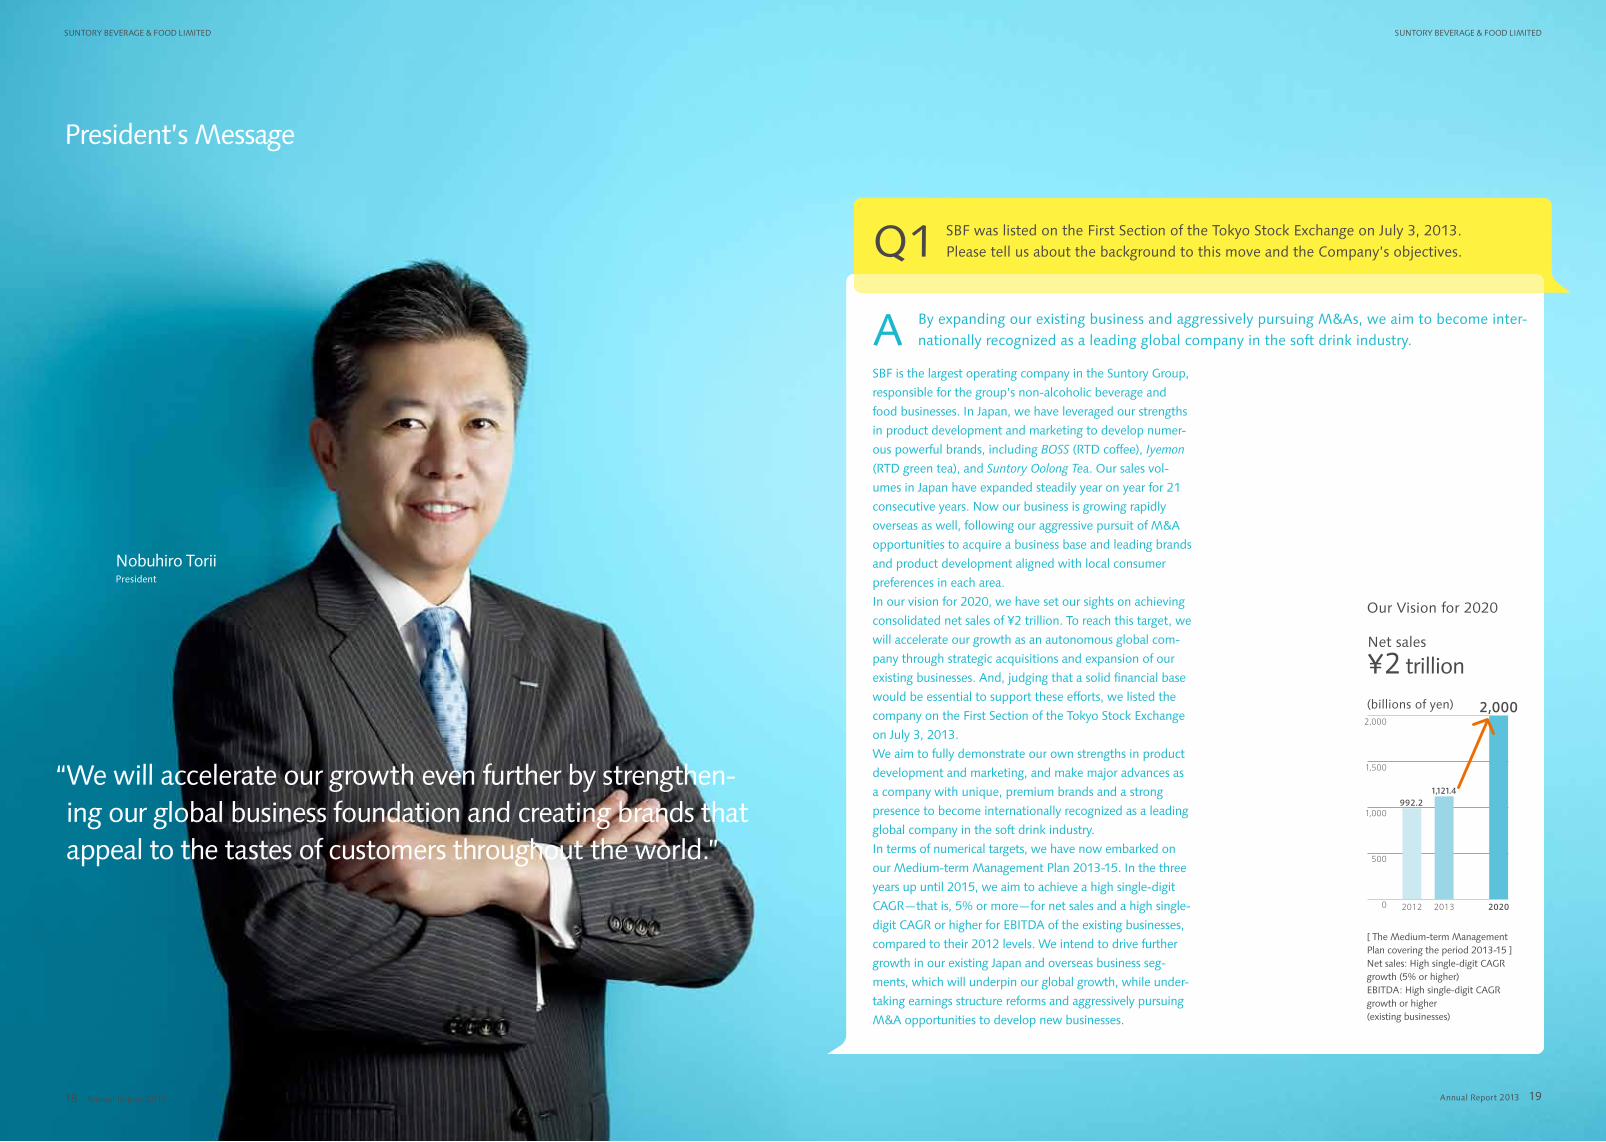
President’s Message
“We will accelerate our growth even further by strengthen-ing our global business foundation and creating brands that appeal to the tastes of customers throughout the world.”
SBF is the largest operating company in the Suntory Group,
responsible for the group’s non-alcoholic beverage and
food businesses. In Japan, we have leveraged our strengths
in product development and marketing to develop numer-
ous powerful brands, including BOSS (RTD coffee), Iyemon
(RTD green tea), and Suntory Oolong Tea. Our sales vol-
umes in Japan have expanded steadily year on year for 21
consecutive years. Now our business is growing rapidly
overseas as well, following our aggressive pursuit of M&A
opportunities to acquire a business base and leading brands
and product development aligned with local consumer
preferences in each area.
In our vision for 2020, we have set our sights on achieving
consolidated net sales of ¥2 trillion. To reach this target, we
will accelerate our growth as an autonomous global com-
pany through strategic acquisitions and expansion of our
existing businesses. And, judging that a solid financial base
would be essential to support these efforts, we listed the
company on the First Section of the Tokyo Stock Exchange
on July 3, 2013.
We aim to fully demonstrate our own strengths in product
development and marketing, and make major advances as
a company with unique, premium brands and a strong
presence to become internationally recognized as a leading
global company in the soft drink industry.
In terms of numerical targets, we have now embarked on
our Medium-term Management Plan 2013-15. In the three
years up until 2015, we aim to achieve a high single-digit
CAGR—that is, 5% or more—for net sales and a high single-
digit CAGR or higher for EBITDA of the existing businesses,
compared to their 2012 levels. We intend to drive further
growth in our existing Japan and overseas business seg-
ments, which will underpin our global growth, while under-
taking earnings structure reforms and aggressively pursuing
M&A opportunities to develop new businesses.
Q1 SBF was listed on the First Section of the Tokyo Stock Exchange on July 3, 2013. Please tell us about the background to this move and the Company’s objectives.
A By expanding our existing business and aggressively pursuing M&As, we aim to become inter-nationally recognized as a leading global company in the soft drink industry.
Nobuhiro ToriiPresident
Our Vision for 2020
2020201320120
500
1,000
1,500
2,000
992.2
2,000
1,121.4
(billions of yen)
Net sales
¥2 trillion
[ The Medium-term Management Plan covering the period 2013-15 ]Net sales: High single-digit CAGR growth (5% or higher)EBITDA: High single-digit CAGR growth or higher (existing businesses)
Annual Report 2013 Annual Report 2013
SuntoRy BeveRAge & Food Limited SuntoRy BeveRAge & Food Limited
2120
Crédits Photo © Thomas Bismuth
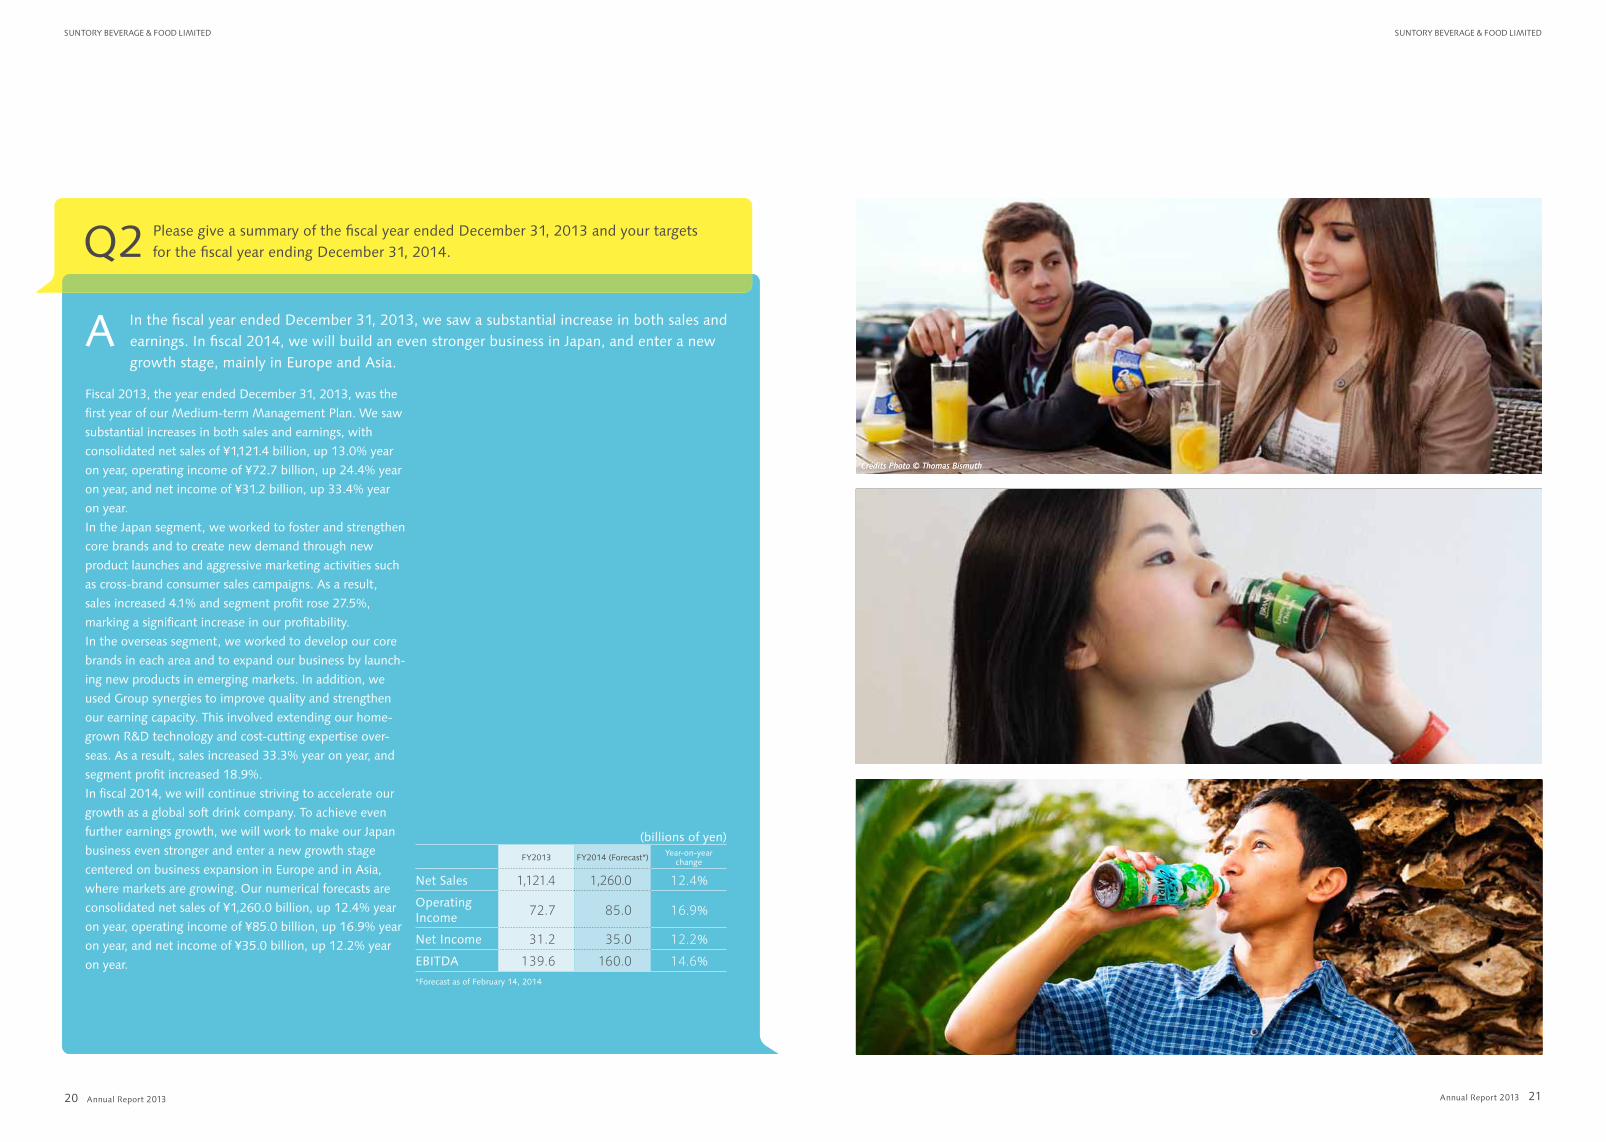
Fiscal 2013, the year ended December 31, 2013, was the
first year of our Medium-term Management Plan. We saw
substantial increases in both sales and earnings, with
consolidated net sales of ¥1,121.4 billion, up 13.0% year
on year, operating income of ¥72.7 billion, up 24.4% year
on year, and net income of ¥31.2 billion, up 33.4% year
on year.
In the Japan segment, we worked to foster and strengthen
core brands and to create new demand through new
product launches and aggressive marketing activities such
as cross-brand consumer sales campaigns. As a result,
sales increased 4.1% and segment profit rose 27.5%,
marking a significant increase in our profitability.
In the overseas segment, we worked to develop our core
brands in each area and to expand our business by launch-
ing new products in emerging markets. In addition, we
used Group synergies to improve quality and strengthen
our earning capacity. This involved extending our home-
grown R&D technology and cost-cutting expertise over-
seas. As a result, sales increased 33.3% year on year, and
segment profit increased 18.9%.
In fiscal 2014, we will continue striving to accelerate our
growth as a global soft drink company. To achieve even
further earnings growth, we will work to make our Japan
business even stronger and enter a new growth stage
centered on business expansion in Europe and in Asia,
where markets are growing. Our numerical forecasts are
consolidated net sales of ¥1,260.0 billion, up 12.4% year
on year, operating income of ¥85.0 billion, up 16.9% year
on year, and net income of ¥35.0 billion, up 12.2% year
on year.
Q2 Please give a summary of the fiscal year ended December 31, 2013 and your targets for the fiscal year ending December 31, 2014.
A In the fiscal year ended December 31, 2013, we saw a substantial increase in both sales and earnings. In fiscal 2014, we will build an even stronger business in Japan, and enter a new growth stage, mainly in Europe and Asia.
Crédits Photo © Thomas Bismuth
(billions of yen)
FY2013 FY2014 (Forecast*) Year-on-year change
Net Sales 1,121.4 1,260.0 12.4%
Operating Income 72.7 85.0 16.9%
Net Income 31.2 35.0 12.2%
EBITDA 139.6 160.0 14.6%
*Forecast as of February 14, 2014
Annual Report 2013 Annual Report 2013
SuntoRy BeveRAge & Food Limited SuntoRy BeveRAge & Food Limited
2322
Q4 Please talk about your initiatives for continuously increasing SBF’s corporate value.
Could you please give your closing message to shareholders and investors.
We will continue to grow in the tradition of the Suntory
Group, exemplified by the corporate motto, Yatte
Minahare–Go for it! We will propose unique products
tailored to meet the taste preferences of our customers in
various countries as we strive to become a leading global
soft drink company and meet the expectations of our
shareholders by continuously increasing our corporate
value. I ask for your continued support for our endeavors.
We have a corporate mission of “In Harmony with People
and Nature.” This informs our activities as a company that
provides soft drinks—we work to protect the earth’s
valuable water resources, to protect the environment that
provides that water, and to provide safe, reliable, high
quality products and services.
Management is also included in this. As a global
company, we strive to promote sound management and
to build a high level of trust in our relationships with
stakeholders. We are also working to strengthen our
corporate governance.
We also recognize that returning profits to our sharehold-
ers is one of our most important management tasks. Our
basic policy is to aim for a consolidated dividend payout
ratio of 30% or more of net income before amortization
of goodwill, giving overall consideration to the business
environment and performance, and prioritizing strategic
investments and capital expenditures aimed at promoting
sustained profit growth and increased corporate value.
A We are aiming to grow sustainably by providing safe, reliable, high quality products and building trust in our relationships with our stakeholders.
The type of value we want to offer customers worldwide is
encapsulated in our slogan, “A quest for the best tastes &
quality to bring happiness & wellness into everyday life.”
Having set out our vision for achieving consolidated net
sales of ¥2 trillion by 2020, we have adopted the following
policies for achieving it: 1) strengthen core brands and
create new demand in our domestic business, 2) strength-
en the business foundation focused on key areas in our
overseas business, and 3) develop new business by aggres-
sively pursuing M&A opportunities.
There is no clever scheme for implementing these policies—
the only real approach is to accurately grasp customer needs
in Japan and each area overseas, swiftly develop products to
meet those needs, and deliver them to customers.
We are expecting competition to intensify in our domes-
tic business. To meet this challenge, as well as continuing
to focus on strengthening our existing core brands, we
will develop products by leveraging our powerful brand-
ing capabilities. We will strive to create new demand by
fostering and reinforcing high value-added FOSHU prod-
ucts, and developing products that offer SBF’s unique and
inimitable value.
In responding to the needs of Japanese consumers as their
tastes have diversified, we have developed strengths in
product development and marketing. I believe we can fully
demonstrate these abilities on the global stage too. For
example, there is increasing demand around the world
related to people seeking to be healthier, and this has
created potential for a global expansion in demand for tea
beverages. In fact, the Suntory brand authentic green tea
beverages Mirai, MYTEA Oolong Tea, and TEA+ Oolong Tea,
developed with tea beverage technology cultivated in
Japan, are now seeding new markets in Southeast Asia.
In our overseas business, we will not only drive business
expansion by introducing Suntory brands like this, but aim
to achieve continuous business growth by promoting
synergy creation through the sales of strong brands that
straddle national and corporate boundaries and the transfer
of Japan’s advanced beverage production technologies to
other parts of Suntory Beverage & Food Limited Group (the
Group).
In addition to growing our existing businesses in Japan and
overseas, we will also expand our business through aggres-
sive pursuit of M&A opportunities. For SBF, M&As are
premised on targets that match with our strategy, have a
strong brand and a strong distribution platform. Guided by
these premises, in 2009, we acquired the Frucor Group in
New Zealand and the Orangina Schweppes Group in France.
Then, in 2013, we acquired Lucozade and Ribena, two
leading brands with established businesses in the U.K.,
Africa, and Asia.
Now, having secured a business foundation in Europe and
Asia, to a certain extent, we will take our global manage-
ment framework to the next level. Specifically, we will
position Suntory Beverage & Food Asia Pte. Ltd. and the
newly established Suntory Beverage & Food Europe Limited
as regional managing companies and advance our manage-
ment from an individual company basis to a regional basis.
The change will give us the speed to respond flexibly to
customer needs and market changes at the regional level,
helping us to accelerate business growth.
Looking at our medium- to long-term direction, we will
continue to develop our businesses globally, including
Africa, the Middle East and emerging markets, with the aim
of increasing the share of overseas business sales.
Q3 What kind of strategies do you have in mind for achieving the vision for 2020 of consolidated net sales of ¥2 trillion?
A We will utilize our strengths in product development and marketing to drive faster growth in our Japan and overseas segments.
Nobuhiro ToriiPresident
Annual Report 2013 Annual Report 2013
SuntoRy BeveRAge & Food Limited SuntoRy BeveRAge & Food Limited
2524
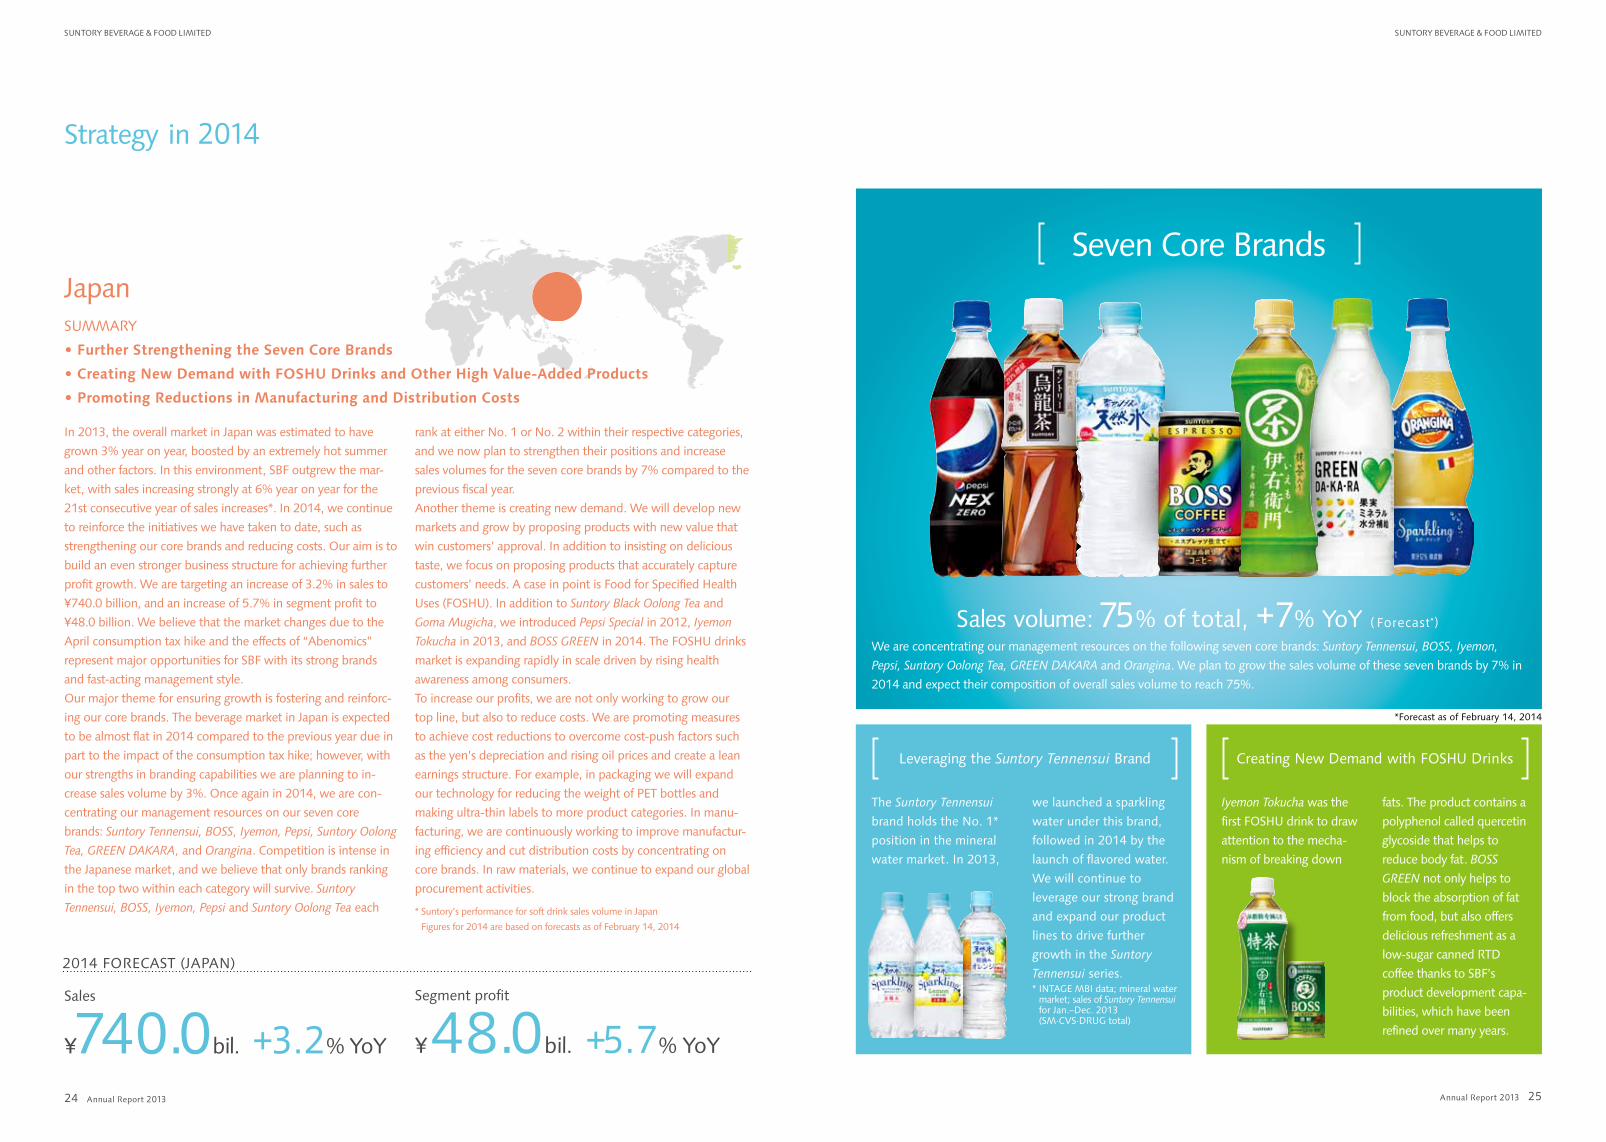
Leveraging the Suntory Tennensui Brand Creating New Demand with FOSHU Drinks
The Suntory Tennensui
brand holds the No. 1*
position in the mineral
water market. In 2013,
Iyemon Tokucha was the
first FOSHU drink to draw
attention to the mecha-
nism of breaking down
we launched a sparkling
water under this brand,
followed in 2014 by the
launch of flavored water.
We will continue to
leverage our strong brand
and expand our product
lines to drive further
growth in the Suntory
Tennensui series.* INTAGE MBI data; mineral water
market; sales of Suntory Tennensui for Jan.–Dec. 2013 (SM·CVS·DRUG total)
fats. The product contains a
polyphenol called quercetin
glycoside that helps to
reduce body fat. BOSS
GREEN not only helps to
block the absorption of fat
from food, but also offers
delicious refreshment as a
low-sugar canned RTD
coffee thanks to SBF’s
product development capa-
bilities, which have been
refined over many years.
Sales volume: 75% of total, +7% YoY ( Forecast*)
We are concentrating our management resources on the following seven core brands: Suntory Tennensui, BOSS, Iyemon,
Pepsi, Suntory Oolong Tea, GREEN DAKARA and Orangina. We plan to grow the sales volume of these seven brands by 7% in
2014 and expect their composition of overall sales volume to reach 75%.
Seven Core Brands
In 2013, the overall market in Japan was estimated to have
grown 3% year on year, boosted by an extremely hot summer
and other factors. In this environment, SBF outgrew the mar-
ket, with sales increasing strongly at 6% year on year for the
21st consecutive year of sales increases*. In 2014, we continue
to reinforce the initiatives we have taken to date, such as
strengthening our core brands and reducing costs. Our aim is to
build an even stronger business structure for achieving further
profit growth. We are targeting an increase of 3.2% in sales to
¥740.0 billion, and an increase of 5.7% in segment profit to
¥48.0 billion. We believe that the market changes due to the
April consumption tax hike and the effects of “Abenomics”
represent major opportunities for SBF with its strong brands
and fast-acting management style.
Our major theme for ensuring growth is fostering and reinforc-
ing our core brands. The beverage market in Japan is expected
to be almost flat in 2014 compared to the previous year due in
part to the impact of the consumption tax hike; however, with
our strengths in branding capabilities we are planning to in-
crease sales volume by 3%. Once again in 2014, we are con-
centrating our management resources on our seven core
brands: Suntory Tennensui, BOSS, Iyemon, Pepsi, Suntory Oolong
Tea, GREEN DAKARA, and Orangina. Competition is intense in
the Japanese market, and we believe that only brands ranking
in the top two within each category will survive. Suntory
Tennensui, BOSS, Iyemon, Pepsi and Suntory Oolong Tea each
rank at either No. 1 or No. 2 within their respective categories,
and we now plan to strengthen their positions and increase
sales volumes for the seven core brands by 7% compared to the
previous fiscal year.
Another theme is creating new demand. We will develop new
markets and grow by proposing products with new value that
win customers’ approval. In addition to insisting on delicious
taste, we focus on proposing products that accurately capture
customers’ needs. A case in point is Food for Specified Health
Uses (FOSHU). In addition to Suntory Black Oolong Tea and
Goma Mugicha, we introduced Pepsi Special in 2012, Iyemon
Tokucha in 2013, and BOSS GREEN in 2014. The FOSHU drinks
market is expanding rapidly in scale driven by rising health
awareness among consumers.
To increase our profits, we are not only working to grow our
top line, but also to reduce costs. We are promoting measures
to achieve cost reductions to overcome cost-push factors such
as the yen’s depreciation and rising oil prices and create a lean
earnings structure. For example, in packaging we will expand
our technology for reducing the weight of PET bottles and
making ultra-thin labels to more product categories. In manu-
facturing, we are continuously working to improve manufactur-
ing efficiency and cut distribution costs by concentrating on
core brands. In raw materials, we continue to expand our global
procurement activities.
* Suntory’s performance for soft drink sales volume in Japan
Figures for 2014 are based on forecasts as of February 14, 2014
SUMMARY
• Further Strengthening the Seven Core Brands
• Creating New Demand with FOSHU Drinks and Other High Value-Added Products
• Promoting Reductions in Manufacturing and Distribution Costs
Japan
Sales
¥740.0bil. +3.2% YoY
Segment profit
¥48.0bil. +5.7% YoY
Strategy in 2014
2014 FORECAST (JAPAN)
*Forecast as of February 14, 2014
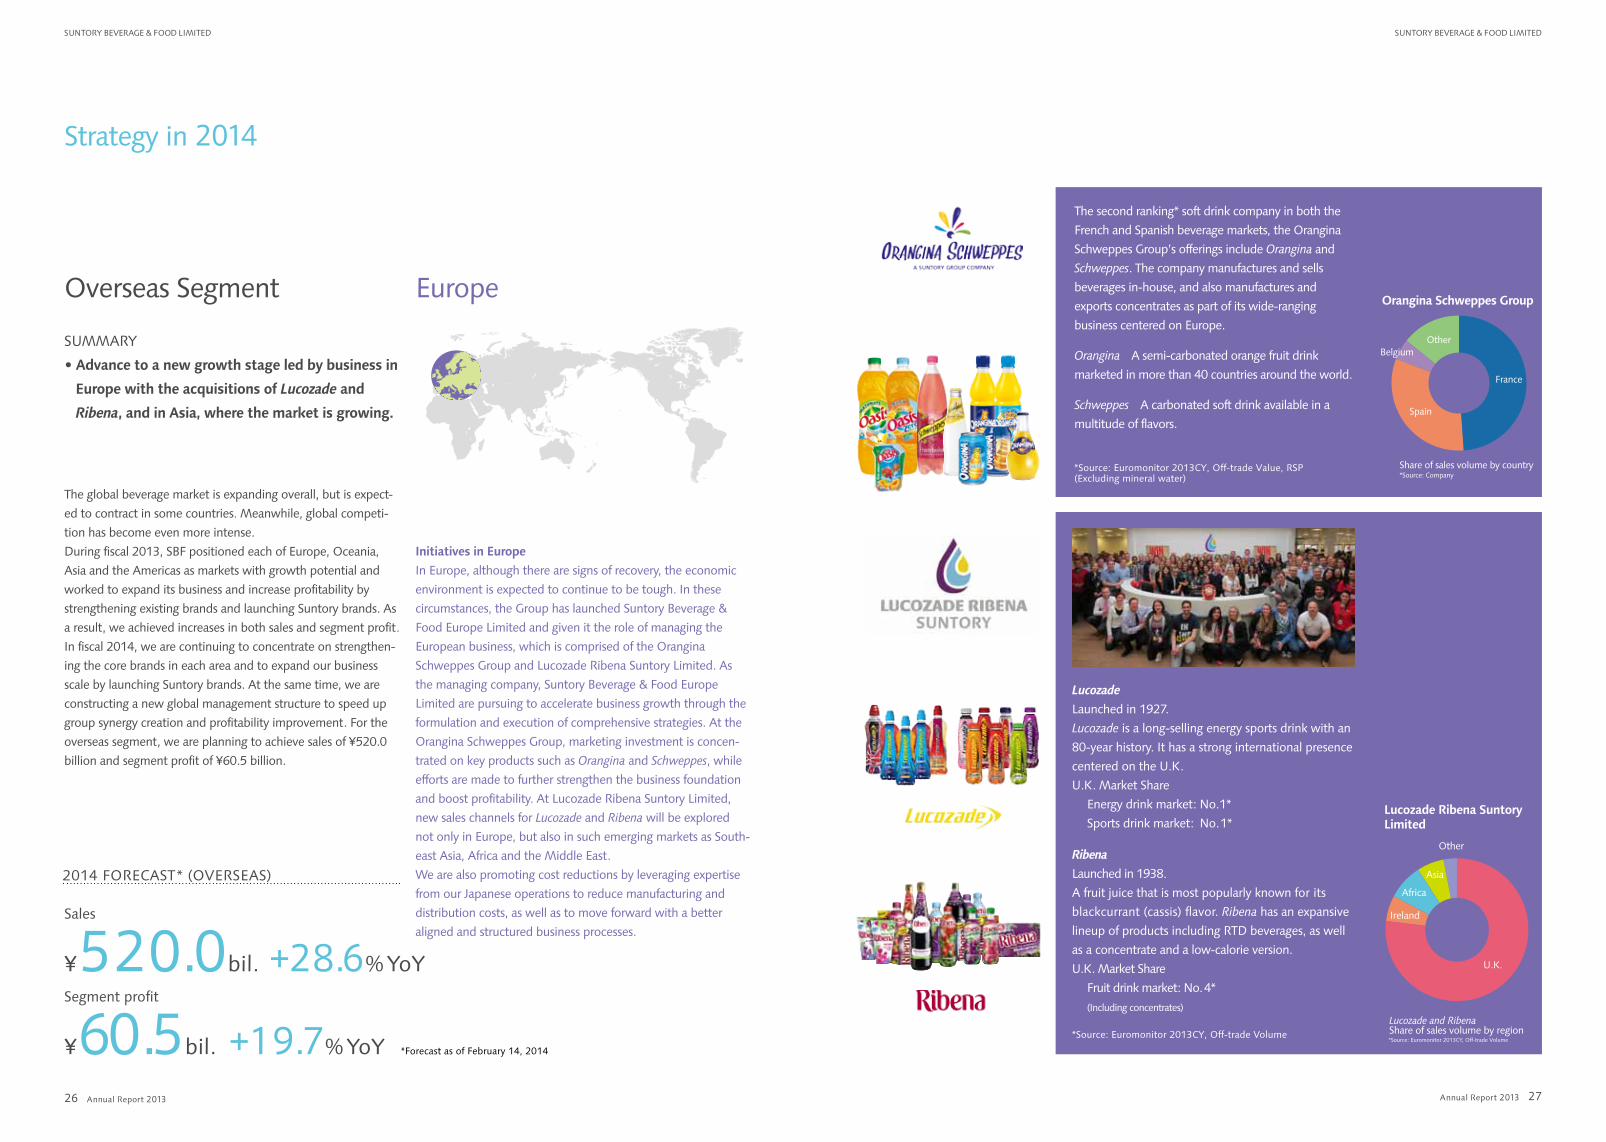
Orangina Schweppes Group
Lucozade Ribena Suntory Limited
Other
Share of sales volume by country*Source: Company
France
Spain
Belgium
Lucozade and RibenaShare of sales volume by region
Other
U.K.
Ireland
Africa
Asia
*Source: Euromonitor 2013CY, Off-trade Volume
Annual Report 2013 Annual Report 2013
SuntoRy BeveRAge & Food Limited SuntoRy BeveRAge & Food Limited
2726
The second ranking* soft drink company in both the
French and Spanish beverage markets, the Orangina
Schweppes Group’s offerings include Orangina and
Schweppes. The company manufactures and sells
beverages in-house, and also manufactures and
exports concentrates as part of its wide-ranging
business centered on Europe.
Orangina A semi-carbonated orange fruit drink
marketed in more than 40 countries around the world.
Schweppes A carbonated soft drink available in a
multitude of flavors.
*Source: Euromonitor 2013CY, Off-trade Value, RSP (Excluding mineral water)
Strategy in 2014
Lucozade
Launched in 1927.
Lucozade is a long-selling energy sports drink with an
80-year history. It has a strong international presence
centered on the U.K.
U.K. Market Share
Energy drink market: No. 1*
Sports drink market: No. 1*
Ribena
Launched in 1938.
A fruit juice that is most popularly known for its
blackcurrant (cassis) flavor. Ribena has an expansive
lineup of products including RTD beverages, as well
as a concentrate and a low-calorie version.
U.K. Market Share
Fruit drink market: No. 4*
(Including concentrates)
*Source: Euromonitor 2013CY, Off-trade Volume
The global beverage market is expanding overall, but is expect-
ed to contract in some countries. Meanwhile, global competi-
tion has become even more intense.
During fiscal 2013, SBF positioned each of Europe, Oceania,
Asia and the Americas as markets with growth potential and
worked to expand its business and increase profitability by
strengthening existing brands and launching Suntory brands. As
a result, we achieved increases in both sales and segment profit.
In fiscal 2014, we are continuing to concentrate on strengthen-
ing the core brands in each area and to expand our business
scale by launching Suntory brands. At the same time, we are
constructing a new global management structure to speed up
group synergy creation and profitability improvement. For the
overseas segment, we are planning to achieve sales of ¥520.0
billion and segment profit of ¥60.5 billion.
Initiatives in Europe
In Europe, although there are signs of recovery, the economic
environment is expected to continue to be tough. In these
circumstances, the Group has launched Suntory Beverage &
Food Europe Limited and given it the role of managing the
European business, which is comprised of the Orangina
Schweppes Group and Lucozade Ribena Suntory Limited. As
the managing company, Suntory Beverage & Food Europe
Limited are pursuing to accelerate business growth through the
formulation and execution of comprehensive strategies. At the
Orangina Schweppes Group, marketing investment is concen-
trated on key products such as Orangina and Schweppes, while
efforts are made to further strengthen the business foundation
and boost profitability. At Lucozade Ribena Suntory Limited,
new sales channels for Lucozade and Ribena will be explored
not only in Europe, but also in such emerging markets as South-
east Asia, Africa and the Middle East.
We are also promoting cost reductions by leveraging expertise
from our Japanese operations to reduce manufacturing and
distribution costs, as well as to move forward with a better
aligned and structured business processes.
SUMMARY
• Advance to a new growth stage led by business in
Europe with the acquisitions of Lucozade and
Ribena, and in Asia, where the market is growing.
Overseas Segment Europe
2014 FORECAST* (OVERSEAS)
Sales
¥520.0bil. +28.6%YoYSegment profit
¥60.5bil. +19.7%YoY *Forecast as of February 14, 2014
Annual Report 2013 Annual Report 2013
SuntoRy BeveRAge & Food Limited SuntoRy BeveRAge & Food Limited
2928
Strategy in 2014
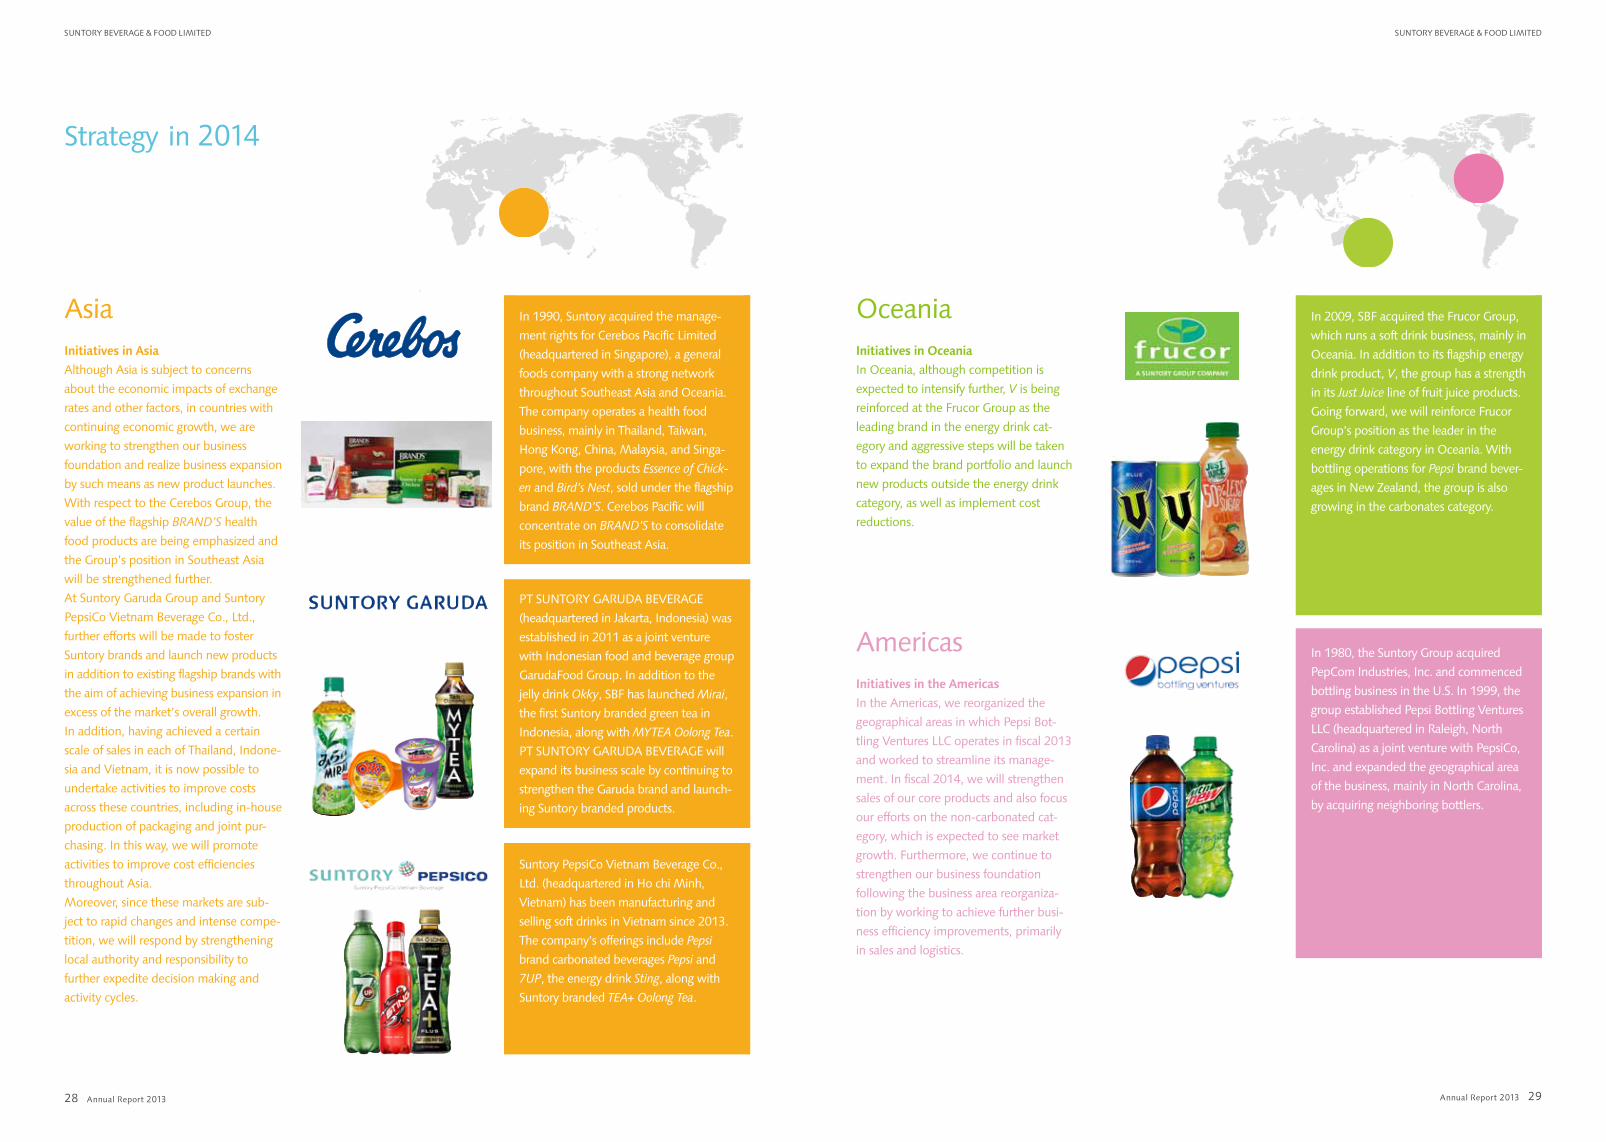
Initiatives in the Americas
In the Americas, we reorganized the
geographical areas in which Pepsi Bot-
tling Ventures LLC operates in fiscal 2013
and worked to streamline its manage-
ment. In fiscal 2014, we will strengthen
sales of our core products and also focus
our efforts on the non-carbonated cat-
egory, which is expected to see market
growth. Furthermore, we continue to
strengthen our business foundation
following the business area reorganiza-
tion by working to achieve further busi-
ness efficiency improvements, primarily
in sales and logistics.
Initiatives in Oceania
In Oceania, although competition is
expected to intensify further, V is being
reinforced at the Frucor Group as the
leading brand in the energy drink cat-
egory and aggressive steps will be taken
to expand the brand portfolio and launch
new products outside the energy drink
category, as well as implement cost
reductions.
Initiatives in Asia
Although Asia is subject to concerns
about the economic impacts of exchange
rates and other factors, in countries with
continuing economic growth, we are
working to strengthen our business
foundation and realize business expansion
by such means as new product launches.
With respect to the Cerebos Group, the
value of the flagship BRAND’S health
food products are being emphasized and
the Group’s position in Southeast Asia
will be strengthened further.
At Suntory Garuda Group and Suntory
PepsiCo Vietnam Beverage Co., Ltd.,
further efforts will be made to foster
Suntory brands and launch new products
in addition to existing flagship brands with
the aim of achieving business expansion in
excess of the market’s overall growth.
In addition, having achieved a certain
scale of sales in each of Thailand, Indone-
sia and Vietnam, it is now possible to
undertake activities to improve costs
across these countries, including in-house
production of packaging and joint pur-
chasing. In this way, we will promote
activities to improve cost efficiencies
throughout Asia.
Moreover, since these markets are sub-
ject to rapid changes and intense compe-
tition, we will respond by strengthening
local authority and responsibility to
further expedite decision making and
activity cycles.
Asia
Americas
OceaniaIn 1990, Suntory acquired the manage-
ment rights for Cerebos Pacific Limited
(headquartered in Singapore), a general
foods company with a strong network
throughout Southeast Asia and Oceania.
The company operates a health food
business, mainly in Thailand, Taiwan,
Hong Kong, China, Malaysia, and Singa-
pore, with the products Essence of Chick-
en and Bird’s Nest, sold under the flagship
brand BRAND’S. Cerebos Pacific will
concentrate on BRAND’S to consolidate
its position in Southeast Asia.
In 1980, the Suntory Group acquired
PepCom Industries, Inc. and commenced
bottling business in the U.S. In 1999, the
group established Pepsi Bottling Ventures
LLC (headquartered in Raleigh, North
Carolina) as a joint venture with PepsiCo,
Inc. and expanded the geographical area
of the business, mainly in North Carolina,
by acquiring neighboring bottlers.
In 2009, SBF acquired the Frucor Group,
which runs a soft drink business, mainly in
Oceania. In addition to its flagship energy
drink product, V, the group has a strength
in its Just Juice line of fruit juice products.
Going forward, we will reinforce Frucor
Group’s position as the leader in the
energy drink category in Oceania. With
bottling operations for Pepsi brand bever-
ages in New Zealand, the group is also
growing in the carbonates category.
PT SUNTORY GARUDA BEVERAGE
(headquartered in Jakarta, Indonesia) was
established in 2011 as a joint venture
with Indonesian food and beverage group
GarudaFood Group. In addition to the
jelly drink Okky, SBF has launched Mirai,
the first Suntory branded green tea in
Indonesia, along with MYTEA Oolong Tea.
PT SUNTORY GARUDA BEVERAGE will
expand its business scale by continuing to
strengthen the Garuda brand and launch-
ing Suntory branded products.
Suntory PepsiCo Vietnam Beverage Co.,
Ltd. (headquartered in Ho chi Minh,
Vietnam) has been manufacturing and
selling soft drinks in Vietnam since 2013.
The company’s offerings include Pepsi
brand carbonated beverages Pepsi and
7UP, the energy drink Sting, along with
Suntory branded TEA+ Oolong Tea.
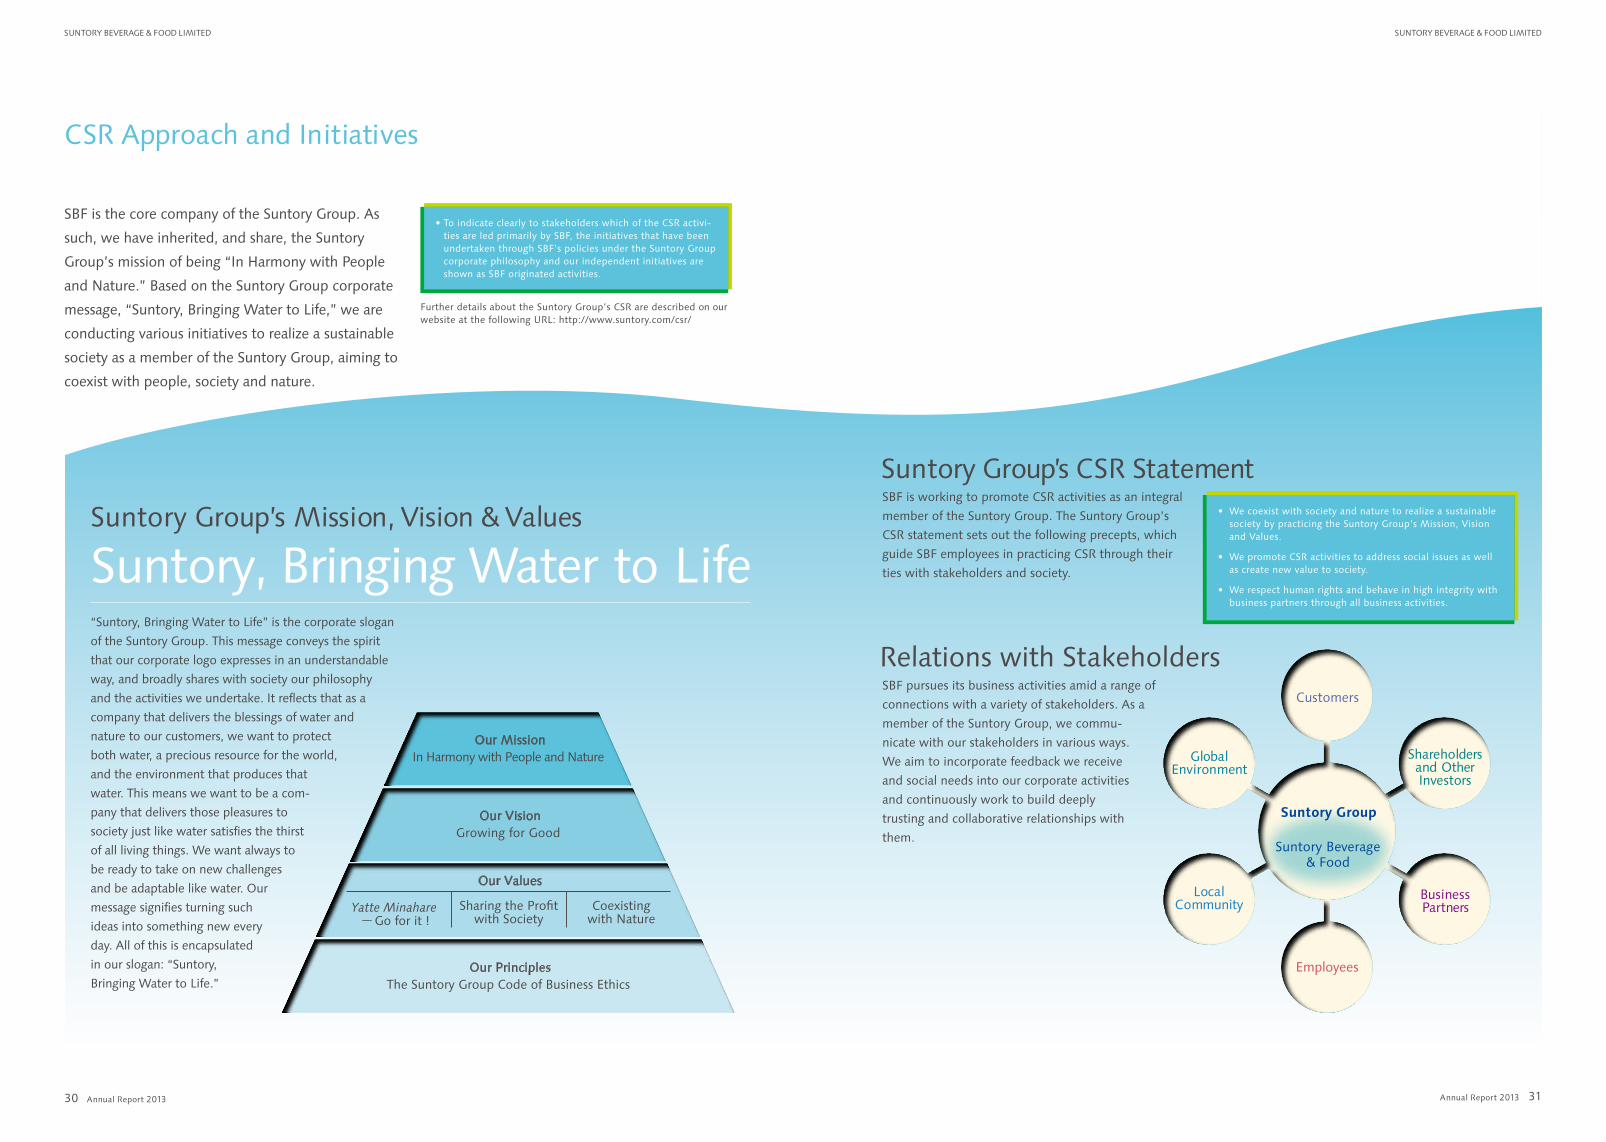
Our Values
Our VisionGrowing for Good
Our PrinciplesThe Suntory Group Code of Business Ethics
Sharing the Profitwith Society
Coexistingwith Nature
Yatte Minahare—Go for it !
Our MissionIn Harmony with People and Nature Global
Environment
Customers
BusinessPartners
Employees
LocalCommunity
Shareholdersand OtherInvestors
Suntory Beverage& Food
Suntory Group
Annual Report 2013 Annual Report 2013
SuntoRy BeveRAge & Food Limited SuntoRy BeveRAge & Food Limited
3130
Suntory, Bringing Water to Life
CSR Approach and Initiatives
SBF is the core company of the Suntory Group. As
such, we have inherited, and share, the Suntory
Group’s mission of being “In Harmony with People
and Nature.” Based on the Suntory Group corporate
message, “Suntory, Bringing Water to Life,” we are
conducting various initiatives to realize a sustainable
society as a member of the Suntory Group, aiming to
coexist with people, society and nature.
SBF is working to promote CSR activities as an integral
member of the Suntory Group. The Suntory Group’s
CSR statement sets out the following precepts, which
guide SBF employees in practicing CSR through their
ties with stakeholders and society.
“Suntory, Bringing Water to Life” is the corporate slogan
of the Suntory Group. This message conveys the spirit
that our corporate logo expresses in an understandable
way, and broadly shares with society our philosophy
and the activities we undertake. It reflects that as a
company that delivers the blessings of water and
nature to our customers, we want to protect
both water, a precious resource for the world,
and the environment that produces that
water. This means we want to be a com-
pany that delivers those pleasures to
society just like water satisfies the thirst
of all living things. We want always to
be ready to take on new challenges
and be adaptable like water. Our
message signifies turning such
ideas into something new every
day. All of this is encapsulated
in our slogan: “Suntory,
Bringing Water to Life.”
SBF pursues its business activities amid a range of
connections with a variety of stakeholders. As a
member of the Suntory Group, we commu-
nicate with our stakeholders in various ways.
We aim to incorporate feedback we receive
and social needs into our corporate activities
and continuously work to build deeply
trusting and collaborative relationships with
them.
Suntory Group’s CSR Statement
Relations with Stakeholders
Suntory Group’s Mission, Vision & Values
• To indicate clearly to stakeholders which of the CSR activi-ties are led primarily by SBF, the initiatives that have been undertaken through SBF’s policies under the Suntory Group corporate philosophy and our independent initiatives are shown as SBF originated activities.
• We coexist with society and nature to realize a sustainable society by practicing the Suntory Group’s Mission, Vision and Values.
• We promote CSR activities to address social issues as well as create new value to society.
• We respect human rights and behave in high integrity with business partners through all business activities.
Further details about the Suntory Group’s CSR are described on our website at the following URL: http://www.suntory.com/csr/
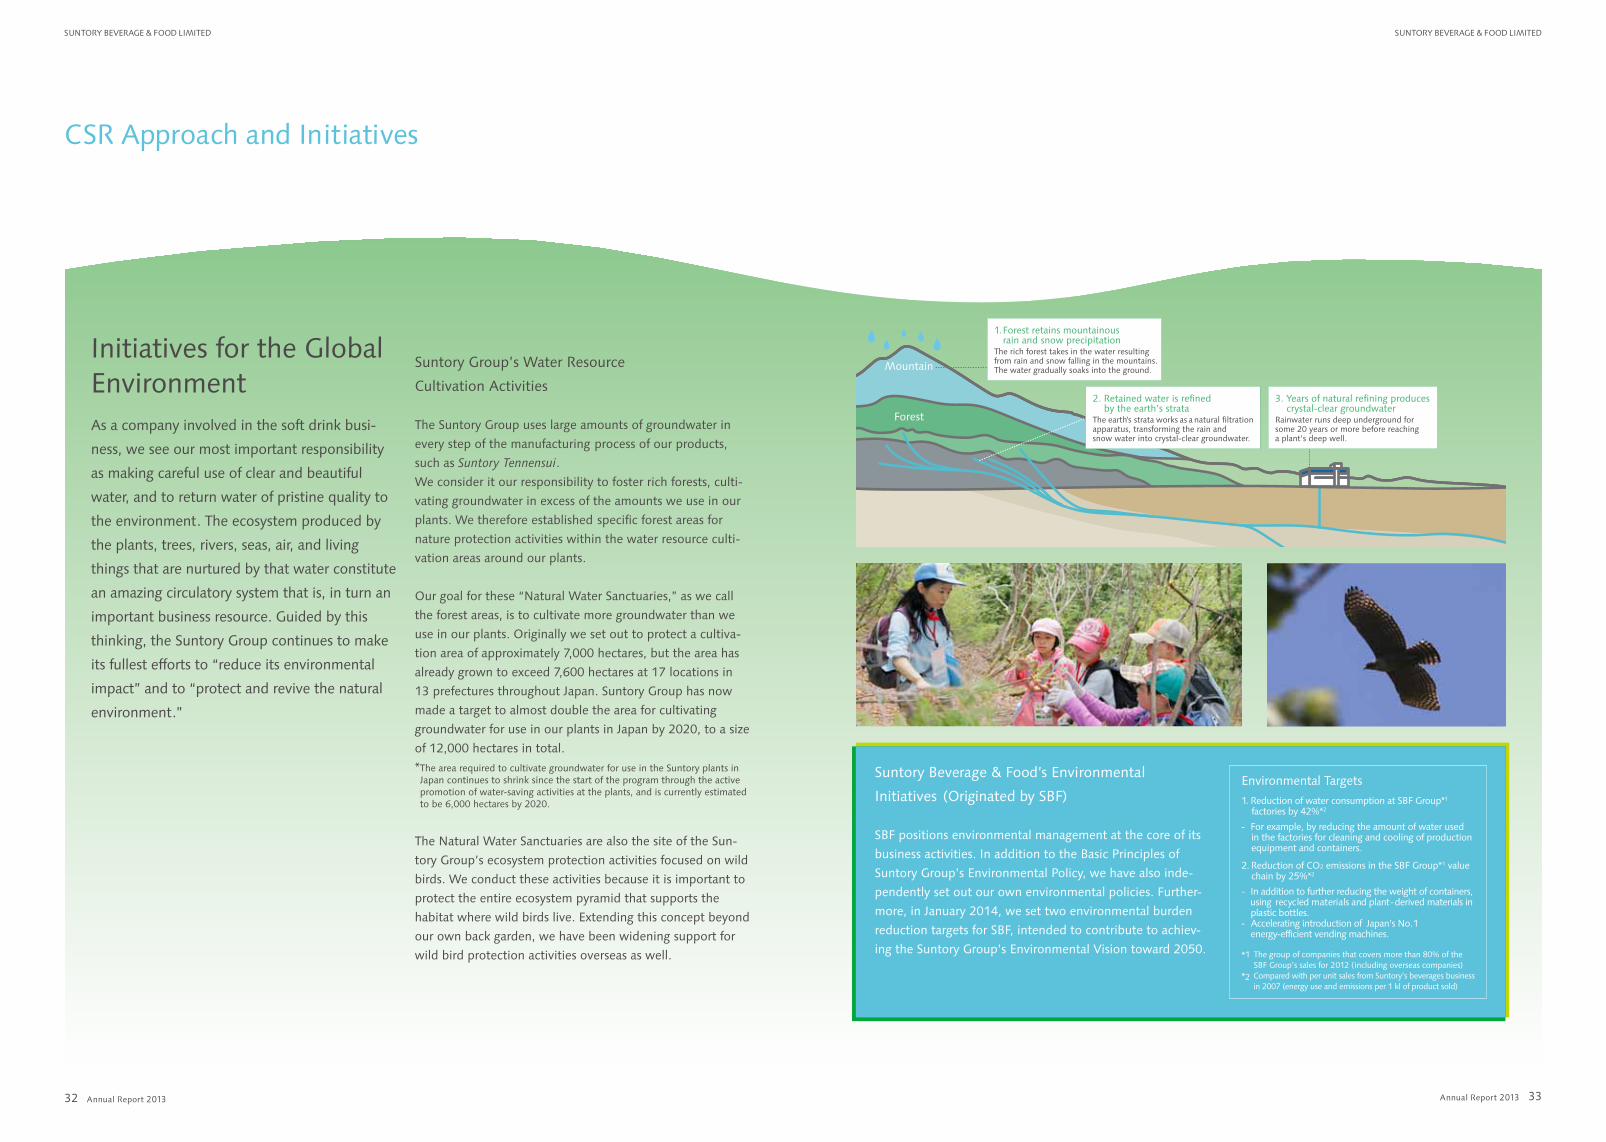
Mountain
Forest
1.Forest retains mountainous rain and snow precipitationThe rich forest takes in the water resulting from rain and snow falling in the mountains. The water gradually soaks into the ground.
2. Retained water is refined by the earth’s strataThe earth’s strata works as a natural filtration apparatus, transforming the rain and snow water into crystal-clear groundwater.
3. Years of natural refining produces crystal-clear groundwaterRainwater runs deep underground for some 20 years or more before reaching a plant’s deep well.
Annual Report 2013 Annual Report 2013
SuntoRy BeveRAge & Food Limited SuntoRy BeveRAge & Food Limited
3332
CSR Approach and Initiatives
As a company involved in the soft drink busi-
ness, we see our most important responsibility
as making careful use of clear and beautiful
water, and to return water of pristine quality to
the environment. The ecosystem produced by
the plants, trees, rivers, seas, air, and living
things that are nurtured by that water constitute
an amazing circulatory system that is, in turn an
important business resource. Guided by this
thinking, the Suntory Group continues to make
its fullest efforts to “reduce its environmental
impact” and to “protect and revive the natural
environment.”
Suntory Group’s Water Resource
Cultivation Activities
The Suntory Group uses large amounts of groundwater in
every step of the manufacturing process of our products,
such as Suntory Tennensui.
We consider it our responsibility to foster rich forests, culti-
vating groundwater in excess of the amounts we use in our
plants. We therefore established specific forest areas for
nature protection activities within the water resource culti-
vation areas around our plants.
Our goal for these “Natural Water Sanctuaries,” as we call
the forest areas, is to cultivate more groundwater than we
use in our plants. Originally we set out to protect a cultiva-
tion area of approximately 7,000 hectares, but the area has
already grown to exceed 7,600 hectares at 17 locations in
13 prefectures throughout Japan. Suntory Group has now
made a target to almost double the area for cultivating
groundwater for use in our plants in Japan by 2020, to a size
of 12,000 hectares in total.
* The area required to cultivate groundwater for use in the Suntory plants in Japan continues to shrink since the start of the program through the active promotion of water-saving activities at the plants, and is currently estimated to be 6,000 hectares by 2020.
The Natural Water Sanctuaries are also the site of the Sun-
tory Group’s ecosystem protection activities focused on wild
birds. We conduct these activities because it is important to
protect the entire ecosystem pyramid that supports the
habitat where wild birds live. Extending this concept beyond
our own back garden, we have been widening support for
wild bird protection activities overseas as well.
Suntory Beverage & Food’s Environmental
Initiatives (Originated by SBF)
SBF positions environmental management at the core of its
business activities. In addition to the Basic Principles of
Suntory Group’s Environmental Policy, we have also inde-
pendently set out our own environmental policies. Further-
more, in January 2014, we set two environmental burden
reduction targets for SBF, intended to contribute to achiev-
ing the Suntory Group’s Environmental Vision toward 2050.
Environmental Targets
1. Reduction of water consumption at SBF Group*1 factories by 42%*2
- For example, by reducing the amount of water used in the factories for cleaning and cooling of production equipment and containers.
2. Reduction of CO2 emissions in the SBF Group*1 value chain by 25%*2
- In addition to further reducing the weight of containers, using recycled materials and plant-derived materials in plastic bottles. - Accelerating introduction of Japan’s No. 1 energy-efficient vending machines.
*1 The group of companies that covers more than 80% of the SBF Group’s sales for 2012 (including overseas companies)
*2 Compared with per unit sales from Suntory’s beverages business in 2007 (energy use and emissions per 1 kl of product sold)
Initiatives for the Global Environment
(1) Reusing water for washing containers
At the Minami Alps Hakushu Water Plant of Suntory
Products Limited, a water cascade is used to achieve one
of the lowest volumes of water used per 1 kl of
production in the industry.
(2) Using water with care
Through steady efforts to save water used in plants, such as
for washing equipment or coolant water, we are working to
reduce water usage by optimizing the washing process and
other means.
Previously
PET bottles recovered from household waste
Quality of PET bottles recovered from Japanese household waste is good on a global basis.
Recycle into PET bottles again at Suntory Group
Reducing Water Usage
83% Reduction in CO2 Emissions
Annual Report 2013 Annual Report 2013
SuntoRy BeveRAge & Food Limited SuntoRy BeveRAge & Food Limited
3534
SBF is constantly working to reduce the amount of raw materials used in PET bottles.
CSR Approach and Initiatives
Reducing CO2 Emissions
(1) Container raw materials
(2) Recycling
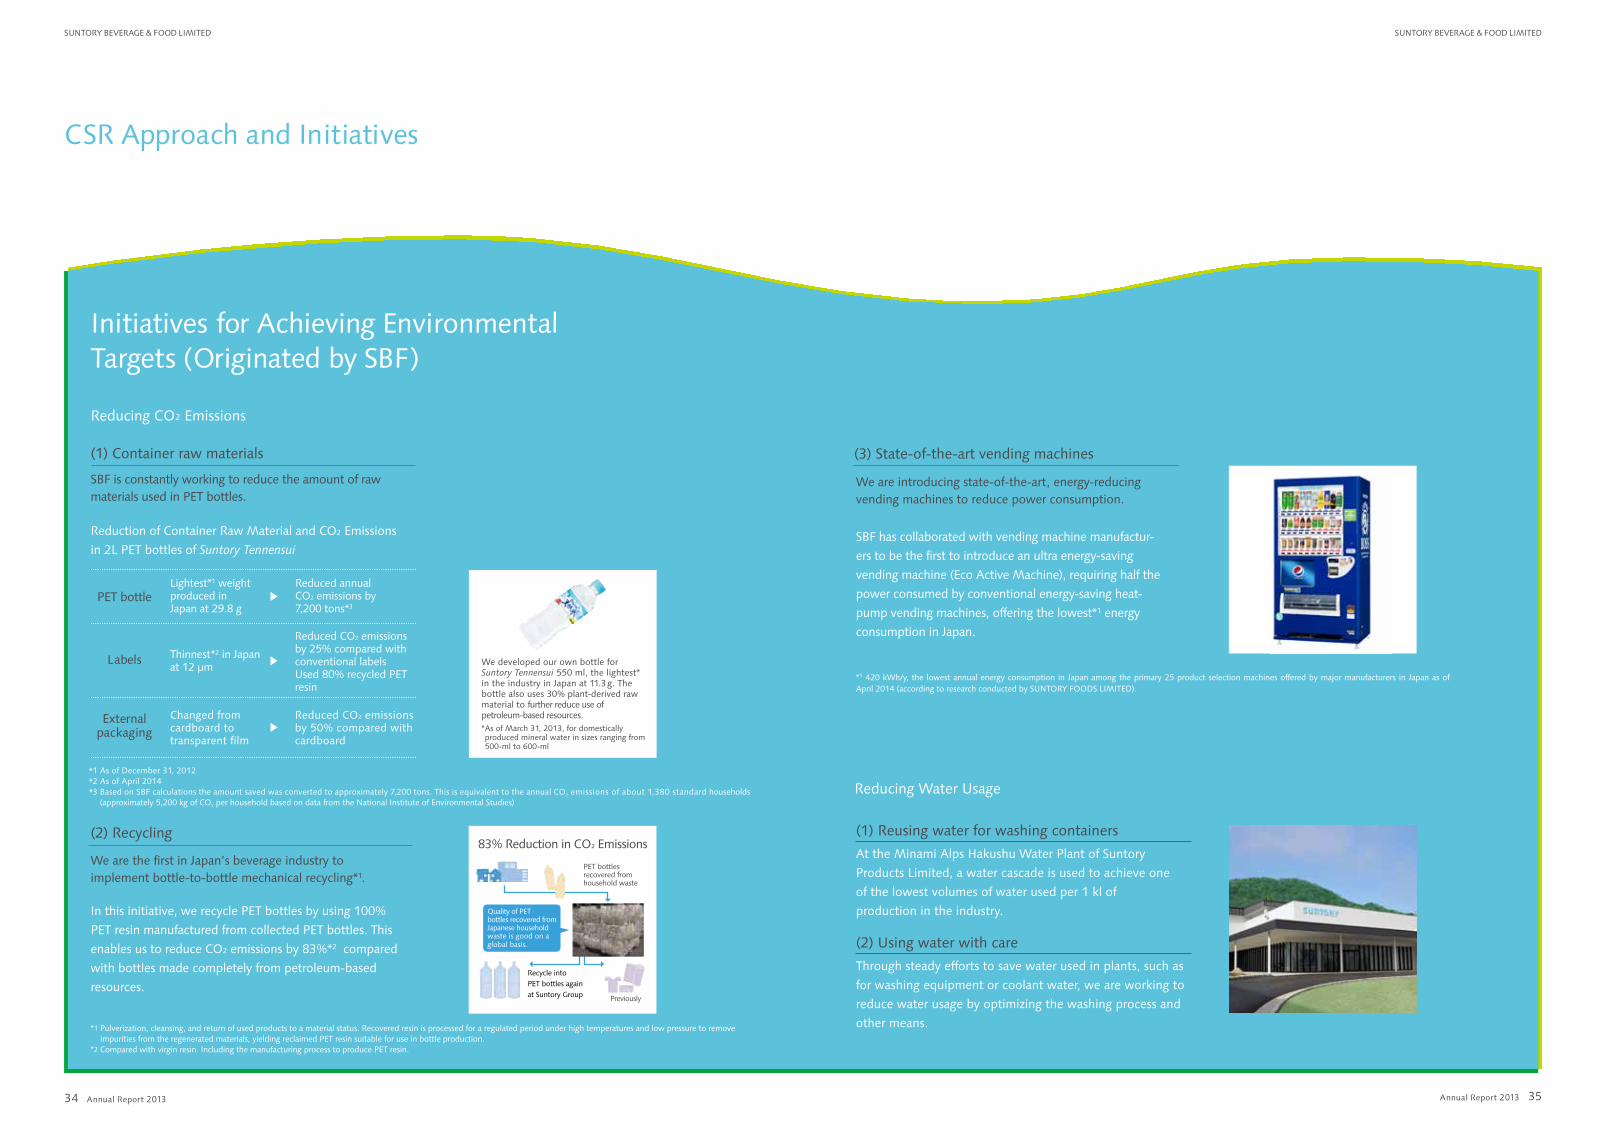
We developed our own bottle for Suntory Tennensui 550 ml, the lightest* in the industry in Japan at 11.3 g. The bottle also uses 30% plant-derived raw material to further reduce use of petroleum-based resources. * As of March 31, 2013, for domestically produced mineral water in sizes ranging from 500-ml to 600-ml
Reduction of Container Raw Material and CO2 Emissions
in 2L PET bottles of Suntory Tennensui
In this initiative, we recycle PET bottles by using 100%
PET resin manufactured from collected PET bottles. This
enables us to reduce CO2 emissions by 83%*2 compared
with bottles made completely from petroleum-based
resources.
We are the first in Japan’s beverage industry to implement bottle-to-bottle mechanical recycling*1.
PET bottle
Labels
Externalpackaging
Lightest*1 weight produced in Japan at 29.8 g
Thinnest*2 in Japan at 12 µm
Changed from cardboard to transparent film
Reduced CO2 emissions by 50% compared with cardboard
Reduced CO2 emissions by 25% compared with conventional labelsUsed 80% recycled PET resin
Reduced annual CO2 emissions by 7,200 tons*3
*1 As of December 31, 2012 *2 As of April 2014 *3 Based on SBF calculations the amount saved was converted to approximately 7,200 tons. This is equivalent to the annual CO2 emissions of about 1,380 standard households
(approximately 5,200 kg of CO2 per household based on data from the National Institute of Environmental Studies)
*1 Pulverization, cleansing, and return of used products to a material status. Recovered resin is processed for a regulated period under high temperatures and low pressure to remove impurities from the regenerated materials, yielding reclaimed PET resin suitable for use in bottle production.*2 Compared with virgin resin. Including the manufacturing process to produce PET resin.
(3) State-of-the-art vending machines
SBF has collaborated with vending machine manufactur-
ers to be the first to introduce an ultra energy-saving
vending machine (Eco Active Machine), requiring half the
power consumed by conventional energy-saving heat-
pump vending machines, offering the lowest*1 energy
consumption in Japan.
We are introducing state-of-the-art, energy-reducing vending machines to reduce power consumption.
*1 420 kWh/y, the lowest annual energy consumption in Japan among the primary 25 product selection machines offered by major manufacturers in Japan as of April 2014 (according to research conducted by SUNTORY FOODS LIMITED).
Initiatives for Achieving Environmental Targets (Originated by SBF)
● Overview of the Process
Traceability
Scientific evaluation (testing and analysis)
DeliveryProduct planning and development
Water
Procurement
Containers and packaging
Ingredients Manufacturing
Premiumgifts
Annual Report 2013 Annual Report 2013
SuntoRy BeveRAge & Food Limited SuntoRy BeveRAge & Food Limited
3736
Initiatives for Customers Initiatives for Local Communities
Initiatives for Employees
Initiatives for Business Partners
Global Human Resources Training Program (Suntory Group)
As a member of the Suntory Group, SBF aims to grow as a
company that provides customers throughout the world with
the highest quality products and services, and enjoys their
support.
Grounded in the Suntory Group’s Quality Policy, which has
been established by the Suntory Group, all SBF employees are
continually working to maintain and improve quality in all of
our processes from product planning and development, to
material procurement, manufacture, distribution, sales and
services. In the area of ingredient procurement in particular,
we conduct risk analysis of each and every ingredient from
various perspectives, applicable to every stage from the pro-
duction of the ingredients to their final use, to ensure that they
are safe and conform with laws. In manufacturing, we employ
testing equipment in all parts of the manufacturing process,
including preparation, mixing, bottling and packaging. We also
carry out multilayered quality checks, making sure that no
foreign substances get into either the containers or their
contents, and looking for container damage and leaks.
We are also strengthening the quality management systems
used by our group companies overseas. In addition to clarify-
ing audit criterion based on international quality standards, we
assessed issues and strengths within each company. We then
worked to increase our level of quality by expanding Japan’s
high quality assurance capability to our overseas Group com-
panies, while applying lessons learned from overseas to our
Group companies in Japan.
We are intent on continuing to exist as a company in
harmony with our local communities. As such, we
value initiatives and communications as a member of
those communities. Moreover, SBF plays a part in the
social contribution activities of the Suntory Group,
and has supported the following initiatives aimed at
coexisting with society.
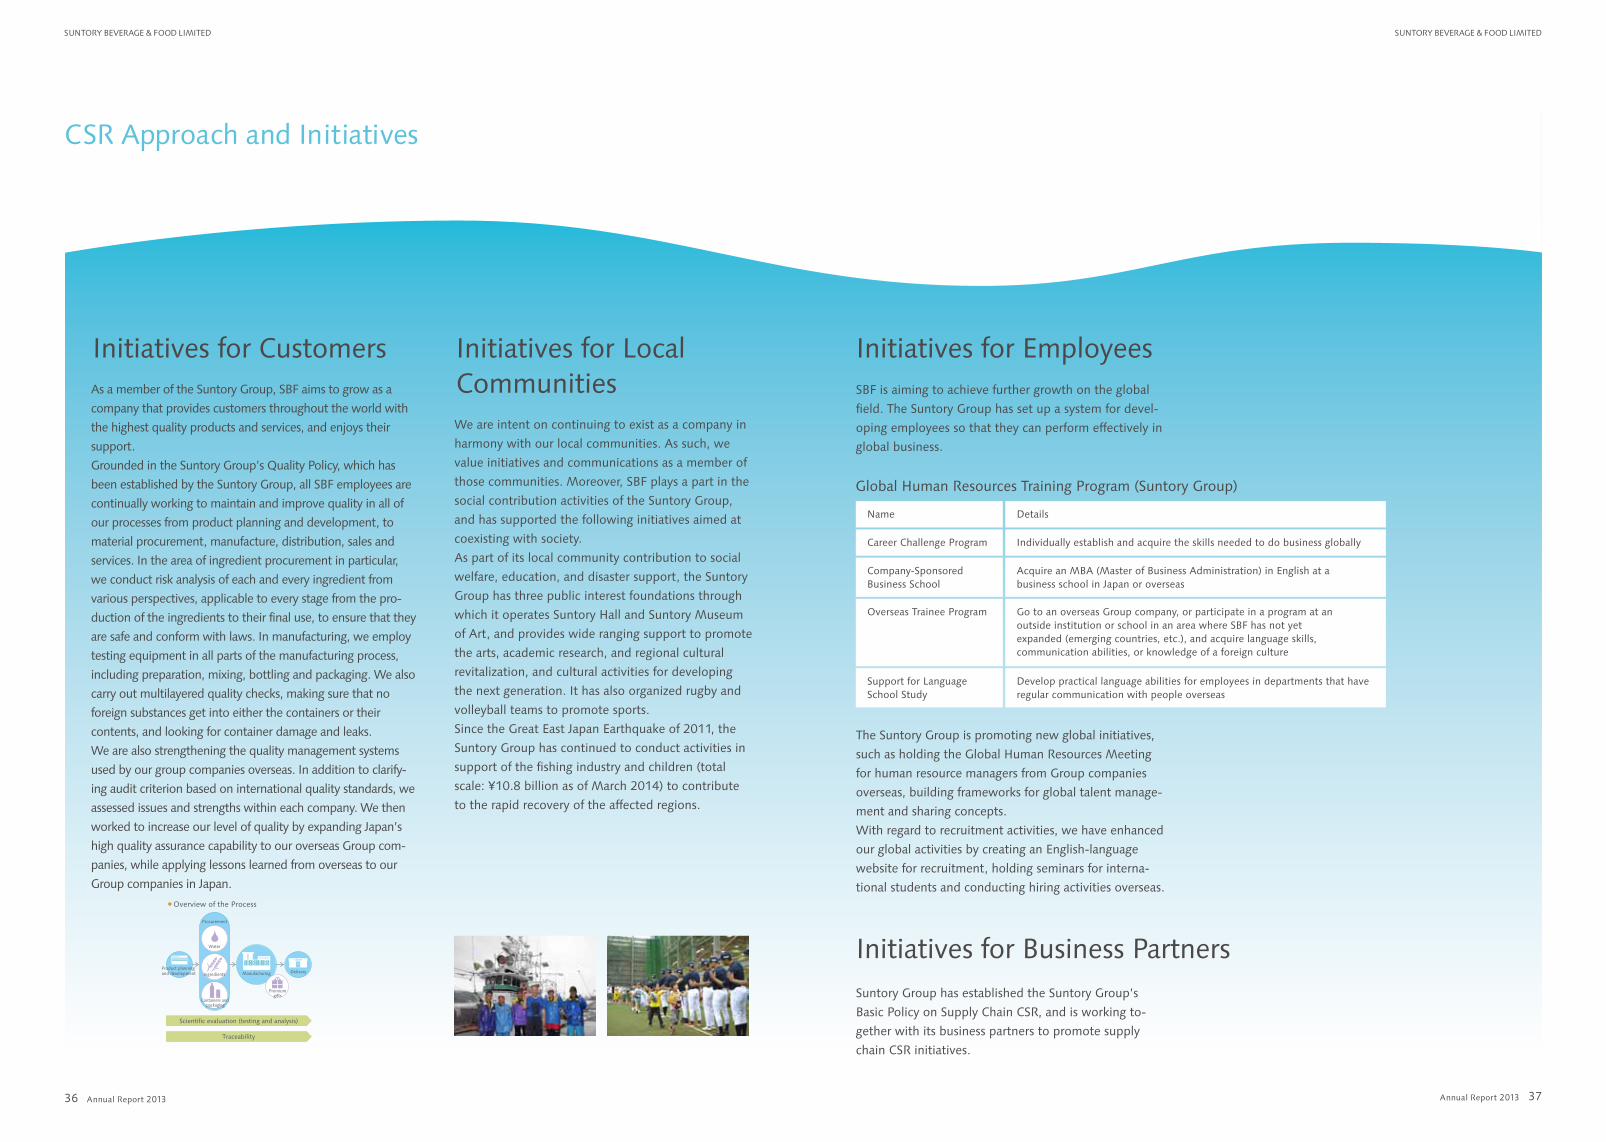
As part of its local community contribution to social
welfare, education, and disaster support, the Suntory
Group has three public interest foundations through
which it operates Suntory Hall and Suntory Museum
of Art, and provides wide ranging support to promote
the arts, academic research, and regional cultural
revitalization, and cultural activities for developing
the next generation. It has also organized rugby and
volleyball teams to promote sports.
Since the Great East Japan Earthquake of 2011, the
Suntory Group has continued to conduct activities in
support of the fishing industry and children (total
scale: ¥10.8 billion as of March 2014) to contribute
to the rapid recovery of the affected regions.
SBF is aiming to achieve further growth on the global
field. The Suntory Group has set up a system for devel-
oping employees so that they can perform effectively in
global business.
The Suntory Group is promoting new global initiatives,
such as holding the Global Human Resources Meeting
for human resource managers from Group companies
overseas, building frameworks for global talent manage-
ment and sharing concepts.
With regard to recruitment activities, we have enhanced
our global activities by creating an English-language
website for recruitment, holding seminars for interna-
tional students and conducting hiring activities overseas.
Suntory Group has established the Suntory Group’s
Basic Policy on Supply Chain CSR, and is working to-
gether with its business partners to promote supply
chain CSR initiatives.
Name
Career Challenge Program
Company-Sponsored Business School
Support for Language School Study
Overseas Trainee Program
Details
Individually establish and acquire the skills needed to do business globally
Acquire an MBA (Master of Business Administration) in English at a business school in Japan or overseas
Develop practical language abilities for employees in departments that have regular communication with people overseas
Go to an overseas Group company, or participate in a program at an outside institution or school in an area where SBF has not yet expanded (emerging countries, etc.), and acquire language skills, communication abilities, or knowledge of a foreign culture
CSR Approach and Initiatives
Group Company Initiatives Overseas (Originated by SBF)
Annual Report 2013 Annual Report 2013
SuntoRy BeveRAge & Food Limited SuntoRy BeveRAge & Food Limited
3938
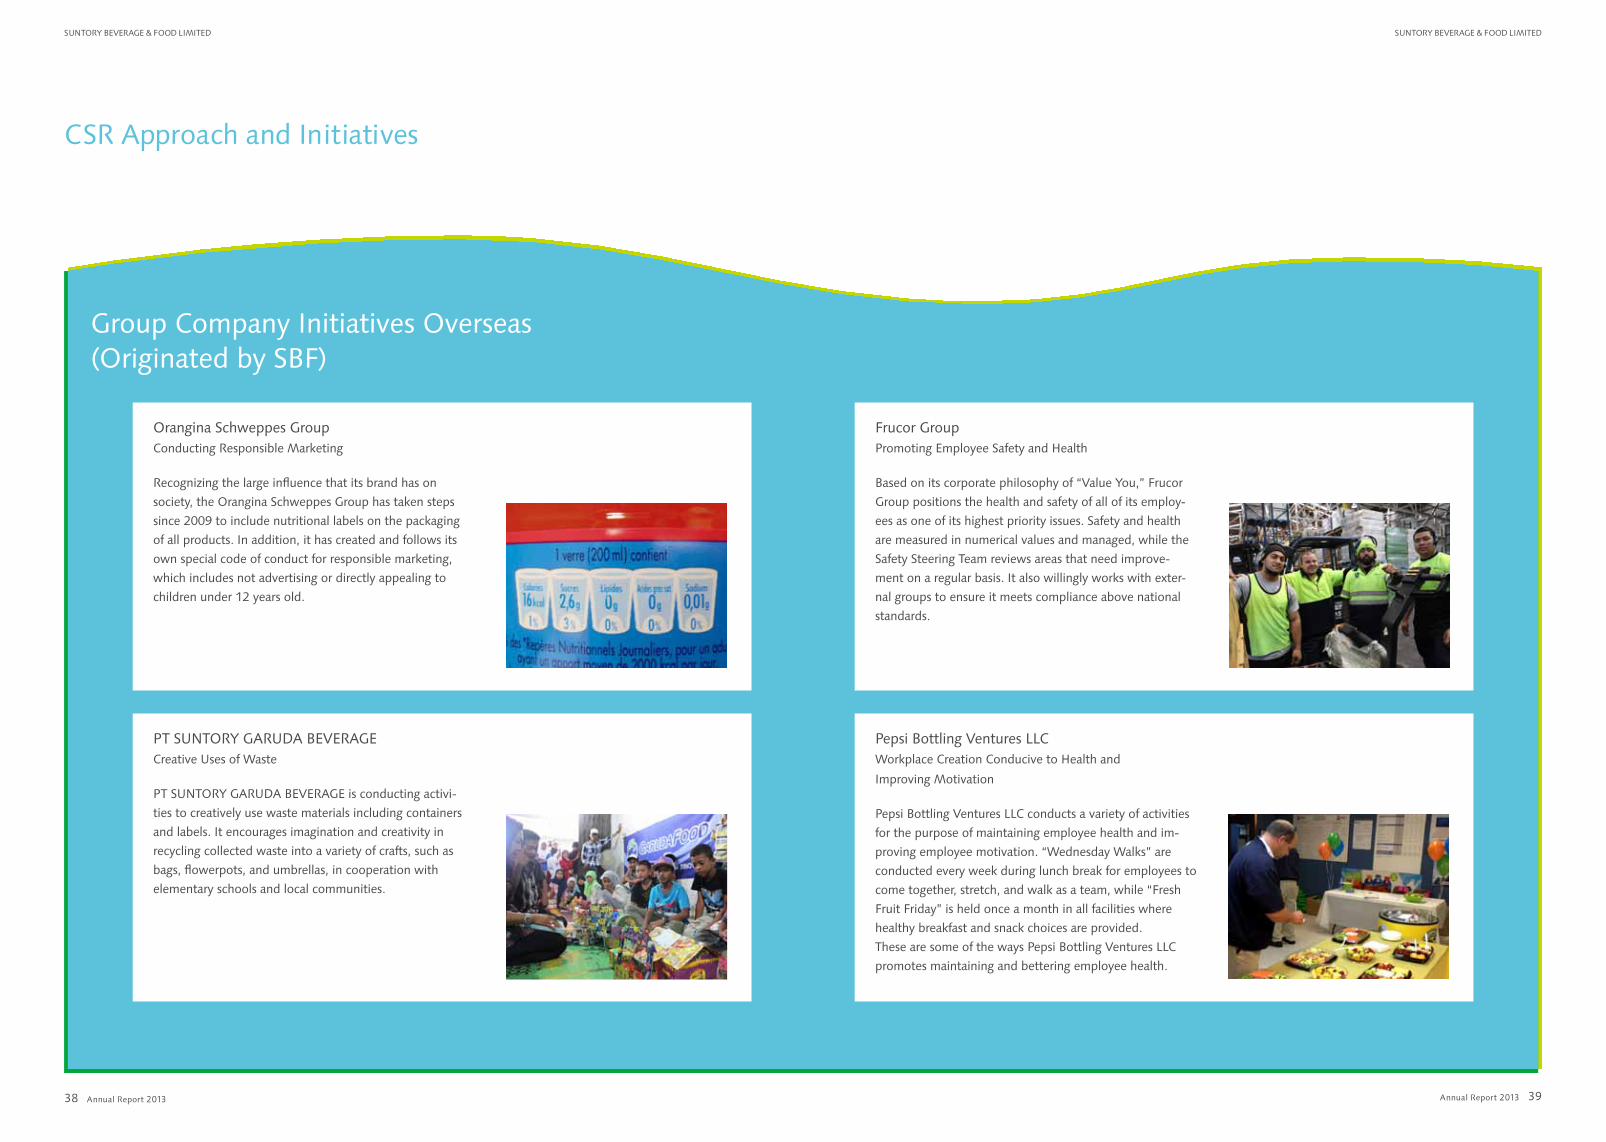
Orangina Schweppes GroupConducting Responsible Marketing
Recognizing the large influence that its brand has on
society, the Orangina Schweppes Group has taken steps
since 2009 to include nutritional labels on the packaging
of all products. In addition, it has created and follows its
own special code of conduct for responsible marketing,
which includes not advertising or directly appealing to
children under 12 years old.
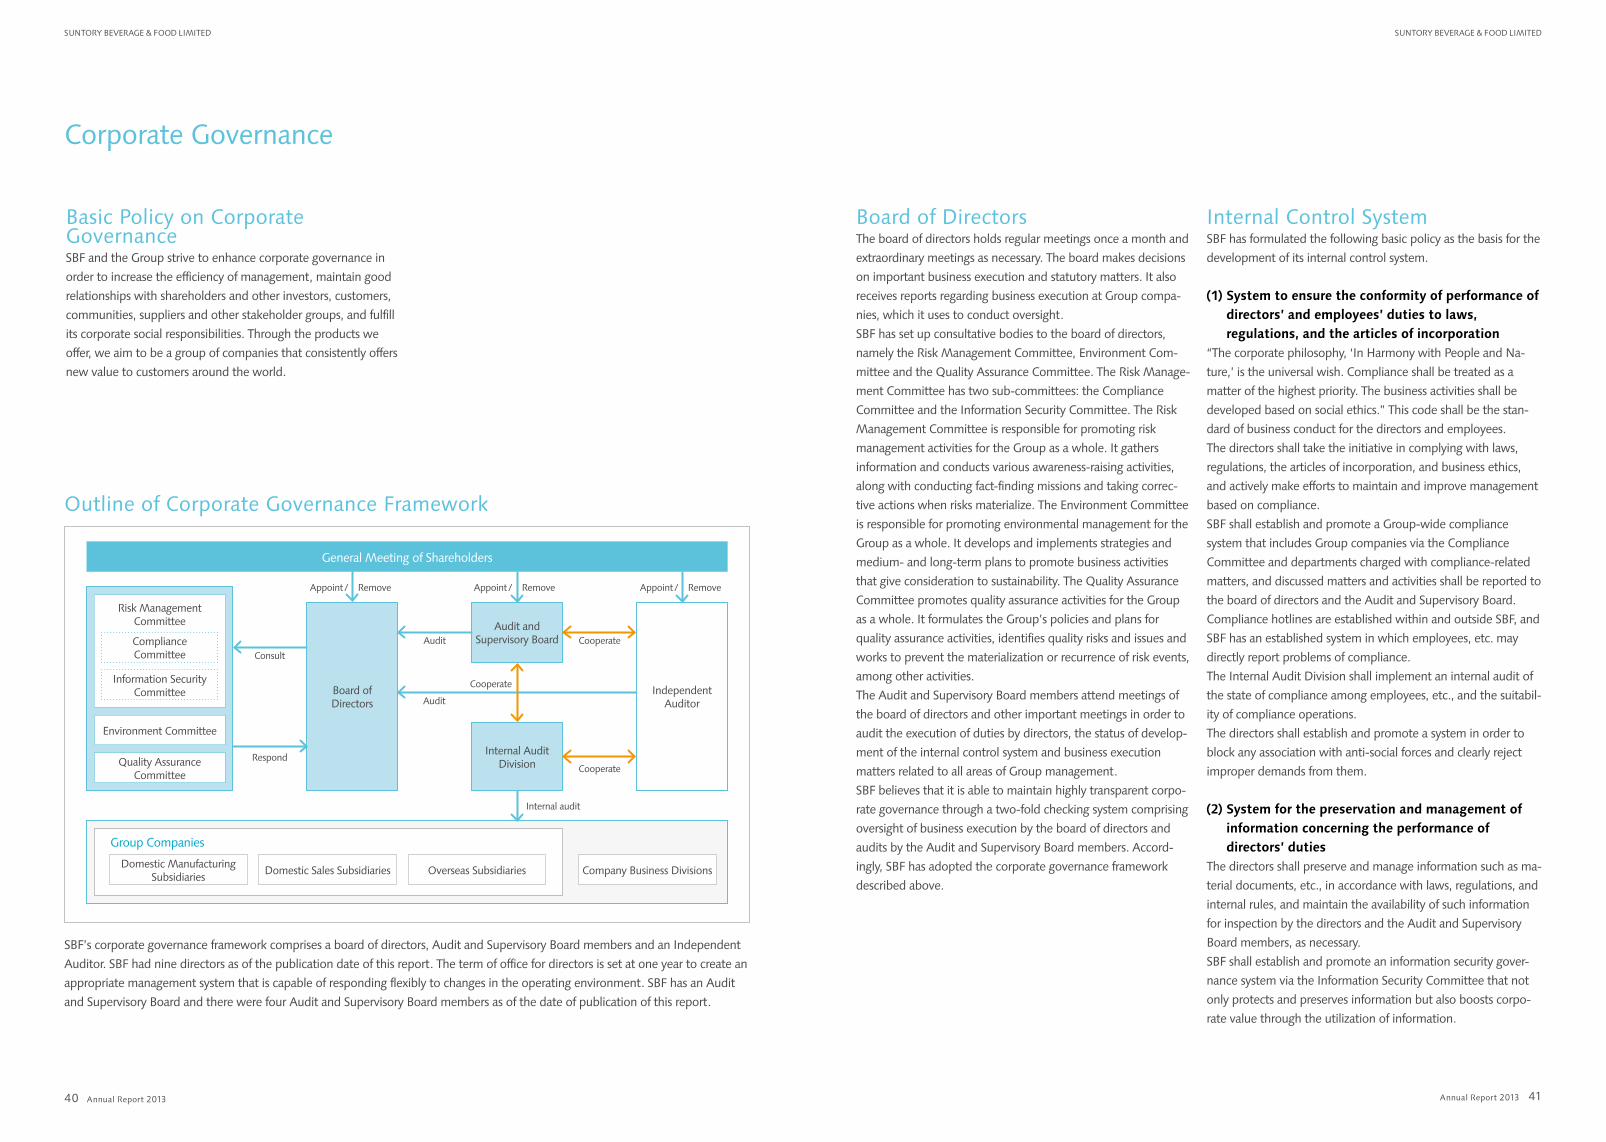
Frucor GroupPromoting Employee Safety and Health
Based on its corporate philosophy of “Value You,” Frucor
Group positions the health and safety of all of its employ-
ees as one of its highest priority issues. Safety and health
are measured in numerical values and managed, while the
Safety Steering Team reviews areas that need improve-
ment on a regular basis. It also willingly works with exter-
nal groups to ensure it meets compliance above national
standards.
PT SUNTORY GARUDA BEVERAGECreative Uses of Waste
PT SUNTORY GARUDA BEVERAGE is conducting activi-
ties to creatively use waste materials including containers
and labels. It encourages imagination and creativity in
recycling collected waste into a variety of crafts, such as
bags, flowerpots, and umbrellas, in cooperation with
elementary schools and local communities.
Pepsi Bottling Ventures LLCWorkplace Creation Conducive to Health and
Improving Motivation
Pepsi Bottling Ventures LLC conducts a variety of activities
for the purpose of maintaining employee health and im-
proving employee motivation. “Wednesday Walks” are
conducted every week during lunch break for employees to
come together, stretch, and walk as a team, while “Fresh
Fruit Friday” is held once a month in all facilities where
healthy breakfast and snack choices are provided.
These are some of the ways Pepsi Bottling Ventures LLC
promotes maintaining and bettering employee health.
CSR Approach and Initiatives
SBF’s corporate governance framework comprises a board of directors, Audit and Supervisory Board members and an Independent
Auditor. SBF had nine directors as of the publication date of this report. The term of office for directors is set at one year to create an
appropriate management system that is capable of responding flexibly to changes in the operating environment. SBF has an Audit
and Supervisory Board and there were four Audit and Supervisory Board members as of the date of publication of this report.
General Meeting of Shareholders
Audit and Supervisory Board
Board of Directors
Internal Audit Division
Independent Auditor
Risk Management Committee
Compliance Committee
Information Security Committee
Environment Committee
Quality Assurance Committee
Group Companies
Domestic Manufacturing Subsidiaries Domestic Sales Subsidiaries Overseas Subsidiaries Company Business Divisions
Appoint / Remove
Consult
Audit Cooperate
Cooperate
Respond
Internal audit
Appoint / RemoveAppoint / Remove
Audit
Cooperate
Annual Report 2013 Annual Report 2013
SuntoRy BeveRAge & Food Limited SuntoRy BeveRAge & Food Limited
4140
Corporate Governance
Basic Policy on Corporate GovernanceSBF and the Group strive to enhance corporate governance in
order to increase the efficiency of management, maintain good
relationships with shareholders and other investors, customers,
communities, suppliers and other stakeholder groups, and fulfill
its corporate social responsibilities. Through the products we
offer, we aim to be a group of companies that consistently offers
new value to customers around the world.
Board of DirectorsThe board of directors holds regular meetings once a month and
extraordinary meetings as necessary. The board makes decisions
on important business execution and statutory matters. It also
receives reports regarding business execution at Group compa-
nies, which it uses to conduct oversight.
SBF has set up consultative bodies to the board of directors,
namely the Risk Management Committee, Environment Com-
mittee and the Quality Assurance Committee. The Risk Manage-
ment Committee has two sub-committees: the Compliance
Committee and the Information Security Committee. The Risk
Management Committee is responsible for promoting risk
management activities for the Group as a whole. It gathers
information and conducts various awareness-raising activities,
along with conducting fact-finding missions and taking correc-
tive actions when risks materialize. The Environment Committee
is responsible for promoting environmental management for the
Group as a whole. It develops and implements strategies and
medium- and long-term plans to promote business activities
that give consideration to sustainability. The Quality Assurance
Committee promotes quality assurance activities for the Group
as a whole. It formulates the Group’s policies and plans for
quality assurance activities, identifies quality risks and issues and
works to prevent the materialization or recurrence of risk events,
among other activities.
The Audit and Supervisory Board members attend meetings of
the board of directors and other important meetings in order to
audit the execution of duties by directors, the status of develop-
ment of the internal control system and business execution
matters related to all areas of Group management.
SBF believes that it is able to maintain highly transparent corpo-
rate governance through a two-fold checking system comprising
oversight of business execution by the board of directors and
audits by the Audit and Supervisory Board members. Accord-
ingly, SBF has adopted the corporate governance framework
described above.
Internal Control SystemSBF has formulated the following basic policy as the basis for the
development of its internal control system.
(1) System to ensure the conformity of performance of directors’ and employees’ duties to laws, regulations, and the articles of incorporation
“The corporate philosophy, ‘In Harmony with People and Na-
ture,’ is the universal wish. Compliance shall be treated as a
matter of the highest priority. The business activities shall be
developed based on social ethics.” This code shall be the stan-
dard of business conduct for the directors and employees.
The directors shall take the initiative in complying with laws,
regulations, the articles of incorporation, and business ethics,
and actively make efforts to maintain and improve management
based on compliance.
SBF shall establish and promote a Group-wide compliance
system that includes Group companies via the Compliance
Committee and departments charged with compliance-related
matters, and discussed matters and activities shall be reported to
the board of directors and the Audit and Supervisory Board.
Compliance hotlines are established within and outside SBF, and
SBF has an established system in which employees, etc. may
directly report problems of compliance.
The Internal Audit Division shall implement an internal audit of
the state of compliance among employees, etc., and the suitabil-
ity of compliance operations.
The directors shall establish and promote a system in order to
block any association with anti-social forces and clearly reject
improper demands from them.
(2) System for the preservation and management of information concerning the performance of directors’ duties
The directors shall preserve and manage information such as ma-
terial documents, etc., in accordance with laws, regulations, and
internal rules, and maintain the availability of such information
for inspection by the directors and the Audit and Supervisory
Board members, as necessary.
SBF shall establish and promote an information security gover-
nance system via the Information Security Committee that not
only protects and preserves information but also boosts corpo-
rate value through the utilization of information.
Outline of Corporate Governance Framework
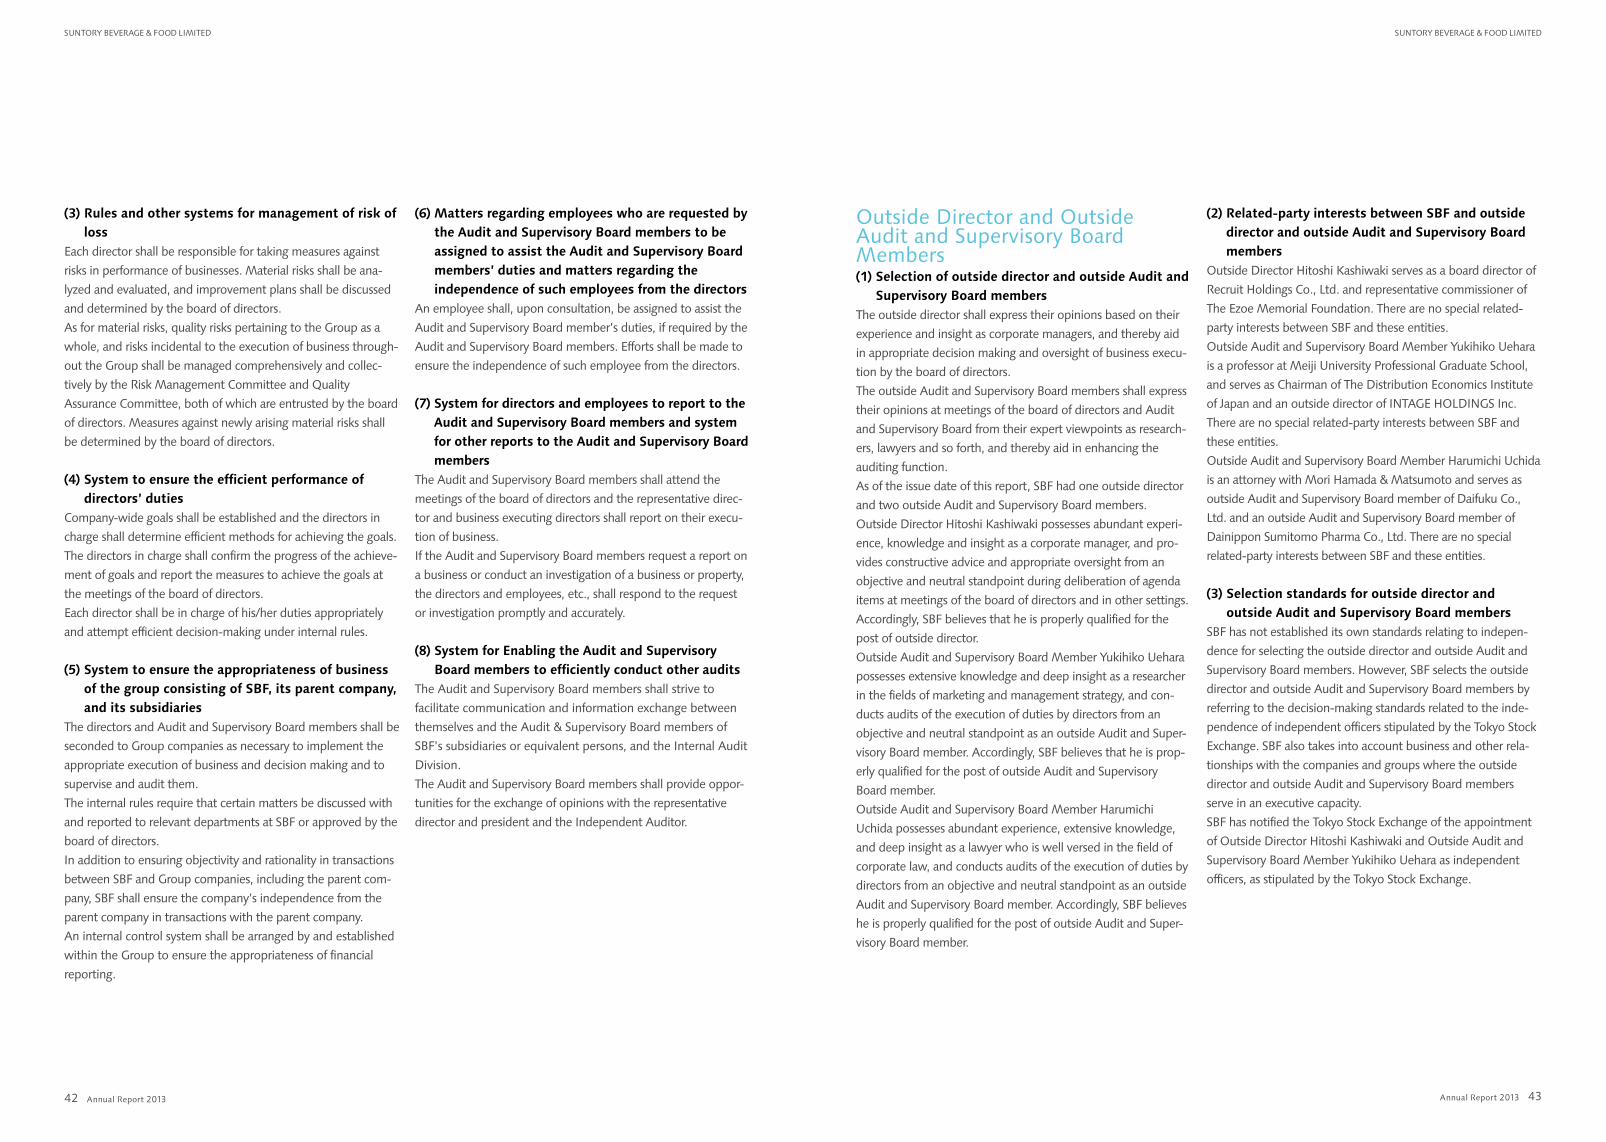
Annual Report 2013 Annual Report 2013
SuntoRy BeveRAge & Food Limited SuntoRy BeveRAge & Food Limited
4342
(3) Rules and other systems for management of risk of loss
Each director shall be responsible for taking measures against
risks in performance of businesses. Material risks shall be ana-
lyzed and evaluated, and improvement plans shall be discussed
and determined by the board of directors.
As for material risks, quality risks pertaining to the Group as a
whole, and risks incidental to the execution of business through-
out the Group shall be managed comprehensively and collec-
tively by the Risk Management Committee and Quality
Assurance Committee, both of which are entrusted by the board
of directors. Measures against newly arising material risks shall
be determined by the board of directors.
(4) System to ensure the efficient performance of directors’ duties
Company-wide goals shall be established and the directors in
charge shall determine efficient methods for achieving the goals.
The directors in charge shall confirm the progress of the achieve-
ment of goals and report the measures to achieve the goals at
the meetings of the board of directors.
Each director shall be in charge of his/her duties appropriately
and attempt efficient decision-making under internal rules.
(5) System to ensure the appropriateness of business of the group consisting of SBF, its parent company, and its subsidiaries
The directors and Audit and Supervisory Board members shall be
seconded to Group companies as necessary to implement the
appropriate execution of business and decision making and to
supervise and audit them.
The internal rules require that certain matters be discussed with
and reported to relevant departments at SBF or approved by the
board of directors.
In addition to ensuring objectivity and rationality in transactions
between SBF and Group companies, including the parent com-
pany, SBF shall ensure the company’s independence from the
parent company in transactions with the parent company.
An internal control system shall be arranged by and established
within the Group to ensure the appropriateness of financial
reporting.
Outside Director and Outside Audit and Supervisory Board Members(1) Selection of outside director and outside Audit and
Supervisory Board membersThe outside director shall express their opinions based on their
experience and insight as corporate managers, and thereby aid
in appropriate decision making and oversight of business execu-
tion by the board of directors.
The outside Audit and Supervisory Board members shall express
their opinions at meetings of the board of directors and Audit
and Supervisory Board from their expert viewpoints as research-
ers, lawyers and so forth, and thereby aid in enhancing the
auditing function.
As of the issue date of this report, SBF had one outside director
and two outside Audit and Supervisory Board members.
Outside Director Hitoshi Kashiwaki possesses abundant experi-
ence, knowledge and insight as a corporate manager, and pro-
vides constructive advice and appropriate oversight from an
objective and neutral standpoint during deliberation of agenda
items at meetings of the board of directors and in other settings.
Accordingly, SBF believes that he is properly qualified for the
post of outside director.
Outside Audit and Supervisory Board Member Yukihiko Uehara
possesses extensive knowledge and deep insight as a researcher
in the fields of marketing and management strategy, and con-
ducts audits of the execution of duties by directors from an
objective and neutral standpoint as an outside Audit and Super-
visory Board member. Accordingly, SBF believes that he is prop-
erly qualified for the post of outside Audit and Supervisory
Board member.
Outside Audit and Supervisory Board Member Harumichi
Uchida possesses abundant experience, extensive knowledge,
and deep insight as a lawyer who is well versed in the field of
corporate law, and conducts audits of the execution of duties by
directors from an objective and neutral standpoint as an outside
Audit and Supervisory Board member. Accordingly, SBF believes
he is properly qualified for the post of outside Audit and Super-
visory Board member.
(6) Matters regarding employees who are requested by the Audit and Supervisory Board members to be assigned to assist the Audit and Supervisory Board members’ duties and matters regarding the independence of such employees from the directors
An employee shall, upon consultation, be assigned to assist the
Audit and Supervisory Board member’s duties, if required by the
Audit and Supervisory Board members. Efforts shall be made to
ensure the independence of such employee from the directors.
(7) System for directors and employees to report to the Audit and Supervisory Board members and system for other reports to the Audit and Supervisory Board members
The Audit and Supervisory Board members shall attend the
meetings of the board of directors and the representative direc-
tor and business executing directors shall report on their execu-
tion of business.
If the Audit and Supervisory Board members request a report on
a business or conduct an investigation of a business or property,
the directors and employees, etc., shall respond to the request
or investigation promptly and accurately.
(8) System for Enabling the Audit and Supervisory Board members to efficiently conduct other audits
The Audit and Supervisory Board members shall strive to
facilitate communication and information exchange between
themselves and the Audit & Supervisory Board members of
SBF’s subsidiaries or equivalent persons, and the Internal Audit
Division.
The Audit and Supervisory Board members shall provide oppor-
tunities for the exchange of opinions with the representative
director and president and the Independent Auditor.
(2) Related-party interests between SBF and outside director and outside Audit and Supervisory Board members
Outside Director Hitoshi Kashiwaki serves as a board director of
Recruit Holdings Co., Ltd. and representative commissioner of
The Ezoe Memorial Foundation. There are no special related-
party interests between SBF and these entities.
Outside Audit and Supervisory Board Member Yukihiko Uehara
is a professor at Meiji University Professional Graduate School,
and serves as Chairman of The Distribution Economics Institute
of Japan and an outside director of INTAGE HOLDINGS Inc.
There are no special related-party interests between SBF and
these entities.
Outside Audit and Supervisory Board Member Harumichi Uchida
is an attorney with Mori Hamada & Matsumoto and serves as
outside Audit and Supervisory Board member of Daifuku Co.,
Ltd. and an outside Audit and Supervisory Board member of
Dainippon Sumitomo Pharma Co., Ltd. There are no special
related-party interests between SBF and these entities.
(3) Selection standards for outside director and outside Audit and Supervisory Board members
SBF has not established its own standards relating to indepen-
dence for selecting the outside director and outside Audit and
Supervisory Board members. However, SBF selects the outside
director and outside Audit and Supervisory Board members by
referring to the decision-making standards related to the inde-
pendence of independent officers stipulated by the Tokyo Stock
Exchange. SBF also takes into account business and other rela-
tionships with the companies and groups where the outside
director and outside Audit and Supervisory Board members
serve in an executive capacity.
SBF has notified the Tokyo Stock Exchange of the appointment
of Outside Director Hitoshi Kashiwaki and Outside Audit and
Supervisory Board Member Yukihiko Uehara as independent
officers, as stipulated by the Tokyo Stock Exchange.
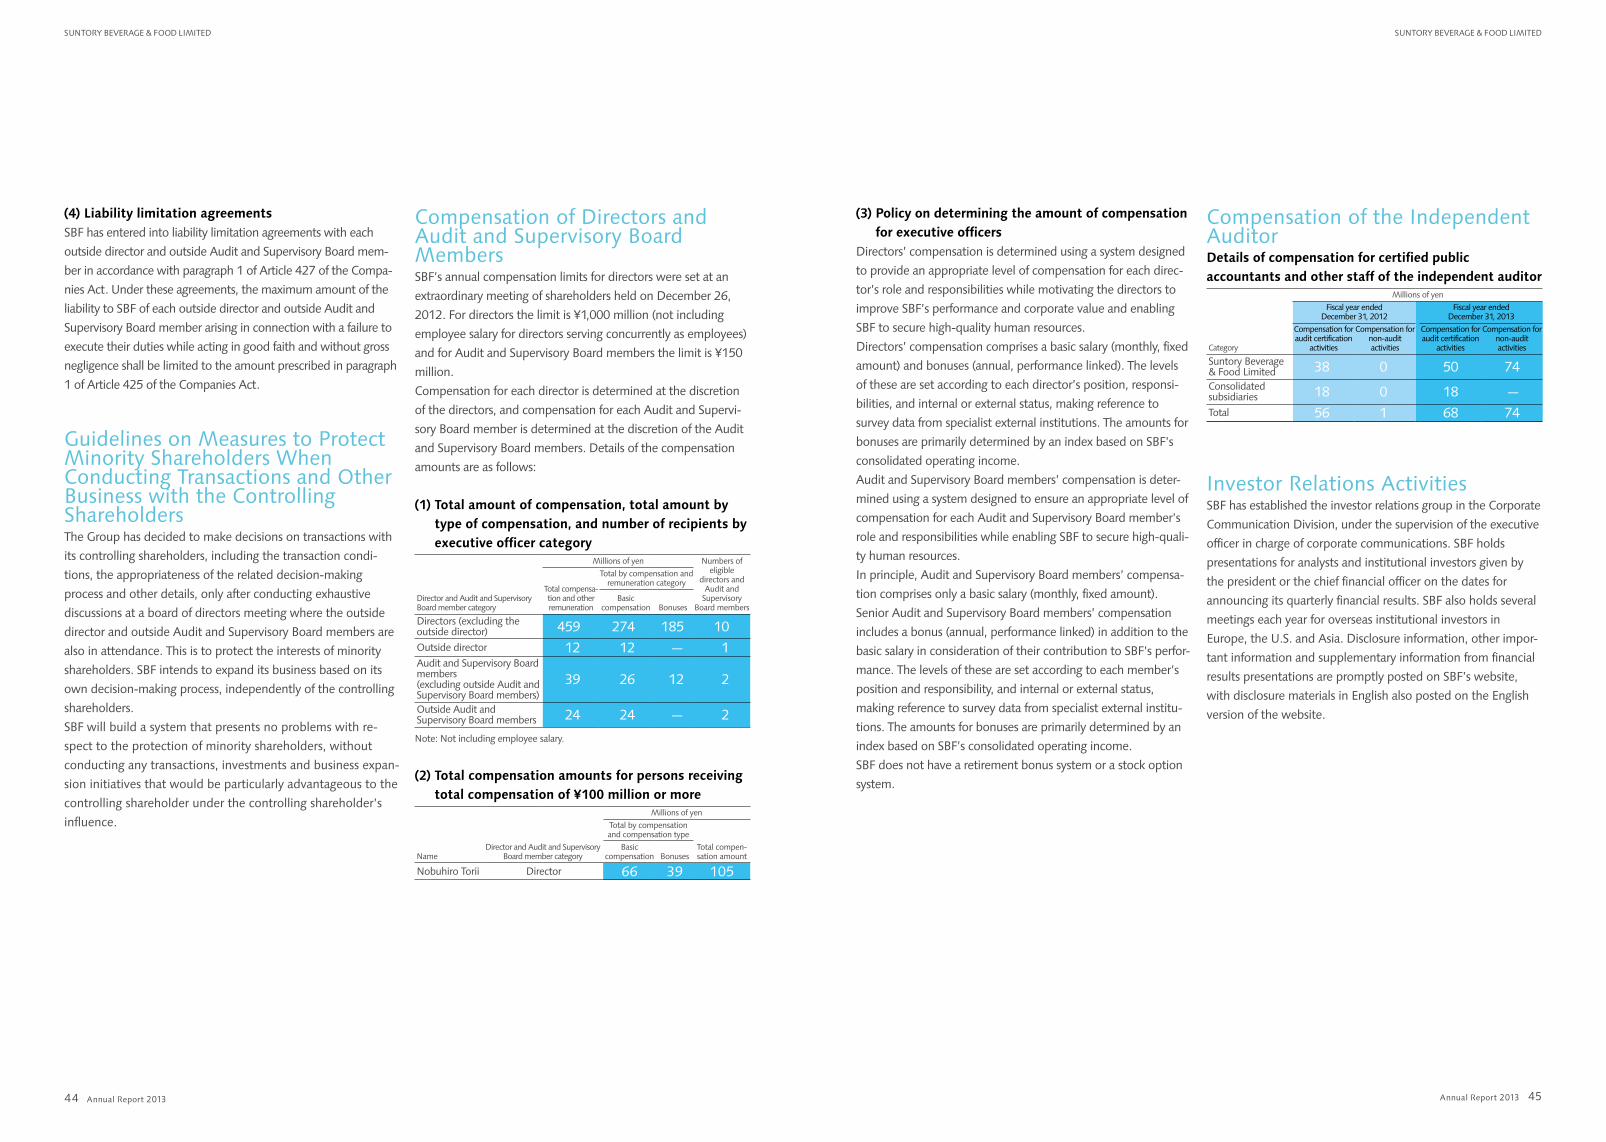
Annual Report 2013 Annual Report 2013
SuntoRy BeveRAge & Food Limited SuntoRy BeveRAge & Food Limited
4544
(4) Liability limitation agreementsSBF has entered into liability limitation agreements with each
outside director and outside Audit and Supervisory Board mem-
ber in accordance with paragraph 1 of Article 427 of the Compa-
nies Act. Under these agreements, the maximum amount of the
liability to SBF of each outside director and outside Audit and
Supervisory Board member arising in connection with a failure to
execute their duties while acting in good faith and without gross
negligence shall be limited to the amount prescribed in paragraph
1 of Article 425 of the Companies Act.
Guidelines on Measures to Protect Minority Shareholders When Conducting Transactions and Other Business with the Controlling ShareholdersThe Group has decided to make decisions on transactions with
its controlling shareholders, including the transaction condi-
tions, the appropriateness of the related decision-making
process and other details, only after conducting exhaustive
discussions at a board of directors meeting where the outside
director and outside Audit and Supervisory Board members are
also in attendance. This is to protect the interests of minority
shareholders. SBF intends to expand its business based on its
own decision-making process, independently of the controlling
shareholders.
SBF will build a system that presents no problems with re-
spect to the protection of minority shareholders, without
conducting any transactions, investments and business expan-
sion initiatives that would be particularly advantageous to the
controlling shareholder under the controlling shareholder’s
influence.
(3) Policy on determining the amount of compensation for executive officers
Directors’ compensation is determined using a system designed
to provide an appropriate level of compensation for each direc-
tor’s role and responsibilities while motivating the directors to
improve SBF’s performance and corporate value and enabling
SBF to secure high-quality human resources.
Directors’ compensation comprises a basic salary (monthly, fixed
amount) and bonuses (annual, performance linked). The levels
of these are set according to each director’s position, responsi-
bilities, and internal or external status, making reference to
survey data from specialist external institutions. The amounts for
bonuses are primarily determined by an index based on SBF’s
consolidated operating income.
Audit and Supervisory Board members’ compensation is deter-
mined using a system designed to ensure an appropriate level of
compensation for each Audit and Supervisory Board member’s
role and responsibilities while enabling SBF to secure high-quali-
ty human resources.
In principle, Audit and Supervisory Board members’ compensa-
tion comprises only a basic salary (monthly, fixed amount).
Senior Audit and Supervisory Board members’ compensation
includes a bonus (annual, performance linked) in addition to the
basic salary in consideration of their contribution to SBF’s perfor-
mance. The levels of these are set according to each member’s
position and responsibility, and internal or external status,
making reference to survey data from specialist external institu-
tions. The amounts for bonuses are primarily determined by an
index based on SBF’s consolidated operating income.
SBF does not have a retirement bonus system or a stock option
system.
Compensation of Directors and Audit and Supervisory Board MembersSBF’s annual compensation limits for directors were set at an
extraordinary meeting of shareholders held on December 26,
2012. For directors the limit is ¥1,000 million (not including
employee salary for directors serving concurrently as employees)
and for Audit and Supervisory Board members the limit is ¥150
million.
Compensation for each director is determined at the discretion
of the directors, and compensation for each Audit and Supervi-
sory Board member is determined at the discretion of the Audit
and Supervisory Board members. Details of the compensation
amounts are as follows:
(1) Total amount of compensation, total amount by type of compensation, and number of recipients by executive officer category
Millions of yen Numbers of eligible
directors and Audit and
Supervisory Board members
Total compensa-tion and other remuneration
Total by compensation and remuneration category
Director and Audit and Supervisory Board member category
Basic compensation Bonuses
Directors (excluding the outside director) 459 274 185 10Outside director 12 12 — 1Audit and Supervisory Board members (excluding outside Audit and Supervisory Board members)
39 26 12 2
Outside Audit and Supervisory Board members 24 24 — 2
Note: Not including employee salary.
(2) Total compensation amounts for persons receiving total compensation of ¥100 million or more
Millions of yen
Director and Audit and Supervisory Board member category
Total by compensation and compensation type
NameBasic
compensation BonusesTotal compen-sation amount
Nobuhiro Torii Director 66 39 105
Compensation of the Independent AuditorDetails of compensation for certified public accountants and other staff of the independent auditor
Millions of yen
Fiscal year ended December 31, 2012
Fiscal year ended December 31, 2013
Category
Compensation for audit certification
activities
Compensation for non-audit activities
Compensation for audit certification
activities
Compensation for non-audit activities
Suntory Beverage & Food Limited 38 0 50 74Consolidated subsidiaries 18 0 18 —Total 56 1 68 74
Investor Relations ActivitiesSBF has established the investor relations group in the Corporate
Communication Division, under the supervision of the executive
officer in charge of corporate communications. SBF holds
presentations for analysts and institutional investors given by
the president or the chief financial officer on the dates for
announcing its quarterly financial results. SBF also holds several
meetings each year for overseas institutional investors in
Europe, the U.S. and Asia. Disclosure information, other impor-
tant information and supplementary information from financial
results presentations are promptly posted on SBF’s website,
with disclosure materials in English also posted on the English
version of the website.
Annual Report 2013 Annual Report 2013
SuntoRy BeveRAge & Food Limited SuntoRy BeveRAge & Food Limited
4746
Board of Directors and Audit & Supervisory Board Members(As of the publishing date of this report)
Financial SectionManagement’s Discussion and Analysis of Financial Condition and Results of Operations ................................................................... 48
Business and Other Risks ...................................................................... 54
Consolidated Balance Sheet .................................................................. 60
Consolidated Statement of Income ....................................................... 62
Consolidated Statement of Comprehensive Income .............................. 63
Consolidated Statement of Changes in Equity ....................................... 64
Consolidated Statement of Cash Flows ................................................. 65
Notes to Consolidated Financial Statements ......................................... 66
Independent Auditor’s Report .............................................................. 87
Directors
Audit & Supervisory Board Members
Representative Director & President
Nobuhiro Torii
Executive Vice President
Yoshihiko KakimiExecutive Vice President
Saburo KogoSenior Managing Director
Nobuhiro KuriharaSenior Managing Director
Shinichiro Hizuka
Director
Masato TsuchidaDirector
Yasuhiko KamadaDirector
Shigehiro AoyamaOutside Director
Hitoshi Kashiwaki
Senior Audit & Supervisory Board Member
Seiichiro Hattori
Audit & Supervisory Board Member
Toru Yamamoto
Outside Audit & Supervisory Board Member
Yukihiko Uehara
Outside Audit & Supervisory Board Member
Harumichi Uchida
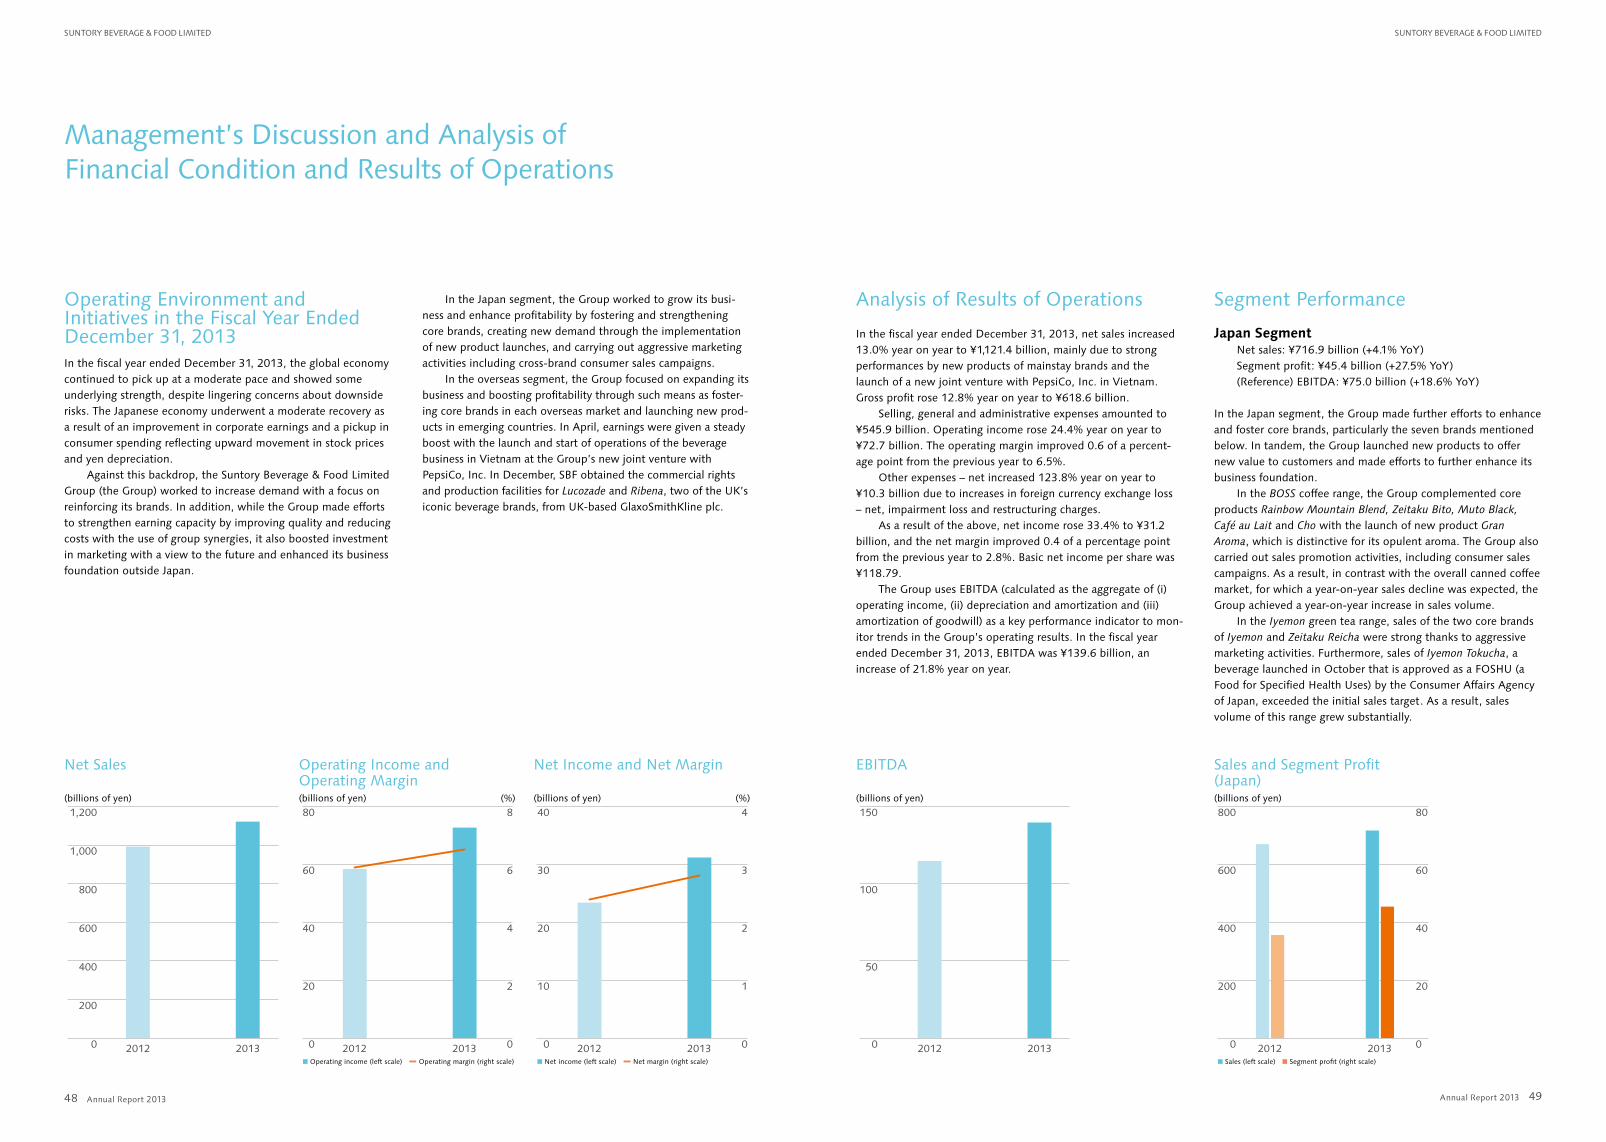
Annual Report 2013 Annual Report 2013
SuntoRy BeveRAge & Food Limited SuntoRy BeveRAge & Food Limited
4948
Operating Environment and Initiatives in the Fiscal Year Ended December 31, 2013In the fiscal year ended December 31, 2013, the global economy continued to pick up at a moderate pace and showed some underlying strength, despite lingering concerns about downside risks. The Japanese economy underwent a moderate recovery as a result of an improvement in corporate earnings and a pickup in consumer spending reflecting upward movement in stock prices and yen depreciation.
Against this backdrop, the Suntory Beverage & Food Limited Group (the Group) worked to increase demand with a focus on reinforcing its brands. In addition, while the Group made efforts to strengthen earning capacity by improving quality and reducing costs with the use of group synergies, it also boosted investment in marketing with a view to the future and enhanced its business foundation outside Japan.
In the Japan segment, the Group worked to grow its busi-ness and enhance profitability by fostering and strengthening core brands, creating new demand through the implementation of new product launches, and carrying out aggressive marketing activities including cross-brand consumer sales campaigns.
In the overseas segment, the Group focused on expanding its business and boosting profitability through such means as foster-ing core brands in each overseas market and launching new prod-ucts in emerging countries. In April, earnings were given a steady boost with the launch and start of operations of the beverage business in Vietnam at the Group’s new joint venture with PepsiCo, Inc. In December, SBF obtained the commercial rights and production facilities for Lucozade and Ribena, two of the UK’s iconic beverage brands, from UK-based GlaxoSmithKline plc.
Analysis of Results of Operations
In the fiscal year ended December 31, 2013, net sales increased 13.0% year on year to ¥1,121.4 billion, mainly due to strong performances by new products of mainstay brands and the launch of a new joint venture with PepsiCo, Inc. in Vietnam. Gross profit rose 12.8% year on year to ¥618.6 billion.
Selling, general and administrative expenses amounted to ¥545.9 billion. Operating income rose 24.4% year on year to ¥72.7 billion. The operating margin improved 0.6 of a percent-age point from the previous year to 6.5%.
Other expenses – net increased 123.8% year on year to ¥10.3 billion due to increases in foreign currency exchange loss – net, impairment loss and restructuring charges.
As a result of the above, net income rose 33.4% to ¥31.2 billion, and the net margin improved 0.4 of a percentage point from the previous year to 2.8%. Basic net income per share was ¥118.79.
The Group uses EBITDA (calculated as the aggregate of (i) operating income, (ii) depreciation and amortization and (iii) amortization of goodwill) as a key performance indicator to mon-itor trends in the Group’s operating results. In the fiscal year ended December 31, 2013, EBITDA was ¥139.6 billion, an increase of 21.8% year on year.
Segment Performance
Japan SegmentNet sales: ¥716.9 billion (+4.1% YoY)Segment profit: ¥45.4 billion (+27.5% YoY)(Reference) EBITDA: ¥75.0 billion (+18.6% YoY)
In the Japan segment, the Group made further efforts to enhance and foster core brands, particularly the seven brands mentioned below. In tandem, the Group launched new products to offer new value to customers and made efforts to further enhance its business foundation.
In the BOSS coffee range, the Group complemented core products Rainbow Mountain Blend, Zeitaku Bito, Muto Black, Café au Lait and Cho with the launch of new product Gran Aroma, which is distinctive for its opulent aroma. The Group also carried out sales promotion activities, including consumer sales campaigns. As a result, in contrast with the overall canned coffee market, for which a year-on-year sales decline was expected, the Group achieved a year-on-year increase in sales volume.
In the Iyemon green tea range, sales of the two core brands of Iyemon and Zeitaku Reicha were strong thanks to aggressive marketing activities. Furthermore, sales of Iyemon Tokucha, a beverage launched in October that is approved as a FOSHU (a Food for Specified Health Uses) by the Consumer Affairs Agency of Japan, exceeded the initial sales target. As a result, sales volume of this range grew substantially.
Management’s Discussion and Analysis of Financial Condition and Results of Operations
Operating Income and Operating Margin(billions of yen) (%)
Net Income and Net Margin
(billions of yen) (%)
EBITDA
(billions of yen)
Net Sales
(billions of yen)
n Operating income (left scale) n Operating margin (right scale) n Net income (left scale) n Net margin (right scale) n Sales (left scale) n Segment profit (right scale)
201320120
20
40
60
80
0
2
4
6
8
201320120
10
20
30
40
0
1
2
3
4
0
50
100
150
201320120
200
400
600
800
1,000
1,200
20132012
Sales and Segment Profit (Japan)(billions of yen)
201320120
200
400
600
800
0
20
40
60
80
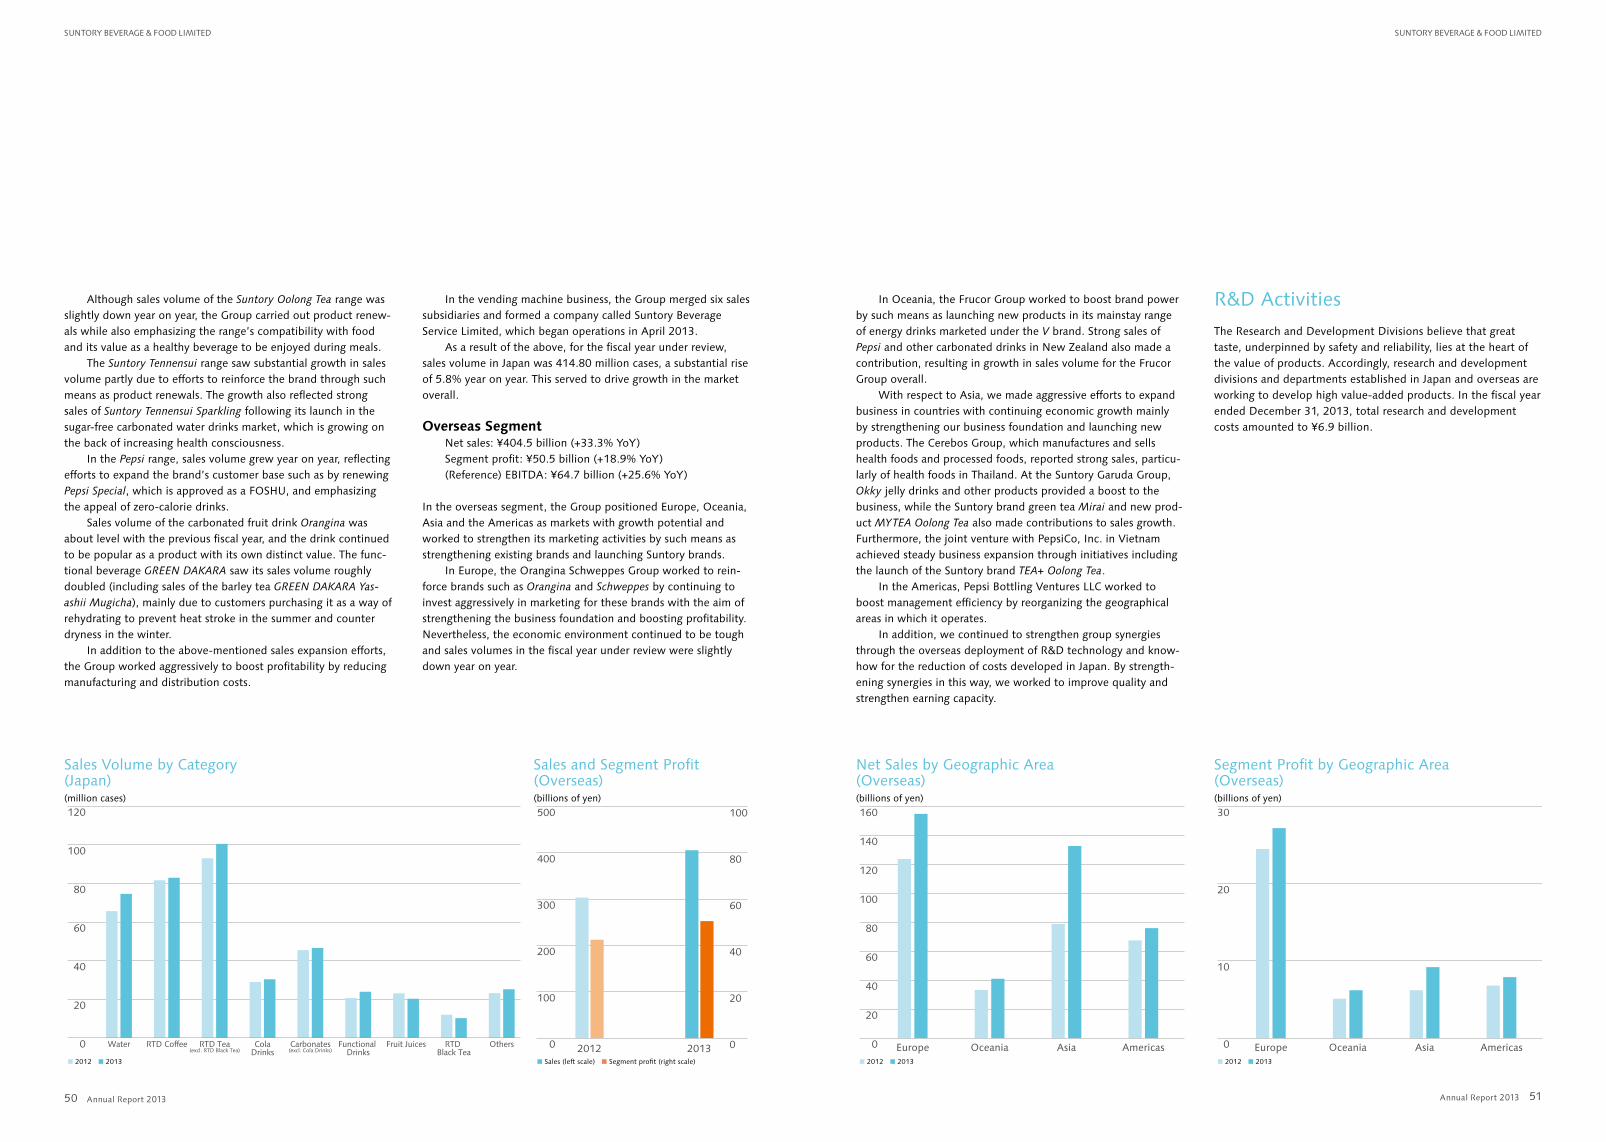
Annual Report 2013 Annual Report 2013
SuntoRy BeveRAge & Food Limited SuntoRy BeveRAge & Food Limited
5150
Although sales volume of the Suntory Oolong Tea range was slightly down year on year, the Group carried out product renew-als while also emphasizing the range’s compatibility with food and its value as a healthy beverage to be enjoyed during meals.
The Suntory Tennensui range saw substantial growth in sales volume partly due to efforts to reinforce the brand through such means as product renewals. The growth also reflected strong sales of Suntory Tennensui Sparkling following its launch in the sugar-free carbonated water drinks market, which is growing on the back of increasing health consciousness.
In the Pepsi range, sales volume grew year on year, reflecting efforts to expand the brand’s customer base such as by renewing Pepsi Special, which is approved as a FOSHU, and emphasizing the appeal of zero-calorie drinks.
Sales volume of the carbonated fruit drink Orangina was about level with the previous fiscal year, and the drink continued to be popular as a product with its own distinct value. The func-tional beverage GREEN DAKARA saw its sales volume roughly doubled (including sales of the barley tea GREEN DAKARA Yas-ashii Mugicha), mainly due to customers purchasing it as a way of rehydrating to prevent heat stroke in the summer and counter dryness in the winter.
In addition to the above-mentioned sales expansion efforts, the Group worked aggressively to boost profitability by reducing manufacturing and distribution costs.
In the vending machine business, the Group merged six sales subsidiaries and formed a company called Suntory Beverage Service Limited, which began operations in April 2013.
As a result of the above, for the fiscal year under review, sales volume in Japan was 414.80 million cases, a substantial rise of 5.8% year on year. This served to drive growth in the market overall.
Overseas SegmentNet sales: ¥404.5 billion (+33.3% YoY)Segment profit: ¥50.5 billion (+18.9% YoY)(Reference) EBITDA: ¥64.7 billion (+25.6% YoY)
In the overseas segment, the Group positioned Europe, Oceania, Asia and the Americas as markets with growth potential and worked to strengthen its marketing activities by such means as strengthening existing brands and launching Suntory brands.
In Europe, the Orangina Schweppes Group worked to rein-force brands such as Orangina and Schweppes by continuing to invest aggressively in marketing for these brands with the aim of strengthening the business foundation and boosting profitability. Nevertheless, the economic environment continued to be tough and sales volumes in the fiscal year under review were slightly down year on year.
In Oceania, the Frucor Group worked to boost brand power by such means as launching new products in its mainstay range of energy drinks marketed under the V brand. Strong sales of Pepsi and other carbonated drinks in New Zealand also made a contribution, resulting in growth in sales volume for the Frucor Group overall.
With respect to Asia, we made aggressive efforts to expand business in countries with continuing economic growth mainly by strengthening our business foundation and launching new products. The Cerebos Group, which manufactures and sells health foods and processed foods, reported strong sales, particu-larly of health foods in Thailand. At the Suntory Garuda Group, Okky jelly drinks and other products provided a boost to the business, while the Suntory brand green tea Mirai and new prod-uct MYTEA Oolong Tea also made contributions to sales growth. Furthermore, the joint venture with PepsiCo, Inc. in Vietnam achieved steady business expansion through initiatives including the launch of the Suntory brand TEA+ Oolong Tea.
In the Americas, Pepsi Bottling Ventures LLC worked to boost management efficiency by reorganizing the geographical areas in which it operates.
In addition, we continued to strengthen group synergies through the overseas deployment of R&D technology and know-how for the reduction of costs developed in Japan. By strength-ening synergies in this way, we worked to improve quality and strengthen earning capacity.
R&D Activities
The Research and Development Divisions believe that great taste, underpinned by safety and reliability, lies at the heart of the value of products. Accordingly, research and development divisions and departments established in Japan and overseas are working to develop high value-added products. In the fiscal year ended December 31, 2013, total research and development costs amounted to ¥6.9 billion.
Sales Volume by Category (Japan)(million cases)
Net Sales by Geographic Area (Overseas)(billions of yen)
Segment Profit by Geographic Area (Overseas)(billions of yen)
Sales and Segment Profit (Overseas)(billions of yen)
20132012 0
20
40
60
80
100
0
100
200
300
400
500
AmericasAsiaOceaniaEurope0
20
40
60
80
100
120
140
160
AmericasAsiaOceaniaEurope0
10
20
30
0
20
40
60
80
100
120
OthersRTD Black Tea
Fruit JuicesFunctional Drinks
Carbonates(excl. Cola Drinks)
ColaDrinks
RTD Tea(excl. RTD Black Tea)
RTD CoffeeWater
n 2012 n 2013 n 2012 n 2013 n 2012 n 2013n Sales (left scale) n Segment profit (right scale)
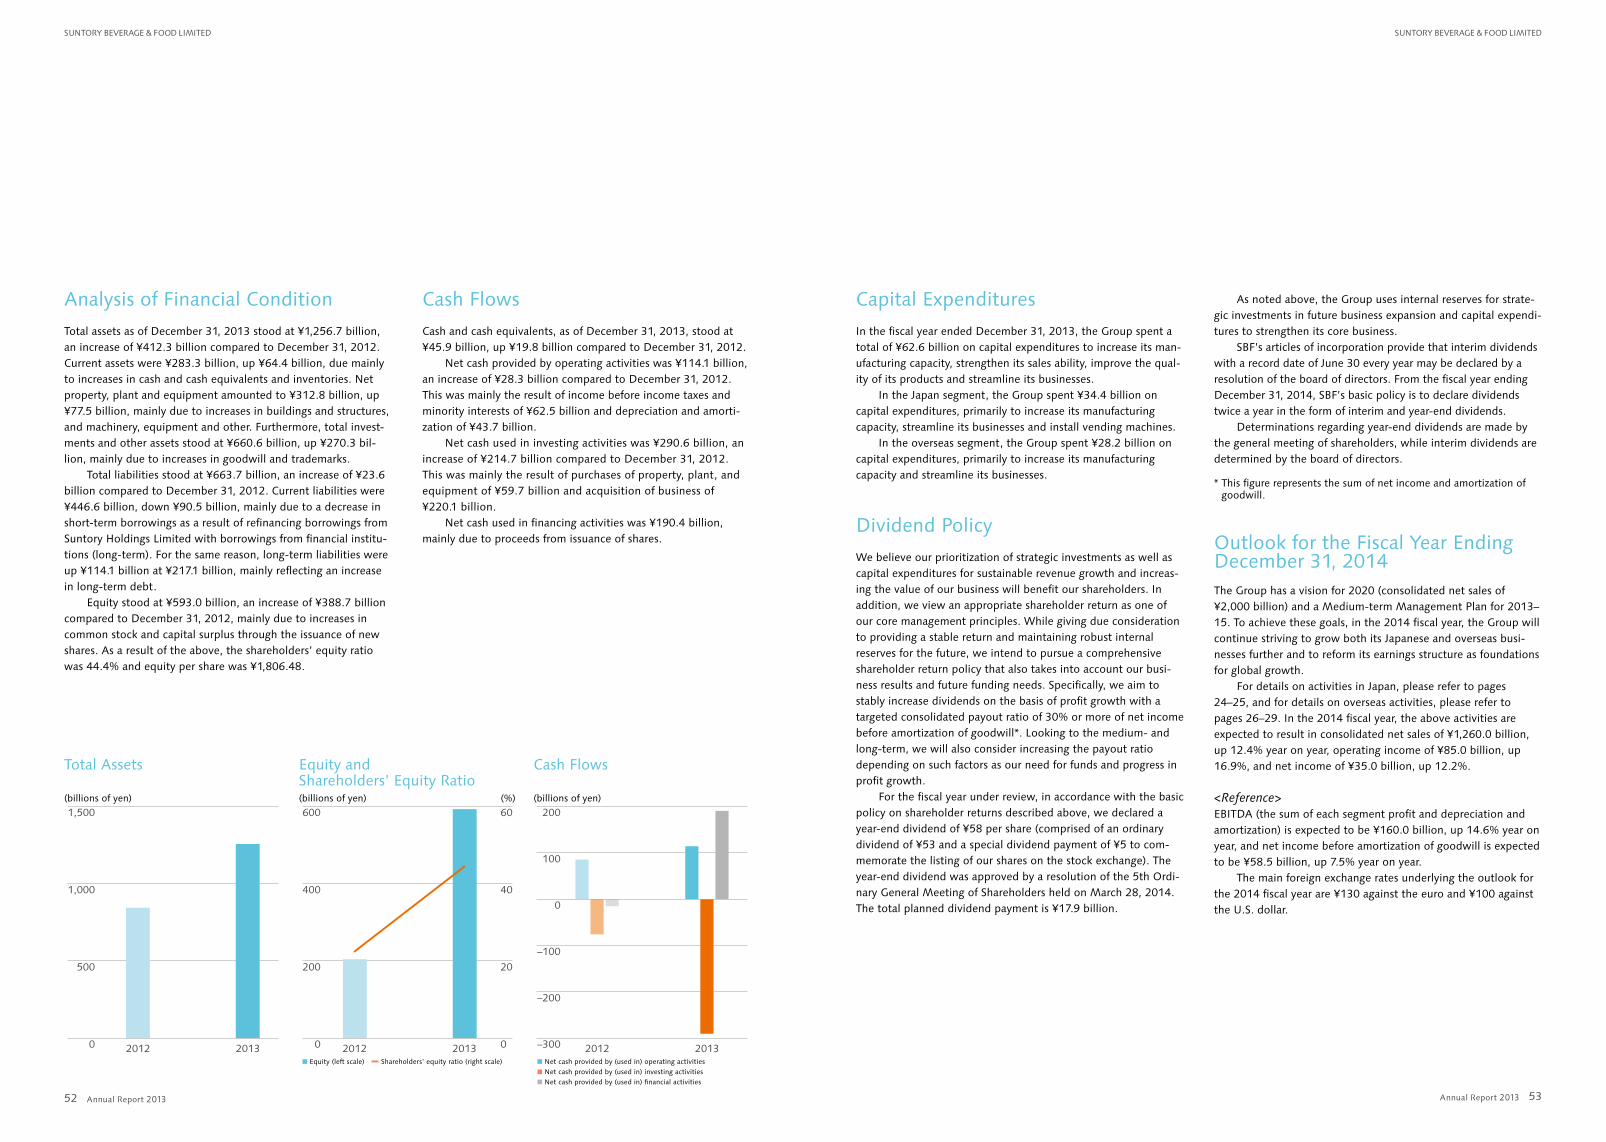
Annual Report 2013 Annual Report 2013
SuntoRy BeveRAge & Food Limited SuntoRy BeveRAge & Food Limited
5352
Analysis of Financial Condition
Total assets as of December 31, 2013 stood at ¥1,256.7 billion, an increase of ¥412.3 billion compared to December 31, 2012. Current assets were ¥283.3 billion, up ¥64.4 billion, due mainly to increases in cash and cash equivalents and inventories. Net property, plant and equipment amounted to ¥312.8 billion, up ¥77.5 billion, mainly due to increases in buildings and structures, and machinery, equipment and other. Furthermore, total invest-ments and other assets stood at ¥660.6 billion, up ¥270.3 bil-lion, mainly due to increases in goodwill and trademarks.
Total liabilities stood at ¥663.7 billion, an increase of ¥23.6 billion compared to December 31, 2012. Current liabilities were ¥446.6 billion, down ¥90.5 billion, mainly due to a decrease in short-term borrowings as a result of refinancing borrowings from Suntory Holdings Limited with borrowings from financial institu-tions (long-term). For the same reason, long-term liabilities were up ¥114.1 billion at ¥217.1 billion, mainly reflecting an increase in long-term debt.
Equity stood at ¥593.0 billion, an increase of ¥388.7 billion compared to December 31, 2012, mainly due to increases in common stock and capital surplus through the issuance of new shares. As a result of the above, the shareholders’ equity ratio was 44.4% and equity per share was ¥1,806.48.
Cash Flows
Cash and cash equivalents, as of December 31, 2013, stood at ¥45.9 billion, up ¥19.8 billion compared to December 31, 2012.
Net cash provided by operating activities was ¥114.1 billion, an increase of ¥28.3 billion compared to December 31, 2012. This was mainly the result of income before income taxes and minority interests of ¥62.5 billion and depreciation and amorti-zation of ¥43.7 billion.
Net cash used in investing activities was ¥290.6 billion, an increase of ¥214.7 billion compared to December 31, 2012. This was mainly the result of purchases of property, plant, and equipment of ¥59.7 billion and acquisition of business of ¥220.1 billion.
Net cash used in financing activities was ¥190.4 billion, mainly due to proceeds from issuance of shares.
Capital Expenditures
In the fiscal year ended December 31, 2013, the Group spent a total of ¥62.6 billion on capital expenditures to increase its man-ufacturing capacity, strengthen its sales ability, improve the qual-ity of its products and streamline its businesses.
In the Japan segment, the Group spent ¥34.4 billion on capital expenditures, primarily to increase its manufacturing capacity, streamline its businesses and install vending machines.
In the overseas segment, the Group spent ¥28.2 billion on capital expenditures, primarily to increase its manufacturing capacity and streamline its businesses.
Dividend Policy
We believe our prioritization of strategic investments as well as capital expenditures for sustainable revenue growth and increas-ing the value of our business will benefit our shareholders. In addition, we view an appropriate shareholder return as one of our core management principles. While giving due consideration to providing a stable return and maintaining robust internal reserves for the future, we intend to pursue a comprehensive shareholder return policy that also takes into account our busi-ness results and future funding needs. Specifically, we aim to stably increase dividends on the basis of profit growth with a targeted consolidated payout ratio of 30% or more of net income before amortization of goodwill*. Looking to the medium- and long-term, we will also consider increasing the payout ratio depending on such factors as our need for funds and progress in profit growth.
For the fiscal year under review, in accordance with the basic policy on shareholder returns described above, we declared a year-end dividend of ¥58 per share (comprised of an ordinary dividend of ¥53 and a special dividend payment of ¥5 to com-memorate the listing of our shares on the stock exchange). The year-end dividend was approved by a resolution of the 5th Ordi-nary General Meeting of Shareholders held on March 28, 2014. The total planned dividend payment is ¥17.9 billion.
As noted above, the Group uses internal reserves for strate-gic investments in future business expansion and capital expendi-tures to strengthen its core business.
SBF’s articles of incorporation provide that interim dividends with a record date of June 30 every year may be declared by a resolution of the board of directors. From the fiscal year ending December 31, 2014, SBF’s basic policy is to declare dividends twice a year in the form of interim and year-end dividends.
Determinations regarding year-end dividends are made by the general meeting of shareholders, while interim dividends are determined by the board of directors.
* This figure represents the sum of net income and amortization of goodwill.
Outlook for the Fiscal Year Ending December 31, 2014The Group has a vision for 2020 (consolidated net sales of ¥2,000 billion) and a Medium-term Management Plan for 2013–15. To achieve these goals, in the 2014 fiscal year, the Group will continue striving to grow both its Japanese and overseas busi-nesses further and to reform its earnings structure as foundations for global growth.
For details on activities in Japan, please refer to pages 24–25, and for details on overseas activities, please refer to pages 26–29. In the 2014 fiscal year, the above activities are expected to result in consolidated net sales of ¥1,260.0 billion, up 12.4% year on year, operating income of ¥85.0 billion, up 16.9%, and net income of ¥35.0 billion, up 12.2%.
<Reference>EBITDA (the sum of each segment profit and depreciation and amortization) is expected to be ¥160.0 billion, up 14.6% year on year, and net income before amortization of goodwill is expected to be ¥58.5 billion, up 7.5% year on year.
The main foreign exchange rates underlying the outlook for the 2014 fiscal year are ¥130 against the euro and ¥100 against the U.S. dollar.
Equity and Shareholders’ Equity Ratio(billions of yen) (%)
Cash Flows
(billions of yen)
Total Assets
(billions of yen)
201320120
200
400
600
0
20
40
60
20132012–300
–200
–100
0
100
200
201320120
500
1,000
1,500
n Equity (left scale) n Shareholders’ equity ratio (right scale) n Net cash provided by (used in) operating activities n Net cash provided by (used in) investing activitiesn Net cash provided by (used in) financial activities
Annual Report 2013 Annual Report 2013
SuntoRy BeveRAge & Food Limited SuntoRy BeveRAge & Food Limited
5554
Business and Other Risks
The following risks could have an impact on the Group’s operat-ing results and financial condition. Please note that forward-looking statements made in this section reflect the Group’s judgment as of the publication date of this annual report.
(1) Risk related to responding effectively to changing consumer preferences and product development
The beverage and food industry is highly susceptible to changes in consumer preferences. In order to generate revenues and profits, we must have product offerings that appeal to consum-ers. Although we strive to effectively monitor changes in the markets for our products, there is no assurance that we will develop new products that appeal to consumers. In particular, one element of our product strategy is to introduce products that appeal to health-conscious consumers, but we may face increased competition as other manufacturers also focus on products that emphasize health. Any significant changes in con-sumer preferences or any inability on our part to anticipate or react to such changes could result in reduced demand for our products and erosion of our competitiveness, and impact our operating results and financial position.
Our continued success is also dependent on our ability to innovate, which includes maintaining a robust pipeline of new products and improving the effectiveness of our product packag-ing and marketing efforts. While we devote significant resources to promoting our brands and new product launches, there can be no assurance as to our continued ability to develop and launch successful new products or to effectively execute our marketing programs. Any failure on our part to achieve appro-priate innovation or successfully launch new products could decrease demand for our products by negatively affecting con-sumer perception of our brands, as well as result in inventory write-offs and other costs.
(2) Risks related to competitionThe beverage industry is highly competitive. We compete with major international beverage companies that, like us, operate in multiple geographic areas, as well as numerous companies that are primarily local in operation. Large competitors can use their resources and scale to rapidly respond to competitive pressures and changes in consumer preferences by introducing new prod-ucts, reducing prices or increasing promotional activities. We also compete with a variety of smaller, regional and private label manufacturers, which may have historical strengths in particular geographic markets or product categories. Our inability to com-pete effectively could have an impact on our operating results and financial condition.
(3) Risks related to potential acquisitions and joint ventures
Identifying and taking advantage of additional acquisition and market entry opportunities in Japan, Europe, other developed markets and emerging markets is an important part of our growth strategy. Accordingly, we regularly evaluate potential acquisitions and joint ventures, some of which are large in size or otherwise substantial. Potential issues associated with these activities could include, among others:• we may be unable to identify appropriate acquisitions and
other opportunities or may be unable to agree on terms with potential counterparties, due to competing bids among other reasons;
• we may fail to receive necessary consents, clearances and approvals in connection with an acquisition or joint venture;
• we may be unable to raise necessary capital on favorable terms;• in entering new geographic markets or product segments, we
may change our business profile and face challenges with which we are unfamiliar or fail to anticipate; and
• we may be unable to realize the full extent of the profits or cost savings that we expect to realize as a result of an acquisi-tion or the formation of a joint venture.
If we do not successfully execute our acquisition and joint venture strategy, we may be unable to realize our medium- and long-term growth objectives.
(4) Risks related to international operationsOur global operations and ongoing investment in developed and especially emerging markets mean we are subject to risks involved in international operations generally. Such risks include, among others:• the need to comply with differing or undeveloped legal, regula-
tory and tax regimes;• negative economic or political developments;• fluctuations in exchange rates; and• disruptions from extraordinary events such as terrorism, political
instability, civil unrest or epidemics such as SARS or avian flu.
We also intend to leverage our product development exper-tise and existing product portfolio in Japan and key overseas group companies to expand our product offerings in other mar-kets. However, there can be no assurance that our existing prod-ucts, variants of our existing products or new products that we make, manufacture, market or sell will be accepted or successful in other markets, due to local competition, product price, cul-tural differences or other factors. If we are unable to develop products that appeal to consumers in new markets in which we have little or no prior experience, our ability to realize our growth objectives could be adversely affected.
(5) Risks related to business plans and business strategies based on medium- and long-term goals
We have developed a medium-term business plan and estab-lished certain long-term business strategies and goals. Although we believe that our plan and these strategies and goals will help us achieve medium- and long-term growth, there can be no assurance that we will be successful in implementing our plan, executing our strategies or achieving our goals. In order to reach our medium- and long-term goals, we will need to achieve growth organically and through acquisitions and joint ventures. In addition to the risks we face in sourcing acquisition and joint venture opportunities and executing and integrating acquisitions and joint ventures as noted in Item (3) above, we also face risks in achieving organic growth in our existing operations. For exam-ple, we may not succeed in implementing business strategies to introduce products commanding premium pricing or to achieve targeted supply chain cost efficiencies.
(6) Risks related to our product safetyAs a beverage and food manufacturer, the safety of our products is vital to our business and we strive to comply with applicable rules and regulations and ensure that our products meet all required quality standards. In addition, we have adopted various quality, environmental, and health and safety standards in our operations. However, despite our efforts, our products may not meet these standards or could otherwise become contaminated. Such failure to meet our standards or contamination of our prod-ucts could occur in our own operations or those of third-party manufacturers, distributors or suppliers, who we do not control. This could result in expensive production interruptions, recalls or liability claims and harm the affected brand and our corporate reputation. Moreover, negative publicity could be generated from unfounded or nominal liability claims or limited recalls.
(7) Risks related to distribution channelsWe sell our products through multiple channels, including wholesalers and major retail groups. In Japan, our vending machine network is also an important distribution channel. Chal-lenges we face with respect to our distribution channels include:• consolidation among retail groups in many markets has resulted
in large, sophisticated retailers with strong bargaining power in terms of pricing and sales promotions. The loss of significant customers, or unfavorable changes to pricing and other terms, could adversely affect our results of operations;
• independent retailing groups, including those in Japan, are introducing competitively priced private label products that contribute to intensifying price competition; and
• the Japanese market is relatively saturated in terms of vending machines, resulting in increased price competition. In addition, sales per machine may decrease due to increased competition from an increase in convenience store locations.
These risks related to our distribution channels could impact our results of operations and financial condition.
(8) Risks related to economic conditionsUnfavorable economic conditions, such as a future recession or economic slowdown in Japan or our other major markets, could negatively affect the affordability of, and consumer demand for, our products. Under challenging economic conditions, consum-ers may seek to reduce discretionary spending by forgoing pur-chases of our products or by shifting away from our products to lower-priced offerings from other companies, including private label brands. Weak consumer demand for our products in Japan or in other major markets could reduce our profitability and negatively affect our results of operations and financial position.
The Japanese government increased the rate of consumption tax from 5% to the current 8% in April 2014 and plans to increase the tax to 10% in October 2015. It is unclear what impact these increases will have on our sales in Japan or whether we will be able to maintain current margin levels following such increases. Furthermore, Japan’s long-term demographic trends generally point to an aging and declining population. This could have a negative impact on consumer demand. If the tax increases or Japan’s demographic trends result in decreased demand for our products or increased pricing pressure, they may have a negative effect on our results of operations and financial position.
(9) Risks related to foreign exchange rate fluctuations
We purchase certain raw materials internationally using currencies other than the Japanese yen, principally the U.S. dollar. Although we use derivative financial instruments to reduce our net expo-sure to exchange rate fluctuations, such hedging instruments do not protect us against all fluctuations and our business and finan-cial performance could be adversely affected. In addition, because our consolidated financial statements are presented in Japanese yen, we must translate revenues, income and expenses, as well as assets and liabilities, of overseas subsidiaries into Japanese yen at exchange rates in effect during or at the end of each reporting period. Therefore, foreign exchange rate fluctuations could impact our results of operations and financial position.
Annual Report 2013 Annual Report 2013
SuntoRy BeveRAge & Food Limited SuntoRy BeveRAge & Food Limited
5756
(10) Risks related to interest rate fluctuationsWe finance a portion of our operations through interest-bearing loans and in the future we may conduct additional debt financing through loans, the issuance of corporate bonds or other means. In addition, we may finance future acquisitions through addi-tional borrowings. Although we use fixed-interest transactions and derivative instruments to manage our interest rate exposure, large increases in interest rates could have an adverse effect on our financial condition and results of operations.
(11) Risks related to goodwill and trademarksAs of December 31, 2013, goodwill stood at ¥400.1 billion and trademarks were ¥184.9 billion. Most of this goodwill is related to the acquisition of the Orangina Schweppes Group, and is scheduled to be amortized over a period of 20 years based on Japanese GAAP and our accounting policies. Furthermore, most of the trademarks are related to the manufacture and sales busi-ness of Lucozade and Ribena, which were acquired from GlaxoSmithKline plc. We do not plan to amortize these trade-marks because their economic useful life cannot be estimated.
We may record additional goodwill and trademarks as a result of conducting new acquisitions and joint ventures in the future. We are required to regularly assess our consolidated intangible assets for any signs of impairment. In cases where we determine that these consolidated intangible assets are impaired, we are required to post an impairment loss. The recording of such an impairment loss could have an adverse effect on our results of operations and financial position.
(12) Risks related to procurement of raw materialsThe principal raw materials we use in our business are aluminum cans and ends, glass bottles, PET bottles and caps, paperboard packaging, sweeteners, juice, fruit, coffee beans, tea leaves and other ingredients.
The price of these materials is affected by changes in weather patterns and supply and demand in the relevant global markets. Additionally, conversion of raw materials into our prod-ucts for sale also uses electricity and natural gas. The cost of the raw materials and energy can fluctuate substantially. Continued increases in the prices of these raw materials and energy could exert pressure on our costs and we may not be able to pass along any such increases to the sales price of our products, which could negatively affect our business, results of operations and financial position.
In addition, some raw materials we use are sourced from industries characterized by a limited supply base. Although we believe we have strong relationships with our suppliers, we could suffer raw material shortages if they are unable to meet our
requirements. The failure of our suppliers to meet our needs could occur for many reasons, including fires, natural disasters, adverse weather conditions, manufacturing problems, disease, crop failures, strikes, transportation issues, supply interruptions, government regulation, political instability and terrorism. Some of these risks may be more acute where the supplier or its facili-ties are located in riskier or less-developed countries or regions. Changing suppliers can require long lead times and any signifi-cant interruption to supply over an extended period of time could substantially harm our business, results of operations and financial position.
(13) Risks related to water supplyWater is the main ingredient in substantially all our products and water resources in many parts of the world are facing unprece-dented challenges from population pressures, pollution, poor man-agement and the impact of climate change. As demand for water resources increases around the world, companies that depend on abundant water resources, including us, may face increased produc-tion costs or capacity constraints which could adversely affect our profitability or growth strategy over the long term.
(14) Risks related to weather conditionsSales of certain types of our products are significantly influenced by weather conditions. We ordinarily record our highest sales volume levels during hotter weather in the spring and summer months, but unseasonably cool weather conditions during this period could depress demand for our products and negatively impact our results of operations and financial position.
(15) Risks related to environmental problemsRecognizing that the global natural environment constitutes one of our management resources, we are working in earnest to implement environmental preservation activities, in an effort to hand a sustainable society to future generations. We are striving to thoroughly reduce water usage, cut CO2 emissions, convert waste materials into useful resources and recycle containers. In the course of executing business operations, we comply with various related environmental regulations. However, in the event of global environmental problems due to global climate change, resource depletion and other issues; environmental pollution caused by accidents, mishaps and other events; and higher cost outlays for investment in new equipment mainly due to amend-ments in relevant laws and regulations, our results of operations and financial position could be negatively affected.
(16) Risks related to supply chainsWe and our business partners source materials and conduct manufacturing activities globally. Using supply chain manage-ment techniques to lower costs and improve profitability is one element of our business strategy, but we may not be able to achieve the targeted efficiencies, due to factors beyond our con-trol. Damage or disruption to our manufacturing or distribution capabilities due to any of the following could impair our ability to make, manufacture, distribute or sell our products: adverse weather conditions or natural disasters; transportation problems; government action; fire; political instability; terrorism; pandemic; industrial accidents or other occupational health and safety issues; or strikes and other labor disputes. Failure to take ade-quate steps to mitigate the likelihood or potential impact of such events, or to effectively manage such events if they occur, could adversely affect our business, financial condition and results of operations, as well as require additional resources to restore our supply chain.
(17) Risks related to management team and employees
Our continued growth requires us to hire, retain and develop our leadership driven management team and highly skilled work-force. We must hire talented new employees and then train them and develop their skills and competencies. Any unplanned turn-over or our failure to develop an adequate succession plan for current management positions could deplete our institutional knowledge base and erode our competitive advantage.
Our operating results and financial position could be adversely affected by increased costs due to increased competi-tion for employees, higher employee turnover or increased employee benefit costs.
(18) Risks related to employee retirement benefit obligations
Our costs related to employee retirement obligations are calcu-lated based on actuarial assumptions and estimates such as an assumed discount rate and estimated returns from employee retirement plan assets. A divergence of actual results from our assumptions or estimates, or a change in those assumptions and estimates, could adversely affect our results of operations and financial position.
(19) Risks related to information systems and services
We depend on key information systems and services to accu-rately and efficiently transact our business, interface with cus-tomers, provide information to management and prepare financial reports, among other activities. In addition, we rely on third-party providers, including a subsidiary of Suntory Holdings Limited, for a number of key information systems and business processing services. Although we have effected policies and procedures to increase the security of these systems and services, they are vulnerable to interruptions or other failures resulting from, among other things, earthquakes and other natural disas-ters, terrorist attacks, software, equipment or telecommunica-tions failures, processing errors, computer viruses, hackers, other security issues or supplier defaults. Security, backup and disaster recovery measures may not be adequate or implemented prop-erly to avoid such disruptions or failures.
(20) Risks related to legal complianceWe are subject to a variety of national and local laws and regula-tions in Japan, Europe, Oceania, Asia, the Americas and the other regions in which we do business. These laws and regula-tions apply to many aspects of our business activities including the manufacture, safety, labeling, transportation, advertising and sale of our products. In particular, if an accident or non- compliance with these laws or regulations results in environmen-tal pollution, we could be subject to claims or sanctions and incur increased costs. Due to our global operations, we must also comply with anti-corruption provisions of Japanese law or for-eign statutes.
Violations of applicable laws or regulations could damage our reputation or result in regulatory or private actions with substantial penalties or damages. In addition, any significant change in such laws or regulations or their interpretation, or the introduction of higher standards or more stringent laws or regu-lations, could result in increased compliance costs.
Recently, a number of jurisdictions have been considering measures such as special excise taxes and new labeling require-ments, serving sizes or other restrictions on the sale of carbon-ated soft drinks on health grounds. Although we believe our product portfolio has a much higher proportion of non- carbonated and healthy products as compared to other global beverage firms, any such regulatory measures could adversely affect our results of operations and financial position.
Annual Report 2013 Annual Report 2013
SuntoRy BeveRAge & Food Limited SuntoRy BeveRAge & Food Limited
5958
(21) Risks related to the reputation of our brandsMaintaining a good reputation globally is critical to selling our branded products. Product contamination or tampering; the failure to maintain high standards for product quality, safety and integrity, including with respect to raw materials and ingredients obtained from suppliers; or allegations of product quality issues, mislabeling or contamination, even if untrue, may harm our reputation and reduce demand for our products or cause produc-tion and sales disruptions. If any of our products fail to meet health or safety standards, cause injury to consumers or are mis-labeled, we may have to engage in a product recall and/or be subject to liability. Furthermore, Suntory Holdings Limited and other Suntory Group companies not under our control also use the “Suntory” brand. Similar problems or compliance failures on the part of such companies could also contribute to negative perceptions of our brand. Damage to our reputation or loss of consumer confidence in our products for any of these or other reasons could result in decreased demand for our products and could have a material adverse effect on our business, financial condition and results of operations, as well as require additional resources to rebuild our reputation.
(22) Risks related to intellectual propertyWe license the “Suntory” brand from our Parent, Suntory Holdings Limited, and expect to continue to do so in the future. If our license is terminated, including because we are no longer a subsidiary of our Parent, our corporate image and marketing efforts could be impacted, and we could be required to make a significant investment in rebranding.
We also license various other trademarks from third parties and license our own trademarks to third parties.
For trademarks licensed from third parties, the licensor may terminate the license arrangement or other agreements. Conse-quently, we may no longer be able to manufacture or sell the related products. The termination of any material license arrangement or other agreements could adversely affect our results of operations and financial position.
For trademarks licensed to third parties, problems could occur with respect to the use of trademarks and related products by these third parties. This could have an impact on our use of the trademarks and the reputation of our brands.
In regions where we have not registered our trademarks, third parties may own or use the same or similar trademarks to our own. In the event that problems occur with respect to the use of trademarks or related products by these third parties, this could adversely affect our brands, and could have an impact on our results of operations and financial position.
We also possess other intellectual property that is important to our business. This intellectual property includes trademarks, copyrights, patents, and other trade secrets. We and third parties could come into conflict over intellectual property rights. Litiga-tion could disrupt our business and cost a substantial amount to protect our rights or defend ourselves against claims. We cannot be certain that the steps we take to protect our rights will be sufficient or that others will not infringe or misappropriate our rights. If we are unable to protect our intellectual property rights, our brands, products and business could be harmed.
(23) Risks associated with control by the ParentAs of the end of March 2014, our Parent, Suntory Holdings Limited, owns 59.48% of the outstanding shares of our common stock, and accordingly, has control, or a veto right with respect to fundamental decisions such as election and removal of our directors and Audit and Supervisory Board members, the approval of joint ventures or other business reorganizations, the transfer of material businesses, amend-ments to our articles of incorporation and the declaration of dividends. Suntory Holdings Limited could continue to influ-ence the determination of all matters that require the approval of the general meeting of shareholders, regardless of the inten-tions of other shareholders. Our management makes decisions independently of our Parent, with no matters requiring the Parent’s prior approval.
1) Details on our main relationships with Suntory Holdings Limited and other subsidiaries are as follows:
Type of transaction Counterparty Method used to determine transaction termsPayment of brand royalties Suntory Holdings Limited The rate of royalty was determined by discussions between the
parties after considering the brand value and other factorsOutsourcing of product shipping Suntory Logistics Ltd. Determined by discussions between the parties after considering
the quality and market price of similar servicesOutsourcing of indirect services (logistics, procurement, customer relations, etc.)
Suntory Business Expert Limited Determined by discussions between the parties after considering the quality of operations and market price of similar services
Purchase of coffee beans Suncafé Ltd. Determined by discussions between the parties after considering the quality and market price of similar services
Payment of personnel-related expenses for seconded employees
Suntory Holdings Limited Determined by discussions based on the personnel expenses of Suntory Holdings Limited
With respect to transactions with the Suntory Group, from the standpoint of ensuring our independence from Suntory Holdings Limited, we regularly report material transactions with the Suntory Group to our board of directors. We have developed a framework to ensure sound and appropriate terms of transac-tions with the Suntory Group, and continue to strengthen this framework. The framework encompasses checks performed by management divisions before transactions and checks of transac-tion details by our Audit and Supervisory Board members and the Internal Audit Division after transactions.
2) Posts held concurrently at Suntory Holdings Limited by our officers
Among our nine directors, Nobuhiro Torii, our President and Representative Director, concurrently serves as a Director of Suntory Holdings Limited. This appointment was made to allow Mr. Torii to participate in the decision-making process of our Parent as the representative of an operating company. Further-more, Shigehiro Aoyama, a Director of ours, is also the Vice President and Representative Director of Suntory Holdings Limited. This appointment was made to reflect his many years of management experience and expertise in our management.
With regard to Audit and Supervisory Board members, Toru Yamamoto, a member of our Audit and Supervisory Board, is also a full-time member of the Audit and Supervisory Board of Suntory Holdings Limited. The purpose of this appointment is to bolster our audit and supervisory framework.
3) Acceptance of seconded personnel (employees) from Suntory Holdings Limited
Among our employees, a certain number of full-time employees other than employees at the level of manager and above are seconded employees from Suntory Holdings Limited. As of December 31, 2013, there were approximately 270 employees seconded to us from Suntory Holdings Limited. Effective April 1,
2013, all of our employees at the level of manager and above who were seconded from Suntory Holdings Limited have trans-ferred to become our employees. All other seconded employees will continue to be employed by Suntory Holdings Limited, and will be transferred to become our employees when they are promoted to the level of manager and above. Furthermore, we will conduct our own recruitment activities independently of the Parent.
4) Trademarks, patents, and comprehensive licensing agreements
We have entered into a licensing agreement with Suntory Holdings Limited regarding our use of the “Suntory” corporate brand. Based on this agreement, we are licensed to use the “ Suntory” name and brand. Under the terms of the agreement, our use of the “Suntory” brand is effective so long as we remain part of the Suntory Group. Based on the agreement, we are paying brand royalties to Suntory Holdings Limited.
We own the patents, designs, and trademarks that we use exclusively in our businesses. However, considering that the “Suntory” corporate brand is an asset that belongs to the entire Suntory Group, Suntory Holdings Limited will continue to own trademarks and other intellectual property that contain the “ Suntory” corporate brand.
5) Suntory group company loan systemWe have historically obtained loans from Suntory Holdings Limited by using the Suntory Group’s group company loan system. To ensure our independence from the Suntory Group in terms of fund procurement and management, we are refinancing these loans with borrowings from financial institutions. We plan to complete the refinancing process by the end of 2014.
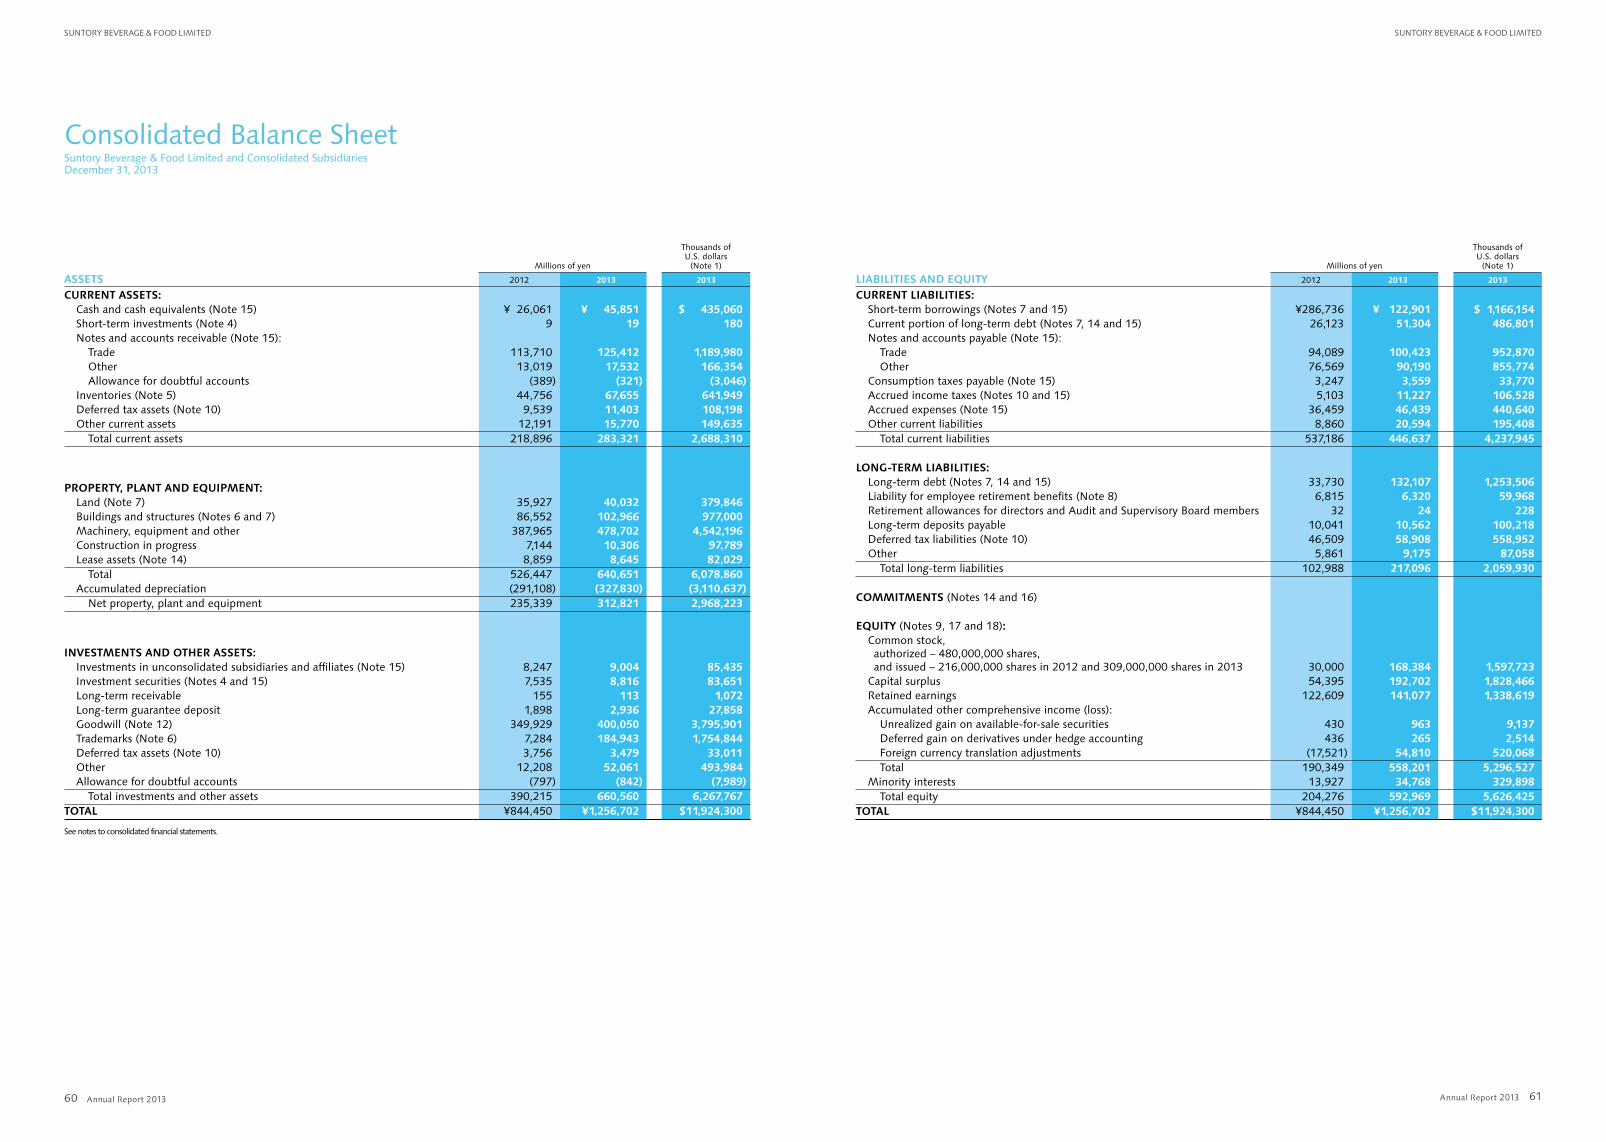
Annual Report 2013 Annual Report 2013
SuntoRy BeveRAge & Food Limited SuntoRy BeveRAge & Food Limited
6160
Consolidated Balance SheetSuntory Beverage & Food Limited and Consolidated SubsidiariesDecember 31, 2013
Millions of yen
Thousands of U.S. dollars
(Note 1)
ASSETS 2012 2013 2013
CURRENT ASSETS:Cash and cash equivalents (Note 15) ¥ 26,061 ¥ 45,851 $ 435,060Short-term investments (Note 4) 9 19 180Notes and accounts receivable (Note 15):
Trade 113,710 125,412 1,189,980Other 13,019 17,532 166,354Allowance for doubtful accounts (389) (321) (3,046)
Inventories (Note 5) 44,756 67,655 641,949Deferred tax assets (Note 10) 9,539 11,403 108,198Other current assets 12,191 15,770 149,635
Total current assets 218,896 283,321 2,688,310
PROPERTY, PLANT AND EQUIPMENT:Land (Note 7) 35,927 40,032 379,846Buildings and structures (Notes 6 and 7) 86,552 102,966 977,000Machinery, equipment and other 387,965 478,702 4,542,196Construction in progress 7,144 10,306 97,789Lease assets (Note 14) 8,859 8,645 82,029
Total 526,447 640,651 6,078,860Accumulated depreciation (291,108) (327,830) (3,110,637)
Net property, plant and equipment 235,339 312,821 2,968,223
INVESTMENTS AND OTHER ASSETS:Investments in unconsolidated subsidiaries and affiliates (Note 15) 8,247 9,004 85,435Investment securities (Notes 4 and 15) 7,535 8,816 83,651Long-term receivable 155 113 1,072Long-term guarantee deposit 1,898 2,936 27,858Goodwill (Note 12) 349,929 400,050 3,795,901Trademarks (Note 6) 7,284 184,943 1,754,844Deferred tax assets (Note 10) 3,756 3,479 33,011Other 12,208 52,061 493,984Allowance for doubtful accounts (797) (842) (7,989)
Total investments and other assets 390,215 660,560 6,267,767TOTAL ¥844,450 ¥1,256,702 $11,924,300
See notes to consolidated financial statements.
Millions of yen
Thousands of U.S. dollars
(Note 1)
LIABILITIES AND EQUITY 2012 2013 2013
CURRENT LIABILITIES:Short-term borrowings (Notes 7 and 15) ¥286,736 ¥ 122,901 $ 1,166,154Current portion of long-term debt (Notes 7, 14 and 15) 26,123 51,304 486,801Notes and accounts payable (Note 15):
Trade 94,089 100,423 952,870Other 76,569 90,190 855,774
Consumption taxes payable (Note 15) 3,247 3,559 33,770Accrued income taxes (Notes 10 and 15) 5,103 11,227 106,528Accrued expenses (Note 15) 36,459 46,439 440,640Other current liabilities 8,860 20,594 195,408
Total current liabilities 537,186 446,637 4,237,945
LONG-TERM LIABILITIES:Long-term debt (Notes 7, 14 and 15) 33,730 132,107 1,253,506Liability for employee retirement benefits (Note 8) 6,815 6,320 59,968Retirement allowances for directors and Audit and Supervisory Board members 32 24 228Long-term deposits payable 10,041 10,562 100,218Deferred tax liabilities (Note 10) 46,509 58,908 558,952Other 5,861 9,175 87,058
Total long-term liabilities 102,988 217,096 2,059,930
COMMITMENTS (Notes 14 and 16)
EQUITY (Notes 9, 17 and 18):Common stock, authorized – 480,000,000 shares, and issued – 216,000,000 shares in 2012 and 309,000,000 shares in 2013 30,000 168,384 1,597,723
Capital surplus 54,395 192,702 1,828,466Retained earnings 122,609 141,077 1,338,619Accumulated other comprehensive income (loss):
Unrealized gain on available-for-sale securities 430 963 9,137Deferred gain on derivatives under hedge accounting 436 265 2,514Foreign currency translation adjustments (17,521) 54,810 520,068Total 190,349 558,201 5,296,527
Minority interests 13,927 34,768 329,898Total equity 204,276 592,969 5,626,425
TOTAL ¥844,450 ¥1,256,702 $11,924,300
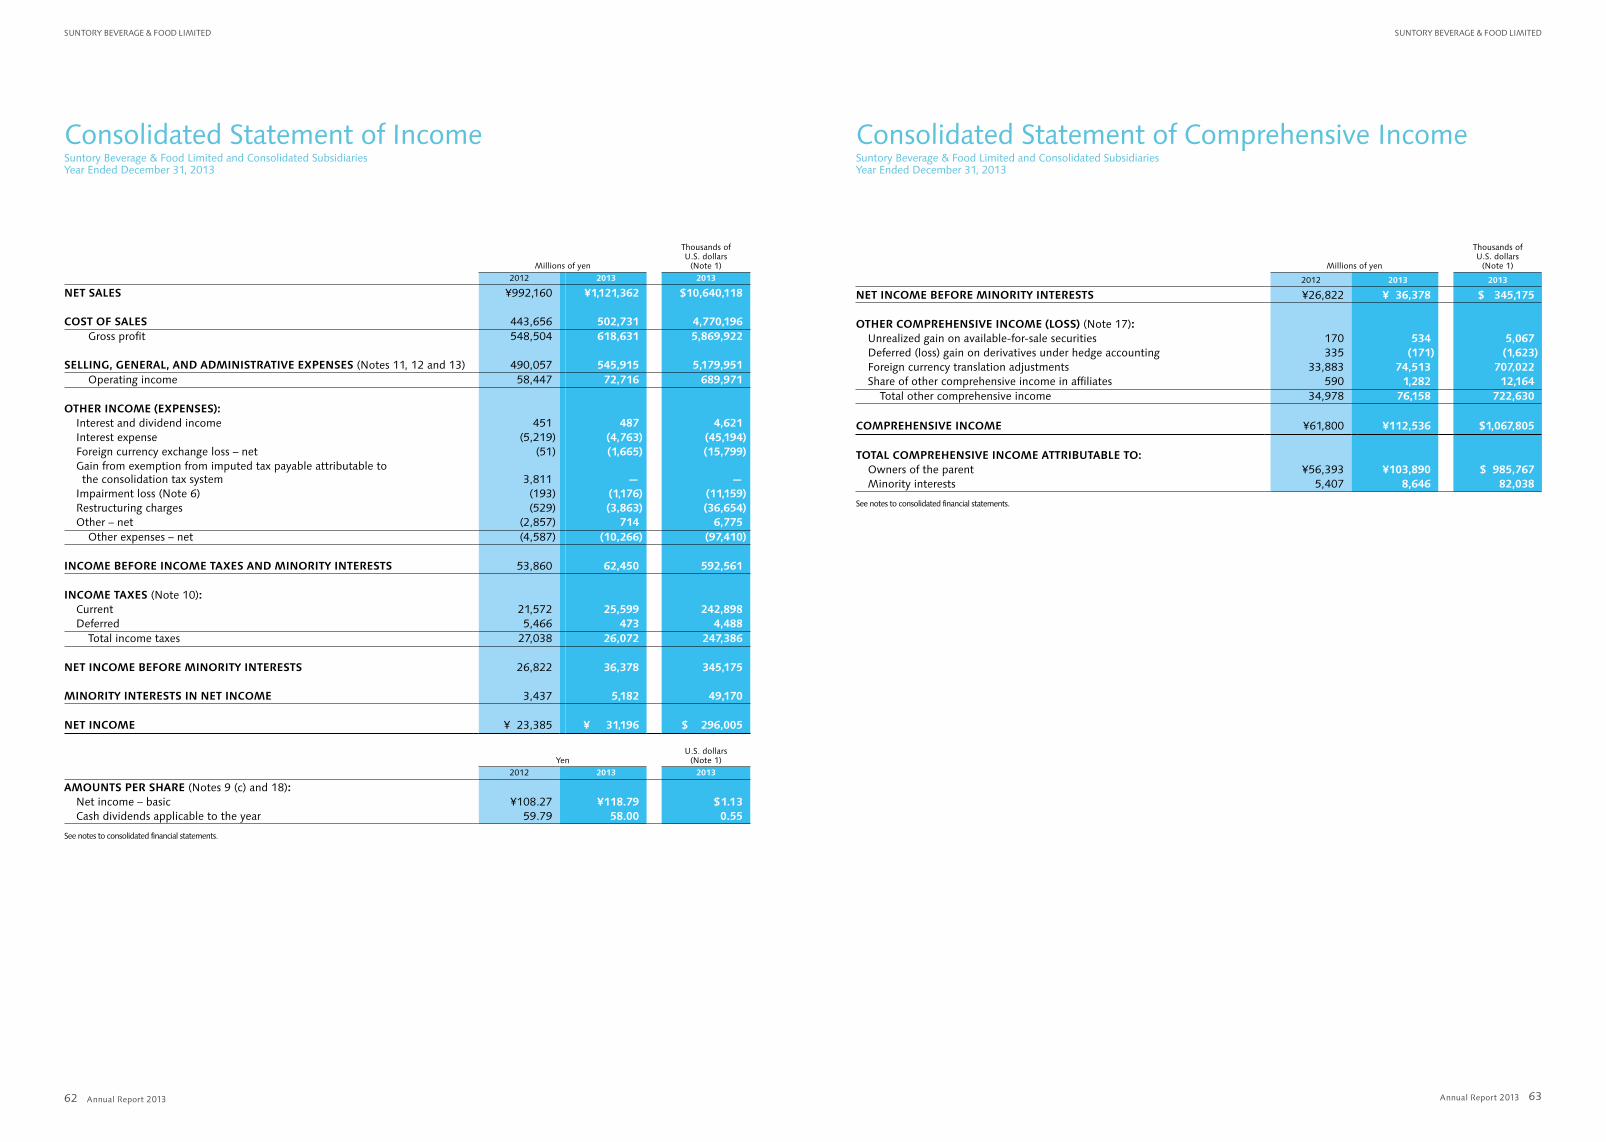
Annual Report 2013 Annual Report 2013
SuntoRy BeveRAge & Food Limited SuntoRy BeveRAge & Food Limited
6362
Consolidated Statement of IncomeSuntory Beverage & Food Limited and Consolidated SubsidiariesYear Ended December 31, 2013
Consolidated Statement of Comprehensive IncomeSuntory Beverage & Food Limited and Consolidated SubsidiariesYear Ended December 31, 2013
Millions of yen
Thousands of U.S. dollars
(Note 1)2012 2013 2013
NET SALES ¥992,160 ¥1,121,362 $10,640,118
COST OF SALES 443,656 502,731 4,770,196Gross profit 548,504 618,631 5,869,922
SELLING, GENERAL, AND ADMINISTRATIVE EXPENSES (Notes 11, 12 and 13) 490,057 545,915 5,179,951Operating income 58,447 72,716 689,971
OTHER INCOME (EXPENSES):Interest and dividend income 451 487 4,621Interest expense (5,219) (4,763) (45,194)Foreign currency exchange loss – net (51) (1,665) (15,799)Gain from exemption from imputed tax payable attributable to the consolidation tax system 3,811 — —
Impairment loss (Note 6) (193) (1,176) (11,159)Restructuring charges (529) (3,863) (36,654)Other – net (2,857) 714 6,775
Other expenses – net (4,587) (10,266) (97,410)
INCOME BEFORE INCOME TAXES AND MINORITY INTERESTS 53,860 62,450 592,561
INCOME TAXES (Note 10):Current 21,572 25,599 242,898Deferred 5,466 473 4,488
Total income taxes 27,038 26,072 247,386
NET INCOME BEFORE MINORITY INTERESTS 26,822 36,378 345,175
MINORITY INTERESTS IN NET INCOME 3,437 5,182 49,170
NET INCOME ¥ 23,385 ¥ 31,196 $ 296,005
YenU.S. dollars
(Note 1)2012 2013 2013
AMOUNTS PER SHARE (Notes 9 (c) and 18):Net income – basic ¥108.27 ¥118.79 $1.13Cash dividends applicable to the year 59.79 58.00 0.55
See notes to consolidated financial statements.
Millions of yen
Thousands of U.S. dollars
(Note 1)
2012 2013 2013
NET INCOME BEFORE MINORITY INTERESTS ¥26,822 ¥ 36,378 $ 345,175
OTHER COMPREHENSIVE INCOME (LOSS) (Note 17):Unrealized gain on available-for-sale securities 170 534 5,067Deferred (loss) gain on derivatives under hedge accounting 335 (171) (1,623)Foreign currency translation adjustments 33,883 74,513 707,022Share of other comprehensive income in affiliates 590 1,282 12,164
Total other comprehensive income 34,978 76,158 722,630
COMPREHENSIVE INCOME ¥61,800 ¥112,536 $1,067,805
TOTAL COMPREHENSIVE INCOME ATTRIBUTABLE TO:Owners of the parent ¥56,393 ¥103,890 $ 985,767Minority interests 5,407 8,646 82,038
See notes to consolidated financial statements.
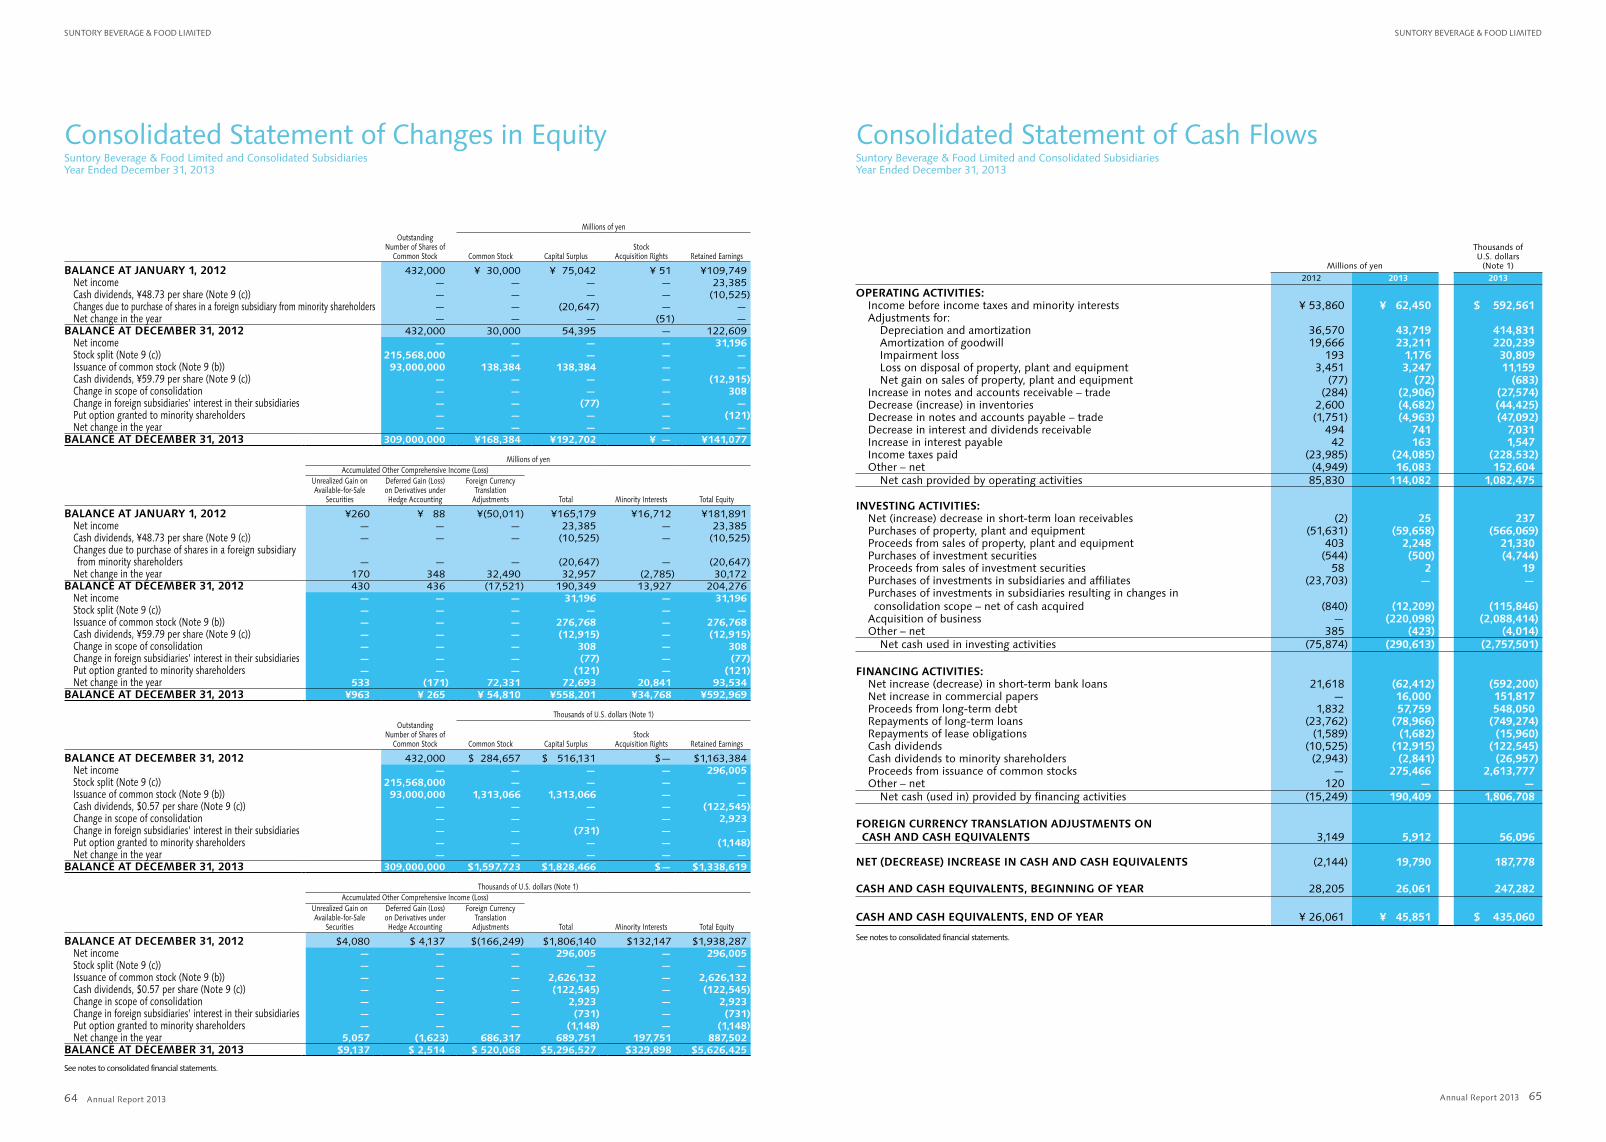
Annual Report 2013 Annual Report 2013
SuntoRy BeveRAge & Food Limited SuntoRy BeveRAge & Food Limited
6564
Consolidated Statement of Changes in EquitySuntory Beverage & Food Limited and Consolidated SubsidiariesYear Ended December 31, 2013
Consolidated Statement of Cash FlowsSuntory Beverage & Food Limited and Consolidated SubsidiariesYear Ended December 31, 2013
Millions of yenOutstanding
Number of Shares of Common Stock Common Stock Capital Surplus
Stock Acquisition Rights Retained Earnings
BALANCE AT JANUARY 1, 2012 432,000 ¥ 30,000 ¥ 75,042 ¥ 51 ¥109,749Net income — — — — 23,385Cash dividends, ¥48.73 per share (Note 9 (c)) — — — — (10,525)Changes due to purchase of shares in a foreign subsidiary from minority shareholders — — (20,647) — —Net change in the year — — — (51) —
BALANCE AT DECEMBER 31, 2012 432,000 30,000 54,395 — 122,609Net income — — — — 31,196Stock split (Note 9 (c)) 215,568,000 — — — —Issuance of common stock (Note 9 (b)) 93,000,000 138,384 138,384 — —Cash dividends, ¥59.79 per share (Note 9 (c)) — — — — (12,915)Change in scope of consolidation — — — — 308Change in foreign subsidiaries’ interest in their subsidiaries — — (77) — —Put option granted to minority shareholders — — — — (121)Net change in the year — — — — —
BALANCE AT DECEMBER 31, 2013 309,000,000 ¥168,384 ¥192,702 ¥ — ¥141,077
Millions of yenAccumulated Other Comprehensive Income (Loss)
Unrealized Gain on Available-for-Sale
Securities
Deferred Gain (Loss) on Derivatives under Hedge Accounting
Foreign Currency Translation
Adjustments Total Minority Interests Total Equity
BALANCE AT JANUARY 1, 2012 ¥260 ¥ 88 ¥(50,011) ¥165,179 ¥16,712 ¥181,891Net income — — — 23,385 — 23,385Cash dividends, ¥48.73 per share (Note 9 (c)) — — — (10,525) — (10,525)Changes due to purchase of shares in a foreign subsidiary from minority shareholders — — — (20,647) — (20,647)
Net change in the year 170 348 32,490 32,957 (2,785) 30,172BALANCE AT DECEMBER 31, 2012 430 436 (17,521) 190,349 13,927 204,276
Net income — — — 31,196 — 31,196Stock split (Note 9 (c)) — — — — — —Issuance of common stock (Note 9 (b)) — — — 276,768 — 276,768Cash dividends, ¥59.79 per share (Note 9 (c)) — — — (12,915) — (12,915)Change in scope of consolidation — — — 308 — 308Change in foreign subsidiaries’ interest in their subsidiaries — — — (77) — (77)Put option granted to minority shareholders — — — (121) — (121)Net change in the year 533 (171) 72,331 72,693 20,841 93,534
BALANCE AT DECEMBER 31, 2013 ¥963 ¥ 265 ¥ 54,810 ¥558,201 ¥34,768 ¥592,969
Thousands of U.S. dollars (Note 1)Outstanding
Number of Shares of Common Stock Common Stock Capital Surplus
Stock Acquisition Rights Retained Earnings
BALANCE AT DECEMBER 31, 2012 432,000 $ 284,657 $ 516,131 $— $1,163,384Net income — — — — 296,005Stock split (Note 9 (c)) 215,568,000 — — — —Issuance of common stock (Note 9 (b)) 93,000,000 1,313,066 1,313,066 — —Cash dividends, $0.57 per share (Note 9 (c)) — — — — (122,545)Change in scope of consolidation — — — — 2,923Change in foreign subsidiaries’ interest in their subsidiaries — — (731) — —Put option granted to minority shareholders — — — — (1,148)Net change in the year — — — — —
BALANCE AT DECEMBER 31, 2013 309,000,000 $1,597,723 $1,828,466 $— $1,338,619
Thousands of U.S. dollars (Note 1)Accumulated Other Comprehensive Income (Loss)
Unrealized Gain on Available-for-Sale
Securities
Deferred Gain (Loss) on Derivatives under Hedge Accounting
Foreign Currency Translation
Adjustments Total Minority Interests Total Equity
BALANCE AT DECEMBER 31, 2012 $4,080 $ 4,137 $(166,249) $1,806,140 $132,147 $1,938,287Net income — — — 296,005 — 296,005Stock split (Note 9 (c)) — — — — — —Issuance of common stock (Note 9 (b)) — — — 2,626,132 — 2,626,132Cash dividends, $0.57 per share (Note 9 (c)) — — — (122,545) — (122,545)Change in scope of consolidation — — — 2,923 — 2,923Change in foreign subsidiaries’ interest in their subsidiaries — — — (731) — (731)Put option granted to minority shareholders — — — (1,148) — (1,148)Net change in the year 5,057 (1,623) 686,317 689,751 197,751 887,502
BALANCE AT DECEMBER 31, 2013 $9,137 $ 2,514 $ 520,068 $5,296,527 $329,898 $5,626,425
See notes to consolidated financial statements.
Millions of yen
Thousands of U.S. dollars
(Note 1)2012 2013 2013
OPERATING ACTIVITIES:Income before income taxes and minority interests ¥ 53,860 ¥ 62,450 $ 592,561Adjustments for:
Depreciation and amortization 36,570 43,719 414,831Amortization of goodwill 19,666 23,211 220,239Impairment loss 193 1,176 30,809Loss on disposal of property, plant and equipment 3,451 3,247 11,159Net gain on sales of property, plant and equipment (77) (72) (683)
Increase in notes and accounts receivable – trade (284) (2,906) (27,574)Decrease (increase) in inventories 2,600 (4,682) (44,425)Decrease in notes and accounts payable – trade (1,751) (4,963) (47,092)Decrease in interest and dividends receivable 494 741 7,031Increase in interest payable 42 163 1,547Income taxes paid (23,985) (24,085) (228,532)Other – net (4,949) 16,083 152,604
Net cash provided by operating activities 85,830 114,082 1,082,475
INVESTING ACTIVITIES:Net (increase) decrease in short-term loan receivables (2) 25 237Purchases of property, plant and equipment (51,631) (59,658) (566,069)Proceeds from sales of property, plant and equipment 403 2,248 21,330Purchases of investment securities (544) (500) (4,744)Proceeds from sales of investment securities 58 2 19Purchases of investments in subsidiaries and affiliates (23,703) — —Purchases of investments in subsidiaries resulting in changes in consolidation scope – net of cash acquired (840) (12,209) (115,846)
Acquisition of business — (220,098) (2,088,414)Other – net 385 (423) (4,014)
Net cash used in investing activities (75,874) (290,613) (2,757,501)
FINANCING ACTIVITIES:Net increase (decrease) in short-term bank loans 21,618 (62,412) (592,200)Net increase in commercial papers — 16,000 151,817Proceeds from long-term debt 1,832 57,759 548,050Repayments of long-term loans (23,762) (78,966) (749,274)Repayments of lease obligations (1,589) (1,682) (15,960)Cash dividends (10,525) (12,915) (122,545)Cash dividends to minority shareholders (2,943) (2,841) (26,957)Proceeds from issuance of common stocks — 275,466 2,613,777Other – net 120 — —
Net cash (used in) provided by financing activities (15,249) 190,409 1,806,708
FOREIGN CURRENCY TRANSLATION ADJUSTMENTS ON CASH AND CASH EQUIVALENTS 3,149 5,912 56,096
NET (DECREASE) INCREASE IN CASH AND CASH EQUIVALENTS (2,144) 19,790 187,778
CASH AND CASH EQUIVALENTS, BEGINNING OF YEAR 28,205 26,061 247,282
CASH AND CASH EQUIVALENTS, END OF YEAR ¥ 26,061 ¥ 45,851 $ 435,060
See notes to consolidated financial statements.
Annual Report 2013 Annual Report 2013
SuntoRy BeveRAge & Food Limited SuntoRy BeveRAge & Food Limited
6766
Notes to Consolidated Financial StatementsSuntory Beverage & Food Limited and Consolidated SubsidiariesYear Ended December 31, 2013
1. Basis of Presentation of Consolidated Financial Statements
The accompanying consolidated financial statements have been pre-pared in accordance with the provisions set forth in the Japanese Finan-cial Instruments and Exchange Act and its related accounting regulations and in accordance with accounting principles generally accepted in Japan (“Japanese GAAP”), which are different in certain respects as to the application and disclosure requirements of International Financial Reporting Standards (“IFRS”).
In preparing these consolidated financial statements, certain reclas-sifications and rearrangements have been made to the consolidated financial statements issued domestically in order to present them in a form that is more familiar to readers outside Japan. In addition, certain reclassifications have been made in the 2012 consolidated financial statements to conform to the classifications used in 2013.
The consolidated financial statements are stated in Japanese yen, the currency of the country in which Suntory Beverage & Food Limited (the ”Company”) is incorporated and operates. The translations of Japanese yen amounts into U.S. dollar amounts are included solely for the convenience of readers outside Japan and have been made at the rate of ¥105.39 to $1,
the exchange rate at December 31, 2013. Such translations should not be construed as representations that the Japanese yen amounts could be converted into U.S. dollars at that or any other rate.
The Company is a 59.48% owned subsidiary of Suntory Holdings Limited (the ”Parent”), a pure holding company that was established on February 16, 2009 through a stock transfer from Suntory Limited (now, Suntory Liquors Limited), a company founded in Osaka in 1899. The Parent and its subsidiaries (together, the ”Suntory Group”) produce and distribute various popular brands of ready-to-drink beverages in various alcoholic and non-alcoholic beverage categories. The Company was established on January 23, 2009 and commenced the non-alcoholic beverage and food business among the Suntory Group on April 1, 2009. The Company was transferred such business by way of corporate split in connection with the reorganization of Suntory Group that adopted the holding company structure mentioned above. On July 3, 2013, the Company’s shares were initially listed on the Tokyo Stock Exchange. See Note 9 (b).
2. Summary of Significant Accounting Policies
(a) Consolidation – The consolidated financial statements as of December 31, 2013, include the accounts of the Company and its 83 significant (76 in 2012) subsidiaries (collectively, the ”Group”).
Under the control or influence concept, those companies in which the Company, directly or indirectly, is able to exercise control over oper-ations are consolidated, and those companies over which the Group has the ability to exercise significant influence are accounted for by the equity method.
Investments in eight (six in 2012) affiliates are accounted for by the equity method.
Investments in the remaining unconsolidated subsidiaries and affiliates are stated at cost. Even if the consolidation or equity method of accounting had been applied to the investments in these companies, the effect on the accompanying consolidated financial statements would not have been material.
The excess of the cost of an acquisition over the fair value of the net assets of the acquired subsidiary at the date of acquisition is being amortized over a period of mainly 20 years, or if immaterial, is charged to income when incurred. Acquired intangible assets with finite useful lives are amortized over the estimated useful lives. Acquired intangible assets with infinite useful lives are not amortized and subject to impair-ment test.
All significant intercompany balances and transactions have been eliminated in consolidation. All material unrealized profit included in assets resulting from transactions within the Group is eliminated.
(b) Unification of Accounting Policies Applied to Foreign Subsidiaries for the Consolidated Financial Statements – In May 2006, the Accounting Standards Board of Japan (ASBJ) issued ASBJ Practical Issues Task Force (PITF) No. 18, Practical Solution on Unification of Accounting Policies Applied to Foreign Subsidiaries for the Consolidated Financial Statements. PITF No. 18 prescribes (1) the accounting policies and procedures applied to a parent company and its subsidiaries for similar transactions and events under similar circumstances should in principle be unified for the preparation of the consolidated financial statements; (2) financial statements prepared by foreign subsidiaries in accordance with either IFRS or the generally accepted accounting principles in the United States of America (“U.S. GAAP”) tentatively may be used for the consolidation process; and (3) however, the following items should be adjusted in the consolidation process so that net income is accounted for in accordance with Japanese GAAP, unless they are not material, 1) amortization of goodwill; 2) scheduled amortization of actuarial gain or loss of pensions that has been directly recorded in equity; 3) expensing capitalized devel-opment costs of research and development (R&D); 4) cancellation of the fair value model of accounting for property, plant and equipment, and investment properties and incorporation of the cost model of account-ing; and 5) exclusion of minority interests from net income, if contained in net income.
(c) Unification of Accounting Policies Applied to Foreign Associated Companies for the Equity Method – In March 2008, the ASBJ issued ASBJ Statement No. 16, Accounting Standard for Equity Method of Accounting for Investments. The new standard requires adjustments to be made to conform the associate’s accounting policies for similar trans-actions and events under similar circumstances to those of the parent company when the associate’s financial statements are used in applying the equity method, unless it is impracticable to determine adjustments. In addition, financial statements prepared by foreign associated compa-nies in accordance with either IFRS or U.S. GAAP tentatively may be used in applying the equity method if the following items are adjusted so that net income is accounted for in accordance with Japanese GAAP, unless they are not material: 1) amortization of goodwill; 2) scheduled amortization of actuarial gain or loss of pensions that has been directly recorded in equity; 3) expensing capitalized development costs of R&D; 4) cancellation of the fair value model of accounting for property, plant and equipment, and investment properties and incorporation of the cost model of accounting; and 5) exclusion of minority interests from net income, if contained in net income.(d) Business Combination – In October, 2003, the Business Accounting Council (BAC) issued a Statement of Opinion, ”Accounting for Business Combinations,” and in December 2005, the ASBJ issued ASBJ Statement No. 7, Accounting Standard for Business Divestitures and ASBJ Guidance No. 10, Guidance for Accounting Standard for Business Combinations and Business Divestitures. The accounting standard for business combinations allows companies to apply the pooling of interests method of account-ing only when certain specific criteria are met such that the business combination is essentially regarded as a uniting of interests.
For business combinations that do not meet the uniting-of-interests criteria, the business combination is considered to be an acquisition and the purchase method of accounting is required. This standard also pre-scribes the accounting for combinations of entities under common control and for joint ventures.
In December 2008, the ASBJ issued a revised accounting standard for business combinations, ASBJ Statement No. 21, Accounting Standard for Business Combinations. Major accounting changes under the revised accounting standard are as follows:
(1) The revised standard requires accounting for business combina-tions only by the purchase method. As a result, the pooling of interests method of accounting is no longer allowed.
(2) The previous accounting standard required R&D costs to be charged to income as incurred. Under the revised standard, in-process R&D costs acquired in a business combination are capitalized as an intangible asset.
(3) The previous accounting standard provided for a bargain pur-chase gain (negative goodwill) to be systematically amortized over a period not exceeding 20 years. Under the revised stan-dard, the acquirer recognizes the bargain purchase gain in profit or loss immediately on the acquisition date after reassessing and confirming that all of the assets acquired and all of the liabilities assumed have been identified after a review of the procedures used in the purchase price allocation.
(e) Cash and Cash Equivalents – Cash and cash equivalents are short-term investments that are readily convertible into cash and that are exposed to insignificant risk of changes in value. Cash and cash equiva-lents include cash on hand, deposits due from the Parent, and deposits in banks (including time deposits). The Group utilizes the finance system provided by the Parent, which satisfies the Group’s short-term invest-ments of cash surplus or cash demands, if any. Besides the finance system provided by the Parent, the Group has been financed from banks and other financial institutions by way of loan on commercial papers, and gradually ceased the use of the finance system provided by the Parent. See Note 15 (1). The Group considers all time deposits with an original maturity of six months or less to be cash and cash equivalents. Generally, such time deposits can also be withdrawn at any time without penalty or diminution of the principal amount.
(f) Inventories – Inventories are primarily stated at the lower of cost determined by the average method or net selling value, which is defined as the selling price, less additional estimated manufacturing costs and estimated direct selling expenses.(g) Short-Term Investments and Investment Securities – Short-term investments and investment securities are classified and accounted for, depending on management’s intent, as either (1) held-to-maturity debt securities, which are expected to be held to maturity with the positive intent and ability to hold to maturity are reported at amortized cost or (2) available-for-sale securities, which are not classified as either trading securities or held-to-maturity debt securities, are reported at fair value, with unrealized gains and losses, net of applicable taxes, reported in a separate component of equity.
Nonmarketable available-for-sale securities are stated at cost deter-mined by the moving-average method. For other-than-temporary declines in fair value, investment securities are reduced to net realizable value by charging the related expense to income.(h) Allowance for Doubtful Accounts – The allowance for doubtful accounts is stated in amounts considered to be appropriate based on the past credit loss experience and an evaluation of potential losses in the receivables outstanding.(i) Property, Plant and Equipment – Property, plant and equipment are stated at cost. Depreciation of property, plant and equipment of the Group is mainly computed using the straight-line method. The range of useful lives is principally from five to 50 years for buildings and struc-tures, and from two to 17 years for machinery, equipment and other. The useful lives for lease assets, which do not transfer ownership of the leased property to the lessee, are the terms of the respective leases.(j) Intangible Assets – Intangible assets are amortized primarily using the straight-line method. Purchased software for internal use and software development costs are amortized based on the straight-line method over an estimated useful life of up to five years.(k) Long-Lived Assets – The Group reviews its long-lived assets for impairment whenever events or changes in circumstance indicate that the carrying amount of an asset or asset group may not be recoverable. An impairment loss would be recognized if the carrying amount of an asset or asset group exceeds the sum of the undiscounted future cash flows expected to result from the continued use and eventual disposi-tion of the asset or asset group. The impairment loss would be measured as the amount by which the carrying amount of the asset or asset group exceeds its recoverable amount, which is the higher of the discounted cash flows from the continued use and eventual disposition of the asset or the net selling price at disposition.(l) Employee Retirement and Pension Plans – The Company and certain consolidated subsidiaries have contributory funded defined benefit pension plans and unfunded retirement benefit plans for employees. The amount of the retirement benefit is, in general, based on the length of service, basic salary at the time of retirement, and cause of retirement. The Group accounts for the liability for retirement benefit based on projected benefit obligations and plan assets at the consolidated balance sheet date. See Note 8.
Unrecognized prior service cost is amortized by the straight-line method mainly over a period of 15 years, which is shorter than the average remaining years of service of the employees.
Unrecognized actuarial differences are amortized in the years fol-lowing the year in which the gain or loss is recognized by the straight-line method mainly over a period of 15 years, which is shorter than the average remaining years of service of the employees.(m) Retirement Allowances for Directors, and Audit and Supervisory Board Members – Upon retirement, directors, and Audit and Supervisory Board members of the Company’s certain domestic subsidiaries and directors of certain foreign subsidiaries are also qualified to receive lump-sum payments based on each company’s internal policies.
Annual Report 2013 Annual Report 2013
SuntoRy BeveRAge & Food Limited SuntoRy BeveRAge & Food Limited
6968
Retirement allowances for directors, and Audit and Supervisory Board members are recorded to state the liability at the amount that would be required if all directors and Audit and Supervisory Board members retired at each balance sheet date.(n) Asset Retirement Obligations – In March 2008, the ASBJ published the accounting standard for asset retirement obligations, ASBJ Statement No. 18, Accounting Standard for Asset Retirement Obligations, and ASBJ Guidance No. 21, Guidance on Accounting Standard for Asset Retirement Obligations. Under this accounting standard, an asset retirement obliga-tion is defined as a legal obligation imposed either by law or contract that results from the acquisition, construction, development, and the normal operation of a tangible fixed asset and is associated with the retirement of such tangible fixed asset. The asset retirement obligation is recognized as the sum of the discounted cash flows required for the future asset retirement and is recorded in the period in which the obliga-tion is incurred if a reasonable estimate can be made. If a reasonable estimate of the asset retirement obligation cannot be made in the period the asset retirement obligation is incurred, the liability should be recog-nized when a reasonable estimate of the asset retirement obligation can be made. Upon initial recognition of a liability for an asset retirement obligation, an asset retirement cost is capitalized by increasing the carry-ing amount of the related fixed asset by the amount of the liability. The asset retirement cost is subsequently allocated to expense through depreciation over the remaining useful life of the asset. Over time, the liability is accreted to its present value each period. Any subsequent revisions to the timing or the amount of the original estimate of undis-counted cash flows are reflected as an increase or a decrease in the carrying amount of the liability and the capitalized amount of the related asset retirement cost.(o) R&D Costs – R&D costs are charged to income as incurred.(p) Consumption Taxes – Consumption taxes are excluded from the revenue and expense accounts, which are subject to such taxes.(q) Leases – In March 2007, the ASBJ issued ASBJ Statement No. 13, Accounting Standard for Lease Transactions, which revised the previous accounting standard for lease transactions issued in June 1993. The revised accounting standard for lease transactions was effective for fiscal years, which began on or after April 1, 2008.
Under the previous accounting standard, finance leases that were deemed to transfer ownership of the leased property to the lessee were capitalized. However, other finance leases were permitted to be accounted for as operating lease transactions, if certain ”as if capitalized” information was disclosed in the note to the lessee’s financial state-ments. The revised accounting standard requires that all finance lease transactions be capitalized to recognize lease assets and lease obligations on the balance sheet. In addition, the revised accounting standard permits leases, which existed at the transition date and do not transfer ownership of the leased property to the lessee, to continue to be accounted for as operating lease transactions with ”as if capitalized” information disclosed in the notes to the lessee’s financial statements.
The Group applied the revised accounting standard effective for the year ended December 31, 2009, and accounted for leases, which existed at the transition date and do not transfer ownership of the leased prop-erty to the lessee as operating lease transactions.(r) Income Taxes – The provision for income taxes is computed based on the pretax income included in the consolidated statements of income. The asset and liability approach is used to recognize deferred tax assets and liabilities for the expected future tax consequences of temporary differences between the carrying amounts and the tax bases of assets and liabilities. Deferred taxes are measured by applying currently enacted tax rates to the temporary differences.
The Parent adopted the consolidated taxation system, which allows the Parent and its wholly owned domestic subsidiaries to base corporate tax payments on the combined profits or losses, for the year ended December 31, 2012.
Due to the issuance of the Company’s common stocks and dispos-als of the Company’s shares by the Parent during the year ended December 31, 2013, the Company is no longer a wholly owned subsid-iary of the Parent and, accordingly, the Company and its domestic con-solidated subsidiaries have been withdrawn from the consolidated tax group of the Parent.(s) Foreign Currency Transactions – All short-term and long-term mon-etary receivables and payables denominated in foreign currencies are translated into Japanese yen by applying the exchange rates at the balance sheet date. The foreign exchange gains and losses from transla-tion are recognized in the consolidated statements of income to the extent that they are not hedged by forward exchange contracts.(t) Foreign Currency Consolidated Financial Statements – The balance sheet accounts of the consolidated foreign subsidiaries are translated into Japanese yen by applying the current exchange rate as of the bal-ance sheet date, except for equity, which is translated at the historical rate. Differences arising from such translation are shown as ”Foreign currency translation adjustments” under accumulated other comprehen-sive income in a separate component of equity.
Revenue and expense accounts of consolidated foreign subsidiaries are translated into Japanese yen at the average exchange rate for their accounting periods.(u) Derivatives and Hedge Activities – The Group uses derivative financial instruments to manage its exposures to fluctuations in foreign exchange rates, interest rates, and commodity prices. These derivative financial instruments are utilized by the Group to reduce volatility risks of foreign currency exchange rates, interest rates, and commodity prices. The Group does not enter into derivatives for trading or speculative purposes.
Derivative financial instruments and foreign currency transactions are classified and accounted for as follows: 1) all derivatives are recog-nized as either assets or liabilities and measured at fair value, and gains or losses on derivative transactions are recognized in the consolidated statement of income and 2) for derivatives used for hedging purposes, if derivatives qualify for hedge accounting because of high correlation and effectiveness between the hedging instruments and the hedged items, gains, or losses on derivatives are deferred until maturity of the hedged transactions. The foreign currency forward contracts and foreign currency option contracts employed to hedge foreign exchange exposures for import purchases, and forward contracts applied for forecasted (or com-mitted) transactions are measured at fair value, but the unrealized gains/losses are deferred until the underlying transactions are completed.
Trade and other payables denominated in foreign currencies, for which foreign currency forward contracts are used to hedge the foreign currency fluctuations, are translated at the contracted rate, if the forward contracts qualify for hedge accounting.
Interest rate and currency swaps, which qualify for hedge accounting and meet specific matching criteria, are not remeasured at market value, but the differential paid or received under the swap agreements is recog-nized and included in interest expense or income, and hedged items denominated in a foreign currency are translated at the contracted rates.
Commodity swap contracts, which qualify for hedge accounting, are measured at market value at the balance sheet date, and any unreal-ized gains or losses are deferred until maturity as deferred gains (losses) under hedge accounting in a separate component of equity.(v) Per Share Information – Basic net income per share (EPS) is computed by dividing net income available to common shareholders by the weighted-average number of common shares outstanding for the period.
Cash dividends per share presented in the accompanying consoli-dated statements of income represent dividends applicable to the respective year, including dividends to be paid after the end of the year.(w) Accounting Changes and Error Corrections – In December 2009, the ASBJ issued ASBJ Statement No. 24, Accounting Standard for Accounting Changes and Error Corrections and ASBJ Guidance No. 24, Guidance on Accounting Standard for Accounting Changes and Error Corrections.
Accounting treatments under this standard and guidance are as follows:(1) Changes in Accounting PoliciesWhen a new accounting policy is applied with a revision of accounting standards, the new policy is applied retrospectively, unless the revised accounting standards include specific transitional provisions. When the revised accounting standards include specific transitional provisions, an entity shall comply with the specific transitional provisions.(2) Changes in PresentationWhen the presentation of consolidated financial statements is changed, prior-period consolidated financial statements are reclas-sified in accordance with the new presentation.(3) Changes in Accounting EstimatesA change in an accounting estimate is accounted for in the period of the change if the change affects that period only and is accounted for prospectively if the change affects both the period of the change and future periods.(4) Corrections of Prior-Period ErrorsWhen an error in prior-period consolidated financial statements is discovered, those prior-period consolidated financial statements are restated.
(x) New Accounting PronouncementsAccounting Standard for Retirement Benefits – On May 17, 2012, the ASBJ issued ASBJ Statement No. 26, Accounting Standard for Retirement Benefits and ASBJ Guidance No. 25, Guidance on Accounting Standard for Retirement Benefits, which replaced the Accounting Standard for Retirement Benefits that had been issued by the Business Accounting Council in 1998 with an effective date of April 1, 2000, and the other related practical guidance, and followed by partial amendments from time to time through 2009.
Major changes are as follows:(1) Treatment in the balance sheetUnder the current requirements, actuarial gains and losses and past service costs that are yet to be recognized in profit or loss are not recognized in the balance sheet, and the difference between retire-ment benefit obligations and plan assets (hereinafter, ”deficit or surplus”), adjusted by such unrecognized amounts, is recognized as a liability or asset.
Under the revised accounting standard, actuarial gains and losses and past service costs that are yet to be recognized in profit or loss shall be recognized within equity (accumulated other com-prehensive income), after adjusting for tax effects, and any resulting deficit or surplus shall be recognized as a liability (liability for retire-ment benefits) or asset (asset for retirement benefits).(2) Treatment in the statement of income and the statement of
comprehensive incomeThe revised accounting standard does not change how to recognize actuarial gains and losses and past service costs in profit or loss. Those amounts would be recognized in profit or loss over a certain period no longer than the expected average remaining working lives of the employees. However, actuarial gains and losses and past service costs that arose in the current period and have not yet been recognized in profit or loss shall be included in other comprehen-sive income and actuarial gains and losses and past service costs that were recognized in other comprehensive income in prior periods and then recognized in profit or loss in the current period shall be treated as reclassification adjustments.(3) Amendments relating to the method of attributing expected
benefit to periods and relating to the discount rate and expected future salary increases
The revised accounting standard also made certain amendments relating to the method of attributing expected benefit to periods and relating to the discount rate and expected future salary increases.
This accounting standard and the guidance for (1) and (2) above are effective for the end of annual periods beginning on or after April 1, 2013, and for (3) above are effective for the beginning of annual periods beginning on or after April 1, 2014, or for the beginning of annual peri-ods beginning on or after April 1, 2015, subject to certain disclosure in March 2015, both with earlier application being permitted from the beginning of annual periods beginning on or after April 1, 2013. How-ever, no retrospective application of this accounting standard to consoli-dated financial statements in prior periods is required.
The Group expects to apply the revised accounting standard for (1) and (2) above from the end of the annual period beginning on January 1, 2014, and for (3) above from the beginning of the annual period begin-ning on January 1, 2015, and is in the process of measuring the effects of applying the revised accounting standard in future applicable periods.
Accounting Standards for Business Combinations and Consolidated Financial Statements – On September 13, 2013, the ASBJ issued revised ASBJ Statement No. 21, Accounting Standard for Business Combinations, revised ASBJ Guidance No. 10, Guidance on Accounting Standards for Business Combinations and Business Divestitures, and revised ASBJ State-ment No. 22, Accounting Standard for Consolidated Financial Statements.
Major accounting changes are as follows:(1) Transactions with noncontrolling interestUnder the current requirements, any difference between the fair value of the consideration received or paid and the amount by which the minority interest is adjusted, is accounted for as an adjustment of goodwill or as profit or loss in the consolidated state-ment of income, if the parent purchases or sells ownership interests in its subsidiary and retains control over its subsidiary. Under the revised requirement, such difference shall be accounted for as capi-tal surplus as long as the parent retains control over its subsidiary.(2) Acquisition-related costsUnder the current requirements, acquisition-related costs, such as advisory fees or professional fees, are included in the acquisition costs of the investment. Under the revised requirements, acquisition-related costs shall be accounted for as expenses in the periods in which the costs are incurred.(3) Provisional accounting treatments for a business combinationIf the initial accounting for a business combination is incomplete by the end of the reporting period in which the business combination occurs, an acquirer shall report in its financial statements provi-sioned amounts for the items for which the accounting is incom-plete. Under the current accounting standard guidance, the adjustments to provisional amounts recorded in a business combi-nation are recognized as profit or loss in the year in which the measurement is completed. Under the revised accounting standard guidance, during the measurement period, which shall not exceed one year from the acquisition, the acquirer shall retrospectively adjust the provisional amounts recognized at the acquisition date to reflect new information obtained about facts and circumstances that existed as of the acquisition date and that would have affected the measurement of the amounts recognized as of that date. Such adjustments shall be recognized as if the accounting for the busi-ness combination had been completed at the acquisition date.(4) Presentation of the consolidated balance sheetIn the consolidated balance sheet, ”minority interest” under the current requirements will be changed to ”noncontrolling interest” under the revised requirements.(5) Presentation of the consolidated statement of incomeIn the consolidated statement of income, ”income before minority interest” under the current requirements will be changed to ”net income” under the revised requirements, and ”net income” under the current requirements will be changed to ”net income attribut-able to owners of the parent” under the revised requirements.
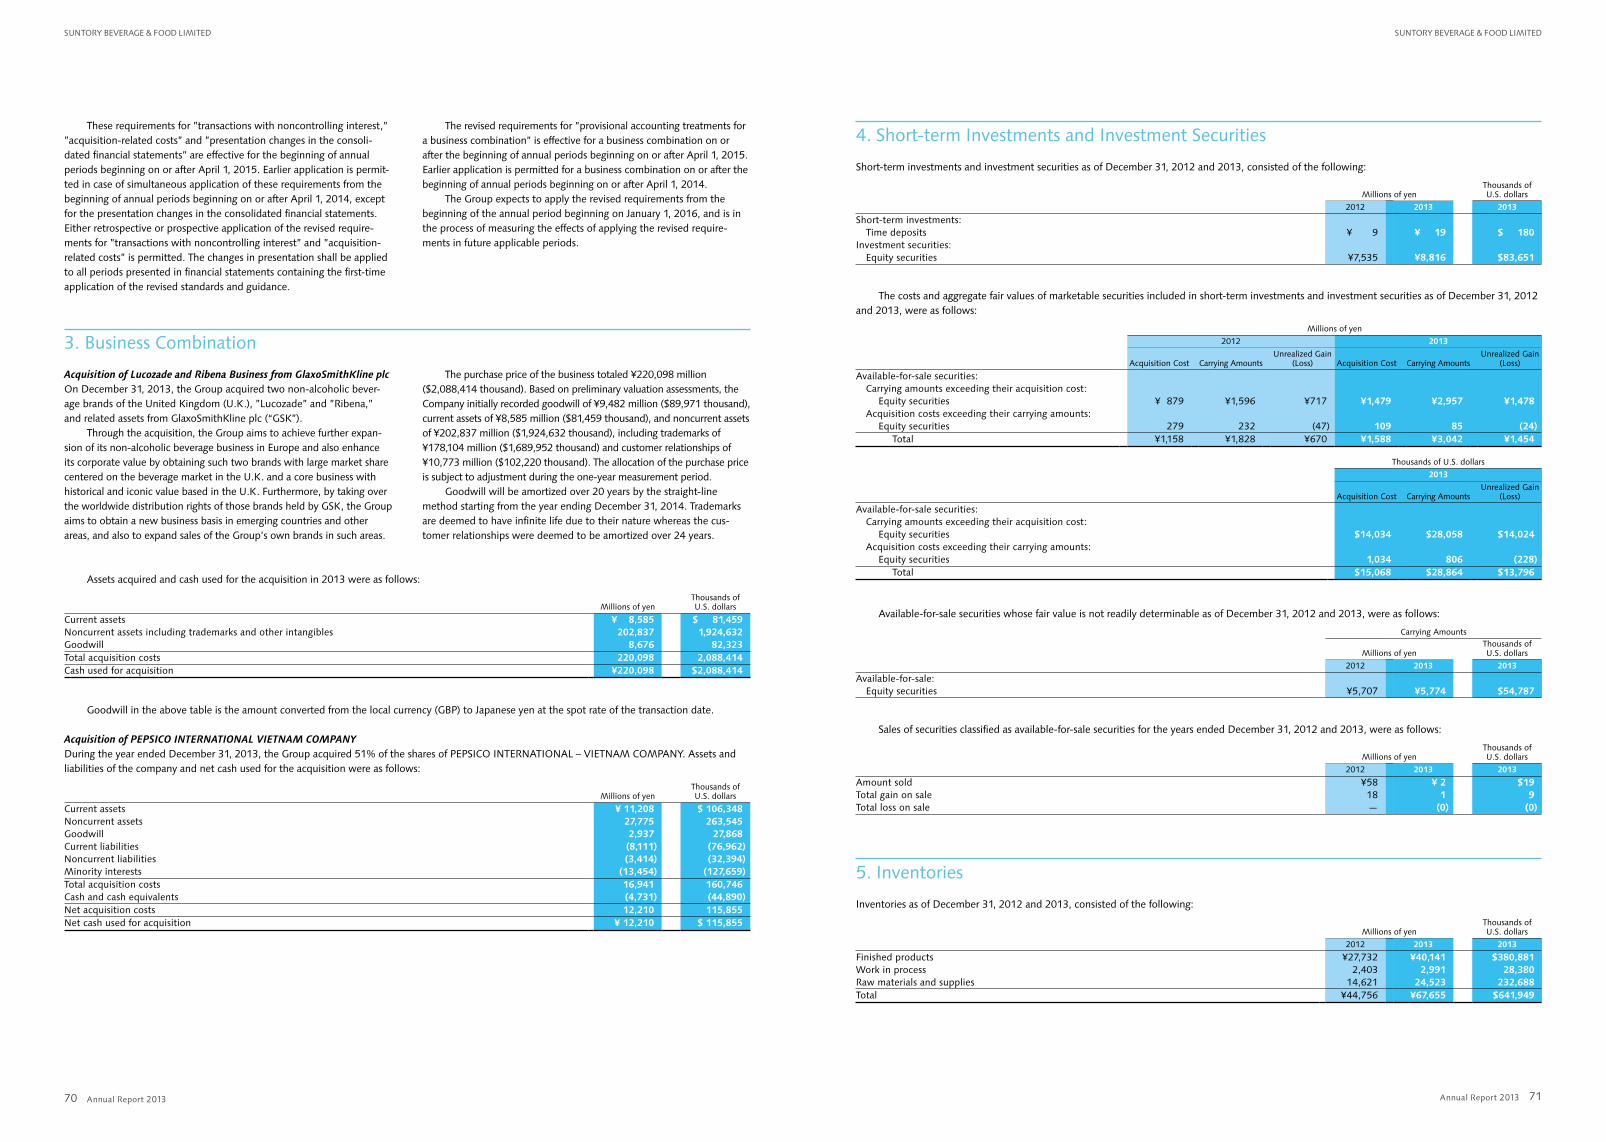
Annual Report 2013 Annual Report 2013
SuntoRy BeveRAge & Food Limited SuntoRy BeveRAge & Food Limited
7170
These requirements for ”transactions with noncontrolling interest,” ”acquisition-related costs” and ”presentation changes in the consoli-dated financial statements” are effective for the beginning of annual periods beginning on or after April 1, 2015. Earlier application is permit-ted in case of simultaneous application of these requirements from the beginning of annual periods beginning on or after April 1, 2014, except for the presentation changes in the consolidated financial statements. Either retrospective or prospective application of the revised require-ments for ”transactions with noncontrolling interest” and ”acquisition-related costs” is permitted. The changes in presentation shall be applied to all periods presented in financial statements containing the first-time application of the revised standards and guidance.
The revised requirements for ”provisional accounting treatments for a business combination” is effective for a business combination on or after the beginning of annual periods beginning on or after April 1, 2015. Earlier application is permitted for a business combination on or after the beginning of annual periods beginning on or after April 1, 2014.
The Group expects to apply the revised requirements from the beginning of the annual period beginning on January 1, 2016, and is in the process of measuring the effects of applying the revised require-ments in future applicable periods.
3. Business Combination
Acquisition of Lucozade and Ribena Business from GlaxoSmithKline plcOn December 31, 2013, the Group acquired two non-alcoholic bever-age brands of the United Kingdom (U.K.), ”Lucozade” and ”Ribena,” and related assets from GlaxoSmithKline plc (“GSK”).
Through the acquisition, the Group aims to achieve further expan-sion of its non-alcoholic beverage business in Europe and also enhance its corporate value by obtaining such two brands with large market share centered on the beverage market in the U.K. and a core business with historical and iconic value based in the U.K. Furthermore, by taking over the worldwide distribution rights of those brands held by GSK, the Group aims to obtain a new business basis in emerging countries and other areas, and also to expand sales of the Group’s own brands in such areas.
The purchase price of the business totaled ¥220,098 million ($2,088,414 thousand). Based on preliminary valuation assessments, the Company initially recorded goodwill of ¥9,482 million ($89,971 thousand), current assets of ¥8,585 million ($81,459 thousand), and noncurrent assets of ¥202,837 million ($1,924,632 thousand), including trademarks of ¥178,104 million ($1,689,952 thousand) and customer relationships of ¥10,773 million ($102,220 thousand). The allocation of the purchase price is subject to adjustment during the one-year measurement period.
Goodwill will be amortized over 20 years by the straight-line method starting from the year ending December 31, 2014. Trademarks are deemed to have infinite life due to their nature whereas the cus-tomer relationships were deemed to be amortized over 24 years.
Assets acquired and cash used for the acquisition in 2013 were as follows:
Millions of yenThousands of U.S. dollars
Current assets ¥ 8,585 $ 81,459Noncurrent assets including trademarks and other intangibles 202,837 1,924,632Goodwill 8,676 82,323Total acquisition costs 220,098 2,088,414Cash used for acquisition ¥220,098 $2,088,414
Goodwill in the above table is the amount converted from the local currency (GBP) to Japanese yen at the spot rate of the transaction date.
Acquisition of PEPSICO INTERNATIONAL VIETNAM COMPANYDuring the year ended December 31, 2013, the Group acquired 51% of the shares of PEPSICO INTERNATIONAL – VIETNAM COMPANY. Assets and liabilities of the company and net cash used for the acquisition were as follows:
Millions of yenThousands of U.S. dollars
Current assets ¥ 11,208 $ 106,348Noncurrent assets 27,775 263,545Goodwill 2,937 27,868Current liabilities (8,111) (76,962)Noncurrent liabilities (3,414) (32,394)Minority interests (13,454) (127,659)Total acquisition costs 16,941 160,746Cash and cash equivalents (4,731) (44,890)Net acquisition costs 12,210 115,855Net cash used for acquisition ¥ 12,210 $ 115,855
4. Short-term Investments and Investment Securities
Short-term investments and investment securities as of December 31, 2012 and 2013, consisted of the following:
Millions of yenThousands of U.S. dollars
2012 2013 2013
Short-term investments:Time deposits ¥ 9 ¥ 19 $ 180
Investment securities:Equity securities ¥7,535 ¥8,816 $83,651
The costs and aggregate fair values of marketable securities included in short-term investments and investment securities as of December 31, 2012 and 2013, were as follows:
Millions of yen
2012 2013
Acquisition Cost Carrying AmountsUnrealized Gain
(Loss) Acquisition Cost Carrying AmountsUnrealized Gain
(Loss)
Available-for-sale securities:Carrying amounts exceeding their acquisition cost:
Equity securities ¥ 879 ¥1,596 ¥717 ¥1,479 ¥2,957 ¥1,478Acquisition costs exceeding their carrying amounts:
Equity securities 279 232 (47) 109 85 (24)Total ¥1,158 ¥1,828 ¥670 ¥1,588 ¥3,042 ¥1,454
Thousands of U.S. dollars
2013
Acquisition Cost Carrying AmountsUnrealized Gain
(Loss)
Available-for-sale securities:Carrying amounts exceeding their acquisition cost:
Equity securities $14,034 $28,058 $14,024Acquisition costs exceeding their carrying amounts:
Equity securities 1,034 806 (228)Total $15,068 $28,864 $13,796
Available-for-sale securities whose fair value is not readily determinable as of December 31, 2012 and 2013, were as follows:
Carrying Amounts
Millions of yenThousands of U.S. dollars
2012 2013 2013
Available-for-sale:Equity securities ¥5,707 ¥5,774 $54,787
Sales of securities classified as available-for-sale securities for the years ended December 31, 2012 and 2013, were as follows:
Millions of yenThousands of U.S. dollars
2012 2013 2013
Amount sold ¥58 ¥ 2 $19Total gain on sale 18 1 9Total loss on sale — (0) (0)
5. Inventories
Inventories as of December 31, 2012 and 2013, consisted of the following:
Millions of yenThousands of U.S. dollars
2012 2013 2013
Finished products ¥27,732 ¥40,141 $380,881Work in process 2,403 2,991 28,380Raw materials and supplies 14,621 24,523 232,688Total ¥44,756 ¥67,655 $641,949
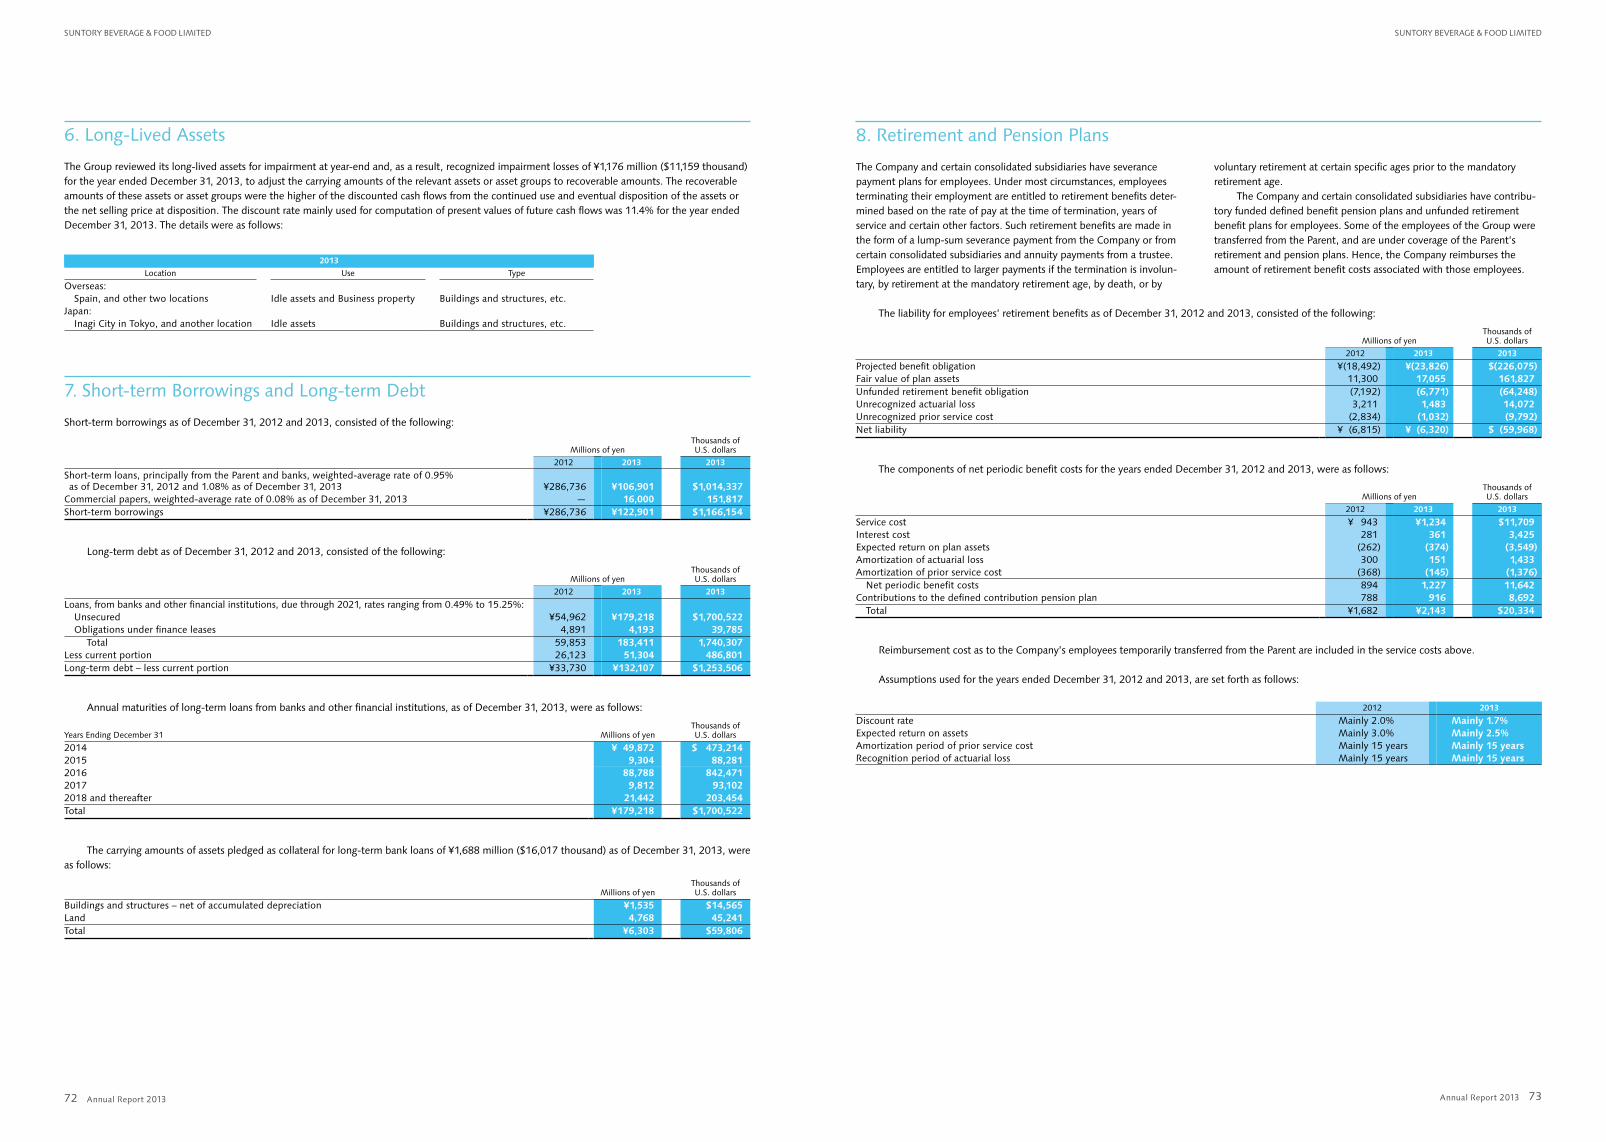
Annual Report 2013 Annual Report 2013
SuntoRy BeveRAge & Food Limited SuntoRy BeveRAge & Food Limited
7372
6. Long-Lived Assets
The Group reviewed its long-lived assets for impairment at year-end and, as a result, recognized impairment losses of ¥1,176 million ($11,159 thousand) for the year ended December 31, 2013, to adjust the carrying amounts of the relevant assets or asset groups to recoverable amounts. The recoverable amounts of these assets or asset groups were the higher of the discounted cash flows from the continued use and eventual disposition of the assets or the net selling price at disposition. The discount rate mainly used for computation of present values of future cash flows was 11.4% for the year ended December 31, 2013. The details were as follows:
2013
Location Use Type
Overseas:Spain, and other two locations Idle assets and Business property Buildings and structures, etc.
Japan:Inagi City in Tokyo, and another location Idle assets Buildings and structures, etc.
7. Short-term Borrowings and Long-term Debt
Short-term borrowings as of December 31, 2012 and 2013, consisted of the following:
Millions of yenThousands of U.S. dollars
2012 2013 2013
Short-term loans, principally from the Parent and banks, weighted-average rate of 0.95% as of December 31, 2012 and 1.08% as of December 31, 2013 ¥286,736 ¥106,901 $1,014,337
Commercial papers, weighted-average rate of 0.08% as of December 31, 2013 — 16,000 151,817Short-term borrowings ¥286,736 ¥122,901 $1,166,154
Long-term debt as of December 31, 2012 and 2013, consisted of the following:
Millions of yenThousands of U.S. dollars
2012 2013 2013
Loans, from banks and other financial institutions, due through 2021, rates ranging from 0.49% to 15.25%:Unsecured ¥54,962 ¥179,218 $1,700,522Obligations under finance leases 4,891 4,193 39,785
Total 59,853 183,411 1,740,307Less current portion 26,123 51,304 486,801Long-term debt – less current portion ¥33,730 ¥132,107 $1,253,506
Annual maturities of long-term loans from banks and other financial institutions, as of December 31, 2013, were as follows:
Years Ending December 31 Millions of yenThousands of U.S. dollars
2014 ¥ 49,872 $ 473,2142015 9,304 88,2812016 88,788 842,4712017 9,812 93,1022018 and thereafter 21,442 203,454Total ¥179,218 $1,700,522
The carrying amounts of assets pledged as collateral for long-term bank loans of ¥1,688 million ($16,017 thousand) as of December 31, 2013, were as follows:
Millions of yenThousands of U.S. dollars
Buildings and structures – net of accumulated depreciation ¥1,535 $14,565Land 4,768 45,241Total ¥6,303 $59,806
8. Retirement and Pension Plans
The Company and certain consolidated subsidiaries have severance payment plans for employees. Under most circumstances, employees terminating their employment are entitled to retirement benefits deter-mined based on the rate of pay at the time of termination, years of service and certain other factors. Such retirement benefits are made in the form of a lump-sum severance payment from the Company or from certain consolidated subsidiaries and annuity payments from a trustee. Employees are entitled to larger payments if the termination is involun-tary, by retirement at the mandatory retirement age, by death, or by
voluntary retirement at certain specific ages prior to the mandatory retirement age.
The Company and certain consolidated subsidiaries have contribu-tory funded defined benefit pension plans and unfunded retirement benefit plans for employees. Some of the employees of the Group were transferred from the Parent, and are under coverage of the Parent’s retirement and pension plans. Hence, the Company reimburses the amount of retirement benefit costs associated with those employees.
The liability for employees’ retirement benefits as of December 31, 2012 and 2013, consisted of the following:
Millions of yenThousands of U.S. dollars
2012 2013 2013
Projected benefit obligation ¥(18,492) ¥(23,826) $(226,075)Fair value of plan assets 11,300 17,055 161,827Unfunded retirement benefit obligation (7,192) (6,771) (64,248)Unrecognized actuarial loss 3,211 1,483 14,072Unrecognized prior service cost (2,834) (1,032) (9,792)Net liability ¥ (6,815) ¥ (6,320) $ (59,968)
The components of net periodic benefit costs for the years ended December 31, 2012 and 2013, were as follows:
Millions of yenThousands of U.S. dollars
2012 2013 2013
Service cost ¥ 943 ¥1,234 $11,709Interest cost 281 361 3,425Expected return on plan assets (262) (374) (3,549)Amortization of actuarial loss 300 151 1,433Amortization of prior service cost (368) (145) (1,376)
Net periodic benefit costs 894 1,227 11,642Contributions to the defined contribution pension plan 788 916 8,692
Total ¥1,682 ¥2,143 $20,334
Reimbursement cost as to the Company’s employees temporarily transferred from the Parent are included in the service costs above.
Assumptions used for the years ended December 31, 2012 and 2013, are set forth as follows:
2012 2013
Discount rate Mainly 2.0% Mainly 1.7%Expected return on assets Mainly 3.0% Mainly 2.5%Amortization period of prior service cost Mainly 15 years Mainly 15 yearsRecognition period of actuarial loss Mainly 15 years Mainly 15 years
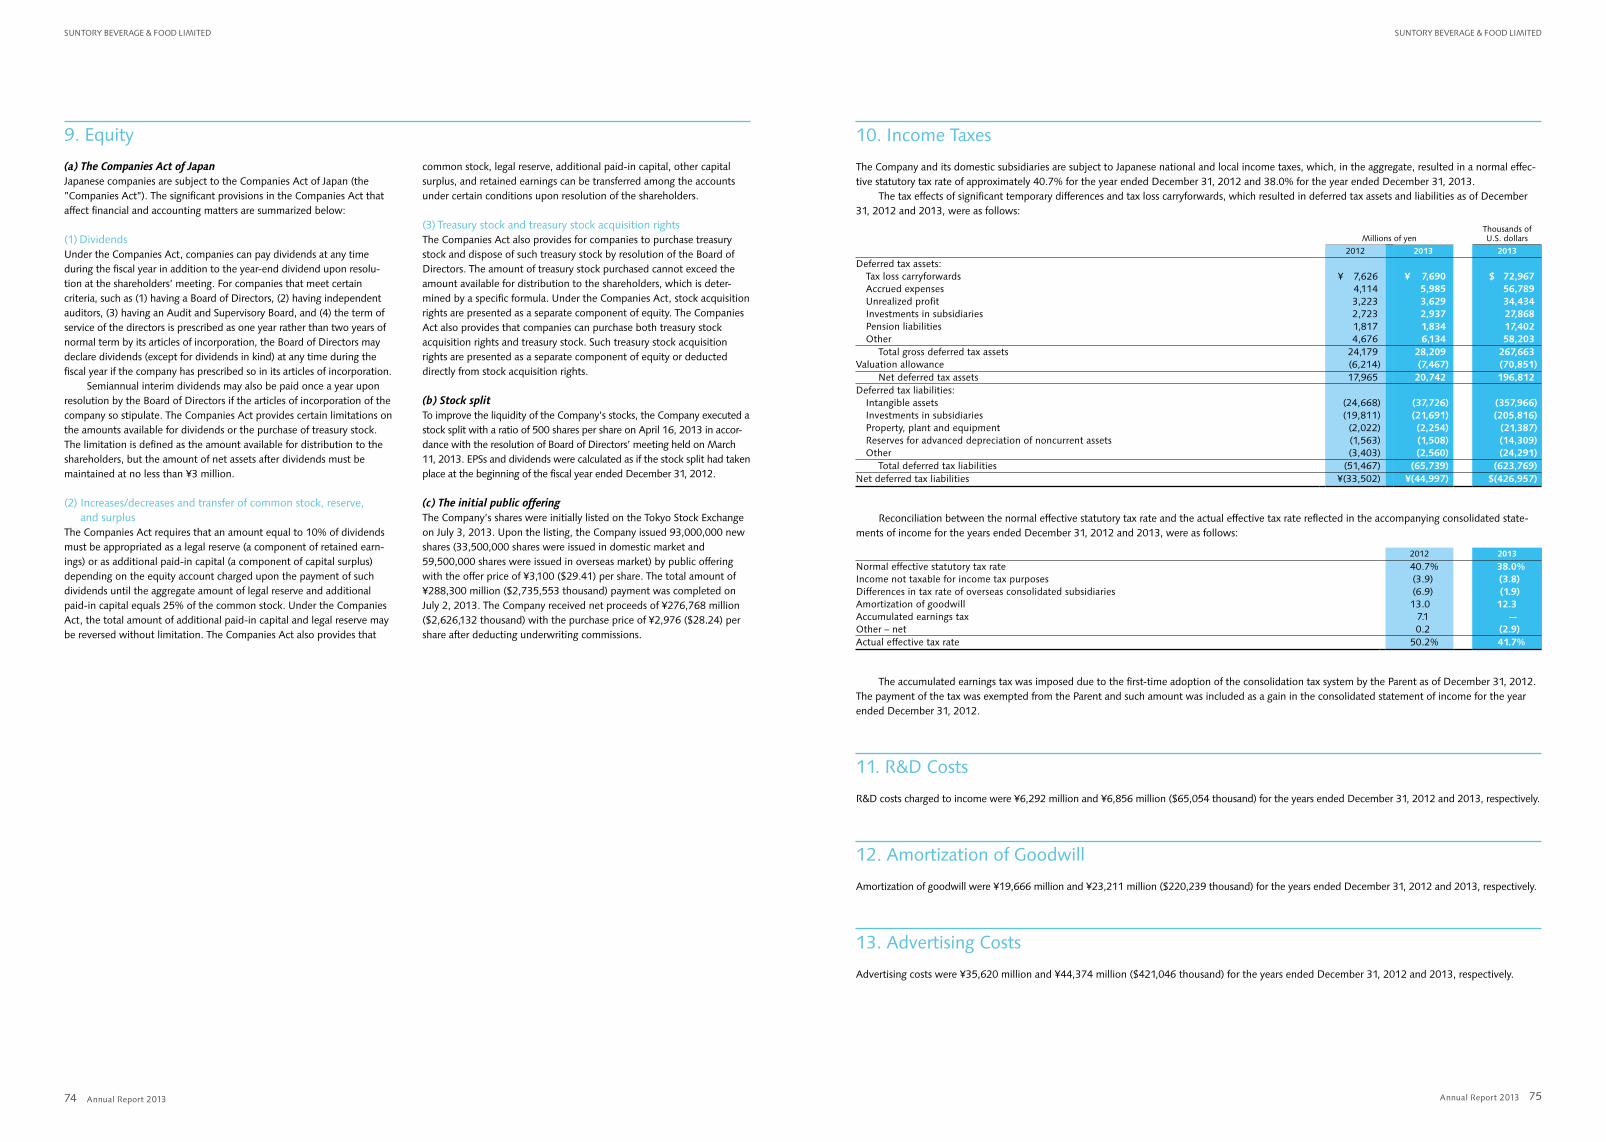
Annual Report 2013 Annual Report 2013
SuntoRy BeveRAge & Food Limited SuntoRy BeveRAge & Food Limited
7574
9. Equity
(a) The Companies Act of JapanJapanese companies are subject to the Companies Act of Japan (the ”Companies Act”). The significant provisions in the Companies Act that affect financial and accounting matters are summarized below:
(1) DividendsUnder the Companies Act, companies can pay dividends at any time during the fiscal year in addition to the year-end dividend upon resolu-tion at the shareholders’ meeting. For companies that meet certain criteria, such as (1) having a Board of Directors, (2) having independent auditors, (3) having an Audit and Supervisory Board, and (4) the term of service of the directors is prescribed as one year rather than two years of normal term by its articles of incorporation, the Board of Directors may declare dividends (except for dividends in kind) at any time during the fiscal year if the company has prescribed so in its articles of incorporation.
Semiannual interim dividends may also be paid once a year upon resolution by the Board of Directors if the articles of incorporation of the company so stipulate. The Companies Act provides certain limitations on the amounts available for dividends or the purchase of treasury stock. The limitation is defined as the amount available for distribution to the shareholders, but the amount of net assets after dividends must be maintained at no less than ¥3 million.
(2) Increases/decreases and transfer of common stock, reserve, and surplus
The Companies Act requires that an amount equal to 10% of dividends must be appropriated as a legal reserve (a component of retained earn-ings) or as additional paid-in capital (a component of capital surplus) depending on the equity account charged upon the payment of such dividends until the aggregate amount of legal reserve and additional paid-in capital equals 25% of the common stock. Under the Companies Act, the total amount of additional paid-in capital and legal reserve may be reversed without limitation. The Companies Act also provides that
common stock, legal reserve, additional paid-in capital, other capital surplus, and retained earnings can be transferred among the accounts under certain conditions upon resolution of the shareholders.
(3) Treasury stock and treasury stock acquisition rightsThe Companies Act also provides for companies to purchase treasury stock and dispose of such treasury stock by resolution of the Board of Directors. The amount of treasury stock purchased cannot exceed the amount available for distribution to the shareholders, which is deter-mined by a specific formula. Under the Companies Act, stock acquisition rights are presented as a separate component of equity. The Companies Act also provides that companies can purchase both treasury stock acquisition rights and treasury stock. Such treasury stock acquisition rights are presented as a separate component of equity or deducted directly from stock acquisition rights.
(b) Stock splitTo improve the liquidity of the Company’s stocks, the Company executed a stock split with a ratio of 500 shares per share on April 16, 2013 in accor-dance with the resolution of Board of Directors’ meeting held on March 11, 2013. EPSs and dividends were calculated as if the stock split had taken place at the beginning of the fiscal year ended December 31, 2012.
(c) The initial public offeringThe Company’s shares were initially listed on the Tokyo Stock Exchange on July 3, 2013. Upon the listing, the Company issued 93,000,000 new shares (33,500,000 shares were issued in domestic market and 59,500,000 shares were issued in overseas market) by public offering with the offer price of ¥3,100 ($29.41) per share. The total amount of ¥288,300 million ($2,735,553 thousand) payment was completed on July 2, 2013. The Company received net proceeds of ¥276,768 million ($2,626,132 thousand) with the purchase price of ¥2,976 ($28.24) per share after deducting underwriting commissions.
10. Income Taxes
The Company and its domestic subsidiaries are subject to Japanese national and local income taxes, which, in the aggregate, resulted in a normal effec-tive statutory tax rate of approximately 40.7% for the year ended December 31, 2012 and 38.0% for the year ended December 31, 2013.
The tax effects of significant temporary differences and tax loss carryforwards, which resulted in deferred tax assets and liabilities as of December 31, 2012 and 2013, were as follows:
Millions of yenThousands of U.S. dollars
2012 2013 2013
Deferred tax assets:Tax loss carryforwards ¥ 7,626 ¥ 7,690 $ 72,967Accrued expenses 4,114 5,985 56,789Unrealized profit 3,223 3,629 34,434Investments in subsidiaries 2,723 2,937 27,868Pension liabilities 1,817 1,834 17,402Other 4,676 6,134 58,203
Total gross deferred tax assets 24,179 28,209 267,663Valuation allowance (6,214) (7,467) (70,851)
Net deferred tax assets 17,965 20,742 196,812Deferred tax liabilities:
Intangible assets (24,668) (37,726) (357,966)Investments in subsidiaries (19,811) (21,691) (205,816)Property, plant and equipment (2,022) (2,254) (21,387)Reserves for advanced depreciation of noncurrent assets (1,563) (1,508) (14,309)Other (3,403) (2,560) (24,291)
Total deferred tax liabilities (51,467) (65,739) (623,769)Net deferred tax liabilities ¥(33,502) ¥(44,997) $(426,957)
Reconciliation between the normal effective statutory tax rate and the actual effective tax rate reflected in the accompanying consolidated state-ments of income for the years ended December 31, 2012 and 2013, were as follows:
2012 2013
Normal effective statutory tax rate 40.7% 38.0%Income not taxable for income tax purposes (3.9) (3.8)Differences in tax rate of overseas consolidated subsidiaries (6.9) (1.9)Amortization of goodwill 13.0 12.3Accumulated earnings tax 7.1 —Other – net 0.2 (2.9)Actual effective tax rate 50.2% 41.7%
The accumulated earnings tax was imposed due to the first-time adoption of the consolidation tax system by the Parent as of December 31, 2012. The payment of the tax was exempted from the Parent and such amount was included as a gain in the consolidated statement of income for the year ended December 31, 2012.
11. R&D Costs
R&D costs charged to income were ¥6,292 million and ¥6,856 million ($65,054 thousand) for the years ended December 31, 2012 and 2013, respectively.
12. Amortization of Goodwill
Amortization of goodwill were ¥19,666 million and ¥23,211 million ($220,239 thousand) for the years ended December 31, 2012 and 2013, respectively.
13. Advertising Costs
Advertising costs were ¥35,620 million and ¥44,374 million ($421,046 thousand) for the years ended December 31, 2012 and 2013, respectively.
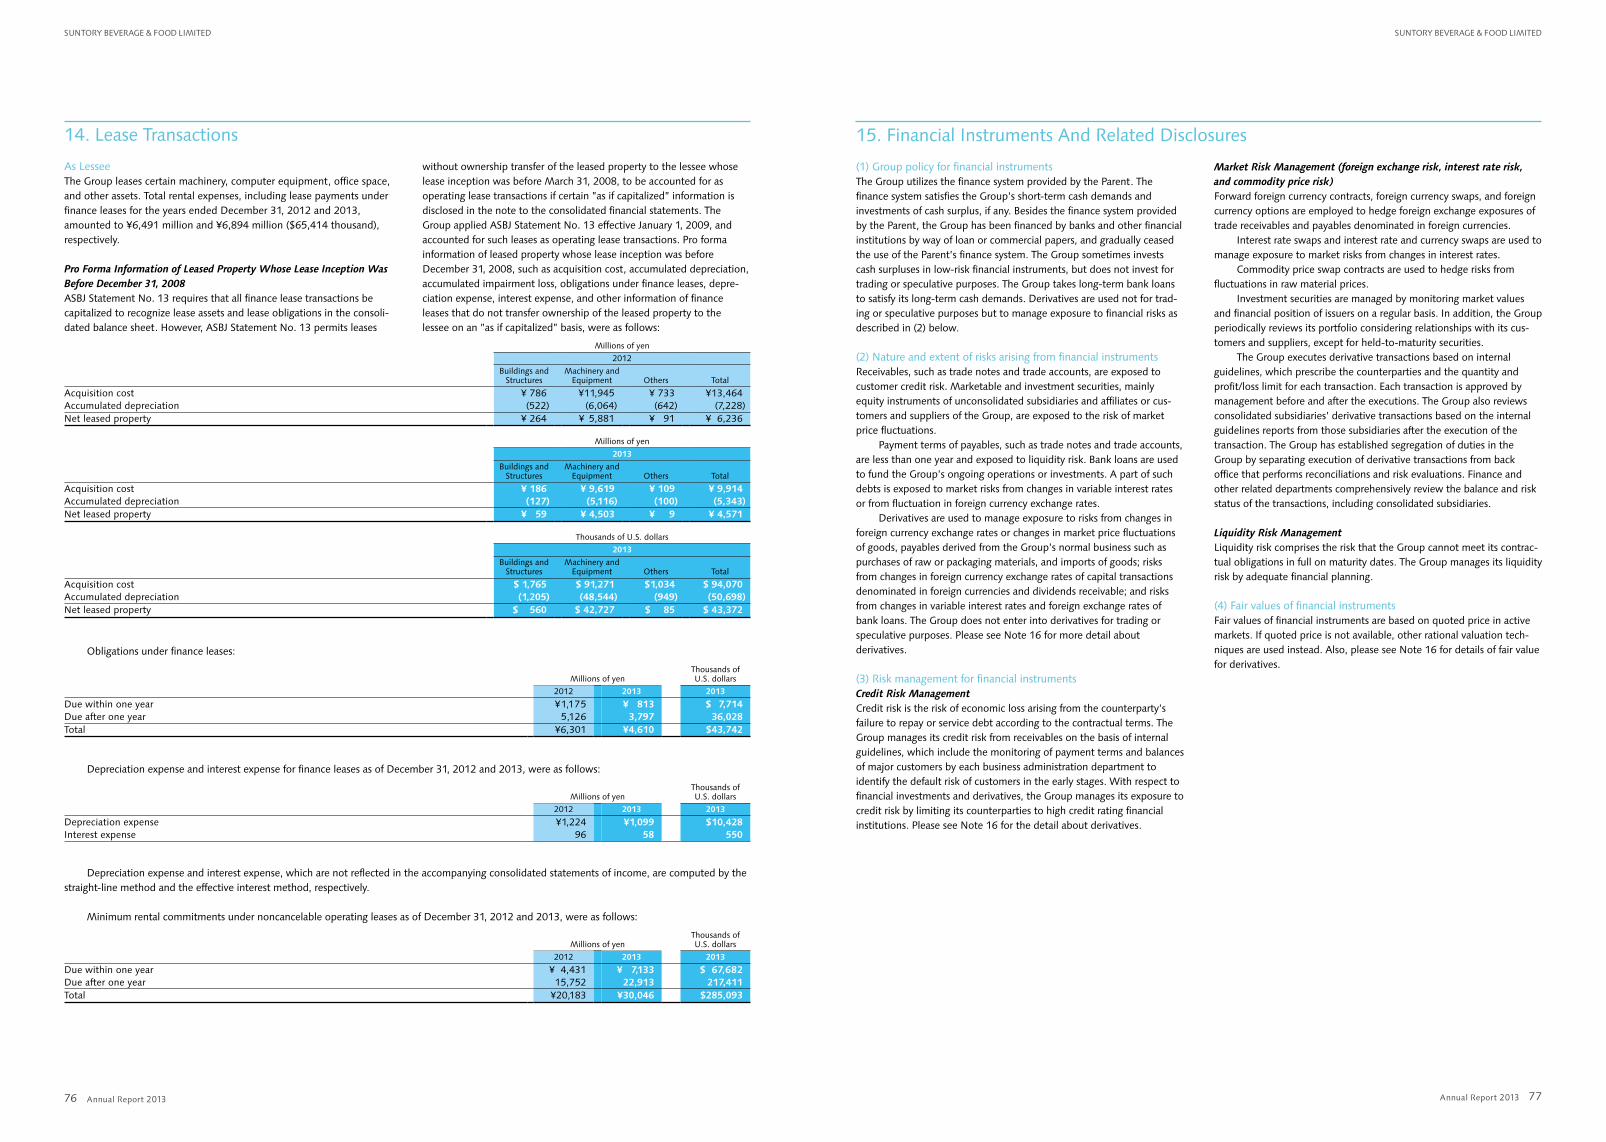
Annual Report 2013 Annual Report 2013
SuntoRy BeveRAge & Food Limited SuntoRy BeveRAge & Food Limited
7776
14. Lease Transactions
As LesseeThe Group leases certain machinery, computer equipment, office space, and other assets. Total rental expenses, including lease payments under finance leases for the years ended December 31, 2012 and 2013, amounted to ¥6,491 million and ¥6,894 million ($65,414 thousand), respectively.
Pro Forma Information of Leased Property Whose Lease Inception Was Before December 31, 2008ASBJ Statement No. 13 requires that all finance lease transactions be capitalized to recognize lease assets and lease obligations in the consoli-dated balance sheet. However, ASBJ Statement No. 13 permits leases
without ownership transfer of the leased property to the lessee whose lease inception was before March 31, 2008, to be accounted for as operating lease transactions if certain ”as if capitalized” information is disclosed in the note to the consolidated financial statements. The Group applied ASBJ Statement No. 13 effective January 1, 2009, and accounted for such leases as operating lease transactions. Pro forma information of leased property whose lease inception was before December 31, 2008, such as acquisition cost, accumulated depreciation, accumulated impairment loss, obligations under finance leases, depre-ciation expense, interest expense, and other information of finance leases that do not transfer ownership of the leased property to the lessee on an ”as if capitalized” basis, were as follows:
Millions of yen
2012
Buildings and Structures
Machinery and Equipment Others Total
Acquisition cost ¥ 786 ¥11,945 ¥ 733 ¥13,464Accumulated depreciation (522) (6,064) (642) (7,228)Net leased property ¥ 264 ¥ 5,881 ¥ 91 ¥ 6,236
Millions of yen
2013
Buildings and Structures
Machinery and Equipment Others Total
Acquisition cost ¥ 186 ¥ 9,619 ¥ 109 ¥ 9,914Accumulated depreciation (127) (5,116) (100) (5,343)Net leased property ¥ 59 ¥ 4,503 ¥ 9 ¥ 4,571
Thousands of U.S. dollars
2013
Buildings and Structures
Machinery and Equipment Others Total
Acquisition cost $ 1,765 $ 91,271 $1,034 $ 94,070Accumulated depreciation (1,205) (48,544) (949) (50,698)Net leased property $ 560 $ 42,727 $ 85 $ 43,372
Obligations under finance leases:
Millions of yenThousands of U.S. dollars
2012 2013 2013
Due within one year ¥1,175 ¥ 813 $ 7,714Due after one year 5,126 3,797 36,028Total ¥6,301 ¥4,610 $43,742
Depreciation expense and interest expense for finance leases as of December 31, 2012 and 2013, were as follows:
Millions of yenThousands of U.S. dollars
2012 2013 2013
Depreciation expense ¥1,224 ¥1,099 $10,428Interest expense 96 58 550
Depreciation expense and interest expense, which are not reflected in the accompanying consolidated statements of income, are computed by the straight-line method and the effective interest method, respectively.
Minimum rental commitments under noncancelable operating leases as of December 31, 2012 and 2013, were as follows:
Millions of yenThousands of U.S. dollars
2012 2013 2013
Due within one year ¥ 4,431 ¥ 7,133 $ 67,682Due after one year 15,752 22,913 217,411Total ¥20,183 ¥30,046 $285,093
15. Financial Instruments And Related Disclosures
(1) Group policy for financial instrumentsThe Group utilizes the finance system provided by the Parent. The finance system satisfies the Group’s short-term cash demands and investments of cash surplus, if any. Besides the finance system provided by the Parent, the Group has been financed by banks and other financial institutions by way of loan or commercial papers, and gradually ceased the use of the Parent’s finance system. The Group sometimes invests cash surpluses in low-risk financial instruments, but does not invest for trading or speculative purposes. The Group takes long-term bank loans to satisfy its long-term cash demands. Derivatives are used not for trad-ing or speculative purposes but to manage exposure to financial risks as described in (2) below.
(2) Nature and extent of risks arising from financial instrumentsReceivables, such as trade notes and trade accounts, are exposed to customer credit risk. Marketable and investment securities, mainly equity instruments of unconsolidated subsidiaries and affiliates or cus-tomers and suppliers of the Group, are exposed to the risk of market price fluctuations.
Payment terms of payables, such as trade notes and trade accounts, are less than one year and exposed to liquidity risk. Bank loans are used to fund the Group’s ongoing operations or investments. A part of such debts is exposed to market risks from changes in variable interest rates or from fluctuation in foreign currency exchange rates.
Derivatives are used to manage exposure to risks from changes in foreign currency exchange rates or changes in market price fluctuations of goods, payables derived from the Group’s normal business such as purchases of raw or packaging materials, and imports of goods; risks from changes in foreign currency exchange rates of capital transactions denominated in foreign currencies and dividends receivable; and risks from changes in variable interest rates and foreign exchange rates of bank loans. The Group does not enter into derivatives for trading or speculative purposes. Please see Note 16 for more detail about derivatives.
(3) Risk management for financial instrumentsCredit Risk ManagementCredit risk is the risk of economic loss arising from the counterparty’s failure to repay or service debt according to the contractual terms. The Group manages its credit risk from receivables on the basis of internal guidelines, which include the monitoring of payment terms and balances of major customers by each business administration department to identify the default risk of customers in the early stages. With respect to financial investments and derivatives, the Group manages its exposure to credit risk by limiting its counterparties to high credit rating financial institutions. Please see Note 16 for the detail about derivatives.
Market Risk Management (foreign exchange risk, interest rate risk, and commodity price risk)Forward foreign currency contracts, foreign currency swaps, and foreign currency options are employed to hedge foreign exchange exposures of trade receivables and payables denominated in foreign currencies.
Interest rate swaps and interest rate and currency swaps are used to manage exposure to market risks from changes in interest rates.
Commodity price swap contracts are used to hedge risks from fluctuations in raw material prices.
Investment securities are managed by monitoring market values and financial position of issuers on a regular basis. In addition, the Group periodically reviews its portfolio considering relationships with its cus-tomers and suppliers, except for held-to-maturity securities.
The Group executes derivative transactions based on internal guidelines, which prescribe the counterparties and the quantity and profit/loss limit for each transaction. Each transaction is approved by management before and after the executions. The Group also reviews consolidated subsidiaries’ derivative transactions based on the internal guidelines reports from those subsidiaries after the execution of the transaction. The Group has established segregation of duties in the Group by separating execution of derivative transactions from back office that performs reconciliations and risk evaluations. Finance and other related departments comprehensively review the balance and risk status of the transactions, including consolidated subsidiaries.
Liquidity Risk ManagementLiquidity risk comprises the risk that the Group cannot meet its contrac-tual obligations in full on maturity dates. The Group manages its liquidity risk by adequate financial planning.
(4) Fair values of financial instrumentsFair values of financial instruments are based on quoted price in active markets. If quoted price is not available, other rational valuation tech-niques are used instead. Also, please see Note 16 for details of fair value for derivatives.
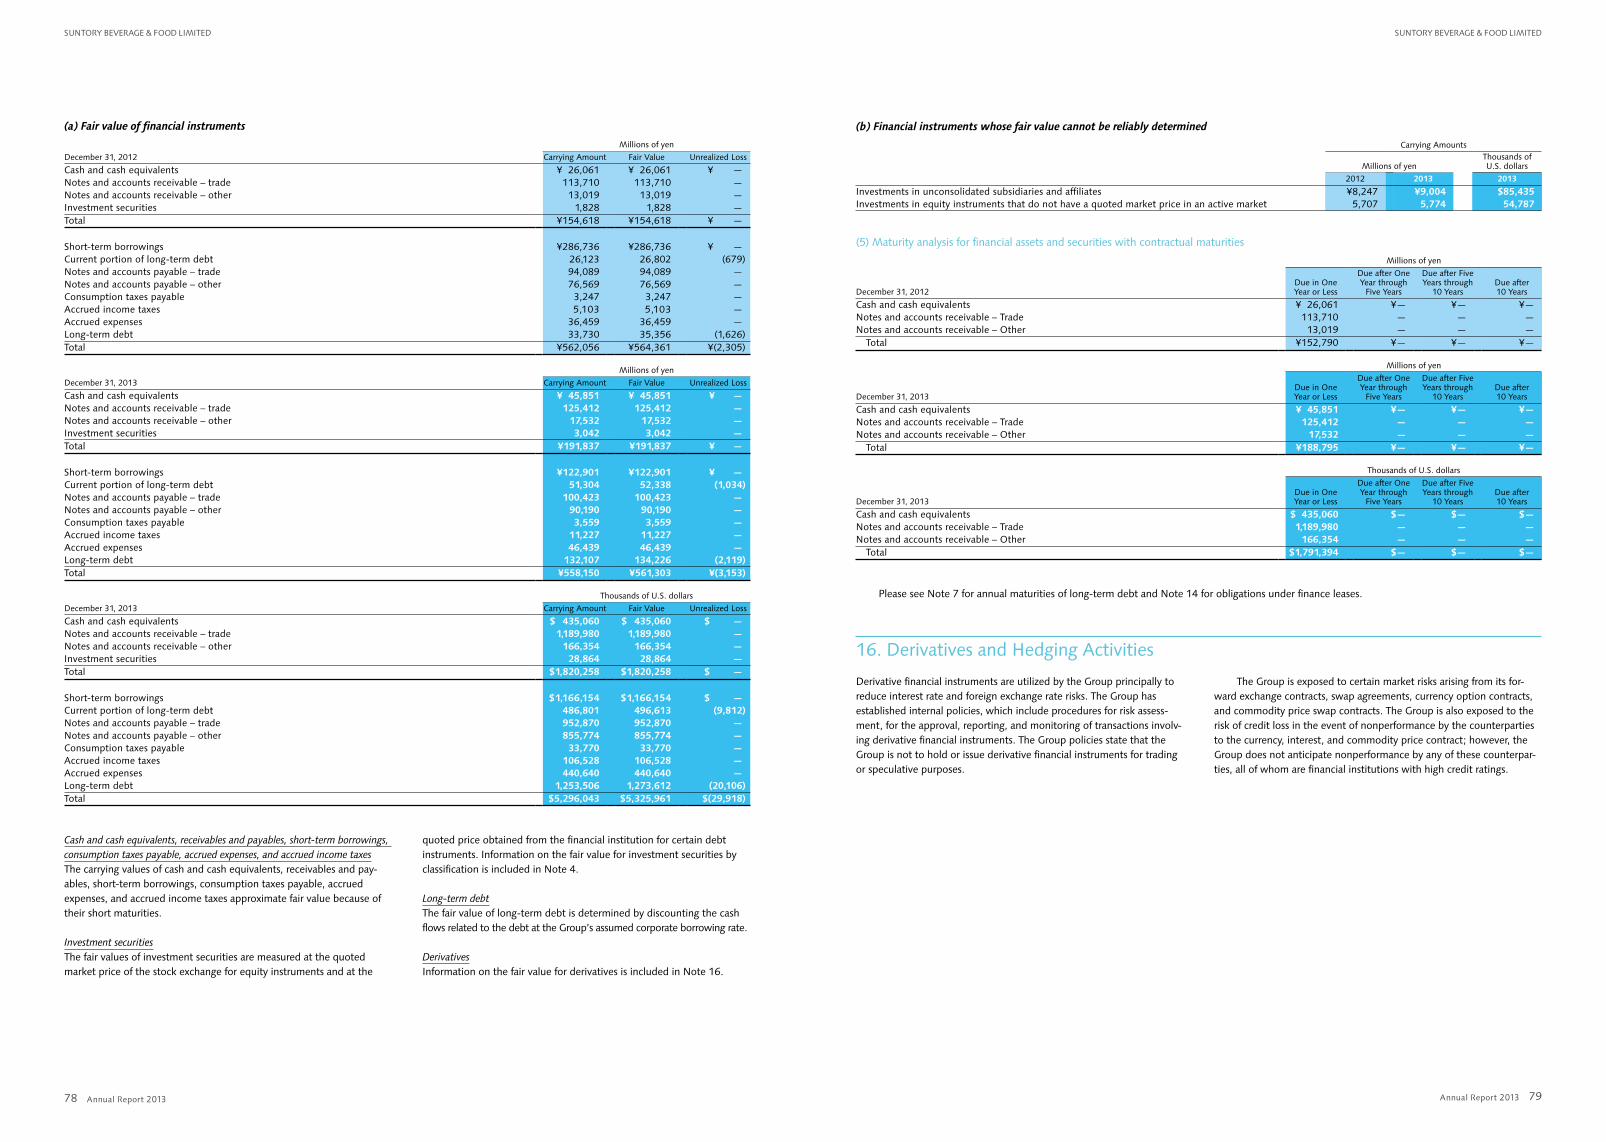
Annual Report 2013 Annual Report 2013
SuntoRy BeveRAge & Food Limited SuntoRy BeveRAge & Food Limited
7978
(a) Fair value of financial instruments
Millions of yen
December 31, 2012 Carrying Amount Fair Value Unrealized Loss
Cash and cash equivalents ¥ 26,061 ¥ 26,061 ¥ —Notes and accounts receivable – trade 113,710 113,710 —Notes and accounts receivable – other 13,019 13,019 —Investment securities 1,828 1,828 —Total ¥154,618 ¥154,618 ¥ —
Short-term borrowings ¥286,736 ¥286,736 ¥ —Current portion of long-term debt 26,123 26,802 (679)Notes and accounts payable – trade 94,089 94,089 —Notes and accounts payable – other 76,569 76,569 —Consumption taxes payable 3,247 3,247 —Accrued income taxes 5,103 5,103 —Accrued expenses 36,459 36,459 —Long-term debt 33,730 35,356 (1,626)Total ¥562,056 ¥564,361 ¥(2,305)
Millions of yen
December 31, 2013 Carrying Amount Fair Value Unrealized Loss
Cash and cash equivalents ¥ 45,851 ¥ 45,851 ¥ —Notes and accounts receivable – trade 125,412 125,412 —Notes and accounts receivable – other 17,532 17,532 —Investment securities 3,042 3,042 —Total ¥191,837 ¥191,837 ¥ —
Short-term borrowings ¥122,901 ¥122,901 ¥ —Current portion of long-term debt 51,304 52,338 (1,034)Notes and accounts payable – trade 100,423 100,423 —Notes and accounts payable – other 90,190 90,190 —Consumption taxes payable 3,559 3,559 —Accrued income taxes 11,227 11,227 —Accrued expenses 46,439 46,439 —Long-term debt 132,107 134,226 (2,119)Total ¥558,150 ¥561,303 ¥(3,153)
Thousands of U.S. dollars
December 31, 2013 Carrying Amount Fair Value Unrealized Loss
Cash and cash equivalents $ 435,060 $ 435,060 $ —Notes and accounts receivable – trade 1,189,980 1,189,980 —Notes and accounts receivable – other 166,354 166,354 —Investment securities 28,864 28,864 —Total $1,820,258 $1,820,258 $ —
Short-term borrowings $1,166,154 $1,166,154 $ —Current portion of long-term debt 486,801 496,613 (9,812)Notes and accounts payable – trade 952,870 952,870 —Notes and accounts payable – other 855,774 855,774 —Consumption taxes payable 33,770 33,770 —Accrued income taxes 106,528 106,528 —Accrued expenses 440,640 440,640 —Long-term debt 1,253,506 1,273,612 (20,106)Total $5,296,043 $5,325,961 $(29,918)
Cash and cash equivalents, receivables and payables, short-term borrowings, consumption taxes payable, accrued expenses, and accrued income taxesThe carrying values of cash and cash equivalents, receivables and pay-ables, short-term borrowings, consumption taxes payable, accrued expenses, and accrued income taxes approximate fair value because of their short maturities.
Investment securitiesThe fair values of investment securities are measured at the quoted market price of the stock exchange for equity instruments and at the
quoted price obtained from the financial institution for certain debt instruments. Information on the fair value for investment securities by classification is included in Note 4.
Long-term debtThe fair value of long-term debt is determined by discounting the cash flows related to the debt at the Group’s assumed corporate borrowing rate.
DerivativesInformation on the fair value for derivatives is included in Note 16.
(b) Financial instruments whose fair value cannot be reliably determined
Carrying Amounts
Millions of yenThousands of U.S. dollars
2012 2013 2013
Investments in unconsolidated subsidiaries and affiliates ¥8,247 ¥9,004 $85,435Investments in equity instruments that do not have a quoted market price in an active market 5,707 5,774 54,787
(5) Maturity analysis for financial assets and securities with contractual maturities
Millions of yen
December 31, 2012Due in One Year or Less
Due after One Year through
Five Years
Due after Five Years through
10 YearsDue after 10 Years
Cash and cash equivalents ¥ 26,061 ¥— ¥— ¥—Notes and accounts receivable – Trade 113,710 — — —Notes and accounts receivable – Other 13,019 — — —
Total ¥152,790 ¥— ¥— ¥—
Millions of yen
December 31, 2013Due in One Year or Less
Due after One Year through
Five Years
Due after Five Years through
10 YearsDue after 10 Years
Cash and cash equivalents ¥ 45,851 ¥— ¥— ¥—Notes and accounts receivable – Trade 125,412 — — —Notes and accounts receivable – Other 17,532 — — —
Total ¥188,795 ¥— ¥— ¥—
Thousands of U.S. dollars
December 31, 2013Due in One Year or Less
Due after One Year through
Five Years
Due after Five Years through
10 YearsDue after 10 Years
Cash and cash equivalents $ 435,060 $— $— $—Notes and accounts receivable – Trade 1,189,980 — — —Notes and accounts receivable – Other 166,354 — — —
Total $1,791,394 $— $— $—
Please see Note 7 for annual maturities of long-term debt and Note 14 for obligations under finance leases.
16. Derivatives and Hedging Activities
Derivative financial instruments are utilized by the Group principally to reduce interest rate and foreign exchange rate risks. The Group has established internal policies, which include procedures for risk assess-ment, for the approval, reporting, and monitoring of transactions involv-ing derivative financial instruments. The Group policies state that the Group is not to hold or issue derivative financial instruments for trading or speculative purposes.
The Group is exposed to certain market risks arising from its for-ward exchange contracts, swap agreements, currency option contracts, and commodity price swap contracts. The Group is also exposed to the risk of credit loss in the event of nonperformance by the counterparties to the currency, interest, and commodity price contract; however, the Group does not anticipate nonperformance by any of these counterpar-ties, all of whom are financial institutions with high credit ratings.
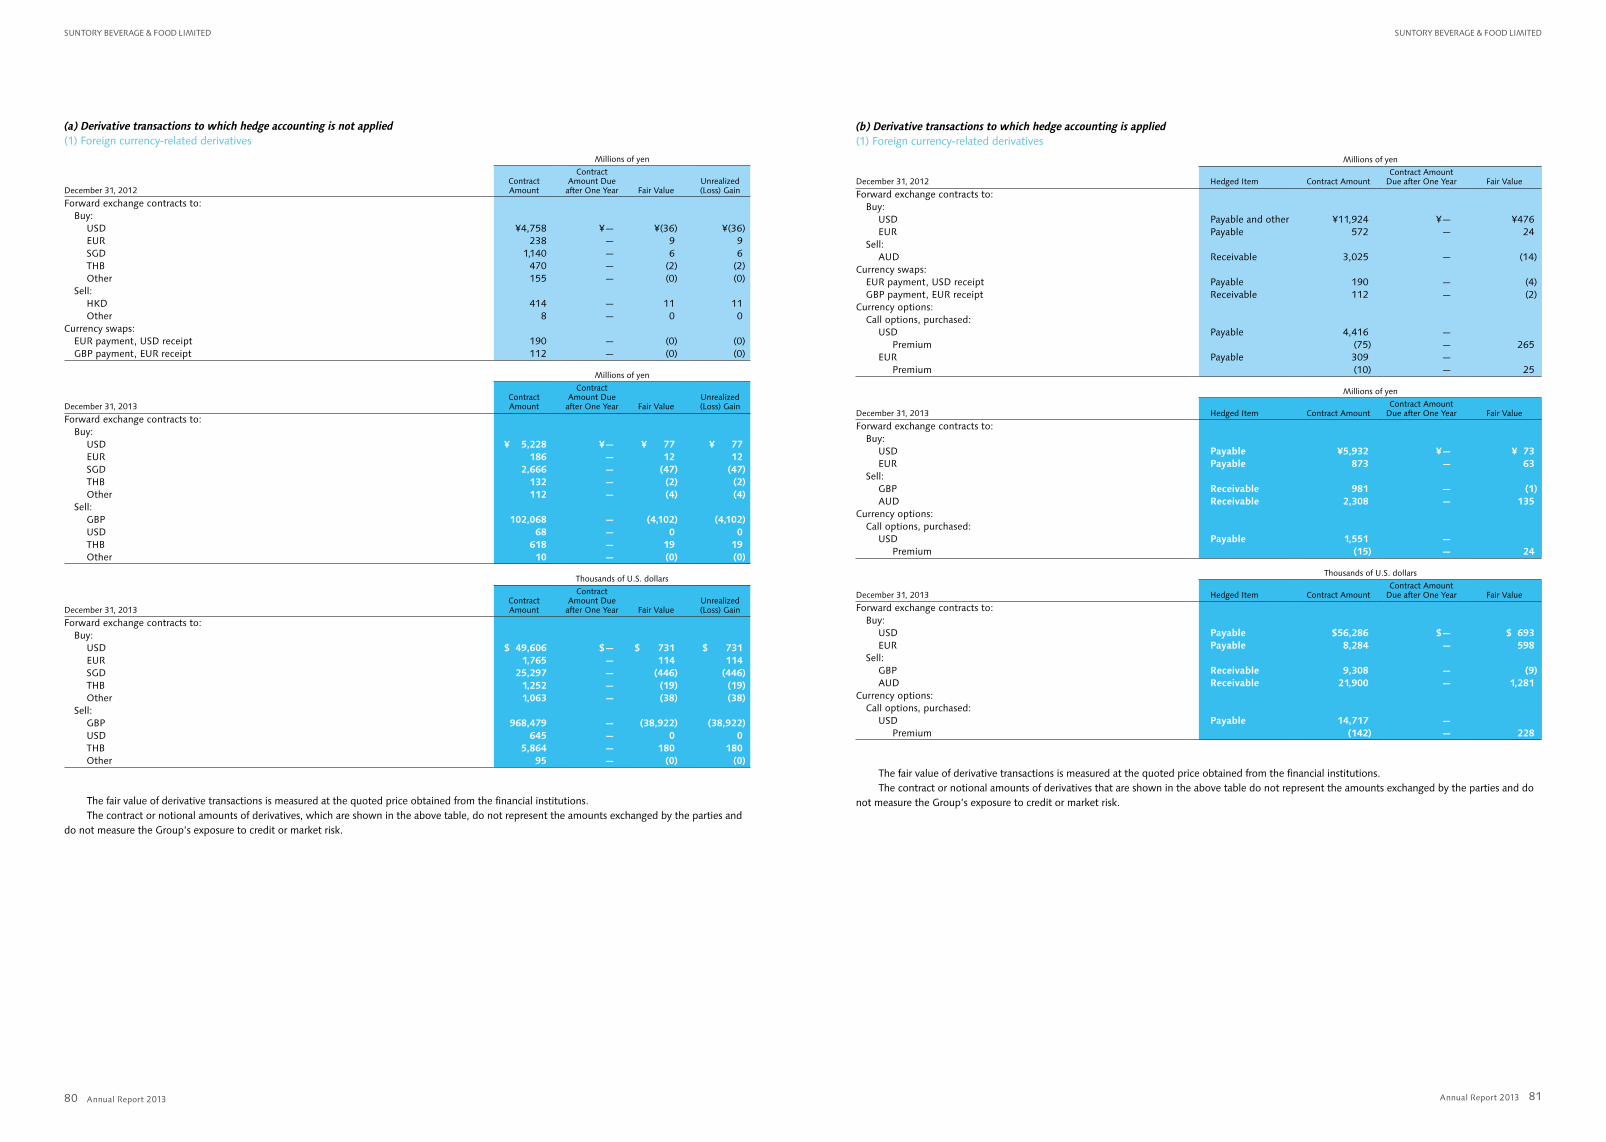
Annual Report 2013 Annual Report 2013
SuntoRy BeveRAge & Food Limited SuntoRy BeveRAge & Food Limited
8180
(a) Derivative transactions to which hedge accounting is not applied(1) Foreign currency-related derivatives
Millions of yen
December 31, 2012Contract Amount
Contract Amount Due
after One Year Fair ValueUnrealized (Loss) Gain
Forward exchange contracts to:Buy:
USD ¥4,758 ¥— ¥(36) ¥(36)EUR 238 — 9 9SGD 1,140 — 6 6THB 470 — (2) (2)Other 155 — (0) (0)
Sell:HKD 414 — 11 11Other 8 — 0 0
Currency swaps:EUR payment, USD receipt 190 — (0) (0)GBP payment, EUR receipt 112 — (0) (0)
Millions of yen
December 31, 2013Contract Amount
Contract Amount Due
after One Year Fair ValueUnrealized (Loss) Gain
Forward exchange contracts to:Buy:
USD ¥ 5,228 ¥— ¥ 77 ¥ 77EUR 186 — 12 12SGD 2,666 — (47) (47)THB 132 — (2) (2)Other 112 — (4) (4)
Sell:GBP 102,068 — (4,102) (4,102)USD 68 — 0 0THB 618 — 19 19Other 10 — (0) (0)
Thousands of U.S. dollars
December 31, 2013Contract Amount
Contract Amount Due
after One Year Fair ValueUnrealized (Loss) Gain
Forward exchange contracts to:Buy:
USD $ 49,606 $— $ 731 $ 731EUR 1,765 — 114 114SGD 25,297 — (446) (446)THB 1,252 — (19) (19)Other 1,063 — (38) (38)
Sell:GBP 968,479 — (38,922) (38,922)USD 645 — 0 0THB 5,864 — 180 180Other 95 — (0) (0)
The fair value of derivative transactions is measured at the quoted price obtained from the financial institutions.The contract or notional amounts of derivatives, which are shown in the above table, do not represent the amounts exchanged by the parties and
do not measure the Group’s exposure to credit or market risk.
(b) Derivative transactions to which hedge accounting is applied(1) Foreign currency-related derivatives
Millions of yen
December 31, 2012 Hedged Item Contract AmountContract Amount
Due after One Year Fair Value
Forward exchange contracts to:Buy:
USD Payable and other ¥11,924 ¥— ¥476EUR Payable 572 — 24
Sell:AUD Receivable 3,025 — (14)
Currency swaps:EUR payment, USD receipt Payable 190 — (4)GBP payment, EUR receipt Receivable 112 — (2)
Currency options:Call options, purchased:
USD Payable 4,416 —Premium (75) — 265
EUR Payable 309 —Premium (10) — 25
Millions of yen
December 31, 2013 Hedged Item Contract AmountContract Amount
Due after One Year Fair Value
Forward exchange contracts to:Buy:
USD Payable ¥5,932 ¥— ¥ 73EUR Payable 873 — 63
Sell:GBP Receivable 981 — (1)AUD Receivable 2,308 — 135
Currency options:Call options, purchased:
USD Payable 1,551 —Premium (15) — 24
Thousands of U.S. dollars
December 31, 2013 Hedged Item Contract AmountContract Amount
Due after One Year Fair Value
Forward exchange contracts to:Buy:
USD Payable $56,286 $— $ 693EUR Payable 8,284 — 598
Sell:GBP Receivable 9,308 — (9)AUD Receivable 21,900 — 1,281
Currency options:Call options, purchased:
USD Payable 14,717 —Premium (142) — 228
The fair value of derivative transactions is measured at the quoted price obtained from the financial institutions.The contract or notional amounts of derivatives that are shown in the above table do not represent the amounts exchanged by the parties and do
not measure the Group’s exposure to credit or market risk.
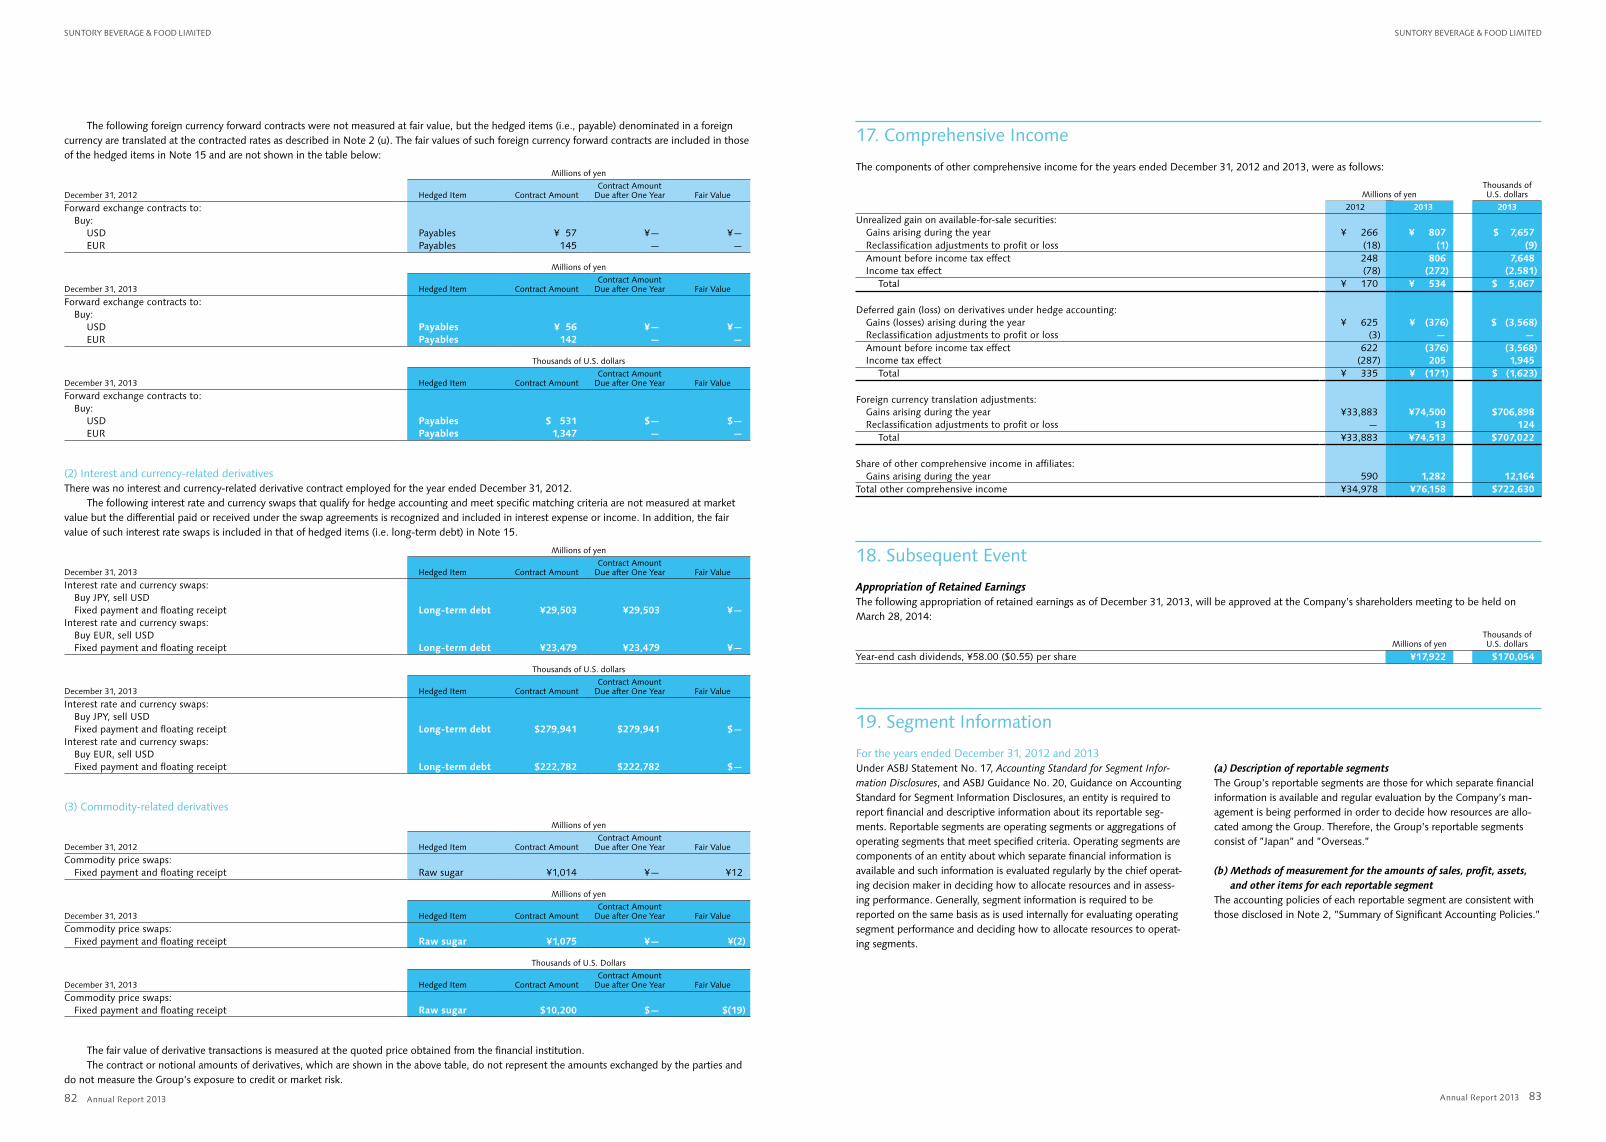
Annual Report 2013 Annual Report 2013
SuntoRy BeveRAge & Food Limited SuntoRy BeveRAge & Food Limited
8382
The following foreign currency forward contracts were not measured at fair value, but the hedged items (i.e., payable) denominated in a foreign currency are translated at the contracted rates as described in Note 2 (u). The fair values of such foreign currency forward contracts are included in those of the hedged items in Note 15 and are not shown in the table below:
Millions of yen
December 31, 2012 Hedged Item Contract AmountContract Amount
Due after One Year Fair Value
Forward exchange contracts to:Buy:
USD Payables ¥ 57 ¥— ¥—EUR Payables 145 — —
Millions of yen
December 31, 2013 Hedged Item Contract AmountContract Amount
Due after One Year Fair Value
Forward exchange contracts to:Buy:
USD Payables ¥ 56 ¥— ¥—EUR Payables 142 — —
Thousands of U.S. dollars
December 31, 2013 Hedged Item Contract AmountContract Amount
Due after One Year Fair Value
Forward exchange contracts to:Buy:
USD Payables $ 531 $— $—EUR Payables 1,347 — —
(2) Interest and currency-related derivativesThere was no interest and currency-related derivative contract employed for the year ended December 31, 2012.
The following interest rate and currency swaps that qualify for hedge accounting and meet specific matching criteria are not measured at market value but the differential paid or received under the swap agreements is recognized and included in interest expense or income. In addition, the fair value of such interest rate swaps is included in that of hedged items (i.e. long-term debt) in Note 15.
Millions of yen
December 31, 2013 Hedged Item Contract AmountContract Amount
Due after One Year Fair Value
Interest rate and currency swaps:Buy JPY, sell USDFixed payment and floating receipt Long-term debt ¥29,503 ¥29,503 ¥—
Interest rate and currency swaps:Buy EUR, sell USDFixed payment and floating receipt Long-term debt ¥23,479 ¥23,479 ¥—
Thousands of U.S. dollars
December 31, 2013 Hedged Item Contract AmountContract Amount
Due after One Year Fair Value
Interest rate and currency swaps:Buy JPY, sell USDFixed payment and floating receipt Long-term debt $279,941 $279,941 $—
Interest rate and currency swaps:Buy EUR, sell USDFixed payment and floating receipt Long-term debt $222,782 $222,782 $—
(3) Commodity-related derivatives
Millions of yen
December 31, 2012 Hedged Item Contract AmountContract Amount
Due after One Year Fair Value
Commodity price swaps:Fixed payment and floating receipt Raw sugar ¥1,014 ¥— ¥12
Millions of yen
December 31, 2013 Hedged Item Contract AmountContract Amount
Due after One Year Fair Value
Commodity price swaps:Fixed payment and floating receipt Raw sugar ¥1,075 ¥— ¥(2)
Thousands of U.S. Dollars
December 31, 2013 Hedged Item Contract AmountContract Amount
Due after One Year Fair Value
Commodity price swaps:Fixed payment and floating receipt Raw sugar $10,200 $— $(19)
The fair value of derivative transactions is measured at the quoted price obtained from the financial institution.The contract or notional amounts of derivatives, which are shown in the above table, do not represent the amounts exchanged by the parties and
do not measure the Group’s exposure to credit or market risk.
17. Comprehensive Income
The components of other comprehensive income for the years ended December 31, 2012 and 2013, were as follows:
Millions of yenThousands of U.S. dollars
2012 2013 2013
Unrealized gain on available-for-sale securities:Gains arising during the year ¥ 266 ¥ 807 $ 7,657Reclassification adjustments to profit or loss (18) (1) (9)Amount before income tax effect 248 806 7,648Income tax effect (78) (272) (2,581)
Total ¥ 170 ¥ 534 $ 5,067
Deferred gain (loss) on derivatives under hedge accounting:Gains (losses) arising during the year ¥ 625 ¥ (376) $ (3,568)Reclassification adjustments to profit or loss (3) — —Amount before income tax effect 622 (376) (3,568)Income tax effect (287) 205 1,945
Total ¥ 335 ¥ (171) $ (1,623)
Foreign currency translation adjustments:Gains arising during the year ¥33,883 ¥74,500 $706,898Reclassification adjustments to profit or loss — 13 124
Total ¥33,883 ¥74,513 $707,022
Share of other comprehensive income in affiliates:Gains arising during the year 590 1,282 12,164
Total other comprehensive income ¥34,978 ¥76,158 $722,630
18. Subsequent Event
Appropriation of Retained EarningsThe following appropriation of retained earnings as of December 31, 2013, will be approved at the Company’s shareholders meeting to be held on March 28, 2014:
Millions of yenThousands of U.S. dollars
Year-end cash dividends, ¥58.00 ($0.55) per share ¥17,922 $170,054
19. Segment Information
For the years ended December 31, 2012 and 2013Under ASBJ Statement No. 17, Accounting Standard for Segment Infor-mation Disclosures, and ASBJ Guidance No. 20, Guidance on Accounting Standard for Segment Information Disclosures, an entity is required to report financial and descriptive information about its reportable seg-ments. Reportable segments are operating segments or aggregations of operating segments that meet specified criteria. Operating segments are components of an entity about which separate financial information is available and such information is evaluated regularly by the chief operat-ing decision maker in deciding how to allocate resources and in assess-ing performance. Generally, segment information is required to be reported on the same basis as is used internally for evaluating operating segment performance and deciding how to allocate resources to operat-ing segments.
(a) Description of reportable segmentsThe Group’s reportable segments are those for which separate financial information is available and regular evaluation by the Company’s man-agement is being performed in order to decide how resources are allo-cated among the Group. Therefore, the Group’s reportable segments consist of ”Japan” and ”Overseas.”
(b) Methods of measurement for the amounts of sales, profit, assets, and other items for each reportable segment
The accounting policies of each reportable segment are consistent with those disclosed in Note 2, ”Summary of Significant Accounting Policies.”
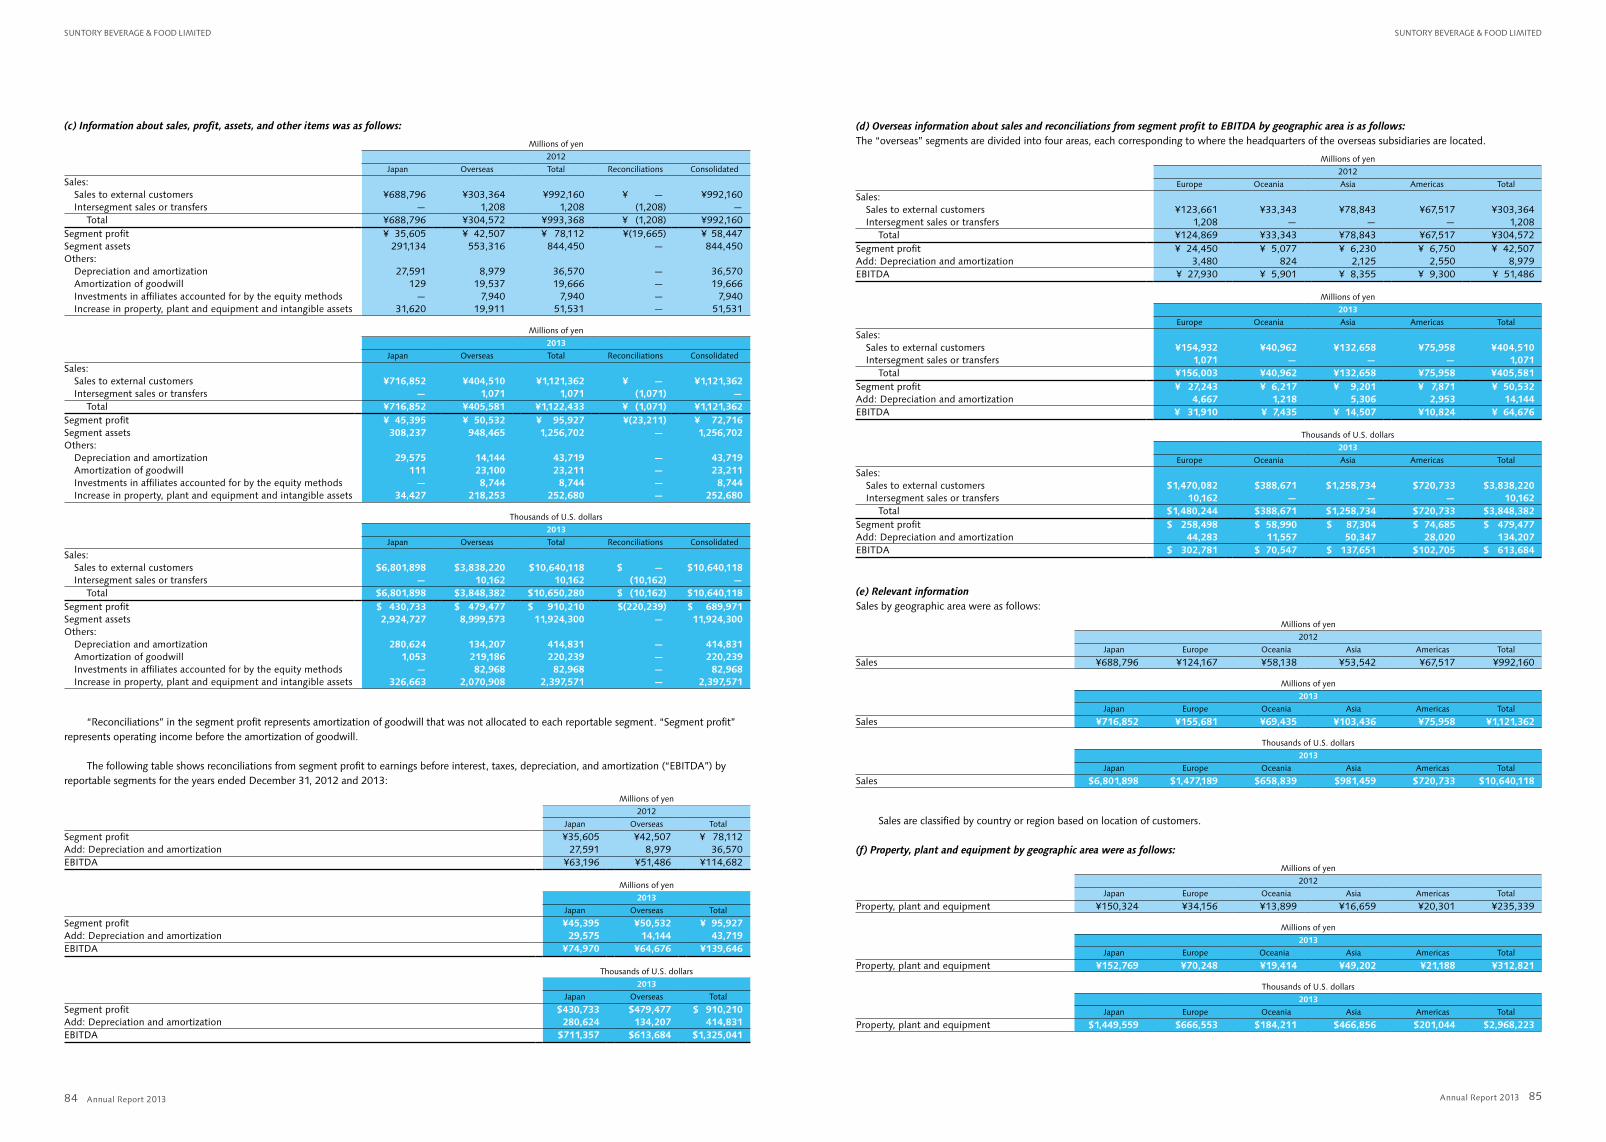
Annual Report 2013 Annual Report 2013
SuntoRy BeveRAge & Food Limited SuntoRy BeveRAge & Food Limited
8584
(c) Information about sales, profit, assets, and other items was as follows:
Millions of yen
2012
Japan Overseas Total Reconciliations Consolidated
Sales:Sales to external customers ¥688,796 ¥303,364 ¥992,160 ¥ — ¥992,160Intersegment sales or transfers — 1,208 1,208 (1,208) —
Total ¥688,796 ¥304,572 ¥993,368 ¥ (1,208) ¥992,160Segment profit ¥ 35,605 ¥ 42,507 ¥ 78,112 ¥(19,665) ¥ 58,447Segment assets 291,134 553,316 844,450 — 844,450Others:
Depreciation and amortization 27,591 8,979 36,570 — 36,570Amortization of goodwill 129 19,537 19,666 — 19,666Investments in affiliates accounted for by the equity methods — 7,940 7,940 — 7,940Increase in property, plant and equipment and intangible assets 31,620 19,911 51,531 — 51,531
Millions of yen
2013
Japan Overseas Total Reconciliations Consolidated
Sales:Sales to external customers ¥716,852 ¥404,510 ¥1,121,362 ¥ — ¥1,121,362Intersegment sales or transfers — 1,071 1,071 (1,071) —
Total ¥716,852 ¥405,581 ¥1,122,433 ¥ (1,071) ¥1,121,362Segment profit ¥ 45,395 ¥ 50,532 ¥ 95,927 ¥(23,211) ¥ 72,716Segment assets 308,237 948,465 1,256,702 — 1,256,702Others:
Depreciation and amortization 29,575 14,144 43,719 — 43,719Amortization of goodwill 111 23,100 23,211 — 23,211Investments in affiliates accounted for by the equity methods — 8,744 8,744 — 8,744Increase in property, plant and equipment and intangible assets 34,427 218,253 252,680 — 252,680
Thousands of U.S. dollars
2013
Japan Overseas Total Reconciliations Consolidated
Sales:Sales to external customers $6,801,898 $3,838,220 $10,640,118 $ — $10,640,118Intersegment sales or transfers — 10,162 10,162 (10,162) —
Total $6,801,898 $3,848,382 $10,650,280 $ (10,162) $10,640,118Segment profit $ 430,733 $ 479,477 $ 910,210 $(220,239) $ 689,971Segment assets 2,924,727 8,999,573 11,924,300 — 11,924,300Others:
Depreciation and amortization 280,624 134,207 414,831 — 414,831Amortization of goodwill 1,053 219,186 220,239 — 220,239Investments in affiliates accounted for by the equity methods — 82,968 82,968 — 82,968Increase in property, plant and equipment and intangible assets 326,663 2,070,908 2,397,571 — 2,397,571
“Reconciliations” in the segment profit represents amortization of goodwill that was not allocated to each reportable segment. “Segment profit” represents operating income before the amortization of goodwill.
The following table shows reconciliations from segment profit to earnings before interest, taxes, depreciation, and amortization (“EBITDA”) by reportable segments for the years ended December 31, 2012 and 2013:
Millions of yen
2012
Japan Overseas Total
Segment profit ¥35,605 ¥42,507 ¥ 78,112Add: Depreciation and amortization 27,591 8,979 36,570EBITDA ¥63,196 ¥51,486 ¥114,682
Millions of yen
2013
Japan Overseas Total
Segment profit ¥45,395 ¥50,532 ¥ 95,927Add: Depreciation and amortization 29,575 14,144 43,719EBITDA ¥74,970 ¥64,676 ¥139,646
Thousands of U.S. dollars
2013
Japan Overseas Total
Segment profit $430,733 $479,477 $ 910,210Add: Depreciation and amortization 280,624 134,207 414,831EBITDA $711,357 $613,684 $1,325,041
(d) Overseas information about sales and reconciliations from segment profit to EBITDA by geographic area is as follows:The “overseas” segments are divided into four areas, each corresponding to where the headquarters of the overseas subsidiaries are located.
Millions of yen
2012
Europe Oceania Asia Americas Total
Sales:Sales to external customers ¥123,661 ¥33,343 ¥78,843 ¥67,517 ¥303,364Intersegment sales or transfers 1,208 — — — 1,208
Total ¥124,869 ¥33,343 ¥78,843 ¥67,517 ¥304,572Segment profit ¥ 24,450 ¥ 5,077 ¥ 6,230 ¥ 6,750 ¥ 42,507Add: Depreciation and amortization 3,480 824 2,125 2,550 8,979EBITDA ¥ 27,930 ¥ 5,901 ¥ 8,355 ¥ 9,300 ¥ 51,486
Millions of yen
2013
Europe Oceania Asia Americas Total
Sales:Sales to external customers ¥154,932 ¥40,962 ¥132,658 ¥75,958 ¥404,510Intersegment sales or transfers 1,071 — — — 1,071
Total ¥156,003 ¥40,962 ¥132,658 ¥75,958 ¥405,581Segment profit ¥ 27,243 ¥ 6,217 ¥ 9,201 ¥ 7,871 ¥ 50,532Add: Depreciation and amortization 4,667 1,218 5,306 2,953 14,144EBITDA ¥ 31,910 ¥ 7,435 ¥ 14,507 ¥10,824 ¥ 64,676
Thousands of U.S. dollars
2013
Europe Oceania Asia Americas Total
Sales:Sales to external customers $1,470,082 $388,671 $1,258,734 $720,733 $3,838,220Intersegment sales or transfers 10,162 — — — 10,162
Total $1,480,244 $388,671 $1,258,734 $720,733 $3,848,382Segment profit $ 258,498 $ 58,990 $ 87,304 $ 74,685 $ 479,477Add: Depreciation and amortization 44,283 11,557 50,347 28,020 134,207EBITDA $ 302,781 $ 70,547 $ 137,651 $102,705 $ 613,684
(e) Relevant informationSales by geographic area were as follows:
Millions of yen
2012
Japan Europe Oceania Asia Americas Total
Sales ¥688,796 ¥124,167 ¥58,138 ¥53,542 ¥67,517 ¥992,160
Millions of yen
2013
Japan Europe Oceania Asia Americas Total
Sales ¥716,852 ¥155,681 ¥69,435 ¥103,436 ¥75,958 ¥1,121,362
Thousands of U.S. dollars
2013
Japan Europe Oceania Asia Americas Total
Sales $6,801,898 $1,477,189 $658,839 $981,459 $720,733 $10,640,118
Sales are classified by country or region based on location of customers.
(f) Property, plant and equipment by geographic area were as follows:
Millions of yen
2012
Japan Europe Oceania Asia Americas Total
Property, plant and equipment ¥150,324 ¥34,156 ¥13,899 ¥16,659 ¥20,301 ¥235,339
Millions of yen
2013
Japan Europe Oceania Asia Americas Total
Property, plant and equipment ¥152,769 ¥70,248 ¥19,414 ¥49,202 ¥21,188 ¥312,821
Thousands of U.S. dollars
2013
Japan Europe Oceania Asia Americas Total
Property, plant and equipment $1,449,559 $666,553 $184,211 $466,856 $201,044 $2,968,223
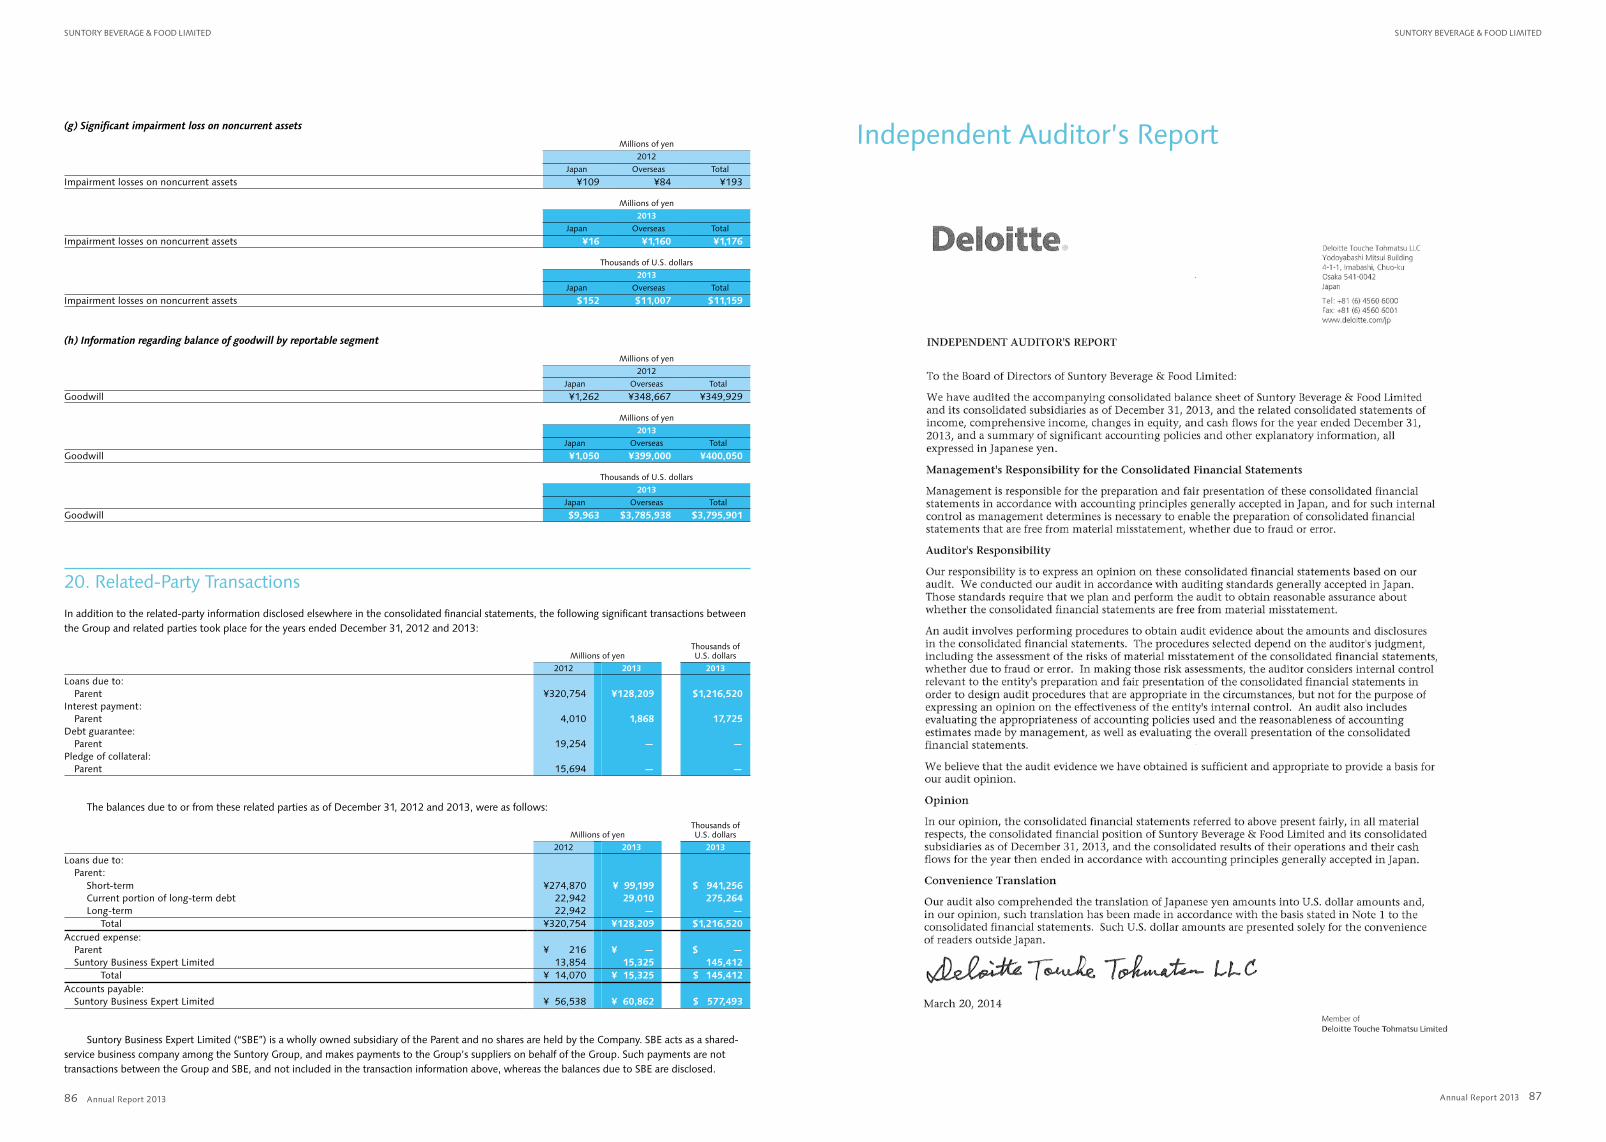
Annual Report 2013 Annual Report 2013
SuntoRy BeveRAge & Food Limited SuntoRy BeveRAge & Food Limited
8786
Independent Auditor’s Report(g) Significant impairment loss on noncurrent assets
Millions of yen
2012
Japan Overseas Total
Impairment losses on noncurrent assets ¥109 ¥84 ¥193
Millions of yen
2013
Japan Overseas Total
Impairment losses on noncurrent assets ¥16 ¥1,160 ¥1,176
Thousands of U.S. dollars
2013
Japan Overseas Total
Impairment losses on noncurrent assets $152 $11,007 $11,159
(h) Information regarding balance of goodwill by reportable segment
Millions of yen
2012
Japan Overseas Total
Goodwill ¥1,262 ¥348,667 ¥349,929
Millions of yen
2013
Japan Overseas Total
Goodwill ¥1,050 ¥399,000 ¥400,050
Thousands of U.S. dollars
2013
Japan Overseas Total
Goodwill $9,963 $3,785,938 $3,795,901
20. Related-Party Transactions
In addition to the related-party information disclosed elsewhere in the consolidated financial statements, the following significant transactions between the Group and related parties took place for the years ended December 31, 2012 and 2013:
Millions of yenThousands of U.S. dollars
2012 2013 2013
Loans due to:Parent ¥320,754 ¥128,209 $1,216,520
Interest payment:Parent 4,010 1,868 17,725
Debt guarantee:Parent 19,254 — —
Pledge of collateral:Parent 15,694 — —
The balances due to or from these related parties as of December 31, 2012 and 2013, were as follows:
Millions of yenThousands of U.S. dollars
2012 2013 2013
Loans due to:Parent:
Short-term ¥274,870 ¥ 99,199 $ 941,256Current portion of long-term debt 22,942 29,010 275,264Long-term 22,942 — —
Total ¥320,754 ¥128,209 $1,216,520Accrued expense:
Parent ¥ 216 ¥ — $ —Suntory Business Expert Limited 13,854 15,325 145,412
Total ¥ 14,070 ¥ 15,325 $ 145,412Accounts payable:
Suntory Business Expert Limited ¥ 56,538 ¥ 60,862 $ 577,493
Suntory Business Expert Limited (“SBE”) is a wholly owned subsidiary of the Parent and no shares are held by the Company. SBE acts as a shared-service business company among the Suntory Group, and makes payments to the Group’s suppliers on behalf of the Group. Such payments are not transactions between the Group and SBE, and not included in the transaction information above, whereas the balances due to SBE are disclosed.
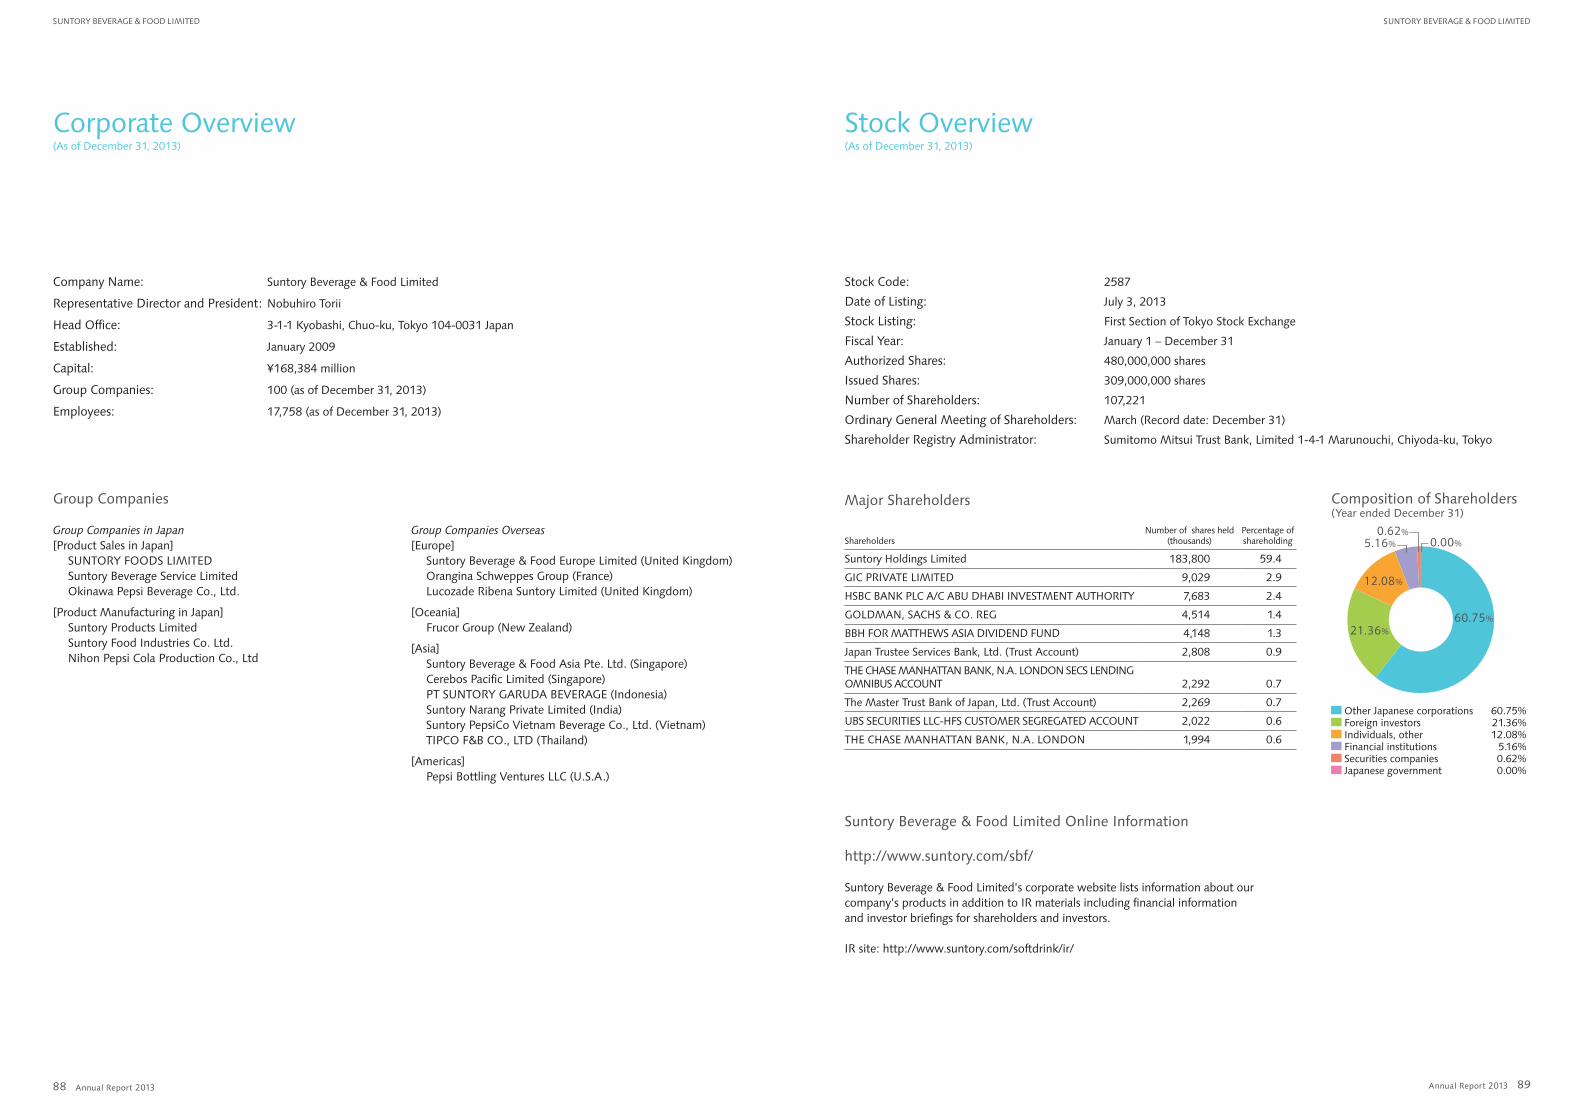
Annual Report 2013 Annual Report 2013
SuntoRy BeveRAge & Food Limited SuntoRy BeveRAge & Food Limited
8988
Corporate Overview(As of December 31, 2013)
Stock Overview(As of December 31, 2013)
Company Name: Suntory Beverage & Food Limited
Representative Director and President: Nobuhiro Torii
Head Office: 3-1-1 Kyobashi, Chuo-ku, Tokyo 104-0031 Japan
Established: January 2009
Capital: ¥168,384 million
Group Companies: 100 (as of December 31, 2013)
Employees: 17,758 (as of December 31, 2013)
Group Companies
Group Companies in Japan[Product Sales in Japan]
SuNTORy FOODS LimiTEDSuntory Beverage Service LimitedOkinawa Pepsi Beverage Co., Ltd.
[Product manufacturing in Japan]Suntory Products LimitedSuntory Food industries Co. Ltd.Nihon Pepsi Cola Production Co., Ltd
Group Companies Overseas[Europe]
Suntory Beverage & Food Europe Limited (united Kingdom)Orangina Schweppes Group (France)Lucozade Ribena Suntory Limited (united Kingdom)
[Oceania]Frucor Group (New Zealand)
[Asia]Suntory Beverage & Food Asia Pte. Ltd. (Singapore)Cerebos Pacific Limited (Singapore)PT SuNTORy GARuDA BEVERAGE (indonesia)Suntory Narang Private Limited (india)Suntory PepsiCo Vietnam Beverage Co., Ltd. (Vietnam)TiPCO F&B CO., LTD (Thailand)
[Americas]Pepsi Bottling Ventures LLC (u.S.A.)
Stock Code: 2587
Date of Listing: July 3, 2013
Stock Listing: First Section of Tokyo Stock Exchange
Fiscal year: January 1 – December 31
Authorized Shares: 480,000,000 shares
issued Shares: 309,000,000 shares
Number of Shareholders: 107,221
Ordinary General meeting of Shareholders: march (Record date: December 31)
Shareholder Registry Administrator: Sumitomo mitsui Trust Bank, Limited 1-4-1 marunouchi, Chiyoda-ku, Tokyo
major Shareholders
ShareholdersNumber of shares held
(thousands)Percentage of shareholding
Suntory Holdings Limited 183,800 59.4
GiC PRiVATE LimiTED 9,029 2.9
HSBC BANK PLC A/C ABu DHABi iNVESTmENT AuTHORiTy 7,683 2.4
GOLDmAN, SACHS & CO. REG 4,514 1.4
BBH FOR mATTHEWS ASiA DiViDEND FuND 4,148 1.3
Japan Trustee Services Bank, Ltd. (Trust Account) 2,808 0.9
THE CHASE mANHATTAN BANK, N.A. LONDON SECS LENDiNG OmNiBuS ACCOuNT 2,292 0.7
The master Trust Bank of Japan, Ltd. (Trust Account) 2,269 0.7
uBS SECuRiTiES LLC-HFS CuSTOmER SEGREGATED ACCOuNT 2,022 0.6
THE CHASE mANHATTAN BANK, N.A. LONDON 1,994 0.6
Suntory Beverage & Food Limited Online information
http://www.suntory.com/sbf/
Suntory Beverage & Food Limited’s corporate website lists information about our company’s products in addition to iR materials including financial information and investor briefings for shareholders and investors.
iR site: http://www.suntory.com/softdrink/ir/
Composition of Shareholders(year ended December 31)
Other Japanese corporations 60.75% Foreign investors 21.36% individuals, other 12.08% Financial institutions 5.16% Securities companies 0.62% Japanese government 0.00%
60.75%
12.08%
0.62%
21.36%
5.16% 0.00%