annual report 2013 - cimc
TRANSCRIPT

A Share Stock Code: 000039H Share Stock Code: 2039
(a joint stock company incorporated in the People's Republic of China with limited liability)
Annual R
eport 2013
China International Marine Containers (Group) Co., Ltd.
Annual Report 2013
China International M
arine Containers (G
roup) Co., Ltd.

Growing Together with you and
Brighter FutureLet’s Join Hands for a
China International Marine Containers (Group) Co., Ltd.Annual Report 2013
This annual report contains certain forward-looking statements with respect to the financial position, operational results and business of the Group. These forward-looking statements are, by their names, subject to significant risk and uncertainties because they relate to events and depend on circumstances that may occur in the future and are beyond the Group’s control. The forward-looking statements reflect the Group’s current views with respect of future events and are not a guarantee of future performance. Actual results may differ from information contained in the forward-looking statements.

Contents
3 Definitions
6 Chapter 1 Corporate Profile
10 Chapter 2 Summary of Accounting Data and Financial Indicators
14 Chapter 3 Chairman’s Statement
20 Chapter 4 Directors’ Report
64 Chapter 5 Management Discussion and Analysis
76 Chapter 6 Report of the Supervisory Committee
78 Chapter 7 Significant Events
94 Chapter 8 Changes in Share Capital and Information on Shareholders
104 Chapter 9 Directors, Supervisors, Senior Management and Employees
120 Chapter 10 Corporate Governance and Corporate Governance Report
140 Chapter 11 Internal Control
149 Chapter 12 Auditor’s Report
151 Chapter 13 Financial Statements Prepared in Accordance with China Accounting Standards
379 Chapter 14 Confirmation from the Directors and Senior Management
380 Chapter 15 Documents Available for Inspection

China International Marine Containers (Group) Co., Ltd.2
Important Notice
The Board of Directors (the “Board”), the Supervisory Committee and the Directors, Supervisors and senior management of the Company warrant that this annual report (the “Report”) is true, accurate and complete and does not contain any false records, misleading statements or material omission and jointly and severally take full legal responsibility.
The 2013 annual report has been reviewed and approved at the sixth meeting of the 7th session of the Board in 2014. All Directors have attended the Board meeting to review and approve this Report.
The proposed profit distribution plan of the Company as considered and approved by the Board is based on the total share capital of the Company as at 31 December 2013, a cash dividend of RMB2.70 (tax inclusive) per 10 shares will be distributed to all shareholders, no bonus shares will be issued, and no share will be converted from reserves into share capital (the “Annual Dividend-Distribution Plan”). The Annual Dividend-Distribution Plan shall be submitted to the Company’s annual general meeting for consideration and approval.
This annual report contains certain forward-looking statements with respect to the financial position, operational results and business of the Group. These forward-looking statements are, by their nature, subject to significant risk and uncertainties because they relate to events and depend on circumstances that may occur in the future and are beyond our control. The forward-looking statements reflect the Group’s current views with respect of future events and are not a guarantee of future performance. Actual results may differ from information contained in the forward-looking statements.
Mr. Li Jianhong, person-in-charge of the Company and Chairman of the Board, Mr. Mai Boliang, president of the Company, and Mr. Jin Jianlong, general manager of the financial department of the Company, person-in-charge of accounting affairs and head of accounting department (the financial controller), hereby warrant the truthfulness, accuracy and completeness of the financial statements contained in this annual report.
No appropriation of funds for non-operating purposes by the Company’s substantial shareholders has occurred.
The financial statements of the Company and its subsidiaries (the “Group”) have been prepared in accordance with the Accounting Standards for Business Enterprises (“CAS”). The financial statements of the Group for 2013 prepared in accordance with CAS have been audited by PricewaterhouseCoopers Zhong Tian LLP, who has issued an audit report with unqualified opinions on the financial statements.
This report contains forward-looking statements in relation to subjects such as future plans, which do not constitute any specific undertakings to investors by the Company. Investors should beware of investment risks.
This annual report has been published in both Chinese and English. In the event of any inconsistency between the two versions, the Chinese version shall prevail.

Annual Report 2013 3
Definitions
For the purpose of this Report, unless the context otherwise requires, the following terms shall have the meanings set out below:
Items Definitions
A share(s) (RMB-denominated ordinary share(s))
ordinary share(s) issued by the Company in the PRC with a nominal value of RMB1.00 each, which are listed on the Shenzhen Stock Exchange and traded in Renminbi;
Board or Board of Directors the board of directors of the Company;The Company China International Marine Containers (Group) Co., Ltd. (中國國際海運集裝箱
(集團)股份有限公司), a joint stock company incorporated under the laws of the PRC with limited liability, the H shares of which are listed on the main board of the Hong Kong Stock Exchange and the A shares of which are listed on the Shenzhen Stock Exchange;
CAS Accounting Standards for Business Enterprises – Basic Standard and 38 Specific Accounting Standards issued by the Ministry of Finance of the People’s Republic of China on 15 February 2006, and application guidance and interpretations to Accounting Standards for Business Enterprises and other related regulations subsequently issued;
CIMC Enric CIMC Enric Holdings Limited (中 集 安 瑞 科 控 股 有 限 公 司), a company incorporated in the Cayman Islands with limited liability on 28 September 2004 and listed on the Main Board of the Hong Kong Stock Exchange (Hong Kong stock code: 3899) on 20 July 2006 and a subsidiary of the Company;
CIMC Hong Kong China International Marine Containers (Hong Kong) Limited (中國國際海運集裝箱(香港)有限公司), a company incorporated in Hong Kong on 30 July 1992 with limited liability and a wholly-owned subsidiary of the Company;
CIMC Raffles CIMC Raffles Offshore (Singapore) Limited, a company incorporated in Singapore on 7 March 1994 with limited liability and a wholly-owned subsidiary of the Company;

4 China International Marine Containers (Group) Co., Ltd.
Definitions
Items Definitions
CIMC Tianda Shenzhen CIMC-Tianda Airport Support Co., Ltd. (深圳中集天達空港設備有限公司), a company incorporated in the PRC on 18 July 1992 and a subsidiary of the Company;
CIMC Vehicle CIMC Vehicle (Group) Co., Ltd. (中集車輛(集團)有限公司), a company incorporated in the PRC on 29 August 1996 and a subsidiary of the Company;
Corporate Governance Code the Corporate Governance Code contained in Appendix 14 of the Hong Kong Listing Rules;
CSRC China Securities Regulatory Commission (中國證券監督管理委員會);Director(s) the director(s) of the Company;The Group, we, our and us the Company and its subsidiaries;GSE Ground Support Equipment refers to airport equipment used to ensure flight
safety. To meet the requirements for aircraft maintenance and flights, airports are equipped with a variety of modern ground support equipment, including but not limited to mechanical, electric, hydraulic and special gas equipment;
H share(s) (overseas-listed foreign share(s))
overseas-listed foreign share(s) issued by the Company with a nominal value of RMB1.00 each, which are listed on the Hong Kong Stock Exchange and traded in Hong Kong dollars;
Hong Kong The Hong Kong Special Administrative Region of the PRC;Hong Kong Listing Rules Rules Governing the Listing of Securities on The Stock Exchange of Hong Kong
Limited;Hong Kong Stock Exchange The Stock Exchange of Hong Kong Limited;Model Code the Model Code for Securities Transactions by Directors of Listed Issuers contained
in Appendix 10 of the Hong Kong Listing Rules;ONE Model Optimization Never Ending, the lean management system of CIMC;PRC or China the People’s Republic of China;QHSE A management system that guides and controls an organization in respect of
Quality, Health, Safety and Environment;The Reporting Period The twelve months started from 1 January 2013 and ended on 31 December 2013.RMB Renminbi, the lawful currency of the PRC;

Annual Report 2013 5
Definitions
Items Definitions
Semi-submersible Drilling Platform
A semi-submersible drilling platform is a mobile oil rig, the upper part of the hull structure is the working deck and the lower part comprises two lower hulls, with the parts connected by support columns. When in operation, the lower hulls are submerged into the water. A semi-submersible platform is generally used in deep seas with water depths ranging from 600-3600m. The platform typically uses a dynamic positioning system for positioning;
Jack-up Drilling Platform A jack-up drilling platform is a mobile oil rig commonly used for shallow water operation. Most jack-up rigs operate in water depths ranging from 250 to 400 feet. This oil drilling equipment is generally used for mounting machinery, power supply, equipment and accommodation facilities for drilling and certain liftable spud legs on a platform floating on the water;
SFO the Securities and Futures Ordinance, Chapter 571 of the Laws of Hong Kong;Shareholder(s) the shareholder(s) of the Company;Shenzhen Listing Rules Rules Governing the Listing of Securities on the Shenzhen Stock Exchange;Shenzhen Stock Exchange the Shenzhen Stock Exchange;Supervisor(s) the member(s) of the Supervisory Committee of the Company;Supervisory Committee the Supervisory Committee of the Company;TEU Twenty-foot equivalent unit, also known as a standard unit (a container with a
length of 20 feet), being used to measure the volume of a container; andUS$, or U.S. dollars United States dollars, the lawful currency of the United States of America.

6 China International Marine Containers (Group) Co., Ltd.
Chapter 1Corporate Profile
The A shares of the Company were listed on the Shenzhen Stock Exchange on 8 April 1994 and its H shares were listed by introduction on the main board of the Hong Kong Stock Exchange on 19 December 2012. The Company is the first enterprise in China with its B shares converted into H shares listed on the main board of the Hong Kong Stock Exchange.

Annual Report 2013 7
Chapter 1Corporate Profile
BASIC CoRPoRAtE PRoFIlE
The Company was incorporated in Shenzhen, Guangdong Province, the PRC under the PRC Company Law as a joint venture on 14 January 1980 and was named as “China International Marine Containers Co., Ltd.” (中國國際海運集裝箱股份有限公司). After being restructured as a joint stock limited company in December 1992, and publicly offered A shares and B shares which were listed on the Shenzhen Stock Exchange in 1994, the Company changed its name to “China International Marine Containers (Group) Co., Ltd.” (中國國際海運集裝箱(集團)股份有限公司) in 1995.
We are a world leading equipment and solution provider in the logistics and energy industries and are principally engaged in the manufacture of containers, energy, chemical and liquid food equipment, offshore engineering equipment and airport facilities as well as the provision of relevant services, including the design and manufacture of international standard dry containers, reefer containers, regional special containers, tank containers, wooden container floorboards, road tank trucks, gas equipment and static tanks, road transportation vehicles, jack-up drilling platforms, semisubmersible drilling platforms, special vessels and passenger boarding bridges, air cargo handling systems, ground vehicles with specific purpose and automatic parking system and the provision of relevant services. In addition, the Group is also engaged in logistics equipment manufacturing and service, real estate development, finance and other businesses. Through business expansion and technology upgrading, we have formed an industry cluster focusing on key equipment and solutions provided for the logistics and energy industries.
1. Company Information
Legal Chinese Name of the Company: 中國國際海運集裝箱(集團)股份有限公司Abbreviated Chinese Name of the Company: 中集集團English Name of the Company: China International Marine Containers (Group) Co., Ltd.Abbreviated English Name of the Company: CIMCLegal Representative: Li JianhongAuthorised representatives: Mai Boliang, Yu YuqunRegistered Address and Address of Head Office: 8th Floor, CIMC R&D Centre,
2 Gangwan Avenue,Shekou, Nanshan District,Shenzhen, Guangdong, PRC
Postal Code: 518067Company Website: http://www.cimc.comEmail Address: [email protected] Place of Business in Hong Kong: 3101-2 Infinitus Plaza,
199 Des Voeux Road Central,Hong Kong

8 China International Marine Containers (Group) Co., Ltd.
Chapter 1Corporate Profile
2. Contact Persons and Means of Communication
Secretary to the Board, Company Secretary: Yu YuqunContact Address: CIMC R&D Centre,
2 Gangwan Avenue,Shekou, Nanshan District,Shenzhen, Guangdong 518067, PRC
Contact Telephone: (86)755-2669 1130Facsimile: (86)755-2682 6579Email Address: [email protected]
Representative of Securities Affairs: Wang XinjiuContact Address: CIMC R&D Centre,
2 Gangwan Avenue,Shekou, Nanshan District,Shenzhen, Guangdong 518067, PRC
Contact Telephone: (86)755-2680 2706Facsimile: (86)755-2681 3950Email Address: [email protected]
Assistant Company Secretary: Cheong Sui FaiContact Address: 3101-2 Infinitus Plaza,
199 Des Voeux Road Central,Hong Kong
Contact Telephone: (852)2528 9386Facsimile: (852)2865 9877Email Address: [email protected]
3. Changes in Registration
Enterprise Legal Business License Registration Number:
440301501119369
Taxation Registration Number: 440300618869509Organisation Code: 61886950-9First Registration Date of the Company: 14 January 1980First Registration Place of the Company: Shenzhen Administration of Industry and CommerceRegistration at the End of the Reporting Period: Same as the aboveChange of the Controlling Shareholder: No controlling shareholder
4. Information Disclosure and locations for Documents for Inspection
Designated Newspapers for Information Disclosure: A Shares: “China Securities Journal”, “Securities Times”, and “Shanghai Securities News”
Authorized websites on which this Report is made available:
A Shares: http://www.cninfo.com.cn
H Shares: http://www.hkexnews.hkLegal Website: www.cimc.comPlaces at which this Report is Available: Office of the Secretary to the Board,
Financial Management Department,CIMC R&D Centre, 2 Gangwan Avenue,Shekou, Nanshan District, Shenzhen,Guangdong 518067, PRC

Annual Report 2013 9
Chapter 1Corporate Profile
5. Stock of the Company
Stock Exchange on which A Shares are Listed: Shenzhen Stock ExchangeAbbreviated Stock Name for A Shares: CIMCStock Code: 000039Stock Exchange on which H Shares are Listed: Hong Kong Stock ExchangeAbbreviated Stock Name for H Shares: CIMC, ZJHD (Note)Stock Code: 02039, 299901 (Note)
Note: Both the abbreviated stock name and the stock code were only used by the original B Shares Shareholders of the Company in the PRC in respect of their trading of H Shares of the Company after H Shares of the Company were listed on the Hong Kong Stock Exchange.
6. other Relevant Information
Hong Kong Share Registrar: Computershare Hong Kong Investor Services LimitedAddress: Rooms 1712-1716, 17th Floor, Hopewell Centre,
183 Queen’s Road East, Wan Chai, Hong Kong
Compliance Adviser Appointed by the Company: Guotai Junan Capital LimitedAddress: 27/F, Low Block, Grand Millennium Plaza,
181 Queen’s Road Central, Hong KongPerson-in-charge of the Compliance Adviser: Anthony WongPeriod under the Supervision of Compliance Adviser:
From 19 December 2012 to the date on which the annual report for the financial year ended on 31 December 2013 was disclosed
Hong Kong Lawyers Appointed by the Company: Paul HastingsAddress: 21-22/F, Bank of China Tower, 1 Garden Road,
Central, Hong Kong
PRC Lawyers Appointed by the Company: Commerce & Finance Law OfficesAddress: 6/F, NCI Tower, A12 Jianguomenwai Avenue,
Chaoyang District, Beijing, China
Auditors Appointed by the Company: PricewaterhouseCoopers Zhong Tian LLPAddress: 11th Floor, PricewaterhouseCoopers Centre,
2 Corporate Avenue, 202 Hu Bin Road,Huangpu District, Shanghai 200021, PRC
Name of the Certified Public Accountants as the signatories:
Zhou Weiran, Cao Cuili

10
Chapter 2Summary of Accounting Data and Financial Indicators
China International Marine Containers (Group) Co., Ltd.
I. KEY ACCoUNtING DAtA AND FINANCIAl INDICAtoRS oF tHE GRoUP FoR tHE lASt tHREE YEARS
Retrospective adjustment to or restatement of the accounting data for prior years by the Company due to change of accounting policies and correction of accounting errors
□ Yes No
2013 2012
Increase/decrease
(%) 2011
Revenue (RMB’000) 57,874,411 54,334,057 6.52% 64,125,053Net profit attributable to equity holders of the Company (RMB’000) 2,180,321 1,939,081 12.44% 3,690,926Net profit attributable to equity holders of the Company after deducting non-recurring profit/loss (RMB’000) 1,343,090 1,706,490 (21.30%) 3,579,162Net cash flows from operating activities (RMB’000) 2,749,926 2,242,919 22.60% 2,254,437Basic earnings per share (RMB/share) 0.82 0.73 12.33% 1.39Diluted earnings per share (RMB/share) 0.81 0.73 10.96% 1.37Weighted average return on net assets of profits attributable to the ordinary shareholders of the Company (%) 11.00% 10.00% 10.00% 21.00%
31 December 2013
31 December 2012
Increase/decrease
(%)31 December
2011
Total assets (RMB’000) 72,605,972 62,992,380 15.26% 64,361,714Net assets attributable to equity holders of the Company (RMB’000) 20,674,037 19,513,176 5.95% 18,633,154

Annual Report 2013 11
Chapter 2Summary of Accounting Data and Financial Indicators
II. NoN-RECURRING PRoFIt oR loSS ItEMS AND AMoUNtS oF tHE GRoUP FoR tHE lASt tHREE YEARS
Unit: RMB’000
ItemAmount for
2013Amount for
2012Amount for
2011
Loss on disposal of non-current assets (23,297) 37,135 13,000Government grants recognised in profit/loss for the
period 155,423 133,270 267,349Gains from the excess of the fair value of attributable
identifiable net assets of the investee upon acquisition over the cost of acquisition 35,017 54,750 –
Remeasurement of the fair value of equity interest in the acquiree held prior to the acquisition date to recognise investment losses (4,792) – –
Gains or losses from changes in fair value arising from holding financial assets at fair value through profit or loss and financial liabilities at fair value through profit or loss, and investment gains arising from disposal of financial assets at fair value through profit or loss, financial liabilities at fair value through profit or loss and available-for-sale financial assets, except for the effective hedging activities related to the Group’s ordinary activities 751,148 41,358 (152,179)
Reversal accounts receivable provided for bad debts on an individual basis 7,110 9,383 –
Fund appropriation fee received from non-financial institutions recognised in the profit/loss for the period 4,793 11,445 8,665
Net gain from disposal of subsidiaries 915 – –Other non-operating income and expenses other than
the above items 24,742 42,786 20,350Less: Effect of income tax (83,152) (73,276) (32,450) Effect of minority interests (after tax) (30,676) (24,260) (12,971)
Total 837,231 232,591 111,764
Notes for the Company’s non-recurring profit or loss items as defined in the Explanatory Announcement on Information Disclosure for Companies Offering Their Securities to the Public No.1 – Non-Recurring Profits or Losses and the non-recurring profit or loss items as illustrated in the Explanatory Announcement on Information Disclosure for Companies Offering Their Securities to the Public No.1 – Non-Recurring Profits or Losses defined as its recurring profit or loss items
□ Applicable Not Applicable

12 China International Marine Containers (Group) Co., Ltd.
Chapter 2Summary of Accounting Data and Financial Indicators
III. KEY FINANCIAl DAtA AND FINANCIAl INDICAtoRS oF tHE GRoUP FoR tHE lASt FIVE YEARS
Unit: RMB’000
For the year ended December 31,Income Statement Items 2013 2012 2011 2010 2009
Revenue 57,874,411 54,334,057 64,125,053 51,768,316 20,475,507Operating profit 3,370,835 2,639,441 4,735,293 3,438,168 1,320,470Profit before income tax expense 3,562,720 2,907,380 5,022,706 3,674,607 1,465,385Income tax expense 928,222 976,950 1,363,768 823,748 384,674Profit for the year 2,634,498 1,930,430 3,658,938 2,850,859 1,080,711Attributable to: Equity holders of the Company 2,180,321 1,939,081 3,690,926 3,001,851 958,967 Non-controlling interest 454,177 (8,651) (31,988) (150,992) 121,744
Unit: RMB’000
As at December 31,Asset and liability Items 2013 2012 2011 2010 2009
Total current assets 41,169,668 38,346,189 40,727,025 33,791,508 20,535,330Total non-current assets 31,436,304 24,646,191 23,634,689 20,339,141 16,823,053Total assets 72,605,972 62,992,380 64,361,714 54,130,649 37,358,383Total current liabilities 32,576,349 25,540,032 31,236,333 29,971,335 15,042,710Total non-current liabilities 15,533,495 15,335,191 11,511,709 4,952,614 6,489,042Total liabilities 48,109,844 40,875,223 42,748,042 34,923,949 21,531,752EquityAttributable to: Equity holders of the Company 20,674,037 19,513,176 18,633,154 16,223,057 14,198,208 Non-controlling interest 3,822,091 2,603,981 2,980,518 2,983,643 1,628,423Total equity 24,496,128 22,117,157 21,613,672 19,206,700 15,826,631
Unit: RMB’000
For the year ended December 31,Cash Flow Items 2013 2012 2011 2010 2009
Net cash flows from operating activities 2,749,926 2,242,919 2,254,437 1,482,901 969,685Net cash flows from investing activities (6,504,459) (1,559,348) (3,576,060) (2,730,302) 2,795Net cash flows from financing activities 3,632,937 (2,889,667) 4,507,951 477,409 520,840

Annual Report 2013 13
Chapter 2Summary of Accounting Data and Financial Indicators
Key Financial Indicators 2013 2012 2011 2010 2009
Basic earnings per share for profit attributable to equity holders of the Company (RMB) 0.82 0.73 1.39 1.13 0.36
Diluted earnings per share for profit attributable to equity holders of the Company (RMB) 0.81 0.73 1.37 1.13 0.36
Net cash flows from operating activities per share (RMB) 1.03 0.84 0.85 0.56 0.36
Net assets per share attributable to equity holders of the Company (RMB) 7.77 7.33 7.00 6.09 5.33
Weighted average return on net assets (%) 11.00% 10.00% 21.00% 20.00% 7.00%
Weighted average return on net assets after deducting non-recurring profit or loss (%) 7.00% 9.00% 20.00% 18.00% (2.00%)
IV. ItEMS At FAIR VAlUE
Unit: RMB’000
Balance at beginning
of year
Profit and loss arising
from fair value
changes in the year
Cumulative changes in fair value
recognised in equity
Impairment provisions
accrued this year
Balance at end of year
Financial assets1. Financial assets at fair value
through profit or loss in the reporting period (excluding financial derivatives) 389,557 2,919 – – 319,605
2. Financial derivatives 12,684 120,530 – – 133,0683. Hedging instruments 2,851 – 10,974 – 7,9404. Financial assets available for sales 609,751 – 2,920 – 7,342Total financial assets 1,014,843 123,449 13,894 – 467,955
Financial liabilities (95,098) 66,434 – – (28,463)
14 China International Marine Containers (Group) Co., Ltd.
Chapter 3Chairman’s Statement
In 2013, the global economy continued to grow slowly. China’s economy improved moderately and turned into a transition period. Against that background, businesses of the Group were affected to different extents, and the Company’s annual revenue and earnings rose slightly as compared with the corresponding period of the previous year. In response to the challenges and pressures from economic restructuring and fluctuation, the Group took prompt action and managed to overcome numerous difficulties. By committing itself to business transformation and strategic upgrading, exploration and formulation of business development strategies, innovation in product technologies and business models, corporate governance and operation compliance, and asset safety and risk control, the Group also witnessed sound development in its business and management and actively fulfilled its social responsibilities. The major achievements the Group has made are as follows:
I am pleased to submit to you the annual report of the Company for the year ended 31 December 2013 for your review. I would also like to express my sincere gratitude for your care and support on behalf of the Board of Directors.
Dear Shareholders,

Annual Report 2013 15
Chapter 3Chairman’s Statement
oPERAtING RESUltS
In 2013, the Company’s revenue reached RMB57.874 billion, representing an increase of 6.52% from RMB54.334 billion for 2012, and the net profits attributable to shareholders of the parent company amounted to RMB2.180 billion, representing an increase of 12.44% from RMB1.939 billion for 2012. The basic earnings per share amounted to RMB0.82, as compared with RMB0.73 in 2012.
The businesses of energy, chemical and liquid food and container contributed the majority of our revenues and profits; the vehicle business achieved marked growth and contributed a higher percentage of our revenues and profits; and the offshore engineering business saw substantial reduction of losses.
BUSINESS DEVEloPMENt
In 2013, the Group further optimized its diversified business structure to keep the proportion of the container business below 50% and achieved significant breakthroughs in the cross-border M&A, business expansion or operational enhancement of emerging businesses, especially the logistics equipment and services, the airport ground support equipment and the offshore engineering equipment.
In the face of numerous adverse external factors in 2013, including weak market demand and increasing pressure from the rising costs of environmental protection and labor, the Group continued to uphold the principle of producing “safe, green, smart and lightweight” products, made reform and innovation in its traditional container manufacturing processes, promoted new-type industrialization, and implemented the philosophies of safety, energy conservation and environmental protection, and people-orientation in its efforts to realize automatic and standardized manufacturing, improve efficiency and reduce costs; successfully developed the second
generation of the energy-saving and environmentally-friendly lightweight container, realizing the upgrading of container products; and replaced traditional foaming technologies with cyclopentane foaming technologies in manufacturing reefer containers, leading to a reduction in green gas emission and contributing to the protection of the ozone layer and the ecological environment. Benefiting from economic recovery, especially the fast-growing natural gas supply and consumption, the Group posted a marked increase in the operating revenues and earnings from the energy and the chemical and liquid food equipment businesses. In 2013, the Group continued its product-focused strategy in the offshore engineering business, made expected progress in the delivery of projects and the undergoing construction works, saw multiplication of its earnings, and completed the annual operation target on loss reduction.
We have always been and will always be an ambitious, responsible and purposeful enterprise. Our mission is to “become a world leading enterprise in the industries in which we are operating that provides high-quality and reliable equipment and services for the logistics and energy industries, brings in high returns to shareholders and employees and creates sustainable value for the society”. Committed to becoming a leader in the logistics and energy equipment industry, the Company adopts a “manufacturing + service” model in business development. We will take due responsibility to shareholders, employees and the whole society, make ourselves one of the best listed companies in both Shenzhen and Hong Kong, and ensure compliance in operation management and corporate governance. These are the basic principles we should follow in pursuing development. Only by upholding these principles can we create a sound platform for the continuous and steady earnings growth of CIMC. To accomplish the above missions, the Company will continue to upgrade its strategies, unswervingly press ahead with the management mechanism with the “5S system” as the core and implement the established strategic control model in 2013.

16 China International Marine Containers (Group) Co., Ltd.
Chapter 3Chairman’s Statement
CoRPoRAtE GoVERNANCE
In 2013, the Company constantly improved its corporate governance system, standardized its operation and optimized its internal control system in accordance with the relevant requirements under the PRC Companies Law, the PRC Securities Law, Corporate Governance Guidelines for Listed Companies, relevant laws and regulations from the CSRC and the requirements of CSRC Shenzhen Bureau, Shenzhen Stock Exchange and the Stock Exchange of Hong Kong Limited for the corporate governance of listed companies. The Company completed the corporate special inspections, institutional improvement and other matters required by the regulatory authorities on a timely basis. The Company has received a public recognition for its active promotion of the standardized development of listed companies from CSRC Shenzhen Bureau in the 5th successive year.
CoRPoRAtE SoCIAl RESPoNSIBIlItY
According to its CSR (corporate social responsibility) vision and strategies, the Group took continuous, proper and effective measures and action in 2013 to assume more social responsibilities and make itself an ecological enterprise able to coordinate and balance the development of all stakeholders. The Group made new achievements and progress in various aspects including scientific development, new-type industrialization, fair operation, environmental protection and energy conservation, safe production, rights and interests of clients and consumers, win-win cooperation, employee relations and participation in community development. The Group won social respect due to its scientific development concept featuring safety, environmental protection and greenness and its efforts in CSR was widely recognised by clients, governments, international organizations, media and other parties concerned.
DIVIDEND DIStRIBUtIoN
Based on the Group’s 2013 operations results and taking into account of the Group’s overall financial position and cash flows situation, the Board of Directors recommended a final dividend of RMB0.27 per share (including applicable taxes) for the year of 2013. The final dividend of 2013 is subject to shareholders’ approval at the annual general meeting for the year of 2013.
PRoSPECtS
Looking forward to 2014, the Group will be presented with both opportunities and challenges. As the impact of the financial crisis fades, the mild rebound in the world economy will sustain and the economy in Europe, America and other countries will continue to recover. In 2014, which will be the first year for China to comprehensively deepen its reform, a number of reform measures will be introduced; the growth model centering on traditional and labor-intensive manufacturing will be challenged; and the economic transition will gain momentum in China. By then, the growth rate of China’s economy will slow down as China shifts its focus from the speed to the quality of economic growth. We expect the next two to three years to be the window of opportunity for China to deepen its reform. So in the coming years, China will likely accelerate the reform of its financial system and interest rate market, continue to adopt a slightly-tightened monetary policy and a prudent fiscal policy, and tighten money supply and financing.
We forecast in 2014, the global shipping sector will see signs of bottoming out and the container trade will grow faster. We are confident that the global container demand will resume growth in the years ahead due to the recovering economy in Europe and America, the stable demand from the road transportation vehicle market, and the tremendous development opportunities in China and other emerging economies. Low-carbon energy consumption will become an inevitable trend in China in the years to come, because it has a bearing not only on China’s state energy strategy and quality economic growth, but also on people’s well-being. Given that the goals set out in the “Twelfth Five-Year Plan” for clean and new energy development will be accomplished gradually and that the measures for energy saving and emission reduction will be implemented by the Government, China’s demand for natural gas will continue to grow and the relevant storage and equipment market and engineering services market will enjoy positive outlook; the chemical equipment market may log a negative growth following the turnaround in 2013; upon completion of deployment across the whole industry chain, the liquid food equipment will see new growth opportunities in China, Southeast Asia, South America and other emerging countries. The global offshore engineering equipment enjoys visible growth potential in the medium and long term thanks to the rebounding trend in demand, especially the active demand for replacing

Annual Report 2013 17
Chapter 3Chairman’s Statement
and upgrading semi-submersible drilling platforms in batches. As a state strategic emerging industry, China’s offshore engineering will benefit greatly from the state supportive policies and the worldwide industrial transfer. Despite these tremendous development opportunities, China’s offshore engineering is still facing daunting challenges and feeling the pressure of the intensifying industry competition.
I n 2 0 1 4 , t h e G r o u p w i l l f u r t h e r p r o m o t e transformation and upgrading and dedicate itself to continuous improvement; advocate constant innovations in and control risks associated with technologies, business models and management mechanisms; and capital ize on the historic opportunity and set challenging growth and development targets to move closer to its goal of becoming a world leading enterprise.
The Group’s rapid growth in the past was mainly attributed to the reform and opening-up polices, the opportunities arising from the move of the global manufacturing center to China, and various internal and external environmental factors such as the corporate governance system and corporate culture. China’s reform will enter a new stage in 2014 and the goal of the reform will be to realize Chinese dreams. Therefore, the Company will continue to uphold the cultural philosophies of “interwovenness and side-by-side development of the nation’s strength and the people’s well-being” and “people-oriented and mutual business”. The core philosophies, mechanisms and culture that had driven the growth of the Company in the past may lose their advantages when the new round of reform begins, so we need to create new advantageous mechanisms and culture, and carry out systematic reforms and make new breakthroughs in product and technology innovation, especially in business model innovation, so as to enhance our competitiveness, optimize our business structure and establish a “cumulative continuously-improving mechanism” that will serve as a solid foundation for the sound and continuous development of the Group.
We will attach greater importance to the healthy development of the Company. We must commit ourselves to sustainable and sound development, and ensure the compliance in operation management, the security of assets, and the accuracy and completeness of financial reports and other related information in all subsidiaries. We should also place more emphasis on the quality of our development when seeking expansion.
We will continue to deepen the transformation and upgrading of our business structure. Both the world economy and China’s economy will remain in transition in the coming two to three years. This will pose great challenges to the Group’s ability to seize opportunities, especially business opportunities, innovate its business models, utilize its external resources, integrate is internal resources, manage significant investments and control risks.
We will give more priority to business and technology innovations and improve relevant mechanisms.
We will continue to deepen the reform of the incentive mechanism to ensure fairness and impartiality, which will help motivate the managers and employees and activate the Company.
We will uphold continuous improvement and promote the establishment of the ONE system to develop a corporate culture advocating 1% daily improvement and set an example for China’s manufacturing industry on the relentless pursuit of continuous of improvement.
We wil l s trengthen our talents cult ivat ion and development system and regard talents as our most valuable resources, so as to ensure we have enough talented people to secure our future development.
li JianhongChairmanShenzhen, the PRC25 March 2014

CIMC HAS FORMED AN INDUSTRY CLUSTER FOCUSING ON KEY EQUIPMENT AND SOLUTIONS FOR THE LOGISTICS AND ENERGY INDUSTRIES
Energy, Chemical and liquid Food EquipmentRevenue:
RMB11.580 billion
Road transportation VehicleRevenue:
RMB13.335 billion
Container ManufacturingRevenue: RMB21.307 billion

Real Estate Development
logistics Services and EquipmentRevenue:
RMB6.216 billion
Airport FacilitiesRevenue:
RMB888 million
Revenue:
RMB1.326 billion
FiancialRevenue:
RMB877 million
Revenue:
RMB6.982 billion
offshore Engineering

20
Chapter 4Directors’ Report
China International Marine Containers (Group) Co., Ltd.
I. oVERVIEw
In 2013, the global economy continued to grow slowly. China’s economy improved moderately and turned into a transition period. Against that background, businesses of the Group were affected to different extents, and the Group’s annual revenue and earnings rose slightly compared with the corresponding period of the previous year. During the Reporting Period, the Group’s revenue reached RMB57.874 billion (RMB54.334 billion in 2012), representing an increase of 6.52% as compared with the corresponding period of the previous year; and the net profits attributable to shareholders of the parent company amounted to RMB2.180 billion (RMB1.939 billion in 2012), representing an increase of 12.44% as compared with the corresponding period of the previous year; and the basic EPS was RMB0.82 (RMB0.73 in 2012), growing by 12.33% as compared with the corresponding period of the previous year.
MARKEt REVIEw
Macro economy, industrial conditions and their impact
In 2013, global economy was still in the adjustment and reform. The U.S. economy recovered significantly, European economy began to rebound, while the emerging economies grew slowly.
Although both the global economy and shipping industry were gradually rising from the periodic bottom, container trade maintained a slow growth, shipping companies were not profitable generally, with both demand for new containers and replacement rate of older containers were at low levels. The demand for containers was weak. Furthermore, no obvious seasonal demand was shown for containers, and raw material prices went down, which led to the fall of container prices, but the RMB exchange rate kept rising. On the other hand, China’s labor legislation and environmental regulations were increasingly strict, which was the main factor for the increase in production cost. Manufacturers in the industry tried to improve production efficiency through relocation, renovation, and introduction of automated production equipment, and 2013 was a difficult year for container industry. In 2013, the domestic container output was approximately 2.7 million TEUs, a slight decrease compared with 2012. The outputs of standard dry containers, reefer containers and special containers were approximately 2.33 million TEUs, 110,000 units and 110,000 units respectively.
Energy, chemical and liquid food equipment industries, especially natural gas equipment industry, were less affected by economic downturn. China’s natural gas price hike was expected to have short-term impact on the demand for some equipment and products but did not affect the overall demand in 2013. Rapid capacity expansion of major products of the industry and numerous new comers escalated the competition.
In 2013, the overall demand of overseas market for road vehicles remained stable. The markets in North America have showed a strong recovery for two years, the European economy bounced from the bottom, and the demand for semi-trailer was largely the same as 2012; the business in emerging markets maintained the rapid growth trend of last year.
Benefiting from the increasing investment in offshore oil exploration and development investment and driven by equipment upgrading, offshore engineering industry remained upbeat. As the shipbuilding industry was facing predicaments of the serious shortfall in new shipbuilding orders and the constant decline in transaction price of new vessels, the leading shipyards have put their efforts on offshore engineering; as a result, the competition of offshore engineering became increasingly fierce in China.

Annual Report 2013 21
Chapter 4Directors’ Report
National industrial policies, regulatory change and its impact
In 2013, under the updated guidance catalog of national industry, the entry threshold of container industry was lowered gradually and competition in the industry was intensified. In recent years, China has been increasingly concerned about environmental protection and gradually included the related indicators into assessment indicators of local government. In particular, China issued the Air Pollution Prevention Scheme (《大氣污染防治行動計劃》) and local governments released implementation details. These movements not only exerted great external pressure to China’s traditional manufacturing industry, but also have brought new opportunities for transformation and upgrading of traditional industries. It is expected that the major environmental technologies or eco-friendly materials, such as waterborne paint, solvent recovery, eco-friendly flooring, cyclopentane foamer (replacement for Freon), will accelerate their application and generalization in container industry.
Since 1 July 2013, China enforced new emission standard on heavy trucks, which upgraded the National Stage III emission standard to the National Stage IV emission standard. This event became the main factor to accelerate the upgrading of special vehicles, thus the sales of semi-trailer in China grew more than 30% over the previous year.
With regard to clean energy, the statistics show that in 2012, natural gas accounted for 24.4% of primary energy consumption in the world, close to oil and coal which accounted for 33.8% and 30.5% respectively. Natural gas, together with oil and coal, have become the world’s three major energy. Over the past decade, the natural gas production of China had an average annual increase of 13% and an average annual growth rate of 16% in natural gas consumption. But currently the proportion of natural gas to one-off energy consumption is still less than 5%, far below the world’s average of 24.4%. The National Energy Administration issued the Shale Gas Industry Policy (《葉岩氣產業政策》), which included shale gas development into national strategic emerging industries, in order to increase financial support for shale gas exploration and development. In recent years, with the rapid development of natural gas industry in the world, it is predicted that by 2020 natural gas will replace coal as the world’s second largest energy source. China’s natural gas and its applicable industries will continue the rapid development so as to replace coal, thus will be able to better address air pollution, smog and other problems.
In 2013, the nation’s offshore engineering industry policy gradually deepened and refined, entering the substantial stage with funding and project support. It also promoted industrialization and accelerated the mergers and acquisitions of leading enterprises in offshore engineering and shipbuilding industries. In February 2013, National Development and Reform Commission (NDRC) issued the Notice on Organization and Implementation of Equipment R&D and Industrialization of Offshore Engineering (2013)” (《關於組織實施2013年海洋工程裝備研發及產業化專項的通知》), which specifically included 12 offshore engineering equipments of three categories into national-special-support products. The three categories are main offshore engineering equipments and ancillary equipments and systems, new offshore engineering equipments, and underwater key equipments. In October 2013, the State Council issued the Guidance on Resolving Severe Overcapacity (《關於化解產能嚴重過剩矛盾的指導意見》), which clearly stated that China would improve the industry’s entry criterion, support mergers and acquisitions, increase industrial concentration, encourage existing shipbuilding capacity transfer to the field of offshore engineering equipment, and raise the proportion of high-end production capacity. Under the guidance of national policy, the competitiveness of our existing offshore operations will be further strengthened.
22 China International Marine Containers (Group) Co., Ltd.
Chapter 4Directors’ Report
II. REVIEw oF tHE GRoUP’S PRINCIPAl BUSINESS DURING tHE REPoRtING PERIoD
The Group is principally engaged in the manufacture of modern transportation equipment, energy, chemical and food equipment, offshore engineering equipment and airport equipment, as well as the provision of relevant services, including the design and manufacture of international standard dry containers, reefer containers, regional special containers, tank containers, wooden container floorboards, road tank trucks, natural gas equipment and static tanks, road transportation vehicles, jack-up drilling platforms, semi-submersible drilling platforms, special vessels and airport equipment. In addition, the Group is also engaged in logistics services and equipment business, real estate development, financial services and other businesses. Currently, the Group is ranked No. 1 in the world in terms of output and sales of standard dry containers, reefer containers and tank containers. The Group is also China’s largest manufacturer of road transportation vehicles and one of China’s major high-end offshore engineering equipment enterprises.
During the Reporting Period, products contributing more than 10% of the Group’s revenue or operating profit are container, road transportation vehicles, energy, chemical and liquid food equipment, offshore engineering and logistics services and equipment.
1. Container Manufacturing Business
During the Reporting Period, the sales and production volume achieved by the Group were the highest among our peers in the industry. We have the capacity to produce a full series of container products with propriety property rights. The Group’s container business mainly deals with standard dry containers, reefer containers and special containers. Special containers mainly included 53-foot inland North America containers, Europe wide containers, bulk containers, special reefer containers, foldable containers and modular construction products.
In 2013, the decrease in demand for containers was primarily due to slow global economic recovery and the decline in the growth of global container business. During the Reporting Period, the total sales of the Group’s ordinary dry containers were 1,088,300 TEUs, representing an increase of 0.68% as compared with the same period of last year. The total sales of reefer containers were 119,600 TEUs, representing a decrease of 3.00% as compared with the same period last year. The total sales of special containers were 63,900 units, representing a decrease of 12.59% as compared with the same period last year. The revenue from our container business was RMB21.307 billion, representing a decrease of 14.22% as compared with last year, and its net profit was RMB1.019 billion, representing a decrease of 43.60% as compared with last year. Among which, the ordinary dry containers recorded a sales revenue of RMB13,252 million, representing a decrease of 14.29% as compared with the same period of previous year; the reefer containers recorded a sales revenue of RMB3,932 million, representing a decrease of 10.03% as compared with the same period of previous year; the special containers recorded a sales revenue of RMB4,414 million, representing a decrease of 26.00% as compared with the same period of previous year. In addition, the price for containers also decreased approximately 10% during the year, which was mostly contributed to our revenue’s decrease. The decrease in our gross profit margin was primarily due to low capacity utilization, declining economies of scale, decreasing price of container, RMB appreciation and other factors caused by unobvious seasonal demand for containers.
In response to the adverse operating environment in 2013, the Group continued its commitment to the comprehensive upgrading of its container business, stepped up efforts in innovation, and improved its management.

Annual Report 2013 23
Chapter 4Directors’ Report
In 2013, adhering to the philosophy of “Safe, Green, Smart Application and Light Weight”, the Company reformed traditional production process and enhanced the automation level to reduce labor intensity and improve production efficiency. It actively promoted research, development and layout on the cold chain industry, and it has the ability to produce 13 categories of reefer containers with 200 different varieties, in addition it had established the world’s only integral production line for special reefer containers. In January 2013, the Group launched the second-generation eco-friendly containers in cooperation with Baosteel, the weight of each container reduces 14%, and the Company had received orders of total 12,000 TEU, this showed an important breakthrough of the Group in terms of container product upgrading. In 2012, China started the accelerated phase-out plan for hydrochlorofluorocarbons (HCFC) in full swing to ensure the implementation of provisions of the Montreal Protocol (《蒙特利爾議定書》), making substantial effort to protect the ozone layer. In April 2013, the Group signed a contract with China’s Ministry of Environmental, with intention to accelerate the phase-out process of HCFC refrigerants, replacing it with new eco-friendly refrigerants cyclopentane in freezer manufacturing industry. Also, it secured the support of approximately over US$18.5 million from the Multilateral Fund. The Company has been making efforts to fulfil its social responsibility and contribute to the protection of ozone layer and ecological environment.
In terms of special containers and modular construction business, the Company enhanced the competitiveness of its core products, strengthened the leading position of its existing mainstream products so as to further increase the market share.
The modular construction business of the Group follows the business model of “Integrated Design, Factory Manufacturing, On-site Installation”, and has the merits of quick transfer, fast build, no pollution and recyclable. It reflects the concept of innovation and pro-environment, and the Company has the ability to independently design the constructions and obtain related complete intellectual property rights. In April 2013, the Company donated container hospitals to the earthquake-stricken areas in Sichuan Ya’an, and they were quickly put into use. In August 2013, the Group and China Merchants at Shekou Industrial Zone signed a co-development agreement about new media industrial park project at Hipster Port, join together they will build the largest container architectural complex in China.
2. Road transportation vehicle business
CIMC Vehicle Group, a subsidiary of the Company, adhered to the strategic development of the full value chain businesses including the design and development of products, the manufacturing and delivery of products, sales of products and services and customer tracking and feedback, committing to the strategic vision of “relying on our national competitive strengths to offer global customers first-class land logistics equipment and services”. In terms of products, it currently has a 10 series, more than 1,000 species of special vehicle product lines, including container transport trailer, flatbed/tailgate transport trailer, low-flatbed semi-trailer, vehicle transport trailer, stake car, van, tank trucks, dump trucks, sanitation trucks, special vehicles, covering major domestic and overseas markets. Due to the effect of anticipation and implementation of the policy that commercial truck’s emission standard should update from level III to level IV, the sales of semi-trailers and refitted vehicle had grown steadily over the year; in overseas emerging market, rapid growth was shown in orders, the revenue gained a substantial increase, the market in North American was relatively stable, but the business in European was more difficult than expected.

24 China International Marine Containers (Group) Co., Ltd.
Chapter 4Directors’ Report
As affected by the above domestic and international economic and industry environments, the Group’s vehicle operation improved substantially. In 2013, the Group sold 104,800 sets of road transportation vehicles (up by 6.07% as compared with the previous year), contributing a revenue of RMB13.335 billion (down by 5.63% as compared with the previous year) and a net profit of RMB264 million (up by 92.69% as compared with the previous year).
The Group’s vehicle operation implemented the strategy of “Prudent Management” in all major regional markets over the world, committing itself to resources integration, improving operational efficiency of asset and profitability, and focused on investing in technology upgrades and construction of marketing network. The Company timely adjusted the business strategy of domestic market, focusing on improving profitability and added value of the leading products, such as reefer trucks and dump trucks. In European market, the main subsidiary LAG is trying to change its primary business, and in order to truly realize commercialized operation, Silvergreen Company promoted various management measures, the main goal of these movements is to develop target customers and optimize the cost structure to meet the average level of the industry. In the market of North American, with the purpose to enhance operating capability, the Company had conducted a lot of expansionary investments and completed a number of annual objectives, such as equity structure adjustment, new plants construction, new product development, and so on. In emerging markets, mergers, acquisitions and newly-built production assembly bases were growing, which ensured the presence of the Group’s mainstream products in the emerging market of major countries. Through extended development, the Group consolidated and expanded its business of vehicle logistic park, a commercial model was clearly shown, a good foundation for future development was laid and the revenue was considerable.
In 2013, under the background of slow recovery in macroeconomics and the implementation of National Stage IV emission standard in certain regions, the domestic market of heavy truck had bounced from the downturn that began two years ago. Benefit from the rapid growth in demand for heavy trucks that consume natural gas, LNG heavy truck business became a new growth point of market demand. By the means of holding 45% of C&C Trucks’ equity, the Company started to develop and operate the heavy truck business. The annual sales income of this business was RMB1.344 billion, an increase of 100.00%, losses reduced further. It is expected that in the future the growth of China’s heavy truck market will slow down, but demand for LNG heavy trucks will probably continue to grow rapidly. C&C Trucks will keep developing medium-sized truck and heavy trucks, lightening the weight of trucks, and through these methods to improve quality and service, build up the brand image and expand the target customers. Also, it will put great effort to develop LNG heavy trucks, launch competitive medium-sized trucks and heavy trucks and achieve economies of scale.
3. Energy, Chemical and liquid Food Equipment Business
The Group’s energy, chemical and liquid food equipment business is mainly conducted through CIMC Enric and its subsidiaries, which are mainly engaged in all types of transportation, storage, design, development, manufacturing, engineering and sales of the processing equipment in these three sectors, and provide technical maintenance services. Energy, chemical equipment products and services are provided by the Company throughout China and the products are exported to Southeast Asia, Europe, North America and South America. In addition, the production base of liquid food equipment products locates in Europe; it supplies products and services worldwide.

Annual Report 2013 25
Chapter 4Directors’ Report
The global demand, especially domestic demand for natural gas, distribution equipment and natural gas vehicles are on the rise. The sales of energy equipment continued to thrive in current year. Demand for tank container, the main product of our chemical equipment business, was better than expected, generally the same as that in 2012. The business environment of liquid food service equipment also improved, and the acquisition of certain assets of the Ziemann Group also expanded the Group’s product mix, driving up its turnover. The revenue from the energy, chemical and liquid food equipment business of the Group in 2013 was RMB11.58 billion, representing an increase of 20.20% as compared with the previous year. The net profit was RMB912 million, representing an increase of 41.34% as compared with the corresponding period of the previous year. Among which the revenue from energy (natural gas) equipment business of CIMC Enric amounted to RMB5,372 million, representing an increase of 25.84% as compared with the corresponding period of the previous year. The revenue from chemical equipment business was RMB3,094 million, representing an increase of 8.70% as compared with the corresponding period of the previous year. The revenue from liquid food equipment business was RMB1,516 million, representing an increase of 56.57% as compared with the corresponding period of the previous year.
During the Reporting Period, CIMC Enric adopted a number of strategies to enhance its core competitive advantages, including upgrading its production capacity, improving its existing product technology and accelerating research and development of new products. Its new plants in China commenced operation one after another, further augmenting its existing production capacity and research and development of new product lines. Since 2012, CIMC Enric focused on and invested resources in developing its EPC (Engineering, Procurement and Construction Contract) business, aiming to provide its customers with integrated solutions. That is one of its long-term strategies to expand its business scale and consolidate its market position.
In 2013, the Group concentrated on blending the assets acquired from the Ziemann Group in 2012 into the business and operating structure of CIMC Enric. As Ziemann Group is the world’s leading provider of solutions for brewery turnkey projects, we are to make good use of the acquired resources, such as its brand, market network, production technology, automated processing and project achievements etc. to support the Group’s growth. The acquisition also contributes to the increase of gross profit margins of CIMC Enric’s liquid food equipment business from the following two aspects: first, CIMC Enric is now armed to provide a full range of brewery equipment and turnkey projects for higher gross profit margin, so the acquisition will help to improve the gross margin of the segment, second, as Ziemann Group used to be one of CIMC Enric’s competitors, the acquisition somewhat alleviated the competition in the market of liquid food equipment.
In order to cope with the market demand, CIMC Enric actively invested in the development of new products and upgrading of its production technologies: working closely with Nanjing Yangzi Petrochemical Design & Engineering Co., Ltd. to ensure overall planning and coordination of R&D and product design; entering into strategic cooperation with the domestic research institutions and external professionals from the steel mills, aiming to develop its own high-strength steel for mobile pressured vessel. In order to secure the Group’s leading position in the market, and ensure sustainable development of the industry in which it operates, CIMC Enric also participated in the establishment of a number of international and industrial product standards in addition to its internal R&D efforts.

26 China International Marine Containers (Group) Co., Ltd.
Chapter 4Directors’ Report
In 2013, the Group spent more efforts in developing overseas markets and building marketing channels, particularly the emerging markets such as South-East Asia, Central Asia and South America, with its annual income from overseas sales grew by approximately 20%. The branch of Shijiazhuang Gas Equipment in the United States was established to cultivate the North American market, leading to a significant growth in the total business volume as compared with the corresponding period of the previous year. Also, the Group has been exploiting the market in Russia and procuring regional strategic cooperation, which remarkable success in cooperation with local competent companies, and concluded the deal of the first set of CNG hydraulic sub-station. The Group will continue to implement proactive sales and marketing initiatives, e.g. building a market information database, deal conclusion-oriented marketing mechanisms and key account management programs, so as to expand its market share.
4. offshore Engineering Business
We are one of the leading general manufacturers of high-end offshore engineering equipment in the world and have been involved in the competitive international market of offshore engineering business all the time. Our major products include semi-submersible drilling platforms, jack-up drilling platforms and high-end auxiliary vessels for offshore engineering.
In 2013, the sales revenue from offshore engineering business of the Group reached RMB6.982 billion in aggregate, representing an increase of 281.67% from RMB1.829 billion in the previous year. It incurred a loss of RMB297 million, narrowing down significantly by 43.67% as compared with the previous year. The significant increase in revenue and the decrease in loss were mainly due to the sales of semi-submersible life platform OOS PROMETHEUS, semi-submersible crane platform OOS Gretha and 300-foot jack-up drilling platforms – MASTER DRILLER, MASTER DRILLER II, and based on the progress of projects under construction, sales revenue increased greatly comparing with the last year when the delivered projects and projects under construction are fewer at the same period, hence the sales revenue were lower at then. As the successful sales of self-constructed projects (two semi-submersible crane/life platforms, two jack-up drilling platforms), the financial costs substantially reduced, with the quality guarantee deposit returned from the delivered projects and other prepaid expenses, the annual loss has significantly reduced, the budget goal has been realized by and large.
In 2013, CIMC Raffles made major breakthroughs in order delivery, especially in delivery of self-built due projects and sales. Two deepwater semi-submersible crane life platforms – OOS Gretha and OOS Prometheus were delivered to the clients in December 2013, were subsequently shipped to Brazil on 23 February 2014 and 9 March 2014 respectively, for delivery to the end user Petrobras. The above semi-submersible crane life platforms are truly “China’s first deep-water semi-submersible platforms developed, designed and constructed completely by the Chinese”, representing a significant breakthrough among mainstream customers and mainstream products. In June and November 2013, agreements were signed with ship-owners for delivery of the 300-foot jack-up drilling platforms MASTER DRILLER and MASTER DRILLER II, respectively, which were the third and fourth jack-up drilling platforms after SUPREME DRILLER and CASPIAN DRILLER. In addition, a jack-up workover platform also secured a one-year lease from COSL. By 2013, CIMC Raffles had basically delivered all the due projects. The litigation with Schahin in Brazil also made good progress and an amount of US$95 million due to the Company has been successfully recovered.
CIMC Raffles also made great progress in project construction. On 28 August 2013, CIMC Raffles kicked off the construction of Frigstad Deepwater Rig Alfa, the world’s largest ultra-deepwater semi-submersible drilling platform with double rigs, in its Haiyang base, for its Norwegian customer, Frigstad Deepwater. In September 2013, the upper hull of its fourth drilling platform “興旺號” – COSL PROSPECTOR XINGWANG, built for COSL, successfully joined with the lower hull as planned, taking the project into the testing phase. In December 2013, its self-built 300-foot jack-up drilling platform was granted an ABS Certificate.

Annual Report 2013 27
Chapter 4Directors’ Report
During the year, the Group continued to strengthen the research and design systems of offshore engineering. In July 2013, the CIMC Institute of Marine Engineering commenced operation. Known as the “National Energy Offshore Oil Drilling Platform Research and Development (Experiment) Center”, it has become an incubator integrating production, teaching and research as well as an international collaborative innovation platform. During the year, the semi-submersible platform designed and developed by Yantai CIMC Raffles independently was granted the First Prize of the Shandong Province Science and Technology Progress Award as well as the First Prize of the Science and Technology Progress Award from the Energy Bureau. In November 2013, the Company and a Swedish company BASSOE TECHNOLOGY AB (referred to as BTAB) signed a sale and purchase agreement to acquire 90% shares of BTAB and the acquisition has been completed. As an emerging offshore engineering design company, BTAB has its core staff richly experienced in offshore engineering projects. BTAB is highly capable of basic design. In less than 5 years after it was established in 2007, it has come out with designs for drilling vessels, semi-submersible drilling auxiliary platform, semi-submersible workover platform and semi-submersible drilling platform, and has obtained many actual vessel projects. The acquisition will help obtain market orders especially in the North Sea market; also, this strategic move integrated resources that benefit the rapid development of offshore engineering. In order to further expand in the field of offshore engineering, this is an important step for the Group; it has positive influence on enhancing the basic design ability of offshore engineering, enriching current product lines and perfecting the industry chain of offshore engineering.
In 2013, the marketing of self-designed products had made progress, with two of our self-designed semi-submersible crane life platforms receiving a long-term lease from Petrobras. Breakthrough was also made in the orders of the Company’s self-designed jack-up production platforms, which also received a long-term lease from PEMEX. Our self-designed GM4-D series, which is China’s first semi-submersible drilling platform that is capable of operating in polar waters, received the second order from the ship-owners in 2013, following the first order in 2012 and commencement of construction in June 2013.
In 2013, the Group focused on the semi-submersible platform and jack-up platform and continued to consolidate its market position, while for the first time, it obtained orders of drilling platforms and production platforms, and this was a breakthrough on new products. Successively it secured bulk orders, including 1+1 semi-submersible drilling platforms, 5+4 jack-up drilling platforms, 1+3 drilling vessels and one jack-up production platform. And the lease of one jack-up service platform from COSL. The total price of the valid orders in 2013 was about US$1.8 billion, and the total price of all orders on hand was about US$4 billion.
By the end of 2013, CIMC Raffles had secured orders of 5 semi-submersible drilling platforms, accounting for 20% of the global market. In the North Sea of Norway, currently, three semisubmersible drilling platforms built by CIMC Raffles are in operation, and another three are under construction. CIMC Raffles has become the main supplier for the semi-submersible drilling platform that specially designed for the harsh environment of North Sea. In Brazil, two deepwater semi-submersible drilling platforms built by CIMC Raffles are presently in operation, and another two semi-submersible crane life platforms are leased by Petrobras for long-time use and will begin their service for Petrobras at the end of March of 2014.

28 China International Marine Containers (Group) Co., Ltd.
Chapter 4Directors’ Report
5. Airport Facilities Business
The airport facilities business of the Group mainly includes boarding bridges, air cargo processing systems, airport ground support equipment (GSE) (including shuttle bus, lifting platform vehicle, fire truck, etc.), stereo garage, logistics and related services.
In 2013, the airport facilities business segment realised revenue of RMB888 million, representing an increase of 17.27% as compared with RMB757 million in the previous year. Its net profit was RMB116 million, representing an increase of 69.03% as compared with RMB69 million in the previous year. The business structure of this segment was further optimized, and the proportion of income from businesses other than civil aviation increased significantly in this segment.
During the year, the Group’s airport facilities business had made expected breakthrough in market expansion, mergers and acquisitions, business expansion and other aspects. In July 2013, the Group announced that it would inject 70% equity interest in Shenzhen CIMC Tianda Airport Support Co., Ltd. (“CIMC Tianda”) into Pteris Global Limited (“Pteris”, a listed company on the main board of the Singapore Stock Exchange, stock code: J74). In October 2013, the Group successfully took over the entire business and assets of a French company, Air Marrel. In November 2013, the Group signed a sale and purchase agreement with Albert Ziegler GmbH & Co KG of Germany to acquire the assets of Ziegler for approximately €57 million, pursuant to which the Company bought related assets and equities or shares of Ziegler’s nine subsidiaries in Germany or other countries. Upon completion of the above acquisitions, technology coordination, collaboration of after-sales service and internal management and resource integration had already started and preliminary results were achieved. Hence, the Group had formally become a manufacturer for high-end fire trucks. The above acquisitions perfected the existing product portfolio of airport facilities business, and synergistic effect had been achieved. The overall competitiveness of airport facilities business had been improved, and our product range of special vehicles had been enriched. Moreover, in the future, these acquisitions will help the Company benefit from China’s urbanization development. A subsidiary of CIMC Tianda, XIEFA Airport Equipment Ltd. (“XIEFA”) is a professional design, manufacturing and services enterprise of airport shuttle bus and other ground support equipment (GSE), which is a leading manufacturer for airport shuttle bus in China. Since CIMC Tianda took over XIEFA in 2012, all by itself, XIEFA had successfully developed the first “bi-directional shuttle bus” in China and delivered it to Perth Airport at Australia. Hong Kong airport, after accepted the delivery of 10 airport shuttle buses manufactured by XIEFA and put them into use, in March 2013, made a new order to purchase 20 new-type bi-directional shuttle buses from XIEFA. After that, XIEFA had made successive breakthroughs in tapping the market of Maldives, Thailand, Indonesia and other overseas countries, achieving further expansion into new overseas markets.
In April 2013, the Group established Shenzhen CIMC Tianda Logistics System Engineering Co., whose main business includes automated sorting system for industrial users, warehouse planning, design, renovation and other EPC projects.

Annual Report 2013 29
Chapter 4Directors’ Report
6. logistics services and equipment business
The Group is committed to offering specialised logistic equipment and comprehensive logistic solution for customers in different industries. The logistic equipment products of the Group mainly comprise of the pallet containers for vehicle, logistics, food, chemical and agricultural purposes, and the the IBC made of stainless steel (Intermediate Bulk Container) for chemical and food usage, as well as specialised logistic equipment. Meanwhile, the Group also provides logistic services based on its standardized logistic appliances, transportation service solutions regarding finished automobiles based on special containers, logistic service solutions regarding logistic of liquid based on IBC containers, logistic service solutions regarding transportation of automobiles based on pallet boxes as well as pallet leasing and repairing services, and dedicated logistics, contract logistics and cold-chain logistics businesses.
In 2013, the Company achieved sales income of RMB6.216 billion and net margin of RMB179 million in its logistics services and equipment business.
During the year, through multiple acquisitions, the Group had accelerated its pace of business expansion. It innovated its trading, financial service and full-life cycle services for containers in container logistics; and has been looking out for new business opportunities in coastal industrial upgrading, China’s central and western development, urbanization, energy conservation and emissions reduction, and green industry development. On 6 March 2013, the Group purchased 36.78% equities of Zhenhua Logistics Group Co., Ltd. (“Zhenhua Group”) after which the Group’s shareholding in Zhenhua Group increased to 75%, and from 1 April 2013, Zhenhua Group became a subsidiary of the Group. Zhenhua Group has become one of our subsidiaries since 1 April 2013. Based in Tianjin, Zhenhua Group mainly engages in logistics related businesses. This acquisition will sharpen the Group’s edge in comprehensive logistics service.
On 30 December 2013, the wholly-owned subsidiary of the Group signed a share sale and purchase agreement with a subsidiary of Maersk Group, the leading company in global shipping industry, to buy 70% shares of Brigantine Services Limited and Brigantine International Holdings Limited. Through this acquisition, the Group expanded its business scale of existing container yard services and container maintenance services, perfected its capacity of full-life cycle services on containers and acquired Brigantine’s business platform and network of used containers. At the same time, this agreement had laid the foundation for further cooperation in the future.
In the 20 years of its development, the Group has completed a shift from the conventional and basic pattern to integrated and value added operations in logistics services and equipment manufacturing, and is reaching out to provide comprehensive logistic solutions. In the future, the Group will continue to promote major projects such as engine packaging and auto parts customers; packaging and logistics services for vehicle components and parts and develop big customers; strengthen lean management over businesses; promote related businesses including domestic logistics, cold chain businesses, logistic finance, engineering and project logistics, equipment manufacturing, supply chain logistics, international shipping agency, international freight agency, and comprehensive logistics at port, and consider chances to enter the e-commerce logistic market.

30 China International Marine Containers (Group) Co., Ltd.
Chapter 4Directors’ Report
7. Real estate development business
In 2013, China’s regulation and control policy on real estate market had no fundamental changes, and the superimposition effect on investment, development and house-purchase still continued, with high market pressure. CIMC Real Estate Development Co., Ltd. of the Group at Shenzhen continued to promote the project construction and sales in Yangzhou, Zhenjiang, Jiangmen and Yangjiang according to the plan, CIMC Innovation Industrial Park Project at Songshan Lake in Dongguan has been started, and other projects at Longhua in Shenzhen, Kunshan in Jiangsu have completed the first-phrase preparations. During the Reporting Period, the real estate business of the Group achieved commercial housing revenue of RMB1.65 billion, rose by 1.29 times on a year-on-year basis. The achieved revenue during the Reporting Period was RMB1.326 billion, with a net profit of RMB157 million.
The Group owns an industrial land at the cooperative zone of modern service industry of Shenzhen Qianhai Port (“Qianhai Cooperative Zone”), with an area of 52,4200 square meters. In the year, the Company had deep communication with the Shenzhen Municipal Government and Qianhai Administration Bureau regarding the development plan of this land, which has gained preliminary recognition and support of the government, but hasn’t reached specific development program yet. The Company will take active action to join in the development and construction of Qianhai in future in the light of the overall planning and requirements, and make new contribution to the development of Qianhai and embody new value. Besides Qianhai Area in Shenzhen, the Group has land reserves or industrial land blocks which are expected to be changed into industrial land for commercial development in Shekou in Shenzhen, Pingshan, Songshan Lake in Dongguan, Yangjiang in Guangdong, Qingdao in Shangdong, Yangzhou in Jiangsu, Zhenjiang, Baoshan in Shanghai, etc.
8. Financial business
As for its financial business, the Group was devoted to the establishment of a financial service system which matches its role as a world leading manufacturer, so as to promote the expansion of its businesses and enhance the efficiency and effectiveness of its internal capital utilization. The main operating subsidiaries consist of CIMC Financial Leasing Co., Ltd. (CIMC Financial Leasing) and CIMC Finance Company Ltd.(CIMC Finance). In 2013, the Group achieved a revenue of RMB877 million and a net profit of RMB431 million, representing an increase of 24.56% and 16.40% as compared with last year, respectively.
Over the past five years, CIMC Financial Leasing has maintained sustained rapid growth, the CAGR (compound average growth rate) of new business volume is 63.3% in these five years, in the same period, the CAGR of net profit is 76.3%. Meanwhile, CIMC Financial Leasing has deeply appreciated the demand of the Group’s strategic customers and rapidly replicated business model, relying on “Chinese capital” and “Chinese design” to integrate global resources. In 2013, based on the project of CMA9200TEU container ship financial lease, CIMC Financial Leasing successfully duplicated business model and signed a lease of 14 8,800 TEU container ships with MSC, the total amount of this project is approximately US$1.19 billion, which expanded the quality assets of ship leasing. Also, the Company furthered the industry-finance synergy with CIMC Raffles, promoted the implementation of major strategic projects and made major breakthroughs in global emerging markets such as Brazil. Comprehensively, the Company pushed forward the industry finance synergy with other segments of the Group, and for the first time, it secured contracts in modular construction, warehouse automation and automatic stereo garage and other financing projects, in the UK, Australia and other international mainstream markets, it has fulfilled the zero breakthrough.
Annual Report 2013 31
Chapter 4Directors’ Report
CIMC Finance deeply implemented a three-year strategic plan, with self-positioning of “fund manager, financial services provider, financial value producer”, entered a new stage of development. As the Group’s “fund manager”, CIMC Finance continued to strengthen the centralized management and effective functioning of the Group’s capital pool, it significantly reduced the liabilities of the Group and well managed the Group’s total capital, lessened the Group’s finance costs, funding costs and transaction costs, and the efficiency of monetary funds was further improved. CIMC Finance had made a new breakthrough in the aspects of “financial services provider, financial value producer”, it launched new businesses such as supply chain finance, foreign exchange settlement, cross-border RMB settlement, guarantee, etc. Also, CIMC Finance developed new financial instruments like electronic commercial draft, inter-bank borrowing and rediscount. These new businesses and tools have further improved the professional competence and service level of the Group’s financial business, at the same time, they exploited new investment and financing channels for the Group, created new financial value and profit growth point, and further enriched the meaning of combination between industry and finance, boosted the development of the industry.
the Company reviewed and concluded the progress of development strategy and business plan reviewed at earlier stage
As for container manufacturing business, the Company optimized adjustment on organizational structure; the operation management is more focused on business and customers, shortening the management chain; and strengthened a mechanism to respond promptly to any changes in orders and the market. In this process, the most sophisticated technologies at present have been utilized. The unified service platform for special containers’ modularization had been initially established, achieving synergistic effect and making progress in the business strategies for new clients and new products. In terms of capacity regional distribution, a certain degree of optimization and adjustment had been carried out, The major investment projects such as Dongguan Fenggang project, Taicang cold container project, Qingdao cold chain industry park, are progressing smoothly.
As for road transportation vehicle business, the Company continued to expand the regional market share, especially in emerging markets, the sales volume grew significantly; it set out the development of “Silvergreen Series” in China, with intention to break through the European market, and it established and gradually improved the auto parts outsourcing system of Europe CSG (CIMC Silvergreen), started China-Europe advanced dump module development project; improved sales and service network.
As for energy, chemical, liquid food equipment and service business, the Company further built and completed the management model and system centering on the business and it reinforced the integration of the M&A resources and advanced the ability on engineering project management by business collaboration and China-EU mutual strengths to enhance engineering business. The Company actively promoted the research and development of new products, intensified the development of special pot boxes and consolidated and improved the existing main equipments and products market shares. As for high pressure, low temperature and medium pressure vessels, pot boxes and liquid food equipments, the Company enhanced the expansion of overseas markets and the building of marketing channels and vigorously promoted the North American market.

32 China International Marine Containers (Group) Co., Ltd.
Chapter 4Directors’ Report
As for offshore engineering business, the Company pushed forward the level of standardization and serialization of products and engineering projects, it arranges the resources of three production bases as a whole; also, it strengthened the supporting capacity of the core equipment, improved advantages on design and manufacturing of piles, enhanced the right of choice on key parts of jack-up platforms, built up the discourse power in the field of jack-up platform, and came up with joint-designed and self-designed ship models, urged improvement on technology and production management.
The reason why the actual operating results is lower or higher by 20% or above than the profit forecast for this year which has been publicly disclosed
□ applicable not applicable
III. FINANCIAl DISCUSSIoN AND ANAlYSIS PREPARED ACCoRDING to tHE REqUIREMENtS oF DoMEStIC SECURItIES REGUlAtoRY AUtHoRItIES
1. Income
In 2013, the Company recorded an revenue of RMB57.874 billion, representing an increase of 6.52% from RMB54.334 billion for 2012, and the net profit attributable to equity holders of the Company amounted to RMB2.180 billion, representing an increase of 12.44% from RMB1.939 billion for 2012. The basic earnings per share amounted to RMB0.82.
the Company’s income of the physical sale is higher than the service revenue or not.
Yes □ No
Industry classification Item 2013 2012
Year-on-year change (%)
Container Sales volumeDry container (’0000 TEU) 108.83 108.09 0.68%Reefer (’0000 TEU) 11.96 12.33 (3.00%)Special container (ten thousand units) 6.39 7.31 (12.59%)
Road transportation vehicles Sales volume (ten thousand units) 10.48 9.88 6.07%Marine engineering business Sales volume
Semi-submersible Drilling Platform (unit) 2 1 100.00%Jack-up Drilling Platform (unit) 4 1 300.00%Production outputSemi-submersible Drilling Platform (unit) 3 3 0.00%Jack-up Drilling Platform (unit) 6 7 (14.29%)
Instruction of the reasons for relevant data changes by 30% on a year-on-year basis
applicable □ not applicable

Annual Report 2013 33
Chapter 4Directors’ Report
2013 saw new achievements in the sales of semi-submersible platform and jack-up platforms of our Offshore Engineering Business compared with the same period of the previous year.
the Company’s major orders in hand
□ applicable not applicable
Products or service changes greatly during the Reporting Period or adjustment of relevant situations
□ applicable not applicable
Major sales clients of the Company
Total sales amount of the top five clients (RMB’000) 8,457,805% of total sales of the top five clients to the annual total sales 14.61%
Information of the top five clients of the Company
Number Name of ClientsSales Volume
(RMB’000)
% of annual total sales
volume
1 Cronos Containers Ltd. 2,503,402 4.32%2 Great Excel International Industrial Ltd 1,684,495 2.91%3 Tal International Container Corporation 1,627,757 2.81%4 SEACO SRL 1,479,201 2.56%5 Hapag-Lloyd AG 1,162,950 2.01%
Total – 8,457,805 14.61%
2. Cost
Industry Classification
Unit: RMB’000
2013 2012Industry classification Projects Amount
% of business cost Amount
% of business cost
Year-on-Year change (%)
Container Direct materials 15,850,452 86.75% 18,774,443 90.88% (15.57%)Road transportation vehicle Direct materials 7,536,974 66.69% 7,196,065 58.74% 4.70%Marine engineering Equipment 2,582,384 37.57% 735,971 42.95% 250.88%
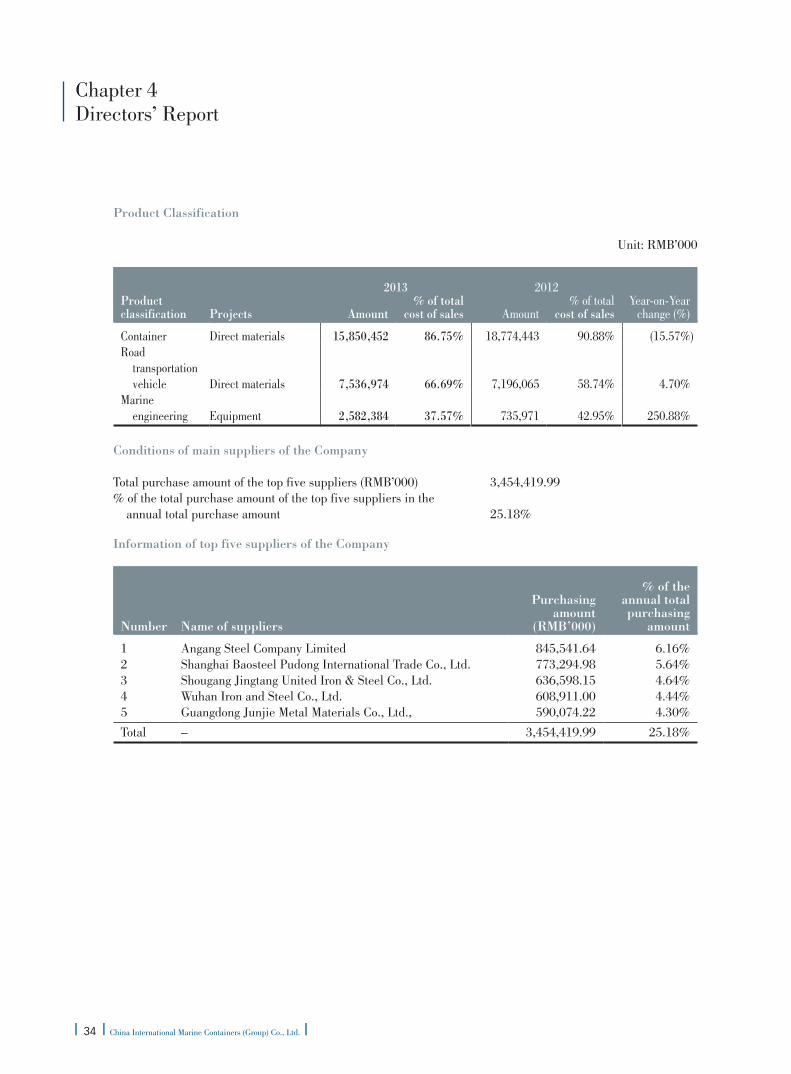
34 China International Marine Containers (Group) Co., Ltd.
Chapter 4Directors’ Report
Product Classification
Unit: RMB’000
2013 2012Product classification Projects Amount
% of total cost of sales Amount
% of total cost of sales
Year-on-Year change (%)
Container Direct materials 15,850,452 86.75% 18,774,443 90.88% (15.57%)Road transportation vehicle Direct materials 7,536,974 66.69% 7,196,065 58.74% 4.70%Marine engineering Equipment 2,582,384 37.57% 735,971 42.95% 250.88%
Conditions of main suppliers of the Company
Total purchase amount of the top five suppliers (RMB’000) 3,454,419.99% of the total purchase amount of the top five suppliers in the annual total purchase amount 25.18%
Information of top five suppliers of the Company
Number Name of suppliers
Purchasing amount
(RMB’000)
% of the annual total purchasing
amount
1 Angang Steel Company Limited 845,541.64 6.16%2 Shanghai Baosteel Pudong International Trade Co., Ltd. 773,294.98 5.64%3 Shougang Jingtang United Iron & Steel Co., Ltd. 636,598.15 4.64%4 Wuhan Iron and Steel Co., Ltd. 608,911.00 4.44%5 Guangdong Junjie Metal Materials Co., Ltd., 590,074.22 4.30%
Total – 3,454,419.99 25.18%

Annual Report 2013 35
Chapter 4Directors’ Report
3. Major Components of Expenses
Unit: RMB’000
Projects 2013 2012Year-on-year
change (%)
Sales expenses 1,832,733 1,765,697 3.80%Finance expenses 438,992 524,557 (16.31%)Management expenses 4,041,552 3,720,704 8.62%Income tax expenses 928,222 976,950 (4.99%)
4. R&D Expenditure
The Company formulated medium-term and long-term development strategies to optimize technical R&D system and platform, accelerated R&D of products and technologies as well as the upgrade and replacement of available products; adhered to the core value of “Innovation”, promote R&D of new products, new technology, new process and equipment; reinforced intellectual property rights protection.
The technical centre of the Group belongs to National Enterprise Technology Centre, and set up 26 group technical centres for various major industries, five of them are research institutes, 21 technical branch centres, and transformed the leading technology into the competitive advantages and commercial success of the clients relying on the strong R&D organizations.
The total expenditure of R&D this year was RMB501.949 million, accounting for 2.05% of annual net assets in 2013, and 0.87% of the revenue in 2013.

36 China International Marine Containers (Group) Co., Ltd.
Chapter 4Directors’ Report
5. Cash Flow
Unit: RMB’000
Item 2013 2012Year-on-year
change (%)
Subtotal of cash flow of operating activities 60,680,452 63,193,687 (3.98%)Subtotal of cash outflow of operating activities 57,930,526 60,950,768 (4.96%)Net value of cash flow generated by operating activities 2,749,926 2,242,919 22.60%Subtotal of cash flow of investing activities 1,445,316 1,149,371 25.75%Subtotal of cash outflow of investing activities 7,949,775 2,708,719 193.49%Net value of cash flow generated by investing activities (6,504,459) (1,559,348) (317.13%)Subtotal of cash inflow of financing activities 22,145,914 18,645,058 18.78%Subtotal of cash outflow of financing activities 18,512,977 21,534,725 (14.03%)Net value of cash flow generated by financing activities 3,632,937 (2,889,667) 225.72%Effect of changes in foreign exchange rate on cash and cash equivalents (94,420) 40,355 (333.97%)Net change of cash and cash equivalent (216,016) (2,165,741) (90.03%)
Instructions for reasons that relevant data change by more than 30%
applicable □ not applicable
Items Change Reasons
Net value of cash flow generated by investing activities
(317.13%) In addition to purchase and construction of fixed assets, intangible assets and other long-term assets, the reporting period, cash paid for vessels under construction increased significantly in the reporting period, compared with the same period of last year.
Net value of cash flow generated by financing activities
225.72% In the reporting period, the business expansion resulted in an increase in cash flow generated by financing activities.
Effect of changes in foreign exchange rate on cash and cash equivalents
(333.97%) In the reporting period, RMB exchange rate fluctuated more than the same period of last year.
Instructions for major differences between cash flow of operation activities of the Company during the Reporting Period and annual net profit this year
□ applicable not applicable

Annual Report 2013 37
Chapter 4Directors’ Report
6. Composition of principle business
Unit: RMB’000
Revenue Cost of salesGross rate
(%)
Year-on-year change in
revenue (%)
Year-on-year change in operation
cost (%)
Year-on-year change in
gross profit margin
Sub-sectorsContainer 21,307,283 18,272,449 14.24% (14.22%) (11.55%) (2.60%)Road transportation vehicle 13,334,698 11,301,512 15.25% (5.63%) (7.75%) 1.95%Energy, chemicals, liquid food equipment 11,579,974 9,202,545 20.53% 20.20% 19.03% 0.78%Marine engineering 6,982,317 6,874,211 1.55% 281.67% 301.15% (4.78%)Airport equipment 887,749 609,412 31.35% 17.27% 16.51% 0.45%Logistics services and equipment 6,215,849 5,417,054 12.85% 201.76% 228.06% (6.99%)Others 2,421,429 1,294,688 46.53% 14.84% 17.93% (1.40%)Combined offset (4,854,888) (4,729,511) – – – –Sub-productsContainer 21,307,283 18,272,449 14.24% (14.22%) (11.55%) (2.60%)Road transportation vehicle 13,334,698 11,301,512 15.25% (5.63%) (7.75%) 1.95%Energy chemicals, liquid food equipment 11,579,974 9,202,545 20.53% 20.20% 19.03% 0.78%Marine engineering 6,982,317 6,874,211 1.55% 281.67% 301.15% (4.78%)Airport equipment 887,749 609,412 31.35% 17.27% 16.51% 0.45%Logistics services and equipment 6,215,849 5,417,054 12.85% 201.76% 228.06% (6.99%)Others 2,421,429 1,294,688 46.53% 14.84% 17.93% (1.40%)Combined offset (4,854,888) (4,729,511) – – – –RegionsChina 20,718,567 – – (10.71%) – –America 11,247,084 – – (17.61%) – –Europe 13,954,472 – – 23.85% – –Asia (excluding China) 8,718,240 – – 138.09% – –Others 3,236,048 – – 26.85% – –
As the statistical method of the Company’s principle business was adjusted during the Reporting Period, the data on our principle business for the past year was derived from the modified statistical method as at the end of the Reporting Period
□ applicable not applicable

38 China International Marine Containers (Group) Co., Ltd.
Chapter 4Directors’ Report
7. Analysis of assets and liabilities
(1) Significant changes in assets items
Unit: RMB’000
As at the end of 2013 As at the end of 2012
Amount% of
total assets Amount% of
total assetsAmount change % change Reasons for the material changes
Notes receivable 1,376,286 1.90% 778,109 1.24% 598,177 77% Mainly due to the increase in sales settled by bills in the Reporting period.
Advance to suppliers
3,393,804 4.67% 1,213,042 1.93% 2,180,762 180% Mainly due to the marked increase in new orders in the offshore engineering segment and the prepayment of equipment purchases in the reporting period.
Other receivables 2,805,061 3.86% 2,114,435 3.36% 690,626 33% Mainly due to the increase in the accounts receivable this year is mainly attributed to borrowings by related parties outside the Group in the reporting period.
Available-for-sale financial assets
7,342 0.01% 609,751 0.97% (602,409) (99%) Mainly due to the decrease in the available-for-sale financial assets is mainly attributed to the disposal of such assets in the reporting period..
Investment properties
324,811 0.45% 183,668 0.29% 141,143 77% Mainly due to the acquisition of Zhenhua Group in the Reporting period.
Construction in progress
6,684,619 9.21% 2,279,993 3.62% 4,404,626 193% Mainly due to the increase in the number of ships under construction in the Reporting period.
Long-term prepaid expenses
96,075 0.13% 47,947 0.08% 48,128 100% Mainly due to the increase in the long-term prepaid expenses in 2013 is mainly attributed to the increase in insurance premium for finance lease items in the Reporting period.
Other non-current assets
333,097 0.46% 203,040 0.32% 130,057 64% Mainly due to the increase in other non-current financial assets in the reporting period is mainly attributed to the acquisition of Zhenhua Logistics Group and Hongxin Kingberg.

Annual Report 2013 39
Chapter 4Directors’ Report
(2) Significant changes in liabilities items
Unit: RMB’000
2013 2012
Amount% of
total assets Amount% of
total assetsAmount change % change Reasons for the material changes
Short-term borrowings
7,244,780 9.98% 5,438,407 8.63% 1,806,373 33% Mainly due to the financing arrangement made to meet the working capital needs in the reporting period.
Dividends payable
197,897 0.27% 38,747 0.06% 159,150 411% Due to dividends payable to minority equity holders as a result of the acquisition of Zhenhua Group in the reporting period.
Current portion of non-current liabilities
2,458,775 3.39% 1,261,940 2.00% 1,196,835 95% Mainly due to the long-term borrowings due within one year that were transferred in in the reporting period.
Long-term payables
242,992 0.33% 145,103 0.23% 97,889 67% Mainly due to the acquisition of Hongxin Kingberg and its subsidiaries in the reporting period.
Financial assets at fair value through profit or loss
27,166 0.04% 82,242 0.13% (55,076) (67%) Mainly due to maturity of some interest rate swap contracts in the reporting period.

40 China International Marine Containers (Group) Co., Ltd.
Chapter 4Directors’ Report
(3) Assets and liabilities measured at fair value
Unit: RMB’000
Items
Balance at the
beginning of the year
Profit or loss arising
from changes in fair value
for the year
Cumulative changes in fair value
recognised in equity
Impairment charged
for the current period
Purchases for the
current period
Sales for the current
period
Balance at the end of
the year
Financial Assets1. Financial assets
at fair value through profit or loss (excluding derivatives) 389,557 2,919 – – – – 319,605
2. Derivative financial assets 12,684 120,530 – – – – 133,068
3. Available-for-sale financial assets 609,751 – 2,920 – – – 7,342
4. Hedging instrument 2,851 – 10,974 – – – 7,940Sub-total of financial assets 1,014,843 123,449 13,894 – – – 467,955Financial liabilities (95,098) 66,434 – – – – (28,463)Total 919,745 189,883 13,894 – – – 439,492
the measurement attributes of the main assets of the Company change or not during the Reporting Period
□ Yes No

Annual Report 2013 41
Chapter 4Directors’ Report
8. Analysis of core competitive Advantages
A development strategy focusing on core businesses to accelerate industrial upgrades
After the global financial crisis in 2008, we stepped up the paces of industrial upgrades, focusing on strategic emerging businesses such as natural gas equipment and offshore engineering equipment while setting foot in financial, logistics and other modern services.
At present, the Company has built up a diversified business portfolio, including container business which continues to take the lead in the industry, as well as road transportation vehicles, energy, chemical and liquid food equipment and offshore engineering businesses with strong competitive edges in the PRC. The long-term focus on core business to constantly sharpen competitiveness in the industry is the core competitive advantage of the Group.
An enterprise framework and management system for continuous improvement and sustainability
The Company has developed a set of effective management models covering business philosophy, governance structure and management mechanism, thus establishing the competitive advantages over its rivals. A standardized and effective corporate governance structure is the institutional safeguards of the Company’s sustainable and healthy development. In recent years, the Company launched the strategic upgrade campaign of “building an empowering platform for sustainable healthy development of CIMC”. According to the organizational transformation direction of “layering management”, the Company established a three-tier management model comprising the Executive Committee, special committees and the Board of Directors as well as a 5S core management process. By introducing the lean management concept and promoting the “ONE” management model to meet the goal of continuous improvements, the Company has established an innovative and forward-looking management system to ensure sustainable and healthy development of its businesses.
Manufacturing management capabilities ensuring high quality at low costs
With the accumulation of large-scale, serialized and standardized management experience and capabilities in the area of container manufacturing over the years and its continuous improvements and upgrades, the Group brings into full play of its manufacturing technologies and process management with high efficiency and competitive costs as well as the core capabilities in lean production management across its business segments.
Integrated resources and collaborative development capacity
In the container sector, the Group has completed industrial consolidation through a series of mergers and acquisitions, and fully integrated supply chain, production and manufacturing, services and other processes to secure its leading cost advantage and leadership in the industry. Hence, on the basis of the existing resources and manufacturing and operating strengths, the Group is able to cultivate new businesses and industry chains for resource sharing and development synergy. The Group is also diversifying into other business segments, aiming to capitalize on local strengths and integrate global resources to establish a new business ecosystem.
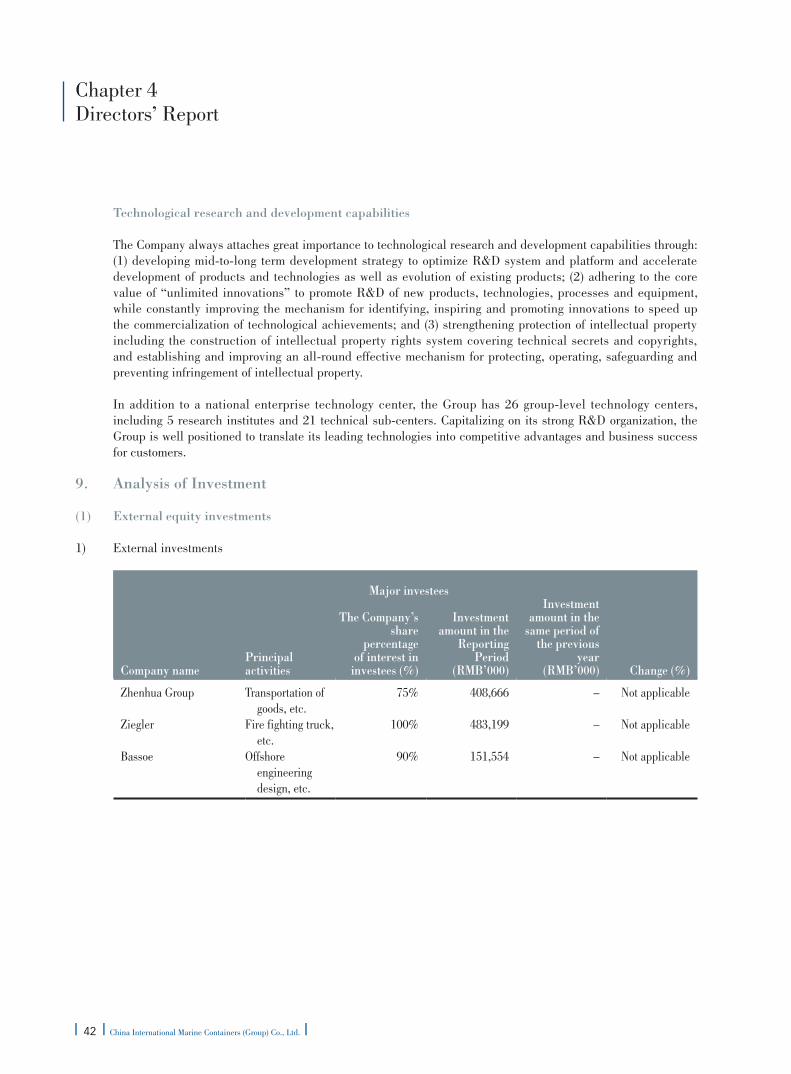
42 China International Marine Containers (Group) Co., Ltd.
Chapter 4Directors’ Report
technological research and development capabilities
The Company always attaches great importance to technological research and development capabilities through: (1) developing mid-to-long term development strategy to optimize R&D system and platform and accelerate development of products and technologies as well as evolution of existing products; (2) adhering to the core value of “unlimited innovations” to promote R&D of new products, technologies, processes and equipment, while constantly improving the mechanism for identifying, inspiring and promoting innovations to speed up the commercialization of technological achievements; and (3) strengthening protection of intellectual property including the construction of intellectual property rights system covering technical secrets and copyrights, and establishing and improving an all-round effective mechanism for protecting, operating, safeguarding and preventing infringement of intellectual property.
In addition to a national enterprise technology center, the Group has 26 group-level technology centers, including 5 research institutes and 21 technical sub-centers. Capitalizing on its strong R&D organization, the Group is well positioned to translate its leading technologies into competitive advantages and business success for customers.
9. Analysis of Investment
(1) External equity investments
1) External investments
Major investees
Company namePrincipal activities
the Company’s share
percentage of interest in investees (%)
Investment amount in the
Reporting Period
(RMB’000)
Investment amount in the
same period of the previous
year (RMB’000) Change (%)
Zhenhua Group Transportation of goods, etc.
75% 408,666 – Not applicable
Ziegler Fire fighting truck, etc.
100% 483,199 – Not applicable
Bassoe Offshore engineering design, etc.
90% 151,554 – Not applicable

Annual Report 2013 43
Chapter 4Directors’ Report
2) Equity investment in Financial institutions
Company nameCompany type
Initial investment
cost (RMB’000)
Number of shares
held at the beginning
of the Reporting
Period (share)
Shareholding at the
beginning of the
Reporting Period (%)
Number of shares
held at the end of the Reporting
Period (share)
Shareholding at the end
of the Reporting
Period (%)
Book value at the end
of Reporting Period
(RMB’000)
Profit and loss
during the Reporting
Period (RMB’000)
Classification in accounting
Source of shareholding
Bank of Communications Schroder
Non-listed financial enterprises
8,125 – 5% – 5% 8,125 5,000 Long-term equity investment
Legal person shares
Total 8,125 – – – – 8,125 5,000 – –
3) Security Investment
Security Stock codeAbbreviation of stock name
Initial investment
cost (RMB’000)
Number of shares
held at the beginning
of the Reporting
Period (share)
Shareholding at the
beginning of the
Reporting Period (%)
Number of shares
held at the end of the Reporting
Period (share)
Shareholding at the end
of the Reporting
Period (%)
Book value at the end
of the year (RMB’000)
Profit and loss
during the Reporting
Period (RMB’000)
Classification in accounting
Source of shareholding
A shares 002024 Suning Commerce Group
146,808 – – 18,779 0.25% 169,574 8,829 Financial assets held for trading
Acquired from secondary market
B shares 200581 Su Weifu-B 49,471 3,000 0.44% 750 0.07% 16,039 (10,404) Financial assets held for trading
Acquired from secondary market
H shares 00368 Sinotrans Ship- H
20,076 2,997 0.08% 2,997 0.08% 6,667 2,150 Financial assets held for trading
Acquired from secondary market
S shares G05.SI GoodPack 100,764 13,500 2.58% 13,500 2.41% 126,907 2,344 Financial assets held for trading
Acquired from secondary market
Other security investments held at the end of the Reporting Period
0 0 – 0 – 418 – – –
Profit or loss from securities investment sold during the Reporting period
0 0 – 0 – – 13,936 – –
Total 317,119 19,497 – 36,026 – 319,605 16,855 – –

44 China International Marine Containers (Group) Co., Ltd.
Chapter 4Directors’ Report
Description of shareholdings in other listed companies
applicable □ not applicable
As of the end of the Reporting Period, the Group’s equity interests in other listed companies are as follows:
Unit: RMB’000
Stock codeAbbreviation of stock name
Amount of initial
investment
Number of shares held
(Million shares)
Shareholding percentage
(%)Year-end
book value
Profit or loss
during the Reporting
Period
Change in the profit
or loss during the Reporting
PeriodClassification in accounts
Source of shareholding
Australian Stock Exchange: OEL
Otto Energy 13,480 14 1.19% 7,342 – 812 Available-for-sale financial assets
Stock acquisition
Hong Kong Stock Exchange: 206
TSC Group 167,591 92.8 13.43% 176,865 8,132 – Long-term equity investment
Stock acquisition
Singapore Stock Exchange: J74
Pteris Global Ltd 84,501 82 14.99% 55,038 (21,455) – Long-term equity investment
Stock acquisition

Annual Report 2013 45
Chapter 4Directors’ Report
(2) Entrusted wealth management, derivatives investment and entrustment loans
1) Derivatives investment
Unit: RMB’000
Name of the derivatives investment operator
Relationship with the Group
Related party transaction or not
type of derivatives investment
Initial investment amount of derivative
investmentDate of commencement
Date of termination
Investments at the
beginning of the period
Provision for impairment
(if any)
Investments at the end of
the period
Proportion of investments
at the end of the reporting
period period to net assets of the Company at
the end of the reporting
(%)
Actual profit or loss during the Reporting
Period
HSBC, Standard
Chartered and other
banks
None No Foreign exchange
forward
contract
– 2014/1/6 2015/5/16 3,008,961 – 11,881,745 58% 122,898
China Construction
Bank
None No Interest rate swap
contract
– 2009/12/28 2018/12/29 1,005,680 – 666,437 3% 64,066
Total – – – 4,014,641 – 12,548,182 – 186,964
Source of funds for derivative investments Self-funded.Litigation case (if applicable) Not applicable.Risk analysis and positions in derivatives
during the Reporting Period and explanations of risk control measures (including but not limited to market risk, liquidity risk, credit risk, operation risk, law risk, etc.)
As at 31 December 2013, the derivative financial instruments held by the Group mainly consisted of foreign exchange forward and interest rate swap contracts. The risks in interest rate swap contracts are closely related to interest rate fluctuations. Foreign exchange forwards are exposed to the risks in foreign currency markets and the certainty of the Group’s future foreign currency cash inflows. The Group exercises control over derivative financial instruments mainly through: prudently choosing and deciding on the type and quantity of additional derivative financial instruments; and establishing strict and standard internal approval system and operational process for derivative transactions, where the approval and authorization procedures at relevant levels are clearly defined to control the associated risks.
Changes in market price or product fair value of derivatives invested during the Reporting Period, where specific methods and relevant assumptions and parameters used shall be disclosed in the analysis of derivatives’ fair value
During the January to December 2013 period, the Group’s derivative financial instruments recorded fair value gains/losses of RMB186.964 million. The fair values of the Group’s derivative financial instruments are determined based on the quoted market prices from external financial institutions.
Explanations of any significant changes in the Company’s accounting policies and specific accounting principles on derivatives between the Reporting Period and the last Reporting Period
Nil
Specific opinions of independent non-executive Directors on the derivatives investment and risk control of the Company
We believe that in accordance with the regulations and requirements of regulatory authorities, the Company has followed the principle of prudence and established sound internal approval system and operational process to manage its derivative investments, and the risk control is effective.

46 China International Marine Containers (Group) Co., Ltd.
Chapter 4Directors’ Report
2) Entrustment Loans
Unit: RMB’000
Borrower
Related party or not Amount
Interest rate
Guarantor or collaterals
Intended purpose of loans
Quanzhou Jincheng Ocean Shipping Co., Ltd.
No 13,514 16.19% Corporate guarantee has been provided, with ships as collateral.
Operating asset turnover
Quanzhou Jincheng Ocean Shipping Co., Ltd.
No 15,930 14.64% Personal guarantee has been provided, with ships as collateral.
Operating asset turnover
Xiamen Xinshuangrong Auto Training Co., Ltd.
No 4,775 21.00% Real estate mortgage and equity pledge have been provided.
Operating asset turnover
Xiamen Yingzhong Fuhai Auto Co.,Ltd.
No 35,157 7.70% Corporate guarantee has been provided.
Operating asset turnover
Shenzhen Pengsangpu Energy-saving Services Co., Ltd.
No 6,800 9.00% Corporate guarantee has been provided, with equipment as collateral.
Operating asset turnover
Xiamen Hongxin International Logistics Co., Ltd.
No 21,873 8.75% Shareholders’ personal guarantees have been provided.
Operating asset turnover
Total – 98,049 – – –

Annual Report 2013 47
Chapter 4Directors’ Report
(3) Analysis of principal subsidiaries and associates
Please refer to the relevant information in “II. Review of the Group’s Principal Business during the Reporting Period” under “Chapter 4 Directors’ Report” in this report for details of the operations principal subsidiaries and associates.
The details on the subsidiaries that began and ceased to be consolidated into the accounts of the Company during the Reporting Period are set out in note IV.4 to the Financial Report prepared in accordance with CAS as set out in this Report.
applicable □ not applicable
Company name
Purpose for obtaining and disposing subsidiaries
Method of obtaining and disposing subsidiaries during the Reporting Period
Impact on overall production and performance
Zhenhua Group To enhance the Group’s service capability in the logistics industry
Business merger The Group’s service capability and competitive advantage in the logistics industry will be enhanced
Bassoe Technology AB To enhance the Group’s ability to provide offshore engineering services
Business merger The Group’s ability to provide offshore engineering services will be improved
Ziegler To expand the product line of the Group’s fire fighting truck business
Business merger The Group’s fire fighting truck business will be expanded, which will help raise the Group’s income and profits

48 China International Marine Containers (Group) Co., Ltd.
Chapter 4Directors’ Report
(4) Major projects invested by non-raised capital investment
Unit: RMB’000
Project name
total amount of
investments planned
Amount of investment during the Reporting
Period
Actual amount of
investment as at the
end of the Reporting
Period Progress
Acquisition of Zhenhua Logistics Group Co., Ltd 710,810 408,666 710,810 100%
Acquisition of CIMC Raffles offshore (Singapore) Limited 3,202,289 235,758 3,202,289 100%
Acquisition of Albert Ziegoler GmbH&Co.KG (“AZG”) 483,199 483,199 483,199 100%
Acquisition of Bassoe Technology AB 151,554 151,554 151,554 100%
Capital increase in Shenzhen Southern CIMC Eastern Logistic Equipment Manufacturing Co., Ltd. 487,752 398,173 487,752 100%
Capital increase in Qingdao CIMC Reefer Container Manufacture Co., Ltd. 529,496 299,752 529,496 100%
Capital increase in Xinhui CIMC Special Transportation Equipment Co., Ltd. 399,341 300,000 399,341 100%
Capital increase in Yangzhou CIMC Tong Hua Special Vehicles Co., Ltd 434,301 142,091 434,301 100%
Capital increase in Frigstad Deepwater Alfa Limited 394,670 388,573 394,670 100%
Capital increase in Frigstad Deepwater Beta Limited 357,016 350,919 357,016 100%
Capital increase in Hongtu Special Aircraft 100,000 80,000 100,000 100%
Establishment of CIMC Cold Chain Research Institution Co., Ltd. 50,000 50,000 50,000 100%
Establishment of CIMC Modular Building Design & Development. Co. Ltd 50,000 50,000 50,000 100%
Establishment of Guangdong Xinhui CIMC Modular Construction Manufacturing Co., Ltd. 80,000 80,000 80,000 100%
Establishment of CIMC Tianda Logistics System Engineering Co., Ltd. 60,000 60,000 60,000 100%

Annual Report 2013 49
Chapter 4Directors’ Report
Project name
total amount of
investments planned
Amount of investment during the Reporting
Period
Actual amount of
investment as at the
end of the Reporting
Period Progress
Establishment of Dongguan CIMC Innovation Industrial Park Co., Ltd. 50,000 50,000 50,000 100%
Establishment of Beacon holdings Group Ltd 134,132 134,132 134,132 100%
Total 7,674,560 3,662,817 7,674,560 –
10. Estimate on the operating results for the period from January to March, 2014
Warning and explanation in the forecast of the possible aggregate net profits from the beginning of the year to the end of the next Reporting Period becoming a loss or significant changes compared to the corresponding period of the previous year
□ applicable not applicable
11. Detailed explanation of changes in accounting policies, accounting estimates and audit method in comparison with the financial report of the previous year
The Ministry of Finance issued the Accounting Standards for Business Enterprises No.39 – fair value measurement and No.40 – the joint venture arrangement and revised standards No.9 – employee compensation, No.30 – presentation of financial statements, No. 33 – the consolidated financial statements and No.2 – long-term equity investment in 2014. The above standards will take effect on 1 July 2014 and overseas listed companies are encouraged to implement them in advance. The Company is a listed company of A shares and H shares, therefore, its 2013 financial statements have been prepared according to the first five of the above standards in advance. We did not adopt No.2 standards in advance, since it was published shortly before our 2013 financial statements were approved for publication and we have not finished the related assessment.
12. Explanation of retrospective restatement for adjustment of significant accounting errors occurred during the Reporting Period
None.

50 China International Marine Containers (Group) Co., Ltd.
Chapter 4Directors’ Report
13. Explanation of changes in the scope of consolidated statement in comparison with financial report of previous year
Please refer to note IV to the Financial Statement compiled in accordance with CAS as set out in this Report for enterprise merger and newly set up companies.
14. Profit distribution and dividend payment of the Company
Formulation, implementation or adjustment of profit distribution policy (especially the cash dividend policy) during the Reporting Period
applicable □ Not applicable
Both the plan for profit distribution and the plan for conversion of capital reserve fund into share capital comply with the Company’s Articles of Association and other relevant provisions during the Reporting Period.
Particulars of Cash Dividend Policy
Was it in compliance with the requirements of the Company’s Articles of Association and the resolution of the general meeting:
Yes
Was the dividend distribution criteria and proportion well-defined and clear: YesWas the related decision making process and mechanism in place: YesDid independent Directors fulfill their duties and play their role: YesWere the medium and small shareholders given opportunities to sufficiently voice
their opinion and make requests and were their legal interests fully protected:Yes
Were conditions and procedures legal and transparent in respect of cash dividend policy with adjustments and changes:
Not applicable
The profit distribution plans and the conversion plans of conversion of capital reserves into share capital in the past three years (the Reporting Period inclusive):
The dividend payment plan in the year of 2013: based on the total share capital of 2,662,396,051 shares of the Company as at 31 December 2013, we distributed RMB2.70 in cash (including tax) for every 10 shares, amounting to a total dividend of RMB718,847,000.
The dividend payment plan for 2012: based on the total share capital 2,662,396,051 shares of the Company as at 31 December 2012, we distributed RMB2.30 in cash (including tax) for every 10 shares, amounting to a total dividend of RMB612,351,000.
The dividend payment plan for 2011: based on the total share capital 2,662,396,051 shares of the Company as at 31 December 2011, we distributed RMB4.60 in cash (including tax) for every 10 shares, amounting to a total dividend of RMB1,224,702,000.

Annual Report 2013 51
Chapter 4Directors’ Report
Cash dividend payments of the Company for the past three years
Unit: RMB’000
Year
Amount of cash dividend (including tax)
Net profit attributable to
ordinary shareholders of
the Company in the consolidated
statements of the year declaring
% of net profit attributable to
ordinary shareholders of the Company in the consolidated
statements
2013 (Proposal) 718,847 2,180,321 32.97%2012 612,351 1,939,081 31.58%2011 1,224,702 3,690,926 33.18%
The Company recorded a profit during the Reporting Period, and the undistributed profit of the Company was positive. However, the Company did not propose a cash dividend distribution plan
□ applicable not applicable
the Formulation and Implementation of the Company’s Dividend Distribution Policy in Cash
The Company has adopted a stable dividend distribution policy in a strict compliance with its relevant commitments in its H share listing document and its Articles of Association. At present, the Company distributes its dividend to shareholders once a year, namely the final dividend, and the total profit distributed in the form of cash dividend shall not be less than 30% of the average annual distributable profit of the Company in the last three years. The Company’s stable and active dividend distribution policy has received a warm welcome from its shareholders and fully protects the interests of its minority shareholders.
The Articles of Association specifically stipulates the Company’s dividend distribution: the Company’s final dividend will be determined at the shareholders’ meeting by ordinary resolutions. The Company is in strict compliance with all relevant provisions under the Articles of Association over the years for its decision-making on dividend distribution. The Company strives to achieve outstanding operating results and a good return for its shareholders.

52 China International Marine Containers (Group) Co., Ltd.
Chapter 4Directors’ Report
15. Plans of profit distribution and conversion of capital reserves into share capital during the Reporting Period
Basis of share capital of distribution plan (share) 2,662,396,051Total cash dividend (RMB) (including tax) 718,847Distributable profit (RMB) 1,308,078% of cash dividends in total a profit distribution 100%
Cash dividend policy:Where the Company is in a developed stage with no substantial capital expenditure arrangement, the dividend distributed in the form of cash shall not be less than 80% of the total profit distribution when distributing its profits.
Description of details of profit distribution or conversion of capital reserves into share capital:Based on the Group’s 2013 operation results and taking into account the Group’s overall financial position and cash flows situation, the Board of Directors recommended a final dividend of RMB0.27 per share (including applicable taxes) for the year of 2013. The final dividend of 2013 is subject to shareholders’ approval at the annual general meeting for the year of 2013.
16. Social Responsibility
Please refer to the full text of the report of social responsibility which has been disclosed on CNINFO Network on http://www.cninfo.com.cn/.
The Company and its subsidiaries are not in the highly polluting industries specified by national environmental protection authorities.
The Company and its subsidiaries suffer from no other severe social safety problems.
No administrative penalty was imposed on the Company and its subsidiaries during the Reporting Period.

Annual Report 2013 53
Chapter 4Directors’ Report
17. Registration Form for Reception of the Survey, Communication, Interview and other activities during the Reporting Period
Date of reception
Venue of reception
Mode of reception
type of party received Party received
Main topics of discussion and information provided
7 January 2013 Company Field research Organization UBS Business structure, recent industrial developments, main business situations, investment progress of the Company, as well as industry outlook in 2013
11 January 2013 Company Field research Organization RBS Investment Bank Same as above14 January 2013 Company Field research Organization First Capital, China Life Insurance, China
Merchants Securities, Morgan Stanley Huaxin, Sun Life Everbright Life
Same as above
15 January 2013 Company Field research Organization Harvest Fund Same as above21 January 2013 Company Field research Organization UBS International Same as above25 January 2013 Company Field research Organization CITIC Securities Same as above28 January 2013 East Factory Field research Organization Morgan Stanley and BNP Paribas Same as above29 January 2013 Company Field research Organization HSBC and Standard Chartered Bank Same as above31 January 2013 Company Field research Organization Morgan Stanley and Barclays Bank Same as above31 January 2013 Zhang Jiagang,
NantongField research Organization UBS International and Bank of America
Merrill LynchSame as above
4 February 2013 Company Field research Organization HSBC and Atlantis Investment Same as above5 February 2013 Company Field research Organization Deutsche Bank Same as above22 March 2013 Hong Kong Field research Organization Securities Analyst and Fund Manager Conference for the result of 2012 annual
report25 March 2013 Hong Kong Field research Organization Morgan Stanley, HSBC and their clients Road show of 2012 annual result28 March 2013 Singapore Field research Organization Goldman Sachs and its clients Road show of 2012 annual result9 April 2013 Yantai Field research Organization DnB, Moon Capital, Swiss Capital Recent situation of marine engineering
business and principal business, investment progress, industry outlook in 2013.
10 April 2013 Company Field research Organization Shenyin Wanguo Business structure, recent industrial developments, main business situations, investment progress of the Company, as well as industry outlook in 2013
19 April 2013 Company Field research Organization Jefferies and its clients, UBS and its clients Same as above6 May 2013 East Factory Field research Organization Guoyuan Securities, Parvest Investment,
Eastern Harbour Investment, Wintech Investment, Shanghai Ruixin Investment
Same as above
21 May 2013 East factory Field research Organization Daiwa Securities Same as above23 May 2013 Company Field research Organization UBS Same as above30 May 2013 Company Field research Organization Soochow Securities Same as above4 June 2013 Company Field research Organization Neuberger Berman Same as above

54 China International Marine Containers (Group) Co., Ltd.
Chapter 4Directors’ Report
Date of reception
Venue of reception
Mode of reception
type of party received Party received
Main topics of discussion and information provided
6 June 2013 Yantai Field research Organization Guosen Securities, Shanghai Changxin Asset Management, Taikang Assets, Tadmor Capital, Everbright Pramerica, Merrill Lynch, Essence Securities, Huatai Securities, Haitong Securities, Ruixin Investment, Shenzhen Bailida Investment, CAIDA Securities, BOCI Securities, Wintech Investment, Harvest Fund, Guotai Fund, Hongyuan Securities, Jaguars Asset Management
Recent development of marine engineering business and principal business, investment progress, industry outlook in 2013.
7 June 2013 Wuhu Field research Organization Guosen Securities, Guotai Fund, Taikang Assets, Everbright Pramerica, Merrill Lynch, Essence Securities, Huatai Securities, Everbright Securities, Haitong Securities, Ruixin Investment, Tanita Shenzhen Investment, CAIDA Securities, BOCI Securities, Hongyuan Securities, Jefferies and its clients
Recent development of heavy truck business and principal business, investment progress, industry outlook in 2013
18 June 2013 Lang Fang Field research Organization Everbright Securities, CRAMC, Ying Feng Capital, Wanjia Fund, Essence Securities, Huatai Securities, Haitong Securities, Xin Chao Capital, China Merchants Securities, BOCI Securities, Hua Chuang Securities, Shenyin Wanguo Securities, Shanghai Sunflower Investment, Shanghai Shangya, CICC Company, J.P. Morgan, Guotai Junan Securities, GF Securities, Guoyuan Securities Hong Kong, CICC Company, Bosera Funds
Recent development of energy and chemical business and principal business, investment progress, industry outlook in 2013
19 June 2013 Zhang Jiagang Field research Organization Everbright Securities, CRAMC, Ying Feng Capital, Wanjia Fund, Essence Securities, Huatai Securities, Haitong Securities, Xin Chao Capital, China Merchants Securities, BOCI Securities, Hua Chuang Securities, Shenyin& Wanguo, Shanghai Sunflower Investment, Shanghai Shangya, CICC Company, J.P. Morgan, Guotai Junan Securities, GF Securities, Guoyuan Securities Hong Kong and Bosera Funds
Recent development of energy and chemical business and principal business, investment progress, industry outlook in 2013
26 June 2013 Shanghai Field research Organization Merrill Lynch, Nomura Asset Management Same as above4 July 2013 Hong Kong Others Organization Capital Construction Conference of
J.P.Morgan ChaseRecent Infrastructure industry situation
and investment strategy

Annual Report 2013 55
Chapter 4Directors’ Report
Date of reception
Venue of reception
Mode of reception
type of party received Party received
Main topics of discussion and information provided
11 July 2013 Company Field research Organization Franklin Trust, EO Capital, KGI Securities The Company’s business status, recent situation of the industry and principal business, investment progress, estimated result of 2013 and industry outlook in this year.
12 July 2013 Company Contact by phone Organization First Beijing Same as above17 Jul 2013 Company Contact by phone Organization Taiwan Yongfeng Investment Trust Same as above19 July 2013 Company Field research Organization Everbright Pramerica Fund, Taikang
Asset Management, Guosen Securities, Minsheng Securities, Huatai Securities, China Merchants Securities, Hua Chuang Securities, Everbright Securities, GF Securities, First State Cinda Asset, Guoyuan Securities in Hong Kong, UBS, Jefferies, GE Capital, Guotai Junan Securities, Changxin Fund, Barclays Capital, Citi Investment Research & Analysis, Macquarie Group, Morgan Stanley, Standard Chartered Bank (Hong Kong) Limited, J.P. Morgan Securities (Asia Pacific) Limited, HSBC, Guotai Junan Securities (H.K.) Limited, Bank of America Merrill Lynch, Goldman Sachs (Asia) L.L.C.
Same as above
22 July 2013 Company Field research Organization Goldman Sachs, Wellington Fund Same as above24 July 2013 Company Field research Organization Grand Cathay Securities Same as above26 July 2013 Company Field research Organization Citigroup Global Same as above28 August 2013 Hong Kong Others Organization Media and analysts Disclosure of interim result of 201330 August 2013 Company Field research Organization Gaoguan Investment Company The Company’s business status, recent
situation of the industry and business, investment progress, interim result of 2013 and industry outlook of this year.
30 August 2013 Company Contact by phone Organization Clients of CLSA Same as above3 September 2013 Company Contact by phone Organization CLSA Same as above9 September 2013 Qianhai,
ShenzhenField research Organization Myriad Asset Management The Company’s business status, recent
situation of the industry and business, investment progress,;the situation of the land in Qianhai
13 September 2013 Shenzhen Written inquiry Others Activities on on-line group reception day for interactive platform of investment relationship
The Company’s business status, recent situation of the industry and business, investment progress, annual result of 2013 and industry outlook of this year.
23 September 2013 Shanghai Field research Organization T Rowe Price Same as above27 September 2013 Company Other Individual Individual investors (communication via
on-site Shareholders’ Meeting)Same as above

56 China International Marine Containers (Group) Co., Ltd.
Chapter 4Directors’ Report
Date of reception
Venue of reception
Mode of reception
type of party received Party received
Main topics of discussion and information provided
14 October 2013 Langfang Field research Organization AIA Recent development of energy and chemical business and principal business, investment progress, industry outlook in 2013
15 October 2013 Yantai Field research Organization AIA Recent development of marine engineering business and principal business, investment progress, industry outlook in 2013
11 November 2013 Company Field research Organization Nissay Asset Management The Company’s business status, recent situation of the industry and business, investment progress, annual result of 2013 and industry outlook of this year.
27 November 2013 Company Field research Organization GF Securities, INDUS Same as above3 December 2013 Company Field research Organization Standard Chartered Bank Same as above6 December 2013 Company Field research Organization Orient Securities Company Same as above27 December 2013 Company Field research Organization Guotai AMC Same as above30 December 2013 Company Contact by phone Organization Unified Asset Management Same as above
IV. BUSINESS PRoSPECtS oF tHE GRoUP IN 2014
1. Economic Environment and Policies
Looking into 2014, the world economy is expected to maintain a momentum of slow recovery and the driving force of the global economy shifts to developed countries with a steady recovery led by the United States. Chinese government will remain relatively stable fiscal policy and steady monetary policy with a slightly tight, and the domestic economy is expected to grow at a stable rate with a moderate rise in the inflation in 2014. IMF and Organization for Economic Cooperation and Development (OECD) expect the world economy will grow at the rate of 3.6% in 2014. However, the global economy will still face a lot of uncertainties in 2014, which includes, the United States phases out the quantitative easing, the Euro Area faces the problem of high debt and low confidence, Japan raises the consumption tax rate, and there is an economic slowdown in BRIC countries, etc.
2. Industry Development trend and Market outlook
(1) In respect of container business, it is expected that the trade volume of global containers will continue to grow in 2014, at a rate greater than 2013. CLARKSONS (a British shipbroker in dynamic analysis of shipbuilding and marine trade) predicts that the growth rate of container trade will reach 6.0% in 2014. Alphaliner (a French shipping consulting firm) predicts that the growth rate of container trade will be 4.4% in 2014, while the shipping capacity of containers will increase by 5.5%, although the gap between the supply and the demand has narrowed compared to 2013, there remains the oversupply of the shipping capacity. Therefore, shipping companies will take measures such as strengthening the alliance and maintaining slow steaming to further improve efficiency, reduce costs, and absorb excess shipping capacity.

Annual Report 2013 57
Chapter 4Directors’ Report
(2) In respect of road transportation vehicle business, the global economy will enter a slow recovery period in 2014, in which the economic environment of North American markets is favorable, and the supply and demand of special vehicles are essentially flat; European economy shows signs of recovery, which is beneficial to the business and client development of the Group; there are growth opportunities for the Chinese market, and the demand for transportation and engineering vehicles will bottom out; the overall economic situation in emerging markets is similar to China, with steady growth in mature markets and urgent demand for new products, and there is a large sales space and significant opportunities for development.
(3) In respect of energy, chemical and liquid food equipment business, 1) Energy equipment business: low-carbon energy is an inevitable trend, the “Twelfth Five-Year” Plan offers appropriate encouragement and support for related industries in future, therefore, the demand for natural gas equipment will also increase fairly rapidly; 2) Chemical equipment business: the global market suffers from overcapacity and stiff competition and there are many uncertainties in the situation of the tank container market, the total demand of which in 2014 is expected to be lower than that in 2013; 3) Liquid food equipment business: the global beer industry is more and more matured, and the European and North American markets suffer from negative growth affected by the weak economy, while emerging economies such as China, Southeast Asia and South America suffer from a new growth taking the place of developed counties.
(4) In respect of offshore engineering business, in recent years, China has introduced many policies to support the offshore engineering industry, in particular the “Twelfth Five-Year” Plan has listed the offshore engineering equipment manufacturing as a strategic emerging industry to supports. This brings a huge strategic opportunity for the development of offshore engineering. The global offshore engineering market is in a booming period, and mainstream oil service companies have completed the replacement of jack-up drilling platforms and drilling rigs. In 2014, many mainstream customers are in demand for batch replacement of old semi-submersible drilling platform. In the next five years, the compound annual growth rate of investment in offshore oil and gas exploration and production will maintain a CAGR of 10%.
3. overall operation targets for our Business Development and Initiatives
In 2014, The Group will continue to promote the transformation and upgrading to seek continuous improvements. It will constantly innovate in technology, business models and management mechanisms and control risks. Major efforts will be made to seize the historic opportunity to set challenging goals for growth and development, to move towards the goal of becoming a worldclass enterprise. The Group will continue to create new systematic and cultural merits, carry out systematic upgrade in product and technical innovation, especially business model and other areas, focus on breakthroughs so as to cultivate competitive edges and optimize business structure and establish an “accumulative continuous improvement mechanism”, in order to lay a new foundation for the continuous healthy development of the Group.
In respect of container business, the Group will continue to focus on connotative growth, begin the transformation towards the service, base on market orientation, strengthen the cost management, optimize the rapid response mechanism, and enhance the competitiveness of core businesses; the Group will make efforts to explore and research new business opportunities for special container business, modular construction business and cold chain business, etc. Meanwhile, in order to adapt to changes in the external environment, it will commit itself to environmental protection and focus more on constantly improving production conditions, ensuring the supply of workers and attaining effective capacity.

58 China International Marine Containers (Group) Co., Ltd.
Chapter 4Directors’ Report
In respect of road transportation vehicle business, in the domestic market, the Group will continue the product innovation and increase investment, to ensure a continuously steady growth of the refrigerator cars business, and exploit opportunities to promote innovative urban logistics vehicles, while increasing the investment in the business of vehicle logistics park, and improving the sales and service network; in North American market, seize market opportunities, promote new product design, and continue the connotation optimization of the Vanguard trailer business, to realize a substantial growth in sales; in the European market, establish the LAG tanker product cluster and expand the brand influence of LAG, and CIMC Silvergreen enters into the European mainstream semi-trailer market; in emerging markets, strengthen cross-border extension of high-end products and brands.
In respect of energy, chemical and liquid food equipment business, the Group will continue to consolidate and strengthen the existing mature products in future, promote the increase in the amount of star-products, and cultivating seeded products; promote the expansion of global markets, focusing on expanding North America, Russia and overseas markets; strengthen technical research and development, and improve the overall technical level; develop the strategic planning, and perform a prospective study for the energy equipment and engineering, to capture potential growth opportunities. By connotation optimization and collaborative sharing, there is a significant increase in the level of manufacturing, supply chain management and labor capacity.
In respect of offshore engineering business, in 2014 the Group will focus on breakthroughs in mainstream customer orders with regard to moderately deepwater semi-submersible drilling platforms. As for the target markets, it will continue to consolidate the position of North Sea markets, and vigorously develop the Brazilian market and other areas, creating synergy between manufacturing capability and design expertise, so as to make a breakthrough in orders with regard to semisubmersible workover platform and the economic semi-submersible drilling platform. 2014 will be a year in which the Group has the most projects under construction and the biggest challenges to its resources and capacity. The Group will accelerate the construction of the project management system, create a procurement system with competitive edge in the field of key equipment/materials, continuously enhance the ONE lean security and improve all the basic management of the Company; gear up the EPC capabilities and centralize all resources on the project to finally ensure achievement of the project; and continue to expand the advantage of the drilling platform, vigorously develop the markets of living platform and production platform, and enrich the product line so as to achieve a sustainable development.
4. Capital Expenditure and Financing Plan
According to the changes in economic situation and operating environment, as well as the needs of the Group’s strategic upgrade and business development, the capital expenditure of the Group is expected to be RMB5.62 billion in 2014, for which various forms of financing arrangements will be considered.
5. Risk Factors for our Future Development
(1) Policy Risks and Challenges
In recent years, China’s economic transformation and upgrading are in full swing. China presents the roadmap for comprehensively deepening reform and overall objectives in the coming years, and various laws and policies are in the changing and adjusting period, especially the industrial policies and tax policies that have a huge impact on the business. The container sector, as part of the traditional manufacturing industries, will face certain policy risks in the coming years, such as the export tax rebate policy, investment approval policy, and industrial land supply policy, etc.

Annual Report 2013 59
Chapter 4Directors’ Report
(2) Economic Risks and Challenges
1) Periodic fluctuations: The industries involved in the business operations of the Group are highly dependent on domestic and global economic performance and often vary with the overall economic environment periodical changes, especially the performance of domestic and global industrial sectors. At present, we are facing various risks including declining growth in global trade, China’s export and the demand for containers. Under the impact of financial reform, exchange rate fluctuations in the RMB against the USD are more frequent and see choppy trading, which will lead to some exchange rate risks.
2) Market competition: The Group is confronted with competition from domestic and foreign enterprises in respect of container manufacturing, road transportation vehicle, energy, chemical and liquid food equipment businesses. Besides, the competition pattern of the industry may change due to entry of new comers or rising capacity of existing rivals. In particular, as a “strategic emerging industry” of high investment and long cycle underpinned by state policy, domestic offshore engineering players may not only compete with overseas leading counters but are also challenged by more domestic traditional shipyards and capital, which may escalate competition in the future.
3) Industry relocation: From the point of view the law of the endogenous demand and industrial transfer of the container industry, the container industry has been maintained a certain synchronicity with the global trade development and industrial transfer. With the development of global economic integration, as well as increase in the cost of various production elements in China, the manufacture of container containerizable commodities is shifting to lower-cost South East Asia, South Asia and Latin America.
(3) Social Risks and Challenges
1) Employment pressure: Due to demographic changes in China, Chinese manufacturers are generally facing the adjustment and change of employment structure. On one hand, the new generation of Chinese manufacturing workers is expecting better labor environment and their demands and needs are becoming increasingly diversified; on the other hand, with gradual loss of demographic dividend and the adjustment to labor policies in China, China’s manufacturers, especially labor-intensive enterprises, see constantly soaring labor costs. The automation represented by the robot is becoming one of key directions for future upgrading of the container industry.
2) Pressure of environmental protection: China has entered a stage of economic restructuring and social transformation and it will continue to implement the strategy of sustainable development. Since 2013, environmental protection, especially the treatment of air pollution, has become one of the top priorities of governments at all levels in China. China’s traditional manufacturing industries, including the container industry, are facing increasing pressure of environmental protection. This is also one of key directions for future upgrading of the container industry.
(4) technical Risks and Challenges
As a traditional industry, pushed by external pressure and internal demand, the container industry is facing major challenges in upgrading of equipment technology, process technology, and product technology, especially the engineering technology upgrading represented by the automation and streamlining as well as the product technology upgrading represented by green, environmental protection and energy conservation. But due to dissatisfactory legal environment for intellectual property protection in China, the Group will still face serious challenges in intellectual property protection in future.
60 China International Marine Containers (Group) Co., Ltd.
Chapter 4Directors’ Report
V. otHER MAttERS REPoRtED BY tHE BoARD oF DIRECtoRS
1. last Five-Years Financial Summary
For the summary of the results and of the assets and liabilities of the Group for the last five financial years, please refer to the sub-section headed “Key Accounting Data and Financial Indicators in the Last Five Years” under the section headed “Chapter 2: Summary of Accounting Data and Financial Indicators” in this annual report.
2. Bank loans and other Borrowings
Details of bank loans and other borrowings of the Company and the Group as at 31 December 2013 are set out in notes V.23, V.34, V.35, V.36 and V.37 to the financial statements prepared in accordance with CAS in this annual report.
3. Interest Capitalisation
Interest capitalised by the Group for the year of 2013 was RMB339.469 million.
4. Fixed Assets
Changes to the fixed assets of the Company and the Group during the year are summarised in note V.14 to the financial statements prepared in accordance with CAS in this annual report.
5. land Value Appreciation tax
Land value appreciation tax paid by the Group for the year ended 31 December 2013 was RMB140.368 million.
6. Reserves
Details of changes to the reserves of the Group for the year ended 31 December 2013 are set out in notes V.42, V.43 and V.44 to the financial statements prepared in accordance with CAS in this annual report.
7. Distributable Reserves
Details of distributable reserves of the Group for the year ended 31 December 2013 are set out in notes V.43 and V.44 to the financial statements prepared in accordance with CAS in the annual report.
8. Management Contract
During the year, the Company did not enter into any management contracts concerning the management or administration of its overall business or any of its material business, nor did any such management contract exist.

Annual Report 2013 61
Chapter 4Directors’ Report
9. Major Suppliers and Customers
The aggregate purchase attributable to the five largest suppliers of the Group was less than 30% of the Group’s total purchase in 2013.
The aggregate revenue derived from the major customers is set out in note V.45 (5) to the financial statements prepared in accordance with CAS in this annual report. The aggregate revenue derived from the five largest customers was less than 30% of the Group’s total sales.
Save as disclosed above, none of the Directors, Supervisors and their associates or any shareholder (who to the knowledge of the Directors were holding 5% or more of the Company’s share capital) had any interest in any of the above-mentioned suppliers and customers.
10. Repurchase, Sale or Redemption of Securities
The Group did not sell any other securities of the Company, nor did it repurchase or redeem any of the securities of the Company during the twelve months ended 31 December 2013.
11. trust Deposits and Irrecoverable overdue time Deposits
As at 31 December 2013, the Company did not have any trust deposits or irrecoverable overdue time deposits.
12. Share option Incentive Scheme
The implementation of share option scheme is helpful to establish an interest sharing and restraint mechanism among the directors, the management and the core employees, by which the management can better balance its long-term goal and short-term goal so as to attract and retain outstanding management candidates and key employees and stimulate sustainable value of incentives which will serve to guarantee the stable development of the Company in the long term and enhance its competitive strength.
For details of the share option scheme of the Company and its subsidiaries, please refer to Section 4: Implementation of the Company’s Share Option Scheme and its Impacts” under Chapter 7: Significant Events in this annual report.
13. Pre-emptive Rights
The Articles of Association or Chinese law had no provisions regarding pre-emptive rights under which the Company must issue new shares on a pro rata basis to existing shareholders.
14. Issue of debenture
Please refer to note V.37 of the consolidated financial statements of this annual report which is prepared according to CAS for details of the issuance of medium-term notes and convertible bonds by the Company.
15. Donation
In 2013, the Company has made a total donation of RMB941,000.

Fiancial Service
Nenghua
RealTransportVehicle
EnergyyChermical
LogisticsEquipment
TrackEquipment
Offshore Business
AirportFacilities
Container
Fiancial Service
Nenghua
RealTransportVehicle
EnergyyChermical
LogisticsEquipment
TrackEquipment
Offshore Business
AirportFacilities
Container

Fiancial Service
Nenghua
RealTransportVehicle
EnergyyChermical
LogisticsEquipment
TrackEquipment
Offshore Business
AirportFacilities
Container
Fiancial Service
Nenghua
RealTransportVehicle
EnergyyChermical
LogisticsEquipment
TrackEquipment
Offshore Business
AirportFacilities
Container

64
Chapter 5Management Discussion and Analysis
China International Marine Containers (Group) Co., Ltd.
The following contents are prepared in accordance with the relevant provisions of the “Hong Kong Listing Rules”. The following discussion and analysis shall be read together with the audited financial statements and notes thereto prepared in accordance with the Accounting Standards for Business Enterprises set out in other chapters.
1. CoNSolIDAtED oPERAtING RESUltS
Unit: RMB’000
2013 2012Percentage
Change (%)
Revenue 57,874,411 54,334,057 6.52%Operating profit 3,370,835 2,639,441 27.71%Net profit attributable to equity holders of the Company 2,180,321 1,939,081 12.44%Net cash inflow from operating activities 2,749,926 2,242,919 22.60%Net change in cash and cash equivalents (216,016) (2,165,741) (90.03%)
During the Reporting Period, the Company recorded a revenue of RMB57,874 million, representing an increase of 6.52% compared with the same period in 2012, the operating profit of RMB3,371 million, and net profit attributable to shareholders of the parent company amounted to RMB2,180 million, representing an increase of 27.71% and 12.44% respectively compared with the same period in 2012. Net cash generated from operating activities amounted to RMB2.750 million, representing an increase of 22.60% compared with the same period in 2012. Net change in cash and cash equivalents amounted to RMB(216) million, representing a significant improvement when compared with RMB(2,166) million in the same period in 2012.

Annual Report 2013 65
Chapter 5Management Discussion and Analysis
2. A N A lY S I S o F R E V E N U E B Y SEGMENt AND REGIoN
The following table lists the revenue of major segments of the Group and the percentage in the total revenue during the following period:
Unit: RMB’000
2013 2012
Sector Revenue
Percentage in the total
revenue (%) Revenue
Percentage in the
total revenue
(%)
Container 21,307,283 36.82% 24,840,079 45.72%Road transportation vehicles 13,334,698 23.04% 14,130,480 26.01%Energy, chemical, liquid food equipment 11,579,974 20.01% 9,633,707 17.73%Offshore engineering 6,982,317 12.06% 1,829,410 3.37%Airport equipment 887,749 1.53% 757,001 1.39%Logistics services and equipment 6,215,849 10.74% 2,059,877 3.79%Others 2,421,429 4.18% 2,108,573 3.88%Combined offset (4,854,888) (8.38%) (1,025,070) (1.89%)
Total 57,874,411 100.00% 54,334,057 100.00%
The following table lists the revenue generated from different regions and the percentage in the total revenue during the following period:
Unit: RMB’000
2013 2012
Region Revenue
Percentage in the total
revenue (%) Revenue
Percentage in the total
revenue (%)
Mainland Chinese 20,718,567 35.80% 23,202,710 42.70%America 11,247,084 19.43% 13,651,754 25.13%Europe 13,954,472 24.12% 11,266,791 20.74%Asia (excluding China) 8,718,240 15.06% 3,661,789 6.74%Others 3,236,048 5.59% 2,551,013 4.69%
Total 57,874,411 100.00% 54,334,057 100.00%

66 China International Marine Containers (Group) Co., Ltd.
Chapter 5Management Discussion and Analysis
Revenue of the Group in 2013 amounted to RMB57,874 million, representing an increase of 6.52% compared with the same period last year. From the prospective of operating results by segment, revenues of containers and road transportation vehicle business declined by 14.22% and 5.63% respectively compared with the same period last year. Revenue from energy, chemical, liquid food and equipment, offshore engineering and airport equipment business soared significantly by 20.20%, 281.67% and 17.27% respectively compared with the same period last year. Revenue of logistics service and equipment business also saw expansion accordingly due to inclusion of Zhenhua Group into the consolidated statements in 2013. By region, revenue from mainland China and America fell slightly while increased significant from Europe and Asia (excluding China). For detailed analysis, please refer to “2. Review of the Group’s Principal Business during the Reporting Period” of “Directors’ Report” in this report.
3. oPERAtING CoStS AND GRoSS MARGIN
The following table lists the cost of sales of major segments of the Group and the percentage in the total cost of sales during the following period:
Unit: RMB’000
2013 2012
Sector Cost of sales
Percentage in the total
cost of sales (%) Cost of sales
Percentage in the total
Cost of sales (%)
Container 18,272,449 37.88% 20,657,972 46.32%Road transportation vehicles 11,301,512 23.43% 12,251,132 27.47%Energy, chemical, liquid food equipment 9,202,545 19.08% 7,731,425 17.33%Offshore engineering 6,874,211 14.25% 1,713,647 3.84%Airport equipment 609,412 1.26% 523,053 1.17%Logistics services and equipment 5,417,054 11.23% 1,651,231 3.70%Others 1,294,688 2.68% 1,097,867 2.46%Combined offset (4,729,511) (9.81%) (1,025,070) (2.29%)
Total 48,242,360 100.00% 44,601,257 100.00%

Annual Report 2013 67
Chapter 5Management Discussion and Analysis
The following table lists the gross profit and gross margin of major segments of the Group during the following period:
Unit: RMB’000
2013 2012
Sector Gross profitGross margin
(%) Gross profitGross margin
(%)
Container 3,034,834 14.24% 4,182,107 16.84%Road transportation vehicles 2,033,186 15.25% 1,879,348 13.30%Energy, chemical, liquid food equipment 2,377,429 20.53% 1,902,282 19.75%Offshore engineering 108,106 1.55% 115,763 6.33%Airport equipment 278,337 31.35% 233,948 30.90%Logistics services and equipment 798,795 12.85% 408,646 19.84%Others 1,126,741 46.53% 1,010,706 47.93%Combined offset (125,377) – – –
Total 9,632,051 16.64% 9,732,800 17.91%
In 2013, the Group’s cost of sales amounted to RMB48,242 million, up about 8.16% from a year earlier. The overall gross margin was 16.64%, down 1.27ppts from a year earlier, mainly due to decline in gross profit of container business, offshore engineering and logistics services and equipment business. Gross margin of sub-sectors of the road transportation vehicles, energy, chemical and liquid food equipment and airport equipment business mounted compared with the same period last year. For detailed analysis, please refer to “II. Review of the Group’s Principal Business during the Reporting Period” of “Directors’ Report” in this report.
4. NoN-oPERAtING INCoME
The Group’s non-operating income in 2013 amounted to RMB274.223 million, a decrease of 23.90% compared with RMB360.365 million in 2012, mainly due to proceeds from disposal of large amount of intangible assets during the same period in 2012.
5. RESEARCH AND DEVEloPMENt CoStS
The Group’s research and development costs in 2013 amounted to RMB501.949 million, an increase of 40.36% compared with RMB357.628 million in 2012, mainly due to an increase in R&D investment.
6. SAlES AND DIStRIBUtIoN CoStS
The Group’s sales and distribution costs in 2013 amounted to RMB1,832.733 million, an increase of 3.80% compared with RMB1,765.697 million in 2012, mainly due to increasing selling expenses resulting from sales revenue compared with the same period last year.
7. ADMINIStRAtIVE ExPENSES
The Group’s administrative expenses in 2013 amounted to RMB4,041.552 million, an increase o f 8 .62% compared wi th RMB3,720.704 million in 2012, mainly due to changes in the consolidation of financial statements and an increase in technology development expenses.

68 China International Marine Containers (Group) Co., Ltd.
Chapter 5Management Discussion and Analysis
8. FINANCIAl ExPENSES
The Group’s financial expenses in 2013 amounted to RMB438.992 million, a decrease of 16.31% compared with RMB524.557 million in 2012, mainly due to a decrease in interest expenditure included in profit or loss resulting from more interest expenditure recorded in capitalization compared with the same period last year.
9. tAxAtIoN
T h e G r o u p ’s t a x i n 2 0 1 3 a m o u n t e d t o RMB928.222 million, a decrease of 4.99% compared with RMB976.950 million in 2012, mainly due to a decrease in the current income tax calculated in accordance with the tax law and relevant regulations compared with the same period last year.
10. P R o F I t At t R I B U tA B l E t o MINoRItY SHAREHolDERS
The Group’s profit attributable to minority shareholders in 2013 amounted to RMB454.177 million, compared with RMB(8.651) million
in 2012, mainly due to changes in earnings of subsidiaries of minority shareholders.
11. lIqUIDItY AND CAPItAl RESoURCES
As at 31 December 2013, the Group’s cash and cash equivalent amounted to RMB4,771.047 million (2012: RMB5,221.539 million). The Group has always maintained sufficient cash on hand to repay the bank loans due, and will concurrently continue to remain prudent in managing its future development and capital expenditure.
As at 31 December 2013, the Group’s bank loans, overdrafts and debentures payable amounted to RMB25,787.466 million (RMB20,799.527 million as of 31 December 2012). In 2013, the Group had appropriated bank loans of RMB19,443.628 million (2012: RMB15,627.848 million) and made repayment of bank loans amounting to RMB16,533.299 million (2012: RMB18,384.272 million).

Annual Report 2013 69
Chapter 5Management Discussion and Analysis
12. CASH Flow DAtA
The following table lists the net cash flow of the Group during the following period:
Unit: RMB’000
2013 2012
Net cash flows from operating activities 2,749,926 2,242,919Net cash flows from investing activities (6,504,459) (1,559,348)Net cash flows from/from financing activities 3,632,937 (2,889,667)Impact of changes in exchange rate on cash and cash equivalents (94,420) 40,355Net change in cash and cash equivalents (216,016) (2,165,741)Balance of cash and cash equivalents at the beginning of the year 4,397,512 6,563,253Balance of cash and cash equivalents at the end of the year 4,181,496 4,397,512
(1) operating activities
The Group’s net cash flows from operating activities amounted to RMB2,242.919 million in 2012 and RMB2,749.926 million in 2013, respectively, not a significant change.
(2) Investing activities
The Group’s net cash flows from investing activities amounted to RMB(1,559.348) million in 2012 and RMB(6,504.459) million in 2013, respectively, mainly due to a sharp increase in cash paid for vessels under construction compared with a year ago, in addition to acquisition and construction of fixed assets, intangible assets and other long-term assets.
(3) Financing activities
The Group’s net cash flows from financing activities amounted to RMB(2,889.667) million in 2012 and RMB3,632.937 million in 2013, respectively, mainly due to business expansion compared with a year ago.
13. CAPItAl StRUCtURE, GEARING RAtIo AND DESCRIPtIoN oF CAlCUlAtIoN BASIS tHEREoF
The Company’s capital structure consists of equity interests attributable to shareholders and liabilities. As at 31 December 2013, the equity interests attributable to shareholders amounted to RMB24,496.128 million, of which the minority interests amounted to RMB3,822.091 million, and the total liabilities amounted to RMB48,109.844 m i l l i o n . T h e t o t a l a s s e t s a m o u n t e d t o RMB72,605.972 million.
The gearing ratios were calculated based on our total debts as at the respective dates divided by our total assets. Our gearing ratios as at 31 December 2012 and 2013 were 64.89% and 66.26%, respectively, mainly due to an increase in the current total liabilities compared with the same period last year.
14. ASSEtS AND lIABIlItIES
For the Group’s assets and liabilities as at 31 December 2013, please refer to “7 Analysis of assets and liabilities” of “Section III: Financial Discussion and Analysis Compiled According to the Requirements of Domestic Securities Regulatory Authorities” under “Chapter 4 Directors’ Report” herein.

70 China International Marine Containers (Group) Co., Ltd.
Chapter 5Management Discussion and Analysis
15. CAPItAl CoMMItMENtS
As at 31 December 2013, the Group had contracted capital commitments of approximately RMB4,096.918 million (RMB2,263.576 million as at 31 December 2012), which was mainly used for construction of vessels for sale or rental, purchase of fixed assets and and foreign investment. The above capital commitment has been included in the 2013 capital expenditure budget.
16. S U B S I D I A R I E S , J o I N t l Y CoNtRollED CoMPANIES AND ASSoCIAtED CoMPANIES oF tHE GRoUP
For the subsidiaries, jointly controlled companies and associated companies of the Group as at 31 December 2013, please refer to note IV. 1 and V. 12 to the financial statements prepared in accordance with CAS in this report.
17. PlEDGE oF ASSEtS
For the details of the pledge of assets of the Group, please refer to note V. 22 to the financial statements prepared in accordance with CAS in this report.
18. SIGNIFICANt INVEStMENtS
For the Group’s significant investments as at 31 December 2013, please refer to “9. Analysis of Investments” of “Section III: Financial Discussion and Analysis Compiled According to the Requirements of Domestic Securities Regulatory Authorities” under “Chapter 4 Directors’ Report” herein.

Annual Report 2013 71
Chapter 5Management Discussion and Analysis
19. FoREIGN ExCHANGE RAtE RISK
The ma jo r i t y o f the Group ’s r evenue i s denominated in U.S. dollars, while most of its expenditure is made in Renminbi. Currently, the PRC government has implemented a regulated floating exchange rate regime based on market supply and demand with reference to a basket of currencies. However, Renminbi is still regulated in capital projects. The exchange rates of Renminbi are affected by domestic and international economic and political changes, and demand and supply for Renminbi. Future exchange rates of Renminbi against other currencies may vary significantly from the current exchange rates, which in turn would affect the operating results and financial position of the Group.
20. FUtURE PlANS FoR MAtERIAl INVEStMENtS AND ExPECtED SoURCE oF FUNDING
Currently, the Group’s operating and capital expenditures are mainly financed by our own fund and external financing. Concurrently, the Group will take a prudent attitude in order to enhance its future operating cash flow. The Group will consider various types of financing activities, to meet future capital expenditure and working capital requirement.
21. CoNtINGENt lIABIlItIES
For the liabilities of the Group as at 31 December 2013, please refer to note VIII. 1 to the financial statements prepared in accordance with CAS in this report.

72 China International Marine Containers (Group) Co., Ltd.
Chapter 5Management Discussion and Analysis
22. GRoUP INSURANCE
The Group carries limited insurance coverage for vehicles and certain assets subject to significant operating risks, in addition to third-party liability insurance against claims relating to personal injury, property and environmental damages arising from accidents and employer’s liability insurance. The effect of non-coverage on future incidents on the Company’s liability cannot be reasonably assessed at present.
23. EMPloYEES AND REMUNERAtIoN PolICIES
A s a t 3 1 D e c e m b e r 2 0 1 3 , t h e r e w e r e approximately 57,686 employees of the Group. The total staff cost of the Group, including Directors’ remuneration, contribution to the retirement benefit schemes and the costs of share option incentive schemes amounted to approximately RMB5,417.434 million.
The Group provided salary and bonus payment to its employees based on performance, qualification, experience and market conditions. The share option incentive scheme is used to recognise and award the contribution and long-term service of the Directors and core employees. Other benefits include contribution to the governmental pension schemes and insurance plans for employees in mainland China.
The Group regularly reviews its remuneration policies, including Directors’ remuneration, and strives to design an improved incentive and assessment mechanism based on operating results of the Group and market conditions.

Annual Report 2013 73
Chapter 5Management Discussion and Analysis
24. PENSIoN BENEFItS
Pursuant to the relevant laws and regulations of the PRC, the Group has provided the basic pension insurance for the employees arranged by local labour and social security bureaus. The Group makes contributions to the pension insurance at the applicable rates based on the amounts stipulated by the government organisation. The contributions are capitalised as part of the cost of assets or charged to current profit or loss on an accrual basis. When employees retire, the local labour and social security bureaus are responsible for the payment of the basic pension benefits to the retired employees.
For details of pension benefits, please refer to note II. 24 and V. 28 to the financial statements prepared in accordance with CAS in this annual report.
25. MARKEt RISKS
For deta i ls o f the Group’s market r isks , please refer to “5. Risk Factors for our Future Development” of “IV. Development Prospects of the Company in 2014” of Chapter 4 Directors’ Report” in this report.


76
Chapter 6Report of the Supervisory Committee
China International Marine Containers (Group) Co., Ltd.
Dear Shareholders,
During the year of 2013, the Supervisory Committee of the Company has performed and discharged its duties and responsibilities conscientiously in accordance with the relevant provisions of the PRC Companies Law and the Articles of Association.
1. MEEtINGS oF tHE SUPERVISoRY CoMMIttEE
Meetingtime of the meeting Resolutions
The 1st meeting of the 6th session, 2013
21 March 2013 1. Resolution on the 1st meeting for 20132. Review opinion on CIMC Internal Control Self-assessment Report for
20123. Review opinion on confirmation of daily connected transactions
in 2012 and the request for approval of the general meeting on continuing connected transactions with COSCO Pacific Limited and the newly-revised annual transaction cap
The 2nd meeting of the 6th session, 2013
23 April 2013 Resolution on the 2nd meeting for 2013
The 3rd meeting of the 6th session, 2013
26 April 2013 Review opinion on the 1st quarter report for 2013
The 1st meeting of the 7th session, 2013
28 June 2013 Resolution on the 1st meeting for 2013
The 2nd meeting of the 7th session, 2013
9 August 2013 Resolution on the by-election of Mr. He Jiale as candidate on behalf of the shareholders of the 7th Supervisory Committee
The 3rd meeting of the 7th session, 2013
27 August 2013 Review opinion on the interim report for 2013
The 4th meeting of the 7th session, 2013
14 October 2013 Resolution on the election of Chairman of the Supervisory Committee
The 5th meeting of the 7th session, 2013
29 October 2013 Review opinion on the 3rd quarter report for 2013
The 6th meeting of the 7th session, 2013
23 December 2013 Opinion on verifying the list of incentive target of share options of A shares granted on 28 September 2010
2. SUPERVISoRY CoMMIttEE’S PRESENCE oN otHER MEEtINGS AND PERFoRMANCE oF otHER oBlIGAtIoNS
All members of the Supervisory Committee have attended the regular meetings convened by the Board of Directors.
3. otHER MAttERS REVIEwED oR CoNCERNED BY tHE SUPERVISoRY CoMMIttEE
(1) opinion of the Supervisory Committee on the lawful operation of the Company
The Supervisory Committee of the Company conscientiously performs its duties in accordance with the applicable provisions of the PRC Companies Law and the Articles of Association. During the year, the members of the Supervisory Committee attended all board meetings. They conducted supervision on the procedures for convening the Board meetings, the decision-making and the actual implementation of the resolutions passed at the shareholders’ meeting by the Board of Directors as well as the decision-making process and business operation process of the Company in accordance with the applicable laws and regulations. The Supervisory

Annual Report 2013 77
Chapter 6Report of the Supervisory Committee
Committee considered that, during the year, the Company has made all decisions in accordance with legitimate procedures and its internal control system is sound. They are of the view that none of the Directors, President and senior management of the Company violated the Company’s Articles of Association or were detrimental to the interests of the Company during their usual course of work, nor have they abused their powers to damage the interests of shareholders and employees.
(2) opinion of the Supervisory Committee on inspection of the financial status of the Company
During the year, the Supervisory Committee has examined the Company’s business and financial situation, audited the annual report and interim report, quarterly reports and other documents submitted by the Board of Directors. The Supervisory Committee is of the view that these financial statements truly and fairly represent the Company’s financial position and operational results.
(3) opinion of the Supervisory Committee on the actual use of proceeds from the latest fund raising exercise
During the Reporting Period, no proceeds raised by the Company were applied.
(4) opinion of the Supervisory Committee on the acquisition and disposal of assets by the Company
During the Reporting Period, acquisition and disposal of assets of the Company were carried out at reasonable considerations, and no insider dealing was discovered. No prejudice to shareholders’ rights, dissipation of the Company’s assets or prejudice to the Company was discovered.
(5) opinion of the Supervisory Committee on connected transactions of the Company
During the Reporting Period, the continuing connected transactions of the Company were carried out with the approval of the general meeting of the Shareholders. Connected transactions were carried out at reasonable and fair considerations, and no prejudice to the non-connected shareholders or the Company was discovered.
(6) opinion of the Supervisory Committee on the operation of the internal control system of the Company and on the self-assessment report on the internal control of the Company.
Having conducted an adequate verification of the Company’s internal control pursuant to the basic regulations governing corporate internal control and the auxiliary guidelines on corporate internal control as well as the requirements of the Internal Control Guidelines for Companies Listed on the SZSE, the Supervisory Committee is of the view that after substantial review on the Company’s internal control systems: the Company’s existing internal control system complies with the requirements of the applicable laws, regulations and rules and can satisfy all the requirements of effective risk control in all material aspects; Self-Assessment Report on internal Control of CIMC for 2013 objectively and truly represents how the Company’s internal control system was established, operated, examined and supervised.
By Order of the Supervisory CommitteeHe JialeChairman of the Supervisory Committee
Shenzhen, the PRC25 March 2014

78
Chapter 7Significant Events
China International Marine Containers (Group) Co., Ltd.
I. MAtERIAl lItIGAtIoN AND ARBItRAtIoN EVENtS
General information of the litigation (arbitration)
Amount involved
(RMB’000)
lead to estimated liabilities or not litigation (arbitration) progress
trial result and impact of the litigation (arbitration)
Implementation of the judgement of the litigation (arbitration)
Disclosure date
Disclosure index
The semi-submersible drilling platforms named SS Pantanal and SS Amazonia built by CIMC Raffles and its subsidiaries for subsidiaries of Schahin Group in Brazil, were delivered in November 2010 and April 2011, respectively. CIMC Raffles and its subsidiaries also provided advances for Schahin Holdings SA and its six connected parties for the construction of drilling platforms.
1,300,000 No The semi-submersible drilling platforms named SS Pantanal and SS Amazonia built by CIMC Raffles and its subsidiaries for subsidiaries of Schahin Group in Brazil, were delivered in November 2010 and April 2011, respectively, but the sales of US$142,300,000 did not be received; Meanwhile, CIMC Raffles also provided advances for Schahin Holdings SA and its six connected parties for the construction of drilling platforms, and the advances of US$66,130,000 did not be received yet.
Since Schahin Holdings SA and its six connected parties did not pay the above amount in accordance with relevant contracts, CIMC Raffles and its subsidiaries lodged a law suit and arbitration application for the sales and the advances against Schahin Holdings SA and its six connected parties in December 2011 and May 2012, respectively. The decision on arbitration for the advances was made in December 2012, and CIMC Raffles received the advances of US$74,270,000 (including the principal of US$66,130,000 and the interest of US$8,140,000) for the period from September to October 2013, which settled the debt of advances; in October 2013, CIMC Raffles received the sales mentioned above of US$21,060,000 (including the principal of US$15,980,000 and the interest of US$5,080,000) according to the pre-decision of the arbitration for the sales; in December 2013, the London High Court made a prejudgment on the law suit for the sales that CIMC Raffles win the law suit and shall be paid US$67,320,000 (including the principal of US$53,350,000 and the interest of US$13,970,000), and the London prejudgment is being performed.
As at 31 December 2013, all the advances have been received and the sales of US$126,320,000 (equivalent to approximately RMB0.77 billion) have not been received yet.
As of the date of the approval of the financial statement, the above law suit and arbitration for the sales have not come to an end yet, and the defendant has counterclaimed. Based on the current progress of the legal proceedings and the professional advice of our lawyers, the Management of the Company was in an optimistic view regarding the litigation results. In the course of the proceedings, the Company will take positive legal measures to ensure that shareholders’ interests are not compromised.
Not yet settled 5 November 2013 http://www.cninfo.com.cn/finalpage/2013-11-05/63237032.PDF
Save as disclosed above, the Company was not involved in any material litigation or arbitration during the Reporting Period which could be expected to have a material adverse effect on our business, financial condition and results of operations.
II. MAttERS qUEStIoNED BY tHE MEDIA
The Company was not involved in any matter which was broadly questioned by the media during the Reporting Period.

Annual Report 2013 79
Chapter 7Significant Events
III. DURING tHE REPoRtING PERIoD, ASSEt tRANSACtIoNS oF tHE GRoUP
BUSINESS MERGERS
Please refer to Note IV.4 and IV.6 “The important business mergers involving enterprises not under common control occurred of the Group during the current period” to the financial statement prepared in accordance with the Accounting Standards for Business Enterprises of PRC in this year’s annual report.
The above transactions did not affect the continuity of the Group’s business and the stability of its management. They are beneficial for the future financial position and operating results of the Group on a continuing basis.
IV. DURING tHE REPoRtING PERIoD, IMPlEMENtAtIoN AND EFFECt oF tHE CoMPANY’S SHARE oPtIoN INCENtIVE SCHEME
1. Share option incentive scheme of the Company
In order to establish and improve the incentive-constraint mechanism, and effectively combine the interests of the shareholders, the interests of the Company and the personal interests of individuals, a “Share Option Incentive” (the “Share Option”, launched in two tranches) was considered and approved at the Extraordinary General Meeting of the Company on 17 September 2010. According to such plan, the first tranche of 54,000,000 share options were registered on 26 January 2011 and the reservation of 6,000,000 share options (the second tranche) were registered on 17 November 2011. Upon the consideration and approval at the 11th meeting of the 7th Board of Directors in 2013, the first exercisable period for the first tranche of share options have met the exercise conditions and was exercisable starting from 14 January 2014. Please refer to the relevant announcements released on the websites of the Shenzhen Stock Exchange, the Hong Kong Stock Exchange and the Company as well as the reports of the Company.

80 China International Marine Containers (Group) Co., Ltd.
Chapter 7Significant Events
Movements of the share options, which have been granted under the Scheme mentioned above, in the year as at 31 December 2013 are set out as below:
Number of underlying shares comprised in share options
Date of Grant
Balance as at
1 January 2013
Granted during
the year
Exercised during
the year
Cancelled during
the year
lapsed during
the year
Balance as at
31 December 2013
Exercise price
per share (RMB) Exercise period
Director Mai Boliang
2010.9.28 3,800,000 950,000 0 0 0 3,800,000 11.35 25% of the granted options 2012.9.28-2014.9.27; 75% of the granted options 2014.9.28-2020.9.27
Other SeniorManagement (Total)
2010.9.28 10,000,000 2,500,000 0 0 0 10,000,000 11.35 25% of the granted options 2012.9.28-2014.9.27; 75% of the granted options 2014.9.28-2020.9.27
Other employees
2010.9.28 40,200,000 10,050,000 0 382,500 0 39,817,500 11.35 25% of the granted options 2012.9.28-2014.9.27; 75% of the granted options2014.9.28-2020.9.27
2011.9.22 6,000,000 0 0 0 0 6,000,000 16.88 25% of the granted options2013.9.22-2015.9.21; 75% of the granted options2015.9.22-2020.9.27
Total – 60,000,000 13,500,000 0 382,500 0 59,617,500 – –
As of 31 December 2013, no option was exercised for the first tranche of share options, representing 0.00% of the total amount of share option scheme.
2. Share option incentive scheme of the subsidiary CIMC Enric
CIMC Enric, a subsidiary of the Company, had adopted a share option plan according to the ordinary resolution passed at its extraordinary general meeting held on 12 July 2006. The plan aimed to reward and give benefit to employees, directors and other eligible persons of CIMC Enric for their contributions to CIMC Enric. On 11 November 2009, CIMC Enric granted share options to several eligible persons according to the plan, in order to subscribe totally 43,750,000 ordinary shares with par value of HK$0.01 per share in the share capital of CIMC Enric (“2009 Enric Share Options”). In addition, CIMC Enric granted share options to several eligible persons on 28 October 2011 according to the plan, in order to subscribe totally 38,200,000 ordinary shares with

Annual Report 2013 81
Chapter 7Significant Events
par value of HK$0.01 per share in the share capital of CIMC Enric (“2011 Enric Share Options”). Please refer to the related announcement of CIMC Enric published on Hong Kong Stock Exchange website, the relevant announcements released on the websites of the Shenzhen Stock Exchange, the Hong Kong Stock Exchange and the Company as well as the regular reports of the Company.
As at 31 December 2013, 3,350,000 share options of the 2009 Enric Share Options and 2,350,000 share options of the 2011 Enric Share Options were lapsed respectively.
The table below sets out the changes in the share options granted under the share option incentive plan of CIMC Enric in the year as at 31 December 2013:
Number of underlying shares comprised in share options
Date of grant
Balance as at
1 January 2013
Granted within
the year
Exercised within
the year
transferred to/from
other categories
within the year
lapsed during
the year
Balance as at
31 December 2013
Exercise price
per share Exercise period
Directors of CIMC EnricZhao Qingsheng 2009.11.11 1,000,000 0 0 0 0 1,000,000 HK$4.00 2010.11.11-2019.11.10
2011.10.28 450,000 0 0 0 0 450,000 HK$2.48 2013.10.28-2021.10.27Gao Xiang 2009.11.11 1,000,000 0 0 0 0 1,000,000 HK$4.00 2010.11.11-2019.11.10
2011.10.28 500,000 0 0 0 0 500,000 HK$2.48 2013.10.28-2021.10.27Jin Jianlong 2009.11.11 800,000 0 0 0 0 800,000 HK$4.00 2010.11.11-2019.11.10
2011.10.28 300,000 0 0 0 0 300,000 HK$2.48 2013.10.28-2021.10.27Yu Yuqun 2009.11.11 800,000 0 (102,000) 0 0 698,000 HK$4.00 2010.11.11-2019.11.10
2011.10.28 300,000 0 0 0 0 300,000 HK$2.48 2013.10.28-2021.10.27Jin Yongsheng 2009.11.11 500,000 0 0 0 0 500,000 HK$4.00 2010.11.11-2019.11.10
2011.10.28 300,000 0 0 0 0 300,000 HK$2.48 2013.10.28-2021.10.27Mr. Van der Burg 2009.11.11 1,000,000 0 (1,000,000) 0 0 0 HK$4.00 2010.11.11-2019.11.10
2011.10.28 400,000 0 0 (400,000) 0 0 HK$2.48 2013.10.28-2021.10.27Wong Chun Ho 2009.11.11 500,000 0 0 0 0 500,000 HK$4.00 2010.11.11-2019.11.10
2011.10.28 300,000 0 0 0 0 300,000 HK$2.48 2013.10.28-2021.10.27Tsui Kei Pang 2011.10.28 300,000 0 0 0 0 300,000 HK$2.48 2013.10.28-2021.10.27Zhang Xueqian 2011.10.28 300,000 0 0 0 0 300,000 HK$2.48 2013.10.28-2021.10.27Employees of CIMC Enric
2009.11.11 19,000,000 0 (7,054,000) 0 0 11,946,000 HK$4.00 2010.11.11-2019.11.102011.10.28 30,350,000 0 (2,510,000) 400,000 (1,070,000) 27,170,000 HK$2.48 2013.10.28-2021.10.27
Other participants
2009.11.11 10,026,000 0 (896,000) 0 0 9,130,000 HK$4.00 2010.11.11-2019.11.102011.10.28 3,420,000 0 (276,000) 0 0 3,144,000 HK$2.48 2013.10.28-2021.10.27
Total – 71,546,000 0 (11,838,000) 0 (1,070,000) 58,638,000 – –
Note: Mr. Van der Burg has left office on 16 July 2013.

82 China International Marine Containers (Group) Co., Ltd.
Chapter 7Significant Events
3. Implementation of equity trust scheme of CIMC Vehicle:
An equity trust scheme of CIMC Vehicle was considered and approved at the general meeting of the Company on 17 October 2007 for implementation (the “CIMC Vehicle Equity Trust Scheme”). Pursuant to the scheme, the senior management related to the vehicle business of the Company and the key employees of the Company’s subsidiary CIMC Vehicle (the “CIMC Vehicle Scheme Participants”) held 20% equity interests in CIMC Vehicle by capital increase of RMB220.7 million through China Resources SZITIC Trust Co., Ltd. (Please refer to the relevant announcements published on the websites of the Shenzhen Stock Exchange, the Hong Kong Stock Exchange and the Company as well as the regular reports of the Company.
As of 31 December 2013, the aforesaid Trust Scheme had allocated 214.115 million share options, representing 97.02% of the total trust scheme.
V. MAtERIAl CoNNECtED tRANSACtIoNS DURING tHE REPoRtING PERIoD
(I) Connected transactions as defined by Chinese laws and regulations:
1. Connected transactions related to daily operations
the related parties
Relationship with the Group
type of the connected transaction
Details of the connected transaction
Pricing principle Price
Amount (RMB’000)
% of the total amount
of similar transactions
Settlement method
Available market price of similar
transactionsDisclosure date
Disclosure index
Ruiji Logistics (Wuhu) Co., Ltd.
Associated company
Commodity Purchasing
Commodity Purchasing
Based on normal commercial terms
– 59,735 0.05% – – – –
Shaanxi Heavy Duty Automobile Co. Ltd.
Minority shareholder of subsidiary
Commodity Purchasing
Commodity Purchasing
Based on normal commercial terms
– 59,140 0.05% – – – –
TSC Offshore Group Limited
Associated company
Commodity Purchasing
Commodity Purchasing
Based on normal commercial terms
– 53,902 0.04% – – – –
Sumitomo Corporation Minority shareholder of subsidiary
Commodity Purchasing
Commodity Purchasing
Based on normal commercial terms
– 22,626 0.02% – – – –
Other related parties – Commodity Purchasing
Commodity Purchasing
Based on normal commercial terms
– 14,321 0.00% – – – –
Subtotal – – – – – 209,724 0.16% – – – –

Annual Report 2013 83
Chapter 7Significant Events
the related parties
Relationship with the Group
type of the connected transaction
Details of the connected transaction
Pricing principle Price
Amount (RMB’000)
% of the total amount
of similar transactions
Settlement method
Available market price of similar
transactionsDisclosure date
Disclosure index
Shaanxi Heavy Duty Automobile Co. Ltd.
Minority shareholder of subsidiary
Commodity sales
Commodity sales
Based on normal commercial terms
– 589,840 1.04% – – – –
Florens Maritime Limited Subsidiary of major shareholder
Commodity sales
Commodity sales
Based on normal commercial terms
– 456,059 0.80% – – – –
Florens Container Corporation S.A.
Subsidiary of major shareholder
Commodity sales
Commodity sales
Based on normal commercial terms
– 431,671 0.76% – – – –
Sumitomo Corporation Minority shareholder of subsidiary
Commodity sales
Commodity sales
Based on normal commercial terms
– 186,072 0.33% – – – –
COSCO Container Industries Limited
Major shareholder of the Company
Commodity sales
Commodity sales
Based on normal commercial terms
– 91,662 0.16% – – – –
C&C Truck Co. Ltd. Associated company
Commodity sales
Commodity sales
Based on normal commercial terms
– 91,032 0.16% – – – –
Florens Container Services Ltd.
Subsidiary of major shareholder
Commodity sales
Commodity sales
Based on normal commercial terms
– 59,770 0.11% – – – –
Guangxi South CIMC Logistics Equipment Co. Ltd.
Associated company
Commodity sales
Commodity sales
Based on normal commercial terms
– 35,963 0.06% – – – –
NYK Line Zhenhua Logistics (Tianjin) Co. Ltd.
Joint-venture Commodity sales
Commodity sales
Based on normal commercial terms
– 17,451 0.03% – – – –
Other related parties – Commodity sales
Commodity sales
Based on normal commercial terms
– 7,135 0.01% – – – –
Total – – – – – 1,966,655 3.46% – – – –
Details of substantial sales return NilNecessity and continuity of the connected transactions, the reasons for selecting the related parties (rather than other market counterparties) to transaction
The above continuing connected transactions are routine in the Company’s normal business operations. They will continuously be governed by the principles of fairness and agreements that are fair and reasonable to the Company. In view of the Company’s long-term relationship with COSCO Pacific Ltd., directors believe that these transactions could promote and will continue to promote the Group’s operations and the growth in container business.
Whether connected transactions will affect the independence of the Company Do not affect the independence of the Company

84 China International Marine Containers (Group) Co., Ltd.
Chapter 7Significant Events
2. Credit and debt among the connected transactions (as defined by Chinese laws and regulations)
Related partiesRelationship with the Group
type of claims and liabilities Reason
Any appropriation of funds for non-operating purposes
opening balance
(RMB’000)
Amount incurred
during Reporting
Period (RMB’000)
Closing Balance
(RMB’000)
Gasfin Investment S.A Minority shareholder of subsidiary
Due to related party Proportionate shareholder loan
No 45,660 (2,732) 42,928
Eighty Eight Dragons Limited
Minority shareholder of subsidiary
Due to related party Proportionate shareholder loan
No – 164,634 164,634
Quercus Limited Minority shareholder of subsidiary
Due to related party Proportionate shareholder loan
No – 48,488 48,488
Shiny Labumum Limited Minority shareholder of subsidiary
Due to related party Proportionate shareholder loan
No – 293 293
Shanghai Fengyang Associate of the Group
Due from related party Proportionate shareholder loan
No 177,482 (143,278) 34,204
New Atlantic Timber (HK) Ltd.
Associate of the Group
Due from related party Proportionate shareholder loan
No 3,953 (120) 3,833
Marine Subsea & Consafe Associate of the Group
Due from related party Shareholder loan No 287,505 (8,594) 278,911
C&C Truck Co. Ltd. Associate of the Group
Due from related party shareholder loan No 17,000 615,732 632,732
Nantong New Atlantic Forest Industry Ltd.
Associate of the Group
Due from related party Proportionate shareholder loan
No – 39,434 39,434
Guangzhou KYH Metal Co.,Ltd.
Associate of the Group
Due from related party Proportionate shareholder loan
No – 9,997 9,997
Pteris Global Ltd Associate of the Group
Due from related party Proportionate shareholder loan
No – 5,785 5,785
Frigstad Deepwater Holding
Associate of the Group
Due from related party Proportionate shareholder loan
No – 155,901 155,901

Annual Report 2013 85
Chapter 7Significant Events
3. other material connected transactions (as defined by Chinese laws and regulations)
During the Reporting Period, the Group did not have any other material connected transactions.
(II). Connected transactions defined in accordance with the Hong Kong listing Rules:
The following connected transactions should be disclosed in this annual report pursuant to Rule 14A. of the Hong Kong Listing Rules.
1. one-off connected transaction
On 23 December, 2013, the Company entered into Subscription Agreements with COSCO Container Industries Limited (“COSCO Container”), pursuant to which the Company has conditionally agreed to allot and issue an aggregate of 65,099,638 new H Shares to COSCO Container at the Subscription Price of HK$13.48 per H Share and COSCO Container has conditionally agreed to subscribe for such new H Shares with cash consideration of HK$877,540,000 in accordance with the subscription agreement.
COSCO Container is a substantial shareholder of the Company, thus it is our connected person pursuant to Rule 14A.11 (1) of the Hong Kong Listing Rules. For details of the above connected transactions, please refer to the Company’s announcements published on 24 December 2013 and the circular released on 21 January 2014.
As of the Reporting Period, the above subscription agreement has not been completed.

86 China International Marine Containers (Group) Co., Ltd.
Chapter 7Significant Events
2. Continuing connected transaction between the Group and CoSCo Pacific limited (“CoSCo Pacific”) and CoSCo Container lines
On 21 March 2013, the Group and COSCO Pacific entered into a framework agreement of commodity sales(“Framework Agreement”), pursuant to which the Group would provide commodities such as containers to COSCO Pacific and its subsidiaries. On 28 June 2013, the agreement was approved by the general meeting in 2012 and became effective and will expire on 31 December 2014.
• Principal terms of the Framework Agreement are as follows:
Pricing principles: The following general pricing principles apply to the determination of service charges payable under the Framework Agreement:
(a) The bidding pricing where the bidding process is required;
(b) Government-prescribed price;
(c) Where there is no government-prescribed price, then the government-guidance price;
(d) Where there is neither government-prescribed price nor government-guidance price, then the market price; or
(e) Where none of the above prices is applicable or where it is not practicable to apply the above pricing policies, then according to the price to be agreed following arm’s length negotiation between the parties.
termination: During the term of the Framework Agreement, each of the parties can serve not less than three months prior written notice to the other party to terminate any specific agreement under the Framework Agreement and the Framework Agreement itself.
• total trading amount in 2013:
The annual trading cap for the year ended 31 December 2013 was RMB1.8 billion, while the actual total transactions during the Reporting Period was RMB1,039.162 million.
• Description of the Connected Relationship between the parties to the transactions:
At the time when the Framework Agreement was signed, COSCO Pacific is the holding company of COSCO Container Lines, a substantial shareholder of the Company. According to Rule 14A.11 of the Hong Kong Listing Rules, COSCO Pacific and its subsidiaries are our connected parties. After that, COSCO Pacific transferred its interests in COSCO Container Lines to Long Honour Investments Limited. COSCO Pacific is a company 30% controlled (severally or jointly) by China Ocean Shipping (Group) Company (“COSCO”), a substantial shareholder of the Company, and its group companies. COSCO Pacific is an associate of COSCO pursuant to Rules 19A.04(b)(i) and (iv) of the Listing Rules. COSCO Pacific and each of its subsidiaries are our connected persons pursuant to Rule 14A.11 of the Listing Rules. As such, the Framework Agreement constitutes a continuing connected transaction of the Company as defined in Rule 14A.14 of the Listing Rules. For details of the above transactions, please refer to the Company’s circular released on 24 April 2013 and announcement published on 21 May 2013.

Annual Report 2013 87
Chapter 7Significant Events
• Purpose of the transaction:
The continuing connected transaction mentioned above is conducted in the daily and general business process of the Company. The transaction will continue to comply with the equity principle and fair and reasonable provisions and agreements in terms of the Company. Given the long-term relationship between the Company and COSCO Pacific, the Directors believed that the transaction will enable to promote and continue to promote the growth of the operation and container business of the Company.
• Independent Non-executive Directors’ Confirmation:
In relation to the above connected transactions of the Group, the independent non-executive directors of the Company have reviewed and confirmed that:
• The connected transactions mentioned above have been entered into in the ordinary and usual course of business of the Company;
• The connected transactions mentioned above have been entered into on normal commercial terms or terms not inferior to those given by the Group or an independent third party (if applicable); and
• The connected transactions mentioned above have been entered into in accordance with the relevant agreements governing them on terms that are fair and reasonable and in the interests of the shareholders of the Company as a whole.
• Auditor’s Confirmation:
The auditors of the Company have reviewed the continuing connected transaction mentioned above and have provided the Board of Directors with a confirmation letter:
• Nothing has come to auditors’ attention that causes them to believe that such continuing connected transactions as disclosed above have not been approved by the Board of Directors;
• In relation to the transactions regarding provision of commodities and services by the Group, nothing has come to auditors’ attention that causes them to believe that the transactions were not, in all material respects, in accordance with the pricing policies of the Group;
• Nothing has come to auditors’ attention that causes them to believe that the transactions were not entered into, in all material respects, in accordance with the relevant agreements governing such transactions, and
• Nothing has come to auditors’ attention that causes them to believe that the actual transaction amounts exceeded the annual caps of the year which the Company disclosed on 22 March 2013.
3. Connected transactions and Related-party transactions
For details of the Group’s connected transactions and related-party transactions in the year, please refer to Note VI to the financial statements prepared under CAS in this annual report. Except the connected transactions as disclosed in this section, there are no other related-party transactions that should be disclosed in accordance with the disclosure provisions in Rule 14A of the Hong Kong Listing Rules.

88 China International Marine Containers (Group) Co., Ltd.
Chapter 7Significant Events
VI. MAtERIAl CoNtRACtS AND tHE PERFoRMANCE tHEREoF
1. No trusteeship, sub-contracting or leasing other company assets making a profit accounting for a profit at 10% or more of total profit of the Company in the current year for the Reporting Period.
2. There was no wealth management for trusteeship during the Reporting Period.
3. Unless otherwise disclosed in the annual report, there were no other significant contracts required to be disclosed during the Reporting Period.
4. Guarantees
Unit: RMB’000
External guarantees undertaken by the Company (excluding guarantees for subsidiaries)
Name of the guaranteed
Disclosure date of the announcement about guarantee amount
Guarantee amount
Actual date (date of the agreement)
Actual amount of guarantee
type of guarantee
Guarantee period
Fulfilled or not
Related party guaranteed or not (Yes or No)
Customers and dealers of the companies under CIMC Vehicle
24 April 2013 1,958,850 1 January 2013 702,140 Surety bond 1-2 years No No
Guarantees provided by one subsidiary to another subsidiary
24 April 2013 16,648,730 1 January 2013 5,769,600 Surety bond 1-2 years No No
Total external guarantee amount approved during the Reporting Period (A1)
809,580 Total actual amount of external guarantee during the Reporting Period (A2)
5,825,050
Total external guarantee amount approved at the end of the Reporting Period (A3)
18,427,580 Total actual external guarantee balance at the end of Reporting Period (A4)
6,471,740

Annual Report 2013 89
Chapter 7Significant Events
the Company’s guarantees for subsidiaries
Name of the guaranteed
Disclosure date of the announcement about guarantee amount
Guarantee amount
Actual implementation date (date of the agreement)
Actual amount of guarantee
type of the guarantee
Guarantee period
Fulfilled or not
Related party guaranteed or not (Yes or No)
Subsidiaries under CIMC Vehicle
24 April 2013 1,489,883 1 January 2013 923,563 Surety bond 1-2 years No No
Guarantees provided by one subsidiary to another subsidiary
24 April 2013 228,634 1 December 2011 228,634 Surety bond 3 years No No
Total guarantee amount for subsidiaries approved during the Reporting Period (B1)
482,817 Total actual guarantee amount for subsidiaries during the Reporting Period (B2)
545,197
Total e guarantee amount for subsidiaries approved at the end of the Reporting Period (B3)
1,718,517 Total actual guarantee balance for subsidiaries at the end of the Reporting Period (B4)
1,152,197
Total guarantee of the Company (total of the above two items)Total guarantee amount approved during the Reporting Period (A1+B1)
563,775 Total actual guarantee amount during the Reporting Period (A2+B2)
1,127,702
Total guarantee amount approved at the end of Reporting Period (A3+B3)
3,561,275 Total actual guarantee balance at the end of the Reporting Period (A4+B4)
1,799,371
% of total actual guarantee amount (A4+B4) in net assets of the Company 87.04%In which:Guarantee amount provided to shareholders, actual controllers and related parties (C) 0Debt guarantee amount provided directly or indirectly to the guaranteed which gearing ratio is over 70% (D) 756,626Amount of those guarantee which amount exceeds 50% of net assets of the Company (E) 765,669Total amount of the above three guarantees (C + D + E) 1,522,295

90 China International Marine Containers (Group) Co., Ltd.
Chapter 7Significant Events
VII. PERFoRMANCE oF CoMMItMENtS
the Commitments of the Company or shareholders with a shareholding above 5% occurred during or before the Reporting Period but continued during the Reporting Period
Commitment Promisor Contents of commitmentDate of commitment
Commitment period Implementation
Other commitments made to the shareholders of the Company
The Company In accordance with the relevant regulations, domestic residents are not eligible to purchase foreign stocks directly, so after the implementation of the plan, domestic residents can only hold or sell its H Shares of the Company which they legally possess due to the change of listing location of shares of the Company, they are not eligible to subscribe the shares of the Company and other H shares or other overseas stocks, and also after the sales of H shares of the Company, the sales income must be timely transferred to the mainland. The Company promises domestic residents that before they are free to purchase overseas stocks, the Company will not finance by the means of allotment
15 August 2012 Before domestic residents are free to buy overseas stocks
During the course of performance
Other commitments made to the shareholders of the Company
The Company Shareholders’ Bonus Return Plan (2012 to 2014)
19 July 2012 2012 to 2014 During the course of performance
The commitment is fulfilled in a timely manner or not
Yes

Annual Report 2013 91
Chapter 7Significant Events
VIII. ENGAGEMENt AND DISENGAGEMENt oF FIRM oF ACCoUNtANtS
the current engaged firm of accountants
The engaged firm of accountants in the mainland
PricewaterhouseCoopers Zhong Tian LLP (“PricewaterhouseCoopers”)
Payment for the accountants (RMB’000) 8,260Term of service of the accountants 2 yearsCPA of the accountants Zhou Weiran, Cao Cuili
The Company engaged PricewaterhouseCoopers as its domestic auditor after it moved to trading in Hong Kong Stock Exchange in 2012 through conversion of its B shares to H shares. Since then, there has been no change. The undersigned CPAs of PricewaterhouseCoopers are Zhou Weiran and Cai Cuili, and it is the second year for them to serve as the undersigned CPAs. Prior to that, KPMG has been engaged as the Company’s domestic auditor since 2007. During the Reporting Period, the Company did not change the engaged accountants.
During the Reporting Period, the Company engaged PricewaterhouseCoopers as its internal control auditor, and the internal control audit payment during the Reporting Period was RMB1 million (already included in the remuneration to the above domestic accountants).
Ix. ExPlANAtIoN oN otHER MAtERIAl MAttERS
1. On 26 April 2013, the Group entered into a series of memoranda of understanding on investment and cooperation with Dongguan Municipal Government and governments of relevant local districts and towns. For relevant information, please refer to the announcement of China International Marine Containers (Group) Co., Ltd. in relation to entering into memoranda of understanding on investment and cooperation with Dongguan Municipal Government (Notice No.: [CIMC] 2013-015) disclosed in China Securities Journal, Shanghai Securities News, Securities Times, Cninfo website (www.cninfo.com.cn) and the Company’s website (www.cimc.com) on 27 April 2013, and the announcement published on the website of the Hong Kong Stock Exchange (www.hkexnews.hk).
On 16 March 2014, the Group entered into an investment agreement with People’s Government of Fengyang Town of Dongguan City, agreeing to complete the first phase of investment of RMB2.5 billion on the Fenggang project within two years after the delivery of the land for the project. The total investment of the project of RMB7 billion shall be invested and implemented by stages. For relevant information, please refer to the announcement of China International Marine Containers (Group) Co., Ltd. in relation to entering into memoranda of understanding on investment and cooperation with Dongguan Municipal Government (Notice No.: [CIMC] 2014-007) disclosed in China Securities Journal, Shanghai Securities News, Securities Times, Cninfo website (www.cninfo.com.cn) and the Company’s website (www.cimc.com) on 16 March 2014, and the announcement published on the website of the Hong Kong Stock Exchange (www.hkexnews.hk).
2. During the Reporting Period, the Company planned to proceed with the proposed bond issue. For relevant information, please refer to the Announcement of China International Marine Containers (Group) Co., Ltd. in relation to the Proposed Issuance of US$ Guaranteed Bonds by Its Subsidiary (Notice No.: [CIMC] 2013- 016) disclosed in China Securities Journal, Shanghai Securities News, Securities Times, Cninfo website (www. cninfo.com.cn) and the Company’s website (www.cimc.com) on 3 May 2013, and the announcement published on the website of the Hong Kong Stock Exchange (www.hkexnews.hk). As at the date of this Report, the above proposed bonds have not been issued.

92 China International Marine Containers (Group) Co., Ltd.
Chapter 7Significant Events
3. On 23 December 2013, the Company entered into H Share Subscription Agreements with each of COSCO Container, Broad Ride Limited (“Broad Ride”) and Promotor Holdings Limited (“Promotor Holdings”) respectively, pursuant to which the Company has conditionally agreed to allot and issue an aggregate of 286,096,100 new H Shares to them at the Subscription Price of HK$13.48 per H Share and COSCO Container, Broad Ride and Promotor Holdings have conditionally agreed to subscribe for such new H Shares in cash. The gross proceeds from the issue of such new H Shares are approximately HK$3,856.58 million. Related information can be found in China Securities Journal, Shanghai Securities News, Securities Times, Cninfo website (www.cninfo.com.cn) and the announcement on the Company’s website (www.cimc.com) (Notice No.: [CIMC] 2013-056) and the announcement released on the website of the Hong Kong Stock Exchange (www. hkexnews.hk) on the date of 25 December 2013. As of the end of the Reporting Period, this designated placement of the said H Shares has not been completed.
The above transactions did not affect the continuity of the Group’s business and the stability of its management. They are beneficial for the future financial position and operating results of the Group on a continuing basis.
x. SIGNIFICANt EVENtS oF tHE GRoUP’S SUBSIDIARIES
On 29 July 2013, CIMC HK, a wholly owned subsidiary of the Company, signed a sale and purchase agreement with Pteris, pursuant to which CIMC HK intended to invest its entire equity of Techman (Hong Kong) Limited in Pteris, and as a consideration Pteris would issue new shares to CIMC HK (or its proxy). For relevant information, please refer to the announcement (Notice No.: [CIMC] 2013-028) disclosed on China Securities Journal, Shanghai Securities News, Securities Times, Cninfo website (www.cninfo.com.cn), the Company’s website (www.cimc.com) on 30 July 2013 and the announcement published on the website of the Hong Kong Stock Exchange (www. hkexnews.hk).
On 6 February 2013, CIMC HK, Shenzhen Techman Technology Co. and Pteris signed a memorandum of the transaction. For relevant information, please refer to the announcement (Notice No.: [CIMC] 2013-002) disclosed on China Securities Journal, Shanghai Securities News, Securities Times (www.cninfo.com.cn) and the Company’s website (www.cimc.com) on 7 February 2013, and the announcement published on the website of the Hong Kong Stock Exchange (www. hkexnews.hk).
On 3 July 2013, CIMC Financial Leasing (Hong Kong) Ltd. and Dalian Shipbuilding Industry Group Co., Ltd. signed a vessel construction contract for the construction of seven 8,800 TEU container vessels; and at the same time, CIMC Financial Leasing (Hong Kong) Ltd. signed a container vessel finance leasing contract with the subsidiary of Mediterranean Shipping Company SA (“MSC”) for a term of 204 months. For relevant information, please refer to the announcement (Notice No.: [CIMC] 2013-024) disclosed on China Securities Journal, Shanghai Securities News, Securities Times (www.cninfo.com.cn) and the Company’s website (www.cimc.com) on 4 July 2013, and the announcement published on the website of the Hong Kong Stock Exchange (www. hkexnews.hk).
On 24 July 2013, CIMC Financial Leasing (Hong Kong) Ltd. and Jiangsu New Times Shipbuilding Co., Ltd. (Jiangsu New Times) signed a vessel construction contract for the construction of five container ships with 8,800 TEU; and at the same time, CIMC Financial Leasing (Hong Kong) Ltd. signed a financial leasing contract with the subsidiary of MSC to lease its container ships for 204 months. For relevant information, please refer to the announcement (Notice No.: [CIMC] 2013-027) disclosed on China Securities Journal, Shanghai Securities News, Securities Times (www.cninfo.com.cn) and the Company’s website (www.cimc.com) on 25 July 2013, and the announcement published on the website of the Hong Kong Stock Exchange (www. hkexnews.hk).

Annual Report 2013 93
Chapter 7Significant Events
On 12 September 2013, CIMC Financial Leasing (Hong Kong) Ltd. and Jiangsu New Times Shipbuilding Co., Ltd. (Jiangsu New Times) signed a vessel construction contract for the construction of two container ships with 8,800 TEU; and at the same time, CIMC Financial Leasing (Hong Kong) Ltd. signed a financial leasing contract with the subsidiary of MSC to lease its container ships for 204 months. For relevant information, please refer to the announcement (Notice No.: [CIMC] 2013-038) disclosed on China Securities Journal, Shanghai Securities News, Securities Times Cninfo Website (www.cninfo.com.cn) and the Company’s website (www.cimc.com) on 13 September 2013, and the announcement published on the website of the Hong Kong Stock Exchange (www. hkexnews.hk)..
As of 4 November 2013, CIMC Raffles had successfully recovered loan, interest and legal fees from Schahin Group (“Schahin”) in Brazil in accordance with related rulings. For relevant information, please refer to the announcement (Notice No.: [CIMC] 2013-044) disclosed on China Securities Journal, Shanghai Securities News, Securities Times Cninfo website (www.cninfo.com.cn) and the Company’s website (www.cimc.com) on 5 November 2013, and the announcement published on the website of the Hong Kong Stock Exchange (www. hkexnews.hk)..
On 7 November 2013 (German time), CIMC Ziegler GmbH (CIMC Ziegler), a wholly owned subsidiary of the Company, Dr. Bruno M. Kubler (“Bankruptcy Administrator”) and Mr. Tobias Sorg (“Mr. Sorg”) signed asset purchase agreements, pursuant to which CIMC Ziegler would purchase from the Bankruptcy Administrator and Mr. Sorg the entire assets (excluding cash and receivables before the completion of the transaction) and partial liabilities closely related to business sustainability of Albert Ziegler Group’s parent company – Albert Ziegler GmbH & Co. KG (“Golden Root Headquarter”), as well as the shares and equity of 9 German and overseas subsidiaries directly held by the Golden Root Headquarter. For more information, please refer to the announcement of the Company (Notice No.: [CIMC] 2013-046) disclosed on China Securities Journal, Shanghai Securities News, Securities Times, Cninfo website (www.cninfo.com.cn) and the Company’s website (www.cimc.com) on 9 November 2013, and the announcement published on the website of the Hong Kong Stock Exchange (www. hkexnews.hk).
xI. PENAltIES oN tHE CoMPANY AND ItS DIRECtoRS, SUPERVISoRS, SENIoR MANAGEMENt, SUBStANtIAl SHAREHolDERS AND REMEDIES tHEREto
During the Reporting Period, none of the Directors, Supervisors, senior management or substantial shareholders was subject to any investigation or administrative penalty by the CSRC, or any denial of participation in the securities market or deemed unsuitable to act as a Director, Supervisor or senior officer of the Company by other administrative authorities or any public criticisms made by a stock exchange.

94
Chapter 8Changes in Share Capital and Information on Shareholders
China International Marine Containers (Group) Co., Ltd.
I. CHANGE IN tHE CoMPANY’S SHAREHolDINGS DURING tHE REPoRtING PERIoD
Unit: Shares
Pre-movement Increase/decrease (+/-) Post-movement
Numbers of shares
Percentage (%)
New Issue
Bonus Issue
Conversion from
Reserves others Sub-totalNumbers of
sharesPercentage
(%)
I. Shares with selling restrictions 371,026 0.01% 0 0 0 329,802 329,802 700,828 0.03%1. State-owned shares 0 0% 0 0 0 0 0 0 0%2. Shares held by state-owned
companies 0 0% 0 0 0 0 0 0 0%3. Shares held by other domestic
investors 371,026 0.01% 0 0 0 329,802 329,802 700,828 0.03%Of which: Shares held by domestic
legal persons 0 0% 0 0 0 0 0 0 0% Shares held by domestic natural persons 371,026 0.01% 0 0 0 329,802 329,802 700,828 0.03%4. Shares held by foreign investors 0 0% 0 0 0 0 0 0 0%Of which: Shares held by foreign
legal persons 0 0% 0 0 0 0 0 0 0% Shares held by foreign natural persons 0 0% 0 0 0 0 0 0 0%
II. Shares without selling restrictions 2,662,025,025 99.99% 0 0 0 (329,802) (329,802) 2,661,695,223 99.97%1. RMB-denominated ordinary
shares 1,231,544,516 46.26% 0 0 0 (329,802) (329,802) 1,231,214,714 46.24%2. Shares traded in non-RMB
currencies and listed domestically 0 0% 0 0 0 0 0 0 0%
3. Shares traded in non-RMB currencies and listed overseas 1,430,480,509 53.73% 0 0 0 0 0 1,430,480,509 53.73%
4. Others 0 0% 0 0 0 0 0 0 0%III. Total Shares 2,662,396,051 100% 0 0 0 0 0 2,662,396,051 100%
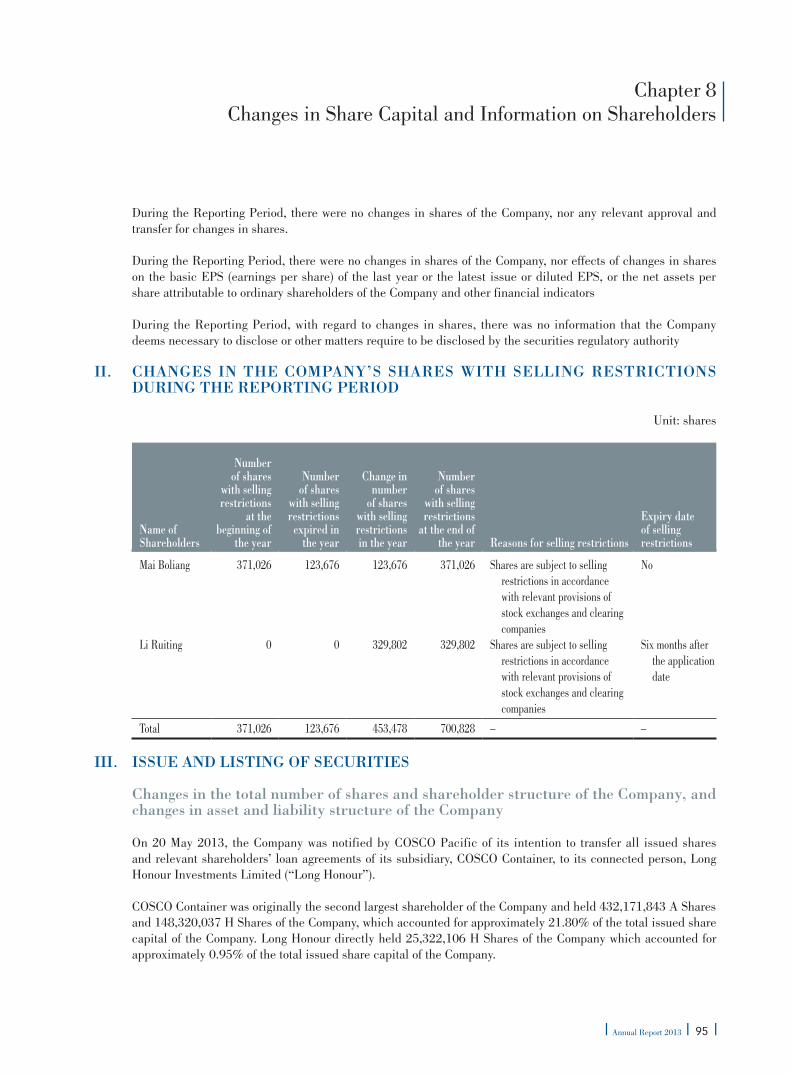
Annual Report 2013 95
Chapter 8Changes in Share Capital and Information on Shareholders
During the Reporting Period, there were no changes in shares of the Company, nor any relevant approval and transfer for changes in shares.
During the Reporting Period, there were no changes in shares of the Company, nor effects of changes in shares on the basic EPS (earnings per share) of the last year or the latest issue or diluted EPS, or the net assets per share attributable to ordinary shareholders of the Company and other financial indicators
During the Reporting Period, with regard to changes in shares, there was no information that the Company deems necessary to disclose or other matters require to be disclosed by the securities regulatory authority
II. CHANGES IN tHE CoMPANY’S SHARES wItH SEllING REStRICtIoNS DURING tHE REPoRtING PERIoD
Unit: shares
Name of Shareholders
Number of shares
with selling restrictions
at the beginning of
the year
Number of shares
with selling restrictions
expired in the year
Change in number
of shares with selling restrictions in the year
Number of shares
with selling restrictions
at the end of the year Reasons for selling restrictions
Expiry date of selling restrictions
Mai Boliang 371,026 123,676 123,676 371,026 Shares are subject to selling restrictions in accordance with relevant provisions of stock exchanges and clearing companies
No
Li Ruiting 0 0 329,802 329,802 Shares are subject to selling restrictions in accordance with relevant provisions of stock exchanges and clearing companies
Six months after the application date
Total 371,026 123,676 453,478 700,828 – –
III. ISSUE AND lIStING oF SECURItIES
Changes in the total number of shares and shareholder structure of the Company, and changes in asset and liability structure of the Company
On 20 May 2013, the Company was notified by COSCO Pacific of its intention to transfer all issued shares and relevant shareholders’ loan agreements of its subsidiary, COSCO Container, to its connected person, Long Honour Investments Limited (“Long Honour”).
COSCO Container was originally the second largest shareholder of the Company and held 432,171,843 A Shares and 148,320,037 H Shares of the Company, which accounted for approximately 21.80% of the total issued share capital of the Company. Long Honour directly held 25,322,106 H Shares of the Company which accounted for approximately 0.95% of the total issued share capital of the Company.

96 China International Marine Containers (Group) Co., Ltd.
Chapter 8Changes in Share Capital and Information on Shareholders
On 27 June 2013, such transfer of equity interest was completed. As at the end of the Reporting Period, Long Honour was the second largest shareholder of the Company and its shareholding percentage was approximately 22.75%. The shares and the shareholding percentage of the Company held by COSCO, the ultimate holding company of COSCO Pacific and Long Honour, remained unchanged upon the completion of such transfer of equity interest.
On 23 December 2013, the Company entered into H Share Subscription Agreements with each of COSCO Container, Broad Ride and Promotor Holdings respectively, pursuant to which the Company has conditionally agreed to allot and issue an aggregate of 286,096,100 new H Shares to them at the Subscription Price of HK$13.48 per H Share and COSCO Container, Broad Ride and Promotor Holdings have conditionally agreed to subscribe for such new H Shares in cash on the terms and subject to the conditions set out therein. The gross proceeds from the issue of such new H Shares are approximately HK$3,856.58 million. For further information, please refer to the announcement disclosed on China Securities Journal, Shanghai Securities News, Securities Times, (www.cninfo.com.cn) and the Company’s website (www.cimc.com) (Notice No.: [CIMC] 2013-056) and the announcement released on the website of the Hong Kong Stock Exchange (www. hkexnews.hk) on the date of 25 December 2013. As of the end of the Reporting Period, this designated placement of the said H Shares has not been completed.
IV. SHAREHolDERS AND ACtUAl CoNtRollERS
1. Number of Shareholders and Shareholdings
The number of shareholders of the Company as at 31 December 2013 was 129,100, including 129,096 holders of A shares and four registered holder of H Shares. The minimum public float of the Company satisfied the requirements of the Hong Kong Listing Rules.
The total number of shareholders of the Company as at 18 March 2014, being the five business days preceding the date of the Company’s result announcement for 2013 was 125,724 including 125,719 holders of A shares and 5 registered holders of H shares.

Annual Report 2013 97
Chapter 8Changes in Share Capital and Information on Shareholders
(1) Shareholdings of the top ten shareholders as at the end of the Reporting Period
Unit: Shares
Shareholdings of the shareholders who hold above 5% or the top ten shareholders
Name of ShareholdersNature of shareholders
Shareholding ratio (%)
Number of shares held
at the end of the
Reporting Period
Changes during the Reporting
Period
Number of shares
with selling restrictions
held at the end of Reporting
Period
Number of shares
without selling
restrictions held at
the end of Reporting
Period
Pledged or frozen shares
Status Number
HKSCC Nominees Limited Foreign legal person
53.73% 1,430,470,309 1,430,470,309
COSCO Container Industries Limited Foreign legal person
16.23% 432,171,843 – – 432,171,843 – –
China Merchants Bank Co., Ltd. – Everbright Pramerica Securities Investment Fund
Domestic non-state-owned legal person
1.45% 38,579,929 – – 38,579,929 – –
Agricultural Bank of China – Post preferred Stock in the Core of Securities Investment Funds
Domestic non-state-owned legal person
0.57% 15,122,394 – – 15,122,394 – –
Taikang Life Insurance Co., Ltd. – Bonus – Individual Bonus -019L-FH002 Shenzhen
Domestic non-state-owned legal person
0.56% 14,806,230 – – 14,806,230 – –
Industrial Bank Co., Ltd. – Everbright Pramerica Bonus Securities Investment Fund
Domestic non-state-owned legal person
0.48% 12,860,574 – – 12,860,574 – –
China Minsheng Banking Corp., Ltd. – Yinhua SZSE 100 Index Classified Securities Investment Fund
Domestic non-state-owned legal person
0.38% 10,217,019 – – 10,217,019 – –
Ouyang Ping Domestic natural person
0.35% 9,229,384 – – 9,229,384 – –
Industrial and Commercial Bank of China – Rong Tong SZSE
100 Index Securities Investment Fund Domestic non-state-owned legal person
0.28% 7,417,185 – – 7,417,185 – –
Bank of China – E Fund SZSE 100 Index Tradable Open-Ended
ETF Securities Investment Fund Domestic non-state-owned legal person
0.28% 7,386,110 – – 7,386,110 – –
The relationship or concerted action of the above mentioned shareholders
None

98 China International Marine Containers (Group) Co., Ltd.
Chapter 8Changes in Share Capital and Information on Shareholders
(2) Shareholdings of top ten shareholders of shares without selling restrictions as at the end of the Reporting Period
Unit: Shares
Shareholdings of top ten shareholders of shares without selling restrictions
Name of Shareholders
Number of shares without
selling restrictions
held at the end of Reporting
Period (Share)
Nature of the shares
Nature of the shares
Number (Share)
HKSCC Nominees Limited 1,430,470,309 H shares 1,430,470,309COSCO Container Industries Limited 432,171,843 A shares 432,171,843China Merchants Bank Co., Ltd. -Everbright Pramerica
Securities Investment Fund38,579,929 A shares 38,579,929
Agricultural Bank of China-Post preferred Stock in the Core of Securities Investment Funds
15,122,394 A shares 15,122,394
Taikang Life Insurance Co., Ltd. – Bonus – Individual Bonus -019L-FH002Shenzhen
14,806,230 A shares 14,806,230
Industrial Bank Co., Ltd. – Everbright Pramerica Bonus Securities Investment Fund
12,860,574 A shares 12,860,574
China Minsheng Banking Corp., Ltd. – Yinhua SZSE 100 Index
Classified Securities Investment Fund 10,217,019 A shares 10,217,019Ouyang Ping 9,229,384 A shares 9,229,384Industrial and Commercial Bank of China
– Rong Tong SZSE100 Index Securities Investment Fund 7,417,185 A shares 7,417,185Industrial and Commercial Bank of China
– Rong Tong SZSE 100 Index Securities Investment Fund 7,386,110 A shares 7,386,110The relationship or concerted action between the top 10
shareholders with selling restrictions, or the top 10 shareholders without selling restrictions and the top 10 shareholders
None
The top 10 shareholders who participate in margin trading or short-selling transactions(if any)
None
Shareholders did not conduct any agreed repurchase transactions during the Reporting Period.
2. Controlling Shareholders
There is no controlling shareholder in the Company. The status of our two largest shareholders, China Merchants (CIMC) Investment Limited and COSCO Container, remain unchanged during the Reporting Period.

Annual Report 2013 99
Chapter 8Changes in Share Capital and Information on Shareholders
3. Actual Controller
There was no actual controller in the Company. There were no changes in the actual controllers during the Reporting Period. The Company was not controlled by any actual controller through trust or other asset management during the Reporting Period.
4. other corporate shareholders with a shareholding above 10%
Name of the corporate shareholder
legal Representative/Unit leader
Date of establishment
organization code
Registered capital
Main business or management activities
China Merchants (CIMC) Investment Co., Ltd.
Wong Sin Yee, Zhang Rizhong, Lin Wuliu
17 January 1995 Not applicable HK$10,000 Investment, shareholding
COSCO Container He Jiale, Meng Qinghui, Su Xiaodong
26 April 2004 Not applicable US$50,000 Investment, shareholding
5. Share Purchasing Plan Proposed or Implemented by Shareholders or Persons Acting in Concert during the Reporting Period
Name of shareholder/persons acting in concert
Number of shares they planned to
increase
% of shareholding they planned
to increase (%)
Number of shares
actually increased
% of shareholding
actually increased
(%)First disclosure date of the plan
Disclosure date of the complement of the plan
COSCO Container Industries 65,099,638 4.55% – – 25 December 2013 –Broad Ride Limited 77,948,412 5.45% – – 25 December 2013 –

100 China International Marine Containers (Group) Co., Ltd.
Chapter 8Changes in Share Capital and Information on Shareholders
V. SUBStANtIAl SHAREHolDERS
1. Disclosure of Substantial Shareholders under the Securities and Futures ordinance of Hong Kong
So far as the Directors are aware, as at 31 December 2013, the persons other than a Director, Supervisor or senior management of the Company who have interests or short positions in the shares or underlying shares of the Company which are discloseable under Divisions 2 and 3 of Part XV of the Securities and Futures Ordinance of Hong Kong are as follows:
Name of shareholdersNature of shareholding
Number of shares Capacity
Percentage of such shares
in the same class of
the issued share capital
(%)
Percentage of total
share capital
(%)
China Merchants Group Limited 1 H Shares 679,927,917(L) Interest of Corporation Controlled by the Substantial Shareholder
47.53 25.54
COSCO2 A Shares 432,171,843(L) Interest of Corporation Controlled by the Substantial Shareholder
35.08 16.23
H Shares 173,642,143(L) Interest of Corporation Controlled by the Substantial Shareholder
12.14 6.52
Hony Capital Management Limited3 H Shares 137,255,434 (L) Interest of Corporation Controlled by the Substantial Shareholder
9.60 5.16
Templeton Asset Management (Singapore) Ltd.
H Shares 114,747,467 (L) Investment Manager 8.02 4.31
(L) Long position
Note 1: China Merchants Group Limited, through various subsidiaries, had an interest in the H shares of the Company, all of which 679,927,917 H shares (long position) were held in its capacity as interest of corporation controlled by the substantial shareholder.
Note 2: COSCO, through various subsidiaries, had an interest in the A shares and H shares of the Company, all of which 432,171,843 A shares (long position) and 173,642,143 H Shares (Long position) were held in its capacity as interest of corporation controlled by the substantial shareholder.
Note 3: Hony Capital Management Limited, through various subsidiaries, had an interest in the H shares of the Company, all of which 137,255,434 H shares (long position) were held in its capacity as interest of corporation controlled by the substantial shareholder.
Save as disclosed above and so far as the Directors are aware, as at 31 December 2013, no person (other than a Director, Supervisor or senior management of the Company) has an interest or short position in the shares of the Company according to the register of interests in shares and short positions kept by the Company pursuant to Section 336 of the Securities and Futures Ordinance of Hong Kong.

Annual Report 2013 101
Chapter 8Changes in Share Capital and Information on Shareholders
2. Substantial Shareholders
China Merchants Group Limited was incorporated on 14 October 1986 in the PRC. Its registered capital is RMB10.05 billion and its chairman is Fu Yuning. The three core business sectors of China Merchants Group Limited focus on the construction, operation and service in respect of transportation and related infrastructure (ports, toll roads, energy transportation and logistics), financial investment and management, property development and management.
COSCO was incorporated on 27 April 1961 in the PRC. Its registered capital is RMB4,103.367 million and its chairman is Ma Zehua. COSCO is an international company with its businesses covering marine transportation, logistics terminals, ship building and repairing.
Except for China Merchants Group Limited and COSCO, no other legal person holds 10% or more of the shares in the Company (excluding HKSCC Nominees Limited).
3. the equity interest structure between the Company and the substantial shareholders
VI. SUFFICIENCY oF PUBlIC FloAt
Based on the information that is publicly available to the Company and within the knowledge of the Directors, the Directors confirm that the public float of the Company has satisfied relevant requirements under the Hong Kong Listing Rules during the Reporting Period.
China Merchants Holdings(International) Company Limited
loNG HoNoUR INVEStMENtS lIMItED
China MerchantsGroup Limited
100%
100%
100%
100%
100%
21.80% 25.54% 30.04%
100%
55.10%
0.95% 21.67%
State-owned Assets Supervision and Administration Commission
of the State Council
COSCO
CIMC
COSCO (Hong Kong)Group Limited
COSCO ContainerIndustries Limited
China Merchants (CIMC)Investment Limited
Other AShareholders
Other HShareholders


104
Chapter 9Directors, Supervisors, Senior Management and Employees
China International Marine Containers (Group) Co., Ltd.
I. BRIEF BIoGRAPHY oF tHE DIRECtoRS, SUPERVISoRS AND SENIoR MANAGEMENt
1. Directors
Information on the current Directors during the Reporting Period is set out below:
Number of Shares held in the Company (Share)
Name Gender Age Position term
As at 31 December
2012
As at 31 December
2013
Li Jianhong M 57 Chairman and Non-executive Director 3 Nil NilMai Boliang M 54 Executive Director and President 3 494,702 494,702Wang Hong M 51 Non-executive Director 3 Nil NilWu Shuxiong M 59 Non-executive Director 3 Nil NilLi Kejun M 62 Independent non-executive Director 3 Nil NilPan Chengwei M 67 Independent non-executive Director 3 Nil NilWong Kwai Huen, Albert
M 62 Independent non-executive Director 3 Nil Nil
Brief biography of Directors:
Mr. li Jianhong (李建紅), aged 57, has been a Director of the Company since 2 March 1995. He once acted as the Chairman and Vice Chairman of the Company and was elected as the Chairman of the Company again on 25 October 2010. Mr. Li has been the chairman of China Merchants Energy Shipping Co., Ltd. (招商局能源運輸股份有限公司) (Shanghai stock code: 601872) since November 2010 and the vice chairman and an executive director of China Merchants International (Hong Kong stock code: 144) since October 2010. Mr. Li also holds the position of director and president of China Merchants Group. He had worked for COSCO and held various positions, including factory director of COSCO Nantong Shipyard (中遠南通船廠), general manager of COSCO Industry Company (中遠工業公司), assistant to the president, chief economist and executive vice president of COSCO, chairman of COSCO Corporation (Singapore) Limited (中遠投資(新加坡)有限公司), a company listed in Singapore, Sino-Ocean Land Holdings Limited (遠洋地產控股有限公司) (Hong Kong stock code: 3377), COSCO Shipyard Group Co., Ltd. (中遠船務工程集團有限公司) and Nantong COSCO KHI Ship Engineering Co., Ltd. (南通中遠川崎船舶工程有限公司), a director of COSCO Holdings (Hong Kong stock code: 1919, Shanghai stock code: 601919), COSCO Pacific (Hong Kong stock code: 1199) and COSCO International Holdings Limited (Hong Kong stock code: 517). Mr. Li was also the vice chairman of Chinese Society of Naval Architecture and Marine Engineering (CSNAME) and the vice president of China Association of Naval Shipping Industry (CANSI). He was awarded the third session of National Outstanding Young Entrepreneur in 1993, the Model Worker of National Transportation System in 1994 and the National Model Worker in 1995. Mr. Li obtained his MBA degree from University of East London in October 2000 and a master degree in economic administration from Jilin University in 1998. He is a senior economist.

Annual Report 2013 105
Chapter 9Directors, Supervisors, Senior Management and Employees
Mr. Mai Boliang (麥伯良), aged 54, has been the President of the Company since 7 March 1994 and an Executive Director of the Company since 8 March 1994. Mr. Mai joined the Company in 1982 and served as manager of Product Technical Department and the deputy manager. Mr. Mai graduated from mechanical engineering of South China University of Technology in July 1982 with a bachelor degree.
Mr. wang Hong (王 宏), aged 51, has been a Director of the Company since 23 April 2007. He has been a director of China Merchants Property Development Co., Ltd. (Shenzhen stock code: 000024), also a company listed in Singapore, since April 2011, a director of China Merchants Energy Shipping Co., Ltd. (Shanghai stock code: 601872) since May 2010 and the general manager of planning department of China Merchants Group since February 2011 and its chief economist since February 2012. Mr. Wang has also been an executive director of China Merchants International (Hong Kong stock code: 144) since May 2005. He worked as vice chairman of Shanghai International Port (Group) Co., Ltd. (Shanghai stock code: 600018) from June 2005 to July 2009, chairman of China Merchants Holdings (Pacific) Limited, a company listed in Singapore, from May 2005 to February 2009, deputy managing director of China Merchants International (Hong Kong stock code: 144) from 2005 to 2009 and its chief operational officer from 2007 to 2009. Prior to that, Mr. Wang worked as general manager of performance appraisal department, human resources department and strategic research department of China Merchants Group. He also served as managing director of Hoi Tung Marine Machinery Suppliers Limited, general manager of financial department, shipping department and vice manager of China Communications Import & Export Corporation and the marine engineer of COSCO Guangzhou Ocean Shipping Company (中遠廣州遠洋運輸公司) Mr. Wang graduated from turbine management in Dalian Maritime University in 1982 and obtained a MBA degree from Graduate School of University of Science and Technology Beijing in 1991 and Ph.D degree in management from Gradual School of Chinese Academy of Social Sciences in July 1999.
Mr. wu Shuxiong (吳樹雄), aged 59, has been the vice president of COSCO (Hong Kong) Group Limited since November 2011. Mr. Wu served as a supervisor of China COSCO Holdings Company Limited (HK stock code: 1919) from March 2005 to January 2012. Mr. Wu has also been a non-executive director of COSCO International Holdings Limited (HK stock code: 00517) since April 2012. Mr. Wu has over 30 years of experience in the shipping industry and has extensive experience in corporate operational management and ship management. Mr. Wu had been the marine chief engineer, the section manager of safety and technology of ship management department, the deputy manager of ship management department of Shanghai Ocean Shipping Company Ltd., the general manager of Shanghai Far East Container Manufacturing Co., Ltd. the deputy general manager of Shanghai Ocean Shipping Company Ltd. the deputy general manager and director of COSCO Container Lines Co., Ltd.. Mr. Wu graduated from Shanghai Jiao Tong University in 1989, majoring in transportation management and he is a senior engineer.
106 China International Marine Containers (Group) Co., Ltd.
Chapter 9Directors, Supervisors, Senior Management and Employees
Mr. li Kejun (李科浚), aged 62, is from Haicheng, Liaoning. He is a senior engineer who is entitled to special government allowance and a registered safety engineer of the PRC. He graduated from the department of Marine Navigation of Dalian Maritime University in 1975; studied Law at McGill University, Canada from 1976 to 1978; was trained at Central Party School of the Communist Party of China from 1991 to 1992; studied world economy at the World Economy Research Institute of Central Party School of the Communist Party of China with a master degree from 1993-1995; and attended the 155th Advanced Business Administration Seminar at Harvard Business School during the second half of 1998. Mr. Li started his career in 1968. He worked as a teacher at the department of Marine Navigation of Dalian Maritime University since 1975. He then worked at the Ministry of Transportation of the PRC since 1978 and served as the chief surveyor, the deputy director, the director and the deputy director general of Register of Shipping of the PRC and an executive director and the vice president of China Merchants Group Limited. He was the director-general and the chairman (president) of the China Classification Society from 1999 to 2011. He was the chairman of Council for International Association of Classification Societies (IACS) from 2006 to 2007 and was the first chairman of The Association of Asian Classification Societies (ACS) from 2010 to 2011. He retired at the end of 2011. He retired at the end of 2011. Currently, he is the chairman of China Association of Communications Enterprises Management and the honorable director-general of the China Classification Society. He has been the independent director of Weichai Heavy Machinery Co., Ltd (Stock Code: 000880) since May 2013.
Mr. Pan Chengwei (潘承偉), aged 67, graduated from The Ministry of Transportation Management Cadre Institute with an associate bachelor degree and he is an accountant. He started his career in 1965 and retired in November 2008. He had served as the head of finance department of China Ocean Shipping Company, the general manager of finance department of COSCO, the general manager of finance department of COSCO (Hong Kong) Group Limited, the general manager of COSCO (H.K.) Property Development Limited, the general manager of COSCO (H.K.) Industry & Trade Holdings Ltd., the chief representative of Shenzhen representative office of COSCO (Hong Kong) Group Limited and the chief financial officer of Shenzhen Guangju Energy Co., Ltd., the general manager of COSCO (Cayman) Fortune Holding Co., Ltd. and its Hong Kong branch, and the compliance manager of the fuel & oil futures department of COSCO. He has been an independent non-executive director of Shenzhen Nanshan Power Co., Ltd. and China Merchants Bank Co., Ltd. since May 2011 and July 2012, respectively.
Mr. wong Kwai Huen, Albert (王桂塤), aged 62, JP. holds a bachelor degree of art from Chinese University of Hong Kong, a bachelor of laws degree from University of London, a diploma in Chinese law from University of East Asia, Macau and graduated from the College of Law, U.K.. He is a practicing solicitor in Hong Kong and UK, a China Appointed Attesting Officer, and he is qualified to practise law in Australia and Singapore. Mr. Wong had once been an independent non-executive Director of Datang International Power Generation Co., Ltd. and a foreign legal counsel for the Jiangsu Provincial Government, and now he is the independent non-executive Director of China PICC Asset Management Co., Ltd.. He had once been the Managing Partner of China region for 15 years in two international large law firms in aggregate, and also worked for the Lands Department, Department of Justice and Legislative Council of the Hong Kong SAR for 10 years in total. He was appointed as committee member of Hong Kong International Airport Authority and Hospital Authority in June 2011 and December 2012 successively. He was the former Chairman of Hong Kong International Arbitration Centre, and is senior member of the Chartered Institute of Arbitrators in UK and Hong Kong Institute of Arbitrators, and was the former chairman of Hong Kong Institute of Arbitrators. He is also the vice-chairman of Hong Kong Inland Revenue Board of Review, chairman of Hong Kong Copyright Appeal Tribunal, chairman of the Professional Advisory Committee of Hong Kong Trade Development Council, former president and council member of the Law Society of Hong Kong, council member of the Hong Kong Institute of Directors and the voting member for the Best Director of the Year. He holds the posts of honorary lecturer or professor in Hong Kong University, the Chinese University of Hong Kong, City University and Shue Yan University, and is a director, president, chairman, treasurer, etc. in different public bodies and charity institutions.

Annual Report 2013 107
Chapter 9Directors, Supervisors, Senior Management and Employees
2. Supervisors
Information on the current Supervisors during the Reporting Period is set out below:
Number of Shares held in the Company (Share)
Name Gender Age Position term
As at 31 December
2012
As at 31 December
2013
He Jiale Male 59 Chairman of Supervisory Committee 3 0 0Wong Sin Yue, Cynthia Female 61 Supervisor 3 0 0Xiong Bo Male 54 Supervisor 3 0 0
Brief biography of the Supervisors:
Mr. He Jiale (何家樂), aged 59, has been a director and chief financial officer of COSCO (Hong Kong) Group Limited since February 2012. Mr. He has also been a non-executive director of Chong Hing Bank Limited (HK stock code: 1111) since May 2012. He was an executive director of COSCO International Holdings Limited (HK stock code: 00517) from November 2003 to January 2006 and has been its executive director since April 2012. Mr. He was an executive director of COSCO Pacific Limited (HK stock code: 1199) from November 2003 to June 2005 and was its executive director from January 2009 to March 2013. Mr. He has over 30 years of work experience in shipping industry and has extensive experience in corporate finance and financial management. He served as deputy director of finance division of Shanghai Ocean Shipping Company Ltd., the deputy general manager of Finance Department of the COSCO Container Lines, deputy general manager of finance and capital department of China Ocean Shipping (Group) Company, chief accountant of COSCO Container Lines Co., Ltd., financial controller of COSCO (Hong Kong) Group Limited and chief financial officer of China COSCO Holdings Company Limited (HK stock code: 1919). Mr. He graduated from the postgraduate studies of management science and engineering from Shanghai University and he is a senior accountant.
Ms. wong Sin Yue, Cynthia (黃倩如), aged 61, has been a Supervisor of the Company since 22 June 2009. She has been working for China Merchants Holdings (International) Co., Ltd (HK stock code: 144) since November 2003, firstly as general manager of Project Development Department, and has been vice-general manager of the company responsible for financial affairs since July 2004. Ms. Wong has been appointed as an independent non-execute director of China Gas Holdings Co., Ltd (HK stock code: 384) since October 2003, and further been appointed as chairlady of its board of directors (independent and non-executive) since March 2011. Ms. Wong has over 15 years’ experience as a top executive in a number of international reputable investment banks, including Societe Generale, Deutsche, Morgan Grenfell, Samuel Montague and Bear Stearns Asia and has provided financial advisory and corporate finance services for not less than 50 companies in the Great China Region and Asia. Ms. Wong received her MBA degree from University of East Asia, Macau in 1989.
Mr. xiong Bo (熊波), aged 54, joined the Company in 1991. He has been the Tax Accountant of Finance Management Department of the Company since March 1991. Mr. Xiong has been the Chairman of the Labor Union of the Company since 1996. He graduated from Heilongjiang Radio and TV University in 1982 with major in electronics and received a bachelor’s degree.

108 China International Marine Containers (Group) Co., Ltd.
Chapter 9Directors, Supervisors, Senior Management and Employees
3. Senior Management
Information on current members of the Senior Management of the Company during the Reporting Period is set out below:
Number of Shares held in the Company (Share)
Name Gender Age Position term
As at 31 December
2012
As at 31 December
2013
Mai Boliang M 54 President 3 494,702 494,702Zhao Qingsheng M 61 Vice President 3 Nil NilWu Fapei M 55 Vice President 3 Nil NilLi Yinhui M 46 Vice President 3 Nil NilLiu Xuebin M 54 Vice President 3 2,400 2,400Yu Ya M 58 Vice President 3 Nil NilZhang Baoqing M 57 Vice President 3 Nil NilYu Yuqun M 48 Secretary to the Board of Directors 3 Nil NilJin Jianlong M 60 General Manager of Financial Department 3 Nil Nil
Zeng Beihua F 59General Manager of Capital Management
Department 3 Nil Nil
Brief biography of the Senior Management:
Mr. Mai Boliang (麥伯良), is a Director and the president of the Company. For details of Mr. Mai Boliang, please refer to the sub-section headed “Brief Biography of the Directors, Supervisors and Senior Management – Directors” in this Chapter.
Mr. Zhao qingsheng (趙慶生), aged 61, was the vice Chairman of the Company from 1997 to 1999 and appointed as our vice president in 1999. He has been the chairman or director of a number of subsidiaries of the Company and the chairman of board of directors of CIMC Enric (Hong Kong stock code: 3899) since September 2007. Mr. Zhao joined China Merchants Group in 1983 and served as general manager of the enterprise department in China Merchants Group from 1991 to 1995. He worked in China Merchants International (Hong Kong stock code: 1199) as the vice general manager from 1995 to 1999. He graduated from Wuhan University of Technology (formerly known as Wuhan University of Water Transportation Engineering), majoring in vessel gas engineering in 1982.
Mr. wu Fapei (吳發沛), aged 55, has been a vice president of the Company since March 2004. He joined the Company in 1996, was appointed as the manager of Information Management Department in December 1996, then the assistant to the president in December 1998 and further the Board secretary from December 1999 to March 2004. Before that, he used to be a teacher and associate professor of School of Business Administration in South China University of Technology and the deputy general manager of Zhaoqing Nanhua Bicycle Ronghui Co., Ltd. in Guangdong. Mr. Wu graduated from South China University of Technology with a bachelor degree in mechanical manufacturing in July 1982 and a master degree in engineering in July 1989.

Annual Report 2013 109
Chapter 9Directors, Supervisors, Senior Management and Employees
Mr. li Yinhui (李胤輝), aged 46, has been a vice president of the Company since March 2004. He has been the chairman or director of a number of subsidiaries of the Company since 2004. He worked with us as part-time vice president from October 2002 to October 2003. Mr. Li worked in Ministry of Commerce from March 2003. Between May 1993 and March 2003, he worked in State Commission of Foreign Trade and Economic Cooperation. Prior to that, Mr. Li worked in Central Committee of Chinese Communist Youth League. He received his bachelor degree in history from Jilin University in July 1991, a MBA degree from School of Business in Nanjing University in December 1997 and Ph.D in economics from Jilin University in June 2001.
Mr. liu xuebin (劉學斌), aged 54, has been a vice president of the Company since March 2004. He joined the Group in 1982, and once worked in the Company’s Procurement Department from 1982 to 1990, deputy general manager of Nantong Shunda Container Co., Ltd. (南通順達集裝箱有限公司) from 1990 to 1994, deputy general manager of the Container Branch of the Company from 1994 to 1995, and general manager of Xinhui CIMC Container Co., Ltd. (新會中集集裝箱有限公司) from 1995 to 1997. From 1997 to 2013, he was appointed as general manager of Shenzhen Southern CIMC Containers Manufacture Co., Ltd. (深圳南方中集集裝箱製造有限公司) and in December 1998, he held the positions of the assistant to the president of the Company and chairman of Xinhui CIMC Container Co., Ltd. (新會中集集裝箱有限公司). Since January 2011, he was appointed as deputy general manager of CIMC Containers Holding Co., Ltd. (中集集裝箱控股有限公司). Mr. Liu graduated from Shenzhen University with a bachelor degree in business administration in August 1990.
Mr. Yu Ya (于亞), aged 58, has been a vice president of the Company since March 2010. Mr. Yu has been working with the Company since August 2007, serving as vice secretary of the Party Committee and general manager of Public affairs department. He has also been the chairman or a director of a number of subsidiaries of the Company since October 2009. He once worked for central ministries as deputy director, for China Light Industry Corporation as vice president and for Capgemini as executive director and executive vice president in Greater China Region. Mr. Yu graduated from the Mechanical Engineering Department of Tianjin Light Industry Vocational Technical College in July 1984 and obtained a MBA degree from Nanjing University in June 1997.
Mr. Zhang Baoqing (張寶清), aged 57, was appointed as a Vice President of the Company in March 2012. Since June 1995, Mr. Zhang has been the deputy general manager and then the general manager of Guangdong Xinhui CIMC Containers Wood Flooring Co., Ltd. (廣東新會中集集裝箱木地板有限公司), and since January 2003, he was the general manager of Guangdong Xinhui CIMC Special Transportation Equipment Co., Ltd. (廣東新 會中集特種運輸設備有限公司), and since June 2011, the general manager of CIMC Containers Holding Co., Ltd. (Container business) under the Group. Mr. Zhang once acted as the assistant to the president of the Group from March 2004 to March 2012, deputy general manager of Guangdong Xinhui CIMC Containers Wood Flooring Co., Ltd. from March 2004 to March 2012, and the general manager of Guangdong Xinhui CIMC Wood Development Co., Ltd from February 2009 to March 2013. Before that, he once worked as assistant to the general manager and general manager of technical department of Nantong Shunda Containers Co., Ltd. (南通順達集裝箱有限公司). Mr. Zhang is a senior engineer. He graduated from South China University of Technology with a bachelor degree in mechanical design and automation science in July 1982.

110 China International Marine Containers (Group) Co., Ltd.
Chapter 9Directors, Supervisors, Senior Management and Employees
Mr. Yu Yuqun (于玉群), aged 48, has been the secretary to the Board of the Company since March 2004 and has been the Company Secretary since 25 October 2012. He joined the Company in 1992 and subsequently worked as deputy manager, manager of Financial Affairs Department and manager of the office of secretary to the Board, responsible for investors relationship and fund management. Mr. Yu became the representative for securities affairs of the Company since its listing on the Shenzhen Stock Exchange in 1994. Mr. Yu has been appointed as an executive director of CIMC Enric (Hong Kong stock code: 3899) since September 2007 and a director of several subsidiaries of the Company since 2004. He has been appointed as a non-executive director of TSC Group Holdings Limited (Hong Kong stock code: 206) and Pteris Global Limited (a company listed on the main board of the Singapore Stock Exchange) in March 2011 and 2012, respectively. From July 1987 to October 1989, he worked in the State Price Control Bureau. Mr. Yu graduated from Beijing University and obtained a bachelor’s degree in economics in July 1987 and a master’s degree in economics in July 1992.
Mr. Jin Jianlong (金建隆), aged 60, has been the general manager of Financial Department since October 2001. Mr. Jin has been an executive director of CIMC Enric (Hong Kong stock code: 3899) since September 2007 and a number of subsidiaries of the Company since 2001. He joined the Group in 1989, appointed as the manager of of the Financial Management Department of Shenzhen Southern CIMC Containers Manufacture Co., Ltd. (深圳南方中集集裝箱製造有限公司) and then of the Financial Management Department of the Company. From August 1975 to April 1989, he worked in Hangzhou Iron & Steel Works as manager of its financial department. He graduated from Maanshan Institute of Iron and Steel Technology in July 1985, majoring in accounting. He is an accountant.
Ms. Zeng Beihua (曾北華), aged 59, has been the general manager of Capital Management Department of the Company since December 2009. She has been the executive director of CIMC Financial Leasing and CIMC Finance since 2007 and 2010, respectively. Ms. Zhen joined the Company in 1989, and once took the positions of the general manager of Financial Management Department from April 1989 to 2001, the general manager of CIMC Vehicle from 2002 to 2009, the general manager of CIMC Financial Leasing from August 2007 to August 2012, and general manager of CIMC Finance from February 2010 to August 2012. Ms. Zeng graduated from Wuhan University, majoring in accounting in July 1989, studied accounting at Shanghai University of Finance and Economics from 1996 to 1997. She studied in the diploma in management program in China Europe International Business School and graduated in 2002.

Annual Report 2013 111
Chapter 9Directors, Supervisors, Senior Management and Employees
II. SHAREHolDINGS’ CHANGES oF DIRECtoR, SUPERVISoR AND SENIoR MANAGEMENt
During the Reporting Period, shareholdings of Director, Supervisor and Senior Management remain.
Interests of Directors, Supervisors and Chief Executives in the Share Capita l of the Company and associated corporation thereof
As at 31 December 2013, the interest and short positions held by Directors, Supervisors and chief executive of the Company in any shares, underlying shares or debentures of the Company or any associated corporation within the meaning of Part XV of the Securities and Futures Ordinance of Hong Kong required to be recorded in the register mentioned under Section 352 of the Securities and Futures Ordinance of Hong Kong or as otherwise notifiable to the Company and the Hong Kong Stock Exchange by the Directors and Supervisors pursuant to the Model Code are as follows:
1. Interest in the shares of the Company
Name Nature of interest Number of sharesClass of shares
Mai Boliang Beneficial interest 494,702 A Shares
2. Interest in the underlying shares of the Company
As at 31 December 2013, none Director, Supervisor and Chief Executive of the Company held the interest in the underlying shares of the Company.
3. Interest in the associated corporation
NameName of associated corporation Nature of interest
Number of shares
Mai BoliangCIMC Vehicle (Group) Co., Limited Beneficiary of a trust 10,350,000

112 China International Marine Containers (Group) Co., Ltd.
Chapter 9Directors, Supervisors, Senior Management and Employees
III. MAIN woRKING ExPERIENCES oF DIRECtoR, SUPERVISoR AND SENIoR MANAGEMENt oF tHE CoMPANY oF tHE lASt FIVE YEARS
For main working experiences of director, supervisor and senior management of the Company of the last five years, please refer to “I. Brief biography of the Directors, Supervisors and Senior Management during the Reporting Period” in this Chapter.
Job status of Directors, Supervisors and Senior Management in Shareholders’ company is set out as follows:
NameName of Shareholders’ company
Position in shareholders’ company
Start of term of office
End of term of office
with compensationallowance from shareholders’ company or not
Li Jianhong China Merchants Group Limited Director and President 23 August 2010 – YesChina Merchants Group Limited Executive Director and
Vice Chairman of Board of Directors
14 October 2010 – No
Wang Hong China Merchants Group Limited General Manager of Corporate Planning Department
1 February 2011 – Yes
Chief Economist 29 February 2012 – YesChina Merchants Group Limited Director 11 May 2005 – No
Wu Shuxiong COSCO (Hong Kong) Group Co.,Ltd.
Director and Vice President
28 November 2011 – Yes
He Jiale COSCO (Hong Kong) Group Co.,Ltd.
Director and Chief Financial Officer
15 February 2012 – Yes

Annual Report 2013 113
Chapter 9Directors, Supervisors, Senior Management and Employees
Job status of Directors, Supervisors and Senior Management in other companies is set out as follows:
Name Name of other companyPosition in other company
Start of term of office
End of term of office
with compensation allowance from other company or not
Li Jianhong China Merchants Energy Shipping Co., Ltd.
Chairman 1 November 2010 – No
Wang Hong China Merchants Energy Shipping Co., Ltd.
Director 27 May 2010 – No
China Merchants Property Development Co., Ltd.
Director 13 April 2011 – No
Wu Shuxiong COSCO International Holdings Limited
Non-executive Director 10 April 2012 – No
Li Kejun Weichai Heavy Machinery Co., Ltd
Independent Director 22 May 2013 – No
Pan Chengwei China Merchants Bank Co., Ltd. Independent Director 09 July 2012 – YesShenzhen Nanshan Power
Co., Ltd.Independent Director 22 May 2011 – Yes
Wong Kwai Huen, Albert
PICC Asset Management Co., Ltd.
Independent Non-executive Director
18 February 2013 – Yes
He Jiale Chong Hing Bank Limited Non-executive Director 22 May 2012 14 February 2014 YesCOSCO International Holdings
LimitedExecutive Director 10 April 2012 – No
IV. R E M U N E R At I o N o F D I R E C t o R S , S U P E RV I S o R S A N D S E N I o R MANAGEMENt
1. the decision-making process, basis for determination and actual payment of remuneration of Directors, Supervisors and Senior Management
In accordance with the provisions of Articles of Association of the Company, remuneration of the Directors and Supervisors shall be determined by the General Meeting, while remuneration of the Senior Management shall be determined by the Board of Directors. During the Reporting Period, the Directors and Supervisors of the Company shall not receive remuneration due to holding the relevant positions of directors and supervisors. Senior Management (Note: Senior Management is the personnel employed by the Board of Directors) shall receive remuneration from the Company or its subsidiaries.
The Company has established complete salary system and remuneration regulations, and the Company adopts annual salary system. The Board of Directors of the Company shall pay remuneration to the Senior Management according to the “Regulations for Annual Performance Assessment and Incentive for the Personnel Employed by the CIMC Board of Directors”
Through the agreement of the Board of Directors and the General Meeting and based on the employment duration, the Independent Directors are awarded with RMB120,000 as independent allowance during the Reporting Period. In addition, Independent Directors didn’t receive other remuneration during the Reporting Period.

114 China International Marine Containers (Group) Co., Ltd.
Chapter 9Directors, Supervisors, Senior Management and Employees
The Supervisor Mr. Xiongbo received remuneration from the Company due to the other positions he held at the Company.
The details of remuneration (pre-tax) of current Directors, Supervisors and Senior Management are as the Remuneration Table for Directors, Supervisors and Senior Management.
2. Remuneration of Directors, Supervisors and Senior Management during the Reporting Period
Unit: RMB’000
Name Position Gender Age Job state
total remuneration
from the Company
total remuneration
from shareholders’
company
Actually received
remuneration at the end
of the Reporting
Period
Directors:Li Jianhong Chairman and Non-executive
DirectorMale 57 Current – – –
Mai Boliang Executive Director and President
Male 54 Current 8,697 – 8,697
Zhang Minjie Vice Chairman, non-executive Director
Male 55 Retired 0 – –
Wang Xingru Non-executive Director Male 48 Retired 0 – –Wang Hong Non-executive Director Male 51 Current – – –Wu Shuxiong Non-executive Director Male 59 Current – – –Ding Huiping Independent Non-executive
DirectorMale 57 Retired 60 0 60
Jin Qingjun Independent Non-executive Director
Male 56 Retired 60 0 60
Xu Jing’an Independent Non-executive Director
Male 72 Retired 60 0 60
Li Kejun Independent Non-executive Director
Male 62 Current 60 0 60
Pan Chengwei Independent Non-executive Director
Male 67 Current 60 0 60
Wong Kwai Huen, Albert
Independent Non-executive Director
Male 62 Current 60 0 60
Supervisors:He Jiale Chairman of the Supervisory
CommitteeMale 59 Current 0 – –
Wong Sin Yue, Cynthia
Supervisor Female 61 Current 0 – –
Xiong Bo Supervisor Male 54 Current 210 0 210Feng Wanguang Supervisor Male 67 Retired 1,719 0 1,719

Annual Report 2013 115
Chapter 9Directors, Supervisors, Senior Management and Employees
Name Position Gender Age Job state
total remuneration
from the Company
total remuneration
from shareholders’
company
Actually received
remuneration at the end
of the Reporting
Period
Li Ruiting Supervisor Male 66 Retired 2,351 0 2,351Lv Shijie Supervisor Male 49 Retired 0 0 0Senior Management:Zhao Qingsheng Vice President Male 61 Current 4,308 0 4,308Wu Fapei Vice President Male 55 Current 3,023 0 3,023Li Yinhui Vice President Male 46 Current 2,721 0 2,721Liu Xuebin Vice President Male 54 Current 3,737 0 3,737Yu Ya Vice President Male 58 Current 2,935 0 2,935Zhang Baoqing Vice President Male 57 Current 3,748 0 3,748Yu Yuqun Secretary to the Board Male 48 Current 2,515 0 2,515Jin Jianlong General Manager of Financial
DepartmentMale 60 Current 2,603 0 2,603
Zeng Beihua General Manager of Capital Management Department
Female 59 Current 2,505 0 2,505
Total – – – – 41,432 – 41,432
Note: (1) Mr. Mai Boliang has received the remuneration from the Company due to his position of president in the Company.
Note: (2) Mr. Xiong Bo has received remuneration from the Company due to his position held in the Company other than the Supervisor.
The top five people who received the highest remuneration from the Group in 2013 have been listed in the above table.

116 China International Marine Containers (Group) Co., Ltd.
Chapter 9Directors, Supervisors, Senior Management and Employees
3. options granted to Directors, Supervisors and Senior Management during the Reporting Period
Name Position
Granted during the Reporting
Period (Share)
Exercised during the Reporting
Period (Share)
Exercise price of
exercised during the Reporting
Period (RMB/share)
Market price at the
end of the Reporting
Period (RMB/share)
Number restricted
shares at the
beginning of the
period (Share)
Number of newly granted
restricted shares
during the Reporting
Period (Share)
Grant price of
restricted shares (RMB/share)
Number of restricted
shares held at the end
of the period
(Share)
Mai Boliang President and Executive Director
950,000 0 11.35 14.86 0 – – 0
Zhao Qingsheng
Vice President 375,000 0 11.35 14.86 0 – – 0
Liu Xuebin Vice President 375,000 0 11.35 14.86 0 – – 0Wu Fapei Vice President 250,000 0 11.35 14.86 0 – – 0Li Yinhui Vice President 250,000 0 11.35 14.86 0 – – 0Yu Ya Vice President 250,000 0 11.35 14.86 0 – – 0Zhang Baoqing Vice President 250,000 0 11.35 14.86 0 – – 0Yu Yuqun Secretary to the
Board of Directors250,000 0 11.35 14.86 0 – – 0
Jin Jianlong General Manager of Financial Department
250,000 0 11.35 14.86 0 – – 0
Zeng Beihua General Manager of Capital Management Department
250,000 0 11.35 14.86 0 – – 0
Total – 3,450,000 0 – – 0 0 – 0
4. Remuneration Policy of the Senior Management
The remuneration policy of the Senior Management of the Company shall be subject to the “Regulations for Annual Performance Assessment and Incentive for the Personnel Employed by the CIMC Board of Directors”.The Company’s senior management remuneration policy links financial interests of the senior management with the Group’s operating results and the performance of its shares in the market.

Annual Report 2013 117
Chapter 9Directors, Supervisors, Senior Management and Employees
V. CHANGES oF DIRECtoRS, SUPERVISoRS AND SENIoR MANAGEMENt DURING tHE REPoRtING PERIoD
Name Position type Date Reason
Ding Huiping Independent Non-executive Director
Retired upon expiration of the appointment term
28 June 2013 Expiration of appointment term
Jin Qingjun Independent Non-executive Director
Retired upon expiration of the appointment term
28 June 2013 Expiration of appointment term
Xu Jing’an Independent Non-executive Director
Retired upon expiration of the appointment term
28 June 2013 Expiration of appointment term
Feng Wanguang Staff Supervisor Retired upon expiration of the appointment term
28 June 2013 Expiration of appointment term
Li Kejun Independent Non-executive Director
Elected 28 June 2013 Elected
Pan Chengwei Independent Non-executive Director
Elected 28 June 2013 Elected
Wong Kwai Huen, Albert
Independent Non-executive Director
Elected 28 June 2013 Elected
Wang Xingru Non-executive Director Retire 18 July 2013 ResignedLv Shijie Supervisory Retired 18 July 2013 ResignedWu Shuxiong Non-executive Director Elected 27 September 2013 ElectedHe Jiale Supervisor Elected 27 September 2013 Elected as the Chief Supervisor
on 14 October 2013Xu Minjie Vice-chairman Retired 8 November 2013 ResignedLi Ruiting Staff Supervisor Retired 2 December 2013 ResignedXiong Bo Staff Supervisor Elected 4 December 2013 Elected
VI. CHANGES oF DIRECtoRS, SUPERVISoRS AND SENIoR MANAGEMENt AFtER tHE END oF tHIS YEAR
The first extraordinary general meeting of the Company in 2014 held on 7 March considered and approved the appointment of Mr. Zhang Liang as a non-executive Director of the Company. On the same day, the fifth session of the seventh Board of Director of the Company in 2014 considered and approved the appointment of Mr. Zhang Liang as the vice chairman and a member of the Strategic Development Committee.
VII. CHANGES oF CoRE tECHNICAl GRoUP oR KEY tECHNICIANS DURING tHE REPoRtING PERIoD (ExClUDING DIRECtoRS, SUPERVISoRS AND SENIoR MANAGEMENt)
During the Reporting Period, core technical group or key technicians (excluding Directors, Supervisors and Senior Management) remain unchanged.

118 China International Marine Containers (Group) Co., Ltd.
Chapter 9Directors, Supervisors, Senior Management and Employees
VIII. EMPloYEES oF tHE CoMPANY
As at 31 December 2013, the Group had a total of 57,686 employees.
Number of in-service employees 57,686Number of retired employees whose expense should be assumed by the Company 0
Profesional composition
Composition Number of employeesPercentage of total
no. of employees (%)
Management personnel 353 0.62%Production personnel 40,317 69.88%Sales personnel 2,179 3.77%Technical personnel 2,861 4.96%Financial personnel 878 1.53%Administration personnel 11,098 19.24%
Education background
Composition Number of employeesPercentage of total
no. of employees (%)
PHD 34 0.06%Master 907 1.58%Bachelor 7,474 12.95%College 7,367 12.76%Senior high school or below 41,904 72.65%
EDUCAtIoN BACKGRoUND
1.58%
12.95%
12.76%
72.65%
558851.58%8%
12.95%
12.76%
72.65%
1
%
College
Senior high or below
BachelorMasterDoctor
0.06%
69.88%
3.77%
4.96%
1.53%
19.24%
0.62%
Production personnel
Sales personnel
technical personnel
Financial personnel
Administrationpersonnel
Management personnel
PRoFESSIoNAl CoMPoSItIoN

Annual Report 2013 119
Chapter 9Directors, Supervisors, Senior Management and Employees
Ix. EMPloYEE wElFARE PlANS
Details on employee welfare plans of the Company are set out in notes II.24 and V.28 to the financial statements prepared in accordance with CAS in this annual report.

120
Chapter 10Corporate Governance and Corporate Governance Report
China International Marine Containers (Group) Co., Ltd.
The Company has prepared the “Corporate Governance Work Report” and the “Corporate Governance Report” in accordance with different requirements in form and content of PRC securities regulatory authorities and the Hong Kong Listing Rules, respectively. To avoid undue repetitions and to keep the presentation lucid, a cross- referencing approach has been adopted.
PARt I: CoRPoRAtE GoVERNANCE woRK REPoRt (PREPARED IN ACCoRDANCE wItH PRC SECURItIES REGUlAtoRY REqUIREMENtS)
I. Situation of Corporate Governance
During the Reporting Period, the Company constantly enhanced the Company’s corporate governance and improved its standardized operation in strict compliance with the requirements of laws and regulations including the PRC Companies Law, Corporate Governance Guidelines for Listed Companies, Guidance Opinion on Establishing a System of Independent Directors in Listed Companies, Rules of General Meetings of Listed Companies and Guidelines on the Articles of Association of Listed Companies. In accordance with a series of rules and regulations of the Company such as the Rules of Procedure for Shareholders’ Meeting, the Rules of Procedure for Board of Directors and the Rules of Procedure for Supervisory Committee, the Company implemented corporate governance by giving full play to the role of Board committees, which ensured the due performance of functions and responsibility of the general meeting, the Board of Directors and the Supervisory Committee and the effective safeguarding of the interests of the shareholders and the Company. Thereby, the Company preliminarily established a corporate governance structure which is in line with the requirements of management of modern enterprise.
In accordance with standards for the corporate governance of listed companies by CSRC, CSRC Shenzhen Bureau, Shenzhen Stock Exchange and the Hong Kong Stock Exchange, the Company communicated proactively with relevant regulatory authorities, positively and timely completed corporate governance rectification, special inspection and system establishment as required by relevant regulatory authorities, and promptly gave feedbacks as required. The Company has received a public recognition for its promotion of self-disciplined works from CSRC Shenzhen Bureau in the fifth successive year.
During the Reporting Period, the Company went through the 2013 Special Examination on the taxation of key tax source enterprises conducted by State Administration of Taxation. As the management of the Company paid high attention to the examination, the Company completed the examinations of the SAT and provincial and municipal taxation authorities in stages through unified deployment and hierarchical setting up of special tax examination groups in the Company and the active cooperation with various enterprises, and won recognition from the tax authorities of different levels. At the same time, the tax risk prevention mechanism and tax compliance were enhanced in the Company and its domestic subsidiaries.

Annual Report 2013 121
Chapter 10Corporate Governance and Corporate Governance Report
In 2013, the Company continued to place emphasis on and committed to improving investor relations management by, in the interest of small and medium investors, adopting effective and innovative measures in daily work and settlement of major issues to strengthen all-around communication with shareholders and investors. In June 2013, the Company received the large-scale collective research involving multiple securities brokers, funds and other institutional investors, which visited the Company’s production bases for its offshore engineering equipment, heavy truck, energy and chemical equipment businesses. In September 2013, the Company participated in the activity of “Online Interactive Platform Open Day for Investors of Shenzhen-listed Companies” hosted by CSRC Shenzhen Bureau, the Association of Shenzhen-Listed Companies, and Shenzhen Securities Information Co., Ltd, and strengthened the communication and interaction with small and medium investors and shareholders. The Company achieved good communication effect and customer satisfaction through a continuous, comprehensive, in-depth and multi-level communication.
There are no differences between Corporate Governance and ‘Company Law” and relevant requirements of China’s Securities Regulatory Commission
Development of special activities of corporate governance, and the formulation and implementation of registration and management system of insiders
The Company has established an Insider Registration and management System according to various securities regulatory requirements and has revised the above system in 2011. The above system, which specifies the scope of inside information and insiders, the approval, registration and filing system of inside information and confidentiality obligation, has become an important part of the Company’s internal control system. In respect of implementation of inside information and insider management system, the Company carried out an effective supervision on internal circulation and disclosure of inside information in accordance with the various systems and requirements on a strict basis. Self-examination result shows that no insiders has used any inside information to trade the Company’s shares before disclosure of major sensitive information affecting the Company’s share price in 2013. During the Reporting Period, no unpublished information was submitted to substantial shareholders by the Company.

122 China International Marine Containers (Group) Co., Ltd.
Chapter 10Corporate Governance and Corporate Governance Report
II. Relevant Situations of Annual General Meeting and Extraordinary General Meeting Convened during the Reporting Period
1. Annual General Meeting Convened during the Reporting Period
Session of meeting Date Name of proposal Resolution Disclosure date Disclosure index
2012 Annual General Meeting of China International Marine Containers (Group) Co., Ltd.
28 June 2013 (1) “Annual Work Report of Board of Directors of 2012” (2) “Annual Work Report of Board of Supervisors of 2012” (3) ‘Annual Report of 2012’ (4) “Pre-Plan of Annual Profit Distribution and Dividends of 2012” (5) ‘Proposal for employing accounting firm”, (6) “Proposals for providing grant of bank credit and project to the subsidiaries in 2013 “ (7) “Proposals for CIMC Vehicle (Group) Co., Ltd. and its subsidiaries to provide credit guaranty to their affiliated dealer and clients” (8) “Proposals for CIMC Vehicle (Group) Co., Ltd. to provide credit guarantee of bank credit to its subsidiaries” (9) “Proposals that the ‘ CIMC Group Finance Co., Ltd. applies to manage overseas guarantee business for member companies of the group” (10) “Proposals fo r submi t t ing to the Genera l Meet ing for approval of the continuous connected transaction with COSCO Pacific Limited and newly revised annual trade limit” (11) “Proposal for electing directors of the 7th Board of Directors”. (12) “Proposals for electing the independent directors of 7th Board of Directors” (13) “Proposals for electing supervisors of representative shareholders of the 7th Board of Supervisors (14) “Proposals for the General Meeting to give ordinary authorization to the Board of Directors on issuing the shares” (15) “Proposal for revising ‘Rules of Procedure of the General Meeting’”. (16) “Proposals for revising ‘Rule of procedures of the Board of Directors’” (17) “Proposals for revising ‘Rules of Procedures of the Board of Supervisors’”
Considered and reviewed one by one
29 June 2013 Cninfo website (http://www.cninfo.com.cn/) Hong Kong Stock Exchange website (http://www.hkexnews.hk)

Annual Report 2013 123
Chapter 10Corporate Governance and Corporate Governance Report
2. Extraordinary General Meeting Convened during the Reporting Period
Session of meeting Date Name of proposal Resolution Disclosure date Disclosure index
The first Extraordinary General Meeting of China International Marine Containers (Group) Co., Ltd. in 2013
27 September 2013
(1) ‘Proposals for re-electing Mr. Wu Shuxiong as the Director of the 7th Board of Directors’ (2) “Proposals for reelecting Mr. He Jiale as the Supervisor of the 7th Board of Supervisors”
Considered and reviewed one by one
28 September 2013
Cninfo website (http://www.cninfo.com.cn/) Hong Kong Stock Exchange website (http://www.hkexnews.hk)
III. Performance of Independent Non-executive Directors’ Duties during the Reporting Period
In 2013, the independent non-executive Directors of the Company were committed to strictly and diligently performing their duties in accordance with the relevant domestic and overseas laws and regulations and the Articles of Association. During the Reporting Period, they reviewed the proposals and relevant documents presented by the Company and actively participated in the meetings of the Board of Directors and special committees of the Board (please refer to the section headed “Directors’ Report” of this annual report for detailed information on the attendance of the meetings) They expressed their views objectively and independently protecting the interests of the independent shareholders and played a part in the checks and balances of the decision making process of the Board. Independent non-executive Directors reviewed regular reports of the Company diligently. They had discussions with external auditors in regular and special meetings before and after their year-end auditing works. Such meetings were held prior to the Board meetings. During the Reporting Period, the independent Non-executive Directors of the Company did not object to any motions, resolutions and other matters discussed at the meetings of the Board.
1. Independent Non-executive Directors’ attendance to the Board of Director and the General Meeting
Independent Non-executive Directors’ attendance to the Board of Director
Name of Independent Non-executive Director
Attending times to
the Board of Directors
Attendance times
Attending times by means of
telecommunication
Entrusted attendance
timesAbsence
times
Not personally attend two consecutive meetings
Ding Huiping 5 2 3 0 0 NoJin Qingjun 5 2 3 0 0 NoXu Jing’an 5 2 3 0 0 NoLi Kejun 11 3 8 0 0 NoPan Chengwei 11 3 8 0 0 NoWong Kwai Huen, Albert 11 3 8 0 0 No
During the Reporting Period, the Independent Non-executive Directors attended the shareholders’ general meeting once.
124 China International Marine Containers (Group) Co., Ltd.
Chapter 10Corporate Governance and Corporate Governance Report
2. Independent Non-executive Directors’ opposition to relevant proposals of the Company
During the Reporting Period, the Independent Non-executive Directors did not present any opposition to relevant proposals of the Company.
3. other descriptions on performance of Independent Non-executive Directors’ duties
During the Reporting Period, the Company did not reject any relevant proposals given by the Independent Non-executive Directors
IV. Duty Performance of Special Committees of Board of Directors during the Reporting Period
The Board of Directors set up four special committees, i.e. Audit Committee, Remuneration and Appraisal Committee, Strategic Development Committee, and Nomination Committee. Those special committees will conscientiously perform their duties in accordance with “Governance Guidelines of Listed Company”, “Articles of Associations”, “Rules of Procedures of the Board of Directors” and the authorities and obligation endowed by the implement rules of each special committee.
During the Reporting Period, the meetings of each special committee under the Board of Directors can be seen in “3. Special Committees of the Board” of “Part II: Corporate Governance Report Prepared in Accordance with the Requirements of the Hong Kong Listing Rules” in this Chapter.
V. operation of the Supervisory Committee
The Supervisory Committee did not discover risks of the Company in the supervision during the Reporting Period
The Supervisory Committee has no objections to the supervision matters during the Reporting Period.
VI. Independence of the Company from its substantial Shareholders in respect of business, personnel, asset, organizational structure and finance
The substantial shareholders of the Company are China Merchants Group and COSCO. The Company is independent from its substantial shareholders in respect of our business, personnel, asset, organizational structure and finance, and independently assume the responsibilities and risks. (i) Personnel; the labor, personnel and salary management institution of the Company are independent, the system is complete, and the personnel is completely independent of the substantial shareholders, the senior management of the Company has no dual offices in shareholders’ companies, and all of them are paid by the listed company; the financial personnel of the Company has no part-time job in associated companies. (ii) Assets; the property rights between the Company and the substantial shareholders are clear, with complete procedures, and the property rights is managed by the Company independently, the substantial shareholders do not occupy or govern the assets nor interfere with the listed company on operating management of the assets. (iii) Finance: the finance department, financial accounting system, financial management system and bank account are independent, and pay the taxes independently. (iv) Institutions: the Board of Directors, the board of supervisors and other internal institutions are complete and operate independently. The substantial shareholders perform its rights according to the law and assume the corresponding obligations, and don’t directly or indirectly interfere with the business activities of the Company exceeding the Board of Directors; (v) Business: the production system, purchase system auxiliary production system and sales system are complete. The Company is totally independent, holding the intangible assets such as industrial property, trademark, non-patient technology, etc. During the Reporting Period, the Company didn’t provide undisclosed information and other non-standard governance problems to the substantial shareholders and actual controllers

Annual Report 2013 125
Chapter 10Corporate Governance and Corporate Governance Report
The Company is independent from its substantial shareholders, China Merchants Group Limited and COSCO, in respect of our business, personnel, asset, organizational structure and finance. The Company has independent and comprehensive business operations and management capabilities.
VII. Horizontal Competitions
The Company and the subsidiary of controlling shareholder of the biggest shareholder – China Merchants Group have horizontal operation, that is to say marine engineering business, one of the businesses of the Group, is the same or similar to that of China Merchants Group – controlling shareholder of our biggest shareholder, which constituted a certain horizontal competition relationship to some extent. The main reason is that the subsidiary of the controlling shareholder of our biggest shareholder – China Merchants Group has entered and developed marine engineering equipment business earlier than the Company, and the Company entered marine engineering equipment market via purchasing Yantai Raffles, and put marine engineering equipment business as one of the core business of the Company. But the China Merchants Group is not the controlling shareholder of the Company. The Company will keep communication and coordination with the substantial shareholders, so as to avoid direct competition among the positioning of business development, leading products, target market, etc.
The container business of the Group has relations with the subsidiaries of China Shipping Ocean Company in product sales and purchases, for more details, please refer to the section about connected transactions in Note VI.5 to the financial statement prepared in accordance with the Accounting Standards for Business Enterprises of PRC in this Annual Report.
VIII. Appraisal and Incentives of Senior Management
In order to promote the Company’s development in a standardized, sound and orderly manner, to attract more talents and to maintain the stability of the senior management, the Board of Director has formulated the”Regulations for Annual Performance Assessment and Incentive for the Personnel Employed by the CIMC Board of Directors”, and established the performance appraisal and incentive and restraint mechanisms which link the remuneration of senior management with both the Company’s performance and individual performance.
On 17 September 2010, “Revision (Draft) of Stock Option Incentive Plan of China International Marine Containers (Group) Co., Ltd.” of the Company was passed on the first Extraordinary General Meeting in 2010. The Company proposed incentive plan of the stock option of A share, relevant information can be seen in “IV Implementation and Effect of Stock Rights Incentives of the Company in the Reporting Period” in “Section 7 Significant Events’.
Stock option incentive plan is conducive to the interest share and restriction mechanism between shareholders, management group and key staffs; the management can balance short-term target and long-term target better; absorb and maintain excellent management personnel and business backbones; continue to create the incentive value, ensure the long-term stable development of the Company and reinforce the competitiveness of the Company.

126 China International Marine Containers (Group) Co., Ltd.
Chapter 10Corporate Governance and Corporate Governance Report
PARt II: CoRPoRAtE GoVERNANCE REPoRt (PREPARED IN ACCoRDANCE wItH tHE REqUIREMENtS oF tHE HoNG KoNG lIStING RUlES)
The Company has been committed to enhancing the Company’s corporate governance standards. Through strict corporate governance practices, the Company strives to enhance corporate value and ensure our long-term sustainable development, and to fulfill corporate responsibility as a listed company as well as maximize long-term shareholders value.
The Company has complied with the code provisions under the Corporate Governance Code set out in Appendix 14 of the Hong Kong Listing Rules during the Reporting Period, except for deviation of the code provisions A.1.1, A.6.7, A.2.7 and A.5.6, the details of which and its considerations have been disclosed in the relevant paragraphs below.
I. Compliance with the Model Code for Securities transactions by Directors of listed Issuers
The Company has adopted the provisions in relation to dealing in shares of the Company by Directors as set out in the Model Code for Securities Transactions by Directors of Listed Issuers contained in Appendix 10 of the Hong Kong Listing Rules (the “Model Code”). Each Director and Supervisor has confirmed to the Company that each of them has complied with the requirements set out in the Model Code during the Reporting Period.
II. Composition and Meetings of the Board of Directors
1. Composition of the Board of Directors and the attendance rate
Pursuant to the provisions of Articles of Association of the Company, the Board of Directors shall convene at least four meetings each year. In 2013, the Board of Directors of the Company convened 16 meetings, including 3 on-site meetings and 13 meetings held in a way of written review resolutions. In 2013, the attendance of all directors to the Board meetings is as follows:
Name PositionsAttendance Rate
(%)
Li Jianhong Chairman and Non-executive Director 100Xu Minjie Vice Chairman and Non-executive Director (Until 8 November 2013) 100Mai Boliang Executive Director and President 100Wang Hong Non-executive Director 100Wu Shuxiong Non-executive Director 100Wang Xingru Non-executive Director (Until 18 July 2013) 71Ding Huiping Independent Non-executive Director (Until 28 June 2013) 100Jin Qingjun Independent Non-executive Director (Until 28 June 2013) 100Xu Jing’an Independent Non-executive Director (Until 28 June 2013) 100Li Kejun Independent Non-executive Director 100Pan Chengwei Independent Non-executive Director 100Wong Kwai Huen, Albert
Independent Non-executive Director 100
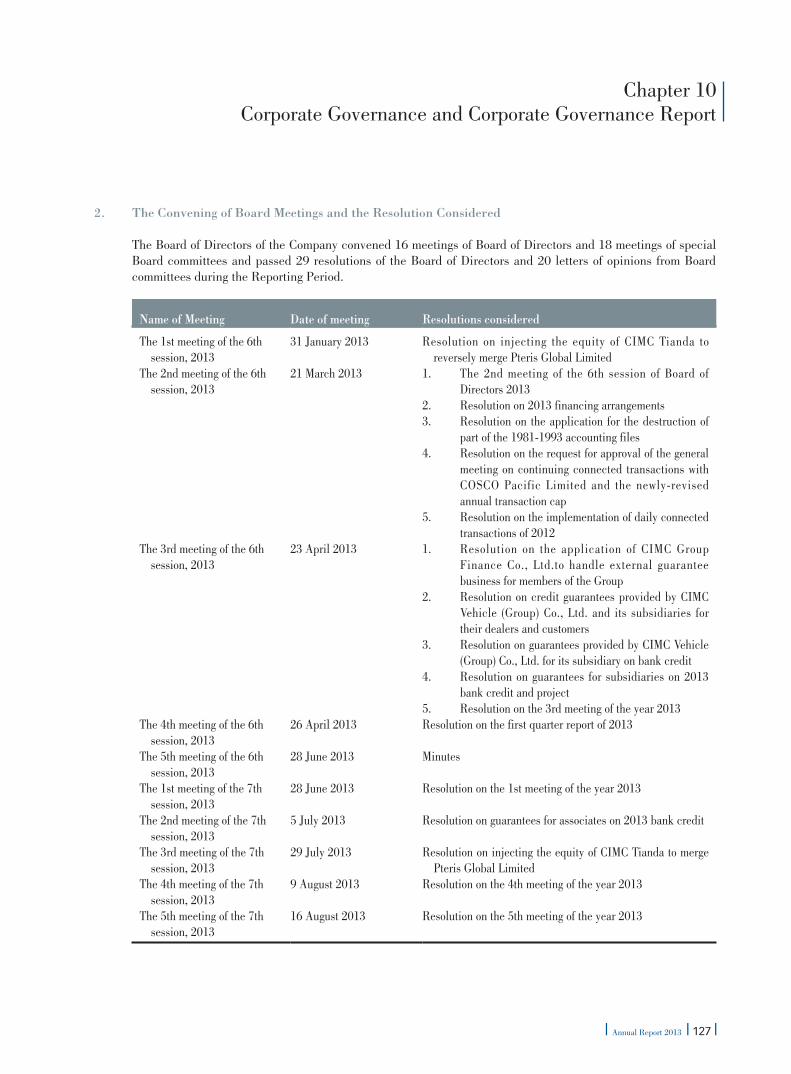
Annual Report 2013 127
Chapter 10Corporate Governance and Corporate Governance Report
2. the Convening of Board Meetings and the Resolution Considered
The Board of Directors of the Company convened 16 meetings of Board of Directors and 18 meetings of special Board committees and passed 29 resolutions of the Board of Directors and 20 letters of opinions from Board committees during the Reporting Period.
Name of Meeting Date of meeting Resolutions considered
The 1st meeting of the 6th session, 2013
31 January 2013 Resolution on injecting the equity of CIMC Tianda to reversely merge Pteris Global Limited
The 2nd meeting of the 6th session, 2013
21 March 2013 1. The 2nd meeting of the 6th session of Board of Directors 2013
2. Resolution on 2013 financing arrangements3. Resolution on the application for the destruction of
part of the 1981-1993 accounting files4. Resolution on the request for approval of the general
meeting on continuing connected transactions with COSCO Pacific Limited and the newly-revised annual transaction cap
5. Resolution on the implementation of daily connected transactions of 2012
The 3rd meeting of the 6th session, 2013
23 April 2013 1. Resolution on the application of CIMC Group Finance Co., Ltd.to handle external guarantee business for members of the Group
2. Resolution on credit guarantees provided by CIMC Vehicle (Group) Co., Ltd. and its subsidiaries for their dealers and customers
3. Resolution on guarantees provided by CIMC Vehicle (Group) Co., Ltd. for its subsidiary on bank credit
4. Resolution on guarantees for subsidiaries on 2013 bank credit and project
5. Resolution on the 3rd meeting of the year 2013The 4th meeting of the 6th
session, 201326 April 2013 Resolution on the first quarter report of 2013
The 5th meeting of the 6th session, 2013
28 June 2013 Minutes
The 1st meeting of the 7th session, 2013
28 June 2013 Resolution on the 1st meeting of the year 2013
The 2nd meeting of the 7th session, 2013
5 July 2013 Resolution on guarantees for associates on 2013 bank credit
The 3rd meeting of the 7th session, 2013
29 July 2013 Resolution on injecting the equity of CIMC Tianda to merge Pteris Global Limited
The 4th meeting of the 7th session, 2013
9 August 2013 Resolution on the 4th meeting of the year 2013
The 5th meeting of the 7th session, 2013
16 August 2013 Resolution on the 5th meeting of the year 2013

128 China International Marine Containers (Group) Co., Ltd.
Chapter 10Corporate Governance and Corporate Governance Report
Name of Meeting Date of meeting Resolutions considered
The 6th meeting of the 7th session, 2013
27 August 2013 Resolution on the interim report of the year 2013
Resolution on additional guarantees for subsidiaries on 2013 bank credit and project
The 7th meeting of the 7th session, 2013
11 September 2013 Resolution on the adjustment of exercise price of share option incentive plan
The 8th meeting of the 7th session, 2013
14 October 2013 Resolution on the consideration of members of special committees of the Board of Directors
The 9th meeting of the 7th session, 2013
29 October 2013 Resolution on the third quarter report of the year 2013
The 10th meeting of the 7th session, 2013
7 November 2013 1. Resolution on the acquisition of Germany fire and rescue vehicle enterprise Albert Ziegler Group
2. Resolution on the provision of debt restructuring for Pteris Global Limited
The 11th meeting of the 7th session, 2013
23 December 2013 1. Resolution on granting exercise right to incentive target of share options of A shares granted on 28 September 2010
2. Resolution on the consent to elect Mr. Zhang Liang as the candidate for the 7th Board of Directors
3. Resolution on matters related to non-public issue of overseas listed foreign shares (H shares) of China International Marine Containers (Group) Co., Ltd. in accordance with general mandate
Code A.1.1 requires that “The board should meet regularly and board meetings should be held at least four times a year at approximately quarterly intervals.” During the reporting period, the Company held 16 board meetings and three of which were regular meetings. During the management and monitoring of business operations, executive Directors from time to time decide to propose holding meetings for important business and administrative matters. Therefore, some of the decisions are made by all the directors by way of written resolutions. The Directors believe that the fairness and effectiveness of the decision-making process related to business needs have been adequately ensured. Going forward, the company will strive to practice good corporate governance practices.
Code A.6.7 requires that “Independent non-executive directors and other non-executive directors should also attend general meetings and develop a balanced understanding of the views of shareholders.” Independent non-executive Directors failed to attend the First Extraordinary General Meeting of 2013 held on 27 September 2013 due to engagement in other important businesses.
Code A.2.7 requires that “The chairman should at least annually hold meetings with the non-executive directors (including independent non-executive directors) without the executive directors present.” The Company has only one executive Director and the Company’s business operation is managed and monitored by the executive Director. The Directors consider that during the reporting period there is no meeting which the executive Director needs to be avoided. Therefore, the Company has not held a board meeting without the executive Director present during the reporting year.

Annual Report 2013 129
Chapter 10Corporate Governance and Corporate Governance Report
Code Provision A.5.6 stipulates that “The Nomination Committee (or the Board) should have a policy concerning diversity of the board members, and should disclose the policy or a summary of the policy in the Corporate Governance Report.” Although the written policy regarding diversity of the directors has not yet been formally adopted during the reporting period, the Board considers that the Company’s existing practices have covered requirements on diversity of the Board members, and the Company has revised the working guidelines for the Nomination Committee on March 25, 2014, which clarified the policy of diversity of the board members, i.e. the selection of candidates for the board of directors will be based on a diverse range of areas, including, but not limited to, gender, age, cultural and educational background, professional experience, skills and knowledge. On top of the above conditions, qualities such as the candidate’s comprehensive value to the Company, his/her potential contribution to the Board and requirements on diversity of the Board members will be taken into account when the final decision is made.
3. operation of the Board of Directors
The Company’s Board is elected by the shareholders’ general meeting of the Company through voting and is held accountable to the shareholders’ general meeting. The primary responsibilities of the Board of Directors are to provide strategic guidance to the Company, exercise effective supervision over the senior management, ensure that the Company’s interests are protected and are accountable to the shareholders. In accordance with the Articles of Association or as authorised by the shareholders, the Board of Directors makes decisions on certain important matters, including strategic proposals and medium-to-long term planning; annual business plans and investment plans; annual financial budgets; annual criteria for assessment of the performance of members of working units of the Company and annual remuneration plans; interim and annual financial reports; preliminary distribution plans in respect of interim profit and full year profit; and material issues involving development, and acquisition or corporate reorganisation of the Company. The Directors and the Board of Directors carry out corporate governance duties in respect of the Company in a serious and responsible manner. The Directors are elected strictly following the procedures for election and appointment of Directors provided for in the Articles of Association. The Directors attend Board meetings in a serious and responsible manner, perform their duties as Directors seriously and diligently, make important decisions concerning the Company, appoint and supervise the members of the operation units of the Company.
The Company has established a system of independent non-executive Directors. There are three independent non-executive Directors in the Board of Directors, which satisfied the minimum number of independent non-executive Directors required under the Hong Kong Listing Rules. The Company has received a confirmation of independence from each of the 3 independent non-executive Directors pursuant to Rule 3.13 of the Hong Kong Listing Rules. The Company considers that the 3 independent non-executive Directors are completely independent of the Company, its substantial shareholders and its connected persons and comply fully with the requirements concerning independent non-executive Directors under the Hong Kong Listing Rules. Mr Pan Chengwei, an independent non-executive Director, has appropriate accounting and financial management experience as required under Rule 3.10 of the Hong Kong Listing Rules. Please refer to the section headed “Brief Biography of the Directors” under “Chapter 9: Directors, Supervisors, Senior Management and Employees” for detailed biographies of Mr Pan Chengwei. The 3 independent non-executive Directors do not hold other positions in the Company. They perform their duties seriously according to the Articles of Association and the relevant requirements under the applicable laws and regulations.
The Board of Directors has established the Audit Committee, the Strategic Development Committee, the Remuneration and Appraisal Committee and the Nomination Committee. The main responsibilities of such committees are to provide support to the Board of Directors in the decision-making process. The Directors participating in these special board committees focus on particular issues according to the work allocation and make recommendations on the improvement of the corporate governance of the Company.

130 China International Marine Containers (Group) Co., Ltd.
Chapter 10Corporate Governance and Corporate Governance Report
4. the Chairman and President
The Chairman and the President of the Company are two different positions with different duties and responsibilities. Mr. Li Jianhong is the Chairman of the Company and Mr. Mai Boliang is the President of the Company.
Pursuant to the Articles of Association, the primary duties and responsibilities of the Chairman are chairing the shareholders’ general meetings and convening and chairing meetings of the Board of Directors, responsible for strategic development, inspecting the implementation of Board resolutions, signing certificates of securities issued by the Company, and other duties and power authorised under the Articles of Association and by the Board of Directors.
The primary duties and responsibilities of the President are deciding the overall corporate strategies, managing production and operation, further develop the businesses, organising the implementation of Board resolutions, organising the implementation of annual business plans and investment plans of the Company, formulating plans for the establishment of internal management institutions of the Company, devising the basic management system of the Company, formulating specific rules and regulations of the Company, advising the Board of Directors to appoint or dismiss Senior Vice Presidents, Vice Presidents, the Chief Financial Officer and other senior management personnel, appointing or dismissing management staff other than those that should be appointed or dismissed by the Board of Directors, and performing other duties and power authorised by the Articles of Association and the Board of Directors.
There is no relationship (including financial, business, family or other material/relevant relationship(s)) among members of the Board of Directors and between the Chairman and the President of the Company.
To continue to develop and update their knowledge and skills so as to better perform their responsibilities as directors, the Directors of the Company have attended the relevant trainings offered by legal counsels, the Exchange and CSRC Shenzhen Bureau.
5. term of office of Directors
Pursuant to the Articles of Association, the Directors of the Company (including non-executive Directors) shall be elected at the shareholders’ general meeting and serve a term of office of three years. Upon the expiry of their term of office, the Directors may be re-elected for another session. The term of office of the independent non-executive Directors shall not exceed six years.
6. Directors’ remuneration
Among the eight Directors of the Company, Mr. Mai Boliang was paid by the Company due to his position as President. Other than that, the Company did not pay the non-executive Directors (other than the independent non-executive Directors) during the Reporting Period. As considered and passed by the Board of Directors and shareholders’ general meeting, each of the independent non-executive Directors received an allowance of RMB120,000 every year. Other than that, the Company did not provide other remuneration to the independent non-executive Directors during this year. In the review and determination of specific remuneration packages for Directors, the Company’s Remuneration and Appraisal Committee may consider factors such as salaries paid by comparable companies, time of commitment and responsibilities of the Directors.

Annual Report 2013 131
Chapter 10Corporate Governance and Corporate Governance Report
7. Interests of Directors
(1) Interests of Directors and Supervisors in Contracts
During the Reporting Period, none of the Directors or Supervisors of the Company had any material personal interests, either directly or indirectly, in any contract of significance to which the Company or any of its subsidiaries was a party.
(2) Competing Interests of Directors and Supervisors
During the Reporting Period, none of the Directors or Supervisors had any interests in a business that competes or may compete directly or indirectly with the business of the Group.
III. Special Committees of the Board
1. the Remuneration and Appraisal Committee
(1) The Duties and Responsibilities of the Remuneration and Appraisal Committee
The main duties and responsibilities of the Remuneration and Appraisal Committee are: study and formulate evaluation criteria of senior management and perform evaluation and propose remuneration policies and plans; make recommendations regarding the evaluation criteria and remuneration policies of Directors; formulate share incentive plans pursuant to provisions of relevant laws, regulations and normative documents; responsible for the management of share incentive plans, including but not limited to reviews on the qualification of grantees, grant condition and exercise condition; other matters authorized by the Board.
(2) Members of the Remuneration and Appraisal Committee and the Attendance Rate
The Remuneration and Appraisal Committee of the Company comprises five Directors, including three independent non-executive Directors and two non-executive Directors. During the Reporting Period, the Chairman of the Remuneration and Appraisal Committee is Mr. Li Kejun, and the members include Mr. Wang Hong, Mr. Wu Shuxiong, Mr. Pan Chengwei and Mr. Wong Kwai Huen, Albert.
Members of the Remuneration and Appraisal Committee Attendance times
Entrusted attendance times
The 6th Session Mr. Jin Qingjun 2 0Mr. Ding Huiping 2 0Mr. Xu Jing’an 2 0Mr. Wang Hong 2 0Mr. Wang Xingru 1
The 7th Session Mr. Li Kejun (Chairman) 1 0Mr. Pan Chengwei 1 0Mr. Wong Kwai Huen, Albert 1 0Mr. Wang Hong 1 0Mr. Wu Shuxiong 1 0

132 China International Marine Containers (Group) Co., Ltd.
Chapter 10Corporate Governance and Corporate Governance Report
(3) The work of the Remuneration and Appraisal Committee during the Reporting Period
The Remuneration and Appraisal Committee held 3 meetings during the Reporting Period, and the proposals they deliberated are as follows:
Name of Meeting Date of meeting Resolution considered
The 1st meeting of the 6th session, 2013
20 March 2013 Audit opinion on the remuneration disclosed by Directors, Supervisors and Senior Management
The 2nd meeting of the 6th session, 2013
25 June 2013 No resolution.
The 1st meeting of the 7th session, 2013
23 December 2013 Opinion on verifying the list of incentive target of share options of A shares granted on 28 September 2010
2. Nomination Committee
(1) The Duties and Responsibilities of the Nomination Committee
The main duties and responsibilities of the Nomination Committee are to review the structure, size and composition of the Board of Directors at least annually and make recommendations on any proposed changes to the Board to select and nominate any person to be the Director; to identify individuals suitably qualified to become Board members and select or make recommendations to the Board on the selection of individuals nominated for directorships; to assess the independence of independent non-executive directors; to make recommendations to the Board on relevant matters relating to the appointment or re-appointment of directors, and succession planning for directors; to evaluate the Directors’ work and make suggestions or recommendations on the replacement of Directors based on the evaluation results (if applicable); and to review the Company’s policy on diversity of Board members.
(2) Members of the Nomination Committee and the Attendance Rate
The Nomination Committee comprises three Directors, including two independent non-executive Directors and one independent non-executive Director. The Chairman of the Nomination Committee is Mr. Wong Kwai Huen, Albert, and the members include Mr. Pan Chengwei and Mr. Li Jianhong.
Members of the Nomination Committee Attendance timesEntrusted
attendance times
Mr. Wong Kwai Huen, Albert (Chairman) 2 0Mr. Li Jianhong 2 0Mr. Pan Chengwei 2 0

Annual Report 2013 133
Chapter 10Corporate Governance and Corporate Governance Report
(3) The work of the Nomination Committee during the Reporting Period
The Nomination Committee held 2 meetings during the Reporting Period, and the proposals they deliberated are as follows:
Name of Meeting Date of meeting Resolution considered
The 1st meeting of the 7th session, 2013
25 July 2013 Opinion on the nomination of Mr. Wu Shuxiong as candidate of the 7th session of Board of Directors
The 2nd meeting of the 7th session, 2013
23 December 2013 Opinion on the nomination of Mr. Zhang Liang as candidate of the 7th session of Board of Directors by by-election
(4) Amending the Working Rules for the Nomination Committee
Code Provision A.5.6 stipulates that “The Nomination Committee (or the Board) should have a policy concerning diversity of the board members, and should disclose the policy or a summary of the policy in the Corporate Governance Report.” Although the written policy regarding diversity of the directors has not yet been formally adopted during the reporting period, the Board considers that the Company’s existing practices have covered requirements on diversity of the Board members, and the Company has revised the working guidelines for the Nomination Committee on March 25, 2014, which clarified the policy of diversity of the board members, i.e. the selection of candidates for the board of directors will be based on a diverse range of areas, including, but not limited to, gender, age, cultural and educational background, professional experience, skills and knowledge. On top of the above conditions, qualities such as the candidate’s comprehensive value to the Company, his/her potential contribution to the Board and requirements on diversity of the Board members will be taken into account when the final decision is made.
(5) Procedures and Criteria of Nomination of Directors
Pursuant to the Articles of Association of the Company, election and replacement of Directors shall be proposed to the shareholders’ general meeting for approval. The Nomination Committee of the Board of Directors (the Board of Directors), the Supervisory Committee and the Shareholders whose shareholding represents 1% or more of the voting shares of the Company are entitled to make proposals. The Secretariat of the Board of Directors is responsible for preparing relevant procedural documents, including but not limited to recommendation letters, resume of candidates, tables of basic information and letters of resignations, which shall be submitted to the Board of Directors for consideration, and then to the Shareholders’ General Meeting for approval upon the consent of the director candidates and qualification review of the Board’s Nomination Committee. At the same time, resigning Directors are requested to sign resignation letters. Pursuant to the Articles of Association, the Company is required to give notice of the shareholders’ meeting to shareholders in writing 45 days in advance and send a circular to shareholders. Pursuant to Rule 13.51(2) of the Hong Kong Listing Rules, information concerning the name list, resumes and emoluments of the candidates for directorship must be set out in the circular to shareholders to facilitate voting by shareholders. The new Directors must be approved by more than half of the total voting shares held by the shareholders present in person or by proxy at the shareholders’ general meeting.

134 China International Marine Containers (Group) Co., Ltd.
Chapter 10Corporate Governance and Corporate Governance Report
3. Audit Committee
(1) The Duties and Responsibilities of the Audit Committee
The major duties and responsibilities of the Audit Committee of the Company are: making proposals of engaging or replacing external audit firms (including auditing of both financial statements and internal control, hereinafter referred to as the “external audit”); supervising the Company’s internal audit system and its implementation; responsible for conducting communication between our internal audit department and external auditors; reviewing the Company’s financial information and its disclosures; reviewing the implementation of Company’s internal control system and its self-evaluation; conducting a conclusive review and the confirmation of the Company’s material defects in respect of internal control; conducting audit on material connected transactions;; and other duties authorized by the Board.
(2) Members of the Audit Committee and the Attendance Rate
During the Reporting Period, the Audit Committee comprises three independent non-executive Directors. The Chairman of the Audit Committee is Mr. Pan Chengwei, and the members include Mr. Li Kejun and Mr. Wong Kwai Huen, Albert.
Members of Audit Committee Attendance timesEntrusted
attendance times
The 6th Session Mr. Ding Huiping 2 0Mr. Xu Jing’an 2 0Mr. Wang Xingru 2 0
The 7th Session Mr. Pan Chengwei (Chairman) 4 0Mr. Li Kejun 4 0Mr. Wong Kwai Huen, Albert 4 0

Annual Report 2013 135
Chapter 10Corporate Governance and Corporate Governance Report
(3) The work of the Audit Committee during the Reporting Period
During the Reporting Period, the Audit Committee held 6 meetings. Two of the meetings of the Audit Committee were held by way of written resolution.
Name of Meeting Date of meeting Resolution considered
The 1st meeting of the 6th session, 2013
8 March 2013 No resolution
The 2nd meeting of the 6th session, 2013
20 March 2013 1. Audit opinion on the “2012 CIMC internal control self-assessment report”
2. Audit opinion on the implementation of 2012 daily connected transactions
3. Audi t op in ion on per fo rmance evaluation of accounting firm and proposal of audit agency for 2013
4. Audit opinion on the request for approval of the general meeting on continuing connected transactions with COSCO Pacific Limited and the newly-revised annual transaction cap
5. Audit opinion on “2012 CIMC Annual Financial Report”
The 1st meeting of the 7th session, 2013
26 August 2013 Audit opinion on 2013 Interim Report
The 2nd meeting of the 7th session, 2013
28 October 2013 Audit opinion on the 3rd Quarter Report of 2013
The 3rd meeting of the 7th session, 2013
23 December 2013, morning
Opinion on matters related to non-public issue of overseas listed foreign shares (H shares) of China International Marine Containers (Group) Co., Ltd. in accordance with general mandate
The 4th meeting of the 7th session, 2013
23 December 2013, afternoon
No resolution
4. Strategy Committee
During the Reporting Period, the Strategy Committee of the Company held various meetings through interview, telephone, email, electrocommunication and other methods to discuss important matters of the Company, keep close contact effectively and make sure the performance of its duties and responsibilities. At the same time, the CIMC investment review committee under the Strategy Committee has also held seven meetings to give full evaluations on the Company’s major investments and acquisitions, which provided a strong basis for the decision of the Board.

136 China International Marine Containers (Group) Co., Ltd.
Chapter 10Corporate Governance and Corporate Governance Report
IV. Shareholders and Shareholders’ General Meetings
1. Shareholders’ Right
To ensure that all shareholders of the Company enjoy equal rights and exercise their rights effectively, the Company convenes shareholders’ general meetings every year pursuant to its Articles of Association.
Pursuant to the Articles of Association, shareholder(s) individually or jointly holding more than 3% of the Company’s shares are entitled to propose resolutions to the Company. The shareholder(s) individually or jointly holding more than 3% of the Company’s shares are entitled to submit extraordinary resolutions in writing to the Board of Directors 10 days prior to the shareholders’ general meeting.Pursuant to the Articles of Association, the shareholder(s) are entitled to supervise the operation of the Company, make recommendation or enquiries to the Company.
During the Reporting Period, for general meetings of the Company convened and the corresponding resolutions passed and approved, please refer to “2. Relevant Situations of Annual General Meeting and Extraordinary General Meeting Convened during the Reporting Period” in this Chapter of this report.
2. Attendance rates of the Directors at the shareholders’ general meetings are as follows:
Position Name Attendance Rate (%)
Chairman and Non-executive Director Li Jianhong 50%Vice Chairman and Non-executive Director Xu Minjie (until 8 November 2013) 100%Executive Director and President Mai Boliang 50%Non-executive Director Wang Hong 50%Non-executive Director Wang Xingru (until 18 July 2013) 0%Non-executive Director Wu Shuxiong 0%Independent non-executive Director Ding Huiping 100%Independent non-executive Director Jin Qingjun 100%Independent non-executive Director Xu Jing’an 100%Independent non-executive Director Li Kejun 0%Independent non-executive Director Pan Chengwei 0%Independent non-executive Director Wong Kwai Huen, Albert 0%
The resolutions passed at the above annual and extraordinary shareholders’ general meetings, together with relevant details, have been set out in the relevant announcements published on the websites of the SZSE, cninfo (http://www.cninfo.com.cn), Hong Kong Stock Exchange (www.hkexnews.hk) and the Company.
3. the implementation of resolutions of annual general meeting by the Board
All members of the Board have seriously and diligently performed their duties, implemented the resolutions passed at the annual general meeting and accomplished all tasks as authorized by the annual general meeting according to the relevant laws, regulations and rules of the respective jurisdictions where Company’s shares are listed and the provisions as set out in the Company’s Articles of Association.

Annual Report 2013 137
Chapter 10Corporate Governance and Corporate Governance Report
4. Requisition by shareholders to convene a general meeting
Pursuant to the Articles of Association of the Company, shareholder(s) individually or jointly holding a total of 10% or more of the shares of the Company are entitled to request the Board of Directors in writing to convene an extraordinary general meeting or a class shareholders’ general meeting. Two or more shareholders holding a total of 10% or more of the shares carrying voting right of the Company may sign one or more written requests of identical form and substance requesting the Board of Directors to convene a class shareholders’ general meeting or extraordinary general meeting and stating the subject of the meeting. If the Board of Directors disagrees with the proposal of convening an extraordinary general meeting requested by such shareholders, such shareholders shall make a written resolution to the Supervisory Committee for convening such an extraordinary general meeting. If the Supervisory Committee agrees to convene such a meeting, a notice of such meeting shall be issued within 5 days upon receipt of the proposal. Changes made to the original proposal shall be approved by the original proposer. If the Supervisory Committee fails to dispatch a notice of the shareholders’ general meeting within a prescribed period of time, it shall be deemed that the Supervisory Committee fails to convene and preside over the shareholders’ general meeting. In that case, the shareholder(s) individually or jointly holding 10% or more of the shares of the Company for a continuous period of 90 days may convene and preside over a shareholders’ general meeting by himself/themselves, provided that prior to the announcement of the resolutions of the shareholders’ general meeting the shares held by such convening shareholder(s) shall not be less than 10% of the shares of the Company. The reasonable expenses incurred by such shareholders for a shareholders’ general meeting or a class shareholders’ general meeting shall be borne by the Company and shall be deducted from the remuneration paid by the Company to the negligent Directors.
The Company values feedbacks from its shareholders, investors and the public. Enquiries and proposals are welcome and can be submitted to the Company through the following:
By phone: 86 (755) 2680 2706By fax: 86 (755) 2681 3950By post: CIMC R&D Centre, 2 Gangwan Avenue, Shekou, Nanshan District, Shenzhen, Guangdong 518067, PRCBy email: [email protected]
V. Supervisors and the Supervisory Committee
The Supervisory Committee of the Company is accountable to the shareholders’ general meeting. All of the Supervisors have discharged their duties seriously in accordance with the provisions of the Articles of Association, attended all Board meetings and persistently reported their work to the shareholders’ general meeting. In line with the spirit of accountability to all shareholders, the Supervisory Committee monitored the financial affairs and internal control of the Company and the performance of duties and responsibilities by the Directors, managers and other senior management personnel of the Company to ensure that they have performed their duties in compliance with applicable laws and regulations.
VI. Directors’ Responsibilities in Preparing Financial Statements
The Directors are responsible to review the financial statements in each financial year with the support from the accounting departments, and to ensure that the relevant accounting practices and policies are observed and CAS are complied with in the compilation of such financial statements in order to report the financial position of the Company in a true and fair manner.

138 China International Marine Containers (Group) Co., Ltd.
Chapter 10Corporate Governance and Corporate Governance Report
Details of the Auditors’ reporting responsibilities and the statements of their feedbacks to the financial statements of the Company for the year ended 31 December 2013 are in “Chapter 12 Auditor’s Report” of this report.
VII. Continuing operations
The Directors, having made appropriate enquiries, considered that the Company has adequate resources to continue operations for the foreseeable future and that, for this reason, it is appropriate to adopt the basis of continuing operations in the preparation of the financial statements. If the Directors learn the major uncertain events or situations that may have a strong impact on the sustainable operation capability of the Company, the Directors shall clearly disclose and discuss the uncertain factors in detail in the Corporate Governance Report.
VIII. Remuneration of the Auditors
For information relating to the remuneration received by the auditors for their services to the Company, please refer to the sub-section headed “Engagement and disengagement of accountants” of “Chapter 7 Significant Events” in this annual report.
Ix. Company Secretary
The Company Secretary (Mr. Yu Yuqun) shall be responsible for facilitating the Board procedures of the Company and the communications among Directors, between the Directors and the shareholders, and among the management. The resume of the Company Secretary is listed in “I. Brief Biography of the Directors, Supervisors and Senior Management” of “Section 9 Directors, Supervisors, Senior Management and Employees” of this Report. In 2013, the Company Secretary has received trainings more than 15 hours of advancing his professional skills and knowledge.
x. Investor Relations
In 2013, the Company continued to place emphasis on and committed to improving investor relations management by, in the interest of small and medium investors, adopting effective and innovative measures in daily work and settlement of major issues to strengthen all-around communication with shareholders and investors. In June, the Company received the large-scale collective research involving multiple securities brokers, funds and other institutional investors, which visited the Company’s production bases for its offshore engineering equipment, heavy truck, energy and chemical equipment businesses. In September, the Company participated in the activity of “Online Interactive Platform Open Day for Investors of Shenzhen-listed Companies” hosted by CSRC Shenzhen Bureau, the Association of Shenzhen-Listed Companies, and Shenzhen Securities Information Co., Ltd, and strengthened the communication and interaction with small and medium investors and shareholders. The Company achieved good communication effect and customer satisfaction through a continuous, comprehensive, in-depth and multi-level communication.

Annual Report 2013 139
Chapter 10Corporate Governance and Corporate Governance Report
xI. Internal Control
The Board of Directors reviewed the internal control system of the Group, and believed that the internal control system for the year ended 31 December 2013 functioned properly. For details about the internal control system of the Company for 2012, please refer to the Chapter 11 “Internal Control” of this Annual Report.
xII. others
Information on corporate governance, mechanisms for assessment of performance and performance incentives and restrictions of the Company, information disclosure and transparency, the relationship with substantial shareholders, performance of duties by the independent non-executive Directors, professional and ethical code for senior management personnel and code of conduct for staff and workers can accessed on the Company’s website at www.cimc.com. You may access such information by following these steps:
1. From our main web page, click “Investor Relations”;
2. Next, click “Corporate Governance”; and
3. Finally, click on the information you are looking for.

140
Chapter 11Internal Control
China International Marine Containers (Group) Co., Ltd.
I. CoNStRUCtIoN oF INtERNAl CoNtRol
(I) Achievements of internal control during the current year
In 2013, the Company evaluated the operation of the internal control systems of itself and its subsidiaries. The evaluation results were submitted to the Internal Control Committee of the Company for consideration and approval. At the first meeting held by the Internal Control Committee in 2013, the Internal Control Committee heard the internal control working report for 2012 and the working plan for 2013, which was also considered and approved by the Audit Committee of the Board; the Company also organized the relevant operational units to prepare internal control self-assessment reports for 2012. PricewaterhouseCoopers has completed the internal auditing and has issued unqualified opinions on the internal control audit report; the Company has amended its existing internal control system, including the amended Supervisory System of Cadres and Personnel in Sensitive Positions (《幹部及敏感崗位人員監察制度》) and Measures for Economic Responsibility Audit (《經濟責任審計辦法》) being published in July, Internal Audit System (《內部審計制度》), Internal Control System (《內部控制制度》) and Measures for Internal Control Evaluation (《內部控制評價辦法》) being published in August, Provisions on Honest and Clean Conduct of Cadres and Personnel in Sensitive Positions of CIMC (《中集集團幹部及敏感崗位人員廉潔從業規定》) and Administrative Measures of Supervising Complaints and Reports (《監察投訴舉報管理辦法》) being published in December; the Company has convened the first internal control and internal audit meeting in history to have a systematic conclusion on the internal control and internal audit work in 2012 and invited the person-in-charge of internal control in the Ministry of Finance to make thematic speeches.
During the Reporting Period, the Group achieved full coverage of internal controls for all domestic corporate entities, while the majority of the Company’s overseas subsidiaries are also covered. Each business unit has formulated monthly plans under the guidance of the Group Headquarters and these plans are being implemented; cooperation is undertaken with specialist functional units to jointly strengthen such specific risk control tasks as corporate merger, procurement business, employment risks, expenditure control, etc.; exchange visits by professional personnel from external organizations are organized to expand sharing of internal controls experience; internally in the Group, a code of conduct for directors and staff personnel is disseminated in an effort to build up a “Sunshine and Transparency” establishment structure, as well as constantly refining the anti-fraud mechanisms. Furthering the four key internal controls tasks of training and development system for internal controls personnel, compiling a hierarchically and functionally defined internal controls manual, internal controls compliance program and risk management: formulate the benchmark criteria for internal controls audit personnel, develop internal controls series of training courses, provide training for internal controls trainers, promote personal development for internal controls personnel; completing compilation of internal controls manuals for 8 corporate entities; completing the accreditation program for internal controls compliance in the first pilot corporate entity, whilst developing and issuing a set of internal controls compliance training courses for “CIMC Group Internal Controls Compliance Program Accreditation Auditing Arrangement” and the relevant standards and detailed implementation rules; on the basis of the exercise in codifying the 2012 pilot KRI indicator system, completing the demand analysis and solution planning in the GRC development feasibility study.
In October 2013, the first provincial-level public body on internal controls – the Guangdong Enterprise Institute for Internal Controls, was founded in Guangzhou. As one of the key founding members of this Institute, China International Marine Containers (Group) Co., Ltd was elected as an associate-director corporation for Guangdong Enterprise Institute for Internal Controls; in December of the same year, China International Marine Containers (Group) Co., Ltd was honored with all three of the “China Listed Company Internal Control Top-100 Prize”, “China Listed Company Internal Control Outstanding Leadership Prize”, and “China Listed Company Outstanding Internal Control Management Prize” awarded by the China Internal Control Research Center.

Annual Report 2013 141
Chapter 11Internal Control
(II) Scope of Assessment for Internal Controls
The Company has over one hundred operating wholly-owned and holding subsidiaries in such countries and regions as Mainland China and North America, Europe, Asia, and Australia. According to “Compilation and Reporting Rule No. 21 for Information Disclosure by Publicly Listed Enterprises – General Provisions for Annual Internal Controls Assessment Report” jointly released by the SFC and the Ministry of Finance, we have selected for self-assessment 92 domestic corporate entities including the Group Headquarters and all the revenues-earning entities whose total assets, total revenue and net profits collectively accounted for over 90% of the relevant benchmark indicators of the audited consolidated financial statements for the Group as a whole in 2013. The Group is moving ahead with development of internal controls standards for our overseas subsidiaries, as the overseas subsidiaries will be progressively included into the internal controls assessment.
Due to the fact the Company’s business activities are spanning numerous industries and sectors in the aforementioned countries and regions and are gradually taking on a global outlook, there are significant variations in operation and management models, and differing internal controls requirements for each entity, hence, on the basis of the “Application Guidelines for Enterprise Internal Controls” and “Internal Controls Guidelines for SZEC-Listed Companies”, the main business activities and subject matters included into the scope of assessment encompassed the 18 application modules mandated by the Basic Criteria for Enterprise Internal Controls plus such internal controls processes as subsidiaries’ management, related transaction, information disclosure, production management, intellectual property rights, and so on. Moreover, in consideration of the distinct characteristics of different business activities, the Group has also developed relevant internal controls modules for high-risk business activities, for example, the financial services arm’s independent lending activities, bill financing, finance lease, etc.; the development projects, hotel management and so on undertaken by the real estate arm of the Group.
The aforementioned organization units, business activities and subject matters that are included in the assessment encompass the key facets of the operations of the Group Headquarters, the various business arms, and operational management of the domestic subsidiaries, and there is no significant omission.
(III) the Basis for the Internal Controls Assessment tasks and Criteria for Identifying Internal Controls Deficiency
The Company strictly follows the requirements in “Basic Criteria for Enterprise Internal Controls”, “Enterprise Internal Controls Assessment Guidelines” jointly issued by the five central government bodies, as well as the Group’s own “CIMC Group Internal Controls Assessment Arrangement” to actively conduct internal controls assessment according to the principles of functionally defined management and hierarchical reporting. Such methods as individual interviews, walkthrough exercises, and sampling tests were adopted during the assessment process to widely gather evidence on the effectiveness of the internal controls designs for the enterprises under assessment, analyzing and identifying any design and operational deficiencies on the internal controls designs, as well as drawing up a working blueprint to record the contents of the assessment tasks including essential elements of the assessment, the main risk factors, adopted control measures, relevant supporting materials, and the assessment results and so on.

142 China International Marine Containers (Group) Co., Ltd.
Chapter 11Internal Control
In accordance to the requirements for identifying significant deficiency, important deficiency and general deficiency as set out in the Criteria Benchmarks for Enterprise Internal Controls and by also taking into consideration such factors as the assessed entity’s scale, industry characteristics, corporate strategic objectives, risk aversion, risk tolerance and so on, the Group’s Board of Directors would differentiate between financial statement internal controls and non-financial statement internal controls to draw up the deficiency identification criteria appropriate for the assessed entity’s internal controls approaching from the two dimensions of quantitative benchmark and qualitative benchmark and to ensure consistency with previous years. The Group has determined the internal controls deficiency identification criteria to be the following:
1. Financial Statement Internal Controls Deficiency Identification Criteria
(1) The Group determines the quantitative benchmark for assessing financial statement internal controls deficiency as the following:
On the basis of the data presented on the annual consolidated financial statements, the quantitative benchmark for severity of consolidated financial statements reporting errors (including omissions) by listed company is determined:
Category of Deficiency
quantitative Assessment Benchmark for Financial Statement Internal Controls Deficiency (the erroneously reported amounts in financial statements fall between the following range)
Significant Deficiency 1. Erroneously reported amounts >= 0.5% of total sales revenues;2. Erroneously reported amounts >= 5% of total profits;3. Erroneously reported amounts >= 1% of total assets;4. Erroneously reported amounts >= 1% of total stakeholders’ interests.
Important Deficiency 1. 0.1% total sales revenues <= erroneously reported amounts < 0.5% of total sales revenues;
2. 1% total profits <= erroneously reported amounts < 5% of total profits;3. 0.2% total assets <= erroneously reported amounts < 1% of total assets;4. 0.2% of total stakeholders’ interests <= erroneously reported amounts < 1%
of total stakeholders’ interests.
General Deficiency 1. Erroneously reported amounts < 0.1% of total sales revenues;2. Erroneously reported amounts < 1% of total profits;3. Erroneously reported amounts < 0.2% of total assets;4. Erroneously reported amounts < 0.2% of total stakeholders’ interests.
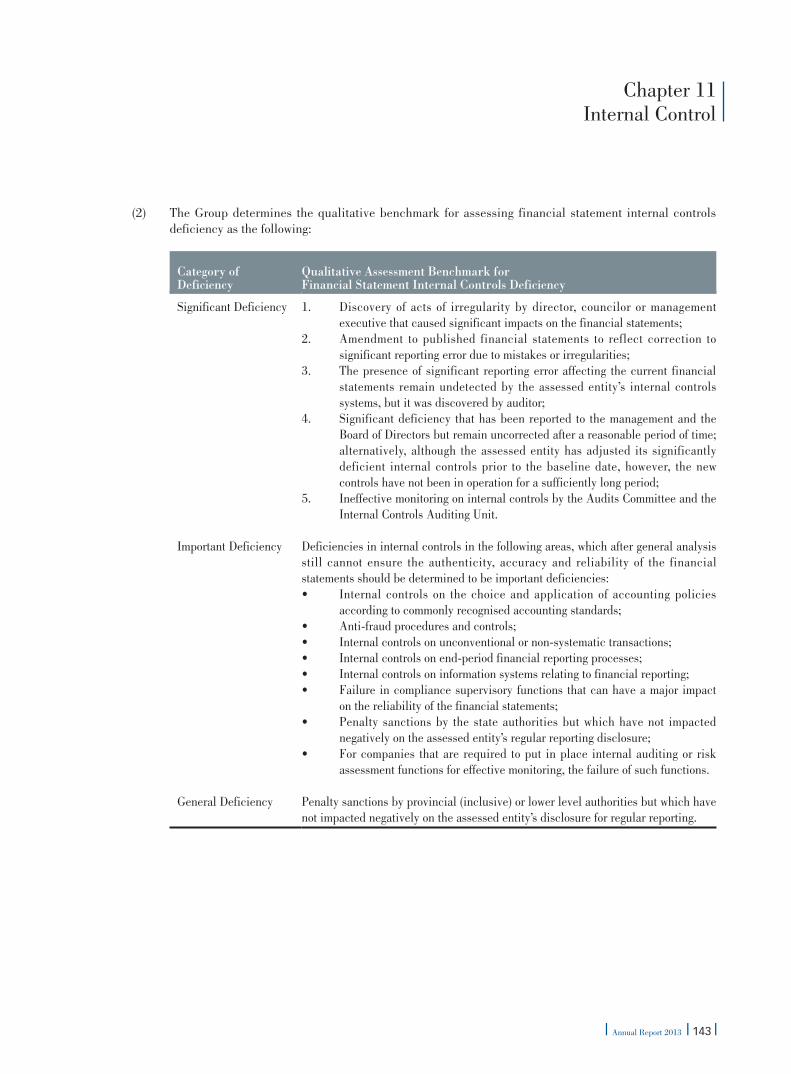
Annual Report 2013 143
Chapter 11Internal Control
(2) The Group determines the qualitative benchmark for assessing financial statement internal controls deficiency as the following:
Category of Deficiency
qualitative Assessment Benchmark for Financial Statement Internal Controls Deficiency
Significant Deficiency 1. Discovery of acts of irregularity by director, councilor or management executive that caused significant impacts on the financial statements;
2. Amendment to published financial statements to reflect correction to significant reporting error due to mistakes or irregularities;
3. The presence of significant reporting error affecting the current financial statements remain undetected by the assessed entity’s internal controls systems, but it was discovered by auditor;
4. Significant deficiency that has been reported to the management and the Board of Directors but remain uncorrected after a reasonable period of time; alternatively, although the assessed entity has adjusted its significantly deficient internal controls prior to the baseline date, however, the new controls have not been in operation for a sufficiently long period;
5. Ineffective monitoring on internal controls by the Audits Committee and the Internal Controls Auditing Unit.
Important Deficiency Deficiencies in internal controls in the following areas, which after general analysis still cannot ensure the authenticity, accuracy and reliability of the financial statements should be determined to be important deficiencies:• Internal controls on the choice and application of accounting policies
according to commonly recognised accounting standards;• Anti-fraud procedures and controls;• Internal controls on unconventional or non-systematic transactions;• Internal controls on end-period financial reporting processes;• Internal controls on information systems relating to financial reporting;• Failure in compliance supervisory functions that can have a major impact
on the reliability of the financial statements;• Penalty sanctions by the state authorities but which have not impacted
negatively on the assessed entity’s regular reporting disclosure;• For companies that are required to put in place internal auditing or risk
assessment functions for effective monitoring, the failure of such functions.
General Deficiency Penalty sanctions by provincial (inclusive) or lower level authorities but which have not impacted negatively on the assessed entity’s disclosure for regular reporting.

144 China International Marine Containers (Group) Co., Ltd.
Chapter 11Internal Control
2. Non-Financial Statement Internal Controls Deficiency Identification Criteria
(1) The Group determines the quantitative benchmark for assessing non-financial statement internal controls deficiency as the following:
Category of Deficiency
quantitative Assessment Benchmark for Non-Financial Statement Internal Controls Deficiency
Significant Deficiency 1. Failure to maintain and/or update documentation contents for the internal controls systems for 3 years and more in succession, and failure to retain a full set of working papers for internal controls sampling checks;
2. Continuous interruption of normal service for a period of over 48 hours in such important public IT systems or platforms as corporate communication systems (including network, correspondence, telephone), ERP system, financial information system, PDM system, OA system and so on.
Important Deficiency 1. Failure to maintain and/or update documentation contents for the internal controls systems for 2 years in succession, and failure to retain a full set of working papers for internal controls sampling checks;
2. Continuous interruption of normal service for a period of over 24 hours but less than 48 hours, in such important public IT systems or platforms as corporate communication systems (including network, correspondence, telephone), ERP system, financial information system, PDM system, OA system and so on.
General Deficiency 1. Failure to perform annual maintenance and update internal controls system documentation, and failure to retain a full set of working papers for internal controls sampling checks;
2. Instabilities with occasional service interruption of such important public IT systems or platforms as corporate communication systems (including network, correspondence, telephone), ERP system, financial information system, PDM system, OA system and so on; but normal operation can be recovered within a period of 24 hours.

Annual Report 2013 145
Chapter 11Internal Control
(2) The Group determines the qualitative benchmark for assessing non-financial statement internal controls deficiency as the following:
Category of Deficiency
qualitative Assessment Benchmark for Non-Financial Statement Internal Controls Deficiency
Significant Deficiency 1. The assessed entity’s business activities in serious violation of the laws and regulations of the state;
2. Non-compliance in major policy decisions, substantive matters, appointment and dismissal of key personnel, as well as the decision processes for large sum payments.
Important Deficiency 1. Important deficiencies remain un-rectified after being reported to the management and after lapse of a reasonable period;
2. Patented technology or proprietary technology being infringed upon or confidentiality is compromised thus undermining market competitiveness of the assessed entity’s one or more products; but this has not affected the assessed entity’s market position.
General Deficiency Patented technology or proprietary technology being infringed upon or confidentiality is compromised thus undermining market competitiveness of the assessed entity’s one or more products; but the effect is minimal.
(IV) Notes on other Substantive Matters Relating to Internal Controls
In the wake of ever demanding external compliance requirements and the occurrence of such changes as internal upgrades, functionally defined management, diversification of business activities, globalization and so on for the Group, internal risk controls and the relevant established arrangements would need to make timely adjustments in the face of changing circumstances, hence further improving the standard of corporate governance, fully implementing and refining the institutional systems for corporate internal controls across the board whilst putting into practice effective supervisory monitoring. China International Marine Containers (Group) Co., Ltd will continue to refine its internal controls systems, furthering efforts in the four key internal controls tasks to coordinate with relevant functional undertakings of the Group, further bolstering risk controls in specialized areas, strengthening standardization and streamlining the business management processes; underpin the effectiveness of the monitoring mechanisms for internal controls whilst expanding the efforts to disseminate a cultural notion for internal controls and cultivating a cultural ambience for internal controls, promoting healthy and sustainable development for the Group, and ensuring attainment of the Group’s strategic objectives.

146 China International Marine Containers (Group) Co., Ltd.
Chapter 11Internal Control
(V) Assessment Conclusions for Internal Controls
According to the findings in identifying the Group’s significant deficiency in financial statement internal controls, on the baseline date of the internal controls assessment report, the Group has no significant deficiency in financial statement internal controls. The Board of Directors is of the opinion that, the Group has duly complied with the Criteria Benchmarks for Enterprise Internal Controls and the requirements of other relevant provisions to maintain effective financial statement internal controls in key areas.
According to the findings in identifying the Group’s significant deficiency in non-financial statement internal controls, on the baseline date of the internal controls assessment report, the Group has not found any significant deficiency in non-financial statement internal controls.
No factor that would materially affect the assessment conclusion on the effectiveness of the internal controls has come to light between the baseline date and the publication date of the internal controls assessment report.
China International Marine Containers (Group) Co., Ltd will continue to upgrade and refine its internal controls systems, while directing attention into operational outcomes, and strengthening monitoring checks by internal controls in order to provide reasonable guarantees for the authenticity and completeness of financial statements and attainment of the Group’s strategic and business objectives at the same time promoting healthy and sustainable development for the Group.
II. StAtEMENt oF tHE BoARD oF DIRECtoRS oN INtERNAl CoNtRol RESPoNSIBIlItIES
The Board of Directors of the Company is responsible for the establishment and full maintenance of internal control system of financial reports.

Annual Report 2013 147
Chapter 11Internal Control
III. BASIS FoR EStABlISHMENt oF INtERNAl CoNtRol oF FINANCIAl REPoRtS
According to Basic Norms for Enterprise Internal Control, Application Guidelines for Enterprise Internal Control and Guidelines for Evaluation of Enterprise Internal Control jointly issued by five ministries and commissions such as CSRC and the Ministry of Finance and based on the actual situation of the Company, the Company formulated Internal Control System of CIMC, Measures for Internal Control Evaluation of CIMC, Operational Guidelines for Sample Tests on Internal Control Evaluation of CIMC, Standards and Framework for the Evaluation on Internal Control Defects of CIMC, Manual of Internal Control of Group Company and other documents about regulations and procedures, and organise professional teams to evaluate the effectiveness of the design and operation of internal control of the companies they belong to in accordance with the aforesaid norms and company regulations and procedures.
IV. INtERNAl CoNtRol EVAlUAtIoN REPoRt
Details of material defects of internal control detected during the Reporting Period in the internal control evaluation report
1. Identification and rectification of defects of internal control detected in the financial statements
During the Reporting Period, the Company did not have material and significant defects of internal control detected in the financial statements (including the material and significant defects of internal control detected in the financial statements that have not been rectified at the end of the previous year).
2. Identification and rectification of defects of internal control detected in non-financial statements
During the Reporting Period, no material and significant defects of internal control detected in the non-financial statements (including the material and significant defects of internal control detected in the non-financial statements that have not been rectified at the end of the previous year) were found by the Company
3. No factor that would materially affect the assessment conclusion on the effectiveness of the internal controls has come to light between the baseline date and the publication date of the internal controls assessment report.
Disclosure date of full text of internal control evaluation report 26 March 2014Disclosure index of full text of internal control evaluation report http://www.cninfo.com.cn/

148 China International Marine Containers (Group) Co., Ltd.
Chapter 11Internal Control
V. INtERNAl CoNtRol AUDIt REPoRt
the paragraphs of opinions on approval in the internal control audit report
We believe, as at 31 December 2013, the Company and its major subsidiaries maintained effective financial report internal control in all material respects according to Basic Norms for Enterprise Internal Control and relevant provisions.
Disclosure date of full text of internal control audit report 26 March 2014Disclosure index of full text of internal control audit report http://www.cninfo.com.cn/
Accountants firm did not prescribe internal control audit report of nonstandard views.
The internal control audit report prescribed by accountants firm is consistent with the self-evaluation report of the Board of Directors.
VI. EStABlISHMENt AND IMPlEMENtAtIoN oF ACCoUNtABIlItY SYStEM oF SIGNIFICANt ERRoRS IN ANNUAl REPoRt
In March 2010, the Company formulated the Accountability System of Significant Errors in Annual Report of CIMC, which was submitted to and adopted by the 8th meeting of the 6th Board of Directors. During the Reporting Period, the Annual Report 2012 is disclosed, no material supplementation of missing information occurred. No material accounting errors correction, results forecast modification and other situations occurred.

Annual Report 2013 149
Chapter 12 Auditor’s Report
PwC ZT Shen Zi (2014) No.10067(Page 1 of 2)
All Shareholders of China International Marine Containers (Group) Co., Ltd.:
We have audited the accompanying financial statements of China International Marine Containers (Group) Co., Ltd. (“the Group”), which comprise the consolidated and company balance sheets as at 31 December 2013, and the consolidated and company income statements, the consolidated and company statements of changes in shareholders’ equity and the consolidated and company cash flow statements for the year then ended, and the notes to the financial statements.
I. MANAGEMENt’S RESPoNSIBIlItY FoR tHE FINANCIAl StAtEMENtS
Management of the Group is responsible for the preparation and fair presentation of these financial statements in accordance with the requirements of Accounting Standards for Business Enterprises, and for such internal control as management determines is necessary to enable the preparation of financial statements that are free from material misstatement, whether due to fraud or error.
II. AUDItoR’S RESPoNSIBIlItY
Our responsibility is to express an opinion on these financial statements based on our audit. We conducted our audit in accordance with China Standards on Auditing. Those standards require that we comply with ethical requirements and plan and perform the audit to obtain reasonable assurance about whether the financial statements are free from material misstatement.
PricewaterhouseCoopers Zhong Tian LLP, 11/F PricewaterhouseCoopers Center2 Corporate Avenue, 202 Hu Bin Road, Huangpu District, Shanghai 200021, PRCT: +86 (21) 2323 8888, F: +86 (21) 2323 8800, www.pwccn.com
普華永道中天會計師事務所(特殊普通合夥)

150 China International Marine Containers (Group) Co., Ltd.
Chapter 12 Auditor’s Report
PwC ZT Shen Zi (2014) No.10067(Page 2 of 2)
An audit involves performing procedures to obtain audit evidence about the amounts and disclosures in the financial statements. The procedures selected depend on the auditor’s judgment, including the assessment of the risks of material misstatement of the financial statements, whether due to fraud or error. In making those risk assessments, the auditor considers internal control relevant to the entity’s preparation and fair presentation of the financial statements in order to design audit procedures that are appropriate in the circumstances. An audit also includes evaluating the appropriateness of accounting policies used and the reasonableness of accounting estimates made by management, as well as evaluating the overall presentation of the financial statements.
We believe that the audit evidence we have obtained is sufficient and appropriate to provide a basis for our audit opinion.
III. oPINIoN
In our opinion, the accompanying financial statements present fairly, in all material respects, the consolidated and company’s financial position of the Group as at 31 December 2013, and their financial performance and cash flows for the year then ended in accordance with the requirements of Accounting Standards for Business Enterprises.
PricewaterhouseCoopers Certified Public Accountant Zhou Wei RanZhong Tian LLP
Shanghai, the People’s Republic of China Certified Public Accountant Cao Cui Li25 March 2014

Annual Report 2013 151
Chapter 13 Financial Statements Prepared in Accordance
with China Accounting StandardsAs at 31 December 2013
(All amounts in RMB’000 unless otherwise stated)(English Translation for Reference Only)
Consolidated Balance Sheet
Note31 December
201331 December
2012
ASSEtSCurrent assets: Cash at bank and on hand V.1 4,771,047 5,221,539 Financial assets at fair value through profit or loss V.2 459,679 405,092 Notes receivable V.3 1,376,286 778,109 Accounts receivable V.4 10,066,489 8,238,033 Advance to suppliers V.6 3,393,804 1,213,042 Interest receivable 747 14,410 Other receivables V.5 2,805,061 2,114,435 Inventories V.7 15,960,590 18,034,726 Current portion of non-current assets V.8 1,513,337 1,636,332 Other current assets V.9 822,628 690,471
total current assets 41,169,668 38,346,189
Non-current assets: Financial assets at fair value through profit or loss V.2 934 – Available-for-sale financial assets V.10 7,342 609,751 Long-term receivables V.11 2,952,418 2,540,574 Long-term equity investments V.12 1,576,613 1,913,762 Investment properties V.13 324,811 183,668 Fixed assets V.14 13,508,082 11,608,747 Construction in progress V.15 6,684,619 2,279,993 Intangible assets V.16 3,699,969 3,273,750 Goodwill V.17 1,395,938 1,267,162 Long-term prepaid expenses V.18 96,075 47,947 Deferred tax assets V.19 856,406 717,797 Other non-current assets V.20 333,097 203,040
total non-current assets 31,436,304 24,646,191
totAl ASSEtS 72,605,972 62,992,380

152 China International Marine Containers (Group) Co., Ltd.
As at 31 December 2013(All amounts in RMB’000 unless otherwise stated)(English Translation for Reference Only)
Chapter 13Financial Statements Prepared in Accordance with China Accounting Standards
Note31 December
201331 December
2012
lIABIlItIES AND SHAREHolDERS’ EqUItYCurrent liabilities: Short-term borrowings V.23 7,244,780 5,438,407 Financial liabilities at fair value through profit or loss V.24 1,297 12,856 Notes payable V.25 1,173,361 989,710 Accounts payable V.26 7,781,645 7,059,420 Advances from customers V.27 2,920,888 2,722,482 Employee benefits payable V.28 2,176,741 2,019,563 Taxes payable V.29 683,137 747,530 Interest payable V.30 213,528 203,288 Dividends payable V.31 197,897 38,747 Other payables V.32 5,019,498 4,292,597 Provisions V.33 784,481 753,492 Current portion of non-current liabilities V.34 2,458,775 1,261,940 Other current liabilities V.35 1,920,321 –
total current liabilities 32,576,349 25,540,032
Non-current liabilities: Financial liabilities at fair value through profit or loss V.24 27,166 82,242 Long-term borrowings V.36 7,761,243 7,641,785 Debentures payables V.37 6,450,730 6,462,235 Long-term payables V.38 242,992 145,103 Payables for specific projects V.39 3,735 4,802 Deferred tax liabilities V.19 661,200 650,394 Other non-current liabilities V.40 386,429 348,630
total non-current liabilities 15,533,495 15,335,191
total liabilities 48,109,844 40,875,223
Shareholders’ equity Share capital V.41 2,662,396 2,662,396 Capital surplus V.42 707,700 930,482 Surplus reserve V.43 3,121,288 3,059,836 Undistributed profits V.44 14,899,313 13,392,795 Difference on translation of foreign currency financial statements (716,660) (532,333)
total equity attributable to shareholders of the company 20,674,037 19,513,176
Minority interests 3,822,091 2,603,981
total equity 24,496,128 22,117,157
total liabilities and shareholders’ equity 72,605,972 62,992,380
The accompanying notes form an integral part of these financial statements.
Legal representative’s authorised person
The person in charge of accounting affairs
The head of theaccounting department
Company stamp
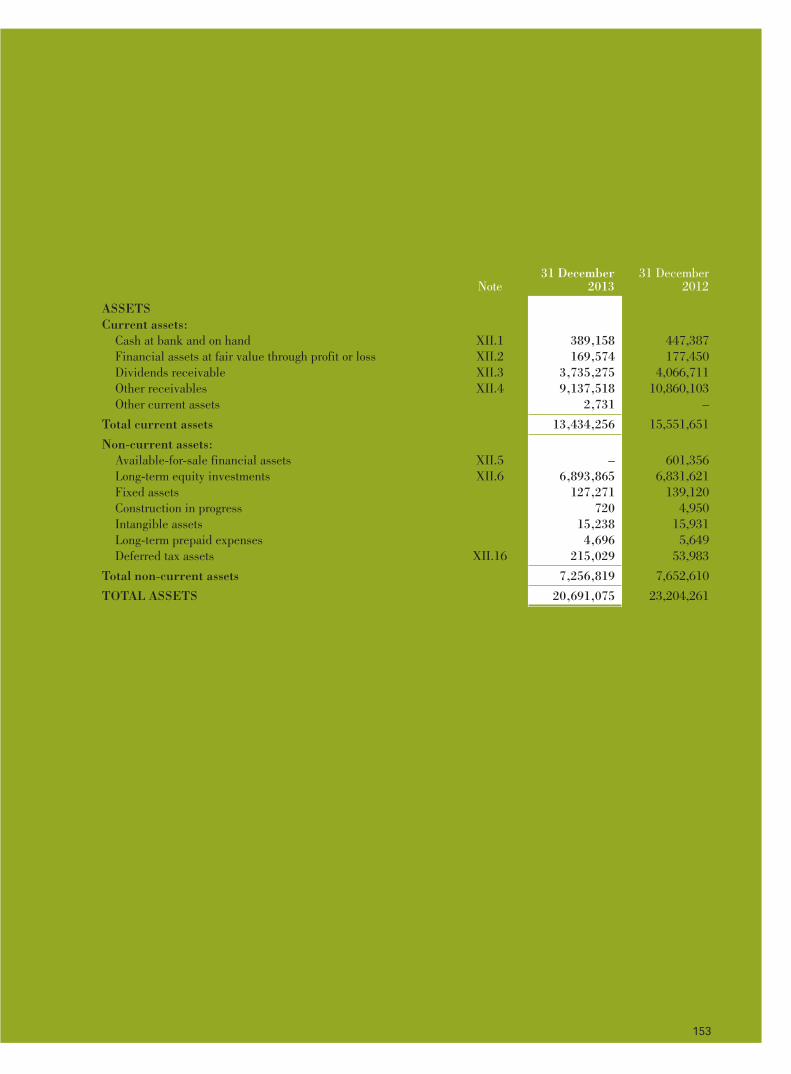
Annual Report 2013 153
Chapter 13 Financial Statements Prepared in Accordance with China Accounting Standards
As at 31 December 2013(All amounts in RMB’000 unless otherwise stated)
(English Translation for Reference Only)
Balance Sheet
Note31 December
201331 December
2012
ASSEtSCurrent assets: Cash at bank and on hand XII.1 389,158 447,387 Financial assets at fair value through profit or loss XII.2 169,574 177,450 Dividends receivable XII.3 3,735,275 4,066,711 Other receivables XII.4 9,137,518 10,860,103 Other current assets 2,731 –
total current assets 13,434,256 15,551,651
Non-current assets: Available-for-sale financial assets XII.5 – 601,356 Long-term equity investments XII.6 6,893,865 6,831,621 Fixed assets 127,271 139,120 Construction in progress 720 4,950 Intangible assets 15,238 15,931 Long-term prepaid expenses 4,696 5,649 Deferred tax assets XII.16 215,029 53,983
total non-current assets 7,256,819 7,652,610
totAl ASSEtS 20,691,075 23,204,261

154 China International Marine Containers (Group) Co., Ltd.
Chapter 13Financial Statements Prepared in Accordance with China Accounting StandardsAs at 31 December 2013(All amounts in RMB’000 unless otherwise stated)(English Translation for Reference Only)
Note31 December
201331 December
2012
lIABIlItIES AND SHAREHolDERS’ EqUItYCurrent liabilities: Short-term borrowings XII.7 – 465,703 Financial liabilities at fair value through profit or loss XII.8 – 8,987 Employee benefits payable XII.9 856,016 657,886 Taxes payable XII.10 10,283 43,493 Interest payable XII.11 184,734 187,691 Other payables XII.12 3,547,522 3,574,947 Current portion of non-current liabilities XII.13 2,135,000 1,257,100
total current liabilities 6,733,555 6,195,807
Non-current liabilities: Financial liabilities at fair value through profit or loss XII.8 26,865 81,944 Long-term borrowings XII.14 837,000 3,875,845 Debentures payable XII.15 5,993,413 5,990,833
total non-current liabilities 6,857,278 9,948,622
total liabilities 13,590,833 16,144,429
Shareholders’ equity Share capital V.41 2,662,396 2,662,396 Capital surplus XII.17 8,480 334,259 Surplus reserve V.43 3,121,288 3,059,836 Undistributed profits 1,308,078 1,003,341
total equity 7,100,242 7,059,832
totAl lIABIlItIES AND SHAREHolDERS’ EqUItY 20,691,075 23,204,261
The accompanying notes form an integral part of these financial statements.
Legal representative’s authorised person
The person in charge of accounting affairs
The head of theaccounting department
Company stamp

Annual Report 2013 155
Chapter 13 Financial Statements Prepared in Accordance with China Accounting Standards
As at 31 December 2013(All amounts in RMB’000 unless otherwise stated)
(English Translation for Reference Only)
Consolidated Income StatementNote 2013 2012
I. Revenue V.45 57,874,411 54,334,057Less: Cost of sales V.45 48,242,360 44,601,257
Taxes and surcharges V.46 507,568 506,040Selling and distribution expenses V.47 1,832,733 1,765,697General and administrative expenses V.48 4,041,552 3,720,704Financial expenses-net V.49 438,992 524,557Asset impairment losses V.52 138,931 537,071
Add: Profit from changes in fair value V.50 189,883 58,561Investment Income/(loss) V.51 508,677 (97,851)
Including: Share of losses of associates and joint ventures (54,458) (76,731)
II. operating profit 3,370,835 2,639,441Add: Non-operating income V.53 274,223 360,365Less: Non-operating expenses V.54 82,338 92,426
Including: Losses on disposal of non-current assets 34,719 47,569
III. total profit 3,562,720 2,907,380Less: Income tax expenses V.55 928,222 976,950
IV. Net profit 2,634,498 1,930,430Attributable to equity holders of the Company 2,180,321 1,939,081Minority interests 454,177 (8,651)
V. Earnings per share(I) Basic earnings per share (RMB) V.56 0.82 0.73(II) Diluted earnings per share (RMB) V.56 0.81 0.73
VI. other comprehensive income, net of tax V.57 (585,401) 58,828Items that may be reclassified subsequently to profit or lossChange in value of available-for-sale financial assets-after tax (408,096) 28,518Gain/(loss) of cash flow hedges-after tax 4,326 (5,864)Currency translation differences (181,631) 34,754Other comprehensive income – 1,420
VII. total comprehensive income 2,049,097 1,989,258
Attributable to equity holders of the Company 1,592,224 1,997,506Minority interests 456,873 (8,248)
The accompanying notes form an integral part of these financial statements.
Legal representative’s authorised person
The person in charge of accounting affairs
The head of theaccounting department
Company stamp

156 China International Marine Containers (Group) Co., Ltd.
Chapter 13Financial Statements Prepared in Accordance with China Accounting StandardsAs at 31 December 2013(All amounts in RMB’000 unless otherwise stated)(English Translation for Reference Only)
Income StatementNote 2013 2012
I. Revenue XII.18 192,684 241,531Less: Cost of sales XII.18 – 16
Taxes and surcharges 34,096 36,563General and administrative expenses 513,238 413,366Asset impairment losses (3) (103)Financial expenses-net 211,626 221,789
Add: Profit from changes in fair value XII.19 72,896 19,131Investment income XII.20 1,440,535 1,431,996
II. operating profit 947,158 1,021,027Add: Non-operating income XII.21 1,718 55,259Less: Non-operating expenses 1,645 1,254
Including: Losses on disposal of non-current assets – –
III. total profit 947,231 1,075,032Less: Income tax expenses XII.22 (31,309) 8,271
IV. Net profit 978,540 1,066,761
V. other comprehensive income, net of tax XII.23 (407,284) 27,901Items that may be reclassified subsequently to profit or lossChange in value of available-for-sale financial assets-after tax (407,284) 27,901
VI. total comprehensive income 571,256 1,094,662
The accompanying notes form an integral part of these financial statements.
Legal representative’s authorised person
The person in charge of accounting affairs
The head of theaccounting department
Company stamp

Annual Report 2013 157
Chapter 13 Financial Statements Prepared in Accordance with China Accounting Standards
As at 31 December 2013(All amounts in RMB’000 unless otherwise stated)
(English Translation for Reference Only)
Consolidated Cash Flow StatementNote 2013 2012
I. Cash flows from operating activities:Cash received from sales of goods or rendering of services 58,823,330 60,176,127Refund of taxes and surcharges 1,229,184 2,265,507Cash received relating to other operating activities V.58(1) 627,938 752,053
Sub-total of cash inflows 60,680,452 63,193,687
Cash paid for goods and services 47,175,580 51,619,237Cash paid to and on behalf of employees 5,222,132 4,794,471Payments of taxes and surcharges 2,366,532 1,685,299Cash paid relating to other operating activities V.58(2) 3,166,282 2,851,761
Sub-total of cash outflows 57,930,526 60,950,768
Net cash inflows from operating activities V.59(1) 2,749,926 2,242,919
II. Cash flows from investing activities:Cash received from disposal of investments 181,565 439,752Cash received from returns on investments 841,582 71,934Net cash received from disposal of fixed assets, intangible assets and other long-term assets 158,004 358,966Cash received relating to other investing activities V.58(3) 264,165 278,719
Sub-total of cash inflows 1,445,316 1,149,371
Cash paid to acquire fixed assets intangible assets and other long-term assets 6,929,534 2,087,094Cash paid to acquire investments 73,824 325,079Net cash paid to acquire subsidiaries and other business units 946,417 296,546
Sub-total of cash outflows 7,949,775 2,708,719
Net cash outflows from investing activities (6,504,459) (1,559,348)

158 China International Marine Containers (Group) Co., Ltd.
Chapter 13Financial Statements Prepared in Accordance with China Accounting StandardsAs at 31 December 2013(All amounts in RMB’000 unless otherwise stated)(English Translation for Reference Only)
Note 2013 2012
III. Cash flows from financing activitiesCash received from capital contributions 184,706 129,303
Including: Cash received from capital contributions by minority shareholders of subsidiaries 184,706 129,303
Cash received from borrowings 19,443,628 15,627,848Cash received from issuance of debentures – 2,471,402Cash received relating to other financing activities V.58(4) 2,517,580 416,505
Sub-total of cash inflows 22,145,914 18,645,058
Cash repayments of borrowings 16,533,299 18,384,272Cash payments for interest expenses and distribution of dividends or profits 1,670,234 2,292,118
Including: Cash payments for dividends or profit to minority shareholders of subsidiaries 192,223 213,163
Cash payments relating to other financing activities V.58(5) 309,444 858,335
Sub-total of cash outflows 18,512,977 21,534,725
Net cash (outflows)/inflows from financing activities 3,632,937 (2,889,667)
IV. Effect of foreign exchange rate changes on cash and cash equivalents (94,420) 40,355
V. Net decrease in cash and cash equivalents V.59(1) (216,016) (2,165,741)Add: Cash and cash equivalents at beginning of year 4,397,512 6,563,253
VI. Cash and cash equivalents at end of year 4,181,496 4,397,512
The accompanying notes form an integral part of these financial statements.
Legal representative’s authorised person
The person in charge of accounting affairs
The head of theaccounting department
Company stamp

Annual Report 2013 159
Chapter 13 Financial Statements Prepared in Accordance with China Accounting Standards
As at 31 December 2013(All amounts in RMB’000 unless otherwise stated)
(English Translation for Reference Only)
Cash Flow StatementNote 2013 2012
I. Cash flows from operating activities:Cash received from sales of goods or rendering of services 192,745 241,531Cash received relating to other operating activities 2,093,429 3,375,532Sub-total of cash inflows 2,286,174 3,617,063Cash paid for goods and services 2,732 16Cash paid to and on behalf of employees 106,708 128,812Payments of taxes and surcharges 68,791 59,232Cash paid relating to other operating activities 134,581 4,374,140Sub-total of cash outflows 312,812 4,562,200Net cash outflows from operating activities XII.24 1,973,362 (945,137)
II. Cash flows from investing activities:Cash received from disposal of investments 236,437 –Cash received from returns on investments 1,785,125 2,816,622Net cash received from disposal of fixed assets, intangible assets and other long-term assets 4,279 62,963Sub-total of cash inflows 2,025,841 2,879,585Cash paid to acquire fixed assets, intangible assets and other long-term assets 6,488 16,301Cash paid to acquire investments 136,767 210,114Net cash paid to acquire subsidiaries and other business units 152,617 1,951,951Sub-total of cash outflows 295,872 2,178,366Net cash inflows from investing activities 1,729,969 701,219
III. Cash flows from financing activitiesCash received from borrowings 1,586,485 5,617,820Sub-total of cash inflows 1,586,485 5,617,820Cash repayments of borrowings 4,213,132 3,699,716Cash payments for interest expenses and distribution of dividends or profits 1,134,460 1,657,147Sub-total of cash outflows 5,347,592 5,356,863Net cash inflows from financing activities (3,761,107) 260,957
IV. Effect of foreign exchange rate changes on cash and cash equivalents (405) –
V. Net increase in cash and cash equivalents XII.24 (58,181) 17,039Add: Cash and cash equivalents at beginning of year 444,913 427,874
VI. Cash and cash equivalents at end of year XII.24 386,732 444,913
The accompanying notes form an integral part of these financial statements.
Legal representative’s authorised person
The person in charge of accounting affairs
The head of theaccounting department
Company stamp

160 China International Marine Containers (Group) Co., Ltd.
Chapter 13Financial Statements Prepared in Accordance with China Accounting StandardsAs at 31 December 2013(All amounts in RMB’000 unless otherwise stated)(English Translation for Reference Only)
Con
solid
ated
Sta
tem
ent o
f Cha
nges
in S
hare
hold
ers’
Equ
ity
Item
Note
2013
2012
Attri
butab
le to e
quity
holde
rs of
the Co
mpan
yAtt
ributa
ble to
equit
y hold
ers of
the C
ompan
y
Share
capit
alCa
pital
surplu
sSu
rplus
reserv
eUn
distrib
uted
profits
Differ
ence o
n tra
nslatio
n of f
oreign
cur
rency
financ
ial sta
tement
sMi
nority
intere
st
total
shareh
olders
’ equ
itySha
re capi
talCa
pital su
rplus
Surplu
s reser
veUn
distrib
uted
profits
Differe
nce on
tran
slation
of f
oreign
cur
rency
financi
al sta
tement
sMi
nority
int
erest
Total
shareh
olders
’ equ
ity
I. Ba
lance
at 1 J
anua
ry2,6
62,39
693
0,482
3,059
,836
13,39
2,795
(532,3
33)
2,603
,981
22,11
7,157
2,662
,396
799,2
612,9
53,16
012
,785,0
92(56
6,755
)2,9
80,51
821
,613,6
72II.
Mov
emen
ts for
the ye
ar(I)
tota
l comp
rehen
sive in
come
1. Ne
t prof
it–
––
2,180
,321
–45
4,177
2,634
,498
––
–1,9
39,08
1–
(8,65
1)1,9
30,43
02.
Other
compre
hensiv
e inco
meV.5
7–
(403,7
70)
––
(184,3
27)
2,696
(585,4
01)
–24
,003
––
34,42
240
358
,828
Sub-t
otal o
f 1&2
–(40
3,770
)–
2,180
,321
(184,3
27)
456,8
732,0
49,09
7–
24,00
3–
1,939
,081
34,42
2(8,
248)
1,989
,258
(II) C
apita
l contr
ibutio
n and
withd
rawal
by
owne
rs1.
Contr
ibutio
ns by
minor
ity Sh
arehol
ders
––
––
–18
4,706
184,7
06–
22,35
2–
––
106,9
5112
9,303
2. Inc
rease
in mi
nority
inter
ests r
esulte
d
from
acquis
ition o
r esta
blishm
ent of
subsid
iary
––
––
–53
9,362
539,3
62–
––
––
39,34
739
,347
3. De
crease
in ca
pital
surplu
s resu
lted f
rom
acq
uisitio
n of m
inority
inter
estIV.
10–
(188,7
90)
––
–(12
0,654
)(30
9,444
)–
(168,6
57)
––
–(62
5,888
)(79
4,545
)4.
Decre
ase in
mino
rity in
terest
s resu
lted
fro
m dis
posal
of sub
sidiar
yIV.
11–
278,2
73–
––
258,6
1753
6,890
–17
8,916
––
–18
4,500
363,4
165.
Dispos
al of
subsid
iaries
(lose
contro
l)–
––
––
(443)
(443)
––
––
––
–6.
Decre
ase in
capit
al sur
plus r
esulte
d from
corpor
ate re
struct
uring
––
––
––
––
(42,69
6)–
––
42,69
6–
7. Inc
rease
in cap
ital su
rplus
result
ed fro
m
sha
re opt
ion ex
ercise
d by s
ubsid
iary
–3,2
99–
––
31,14
734
,446
–1,8
80–
––
16,90
618
,786
8. Inc
rease
in sha
rehold
ers’ eq
uity r
esulte
d
from
share-
based
payme
ntsVI
I.2–
88,20
6–
––
2,853
91,05
9–
115,4
23–
––
2,856
118,2
79(II
I) Prof
it dist
ributi
on1.
Appro
priati
on to
surplu
s rese
rves
V.42
––
61,45
2(61
,452)
––
––
–10
6,676
(106,6
76)
––
–2.
Profit
distrib
ution
to sha
rehold
ersV.4
3(1)
––
–(61
2,351
)–
(134,3
51)
(746,7
02)
––
–(1,
224,7
02)
–(13
5,657
)(1,
360,3
59)
III. B
alanc
e at 3
1 Dece
mber
2,662
,396
707,7
003,1
21,28
814
,899,3
13(71
6,660
)3,8
22,09
124
,496,1
282,6
62,39
693
0,482
3,059
,836
13,39
2,795
(532,3
33)
2,603
,981
22,11
7,157
The
acco
mpa
nyin
g no
tes
form
an
inte
gral
par
t of t
hese
fina
ncia
l sta
tem
ents
.
Lega
l rep
rese
ntat
ive’
s au
thor
ised
per
son
The
pers
on in
cha
rge
of
acco
untin
g af
fair
sTh
e he
ad o
f the
acco
untin
g de
part
men
tC
ompa
ny s
tam
p

Annual Report 2013 161
For the year ended 31 December 2013(All amounts in RMB’000 unless otherwise stated)
(English Translation for Reference Only)
Chapter 13 Financial Statements Prepared in Accordance with China Accounting Standards
Stat
emen
t of C
hang
es in
Sha
reho
lder
s’ E
quity
2013
2012
Item
Note
Share
capit
alCa
pital
reserv
eSu
rplus
res
erve
Undis
tribu
ted
profi
ts
total
sha
rehold
ers’
equit
ySh
are
capita
lCa
pital
reserv
eSu
rplus
reserv
eUn
distrib
uted
profits
Total
shareh
olders
’ equ
ity
I. Ba
lance
at 1 J
anua
ry2,6
62,39
633
4,259
3,059
,836
1,003
,341
7,059
,832
2,662
,396
199,3
222,9
53,16
01,2
67,95
87,0
82,83
6II.
Mov
emen
ts for
the ye
ar(I)
total
comp
rehen
sive in
come
1. Ne
t prof
it–
––
978,5
4097
8,540
––
–1,0
66,76
11,0
66,76
12.
Other
compre
hensiv
e inco
meXI
I.23
–(40
7,284
)–
–(40
7,284
)–
27,90
1–
–27
,901
Sub-t
otal o
f 1&2
–(40
7,284
)–
978,5
4057
1,256
–27
,901
–1,0
66,76
11,0
94,66
2
(II) C
apita
l contr
ibutio
n and
withd
rawal
by ow
ners
1. Inc
rease
in sha
rehold
ers’ eq
uity
result
ed fro
m sha
re-bas
ed pay
ment
VII.2
–81
,505
––
81,50
5–
107,0
36–
–10
7,036
(III) Pr
ofit d
istrib
ution
1. Ap
propri
ation
to sur
plus r
eserve
sV.4
2–
–61
,452
(61,45
2)–
––
106,6
76(10
6,676
)–
2. Pro
fit dis
tributi
on to
shareh
olders
V.43(1
)–
––
(612,3
51)
(612,3
51)
––
–(1,
224,7
02)
(1,22
4,702
)
III. B
alanc
e at 3
1 Dece
mber
2,662
,396
8,480
3,121
,288
1,308
,078
7,100
,242
2,662
,396
334,2
593,0
59,83
61,0
03,34
17,0
59,83
2
The
acco
mpa
nyin
g no
tes
form
an
inte
gral
par
t of t
hese
fina
ncia
l sta
tem
ents
.
Lega
l rep
rese
ntat
ive’
s au
thor
ised
per
son
The
pers
on in
cha
rge
of
acco
untin
g af
fair
sTh
e he
ad o
f the
acco
untin
g de
part
men
tC
ompa
ny s
tam
p

162 China International Marine Containers (Group) Co., Ltd.
Chapter 13Financial Statements Prepared in Accordance with China Accounting StandardsFor the year ended 31 December 2013(All amounts in RMB’000 unless otherwise stated)(English Translation for Reference Only)
Notes to the Financial StatementsI. GENERAl INFoRMAtIoN
China International Marine Containers (Group) Co., Ltd. (the “Company”), formerly “China International Marine Containers Co., Ltd.”, was a Sino-foreign joint venture set up by China Merchants Group, the East Asiatic Company (Denmark) and Ocean Containers Inc.(USA). In December 1992, as approved by “Shen Fu Ban Fu [1992] 1736” issued by the General Office of the People’s Government of Shenzhen and “Shen Ren Yin Fu Zi (1992) 261” issued by Shenzhen Special Economic Zone Branch of People’s Bank of China, the Company was restructured as an incorporated company set up by directional subscription and was renamed as “China International Marine Containers Co., Ltd.” by the original corporate shareholders of the Company. On 31 December 1993 and 17 January 1994 respectively, the Company issued ordinary shares denominated in Renminbi for domestic investors (A Shares) and for foreign shares issued domestically (B Shares), and commenced trading on Shenzhen Stock Exchange. Pursuant to “Shen Fu Ban Fu [1993] 925” issued by the General Office of the People’s Government of Shenzhen and “Shen Zheng Ban Fu [1994] 22” issued by Shenzhen Securities Administration Office. On 1 December 1995, as approved by the State Administration of Industry and Commerce, the Company changed its name to “China International Marine Containers (Group) Co., Ltd”.
As at 19 December 2012, the Company’s domestically listed foreign shares (B shares) changed listing location and went publication on the main market of the Stock Exchange of Hong Kong through the way of introduction. Henceforth, all the company’s B shares converted to overseas listed foreign shares (H shares). After conversion, the share capital of the Company amounted to 2,662,396,051 shares. Please refer to Note V.41 for details of the share capital.
The principal activities of the Company and its subsidiaries (together referred to as the “Group”) are the manufacturing of modern transportation facilities, facilities for energy, food, chemistry and rendering of relative services. Detailed activities are the manufacturing and repairing of containers and other relevant business; utilizing the Group’s equipment to process and manufacture various parts, structure components and relevant machines; providing cutting, punching, moulding, riveting surface treatment (including sand/paint spraying, welding and assembly) and other processing services; developing, manufacturing and selling of various high-tech and high performance special vehicles and semi-trailers; leasing of containers; developing, production and sales of high-end fuel gas equipments such as pressure container and compressor; providing integrated services for natural gas distribution; production of static container and pot-type wharf equipments and providing EP+CS (engineering procurement and construction supervision) technical service for the storage and processing of LNG, LPG and other petrochemical gases. Apart from the above, the Group is also engaged in manufacturing of logistic equipment and related services, marine projects, railway trucks production and property development, etc.
CIMC Enric Holdings Limited, the subsidiary of the Group, is listed in the Main Board of the Stock Exchange of Hong Kong Limited. The principal activities of the Group are the design, development, manufacturing, engineering and sales of, and the provision of technical maintenance service for, a wide spectrum of transportation, storage and processing equipment that is widely used in energy, chemical and liquid food industries.
These financial statements have been approved for issue by the Company’s Board of Directors on 25 March 2014.

Annual Report 2013 163
Chapter 13 Financial Statements Prepared in Accordance with China Accounting Standards
For the year ended 31 December 2013(All amounts in RMB’000 unless otherwise stated)
(English Translation for Reference Only)
II. SUMMARY oF SIGNIFICANt ACCoUNtING PolICIES AND ACCoUNtING EStIMAtES
1. Basis of preparation
The financial statements were prepared in accordance with the Basic Standard and specific standards of the Accounting Standards for Business Enterprises issued by the Ministry of Finance on 15 February 2006, the Application Guidance for Accounting Standards for Business Enterprises, the Interpretations of Accounting Standards for Business Enterprises and other relevant regulations issued (hereafter collectively referred to as ‘the Accounting Standards for Business Enterprises’ or ‘CAS’) and the disclosure requirements in the Preparation Convention of Information Disclosure by Companies Offering Securities to the Public No.15 – General Rules on Financial Reporting (2010 revised) issued by the China Securities Regulatory Commission.
In 2014, the Ministry of Finance promulgated the Accounting Standards for Business Enterprises No.39 – Fair Value Measurement, Accounting Standards for Business Enterprises No.40 – Joint Arrangements, Accounting Standards for Business Enterprises No.9 – Employee Benefits(Revised in 2014), Accounting Standards for Business Enterprises No.30 – Presentation of Financial Statements(Revised in 2014), Accounting Standards for Business Enterprises No.33 – Consolidated Financial Statements(Revised in 2014) and Accounting Standards for Business Enterprises No.2 – Long-term Equity Investment(Revised in 2014). The abovementioned standards will take effect as from 1 July 2014 and overseas listed enterprises are encouraged to implement them in advance. The Company is an A-share and H-share listed company. Therefore, the Group has prepared the financial statements of 2013 in accordance with the first five standards abovementioned in advance (Note II.33). As the date of issue of the last standard is too close to the approval date of the Group’s financial statements, the Group has not been able to make assessments on it and therefore it has not been adopted in advance.
2. Statement of compliance with the Accounting Standards for Business Enterprises
The financial statements of the Company for the year ended 31 December 2013 are in compliance with the Accounting Standards for Business Enterprises, and truly and completely present the financial position of the Consolidated and the Company as of 31 December 2013 and of their financial performance, cash flows and other information for the year then ended.
3. Accounting year
The Company’s accounting year starts on 1 January and ends on 31 December.
4. Recording currency
Functional currency is determined by the Company and its subsidiaries on the basis of the currency in which major income and costs are denominated and settled.
The functional currency of the Company and its subsidiaries domiciled in PRC are Renminbi. Hong Kong and the overseas subsidiaries use local currencies as their functional currencies. Foreign currencies are defined as currency other than functional currency.
Financial statements of the Company are presented in Renminbi. For subsidiaries using currencies other than Renminbi as their functional currencies, the Company translates the financial statements of these subsidiaries into Renminbi (see Note II.8).

164 China International Marine Containers (Group) Co., Ltd.
Chapter 13Financial Statements Prepared in Accordance with China Accounting StandardsFor the year ended 31 December 2013(All amounts in RMB’000 unless otherwise stated)(English Translation for Reference Only)
II. SUMMARY oF SIGNIFICANt ACCoUNtING PolICIES AND ACCoUNtING EStIMAtES (CoNtINUED)
5. Accounting treatments for business combinations involving enterprises under and those not under common control
(1) Business combinations involving enterprises under common control
A business combination involving enterprises under common control is a business combination in which all of the combining enterprises are ultimately controlled by the same party or parties both before and after the business combination, and that control is not transitory. The assets and liabilities obtained are measured at the carrying amounts as recorded by the enterprise being combined at the combination date. The difference between the carrying amount of the net assets obtained and the carrying amount of consideration paid for the combination (or the total face value of shares issued) is adjusted to capital premium in the capital reserve. If the balance of the capital premium is insufficient, any excess is adjusted to retained earnings. Any costs directly attributable to the combination shall be recognised in profit or loss for the current period when occurred. The combination date is the date on which one combining enterprise effectively obtains control of the other combining enterprises.
(2) Business combinations involving enterprises not under common control
A business combination involving enterprises not under common control is a business combination in which all of the combining enterprises are not ultimately controlled by the same party or parties both before and after the business combination.
Where 1) the aggregate of the fair value at the acquisition date of assets transferred (including the acquirer’s previously held equity interest in the acquiree), liabilities incurred or assumed, and equity securities issued by the acquirer, in exchange for control of the acquiree, exceeds 2) the acquirer’s interest in the fair value at the acquisition date of the acquiree’s identifiable net assets, the difference is recognised as goodwill (see Note II.18). Where 1) is less than 2), the difference is recognised in profit or loss for the current period. The costs of the issuance of equity or debt securities as a part of the consideration paid for the acquisition are included as a part of initial recognition amount of the equity or debt securities. Other acquisition-related costs arising from the business combination are recognised as expenses in the periods in which the costs are incurred. The difference between the fair value and the carrying amount of the assets transferred is recognised in profit or loss. The acquiree’s identifiable asset, liabilities and contingent liabilities, if satisfying the recognition criteria, are recognised by the Group at their fair value at the acquisition date. The acquisition date is the date on which the acquirer effectively obtains control of the acquiree.

Annual Report 2013 165
Chapter 13 Financial Statements Prepared in Accordance with China Accounting Standards
For the year ended 31 December 2013(All amounts in RMB’000 unless otherwise stated)
(English Translation for Reference Only)
II. SUMMARY oF SIGNIFICANt ACCoUNtING PolICIES AND ACCoUNtING EStIMAtES (CoNtINUED)
6. Preparation of consolidated financial statements
The scope of consolidated financial statements is based on control and the consolidated financial statements comprise the Company and its subsidiaries. Control means the group has rights in the invested entity, and could gain returns through its involvement with the entity as well as has the ability to affect those returns through its power over the entity. The financial position, financial performance and cash flows of subsidiaries are included in the consolidated financial statements from the date that control commences until the date that control ceases.
Where a subsidiary was acquired during the reporting period, through a business combination involving enterprises under common control, the financial statements of the subsidiary are included in the consolidated financial statements as if the combination had occurred at the date that the ultimate controlling party first obtained control. The opening balances and the comparative figures of the consolidated financial statements are also restated. In the preparation of the consolidated financial statements, the subsidiary’s assets and liabilities based on their carrying amounts are included in the consolidated balance sheet, and financial performance is included in the consolidated income statement, respectively, from the date that the ultimate parent company of the Company obtains the control of the subsidiary to be consolidated.
Where a subsidiary was acquired during the reporting period, through a business combination involving enterprises not under common control, the identifiable assets and liabilities of the acquired subsidiaries are included in the scope of consolidation from the date that control commences, base on the fair value of those identifiable assets and liabilities at the acquisition date.
For a business combination not involving enterprises under common control and achieved in stages, the Group remeasures its previously-held equity interest in the acquiree to its fair value at the acquisition date. The difference between the fair value and the carrying amount is recognised as investment income for the current period; the amount recognised in other comprehensive income relating to the previously-held equity interest in the acquiree is reclassified as investment income for the current period.
Where the Company acquires a minority interest from a subsidiary’s minority shareholders or disposes of a portion of an interest in a subsidiary without a change in control, the difference between the amount by which the minority interests are adjusted and the amount of the consideration paid or received is adjusted to the capital reserve (capital surplus) in the consolidated balance sheet. If the credit balance of capital reserve (capital surplus) is insufficient, any excess is adjusted to retained earnings.
When the Group loses control of a subsidiary due to the disposal of a portion of an equity investment, the Group derecognises assets, liabilities, minority interests and other related items in owners’ equity in relation to that subsidiary. The remaining equity investment is remeasured at its fair value at the date when control is lost. Any gains or losses therefore incurred are recognised as investment income for the current period when control is lost.

166 China International Marine Containers (Group) Co., Ltd.
Chapter 13Financial Statements Prepared in Accordance with China Accounting StandardsFor the year ended 31 December 2013(All amounts in RMB’000 unless otherwise stated)(English Translation for Reference Only)
II. SUMMARY oF SIGNIFICANt ACCoUNtING PolICIES AND ACCoUNtING EStIMAtES (CoNtINUED)
6. Preparation of consolidated financial statements (Continued)
Owners’ equity of subsidiaries, profit or loss and comprehensive income not attributable to the Company are recorded as minority interests, profit or loss attributable to minority shareholders and comprehensive income attributable to minority shareholders, respectively, and are presented separately within the items of owners’ equity, net profit and total comprehensive income in the consolidated financial statements.
When the amount of loss for the current period attributable to the minority shareholders of a subsidiary exceeds the minority shareholders’ portion of the opening balance of shareholders’ equity of the subsidiary, the excess is allocated against the minority interests.
When the accounting period or accounting policies of a subsidiary are different from those of the Company, the Company makes necessary adjustments to the financial statements of the subsidiary based on the Company’s own accounting period or accounting policies. Intra-group balances and transactions, and any unrealised profit or loss arising from intra-group transactions, are eliminated in preparing the consolidated financial statements. Unrealised losses resulting from intra-group transactions are eliminated in the same way as unrealised gains but only to the extent that there is no evidence of impairment.
7. Cash and cash equivalents
Cash and cash equivalents comprise cash on hand, deposits that can be readily drawn on demand, and short-term and highly liquid investments that are readily convertible to known amounts of cash and which are subject to an insignificant risk of changes in value.
8. Foreign currency transactions and translation of financial statements denominated in foreign currency
When the Group receives capital in foreign currencies from investors, the capital is translated to functional currency at the spot exchange rate at the date of the receipt. Other foreign currency transactions are, on initial recognition, translated to functional currency at the rates that approximate the spot exchange rates at the dates of the transactions.
A spot exchange rate is an exchange rate quoted by the People’s Bank of China. A rate that approximates the spot exchange rate is a rate determined under a systematic and rational method, normally the average exchange rate of the current period or the weighted average exchange rate.
Monetary items denominated in foreign currencies are translated to functional currency at the spot exchange rate at the balance sheet date. The resulting exchange differences, except for those arising from the principal and interest of specific foreign currency borrowings for the purpose of acquisition, construction or production of qualifying assets (see Note II.16), are recognised in profit or loss. Non-monetary items denominated in foreign currencies that are measured at historical cost are translated to functional currency using the foreign exchange rate at the transaction date. Non-monetary items denominated in foreign currencies that are measured at fair value are translated using the foreign exchange rate at the date the fair value is determined; the resulting exchange differences are recognised in profit or loss, except for the differences arising from the translation of available-for-sale financial assets, which are recognised as other comprehensive income in capital reserve. The effect of exchange rate changes on cash presented separately in the cash flow statement.

Annual Report 2013 167
Chapter 13 Financial Statements Prepared in Accordance with China Accounting Standards
For the year ended 31 December 2013(All amounts in RMB’000 unless otherwise stated)
(English Translation for Reference Only)
II. SUMMARY oF SIGNIFICANt ACCoUNtING PolICIES AND ACCoUNtING EStIMAtES (CoNtINUED)
8. Foreign currency transactions and translation of financial statements denominated in foreign currency (Continued)
The assets and liabilities of foreign operation are translated to functional currency at the spot exchange rates at the balance sheet date. The equity items, excluding “Retained earnings”, are translated to functional currency at the spot exchange rates at the transaction dates. The income and expenses of foreign operation are translated to functional currency at the rates that approximate the spot exchange rates at the transaction dates. The resulting translation differences are recognised in a separate component of equity. Upon disposal of a foreign operation, the cumulative amount of the translation differences recognised in equity which relates to that foreign operation is transferred to profit or loss in the period in which the disposal occurs. The cash flows of overseas operations are translated at the spot exchange rates on the dates of the cash flows. The effect of exchange rate changes on cash presented separately in the cash flow statement.
9. Financial instruments
Financial instruments include cash at bank and on hand, financial assets at fair value through profit or loss, receivables, available-for-sale financial assets, investments in equity securities other than long-term equity investments (see Note II.12), payables, loans, borrowings and debentures payable.
(1) Financial Assets
(a) Classification of financial assets
Financial assets are classified into the following categories at initial recognition: financial assets at fair value through profit or loss, receivables, available-for-sale financial assets and held-to-maturity investments. The classification of financial assets depends on the Group’s intention and ability to hold the financial assets.
– Financial assets at fair value through profit or loss
Financial assets at fair value through profit or loss include financial assets held for the purpose of selling in short term.
– Receivables
Receivables are non-derivative financial assets with fixed or determinable payments that are not quoted in an active market.
– Available-for-sale financial assets
Available-for-sale financial assets are non-derivatives that are either designated in this category or not classified in any of the other categories. They are included in non-current assets unless the investment matures or management intends to dispose of it within 12 months of the end of the reporting period.

168 China International Marine Containers (Group) Co., Ltd.
Chapter 13Financial Statements Prepared in Accordance with China Accounting StandardsFor the year ended 31 December 2013(All amounts in RMB’000 unless otherwise stated)(English Translation for Reference Only)
II. SUMMARY oF SIGNIFICANt ACCoUNtING PolICIES AND ACCoUNtING EStIMAtES (CoNtINUED)
9. Financial instruments (Continued)
(1) Financial Assets (Continued)
(b) Recognition and measurement
Financial assets are recognised at fair value on the balance sheet when the Group becomes a party to the contractual provisions of the financial instrument. In the case of financial assets at fair value through profit or loss, the related transaction costs incurred at the time of acquisition are recognised in profit or loss for the current period. For other financial assets, transaction costs that are attributable to the acquisition of the financial assets are included in their initial recognition amounts.
Financial assets at fair value through profit or loss are subsequently measured at fair value. Investments in equity instruments are measured at cost when they do not have a quoted market price in an active market and whose fair value cannot be reliably measured. Receivables are measured at amortised cost using the effective interest method.
Gain or loss arising from change in the fair value of financial assets at fair value through profit or loss is recognised in profit or loss. Interests and cash dividends received during the period in which such financial assets are held, as well as the gains or losses arising from disposal of these assets are recognised in profit or loss for the current period.
Accumulated fair value adjustments of available-for-sale financial assets are recognised in equity except impairment and exchange gains and losses of foreign currency financial assets. When available-for-sale financial assets are disrecognised, the accumulated fair value adjustments recognised in equity are included in the income statement. Interest on available-for-sale securities calculated using the effective interest method and cash dividends on available-for-sale equity instruments when the group’s right to receive payments is established are recognised in the income statement as part of other income.
(c) Impairment of financial assets
The Group assesses the carrying amounts of financial assets other than those at fair value through profit or loss at each balance sheet date. If there is objective evidence that a financial asset is impaired, the Group determines the amount of impairment loss.
When an impairment loss on a financial asset carried at amortised cost has occurred, the amount of loss is measured at the difference between the asset’s carrying amount and the present value of its estimated future cash flows (excluding future credit losses that have not been incurred). If there is objective evidence that the value of the financial asset recovered and the recovery is related objectively to an event occurring after the impairment was recognised, the previously recognised impairment loss is reversed and the amount of reversal is recognised in profit or loss.
Objective evidence indicating a financial asset is impaired represents matters actually happen subsequently to the initial recognition of the financial assets and exert influences the financial assets’ estimated future cash flows which can be reliably measured by the Group.

Annual Report 2013 169
Chapter 13 Financial Statements Prepared in Accordance with China Accounting Standards
For the year ended 31 December 2013(All amounts in RMB’000 unless otherwise stated)
(English Translation for Reference Only)
II. SUMMARY oF SIGNIFICANt ACCoUNtING PolICIES AND ACCoUNtING EStIMAtES (CoNtINUED)
9. Financial instruments (Continued)
(1) Financial Assets (Continued)
(c) Impairment of financial assets (Continued)
Evidence of held-to-maturity equity instrument is impaired comprises a significant or prolonged decline in the fair value of an investment in an equity instrument below its cost. The Group assesses all available-for-sale financial assets on an individual basis at each balance sheet date. Impairment loss should be recognised if the fair value of an equity instrument has is than 50% (50% inclusive) of its initial investment cost or in the case that the fair value has been less than the initial investment cost for more than one year(one year inclusive). The Group will consider other relevant factors, such as the price volatility, to determine whether an impairment loss should be recognised for the equity instrument if the decline in the fair value of an equity instrument is more than 20% (20% inclusive) but less than 50% of its initial investment cost.
When an available-for-sale financial asset is impaired, the cumulative loss arising from decline in fair value that has been recognised directly in equity is reclassified to profit or loss. If, after an impairment loss has been recognised on an available-for-sale debt instrument, the fair value of the debt instrument increases in a subsequent period and the increase can be objectively related to an event occurring after the impairment loss was recognised, the impairment loss is reversed through profit or loss. An impairment loss recognised for an investment in an equity instrument classified as available-for-sale is reversed through equity.
A financial assets is derecognised when one of the below criteria is met:
– the contractual rights to receive the cash flows from the financial asset expire;
– the financial asset has been transferred and the Group transfers substantially all the risks and rewards of ownership of the financial asset to the transferee;
– the financial asset has been transferred and the Group has not retained control of the financial asset, although the Group neither transfers nor retains substantially all the risks and rewards of ownership of the financial asset.
On derecognition of a financial asset, the difference between the carrying amount and the consideration received and the cumulative changes in fair value that had been recognised directly in equity, is recognised in profit or loss.

170 China International Marine Containers (Group) Co., Ltd.
Chapter 13Financial Statements Prepared in Accordance with China Accounting StandardsFor the year ended 31 December 2013(All amounts in RMB’000 unless otherwise stated)(English Translation for Reference Only)
II. SUMMARY oF SIGNIFICANt ACCoUNtING PolICIES AND ACCoUNtING EStIMAtES (CoNtINUED)
9. Financial instruments (Continued)
(2) Financial liabilities
Financial liabilities are classified into the following categories at initial recognition: financial liabilities at fair value through profit or loss and other financial liabilities. The financial liabilities of the Group are mainly other financial liabilities, including payables, borrowings and debentures payable.
Payables, including accounts payable and other payables are recognised initially at fair value and subsequently measured at amortised cost using the effective interest method.
Borrowings and debentures payable are recognised initially at fair value, net of transaction costs incurred and subsequently measured at amortised cost using the effective interest method.
Other financial liabilities with maturities no more than one year are classified as current liabilities. Other financial liabilities with maturities over one year but are due within one year at the balance sheet date are classified as the current portion of non-current liabilities. Others are classified as non-current liabilities.
A financial liability is derecognised or partly derecognised when the current obligation is discharged or partly discharged. The difference between the carrying amount of the financial liability or the derecognised part of the financial liability and the consideration paid is recognised in profit or loss.
(3) Determination of fair value
The fair value of a financial instrument that is traded in an active market is determined at the quoted price in the active market. The fair value of a financial instrument that is not traded in an active market is determined by using an appropriate valuation technique that is applicable to current circumstances and supported by sufficient available data and other information. Valuation techniques mainly include market approach and income approach. When applying valuation techniques, inputs used by market participants in the transactions of the assets or liabilities with similar characteristics would be used and observable inputs would be given priority to the extent possible. Unobservable inputs would only be used when it is impossible or impracticable to obtain relevant observable inputs.
(4) Equity instrument
An equity instrument is a contract that proves the ownership interest of the assets after deducting all liabilities in the Group.
The consideration received from the issuance of equity instruments net of transaction costs is recognised in shareholders’ equity.
Consideration and transaction costs paid by the Group for repurchasing self-issued equity instruments are deducted from shareholders’ equity.

Annual Report 2013 171
Chapter 13 Financial Statements Prepared in Accordance with China Accounting Standards
For the year ended 31 December 2013(All amounts in RMB’000 unless otherwise stated)
(English Translation for Reference Only)
II. SUMMARY oF SIGNIFICANt ACCoUNtING PolICIES AND ACCoUNtING EStIMAtES (CoNtINUED)
10. Receivables
Receivables comprise accounts receivable and other receivables. Accounts receivable arising from sale of goods or rendering of services are initially recognised at fair value of the contractual payments from the buyers or service recipients.
Receivables are assessed for impairment both on an individual basis and on a collective group basis.
Where impairment is assessed on an individual basis, an impairment loss in respect of a receivable is calculated as the excess of its carrying amount over the present value of the estimated future cash flows (exclusive of future credit losses that have not been incurred) discounted at the original effective interest rate. All impairment losses are recognised in profit or loss.
The assessment is made collectively where receivables share similar credit risk characteristics (including those having not been individually assessed as impaired), based on their historical loss experiences, and adjusted by the observable figures reflecting present economic conditions.
If, after an impairment loss has been recognised on receivables, there is objective evidence of a recovery in value of the financial asset which can be related objectively to an event occurring after the impairment was recognised, the previously recognised impairment loss is reversed through profit or loss. A reversal of an impairment loss will not result in the asset’s carrying amount exceeding that which would have been determined had no impairment loss been recognised in prior years.
(1) Receivables that are individually significant and impairment provided on an individual basis:
Criteria of provision for receivable that are individually significant and impairment provided on an individual basis.
Individually significant receivables are the receivables with the individual amount over RMB10 million (inclusive) or accounting to 5% or more of the total receivables.
Method of provision for receivable that are individually significant and impairment provided on an individual basis.
An impairment loss is calculated as the excess of its carrying amount over the present value of the estimated future cash flows (exclusive of future credit losses that have not been incurred) discounted at the original effective interest rate.
(2) Receivable that are individually insignificant but impairment provided on an individual basis:
Criteria of provision for receivables that are individually insignificant but impairment provided on an individual basis.
Within the receivables whose amounts are individually insignificant, impairment is assessed on an individual basis for the overdue receivables unpaid after collection efforts or with unique characteristics.
Method of provision for receivable that are individually insignificant but impairment provided on an individual basis.
An impairment loss is calculated as the excess of its carrying amount over the present value of the estimated future cash flows (exclusive of future credit losses that have not been incurred) discounted at the original effective interest rate.

172 China International Marine Containers (Group) Co., Ltd.
Chapter 13Financial Statements Prepared in Accordance with China Accounting StandardsFor the year ended 31 December 2013(All amounts in RMB’000 unless otherwise stated)(English Translation for Reference Only)
II. SUMMARY oF SIGNIFICANt ACCoUNtING PolICIES AND ACCoUNtING EStIMAtES (CoNtINUED)
10. Receivables (Continued)
(3) Receivables that are assessed for impairment on a collective group basis:
The assessment is made collectively where receivables share similar credit risk characteristics, including those having not been individually assessed as impaired.
Determination method of the group based on credit risk characteristics
Accounts receivable are divided into six groups of containers, vehicles, energy and chemistry equipment, offshore engineering, airport facilities, other business, and due from related parties, land lease prepayments and operating deposits according to the industry and business nature of customers and the characteristics of the receivables. As to Offshore engineering groups, the relevant receivables within credit period have lower credit risk after the grouping based on credit risk characteristics according to individual credit risk assessment and historical data. As to other groups like due from related parties, land lease prepayments operating deposits, and etc, if the credit risk is assessed low after grouping based on the assessment on credit risk and their historical loss experience, no impairment loss is recognised for those groups.
Group 1 Containers
Group 2 Road transportation vehicles
Group 3 Energy, chemical, food equipment
Group 4 Airport facilities
Group 5 Logistics services and equipment
Group 6 Other business
Methods of provision for receivables assessed on a collective group basis (based on an ageing analysis, a percentage of the total balance and others).
Containers Provision is determined based on an ageing analysis(Overdue aging)
Road transportation vehicles Provision is determined based on an ageing analysis(Overdue aging)
Energy, chemical, food equipment Provision is determined based on an ageing analysis(Overdue aging)
Airport facilities Provision is determined based on an ageing analysis(Overdue aging)
Logistics services and equipment Provision is determined based on an ageing analysis(Overdue aging)
Other business Provision is determined based on an ageing analysis(Overdue aging)

Annual Report 2013 173
Chapter 13 Financial Statements Prepared in Accordance with China Accounting Standards
For the year ended 31 December 2013(All amounts in RMB’000 unless otherwise stated)
(English Translation for Reference Only)
II. SUMMARY oF SIGNIFICANt ACCoUNtING PolICIES AND ACCoUNtING EStIMAtES (CoNtINUED)
10. Receivables (Continued)
(3) Receivables that are assessed for impairment on a collective group basis:(Continued)
For the above groups, provision is made based on their respective ageing analysis follows:
Percentage of total accounts receivable (%)Ageing Group 1, 2, 4, 5, 6 Group 3
Within 1 year (inclusive) 5% 0%~5%1 to 2 years (inclusive) 30% 30%Over 2 years 100% 100%
(4) When the Group transfers the accounts receivable to the financial institutions without recourse, the difference between the proceeds received from the transaction and their carrying amounts and the related taxes is recognised in profit or loss for the current period.
11. Inventories
(1) Classification
Inventories include raw materials, work in progress, semi-finished goods, finished goods and reusable materials. Reusable materials include low-value consumables, packaging materials and other materials, which can be used repeatedly but do not meet the definition of fixed assets.
(2) Cost of inventories
Cost of inventories is calculated using the weighted average method.

174 China International Marine Containers (Group) Co., Ltd.
Chapter 13Financial Statements Prepared in Accordance with China Accounting StandardsFor the year ended 31 December 2013(All amounts in RMB’000 unless otherwise stated)(English Translation for Reference Only)
II. SUMMARY oF SIGNIFICANt ACCoUNtING PolICIES AND ACCoUNtING EStIMAtES (CoNtINUED)
11. Inventories (Continued)
(3) the underlying factors in the determination of net realisable values of inventories and basis of provision for decline in value of inventories
Inventories are initially measured at cost. Cost of inventories comprises all costs of purchase, costs of conversion and other expenditures incurred in bringing the inventories to their present location and condition. Borrowing costs directly related to the production of qualifying inventories are also included in the cost of inventories (see Note II.16). In addition to the purchasing cost of raw materials, work in progress and finished goods include direct labour costs and an appropriate allocation of production overheads.
At the balance sheet date, inventories are carried at the lower of cost and net realisable value.
Net realisable value is the estimated selling price in the normal course of business less the estimated costs to completion and the estimated expenses and related taxes necessary to make the sale. The net realisable value of materials held for use in the production of inventories is measured based on the net realisable value of the finished goods in which they will be incorporated. The net realisable value of the quantity of inventory held to satisfy sales or service contracts is based on the contract price. If the quantities of inventories specified in sales contracts are less than the quantities held by the Group, the net realisable value of the excess portion of inventories shall be based on general selling prices.
Any excess of the cost over the net realisable value of each class of inventories is recognised in profit or loss as a provision for diminution in the value of inventories.
(4) Inventory system
The Group maintains a perpetual inventory system.
(5) Amortisation of reusable material including low-value consumables and packaging material
Reusable materials including low-value consumables and packaging materials are amortised in full when received for use. The amounts of the amortisation are included in the cost of the related assets or profit or loss.

Annual Report 2013 175
Chapter 13 Financial Statements Prepared in Accordance with China Accounting Standards
For the year ended 31 December 2013(All amounts in RMB’000 unless otherwise stated)
(English Translation for Reference Only)
II. SUMMARY oF SIGNIFICANt ACCoUNtING PolICIES AND ACCoUNtING EStIMAtES (CoNtINUED)
12. long-term equity investments
Long-term equity investments comprise the Company’s long-term equity investments in its subsidiaries, the Group’s long-term equity investments in its joint ventures and associates, as well as the long-term equity investments where the Group does not have control, joint control or significant influence over the investees and which are not quoted in an active market and whose fair value cannot be reliably measured.
Subsidiaries are the investees over which the Company is able to exercise control. Joint ventures are the investees over which the Group is able to exercise joint control together with other ventures and the Group enjoys the rights only on the net assets of investees. Associates are the investees that the Group has significant influence on their financial and operating policies.
Investments in subsidiaries are presented in the Company’s financial statements using the cost method, and are adjusted for preparing the consolidated financial statements using the equity method. Investments in joint ventures and associates are accounted for using the equity method. Other long-term equity investments, where the Group does not have control, joint control or significant influence over the investees and which are not quoted in an active market and whose fair value cannot be reliably measured, are accounted for using the cost method.
(1) Determination of investment cost
For long-term equity investments acquired through a business combination: for long-term equity investments acquired through a business combination involving enterprises under common control, the investment cost shall be the absorbing party’s share of the carrying amount of owners’ equity of the party being absorbed at the combination date; for long-term equity investment acquired through a business combination involving enterprises not under common control, the investment cost shall be the combination cost.
For long-term equity investments acquired not through a business combination: for long-term equity investment acquired by payment in cash, the initial investment cost shall be the purchase price actually paid; for long-term equity investments acquired by issuing equity securities, the initial investment cost shall be the fair value of the equity securities issued.
(2) Subsequent measurement
For long-term equity investments accounted for using the cost method, they are measured at the initial investment costs, and cash dividends or profit distribution declared by the investees are recognised as investment income in profit or loss.
For long-term equity investments accounted for using the equity method, where the initial investment cost of a long-term equity investment exceeds the Group’s share of the fair value of the investee’s identifiable net assets at the acquisition date, the long-term equity investment is measured at the initial investment cost; where the initial investment cost is less than the Group’s share of the fair value of the investee’s identifiable net assets at the acquisition date, the difference is included in profit or loss and the cost of the long-term equity investment is adjusted upwards accordingly.

176 China International Marine Containers (Group) Co., Ltd.
Chapter 13Financial Statements Prepared in Accordance with China Accounting StandardsFor the year ended 31 December 2013(All amounts in RMB’000 unless otherwise stated)(English Translation for Reference Only)
II. SUMMARY oF SIGNIFICANt ACCoUNtING PolICIES AND ACCoUNtING EStIMAtES (CoNtINUED)
12. long-term equity investments (Continued)
(2) Subsequent measurement (Continued)
For long-term equity investments accounted for using the equity method, the Group recognises the investment income according to its share of net profit or loss of the investee. If the accounting policies and the accounting periods are inconsistent between the Company and investees, the financial statements of investees are adjusted in accordance with the accounting policies and accounting period of the Company. The Group discontinues recognising its share of net losses of an investee after the carrying amount of the long-term equity investment together with any long-term interests that, in substance, form part of the investor’s net investment in the investee are reduced to zero. However, if the Group has obligations for additional losses and the criteria with respect to recognition of provisions under the accounting standards on contingencies are satisfied, the Group continues recognising the investment losses and the provisions. For changes in owners’ equity of the investee other than those arising from its net profit or loss, the Group records its proportionate share directly into capital surplus, provided that the Group’s proportion of shareholding in the investee remains unchanged. The carrying amount of the investment is reduced by the Group’s share of the profit distribution or cash dividends declared by an investee. The unrealised profits or losses arising from the intra-group transactions amongst the Group and its investees are eliminated in proportion to the Group’s equity interest in the investees, and then based on which the investment gains or losses are recognised. For the loss on the intra-group transaction amongst the Group and its investees attributable to asset impairment, any unrealised loss is not eliminated.
(3) Basis for determining the existence of joint control or significant influence over an investee
Control is the power over the investee to enjoy variable returns by participating in related activities of the investee and the ability to affect the return amount by executing the power over the investee.
Joint control is the sharing of control over an arrangement according to related agreement, and exists only when the decisions relating to the activity of the arrangement require the unanimous consent of the parties sharing control.
Significant influence is the power to participate in the determination of financial and operating policies of the investee, but is not control or joint control over those policies.
(4) Method of impairment testing and measuring
The carrying amount of long-term equity investments in subsidiaries, joint ventures and associates is reduced to the recoverable amount if the recoverable amount is below the carrying amount. For other long-term equity investments which are not quoted in an active market and whose fair value cannot be reliably measured, the excess of its carrying amount over the present value of future cash flows discounted at the prevailing market yield rate for similar financial assets is recognised as impairment loss and cannot be reversed once recognised.

Annual Report 2013 177
Chapter 13 Financial Statements Prepared in Accordance with China Accounting Standards
For the year ended 31 December 2013(All amounts in RMB’000 unless otherwise stated)
(English Translation for Reference Only)
II. SUMMARY oF SIGNIFICANt ACCoUNtING PolICIES AND ACCoUNtING EStIMAtES (CoNtINUED)
13. Investment properties
Investment properties are properties held either to earn rental income or for capital appreciation or for both. Investment properties are accounted for using the cost model and stated in the balance sheet at cost less accumulated depreciation, amortisation and impairment losses. Subsequent expenditures incurred in relation to an investment property are included in the cost of the investment property when it is probable that the associated economic benefits will flow to the Group and their costs can be reliably measured; otherwise, the expenditures are recognised in profit or loss in the period in which they are incurred. An investment property is depreciated or amortised, less its estimated residual value, using the straight line method over its estimated useful life, unless the investment properties are classified as held for sale (see Note II.28). For the method of impairment testing and measuring, refer to Note II.20.
The useful lives, residual value rate and depreciation/amortisation rate of each class of investment properties are as follows:
Useful lifeResidual value
rate (%)
Depreciation/Amortisation
rate (%)
Land use rights 29 – 50 years – 2% – 3.4%Plant and buildings 20 – 30 years 10% 3% – 4.5%
When an investment property is transferred to owner-occupied properties, it is reclassified as fixed asset or intangible asset at the date of the transfer. When an owner-occupied property is transferred out for earning rentals or for capital appreciation, the fixed asset or intangible asset is reclassified as investment properties at its carrying amount at the date of the transfer.
The investment property’s estimated useful life, net residual value and depreciation (amortisation) method applied are reviewed and adjusted as appropriate at each year-end.
An investment property is derecognised on disposal or when the investment property is permanently withdrawn from use and no future economic benefits are expected from its disposal. The net amount of proceeds from sale, transfer, retirement or damage of an investment property after its carrying amount and related taxes and expenses is recognised in profit or loss for the current period.

178 China International Marine Containers (Group) Co., Ltd.
Chapter 13Financial Statements Prepared in Accordance with China Accounting StandardsFor the year ended 31 December 2013(All amounts in RMB’000 unless otherwise stated)(English Translation for Reference Only)
II. SUMMARY oF SIGNIFICANt ACCoUNtING PolICIES AND ACCoUNtING EStIMAtES (CoNtINUED)
14. Fixed assets
(1) Recognition
Fixed assets represent the tangible assets held by the Group for use in the production of goods or supply of services, for rental to others or for operation and administrative purposes with useful lives over one year.
The cost of a purchased fixed asset comprises the purchase price, related taxes, and any directly attributable expenditure for bringing the asset to working condition for its intended use. The cost of self-constructed assets is measured in accordance with the policy set out in Note II.15.
Where parts of an item of fixed asset have different useful lives or provide benefits to the Group in different patterns thus necessitating use of different depreciation rates or methods, each part is recognised as a separate fixed asset.
The subsequent costs including the cost of replacing part of an item of fixed assets are recognised in the carrying amount of the item if the to recognise fixed assets criteria are satisfied, and the carrying amount of the replaced part is derecognised. The costs of the day-to-day servicing of fixed assets are recognised in profit or loss as incurred.
Fixed assets are stated in the balance sheet at cost less accumulated depreciation and impairment losses.
(2) Depreciation
Fixed assets are depreciated using the straight-line method to allocate the cost of the assets to their estimated residual values over their estimated useful lives, unless the fixed asset is classified as held for sale (see Note II.28). For the fixed assets that have been provided for impairment loss, the related depreciation charge is prospectively determined based upon the adjusted carrying amounts over their remaining useful lives. The estimated useful lives, residual values and depreciation rates of each class of fixed assets are as follows:
ClassesPeriod (years)
Residual value rate
Depreciation Depreciation
rate
Plants and buildings 20 – 30 years 10% 3 – 4.5%Machinery and equipment 10 -12 years 10% 7.5 -9%Office and other equipment 3 – 5 years 10% 18-30%Motor vehicles 5 years 10% 18%Dock, wharf 50 years 10% 1.8%Offshore engineering equipment 15 – 30 years 10% 3 – 6%
Useful lives, residual value and depreciation methods are reviewed at least at each year-end.
(3) For the method of impairment testing and measuring, refer to Note II.20.

Annual Report 2013 179
Chapter 13 Financial Statements Prepared in Accordance with China Accounting Standards
For the year ended 31 December 2013(All amounts in RMB’000 unless otherwise stated)
(English Translation for Reference Only)
II. SUMMARY oF SIGNIFICANt ACCoUNtING PolICIES AND ACCoUNtING EStIMAtES (CoNtINUED)
14. Fixed assets (Continued)
(4) Basis for identification of fixed assets held under finance leases and related measurement
For criteria of recognition and method of measuring for fixed assets under a finance lease, refer to Note II 27(3).
(5) Disposal
A fixed asset is derecognised on disposal or when no future economic benefits are expected from its use or disposal. The amount of proceeds from disposal on sale, transfer, retirement or damage of a fixed asset net of its carrying amount and related taxes and expenses is recognised in profit or loss for the current period.
15. Construction in progress
Construction in progress is measured at actual cost. The cost of self-constructed assets includes the cost of materials, direct labour, capitalised borrowing costs (see Note II.16), and any other costs directly attributable to bringing the asset to working condition for its intended use.
A self-constructed asset is included in construction in progress before it is transferred to fixed asset when it is ready for its intended use. No depreciation is provided against construction in progress. Construction in progress is stated in the balance sheet at cost less impairment losses (see Note II.20).
16. Borrowing costs
Borrowing costs incurred directly attributable to the acquisition, construction or production of a qualifying asset are capitalised as part of the cost of the asset.
Except for the above, other borrowing costs are recognised as financial expenses in the income statement when incurred.
During the capitalisation period, the amount of interest (including amortisation of any discount or premium on borrowing) to be capitalised in each accounting period is determined as follows:
– Where funds are borrowed specifically for the acquisition, construction or production of a qualifying asset, the amount of interest to be capitalised is the interest expense calculated using effective interest rates during the period less any interest income earned from depositing the borrowed funds or any investment income on the temporary investment of those funds before being used on the asset.
– Where funds are borrowed generally and used for the acquisition, construction or production of a qualifying asset, the amount of interest to be capitalised on such borrowings is determined by applying a capitalisation rate to the weighted average of the excess amounts of cumulative expenditures on the asset over the above amounts of specific borrowings. The capitalisation rate is the weighted average of the interest rates applicable to the general-purpose borrowings.

180 China International Marine Containers (Group) Co., Ltd.
Chapter 13Financial Statements Prepared in Accordance with China Accounting StandardsFor the year ended 31 December 2013(All amounts in RMB’000 unless otherwise stated)(English Translation for Reference Only)
II. SUMMARY oF SIGNIFICANt ACCoUNtING PolICIES AND ACCoUNtING EStIMAtES (CoNtINUED)
16. Borrowing costs (Continued)
The effective interest rate is determined as the rate that exactly discounts estimated future cash flow through the expected life of the borrowing or, when appropriate, a shorter period to the initially recognised amount of the borrowings.
During the capitalisation period, exchange differences related to the principal and interest on a specific-purpose borrowing denominated in foreign currency are capitalised as part of the cost of the qualifying asset. The exchange differences related to the principal and interest on foreign currency borrowings other than a specific-purpose borrowing are recognised as a financial expense in the period in which they are incurred.
The capitalisation period is the period from the date of commencement of capitalisation of borrowing costs to the date of cessation of capitalisation, excluding any period over which capitalisation is suspended. Capitalisation of borrowing costs commences when expenditure for the asset is being incurred, borrowing costs are being incurred and activities of acquisition, construction or production that are necessary to prepare the asset for its intended use or sale are in progress, and ceases when the assets become ready for their intended use or sale. Capitalisation of borrowing costs is suspended when the acquisition, construction or production activities are interrupted abnormally and the interruption lasts over three months.
17. Intangible assets
Intangible assets are stated in the balance sheet at cost less accumulated amortisation (where the estimated useful life is finite) and impairment losses (see Note II.20). For an intangible asset with finite useful life, its cost less residual value and impairment loss is amortised on the straight-line method or other more appropriate methods that can reflect the pattern in which the asset’s economic benefits are expected to be realised over its estimated useful life, unless the intangible asset is classified as held for sale (see Note II.28).
The respective amortisation periods for such intangible assets are as follows:
Amortisation periods (years)
Land use rights 20 – 50Maritime space use rights 40 – 50Technological know-how and trademarks 5 – 10Timber concession rights 20Customer relationships 3 – 8Customer contracts 3 – 4
For an intangible asset with a finite useful life, review of its useful life and amortisation method is performed at each year-end, with adjustment made as appropriate.
An intangible asset is regarded as having an indefinite useful life and is not amortised when there is no foreseeable limit to the period over which the asset is expected to generate economic benefits for the Group.

Annual Report 2013 181
Chapter 13 Financial Statements Prepared in Accordance with China Accounting Standards
For the year ended 31 December 2013(All amounts in RMB’000 unless otherwise stated)
(English Translation for Reference Only)
II. SUMMARY oF SIGNIFICANt ACCoUNtING PolICIES AND ACCoUNtING EStIMAtES (CoNtINUED)
17. Intangible assets (Continued)
Expenditures on an internal research and development project are classified into expenditures on the research phase and expenditures on the development phase. Research is original and planned investigation undertaken with the prospect of gaining new scientific or technical knowledge and understanding. Development is the application of research findings or other knowledge to a plan or design for the production of new or substantially improved materials, devices, products or processes before the start of commercial production or use.
The expenditure on an internal research and development project is classified into expenditure on the research phase and expenditure on the development phase based on its nature and whether there is material uncertainty that the research and development activities can form an intangible asset at end of the project.
Expenditure on the research phase is recognised in profit or loss in the period in which it is incurred. Expenditure on the development phase is capitalised only if all of the following conditions are satisfied:
– it is technically feasible to complete the intangible asset so that it will be available for use or sale;
– management intends to complete the intangible asset, and to use or sell it;
– it can be demonstrated how the intangible asset will generate economic benefits;
– there are adequate technical, financial and other resources to complete the development and the ability to use or sell the intangible asset; and the expenditure attributable to the intangible asset during its development phase can be reliably measured.
Other development expenditures that do not meet the conditions above are recognised in profit or loss in the period in which they are incurred. Development costs previously recognised as expenses are not recognised as an asset in a subsequent period. Capitalised expenditure on the development phase is presented as development costs in the balance sheet and transferred to intangible assets at the date that the asset is ready for its intended use.
18. Goodwill
Goodwill represents the excess of cost of acquisition over the acquirer’s interest in the fair value of the identifiable net assets of the acquiree under the business combination involving entities not under common control.
Goodwill is not amortised and is stated at cost less accumulated impairment losses (see Note II.20). On disposal of an asset group or a set of asset groups, any attributable amount of purchased goodwill is written off and included in the calculation of the profit or loss on disposal.

182 China International Marine Containers (Group) Co., Ltd.
Chapter 13Financial Statements Prepared in Accordance with China Accounting StandardsFor the year ended 31 December 2013(All amounts in RMB’000 unless otherwise stated)(English Translation for Reference Only)
II. SUMMARY oF SIGNIFICANt ACCoUNtING PolICIES AND ACCoUNtING EStIMAtES (CoNtINUED)
19. long-term prepaid expenses
Long-term prepaid expenses are amortised on a straight-line method within the beneficial period:
Item Amortisation period
Water and electricity capacity enlargement expenses 5 to 10 yearsRental 2 to 10 yearsOthers 5 to 10 years
20. Impairment of long-term assets
Fixed assets, construction in progress, intangible assets with finite useful lives, investment properties measured using the cost model and long-term equity investments in subsidiaries, joint ventures and associates are tested for impairment if there is any indication that the assets may be impaired at the balance sheet date. If the result of the impairment test indicates that the recoverable amount of an asset is less than its carrying amount, a provision for impairment and an impairment loss are recognised for the amount by which the asset’s carrying amount exceeds its recoverable amount. The recoverable amount is the higher of an asset’s fair value less costs to sell and the present value of the future cash flows expected to be derived from the asset. Provision for asset impairment is determined and recognised on the individual asset basis. If it is not possible to estimate the recoverable amount of an individual asset, the recoverable amount of a group of assets to which the asset belongs is determined. A group of assets is the smallest group of assets that is able to generate independent cash inflows.
Goodwill that is separately presented in the financial statements is tested at least annually for impairment, irrespective of whether there is any indication that it may be impaired. In conducting the test, the carrying value of goodwill is allocated to the related asset groups or groups of asset groups which are expected to benefit from the synergies of the business combination. If the result of the test indicates that the recoverable amount of an asset group or group of asset groups, including the allocated goodwill, is lower than its carrying amount, the corresponding impairment loss is recognised. The impairment loss is first deducted from the carrying amount of goodwill that is allocated to the asset group or group of asset groups, and then deducted from the carrying amounts of other assets within the asset groups or groups of asset groups in proportion to the carrying amounts of assets other than goodwill.
Once an impairment loss is recognised, it is not reversed in a subsequent period.

Annual Report 2013 183
Chapter 13 Financial Statements Prepared in Accordance with China Accounting Standards
For the year ended 31 December 2013(All amounts in RMB’000 unless otherwise stated)
(English Translation for Reference Only)
II. SUMMARY oF SIGNIFICANt ACCoUNtING PolICIES AND ACCoUNtING EStIMAtES (CoNtINUED)
21. Provisions and contingent liabilities
Provisions for product warranties, onerous contracts etc. are recognised when the Group has a present obligation, it is probable that an outflow of economic benefits will be required to settle the obligation, and the amount of the obligation can be measured reliably.
A provision is initially measured at the best estimate of the expenditure required to settle the related present obligation. Factors surrounding a contingency, such as the risks, uncertainties and the time value of money, are taken into account as a whole in reaching the best estimate of a provision. Where the effect of the time value of money is material, the best estimate is determined by discounting the related future cash outflows. The increase in the discounted amount of the provision arising from passage of time is recognised as interest expense.
The carrying amount of provisions is reviewed at each balance sheet date and adjusted to reflect the current best estimate.
In terms of a possible obligation resulting from a past transaction or event, whose existence will only be confirmed by the occurrence or non-occurrence of uncertain future events or a present obligation resulting from a past transaction or event, where it is not probable that the settlement of the above obligation will cause an outflow of economic benefits, or the amount of the outflow cannot be estimated reliably, the possible or present obligation is disclosed as a contingent liability.
22. Share-based payments
(1) Classification
Share-based payment transactions in the Group are classified as equity-settled share-based payments and cash-settled share-based payments.
(2) Method to determine the fair value of equity instruments
Fair value of stock option is estimated based on binomial lattice model. Contract term of the stock option is used as the input variable of this model. And the binomial lattice model includes estimation of early execution of the option. The following factors are taken into account when using the binomial lattice model: (1) exercise price of the option; (2) vesting period; (3) current price of basic stocks; (4) expected fluctuation of stocks; (5) expected dividends of stocks; (6) risk-free rate within the option term

184 China International Marine Containers (Group) Co., Ltd.
Chapter 13Financial Statements Prepared in Accordance with China Accounting StandardsFor the year ended 31 December 2013(All amounts in RMB’000 unless otherwise stated)(English Translation for Reference Only)
II. SUMMARY oF SIGNIFICANt ACCoUNtING PolICIES AND ACCoUNtING EStIMAtES (CoNtINUED)
22. Share-based payments (Continued)
(3) Basis of the best estimate of the number of equity instruments expected to vest
At each balance sheet date during the vesting period, the Group makes the best estimation according to the latest information of the number of employees who are granted to vest and revises the number of equity instruments expected to vest. On vesting date, the estimate shall be equal to the number of equity instruments that ultimately vested.
(4) Accounting treatment for share-based payment
– Equity-settled share-based payments
Where the Group uses shares or other equity instruments as consideration for services received from the employees, the payment is measured at the fair value of the equity instruments granted to the employees at the grant date. If the equity instruments granted to employees vest immediately, the fair value of the equity instruments granted is, on grant date, recognised as relevant cost or expenses with a corresponding increase in capital reserve. If the equity instruments granted to employees do not vest until the completion of services for a vesting period, or until the achievement of a specified performance condition, the Group, at each balance sheet date during the vesting period, makes the best estimation according to the latest information of the number of employees who are granted to vest and revises the number of equity instruments expected to vest. Based on the best estimation, the Group recognises the services received for the current period as related costs or expenses, with a corresponding increase in capital reserve, at an amount equal to the fair value of the equity instruments at the grant date.
– Cash-settled share-based payments
Where the Group receives services from employees by incurring a liability to deliver cash or other assets for amounts that are determined based on the price of shares or other equity instruments, the service received from employees is measured at the fair value of the liability incurred. If the rights under a cash-settled share-based payment do not vest until the completion of services for a vesting period, or until the achievement of a specified performance condition, the Group, at each balance sheet date during the vesting period, recognises the services received for the current period as related costs or expenses, with a corresponding increase in liability, at an amount equal to the fair value of the liability based on the best estimate of the outcome of vesting.

Annual Report 2013 185
Chapter 13 Financial Statements Prepared in Accordance with China Accounting Standards
For the year ended 31 December 2013(All amounts in RMB’000 unless otherwise stated)
(English Translation for Reference Only)
II. SUMMARY oF SIGNIFICANt ACCoUNtING PolICIES AND ACCoUNtING EStIMAtES (CoNtINUED)
23. Revenue recognition
Revenue is the gross inflow of economic benefit in the periods arising in the course of the Group’s ordinary activities when the inflows result in increase in shareholders’ equity, other than increase relating to contributions from shareholders. Revenue is recognised in profit or loss when it is probable that the economic benefits will flow to the Group, the revenue and costs can be measured reliably and the following respective conditions are met.
(1) Sale of goods
Revenue from sale of goods is recognised when all of the general conditions stated above and following conditions are satisfied:
– The significant risks and rewards of ownership of goods have been transferred to the buyer;
– The Group retains neither continuing managerial involvement to the degree usually associated with ownership nor effective control over the goods sold.
Revenue from the sale of goods is measured at the fair value of the considerations received or receivable under the sales contract or agreement.
(a) Containers and airport facilities sales revenue
The group recognises revenue after receive acceptance certificates from customers.
(b) Road transportation vehicles sales revenue
Sales of road transportation vehicles are divided into sales to domestic customers and sales to overseas customers. As to sales to domestic customers, the Group recognises revenue after customers pick up vehicles. As to sales to overseas customers, the Group recognises revenue after vehicles are loaded to specified ship in specific port assigned by the customer pursuant to contracts.
(c) Real estate sales revenue
After the property is completed and pass the acceptance inspection so as to achieve the delivery conditions according to sales contract, the Group recognises revenue if it receives proof of payment based on sales contract (usually when it receives the initial payment and has arranged the remaining payment schedule).

186 China International Marine Containers (Group) Co., Ltd.
Chapter 13Financial Statements Prepared in Accordance with China Accounting StandardsFor the year ended 31 December 2013(All amounts in RMB’000 unless otherwise stated)(English Translation for Reference Only)
II. SUMMARY oF SIGNIFICANt ACCoUNtING PolICIES AND ACCoUNtING EStIMAtES (CoNtINUED)
23. Revenue recognition (Continued)
(2) Revenue from construction contracts
Where the outcome of a construction contract can be estimated reliably, contract revenue and contract expenses associated with the construction contract are recognised at the balance sheet date using the percentage of completion method.
The stage of completion of a contract is determined based on completion of a physical proportion of the contract work.
When the outcome of a construction contract cannot be estimated reliably:
– If the contract costs can be recovered, revenue is recognised to the extent of contract costs incurred that can be recovered, and the contract costs are recognised as contract expenses when incurred;
– If the contract costs cannot be recovered, the contract costs are recognised as contract expenses immediately when incurred, and no contract revenue is recognised.
Construction contract revenue includes initial revenue stipulated by contract and increased amount generated by contract alteration.
Increased amount cannot be recognised as contract revenue unless the following contract alteration terms are all satisfied:
– Client accepts and confirms the increased amount generated by contract alteration;
– Increased amount can be reliably measured.
Contract anticipated loss is recognised when estimated total construction contract cost exceeds contract revenue. Provision should be made for contract anticipated loss and charged into profit and losses for the current period.

Annual Report 2013 187
Chapter 13 Financial Statements Prepared in Accordance with China Accounting Standards
For the year ended 31 December 2013(All amounts in RMB’000 unless otherwise stated)
(English Translation for Reference Only)
II. SUMMARY oF SIGNIFICANt ACCoUNtING PolICIES AND ACCoUNtING EStIMAtES (CoNtINUED)
23. Revenue recognition (Continued)
(3) Rendering of services
Revenue from rendering of services is measured at the fair value of the considerations received or receivable under the contract or agreement.
At the balance sheet date, where outcome of a transaction involving the rendering of services can be estimated reliably, revenue from the rendering of services is recognised by reference to the stage of completion of the transaction based on the progress of work performed.
Where outcome of rendering of services cannot be estimated reliably, if the costs incurred are expected to be recoverable, revenues are recognised to the extent that the costs incurred that are expected to be recoverable, and an equivalent amount is charged to profit or loss as service cost; if the costs incurred are not expected to be recoverable, the costs incurred are recognised in profit or loss and no service revenue is recognised.
For freight agencies, revenues are recognised at the ship departure date (export) or the arrival date (import). As to land freight agencies, revenues are recognised when goods have arrived at the specified location. For shipping agency: revenues are recognised at the day that ship departures.
(4) transfer of asset use rights
Interest income is recognised on a time proportion basis with reference to the principal outstanding and the applicable effective interest rate.
Income from an operating lease is recognised on a straight-line basis over the period of the lease. Income from a financing lease is recognised on real interest method over the period of the lease.

188 China International Marine Containers (Group) Co., Ltd.
Chapter 13Financial Statements Prepared in Accordance with China Accounting StandardsFor the year ended 31 December 2013(All amounts in RMB’000 unless otherwise stated)(English Translation for Reference Only)
II. SUMMARY oF SIGNIFICANt ACCoUNtING PolICIES AND ACCoUNtING EStIMAtES (CoNtINUED)
24. Employee benefits
Employee benefits mainly include all kinds of remuneration such as wages, bonuses, allowances and subsidies, staff welfare, social security contributions, housing funds, labour union funds and employee education incurred in exchange for service rendered by employees or compensation to the termination of employment relationship.
(a) Short-term wages
Actual short-term wages are recognised as liabilities in the periods when the employees render services and are charged into profit or loss or capitalised in costs of related assets. The non-monetary welfare is measured at fair value.
(b) Basic pension insurance
The Group’s employees participated in the basic social pension insurance organised and implemented by local labour and social security bureau. The Group paid the basic pension issuance expenses monthly to designated insurance companies for its employees according to the basis amounts and rates determined by the local regulations. After retirement, local labour and social security bureau is responsible for paying the pension benefit to the retired employees. The amounts of pension insurance payable calculated according to the above regulations are recognised as liabilities during the periods when the employees render services and are charged to profit or loss or capitalised in costs of related assets.
(c) the compensation for the termination of employment relationship
The Group provides compensation for the termination of employment relationship before the expiry of employment contracts or compensation to encourage employees’ voluntary layoffs, which is recognised as a liability and charged to profit or loss on the earlier one when (i) the Group is unable to unilaterally withdraw the plan on the termination of employment relationship or the layoff proposal and (ii) costs and expenses in relation to the payment of compensation to the termination of employment relationship are recognised.
Annual Report 2013 189
Chapter 13 Financial Statements Prepared in Accordance with China Accounting Standards
For the year ended 31 December 2013(All amounts in RMB’000 unless otherwise stated)
(English Translation for Reference Only)
II. SUMMARY oF SIGNIFICANt ACCoUNtING PolICIES AND ACCoUNtING EStIMAtES (CoNtINUED)
25. Government grants
Government grants are transfers of monetary assets or non-monetary assets from the government to the Group at nil consideration except for the capital contribution from the government as an investor in the Group, including refund of taxes and financial subsidies, etc.. Special funds such as investment grants allocated by the government, if clearly defined in official documents as part of “capital reserve” are dealt with as capital contributions, and not regarded as government grants.
A government grant is recognised when the conditions attached to it can be complied with and the government grant can be received.
If a government grant in the form of transfer of monetary assets, the grant is measured at the amount received or receivable. For a government grant in the form of transfer of non-monetary assets, it is measured at fair value; if the fair value is not reliably determinable; the grant is measured at nominal amount.
Government grants related to assets represent grants obtained from government which are to compensate long-term assets purchased or other ways. Government grants related to income represent those government grants other than related to assets.
A government grant related to an asset is recognised as deferred income, and evenly amortised to profit or loss over the useful life of the related asset. Government grants measured at nominal amounts are recognised immediately in profit or loss for the current period. For government grants related to income, where the grant is a compensation for related expenses or losses to be incurred by the Group in the subsequent periods, the grant is recognised as deferred income, and included in profit or loss over the periods in which the related costs are recognised; where the grant is a compensation for related expenses or losses already incurred by the Group, the grant is recognised immediately in profit or loss for the current period.
26. Deferred tax assets and deferred tax liabilities
Deferred tax assets and liabilities arise from deductible and taxable temporary differences respectively, being the differences between the carrying amounts of assets and liabilities for financial reporting purposes and their tax bases, which include the deductible losses and tax credits carry forward to subsequent periods. Deferred tax assets are recognised to the extent that it is probable that future taxable profits will be available against which deductible temporary differences can be utilised.
Deferred tax is not recognised for the temporary differences arising from the initial recognition of assets or liabilities in a transaction that is not a business combination and that affects neither accounting profit nor taxable profit (or tax loss). No deferred tax liability is recognised for a temporary difference arising from the initial recognition of goodwill.
At the balance sheet date, the amount of deferred tax recognised is measured based on the expected manner of recovery or settlement of the carrying amount of the assets and liabilities, using tax rates that are expected to be applied in the period when the asset is recovered or the liability is settled in accordance with tax laws.

190 China International Marine Containers (Group) Co., Ltd.
Chapter 13Financial Statements Prepared in Accordance with China Accounting StandardsFor the year ended 31 December 2013(All amounts in RMB’000 unless otherwise stated)(English Translation for Reference Only)
II. SUMMARY oF SIGNIFICANt ACCoUNtING PolICIES AND ACCoUNtING EStIMAtES (CoNtINUED)
26. Deferred tax assets and deferred tax liabilities (Continued)
The carrying amount of a deferred tax asset is reviewed at each balance sheet date. The carrying amount of a deferred tax asset is reduced to the extent that it is no longer probable that sufficient taxable profits will be available to allow the benefit of the deferred tax asset to be utilised. Such reduction is reversed to the extent that it becomes probable that sufficient taxable profits will be available.
Deferred tax liabilities are recognised for temporary differences arising from investments in subsidiaries, associates and joint ventures, except where the Group is able to control the timing of reversal of the temporary difference, and it is probable that the temporary difference will not reverse in the foreseeable future. When it is probable that the temporary differences arising from investments in subsidiaries, associates and joint ventures will be reversed in the foreseeable future and that the taxable profit will be available in the future against which the temporary differences can be utilised, the corresponding deferred tax assets are recognised.
At the balance sheet date, deferred tax assets and liabilities are offset if all the following conditions are met:
– the taxable entity has a legally enforceable right to set off current tax assets against current tax liabilities; and
– they relate to income taxes levied by the same tax authority on either the same taxable entity; or different taxable entities which either intend to settle the current tax liabilities and assets on a net basis, or to realize the assets and settle the liabilities simultaneously, in each future period in which significant amounts of deferred tax liabilities or assets are expected to be settled or recovered.
27. operating and finance leases
A lease is classified as either a finance lease or an operating lease. A finance lease is a lease that transfers substantially all the risks and rewards incidental to ownership of a leased asset to the lessee, irrespective of whether the legal title to the asset is eventually transferred. An operating lease is a lease other than a finance lease.
(1) operating lease charges
Rental payments under operating leases are recognised as costs or expenses on a straight-line basis over the lease term.

Annual Report 2013 191
Chapter 13 Financial Statements Prepared in Accordance with China Accounting Standards
For the year ended 31 December 2013(All amounts in RMB’000 unless otherwise stated)
(English Translation for Reference Only)
II. SUMMARY oF SIGNIFICANt ACCoUNtING PolICIES AND ACCoUNtING EStIMAtES (CoNtINUED)
27. operating and finance leases (Continued)
(2) Assets leased out under operating leases
Fixed assets leased out under operating leases, except for investment properties (see Note II.13) are depreciated in accordance with the Group’s depreciation policies described in Note II.14(2). Impairment losses are provided for in accordance with the accounting policy described in Note II.20. Other leased out assets under operating leases are amortised using the straight-line method. Income derived from operating leases is recognised in the income statement using the straight-line method over the lease term. If initial direct costs incurred in respect of the assets leased out are material, the costs are initially capitalised and subsequently amortised in profit or loss over the lease term on the same basis as the lease income. Otherwise, the costs are charged to profit or loss immediately.
(3) Assets acquired under finance leases
When the Group acquires an asset under a finance lease, the asset is measured at an amount equal to the lower of its fair value and the present value of the minimum lease payments, each determined at the inception of the lease. At the commencement of the lease term, the minimum lease payments are recorded as long-term payables. The difference between the value of the leased assets and the minimum lease payments is recognised as unrecognised finance charges. Initial direct costs that are attributable to a finance lease incurred by the Group are added to the amounts recognised for the leased asset. Depreciation and impairment losses are accounted for in accordance with the accounting policies described in Notes II.14(2) and II.20, respectively.
If there is a reasonable certainty that the Group will obtain ownership of a leased asset at the end of the lease term, the leased asset is depreciated over its estimated useful life. Otherwise, the leased asset is depreciated over the shorter of the lease term and its estimated useful life.
Unrecognised finance charge under finance lease is amortised using an effective interest method over the lease term. The amortisation is accounted for in accordance with principles of borrowing costs (see Note II.16).
At the balance sheet date, long-term payables arising from finance leases, net of the unrecognised finance charges, are presented as long-term payables or non-current liabilities due within one year, respectively, in the balance sheet.

192 China International Marine Containers (Group) Co., Ltd.
Chapter 13Financial Statements Prepared in Accordance with China Accounting StandardsFor the year ended 31 December 2013(All amounts in RMB’000 unless otherwise stated)(English Translation for Reference Only)
II. SUMMARY oF SIGNIFICANt ACCoUNtING PolICIES AND ACCoUNtING EStIMAtES (CoNtINUED)
27. operating and finance leases (Continued)
(4) Assets leased out under finance leases
At the commencement of the lease term, the Group recognises the aggregate of the minimum lease receipts determined at the inception of a lease and the initial direct costs as finance lease receivable. The difference between the aggregate of the minimum lease receipts, the initial direct costs, and the aggregate of their present value is recognised as unearned finance income.
Unearned finance income is allocated to each accounting period during the lease term using the effective interest method. At the balance sheet date, finance lease receivables, net of unearned finance income, are presented as long-term receivables or non-current assets due within one year, respectively in the balance sheet.
28. Assets held for sale
A non-current asset or disposal group is classified as held for sale when meet the following criteria:
– The non-current asset or disposal group could be disposed immediately according to usual terms at present condition;
– The disposal plan has been approved properly;
– An non-cancellable transfer agreement has been signed with the transferee;
– This transfer is expected to be completed within one year;
Non-current assets held for sale are stated at the lower of carrying amount and net realisable value. Any excess of the carrying amount over the net realisable value is recognised as impairment loss.
Assets and liabilities of a non-current asset or disposal group which is classified as held for sale are classified as current assets and current liabilities.
A discontinued operation is a component which has been disposed or classified as held for sale of the group’s business and the operations and financial reporting of the discontinued operation can be clearly distinguished from the rest of the group and can meet one of the following criteria:
– This component of the business represents a separate major line of business or geographic area of operations;
– This component of the business is part of a single co-ordinated plan to dispose of a separate major line of business or geographical area of operations;
– This component of the business is a subsidiary acquired exclusively with a view to resale.

Annual Report 2013 193
Chapter 13 Financial Statements Prepared in Accordance with China Accounting Standards
For the year ended 31 December 2013(All amounts in RMB’000 unless otherwise stated)
(English Translation for Reference Only)
II. SUMMARY oF SIGNIFICANt ACCoUNtING PolICIES AND ACCoUNtING EStIMAtES (CoNtINUED)
29. Hedge accounting
Hedge accounting is a method which recognises the offsetting effects on profit or loss of changes in the fair values of the hedging instrument and the hedged item in the same accounting period(s).
Hedged items are the items that expose the Group to risks of changes in fair value or future cash flows and that are designated as being hedged. The Group’s hedged item include a forecast transaction that is settled with a fixed amount of foreign currency and expose the Group to foreign currency risk.
A hedging instrument is a designated derivative whose changes in fair value or cash flows are expected to offset changes in the fair value or cash flows of the hedged item. For a hedge of foreign currency risk, a non-derivative financial asset or non-derivative financial liability may also be used as a hedging instrument.
The hedge is assessed by the Group for effectiveness on an ongoing basis and judged whether it has been highly effective throughout the accounting periods for which the hedging relationship was designated. A hedge is regarded as highly effective if both of the following conditions are satisfied:
– at the inception and in subsequent periods, the hedge is expected to be highly effective in achieving offsetting changes in fair value or cash flows attributable to the hedged risk during the period for which the hedge is designated;
– the actual results of offsetting are within a range of 80% to 125%.

194 China International Marine Containers (Group) Co., Ltd.
Chapter 13Financial Statements Prepared in Accordance with China Accounting StandardsFor the year ended 31 December 2013(All amounts in RMB’000 unless otherwise stated)(English Translation for Reference Only)
II. SUMMARY oF SIGNIFICANt ACCoUNtING PolICIES AND ACCoUNtING EStIMAtES (CoNtINUED)
29. Hedge accounting (Continued)
Cash flow hedges
A cash flow hedge is a hedge of the exposure to variability in cash flows. The portion of the gain or loss on the hedging instrument that is determined to be an effective hedge is recognised directly in shareholders’ equity as a separate component. That effective portion is adjusted to the lesser of the following in absolute amounts:
– the cumulative gain or loss on the hedging instrument from inception of the hedge;
– The cumulative change in present value of the expected future cash flows on the hedged item from inception of the hedge.
The portion of the gain or loss on the hedging instrument that is determined to be an ineffective hedge is recognised in profit or loss.
If a hedge of a forecast transaction subsequently results in the recognition of a non-financial asset or non-financial liability, the associated gain or loss is removed from shareholders’ equity and recognised in profit or loss in the same period during which the financial asset or financial liability affects profit or loss. However, if the Group expects that all or a portion of a net loss recognised directly in shareholders’ equity will not be recovered in future accounting periods, it reclassifies into profit or loss the amount that is not expected to be recovered.
If a hedge of a forecast transaction subsequently results in the recognition of a financial asset or a financial liability, the associated gain or loss is removed from equity and recognised in profit or loss in the same period during which the financial asset or financial liability affects profit or loss. However, if the Group expects that all or a portion of a net loss recognised directly in shareholders’ equity will not be recovered in future accounting periods, it reclassifies into profit or loss the amount that is not expected to be recovered.
For cash flow hedges, other than those covered by the preceding two policy statements, the associated gain or loss is removed from shareholders’ equity and recognised in profit or loss in the same period or periods during which the hedged forecast transaction affects profit or loss.
When a hedging instrument expires or is sold, terminated or exercised, or the hedge no longer meets the criteria for hedge accounting, the Group will discontinue the hedge accounting treatments prospectively. In this case, the gain or loss on the hedging instrument that remains recognised directly in shareholders’ equity from the period when the hedge was effective shall not be reclassified into profit or loss and is recognised in accordance with the above policy when the forecast transaction occurs. If the forecast transaction is no longer expected to occur, the gain or loss on the hedging instrument that remains recognised directly in shareholders’ equity from the period when the hedge was effective shall be reclassified into profit or loss immediately.

Annual Report 2013 195
Chapter 13 Financial Statements Prepared in Accordance with China Accounting Standards
For the year ended 31 December 2013(All amounts in RMB’000 unless otherwise stated)
(English Translation for Reference Only)
II. SUMMARY oF SIGNIFICANt ACCoUNtING PolICIES AND ACCoUNtING EStIMAtES (CoNtINUED)
30. Dividend distribution
Cash dividend is recognised as a liability for the period in which the dividend is approved by the shareholders’ meeting.
Dividends or distributions of profits proposed in the profit appropriation plan which will be authorised and declared after the balance sheet date, are not recognised as a liability at the balance sheet date but disclosed in the notes separately.
31. Related parties
If a party has the power to control, jointly control or exercise significant influence over another party, or vice versa, or where two or more parties are subject to common control or joint control from another party, they are considered to be related parties. Related parties may be individuals or enterprises. Enterprises with which the Company is under common control only from the State and that have no other related party relationships are not regarded as related parties of the Group. Related parties of the Group and the Company include, but are not limited to:
(a) the Company’s parent;
(b) the Company’s subsidiaries;
(c) enterprises that are controlled by the Company’s parent;
(d) investors that have joint control or exercise significant influence over the Group;
(e) enterprises or individuals if a party has control, joint control over both the enterprises or individuals and the Group;
(f) joint ventures of the Group, including subsidiaries of joint ventures;
(g) associates of the Group, including subsidiaries of associates;
(h) principal individual investors and close family members of such individuals;
(i) key management personnel of the Group and close family members of such individuals;
(j) key management personnel of the Company’s parent and close family members of such individuals;
(k) close family members of key management personnel of the Company’s parent; and
(l) other enterprises that are controlled or jointly controlled by principal individual investors, key management personnel of the Group, and close family members of such individuals.

196 China International Marine Containers (Group) Co., Ltd.
Chapter 13Financial Statements Prepared in Accordance with China Accounting StandardsFor the year ended 31 December 2013(All amounts in RMB’000 unless otherwise stated)(English Translation for Reference Only)
II. SUMMARY oF SIGNIFICANt ACCoUNtING PolICIES AND ACCoUNtING EStIMAtES (CoNtINUED)
31. Related parties (Continued)
Besides the related parties stated above determined in accordance with the requirements of CAS, the following enterprises and individuals are considered as (but not restricted to) related parties based on the disclosure requirements of Administrative Procedures on the Information Disclosures of Listed Companies issued by the CSRC:
(m) enterprises or persons that act in concert that hold 5% or more of the Company’s shares;
(n) individuals and close family members of such individuals who directly or indirectly hold 5% or more of the Company’s shares, supervisors for listed companies and their close family members;
(o) enterprises that satisfy any of the aforesaid conditions in (a), (c) and (m) during the past 12 months or will satisfy them within the next 12 months pursuant to a relevant agreement;
(p) individuals who satisfy any of the aforesaid conditions in (i), (j) and (n) during the past 12 months or will satisfy them within the next 12 months pursuant to a relevant agreement; and
(q) enterprises, other than the Company and subsidiaries controlled by the Company, which are controlled directly or indirectly by an individual defined in (i), (j), (n) or (p), or in which such an individual assumes the position of a director or senior executive.
32. Segment reporting
Reportable segments are identified based on operating segments which are determined based on the structure of the Group’s internal organisation, management requirements and internal reporting system. An operating segment is a component of the Group that meets the following conditions:
– It engages in business activities from which it may earn revenues and incur expenses;
– Its financial performance are regularly reviewed by the Group’s management to make decisions about resource to be allocated to the segment and assess its performance;
– The Group is able to obtain its financial information regarding financial position, financial performance and cash flows, etc.

Annual Report 2013 197
Chapter 13 Financial Statements Prepared in Accordance with China Accounting Standards
For the year ended 31 December 2013(All amounts in RMB’000 unless otherwise stated)
(English Translation for Reference Only)
II. SUMMARY oF SIGNIFICANt ACCoUNtING PolICIES AND ACCoUNtING EStIMAtES (CoNtINUED)
32. Segment reporting (Continued)
Two or more operating segments may be aggregated into a single operating segment if the segments have same or similar economic characteristics, and are similar in respect of the following aspects:
– the nature of each product and service;
– the nature of production processes;
– the type or class of customers for the products and services;
– the methods used to distribute the products or provide the services;
– the legal and regulatory impact on manufacturing of products and rendering of services.
Inter-segment revenues are measured on the basis of actual transaction price for such transactions for segment reporting, and segment accounting policies are consistent with those for the consolidated financial statements.

198 China International Marine Containers (Group) Co., Ltd.
Chapter 13Financial Statements Prepared in Accordance with China Accounting StandardsFor the year ended 31 December 2013(All amounts in RMB’000 unless otherwise stated)(English Translation for Reference Only)
II. SUMMARY oF SIGNIFICANt ACCoUNtING PolICIES AND ACCoUNtING EStIMAtES (CoNtINUED)
33. Changes in significant accounting policies
Details and reasons for changes of accounting policies Procedures for approvalFinancial statement items affected Amount affected
(a) Employee benefits
As stated in Note 2(1), the Group early adopted ‘Accounting Standards for Enterprises No. 9 – Employee Benefits’ (Revised in 2014) issued by Ministry of Finance in 2014. This change in accounting policy does not have any impact on the Group’s measurement and disclosure of employee benefits in the financial statements for 2013.
The changes of such accounting policies have been approved by the Board of Directors of the Company on 25 March 2014.
None None
(b) Presentation of financial statements
As stated in Note 2(1), the Group early adopted ‘Accounting Standards for Enterprises No. 30 – Presentation of Financial Statements’ (Revised in 2014)’ issued by Ministry of Finance in 2014 and the comparative financial statement figures have been adjusted accordingly.
The changes of such accounting policies have been approved by the Board of Directors of the Company on 25 March 2014.
Other comprehensive income
Other comprehensive income for the year ended 31 December 2013 and 2012 amounting to RMB(585,401,000)and RMB58,828,000, respectively, were included in ‘Item that may be reclassified subsequently to profit and loss’.
(c) Fair value measurements
As stated in Note 2(1), the Group early adopted ‘Accounting Standards for Enterprises No. 39 – Fair value measurement’ issued by Ministry of Finance in 2014. Certain disclosures in relation to fair value have been included in the financial statements for the year ended 31 December 2013 according to this standard. No adjustment to the disclosure in the comparative financial statements is required according to this standard.
The changes of such accounting policies have been approved by the Board of Directors of the Company on 25 March 2014.
Not applicable Not applicable
(d) Consolidated financial statements and joint arrangement
As stated in Note 2(1), the Group early adopted ‘Accounting Standards for Enterprises No. 33 – Consolidated Financial Statements’ (Revised in 2014) and ‘Accounting Standards for Enterprises No. 40 – Joint Arrangement’ issued by Ministry of Finance in 2014. These changes in accounting policies do not have any impact both on the Group’s financial statements for 2013 and the comparative financial statements.
The changes of such accounting policies have been approved by the Board of Directors of the Company on 25 March 2014.
None None

Annual Report 2013 199
Chapter 13 Financial Statements Prepared in Accordance with China Accounting Standards
For the year ended 31 December 2013(All amounts in RMB’000 unless otherwise stated)
(English Translation for Reference Only)
II. SUMMARY oF SIGNIFICANt ACCoUNtING PolICIES AND ACCoUNtING EStIMAtES (CoNtINUED)
34. Critical accounting estimates and judgments
The preparation of financial statements requires management to make estimates and assumptions that affect the application of accounting policies and the reported amounts of assets, liabilities, income and expenses. Actual results may differ from these estimates. Estimates and underlying assumptions are reviewed on an ongoing basis. Revisions to accounting estimates are recognised in the period in which the estimate is revised and in any future periods affected.
Notes V.17, VII.3 and XI.3 contain information about the assumptions and their risk factors relating to impairment of goodwill, share-based payments and fair value of financial instruments. Other key sources of estimation uncertainty are as follows:
(1) Impairment of receivables
As described in Note II.10, receivables that are measured at amortised cost are reviewed at each balance sheet date to determine whether there is objective evidence of impairment. If any such evidence exists, impairment loss is recognised. Objective evidence of impairment includes observable data that comes to the attention of the Group about loss events such as a significant decline in the estimated future cash flow of an individual debtor or the portfolio of debtors, and significant changes in the financial condition that have an adverse effect on the debtor. If there has been a change in the factors used to determine the provision for impairment which indicates that the value of the receivables has recovered, the impairment loss recognised in prior years is reversed.
(2) Provision for diminution in value of inventories
As described in Note II.11, the net realisable value of inventories is under management’s regular review, and as a result, provision for diminution in value of inventories is recognised for the excess of inventories’ carrying amounts over their net realisable value. When making estimates of net realisable value, the Group takes into consideration the use of inventories held on hand and other information available to form the underlying assumptions, including the inventories’ market prices and the Group’s historical operating costs. The actual selling price, the costs of completion and the costs necessary to make the sale and relevant taxes may vary based on the changes in market conditions and product saleability, manufacturing technology and the actual use of the inventories, resulting in the changes in provision for diminution in value of inventories. The net profit or loss may then be affected in the period when the provision for diminution in value of inventories is adjusted.
200 China International Marine Containers (Group) Co., Ltd.
Chapter 13Financial Statements Prepared in Accordance with China Accounting StandardsFor the year ended 31 December 2013(All amounts in RMB’000 unless otherwise stated)(English Translation for Reference Only)
II. SUMMARY oF SIGNIFICANt ACCoUNtING PolICIES AND ACCoUNtING EStIMAtES (CoNtINUED)
34. Critical accounting estimates and judgments (Continued)
(3) Impairment of long-term assets
As described in Note II.20, assets such as fixed assets, intangible assets and investment properties are reviewed at each balance sheet date to determine whether the carrying amount exceeds the recoverable amount of the assets. If any such indication exists, an impairment loss is recognised.
The recoverable amount of an asset (asset group) is the greater of its fair value less costs to sell and its present value of expected future cash flows. Since a market price of the asset (the asset group) cannot be obtained reliably, the fair value of the asset cannot be estimated reliably. In assessing value in use, significant judgements are exercised over the asset’s production, selling price, related operating expenses and discounting rate to calculate the present value. All relevant materials which can be obtained are used for estimation of the recoverable amount, including the estimation of the production, selling price and related operating expenses based on reasonable and supportable assumption.
(4) Depreciation and amortisation of assets such as fixed assets, intangible assets and investment properties
As described in Note II.13, 14 and 17, investment properties, fixed assets and intangible assets are depreciated and amortised over their useful lives after taking into account residual value. The useful lives of the assets are regularly reviewed to determine the depreciation and amortisation costs charged in each reporting period. The useful lives of the assets are determined based on historical experiences of similar assets and the estimated technical changes. If there have been significant changes in the factors used to determine the depreciation or amortisation, the rate of depreciation or amortisation is revised prospectively.
(5) warranty provisions
As described in Note V.33, the Group makes provisions under the warranties it gives on the sale of its products based mainly on the Group’s recent claim experience. Because it is possible that the recent claim experience may not be indicative of future claims that the Group will receive in respect of past sales, a considerable level of management’s judgement is required and exercised to estimate the provision. Any increase or decrease in the provision will affect profit or loss in future years.

Annual Report 2013 201
Chapter 13 Financial Statements Prepared in Accordance with China Accounting Standards
For the year ended 31 December 2013(All amounts in RMB’000 unless otherwise stated)
(English Translation for Reference Only)
II. SUMMARY oF SIGNIFICANt ACCoUNtING PolICIES AND ACCoUNtING EStIMAtES (CoNtINUED)
34. Critical accounting estimates and judgments (Continued)
(6) Construction contract
As described in Note II.23, contract revenue and contract profit are recognised based on the stage of completion of a contract which is determined with reference to the proportion of the physical construction work completed to the total estimated construction work. Where a contract is completed substantially and its contract revenue and contract expenses to completion can be reliably measured, the Group estimates contract revenue and contract expenses with reference to its recent construction experience and the nature of the construction contracts. For a contract that is not completed substantially, contract revenue that should be recognised based on its stage of completion, is not recognised and disclosed in the financial statements. Therefore, at the balance sheet date, actual total contract revenue and total contract cost may be higher or lower than the estimated total contract revenue and total contract cost and any change of estimated total contract revenue and total contract cost may have financial impact on future profit or loss.
(7) Income taxes
The Group is subject to income taxes in numerous jurisdictions. There are many transactions and events for which the ultimate tax determination is uncertain during the ordinary course of business. Significant judgment is required from the Group in determining the provision for income taxes in each of these jurisdictions. Where the final tax outcome of these matters is different from the amounts that were initially recorded, such differences will impact the income tax and deferred tax provisions in the period in which such determination is made.
Determining income tax provisions involves judgement on the future tax treatment of certain transactions. The Group carefully evaluates tax implications of transactions and tax provisions are set up accordingly. The tax treatment of such transactions is reconsidered periodically to take into account all changes in tax legislations. Deferred tax assets are recognised for tax losses not yet used and temporary deductible differences. As those deferred tax assets can only be recognised to the extent that it is probable that future taxable profit will be available against which the unused tax credits can be utilised, management’s judgment is required to assess the probability of future taxable profits. Management’s assessment is constantly reviewed and additional deferred tax assets are recognised if it becomes probable that future taxable profits will allow the deferred tax asset to be recovered.
III. tAxAtIoN
1. Main taxes categories and rates
types of tax taxable base tax rate
Value added tax (VAT)(a) The output VAT calculated based on taxable income from sales of goods and rendering of service, after subtracting the deductible input VAT of the period, is VAT payable
6%, 11% and 17%
Business tax(a) Taxable revenue 5%Urban maintenance and construction tax
Business tax payable and VAT payable 7%
Income tax Taxable income Note 1The Netherlands/Australia service tax rate
Calculated based on revenue arising from sales of goods and rendering of service, less deductible or refundable taxes for purchase of goods
10-19%

202 China International Marine Containers (Group) Co., Ltd.
Chapter 13Financial Statements Prepared in Accordance with China Accounting StandardsFor the year ended 31 December 2013(All amounts in RMB’000 unless otherwise stated)(English Translation for Reference Only)
III. tAxAtIoN (CoNtINUED)
1. Main taxes categories and rates (Continued)
(a) Pursuant to “Circular on the Launch of Pilot for the Change from Business Tax to Value-Added Tax in Shanghai in the transportation industry and modern service industry” issued by the Ministry of Finance and the State Administration of Taxation (Cai Shui[2011]No.111), incomes from the transportation industry and modern service of subsidiaries of the Group registered in Shanghai are applicable to VAT since 1 January 2012, with tax rate of 6%.
Pursuant to “Circular on the Launch of Pilot for the Change from Business Tax to Value-Added Tax in Beijing and other 7 regions in the transportation industry and some modern service industries” issued by the Ministry of Finance and the State Administration of Taxation (Cai Shui[2012]No.71), incomes from modern service industries (including logistics support service and tangible movable property leasing) of the subsidiaries of the Group registered in Beijing, Tianjin, Jiangsu, Anhui, Zhejiang (including Ningbo), Fujian (including Xiamen), Hubei, Guangdong (including Shenzhen) are applicable to VAT since August 2012, with tax rate of 17% or 6%.
Pursuant to “Circular on the Launch of Pilot for the Change from Business Tax to Value-Added Tax nation widely in the transportation industry and modern service industry” issued by the Ministry of Finance and the State Administration of Taxation (Cai Shui[2013]No.37), incomes from modern service industries (including logistics support service and tangible movable property leasing) of the subsidiaries of the Group which operate in financial leasing, logistics industry and container yard services are applicable to VAT since 1 August 2013, with tax rate of 17% or 6%.
Note 1: The income tax rates applicable to the Group for the year are as follows:
2013 2012
The Company 25% 25%Subsidiaries registered in China 15-25% 12.5-25%Subsidiaries registered in Hong Kong 16.5% 16.5%Subsidiaries registered in British Virgin Islands – –Subsidiary registered in Suriname 36% 36%Subsidiary registered in Cambodia 20% 20%Subsidiary registered in US 15-35% 15-35%Subsidiary registered in Germany 15.83-31.6% 15.83-31.6%Subsidiary registered in Britain 25% 25%Subsidiary registered in Australia 30% 30%Subsidiary registered in the Netherlands 25.5% 25.5%Subsidiary registered in Belgium 34% 34%Subsidiary registered in Denmark 25% 25%Subsidiary registered in Finland 24.5% 24.5%Subsidiary registered in Poland 19% 19%Subsidiary registered in Thailand 20% 23%Subsidiary registered in Singapore 17% 17%

Annual Report 2013 203
Chapter 13 Financial Statements Prepared in Accordance with China Accounting Standards
For the year ended 31 December 2013(All amounts in RMB’000 unless otherwise stated)
(English Translation for Reference Only)
III. tAxAtIoN (CoNtINUED)
2. Preferential tax treatments
The Group’s subsidiaries that are entitled to preferential tax treatments are as follows:
Name of enterprises
local statutory
tax ratePreferential
rate Reasons
1 Shenzhen CIMC – Tianda Airport Support Co., Ltd.
25% 15% Continue to be recognised as high-tech enterprises in 2013 entitled to 15% preferential rate
2 Shenzhen CIMC Intelligent Technology Co., Ltd.
25% 15% Recognised as high-tech enterprises, in 2011 entitled to 15% preferential rate
3 Shanghai CIMC Reefer Containers Co., Ltd.
25% 15% Continue to be recognised as high-tech enterprises, in 2012 entitled to 15% preferential rate
4 Nantong CIMC Special Transportation Equipment Manufacture Co., Ltd.
25% 15% Continue to be recognised as high-tech enterprises, in 2012 entitled to 15% preferential rate
5 Xinhui CIMC Special Transportation Equipment Co., Ltd.
25% 15% Continue to be recognised as high-tech enterprises in 2013 entitled to 15% preferential rate
6 Dalian CIMC Logistics Equipment Co., Ltd.
25% 15% Recognised as high-tech enterprises, in 2011 entitled to 15% preferential rate
7 Tianjin CIMC Logistics Equipments Co., Ltd.
25% 15% Recognised as high-tech enterprises, in 2012 entitled to 15% preferential rate
8 Shenzhen CIMC Special Vehicle Co., Ltd.
25% 15% Recognised as high-tech enterprises, in 2011 entitled to 15% preferential rate
9 Yangzhou CIMC Tong Hua Special Vehicles Co., Ltd
25% 15% Recognised as high-tech enterprises, in 2011 entitled to 15% preferential rate
10 Zhumadian CIMC Huajun Casting Co. Ltd.
25% 15% Recognised as high-tech enterprises, in 2012 entitled to 15% preferential rate

204 China International Marine Containers (Group) Co., Ltd.
Chapter 13Financial Statements Prepared in Accordance with China Accounting StandardsFor the year ended 31 December 2013(All amounts in RMB’000 unless otherwise stated)(English Translation for Reference Only)
III. tAxAtIoN (CoNtINUED)
2. Preferential tax treatments (Continued)
The Group’s subsidiaries that are entitled to preferential tax treatments are as follows (Continued):
Name of enterprises
local statutory
tax ratePreferential
rate Reasons
11 Zhangjiagang CIMC Sanctum Cryogenic Equipment Machinery Co., Ltd.
25% 15% Recognised as high-tech enterprises, in 2011 entitled to 15% preferential rate
12 Enric (Bengbu) Compressor Co., Ltd.
25% 15% Continue to be recognised as high-tech enterprises, in 2011 entitled to 15% preferential rate
13 Shijiazhuang Enric Gas Equipment Co., Ltd.
25% 15% Continue to be recognised as high-tech enterprises, in 2011 entitled to 15% preferential rate
14 Enric (Lang fang) Energy Equipment Integration Co.,Ltd.
25% 15% Recognised as high-tech enterprises, in 2012 entitled to 15% preferential rate
15 Jingmen Hongtu Special Aircraft Manufacturing Co., Ltd
25% 15% Continue to be recognised as high-tech enterprises, in 2012 entitled to 15% preferential rate
16 Nantong CIMC Tank Equipment Co., Ltd
25% 15% Continue to be recognised as high-tech enterprises, in 2012 entitled to 15% preferential rate
17 Yangzhou Tonglee Reefer Container Co., Ltd.
25% 15% Recognised as high-tech enterprises in 2013 entitled to 15% preferential rate
On 6 December 2007, State Council of People’s Republic of China promulgated detailed implementation rules of the New Tax Law. According to the implementation rules started from 1 January 2008, a withholding tax is applied on dividends distributed by foreign-invested enterprises to Hong Kong or other overseas investors with a tax rate of 5% or 10%, respectively. Therefore, at 31 December 2013, temporary difference caused by the Group’s subsidiaries’ undistributed profits amounted to RMB3,892,743,000 (2012: RMB4,810,979,000). Accordingly, deferred tax liabilities amounting to RMB355,651,000 (2012: RMB405,726,000) were recognised by the Group at year end.

Annual Report 2013 205
Chapter 13 Financial Statements Prepared in Accordance with China Accounting Standards
For the year ended 31 December 2013(All amounts in RMB’000 unless otherwise stated)
(English Translation for Reference Only)
IV. BUSINESS CoMBINAtIoNS AND tHE CoNSolIDAtED FINANCIAl StAtEMENtS
1. Company status of investment in subsidiaries
All subsidiaries of the Group were established or acquired through combination not under common control. There is no acquisition of subsidiaries through combination under common control.
In 2013, the number of companies included in the scope of consolidation added up to 432. Except for the subsidiaries listed as below, the number of other subsidiaries held by the Group was 247, with paid-in capital amounting to RMB118,860,720.86. Other subsidiaries mainly included those engaged in manufacturing or service provision, which have relatively small scale of operation and the paid-in capital was below RMB20 million or USD3 million. Other subsidiaries also included those investment holding companies with no operating activities registered in Hong Kong, British Virgin Islands or other overseas countries.
(1) Subsidiaries obtained through establishment or business combination
(i) Domestic subsidiaries:
Name Entity typeRegistration Place
Registered capital
Main Premises Business scope
Actual investment and actual net amount of
Investment of the company at the end of the year
Shareholding percentage
%
Voting rights
%
within consolidation
scope
Amount of minority
interest at the end of
the year RMB’000
Amount of gain/(loss)
for current period
attributable to minority
shareholders that allocated
to minority interests
RMB’000Currency
Amount of original
currency Currency
Amount of original
currency
1 Shenzhen Southern CIMC Containers Manufacture Co., Ltd. (SCIMC)
Corporation Shenzhen, Guangdong
USD 16,600,000.00 Shenzhen, Guangdong
Manufacture, repair and sale of container, container stockpiling business
USD 16,600,000.00 100.00% 100.00% Yes – –
2 Shenzhen Southern CIMC Logistics Equipment Manufacturing Co., Ltd. (SCIMCEL)
Corporation Shenzhen, Guangdong
USD 80,000,000.00 Shenzhen, Guangdong
Manufacture and repair of container design and manufacture of new-style special road and port mechanical equipment
USD 80,000,000.00 100.00% 100.00% Yes – –
3 Xinhui CIMC Container Co., Ltd. (XHCIMC)
Corporation Jiangmen, Guangdong
USD 24,000,000.00 Jiangmen, Guangdong
Manufacture, repair and sale of containers
USD 16,800,000.00 70.00% 70.00% Yes 47,209 2,594
4 Nantong CIMC Shunda Containers Co., Ltd. (NTCIMC)
Corporation Nantong, Jiangsu
USD 7,700,000.00 Nantong, Jiangsu
Manufacture, repair and sale of containers
USD 5,467,000.00 71.00% 71.00% Yes 31,130 2,241
5 Tianjin CIMC Containers Co., Ltd. (TJCIMC)
Corporation Tianjin USD 50,000,000.00 Tianjin Manufacture and sale of container as well as relevant technical advisory; container stockpiling business
USD 50,000,000.00 100.00% 100.00% Yes – –
6 Dalian CIMC Containers Co., Ltd. (DLCIMC)
Corporation Dalian, Liaoning
USD 17,400,000.00 Dalian, Liaoning
Manufacture and sale of container as well as relevant technical advisory; container stockpiling business
USD 17,400,000.00 100.00% 100.00% Yes – –
7 Ningbo CIMC Logistics Equipment Co., Ltd. (NBCIMC)
Corporation Ningbo, Zhejiang
USD 15,000,000.00 Ningbo, Zhejiang
Manufacture and sale of container as well as relevant technical advisory; container stockpiling business
USD 15,000,000.00 100.00% 100.00% Yes – –

206 China International Marine Containers (Group) Co., Ltd.
Chapter 13Financial Statements Prepared in Accordance with China Accounting StandardsFor the year ended 31 December 2013(All amounts in RMB’000 unless otherwise stated)(English Translation for Reference Only)
Name Entity typeRegistration Place
Registered capital
Main Premises Business scope
Actual investment and actual net amount of
Investment of the company at the end of the year
Shareholding percentage
%
Voting rights
%
within consolidation
scope
Amount of minority
interest at the end of
the year RMB’000
Amount of gain/(loss)
for current period
attributable to minority
shareholders that allocated
to minority interests
RMB’000Currency
Amount of original
currency Currency
Amount of original
currency
8 Taicang CIMC Containers Co., Ltd. (TCCIMC)
Corporation Taicang, Jiangsu
USD 40,000,000.00 Taicang, Jiangsu
Manufacture and repair of container
USD 40,000,000.00 100.00% 100.00% Yes – –
9 Yangzhou Runyang Logistics Equipments Co., Ltd. (YZRYL)
Corporation Yangzhou, Jiangsu
USD 20,000,000.00 Yangzhou, Jiangsu
Manufacture and repair of container
USD 20,000,000.00 100.00% 100.00% Yes – –
10 Shanghai CIMC Yangshan Logistics Equipments Co., Ltd. (SHYSLE)
Corporation Shanghai USD 20,000,000.00 Shanghai Manufacture and sale of container as well as relevant technical advisory
USD 20,000,000.00 100.00% 100.00% Yes – –
11 Shanghai CIMC Reefer Containers Co., Ltd. (SCRC)
Corporation Shanghai USD 31,000,000.00 Shanghai Manufacture and sale of refrigeration and heat preservation device of reefer container, refrigerator car and Heat; Preservation car
USD 28,520,000.00 92.00% 92.00% Yes 58,186 23,316
12 Nantong CIMC Special Transportation Equipment Manufacture Co., Ltd. (NTCIMCS)
Corporation Nantong, Jiangsu
USD 10,000,000.00 Nantong, Jiangsu
Manufacture, sale and repair of various trough, tank as well as various special storing and transporting equipments and parts
USD 7,100,000.00 71.00% 71.00% Yes 22,739 3,137
13 Xinhui CIMC Special Transportation Equipment Co., Ltd. (XHCIMCS)
Corporation Jiangmen, Guangdong
USD 65,498,958.45 Jiangmen, Guangdong
Manufacture and sale of various container, semi-finished container product and relevant components product and relevant components and maintenance service
USD 65,498,958.45 100.00% 100.00% Yes – –
14 Nantong CIMC Tank Equipment Co., Ltd (NTCIMCT)
Corporation Nantong, Jiangsu
USD 25,000,000.00 Nantong, Jiangsu
Manufacture and sale of various container, semi-finished container relevant components and parts
USD 17,535,000.00 70.14% 100.00% Yes Note 1 Note 1
15 Dalian CIMC Railway Equipment Co., Ltd (DLCIMCS)
Corporation Dalian, Liaoning
USD 20,000,000.00 Dalian, Liaoning
Design, manufacture and sale of various railway freight equipment products such as railway container flat car, open wagon and hopper wagon
USD 20,000,000.00 100.00% 100.00% Yes – –
IV. BUSINESS CoMBINAtIoNS AND tHE CoNSolIDAtED FINANCIAl StAtEMENtS (CoNtINUED)
1. Company status of investment in subsidiaries (Continued)
(1) Subsidiaries obtained through establishment or business combination (Continued)
(i) Domestic subsidiaries: (Continued)

Annual Report 2013 207
Chapter 13 Financial Statements Prepared in Accordance with China Accounting Standards
For the year ended 31 December 2013(All amounts in RMB’000 unless otherwise stated)
(English Translation for Reference Only)
Name Entity typeRegistration Place
Registered capital
Main Premises Business scope
Actual investment and actual net amount of
Investment of the company at the end of the year
Shareholding percentage
%
Voting rights
%
within consolidation
scope
Amount of minority
interest at the end of
the year RMB’000
Amount of gain/(loss)
for current period
attributable to minority
shareholders that allocated
to minority interests
RMB’000Currency
Amount of original
currency Currency
Amount of original
currency
16 Nantong CIMC Large-sized Tank Co., Ltd.
Corporation Nantong, Jiangsu
USD 47,700,000.00 Nantong, Jiangsu
Design, production and sale of tank relevant parts; undertaking tank-related general contracting projects
USD 47,700,000.00 100.00% 100.00% Yes – –
17 Shenzhen CIMC Special Vehicle Co., Ltd. (CIMCSV)
Corporation Shenzhen, Guangdong
RMB 200,000,000.00 Shenzhen, Guangdong
Development, production and sales of various special-use vehicles, as well as relevant components and parts
RMB 160,000,000.00 80.00% 100.00% Yes Note 4 Note 4
18 Qingdao CIMC Special Vehicle Co., Ltd. (QDSV)
Corporation Qingdao, Shandong
RMB 62,880,000.00 Qingdao, Shandong
Development, production and sales of various special-use vehicles, special vehicles, vehicles, refitting trailer series as well as relevant components and parts
RMB 55,875,168.00 88.86% 100.00% Yes Note 4 Note 4
19 Foshan CIMC logistics. equipment Co., Ltd
Corporation Foshan, Guangdong
RMB 3,000,000.00 Foshan, Guangdong
Design, production, sale and maintenance of logistics equipment and tooling equipment
RMB 3,000,000.00 100.00% 100.00% Yes – –
20 Shanghai CIMC Vehicle Logistics Equipments Co., Ltd. (SHL)
Corporation Shanghai RMB 90,204,082.00 Shanghai Development, construction, operation leasing, sales of warehousing and auxiliary facilities; property
RMB 72,163,265.60 80.00% 100.00% Yes Note 4 Note 4
21 Beijing CIMC Vehicle Logistics Equipments Co., Ltd. (BJVL)
Corporation Beijing RMB 20,000,000.00 Beijing Construction and operation of auxiliary warehousing equipments management and relevant service
RMB 16,000,000.00 80.00% 100.00% Yes Note 4 Note 4
22 CIMC Vehicle (Liaoning) Co., Ltd. (LNVS)
Corporation Yingkou, Liaoning
RMB 40,000,000.00 Yingkou, Liaoning
Development and production of various trailer, special-use vehicles as well as components and parts
RMB 32,000,000.00 80.00% 100.00% Yes Note 4 Note 4
23 Tianjin CIMC Special Vehicles Co., Ltd. (TJXV)
Corporation Tianjin RMB 30,000,000.00 Tianjin Production and sales of box car,mechanical products, metal structure member; relevant advisory service
RMB 24,000,000.00 80.00% 100.00% Yes Note 4 Note 4
IV. BUSINESS CoMBINAtIoNS AND tHE CoNSolIDAtED FINANCIAl StAtEMENtS (CoNtINUED)
1. Company status of investment in subsidiaries (Continued)
(1) Subsidiaries obtained through establishment or business combination (Continued)
(i) Domestic subsidiaries: (Continued)

208 China International Marine Containers (Group) Co., Ltd.
Chapter 13Financial Statements Prepared in Accordance with China Accounting StandardsFor the year ended 31 December 2013(All amounts in RMB’000 unless otherwise stated)(English Translation for Reference Only)
Name Entity typeRegistration Place
Registered capital
Main Premises Business scope
Actual investment and actual net amount of
Investment of the company at the end of the year
Shareholding percentage
%
Voting rights
%
within consolidation
scope
Amount of minority
interest at the end of
the year RMB’000
Amount of gain/(loss)
for current period
attributable to minority
shareholders that allocated
to minority interests
RMB’000Currency
Amount of original
currency Currency
Amount of original
currency
24 CIMC -SHAC (Xi’An) Special Vehicle Co., Ltd. (XASV)
Corporation Xi’an Shaanxi RMB 50,000,000.00 Xi’an Shaanxi Development and production of various trailer, special vehicle and the components and parts; providing relevant technical service
RMB 30,000,000.00 60.00% 75.00% Yes Note 4 Note 4
25 Gansu CIMC Huajun Vehicle Co., Ltd. (GSHJ)
Corporation Baiyin, Gansu RMB 25,000,000.00 Baiyin, Gansu Refitting of special vehicles, manufacture of trailer and fittings as well as automobile fittings; sales of relevant materials
RMB 20,000,000.00 80.00% 100.00% Yes Note 4 Note 4
26 Xinhui CIMC Composite Material Manufacture CO., LTD (XHCM)
Corporation Jiangmen, Guangdong
RMB 129,000,000.00 Jiangmen, Guangdong
Production, development, processing and sales of various composite plate products such as plastics, plastic alloy
RMB 103,200,000.00 80.00% 100.00% Yes Note 4 Note 4
27 Qingdao CIMC Eco-Equipment Co., Ltd. (QDHB)
Corporation Qingdao, Shandong
RMB 137,930,000.00 Qingdao, Shandong
Development, manufacture, sales and service for garbage treatment truck and the components and parts
RMB 90,482,080.00 65.60% 82.00% Yes Note 4 Note 4
28 Shanghai CIMC Special Vehicle Co., Ltd. (SHCIMCV)
Corporation Shanghai RMB 30,000,000.00 Shanghai Development and production of box trailer, box car as well as relevant mechanical products
RMB 24,600,000.00 82.00% 100.00% Yes Note 4 Note 4
29 CIMC Financing and Leasing Co., Ltd. (CIMCVL)
Corporation Shenzhen, Guangdong
RMB 70,000,000.00 Shenzhen, Guangdong
Finance lease business; disposal and maintenance for residual value of leased property; advisory and warranty for leasing transaction
RMB 70,000,000.00 100.00% 100.00% Yes – –
30 Qingdao Refrigeration Transport Equipment Co., Ltd. (QDRV)
Corporation Qingdao, Shandong
USD 86,846,680.00 Qingdao, Shandong
Manufacture and sales of Various, Manufacture and sales of various other transport equipments and spare parts
USD 86,846,680.00 100.00% 100.00% Yes – –
31 Nantong CIMC Tank Equipment Co., Ltd. (NTCY)
Corporation Nantong, Jiangsu
RMB 69,945,550.00 Nantong, Jiangsu
Manufacture and repair of large-sized tank, production of various pressurization tank car, special pressurization trough, tank and parts
RMB 49,059,808.77 70.14% 100.00% Yes Note 1 Note 1
IV. BUSINESS CoMBINAtIoNS AND tHE CoNSolIDAtED FINANCIAl StAtEMENtS (CoNtINUED)
1. Company status of investment in subsidiaries (Continued)
(1) Subsidiaries obtained through establishment or business combination (Continued)
(i) Domestic subsidiaries: (Continued)

Annual Report 2013 209
Chapter 13 Financial Statements Prepared in Accordance with China Accounting Standards
For the year ended 31 December 2013(All amounts in RMB’000 unless otherwise stated)
(English Translation for Reference Only)
Name Entity typeRegistration Place
Registered capital
Main Premises Business scope
Actual investment and actual net amount of
Investment of the company at the end of the year
Shareholding percentage
%
Voting rights
%
within consolidation
scope
Amount of minority
interest at the end of
the year RMB’000
Amount of gain/(loss)
for current period
attributable to minority
shareholders that allocated
to minority interests
RMB’000Currency
Amount of original
currency Currency
Amount of original
currency
32 Shenzhen CIMC – Tianda Airport Support Ltd. (TAS)
Corporation Shenzhen, Guangdong
USD 13,500,000.00 Shenzhen, Guangdong
Production and operation of various airport-purpose electromechanical equipment products
USD 9,450,000.00 70.00% 70.00% Yes Note 7 Note 7
33 Xinhui CIMC Wood Co., Ltd. (XHCIMCW)
Corporation Jiangmen, Guangdong
USD 15,500,000.00 Jiangmen, Guangdong
Production of container-purpose wood floor and relevant products of various specifications; providing relevant technical advisory service
USD 15,500,000.00 100.00% 100.00% Yes – –
34 Inner Mongolia Holonbuir CIMC Wood Co., Ltd. (NMGW)
Corporation Inner Mongolia USD 12,000,000.00 Inner Mongolia
Production and sales of various container wood floors and wood products for transport equipments
USD 12,000,000.00 100.00% 100.00% Yes – –
35 Jiaxing CIMC Wood Co., Ltd. (JXW)
Corporation Jiaxing, Zhejiang
USD 5,000,000.00 Jiaxing, Zhejiang
Production and sales of container wood floors, wood products for transport equipments and other wood products
USD 5,000,000.00 100.00% 100.00% Yes – –
36 Xuzhou CIMC Wood Co., Ltd (XZW)
Corporation Xuzhou, Jiangsu
RMB 50,000,000.00 Xuzhou, Jiangsu
Production and sales of container wood floor; purchasing and sales of timber
RMB 50,000,000.00 100.00% 100.00% Yes – –
37 Shenzhen Southern CIMC Containers Service Co., Ltd. (SCIMCL)
Corporation Shenzhen, Guangdong
USD 5,000,000.00 Shenzhen, Guangdong
Engaged in container transshipment,stockpiling, devanning,vannin, maintenance
USD 5,000,000.00 100.00% 100.00% Yes – –
38 Ningbo CIMC Container Service Co., Ltd. (NBCIMCL)
Corporation Ningbo, Zhejiang
RMB 30,000,000.00 Ningbo, Zhejiang
Goods traffic; goods package, sorting,examination and logistics advisory service
RMB 30,000,000.00 100.00% 100.00% Yes – –
39 Shanghai CIMC Yangshan Container Service Co., Ltd. (SHYLE)
Corporation Shanghai USD 7,000,000.00 Shanghai Container transshipment, stockpiling, devanning, vanning, and warehousing,container maintenance, try-off and technical service
USD 6,650,000.00 95.00% 100.00% Yes 812 (328)
IV. BUSINESS CoMBINAtIoNS AND tHE CoNSolIDAtED FINANCIAl StAtEMENtS (CoNtINUED)
1. Company status of investment in subsidiaries (Continued)
(1) Subsidiaries obtained through establishment or business combination (Continued)
(i) Domestic subsidiaries: (Continued)
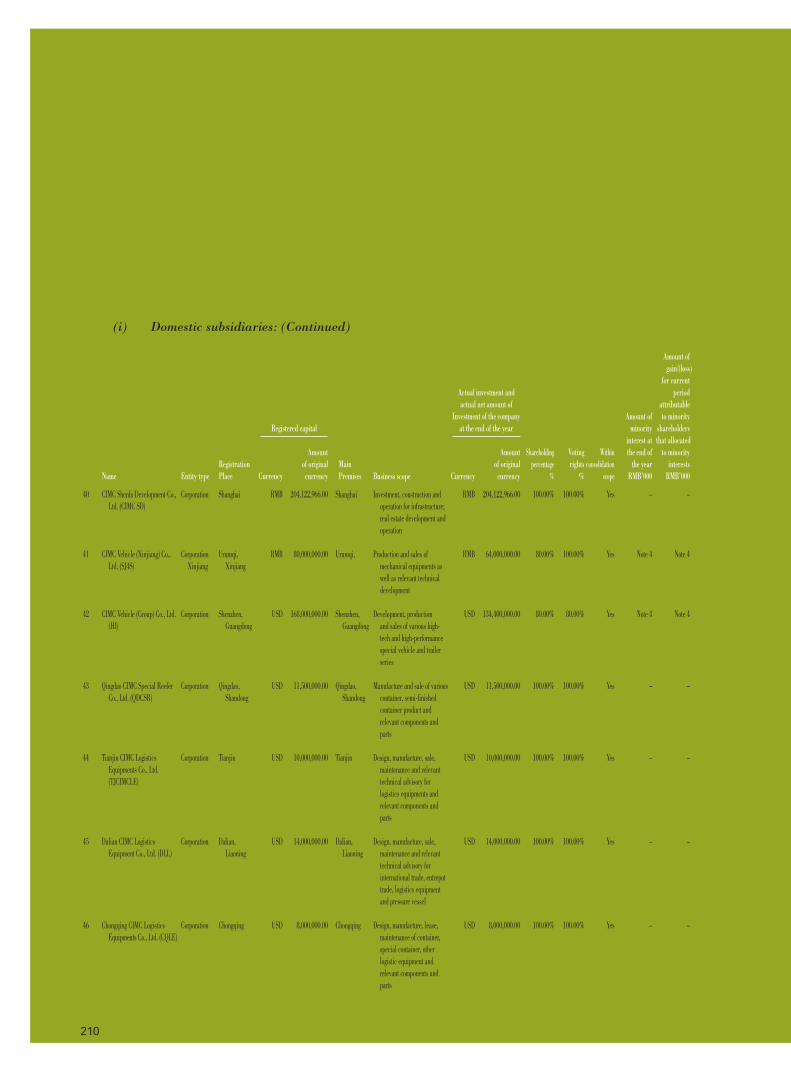
210 China International Marine Containers (Group) Co., Ltd.
Chapter 13Financial Statements Prepared in Accordance with China Accounting StandardsFor the year ended 31 December 2013(All amounts in RMB’000 unless otherwise stated)(English Translation for Reference Only)
Name Entity typeRegistration Place
Registered capital
Main Premises Business scope
Actual investment and actual net amount of
Investment of the company at the end of the year
Shareholding percentage
%
Voting rights
%
within consolidation
scope
Amount of minority
interest at the end of
the year RMB’000
Amount of gain/(loss)
for current period
attributable to minority
shareholders that allocated
to minority interests
RMB’000Currency
Amount of original
currency Currency
Amount of original
currency
40 CIMC Shenfa Development Co., Ltd. (CIMC SD)
Corporation Shanghai RMB 204,122,966.00 Shanghai Investment, construction and operation for infrastructure; real estate development and operation
RMB 204,122,966.00 100.00% 100.00% Yes – –
41 CIMC Vehicle (Xinjiang) Co., Ltd. (SJ4S)
Corporation Xinjiang
Urumqi, Xinjiang
RMB 80,000,000.00 Urumqi, Production and sales of mechanical equipments as well as relevant technical development
RMB 64,000,000.00 80.00% 100.00% Yes Note 4 Note 4
42 CIMC Vehicle (Group) Co., Ltd. (HI)
Corporation Shenzhen, Guangdong
USD 168,000,000.00 Shenzhen, Guangdong
Development, production and sales of various high-tech and high-performance special vehicle and trailer series
USD 134,400,000.00 80.00% 80.00% Yes Note 4 Note 4
43 Qingdao CIMC Special Reefer Co., Ltd. (QDCSR)
Corporation Qingdao, Shandong
USD 11,500,000.00 Qingdao, Shandong
Manufacture and sale of various container, semi-finished container product and relevant components and parts
USD 11,500,000.00 100.00% 100.00% Yes – –
44 Tianjin CIMC Logistics Equipments Co., Ltd. (TJCIMCLE)
Corporation Tianjin USD 10,000,000.00 Tianjin Design, manufacture, sale, maintenance and relevant technical advisory for logistics equipments and relevant components and parts
USD 10,000,000.00 100.00% 100.00% Yes – –
45 Dalian CIMC Logistics Equipment Co., Ltd. (DLL)
Corporation Dalian, Liaoning
USD 14,000,000.00 Dalian, Liaoning
Design, manufacture, sale, maintenance and relevant technical advisory for international trade, entrepot trade, logistics equipment and pressure vessel
USD 14,000,000.00 100.00% 100.00% Yes – –
46 Chongqing CIMC Logistics Equipments Co., Ltd. (CQLE)
Corporation Chongqing USD 8,000,000.00 Chongqing Design, manufacture, lease, maintenance of container, special container, other logistic equipment and relevant components and parts
USD 8,000,000.00 100.00% 100.00% Yes – –
IV. BUSINESS CoMBINAtIoNS AND tHE CoNSolIDAtED FINANCIAl StAtEMENtS (CoNtINUED)
1. Company status of investment in subsidiaries (Continued)
(1) Subsidiaries obtained through establishment or business combination (Continued)
(i) Domestic subsidiaries: (Continued)

Annual Report 2013 211
Chapter 13 Financial Statements Prepared in Accordance with China Accounting Standards
For the year ended 31 December 2013(All amounts in RMB’000 unless otherwise stated)
(English Translation for Reference Only)
Name Entity typeRegistration Place
Registered capital
Main Premises Business scope
Actual investment and actual net amount of
Investment of the company at the end of the year
Shareholding percentage
%
Voting rights
%
within consolidation
scope
Amount of minority
interest at the end of
the year RMB’000
Amount of gain/(loss)
for current period
attributable to minority
shareholders that allocated
to minority interests
RMB’000Currency
Amount of original
currency Currency
Amount of original
currency
47 Dalian CIMC Heavy Logistics Equipments Co., Ltd. (DLZH)
Corporation Dalian, Liaoning
USD 45,170,000.00 Dalian, Liaoning
International trade, entrepot trade, design, manufacture, sale, and relevant technical advisory of pressure vessel; manufacture and installation, other service of relevant components and parts of pressure vessel
USD 45,170,000.00 100.00% 100.00% Yes – –
48 Shenzhen CIMC Intelligent Technology Co., Ltd. (CIMC Tech)
Corporation Shenzhen, Guangdong
RMB 20,000,000.00 Shenzhen, Guangdong
Design, development, sale, surrogate of electron production software and system
RMB 20,000,000.00 100.00% 100.00% Yes – –
49 CIMC Taicang refrigeration equipment logistics Co., Ltd. (TCCRC)
Corporation Taicang. Jiangsu
RMB 450,000,000.00 Taicang. Jiangsu
Research and development, production and sale of reefer container and special container
RMB 450,000,000.00 100.00% 100.00% Yes – –
50 Hunan CIMC Bamboo Industry Development Co., Ltd. (HNW)
Corporation Suining, Hunan RMB 28,000,000.00 Suining, Hunan
Manufacturing and sale of bamboo and wood product
RMB 28,000,000.00 100.00% 100.00% Yes – –
51 CIMC Jidong (Qinhuangdao) Vehicles Manufacture Co., Ltd (QHDV)
Corporation Qinhuangdao, Hebei
RMB 70,000,000.00 Qinhuangdao, Hebei
Sale of car and car components and parts
RMB 42,000,000.00 60.00% 75.00% Yes Note 4 Note 4
52 CIMC Energy Chemical Engineering technology Co., Ltd.
Corporation Shenzhen, Guangdong
RMB 5,000,000.00 Shenzhen, Guangdong
Design and development projects for energy, chemical food related equipment; contractor techniques transfer
RMB 5,000,000.00 100.00% 100.00% Yes – –
53 CIMC Management and Training(Shenzhen) Co., Ltd.
Corporation Shenzhen, Guangdong
RMB 50,000,000.00 Shenzhen, Guangdong
Design of marketing activities scheme organization of academic and commercial conference and exhibition
RMB 50,000,000.00 100.00% 100.00% Yes – –
54 Yangzhou Lijun Industry and Trade Co., Ltd. (“Yangzhou Lijun”)
Corporation Yangzhou, Jiangsu
RMB 70,000,000.00 Yangzhou, Jiangsu
Production and sales of mechanical equipments and relevant components and parts; technical advisory and other service
RMB 70,000,000.00 100.00% 100.00% Yes – –
IV. BUSINESS CoMBINAtIoNS AND tHE CoNSolIDAtED FINANCIAl StAtEMENtS (CoNtINUED)
1. Company status of investment in subsidiaries (Continued)
(1) Subsidiaries obtained through establishment or business combination (Continued)
(i) Domestic subsidiaries: (Continued)

212 China International Marine Containers (Group) Co., Ltd.
Chapter 13Financial Statements Prepared in Accordance with China Accounting StandardsFor the year ended 31 December 2013(All amounts in RMB’000 unless otherwise stated)(English Translation for Reference Only)
Name Entity typeRegistration Place
Registered capital
Main Premises Business scope
Actual investment and actual net amount of
Investment of the company at the end of the year
Shareholding percentage
%
Voting rights
%
within consolidation
scope
Amount of minority
interest at the end of
the year RMB’000
Amount of gain/(loss)
for current period
attributable to minority
shareholders that allocated
to minority interests
RMB’000Currency
Amount of original
currency Currency
Amount of original
currency
55 Yangzhou Taili Special Equipment Co., Ltd. (“Yangzhou Taili”)
Corporation Yangzhou, Jiangsu
RMB 70,000,000.00 Yangzhou, Jiangsu
Design, manufacturing and maintenance of containers, board square cabin and; relevant components and parts relevant advisory and service
RMB 70,000,000.00 100.00% 100.00% Yes – –
56 Yantai CIMC Marine Engineering Academe Co., Ltd. (“MEA”)
Corporation Yantai, Shandong
RMB 150,000,000.00 Yantai, Shandong
Research and development of marine operation platform and other marine engineering service
RMB 150,000,000.00 100.00% 100.00% Yes – –
57 Shanghai Lifan Container Service Co., Ltd. (“Shanghai Lifan”)
Corporation Shanghai RMB 1,000,000.00 Shanghai Refitting and maintenance of containers; providing containers information system management and advisory service
RMB 420,000.00 42.00% 60.00% Yes 655 187
58 CIMC Wood Development Co., Ltd. (“CIMCWD”)
Corporation Dongguan, Guangdong
RMB 150,000,000.00 Dongguan, Guangdong
Development, production and sales of wood products for various modern transportation equipment
RMB 150,000,000.00 100.00% 100.00% Yes – –
59 Shenzhen CIMC Skyspace Real Estate Development Co., Ltd (CIMC Tianyu)
Corporation Shenzhen, Guangdong
RMB 254,634,066.00 Shenzhen, Guangdong
Real estate development RMB 229,170,659.40 90.00% 90.00% Yes Note 2 Note 2
60 Yangzhou CIMC grand space Real Estate Development Co., Ltd (CIMC Haoyu)
Corporation Yangzhou, Jiangsu
RMB 25,000,000.00 Yangzhou, Jiangsu
Real Estate Development, sales and leasing
RMB 22,500,000.00 90.00% 100.00% Yes Note 2 Note 2
61 Jiangmen CIMC skyspace Real Estate Co., Ltd (“Jiangmen Dichan”)
Corporation Jiangmen, Guangdong
RMB 30,000,000.00 Jiangmen, Guangdong
Real estate development, projects sale of decoration and building materials
RMB 27,000,000.00 90.00% 100.00% Yes Note 2 Note 2
62 Ningbo Runxin Container Co., Ltd
Corporation Ningbo, Zhejiang
RMB 5,000,000.00 Ningbo, Zhejiang
Cleaning and repair of containers,stockpiling, vanning
RMB 3,000,000.00 60.00% 60.00% Yes (9) 297
63 Chengdu CIMC Vehicle Co., Ltd (“CD Vehicle”)
Corporation Chengdu, Sichuan
RMB 60,000,000.00 Chengdu, Sichuan
Development, production and sale of various special-use vehicles, as well as Warehouse equipment
RMB 48,000,000.00 80.00% 100.00% Yes Note 4 Note 4
IV. BUSINESS CoMBINAtIoNS AND tHE CoNSolIDAtED FINANCIAl StAtEMENtS (CoNtINUED)
1. Company status of investment in subsidiaries (Continued)
(1) Subsidiaries obtained through establishment or business combination (Continued)
(i) Domestic subsidiaries: (Continued)

Annual Report 2013 213
Chapter 13 Financial Statements Prepared in Accordance with China Accounting Standards
For the year ended 31 December 2013(All amounts in RMB’000 unless otherwise stated)
(English Translation for Reference Only)
Name Entity typeRegistration Place
Registered capital
Main Premises Business scope
Actual investment and actual net amount of
Investment of the company at the end of the year
Shareholding percentage
%
Voting rights
%
within consolidation
scope
Amount of minority
interest at the end of
the year RMB’000
Amount of gain/(loss)
for current period
attributable to minority
shareholders that allocated
to minority interests
RMB’000Currency
Amount of original
currency Currency
Amount of original
currency
64 CIMC Finance Company (“Finance Company”)
Corporation Shenzhen, Guangdong
RMB 500,000,000.00 Shenzhen, Guangdong
Providing financial service RMB 500,000,000.00 100.00% 100.00% Yes – –
65 Shenzhen CIMC Investment Holding company (“SZ Investment Holding”)
Corporation Shenzhen, Guangdong
RMB 75,000,000.00 Shenzhen, Guangdong
Investment, sale and leasing of containers and container property
RMB 75,000,000.00 100.00% 100.00% Yes – –
66 Zhumadian CIMC Huajun Vehicle Trading Co.,Ltd (“HJQM”)
Corporation Zhumadian, Henan
RMB 10,000,000.00 Zhumadian, Henan
Sales and repair of various vehicles, as well as relevant components and parts
RMB 8,000,000.00 80.00% 100.00% Yes Note 4 Note 4
67 Zhumadian CIMC Huajun Casting Co. Ltd. (HJCAST)
Corporation Zhumadian, Henan
RMB 297,762,000.00 Zhumadian, Henan
casting manufacturing for Vehicle and coal mining machinery
RMB 166,746,720.00 56.00% 70.00% Yes Note 4 Note 4
68 Ocean Engineering Design & Research Institute of CIMC (SHOE)
Corporation Shanghai RMB 50,000,000.00 Shanghai Design and research of marine operation platform and other offshore engineering
RMB 50,000,000.00 100.00% 100.00% Yes – –
69 Shenzhen CIMC Investment Co., Ltd (SZ Investment)
Corporation Shenzhen, Guangdong
RMB 60,000,000.00 Shenzhen, Guangdong
Equity investment investment management and related investment business
RMB 60,000,000.00 100.00% 100.00% Yes – –
70 Shenzhen Sky Capital Co., Ltd (SESKYC)
Corporation Shenzhen, Guangdong
RMB 90,000,000.00 Shenzhen, Guangdong
Equity investment investment management and related investment business
RMB 90,000,000.00 100.00% 100.00% Yes – –
71 Ningbo MRO Trading Co.,Ltd. (MRO)
Corporation Ningbo, Zhejiang
RMB 10,000,000.00 Ningbo, Zhejiang
Production and sales of gas mask and other plastic productions
RMB 10,000,000.00 100.00% 100.00% Yes – –
72 Shenzhen CIMC Container Holding Co., Ltd. (Container Holding)
Corporation Shenzhen, Guangdong
RMB 1,000,000,000.00 Shenzhen, Guangdong
Equity investment management and related investment business
RMB 1,000,000,000.00 100.00% 100.00% Yes – –
73 Chengdu CIMC Logistics Equipments Co., Ltd.
Corporation Chengdu, Sichuan
RMB 7,500,000.00 Chengdu, Sichuan
Chemical liquid tank truck and semi-trailer
RMB 6,000,000.00 80.00% 100.00% Yes Note 4 Note 4
IV. BUSINESS CoMBINAtIoNS AND tHE CoNSolIDAtED FINANCIAl StAtEMENtS (CoNtINUED)
1. Company status of investment in subsidiaries (Continued)
(1) Subsidiaries obtained through establishment or business combination (Continued)
(i) Domestic subsidiaries: (Continued)

214 China International Marine Containers (Group) Co., Ltd.
Chapter 13Financial Statements Prepared in Accordance with China Accounting StandardsFor the year ended 31 December 2013(All amounts in RMB’000 unless otherwise stated)(English Translation for Reference Only)
Name Entity typeRegistration Place
Registered capital
Main Premises Business scope
Actual investment and actual net amount of
Investment of the company at the end of the year
Shareholding percentage
%
Voting rights
%
within consolidation
scope
Amount of minority
interest at the end of
the year RMB’000
Amount of gain/(loss)
for current period
attributable to minority
shareholders that allocated
to minority interests
RMB’000Currency
Amount of original
currency Currency
Amount of original
currency
74 Shanxi CIMC Vehicle Industry Garden
Corporation Xianyang, Shaanxi
RMB 80,000,000.00 Xianyang, Shaanxi
Production and sales Of vehicle RMB 64,000,000.00 80.00% 100.00% Yes Note 4 Note 4
75 CIMC Holdings (B.V.I.) Limited (CIMC BVI)
Corporation Jiangmen, Guangdong
RMB 130,000,000.00 Jiangmen, Guangdong
Investment RMB 130,000,000.00 100.00% 100.00% Yes – –
76 CIMC modular building design & Development Co. Ltd.
Corporation Jiangmen, Guangdong
RMB 50,000,000.00 Jiangmen, Guangdong
Design modular building and decorations
RMB 50,000,000.00 100.00% 100.00% Yes – –
77 CIMC Cold Chain Research Institute Co., Ltd.
Corporation Qingdao, Shandong
RMB 50,000,000.00 Qingdao, Shandong
Standard shipping refrigerated Containers and refrigerated containers
RMB 50,000,000.00 100.00% 100.00% Yes – –
78 CIMC Cold Chain Investment Co. Ltd.
Corporation Qingdao, Shandong
RMB 809,000,000.00 Qingdao, Shandong
Investments RMB 809,000,000.00 100.00% 100.00% Yes – –
79 Shenyang CIMC Industrial Park Investment and Development Co., Ltd.
Corporation Shenyang, Liaoning
RMB 20,000,000.00 Shenyang, Liaoning
Investment management, asset trustee management
RMB 16,000,000.00 80.00% 100.00% Yes Note 4 Note 4
80 Shenzhen Tianda CIMC Logistics System Engineering Co Ltd
Corporation Shenzhen, Guangdong
RMB 60,000,000.00 Shenzhen, Guangdong
Automatic logistics system engineering, real-time logistics management system
RMB 42,000,000.00 70.00% 100.00% Yes Note 7 Note 7
IV. BUSINESS CoMBINAtIoNS AND tHE CoNSolIDAtED FINANCIAl StAtEMENtS (CoNtINUED)
1. Company status of investment in subsidiaries (Continued)
(1) Subsidiaries obtained through establishment or business combination (Continued)
(i) Domestic subsidiaries: (Continued)

Annual Report 2013 215
Chapter 13 Financial Statements Prepared in Accordance with China Accounting Standards
For the year ended 31 December 2013(All amounts in RMB’000 unless otherwise stated)
(English Translation for Reference Only)
Name Entity typeRegistration Place
Registered capital
Main Premises Business scope
Actual investment and actual net amount of
Investment of the company at the end of the year
Shareholding percentage
%
Voting rights
%
within consolidation
scope
Amount of minority
interest at the end of
the year RMB’000
Amount of gain/(loss)
for current period
attributable to minority
shareholders that allocated
to minority interests
RMB’000Currency
Amount of original
currency Currency
Amount of original
currency
81 Jiangmen CIMC Skyspace Investment Co., Ltd.
Corporation Jiangmen, Guangdong
RMB 10,000,000.00 Jiangmen, Guangdong
Industrial investment, private investment, Enterprise Management Consulting
RMB 9,000,000.00 90.00% 100.00% Yes Note 2 Note 2
82 Dongguan cimc innovation industrial park development Co., Ltd.
Corporation Dongguan, Guangdong
RMB 50,000,000.00 Dongguan, Guangdong
Innovation industrial park investment, real estate development & management
RMB 45,000,000.00 90.00% 100.00% Yes Note 2 Note 2
83 Zhejiang Teng Long Industry Group Co., Ltd.
Corporation Quzhou, Zhejiang
RMB 6,000,000.00 Quzhou, Zhejiang
Sale of wood and bamboo products,bamboo and wood technology research and development, consulting
RMB 3,060,000.00 51.00% 51.00% Yes 2,940 –
84 Guangdong Xinhui Modular Building Manufacturing Co. Ltd.
Corporation Jiangmen, Guangdong
RMB 80,000,000.00 Jiangmen, Guangdong
Production and sale of integrated houses, prefabricated houses, metal structure
RMB 80,000,000.00 100.00% 100.00% Yes – –
85 Shenzhen CIMC new process of Automotive Supply Chain Management Co. Ltd.
Corporation Shenzhen, Guangdong
RMB 10,000,000.00 Shenzhen, Guangdong
Supply Chain Management RMB 6,000,000.00 60.00% 60.00% Yes 1,758 (2,243)
86 Shanghai Xinzhitu Logistics Corporation Shanghai RMB 10,000,000.00 Shanghai International Freight transport agents, general
RMB 10,000,000.00 100.00% 100.00% Yes – –
IV. BUSINESS CoMBINAtIoNS AND tHE CoNSolIDAtED FINANCIAl StAtEMENtS (CoNtINUED)
1. Company status of investment in subsidiaries (Continued)
(1) Subsidiaries obtained through establishment or business combination (Continued)
(i) Domestic subsidiaries: (Continued)

216 China International Marine Containers (Group) Co., Ltd.
Chapter 13Financial Statements Prepared in Accordance with China Accounting StandardsFor the year ended 31 December 2013(All amounts in RMB’000 unless otherwise stated)(English Translation for Reference Only)
IV. BUSINESS CoMBINAtIoNS AND tHE CoNSolIDAtED FINANCIAl StAtEMENtS (CoNtINUED)
1. Company status of investment in subsidiaries (Continued)
(1) Subsidiaries obtained through establishment or business combination (Continued)
(ii) Overseas subsidiaries:
NameRegistration Place
Registered capital
Main Premises Business scope
Actual investment and actual net amount of
Investment of the company at the end of the year
Shareholding percentage %
Voting rights %
within consolidation
scope
Amount of minority
interest at the end of
the year RMB’000
Amount of gain/(loss) for
current period attributable to minority
shareholders that allocated
to minority interests
RMB’000Currency
Amount of original
currency Currency
Amount of original
currency
87 CIMC Holdings (B.V.I.)Limited British Virgin Islands
USD 34,001.00 British Virgin Islands
Investment USD 34,001.00 100.00% 100.00% Yes – –
88 CIMC Tank Equipment Investment Holdings Co.,Ltd.
Hongkong, China
HKD 4,680,000.00 Hongkong, China
Investment HKD 4,680,000.00 100.00% 100.00% Yes – –
89 CIMC-SMM Vehicle (Thailand) CO., LTD. (Thailand V)
Thailand THB 260,000,000.00 Thailand Production and sales of various special vehicles
THB 213,200,000.00 82.00% 82.00% Yes Note 4 Note 4
90 CIMC Vehicle Investment Holding Co.,Ltd. (“CIMC Vehicle”)
Hongkong, China
USD 50,000.00 Hongkong, China
Investment USD 40,000.00 80.00% 100.00% Yes Note 4 Note 4
91 CIMC Europe BVBA (“BVBA”) Belgium EUR 18,550.00 Belgium Investment EUR 18,550.00 100.00% 100.00% Yes – –
92 China International Marine Containers (HongKong) Limited (“CIMC Hong Kong”)
Hongkong, China
HKD 2,000,000.00 Hongkong, China
Investment HKD 2,000,000.00 100.00% 100.00% Yes Note 5 Note 5
93 CIMC Burg B.V. (“BV”) Holland EUR 60,000,000.00 Holland Investment EUR 60,000,000.00 100.00% 100..00% Yes – –
94 Tacoba Forestry Consultant N.V (“Tacoba”)
Suriname SF 3,000,000.00 Suriname Sale of wood SF 3,000,000.00 100.00% 100.00% Yes – –
95 Charm Wise Limited (“Charm Wise”)
Hongkong, China
USD 1.00 Hongkong, China
Investment USD 1.00 100.00% 100.00% Yes – –
96 Gold Terrain Assets Limited (“GTA”)
British Virgin Islands
USD 1.00 British Virgin Islands
Investment USD 1.00 100.00% 100.00% Yes – –

Annual Report 2013 217
Chapter 13 Financial Statements Prepared in Accordance with China Accounting Standards
For the year ended 31 December 2013(All amounts in RMB’000 unless otherwise stated)
(English Translation for Reference Only)
NameRegistration Place
Registered capital
Main Premises Business scope
Actual investment and actual net amount of
Investment of the company at the end of the year
Shareholding percentage %
Voting rights %
within consolidation
scope
Amount of minority
interest at the end of
the year RMB’000
Amount of gain/(loss) for
current period attributable to minority
shareholders that allocated
to minority interests
RMB’000Currency
Amount of original
currency Currency
Amount of original
currency
97 Full Medal Holdings Ltd. (“Full Medal”)
British Virgin Islands
USD 50,000.00 British Virgin Islands
Investment USD 35,070.00 70.14% 100.00% Yes Note 1 Note 1
98 Charm Ray Holdings Limited (“Charm Ray”)
Hongkong, China
HKD 1.00 Hongkong, China
Investment HKD 0.70 70.14% 100.00% Yes Note 1 Note 1
99 Charm Beat Enterprises Limited (“Charm Beat”)
British Virgin Islands
USD 1.00 British Virgin Islands
Investment USD 1.00 100.00% 100.00% Yes – –
100 Sharp Vision Holdings Limited (“Sharp Vision”)
Hongkong, China
HKD 1.00 Hongkong, China
Investment HKD 1.00 100.00% 100.00% Yes – –
101 Sound Winner Holdings Limited (“Sound Winner”)
British Virgin Islands
USD 10,000.00 British Virgin Islands
Investment USD 7,014.00 70.14% 100.00% Yes Note 1 Note 1
102 Grow Rapid Limited (“Grow Rapid”)
Hongkong, China
HKD 1.00 Hongkong, China
Investment HKD 1.00 100.00% 100.00% Yes – –
103 Powerlead Holding Ltd. (“Powerlead”)
British Virgin Islands
USD 10.00 British Virgin Islands
Investment USD 10.00 100.00% 100.00% Yes – –
104 Cooperatie Vela U.A. Holland EUR 18,000.00 Holland Investment EUR 12,625.20 70.14% 100.00% Yes Note 1 Note 1
105 Vela Holding B.V. Holland EUR 18,000.00 Holland Investment EUR 12,625.20 70.14% 100.00% Yes Note 1 Note 1
106 CIMC Financial Leasing (HK) Co Ltd.
Hongkong, China
HKD 500,000.00 Hongkong, China
Finance Lease HKD 500,000.00 100.00% 100.00% Yes – –
IV. BUSINESS CoMBINAtIoNS AND tHE CoNSolIDAtED FINANCIAl StAtEMENtS (CoNtINUED)
1. Company status of investment in subsidiaries (Continued)
(1) Subsidiaries obtained through establishment or business combination (Continued)
(ii) Overseas subsidiaries: (Continued)

218 China International Marine Containers (Group) Co., Ltd.
Chapter 13Financial Statements Prepared in Accordance with China Accounting StandardsFor the year ended 31 December 2013(All amounts in RMB’000 unless otherwise stated)(English Translation for Reference Only)
NameRegistration Place
Registered capital
Main Premises Business scope
Actual investment and actual net amount of
Investment of the company at the end of the year
Shareholding percentage %
Voting rights %
within consolidation
scope
Amount of minority
interest at the end of
the year RMB’000
Amount of gain/(loss) for
current period attributable to minority
shareholders that allocated
to minority interests
RMB’000Currency
Amount of original
currency Currency
Amount of original
currency
107 CIMC Offshore Holdings Limited (“CIMC Offshore”)
Hongkong, China
HKD 342,860,173.00 Hongkong, China
Investment HKD 342,860,173.00 100.00% 100.00% Yes Note 5 Note 5
108 Cooperatie CIMC U.A. (“COOP”) Holland EUR 25,500,000.00 Holland Investment EUR 25,500,000.00 100.00% 100.00% Yes – –
109 North Sea Rigs Holdings (“NSR”) British Virgin Islands
USD 1.00 British Virgin Islands
Finance Lease project company USD 1.00 100.00% 100.00% Yes – –
110 Hongkong CIMC Tianda Airport Support Ltd. (“TAS Hongkong”)
Hongkong, China
HKD 1,000,000.00 Hongkong, China
Investment HKD 700,000.00 70.00% 100.00% Yes Note 7 Note 7
111 CIMC Development (Australia) Pty Ltd (“Development Australia”)
Australia AUD 8,000,000.00 Australia Investment AUD 8,000,000.00 100.00% 100.00% Yes – –
112 Beacon holdings Group Ltd (“Beacon holdings”)
British Virgin Islands
USD 22,000,000.00 British Virgin Islands
Finance Lease project company USD 22,000,000.00 100.00% 100.00% Yes – –
IV. BUSINESS CoMBINAtIoNS AND tHE CoNSolIDAtED FINANCIAl StAtEMENtS (CoNtINUED)
1. Company status of investment in subsidiaries (Continued)
(1) Subsidiaries obtained through establishment or business combination (Continued)
(ii) Overseas subsidiaries: (Continued)

Annual Report 2013 219
Chapter 13 Financial Statements Prepared in Accordance with China Accounting Standards
For the year ended 31 December 2013(All amounts in RMB’000 unless otherwise stated)
(English Translation for Reference Only)
IV. BUSINESS CoMBINAtIoNS AND tHE CoNSolIDAtED FINANCIAl StAtEMENtS (CoNtINUED)
1. Company status of investment in subsidiaries (Continued)
(2) the Group does not have subsidiaries obtained through combination under common control
(3) Subsidiaries acquired through combinations under non-common control
(i) Domestic subsidiaries:
Name Entity typeRegistration Place
Registered capital
Main Premises Business scope
Actual investment and actual net amount of
Investment of the company at the end of the year
Shareholding percentage
%
Voting rights
%
within consolidation
scope
Amount of minority
interest at the end of
the year RMB’000
Amount of gain/(loss) for
current period attributable to minority
shareholders that allocated
to minority interests
RMB’000Currency
Amount of original
currency Currency
Amount of original
currency
1 Luoyang CIMC Lingyu Automobile CO., LTD. (LYV)
Corporation Luoyang, Henan
RMB 100,000,000.00 Luoyang, Henan
Production and sales of passenger car, tank car; machining; operation of import and export business
RMB 60,000,000.00 60.00% 75.00% Yes Note 4 Note 4
2 Wuhu CIMC RuiJiang Automobile CO LTD (WHVS)
Corporation Wuhu, Anhui RMB 100,000,000.00 Wuhu, Anhui Development, production and sales of various special vehicles, ordinary mechanical products and metal structure parts
RMB 60,000,000.00 60.00% 75.00% Yes Note 4 Note 4
3 Liangshan Dongyue Vehicle Co., Ltd. (LSDYV)
Corporation Liangshan, Shandong
RMB 90,000,000.00 Liangshan, Shandong
Production and sales of mixing truck, special vehicle and components and parts
RMB 54,000,000.00 60.00% 75.00% Yes Note 4 Note 4
4 Qingdao CIMC Container Manufacture Co., Ltd (QDCC)
Corporation Qingdao, Shandong
USD 27,840,000.00 Qingdao, Shandong
Manufacture and repair of container,processing and manufacture of various mechanical parts, structures and equipment
USD 27,840,000.00 100.00% 100.00% Yes – –
5 Qingdao CIMC Reefer Container Manufacture Co., Ltd.(QDCRC)
Corporation Qingdao, Shandong
USD 86,846,680.00 Qingdao, Shandong
Manufacture and sale of refrigeration and heat preservation device of reefer container, refrigerator car and heat preservation car; providing relevant technical advisory and maintenance service
USD 86,846,680.00 100.00% 100.00% Yes – –
6 Tianjin CIMC North Ocean Container Co., Ltd. (TJCIMC)
Corporation Tianjin USD 15,469,300.00 Tianjin Manufacture and sale of container as well as vehicle, ship, equipment and steel structure specially used for container; warehousing and after sales service for container
USD 15,469,300.00 100.00% 100.00% Yes – –
7 Shanghai CIMC Baowell Industries Co. Ltd (SBWI)
Corporation Shanghai USD 28,500,000.00 Shanghai Manufacture and sale of container as well as relevant technical advisory
USD 27,000,900.00 94.74% 94.74% Yes 10,522 800

220 China International Marine Containers (Group) Co., Ltd.
Chapter 13Financial Statements Prepared in Accordance with China Accounting StandardsFor the year ended 31 December 2013(All amounts in RMB’000 unless otherwise stated)(English Translation for Reference Only)
Name Entity typeRegistration Place
Registered capital
Main Premises Business scope
Actual investment and actual net amount of
Investment of the company at the end of the year
Shareholding percentage
%
Voting rights
%
within consolidation
scope
Amount of minority
interest at the end of
the year RMB’000
Amount of gain/(loss) for
current period attributable to minority
shareholders that allocated
to minority interests
RMB’000Currency
Amount of original
currency Currency
Amount of original
currency
8 CIMC Vehicle (Shandong) Co. Ltd.(KGR)
Corporation Zhangqiu, Shandong
RMB 18,930,100.00 Zhangqiu, Shandong
Development and manufacture of refrigerator car, tank car, trailer, box car,special vehicles and various series products
RMB 13,177,246.61 69.61% 87.01% Yes Note 4 Note 4
9 Zhangzhou CIMC Container Co., Ltd. (ZZCIMC)
Corporation Zhangzhou, Fujian
USD 23,000,000.00 Zhangzhou, Fujian
Manufacture and sale of container as well as relevant technical advisory
USD 23,000,000.00 100.00% 100.00% Yes – –
10 Yangzhou CIMC Tong Hua Special Vehicles Co., Ltd. (YZTH)
Corporation Yangzhou, Jiangsu
RMB 4,343,007,500.00 Yangzhou, Jiangsu
Development, production and sales of various special-use vehicles, refitting vehicles, special vehicles, trailer series as well as relevant components and parts
RMB 3,474,406,000.00 80.00% 100.00% Yes Note 4 Note 4
11 Zhumadian CIMC Huajun Vehicle Co. Ltd. (HJCIMC)
Corporation Zhumalian, Henan
RMB 85,340,000.00 Zhumalian, Henan
Refitting of special vehicles, sales of trailer and fittings; sales of vehicle related materials
RMB 68,272,000.00 80.00% 100.00% Yes Note 4 Note 4
12 Zhangjiagang CIMC Sanctum Cryogenic Equipment Machinery Co., Ltd. (SDY)
Corporation Zhangjiagang, Jiangsu
RMB 144,862,042.01 Zhangjiagang, Jiangsu
Development, manufacture and installation of deep freezing unit,petrochemical mechanical equipment,tank container, pressure vessel
RMB 101,606,236.27 70.14% 100.00% Yes Note 1 Note 1
13 Donghwa Container Transportation Service Co., Ltd. (DHCTS)
Corporation Shanghai USD 4,500,000.00 Shanghai Container cargo devanning, vanning; canvass for cargo; allotment and customs declaration; container maintenance and stockpiling; supply of components and parts
USD 3,150,000.00 70.00% 70.00% Yes 28,165 4,453
14 Yangzhou Tonglee Reefer Container Co., Ltd. (TLC)
Corporation Yangzhou, Jiangsu
USD 34,100,000.00 Yangzhou, Jiangsu
Manufacture and sale of reefer container and special container;providing relevant technical advisory and maintenance service
USD 34,100,000.00 100.00% 100.00% Yes – –
IV. BUSINESS CoMBINAtIoNS AND tHE CoNSolIDAtED FINANCIAl StAtEMENtS (CoNtINUED)
1. Company status of investment in subsidiaries (Continued)
(3) Subsidiaries acquired through combinations under non-common control (Continued)
(i) Domestic subsidiaries: (Continued)

Annual Report 2013 221
Chapter 13 Financial Statements Prepared in Accordance with China Accounting Standards
For the year ended 31 December 2013(All amounts in RMB’000 unless otherwise stated)
(English Translation for Reference Only)
Name Entity typeRegistration Place
Registered capital
Main Premises Business scope
Actual investment and actual net amount of
Investment of the company at the end of the year
Shareholding percentage
%
Voting rights
%
within consolidation
scope
Amount of minority
interest at the end of
the year RMB’000
Amount of gain/(loss) for
current period attributable to minority
shareholders that allocated
to minority interests
RMB’000Currency
Amount of original
currency Currency
Amount of original
currency
15 Qingdao Kooll Logistics Co., Ltd (QDHFL)
Corporation Qingdao, Shandong
RMB 20,000,000.00 Qingdao, Shandong
Container warehousing, stockpiling,devanning, vanning, load and unload, cleaning, maintenance; goods processing
RMB 16,000,000.00 80.00% 80.00% Yes 1,601 (249)
16 Enric (Bengbu) Compressor Co., Ltd. (Enric Bengbu)
Corporation Bengbu, Anhui HKD 60,808,385.00 Bengbu, Anhui
Manufacturing base of NG compressor and related products
HKD 42,651,001.24 70.14% 100.00% Yes Note 1 Note 1
17 Shijiazhuang Enric Gas Equipment Co., Ltd. (“Shijiazhuang Enric”)
Corporation Shijiazhuang, Hebei
USD 7,000,000.00 Shijiazhuang, Hebei
Manufacturing pressure vessel USD 4,909,800.00 70.14% 100.00% Yes Note 1 Note 1
18 Enric (Lang fang) Energy Equipment integration Co., Ltd. (Langfang Enric)
Corporation Langfang, Hebei
HKD 50,000,000.00 Langfang, Hebei
Manufacturing and exploiting Energy Equipment integration
HKD 35,070,000.00 70.14% 100.00% Yes Note 1 Note 1
19 Enric (Beijing) Energy Technology Co., Ltd (Beijing Enric)
Corporation Beijing HKD 40,000,000.00 Beijing Manufacturing and exploiting Energy Equipment integration
HKD 28,056,000.00 70.14% 100.00% Yes Note 1 Note 1
20 CIMC Enric (Jingmen) Energy Equipment Co., Ltd.
Corporation Jingmen, Hubei HKD 50,000,000.00 Jingmen, Hubei
Sales of chemical and gas machineries and equipments as well as after sales services; research and development of energy conservation techniques
HKD 35,070,000.00 70.14% 100.00% Yes Note 1 Note 1
21 Jingmen Hongtu Special Aircraft manufacturing Co., Ltd
Corporation Jingmen, Hubei RMB 100,000,000.00 Jingmen, Hubei
Development and sales of flight vehicle manufacturing techniques, design, production and sales of specialized motor vehicles, tanks and pressure vessel
RMB 56,110,000.00 56.11% 80.00% Yes Note 1 Note 1
22 Ningguo CIMC Wood Co., Ltd. (“NGCIMCW”)
Corporation Ningguo, Anhui USD 1,300,000.00 Ningguo, Anhui
Construction of offshore project and supplement
USD 780,000.00 60.00% 60.00% Yes 3,921 (848)
IV. BUSINESS CoMBINAtIoNS AND tHE CoNSolIDAtED FINANCIAl StAtEMENtS (CoNtINUED)
1. Company status of investment in subsidiaries (Continued)
(3) Subsidiaries acquired through combinations under non-common control (Continued)
(i) Domestic subsidiaries: (Continued)

222 China International Marine Containers (Group) Co., Ltd.
Chapter 13Financial Statements Prepared in Accordance with China Accounting StandardsFor the year ended 31 December 2013(All amounts in RMB’000 unless otherwise stated)(English Translation for Reference Only)
Name Entity typeRegistration Place
Registered capital
Main Premises Business scope
Actual investment and actual net amount of
Investment of the company at the end of the year
Shareholding percentage
%
Voting rights
%
within consolidation
scope
Amount of minority
interest at the end of
the year RMB’000
Amount of gain/(loss) for
current period attributable to minority
shareholders that allocated
to minority interests
RMB’000Currency
Amount of original
currency Currency
Amount of original
currency
23 Yantai CMIC Raffles offshore Ltd. (YCRO)
Corporation Yantai, Shandong
RMB 1,676,690,000.00 Yantai, Shandong
Construction of dock; Designation,production of ship; production of equipment of pressure and offshore oil platform
RMB 1,641,311,841.00 97.89% 100.00% Yes – –
24 Yantai CIMC Raffles ship Co., Ltd (“YCRS”)
Corporation Yantai, Shandong
RMB 125,980,000.00 Yantai, Shandong
Construction of ship as well as component;sales of container and offshore oil platform channel and steel production
RMB 105,155,506.00 83.47% 83.47% Yes – –
25 Haiyang CIMC Raffles offshore Ltd. (“HCRO”)
Corporation Haiyang, Shandong
RMB 200,000,000.00 Haiyang, Shandong
Construction of dock; Designation,production of ship; production of equipment of pressure and offshore oil platform
RMB 195,780,000.00 97.89% 100.00% Yes – –
26 Longkou CIMC Raffles offshore engineering Co., Ltd (“LCRO”)
Corporation Longkou, Shandong
RMB 290,000,000.00 Longkou, Shandong
Construction of offshore project and supplement
RMB 283,881,000.00 97.89% 100.00% Yes – –
27 Shandong Master Special Vehicle Manufacturing Co., Ltd (“SDMV”)
Corporation Jining, Shandong
RMB 22,000,000.00 Jining, Shandong
manufacture and sales of mixing truck,special vehicle and components and parts
RMB 13,200,000.00 60.00% 75.00% Yes Note 4 Note 4
28 Xinfa Airport Equipment Ltd. Corporation Beijing RMB 10,000,000.00 Beijing manufacture and sales of airport shuttle buses
RMB 7,000,000.00 70.00% 70.00% Yes Note 7 Note 7
IV. BUSINESS CoMBINAtIoNS AND tHE CoNSolIDAtED FINANCIAl StAtEMENtS (CoNtINUED)
1. Company status of investment in subsidiaries (Continued)
(3) Subsidiaries acquired through combinations under non-common control (Continued)
(i) Domestic subsidiaries: (Continued)

Annual Report 2013 223
Chapter 13 Financial Statements Prepared in Accordance with China Accounting Standards
For the year ended 31 December 2013(All amounts in RMB’000 unless otherwise stated)
(English Translation for Reference Only)
Name Entity typeRegistration Place
Registered capital
Main Premises Business scope
Actual investment and actual net amount of
Investment of the company at the end of the year
Shareholding percentage
%
Voting rights
%
within consolidation
scope
Amount of minority
interest at the end of
the year RMB’000
Amount of gain/(loss) for
current period attributable to minority
shareholders that allocated
to minority interests
RMB’000Currency
Amount of original
currency Currency
Amount of original
currency
29 Yangjiang Shangdong Furi Real Estate Co.,Ltd (“YJFR”)
Corporation Yangjiang, Guangdong
RMB 10,000,000.00 Yangjiang, Guangdong
Real estate development and operation planning and consulting,sale of construction materials and inner house decoration
RMB 6,000,000.00 60.00% 60.00% Yes Note 2 Note 2
30 Nanjing Yangzi Petrochemical Design & Engineering Co., Ltd. (“YPDI”)
Corporation Nanjing, Jiangsu
RMB 30,000,000.00 Nanjing, Jiangsu
project relating to petrochemical industry
RMB 21,042,000.00 70.14% 100.00% Yes Note 1 Note 1
31 Zhenhua Logistics Group Co., Ltd. (“Zhenhua Group”)
Corporation Tianjin USD 51,956,000.00 Tianjin Container and cargo distribution and repairment
USD 38,967,000.00 75,00% 75.00% Yes Note 6 Note 6
32 Xiamen Hongxin Berg Leasing Co. Ltd. (“Hongxin Berg”)
Corporation Xiamen, Fujian USD 10,000,000.00 Xiamen, Fujian
Financial leasing and leasing business
USD 5,100,000.00 51.00% 51.00% Yes 48,138 6,998
33 Tianjin Zhenhua Haijing Logistics Co. Ltd. (“Zhenhua Haijing”)
Corporation Tianjin RMB 145,000,000.00 Tianjin construction and operation of warehousing facilities Container depot
RMB 65,250,000.00 45.00% 60.00% Yes Note 6 Note 6
34 Tianjin Zhenhua International Logistics Co. Ltd. (“Zhenhua IL”)
Corporation Tianjin RMB 133,972,922.00 Tianjin Non-vessel carrier, freight agent RMB 100,479,691.50 75.00% 100.00% Yes Note 6 Note 6
IV. BUSINESS CoMBINAtIoNS AND tHE CoNSolIDAtED FINANCIAl StAtEMENtS (CoNtINUED)
1. Company status of investment in subsidiaries (Continued)
(3) Subsidiaries acquired through combinations under non-common control (Continued)
(i) Domestic subsidiaries: (Continued)

224 China International Marine Containers (Group) Co., Ltd.
Chapter 13Financial Statements Prepared in Accordance with China Accounting StandardsFor the year ended 31 December 2013(All amounts in RMB’000 unless otherwise stated)(English Translation for Reference Only)
Name Entity typeRegistration Place
Registered capital
Main Premises Business scope
Actual investment and actual net amount of
Investment of the company at the end of the year
Shareholding percentage
%
Voting rights
%
within consolidation
scope
Amount of minority
interest at the end of
the year RMB’000
Amount of gain/(loss) for
current period attributable to minority
shareholders that allocated
to minority interests
RMB’000Currency
Amount of original
currency Currency
Amount of original
currency
35 Shandong Zhenhua Logistics Co., Ltd. (“Shandong Zhenhua”)
Corporation Qingdao, Shandong
USD 9,150,000.00 Qingdao, Shandong
General cargo, dangerous goods transport
USD 6,862,500.00 75.00% 100.00% Yes Note 6 Note 6
36 Tianjin Zhenhua Customs Broker Co. Ltd. (“Tianjin CB”)
Corporation Tianjin RMB 12,516,441.00 Tianjin Customs clearance and related consulting services
RMB 9,387,330.75 75.00% 100.00% Yes Note 6 Note 6
37 Zhenhua International Shipping Agency (Qingdao) Co., Ltd.
Corporation Qingdao, Shandong
RMB 10,000,000.00 Qingdao, Shandong
International shipping agency business
RMB 7,500,000.00 75.00% 100.00% Yes Note 6 Note 6
38 Tianjin Zhenhua International Corporation Shipping Agency Co. Ltd.
Tianjin RMB 10,000,000.00 Tianjin International shipping agency business
RMB 7,500,000.00 75.00% 100.00% Yes Note 6 Note 6
39 Shanghai Zhenhua Corporation International Shipping Agencies Ltd.
Shanghai RMB 10,000,000.00 Shanghai International shipping agency business
RMB 7,500,000.00 75.00% 100.00% Yes Note 6 Note 6
40 Tianjin Port CIMC Zhenhua Logistics Co., Ltd.
Corporation Tianjin RMB 50,000,000.00 Tianjin General cargo, dangerous goods transport
RMB 37,500,000.00 75.00% 100.00% Yes Note 6 Note 6
41 Tianjin Zhenhua International Trade Bonded Warehousing Co. Ltd.
Corporation Tianjin RMB 5,628,836.00 Tianjin Cargo transport agency services RMB 4,221,627.00 75.00% 100.00% Yes Note 6 Note 6
IV. BUSINESS CoMBINAtIoNS AND tHE CoNSolIDAtED FINANCIAl StAtEMENtS (CoNtINUED)
1. Company status of investment in subsidiaries (Continued)
(3) Subsidiaries acquired through combinations under non-common control (Continued)
(i) Domestic subsidiaries: (Continued)

Annual Report 2013 225
Chapter 13 Financial Statements Prepared in Accordance with China Accounting Standards
For the year ended 31 December 2013(All amounts in RMB’000 unless otherwise stated)
(English Translation for Reference Only)
IV. BUSINESS CoMBINAtIoNS AND tHE CoNSolIDAtED FINANCIAl StAtEMENtS (CoNtINUED)
1. Company status of investment in subsidiaries (Continued)
(3) Subsidiaries acquired through combinations under non-common control (Continued)
(ii) Overseas subsidiaries:
NameRegistration Place
Registered capital
Main Premises Business scope
Actual investment and actual net amount of
Investment of the company at the end of the year
Shareholding percentage
%
Voting rights
%
within consolidation
scope
Amount of minority
interest at the end of
the year RMB’000
Amount of gain/(loss) for
current period attributable to minority
shareholders that allocated
to minority interests
RMB’000Currency
Amount of original
currency Currency
Amount of original
currency
42 CIMC Rolling Stock Australia Pty Ltd. (CIMC Aus)
Australia AUD 50,000.00 Australia Sales of vehicles AUD 50,000.00 100.00% 100.00% Yes – –
43 Enric Energy Equipment Holdings Limited (Enric)
Cayman Islands
HKD 120,000,000.00 Cayman Islands Investment HKD 84,168,000.00 70.14% 100.00% Yes Note 1 Note 1
44 Burg Industries B.V. Holland EUR 3,403,351.62 Holland Investment EUR 3,403,351.62 100.00% 100.00% Yes – –
45 Holvrieka Holding B.V. Holland EUR 12,000,000.00 Holland Investment EUR 8,416,800.00 70.14% 100.00% Yes Note 1 Note 1
46 Holvrieka B.V. Holland EUR 136,200.00 Holland Sales of tank equipment EUR 95,530.68 70.14% 100.00% Yes Note 1 Note 1
47 Holvrieka Nirota B.V. Holland EUR 680,670.32 Holland Production, assembly and sale EUR 477,422.16 70.14% 100.00% Yes Note 1 Note 1
48 Noordkoel B.V. Holland EUR 500,000.00 Holland Sales of tank equipment EUR 350,700.00 70.14% 100.00% Yes Note 1 Note 1
49 Beheermaatschappij Burg B.V. Holland EUR 453,780.22 Holland Investment EUR 453,780.22 100.00% 100.00% Yes Note 1 Note 1
50 Burg Carrosserie B.V. Holland EUR 90,756.04 Holland Production of road transport vehicle
EUR 90,756.04 100.00% 100.00% Yes – –
51 Exploitatiemaatschappij Intraprogres B.V
Holland EUR 79,411.54 Holland Trade, financing and leasing of road transport vehicle
EUR 79,411.54 100.00% 100.00% Yes – –

226 China International Marine Containers (Group) Co., Ltd.
Chapter 13Financial Statements Prepared in Accordance with China Accounting StandardsFor the year ended 31 December 2013(All amounts in RMB’000 unless otherwise stated)(English Translation for Reference Only)
NameRegistration Place
Registered capital
Main Premises Business scope
Actual investment and actual net amount of
Investment of the company at the end of the year
Shareholding percentage
%
Voting rights
%
within consolidation
scope
Amount of minority
interest at the end of
the year RMB’000
Amount of gain/(loss) for
current period attributable to minority
shareholders that allocated
to minority interests
RMB’000Currency
Amount of original
currency Currency
Amount of original
currency
52 Hobur Twente B.V. Holland EUR 226,890.11 Holland Production and sale of oil and components and parts
EUR 226,890.11 100.00% 100.00% Yes – –
53 Burg Service B.V. Holland EUR 250,000.00 Holland Assembly and repair of road transport vehicle and tank equipment
EUR 250,000.00 100.00% 100.00% Yes – –
54 LAG Trailers N.V. Belgium EUR 3,245,000.00 Belgium Manufacturing trailer EUR 3,245,000.00 100.00% 100.00% Yes – –
55 Holvrieka N.V. Belgium FRF 40,000,000.00 Belgium Manufacturing tank equipment FRF 28,056,000.00 70.14% 100.00% Yes Note 1 Note 1
56 Immo burg N.V. Belgium EUR 248,000.00 Belgium Manufacturing road transport vehicle
EUR 248,000.00 100.00% 100.00% Yes – –
57 Holvrieka Danmark A/S Denmark DKK 1,000,000.00 Denmark Manufacturing tank equipment DKK 701,400.00 70.14% 100.00% Yes Note 1 Note 1
58 Direct Chassis LLC (“DCEC”) USA USD 10,000,000.00 USA Manufacturing and sales of special vehicles
USD 10,000,000.00 100.00% 100.00% Yes – 1,699
59 CIMC TGE Gasinvestments SA (“TGESA”)
Luxemburg EUR 50,000.00 Luxemburg Investment EUR 30,000.00 60.00% 60.00% Yes Note 3 Note 3
60 TGE Gas Engineering GmbH (“TGE Gas”)
Germany EUR 1,000,000.00 Germany Provide EP+CS (Design, Purchase and Construction Supervision) or other technical project services in LNG,LPG and storage and disposal of other
EUR 600,000.00 60.00% 100.00% Yes Note 3 Note 3
IV. BUSINESS CoMBINAtIoNS AND tHE CoNSolIDAtED FINANCIAl StAtEMENtS (CoNtINUED)
1. Company status of investment in subsidiaries (Continued)
(3) Subsidiaries acquired through combinations under non-common control (Continued)
(ii) Overseas subsidiaries: (Continued)

Annual Report 2013 227
Chapter 13 Financial Statements Prepared in Accordance with China Accounting Standards
For the year ended 31 December 2013(All amounts in RMB’000 unless otherwise stated)
(English Translation for Reference Only)
NameRegistration Place
Registered capital
Main Premises Business scope
Actual investment and actual net amount of
Investment of the company at the end of the year
Shareholding percentage
%
Voting rights
%
within consolidation
scope
Amount of minority
interest at the end of
the year RMB’000
Amount of gain/(loss) for
current period attributable to minority
shareholders that allocated
to minority interests
RMB’000Currency
Amount of original
currency Currency
Amount of original
currency
61 CIMC Raffles Offshore (Singapore) Limited (“Raffles”)
Singapore USD 624,541,970.96 Singapore Production of various ship for offshore oil and gas, including jack-up drilling platforms, semi-submersible drilling Platforms, FPSOs,FSOs
USD 624,541,970.96 100.00% 100.00% Yes – –
62 CIMC Raffles Investments Limited Hongkong, China
HKD 2.00 Hongkong, China
Investment HKD 2.00 100.00% 100.00% Yes – –
63 CIMC Raffles Leasing Pte Ltd. Singapore SGD 2.00 Singapore Leasing of marine ship SGD 2.00 100.00% 100.00% Yes – –
64 Caspian Driller Pte.Ltd. Singapore USD 30,000,000.00 Singapore Leasing of marine ship USD 30,000,000.00 100.00% 100.00% Yes – –
65 Technodyne International Limited (“Technodyne”)
United Kingdom
GBP 1.00 United Kingdom Research and development of Energy equipment
GBP 0.60 60.00% 100.00% Yes Note 3 Note 3
66 Gadidae AB. Sweden SEK 1,000.00 Sweden Investment SEK 1,000.00 100.00% 100.00% Yes – –
67 Perfect Victor Investments Limited (“Perfect Victor”)
Hongkong, China
USD 1.00 Hongkong, China
Investment USD 1.00 100.00% 100.00% Yes – –
68 Ziemann International GmbH (“Ziemann Group”)
Germany EUR 16,000,000.00 Germany Design, production and sales of beer fermentation machine and relevant services
EUR 11,222,400.00 70.14% 100.00% Yes Note 1 Note 1
69 Albert Ziegler GmbH (“Ziegler”) Germany EUR 10,025,000.00 Germany Designation of Marine engineering
EUR 10,025,000.00 100.00% 100.00% Yes – –
IV. BUSINESS CoMBINAtIoNS AND tHE CoNSolIDAtED FINANCIAl StAtEMENtS (CoNtINUED)
1. Company status of investment in subsidiaries (Continued)
(3) Subsidiaries acquired through combinations under non-common control (Continued)
(ii) Overseas subsidiaries: (Continued)

228 China International Marine Containers (Group) Co., Ltd.
Chapter 13Financial Statements Prepared in Accordance with China Accounting StandardsFor the year ended 31 December 2013(All amounts in RMB’000 unless otherwise stated)(English Translation for Reference Only)
NameRegistration Place
Registered capital
Main Premises Business scope
Actual investment and actual net amount of
Investment of the company at the end of the year
Shareholding percentage
%
Voting rights
%
within consolidation
scope
Amount of minority
interest at the end of
the year RMB’000
Amount of gain/(loss) for
current period attributable to minority
shareholders that allocated
to minority interests
RMB’000Currency
Amount of original
currency Currency
Amount of original
currency
70 Bassoe Technology AB (“Bassoe”) Sweden SEK 1,000,000.00 Sweden Designation of Marine engineering
SEK 900,000.00 90.00% 100.00% Yes 2,146 –
71 Verbus Systems Limited (“Verbus Systems”)
United Kingdom
GBP 3,884,303.00 United Kingdom Investment GBP 3,107,442.40 80.00% 100.00% Yes (7,628) (2,625)
72 Zhenhua logistics (Hongkong) Co., Ltd. (“Zhenhua Hongkong”)
Hongkong, China
HKD 6,600,000.00 Hongkong, China
Logistics HKD 4,950,000.00 75.00% 100.00% Yes Note 6 Note 6
73 CIMC Australia Road Transport Equipment Pty Ltd (“CARTE”)
Australia AUD 8,300,000.00 Australia Investment AUD 6,640,000.00 80.00% 100.00% Yes Note 4 Note 4
Note 1 Enric and its subsidiaries’ minority interests amounted to RMB1,576,657,000, against which RMB290,176,000 of gain attributed to minority shareholders was allocated.
Note 2 CIMC Tianyu and its subsidiaries’ minority interests amounted to RMB172,762,000, against which RMB40,620,000 of gain attributed to minority shareholders was allocated.
Note 3 TGE SA and its subsidiaries’ minority interests amounted to RMB79,320,000, against which RMB2,632,000 of gain attributed to minority shareholders was allocated.
Note 4 HI and its subsidiaries’ minority interests amounted to RMB908,796,000, against which RMB72,107,000 of gain attributed to minority shareholders was allocated.
Note 5 As at 31 December 2013, the cumulated dividends declared by CIMC Hong Kong to the Company was HKD3,840,313,000 (RMB3,019,351,000). The company had no plan to receive the dividends in foreseeable future, therefor, it comprise net investment to CIMC Hong Kong.
Note 6 Zhenhua Group and its subsidiaries’ minority interests amounted to RMB328,335,000, against which RMB29,996,000 of gain attributed to minority shareholders was allocated.
Note 7 TAS and its subsidiaries’ minority interests amounted to RMB123,144,000, against which RMB22,910,000 of gain attributed to minority shareholders was allocated.
IV. BUSINESS CoMBINAtIoNS AND tHE CoNSolIDAtED FINANCIAl StAtEMENtS (CoNtINUED)
1. Company status of investment in subsidiaries (Continued)
(3) Subsidiaries acquired through combinations under non-common control (Continued)
(ii) Overseas subsidiaries: (Continued)

Annual Report 2013 229
Chapter 13 Financial Statements Prepared in Accordance with China Accounting Standards
For the year ended 31 December 2013(All amounts in RMB’000 unless otherwise stated)
(English Translation for Reference Only)
IV. BUSINESS CoMBINAtIoNS AND tHE CoNSolIDAtED FINANCIAl StAtEMENtS (CoNtINUED)
1. Company status of investment in subsidiaries (Continued)
(4) Subsidiaries with significant minority interests is as follows:
Minority interests as at
31/12/2013
Net Profit attribute
to minority interests in
2013
Dividends distributed to minority interests in
2013
Enric 1,576,657 290,176 32,283
Main financial information of aforementioned subsidiary:
Financial condition as at 31 December 2013Current
assetsNon-current
assetsCurrent
liabilitiesNon-current
liabilities Net assets
Enric 7,068,984 2,491,194 4,090,343 461,165 5,008,670
Financial condition as at 31 December 2012Current
assetsNon-current
assetsCurrent
liabilitiesNon-current
liabilities Net assets
Enric 5,324,243 2,402,939 3,115,212 534,131 4,077,839
Business Performance in 2013
Revenue total profit Net profit
other compre-hensive income
total compre-hensive income
Enric 9,981,462 1,182,982 980,666 12,158 992,824
Business Performance in 2012
Revenue Total profit Net profit
Other compre-hensive income
Total compre-hensive income
Enric 8,082,895 927,138 765,576 34,704 800,280

230 China International Marine Containers (Group) Co., Ltd.
Chapter 13Financial Statements Prepared in Accordance with China Accounting StandardsFor the year ended 31 December 2013(All amounts in RMB’000 unless otherwise stated)(English Translation for Reference Only)
IV. BUSINESS CoMBINAtIoNS AND tHE CoNSolIDAtED FINANCIAl StAtEMENtS (CoNtINUED)
1. Company status of investment in subsidiaries (Continued)
(4) Subsidiaries with significant minority interests is as follows: (Continued)
Cash Flows in 2013Net cash
inflows from
operating activities
Net cash outflows
from investing activities
Net cash outflows
from financing activities
Cash and cash
equivalents at beginning
of year
Cash and cash
equivalents at end of
year
Enric 1,116,005 (236,910) (286,581) 953,308 1,532,190
Cash Flows in 2012
Net cash inflows from
operating activities
Net cash outflows
from investing activities
Net cash outflows
from financing activities
Cash and cash
equivalents at beginning
of year
Cash and cash
equivalents at end of
year
Enric 856,704 (726,458) (211,098) 992,130 953,308
2. there are no entities set up for special purpose or operating entities controlled through entrusted operation and lease.
3. Changes in the scope of consolidation for the consolidation financial statements
Newly purchased (see Note IV.6) and established subsidiaries in the year change the scope of the consolidation financial statements.
4. Subsidiaries newly included in the scope of consolidation and excluded from the scope of consolidation for the current year
(1) Subsidiaries newly included in the scope of consolidation
Net asset as at 31 December
2013Net profit
for 2013
Zhenhua Group – Acquired through business combination(i) 998,364 75,640Bassoe – Acquired through business combination(i) 21,455 –Ziegler – Acquired through business combination(i) 246,272 –
(i) The companies disclosed above were acquired in a business combination involving enterprises not under common control. The net profit for the current period is the net profit earned from the acquisition date to 31 December 2013 (Note IV 6).

Annual Report 2013 231
Chapter 13 Financial Statements Prepared in Accordance with China Accounting Standards
For the year ended 31 December 2013(All amounts in RMB’000 unless otherwise stated)
(English Translation for Reference Only)
IV. BUSINESS CoMBINAtIoNS AND tHE CoNSolIDAtED FINANCIAl StAtEMENtS (CoNtINUED)
4. Subsidiaries newly included in the scope of consolidation and excluded from the scope of consolidation for the current year (Continued)
(2) other subsidiaries newly included in the scope of consolidation mainly comprised of Hongxin Berg and other 103 subsidiaries.
(3) there was no significant subsidiary, special purpose entity, business entity that having control through being entrusted to manage or leasing that was excluded from the scope of consolidation for the current year.
5. there is no acquisition through combination under common control for the current year (2012: Nil).
6. the Group’s acquisition through combination not under common control for the current year
(1) Zhenhua Group
Amount of goodwill Calculation of goodwill
Zhenhua Group 21,994 Goodwill is recognised at the excess of the combination cost over the acquirer’s interests in the fair value of the acquiree’s identifiable net assets acquired during the acquisition. The calculation is as follows.
On 6 March 2013, the Group signed share transfer contract with other shareholders of Zhenhua Group to acquire 36.78% of equity interest in Zhenhua Group at the consideration of RMB408,666,000. Before this transaction, the Group already held 38.22% of equity interest in Zhenhua Group. This deal completed on 1 April 2013 and the Group’s equity interests in Zhenhua Group increased to 75% after the deal.
Zhenhua Group locate in Tianjin and mainly engage in logistics related business.
(i) Details of the costs of combination and goodwill recognised are as follows:
Costs of combination - Cash paid 408,666 The fair value of long-term equity investment held before 401,343Less: fair value of identifiable net assets obtained (788,015)
Goodwill 21,994
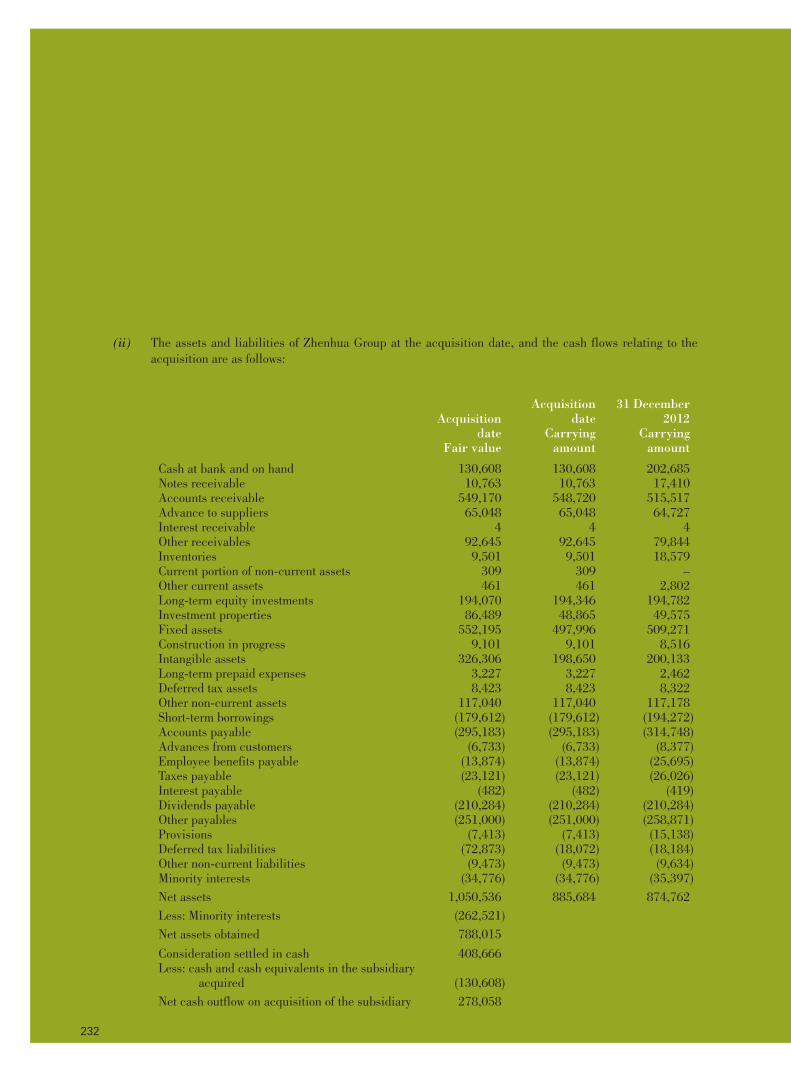
232 China International Marine Containers (Group) Co., Ltd.
Chapter 13Financial Statements Prepared in Accordance with China Accounting StandardsFor the year ended 31 December 2013(All amounts in RMB’000 unless otherwise stated)(English Translation for Reference Only)
IV. BUSINESS CoMBINAtIoNS AND tHE CoNSolIDAtED FINANCIAl StAtEMENtS (CoNtINUED)
6. the Group’s acquisition through combination not under common control for the current year (Continued)
(1) Zhenhua Group (Continued)
(ii) The assets and liabilities of Zhenhua Group at the acquisition date, and the cash flows relating to the acquisition are as follows:
Acquisition date
Fair value
Acquisition date
31 December 2012
Carrying amount
Carrying amount
Cash at bank and on hand 130,608 130,608 202,685Notes receivable 10,763 10,763 17,410Accounts receivable 549,170 548,720 515,517Advance to suppliers 65,048 65,048 64,727Interest receivable 4 4 4Other receivables 92,645 92,645 79,844Inventories 9,501 9,501 18,579Current portion of non-current assets 309 309 –Other current assets 461 461 2,802Long-term equity investments 194,070 194,346 194,782Investment properties 86,489 48,865 49,575Fixed assets 552,195 497,996 509,271Construction in progress 9,101 9,101 8,516Intangible assets 326,306 198,650 200,133Long-term prepaid expenses 3,227 3,227 2,462Deferred tax assets 8,423 8,423 8,322Other non-current assets 117,040 117,040 117,178Short-term borrowings (179,612) (179,612) (194,272)Accounts payable (295,183) (295,183) (314,748)Advances from customers (6,733) (6,733) (8,377)Employee benefits payable (13,874) (13,874) (25,695)Taxes payable (23,121) (23,121) (26,026)Interest payable (482) (482) (419)Dividends payable (210,284) (210,284) (210,284)Other payables (251,000) (251,000) (258,871)Provisions (7,413) (7,413) (15,138)Deferred tax liabilities (72,873) (18,072) (18,184)Other non-current liabilities (9,473) (9,473) (9,634)Minority interests (34,776) (34,776) (35,397)Net assets 1,050,536 885,684 874,762Less: Minority interests (262,521)Net assets obtained 788,015
Consideration settled in cash 408,666Less: cash and cash equivalents in the subsidiary
acquired (130,608)Net cash outflow on acquisition of the subsidiary 278,058

Annual Report 2013 233
Chapter 13 Financial Statements Prepared in Accordance with China Accounting Standards
For the year ended 31 December 2013(All amounts in RMB’000 unless otherwise stated)
(English Translation for Reference Only)
IV. BUSINESS CoMBINAtIoNS AND tHE CoNSolIDAtED FINANCIAl StAtEMENtS (CoNtINUED)
6. the Group’s acquisition through combination not under common control for the current year (Continued)
(1) Zhenhua Group (Continued)
(ii) The assets and liabilities of Zhenhua Group at the acquisition date, and the cash flows relating to the acquisition are as follows: (Continued)
As at the date of acquisition, the fair values of identifiable long-term equity investments, investment properties, fixed assets and intangible assets were defined by valuation, and deferred tax liabilities were recognised accordingly. The fair value of other assets were similar to their carrying amount.
The revenue, net profit and cash flows of Zhenhua Group of the period from the acquisition date to 31 December 2013 are as follows:
Revenue 3,907,164Net profit 75,640Cash flows from operating activities 88,846Net cash flows 81,785
(2) Bassoe
Profit in combination Calculation of goodwill
Bassoe 132,245 Goodwill is recognised at the excess of the combination cost over the acquirer’s interests in the fair value of the acquiree’s identifiable net assets acquired during the acquisition. The calculation is as follows.
On 31 December 2013, the Group acquired 90% of equity interests in Bassoe Technology AB at the consideration of USD24,855,000 equivalent to approximately (RMB152,423,000) from BASSTECH AS and employee shareholders through its wholly-owned subsidiary CIMC TOP GEAR B.V..
Bassoe is a service company providing design services for offshore engineering.
Goodwill from this business combination is mainly to improve the design ability of offshore engineering business.
(i) Details of the costs of combination and profit recognised are as follows:
Costs of combination -Cash paid 151,554Less: fair value of identifiable net assets obtained (19,309)
Goodwill 132,245

234 China International Marine Containers (Group) Co., Ltd.
Chapter 13Financial Statements Prepared in Accordance with China Accounting StandardsFor the year ended 31 December 2013(All amounts in RMB’000 unless otherwise stated)(English Translation for Reference Only)
IV. BUSINESS CoMBINAtIoNS AND tHE CoNSolIDAtED FINANCIAl StAtEMENtS (CoNtINUED)
6. the Group’s acquisition through combination not under common control for the current year (Continued)
(2) Bassoe (Continued)
(ii) The assets and liabilities of Bassoe at the acquisition date, and the cash flows relating to the acquisition are as follows:
Acquisition date Acquisition date31 December
2012Fair value Carrying amount Carrying amount
Cash at bank and on hand 19,752 19,752 19,752Accounts receivable 16,040 16,040 16,040Advance to suppliers 2,310 2,310 2,310Inventories 3,681 3,681 3,681Fixed assets 1,215 1,215 1,215Accounts payable (4,377) (4,377) (4,377)Employee benefits payable (10,981) (10,981) (10,981)Taxes payable (2,257) (2,257) (2,257)Other payables (3,928) (3,928) (3,928)
Net assets 21,455 21,455 21,455
Less: Minority interests (2,146)
Net assets obtained 19,309
Consideration settled in cash 151,554Less: cash and cash equivalents in the subsidiary
acquired (19,752)
Net cash outflow on acquisition of the subsidiary 131,802
The revenue, net profit and cash flows of Bassoe for the period from the acquisition date to 31 December 2013 is immaterial to the Group.

Annual Report 2013 235
Chapter 13 Financial Statements Prepared in Accordance with China Accounting Standards
For the year ended 31 December 2013(All amounts in RMB’000 unless otherwise stated)
(English Translation for Reference Only)
IV. BUSINESS CoMBINAtIoNS AND tHE CoNSolIDAtED FINANCIAl StAtEMENtS (CoNtINUED)
6. the Group’s acquisition through combination not under common control for the current year (Continued)
(3) Ziegler
Amount ofnegative goodwill Calculation of negative goodwill
Ziegler 35,017 Negative goodwill is recognised at the excess of the combination cost over the acquirer’s interests in the fair value of the acquiree’s identifiable net assets acquired during the acquisition. The calculation is as follows.
On 31 December 2013, CIMC Ziegler, a wholly owned subsidiary of the Company, acquired all assets(included equity in subsidiaries) other than cash and receivables of Albert Ziegler GmbH&Co.KG(“AZG”) for a consideration of EUR 57,404,000 (equivalent to approximately RMB483,199,000), by entering into an assets purchase agreement with the administrators in bankruptcy of AZG.
AZG is one of the world’s leading firefighting equipments manufactures. Its headquarter located in Giengen, Germany. AZG had six production bases, who located in Germany (including 1 located in headquarter in Giengen), the Netherlands, Croatia and Indonesia. Also it had 3 sales and service subsidiaries located in Italy, Slovenia and the Czech Republic. This acquisition could enhance the Group’s competitive advantage in the high-end market for firefighting vehicles.
(i) Details of the costs of combination and profit recognised are as follows:
Costs of combination - Cash paid 483,199Less: Fair value of identifiable net assets obtained (518,216)
Profit from business combination (35,017)
The holding company of AZG Group was forced into bankruptcy compulsory liquidation procedure, therefore the Group successfully bid for aforementioned assets with at a lower price and got profit from this business combination.

236 China International Marine Containers (Group) Co., Ltd.
Chapter 13Financial Statements Prepared in Accordance with China Accounting StandardsFor the year ended 31 December 2013(All amounts in RMB’000 unless otherwise stated)(English Translation for Reference Only)
IV. BUSINESS CoMBINAtIoNS AND tHE CoNSolIDAtED FINANCIAl StAtEMENtS (CoNtINUED)
6. the Group’s acquisition through combination not under common control for the current year (Continued)
(3) Ziegler (Continued)
(ii) The assets and liabilities of Zhenhua Group at the acquisition date, and the cash flows relating to the acquisition are as follows:
Acquisition date
Fair value
Acquisition date
31 December 2012
Carrying amount
Carrying amount
Cash at bank and on hand 66,733 66,733 66,733Accounts receivable 83,212 83,212 83,212Other receivables 4,486 4,486 4,486Inventories 258,541 258,541 258,541Other long-term equity investments 48,933 15,768 15,768Fixed assets 144,387 44,160 44,160Intangible assets 69,431 – –Deferred tax assets 1,742 1,742 1,742Short-term borrowings (11,577) (11,577) (11,577)Accounts payable (27,023) (27,023) (27,023)Advances from customers (12,028) (12,028) (12,028)Employee benefits payable (25,414) (25,414) (25,414)Taxes payable (30,552) (30,552) (30,552)Interest payable (398) (398) (398)Other payables (26,840) (26,840) (26,840)Provisions (15,378) (15,378) (15,378)Deferred tax liabilities (10,039) – –
Net assets obtained 518,216 325,432 325,432
Consideration settled in cash 483,199Less: cash and cash equivalents in the subsidiary
acquired (66,733)
Net cash outflow on acquisition of the subsidiary 416,466
The revenue, net profit and cash flows of Ziegler for the period from the acquisition date to 31 December 2013 is immaterial to the Group.

Annual Report 2013 237
Chapter 13 Financial Statements Prepared in Accordance with China Accounting Standards
For the year ended 31 December 2013(All amounts in RMB’000 unless otherwise stated)
(English Translation for Reference Only)
IV. BUSINESS CoMBINAtIoNS AND tHE CoNSolIDAtED FINANCIAl StAtEMENtS (CoNtINUED)
6. the Group’s acquisition through combination not under common control for the current year (Continued)
(4) CIMC Air Marrel SAS, General transport Equipment Pty ltd. and Hongxin Berg
In 2013, the Group acquired certain assets of CIMC Air Marrel SAS for an aggregate consideration of EUR 1,200,000 (equivalent to RMB10,101,000), by entering into an assets purchase agreement with the administrators in the bankruptcy of CIMC Air Marrel SAS. This acquisition is considered as business combination. According to the valuation result, no goodwill occurred from this acquisition.
In 2013, the Company acquired 100% of equity interests in Australian company General Transport Equipment Pty Ltd. fora consideration of AUD 6,860,000(equivalent to RMB37,242,000), through its 80% owned subsidiary, CIMC Australia Road Transport Equipment Pty Ltd.. According to the valuation result, no goodwill occurred from this acquisition.
In 2013, CIMC Financing and Leasing Co., Ltd., Shenzhen CIMC Investment Co., Ltd and Shenzhen Sky Capital Co., Ltd which are all wholly-owned subsidiaries of the Company signed shareholding transfer contracts with Xiamen Hongxin Berg Leasing Co. Ltd. respectively and acquired aggregate 51% of equity in Hongxin Berg for a total consideration of RMB50,122,000. An amount of RMB10,590,000 of Goodwill was recognised by the Group.
The considerations paid in the above three business combination, the revenue, net profit and cash flows of the 3 aforementioned business combinations for the period from the acquisition date to 31 December 2013 are immaterial to the Group.
7. there is no loss of control of subsidiaries by disposal of equity interest for the current year.
8. there is no reverse acquisition of the Group for the current year.
9. there is no consolidation by merger of the Group for the current year.
10. Significant acquisition of minority interests for the current year
(1) On 8 February 2013, the Group completed its acquisition of remaining 11.42% of equity interests Raffles for a consideration of USD0.55 per share through its wholly owned subsidiary- CIMC Offshore. Since then, Raffles became a wholly owned subsidiary of CIMC Offshore.
The difference between the consideration paid for acquisition of minority interests and the additional share of the subsidiary’s identifiable net assets was amounted to RMB136,434,000, which was recognised in capital surplus.
(2) On 31 December 2013, CIMC USA, the wholly owned subsidiary of the Group completed its acquisition of 40% of equity interests in of Direct Classis LLC for a consideration of USD6,101,000. Since then, Direct Classis LLC became a wholly owned subsidiary of CIMC USA.
The difference between the consideration paid for acquisition of minority interests and the additional share of the subsidiary’s identifiable net assets amounted to RMB2,054,000, which was recognised in capital surplus.

238 China International Marine Containers (Group) Co., Ltd.
Chapter 13Financial Statements Prepared in Accordance with China Accounting StandardsFor the year ended 31 December 2013(All amounts in RMB’000 unless otherwise stated)(English Translation for Reference Only)
IV. BUSINESS CoMBINAtIoNS AND tHE CoNSolIDAtED FINANCIAl StAtEMENtS (CoNtINUED)
11. Significant disposal of subsidiary’s equity for current year
In 2013, CIMC Vehicle, the Company’s 80% owned subsidiary, disposed 75,056,000 number of ordinary shares of Enric at the price of HKD8.37 per share, representing approximately 3.19% equity interests, and received total proceeds of HKD628,219,000 (equivalent to RMB: 498,040,000). The difference between the proceeds from disposal and the share of the subsidiary’s identifiable net assets was amounted to RMB279,273,000, which was recognised in capital surplus.
12. Exchange rates applied to financial statement items of foreign operations
Average exchange rateBenchmark rate on reporting date
2013 201231 December
201331 December
2012
USD 6.1767 6.3091 6.0976 6.2854EUR 8.2372 8.1235 8.4175 8.3195HKD 0.7964 0.8135 0.7862 0.8108JPY 0.0623 0.0785 0.0578 0.0730
The shareholders’ equity items other than “undistributed profits”, income and expense items, and the cash flows are translated at the spot exchange rates at the dates of the transactions.

Annual Report 2013 239
Chapter 13 Financial Statements Prepared in Accordance with China Accounting Standards
For the year ended 31 December 2013(All amounts in RMB’000 unless otherwise stated)
(English Translation for Reference Only)
V. NotES to tHE CoNSolIDAtED FINANCIAl StAtEMENtS
1. Cash at bank and on hand
31 December 2013 31 December 2012
Amount in foreign currency
Exchange rate
Amount in RMB
Amount in foreign currency
Exchange rate
Amount in RMB
’000 ’000 ’000 ’000
Cash on handRMB 2,031 1.0000 2,031 RMB 1,119 1.0000 1,119USD 28 6.0976 172 USD 21 6.2854 134HKD 13 0.7862 10 HKD 17 0.8108 14JPY 335 0.0578 19 JPY 753 0.0730 55EUR 27 8.4175 226 EUR 29 8.3195 240Others 19 Others 18
Sub-total 2,477 1,580
Bank depositsRMB 2,258,211 1.0000 2,258,211 RMB 1,777,496 1.0000 1,777,496USD 175,360 6.0976 1,069,266 USD 282,272 6.2854 1,774,192HKD 318,998 0.7862 250,804 HKD 82,389 0.8108 66,801JPY 535,476 0.0578 30,935 JPY 530,164 0.0730 38,702AUD 34,444 5.4289 186,995 AUD 17,779 6.5359 116,200EUR 30,508 8.4175 256,800 EUR 65,527 8.3195 545,150Others 75,316 Others 74,079
Sub-total 4,128,327 4,392,620
Other cash balancesRMB 581,877 1.0000 581,877 RMB 599,864 1.0000 599,864USD 9,514 6.0976 58,014 USD 36,180 6.2854 227,402HKD 30 0.7862 23 HKD 90 0.8108 73EUR 39 8.4175 329 EUR – 8.3195 –
Sub-total 640,243 827,339
Total 4,771,047 5,221,539
As at 31 December 2013, restricted cash at bank and on hand of the Group amounted to RMB589,551,000 (31 December 2012: RMB824,027,000). Refer to Note V.22 for details.
As at 31 December 2013, restricted cash at bank and on hand of the Group included deposit with central bank totalling of RMB330,205,000 of Finance Company, the subsidiary of the Group (31 December 2012: RMB559,009,000). Finance Company is a finance institution authorised by the People’s Bank of China.

240 China International Marine Containers (Group) Co., Ltd.
Chapter 13Financial Statements Prepared in Accordance with China Accounting StandardsFor the year ended 31 December 2013(All amounts in RMB’000 unless otherwise stated)(English Translation for Reference Only)
V. NotES to tHE CoNSolIDAtED FINANCIAl StAtEMENtS (CoNtINUED)
2. Financial assets at fair value through profit or loss
(1) Classification of financial assets at fair value through profit or loss
Note31 December
201331 December
2012
Current Portion1. Investments in equity instrument held for trading
– Listed companies (3) 319,605 389,5572. Derivative financial assets
– Forward contract (4) 132,134 12,6843. Hedging Instrument 7,940 2,851
Total 459,679 405,092
Non-current PortionDerivative financial assets – Forward contract (4) 934 –
(2) As at 31 December 2013, there is no material restriction of the investment in financial assets at fair value through profit or loss.
(3) the equity instruments held for trading are securities listed on the Stock Exchange of Hong Kong limited, the Shenzhen Stock Exchange and the Singapore Exchange limited, of which the fair value is determined at the closing price the Stock Exchange of Hong Kong limited, the Shenzhen Stock Exchange and the Singapore Exchange limited on the last trading day of the year.
(4) Derivative financial assets at fair value through profit or loss
As at 31 December 2013, the Group had certain open forward contracts (mainly unsettled forward contracts) denominated in U.S. dollars. The nominal value of these contracts amounted to USD1,902 million. The Group had other unsettled forward contracts of Japanese Yuan, Euro, Australian Dollar and Pound. The nominal value of these amounted to JPY 964 million, EUR 14.60 million, AUD 8.70 million and GBP 4 million respectively. Pursuant to these forward contracts, the Group and the Company are required to buy/sell foreign currencies, such as USD, Euro, Japanese Yuan, and etc. of contracted nominal value at agreed rates in exchange of RMB at the contract settlement dates. These forwards contracts will be settled on a net basis by comparing the market rates at the settlement dates and the agreed rates. The settlement dates of the aforesaid forwards contracts range from 6 January 2014 to 16 May 2015.

Annual Report 2013 241
Chapter 13 Financial Statements Prepared in Accordance with China Accounting Standards
For the year ended 31 December 2013(All amounts in RMB’000 unless otherwise stated)
(English Translation for Reference Only)
V. NotES to tHE CoNSolIDAtED FINANCIAl StAtEMENtS (CoNtINUED)
3. Notes receivable
(1) Classification of Notes receivable
31 December 2013
31 December 2012
Bank acceptance notes 1,336,187 776,309Trade acceptance notes 40,099 1,800
Total 1,376,286 778,109
All of the above bills receivable are due within one year.
No amount due from shareholders who hold 5% or more of the voting rights of the Company is included in the above balance of bills receivable.
(2) As at 31 December 2013, the Group had no pledged notes receivable (31 December 2012: Nil).
(3) As at 31 December 2013, there were no amount transferred to accounts receivable from acceptance bills due to failure of performance by the issuers (31 December 2012: Nil).
(4) At 31 December 2013, the five largest amounts of outstanding notes receivable endorsed by the Group are:
Issuer Issuance date Maturity date Amount Notes
Luoyang Urban Development& Investment Group Co., Ltd.
27 December 2013 27 June 2014 10,000 Bank acceptance notes
Qingdao Yu Tiancheng Industrial Co., Ltd.
15 August 2013 15 February 2014 6,000 Bank acceptance notes
Beijing Futian International Trade Co., Ltd.
10 September 2013 10 March 2014 5,000 Bank acceptance notes
Shaanxi Emerging Era of Automobile Sales Co., Ltd.
15 October 2013 15 April 2014 5,000 Bank acceptance notes
Daqing Lianxin Technology Engineering Co., Ltd
28 October 2013 28 April 2014 5,000 Bank acceptance notes
Total 31,000

242 China International Marine Containers (Group) Co., Ltd.
Chapter 13Financial Statements Prepared in Accordance with China Accounting StandardsFor the year ended 31 December 2013(All amounts in RMB’000 unless otherwise stated)(English Translation for Reference Only)
V. NotES to tHE CoNSolIDAtED FINANCIAl StAtEMENtS (CoNtINUED)
4. Accounts receivable
(1) Accounts receivables are analysed by customer categories as follows:
31 December 2013
31 December 2012
Category containers 2,760,476 2,711,559Category transportation vehicles 2,093,979 1,827,664Category energy, chemistry and food equipment 2,516,083 2,215,151Category offshore engineering 1,314,554 1,022,797Category airport facilities 599,073 413,934Category logistics services and equipment 1,020,275 122,126Category others 163,684 294,723
Sub-total 10,468,124 8,607,954Less: provision for bad debts (401,635) (369,921)
Total 10,066,489 8,238,033
(2) the ageing of accounts receivable is analysed as follows:
31 December 2013
31 December 2012
Within 1 year (inclusive) 9,175,028 7,524,7491 to 2 years (inclusive) 358,007 814,7302 to 3 years (inclusive) 719,123 162,123Over 3 years 215,966 106,352
Sub-total 10,468,124 8,607,954Less: provision for bad debts (401,635) (369,921)
Total 10,066,489 8,238,033

Annual Report 2013 243
Chapter 13 Financial Statements Prepared in Accordance with China Accounting Standards
For the year ended 31 December 2013(All amounts in RMB’000 unless otherwise stated)
(English Translation for Reference Only)
V. NotES to tHE CoNSolIDAtED FINANCIAl StAtEMENtS (CoNtINUED)
4. Accounts receivable (Continued)
(3) Accounts receivables are analysed by categories as follows:
31 December 2013 31 December 2012
Ending balance Provision for bad debts Ending balance Provision for bad debts
Amount% of total
balance Amount Ratio Amount% of total
balance Amount Ratio
With amounts that are individually significant and that the related provision for bad debts is provided on the individual basis (4) 1,702,814 16.27% 171,748 10.09% 1,431,696 16.63% 169,086 11.81%
With amounts that are not individually significant but that the related provision for bad debts is provided on the individual basis (5) 290,223 2.77% 50,388 17.36% 45,659 0.53% 16,089 35.24%
That the related provision for bad debts is provided on the grouping basis*Group containers 2,524,211 24.11% 222 0.01% 2,435,399 28.30% 1,319 0.05%Group transportation vehicles 1,495,750 14.29% 69,293 4.63% 1,689,304 19.62% 94,664 5.60%Group energy, chemistry and
food equipment 2,343,713 22.39% 70,510 3.01% 2,087,691 24.25% 61,903 2.97%Group airport facilities 515,839 4.93% 24,442 4.74% 386,219 4.49% 22,377 5.79%Group logistics services and
equipment 923,262 8.82% 13,846 1.50% 285,541 3.32% 4,060 1.42%Group others 672,312 6.42% 1,186 0.18% 246,445 2.86% 423 0.17%
Group sub-total (6) 8,475,087 80.96% 179,499 2.12% 7,130,599 82.84% 184,746 2.59%
Total 10,468,124 100.00% 401,635 3.84% 8,607,954 100.00% 369,921 4.30%
Note*: This category includes accounts receivable individually tested but not impaired.
As at 31 December 2013, there were no collaterals that the Group held for accounts receivable that were made impairment aforesaid.

244 China International Marine Containers (Group) Co., Ltd.
Chapter 13Financial Statements Prepared in Accordance with China Accounting StandardsFor the year ended 31 December 2013(All amounts in RMB’000 unless otherwise stated)(English Translation for Reference Only)
V. NotES to tHE CoNSolIDAtED FINANCIAl StAtEMENtS (CoNtINUED)
4. Accounts receivable (Continued)
(3) Accounts receivables are analysed by categories as follows: (Continued)
Individually significant items represent accounts receivable with an individual amount over RMB10,000,000 (inclusive) or the book value of which account for 5% (inclusive) of the total accounts receivable in individual financial statements included in the consolidated financial statement.
Accounts receivable denominated in foreign currencies are as follows:
31 December 2013 31 December 2012
Amount in foreign currency
Exchange rate
Amount in RMB
Amount in foreign currency
Exchange rate
Amount in RMB
RMB 5,559,228 1.0000 5,559,228 3,230,211 1.0000 3,230,211USD 707,724 6.0976 4,315,419 697,967 6.2854 4,386,969HKD 25,752 0.7862 20,246 21,384 0.8108 17,339JPY 298,010 0.0578 17,225 520,829 0.0730 38,046AUD 13,752 5.4289 74,658 25,099 8.3195 208,809EUR 46,089 8.4175 387,954 103,649 6.5359 677,446Others 93,394 49,134
Total 10,468,124 8,607,954
(4) As at 31 December 2013, accounts receivable with amounts that are individually significant and that the related provision for bad debts is provided on the individual basis are analysed as follows:
Ending balance
Provision for bad
debts Ratio Reason
Group containers 229,906 2,942 1.28% Provision is made based on the estimated recoverable amount according to assessment of credit risk and historical data
Group transportation vehicles 352,642 31,351 8.89%Group energy, chemistry and
food equipment 167,274 5,084 3.04%Group offshore engineering 799,498 105,889 13.24%Group airport facilities 83,234 4,673 5.61%Group logistics services and
equipment 64,483 21,779 33.77%Group others 5,777 30 0.52%
Total 1,702,814 171,748 10.09%

Annual Report 2013 245
Chapter 13 Financial Statements Prepared in Accordance with China Accounting Standards
For the year ended 31 December 2013(All amounts in RMB’000 unless otherwise stated)
(English Translation for Reference Only)
V. NotES to tHE CoNSolIDAtED FINANCIAl StAtEMENtS (CoNtINUED)
4. Accounts receivable (Continued)
(5) As at 31 December 2013, accounts receivable with amounts that are not individually significant but that the related provision for bad debts is provided on the individual basis are analysed as follows:
Ending balance
Provision for bad
debts Ratio Reason
Group containers 6,359 1,618 25.44% Provision is made based on the estimated recoverable amount according to assessment of credit risk and historical data
Group transportation vehicles 245,587 30,548 12.44%Group energy, chemistry and
food equipment 5,096 607 –Group offshore engineering 651 651 100.00%Group airport facilities 32,530 16,964 52.15%Group logistics services and
equipment – – –
Total 290,223 50,388 17.36%
(6) Accounts receivable that the related provision for bad debts is provided on grouping basis using the ageing analysis method are analysed as follows:
31 December 2013 31 December 2012
Ending balance Provision for bad
debts
Ending balance Provision for bad
debtsAmount% of total
balance Amount% of total
balance
Within 1 year 8,072,731 77.12% 37,076 6,719,921 78.08% 86,7181 to 2 years 227,024 2.17% 14,649 261,199 3.03% 18,5762 to 3 years 106,062 1.01% 79,843 98,503 1.14% 29,011Over 3 years 69,270 0.66% 47,931 50,976 0.59% 50,441
Total 8,475,087 80.96% 179,499 7,130,599 82.84% 184,746
The ageing is counted starting from the date the account receivable is recognised.
(7) the recovery of provision in current year
There were accounts receivable that the related provision for bad debts had been provided in full amount or in large proportion in previous years but are collected or reversed in full amount or in large proportion in current year and it amounts to RMB7,768,000. The related revered bad debts provision amounts to RMB7,110,000 (2012: Nil).
(8) Accounts receivable that are written off in current year
There were no material accounts receivable that are written off in current year (2012: Nil).

246 China International Marine Containers (Group) Co., Ltd.
Chapter 13Financial Statements Prepared in Accordance with China Accounting StandardsFor the year ended 31 December 2013(All amounts in RMB’000 unless otherwise stated)(English Translation for Reference Only)
V. NotES to tHE CoNSolIDAtED FINANCIAl StAtEMENtS (CoNtINUED)
4. Accounts receivable (Continued)
(9) As at 31 December 2013, the five largest accounts receivable are analysed as follows:
Company NameRelationship
with the Group Amount Ageing% of total
balance
Soratu Drilling LLC None 485,343 2 to 3 years 4.64%Compagnie Maritime d’Affretement None 422,145 Within 1 year 4.03%Great Excel International Industrial
Limited None 414,634 Within 1 year 3.96%Sea Containers Ltd. None 413,394 Within 1 year 3.95%Baerfield Drilling LLC None 284,908 1 to 2 years 2.72%
Total 2,020,424 19.30%
The total amount of the Group’s five largest accounts receivable at 31 December 2012 was RMB2,015,627,000, 23.41% of the total accounts receivable.
(10) Accounts receivable from shareholders holding more than 5% (including 5%) of the voting rights of the Company are analysed as follows:
As at 31 December 2013, no amount due from shareholders holding more than 5% (including 5%) of the voting rights of the Company is included in the above balance of accounts receivable (31 December 2012:Nil).
(11) Accounts receivable from related parties are analysed as follows:
As at 31 December 2013, the Group’s accounts receivable due from related parties amount to RMB278,250,000 (31 December 2012: RMB218,419,000), accounting for 2.66% of the total accounts receivable (31 December 2012: 2.54%).
31 December 2013 31 December 2012
Company nameRelationship with the Group Amount
% of total balance
Provision for bad debts Amount
% of total balance
Provision for bad debts
Shanxi Heavy Duty Automobile Co., Ltd. (“SXHDA”)
Minority shareholders of subsidiaries 90,605 0.87% – 83,971 0.98% –
C&C Trucks Co., Ltd. (“C&C Trucks”)
Associate57,927 0.55% – 2,701 0.03% –
Florens Maritime Limited Subsidiary of significant shareholder 45,164 0.43% – 352 – –
Florens Container Corp. SA Subsidiary of significant shareholder 26,771 0.26% – 75 – –
Other related parties 57,783 0.55% – 131,320 1.53% –
Total 278,250 2.66% – 218,419 2.54% –

Annual Report 2013 247
Chapter 13 Financial Statements Prepared in Accordance with China Accounting Standards
For the year ended 31 December 2013(All amounts in RMB’000 unless otherwise stated)
(English Translation for Reference Only)
V. NotES to tHE CoNSolIDAtED FINANCIAl StAtEMENtS (CoNtINUED)
4. Accounts receivable (Continued)
(12) Accounts receivable derecognised due to transfer of financial assets are analysed as follows:
Accounts receivable with a carrying amount of RMB487,524,000 (2012: RMB412,241,000) are derecognised due to transfer of financial assets in current year, with no losses occurred (2012: Nil). The accounts receivable are transferred to financial institutions without recourse.
(13) Amount of assets and liabilities recognised due to the continuing involvement of securitised accounts receivable
There were no securitised accounts receivable during the year (2012: Nil).
As at 31 December 2013, restricted accounts receivable amount to RMB148,235,000 (31 December 2012: Nil). Refer to Note V.22.

248 China International Marine Containers (Group) Co., Ltd.
Chapter 13Financial Statements Prepared in Accordance with China Accounting StandardsFor the year ended 31 December 2013(All amounts in RMB’000 unless otherwise stated)(English Translation for Reference Only)
V. NotES to tHE CoNSolIDAtED FINANCIAl StAtEMENtS (CoNtINUED)
5. other receivables
(1) other receivables are analysed by categories as follows:
31 December 2013
31 December 2012
Receivables arising from financing to related parities 1,160,797 638,940Loans 206,517 504,369Drawback tax receivable 438,385 280,829Deposit 233,154 138,289Prepayment for land and equipment 57,727 109,776Receivable from transfer of equity investment 70,650 70,650Others 760,283 512,520
Sub-total 2,927,513 2,255,373Less: provision for bad debts (122,452) (140,938)
Total 2,805,061 2,114,435
(2) the ageing of other receivables is analysed as follows:
31 December 2013
31 December 2012
Within 1 year (Inclusive) 2,234,614 1,083,4761 to 2 years (Inclusive) 90,325 224,1382 to 3 years (Inclusive) 45,657 317,585Over 3 years 556,917 630,174
Sub-total 2,927,513 2,255,373Less: provision for bad debts (122,452) (140,938)
Total 2,805,061 2,114,435
The ageing is counted starting from the date the other receivable is recognised.

Annual Report 2013 249
Chapter 13 Financial Statements Prepared in Accordance with China Accounting Standards
For the year ended 31 December 2013(All amounts in RMB’000 unless otherwise stated)
(English Translation for Reference Only)
V. NotES to tHE CoNSolIDAtED FINANCIAl StAtEMENtS (CoNtINUED)
5. other receivables (Continued)
(3) other receivables are analysed by categories as follows:
31 December 2013 31 December 2012
Ending balance Provision for bad debts Ending balance Provision for bad debts
Note Amount% of total
balance Amount Ratio Amount% of total
balance Amount Ratio
Other receivables with amounts that are individually significant (4) 1,825,472 62.36% 46,157 2.53% 1,368,956 60.70% 71,145 5.20%Other receivables with amounts that are not individually significant (5) 1,102,041 37.64% 76,295 6.92% 886,417 39.30% 69,793 7.87%
Total 2,927,513 100.00% 122,452 4.18% 2,255,373 100.00% 140,938 6.25%
There were no collaterals that the Group held for other receivables that were made impairment aforesaid.
Individually significant items represent other receivables with an individual amount over RMB10,000,000 (inclusive) or the book value of which account for 5% (inclusive) of the total other receivables in individual financial statements included in the consolidated financial statement.
(4) As at 31 December 2013, other receivables with amounts that are individually significant and that the related provision for bad debts is provided on the individual basis are analysed as follows:
Ending balance
Provision for bad debts Ratio Reason
Receivables arising from financing to related parties 1,153,327 – 0% Note 1
Receivables arising from transfer of equity investment 70,650 – 0% Note 1
Receivables arising from purchase of land use right 15,650 – 0% Note 1
Receivables arising from financing to third parties 115,171 – 0% Note 1
Others 470,674 46,157 10% Note 1
Total 1,825,472 46,157 3%
Note 1: The provision for bad and doubtful debts is individually assessed based on the recoverability of individual balance.
(5) As at 31 December 2013, other receivables with amounts that are not individually significant but that the related provision for bad debts is provided on the individual basis are analysed as follows:
The Group assessed impairment of other receivables with amounts that are not individually significant and made provision of impairment of RMB76,295,000 as at 31 December 2013.

250 China International Marine Containers (Group) Co., Ltd.
Chapter 13Financial Statements Prepared in Accordance with China Accounting StandardsFor the year ended 31 December 2013(All amounts in RMB’000 unless otherwise stated)(English Translation for Reference Only)
V. NotES to tHE CoNSolIDAtED FINANCIAl StAtEMENtS (CoNtINUED)
5. other receivables (Continued)
(6) the recovery of provision in current year
There were no other receivables that the related provision for bad debts had been provided in full amount or in large proportion in previous years but are collected or reversed in full amount or in large proportion in current year (2012: Nil).
(7) other receivables that are written off in current year
There were no material other receivables that are written off in current year (2012: Nil).
(8) As at 31 December 2013, the five largest other receivables are analysed as follows:
Company Name NoteRelationship with the Group Amount Aging
% of total balance
C&C Trucks (i) Associate 635,825 within 1 year 21.68%Marine Subsea & Consafe (ii) Associate 278,911 Over 3 years 9.53%Frigstad Deepwater Holding
LimitedMinority shareholders
of subsidiaries155,901 Within 1 year 5.33%
Local State administration of Taxation in Yantai Export processing zone
None 133,807 Within 1 year and 2 to 3 years
4.57%
China Merchants Property Development Co., Ltd (“SZMPD”)
Significant shareholders of subsidiaries
70,650 Over 3 years 2.41%
Total 1,275,094 43.52%
The Group’s five largest other receivables as at 31 December 2012 amounted to RMB1,122,435,000, accounting for 49.77% of the total other receivables.
(i) The Group lent C&C Trucks loans and paid daily transactions on behalf of C&C Trucks.
(ii) Raffles completed its acquisition of Gadidae AB (formerly known as Consafe MSV AB) on 31 January 2011. Since December 2007, Gadidae AB had been making loans to its associate, Marine Subsea & Consafe (“MSC”), which amounted to USD35,625,000 (RMB217,226,000) as at 31 December 2011. Raffles recognised interest income according to loan agreement and recorded expenses paid on behalf of MSC with total amount of USD10,116,000 (RMB61,685,000) from 2007 to 31 January 2011.
(9) other receivables from shareholders holding more than 5% (including 5%) of the voting rights of the Company are analysed as follows:
As at 31 December 2013, no amount due from shareholders holding more than 5% (including 5%) of the voting rights of the Company is included in the above balance of other receivables (31 December 2012:Nil).

Annual Report 2013 251
Chapter 13 Financial Statements Prepared in Accordance with China Accounting Standards
For the year ended 31 December 2013(All amounts in RMB’000 unless otherwise stated)
(English Translation for Reference Only)
V. NotES to tHE CoNSolIDAtED FINANCIAl StAtEMENtS (CoNtINUED)
5. other receivables (Continued)
(10) As at 31 December 2013, other receivables from related parties are analysed as follows:
31 December 2013 31 December 2012
Company NameRelationship with the Group Amount Nature
% of total balance
Provision for bad debts Amount
% of total balance
Provision for bad debts
C&C Trucks Associate 635,825 Funding, daily
transactions
21.68% – 171,166 7.59% –
Marine Subsea & Consafe Associate 278,911 Funding 9.53% – 287,505 12.75% –Frigstad Deepwater Holding Limited
Minority shareholders of subsidiaries
155,901 Funding 5.33% – – – –
SZMPD Significant shareholder of the Group
70,650 transfer of equity
investment
2.41% – 70,650 3.13% –
Others 98,062 3.35% – 184,303 8.17% –
Total 1,239,349 42.30% – 713,624 31.64% –
(11) other receivables denominated in foreign currencies are as follows:
31 December 2013 31 December 2012
Amount in foreign currency
Exchange rate
Amount in RMB
Amount in foreign currency
Exchange rate
Amount in RMB
RMB 2,119,056 1.0000 2,119,056 1,639,933 1.0000 1,639,933USD 91,823 6.0976 559,899 64,078 6.2854 402,752HKD 21,709 0.7862 17,068 49,403 0.8108 40,057EUR 16,440 8.4175 138,387 14,933 8.3195 124,236Others 93,103 48,395
Total 2,927,513 2,255,373
(12) As at 31 December 2013, there is no government grant recognised based on receivables.
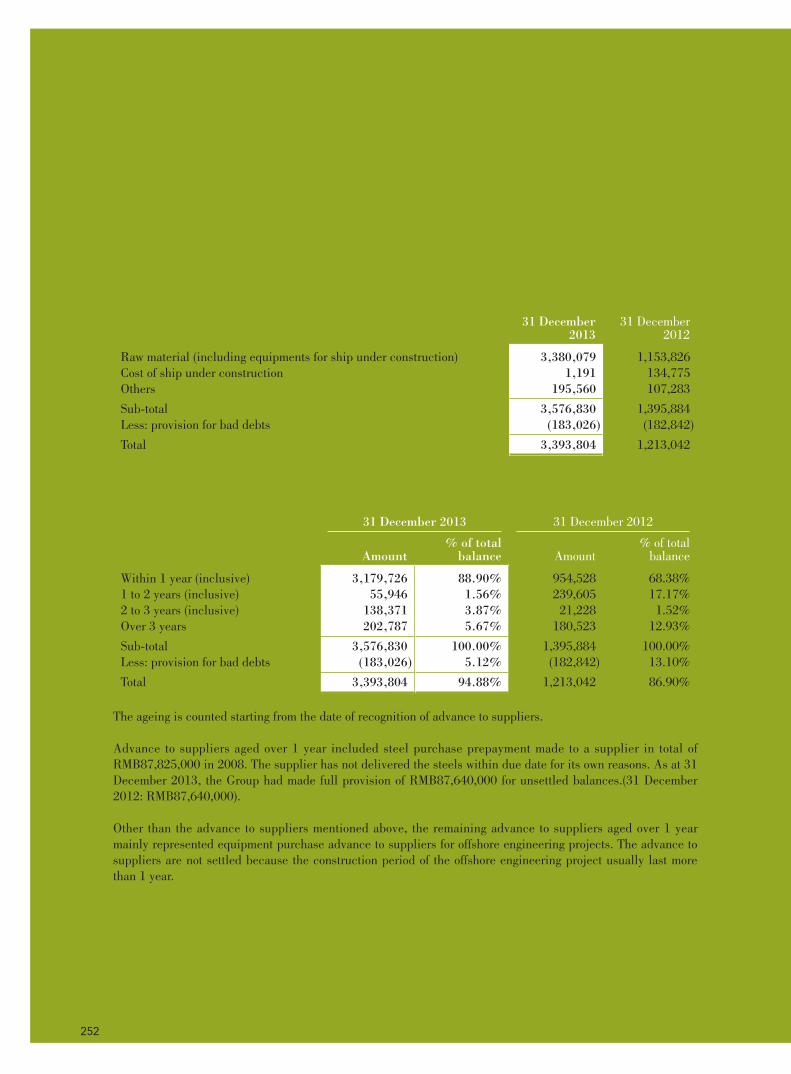
252 China International Marine Containers (Group) Co., Ltd.
Chapter 13Financial Statements Prepared in Accordance with China Accounting StandardsFor the year ended 31 December 2013(All amounts in RMB’000 unless otherwise stated)(English Translation for Reference Only)
V. NotES to tHE CoNSolIDAtED FINANCIAl StAtEMENtS (CoNtINUED)
6. Advance to suppliers
(1) Advance to suppliers are analysed by categories as follows:
31 December 2013
31 December 2012
Raw material (including equipments for ship under construction) 3,380,079 1,153,826Cost of ship under construction 1,191 134,775Others 195,560 107,283
Sub-total 3,576,830 1,395,884Less: provision for bad debts (183,026) (182,842)
Total 3,393,804 1,213,042
(2) the ageing of advance to suppliers is analysed below:
31 December 2013 31 December 2012
Amount% of total
balance Amount% of total
balance
Within 1 year (inclusive) 3,179,726 88.90% 954,528 68.38%1 to 2 years (inclusive) 55,946 1.56% 239,605 17.17%2 to 3 years (inclusive) 138,371 3.87% 21,228 1.52%Over 3 years 202,787 5.67% 180,523 12.93%
Sub-total 3,576,830 100.00% 1,395,884 100.00%Less: provision for bad debts (183,026) 5.12% (182,842) 13.10%
Total 3,393,804 94.88% 1,213,042 86.90%
The ageing is counted starting from the date of recognition of advance to suppliers.
Advance to suppliers aged over 1 year included steel purchase prepayment made to a supplier in total of RMB87,825,000 in 2008. The supplier has not delivered the steels within due date for its own reasons. As at 31 December 2013, the Group had made full provision of RMB87,640,000 for unsettled balances.(31 December 2012: RMB87,640,000).
Other than the advance to suppliers mentioned above, the remaining advance to suppliers aged over 1 year mainly represented equipment purchase advance to suppliers for offshore engineering projects. The advance to suppliers are not settled because the construction period of the offshore engineering project usually last more than 1 year.

Annual Report 2013 253
Chapter 13 Financial Statements Prepared in Accordance with China Accounting Standards
For the year ended 31 December 2013(All amounts in RMB’000 unless otherwise stated)
(English Translation for Reference Only)
V. NotES to tHE CoNSolIDAtED FINANCIAl StAtEMENtS (CoNtINUED)
6. Advance to suppliers (Continued)
(3) As at 31 December 2013, the five largest advance to suppliers are analysed as follows:
Company name
Relationship with the Group Amount
% of total
balance
Date of making advance
Reason for being unsettled
National oilwell Varco Norway AS None 1,066,068 31.34% 2012-2013 Vessels still under construction within due date
Thrustmaster of Texas, Inc None 221,645 6.52% 2008-2012 Goods not yet received within due date
Friede & Goldman Marketing BV None 147,068 4.32% 2011-2013 Vessels still under construction within due date
AKER MH AS None 91,604 2.69% 2012-2013 Goods transported in batches not yet received within due date
Stx Heavy Industries Co., Ltd. None 85,857 2.52% 2011 Goods transported in batches not yet received within due date
Total 1,612,242 47.39%
(4) Advance to shareholders holding more than 5% (including 5%) of the voting rights of the Company are analysed as follows:
As at 31 December 2013, no amount advance to shareholders holding more than 5% (including 5%) of the voting rights of the Company is included in the above balance of advance to suppliers (31 December 2012: Nil).

254 China International Marine Containers (Group) Co., Ltd.
Chapter 13Financial Statements Prepared in Accordance with China Accounting StandardsFor the year ended 31 December 2013(All amounts in RMB’000 unless otherwise stated)(English Translation for Reference Only)
V. NotES to tHE CoNSolIDAtED FINANCIAl StAtEMENtS (CoNtINUED)
6. Advance to suppliers (Continued)
(5) Advance to related parties are analysed as follows:
31 December 2013 31 December 2012
Company NameRelationship with the Group Amount
% of total balance
Provision for bad debts Amount
% of total balance
Provision for bad debts
Tianjin Port International Logistics Development Co., Ltd.
Minority shareholders of subsidiaries
61 – – – – –SXHDA Minority shareholders of
subsidiaries 7 – – 134 0.01% –Xiamen CIMC Haitou
Container Service Co., Ltd.
Associate
– – – 351 0.03% –
Total 68 – – 485 0.04% –
(6) Advance to suppliers denominated in foreign currencies are as follows:
31 December 2013 31 December 2012
Amount in foreign currency
Exchange rate
Amount in RMB
Amount in foreign currency
Exchange rate
Amount in RMB
RMB 834,831 1.0000 834,831 579,645 1.0000 579,645USD 329,630 6.0976 2,009,937 118,729 6.2854 746,253EUR 62,041 8.4175 522,231 5,634 8.3195 46,872JPY 2,824,829 0.0578 163,194 – – –GBP 3,137 10.0604 31,557 2,021 10.1626 20,536HKD 1,536 0.7862 1,208 2,684 0.8108 2,176AUD 858 5.4289 4,658 62 6.5359 402Others 9,215 –
Total 3,576,831 1,395,884

Annual Report 2013 255
Chapter 13 Financial Statements Prepared in Accordance with China Accounting Standards
For the year ended 31 December 2013(All amounts in RMB’000 unless otherwise stated)
(English Translation for Reference Only)
V. NotES to tHE CoNSolIDAtED FINANCIAl StAtEMENtS (CoNtINUED)
7. Inventories
(1) Inventories are summarised by categories as follows:
31 December 2013 31 December 2012
Ending balance
Provision for decline
in the value of
inventoriesCarrying
amountEnding balance
Provision for decline in
the value of inventories
Carrying amount
Raw materials 4,344,076 (188,127) 4,155,949 4,260,175 (146,690) 4,113,485Work in progress 2,395,311 (28,284) 2,367,027 2,094,286 (12,369) 2,081,917Finished goods 3,029,760 (106,330) 2,923,430 3,540,952 (70,542) 3,470,410Consignment stocks 166,835 (542) 166,293 203,874 (592) 203,282Spare parts 62,071 – 62,071 70,811 – 70,811Low-valued
consumables 42,167 – 42,167 44,353 – 44,353Materials in transit 55,202 – 55,202 63,803 – 63,803Completed properties
held for sale 186,157 186,157 139,254 – 139,254Properties under
development 2,033,079 2,033,079 1,838,319 – 1,838,319Ship under construction 2,593,482 (77,567) 2,515,915 5,914,418 (148,698) 5,765,720Offshore engineering
equipment 1,453,300 – 1,453,300 243,372 – 243,372
Total 16,361,440 (400,850) 15,960,590 18,413,617 (378,891) 18,034,726
The Group’s closing balances of inventories included capitalised borrowing cost amounting to RMB452,169,000 (31 December 2012: RMB427,156,000). The interest rate per annum at which the borrowing costs were capitalised was 4.77 % (2012: 5.58%).
As at 31 December 2013, the restricted inventories amount to RMB339,070,000 (31 December 2012: Nil), please refer to Note V.22.

256 China International Marine Containers (Group) Co., Ltd.
Chapter 13Financial Statements Prepared in Accordance with China Accounting StandardsFor the year ended 31 December 2013(All amounts in RMB’000 unless otherwise stated)(English Translation for Reference Only)
V. NotES to tHE CoNSolIDAtED FINANCIAl StAtEMENtS (CoNtINUED)
7. Inventories (Continued)
(2) Inventories movement for the year is as follows:
Beginning balance
Additionsdue to
businesscombinations
Increase in current year
Decrease in current year
Ending balance
Raw materials 4,260,175 419,082 42,387,924 (42,723,105) 4,344,076Work in progress 2,094,286 – 35,965,640 (35,664,615) 2,395,311Finished goods 3,540,952 16,578 40,771,514 (41,299,284) 3,029,760Consignment stocks 203,874 – 2,648,371 (2,685,410) 166,835Spare parts 70,811 – 290,333 (299,073) 62,071Low-valued consumables 44,353 – 212,214 (214,400) 42,167Materials in transit 63,803 5,788 87,908 (102,297) 55,202Completed properties held for sale 139,254 – 796,117 (749,214) 186,157Properties under development 1,838,319 – 990,877 (796,117) 2,033,079Ship under construction 5,914,418 – 2,539,889 (5,860,825) 2,593,482Offshore engineering equipment 243,372 – 2,754,363 (1,544,435) 1,453,300
Total 18,413,617 441,448 129,445,150 (131,938,775) 16,361,440
(3) Provision for decline in the value of inventories are as follows:
CategoryBeginning
balance
Additionsdue to
businessconbinations
Increase in current year
Decrease in current year
Exchange differences
arising from translating
foreign operations
Ending balanceReversal write-off
Raw materials 146,690 42,782 43,745 (25,123) (17,967) (2,000) 188,127Work in progress 12,369 – 17,424 (1,841) (509) 841 28,284Finished goods 70,542 – 42,209 (13,028) (461) 7,068 106,330Consignment stocks 592 – – (50) – – 542Ship under construction 148,698 – 78,573 (45,906) (98,938) (4,860) 77,567
Total 378,891 42,782 181,951 (85,948) (117,875) 1,049 400,850
(a) The provision for decline in value of the Group’s inventories during the year was recognised mainly for the price drop of certain products and the slow-moving or waste materials.

Annual Report 2013 257
Chapter 13 Financial Statements Prepared in Accordance with China Accounting Standards
For the year ended 31 December 2013(All amounts in RMB’000 unless otherwise stated)
(English Translation for Reference Only)
V. NotES to tHE CoNSolIDAtED FINANCIAl StAtEMENtS (CoNtINUED)
7. Inventories (Continued)
(3) Provision for decline in the value of inventories are as follows: (Continued)
(b) Written back of provision for decline in value of the Group’s inventories during the year is as follows:
Category Basis for provision Reason for reversal/write-off% of total
balance
Raw materials Carrying amount is lower than the net realisable value
Increase in net realisable value resulted from using or selling of inventories 0.58%
Work in progress Carrying amount is lower than the net realisable value
Increase in net realisable value resulted from using or selling of inventories 0.08%
Finished goods Carrying amount is lower than the net realisable value
Increase in net realisable value resulted from using or selling of inventories 0.43%
Consignment stocks Carrying amount is lower than the net realisable value
Increase in net realisable value resulted from using or selling of inventories 0.03%
Ship under construction Carrying amount is lower than the net realisable value
Increase in net realisable value resulted from using or selling of inventories 1.77%
8. Current portion of non-current assets
31 December 2013
31 December 2012
Finance leases 1,800,870 1,631,762Less: unrealised financing income (245,878) (282,772)Sales of goods by instalments 8,241 345,354Others – 3,049
Sub-total 1,563,233 1,697,393Less: provision for impairment (49,896) (61,061)
Total 1,513,337 1,636,332

258 China International Marine Containers (Group) Co., Ltd.
Chapter 13Financial Statements Prepared in Accordance with China Accounting StandardsFor the year ended 31 December 2013(All amounts in RMB’000 unless otherwise stated)(English Translation for Reference Only)
V. NotES to tHE CoNSolIDAtED FINANCIAl StAtEMENtS (CoNtINUED)
9. other current assets
31 December 2013
31 December 2012
Tax deductible/withheld 822,249 690,087Other 379 384
Total 822,628 690,471
10. Available-for-sale financial assets
31 December 2013
31 December 2012
Available-for-sale equity instruments(1) 7,342 609,751
Including: market value of listed securities 7,342 609,751– Mainland China – 601,356– Hongkong, China 7,342 8,395
(1) During the year, available-for-sale financial assets held by the Group and the Company are equity investments in Otto Energy Limited with a carrying value of USD1,204,000 (RMB7,342,000).
(2) Detail information of the available-for-sale financial assets are as follows:
31 December 2013 31 December 2012
Available-for-sale equity instruments – Fair value 7,342 609,751 – Historical cost 4,422 68,727 – Accumulated net change in fair value of available-for-sale financial assets recognised in
other comprehensive income 2,920 541,024
(3) As at the end of Reporting Period, the Group evaluates the available-for-sale equity instruments to determine whether the investments are impaired. The Group assesses that there is no objective evidence of impairment exists so that no impairment losses recorded in 2012 and 2013.

Annual Report 2013 259
Chapter 13 Financial Statements Prepared in Accordance with China Accounting Standards
For the year ended 31 December 2013(All amounts in RMB’000 unless otherwise stated)
(English Translation for Reference Only)
V. NotES to tHE CoNSolIDAtED FINANCIAl StAtEMENtS (CoNtINUED)
11. long-term receivables
Item31 December
201331 December
2012
Finance Leases 3,333,028 3,111,214Less: Unrealised financing income (433,236) (529,883)
Net finance leases 2,899,792 2,581,331Sales of goods by instalments 123,951 30,296Others 43,587 45,745
Sub-total 3,067,330 2,657,372Less: provision for impairment (114,912) (116,798)
Total 2,952,418 2,540,574
The total future minimum lease receipts under finance leases after the balance sheet date, which are based on contractual undiscounted cash flows (including interest payments computed using contractual rates or, if floating, based on rates current at the balance sheet date), are receivable as follows:
Minimum lease receipts31 December
201331 December
2012
Within 1 year (inclusive) 1,800,870 1,631,7621 and 2 years (inclusive) 1,283,217 1,014,2132 and 3 years (inclusive) 661,255 564,213Over 3 years 1,388,556 1,532,788Less: unrealised finance income (679,114) (812,655)
Total 4,454,784 3,930,321
Long-term receivables with a carrying amount of RMB83,107,000 (2012: RMB1,502,989,000 with a gain of RMB251,453,000) was derecognised due to transferring of financial assets in current year.
Amount
Gain or loss due to
derecognition
Derecognition of long-term receivables under finance leases due to sold-out 1,184 540

260 China International Marine Containers (Group) Co., Ltd.
Chapter 13Financial Statements Prepared in Accordance with China Accounting StandardsFor the year ended 31 December 2013(All amounts in RMB’000 unless otherwise stated)(English Translation for Reference Only)
V. NotES to tHE CoNSolIDAtED FINANCIAl StAtEMENtS (CoNtINUED)
12. long-term equity investments
(1) long-term equity investments are analysed by categories as follows:
Note31 December
201331 December
2012
Joint ventures V.12(2) 197,863 48,990Associates V.12(3) – quoted 231,903 247,619 – unquoted 708,681 1,227,920Other long-term equity investments V.12(4) 441,233 392,300
Sub-total 1,579,680 1,916,829Less: provision for impairment (3,067) (3,067)
Total 1,576,613 1,913,762
The listed associates are Pteris Global Ltd listed on Singapore Exchange Limited, and TSC Offshore Group Limited (“TSC”) listed on the Stock Exchange of Hong Kong Limited.
The fair value of the associates with quoted prices mentioned above is as follows:
31 December 2013
31 December 2012
TSC 211,817 170,115Pteris Global Ltd 66,996 46,672
Total 278,813 216,787
No substantial restriction exists which prohibits the transfer of funds between the Group and the joint ventures and associates.

Annual Report 2013 261
Chapter 13 Financial Statements Prepared in Accordance with China Accounting Standards
For the year ended 31 December 2013(All amounts in RMB’000 unless otherwise stated)
(English Translation for Reference Only)
V. NotES to tHE CoNSolIDAtED FINANCIAl StAtEMENtS (CoNtINUED)
12. long-term equity investments (Continued)
(2) An analysis of long-term equity investments in joint ventures movement of the year is as follows:
Accounting method
Investment cost
31 December
2012
Increase/Decrease in investment
Share of net profit using
the equity method
Share of other compre-hensive income
Cash dividend declared
change in foreign exchange
rates
31 December
2013Share
holding (%)Voting
rights (%)
Provision for
impairment
Impairment provided in the current
year
Ruiji Logistics (Wuhu) Co., Ltd (“WHRJL”) Equity method 9,884 10,512 – (157) – – – 10,355 50.00% 50.00% – –Guangxi Southern CIMC
Logistics Equipment Manufacturing Co., Ltd. (“GXNFWL”) Equity method 15,000 22,321 – 5,711 – – – 28,032 50.00% 50.00% – –
Supercool (Shanghai) Refrigeration Equipment Co. Ltd (“SCSCRC”) Equity method 8,002 6,521 – (1,781) – – – 4,740 50.00% 50.00% – –
Shanghai Shenyi Special Vehicle Parts Co., Ltd (“Shanghai Shenyi”) Equity method 9,947 9,636 – 173 – – (304) 9,505 25.00% 25.00% – –
NYK Zhenhua logistics (Tianjin) Co. Ltd. (“NKY Zhenhua”) Equity method 33,771 – 69,262 1,455 – (5,619) – 65,098 38.25% 38.25% – –
Three Eyre Shanghai Zhenhua Logistics Co. Ltd. (“Shanghai Three Eyre”) Equity method 24,557 – 61,273 595 – – – 61,868 38.25% 38.25% – –
Kawasaki Zhenghua logistics (Tianjin) Co. Ltd. (“Kawasaki Zhenghua”) Equity method 14,063 – 17,832 433 – – – 18,265 38.25% 38.25% – –
Sub-total 48,990 148,367 6,429 – (5,619) (304) 197,863 – –
Li Guiping who was management of the group was appointed as a non-executive director of Shanghai ShenYi. According to the joint venture articles, the resolutions of the board of directors should only be accepted until all attending directors or deputies agree. The group assesses that Shanghai ShenYi are under joint control and should be accounted for using the equity method in the following period.
The board of directors of NYK Zhenhua consist of six directors, of which three directors were appointed by the Group. According to the joint venture articles, the resolutions of the board of directors should only be accepted until all attending directors agree. The group assesses that NYK Zhenhua are under joint control and should be accounted for using the equity method in the following period.
The board of directors of Shanghai Three Eyre consist of six directors, of which three directors were appointed by the Group. According to the joint venture articles, the resolutions of the board of directors should only be accepted until all attending directors agree. The group assesses that Shanghai Three Eyre are under joint control and should be accounted for using the equity method in the following period.
The board of directors of Kawasaki Zhenghua consist of seven directors, of which four directors were appointed by the Group. According to the joint venture articles, the resolutions of the board of directors should only be accepted until 2/3 of all attending directors agree. The group assesses that Kawasaki Zhenghua are under joint control and should be accounted for using the equity method in the following period.

262 China International Marine Containers (Group) Co., Ltd.
Chapter 13Financial Statements Prepared in Accordance with China Accounting StandardsFor the year ended 31 December 2013(All amounts in RMB’000 unless otherwise stated)(English Translation for Reference Only)
V. NotES to tHE CoNSolIDAtED FINANCIAl StAtEMENtS (CoNtINUED)
12. long-term equity investments (Continued)
(3) An analysis of long-term equity investments in associates movement of the year is as follows:
Accounting method
Investment cost
31 December
2012
Increase/Decrease in investment
Share of net profit using
the equity method
Share of Other
compre-hensive income
Cash dividend declared
change in foreign exchange
rates
31 December
2013Share
holding (%)Voting
rights (%)
Provision for
impairment
Impairment provided in the current
year
Xinyang Wood Hong Kong Co., Ltd. (“XYW”) Equity method 2,916 2,779 – 12 – – (7) 2,784 20.00% 20.00% – –
Ningbo Beilun Donghua Container Service Co., Ltd. (“NBBL”) Equity method 3,579 3,164 – 1,046 – (1,050) – 3,160 21.00% 21.00% – –
Tianjin Port CIMC Zhenhua Logistics Co., Ltd. (“Tianjin Port CIMC”) Equity method 21,403 43,809 (43,913) 104 – – – – – – – –
Zhenhua Logistics Group Co., Ltd. (“Tianjin Zhenhua”) Equity method 302,144 483,059 (402,643) 4,176 – (84,592) – – – – – –
Xiamen CIMC Haitou Container Service Co., Ltd. (“Xiamen CIMC”) Equity method 11,479 15,285 – 4,793 – (2,981) – 17,097 45.00% 45.00% – –
Dalian Jilong Logistics Co., Ltd. (“DLJLL”) Equity method 16,844 39,156 – 1,336 – – – 40,492 30.00% 30.00% – –
C&C Trucks Equity method 540,000 326,517 – (88,592) – – – 237,925 45.00% 45.00% – –Senju(Jiangmen) Technology
Material Co., Ltd. (“Senju Technology”) Equity method 6,072 6,809 – 694 – – – 7,503 24.00% 24.00% – –
TRS Transportkoeling B.V. (“TRS”) Equity method 12,030 13,464 – 2,224 – – 267 15,955 39.64% 39.64% – –
Eurotank Oy (“Eurotank”) Equity method 6,946 8,988 – 1,073 – (597) 57 9,521 50.00% 50.00% – –Shanghai Fengyang Real
Estate Development Co., Ltd. (“Shanghai Fengyang”) Equity method 12,000 143,560 – 13,626 – – – 157,186 40.00% 40.00% – –
KYH Steel Holding Ltd. (“KYH”) Equity method 27,625 126,778 – 7,906 – – 254 134,938 31.83% 31.83% – –
Xiamen CIMC Haitou Logistics Co., Ltd. (“Xiamen Haitou”) Equity method 6,153 5,622 – (435) – – – 5,187 49.00% 49.00% – –
Xiamen Hongji Container Development Co. Ltd. (“Xiamen Hongji”) Equity method 4,900 8,545 (11,771) 3,226 – – – – – – – –
TSC Offshore Group Ltd. (“TSC”) Equity method 167,591 168,837 – 8,132 – – (104) 176,865 13.43% 13.43% – –Pteris Global Ltd Equity method 84,501 78,782 – (21,455) – – (2,289) 55,038 14.99% 14.99% – –Marine Subsea & Consafe
Limited Equity method 2 2 – – – – – 2 40.00% 40.00% (2) –Wuhan Automobile magazine
Co. Ltd. Equity method 383 383 – 80 – – – 463 19.00% 19.00% – –Tianzhu (Shanghai) International
Freight Agency Co., Ltd. Equity method 1,616 – 1,616 112 – – – 1,728 22.50% 22.50% – –BaZhou LiHua gas storage and
transportation Co.,Ltd Equity method 48,940 – 48,940 – – – – 48,940 20.00% 20.00% – –Jiangsu Ruicheng Machinery
Co., Ltd (“Jiangsu Ruicheng”) Equity method 20,000 – 20,000 – – – – 20,000 6.90% 6.90% – –Chengdu Jihaixin Industrial
Co., Ltd. Equity method 1,800 – 1,800 – – – – 1,800 32.00% 32.00% – –Jiuquan Enric Kunlun Cryogenic
Machinery Co., Ltd. Equity method 4,000 – 4,000 – – – – 4,000 28.06% 28.06% – –
Total 1,475,539 (381,971) (61,942) – (89,220) (1,822) 940,584 (2) –

Annual Report 2013 263
Chapter 13 Financial Statements Prepared in Accordance with China Accounting Standards
For the year ended 31 December 2013(All amounts in RMB’000 unless otherwise stated)
(English Translation for Reference Only)
V. NotES to tHE CoNSolIDAtED FINANCIAl StAtEMENtS (CoNtINUED)
12. long-term equity investments (Continued)
(3) An analysis of long-term equity investments in associates movement of the year is as follows: (Continued)
As at 31 December 2013, except for Marine Subsea & Consafe, there is no need for the Group to made provision for long-term equity investments in joint ventures and associates based on the provision testing result that compared the estimated recoverable amount and book value of long-term equity investments in joint ventures and associates.
Mr. Yu Yuquan, the Group’s secretary of the Board, was assigned as non-executive director of TSC on 15 March 2011. Therefore, the Group had significant influence over TSC and investment in TSC is measured for using the equity method.
Mr. Yu Yuquan, the Group’s secretary of the Board, was assigned as non-executive director of Pteris Global Ltd on 24 September 2012. Therefore, the Group had significant influence over Pteris Global Ltd and investment in Pteris Global Ltd is measured for using the equity method.
The Group holds 19% shares in Wuhan Automobile magazine Co. Ltd. As Yang Guanghui of the company was appointed as a non-executive director of Wuhan Automobile magazine Co. Ltd., the Group considers it has significant influence on Wuhan Automobile magazine Co. Ltd. Therefore, the investment in Wuhan Automobile magazine Co. Ltd. is measured for using the equity method.
The Group holds 6.9% shares in Jiangsu Ruicheng. As Zheng Xianling of the company was appointed as a non-executive director of Jiangsu Ruicheng, the Group considers it has significant influence on Jiangsu Ruicheng. Therefore, the investment in Jiangsu Ruicheng is measured for using the equity method.

264 China International Marine Containers (Group) Co., Ltd.
Chapter 13Financial Statements Prepared in Accordance with China Accounting StandardsFor the year ended 31 December 2013(All amounts in RMB’000 unless otherwise stated)(English Translation for Reference Only)
V. NotES to tHE CoNSolIDAtED FINANCIAl StAtEMENtS (CoNtINUED)
12. long-term equity investments (Continued)
(4) An analysis of other long-term equity investments movement of the year is as follows:
Accounting method
Investment cost
31 December 2012
Increase/Decrease in investment
31 December 2013
Share holding (%)
Voting rights (%)
Explanation of disparity
between percentages of share holding
and voting rights
Provision for
impairment
Impairment provided in the
current yearCash dividend
declared
Bank of Communications
Schroder Fund Management
Co., Ltd.
(“BOCM Schroder”) Cost method 8,125 8,125 – 8,125 5.00% 5.00% N/A – – 5,000
Donghua Container
Transportation Service
Co., Ltd. Cost method 270 270 – 270 5.00% 5.00% N/A – – –
China United International
Rail Containers Co., Ltd.
(“CRIntermodal”) Cost method 380,780 380,780 – 380,780 10.00% 10.00% N/A – – –
Guangdong samsung
enterprise group co., LTD
(“Guangdong Samsung”) Cost method 1,365 1,365 – 1,365 0.09% 0.09% N/A (1,365) – –
Beihai Yinjian Investment
Co.,Ltd. (“Beihai Yinjian”) Cost method 1,700 1,700 – 1,700 1.01% 1.01% N/A (1,700) – –
Others 60 48,933 48,993 – – –
Total 392,300 48,933 441,233 (3,065) – 5,000

Annual Report 2013 265
Chapter 13 Financial Statements Prepared in Accordance with China Accounting Standards
For the year ended 31 December 2013(All amounts in RMB’000 unless otherwise stated)
(English Translation for Reference Only)
V. NotES to tHE CoNSolIDAtED FINANCIAl StAtEMENtS (CoNtINUED)
12. long-term equity investments (Continued)
(5) Main financial information of major associates is as follows:
C&C trucks Shanghai Fengyang KYH Pteris tSC
2013 2012 2013 2012 2013 2012 2013 2012 2013 201231 December 31 December 31 December 31 December 31 December 31 December 31 December 31 December 31 December 31 December
Cash at bank and on hand 245,816 328,177 178,598 71,878 99,778 107,628 100,284 68,211 149,707 188,951Other current assets 1,474,168 788,368 1,432,787 948,391 987,620 1,060,597 252,432 441,055 1,316,210 986,441
Total current assets 1,719,984 1,116,545 1,611,384 1,020,269 1,087,398 1,168,225 352,716 509,266 1,465,917 1,175,392Total non-current assets 1,942,630 1,958,701 187 240 53,963 103,186 141,509 154,340 565,293 580,293Accounts payable 888,963 522,111 126,352 129,795 597,856 645,885 89,460 93,433 547,829 528,189Other financial liabilities 1,040,975 749,135 1,061,627 282,122 – – 212,885 233,906 204,707 83,626Other current liabilities 735,058 685,925 31,714 250,778 31,310 143,903 – – 7,019 –
Total current liabilities 2,664,996 1,957,171 1,219,693 662,695 629,166 789,788 302,345 327,339 759,556 611,815Financial liabilities 7,868 11,551 – – – – 15,568 588 59,634 22,652Other non-current liabilities 449,647 369,545 – – 88,262 83,325 1,866 2,830 37,922 6,019
Total non-current liabilities 457,515 381,096 – – 88,262 83,325 17,434 3,418 97,557 28,671Net assets 540,103 736,976 391,878 357,814 423,933 398,298 174,446 332,849 1,174,097 1,115,199
Total equity attributable to shareholders of the company 528,722 725,592 391,878 357,814 423,933 398,298 185,973 344,375 1,141,850 1,082,951
Adjustments according to fair value of net identifiable assets and Goodwill – – 1,085 1,085 – – 181,195 181,195 155,764 155,764
Total equity attributable to shareholders of the company(adjusted) 528,722 725,592 392,963 358,899 423,933 398,298 367,168 525,570 1,297,614 1,238,716
Share holding (%) 45.00% 45.00% 40.00% 40.00% 31.83% 31.83% 14.99% 14.99% 13.63% 13.63%
Share of net profit of the Group 237,925 326,517 157,186 143,560 134,938 126,778 55,038 78,782 176,865 168,837
Provision for impairment – – – – – – – – – –
Long-term equity investments 237,925 326,517 157,186 143,560 134,938 126,778 55,038 78,782 176,865 168,837
Revenue 1,344,007 672,028 63,951 65,044 2,058,725 2,048,783 242,768 80,839 1,051,340 831,810Depreciation and
amortisation expenses – – – – – – (12,792) (3,699) – –Interest income – – (863) (1,276) – – – – – –Interest expenses 100,151 79,184 – – – (29,263) (6,668) (1,402) (19,827) (13,134)Total profit (185,608) (295,453) 38,666 30,545 27,427 29,443 (143,399) (38,224) 67,610 25,012Income tax expenses 11,265 (9,962) 4,602 7,673 2,588 5,570 (270) (72) (7,947) (12,716)Net profit (196,873) (285,491) 34,064 22,872 24,840 23,873 (143,129) (38,152) 59,663 12,296
TSC is a company listed on the Stock Exchange of Hong Kong Limited, and its announcement day is late than CIMC’s. After the Group’s assessment, they consider TSC’s operating results are not significant to the Group. So the TSC’s operating results disclosed above is projected from its semi-annual report. And the Group will make adjustments based on its announcement in next year.

266 China International Marine Containers (Group) Co., Ltd.
Chapter 13Financial Statements Prepared in Accordance with China Accounting StandardsFor the year ended 31 December 2013(All amounts in RMB’000 unless otherwise stated)(English Translation for Reference Only)
V. NotES to tHE CoNSolIDAtED FINANCIAl StAtEMENtS (CoNtINUED)
12. long-term equity investments (Continued)
(6) the financial position and operating results of joint ventures are not significant to the Group, so their main financial information is not disclosed in the notes.
13. Investment properties
Buildings land use rights total
Cost:Beginning balance 115,950 94,817 210,767Business combination 66,744 47,044 113,788Additions in current year 100,167 20,922 121,089Disposal in current year (24,414) (5,072) (29,486)
Ending balance 258,447 157,711 416,158
Accumulated depreciation/amortisationBeginning balance 12,731 14,368 27,099Business combination 20,850 6,449 27,299Transferred in current year 32,447 2,666 35,113Depreciation/amortisation charged in current year 5,552 2,553 8,105Decrease in current year (5,583) (686) (6,269)
Ending balance 65,997 25,350 91,347
Carrying amountAt the end of the year 192,450 132,361 324,811
At the beginning of the year 103,219 80,449 183,668
In 2013, RMB8,105,000 of depreciation and amortisation is charged for the investment properties (2012: RMB4,925,000).
There was no provision for impairment for investment properties in 2013 (2012: Nil).
The land use rights by locations and the approved land use periods are analysed as follows:
31 December 2013
31 December 2012
Outside Hong Kong – 10 to 50 years 132,361 80,449
In 2013, the investment properties generated RMB51,752,000 (2012: RMB28,320,000) of lease income, and incurred RMB12,290,000 (2012: RMB5,256,000) of direct expenditures.

Annual Report 2013 267
Chapter 13 Financial Statements Prepared in Accordance with China Accounting Standards
For the year ended 31 December 2013(All amounts in RMB’000 unless otherwise stated)
(English Translation for Reference Only)
V. NotES to tHE CoNSolIDAtED FINANCIAl StAtEMENtS (CoNtINUED)
14. Fixed assets
(1) Fixed assets by categories
BuildingsMachinery and
equipmentoffice & other
equipment Motor vehicles
offshore engineering
special equipment Dock & Port total
Cost:Beginning balance 6,723,469 7,090,364 832,257 834,213 596,717 1,258,130 17,335,150Additions due to business
combination 806,925 320,109 154,315 72,728 – – 1,354,077Additions in current year 109,147 324,699 190,485 43,136 16,619 42,935 727,021Transfers from construction
in progress 549,913 761,567 50,242 21,915 61,335 33,225 1,478,197Decrease in current year (170,021) (265,446) (32,610) (63,192) (1,502) (419) (533,190)Exchange differences
arising from translating foreign operations (13,166) (37,839) (1,978) (460) (22,431) (38,559) (114,433)
Ending balance 8,006,267 8,193,454 1,192,711 908,340 650,738 1,295,312 20,246,822Accumulated depreciationBeginning balance 1,554,112 2,754,731 497,377 307,646 105,591 118,228 5,337,685Additions due to business
combination 165,083 84,733 43,958 63,724 – – 357,498Depreciation charged in
current year 248,046 523,533 96,737 52,699 40,669 28,433 990,117Decrease in current year (48,256) (166,905) (24,395) (46,405) (52) (254) (286,267)Exchange differences
arising from translating foreign operations (1,634) (8,830) (1,348) (267) (3,868) (3,892) (19,839)
Ending balance 1,917,351 3,187,262 612,329 377,397 142,340 142,515 6,379,194Provision for impairmentBeginning balance 322,629 65,551 526 12 – – 388,718Impairment provided in
current year 1,034 3,685 539 266 – – 5,524Written off on disposal (16,169) (21,065) – – – – (37,234)Exchange differences
arising from translating foreign operations 2,493 45 – – – – 2,538
Ending balance 309,987 48,216 1,065 278 – – 359,546Carrying amountAt the end of the year 5,778,929 4,957,976 579,317 530,665 508,398 1,152,797 13,508,082At the beginning of the year 4,846,728 4,270,082 334,354 526,555 491,126 1,139,902 11,608,747
As at 31 December 2013, restricted fixed assets of the Group amounted to RMB14,632,000 (2012: RMB10,897,000). Refer to Note V.22 for details.
In 2013, depreciation charged to fixed assets amounts to RMB990,117,000 (2012: RMB847,720,000), of which RMB777,650,000 (2012: RMB666,010,000) has been charged in cost of sales, RMB37,015,000 (2012: RMB8,487,000) in selling and distribution expenses, and RMB175,452,000 (2012: RMB173,223,000) in general and administrative expenses.
The costs of fixed assets transferred from construction in progress amount to RMB1,478,197,000 (2012: RMB1,382,585,000).

268 China International Marine Containers (Group) Co., Ltd.
Chapter 13Financial Statements Prepared in Accordance with China Accounting StandardsFor the year ended 31 December 2013(All amounts in RMB’000 unless otherwise stated)(English Translation for Reference Only)
V. NotES to tHE CoNSolIDAtED FINANCIAl StAtEMENtS (CoNtINUED)
14. Fixed assets (Continued)
(2) As at 31 December 2013, the Group had no temporarily idle fixed assets.
(3) Fixed assets held under finance leases
31 December 2013 31 December 2012
CostAccumulated depreciation
Carrying amount Cost
Accumulated depreciation
Carrying amount
Machinery and equipment 35,576 (8,866) 26,710 39,411 (10,257) 29,154
(4) Fixed assets leased out under operating leases
Carrying amount
Buildings 59,910Machinery and equipment 95,341
Total 155,251
(5) Held-for-sale fixed assets
As at 31 December 2013, there were no held-for-sale fixed assets (31 December 2012: Nil).
(6) Fixed assets with pending certificates of ownership
Carrying amount
Reasons for not yet obtaining certificates of title
Estimated date that certificate of title
will be obtained
Factory 780,572 Put to use, certificate being in the progress By the end of 2014Office building 144,284 Put to use, certificate being in the progress By the end of 2014Workshop 250,773 Incomplete certificate, being in the progress By the end of 2014Dormitory and Canteen 50,687 Put to use, certificate being in the process By the end of 2014Warehouse 108,705 Lack of reporting materials, under preparation By the end of 2014Others 50,760 Certificate being in the progress By the end of 2014
Total 1,385,781

Annual Report 2013 269
Chapter 13 Financial Statements Prepared in Accordance with China Accounting Standards
For the year ended 31 December 2013(All amounts in RMB’000 unless otherwise stated)
(English Translation for Reference Only)
V. NotES to tHE CoNSolIDAtED FINANCIAl StAtEMENtS (CoNtINUED)
15. Construction in progress
(1) Construction in progress
31 December 2013 31 December 2012
Ending balance
Provision for impairment
Carrying amount Ending balance
Provision for impairment
Carrying amount
Dalian Heavy Logistics Production Line equipment 9,345 – 9,345 19,762 – 19,762
XHCIMCS Production Line and Power Facilities Reconstruction Project 20,102 – 20,102 2,494 – 2,494
Eastern Logistic 3rd Phase Project – – – 25,599 – 25,599Raffles sea route project – – – 45,303 – 45,303Raffles Jack-up Drilling Platform 1,256,168 – 1,256,168 1,175,418 – 1,175,418Raffles painting workshop – – – 18,251 – 18,251Raffles Terry project 126,066 – 126,066 96,989 – 96,989MEA 1st stage R&D Project 317,555 – 317,555 236,705 – 236,705TAS New Plant Project 107,030 – 107,030 42,425 – 42,425TCCIMC new factory project – – – 114,961 – 114,961DLL special production line 313 – 313 17,485 – 17,485Yangshan Logistic Diluent recovery project – – – 15,622 – 15,622Tianjin CIMC 48 m/min plate automatic
production line 15,917 – 15,917 15,274 – 15,274Tianjin CIMC automatic processing
workshop project 16,360 – 16,360 12,712 – 12,712TCCIMC LFYD-00 continuous roof forming
production line 11,760 – 11,760 11,760 – 11,760Dalian Railway steel equipment warehouse 815 – 815 10,296 – 10,296Ningbo CIMC No. 4 costing line – – – 10,019 – 10,019SZ Investment Holding Qianhai Office 24,186 – 24,186 – – –Raffles Drilling Platform H194 658,990 – 658,990 – – –Raffles 600T Crane (E022198015) 41,635 – 41,635 – – –Raffles Plane block production line
(E22026) 22,115 – 22,115 – – –Raffles Solid pile frame workshop (E82005) 18,589 – 18,589 – – –Raffles Terminal 16,502 – 16,502 – – –Raffles power line (power supply, gas supply)
phase ii 13,557 – 13,557 – – –Raffles paint workshop phase ii 11,570 – 11,570 – – –Raffles 600T Crane base (E022198014) 11,076 – 11,076 – – –QDCRC building steel structure of 1#, 2#
factory 38,346 – 38,346 – – –QDCRC Roads and other infrastructure
construction projects 22,806 – 22,806 – – –QDCRC factories and warehouses
constructions 22,302 – 22,302 – – –Vessels under construction of leasing
company 3,406,804 – 3,406,804 – – –Others 494,710 – 494,710 410,794 (1,876) 408,918
Total 6,684,619 – 6,684,619 2,281,869 (1,876) 2,279,993
The carrying amounts of construction in progress at the end of the year included capitalised borrowing cost of RMB447,536,000 (2012: RMB78,991,000). The interest rate adopted for determining capitalised at borrowing cost for the current year was 4.36% (2012: 5.04%).
As at 31 December 2013, amounting RMB1,223,018,000 construction in progress of the Group are with restrictions in ownership (2012: RMB1,184,650,000). Refer to Note V.22 for details.

270 China International Marine Containers (Group) Co., Ltd.
Chapter 13Financial Statements Prepared in Accordance with China Accounting StandardsFor the year ended 31 December 2013(All amounts in RMB’000 unless otherwise stated)(English Translation for Reference Only)
V. NotES to tHE CoNSolIDAtED FINANCIAl StAtEMENtS (CoNtINUED)
15. Construction in progress (Continued)
(2) Movement of significant projects of construction in progress in current year
Budgeted amount
31 December 2012
Additionsdue to
businesscombinations
Increase in current year
transfer to fixed assets
31 December 2013
Proportion of expenditures
incurred to budgeted
amountProgress of
construction
Cumulative capitalised borrowing
costs
Including: borrowing
costs capitalised in current year
Capitalisation rate
Source of funds
Exchange differences
arising from translating
foreign operations
Dalian Heavy Logistics Production Line equipment 143,392 19,762 – 9,911 (20,328) 9,345 55.00% 55.00% – – – Self-funding –XHCIMCS Production Line and Power Facilities
Reconstruction Project 22,942 2,494 – 33,572 (15,964) 20,102 87.62% 80.00% – – – Self-funding –Eastern Logistic 3rd Phase Project 469,365 25,599 – 4,569 (30,168) – 95.74% 100.00% – – – Self-funding –Raffles sea route project 73,737 45,303 – – (45,303) – 61.40% 100.00% – – – Self-funding –Raffles Jack-up Drilling Platform 1,256,168 1,175,418 – 117,783 – 1,256,168 100.00% 100.00% 100,484 32,526 4.09% Self-funding and
bank loan(37,033)
Raffles painting workshop 20,000 18,251 – 138 (18,389) – 91.94% 100.00% – – – Self-funding –Raffles Terry project 126,066 96,989 – 29,077 – 126,066 100.00% 99.99% – – – Self-funding –MEA 1st stage R&D Project 398,000 236,705 – 80,850 – 317,555 79.79% 99.00% 21,416 14,091 5.25% Self-funding and
bank loan–
TAS New Plant Project 320,000 42,425 – 64,605 – 107,030 33.45% 60.00% 3,461 2,467 6.15% Bank loan –TCCIMC new factory project 583,097 114,961 – 227,957 (342,918) – 88.00% 100.00% – – – Self-funding –DLL special production line 35,728 17,485 – 10,289 (27,461) 313 77.74% 100.00% 1,081 971 6.60% Self-funding and
bank loan–
Yangshan Logistic Diluent recovery project 20,000 15,622 – 1,186 (16,808) – 84.04% 100.00% – – – Self-funding –Tianjin CIMC 48 m/min plate automatic
production line 20,000 15,274 – 643 – 15,917 80.00% 80.00% – – – Self-funding –Tianjin CIMC automatic processing workshop project 20,000 12,712 – 3,648 – 16,360 82.00% 85.00% – – – Self-funding –TCCIMC LFYD-00 continuous roof forming
production line 16,800 11,760 – – – 11,760 70.00% 70.00% – – – Self-funding –Dalian Railway steel equipment warehouse 12,870 10,296 – 3,533 (13,014) 815 101.00% 100.00% – – – Self-funding –Ningbo CIMC No. 4 costing line 11,600 10,019 – 1,048 (11,067) – 95.41% 100.00% – – – Self-funding –SZ Investment Holding Qianhai Office 32,089 100 – 24,086 – 24,186 75.37% 75.00% – – – Self-funding –Raffles Drilling Platform H194 686,681 – – 667,538 – 658,990 95.96% 95.96% 62,675 17,907 4.09% Self-funding and
bank loan(8,548)
Raffles 600T Crane (E022198015) 43,365 – – 42,175 – 41,635 96.00% 96.00% – – – Self-funding (540)Raffles Plane block production line (E22026) 67,000 – – 22,402 – 22,115 33.00% 33.00% – – – Self-funding (287)Raffles Solid pile frame workshop (E82005) 20,922 – – 18,830 – 18,589 88.84% 88.84% – – – Self-funding (241)Raffles Terminal 16,502 – – 16,716 – 16,502 100.00% 99.99% – – – Self-funding (214)Raffles power line (power supply, gas supply)
phase ii 15,059 – – 13,732 – 13,557 90.00% 90.00% – – – Self-funding (175)Raffles paint workshop phase ii 14,461 – – 11,720 – 11,570 80.00% 80.00% – – – Self-funding (150)Raffles 600T Crane base (E022198014) 12,305 1,126 – 10,113 – 11,076 90.00% 90.00% – – – Self-funding (163)QDCRC building steel structure of 1#, 2# factory 54,780 – – 38,346 – 38,346 70.00% 70.00% – – – Self-funding –QDCRC Roads and other infrastructure
construction projects 27,270 – – 22,806 – 22,806 83.63% 83.63% – – – Self-funding –QDCRC factories and warehouses constructions 37,170 – – 22,302 – 22,302 60.00% 60.00% – – – Self-funding –Vessels under construction of leasing company 17,991,316 – – 3,454,588 – 3,406,804 18.94% 22.37%~98.78% 257,737 112,031 4.36% Bank loans and
convertible bonds
(47,784)
Others 407,692 9,101 1,029,647 (936,777) 494,710 682 682 – (14,953)
Total 2,279,993 9,101 5,983,810 (1,478,197) 6,684,619 447,536 180,675 (110,088)
As at 31 December 2013, no provision for impairment for construction in progress was made by the Group (31 December 2012: RMB1,876,000).

Annual Report 2013 271
Chapter 13 Financial Statements Prepared in Accordance with China Accounting Standards
For the year ended 31 December 2013(All amounts in RMB’000 unless otherwise stated)
(English Translation for Reference Only)
V. NotES to tHE CoNSolIDAtED FINANCIAl StAtEMENtS (CoNtINUED)
16. Intangible assets
(1) Intangible assets by categories
land use rights
technical know-how and trade
marks
timber concession
rightsCustomer
relationshipsCustomer contracts
Maritime use rights
Franchise rights total
CostBeginning balance 3,144,793 1,017,986 226,678 105,504 135,035 80,123 – 4,710,119Additions due to business
combination 247,898 91,328 – 104,200 – – 53,300 496,726Increase in current year 154,445 41,463 – – – 2,436 – 198,344Decrease in current year (38,464) (10,032) – – – – – (48,496)Exchange differences arising from
translating foreign operations (11,529) (1,389) (6,879) 958 (1,145) (2,425) – (22,409)
Ending balance 3,497,143 1,139,356 219,799 210,662 133,890 80,134 53,300 5,334,284
Accumulated amortisationBeginning balance 382,054 630,141 99,800 78,279 81,742 12,121 – 1,284,137Additions due to business
combination 36,849 838 – – – – – 37,687Amortisation charged in current
year 74,005 79,162 4,405 20,664 1,017 3,570 182,823Decrease in current year (4,437) (9,688) – – – – – (14,125)Exchange differences arising from
translating foreign operations (1,040) (771) (3,085) 917 (1,133) (294) – (5,406)
Ending balance 487,431 699,682 101,120 99,860 81,626 15,397 – 1,485,116
Provision for impairmentBeginning balance – – 99,968 – 52,264 – – 152,232Exchange differences arising from
translating foreign operations – – (3,033) – – – – (3,033)
Ending balance – – 96,935 – 52,264 – – 149,199
Carrying amountAt the end of the year 3,009,712 439,674 21,744 110,802 – 64,737 53,300 3,699,969
At the beginning of the year 2,762,739 387,845 26,910 27,225 1,029 68,002 – 3,273,750
In 2013, amortisation expenses of intangible assets amount to RMB182,823,000 (2012: RMB237,605,000) in total, of which RMB182,823,000 (2012: RMB237,605,000) is recognised in profit or loss for the current period.

272 China International Marine Containers (Group) Co., Ltd.
Chapter 13Financial Statements Prepared in Accordance with China Accounting StandardsFor the year ended 31 December 2013(All amounts in RMB’000 unless otherwise stated)(English Translation for Reference Only)
V. NotES to tHE CoNSolIDAtED FINANCIAl StAtEMENtS (CoNtINUED)
16. Intangible assets (Continued)
(2) land use rights by locations and approved land use periods are analysed as follows:
31 December 2013
31 December 2012
Outside Hong Kong – 10 to 50 years 3,009,712 2,762,739
(3) Intangible assets with pending certificates of ownership
Carrying amount
Reasons for not yet obtaining certificates of title
Estimated date that certificate of title will be
obtained
Nantong Tank Land (2008) No. 0301018
69,153 Certificate being in the progress By the end of 2014
SCIMCEL Tangkeng land use right 60,556 Certificate being in the progress By the end of 2014Qingdao CIMC phase II land 57,843 Certificate being in the progress By the end of 2014Nantong Tank Land (2009)
No. 030103050,107 Certificate being in the progress By the end of 2014
XHCIMCS Yinzhou lake production base
42,316 Certificate being in the progress By the end of 2014
Wuhu Vehicle Phase III land 8,107 Certificate being in the progress By the end of June 2014
YZTHT land 4,286 Certificate being in the progress By the end of 2014Qingdao CIMC Reefer land 2,355 Certificate being in the progress By the end of 2014SCIMCEL dormitory-CIMC garden
land1,956 Certificate being in the progress By the end of 2014
Total 296,679
After the evaluation of board of directors of the Group, the aforementioned intangible assets with pending certificates has no risk of impairment. The group assesses at the end of each reporting period whether there is objective evidence that assets other than inventory, financial assets and other long term equity investments are impaired to make sure that its carrying amount doesn’t exceed its recoverable amount. If there is evidence indicates it is possible that the carrying amount of long term assets could not recover, the related asset should be deemed impaired and recognise impairment loss.
(4) As at 31 December 2013, there were no intangible assets of the Group with restriction in ownership (31 December 2012: Nil).
(5) As at 31 December 2013, the intangible asset with indefinite useful lives is Gas station Franchise which amount to RMB53,300,000 (31 December 2012: Nil)

Annual Report 2013 273
Chapter 13 Financial Statements Prepared in Accordance with China Accounting Standards
For the year ended 31 December 2013(All amounts in RMB’000 unless otherwise stated)
(English Translation for Reference Only)
V. NotES to tHE CoNSolIDAtED FINANCIAl StAtEMENtS (CoNtINUED)
17. Goodwill
Name of investee or goodwill items Note
Beginning balance
Increase in current
year
Decrease in current
year
Exchange differences
arising from translating
foreign operations
Ending balance
Enric (1) 572,701 – (26,366) – 546,335TGE SA (2) 178,811 – – 656 179,467Technodyne 27,430 – – – 27,430Gadidae AB 12,254 – – – 12,254YPDI 86,558 – – – 86,558Bassoe (3) – 132,245 – – 132,245Zhenhua Group (3) – 21,994 – – 21,994Others 413,240 11,586 – (11,339) 413,487
Sub-total 1,290,994 165,825 (26,366) (10,683) 1,419,770
Less: provision for impairmentGadidae AB 12,254 – – – 12,254Others 11,578 – – – 11,578
Sub-total 23,832 – – – 23,832
Total 1,267,162 165,825 (26,366) (10,683) 1,395,938
(1) the Group paid RMB1,094,076,000 as acquisition cost for acquiring 41.55% equity interest in Enric in 2007. the excess of acquisition cost over the Group’s interest in the fair value of Enric’s identifiable assets and liabilities was recognised as goodwill attributable to Enric. As at 31 December 2013, goodwill attributable to Enric amounted to RMB546,335,000 (2012: RMB572,701,000).
The recoverable amount of Enric is determined based on the present value of expected future cash flows. The present value of expected future cash flows was calculated based on the most recent ten-year financial budgets approved by management of the Group and a discounting rate of 13%. The cash flows beyond the ten-year budget period were assumed to keep stable. There was no impairment considered necessary for the goodwill based on the calculations. As key assumptions on which management has made the future cash projections are subject to change, management believes that any adverse change in the key assumptions would cause the carrying amount exceeding its recoverable amount.
The calculation of present value of expected future cash flows of Enric was based on key assumptions of 10% of gross profit ratio and 3%~10% of operating sales growth, which was determined by management on the basis of past performance before the budget period.
Goodwill derecognised in 2013 arose from disposal of 3.19% of the equity interests in Enric (Note IV 11).

274 China International Marine Containers (Group) Co., Ltd.
Chapter 13Financial Statements Prepared in Accordance with China Accounting StandardsFor the year ended 31 December 2013(All amounts in RMB’000 unless otherwise stated)(English Translation for Reference Only)
V. NotES to tHE CoNSolIDAtED FINANCIAl StAtEMENtS (CoNtINUED)
17. Goodwill (Continued)
(2) the Group paid RMB243,096,000 as acquisition cost for the 60% equity interests in tGE SA in 2008. the excess of acquisition cost over the Group’s interest in the fair value of tGE SA’s identifiable assets and liabilities was recognised as goodwill attributable to tGE SA. As at 31 December 2013, goodwill attributable to tGE SA amounted to RMB179,467,000 (2012: RMB178,811,000).
The recoverable amount of TGE SA is determined based on the present value of expected future cash flows. The present value of expected future cash flows was calculated based on the most recent ten-year financial budgets approved by management of the Group and a discounting rate of 12%. The cash flows beyond the ten-year budget period were assumed to keep stable. There was no impairment considered necessary for the goodwill based on the calculations. As key assumptions on which management has made the future cash projections are subject to change, management believes that any adverse change in the key assumptions would cause the carrying amount exceeding its recoverable amount.
The calculation of present value of expected future cash flows of TGE SA was based on key assumptions of 13.8% of gross profit ratio and 3%-6% of operating sales growth, which was determined by management on the basis of past performance before the budget period.
(3) the details of goodwill arose from acquisition of Bassoe and Zhenhua Group, refer to IV. 6(1), IV. 6(2).
(4) Impairment test for asset group including goodwill
The goodwill allocated to the asset groups and groups of asset groups are summarised by operating segments as follows:
31 December 2013
31 December 2012
Container asset group 127,524 127,524Road transportation vehicles asset group 72,607 77,752Energy, chemical and food equipment asset group 900,409 926,119Offshore engineering asset group 234,338 103,135Logistics services and equipment asset group 26,018 –Asset groups with insignificant allocation percentage of goodwill group 35,042 32,632
Total 1,395,938 1,267,162

Annual Report 2013 275
Chapter 13 Financial Statements Prepared in Accordance with China Accounting Standards
For the year ended 31 December 2013(All amounts in RMB’000 unless otherwise stated)
(English Translation for Reference Only)
V. NotES to tHE CoNSolIDAtED FINANCIAl StAtEMENtS (CoNtINUED)
18. long-term prepaid expenses
Beginning balance
Additionsdue to
businesscombinations
Additions in current year
Amortisation in current
year
Exchange differences
arising from translating
foreign operations
Ending balance
Yard facility expenses 12,560 – 2,967 (2,817) – 12,710Rental 3,528 – 2,019 (2,963) – 2,584Project insurance 3,301 – 18,370 (397) (328) 20,946Improvements to fixed
assets held under operating leases 2,583 – 1,254 (1,084) – 2,753
Water and electricity capacity enlargement expenses 1,086 – – (294) (1) 791
Operating lease interest expenses – 5,877 1,640 (207) – 7,310
Others 24,889 7,753 29,812 (12,623) (850) 48,981
Sub-total 47,947 13,630 56,062 (20,385) (1,179) 96,075Less: provision for
impairment – – – – – –
Total 47,947 13,630 56,062 (20,385) (1,179) 96,075

276 China International Marine Containers (Group) Co., Ltd.
Chapter 13Financial Statements Prepared in Accordance with China Accounting StandardsFor the year ended 31 December 2013(All amounts in RMB’000 unless otherwise stated)(English Translation for Reference Only)
V. NotES to tHE CoNSolIDAtED FINANCIAl StAtEMENtS (CoNtINUED)
19. Deferred tax assets and deferred tax liabilities
(1) the offsetting balances of deferred tax assets and liabilities offset and corresponding deductible or taxable temporary differences
31 December 2013 31 December 2012
Deductible/(taxable)
temporary differences
Deferred tax assets/
(liabilities)
Deductible/(taxable)
temporary differences
Deferred tax assets/
(liabilities)
Deferred tax assets:Provision for asset impairment 699,393 143,546 700,105 154,652Provisions 627,866 119,400 694,234 142,764Employee benefits payable 1,603,419 378,868 1,409,704 332,487Accrued expenses 233,385 44,391 283,662 61,695Deductible losses 650,214 162,435 473,485 105,516Movement for fair value of financial
assets at fair value through profit or loss/hedging instruments 27,254 6,775 109,688 27,407
Others 101,028 24,959 119,897 28,584
Sub-total 3,942,559 880,374 3,790,775 853,105
Offsetting amount (106,316) (23,968) (542,826) (135,308)
offsetting balances 3,836,243 856,406 3,247,949 717,797
Deferred tax liabilities:Movement for fair value of financial
assets at fair value through profit or loss/hedging instruments (139,320) (31,035) (24,104) (5,500)
Available-for-sale financial assets (2,920) (730) (541,024) (130,138)Movement for fair value of hedging
instrument (10,974) (1,646) (5,885) (883)Revaluation gain through combination (722,751) (193,063) (745,851) (185,228)Estimated dividend income earned
for non-resident foreign enterprises (3,892,743) (355,651) (4,810,979) (405,726)Others (446,955) (103,043) (201,698) (58,227)
Sub-total (5,215,663) (685,168) (6,329,541) (785,702)
Offsetting amount 106,316 23,968 542,826 135,308
offsetting balances (5,109,347) (661,200) (5,786,715) (650,394)

Annual Report 2013 277
Chapter 13 Financial Statements Prepared in Accordance with China Accounting Standards
For the year ended 31 December 2013(All amounts in RMB’000 unless otherwise stated)
(English Translation for Reference Only)
V. NotES to tHE CoNSolIDAtED FINANCIAl StAtEMENtS (CoNtINUED)
19. Deferred tax assets and deferred tax liabilities
(2) Unrecognised deferred tax assets
31 December 2013
31 December 2012
Deductible losses 833,015 714,548Impairment losses of timber Concession rights 22,119 22,119Others 66,658 66,658
Total 921,792 803,325
(3) Deductible losses that are not recognised as deferred tax assets will expire in the following years:
31 December 2013
31 December 2012 Note
2013 – 102,8682014 185,744 270,6042015 374,180 459,0402016 1,876,729 1,961,5892017 1,207,327 1,292,187After 2017 1,611,201 758,870 Note 1
Total 5,255,181 4,845,158
Note 1: By the end of 2012 and 2013, unrecognised deferred tax assets aged over 5 years (inclusive) arising from deductible tax losses resulted from foreign subsidiaries’ operating losses. Deductible tax losses generated from Hong Kong, the United States of America, the United Kingdom of Great Britain and Australia can be offset with future profit indefinitely; deductible tax losses generated from the Netherlands can be offset in the subsequent nine years.
At 31 December 2013, temporary differences relating to undistributed profits of Enric and its subsidiaries amounted to RMB864,129,000 (2012: RMB684,749,000). Deferred tax liabilities of RMB84,807,000 (2012: RMB64,316,000) have not been recognised in respect of the tax that would be payable on the distribution of these retained profits as Enric controls the dividend policy of these subsidiaries and it has been determined that it is probable that profits available for appropriation to Enric will not be distributed in the foreseeable future.
At 31 December 2013, the Group had no unrecognised deferred tax liabilities.

278 China International Marine Containers (Group) Co., Ltd.
Chapter 13Financial Statements Prepared in Accordance with China Accounting StandardsFor the year ended 31 December 2013(All amounts in RMB’000 unless otherwise stated)(English Translation for Reference Only)
V. NotES to tHE CoNSolIDAtED FINANCIAl StAtEMENtS (CoNtINUED)
20. other non-current assets
31 December 2013
31 December 2012
Prepayment for construction 33,267 61,881Prepayment for buildings 41,999 41,999Prepayment for machinery 3,625 39,853Prepayment for land use right 20,738 38,785Prepayment for equity 17,420 17,420Prepayment for trade receivables 116,962 –Entrusted loans 98,049 –Others 1,037 3,102
Total 333,097 203,040
21. Provision for asset impairment
Beginning balance
Additionsdue to
businesscombinations
Increase in current year
Decrease in current year
Exchange differences
arising from translating
foreign operations
Ending balanceReversal write-off
Provision for bad debts
Including: provision for bad debts of accounts receivable 369,921 22,074 80,670 (34,070) (33,847) (3,113) 401,635
Provision for bad debts of other receivables 140,938 14 26,821 (19,418) (24,132) (1,771) 122,452
Provision for bad debts of advances to suppliers 182,842 – 3,151 – (261) (2,706) 183,026
Provision for bad debts of current portion of non-current assets 61,061 – – (11,165) – – 49,896
Provision for bad debts of long-term receivables 116,798 6,699 11 (8,596) – – 114,912
Provision for decline in value of inventories 378,891 42,782 181,951 (85,948) (117,875) 1,049 400,850
Provision for impairment of long-term equity investments 3,067 – – – – – 3,067
Provision for impairment of fixed assets 388,718 – 5,524 – (37,234) 2,538 359,546Provision for impairment of construction
in progress 1,876 – – – (1,876) – –Provision for impairment of intangible assets 152,232 – – – – (3,033) 149,199Provision for impairment of goodwill 23,832 – – – – – 23,832
Total 1,820,176 71,569 298,128 (159,197) (215,225) (7,036) 1,808,415
Please refer to the respective notes of the assets for reasons of the provisions.

Annual Report 2013 279
Chapter 13 Financial Statements Prepared in Accordance with China Accounting Standards
For the year ended 31 December 2013(All amounts in RMB’000 unless otherwise stated)
(English Translation for Reference Only)
V. NotES to tHE CoNSolIDAtED FINANCIAl StAtEMENtS (CoNtINUED)
22. Restricted assets
As at 31 December 2013, assets with restrictions in their ownership are as follows:
NoteBeginning
balanceIncrease in
current yearDecrease in
current year
Exchange differences
arising from translating
foreign operations
Ending balance
Assets guaranteed – Cash at bank
and on hand V.1 824,027 2,397,524 (2,626,267) (5,733) 589,551 – Accounts
receivable V.4 – 148,235 – – 148,235 – Inventories V.7 – 339,070 – – 339,070 – Fix assets V.14 10,897 11,577 (7,842) – 14,632 – Construction in
progress V.15 1,184,650 74,720 – (36,352) 1,223,018
Total 2,019,574 2,971,126 (2,634,109) (42,085) 2,314,506
The above fixed assets and intangible assets were secured for bank loans. Refer to Note V.23, Note V.34 and Note V.36 for short-term and long-term secured loans analysis. The restricted cash at bank and on hand were guarantee deposit and deposit with the People’s Bank of China by Finance Company.

280 China International Marine Containers (Group) Co., Ltd.
Chapter 13Financial Statements Prepared in Accordance with China Accounting StandardsFor the year ended 31 December 2013(All amounts in RMB’000 unless otherwise stated)(English Translation for Reference Only)
V. NotES to tHE CoNSolIDAtED FINANCIAl StAtEMENtS (CoNtINUED)
23. Short-term borrowings
(1) Classification of short-term borrowings
Note31 December
201331 December
2012
Guaranteed (a)RMB 10,000 495,156USD 609,756 2,541,196HKD – 117,583EUR – 213,180
Sub-total 619,756 3,367,115
Pledged (b)USD 724,593 608,602
Impawn (c)RMB 12,848 –EUR 11,577 –
Sub-total 24,425 –
UnsecuredRMB 280,362 249,801USD 4,698,684 1,116,460EUR 860,777 90,466GBP – 5,870AUD 36,183 93
Sub-total 5,876,006 1,462,690
total 7,244,780 5,438,407
(a) As of 31 December 2013, guarantee borrowings of the Group included bank loans amounting to RMB10,000,000 guaranteed by Enric for its subsidiaries and RMB609,756,000 guaranteed by Raffles for its subsidiaries.
(b) As at 31 December 2013, Raffles, the subsidiary of the Company, used YCRO’s construction contract of H195 drilling platform project, lease contract of H195 drilling platform project signed with Dragon Oil, operation agreement of H195 drilling platform project signed with Momentum Engineering, it’s stake in Caspian Driller Pte and guarantee slip from China Export&Credit Insurance Corporation (effective from the 6th withdrawal) as pledge to borrow loan from China Development Bank amounting to USD96,310,000. Also TAS and SCRC used invoice from trade receivable amounting to USD11,546,000 (equivalent to RMB70,400,000) and USD12,765,000 (equivalent to RMB77,835,000) respectively as pledge to borrow loan from bank amounting to USD10,391,000 (equivalent to RMB63,360,000) and USD12,135,000 (equivalent to RMB73,986,000) respectively.

Annual Report 2013 281
Chapter 13 Financial Statements Prepared in Accordance with China Accounting Standards
For the year ended 31 December 2013(All amounts in RMB’000 unless otherwise stated)
(English Translation for Reference Only)
V. NotES to tHE CoNSolIDAtED FINANCIAl StAtEMENtS (CoNtINUED)
23. Short-term borrowings (Continued)
(1) Classification of short-term borrowings (Continued)
(c) As at 31 December 2013, Hongxin Berg used pledged deposits amounting to RMB3,500,000 as impawn conditions to borrow loans amounting to RMB12,848,000. Also Ziegler used fixed assets and inventories with a total amount of EUR 1,375,000 (equivalent to RMB11,577,000) as impawn conditions to borrow loans from bank which amount to EUR 1,375,400 (equivalent to RMB11,577,000).
(d) As at 31 December 2013, there is no short-term borrowing to shareholders holding more than 5% (including 5%) of the voting rights of the Group or related parties.
(e) As at 31 December 2013, the weighted average interest rate of short-term borrowings is 2.50% annually (31 December 2012: 3.89%).
(2) Short-term borrowings that are due but not repaid
As at 31 December 2013, the Group had no past due and un-repaid short-term borrowings.
24. Financial liabilities at fair value through profit or loss
Note31 December
201331 December
2012
CurrentDerivative financial liabilities – foreign future contracts V.2(4) 1,297 3,869 – swap contract for interest rate (i) – 8,987
Sub-total 1,297 12,856
Non-currentDerivative financial liabilities – foreign future contracts V.2(4) 301 298 – swap contract for interest rate (i) 26,865 81,944
Sub-total 27,166 82,242
Total 28,463 95,098
(i) As at 31 December 2013, the Group had 2 unsettled interest rate swap contracts denominated in U.S. dollars. The nominal value of these contracts amounted to USD109,000,000. The maturity dates of these interest rate swap contracts range from 28 April 2017 and 29 December 2018. As at 31 December 2013, the company recognised on the foresaid contracts in their fair values of RMB26,865,000 as financial liabilities at fair value through profit or loss. Transaction costs on realisation have not been considered when calculating the fair values.

282 China International Marine Containers (Group) Co., Ltd.
Chapter 13Financial Statements Prepared in Accordance with China Accounting StandardsFor the year ended 31 December 2013(All amounts in RMB’000 unless otherwise stated)(English Translation for Reference Only)
V. NotES to tHE CoNSolIDAtED FINANCIAl StAtEMENtS (CoNtINUED)
25. Notes payable
31 December 2013
31 December 2012
Bank acceptance notes 885,662 778,922Trade acceptance notes 279,209 210,788Other notes payable 8,490 –
Total 1,173,361 989,710
The above notes payable are due within one year.
26. Accounts payable
(1) the Group’s accounts payable is as follows:
31 December 2013
31 December 2012
Raw materials suppliers 7,781,645 7,059,420
The ageing of accounts payable is analysed as follows:
31 December 2013
31 December 2012
Within 1 year 7,394,944 6,714,3271 to 2 years 204,088 220,5212 to 3 years 81,389 51,445Over 3 years 101,224 73,127
Total 7,781,645 7,059,420
As at 31 December 2013, accounts payable over 1 year with a carrying amount of RMB386,701,000 (31 December 2012: RMB345,093,000) are mainly payables related to offshore engineering business. The payable are not settled because the construction period of the offshore engineering project usually last more than 1 year.

Annual Report 2013 283
Chapter 13 Financial Statements Prepared in Accordance with China Accounting Standards
For the year ended 31 December 2013(All amounts in RMB’000 unless otherwise stated)
(English Translation for Reference Only)
V. NotES to tHE CoNSolIDAtED FINANCIAl StAtEMENtS (CoNtINUED)
26. Accounts payable (Continued)
(1) the Group’s accounts payable is as follows: (Continued)
Accounts payable denominated in foreign currencies are as follows:
31 December 2013 31 December 2012
Currency
Amount in foreign currency
Exchange rate
Amount in RMB
Amount in foreign currency
Exchange rate
Amount in RMB
’000 ’000 ’000 ’000
RMB 6,733,415 1.0000 6,733,415 5,871,059 1.0000 5,871,059USD 124,097 6.0976 756,692 123,291 6.2854 774,925HKD 1,197 0.7862 941 1,681 0.8108 1,363JPY 12,048 0.0578 696 61,095 0.0730 4,463EUR 20,860 8.4175 175,587 25,258 8.3195 210,134AUD 8,587 5.4289 46,619 13,352 6.5359 87,265Others 67,695 110,211
Total 7,781,645 7,059,420
(2) Accounts payable to shareholders holding more than 5% (including 5%) of the voting rights of the Company or accounts payable are as follows:
31 December 2013 31 December 2012
Company nameRelationship with the Group Amount
% of total balance Amount
% of total balance
TSC Offshore Group Limited Associate company 93,854 1.21% 85,050 1.20%WHRJL Joint Venture
company 50,756 0.65% 7,620 0.11%Other related parties 6,789 0.09% 25,086 0.35%
Total 151,399 1.95% 117,756 1.66%

284 China International Marine Containers (Group) Co., Ltd.
Chapter 13Financial Statements Prepared in Accordance with China Accounting StandardsFor the year ended 31 December 2013(All amounts in RMB’000 unless otherwise stated)(English Translation for Reference Only)
V. NotES to tHE CoNSolIDAtED FINANCIAl StAtEMENtS (CoNtINUED)
27. Advances from customers
(1) the Group’s advances from customers is as follows:
31 December 2013
31 December 2012
Advances for goods 2,326,678 1,905,725Advances for construction 47,200 211,174Advances for property 332,001 380,573Others 215,009 225,010
Total 2,920,888 2,722,482
As at 31 December 2013, there is no amount due to shareholders who hold 5% or more of the voting rights of the Company in the balance of advances from customers (2012: Nil).
Advances from customers denominated in foreign currencies are as follows:
31 December 2013 31 December 2012
Currency
Amount in foreign currency
Exchange rate
Amount in RMB
Amount in foreign currency
Exchange rate
Amount in RMB
’000 ’000 ’000 ’000
RMB 2,158,531 1.0000 2,158,531 1,595,505 1.0000 1,595,505USD 100,126 6.0976 610,527 116,344 6.2854 731,262EUR 1,360 8.4175 11,449 3,536 8.3195 29,416HKD 3,870 0.7862 3,043 35,226 0.8108 28,562AUD 13,619 5.4289 73,935 47,326 6.5359 309,323Others 63,403 28,414
Total 2,920,888 2,722,482
As at 31 December 2013, there was no significant advances from customers aged over one year.
(2) the Group’s advances from customers due to related parties is as follows:
31 December 2013 31 December 2012
Company nameRelationship with the Group Amount
% of total balance Amount
% of total balance
Tianzhu (Shanghai) International Freight Agency Co., Ltd.
Associate 2,277 0.08% – –
Total 2,277 0.08% – –

Annual Report 2013 285
Chapter 13 Financial Statements Prepared in Accordance with China Accounting Standards
For the year ended 31 December 2013(All amounts in RMB’000 unless otherwise stated)
(English Translation for Reference Only)
V. NotES to tHE CoNSolIDAtED FINANCIAl StAtEMENtS (CoNtINUED)
28. Employee benefits payable
Beginning balance
Business combination
Increase in current
year
Decrease in current
year
Exchange differences
arising from translating
foreign operations
Ending balance
Wages and salaries, bonuses, allowances and subsidies 1,347,771 41,055 3,758,105 (3,720,307) (2,197) 1,424,427
Senior management bonus 407,812 – – (19,206) – 388,606
Profit-sharing bonus – – 66,916 – – 66,916Termination benefits 6,548 – 4,911 (4,853) 77 6,683Cash-settled share-
based payments 492 – – – (16) 476Housing funds 5,030 3,027 138,496 (134,029) (64) 12,460Labor union funds and
employee education funds 56,614 678 34,076 (47,728) (114) 43,526
Staff welfare and others 195,296 10,536 1,323,871 (1,296,009) (47) 233,647
Total 2,019,563 55,296 5,326,375 (5,222,132) (2,361) 2,176,741
Please refer to Note VII for cash-settled shared-based payments.
As at 31 December 2013, no defaulted payables are included in the balance of employee benefits payable.
Salaries, bonus and allowances payables represent salaries accrued for current month and bonus accrued for subsidiaries in accordance with the result of annual performance and the performance assessment plan of the Group. According to the requirement of the performance assessment plan, annual accrued bonus would be paid over three years based on the percentage determined by the management; therefore, there was a balance of such accrued bonus at the end of the year.
Senior management bonus is determined on the assessment of certain key performance index. The above bonus is proposed by Chief Executive Officer of the Group and the payment is subject to review and approval by board chairman and vice board chairman of the Group. The balance of senior management bonus payable was unpaid balance accrued in prior years.

286 China International Marine Containers (Group) Co., Ltd.
Chapter 13Financial Statements Prepared in Accordance with China Accounting StandardsFor the year ended 31 December 2013(All amounts in RMB’000 unless otherwise stated)(English Translation for Reference Only)
V. NotES to tHE CoNSolIDAtED FINANCIAl StAtEMENtS (CoNtINUED)
29. taxes payable
31 December 2013
31 December 2012
Value-added-tax payable 88,098 50,891Business tax payable 11,245 17,236Enterprise income tax payable 369,023 515,363Withholding individual income tax 19,566 14,519City maintenance and construction tax payable 29,497 52,892Educational surcharge payable 22,984 42,204Land appreciation tax 88,616 24,893Others 54,108 29,532
Total 683,137 747,530
30. Interest payable
31 December 2013
31 December 2012
Interest of long-term borrowings with periodic payments of interest and return of principal at maturity 10,909 10,501
Interest of short-term borrowings 22,491 9,570Interest of corporate debentures 180,088 176,670Others 40 6,547
Total 213,528 203,288
31. Dividends payable
31 December 2013
31 December 2012
Minority shareholders of subsidiaries 197,897 38,747

Annual Report 2013 287
Chapter 13 Financial Statements Prepared in Accordance with China Accounting Standards
For the year ended 31 December 2013(All amounts in RMB’000 unless otherwise stated)
(English Translation for Reference Only)
V. NotES to tHE CoNSolIDAtED FINANCIAl StAtEMENtS (CoNtINUED)
32. other payables
(1) the analysis of the Group’s other payables is as follows:
Note31 December
201331 December
2012
Advance received 1,402,372 969,977Transportation expenses 444,328 734,772Accruals 946,826 612,202Advance received for shipbuilding (4) 410,366 423,004Current account with subsidiary’s minority 414,133 350,125Quality guarantees 436,813 319,940Equipment or land use rights 224,393 195,375Professional and training fees 13,034 67,198Housing maintenance fees 18,021 21,590Royalties 19,190 20,355Insurances 14,896 16,504Others 675,126 561,555
Total 5,019,498 4,292,597
Other payables denominated in foreign currencies are as follows:
31 December 2013 31 December 2012
Amount in foreign currency
Exchange rate
Amount in RMB
Amount in foreign currency
Exchange rate
Amount in RMB
’000 ’000 ’000 ’000
RMB 3,311,291 1.0000 3,311,291 1,984,086 1.0000 1,984,086USD 230,169 6.0976 1,403,470 266,970 6.2854 1,678,011HKD 45,458 0.7862 35,741 107,342 0.8108 87,033JPY 37,788 0.0578 2,183 2,931 0.0730 214EUR 26,171 8.4175 220,298 58,147 8.3195 483,750AUD 1,713 5.4289 9,298 5,116 6.5359 33,441Other 29,747 37,217 26,062
Total 5,019,498 4,292,597

288 China International Marine Containers (Group) Co., Ltd.
Chapter 13Financial Statements Prepared in Accordance with China Accounting StandardsFor the year ended 31 December 2013(All amounts in RMB’000 unless otherwise stated)(English Translation for Reference Only)
V. NotES to tHE CoNSolIDAtED FINANCIAl StAtEMENtS (CoNtINUED)
32. other payables (Continued)
(2) As at 31 December 2013, no amount due to shareholders who hold 5% or more of the voting rights of the Company is included in the balance of other payables. other payables to related parties:
Company name Relationship with the Group31 December
201331 December
2012
Marine Subsea & Consafe Associate 410,366 423,004Eighty Eight Dragons Limited Minority shareholder of subsidiary 164,634 –Shunde Furi Real Estate Investment
Co., LtdMinority shareholder of subsidiary
152,237 253,513Quercus Limited Minority shareholder of subsidiary 48,488 –Gasfin Investment S.A Minority shareholder of subsidiary 48,185 45,660TSC Offshore Group Limited Associate 30,893 13,384Shanghai Fengyang Associate 26,390 2,454Shunde Binuo Sunshine Real Estate
Co., LtdMinority shareholder of subsidiary
– 43,850Other related parties 1,842 8,465
Total 883,035 790,330
(3) Significant other payables aged over one year:
As at 31 December 2013, significant other payables aged over one year represented quality guarantee, vehicle mortgage guarantee and various deposits.
(4) Raffles and Gadidae AB entered into a shipbuilding contract, which was terminated afterwards, for the construction and sale of a submersible drilling rig from Raffles to Gadidae AB in 2007. Subsequently Gadidae AB and MSC entered into a contract which Gadidae AB would sell this vessel to MSC. Gadidae AB received USD67,300,000, equivalent to RMB410,366,000, progress billing from MSC in 2007.

Annual Report 2013 289
Chapter 13 Financial Statements Prepared in Accordance with China Accounting Standards
For the year ended 31 December 2013(All amounts in RMB’000 unless otherwise stated)
(English Translation for Reference Only)
V. NotES to tHE CoNSolIDAtED FINANCIAl StAtEMENtS (CoNtINUED)
33. Provisions
NoteBeginning
balance
Increase in current
year
Payment in current
year
Reversal in current
year
Exchange differences
arising from
translating foreign
operationsEnding balance
Product warranties (1) 661,612 296,424 52,160 224,212 (12,230) 669,434Guarantees for third
parties (2) 4,219 – – – – 4,219Others (3) 87,661 53,104 4,527 22,145 (3,265) 110,828
Total 753,492 349,528 56,687 246,357 (15,495) 784,481
(1) The Group provides after-sales repair warranty to the customers, ranging from two to seven years for containers, one year for trailers, one to seven years for tank equipments, one to two years for airport ground facilities and one year for offshore business after delivery of vessels. The Group will provide repair and maintenance services in accordance with sales contracts during the warranty period in the event of any non-accidental breakdown or quality problems. The balance of “Provisions – Warranties for product quality” represents the Group’s estimated obligation for such warranties of products sold out during the year and in the previous fiscal years.
(2) The amount represents the possible loss for a bank guarantee letter issued by the Company’s subsidiary – TAS.
(3) HI provide guarantees in respect of banking facilities granted to customers who drew down loans under banking facilities to settle outstanding payables arising from purchase of trailers from the Group. HI would provide provision for the possible loss considering the credit quality.

290 China International Marine Containers (Group) Co., Ltd.
Chapter 13Financial Statements Prepared in Accordance with China Accounting StandardsFor the year ended 31 December 2013(All amounts in RMB’000 unless otherwise stated)(English Translation for Reference Only)
V. NotES to tHE CoNSolIDAtED FINANCIAl StAtEMENtS (CoNtINUED)
34. Current portion of non-current liabilities
(1) the analysis of the Group’s current portion of non-current liabilities by categories is as follows:
Note31 December
201331 December
2012
Current portion of long-term borrowings – Unsecured (2) 2,281,341 1,257,100 – Guaranteed 6,062 – – Pledged 122,989 –
Sub-total 2,410,392 1,257,100
Current portion of long-term payables (3) 47,016 4,840Current portion of other non-current liabilities 1,367 –
Total 2,458,775 1,261,940
There were no overdue borrowings with extended maturity included in current portion of long-term borrowings.
(2) Current portion of long-term borrowings
(a) Current portion of long-term borrowings denominated in foreign currencies are as follows:
31 December 2013 31 December 2012
Amount in foreign currency
Exchange rate
Amount in RMB
Amount in foreign currency
Exchange rate
Amount in RMB
’000 ’000 ’000 ’000
Bank borrowings – RMB 2,181,497 1.0000 2,181,497 – 1.0000 – – USD 24,000 6.0976 146,341 200,000 6.2855 1,257,100 – EUR 105,000 0.7862 82,554 – 8.3195 –
2,410,392 1,257,100

Annual Report 2013 291
Chapter 13 Financial Statements Prepared in Accordance with China Accounting Standards
For the year ended 31 December 2013(All amounts in RMB’000 unless otherwise stated)
(English Translation for Reference Only)
V. NotES to tHE CoNSolIDAtED FINANCIAl StAtEMENtS (CoNtINUED)
34. Current portion of non-current liabilities (Continued)
(2) Current portion of long-term borrowings (Continued)
(b) As at 31 December 2013, the five largest current portion of long-term borrowings are as follows:
31 December 2013 31 December 2012
Starting date Ending date CurrencyInterest
rate
Amount in foreign currency
Amount in RMB
Amount in foreign currency
Amount in RMB
(%) ’000 ’000 ’000 ’000
The Export-import Bank of China 01/02/2011 01/02/2014 RMB Note (i) 500,000 500,000 500,000 500,000
The Export-import Bank of China 15/06/2011 15/06/2014 RMB Note (i) 400,000 400,000 400,000 400,000
The Export-import Bank of China 28/07/2011 18/07/2014 RMB Note (i) 300,000 300,000 300,000 300,000
The Export-import Bank of China 10/08/2011 10/08/2014 RMB Note (i) 300,000 300,000 300,000 300,000
The Export-import Bank of China 21/06/2011 21/06/2014 RMB Note (i) 200,000 200,000 200,000 200,000
Total 1,700,000 1,700,000
Note (i): Execute People’s Bank of China export seller’s credit rate, quarterly reviewed.
(3) Current portion of long-term payables
As at 31 December 2013, current portion of long-term payables included net financial leasing payable of RMB46,942,000, which is total amount of RMB51,160,000 minus unrecognised financing expenses of RMB4,218,000 and payables to compensate employee occupation disease of RMB74,000.
As at 31 December 2012, current portion of long-term payables included net financial leasing payable of RMB4,731,000, which is total amount of RMB4,886,000 minus unrecognised financing expenses of RMB155,000 and payables to compensate employee occupation disease of RMB109,000.
The Group had no financial leasing guaranteed by independent third parties.
35. other current liabilities
31 December 2013
31 December 2012
Commercial paper issued by the Group 1,920,321 –

292 China International Marine Containers (Group) Co., Ltd.
Chapter 13Financial Statements Prepared in Accordance with China Accounting StandardsFor the year ended 31 December 2013(All amounts in RMB’000 unless otherwise stated)(English Translation for Reference Only)
V. NotES to tHE CoNSolIDAtED FINANCIAl StAtEMENtS (CoNtINUED)
36. long-term borrowings
(1) the analysis of the Group’s long-term loans is as follows:
Note31 December
201331 December
2012
Bank borrowings – Unsecured 7,151,439 4,596,695 – Pledged (a) 550,726 547,620 – Guaranteed (b) 52,979 2,497,470 – Impawn (c) 6,099 –
Total 7,761,243 7,641,785
Long-term borrowings denominated in foreign currencies are as follows:
31 December 2013 31 December 2012
Interest rate
Amount in foreign currency Exchange rate
Amount in RMB Interest rate
Amount in foreign currency Exchange rate
Amount in RMB
’000 ’000 ’000 ’000
– RMB People’s Bank of China’s export seller’s credit rates, will be reviewed every quarter to PBOC’s Benchmark Rate+10%
910,313 1.0000 910,313 4.76% for the 1st quarter and will be reviewed every quarter to PBOC’s Benchmark Rate+10%
3,520,454 1.0000 3,520,454
– USD 3%~3-month LIBOR+310BP 1,056,736 6.0970 6,442,920 1-month LIBOR+190BP~3-month LIBOR+315BP
587,100 6.2855 3,681,507
– HKD 3-month HIBOR+210BP~3-month LIBOR+230BP
435,000 0.7862 342,008 HIBO+2.2%~3-month LIBOR+230BP
584,604 0.8108 438,647
– AUD 8.63% 270 5.4289 1,468 8.63 180 6.5359 1,177– CAD LIBOR+310BPS 11,269 5.7265 64,534 – – – –
7,761,243 7,641,785

Annual Report 2013 293
Chapter 13 Financial Statements Prepared in Accordance with China Accounting Standards
For the year ended 31 December 2013(All amounts in RMB’000 unless otherwise stated)
(English Translation for Reference Only)
V. NotES to tHE CoNSolIDAtED FINANCIAl StAtEMENtS (CoNtINUED)
36. long-term borrowings (Continued)
(1) the analysis of the Group’s long-term loans is as follows: (Continued)
(a) As at 31 December 2013, the Group’s long-term pledged borrowings were borrowed by CIMC USA Leasing amounted to USD79,736,000 (equivalent to RMB486,192,000) and CAD 11,269,240 (equivalent to RMB64,534,000) which was pledged by the subject matters of financing lease contracts.
(b) As at 31 December 2013, the Group’s long-term guaranteed borrowings comprise borrowings amounting to RMB1,000,000 guaranteed by Enric for its subsidiaries and borrowings amounting to RMB51,979,000 guaranteed by Xiamen Hongxin Entrepreneur Incubator Investment Co. Ltd. for Hongxin Berg.
(c) As at 31 December 2013, the Group’s long-term Impawn borrowings are pledged deposits loan from Hongxin Berg. The pledged deposits amount to RMB3,500,000 (Meanwhile it is also the short-term Impawn borrowings).
(d) No amount due to the shareholders who hold 5% or more of the voting rights of the Company or due to related parties is included in the above balance of long-term borrowings.
(e) As at 31 December 2013, the weighted average interest rate of long-term borrowings is 3.43% annually (31 December 2012: 3.24%).
(2) As at 31 December 2013, the five largest long-term borrowings are as follows:
31 December 2013 31 December 2012
Starting date Ending date Currency Interest rate (%)
Amount in foreign currency
Amount in RMB
Amount in foreign currency
Amount in RMB
’000 ’000 ’000 ’000
China Development bank 13/12/2013 21/06/2016 USD 6-month LIBOR+310BP 520,000 3,170,369 225,100 1,414,834Syndicated loan 13/03/2012 13/01/2015 USD 1-month LIBOR+190BP 225,000 1,371,794 100,000 628,536Syndicated loan 02/05/2012 07/11/2015 USD 3-month LIBOR+230BP 100,000 609,686 500,000 500,000Syndicated loan 04/01/2012 07/11/2015 HKD 3-month LIBOR+230BP 390,000 306,628 65,000 408,548China Development bank 02/07/2013 01/12/2015 USD 3-month LIBOR+310BP 40,000 243,902 400,000 400,000
Total 5,702,379 3,351,918
As at 31 December 2013, there were no overdue long-term borrowings of which the durations are extended.

294 China International Marine Containers (Group) Co., Ltd.
Chapter 13Financial Statements Prepared in Accordance with China Accounting StandardsFor the year ended 31 December 2013(All amounts in RMB’000 unless otherwise stated)(English Translation for Reference Only)
V. NotES to tHE CoNSolIDAtED FINANCIAl StAtEMENtS (CoNtINUED)
37. Debentures payable
Beginning balance
Increase in current year
Decrease in current year
Ending balance
Medium-term notes 5,990,833 2,580 – 5,993,413Convertible bonds 471,402 – (14,085) 457,317
Total 6,462,235 2,580 (14,085) 6,450,730
(1) Related information is as follows:
Debenture name Par value Issuance date MaturityIssuance amount
Discount at the
beginning of the year
Amortization in current
year
Discount at the end of
the year
Effect of foreign
exchange rate changes
Ending balance
Medium-term notes – 11CIMC MTN1 4,000,000 23 May 2011 5 years 4,000,000 (9,167) 2,580 (6,587) – 3,993,413Medium-term notes – 12CIMC MTN1 2,000,000 24 May 2012 3 years 2,000,000 – – – – 2,000,000Convertible bonds 471,402 10 December 2012 3 years 471,402 – – – (14,085) 457,317
Total 6,450,730
The company issued medium-term notes (MTN) on 20 May 2011 with a ceiling of RMB6 billion to institutional investors in the national inter-bank bond market. The first phase of MTN with a total amount of RMB4 billion, a term of five years from 23 May 2011 to 22 May 2016, par value of RMB100 per note and fixed interest rate of 5.23% per annum was successfully issued publicly. Interest is to be paid on 23rd May each year in the arrears until redemption and par value is to be paid on 23 May 2016. The notes are unsecured and targets institutional investors in the national inter-bank market.
The company issued the second phase of MTN on 22 May 2012 with a total amount of RMB2 billion, a term of three years from 24 May 2012 to 23 May 2015, par value of RMB100 per note and fixed interest rate of 4.43% per annum. Interest is to be paid on 24th May each year in the arrears until redemption and par value is to be paid on 24 May 2015. The notes are unsecured and targets institutional investors in the national inter-bank market.
China Merchants Bank Co., Ltd. is the lead underwriter. Book building and centralised placing were adopted for this issue. The MTN recorded as debenture was subsequently measured at amortized cost using the effective interest.
NSR, a subsidiary of the financial leasing, issued three-year convertible bonds (“CB”) to third party investor on 10 December, 2012. The par value and the amount was USD75,000,000 with fixed interest rate of 5%. If NSR’s offshore drilling platform project have completed and found the eligible leasee, the CB would directly converted to the Category B shares of NSR. In addition, during the life of the CB, the bond holder has the rights to convert the CB to Category B shares of NSR. At the CB maturity date, if the holder have chosen not convert, the NSR should buy-back all the CB and ensure the redemption price could enable the holder obtain 15% internal rate of return.

Annual Report 2013 295
Chapter 13 Financial Statements Prepared in Accordance with China Accounting Standards
For the year ended 31 December 2013(All amounts in RMB’000 unless otherwise stated)
(English Translation for Reference Only)
V. NotES to tHE CoNSolIDAtED FINANCIAl StAtEMENtS (CoNtINUED)
37. Debentures payable (Continued)
(1) Related information is as follows: (Continued)
According to the agreement, when the CB have converted to Category B shares of NSR, NSR should buy-back 25%, 25% and 50% of the Category B shares at the end of 3, 4, and 5 years after the issuance of CB, respectively. The redemption price would depend on the offshore drilling platform’s lease or sales price, but should make sure the original CB holder obtain not less than 15% internal rate of return. The group has made provisions of financing cost of the convertible bonds on the basis of 15% in other payables.
38. long-term payables
31 December 2013
31 December 2012
Financial Leasing payables 120,317 23,056Payable to minority shareholders 120,789 120,789Others 1,886 1,258
Total 242,992 145,103
(1) As at 31 December 2013, the five largest long-term payables are as follows:
lender Expiration dateInitial
amountInterest rate (%)
Interest accrued
Ending balance Conditions
Minority shareholders of subsidiaries – – – – 120,789 –
Jiangyin Lin Sheng machinery Co., Ltd. 2014.01-2016.12 31,740 8.55% 2,560 31,740 –
Beijing New Universal Science and Technology Co., Ltd. 2014.01-2015.11 23,920 8.04% 1,820 23,920 –
Shanghai Zhongkai Group co., Ltd. 2013.11-2015.08 23,500 12.86% 1,000 23,500 –
Quanzhou yongsheng Electroplating Industrial Co., Ltd. 2017.01.01 – – – 10,000 –
Total 209,949
As at 31 December 2013, there is no long-term payables of the Group denominated in USD (31 December 2012: RMB23,056,000).

296 China International Marine Containers (Group) Co., Ltd.
Chapter 13Financial Statements Prepared in Accordance with China Accounting StandardsFor the year ended 31 December 2013(All amounts in RMB’000 unless otherwise stated)(English Translation for Reference Only)
V. NotES to tHE CoNSolIDAtED FINANCIAl StAtEMENtS (CoNtINUED)
38. long-term payables (Continued)
(2) Details of payable for finance leases
As at 31 December 2013, the total future minimum lease payments under finance leases, which are based on contractual undiscounted cash flows (including interest payments computed using contractual rates or, if floating, based on rates current at the balance sheet date), were as follows:
minimum lease payments31 December
201331 December
2012
Within 1 year (inclusive) 51,160 4,886Over 1 year but within 2 years (inclusive) 12,882 4,886Over 2 years but within 3 years (inclusive) 18,520 4,886Over 3 years 90,467 14,040
Sub-total 173,029 28,698Less: unrecognised finance expenses (5,770) (911)
Carrying amounts 167,259 27,787
Please refer to Note V.34 for net financial leasing payable due within one year minus unrecognised financing expenses.
The Group had no financial leasing guaranteed by third party in the year.
(3) As at 31 December 2013, there is no amount due to the shareholders who hold 5% or more of the voting rights of the Company. Amount due to related parties is as follows:
Company nameRelationship with the Company
31 December 2013
31 December 2012
Shunde Furi Real Estate Investment Co., Ltd
Subsidiaries minority shareholder 120,789 120,789
Total 120,789 120,789
39. Payables for specific projects
Beginning balance
Increase in current year
Decrease in current year
Exchange differences
arising from translating
foreign operations
Ending balance
Project funds 4,802 904 (1,971) – 3,735

Annual Report 2013 297
Chapter 13 Financial Statements Prepared in Accordance with China Accounting Standards
For the year ended 31 December 2013(All amounts in RMB’000 unless otherwise stated)
(English Translation for Reference Only)
V. NotES to tHE CoNSolIDAtED FINANCIAl StAtEMENtS (CoNtINUED)
40. other non-current liabilities
Note31 December
201331 December
2012
Deferred income (1) 386,429 348,630
(1) Deferred income
31 December 2013
31 December 2012
Government grants related to assets TAS industrial base project 30,593 30,000 Enric relocation compensation 143,715 143,715 Enric new factory government grants 94,273 94,273 TCCIMC land compensation 22,957 23,523 MEA special funds to support industrial innovation 8,279 9,199 Shandong R&D fund 5,220 7,871 QDCSR Polyurethane foam industry HCFC-141B fund 5,598 – Zhenhua Group Drop and Pull Transport program 15,397 – Others 9,764 7,843
Government grants related to income Enric major technology application fund 30,225 6,000 Others 20,408 26,206
Total 386,429 348,630

298 China International Marine Containers (Group) Co., Ltd.
Chapter 13Financial Statements Prepared in Accordance with China Accounting StandardsFor the year ended 31 December 2013(All amounts in RMB’000 unless otherwise stated)(English Translation for Reference Only)
V. NotES to tHE CoNSolIDAtED FINANCIAl StAtEMENtS (CoNtINUED)
40. other non-current liabilities (Continued)
(1) Deferred income (Continued)
31 December 2012
Business combination
Newly acquired
government grants
Amortised to non-
operating income
Other changes
31 December 2013
Related to assets/income
Enric relocation compensation 143,715 – – – – 143,715 Related to assetsEnric new factory government grants 94,273 – – – – 94,273 Related to assetsTAS industrial base project 30,000 – 600 (7) – 30,593 Related to assetsEnric major technology application fund 6,000 – 24,225 – – 30,225 Related to incomeTCCIMC land compensation 23,523 – – (566) – 22,957 Related to assetsZhenhua Group Drop and Pull Transport program – 9,634 6,440 (677) – 15,397 Related to assetsCQLE Land grant fee refund 8,824 – – (201) – 8,623 Related to incomeMEA special funds to support industrial innovation 9,199 – – (920) – 8,279 Related to assetsMEA-other 6,121 – 200 (20) – 6,301 Related to incomeQDCSR Polyurethane foam industry HCFC-141B fund – – 5,598 – – 5,598 Related to assetsShandong R&D fund 7,871 – 90 (1,517) (1,224) 5,220 Related to assetsOthers 19,104 – 6,930 (1,960) (8,826) 15,248 Related to assets
Total 348,630 9,634 44,083 (5,868) (10,050) 386,429

Annual Report 2013 299
Chapter 13 Financial Statements Prepared in Accordance with China Accounting Standards
For the year ended 31 December 2013(All amounts in RMB’000 unless otherwise stated)
(English Translation for Reference Only)
V. NotES to tHE CoNSolIDAtED FINANCIAl StAtEMENtS (CoNtINUED)
41. Share capital
31 December 2012
Decrease in current year
Change of shares subject
to selling restriction
31 December 2013
’000 ’000 ’000 ’000
Shares subject to trading restriction – Held by domestic natural person 371 330 – 701
Shares not subject to trading restriction – RMB-denominated ordinary shares 1,231,544 – (330) 1,231,214 – Foreign shares listed overseas 1,430,481 – – 1,430,481
Total 2,662,396 330 (330) 2,662,396
31 December 2011
Decrease in current year
Change of shares subject
to selling restriction
31 December 2012
’000 ’000 ’000 ’000
Shares subject to trading restriction – Held by domestic natural person 373 – (2) 371
Shares not subject to trading restriction – RMB-denominated ordinary shares 1,231,544 – – 1,231,544 – Foreign shares listed domestically 1,430,479 (1,430,479) – – – Foreign shares listed overseas – 1,430,479 2 1,430,481
Total 2,662,396 – – 2,662,396
The par value of the aforesaid shares was RMB1.00 per share.
On 19 December 2012, the Company’s B shares changed listing location and went publication on the main market of the Stock Exchange of Hong Kong through the way of introduction. Henceforth, all the company’s B shares converted to overseas listed foreign shares (H shares).

300 China International Marine Containers (Group) Co., Ltd.
Chapter 13Financial Statements Prepared in Accordance with China Accounting StandardsFor the year ended 31 December 2013(All amounts in RMB’000 unless otherwise stated)(English Translation for Reference Only)
V. NotES to tHE CoNSolIDAtED FINANCIAl StAtEMENtS (CoNtINUED)
42. Capital surplus
31 December 2012
Increase in current year
Decrease in current year
31 December 2013
Share premium 201,222 – – 201,222Other capital surplus: – Property revaluation reserve 43,754 – – 43,754 – Exchange reserve on foreign currency capital 692 – – 692 – Donated non-cash assets reserve 257 – – 257 – Change in fair value and disposal of available-for-sale financial assets 541,024 – (538,104) 2,920 – Effective portion of changes in fair value of cash flow hedges 5,885 5,089 – 10,974 – Deferred tax effect (131,021) 130,008 (763) (1,776) – Equity settled share-based payment 312,377 88,206 – 400,583 – Capital surplus due to share option exercised by subsidiary 1,880 3,299 – 5,179 – Capital surplus due to minority shareholders’ contribution 101,376 – – 101,376 – Decrease in minority interests resulted from disposal of subsidiary (not loss the controlling rights on the subsidiary) 178,916 278,273 – 457,189 – Capital surplus due to corporate restructuring (42,696) – – (42,696) – Capital surplus due to acquiring minority shareholders’ equity 78,457 – (188,790) (110,333) – Capital surplus due to minority shareholders’ contributor (58,964) – – (58,964) – Effect of functional currency change (406,795) – – (406,795)Others 104,118 – – 104,118
Total 930,482 504,875 (727,657) 707,700

Annual Report 2013 301
Chapter 13 Financial Statements Prepared in Accordance with China Accounting Standards
For the year ended 31 December 2013(All amounts in RMB’000 unless otherwise stated)
(English Translation for Reference Only)
V. NotES to tHE CoNSolIDAtED FINANCIAl StAtEMENtS (CoNtINUED)
42. Capital surplus (Continued)
31 December 2011
Increase in current year
Decrease in current year
31 December 2012
Share premium 201,222 – – 201,222Other capital surplus: – Property revaluation reserve 43,754 – – 43,754 – Exchange reserve on foreign currency capital 692 – – 692 – Donated non-cash assets reserve 257 – – 257 – Change in fair value of available-for-sale financial assets 503,276 37,748 – 541,024 – Effective portion of changes in fair value of cash flow hedges 12,784 – (6,899) 5,885 – Deferred tax effect (122,756) – (8,265) (131,021) – Equity settled share-based payment 196,954 115,423 – 312,377 – Capital surplus due to share option exercised by subsidiary – 1,880 – 1,880 – Capital surplus due to minority shareholders’ contribution 79,024 22,352 – 101,376 – Decrease in minority interests resulted from disposal of subsidiary (not loss the controlling rights on the subsidiary) – 178,916 – 178,916 – Capital surplus due to corporate restructuring – – (42,696) (42,696) – Capital surplus due to acquiring minority shareholders’ equity 247,114 – (168,657) 78,457 – Capital surplus due to minority shareholders’ contributor (58,964) – – (58,964) – Effect of functional currency change (406,795) – – (406,795)Others 102,699 1,630 (211) 104,118
Total 799,261 357,949 (226,728) 930,482
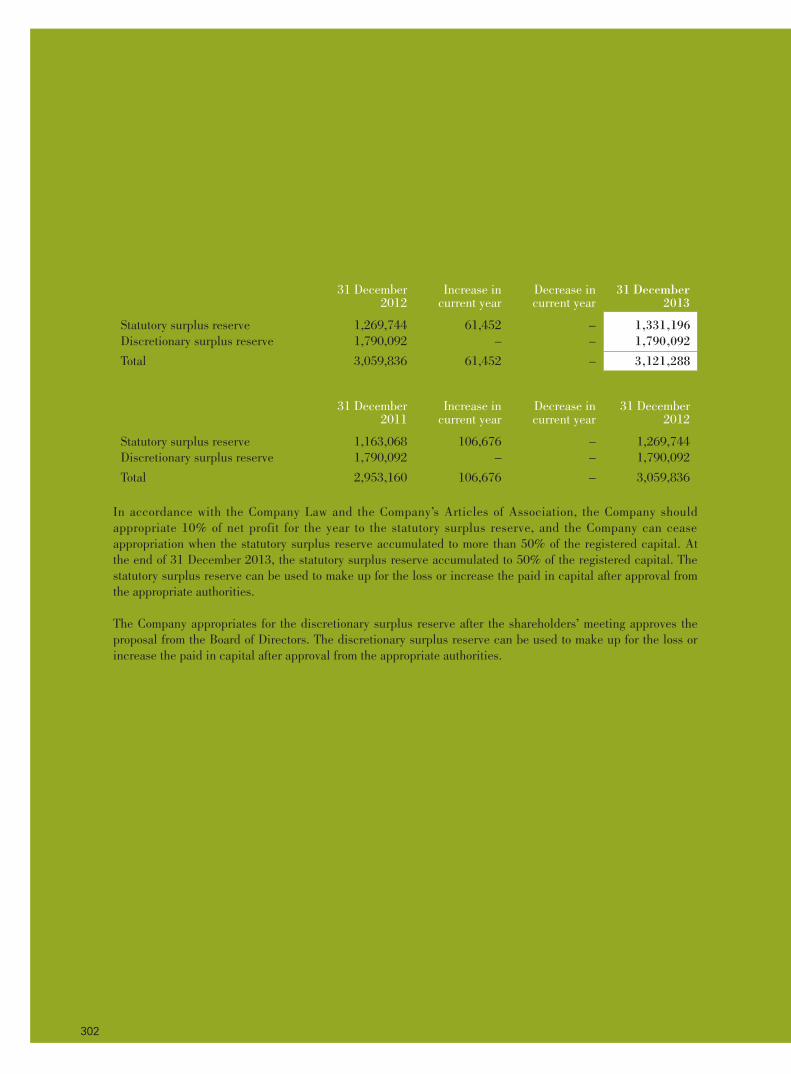
302 China International Marine Containers (Group) Co., Ltd.
Chapter 13Financial Statements Prepared in Accordance with China Accounting StandardsFor the year ended 31 December 2013(All amounts in RMB’000 unless otherwise stated)(English Translation for Reference Only)
V. NotES to tHE CoNSolIDAtED FINANCIAl StAtEMENtS (CoNtINUED)
43. Surplus reserve
31 December 2012
Increase in current year
Decrease in current year
31 December 2013
Statutory surplus reserve 1,269,744 61,452 – 1,331,196Discretionary surplus reserve 1,790,092 – – 1,790,092
Total 3,059,836 61,452 – 3,121,288
31 December 2011
Increase in current year
Decrease in current year
31 December 2012
Statutory surplus reserve 1,163,068 106,676 – 1,269,744Discretionary surplus reserve 1,790,092 – – 1,790,092
Total 2,953,160 106,676 – 3,059,836
In accordance with the Company Law and the Company’s Articles of Association, the Company should appropriate 10% of net profit for the year to the statutory surplus reserve, and the Company can cease appropriation when the statutory surplus reserve accumulated to more than 50% of the registered capital. At the end of 31 December 2013, the statutory surplus reserve accumulated to 50% of the registered capital. The statutory surplus reserve can be used to make up for the loss or increase the paid in capital after approval from the appropriate authorities.
The Company appropriates for the discretionary surplus reserve after the shareholders’ meeting approves the proposal from the Board of Directors. The discretionary surplus reserve can be used to make up for the loss or increase the paid in capital after approval from the appropriate authorities.

Annual Report 2013 303
Chapter 13 Financial Statements Prepared in Accordance with China Accounting Standards
For the year ended 31 December 2013(All amounts in RMB’000 unless otherwise stated)
(English Translation for Reference Only)
V. NotES to tHE CoNSolIDAtED FINANCIAl StAtEMENtS (CoNtINUED)
44. Undistributed profits
Note 2013 2012
Undistributed profits at the beginning of the year 13,392,795 12,785,092Add: net profit attributable to the Company for the current period 2,180,321 1,939,081Less: appropriation for surplus reserve (61,452) (106,676)Less: ordinary share dividends payable (1) (612,351) (1,224,702)
Undistributed profits at the end of the year (2) 14,899,313 13,392,795
(1) Dividends of ordinary shares declared during the year
2013 2012
Dividends proposed but not declared – –
Total proposed dividends in the year 612,351 1,224,702
In accordance with the resolution at the shareholders’ general meeting of the Company, dated on 28 June 2013, the Company paid a cash dividend in the amount of RMB0.23 per share to the ordinary shareholders on 15 August 2013 (2012: RMB0.46 per share), amounting to RMB612,351,000 calculated by issued shares (2012: RMB1,224,702,000).
(2) Undistributed profits at the end of the year
As at 31 December 2013, the net profit attributable to the Company included an appropriation of RMB895,468,000 to surplus reserve made by the subsidiaries (31 December 2012: RMB781,057,000).

304 China International Marine Containers (Group) Co., Ltd.
Chapter 13Financial Statements Prepared in Accordance with China Accounting StandardsFor the year ended 31 December 2013(All amounts in RMB’000 unless otherwise stated)(English Translation for Reference Only)
V. NotES to tHE CoNSolIDAtED FINANCIAl StAtEMENtS (CoNtINUED)
45. Revenue and cost of sales
(1)2013 2012
Revenue from main operations 56,699,378 52,944,160Revenue from other operations 1,175,033 1,389,897Cost of sales from main operations 47,683,165 44,122,978Cost of sales from other operations 559,195 478,279
There was no individual construction contract whose revenue amounted to more than 10% of the total revenue.
(2) Revenue and cost of sales from main operations by industries and by products
2013 2012
Industry
Revenue from main operations
Cost of sales from main operations
Revenue from main operations
Cost of sales from main operations
Containers 20,742,617 17,914,037 24,536,883 20,542,280Road transportation vehicles 12,710,935 10,878,433 13,391,366 11,737,514Energy and chemistry equipment 10,977,969 8,734,675 8,922,887 7,191,674Offshore business 3,457,644 3,473,166 1,794,133 1,676,172Airport facilities 836,688 588,824 682,234 510,526Logistics services and equipment 5,954,903 5,189,031 2,035,892 1,642,601Others 2,018,622 904,999 1,580,765 822,211
Total 56,699,378 47,683,165 52,944,160 44,122,978
(3) Revenue and cost of sales from main operations by locations
2013 2012
Revenue from main operations
Cost of sales from main operations
Revenue from main operations
Cost of sales from main
operations
P.R China 51,509,655 43,146,391 46,976,604 39,360,607America 1,827,487 1,654,810 1,697,876 1,520,158Europe 1,787,657 1,574,318 2,804,330 2,342,730Asia 591,614 460,149 245,806 195,773Others 982,965 847,497 1,219,544 703,710
Total 56,699,378 47,683,165 52,944,160 44,122,978
The revenue and cost of sale from main operations by locations is determined on the location at which the services were provided or the goods were delivered.

Annual Report 2013 305
Chapter 13 Financial Statements Prepared in Accordance with China Accounting Standards
For the year ended 31 December 2013(All amounts in RMB’000 unless otherwise stated)
(English Translation for Reference Only)
V. NotES to tHE CoNSolIDAtED FINANCIAl StAtEMENtS (CoNtINUED)
45. Revenue and cost of sales (Continued)
(4) Revenue and cost of sales from other operations
2013 2012
Revenue from other operations
Cost of sales from other operations
Revenue from other operations
Cost of sales from other operations
Rendering of services 622,975 283,810 902,984 52,772Sale of raw materials 552,058 275,385 486,913 425,507
Total 1,175,033 559,195 1,389,897 478,279
(5) Revenue from the five largest customers of the Group in 2013
Customer Revenue% of
total revenue
Cronos Containers Ltd. 2,503,402 4.32%Great Excel International Industrial Limited 1,684,495 2.91%TAL International Container Corporation 1,627,757 2.81%SEACO SRL 1,479,201 2.56%Hapag-Lloyd AG 1,162,950 2.01%
Total 8,457,805 14.61%
In 2012, revenue from the five largest customers of the Group with an amount of RMB11,434,570,000, accounts for 21.05% of the total revenue of the Group.
46. taxes and surcharges
2013 2012 Tax base
Business tax 146,516 145,171 3% – 5% of revenueCity maintenance and construction tax 123,129 133,928 7% of VAT and business tax paidEducational surcharge 89,804 99,820 3% – 5% of VAT and business
tax paidLand appreciation tax 140,368 106,536 Appreciation amount in
transferring property and applicable tax rate
Others 7,751 20,585
Total 507,568 506,040

306 China International Marine Containers (Group) Co., Ltd.
Chapter 13Financial Statements Prepared in Accordance with China Accounting StandardsFor the year ended 31 December 2013(All amounts in RMB’000 unless otherwise stated)(English Translation for Reference Only)
V. NotES to tHE CoNSolIDAtED FINANCIAl StAtEMENtS (CoNtINUED)
47. Selling and distribution expenses
2013 2012
Transportation and distribution expenses 698,206 764,296External sales commission 38,680 47,332Employ benefit 428,301 235,374Warranty 69,641 133,239Others 597,905 585,456
Total 1,832,733 1,765,697
48. General and administrative expenses
2013 2012
Low-value consumables and materials consumed 93,295 93,251Rental 107,514 59,487Depreciation 175,452 173,223Employ Benefit 1,453,137 1,416,372Taxes and surcharges 160,611 144,233Agency fee 172,765 277,488Audit fees 8,260 5,630Technology development costs 501,949 357,628Amortisation 150,453 210,082Performance bonus and president bonus 452,560 221,293Share-based payment expenses 91,059 118,279Office expenditure, entertainment fee and others 674,497 643,738
Total 4,041,552 3,720,704

Annual Report 2013 307
Chapter 13 Financial Statements Prepared in Accordance with China Accounting Standards
For the year ended 31 December 2013(All amounts in RMB’000 unless otherwise stated)
(English Translation for Reference Only)
V. NotES to tHE CoNSolIDAtED FINANCIAl StAtEMENtS (CoNtINUED)
49. Financial expenses-net
2013 2012
Interest expenses 877,600 907,869
Including: Bank borrowings 551,363 561,866 Finance leases 5,469 71,196 Debentures payable 312,520 266,232 Other liabilities 8,248 8,575
Less: borrowing costs capitalised (339,469) (161,821)Interest income (248,698) (295,015)Exchange (gains)/losses 72,182 (322)Others 77,377 73,846
Total 438,992 524,557
Interest expenses are analysed by the repayment terms of bank and other borrowings as follows:
31 December 2013 31 December 2012
Bank borrowings
other borrowings
Bank borrowings
Other borrowings
Wholly repayable within five years 575,781 – 561,866 –
50. Profit/(losses) from changes in fair value
2013 2012
Financial assets at fair value through profit or loss – Changes in fair value during the year 1. Profit/(losses) from changes in fair value of equity instrument held for trading 16,855 21,152 2. Losses from changes in fair value of derivative financial instrument 120,530 (12,562) – Profit/(losses) for derecognised financial assets at fair value through profit or loss (13,936) 46,571
Sub-total 123,449 55,161
Financial liabilities at fair value through profit or loss – Changes in fair value during the year 1. Losses from changes in fair value of derivative financial instrument 66,434 3,400
Total 189,883 58,561

308 China International Marine Containers (Group) Co., Ltd.
Chapter 13Financial Statements Prepared in Accordance with China Accounting StandardsFor the year ended 31 December 2013(All amounts in RMB’000 unless otherwise stated)(English Translation for Reference Only)
V. NotES to tHE CoNSolIDAtED FINANCIAl StAtEMENtS (CoNtINUED)
51. Investment (losses)/income
(1) Investment (losses)/income by categories
2013 2012
Income earned during the holding period of financial assets at fair value through profit or loss – 6,661(Loss)/income from disposal of financial assets at fair value through profit or loss 13,936 (40,140)Income earned during the holding period of available-for-sale financial assets 13,222 11,138Income earned from disposal of available-for-sale financial assets 534,108 –Income from long-term equity investment under cost method 5,000 5,124Loss from long-term equity investment under equity method (55,513) (76,731)Income from disposal of long-term equity investment 916 3Remeasurement of the fair value of equity interest in the acquiree held prior to the acquisition date recognised investment losses (4,792) –Others 1,800 (3,906)
Total 508,677 (97,851)
Investment income from listed investments amount to RMB547,943,000 and investment losses from non-listed investments amount to RMB39,266,000(in 2012 investment losses from listed and non-listed investments amount to RMB26,384,000 and RMB71,467,000 respectively).
(2) In investment income from long-term equity investment under cost method, investees that contributed investment income for more than 5% of the Group’s total profit, or the top five investees that contributed most to the Group’s investment income are set out as follows:
Investee 2013 2012 Reason for current year fluctuation
BOCM Schroder Stolt Fund Management
5,000 5,000 Cash dividend was distributed during the year
Stolt Donghua Container Co., Ltd – 50 No cash dividend distributed during the year
Total 5,000 5,050

Annual Report 2013 309
Chapter 13 Financial Statements Prepared in Accordance with China Accounting Standards
For the year ended 31 December 2013(All amounts in RMB’000 unless otherwise stated)
(English Translation for Reference Only)
V. NotES to tHE CoNSolIDAtED FINANCIAl StAtEMENtS (CoNtINUED)
51. Investment (losses)/income (Continued)
(3) In investment income from long-term equity investment under equity method, investees that contributed investment income for more than 5% of the Group’s total profit, or the top five investees that contributed most investment income to the Group’s total profit are set out as follows:
Investee 2013 2012 Reason for current year fluctuation
C&C Trucks (88,593) (128,471) Changes in profit and loss of the investee
Pteris Global Ltd (21,455) (5,719) Changes in profit and loss of the investee
Shanghai Fengyang 13,626 9,149 Changes in profit and loss of the investee
TSC Offshore Group Ltd. (“TSC”) 8,132 1,676 Changes in profit and loss of the investee
KYH Steel Holding Ltd. (“KYH”) 7,906 7,599 Changes in profit and loss of the investee
Total (80,384) (115,766)
There is no significant restriction on the remittance of investment income.
52. Asset impairment losses
There was no significant restriction on the remittance of investment income to the investor.
2013 2012
Accounts receivable 46,600 43,363Advance to suppliers 3,151 93,115Other receivables 7,403 20,853Inventories 96,003 74,838Current portion of non-current assets (11,165) 36,599Long-term receivables (8,585) 75,831Fixed assets 5,524 190,596Construction in progress – 1,876
Total 138,931 537,071
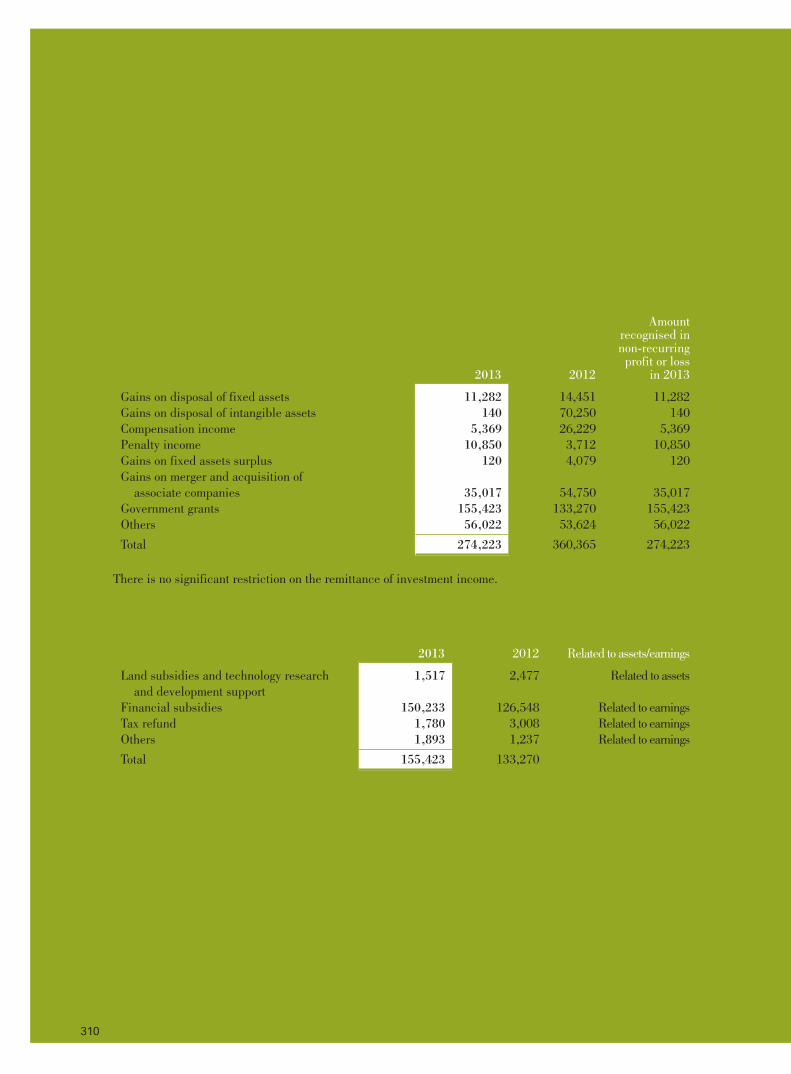
310 China International Marine Containers (Group) Co., Ltd.
Chapter 13Financial Statements Prepared in Accordance with China Accounting StandardsFor the year ended 31 December 2013(All amounts in RMB’000 unless otherwise stated)(English Translation for Reference Only)
V. NotES to tHE CoNSolIDAtED FINANCIAl StAtEMENtS (CoNtINUED)
53. Non-operating income
(1) Non-operating income by categories
2013 2012
Amount recognised in non-recurring profit or loss
in 2013
Gains on disposal of fixed assets 11,282 14,451 11,282Gains on disposal of intangible assets 140 70,250 140Compensation income 5,369 26,229 5,369Penalty income 10,850 3,712 10,850Gains on fixed assets surplus 120 4,079 120Gains on merger and acquisition of associate companies 35,017 54,750 35,017Government grants 155,423 133,270 155,423Others 56,022 53,624 56,022
Total 274,223 360,365 274,223
There is no significant restriction on the remittance of investment income.
(2) Details of government grants
2013 2012 Related to assets/earnings
Land subsidies and technology research and development support
1,517 2,477 Related to assets
Financial subsidies 150,233 126,548 Related to earningsTax refund 1,780 3,008 Related to earningsOthers 1,893 1,237 Related to earnings
Total 155,423 133,270

Annual Report 2013 311
Chapter 13 Financial Statements Prepared in Accordance with China Accounting Standards
For the year ended 31 December 2013(All amounts in RMB’000 unless otherwise stated)
(English Translation for Reference Only)
V. NotES to tHE CoNSolIDAtED FINANCIAl StAtEMENtS (CoNtINUED)
54. Non-operating expenses
2013 2012
Amount recognised in non-recurring profit or loss
in 2013
Losses on disposal of fixed assets 34,718 47,034 34,718Losses on disposal of intangible assets 1 535 1Donations 941 2,787 941Penalty expenses 3,653 8,997 3,653Compensation expenses 3,856 1,599 3,856Others 39,169 31,474 39,169
Total 82,338 92,426 82,338
55. Income tax expenses
2013 2012
Current income tax calculated based on tax law and related regulations 926,781 1,042,387Deferred income tax 1,441 (65,437)
Total 928,222 976,950
Reconciliation between income tax expenses and accounting profits is as follows:
2013 2012
Total profit 3,562,720 2,907,380Income tax expenses calculated at applicable tax rates 822,909 654,121Effect of tax incentive (177,482) (193,007)Expenses not deductible for tax purposes 113,039 93,940Income not subject to tax (16,221) (40,841)Utilisation of previously unrecognised tax losses (98,004) (14,099)Tax effect of unrecognised tax losses 216,470 398,323Deductible temporary differences for which no deferred tax asset was recognised in previous years (4,518) –Effect of tax rate change on deferred tax 3,323 (18,466)Tax refund for income tax annual filing 324 5,199Domestic purchased equipment tax refund (14,048) –Income tax accruals for profit of foreign holding companies in current year 82,430 91,780
Income tax expenses 928,222 976,950

312 China International Marine Containers (Group) Co., Ltd.
Chapter 13Financial Statements Prepared in Accordance with China Accounting StandardsFor the year ended 31 December 2013(All amounts in RMB’000 unless otherwise stated)(English Translation for Reference Only)
V. NotES to tHE CoNSolIDAtED FINANCIAl StAtEMENtS (CoNtINUED)
56. Earnings per share
(1) Basic earnings per share
Basic earnings per share is calculated by dividing consolidated net profit attributable to ordinary shareholders of the Company by the weighted average number of ordinary shares outstanding:
2013 2012
Consolidated profit attributable to ordinary shareholders of the Company 2,180,321 1,939,081Weighted average number of ordinary shares outstanding 2,662,396 2,662,396Basic earnings per share 0.82 0.73
(2) Diluted earnings per share
Diluted earnings per share is calculated by dividing net profit attributable to ordinary shareholders of the Company adjusted based on the dilutive potential ordinary shares by the adjusted weighted average number of ordinary shares outstanding.
2013 2012
Consolidated net profit attributable to ordinary shareholders of the Company 2,180,321 1,939,081Effect of subsidiaries’ share option program (22,690) –Consolidated profit attributable to ordinary shareholders of the Company (adjusted) 2,157,631 1,939,081Weighted average number of ordinary shares outstanding (diluted) (’000) 2,669,354 2,671,467Diluted earnings per share 0.81 0.73
The subsidiaries’ share option program is not immaterial to the Company’s diluted earning per share in 2012.
(a) Calculation of weighted average number of ordinary shares outstanding (diluted)
2013 2012
Issued ordinary shares at 1 January (’000) 2,662,396 2,662,396Effect of share options (’000) 6,958 9,071
Weighted average number of ordinary shares at 31 December (diluted) (’000) 2,669,354 2,671,467
The board of directors the Company was authorised to grant 60,000,000 shares (2.25% of the total issued shares 2,662,396,051 of the Company) to the senior management and other staff. According to the share options plan in Note VII.2, the exercisable share options during the year were 13,357,500 shares. Please refer to Note VII for the details of share options.

Annual Report 2013 313
Chapter 13 Financial Statements Prepared in Accordance with China Accounting Standards
For the year ended 31 December 2013(All amounts in RMB’000 unless otherwise stated)
(English Translation for Reference Only)
V. NotES to tHE CoNSolIDAtED FINANCIAl StAtEMENtS (CoNtINUED)
57. other comprehensive income
31 December 2012
Changes in current year
Tax effect Reclassification
31 December 2013
Other comprehensive income to be reclassified to profit or loss in subsequent accounting periods when specified conditions are met – Net change in fair value of available-for-sale financial assets and transfer to profit or loss arising from reclassification 410,956 (3,996) (534,108) 130,008 2,860 – Other comprehensive income arising from cash flow hedging instruments 5,002 5,089 – (763) 9,328 – Difference on translation of foreign currency financial statements (532,001) (181,631) – – (713,632) – Others 1,420 – – – 1,420
(114,623) (180,538) (534,108) 129,245 (700,024)
31 December 2011
Changes in current year
Tax effect Reclassification
31 December 2012
Other comprehensive income to be reclassified to profit or loss in subsequent accounting periods when specified conditions are met – Net change in fair value of available-for-sale financial assets and transfer to profit or loss arising from reclassification 382,438 37,818 – (9,300) 410,956 – Other comprehensive income arising from cash flow hedging instruments 10,866 (6,899) – 1,035 5,002 – Difference on translation of foreign currency financial statements (566,755) 34,754 – – (532,001) – Others – 1,420 – – 1,420
(173,451) 67,093 – (8,265) (114,623)

314 China International Marine Containers (Group) Co., Ltd.
Chapter 13Financial Statements Prepared in Accordance with China Accounting StandardsFor the year ended 31 December 2013(All amounts in RMB’000 unless otherwise stated)(English Translation for Reference Only)
V. NotES to tHE CoNSolIDAtED FINANCIAl StAtEMENtS (CoNtINUED)
58. Notes to the consolidated cash flow statement
(1) Cash received relating to other operating activities
2013 2012
Cash received from government grants related to assets 20,889 148,457Cash received from guarantee deposit, Security deposit 57,727 31,356Cash received from government grants related to income 173,850 123,008Cash received from penalty income 10,850 150,066Cash received from compensation income 5,369 29,941Others 359,253 269,225
Total 627,938 752,053
(2) Cash paid relating to other operating activities
2013 2012
Cash paid for transportation and distribution expenses 698,206 764,296Cash paid for rental, insurance and other selling and distribution expenses 107,514 59,487Cash paid for technical development costs 501,949 357,628Cash paid for warranty 56,687 157,151Cash paid for external sales commission 38,680 47,332Cash paid for entertainment fee 674,146 644,718Cash paid for travelling, office expenditure and other expenses in ordinary operation 1,089,100 821,149
Total 3,166,282 2,851,761
(3) Cash received relating to other investing activities
2013 2012
Cash received from interest income 264,165 278,719

Annual Report 2013 315
Chapter 13 Financial Statements Prepared in Accordance with China Accounting Standards
For the year ended 31 December 2013(All amounts in RMB’000 unless otherwise stated)
(English Translation for Reference Only)
V. NotES to tHE CoNSolIDAtED FINANCIAl StAtEMENtS (CoNtINUED)
58. Notes to the consolidated cash flow statement (Continued)
(4) Cash received relating to other financing activities
2013 2012
Cash received from issuing of commercial paper 1,920,321 –Cash received from disposal of subsidiaries equity 562,813 397,719Cash received from share option exercised by subsidiary 34,446 18,786
Total 2,517,580 416,505
(5) Cash paid relating to other financing activities
2013 2012
Cash paid for from acquiring minority interests 309,444 794,545Others – 63,790
Total 309,444 858,335

316 China International Marine Containers (Group) Co., Ltd.
Chapter 13Financial Statements Prepared in Accordance with China Accounting StandardsFor the year ended 31 December 2013(All amounts in RMB’000 unless otherwise stated)(English Translation for Reference Only)
V. NotES to tHE CoNSolIDAtED FINANCIAl StAtEMENtS (CoNtINUED)
59. Information to cash flow statement
(1) Supplementary information to the consolidated cash flow statement
(a) Reconciliation from net profit to cash flows from operating activities:
2013 2012
Net profit 2,634,498 1,930,430Add: Provisions for asset impairment 138,931 537,071 Depreciation of fixed assets 990,117 847,720 Amortisation of intangible assets 182,823 237,605 Amortisation of investment properties and long-term prepaid expenses 28,490 24,653 (Gains)/losses on disposal of fixed assets, intangible assets and other long-term assets 23,297 (37,132)Less: Gains on merger and acquisition of associate companies (35,017) (54,750) (Profit)/losses on change in fair value (189,883) (58,561) Financial expenses 289,433 451,033 Investment losses/(income) (508,677) 97,851 Share-based payment expenses 91,059 118,279 Increase in deferred tax assets (126,825) (21,072) (Decrease)/increase in deferred tax liabilities (126,907) (35,697) Increase in inventories 2,715,219 (1,875,133) (Decrease)/increase in operating receivables (4,202,508) 2,418,332 Increase/(decrease) in operating payables 845,876 (2,339,129) Exchange differences arising from translating foreign operations – 1,419
Net cash flows from operating activities 2,749,926 2,242,919
Significant investing and financing activities that do not involve cash receipts and payments in 2013.
(b) Net (decrease)/increase in cash and cash equivalents:
2013 2012
Cash and cash equivalents at the end of the year 4,181,496 4,397,512Less: cash and cash equivalents at the beginning of the year 4,397,512 6,563,253
Net (decrease)/increase in cash and cash equivalents (216,016) (2,165,741)

Annual Report 2013 317
Chapter 13 Financial Statements Prepared in Accordance with China Accounting Standards
For the year ended 31 December 2013(All amounts in RMB’000 unless otherwise stated)
(English Translation for Reference Only)
V. NotES to tHE CoNSolIDAtED FINANCIAl StAtEMENtS (CoNtINUED)
59. Information to cash flow statement (Continued)
(2) Information on acquisition of subsidiaries and other business units during the year
2013 2012
Information on acquisition of subsidiaries and other business units:1. Consideration for acquisition 1,206,846 428,4902. Cash and cash equivalents paid for acquisition 1,206,846 406,964 Less: Cash and cash equivalents held by subsidiaries and other business units 260,429 77,418 Less: Cash and cash equivalents already paid – 33,0003. Net cash paid for the acquisition 946,417 296,5464. Non-cash assets and liabilities held by the acquired subsidiaries and other business units Current assets 1,234,058 910,828 Non-current assets 1,921,405 243,997 Current liabilities 1,117,745 (604,838) Non-current liabilities 682,747 (225,380) Minority interest (539,362) (39,347)
(3) Cash and cash equivalents
2013 2012
CashIncluding: cash on hand 2,477 1,580Cash at bank that can be readily drawn on demand 4,128,327 4,392,620Other monetary fund that can be readily drawn on demand 50,692 3,312
Cash and cash equivalents at the end of the year 4,181,496 4,397,512
Note: Aforesaid “Cash at bank and on hand” excluded restricted cash and short-term investment.

318 China International Marine Containers (Group) Co., Ltd.
Chapter 13Financial Statements Prepared in Accordance with China Accounting StandardsFor the year ended 31 December 2013(All amounts in RMB’000 unless otherwise stated)(English Translation for Reference Only)
VI. RElAtED PARtIES AND RElAtED PARtY tRANSACtIoNS
1. the company does not have immediate holding company.
2. For the information on the subsidiaries of the company, refer to Note IV.1.
3. For the information about the joint ventures and associates of the Company, refer to Note V.12.(2) and (3).
4. Information of other related parties
organisation name Relationship with the GroupCode of organisation
Florens Container Services Ltd. Subsidiary of significant shareholder N/AFlorens Container Corporation S.A. Subsidiary of significant shareholder N/AFlorens Maritime Limited Subsidiary of significant shareholder N/AShenzhen China Merchants Real Estated Co., Ltd Subsidiary of significant shareholder 61884513-6Gasfin Investment S.A Minority shareholder of subsidiary N/ACOSCO Container Industries Limited Significant shareholder N/AChina Merchant International Ltd. Significant shareholder N/AMitsui & Co., Ltd. Minority shareholder of subsidiary N/AShanxi Heavy Duty Automobile Co., Ltd. Minority shareholder of subsidiary 74127207-0Sumitomo Corporation Minority shareholder of subsidiary N/AShunde Furi Real Estate Investment Co., Ltd Minority shareholder of subsidiary 66332839-XZhejiang Tenglong Bamboo Industry Group Minority shareholder of subsidiary 73201662-2Tianjin Port International Logistics Development Co., Ltd.
Minority shareholder of subsidiary 74404796-0
Frigstad Deepwater Holding Limited Minority shareholder of subsidiary N/AEighty Eight Dragons Limited Minority shareholder of subsidiary N/AQuercus Limited Minority shareholder of subsidiary N/AShiny Laburnum Limited Minority shareholder of subsidiary N/A
Note: Significant shareholders represent shareholders holding more than 5% (inclusive) of the Company’s shares.

Annual Report 2013 319
Chapter 13 Financial Statements Prepared in Accordance with China Accounting Standards
For the year ended 31 December 2013(All amounts in RMB’000 unless otherwise stated)
(English Translation for Reference Only)
VI. RElAtED PARtIES AND RElAtED PARtY tRANSACtIoNS (CoNtINUED)
5. Related party transactions
The following transactions with related parties were conducted under normal commercial terms or relevant agreements.
(1) Purchase of goods and receiving of services
the Group
2013 2012
NameNature of the transaction Amount
% of the total
amount of similar
transactions Amount
% of the total
amount of similar
transactions
WHRJL Purchase of goods 59,735 0.05% 29,040 0.02%SXHDA Purchase of goods 59,140 0.05% 34,342 0.03%TSC Purchase of goods 53,902 0.04% 15,616 0.01%Sumitomo Corporation Purchase of goods 22,626 0.02% 37,670 0.03%Other related parties Purchase of goods 14,321 0.00% 5,335 0.00%
Sub-total Purchase of goods 209,724 0.16% 122,003 0.09%
Other related parties Receiving of services 2,225 0.40% 6,421 1.34%
the Company
Receiving of services of the company refer to VI.5(5).

320 China International Marine Containers (Group) Co., Ltd.
Chapter 13Financial Statements Prepared in Accordance with China Accounting StandardsFor the year ended 31 December 2013(All amounts in RMB’000 unless otherwise stated)(English Translation for Reference Only)
VI. RElAtED PARtIES AND RElAtED PARtY tRANSACtIoNS (CoNtINUED)
5. Related party transactions (Continued)
(2) Sale of goods and rendering of services
the Group
2013 2012
NameNature of the transaction Amount
% of the total
amount of similar
transactions Amount
% of the total
amount of similar
transactions
SXHDA Sale of goods 589,840 1.04% 583,138 1.10%Florens Container Corporation S.A. Sale of goods 456,059 0.80% 446,665 0.84%Florens Maritime Limited Sale of goods 431,671 0.76% 967,059 1.83%Sumitomo Corporation Sale of goods 186,072 0.33% 244,933 0.46%COSCO Container Industries Limited Sale of goods 91,662 0.16% 30,344 0.06%C&C Trucks Sale of goods 91,032 0.16% 38,041 0.07%Florens Container Services Ltd. Sale of goods 59,770 0.11% – –GXNFWL Sale of goods 35,963 0.06% 20,867 0.04%NYK Zhenhua Sale of goods 17,451 0.03% – –Other related parties Sale of goods 7,135 0.01% 63,211 0.12%
Sub-total Sale of goods 1,966,655 3.46% 2,394,258 4.52%
Other related parties Rendering of services 9,406 1.08% 8,566 0.62%

Annual Report 2013 321
Chapter 13 Financial Statements Prepared in Accordance with China Accounting Standards
For the year ended 31 December 2013(All amounts in RMB’000 unless otherwise stated)
(English Translation for Reference Only)
VI. RElAtED PARtIES AND RElAtED PARtY tRANSACtIoNS (CoNtINUED)
5. Related party transactions (Continued)
(3) Financing
the Group
Name Amount Starting date Ending date
Interest income earned/interest
expense recognised in 2013 Note
Financing receivedGasfin Investment S.A 42,928 19 September 2008 Not fixed repayment date 1,987 Shareholder loansEighty Eight Dragons Limited 164,634 27 December 2013 27 December 2017 – Shareholder loansQuercus Limited 48,488 27 December 2013 27 December 2017 – Shareholder loansShiny Laburnum Limited 293 27 December 2013 27 December 2017 – Shareholder loans
256,343
Financing providedShanghai Fengyang 34,204 25 December 2007 Not fixed repayment date 3,817 Shareholder loansXYW 3,833 20 June 2006 Not fixed repayment date – Shareholder loansMarine Subsea & Consafe 278,911 1 December 2007 Not fixed repayment date – Shareholder loansC&C Trucks 632,732 10 May 2013,
15 July 2013, 17 October 2013, 31 October 2013 and 15 November 2013
9 May 2014, 15 July 2014, 17 October 2014, 31 October 2014 and 14 November 2014
19,379 Shareholder loans
Nantong New Atlantic Forest Industry Ltd.
39,434 3 April 2013, 21 May 2013, 22 July 2013, 1 November 2013, 17 December 2013 and 24 December 2013
3 April 2014, 21 May 2014, 22 July 2014, 31 October 2014, 17 December 2014 and 24 December 2014
1,950 Shareholder loans
Guangzhou Kyh Metal Co., Ltd. 9,997 29 December 2013 and 23 December 2013
9 June 2014 and 23 June 2014
244 Shareholder loans
Pteris Global Ltd 5,785 5 March 2013 5 March 2014 – Shareholder loansFrigstad Deepwater Holding Limited
155,901 16 April 2013 Not fixed repayment date – Shareholder loans
1,160,797
the Company
Name Amount Starting date Ending date
Interest income earned/interest
expense recognised in 2013 Note
Financing providedShanghai Fengyang 34,204 25 December 2007 Not fixed repayment date 3,817 Shareholder loans

322 China International Marine Containers (Group) Co., Ltd.
Chapter 13Financial Statements Prepared in Accordance with China Accounting StandardsFor the year ended 31 December 2013(All amounts in RMB’000 unless otherwise stated)(English Translation for Reference Only)
VI. RElAtED PARtIES AND RElAtED PARtY tRANSACtIoNS (CoNtINUED)
5. Related party transactions (Continued)
(4) other related party transactions
(i) The Company adopted a new share options scheme since 28 September 2010 (see Note VII). Details of unexercised share options granted to key management personnel as at 31 December 2013 are as follows:
Name PositionNumber of granted
share options (in ’000)
Mai Boliang President, Chairman 3,800Zhao Qingsheng Vice Chairman 1,500Wu Fapei Vice Chairman 1,000Li Yinhui Vice Chairman 1,000Yu Ya Vice Chairman 1,000Liu Xuebin Vice Chairman 1,500Zhang Baoqing Vice Chairman 1,000Jin Jianliong General Manager of Finance Department 1,000Zeng Beihua General Manager of Treasury Department 1,000Yu Yuqun Secretary of the Board 1,000
Total 13,800
Some key management personnel were not only granted the above share options of the Company but also were granted share options of Enric, the subsidiary of the Company. Details of unexercised share options granted to key management personnel as at 31 December 2013 are as follows:
Name PositionNumber of granted
share options (in ’000)
Zhao Qingsheng Vice Chairman 1,450Wu Fapei Vice Chairman 500Jin Jianliong General Manager of Finance Department 1,100Yu Yuqun Secretary of the Board 998
Total 4,048
For detailed information for fair value of the granted share options aforesaid, please refer to Note VII.

Annual Report 2013 323
Chapter 13 Financial Statements Prepared in Accordance with China Accounting Standards
For the year ended 31 December 2013(All amounts in RMB’000 unless otherwise stated)
(English Translation for Reference Only)
VI. RElAtED PARtIES AND RElAtED PARtY tRANSACtIoNS (CoNtINUED)
5. Related party transactions (Continued)
(4) other related party transactions (Continued)
(ii) Directors’ and key management personnel’s emoluments
Directors’ and key management personnel’s emoluments For the year ended 31 December 2013 are as follows:
Name RemunerationSalary and allowance Pension Bonus
Sign-off bonus
termination benefits others total
DirectorsMai Boliang – 2,388 37 6,249 – – 23 8,697Li Jianghong – – – – – – – –Xu Minjie – – – – – – – –Wang Hong – – – – – – – –Wang Xingru – – – – – – – –Wu Shuxiong Note (i) – – – – – – – –Wong Kwai Huen, Albert Note (i) 60 – – – – – – 60Li Kejun Note (i) 60 – – – – – – 60Pan Chengwie Note (i) 60 – – – – – – 60Xu Jingan 60 – – – – – – 60Ding Huiping 60 – – – – – – 60Jin Qingjun 60 – – – – – – 60
Sub-total 360 2,388 37 6,249 – – 23 9,057
SupervisorsLv Shijie – – – – – – – –Wong Sin Yue – – – – – – – –He Jiale – – – – – – – –Feng Wanguang – 319 – 1,400 – – – 1,719Li Ruiting – 651 – 1,700 – – – 2,351Xiong Bo – 141 27 32 – – 10 210
Sub-total – 1,111 27 3,132 – – 10 4,280
Note (i): Mr. Wu Shuxiong began to serve as director of the company on 27 September 2013. The sixth session of the board of independent directors: Mr. Ding Huiping, Mr. Xu Jingan and Mr. Jin QingJun’s term expired in April 2013. Mr. Wong Kwai Huen, Albert, Mr Li Kejun and Mr Pan Chengwei were elected to serve as the seventh session of the board of independent directors of the company since 28 June 2013.

324 China International Marine Containers (Group) Co., Ltd.
Chapter 13Financial Statements Prepared in Accordance with China Accounting StandardsFor the year ended 31 December 2013(All amounts in RMB’000 unless otherwise stated)(English Translation for Reference Only)
VI. RElAtED PARtIES AND RElAtED PARtY tRANSACtIoNS (CoNtINUED)
5. Related party transactions (Continued)
(4) other related party transactions (Continued)
(ii) Directors’ and key management personnel’s emoluments (Continued)
RemunerationSalary and allowance Pension Bonus
Sign-off bonus
termination benefits others total
other key management personnelZhao Qingsheng – 1,108 – 3,200 – – – 4,308Wu Fapei – 963 37 2,000 – – 23 3,023Li Yinhui – 963 35 1,700 – – 23 2,721Liu Xuebin – 1,077 37 2,600 – – 23 3,737Zhang Baoqing – 1,020 35 2,670 – – 23 3,748Yu Ya – 1,077 35 1,800 – – 23 2,935Jin Jianlong – 843 37 1,700 – – 23 2,603Zeng Beihua – 855 – 1,650 – – – 2,505Yu Yuqun – 855 37 1,600 – – 23 2,515
Sub-total – 8,761 253 18,920 – – 161 28,095
Total 360 12,260 317 28,301 – – 194 41,432
The five individuals whose emoluments are the highest in 2013 are included aforesaid.
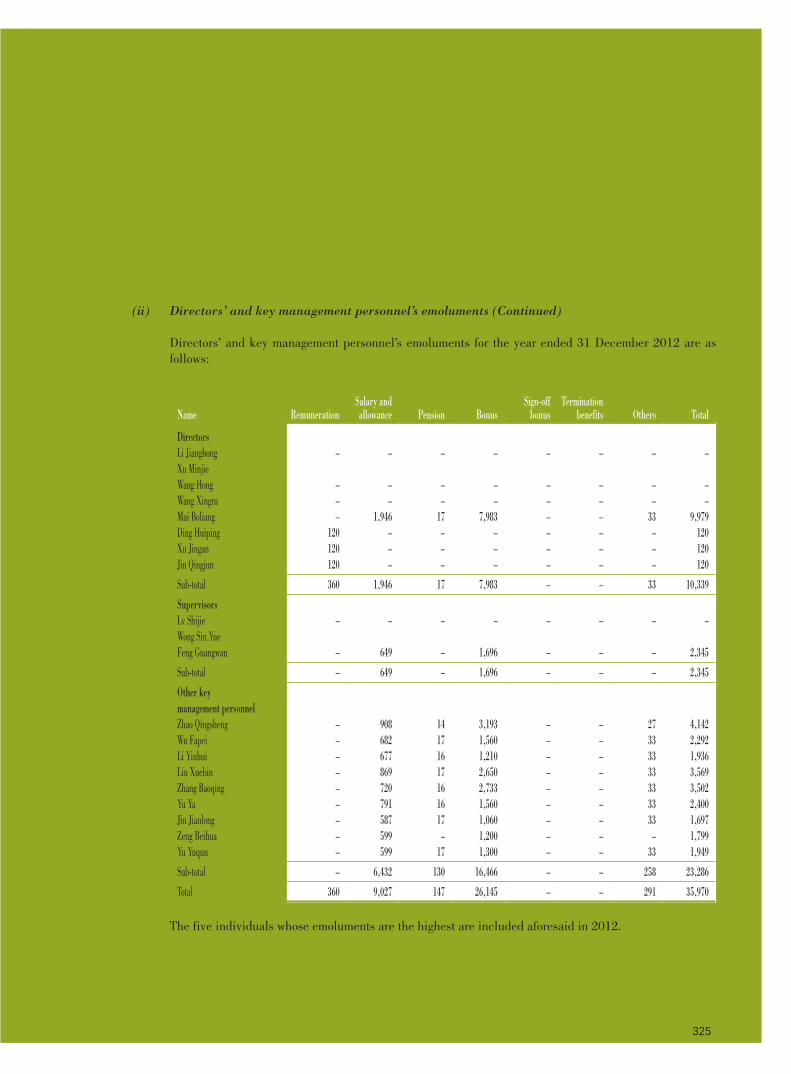
Annual Report 2013 325
Chapter 13 Financial Statements Prepared in Accordance with China Accounting Standards
For the year ended 31 December 2013(All amounts in RMB’000 unless otherwise stated)
(English Translation for Reference Only)
VI. RElAtED PARtIES AND RElAtED PARtY tRANSACtIoNS (CoNtINUED)
5. Related party transactions (Continued)
(4) other related party transactions (Continued)
(ii) Directors’ and key management personnel’s emoluments (Continued)
Directors’ and key management personnel’s emoluments for the year ended 31 December 2012 are as follows:
Name RemunerationSalary and allowance Pension Bonus
Sign-off bonus
termination benefits others total
DirectorsLi Jianghong – – – – – – – –Xu MinjieWang Hong – – – – – – – –Wang Xingru – – – – – – – –Mai Boliang – 1,946 17 7,983 – – 33 9,979Ding Huiping 120 – – – – – – 120Xu Jingan 120 – – – – – – 120Jin Qingjun 120 – – – – – – 120
Sub-total 360 1,946 17 7,983 – – 33 10,339
SupervisorsLv Shijie – – – – – – – –Wong Sin YueFeng Guangwan – 649 – 1,696 – – – 2,345
Sub-total – 649 – 1,696 – – – 2,345
other key management personnelZhao Qingsheng – 908 14 3,193 – – 27 4,142Wu Fapei – 682 17 1,560 – – 33 2,292Li Yinhui – 677 16 1,210 – – 33 1,936Liu Xuebin – 869 17 2,650 – – 33 3,569Zhang Baoqing – 720 16 2,733 – – 33 3,502Yu Ya – 791 16 1,560 – – 33 2,400Jin Jianlong – 587 17 1,060 – – 33 1,697Zeng Beihua – 599 – 1,200 – – – 1,799Yu Yuqun – 599 17 1,300 – – 33 1,949
Sub-total – 6,432 130 16,466 – – 258 23,286
Total 360 9,027 147 26,145 – – 291 35,970
The five individuals whose emoluments are the highest are included aforesaid in 2012.

326 China International Marine Containers (Group) Co., Ltd.
Chapter 13Financial Statements Prepared in Accordance with China Accounting StandardsFor the year ended 31 December 2013(All amounts in RMB’000 unless otherwise stated)(English Translation for Reference Only)
VI. RElAtED PARtIES AND RElAtED PARtY tRANSACtIoNS (CoNtINUED)
5. Related party transactions (Continued)
(4) other related party transactions (Continued)
(ii) Directors’ and key management personnel’s emoluments (Continued)
Number of individuals
2013 2012
Emolument bands:RMB0-1,000,000 7 9RMB1,000,000-1,500,000 – –RMB1,500,000-2,000,000 12 11
6. Receivables from and payables to related parties
Details of accounts receivable please refer to Note V.4
Details of other receivables please refer to Note V.5
Details of advance to suppliers please refer to Note V.6.
Details of accounts payable please refer to Note V.26
Details of other payables please refer to Note V.32.
7. Commitments in relation to related parties
As at 31 December 2013, there are no commitments in relation to related parties contracted for but not yet necessary to be recognised on the balance sheet by the Group.

Annual Report 2013 327
Chapter 13 Financial Statements Prepared in Accordance with China Accounting Standards
For the year ended 31 December 2013(All amounts in RMB’000 unless otherwise stated)
(English Translation for Reference Only)
VII. SHARE-BASED PAYMENtS
1. Information about share-based payments
Total equity instruments granted during the year
–
Total equity instruments exercised during the year
–
Total equity instruments forfeited during the year
–
The exercise price of outstanding share options at the end of the year and residual life of the share options contracts
1. Equity-settled share options granted by Enric in 2009 and 2011: HKD4 and HKD2.48 per share respectively, the residual life of contract is 5.83 and 7.82 years respectively;
2. Equity-settled share options granted by the Company in 2010 and 2011: RMB11.35 and RMB16.88 per share respectively (after adjustment), the residual life of contracts is both 6.74 years.
The price of other outstanding equity instruments at the end of the year and residual life of relevant contracts
–
Expenses recognised for the year arising from share-based payments are as follows:
2013 2012
Equity-settled share-based payment 91,059 118,279
2. Information on equity-settled share-based payment
(1) Information on equity-settled share-based payment of Enric
Enric, a subsidiary of the Company, carried out a share options plan (the “Plan I”), which was approved by the shareholders’ meeting on 11 November 2009. According to the Plan, the key management personnel and other employees in Enric were granted share options of Enric at nil consideration to subscribe for shares of Enric. The options are 50% exercisable after one year from the date of grant and are then 100% exercisable after two years from the date of grant. Each option gives the holder the right to subscribe for one ordinary share in Enric. The total number of share options granted was 43,750,000, with the exercise price of HKD4 per share.
Enric carried out another share options plan (the “Plan II”), which was approved by the shareholders’ meeting on 28 October 2011. According to Plan II, the board of directors of the Company was authorised to grant share options to the key management personnel and other employees of Enric at nil consideration to subscribe for shares of Enric. The options are 40% exercisable after one year from the date of grant and, 70% exercisable after 2 years from the date of grant, and then 100% exercisable after 3 years from the date of grant. Each option gives the holder the right to subscribe for one ordinary share in Enric. The total number of share options granted was 38,200,000, with exercise price of HKD2.48 per share.

328 China International Marine Containers (Group) Co., Ltd.
Chapter 13Financial Statements Prepared in Accordance with China Accounting StandardsFor the year ended 31 December 2013(All amounts in RMB’000 unless otherwise stated)(English Translation for Reference Only)
VII. SHARE-BASED PAYMENtS (CoNtINUED)
2. Information on equity-settled share-based payment (Continued)
(1) Information on equity-settled share-based payment of Enric (Continued)
Movement of share options of Enric:
2013 2012’000 ’000
Beginning balance 71,546 78,700Exercised in current period (11,838) (5,774)Cancelled in current period (1,070) (1,280)Forfeited in current period – (100)
Ending balance 58,638 71,546
(2) Information on equity-settled share-based payment of the Company
A share options scheme (the “Scheme”) was approved in the shareholders’ meeting of the Company held on 28 September 2010. According to the Scheme, the board of directors of the Company was authorised to grant share potions to the key management personnel and other employees to subscribe for shares of the Company. The effective period of the Scheme is ten years from the first grant date of share options. The options are exercisable in two periods. The options are 25% exercisable from the first transaction date after 24 months since the grant date to the last transaction date after 48 months since grant date. The remaining 75% are exercisable from the first transaction date after 48 months since grant date to the last transaction date of the Scheme. Each option gives the holder the right to subscribe for one ordinary share in the Company. In addition, the holder must simultaneously satisfactory all the condition as follows:
(a) The holder should pass the previous year’s evaluation.
(b) The increase of net profit attributable to ordinary shareholders of the Company after deducting nonrecurring profit or loss should not be lower than the 6% and the average return on net assets after deducting non-recurring profit or loss should not be lower than 10% for the previous year of the exercise date.
(c) During the waiting period, the net profit attributable to ordinary shareholders of the Company and the net profit attributable to ordinary shareholders of the Company after deducting non-recurring profit or loss should not be lower than the average figures of the three fiscal years before the grant day or negative.
The total number of share options granted was 60,000,000, 54,000,000 among which were for the initial grant with exercise price of RMB12.39 per share while the remaining 6,000,000 options were for reservation.
The Company distributed a cash dividend of RMB0.35 per share, RMB0.46 per share and RMB0.23 per share on 31 May 2011, 21 June 2012 and 28 June 2013 respectively to ordinary shareholders. In accordance with the Scheme, upon the implementation of the annual dividend distribution plan for 2011, 2012 and 2013, the Board of Directors would adjust the exercise price of the aforementioned 54,000,000 share options granted on 28 September 2010. The adjusted exercise price is RMB11.35 per share.

Annual Report 2013 329
Chapter 13 Financial Statements Prepared in Accordance with China Accounting Standards
For the year ended 31 December 2013(All amounts in RMB’000 unless otherwise stated)
(English Translation for Reference Only)
VII. SHARE-BASED PAYMENtS (CoNtINUED)
2. Information on equity-settled share-based payment (Continued)
(2) Information on equity-settled share-based payment of the Company (Continued)
According to the resolution approved by the Shareholders’ General Meeting on 22 September 2011, the aforementioned 6,000,000 share options for reservation in the Scheme on 28 September 2010 were granted with exercise price of RMB17.57 per share. Upon the implementation of annual dividend distribution plan for 2011 and 2012 to ordinary shareholders with cash dividend of RMB0.46 and RMB0.23 respectively, the adjusted option exercise price is RMB16.88.
Movement of share options of the Company:
2013 2012’000 ’000
Beginning balance 59,680 60,000Forfeited in current year (63) (320)
Ending balance 59,617 59,680
(3) Equity-settled share-based payment of CIMC tianyu
In 2013, CIMC Tianyu, one subsidiary of the Group, implemented an equity trust scheme. Through this program, employees, who participated in the scheme, bought 8% stake of CIMC Tianyu from CIMC SD, who is the direct holding company of CIMC Tianyu, through Chang’an International Trust Co. Ltd.
Since CIMC Tianyu is an unlisted company that its shares are less liquid, therefore it is hard to exit this plan because of restrictions. Also the fair value of this share-based payment is low. Therefore, the Group did not recognise corresponding equity-settled share-based payments as to this equity trust scheme.

330 China International Marine Containers (Group) Co., Ltd.
Chapter 13Financial Statements Prepared in Accordance with China Accounting StandardsFor the year ended 31 December 2013(All amounts in RMB’000 unless otherwise stated)(English Translation for Reference Only)
VII. SHARE-BASED PAYMENtS (CoNtINUED)
2. Information on equity-settled share-based payment (Continued)
(4) Basis of the best estimate of the number of equity instruments expected to vest is as follows:
At each balance sheet date during the vesting period, the Company makes the best estimation according to the latest information of the number of employees who are granted to vest and revises the number of equity instruments expected to vest. On vesting date, the estimate shall be equal to the number of equity instruments that ultimately vested.
There was no significant difference of estimation between current year and last year.
As at 31 December 2013, Accumulated amount recognised in capital reserve for equity-settled share-based payments 400,583
Total expenses recognised for equity-settled share-based payments for current yearIncluding: – attributable to the Company 81,505 – attributable to Enric 9,554
91,059
The number of options exercised this year of Enric is 11,838,000 (2012: 5,774,000).
3. Information on cash-settled share-based payment
According to the approved Share Appreciation Rights Scheme (draft) Revised (“Scheme”) during the board meeting of Raffles held on 27 September 2011, a subsidiary of the Group, Raffles adopted Share Appreciation Rights (“SARs”) which is to grant the relevant incentive recipients the right to receive incentive amount in cash from Raffles upon the satisfaction of relevant financial performance of Raffles. Incentive amount is the excess of fair market price of A share of the Company on a particular date over the exercise price.
The scope of incentive recipients of this scheme: the appointed senior management who is non-Chinese nationality of Raffles and its subsidiaries or associates as well as person(s) who made special contribution to the company in the discretion of the board. Accordingly, the there are 4 incentive recipients in the scope with total 760,000 SARs granted.
The Scheme is conditional, which sets stipulations for appraisal result of incentive recipients’ performance, misconduct activity and financial performance standards of the Group to fulfil.
The SARs are exercisable in 2 instalments periods after 2 years from the rights grant date upon the satisfaction of exercisable conditions.
(1) The SARs are up to 25% exercisable from the first transaction date after 24 months since grant date to the last transaction date after 48 months since grant date.
(2) The remaining SARs up to 75% are exercisable from the first transaction date after 48 months since grant date to the last transaction date of the Scheme.
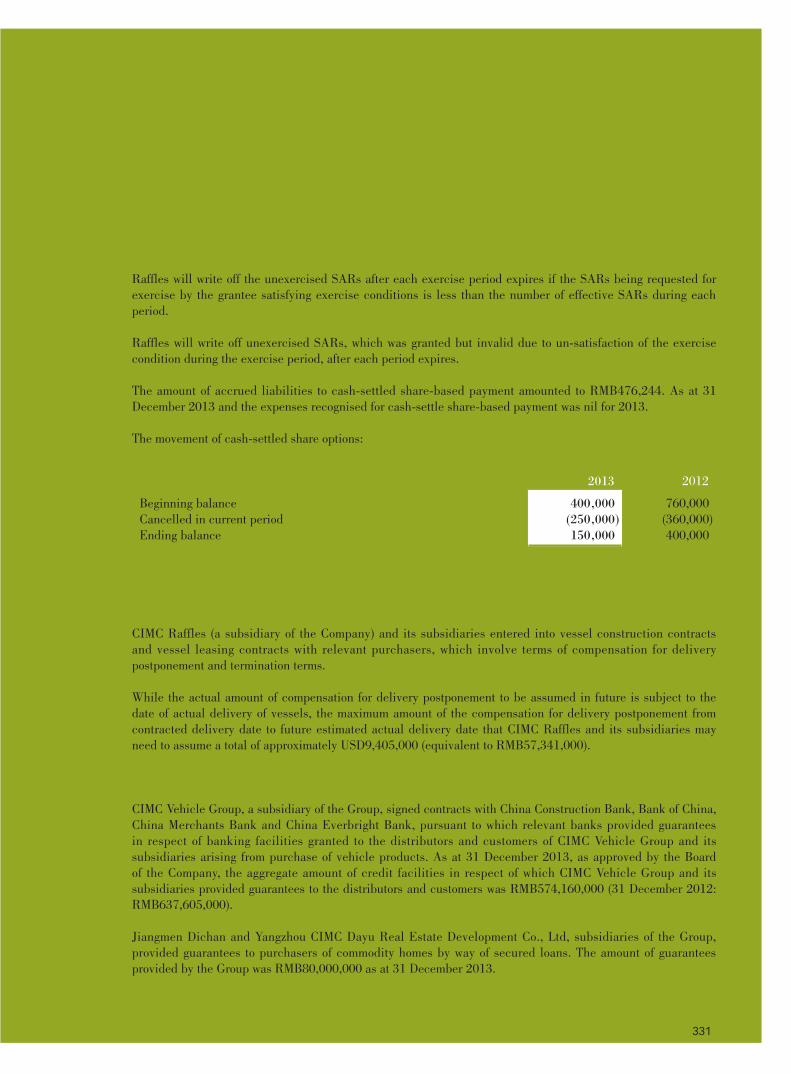
Annual Report 2013 331
Chapter 13 Financial Statements Prepared in Accordance with China Accounting Standards
For the year ended 31 December 2013(All amounts in RMB’000 unless otherwise stated)
(English Translation for Reference Only)
VII. SHARE-BASED PAYMENtS (CoNtINUED)
3. Information on cash-settled share-based payment (Continued)
Raffles will write off the unexercised SARs after each exercise period expires if the SARs being requested for exercise by the grantee satisfying exercise conditions is less than the number of effective SARs during each period.
Raffles will write off unexercised SARs, which was granted but invalid due to un-satisfaction of the exercise condition during the exercise period, after each period expires.
The amount of accrued liabilities to cash-settled share-based payment amounted to RMB476,244. As at 31 December 2013 and the expenses recognised for cash-settle share-based payment was nil for 2013.
The movement of cash-settled share options:
2013 2012
Beginning balance 400,000 760,000Cancelled in current period (250,000) (360,000)Ending balance 150,000 400,000
VIII. CoNtINGENCIES
1. Contingent liabilities
CIMC Raffles (a subsidiary of the Company) and its subsidiaries entered into vessel construction contracts and vessel leasing contracts with relevant purchasers, which involve terms of compensation for delivery postponement and termination terms.
While the actual amount of compensation for delivery postponement to be assumed in future is subject to the date of actual delivery of vessels, the maximum amount of the compensation for delivery postponement from contracted delivery date to future estimated actual delivery date that CIMC Raffles and its subsidiaries may need to assume a total of approximately USD9,405,000 (equivalent to RMB57,341,000).
2. Guarantees provided for external parties
CIMC Vehicle Group, a subsidiary of the Group, signed contracts with China Construction Bank, Bank of China, China Merchants Bank and China Everbright Bank, pursuant to which relevant banks provided guarantees in respect of banking facilities granted to the distributors and customers of CIMC Vehicle Group and its subsidiaries arising from purchase of vehicle products. As at 31 December 2013, as approved by the Board of the Company, the aggregate amount of credit facilities in respect of which CIMC Vehicle Group and its subsidiaries provided guarantees to the distributors and customers was RMB574,160,000 (31 December 2012: RMB637,605,000).
Jiangmen Dichan and Yangzhou CIMC Dayu Real Estate Development Co., Ltd, subsidiaries of the Group, provided guarantees to purchasers of commodity homes by way of secured loans. The amount of guarantees provided by the Group was RMB80,000,000 as at 31 December 2013.
332 China International Marine Containers (Group) Co., Ltd.
Chapter 13Financial Statements Prepared in Accordance with China Accounting StandardsFor the year ended 31 December 2013(All amounts in RMB’000 unless otherwise stated)(English Translation for Reference Only)
VIII. CoNtINGENCIES (CoNtINUED)
3. Notes payable issued but not accounted for, outstanding credit issued but undue and outstanding performance guarantees
The Group does not recognise bills payable or letter of credit issued as deposits. Corresponding inventories, advance to suppliers and notes payable are recognised at the earlier of the date of delivery of goods and the maturity date of the bills issued.
As at 31 December 2013, the Group had bills issued but not accounted for and outstanding letters of credit totalling RMB904,044,000 (31 December 2012: RMB717,454,000).
As at 31 December 2013, CIMC Raffles had outstanding balance of performance guarantees issued by relevant banks totalling USD723,036,000 (equivalent to RMB4,408,278,000), all of which were issued for vessel purchasers. (31 December 2012: RMB3,522,355,000).
As at 31 December 2013, TAS had outstanding balance of guarantees issued by relevant banks totalling RMB141,001,000, of which balance of performance guarantees, bid guarantees, quality guarantees and guarantees provided to suppliers was RMB43,172,000, RMB24,275,000, RMB8,072,000 and RMB65,482,000, respectively. (total balance as at 31 December 2012: RMB300,599,000).
As at 31 December 2013, CIMC Enric had outstanding balance of letters of guarantee of RMB42,846,000 and USD2,538,000 (equivalent to RMB15,475,000), totalling RMB58,321,000, which were all performance guarantees (2012: nil).
4. Significant pending litigations
The semi-submersible oil drilling rigs, i.e. SS Pantanal and SS Amazonia, built by CIMC Raffles and its subsidiaries for a subsidiary of SCHAHIN Group in Brazil, were finally delivered in November 2010 and April 2011 respectively, with an account receivable of USD142.30 million to be collected. Meanwhile, CIMC Raffles provided advances to Schahin Holdings SA and its six associates for building the drilling rig, with USD66.13 million to be collected.
As Schahin Holdings SA and its six associates failed to settle the above amounts as per the contracts, Raffles and its subsidiaries filed a lawsuit and application for arbitration against them in December 2011 and May 2012 respectively, in respect of the accounts receivable and advances. The arbitration in respect of the advances concluded in December 2012, whereby CIMC Raffles recovered the full amount of the advances of USD74.27 million (including the principal of USD66.13 million and interest of USD8.14 million) during September and October 2013. In October 2013, CIMC Raffles recovered the aforesaid accounts receivable of USD21.06 million (including the principal of USD15.98 million and interest of USD5.08 million) based on the ruling of the pre-arbitration in respect of the accounts receivable. In December 2013, London High Court ruled in favour of CIMC Raffles in respect of the accounts receivable of USD67.32 million (including the principal of USD53.35 million and interest of USD13.97 million), which is in the process of execution.
As at 31 December 2013, the advances have been fully recovered, with an outstanding account receivable of USD126.32 million (equivalent to approximately RMB770 million).
As at the date of approval of the financial statement, the litigation and arbitration in respect of the above account receivables have not been concluded and the defendant has filed a counter-charge. In accordance with the status of the legal proceedings and by reference to legal opinions, the management of the Company is optimistic about the prospects of the litigation and arbitration and will take positive measures to safeguard its shareholders’ interests during the process.

Annual Report 2013 333
Chapter 13 Financial Statements Prepared in Accordance with China Accounting Standards
For the year ended 31 December 2013(All amounts in RMB’000 unless otherwise stated)
(English Translation for Reference Only)
Ix. CoMMItMENtS
1. Significant commitments
(1) Capital commitments
2013 2012
Significant fixed assets purchase contracts entered into under performance or preparation of performance 125,662 406,690Investment contracts entered into but not performed or performed partially – 17,420Significant contracts entered into for Ships to be manufactured for sales or lease 3,962,914 1,804,449External investment approved by the Board of Directors 8,342 35,017Total 4,096,918 2,263,576
Capital commitments authorised by the management but are not yet contracted for
31 December 2013
31 December 2012
Buildings, machinery and equipment 8,342 468Intangible assets – 34,549
8,342 35,017
The Group’s share of the joint ventures’ own commitments for capital expenditure are as follows:
31 December 2013
31 December 2012
Buildings, machinery and equipment 1,561 280
(2) operating lease commitments
The future minimum lease payments due under the signed irrevocable operating leases contracts are summarised as follows:
2013 2012
Within 1 year (inclusive) 66,332 73,628Over 1 year but within 2 years (inclusive) 46,441 58,491Over 2 years but within 3 years (inclusive) 28,131 52,967Over 3 years 50,568 127,181Total 191,472 312,267
Operating lease recognised as expenses in 2013 is RMB63,518,000 (2012: RMB90,560,000).
(3) Fulfilment of commitments for the previous period
The Group has fulfilled the capital and operating lease commitments as at 31 December 2012.

334 China International Marine Containers (Group) Co., Ltd.
Chapter 13Financial Statements Prepared in Accordance with China Accounting StandardsFor the year ended 31 December 2013(All amounts in RMB’000 unless otherwise stated)(English Translation for Reference Only)
x. EVENtS AFtER tHE BAlANCE SHEEt DAtE
1. Dividend distribution after the balance sheet date
Dividend proposed (Note (1)) 718,847,000
(1) Dividend for ordinary shares proposed after balance sheet date
Board of directors proposed to distribute cash dividend of RMB0.27 per share (2012: RMB0.23 per share) to ordinary shareholders of the Company on 25 March 2014, totally RMB718,847,000 (2012: RMB612,351,000). The proposal is pending for approval of the Shareholders Meeting. The cash dividend proposed after the balance sheet date had not been recognised as a liability at the balance sheet date.
2. On 23 December 2013, the Company entered into H Share Subscription Agreements with each of COSCO Container, Broad Ride Limited (“Broad Ride”) and Promotor Holdings Limited (“Promotor Holdings”) respectively, pursuant to which the Company has conditionally agreed to allot and issue an aggregate of 286,096,100 new H Shares to them at the Subscription Price of HK$13.48 per share and COSCO Container, Broad Ride and Promotor Holdings have conditionally agreed to subscribe for such new H Shares in cash. The gross proceeds from the issue of such new H Shares are approximately HK$3,856.58 million. The transaction related to the issue of the H Shares above was considered and approved at the first extraordinary general meeting of Company in 2014 held on 7 March 2014.
3. Pursuant to Circular No. 9 in 2014, i.e. the “Circular on Relevant Issues Regarding Determination of Resident Enterprises as per Actual Administrative Authority Standards” issued by the State Administration of Taxation on 29 January 2014, the Group has consulted the Local Taxation Bureau of Shenzhen City in respect of the application of the 19 overseas companies under the Group’s control to be Chinese resident enterprises. In March 2014, the Group received the reply from the Local Taxation Bureau of Shenzhen City via Shekou Local Taxation Bureau, which recognised the 19 overseas companies under the Group’s control as Chinese resident enterprises, effective since 2013. This is a non-adjusting event after the balance sheet date.

Annual Report 2013 335
Chapter 13 Financial Statements Prepared in Accordance with China Accounting Standards
For the year ended 31 December 2013(All amounts in RMB’000 unless otherwise stated)
(English Translation for Reference Only)
xI. otHER SIGNIFICANt MAttERS
1. leases
Please refer to Notes V.11 and V.38 for reference of the Group’s receivables and payables related to finance lease.
2. Segment reporting
In accordance with the Group’s internal organisation structure, management requirement and internal reporting process, eight reportable segments are identified by the Group including Containers, Road transportation vehicles, Energy, chemistry and food equipment, Offshore business, Airport facilities, Logistic equipments and services, Railway trucks manufactory and Property development. Each reportable segment is an independent business segment providing different products and services. Independent management is applied to individual business segment as different technical and market strategy are adopted. The Group reviews the financial information of individual segment regularly to determine resources allocation and performance assessment.
(1) Segment profits, losses, assets and liabilities
In order to assess the segment performance and resources allocation, the Group’s management review segment revenue, expenses, assets and liabilities of each segment regularly. The preparation basis of such information is detailed as follows:
Segment assets include tangible assets, intangible assets, other long-term assets and accounts receivable, etc, but exclude deferred tax assets and other un-allocated headquarter assets. Segment liabilities include payables, bank loans, provision, special payables and other liabilities, while deferred tax liabilities are exclude.
Segment profit represents revenue (including external revenue and inter-segment revenue), offsetting segment expenses, depreciation and amortisation, impairment losses, interest expenses and income attributable to individual segment. Transactions conducted among segments are under normal non-related party transaction commercial terms.

336 China International Marine Containers (Group) Co., Ltd.
Chapter 13Financial Statements Prepared in Accordance with China Accounting StandardsFor the year ended 31 December 2013(All amounts in RMB’000 unless otherwise stated)(English Translation for Reference Only)
xI. otHER SIGNIFICANt MAttERS (CoNtINUED)
2. Segment reporting (Continued)
(1) Segment profits, losses, assets and liabilities (Continued)
Information to be disclosed on each of the Group’s reportable segment (including management’s periodically reviewed information and disclosure required by accounting standard) that the Group uses in measuring segments’ profit/(losses), assets and liabilities is set out as follows:
Item Containers
Road transportation
vehicles
Energy, chemistry and food
equipmentoffshore business
Airport facilities
logistic equipments
and services others
Elimination between
segmentsUnallocated
items total2013 2013 2013 2013 2013 2013 2013 2013 2013 2013
External transaction 21,100,212 13,120,561 11,209,761 3,501,509 887,749 6,020,609 2,009,142 – 24,868 57,874,411Inter segment transaction 207,071 214,137 370,213 3,480,808 – 195,240 387,419 (4,854,888) – –Investment income/(losses) in joint ventures and associates 12 4,243 – – – 18,332 (2,275) – (74,770) (54,458)Impairment loss for the year 8,436 101,835 (982) 11,241 (214) 35,429 (16,811) – (3) 138,931Depreciation and amortization expenses 326,872 251,286 247,326 184,535 4,680 125,755 60,976 – – 1,201,430Interest income 179,859 53,119 32,779 84,052 1,739 68,407 583,142 (761,497) 7,098 248,698Interest expenses 58,836 139,994 65,380 473,638 4,066 59,494 157,586 (781,424) 700,030 877,600Segment operating profit/(losses) 1,347,531 404,364 1,136,514 (321,580) 128,098 226,797 672,180 142,524 (173,708) 3,562,720Income tax expenses 328,469 139,972 224,320 (24,856) 11,783 47,960 175,966 – 24,608 928,222Net profit/(losses) 1,019,062 264,392 912,194 (296,724) 116,315 178,837 496,214 142,524 (198,316) 2,634,498Segment total assets 15,824,315 11,285,763 11,194,382 15,833,637 1,728,778 4,179,781 18,024,963 (8,439,676) 2,974,029 72,605,972Segment total liabilities 9,173,415 6,916,329 7,276,512 15,370,153 815,723 3,080,524 239,842 (13,820,498) 19,057,844 48,109,844Supplementary information: – Segment expenditures/ (income) other than depreciation and amortization (25,248) 106,531 (2,651) 960 (3,180) 13,054 48,134 – (135,761) 1,839 – Long-term equity investment of joint ventures and associates 2,784 44,747 4,000 – – 246,096 287,797 – 553,023 1,138,447 – Segment expenditures raising from additions of non-current assets 1,468,946 617,126 798,894 1,657,731 288,683 1,839,939 3,810,834 – – 10,482,153
Segment Information of Logistic equipments and services is not important to the Group, so the Group doesn’t reclassify its segment Information in 2012.

Annual Report 2013 337
Chapter 13 Financial Statements Prepared in Accordance with China Accounting Standards
For the year ended 31 December 2013(All amounts in RMB’000 unless otherwise stated)
(English Translation for Reference Only)
xI. otHER SIGNIFICANt MAttERS (CoNtINUED)
2. Segment reporting (Continued)
(1) Segment profits, losses, assets and liabilities (Continued)
Information to be disclosed on each of the Group’s reportable segment (including management’s periodically reviewed information and disclosure required by accounting standard) that the Group uses in measuring segments’ profit/(losses), assets and liabilities is set out as follows:
Item Containers
Road transportation
vehicles
Energy, chemistry and food
equipmentOffshore business
Airport facilities Others
Elimination between
segmentsUnallocated
items Total2012 2012 2012 2012 2012 2012 2012 2012 2012
External transaction 24,797,342 13,789,685 9,257,212 1,829,410 757,001 3,903,407 – – 54,334,057Inter segment transaction 42,737 340,795 376,495 – – 265,043 (1,025,070) – –Investment income/(losses) in joint ventures and associates (1) 198,006 – 3,656 – 36,105 (322,626) 8,129 (76,731)Impairment loss for the year (25,197) 228,451 11,571 192,228 17,269 112,749 – – 537,071Depreciation and amortization expenses 310,344 290,027 238,683 166,469 4,497 99,958 – – 1,109,978Interest income 49,795 12,115 19,853 91,431 380 96,366 – 25,075 295,015Interest expenses 13,947 100,074 31,031 99,072 91 97,788 – 404,045 746,048Segment operating profit/(losses) 2,348,464 172,137 802,409 (516,652) 79,018 959,276 (322,626) (614,646) 2,907,380Income tax expenses 541,588 34,924 157,033 10,123 10,203 223,079 – – 976,950Net profit/(losses) 1,806,876 137,213 645,376 (526,775) 68,815 736,197 (322,626) (614,646) 1,930,430Segment total assets 17,327,722 10,817,255 9,547,063 15,834,077 860,208 16,781,369 (23,251,400) 15,076,086 62,992,380Segment total liabilities 9,964,903 6,292,008 5,874,589 14,438,946 482,075 9,358,375 (17,525,691) 11,990,018 40,875,223Supplementary information: – Segment expenditures/(income) other than depreciation and amortization (8,658) 228,858 15,832 124,312 17,276 104,903 – (75,378) 407,145 – Long-term equity investment of joint ventures and associates 2,779 38,898 – – – 848,193 – 634,276 1,524,146 – Segment expenditures raising from additions of non-current assets 1,118,397 585,388 655,435 1,074,694 22,619 247,887 – – 3,704,420

338 China International Marine Containers (Group) Co., Ltd.
Chapter 13Financial Statements Prepared in Accordance with China Accounting StandardsFor the year ended 31 December 2013(All amounts in RMB’000 unless otherwise stated)(English Translation for Reference Only)
XI. OTHER SIGNIFICANT MATTERS (CONTINUED)
2. Segment reporting (Continued)
(2) Geographic information
The following table sets out information about the geographical information of the Group’s revenue from external customers and the Group’s non-current assets (excluding financial assets and deferred tax assets, same for the below). The geographical locations of customers are based on the location at which the services were provided or the goods were delivered. The geographical locations of the specified non-current assets are based on the physical location of the assets (for fixed assets), or the location of the business to which they are allocated (for intangible assets and goodwill), or the location of operations of the associates and joint ventures.
Geographic information
Revenue from external customers total non-current assets
2013 201231 December
201331 December
2012
P.R.China 20,718,567 23,202,710 20,855,399 18,099,106Asia (exclusive of China) 8,718,240 3,661,789 42,505 47,508America 11,247,084 13,651,754 5,779,386 313,853Europe 13,954,472 11,266,791 900,456 1,018,737Others 3,236,048 2,551,013 41,458 49,731
Total 57,874,411 54,334,057 27,619,204 19,528,935
3. Risk analysis, sensitivity analysis, and fair values of financial instruments
The Group has exposure to the following risks from its use of financial instruments in the normal course of the Group’s operations, which mainly include:
• Credit risk
• Liquidity risk
• Interest rate risk
• Foreign exchange risk
This note presents information about the Group’s exposure to each of the above risks and their sources, the Group’s objectives, policies and processes for measuring and managing risks and etc.
The Group aims to seek the appropriate balance between the risks and benefits from its use of financial instruments and to mitigate the adverse effects that the risks of financial instruments have on the Group’s financial performance. Based on such objectives, the Group’s risk management policies are established to identify and analyses the risks faced by the Group, to set appropriate risk limits and controls, and to monitor risks and adherence to limits. Risk management policies and systems are reviewed regularly to reflect changes in market conditions and the Group’s activities. The internal audit department of the Group undertakes both regular and ad-hoc reviews of risk management controls and procedures.
Annual Report 2013 339
Chapter 13 Financial Statements Prepared in Accordance with China Accounting Standards
For the year ended 31 December 2013(All amounts in RMB’000 unless otherwise stated)
(English Translation for Reference Only)
xI. otHER SIGNIFICANt MAttERS (CoNtINUED)
3. Risk analysis, sensitivity analysis, and fair values of financial instruments (Continued)
(1) Credit risk
Credit risk is the risk that one party to a financial instrument will cause a financial loss for the other party by failing to discharge an obligation. The Group’s credit risk is primarily attributable to cash at bank, receivables, debt investments and derivative financial instruments entered into for hedging purposes and etc. Exposure to these credit risks are monitored by management on an ongoing basis.
The cash at bank of the Group is mainly held with well-known financial institutions. Management does not foresee any significant credit risks from these deposits and does not expect that these financial institutions may default and cause losses to the Group.
In respect of receivables, the risk management committee of the Group has established a credit policy under which individual credit evaluations are performed on all customers to determine the credit limit and terms applicable to the customers. These evaluations focus on the external ratings of the customers and their bank credit records where available and previous payment records (if available). Receivables are due within from 30 to 90 days from the date of billing. Normally, the Group does not obtain collateral from customers, but earnest or prepayment money is requested sometimes due to the customer’s situation.
Most of the Group’s and the Company’s customers have been transacting with the Group or the Company for a long time, and losses have occurred infrequently. In monitoring customer credit risk, customers are grouped according to some factors, such as ageing and maturity date. This Group has made the provision for the significant overdue receivables at 31 December 2013.
Guideline from the Group basis to the assets of associates and jointly controlled, profit forecast of development project provide fund to associates and jointly controlled entity and continue to monitor the project progress and its operating to ensure the recoverability of the fund.
In addition, the debtors of the Group those are neither past due nor impaired mainly due to a wide range of customers for whom there was no recent history of default.
The Group’s exposure to credit risk is influenced mainly by the individual characteristics and industries of each customer rather than country or area in which the customers operate and therefore significant concentrations of credit risk arise primarily when the Group has significant exposure to individual customers. At the balance sheet date, the Group and the Company had a certain concentration of credit risk, as 15.08% (2012: 20.05%) of the total accounts receivable and other receivables were due from the five largest customers of the Group.
Investments are normally made only in liquid securities quoted on a recognised stock exchange, except where entered into for long-term strategic purposes. Transactions involving derivative financial instruments are made with counterparties of sound credit standing and with whom the Group has a signed netting ISDA agreement (International Swap Derivative Association). Given their high credit standing, management does not expect any investment counterparty to fail to meet its obligations.
The maximum exposure to credit risk is represented by the carrying amount of each financial asset, including derivative financial instruments, in the balance sheet. Except for the financial guarantees given by the Group as set out in Note VIII, the Group and the Company do not provide any other guarantees which would expose the Group or the Company to credit risk. The maximum exposure to credit risk in respect of these financial guarantees at the balance sheet date is disclosed in Note VIII.

340 China International Marine Containers (Group) Co., Ltd.
Chapter 13Financial Statements Prepared in Accordance with China Accounting StandardsFor the year ended 31 December 2013(All amounts in RMB’000 unless otherwise stated)(English Translation for Reference Only)
xI. otHER SIGNIFICANt MAttERS (CoNtINUED)
3. Risk analysis, sensitivity analysis, and fair values of financial instruments (Continued)
(2) liquidity risk
Liquidity risk is the risk that an enterprise may encounter deficiency of funds in meeting obligations associated with financial liabilities. The Company is responsible for the cash management, including short term investment of cash surpluses and the raising of loans to cover expected cash demands, for individual subsidiaries subject to approval by the Company’s board when the borrowings exceed certain predetermined levels of authority. The Group’s policy is to regularly monitor its liquidity requirements and its compliance with lending covenants, to ensure that it maintains sufficient reserves of cash, readily realisable marketable securities and adequate committed lines of funding from major financial institutions to meet its liquidity requirements in the short and longer term.
The following tables show the remaining contractual maturities at the balance sheet date of the Group’s financial assets and financial liabilities, which are based on contractual undiscounted cash flows (including interest payments computed using contractual rates or if floating, based on prevailing interest rates at 31 December) and the earliest date the Group can be required to pay:
31 December 2013Contractual undiscounted cash flow
within 1 year or
on demand1 to 2 years
2 to 5 years
over 5 years total
Balance sheet carrying amount
Financial assetsCash at bank and on hand 4,771,047 – – – 4,771,047 4,771,047Accounts receivable and other receivables 12,871,550 – – – 12,871,550 12,871,550Current portion of non-current assets 1,513,337 – – – 1,513,337 1,513,337Long-term receivables 1,809,278 1,308,192 1,609,652 637,056 5,364,178 2,952,418
Sub-total 20,965,212 1,308,192 1,609,652 637,056 24,520,112 22,108,352
Financial liabilitiesShort-term borrowings 7,244,780 – – – 7,244,780 7,244,780Debentures payable 320,666 2,777,983 4,209,200 – 7,307,849 6,450,730Accounts payable and other payables 12,801,143 – – – 12,801,143 12,801,143Current portion of non-current liabilities 2,458,775 – – – 2,458,775 2,458,775Long-term borrowings 270,165 3,874,365 4,728,239 – 8,872,769 7,761,243Long-term payables 51,235 12,882 64,435 165,051 293,603 242,992
Sub-total 23,146,764 6,665,230 9,001,874 165,051 38,978,919 36,959,663
Net total (2,181,552) (5,357,038) (7,392,222) 472,005 (14,458,807) (14,851,311)

Annual Report 2013 341
Chapter 13 Financial Statements Prepared in Accordance with China Accounting Standards
For the year ended 31 December 2013(All amounts in RMB’000 unless otherwise stated)
(English Translation for Reference Only)
xI. otHER SIGNIFICANt MAttERS (CoNtINUED)
3. Risk analysis, sensitivity analysis, and fair values of financial instruments (Continued)
(2) liquidity risk (Continued)
31 December 2012Contractual undiscounted cash flow
Within 1 year or
on demand1 to 2 years
2 to 5 years
Over 5 years Total
Balance sheet carrying amount
Financial assetsCash at bank and on hand 5,221,539 – – – 5,221,539 5,221,539Accounts receivable and other receivables 10,352,468 – – – 10,352,468 10,352,468Current portion of non-current assets 1,636,332 – – – 1,636,332 1,636,332Long-term receivables 343,833 1,034,424 1,366,884 812,274 3,557,415 2,540,574
Sub-total 17,554,172 1,034,424 1,366,884 812,274 20,767,754 19,750,913
Financial liabilitiesShort-term borrowings 5,438,407 – – – 5,438,407 5,438,407Debentures payable 321,370 321,370 7,320,592 – 7,963,332 6,462,235Accounts payable and other payables 11,352,017 – – – 11,352,017 11,352,017Current portion of non-current liabilities 1,261,940 – – – 1,261,940 1,261,940Long-term borrowings 2,457,709 4,511,907 1,835,149 197,743 9,002,508 7,641,785Long-term payables 4,886 4,886 18,926 143,142 171,840 145,103
Sub-total 20,836,329 4,838,163 9,174,667 340,885 35,190,044 32,301,487
Net total (3,282,157) (3,803,739) (7,807,783) 471,389 (14,422,290) (12,550,574)
Bank and other borrowings are analysed by repayment terms as follows:
31 December 2013 31 December 2012
Bank borrowings
other borrowings
Bank borrowings
Other borrowings
Wholly repayable within five years 15,006,022 – 13,789,671 –

342 China International Marine Containers (Group) Co., Ltd.
Chapter 13Financial Statements Prepared in Accordance with China Accounting StandardsFor the year ended 31 December 2013(All amounts in RMB’000 unless otherwise stated)(English Translation for Reference Only)
xI. otHER SIGNIFICANt MAttERS (CoNtINUED)
3. Risk analysis, sensitivity analysis, and fair values of financial instruments (Continued)
(3) Interest rate risk
The Group determines the appropriate weightings of the fixed and floating rate interest-bearing instruments based on the current market conditions and performs regular reviews and monitoring to achieve an appropriate mix of fixed and floating rate exposure.
(a) As at 31 December, the Group held the following interest-bearing financial instruments:
31 December 2013 31 December 2012
Interest rate (%) Amount
Interest rate (%) Amount
Fixed rates interest-bearing financial instrumentsFinancial assets – Long-term receivables 2.58%-17.53% 2,952,418 2.58%-17.53% 2,540,574 – Current portion of non-current assets 2.58%-17.53% 1,513,337 2.58%-17.53% 1,636,332
Financial liabilities – Short-term borrowings 0.93%~8.31% 4,047,240 0.94%-7.02% 3,929,032 – Debentures payable 4.43%-5.23% 6,450,730 4.43%-5.23% 6,462,235 – Long-term borrowings 3%-8.63% 122,769 3.00%-8.63% 11,548
Total (6,154,984) (6,225,909)
31 December 2013 31 December 2012
Interest rate (%) Amount
Interest rate (%) Amount
Floating rates interest-bearing financial instrumentsFinancial assets – Cash at bank and on hand 0.35%-3.75% 4,771,047 0.35%-3.75% 5,221,539
Financial liabilities – Current portion of long-term borrowings Note V.34 2,410,392 Note V.34 1,257,100 – Long-term borrowings Note V.36 7,638,474 Note V.36 7,630,237 – Short-term borrowing 1-month
lIBoR+90 bps~6-month libor+380 bps
3,197,540 3-month LIBOR+1.8%
~ PBOC’s Benchmark Rate+10%
1,509,375
– Long-term payables Note V.38 242,992 Note V.38 23,056 – Current portion of long-term payables Note V.34 47,016 Note V.34 4,731
Total (8,765,367) (5,202,960)

Annual Report 2013 343
Chapter 13 Financial Statements Prepared in Accordance with China Accounting Standards
For the year ended 31 December 2013(All amounts in RMB’000 unless otherwise stated)
(English Translation for Reference Only)
xI. otHER SIGNIFICANt MAttERS (CoNtINUED)
3. Risk analysis, sensitivity analysis, and fair values of financial instruments (Continued)
(3) Interest rate risk (Continued)
(b) Sensitivity analysis
As at 31 December 2013, it is estimated that a general increase/decrease of 25 basis points (31 December 2012: 25 basis points) in interest rates, with all other variables held constant, would increase/decrease the Group’s net profit by RMB21,913,000 (2012: RMB9,756,000), and equity by RMB21,913,000 (2012: RMB9,756,000).
The sensitivity analysis above indicates the instantaneous change in the net profit and equity that would arise assuming that the change in interest rate had occurred at the balance sheet date and had been applied to re-measure those financial instruments held by the Group which expose the Group to fair value interest rate risk at the balance sheet date. In respect of the exposure to cash flow interest rate risk arising from floating rate non-derivative instruments held by the Group at the balance sheet date, the impact on the net profit and equity is estimated as an annualised impact on interest expense or income of such a change in interest rates. The analysis was performed on the same basis for the previous year.
(4) Foreign exchange risk
The major currency received by the Group is USD and the major currency paid out is RMB. In order to avoid the risks resulting from the fluctuation of the exchange rate of RMB, in respect of accounts receivable and payables denominated in foreign currencies, the Group ensures that its net exposure is kept to an acceptable level by buying or selling foreign currencies at spot rates when necessary to address short-term imbalances.
(a) Besides the exposure to currency risk arising from financial assets at fair value through profit or loss and financial liabilities at fair value through profit or loss disclosed in Note V.2 and V.24, the Group’s exposure as at 31 December to currency risk arising from recognised assets or liabilities denominated in foreign currencies is follows. For presentation purposes, the amounts of the exposure are shown in RMB, translated using the spot rate at the balance sheet date. Differences resulting from the translation of the financial statements denominated in foreign currency are excluded.
31 December 2013 31 December 2012
USD EUR HKD JPY USD EUR HKD JPY
Cash at bank and on hand 1,127,452 257,355 250,837 30,954 2,001,728 545,391 66,888 38,757Receivables 4,875,318 526,341 37,314 17,225 4,789,721 801,682 57,396 38,046Short-term borrowings (6,033,033) (872,354) – – (4,266,258) (303,646) (117,583) –Long-term receivables 1,140,229 7,713 – – 1,108,073 8,728 – –Long-term borrowings (6,442,920) – (342,008) – (3,681,507) – (438,647) –Long-term payables – – – – (23,056) – – –Payables (2,160,162) (395,885) (36,682) (2,879) (2,452,936) (693,884) (88,396) (4,677)Provisions (146,648) (20,647) (4) – (416,856) (13,708) (275) –Current portion of non-current liabilities (146,341) – (82,554) – (1,257,100) – – –
Gross balance sheet exposure (7,786,105) (497,477) (173,097) 45,300 (4,198,191) 344,563 (520,617) 72,126

344 China International Marine Containers (Group) Co., Ltd.
Chapter 13Financial Statements Prepared in Accordance with China Accounting StandardsFor the year ended 31 December 2013(All amounts in RMB’000 unless otherwise stated)(English Translation for Reference Only)
xI. otHER SIGNIFICANt MAttERS (CoNtINUED)
3. Risk analysis, sensitivity analysis, and fair values of financial instruments (Continued)
(4) Foreign exchange risk (Continued)
(b) The following are the exchange rates for RMB against foreign currencies applied by the Group and the Company:
Average exchange rate Benchmark exchange rate
2013 201231 December
201331 December
2012
USD 6.1767 6.3091 6.0976 6.2854EUR 8.2372 8.1235 8.4175 8.3195HKD 0.7964 0.8135 0.7862 0.8108JPY 0.0623 0.0785 0.0578 0.0730
(c) Sensitivity analysis
Assuming all other risk variables remained constant, 2.00%, 4.00%, 2.00% and 5.00% strengthening of the RMB against the USD, EUR, HK dollar and Japanese Yen respectively at 31 December 2013 (1.00%, 2.54%, 0.85% and 10.00% strengthening of the RMB against the USD, EUR, HK dollar, and Japanese Yen respectively at 31 December 2012) would have increased (decreased) equity and net profit by the amount shown below; whose effect is in RMB and translated using the spot rate at the balance sheet date:
Equity Net profit
31 December 2013USD 116,792 119,993EUR 14,924 14,767HKD 2,596 1,358JPY (1,699) (1,699)
Total 132,613 134,419
31 December 2012USD 31,486 31,486EUR (6,564) (6,564)HKD 3,319 3,319JPY (5,409) (5,409)
Total 22,832 22,832
2.00%, 4.00%, 2.00% and 5.00% weakening of the RMB against USD, EUR, HK dollar and Japanese Yen respectively at 31 December 2013 (1.00%, 2.54%, 0.85% and 10.00% weakening of the RMB against the USD, EUR, HK dollar, and Japanese Yen respectively at 31 December 2012) would have had the equal but opposite effect on the amounts shown above, on the basis that all other variables remain constant.

Annual Report 2013 345
Chapter 13 Financial Statements Prepared in Accordance with China Accounting Standards
For the year ended 31 December 2013(All amounts in RMB’000 unless otherwise stated)
(English Translation for Reference Only)
xI. otHER SIGNIFICANt MAttERS (CoNtINUED)
3. Risk analysis, sensitivity analysis, and fair values of financial instruments (Continued)
(4) Foreign exchange risk (Continued)
(c) Sensitivity analysis (Continued)
The sensitivity analysis above assumes that the change in foreign exchange rates had been applied to re-measure those financial instruments held by the Group which expose the Group to foreign currency risk at the balance sheet date, the analysis excludes differences that would result from the translation of the financial statements denominated in foreign currency. The analysis is performed on the same basis for the previous year.
The above sensitive analysis does not include exposure to currency risk arising from foreign future contracts, Japanese Yen exchange option and swap contact for interest rate disclosed in Notes V.2 and V.24 about financial assets at fair value through profit or loss and financial liabilities at fair value through profit or loss, but the change in exchange rate may have effect on shareholders’ equity and net profit.
(5) other price risks
Other price risks are stock price risk. As at 31 December 2013, the Group held 18,779,000 tradable shares of Suning Commerce Group Co., Ltd. Securities, and 13,500,000 tradable shares of GoodPack Securities.
As at 31 December 2013, it is estimated that a general increase/decrease of composite index of Shanghai A-share 5.00% (31 December 2012: 5.00%), with all other variables held constant, would increase/decrease the Group’s shareholders’ equity by RMB16,549,000 (31 December 2012: RMB37,472,000).
The sensitivity analysis above arise assuming that the change in composite index of Shanghai A-share occurred at the balance sheet date is reasonable and had been applied to re-measure those investments in securities held by the Group. The sensitivity analysis is also based on another assumption, namely, the fair value of the investments in securities held by the Group is relevant to composite index of stock market, and available-for-sales securities investment has same risk factor as trading securities investment, and all other variables held constant. 20.00% change in composite index of Shanghai A-share is a reasonable expectation of the Group for the period from the balance date to the next balance sheet date.

346 China International Marine Containers (Group) Co., Ltd.
Chapter 13Financial Statements Prepared in Accordance with China Accounting StandardsFor the year ended 31 December 2013(All amounts in RMB’000 unless otherwise stated)(English Translation for Reference Only)
xI. otHER SIGNIFICANt MAttERS (CoNtINUED)
4. Estimates of fair value of financial instruments
The level in the fair value hierarchy within which the fair value measurement is categorised in its entirety is determined on the basis of the lowest level input that is significant to the fair value measurement in its entirety.
Level 1: Quoted prices (unadjusted) in active markets for identical assets or liabilities;
Level 2: Inputs other than quoted prices included within level 1 that are observable for the asset or liability, either directly (that is, as prices) or indirectly (that is, derived from prices).
Level 3: Inputs for the asset or liability that are not based on observable market data (that is, unobservable inputs).
(1) Financial instruments measured at fair value
The following table presents the Group’s assets and liabilities that are measured at fair value in the above three levels as at 31 December 2013:
Assets Note level 1 level 2 level 3 total
Financial assets at fair value through profit or loss – – – –Investments in equity instrument held for trading V.2 319,605 – – 319,605Derivative financial assets V.2 – 133,068 – 133,068Hedging Instrument V.2 – 7,940 – 7,940
Sub-total 319,605 141,008 – 460,613
Available-for-sale financial assets V.10 7,342 – – 7,342
Total 326,947 141,008 – 467,955
liabilities Note level 1 level 2 level 3 total
Financial liabilities at fair value through profit or loss – – – –Derivative financial liabilities V.24 – (28,463) – –
Total – (28,463) – –

Annual Report 2013 347
Chapter 13 Financial Statements Prepared in Accordance with China Accounting Standards
For the year ended 31 December 2013(All amounts in RMB’000 unless otherwise stated)
(English Translation for Reference Only)
xI. otHER SIGNIFICANt MAttERS (CoNtINUED)
4. Estimates of fair value of financial instruments(Continued)
(1) Financial instruments measured at fair value (Continued)
The following table presents the Group’s assets and liabilities that are measured at fair value in the above three levels as at 31 December As at 31 December 2012:
Assets Note Level 1 Level 2 Level 3 Total
Financial assets at fair value through profit or loss – – – –Investments in equity instrument held for trading V.2 389,557 – – 389,557Derivative financial assets V.2 – 12,684 – 12,684Hedging Instrument V.2 – 2,851 – 2,851
Sub-total 389,557 15,535 – 405,092
Available-for-sale financial assets V.10 609,751 – – 609,751
Total 999,308 15,535 – 1,014,843
Liabilities Note Level 1 Level 2 Level 3 Total
Financial liabilities at fair value through profit or loss – – – –Derivative financial liabilities V.24 – (95,098) – (95,098)
Total – (95,098) – (95,098)
The Group make the date when matters occurred which result in significant transfers between instruments in the three levels as the point of transfer. During the year ended 31 December 2013, there were no significant transfers between instruments in Level 1 and Level 2 neither nor Level 2 and Level 3.
(2) Fair value of other financial instruments (financial instruments not measured at fair value)
All financial instruments are carried at amounts not materially different from their fair values As at 31 December 2013.

348 China International Marine Containers (Group) Co., Ltd.
Chapter 13Financial Statements Prepared in Accordance with China Accounting StandardsFor the year ended 31 December 2013(All amounts in RMB’000 unless otherwise stated)(English Translation for Reference Only)
xI. otHER SIGNIFICANt MAttERS (CoNtINUED)
4. Estimates of fair value of financial instruments(Continued)
(3) Estimation and assumption of fair values
The following summarises the major methods and assumptions used in estimating the fair values of financial assets at fair value through profit or loss and financial liabilities at fair value through profit or loss, available-for-sale financial assets, and items set out in Note XI.3.(6) that measured at fair value on the balance sheet date.
(a) Equity investments
Fair value is based on quoted market prices at the balance sheet date for fair values of financial assets at fair value through profit or loss and financial liabilities at fair value through profit or loss (excluding derivatives), and available-for-sale financial assets if there is an active market.
(b) Receivables
The fair value is estimated as the present value of the future cash flows, discounted at the market interest rates at the balance sheet date.
(c) Borrowings, debentures payable, long-term payables and other non-derivatives financial liabilities
The fair value is estimated as the present value of future cash flows, discounted at the market rate of interest at the balance sheet date.
(d) Derivatives
The fair value of forward exchange contracts is either based on their listed market prices or by discounting the contractual forward price and deducting the current spot rate. The fair value of interest rate swaps is based on broker quotes. The quotes are tested for reasonableness by discounting estimated future cash flows based on the terms and maturity of each contract and using market interest rates for a similar interest rate instrument at the measurement date.
(e) Financial guarantees
The fair value of financial guarantees issued is determined by reference to fees charged in an arm’s length transaction for similar services, when such information is obtainable, or is otherwise estimated by reference to interest rate differentials, by comparing the actual rates charged by lenders when the guarantee is made available with the estimated rates that the lenders would have charged, had the guarantees not been available, where reliable estimates of such information can be made.

Annual Report 2013 349
Chapter 13 Financial Statements Prepared in Accordance with China Accounting Standards
For the year ended 31 December 2013(All amounts in RMB’000 unless otherwise stated)
(English Translation for Reference Only)
xI. otHER SIGNIFICANt MAttERS (CoNtINUED)
4. Estimates of fair value of financial instruments(Continued)
(3) Estimation and assumption of fair values(Continued)
(f) Interest rates used for determining fair value
The interest rates used to discount estimated cash flows are based on same term loans’ rates announced by People’s Bank of China at the balance sheet date plus an adequate credit spread and are as follows:
Interest rates used in 2013
Interest rates used in 2012
Borrowings 1.75%-5.99% 1.75%-5.99%Receivables 5.60%-6.55% 5.60%-6.55%
5. Assets and liabilities measured at fair value
Beginning balance
Gains or losses arising from changes
in fair value in
current year
Cumulative amount of changes in fair value
recognised directly in
equity
Impairment loss in
current yearEnding balance
Financial assets1. Financial assets at fair
value through profit or loss (excluding derivatives) 389,557 2,919 – – 319,605
2. Derivative financial assets 12,684 120,530 – – 133,0683. Hedging Instrument 2,851 – 10,974 – 7,9404. Available-for-sale
financial assets 609,751 – 2,920 – 7,342
Sub-total 1,014,843 123,449 13,894 – 467,955
Financial liabilities (95,098) 66,434 – – (28,463)

350 China International Marine Containers (Group) Co., Ltd.
Chapter 13Financial Statements Prepared in Accordance with China Accounting StandardsFor the year ended 31 December 2013(All amounts in RMB’000 unless otherwise stated)(English Translation for Reference Only)
xI. otHER SIGNIFICANt MAttERS (CoNtINUED)
6. Financial assets and liabilities in foreign currencies
Beginning balance
Gains or losses
arising from changes in
fair value in current year
Cumulative amount of changes in fair value
recognised directly in
equity
Impairment loss in
current yearEnding balance
Financial assets1. Financial assets at fair value
through profit or loss (excluding derivatives) 211,702 (24,743) – – 150,031
2. Derivative financial assets 12,684 120,530 – – 133,0683. Hedging Instrument 2,851 – 10,974 – 7,9404. Receivables 7,926,223 – – (23,449) 9,607,2955. Available-for-sale financial
assets 8,396 – 2,920 – 7,342
Sub-total 8,161,856 95,787 13,894 (23,449) 9,905,676
Financial liabilities (14,813,884) 66,434 – – (17,568,651)
7. Capital management
The Group’s objectives when managing capital are to safeguard the group’s ability of sustainable development in order to provide returns for shareholders and benefits for other stakeholders and to maintain an optimal capital structure to reduce the cost of capital.
In order to maintain or adjust the capital structure, the Group may adjust the amount of dividends paid to shareholders, return capital to shareholders, issue new shares or sell assets to reduce debt.
The Group monitors capital on the basis of Debt-Asset ratio. This ratio is calculated as total liabilities divided by total assets.
The Group manages capital status by controlling the Debt-Asset ratio not to exceed 68%. This strategy is consistent with last year. The Debt-Asset ratio as at 31 December 2013 and 2012 were as follows:
31 December 2013
31 December 2012
Total Liabilities 48,109,844 40,875,223Total Assets 72,605,972 62,992,380
Debt-Asset ratio 66% 65%

Annual Report 2013 351
Chapter 13 Financial Statements Prepared in Accordance with China Accounting Standards
For the year ended 31 December 2013(All amounts in RMB’000 unless otherwise stated)
(English Translation for Reference Only)
xII. NotES to tHE HolDING CoMPANY’S FINANCIAl StAtEMENtS
1. Cash at bank and on hand
31 December 2013 31 December 2012
Amount in foreign currency
Exchange rate
Amount in RMB
Amount in foreign currency
Exchange rate
Amount in RMB
’000 ’000 ’000 ’000
Bank depositsRMB 383,707 1.0000 383,707 424,020 1.0000 424,020USD 322 6.0976 1,964 1,242 6.2854 7,810HKD 10 0.7862 8 10 0.8108 8JPY 12,504 0.0578 722 12,504 0.0730 913EUR 35 8.4175 298 35 8.3195 293
Sub-total 386,699 433,044
Other cash balancesRMB 135 1.0000 135 11,972 1.0000 11,972USD 381 6.0976 2,324 377 6.2854 2,371
Sub-total 2,459 14,343
Total 389,158 447,387
As at 31 December 2013, restricted cash at bank and on hand of the Company amounted to RMB2,426,000 (31 December 2012: RMB2,474,000).
2. Financial assets at fair value through profit or loss
(1) Classification
31 December 2013
31 December 2012
Investments in equity instrument held for trading– Listed companies 169,574 177,450
Including: market value of the listed investments 169,574 177,450
Both the investments in debentures held for trading and the investments in equity instruments held for trading are securities listed on the Shanghai Stock Exchange, of which the fair value is determined at the closing price of the Shanghai Stock Exchange on the last trading day of the year.
(2) As at 31 December 2013, there is no restriction on sale of financial assets at fair value through profit or loss.

352 China International Marine Containers (Group) Co., Ltd.
Chapter 13Financial Statements Prepared in Accordance with China Accounting StandardsFor the year ended 31 December 2013(All amounts in RMB’000 unless otherwise stated)(English Translation for Reference Only)
xII. NotES to tHE HolDING CoMPANY’S FINANCIAl StAtEMENtS (CoNtINUED)
3. Dividends receivable
31 December 2013
31 December 2012
CIMC Hong Kong 3,019,369 3,108,609SCIMC 592,706 592,706HI 123,200 216,836SHYSLE – 110,628Finance Company – 37,932
Total 3,735,275 4,066,711
4. other receivables
(1) other receivables are analysed by categories as follows:
31 December 2013
31 December 2012
Amounts due from associates 9,116,641 10,862,091Deposits 20,156 184Others 5,468 2,601
Sub-total 9,142,265 10,864,876Less: provision for bad debts (4,747) (4,773)
Total 9,137,518 10,860,103
(2) the ageing of other receivables is analysed as follows:
31 December 2013
31 December 2012
Within 1 year (Inclusive) 9,086,457 10,693,9251 to 2 years (Inclusive) 29,206 20,0002 to 3 years (Inclusive) 20,000 2,000Over 3 years 6,602 148,951
Sub-total 9,142,265 10,864,876Less: provision for bad debts (4,747) (4,773)
Total 9,137,518 10,860,103
The ageing is counted starting from the date the other receivable is recognised.

Annual Report 2013 353
Chapter 13 Financial Statements Prepared in Accordance with China Accounting Standards
For the year ended 31 December 2013(All amounts in RMB’000 unless otherwise stated)
(English Translation for Reference Only)
xII. NotES to tHE HolDING CoMPANY’S FINANCIAl StAtEMENtS (CoNtINUED)
4. other receivables (Continued)
(3) other receivables are analysed by categories as follows:
31 December 2013 31 December 2012
Note Ending balance Provision for bad debts Ending balance Provision for bad debts
Amount% of total
balance Amount% of total
balance Amount% of total
balance Amount% of total
balance
Other receivables with amounts that are individually significant (4) 9,109,639 99.64% – – 10,698,979 98.47% – –Other receivables with amounts that are not individually significant (5) 32,626 0.36% 4,747 14.55% 165,897 1.53% 4,773 2.88%
Total 9,142,265 100.00% 4,747 0.05% 10,864,876 100.00% 4,773 0.04%
There were no collaterals that the Company held for other receivables that were made impairment aforesaid.
Individually significant items represent other receivables with an individual amount over RMB10,000,000 (inclusive) or the book value of which account for 5% (inclusive) of the total other receivables in individual financial statements included in the consolidated financial statement.
(4) As at 31 December 2013, other receivables with amounts that are individually significant and that the related provision for bad debts is provided on the individual basis
As at 31 December 2013, the Company has no other receivables with amounts that are individually significant and that the related provision for bad debts is provided on the individual basis (31 December 2012: Nil).
(5) As at 31 December 2013, other receivables with amounts that are not individually significant but that the related provision for bad debts is provided on the individual basis
As at 31 December 2013, the Company has no other receivables with amounts that are not individually significant but that the related provision for bad debts is provided on the individual basis (31 December 2012: Nil).

354 China International Marine Containers (Group) Co., Ltd.
Chapter 13Financial Statements Prepared in Accordance with China Accounting StandardsFor the year ended 31 December 2013(All amounts in RMB’000 unless otherwise stated)(English Translation for Reference Only)
xII. NotES to tHE HolDING CoMPANY’S FINANCIAl StAtEMENtS (CoNtINUED)
4. other receivables (Continued)
(6) other receivables that the related provision for bad debts is provided on grouping basis using the ageing analysis method are analysed as follows:
31 December 2013 31 December 2012
Ending balanceProvision
for bad debts Ending balanceProvision
for bad debts
Amount% of total
balance Amount Ratio Amount% of total
balance Amount Ratio
Within 1 year 27,204 0.30% – – 161,124 1.48% – –1 to 2 years 675 0.01% – – – – – –2 to 3 years – 0.00% – – 2,000 0.02% 2,000 100%3 to 4 years 2,000 0.02% 2,000 100% 2,773 0.03% 2,773 100%4 to 5 years 2,747 0.03% 2,747 100% – – – –Over 5 years – – – – – – – –
Total 32,626 0.36% 4,747 14.55% 165,897 1.53% 4,773 2.88%
(7) the recovery of provision in current year
There were no other receivables that the related provision for bad debts had been provided in full amount or in large proportion in previous years but are collected or reversed in full amount or in large proportion in current year (2012: Nil).
(8) other receivables that are written off in current year
There were no material other receivables that are written off in current year (2012: Nil).

Annual Report 2013 355
Chapter 13 Financial Statements Prepared in Accordance with China Accounting Standards
For the year ended 31 December 2013(All amounts in RMB’000 unless otherwise stated)
(English Translation for Reference Only)
xII. NotES to tHE HolDING CoMPANY’S FINANCIAl StAtEMENtS (CoNtINUED)
4. other receivables (Continued)
(9) As at 31 December 2013, the five largest other receivables are analysed as follows:
Relationship with the
Company Amount Aging% of total
balance
Total amounts due from subsidiaries Subsidiaries 9,082,437 Within 1 year 99.35%Shanghai Fengyang Associate 34,204 Within 1 year,
1 to 2 years, and over 3 years
0.37%
Yantai Hi-tech Industrial Park Finance Bureau
Nil 20,000 2 to 3 years 0.22%
Xietong Ltd. Nil 2,000 3 to 4 years 0.02%Xilu golf club Nil 525 1 to 2 years 0.01%
9,139,166 99.97%
The Company’s five largest other receivables as at 31 December 2012 amounted to RMB10,859,695,000, accounting for 99.94% of the total other receivables.
(10) other receivables from shareholders holding more than 5% (including 5%) of the voting rights of the Company are analysed as follows:
As at 31 December 2013, no amount due from shareholders holding more than 5% (including 5%) of the voting rights of the Company is included in the above balance of other receivables.
(11) other receivables from related parties
Relationship with the Company Amount
% of total balance
Associates Associates 34,204 0.37%Subsidiaries Subsidiaries 9,082,437 99.35%
Total 9,116,641 99.72%

356 China International Marine Containers (Group) Co., Ltd.
Chapter 13Financial Statements Prepared in Accordance with China Accounting StandardsFor the year ended 31 December 2013(All amounts in RMB’000 unless otherwise stated)(English Translation for Reference Only)
xII. NotES to tHE HolDING CoMPANY’S FINANCIAl StAtEMENtS (CoNtINUED)
4. other receivables (Continued)
(12) other receivables derecognised due to transfer of financial assets
There were no other receivables derecognised due to transfer of financial assets of the Company in this year (2012: Nil).
(13) Amount of assets and liabilities recognised due to the continuing involvement of securitised other receivables
There were no securitised other receivables during this year (2012: Nil).
5. Available-for-sale financial assets
31 December 2013
31 December 2012
Available-for-sale equity instruments – 601,356
Detailed analysis for the Company’s available-for-sale financial assets, refer to Note V.10.
6. long-term equity investments
(1) long-term equity investments are analysed by categories as follows:
31 December 2013
31 December 2012
Subsidiaries, unlisted 6,048,812 5,896,195Joint ventures, unlisted 4,740 6,521Associates, unlisted 451,408 540,000Other long-term equity investments, unlisted 391,970 391,970
Sub-total 6,896,930 6,834,686Less: provision for impairment (3,065) (3,065)
Total 6,893,865 6,831,621
There is no restriction on sale of the long-term equity investments held by the Company.

Annual Report 2013 357
Chapter 13 Financial Statements Prepared in Accordance with China Accounting Standards
For the year ended 31 December 2013(All amounts in RMB’000 unless otherwise stated)
(English Translation for Reference Only)
xII. NotES to tHE HolDING CoMPANY’S FINANCIAl StAtEMENtS (CoNtINUED)
6. long-term equity investments (Continued)
(2) An analysis of long-term equity investments movement of the year is as follows:
InvesteeInvestment
cost
31 December
2012
Current year
movement
31 December
2013
Share holding
(%)
Voting rights
(%)
Explanation of disparity
between percentages
of share holding and voting rights
Provision for
impairment
Impairment provided in the current
year
Cash dividend declared
Cost method – Investment in subsidiariesSCIMC 82,042 82,042 – 82,042 100.00% 100.00% – – – –SCIMCEL 82,042 82,042 – 82,042 100.00% 100.00% – – – –XHCIMC 36,500 36,500 – 36,500 100.00% 100.00% – – – 31,585CIMC Yuandong – 114,249 (114,249) – – – – – – –TJCIMC 77,704 77,704 – 77,704 100.00% 100.00% – – – –TJCIMCN 239,960 239,960 – 239,960 100.00% 100.00% – – – 119,525QDCC 60,225 60,225 – 60,225 100.00% 100.00% – – – 27,279DLCIMC 48,764 48,764 – 48,764 100.00% 100.00% – – – –NBCIMC 24,711 24,711 – 24,711 100.00% 100.00% – – – 26,648SBWI 66,558 66,558 – 66,558 94.75% 94.75% – – – 23,586TCCIMC 131,654 131,654 – 131,654 100.00% 100.00% – – – 82,479ZZCIMC 100,597 100,597 – 100,597 100.00% 100.00% – – – 36,529SHYSLE 193,204 78,955 114,249 193,204 100.00% 100.00% – – – 54,463CQVL 39,499 39,499 – 39,499 100.00% 100.00% – – – –SCRC 200,892 200,892 – 200,892 92.00% 92.00% – – – 156,688QDCRC 54,225 54,225 – 54,225 100.00% 100.00% – – – 45,599XHCIMCS 82,026 82,026 – 82,026 100.00% 100.00% – – – 177,895DLL 46,284 46,284 – 46,284 100.00% 100.00% – – – 26,860QDCSR 12,743 12,743 – 12,743 100.00% 100.00% – – – 23,003TJCIMCLE 47,750 39,127 8,623 47,750 100.00% 100.00% – – – 27,669CIMC Hong Kong 1,690 1,690 – 1,690 100.00% 100.00% – – – –CIMC USA Inc. 171,740 171,740 – 171,740 100.00% 100.00% – – – –

358 China International Marine Containers (Group) Co., Ltd.
Chapter 13Financial Statements Prepared in Accordance with China Accounting StandardsFor the year ended 31 December 2013(All amounts in RMB’000 unless otherwise stated)(English Translation for Reference Only)
xII. NotES to tHE HolDING CoMPANY’S FINANCIAl StAtEMENtS (CoNtINUED)
6. long-term equity investments (Continued)
(2) An analysis of long-term equity investments movement of the year is as follows (Continued):
InvesteeInvestment
cost
31 December
2012
Current year
movement
31 December
2013
Share holding
(%)
Voting rights
(%)
Explanation of disparity
between percentages
of share holding and voting rights
Provision for
impairment
Impairment provided in the current
year
Cash dividend declared
CIMCSD 162,686 162,686 – 162,686 100.00% 100.00% – – – –HI 606,912 606,912 – 606,912 80.00% 80.00% – – – 123,200CIMC Tech 41,526 13,726 27,800 41,526 100.00% 100.00% – – – –TCCRC 311,792 311,792 – 311,792 100.00% 100.00% – – – –CIMCWD 108,544 108,544 – 108,544 100.00% 100.00% – – – –CIMC Management and Training (Shenzhen) 48,102 48,102 – 48,102 100.00% 100.00% – – – –DLZH 182,136 111,083 71,053 182,136 100.00% 100.00% – – – –MEA 111,703 111,703 – 111,703 100.00% 100.00% – – – –SZW 3,472 3,472 – 3,472 100.00% 100.00% – – – –TLC 126,689 81,548 45,141 126,689 100.00% 100.00% – – – –SZSCIMCL 71,717 71,717 – 71,717 100.00% 100.00% – – – 2,968SZ investment 72,401 72,401 – 72,401 100.00% 100.00% – – – –Finance Company 482,590 482,590 – 482,590 100.00% 100.00% – – – 9,312CIMC Vehicle Finance and Leasing Co., Ltd. 422,363 422,363 – 422,363 100.00% 100.00% – – – –QDSV 26,912 26,912 – 26,912 80.00% 80.00% – – – –SHGYTY 40,000 40,000 – 40,000 100.00% 100.00% – – – –CIMCI 60,000 60,000 – 60,000 100.00% 100.00% – – – –SZSKYC 90,000 90,000 – 90,000 100.00% 100.00% – – – –DLCIMCS 69,806 69,806 – 69,806 100.00% 100.00% – – – –Container holding 1,000,000 1,000,000 – 1,000,000 100.00% 100.00% – – – –Cooperatie CIMC U.A 205,022 205,022 – 205,022 99.00% 99.00% – – – –Tianjin Kangde Logistics Equipment Co,. Ltd 3,629 3,629 – 3,629 100.00% 100.00% – – – –
Sub-total 6,048,812 5,896,195 152,617 6,048,812 – – 995,288

Annual Report 2013 359
Chapter 13 Financial Statements Prepared in Accordance with China Accounting Standards
For the year ended 31 December 2013(All amounts in RMB’000 unless otherwise stated)
(English Translation for Reference Only)
xII. NotES to tHE HolDING CoMPANY’S FINANCIAl StAtEMENtS (CoNtINUED)
6. long-term equity investments (Continued)
(3) long-term equity investments in associates and joint ventures are as follows:
InvesteeInvestment
cost
31 December
2012
Current year
movement
31 December
2013
Share holding
(%)
Voting rights
(%)
Explanation of disparity
between percentages
of share holding and voting rights
Provision for
impairment
Impairment provided in the current
year
Cash dividend declared
Equity method – Associates C&C trucks 540,000 540,000 (88,592) 451,408 45.00% 45.00% – – –
Sub-total 540,000 540,000 (88,592) 451,408 – – –
Equity method – Joint ventureSCSCRC 9,000 6,521 (1,781) 4,740 50.00% 50.00% – – –
Sub-total 9,000 6,521 (1,781) 4,740 – – –
Cost method – other long-term equity investmentChina Railway United Logistics 380,780 380,780 – 380,780 10.00% 10.00% – – –Beihai Yinjian 1,700 1,700 – 1,700 1.01% 1.01% (1,700) – –Guangdong Samsung 1,365 1,365 – 1,365 0.09% 0.09% (1,365) – –BOCM Schroder Stolt Fund Management 8,125 8,125 – 8,125 5.00% 5.00% – – 5,000
Sub-total 391,970 391,970 – 391,970 (3,065) – 5,000
Total 6,989,782 6,834,686 62,244 6,896,930 (3,065) – 5,000
Important financial Information for the Company’s associates and joint ventures please refer to disclosure of consolidated Long-term equity investments.

360 China International Marine Containers (Group) Co., Ltd.
Chapter 13Financial Statements Prepared in Accordance with China Accounting StandardsFor the year ended 31 December 2013(All amounts in RMB’000 unless otherwise stated)(English Translation for Reference Only)
xII. NotES to tHE HolDING CoMPANY’S FINANCIAl StAtEMENtS (CoNtINUED)
6. long-term equity investments (Continued)
(4) Provision for impairment of long-term equity investments
31 December 2012
Increase in current year
Decrease in current year
31 December 2013
Other long-term equity investments 3,065 – – 3,065
7. Short-term borrowings
31 December 2013
31 December 2012
UnsecuredRMB – 465,703
8. Financial liabilities at fair value through profit or loss
31 December 2013
31 December 2012
Current portionDerivative financial liabilities– Interest swap contract – 8,987
Sub-total – 8,987
Non-current portion– Swap contract for interest rate 26,865 81,944
Sub-total 26,865 81,944
Total 26,865 90,931

Annual Report 2013 361
Chapter 13 Financial Statements Prepared in Accordance with China Accounting Standards
For the year ended 31 December 2013(All amounts in RMB’000 unless otherwise stated)
(English Translation for Reference Only)
xII. NotES to tHE HolDING CoMPANY’S FINANCIAl StAtEMENtS (CoNtINUED)
9. Employee benefits payable
Beginning balance
Increase in current year
Decrease in current year
Ending balance
Wages and salaries, bonuses, allowances and subsidies 250,000 224,717 (74,717) 400,000Senior management bonus 407,812 – (19,206) 388,606Profit-sharing bonus – 66,916 – 66,916Staff welfare and others 74 13,205 (12,785) 494
Total 657,886 304,838 (106,708) 856,016
10. taxes payable
31 December 2013
31 December 2012
Enterprise income tax payable 3,148 33,144Withholding individual income tax 1,202 2,466Business tax payable 5,244 6,752Others 689 1,131
Total 10,283 43,493
11. Interest payable
31 December 2013
31 December 2012
Interest of long-term borrowings with periodic payments of interest and return of principal at maturity 4,646 10,500Interest of short-term borrowings – 521Interest of corporate debentures 180,088 176,670
Total 184,734 187,691

362 China International Marine Containers (Group) Co., Ltd.
Chapter 13Financial Statements Prepared in Accordance with China Accounting StandardsFor the year ended 31 December 2013(All amounts in RMB’000 unless otherwise stated)(English Translation for Reference Only)
xII. NotES to tHE HolDING CoMPANY’S FINANCIAl StAtEMENtS (CoNtINUED)
12. other payables
(1) the analysis of the Company’s other payables is as follows:
Item31 December
201331 December
2012
Amounts due to subsidiaries 3,505,729 3,470,041Quality guarantees 501 687Advance received 30,000 30,000Professional and training fees – 56,866Accruals 4,344 7,265Others 6,948 10,088
Total 3,547,522 3,574,947
Other payables denominated in foreign currencies are as follows:
31 December 2013 31 December 2012
Currency
Amount in foreign currency
Exchange rate
Amount in RMB
Amount in foreign currency
Exchange rate
Amount in RMB
’000 ’000 ’000 ’000
RMB 3,542,909 1.0000 3,542,909 3,570,165 1.0000 3,570,165USD 753 6.0976 4,590 753 6.2854 4,732HKD 29 0.7862 23 61 0.8108 50
Total 3,547,522 3,574,947

Annual Report 2013 363
Chapter 13 Financial Statements Prepared in Accordance with China Accounting Standards
For the year ended 31 December 2013(All amounts in RMB’000 unless otherwise stated)
(English Translation for Reference Only)
xII. NotES to tHE HolDING CoMPANY’S FINANCIAl StAtEMENtS (CoNtINUED)
12. other payables (Continued)
(2) As at 31 December 2013, no amount due to shareholders who hold 5% or more of the voting rights of the Company is included in the balance of other payables.
Other payables to related parties:
Company nameRelationship
with the Company31 December
201331 December
2012
Subsidiaries Subsidiaries 3,505,729 3,470,041
(3) Significant other payables aged over one year:
As at 31 December 2013, significant other payables aged over one year represented quality guarantee, vehicle mortgage guarantee and various deposits.

364 China International Marine Containers (Group) Co., Ltd.
Chapter 13Financial Statements Prepared in Accordance with China Accounting StandardsFor the year ended 31 December 2013(All amounts in RMB’000 unless otherwise stated)(English Translation for Reference Only)
xII. NotES to tHE HolDING CoMPANY’S FINANCIAl StAtEMENtS (CoNtINUED)
13. Current portion of non-current liabilities
(1) the analysis of the Company’s current portion of non-current liabilities by categories is as follows:
Note31 December
201331 December
2012
Current portion of long-term borrowings– Unsecured (2) 2,135,000 1,257,100
(2) Current portion of long-term borrowings denominated in foreign currencies are as follows:
31 December 2013 31 December 2012
Interest rate
Amount in foreign currency
Exchange rate
Amount in RMB Interest rate
Amount in foreign currency
Exchange rate
Amount in RMB
’000 ’000 ’000 ’000
Bank borrowings– RMB 4.20% 1,170,000 1.0000 1,170,000 – – – –– RMB 4.92% 900,000 1.0000 900,000 – – – –– RMB 5.95% 65,000 1.0000 65,000 – – – –– USD – – – – LIBOR+
90 BP&USD LIBOR +1.85%
200,000 6.2855 1,257,100
Total 2,135,000 1,257,100
As at 31 December 2013, there were no overdue long-term borrowings of which the durations are extended (As at 31 December 2012: Nil).

Annual Report 2013 365
Chapter 13 Financial Statements Prepared in Accordance with China Accounting Standards
For the year ended 31 December 2013(All amounts in RMB’000 unless otherwise stated)
(English Translation for Reference Only)
xII. NotES to tHE HolDING CoMPANY’S FINANCIAl StAtEMENtS (CoNtINUED)
13. Current portion of non-current liabilities (Continued)
(2) Current portion of long-term borrowings denominated in foreign currencies are as follows (Continued):
(a) The analysis of the Company’s current portion of non-current liabilities is as follows:
31 December 2013 31 December 2012
lender Starting date Ending date CurrencyInterest rate
(%)
Amount in foreign currency
Amount in RMB
Amount in foreign
currencyAmount in
RMB’000 ’000 ’000 ’000
China Development bank
12/12/2007 12/06/2013 USD 6-month LIBOR+90BP
– – 110,000 691,405
China Development bank
12/12/2007 12/12/2013 USD 6-month LIBOR+90BP
– – 40,000 251,420
ING Bank N.V. 20/05/2010 21/05/2013 USD Floating, USD
LIBOR+1.85%
– – 50,000 314,275
The Export-Import Bank of China
07/01/2011 06/01/2014 RMB 4.20% (Note (i)) 70,000 70,000 – –
The Export-Import Bank of China
01/02/2011 01/02/2014 RMB 4.20% (Note (i)) 500,000 500,000 – –
The Export-Import Bank of China
16/06/2011 16/06/2014 RMB 4.20% (Note (i)) 400,000 400,000 – –
The Export-Import Bank of China
22/06/2011 22/06/2014 RMB 4.20% (Note (i)) 200,000 200,000 – –
The Export-Import Bank of China
28/07/2011 28/07/2014 RMB 4.92% (Note (i)) 300,000 300,000 – –
The Export-Import Bank of China
10/08/2011 10/08/2014 RMB 4.92% (Note (i)) 300,000 300,000 – –
The Export-Import Bank of China
29/09/2011 29/09/2014 RMB 4.92% (Note (i)) 100,000 100,000 – –
The Export-Import Bank of China
28/11/2011 28/11/2014 RMB 4.92% (Note (i)) 200,000 200,000 – –
ING Bank N.V. 01/04/2011 01/04/2014 RMB 5.95% 65,000 65,000 – –
Total 2,135,000 1,257,100
Note (i): Execute People’s Bank of China export seller’s credit rate, quarterly reviewed.
(b) As at 31 December 2013, there were no overdue long-term borrowings of which the durations are extended (As at 31 December 2012: Nil).

366 China International Marine Containers (Group) Co., Ltd.
Chapter 13Financial Statements Prepared in Accordance with China Accounting StandardsFor the year ended 31 December 2013(All amounts in RMB’000 unless otherwise stated)(English Translation for Reference Only)
xII. NotES to tHE HolDING CoMPANY’S FINANCIAl StAtEMENtS (CoNtINUED)
14. long-term borrowings
(1) the analysis of the Company’s long-term loans is as follows:
31 December 2013
31 December 2012
Bank borrowings– Unsecured 837,000 3,875,845
As at 31 December 2013, the Company has no long-term borrowings not wholly repayable within five years.
(2) long-term borrowings denominated in foreign currencies are as follows:
31 December 2013 31 December 2012
Interest rate
Amount in foreign currency
Exchange rate
Amount in RMB
Interest rate
Amount in foreign currency
Exchange rate
Amount in RMB
’000 ’000 ’000 ’000
Bank borrowings– RMB 4.20%~
4.92%837,000 1.0000 837,000 4.20%~
5.95%3,505,000 1.0000 3,505,000
– USD – – – – 3-monthLIBOR
+315BP59,000 6.2855 370,845
Total 837,000 3,875,845

Annual Report 2013 367
Chapter 13 Financial Statements Prepared in Accordance with China Accounting Standards
For the year ended 31 December 2013(All amounts in RMB’000 unless otherwise stated)
(English Translation for Reference Only)
xII. NotES to tHE HolDING CoMPANY’S FINANCIAl StAtEMENtS (CoNtINUED)
14. long-term borrowings (Continued)
(3) As at 31 December 2013, the five largest long-term borrowings
31 December 2013 31 December 2012
lender Starting date Ending date CurrencyInterest rate
(%)
Amount in foreign
currencyAmount in RMB
Amount in foreign
currencyAmount in RMB
’000 ’000 ’000 ’000
The Export-Import Bank of China 28/06/2012 28/06/2015 RMB 4.92% 192,000 192,000 – –The Export-Import Bank of China 24/05/2012 24/05/2015 RMB 4.92% 141,000 141,000 – –The Export-Import Bank of China 04/01/2012 04/01/2015 RMB 4.92% 100,000 100,000 – –The Export-Import Bank of China 18/01/2013 18/01/2016 RMB 4.92% 60,000 60,000 – –The Export-Import Bank of China 11/01/2013 11/01/2016 RMB 4.92% 55,000 55,000 – –
Total 548,000 –
As at 31 December 2013, there were no overdue long-term borrowings of which the durations are extended (As at 31 December 2012: Nil).

368 China International Marine Containers (Group) Co., Ltd.
Chapter 13Financial Statements Prepared in Accordance with China Accounting StandardsFor the year ended 31 December 2013(All amounts in RMB’000 unless otherwise stated)(English Translation for Reference Only)
xII. NotES to tHE HolDING CoMPANY’S FINANCIAl StAtEMENtS (CoNtINUED)
15. Debentures payable
Beginning balance
Increase in current year
Decrease in current year
Ending balance
Medium-term notes 5,990,833 2,580 – 5,993,413
(a) Related information is as follows:
Debenture name Par valueIssuance
date MaturityIssuance amount
Discount at the
beginning of the year
Amortization in current
year
Discount at the end of
the year
Effect of foreign
exchange rate changes
Ending balance
Medium-term notes – 11CIMC MTN1 4,000,000 23/05/2011 5 years 4,000,000 (9,167) 2,580 – (6,587) 3,993,413Medium-term notes – 12CIMC MTN1 2,000,000 24/05/2012 3 years 2,000,000 – – – – 2,000,000Total 6,000,000 (9,167) 2,580 – (6,587) 5,993,413
Information for the Company’s debentures payable please refer to Note V.36.
16. Deferred tax assets and deferred tax liabilities
(1) the offsetting balances of deferred tax assets and liabilities offset and corresponding deductible or taxable temporary differences
31 December 2013 31 December 2012
Deductible/(taxable)
temporary differences
Deferred tax assets/
(liabilities)
Deductible/(taxable)
temporary differences
Deferred tax assets/
(liabilities)
Deferred tax assets:Employee benefits payable 856,016 214,004 657,886 164,472Movement for fair value of financial assets at fair value through profit or loss 26,865 6,716 90,931 22,733Sub-total 882,881 220,720 748,817 187,205Offsetting amount (22,765) (5,691) (550,957) (133,222)
Net amount after offsetting 860,116 215,029 197,860 53,983

Annual Report 2013 369
Chapter 13 Financial Statements Prepared in Accordance with China Accounting Standards
For the year ended 31 December 2013(All amounts in RMB’000 unless otherwise stated)
(English Translation for Reference Only)
xII. NotES to tHE HolDING CoMPANY’S FINANCIAl StAtEMENtS (CoNtINUED)
16. Deferred tax assets and deferred tax liabilities (Continued)
(1) the offsetting balances of deferred tax assets and liabilities offset and corresponding deductible or taxable temporary differences (Continued)
31 December 2013 31 December 2012
Deductible/(taxable)
temporary differences
Deferred tax assets/
(liabilities)
Deductible/(taxable)
temporary differences
Deferred tax assets/
(liabilities)
Deferred tax liabilities:Movement for fair value of available-for-sale financial assets charged to equity – – (537,021) (129,737)Movement for fair value of financial assets at fair value through profit or loss (22,765) (5,691) (13,936) (3,485)
Sub-total (22,765) (5,691) (550,957) (133,222)Offsetting amount 22,765 5,691 550,957 133,222
Offsetting balances – – – –
At 31 December 2013, the Company had no unrecognised deferred tax assets.
17. Capital surplus
31 December 2012
Increase in current year
Decrease in current year
31 December 2013
Share premium 212,656 – – 212,656Other capital surplus: – Property revaluation reserve 43,754 – – 43,754 – Exchange reserve on foreign currency capital 687 – – 687 – Donated non-cash assets reserve 87 – – 87 – Change in fair value of available-for-sale financial assets 537,021 – (537,021) – – Deferred tax effect (129,737) – 129,737 – – Equity settled share-based payment 238,283 81,505 – 319,788Others (568,492) – – (568,492)
Total 334,259 81,505 (407,284) 8,480

370 China International Marine Containers (Group) Co., Ltd.
Chapter 13Financial Statements Prepared in Accordance with China Accounting StandardsFor the year ended 31 December 2013(All amounts in RMB’000 unless otherwise stated)(English Translation for Reference Only)
xII. NotES to tHE HolDING CoMPANY’S FINANCIAl StAtEMENtS (CoNtINUED)
18. Revenue and cost of sales
(1)2013 2012
Revenue from other operations 192,684 241,531Cost of sales from other operations – 16
(2) Revenue and cost of sales from other operations
2013 2012
Revenue from other operations
Cost of sales from other operations
Revenue from other operations
Cost of sales from other operations
Commission 192,196 – 240,731 –Others 488 – 800 16
Total 192,684 – 241,531 16
19. Profit/(losses) from changes in fair value
2013 2012
Financial assets at fair value through profit or loss for the current period– Changes in fair value during the year (7,880) (32,665)– Losses for derecognised financial assets at fair value through profit or loss 16,710 46,601
Financial liabilities at fair value through profit or loss for the current period– Changes in fair value during the year 64,066 5,1951. Losses from changes in fair value of derivative financial instrument 64,066 5,195
Total 72,896 19,131

Annual Report 2013 371
Chapter 13 Financial Statements Prepared in Accordance with China Accounting Standards
For the year ended 31 December 2013(All amounts in RMB’000 unless otherwise stated)
(English Translation for Reference Only)
xII. NotES to tHE HolDING CoMPANY’S FINANCIAl StAtEMENtS (CoNtINUED)
20. Investment income
(1) Investment income by categories
2013 2012
Income from long-term equity investment under cost method 1,000,288 1,469,894Income from long-term equity investment under equity method (90,373) (1,481)Income from disposal of available-for-sale financial assets 534,108 –Income earned during the holding period of available-for-sale financial assets 13,222 11,138Loss from disposal of financial assets at fair value through profit or loss for the current period (16,710) (46,601)Others – (954)
Total 1,440,535 1,431,996
Investment income from listed investments in 2013 amount to RMB530,620,000 (2012: investment loss: RMB35,463,000); and investment income from non-listed investments in 2013 amount to RMB909,915,000 (2012: investment income: RMB1,467,459,000).
(2) In investment income from long-term equity investment under cost method, investees that contributed investment income for more than 5% of the Company’s total profit, or the top five investees that contributed most to the Company’s investment income are set out as follows:
Investee 2013 2012 Reason for current year fluctuation
XHCIMCS 177,895 211,224 Dividend distributed in 2013 is less than that in 2012
SCRC 156,688 204,936 Dividend distributed in 2013 is less than that in 2012
HI 123,200 – Dividend distributed in 2013 is more than that in 2012
TJCIMCN 119,525 192,370 Dividend distributed in 2013 is less than that in 2012
TCCIMC 82,479 148,277 Dividend distributed in 2013 is less than that in 2012
Total 659,787 756,807
There was no significant restriction on the remittance of investment income to the investor.

372 China International Marine Containers (Group) Co., Ltd.
Chapter 13Financial Statements Prepared in Accordance with China Accounting StandardsFor the year ended 31 December 2013(All amounts in RMB’000 unless otherwise stated)(English Translation for Reference Only)
xII. NotES to tHE HolDING CoMPANY’S FINANCIAl StAtEMENtS (CoNtINUED)
20. Investment income (Continued)
(3) In investment income from long-term equity investment under equity method, investment income from investee is set out as follows:
Investee 2013 2012 Reason for current year fluctuation
C&C Trucks (88,593) – New associate acquired in the end of 2012
SCSCRC (1,780) (1,481) Loss occurred in 2013 is more than that in 2012
(90,373) (1,481)
21. Non-operating income
(1) Non-operating income by categories
2013 2012
Gains on disposal of fixed assets 25 1,320Gains on disposal of intangible assets – 50,531Government grants 1,052 3,275Others 641 133
Total 1,718 55,259
(2) Details of government grants
2013 2012
Financial subsidies 1,052 3,275
22. Income tax expenses
2013 2012
Current income tax calculated based on tax law and related regulations – –Deferred income tax (31,309) 8,271
Total (31,309) 8,271

Annual Report 2013 373
Chapter 13 Financial Statements Prepared in Accordance with China Accounting Standards
For the year ended 31 December 2013(All amounts in RMB’000 unless otherwise stated)
(English Translation for Reference Only)
xII. NotES to tHE HolDING CoMPANY’S FINANCIAl StAtEMENtS (CoNtINUED)
22. Income tax expenses (Continued)
Reconciliation between income tax expenses and accounting profits is as follows:
2013 2012
Total profit 947,231 1,075,032Income tax expenses calculated at applicable tax rates 236,807 268,757Expenses not deductible for tax purposes 1,157 16,495Tax effect of tax loss for which no deferred tax asset was recognised in this Reporting Period – 89,241Unrecognised tax losses in last Reporting Period (38,489) –Income not subject to tax (230,784) (366,222)
Income tax expenses (31,309) 8,271
23. other comprehensive income
31 December 2012
Changes in current year Tax effect Reclassification
31 December 2013
Other comprehensive income to be reclassified to profit or loss in subsequent accounting periods when specified conditions are met: Net change in fair value of available-for-sale financial assets and transfer to/from profit or loss arising from reclassification 407,284 (2,913) 129,737 (534,108) –
31 December 2011
Changes in current year Tax effect Reclassification
31 December 2012
Other comprehensive income to be reclassified to profit or loss in subsequent accounting periods when specified conditions are met: Net change in fair value of available-for-sale financial assets and transfer to/from profit or loss arising from reclassification 379,383 37,201 (9,300) – 407,284

374 China International Marine Containers (Group) Co., Ltd.
Chapter 13Financial Statements Prepared in Accordance with China Accounting StandardsFor the year ended 31 December 2013(All amounts in RMB’000 unless otherwise stated)(English Translation for Reference Only)
xII. NotES to tHE HolDING CoMPANY’S FINANCIAl StAtEMENtS (CoNtINUED)
24. Notes to the consolidated cash flow statement
(1) Supplementary information to the consolidated cash flow statement
(a) Reconciliation from net profit to cash flows from operating activities
2013 2012
Net profit 978,540 1,066,761Add: Provisions for asset impairment (3) (103)Depreciation of fixed assets 16,790 17,200Amortisation of intangible assets 693 364Amortisation of long-term prepaid expenses 2,311 2,005Gains on disposal of fixed assets, intangible assets 141 (51,851)Profit on change in fair value (72,896) (19,131)Financial expenses 580,727 489,425Investment income (1,440,535) (1,431,996)Share-based payment expenses 81,505 107,036Increase in deferred tax assets (31,309) 8,271Decrease/(Increase) in operating receivables 1,719,904 (4,061,221)Increase in operating payables 137,494 2,928,103
Net cash flows from operating activities 1,973,362 (945,137)
(b) Net increase in cash and cash equivalents
2013 2012
Cash and cash equivalents at the end of the year 386,732 444,913Less: cash and cash equivalents at the beginning of the year 444,913 427,874
Net increase in cash and cash equivalents (58,181) 17,039
(2) Cash and cash equivalents
2013 2012
CashIncluding: Cash at bank that can be readily drawn on demand 386,699 433,044Other monetary fund that can be readily drawn on demand 33 11,869
Cash and cash equivalents at the end of the year 386,732 444,913
Note: Aforesaid “Cash at bank and on hand” excluded restricted cash and short-term investment.

Annual Report 2013 375
Chapter 13 Financial Statements Prepared in Accordance with China Accounting Standards
For the year ended 31 December 2013(All amounts in RMB’000 unless otherwise stated)
(English Translation for Reference Only)
xIII. NEt CURRENt ASSEtS
the Group
31 December 2013
31 December 2012
Current assets 41,169,668 38,346,189Less: current liabilities 32,576,349 25,540,032
Net current assets 8,593,319 12,806,157
the Company
31 December 2013
31 December 2012
Current assets 13,434,256 15,551,651Less: current liabilities 6,733,555 6,195,807
Net current assets 6,700,701 9,355,844
xIV. totAl ASSEtS lESS CURRENt lIABIlItIES
the Group
31 December 2013
31 December 2012
Total assets 72,605,972 62,992,380Less: current liabilities 32,576,349 25,540,032
Total assets less current liabilities 40,029,623 37,452,348
the Company
31 December 2013
31 December 2012
Total assets 20,691,075 23,204,261Less: current liabilities 6,733,555 6,195,807
Total assets less current liabilities 13,957,520 17,008,454

376
Chapter 13Financial Statements Prepared in Accordance with China Accounting StandardsFor the year ended 31 December 2013(All amounts in RMB’000 unless otherwise stated)
China International Marine Containers (Group) Co., Ltd.
SUPPlEMENtARY INFoRMAtIoN1. Statement of non-recurring profit or loss
2013
Loss on disposal of non-current assets (23,297)Government grants recognised in profit or loss for the current period 155,423Gains from the excess of the fair value of attributable identifiable net assets of the investee upon acquisition over the cost of acquisition 35,017Remeasurement of the fair value of equity interest in the acquiree held prior to the acquisition date recognised in investment losses (4,792)Gains or losses from changes in fair value arising from holding financial assets at fair value through profit or loss and financial liabilities at fair value through profit or loss, and investment gains arising from disposal of financial assets at fair value through profit or loss, financial liabilities at fair value through profit or loss and available-for-sale financial assets, except for the effective hedging activities related to the Group’s ordinary activities 751,148Reversal of accounts receivable provided for bad debts on an individual basis 7,110Fund appropriation fee received from non-financial institutions recognised in the profit/loss for the period 4,793Net gain from disposal of subsidiary 915Other non-operating income and expenses other than the above items 24,742Effect of income tax (83,152)Effect of minority interests (after tax) (30,676)
Total 837,231
Note: Aforesaid non-recurring profit or loss was presented at amount before taxation.
Basis for preparation of statement of non-recurring profit or loss
Under the requirements in Explanatory announcement No. 1 on information disclosure by companies offering securities to the public – non-recurring profit or loss [2008] from CSRC, non-recurring profit or loss refer to those arises from transactions and events that are not directly relevant to ordinary activities, or that are relevant to ordinary activities, but are extraordinary and not expected to recur frequently that would have an influence on users of financial statements making economic decisions on the financial performance and profitability of an enterprise.

Annual Report 2013 377
Chapter 13 Financial Statements Prepared in Accordance with China Accounting Standards
For the year ended 31 December 2013(All amounts in RMB’000 unless otherwise stated)
SUPPlEMENtARY INFoRMAtIoN (CoNtINUED)
2. Return on net assets and earnings per share
In accordance with Interpretive Pronouncement on the Preparation of Information Disclosures of Companies Issuing Public Shares No. 9 – Earnings per share and return on net assets (2010 revised) and relevant requirements of accounting standard, the calculation of earnings per share and return on net assets of the Company is listed as follows:
weighted average
return on net assets (%) Earnings per share
Basic earnings per share
Diluted earnings
per share
Net profit attributable to ordinary shareholders of the Company 11% 0.82 0.81Net profit attributable to ordinary shareholders of the Company after deducting non-recurring profit or loss 7% 0.50 0.49
3. Explanations of irregular fluctuations and related reasons on major items of the financial statements
Assets:31 December
201331 December
2012Fluctuation amount
and percentage
Amount %
Notes receivable (1) 1,376,286 778,109 598,177 77%Advance to suppliers (2) 3,393,804 1,213,042 2,180,762 180%Other receivables (3) 2,805,061 2,114,435 690,626 33%Available-for-sale financial assets (4) 7,342 609,751 (602,409) -99%Investment properties (5) 324,811 183,668 141,143 77%Construction in progress (6) 6,684,619 2,279,993 4,404,626 193%Long-term prepaid expenses (7) 96,075 47,947 48,128 100%Other non-current assets (8) 333,097 203,040 130,057 64%
(1) Notes receivable: mainly due to the increase of sales settled by bills.(2) Advance to suppliers: mainly due to the prepayments for the purchase of machinery resulting from more orders accepted by the offshore engineering
segment.(3) Other receivables: mainly due to the increase of lending to external related parties.(4) Available-for-sale financial assets: mainly due to the disposals of available-for-sale financial assets.(5) Investment properties: mainly due to the acquisition of Zhenhua Group.(6) Construction in progress: mainly due to the new vessels under construction.(7) Long-term prepaid expenses: mainly due to the increase insurance premium for financial lease items.(8) Other non-current assets: mainly due to the acquisition of Zhenhua Group and Hongxin Berg.

378 China International Marine Containers (Group) Co., Ltd.
Chapter 13Financial Statements Prepared in Accordance with China Accounting StandardsFor the year ended 31 December 2013(All amounts in RMB’000 unless otherwise stated)
SUPPlEMENtARY INFoRMAtIoN (CoNtINUED)
3. Explanations of irregular fluctuations and related reasons on major items of the financial statements (continued)
liabilities:31 December
201331 December
2012Fluctuation amount and
percentage
Amount %
Short-term borrowings (1) 7,244,780 5,438,407 1,806,373 33%Dividends payable (2) 197,897 38,747 159,150 411%Current portion of non-current liabilities (3) 2,458,775 1,261,940 1,196,835 95%Long-term payables (4) 242,992 145,103 97,889 67%Financial liabilities at fair value through profit or loss-non-current portion (5) 27,166 82,242 (55,076) (67%)
(1) Short-term borrowings: mainly due to the financing arrangement to meet the requirement working capital.
(2) Dividends payable: mainly due to the dividends payable to minority shareholders resulting from the acquisition of Zhenhua Group.
(3) Current portion of non-current liabilities: mainly due to the transfer of long-term borrowings due within one year.
(4) Long-term payables: mainly due to the acquisition of Hongxin Kingberg.
(5) Financial liabilities at fair value through profit or loss-non-current portion: mainly due to certain interest rate swap contracts falling due during the Reporting Period.
Profit and loss31 December
201331 December
2012Fluctuation amount and
percentage
Amount %
Asset impairment losses (1) 138,931 537,071 (398,140) (74%)Investment income/(losses) (2) 508,677 (97,851) 606,528 620%Profit from changes in fair value (3) 189,883 58,561 131,322 224%Minority interests (4) 454,177 (8,651) 462,828 5,350%
(1) Asset impairment losses: mainly due to the provision provided for the property located in Europe considering the European debt crisis’ impact on the real estate market in last Reporting Period.
(2) Investment (losses)/income: mainly due to the disposals of available-for-sale financial assets.
(3) Profit/(losses) from changes in fair value: mainly due to the changes in fair value of available-for-sale financial assets and derivative financial instruments.
(4) Minority interests: mainly due to the changes in financial position of minority shareholders’ subsidiaries.

Annual Report 2013 379
Chapter 14 Confirmation from the
Directors and Senior Management
According to relevant provisions and requirements of the PRC Securities Law and Measures for Information Disclosure of Companies Offering Shares to the Public promulgated by the CSRC, as the Board of Directors and senior management of the Company, we have carefully reviewed the annual report for 2013 and concluded that this annual report truly and objectively represents the business performance of the Company, it contains no false representations, misleading statements or material omissions and complies with the requirements of the CSRC and other relevant regulatory authorities.

380
Chapter 15 Documents Available for Inspection
China International Marine Containers (Group) Co., Ltd.
The following documents will be available for inspection at the headquarters of the Company in Shenzhen upon request by the relevant regulatory authorities and shareholders in accordance with the laws and regulations and the Articles of Association:
1. The annual report signed by the Chairman of the Board.
2. The financial statements under the hand and seal of the Legal Representative, Chief Financial Officer, person-in-charge of accounting institution (accounting officer).
3. The original of the Audit Report under the seal of the Accountants Firm and under the hand of Certified Public Accountants.
4. The original copies of the documents and announcement of the Company published in the newspaper stipulated by the China Securities Regulatory Commission during the Reporting Period.
5. Copies of all Chinese and English announcements of the Company published on the websites of the Hong Kong Stock Exchange and the Company during the period of the annual report.
6. The Articles of Association.
April 2014

CIMC R&D Center, No.2 Gangwan Avenue, Shekou,Nanshan District, Shenzhen, Guangdong, P.R.C
Tel: 86-755-26691130Fax: 86-755-26692707
www.cimc.com
Annual R
eport 2013C
hina International Marine C
ontainers (Group) C
o., Ltd.
創•造•新價值Driving new value Moving the world