annual report 2013 - gtslogistic.com · bureaucratic apparatus to organize new block trains'...
TRANSCRIPT

Annual Report 2013
3 Our story 13 Mission 17 Vision 21 Market 27 Our strength 37 Consolidated financial statements
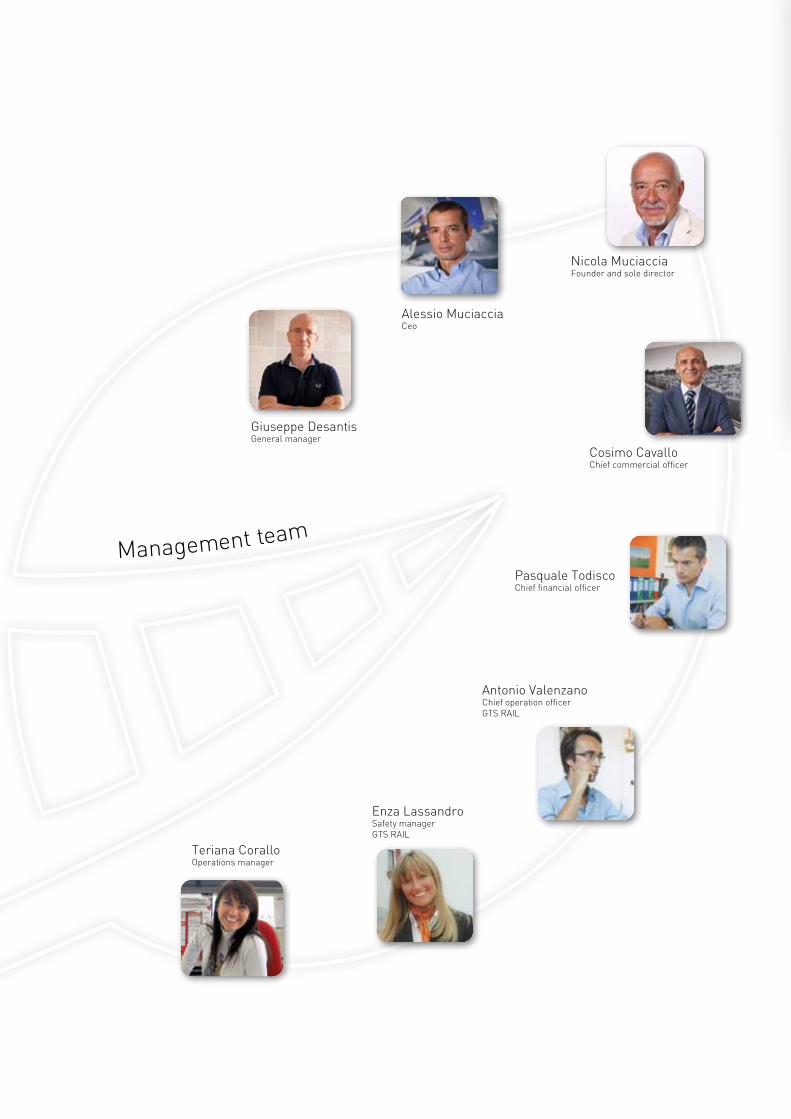
Alessio MuciacciaCeo
Giuseppe DesantisGeneral manager
Antonio ValenzanoChief operation officerGTS RAIL
Cosimo CavalloChief commercial officer
Pasquale TodiscoChief financial officer
Enza LassandroSafety managerGTS RAIL
Teriana CoralloOperations manager
Nicola MuciacciaFounder and sole director
Management team
[ 3 ]
Our story
[ 4 ]
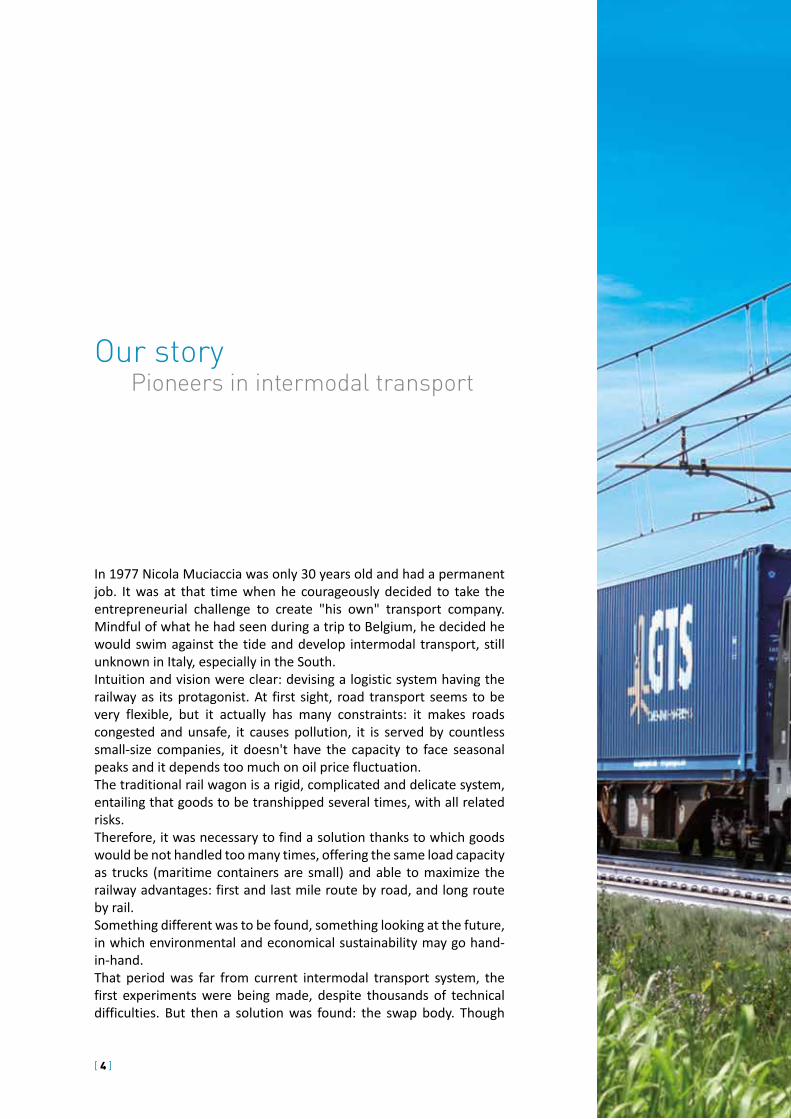
Our story Pioneers in intermodal transport
In 1977 Nicola Muciaccia was only 30 years old and had a permanent job. It was at that time when he courageously decided to take the entrepreneurial challenge to create "his own" transport company. Mindful of what he had seen during a trip to Belgium, he decided he would swim against the tide and develop intermodal transport, still unknown in Italy, especially in the South. Intuition and vision were clear: devising a logistic system having the railway as its protagonist. At first sight, road transport seems to be very flexible, but it actually has many constraints: it makes roads congested and unsafe, it causes pollution, it is served by countless small-size companies, it doesn't have the capacity to face seasonal peaks and it depends too much on oil price fluctuation. The traditional rail wagon is a rigid, complicated and delicate system, entailing that goods to be transhipped several times, with all related risks.Therefore, it was necessary to find a solution thanks to which goods would be not handled too many times, offering the same load capacity as trucks (maritime containers are small) and able to maximize the railway advantages: first and last mile route by road, and long route by rail.Something different was to be found, something looking at the future, in which environmental and economical sustainability may go hand-in-hand.That period was far from current intermodal transport system, the first experiments were being made, despite thousands of technical difficulties. But then a solution was found: the swap body. Though

[ 5 ]
Ci vuole qualcosa di diverso, qualcosa che guardi al futuro, dove compatibilità e sostenibilità ambientale ed economica vadano di pari passo.
[ 6 ]
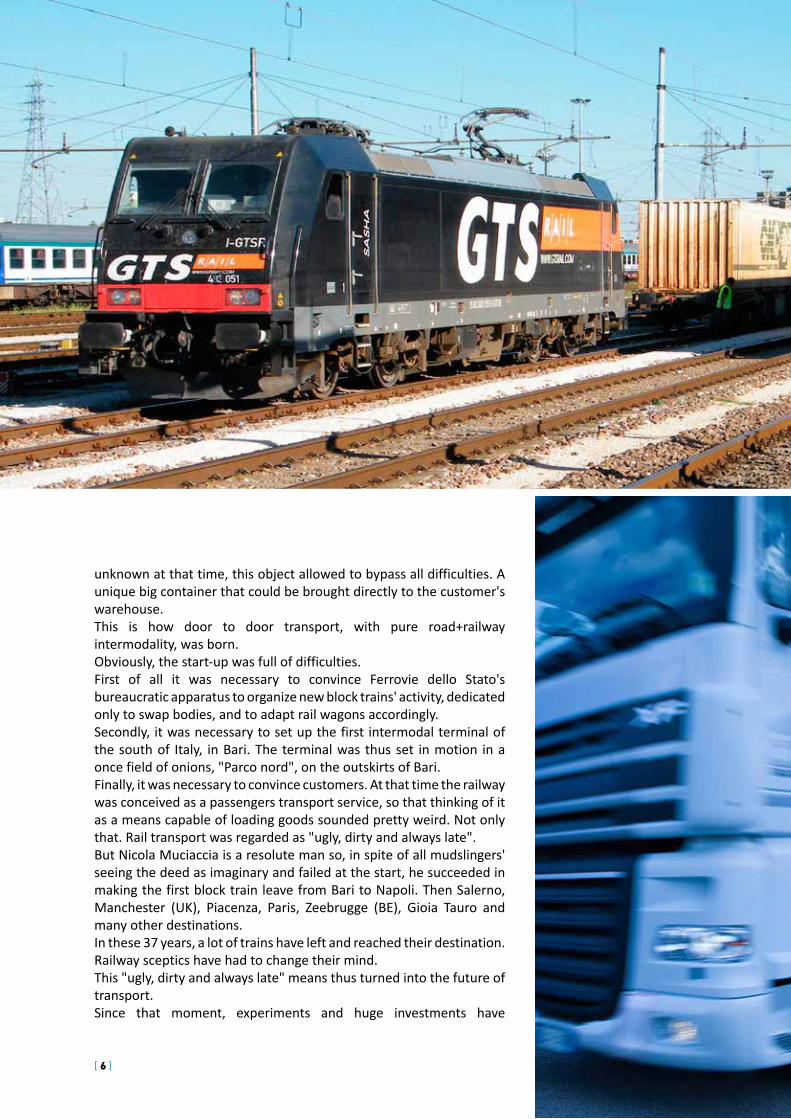
unknown at that time, this object allowed to bypass all difficulties. A unique big container that could be brought directly to the customer's warehouse. This is how door to door transport, with pure road+railway intermodality, was born.Obviously, the start-up was full of difficulties.First of all it was necessary to convince Ferrovie dello Stato's bureaucratic apparatus to organize new block trains' activity, dedicated only to swap bodies, and to adapt rail wagons accordingly. Secondly, it was necessary to set up the first intermodal terminal of the south of Italy, in Bari. The terminal was thus set in motion in a once field of onions, "Parco nord", on the outskirts of Bari.Finally, it was necessary to convince customers. At that time the railway was conceived as a passengers transport service, so that thinking of it as a means capable of loading goods sounded pretty weird. Not only that. Rail transport was regarded as "ugly, dirty and always late".But Nicola Muciaccia is a resolute man so, in spite of all mudslingers' seeing the deed as imaginary and failed at the start, he succeeded in making the first block train leave from Bari to Napoli. Then Salerno, Manchester (UK), Piacenza, Paris, Zeebrugge (BE), Gioia Tauro and many other destinations. In these 37 years, a lot of trains have left and reached their destination. Railway sceptics have had to change their mind. This "ugly, dirty and always late" means thus turned into the future of transport.Since that moment, experiments and huge investments have
la solidità patrimoniale consente nuovi investimenti e il circolo virtuoso prende il volo.

[ 7 ]
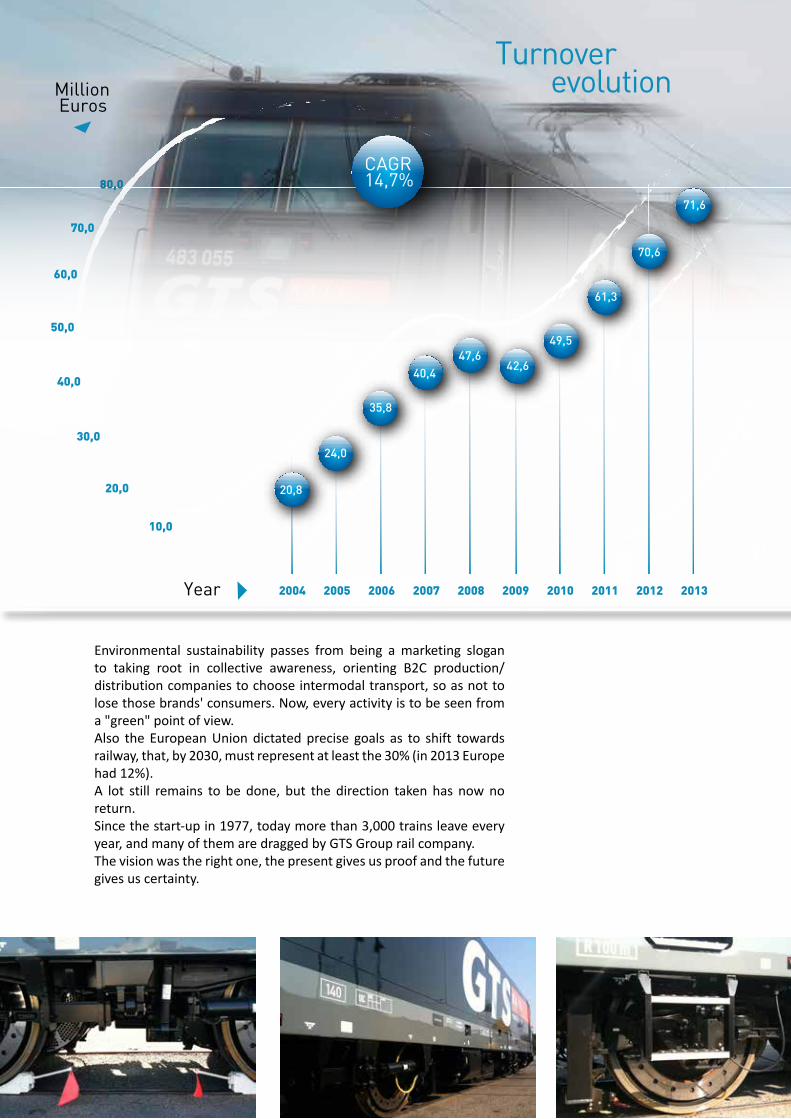
increased, to support an activity that, by definition, is "capital intensive". Another big initial difficulty consisted in starting with a big plan and few financial resources. At that time, addressing banks to ask for financial support to buy a swap body for intermodal transport meant paying the penalty for being the first ones investing in an unknown field. Though, with a thousand difficulties, the project gains a foothold. The € 100,000 turnover in 1977 becomes € 1,500,000 in 1983, € 7,500,000 in 1999 and € 20,000,000 in 2004, reporting a steady growth over the years. Everything starts to speed up, growth increases at higher rates, financial strength allows new investments. The virtuous cycle takes off.Yet in 2007 something starts to change. Liberalization in the railway sector tentatively starts in Europe, and in Italy, too, something starts to move.

[ 8 ]

[ 9 ]
The train, formerly "ugly, dirty and always late", turns into the future of transport.
Crisis starts to appear. In this context, Italian policy gives a precise input to Ferrovie dello Stato: becoming a company following market rules and moving to positive the balance sheet.For a field like Trenitalia railway cargo, that historically records severe economical losses, the mission is everything but simple. A decision is taken: cutting connections, especially long-distance ones.All relations with the south of Italy are bound to die. Liberalization has brought foreign companies to Italy, but they

[ 10 ]
are interested more in cross-border traffic than in domestic long-distance traffic.An apocalyptic scenario appears: without rail companies, intermodal transport is bound to die, without intermodal transport, GTS is bound to die. But Nicola Muciaccia doesn't give up. Thanks also to his son Alessio's enthusiasm and resolution (after graduating with honours in Economic and Business Administration, he immediately starts working in his family's company), he decides to take another momentous challenge: becoming a railway company, so as to guarantee continuity to services to and from the South of Italy. A threat turns into an opportunity.In 2009 the first trains self-produced with GTS group's rail company leave.Everything is made in house with locomotives bought from Bombardier, drivers and an operations room 24/7/365 open. The production process verticalization, with the integration of the core activity, namely rail traction, allows the Group to make the quantum leap.As a matter of fact, the control of production has allowed to prove the rail as an efficient, affordable, flexible and reliable transport system.And results confirm this.
The control of production has allowed to prove the rail as an efficient, affordable, flexible and reliable system.
Million Euros
Year 2004
80,0
2005 2006 2007 2008 2009 2010 2011 2012 2013
70,0
60,0
50,0
40,0
30,0
20,0
10,0
20,8
24,0
35,8
40,4 47,6
42,6
49,5
61,3
70,6
71,6
CAGR14,7%
Turnover evolution
[ 11 ]
Environmental sustainability passes from being a marketing slogan to taking root in collective awareness, orienting B2C production/distribution companies to choose intermodal transport, so as not to lose those brands' consumers. Now, every activity is to be seen from a "green" point of view. Also the European Union dictated precise goals as to shift towards railway, that, by 2030, must represent at least the 30% (in 2013 Europe had 12%). A lot still remains to be done, but the direction taken has now no return.Since the start-up in 1977, today more than 3,000 trains leave every year, and many of them are dragged by GTS Group rail company.The vision was the right one, the present gives us proof and the future gives us certainty.
Million Euros
Year 2004
80,0
2005 2006 2007 2008 2009 2010 2011 2012 2013
70,0
60,0
50,0
40,0
30,0
20,0
10,0
20,8
24,0
35,8
40,4 47,6
42,6
49,5
61,3
70,6
71,6
CAGR14,7%
Turnover evolution


[ 13 ]
Mission

[ 14 ]
Mission
It's our awareness and our belief.Our company's strength lied in having the capability to devise a scenario that concretely materialized.In this field we built our project and our investments were aimed at equipping ourselves with all the assets essential to create an adequate production structure.The great passion and enthusiasm characterizing our daily actions derive from a deep awareness: growth margins are virtually endless.In Europe only 12% of goods moved uses intermodality and this is no longer acceptable (also considering EU provision), as a consequence it's easy to see how many opportunities GTS can seize.Even if our company is 36 years old, we believe we are still at the beginning. It is as if everything we have done so far was only our starting point: we are at the initial stage of the product life cycle.Therefore, our mission consists in being the Solution for a Green Intermodal Transport."Green" means sustainable in the widest possible sense, in our thinking.There is a lot of talk about a generational pact to be made, so that in the present we don't exhaust the resources that our sons and the sons of our sons will need in the future.It is possible to talk about sustainability from two points of view, that represent our milestones: environmental and economical sustainability.Road transport is one of the main "energy-eaters" (oil) of our system, therefore it is one of the main pollution sources.
We are “The Green Transport Solution”.
THE GREEN TRANSPORT SOLUTION

[ 15 ]
This is only one of the numerous negative effects caused by road transport.As a matter of fact, we can easily ascribe to road transport social costs regarding: road accidents, dead and injured people, public health, limited mobility and traffic, infrastructure systems wear and tear, various types of pollution.All this costs billion Euros to the community, let alone the thousands
"Green" means sustainable in the widest possible sense, in our thinking.

[ 16 ]
lives that every year are broken on roads. But there is something more. The volumes moved, deriving from globalization and regionalization of production, are expected to double in the next 20 years.The road infrastructure system today can't bear the pressure, and to cope with growing volumes, investments required would be oversized.Intermodality is the solution.Suffice it to say that intermodality in average allows to save 75% in terms of C02 emissions reduction, compared with all-road transport. In one fell swoop, it is possible to guarantee really eco-friendly logistic systems.But being environmentally sustainable has little value if there is not a real economical solidity.We are a private company and as such we have to make profits and generate cash to finance our growth and development programs.GTS's format, entailing the verticalization of the production process, allows to combine economical and capital health with support to the environment.This is our "non secret": THE GREEN TRANSPORT SOLUTION.
GTS's format, entailing the verticalization of the production process, allows to combine economical and capital health with support to the environment.
Our respect for the environment is mirrored
by these numbers
saved to the environmentfrom 1977 to 2013
equivalent to the sequestration capacity of
trees
670.857.153 Kg. of CO2
33.000.000
[ 17 ]
Vision
[ 18 ]
Vision
What makes a company a great company? Being able to envisage the future, to satisfy unexpressed or dormant needs or create new ones. History teaches us this concept. Great entrepreneurs have been able to look beyond and cross the boundaries of technology, prejudices, ideologies and traditional business models. People often start from basic needs to transform simple ideas into successful business projects.And that's where we start from, too.Our 1977 vision remained basically unchanged. Of course we updated and widened it, but its guidelines are the same.The core idea consists in the assumption that goods and people mobility will more and more have to come to terms with two factors:1. higher quality, against decreasing prices2. economical and environmental sustainabilityAs to the first factor, suffice it to think at what e-commerce, in the goods field, and at high-speed railway lines or low-cost airlines, in the passengers field, brought about. In Italy people regard the train as an ineffective and unstable means of transport, both for goods and for people transportation.GTS's goal is turning this prejudice upside down by proving that the railway is not a dying-out dinosaur, but an extraordinarily versatile, flexible and reliable tool.
As to the second factor, it goes without saying that logistics, just like
The railway is not a dying-out dinosaur, but an extraordinarily versatile, flexible and reliable tool.
[ 19 ]
[ 20 ]
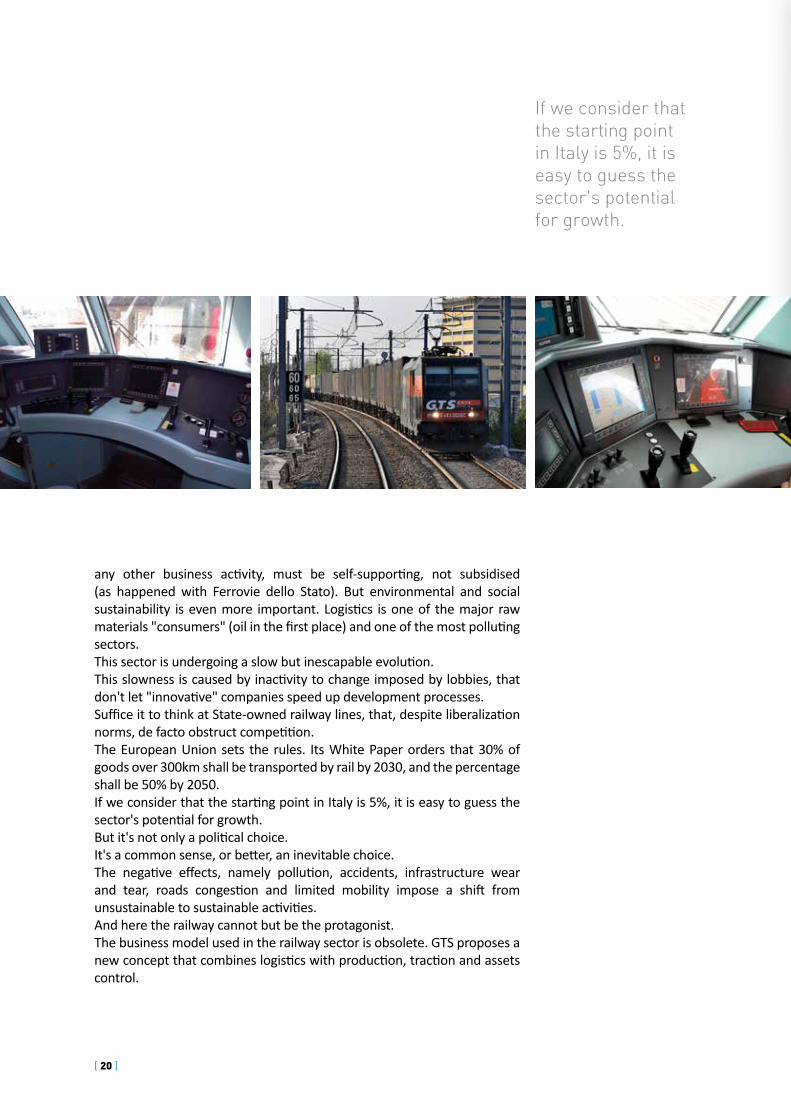
any other business activity, must be self-supporting, not subsidised (as happened with Ferrovie dello Stato). But environmental and social sustainability is even more important. Logistics is one of the major raw materials "consumers" (oil in the first place) and one of the most polluting sectors.This sector is undergoing a slow but inescapable evolution.This slowness is caused by inactivity to change imposed by lobbies, that don't let "innovative" companies speed up development processes.Suffice it to think at State-owned railway lines, that, despite liberalization norms, de facto obstruct competition. The European Union sets the rules. Its White Paper orders that 30% of goods over 300km shall be transported by rail by 2030, and the percentage shall be 50% by 2050.If we consider that the starting point in Italy is 5%, it is easy to guess the sector's potential for growth.But it's not only a political choice.It's a common sense, or better, an inevitable choice.The negative effects, namely pollution, accidents, infrastructure wear and tear, roads congestion and limited mobility impose a shift from unsustainable to sustainable activities. And here the railway cannot but be the protagonist. The business model used in the railway sector is obsolete. GTS proposes a new concept that combines logistics with production, traction and assets control.
If we consider that the starting point in Italy is 5%, it is easy to guess the sector's potential for growth.

[ 21 ]
The market

[ 22 ]
The market
Cargo transport plays a strategic role for Europe's economic growth and for relations between its fields and regions; simultaneously it has an ever increasing role in both CO2 emissions, having effects on global climate, and in pollutant emissions, having harmful effects on a local and regional scale. External variables, such as the rise in fuel price, and internal variables, such as the greater development of intermodality and combined transport, prove that this sector has a remarkable potential, just like GTS, being a benchmark player in the field. According to Istat surveys, carried out in 2012, annual goods handling (road, rail, sea) is divided into 95% road and 5% rail (well below the European average, that is 12%), whereas the total sum of goods transported by other means (rail cabotage waterway) represents 13%. The volume of internal annual transported goods, equal to 1.5 billion tons, that, multiplied by medium distances, reaches 165 billion tons/km, produces external costs amounting to 5.79 billion Euros. As a mere indication, if this volume travelled by rail, it would produce external costs for a total of 2.48 billion Euros, thus allowing an environmental saving of 57%. Therefore, the most rational and effective solution remains modality shift, moving long-distance goods transport to rail and cabotage. In Italy, important sectors such as large distribution of mass consumption goods increasingly approach intermodal transport, as they are becoming responsive to emissions reduction and to the search for other models than "all-road". As a matter of fact, the goal is moving the hundred thousand road transports from road to rail, with huge potential for development; it is esteemed that, only in the food sector, 450,000 load units* may travel no longer by road but by rail, thus joining thousands of other sectors. This data is also supported by a survey about rail transport,
Cargo transport plays a strategic role for Europe's economical growth
[ 23 ]
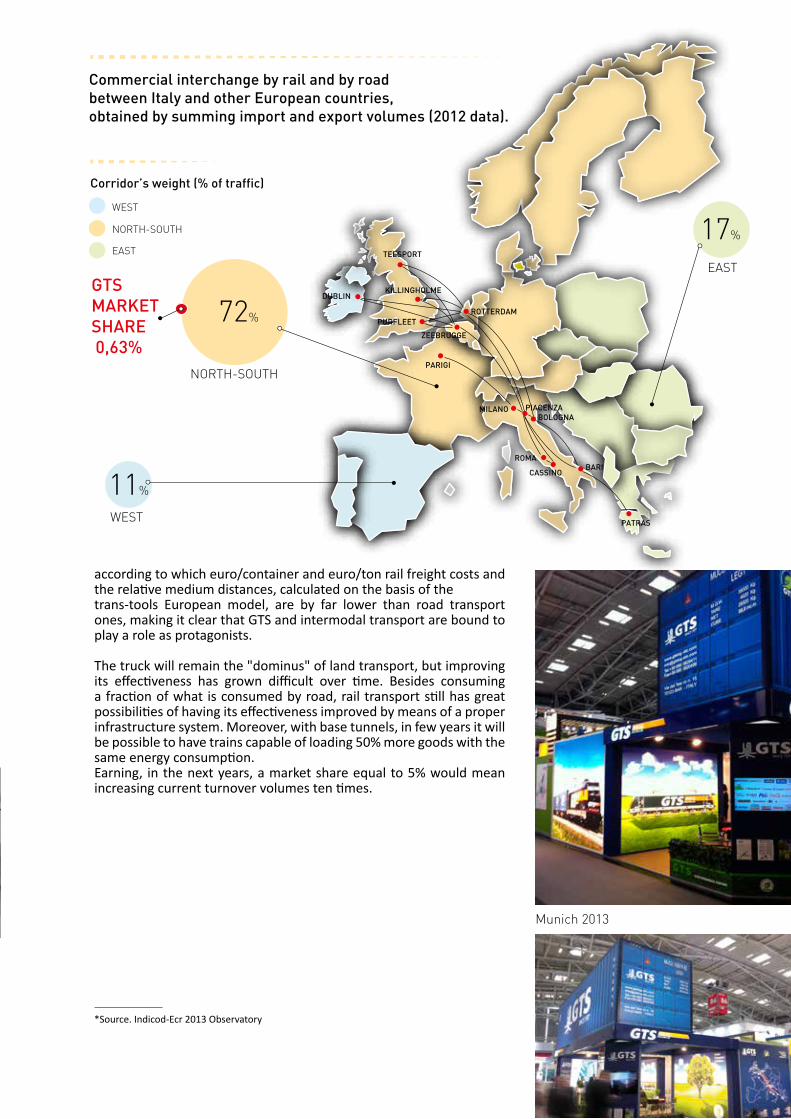
according to which euro/container and euro/ton rail freight costs and the relative medium distances, calculated on the basis of the trans-tools European model, are by far lower than road transport ones, making it clear that GTS and intermodal transport are bound to play a role as protagonists.
The truck will remain the "dominus" of land transport, but improving its effectiveness has grown difficult over time. Besides consuming a fraction of what is consumed by road, rail transport still has great possibilities of having its effectiveness improved by means of a proper infrastructure system. Moreover, with base tunnels, in few years it will be possible to have trains capable of loading 50% more goods with the same energy consumption.Earning, in the next years, a market share equal to 5% would mean increasing current turnover volumes ten times.
Commercial interchange by rail and by roadbetween Italy and other European countries, obtained by summing import and export volumes (2012 data).
Corridor’s weight (% of traffic)
WEST
NORTH-SOUTH
DUBLIN
TEESPORT
KILLINGHOLME
PURFLEETROTTERDAM
EAST
72%
17%
11%
NORTH-SOUTH
WEST
EASTGTSMARKET SHARE 0,63%
ZEEBRUGGE
PARIGI
MILANO PIACENZABOLOGNA
ROMA
CASSINOBARI
PATRAS
*Source. Indicod-Ecr 2013 Observatory
Munich 2013
[ 24 ]
As to GTS RAIL, affinities between goods and passengers are remarkable. As a matter of fact, GTS RAIL Spa was set with the specific aim to enter also this market.Regulatory liberalization has made significant progress in Europe, especially in the goods sector. As to passengers, the process has been slower, but we can affirm that today it is fully operational. Unlike other EU countries, where trains are considered as an extraordinary resource to shorten physical, economical and cultural distances, in Italy a different choice has been made.A very high government debt, cuts to public expense and the need to "tighten the belt" inescapably affected also subsidised mobility sectors, among which there is also the rail sector, of course.Long-distance connections and regional transport have become prerogative of few (rich) regions, at the expense of many areas of the country.Obsolete and ill-kept wagons fostered a common feeling of "abandonment" in given geographical areas, that, for this reason, feel discriminated against.Therefore, the train has turned into the symbol of territorial discrimination, referred to whenever difference in citizens treatment is to be stressed. If abroad you can travel from Paris to London in 2 hours and 30 minutes, in Italy it takes more than 4 hours and a half to travel from Bari to Rome, with everything but modern trains.
GTS RAIL and passengers transport

[ 25 ]
GTS comes with a fundamental competitive advantage: its structure is 80% ready to be adapted to passengers transport.
At a regional level, all the various licensed railway lines, subsidised by regions, are facing the same condition as national incumbent. Fewer resources result in cuts and then in less services for citizens.We are witnessing the decay of a previously highly subsidised sector, that will leave more operational space to private companies, which will stand out thanks to their efficiency and quality.Users are looking forward to having the possibility to support an independent brand, able to demonstrate that people deserve something better.GTS comes with a fundamental competitive advantage. In other words, its structure is 80% ready to be adapted to passengers convoys.Suffice it to think at driving personnel, training structure, safety management systems, operations room and locomotives, that can transport goods by night and passengers by day.So, we are almost completely ready. We only need to turn the key and wait for the stationmaster's whistle to leave.
[ 26 ]
[ 27 ]
Our strength

[ 28 ]
Our strength 10 good reasons to choose GTS
Market leadership, built in 36 years at the service of clients and of the environment. We serve more than 600 customers all over Europe: big industrial and distributive multinational companies and SMEs in search for a "green" and efficient logistic solution to transport their goods.
Vertical integration of the production process. With great passion, sacrifice and investments, we built a format, unique in Europe, that allows to keep the main variables of our service under control (wagons and swap bodies, rail traction), so as to guarantee efficiency, competitiveness and customer-tailored green solutions.
Strong and efficient logistic network. Daily connections from and to all Europe without loads shifting and with a vast range of services: Door to Door, Terminal to Terminal, Door to Terminal, Terminal to Door. All of them with only one reference person.
Motivated, problem-solving oriented, young but expert human resources. Our real capital is represented by our 120 employees. The average age is 37 years, with a 55% of female quota among employees. Passion, strong motivation, expertise characterize our daily work, through which we make sure that more than 300 swap bodies are delivered all over Europe each day. Specialized education, mental and physical wellbeing, supported by
1
23
4
[ 29 ]

[ 30 ]
our facilities (gym, basket and football courts, recreation room, kitchen), contribute to keep motivation levels high.
Generational handover already carried out with success. Soon after graduating with honours in Economic and Business Administration at the University of Bari, Alessio Muciaccia, only 23, began to work side-by-side with his father and company founder. His resolution and desire to learn immediately allowed him to hold tasks of greater responsibility. His passion for intermodality and, in particular, for trains earned him the role of CEO of the Group's emerging rail division, which, in two years only and starting from scratch (it couldn't be different), acquired the railway licence and the safety certificate for the autonomous traction of its own cargo trains. Today GTS RAIL is among the first 4 Italian rail companies in terms of trains/km and Alessio, 37 years old, runs the whole Group with authority. Since 2012 he has been appointed as Chairman of Bari Confindustria's Logistics Section and Member of the Executive Committee.
Customized and personal approach to clients. Flexibility, reliability and execution promptness. For GTS, clients are never only numbers. In daily contact, we always try to understand their needs and to reply even if requests come outside standard office hours. Our clients can rely on a sole contact person (one of our
5
6

[ 31 ]
employees), they may refer to for any request. More importantly, our replies are prompt and our services reach excellence levels, as certified by clients themselves. Of course, there is room for improvement, this is one of our strong beliefs.
Integrated and modern informative system, open to clients' needsHigh work reliability is now a fundamental prerequisite. All systems are performed on cluster redundant servers, so as to guarantee continuity of service in the event of accidental breakage of one of the physical devices. Connectivity is ensured by a proprietary fibre backbone with backup in dsl technology. Storage is physically redundant and regularly replicated in order to ensure extreme security. Therefore, software is 24-hours operational, also during scheduled maintenance. Security is ensured by highly reliable networking systems and by cutting-edge Cisco firewall.GTS Client is an in-house created and developed Software, with which all operational processes are managed, in compliance with GTS's business model. It combines and interacts with the clients' systems. AMS (Automatic Message System) is the system for the constant monitoring of transport, that notifies clients of ongoing transports status.Customer Desk available, both via Web and via APP, for our clients and their needs (order entry,
7

[ 32 ]
CO2 saving monitoring, administrative area, CRM).GTSGO is a web platform to cooperate with suppliers of road traction.
Strong financial position and positive economic results. In Italy and Europe there are very few transport companies that can boast of a strong financial position and the capacity to produce economically sustainable margins. GTS is among these few companies, as it can boast of 37 years of positive balance sheets. A great deal of consideration has always been given to objective (added value) and subjective profitability (ROE), in the belief that there cannot be a proper remuneration of the shareholders' structure unless accompanied by a careful and equitable process of wealth sharing, created by means of entrepreneurial actions, among all participants and stakeholders who, in various ways, contribute to value making, intended as corporate goal.
Transparency in balance sheets. Could a better guarantee exist for a client, a supplier or any other stakeholder, who can rely on balance sheets certified by external independent auditors? GTS has voluntarily been acting this way since 2008.
8
9
[ 33 ]
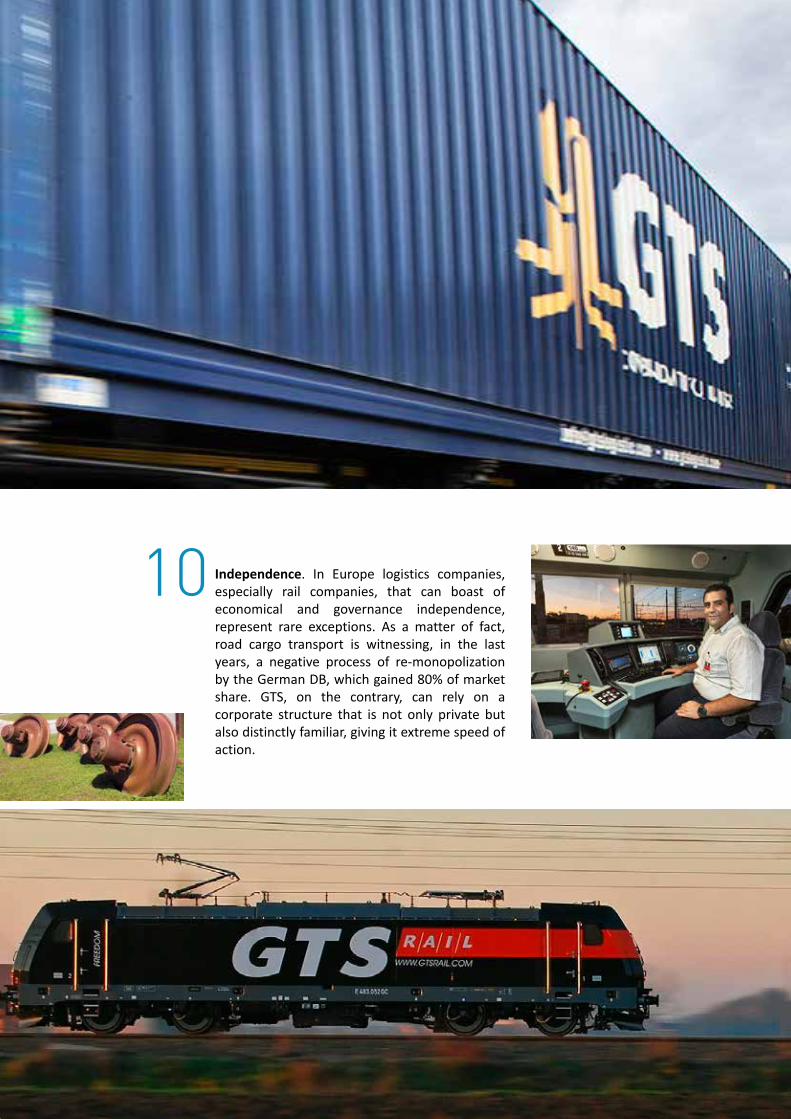
10 Independence. In Europe logistics companies, especially rail companies, that can boast of economical and governance independence, represent rare exceptions. As a matter of fact, road cargo transport is witnessing, in the last years, a negative process of re-monopolization by the German DB, which gained 80% of market share. GTS, on the contrary, can rely on a corporate structure that is not only private but also distinctly familiar, giving it extreme speed of action.

[ 34 ]
[ 35 ]
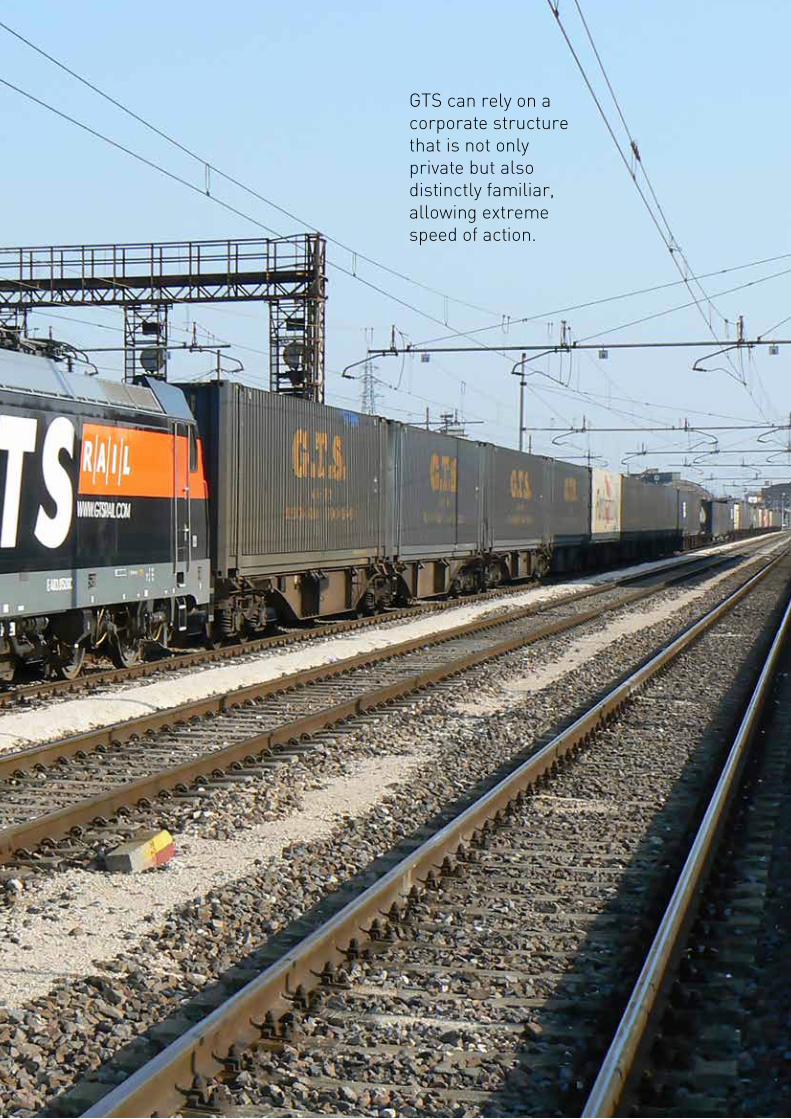
GTS can rely on a corporate structure that is not only private but also distinctly familiar, allowing extreme speed of action.

[ 36 ]
[ 37 ]
2013 Consolidated Financial Statements
[ 38 ]
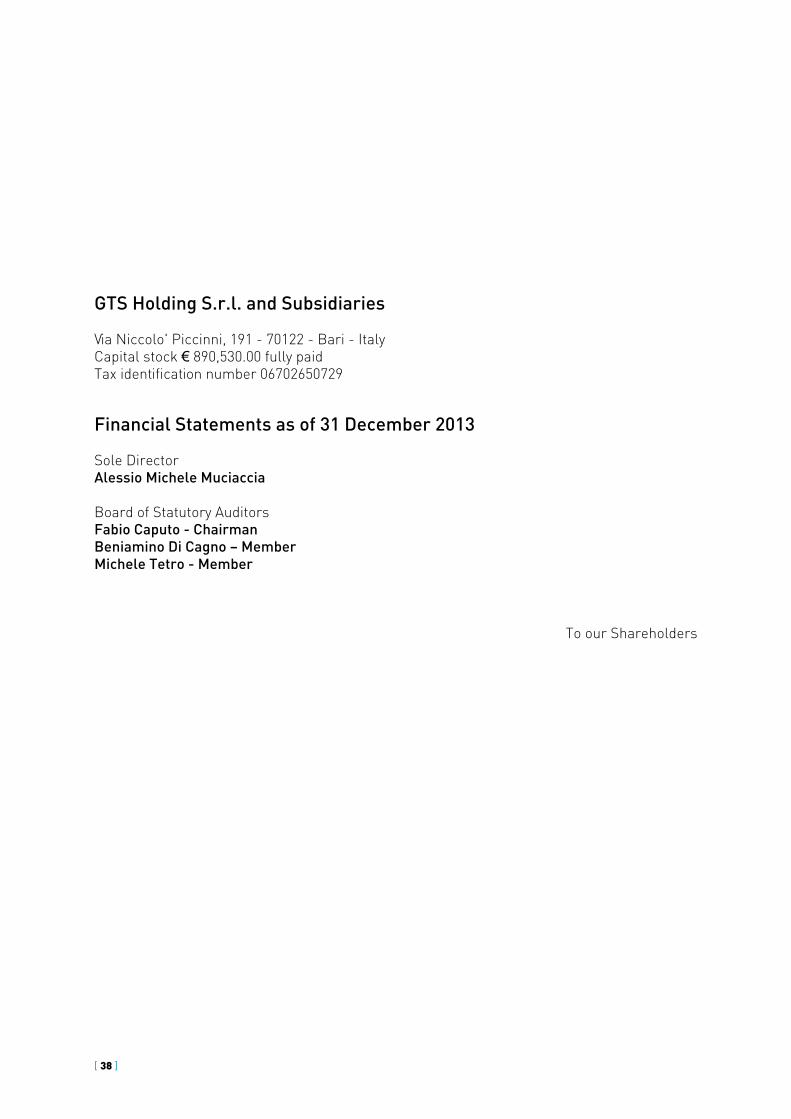
GTS Holding S.r.l. and Subsidiaries
Via Niccolo' Piccinni, 191 - 70122 - Bari - ItalyCapital stock € 890,530.00 fully paidTax identification number 06702650729
Financial Statements as of 31 December 2013
Sole DirectorAlessio Michele Muciaccia
Board of Statutory AuditorsFabio Caputo - ChairmanBeniamino Di Cagno – Member Michele Tetro - Member
To our Shareholders
[ 39 ]
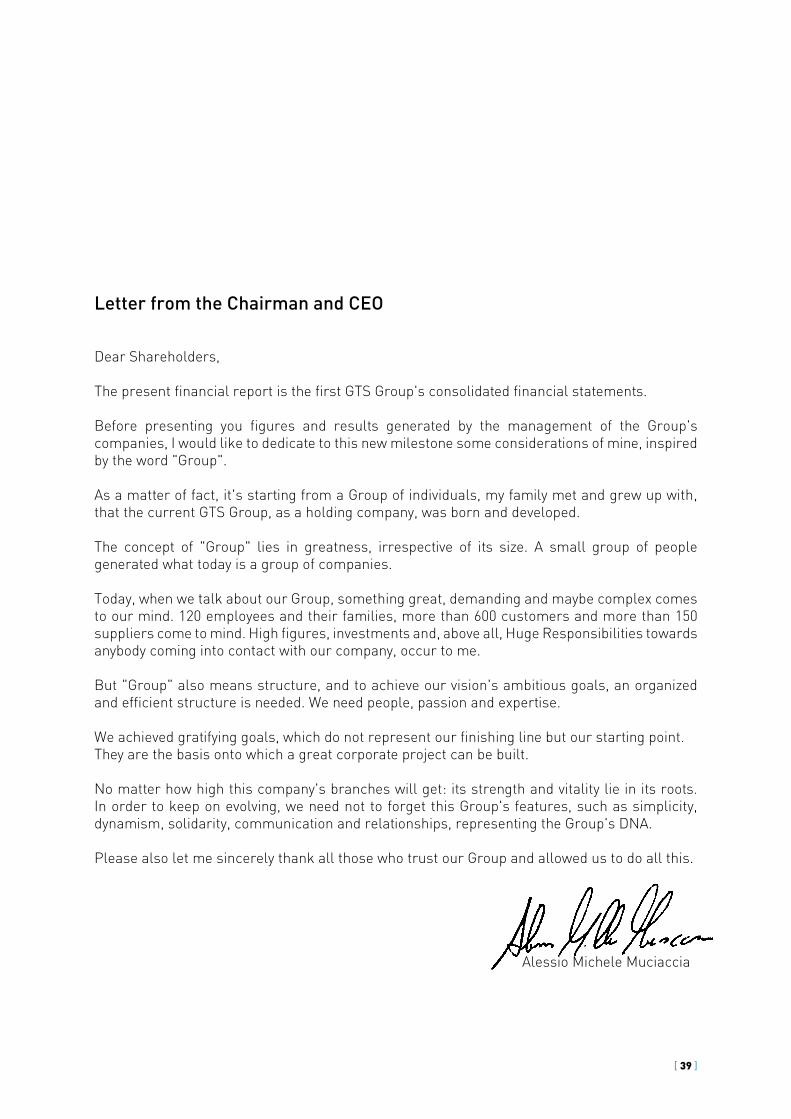
Letter from the Chairman and CEO
Dear Shareholders,
The present financial report is the first GTS Group's consolidated financial statements.
Before presenting you figures and results generated by the management of the Group's companies, I would like to dedicate to this new milestone some considerations of mine, inspired by the word "Group".
As a matter of fact, it's starting from a Group of individuals, my family met and grew up with, that the current GTS Group, as a holding company, was born and developed.
The concept of "Group" lies in greatness, irrespective of its size. A small group of people generated what today is a group of companies.
Today, when we talk about our Group, something great, demanding and maybe complex comes to our mind. 120 employees and their families, more than 600 customers and more than 150 suppliers come to mind. High figures, investments and, above all, Huge Responsibilities towards anybody coming into contact with our company, occur to me.
But "Group" also means structure, and to achieve our vision's ambitious goals, an organized and efficient structure is needed. We need people, passion and expertise.
We achieved gratifying goals, which do not represent our finishing line but our starting point.They are the basis onto which a great corporate project can be built.
No matter how high this company's branches will get: its strength and vitality lie in its roots. In order to keep on evolving, we need not to forget this Group's features, such as simplicity, dynamism, solidarity, communication and relationships, representing the Group's DNA.
Please also let me sincerely thank all those who trust our Group and allowed us to do all this.
Alessio Michele Muciaccia

Consolidated Financial Statements as of 31 December 2013GTS Holding Srl Group
BALANCE SHEET
[ 40 ]
Assets€
A) FIXED ASSETSI - Intangible assets 1) Set-up costs 398,8902) Industrial and intellectual property rights 133,8663) Pre-payments and other intangible assets in progress 33,5534) Other intangible assets 430,339
Total intangible assets 996,648
II - Tangible assets1) Land and industrial buildings 4,383,7822) Machinery and equipment 16,394,7313) Industrial machinery 21,5994) Other tangible assets 923,5795) Pre-payments and other intangible assets in progress 98,160
Total tangible assets 21,821,852
III - Financial assets1) Investments -
a) Investments in subsidiaries 70,452 d) Investments in other affiliates 1,500
2) Receivablesa) Non consolidated subsidiaries receivables 58,381 d) Other receivables 1,622,179
Deposits 289,693 Financial receivables 1,332,487 Total financial assets 1,752,512
Total fixed assets (B) 24,571,012
C) Current assetsII - Receivables1) Trade receivables 19,952,026 3) Receivables from associates -4-bis) Tax receivables 4,178,716 4-ter) Deferred tax assets receivables 177,287 5) Other receivables 3,913,232
Total current receivables 28,221,261
IV - Cash and cash equivalents1) Bank and postal deposits 2,043,495 3) Cash on hand 7,282
Total cash and cash equivalents 2,050,777
Total current assets (C) 30,272,037
D) Accrued income and prepaymentsAccrued income and prepayments 789,411 Total accrued income and prepayments 789,411
Total assets 55,632,460

LiabilitiesBALANCE SHEET
[ 41 ]
€
A) Net equityI- Share capital 890,530III - Revaluation reserve -IV- Legal reserve 44,502VI- Portfolio treasury shares reserve -VII- Other reserves 826,162VIII- Retained earnings (loss) -IX- Net income/loss 1,066,552 Consolidation reserve 2,562,312 Total Group's net equity 5,390,059
Minority interests reserves 3,813,604 Minority interests net result 1,040,285 Minority interests 4,853,889
Total net equity 10,243,947
C) Provisions for contingencies and obligations1) Pension liabilities 350,000 2) Deferred tax provision 1,557,489 3) Other provisions 1,019,173 Total provisions for contingencies and obligations 2,926,663
Employee termination indemnity 1,185,976
D) PayablesPayables
4) Due to banks within 12 months 3,547,032 Due to banks over 12 months 13,069,380
5) Due to other financial partners 6,264 6) Prepayments received 1,158 7) Trade payables 17,051,199 10) Payables to associates12) Due tax payables 850,954 13) Due to social security institutions 285,316 14) Other debts 1,478,289
Total debts 36,289,591
E) Accrued expenses and deferred incomeAccrued expenses and deferred income 4,986,283 Total accrued expenses and deferred income 4,986,283
Total liabilities 55,632,460

INCOME STATEMENT as of 31 December 2013
€
A) Value of production 1) Revenues from sales and services 72,274,520 5) Other revenues 5,038,589a) Operating grants 4,524,504 b) Other revenues 514,085
Total value of production 77,313,109
B) Costs of production6) Costs for raw materials (1,073,626)7) Services costs (58,996,305)8) Costs for leases and rentals (3,204,067)9) Personnel costs (6,800,351)
a) Wages and salaries (4,932,596) b) Social security contributions (1,510,041) c) Employee termination (309,352) e) Other costs (48,362)
10) Amortization and depreciation (2,247,907)a) Intangible amortization (426,484)b) Tangible amortization (1,646,597)d) Depreciation of credits in current receivables (174,826)
Provision charges for risks (47,922)Other provision charges (290,636)Other costs (657,670)TOTAL COSTS OF PRODUCTION (73,318,484)
DIFFERENCE BETWEEN VALUES AND COSTS OF PRODUCTION (A-B) 3,994,625
C) Financial income and charges
16) Other financial income 151,912
17) Interests and other financial charges (400,491)
17 bis) Net income (loss) on exchange 41,128
Total of 16 + 17 + 17 bis (207,451)
D) Value adjustments of financial activities
19) Depreciations -b) Depreciation of financial assets - non investments (27,651)
Total adjustments of financial activities (27,651)
E) Extraordinary income and charges
20) Extraordinary income -Other extraordinary income 278,514
21) Extraordinary charges -Other extraordinary charges (418,045)Total extraordinary income and charges (139,532)
Before tax result 3,619,991
22) Income taxes Current taxes (926,194)Deferred tax charges and benefits (586,960)Total income taxes (1,513,154)
23) NET INCOME 2,106,837
Group result 1,066,552Minority interests 1,040,285
[ 43 ]
Management report
An analysis of the market in which the Group operates:Transport sector and Rail transport.
"An efficient transport system is an indispensible requisite for EU's prosperity: we need less congestion, reduced gas emissions, increased employment and a higher economic growth. It is also the key to a well functioning internal market and to guarantee to all of EU regions to remain fully and competitively integrated in the world economy. Transport is also vital for the economy itself: many European companies are world leaders in infrastructure, logistics, traffic management systems and manufacturing of transport equipment. It is crucial that European transport continues to develop and invest to maintain its competitive position. Nonetheless, in a world in which oil price constantly increases, traffic congestion rises and climate change looms, EU transport system needs radical innovation to maintain its prominent role as driving force of economic growth and to keep up with a fiercer and fiercer global competition. In order not to have our freedom of movement compromised, we need to break the transport system’s dependence on oil without sacrificing its efficiency. The strategy defined with this White Paper shows how this transformation can be achieved through ten challenging goals, devised to orient strategies and evaluate progress." - Siim Kallas, Vice-President of the Commission, responsible for transport, in his introduction to the transport White Paper - Transport 2050 (March 2011).Point 3 of paragraph 2.5 of the White Paper: "3) 30% of road freight over 300 km should shift to other modes such as rail or waterborne transport by 2030, and more than 50% by 2050, facilitated by efficient and green freight corridors."These are the strategic goals at the basis of EU's competitive challenge. One of the first fundamental steps that every country can take to contribute coherently to such development is guaranteeing impartiality in access to infrastructure. An Authority has been active in Italy since 2012 regulating transport, intended to play as third party in defining the conditions of access to the rail network, financing areas and procedures in rail transport public service and, finally, the schemes of calls for tenders for exclusive transport services. Such Authority has jurisdiction over the transport sector and over access to related infrastructure and complementary services.Pursuant to article 37 of Italian Decree-law n. 201/2011, the Transport Regulation Authority is entrusted, among others, the following functions:• adopting methodologies encouraging competition, guaranteeing management productive
efficiency and a limitation of costs for users, companies and consumers; guaranteeing equitable and non-discriminatory conditions of access to rail, port, airport infrastructures and to motorway networks, without prejudice to the authority of the Agency for road and motorway infrastructures, as well as to passengers and cargo mobility at national, local and urban level, also linked to stations, airports and ports;
• if deemed as necessary in relation to the competition situation actually existing in national and local transport services single markets, defining criteria to establish charges, tolls and rents;
• checking that such criteria are properly implemented by interested parties;• checking that in regional rail transport calls for tenders there are no discriminatory
conditions or conditions preventing access to potential competitors, with special reference to the availability of rolling stock at the time of the call for tenders;
• acting as regulation body for access to rail infrastructure, defining criteria to establish tolls and to assign tracks and capacity as well as monitoring their proper implementation;
• in the rail transport sector, heard the Italian Ministry of Infrastructure and Transport, regions and interested local bodies, defining the public service's scopes of application on

[ 44 ]
tracks and financing modalities. After an adequate observation period, the Authority analyses the efficiency of the various degrees of separation between the company managing the infrastructure and the rail company, also in relation to the experience of other EU Member States and to the need for protecting commuters (art.37 of Italian Decree-law n. 1/2012);
From 2014 on the Authority website, it is possible to find the first Survey resolutions, in the activities section. We hope the Authority's activity may restore, as soon as possible, adequate competition levels in a market still predominantly covered by National Incumbent. According to trade associations' official estimates, in 2013 the freight transport market went through a slight increase in the production of trains/km 43.279 million vs. 43.206 million in 2012, with an increase in trains/km produced by private companies to the detriment of the major national operator.However, what mainly makes forecasts of the reference market more and more positive is the increase in the number of rail service users. "Intermodality", therefore "rail", and its Green appeal seems to rub off on more and more professional and non-professional operators. Such are the benefits expected from a shift to a "Green" transport solution that it is hard to resist to the temptation of "being among the upholders of such progress".Proof is given by the trend of freight traffic in the last years. Below, a Federtrasporti survey on the year that has just closed.
Table 1. Indicators of demand for freight transport in 2013
January-June 2013 July-December 2013
Rail transport (trend % variations)1 Tonnes-km
0.8 -
Air transport (tonnes; trend % variations)2
FreightMail
-0.4-0.1-0.4
1.11.4-2.9
Maritime transport of containers (teu.; var. % tend.)3 4.0 -
Motorway transport (heavy vehicles-km; var. % tend.)4 -3.8 -3.0
Road transport5 National demandInternational demand
-35.7-
-29.710.6
1Data relating to freight transport carried out by the companies of FS Italiane Group2In the second column, trend variations of January-October 2013.3Provisional data; the ports considered represent 95% of container traffic carried out in 20124In the second column, potential percentage changes relating to January-October 20135Values indicated represent the balance between the demands for increase and the demands for decrease on potential trend of demand (tonnes) in the first column in the first semester of 2013, then in the second semester of 2013 (forecasts).
The transport market is undergoing an expected evolution, pushed even more by the economic crisis that has characterised the last years.The solution to such change is represented by the activities offered by the Group. The GTS Group has been operating in intermodal transport since 1977 combining different transport solutions; since 2010 it has been vertically integrating rail transport production by means of its subsidiary GTS Rail SpA.

[ 45 ]
Significant facts From 4 to 7 June 2013 the Group companies, G.T.S. - General Transport Service SpA and GTS Rail SpA took part in Transport Logistic, an international trade fair held in Munich representing one of the most important sector showcase (110,000 square metres of exposition) with 53,000 visitors and 2,013 exhibitors from 63 countries. In October 2013 the Dutch law company G.T.S. Netherland B.V. was set up, whose shares are held for 65% by the Group with the aim to cover commercial traffic of one of the most important ports in Europe.Last December GTS Rail S.r.l. changed its legal form into GTS Rail SpA.
Subsequent events
As of drafting of the Balance sheet, 31 December 2013, there are no subsequent significant events after year end. We will only inform about the issuance of the national rail passengers licence to GTS Rail SpA by the Italian Ministry of Infrastructures and Transports on 02/04/2014.In March 2013 GTS Rail SpA executed a contract for the purchase of 2 Bombardier electric locomotives, Traxx 140 DC, whose delivery is expected to be made in the first four months of 2015.
Results of operations
The year that has just ended recorded a net profit of 2,107,000 Euros, with a result before tax of 3,620,000 Euros, equal to 5% of the turnover. It was considered as worthwhile to reclassify the income statement according to the value added scheme, that allows to completely perceive the wealth creation process and its distribution among components of the corporate system.
Reclassified income statement 2013 %
Value of production 72,789
Costs of production (59,407) -81.6%
Value added 13,381 18.4%
Personnel costs (6,800) -9.3%
EBITDA 6,581 9.0%
Amortization and Depreciation (2,586) -3.6%
Operational income 3,995 5.5%
Financial results (235) -0.3%
Other non-operating results (140) -0.2%
Earnings (losses) before taxes 3,620 5.0%
Income taxes (1,513) 2.5%
Net income/(loss) 2,107 2.9%
During this financial year, more than 600 customers availed themselves of our intermodal transport services, for a total of more than 57,000 shipments. Among our customers, two overcome 5% of the total turnover, which proves how sound the Group's policy of customer diversification is, so as to reduce the risk of reliance on single customers. An overview of Revenues, organized on the basis of the type of activity carried out by the Group, is given below:

[ 46 ]
Euros
Transport services 71,552,745 Rent of rolling stock 480,859 Rail and ancillary services 255,057 Other revenues 500,119
72,788,780
The group operated a total of 2,599 one/way Trains of which 1,155 for the domestic market directly and the remaining 1,444 for the international market produced with third party suppliers. During the year good load factor levels have been achieved on the main domestic and international paths, also thanks to a commercial intervention on the weakest areas, so as to guarantee a higher coverage of territory and customers. For more details on costs, please refer to the Notes to the Financial Statements.This year's net income was 2,107 thousand Euros with a R.O.E. of 25.75% and a R.O.I. of 7.18%. In order to better conduct the economic analysis, it has been deemed as necessary to link to the above-mentioned ROE (subjective indicator), expressing profitability referable to shareholders, another economic indicator defined as objective. In this specific case, it coincides with that aggregate inferable from the scheme of the income statement above reclassified, namely Value Added. Such economic indicator expresses profitability referable to the personnel, technical means, financial and, at last, "public administration" components (taxes). In short, it allows to express a judgment on the achievement of the company's profitability condition/goal, in terms of production of adequate wealth and its equitable distribution among all components in the corporate project. The emerging quantification, equal to 13.4 million Euros, confirms the adequacy of wealth produced and of its consequent distribution, as can be inferred by the reclassification scheme, and allows to express a positive consideration as to the accurate process of wealth distribution that the management has tried to carry out with extreme attention over time.
[ 47 ]
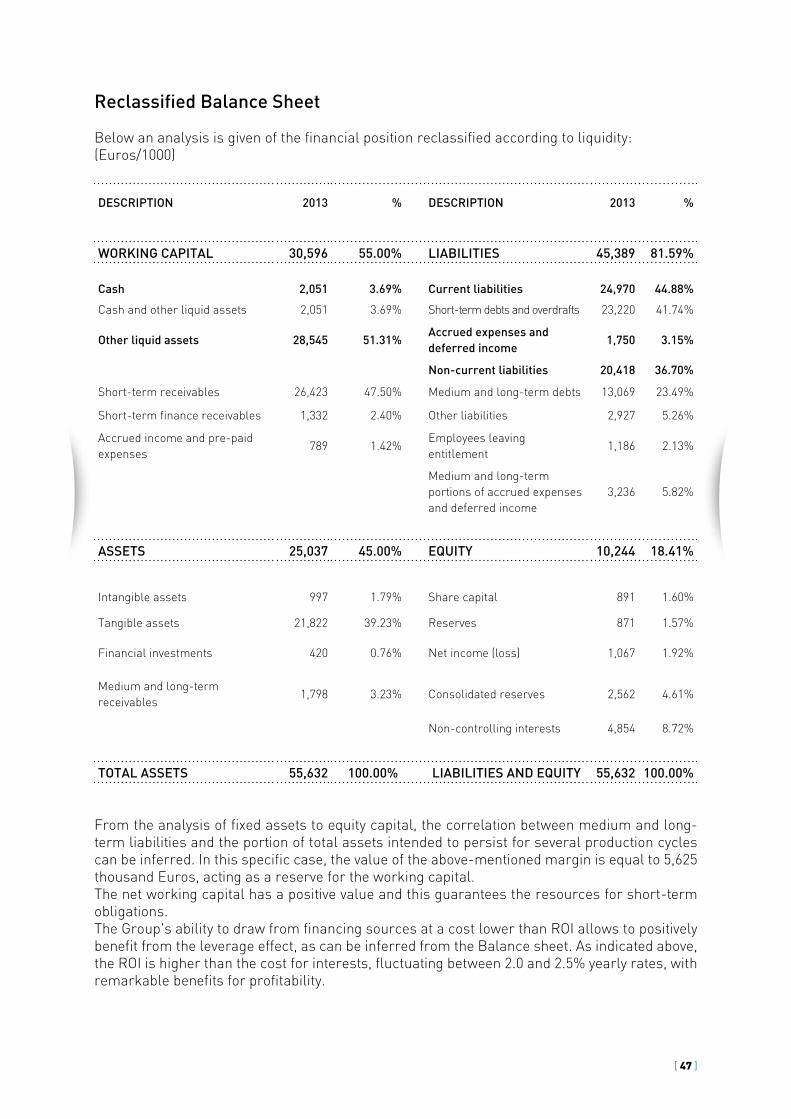
Reclassified Balance Sheet
Below an analysis is given of the financial position reclassified according to liquidity:(Euros/1000)
DESCRIPTION 2013 % DESCRIPTION 2013 %
WORKING CAPITAL 30,596 55.00% LIABILITIES 45,389 81.59%
Cash 2,051 3.69% Current liabilities 24,970 44.88%
Cash and other liquid assets 2,051 3.69% Short-term debts and overdrafts 23,220 41.74%
Other liquid assets 28,545 51.31%Accrued expenses and deferred income
1,750 3.15%
Non-current liabilities 20,418 36.70%
Short-term receivables 26,423 47.50% Medium and long-term debts 13,069 23.49%
Short-term finance receivables 1,332 2.40% Other liabilities 2,927 5.26%
Accrued income and pre-paid expenses
789 1.42%Employees leaving entitlement
1,186 2.13%
Medium and long-term portions of accrued expenses and deferred income
3,236 5.82%
ASSETS 25,037 45.00% EQUITY 10,244 18.41%
Intangible assets 997 1.79% Share capital 891 1.60%
Tangible assets 21,822 39.23% Reserves 871 1.57%
Financial investments 420 0.76% Net income (loss) 1,067 1.92%
Medium and long-term receivables
1,798 3.23% Consolidated reserves 2,562 4.61%
Non-controlling interests 4,854 8.72%
TOTAL ASSETS 55,632 100.00% LIABILITIES AND EQUITY 55,632 100.00%
From the analysis of fixed assets to equity capital, the correlation between medium and long-term liabilities and the portion of total assets intended to persist for several production cycles can be inferred. In this specific case, the value of the above-mentioned margin is equal to 5,625 thousand Euros, acting as a reserve for the working capital.The net working capital has a positive value and this guarantees the resources for short-term obligations. The Group's ability to draw from financing sources at a cost lower than ROI allows to positively benefit from the leverage effect, as can be inferred from the Balance sheet. As indicated above, the ROI is higher than the cost for interests, fluctuating between 2.0 and 2.5% yearly rates, with remarkable benefits for profitability.

[ 48 ]
Net financial position
(Euros/1000) 2013 2012* Delta
CASH 2,005 1,186 820
Current financial receivables 1,332 - 1,332Part of short-term financial investments 1,332 - 1,332
Short-term financial debts (3,823) (4,423) (600)Bank overdrafts and advances on invoices (755) (1,467) (712)
Short-term part of long-term debts (1,048) (1,027) 21
Short-term debts for leasing (2,020) (1,930) 90
Short-term financial position (486) (3,238) 2,752
Medium and long-term financial receivables - 1,332 (1,332)Financial loans to third parties - 1,332 (1,332)
Medium and long-term financial debts (13,070) (15,017) (1,947)Loans from banks (3,669) (4,702) (1,034)
Long-term debts for leasing (9,401) (10,315) (914)
Net long-term financial position (13,070) (13,685) 615
TOTAL FINANCIAL POSITION (13,556) (16,923) 3,368
*pro-forma
The total debts reduced by more than 3,3 million Euros. In detail, long-term debts, apart from leasing, reduce by 1,055 thousand Euros and short-term bank overdrafts reduce by 712 thousand Euros. This is to be combined with an increase in cash and cash equivalents by 820 thousand Euros. Debts taken out towards leasing financial institutions increase because of new contracts executed in 2013 for a total of 823 thousand Euros, against reimbursed amounts of 1,977 thousand Euros during the financial year. The total financial position, equal to 13,268 thousand Euros, is represented for more than 93% (12,363 thousand Euros) by long-term debts. The Group has more than 8 million Euros credit lines, only used for 755 thousand Euros.
Investments managementTangible assets
The Group has always implemented a careful policy of re-investment of net income produced and used leverage in order to endow itself with plants and equipments for production.The Group can provide its Customers with a set of assets counting today more than 1,800 containers (boxes and swap body containers), a fleet of 20 trucks for road transport, 3 cranes, 260 rail wagons (of which 30 are company owned) and 5 state-of-the-art Bombardier electric locomotives, Traxx 140 DC model. Investments led to the creation of a tax credit pursuant to article 1, paragraphs 271-279 of law

[ 49 ]
27 December 2006, n. 296, and subsequent amendments of law 3 June 2008, n. 97. Such credit is equal to 3.882.493 Euros and has been used since 2013 by means of compensation. This will determine a considerable financial advantage.For 2013 the Group in planning to invest in rail cars for a total of 8.3 million Euros, so as to enlarge its equipment of owned rail wagons.All locomotives and rail wagons are covered by insurance against the risk of accidental events.
Intangible assets
Aware that such intangible elements represent an unavoidable competitive advantage, the Group developed, in the sectors in which it operates, different "Core Competences" and "Intangible assets" thanks to which it can stand out on the market and maintain a high competitive level in providing services.
Information & Communication Technologies
Managing information properly is the aim of our Production Control Systems. The Group continuously invests in the development and maintenance of IT systems with the aim to offer prompt information to both external and internal users. Integration with various customers and suppliers and with the Group companies is a relentless process representing an "Add on" for the complex handling of information deriving from different sources.
Railway licence
GTS Rail SpA is holder of Italian railway licence number 50. Such licence, obtained in 2008, allows to carry out the railway activity in the national network. Its obtainment was the result of a long and complex procedure, entirely managed inside the company with its own resources. During this step, and during revision by supervisory authorities, ample evidence has been given of the Group's proper economical-financial capacity, as well as of its proper organizational structure.
Safety certificate
In 2011 the Group obtained an important territorial extension of its "Safety certificate" in Italy, thanks to which it will have the possibility to serve places such as: Pomezia, Cassino, Lugo, Novara, Padova, Brescia, Chiasso and Luino. Such extension was planned on the basis of possible commercial developments, by guaranteeing the possibility to connect the most important Italian intermodal terminals with beyond-the-Alps passages. The Safety certificate is a permit released by the Italian National Rail Safety Agency to every Rail company. It describes the type of transport allowed and the National Rail Infrastructure lines onto which such transports can be carried out.Obtained the territorial extension of the Safety certificate, at the end of 2011 the Group planned and applied for its service to be extended to Dangerous Goods. Such permit allows GTS Rail SpA to offer its services to a wide range of potential customers operating in the logistic sector of the chemical and petrochemical industries. The group's retention of the Safety certificate is subject to high standards of personnel training as well as to precise company procedures and processes. GTS Rail SpA's company assets can boast numerous highly skilled human resources, thanks to which it can envisage further developments in terms of traffic and services offered.GTS RAIL adjusted its Safety Management System according to Italian and European standards required by Legislative Decree 10 August 2007, n. 162, implementing Directive 2004/49/CE.
[ 50 ]
Following a long and complex adjustment process, GTS RAIL has been one of the first Italian companies to obtain a new Safety certificate, released by the Italian National Rail Safety Agency on 04/08/2011, consisting in part A and part B. Part A contains the general requirements of the safety management system and is valid on the whole European Union territory, giving GTS RAIL SpA the possibility to launch its services in other EU countries more easily.Part B of the certificate attests the acceptance of measures adopted by the rail company to satisfy specific requirements needed for safety in circulations on the Italian railway infrastructure, deriving from national Operational rules, Technical standards and Safety standards at the time of Safety certificate release.
Training
The training of human resources is critical to guarantee expected production levels. This field's specificity requires resources' training before they enter the production process and during its fulfilment. The company constantly invests in training courses to keep professional profiles updated. Such human capital represents another strategic asset owned by the Group. Building core competences to develop such knowledge has allowed the Group to grow dynamically and to meet the market's needs and requests promptly.

[ 51 ]
Notes to Financial Statements
Dear Shareholders,
The following consolidated financial statements of GTS Holding Srl, consisting in Balance Sheet, Income statement and Notes to Financial Statements, is drafted according to the accounting standards and rules provided by legislative decree 127 of 9 April 1991.For any information regarding subsequent events and company foreseeable going concern, please refer to the Management report.
1. Group's activities and consolidated financial statements' criteria
GTS Holding S.r.l. (hereinafter referred to as "Parent company") and its subsidiaries (hereinafter referred to, together with GTS Holding S.r.l., as "Wind Holding Group" or "Group") mainly operate in the transport industry, more specifically in Intermodal and rail transport, and also carries out ancillary activities of services to companies and complementary services. In particular the Group operates in the following fields:- Freight intermodal transport for third parties, in the main European and Mediterranean
countries.- Organization and management of transport and logistics services for third parties;- Rail traction services in the Italian and Swiss territories;- Creation, Management and Retaining of Competences in the rail sector;- Creation and Management of real estate assets.The consolidated financial statements as of 31 December 2013 includes the balance sheet of the following companies:
Field of activity and Companies
Parent company Registered office GTS Holding S.r.l. Bari (IT)
Subsidiaries Registered office % of interest Share capitalTrasporto e LogisticaG.T.S. - General Transport Service SpA. Bari (IT) 52% EUR 900,000GTS Rail & Logistic UK Limited London (UK) 100% GBP 10,000G.T.S. Nederland B.V. Rotterdam (NL) 65% EUR 10,000Rail transportGTS Rail SpA. Bari (IT) 52% EUR 1,294,000Gts Rail Sagl Lugano (CH) 100% CHF 50,000Real EstateMuciaccia Costruzioni Gruppo GTS S.R.L Bari (IT) 62% EUR 500,000
The financial report as of 31 December 2013 is the Group's first consolidated financial statements. As to the companies listed above, G.T.S. General Transport Service SpA, GTS Rail SpA and Muciaccia Costruzioni Gruppo Gts have been fully consolidated, whereas the other companies have been evaluated at their cost as they were not material.
[ 52 ]
2. Principles of Consolidation
The principles of consolidation followed in the preparation of the consolidated financial statements are outlined below.a) The consolidated financial statements are the result of the aggregated financial statement
as of 31 December 2013 of the parent company and of its subsidiaries as mentioned above, respectively approved by their boards of directors or sole administrators, adequately reclassified and amended in order for them to be consistent with the Group consolidation policies.
b) The result of the companies that are consolidated for the first time during the financial year is fully consolidated only in case the consolidation conditions arise in the first period of the year. The net profit (loss) is shown in a different line of the consolidated profit and loss.
c) The financial year, for all the Group's companies, coincides with the calendar year.d) The assets and liabilities of subsidiaries are consolidated on a line-by-line basis and
the carrying value of intercompany investments held is eliminated against the related shareholder’s equity accounts. The non-controlling interests of consolidated subsidiaries are separately reported in the consolidated balance sheets and consolidated statements of operations. All intercompany balances and transactions are eliminated in consolidation.
The difference between the carrying value of intercompany investments of subsidiaries and the related shareholders' account, at the date of acquisition, is allocated, where possible, to the related either asset or liabilities of the subsidiaries' financial statements.
In case of positive difference, which constitutes the goodwill paid for the subsidiaries, the different amount is allocated in the line "goodwill arising from acquisitions" and it is amortized over five years.
In case of negative difference, this is recorded in the line "consolidation reserve" unless the negative difference has to be referred to adverse forecasted result of the subsidiary following the acquisition. In this case the difference is allocated line "other liabilities". The amount will be released to the profit and loss when the forecasted negative result is realized.
e) All intercompany balances and transactions are eliminated in consolidation. Profits and losses deriving from intercompany transactions and not realized with third independent parties are eliminated, when material, also considering the relative tax effects.
f) The non-controlling interests of consolidated subsidiaries are separately reported in the consolidated balance sheets and consolidated statements of operations in line "minority interests".
g) The fiscal effect of consolidation adjustments, when material, is recorded and represented in the financial statements. The deferred tax assets and the deferred tax liabilities are respectively and separately shown in the balance sheet. In the consolidated statements of operations, deferred taxes are shown in the group "net income taxes".
h) In the consolidated financial statements the tax on dividends distribution are not recorded when it is assumed that the profit will be reinvested in the company. In the same case no taxes are recorded on reserve that will be subject to taxation only in case of distribution to the shareholders.
[ 53 ]
3. Evaluation and accounting principles adopted for the preparation of the consolidated financial statements
The present consolidated financial statements are prepared according to Italian legal law requirements governing financial statements, considered in conjunction with established accounting principles promulgated by the Italian Accounting Profession (OIC). Assets and liabilities are evaluated based on the general criteria of prudence and matching principle, on the basis of the going concern assumption. The evaluation criteria and significant accounting policies followed in the preparation of the consolidated financial statements are outlined below.
Intangible assets
Intangible assets are recorded at cost, net of the amortization expense calculated on the straight-line method. Other intangible assets primarily include software and trademarks, and are stated at cost, net of the amortization expense calculated on the straight-line method over their estimated useful life. Set-up costs, advertising costs and goodwill are recorded with the consent of the board of statutory auditors, and are stated at cost, net of the amortization expense calculated on the straight-line method over a period of five years. The carrying amounts of these assets are reviewed to determine if they are in excess of their recoverable amount at the consolidated balance sheet date. If the carrying amount exceeds the recoverable amount, the asset is written down to the recoverable amount.
Tangible assets
Properties, plants and equipments are stated at historical cost except for certain buildings that were revaluated in 2000, 2001 and 2009 according to Italian revaluation laws.The cost or revaluation of fixed assets is depreciated on the straight-line method over the assets' estimated useful lives. The assets acquired by the user of leasing contracts are recorded in the balance sheet using the so-called "financial method", so the value of the asset is recorded among the equipments and the debt towards leasing companies is recorded among the liabilities and progressively reduced on the basis of the relative amortization plan. In the profit and loss the leasing costs are replaced by costs of interest and by amortization costs according to the useful lives of the acquired good.Maintenance and repairs are expensed; significant improvements are capitalized and depreciated over the useful life of the related assets.
Investment in affiliates and other financial assets
Investments in controlled and associated companies that are not consolidated according to the full method are evaluated according to the equity method. Investments in affiliates and other financial assets are recorded according to historic cost criteria. Eventually they are write-off when their market value results to be permanently inferior. Investments in controlled companies and affiliates which are held for sale are evaluated at the lower value between historic cost and market value.
Accounts receivable and payable
Receivables are recorded at their probable realization value at the balance sheet date. This is realized by stating the receivables at their nominal value net of an allowance for doubtful accounts. Payables are stated at their face value.
[ 54 ]
Cash and cash equivalents
Cash is booked at its face value, whereas bank accounts and deposits are recorded at their probable realization value, that, in this case, coincides with face value. Bank deposits in currencies other than Euro are converted using the exchange rate at the date of balance sheet published by Bank of Italy.
Employees’ leaving entitlement
Leaving entitlements represent amounts accrued for each Italian employee that are due and payable upon termination of employment, assuming immediate separation, determined in accordance with applicable Italian labour laws. The Group accrues the full amount of employees’ vested benefit obligation as determined by such laws for leaving entitlements.
Contingencies
Liabilities for loss contingencies are recorded when it is probable that a liability has been incurred and the amount of the loss can be reasonably estimated.
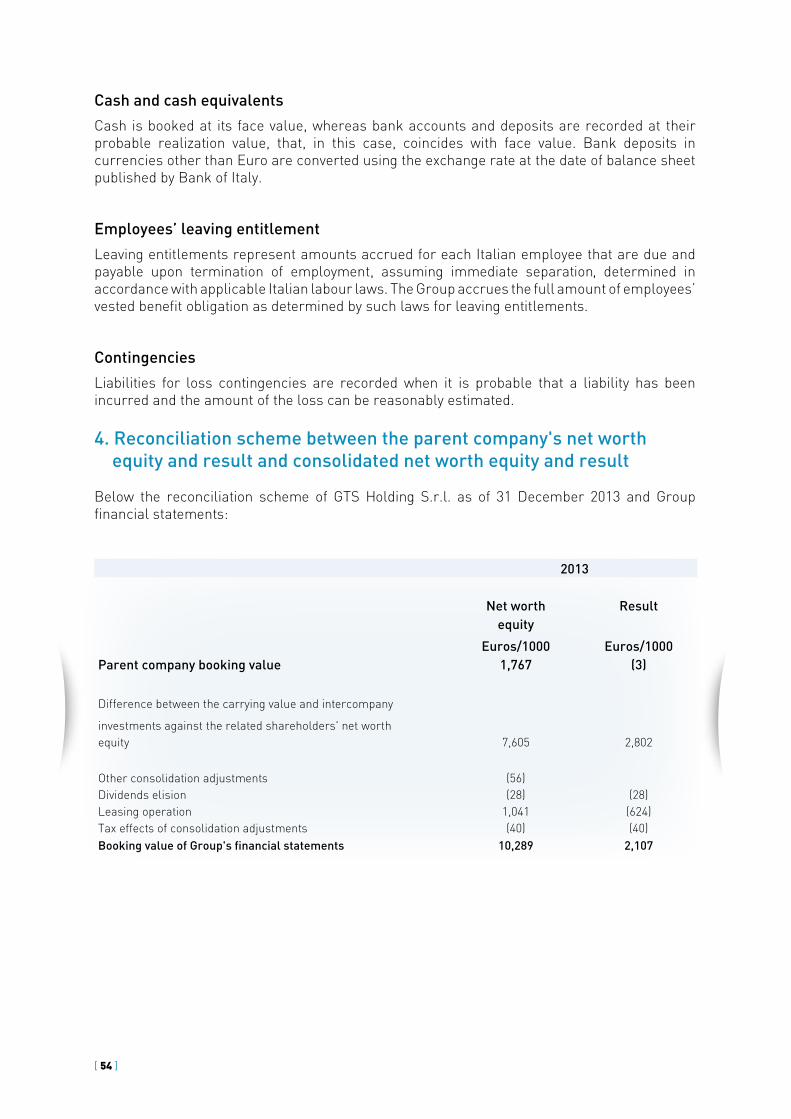
4. Reconciliation scheme between the parent company's net worth equity and result and consolidated net worth equity and result
Below the reconciliation scheme of GTS Holding S.r.l. as of 31 December 2013 and Group financial statements:
2013
Net worth Resultequity
Euros/1000 Euros/1000Parent company booking value 1,767 (3)
Difference between the carrying value and intercompany
investments against the related shareholders' net worth equity 7,605 2,802
Other consolidation adjustments (56)Dividends elision (28) (28)Leasing operation 1,041 (624)Tax effects of consolidation adjustments (40) (40)Booking value of Group's financial statements 10,289 2,107
[ 55 ]
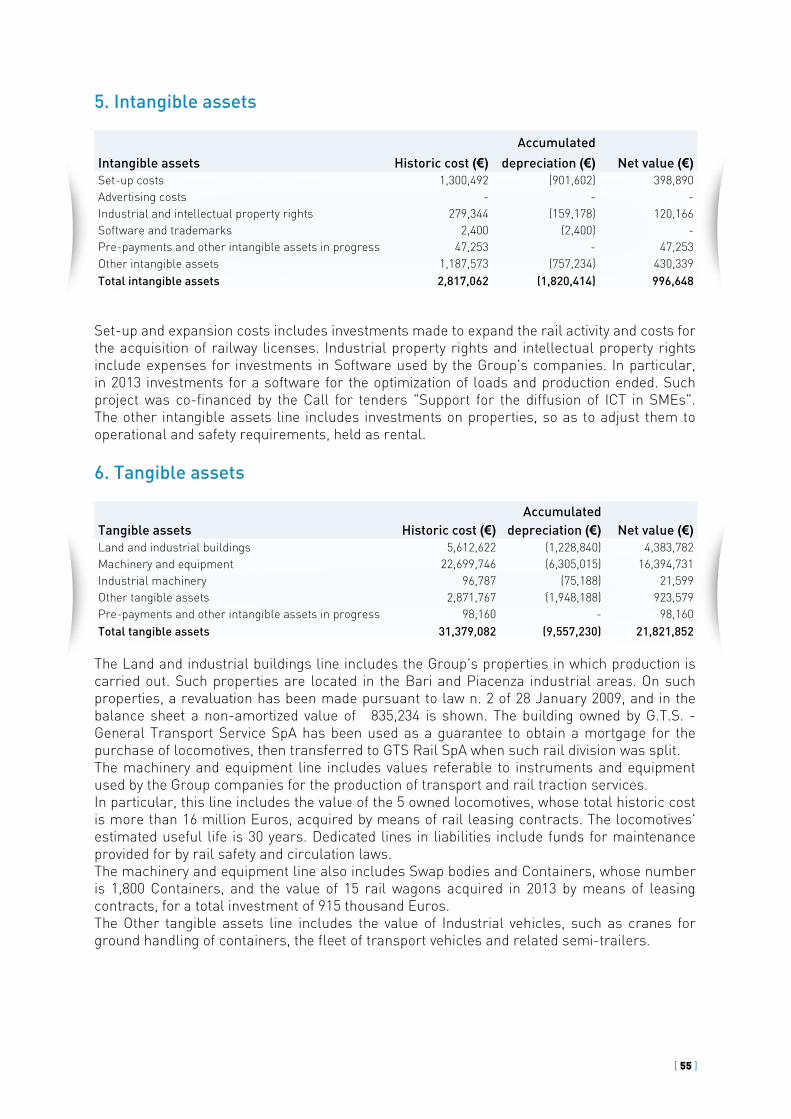
5. Intangible assets
Accumulated
Intangible assets Historic cost (€) depreciation (€) Net value (€)Set-up costs 1,300,492 (901,602) 398,890Advertising costs - - -Industrial and intellectual property rights 279,344 (159,178) 120,166Software and trademarks 2,400 (2,400) -Pre-payments and other intangible assets in progress 47,253 - 47,253Other intangible assets 1,187,573 (757,234) 430,339Total intangible assets 2,817,062 (1,820,414) 996,648
Set-up and expansion costs includes investments made to expand the rail activity and costs for the acquisition of railway licenses. Industrial property rights and intellectual property rights include expenses for investments in Software used by the Group's companies. In particular, in 2013 investments for a software for the optimization of loads and production ended. Such project was co-financed by the Call for tenders "Support for the diffusion of ICT in SMEs". The other intangible assets line includes investments on properties, so as to adjust them to operational and safety requirements, held as rental.
6. Tangible assets
AccumulatedTangible assets Historic cost (€) depreciation (€) Net value (€)Land and industrial buildings 5,612,622 (1,228,840) 4,383,782Machinery and equipment 22,699,746 (6,305,015) 16,394,731Industrial machinery 96,787 (75,188) 21,599Other tangible assets 2,871,767 (1,948,188) 923,579Pre-payments and other intangible assets in progress 98,160 - 98,160Total tangible assets 31,379,082 (9,557,230) 21,821,852
The Land and industrial buildings line includes the Group's properties in which production is carried out. Such properties are located in the Bari and Piacenza industrial areas. On such properties, a revaluation has been made pursuant to law n. 2 of 28 January 2009, and in the balance sheet a non-amortized value of € 835,234 is shown. The building owned by G.T.S. - General Transport Service SpA has been used as a guarantee to obtain a mortgage for the purchase of locomotives, then transferred to GTS Rail SpA when such rail division was split. The machinery and equipment line includes values referable to instruments and equipment used by the Group companies for the production of transport and rail traction services.In particular, this line includes the value of the 5 owned locomotives, whose total historic cost is more than 16 million Euros, acquired by means of rail leasing contracts. The locomotives' estimated useful life is 30 years. Dedicated lines in liabilities include funds for maintenance provided for by rail safety and circulation laws. The machinery and equipment line also includes Swap bodies and Containers, whose number is 1,800 Containers, and the value of 15 rail wagons acquired in 2013 by means of leasing contracts, for a total investment of 915 thousand Euros.The Other tangible assets line includes the value of Industrial vehicles, such as cranes for ground handling of containers, the fleet of transport vehicles and related semi-trailers.
[ 56 ]
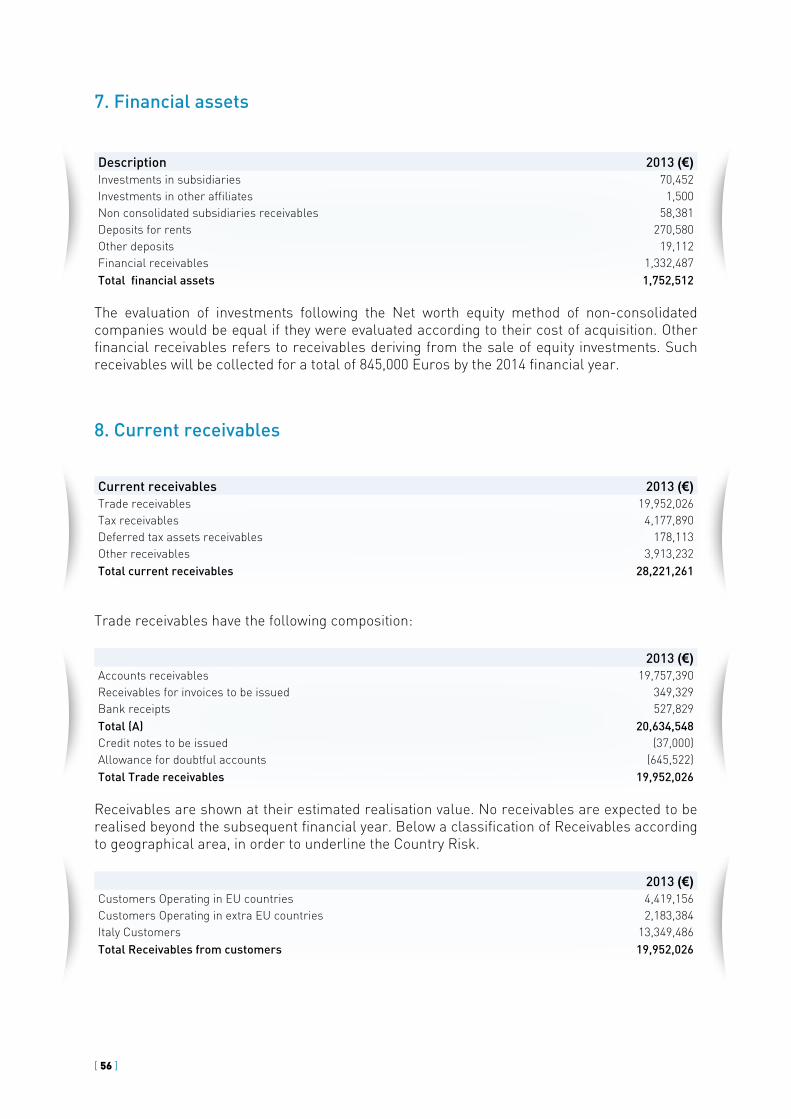
7. Financial assets
Description 2013 (€)Investments in subsidiaries 70,452 Investments in other affiliates 1,500 Non consolidated subsidiaries receivables 58,381 Deposits for rents 270,580 Other deposits 19,112 Financial receivables 1,332,487 Total financial assets 1,752,512
The evaluation of investments following the Net worth equity method of non-consolidated companies would be equal if they were evaluated according to their cost of acquisition. Other financial receivables refers to receivables deriving from the sale of equity investments. Such receivables will be collected for a total of 845,000 Euros by the 2014 financial year.
8. Current receivables
Current receivables 2013 (€)Trade receivables 19,952,026 Tax receivables 4,177,890 Deferred tax assets receivables 178,113 Other receivables 3,913,232 Total current receivables 28,221,261
Trade receivables have the following composition:
2013 (€)Accounts receivables 19,757,390Receivables for invoices to be issued 349,329Bank receipts 527,829Total (A) 20,634,548Credit notes to be issued (37,000)Allowance for doubtful accounts (645,522)Total Trade receivables 19,952,026
Receivables are shown at their estimated realisation value. No receivables are expected to be realised beyond the subsequent financial year. Below a classification of Receivables according to geographical area, in order to underline the Country Risk.
2013 (€)Customers Operating in EU countries 4,419,156 Customers Operating in extra EU countries 2,183,384 Italy Customers 13,349,486 Total Receivables from customers 19,952,026

[ 57 ]
Below a detailed description of Tax receivables as of date of balance sheet.
Tax receivables 2013 (€)Irap reimbursements 83,114 VAT credit 137,606 Investment tax credits 3,833,317 Excise on fuel 62,427 Other tax receivables 61,426 Total tax receivables 4,177,890
The Investments tax credits line refers to tax credit pursuant to Article 1, paragraphs 271-279 of law 27 December 2006, n. 296 and subsequent amendments as set forth in Decree-law 3 June 2008, n. 97. In the consolidated financial statements such tax credit has been correlated with the process of depreciation and amortization of assets that generated its advantage. Such credit has been usable since 2013 financial year, even if only to direct taxes ends, whereas it will generate more benefits starting from the next financial year, to the compensation extent permitted by law, since it can be compensated for by different types of payables to the State.
Deferred tax assets are recorded in the Financial statements because the management has assessed they can be realized with reasonable certainty. They refer to the following fiscal reversals:
Deferred tax assets 2013 (€)Revaluation of asset by law 53,990 Other liabilities 21,429 Accumulated doubtful accounts 88,122 Other minor differences 13,746 Total deferred tax assets 177,287
Other receivables are analyzed as follows:
Other receivables 2013 (€)Receivables for Ministry of Transport grants 1,940,729 Receivables for other Non-national bodies grants 1,467,822 Others 496,907 Total other receivables 3,905,458
A detail is given of other receivables analyzed in terms of estimated collectability:
Other receivables Within 12 months (€) Within 5 years (€) Over 5 years (€)Receivables for Ministry of Transport grants 142,414 852,449 945,866 Receivables for other Non-national bodies grants 1,467,822 - -Others 504,630 - -Total other receivables 2,114,866 852,449 945,866
9. Cash and cash equivalents
Cash and cash equivalents as of 31 December 2013 are analyzed as follows: Cash and cash equivalents 2013 (€)Bank and postal deposits 2,043,495 Cash on hand 7,283 Total cash and cash equivalents 2,022,792
[ 58 ]
Such cash and cash equivalents are located in National credit institutions and are highly liquid. Among cash and cash equivalents, cash foreign currency held is converted to current exchanges as of 31/12/2013.
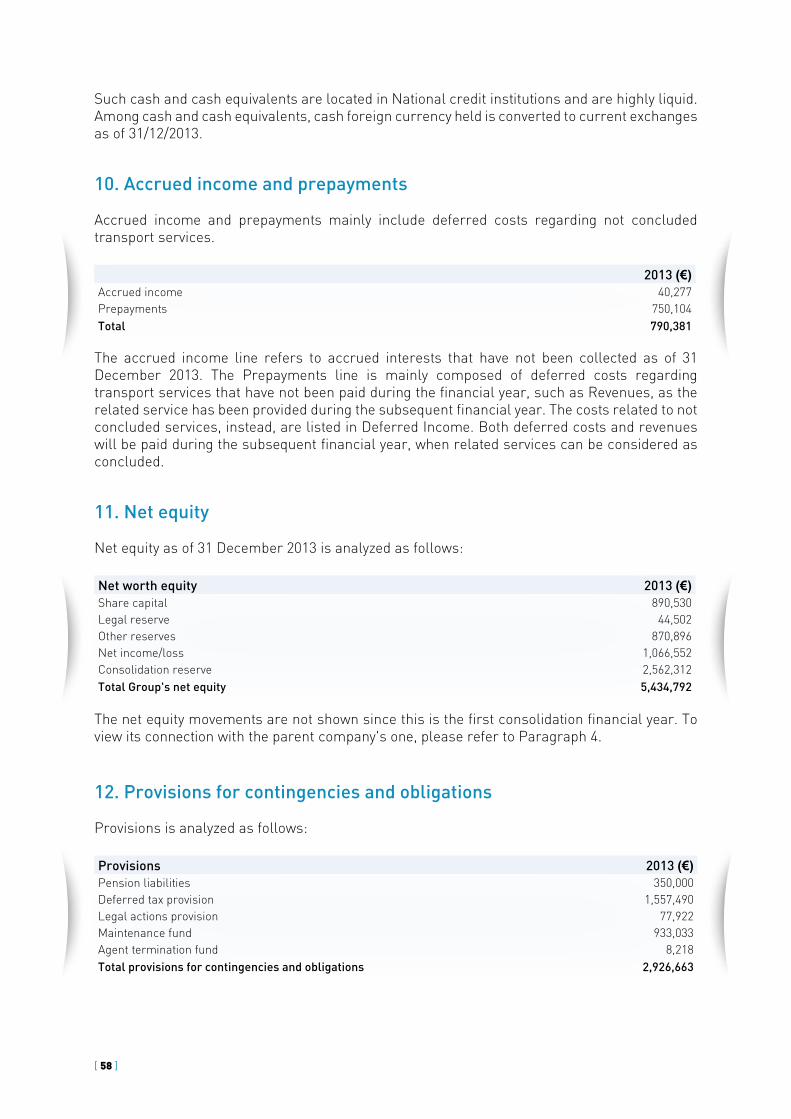
10. Accrued income and prepayments
Accrued income and prepayments mainly include deferred costs regarding not concluded transport services.
2013 (€)Accrued income 40,277 Prepayments 750,104 Total 790,381
The accrued income line refers to accrued interests that have not been collected as of 31 December 2013. The Prepayments line is mainly composed of deferred costs regarding transport services that have not been paid during the financial year, such as Revenues, as the related service has been provided during the subsequent financial year. The costs related to not concluded services, instead, are listed in Deferred Income. Both deferred costs and revenues will be paid during the subsequent financial year, when related services can be considered as concluded.
11. Net equity
Net equity as of 31 December 2013 is analyzed as follows:
Net worth equity 2013 (€)Share capital 890,530Legal reserve 44,502Other reserves 870,896Net income/loss 1,066,552Consolidation reserve 2,562,312Total Group's net equity 5,434,792
The net equity movements are not shown since this is the first consolidation financial year. To view its connection with the parent company's one, please refer to Paragraph 4.
12. Provisions for contingencies and obligations
Provisions is analyzed as follows:
Provisions 2013 (€)Pension liabilities 350,000 Deferred tax provision 1,557,490 Legal actions provision 77,922 Maintenance fund 933,033 Agent termination fund 8,218 Total provisions for contingencies and obligations 2,926,663
[ 59 ]
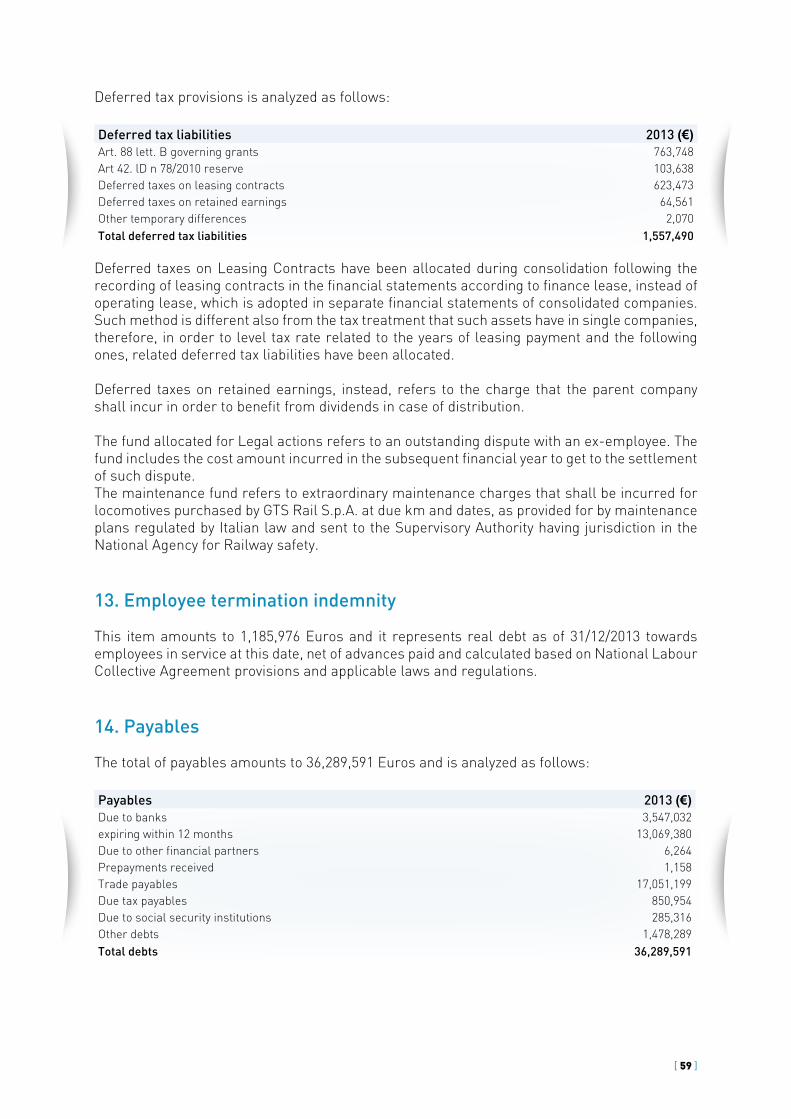
Deferred tax provisions is analyzed as follows:
Deferred tax liabilities 2013 (€)Art. 88 lett. B governing grants 763,748 Art 42. lD n 78/2010 reserve 103,638 Deferred taxes on leasing contracts 623,473 Deferred taxes on retained earnings 64,561 Other temporary differences 2,070 Total deferred tax liabilities 1,557,490
Deferred taxes on Leasing Contracts have been allocated during consolidation following the recording of leasing contracts in the financial statements according to finance lease, instead of operating lease, which is adopted in separate financial statements of consolidated companies. Such method is different also from the tax treatment that such assets have in single companies, therefore, in order to level tax rate related to the years of leasing payment and the following ones, related deferred tax liabilities have been allocated.
Deferred taxes on retained earnings, instead, refers to the charge that the parent company shall incur in order to benefit from dividends in case of distribution.
The fund allocated for Legal actions refers to an outstanding dispute with an ex-employee. The fund includes the cost amount incurred in the subsequent financial year to get to the settlement of such dispute.The maintenance fund refers to extraordinary maintenance charges that shall be incurred for locomotives purchased by GTS Rail S.p.A. at due km and dates, as provided for by maintenance plans regulated by Italian law and sent to the Supervisory Authority having jurisdiction in the National Agency for Railway safety.
13. Employee termination indemnity
This item amounts to 1,185,976 Euros and it represents real debt as of 31/12/2013 towards employees in service at this date, net of advances paid and calculated based on National Labour Collective Agreement provisions and applicable laws and regulations.
14. Payables
The total of payables amounts to 36,289,591 Euros and is analyzed as follows:
Payables 2013 (€)Due to banks 3,547,032 expiring within 12 months 13,069,380 Due to other financial partners 6,264 Prepayments received 1,158 Trade payables 17,051,199 Due tax payables 850,954 Due to social security institutions 285,316 Other debts 1,478,289 Total debts 36,289,591

[ 60 ]
As to debts due to banks, more details are given below
Debts due to banks 2013 (€)Advances on invoices 775,081 G.T.S General Transport Services loan 2,063,325 GTS Rail S.p.a. loan 1,456,576 Muciaccia Costruzioni S.r.l. loan 1,176,600 Debt vs. leasing companies 11,144,830 Total debts due to banks 16,616,412
Trade payables are analyzed as follows:
2013 (€)Trade payables for invoices received 15,484,632 Trade payables for invoices to be received 2,089,777 Credit notes to be received (523,210)
17,051,199
The due tax payables line includes the following:
2013 (€)Withholding taxes 197,951 VAT to be reimbursed 114,356 Other taxes 36,300 Ires (income taxes) 411,499 Irap (income taxes) 90,848 Total due tax payables 850,954
A detailed description of payables due to social security institutions and of other payables is given below
2013 (€)Inps 253,853 Inail 12,127 Other social security institutions 19,336 Total of other social security institutions 285,316
Detail of other debts 2013 (€)Personnel compensation 967,008 Customers guarantee deposits 59,600 Sole administrators 22,442 Shareholders 332,032 Shareholders for dividends 97,207 Total other debts 1,478,289
[ 61 ]
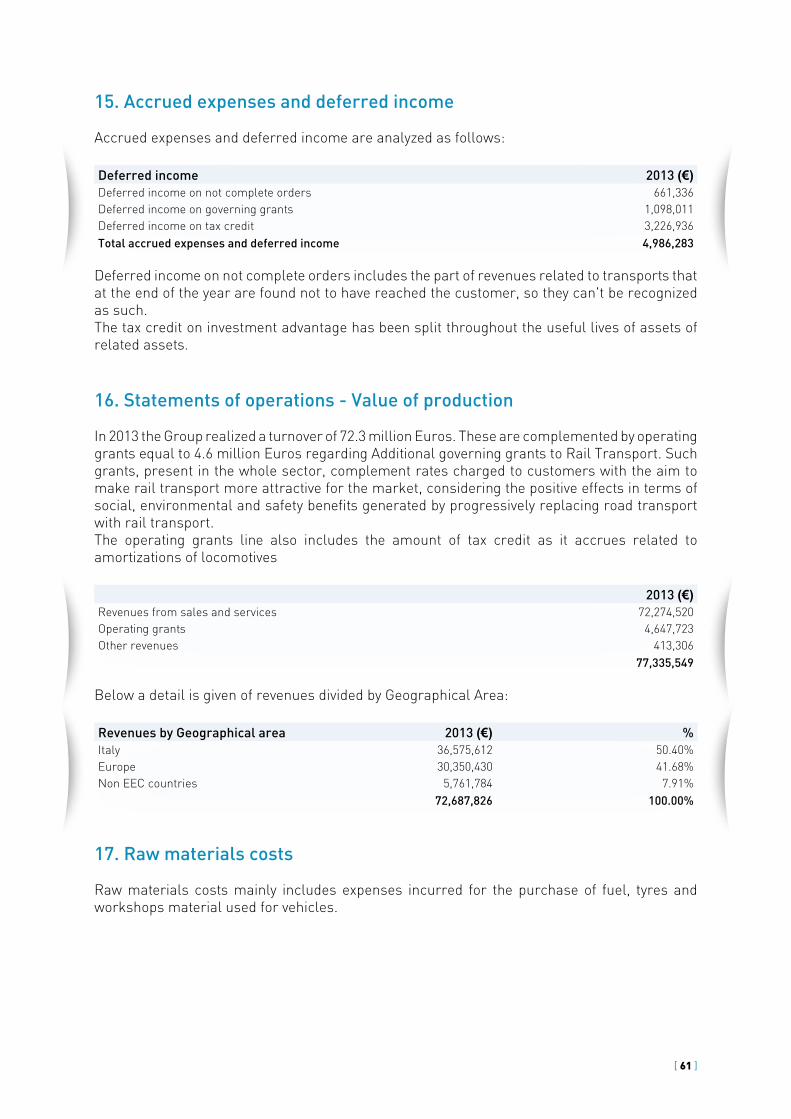
15. Accrued expenses and deferred income
Accrued expenses and deferred income are analyzed as follows:
Deferred income 2013 (€)Deferred income on not complete orders 661,336 Deferred income on governing grants 1,098,011 Deferred income on tax credit 3,226,936 Total accrued expenses and deferred income 4,986,283
Deferred income on not complete orders includes the part of revenues related to transports that at the end of the year are found not to have reached the customer, so they can't be recognized as such. The tax credit on investment advantage has been split throughout the useful lives of assets of related assets.
16. Statements of operations - Value of production
In 2013 the Group realized a turnover of 72.3 million Euros. These are complemented by operating grants equal to 4.6 million Euros regarding Additional governing grants to Rail Transport. Such grants, present in the whole sector, complement rates charged to customers with the aim to make rail transport more attractive for the market, considering the positive effects in terms of social, environmental and safety benefits generated by progressively replacing road transport with rail transport. The operating grants line also includes the amount of tax credit as it accrues related to amortizations of locomotives
2013 (€)Revenues from sales and services 72,274,520 Operating grants 4,647,723 Other revenues 413,306
77,335,549
Below a detail is given of revenues divided by Geographical Area:
Revenues by Geographical area 2013 (€) %Italy 36,575,612 50.40%Europe 30,350,430 41.68%Non EEC countries 5,761,784 7.91%
72,687,826 100.00%
17. Raw materials costs
Raw materials costs mainly includes expenses incurred for the purchase of fuel, tyres and workshops material used for vehicles.

[ 62 ]
18. Services costs
Services costs are analyzed as follows:
Detail of services costs 2013 (€) Road transport services 21,915,439 Rail transport services 21,243,436 Sea transport services 6,478,392 Terminal services 3,564,837 Rail traction services 2,468,251 Maintenance services 1,028,229 Insurance costs 430,888 Board and lodging costs 378,873 Compensation of directors and auditors 352,612 Commercial services 348,861 Consultancy services 244,826 Transport ancillary services 209,805 Other services 331,855 Total 58,996,304
19. Compensation of Directors and Statutory Auditors
Compensation of directors and auditors are analyzed as follows:
2013 (€)Compensation of directors 290,000 Auditors 62,612
20. Costs for leases and rentals
Leases costs 2013 (€)Rental of Rail material 2,556,460 Leases of properties 533,728 Other leases costs 113,879 Total of leases costs 3,204,067
This section includes rental costs for Locomotives and rail wagons, as well as rental costs of areas used by the Group to carry out its activities.
21. Personnel costs
Personnel costs are analyzed as follows:
Personnel costs 2013 (€)Wages and salaries 4,932,596 Social security contributions 1,510,041 Severance indemnity 309,352 Other costs 48,362 Total 6,800,351
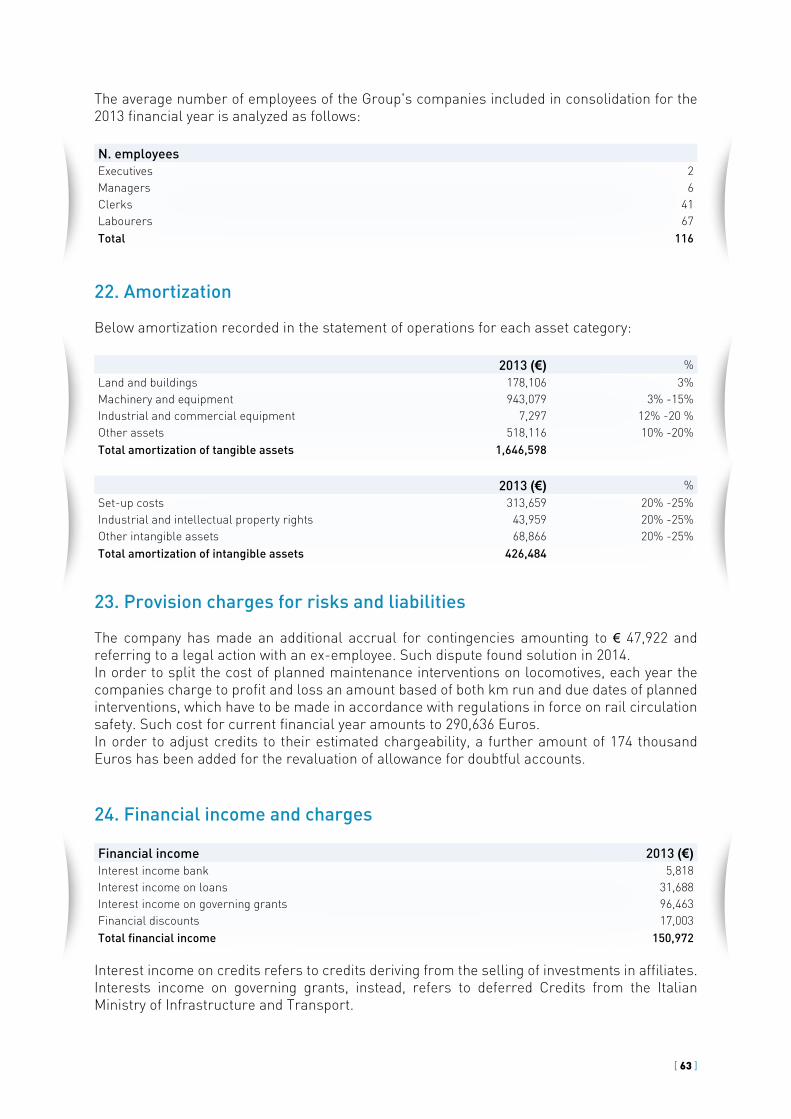
[ 63 ]
The average number of employees of the Group's companies included in consolidation for the 2013 financial year is analyzed as follows:
N. employees Executives 2 Managers 6Clerks 41 Labourers 67 Total 116
22. Amortization
Below amortization recorded in the statement of operations for each asset category:
2013 (€) %Land and buildings 178,106 3%Machinery and equipment 943,079 3% -15%Industrial and commercial equipment 7,297 12% -20 %Other assets 518,116 10% -20%Total amortization of tangible assets 1,646,598
2013 (€) %Set-up costs 313,659 20% -25%Industrial and intellectual property rights 43,959 20% -25%Other intangible assets 68,866 20% -25%Total amortization of intangible assets 426,484
23. Provision charges for risks and liabilities
The company has made an additional accrual for contingencies amounting to € 47,922 and referring to a legal action with an ex-employee. Such dispute found solution in 2014.In order to split the cost of planned maintenance interventions on locomotives, each year the companies charge to profit and loss an amount based of both km run and due dates of planned interventions, which have to be made in accordance with regulations in force on rail circulation safety. Such cost for current financial year amounts to 290,636 Euros.In order to adjust credits to their estimated chargeability, a further amount of 174 thousand Euros has been added for the revaluation of allowance for doubtful accounts.
24. Financial income and charges
Financial income 2013 (€)Interest income bank 5,818 Interest income on loans 31,688 Interest income on governing grants 96,463 Financial discounts 17,003 Total financial income 150,972
Interest income on credits refers to credits deriving from the selling of investments in affiliates. Interests income on governing grants, instead, refers to deferred Credits from the Italian Ministry of Infrastructure and Transport.

[ 64 ]
Financial charges 2013 (€)On loans 310,764 On advances on invoices 58,776 On bank accounts 309 On interest bank overdrafts 14,169 Other 16,473 Total financial charges 400,491
Interest charges on loans include charges paid against medium and long-term financing and against financial leasing.
25. Extraordinary income and charges
This section mainly includes income and charges referring to previous financial years, in particular higher charges for locomotives maintenance not estimated in previous financial years, amounting to 326.709 Euros.
26. Income taxes
The Group's consolidated companies are subject to the following income tax rates:
2013 (€)Ires 27.5%Irap 3.90%-4.82%
Income taxes are composed as follows:
2013 (€)Ires - current income tax 561,497Irap - current income tax 364,697Ires deferred taxes charges 655,132Irap deferred taxes charges -Ires deferred taxes benefits (16,595)Irap deferred taxes benefits (52,027)
Below a scheme of reconciliation regarding Income tax of Companies of current year.
Reconciliation between theoretical taxes on net income and fiscal taxable income
Taxable income (€) Rate Tax (€)
Before taxes result 3,619,993 27.50% 995,498Temporary differences taxable in subsequent years (1,364,341) 27.50% (375,194)Temporary differences deductible in subsequent years 189,188 27.50% 52,027Reversal of temporary differences from previous years 1,545,693 27.50% 425,066Permanent differences 543,769 27.50% 149,537Non-taxable income (75,802) 27.50% (20,846)Operating losses carry-forwards from previous years (2,416,693) 27.50% (664,590)Operating losses carry-forwards from current year/Taxable income 2,041,807 561,497

[ 65 ]

[ 66 ]

BARI (IT)HeadquarterVia del Tesoro, 1570132 BariTel. +39 080 5820411Fax +39 080 5820499
MILANO (IT)Via G. Di Vittorio, 120017 Mazzo di Rho (MI)Tel. +39 02 93904385Fax +39 02 93901565
ROTTERDAM (NL)G.T.S. Nederland B.V.Vareseweg, 413047 AT RotterdamTel. +31 (0) 10 7371 685-686
LONDON (UK)GTS Rail&Logistics UK LimitedGround Floor6 Dyer's BuildingsECIN 2IT London
www.gtslogistic.comwww.gtsrail.comwww.gtsgo.itinfo@gtslogistic.com

designmino onorati
+ 39 349.782.71.42 - [email protected]
Printed on paper (FSC) and ink environment friendly
July 2014
This document has been translated into English for the convenienceof international readers. The original Italian should be considered theauthoritative version.