annual report 2012/2013 - public...
TRANSCRIPT
Annual Report 2012/2013

1
23 October 2013 The Hon Brian Wightman MP Attorney General and Minister for Justice, Level 10, 15 Murray Street HOBART TAS 7000 Dear Minister, In accordance with Section 55 of the Government Business Enterprises Act 1995, we submit for your information and presentation to Parliament the Report of the Public Trustee for the year ended 30 June 2013. The Report has been prepared in accordance with the provisions of the Government Business Enterprises Act 1995. Yours faithfully,
Craig Stephens Peter Maloney Chairperson Chief Executive Officer The Board of the Public Trustee Public Trustee

2
Contents
Responsible Minister ................................................................................................. 3
Principal Legislation ................................................................................................... 3
Main Undertakings ..................................................................................................... 3
Our Mission, Vision and Values ................................................................................. 4
Chairperson’s Report ................................................................................................. 5
Chief Executive Officer’s Report ................................................................................ 7
Structure of the Public Trustee ................................................................................ 10
Corporate Governance ............................................................................................ 11
Statement of Corporate Intent ................................................................................. 15
Key Performance Indicators .................................................................................... 16
Financial Commentary ............................................................................................. 18
Financial Statements ............................................................................................... 20
Independent Audit Report ........................................................................................ 49
Superannuation Declaration .................................................................................... 51
Public Interest Disclosures Act 2002 ....................................................................... 52
Managing Performance in the Public Trustee ......................................................... 52

3
Responsible Minister The Public Trustee is directly responsible to the Attorney General and Minister for Justice for the administration of its principal legislation and for ensuring the Public Trustee is managed in accordance with sound commercial practices.
Principal Legislation Two Acts of Parliament comprise the principal legislation affecting the Public Trustee.
• The Public Trustee Act 1930 is the Portfolio Act and sets out the organisation’s basic powers and duties; and
• The Government Business Enterprises Act 1995 creates the corporation and determines how the Public Trustee is operated and controlled.
Main Undertakings The main undertaking of the Public Trustee is to offer trustee services to the Tasmanian community by:
• preparing Wills and Enduring Powers of Attorney;
• acting as an executor of estates, or estate administrator if there is no Will;
• assuming the role of executor when a person named in a Will is unable or
unwilling to act;
• acting as attorney for people requiring assistance to manage their financial affairs;
• acting as trustee for various types of trusts including accident compensation awards;
• assisting people to manage their financial affairs when the Public Trustee is appointed as a financial administrator by the Guardianship and Administration Board; and
• managing funds under the control of the Public Trustee in order to provide a commercial rate of return to contributors.

4
Our Mission, Vision and Values Throughout the Public Trustee, we seek to apply our mission, vision and values to decision making, programs and policies at every level, every day. The Mission states the purpose of the Public Trustee – the reason for our existence. The Vision is the goal for the future; it states where the Public Trustee, as an organisation, is heading. The Values guide our behaviour and are based on the shared beliefs of the employees, management and Board of Directors of the Public Trustee. Mission Statement
To offer specialist and independent trustee services to all Tasmanians. Vision Statement
To be recognised for our professionalism, respected for our integrity and valued by our clients. Values Statement
In seeking to achieve the mission and vision of the Public Trustee, the primary values of the staff, management and Board of Directors of the Public Trustee are:
• Respect – personal and professional respect for each other and our clients.
• Service – a client service focus achieved by team work across the whole
organisation.
• Integrity – open, honest and ethical service delivery.
5
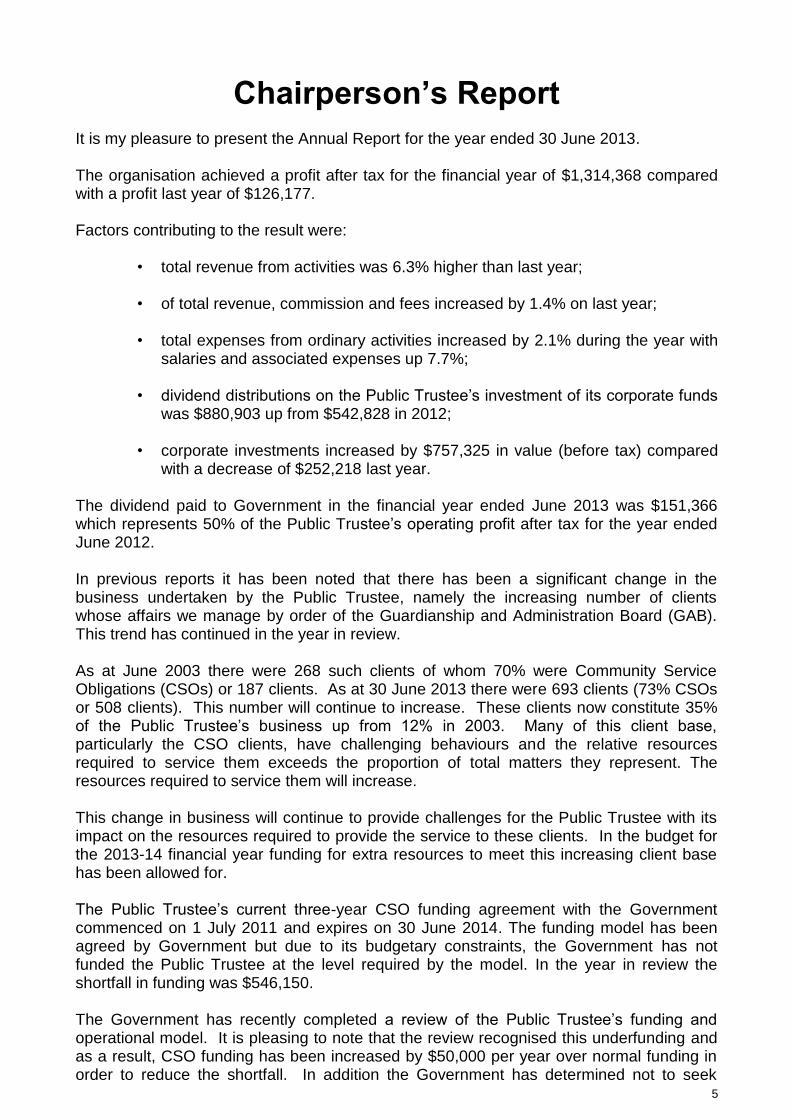
Chairperson’s Report It is my pleasure to present the Annual Report for the year ended 30 June 2013. The organisation achieved a profit after tax for the financial year of $1,314,368 compared with a profit last year of $126,177. Factors contributing to the result were:
• total revenue from activities was 6.3% higher than last year;
• of total revenue, commission and fees increased by 1.4% on last year;
• total expenses from ordinary activities increased by 2.1% during the year with salaries and associated expenses up 7.7%;
• dividend distributions on the Public Trustee’s investment of its corporate funds was $880,903 up from $542,828 in 2012;
• corporate investments increased by $757,325 in value (before tax) compared
with a decrease of $252,218 last year. The dividend paid to Government in the financial year ended June 2013 was $151,366 which represents 50% of the Public Trustee’s operating profit after tax for the year ended June 2012. In previous reports it has been noted that there has been a significant change in the business undertaken by the Public Trustee, namely the increasing number of clients whose affairs we manage by order of the Guardianship and Administration Board (GAB). This trend has continued in the year in review. As at June 2003 there were 268 such clients of whom 70% were Community Service Obligations (CSOs) or 187 clients. As at 30 June 2013 there were 693 clients (73% CSOs or 508 clients). This number will continue to increase. These clients now constitute 35% of the Public Trustee’s business up from 12% in 2003. Many of this client base, particularly the CSO clients, have challenging behaviours and the relative resources required to service them exceeds the proportion of total matters they represent. The resources required to service them will increase. This change in business will continue to provide challenges for the Public Trustee with its impact on the resources required to provide the service to these clients. In the budget for the 2013-14 financial year funding for extra resources to meet this increasing client base has been allowed for. The Public Trustee’s current three-year CSO funding agreement with the Government commenced on 1 July 2011 and expires on 30 June 2014. The funding model has been agreed by Government but due to its budgetary constraints, the Government has not funded the Public Trustee at the level required by the model. In the year in review the shortfall in funding was $546,150. The Government has recently completed a review of the Public Trustee’s funding and operational model. It is pleasing to note that the review recognised this underfunding and as a result, CSO funding has been increased by $50,000 per year over normal funding in order to reduce the shortfall. In addition the Government has determined not to seek

6
payment of a dividend while the amount of any dividend is less than the funding gap. This is to be reviewed on an annual basis. The Public Trustee welcomes these decisions by Government. Client’s funds under management, which total $156M, continue to be a core area of business for the organisation. The deposit rate paid by the Public Trustee’s Common Fund during the year was competitive and reflected market trends. Interest rates paid to contributors ranged from 3.19% to 4.06% per annum and averaged 3.59%. The Public Trustee’s two diversified group investment funds, No 1 and No 2 Funds, have exposure to varying allocations of defensive and growth assets. Established in May 2004 the Funds provided net returns of 8.36% and 15.17% respectively for the year to the end of June 2013. As in previous years, the Directors and Senior Managers undertook a facilitated review of the organisation’s Corporate Plan. The strategies identified will form the basis of action items for the Board and the organisation over the next three years. The Public Trustee regularly reviews its various strategies and policies. The Risk Management and Business Continuity Plans are reviewed annually. Corporate governance continues to be a matter of focus for the Board. All directors are graduates of the Australian Institute of Company Directors (AICD) through which they maintain their professional development and corporate governance knowledge. The Board undertook a formal discussion on governance procedures undertaken by Directors and have introduced one on one reviews between each Director and myself as Chairperson. It is envisaged formal Board Reviews as previously undertaken will continue in the coming year. The Board is also actively working to plan appropriate replacements to the Board and Management in a period of significant change to ensure an orderly transition for the organisation. The former Chairperson of the Board, Ann Cunningham, retired during the year after serving on the Board since 2000 and being Chairperson from 2004. I would like to thank Ann for her valued contribution both to the Board and the Public Trustee over such an extended period of time. I thank my fellow Board members for their hard work and support to the organisation with particular thanks going to Beth Mathison who chairs both the Audit Committee and the Marketing Committee. Finally, I would like to thank our CEO Peter Maloney and his dedicated management team for their efforts for the organisation over the year. Peter will be retiring during the coming year and his unstinting efforts to improve the operations of the Public Trustee will be missed.
Craig Stephens Chairperson Board of the Public Trustee

7
Chief Executive Officer’s Report
I have pleasure in presenting my report for the financial year 2012-13. We have achieved an outstanding financial result which is very pleasing. The results of our other performance measures are also pleasing. The Public Trustee surveys its clients to gauge feedback as to the standard of service we provide. Our largest client group is our beneficiaries. The service we provide to them is at the core of our business. Of 535 surveys sent to beneficiaries during 2012-2013, we received a response rate of 34%. Of those beneficiaries who responded, 85% stated their experience in dealing with the Public Trustee either met or exceeded their expectation. This is measured against a target of 85% so this is a very pleasing result. The feedback from these surveys is most welcome and is used by the Public Trustee to assist us in developing strategies for continuous improvement in client service. Our Will client surveys continue to produce outstanding results. For the year in review we distributed 770 surveys with a 46% response rate. Of those who responded, in excess of 99% stated that their experience with dealing with the Public Trustee met or exceeded their expectations. This once again is a tremendous result and reflects well on those in the organisation who take Will instructions and in particular the professionalism of the Legal Services team. Our new business in our core areas was comparable with last year. We wrote 707 new Wills and 1024 revision Wills. We continued with our program of regional Will writing days throughout the State. There were 20 places visited throughout the year with 32 days scheduled for attendance. 290 Tasmanians took the opportunity of having their Will prepared at these visits. We have received excellent feedback from the persons who attended these days, many of whom commented that they are very appreciative that we travel to their region to provide this service. Public presentations and seminars continue to be a core area of activity for the organisation. We conducted 55 seminars and presentations around the state to a variety of groups and organisations with 2694 attendees. We continue to be active in the area of marketing and communication. Our focus this year was effective communication of our services which was reflected in new television and print advertisement campaigns. This initiative was as a result of the findings of brand research. During the past year we also reviewed the way we deliver information to our clients and their experience when using our services. The Public Trustee website is being upgraded to enhance consumer experience by adopting recommendations made through website analysis and market research. The improvements will make it easier for people to make a Will appointment and to access our information on various applications such as mobile phones and tablets. It will make it easier for us to update website data. Launch of the site is scheduled for the 2013-2014 financial year. A review of our clients’ 'Will writing experience' was conducted statewide and saw improvements in communication, presentation and appointment confirmation including the introduction of a SMS appointment reminder option which has been well received.

8
This year we again provided our popular seminars in Hobart, Launceston, Devonport and Burnie for our Will clients. This provides them with up to date information on matters of interest to them. The seminars were well attended. We also produced two editions of our newsletter ‘Matters of Trust’ which contains useful information for our clients and the Tasmanian community. The Public Trustee recognises and values the contribution employees make, at all levels, to the delivery of our services. To assist employees develop and maintain the skills and knowledge they need to undertake their roles, the year in review has seen a continued focus on our leadership program and employee learning and development. Work has commenced on reviewing our induction program and developing a competency assessment framework for our Client Account Managers who play a key role in providing professional, high quality and timely service delivery to our clients. A review of all critical processes is underway to ensure corporate knowledge is captured and retained within the organisation. This work will assist with our workforce planning in ensuring employees retain the knowledge and understanding they need to provide high levels of client service. Creating a culture of innovation continues to be a key focus with the introduction of a framework to capture, evaluate and implement ideas. Maintaining a healthy and safe workplace continues to be a high priority for the Public Trustee. Work commenced during the year in identifying actions required to achieve a compliant Workplace Health and Safety Management System and ensure compliance with the new Workplace Health and Safety legislation. An audit to measure compliance has been conducted and a gap analysis and action plan will be undertaken once the final audit report is received. Some of the key opportunities for improvement over the next 12 months include a continuation of our client service focus training with workshops for our leadership group and employees on integrity and ethics; accountability; client service delivery and problem solving and decision making. Improvement in efficiencies and business processes continues to be a high priority. During the year several new initiatives were completed. These included new modules for creditor payments, batch processing and payment vouchers. These initiatives were all driven by the need to increase the efficiency of delivering services to our clients whose affairs we manage by order of the Guardianship and Administration Board. There has been a dramatic increase in activity for these clients and these efficiencies were to address back office support. In addition our major software provider was invited to undertake a complete benchmark review on the Public Trustee’s use of its software. A number of recommendations and suggested business improvements arose from this review and these are being assessed and implemented. This will be my last annual report as Chief Executive Officer of the Public Trustee. I am pleased to have been able to oversee its continued growth as a financially successful client focussed organisation that has the respect of the Tasmanian community.

9
I acknowledge the tremendous support I have received from the Board of Directors and the people who work at the Public Trustee. As we enter a new era, I wish the incoming Chief Executive Officer well for the future. Peter Maloney Chief Executive Officer

10
Structure of the Public Trustee
Parliament
The Board of the Public Trustee
Craig Stephens (Chairperson) Peter Maloney, Beth Mathison,
Peter Blackwood, Caroline Rockefeller
Stakeholder Minister Treasurer
The Hon Lara Giddings MP
Portfolio Minister Attorney General & Minister for Justice
The Hon Brian Wightman MP
Audit Committee Beth Mathison (Chairperson)
Chief Executive Officer Peter Maloney
Investment Committee Craig Stephens (Chairperson)
Marketing Committee Beth Mathison (Chairperson)
General Manager Corporate Services Duncan Hall
Executive Assistant Tess Hill
Manager Marketing & Business Development
Mary-Anne Legro
Corporate Solicitor Tim Levis
Manager Financial Operations Scott Parnham
Manager Client Services Gaylene Cunningham
Manager Human Resources Angela Dougan
Manager Estate Team Paul Webb
North West Manager Fiona Sullivan
Northern Manager Patsy Marshall
Manager Personal Services Team Philip Heaton

11
Corporate Governance
The Board of the Public Trustee The Public Trustee is a Government Business Enterprise owned by the Government on behalf of the Tasmanian Community. It is established under the Government Business Enterprises Act 1995. The Board of the Public Trustee is responsible to the Treasurer and the Attorney General for managing and conducting the business and affairs of the Public Trustee in accordance with sound commercial practice. It ensures that the Public Trustee performs its statutory obligations. In carrying out its responsibilities, the Board:
• sets the strategic direction of the organisation;
• secures and monitors organisational performance;
• ensures compliance with statutory requirements; and
• manages risk. The Board currently comprises four independent Directors and one Executive Director. One Director retired during the year and as at 30 June 2013 had yet to be replaced. Directors are appointed by the Treasurer and the Attorney-General on the recommendation of the Board. Directors are selected on the basis of their complementary skills and ability to add value to the Board. Directors are appointed after consideration by the Government Director Selection Advisory Panel. A number of committees have been established to assist the Board in carrying out its functions and responsibilities. One of the major responsibilities of the Board is to manage risk, not only in the interest of the Public Trustee, but also to protect the interest of its clients. The Audit Committee is responsible for monitoring corporate risk assessment processes and controls and the establishment of, and ongoing compliance with, an internal risk control framework. The Public Trustee manages large sums of money on behalf of its clients. It has established an Investment Committee which also has responsibility for the oversight of the organisation's investment review processes to ensure that appropriate client investment decisions are made. Clients are assured that the Public Trustee has the necessary safeguards in place to protect their interests. Given that the Public Trustee is a business operating in a commercial environment, marketing initiatives play an important part in developing its business. The Marketing Committee comprises Directors with marketing expertise. It provides advice and recommendations to the Board in relation to marketing strategies and promotional activities which underpin the strategic direction of the business.

12
These arrangements ensure that the Public Trustee has the appropriate governance structures in place to ensure that it operates as a successful Government Business Enterprise in a competitive commercial environment. The Board delegates responsibility for the day to day management of the business and oversight of the implementation of strategies approved by the Board in the strategic plan to the Chief Executive Officer.
Board members:
Ann Cunningham LLB (Hons) Retired as Chairperson16 April 2013 - Board member April 2000 Chairperson of the Board May 2004 Member of the Audit Committee Chairperson of the Investment Committee Fellow of the Australian Institute of Company Directors Ann Cunningham is a barrister and solicitor, an accredited mediator and arbitrator. She is also Senior Member of the Administrative Appeals Tribunal, Presiding Member of The Resource Management and Planning Appeals Tribunal, a Director of the Marine and Safety Tasmania Board, Independent Panel Member Tasmanian Government Directors Appointment Panel and a State Councillor of the Australian Institute of Company Directors.
Craig Stephens BCom Chairperson as from 16 April 2013 Board Member October 2004 Chairperson of the Investment Committee Member of the Audit Committee Graduate member of the Australian Institute of Company Directors Mr Stephens is a Chartered Accountant. His background in corporate accounting, risk management and auditing provide an important contribution to the Board skill set. Craig is a key contributor to the Board's budgeting and financial management processes.
Peter Maloney LLB Executive Director Board Member August 1996 Chairperson of the Board 2001-2003 Chief Executive Officer February 2003 Member of the Investment Committee Member of the Marketing Committee Graduate member of the Australian Institute of Company Directors Prior to being appointed CEO of the Public Trustee in 2003 Peter was a Senior Executive with the Department of Justice. Mr Maloney's CEO role is complemented by his understanding of the Public Trustee gained during his tenure as a Board Director since

13
1996 including 2 years as Chairperson. He is a barrister and solicitor and is also a member of the Salvation Army Advisory Committee.
Beth Mathison BA, Grad Dip IR & HR, MBA
Board Member March 2007 Chairperson of the Marketing Committee Chairperson of the Audit Committee (since April 2013) Fellow of the Australian Institute of Company Directors Fellow of the Australian Institute of Management Ms Mathison's wide ranging commercial experience including marketing, strategy, business profitability improvement and human resource management has been gained during the course of an extensive career in corporate positions, not-for-profit sector and private industry in Australia and the UK. Beth is currently a Director of St Michael’s Collegiate School and has held Directorships of the MS Society and HR International.
Peter Blackwood
Board Member January 2010 Member of the Marketing Committee Member of the Audit Committee Fellow of the Australian Institute of Company Directors Prior to joining the Board Mr Blackwood had a long career in the not for profit sector having been CEO of Oak Tasmania. Peter brings with him extensive experience in the community sector and is currently also a Director of Common Ground Tasmania.
Caroline Rockefeller BCom Board Member January 2010 Member of the Investment Committee Graduate member of the Australian Institute of Company Directors Ms Rockefeller has an extensive private sector background in the banking and financial services sector which has given her an understanding of financial markets and investment principles. This is particularly valuable in her role as a member of the Public Trustee's Investment Committee. Caroline is also a director of the Motor Accidents Insurance Board.
Board Performance Review The Board has traditionally conducted an annual Self-Assessment by way of a questionnaire completed by all Directors. Due to the change in Chairperson during the year as well as expected changes in the Board in the coming months this Self-Assessment was not undertaken. Instead the Board through a formal discussion considered all governance processes undertaken by Directors. As a result of this review it was agreed all Board members will have a one on one review with the Chairperson to consider further aspects of governance. It is envisaged the previous Self-Assessment methodology will be continued in future years.

14
CEO Performance Review The performance of the CEO is reviewed annually against a performance management agreement. It is conducted by a subcommittee of the Board and reports to it.
Code of Conduct The Board has adopted a Code of Conduct for Directors. Please refer to our website www.publictrustee.tas.gov.au for further information.
Board Attendance The number of Board and Committee meetings held in the period each Director held office during the financial year and the number of meetings attended by each Director is as follows:
Board
Meetings Audit
Committee Investment Committee
Marketing Committee
Number Held
Number attended
Number held
Number attended
Number held
Number attended
Number held
Number Attended
Ann Cunningham
(retired 16.4.2013) 13 10 3 2 6 5 -
-
Craig Stephens
(Appointed to Investment Cttee April 2013)
13 13 3 3 6 1 -
-
Beth Mathison 13 11 3 2 - - 6 6
Caroline Rockefeller 13 11 - - 6 6 - -
Peter Blackwood (Appointed to Audit Cttee April 2013)
13 12 3 1 - - 6 6
Peter Maloney 13 13 3 3 6 6 6 6
Disclosure requirements Directors have the right to seek independent professional advice in relation to matters pertaining to the Public Trustee and their role as a Director. The cost of that advice will be paid by the Public Trustee. When seeking such advice, Directors are required to inform the Chairperson in advance.

15
Statement of Corporate Intent This Statement of Corporate Intent (SCI) is a high level summary of the Corporate Plan and includes a performance agreement between the Board of the Public Trustee and the Shareholding Ministers.
The performance agreement details the key financial and non-financial targets for the Public Trustee for 2012-13 as agreed between the Board and the Shareholding Ministers through the 2012-13 Corporate Planning process. It also details estimates for the following three years.
The SCI has been prepared in accordance with the Ministerial Charter for the Public Trustee.
STRATEGIC DIRECTION The Public Trustee is a Government Business Enterprise (GBE) established by the Public Trustee Act 1930. Principal commercial activities undertaken include the provision to the general community of access to professional advice and service in relation to trustee services including:
preparation of wills;
estate administration;
trust management and powers of attorney; and
protection of the financial interests of individuals under a legal, physical or intellectual disability where the Public Trustee is appointed to act on their behalf.
The strategic direction of the Public Trustee for the period of the Corporate Plan focuses on the implementation of strategies designed to increase market share in the commercial deceased estate administration business and the efficiency and profitability of the Public Trustee, consistent with its community service obligations. Over the Corporate Plan period the Public Trustee will be focussed on:
building its commercial business base to ensure the commercial success of the Public Trustee;
shaping and promoting the public profile of the Public Trustee within the Tasmanian community;
increasing efficiencies in business processes through innovation and continuous improvement; and
delivery of higher quality of client service through continuous improvement.

16
PERFORMANCE AGREEMENT This Performance Agreement sets out the key financial and non-financial targets for 2012-13, and estimates for the following two years are detailed in the tables below. Financial Returns to Government
Target Estimates
2012-13 2013-14 2014-15
Dividends Paid ($ ‘000 ) 84 13 11
Tax Equivalents Paid ($ ’000) 72 11 9
Total 156 24 20
Dividends have been calculated based on a 50 per cent payout ratio on operating profit less tax on operations. Financial Targets
Target Estimates
2012-13 2013-14 2014-15
Operating Profit Before Tax ($ ‘000) 36 31 5
Operating Profit After Tax ($’000) 25 22 3
Net Profit after Tax ($m) 170 170 154
Capital Expenditure ($ ‘000) 250 500 100
Operating Margin 1.0 1.0 1.0
Return on Assets (%) 0.2 0.2 0.0
Return on Equity (%) 3.4 3.0 2.6
Capital Adequacy (%) 13 14 16
Key Non Financial Performance Indicators
Target Estimates
2012-13 2013-14 2014-15
Number of new wills written 750 750 750
Number of revision wills written 1,000 1,000 1,000
Beneficiary survey results (overall satisfaction rating)
85% 85% 85%
Will client survey results (overall satisfaction rating)
85% 85% 85%

17
Community Service Obligations In line with the terms of the Public Trustee’s Ministerial Charter, the Government will provide funding to assist in meeting the cost of non-commercial activities (Community Service Obligations) required to be undertaken by the Public Trustee. The Public Trustee performs the following Community Service Obligations on behalf of the Government:
Administration of Absolute Estates with a gross asset value of less than $60 000;
Administration of Continuing Trust and Life Tenancy Estates with a gross asset value of less than $20 000;
Administration and management of Minor Trusts with a gross asset value of less than $100 000; and
Management of assets for Represented Persons with a gross asset value of less than $100 000.
The Government has a three year funding agreement with the Public Trustee which provides the following amounts.
CSO Costs and Funding Target Estimates
2012-13 2013-14 2014-15
Community Service Obligations ($ ‘000) 1 360 1 420 1 456
The Government has agreed to undertake a review of the Public Trustee’s funding and operating model to ensure that the business remains viable over the longer term.
Definitions Operating Profit Before Tax means Operating revenue less operating expenditure. Operating Profit After Tax means Operating profit before tax less income tax payable on operating profit. Net Profit after Tax means Net profit before tax less income tax. Operating Margin means Operating revenue / operating expenditure. Return on Assets means Operating Profit before Tax / [(Opening Assets + Closing Assets) / 2]. Return on Equity means Net Profit after Tax / [(Opening Equity + Closing Equity) / 2]. Capital Adequacy means Tangible Reserves / Tangible Assets.

18
Financial Commentary The Statement of Corporate Intent sets out the key financial and non-financial targets for 2012-13. The actual performance against these targets is shown below. Financial Returns to Government
Target Actual
2012-13 2012-13
Dividends Paid ($ ‘000 ) 84 151
Tax Equivalents Paid ($ ’000) 72 121
Total 156 272
The increased dividend and tax equivalent payments are based on the actual operating profit achieved for the year ended June 2012. The SCI targets were based on the estimated operating profit for this period. Financial Targets
Target Actual
2012-13 2012-13
Operating Profit Before Tax ($ ‘000) 36 804
Operating Profit After Tax ($’000) 25 562
Net Profit after Tax ($000) 170 1314
Capital Expenditure ($ ‘000) 250 112
Operating Margin 1.01 1.11
Return on Assets (%) 0.2 4.5
Return on Equity (%) 3.4 42.9
Capital Adequacy (%) 13 2.2
The favourable result for operating profit, pre and post-tax, is mainly attributable to increased earnings from corporate investments.
The actual net profit after tax compared to target is favourable due to the significant increase in valuation of corporate investments of $757,000.

19
The key return ratios are favourable as a consequence of the higher than targeted operating profit achieved with a similar asset base.
The poor actual capital adequacy (tangible reserves/tangible assets) percentage of 2.2% compared to the target of 13% arises because of a deflated actual reserve amount. This reserve figure is reduced by the RBF liability provision which has exhibited marked volatility in recent years following actuarial advice. In 2011 this liability was valued at $10.3M; in 2012 it increased by $4.2M to $14.5M and in 2013 it has reduced by $1.7M to $12.8M.
Capital Structure The Public Trustee has no corporate borrowings. The equity of the Public Trustee is wholly represented by retained earnings.
Support for Tasmanian Business The Public Trustee supports Tasmanian business by sourcing all services and supplies within Tasmania where those services and supplies are competitively available at the standard required by the Public Trustee.
Staffing As at 30 June 2013 the Public Trustee employed 53 staff on a full time equivalent basis.
Community Service Obligation Payments In accordance with the provisions contained in Part 9 of the Government Business Enterprises Act 1995, Community Service Obligations have been declared to encompass the responsibility of the Public Trustee to administer estates, trusts and the financial affairs of represented persons, notwithstanding that the financial value of these matters prohibits full cost recovery. As at 30 June 2013, matters classified as Community Service Obligations accounted for 49% of the matters administered by the Public Trustee. The net avoidable cost to meet these obligations for the 2013 financial year was $1,906,150. The Treasurer, as purchasing minister, enters into an agreement with the Public Trustee to fund the provision of Community Service Obligations. The funding received by the Public Trustee for the 2013 financial year was $1,360,000.

20
ABN 11 223 649 773
Financial Statements 30 June 2013

Auditor’s Independence Declaration
21

Statement of Comprehensive Income for the year ended 30 June 2013
22
Note 2013 2012
$ $
Revenue
Sales revenue 2 7,027,550 6,901,998
Other revenue 2 956,434 608,356
Fair value gains on financial assets 757,325 -
Total revenue 8,741,309
7,510,354
Expenses
Administrative expenses (1,685,365) (1,753,679)
Depreciation expense (94,971) (97,842)
Employee benefits expense 3 (4,394,326) (4,081,350)
Fair value losses on financial assets - (252,218)
Finance expense 3 (573,235) (679,581)
Occupancy expenses (432,020) (421,598)
Total expenses 7,179,917
7,286,268
Profit before income tax equivalent 1,561,392
224,086
Income tax equivalent expense 4a (247,024) (97,909)
Net profit for the year 3 1,314,368
126,177
Other comprehensive income
Items that will not be classified to profit or loss:
Fair value gains (losses) on superannuation liabilities, net of tax 4b, 16 1,273,509 (2,853,740)
Other comprehensive income for the year 1,273,509
(2,853,740)
Total comprehensive income for the year 2,587,877
(2,727,563)
The accompanying notes form part of these financial statements.

Statement of Financial Position as at 30 June 2013
23
Note 2013 2012
$ $
Assets
Current assets
Cash and cash equivalents 8 2,731,748 2,297,144
Trade and other receivables 9 508,233 196,001
Financial assets 10 10,801,777 10,044,454
Other assets 12 36,706 36,183
Total current assets 14,078,464
12,573,782
Non-current assets
Deferred tax assets 14 3,963,908 4,548,343
Plant and equipment 11 460,597 443,835
Total non-current assets 4,424,505
4,992,178
Total assets 18,502,969
17,565,960
Liabilities
Current liabilities
Trade and other payables 13 623,351 629,131
Current tax payable 14 67,668 (19,688)
Provisions 15 1,121,740 1,008,079
Total current liabilities 1,812,759
1,617,522
Non-current liabilities
Provisions 15 12,406,772
14,101,511
Total non-current liabilities 12,406,772
14,101,511
Total liabilities 14,219,531
15,719,033
Net assets 4,283,438
1,846,927
Equity
Retained earnings 4,283,438 1,846,927
Total equity 4,283,438
1,846,927
The accompanying notes form part of these financial statements.

Statements of Changes in Equity for the year ended 30 June 2013
24
Note Retained earnings
Total
$ $
Balance at 1 July 2011 4,799,035 4,799,035
Comprehensive income
Profit (loss) for the year 126,177 126,177
Other comprehensive income for the year, net of income tax (2,853,740) (2,853,740)
Total comprehensive income for the year (2,727,563) (2,727,563)
Transactions with owners, in their capacity as owners, and other transfers
Dividends paid for the year 7 (224,545) (224,545)
Total transactions with owners and other transfers (224,545) (224,545)
Balance at 30 June 2012 1,846,927
1,846,927
Balance at 1 July 2012 1,846,927 1,846,927
Comprehensive income
Profit (loss) for the year 1,314,368 1,314,368
Other comprehensive income for the year, net of income tax 1,273,509 1,273,509
Total comprehensive income for the year 2,587,877 2,587,877
Transactions with owners, in their capacity as owners, and other transfers
Dividends paid for the year 7 (151,366) (151,366)
Total transactions with owners and other transfers (151,366) (151,366)
Balance at 30 June 2013 4,283,438
4,283,438
The accompanying notes form part of these financial statements.

Statement of Cash Flows for the year ended 30 June 2013
25
Note 2013 2012
$ $
Cash flows from operating activities
Receipts from customers 7,543,499 7,731,433
Payments to suppliers and employees (7,423,382) (7,259,957)
Interest received 75,531 65,528
Income tax equivalent paid (121,023) (121,373)
Net cash from operating activities 18 74,625 415,631
Cash flows from investing activities
Distributions from financial assets 623,078 977,775
Purchase of plant and equipment (111,733) (105,491)
Net cash provided (used) in investing activities 511,345 872,284
Cash flows from financing activities
Dividends paid (151,366) (224,545)
Net cash used in financing activities (151,366) (224,545)
Net increase (decrease) in cash held 434,604 1,063,370
Cash at the beginning of the year 8 2,297,144 1,233,774
Cash at the end of the year 8 2,731,748 2,297,144
The accompanying notes form part of these financial statements.

Notes to the Financial Statements for the year ended 30 June 2013
26
The Public Trustee (“the entity”) is a Tasmanian Government Business Enterprise operating since 1853 offering professional, independent trustee services to the Tasmanian community. The duties and obligations of the entity are set out in the Trustee Act 1898 and the Public Trustee Act 1930 determines the constitution and
regulation of the entity. The Public Trustee’s Australian Business Number is 11 223 649 773. Its principal place of business is 116 Murray Street, Hobart, Tasmania. The financial statements were authorised by the directors for issue on 12 August 2013.
Note 1. Statement of significant accounting policies
Basis of preparation
The financial statements are general purpose financial statements that have been prepared in accordance with Australian Accounting Standards, Australian Accounting Interpretations, other authoritative pronouncements of the Australian Accounting Standards Board (“AASB”), the Government Business Enterprise Act 1995 and related Treasurer’s Instructions. The entity is a for-profit entity for financial reporting purposes under Australian Accounting Standards. Australian Accounting Standards set out accounting policies that the AASB has concluded would result in financial statements containing relevant and reliable information about transactions, events and conditions. Compliance with Australian Accounting Standards ensures that the financial statements and notes also comply with International Financial Reporting Standards as issued by the IASB. Material accounting policies adopted in the preparation of the financial statements are presented below and have been consistently applied unless otherwise stated. Except for cash flow information, the financial statements have been prepared on an accruals basis and are based on historical costs, modified, where applicable, by the measurement at fair value of selected non-current assets, financial assets and financial liabilities. a. Income Tax Equivalent
Pursuant to the Government Business Enterprise Act 1995 the entity is required to pay an income
tax equivalent to the State of Tasmania as if it were a company pursuant to Australian income tax laws. The entity has applied tax effect accounting principles prescribed in AASB112 Income Taxes.
The income tax expense (income) for the year comprises current income tax expense (income) and deferred tax expense (income). Current income tax expense charged to profit or loss is the tax payable on taxable income. Current tax liabilities (assets) are measured at the amounts expected to be paid to (recovered from) the
relevant taxation authority. Deferred income tax expense reflects movements in deferred tax asset and deferred tax liability balances during the year as well as unused tax losses. Current and deferred income tax expense (income) is charged or credited outside profit or loss when the tax relates to items that are recognised outside profit or loss. No deferred income tax is recognised from the initial recognition of an asset or liability where there is no effect on accounting or taxable profit or loss. Deferred tax assets and liabilities are calculated at the tax rates that are expected to apply to the period when the asset is realised or the liability is settled and their measurement also reflects the manner in which management expects to recover or settle the carrying amount of the related asset or liability. Deferred tax assets relating to temporary differences and unused tax losses are recognised only to the extent that it is probable that future taxable profit will be available against which the benefits of the deferred tax asset can be utilised. Current tax assets and liabilities are offset where a legally enforceable right of set-off exists and it is intended that net settlement or simultaneous realisation and settlement of the respective asset and liability will occur. Deferred tax assets and liabilities are offset where: (a) a legally enforceable right of set-off exists; and (b) the deferred tax assets and liabilities relate to income taxes levied by the same taxation authority on either the same taxable entity or different taxable entities where it is intended that net settlement or simultaneous realisation and settlement of the respective asset and liability will occur in future periods in which significant amounts of deferred tax assets or liabilities are expected to be recovered or settled.
b. Plant and Equipment
Each class of plant and equipment is carried at cost as indicated less, where applicable, any accumulated depreciation and impairment losses. Plant and equipment
Plant and equipment are measured on the cost basis and are therefore carried at cost less accumulated depreciation and any accumulated impairment. In the event the carrying amount of plant and equipment is greater than the estimated recoverable amount, the carrying amount is written down immediately to the estimated recoverable amount and impairment losses are recognised either in profit of loss or as a revaluation decrease if the impairment losses relate to a revalued asset. A formal assessment of recoverable amount is made when impairment indicators are present (refer to Note 1 (e) for details of impairment).

Notes to the Financial Statements for the year ended 30 June 2013
27
Depreciation
The depreciable amount of all fixed assets is depreciated on a straight-line basis over the asset’s useful life to the entity commencing from the time the asset is held ready for use. Leasehold improvements are depreciated over the shorter of either the unexpired period of the lease or the estimated useful lives of the improvements. The depreciation rates used for each class of depreciable assets are: Class of Fixed Asset Depreciation Rate Plant and equipment 10% to 40% The assets’ residual values and useful lives are reviewed, and adjusted if appropriate, at the end of each reporting period. An asset’s carrying amount is written down immediately to its recoverable amount if the asset’s carrying amount is greater than its estimated recoverable amount. Gains and losses on disposals are determined by comparing proceeds with the carrying amount. These gains and losses are included in the statement of comprehensive income. When revalued assets are sold, amounts included in the revaluation surplus relating to that asset are transferred to retained earnings.
c. Leases
Lease payments for operating leases, where substantially all the risks and benefits remain with the lessor, are recognised as expenses in the periods in which they are incurred.
d. Financial Instruments
Recognition and initial measurement
Financial assets and financial liabilities are recognised when the entity becomes a party to the contractual provisions to the instrument. For financial assets, this is equivalent to the date that the entity commits itself to either purchase or sale of the asset (ie trade date accounting is adopted). Financial instruments are initially measured at fair value plus transactions costs except where the instrument is classified as ‘at fair value through profit or loss’ in which case the transaction costs are expensed to profit or loss immediately. Classification and subsequent measurement
Financial instruments are measured at fair value, amortised cost using the effective interest rate method, or cost. Amortised cost is calculated as the amount at which the financial asset or financial liability is measured at initial recognition less principal repayments and any reduction for impairment, and adjusted for any cumulative amortisation of the difference between that initial amount and the
maturity amount calculated using the effective interest method.
Fair value is determined based on current bid prices for all quoted investments. Valuation techniques are applied to determine the fair value for all unlisted securities, including recent arm’s length transactions and reference to similar instruments. The effective interest method is used to allocate interest income or interest expense over the relevant period and is equivalent to the rate that exactly discounts estimated future cash payments or receipts (including fees, transaction costs and other premiums or discounts) through the expected life (or when this cannot be reliably predicted, the contractual term) of the financial instrument to the net carrying amount of the financial asset or financial liability. Revisions to expected future net cash flows will necessitate an adjustment to the carrying value with a consequential recognition of an income or expense in profit or loss. (i) Financial assets at fair value through
profit or loss
Financial assets are classified at ‘fair value through profit or loss’ when they are either held for trading for the purpose of short term profit taking, derivatives not held for hedging purposes, or when they are designated as such to avoid an accounting mismatch or to enable performance evaluation where a group of financial assets is managed by key management personnel on a fair value basis in accordance with a documented risk management or investment strategy. Such assets are subsequently measured at fair value with changes in carrying value being included in profit or loss.
(ii) Loans and receivables
Loans and receivables are non-derivative financial assets with fixed or determinable payments that are not quoted in an active market and are subsequently measured at amortised cost.
(iii) Held-to-maturity investments
Held-to-maturity investments are non-derivative financial assets that have fixed maturities and fixed or determinable payments, and it is the entity’s intention to hold these investments to maturity. They are subsequently measured at amortised cost.
(iv) Available-for-sale financial assets
Available-for-sale financial assets are non-derivative financial assets that are either not capable of being classified into other categories of financial assets due to their nature or they are designated as such by management. They comprise investments

Notes to the Financial Statements for the year ended 30 June 2013
28
in non rated managed investment funds where there is neither a fixed maturity nor fixed or determinable payments.
They are subsequently measured at fair
value with any remeasurement recognised in other comprehensive income.
Available-for-sale financial assets are
classified as non-current assets when they are expected to be sold after 12 months from the end of the reporting period. All other available-for-sale financial assets are classified as current assets.
(v) Financial liabilities
Non-derivative financial liabilities other than financial guarantees are subsequently measured at amortised cost.
Impairment
At the end of each reporting date, the entity assesses whether there is objective evidence that a financial asset has been impaired. A financial asset or a group of financial assets is deemed to be impaired if, and only if, there is objective evidence of impairment as a result of one or more events (a ‘loss event’) having occurred, which has an impact on the estimated future cash flows of the financial asset(s). In the case of available-for-sale financial instruments, a significant or prolonged decline in the value of the instrument is considered to constitute a loss event. Impairment losses are recognised in profit or loss immediately. Also, any cumulative decline in fair value previously recognised in other comprehensive income is reclassified to profit or loss at this point. De-recognition
Financial assets are derecognised where the contractual rights to receipt of cash flows expire or the asset is transferred to another party whereby the entity no longer has any significant continuing involvement in the risks and benefits associated with the asset. Financial liabilities are derecognised where the related obligations are either discharged, cancelled or have expired. The difference between the carrying amount of the financial liability extinguished or transferred to another party and the fair value of consideration paid, including the transfer of non-cash assets or liabilities assumed, is recognised in profit or loss.
e. Impairment of Assets
At the end of each reporting period, the entity assesses whether there is any indication that an asset may be impaired. The assessment will include the consideration of external and internal sources of information. If such an indication exists, an impairment test is carried out on the asset by comparing the recoverable amount of the asset, being the higher of the asset’s fair value less costs to sell and value in use, to the asset’s carrying
amount. Any excess of the asset’s carrying amount over its recoverable amount is recognised immediately in profit or loss, unless the asset is carried at a revalued amount in accordance with another Standard (eg in accordance with the revaluation model in AASB 116). Any impairment loss of a revalued asset is treated as a revaluation decrease in accordance with that other Standard. Where it is not possible to estimate the recoverable amount of an individual asset, the entity estimates the recoverable amount of the cash-generating unit to which the asset belongs.
f. Employee Benefits
Provision is made for the entity’s liability for employee benefits arising from services rendered by employees to the end of the reporting period. Employee benefits that are expected to be settled within one year have been measured at the amounts expected to be paid when the liability is settled. Employee benefits payable later than one year have been measured at the present value of the estimated future cash outflows to be made for those benefits. In determining the liability, consideration is given to employee wage increases and the probability that the employee may satisfy vesting requirements. Those cash flows are discounted using market yields on national government bonds with terms to maturity that match the expected timing of cash flows attributable to employee benefits. Liabilities under the Retirement Benefits Fund (“RBF”) defined benefit plan are calculated by the State appointed actuary. Expenses related to current employment are recognised in the Statement of Comprehensive Income in Employee Benefits Expense. Actuarial gains and losses arising from changes in actuarial assumptions used to calculate the present value of future liabilities are recognised immediately through Other Comprehensive Income in the year in which they occur. Refer note 16.
g. Provisions
Provisions are recognised when the entity has a legal or constructive obligation, as a result of past events, for which it is probable that an outflow of economic benefits will result and that outflow can be reliably measured. Provisions are measured using the best estimate of the amounts required to settle the obligation at the end of the reporting date.
h. Cash and cash equivalents
Cash and cash equivalents include cash on hand, deposits held at call with banks, other short-term highly liquid investments with original maturities of three months or less, and bank overdrafts.

Notes to the Financial Statements for the year ended 30 June 2013
29
i. Revenue and other income
Revenue is measured at the fair value of the consideration received or receivable after taking into account any trade discounts and volume rebates allowed. When the inflow of consideration is deferred it is treated as the provision of financing and is discounted at a rate of interest that is generally accepted in the market for similar arrangements. The difference between the amount initially recognised and the amount ultimately received is interest revenue. Interest revenue is recognised using the effective interest method. Dividend revenue is recognised when the right to receive a dividend has been established.
j. Trade and other payables
Trade and other payables represent the liability for goods and services received by the entity during that remain unpaid at the end of the reporting period. The balance is recognised as a current liability with the amount being normally paid within 30 days of recognition of the liability.
k. Goods and Services Tax (GST)
Revenues, expenses and assets are recognised net of the amount of GST, except where the amount of GST incurred is not recoverable from the Australian Taxation Office (“ATO”). Receivables and payables are stated inclusive of the amount of GST receivable or payable. The net amount of GST recoverable from, or payable to, the ATO is included with other receivables or payables in the statement of financial position. Cash flows in the Statement of Cash Flows are presented on a gross basis. The GST components of cash flows arising from investing or financing activities, which are recoverable from or payable to the ATO, are presented as operating cash flows included in receipts from customers or payments to suppliers.
l. Comparative Figures
When required by Accounting Standards, comparative figures have been adjusted to conform to changes in presentation for the current financial year.
m. Critical accounting estimates and judgements
The directors evaluate estimates and judgements incorporated into the financial statements based on historical knowledge and best available current information. Estimates assume a reasonable expectation of future events and are based on current trends and economic data, obtained both externally and within the entity.
Key estimates (i) Impairment - general
The entity assesses impairment at each reporting period by evaluation of conditions and events specific to the entity that may be indicative of impairment triggers. Recoverable amounts of relevant assets are reassessed using value-in-use calculations which incorporate various key assumptions. There was no impairment recognised in the current year.
(ii) Impairment – carbon price
In November 2011, the Federal Parliament passed the Clean Energy Act 2011, which implements a carbon pricing mechanism from 1 July 2012. Under the mechanism, entities that produce over the threshold level of carbon emissions will be required to purchase permits to offset their carbon emissions.
The entity is not directly impacted by the
carbon pricing mechanism because it does not control facilities that produce emissions greater than the threshold level. However, the entity will be indirectly impacted by the mechanism through increases in the prices it pays for energy and materials purchased from suppliers that are impacted by the introduction of the mechanism. The entity also anticipates that it will experience an increase in expenditures related to waste disposal under the carbon pricing mechanism, although any future increases in such costs are likely to be less significant than the anticipated increases in energy and material costs.
Management of the entity has considered
whether the introduction of the carbon pricing mechanism is an impairment indicator and has determined that it is not expected to have a significant impact on the estimated net cash flows of the entity’s operations or the recoverability of its assets.
(iii) Employee benefits
Assumptions utilised in the determination of the entity’s employee entitlement provisions are discussed in note 1(f).
(iv) Financial Instruments
Assumptions utilised in the determination of the entity’s valuation of its investment are discussed in note 1(d).
(v) Defined benefit superannuation fund
obligations
Actuarial assumptions utilised in the determination of the entity's defined benefit superannuation fund obligations are discussed in note 16.
Notes to the Financial Statements for the year ended 30 June 2013
30
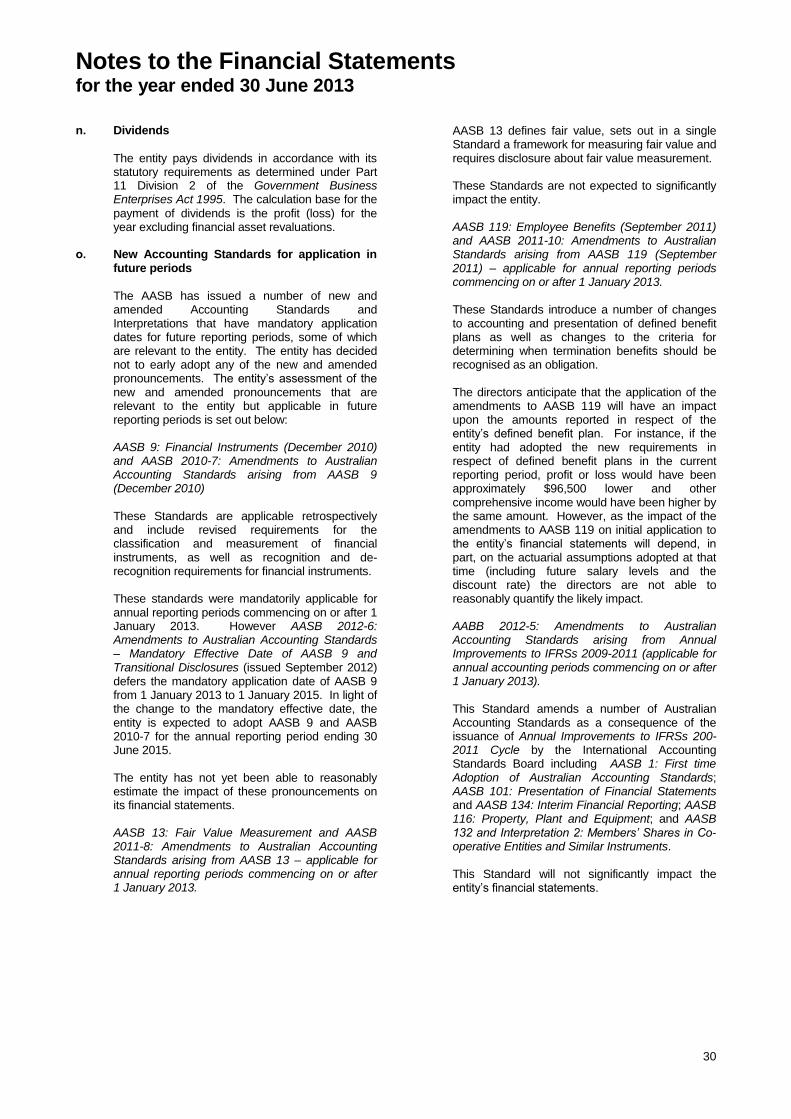
n. Dividends
The entity pays dividends in accordance with its statutory requirements as determined under Part 11 Division 2 of the Government Business Enterprises Act 1995. The calculation base for the
payment of dividends is the profit (loss) for the year excluding financial asset revaluations.
o. New Accounting Standards for application in future periods
The AASB has issued a number of new and amended Accounting Standards and Interpretations that have mandatory application dates for future reporting periods, some of which are relevant to the entity. The entity has decided not to early adopt any of the new and amended pronouncements. The entity’s assessment of the new and amended pronouncements that are relevant to the entity but applicable in future reporting periods is set out below: AASB 9: Financial Instruments (December 2010) and AASB 2010-7: Amendments to Australian Accounting Standards arising from AASB 9 (December 2010)
These Standards are applicable retrospectively and include revised requirements for the classification and measurement of financial instruments, as well as recognition and de-recognition requirements for financial instruments. These standards were mandatorily applicable for annual reporting periods commencing on or after 1 January 2013. However AASB 2012-6: Amendments to Australian Accounting Standards – Mandatory Effective Date of AASB 9 and Transitional Disclosures (issued September 2012) defers the mandatory application date of AASB 9 from 1 January 2013 to 1 January 2015. In light of the change to the mandatory effective date, the entity is expected to adopt AASB 9 and AASB 2010-7 for the annual reporting period ending 30 June 2015. The entity has not yet been able to reasonably estimate the impact of these pronouncements on its financial statements. AASB 13: Fair Value Measurement and AASB 2011-8: Amendments to Australian Accounting Standards arising from AASB 13 – applicable for annual reporting periods commencing on or after 1 January 2013.
AASB 13 defines fair value, sets out in a single Standard a framework for measuring fair value and requires disclosure about fair value measurement. These Standards are not expected to significantly impact the entity. AASB 119: Employee Benefits (September 2011) and AASB 2011-10: Amendments to Australian Standards arising from AASB 119 (September 2011) – applicable for annual reporting periods commencing on or after 1 January 2013. These Standards introduce a number of changes to accounting and presentation of defined benefit plans as well as changes to the criteria for determining when termination benefits should be recognised as an obligation. The directors anticipate that the application of the amendments to AASB 119 will have an impact upon the amounts reported in respect of the entity’s defined benefit plan. For instance, if the entity had adopted the new requirements in respect of defined benefit plans in the current reporting period, profit or loss would have been approximately $96,500 lower and other comprehensive income would have been higher by the same amount. However, as the impact of the amendments to AASB 119 on initial application to the entity’s financial statements will depend, in part, on the actuarial assumptions adopted at that time (including future salary levels and the discount rate) the directors are not able to reasonably quantify the likely impact. AABB 2012-5: Amendments to Australian Accounting Standards arising from Annual Improvements to IFRSs 2009-2011 (applicable for annual accounting periods commencing on or after 1 January 2013). This Standard amends a number of Australian Accounting Standards as a consequence of the issuance of Annual Improvements to IFRSs 200-2011 Cycle by the International Accounting Standards Board including AASB 1: First time Adoption of Australian Accounting Standards; AASB 101: Presentation of Financial Statements and AASB 134: Interim Financial Reporting; AASB 116: Property, Plant and Equipment; and AASB 132 and Interpretation 2: Members’ Shares in Co-operative Entities and Similar Instruments. This Standard will not significantly impact the entity’s financial statements.

Notes to the Financial Statements for the year ended 30 June 2013
31
2013 2012
$ $
Note 2. Revenue and other income
Sales revenue
- fees and commissions 5,667,550 5,590,582
- funding of community service obligations 1,360,000 1,311,416
7,027,550 6,901,998
Other revenue
- dividends received from other persons 880,903 542,828
- interest received from other persons 75,531 65,528
956,434 608,356
Note 3. Net profit for the year
Profit before income tax includes the following specific expenses: Expenses
Employee benefits expense
- wages and salaries 3,266,759 3,067,652
- defined benefits superannuation service cost (note 16) 219,485 191,434
- defined benefits superannuation expected return on assets (note 16) (178,705) (171,006)
- other associated personnel expenses 1,086,787 993,270
4,394,326 4,081,350
Finance expenses
- defined benefits superannuation interest cost (note 16) 573,235 679,581
Net profit (loss) for the year excluding financial asset revaluations
Net profit (loss) for the year excluding financial asset revaluations is reconciled as follows:
Net Profit for the year 1,314,368 126,177
Fair value (gains) losses on financial assets, net of tax (note 4) (530,128) 176,553
Net Profit (loss) for the year excluding financial asset revaluations 784,240 302,730
The entity pays dividends in accordance with its statutory requirements as determined under Part 11 Division 2 of the Government Business Enterprises Act 1995. The calculation base for the payment of dividends is the profit (loss) for the year excluding financial asset revaluations.

Notes to the Financial Statements for the year ended 30 June 2013
32
2013 2012
$ $
Note 4. Tax equivalent expense
a. The components of income tax equivalent expense comprise:
Current tax 208,380 132,293
Deferred tax 38,644 (34,383)
247,024 97,909
b. The prima facie income tax equivalent on profit before income tax is
reconciled to income tax equivalent as follows:
Prima facie tax payable on profit before income tax at 30% (2012: 30%)
- entity 468,418 67,225
Add tax effect of:
- write-down adjustments to plant and equipment - 60
- entertainment 428 -
- deferred tax assets relating to potential capital losses not recognised - 63,408
- over provision for income tax in prior years 76,676 -
Less tax effect of:
- available franking credits (36,915) (30,621)
- foreign tax credits (5,951) (2,163)
- utilisation of capital losses not previously recognised (65,590) -
- deferred tax on movement of investments not previously recognised (182,039) -
- non-taxable capital gain (8,003) -
Income tax attributable to entity 247,024 97,909
Fair value gains (losses) on financial assets 757,325 (252,218)
Income tax (expense) benefit at 30% (227,197) 75,665
Net-of-tax amount 530,128 (176,553)
c. Tax effects relating to each component of other comprehensive income:
Superannuation liabilities revaluation
Before tax amount 1,819,299 (4,076,771)
Income tax equivalent (expense) benefit (545,790) 1,223,031
Net-of-tax amount 1,273,509 (2,853,740)

Notes to the Financial Statements for the year ended 30 June 2013
33
Note 5. Key management personnel compensation
Director remuneration The following table discloses the remuneration details in bands for each person that acted as a non-executive director during the current and previous financial years:
Short Term Employment Benefits
Number Directors fees Committee fees Other Superannuation Total
$ $ $ $ $
2013
$40,000 + 1 34,889 2,750 - 3,387 41,026
$nil to $40,000 4 76,720 7,350 - 7,565 91,635
2012
$40,000 + 1 33,847 3,200 - 3,334 40,381
$nil to $40,000 4 75,216 7,500 - 7,443 90,159
Non-executive directors are appointed by the Governor-in-Council on the joint recommendation of the Treasurer and Portfolio Minister. Each instrument of appointment is for a maximum period of three years and prescribes the relevant remuneration provisions. Directors can be reappointed. The level of fees paid to non-executive directors is administered by the Department of Premier and Cabinet as are additional fees paid in respect of their work on Board Committees. Superannuation is paid at the appropriate rates as prescribed by superannuation guarantee legislation. No other leave, termination or retirement benefits are accrued or paid to directors. Directors are entitled to reimbursement of expenses incurred while attending to Board business. Non-executive directors’ remuneration is reviewed periodically whenever there is an increase in State Service wages with increases subject to approval by the Treasurer and Portfolio Minister. Executive remuneration The following table discloses the remuneration details for senior executives during the current and two previous financial years. The senior executives are members of the entity’s Executive Management Team.
Short Term Employment Benefits
Number Cash Bonuses Other Superannuation Total
$ $ $ $ $
2013 7 672,454 - 27,549 68,787 768,790
2012 6 637,151 - 30,549 65,310 733,010
2011 7 584,366 - 30,156 59,906 674,428

Notes to the Financial Statements for the year ended 30 June 2013
34
Position held at 30 June 2013
and any change Contract details Performance
related
Peter Maloney Chief Executive Officer and
Executive Director 1 year from 21 February 2013 0%
Duncan Hall General Manager Corporate Services 5 years from 29 May 2011 0%
Gaylene Cunningham Manager Client Services Permanent 0%
Tim Levis Corporate Solicitor Permanent 0%
Scott Parnham Manager Financial Operations Permanent 0%
Angela Dougan Human Resources Manager Permanent from 20 September 2012 0%
Beth Chapman Human Resources Manager Permanent until 25 September 2012 0%
The employment terms and conditions of Chief Executive Officer and the General Manager Corporate Services are contained in individual employment contracts which prescribe total remuneration, superannuation, annual and long service leave, motor vehicle and salary sacrifice provisions. The Corporate Solicitor is employed pursuant to the Legal Practitioners Agreement 2010 and the remaining members of the executive are employed pursuant to the Tasmanian State Services Award 2008. The Chief Executive Officer is appointed by the Premier on the recommendation of the Board. The remuneration package is in accordance with the Senior Executive Service determination. There is no provision within the senior executives’ remuneration packages for the payment of short term incentives based on meeting key performance indicators. The performance of each senior executive, including the Chief Executive Officer, is reviewed annually. The terms of employment of the Chief Executive Officer and the General Manager Corporate Services, contain a termination clause that requires the senior executive or the Board to provide a minimum notice period of up to 6 months prior to termination of the contract. Employment contracts have durations not exceeding five years.
2013 2012
$ $
The totals of the remuneration paid to key management personnel during the year are as follows:
Short-term employee benefits 821,712 787,463
Post-employment benefits 79,739 76,087
901,451 863,550
For the year ended 30 June 2013 the entity identified five directors and seven employees (2012: five directors and six employees) as key management personnel in accordance with AASB 124: Related Party Disclosure. Note 21 lists the Directors of the entity at 30 June 2013.
Overseas travel There was no overseas travel undertaken on behalf of the entity during the year by the Chairman, Directors or Chief Executive Officer.

Notes to the Financial Statements for the year ended 30 June 2013
35
2013 2012
$ $
Note 6. Auditor’s remuneration
Remuneration of the auditor for:
- auditing the financial statements 27,680 26,620
Note 7. Dividends
Declared and paid 151,366 224,545
Note 8. Cash and cash equivalents
Cash at bank and on hand 900 900
Short term bank deposits 2,730,848 2,296,244
2,731,748 2,297,144
The effective interest rate on short-term bank deposits was between 2.9% and 3.9% (2012: between 3.8% and 4.7%).
Reconciliation of cash Cash at the end of the financial year as shown in the statement of cash flows is reconciled to items in the statement of financial position as follows:
Cash and cash equivalents 2,731,748 2,297,144
In its capacity as trustee and financial administrator the entity holds funds on behalf of it clients that are not available for use by the entity. Details of the cash held under management and trusteeship have been included at note 24.
Note 9. Trade and other receivables
Current
Trade receivables 508,233 196,001
Credit risk The entity has no significant concentration of credit risk with respect of any single counterparty or group of counterparties. The class of assets described as “trade and other receivables” is considered to be the main source of credit risk related to the entity. The following table details the entity’s trade and other receivables exposed to credit risk with ageing analysis and impairment provided for thereon. Amounts are considered “past due” when the debt has not been settled, with the terms and conditions agreed between the entity and the customer or counterparty to the transaction. Receivables that are past due are assessed for impairment by ascertaining solvency of the debtors and are provided for where there are specific circumstances indicating that the debt may not be fully repaid to the entity. The balances of receivables that remain within initial trade terms (as detailed in the table) are considered to be of high credit quality.
Gross
Past due and
impaired
Past due but not impaired (days overdue) Within
trade terms < 30 days 31 - 60 days
61 - 90 days > 90 days
$ $ $ $ $ $ $
2013
Trade receivables 508,233 - - - - - 508,233
2012
Trade receivables 196,001 - - - - - 196,001

Notes to the Financial Statements for the year ended 30 June 2013
36
2013 2012
$ $
Note 10. Financial assets
Available-for-sale financial investments
Investments in managed funds, at fair value 10,801,777 10,044,454
Available-for-sale financial assets comprise investments in managed funds. There are no fixed returns or fixed maturity dates attached to these investments. No intention to dispose of any unlisted available-for-sale financial assets existed at 30 June 2013.
Note 11. Plant and equipment
Plant and equipment
Leasehold improvements at cost 339,141 339,141
Accumulated amortisation (219,360) (203,384)
119,781 135,757
Fixtures, furniture and equipment at cost 1,019,040 907,307
Accumulated depreciation (678,224) (599,229)
340,816 308,078
460,597 443,835
Movement in carrying amounts Movement in the carrying amounts of each class of plant and equipment between the beginning and end of the current financial year
Leasehold improvements
Balance at 1 July 135,757 101,442
Additions - 47,998
Depreciation expense (15,976) (13,683)
Balance at 30 June 119,781 135,757
Fixtures, furniture and equipment
Balance at 1 July 308,078 334,744
Additions 111,733 57,493
Depreciation expense (78,995) (84,159)
Balance at 30 June 340,816 308,078
Note 12. Other assets
Current
Prepayments 36,706 36,183

Notes to the Financial Statements for the year ended 30 June 2013
37
2013 2012
$ $
Note 13. Trade and other payables
Current
Trade payables 275,706 149,892
Sundry payables and accrued expenses 347,645 479,239
623,351 629,131
Note 14. Tax
Current
Income tax payable (receivable) 67,668 (19,688)
Non Current
Deferred tax assets
Balance at 1 July 4,548,343 3,290,928
Provisions – employee benefits (474,323) 1,246,753
Other expenses (4,834) 10,663
Changes in value of available-for-sale financial investments (105,278) -
Balance at 30 June 3,963,908 4,548,343
At 30 June 2012 a deferred tax asset of $182,039 relating to the excess of the tax cost base of financial assets over their carrying value was not recognised. At the time it was considered not probable that future capital gains would arise against which this benefit would be realised.
Note 15. Provisions
Employee benefits
Balance at 1 July 15,109,590 10,953,749
Additional provisions 990,461 5,245,871
Amounts used (776,514) (957,371)
Unused amounts reversed (1,795,025) (132,659)
Balance at 30 June 13,528,512 15,109,590
Analysis of total provisions
Current 1,121,740 1,008,079
Non-current 12,406,772 14,101,511
13,528,512 15,109,590
Provision for long term employee benefits Provision for employee benefits represents amounts accrued for annual leave and long service leave. The current portion of this provision included the total amount accrued for annual leave entitlements and the amounts accrued for long service leave entitlements that have vested due to employees having completed the required period of service. Based on past experience, the entity does not expect the full amount of annual leave or long service leave balances classified as current liabilities to be settled within the next twelve months. However these amounts must be classified as current liabilities since the entity does not have an unconditional right to defer settlement of these amounts in the event employees wish to use their leave entitlements. The non-current portion for this provision includes amounts accrued for long service leave entitlements that have not yet vested in relation to those employees who have not yet completed the required period of service. In calculating the present value of future cash flows in respect of long service leave, the probability of long service leave being taken is based on historical data. The measurement and recognition criteria relating to employee benefits have been discussed in Note 1(f).

Notes to the Financial Statements for the year ended 30 June 2013
38
2013 2012
$ $
Note 16. Retirement benefit obligations Fund Information The Retirement Benefits Fund (“RBF”) is a defined benefit fund in which members receive lump sum benefits on resignation and lump sum or pension benefits on retirement, death or invalidity. The defined benefit section of RBF is closed to new members. All new members receive accumulation only benefits.
Reconciliation of the defined benefit obligation
Present value of the defined benefit obligation at the beginning of the year 16,946,000 12,669,000
Current service cost 219,485 191,434
Interest cost 573,235 679,581
Estimated contributions by plan participants 57,000 62,000
Actuarial (gains) losses (1,781,029) 4,233,259
Estimated benefits paid (657,206) (865,839)
Estimated taxes, premiums and expenses (24,485) (23,435)
Present value of the defined benefit obligation at the end of the year 15,333,000 16,946,000
The defined benefit obligation consists entirely of amounts from plans that are wholly or partly funded.
Reconciliation of the fair value of scheme assets
Fair value of plan assets at the beginning of the year 2,463,481 2,353,301
Expected return on plan assets 178,705 171,006
Actuarial gains (losses) 38,270 156,488
Estimated employer contributions 464,319 609,960
Estimated participant contributions 57,000 62,000
Estimated benefit payments (657,206) (865,839)
Estimated taxes, premiums and expenses 24,485 (23,435)
Fair value of plan assets at the end of the year 2,520,084 2,463,481
Reconciliation of the assets and liabilities recognised in the statement of financial position
Defined benefit obligation 15,333,000 16,946,000
Fair value of plan assets (2,520,084) (2,463,481)
Net superannuation liability (asset) 12,812,916 14,482,519
Current net liability 532,000 467,000
Non-current net liability 12,280,916 14,015,519
12,812,916 14,482,519
Expense recognised in the statement of comprehensive income
Service cost 219,485 191,434
Interest cost 573,235 679,581
Expected return on assets (178,705) (171,006)
614,015 700,009
Amounts recognised in other comprehensive income
Actuarial (gains) losses (1,819,299) 4,076,711
Cumulative amount recognised in other comprehensive income
Cumulative amount of actuarial (gains) losses at end of prior year 5,992,214 1,915,443
Actuarial (gains) losses recognised during the year (1,819,299) 4,076,771
Cumulative amount of actuarial (gains) losses at end of year 4,172,915 5,992,214
Actual return on fund assets
Actual return on plan assets 216,975 327,494

Notes to the Financial Statements for the year ended 30 June 2013
39
2013 2012
% %
Percentage invested in each asset class at the statement of financial position date
As at 31 March 2013 31 March 2012
Australian equity 27 25
International equity 19 18
Fixed income 12 12
Property 15 17
Alternatives / other 24 24
Cash 3 4
Fair value of fund assets The fair value of the fund assets includes no amounts relating to: - any of the entity’s own financial instruments, and - any property occupied by, or other assets used by, the entity. Expected rate of return on fund assets The expected return on assets assumption is determined by weighting the expected long-term return for each asset class by the target allocation of assets to each class and allowing for the correlations of the investment returns between asset classes. The returns used for each asset class are net of estimated investment tax and investment fees.
Principal actuarial assumptions at the statement of financial position date
As at 30 June 2013 30 June 2012
Discount rate 4.25 pa 3.45 pa
Expected rate of return on plan assets n/a 7.50 pa
Expected salary increase rate 3.00 pa 3.50 pa
Expected rate of increase in compulsory preserved amounts 3.75 pa 3.75 pa
Expected pension increase rate 2.50 pa 2.50 pa
The expected return on assets is no longer applicable from 30 June 2013 due to the revised accounting standard.
2013 2012 2011 2010 2009
$ $ $ $ $
Historical information
Present value of defined benefit obligation 15,333,000 16,946,000 12,669,000 12,844,000 11,258,000
Fair value of plan assets (2,520,084) (2,463,481) (2,353,301) (2,447,331) (2,283,304)
Deficit in plan 12,812,916 14,482,519 10,315,699 10,396,669 8,974,696
Experience adjustment (gain) loss plan assets (38,270) (156,488) 163,409 (92,052) 414,237
Experience adjustment (gain) loss plan liabilities 152,971 455,259 (193,239) 470,194 831,128
2014
$
Expected contributions
Expected employer contributions 532,000

Notes to the Financial Statements for the year ended 30 June 2013
40
2013 2012
$ $
Note 17. Leasing commitments
Operating lease commitments Non cancellable operating leases contracted for but not capitalised in the financial
statements.
Payable – minimum lease payments:
- Not later than one year 541,580 549,033
- Later than one year but not later than five years 968,611 844,627
- Later than five years 61,321 -
1,571,512 1,393,660
The property lease in Hobart is a non-cancellable lease with a five year term, with rent payable monthly in advance. Contingent rental provisions within the lease agreement require that the minimum lease payments should be increased at the higher of consumer price index (“CPI”) or 0% per annum. An option exists to renew the lease at the end of the five year term for an additional term of five years. An option also exists to renew the lease at the end of the first additional term for a further additional term of five years. The property lease in Launceston is a non-cancellable lease with a five year term, with rent payable monthly in advance. Contingent rental provisions within the lease agreement require that the minimum lease payments should be increased at the higher of consumer price index (“CPI”) or 0% per annum. An option exists to renew the lease at the end of the five year term for an additional term of five years. The property lease in Burnie is a non-cancellable lease with a five year term, with rent payable monthly in advance. Contingent rental provisions within the lease agreement require that the minimum lease payments should be increased at the higher of consumer price index (“CPI”) or 0% per annum. An option exists to renew the lease at the end of the five year term for an additional term of five years. An option also exists to renew the lease at the end of the first additional term for a further additional term of five years. The property lease in Devonport is a non-cancellable lease with a two year term, with rent payable monthly in advance. An option exists to renew the lease at the end of the two year term for an additional term of two years.
Note 18. Cash flow information
a. Reconciliation of cash flows from operations with profit after income tax
Profit (loss) after income tax before other comprehensive income 1,314,368 126,177
Non cash and financing flows in profit (loss):
Depreciation 94,971 97,842
Re-measurement of financial assets (757,325) 252,218
Distribution income treated as investing activities (880,903) (542,828)
Changes in assets and liabilities:
(Increase) decrease in trade and other receivables (54,405) 302,843
(Increase) decrease in prepayments (523) (13,712)
(Increase) increase in deferred tax assets 38,645 (34,569)
Decrease (increase) in trade and other payables (5,780) 137,670
Decrease (increase) in current tax payable 87,356 10,920
Decrease (increase) in provisions 238,221 79,070
Cash flows from operations 74,625 415,631

Notes to the Financial Statements for the year ended 30 June 2013
41
Note 19. Contingent liabilities and contingent assets The entity had no contingent liabilities and no contingent assets at the end of the reporting period.
Note 20. Events after the reporting period The directors are not aware of any significant events since the end of the reporting period.
Note 21. Operating segments The entity provides trustee and related financial services and operates predominantly in Tasmania and has no separate operating segments.
Note 22. Related party transactions a. The entity’s main related parties are as follows: Key management personnel Any person(s) having authority and responsibility for planning, directing and controlling the activities of the entity, directly or
indirectly, including any director (whether executive or otherwise) of that entity, is considered key management personnel. For details of disclosures relating to key management personnel, refer to note 5: Key management personnel compensation. Other related parties Other related parties include entities over which key management personnel have joint control. b. Transactions with related parties Transactions between related parties are on normal commercial terms and conditions no more favourable than those
available to other parties unless otherwise stated.
2013 2012
$ $
Purchase of goods and services - Burnie Office rental expenses paid to Long Rock Pty Ltd until 30 November
2012. Director Ms CJM Rockefeller’s husband was a director of Long Rock Pty Ltd. 19,488
46,057
The Directors of the entity at 30 June 2013 were:
- Mr CJ Stephens, Chairman - Mr PM Maloney, Chief Executive Officer - Ms B Mathison - Ms CJM Rockefeller - Mr PR Blackwood
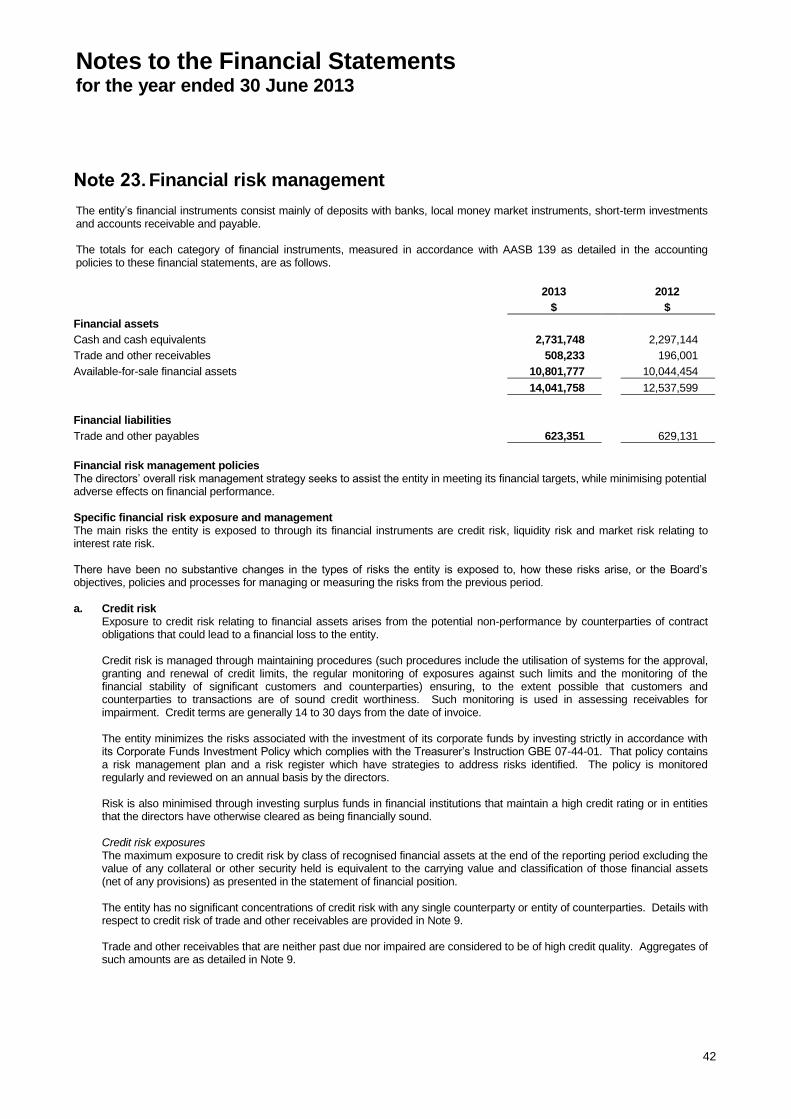
Notes to the Financial Statements for the year ended 30 June 2013
42
Note 23. Financial risk management
The entity’s financial instruments consist mainly of deposits with banks, local money market instruments, short-term investments and accounts receivable and payable. The totals for each category of financial instruments, measured in accordance with AASB 139 as detailed in the accounting policies to these financial statements, are as follows.
2013 2012
$ $
Financial assets
Cash and cash equivalents 2,731,748 2,297,144
Trade and other receivables 508,233 196,001
Available-for-sale financial assets 10,801,777 10,044,454
14,041,758 12,537,599
Financial liabilities
Trade and other payables 623,351 629,131
Financial risk management policies The directors’ overall risk management strategy seeks to assist the entity in meeting its financial targets, while minimising potential adverse effects on financial performance. Specific financial risk exposure and management The main risks the entity is exposed to through its financial instruments are credit risk, liquidity risk and market risk relating to interest rate risk. There have been no substantive changes in the types of risks the entity is exposed to, how these risks arise, or the Board’s objectives, policies and processes for managing or measuring the risks from the previous period. a. Credit risk Exposure to credit risk relating to financial assets arises from the potential non-performance by counterparties of contract
obligations that could lead to a financial loss to the entity. Credit risk is managed through maintaining procedures (such procedures include the utilisation of systems for the approval,
granting and renewal of credit limits, the regular monitoring of exposures against such limits and the monitoring of the financial stability of significant customers and counterparties) ensuring, to the extent possible that customers and counterparties to transactions are of sound credit worthiness. Such monitoring is used in assessing receivables for impairment. Credit terms are generally 14 to 30 days from the date of invoice.
The entity minimizes the risks associated with the investment of its corporate funds by investing strictly in accordance with
its Corporate Funds Investment Policy which complies with the Treasurer’s Instruction GBE 07-44-01. That policy contains a risk management plan and a risk register which have strategies to address risks identified. The policy is monitored regularly and reviewed on an annual basis by the directors.
Risk is also minimised through investing surplus funds in financial institutions that maintain a high credit rating or in entities
that the directors have otherwise cleared as being financially sound. Credit risk exposures The maximum exposure to credit risk by class of recognised financial assets at the end of the reporting period excluding the
value of any collateral or other security held is equivalent to the carrying value and classification of those financial assets (net of any provisions) as presented in the statement of financial position.
The entity has no significant concentrations of credit risk with any single counterparty or entity of counterparties. Details with
respect to credit risk of trade and other receivables are provided in Note 9. Trade and other receivables that are neither past due nor impaired are considered to be of high credit quality. Aggregates of
such amounts are as detailed in Note 9.

Notes to the Financial Statements for the year ended 30 June 2013
43
Credit risk related to balances with banks and other financial institutions is managed in accordance with approved board
policy. The following table provides information regarding the credit risk relating to cash and money market securities based on Standard and Poor’s counterparty credit ratings:
2013 2012
$ $
Cash and cash equivalents
- AA- Rated 2,730,848 2,296,244
Financial assets
- AAAm Rated 1,050,000 1,000,000
- Unrated 9,751,777 9,044,454
10,801,777 10,044,454
b. Liquidity risk Liquidity risk arises from the possibility that the entity might encounter difficulty in settling its debts or otherwise meeting its
obligations related to financial liabilities. The entity manages this risk through the following mechanisms: - preparing forward looking cash flow analysis in relation to its operational, investing and financing activities, - maintaining a reputable credit profile, - only investing surplus cash with major financial institutions, and - comparing the maturity profile of financial liabilities with the realisation profile of financial assets.
The table below reflect the undiscounted contractual maturity for financial liabilities. Cash flows realised from financial assets reflect management’s expectation as to the timing of realisation. Actual timing may
therefore differ from that disclosed. The timing of cash flows presented in the table to settle financial liabilities reflects the earliest contractual settlement dates and does not reflect management’s expectations that banking facilities will be rolled forward.
Financial liability and financial asset maturity analysis
Within 1 year 1 to 5 years Total
2013 2012 2013 2012 2013 2012
$ $ $ $ $ $
Financial liabilities due for payment
Trade and other payables (623,351) (629,131) - - (623,351) (629,131)
Total expected outflows (623,351) (629,131) - - (623,351) (629,131)
Financial assets – cash flow realisable
Cash and cash equivalents 2,731,748 2,297,144 - - 2,731,748 2,297,144 Trade, and other receivables 508,233 196,001 - - 508,233 196,001
Financial assets 10,801,777 10,044,454 - - 10,801,777 10,044,454
Total anticipated inflows 14,041,758 12,537,599 - - 14,041,758 12,537,599
Net (outflow)/inflow on financial instruments 13,418,407 11,908,468 - - 13,418,407 11,908,468

Notes to the Financial Statements for the year ended 30 June 2013
44
c. Market risk Interest rate risk Exposure to interest rate risk arises on financial assets and financial liabilities recognised at the end of the reporting period
whereby a future change in interest rates will affect future cash flows or the fair value of fixed rate financial instruments. The entity is also exposed to earnings volatility on floating rate instruments. The financial instruments which primarily expose the entity to interest rate risk are government and fixed interest securities and cash and cash equivalents.
Price risk Price risk relates to the risk that fair value or future cash flows of a financial instrument will fluctuate because of changes in
market prices of securities held. Such risk is managed through diversification of investments across industries and geographic locations.
Sensitivity analysis The following table illustrates sensitivities to the entity’s exposures to changes in interest rates and equity prices. The table indicates the impact on how profit and equity values reported at balance date would have been affected by changes in the relevant risk variable that management considers to be reasonably possible. These sensitivities assume that the movement in a particular variable is independent of other variables.
Profit Equity
$ $
Year ended 30 June 2013
+/- 100 bps in interest rates 27,308 19,116
+/- 100 bps in investments 108,018 75,612
Year ended 30 June 2012
+/- 100 bps in interest rates 22,962 16,074
+/- 100 bps in investments 100,445 70,311
There have been no changes in any of the methods or assumptions used to prepare the above sensitivity analysis from the prior year.
Net fair values Fair value estimation The fair values of financial assets and financial liabilities are presented in the following table and can be compared to their carrying values as presented in the statement of financial position. Fair value is the amount at which an asset could be exchanged, or a liability settled, between knowledgeable, willing parties in an arm’s length transaction. Fair values derived may be based on information that is estimated or subject to judgement, where changes in assumptions may have a material impact on the amounts estimated. Areas of judgement and the assumptions have been detailed below. Where possible, valuation information used to calculate fair value is extracted from the market, with more reliable information available from markets that are actively traded. Where securities are unlisted and no market quotes are available, fair value is obtained using discounted cash flow analysis and other valuation techniques commonly used by market participants. Differences between fair values and carrying values of financial instruments with fixed interest rates are due to the change in discount rates being applied by the market since their initial recognition by the entity. Most of these instruments, which are carried at amortised cost (ie trade receivables), are to be held until maturity and therefore the net fair value figures calculated bear little relevance to the entity.

Notes to the Financial Statements for the year ended 30 June 2013
45
Financial instruments measured at fair value The financial instruments recognised at fair value in the statement of financial position have been analysed and classified using a fair value hierarchy reflecting the significance of the inputs used in making the measurements. The fair value hierarchy consists of the following levels: - quoted unit prices (unadjusted) in active markets for identical assets or liabilities (level 1); - inputs other than quoted prices included within level 1 that are observable for the asset or liability, either directly (as prices)
or indirectly (derived from prices) (level 2); and - inputs for the asset or liability that are not based on observable market data (unobservable inputs) (level 3).
Level 1 Level 2 Level 3 Total
$ $ $ $
2013
Financial assets
Available-for-sale financial assets
- investments in managed funds 10,801,777 - - 10,801,777
2012
Financial assets
Available-for-sale financial assets
- investments in managed funds 10,044,454 - - 10,044,454
Included within level 1 of the hierarchy are investments. The fair value of these financial assets has been based on the closing quoted unit prices at the end of the reporting period, excluding transaction costs. No transfers between the levels of the fair value hierarchy occurred during the current or previous reporting period.

Notes to the Financial Statements for the year ended 30 June 2013
46
Note 24. Client assets under management and trusteeship The entity manages the assets of its clients pursuant to The Public Trustee Act 1930. These assets are not reflected in the Statement of Financial Position as they are held in trust. The entity maintains two investment funds to provide clients with a prudent investment for the particular circumstances of each client. The details of the fund assets are as follows:
Common Fund No. 1 Fund No. 2 Fund
$ $ $
2013
Net assets
Cash 5,702,444 205,517 255,047
Term deposits 56,000,000 - -
Receivables - 238,541 2,593,754
Financial assets
- Cash - 3,439,381 5,418,750
- Australian fixed interest - 3,131,709 19,295,430
- Australian equities - 1,242,751 17,996,740
- Property securities - 549,262 6,760,107
- International equities - 725,016 7,581,000
- International equities (hedged) - 590,280 6,974,695
Payables - (219,121) (2,503,314)
61,702,444 9,903,336 64,372,209
Equity
Client funds 58,970,597 9,903,336 64,372,209
Entity funds 2,731,847 - -
61,702,444 9,903,336 64,372,209
2012
Net assets
Cash 8,058,512 - -
Term deposits 54,750,000 - -
Receivables - - -
Financial assets
- Cash - 4,583,387 5,826,783
- Australian fixed interest - 3,513,035 17,325,520
- Australian equities - 1,752,868 17,866,006
- Property securities - 604,019 6,097,448
- International equities - 658,601 6,204,460
- International equities (hedged) - 612,071 6,033,742
Payables - - -
62,808,512 11,723,981 59,353,959
Equity
Client funds 60,512,268 11,723,981 59,353,959
Entity funds 2,296,244 - -
62,808,512 11,723,981 59,353,959

Notes to the Financial Statements for the year ended 30 June 2013
47
A summary of the investment flows to and from each fund and the allocation of net fund earnings follows:
Common Fund No. 1 Fund No. 2 Fund
$ $ $
2013
Fund value
Balance at 1 July 62,808,512 11,723,981 59,353,959
Applications 90,175,440 1,423,000 7,283,500
Redemptions (91,281,508) (3,538,355) (4,702,894)
Unrealised capital gains (losses) - 294,710 2,437,644
Balance at 30 June 61,702,444 9,903,336 64,372,209
Fund earnings
Unrealised capital gains (losses) - 294,710 2,437,644
Net earnings distributed to investors 2,164,585 481,992 4,550,767
2,164,585 776,702 6,988,411
2012
Fund value
Balance at 1 July 53,869,317 13,174,449 63,665,541
Applications 91,675,491 766,000 2,501,000
Redemptions (82,736,296) (1,849,000) (2,647,000)
Unrealised capital gains (losses) - (367,468) (4,165,582)
Balance at 30 June 62,808,512 11,723,981 59,353,959
Fund earnings
Unrealised capital gains (losses) - (367,468) (4,165,582)
Net earnings distributed to investors 2,689,884 586,346 2,576,385
2,689,884 218,878 (1,589,197)

Statement of Certification
48
In the opinion of the directors of the Public Trustee (“the entity”): a) the financial statements and notes of the entity are in accordance with the Government Business Enterprises Act
1995, including:
(i) giving a true and fair view of the results and cash flows for the year ended 30 June 2013 and the financial position as at 30 June 2013 of the entity; and
(ii) complying with the Australian Accounting Standards and Interpretations and with the Treasurer’s
Instructions.
b) there are reasonable grounds to believe that the entity will be able to pay its debts as and when they fall due. This declaration has been made after receiving the following declaration from the Chief Executive Officer and Manager Financial Operations of the entity: a) the financial records of the enterprise for the year ended 30 June 2013 have been properly maintained in
accordance with Section 51 of the Government Business Enterprises Act 1995;
b) the financial statements and notes for the year ended 30 June 2013 have been prepared in accordance with
Section 52 of the Government Business Enterprises Act 1995; and c) the financial statements and notes for the year ended 30 June 2013 give a true and fair view. Signed in accordance with a resolution of the directors: Craig J Stephens Caroline JM Rockefeller Director Director Hobart, 12 August 2013

Independent Auditor’s Report
49

Independent Auditor’s Report
50

51
Superannuation Declaration
I hereby certify that the Public Trustee has met its obligations under the Commonwealth’s Superannuation Guarantee (Administration) Act 1992 in respect of any employee who is a member of a complying superannuation scheme to which the Public Trustee contributes.
Peter M Maloney Chief Executive Officer Hobart, 12 August 2013

52
Public Interest Disclosures Act 2002
In accordance with the Public Interest Disclosures Act 2002, the Public Trustee has developed procedures and established a system for reporting disclosures of improper conduct or detrimental action by the Public Trustee or its employees. Any person wishing to obtain a copy of these procedures may do so by downloading an electronic version of the document from our website www.publictrustee.tas.gov.au or a hard copy of it is available on request from any of our branches. During the year in review, no disclosed matters were made to the Public Trustee.
Managing Performance in the Public Trustee In accordance with Employment Direction No. 26 – Managing Performance in the State Service, employment practices at the Public Trustee are aligned to meet priorities, strategies, operational plans and the corporate values. Priorities are identified through the corporate planning process; individual unit business plans and alignment with individual roles within the organisation. The Public Trustee places a high importance on performance management and this is reinforced through a number of practices. The Public Trustee’s performance management system includes a comprehensive induction program; the probationary process (where applicable); the development of annual performance agreements with all employees, the identification of learning and development needs; career progression planning; and regular reviews of an individual’s performance against their plan.