annual report 2012 · profile vision ranking as one of japan’s leading chemical companies, showa...
TRANSCRIPT

ANNUAL REPORT 2012
Evolution into a Company that Creates Added Value

Profile
Vision
Ranking as one of Japan’s leading chemical companies, Showa Denko K.K. operates in the six major segments of petro chemicals, chemicals, electronics, inorganics, aluminum, and others. The Showa Denko Group has been implementing its medium-term consolidated business plan “PEGASUS” since January 2011. Despite the severe business environment owing to the slowdown in overseas economies centering on Europe and China, and prolonged appreciation of the yen, we took various measures in 2012 under “PEGASUS.” Specifically, we promoted the capacity expansion project at our U.S. graphite electrode subsidiary, and decided to establish a new graphite electrode production site in China. We also established an aluminum casting subsidiary in Malaysia for our Shotic business. To establish ourselves as a chemical company with a strong presence on the global market, we will continue to promote growth strategies in which our HD media and graphite elec-trode businesses serve as our “Wings.” We will also work to improve our business portfolio and build up strong and diversi-fied businesses on a global scale, thereby establishing leading positions in various market segments. Showa Denko aims to earn the full trust and confidence of the market and society, always managing operations based on the principles of corporate social responsibility. The Company is also committed to the principles of Responsible Care and is vigorously carrying out an action plan to protect the environ-ment as well as health and safety.
We at the Showa Denko Group will provide products and ser-vices that are useful and safe and exceed our customers’ expectations, thereby enhancing the value of the Group, giving satisfaction to our shareholders, and contributing to the sound growth of international society as a responsible corporate citizen.
Contents
Showa Denko at a Glance 1
Consolidated Five-Year Summary 2
Message from the Management 3
2012 Achievements of Medium-Term Business Plan “PEGASUS” 7
Research and Development 10
Review of Operations 14
Corporate Social Responsibility 18
Responsible Care Activities 19
Board of Directors 20
Corporate Governance 21
Consolidated Six-Year Summary 24
Management’s Discussion and Analysis 25
Consolidated Balance Sheets 28
Consolidated Statements of Income 30
Consolidated Statements of Comprehensive Income 31
Consolidated Statements of Changes in Net Assets 32
Consolidated Statements of Cash Flows 33
Notes to Financial Statements 34
Report of Independent Certified Public Accountants 54
Major Subsidiaries and Affiliates 55
Corporate Data 56
Forward-Looking StatementsThis annual report contains statements relating to management’s projections of future profits, the pos-sible achievement of the Company’s financial goals and objectives, and management’s expectations for the Company’s product development program. The Company cannot guarantee that these expectations and projections will be realized or correct. Actual results may differ materially from the results antici-pated in the statements included herein due to a variety of factors, including such economic factors as fluctuations in foreign currency exchange rates as well as market supply and demand conditions. The timely commercialization of products under development by the Company may be disrupted or delayed by a variety of factors, including market acceptance, the introduction of new products by competitors, and changes in regulations or laws. The foregoing list of factors is not inclusive.

Showa Denko at a Glance
24.6%
PetrochemicalsOlefins (ethylene and propylene) and organic chemicals (vinyl acetate mono-mer, ethyl acetate, and allyl alcohol)
16.4%
ChemicalsFunctional polymers, industrial gases (liq-uefied carbon dioxide, dry ice, oxygen, nitrogen, and hydrogen), basic chemicals (liquid ammonia, acrylonitrile, and chloro-prene rubber), and electronic chemicals (specialty gases)
21.1%
ElectronicsHard disks (HDs), compound semiconduc-tors (LED chips), and rare earth magnetic alloys
8.5%
InorganicsGraphite electrodes and ceramics (alumi-num hydroxide, and alumina)
11.9%
AluminumRolled products ( high-purity foils for capacitors), extruded products (cylinders for laser beam printers (LBPs)), forged products, heat exchangers, and beverage cans
17.5%
OthersLithium-ion battery (LIB) materials, build-ing products, and general trading
Note: The above ratios of respective segments have been calculated after adding the amount of adjustments to net sales.
Net Sales 2012
¥739.8 billion
Showa Denko K.K. 1

Consolidated Five-Year Summary
Showa Denko K.K. and Consolidated SubsidiariesDecember 31 Millions of yen
Thousands of U.S. dollars (Note 1)
2012 2011 2010 2009 2008 2012
For the year Net sales ........................................................................... ¥739,811 ¥854,158 ¥797,189 ¥678,204 ¥1,003,876 $ 8,544,825 Operating income (loss) ...................................................... 28,108 47,357 38,723 (4,983) 26,792 324,646 Net income (loss) ............................................................... 9,368 16,980 12,706 (37,981) 2,451 108,196 Depreciation and amortization (Note 2) ................................ 46,232 49,413 50,678 54,358 60,439 533,975
At year-end Total assets ....................................................................... 933,162 941,303 924,484 958,303 962,010 10,778,029 Total net assets .................................................................. 314,966 295,745 284,965 286,722 265,459 3,637,863
Yen U.S. dollars (Note 1)
Per share Net income (loss)—primary (Note 3) ................................... ¥ 6.26 ¥ 11.35 ¥ 8.49 ¥ (29.44) ¥ 1.96 $0.07 Net income—fully diluted (Note 3) ...................................... — 11.20 — — — — Net assets ......................................................................... 182.24 168.33 161.47 163.11 192.85 2.10 Cash dividends (applicable to the period) ............................. 3.00 3.00 3.00 3.00 5.00 0.03
Number of employees at year-end ..................................... 9,890 11,542 11,597 11,564 11,756
Notes: 1. Yen amounts have been translated into U.S. dollars, for convenience only, at the rate of ¥86.58 to US$1.00, the approximate rate of exchange at December 31, 2012. 2. Effective from the year ended December 31, 2011, the Companies have applied “Accounting Standard for Disclosures about Segments of an Enterprise and Related
Information” (Accounting Standards Board of Japan (ASBJ) Statement No. 17, issued on June 30, 2010) and “Guidance on the Accounting Standard for Disclosures about Segments of an Enterprise and Related Information” (ASBJ Guidance No. 20, issued on March 21, 2008). The segment information for the year ended December 31, 2010, which is restated under the accounting standard, is disclosed for comparison purposes.
3. Net income per share has been computed based on the average number of shares of common stock outstanding during the respective fiscal year. Fully diluted net income per share additionally assumes the conversion of the convertible bonds. Diluted net income per share for 2012 and 2010 was not disclosed because the Company had no securities with dilutive effects. Although the potential for stock dilution exists, diluted net income per share for 2009 was not disclosed because the Company posted a net loss. Diluted net income per share in 2008 was not disclosed because there was no dilutive stock at December 31, 2008.
Operating Income by Segment Net Income
(Billions of yen) (Billions of yen)
20122011201020092008-20
-10
0
10
20
30
40
50
60
20122011201020092008-40
0
5
10
15
20
L Electronics L Petrochemicals L Chemicals L Inorganics L Aluminum L HQ costs
See note 2.
L Electronics L Petrochemicals L Chemicals L Inorganics L Aluminum L Others L Adjustments
2 A Unique Chemical Company

Message from the Management
Kyohei Takahashi, Chairman of the Board Hideo Ichikawa, President and CEO
Our business environment in 2012
remained severe, with the Japanese econo-
my facing a difficult situation due to the
slowdown in overseas economies amid the
sovereign debt crisis in Europe, lower eco-
nomic growth in China, strong appreciation
of the yen, and the resultant decline in
exports. These factors combined to cause
negative growth of the Japanese economy
in the third quarter of 2012. In the petro-
chemicals industry, severe production
adjustments continued, reflecting stagnant
demand in Japan and China. The electronic
parts/materials industry also experienced
substantial production adjustments in LCD
panels, notwithstanding increases in smart-
phone production.
Under these circumstances, the Showa
Denko Group is aiming to strengthen its
presence on the global market by imple-
menting its medium-term consolidated busi-
ness plan PEGASUS launched in 2011. The
Group is promoting its growth strategies
with the hard disk (HD) media and graphite
electrode businesses as its “Wings,” while
aiming to build up strong and diversified
businesses on a global scale and establish
leading positions on the market.
In 2012, the Group recorded consolidated
net sales of ¥739,811 million, down 13.4%
from the previous year. The decline in net
sa les ref lected lower sa les in the
Petrochemicals segment, which experienced
trouble with equipment, and in the
Aluminum segment, which transferred the
automotive air-conditioner heat exchanger
business. Operating income decreased
40.6%, to ¥28,108 million, due to lower
profit in all segments except Electronics, in
which profit increased due to higher ship-
ment volumes of HD media. Net income
decreased 44.8%, to ¥9,368 million.
Dividends of ¥3.00 per share were paid to
shareholders on record at the end of Decem-
ber 2012. We made capital investments to
ensure future growth, expanding the capacity
for producing HD media, centering on our site
in Singapore, and silicon carbide (SiC) epitax-
ial wafers for power devices. As a result, our
capital expenditures in 2012 amounted to
¥42,503 million, up ¥3,709 million.
Showa Denko K.K. 3

Message from the Management
The outstanding balance of interest-bear-
ing debt as of the end of 2012 fell ¥5,046
million from the end of the previous year, to
¥342,262 million, as a result of continued
reduction efforts.
Segment PerformancesA breakdown of net sales and operating
income by segment is as follows:
In the Petrochemicals segment, sales
decreased 23.7%, to ¥190,939 million.
Sales of olefins decreased owing to signifi-
cantly lower shipment volumes, reflecting
trouble with the ethylene plant that occurred
in the first half of 2012 and lasted for about
90 days, and production cuts due to the
slackening supply-demand situation in the
Asian market. Sales of organic chemicals
also decreased due to lower shipment vol-
umes of vinyl acetate and ethyl acetate. The
segment recorded an operating loss of
¥977 million (down ¥4,461 million).
In the Chemicals segment, sales slipped
2.2%, to ¥127,376 million. Sales of func-
tional polymers, industrial gases, and elec-
tronic chemicals were maintained at the
previous year’s level. Sales of basic chemi-
cals decreased despite higher liquefied
ammonia sales, as acrylonitrile sales
declined due to production cuts, reflecting
lower demand, and a stagnant market. The
segment recorded an operating loss of ¥875
million (down ¥2,911 million), reflecting the
slackening supply-demand situation of basic
chemicals and the increase in electricity
rates.
In the Electronics segment, sales
decreased 1.0%, to ¥163,306 million. Sales
of HD media increased due to the contribu-
tion of the capacity expansion and the
increase in shipment volumes of high-
capacity media. Sales of compound semi-
conductors increased slightly due to
higher shipment volumes for LCD backlight
applications, notwithstanding the influence
of production adjustments in the electric
appliance industry. Meanwhile, sales of rare
earth magnetic alloys decreased significant-
ly due to the influence of low magnet
demand and inventory adjustments in the
rare earth magnet industry. Operating
income rose 6.8%, to ¥32,311 million,
reflecting steady conditions of the HD media
business.
In the Inorganics segment, sales
decreased 15.5%, to ¥65,573 million.
Although our U.S. subsidiary’s graphite elec-
trode sales increased due to higher selling
prices, sales of graphite electrodes on a
non-consolidated basis decreased due part-
ly to lower volumes of shipments to the
Asian market. As a result, overall sales of
graphite electrodes decreased. Sales of
ceramics decreased as shipment volumes
for electronic materials applications fell
sharply due to the slackening supply-
demand situation. Operating income
decreased 69.4%, to ¥2,954 million.
In the Aluminum segment, sales fell
25.8%, to ¥92,206 million. Sales of rolled
products declined sharply due to the fall in
shipment volumes of high-purity foils for
capacitors, reflecting severe production/
inventory adjustments in the capacitor
industry. Sales of extrusions/specialty prod-
ucts decreased due to the fall in shipment
volumes of aluminum cylinders for laser
beam printers. Sales of Shotic™ forged
products and aluminum cans were main-
tained at the previous year’s level. Sales of
heat exchangers decreased significantly due
to the transfer of the automotive air-
conditioner heat exchanger business to
Keihin Corporation in January 2012. Operat-
ing income fell 74.5%, to ¥1,581 million.
In the Others segment, sales fell 10.2%,
to ¥135,280 million. Sales of lithium-ion
battery (LIB) materials decreased slightly
due to low demand for automotive applica-
tions, notwithstanding higher shipment vol-
umes for smartphone applications. Shoko
Co., Ltd.’s sales decreased due partly to
lower shipment volumes of metals.
Operating income fell 95.2%, to ¥89 million,
due partly to the increase in fixed costs per-
taining to the LIB materials business.
Business Strategy for the Second- half Period under PEGASUSThis year, we will work out our business
strategy for the second-half period under
PEGASUS. As for the HD media and graphite
electrode businesses, which are our base
(growth) businesses, we will maintain their
growth strategies. We will continue position-
ing them as “growth drivers,” preferentially
allocating managerial resources and taking
various steps for expansion, including the
increase in production capacities. At the
same time, we will make sure that these
businesses will play a key role in increasing
profit and cash flows for the Group.
We have also decided that 2013 should
be a year for redesigning the Group’s busi-
nesses. Our efforts will be focused on
strengthening the global supply chains and
improving the profitability of domestic oper-
ations.
a) Strengthening the global supply
chains
The Showa Denko Group is currently estab-
lishing new operation sites in foreign coun-
tries in several business areas. We will aim
to catch new business opportunities and
strengthen our presence, especially in the
ASEAN market. Furthermore, we will estab-
lish a distribution network covering our
domestic and overseas sites, as well as our
suppliers and customers. We will also make
proposals on products and solutions. Thus,
we will establish global supply chains,
4 A Unique Chemical Company

integrating development, production, and
marketing.
b) Improving the profitability
of domestic operations
We need to speedily improve the profitability
of production sites in Japan and of busi-
nesses that depend largely on domestic
demand. To accomplish this end, we are
promoting the redesigning of our business
models, setting target costs, and developing
new markets. From a medium- to long-term
point of view, we will consider consolidation
and relocation of domestic sites.
The world economy is increasingly uncer-
tain. Our business structure is undergoing
substantial changes with the shift of mar-
kets and customers for the Group’s products
from Japan to foreign countries. Under these
circumstances, the Group will redesign its
business models in response to the changes
in competitive conditions for respective
operations, aiming to speedily return to a
growth track. In the latter half of 2013, we
will announce our new business plans for
the second-half period under PEGASUS.
Measures Implemented or Decided in 20121. Investing in a graphite electrode
company in China
We signed an agreement with Sinosteel
Corporation, of China, to acquire 67% of
shares in Sinosteel’s wholly owned subsid-
iary Sinosteel Sichuan Carbon Co., Ltd.
(Sichuan Carbon). This is in accordance with
our plan to expand operations in China and
other Asian countries to supply graphite
electrodes used in electric steel production.
We made Sichuan Carbon a consolidated
subsidiary of ours in March 2013. With the
addition of Sichuan Carbon’s 22,000t/y
plant to its existing facilities in Japan and
the United States, the Group’s total graphite
electrode production capacity has reached
127,000t/y. After capacity expansion in the
United States, the Group’s total capacity will
further increase to 157,000t/y in 2014.
Thus, we will establish ourselves as a lead-
ing supplier of graphite electrodes in the
world.
2. Increasing SiC epitaxial wafer
production capacity by 2.5 times
In August 2012, we increased our SiC epi-
taxial wafer production capacity by 2.5
times, to 1,500 units a month. The wafers
are used in SiC power devices for a wide
range of applications, including automobiles,
railcars, and home electric appliances. In
particular, SiC power devices are expected
to be used increasingly in inverters to con-
trol the rotation of motors. Such inverters
are already commercialized in some home
electric appliances, and used in subway rail-
cars. Following the capacity expansion, we
will continue developing SiC epitaxial wafers
with larger diameters, fewer defects, and
higher uniformity. Specifically, we will accel-
erate the development of six-inch SiC epi-
taxial wafers for heavy-current, high-voltage
applications.
3. Constructing an aluminum casting
plant in Malaysia
We established an aluminum casting sub-
sidiary Shotic Malaysia Sdn. Bhd. in the
state of Johor, Malaysia. The new subsidiary
will start commercial production by the end
of 2014. In addition to an integrated alumi-
num casting/forging facility at Kitakata,
Japan, we are operating one plant each in
Portugal and Singapore for producing forged
aluminum parts. We have been selling the
products (Shotic™) on the world market,
mainly for use in automotive parts. With the
scheduled construction of the new casting
plant in Malaysia, we will aim to better meet
growing demand in the Asian market. By
securing casting capability at these two
locations, we intend to ensure the security
of supply. We will expand the Shotic busi-
ness as a key component of our Aluminum
segment.
4. Constructing a high-purity aluminum
foil plant in China
Our new subsidiary Showa Denko Aluminum
(Nantong) Co., Ltd., is building a plant at a
Graphite electrodes SiC epitaxial wafers Shotic™
Showa Denko K.K. 5

Message from the Management
site in Nantong, Jiangsu Province, China.
The new subsidiary forms part of our plan to
expand the capacitor-grade, high-purity alu-
minum foil business. The new plant in China,
scheduled for start-up in the second half of
2013, will finish rolled foil supplied from our
Sakai Plant, and supply final products to our
customers in China. Aluminum electrolytic
capacitors are used widely in electric appli-
ances and transport machinery. Demand for
aluminum electrolytic capacitors in China is
expected to grow, reflecting continued eco-
nomic growth in that country. With the
establishment of the new plant in China, we
will aim to better meet the growing demand
for capacitor-grade, high-purity aluminum
foil.
5. Establishing joint venture
for GaN LED chip business
In December 2012, we transferred our busi-
ness in gallium-nitride (GaN)-based blue
LED chips to TS Opto Co., Ltd., a joint ven-
ture between Showa Denko K.K. and Toyoda
Gosei Co., Ltd. Through the joint venture, we
are aiming to achieve synergistic effects in
R&D, improving brightness and production
efficiency. In the LED business other than the
GaN LED chips, such as aluminum-gallium-
indium-phosphide (AlGaInP), gallium-arsenide
(GaAs), and gallium-phosphide (GaP), we will
continue our independent operations.
6. Increasing LIB packaging material
production capacity
In August 2012, our subsidiary Showa
Denko Packaging Co., Ltd., decided to
increase its production capacity for alumi-
num laminated films used for packaging
LIBs. Specifically, Showa Denko Packaging
decided to double its annual production
capacity versus the 2010 level by the sec-
ond half of 2013. Compared with metallic
LIBs, pouch-type LIBs based on aluminum
laminated films provide higher flexibility in
molding, lighter weight, and better heat dis-
sipation. Thus, pouch-type LIBs are widely
used as small LIBs for portable devices.
Reflecting the rapid growth of the market for
smartphones and tablet PCs, demand for
aluminum laminated film is expected to
grow, as it contributes toward the miniatur-
ization of LIBs.
The Group will continue contributing to the
sound growth of society by developing and
providing useful and safe technologies,
products, and services. We will ensure safe-
ty, conserve resources and energy, and
reduce the volume of industrial waste to be
discharged and chemical substances to be
emitted, thereby contributing to the protec-
tion of the global environment.
The business environment will continue to
be challenging throughout 2013. The Group
will work hard to redesign its business
structure to cope with the severe environ-
ment, aiming to speedily return to a growth
track. We will quickly respond to the chang-
es in the business environment and contin-
ue to carry out reforms.
We look forward to the continued support
from our fellow shareholders and all other
stakeholders.
March 27, 2013
Kyohei Takahashi, Chairman of the Board
Hideo Ichikawa, President and CEO
High-purity aluminum foils for capacitors LIB packaging materials
6 A Unique Chemical Company

(Billions of yen)
0
40
10
50
60
20
30
2013Forecast
2012201120102009
L Petrochemicals L Chemicals L Electronics L Inorganics L Aluminum L Others
Notes: 1. See note 2 on page 2. 2. The 2013 forecast was announced on February 14, 2013.
2012 Achievements of Medium-Term Business Plan “PEGASUS”
The Showa Denko Group is carrying out “PEGASUS” for the 2011–2015 period.
The name “PEGASUS,” a Winged Horse from Greek mythology, is a symbol of the Group with two “wings”—The HD media and graphite electrode businesses—and powerful “legs”—Stable base businesses, growth busi-nesses, new growth businesses for the next generation, and strong R&D activities. By carrying out “PEGASUS,” the Group is building up strong and diversified businesses on a global scale, thereby establish-ing leading positions in various market segments.
SiC Epi-wafers for Power Devices
Organic EL for Lighting
Trends in Capital Investments
Our capital investments in 2012 were
focused on projects in growth businesses,
centering on capacity expansions for HD
media and SiC epitaxial wafers for power
devices. In 2013, we will make major invest-
ments in the Inorganics segment: full-scale
expansion work at SDKC, of the United
States, and capital investment at Showa
Denko Sichuan Carbon Inc., in China.
Petrochemicals
Basic Chemicals
Aluminum Foils for Capacitors
Cylinders for LBPs
Battery Materials
High-purity Gases for
Semiconductor Processing
Stable base
businesses
Next-generation
growth businesses
Strong R&D activities
See page 10
Growth businesses
Two wings
HD media
Four legs
Graphite electrodes
Showa Denko K.K. 7

• Expanding the capacity at Showa
Denko Carbon, Inc., of the United
States, for completion in 2014
Measures Implemented or Decided in 2012
Strengthening the Global Supply Chains
While strengthening our existing
businesses in China, we will aim
to catch new business opportu-
nities and strengthen our pres-
ence in the ASEAN market.
We will establish global sup-
ply chains covering our domestic
and overseas sites as well as
our suppliers and customers,
integrating development, pro-
duction, and marketing.
Graphite Electrodes• Acquired a stake in a Chinese company;
Showa Denko Sichuan Carbon Inc.
became our subsidiary in March 2013
Steadily implemented measures for growth, centering on the HD media and graphite electrode businesses
HD Media• Contribution of the capacity expansion
implemented mainly at our site in
Singapore
• Leading the industry in the supply of
the sixth-generation, high-capacity
media (2.5-inch, 500GB)
1
4
Showa Denko Sichuan Carbon Inc.
High-purity aluminum foil
Chemical alumina
Shotic™
Showa Denko Carbon, Inc.
Road Map toward Higher Storage Capacity
2006 2008 2010 2012 2014 2016
(GB/p)
(Storage capacity per 2.5” media)
40% year growth
Slowdown to a 20% year growth
TAMR
SMRPMR
500GB
334GB
1TB750GB
650GB500
1,000
Showa Denko HD Yamagata K.K.
Showa Denko Electronics K.K. (Ichihara)
Showa Denko HD Trace Corp.
Showa Denko HD (Malaysia) Sdn. Bhd.
Showa Denko HD Singapore Pte. Ltd.
Showa Denko HD America Corp.
Sichuan, China
Graphite electrodes
P ChemicalsP InorganicsP Aluminum
Nantong, China The new plant, scheduled for start-up in the second half of 2013, will finish rolled foil sup-plied from our Sakai Plant, and provide final products to our customers in China.
Johor, MalaysiaUnder construction for start-up in 2014; Together with the existing forging plant in Singapore, the new plant will contribute toward expanding overseas operations.
Tayan, Indonesia Building a 300,000t/y chemical alumina plant for start-up in 2015 (Our chemical alumina production in Japan will be ter-minated following the start-up of the new plant in Indonesia.)
8 A Unique Chemical Company

Improving the Profitability of Domestic Operations
Improving Financial Strength
• Strengthening operations by review-
ing our business structure
We will promote the redesigning of our
business models, reviewing development/
production systems, setting target costs,
and developing new markets.
• Implementation of organizational
changes
We have changed our organization to
ensure speedy and timely decision mak-
ing. As a result of the abolishment of the
Business Sector and Headquarters sys-
tems and the shift to a system of direct
supervision by the CEO, we now have a
“flat” and agile organization.
SiC Epi-wafers for Power Devices• Operating as the sole volume-producer of SiC
epitaxial wafers for power devices• Expanded the production capacity by 2.5
times in August 2012
Battery Materials• Decided to double the production capacity
for aluminum laminated films for LIB pack-aging, versus the 2010 level
LEDs• Established a joint venture with Toyoda
Gosei for the GaN blue LED business
High-purity Aluminum Foils• Started constructing a new plant in
Nantong, China, to strengthen the business in capacitor-grade, high-purity aluminum foil
Petrochemicals• Aiming to increase the ratio of the use of
non-naphtha feedstock, to 40%• Developing acetaldehyde-process butadi-
ene: Aiming to start commercial production in 2016
Shotic• Building a new casting plant in Malaysia
Strategy for Specialty Gases
We are strengthening our production/
distribution bases in Asia for business
areas we have strengths, such as high-
purity ammonia for compound semicon-
ductors, nitrous oxide for deposition of
nitride films, and hydrogen bromide for
etching and cleaning.
Interest-bearing debt decreased from the
previous year as a result of continued
reduction efforts. The D/E ratio also
improved.
2
3
Net Sales by Geographic Area(Billions of yen)
0
600
900
300
2012201120102009
L Asia L Others L Japan
(Effective January 4, 2013)
Business Development
Center
CEO
Business divisions (13) Plants (12)
Production,technology, SCM
Business strategy,marketing
R&D
Staffsections atHead Office
Interest-bearing Debt and D/E Ratio(Billions of yen/times)
342.3347.3351.0
392.9
373.9
1.48
1.301.23
1.171.09
20122011201020092008
L Interest-bearing debt P D/E ratio
Shanghai Showa ChemicalsShanghai Showa Electronics Materials
Korea Showa Chemicals(Specialty gases)
Zhejiang Quzhou Juhua Showa Electronic Chemical Materials (Specialty gases)
Showa Specialty Gas (Taiwan) Taiwan Showa Chemicals Manufacturing(Chemical products)
Showa Specialty Gas Singapore
Showa Denko K.K. 9

Research and Development
Petrochemicals
In this segment, we are fully utilizing our
proprietary technologies for catalysts,
organic synthesis, and polymer synthesis
to meet the needs of manufacturers of
printing ink, paint, electronic materials,
and automotive parts. As the supply of
butadiene is expected to become tight due
to the limitations of capacity increase
despite globally growing demand, we are
vigorously examining a new butadiene
production process technology, utilizing
our technology/business base. We are
improving the performance of existing cat-
alysts and developing new catalysts for
acetyl chemicals and allyl alcohol to fur-
ther strengthen our proprietary production
processes. As for n-propyl acetate, an allyl
alcohol derivative used as an environment-
friendly solvent, we are continuing steady
production and developing new applica-
tions.
Furthermore, to meet growing demand
for allyl ester resin for use in optical mate-
rials, we are developing new grades and
making marketing efforts to expand mar-
kets. In the area of heat- resistant trans-
parent f i lm SHORAYAL™, which is
expected to be used in displays and other
electronic applications, we are distributing
a sufficient volume of samples from our
pilot plant for evaluation by potential cus-
tomers. We are concurrently promoting the
development of other types of new films,
utilizing the film production/evaluation
technologies we obtained from the devel-
opment of SHORAYAL™. While we are
developing green sustainable chemical
processes under national projects, much
progress has been made in applying basic
technologies to gas separation and recov-
ery. We are now studying ways of using
such technologies on a commercial basis,
hoping to substantially cut energy con-
sumption in our basic processes for man-
u f a c t u r i n g p e t r o c h e m i c a l s . T h e
Petrochemicals segment invested ¥653
million in R&D in 2012.
Chemicals
To quickly meet wide-ranging customer
needs and make timely proposals on key
materials for new product development by
customers, we are developing semicon-
ductor-processing materials, photofunc-
t i ona l ma te r ia l s , so lde r res i s t s ,
high-performance gels, organic intermedi-
ates, and base materials for cosmetics.
Regarding photofunctional materials
that support the production of high-
performance LCDs, we worked to develop
markets for multifunctional-thiol-based
compounds for addition to photo-curing
resins as well as photo polymerization ini-
tiators. Based on our new multifunctional-
thiol-based-compound plant completed in
2012, we are developing many new appli-
cations as additives in industrial resin
compositions. Our solder resist for flexible
circuit boards in TVs and other large LCDs
has been well received by the market. We
developed new grades that meet market
requirements utilizing the information net-
work with customers, and started supply-
ing them to various markets.
In the area of high-performance gels,
we took a first step to enter a new busi-
ness field through a strategic partnership
Showa Denko and its Group companies are promoting R&D in line with their medium-term consolidated business plan PEGASUS, allocating resources preferentially to the two business domains of “Energy/Environment” and “Electronics.” We are pur-suing our strategy of promoting the interconnection of inorganic, metal, and organic chemical technologies, while attaching great importance to marketing activities. In particular, we are focusing on such promising areas as advanced battery materials, high-performance optical films, and silicon carbide (SiC) epitaxial wafers, aiming to speedily commercialize these products. Showa Denko and its Group companies invested ¥20,633 million (US$238 million) in R&D in 2012. A breakdown by segment of R&D efforts and investments during the year is as follows:
SHORAYAL™
10 A Unique Chemical Company10 A Unique Chemical Company

with BIA Separations GesmbH, of Austria.
We expect to achieve good synergistic
effect in purification technology for bio-
pharmaceuticals, a market area growing
very rapidly in recent years. As for
high-performance liquid chromatography
columns (Shodex™), in which we have
had a long history, we are developing new
products meeting the needs in the emerg-
ing economies and providing analytical
know-how and technical service, in addi-
tion to the development of columns for
sophisticated analysis. We are developing
organic intermediates, utilizing our propri-
etary materials and strengths in precision
organic synthesis technology. As for base
materials for cosmetics, in addition to
high-performance vitamin C derivative
Apprecier™, we are making preparations
for launching various new compounds. We
are also developing new liquid electrolytes
for LIBs.
In semiconductor processing materials,
we are developing chemical mechanical
polishing (CMP) slurries for metal polish-
ing at very small line widths, high-purity
gases for etching, cleaning, and film depo-
sition, and high-purity chemicals for
cleaning agents and solvents. We are also
developing charge dissipating agents for
electron-beam lithography processes. As
part of these efforts, we have developed
volume production technologies for
high-purity carbonyl fluoride, a cleaning
gas with a very low level of global warm-
ing potential, and high-purity hydrogen
selenide, used as a film deposition materi-
al for solar cells. The Chemicals segment’s
R&D investment amounted to ¥3,176 mil-
lion in 2012.
Electronics
We are accelerating the development of
state-of-the-art technologies to meet the
increasingly sophisticated market require-
ments. As for storage materials, we are
continuing to develop new technologies as
the world’s largest independent HD media
manufacturer. We are producing HD media
with higher performance using perpendic-
ular magnetic recording (PMR) technology,
which we have commercialized for the
first time in the world. At the same time,
we are developing shingled write magnet-
ic recording media, the next-generation
technology that will further increase
recording density, as well as thermal
assist recording and bit-patterned media
technologies. We are making preparations
for commercialization of these new media
products. Using PMR technology, we are
making commercial shipments of 2.5-inch
and 3.5-inch HD media with recording
capacity of 500 gigabytes and 1 terabyte
CIM™ monolithic columns produced by BIA Separations
HDs Ultrabright LED chips
per disk, respectively, which represented
the highest recording capacity for those
sizes in December 2012.
We are continuing to develop LED chips
with higher brightness and power. Using
our proprietary light emitting layer tech-
nology, we have developed aluminum-
gallium- indium-phosphide (AlGaInP) LED
chips that emit red light with a wavelength
of 660 nm, the optimum light for acceler-
ating the growth of plants. These new LED
chips have been adopted at various facili-
ties and model plants. As for infrared LED
chips, we are developing reflection-type
and point-light-source products based on
the metal organic chemical vapor deposi-
tion (MOCVD) process, in addition to the
conventional liquid phase epitaxial pro-
cess. As for indium-gallium-nitride (InGaN)
LED chips, we established a joint venture
with Toyoda Gosei Co., Ltd. to improve
brightness and production efficiency.
In the area of neodymium-iron-boron
magnetic alloys, we are meeting market
requirements for high-performance mag-
nets through sophisticated casting tech-
nologies and the better control of alloy
microstructures. Furthermore, we are con-
tinuing to develop a new composition with
lower levels of added dysprosium (a kind
of rare metal) that will maintain high levels
of magnetic force at high temperatures, to
Showa Denko K.K. 11Showa Denko K.K. 11

Research and Development
meet the needs of the automobile industry.
The Electronics segment invested ¥5,013
million in R&D in 2012.
Neodymium-iron-boron magnetic alloys
Inorganics
We are developing materials and applica-
tions by fully utilizing our proprietary
material/process technologies. We are
developing fillers with high heat dissipation
and high electrical insulating properties to
serve the needs for compact and high-
performance electronic and power devic-
es. Based on our strengths in nanoparticle
technology, we developed, as part of a
national project that ended in February
2012, a visible-light-responsive photocat-
alyst for antibacterial/antiviral agents with
improved levels of indoor activity. We are
developing applications in final products in
cooperation with former partners in the
national project. The Inorganics segment
spent ¥386 million on R&D in 2012.
Aluminum
We are developing light, strong, and
high-performance materials, parts, and
products to meet market needs while con-
ducting research on basic technologies
pertaining to their production. Utilizing our
proprietary pressurized continuous casting
technology, pressurized horizontal com-
pletely continuous casting technology, and
forging technology, we are developing new
alloys and products. In view of the grow-
ing automobile market in Asian countries,
we are developing aluminum cast rods
and forgings with still higher performance
for use in automotive parts.
We are improving our die technology for
extrusion, forging, drawing, and press
working; our process technologies for
purification, fabrication, and bonding; as
well as our simulation technology for
structural and hot fluid studies. The
Aluminum segment’s R&D investment
amounted to ¥2,102 million in 2012.
Others
We are continuing to develop and market
materials and components that will ensure
sufficient capacity, output, life, and low
electrical resistance in large LIBs for vari-
ous types of electric vehicles. We are pro-
viding such solutions as SCMG™ graphite
anode material, VGCF™ carbon nanotube,
SDX ™ carbon-coated aluminum foils, and
aluminum laminated films for packaging.
We increased our production capacity
of four-inch SiC epitaxial wafers for power
devices at the Chichibu Plant by 2.5 times,
to 1,500 units a month, through facility
expansion and improvement of production
technology. These epitaxial wafers have
high surface smoothness and fewer
crystal defects. Compared with the main-
stream silicon-based semiconductors, SiC
power devices using SiC epitaxial wafers
have the advantage of being able to
endure high voltage and heavy current
and to operate at high temperatures.
We developed a high-speed plant culti-
vation technology, the “Shigyo method,” in
cooperation with Yamaguchi University for
use in plant growth facilities based on our
proprietary high-brightness LED chips. We
are developing the market for this technol-
ogy. The technology has been adopted by
Kawauchi Village, Fukushima Prefecture,
at its LED-based plant growth facility.
In the area of printed electronics, we
developed printable silver nanowire ink joint-
ly with Osaka University. The product enables
free formation of patterns through printing.
As common R&D activities, Showa
Denko’s Corporate R&D Center conducted
basic research into new areas with a view
to fostering new businesses and develop-
ing technologies common to different seg-
ments. The Analysis & Physical Properties
Center and the Safety Evaluation Center
supported each segment’s R&D efforts by
providing expertise in computational sci-
ence as well as conducting analyses and
investigations. R&D expenditures in 2012
in the Others segment, including common
activities, totaled ¥9,303 million.
Decahedral titanium oxide fine particles Silver-nanowire-ink-based film after curing
12 A Unique Chemical Company12 A Unique Chemical Company

Progress in R&D Strategy under “PEGASUS”
As from January 2013, we have introduced
a new R&D organization, establishing the
Business Development Center as the focus
of our R&D activities. The center consists of
two laboratories, projects for commercializa-
tion, and technical assistance centers serv-
ing all business segments. Each unit, with a
specific R&D mission, works together and
promotes personnel exchanges to establish
the Group’s techn ica l advantages.
Meanwhile, in areas where R&D and pro-
duction need to be integrated owing to the
specific culture of business, development
departments at plants perform R&D func-
tions. Specifically, in the areas of aluminum
and HD media, R&D functions continue to
be performed under direct supervision of
relevant business divisions. The Analysis &
Physical Properties Center and the Safety
Evaluation Center continue to provide tech-
nical support to common R&D activities.
The Institute for Polymers and Chemicals
The Institute for Polymers and Chemicals
has been established to increase the effi-
ciency and speed in the development of
functional materials that should be complet-
ed within a relatively short period, by assem-
bling technical experts for specific areas
from plants, business divisions, and corpo-
rate R&D units. The new institute enables
the integration of our experience and tech-
nology pertaining to wide-ranging organic/
inorganic materials. Through efforts to coor-
dinate different materials, we will be able to
realize new properties that are not possible
when we simply try to improve individual
materials. Thus, we will provide solutions to
existing customers and new markets. Fur-
thermore, we will apply core functions of
materials to different kinds of products, as
well as meet the needs of both high-end
products with high performance and low-end
products in growing markets. The institute
will work together with business divisions to
establish unique businesses and with a
strong presence in areas that have relation-
ships with existing operations and that have
growth potential.
The Institute for Advanced
and Core Technology
The Institute for Advanced and Core
Technology is focused on two business/
development domains and three technology
families: 1. Carbon materials and technolo-
gy, 2. Thin film materials and technology,
and 3. Catalytic materials and technology.
Through this institute, we are aiming to cre-
ate new businesses by deepening our core
material technologies, including nano car-
bon and other functional carbon materials.
Focusing on Nano Carbon
As from the beginning of this year, we have
entered into a strategic partnership with
Mitsubishi Corporation in the business of
fullerene, a typical carbon nano material. The
Institute for Advanced and Core Technology
will promote the development of this materi-
al. The institute has also started developing
graphene in cooperation with Tohoku
University. Since we are already commercial-
ly producing VGCF ™ carbon nanotubes as
additives in LIBs, we now cover all the three
major carbon nano materials. Based on our
experience as the world’s first commercial
producer of carbon nanotubes, we will
develop advanced applications in Electronics
and Energy—major business domains under
“PEGASUS”— creating businesses that will
contribute to the Group’s profit.
Changes in R&D Organization
Development in areas related to growth sectors
Growth & New growth sectors(Electronics/Energy & Environment)
Strengthen existing businesses
Power-deviceSiC Epi-wafer Project
Development departments
at plants
Institute for Polymersand Chemicals
Institute for Advanced and
Core Technology
Nano CarbonThin FilmCatalysts
Green Innovation Project
AluminumHD Media
LIB Materials
Search R&D Commercialization
Graphene
Collaborating with Japan Science and Technology Agency (JST) and Tohoku
University
Fullerene
Frontier Carbon Corp.(Joint venture with Mitsubishi Corp.)
Carbon nanotube
(VGCF ™)
A model of graphene’s molecular structure
Use in organic photovoltaic cells
Use in lithium-ion batteries
Showa Denko K.K. 13

Review of Operations
Petrochemicals
Consolidated Business Results (Millions of yen)
2012 2011 Difference Rate of change
Sales 190,939 250,396 -59,456 -23.7%
Operating income -977 3,484 -4,461 —
Outlook
Sales of olefins significantly decreased
owing mainly to the influence of the trouble
with the ethylene plant that occurred in the
first half of 2012. Sales of organic chemicals
Chemicals
Consolidated Business Results (Millions of yen)
2012 2011 Difference Rate of change
Sales 127,376 130,203 -2,827 -2.2%
Operating income -875 2,035 -2,911 —
Outlook
Sales of functional polymers, industrial
gases, and electronic chemicals were main-
tained at the previous year’s level. Sales of
basic chemicals decreased despite higher
liquefied ammonia sales, as acrylonitrile
sales declined due to the sluggish market
and depressed demand for their main use as
materials for acrylic fiber and acrylonitrile-
butadiene-styrene (ABS) resins.
also decreased due to lower shipment vol-
umes of ethyl acetate, etc.
As a result, the Petrochemicals segment’s
sales decreased 23.7%, to ¥190,939 mil-
lion. The segment recorded an operating
loss of ¥977 million (down ¥4,461 million).
Olefins
Ethylene production in Japan totaled
6,146,000 tons in 2012, a decrease from
6,690,000 tons in the preceding year, owing
partly to the depressed domestic demand
due to an economic slump, the decline of
the export of ethylene’s derivatives due to
the soft global market and unprofitable
exports caused by the strong yen, and the
increase in the import of ethylene’s deriva-
tives due to the strong yen. Showa Denko
As a result, the Chemicals segment’s
sales slipped 2.2%, to ¥127,376 million.
The segment recorded an operating loss of
¥875 million (down ¥2,911 million).
Topics
In July 2012, SDK started using its wholly
owned subsid iar y Shanghai Showa
Electronics Materials Co., Ltd. (SSE), to
strengthen its business in China related to
high-purity gases for electronics. SSE pro-
duces and sells equipment for treating used
high-purity gases resulting from the produc-
tion of semiconductors, etc. SSE will expand
its operations in the future, covering produc-
tion, sales, and distribution of high-purity
gases for the Chinese electronics industry.
In July 2012, Union Showa K.K., a joint ven-
ture between SDK and UOP LLC, of the United
States, announced that it successfully devel-
oped a new method of stable solidification of
insoluble ferrocyanide widely used to remove
radioactive cesium. Insoluble ferrocyanide
(SDK)’s ethylene production in 2012 was
463,000 tons, a decrease of 191,000 tons
from 2011. Our olefin plant utilization rate in
the second half of 2012 was about 90% on
average due to production cuts that reflect-
ed the slackening supply-demand situation
in the global market.
As a result, sales of olefins slumped sig-
nificantly, and operating income from this
business decreased.
Organic Chemicals
Sales of ethyl acetate decreased due to lower
shipment volumes in response to the sluggish
demand for solvents. Sales of vinyl acetate also
decreased due to lower shipment volumes.
maintains high cesium-absorbing- volume
capacity even in contaminated cooling
water. However, insoluble ferrocyanide is
easily decomposed by heat, resulting in the
vaporization of cesium. Thus, an innovative
method of heat solidification that allows sta-
ble containment of cesium had been sought.
Union Showa, under the guidance of
Professor Hitoshi Mimura of Tohoku
University, succeeded in developing a new
method of stable solidification by heat-treat-
ing a mixture of used ferrocyanide and zeo-
lite. Under the method, zeolite traps cesium
vaporized by heat treatment, preventing the
release of cesium into the air.
Molecular sieves (zeolites)
14 A Unique Chemical Company

Electronics
Consolidated Business Results (Millions of yen)
2012 2011 Difference Rate of change
Sales 163,306 165,011 -1,705 -1.0%
Operating income 32,311 30,242 2,069 6.8%
Outlook
Sales of hard disk (HD) media increased due
to the contribution of the production capaci-
ty expansion carried out in the previous year.
Sales of compound semiconductors
increased slightly. Meanwhile, sales of rare
earth magnetic alloys decreased significant-
ly due to the influence of inventory adjust-
ments in the rare earth magnet industry.
As a result, the Electronics segment’s
sales decreased 1.0%, to ¥163,306 million.
However, operating income rose 6.8%, to
¥32,311 million, reflecting increased ship-
ment volumes of HD media.
Hard Disks
In the first half of 2012, the supply-demand
situation of HD media was tightened due to
the smooth recovery of the hard disk drive
(HDD) industry from the floods in Thailand in
the previous year. The shipment volume of
HD media, especially those of high density
2.5-inch 500GB HD media, increased from
the same period of the previous year as a
result of the production capacity expansion
carried out in the previous year.
In the second half of 2012, the shipment
volume of HD media was negatively affected
by the reduction of production by HDD man-
ufacturers, reflecting the sluggish demand
for PCs.
As a result, HD media’s sales and operat-
ing income in 2012 increased due to higher
shipment volumes.
Showa Denko HD Singapore Pte. Ltd.
Compound Semiconductors
Concerning compound semiconductors,
sales increased slightly due to higher ship-
ment volumes for LCD backlight applications,
notwithstanding the influence of production
adjustments in the electric appliance indus-
try. As a result, the operating income of com-
pound semiconductors increased.
Topics
In December 2012, SDK transferred its busi-
ness in gallium-nitride (GaN)-based blue LED
chips to its wholly owned subsidiary TS Opto
Co., Ltd., through a company split, and trans-
ferred 70% of its shares in TS Opto to Toyoda
Gosei Co., Ltd., thereby making TS Opto a
joint venture between SDK and Toyoda Gosei.
Through the joint venture, SDK will aim to
achieve synergistic effects in R&D, improving
brightness and production efficiency. In the
LED business other than the GaN LED chips,
SDK will continue its independent operations.
SDK decided to provide Kawauchi Village,
Fukushima Prefecture, with a new cultivation
method for LED-based plant growth facilities
for free. The village is building an LED-based
plant growth facility, and is planning to start
producing leaf lettuce and herbs by the end
of the first half of 2013. SDK will continue to
contribute toward ensuring a stable supply of
safe food and promoting agriculture through
the provision of LED chips that emit light with
optimized wavelengths for plant growth and
the innovative “Shigyo method” technology.
In January 2013, SDK’s LED-based light-
ing system for plant growth facilities was
awarded the Nikkei Business Daily Awards
for Superiority in the 2012 Nikkei Superior
Products and Service Awards.
Note: SDK has developed the new cultivation method jointly with Professor Masayoshi Shigyo, Faculty of Agriculture, Yamaguchi University. Compared with conventional LED-based plant growth facilities, the new method shortens shipment cycles and increases the amount of harvest through the irradiation of lights at optimized ratios for plant growth, using LED chips produced by SDK.
Cultivation of vegetables using LED light source
Kawauchi Village’s plant growth facility upon completion (Conceptu-al drawing provided by the village)
Rare Earths
Sales of rare earth magnetic alloys decreased
significantly due to a major reduction in the
shipment volumes and price reductions,
reflecting the inventory adjustments in the rare
earth magnet industry on the rebound of the
accelerated procurement of rare earth mag-
netic alloys as countermeasures against the
strong appreciation of raw material prices in
2011. As a result, the operating income of rare
earth magnetic alloys decreased significantly.
Showa Denko K.K. 15

Review of Operations
Inorganics
Consolidated Business Results (Millions of yen)
2012 2011 Difference Rate of change
Sales 65,573 77,564 -11,991 -15.5%
Operating income 2,954 9,640 -6,687 -69.4%
Outlook
Although our U.S. subsidiary’s graphite elec-
trode sales increased due to higher selling
prices, sales of graphite electrodes on a
non-consolidated basis decreased due part-
ly to lower volumes of shipments to the
Asian market. As a result, overall sales of
graphite electrodes decreased. Sales of
ceramics decreased as shipment volumes
of cerium oxide for electronic material
applications fell sharply due to the slacken-
ing supply-demand situation.
Aluminum
Consolidated Business Results (Millions of yen)
2012 2011 Difference Rate of change
Sales 92,206 124,280 -32,074 -25.8%
Operating income 1,581 6,212 -4,630 -74.5%
As a result, the Inorganics segment’s
sales decreased 15.5%, to ¥65,573 million,
and operating income decreased 69.4%, to
¥2,954 million, due mainly to lower operat-
ing income of cerium oxide.
Ceramics
Concerning the Ceramics business, sales
and operating income decreased due mainly
to a major reduction in the shipment vol-
umes of cerium oxide, reflecting the prog-
ress in our customers’ efforts to reduce the
consumption of cerium oxide as counter-
measures against the strong appreciation of
its prices, which was caused by the sub-
stantial appreciation of raw materials prices
in 2011.
Carbons
Concerning the graphite electrode business,
although our U.S. subsidiary’s sales
increased, sales on a non-consolidated
basis decreased due to stagnant demand of
the Asian electric furnace steel industry.
As a result, the operating income of our
Outlook
Sales of rolled products declined due to the
fall in shipment volumes of high-purity foils
for capacitors. Sales of extrusions/specialty
products decreased due to the fall in ship-
ment volumes of aluminum cylinders for
laser beam printers. Sales of heat exchang-
ers decreased significantly due to the trans-
fer of the automotive air-conditioner heat
exchanger business to Keihin Corporation in
January 2012. Sales of Shotic™ forged
products and aluminum cans were main-
tained at the previous year’s level.
As a result, the Aluminum segment’s sales
fell 25.8%, to ¥92,206 million, and operating
income fell 74.5%, to ¥1,581 million.
graphite electrode business was almost the
same as that of the previous year, though
the overall sales decreased.
Topics
In March 2013, SDK acquired 67% of shares
in Sinosteel Sichuan Carbon Co., Ltd., a whol-
ly owned subsidiary of Sinosteel Corporation,
of China, and made the company an SDK
subsidiary. This is in accordance with SDK’s
plan to expand operations in China and other
Asian countries to supply graphite electrodes
used in electric steel production. When
Sichuan Carbon’s 22,000t/y plant is added to
the existing facilities in Japan and the United
States, the Showa Denko Group’s total graph-
ite electrode production capacity will reach
127,000t/y. After capacity expansion in the
United States, the Group’s total capacity will
further increase to 157,000t/y in 2014. Thus,
SDK will establish itself as a leading global
supplier of graphite electrodes.
Rolled Products
Production of high-purity foils for capacitors
decreased significantly due to severe inven-
tory adjustments in the aluminum electro-
lytic capacitor industry.
Topics
As part of our plan to expand the capacitor-
grade, high-purity aluminum foil business,
SDK is now expanding the production
capacity of rolled foils at the Sakai Plant and
constructing a plant in China to finish rolled
foils. These measures will expand SDK’s
production capacity of capacitor-grade,
high-purity aluminum foils from currently
2,000t/month to 3,000t/month in 2013. In
16 A Unique Chemical Company

OthersConsolidated Business Results (Millions of yen)
2012 2011 Difference Rate of change
Sales 135,280 150,583 -15,303 -10.2%
Operating income 89 1,860 -1,772 -95.2%
Outlook
Sales of lithium-ion battery (LIB) materials
decreased slightly due to lower shipment
volumes for electric vehicle applications,
March 2012, SDK held a groundbreaking
ceremony for its subsidiary Showa Denko
Aluminum (Nantong) Co., Ltd., at a site in
Nantong, Jiangsu Province, China. The new
plant in China, scheduled for start-up in the
second half of 2013, will finish rolled foils
supplied from SDK’s Sakai Plant, and supply
final products to customers in China.
Aluminum electrolytic capacitors are used
widely in electric appliances and transport
machinery. Demand for aluminum electro-
lytic capacitors in China is expected to grow,
reflecting continued economic growth in that
country. With the establishment of the new
plant in China, SDK aims to meet the grow-
ing demand for capacitor-grade, high-purity
aluminum foils in a timely manner.
Extrusions/Specialty Products
In the first half of 2012, demand for extru-
sions from the automotive industry was
good. In the second half of 2012, however,
extrusions recorded lower shipment volumes
due to an economic slump. In addition, the
shipment volumes of aluminum cylinders for
laser beam printers decreased due to the
inventory adjustments in the laser beam
printer industry. As a result, sales and oper-
ating income of extrusions and specialty
products decreased.
Shotic
SDK has been producing and selling casted/
forged aluminum products (trade name:
Shotic™) on the world market, mainly for
use in automotive parts. We maintained high
shipment volumes in the Shotic business in
2012. As a result, sales and operating
income of the Shotic business were main-
tained at the previous year’s level.
Topics
SDK established an aluminum casting subsid-
iary Shotic Malaysia Sdn. Bhd. in the state of
Johor, Malaysia. The new subsidiary will start
commercial production by the end of 2014. In
addition to an integrated aluminum casting/
forging facility at Kitakata, Japan, SDK is oper-
ating one plant each in Portugal and Singapore
for producing forged aluminum parts. With the
scheduled construction of the new casting
plant in Malaysia, SDK aims to better meet
growing demand in the Asian market. By
securing casting capability at these two loca-
tions, SDK intends to ensure the security of
supply. SDK will expand the Shotic business as
a key component of its Aluminum segment.
Shotic™
Heat Exchangers
Sales of heat exchangers decreased signifi-
cantly due to the transfer of the automotive
air-conditioner heat exchanger business to
Keihin Corporation in January 2012. SDK
will continue to focus its efforts in its heat
exchanger business on expanding the sales
of direct cooling devices for power control
units in hybrid cars and heat exchangers for
electrical and industrial machinery applica-
tions.
Aluminum Cans
The scale of the aluminum cans market for
the domestic beverage industry as a whole
was maintained at the previous year’s level.
Shipment volumes of aluminum cans for the
domestic beer industry have been decreas-
ing continuously. However, the market of
nonalcoholic beer has been expanding very
rapidly, and total sales of beer and beerlike
beverages in 2012 were maintained at the
previous year’s level. In addition, the ship-
ment volumes of aluminum cans for soft
drinks increased. Reflecting these, SDK’s
sales of aluminum cans slightly increased,
and its operating income also slightly
increased due to cost reductions.
notwithstanding higher shipment volumes
for smartphone applications. Shoko Co.,
Ltd.’s sales decreased due partly to lower
shipment volumes of metals.
As a result, the Others segment’s sales
fell 10.2%, to ¥135,280 million. Operating
income fell 95.2%, to ¥89 million.
Showa Denko K.K. 17

Corporate Social Responsibility
Our Code of Conduct and Its Practical GuideIn 2012, we completely revised the “Code of
Conduct” for the Showa Denko Group
employees established in 1998 and the
“Guidelines” enacted in the following year,
put the new version out as “Our Code of
Conduct and Its Practical Guide,” and dis-
tributed the Japanese version of it to all
employees of SDK and its affiliated compa-
nies in Japan. We also translated it into
eight other languages corresponding to the
foreign countries and areas where SDK’s
overseas offices and overseas affiliated
companies are located, put them and the
Japanese version in one volume as the
“Global Version,” and distributed it to all
employees of relevant offices and overseas
affiliated companies in order to enable all
employees of the Group to act under com-
mon norms. We are having “Our Code of
Conduct and Its Practical Guide” penetrate
all employees of the Group through reading
sessions implemented during Corporate
Ethics Month, which we hold in January
every year. We are encouraging every
employee to consider how the Group can
support various manufacturing industries by
fully utilizing the Group’s competence cen-
tering on chemical technologies, and to con-
tribute to the sound growth of society.
Involvement in Community ActivitiesIn line with its Vision that stresses contribu-
tion to society through business activities,
the Group is addressing global environmen-
tal issues, such as the mitigation of climate
change and biodiversity efforts, as important
matters for management. The Group, there-
fore, is making strenuous efforts to reduce
GHG emissions and develop technologies
pertaining to the environment and energy. In
addition, fully utilizing their chemistry-relat-
ed resources, many of the Group’s operation
sites are contributing toward solving relevant
local communities’ issues, covering such
areas as education, regional development,
and welfare.
In particular, many of the Group’s opera-
tion sites in Japan and foreign countries are
helping the chemical/environmental educa-
tion of young people. Many sites constantly
provide classes on demand to elementary
schools in neighborhoods located near our
work sites. A considerable number of people
have participated in the guided tours to
observe the plastic containers recycling
plant in the Kawasaki Plant. The Head Office
participated in the “Summer Chemistry
Experiment Event for Children” sponsored by
the Japan Chemical Industry Association.
The Head Office also held chemistry educa-
tion programs for school teachers. As a
member of the chemical industry, which has
a substantial impact on the natural environ-
ment, we believe it is a part of our social
responsibility to communicate the impor-
tance of environmental protection and
chemical technologies to the younger gener-
ation who will lead the future, in addition to
reducing environmental impact resulting
from our business activities.
We also have positively taken part in
many Responsible Care (RC) Community
Dialogue Meetings organized by the Japan
Chemical Industry Association as part of its
RC activities, and exchange opinions proac-
tively with local residents and administrative
staff members.
In the area of regional welfare, the Group
is supporting local communities through the
recycling of aluminum cans. The Group
gives donations to welfare facilities, etc.,
based on the number of aluminum cans
recovered mainly by its employees. This alu-
minum can recycling activity has a more
than 40-year history.
For more information on our CSR activi-
ties, please visit our website:
http://www.sdk.co.jp/english/csr.html
Our Code of ConductAs officers and employees of the Showa Denko Group,1. We will act with integrity as a
responsible citizen of the interna-tional society.
2. We will provide our customers with satisfaction and safety.
3. We will develop corporate culture that helps every member of the Group to fully display his/her ability.
4. We will meet the expectations of local communities.
5. We will make vigorous efforts to maintain and improve the global environment.
Class on demand for making objects (Kitakata Plant)
Volunteers participating in a cleaning activity in Hirano district (As part of the RC Community Dialogue Meetings) (Tokuyama Plant)
18 A Unique Chemical Company

Responsible Care Activities
Responsible Care is the chemical industry’s global voluntary initiative, representing a commitment to work together to continuously improve the health, safety, and environmental per-formance of chemicals over their entire life cycles, namely, their development, production, distribution, use, final con-sumption, and disposal. Showa Denko has been performing its Responsible Care activities since 1995, when it established action guide-lines to implement the program. The Showa Denko Group’s Responsi-ble Care activities are conducted within our 13 business divisions/departments, 15 operation sites, 3 branches, the Busi-ness Develop ment Center, and 14 subsid-iaries/affiliates, based on voluntary, specific action plans prepared in line with the CSR Committee’s basic plan. The following are some examples of our RC activities:
Energy ConservationWe are making our best efforts to conserve energy to contribute to the prevention of global warming and protect natural resourc-es. Due mainly to the substantial influence of production troubles, the effect of improve-ments of production facilities in 2010, on our rate of energy consumption per unit produc-tion in 2011, was very limited. Our rate of energy consumption per unit production in 2011, that was 91.4% of the 1990 figure, was almost the same as that of the previous year. We will continue promoting energy con-servation in a systematic manner. Moreover, approximately 20% of our total electricity requirements are now met by our hydroelec-tric power plants. We will continue to make the most of this clean source of energy.
Reduction of Greenhouse Gas EmissionsOur greenhouse gas (GHG) emissions in 2011 fell 20% from the base year (1990) figure. As for the commitment period (2008-2011), our GHG emissions fell 15% on the average. We are confident we will be able to achieve the goal of a 6% reduction from the 1990 figure within the time frame of 2008-2012 under the Kyoto Protocol. However, we are proceeding with further reduction efforts.
Contribution to a Recycling-based SocietyWe are committed to effectively using indus-trial waste and to reducing the volume of its
discharge. As a result, the final volume of landfill disposal in 2011 was reduced by 89% from the 1990 base level, due partly to inorganic sludge (in cement, for example). We will continue working to reduce industrial waste. A large number of employees within the Group are engaged in the recycling of aluminum cans. We are utilizing waste plas-tic as synthesis gas for ammonia production. Thus, we are making contributions toward a recycling-based society.
Development of Technologies and ProductsFully utilizing its core technologies, the Group is continuing to develop new products and technologies to contribute to sustainable growth of society. For example, we are accel-erating our development and marketing efforts in the business field of plant factories. The market size of plant factories is expected to increase because plant factories have many advantages, including realization of sta-ble food production not affected by weather and farming without insecticides due to their insect-damage-free environment. To stimu-late the market growth of plant factories, we have developed ultra-bright red LED chips that emit red light of optimum wavelength for accelerating the growth of plants, and are actively promoting equipment for plant facto-ries, including heat-insulating walls for clean rooms. On the other hand, our efforts to enhance environment-conscious manage-ment and business continuity management with disaster preparedness were highly rated by the Development Bank of Japan (DBJ), and we have been given the highest ratings in the DBJ’s Environmental Responsibility Ra t i ngs and Bus iness Con t i nu i t y Management Ratings.
Commitment to Chemical SafetyFollowing the enforcement of the EU’s new chemica l l eg is la t ion (Reg is t ra t ion , Evaluation, Authorization and Restriction of Chemicals, or REACH), we completed the registration of 10 substances in 2010. We are now making preparations for registration in 2013. We are also steadily addressing the EU’s rules of Clas sification, Labeling and Packaging (CLP).
Environment-related Investment
(Billions of yen)
0
40
20
30
10
50
’10 ’11’09’08’07’06’05’04’03’02’90Cumulative value since 1990(Showa Denko K.K.)
Energy Consumption Rate Transition
70
90
80
100
’10 ’11’09’08’07’06’05’04’03’02’90Relative value: base year 1990(Showa Denko K.K.)
Trends in the Final Volume of Landfill Disposal
(Tons/year)
0
10,000
15,000
5,000
20,000
’10 ’11’09’08’07’06’05’04’03’02’90
Base year 1990(Showa Denko K.K.)
Trends in Greenhouse Gas Emissions
(Emissions: Kt-CO2)
2,000
3,000
2,500
3,500
’08 –’12Group’starget
’10 ’11’09’08’07’90
Base year 1990(SDK and Consolidated Subsidiaries in Japan)
Note: On this page, the term “year” refers to the period from April 1 of the relevant year through March 31 of the next year, except the graph “Environment-related Investment.”
Showa Denko K.K. 19

Board of Directors (As of March 27, 2013)
From left to right: Akiyoshi Morita, Masaru Amano, Shunji Fukuda, Akira Koinuma, Kyohei Takahashi, Hideo Ichikawa, Yoshikazu Sakai, Hirokazu Iwasaki, and Tomofumi Akiyama
BOARD OF DIRECTORS
Representative Director, Chairman of the Board
Kyohei Takahashi
Representative Director, President
Hideo Ichikawa
Directors
Akira KoinumaYoshikazu SakaiShunji FukudaHirokazu IwasakiMasaru AmanoTomofumi Akiyama (Outside Director)
Akiyoshi Morita (Outside Director)
AUDITORS
Standing Statutory Auditors
Ichiro NomuraAkira Sakamoto
Auditors
Hiroyuki Tezuka (Outside Auditor)
Yukio Obara (Outside Auditor)
Kiyomi Saito (Outside Auditor)
CORPORATE OFFICERS AND SENIOR CORPORATE FELLOW
Chief Executive Officer
Hideo Ichikawa
Managing Corporate Officers
Takashi MiyazakiGeneral Manager, Petrochemicals Division and Olefins Department
Shunichi ShiraishiOfficer in charge of Aluminum Rolled Products, Aluminum Specialty Components, and Aluminum Can divisions
Akira KoinumaChief Technology Officer; Officer in charge of Production Technology, Energy & Electricity, SPS Innovation, and CSR departments, Chairman, Safety Measures Committee
Corporate Officers
Yoshikazu SakaiChief Financial Officer; Officer in charge of Finance & Accounting and Information Systems departments
Shunji FukudaOfficer in charge of Industrial Gases, Basic Chemicals, and Corporate Strategy departments
Hirokazu IwasakiOfficer in charge of complex and plants (Oita Complex and Kawasaki, Higashinagahara, Tokuyama, Isesaki, Tatsuno, Yokohama, Shiojiri, Chichibu, Omachi, Oyama, and Kitakata plants)
Yoshiharu MizunoOfficer in charge of Ceramics and Carbons divisions
Masaru AmanoChief Risk Management Officer; Officer in charge of Internal Audit, Legal & Intellectual Property, General Affairs & Human Resources, and Purchasing & SCM departments; Chairman, Security Export Control Committee
Robert C. WhittenPresident and CEO, Showa Denko Carbon, Inc.; Assistant to President in charge of special assignment matters (in charge of Global Marketing)
Tetsuo NakajoOfficer in charge of Corporate R&D Department; General Manager, Business Development Center
Yoshiyuki NishimuraOfficer in charge of Electronic Chemicals, Functional Chemicals, Electronics Materials divisions, and Advanced Battery Materials Department
Atsushi MizutaniGeneral Representative in China, General Manager, China Office, Corporate Strategy Department, President of Showa Denko (Shanghai) Co., Ltd.
Saburo MutoGeneral Manager, Finance & Accounting Department
Jiro IshikawaGeneral Manager, HD Division
Keiichi KamiguchiGeneral Manager, Corporate Strategy Department
Kanji TakasakiAssistant to President in charge of special assignment matters; Executive Vice President of Keihin Thermal Technology Co., Ltd.
Hitoshi TanakaGeneral Manager, Carbons Division
Tatsuharu AraiOita Complex Representative
Nobuhiko KawamuraGeneral Manager, Electronics Materials Division
Jun TanakaGeneral Manager, Advanced Battery Materials Department; President, Showa Denko Packaging Co., Ltd.
Kohei MorikawaGeneral Manager, Electronic Chemicals Division
Senior Corporate Fellow
Takashi NakayamaAssistant to President in charge of new business creation relating to chemicals
20 A Unique Chemical Company

Corporate Governance
1. Basic concept regarding corporate governanceWe fully recognize the importance of corpo-
rate governance as a means to ensure the
soundness, effectiveness, and transparency
of management, and to earn the full trust
and confidence of the market and society,
thereby enhancing corporate value over the
long term. The Company is, therefore, taking
various measures to strengthen compliance
and management supervision, clarify man-
agement responsibility, ensure quick deci-
sion making and effective execution, and
improve disclosure. We also aim to strength-
en relations with our stakeholders, including
shareholders, customers, suppliers, citizens,
and employees. Based on the above, we
have clarified our mission in the form of the
Company vision stated below, working hard
to realize this vision.
VISIONWe at the Showa Denko Group will provide
products and services that are useful and
safe and exceed our customers’ expecta-
tions, thereby enhancing the value of the
Group, giving satisfaction to our sharehold-
ers, and contributing to the sound growth of
international society as a responsible corpo-
rate citizen.
2. Situation of the Company’s super vision and decision- making functionsWe have adopted the auditor system to
enhance the fairness and transparency of
management, ensuring efficient manage-
ment of the Company. To clearly separate
management supervision functions from
business execution functions, we have intro-
duced the corporate officer system. The top
management team, consisting of the Presi-
dent and corporate officers in charge of
respective operations, is working to increase
the speed of decision making and vitalize
operations. Meanwhile, the Company has
substantially reduced the number of direc-
tors. In addition, we have strengthened the
supervision functions by appointing outside
directors. At Board meetings held once or
twice a month, the Board decides the Com-
pany’s basic policy and decides, after full
deliberation, on matters provided for in the
Companies Act and the Company’s Articles
of Incorporation as well as important matters
for the execution of the Company’s opera-
tions, ensuring a speedy and vigorous deci-
sion-making process. We appoint directors
from the viewpoint of strengthening corpo-
rate governance, aiming to strengthen the
Board of Directors’ supervision functions
and ensure the propriety of the decision-
making process. We make sure that corpo-
rate officers whose duties are primarily
business execution will not concurrently
serve as directors, in principle. Furthermore,
we have abolished the system of officer
directors except for the Chairman and the
President, while strengthening the super-
vision by auditors (including outside auditors)
and mutual supervision among directors.
The term of office of directors has been
shortened to one year to ensure a quick
response to changes in the business envi-
ronment and to clarify management respon-
sibility of directors. At the Company’s
ordinary general meeting of shareholders
held on March 27, 2013, nine directors,
including two outside directors, were
appointed.
3. Situation of business execution The Management Committee, which meets
once a week in principle and is chaired
by the President, deliberates and decides on
matters to be referred to the Board of
Directors’ meetings and important matters
pertaining to overall management of the
Company. The decisions are made after
deliberations on two occasions. As for
investment plans, their risks are examined
by task teams before referral to the
Management Committee, and their progress
is monitored after authorization. The Compa-
ny’s medium-term business plans are decid-
ed not only by the Management Committee
but also by the participation of all corporate
officers. The Company considers that
responsible execution forms the basis of
corporate activities. The Company evaluates
performances of respective business seg-
ments to ensure the effective implementa-
tion of the performance-based evaluation
system. The Company has Security Export
Control and Safety Measures committees
under the CSR Committee chaired by the
President. The Company also has Responsi-
ble Care, Risk Management, Human Rights/
Corporate Ethics, and IR promotion councils.
These committees and councils investigate,
study, and deliberate on specific matters
important for the execution of businesses.
4. Situation of auditing functions The Company’s Board of Auditors consists of
five auditors, including three outside auditors.
The auditors attend the Board of Directors’
meetings and other important internal meet-
ings, offering opinions as necessary. They
audit the execution of operations through
such means as field investigations, hearing
sessions, and perusal of important docu-
ments, making proposals and providing
advice and recommendations to ensure the
sound management of the Company. They
are working to strengthen the consolidated
auditing system in cooperation with auditors
of major associated companies. We have
a department for internal audit reporting
directly to the President. The Internal Audit
Department invest igates the overal l
Showa Denko K.K. 21

Corporate Governance
execution of business, checking for accura-
cy, propriety, and efficiency. It also investi-
gates the management policies, business
plans, and their execution, checking for con-
sistency and soundness. The results of
internal auditing are reported to auditors to
ensure consistency with audits by auditors.
As for matters relating to the environment
and safety, respective divisions in charge
conduct Responsible Care audits. KPMG
AZSA LLC. conducts auditing of the Compa-
ny based on an auditing contract and an
annual plan agreed upon with auditors, and
provides audit results to auditors. The
accounting corporation and auditors
exchange information and views from time
to time to strengthen their cooperation.
5. Compliance and risk managementThe Company’s Board of Directors has
decided to strengthen compliance and pro-
mote risk management as key components
of its internal control system. The Board will
continue to work on these issues.
Compliance
The Company is working to strengthen com-
pliance through the Code of Conduct for its
employees and the Human Rights/Corporate
Ethics Promotion Council, which is under the
CSR Committee chaired by the President.
Every January, we observe Corporate Ethics
Month to renew our awareness. Further-
more, compliance is strengthened through
various seminars provided by staff sections
and activities organized by respective busi-
ness sectors. In the event of transgressions,
the Company takes measures to prevent
recurrence and takes disciplinary actions.
The performance evaluation of relevant sec-
tors is to reflect such transgressions. To pre-
vent a transgression or detect it early, we
have established an internal check system
and channels of communication for report-
ing the matter.
Risk management
The Management Committee examines
important matters from various angles. In
particular, investment plans are examined
carefully from such viewpoints as strategic
importance and risk management. Further-
more, their progress is monitored and their
results are reviewed. Respective business
sectors analyze and evaluate their own busi-
ness risks. The Risk Management Promotion
Council, which is chaired by the Company’s
Chief Risk Management Officer, is under the
CSR Committee chaired by the President.
The Risk Management Promotion Council
decides the Company’s basic risk manage-
ment policy, regularly evaluates overall risks,
works out measures regarding high-risk
matters, and checks how the measures are
implemented by relevant business sectors.
As to individual risks pertaining to envi-
ronmental protection, industrial safety,
disaster prevention, chemical substances,
product quality, intellectual property, fair
trade, export control, and legal matters, rele-
vant staff sections establish in-house rules
and manuals, provide seminars, and man-
age risks through the review and authoriza-
tion of proposals from business sectors. In
the event of an emergency, the Company
will set up crisis headquarters to take swift
action and minimize damage.
6. Reaction policy on large-scale purchases of the Company’s stock certificates, etc.The Company believes that its shareholders
should be determined through the free
movement of its shares in the market.
Although proposals regarding the large-
scale purchases of the Company’s shares
are made by specific persons, the decision
whether to sell the Company’s shares in
response to such a proposal shall eventually
be made based on the opinion of the share-
holders, which is reached after being given
the sufficient information necessary for
making an appropriate decision and suffi-
cient time for consideration.
However, the purposes of some large-
scale purchases do not contribute to the tar-
get company’s corporate value and the
common interests of shareholders, such as
those that a) obviously damage the corpo-
rate value and common interests of share-
holders or b) do not provide sufficient time
nor information for the target company’s
board of directors or shareholders to exam-
ine the conditions of the purchase. The
Company believes that, ideally, its share-
holders should make the decision as to
whether the large-scale purchases proposed
by a specific person or other entity secure
and enhance the Company’s corporate value
and the common interests of shareholders,
by obtaining necessary and sufficient infor-
mation from both the purchaser and the
Company’s Board of Directors.
The Company’s Board of Directors has
determined that it is necessary to continue
to have certain rules to prevent purchases
which do not contribute to enhancing the
Company’s corporate value and which are
contrary to the common interests of share-
holders. Therefore, the Company has
renewed its Reaction Policy on Large-scale
Purchases of the Company’s Stock
Certificates, which was approved and intro-
duced at the Company’s ordinary general
meeting of shareholders in March 2008, by
modifying a portion of its contents and
obtaining approval at the Company’s ordi-
nary general meeting of shareholders in
March 2011.
22 A Unique Chemical Company

7. OtherRemuneration, etc., to directors, auditors, and auditing corporation (for the period from January
1 through December 31, 2012)
Remuneration, etc., to directors and auditors
Number of applicable persons Paid amount
Directors (excluding outside directors) 8 ¥308 million
Auditors (excluding outside auditors) 3 ¥61 million
Outside directors and auditors 6 ¥52 million
Total 17 ¥421 million
Note: The above remuneration figures do not include salaries to some of the directors they receive in the capacity of employees. The amount of such salaries totaled ¥15 million.
Remuneration to the auditing corporation
Paid amount
Name of accounting auditor: KPMG AZSA LLC. Remuneration for the issuance of auditing certification based on the audit contract
¥152 million
8. Personal/financial relations and interests between the Company and outside directors/auditorsThe Company has two outside directors and three outside auditors. None of them has special
interests in the Company. An outline of the Company’s corporate governance system is as
shown below.
Shareholders’ Meeting
Execution of Duty
JobAudits
Decision Making and SupervisionAuditing
Board of Auditors
Auditors
Top Management
President Corporate Officers in Charge
Accounting Audits
Links
InternalAudits
Business Divisions
Staff Sections
Security Export Control Committee
Safety Measures Committee
Human Rights/Corporate Ethics Promotion Council
Responsible Care Promotion Council
Risk Management Promotion Council
IR Promotion Council
Board of Directors
Management Committee
R&D Committee
CSR Committee
Internal Audit Department
AccountingAuditor
Showa Denko K.K. 23

Consolidated Six-Year Summary
Showa Denko K.K. and Consolidated SubsidiariesDecember 31 Millions of yen
Thousands of U.S. dollars (Note 1)
2012 2011 2010 2009 2008 2007 2012
For the year
Net sales ..................................................... ¥739,811 ¥854,158 ¥797,189 ¥678,204 ¥1,003,876 ¥1,023,238 $ 8,544,825
Petrochemicals (Note 2) ........................... 190,939 250,396 199,590 235,999 400,173 395,105 2,205,353
Chemicals (Note 2) .................................. 127,376 130,203 133,578 91,887 93,319 84,709 1,471,192
Electronics (Note 2) .................................. 163,306 165,011 147,988 127,807 188,778 201,013 1,886,190
Inorganics (Note 2) .................................. 65,573 77,564 77,958 53,711 88,797 84,599 757,370
Aluminum (Note 2) ................................... 92,206 124,280 130,084 168,799 232,809 257,812 1,064,984
Others (Note 2) ........................................ 135,280 150,583 154,084 — — — 1,562,489
Adjustments (Note 2) ............................... (34,870) (43,879) (46,093) — — — (402,753)
Operating income (loss) ................................ 28,108 47,357 38,723 (4,983) 26,792 76,671 324,646
Net income (loss) ......................................... 9,368 16,980 12,706 (37,981) 2,451 33,066 108,196
R&D expenditures ........................................ 20,633 21,597 20,670 20,743 20,072 17,396 238,314
Capital expenditures .................................... 42,503 38,794 58,035 38,666 54,799 69,346 490,907
Depreciation and amortization (Note 2) .......... 46,232 49,413 50,678 54,358 60,439 49,761 533,975
At year-end
Total assets ................................................. 933,162 941,303 924,484 958,303 962,010 1,029,629 10,778,029
Total net assets ............................................ 314,966 295,745 284,965 286,722 265,459 298,659 3,637,863
Yen U.S. dollars (Note 1)
Per share
Net income (loss)—primary (Note 3) ............. ¥ 6.26 ¥ 11.35 ¥ 8.49 ¥ (29.44) ¥ 1.96 ¥ 27.52 $0.07
Net income—fully diluted (Note 3) ................ — 11.20 — — — 26.50 —
Net assets ................................................... 182.24 168.33 161.47 163.11 192.85 222.31 2.10
Cash dividends (applicable to the period) ............................ 3.00 3.00 3.00 3.00 5.00 5.00 0.03
Number of employees at year-end ............... 9,890 11,542 11,597 11,564 11,756 11,329
Notes: 1. Yen amounts have been translated into U.S. dollars, for convenience only, at the rate of ¥86.58 to US$1.00, the approximate rate of exchange at December 31, 2012.2. Effective from the year ended December 31, 2011, the Companies have applied “Accounting Standard for Disclosures about Segments of an Enterprise and Related
Information” (Accounting Standards Board of Japan (ASBJ) Statement No. 17, issued on June 30, 2010) and “Guidance on the Accounting Standard for Disclosures about Segments of an Enterprise and Related Information” (ASBJ Guidance No. 20, issued on March 21, 2008). The segment information for the year ended December 31, 2010, which is restated under the accounting standard, is disclosed for comparison purposes.
3. Net income per share has been computed based on the average number of shares of common stock outstanding during the respective fiscal year. Fully diluted net income per share additionally assumes the conversion of the convertible bonds. Diluted net income per share for 2012 and 2010 was not disclosed because the Company had no securities with dilutive effects. Although the potential for stock dilution exists, diluted net income per share for 2009 was not disclosed because the Company posted a net loss. Diluted net income per share in 2008 was not disclosed because there was no dilutive stock at December 31, 2008.
24 A Unique Chemical Company

Management’s Discussion and Analysis
Results of Operations
Consolidated net sales in 2012 totaled ¥739,811 million (US$8,545 mil-
lion), a decrease of ¥114,347 million, or 13.4%, from the previous year
due to lower sales in the Petrochemicals segment, which experienced
trouble with equipment in the first half of the year, and in the Aluminum
segment, which transferred the automotive air-conditioner heat exchang-
er business.
The cost of sales decreased ¥90,694 million, or 12.6%, to ¥628,628
million (US$7,261 million), reflecting the decrease in net sales.
Selling, general and administrative expenses decreased ¥4,403 mil-
lion, or 5.0%, to ¥83,076 million (US$960 million), due partly to the fall
in transportation expenses.
We recorded operating income of ¥28,108 million (US$325 million),
down ¥19,249 million, or 40.6%, due to the decrease in operating
income in all segments except Electronics.
R&D expenditures decreased ¥964 million, to ¥20,633 million
(US$238 million).
Information by Business Segment
A breakdown of net sales and operating income by business segment
is as follows.
PetrochemicalsProduction of ethylene and propylene decreased significantly from the
previous year due to the influence of the trouble with the ethylene plant
that occurred in the first half of 2012 as well as production cuts that
reflected the globally sluggish demand. Sales of olefins decreased owing
to significantly lower shipment volumes. Sales of organic chemicals also
decreased due to lower shipment volumes of vinyl acetate and ethyl
acetate.
As a result, the Petrochemicals segment’s sales decreased ¥59,456
million, or 23.7%, to ¥190,939 million (US$2,205 million). The segment
recorded an operating loss of ¥977 million (US$11 million), down
¥4,461 million from the previous year, reflecting the fall in shipment
volumes.
ChemicalsSales of functional polymers, industrial gases, and electronic chemicals
were maintained at the previous year’s level. Sales of basic chemicals
decreased despite higher liquefied ammonia sales, as acrylonitrile sales
declined due to production cuts, reflecting lower demand and the
stagnant market.
As a result, the Chemicals segment’s sales slipped ¥2,827 million,
or 2.2%, to ¥127,376 million (US$1,471 million). The segment recorded
an operating loss of ¥875 million (US$10 million), down ¥2,911 million
from the previous year.
ElectronicsSales of HD media increased due to the contribution of the capacity
expansion and the increase in shipment volumes of high-capacity media.
Sales of compound semiconductors increased slightly due to higher
shipment volumes for LCD backlight applications, notwithstanding the
influence of production adjustments in the electric appliance industry.
Meanwhile, sales of rare earth magnetic alloys decreased significantly
due to the influence of inventory adjustments in the rare earth magnet
industry.
As a result, the Electronics segment’s sales slipped ¥1,705 million,
or 1.0%, to ¥163,306 million (US$1,886 million). However, operating
income rose ¥2,069 million, or 6.8%, to ¥32,311 million (US$373 mil-
lion).
InorganicsAlthough our U.S. subsidiary’s graphite electrode sales increased due to
higher selling prices, sales of graphite electrodes on a non-consolidated
basis decreased due partly to lower volumes of shipments to the Asian
market. As a result, overall sales of graphite electrodes decreased. Sales
of ceramics decreased as shipment volumes of cerium oxide for electric
material applications fell sharply due to the slackening supply-demand
situation.
As a result, the Inorganics segment’s sales decreased ¥11,991 mil-
lion, or 15.5%, to ¥65,573 million (US$757 million), and operating
income decreased ¥6,687 million, or 69.4%, to ¥2,954 million
(US$34 million).
Net Sales by Segment Operating Income
(Billions of yen) (Billions of yen)
201220112010200920080
200
400
600
800
1,000
1,200
20122011201020092008-10
0
20
10
30
40
50
�� Petrochemicals �� Chemicals �� Electronics �� Inorganics �� Aluminum �� Others
Note: Regarding changes in the segmentation, see note 2 on page 24. Showa Denko K.K. 25
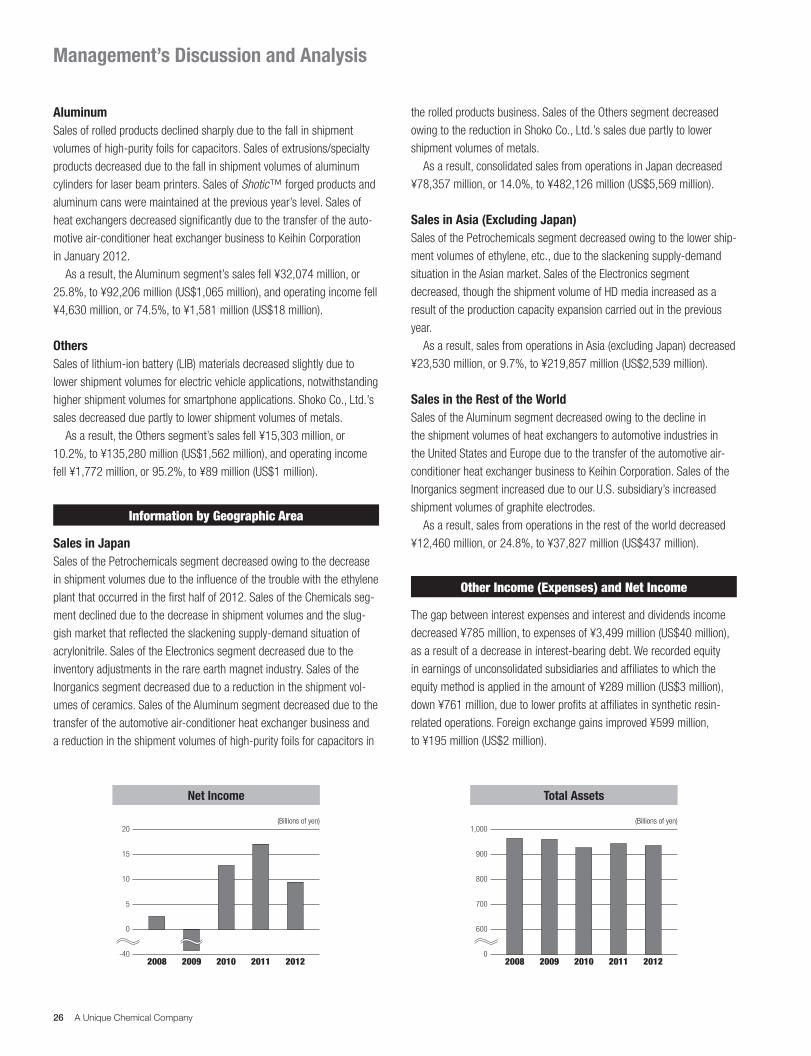
Management’s Discussion and Analysis
Net Income Total Assets
(Billions of yen) (Billions of yen)
20122011201020092008-40
0
5
10
15
20
201220112010200920080
600
700
800
900
1,000
AluminumSales of rolled products declined sharply due to the fall in shipment
volumes of high-purity foils for capacitors. Sales of extrusions/specialty
products decreased due to the fall in shipment volumes of aluminum
cylinders for laser beam printers. Sales of Shotic™ forged products and
aluminum cans were maintained at the previous year’s level. Sales of
heat exchangers decreased significantly due to the transfer of the auto-
motive air-conditioner heat exchanger business to Keihin Corporation
in January 2012.
As a result, the Aluminum segment’s sales fell ¥32,074 million, or
25.8%, to ¥92,206 million (US$1,065 million), and operating income fell
¥4,630 million, or 74.5%, to ¥1,581 million (US$18 million).
OthersSales of lithium-ion battery (LIB) materials decreased slightly due to
lower shipment volumes for electric vehicle applications, notwithstanding
higher shipment volumes for smartphone applications. Shoko Co., Ltd.’s
sales decreased due partly to lower shipment volumes of metals.
As a result, the Others segment’s sales fell ¥15,303 million, or
10.2%, to ¥135,280 million (US$1,562 million), and operating income
fell ¥1,772 million, or 95.2%, to ¥89 million (US$1 million).
Information by Geographic Area
Sales in JapanSales of the Petrochemicals segment decreased owing to the decrease
in shipment volumes due to the influence of the trouble with the ethylene
plant that occurred in the first half of 2012. Sales of the Chemicals seg-
ment declined due to the decrease in shipment volumes and the slug-
gish market that reflected the slackening supply-demand situation of
acrylonitrile. Sales of the Electronics segment decreased due to the
inventory adjustments in the rare earth magnet industry. Sales of the
Inorganics segment decreased due to a reduction in the shipment vol-
umes of ceramics. Sales of the Aluminum segment decreased due to the
transfer of the automotive air-conditioner heat exchanger business and
a reduction in the shipment volumes of high-purity foils for capacitors in
the rolled products business. Sales of the Others segment decreased
owing to the reduction in Shoko Co., Ltd.’s sales due partly to lower
shipment volumes of metals.
As a result, consolidated sales from operations in Japan decreased
¥78,357 million, or 14.0%, to ¥482,126 million (US$5,569 million).
Sales in Asia (Excluding Japan)Sales of the Petrochemicals segment decreased owing to the lower ship-
ment volumes of ethylene, etc., due to the slackening supply-demand
situation in the Asian market. Sales of the Electronics segment
decreased, though the shipment volume of HD media increased as a
result of the production capacity expansion carried out in the previous
year.
As a result, sales from operations in Asia (excluding Japan) decreased
¥23,530 million, or 9.7%, to ¥219,857 million (US$2,539 million).
Sales in the Rest of the WorldSales of the Aluminum segment decreased owing to the decline in
the shipment volumes of heat exchangers to automotive industries in
the United States and Europe due to the transfer of the automotive air-
conditioner heat exchanger business to Keihin Corporation. Sales of the
Inorganics segment increased due to our U.S. subsidiary’s increased
shipment volumes of graphite electrodes.
As a result, sales from operations in the rest of the world decreased
¥12,460 million, or 24.8%, to ¥37,827 million (US$437 million).
Other Income (Expenses) and Net Income
The gap between interest expenses and interest and dividends income
decreased ¥785 million, to expenses of ¥3,499 million (US$40 million),
as a result of a decrease in interest-bearing debt. We recorded equity
in earnings of unconsolidated subsidiaries and affiliates to which the
equity method is applied in the amount of ¥289 million (US$3 million),
down ¥761 million, due to lower profits at affiliates in synthetic resin-
related operations. Foreign exchange gains improved ¥599 million,
to ¥195 million (US$2 million).
26 A Unique Chemical Company

We recorded a loss of ¥1,834 million (US$21 million), net, on sales
and retirement of noncurrent assets, deterioration of ¥435 million. We
also recorded a loss of ¥3,481 million (US$40 million) for the impair-
ment loss, a decrease of ¥1,146 million, due mainly to structural reform
in our carbon nanotube business, which produces vapor grown carbon
fiber (VGCF ™-X ) mainly used as additives for plastics. Loss on valuation
of investment securities increased ¥2,497 million, to ¥2,973 million
(US$34 million), due mainly to a valuation loss of our equity investment
in an aluminum smelting company in Venezuela. On the other hand, in
2012, we did not record an extraordinary loss related to the Great East
Japan Earthquake in March 2011, which amounted ¥3,207 million
(US$37 million) in 2011. Overall, the total of other income (expenses)
amounted to a loss of ¥16,820 million (US$194 million), an improve-
ment of ¥4,462 million.
As a result, the Company posted income before taxes and minority
interests of ¥11,288 million (US$130 million), down ¥14,787 million
from the previous year. After corporate income taxes, current, of ¥4,925
million (US$57 million), corporate income taxes, deferred, of ¥(4,674)
million (US$(54) million), and minority interests in income of ¥1,670 mil-
lion (US$19 million), the Company recorded net income of ¥9,368 mil-
lion (US$108 million), down ¥7,612 million over the previous year.
Financial Position
Total AssetsTotal assets decreased ¥8,141 million from the end of the previous year,
to ¥933,162 million (US$10,778 million). Cash and deposits decreased
¥3,581 million, to ¥51,606 million (US$596 million). Inventories
decreased ¥1,954 million, to ¥121,761 million (US$1,406 million),
reflecting the transfer of the automotive air-conditioner heat exchanger
business. Net property, plant and equipment decreased ¥9,111 million,
to ¥473,253 million (US$5,466 million), as the amount of capital invest-
ment was lower than that of depreciation expenses. Total investments
and other assets increased ¥8,073 million, to ¥117,682 million
(US$1,359 million), due partly to the rise in valuation on available-
for-sale securities.
LiabilitiesInterest-bearing debt decreased ¥5,046 million from the end of the pre-
vious year, to ¥342,262 million (US$3,953 million), as a result of contin-
ued debt reduction efforts. Total liabilities decreased ¥27,362 million, to
¥618,196 million (US$7,140 million), due partly to the fall in accounts
payable.
Net AssetsNet assets increased ¥19,221 million from the end of the previous year,
to ¥314,966 million (US$3,638 million), due partly to the posting of net
income and the increase in the foreign currency translation adjustment.
Capital ExpendituresCapital expenditures increased ¥3,709 million, to ¥42,503 million
(US$491 million), due partly to the production capacity expansion pro-
grams, one in our U.S. subsidiary in the graphite electrode business and
another in the business of SiC epitaxial wafers for power devices.
Cash FlowsNet cash provided by operating activities decreased ¥16,127 million
from the previous year, to ¥53,310 million (US$616 million), due partly
to a decrease in income before income taxes and minority interests. Net
cash used in investing activities increased ¥1,538 million, to ¥40,209
million (US$464 million), due partly to the increase in purchase of plant,
property and equipment. Cash flows from financing activities ended up in
net payment of ¥20,150 million (US$233 million), an increase of ¥2,854
million in payment, as a result of continued debt reduction efforts. As a
result, taking the effects of exchange rate fluctuations into account, cash
and cash equivalents at the end of 2012 decreased ¥3,772 million, to
¥51,254 million (US$592 million).
Total Net Assets Interest-Bearing Debt Cash Flows from Operating Activities
(Billions of yen) (Billions of yen) (Billions of yen)
201220112010200920080
100
200
300
400
201220112010200920080
300
350
400
201220112010200920080
20
40
60
80
Showa Denko K.K. 27

Consolidated Balance Sheets
Showa Denko K.K. and Consolidated SubsidiariesAt December 31, 2012 and 2011 Millions of yen
Thousands of U.S. dollars (Note 6)
ASSETS 2012 2011 2012
Current assets Cash and deposits (Notes 2, 7 and 8) ............................................................................... ¥ 51,606 ¥ 55,187 $ 596,054 Notes and accounts receivable (Notes 8 and 11) ............................................................... 151,417 153,271 1,748,873 Allowance for doubtful accounts (Note 2) .......................................................................... (107) (186) (1,237) Inventories (Note 2) ......................................................................................................... 121,761 123,715 1,406,345 Deferred tax assets (Note 14) .......................................................................................... 5,733 3,177 66,215 Other current assets ....................................................................................................... 11,697 12,726 135,099
Total current assets ................................................................................................ 342,108 347,890 3,951,349
Property, plant and equipment (Notes 2 and 3) Land (Note 20) ............................................................................................................... 254,257 254,851 2,936,667 Buildings and structures .................................................................................................. 244,473 240,574 2,823,661 Machinery, equipment and vehicles .................................................................................. 695,024 701,150 8,027,533 Construction in progress ................................................................................................. 15,469 12,475 178,672
1,209,222 1,209,049 13,966,533 Less: Accumulated depreciation ....................................................................................... (735,970) (726,686) (8,500,459)
Net property, plant and equipment ........................................................................... 473,253 482,363 5,466,075
Investments and other assets Investment securities (Notes 2, 8, 9, and 12) .................................................................... 67,778 59,570 782,838 Long-term loans ............................................................................................................ 196 1,700 2,267 Deferred tax assets (Notes 2 and 14) ............................................................................... 27,494 27,533 317,556 Other ............................................................................................................................. 22,755 21,697 262,822 Allowance for doubtful accounts (Note 2) .......................................................................... (542) (891) (6,259)
Total investments and other assets ......................................................................... 117,682 109,609 1,359,224
Goodwill (Notes 2 and 25) ................................................................................................. 120 1,441 1,382
Total assets ........................................................................................................ ¥ 933,162 ¥ 941,303 $10,778,029
See notes to financial statements.
28 A Unique Chemical Company

Millions of yenThousands of
U.S. dollars (Note 6)
LIABILITIES AND NET ASSETS 2012 2011 2012
Current liabilities Short-term debt (Notes 8 and 12) .......................................................................................... ¥ 88,741 ¥ 68,122 $ 1,024,957 Current portion of long-term debt (Notes 8 and 12) ................................................................. 46,623 79,414 538,495 Notes and accounts payable (Notes 8 and 11) ........................................................................ 151,372 163,165 1,748,353 Income taxes payable ............................................................................................................ 2,363 2,511 27,292 Provision for repairs (Note 2) ................................................................................................. 76 264 883 Provision for bonuses (Note 2) ............................................................................................... 2,225 2,257 25,696 Provision for business structure improvement (Note 2) ............................................................ — 65 — Provision for Niigata Minamata Disease (Note 2) ..................................................................... 964 437 11,133 Other current liabilities (Note 14) ........................................................................................... 30,754 33,611 355,204
Total current liabilities ................................................................................................... 323,118 349,846 3,732,013
Noncurrent liabilities Long-term debt less current portion (Notes 8 and 12) ............................................................. 206,898 199,772 2,389,673 Lease obligations (Notes 2 and 17) ........................................................................................ 11,253 14,394 129,974 Deferred tax liabilities (Note 14) ............................................................................................. 2,110 2,460 24,375 Provision for retirement benefits (Notes 2 and 13) ................................................................... 23,433 24,720 270,648 Provision for repairs (Note 2) ................................................................................................. 2,351 1,412 27,156 Provision for loss on the Great East Japan Earthquake (Note 2) ................................................ — 778 — Deferred tax liabilities for land revaluation (Note 20) ................................................................ 39,905 40,025 460,909 Other noncurrent liabilities (Note 12) ...................................................................................... 9,127 12,150 105,418
Total noncurrent liabilities .............................................................................................. 295,078 295,711 3,408,153
Contingent liabilities (Note 18)
Net assets (Note 19)Shareholders’ equity Capital stock Authorized, 3,300,000,000 shares Issued, 2012—1,497,112,926 shares .............................................................................. 140,564 — 1,623,510 Issued, 2011—1,497,112,926 shares .............................................................................. — 140,564 — Capital surplus...................................................................................................................... 62,222 62,222 718,661 Retained earnings ................................................................................................................. 53,172 48,851 614,137 Less: Treasury stock at cost, 2012—509,457 shares ............................................................. (145) — (1,674) Less: Treasury stock at cost, 2011—493,166 shares ............................................................. — (143) —
Total shareholders’ equity .............................................................................................. 255,812 251,494 2,954,634
Accumulated other comprehensive income Valuation difference on available-for-sale securities ................................................................ 924 (4,939) 10,672 Deferred gains or losses on hedges ....................................................................................... (305) (913) (3,526) Revaluation reserve for land (Note 20) .................................................................................... 28,025 28,240 323,692 Foreign currency translation adjustment (Note 2) .................................................................... (11,722) (21,955) (135,385)
Total accumulated other comprehensive income ............................................................. 16,922 433 195,452
Minority interests .................................................................................................................. 42,232 43,819 487,777
Total net assets ............................................................................................................ 314,966 295,745 3,637,863
Total liabilities and net assets .................................................................................... ¥933,162 ¥941,303 $10,778,029
Showa Denko K.K. 29

Consolidated Statements of Income
Showa Denko K.K. and Consolidated SubsidiariesFor the years ended December 31, 2012 and 2011 Millions of yen
Thousands of U.S. dollars (Note 6)
2012 2011 2012
Net sales ................................................................................................................................ ¥739,811 ¥854,158 $8,544,825Cost of sales (Note 22) ............................................................................................................ 628,628 719,322 7,260,656
Gross profit .......................................................................................................................... 111,183 134,836 1,284,169Selling, general and administrative expenses (Notes 21 and 22) .......................................... 83,076 87,479 959,523
Operating income ................................................................................................................. 28,108 47,357 324,646
Other income (expenses) Interest and dividends income ............................................................................................... 1,105 1,048 12,768 Equity in earnings of unconsolidated subsidiaries and affiliates ................................................ 289 1,050 3,339 Gain on sales of investment securities, net ............................................................................. 145 180 1,680 Loss on valuation of investment securities .............................................................................. (2,973) (475) (34,333) Rent income on noncurrent assets ......................................................................................... 1,403 1,152 16,203 Gain (Loss) on sales of noncurrent assets, net ........................................................................ (89) 530 (1,031) Interest expenses .................................................................................................................. (4,604) (5,332) (53,180) Loss on retirement of noncurrent assets ................................................................................. (1,745) (1,929) (20,158) Impairment loss (Note 15) ..................................................................................................... (3,481) (4,627) (40,208) Subsidy income .................................................................................................................... 1,443 198 16,668 Costs for temporary suspension of production ........................................................................ (1,233) (762) (14,236) Provision for Niigata Minamata Disease (Note 2) ..................................................................... (964) (437) (11,133) Compensation income ........................................................................................................... 145 — 1,677 Reversal of provision for loss on the Great East Japan Earthquake ........................................... 237 — 2,737 Reversal of provision for retirement benefits ........................................................................... — 660 — Residual gain on invested assets ........................................................................................... — 250 — Loss on the Great East Japan Earthquake (Note 2) .................................................................. — (3,207) — Other, net ............................................................................................................................. (6,499) (9,578) (75,061)
Total................................................................................................................................. (16,820) (21,281) (194,268)
Income before income taxes and minority interests ........................................................... 11,288 26,076 130,378Income taxes (Notes 2 and 14)
Current ................................................................................................................................ 4,925 4,683 56,881 Deferred ............................................................................................................................... (4,674) 1,720 (53,986)Income before minority interests .......................................................................................... 11,037 19,672 127,482Minority interests in income ................................................................................................. 1,670 2,692 19,287
Net income ...................................................................................................................... ¥ 9,368 ¥ 16,980 $ 108,196
Yen U.S. dollars (Note 5)
Per share amounts Net income—primary ........................................................................................................... ¥6.26 ¥11.35 $0.07 Net income—fully diluted ...................................................................................................... — 11.20 — Cash dividends (applicable to the period) ................................................................................ 3.00 3.00 0.03
Note: Net income per share has been computed based on the average number of shares of common stock outstanding during the respective fiscal year. Fully diluted net income per share additionally assumes the conversion of the convertible bonds. Diluted net income per share for 2012 was not disclosed because the Company had no securities with dilutive effects.
See notes to financial statements.
30 A Unique Chemical Company
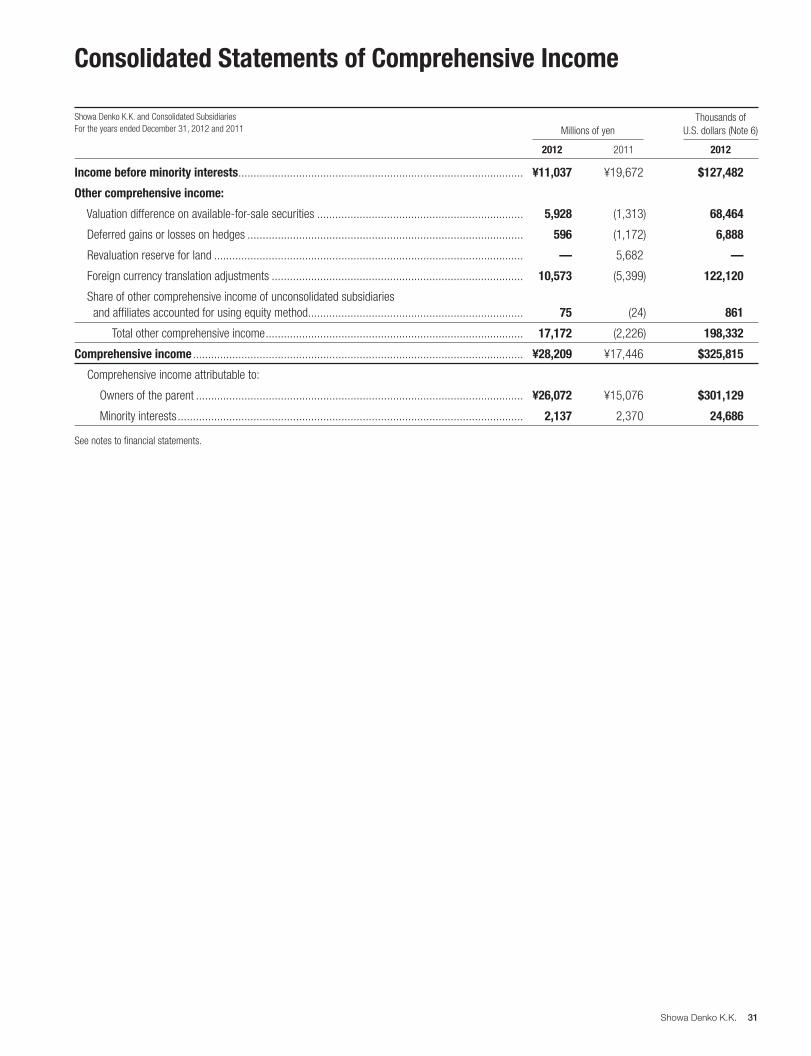
Consolidated Statements of Comprehensive Income
Showa Denko K.K. and Consolidated SubsidiariesFor the years ended December 31, 2012 and 2011 Millions of yen
Thousands of U.S. dollars (Note 6)
2012 2011 2012
Income before minority interests .............................................................................................. ¥11,037 ¥19,672 $127,482
Other comprehensive income:
Valuation difference on available-for-sale securities .................................................................... 5,928 (1,313) 68,464
Deferred gains or losses on hedges ........................................................................................... 596 (1,172) 6,888
Revaluation reserve for land ...................................................................................................... — 5,682 —
Foreign currency translation adjustments ................................................................................... 10,573 (5,399) 122,120
Share of other comprehensive income of unconsolidated subsidiaries and affiliates accounted for using equity method ....................................................................... 75 (24) 861
Total other comprehensive income ..................................................................................... 17,172 (2,226) 198,332
Comprehensive income ............................................................................................................. ¥28,209 ¥17,446 $325,815
Comprehensive income attributable to:
Owners of the parent ............................................................................................................ ¥26,072 ¥15,076 $301,129
Minority interests .................................................................................................................. 2,137 2,370 24,686
See notes to financial statements.
Showa Denko K.K. 31

Consolidated Statements of Changes in Net Assets
Showa Denko K.K. and Consolidated SubsidiariesFor the years ended December 31, 2012 and 2011
Thousands Millions of yen
Number of shares of
capital stockCapitalstock
Capitalsurplus
Retainedearnings
Treasurystock
Valuation difference on
available-for-sale
securities
Deferredgains orlosses
onhedges
Revaluationreservefor land
Foreigncurrency
translationadjustment
Minorityinterests
Totalnet
assets
Balance at December 31, 2010 ............. 1,497,113 ¥140,564 ¥62,223 ¥36,916 ¥(178) ¥(3,749) ¥ 269 ¥22,373 ¥(16,778) ¥43,325 ¥284,965
Dividends from surplus ......... — — — (4,490) — — — — — — (4,490) Net income .......................... — — — 16,980 — — — — — — 16,980 Purchase of treasury stock ... — — — — (3) — — — — — (3) Disposal of treasury stock .... — — (1) — 38 — — — — — 37 Decrease by increase of consolidated subsidiaries ... — — — (334) — — — — — — (334) Reversal of revaluation
reserve for land ................. — — — (222) — — — — — — (222) Other .................................. — — — 1 — — — — — — 1 Net changes of items other
than shareholders’ equity ... — — — — — (1,190) (1,182) 5,867 (5,176) 494 (1,188)
Balance at December 31, 2011 ............. 1,497,113 ¥140,564 ¥62,222 ¥48,851 ¥(143) ¥(4,939) ¥ (913) ¥28,240 ¥(21,955) ¥43,819 ¥295,745
Dividends from surplus ......... — — — (4,490) — — — — — — (4,490) Net income .......................... — — — 9,368 — — — — — — 9,368 Purchase of treasury stock ... — — — — (3) — — — — — (3) Disposal of treasury stock .... — — (1) — 1 — — — — — 0 Decrease by decrease of consolidated subsidiaries ... — — — (758) — — — — — — (758) Reversal of revaluation
reserve for land ................. — — — 214 — — — — — — 214 Other .................................. — — — (14) — — — — — — (14) Net changes of items other
than shareholders’ equity ... — — — — — 5,863 608 (214) 10,233 (1,587) 14,903Balance at December 31, 2012 ............. 1,497,113 ¥140,564 ¥62,222 ¥53,172 ¥(145) ¥ 924 ¥ (305) ¥28,025 ¥(11,722) ¥42,232 ¥314,966
Thousands Thousands of U.S. dollars (Note 6)
Number of shares of
capital stockCapitalstock
Capitalsurplus
Retainedearnings
Treasurystock
Valuation difference on
available-for-sale
securities
Deferredgains orlosses
onhedges
Revaluationreservefor land
Foreigncurrency
translationadjustment
Minorityinterests
Totalnet
assets
Balance at December 31, 2011 ............. 1,497,113 $1,623,510 $718,667 $564,235 $(1,651) $(57,050) $(10,544) $326,168 $(253,578) $506,106 $3,415,863
Dividends from surplus ......... — — — (51,858) — — — — — — (51,858) Net income .......................... — — — 108,196 — — — — — — 108,196 Purchase of treasury stock ... — — — — (34) — — — — — (34) Disposal of treasury stock .... — — (6) — 11 — — — — — 5 Decrease by decrease of consolidated subsidiaries ... — — — (8,750) — — — — — — (8,750) Reversal of revaluation
reserve for land ................. — — — 2,476 — — — — — — 2,476 Other .................................. — — — (163) — — — — — — (163) Net changes of items other
than shareholders’ equity ... — — — — — 67,722 7,018 (2,476) 118,194 (18,329) 172,128Balance at December 31, 2012 ............. 1,497,113 $1,623,510 $718,661 $614,137 $(1,674) $ 10,672 $ (3,526) $323,692 $(135,385) $487,777 $3,637,863
See notes to financial statements.
32 A Unique Chemical Company

Consolidated Statements of Cash Flows
Showa Denko K.K. and Consolidated SubsidiariesFor the years ended December 31, 2012 and 2011 Millions of yen
Thousands of U.S. dollars (Note 6)
2012 2011 2012
Cash flows from operating activities Income before income taxes and minority interests ..................................................................... ¥11,288 ¥26,076 $130,378 Adjustments for: Depreciation and amortization ............................................................................................... 46,232 49,413 533,975 Impairment loss .................................................................................................................... 3,481 4,627 40,208 Amortization of goodwill ........................................................................................................ 1,195 1,200 13,803 Increase (Decrease) in provision for business structure improvement ....................................... (65) (2) (751) Increase (Decrease) in provision for retirement benefits ........................................................... (1,292) (1,558) (14,919) Interest and dividends income ............................................................................................... (1,105) (1,048) (12,768) Interest expenses ................................................................................................................. 4,604 5,332 53,180 Equity in (earnings) losses of unconsolidated subsidiaries and affiliates .................................... (289) (1,050) (3,339) Loss (Gain) on sales and valuation of investment securities ..................................................... 2,827 296 32,654 Loss on retirement of noncurrent assets................................................................................. 1,745 1,929 20,158 Loss (Gain) on sales of noncurrent assets ............................................................................... 89 (530) 1,031 Decrease (Increase) in notes and accounts receivable–trade ....................................................... 2,746 (4,829) 31,716 Decrease (Increase) in inventories .............................................................................................. 1,808 (23,904) 20,886 Increase (Decrease) in notes and accounts payable–trade ........................................................... (10,281) 3,486 (118,745) Other, net ................................................................................................................................. (1,005) 18,532 (11,604) Subtotal ........................................................................................................................... 61,979 77,969 715,862 Interest and dividends income received ...................................................................................... 1,767 2,144 20,409 Interest expenses paid .............................................................................................................. (4,736) (5,416) (54,706) Income taxes paid ..................................................................................................................... (5,700) (5,260) (65,836) Net cash provided by (used in) operating activities .......................................................... 53,310 69,437 615,729Cash flows from investing activities Proceeds from sales and redemption of securities ...................................................................... 2 2 27 Purchase of property, plant and equipment ................................................................................. (41,366) (32,627) (477,777) Proceeds from sales of property, plant and equipment ................................................................. 1,876 716 21,671 Proceeds from transfer of business ............................................................................................ 3,506 92 40,499 Purchase of investment securities .............................................................................................. (2,735) (5,782) (31,594) Proceeds from sales of investment securities.............................................................................. 255 411 2,947 Purchase of investments in subsidiaries ..................................................................................... (347) — (4,013) Net decrease (increase) in short-term loans receivable ................................................................ 639 (340) 7,385 Payments of long-term loans receivable ..................................................................................... (938) (1,903) (10,836) Collection of long-term loans receivable ..................................................................................... 243 2,137 2,807 Other, net ................................................................................................................................. (1,345) (1,378) (15,536) Net cash provided by (used in) investing activities ........................................................... (40,209) (38,672) (464,419)Cash flows from financing activities Increase (Decrease) in short-term debt, net ................................................................................ 20,417 (11,404) 235,820 Proceeds from long-term loans payable ..................................................................................... 43,500 61,099 502,426 Repayments of long-term loans payable ..................................................................................... (59,432) (59,959) (686,441) Proceeds from issuance of bonds .............................................................................................. 10,000 10,000 115,500 Redemption of bonds ................................................................................................................ (20,000) (3,000) (231,000) Cash dividends paid .................................................................................................................. (4,475) (4,471) (51,685) Cash dividends paid to minority shareholders ............................................................................. (2,014) (2,171) (23,261) Other, net ................................................................................................................................. (8,146) (7,389) (94,089) Net cash provided by (used in) financing activities .......................................................... (20,150) (17,295) (232,730)Effect of exchange rate changes on cash and cash equivalents ............................................ 3,264 (1,941) 37,694Net increase (decrease) in cash and cash equivalents ........................................................... (3,786) 11,529 (43,726)Cash and cash equivalents at beginning of the year ............................................................... 55,026 43,459 635,550Increase in cash and cash equivalents from newly consolidated subsidiary ........................ — 34 —Increase in cash and cash equivalents resulting from merger ............................................... 14 4 162Cash and cash equivalents at end of the year (Notes 2 and 7) .................................................. ¥51,254 ¥55,026 $591,986
See notes to financial statements.
Showa Denko K.K. 33
Notes to Financial Statements
Showa Denko K.K. and Consolidated Subsidiaries
1. BASIS OF REPORTING AND FINANCIAL STATEMENTSThe accompanying consolidated financial statements have been prepared in accordance with accounting principles and practices gener-ally accepted in Japan, which are different in certain respects as to application and disclosure requirements from International Financial Reporting Standards, and restructured and translated into English from the consolidated financial statements which have been filed with the Kanto Local Finance Bureau as required by the Financial Instruments and Exchange Law of Japan.
2. SUMMARY OF SIGNIFICANT ACCOUNTING POLICIES(a) Principles of ConsolidationThe consolidated financial statements for the years ended December 31, 2012 and 2011 include the accounts of the Company and its 38 and 42, respectively, significant subsidiaries (collectively “the Companies”). For the purposes of the consolidated financial statements, all signifi-cant intercompany transactions, account balances and unrealized profits among the Companies are entirely eliminated and the portions thereof attributable to minority interests are credited or charged to minority interests. Accounts of subsidiaries whose business year-ends differ by more than three months from December 31 have been included using appro-priate interim financial information. In the initial consolidation, assets and liabilities of subsidiaries including those attributable to minority stockholders are recorded based on fair value in the accompanying consolidated financial statements. Goodwill, which is the difference between the acquisition cost and the underlying net assets at fair value at the date of acquisition, is amortized over a period not exceeding 20 years on a straight-line basis.
(b) Investments in Unconsolidated Subsidiaries and Affiliates The Company applied the equity method of accounting for investments in 2 unconsolidated subsidiaries in both 2012 and 2011, and 17 affili-ates in 2012 and 16 affiliates in 2011. All underlying intercompany profits obtained from transactions among the Companies and unconsolidated subsidiaries and affiliates to which the equity method is applied are eliminated in the consolidated financial statements.
(c) Translation of Foreign Currency AccountsAll receivables and payables denominated in foreign currencies at the balance sheet date are translated into Japanese yen at the current exchange rates. The resulting exchange gains or losses are credited or charged to income. The financial statements of certain consolidated subsidiaries of foreign nationality are translated into Japanese yen at the year-end rate for assets and liabilities, at historical rates for the other balance sheet accounts exclusive of the current year’s net income, and at the average annual rate for revenue and expense accounts and net income.
Translation adjustments resulting from the process of translating the financial statements of foreign subsidiaries into Japanese yen are accu-mulated and reported as a component of net assets on the consolidated balance sheet.
(d) Cash and Cash EquivalentsCash and cash equivalents in the consolidated statement of cash flows are composed of cash on hand, bank deposits available for withdrawal on demand and short-term investments with original maturities of three months or less and minor risk of value fluctuation.
(e) SecuritiesDebt securities that are intended to be held to maturity (“held-to-maturi-ty debt securities”) are stated at amortized cost on the balance sheet. Available-for-sale securities with available fair market values are stated at fair market values. Unrealized gains and unrealized losses on these available-for-sale securities are reported, net of applicable income taxes, as a separate component of the net assets. Realized gains or losses on sale of the available-for-sale securities are computed using primarily the moving-average cost. Available-for-sale securities with no available fair market values are stated primarily at moving-average cost.
(f) Allowance for Doubtful AccountsTo provide for losses from bad debts, the allowance is provided accord-ing to the actual rate of default for ordinary receivables and in view of the probability of recovery for specific doubtful receivables.
(g) InventoriesInventories are stated at the lower of cost or market, using principally the gross-average cost method. The carrying value on the consolidated balance sheets is stated by the devaluation method based on declines in profitability.
(h) Property, Plant and EquipmentProperty, plant and equipment is stated at cost, in principle. Depreciation of property, plant and equipment is computed principally by the straight-line method, but the declining- balance method is applied to certain fac-tories of the Company and some of the consolidated subsidiaries.
(i) Intangible AssetsThe Company and some of the consolidated subsidiaries principally apply the straight-line method over five years to amortize intangible assets.
(j) Leased AssetsLeased assets in finance lease transactions that do not transfer owner-ship to the lessee are depreciated using the straight-line method on the assumption that the useful life is equal to the lease term and the residual value is equal to zero. For leases with a residual value guarantee, the contracted residual value is considered to be the residual value for finan-cial accounting purposes.
34 A Unique Chemical Company

Please note that finance lease transactions, other than those involving the transfer of ownership and which commenced on or before December 31, 2008, are accounted for by the same methods as for operating lease transactions.
(k) Provision for Business Structure ImprovementThe Company and some of the consolidated subsidiaries record the pro-vision for business structure improvement on an accrual basis to provide for expenses and losses resulting from their restructuring programs.
(l) Provision for BonusesA provision for bonuses is provided at an amount estimated based on the bonus to be paid subsequent to the balance sheet date.
(m) Provision for Retirement BenefitsA provision for retirement benefits is provided based on the projected benefit obligation and fair value of plan assets at the end of the year. Prior service costs are amortized on a straight-line basis over certain periods (mainly 12 years) within the average remaining service periods. The unrecognized actuarial gain or loss is amortized starting the year after such actuarial loss is determined on a straight-line basis over certain periods (mainly 12 years) within the average remaining service periods.
(n) Provision for RepairsThe Company and some of the consolidated subsidiaries provide a provision for repairs in an amount estimated to be necessary for the scheduled maintenance for certain production equipment.
(o) Provision for Niigata Minamata DiseaseTo provide for lump-sum payments pursuant to the Special Measures Law Regarding Relief to Persons Suffering from Minamata Disease and Regarding Solutions to the Minamata Disease Problem, the Company makes a provision in the expected amount of such payments.
(p) Provision for Loss on the Great East Japan EarthquakeThe Company provides a provision for loss on the Great East Japan Earthquake to cover the damages of the subsidiary devastated by the earthquake.
(q) Income TaxesIncome taxes consist of corporation, enterprise and inhabitants taxes. The provision for income taxes is computed based on the pretax income of each of the Company and its consolidated subsidiaries with certain adjust-ments required for consolidation and tax purposes. The asset and liability approach is used to recognize deferred tax assets and liabilities for the expected future tax consequences of temporary differences between the carrying amounts and the tax bases of assets and liabilities. (Valuation allowances are recorded to reduce deferred tax assets based on the assessment of the realizability of the tax benefits.)
Application of the consolidated taxation systemThe Company and certain domestic consolidated subsidiaries have ap-plied for approval to adopt the consolidated taxation system from the year ending December 31, 2013. As of the current fiscal year, the Company and certain domestic consolidated subsidiaries have implemented accounting treatment and presentation based on the “Practical Solution
on Tentative Treatment of Tax Effect Accounting under the Consolidated Taxation System (Part 1)” (ASBJ Practical Issues Task Force No. 5, issued on March 18, 2011) and the “Practical Solution on Tentative Treatment of Tax Effect Accounting under the Consolidated Taxation System (Part 2)” (ASBJ Practical Issues Task Force No. 7 issued on June 30, 2010) under the assumption that it will apply a consolidated taxation system.
(r) Derivative Financial Instruments and Hedge AccountingThe Company and certain subsidiaries state all derivative financial instruments at fair value and recognize changes in fair value as gains or losses unless the derivative financial instruments are used for hedging purposes. If the derivative financial instruments meet certain hedging criteria, the Company and certain subsidiaries defer recognition of gains or loss-es resulting from changes in fair value of derivative financial instruments until the related gains or losses on hedged items are recognized. However, when forward exchange contracts meet certain hedging criteria, the hedged items are stated by the forward exchange contracts rate. If interest rate swap contracts meet certain hedging criteria, the net amount to be paid or received under the interest rate swap contracts is added to or deducted from interest on the assets or liabilities for which the interest rate swap contracts were executed. Hedge accounting is not applied at some of the foreign subsidiaries.
(s) Reclassifications Certain reclassifications have been made in the 2011 financial state-ments to conform to the presentation of 2012.
3. CHANGES IN ACCOUNTING POLICIESChanges in the Method of DepreciationThe Company and certain domestic consolidated subsidiaries, accompany-ing the revisions in the Corporation Tax Act of Japan, have changed their accounting methods for depreciation based on the revised Corporation Tax Act for tangible fixed assets acquired on or after April 1, 2012. Please note that the change in net income following these accounting changes was not material.
4. THE “ACCOUNTING STANDARD FOR RETIREMENT BENEFITS” (ACCOUNTING STANDARDS BOARD OF JAPAN STATEMENT NO. 26, ISSUED ON MAY 17, 2012) AND THE “GUIDANCE ON ACCOUNTING STANDARD FOR RETIREMENT BENEFITS” (ACCOUNTING STANDARDS BOARD OF JAPAN GUIDANCE NO. 25, ISSUED ON MAY 17, 2012)(a) OverviewRevisions apply mainly to the accounting treatments for unrecognized actuarial gains and losses as well as unrecognized prior service costs, the calculation methods for retirement benefit obligations as well as ser-vice costs, and broadening disclosure taking into consideration improve-ments to financial reporting and international trends.
(b) Scheduled Effective DateThe revised Accounting Standard and Guidance are scheduled to take effect from the end of each consolidated accounting period that com-mences after January 1, 2014. However, revisions to the calculation methods for retirement benefit obligations and service costs are sched-uled to take effect from the beginning of each consolidated accounting period that commences after January 1, 2015.
Showa Denko K.K. 35

Notes to Financial Statements
(c) The Impact of the Adoption of the Revised Accounting Standard and GuidanceThe impact of the adoption of the revised accounting standard and guid-ance on consolidated financial statements are currently under evaluation.
5. SUPPLEMENTARY INFORMATIONAccounting changes and prior year error corrections that occurred after the beginning of the year ended December 31, 2012, have been treated in accord with the “Accounting Standard for Accounting Changes and Error Corrections” (ASBJ Statement No. 24, issued on December 4, 2009) and the “Guidance on the Accounting Standard for Accounting Changes and Error Corrections” (ASBJ Guidance No. 24, issued December 4, 2009).
6. JAPANESE YEN AND TRANSLATION INTO U.S. DOLLARSThe Companies’ accounting records are maintained in yen. Yen amounts included in the financial statements are rounded to the nearest one mil-lion unit. Therefore, the total and sub total amounts presented in the financial statements may not equal the exact sum of the individual bal-ances. The U.S. dollar amounts appearing in the accompanying financial statements and notes thereto represent the arithmetical results of trans-lating yen into U.S. dollars at the rate of ¥86.58 to US$1.00, the approx-imate rate of exchange at December 31, 2012. The inclusion of such U.S. dollar amounts is solely for the convenience of readers; it does not carry with it any implication that yen amounts have been or could be converted into U.S. dollars at that rate.
7. CASH FLOW STATEMENTS(a) Cash and deposits as of December 31, 2012 and 2011 on the consolidated balance sheets and cash equivalents at December 31, 2012 and 2011 on the con solidated statements of cash flows were reconciled as follows:
Millions of yenThousands of U.S. dollars
2012 2011 2012
Cash and deposits ............................................................................................................................................ ¥51,606 ¥55,187 $596,054Original maturities more than three months ........................................................................................................ (352) (161) (4,068)
Cash and cash equivalents ................................................................................................................................ ¥51,254 ¥55,026 $591,986
(b) Breakdown of the assets and liabilities that decreased during the fiscal year because of the business divestitureThe breakdown of assets and liabilities that decreased because the Company transferred the business of manufacturing its heat exchange components for use in automotive air conditioners business to Keihin Corporation is as follows: Current assets: ¥10,012 million ($115,639 thousand) Fixed assets: ¥ 3,385 million ($ 39,097 thousand) Total assets: ¥13,396 million ($154,724 thousand)
Current liabilities: ¥ 3,991 million ($ 46,096 thousand) Noncurrent liabilities: ¥ 17 million ($ 196 thousand) Total liabilities: ¥ 4,008 million ($ 46,292 thousand)
8. FINANCIAL INSTRUMENTS(a) Overview (1) Management policy relating to financial instruments The Companies finance necessary long-term funds by bank loans and bond issues following the capital investment plans and finance short-term operating funds by bank loans and commercial paper. Temporary excess funds are invested exclusively in financial instruments which have fixed returns and low risk of falling below par values. The Companies use derivative transactions to hedge the following risks and do not enter into derivative transactions for speculative purposes.
(2) Types of financial instruments and related risks Operating receivables, such as notes and accounts receivable, are exposed to credit risk. Foreign-currency-denominated accounts receiv-able incurred through exports are exposed to foreign currency fluctuation risk. However, the Companies hedge the risk by utilizing forward exchange contracts, currency options, and currency swaps based on internal rules that set out foreign currency risk management principles. Marketable securities and investment securities mainly consist of the stocks of partner companies to maintain and strengthen their business relationships and are exposed to market fluctuation risk. Operating payables, such as notes and accounts payable–trade and other, are due within one year. Foreign-currency-denominated accounts payable incurred through imports of raw materials are exposed to foreign currency fluctuation risk. The Companies hedge the risk by utilizing for-ward exchange contracts following internal rules that set out the foreign currency risk management principles. Short-term debt and commercial paper are mainly used to finance short-term operating funds, and long-term debts and bonds are mainly used to finance equipment funds. Since some of long-term debt is made up of variable interest rate loans, it is exposed to interest rate fluctuation risk. However, interest rate swaps are used for most loans to hedge the risk. The Companies utilize derivative transactions, such as forward exchange contracts, currency options, and currency swaps, to hedge the foreign currency fluctuation risk of operating receivables and payables denominated in foreign currencies and financing transactions denomi-nated in foreign currencies. Interest rate swaps are utilized to hedge the interest rate fluctuation risk, and aluminum forward transactions are utilized to hedge the market fluctuation risk.
36 A Unique Chemical Company

(3) Risk management relating to financial instruments (i) Credit risk management (risk of default by the counterparties) The Company follows internal rules that set out accounts receivable management principles. The compliance department works with the sales division in each sector and monitors the customers’ credit condi-tions periodically and reviews the sales policy checking the sales volume and balances. The Company takes measures to obtain information on and minimize the credit risk that may arise due to the deterioration in the financial condition of their customers. Consolidated subsidiaries monitor their customers’ financial and credit conditions based on their internal rules. There is no material credit risk of held-to-maturity debt securities as they are limited to only highly rated securities. The Companies utilize derivative transactions only with creditworthy financial institutions and trading companies to minimize credit risk. The maximum credit risk as of December 31, 2012 is disclosed as the balance sheet amount of financial instruments exposed to credit risk.
(ii) Market risk management (risk of fluctuations in foreign currency and interest rates)
For operating receivables and payables and loans denominated in foreign currencies, the Company and certain consolidated subsidiaries utilize forward exchange contracts, currency options, and currency swaps to hedge some of the foreign currency fluctuation risk, which is categorized by currency and maturity date. The Company and certain consolidated subsidiaries utilize currency swaps to hedge the interest rate fluctuation risk of loans. For marketable securities and investment securities, the Companies regularly review the fair value and issuers’ financial conditions and review the Companies’ portfolio on an ongoing basis, except for held-to-maturity debt securities, according to market conditions and the business relationships with counterparties.
The Company has internal management rules that set out the approv-al authorities and procedures of the derivative transactions. The derivative transactions are carried out based on the appropriate approver set out in the internal rules. For currency-related derivative transactions, each division and the treasury department perform and manage transactions and report to the director in charge periodically. For interest-related derivative transactions, the treasury department performs and manages the transactions and reports to the director in charge periodically. For commodity-related derivative transactions, each division performs and manages the transactions and reports to the director in charge periodically. Consolidated subsidiaries perform and manage derivative transactions based on their internal management standards.
(iii) Liquidity risk management (risk of default on payment due dates)
The Company manages liquidity risk by requiring the treasury depart-ment to prepare and update cash plans, based on the schedule for cash inflows and disbursements in each division. In addition, the Company signs commitment line contracts and makes other arrangements with financial institutions to secure the necessary liquidity. Consolidated subsidiaries manage their liquidity risk through similar procedures.
(4) Supplemental explanation on fair value of financial instruments As well as the values being based on market prices, fair value of finan-cial instruments includes values which are reasonably calculated in case market prices do not exist. As the calculation of those values uses cer-tain assumptions, those values may vary in the case of different assump-tions being applied. Also, for the contract amount and others regarding derivative transactions described in Note 10. DERIVATIVE FINANCIAL INSTRUMENTS, the contract amount itself does not indicate market risk related to derivative transactions.
(b) Fair Value of Financial Instruments At December 31, book value, fair value and difference were as follows. The financial instruments whose fair value is extremely difficult to determine are not included below.
Year ended December 31, 2012 Millions of yen
Book value Fair value Difference
(1) Cash and deposits ................................................................................................................................... ¥ 51,606 ¥ 51,606 ¥ —(2) Notes and accounts receivable–trade ....................................................................................................... 138,189 138,189 —(3) Marketable securities and investment securities ........................................................................................ 34,372 34,372 (0)
Total assets ............................................................................................................................................. ¥224,168 ¥224,168 ¥ (0)
(1) Notes and accounts payable–trade........................................................................................................... ¥107,241 ¥107,241 ¥ —(2) Short-term debt ...................................................................................................................................... 63,741 63,741 —(3) Current portion of long-term debt ............................................................................................................. 46,623 46,805 182 (4) Commercial paper ................................................................................................................................... 25,000 25,000 —(5) Accounts payable–other .......................................................................................................................... 56,492 56,492 —(6) Bonds..................................................................................................................................................... 30,000 30,239 239 (7) Long-term debt ....................................................................................................................................... 176,898 178,667 1,769
Total liabilities .......................................................................................................................................... ¥505,995 ¥508,185 ¥2,190
Derivative transactions* ............................................................................................................................ ¥ (1,000) ¥ (1,000) ¥ —
Showa Denko K.K. 37

Notes to Financial Statements
Year ended December 31, 2011 Millions of yen
Book value Fair value Difference
(1) Cash and deposits ................................................................................................................................... ¥ 55,187 ¥ 55,187 ¥ —
(2) Notes and accounts receivable–trade ....................................................................................................... 139,364 139,364 —
(3) Marketable securities and investment securities ........................................................................................ 30,102 30,102 (0)
Total assets ............................................................................................................................................. ¥224,653 ¥224,653 ¥ (0)
(1) Notes and accounts payable–trade........................................................................................................... ¥117,152 ¥117,152 ¥ —
(2) Short-term debt ...................................................................................................................................... 68,122 68,122 —
(3) Current portion of long-term debt ............................................................................................................. 59,414 59,670 257
(4) Current portion of bonds .......................................................................................................................... 20,000 20,158 158
(5) Accounts payable–other .......................................................................................................................... 58,704 58,704 —
(6) Bonds..................................................................................................................................................... 20,000 20,017 17
(7) Long-term debt ....................................................................................................................................... 179,772 181,255 1,483
Total liabilities .......................................................................................................................................... ¥523,164 ¥525,079 ¥1,915
Derivative transactions* ............................................................................................................................ ¥ (1,832) ¥ (1,832) ¥ —
Year ended December 31, 2012 Thousands of U.S. dollars
Book value Fair value Difference
(1) Cash and deposits ................................................................................................................................... $ 596,054 $ 596,054 $ —(2) Notes and accounts receivable–trade ....................................................................................................... 1,596,089 1,596,089 —(3) Marketable securities and investment securities ........................................................................................ 396,998 396,998 (0)
Total assets ............................................................................................................................................. $2,589,141 $2,589,141 $ (0)
(1) Notes and accounts payable–trade........................................................................................................... $1,238,640 $1,238,640 $ —(2) Short-term debt ...................................................................................................................................... 736,207 736,207 —(3) Current portion of long-term debt ............................................................................................................. 538,495 540,600 2,105(4) Commercial paper ................................................................................................................................... 288,750 288,750 —(5) Accounts payable–other .......................................................................................................................... 652,479 652,479 —(6) Bonds..................................................................................................................................................... 346,500 349,261 2,760(7) Long-term debt ....................................................................................................................................... 2,043,173 2,063,605 20,432
Total liabilities .......................................................................................................................................... $5,844,244 $5,869,543 $25,298
Derivative transactions* ............................................................................................................................ $ (11,552) $ (11,552) $ —
* Derivative assets and liabilities are on a net basis.
Notes: 1. Valuation method for financial instruments and information on marketable securities and derivative transactions
• Assets
Cash and deposits and Notes and accounts receivable–trade
The book value is deemed to approximate the fair value since these are scheduled to be settled in a short period of time.
Marketable securities and investment securities
Fair value of these securities is based on the price on stock exchanges. Refer to Note 9. SECURITIES regarding the securities categorized by holding purposes.
• Liabilities
Notes and accounts payable–trade, Short-term debt, Commercial paper, and Accounts payable–other
The book value is deemed to approximate the fair value since these are scheduled to be settled in a short period of time.
Current portion of long-term debt and Long-term debt
The fair value is measured as the net present value of estimated cash flows by discounting the principal and interest value using the interest rate applied to the new loans. Part of the long-term loans
are variable rate loans, and they are subject to special treatment of interest rate swaps (refer to Note 10. DERIVATIVE FINANCIAL INSTRUMENTS); the fair value is measured as the net present value
of estimated cash flows by discounting the total amount of principal and interest processed as interest rate swaps using the interest rate applied to the new loans.
Current portion of bonds and Bonds
As for bonds with short maturities, the book value is deemed to approximate the fair value since these are scheduled to be settled in a short period of time. For others, fair value is based on the mar-
ket prices.
• Derivative transactions
Refer to Note 10. DERIVATIVE FINANCIAL INSTRUMENTS.
38 A Unique Chemical Company

2. Financial instruments for which fair value is extremely difficult to determine
Millions of yenThousands of U.S. dollars
2012 2011 2012
Non-listed equity securities ..................................................................................................................... ¥33,408 ¥29,470 $385,863
These securities are not included in the above Marketable securities and investment securities, as there was no quoted market value, estimating the future cash flows is deemed to be practically
impossible and it is extremely difficult to determine the fair value.
3. The redemption schedule for financial assets and securities with maturities
Year ended December 31, 2012 Millions of yen
Due in 1 year or less
Due after 1 year through 5 years
Due after 5 years through 10 years
Due after10 years
Cash and deposits ..................................................................................................... ¥ 51,606 ¥— ¥— ¥—Notes and accounts receivable–trade .......................................................................... 138,189 — — —Marketable securities and investment securities:
Held-to-maturity debt securities
Government and local bonds and others.............................................................. 2 0 — —
Total ............................................................................................................. ¥189,798 ¥ 0 ¥— ¥—
Year ended December 31, 2011 Millions of yen
Due in 1 year or less
Due after 1 year through 5 years
Due after 5 years through 10 years
Due after10 years
Cash and deposits ..................................................................................................... ¥ 55,187 ¥— ¥— ¥—
Notes and accounts receivable–trade .......................................................................... 139,364 — — —
Marketable securities and investment securities:
Held-to-maturity debt securities
Government and local bonds and others.............................................................. 2 2 — —
Total ............................................................................................................. ¥194,553 ¥ 2 ¥— ¥—
Year ended December 31, 2012 Thousands of U.S. dollars
Due in 1 year or less
Due after 1 year through 5 years
Due after 5 years through 10 years
Due after10 years
Cash and deposits ..................................................................................................... $ 596,054 $— $— $—Notes and accounts receivable–trade .......................................................................... 1,596,089 — — —Marketable securities and investment securities:
Held-to-maturity debt securities
Government and local bonds and others.............................................................. 23 0 — —
Total ............................................................................................................. $2,192,166 $ 0 $— $—
4. The scheduled maturities of bonds and long-term debt after December 31, 2012 and 2011
Refer to Note 12. SHORT-TERM DEBT AND LONG-TERM DEBT.
9. SECURITIES(a) Held-to-maturity debt securities
Year ended December 31, 2012 Millions of yen
Book value Fair value Difference
Held-to-maturity debt securities whose fair value exceeds their book value
Local government bonds ........................................................................................................................................ ¥— ¥— ¥—Held-to-maturity debt securities whose fair value does not exceed their book value
Local government bonds ........................................................................................................................................ 2 2 (0)
Total.................................................................................................................................................................. ¥ 2 ¥ 2 ¥ (0)
Showa Denko K.K. 39

Notes to Financial Statements
Year ended December 31, 2011 Millions of yen
Book value Fair value Difference
Held-to-maturity debt securities whose fair value exceeds their book value
Local government bonds ........................................................................................................................................ ¥— ¥— ¥—
Held-to-maturity debt securities whose fair value does not exceed their book value
Local government bonds ........................................................................................................................................ 5 5 (0)
Total.................................................................................................................................................................. ¥ 5 ¥ 5 ¥ (0)
Year ended December 31, 2012 Thousands of U.S. dollars
Book value Fair value Difference
Held-to-maturity debt securities whose fair value exceeds their book value
Local government bonds ........................................................................................................................................ $— $— $—Held-to-maturity debt securities whose fair value does not exceed their book value
Local government bonds ........................................................................................................................................ 26 26 (0)
Total.................................................................................................................................................................. $26 $26 $ (0)
(b) Available-for-sale securities
Year ended December 31, 2012 Millions of yen
Book value Acquisition cost Difference
Available-for-sale securities whose book value exceeds their acquisition cost
Equity securities ......................................................................................................................................... ¥21,984 ¥17,670 ¥4,314Available-for-sale securities whose book value is less than their acquisition cost
Equity securities ......................................................................................................................................... 12,386 13,365 (979)
Total....................................................................................................................................................... ¥34,370 ¥31,035 ¥3,335
Year ended December 31, 2011 Millions of yen
Book value Acquisition cost Difference
Available-for-sale securities whose book value exceeds their acquisition cost
Equity securities ......................................................................................................................................... ¥11,065 ¥ 8,346 ¥ 2,719
Available-for-sale securities whose book value is less than their acquisition cost
Equity securities ......................................................................................................................................... 19,032 25,736 (6,704)
Total....................................................................................................................................................... ¥30,097 ¥34,082 ¥(3,985)
Year ended December 31, 2012 Thousands of U.S. dollars
Book value Acquisition cost Difference
Available-for-sale securities whose book value exceeds their acquisition cost
Equity securities ......................................................................................................................................... $253,915 $204,089 $49,827Available-for-sale securities whose book value is less than their acquisition cost
Equity securities ......................................................................................................................................... 143,058 154,366 (11,307)
Total....................................................................................................................................................... $396,974 $358,455 $38,519
40 A Unique Chemical Company

(c) The following tables summarize available-for-sale securities sold in the years ended December 31, 2012 and 2011:
Year ended December 31, 2012 Millions of yen
Sales Gross gain Gross loss
Equity securities ......................................................................................................................................................... ¥255 ¥145 ¥—
Total ...................................................................................................................................................................... ¥255 ¥145 ¥—
Year ended December 31, 2011 Millions of yen
Sales Gross gain Gross loss
Equity securities ......................................................................................................................................................... ¥338 ¥225 ¥(37)
Corporate bonds ........................................................................................................................................................ 71 — (13)
Total ...................................................................................................................................................................... ¥409 ¥225 ¥(49)
Year ended December 31, 2012 Thousands of U.S. dollars
Sales Gross gain Gross loss
Equity securities ......................................................................................................................................................... $2,948 $1,680 $—
Total ...................................................................................................................................................................... $2,948 $1,680 $—
(d) Value of securities written off due to impairmentFor the years ended December 31, 2012 and 2011, the Companies recorded an impairment loss of ¥2,973 million (US$34,333 thousand) on available-for-sale securities and ¥289 million on available-for-sale securities with fair market values, respectively. Securities are deemed to be “substantially declined” when their fair values have declined 30% or more. When their fair values have declined 50% or more, the impairment losses are recorded on those securities. When their fair values have declined between 30% and 50%, the impairment losses are recorded on those securities unless such values are considered to be recoverable on an individual basis.
10. DERIVATIVE FINANCIAL INSTRUMENTS(a) Derivative Transactions to which Hedge Accounting Is not Applied
Millions of yen Thousands of U.S. dollars
2012 2011 2012
Contract amount
Contract amount
over 1 yearFair
valueValuation gain (loss)
Contract amount
Contract amount
over 1 yearFair
valueValuation gain (loss)
Contract amount
Contract amount
over 1 yearFair
valueValuation gain (loss)
(1) Currency related:Forward exchange contracts:
Selling
U.S. dollar ......................................... ¥1,907 ¥ — ¥(149) ¥(149) ¥1,256 ¥ — ¥ 1 ¥ 1 $22,022 $ — $(1,719) $(1,719) Buying
U.S. dollar ......................................... 53 — 4 4 259 — 2 2 613 — 43 43
Currency swaps:
Receipt Singapore dollar
Payment U.S. dollar ........................... — — — — — — — — — — — —
(2) Interest rate related:Interest rate swaps:
Receipt—variable rate/ Payment—fixed rate ............................ 8,429 6,404 (333) (333) 9,387 7,569 (326) (326) 97,361 73,970 (3,841) (3,841)
(3) Commodity related:Aluminum forward transactions:
Buying .................................................. 119 — (7) (7) 300 — (15) (15) 1,373 — (81) (81)
Note: Fair value calculation method: Fair values of forward exchange contracts are stated by the forward exchange rates. Fair values of currency and interest rate swaps are measured at the quoted price
obtained from the financial institutions. Fair values of aluminum forward transactions are stated by forward quotations of the London Metal Exchange.
Showa Denko K.K. 41

Notes to Financial Statements
(b) Derivative Transactions to which Hedge Accounting Is Applied
Millions of yen Thousands of U.S. dollars
2012 2011 2012
Contract amount
Contract amount
over 1 yearFair
valueContract amount
Contract amount
over 1 yearFair
valueContract amount
Contract amount
over 1 yearFair
value
(1) Currency related:Principle method Forward exchange contracts:
Buying
U.S. dollar ............................................................ ¥ 7,615 ¥ 292 ¥ 274 ¥ 7,230 ¥ 508 ¥ (304) $ 87,948 $ 3,367 $ 3,169 Euro ..................................................................... 21 — 1 12 — (0) 242 — 8 Selling
U.S. dollar ............................................................ 23,432 — (1,292) 13,039 — 59 270,637 — (14,921) Euro ..................................................................... 1,685 — (135) 567 — 20 19,466 — (1,562)
Allocation methodForward exchange contracts:
Buying
U.S. dollar ............................................................ ¥ 5,075 ¥ — ¥ — ¥ 4,624 ¥ — ¥ — $ 58,618 $ — $ — Euro ..................................................................... — — — 4 — — — — — Selling
U.S. dollar ............................................................ 11,173 430 — 9,315 — — 129,043 4,971 — Euro ..................................................................... 2,008 — — 1,877 — — 23,188 — — Thai baht .............................................................. — — — 0 — — — — —
(2) Interest rate related:Special methodInterest rate swaps:
Receipt—variable rate/Payment—fixed rate .............. ¥117,909 ¥98,154 ¥ — ¥122,078 ¥93,509 ¥ — $1,361,847 $1,133,677 $ —
(3) Commodity related:Principle method Aluminum forward contracts:
Buying ..................................................................... ¥ 17,872 ¥11,918 ¥ 636 ¥ 19,897 ¥12,657 ¥(1,213) $ 206,420 $ 137,659 $ 7,341 Selling ...................................................................... 1,541 — 1 1,744 — (57) 17,795 — 15
Notes: 1. Main items hedged by forward exchange contracts are accounts payable for buying, accounts receivable for selling and long-term debt by interest rate swaps. Main items hedged by aluminum
forward transactions are aluminum metal transactions.
2. Fair value calculation method: Fair values of forward exchange contracts are stated by the forward exchange rates. Fair values of currency swaps are measured at the quoted price obtained from the
financial institutions. Fair values of aluminum forward transactions are stated by forward quotations of the London Metal Exchange.
3. Fair values of forward exchange contracts that meet allocation method criteria are reflected in the fair values of accounts receivable and accounts payable of their hedged items.
4. Fair values of interest rate swaps that meet special treatment criteria are reflected in the fair values of long-term debt of their hedged item.
11. EFFECT OF YEAR-END DATE ON FINANCIAL STATEMENTSThe year-end date of 2012, namely, December 31, 2012, was a bank holiday. Although notes receivable and payable maturing on this date were accord-ingly settled on January 4, 2013, the Companies accounted for those notes in their financial statements as if they had been settled on the maturity date. Notes outstanding at December 31, 2012 and 2011 dealt with in the above-mentioned manner were as follows:
Millions of yenThousands of U.S. dollars
2012 2011 2012
Notes receivable ...................................................................................................................................................... ¥1,754 ¥451 $20,264Notes payable .......................................................................................................................................................... 546 743 6,311
42 A Unique Chemical Company

12. SHORT-TERM DEBT AND LONG-TERM DEBTAt December 31, 2012 and 2011, the short-term debt of the Companies consisted of the following:
Millions of yenThousands of U.S. dollars
2012 2011 2012
Bank loans at the average interest rate of 0.63% .............................................................................................. ¥63,741 ¥68,122 $ 736,207Commercial paper........................................................................................................................................... 25,000 — 288,750
Total ........................................................................................................................................................... ¥88,741 ¥68,122 $1,024,957
At December 31, 2012 and 2011, the long-term debt of the Companies consisted of the following:
Millions of yenThousands of U.S. dollars
2012 2011 2012
1.81% bonds due 2012 .............................................................................................................................. ¥ — ¥ 10,000 $ —1.49% bonds due 2012 .............................................................................................................................. — 10,000 —0.88% bonds due 2015 .............................................................................................................................. 10,000 10,000 115,5000.67% bonds due 2016 .............................................................................................................................. 10,000 10,000 115,5000.63% bonds due 2017 .............................................................................................................................. 10,000 — 115,500¥24,000,000,000 subordinated convertible bonds due 2014 ........................................................................ 24,000 24,000 277,200Loans principally from banks and insurance companies due 2012 to 2018 at the average interest rate of 0.92% ......................................................................................................... 223,521 239,186 2,581,667
277,521 303,186 3,205,368Elimination of intercompany transactions ...................................................................................................... (24,000) (24,000) (277,200)Less: Current portion ................................................................................................................................... (46,623) (79,414) (538,495)
Total ....................................................................................................................................................... ¥206,898 ¥199,772 $2,389,673
Note: Information on bonds with stock acquisition rights is as follows:
Bonds ¥24,000,000,000 subordinated convertible bonds due 2014
Kind of stock The Company’s common stock
Issue price of rights (¥) No cost
Issue price (¥) ¥291 per share
Total amount of issue (¥) ¥24,000,000,000
Total amount of stock acquisition rights exercised (¥) —
Percentage of stock acquisition rights granted (%) 100
Exercisable period October 15, 2009 to October 21, 2014
Note: When stock acquisition rights are exercised, the corresponding bonds with such acquisition rights are all invested. The prices of such bonds are deemed to be their face value. The initial conversion price
was ¥291.
The aggregate annual maturities of the noncurrent portion of long-term debt were as follows:
Years ending December 31
Millions of yenThousands of U.S. dollars
2014.................................................................................................................................................................................. ¥ 41,279 $ 476,7722015.................................................................................................................................................................................. 78,613 907,9782016.................................................................................................................................................................................. 51,965 600,1952017.................................................................................................................................................................................. 30,441 351,5992018 and thereafter ............................................................................................................................................................ 4,600 53,130
Total ............................................................................................................................................................................... ¥206,898 $2,389,673
Showa Denko K.K. 43

Notes to Financial Statements
At December 31, 2012 and 2011, the following assets were pledged as collateral for long-term debt:
Millions of yenThousands of U.S. dollars
2012 2011 2012
Assets pledged as collateral
Investment securities .............................................................................................................................. ¥ 2,914 ¥ 2,925 $ 33,657 Property, plant and equipment, less accumulated depreciation ................................................................... 156,948 167,870 1,812,756
Total................................................................................................................................................... ¥159,862 ¥170,796 $1,846,413
Secured short-term debt and long-term debt
Long-term debt (includes due within 1 year) ............................................................................................. ¥ 154 ¥ 738 $ 1,779 Other debt .............................................................................................................................................. 487 676 5,625
Total................................................................................................................................................... ¥ 641 ¥ 1,414 $ 7,404
13. PROVISION FOR RETIREMENT BENEFITS(a) The plans’ funded status and amount recognized on the accompanying consolidated balance sheets as of December 31, 2012 and 2011 were as follows:
Millions of yenThousands of U.S. dollars
2012 2011 2012
Benefit obligation at the end of year ............................................................................................................. ¥(87,369) ¥(92,003) $(1,009,116)Fair value of plan assets at the end of year ................................................................................................... 54,896 52,426 634,051
Funded status ............................................................................................................................................. (32,473) (39,577) (375,066)Unrecognized actuarial loss ......................................................................................................................... 11,514 18,091 132,990Unrecognized prior service cost ................................................................................................................... (2,272) (3,024) (26,245)
Net amount recognized ........................................................................................................................... (23,231) (24,510) (268,321)Prepaid pension expense ............................................................................................................................. 202 210 2,327
Provision for retirement benefits .............................................................................................................. ¥(23,433) ¥(24,720) $ (270,651)
(b) The components of net retirement benefit costs for the years ended December 31, 2012 and 2011 were as follows:
Millions of yenThousands of U.S. dollars
2012 2011 2012
Service cost .......................................................................................................................................................... ¥2,263 ¥2,350 $26,138Interest cost ......................................................................................................................................................... 1,830 2,019 21,135Expected return on plan assets .............................................................................................................................. (1,012) (1,106) (11,684)Recognized actuarial loss ...................................................................................................................................... 3,807 4,041 43,972Prior service cost .................................................................................................................................................. (752) (778) (8,684)
Net periodic cost ............................................................................................................................................... 6,137 6,527 70,882
Cost for defined contribution plan ........................................................................................................................... 414 191 4,781
Total............................................................................................................................................................. ¥6,550 ¥6,718 $75,657
(c) The assumptions and basis as of December 31, 2012 and 2011 were as follows:
2012 2011
Discount rate ....................................................................................................................................................... Mainly 2.0% Mainly 2.0%
Expected rate of return on plan assets ................................................................................................................... Mainly 2.0% Mainly 2.0%
Amortization period for actuarial loss ..................................................................................................................... Mainly 12 years Mainly 12 years
Amortization period for prior service cost ............................................................................................................... Mainly 12 years Mainly 12 years
44 A Unique Chemical Company

14. INCOME TAXES(a) At December 31, 2012 and 2011, significant components of deferred tax assets and liabilities were as follows:
Millions of yenThousands of U.S. dollars
2012 2011 2012
Deferred tax assets
Tax loss carryforwards ................................................................................................................................... ¥26,466 ¥21,883 $305,685 Provision for retirement benefits .................................................................................................................... 8,400 8,869 97,025 Write-down of marketable and investment securities ....................................................................................... 8,048 6,782 92,951 Impairment loss ............................................................................................................................................ 4,994 6,255 57,684 Loss on valuation of inventories ..................................................................................................................... 1,183 1,051 13,661 Depreciation and amortization ....................................................................................................................... 1,095 1,769 12,647 Unrealized earnings from the sale of fixed assets ............................................................................................ 997 1,076 11,518 Allowance for doubtful accounts .................................................................................................................... 920 700 10,620 Provision for repairs ...................................................................................................................................... 856 616 9,889 Write-down of golf club membership .............................................................................................................. 715 578 8,261 Provision for bonuses .................................................................................................................................... 644 754 7,443 Undetermined accrued liabilities .................................................................................................................... 313 2,319 3,611 Deferred gains or losses on hedges ............................................................................................................... 212 606 2,452 Other ........................................................................................................................................................... 2,739 2,136 31,632
Subtotal of deferred tax assets ...................................................................................................................... 57,583 55,394 665,079 Valuation allowance ...................................................................................................................................... (17,759) (18,180) (205,119)
Total deferred tax assets ................................................................................................................................ 39,823 37,214 459,960
Deferred tax liabilities
Amount of revaluation from the book value ..................................................................................................... (4,343) (4,343) (50,161) Foreign subsidiaries’ undistributed retained earnings ...................................................................................... (1,563) (2,102) (18,053) Valuation difference on available-for-sale securities ........................................................................................ (1,179) — (13,617) Special depreciation reserve .......................................................................................................................... (821) (1,150) (9,477) Reserve for advanced depreciation of fixed assets .......................................................................................... (483) (423) (5,581) Other ........................................................................................................................................................... (413) (959) (4,767)
Total deferred tax liabilities ............................................................................................................................ (8,801) (8,977) (101,655)
Allowance for doubtful accounts ........................................................................................................................ ¥31,022 ¥28,237 $358,304
(b) The net deferred tax assets at December 31, 2012 and 2011 were included in the consolidated balance sheets as follows:
Millions of yenThousands of U.S. dollars
2012 2011 2012
Deferred tax assets—current ............................................................................................................................ ¥ 5,733 ¥ 3,177 $ 66,215Deferred tax assets—noncurrent ....................................................................................................................... 27,494 27,533 317,556Other current liabilities ...................................................................................................................................... (94) (14) (1,091)Deferred tax liabilities—noncurrent .................................................................................................................... (2,110) (2,460) (24,375)
Showa Denko K.K. 45

Notes to Financial Statements
(c) Significant items in the reconciliation of the normal income tax rate to the effective rate at December 31, 2012 and 2011 were as follows:
2012 2011
Normal income tax rate in Japan ......................................................................................................................................................... 40.7% 40.7%
Differences of statutory tax rate in subsidiaries .................................................................................................................................... (42.4) (19.9)
Deferred taxes on undistributed earnings of foreign subsidiaries ........................................................................................................... (5.5) 2.7
Unrealized earnings from the sale of fixed assets ................................................................................................................................. (4.6) (1.8)
Effect on the reexamination of recoverability ........................................................................................................................................ 5.9 (6.3)
Effects of changes in the effective statutory tax rate ............................................................................................................................. 3.9 8.2
Amortization of goodwill ..................................................................................................................................................................... 3.7 1.9
Other ................................................................................................................................................................................................ 0.5 (0.8)
Effective tax rate ............................................................................................................................................................................ 2.2% 24.6%
15. IMPAIRMENT LOSS At December 31, 2012, major losses on impairment of fixed assets were as follows:
Location Major use Asset category Millions of yenThousands of U.S. dollars
Aizuwakamatsu City, Fukushima Prefecture Idle assets Machinery and equipment, etc. ¥ 178 $ 2,055Ichihara City, Chiba Prefecture Idle assets Machinery and equipment 393 4,540Yokohama City, Kanagawa Prefecture Production facilities Machinery and equipment, etc. 709 8,187Oita City, Oita Prefecture Production facilities Machinery and equipment, etc. 1,696 19,591Guangdong, China Rent facilities Machinery and equipment 284 3,285Other ......................................................................................................................................................................................... 221 2,551
Total ....................................................................................................................................................................................... ¥3,481 $40,208
46 A Unique Chemical Company

16. OTHER COMPREHENSIVE INCOME Reclassification adjustments and tax effects for components of other comprehensive income for the year ended December 31, 2012 are as follows:
Year ended December 31, 2012
Millions of yenThousands of U.S. dollars
Valuation difference on available-for-sale securities
Increase during the year ..................................................................................................................................................... ¥ 4,459 $ 51,496 Reclassification adjustments ............................................................................................................................................... 2,825 32,626
Amount before income tax effect ........................................................................................................................................ 7,283 84,122 Income tax effect ............................................................................................................................................................... (1,356) (15,659)
Total.............................................................................................................................................................................. 5,928 68,464
Deferred gains or losses on hedges
Decrease during the year ................................................................................................................................................... (723) (8,355) Reclassification adjustments ............................................................................................................................................... 341 3,943 Adjustments of acquisition cost of assets ............................................................................................................................ 1,361 15,718
Amount before income tax effect ........................................................................................................................................ 979 11,307 Income tax effect ............................................................................................................................................................... (383) (4,418)
Total.............................................................................................................................................................................. 596 6,888
Foreign currency translation adjustments
Increase during the year ..................................................................................................................................................... 10,101 116,666 Reclassification adjustments ............................................................................................................................................... 472 5,454
Amount before income tax effect ........................................................................................................................................ 10,573 122,120 Income tax effect ............................................................................................................................................................... — —
Total.............................................................................................................................................................................. 10,573 122,120
Share of other comprehensive income of unconsolidated subsidiaries and affiliates accounted for using equity method
Increase during the year ..................................................................................................................................................... 74 852 Reclassification adjustments ............................................................................................................................................... 1 9
Total.............................................................................................................................................................................. 75 861
Total other comprehensive income .............................................................................................................................. ¥17,172 $198,332
17. INFORMATION FOR CERTAIN LEASES(a) Finance Leases as a LesseeFinance lease transactions other than those involving transfer of ownership to the lessee
(1) Type of leased assetsa) Tangible fixed assets: Principally equipment for manufacturing hard discs and steam-powered electric generation equipment (machinery and equipment)b) Intangible fixed assets: Software
Showa Denko K.K. 47

Notes to Financial Statements
(2) Method of depreciation: The depreciation method of leased assets is described in the sub-section “2. (j) Leased Assets” within the sec-tion “Summary of Significant Accounting Policies.”
Please note that finance lease transactions, other than those involving the transfer of ownership and which commenced on or before December 31, 2008, are accounted for in the same manner as operating lease transactions. The content of such transactions is as follows: At December 31, 2012 and 2011, assets leased under non-capitalized financial leases were as follows:
Millions of yenThousands of U.S. dollars
2012 2011 2012
Machinery and equipment ..................................................................................................................................... ¥6,228 ¥8,883 $71,933Other ................................................................................................................................................................... 27 65 312Less: Accumulated depreciation and amortization ................................................................................................... (4,910) (6,602) (56,705)Less: Accumulated impairment loss ....................................................................................................................... — — —
Total ................................................................................................................................................................. ¥1,345 ¥2,346 $15,540
At December 31, 2012 and 2011, future minimum lease payments for the remaining lease periods were as follows:
Millions of yenThousands of U.S. dollars
2012 2011 2012
Due within one year .............................................................................................................................................. ¥ 596 ¥ 946 $ 6,886Due over one year ................................................................................................................................................. 749 1,400 8,654
Total ................................................................................................................................................................. ¥1,345 ¥2,346 $15,540
At December 31, 2012 and 2011, paid lease fees and equivalent depreciation expense amounts were as follows:
Millions of yenThousands of U.S. dollars
2012 2011 2012
Paid lease fees ........................................................................................................................................................ ¥938 ¥1,458 $10,830Amortization expense fees ........................................................................................................................................ — 34 —Equivalent depreciation expense fees ........................................................................................................................ 938 1,458 10,830
Note: Equivalent depreciation expense amounts are calculated using the straight-line method, with the lease period as the useful life and zero (0) as the residual value.
(b) Operating Leases as a LesseeAt December 31, 2012 and 2011, assets leased under non-capitalized operating leases were as follows: Future minimum lease payments for the remaining lease periods:
Millions of yenThousands of U.S. dollars
2012 2011 2012
Due within one year .............................................................................................................................................. ¥ 359 ¥ 364 $ 4,150Due over one year ................................................................................................................................................. 1,726 1,663 19,933
Total ................................................................................................................................................................. ¥2,085 ¥2,027 $24,083
(c) Operating Leases as a LessorAt December 31, 2012 and 2011, noncancellable operating lease receivables for the remaining lease periods were as follows: Future minimum lease receivables for the remaining lease periods:
Millions of yenThousands of U.S. dollars
2012 2011 2012
Due within one year .............................................................................................................................................. ¥ 104 ¥ 152 $ 1,205Due over one year ................................................................................................................................................. 1,053 1,760 12,157
Total ................................................................................................................................................................. ¥1,157 ¥1,912 $13,362
48 A Unique Chemical Company

18. CONTINGENT LIABILITIESAt December 31, 2012 and 2011, the Companies were guarantors for the borrowings below. The guarantees were principally for unconsolidated subsid-iaries, affiliates and others.
Millions of yenThousands of U.S. dollars
2012 2011 2012
Guarantees ........................................................................................................................................................... ¥6,652 ¥2,346 $76,835
As the amounts include joint and several guarantors’ portions as well as the Companies’, the actual amounts that the Companies were contingently liable to pay were smaller than the above.
19. NET ASSETSThe Corporation Law of Japan (the “Law”) provides that the entire amount paid for new shares may be credited to the stated capital, with the provision that, by resolution of the Board of Directors, up to one-half of such amount paid for new shares may be credited to additional paid-in capital, which is included in capital surplus. The Law provides that an amount equal to 10% of cash appropriations of retained earnings shall be set aside as additional paid-in capital or a legal earnings reserve until the total of such reserve and additional paid-in capital equals 25% of the stated capital. Additional paid-in capital and the legal earnings reserve may be used to eliminate or reduce a deficit, if any, or be capitalized by resolution at the Ordinary General Meeting of Shareholders. All additional paid-in capital and the legal earnings reserve may be transferred to other capital surplus and retained earnings, respectively, which are poten-tially available for dividends. Additional paid-in capital and the legal earnings reserve are included in capital surplus and retained earnings, respectively. The Law does not have a definition about the classification of paid-in capital between common stock and preferred stock. Accordingly, the Company states its capital in the total amount paid by issuing common stock and preferred stock. The maximum amount that the Company can distribute as dividends is calculated based on the unconsolidated financial statements of the Company in accordance with Japanese laws and regulations.
20. REVALUATION RESERVE FOR LANDThe Company and some of its consolidated subsidiaries revalued the land they own for business in accordance with the Law con cerning Revaluation of Land. The difference between the revalued amount and the book value, after the deduction of applicable tax, is stated as a land revaluation reserve. The revaluation was conducted using methods stipulated in the ordinance for enforcement of the law, specifically, the method in Item 4 of Article 2 (Reasonable Adjustment of the Appraised Value Relating to Land Price Tax), and the method in Item 5 of Article 2 (Estimation by Experts). The excess of the carrying amount of the revalued land over the market value at December 31, 2012 was ¥70,678 million (US$816,332 thousand).
21. SELLING, GENERAL AND ADMINISTRATIVE EXPENSESSelling, general and administrative expenses for the years ended December 31, 2012 and 2011 were summarized as follows:
Millions of yenThousands of U.S. dollars
2012 2011 2012
Freight ............................................................................................................................................................. ¥18,033 ¥19,035 $208,278Employees’ compensation ................................................................................................................................. 19,988 20,550 230,859Other ............................................................................................................................................................... 45,055 47,894 520,386
Total ............................................................................................................................................................. ¥83,076 ¥87,479 $959,523
Research and development expenses included in this summary for the years ended December 31, 2012 and 2011 were ¥20,451 million (US$236,208 thousand) and ¥21,495 million, respectively.
22. RESEARCH AND DEVELOPMENTResearch and development costs included in manufacturing costs, general and administrative expenses for the years ended December 31, 2012 and 2011 were ¥20,633 million (US$238,314 thousand) and ¥21,597 million, respectively.
Showa Denko K.K. 49

Notes to Financial Statements
23. SEGMENT INFORMATION(a) Information about sales, operating income, assets, and other items by reportable segment
Year ended December 31, 2012 Millions of yen
Petrochemicals Chemicals Electronics Inorganics Aluminum Others Total Adjustments Consolidated
SalesOutside customers .................................. ¥185,434 ¥118,504 ¥161,125 ¥ 57,191 ¥ 87,960 ¥129,597 ¥739,811 ¥ — ¥739,811Inter-segment ......................................... 5,506 8,872 2,181 8,382 4,246 5,684 34,870 (34,870) —
Total ................................................... 190,939 127,376 163,306 65,573 92,206 135,280 774,681 (34,870) 739,811
Operating income (loss) ........................... ¥ (977) ¥ (875) ¥ 32,311 ¥ 2,954 ¥ 1,581 ¥ 89 ¥ 35,082 ¥ (6,975) ¥ 28,108
Assets .................................................... ¥142,973 ¥181,582 ¥164,469 ¥125,900 ¥151,024 ¥122,852 ¥888,799 ¥44,362 ¥933,162Depreciation and amortization .................. 7,207 9,162 16,287 3,381 6,072 2,380 44,488 1,744 46,232Amortization of goodwill .......................... 6 (211) 90 1,368 (38) (20) 1,195 — 1,195Investments in unconsolidated subsidiaries and affiliates accounted for using equity method ......................... 14,009 1,586 296 1,486 32 272 17,680 — 17,680
Increase in property, plant and equipment and intangible assets ............ 3,699 8,477 11,679 8,441 4,302 3,412 40,010 2,492 42,503
Notes: 1. Adjustments are as follows:
(1) Elimination of intersegment transactions of ¥204 million (US$2,357 thousand) and total corporate expenses of ¥7,179 million (US$82,914 thousand) which were not allocated to any reportable
segment were included in “Adjustments” for “Operating income” of ¥(6,975) million (US$(80,556) thousand). Total corporate expenses principally consist of total corporate common research expens-
es which are not attributable to any reportable segment.
(2) Elimination of intersegment receivables and payables and assets of ¥(23,546) million (US$(271,960) thousand) and total corporate assets of ¥67,909 million (US$784,346 thousand) which were
not allocated to any reportable segment were included in “Adjustments” for “Assets” of ¥44,362 million (US$512,386 thousand). Total corporate assets principally consist of surplus funds of the
Companies under management (in the form of cash and deposits), deferred tax assets and assets related to total corporate common research and development expenses.
2. Amortization of negative goodwill was included in “Amortization of goodwill.”
Year ended December 31, 2011 Millions of yen
Petrochemicals Chemicals Electronics Inorganics Aluminum Others Total Adjustments Consolidated
SalesOutside customers .................................. ¥243,569 ¥120,308 ¥163,119 ¥ 68,129 ¥118,369 ¥140,664 ¥854,158 ¥ — ¥854,158
Inter-segment ......................................... 6,827 9,895 1,892 9,435 5,911 9,919 43,879 (43,879) —
Total ................................................... 250,396 130,203 165,011 77,564 124,280 150,583 898,037 (43,879) 854,158
Operating income ................................... ¥ 3,484 ¥ 2,035 ¥ 30,242 ¥ 9,640 ¥ 6,212 ¥ 1,860 ¥ 53,473 ¥ (6,116) ¥ 47,357
Assets .................................................... ¥145,753 ¥183,728 ¥170,046 ¥120,731 ¥162,701 ¥121,244 ¥904,202 ¥37,100 ¥941,303
Depreciation and amortization .................. 7,082 9,417 19,164 3,505 6,874 2,107 48,148 1,265 49,413
Amortization of goodwill .......................... 6 (210) 86 1,368 (29) (20) 1,200 — 1,200
Investments in unconsolidated subsidiaries and affiliates accounted for using equity method ......................... 14,364 628 — 2,140 187 269 17,588 — 17,588
Increase in property, plant and equipment and intangible assets ............ 2,645 6,811 13,506 5,308 5,380 3,476 37,126 1,668 38,794
Notes: 1. Adjustments are as follows:
(1) Elimination of intersegment transactions of ¥178 million and total corporate expenses of ¥6,294 million which were not allocated to any reportable segment were included in “Adjustments” for
“Operating income” of ¥(6,116) million. Total corporate expenses principally consist of total corporate common research expenses which are not attributable to any reportable segment.
(2) Elimination of intersegment receivables and payables and assets of ¥(32,465) million and total corporate assets of ¥69,565 million which were not allocated to any reportable segment were
included in “Adjustments” for “Assets” of ¥37,100 million. Total corporate assets principally consist of surplus funds of the Companies under management (in the form of cash and deposits), deferred
tax assets and assets related to total corporate common research and development expenses.
2. Amortization of negative goodwill was included in “Amortization of goodwill.”
50 A Unique Chemical Company

Year ended December 31, 2012 Thousands of U.S. dollars
Petrochemicals Chemicals Electronics Inorganics Aluminum Others Total Adjustments Consolidated
SalesOutside customers ...... $2,141,763 $1,368,721 $1,860,999 $ 660,558 $1,015,943 $1,496,843 $ 8,544,825 $ — $ 8,544,825Inter-segment ............. 63,590 102,472 25,192 96,812 49,041 65,647 402,753 (402,753) —
Total ....................... 2,205,353 1,471,192 1,886,190 757,370 1,064,984 1,562,489 8,947,579 (402,753) 8,544,825
Operating income (loss) ........................ $ (11,279) $ (10,111) $ 373,190 $ 34,114 $ 18,264 $ 1,024 $ 405,202 $ (80,556) $ 324,646
Assets ........................ $1,651,342 $2,097,272 $1,899,616 $1,454,152 $1,744,324 $1,418,938 $10,265,643 $512,386 $10,778,029Depreciation and amortization ....... 83,236 105,820 188,111 39,048 70,131 27,488 513,832 20,143 533,975Amortization of goodwill.................... 66 (2,432) 1,034 15,804 (439) (230) 13,803 — 13,803Investments in unconsolidated sub-sidiaries and affiliates accounted for using equity method ........... 161,807 18,322 3,417 17,163 365 3,136 204,210 — 204,210
Increase in property, plant and equipment and intangible assets ... 42,719 97,909 134,895 97,496 49,691 39,410 462,119 28,788 490,907
(b) Information about geographical areas
Year ended December 31, 2012 Millions of yen
Japan Asia Others Total
Sales ................................................................................................................................................ ¥482,126 ¥219,857 ¥37,827 ¥739,811
Year ended December 31, 2011 Millions of yen
Japan Asia Others Total
Sales ................................................................................................................................................ ¥560,483 ¥243,387 ¥50,287 ¥854,158
Year ended December 31, 2012 Thousands of U.S. dollars
Japan Asia Others Total
Sales ................................................................................................................................................ $5,568,564 $2,539,354 $436,907 $8,544,825
Year ended December 31, 2012 Millions of yen
Japan Others Total
Property, plant and equipment .................................................................................................................... ¥419,879 ¥53,374 ¥473,253
Year ended December 31, 2011 Millions of yen
Japan Others Total
Property, plant and equipment .................................................................................................................... ¥431,546 ¥50,817 ¥482,363
Year ended December 31, 2012 Thousands of U.S. dollars
Japan Others Total
Property, plant and equipment .................................................................................................................... $4,849,609 $616,466 $5,466,075
(c) Information about impairment loss on property, plant and equipment by reportable segment
Year ended December 31, 2012 Millions of yen
Petrochemicals Chemicals Electronics Inorganics Aluminum Others Elimination Total
Impairment loss on assets ............................................................... ¥15 ¥256 ¥677 ¥2,417 ¥115 ¥2 ¥— ¥3,481
Showa Denko K.K. 51

Notes to Financial Statements
Year ended December 31, 2011 Millions of yen
Petrochemicals Chemicals Electronics Inorganics Aluminum Others Elimination Total
Impairment loss on assets ............................................................... ¥232 ¥176 ¥3,160 ¥798 ¥73 ¥188 ¥— ¥4,627
Year ended December 31, 2012 Thousands of U.S. dollars
Petrochemicals Chemicals Electronics Inorganics Aluminum Others Elimination Total
Impairment loss on assets ............................................................... $169 $2,954 $7,825 $27,912 $1,324 $22 $— $40,206
(d) Information about amortization of goodwill and unamortized balance by reportable segment
Year ended December 31, 2012 Millions of yen
Petrochemicals Chemicals Electronics Inorganics Aluminum Others Elimination Total
Amortization .................................................................................. ¥ 6 ¥283 ¥122 ¥1,368 ¥ 22 ¥ 8 ¥— ¥1,810Unamortized balance ...................................................................... 40 582 619 4,154 222 64 — 5,681
Year ended December 31, 2011 Millions of yen
Petrochemicals Chemicals Electronics Inorganics Aluminum Others Elimination Total
Amortization .................................................................................. ¥ 6 ¥284 ¥118 ¥1,368 ¥ 31 ¥ 8 ¥— ¥1,815
Unamortized balance ...................................................................... 46 866 737 5,522 376 70 — 7,617
Year ended December 31, 2012 Thousands of U.S. dollars
Petrochemicals Chemicals Electronics Inorganics Aluminum Others Elimination Total
Amortization .................................................................................. $ 66 $3,274 $1,410 $15,804 $ 256 $ 97 $— $20,905Unamortized balance ...................................................................... 463 6,726 7,149 47,979 2,558 737 — 65,612
Amortization of negative goodwill arose from business combinations prior to April 1, 2010 and its unamortized balance are as follows:
Year ended December 31, 2012 Millions of yen
Petrochemicals Chemicals Electronics Inorganics Aluminum Others Elimination Total
Amortization .............................................................................. ¥— ¥ 494 ¥ 33 ¥— ¥ 60 ¥ 28 ¥— ¥ 615Unamortized balance .................................................................. — 3,802 488 — 899 372 — 5,561
Year ended December 31, 2011 Millions of yen
Petrochemicals Chemicals Electronics Inorganics Aluminum Others Elimination Total
Amortization .............................................................................. ¥— ¥ 494 ¥ 33 ¥— ¥ 60 ¥ 28 ¥— ¥ 615
Unamortized balance .................................................................. — 4,296 520 — 959 401 — 6,176
Year ended December 31, 2012 Thousands of U.S. dollars
Petrochemicals Chemicals Electronics Inorganics Aluminum Others Elimination Total
Amortization .............................................................................. $— $ 5,706 $ 376 $— $ 695 $ 327 $— $ 7,103Unamortized balance .................................................................. — 43,912 5,634 — 10,383 4,301 — 64,230
24. BUSINESS COMBINATIONS (Items relating to business combinations)For the year ended December 31, 2012Business Divestitures
1. Outline of the Business Divestiture(1) Name of the company receiving the divested businessKeihin Corporation
(2) Activities of the business divestitureThe Showa Denko Group’s production of heat exchange equipment for use in automobile air conditioners
52 A Unique Chemical Company
(3) Reason for the business divestitureThe Company manufactures aluminum condensers, evaporators, and other heat exchange components and supplies these to automobile manufacturers and producers of automobile air-conditioner systems. Going forward, the growth of the world automobile industry is expected to be driven by the emerg-ing countries, but, on the other hand, the operating environment for this business will be influenced by the need to develop eco-friendly products and growing competition along with the trend toward low-priced products in the emerging countries. In view of these circumstances, to provide for the growth of this business, the options for strengthening the competitiveness of this business will be limited if it continues to focus on heat exchange components, and it will be essential to take initiatives together with manufacturers of automobile air-conditioning systems. For this reason, the Company transferred this business to Keihin Corporation, which is a manufacturer of automobile air-conditioning systems and a major customer for this business.
(4) Date of the business divestitureJanuary 1, 2012
(5) Outline of the divestiture, including the legal form of the separationWith Showa Denko K.K. as the company conducting the divestiture, this business was divested and absorbed (physical divestiture) by wholly owned subsidiary Thermal Technology Co., Ltd. In addition, the Company transferred 60% of Thermal Technology Co., Ltd. shares to Keihin Corporation. Plans call for transferring the remaining 40% of that company’s shares to Keihin Corporation with a target date of two years from the date of the business divestiture.
2. Outline of Accounting TreatmentThe accounting treatment of this divestiture was based on the “Accounting Standard for Business Divestitures” (ASBJ Statement No. 7, revised on December 26, 2008) and the “Guidance for Accounting Standards for Business Combinations and Business Divestitures” (ASBJ Guidance No. 10, revised on December 26, 2008).
(1) Profit of the divestiture¥(89) million (US$(7,706) thousand)
(2) Outline of transfer of assets and liabilitiesCurrent assets: ¥10,012 million (US$ 866,839 thousand)Fixed assets: ¥ 3,385 million (US$ 293,073 thousand)Total assets: ¥13,396 million (US$1,159,826 thousand)
Current liabilities: ¥ 3,991 million (US$ 345,541 thousand)Fixed liabilities: ¥ 17 million (US$ 1,472 thousand)Total liabilities: ¥ 4,008 million (US$ 347,013 thousand)
(3) Reportable segment that the business that was divested belonged toAluminum
(4) Approximate estimate of the profit and loss accompanying the transfer of this business that was included in the calculations made in the preparation of the consolidated financial statements for the year ended December:Not applicable
25. PRESENTATION OF GOODWILL AND NEGATIVE GOODWILLGoodwill and negative goodwill are netted against each other. The pre-netted amounts as of December 31, 2012 and 2011 are shown below.
Millions of yenThousands of U.S. dollars
2012 2011 2012
Goodwill ............................................................................................................................................................... ¥5,681 ¥7,617 $65,612Negative goodwill .................................................................................................................................................. 5,561 6,176 64,230
Net .................................................................................................................................................................. ¥ 120 ¥1,441 $ 1,382
Showa Denko K.K. 53

Report of Independent Certified Public Accountants
54 A Unique Chemical Company

Major Subsidiaries and Affiliates (As of December 31, 2012)
Subsidiaries
Name Ownership (%)*1 Main Product(s) or Business(es)
PT. Showa Esterindo Indonesia 67.0 Ethyl acetate
Shoko Co., Ltd.*2 (T8090) 44.0 General trading
Showa Aluminum Can Corporation 100.0 Beer and soft drink cans
Showa Denko Carbon, Inc. 100.0 Graphite electrodes
Showa Denko Gas Products Co., Ltd. 100.0 Liquefied carbon dioxide, dry ice, industrial gases, etc.
Showa Denko HD Singapore Pte. Ltd. 100.0 Hard disks
Showa Denko HD Trace Corporation 99.4 Hard disks, aluminum substrates for hard disks
Showa Denko HD Yamagata K.K. 100.0 Hard disks
Showa Denko Kenzai K.K. 100.0 Plaster materials, fireproofing pipe, wall siding, etc.
Showa Denko Packaging Co., Ltd. 100.0 Packaging/containers for food, medicine, and electronic parts
SD Preferred Capital Ltd. 100.0 Preferred securities capital
*1 Proportion of ownership interest (direct or indirect) by Showa Denko K.K. and its subsidiaries in terms of the number of shares with exercisable voting rights *2 Tokyo Stock Exchange listed company
As of December 31, 2012, Showa Denko K.K. had 38 consolidated subsidiaries, including the above.
Affiliates
NameEquity
Participation (%)Main Product(s) or Business(es)
Japan Polyethylene Corporation 42.0 High- and low-density polyethylene
SunAllomer Ltd. 50.0 Polypropylene and advanced polypropylene-based materials
Union Showa K.K. 50.0 Molecular sieves
As of December 31, 2012, Showa Denko K.K. had 19 subsidiaries or affiliates to which the equity method was applied.
Showa Denko K.K. 55

Corporate Data
Investor Information
Regular General MeetingThe regular general meeting of shareholders was held on March 27,
2013.
Number of Shares Outstanding1,497,112,926 at December 31, 2012
Number of Shareholders105,843 at December 31, 2012
Classification of StockAll stock issued by Showa Denko is common stock.
Stock Transfer AgentMizuho Trust & Banking Co., Ltd.
2-1, Yaesu 1-chome,
Chuo-ku, Tokyo 103-8670,
Japan
Shareholders by Sector (At December 31, 2012)
Number of shares held
(thousands)%
Financial firms 629,448 42.04
Individuals 436,051 29.13
Foreign corporate entities, etc. 320,367 21.40
Japanese corporate entities 84,791 5.66
Securities firms 26,456 1.77
Total 1,497,113 100.00
Head OfficeShowa Denko K.K.
13-9, Shiba Daimon 1-chome,
Minato-ku, Tokyo 105-8518,
Japan
Phone: +81-3-5470-3235
Fax: +81-3-3431-6215
e-mail: [email protected]
URL: http://www.sdk.co.jp/english
Commercial Subsidiaries Abroad
Showa Denko America, Inc. 420 Lexington Avenue, Suite #2335A
New York, NY 10170
U.S.A.
Phone: +1-212-370-0033
Fax: +1-212-370-4566
Showa Denko Europe GmbHKonrad-Zuse-Platz 4
81829 Munich
Germany
Phone: +49-89-939-9620
Fax: +49-89-939-96250
Showa Denko Singapore (Pte.) Ltd.4 Shenton Way
#16-01 SGX Centre 2
Singapore 068807
Phone: +65-6223-1889
Fax: +65-6223-6007
Showa Denko (Shanghai) Co., Ltd.18F, Wang-Wang Building
No. 211, Shimen Yi Road, Shanghai, 200041
People’s Republic of China
Phone: +86-21-6217-5000
Fax: +86-21-6217-9840
56 A Unique Chemical Company

Printed in JapanPrinted in Japan
13-9, Shiba Daimon 1-chome, Minato-ku, Tokyo 105-8518, Japan
SHOWA DENKO K.K.