annual report 2012 - hawaii state energy office
TRANSCRIPT

State of Hawaii Energy Resources Coordinator’s Annual Report 2012
State of Hawaii Department of Business, Economic Development and Tourism Hawaii State Energy Office ● energy.hawaii.gov

Department of Business, Economic Development and Tourism Hawaii State Energy Office 235 S. Beretania Street, No. 502 Honolulu, Hawaii 96813 808-587-3807 Email: [email protected] More information on the Hawaii State Energy Office’s programs and initiatives can be found at energy.hawaii.gov.
02 | STATE OF HAWAII ENERGY RESOURCES COORDINATOR’S ANNUAL REPORT 2012

T C
Welcome ……………………………………………………………………………………………………. Page 04
Introduc on .....................................................................................................Page 05
Summary ..........................................................................................................Page 06
Key Indicator: Renewable Por olio Standard (RPS) ......................................... Page 12
Key Indicator: Energy Efficiency Por olio Standard (EEPS) ...............................Page 21
Key Indicator: Jobs ............................................................................................Page 34
Transporta on ..................................................................................................Page 38
Innova on, Planning & Policy ...........................................................................Page 43
Funding: Energy Security Special Fund (ESSF) & Grants ...................................Page 49

I
This edition of the Energy Resources Coordinator’s (ERC) Report captures and summarizes the
State of Hawaii’s commitment to addressing the State’s energy needs and its focus on developing
and deploying clean energy programs and policies. The report reveals Hawaii’s dependence on
foreign oil and why there is an urgency to move from fossil fuels towards renewable energy
resources including transportation. It also shows the roles energy efficiency, innovative planning
and funding are playing in the clean energy pursuit and what impacts they are having on Hawaii’s
economy.
As this ERC report will demonstrate, the State of Hawaii is on the path to position itself as an
energy leader and achieve its clean energy goal of 70% by 2030.
~ Richard Lim, Director, DBEDT
05 | STATE OF HAWAII ENERGY RESOURCES COORDINATOR’S ANNUAL REPORT 2012

S
06 | STATE OF HAWAII ENERGY RESOURCES COORDINATOR’S ANNUAL REPORT 2012
The State of Hawaii has a bold energy agenda – achieve 70% clean energy by the year 2030. Along with reducing our islands’ dependency on fossil fuels and increasing efficiency usages, the clean energy plan is also contributing to the State’s economy by creating jobs and attracting foreign investment. The State’s Department of Business, Economic Development and Tourism (DBEDT) is leading the charge via its Energy Office. The State Energy Office has embarked on a strategic plan with a mission to establish a clean energy infrastructure as a catalyst for economic growth, develop “test bed” investment opportunities and advance Hawaii’s energy security. The clean energy plan is focusing on several key areas – Renewable Portfolio Standards (RPS); Transportation; Energy Efficiency Portfolio Standards (EEPS); Jobs; Innovation, Planning and Policy; and Funding.
KEY INDICATIOR: RENEWABLE PORTFOLIO STANDARDS (RPS)
Today, imported oil supplies nearly all of Hawaii’s energy, making it the most dependent state in the U.S. The State of Hawaii must significantly change how it generates energy by achieving 40% from local renewable sources.
Currently, Hawaii generates about 12% of its energy from renewable sources such as wind, solar, geothermal and biofuels, and is well on its way towards reaching its 2015 RPS benchmark of 15%
Hawaii ranks third in the nation for cumulative installed photovoltaic capacity per capita.
The State Energy Office is currently tracking 52 renewable energy projects currently in development.
The State has partnered with the U.S. Department of Defense, Pacific Command’s Green Initiative for Fuels Transition Pacific (GIFTPAC) program to replace 25% of the petroleum fuel used by the Department of Defense in Hawaii with domestically produced, non-fossil, cost-competitive, military specification biofuel that reduces price volatility.
KEY INDICATOR: ENERGY EFFICIENCY PORTFOLIO STANDARDS (EEPS)
Energy efficiency is set to account for 30% of Hawaii’s 70% clean energy goal by 2030. The State Energy Office is encouraging Hawaii residents and businesses to adopt a more energy-efficient practice with numerous programs, including financial assistance for energy projects and technical evaluation for existing buildings.
Currently, Hawaii’s EEPS level is over 12%.
Hawaii’s annual electricity consumption decreased from 10.6 TWhs in 2006 to 9.9 TWhs in 2011.
Hawaii’s annual electricity cost rose to $3.1 billion in 2011 as a result of fluctuations in fuel prices.
Hawaii ranks first in the nation for energy savings performance contracting per capita. The State Energy Office is aggressively working to retain the top spot.

S
07 | STATE OF HAWAII ENERGY RESOURCES COORDINATOR’S ANNUAL REPORT 2012
KEY INDICATOR: JOBS
Hawaii’s clean energy industry sector continues to grow, leading to the creation of more jobs and increased economic development.
Currently, Hawaii ranks third in the U.S. in clean energy job growth.
Hawaii has more than 11,000 green jobs statewide and is estimated to reach more than 19,000 green jobs in 2018.
The solar industry accounted for 26% of all construction expenditures in Hawaii in 2012. TRANSPORTATION
With the majority of our energy coming from imported oil supplies, reducing the use of petroleum fuel for ground transportation plays a key role in achieving Hawaii’s clean energy goals. Notable progress has occurred in the deployment of electric vehicles and supporting infrastructure.
Hawaii’s gasoline prices are consistently higher than the national average. In 2012, the monthly state average regular gas price was $4.39 per gallon.
Hawaii has more than 200 publicly available electric vehicle chargers at over 80 locations statewide.
The State Energy Office continues to develop key relationships, such as a partnership with the U.S. Environmental Protection Agency that is focusing on reducing Hawaii’s Vehicle Miles Traveled (VMT) by at least 1% per year.
INNOVATON, PLANNING AND POLICY (IPP)
To remain focused on growing Hawaii’s economy, the State Energy Office’s Innovation, Planning and Policy (IPP) branch has an objective to spur innovation and job creation by seeking, attracting and developing clean energy opportunities for the State.
The State Energy Office is participating in major energy policy issues and decisions, such as the interisland undersea cable system and the Integrated Resource Planning (IRP) process.
IPP is building momentum among foreign investors from countries such as Japan, China and Korea who are looking to develop “test bed” projects in the islands.
IPP is proposing legislation to develop a new program to enable low-cost loans for green infrastructure investments, with the goal to make clean energy affordable to all in order to increase penetration of energy efficiency and renewable energy, particularly in underserved markets.
FUNDING
The State Energy Office has allocated invaluable state and federal funds toward key initiatives that support growth of Hawaii’s clean energy economy and achieves the State’s 70% clean energy goal by 2030.
In 2012, the State Energy Office moved towards converting 100% of its fiscal intake from the State-allocated Act 73 Energy Security Special Fund (ESSF) and the per-barrel tax on petroleum products.

S
Dependence on Imported Fossil Fuels
In the U.S., petroleum accounts for only 2% of electrical genera on. In Hawaii, we rely on petroleum for 75% of our electrical genera on and 96% of our fuel for transporta on. Now, we get 12% of our energy from renewable energy sources, and we are on track to increase this figure to 15% by 2015.
HAWAII’S ENERGY LANDSCAPE: VULNERABILITY AND OPPORTUNITY
The following charts illustrate Hawaii’s energy landscape. Hawaii is unique because it has both great vulnerability and great opportunity. Hawaii is vulnerable because of its isolation and dependency on the rest of the world for most of its food and resources. But this dependency, which results in extremely high energy costs, presents an opportunity to reposition its energy infrastructure through the development of renewables as it strives to achieve energy independence.
08 | STATE OF HAWAII ENERGY RESOURCES COORDINATOR’S ANNUAL REPORT 2012
Note: Es mated based on 2010 U.S. Energy Informa on Administra on data
Source: Department of Business, Economic Development & Tourism
Dependence on Imported Fossil Fuels
Electric Genera on Transporta on

Energy Costs as a Percent of GDP This chart shows energy costs in rela on to our gross domes c product. The impact of oil vola lity on Hawaii’s economy is apparent. When oil prices rose between 2005 to 2008, and again in 2011, energy costs accounted for an outsized por on of the GDP.
09 | STATE OF HAWAII ENERGY RESOURCES COORDINATOR’S ANNUAL REPORT 2012
S

S
U.S. vs Hawaii Electricity Prices Hawaii’s electricity prices are more than three mes higher than the U.S. average. This is a significant tax on Hawaii’s economy and its residents. These high prices make renewable energy projects more economically viable than in the rest of the United States.
10 | STATE OF HAWAII ENERGY RESOURCES COORDINATOR’S ANNUAL REPORT 2012
High Gasoline Prices—Hawaii vs U.S. Hawaii’s gasoline prices are some of the highest in the U.S. This comes as a shock to most residents in Hawaii and it serves as a catalyst to consider more fuel efficient cars.
Source: Monthly Energy Trends, May 2012 (Department of Business, Economic Development & Tourism, U.S. Energy Informa on Administra on)
Source: Monthly Energy Trends, May 2012 (Department of Business, Economic Development & Tourism, U.S. Energy Informa on Administra on)

S
Renewable Energy and Energy Efficiency Por olio Standards With our sights set on achieving 70% clean energy by 2030, how is Hawaii doing now? The following chart displays the 2011 RPS and EEPS levels (11.9% and 12.1%, respec vely, for a total of 24.0%) and illustrates how they have increased over the past five years. The next benchmark for RPS is in 2015 which is 15% and we feel we are on target to reach and possibly even exceed it.
2012 Hawaii Report Card
Highlights: Na onal Rankings
1st in Energy Savings Performance Contrac ng
3rd in Cumula ve Installed Photovoltaic Capacity per Capita Na onal Recogni ons
1st Place in Race to the Top compe on for Energy Savings Performance Contrac ng
LEED Gold Cer fica on for Exis ng Buildings: Opera ons and Maintenance for State Office Tower
ENERGY STAR ra ng of 96 points for State Office Tower
11 | STATE OF HAWAII ENERGY RESOURCES COORDINATOR’S ANNUAL REPORT 2012
Source: Renewable Por olio Standards Status Reports, 2007‐2011 (Hawaii Public U li es Commission)

K I : RPS
12 | STATE OF HAWAII ENERGY RESOURCES COORDINATOR’S ANNUAL REPORT 2012

SECURING THE RENEWABLE FUTURE
Hawaii is rich in renewable energy resources that have the potential to free us from our dependence on imported oil, which today supplies the majority of our energy. With the islands’ plentiful sunshine, strong trade winds, surrounding ocean, terrestrial streams, geothermal resource, temperate climate and year-round growing season, Hawaii is ideally poised to achieve its goal of 40% energy generation from renewable sources by 2030. The State Energy Office is now tracking 52 renewable energy projects that are in the development phase and 45 operational renewable energy projects.
K I : RPS
Hawaii Renewable Por olio Standards (RPS) Levels 2005‐2011 This chart shows Hawaii’s Renewable Por olio Standards (RPS) levels from 2005‐2011. State law requires that Hawaii achieve 15% of its electrical needs from renewable genera on and energy efficiency by December 31, 2015. In 2011, the statewide RPS level was 11.93% ‐ on track to mee ng the 15% goal by 2015.
13 | STATE OF HAWAII ENERGY RESOURCES COORDINATOR’S ANNUAL REPORT 2012
Hawaii Renewable Por olio Standards (RPS) Levels from 2005‐2011

K I : RPS
Hawaii Renewable Genera on by Resource 2007‐2011 Of the electricity generated by renewable resources, those that are generated from wind, distributed photovoltaic (PV), geothermal, hydro and biofuels are increasingly contribu ng to Hawaii’s renewable por olio. Hawaii can an cipate con nued growth in wind and PV, and is now working on laying the groundwork for geothermal and biofuel development, both of which require infrastructure and regulatory work.
Hawaii Renewable Energy Genera on 2005‐2011 Since 2006, Hawaii’s renewable electricity genera on as a percentage of total genera on has been on average 1.7% above that of the U.S.
14 | STATE OF HAWAII ENERGY RESOURCES COORDINATOR’S ANNUAL REPORT 2012
*
*1.85 GWhs a ributed to photovoltaic in 2011
Source: Renewable Por olio Standards Status Reports, 2005‐2011 (Hawaii Public U li es Commission), Energy Informa on Administra on

K I : RPS
New Distributed Renewable Energy Systems Installed in Hawaii Annually 2001‐2011 By 2011, 9,835 distributed renewable energy systems with a total capacity of 61 MWs were installed statewide under the u li es’ Net Energy Metering, Schedule Q and Feed‐In‐Tariff programs. Since 2006, distributed genera on system installa ons have increased rapidly. Whereas only 30 systems with a total capacity of 163 kW were installed in 2005, 5,276 systems were installed statewide with a total capacity of 29,697 kW in 2011 alone.
Third in the Na on: Cumula ve Installed Photovoltaic Capacity per Capita Hawaii was ranked third in the na on in cumula ve installed photovoltaic capacity per capita in 2011 according to U.S. Solar Market Trends, with 62.6 Direct Current Wa s (WDC) per capita installed at the end of 2011. The cumula ve installa ons were 4.8 mes the na onal average of 13 WDC per capita.
15 | STATE OF HAWAII ENERGY RESOURCES COORDINATOR’S ANNUAL REPORT 2012

K I : RPS
State Energy Project Tracking
Along with continually monitoring and tracking the progress of renewable energy projects, the State Energy Office also assists with project development, including providing agency-developer coordination, clarifying permitting processes and requirements, accepting of environmental impact statements and offering general development guidance. Based on available information as of October 2012, the State is tracking 52 proposed projects statewide that are in various stages of development. Once a project is up-and-running it is noted as being completed and transferred to our online map of operating renewable energy projects.
16 | STATE OF HAWAII ENERGY RESOURCES COORDINATOR’S ANNUAL REPORT 2012
52 Currently Proposed Renewable Energy Projects in Hawaii Clean energy will do more than improve the environment; it will also supercharge Hawaii’s economy. As the chart below indicates, 52 renewable energy projects are in the development process, thus proving that Hawaii is the ideal laboratory for clean energy development and investment.

K I : RPS
The State Energy Office assisted with the permitting and siting of the following pilot and production facilities now operating or under construction: Auwahi Wind Farm (21 MW)
HAWAI‘I GAS Synthetic Natural Gas (SNG) Pilot Plant (demonstration project)
Kaheawa Wind Power II (21 MW)
Kalaeloa Renewable Energy Park (5 MW)
Kalaeloa Solar Power I and II (2 x 5 MW)
Kawailoa Wind Farm (69 MW)
UOP/Honeywell Integrated Bio-Refinery Facility (4 barrels/day, demonstration project)
17 | STATE OF HAWAII ENERGY RESOURCES COORDINATOR’S ANNUAL REPORT 2012
As of October 2012, five projects reached the completion phase this year: Big Island Biodiesel (Pacific Biodiesel, Inc.) Resource: Biofuel Production: 5 MGY HAWAI‘I GAS (formerly The Gas Company) Resource: Synthetic Natural Gas (SNG) Demonstration project Kaheawa Wind Power II (First Wind) Resource: Wind Production: 21 MW Kapolei Sustainable Energy Park (Forest City) Resource: Photovoltaic Production: 1.18 MW Puna Geothermal Venture Expansion (Ormat) Resource: Geothermal Production: 8 MW

2012 A P
K I : RPS
HAWAII CLEAN ENERGY PROGRAMMATIC ENVIRONMENTAL IMPACT STATEMENT (PEIS)
The Hawaii Clean Energy Programmatic Environmental Impact Statement (PEIS) will analyze, at a programmatic level, the potential environmental impacts of clean energy activities and technologies with the potential for near-term development or application in Hawaii. As a cooperating agency, the State of Hawaii assisted the U.S. Department of Energy (DOE) with
gathering public comments on the scope of the PEIS and continues to gather reports, assessments, and other resources to be included in the PEIS.
The scoping process sought public input and comment on a variety of clean energy activities and
technologies, including energy efficiency, distributed renewables, utility-scale renewables, alternative transportation fuels and modes, and electrical transmission and distribution.
Meetings were held throughout the State, on the islands of Oahu, Kauai, Maui, Molokai, Lanai and
Hawaii. Reports developed by the State and comments received previously will be available for use by the DOE
and its cooperating agencies in the PEIS project. DOE’s proposed action is to develop guidance that it can use in making decisions about future DOE
funding or other actions to support Hawaii in achieving the State’s clean energy goals. The PEIS will support the achievement of statewide clean energy objectives by providing reference
information to assist in the development of diverse energy projects throughout the State.
18 | STATE OF HAWAII ENERGY RESOURCES COORDINATOR’S ANNUAL REPORT 2012

K I : RPS
RENEWABLE ENERGY PROJECTS IN HAWAII—HAWAII’S CLEAN ENERGY LEADERS
This list showcases 40 renewable energy projects that are demonstrating progress in becoming commercial enterprises and have potential to assist the State of Hawaii in achieving its collective goals under the Hawaii Clean Energy Initiative. Updated quarterly to reflect industry developments, this list can be found at energy.hawaii.gov/programs/cleanenergy-leaders.
19 | STATE OF HAWAII ENERGY RESOURCES COORDINATOR’S ANNUAL REPORT 2012
ISLAND CLEAN ENERGY PROJECTS MAP
The Island Clean Energy Projects map is an interactive tool that charts a variety of renewable energy projects and their locations throughout the State. Users can search by name, island, location or technology for a specific project. By clicking on the project, users can get more details such as the amount of energy/fuel that is being generated and the project status. This interactive map can be found at hawaiicleanenergyinitia-tive.org/island-projects-new/.

K I : RPS
PERMIT FACILITATION
Published Version 1 of the online Permitting Wizard, which identifies the permitting requirements for individual projects. It also provides useful information (permit packets) for over 160 federal, state, and county permits, including process steps, estimated timelines and costs, agency contacts, and relevant laws or references.
Published Version 2 of A Guide to Renewable Energy Facility Permits in Hawaii, provides useful information on permitting and renewable energy project development in Hawaii based on input from the regulatory agencies, development community, and other stakeholders.
Funded and supported the Department of Health’s (DOH) online ePermitting Portal and electronic document tool. DOH now has many environmental permits available for online processing and estimates this may save up to 30% of permit process time. Since its public release in April 2012, over 700 clean water permit renewals, totaling over $300,000 in fees, have been electronically submitted to and processed by DOH. The tool also gives DOH the ability to immediately modify permit applications and forms. Furthermore, ePermitting serves as a model for other state and county permitting agencies seeking to implement similar online permitting services.
INSTALLATION OF HELCO’S BATTERY ENERGY STORAGE SYSTEMS (BESS)
This program, funded by the 2009 American Recovery and Reinvestment Act (ARRA) - State Energy Program, helped HELCO install a Battery Energy Storage System in order to demonstrate stabilization of voltage and frequency fluctuations on a 12 kV distribution circuit for intermittent renewable energy sources. The application of energy storage technology offers a promising potential to optimize integration of Hawaii’s wide variety of available renewable energy sources, and provides progress towards meeting the goals of the Renewable Portfolio Standards and the Hawaii Clean Energy Initiative.
“RENEWABLE ENERGIS” MAP APPLICATION
The application provides a way to search for and map the renewable energy (solar, wind, geothermal, hydro, biomass, OTEC and/or wave) attributes of any piece of property statewide. To get this information, the user simply needs to specify a street address or a tax map key (TMK), point the cursor on the map or draw a polygon on the map. Renewable EnerGIS will serve as an invaluable renewable energy project planning and development tool by providing site-specific information on resource potential and permitting requirements.
20 | STATE OF HAWAII ENERGY RESOURCES COORDINATOR’S ANNUAL REPORT 2012

K I : EEPS
21 | STATE OF HAWAII ENERGY RESOURCES COORDINATOR’S ANNUAL REPORT 2012

K I : EEPS
ACHIEVING EFFICIENCY
A big part of the State of Hawaii’s clean energy goal is to decrease electricity consumption by 30% (4,300 gigawatt hours) by the year 2030. Cutting the amount of electricity businesses and households utilize will lead to smaller utility bills, thus saving consumers money that can be reinvested into the economy. The State Energy Office is seeking solutions that will chart a practical way to reduce energy use through efficiency methods.
Hawaii Energy Efficiency Por olio Standards (EEPS) Levels 2005‐2011 This graph shows Hawaii’s Energy Efficiency Por olio Standards (EEPS) levels from 2005‐2011. The EEPS requires that by 2030, annual energy savings amount to 30% of annual electricity sales statewide. In 2005, the statewide EEPS level was 5.02%. By 2011, the EEPS level rose to 12.12%.
22 | STATE OF HAWAII ENERGY RESOURCES COORDINATOR’S ANNUAL REPORT 2012

K I : EEPS
Hawaii Annual Electricity Cost and Consump on 2006‐2011 Hawaii’s annual electricity consump on has decreased in the past 6 years from 10.6 TWhs in 2006 to less than 10.0 TWh in 2011. However, the cost of electricity has varied as a result of fluctua ons in fuel prices. At its peak, the annual cost of electricity in Hawaii rose to $3.0 billion in 2008 from $2.2 billion in 2006. In 2009, the cost of electricity dropped to $2.1 billion, only to increase to over $3.0 billion in 2011.
23 | STATE OF HAWAII ENERGY RESOURCES COORDINATOR’S ANNUAL REPORT 2012
Hawaii Annual Electricity Consump on 2006‐2011
Hawaii Annual Electricity Cost 2006‐2011

K I : EEPS
First in Na on: Energy Savings Performance Contrac ng Per Capita Hawaii was ranked first in the na on for energy savings performance contrac ng by the Energy Services Coali on, with $132.25 per capita in energy savings performance contracts. This is almost 3.7 mes the na onal average of $36.04 per capita.
24 | STATE OF HAWAII ENERGY RESOURCES COORDINATOR’S ANNUAL REPORT 2012
Hawaii State Agencies Electricity Consump on and Cost FY05‐FY2011 The chart shows Hawaii state agency electricity consump on increased slightly from fiscal years 2005 to 2007. Star ng in fiscal year 2008, however, electricity consump on declined for three years in a row as a result of efficiency measures. There was a slight increase in 2011, mostly a ributed to new facili es coming on line. Overall, since fiscal year 2005, the State has decreased its electricity consump on by 4.6%, but, due to the increased cost of oil, state electricity costs have risen 62.4%. Note: 2012 data forthcoming. Check energy.hawaii.gov for updates.

K I : EEPS
Hawaii ENERGY STAR Building 2003‐2012 Agencies can benchmark buildings to compare energy usage with other buildings in their por olio or similar buildings na onally to iden fy investment priori es. If a building’s ENERGY STAR score ranks in the top 25% of all buildings of its type, it can be cer fied as an ENERGY STAR building. Since 2003, 61 Hawaii buildings have received the ENERGY STAR cer fica on. They include 24 public and 37 private buildings totaling approximately 15.5 million square feet of floor space.
25 | STATE OF HAWAII ENERGY RESOURCES COORDINATOR’S ANNUAL REPORT 2012
Hawaii ENERGY STAR Buildings 2003‐2011

2012 A P
K I : EEPS
26 | STATE OF HAWAII ENERGY RESOURCES COORDINATOR’S ANNUAL REPORT 2012
FIRST IN THE NATION: “RACE TO THE TOP” FOR PERFORMANCE CONTRACTING
The State Energy Office took home top honors on behalf of the State of Hawaii in the 2012 “Race to the Top” competition, presented by the Energy Services Coalition (ESC). “Race to the Top” ranks states by investment per capita in energy savings performance contracting, which enables building owners to use future energy savings to cover upfront costs for energy saving projects, eliminating the need to dip into capital budgets. The State of Hawaii has invested $132.25 per capita, an increase from its previous figure of $117.09 per capita. ECS is a national nonprofit organization composed of a network of experts who collaborate to increase energy efficiency and building upgrades through energy savings performance contracting.
Additional projects not included below, but under development, include: Department of Transportation (15 airports/5 harbors and highways facilities), City and County of Honolulu Board of Water Supply, City and County of Honolulu Honoulili Waste Water Treatment Plant, and the University of Hawaii at Hilo.

K I : EEPS
27 | STATE OF HAWAII ENERGY RESOURCES COORDINATOR’S ANNUAL REPORT 2012
LEED GOLD CERTIFICATION FOR STATE OFFICE TOWER
The U.S. Green Building Council recognized the State Office Tower (SOT) with a prestigious Leadership in Energy and Environmental Design (LEED) Gold Level award in the category of Existing Buildings: Operations & Maintenance. The SOT is the first major office building, public and private, to receive LEED Gold in the category for Existing Buildings. The certification is a third-party verification that the 161,000-square foot SOT is being operated in a manner that maximizes operational efficiency and minimizes environmental impacts: reduced energy, water and resource consumption; enhanced indoor environment; minimized operational costs. The State Office Tower achieved a score of 96 under the ENERGY STAR Portfolio Manager program of the U.S. Environmental Protection Agency. A score of 96 means the SOT is in the 96 percentile for energy efficiency of similar buildings in the nation.

K I : EEPS
Sources: HECO and KIUC
STATE AGENCIES ARE MANAGING THEIR ENERGY USE
During FY11, state agencies’ energy consumption increased minimally by 0.6% above FY10 levels, but the state paid 17.1 %, more than FY10. When comparing FY11 figures against the 2005 baseline year, energy consumption dropped 4.6%, but, due to the increasing cost for electricity, costs rose 62.3%. Data for FY 12 forthcoming. Check energy.hawaii.gov for updates.
28 | STATE OF HAWAII ENERGY RESOURCES COORDINATOR’S ANNUAL REPORT 2012
The chart below shows the percentage of change from the baseline year each year since the Lead By Example program began. Shown are the price of oil, the average retail price of electricity (based on EIA‐826 repor ng, dividing u lity total revenues by total kWh sold and including fuel adjustment cost), total State of Hawaii electricity costs and the State of Hawaii electricity consump on (kWh).

K I : EEPS
ADVANCING ENERGY EFFICIENCY IN HAWAII PUBLIC FACILITIES
DBEDT was awarded a U.S. Department of Energy grant for a $350,000 State Energy Program 2012 Competitive Award which will be applied to strengthening, enhancing and expanding its existing energy efficiency programs by: Incorporating ENERGY STAR Portfolio Manager to benchmark appropriate State Executive Branch
facilities. Using the results to encourage state agencies to bundle facilities to pursue energy efficiency through
energy savings performance contracts or other financing mechanisms.
29 | STATE OF HAWAII ENERGY RESOURCES COORDINATOR’S ANNUAL REPORT 2012
RURAL SMALL BUSINESSES AND FARMS PROGRAM
DBEDT was awarded a U.S. Department of Agriculture grant for the Rural Energy for America program which provides professional services to prepare energy audits for eligible rural small businesses and farms, with support and in partnership with Hawaii Energy and the Counties of Maui and Hawaii. The program also assists the audit recipients in locating funding to implement the energy efficiency measures identified in the audit. Audit recipients will provide 25% of the cost of the audit and DBEDT is providing $25,000 in-kind cost share for managing and marketing the program. The project will advance Hawaii’s food and energy security.
GREENSUN HAWAII LOAN PROGRAM
On October 26, 2011, the State launched its GreenSun Hawaii Loan Loss Reserve (LLR) Program for energy efficiency and renewable energy installations for residential and commercial (including multi-family and nonprofit) properties. The LLR Program gives participating lenders access to a loan loss reserve designed to cover a portion of the risk financial institutions face in making loans to finance energy efficiency measures and renewable energy systems. The program currently has ten Participating Lenders and 32 Authorized Contractors statewide.
GreenSun Hawaii has since passed the $1 million milestone in low interest loans issued. We estimate energy savings of 258,000 kilowatt hours annually (6,450,000 over the life of the installations) and a combined savings in the participants’ electric bill in excess of $108,000 annually ($2.7 million over the life of the system). The energy saved annually is equivalent to powering 460 households a year.
ASSISTANCE TO BUSINESSES
The State Energy Office benchmarked and certificated 23 buildings as ENERGY STAR , mainly hotels, office buildings, and medical facilities, and schools. We also worked with building owners to bring buildings to ENERGY STAR standing.
AMERICAN RECOVERY AND REINVESTMENT ACT-FUNDED ENERGY EFFICIENCY IMPROVEMENT IMPACTS IN THE COMMUNITY

K I : EEPS
30 | STATE OF HAWAII ENERGY RESOURCES COORDINATOR’S ANNUAL REPORT 2012
ASSISTANCE TO NONPROFITS
The State Energy Office provided energy efficiency rebates through Hawaii Energy so that it could offer government and non-profit organization facilities up to 25 percent of costs to purchase and install customized energy efficiency measures: recipients included Castle Medical Center, the largest recipient of those funds, followed by Royal Iolani’s Association of Apartment Owners (AOAO), Bishop Museum, Pali Momi Medical Center, 1717 Ala Wai AOAO, and Moana Pacific AOAO.
ASSISTANCE TO RESIDENCES
There were a number of programs covering all islands. Programs were provided through Hawaii Energy, Kauai Island Utility Cooperative, the State Department of Hawaiian Home Lands, and the State Department of Labor and Industrial Relations’ Office of Community Services. Residences received one or more of the energy conservation measures noted below. Recipients varied depending on the programs and included residences such as utility rate payers to any utility in the state as well as low-income households that qualified under federal guidelines. The aggregated amount from all energy conservation measures listed below are the equivalent of powering 9,485 homes for one year.
Installed Estimated Savings
CFL 4,359 $ 540,255.49
E* Refrigerators 8,280 $ 3,539,858.98
SWH 2,470 $13,898,240.83
Heat Pumps 37 $ 226,877.53
Clothes Washers 13 $ 10,916.91
A/C 8 $ 12,195.59
Power Strips 998 $ 1,016,195.29
Low-Flow Aerators 476 $ 0.00
Low-Flow Shower Heads 505 $ 603,391.93
Solar PV 33 $ 1,926,135.20
TOTAL $21,424,396.16
ASSISTANCE TO GOVERNMENT AGENCIES
Provided technical assistance for performance contracting to state and county agencies that resulted in the Race to the Top Award.
Certified the State Office Tower for Leadership in Energy and Environmental Design (LEED) Gold for Existing Buildings: Operations & Maintenance.
Installed 1,005 photovoltaic panels on the Kalanimoku Building. Updated the State of Hawaii building code for state public buildings.
K I : EEPS
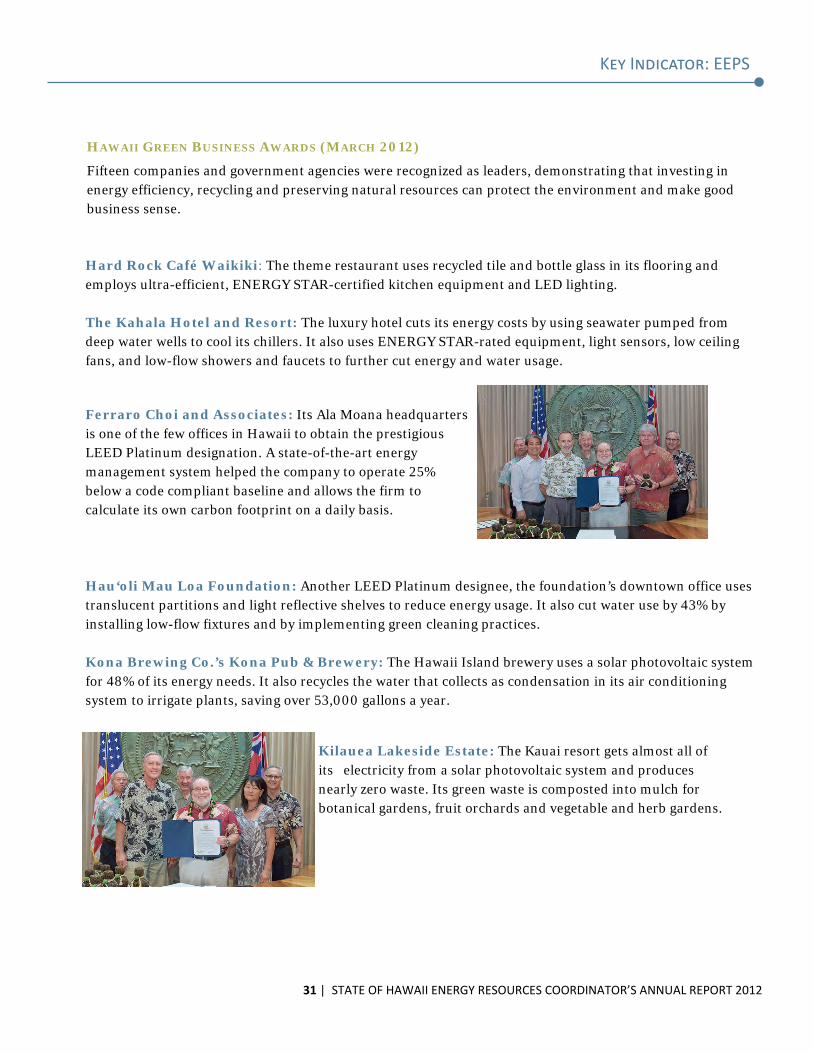
HAWAII GREEN BUSINESS AWARDS (MARCH 2012)
Fifteen companies and government agencies were recognized as leaders, demonstrating that investing in energy efficiency, recycling and preserving natural resources can protect the environment and make good business sense.
Hard Rock Café Waikiki: The theme restaurant uses recycled tile and bottle glass in its flooring and employs ultra-efficient, ENERGY STAR-certified kitchen equipment and LED lighting. The Kahala Hotel and Resort: The luxury hotel cuts its energy costs by using seawater pumped from deep water wells to cool its chillers. It also uses ENERGY STAR-rated equipment, light sensors, low ceiling fans, and low-flow showers and faucets to further cut energy and water usage. Ferraro Choi and Associates: Its Ala Moana headquarters is one of the few offices in Hawaii to obtain the prestigious LEED Platinum designation. A state-of-the-art energy management system helped the company to operate 25% below a code compliant baseline and allows the firm to calculate its own carbon footprint on a daily basis. Hau‘oli Mau Loa Foundation: Another LEED Platinum designee, the foundation’s downtown office uses translucent partitions and light reflective shelves to reduce energy usage. It also cut water use by 43% by installing low-flow fixtures and by implementing green cleaning practices. Kona Brewing Co.’s Kona Pub & Brewery: The Hawaii Island brewery uses a solar photovoltaic system for 48% of its energy needs. It also recycles the water that collects as condensation in its air conditioning system to irrigate plants, saving over 53,000 gallons a year.
Kilauea Lakeside Estate: The Kauai resort gets almost all of its electricity from a solar photovoltaic system and produces nearly zero waste. Its green waste is composted into mulch for botanical gardens, fruit orchards and vegetable and herb gardens.
31 | STATE OF HAWAII ENERGY RESOURCES COORDINATOR’S ANNUAL REPORT 2012

K I : EEPS
Marriott’s Maui Ocean Club: The Ka‘anapali resort recycles most of its construction and electronic waste and donates all HI-5 recyclables to local high schools. Motion sensor light switches and low-flow water fixtures and toilets have sharply reduced its water and energy usage. Il Gelato Hawaii: The local gelato maker reuses its large tubs used to deliver its products, sparing Oahu’s landfills over 12,000 containers each year. It has also controlled gasoline costs by improving the scheduling of its delivery and pick-up routes. Hyatt Regency Waikiki Beach Resort and Spa: As part of a $13 million facelift to its third floor level, the ENERGY STAR-labeled Waikiki hotel opted to use recycled glass planters and drought tolerable plants to help save more than 4.7 million gallons of water a year.
Central Pacific Plaza: The downtown high-rise, which has earned the ENERGY STAR designation for the past eight years, has reduced its energy usage by an average of 25% a year. The building’s water retrofits have saved more than 2.7 million gallons since 2003.
Holiday Inn Waikiki Beachcomber Hotel: As an ENERGY STAR-rated building, the Waikiki hotel installed variable speed chillers and other energy efficiency measures, reducing energy use by over 20%, equivalent to 4,000 kWh per day. An upgraded cooling tower saves more than 624,000 gallons of water each year. The Ritz-Carlton Kapalua Maui Resort and Luxury Hotel: By investing in computerized moisture sensing devices for its irrigation system and modifying irrigation schedules, the luxury hotel sharply reduced its water usage. It also installed LED lighting in public areas and adjusted hot water heater settings to cut energy use.
32 | STATE OF HAWAII ENERGY RESOURCES COORDINATOR’S ANNUAL REPORT 2012

K I : EEPS
Honeywell Utility Solutions: Through the Hawaii Energy “Go Green” program, Honeywell helps Hawaii’s consumers qualify for incentives for installing solar water heaters or make other energy efficiency measures. At its own local offices, the company provides subsidized bus passes to employees, eliminated the use of all plastic utensils and buys only recycled paper products. County of Maui Water Resource and Planning Division: The county division installed more efficient toilet fixtures and flow restrictors at its faucets, cutting water usage by 56% or roughly 133 gallons per day.
The Department of Business, Economic Development and Tourism and the Department of Accounting and General Services: To achieve a LEED certification for the State Office Tower building in downtown Honolulu, high-efficiency lighting, lighting sensors, low-flush toilets and low-flow faucets were installed, saving 36,270 gallons of water a year and 100,000 kWh of electricity.
33 | STATE OF HAWAII ENERGY RESOURCES COORDINATOR’S ANNUAL REPORT 2012

K I : J
34 | STATE OF HAWAII ENERGY RESOURCES COORDINATOR’S ANNUAL REPORT 2012

K I : JOBS
POWERING THE ECONOMY
Hawaii’s pursuit of energy independence by 2030 is contributing to Hawaii’s economy by generating millions of dollars in new investment and creating thousands of new jobs. With more than 11,000 green jobs statewide, Hawaii ranks third in the nation for clean tech job growth, which is helping to offset job losses in the traditional construction sector.
Hawaii’s Clean Economy Job Growth Hawaii is posi oning clean energy as a catalyst for economic growth and job crea on with 6.5% increase in green jobs between 2003 and 2010 with con nuing gains in 2011.
35 | STATE OF HAWAII ENERGY RESOURCES COORDINATOR’S ANNUAL REPORT 2012
*Es mated. Source: Reality Check: How Green is Hawaii’s Workforce, April 2012 (Department of Labor & Industrial Rela ons)
*

K I : JOBS
Green Jobs by Industry Clean energy is powering Hawaii’s economy by a rac ng green business and crea ng a workforce for the future. The chart below shows which industries account for green jobs and how they are es mated to grow from over 11,000 in 2010 (the last year data was reported) to an es mated 19,250 in 2018.
36 | STATE OF HAWAII ENERGY RESOURCES COORDINATOR’S ANNUAL REPORT 2012
Aggregate Clean Economy Hawaii ranked third in the na on in clean energy jobs from 2003‐2010 by the Brookings Ins tute. The chart below illustrates Hawaii as being in the top percen le in this na on‐wide study.
Source: Sizing the Clean Economy, August 2011 (Brookings Institute)

Solar‐Related Construc on Expenditures Hawaii’s solar industry has had a significant impact on the construc on industry. As of 2012, it accounted for 26% of all construc on expenditures in the State, providing a much needed s mulus to the construc on industry, which has been severely impacted by the downturn in real estate development.
37 | STATE OF HAWAII ENERGY RESOURCES COORDINATOR’S ANNUAL REPORT 2012
K I : JOBS

T
38 | STATE OF HAWAII ENERGY RESOURCES COORDINATOR’S ANNUAL REPORT 2012

TRANSPORTATION
TRANSPORTATION ON THE MOVE
To reduce Hawaii’s consumption of petroleum within the transportation sector, the State Energy Office is looking at plug in electric vehicles (EV) as well as other alternative transportation solutions to address the challenges of modernizing our energy system and building a clean transportation future. Hawaii’s leaders and stakeholders view the adoption and widespread deployment of EVs as a key approach towards the reduction of our fossil fuel dependency. To date, there are 1,016 EVs registered in Hawaii, up from 581 at the end of 2011. According to an October 31, 2012 Edmunds.com press release, Hawaii ranks 10th in the nation for EV registrations, with 2.9% of all EVs sold in the country in 2012 being here in the islands.
Average Monthly Regular Gasoline Price Hawaii vs U.S. January 2006‐September 2012 Hawaii’s gasoline prices are consistently higher than the na onal average. From 2006 to September 2012, the monthly state average regular gasoline prices ranged from $2.80 to $4.39 per gallon, whereas the na onal average ranged from $2.29 to $3.83 per gallon. Of the various coun es in the state, Maui County consistently had the highest gas prices followed by Hawaii County and the City & County of Honolulu. Kauai County data points are not included as the data source for this chart does not track monthly regular gasoline prices for Kauai County.
39 | STATE OF HAWAII ENERGY RESOURCES COORDINATOR’S ANNUAL REPORT 2012

TRANSPORTATION
Current EV Charging Network The adop on of public charging loca ons will play a vital role in limi ng EV drivers’ range anxiety and reaching the HCEI target of reducing petroleum use for ground transporta on. The State Energy Office has recognized that charging availability is a key driver for EV adop on in Hawaii and a poten al barrier if infrastructure is not developed to meet the needs of EV deployment in a mely manner. Thanks largely to the successful Hawaii EV Ready Program, Hawaii has surged to the na onal forefront for the deployment of public charging sta ons and is currently the na on’s leader for public EV charging sta ons on a per capita basis. The following charts show Hawaii’s publicly available chargers across the State, as of October 2012. Note – A ‘charger’ can have one or more ports. The number of ‘ports’ determines how many vehicles each charger can service at a me. One ‘port’ can service one vehicle.
40 | STATE OF HAWAII ENERGY RESOURCES COORDINATOR’S ANNUAL REPORT 2012
Source: Department of Business, Economic Development & Tourism, September 2012
Island Number of Chargers Number of Ports
Oahu 155 179
Hawaii 20 34
Kauai 18 21
Maui 31 39
State of Hawaii 224 273
Number of Publicly Available EV Chargers Installed
Charging station at Turtle Bay Resort, Oahu. Photo courtesy of Better Place

2012 A P
TRANSPORTATION
THE HAWAII EV READY PROGRAM
The Hawaii State Energy Office completed The Hawaii EV Ready program, designed to help accelerate EV adoption across Hawaii. Funded by the American Recovery and Reinvestment Act (ARRA), the Hawaii EV Ready program provided grants and rebates to stimulate the market demand of EVs and charging infrastructure.
The Hawaii EV Ready Grant Program helped to install >> over 230 Level 2 EV charging sites and six DC fast chargers, at more than 95 locations statewide. The new stations were made possible by private, Hawaii business investment, and $2.3 million in federal ARRA stimulus funds through the Hawaii EV Ready Grant Program. In partnership with EV Grant recipient Plug in America, the >> State Energy Office published the EV Ready Guidebook for Commercial Electric Vehicle Charging Station installations, available free of charge online at the State Energy Office’s and Plug In America’s websites. Grant recipient, The City and County of Honolulu, made residential building permits available online for the installation of charging stations. The EV Ready Rebate program ran through April 2012 and provided rebates for the purchase of EVs and chargers. The program provided 455 rebates for EVs, and 279 public and private charger rebates.
The EV Ready Program also allocated $475,500 to the State of Hawaii’s Department of Accounting and
General Services Automotive Management Division. The Division’s State motor pool purchased a total of 10 EVs (Chevrolet Volts and Nissan LEAFs) and installed over a dozen level two charging stations at the state motor pool and in state owned public parking lots.
41 | STATE OF HAWAII ENERGY RESOURCES COORDINATOR’S ANNUAL REPORT 2012

TRANSPORTATION
MAUI ELECTRIC VEHICLE ALLIANCE
The State Energy Office continues to support the Maui EV Alliance under the Department of Energy “Clean Cities Community Readiness and Planning for Plug-In Electric Vehicles and Charging Infrastructure” grant, which was awarded to the University of Hawaii Maui College in September 2011. The primary goal of the grant project is to develop an EV Implementation Plan for Maui County. The plan is intended to be a model that can be adapted for broader application across the State of Hawaii and other regions of the United States.
The State Energy Office is drafting an EV report for the Maui EV Alliance titled: Driving EVs Forward: A Case Study of the Market Introduction and Deployment of the EV in Hawaii. The purpose of the report is to share Hawaii’s experiences on EV demonstration and deployment, identify challenges and opportunities, and highlight best practices for creating a prosperous EV market in Hawaii.
HONOLULU CLEAN CITIES
The State Energy Office partnered with the Honolulu Clean Cities Coalition to directly assist the Maui EV Alliance. The Energy Office provided technical advice and information pertaining directly to the preparation and editing of Honolulu Clean Cities Coalition recently published report titled: “Lessons Learned: The Early Adoption of Electric Vehicle Charging Stations from the Perspective of Oahu’s Commercial Properties.” The report is available free of charge online at the State Energy Office’s and Honolulu Clean Cities’ websites: energy.hawaii.gov honolulucleancities.org STATE OF HAWAII EV CHARGING STATIONS DATABASE
The State Energy Office has created a statewide database for publicly available EV charging stations and continuously updates the database as new charging stations come online. The database provides general directions to EV chargers by island, city, zip code, parking lot, street address, station availability (hours), number of chargers, number of ports, charger level, charge fee, and manufacturer. The database is available for download on the State Energy Office website – energy.hawaii.gov.
42 | STATE OF HAWAII ENERGY RESOURCES COORDINATOR’S ANNUAL REPORT 2012

I , P P
43 | STATE OF HAWAII ENERGY RESOURCES COORDINATOR’S ANNUAL REPORT 2012

I , P P
SEEKING, ATTRACTING AND DEVELOPING CLEAN ENERGY OPPORTUNITIES
With the evolving energy environment in Hawaii, the State is also focused on expanding the current clean energy momentum to spur economic development and diversification with sustainable job and business growth through the creation of an innovation ecosystem. The State Energy Office has a new focus on Innovation, Planning and Policy to help shape the State’s energy future through core policy and planning activities and by attracting innovation and investment opportunities, including positioning Hawaii as the clean energy test bed of the world.
ACT 165 – INTERISLAND ELECTRIC TRANSMISSION CABLE SYSTEMS
On June 27, 2012, Governor Neil Abercrombie signed into law the bill aimed to move Hawaii forward in reducing its dependence on imported oil. The measure enacted was Senate Bill 2785, now known as Act 165. Senate Bill 2785 established a regulatory structure for the installation and implementation of an interisland high-voltage electric transmission cable system and for the construction of on-island transmission infrastructure. Interconnecting the islands will provide an effective and efficient means to introduce signifi-cantly more renewable energy into a stable grid environment and is an important step in securing more uniform and predictable electricity rates throughout the State.
Among Governor Neil Abercrombie’s priority bills this past session.
Established the regulatory structure under which interisland transmission cables can be developed, financed, and constructed on commercially reasonable terms.
Amended other sections of the Hawaii Revised Statutes to reflect the existence of a separate and distinct entity transmitting power to and receiving revenue from an existing electric utility that is not owned or controlled by that electric utility.
2012 A P ENERGY POLICIES
The State Energy Office continues to lead DBEDT’s participation in major energy policy issues and decisions to ensure Hawaii’s energy transformation to reduce its dependence on imported foreign oil.
44 | STATE OF HAWAII ENERGY RESOURCES COORDINATOR’S ANNUAL REPORT 2012

I , P P
ACT 168—RELATED TO ELECTRIC VEHICLE PARKING
Added time restrictions to free EV parking incentive and defines EVs to federal standards. With the new definition of EVs, County vehicle registration agencies in Hawaii are now required to define
all types of EVs as Electric. For example, the plug-in Toyota Prius Hybrid qualifies as an EV.
ACT 89—RELATED TO ELECTRIC VEHICLE PARKING ACCOMMODATIONS Updated Act 156, 2009 EV parking requirement to
require public accommodations with over 100 stalls available to the public to set aside at least one parking stall to be designated for the exclusive use of EVs, removing the Act 156’s 1% requirement.
Allows EV parking stalls to be located anywhere in the
parking structure or lot, provided that the EV parking stalls do not displace or reduce accessible stalls required by the Americans with Disabilities Act Accessibility.
INTEGRATED RESOURCE PLANNING (IRP): ENERGY PLANNING
The PUC approved a new framework for a broader, more dynamic IRP process that uses scenarios to develop clean energy plans with consideration for the range of possible futures we may face.
PUC issued Order No. 30233 on March 1, 2012 to initiate HECO Companies’ Integrated Resource
Planning Process based on the revised IRP framework. A large community advisory group from across the state has convened to represent diverse community,
environmental, social, political, and cultural interests consistent with the goal of the IRP.
ACT 97—RELATED TO GEOTHERMAL EXPLORATION AND DEVELOPMENT
Removed the geothermal resource subzone designation process and allows geothermal development in all State Land Districts (all other permits apply). The Subzone designation process was viewed as an additional regulatory step that provided safeguards otherwise mandated in other required approvals and permits.
Differentiated 'exploration' and 'development' to clarify which exploratory activities can be conducted
without the same level of regulation (permits) required for development activities. The changes should facilitate geothermal exploration and development without increased environmental risk.
45 | STATE OF HAWAII ENERGY RESOURCES COORDINATOR’S ANNUAL REPORT 2012

I , P P
HAWAII’S ENERGY ASSURANCE PROGRAM
The State Energy Office leads the State government’s effort to ensure a robust, secure, and resilient energy infrastructure in the contemporary energy ecosystem. DBEDT works closely with State Civil Defense and dozens of government and industry emergency management and security partners to lower vulnerabilities, deter threats, minimize the consequences of energy disruptions, and enhance recovery of Hawaii’s energy systems, resources, and markets. Hawaii’s Energy Assurance Program provides organizational and planning coordination and support to facilitate the rapid restoration of Hawaii’s physical, human and cyber energy infrastructure in a disruption event, as well as works to mitigate impacts of any energy shortage. On a daily basis, the Energy Assurance Program tracks natural and manmade energy disruption events and homeland security related incidents which could impact Hawaii’s energy supply and delivery.
ENERGY ASSURANCE EXERCISE
The State Energy Office coordinated the State of Hawaii Energy Assurance Plan (EAP) Tabletop Exercise (TTX) in July. The TTX provided participants an opportunity to evaluate the effectiveness of energy response plans in the event of an energy disruption or emergency impacting the State. Over 80 representatives from Federal, State and County government, agencies with energy and emergency management responsibilities, the energy industry, and personnel involved in critical infrastructure protection participated. Participants demonstrated capabilities in planning, restoration of lifelines, communications, and economic and community recovery. Participants identified strengths and areas for improvement in the EAP and each agency’s emergency response. During the exercise, participants discussed current EAP policies and procedures, emergency response best practices, and potential solutions. Participants identified ways to improve their agency’s energy related operations. The TTX resulted in renewed commitment and focus on state level energy assurance partnerships, coordination, and planning.
46 | STATE OF HAWAII ENERGY RESOURCES COORDINATOR’S ANNUAL REPORT 2012

I , P P
INTERNATIONAL AGREEMENTS
International agreements advance Hawaii’s clean energy infrastructure deployment and solidify Hawaii as the clean energy test bed of the Asia Pacific.
Clean Energy Investment and Deployment Program
Japan-U.S. Island Grid Project Korea Smart Grid Project
Description
Agreement with the China Council for Promotion of International Trade (CCPIT)
to promote Chinese clean energy investment and deployment in Hawaii.
Description
Agreement with New Energy and Industrial Technology Development
Organization (NEDO) for a $37 million research and development partnership to
demonstrate advanced smart grid technologies on Maui.
Description
Partnership with Korea Smart Grid Institute (KSGI) to pilot advanced energy
efficiency and micro smart grid technologies in Oahu hotels, as well as
explore business opportunities for EV sharing.
Objective
Advance clean energy deployment in the Asia Pacific
Objective
Showcase Hawaii as the clean energy test bed of the Asia Pacific
Objective
Showcase Hawaii as the clean energy test bed of the Asia Pacific
Partner
China Council for the Promotion of International Trade (CCPIT)
Partner
New Energy and Industrial Technology Development Organization (NEDO)
Partner
Korea Smart Grid Institute (KSGI)
Participating Organizations
Currently identifying companies to partner
Participating Organizations
Japan: Hitachi, Mizuho, CyberDefense Hawaii: US DOE & national labs, HECO,
MECO, HNEI MEDB, Maui County
Potential Participating Organizations
Korea: LG Electronics, Nara Controls, Hyundai, Hyosung, KT
Hawaii: Royal Hawaiian Hotel, Moana Surfrider Hotel, Sheraton Waikiki Hotel,
Enterprise Car Rental, Green Car Hawaii, HECO, HNEI
Status
MOU completed August 12, 2012. Currently planning program activities and
events.
Status
MOU completed November 22, 2011. AEC Hawaii established as Hitachi's
Hawaii entity. Starting volunteer recruitment activities.
Status
MOU to be completed end of 2012/beginning of 2013
47 | STATE OF HAWAII ENERGY RESOURCES COORDINATOR’S ANNUAL REPORT 2012

I , P P
2012 ASIA PACIFIC CLEAN ENERGY SUMMIT AND EXPO
The State Energy Office held a successful Asia Pacific Clean Energy Summit and Expo (APCESE) in August 2012 to showcase the State’s abilities as a model for innovative clean energy test beds. Approximately 780 attendees representing 19 countries including the United States, Japan, South Korea, China and Australia packed the Hawaii Convention Center for the three-day conference, which included informative panel discussions, an interactive expo and networking opportunities.
APCESE provided 21 breakout panel sessions featuring 123 speakers representing a comprehensive array of clean energy topics, covering areas of Power Generation and Management, Integration and Transportation Solutions, Global and Hawaii Project Opportunities and Military Opportunities and Programs.
The Defense Energy Technology Challenge (DETC) received more than 250 submissions of which 18 were from Hawaii. The top nine DETC projects and top seven Transformative Reduction in Operational Energy Consumption (TROPEC) projects made presentations to defense, clean industry and investment communities with real-time feedback and potential matching with test and procurement opportunities. Of the 18 Hawaii submissions, five were chosen to present.
The Project Finance Connect Program received just over 100 submissions of which seven were from Hawaii. The program matched growth stage companies and clean energy projects with finance sources, developers and partners.
There were also more than 130 Poster Presentation submissions of which 22 were from Hawaii.
New to APCESE this year was a “matchmaking” service that highlighted 50 clean energy project ideas in various stages of development and provided opportunities for investors to make one-on-one appointments with them. Fifteen of the 50 projects were from Hawaii.
“This year’s Summit was tremendously successful in bringing together all the stakeholders in clean energy, not only in the State of Hawaii, but also internationally. I particularly found the Defense Energy Technology Challenge presentations useful in identifying new, refreshing, innovative and promising solutions.”
- George Kailiwai III Director, Resources and Assessments (J8) United State Pacific Command
48 | STATE OF HAWAII ENERGY RESOURCES COORDINATOR’S ANNUAL REPORT 2012

F : ESSF G
49 | STATE OF HAWAII ENERGY RESOURCES COORDINATOR’S ANNUAL REPORT 2012

F : ESSF G
DBEDT’s Strategic Industries Division has historically received funds from state and federal sources, with its programmatic budget being 90% federally funded. In 2012, the State Energy Office moved towards converting 100% of its fiscal intake from the State-allocated Act 73 Energy Security Special Fund (ESSF) and the per-barrel tax on petroleum products. At the same time, the State Energy Office reduced its staff from 43 to 34 positions. The State Energy Office has allocated these resources toward pivotal energy-related programs and energy efficiency initiatives in support of growing Hawaii’s clean energy economy and achieving the Hawaii Clean Energy Initiative (HCEI) goal of 70% clean energy by 2030.
DBEDT Strategic Industries Division: Revenue and Expenses For the 2012 fiscal year, the Strategic Industries Division’s revenues and expenditures by source of funding were as follows:
50 | STATE OF HAWAII ENERGY RESOURCES COORDINATOR’S ANNUAL REPORT 2012

F : ESSF G
ACT 73 - ENERGY SECURITY SPECIAL FUND
In 2010, the Hawaii State Legislature concluded it is in the best interest of Hawaii’s residents to become self-sufficient in energy and food needs and to protect the health and function of the environment. Recognizing that Hawaii is endowed with the assets needed to significantly improve its energy independence and food sustainability over the next twenty years, if appropriate personnel resources and funding are used wisely, the legislature agreed that the state must ensure both immediate and long-term strategies are well-resourced, coordinated and focused. As such, the legislature passed Act 73 – Energy Security Special Fund (ESSF) to allocate critical resources to HCEI and the State Energy Office. More specifically, Act 73 is designed to:
Promote economic development for local food and energy businesses by providing necessary
funding, guidance, and infrastructure;
Ensure Hawaii is energy and food self-sufficient and sustainable to the maximum extent feasible;
Help Hawaii’s natural resources and population adapt and be resilient to the inevitable challenges brought on by climate change;
Create a Hawaii economic development task force to accelerate and support public and private efforts to make Hawaii energy and food self-sufficient, consistent with the “Hawaii 2050 Sustainability Plan,” the “Hawaii Clean Energy Initiative,” and other government and community planning efforts (The Hawaii Economic Development Task Force submitted its final report to the Legislature in 2012, and in accordance with the statute’s provision, it has ceased to exist on June 30, 2012);
Establish an agricultural development and food security special fund to fund activities intended to increase agricultural production or processing that may lead to reduced importation of food, fodder or feed from outside the state;
Establish a clean energy initiative to manage the state’s transition to a clean energy economy; and
Establish an energy system development special fund within the Hawaii Natural Energy Institute at the University of Hawaii.
The legislature also agreed that undertaking the important task of energy and food security requires a long-term commitment and the investment of substantial financial resources. To that end, Act 73 also increased the per-barrel tax on petroleum products under the environmental response, energy and food security tax, formerly known as the environmental response tax.
51 | STATE OF HAWAII ENERGY RESOURCES COORDINATOR’S ANNUAL REPORT 2012

F : ESSF G
Energy Security Special Fund—Obligated & Planned Investments With the reduc on in American Recovery and Reinvestment Act (ARRA) funding for the 2013 fiscal year, the ESSF will cover a substan ally larger por on of the State Energy Office’s personnel costs and program support.
52 | STATE OF HAWAII ENERGY RESOURCES COORDINATOR’S ANNUAL REPORT 2012

F : ESSF G
DBEDT Strategic Industries Division ‐ Federal Grants Por olio The State Energy Office’s Federal Grants Por olio is comprised of a number of compe ve and non‐compe ve grants.
53 | STATE OF HAWAII ENERGY RESOURCES COORDINATOR’S ANNUAL REPORT 2012