annual report 2011 - permasteelisa group · annual report 2011. 1 annual report 2011. 2 ......
TRANSCRIPT

2011ANNUAL REPORT
1
A N N U A L R E P O R T
2011

2
Ph.
: Kar
in J
obst
3
4
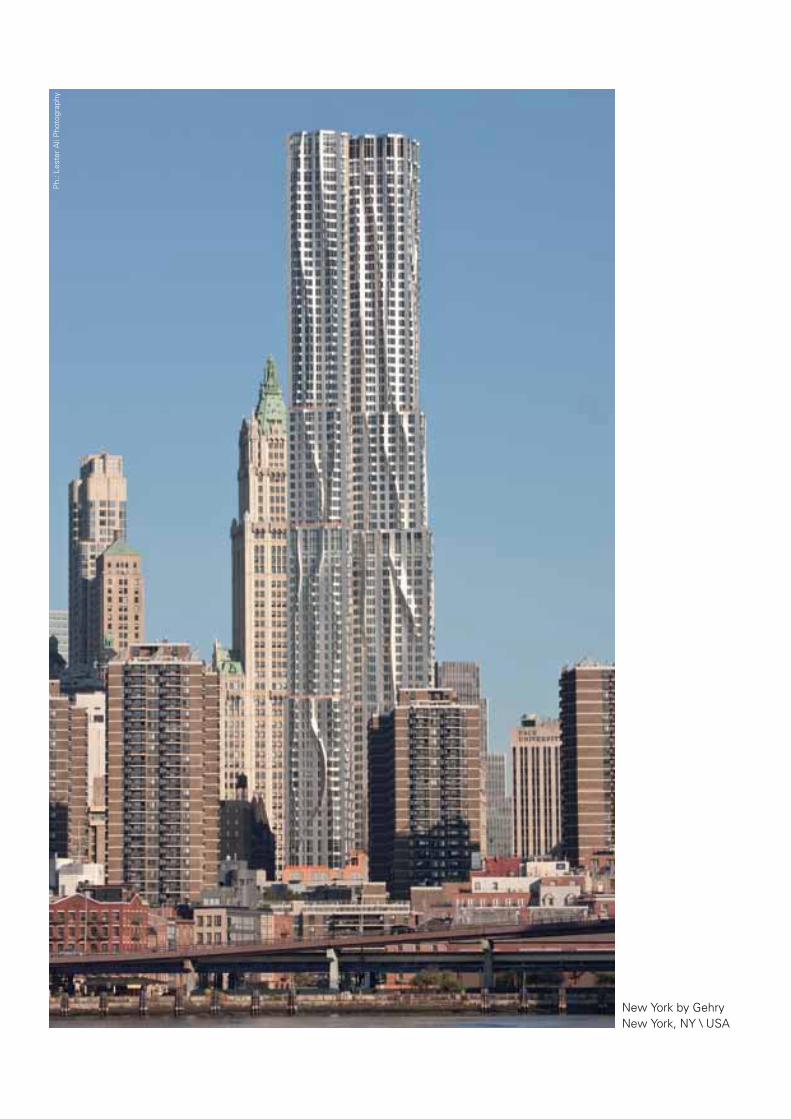
New York by GehryNew York, NY \ USA
Ph.
: Les
ter
Ali
Pho
togr
aphy
5
Administration and Controlling Boards
Group Structure
Management Report to the Consolidated Financial Statements
and to the Statutory Financial Statements
Main economic and financial dataPerformance for the periodOverview of ongoing projects and main project acquisitionsMain risks and uncertainties which Permasteelisa S.p.A. and the Group are exposed toThe Group’s organizational structureResearch and innovation
Technical Support Group
Information TechnologyHuman ResourcesShareholdersTreasury sharesTransactions with related partiesSignificant events subsequent to year end and outlookOther disclosuresOperating performance and financial position of Permasteelisa S.p.A.Approval of the Statutory Financial Statements and allocation of 2011 result
Permasteelisa Group - Consolidated Financial Statements
for the year ended 31 December 2011
Consolidated income statementStatement of comprehensive incomeConsolidated statement of financial positionConsolidated statement of cash flowsConsolidated statement of net equity changesNotes to the Consolidated Financial StatementsAppendix I: Permasteelisa Group’s companies
Permasteelisa S.p.A. - Statutory Financial Statements
for the year ended 31 December 2011
Income statementStatement of comprehensive incomeStatement of financial positionStatement of cash flowsStatement of net equity changesNotes to the Statutory Financial StatementsAppendix I: Receivables and payables broken down by geographical area
Auditors’ report on the Consolidated Financial Statements
Auditors’ report on the Statutory Financial Statements
Report of the Board of Statutory Auditors
Company Name
Permasteelisa S.p.A. with sole shareholder
Registered Office Share Capital
Viale E. Mattei 21/23 Euro 6,900,000 fully paid in Treviso REA31029 Vittorio Veneto, Treviso, Italy (Economic and Administrative Repertory) enrolment no. 169833
Index
79
11
131421485050
51
515357575757586063
65
66
6768697172
121
125
126126127128130131178
182184186
\\\
\\\
\\\
\
\
\
\
\
\
\
\
\
\
\
\
\
\
\
\
\
\
\
\
\
\
\
\
\
\
\
\
\
\
\
6
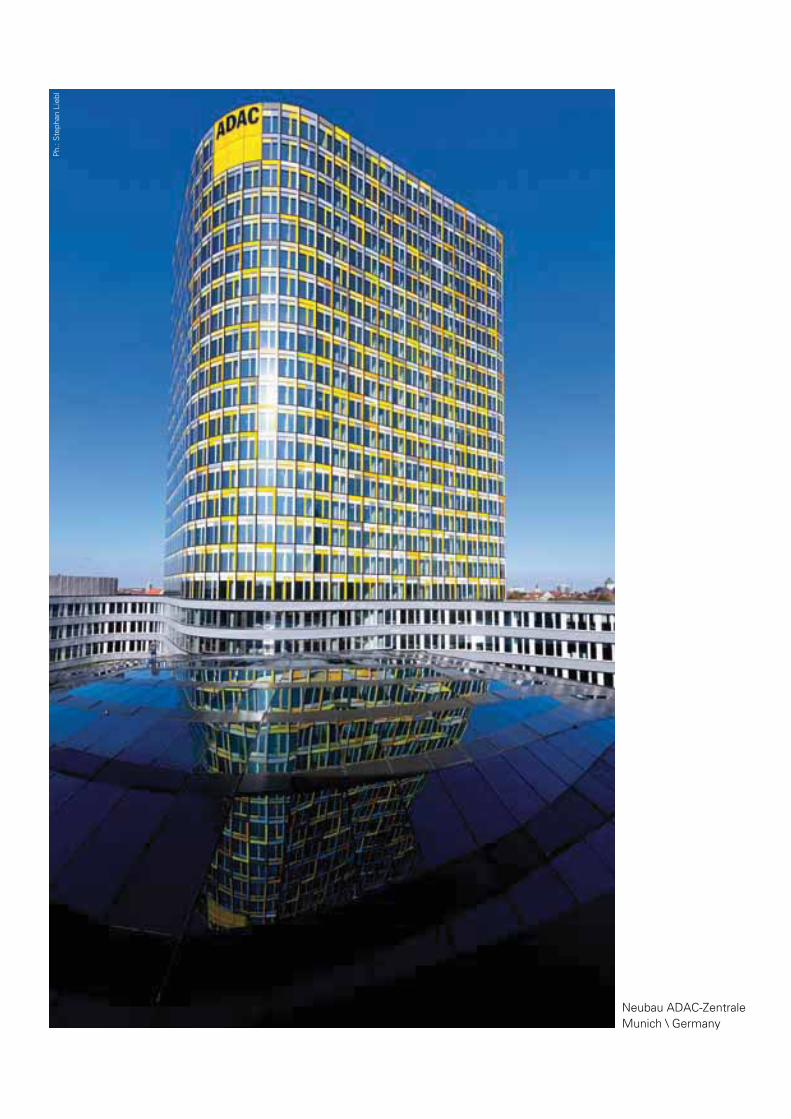
Neubau ADAC-ZentraleMunich \ Germany
Ph.
: Ste
phan
Lie
bl

7
Board of Directors in charge up to 6 December 2011
Chairman Davide Croff
Chief Executive Officer Nicola Greco
Vice Chairman Lucio Mafessanti
Directors Marcello Agnoli (1)
Gherardo Barbini (1)
Vitaliano Arese BorromeoGabriele Del TorchioMaurizio FerrariEdoardo Lanzavecchia (2)
Cesare Piovene Porto Godi (1) Valentina PippoloDante Razzano (2)
Luca Zacchetti(1) Member of the Internal Controlling Committee(2) Member of the Committee on Directors’ Remuneration
Board of Directors in charge since 6 December 2011
Chairman Davide Croff
Chief Executive Officer Nicola Greco
Directors Mitsuru AkahiraToshimasa Iue (1) (2)
Takashi Okuda (2)
Takashi Tsutsui (2)
Schinichi Tanzawa (1)
Makoto Yoshitaka (1) (1) Member of the Internal Controlling Committee(2) Member of the Committee on Directors’ Remuneration
Board of Auditors in charge up to 6 December 2011
Statutory Auditors Roberto Spada - ChairmanMassimo GallinaMaurizio Salom
Standing Auditors Andrea ParoliniRaoul Francesco Vitulo
Board of Auditors in charge since 6 December 2011
Statutory Auditors Eugenio Romita - ChairmanAntonella AlfonsiRoberto Spada
Standing Auditors Michele CrisciLuigi Provaggi
Independent Auditors PricewaterhouseCoopers S.p.A.
Administration and Controlling Boards
Administration and Controlling Boards
8
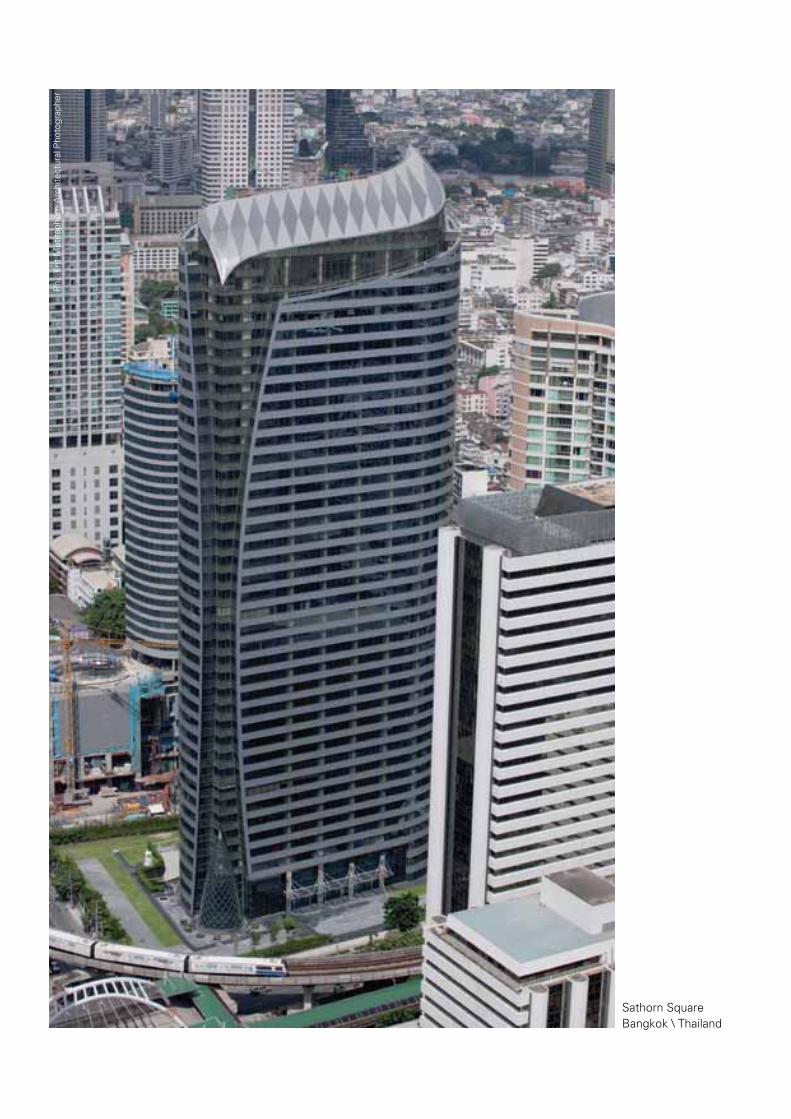
Sathorn SquareBangkok \ Thailand
Ph.
: Krit
Mut
itaph
orn
Arc
hite
ctur
al P
hoto
grap
her
9
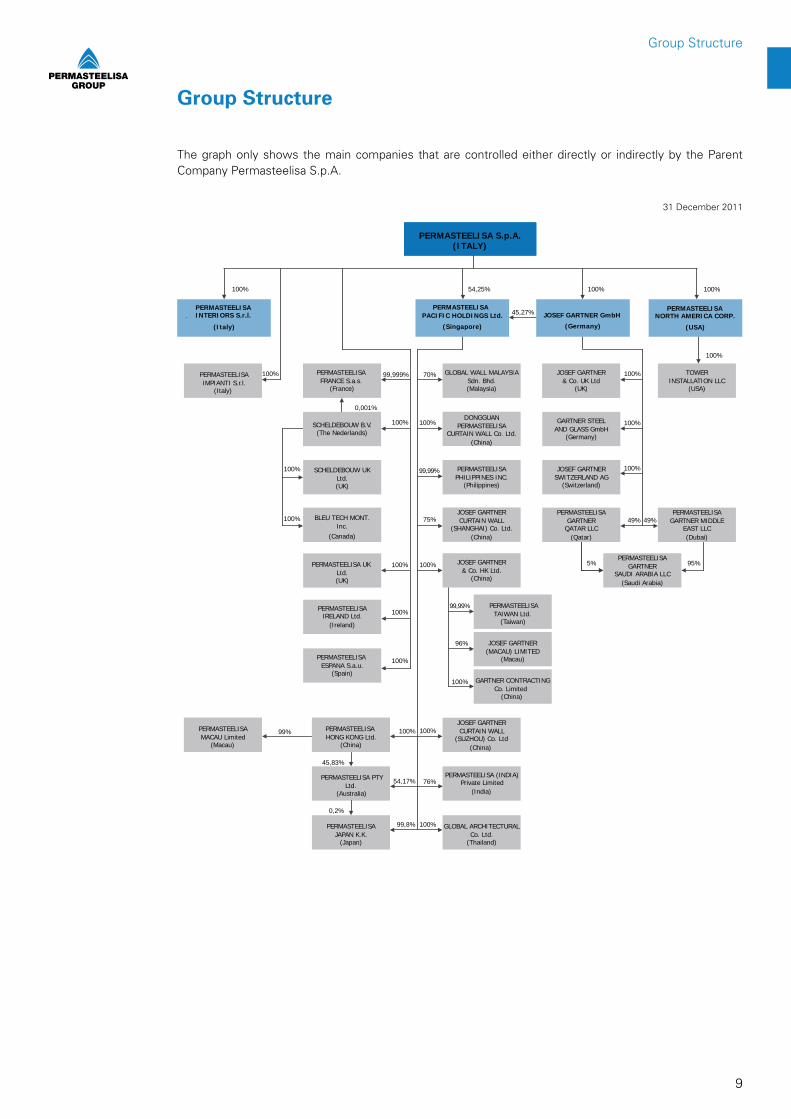
Group Structure
The graph only shows the main companies that are controlled either directly or indirectly by the Parent Company Permasteelisa S.p.A.
31 December 2011
100%
PERMASTEELISA INTERIORS S.r.l.
(Italy)
PERMASTEELISA .l.r.S ITNAIPMI
(Italy)
PERMASTEELISA PACIFIC HOLDINGS Ltd.
(Singapore)
100%
PERMASTEELISA UK Ltd.(UK)
JOSEF GARTNERSWITZERLAND AG
(Switzerland)
SCHELDEBOUW UKLtd.(UK)
100%
GARTNER STEELAND GLASS GmbH
(Germany)
PERMASTEELISAIRELAND Ltd.
(Ireland)
100%
49%
5% 95%
49%
100%
100%
PERMASTEELISA NORTH AMERICA CORP.
(USA)
100%
100%
PERMASTEELISAGARTNER MIDDLE
EAST LLC(Dubai)
PERMASTEELISAGARTNER
QATAR LLC(Qatar)
PERMASTEELISA GARTNER
SAUDI ARABIA LLC(Saudi Arabia)
JOSEF GARTNER& Co. UK Ltd
(UK)
100%
100% 54,25%
45,27%
TOWERINSTALLATION LLC
(USA)
DONGGUANPERMASTEELISA
CURTAIN WALL Co. Ltd.(China)
GLOBAL WALL MALAYSIASdn. Bhd.(Malaysia)
JOSEF GARTNER& Co. HK Ltd.
(China)
JOSEF GARTNERCURTAIN WALL
(SHANGHAI) Co. Ltd.(China)
PERMASTEELISAPHILIPPINES INC.
(Philippines)
PERMASTEELISAJAPAN K.K.
(Japan)
PERMASTEELISA MACAU Limited
(Macau)
100%
70% 99,999%
99,99%
75%
100%
100%
PERMASTEELISA TAIWAN Ltd.
(Taiwan)
99,99%
JOSEF GARTNER(MACAU) LIMITED
(Macau)
96%
GARTNER CONTRACTINGCo. Limited
(China)
PERMASTEELISA PTY Ltd.
(Australia)
PERMASTEELISA HONG KONG Ltd.
(China)
PERMASTEELISA (INDIA) Private Limited
(India)
GLOBAL ARCHITECTURALCo. Ltd.
(Thailand)
54,17%
45,83%
76%
100%
100% 99%
0,2%
99,8%
100%
100%
BLEU TECH MONT.Inc.
(Canada)
PERMASTEELISA FRANCE S.a.s.
(France)
PERMASTEELISA ESPANA S.a.u.
(Spain)
JOSEF GARTNER CURTAIN WALL
(SUZHOU) Co. Ltd (China)
100%
100%
0,001%
100%
JOSEF GARTNER GmbH
(Germany)
PERMASTEELISA S.p.A.(ITALY)
SCHELDEBOUW B.V.(The Nederlands)
Group Structure

10
Ph.
: Ste
phan
Lie
bl
11

12
Management Report
Dear Shareholders,this is the report to the Consolidated Financial Statements and to the Statutory Financial Statements of Permasteelisa S.p.A. for the year ended 31 December 2011.
The purpose of this report is to provide you with an overview of the Parent Company and the Group’s operations in reference to the year which has just ended, in addition to its future prospects. The notes to the Consolidated Financial Statements and to the Statutory Financial Statements will provide you with any additional information you may require on the numerical data supplied in the statement of financial position, the income statement, the statement of cash flows and the statement of net equity changes.
At the end of the year the Company was acquired by JS Group Corporation, a Japanese company listed on the Tokyo Stock Exchange: the transaction took place on 6 December 2011 by cash without any process of “Leverage Buy Out”, after six months of negotiation and the obtaining of the requested antitrust nulla-osta.
Management Report
2011ANNUALREPORT
13
Management Report
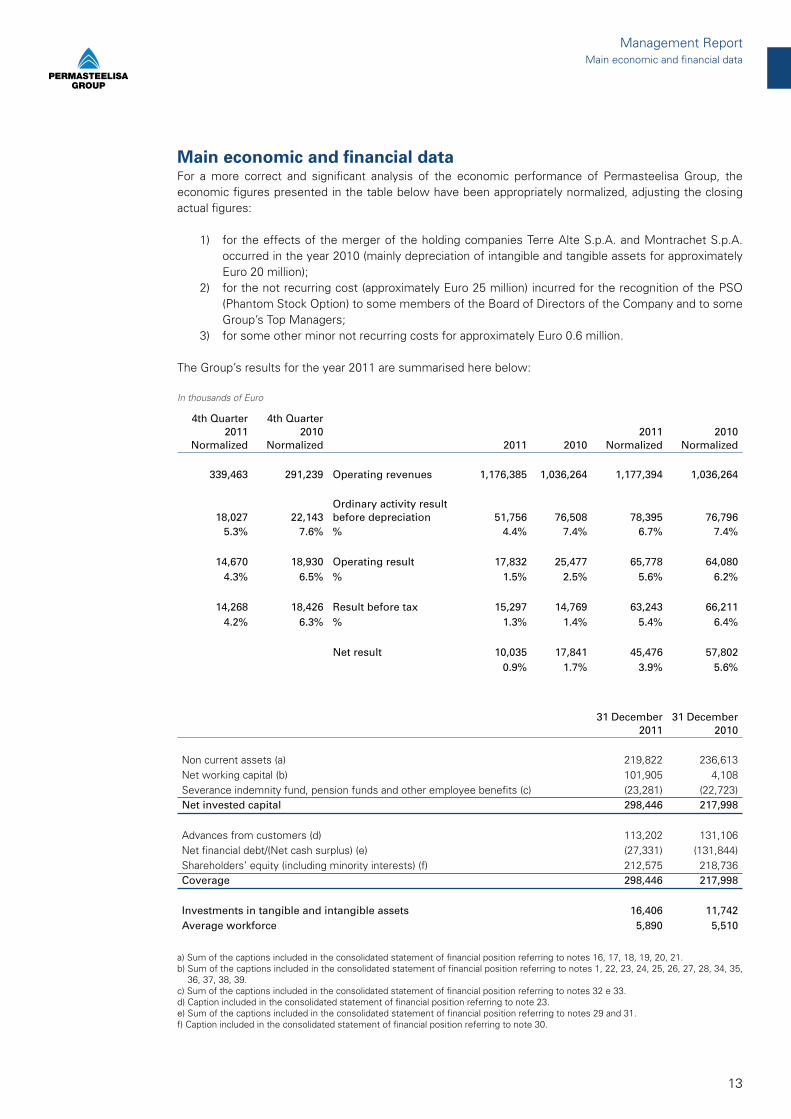
Main economic and financial dataFor a more correct and significant analysis of the economic performance of Permasteelisa Group, the economic figures presented in the table below have been appropriately normalized, adjusting the closing actual figures:
1) for the effects of the merger of the holding companies Terre Alte S.p.A. and Montrachet S.p.A. occurred in the year 2010 (mainly depreciation of intangible and tangible assets for approximately Euro 20 million);
2) for the not recurring cost (approximately Euro 25 million) incurred for the recognition of the PSO (Phantom Stock Option) to some members of the Board of Directors of the Company and to some Group’s Top Managers;
3) for some other minor not recurring costs for approximately Euro 0.6 million.
The Group’s results for the year 2011 are summarised here below:
In thousands of Euro
4th Quarter 2011
Normalized
4th Quarter 2010
Normalized 2011 20102011
Normalized2010
Normalized
339,463 291,239 Operating revenues 1,176,385 1,036,264 1,177,394 1,036,264
18,027 22,143Ordinary activity result before depreciation 51,756 76,508 78,395 76,796
5.3% 7.6% % 4.4% 7.4% 6.7% 7.4%
14,670 18,930 Operating result 17,832 25,477 65,778 64,0804.3% 6.5% % 1.5% 2.5% 5.6% 6.2%
14,268 18,426 Result before tax 15,297 14,769 63,243 66,2114.2% 6.3% % 1.3% 1.4% 5.4% 6.4%
Net result 10,035 17,841 45,476 57,8020.9% 1.7% 3.9% 5.6%
31 December 2011
31 December 2010
Non current assets (a) 219,822 236,613Net working capital (b) 101,905 4,108Severance indemnity fund, pension funds and other employee benefits (c) (23,281) (22,723)Net invested capital 298,446 217,998
Advances from customers (d) 113,202 131,106Net financial debt/(Net cash surplus) (e) (27,331) (131,844)Shareholders’ equity (including minority interests) (f) 212,575 218,736Coverage 298,446 217,998
Investments in tangible and intangible assets 16,406 11,742Average workforce 5,890 5,510
a) Sum of the captions included in the consolidated statement of financial position referring to notes 16, 17, 18, 19, 20, 21.b) Sum of the captions included in the consolidated statement of financial position referring to notes 1, 22, 23, 24, 25, 26, 27, 28, 34, 35, 36, 37, 38, 39. c) Sum of the captions included in the consolidated statement of financial position referring to notes 32 e 33.d) Caption included in the consolidated statement of financial position referring to note 23.e) Sum of the captions included in the consolidated statement of financial position referring to notes 29 and 31.f) Caption included in the consolidated statement of financial position referring to note 30.
Main economic and financial data
14
In the year 2011 the revenues increase already shown in the previous period is confirmed; this increase has particular strength either in absolute sense (+13.5%) or if related to a certainly still not strong market.
At the same time, the Group prosecuted the effort of engineering and production processes rationalization that should allow to maintain, and if possible to increase, the profitability and ability to generate positive cash flows in different geographical and market scenarios.
In the year 2011, the Group structure increased its decentralized organization, with the intention from one side to emphasize the global vocation and from the other one the adoption, on different projects, of a contract execution based on the joined participation of several Business Unit, following a “low-low” scheme supported by an even more advanced ICT platform.
The profitability data are good despite a small percentage decline compared to 2010: the “normalized” EBITDA amounting to Euro 78,395 million is very close to be the best result in absolute value achieved by Permasteelisa Group.
The shift of the turnover and of the business to the Middle and Far East markets, together with the different distributions of cash directly or indirectly occurred between 2009 and 2011, means instead a deterioration of the Net Financial Position, which decreased to approximately Euro 27.3 million at the end of the year, even if remaining positive.
The economic Backlog at the year end is almost the same of the previous year, as the decrease is due to the cancellation from of some project orders awarded since long time but never really entered in the execution phase (as one of the Ground Zero towers in New York).
At corporate level the most relevant transaction, already highlighted, has been the acquisition of 100% of Permasteelisa S.p.A. share capital by JS Group Corporation, a Japanese industrial giant with a turnover 10 times higher than that of Permasteelisa Group, and characterized by a relevant presence in the Far East with reference to the production and sale of industrial products related the construction market. On the other hand, the JS Group has not any significant presence in the “Contracting” business, where instead Permasteelisa is present.
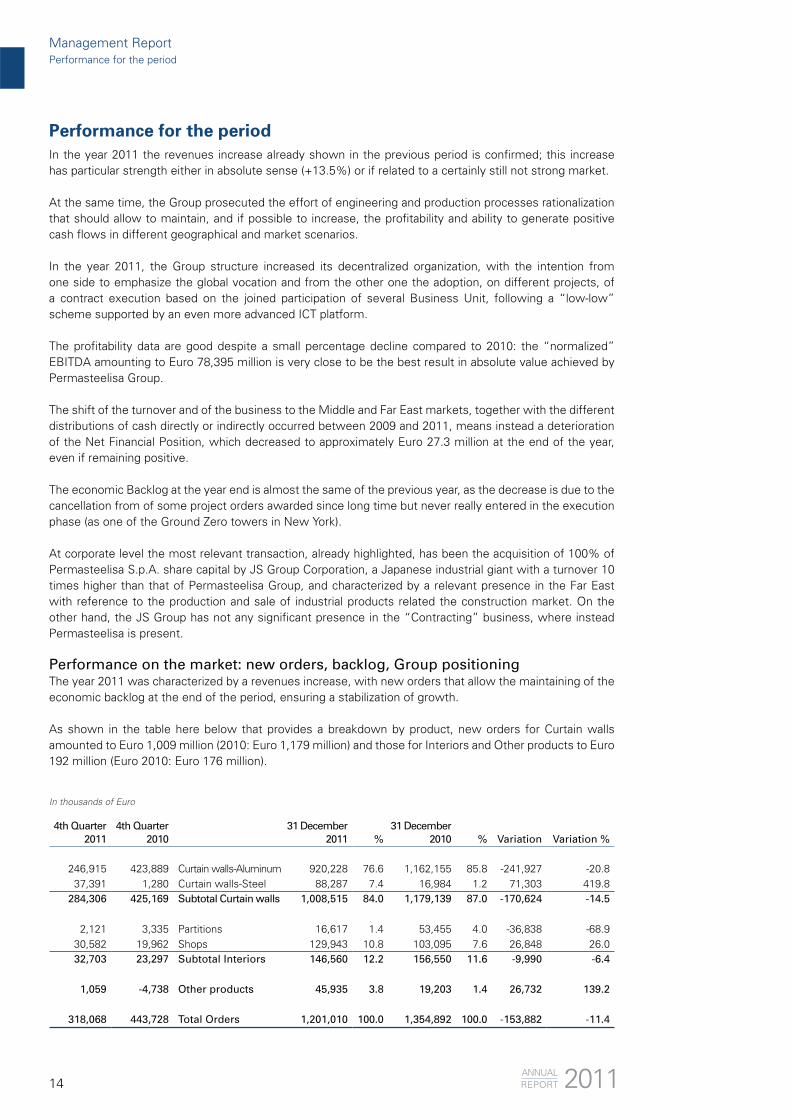
Performance on the market: new orders, backlog, Group positioningThe year 2011 was characterized by a revenues increase, with new orders that allow the maintaining of the economic backlog at the end of the period, ensuring a stabilization of growth.
As shown in the table here below that provides a breakdown by product, new orders for Curtain walls amounted to Euro 1,009 million (2010: Euro 1,179 million) and those for Interiors and Other products to Euro 192 million (Euro 2010: Euro 176 million).
In thousands of Euro
4th Quarter2011
4th Quarter2010
31 December2011 %
31 December2010 % Variation Variation %
246,915 423,889 Curtain walls-Aluminum 920,228 76.6 1,162,155 85.8 -241,927 -20.837,391 1,280 Curtain walls-Steel 88,287 7.4 16,984 1.2 71,303 419.8
284,306 425,169 Subtotal Curtain walls 1,008,515 84.0 1,179,139 87.0 -170,624 -14.5
2,121 3,335 Partitions 16,617 1.4 53,455 4.0 -36,838 -68.930,582 19,962 Shops 129,943 10.8 103,095 7.6 26,848 26.032,703 23,297 Subtotal Interiors 146,560 12.2 156,550 11.6 -9,990 -6.4
1,059 -4,738 Other products 45,935 3.8 19,203 1.4 26,732 139.2
318,068 443,728 Total Orders 1,201,010 100.0 1,354,892 100.0 -153,882 -11.4
Performance for the period
Performance for the periodManagement Report
2011ANNUALREPORT
15
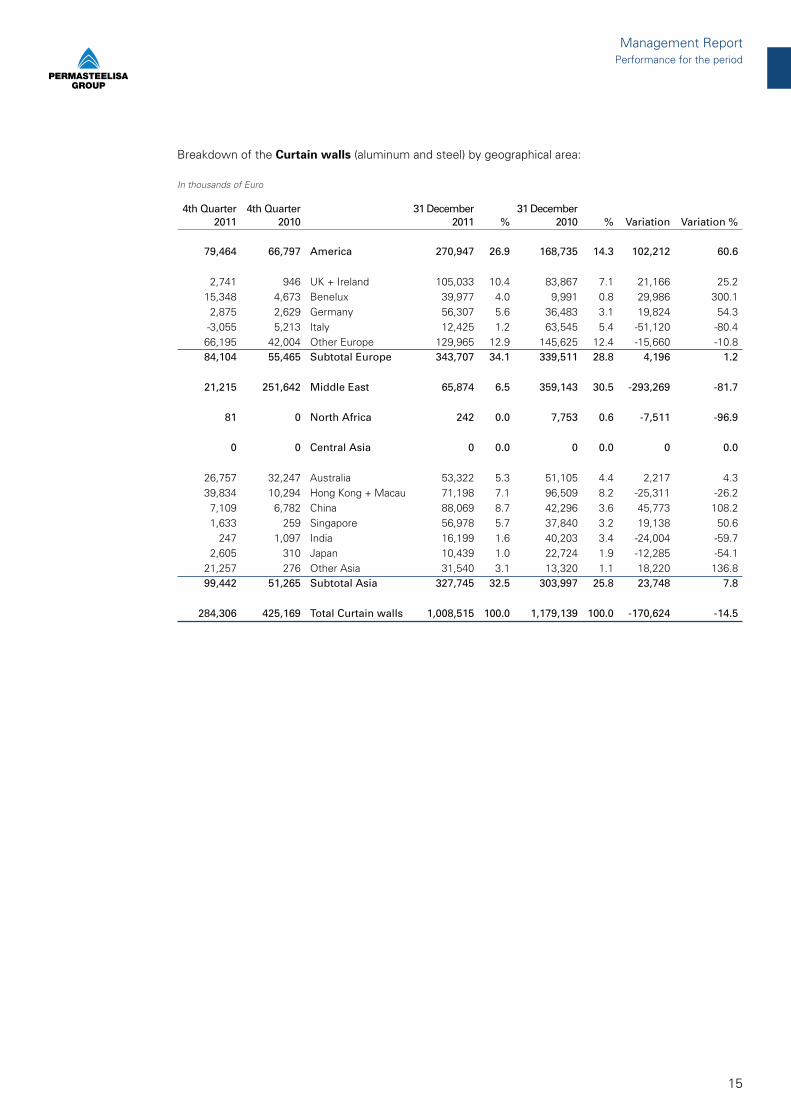
Breakdown of the Curtain walls (aluminum and steel) by geographical area:
In thousands of Euro
4th Quarter2011
4th Quarter2010
31 December2011 %
31 December2010 % Variation Variation %
79,464 66,797 America 270,947 26.9 168,735 14.3 102,212 60.6
2,741 946 UK + Ireland 105,033 10.4 83,867 7.1 21,166 25.215,348 4,673 Benelux 39,977 4.0 9,991 0.8 29,986 300.12,875 2,629 Germany 56,307 5.6 36,483 3.1 19,824 54.3-3,055 5,213 Italy 12,425 1.2 63,545 5.4 -51,120 -80.466,195 42,004 Other Europe 129,965 12.9 145,625 12.4 -15,660 -10.884,104 55,465 Subtotal Europe 343,707 34.1 339,511 28.8 4,196 1.2
21,215 251,642 Middle East 65,874 6.5 359,143 30.5 -293,269 -81.7
81 0 North Africa 242 0.0 7,753 0.6 -7,511 -96.9
0 0 Central Asia 0 0.0 0 0.0 0 0.0
26,757 32,247 Australia 53,322 5.3 51,105 4.4 2,217 4.339,834 10,294 Hong Kong + Macau 71,198 7.1 96,509 8.2 -25,311 -26.27,109 6,782 China 88,069 8.7 42,296 3.6 45,773 108.21,633 259 Singapore 56,978 5.7 37,840 3.2 19,138 50.6
247 1,097 India 16,199 1.6 40,203 3.4 -24,004 -59.72,605 310 Japan 10,439 1.0 22,724 1.9 -12,285 -54.1
21,257 276 Other Asia 31,540 3.1 13,320 1.1 18,220 136.899,442 51,265 Subtotal Asia 327,745 32.5 303,997 25.8 23,748 7.8
284,306 425,169 Total Curtain walls 1,008,515 100.0 1,179,139 100.0 -170,624 -14.5
Performance for the periodManagement Report
16
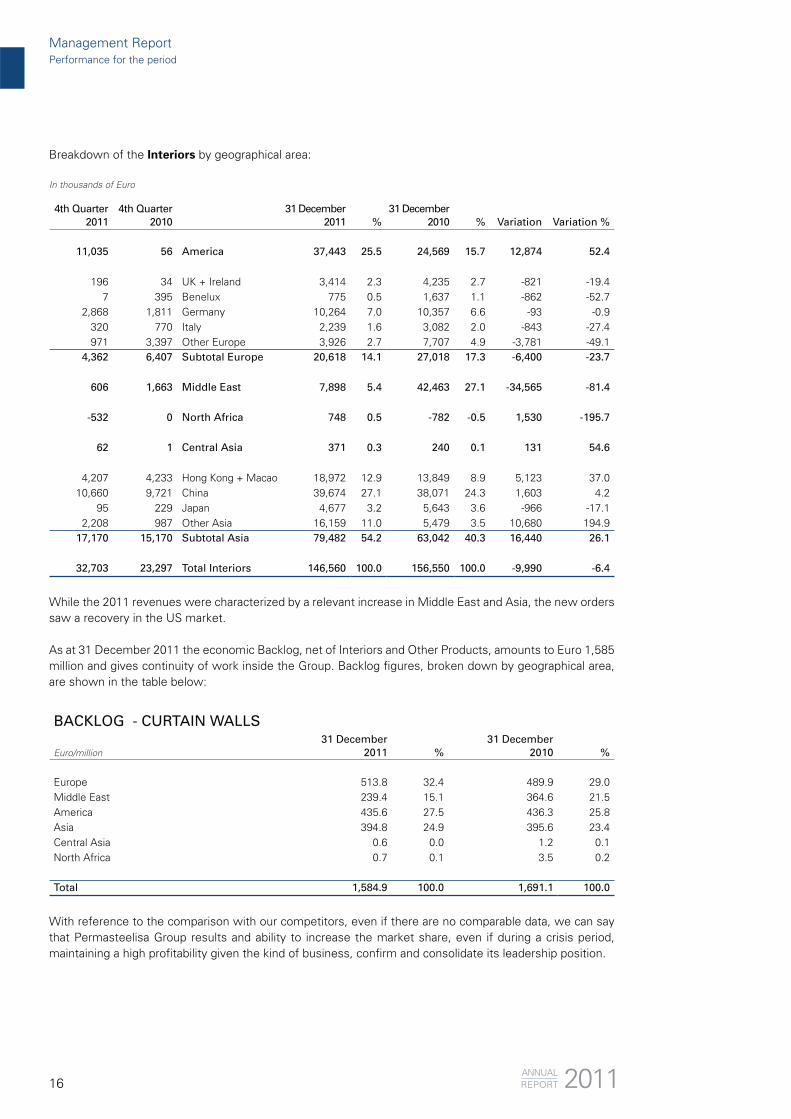
Breakdown of the Interiors by geographical area:
In thousands of Euro
4th Quarter2011
4th Quarter2010
31 December2011 %
31 December2010 % Variation Variation %
11,035 56 America 37,443 25.5 24,569 15.7 12,874 52.4
196 34 UK + Ireland 3,414 2.3 4,235 2.7 -821 -19.47 395 Benelux 775 0.5 1,637 1.1 -862 -52.7
2,868 1,811 Germany 10,264 7.0 10,357 6.6 -93 -0.9320 770 Italy 2,239 1.6 3,082 2.0 -843 -27.4971 3,397 Other Europe 3,926 2.7 7,707 4.9 -3,781 -49.1
4,362 6,407 Subtotal Europe 20,618 14.1 27,018 17.3 -6,400 -23.7
606 1,663 Middle East 7,898 5.4 42,463 27.1 -34,565 -81.4
-532 0 North Africa 748 0.5 -782 -0.5 1,530 -195.7
62 1 Central Asia 371 0.3 240 0.1 131 54.6
4,207 4,233 Hong Kong + Macao 18,972 12.9 13,849 8.9 5,123 37.010,660 9,721 China 39,674 27.1 38,071 24.3 1,603 4.2
95 229 Japan 4,677 3.2 5,643 3.6 -966 -17.12,208 987 Other Asia 16,159 11.0 5,479 3.5 10,680 194.9
17,170 15,170 Subtotal Asia 79,482 54.2 63,042 40.3 16,440 26.1
32,703 23,297 Total Interiors 146,560 100.0 156,550 100.0 -9,990 -6.4
While the 2011 revenues were characterized by a relevant increase in Middle East and Asia, the new orders saw a recovery in the US market.
As at 31 December 2011 the economic Backlog, net of Interiors and Other Products, amounts to Euro 1,585 million and gives continuity of work inside the Group. Backlog figures, broken down by geographical area, are shown in the table below:
BACKLOG - CURTAIN WALLS
Euro/million31 December
2011 %31 December
2010 %
Europe 513.8 32.4 489.9 29.0 Middle East 239.4 15.1 364.6 21.5 America 435.6 27.5 436.3 25.8 Asia 394.8 24.9 395.6 23.4 Central Asia 0.6 0.0 1.2 0.1North Africa 0.7 0.1 3.5 0.2
Total 1,584.9 100.0 1,691.1 100.0
With reference to the comparison with our competitors, even if there are no comparable data, we can say that Permasteelisa Group results and ability to increase the market share, even if during a crisis period, maintaining a high profitability given the kind of business, confirm and consolidate its leadership position.
Management ReportPerformance for the period
2011ANNUALREPORT

17
Operating performance - Results
Operating revenuesA better understanding of the Group’s business trend is provided in the table below, where the operating revenues are broken down by type of product and geographical area compared to 2010.In 2011 operating revenues amounted to Euro 1,176,385 thousand, with an increase of 13.5% compared to the previous year (Euro 1,036,264 thousand).
Operating revenues broken down by product are shown below:
In thousands of Euro
4th Quarter2011
4th Quarter2010
31 December2011 %
31 December2010 % Variation Variation %
265,895 232,533 Curtain walls-Aluminum 955,317 81.2 855,451 82.6 99,866 11.719,465 9,378 Curtain walls-Steel 46,734 4.0 23,858 2.3 22,876 95.9
285,360 241,911 Subtotal Curtain walls 1,002,051 85.2 879,309 84.9 122,742 14.0
10,296 8,156 Partitions 43,507 3.7 25,827 2.5 17,680 68.535,789 33,810 Shops 115,625 9.8 108,876 10.5 6,749 6.246,085 41,966 Subtotal Interiors 159,132 13.5 134,703 13.0 24,429 18.1
8,018 7,361 Other products 15,202 1.3 22,252 2.1 -7,050 -31.7
339,463 291,238 Total Operating Revenues 1,176,385 100.0 1,036,264 100.0 140,121 13.5
Breakdown of the Curtain walls (aluminum and steel) by geographical area:
In thousands of Euro
4th Quarter2011
4th Quarter2010
31 December2011 %
31 December2010 % Variation Variation %
51,672 35,184 America 162,199 16.2 131,806 15.0 30,393 23.1
19,639 44,479 UK + Ireland 100,354 10.0 172,887 19.7 -72,533 -42.07,107 7,961 Benelux 29,210 2.9 40,596 4.6 -11,386 -28.0
13,033 14,080 Germany 53,408 5.3 66,389 7.6 -12,981 -19.613,684 11,661 Italy 58,857 5.9 40,680 4.6 18,177 44.725,107 13,616 Other Europe 82,873 8.3 47,719 5.4 35,154 73.778,570 91,797 Subtotal Europe 324,702 32.4 368,271 41.9 -43,569 -11.8
61,448 34,963 Middle East 164,229 16.4 96,682 11.0 67,547 69.9
514 2,112 North Africa 3,106 0.3 4,222 0.5 -1,116 -26.4
47 366 Central Asia 484 0.0 5,986 0.7 -5,502 -91.9
15,866 5,733 Australia 52,774 5.3 33,591 3.8 19,183 57.127,951 23,781 Hong Kong + Macao 94,971 9.5 73,338 8.3 21,633 29.514,265 7,702 China 38,578 3.8 35,187 4.0 3,391 9.619,706 16,253 Singapore 72,971 7.3 58,679 6.7 14,292 24.44,859 8,680 India 28,600 2.9 30,121 3.4 -1,521 -5.08,385 10,022 Japan 51,878 5.2 29,268 3.3 22,610 77.32,077 5,318 Other Asia 7,559 0.7 12,158 1.4 -4,599 -37.8
93,109 77,489 Subtotal Asia 347,331 34.7 272,342 30.9 74,989 27.5
285,360 241,911 Total Curtain Wall 1,002,051 100.0 879,309 100.0 122,742 14.0
Management ReportPerformance for the period

18
Breakdown of the Interiors by geographical area:
In thousands of Euro
4th Quarter2011
4th Quarter2010
31 December2011 %
31 December2010 % Variation Variation %
8,602 10,254 America 34,382 21.6 34,881 25.9 -499 -1.4
1,572 792 UK + Ireland 4,268 2.7 3,977 2.9 291 7.376 655 Benelux 875 0.5 1,434 1.1 -559 -39.0
2,329 3,934 Italy 12,263 7.7 12,641 9.4 -378 -3.0472 1,237 France 2,407 1.5 6,891 5.1 -4,484 -65.1
1,388 4,454 Other Europe 3,786 2.4 11,276 8.4 -7,490 -66.45,837 11,072 Subtotal Europe 23,599 14.8 36,219 26.9 -12,620 -34.8
7,059 2,773 Middle East 30,611 19.2 4,181 3.1 26,430 632.1
19 850 North Africa 598 0.4 2,249 1.7 -1,651 -73.4
281 -8 Central Asia 345 0.2 239 0.2 106 44.4
4,125 3,587 Hong Kong + Macau 13,730 8.6 9,074 6.7 4,656 51.313,582 10,003 China 37,647 23.7 37,338 27.7 309 0.82,332 1,750 Japan 6,027 3.8 4,798 3.6 1,229 25.64,248 1,685 Other Asia 12,193 7.7 5,724 4.2 6,469 113.0
24,287 17,025 Subtotal Asia 69,597 43.8 56,934 42.2 12,663 22.2
46,085 41,966 Total Interiors 159,132 100.0 134,703 100.0 24,429 18.1
ProfitabilityThe normalized data of year 2011 show an EBITDA of Euro 78.4 million (2010: Euro 76.8 million), that corresponds to 6.7% of operating revenues (2010: 7.4%), and a EBIT of Euro 65.8 million (2010: Euro 64 million), that corresponds to 5.6% of operating revenues (2010: 6.2%): these values remain at excellent performance levels with respect to those achieved during the economic Turnaround of the 2007-2009 period.As already mentioned, the Group went through the construction world crisis with a strong resistance, showing a prompt repositioning capacity. Now there is a partial shift to Middle East and Asian markets, more competitive and less disposed to recognize significant “prizes” to the technical and technology quality of Permasteelisa: this means a small decrease of the margin in comparison with the moments of excellence, to which Permasteelisa has to react and is reacting with a refining of its internal processing to recover some percentage points on costs management.
Financial performance - ResultsThe consolidated non-current assets are equal to Euro 219,822 thousand (2010: Euro 236,613 thousand); the decrease of Euro 16,791 thousand compared to the closing figures of the previous year is mainly due to the depreciation of the intangible assets “Economic Backlog” and “Customer relationship” (approximately Euro 18 million) and of the higher value of some buildings and lands (approximately Euro 1 million) that arose from the allocation of the “excess cost” (approximately Euro 128.5 million) paid by Terre Alte S.p.A (subsequently merged into Permasteelisa S.p.A. during year 2010) for the acquisition of Permasteelisa Group.
The consolidated net working capital presents a positive value for approximately Euro 101,905 thousand (2010: Euro 4,108 thousand), showing an increase compared to the closing figure of the previous year due to the absorption of the operating working capital (i.e. the sum of the captions assets for contracts work-in-progress, inventories and trade receivables minus liabilities for contracts work-in-progress and
Management ReportPerformance for the period
2011ANNUALREPORT
19
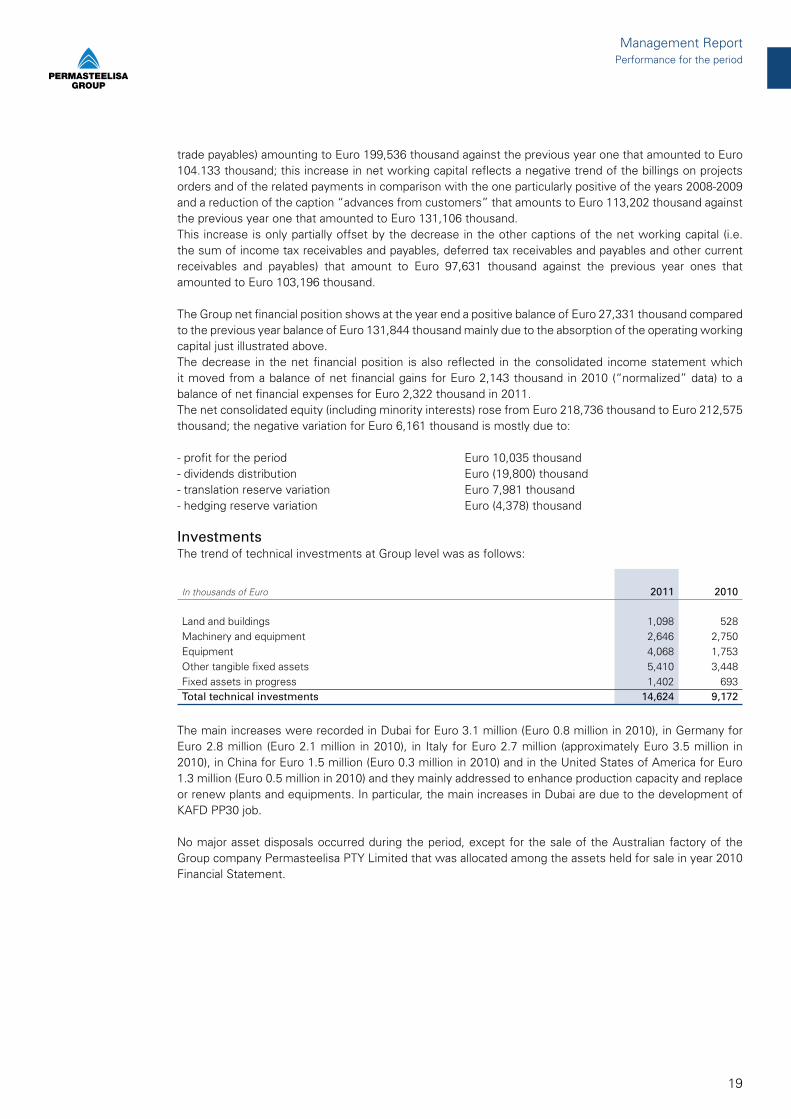
trade payables) amounting to Euro 199,536 thousand against the previous year one that amounted to Euro 104.133 thousand; this increase in net working capital reflects a negative trend of the billings on projects orders and of the related payments in comparison with the one particularly positive of the years 2008-2009 and a reduction of the caption “advances from customers” that amounts to Euro 113,202 thousand against the previous year one that amounted to Euro 131,106 thousand.This increase is only partially offset by the decrease in the other captions of the net working capital (i.e. the sum of income tax receivables and payables, deferred tax receivables and payables and other current receivables and payables) that amount to Euro 97,631 thousand against the previous year ones that amounted to Euro 103,196 thousand.
The Group net financial position shows at the year end a positive balance of Euro 27,331 thousand compared to the previous year balance of Euro 131,844 thousand mainly due to the absorption of the operating working capital just illustrated above.The decrease in the net financial position is also reflected in the consolidated income statement which it moved from a balance of net financial gains for Euro 2,143 thousand in 2010 (“normalized” data) to a balance of net financial expenses for Euro 2,322 thousand in 2011.The net consolidated equity (including minority interests) rose from Euro 218,736 thousand to Euro 212,575 thousand; the negative variation for Euro 6,161 thousand is mostly due to:
- profit for the period Euro 10,035 thousand- dividends distribution Euro (19,800) thousand- translation reserve variation Euro 7,981 thousand- hedging reserve variation Euro (4,378) thousand
InvestmentsThe trend of technical investments at Group level was as follows:
In thousands of Euro 2011 2010
Land and buildings 1,098 528Machinery and equipment 2,646 2,750Equipment 4,068 1,753Other tangible fixed assets 5,410 3,448Fixed assets in progress 1,402 693Total technical investments 14,624 9,172
The main increases were recorded in Dubai for Euro 3.1 million (Euro 0.8 million in 2010), in Germany for Euro 2.8 million (Euro 2.1 million in 2010), in Italy for Euro 2.7 million (approximately Euro 3.5 million in 2010), in China for Euro 1.5 million (Euro 0.3 million in 2010) and in the United States of America for Euro 1.3 million (Euro 0.5 million in 2010) and they mainly addressed to enhance production capacity and replace or renew plants and equipments. In particular, the main increases in Dubai are due to the development of KAFD PP30 job.
No major asset disposals occurred during the period, except for the sale of the Australian factory of the Group company Permasteelisa PTY Limited that was allocated among the assets held for sale in year 2010 Financial Statement.
Management ReportPerformance for the period
20
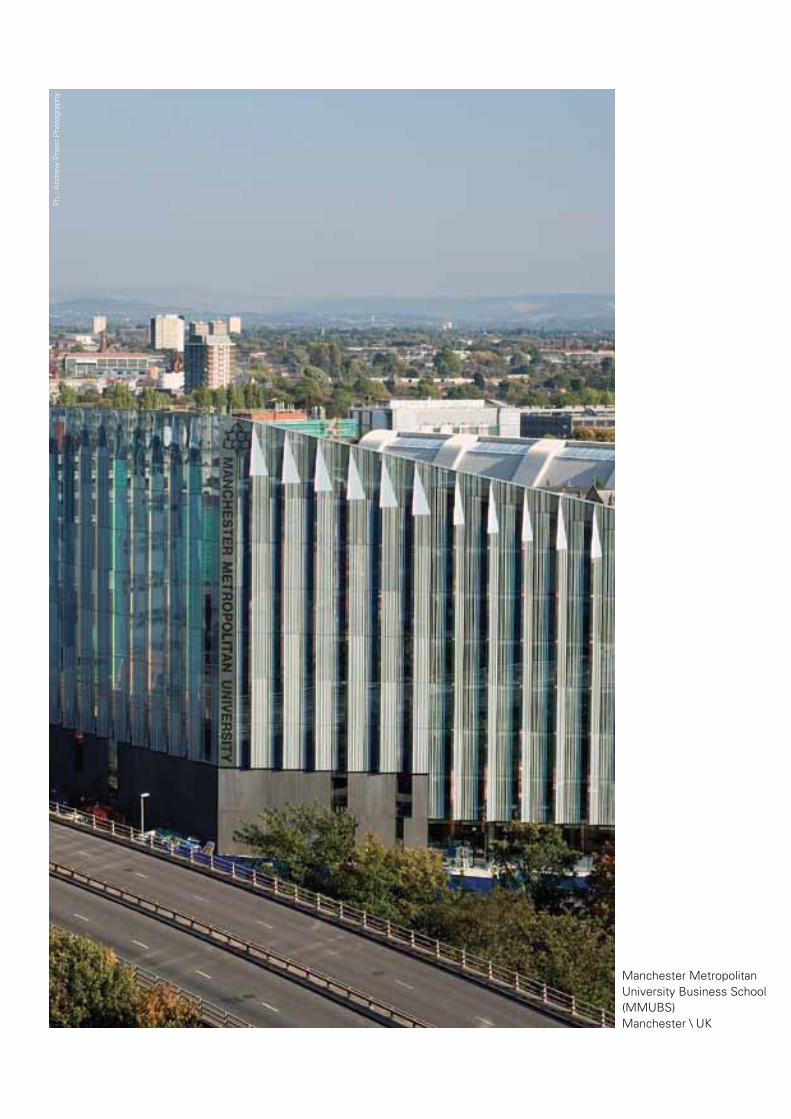
Manchester Metropolitan University Business School (MMUBS)Manchester \ UK
Ph.
: And
rew
Prie
st P
hoto
grap
hy

21
Overview of ongoing projects and main project acquisitions
Overview of ongoing projects and main project acquisitions
Permasteelisa Group’s main ongoing projects for 2011 have been broken into the Group’s two reference sectors:
\ Curtain walls\ Interiors
CURTAIN WALLS
Projects are broken down into three areas:
\\ Main project acquisitions \\ Main ongoing projects \\ Main completed projects
within each area the projects are listed per Business Unit/Product line.
\\ Main project acquisitions for 2011Below are the main projects awarded by the Permasteelisa Group in 2011.
\\\ Business Unit North America
3 World Trade Center
New York, NY \ USA
Project awarded by Permasteelisa North America Corp and designed by architects Rogers Stirk Harbour + Partners in collaboration with Adamson Associates.
The building of approximately 93,600 square meters of curtain walls will be used as commercial offi ces and will be completed during 2014.
Ph.
: Silv
erst
ein
Pro
pert
ies
Inc.
Ph.
: Silv
erst
ein
Pro
pert
ies
Inc.
Management Report

22
\\\ Business Unit Europe
Management ReportOverview of ongoing projects and main project acquisitions
International Gem Tower
New York, NY \ USA
Project awarded by Permasteelisa North America Corp, designed by architects Skidmore, Owings & Merrill LLP and developed by Tishman Construction Corp.
The building of approximately 21,600 square meters of curtain walls will be completed at the beginning of 2013.
Area Garibaldi Tower A
Milan \ Italy
Project awarded by Permasteelisa S.p.A., 12,100 square meters of curtain walls, designed by architects Massimo Roj, Progetto CMR.
Ph.
: Ext
ell D
evel
opm
ent
Ph.
: Ale
ssan
dro
Pan
dini
Ph.
: Ext
ell D
evel
opm
ent
Ph.
: Ale
ssan
dro
Pan
dini
2011ANNUALREPORT
23
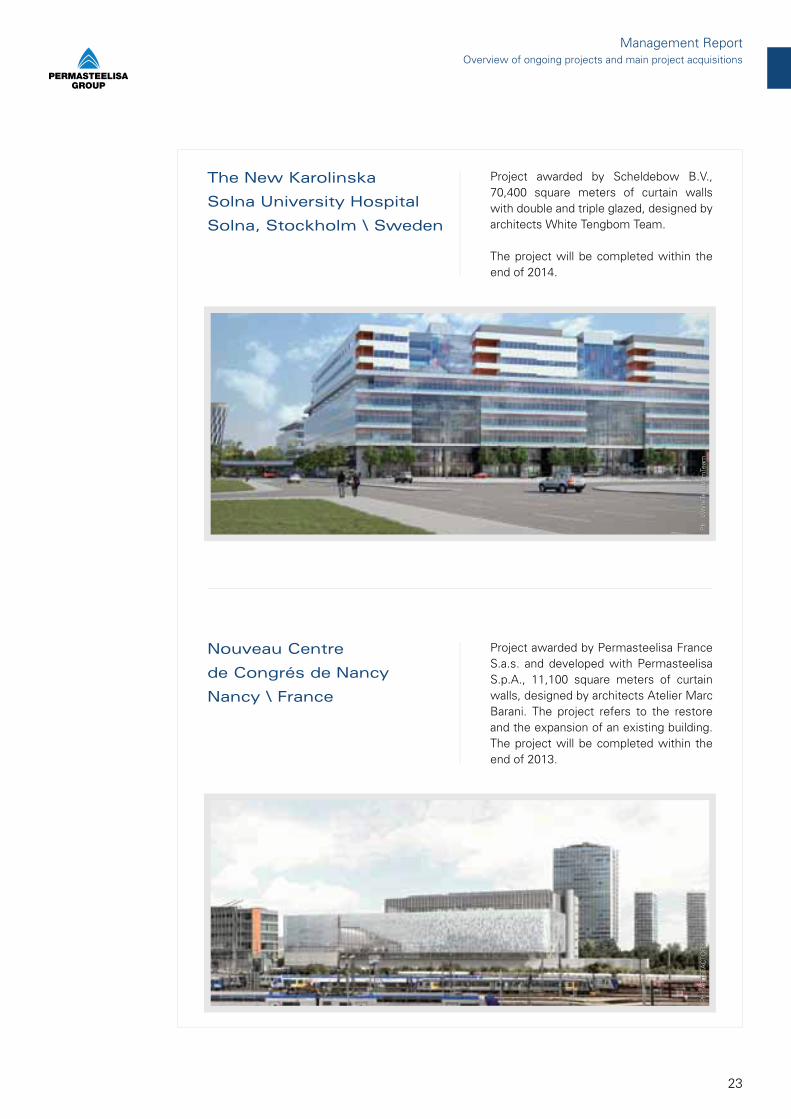
The New Karolinska
Solna University Hospital
Solna, Stockholm \ Sweden
Project awarded by Scheldebow B.V., 70,400 square meters of curtain walls with double and triple glazed, designed by architects White Tengbom Team.
The project will be completed within the end of 2014.
Nouveau Centre
de Congrés de Nancy
Nancy \ France
Project awarded by Permasteelisa France S.a.s. and developed with Permasteelisa S.p.A., 11,100 square meters of curtain walls, designed by architects Atelier Marc Barani. The project refers to the restore and the expansion of an existing building. The project will be completed within the end of 2013.
Ph.
: Whi
teTe
ngbo
mTe
amP
h.: A
RTE
FAC
TOR
YP
h.: W
hite
Teng
bom
Team
Ph.
: AR
TEFA
CTO
RY
Overview of ongoing projects and main project acquisitionsManagement Report
24
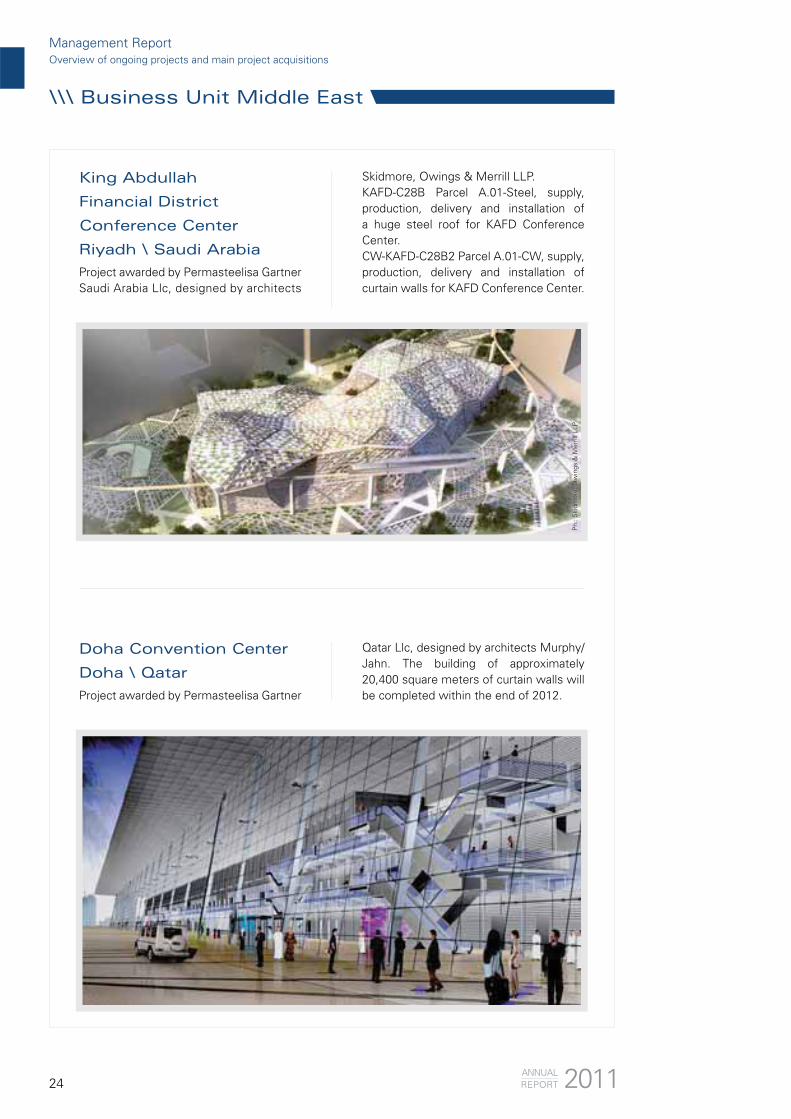
\\\ Business Unit Middle East
King Abdullah
Financial District
Conference Center
Riyadh \ Saudi Arabia
Doha Convention Center
Doha \ Qatar
Skidmore, Owings & Merrill LLP.KAFD-C28B Parcel A.01-Steel, supply, production, delivery and installation of a huge steel roof for KAFD Conference Center.CW-KAFD-C28B2 Parcel A.01-CW, supply, production, delivery and installation of curtain walls for KAFD Conference Center.
Qatar Llc, designed by architects Murphy/Jahn. The building of approximately 20,400 square meters of curtain walls will be completed within the end of 2012.Project awarded by Permasteelisa Gartner
Project awarded by Permasteelisa Gartner Saudi Arabia Llc, designed by architects
Ph.
: Ski
dmor
e, O
win
gs &
Mer
rill L
LPP
h.: S
kidm
ore,
Ow
ings
& M
erril
l LLP
2011ANNUALREPORT
Management ReportOverview of ongoing projects and main project acquisitions

25
\\\ Product Line Gartner
LEO
Frankfurt \ Germany
30,000 square meters of curtain walls, designed by architects schneider+schumacher.Owner: Deka Immobilien Investment.Project awarded by Josef Gartner GmbH,
Building 1 Roche
Basel \ Switzerland
Project awarded by Josef Gartner GmbH, 33.200 square meters of curtain walls, designed by architects Herzog & de Meuron.
Ph.
: Cop
yrig
ht ©
F. H
offm
ann-
La R
oche
Ltd
.P
h.: D
eka
Imm
obili
en In
vest
men
t G
mbH
Ph.
: Dek
a Im
mob
ilien
Inve
stm
ent
Gm
bHP
h.: C
opyr
ight
© F
. Hof
fman
n-La
Roc
he L
td.
Overview of ongoing projects and main project acquisitionsManagement Report

26
Hai Xia Exchange Centre
Xiamen \ P. R. of China
Project awarded by Josef Gartner Curtain Wall (Shanghai) Co. Ltd., 64,000 square meters of curtain walls, designed by architects Gravity Partnership Ltd. The project is expected to be completed within May 2012.
Ph.
: gra
vity
par
tner
ship
ltd
Pazhou Hotel
and Mix-used Development
Guangzhou \ P. R. of China
Project awarded by Josef Gartner Curtain Wall (Shanghai) Co. Ltd., 71,000 square meters of curtain walls, designed by architects Aedas. The building will be used for show, offi ces and hotel. The project is expected to be completed within the end of 2012.
Ph.
: Im
age
Cou
rtes
y of
Aed
as A
rchi
tect
s Li
mite
dP
h.: I
mag
e C
ourt
esy
of A
edas
Arc
hite
cts
Lim
ited
\\\ Business Unit Asia
Management ReportOverview of ongoing projects and main project acquisitions
2011ANNUALREPORT

27
8 Chifl ey Square
Sydney \ Australia
Project awarded by Permasteelisa PTY Limited, 9,200 square meters of curtain walls, designed by architects Rogers Stirk Harbour + Partners, Lippmann Associates in partnership with Mirvac Design.
The project is expected to be completed within the end of 2012.
\\ Main ongoing projects in 2011Permasteelisa Group’s main ongoing projects in 2011 are described below.
CUNY Advanced Science
Research Center
New York, NY \ USA
\\\ Business Unit North America
Project awarded by Permasteelisa North America Corp. and designed by architects Kohn Pedersen Fox Associates / Flad Architects. The building of 23,700 square meters of curtain walls will be completed within July 2012.
Ph.
: Mirv
acP
h.: M
irvac
Overview of ongoing projects and main project acquisitionsManagement Report

28
\\\ Business Unit Europe
ONE57 (Carnegie 57)
New York, NY \ USA
Project awarded by Permasteelisa North America Corp. and designed by architects Christian De Portzamparc in collaboration with SLCE Architects.
The building, of approximately 48,000 square meters of curtain walls, will be used for luxury residences and hotel.
Class Business Center
for Complex
Pushkinskiy LLC
Donetsk \ Ukraine
Project awarded by Permasteelisa S.p.A. and designed by architects Karl Schwitzke, Schwitzke & Partner.
The building, of approximately 18,300 square meters of curtain walls, will be completed within the fi rst six months of 2012.
Ren
derin
g: ©
John
Fot
iadi
s A
rchi
tect
/BB
Gro
upR
ende
ring:
©Jo
hn F
otia
dis
Arc
hite
ct/B
B G
roup
2011ANNUALREPORT
Management ReportOverview of ongoing projects and main project acquisitions

29
Nuovo Centro Direzionale
Intesa San Paolo
Turin \ Italy
Project awarded by Permasteelisa S.p.A. and designed by architects Renzo Building Workshop.
The building, of approximately 52,600 square meters of curtain walls, will be completed within the end of 2013.
Hospital de Móstoles
Madrid \ Spain
Project awarded by Permasteelisa España S.A.U. and designed by architects Rafael de la Hoz. The building consists in a total of 8,300 square meters of curtain walls.
Ph.
: Ren
zo P
iano
Bui
ldin
g W
orks
hop
Overview of ongoing projects and main project acquisitionsManagement Report

30
Musée du Louvre Lens
Lens \ France
Kazuyo Sejima + Ryue in collaboration with IMREY CULBERT/Catherine Mosbach, Extra Muros SA D’Architecture/Antoine Belin. The building consists in a total of 13,000 square meters of curtain walls.
Project awarded by Permasteelisa France S.a.s. and designed by architects SANAA,
King Abdullah Financial
District PP30
Riyadh \ Saudi Arabia
of 12 parcels of the King Abdullah Financial District, to be completed within the end of 2012. The project, developed by Saudi Binladin Group, involves several architectural offi ces, including Foster, Gensler, HLA, Perkins Will and consists in the supply and installation of curtain wall systems.
Project awarded by Permasteelisa Gartner Saudi Arabia Llc, consists in the execution
Ph.
: im
age
SA
NA
A ©
SA
NA
A/Im
rey
Cul
bert
/Cat
herin
e M
osba
chS
ourc
e: w
ww
.kin
gabd
ulla
hfin
anci
aldi
stric
t.co
mP
h.: i
mag
e S
AN
AA
©S
AN
AA
/Imre
y C
ulbe
rt/C
athe
rine
Mos
bach
Sou
rce:
ww
w.k
inga
bdul
lahf
inan
cial
dist
rict.
com
2011ANNUALREPORT
Management ReportOverview of ongoing projects and main project acquisitions
\\\ Business Unit Middle East
31
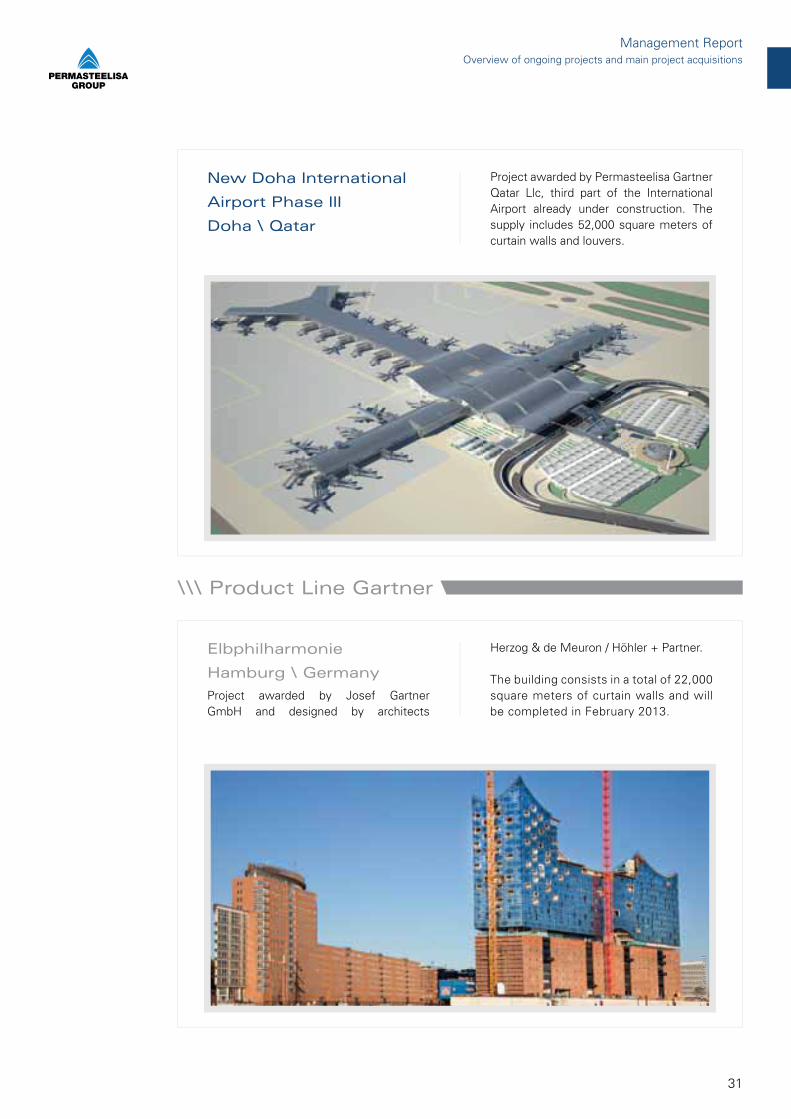
New Doha International
Airport Phase III
Doha \ Qatar
Project awarded by Permasteelisa Gartner Qatar Llc, third part of the International Airport already under construction. The supply includes 52,000 square meters of curtain walls and louvers.
\\\ Product Line Gartner
Elbphilharmonie
Hamburg \ Germany
Herzog & de Meuron / Höhler + Partner.
The building consists in a total of 22,000 square meters of curtain walls and will be completed in February 2013.
Ph.
: Kar
in J
obst
Ph.
: Kar
in J
obst
Overview of ongoing projects and main project acquisitionsManagement Report
Project awarded by Josef Gartner GmbH and designed by architects

32
\\\ Business Unit Asia
New Development
European Central Bank
Frankfurt \ Germany
Project awarded by Josef Gartner GmbH and designed by architects COOP HIMMELB(L)AU.
The supply consists in 30,000 square meters of curtain walls and steel. The building will be the new Head offi ce of the European Central Bank.
The project will be completed in September 2013.
Sathorn Square
Bangkok \ Thailand
Project awarded by Permasteelisa Projects (Thailand) Ltd. and Global Architectural Co. Ltd. and designed by architects P&T Group.
The building consists in a total of 49,800 square meters of curtain walls.
Ph.
: ©R
TTP
h.: ©
Krit
Mut
itaph
orn
Arc
hite
ctur
al P
hoto
grap
her
Ph.
: ©R
TTP
h.: ©
Krit
Mut
itaph
orn
Arc
hite
ctur
al P
hoto
grap
her
2011ANNUALREPORT
Management ReportOverview of ongoing projects and main project acquisitions

33
Hennessy Centre
Redevelopment-Podium
Hong Kong \ P. R. of China
Project awarded by Josef Gartner & Co. (HK) Ltd. and designed by architects Kohn Pedersen Fox Associates in collaboration with Dennis Lau & Ng Chun Man Architects & Engineers (H.K.) Ltd (DLN).
The building consists in a total of 10,500 square meters of curtain walls.
Overview of ongoing projects and main project acquisitionsManagement Report
Kerry Centre
(North Package)
Shanghai \ P. R. of China
Project awarded by Josef Gartner Curtain Wall (Shanghai) Co. Ltd. and designed by architects Kohn Pedersen Fox Associates. The building consists in a total of 60,000 square meters of surface and will be used as offi ces and shops. The project will be completed during 2012.
34
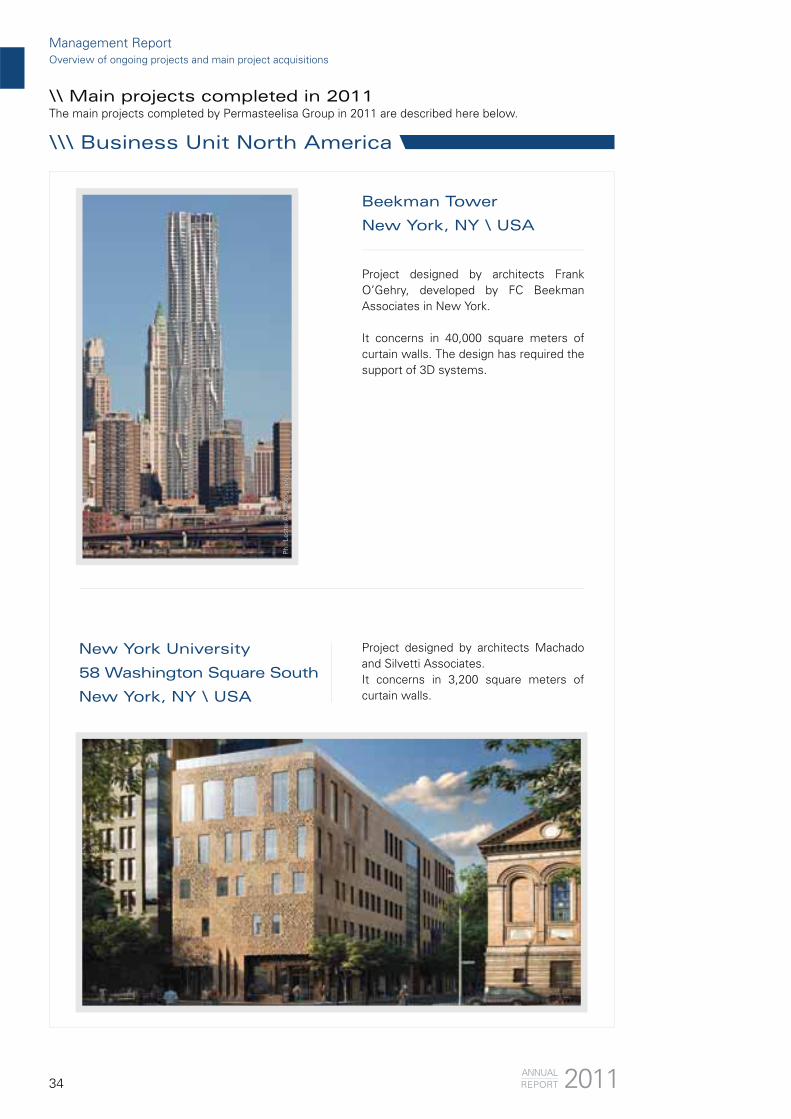
Beekman Tower
New York, NY \ USA
Project designed by architects Frank O’Gehry, developed by FC Beekman Associates in New York.
It concerns in 40,000 square meters of curtain walls. The design has required the support of 3D systems.
\\ Main projects completed in 2011The main projects completed by Permasteelisa Group in 2011 are described here below.
New York University
58 Washington Square South
New York, NY \ USA
Project designed by architects Machado and Silvetti Associates.It concerns in 3,200 square meters of curtain walls.
Ph.
: Les
ter
Ali
Pho
togr
aphy
Ph.
: Les
ter
Ali
Pho
togr
aphy
2011ANNUALREPORT
Management ReportOverview of ongoing projects and main project acquisitions
\\\ Business Unit North America
35
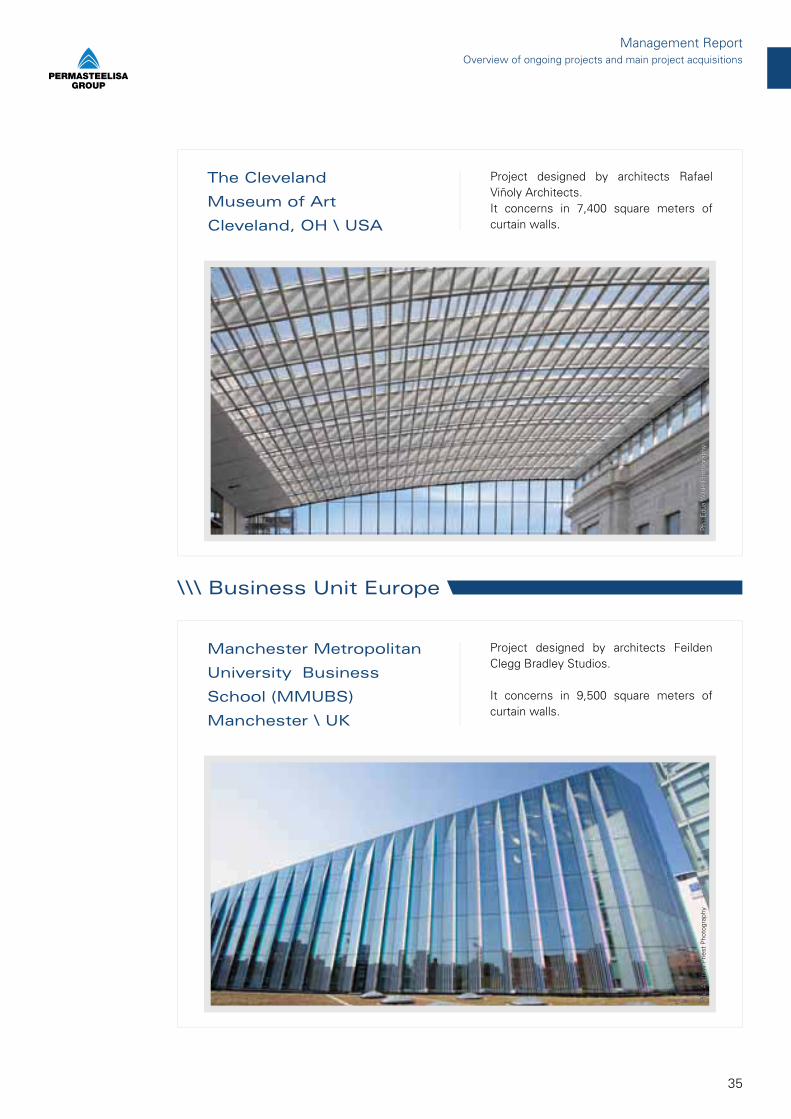
The Cleveland
Museum of Art
Cleveland, OH \ USA
Project designed by architects Rafael Viñoly Architects.It concerns in 7,400 square meters of curtain walls.
Ph.
: Edu
a W
ilde
Pho
togr
aphy
Ph.
: Edu
a W
ilde
Pho
togr
aphy
\\\ Business Unit Europe
Manchester Metropolitan
University Business
School (MMUBS)
Manchester \ UK
Project designed by architects Feilden Clegg Bradley Studios.
It concerns in 9,500 square meters of curtain walls.
Ph.
: And
rew
Prie
st P
hoto
grap
hyP
h.: A
ndre
w P
riest
Pho
togr
aphy
Overview of ongoing projects and main project acquisitionsManagement Report

36 2011
Rabobanktoren
Utrecht \ The Netherlands
Urbis, the project provided the supply of 20,000 square meters of curtain walls.
Project awarded by Scheldebouw B.V.
Baku Port
Baku \ Azerbaijan
Project awarded by Permasteelisa Gartner Dubai Llc and designed by architects Chapman Taylor.
The project provided the supply of 21,000 square meters of curtain walls for a tower of 32 fl oors used as offi ces and, in the penthouse area, as First Lady’s offi ces.
Ph.
: IM
RE
CS
AN
Y/M
embe
r of
Dut
ch A
rchi
tect
ural
Pho
togr
aphe
rs (D
AP
h)P
h.: I
MR
E C
SA
NY
/Mem
ber
of D
utch
Arc
hite
ctur
al P
hoto
grap
hers
(DA
Ph)
ANNUALREPORT
Management ReportOverview of ongoing projects and main project acquisitions
\\\ Business Unit Middle East

37
Doha International
Airport Phase II
Doha \ Qatar
Project awarded by Permasteelisa Gartner Qatar Llc, second phase of the airport already under construction. The supply consists in approximately 35,000 square meters of curtain walls and louvers.
\\\ Product Line Gartner
Cannon Place
London \ UK
Project awarded at the end of 2008 after a PCSA phase (Pre Construction Service Agreement).
It consists in 14,500 square meters of curtain walls designed by architects FOGGO Associates of London.
Ph.
: Pho
togr
aphy
by
Sim
on K
enne
dyP
h.: P
hoto
grap
hy b
y S
imon
Ken
nedy
Overview of ongoing projects and main project acquisitionsManagement Report
38
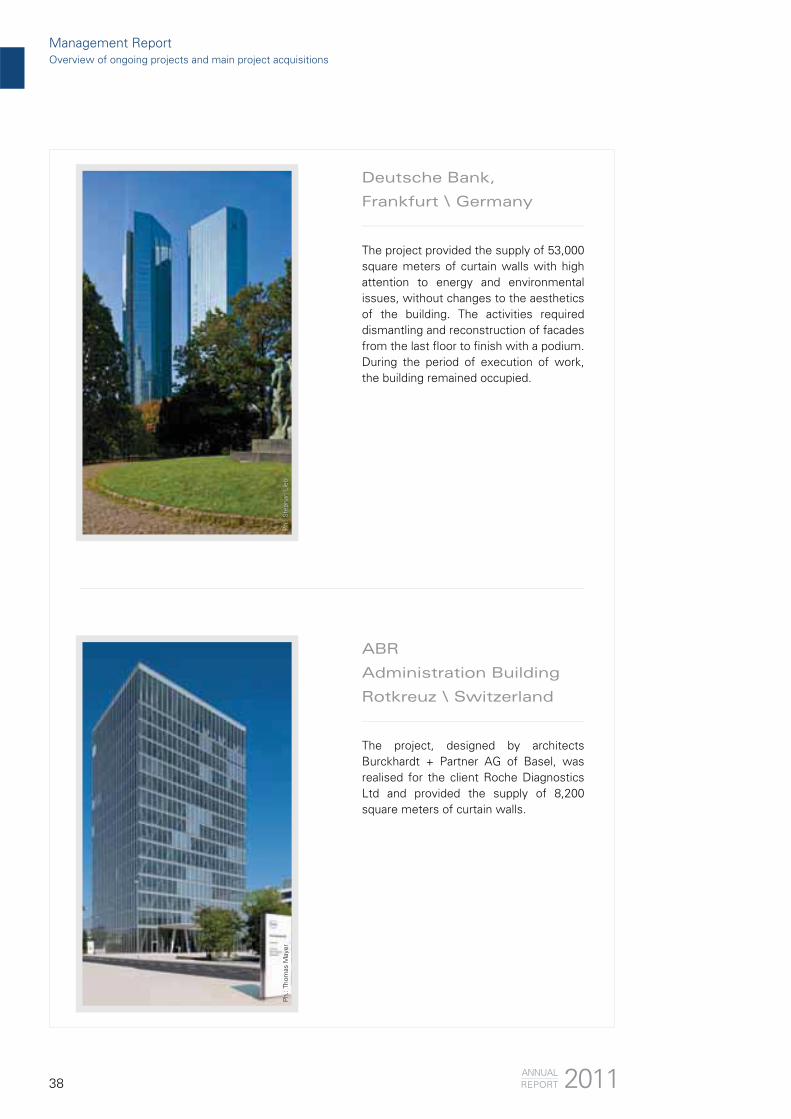
Deutsche Bank,
Frankfurt \ Germany
The project provided the supply of 53,000 square meters of curtain walls with high attention to energy and environmental issues, without changes to the aesthetics of the building. The activities required dismantling and reconstruction of facades from the last fl oor to fi nish with a podium. During the period of execution of work, the building remained occupied.
ABR
Administration Building
Rotkreuz \ Switzerland
The project, designed by architects Burckhardt + Partner AG of Basel, was realised for the client Roche Diagnostics Ltd and provided the supply of 8,200 square meters of curtain walls.
Ph.
: Ste
phan
Lie
blP
h.: S
teph
an L
iebl
Ph.
: Tho
mas
May
erP
h.: T
hom
as M
ayer
2011ANNUALREPORT
Management ReportOverview of ongoing projects and main project acquisitions
39
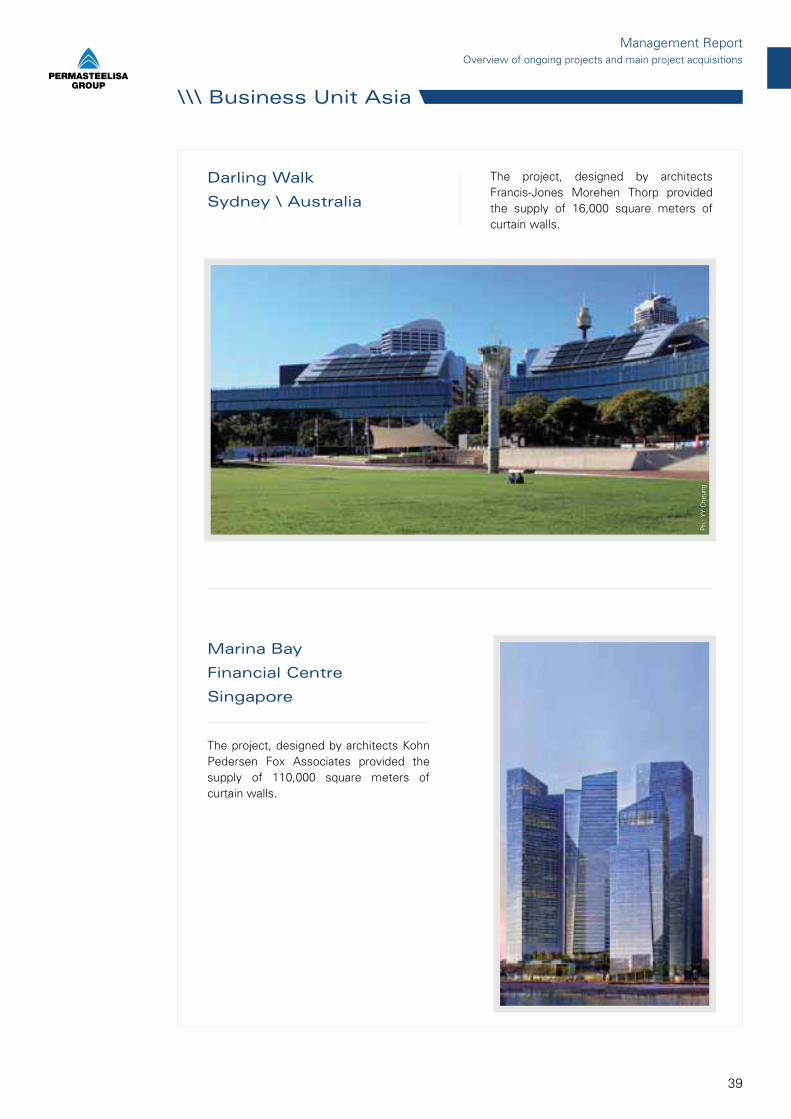
\\\ Business Unit Asia
Darling Walk
Sydney \ Australia
The project, designed by architects Francis-Jones Morehen Thorp provided the supply of 16,000 square meters of curtain walls.
Ph.
: YY
Che
ung
Marina Bay
Financial Centre
Singapore
The project, designed by architects Kohn Pedersen Fox Associates provided the supply of 110,000 square meters of curtain walls.
Overview of ongoing projects and main project acquisitionsManagement Report

40
Tamar Development
Project
Hong Kong \ P. R. of China
The project, designed by architects Rocco Design Architects Ltd. provided the supply of 105,800 square meters of curtain walls.
Ph:
Stu
art
Woo
ds
2011ANNUALREPORT
Management ReportOverview of ongoing projects and main project acquisitions

41
The main project ongoing or completed in 2011 and involving the Interiors Business Unit are broken down into the following product lines:
\\ Partition/Glazed Metal Work\\ EPC (Engineering Procurement Contract)\\ Shops/Retail - Museum
\\\ Main projects acquisition for 2011 and still ongoing
\\ Partition/Glazed Metal Work
INTERIORS
Overview of ongoing projects and main project acquisitionsManagement Report
Santo Spirito Hospital,
Casale Monferrato
Alessandria \ Italy
Project awarded by Permasteelisa Interiors S.r.l. and designed by architects G Studio.
The project concerns the supply and installation of a raised fl oor and PVC coating, suspending ceiling, mobile partitions and doors for the realization of the surgical unit of the new hospital.
The partitions are self-supporting and practicable internally by the plants in order to minimize the interference. Materials are selected for their compatibility with the sterile environment.
42
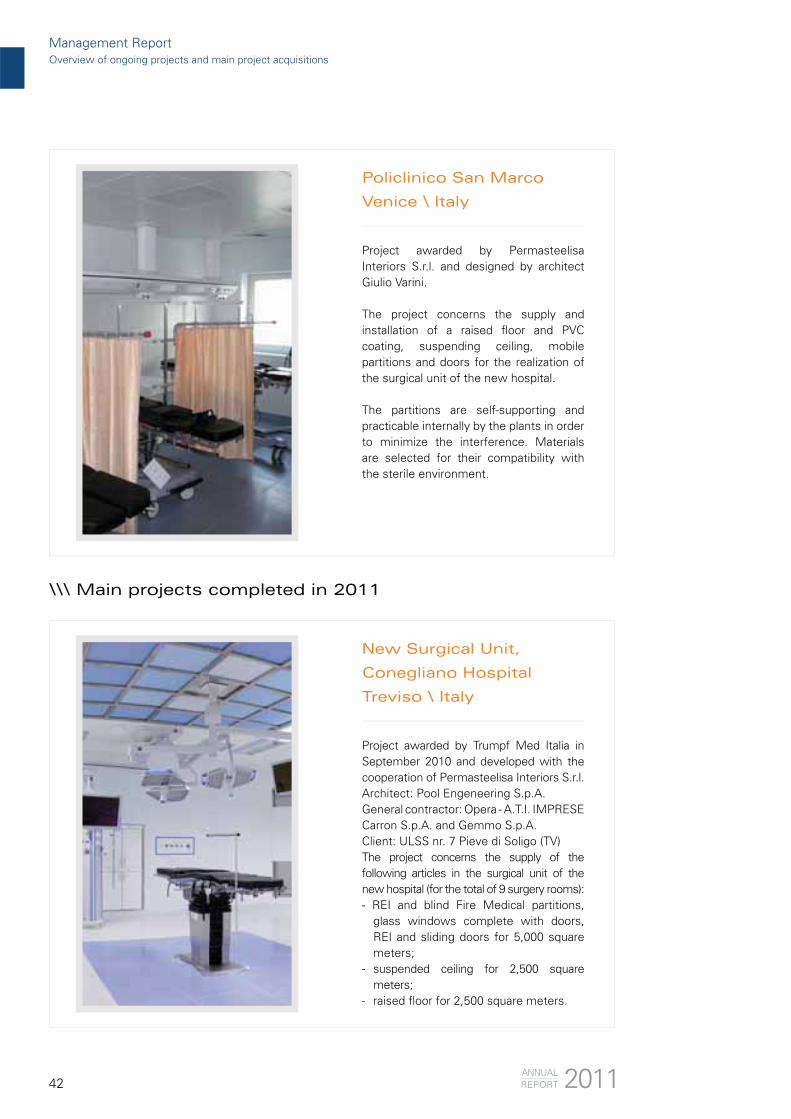
Policlinico San Marco
Venice \ Italy
Project awarded by Permasteelisa Interiors S.r.l. and designed by architect Giulio Varini.
The project concerns the supply and installation of a raised fl oor and PVC coating, suspending ceiling, mobile partitions and doors for the realization of the surgical unit of the new hospital. The partitions are self-supporting and practicable internally by the plants in order to minimize the interference. Materials are selected for their compatibility with the sterile environment.
New Surgical Unit,
Conegliano Hospital
Treviso \ Italy
Project awarded by Trumpf Med Italia in September 2010 and developed with the cooperation of Permasteelisa Interiors S.r.l.Architect: Pool Engeneering S.p.A.General contractor: Opera - A.T.I. IMPRESE Carron S.p.A. and Gemmo S.p.A.Client: ULSS nr. 7 Pieve di Soligo (TV)The project concerns the supply of the following articles in the surgical unit of the new hospital (for the total of 9 surgery rooms):- REI and blind Fire Medical partitions,
glass windows complete with doors, REI and sliding doors for 5,000 square meters;
- suspended ceiling for 2,500 square meters;
- raised fl oor for 2,500 square meters.
\\\ Main projects completed in 2011
2011ANNUALREPORT
Management ReportOverview of ongoing projects and main project acquisitions

43
\\ EPC (Engineering Procurement Contract)
\\\ Partition Projects (USA)
Hotel Renaissance
Tlemcen \ Algeria
Supply and installation of fl oors, suspended ceiling, interior partitions, lights and furnishing supplies for suites and public areas (lobbies, restaurants, conference rooms, fi tness areas and disco).
GAP: supply of Fire offi ce partitions
Department of Health: supply and installation of Axis offi ce partitions
Analysis Group: supply of Axis offi ce partitions
Rice University: supply of Axis offi ce partitions
Symrise: supply and installation of Fire offi ce partitions
Overview of ongoing projects and main project acquisitionsManagement Report
44
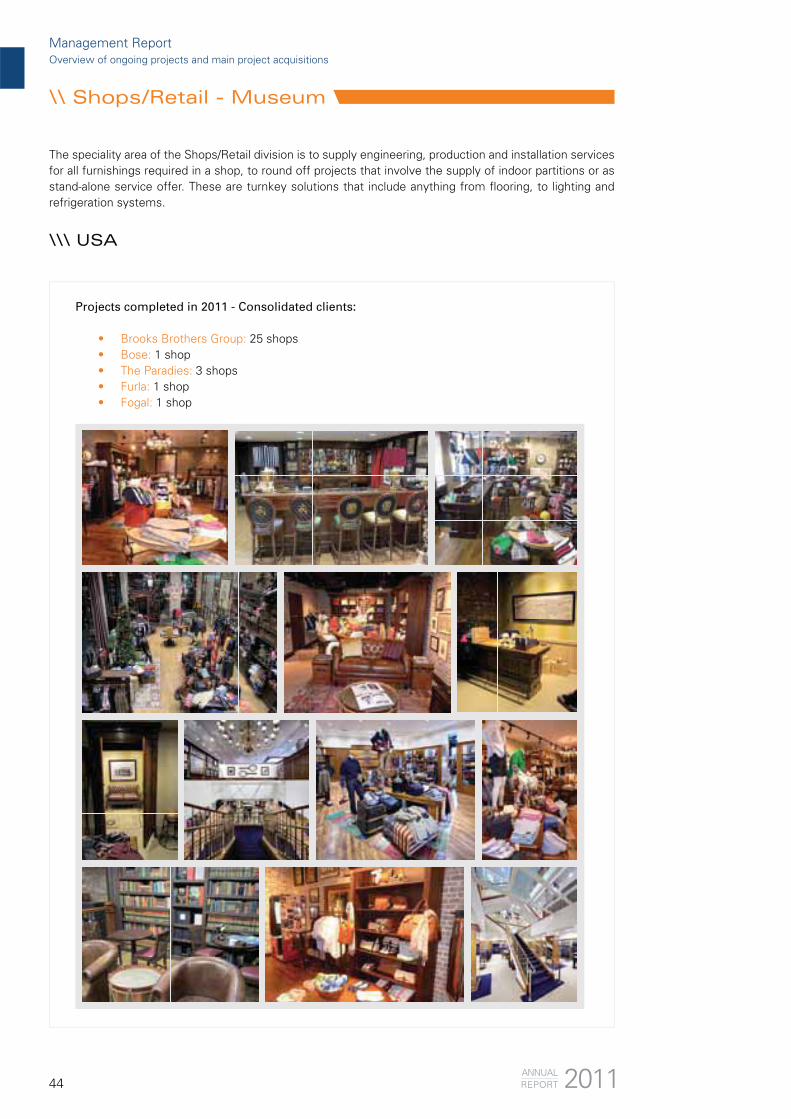
\\ Shops/Retail - Museum
The speciality area of the Shops/Retail division is to supply engineering, production and installation services for all furnishings required in a shop, to round off projects that involve the supply of indoor partitions or as stand-alone service offer. These are turnkey solutions that include anything from fl ooring, to lighting and refrigeration systems.
Projects completed in 2011 - Consolidated clients:
Brooks Brothers Group: 25 shops1 shop
3 shops1 shop 1 shop
\\\ USA
2011ANNUALREPORT
Management ReportOverview of ongoing projects and main project acquisitions

45
Museum of Natural
History of Venice
Venice \ Italy
The scope of the supply consists in the construction of the fi rst fl oor rooms of the Museum of Natural History, which included:
- moving of the exhibits;- making of new partitions and walking surfaces;- installing of new showcases and
exhibitors;- adapting of plant and lighting equipment;- making new sounds system and video
projection.
Ph:
Gar
din
& M
azzo
liP
h: G
ardi
n &
Maz
zoli
\\\ Europe
Overview of ongoing projects and main project acquisitionsManagement Report
Projects completed in 2011Consolidated clients:
14 shops17 shops
19 shops2 shops
3 shops1 shop6 shops
1 shop1 shop
4 shops5 shops
2 shops1 shop
6 shops, of which:
- Flagship: 5 - Corners: 1
13 museums (including turnkey solutions and supply alone).

46
The Interiors Business in Asia can be broken down in the following main areas:
Fitting Out and furniture; Shop fronts; Turnkey projects.
During 2011 more than 160 projects were awarded involving consolidated and new clients featuring an increasing trend compared to 2010.
Consolidated clients in 2011:
6 shops 21 shops
13 shops 5 shops
12 shops 20 shops
11 shops 8 shops
31 shops 5 shops
7 shops
New clients:
Other clients:
\\\ Asia
2011ANNUALREPORT
Management ReportOverview of ongoing projects and main project acquisitions

47
Overview of ongoing projects and main project acquisitionsManagement Report

48
Main risks and uncertainties which Permasteelisa S.p.A. and the Group are exposed to
No changes in the management approach or events that generate substantial changes in the risk profiles to which the Group is exposed to occurred in the year ended 31 December 2011: at the same time, the market fluctuation led the Management to increase the preventive attention to the risks connected to Permasteelisa Group activity. These risks are political, technical and technological, financial and credit, environmental and commercial.The main attention is focused on financial and credit risk: certainly the present growing markets have financial and credit risks higher than those the main markets of the Group (Europe and United States) had some years ago, without however that this fact represents a real warning but only more attention.
Risks associated with general economic conditionsThe global presence of Permasteelisa Group, as already underlined, has the positive characteristic to balance the economical risk and the negative one to multiply the exposure on risk situation.In Europe, in particular, the Euro break down risk has been monitored and suitable actions had been designed.Now this situation, even if always still present, is felt better than before.Other dangerous economic environments do not seem to be reported, except for the company rule of the promptly realization of adequate hedging on foreign currencies.
Risks associated with the Group’s resultsDespite the constant fluctuations in the market, the Group continues to prove to be able to achieve adequate “market share” year after year.It is instead evident that the market prices become more aggressive year after year, with the shift to the rising markets: in this context, Permasteelisa is proceeding to an important reallocation of its “Value proposition”.The Group’s perspective is now to be, if not “Cost Leader”, a “Cost focused Differentiation Leader”, although used to be for years the Leader in Differentiation; therefore it affords “low-low” execution methods of the projects, often sharing the components among the different Business Units and choosing for each component the better positioned Business Unit for an execution with the most competitive prices in the market. In this way Permasteelisa exploits its global organization (the only one in the market) to gain competitiveness according to a not accessible way for its main competitors.An adequate Project Management and an advanced ICT support are the necessary corollary.The combination of all these actions, ongoing for several years with satisfactory results, is what allows Permasteelisa Group and its shareholders to look at every market and environment evolution with serenity and confidence.
Risks associated with financing requirementsThe Permasteelisa Group’s financial position, after been evolving in strongly positive terms in the last years so that to represent one of the leading elements of the Group’s strength, is now less bright than in the past, but remaining positive. The reasons have to be found in the release of substantial monetary flows in years 2009 and 2011 to support extraordinary capital transactions and at the same time in a credit closure that, focusing on some of the main customers of the Group, inevitably had an impact on Permasteelisa. Therefore today the Group has adequate financial resources, and “committed” Back-up facilities that allow to afford safely all the projects possible requirements.
Risks associated with fluctuating exchange and interest rates, commodity prices and the cancellation of assigned projects ordersAs already mentioned in the Management report of the previous year, as an international player on the global market, Permasteelisa Group is naturally exposed to market risks associated to fluctuation of exchange and interest rates, and of the prices of the commodities that characterize its business (aluminum). This kind of risk is hedged through tools aimed at stabilising exchange rates (currency swaps) and commodity prices (commodities swap) as soon as the projects are assigned. With regard to commodities, these risks are faced also through the careful management of transactions with reference suppliers. As a result, the “exchange rate risk” and the “commodity price risk” are outstanding and managed with the customer for the sole duration of the offer until the assignment, except if the offer (but this only happens rarely) is calculated at current exchange rate/prices. Facing the higher risks associated to exchange rates (and the interest rates on so-called “forward” exchange rates) and commodities, another risk that needs to be
2011ANNUALREPORT
Management ReportMain risks and uncertainties which Permasteelisa S.p.A. and the Group are exposed to
49
considered is associated to the hedging operations on projects orders that are cancelled after their start date. This risk is still rather low and in any case to be considered within the right to the reimbursement to all costs borne for the cancelled projects orders.Furthermore, in the framework of the consolidation of its accounts, Permasteelisa Group is exposed to “translation” risks as a result of the variation of the Euro vis-à-vis the main currencies of payment other than the Euro. This is nevertheless a risk that is inherently part of a global company’s income statement structure and has not become more critical as a result of the current general crisis of the markets.
Risks associated with relationships with suppliersThe relationships with the suppliers are one of the main strength of Permasteelisa Group and, therefore, they are constantly kept under observation and control, and also helped when needed.Therefore this risk, while potentially existing, has adequate coverage in the attention with which the Group is dealing with, ready to solve any unusual situations.
Risks associated with managementEffective countermeasures against this risk are the strong affection of all Management to the Company, and the instruments of Retention tools implemented by the Company.
Risks associated with competitiveness in the areas the Group works inThis risk, already mentioned in the part related to the general economic conditions, naturally increases with the movement of the market to the rising geographical markets.Permasteelisa can hardly exclude to operate in those countries, otherwise it should renounce to its leader position, and therefore have to improve its competitive advantages arising from its global structure and its core skills, but especially have to continue to refine its design, construction, installation and Project Management processes as already done until now in an excellent way. Therefore this risk, if correctly afforded to, can become an opportunity.
Risks associated with environmental policiesThe Group’s environmental policy should be considered an opportunity rather than a risk: indeed, more restrictive regulations and procedures especially in the area of bioclimatic and environmentally sustainable architecture in addition to more restrictive laws on energy saving will translate into more favorable market conditions for the company and the Group’s products and advanced technologies.
*******
As Parent company, Permasteelisa S.p.A. is basically exposed to the same risks and uncertainties described for the Group.
Further details, including more technical information on the management of some of the business risks illustrated here, are provided in the dedicated notes to both the Consolidated Financial Statements and the Statutory Financial Statements for the year.
Main risks and uncertainties which Permasteelisa S.p.A. and the Group are exposed toManagement Report
50
The Group’s organizational structure
During 2011 there were no specific reorganization and semplification in the corporate structure.
Research and innovationDuring 2011 Permasteelisa confirmed its intention to improve and release its own know-how through a number of activities as:
the sharing of final results of completed and in progress researches; the collection of new proposals and ideas that can be converted into research and development
projects, following an appropriate evaluation by the Top Management; the continuation of the publication of the newsletter devoted to R&D/technical themes; the organization of specific courses designed to properly prepare and train the technical staff of the
company.
In addition to these activities, on request of the R&D structure, during 2011 more attention was paid to the correct dissemination of the information, and to the improvement of the protection/securitization of all the sensitive information that compose Permasteelisa’s know-how, systems and projects.In this regards, it was decided to start and promote the following activities transversely to the pure Research and Development studies,:
the implementation and dissemination of a “confidentiality agreement” to all technical employees, a document according to which each (technical) employee of Permasteelisa guarantees the not dissemination of sensitive data/information of which the employee may come into possession;
the implementation of a secured document storage, to which each user has a profiled access, based on the role that the employee has within the Organization.
With reference to the research and development activities, in 2011 the Group focused on the improvement of projects execution internal processes (the construction of buildings architectural envelopes) and on the development of new products.With reference to the improvement of internal processes, particular attention was paid to the formulation of applications in order to manage the design and discretization of complex surfaces, through system solutions and/or simple/innovative systems, in addition to more efficient production and installation systems in terms of cost and times of execution.With reference instead to the “new products” researches, research studies were developed on the basis of the following targets:
to make the buildings more “green” and comfortable, increasing energy saving and the using of renewable energy;
to increase the security level inside buildings; to study and use new materials and systems in the realization of the architectural envelopes; to increase the efficiency of processes also through the development and utilization of new IT
tools.
Among all, the research activities in 2011 focused mainly on the developing of new systems, through the pursuance of the following projects:
Building Physics, Energy saving, Renewable energy Solar Cooling System: project intended to the integration in the façade of a system of collectors
that uses the solar energy to heat and cool the building, through specific thermodynamic machines and dedicated plant. A special translucent collector is under development so that the final result will have an high architectural integration.
Double Integrated System Façade
Façade Integrated System
Façade Integrated Wind Power
Structural & Safety Bomb Blast Technology/Cablenet: after a first and consolidated development of the bomb blast
façade (i.e. explosion resistant), the study is now addressed to investigate the reaction of the
The Group’s organizational structure \ Research and innovation Management Report
2011ANNUALREPORT

51
various components of the facade, in addition to the energy transformation resulting from the explosion and its potential effects.
Design & Material TEC Façade: already ongoing since 2010, the project includes the development of a façade that
uses composite materials reinforced with glass fiber (FRP Fiber Reinforcement Plastic). Good thermal performance of the façade and the transparency of the opaque portion have already been studied and confirmed. This product will make available innovative architectural solutions, particular visual effects in addition to a low environmental impact as they are completely recyclable materials. In 2011 activities were developed related to the realization of a first prototype in real scale and to the subsequent performance check.
In 2011, research and development costs for Euro 3,475 thousand (2010: 3,824 thousand) were entered into the Group’s income statement, of which Euro 43 thousand (2010: Euro 82 thousand) for depreciation and amortization of costs items capitalized in previous year under the item “Development costs” included in the caption “Intangible assets”.
Technical Support GroupDuring 2011, as in previous years, Permasteelisa Group continued to dedicate resources to the activities of the Technical Support Group (TSG, knowledge management structure of Permasteelisa Group) for the dissemination and sharing of technical knowledge between Group companies, through the daily exchange of information and through dedicated meetings like those organized during 2011.Moreover, the consolidated project “Permasteelisa Technical Academy” helped to increase the high level of technical knowledge through training courses on specific topics such as “Design and Material” and “Building Physics”.TSG organization in Permasteelisa Group is the core of the creation and dissemination of a common technique and also allows the sharing of information and problems that can be solved through the exchange of opinions and experiences.
Information TechnologyDuring 2011 Permasteelisa worked mainly on the extension of SAP ERP adding new features that were made available to be used by all Group companies.In particular the modules on which Permasteelisa focused on are:
PSP (SAP Permasteelisa Production). Within this module, which represents Permasteelisa production and distribution processes, new modules of transport management were developed and set up: these include the cost optimization and the integrated management of logistics providers. SAP PSP is presently in use in Italy, Middle East and Germany. Its roll out in the other Group companies is planned in the next years.
Cash-flow: for the control of project cash flow and the monitoring of financial performance during the project execution.
Also in 2011 Permasteelisa continued the development of the new integrated product configurator system. This project developed together with Autodesk includes the complete cycle of product development, from the quotation to the project development until the start of production and the support of the pose activity on site.During 2011 the product was released for the quotation phase and the first two pilot projects for the design phase were started.The integrated management of corporate network was extended on two sides: the broadband optimization through an installation project of band compressors and the standardization of the corporate infrastructure with the installation of standard servers in all local companies.
Technical Support Group \ Information TechnologyManagement Report
52
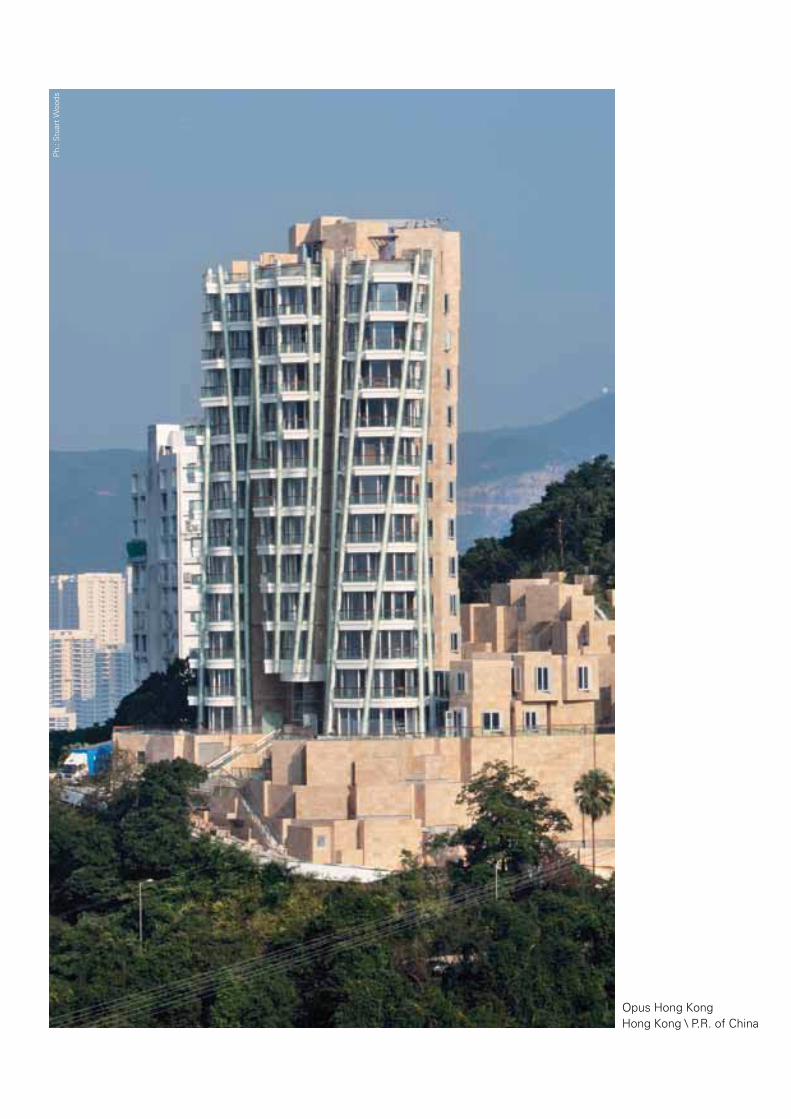
Opus Hong KongHong Kong \ P.R. of China
Ph.
: Stu
art
Woo
ds
53
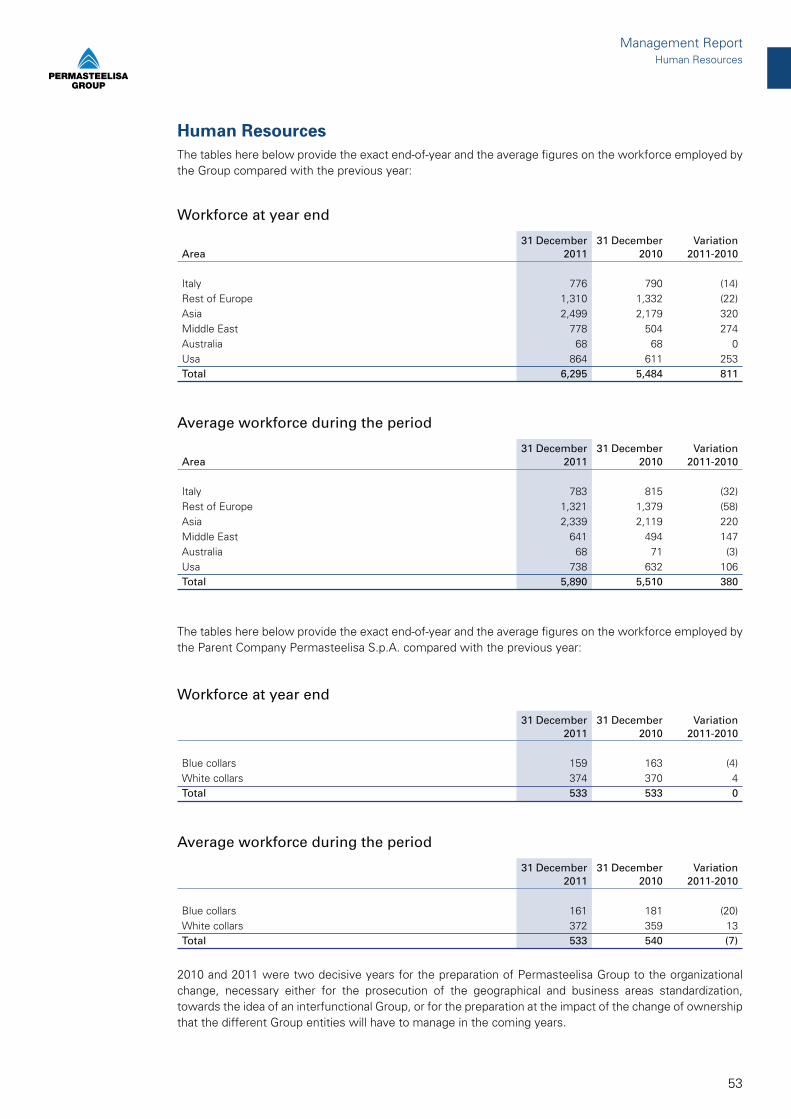
The tables here below provide the exact end-of-year and the average figures on the workforce employed by the Group compared with the previous year:
Workforce at year end
Area31 December
201131 December
2010Variation
2011-2010
Italy 776 790 (14)Rest of Europe 1,310 1,332 (22)Asia 2,499 2,179 320Middle East 778 504 274Australia 68 68 0Usa 864 611 253Total 6,295 5,484 811
Average workforce during the period
Area31 December
201131 December
2010Variation
2011-2010
Italy 783 815 (32)Rest of Europe 1,321 1,379 (58)Asia 2,339 2,119 220Middle East 641 494 147Australia 68 71 (3)Usa 738 632 106Total 5,890 5,510 380
The tables here below provide the exact end-of-year and the average figures on the workforce employed by the Parent Company Permasteelisa S.p.A. compared with the previous year:
Workforce at year end
31 December 2011
31 December 2010
Variation 2011-2010
Blue collars 159 163 (4)White collars 374 370 4Total 533 533 0
Average workforce during the period
31 December 2011
31 December 2010
Variation 2011-2010
Blue collars 161 181 (20)White collars 372 359 13Total 533 540 (7)
2010 and 2011 were two decisive years for the preparation of Permasteelisa Group to the organizational change, necessary either for the prosecution of the geographical and business areas standardization, towards the idea of an interfunctional Group, or for the preparation at the impact of the change of ownership that the different Group entities will have to manage in the coming years.
Human Resources
Human ResourcesManagement Report
54
Once again the training activity performed and will perform a key role in contribution to the alignment, to the dissemination and to the settlement of the change, driving significantly to the cohesion and dissemination of shared and common principles through the organizational learning and in particular through the dissemination of a common vision, the alignment with company targets, the resources empowerment and a leadership style which aims to develop employees’ technical and management skills, to their commitment and their cooperation between different geographical entities.
For these purposes, in 2011 the Group performed training activities related to:
Further consolidation of management skills in top management including the activities of performance management of the staff, that will continue in the coming years;
alignment and joint work of manager teams in the different Group Business Units; continuing education and professional development of technical resources (PTech Academy
Program); enhanced language training with special attention to English.
Above mentioned projects are described here below.
Management trainingTo help to manage the process of change that Permasteelisa is experiencing, management training focused primarily on the development of leadership skills, both inter-Business Units and intra-Business Units, thus promoting the local decision making coherence, the dialogue and the knowledge sharing between the different Business Units.The development of leadership skills is continuing, through training and coaching activities also by Group managers, with the main but not sole purpose to help employees to deal with and to overcome resistance at the change, promoting the dissemination of common objects towards which each individual of the team should strive.
The effort for the change was confirmed with the continuous development and diffusion of “Appraisals” systems during 2011, maintaining the promise to have them for all the “core roles” from 2012.
The Performance Management is coming always more pervasive into Permasteelisa Group culture, facilitating the business targets measurability and the integration of diversity through the coherence of the Key Performance Indicators by role, and the managers’ supervision and management on this issue is even more critical for the future successes of the Group.
Technical and specialised trainingAlso in 2011 the important technical training program called “Permasteelisa Technical Academy” continued.
The program is aimed at enhancing the skills of the Company’s technical resources worldwide, enabling them to acquire technical skills in a structured, coherent and planned way.
The Company launched this initiative after realising that suitably trained resources were difficult to find on the market and that training was therefore crucial for consolidating and maintaining the Group’s competitiveness. Relying on the valuable support of in-house technicians, the initiative aims to create a standardised and internationally accepted training method for sharing knowledge and exchanging information within the Group.
Technical staff receives basic and advanced level training on subjects such as thermal and acoustic performance of materials, structures, design and quality matters.
In addition to compulsory attendance, course requirements include passing a specific examination for each module as a prerequisite for admission to the next course. During the first year of experimentation, classroom teaching was accompanied by visits to the factories of some of our major suppliers, to have a
Human ResourcesManagement Report
2011ANNUALREPORT

55
closer look at materials and fully understand their characteristics and distinctive features: technicians must be aware of them when designing the products.
At the end of 2011 the 4 Academy technical modules are being finalized, with the participation of more than 500 of the best technicians of all Permasteelisa business units.
The structure of “Permasteelisa Academy” above illustrated had a high technical and educational recognition in the Group and consequently since 2012 the basis is placing to develop it also on other “core” roles for our business, i.e. Project Managers.
Training was ongoing on the issues of health, prevention and safety at the workplace (first aid training to selected personnel, fire prevention, etc.), area in which also relevant organizational changes during 2012 are expected.
Language training - focus on Permasteelisa S.p.A. and Permasteelisa Interiors S.r.l.The training initiatives for 2011 included individual and team lessons aimed at enhancing the staff’s knowledge of foreign languages, mainly English. The individual improvements in written and spoken language learning, are now recognizable and continuously measurable.
Due to Permasteelisa S.p.A. “service” activities on France, in year 2011 French courses started for the employees interested in these activities.
Additionally, training courses were supplied to production personnel of Permasteelisa S.p.A. and Permasteelisa Interiors S.r.l. on the following topics:
assembly mounting warehouse/inventory management training for shop-floor workers training for overhead crane operators training for forklift operators Italian legislative decree 81/08
In addition the “people management” competence for chiefs of blue-collar areas was reinforced.
During 2011 Permasteelisa S.p.A. and Permasteelisa Interiors S.r.l. provided training for approximately Euro 156 thousand, some of which also financed by third parties.
Human ResourcesManagement Report

56
New BabylonThe Hague \ The Netherlands
Ph.
: The
a va
n de
n H
euve
l/Mem
ber
of D
utch
Arc
hite
ctur
al P
hoto
grap
hers
(DA
Ph)

57
Following the already mentioned acquisition occurred on 6 December 2011, the Company is now owned by the sole shareholder Lixil Corporation itself owned by JS Group Corporation.
Treasury sharesAs of 31 December 2011 the Company does not own any treasury shares.
Transactions with related partiesThe details of any transactions with related parties, including transactions with other Group companies, are provided in the dedicated section of the notes to the Consolidated Financial Statements and the Statutory Financial Statements for the year.
Unconventional or unusual operationsThere are no entries or transactions resulting from unconventional or unusual operations during the year 2011 having any relevance on the operating performance and the financial position for the period of the Group and of the Parent company Permasteelisa S.p.A., except the already mentioned presence (in the previous years) of a number of agency contracts agreed in previous periods with a counterparty in a Middle Eastern country, that have fees that are much higher than those normally applied in the related business; these contracts are still legally valid in the country of reference and therefore, while the activities to close them are in progress, their economic and financial effects are adequately evaluated in company accounts.
Significant events subsequent to year end and outlook
Significant events subsequent to year endThere are no significant events subsequent to year end.
OutlookThe year 2012 is expected to be positive, in line with the strategic plan forecast. The economic backlog is adequate, and there are appropriate provisions to cover some specific risk situations.Permasteelisa continues to pursue a growth strategy for which the world market recovery will be essential.The commercial and strategic guidelines implementation are the means to guarantee the prosecution of the virtuous management that characterised the past years, thus allowing the Company to suitably react to the frequent and sudden market fluctuations.
Shareholders
Shareholders \ Treasury shares \ Transactions with related partiesSignificant events subsequent to year end and outlook
Management Report
58
Pursuant to Leg. Decree 196/2003 art. 34 of Privacy Code and the Technical Regulations (Annex B of Leg. Decree 196/2003), the Company approved the fourth revision of the Security Policy Document (DPS) providing minimum security levels as required by the regulations in force. The fourth revision of the Security Policy Document (DPS) and the previous versions are filed at the Company’s registered offices where can be consulted freely.
Pursuant to Leg. Decree 231/2001, Permasteelisa’s Board of Directors, by resolution of 28 August 2009, approved the current version of the Organizational, Management and Control Model that replaced the previous versions approved in 2005 and in 2007.With the adoption of this model, the Company intends to pursue the following main objectives:
- to promote the awareness of proper and transparent management of the Company, of the compliance with local regulations and of the fundamental principles of ethics in making business;
- to confirm that any illicit action is strongly condemned by the Company, as contrary to the law regulations and to the ethical principles of which the Company is the carrier and which intends to follow in making business;
- to allow the Company a continuous control and a careful monitoring on its activities, in order to promptly act where risk profiles appears and eventually apply the disciplinary measures provided by the Model itself;
- to determine the awareness in people operating in the name and on behalf of the Company that any illegal actions provided by the Decree is punishable by penalties to the author and administrative fines to the Company.
The Model consists of a General and a Special Section.
In the General Section the following items are described the contents and the impacts of the Leg. Decree 231/01, the general features of the Model, the categories of Offences that could result in the Company’s liability, the features, the powers and functions of the Compliance Board (that must be named by the Board of Directors), the disciplinary system and the guiding principles of staff training.
The Special Section describes in detail, with reference to the specific crime risk at which the Company considers to be exposed, the sensitive areas map, the alignment of the preventive controls system and the specific protocols regarding the sensitive areas.
The Model is available on the section Investor relations/Corporate governance of the corporate website.
The Permasteelisa Group’s Code of Ethics was elaborated by the Audit Committee in line with the International Standards of Corporate Social Responsibility and approved by the Parent Company Board of Directors on 26 November 2010.The Code of Ethics clearly defines the values which the Group applies to reach its objectives. Such code is applied both inside and outside the company and aims at fostering the efficiency and reliability of the Group.Permasteelisa considers to be of the utmost importance the compliance with the laws and the regulations in force in any country where it may operate. Permasteelisa considers honesty, reliability, impartiality, correctness and good faith to be the key factors of its success.The Group acknowledges the importance of its ethical-social responsibility in business and it is committed to safeguarding the interests of its stakeholders and others with whom it interacts.
The Code is available on the corporate website www.permasteelisagroup.com
The Company does not have any registered office.
Other disclosures
Other disclosuresManagement Report
2011ANNUALREPORT
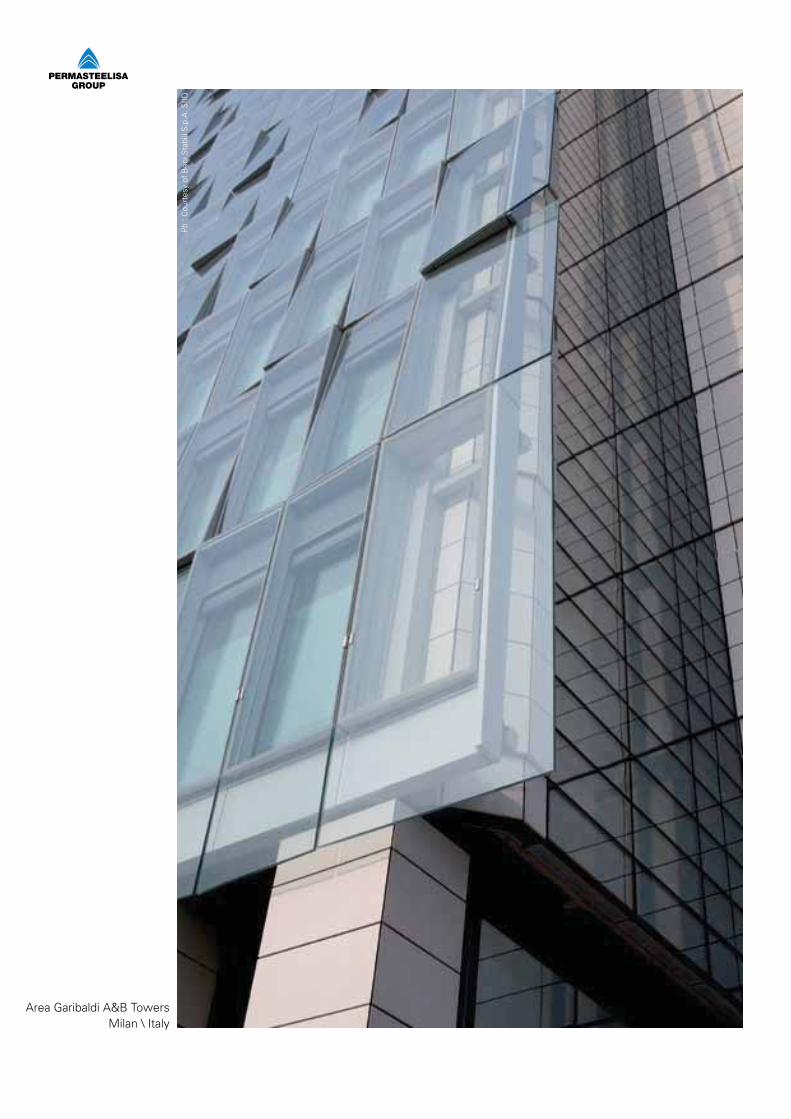
59
Area Garibaldi A&B TowersMilan \ Italy
Ph.
: Cou
rtes
y of
Ben
i Sta
bili
S.p
.A. S
IIQ

60
The below tables were prepared based on the Statutory Financial Statements for the year ending on 31 December 2011 which we address to. The Statutory Financial Statements were prepared in compliance with the International Financial Reporting Standards (“IFRS”) issued by the International Accounting Standard Board (“IASB”) and certified by the European Union, in addition to the provisions issued pursuant to Art. 9 of Leg. Decree no. 38/2005.
Operating performanceThe Parent Company’s Income statement for the year 2011 shows a gain of Euro 1,993 thousand against the previous year that closed with a loss of Euro 4,625 thousand.
The summary results are as follows:
In thousands of Euro 2011 2010
Revenues 111,357 82,310Other operating income 22,441 21,552Total operating revenues 133,798 103,862
Raw materials and consumables used (53,460) (29,518)Services expenses and use of third party assets (49,012) (29,694)Personnel expenses (50,740) (35,279)Depreciation, amortization and impairment losses (3,863) (6,588)Bad debts provision 0 0Provision for risks and charges (1,352) (5,608)Other operating expenses (304) (340)In-house enhancement of fixed assets 30 713Total operating expenses (158,701) (106,314)
Operating result (24,903) (2,452)
Financial income 43,491 32,953Financial expenses (20,510) (35,186)Net financial income 22,981 (2,233)
Revaluation of equity investments 0 0Write-downs of equity investments 0 (3,000)Profit before tax (1,922) (7,685)Income tax expense 3,915 3,060Profit after tax 1,993 (4,625)
Comparing the figures of 2011 with those of the corresponding previous, it appears that the operating result is negative for approximately Euro 24.9 million with respect to the negative result of Euro 2.5 million of the previous year; the difference is due to an extraordinary item for Euro 16.5 million concerning the recognition of the Phantom Stock Options to some members of the Board of Directors and to some Company’s top managers and to a negative result on ongoing projects management not only in Italian market but also in the British one normally more profitable.
With reference to the net financial result, the significant positive balance is due to the dividend distribution for approximately Euro 27.2 million (2010: Euro 12.7 million) and to the decrease of net financial interests from Euro 14.1 million to 3.1 million (the high level of the financial interests in year 2010 was due to the acquired debt from Permasteelisa S.p.A. after the merger with Terre Alte S.p.A. and Montrachet S.p.A. and subsequently reimbursed).
Operating performance and financial position of Permasteelisa S.p.A.
Operating performance and financial position of Permasteelisa S.p.A.Management Report
2011ANNUALREPORT
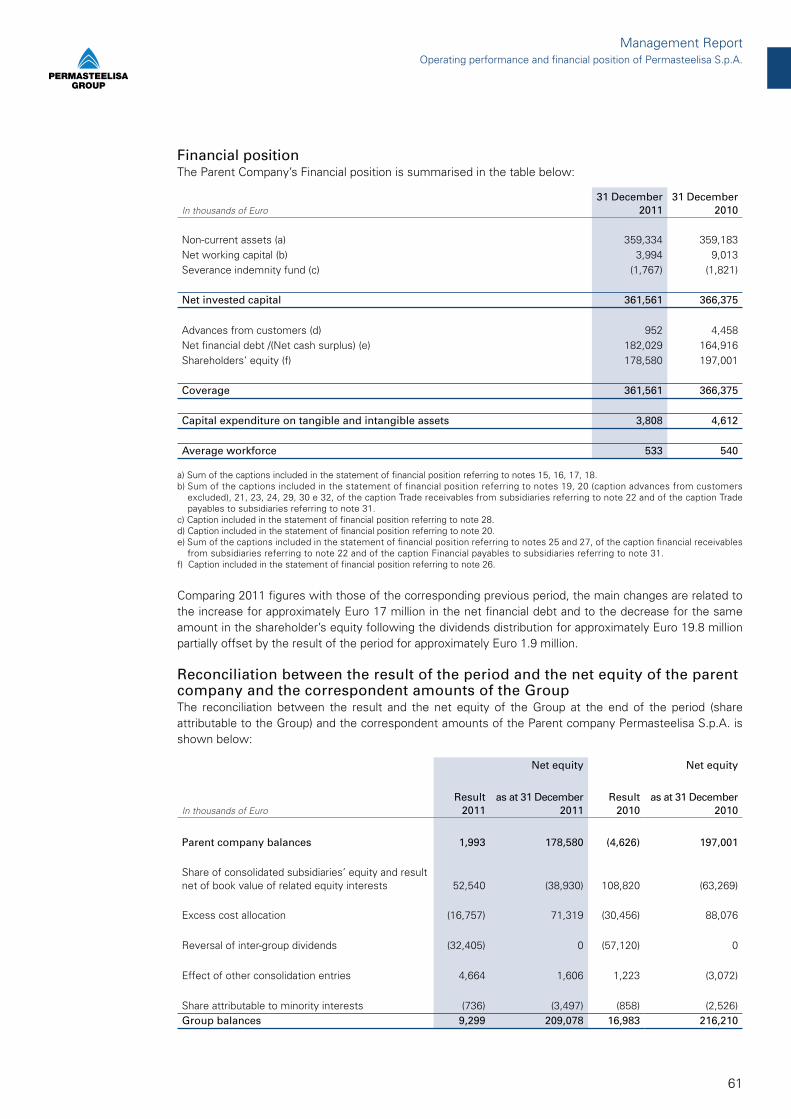
61
Financial positionThe Parent Company’s Financial position is summarised in the table below:
In thousands of Euro 31 December
201131 December
2010
Non-current assets (a) 359,334 359,183Net working capital (b) 3,994 9,013Severance indemnity fund (c) (1,767) (1,821)
Net invested capital 361,561 366,375
Advances from customers (d) 952 4,458Net financial debt /(Net cash surplus) (e) 182,029 164,916Shareholders’ equity (f) 178,580 197,001
Coverage 361,561 366,375
Capital expenditure on tangible and intangible assets 3,808 4,612
Average workforce 533 540
a) Sum of the captions included in the statement of financial position referring to notes 15, 16, 17, 18.b) Sum of the captions included in the statement of financial position referring to notes 19, 20 (caption advances from customers
excluded), 21, 23, 24, 29, 30 e 32, of the caption Trade receivables from subsidiaries referring to note 22 and of the caption Trade payables to subsidiaries referring to note 31.
c) Caption included in the statement of financial position referring to note 28.d) Caption included in the statement of financial position referring to note 20.e) Sum of the captions included in the statement of financial position referring to notes 25 and 27, of the caption financial receivables
from subsidiaries referring to note 22 and of the caption Financial payables to subsidiaries referring to note 31. f) Caption included in the statement of financial position referring to note 26.
Comparing 2011 figures with those of the corresponding previous period, the main changes are related to the increase for approximately Euro 17 million in the net financial debt and to the decrease for the same amount in the shareholder’s equity following the dividends distribution for approximately Euro 19.8 million partially offset by the result of the period for approximately Euro 1.9 million.
Reconciliation between the result of the period and the net equity of the parent company and the correspondent amounts of the GroupThe reconciliation between the result and the net equity of the Group at the end of the period (share attributable to the Group) and the correspondent amounts of the Parent company Permasteelisa S.p.A. is shown below:
Net equity Net equity
In thousands of EuroResult
2011as at 31 December
2011Result
2010as at 31 December
2010
Parent company balances 1,993 178,580 (4,626) 197,001
Share of consolidated subsidiaries’ equity and result net of book value of related equity interests 52,540 (38,930) 108,820 (63,269)
Excess cost allocation (16,757) 71,319 (30,456) 88,076
Reversal of inter-group dividends (32,405) 0 (57,120) 0
Effect of other consolidation entries 4,664 1,606 1,223 (3,072)
Share attributable to minority interests (736) (3,497) (858) (2,526)Group balances 9,299 209,078 16,983 216,210
Operating performance and financial position of Permasteelisa S.p.A.Management Report

62
Brooks Brothers BroadwayNew York, NY \ USA

63
Shareholders,we submit to your approval the Statutory Financial Statements of the Company for the period ended on 31 December 2011, that show a net result for the period of Euro 1,992,546, leaving to you any decision about its destination.
28 March 2012
On behalf of the Board of Directors
The Chief Executive Officer The Chairman of the Board of DirectorsNicola Greco Davide Croff
Approval of the Statutory Financial Statements and allocation of 2011 result
Approval of the Statutory Financial Statements and allocation of 2011 resultManagement Report

64
Ph.
: Les
ter
Ali
Pho
togr
aphy
65

66
In thousands of Euro Notes 2011 2010
Operating revenues 1,156,730 1,023,826Other operating income 4 19,655 12,438Total operating revenues 3 1,176,385 1,036,264
Raw materials and consumables used 5 (418,051) (317,174)Services expenses and use of third party assets 5 (430,725) (372,767)Personnel expenses 6 (255,848) (224,828)Depreciation, amortization and impairment losses 7 (33,924) (51,042)Bad debts provision 8 (1,172) (14,817)Provision for risks and charges 9 (8,824) (24,812)Other operating expenses 10 (10,469) (6,544)In-house enhancement of fixed assets 460 1,185Total operating expenses (1,158,553) (1,010,799)
Ordinary activity result 17,832 25,465
Gain on the disposal of investments 11 0 12
Operating result 17,832 25,477
Financial income 12 28,383 30,275Financial expenses 12 (30,705) (41,116)Net financial expenses 12 (2,322) (10,841)
Revaluation of equity investments 13 57 265Write-downs of equity investments 14 (270) (132)Profit before tax 15,297 14,769
Income tax expense 15 (5,262) 3,072Profit after tax 10,035 17,841
Attributable to: Group 9,299 16,982Minority 736 859 Profit for the period 10,035 17,841
Consolidated Financial Statements
Consolidated income statementfor the year ended 31 December 2011
Consolidated income statement
2011ANNUALREPORT

67
Consolidated Financial Statements
In thousands of Euro 2011 2010
Profit/(Loss) for the period (A) 10,035 17,841
Hedging reserves for risks variation, net of tax (4,378) (2,692)Gains/(losses) on exchange differences on translating foreign operations 7,981 10,211Total Other comprehensive income, net of tax (B) 3,603 7,519
Total Comprehensive income (A)+(B) 13,638 25,360
Total Comprehensive income attributable to: Group 12,667 24,304Minority 971 1,056
13,638 25,360
Statement of comprehensive incomefor the year ended 31 December 2011
Statement of comprehensive income

68
In thousands of Euro Notes31 December
201131 December
2010
Assets Intangible assets 16 111,102 130,865Tangible assets 17 107,559 105,050Equity investments in not consolidated subsidiaries 18 440 308Equity investments in associates companies 19 0 20Other equity investments 20 678 329Other non-current assets 21 43 41Deferred tax assets 22 52,280 39,250Total non-current assets 272,102 275,863Contracts work-in-progress 23 354,506 235,303Inventories 23 9,114 8,160Trade receivables from third parties 24 267,801 237,838Trade receivables from not consolidated subsidiaries 25 44 20Trade receivables from associated companies 26 244 32Financial receivables from not consolidated subsidiaries 25 0 154Income tax receivables 27 10,315 12,789Other current assets 28 38,782 21,567Cash and cash equivalents 29 85,429 134,979Assets classified as held for sale 1 0 3,173Total current assets 766,235 654,015Total assets 1,038,337 929,878
Equity Share capital 30 6,900 6,900Legal reserve 30 1,380 1,380Share premium 30 0 16,416Revaluation reserve 30 0 3,523Hedging reserves for risks 30 (6,286) (1,751)Translation reserve 30 (7,571) (15,474)Other reserves 30 205,356 190,169Retained earnings 30 0 (1,936)Profit/(loss) for the period 30 9,299 16,983Total equity attributable to the Group 209,078 216,210Minority interests 30 3,497 2,526Total equity 212,575 218,736Liabilities Amounts payables to banks and other financial creditors 31 170 126Severance indemnity fund 32 2,746 2,789Pension funds and other employee benefits 33 20,535 19,934Provisions for risks and charges 34 50,945 56,552Deferred tax liabilities 22 57,960 59,237Total non-current liabilities 132,356 138,638Amounts payable to banks and other financial creditors 31 57,928 3,009Excess of progress billings over work-in-progress 23 164,819 164,417Advances from customers 23 113,202 131,106Trade payables to third parties 35 266,928 212,497Trade payables to not consolidated subsidiaries 36 208 295Trade payables to associated companies 37 218 12Income tax payables 38 8,582 8,521Other current liabilities 39 81,521 52,647Total current liabilities 693,406 572,504Total liabilities 825,762 711,142Total equity and liabilities 1,038,337 929,878
Consolidated statement of financial positionas at 31 December 2011
Consolidated statement of financial position
2011ANNUALREPORT
Consolidated Financial Statements
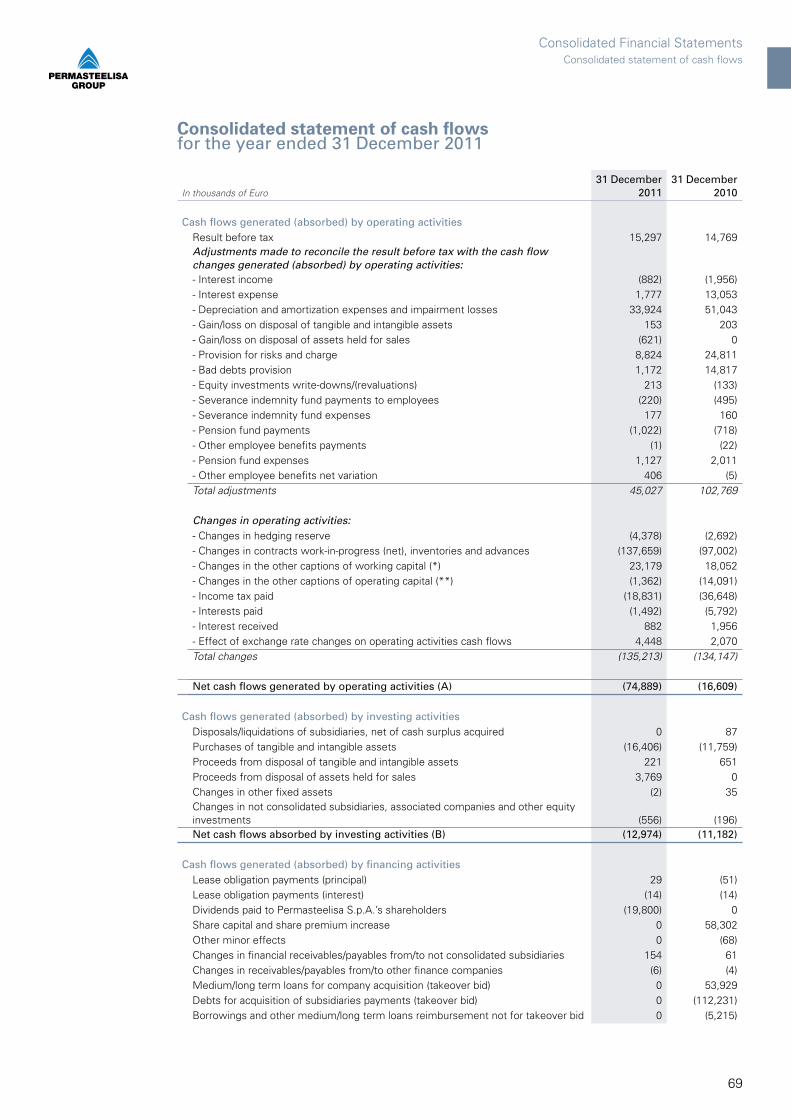
69
Consolidated statement of cash flowsfor the year ended 31 December 2011
In thousands of Euro31 December
201131 December
2010
Cash flows generated (absorbed) by operating activities Result before tax 15,297 14,769Adjustments made to reconcile the result before tax with the cash flow changes generated (absorbed) by operating activities:
- Interest income (882) (1,956)- Interest expense 1,777 13,053- Depreciation and amortization expenses and impairment losses 33,924 51,043- Gain/loss on disposal of tangible and intangible assets 153 203- Gain/loss on disposal of assets held for sales (621) 0 - Provision for risks and charge 8,824 24,811- Bad debts provision 1,172 14,817- Equity investments write-downs/(revaluations) 213 (133)- Severance indemnity fund payments to employees (220) (495)- Severance indemnity fund expenses 177 160- Pension fund payments (1,022) (718)- Other employee benefits payments (1) (22)- Pension fund expenses 1,127 2,011- Other employee benefits net variation 406 (5)Total adjustments 45,027 102,769
Changes in operating activities: - Changes in hedging reserve (4,378) (2,692)- Changes in contracts work-in-progress (net), inventories and advances (137,659) (97,002)- Changes in the other captions of working capital (*) 23,179 18,052- Changes in the other captions of operating capital (**) (1,362) (14,091)- Income tax paid (18,831) (36,648)- Interests paid (1,492) (5,792)- Interest received 882 1,956- Effect of exchange rate changes on operating activities cash flows 4,448 2,070Total changes (135,213) (134,147)
Net cash flows generated by operating activities (A) (74,889) (16,609)
Cash flows generated (absorbed) by investing activities
Disposals/liquidations of subsidiaries, net of cash surplus acquired 0 87Purchases of tangible and intangible assets (16,406) (11,759)Proceeds from disposal of tangible and intangible assets 221 651Proceeds from disposal of assets held for sales 3,769 0Changes in other fixed assets (2) 35Changes in not consolidated subsidiaries, associated companies and other equity investments (556) (196)Net cash flows absorbed by investing activities (B) (12,974) (11,182)
Cash flows generated (absorbed) by financing activities
Lease obligation payments (principal) 29 (51)Lease obligation payments (interest) (14) (14)Dividends paid to Permasteelisa S.p.A.’s shareholders (19,800) 0Share capital and share premium increase 0 58,302Other minor effects 0 (68)Changes in financial receivables/payables from/to not consolidated subsidiaries 154 61Changes in receivables/payables from/to other finance companies (6) (4)Medium/long term loans for company acquisition (takeover bid) 0 53,929Debts for acquisition of subsidiaries payments (takeover bid) 0 (112,231)Borrowings and other medium/long term loans reimbursement not for takeover bid 0 (5,215)
Consolidated statement of cash flowsConsolidated Financial Statements

70
Borrowings and other medium/long term loans reimbursement for takeover bid 0 (160,000)Net cash flows absorbed by financing activities (C) (19,637) (165,291)
Net increase/(decrease) in cash surplus/(deficit) (A+B+C) (107,500) (193,082)
Net cash surplus/(deficit) as at 1 January (D) 132,042 319,964
Effect of exchange rate changes on balances held in foreign currency (E) 3,011 5,160
Net cash surplus/(deficit) as at 31 December (A+B+C+D+E) 27,553 132,042
Net cash surplus/(deficit) includes: Bank and post current accounts and deposits 85,259 134,799Cash in hand 170 180Bank overdrafts and other short-term loans (57,876) (2,937)
27,553 132,042
(*) The other captions of working capital refer to the following captions included in the statement of financial position of the Group: trade receivables and payables from/to third parties and from/to not consolidated subsidiaries and associated companies.
(**) The other captions of operating capital refer to the following captions included in the statement of financial position of the Group: income tax receivables and payables, deferred tax assets and liabilities, other current assets and liabilities, provisions for risks and charges.
Consolidated Financial StatementsConsolidated statement of cash flows
2011ANNUALREPORT
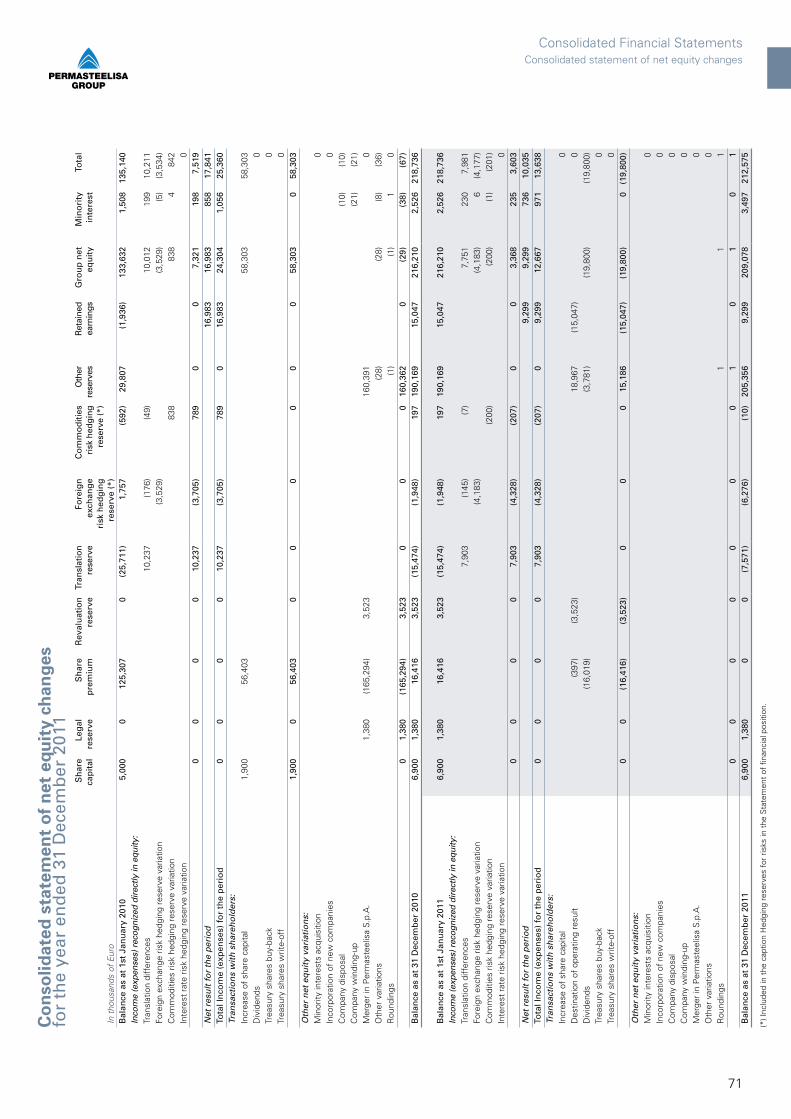
71
In t
hous
ands
of
Eur
o
Sh
are
cap
ital
Leg
al
rese
rve
Sh
are
pre
miu
mR
eval
uat
ion
re
serv
eTr
ansl
atio
n
rese
rve
Fore
ign
ex
chan
ge
risk
hed
gin
g
rese
rve
(*)
Co
mm
od
ities
ri
sk h
edg
ing
re
serv
e (*
)
Oth
er
rese
rves
Ret
aine
dea
rnin
gsG
rou
p n
et
equ
ity
Min
ori
ty
inte
rest
Tota
l
Bal
ance
as
at 1
st J
anu
ary
2010
5,00
00
125,
307
0(2
5,71
1)1,
757
(592
)29
,807
(1,9
36)
133,
632
1,50
813
5,14
0In
com
e (e
xpen
ses)
rec
ogni
zed
dire
ctly
in e
quity
:Tr
ansl
atio
n di
ffer
ence
s10
,237
(176
)(4
9)10
,012
199
10,2
11Fo
reig
n ex
chan
ge r
isk
hedg
ing
rese
rve
varia
tion
(3,5
29)
(3,5
29)
(5)
(3,5
34)
Com
mod
ities
ris
k he
dgin
g re
serv
e va
riatio
n83
883
84
842
Inte
rest
rat
e ris
k he
dgin
g re
serv
e va
riatio
n0
00
00
10,2
37(3
,705
)78
90
07,
321
198
7,51
9N
et r
esu
lt f
or
the
per
iod
16,9
8316
,983
858
17,8
41To
tal I
nco
me
(exp
ense
s) f
or
the
per
iod
00
00
10,2
37(3
,705
)78
90
16,9
8324
,304
1,05
625
,360
Tran
sact
ion
s w
ith
sh
areh
old
ers:
Incr
ease
of
shar
e ca
pita
l1,
900
56,4
0358
,303
58,3
03D
ivid
ends
0Tr
easu
ry s
hare
s bu
y-ba
ck0
Trea
sury
sha
res
writ
e-of
f0
1,90
00
56,4
030
00
00
058
,303
058
,303
Oth
er n
et e
qu
ity
vari
atio
ns:
Min
ority
inte
rest
s ac
quis
ition
0In
corp
orat
ion
of n
ew c
ompa
nies
0C
ompa
ny d
ispo
sal
(10)
(10)
Com
pany
win
ding
-up
(21)
(21)
Mer
ger
in P
erm
aste
elis
a S
.p.A
.1,
380
(165
,294
)3,
523
160,
391
0O
ther
var
iatio
ns(2
8)(2
8)(8
)(3
6)R
ound
ings
(1
)(1
)1
00
1,38
0(1
65,2
94)
3,52
30
00
160,
362
0(2
9)(3
8)(6
7)B
alan
ce a
s at
31
Dec
emb
er 2
010
6,90
01,
380
16,4
163,
523
(15,
474)
(1,9
48)
197
190,
169
15,0
4721
6,21
02,
526
218,
736
Bal
ance
as
at 1
st J
anu
ary
2011
6,90
01,
380
16,4
163,
523
(15,
474)
(1,9
48)
197
190,
169
15,0
4721
6,21
02,
526
218,
736
Inco
me
(exp
ense
s) r
ecog
nize
d di
rect
ly in
equ
ity:
Tran
slat
ion
diff
eren
ces
7,90
3(1
45)
(7)
7,75
123
07,
981
Fore
ign
exch
ange
ris
k he
dgin
g re
serv
e va
riatio
n
(4,1
83)
(4
,183
)6
(4,1
77)
Com
mod
ities
ris
k he
dgin
g re
serv
e va
riatio
n
(2
00)
(200
)(1
)(2
01)
Inte
rest
rat
e ris
k he
dgin
g re
serv
e va
riatio
n
00
00
07,
903
(4,3
28)
(207
)0
03,
368
235
3,60
3N
et r
esu
lt f
or
the
per
iod
9,29
99,
299
736
10,0
35To
tal I
nco
me
(exp
ense
s) f
or
the
per
iod
00
00
7,90
3(4
,328
)(2
07)
09,
299
12,6
6797
113
,638
Tran
sact
ion
s w
ith
sh
areh
old
ers:
Incr
ease
of
shar
e ca
pita
l
0D
estin
atio
n of
ope
ratin
g re
sult
(397
)(3
,523
)
18,9
67(1
5,04
7)0
Div
iden
ds
(1
6,01
9)
(3
,781
)
(19,
800)
(19,
800)
Trea
sury
sha
res
buy-
back
0
Trea
sury
sha
res
writ
e-of
f
00
0(1
6,41
6)(3
,523
)0
00
15,1
86(1
5,04
7)(1
9,80
0)0
(19,
800)
Oth
er n
et e
qu
ity
vari
atio
ns:
Min
ority
inte
rest
s ac
quis
ition
0
Inco
rpor
atio
n of
new
com
pani
es
0C
ompa
ny d
ispo
sal
0
Com
pany
win
ding
-up
0
Mer
ger
in P
erm
aste
elis
a S
.p.A
.
0O
ther
var
iatio
ns
0R
ound
ings
1
11
00
00
00
01
01
01
Bal
ance
as
at 3
1 D
ecem
ber
201
16,
900
1,38
00
0(7
,571
)(6
,276
)(1
0)20
5,35
69,
299
209,
078
3,49
721
2,57
5
(*) I
nclu
ded
in t
he c
aptio
n H
edgi
ng r
eser
ves
for
risks
in t
he S
tate
men
t of
fina
ncia
l pos
ition
.
Co
nso
lid
ate
d s
tate
men
t o
f n
et
eq
uit
y c
han
ges
for
the
year
en
ded
31
Dec
emb
er 2
011
Consolidated statement of net equity changesConsolidated Financial Statements

72
Company’s informationPermasteelisa S.p.A. (hereinafter referred to as the “Company” or “Parent Company”) is a company domiciled in Italy that operates internationally both directly and indirectly through its subsidiaries in the field of the design, production and installation of architectural components (curtain walls, partition walls and doors) and interior design. The Company’s Consolidated Financial Statements for the year ending 31 December 2011 include the Company and its subsidiaries involved in the consolidation (hereinafter referred to as the “Group”) which are listed in the table annexed to the Notes to the Consolidated Financial Statements entitled “Permasteelisa Group’s companies”. This table also highlights the Group’s equity investments in non-consolidated subsidiaries, associated and other companies. The Consolidated Financial Statements of the Permasteelisa S.p.A. Group have been prepared in Euro, which is the currency of the economic area in which the Company operates. The Consolidated Financial Statements were approved by the Board of Directors on 28 March 2012. These financial statements are subject to audit by PricewaterhouseCoopers S.p.A.
On 6 December 2011, the previous sole shareholder Cima Cladding S.A. sold its equity investment in Permasteelisa S.p.A. to the Japanese company Lixil Corporation, itself owned by JS Group Corporation, company listed on the Tokyo Stock Exchange.
Financial tablesThe tables provided for the statement of financial position, the income statement, the statement of cash flows and of net equity changes are the same as those used for the Consolidated Financial Statements as at 31 December 2010.The statement of financial position, the income statement, the statement of cash flows and of net equity changes used for the period closed as at 31 December 2011 are prepared in thousands of Euro and are characterised as follows:
Statement of financial positionThe method whereby assets and liabilities are broken down into “current and non-current” was adopted.Current assets include assets (such as inventories, assets for contracts work-in-progress and trade receivables) which are sold, consumed or realised as part of the normal operating cycle, even when they are not expected to be realised within 12 months after the balance sheet date. Some current liabilities, such as trade payables and some accruals for employees and other operating costs, are part of the working capital used in the normal operating cycle. Such operating items are classified as current liabilities even if they are due to be settled more than 12 months after the balance sheet date.
Income statementThe adopted method breaks costs down based on their nature.
Statement of cash flowsThe indirect method was employed.
Statement of net equity changesThe statement that shows all the changes of the net equity was adopted.
Accounting principles(a) Statement of complianceThe Permasteelisa Group adopts the IFRS International Accounting Standards issued by the International Accounting Standards Board (“IASB”) and endorsed by the European Union. IFRS is understood to include also the International Accounting Standards (“IAS”) that are currently in force in addition to the interpretations made available by the International Financial Reporting Interpretations Committee (“IFRIC”), previously known as the Standing Interpretations Committee (“SIC”).These Consolidated Financial Statements were prepared in accordance with the accounting standards described in the paragraphs below, namely the same standards that were used to prepare the Consolidated Financial Statements as at 31 December 2010, except for what illustrated in this section, under letters z); however, with no effect on the Consolidated Financial Statements.
Notes to the Consolidated Financial Statements
Notes to the Consolidated Financial Statements
Consolidated Financial Statements
2011ANNUALREPORT

73
With reference to the comparative figures as at 31 December 2010, provided for comparative purposes in the consolidated statement of financial position and in the notes, a figure has been reclassified with respect to that one reported in the Consolidated Financial Statement as at 31 December 2010. The reclassification has involved the caption “Other current liabilities” that has been decreased for Euro 1,024 thousand and the caption “Pension fund and other employee benefits” that has been increased for the same amount.
(b) Basis of preparationThe financial statements are presented in Euro, rounded to the nearest thousand. They are prepared on the historical cost basis except for the following assets and liabilities that, if any, are stated at their fair value: derivative financial instruments, financial instruments held for trading, financial instruments classified as available-for-sale.The preparation of financial statements in conformity with IFRS requires management to make judgments, estimates and assumptions that affect the application of policies and reported amounts of assets and liabilities, income and expenses. The estimates and associated assumptions are based on historical experience and various other factors that are believed to be reasonable under the circumstances, the results of which form the basis of making the judgments about carrying values of assets and liabilities that are not readily apparent from other sources. Actual results may differ from these estimates. The estimates and underlying assumptions are reviewed on an ongoing basis. Revisions to accounting estimates are recognised in the period in which the estimate is revised if the revision affects only that period, or in the period of the revision and future periods if the revision affects both current and future periods.The accounting principles exposed in the following paragraphs have been consistently applied for all the periods included in this Consolidated Financial Statements.These accounting principles have generally been applied consistently by the Group companies in the preparation of the financial statements for consolidation purposes; but, where necessary, specific adjustments have been applied by the Company to make these financial statements in compliance with IFRS.
(c) Basis of consolidation(i) Subsidiaries Subsidiaries are entities controlled directly or indirectly by the Company. Control exists when the Company has the power, directly or indirectly, to govern the financial and operating policies of an entity so as to obtain benefits from its activities. In assessing control, potential voting rights that presently are exercisable or convertible are taken into account.The subsidiaries are consolidated using the line by line method.The financial statements of subsidiaries are included in the Consolidated Financial Statements from the date that control commences until the date that control ceases.All subsidiaries are included in the Consolidated Financial Statements, unless some considered not material. Not consolidated subsidiaries are stated at their fair value.Receivables and payables, income and expenses and all relevant transaction occurred between consolidated companies, are eliminated in preparing the Consolidated Financial Statements, unless they are immaterial; in particular intragroup gains deriving from contracts work-in-progress realized in the Group are eliminated.The minority interests and the result attributable to minority are indicated separately in the consolidated statement of financial position and in the consolidated income statement.All consolidated subsidiaries close their year as at 31 December, except for Permasteelisa (India) Private Limited whose financial period ends as at 31 March; consequently, specific financial statements for consolidation purposes is prepared by this subsidiary as at 31 December.
(ii) Associated companies
Associates are those entities in which the Group has significant influence, but not control, over the financial and operating policies (generally accompanied by a percentage of ownership is between 20% and 50%). The Consolidated Financial Statements include the Group’s share of the total recognised gains and losses of associated companies on an equity accounted basis, from the date that significant influence commences until the date that significant influence ceases. When the Group’s share of losses exceeds its equity investment
Notes to the Consolidated Financial StatementsConsolidated Financial Statements
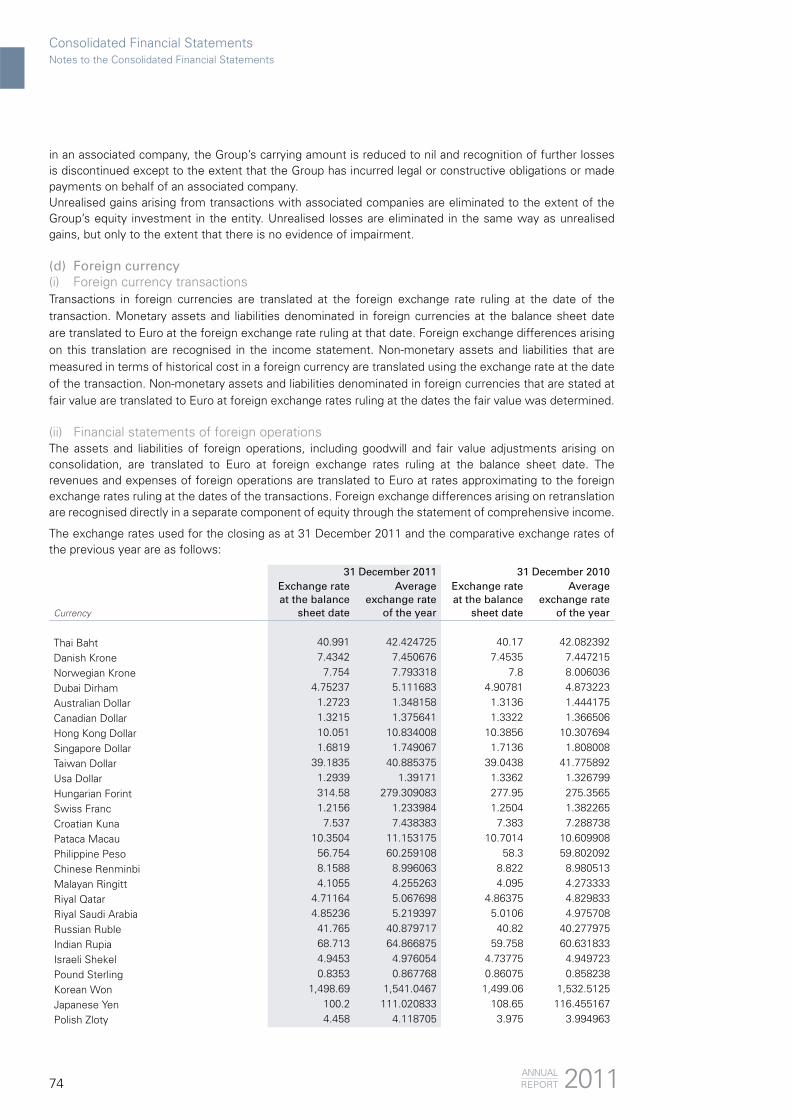
74
in an associated company, the Group’s carrying amount is reduced to nil and recognition of further losses is discontinued except to the extent that the Group has incurred legal or constructive obligations or made payments on behalf of an associated company.Unrealised gains arising from transactions with associated companies are eliminated to the extent of the Group’s equity investment in the entity. Unrealised losses are eliminated in the same way as unrealised gains, but only to the extent that there is no evidence of impairment.
(d) Foreign currency (i) Foreign currency transactionsTransactions in foreign currencies are translated at the foreign exchange rate ruling at the date of the transaction. Monetary assets and liabilities denominated in foreign currencies at the balance sheet date are translated to Euro at the foreign exchange rate ruling at that date. Foreign exchange differences arising on this translation are recognised in the income statement. Non-monetary assets and liabilities that are measured in terms of historical cost in a foreign currency are translated using the exchange rate at the date of the transaction. Non-monetary assets and liabilities denominated in foreign currencies that are stated at fair value are translated to Euro at foreign exchange rates ruling at the dates the fair value was determined.
(ii) Financial statements of foreign operations The assets and liabilities of foreign operations, including goodwill and fair value adjustments arising on consolidation, are translated to Euro at foreign exchange rates ruling at the balance sheet date. The revenues and expenses of foreign operations are translated to Euro at rates approximating to the foreign exchange rates ruling at the dates of the transactions. Foreign exchange differences arising on retranslation are recognised directly in a separate component of equity through the statement of comprehensive income.
The exchange rates used for the closing as at 31 December 2011 and the comparative exchange rates of the previous year are as follows:
31 December 2011 31 December 2010
Currency
Exchange rate at the balance
sheet date
Average exchange rate
of the year
Exchange rate at the balance
sheet date
Average exchange rate
of the year
Thai Baht 40.991 42.424725 40.17 42.082392
Danish Krone 7.4342 7.450676 7.4535 7.447215
Norwegian Krone 7.754 7.793318 7.8 8.006036
Dubai Dirham 4.75237 5.111683 4.90781 4.873223
Australian Dollar 1.2723 1.348158 1.3136 1.444175
Canadian Dollar 1.3215 1.375641 1.3322 1.366506
Hong Kong Dollar 10.051 10.834008 10.3856 10.307694
Singapore Dollar 1.6819 1.749067 1.7136 1.808008
Taiwan Dollar 39.1835 40.885375 39.0438 41.775892
Usa Dollar 1.2939 1.39171 1.3362 1.326799
Hungarian Forint 314.58 279.309083 277.95 275.3565
Swiss Franc 1.2156 1.233984 1.2504 1.382265
Croatian Kuna 7.537 7.438383 7.383 7.288738
Pataca Macau 10.3504 11.153175 10.7014 10.609908
Philippine Peso 56.754 60.259108 58.3 59.802092
Chinese Renminbi 8.1588 8.996063 8.822 8.980513
Malayan Ringitt 4.1055 4.255263 4.095 4.273333
Riyal Qatar 4.71164 5.067698 4.86375 4.829833
Riyal Saudi Arabia 4.85236 5.219397 5.0106 4.975708
Russian Ruble 41.765 40.879717 40.82 40.277975
Indian Rupia 68.713 64.866875 59.758 60.631833
Israeli Shekel 4.9453 4.976054 4.73775 4.949723
Pound Sterling 0.8353 0.867768 0.86075 0.858238
Korean Won 1,498.69 1,541.0467 1,499.06 1,532.5125
Japanese Yen 100.2 111.020833 108.65 116.455167
Polish Zloty 4.458 4.118705 3.975 3.994963
2011ANNUALREPORT
Consolidated Financial StatementsNotes to the Consolidated Financial Statements
75
(iii) Net investment in foreign operationsExchange differences arising from the translation of the net investment in foreign operations, and of related hedges are taken to a specific reserve. They are released into the income statement upon disposal.
(e) Business combinationsBusiness combinations initiated before 1 January 2010 and completed before that date are recognized on the basis of IFRS 3 (2004).Such business combinations are recognized using the purchase method, were the purchase cost is equal to the fair value at the date of the exchange of the assets acquired and the liabilities incurred or assumed, plus costs directly attributable to the acquisition. This cost is allocated by recognizing the assets, liabilities and identifiable contingent liabilities of the acquired company at their fair values. Any positive difference between the cost of the acquisition and the fair value of the net assets acquired pertaining to the shareholders Parent company is recognized as goodwill. Any negative difference is recognized in profit or loss. If the fair values of the asset, liabilities and contingent liabilities can only be calculate on a provisional basis, the business combination is recognized using such provisional values.
The value of the non-controlling interests is determined in proportion to the interest held by minority shareholders in the net assets. In the case of business combination achieved in stages, at the date of acquisition of control the net assets acquired previously are remeasured to fair value and any adjustments are recognized in equity. Any adjustments resulting from the completion of the measurement process are recognized within twelve month of the acquisition date.Business combination carried out as from 1 January 2010 are recognized of the basis of IFRS 3 (2008). More specifically, business combination are recognized using the acquisition method where the purchase costs is equal to the fair value at the end of exchange of the assets acquired and the liabilities incurred or assumed as well as equity instruments issued by the purchaser. Costs directly attributable to the acquisition are recognized though profit or loss. This cost is allocated by recognizing the assets, liabilities and identifiable contingent liabilities of the acquired company at their fair values as at the acquisition date. Any positive difference between the price paid, measured at fair value as at the acquisition date plus the value of any non-controlling interests, and the net value of the identifiable assets and liabilities of the acquiree measured at fair value is recognized as goodwill. Any negative difference is recognized in profit or loss. The value of non-controlling interests is determined either in proportion to the interest held by minority shareholders in the net identifiable assets of the acquiree or at their fair value as at the acquisition date.If the fair values of the assets, liabilities and contingent liabilities can only be calculated on a provisional basis, the business combination is recognised using such provisional values. Any adjustments resulting from the completion of the measurement process are recognized within twelve month of the date of acquisition, restating comparative figures.In the case of business combination achieved in stages, at the date of acquisition of control the holdings acquired previously are remeasured to fair value and any positive or negative difference is recognized in profit or loss.
(f) Derivative financial instrumentsThe Group uses derivative financial instruments (generally forward exchange contracts and swaps) only to hedge its exposure to foreign currency risk, to commodities risk and interest risk coming from its operating and financial activities in currencies other than Euro.According to its treasury policy, the Group does not hold or issue derivative financial instruments for trading purposes. Anyway, derivative financial instruments for which the criterion to record the operations as hedging operations are not respected, are recorded as trading instruments.Derivative financial instruments are recognised initially at cost. Subsequent to initial recognition, derivative financial instruments are stated at fair value.The gain or loss on re-measurement to fair value is recognised immediately in profit or loss account. However, where derivatives qualify for hedge accounting, recognition of any resultant gain or loss depends on the nature of the item being hedged (see the accounting policy described in g).The fair value of forward exchange contracts is their quoted market price at the balance sheet date, being the present value of the quoted forward price.
Consolidated Financial StatementsNotes to the Consolidated Financial Statements
76
(g) Hedging(i) Cash flow hedging (foreign currency risk)The Group uses derivative financial instruments to hedge its exposure to foreign currency risk coming from its operating and financial activities in currency other than Euro.In particular, the Group uses derivative financial instruments to hedge the foreign currency risk related to the contracts work-in-progress cash flows. When the Group acquires a job whose future cash flows are denominated in foreign currency, specific forward exchange contracts or swaps on foreign currency are concluded to hedge the foreign currency risk existing on those future cash flows; therefore these hedging operations are related to highly probable future transactions as the job that is hedged is effectively acquired when the hedging contract or contracts are concluded. Considering the length of the Group contracts, the estimation of the timing of the future cash flows is very difficult and subject to changes that can be also relevant; as a consequence, the Group policy consists in making an initial hedging of future cash flows based on a rough estimation of the future cash flows timing and subsequently in:- rolling over the forward exchange contracts or swaps on foreign currency if at the expiry date the correspondent cash flows related to the job does not occur;- in concluding another forward exchange contract or swap on foreign currency, of opposite sign and same expiry date of the existing hedging contracts, if the cash flow related to the job occurs in advance with respect to the expiry date of the existing hedging contracts.The gains and losses deriving from the roll-over operation of these derivative financial instruments and from their evaluation at fair value are recognised directly in the net equity in a specific reserve for the effective part; these gains and losses are removed from the net equity and recorded in the income statement in the same period or periods during which the hedged forecast transaction affects income statement; they are included in the operating revenues or operating expenses if related to hedging operations of job contracts cash flows.The ineffective part of any profit or loss is recognized immediately in the income statement as financial components.On the basis of the method used for hedging the future cash flows related to contracts work-in-progress in foreign currency, the prospective effectiveness is always included in the range requested by IAS 39 (80%-125%); any ineffectiveness can occur retrospectively only if the roll-over operations or the closing in advance of a forward exchange contract or swap on foreign currency are not performed correctly; the measurement of the retrospective ineffectiveness is therefore made continuously monitoring that these cases do not occur.If the hedged transaction is no longer expected to take place, the cumulative unrealised gains or losses recognized in equity are recognised immediately in the income statement as financial components.Finally, according to the Group policy the foreign currency risk hedging is made on the spot rate; as a consequence, the difference between spot rate and forward rate recorded when a roll-over operation is performed and the interest component included in the fair value of the forward contracts or swaps on foreign currency, are always recorded in the income statement in the financial components as hedging expenses/revenues, regardless whether the contract does or does not comply with the requirements for being considered as such.
(ii) Hedge of monetary assets and liabilitiesThe Group uses derivative financial instruments also to hedge economically the foreign exchange exposure of a recognised monetary asset or liability as the loans in foreign currency; in this case no hedge accounting is applied and any gain or loss on the hedging instrument is recognised in the income statement.
(iii) Cash flow hedging (Commodities Risk)The Group uses derivative financial instruments also to hedge price risk on commodities coming from its operating activities.In particular, the Group uses derivative financial instruments to hedge the price risk related to aluminum purchase for the contracts work-in-progress. When the Group acquires a job whose future cash flows are related to aluminum purchase, specific forward exchange contracts or swaps on foreign currency are concluded to hedge the price risk existing on this commodity; therefore these hedging operations are related to highly probable future transactions as the job that is hedged, with regard to the aluminum purchase, is effectively acquired when the hedging contract or contracts are concluded. In consideration of the variability
2011ANNUALREPORT
Consolidated Financial StatementsNotes to the Consolidated Financial Statements
77
of the price of aluminum, the aim of hedging is to freeze this price already since the acquisition of the order itself; subsequently, as the aluminum order as well as the relevant price are agreed with the supplier, the Group shall complete the aluminum forward purchase by completing a transaction of opposite sign. If, upon expiry of the transaction, the order has not been defined yet for the supplier, the hedging contract(s) shall be rolled over.The gains and losses deriving from the regulation of the operations on maturity, including the effect of the possible roll-over operation of these derivative financial instruments and from their evaluation at fair value are recognised directly in the net equity in a specific reserve for the effective part; these gains and losses are removed from the net equity and recorded in the income statement in the same period or periods during which the hedged forecast transaction affects income statement (arrival of the goods); they are included in the operating expenses.The ineffective part of any profit or loss is recognized immediately in the income statement as financial components.On the basis of the method used for hedging of the price risk on the future cash flows payments related to aluminum purchases on contracts work-in-progress, the prospective effectiveness it always included in the range requested by IAS 39 (80%-125%); any ineffectiveness can occur retrospectively only if the roll-over operations or the closing in advance of an hedging contract by operation of the opposite sign when the order to the supplier is fixed are not performed correctly; the measurement of the retrospective ineffectiveness is therefore made continuously monitoring that these cases do not occur.If the hedged transaction is no longer expected to take place, the losses or profits on the accumulated price difference recognized in equity are recognized immediately in the income statement as financial components. Finally, according to the Group policy the commodities price risk is made on the spot rate; as a consequence, the difference between spot rate and forward rate recorded when a roll-over operation is performed and the interest component included in the fair value of the forward contracts or swaps on foreign currency, are always recorded in the income statement in the financial components as hedging expenses/revenues, regardless whether the contract does or does not comply with the requirements for being considered as such.
(iv) Hedge of net investment in foreign operation The portion of the gain or loss on an instrument used to hedge a net investment in a foreign operation that is determined to be an effective hedge is recognised directly in equity. The ineffective portion is recognised immediately in income statement.
(h) Tangible assets(i) Owned tangible assets Items of property, plant and equipment are stated at cost less accumulated depreciation (depreciation criteria are reported below) and impairment losses (see accounting policy o). The cost of self-constructed assets includes the cost of materials, direct labour, and the initial estimate, where relevant, of the costs of dismantling and removing the items and restoring the site on which they are located, and an appropriate proportion of production overheads.Where parts of an item of property, plant and equipment have different useful lives, they are accounted for as separate items of property, plant and equipment according to the “component approach”.
(ii) Leases assets Leases in terms of which the Group assumes substantially all the risks and rewards of ownership are classified as finance leases. The owner-occupied property acquired by way of finance lease is stated at an amount equal to the lower of its fair value and the present value of the minimum lease payments at inception of the lease, less accumulated depreciation (depreciation criteria are reported below) and impairment losses. Lease payments are accounted for as described in accounting policy w.
(iii) Subsequent costs The Group recognises in the carrying amount of an item of property, plant and equipment the cost of replacing part of such an item when that cost is incurred if it is probable that the future economic benefits embodied with the item will flow to the Group and the cost of the item can be measured reliably. All other costs are recognised in the income statement as an expense as incurred.
Consolidated Financial StatementsNotes to the Consolidated Financial Statements
78
(iv) Depreciation Depreciation is charged to the income statement on a straight-line basis over the estimated useful lives of each part of an item of property, plant and equipment. Depreciation is applied from the date the tangible assets are available for use. Land is not depreciated. The estimated useful lives are as follows:
buildings 20-40 years plant and machinery 5-25 years equipment 4-5 years other assets 4-8 years
The useful lives and the residual value, if significant, are annually revised.
(i) Intangible assets(i) GoodwillGoodwill arising on business combinations is initially measured at cost as established at the acquisition date, as defined in the above paragraph. Goodwill is not amortised, but is tested for impairment annually or more frequently if events or changes in circumstances indicate that it might be impaired. After initial recognition, goodwill is measured at cost less any accumulated impairment losses.On disposal of part or whole of a business which was previously acquired and which gave rise to the recognition of goodwill, the remaining amount of the related goodwill is included in the determination of the gain or loss on disposal.
(ii) Research and developmentExpenditure on research activities, undertaken with the prospect of gaining new scientific or technical knowledge and understanding, is recognised in the income statement as an expense as incurred.Expenditure on development activities, whereby research findings are applied to a plan or design for the production of new or substantially improved products and processes, is capitalised if the product or process is technically and commercially feasible and the Group has sufficient resources to complete development. The expenditure capitalised includes the cost of materials, direct labour and an appropriate proportion of overheads.Other development expenditure is recognised in the income statement as an expense as incurred.Capitalised development expenditure is stated at cost less accumulated amortization (amortization criteria are reported below) and impairment losses (see accounting policy o).
(iii) Other intangible assetsOther intangible assets that are acquired by the Group are stated at cost less accumulated amortization (amortization criteria are reported below) and impairment losses (see accounting policy o). Expenditure on internally generated goodwill and brands is recognised in the income statement as an expense as incurred.
(iv) Subsequent expenditure Subsequent expenditure on capitalised intangible assets is capitalised only when it increases the future economic benefits embodied in the specific asset to which it relates. All other expenditure is expensed as incurred.
(v) Amortization Amortization is charged to the income statement on a straight-line basis over the estimated useful lives of intangible assets unless such lives are indefinite. Goodwill, intangible assets with an indefinite useful life and intangible assets not yet available to be used are systematically tested for impairment at each balance sheet date. Other intangible assets are amortised from the date they are available for use. The estimated useful lives are as follows:
rights to use intellectual property (software) 3-5 years trademarks and similar rights 3 years capitalised development costs 5 years
Consolidated Financial StatementsNotes to the Consolidated Financial Statements
2011ANNUALREPORT
79
backlog on the basis of the economical development customer relationship 20 years
(j) Trade receivables to third partiesTrade receivables are recognised initially at fair value and subsequently recorded at the amortised cost, using the effective interest method, net of impairment losses related to amounts considered recoverable, recorded as provision. The estimation of the recoverable amounts is based of future expected cash flows.Trade receivables, whose expiry date is within ordinary trade terms, are not discounted.
(k) Contracts work-in-progressContracts work-in-progress are reported in accordance with the progress stage (or completion percentage) of the works, according to which the costs, revenues, and margin are recognised based on the progress of the productive activity. The policy adopted by the Group is the completion percentage determined by applying the “incurred cost” (cost to cost) criterion.The valuation reflects the best estimate of the contracts made as at the reporting date. Periodically, the assumptions underlying the evaluations are updated. Any economic effect is recorded in the year in which the updates have been made.The contract revenues include the payments agreed upon by contract, work changes, price revision, incentives, and any claims, to the extent that these are likely to be reliably valuated. In particular, the valuation of claims was guided, based on certain technical and legal analysis, towards the positive results that could reasonably be achieved from disputes with the customers.The contracts costs include all the costs that refer directly to the project, the costs that may be attributed to the contract activity in general and that may be allocated to the said project, in addition to any other costs that may be specifically charged to the customer based on the contractual clauses.The contract costs also include the pre-operative costs, which is to say the costs incurred in the initial phase of the contract before the construction activity is began (costs or preparing, tenders, design costs, costs for organization and start-up of production, construction site installation costs) and the post-operative costs that are incurred after the contract is closed (removal of the construction site, return of plant/equipment to base, etc.).Should the completion of a project be forecast to lead to a loss, this shall be recognised in its entirety in the year in which it may be reasonably expected.The contracts in progress are set out net of any depreciation fund and/or final losses, as well as the progress billings for the contract being carried out.This analysis is carried out on a contract by contract basis: should the difference be positive (due to contracts in progress greater than the amounts of the progress billings), it is classified among the assets (contracts work-in-progress); on the other hand, should the difference be negative, it is classified among the liabilities (liabilities for contracts work-in-progress).Should the final losses fund for the individual contract exceed the value of the work entered in the assets, this excess is classified under the provision for risks and charges.Contracts with payment denominated in foreign currency other than the functional currency (Euro for the Group) are valuated by converting the accrued share of payments determined based on the completion percentage method, at the exchange rate ruling at the reporting date for the portion yet not invoiced, and at the exchange rate ruling at the transaction date for the portion already invoiced.
(l) Inventories Inventories are stated at the lower of cost and net realisable value. Net realisable value is the estimated selling price in the ordinary course of business, less the estimated costs of completion and selling expenses. The cost determining method selected as a Group principle is the weighted average cost and includes expenditure incurred in acquiring the inventories and bringing them to their existing location and condition. In the case of manufactured inventories and works in progress, cost includes an appropriate share of overheads based on normal operating capacity.
(m) Other financial assetsOther financial assets that the Group intends and is able to hold until maturity are recorded at the fair value
Consolidated Financial StatementsNotes to the Consolidated Financial Statements
80
of the initial consideration given in exchange plus the related transaction costs. Subsequently, they are valued on an amortised-cost basis using the original effective interest method.Financial assets are derecognised when, following their sale or settlement, the Group is no longer involved in their management and has transferred all risks and rewards of ownership.
(n) Cash and cash equivalentsCash and cash equivalents include bank and post current accounts and deposits. Bank overdrafts, advances and other short-term loans which are repayable on demand and form an integral part of the Group’s cash managements are considered as components of cash surplus or deficit for cash flow statement purposes.
(o) Impairment of tangible and intangible assetsThe carrying amounts of tangible and intangible are reviewed at each balance sheet date to determine whether there is any indication of impairment. If any such indication exists, the asset’s recoverable amount is estimated. Even if there are no indication of impairment, for goodwill, assets that have an indefinite useful life and intangible assets that are not yet available for use, the recoverable amount is estimated at each balance sheet date.An impairment loss is recognised whenever the carrying amount of an asset or its cash-generating unit exceeds its recoverable amount. Impairment losses are recognised in the income statement.Impairment losses recognised in respect of cash-generating units are allocated first to reduce the carrying amount of any goodwill allocated to cash-generating units (group of units) and then, to reduce the carrying amount of the other assets in the unit (group of units) on a pro rata basis.
(i) Calculation of recoverable amountThe recoverable amount of an asset is the greater of their net selling price and value in use. In assessing value in use, the estimated future cash flows are discounted to their present value using a pre-tax discount rate that reflects current market assessments of the time value of money and the risks specific to the asset. For an asset that does not generate largely independent cash inflows, the recoverable amount is determined for the cash-generating unit to which the asset belongs.
(ii) Reversal of impairmentAn impairment loss, except if in respect of goodwill, is reversed and recorded in the income statement, only if the reasons for the impairment loss cease to exist.An impairment loss is reversed only to the extent that the asset’s carrying amount does not exceed the carrying amount that would have been determined, net of depreciation or amortization, if no impairment loss had been recognised.
(p) Equity(i) Share capitalShare capital includes the subscribed and paid up Company’s share capital.
(ii) DividendsDividends are recognised as a liability in the period in which they are declared.
(q) Amounts payable to banks and other financial creditors Amounts payable to banks and other financial creditors are recognised initially at fair value less attributable transaction costs. Subsequent to initial recognition, they are stated at amortised cost with any difference between cost and redemption value being recognised in the income statement over the period of the borrowings or loans on an effective interest basis.
(r) Pension funds and other employee benefits(i) Defined contribution plansObligations for contributions to defined contribution pension plans are recognised as an expense in the income statement as incurred.
(ii) Defined benefit plansThe Group’s net obligation in respect of defined benefit pension plans is calculated separately for each plan
Consolidated Financial StatementsNotes to the Consolidated Financial Statements
2011ANNUALREPORT

81
by estimating the amount of future benefit that employees have earned in return for their service in the current and prior periods; that benefit is discounted to determine its present value, and the fair value of any plan assets is deducted. The discount rate is the yield at the balance sheet date on AAA credit rated bonds that have maturity dates approximating to the terms of the Group’s obligations. The calculation is performed by a qualified actuary using the projected unit credit method.When the benefits of a plan are improved, the portion of the increased benefit relating to past service by employees is recognised as an expense in the income statement on a straight-line basis over the average period until the benefits become vested. To the extent that the benefits vest immediately, the expense is recognised immediately in the income statement.All actuarial gains and losses are recognized immediately in the income statement as the Group decided to not adopt the “corridor approach”.
(iii) Severance indemnity fundThe severance indemnity fund, showed in the statement of financial position, compulsory for the Italian Group companies according to law n. 297/1982, exclusively refers to the amount accrued before 2007; it is considered under IFRS a defined benefit plan and therefore it is calculated according to the method described in the previous paragraph.Following to the reform on complementary pension funds with special reference to the companies with at least 50 employees, the severance indemnity accrued from 1 January 2007 is directly allocated to complementary pension funds or to INPS (Italian National Institute for Social insurance), in compliance with the employees’ choices; consequently, according to IAS 19, obligations towards INPS and contributions to complementary pension funds take on the nature of defined contribution plan.
(iv) Other long-term benefits The Group’s net obligation in respect of other long-term service benefits, other than pension plans, is the amount of future benefit that employees have earned in return for their service in the current and prior periods. The obligation is calculated using the projected unit credit method and is discounted to its present value and the fair value of any related assets is deducted. The discount rate is the yield at the balance sheet date on AAA credit rated bonds that have maturity dates approximating to the terms of the Group’s obligations.
(s) Provision for risks and chargesA provision is recognised in the statement of financial position when the Group has a present legal or constructive obligation as a result of a past event, and it is probable that an outflow of economic benefits will be required to settle the obligation and a reliable estimation of the obligation amount can be done.Provisions are recorded on the basis of the best estimation of the amount that the Group would pay to settle the obligation or to transfer it to third parties at the reporting period.If the effect is material, provisions are determined by discounting the expected future cash flows at a pre-tax rate that reflects current market assessments of the time value of money and, where appropriate, the risks specific to the liability.
(t) Trade payables to third parties Trade payables are recorded at the amortised cost, using the effective interest method. Trade payables, whose expiry dates are within the ordinary trade terms, are not discounted.
(u) Other financial liabilities The other financial liabilities are initially recorded at cost, net of any transaction costs directly attributable to their creation. Following initial recording, financial liabilities are valued on an amortised-cost basis using the effective interest method.Financial liabilities are derecognised when, following their sale or settlement, the Group is no longer involved in their management and has transferred all risks and rewards of ownership.
(v) Revenue recognition(i) Contracts work-in-progressAs soon as the outcome of a contract can be estimated reliably, contract revenue and expenses are recognised
Consolidated Financial StatementsNotes to the Consolidated Financial Statements
82
in the income statement in proportion to the stage of completion of the contract that is calculated as based on the between costs effectively incurred and total costs included in the contract budget. An expected loss on a contract is recognised immediately in the income statement.
(ii) Goods sold and services rendered Revenue from the sale of goods is recognised in the income statement when the significant risks and rewards of ownership have been transferred to the buyer. Revenue from services rendered is recognised in the income statement in proportion to the stage of completion of the transaction at the balance sheet date. The stage of completion is assessed checking the work performed. No revenue is recognised if there are significant uncertainties regarding recovery of the consideration due, associated costs or the possible return of goods.
(w) Expenses(i) Operating lease payments
Payments made under operating leases are recognised in the income statement on a straight-line basis over the term of the lease. Lease incentives received are recognised in the income statement as an integral part of the total lease expense.
(ii) Finance lease paymentsMinimum lease payments are apportioned between the finance charge and the reduction of the outstanding liability. The finance charge is allocated to each period during the lease term so as to produce a constant periodic rate of interest on the remaining balance of the liability.
(iii) Net financial expensesNet financing costs comprise interest payable on borrowings calculated using the effective interest rate method, dividends, foreign exchange gains and losses except for those related to cash flow hedging operations that are included in the operating revenues or expenses, and premiums and discounts related to all forward exchange contracts and swaps on foreign currency.Interest income is recognised in the income statement as it accrues, using the effective interest method. Dividends income is recognised in the income statement on the date the entity’s right to receive payments is established. The interest expense component of finance lease payments is recognised in the income statement using the effective interest rate method. Borrowing costs that are directly attributable to the acquisition, construction or production of qualifying assets (as defined under IAS 23 - Borrowing Costs), which are assets that necessarily take a substantial period of time to get ready for their intended use or sale, are capitalised and amortised over the useful life of the class of assets to which they refer.All other borrowing costs are expensed when incurred.
(x) Income taxIncome tax on the profit or loss for the year comprises current and deferred tax. Income tax is recognised in the income statement except to the extent that it relates to items recognised directly in equity, in which case it is recognised in equity. Current tax is the expected tax payable on the taxable income for the year, using tax rates enacted or substantially enacted at the balance sheet date, and any adjustment to tax payable in respect of previous years.Deferred tax is provided using the balance sheet liability method, providing for temporary differences between the carrying amounts of assets and liabilities for financial reporting purposes and the amounts used for taxation purposes.The following temporary differences are not provided for:
goodwill not deductible for tax purposes; the initial recognition of assets or liabilities that affect neither accounting nor taxable profit; differences relating to investments in subsidiaries to the extent that they will probably not reverse in
the foreseeable future.The amount of deferred tax provided is based on the expected manner of realisation or settlement of the
Consolidated Financial StatementsNotes to the Consolidated Financial Statements
2011ANNUALREPORT

83
carrying amount of assets and liabilities, using tax rates enacted or substantively enacted at the balance sheet date.A deferred tax asset is recognised only to the extent that it is probable that future taxable profits will be available against which the asset can be utilised. Deferred tax assets are reduced to the extent that it is no longer probable that the related tax benefit will be realised. Additional income taxes arising from the distribution of dividends are recognised when the liability associated to the payment of the same dividend is acknowledged. This is justified by the fact that the Group is able to manage the time plan for the distribution of the reserves and it is probable that they will not be distributed in the foreseeable future.
(y) Non-current assets held for sale and discontinued operationsImmediately before classification as held for sale, the measurement of the assets (and all assets and liabilities in a disposal group) is brought up-to-date in accordance with applicable IFRS. Then, on initial classification as held for sale, non-current assets and disposal groups are recognised at the lower of carrying amount and fair value less costs to sell.Impairment losses on initial classification as held for sale are included in profit or loss, even when there is a revaluation. The same applies to gains and losses on subsequent re-measurement. A discontinued operation is a component of the Group’s business that represents a separate major line of business or geographical area of operations or is a subsidiary acquired exclusively with a view to resale.Classification as a discontinued operation occurs upon disposal or when the operation meets the criteria to be classified as held for sale, if earlier. A disposal group that is to be abandoned may also qualify as discontinued operation.
(z) New accounting principlesAccounting standards, amendments and interpretations applied since 1 January 2011
On 4 November 2009, the IASB issued a revised version of IAS 24 - Related Party Disclosures that simplifies the disclosure requirements for government-related entities and clarifies the definition of a related party. Application of this amendment did not have any significant effects on the measurement of items in the Group’s financial statements and had only limited effects on the disclosures for related party transactions provided in these consolidated financial statements.
Accounting standards, amendments and interpretations effective from 1 January 2011
but not applicable to the Group
The following amendments, improvements and interpretations have also been issued and are effective from 1 January 2011; these relate to matters that were not applicable to the Group at the date of these consolidated financial statements but which may affect the accounting for future transactions or arrangements:
Financial Instruments: Presentation, Classification of Rights Issues: an amendment to IAS 32; Prepayments of a Minimum Funding Requirement: an amendment to IFRIC 14; IFRIC 19 - Extinguishing Financial Liabilities with Equity Instruments; Improvement agli IAS/IFRS (2010).
Accounting standards and amendments not yet applicable and not early adopted by the
Group
Except for the amendments to IFRS 7 - Financial Instruments: Disclosures issued on 7 October 2011 described below, the European Union had not yet completed its endorsement process for these standards and amendments at the date of these consolidated financial statements.
On 12 November 2009, the IASB issued a new standard IFRS 9 - Financial Instruments that was subsequently amended. This standard, having an effective date for mandatory adoption of 1 January 2015 retrospectively, represents the completion of the first part of a project to replace IAS 39 and introduces new requirements for the classification and measurement of financial assets and financial liabilities. The new standard uses a single approach to determine whether a financial asset is measured at amortised cost or fair value, replacing the many different rules in IAS 39. The approach in IFRS 9 is based on how an entity manages its financial instruments and the contractual cash flow characteristics of the financial assets. The most significant effect
Consolidated Financial StatementsNotes to the Consolidated Financial Statements

84
of the standard regarding the classification and measurement of financial liabilities relates to the accounting for changes in fair value attributable to changes in the credit risk of financial liabilities designated as at fair value through profit or loss. Under the new standard these changes are recognised in other comprehensive income and are not subsequently reclassified to profit or loss.
On 20 December 2010, the IASB issued an amendment to IAS 12 - Income Taxes which clarify the accounting for deferred tax relating to investment properties measured at fair value. The amendment introduces the presumption that the carrying amount of deferred taxes relating to investment properties measured at fair value under IAS 40 will be recovered through sale. As a result of the amendments, SIC-21 - Income Taxes - Recovery of Revalued Non-Depreciable Assets no longer applies. These amendments are effective retrospectively from 1 January 2012.
On 12 May 2011, the IASB issued IFRS 10 - Consolidated Financial Statements replacing SIC-12 - Consolidation - Special Purpose Entities and parts of IAS 27 - Consolidated and Separate Financial Statements (subsequently reissued as IAS 27 - Separate Financial Statements which addresses the accounting treatment of investments in separate financial statements). The new standard builds on existing principles by identifying the concept of control as the determining factor in whether an entity should be included in the consolidated financial statements of the parent company. The standard provides additional guidance to assist in the determination of control where this is difficult to assess. The standard is effective retrospectively from 1 January 2013.
On 12 May 2011, the IASB issued IFRS 11 - Joint Arrangements superseding IAS 31 - Interests in Joint Ventures and SIC-13 - Jointly-controlled Entities - Non-Monetary Contributions by Venturers. The new standard provides the criteria for identifying joint arrangements by focusing on the rights and obligations of the arrangement rather than its legal form and requires a single method to account for interests in jointly-controlled entities, the equity method. The standard is effective retrospectively from 1 January 2013. Following the issue of the new standard, IAS 28 - Investments in Associates has been amended to include accounting for investments in jointly-controlled entities in its scope of application (from the effective date of the standard).
On 12 May 2011, the IASB issued IFRS 12 - Disclosure of Interests in Other Entities, a new and comprehensive standard on disclosure requirements for all forms of interests in other entities, including subsidiaries, joint arrangements, associates, special purpose vehicles and other unconsolidated vehicles. The standard is effective for annual periods beginning after 1 January 2013.
On 12 May 2011, the IASB issued IFRS 13 - Fair Value Measurement, clarifying the determination of the fair value for the purpose of the financial statements and applying to all IFRSs permitting or requiring a fair value measurement or the presentation of disclosures based on fair value. The standard is effective prospectively from 1 January 2013.
On 16 June 2011, the IASB issued an amendment to IAS 1 - Presentation of Financial Statements requiring companies to group together items within other comprehensive income that may be reclassified to the profit or loss section of the income statement. The amendment is applicable for periods beginning on or after 1 July 2012.
On 16 June 2011, the IASB issued an amended version of IAS 19 - Employee Benefits. The amendments make improvements to the previous version by eliminating the option to defer the recognition of gains and losses, known as the “corridor method”, and by requiring the whole of the fund’s deficit or surplus to be presented in the statement of financial position, the components of cost relating to service and net interest to be recognised in profit or loss and actuarial gains and losses arising from the remeasurement of assets and liabilities at each balance sheet date to be recognised in other comprehensive income. In addition, the return on assets included in net interest costs must now be calculated using the discount rate applicable to liabilities and no longer the expected return on the assets. The amendments also introduce the requirement for additional disclosures to be provided in the notes. The amended version of IAS 19 is applicable on a retrospective basis from 1 January 2013.
Consolidated Financial StatementsNotes to the Consolidated Financial Statements
2011ANNUALREPORT

85
On 16 December 2011, the IASB issued certain amendments to IAS 32 - Financial Instruments: Presentation to clarify the application of certain offsetting criteria for financial assets and financial liabilities in IAS 32. The amendments are effective for annual periods beginning on or after 1 January 2014 and are required to be applied retrospectively.
On 16 December 2011, the IASB issued certain amendments to IFRS 7 - Financial Instruments: Disclosures. The amendments require information about the effect or potential effect of netting arrangements for financial assets and liabilities on an entity’s financial position. Entities are required to apply the amendments for annual reporting periods beginning on or after January 1, 2013, and interim periods within those annual periods. The required disclosures should be provided retrospectively.
Finally, on 7 October 2010, the IASB issued amendments to IFRS 7 - Financial Instruments: Disclosures. The amendments will enable users of financial statements to improve their understanding of transfers (“derecognition”) of financial assets, including an understanding of the possible effects of any risks that may remain with the entity that transferred the assets. The amendments also require additional disclosures if a disproportionate amount of a transfer transaction is undertaken at the end of a reporting period. Entities are required to apply the amendments for annual periods beginning on or after 1 July 2011. Application of this amendment is not expected to have any effects on the measurement of items in the financial statements.
Consolidated Financial StatementsNotes to the Consolidated Financial Statements

86
1. Assets classified as held for sale The amount of Euro 3,173 thousand reported at 31 December 2010, is referred to the Australian premises sold during the year 2011 for which a gain for approximately Euro 600 thousand was realized.
2. Acquisitions of subsidiariesNo acquisitions incurred during the period.
3. Operating revenuesOperating revenues broken down by product are shown below:
In thousands of Euro 2011 2010
Curtain walls 1,002,051 879,310
Interiors 159,132 134,703
Gates 2,172 2,466Other 13,030 19,785
1,176,385 1,036,264
Operating revenues broken down by geographical area are shown below:
In thousands of Euro 2011 2010
Usa and Canada 196,571 166,698
Benelux 30,085 42,029France 34,970 26,789Germany 55,817 71,462Italy 76,349 59,267Poland 329 1,047Spain 21,310 11,467Switzerland 19,292 19,994UK 101,529 166,258Ireland 3,093 10,569
Georgia 263 5,994Other European Countries 12,774 3,604Other Central Asian Countries 829 6,226Other African Countries 4,430 13,665
Dubai 1,228 3,429Qatar 108,003 81,548Other Middle Eastern Countries 92,422 16,536
Australia 56,591 33,941China 76,224 72,525Japan 57,953 34,065Hong Kong 99,729 57,784India 29,371 30,178Korea 0 67Russia 88 371Singapore 77,191 62,531Taiwan 1,905 362Thailand 2,972 8,838Macau 9,001 24,663Other Asian Countries 6,066 4,357
1,176,385 1,036,264
Notes to the Consolidated Financial Statements
Consolidated Financial StatementsNotes to the Consolidated Financial Statements
2011ANNUALREPORT
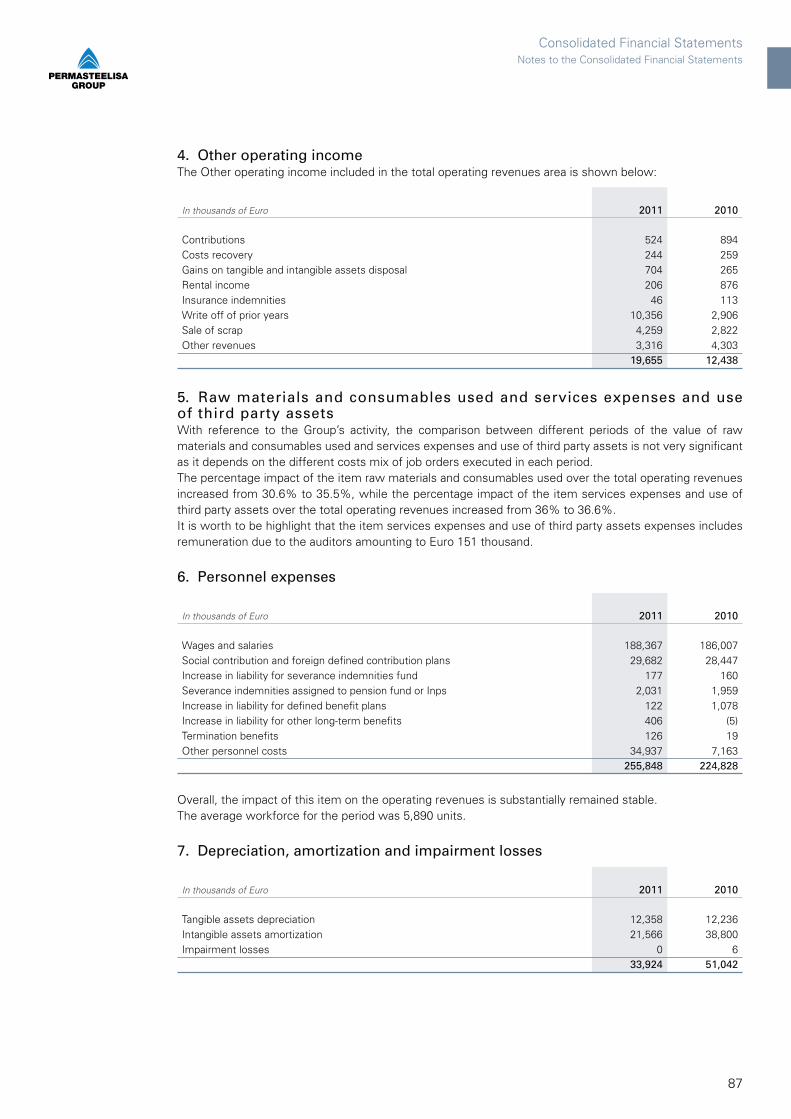
87
4. Other operating incomeThe Other operating income included in the total operating revenues area is shown below:
In thousands of Euro 2011 2010
Contributions 524 894 Costs recovery 244 259Gains on tangible and intangible assets disposal 704 265Rental income 206 876 Insurance indemnities 46 113 Write off of prior years 10,356 2,906 Sale of scrap 4,259 2,822 Other revenues 3,316 4,303
19,655 12,438
5. Raw materials and consumables used and services expenses and use of third party assetsWith reference to the Group’s activity, the comparison between different periods of the value of raw materials and consumables used and services expenses and use of third party assets is not very significant as it depends on the different costs mix of job orders executed in each period.The percentage impact of the item raw materials and consumables used over the total operating revenues increased from 30.6% to 35.5%, while the percentage impact of the item services expenses and use of third party assets over the total operating revenues increased from 36% to 36.6%.It is worth to be highlight that the item services expenses and use of third party assets expenses includes remuneration due to the auditors amounting to Euro 151 thousand.
6. Personnel expenses
In thousands of Euro 2011 2010
Wages and salaries 188,367 186,007Social contribution and foreign defined contribution plans 29,682 28,447Increase in liability for severance indemnities fund 177 160Severance indemnities assigned to pension fund or Inps 2,031 1,959Increase in liability for defined benefit plans 122 1,078Increase in liability for other long-term benefits 406 (5)Termination benefits 126 19Other personnel costs 34,937 7,163
255,848 224,828
Overall, the impact of this item on the operating revenues is substantially remained stable.The average workforce for the period was 5,890 units.
7. Depreciation, amortization and impairment losses
In thousands of Euro 2011 2010
Tangible assets depreciation 12,358 12,236Intangible assets amortization 21,566 38,800Impairment losses 0 6
33,924 51,042
Consolidated Financial StatementsNotes to the Consolidated Financial Statements
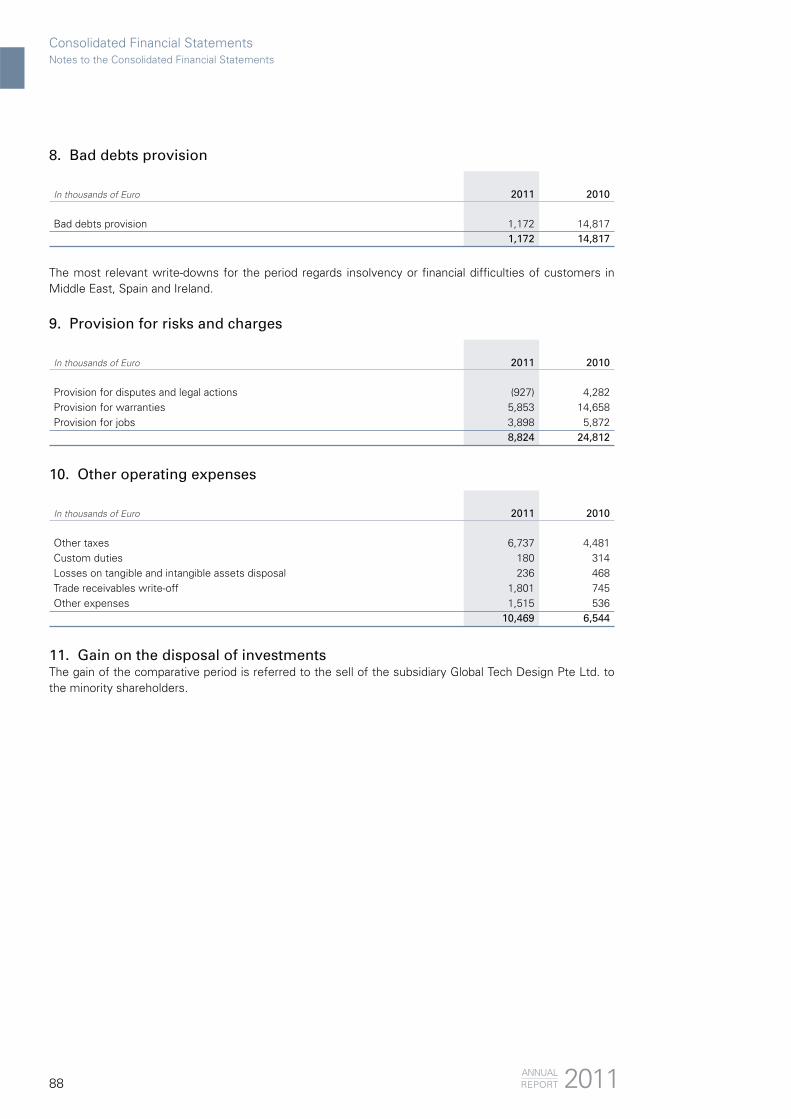
88
8. Bad debts provision
In thousands of Euro 2011 2010
Bad debts provision 1,172 14,8171,172 14,817
The most relevant write-downs for the period regards insolvency or financial difficulties of customers in Middle East, Spain and Ireland.
9. Provision for risks and charges
In thousands of Euro 2011 2010
Provision for disputes and legal actions (927) 4,282 Provision for warranties 5,853 14,658 Provision for jobs 3,898 5,872
8,824 24,812
10. Other operating expenses
In thousands of Euro 2011 2010
Other taxes 6,737 4,481 Custom duties 180 314 Losses on tangible and intangible assets disposal 236 468 Trade receivables write-off 1,801 745 Other expenses 1,515 536
10,469 6,544
11. Gain on the disposal of investmentsThe gain of the comparative period is referred to the sell of the subsidiary Global Tech Design Pte Ltd. to the minority shareholders.
Consolidated Financial StatementsNotes to the Consolidated Financial Statements
2011ANNUALREPORT
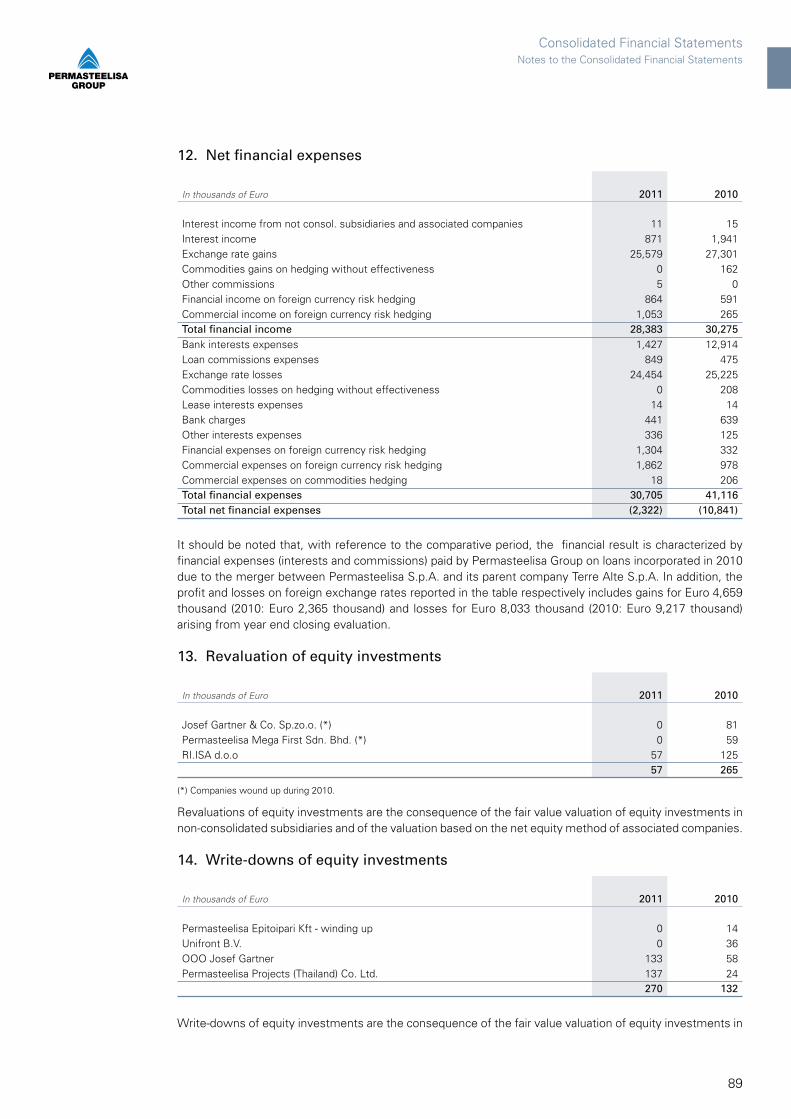
89
12. Net financial expenses
In thousands of Euro 2011 2010
Interest income from not consol. subsidiaries and associated companies 11 15Interest income 871 1,941Exchange rate gains 25,579 27,301Commodities gains on hedging without effectiveness 0 162Other commissions 5 0Financial income on foreign currency risk hedging 864 591Commercial income on foreign currency risk hedging 1,053 265Total financial income 28,383 30,275 Bank interests expenses 1,427 12,914 Loan commissions expenses 849 475 Exchange rate losses 24,454 25,225 Commodities losses on hedging without effectiveness 0 208 Lease interests expenses 14 14 Bank charges 441 639 Other interests expenses 336 125 Financial expenses on foreign currency risk hedging 1,304 332 Commercial expenses on foreign currency risk hedging 1,862 978 Commercial expenses on commodities hedging 18 206 Total financial expenses 30,705 41,116 Total net financial expenses (2,322) (10,841)
It should be noted that, with reference to the comparative period, the financial result is characterized by financial expenses (interests and commissions) paid by Permasteelisa Group on loans incorporated in 2010 due to the merger between Permasteelisa S.p.A. and its parent company Terre Alte S.p.A. In addition, the profit and losses on foreign exchange rates reported in the table respectively includes gains for Euro 4,659 thousand (2010: Euro 2,365 thousand) and losses for Euro 8,033 thousand (2010: Euro 9,217 thousand) arising from year end closing evaluation.
13. Revaluation of equity investments
In thousands of Euro 2011 2010
Josef Gartner & Co. Sp.zo.o. (*) 0 81Permasteelisa Mega First Sdn. Bhd. (*) 0 59RI.ISA d.o.o 57 125
57 265
(*) Companies wound up during 2010.
Revaluations of equity investments are the consequence of the fair value valuation of equity investments in non-consolidated subsidiaries and of the valuation based on the net equity method of associated companies.
14. Write-downs of equity investments
In thousands of Euro 2011 2010
Permasteelisa Epitoipari Kft - winding up 0 14Unifront B.V. 0 36OOO Josef Gartner 133 58Permasteelisa Projects (Thailand) Co. Ltd. 137 24
270 132
Write-downs of equity investments are the consequence of the fair value valuation of equity investments in
Consolidated Financial StatementsNotes to the Consolidated Financial Statements
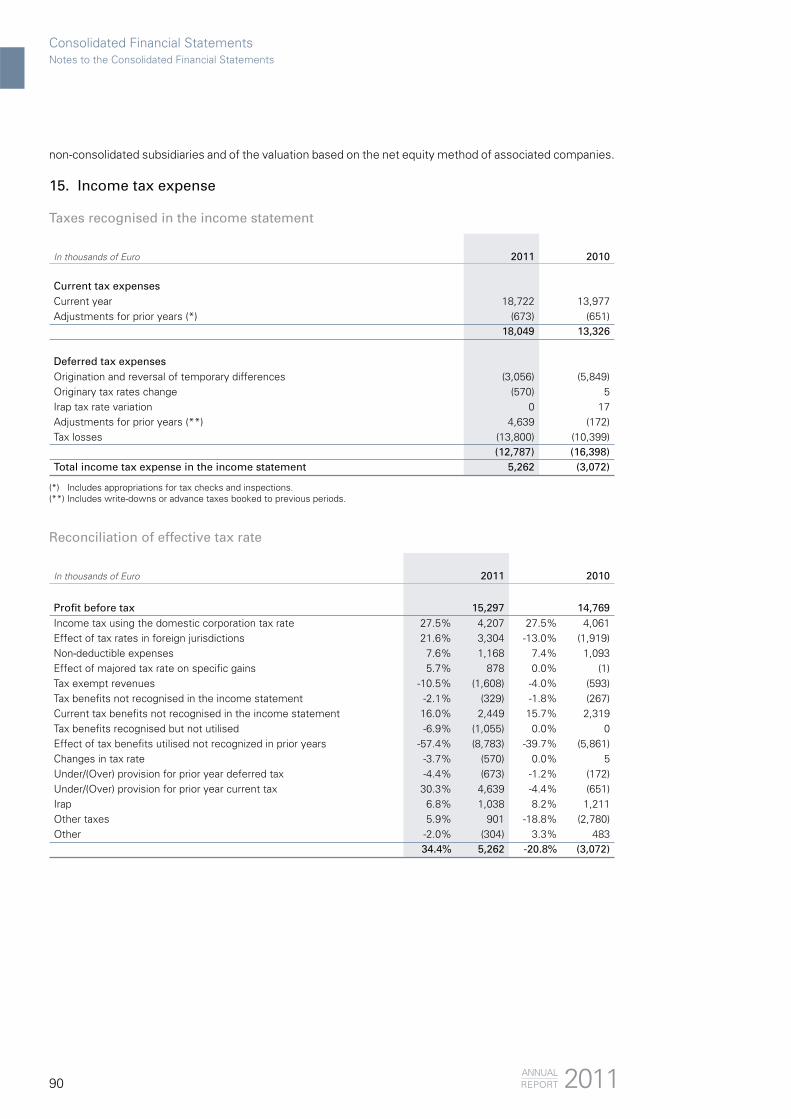
90
non-consolidated subsidiaries and of the valuation based on the net equity method of associated companies.
15. Income tax expense
Taxes recognised in the income statement
In thousands of Euro 2011 2010
Current tax expenses Current year 18,722 13,977Adjustments for prior years (*) (673) (651)
18,049 13,326
Deferred tax expensesOrigination and reversal of temporary differences (3,056) (5,849)Originary tax rates change (570) 5Irap tax rate variation 0 17Adjustments for prior years (**) 4,639 (172)Tax losses (13,800) (10,399)
(12,787) (16,398)Total income tax expense in the income statement 5,262 (3,072)
(*) Includes appropriations for tax checks and inspections.(**) Includes write-downs or advance taxes booked to previous periods.
Reconciliation of effective tax rate
In thousands of Euro 2011 2010
Profit before tax 15,297 14,769Income tax using the domestic corporation tax rate 27.5% 4,207 27.5% 4,061Effect of tax rates in foreign jurisdictions 21.6% 3,304 -13.0% (1,919)Non-deductible expenses 7.6% 1,168 7.4% 1,093Effect of majored tax rate on specific gains 5.7% 878 0.0% (1)Tax exempt revenues -10.5% (1,608) -4.0% (593)Tax benefits not recognised in the income statement -2.1% (329) -1.8% (267)Current tax benefits not recognised in the income statement 16.0% 2,449 15.7% 2,319Tax benefits recognised but not utilised -6.9% (1,055) 0.0% 0Effect of tax benefits utilised not recognized in prior years -57.4% (8,783) -39.7% (5,861)Changes in tax rate -3.7% (570) 0.0% 5Under/(Over) provision for prior year deferred tax -4.4% (673) -1.2% (172)Under/(Over) provision for prior year current tax 30.3% 4,639 -4.4% (651)Irap 6.8% 1,038 8.2% 1,211Other taxes 5.9% 901 -18.8% (2,780)Other -2.0% (304) 3.3% 483
34.4% 5,262 -20.8% (3,072)
Consolidated Financial StatementsNotes to the Consolidated Financial Statements
2011ANNUALREPORT

91
16. Intangible assets
In thousands of Euro
Developmentcosts
Rights to use
intellectual property
Licences and
trade-marks
Otherintangible
assets
Intangibleassets in progress
and advances
Total
Balance at 1 January 2010 124 2,140 14 163,568 1,357 167,203Acquisitions 13 1,013 171 1,373 2,570Other increases 2 405 407Disposals (3) (11) (14)Other decreases (222) (350) (572)Amortization (82) (902) (37,816) (38,800)Impairment losses 0Exchange rate differenceson translation
25
46
71
Balance at 31 December 2010 57 2,678 14 125,736 2,380 130,865
Balance at 1 January 2011 57 2,678 14 125,736 2,380 130,865 Acquisitions 4 494 14 275 996 1,783Other increases 544 544Disposals (4) (4)Other decreases (544) (544)Amortization (48) (1,043) (15) (20,460) (21,566)Impairment losses 0Exchange rate differenceson translation
9 14 1 24
Balance at 31 December 2011 13 2,678 13 105,565 2,833 111,102
Carrying amounts
At 1 January 2010 attributable to: Cost 2,407 10,288 876 179,235 1,357 194,163
Accumulated amortization (2,283) (8,148) (862) (15,667) 0 (26,960) 124 2,140 14 163,568 1,357 167,203
At 31 December 2010 attributable to: Cost 2,422 11,649 1,000 178,902 2,380 196,353
Accumulated amortization (2,365) (8,971) (986) (53,166) 0 (65,488) 57 2,678 14 125,736 2,380 130,865
At 1 January 2011 attributable to: Cost 2,422 11,649 1,000 178,902 2,380 196,353
Accumulated amortization (2,365) (8,971) (986) (53,166) 0 (65,488) 57 2,678 14 125,736 2,380 130,865
At 31 December 2011 attributable to:Cost 2,426 12,596 1,030 179,173 2,833 198,058
Accumulated amortization (2,413) (9,918) (1,017) (73,608) 0 (86,956) 13 2,678 13 105,565 2,833 111,102
The increases for the period in the software category under the item “Rights to use intellectual property” are mainly due to the investments made by the Parent Company (Euro 281 thousand) for other development and the purchase of new licences for SAP software, to the purchase of new licences of the technical office and to the conclusion of the development of S70 technology, the internet portal and the improvement of the corporate network.The increases for the period in the category “Other intangible assets” are mainly due to investments done by the subsidiary Permasteelisa North America Corp. for leasehold improvements.The main increases in the category “Intangible assets and advances” are mainly due to investments done
Consolidated Financial StatementsNotes to the Consolidated Financial Statements
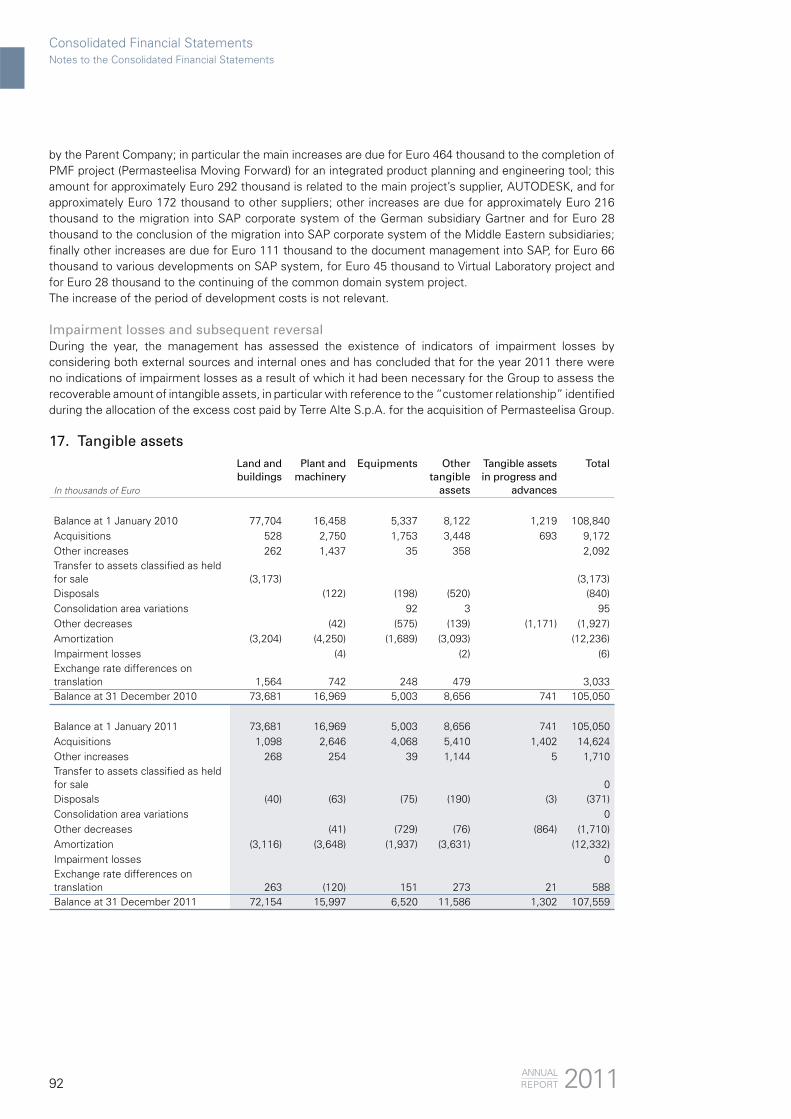
92
by the Parent Company; in particular the main increases are due for Euro 464 thousand to the completion of PMF project (Permasteelisa Moving Forward) for an integrated product planning and engineering tool; this amount for approximately Euro 292 thousand is related to the main project’s supplier, AUTODESK, and for approximately Euro 172 thousand to other suppliers; other increases are due for approximately Euro 216 thousand to the migration into SAP corporate system of the German subsidiary Gartner and for Euro 28 thousand to the conclusion of the migration into SAP corporate system of the Middle Eastern subsidiaries; finally other increases are due for Euro 111 thousand to the document management into SAP, for Euro 66 thousand to various developments on SAP system, for Euro 45 thousand to Virtual Laboratory project and for Euro 28 thousand to the continuing of the common domain system project.The increase of the period of development costs is not relevant.
Impairment losses and subsequent reversalDuring the year, the management has assessed the existence of indicators of impairment losses by considering both external sources and internal ones and has concluded that for the year 2011 there were no indications of impairment losses as a result of which it had been necessary for the Group to assess the recoverable amount of intangible assets, in particular with reference to the “customer relationship” identified during the allocation of the excess cost paid by Terre Alte S.p.A. for the acquisition of Permasteelisa Group.
17. Tangible assets
In thousands of Euro
Land and buildings
Plant and machinery
Equipments Other tangible
assets
Tangible assets in progress and
advances
Total
Balance at 1 January 2010 77,704 16,458 5,337 8,122 1,219 108,840 Acquisitions 528 2,750 1,753 3,448 693 9,172Other increases 262 1,437 35 358 2,092Transfer to assets classified as held for sale (3,173) (3,173)Disposals (122) (198) (520) (840)Consolidation area variations 92 3 95Other decreases (42) (575) (139) (1,171) (1,927)Amortization (3,204) (4,250) (1,689) (3,093) (12,236)Impairment losses (4) (2) (6)Exchange rate differences on translation 1,564 742 248 479
3,033
Balance at 31 December 2010 73,681 16,969 5,003 8,656 741 105,050
Balance at 1 January 2011 73,681 16,969 5,003 8,656 741 105,050 Acquisitions 1,098 2,646 4,068 5,410 1,402 14,624Other increases 268 254 39 1,144 5 1,710Transfer to assets classified as held for sale 0Disposals (40) (63) (75) (190) (3) (371)Consolidation area variations 0Other decreases (41) (729) (76) (864) (1,710)Amortization (3,116) (3,648) (1,937) (3,631) (12,332)Impairment losses 0Exchange rate differences on translation 263 (120) 151 273 21 588Balance at 31 December 2011 72,154 15,997 6,520 11,586 1,302 107,559
Consolidated Financial StatementsNotes to the Consolidated Financial Statements
2011ANNUALREPORT

93
Carrying amounts
At 1 January 2010 attributable to: Cost 127,493 55,766 23,880 30,650 1,219 239,008
Accumulated amortization (49,789) (39,308) (18,543) (22,528) 0 (130,168) 77,704 16,458 5,337 8,122 1,219 108,840
At 31 December 2010 attributable to: Cost 126,269 58,800 24,967 32,901 741 243,678
Accumulated amortization (52,588) (41,831) (19,964) (24,245) 0 (138,628) 73,681 16,969 5,003 8,656 741 105,050
At 1 January 2011 attributable to: Cost 126,269 58,800 24,967 32,901 741 243,678
Accumulated amortization (52,588) (41,831) (19,964) (24,245) 0 (138,628) 73,681 16,969 5,003 8,656 741 105,050
At 31 December 2011 attributable to:Cost 127,650 59,778 26,989 37,689 1,302 253,408
Accumulated amortization (55,496) (43,781) (20,469) (26,103) 0 (145,849) 72,154 15,997 6,520 11,586 1,302 107,559
The main increases were made in Dubai for Euro 3.1 million (2010: Euro 0.8 million), in Germany for Euro 2.8 million (2010: Euro 2.1 million), in Italy for Euro 2.7 million (2010: approximately Euro 3.5 million), in China for Euro 1.5 million (2010: Euro 0.3 million) and in the United States for Euro 1.3 million (2010: Euro 0.5 million) and are mainly due to the increase in the production capacity and the replacement and innovation of the plants. In particular, the main increases in Dubai are due to the development of KAFD PP30 job.
No significant asset disposals occurred during the period.
Impairment losses and subsequent reversalAt the reporting date there have not been particular indications of impairment losses related to tangible assets.
Leased plant and machineryAs at 31 December 2011 the Group holds leased plant and machinery for an amount of Euro 270 thousand (2010: Euro 239 thousand); please refer to note 31 related to payables to banks and other financial creditors.
Tangible assets in progressAs at 31 December 2011 the Group holds tangible assets under construction for the total amount of Euro 1,302 thousand (2010: Euro 741 thousand).
Other informationAs at 31 December 2011 the Group doesn’t have mortgages on buildings and other tangible assets, please refer to the note 42 related to contingencies.
Consolidated Financial StatementsNotes to the Consolidated Financial Statements

94
18. Equity investments in not consolidated subsidiariesThe Group has the following equity investments in not consolidated subsidiaries:
% ownership Carrying amount
In thousands of EuroCountry 31 December
201131 December
201031 December
201131 December
2010
Permasteelisa Epitoipari Kft - winding up Hungary 100.00% 100.00% 0 0RI.ISA d.o.o Croatia 98.55% 98.55% 317 260OOO Josef Gartner Russia 100.00% 100.00% 123 48
440 308
The item variation with respect to 31 December 2010 is mainly attributable to the revaluation of RI.ISA d.o.o. equity investment due to the profit recorded in the year and to the capital increase of OOO Josef Gartner equity investment.
Summary financial information on not consolidated subsidiaries - 100%:
In thousands of EuroAssets Liabilities Net Equity Revenues Profit/
(Loss)
31 December 2011Permasteelisa Epitoipari Kft - winding up 4 0 4 0 0RI.ISA d.o.o 438 117 321 1,166 72OOO Josef Gartner 1,870 1,747 123 6 (128)
2,312 1,864 448 1,172 (56)
In thousands of EuroAssets Liabilities Net Equity Revenues Profit/
(Loss)
31 December 2010Permasteelisa Epitoipari Kft - winding up 4 0 4 0 0RI.ISA d.o.o 477 215 262 1,022 126OOO Josef Gartner 96 48 48 214 (54)
577 263 314 1,236 72
19. Equity investments in associated companiesThe Group has the following equity investments in associated companies:
% ownership Carrying amount
In thousands of EuroCountry 31 December
201131 December
201031 December
201131 December
2010
Unifront B.V. The Netherlands 26.00% 26.00% 0 0Permasteelisa Projects (Thailand) Ltd. Thailand 49.00% 49.00% 0 20
0 20
Consolidated Financial StatementsNotes to the Consolidated Financial Statements
2011ANNUALREPORT

95
Summary financial information on associated companies - 100%:
In thousands of EuroAssets Liabilities Net Equity Revenues Profit/
(Loss)
31 December 2011 Unifront B.V. (*) 96 564 (468) 80 (135)Permasteelisa Projects (Thailand) Ltd. 1,565 1,807 (242) 4,707 (270)
1,661 2,371 (710) 4,787 (405)
(*) Last financial statements available: 31 December 2010.
In thousands of EuroAssets Liabilities Net Equity Revenues Profit/
(Loss)
31 December 2010Unifront B.V. (*) 139 472 (333) 0 (66)Permasteelisa Projects (Thailand) Ltd. 1,200 1,161 39 978 (48)
1,339 1,633 (294) 978 (114)
(*) Last financial statements available: 31 December 2009.
20. Other equity investmentsThe balance as at 31 December 2011 includes the Parent company’s equity investment in Consorzio Interaziendale Prealpi for Euro 77.5 thousand (2010: Euro 71.5 thousand), the Group’s 50% equity investment in the consortium Cladding Technology Italy (CTI) for Euro 25 thousand (2010: Euro 25 thousand), the Parent company’s equity investment in Consorzio Dyepower for Euro 537 thousand (2010: Euro 194 thousand) and the company’s 18% equity investment in Interoxyd AG for Euro 39 thousand (2010: Euro 39 thousand).
21. Other non-current assetsThe caption amounting to Euro 43 thousand (2010: Euro 41 thousand) is related to investments in other secondary securities.
22. Deferred tax assets and liabilitiesDeferred tax assets and liabilities are attributable to the following:
Assets (-) Liabilities (+) Net
In thousands of Euro 2011 2010 2011 2010 2011 2010
Tangible assets (1,509) (1,367) 944 531 (565) (836)Intangible assets (1,760) (2,195) 35,936 41,495 34,176 39,300Inventories (1,000) (1,283) 5,971 5,770 4,971 4,487Trade receivables (1,042) (939) 3 0 (1,039) (939)Financial payables 0 0 0 154 0 154Pension funds and other employee benefits (1,709) (1,631) 0 0 (1,709) (1,631)Provisions for risks and charges (10,091) (8,977) 1,516 1,491 (8,575) (7,486)Trade payables (875) (1,606) 0 0 (875) (1,606)Hedging (1,239) (677) 0 296 (1,239) (381)Other items (4,023) (1,200) 14,403 10,004 10,380 8,804Tax value of loss carry-forwards (29,845) (19,879) 0 0 (29,845) (19,879)Tax (assets)/liabilities (53,093) (39,754) 58,773 59,741 5,680 19,987Set off 813 504 (813) (504) 0 0Net tax (assets)/liabilities (52,280) (39,250) 57,960 59,237 5,680 19,987
The deferred tax assets on tax losses included in the financial statements and entered in the table above are related for approximately Euro 17 million to the US subsidiary Permasteelisa North America Corp. and have expiry date between 2020 and 2028 and for the residual part to the European subsidiaries and have no expiry date.
Consolidated Financial StatementsNotes to the Consolidated Financial Statements

96
With reference to the Group companies overall, with the sole exclusion of the US company on which details are provided in the notes below, no deferred tax assets were recorded relating to temporary differences for Euro 8,309 thousand (2010: Euro 6,892 thousand) and relating to tax losses for Euro 33,832 thousand (2010: Euro 40,187 thousand).
The amount relating to temporary differences for which deferred tax assets were not recorded refers to approximately Euro 6.9 million to Asian companies (2010: approximately Euro 5.1 million) and for the rest to European companies. According to the tax law in force, deductible temporary differences generally do not expire.
The amount relating to tax losses for which deferred tax assets were not recorded refers to European companies for approximately Euro 22 million (2010: approximately Euro 22 million) of which approximately Euro 21 million can be used without time limitation (2010: Euro 20 million) and approximately for Euro 11,9 million (2010: approximately Euro 18.4 million) to Asian companies, mostly (2010: Euro 16.5 million) can be used within 2020 and the remaining indefinitely.
With reference to the US companies, in year 2011 there are no significant deferred tax assets not included in the financial statement; instead, at 31 December 2010, there were:
an amount of federal tax losses for approximately Euro 59.1 million corresponding to Usd 79 million (to be used over a timeframe of 20 years and mainly fall due between 2020 and 2028), to which a tax rate of 34% was applicable and that were subjected to a limitation of annual use of Usd 4.6 million provided by the IRS section 382;and an amount of temporary differences for approximately Euro 8.8 million corresponding to Usd 11.7 million, to which was applicable the federal tax rate of 34% and an applicable average state tax rate for approximately 6% (2009: 7.5%).
Against these figures, a total amount of Euro 19.7 million corresponding to Usd 26.4 million of a total of Euro 28.7 million corresponding to Usd 38.3 million for deferred tax assets had been entered into the financial statements.
The deferred tax assets had not been booked on the aforementioned temporary differences and tax losses as the required conditions were not in place, pursuant to the criteria envisaged by the international accounting principles, hinting at a probable future taxable income on which the Group may use the benefits arising there from.
In addition, with reference to the retained earnings of subsidiaries taxable in Italy if they were repatriated through dividends distribution (approximately Euro 145 million), deferred tax liabilities were not recognized on the portion of them for which the distribution is not likely in the foreseeable future.
Consolidated Financial StatementsNotes to the Consolidated Financial Statements
2011ANNUALREPORT
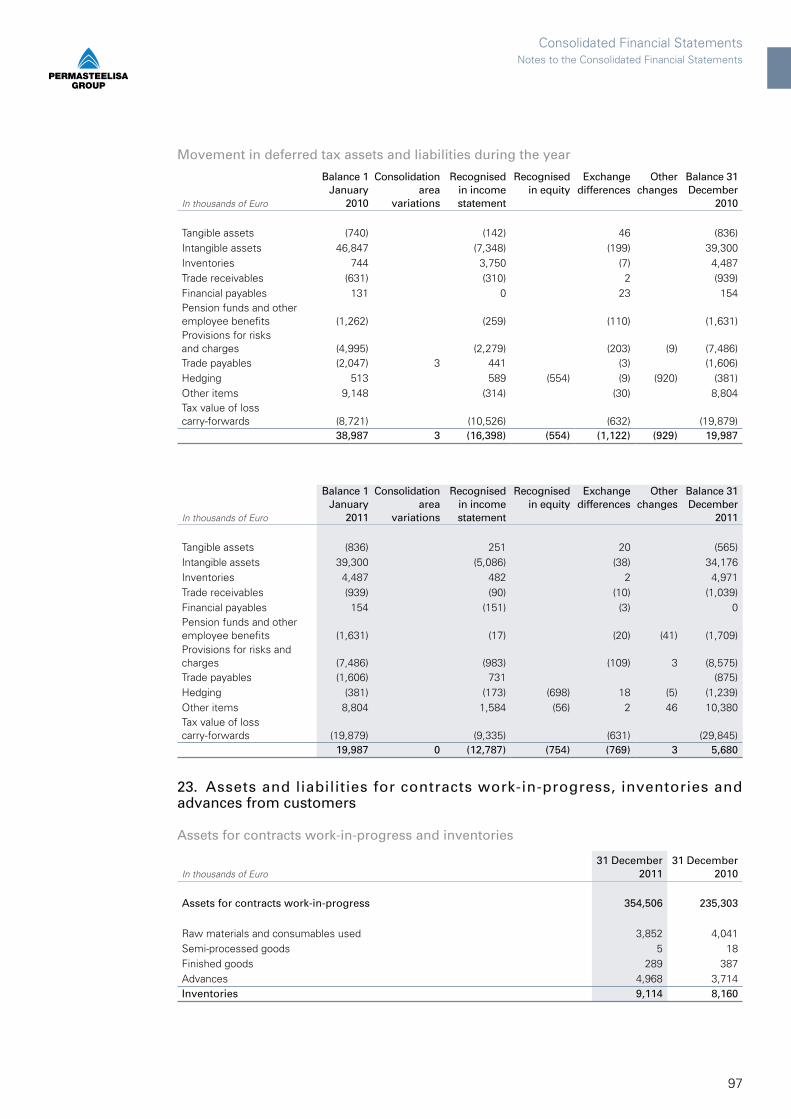
97
Movement in deferred tax assets and liabilities during the year
In thousands of Euro
Balance 1 January
2010
Consolidation area
variations
Recognisedin income statement
Recognised in equity
Exchange differences
Other changes
Balance 31 December
2010
Tangible assets (740) (142) 46 (836)Intangible assets 46,847 (7,348) (199) 39,300Inventories 744 3,750 (7) 4,487Trade receivables (631) (310) 2 (939)Financial payables 131 0 23 154Pension funds and other employee benefits (1,262)
(259)
(110)
(1,631)
Provisions for risksand charges (4,995)
(2,279)
(203) (9) (7,486)
Trade payables (2,047) 3 441 (3) (1,606)Hedging 513 589 (554) (9) (920) (381)Other items 9,148 (314) (30) 8,804Tax value of losscarry-forwards (8,721)
(10,526)
(632)
(19,879)
38,987 3 (16,398) (554) (1,122) (929) 19,987
In thousands of Euro
Balance 1 January
2011
Consolidation area
variations
Recognisedin income statement
Recognised in equity
Exchange differences
Other changes
Balance 31 December
2011
Tangible assets (836) 251 20 (565)Intangible assets 39,300 (5,086) (38) 34,176Inventories 4,487 482 2 4,971Trade receivables (939) (90) (10) (1,039)Financial payables 154 (151) (3) 0Pension funds and other employee benefits (1,631) (17) (20) (41) (1,709)Provisions for risks and charges (7,486) (983) (109) 3 (8,575)Trade payables (1,606) 731 (875)Hedging (381) (173) (698) 18 (5) (1,239)Other items 8,804 1,584 (56) 2 46 10,380Tax value of losscarry-forwards (19,879) (9,335) (631) (29,845)
19,987 0 (12,787) (754) (769) 3 5,680
23. Assets and liabilities for contracts work-in-progress, inventories and advances from customers
Assets for contracts work-in-progress and inventories
In thousands of Euro31 December
201131 December
2010
Assets for contracts work-in-progress 354,506 235,303
Raw materials and consumables used 3,852 4,041 Semi-processed goods 5 18 Finished goods 289 387 Advances 4,968 3,714 Inventories 9,114 8,160
Consolidated Financial StatementsNotes to the Consolidated Financial Statements
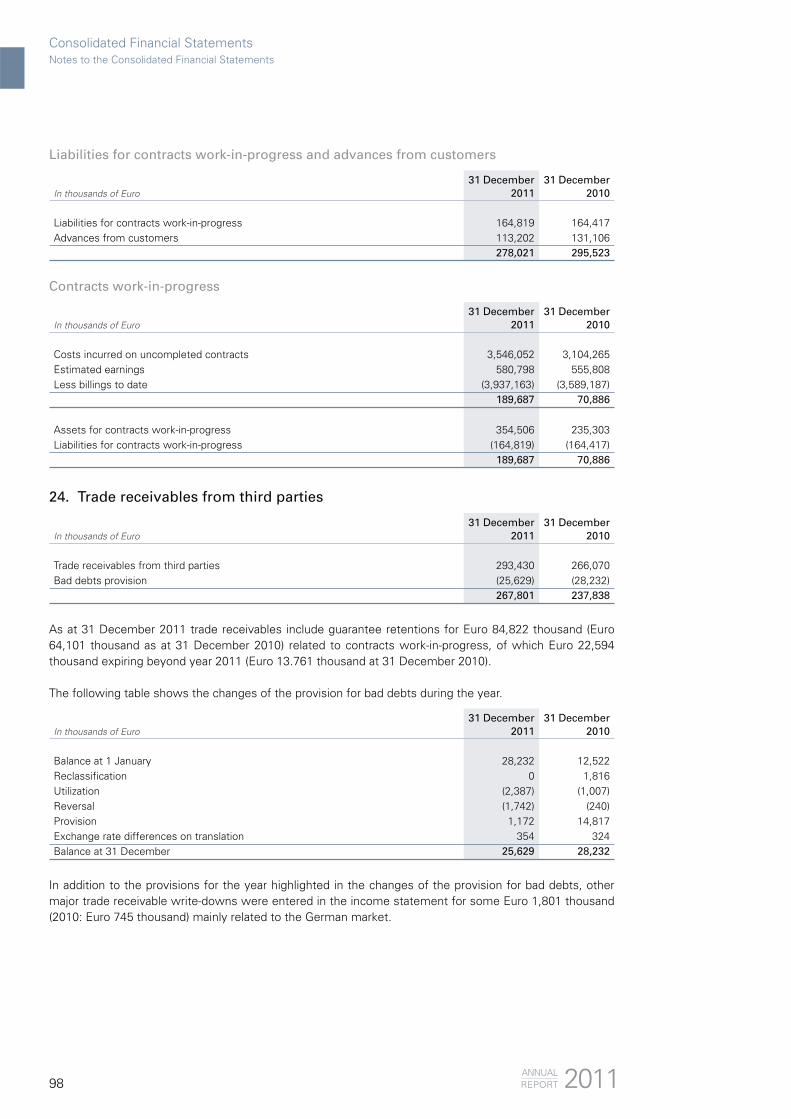
98
Liabilities for contracts work-in-progress and advances from customers
In thousands of Euro31 December
201131 December
2010
Liabilities for contracts work-in-progress 164,819 164,417 Advances from customers 113,202 131,106
278,021 295,523
Contracts work-in-progress
In thousands of Euro31 December
201131 December
2010
Costs incurred on uncompleted contracts 3,546,052 3,104,265 Estimated earnings 580,798 555,808 Less billings to date (3,937,163) (3,589,187)
189,687 70,886
Assets for contracts work-in-progress 354,506 235,303 Liabilities for contracts work-in-progress (164,819) (164,417)
189,687 70,886
24. Trade receivables from third parties
In thousands of Euro31 December
201131 December
2010
Trade receivables from third parties 293,430 266,070Bad debts provision (25,629) (28,232)
267,801 237,838
As at 31 December 2011 trade receivables include guarantee retentions for Euro 84,822 thousand (Euro 64,101 thousand as at 31 December 2010) related to contracts work-in-progress, of which Euro 22,594 thousand expiring beyond year 2011 (Euro 13.761 thousand at 31 December 2010).
The following table shows the changes of the provision for bad debts during the year.
In thousands of Euro31 December
201131 December
2010
Balance at 1 January 28,232 12,522Reclassification 0 1,816Utilization (2,387) (1,007)Reversal (1,742) (240)Provision 1,172 14,817Exchange rate differences on translation 354 324Balance at 31 December 25,629 28,232
In addition to the provisions for the year highlighted in the changes of the provision for bad debts, other major trade receivable write-downs were entered in the income statement for some Euro 1,801 thousand (2010: Euro 745 thousand) mainly related to the German market.
Consolidated Financial StatementsNotes to the Consolidated Financial Statements
2011ANNUALREPORT

99
25. Amounts receivable from not consolidated subsidiaries
In thousands of Euro31 December
201131 December
2010
Trade receivables OOO Josef Gartner 3 3RI.ISA d.o.o. 41 17
44 20
Financial receivables OOO Josef Gartner 0 36RI.ISA d.o.o. 0 118
0 15444 174
26. Trade receivables from associated companies
In thousands of Euro31 December
201131 December
2010
Unifront B.V. 10 10Permasteelisa Projects (Thailand) Ltd. 234 22
244 32
27. Income tax receivables
In thousands of Euro31 December
201131 December
2010
Tax income receivables 10,315 12,789 10,315 12,789
This item should be assessed together with the income tax payable item described in note 38.
28. Other current asset
In thousands of Euro31 December
201131 December
2010
VAT receivables 13,806 5,765 Advances to employees 727 244 Other receivables 17,079 12,334 Accrued income and deferred charges 7,170 3,224
38,782 21,567
The caption “Other receivables” includes:
In thousands of Euro31 December
201131 December
2010
Forward assets 6,753 7,094 Other receivables 10,284 5,209 Loans to other third parties 42 31
17,079 12,334
The item “Forward assets” is ascribable for Euro 6,753 thousand to transactions on foreign currencies (2010: Euro 7,027 thousand), and has no balances in relation to the transactions on commodities (2010:
Consolidated Financial StatementsNotes to the Consolidated Financial Statements
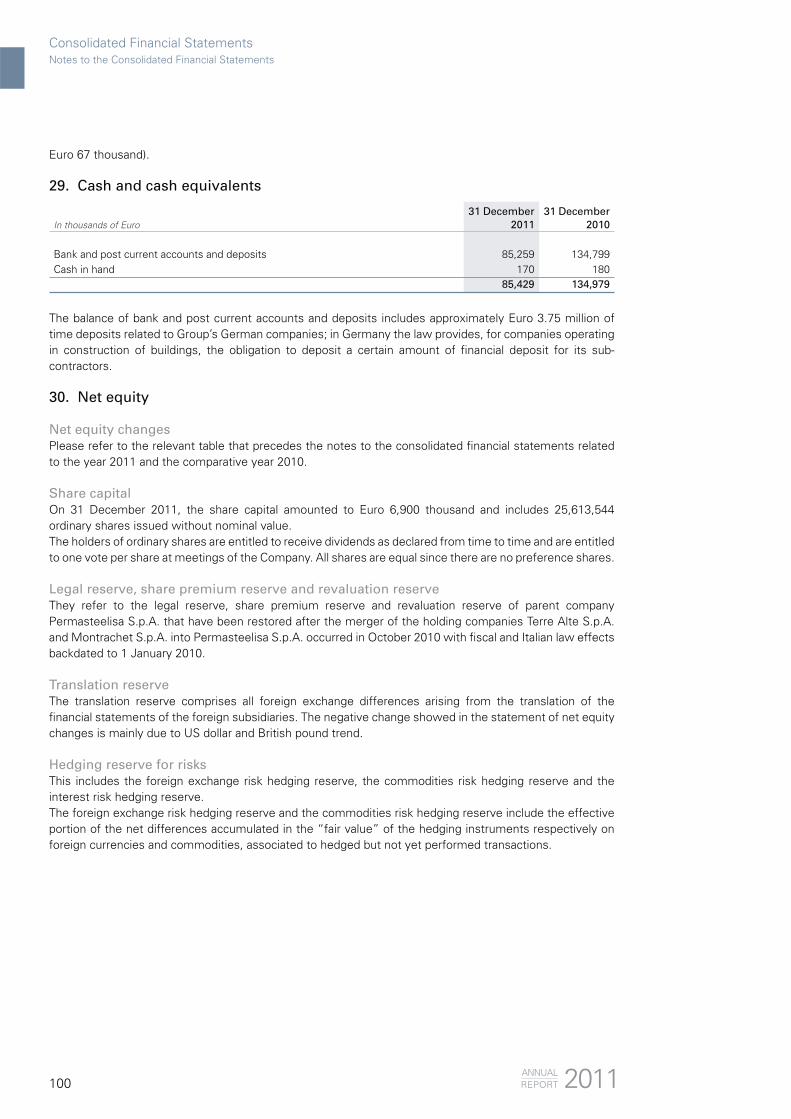
100
Euro 67 thousand).
29. Cash and cash equivalents
In thousands of Euro31 December
201131 December
2010
Bank and post current accounts and deposits 85,259 134,799 Cash in hand 170 180
85,429 134,979
The balance of bank and post current accounts and deposits includes approximately Euro 3.75 million of time deposits related to Group’s German companies; in Germany the law provides, for companies operating in construction of buildings, the obligation to deposit a certain amount of financial deposit for its sub-contractors.
30. Net equity
Net equity changesPlease refer to the relevant table that precedes the notes to the consolidated financial statements related to the year 2011 and the comparative year 2010.
Share capitalOn 31 December 2011, the share capital amounted to Euro 6,900 thousand and includes 25,613,544 ordinary shares issued without nominal value.The holders of ordinary shares are entitled to receive dividends as declared from time to time and are entitled to one vote per share at meetings of the Company. All shares are equal since there are no preference shares.
Legal reserve, share premium reserve and revaluation reserveThey refer to the legal reserve, share premium reserve and revaluation reserve of parent company Permasteelisa S.p.A. that have been restored after the merger of the holding companies Terre Alte S.p.A. and Montrachet S.p.A. into Permasteelisa S.p.A. occurred in October 2010 with fiscal and Italian law effects backdated to 1 January 2010.
Translation reserveThe translation reserve comprises all foreign exchange differences arising from the translation of the financial statements of the foreign subsidiaries. The negative change showed in the statement of net equity changes is mainly due to US dollar and British pound trend.
Hedging reserve for risksThis includes the foreign exchange risk hedging reserve, the commodities risk hedging reserve and the interest risk hedging reserve.The foreign exchange risk hedging reserve and the commodities risk hedging reserve include the effective portion of the net differences accumulated in the “fair value” of the hedging instruments respectively on foreign currencies and commodities, associated to hedged but not yet performed transactions.
Consolidated Financial StatementsNotes to the Consolidated Financial Statements
2011ANNUALREPORT
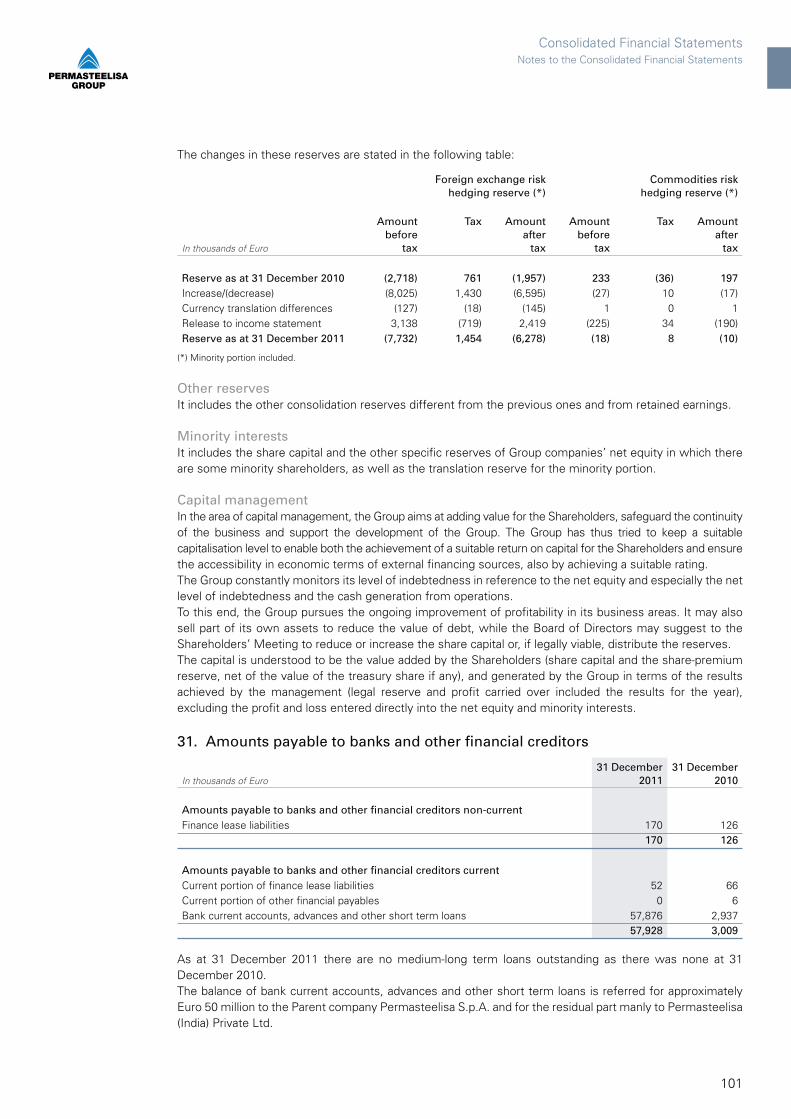
101
The changes in these reserves are stated in the following table:
Foreign exchange riskhedging reserve (*)
Commodities riskhedging reserve (*)
In thousands of Euro
Amount before
tax
Tax Amount after
tax
Amount before
tax
Tax Amount after
tax
Reserve as at 31 December 2010 (2,718) 761 (1,957) 233 (36) 197Increase/(decrease) (8,025) 1,430 (6,595) (27) 10 (17)Currency translation differences (127) (18) (145) 1 0 1Release to income statement 3,138 (719) 2,419 (225) 34 (190)Reserve as at 31 December 2011 (7,732) 1,454 (6,278) (18) 8 (10)
(*) Minority portion included.
Other reservesIt includes the other consolidation reserves different from the previous ones and from retained earnings.
Minority interestsIt includes the share capital and the other specific reserves of Group companies’ net equity in which there are some minority shareholders, as well as the translation reserve for the minority portion.
Capital managementIn the area of capital management, the Group aims at adding value for the Shareholders, safeguard the continuity of the business and support the development of the Group. The Group has thus tried to keep a suitable capitalisation level to enable both the achievement of a suitable return on capital for the Shareholders and ensure the accessibility in economic terms of external financing sources, also by achieving a suitable rating.The Group constantly monitors its level of indebtedness in reference to the net equity and especially the net level of indebtedness and the cash generation from operations.To this end, the Group pursues the ongoing improvement of profitability in its business areas. It may also sell part of its own assets to reduce the value of debt, while the Board of Directors may suggest to the Shareholders’ Meeting to reduce or increase the share capital or, if legally viable, distribute the reserves. The capital is understood to be the value added by the Shareholders (share capital and the share-premium reserve, net of the value of the treasury share if any), and generated by the Group in terms of the results achieved by the management (legal reserve and profit carried over included the results for the year), excluding the profit and loss entered directly into the net equity and minority interests.
31. Amounts payable to banks and other financial creditors
In thousands of Euro31 December
201131 December
2010
Amounts payable to banks and other financial creditors non-current Finance lease liabilities 170 126
170 126
Amounts payable to banks and other financial creditors current Current portion of finance lease liabilities 52 66 Current portion of other financial payables 0 6 Bank current accounts, advances and other short term loans 57,876 2,937
57,928 3,009
As at 31 December 2011 there are no medium-long term loans outstanding as there was none at 31 December 2010.The balance of bank current accounts, advances and other short term loans is referred for approximately Euro 50 million to the Parent company Permasteelisa S.p.A. and for the residual part manly to Permasteelisa (India) Private Ltd.
Consolidated Financial StatementsNotes to the Consolidated Financial Statements

102
The balance referred to Permasteelisa S.p.A. is related to two contracts for credit lines on a revolving basis, set up to cover cash flow needs.A first loan was granted by Monte dei Paschi di Siena for a maximum amount of Euro 75 million. The contract lasts for three years with ending date on December 2013. This credit line, to be used in one or more solutions, has determined the payment of up-front commissions and it is characterized by the application of fees on the used (or not used) amount.On 2 November 2011, for a period of 6 months, this credit line has been used for an amount of Euro 30 million at a six-monthly Euribor rate + spread.The contract includes the obligation to comply with specific financial covenants related to:
ratio between the total consolidated gross financial debt and consolidated Ebitda; ratio between the consolidated Ebitda and net consolidated financial expenses; ratio between the total consolidated gross financial debt and net tangible consolidated equity; net tangible consolidated equity.
As at 31 December 2011, there was full compliance to the financial covenants required.A second loan was granted by Cassa di Risparmio del Veneto for a total amount of Euro 50 million. The contract lasts for three years with ending date on 27 June 2014. This credit line, to be used in one or more solutions, has determined the payment of up-front commissions and it is characterized by the application of fees on the used (or not used) amount.On 9 November 2011, for a period of 3 months, this credit line has been used for an amount of Euro 20 million at a three-monthly Euribor rate + spread.The contract includes the obligation to comply with specific financial covenants related to:
ratio between the gross financial debt and Ebitda; ratio between the Ebitda and net financial expenses; ratio between the net financial debt and equity.
As at 31 December 2011, there was full compliance to the financial covenants required.Regarding to the balance of Permasteelisa (India) Private Ltd., it is related to short-term bank loans used as overdrawn accounts or advances against invoices, normally used by few companies of the Group operating in countries (e.g. India) where intercompany financing is not allowed due to the internal finance regulation. In any case, these financing activities are aimed at covering temporary working capital requirements for less than 3 months.As to the mortgages on real estate or other fixed assets owned by the Group, please refer to note 41.
Finance lease liabilitiesFinance lease liabilities as at 31 December 2011 are payable as follows:
In thousands of Euro
Minimum payments
2011Interest
2011Principal
2011
Minimum payments
2010Interest
2010Principal
2010
Expiry date: Less than 1 year 59 7 52 74 8 66 Between 1 and 5 years 190 20 170 144 18 126 More than 5 years 0 0 0 0 0 0
249 27 222 218 26 192
The weighted average effective interest rate in respect of lease obligation at the balance sheet date is 4.680% (2010: 4.950%).
Consolidated Financial StatementsNotes to the Consolidated Financial Statements
2011ANNUALREPORT

103
Net financial positionTo complete the information reported in these notes, the Group financial position as at 31 December 2011 is reported below.
In thousands of Euro31 December
201131 December
2010
Cash and cash equivalents 85,429 134,979 Amounts payables to bank (57,876) (2,937)Finance lease liabilities (52) (66)Other financial payables 0 (6)Loans for company acquisition 0 0Net financial position - short term 27,501 131,970
Amounts payables to bank 0 0Finance lease liabilities (170) (126)Other financial payables 0 0Net financial position - medium/long term (170) (126)Total net financial position (*) 27,331 131,844
(*) The net financial position does not include financial receivables from not consolidated subsidiaries as this item is not relevant.
The average rates recorded by the Group during the period are as follows:a) current account deposits and bank deposits: 0.956% (2010: 0.661%)b) short-term loans: 7.779% (2010: 13.552%)c) mortgages and medium-long-term loans: not reported because there were no these kind of loans
during the year (2010: 1.516%)d) liabilities on financial leasing: 4.680% (2010: 4.950%).
The actual average rate over overall indebtness stood at 8.111% (2010: 8.862%).
32. Severance indemnity fund
In thousands of Euro31 December
201131 December
2010
Present value of the defined benefit obligation 2,746 2,789 Unrecognised actuarial gains and losses 0 0Recognised liability for severance indemnity fund 2,746 2,789
Movements of the severance indemnity fund
In thousands of Euro31 December
201131 December
2010
Net recognised liability at 1 January 2,789 3,125 Increase for company acquisition 0 0Net variation of the period (43) (336)Net recognised liability at 31 December 2,746 2,789
The severance indemnity fund net variation is detailed in the following table:
In thousands of Euro31 December
201131 December
2010
Net recognised liability at 1 January 2,789 3,125 Payments (220) (495)Expense recognized in the income statement 177 159 Net recognised liability at 31 December 2,746 2,789
Consolidated Financial StatementsNotes to the Consolidated Financial Statements
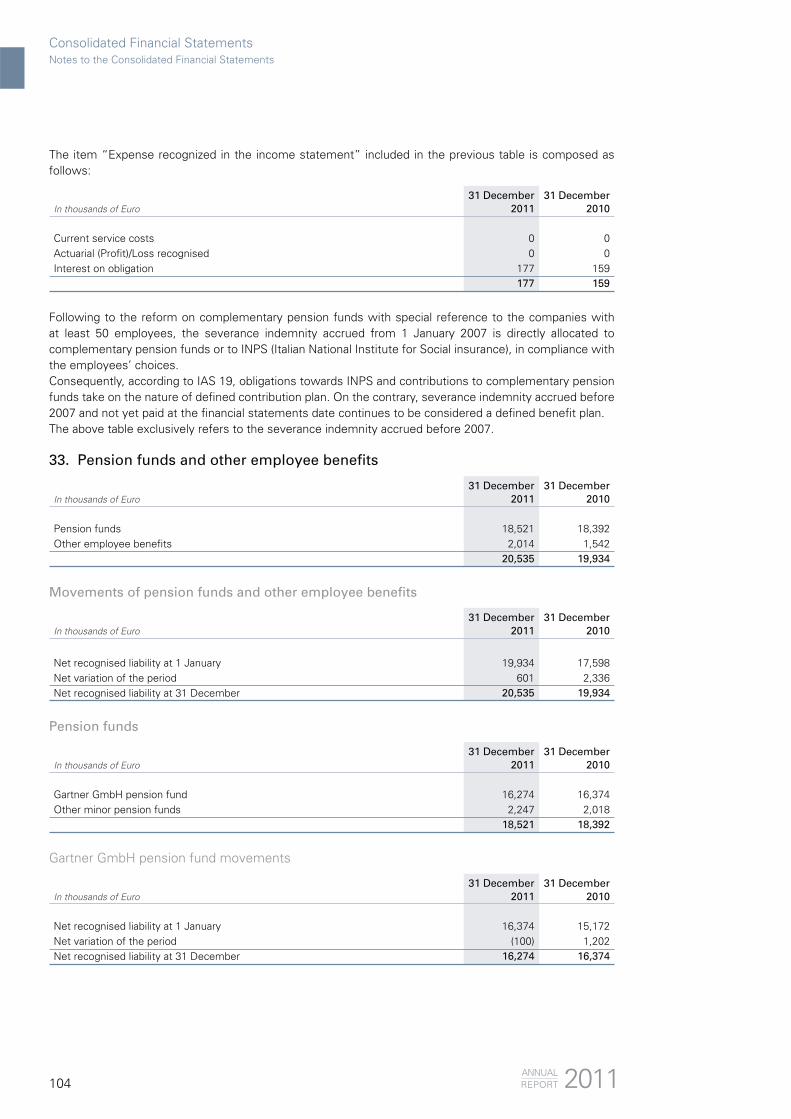
104
The item “Expense recognized in the income statement” included in the previous table is composed as follows:
In thousands of Euro31 December
201131 December
2010
Current service costs 0 0Actuarial (Profit)/Loss recognised 0 0Interest on obligation 177 159
177 159
Following to the reform on complementary pension funds with special reference to the companies with at least 50 employees, the severance indemnity accrued from 1 January 2007 is directly allocated to complementary pension funds or to INPS (Italian National Institute for Social insurance), in compliance with the employees’ choices.Consequently, according to IAS 19, obligations towards INPS and contributions to complementary pension funds take on the nature of defined contribution plan. On the contrary, severance indemnity accrued before 2007 and not yet paid at the financial statements date continues to be considered a defined benefit plan.The above table exclusively refers to the severance indemnity accrued before 2007.
33. Pension funds and other employee benefits
In thousands of Euro31 December
201131 December
2010
Pension funds 18,521 18,392 Other employee benefits 2,014 1,542
20,535 19,934
Movements of pension funds and other employee benefits
In thousands of Euro31 December
201131 December
2010
Net recognised liability at 1 January 19,934 17,598 Net variation of the period 601 2,336Net recognised liability at 31 December 20,535 19,934
Pension funds
In thousands of Euro31 December
201131 December
2010
Gartner GmbH pension fund 16,274 16,374 Other minor pension funds 2,247 2,018
18,521 18,392
Gartner GmbH pension fund movements
In thousands of Euro31 December
201131 December
2010
Net recognised liability at 1 January 16,374 15,172Net variation of the period (100) 1,202Net recognised liability at 31 December 16,274 16,374
Consolidated Financial StatementsNotes to the Consolidated Financial Statements
2011ANNUALREPORT

105
The net variation of Gartner GmbH pension fund is detailed in the following table:
In thousands of Euro31 December
201131 December
2010
Net recognised liability at 1 January 16,374 15,172Refunds 0 241Payments (992) (922)Expense recognised in the income statement 892 1,883Net recognised liability at 31 December 16,274 16,374
Expense recognised in the income statement:
In thousands of Euro31 December
201131 December
2010
Current service costs 173 138Recognised actuarial (gains)/losses (59) 923Interest on obligation 778 822
892 1,883
Other employee benefits
In thousands of Euro31 December
201131 December
2010
Dutch "Jubilee" fund 431 446Other 1,583 1,096
2,014 1,542
Other employee benefits movements
In thousands of Euro31 December
201131 December
2010
Net recognised liability at 1 January 1,542 0Increase for acquisition 0 614Movements 0 1,024Net variation of the period 472 (96)Net recognised liability at 31 December 2,014 1,542
The Dutch “Jubilee” fund is related to the liability for the contractual amount to be recognized to employees of certain Dutch subsidiaries when they reach the 25th and 40th presence anniversary in the company; the liability has been calculated based on a discounting rate of 4.75% (2010: 4.75%) and on the estimation of probability the employees reach the above mentioned anniversaries.
Consolidated Financial StatementsNotes to the Consolidated Financial Statements
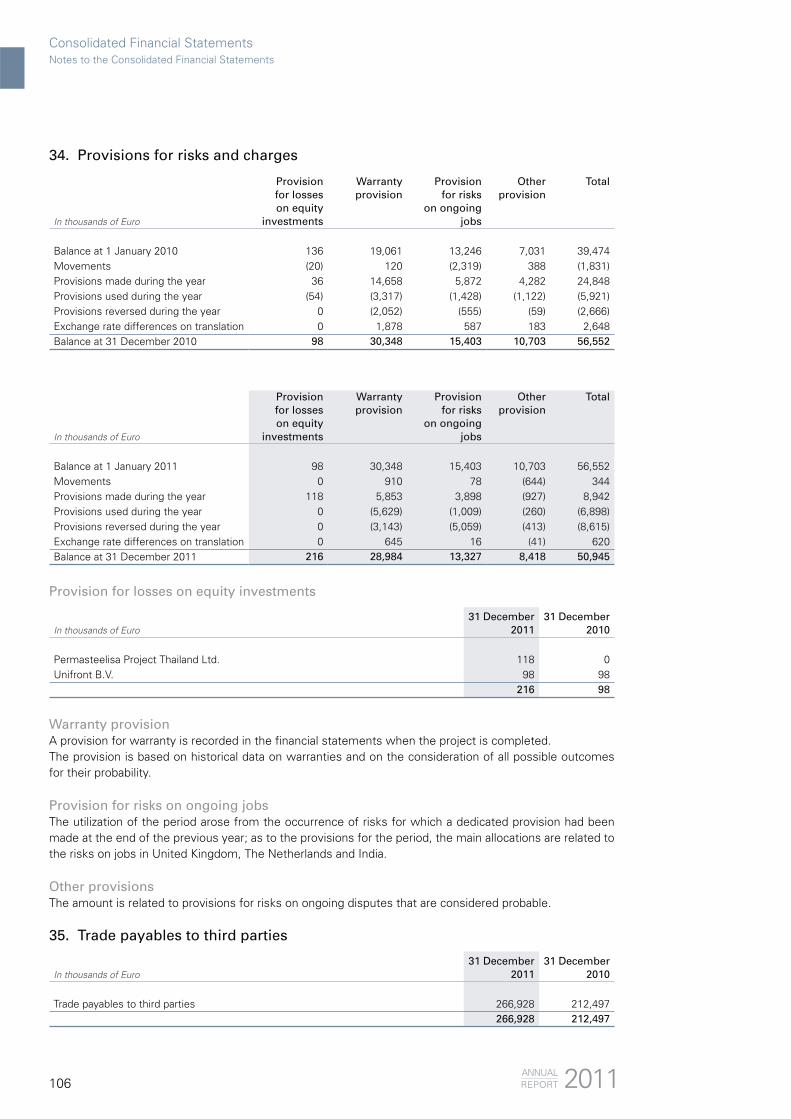
106
34. Provisions for risks and charges
In thousands of Euro
Provisionfor losses on equity
investments
Warranty provision
Provisionfor risks
on ongoing jobs
Other provision
Total
Balance at 1 January 2010 136 19,061 13,246 7,031 39,474Movements (20) 120 (2,319) 388 (1,831)Provisions made during the year 36 14,658 5,872 4,282 24,848Provisions used during the year (54) (3,317) (1,428) (1,122) (5,921)Provisions reversed during the year 0 (2,052) (555) (59) (2,666)Exchange rate differences on translation 0 1,878 587 183 2,648Balance at 31 December 2010 98 30,348 15,403 10,703 56,552
In thousands of Euro
Provisionfor losses on equity
investments
Warranty provision
Provisionfor risks
on ongoing jobs
Other provision
Total
Balance at 1 January 2011 98 30,348 15,403 10,703 56,552 Movements 0 910 78 (644) 344Provisions made during the year 118 5,853 3,898 (927) 8,942Provisions used during the year 0 (5,629) (1,009) (260) (6,898)Provisions reversed during the year 0 (3,143) (5,059) (413) (8,615)Exchange rate differences on translation 0 645 16 (41) 620Balance at 31 December 2011 216 28,984 13,327 8,418 50,945
Provision for losses on equity investments
In thousands of Euro31 December
201131 December
2010
Permasteelisa Project Thailand Ltd. 118 0Unifront B.V. 98 98
216 98
Warranty provisionA provision for warranty is recorded in the financial statements when the project is completed.The provision is based on historical data on warranties and on the consideration of all possible outcomes for their probability.
Provision for risks on ongoing jobsThe utilization of the period arose from the occurrence of risks for which a dedicated provision had been made at the end of the previous year; as to the provisions for the period, the main allocations are related to the risks on jobs in United Kingdom, The Netherlands and India.
Other provisionsThe amount is related to provisions for risks on ongoing disputes that are considered probable.
35. Trade payables to third parties
In thousands of Euro31 December
201131 December
2010
Trade payables to third parties 266,928 212,497 266,928 212,497
Consolidated Financial StatementsNotes to the Consolidated Financial Statements
2011ANNUALREPORT
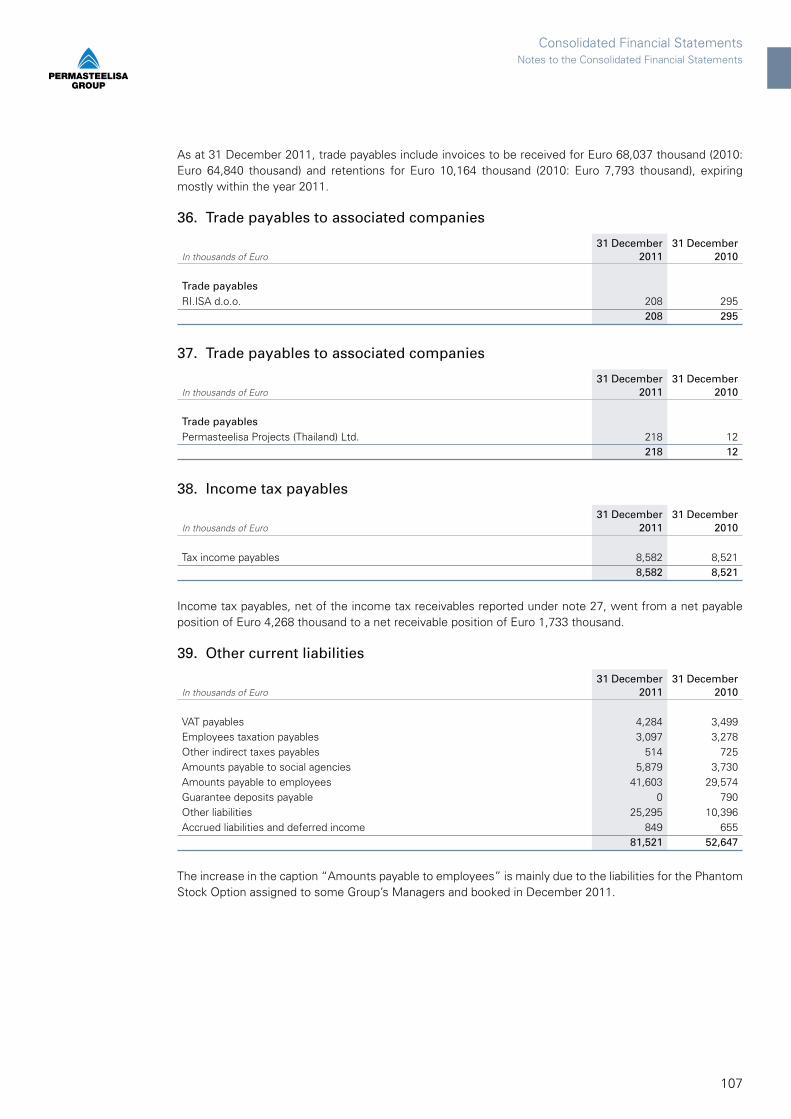
107
As at 31 December 2011, trade payables include invoices to be received for Euro 68,037 thousand (2010: Euro 64,840 thousand) and retentions for Euro 10,164 thousand (2010: Euro 7,793 thousand), expiring mostly within the year 2011.
36. Trade payables to associated companies
In thousands of Euro31 December
201131 December
2010
Trade payablesRI.ISA d.o.o. 208 295
208 295
37. Trade payables to associated companies
In thousands of Euro31 December
201131 December
2010
Trade payables Permasteelisa Projects (Thailand) Ltd. 218 12
218 12
38. Income tax payables
In thousands of Euro31 December
201131 December
2010
Tax income payables 8,582 8,521 8,582 8,521
Income tax payables, net of the income tax receivables reported under note 27, went from a net payable position of Euro 4,268 thousand to a net receivable position of Euro 1,733 thousand.
39. Other current liabilities
In thousands of Euro31 December
201131 December
2010
VAT payables 4,284 3,499 Employees taxation payables 3,097 3,278 Other indirect taxes payables 514 725 Amounts payable to social agencies 5,879 3,730 Amounts payable to employees 41,603 29,574 Guarantee deposits payable 0 790 Other liabilities 25,295 10,396 Accrued liabilities and deferred income 849 655
81,521 52,647
The increase in the caption “Amounts payable to employees” is mainly due to the liabilities for the Phantom Stock Option assigned to some Group’s Managers and booked in December 2011.
Consolidated Financial StatementsNotes to the Consolidated Financial Statements

108
The caption “Other liabilities” includes:
In thousands of Euro31 December
201131 December
2010
Forward liabilities 12,505 6,402 Other liabilities 12,790 3,994
25,295 10,396
Forward liabilities are referred for Euro 12,478 thousand to foreign currency transactions (2010: Euro 6,378 thousand) and for Euro 27 thousand to commodity transactions (2010: Euro 24 thousand).
The increase in the caption “Other liabilities” is mainly due to the liabilities for the Phantom Stock Option assigned to the Chairman and to the Chief Executive Officer of Permasteelisa S.p.A.
40. Risk managementExposure to credit, interest rate, and commodities price and currency risks arises in the normal course of the Company’s business.Historically, derivative financial instruments are used by the Company to hedge its exposure to fluctuations in foreign exchange rates.The Group makes hedging transactions also for the commodities price risk.
Credit riskCredit risk is the risk that a customer or counterparty may fail to meet commitment when it falls due and cause the Company to incur in a financial. The Company’s primary exposure to credit risk arises through its contract receivables. The Company has implemented a specific Risk management system to analysis each specific tender; a rating is given to each project and customer and specific measures are applied to minimize the company’s risk; the system in place also allows monitoring subsequently the credit risk exposure on an ongoing basis.Other financial assets of the Company with exposure to credit risk include cash and cash equivalents and derivative financial instruments to hedge the Company exposure to foreign currency risk. Transactions involving derivative financial instruments are allowed only with counterparties that are of high credit quality. As such, the management does not expect any counterparty to fail to meet their commitments.At the balance sheet date there were no significant concentrations of credit risk on specific customers or on specific geographical areas. The maximum exposure to credit risk is represented by the carrying amount of each financial asset, including derivative financial instruments, in the statement of financial position.
With reference to trade receivables, the maximum exposure to credit risks broken down by geographical area is shown here below:
In thousands of Euro31 December
201131 December
2010
Europe 99,588 93,766Asia 89,981 85,858Australia 2,508 1,124North America 68,997 49,401Central America 33 183South America 23 0Middle East 33,436 37,592North Africa 9 0Total gross receivables broken down by geographical area 294,575 267,924Provision for bad debts (25,629) (28,232)Exchange rate differences on translation (1,145) (1,854)Total net receivables broken down by geographical area 267,801 237,838
With reference to the age of the receivables shown above, please note that as at 31 December 2011 the
Consolidated Financial StatementsNotes to the Consolidated Financial Statements
2011ANNUALREPORT

109
receivables that had not yet reached the expiry date, net of the Provision for bad debts, amounted to 74% of the total (2010: 69%) and the credit due for over one year amounted to 7% (2010: 10%).
Interest rate riskThe Group’s exposure to changes in interest rates relates primarily to interest-earning assets and interest-earning liabilities (amounts receivable from banks and other financial institutions or amounts payable to banks and other financial institutions). Interest rate risk is actively managed at central level to guarantee that interests payments are within acceptable levels and consistent with the Group’s business strategies.The Group does not generally use derivative financial instruments to hedge its exposure to interest rate risk.
Sensitivity analysisThe impact of a variation of 100 basis points in interest rates on the year end date would have determined an increase (decrease) of the net equity and of the results for the period for the amounts shown below. The analysis was done assuming that all the other variables, in particular the exchange rate to foreign currencies, remain stable.
In thousands of Euro
Result for the period Net equity
+100 bp - 100 bp +100 bp - 100 bp
31 December 2011Variable rate loans (78) 78 (78) 78
(78) 78 (78) 78
At the end of 2010 the Group shows a positive net financial position for Euro 131,844 thousand, net of an amount payable to banks and to other financial creditors for Euro 3,135 thousand; considering the limited significance of the Group debt position, the impact of a variation of 100 basis points in interest rates on the year end date, assuming stable the other variables in particular foreign currency exchange rates, would have determined a not relevant increase (decrease) of the net equity and of the results for the period.
Please note that the Group does not have any fixed rate loans ongoing.
Consolidated Financial StatementsNotes to the Consolidated Financial Statements

110
Liquidity riskPolicies and procedures have been established to monitor and control liquidity, at both central level and individual subsidiary level, on a daily basis adopting a cash flow management approach.
The table below shows the detail of the future contractual flows of financial liabilities held by the Group, broken down into financial liabilities not associated to derivative tools and financial liabilities associated to derivative tools.
Exposure to the liquidity risk associated to financial liabilities other than derivative instruments
In thousands of Euro
31 December 2011
Carrying value
Contractual Cash
Flows
Contractual Cash Flows
less than1 year
Contractual Cash Flows
between1 and 5 years
Contractual Cash Flows
exceeding5 years
Financial liabilities other than derivativesTrade payables 266,928 266,928 266,262 666Financial leasing payables 222 250 59 191Other financial payables 0 0 0 0Amounts payables to banks 57,876 57,876 57,876 0Total booked value 325,026 325,054 324,197 857 0
In thousands of Euro
31 December 2010
Carrying value
Contractual Cash
Flows
Contractual Cash Flows
less than1 year
Contractual Cash Flows
between1 and 5 years
Contractual Cash Flows
exceeding5 years
Financial liabilities other than derivativesTrade payables 212,497 212,496 211,830 666Financial leasing payables 192 219 74 145Other financial payables 6 6 6 0Amounts payables to banks 2,937 2,937 2,937 0Total booked value 215,632 215,658 214,847 811 0
Consolidated Financial StatementsNotes to the Consolidated Financial Statements
2011ANNUALREPORT
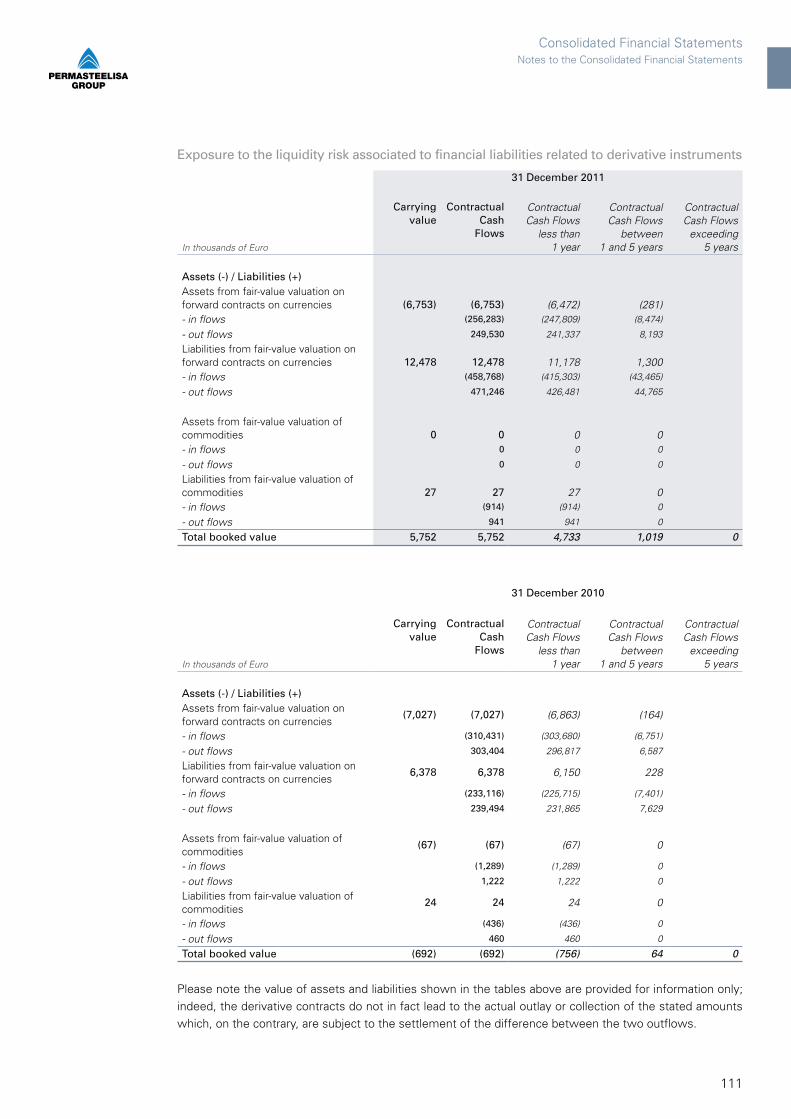
111
Exposure to the liquidity risk associated to financial liabilities related to derivative instruments
In thousands of Euro
31 December 2011
Carrying value
Contractual Cash
Flows
Contractual Cash Flows
less than1 year
Contractual Cash Flows
between1 and 5 years
Contractual Cash Flows
exceeding5 years
Assets (-) / Liabilities (+)Assets from fair-value valuation on forward contracts on currencies (6,753) (6,753) (6,472) (281)
- in flows (256,283) (247,809) (8,474) - out flows 249,530 241,337 8,193 Liabilities from fair-value valuation on forward contracts on currencies 12,478 12,478 11,178 1,300
- in flows (458,768) (415,303) (43,465) - out flows 471,246 426,481 44,765
Assets from fair-value valuation of commodities 0 0 0 0
- in flows 0 0 0 - out flows 0 0 0 Liabilities from fair-value valuation of commodities 27 27 27 0
- in flows (914) (914) 0 - out flows 941 941 0 Total booked value 5,752 5,752 4,733 1,019 0
31 December 2010
In thousands of Euro
Carrying value
Contractual Cash
Flows
Contractual Cash Flows
less than1 year
Contractual Cash Flows
between1 and 5 years
Contractual Cash Flows
exceeding5 years
Assets (-) / Liabilities (+)Assets from fair-value valuation on forward contracts on currencies
(7,027) (7,027) (6,863) (164)
- in flows (310,431) (303,680) (6,751) - out flows 303,404 296,817 6,587 Liabilities from fair-value valuation on forward contracts on currencies
6,378 6,378 6,150 228
- in flows (233,116) (225,715) (7,401) - out flows 239,494 231,865 7,629
Assets from fair-value valuation of commodities
(67) (67) (67) 0
- in flows (1,289) (1,289) 0 - out flows 1,222 1,222 0 Liabilities from fair-value valuation of commodities
24 24 24 0
- in flows (436) (436) 0 - out flows 460 460 0 Total booked value (692) (692) (756) 64 0
Please note the value of assets and liabilities shown in the tables above are provided for information only; indeed, the derivative contracts do not in fact lead to the actual outlay or collection of the stated amounts which, on the contrary, are subject to the settlement of the difference between the two outflows.
Consolidated Financial StatementsNotes to the Consolidated Financial Statements

112
Also note that to correctly assess the liquidity risk, it is necessary to bear in mind the financial assets held by the Group to offset the future cash flows arising from the aforementioned financial liabilities:
a) cash and cash equivalents for Euro 85,429 thousand and Euro 134,979 thousand respectively as at 31 December 2011 and 31 December 2010;
b) trade receivables for Euro 267,801 thousand and Euro 237,838 thousand respectively as at 31 December 2011 and 31 December 2010.
Foreign currency riskThe Group incurs foreign currency risk on contract revenues and purchases and on borrowings and loans denominated in a currency other than Euro. The foreign currencies giving rise this risk are primarily United State dollars, British pounds, Japanese yens, Singapore dollars and Hong Kong dollars.Generally the contracts are hedged for the total amount denominated in foreign currency or for a percentage higher than 90%; see paragraph g for a detailed description of the way used by the Group to hedge its job contracts in foreign currency.In respect to monetary assets and liabilities held in foreign currency other that those related to the contracts, the Group’s policy consists in minimizing the net exposure to change in interest rates by specific medium/short-term forward exchange contracts, rolled over at maturity if necessary.A 10% decrease of the Euro against the following currencies as at 31 December 2011 would have led to the following increase (decrease) of the results for the period and the net equity. The analysis has been performed considering that all the other variables, more specifically the interest rates, had remained constant. The analysis was performed on the same basis compared to the previous period.
In thousands of EuroResult forthe period
Netequity
31 December 2011GBP 143 143USD (690) (690)HKD (19) (19)SGD (871) (871)THB (531) (531)AUD 85 85Others 1,243 1,243
(640) (640)
In thousands of EuroResult forthe period
Netequity
31 December 2010GBP 80 80USD 1,255 1,255HKD (170) (170)SGD (555) (555)THB (72) (72)AUD (51) (51)Others 1,069 1,069
1,556 1,556
A 10% increase of the Euro against the following currencies as at 31 December 2011 and as at 31 December 2010 would have led to the same but opposite effect, again supposing that all other variables had remained constant.Please note that the analysis did not take into account receivables, payables and future trade flows against which the hedging operations were performed. It is reasonable to believe that the variation of the exchange
Consolidated Financial StatementsNotes to the Consolidated Financial Statements
2011ANNUALREPORT

113
rates may lead to an opposite financial effect for this item, for a same or higher amount, on the hedged transactions.
Commodities price riskThe Group has a price risk exposure, including the relevant foreign exchange risk, particularly on aluminum purchases, which are one of the main work order cost items for the Group. As far as managing the aluminum price risk is concerned, the Group’s policy is oriented towards minimizing the need to resort to financial markets for hedging, by conducting relations with the suppliers in order to fix the price for specific time frames. However, in the past the rather swinging trend of the aluminum price has encouraged the Group to launch a limited and selective aluminum price hedging policy for a few specific orders, where freezing the price with the supplier, for the whole period of the order, was merely impossible or not immediate in any case.For a detailed description of the Group’s practices of commodity hedging management on its own orders, please refer to paragraph g of accounting principles.
Fair valueThere are no financial assets or liabilities whose fair value significantly differs from their carrying amount.
Fair value hierarchyIFRS 7 requires financial instruments recognized at fair value in the statement of financial position to be classified on the basis of a hierarchy that reflects the significance of the inputs used in determining fair value. This hierarchical classification applies the following levels:Level 1 - quoted prices in active markets for the asset or liability being measured;Level 2 - inputs other than quoted prices included within Level 1 that are observable for the asset or liability, either directly (i.e., as prices) or indirectly (i.e., derived from prices) on the market;Level 3 - inputs that are not based on observable market data.
The assets and liabilities of Permasteelisa Group that are stated at fair value as at 31 December 2011 are all classified at level 2 except the equity investments in not consolidated subsidiaries that are classified at level 3.
Fair value estimationThe main methods and assumptions used to estimate the “fair value” of the assets and liabilities recorded in the statement of financial position according to this principle or for which its disclosure is requested by the accounting principles in the notes, are as follows.
Not consolidated subsidiariesThe amount deriving from the valuation of these companies by the equity method is considered a good approximation of their fair value.
SecuritiesThe Group presently does not hold significant amounts of securities held for trading or available for sale of held until their maturity.
Derivative contractsThey are evaluated using listed market prices.
Amounts payables to banks and other financial institutionsThe fair value is calculated based on discounting of future cash flows with reference to principal and interest amounts.
Financial leasesAs described in note 31, the Group does not hold significant liabilities for financial leases.
Consolidated Financial StatementsNotes to the Consolidated Financial Statements

114
Trade receivables and payables and other receivables and payablesReceivables and payables with expiring date less than one year, their carrying amount is considered to approximate their fair value.All the other receivables and payables with expiring date greater than one year are discounted to determine their fair value, except for those related to contracts monies retention; the Groups considers that retentions do not represent in any way a financing transaction with the customer due to the fact that the payments terms are beyond one year, as retentions, in the different geographical areas in which the Group operates, are within the normal applied trade conditions; consequently there is no necessity to apply any discounting.As at 31 December 2011 the Group considers that there not retentions out of normal market conditions.
41. Commitments As the balance sheet date, the Group has the followings commitments:
Operating leases
In thousands of Euro31 December
201131 December
2010
Payable:less than 1 year 16,943 11,948within 1 to 5 years 27,117 20,624after 5 years 1,058 1,871
45,118 34,443
The Group leases a number of production sites, offices, warehouse and factory facilities under operating leases. The leases have variable length, some of them with an option to renew the lease after the expiry date. Usually lease payments are periodically increased to reflect market rental conditions. The increase of the period concerns mainly Middle East, China, Hong Kong and Singapore area.
Forward contracts
In thousands of Euro31 December
201131 December
2010
Commitments for forward foreign exchange contracts 750,113 558,640 Commitments for forward contracts on commodities 940 1,658
751,053 560,298
Commitments for forward foreign exchange contracts (buy) 368,882 310,012 Commitments for forward foreign exchange contracts (sell) 381,231 248,628
750,113 558,640
Commitments for forward contracts on commodities (buy) 940 1,222 Commitments for forward contracts on commodities (sell) 0 436
940 1,658
As described in the section on the accounting standards, hedging derivative transactions on foreign currency and commodities are assessed on their “fair value”.As at 31 December 2011, the assessment of the “fair value” of currency hedging brought to the entry of profit for Euro 6,753 thousand (2010: Euro 7,027 thousand) and loss for Euro 12,478 thousand (2010: Euro 6,378 thousand), booked respectively under the items forward assets (note 28) and forward liabilities (note 39). Note that these amounts refer respectively for Euro 5,106 thousand (2010: Euro 2,240 thousand) and Euro 1,227 thousand (2010: Euro 720 thousand) to the valuation of financial currency hedging transactions, namely those covering foreign currency assets and liabilities of financial nature.On the same date, the “fair value” valuation of hedging transactions on commodities brought to the entry of profit for Euro 0 thousand (2010: Euro 67 thousand) and loss for Euro 27 thousand (2010: Euro 24 thousand), entered respectively under the items forward assets (note 28) and forward liabilities (note 39).
Consolidated Financial StatementsNotes to the Consolidated Financial Statements
2011ANNUALREPORT
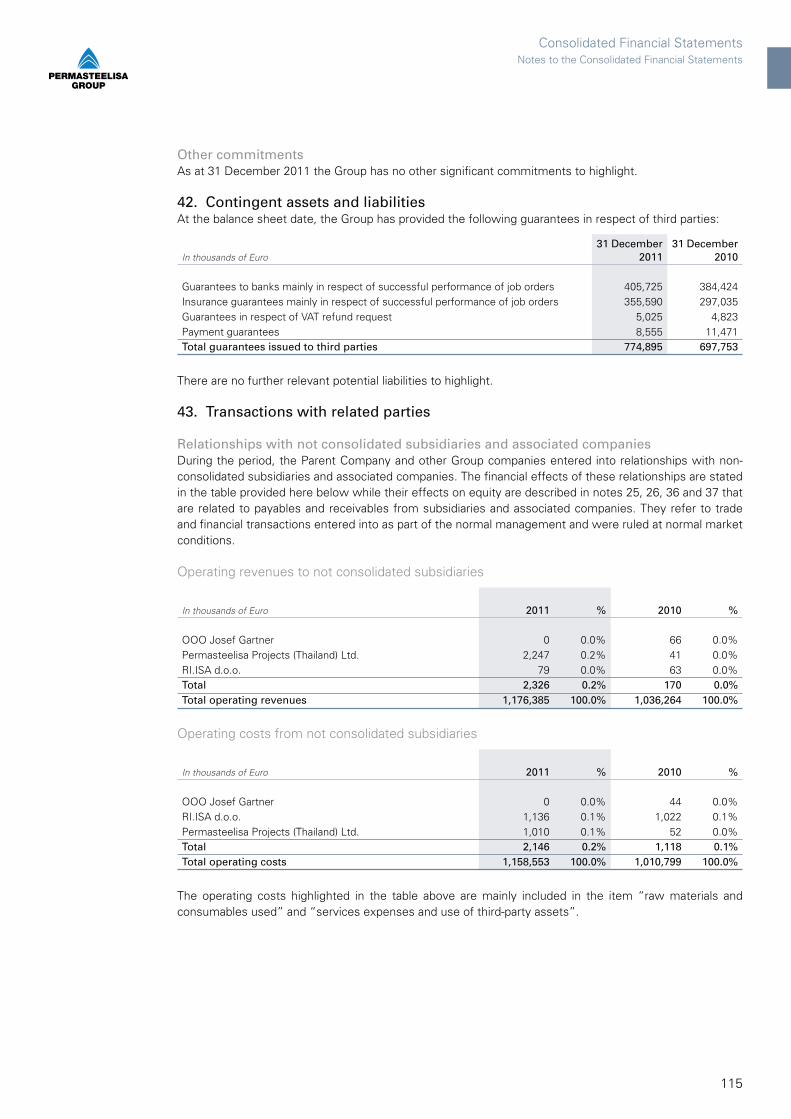
115
Other commitmentsAs at 31 December 2011 the Group has no other significant commitments to highlight.
42. Contingent assets and liabilitiesAt the balance sheet date, the Group has provided the following guarantees in respect of third parties:
In thousands of Euro31 December
201131 December
2010
Guarantees to banks mainly in respect of successful performance of job orders 405,725 384,424Insurance guarantees mainly in respect of successful performance of job orders 355,590 297,035Guarantees in respect of VAT refund request 5,025 4,823Payment guarantees 8,555 11,471Total guarantees issued to third parties 774,895 697,753
There are no further relevant potential liabilities to highlight.
43. Transactions with related parties
Relationships with not consolidated subsidiaries and associated companiesDuring the period, the Parent Company and other Group companies entered into relationships with non-consolidated subsidiaries and associated companies. The financial effects of these relationships are stated in the table provided here below while their effects on equity are described in notes 25, 26, 36 and 37 that are related to payables and receivables from subsidiaries and associated companies. They refer to trade and financial transactions entered into as part of the normal management and were ruled at normal market conditions.
Operating revenues to not consolidated subsidiaries
In thousands of Euro 2011 % 2010 %
OOO Josef Gartner 0 0.0% 66 0.0%Permasteelisa Projects (Thailand) Ltd. 2,247 0.2% 41 0.0%RI.ISA d.o.o. 79 0.0% 63 0.0%Total 2,326 0.2% 170 0.0%Total operating revenues 1,176,385 100.0% 1,036,264 100.0%
Operating costs from not consolidated subsidiaries
In thousands of Euro 2011 % 2010 %
OOO Josef Gartner 0 0.0% 44 0.0%RI.ISA d.o.o. 1,136 0.1% 1,022 0.1%Permasteelisa Projects (Thailand) Ltd. 1,010 0.1% 52 0.0%Total 2,146 0.2% 1,118 0.1%Total operating costs 1,158,553 100.0% 1,010,799 100.0%
The operating costs highlighted in the table above are mainly included in the item “raw materials and consumables used” and “services expenses and use of third-party assets”.
Consolidated Financial StatementsNotes to the Consolidated Financial Statements

116
Financial income to not consolidated subsidiaries
In thousands of Euro 2011 % 2010 %
OOO Josef Gartner 8 0.0% 12 0.0%RI.ISA d.o.o. 3 0.0% 3 0.0%Total 11 0.0% 15 0.0%Total financial income 28,383 100.0% 30,275 100%
There are not financial expenses from not consolidated subsidiaries.As shown by the stated amounts, the weight of these transactions on the Group’s statutory, financial and economic position is not relevant in percentage values.
Consolidated Financial StatementsNotes to the Consolidated Financial Statements
2011ANNUALREPORT

117
Museum of NaturalHistory of Venice
Venice \ Italy
Ph:
Gar
din&
Maz
zoli
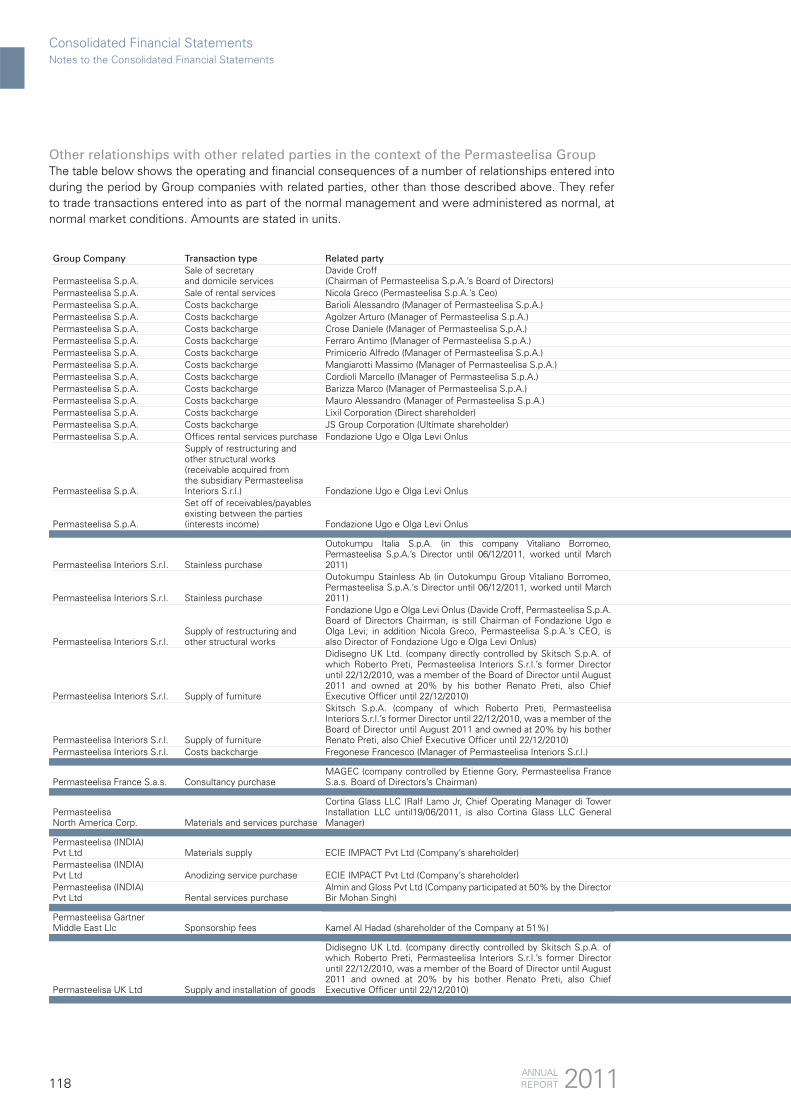
118
Group Company Transaction type Related party
Permasteelisa S.p.A.Sale of secretaryand domicile services
Davide Croff(Chairman of Permasteelisa S.p.A.’s Board of Directors)
Permasteelisa S.p.A. Sale of rental services Nicola Greco (Permasteelisa S.p.A.’s Ceo)Permasteelisa S.p.A. Costs backcharge Barioli Alessandro (Manager of Permasteelisa S.p.A.)Permasteelisa S.p.A. Costs backcharge Agolzer Arturo (Manager of Permasteelisa S.p.A.)Permasteelisa S.p.A. Costs backcharge Crose Daniele (Manager of Permasteelisa S.p.A.)Permasteelisa S.p.A. Costs backcharge Ferraro Antimo (Manager of Permasteelisa S.p.A.)Permasteelisa S.p.A. Costs backcharge Primicerio Alfredo (Manager of Permasteelisa S.p.A.)Permasteelisa S.p.A. Costs backcharge Mangiarotti Massimo (Manager of Permasteelisa S.p.A.)Permasteelisa S.p.A. Costs backcharge Cordioli Marcello (Manager of Permasteelisa S.p.A.)Permasteelisa S.p.A. Costs backcharge Barizza Marco (Manager of Permasteelisa S.p.A.)Permasteelisa S.p.A. Costs backcharge Mauro Alessandro (Manager of Permasteelisa S.p.A.)Permasteelisa S.p.A. Costs backcharge Lixil Corporation (Direct shareholder)Permasteelisa S.p.A. Costs backcharge JS Group Corporation (Ultimate shareholder)Permasteelisa S.p.A. Offices rental services purchase Fondazione Ugo e Olga Levi Onlus
Permasteelisa S.p.A.
Supply of restructuring andother structural works (receivable acquired fromthe subsidiary Permasteelisa Interiors S.r.l.) Fondazione Ugo e Olga Levi Onlus
Permasteelisa S.p.A.
Set off of receivables/payables existing between the parties (interests income) Fondazione Ugo e Olga Levi Onlus
Permasteelisa Interiors S.r.l. Stainless purchase
Outokumpu Italia S.p.A. (in this company Vitaliano Borromeo, Permasteelisa S.p.A.’s Director until 06/12/2011, worked until March 2011)
Permasteelisa Interiors S.r.l. Stainless purchase
Outokumpu Stainless Ab (in Outokumpu Group Vitaliano Borromeo, Permasteelisa S.p.A.’s Director until 06/12/2011, worked until March 2011)
Permasteelisa Interiors S.r.l.Supply of restructuring and other structural works
Fondazione Ugo e Olga Levi Onlus (Davide Croff, Permasteelisa S.p.A. Board of Directors Chairman, is still Chairman of Fondazione Ugo e Olga Levi; in addition Nicola Greco, Permasteelisa S.p.A.’s CEO, is also Director of Fondazione Ugo e Olga Levi Onlus)
Permasteelisa Interiors S.r.l. Supply of furniture
Didisegno UK Ltd. (company directly controlled by Skitsch S.p.A. of which Roberto Preti, Permasteelisa Interiors S.r.l.’s former Director until 22/12/2010, was a member of the Board of Director until August 2011 and owned at 20% by his bother Renato Preti, also Chief Executive Officer until 22/12/2010)
Permasteelisa Interiors S.r.l. Supply of furniture
Skitsch S.p.A. (company of which Roberto Preti, Permasteelisa Interiors S.r.l.’s former Director until 22/12/2010, was a member of the Board of Director until August 2011 and owned at 20% by his bother Renato Preti, also Chief Executive Officer until 22/12/2010)
Permasteelisa Interiors S.r.l. Costs backcharge Fregonese Francesco (Manager of Permasteelisa Interiors S.r.l.)
Permasteelisa France S.a.s. Consultancy purchaseMAGEC (company controlled by Etienne Gory, Permasteelisa France S.a.s. Board of Directors’s Chairman)
PermasteelisaNorth America Corp. Materials and services purchase
Cortina Glass LLC (Ralf Lamo Jr, Chief Operating Manager di Tower Installation LLC until19/06/2011, is also Cortina Glass LLC General Manager)
Permasteelisa (INDIA)Pvt Ltd Materials supply ECIE IMPACT Pvt Ltd (Company’s shareholder)Permasteelisa (INDIA)Pvt Ltd Anodizing service purchase ECIE IMPACT Pvt Ltd (Company’s shareholder)Permasteelisa (INDIA)Pvt Ltd Rental services purchase
Almin and Gloss Pvt Ltd (Company participated at 50% by the Director Bir Mohan Singh)
Permasteelisa GartnerMiddle East Llc Sponsorship fees Kamel Al Hadad (shareholder of the Company at 51%)
Permasteelisa UK Ltd Supply and installation of goods
Didisegno UK Ltd. (company directly controlled by Skitsch S.p.A. of which Roberto Preti, Permasteelisa Interiors S.r.l.’s former Director until 22/12/2010, was a member of the Board of Director until August 2011 and owned at 20% by his bother Renato Preti, also Chief Executive Officer until 22/12/2010)
Other relationships with other related parties in the context of the Permasteelisa GroupThe table below shows the operating and financial consequences of a number of relationships entered into during the period by Group companies with related parties, other than those described above. They refer to trade transactions entered into as part of the normal management and were administered as normal, at normal market conditions. Amounts are stated in units.
Consolidated Financial StatementsNotes to the Consolidated Financial Statements
2011ANNUALREPORT

119
LocalCurrency
Revenue/(Cost)2011
Receivable/(Payable)as at 31 December 2011
Revenue/(Cost) inEuro 2011
Receivable/(Payable) in Euroas at 31 December 2011
EUR 45,000.00 57,600.00 45,000.00 57,600.00EUR 9,168.38 20.46 9,168.38 20.46EUR 426.47 248.62 426.47 248.62EUR 759.13 254.10 759.13 254.10EUR 352.14 117.46 352.14 117.46EUR 211.32 90.14 211.32 90.14EUR 887.76 261.24 887.76 261.24EUR 5,381.13 1,564.50 5,381.13 1,564.50EUR 15.20 16.33 15.20 16.33EUR 96.44 103.63 96.44 103.63EUR 437.26 469.88 437.26 469.88EUR 2,900.66 2,900.66 2,900.66 2,900.66EUR 25,000.00 30,250.00 25,000.00 30,250.00EUR (294,132.50) 0,00 (294,132.50) 0,00
EUR 0.00 1,040,316.13 0.00 1,040,316.13
EUR 43,722.94 43,722.94 43,722.94 43,722.94
EUR (909,602.18) (486,474.08) (909,602.18) (486,474.08)
EUR (2,871,850.98) (221,908.43) (2,871,850.98) (221,908.43)
EUR 782,458.44 781,582.68 782,458.44 781,582.68
EUR 0.00 33,849.33 0.00 33,849.33
EUR 0.00 8,521.97 0.00 8,521.97EUR 788.14 846.94 788.14 846.94
EUR (120,000.00) (23,920.00) (120,000.00) (23,920.00)
USD (1,643,296.07) (287,219.87) (1,180,774.78) (221,979.96)
INR 136,017.00 136,017.00 2,096.86 1,979.49
INR (299,169.00) (299,169.00) (4,612.05) (4,353.89)
INR (6,591,392.00) (39,002.00) (101,614.14) (567.61)
AED (780,000.00) (780,000.00) (152,591.61) (164,128.63)
GBP 0.00 306,298.00 0.00 366,692.21
revenue/receivable 919,702.27 2,371,408.71cost/payable (5,635,178.24) (1,123,332.60)
The highlighted costs and revenues do not significantly affect the total, respectively, of the Group’s operating expenses and operating revenues; the same is valid for the highlighted receivables and payables with respect to the total trade receivables and payables of the Group.
Consolidated Financial StatementsNotes to the Consolidated Financial Statements

120
Transactions with key management personnelThe key management personnel compensations, as defined by IAS 24, are as follows:
In thousands of Euro 2011 2010
Benefits for salaries, wages, compensations, bonus 6,660 9,005Post-employment benefits 169 93Other benefits 19,266 0
26,095 9,098
Total remuneration is included in personnel expenses and is as follows:
In thousands of Euro 2011 2010
General manager 8,645 3,761Chief executive officer and other members of the Board of Directors 13,142 4,604Holding function manager 4,308 733
26,095 9,098
44. Fees payable to the statutory auditors or audit firm of Group companiesThe amount of fees payable to the statutory auditors or audit firm of each Group company (PricewaterhouseCoopers which is the main auditors, Ernst & Young and other local auditors) amount to Euro 1,199 million of which Euro 888 thousand for audit services, Euro 125 thousand for tax services and Euro 186 thousand for other services.The fees referred only to the parent company Permasteelisa S.p.A. amount to Euro 152 thousand, of which Euro 127 thousand for audit services and Euro 25 thousand for other services, in particular that one concerning the preparation of the limited review of the Consolidated Financial Statement as at 30 September 2011, required by the new ultimate parent company JS Group Corporation for consolidation purposes.
45. Significant, non-recurring events and transactionsThere are no events or significant non-recurring transactions to mention.
46. Positions or transactions deriving from unconventional and/or unusual operationsThere are no entries or transactions resulting from unconventional or unusual operations during the year 2011 having any relevance on the operating performance and the financial position for the period of the Group and of the Parent company Permasteelisa S.p.A., except the already mentioned presence (in the previous years) of a number of agency contracts agreed in previous periods with a counterparty in a Middle Eastern country, that have fees for their services that are much higher than those normally applied in the related business; these contracts are still legally valid in the country of reference and therefore, while the activities to close them are carried on, their economic and financial effects are adequately evaluated in company accounts.
47. Subsequent eventsThere are not subsequent events to mention.
Consolidated Financial StatementsNotes to the Consolidated Financial Statements
2011ANNUALREPORT
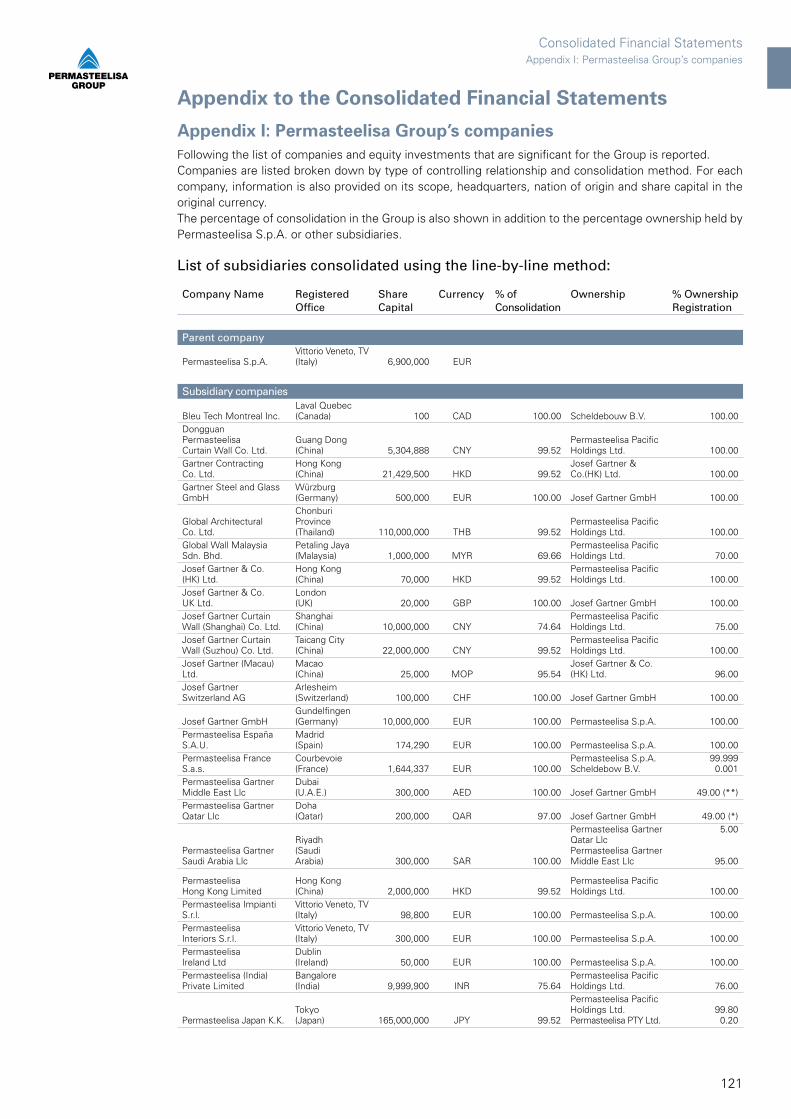
121
Appendix to the Consolidated Financial Statements
Appendix I: Permasteelisa Group’s companies
Appendix I: Permasteelisa Group’s companies
Following the list of companies and equity investments that are significant for the Group is reported.Companies are listed broken down by type of controlling relationship and consolidation method. For each company, information is also provided on its scope, headquarters, nation of origin and share capital in the original currency. The percentage of consolidation in the Group is also shown in addition to the percentage ownership held by Permasteelisa S.p.A. or other subsidiaries.
List of subsidiaries consolidated using the line-by-line method:
Company Name Registered Office
Share Capital
Currency % of Consolidation
Ownership % OwnershipRegistration
Parent company
Permasteelisa S.p.A.Vittorio Veneto, TV(Italy) 6,900,000 EUR
Subsidiary companies
Bleu Tech Montreal Inc.Laval Quebec (Canada) 100 CAD 100.00 Scheldebouw B.V. 100.00
DongguanPermasteelisaCurtain Wall Co. Ltd.
Guang Dong(China) 5,304,888 CNY 99.52
Permasteelisa Pacific Holdings Ltd. 100.00
Gartner ContractingCo. Ltd.
Hong Kong(China) 21,429,500 HKD 99.52
Josef Gartner & Co.(HK) Ltd. 100.00
Gartner Steel and Glass GmbH
Würzburg(Germany) 500,000 EUR 100.00 Josef Gartner GmbH 100.00
Global ArchitecturalCo. Ltd.
Chonburi Province(Thailand) 110,000,000 THB 99.52
Permasteelisa Pacific Holdings Ltd. 100.00
Global Wall MalaysiaSdn. Bhd.
Petaling Jaya (Malaysia) 1,000,000 MYR 69.66
Permasteelisa Pacific Holdings Ltd. 70.00
Josef Gartner & Co. (HK) Ltd.
Hong Kong(China) 70,000 HKD 99.52
Permasteelisa Pacific Holdings Ltd. 100.00
Josef Gartner & Co. UK Ltd.
London(UK) 20,000 GBP 100.00 Josef Gartner GmbH 100.00
Josef Gartner Curtain Wall (Shanghai) Co. Ltd.
Shanghai(China) 10,000,000 CNY 74.64
Permasteelisa Pacific Holdings Ltd. 75.00
Josef Gartner Curtain Wall (Suzhou) Co. Ltd.
Taicang City(China) 22,000,000 CNY 99.52
Permasteelisa Pacific Holdings Ltd. 100.00
Josef Gartner (Macau) Ltd.
Macao(China) 25,000 MOP 95.54
Josef Gartner & Co. (HK) Ltd. 96.00
Josef GartnerSwitzerland AG
Arlesheim(Switzerland) 100,000 CHF 100.00 Josef Gartner GmbH 100.00
Josef Gartner GmbHGundelfingen (Germany) 10,000,000 EUR 100.00 Permasteelisa S.p.A. 100.00
Permasteelisa España S.A.U.
Madrid(Spain) 174,290 EUR 100.00 Permasteelisa S.p.A. 100.00
Permasteelisa France S.a.s.
Courbevoie(France) 1,644,337 EUR 100.00
Permasteelisa S.p.A.Scheldebow B.V.
99.9990.001
Permasteelisa GartnerMiddle East Llc
Dubai(U.A.E.) 300,000 AED 100.00 Josef Gartner GmbH 49.00 (**)
Permasteelisa GartnerQatar Llc
Doha(Qatar) 200,000 QAR 97.00 Josef Gartner GmbH 49.00 (*)
Permasteelisa GartnerSaudi Arabia Llc
Riyadh(SaudiArabia) 300,000 SAR 100.00
Permasteelisa Gartner Qatar LlcPermasteelisa GartnerMiddle East Llc
5.00
95.00
PermasteelisaHong Kong Limited
Hong Kong(China) 2,000,000 HKD 99.52
Permasteelisa Pacific Holdings Ltd. 100.00
Permasteelisa Impianti S.r.l.
Vittorio Veneto, TV(Italy) 98,800 EUR 100.00 Permasteelisa S.p.A. 100.00
PermasteelisaInteriors S.r.l.
Vittorio Veneto, TV(Italy) 300,000 EUR 100.00 Permasteelisa S.p.A. 100.00
PermasteelisaIreland Ltd
Dublin(Ireland) 50,000 EUR 100.00 Permasteelisa S.p.A. 100.00
Permasteelisa (India) Private Limited
Bangalore(India) 9,999,900 INR 75.64
Permasteelisa Pacific Holdings Ltd. 76.00
Permasteelisa Japan K.K.Tokyo(Japan) 165,000,000 JPY 99.52
Permasteelisa Pacific Holdings Ltd.Permasteelisa PTY Ltd.
99.800.20
Consolidated Financial Statements
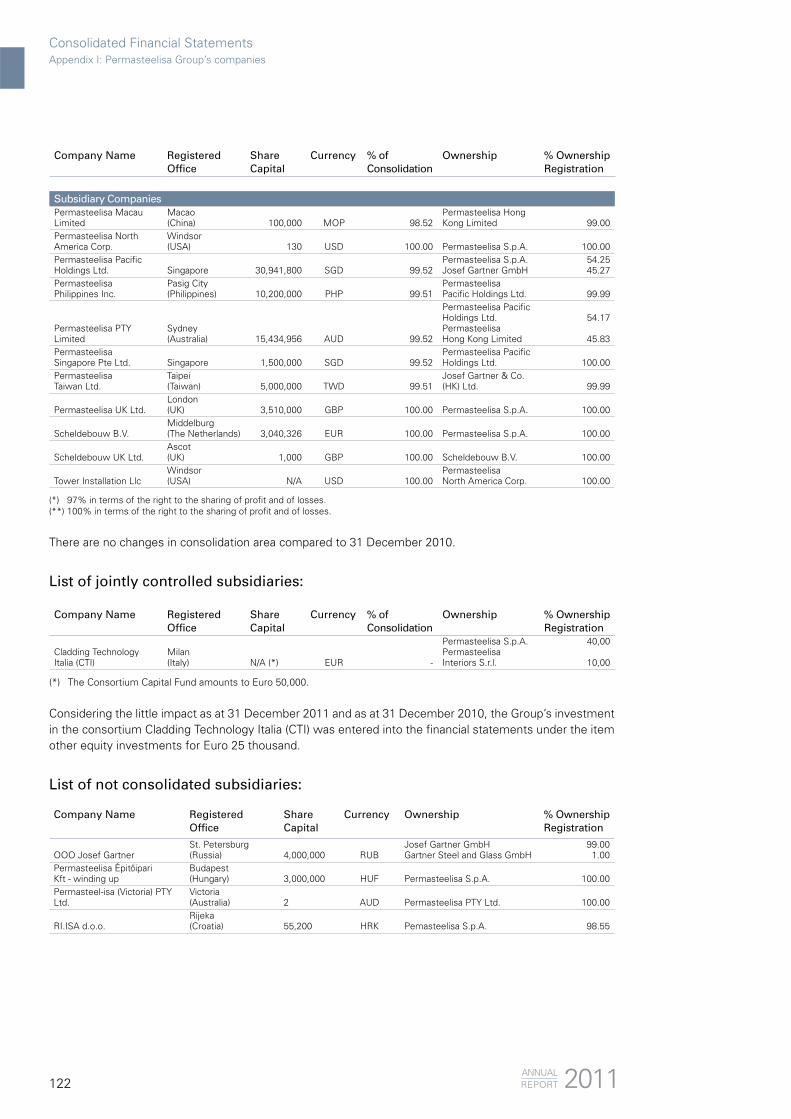
122
Company Name Registered Office
Share Capital
Currency % of Consolidation
Ownership % OwnershipRegistration
Subsidiary CompaniesPermasteelisa Macau Limited
Macao(China) 100,000 MOP 98.52
Permasteelisa Hong Kong Limited 99.00
Permasteelisa North America Corp.
Windsor(USA) 130 USD 100.00 Permasteelisa S.p.A.
100.00
Permasteelisa Pacific Holdings Ltd. Singapore 30,941,800 SGD 99.52
Permasteelisa S.p.A.Josef Gartner GmbH
54.2545.27
PermasteelisaPhilippines Inc.
Pasig City(Philippines) 10,200,000 PHP 99.51
PermasteelisaPacific Holdings Ltd. 99.99
Permasteelisa PTY Limited
Sydney(Australia) 15,434,956 AUD 99.52
Permasteelisa Pacific Holdings Ltd.PermasteelisaHong Kong Limited
54.17
45.83PermasteelisaSingapore Pte Ltd. Singapore 1,500,000 SGD 99.52
Permasteelisa Pacific Holdings Ltd. 100.00
PermasteelisaTaiwan Ltd.
Taipei(Taiwan) 5,000,000 TWD 99.51
Josef Gartner & Co. (HK) Ltd. 99.99
Permasteelisa UK Ltd.London(UK) 3,510,000 GBP 100.00 Permasteelisa S.p.A. 100.00
Scheldebouw B.V.Middelburg(The Netherlands) 3,040,326 EUR 100.00 Permasteelisa S.p.A. 100.00
Scheldebouw UK Ltd.Ascot(UK) 1,000 GBP 100.00 Scheldebouw B.V. 100.00
Tower Installation LlcWindsor(USA) N/A USD 100.00
PermasteelisaNorth America Corp. 100.00
(*) 97% in terms of the right to the sharing of profit and of losses.(**) 100% in terms of the right to the sharing of profit and of losses.
There are no changes in consolidation area compared to 31 December 2010.
List of jointly controlled subsidiaries:
Company Name Registered Office
Share Capital
Currency % of Consolidation
Ownership % OwnershipRegistration
Cladding Technology Italia (CTI)
Milan(Italy) N/A (*) EUR -
Permasteelisa S.p.A.PermasteelisaInteriors S.r.l.
40,00
10,00
(*) The Consortium Capital Fund amounts to Euro 50,000.
Considering the little impact as at 31 December 2011 and as at 31 December 2010, the Group’s investment in the consortium Cladding Technology Italia (CTI) was entered into the financial statements under the item other equity investments for Euro 25 thousand.
List of not consolidated subsidiaries:
Company Name Registered Office
Share Capital
Currency Ownership % OwnershipRegistration
OOO Josef GartnerSt. Petersburg (Russia) 4,000,000 RUB
Josef Gartner GmbHGartner Steel and Glass GmbH
99.001.00
Permasteelisa Épit ipariKft - winding up
Budapest(Hungary) 3,000,000 HUF Permasteelisa S.p.A. 100.00
Permasteel-isa (Victoria) PTY Ltd.
Victoria(Australia) 2 AUD Permasteelisa PTY Ltd. 100.00
RI.ISA d.o.o.Rijeka(Croatia) 55,200 HRK Pemasteelisa S.p.A. 98.55
Appendix I: Permasteelisa Group’s companiesConsolidated Financial Statements
2011ANNUALREPORT

123
Appendix I: Permasteelisa Group’s companies
List of associated companies:
Company Name Registered Office
Share Capital
Currency Ownership % OwnershipRegistration
Permasteelisa Projects(Thailand) Ltd.
Chonburi Province(Thailand) 4,000,000 THB Global Architectural Co. Ltd. 48.98
Unifront B.V.Ulft(The Netherlands) 143,500 EUR Scheldebouw B.V. 26.27
List of other companies held by over 10%:
Company Name Registered Office
Share Capital
Currency Ownership % OwnershipRegistration
Interoxid AGAltenrhein(Switzerland) 50,000 CHF Scheldebouw B.V. 18.00
Dyepower ConsorzioRome(Italy) N/A (**) EURO Permasteelisa S.p.A. 24.70
(**) The Consortium Capital Fund amounts to Euro 390,000.
The Dyepower Consorzio is a non-profit association of companies aiming at promoting, planning and implementing of research & development activities in organic/hybrid photovoltaics, particularly concerning solar cells dye-sensitized on glass or other rigid, non-metallic products. It can also provide services for its associate members in the development, assessment and implementation of research projects in photovoltaics, both within the national territory and in an international context.
Consolidated Financial Statements

124
Ph.
: Cou
rtes
y of
Pel
li C
lark
e P
elli
Arc
hite
cts

125

126
Statutory Financial Statements
In Euro Notes 2011 2010
Revenues 111,357,010 82,310,075Other operating income 4 22,441,371 21,551,718Total operating revenues 1 133,798,381 103,861,793
Raw materials and consumables used 5 (53,459,592) (29,518,271)Services expenses and use of third party assets 5 (49,012,524) (29,694,046)Personnel expenses 6 (50,739,905) (35,278,940)Depreciation, amortization and impairment losses 7 (3,863,284) (6,587,664)Bad debts provision 8 0 0Provision for risks and charges 9 (1,351,752) (5,607,626)Other operating expenses 10 (304,145) (340,071)In-house enhancement of fixed assets 29,819 712,787Total operating expenses (158,701,383) (106,313,831)
Operating result (24,903,002) (2,452,038)
Financial income 11 43,491,027 32,952,439Financial expenses 11 (20,510,112) (35,185,825)Net financial expenses 11 22,980,915 (2,233,386)
Revaluation of equity investments 12 0 0Write-downs of equity investments 13 0 (3,000,000)Profit/(loss) before tax (1,922,087) (7,685,424)Income tax expense 14 3,914,633 3,059,742Profit/(loss) after tax 1,992,546 (4,625,682)
Statement of comprehensive income for the year ended 31 December 2011
In Euro 2011 2010
Profit/(loss) of the period (A) 1,992,546 (4,625,682)
Hedging reserves for risks variation, net of tax (613,760) 67,421
Total Other comprehensive income, net of tax (B) (613,760) 67,421
Total Comprehensive income/(loss) (A)+(B) 1,378,786 (4,558,261)
Income statementfor the year ended 31 December 2011
Income statement \ Statement of comprehensive income
2011ANNUALREPORT

127
Statutory Financial Statements
Statement of financial positionas at 31 December 2011
In Euro Notes31 December
201131 December
2010
Assets Intangible assets 15 9,224,614 9,074,876Tangibles assets 16 30,773,323 31,121,538Equity investments in subsidiaries 17 318,701,688 318,701,689Other equity investments 18 634,104 285,104Deferred tax assets 19 13,385,943 7,366,938Total non-current assets 372,719,672 366,550,145Contracts work-in-progress and inventories 20 10,707,540 19,322,077Trade receivables from third parties 21 31,429,240 23,756,584Trade receivables from subsidiaries 22 29,368,863 16,639,432Financial receivables from subsidiaries 22 36,627,662 26,973,991Income tax receivables 23 1,536,413 1,945,006Other current assets 24 16,625,186 7,857,020Cash and cash equivalents 25 17,840,584 50,044,775Total current assets 144,135,488 146,538,885Total assets 516,855,160 513,089,030
Equity Share capital 26 6,900,000 6,900,000Legal reserve 26 1,380,000 1,380,000Share premium 26 0 16,415,615Revaluation reserve 26 0 3,522,634Foreign Exchange Risk Hedging Reserve 26 (587,559) 8,341Commodities Risk Hedging Reserve 26 (17,859) 0Other reserves 26 168,912,531 173,399,965Profit/(loss) for the period 26 1,992,546 (4,625,682)Total equity 178,579,659 197,000,873Liabilities Amounts payable to banks and other financial creditors 27 0 0Severance indemnity fund 28 1,767,448 1,821,273Deferred tax liabilities 19 11,288,785 11,369,099Provisions for risks and charges 29 11,103,901 15,043,109Total non-current liabilities 24,160,134 28,233,481Amounts payable to banks and other financial creditors 27 50,012,586 22,552Excess of progress billings over work-in-progress 20 6,021,962 3,347,419Advances from customers 20 952,084 4,458,094Trade payables to third parties 30 35,108,069 23,690,938Trade payables to subsidiaries 31 6,366,677 3,737,845Financial payables to subsidiaries 31 186,484,402 241,912,261Other current liabilities 32 29,169,587 10,685,567Total current liabilities 314,115,367 287,854,676Total net equity and liabilities 516,855,160 513,089,030
Statement of financial position

128
Statement of cash flowsfor the year ended 31 December 2011
In thousands of Euro 2011 2010
Cash flows generated (absorbed) by operating activitiesResult before tax (1,922) (7,685)Adjustments made to reconcile the result before tax with the cash low changes generated (absorbed) by operating activities:
- Interest income (1,171) (1,772)- Interest expense 4,177 16,205- Depreciation and amortization expenses and impairment losses 3,863 6,588- Gain/loss on disposal of tangible and intangible assets (13) 1- Provision for risks and charge 1,352 5,608- Equity investments write-downs/(revaluations) 0 3,000- Severance indemnity fund payments to employees (128) (159)- Severance indemnity fund expenses 74 57Total adjustments 8,154 29,528
Changes in operating activities: - Changes in foreign exchange risk hedging reserve (596) 67- Changes in commodities risk hedging reserve (18) 0- Changes in contracts work-in-progress (net) 7,784 (19,863)- Changes in trade receivables/payables from/to third parties 3,744 2,050- Changes in trade receivables/payables from/to subsidiaries (10,100) (3,592)- Changes in the other captions of operating capital (*) 3,111 (7,961)- Income tax paid (734) (1)- Interests paid (3,906) (7,815)- Interest received 1,171 1,772Total changes 456 (35,343)
Net cash flows generated by operating activities (A) 6,688 (13,500)
Cash flows generated (absorbed) by investing activities
Purchases of tangible and intangible assets (3,808) (4,613)Proceeds from disposal of tangible and intangible assets 157 30Changes in other equity investments (349) (43)Changes in subsidiaries equity investments 0 (2,000)Net cash flows absorbed by investing activities (B) (4,000) (6,626)
Cash flows generated (absorbed) by financing activities
Changes in intercompany current accounts (65,082) 1,486Increase of share capital 0 58,302Dividends paid to Permasteelisa S.p.A. shareholders (19,800) 0Medium/long term loans opening 0 53,929OPA debt payment 0 (112,231)Borrowings and other medium/long term loans reimbursement not linked to OPA 0 (5,215)Borrowings and other medium/long term loans reimbursement for OPA 0 (160,000)Net cash flows absorbed by financing activities (C) (84,882) (163,729)
Net increase/(decrease) in cash surplus/(deficit) (A+B+C) (82,194) (183,855)
Net cash surplus/(deficit) as at 1 January (D) 50,022 231,393
Contribution for merger (**) 0 2,484
Net cash surplus/(deficit) as at 31 December (A+B+C+D) (32,172) 50,022
Statement of cash flowsStatutory Financial Statements
2011ANNUALREPORT

129
Net cash surplus/(deficit) includes: Bank and post current accounts and deposits 17,838 50,043Cash in hand 3 2Bank overdrafts and other short-term loans (50,013) (23)
(32,172) 50,022
(*) The other captions of operating capital refer to the following captions included in the statement of financial position of the Company: income tax receivables and payables, deferred tax assets and liabilities, other current assets and liabilities, provisions for risks and charges.
(**) The merger contribution is related to the net cash surplus of Terre Alte S.p.A. and Montrachet S.p.A. for Euro 2,373 thousand and for Euro 111 thousand to Permasteelisa International B.V.
Statement of cash flowsStatutory Financial Statements

130
Sta
tem
en
t o
f n
et
eq
uit
y c
han
ges
for
the
year
en
ded
31
Dec
emb
er 2
011
Statement of net equity changesStatutory Financial Statements
2011ANNUALREPORT
In t
hous
ands
of
Eur
o
Sh
are
cap
ital
Leg
al
rese
rve
Sh
are
pre
miu
mR
eval
uat
ion
re
serv
eE
xtra
ord
inar
yre
serv
eM
erg
er s
urp
lus
rese
rve
Oth
er m
erg
erre
serv
eIa
s co
nve
rsio
nre
serv
e(n
on-a
vaila
ble)
Oth
er Ia
sco
nve
rsio
nre
serv
es
Fore
ign
exch
ang
eri
sk h
edg
ing
re
serv
e
Co
mm
od
itie
sri
sk h
edg
ing
rese
rve
Ret
ain
edea
rnin
gs
Net
eq
uit
y
Bal
ance
as
at 1
st J
anu
ary
2010
6,90
01,
653
26,7
903,
523
2,03
85,
012
031
223
(59)
022
,741
68,9
32
Inco
me
(exp
ense
s) r
ecog
nize
d di
rect
ly in
equ
ity:
Fore
ign
exch
ange
ris
k he
dgin
g re
serv
e va
riatio
n67
67
Com
mod
ities
ris
k he
dgin
g re
serv
e va
riatio
n0
Inte
rest
rat
e ris
k he
dgin
g re
serv
e va
riatio
n0
00
0 0
0 0
0 0
067
00
67
Net
res
ult
fo
r th
e p
erio
d(4
,626
)(4
,626
)
Tota
l In
com
e (e
xpen
ses)
fo
r th
e p
erio
d0
0 0
0 0
0 0
0 0
670
(4,6
26)
4,55
8
Tran
sact
ion
s w
ith
sh
areh
old
ers:
Allo
catio
n of
prio
r ye
ar n
et p
rofit
0
Trea
sury
sha
res
buy-
back
0
Rev
erse
mer
ger
(273
)(1
0,37
5)(2
,038
)(5
,008
)17
2,48
2(1
26)
(22,
741)
131,
921
Dire
ct m
erge
r70
6
Trea
sury
sha
res
writ
e-of
f70
60
Rou
ndin
gs0
0(2
73)
(10,
375)
0(2
,038
)(4
,302
)17
2,48
20
(126
)0
0(2
2,74
1)13
2,62
7
Bal
ance
as
at 3
1 D
ecem
ber
201
06,
900
1,38
016
,416
3,52
30
710
172,
482
312
(103
)8
0(4
,626
)19
7,00
1
Bal
ance
as
at 1
st J
anu
ary
2011
6,90
01,
380
16,4
163,
523
071
017
2,48
231
2(1
03)
80
(4,6
26)
197,
001
Inco
me
(exp
ense
s) r
ecog
nize
d di
rect
ly in
equ
ity:
Fore
ign
exch
ange
ris
k he
dgin
g re
serv
e va
riatio
n(5
95)
(595
)
Com
mod
ities
ris
k he
dgin
g re
serv
e va
riatio
n(1
8)(1
8)
Inte
rest
rat
e ris
k he
dgin
g re
serv
e va
riatio
n0
00
0 0
0 0
0 0
0(5
95)
(18)
0(6
13)
Net
res
ult
fo
r th
e p
erio
d1,
993
1,99
3
Tota
l In
com
e (e
xpen
ses)
fo
r th
e p
erio
d0
0 0
0 0
0 0
0 0
(595
)(1
8)1,
993
1,38
0
Tran
sact
ion
s w
ith
sh
areh
old
ers:
Allo
catio
n of
prio
r ye
ar n
et p
rofit
(397
)(3
,523
)(7
06)
4,62
60
Div
iden
ds(1
6,01
8)(3
,782
)(1
9,80
0)
Trea
sury
sha
res
buy-
back
0
Rev
erse
mer
ger
0
Dire
ct m
erge
r0
Trea
sury
sha
res
writ
e-of
f0
Rou
ndin
gs(1
)(1
)
00
(16,
416)
(3,5
23)
0(7
06)
(3,7
82)
00
00
4,62
6(1
9,80
1)
Bal
ance
as
at 3
1 D
ecem
ber
201
16,
900
1,38
00
00
416
8,70
031
2(1
03)
(587
)(1
8)1,
993
178,
580
Ple
ase
refe
r to
no
te 2
6
131
Statutory Financial Statements
Notes to the Statutory Financial Statements
Company’s informationPermasteelisa S.p.A. (hereinafter referred to as the “Company”) is a company domiciled in Italy that operates internationally both directly and indirectly through its subsidiaries in the field of the design, production and installation of architectural components (curtain walls, partition walls and doors) and interior design.The Statutory Financial Statements of the Permasteelisa S.p.A. have been drawn up in Euro, which is the currency of the economic area in which the Company operates.Permasteelisa S.p.A., as Parent Company, has also prepared the Consolidated Financial Statements of Permasteelisa Group as at 31 December 2011.The draft Financial Statements were approved by the Board of Directors on 28 March 2012 and will be submitted for approval by Shareholders’ meeting convened for 27 April 2012.These financial statements are subject to audit by PricewaterhouseCoopers S.p.A.On 6 December 2011, the previous sole shareholder Cima Cladding S.A. sold its equity investment in Permasteelisa S.p.A. to the Japanese company Lixil Corporation, itself owned by JS Group Corporation, company listed on the Tokyo Stock Exchange.
Financial tablesThe tables provided for the statement of financial position, the income statement, the statement of cash flows and of net equity changes are the same as those used for the Consolidated Financial Statements as at 31 December 2010.The statement of financial position, the income statement, the statement of cash flows and of net equity changes used for the period closed as at 31 December 2011 are prepared in thousands of Euro and are characterised as follows:
Statement of financial positionThe method whereby assets and liabilities are broken down into “current and non-current” was adopted, with separate indication of assets and liabilities held for sale, if any.The current assets include assets (such as inventories, assets for contracts work-in-progress and trade receivables) that are sold, consumed or realised as part of the normal operating cycle, even when they are not expected to be realised within 12 months after the balance sheet date. Some current liabilities, such as trade payables and some accruals for employees and other operating costs, are part of the working capital used in the normal operating cycle. Such operating items are classified as current liabilities even if they are due to be settled more than 12 months after the balance sheet date.
Income statementThe adopted method breaks costs down based on their nature.
Statement of cash flowsThe indirect method was employed.
Statement of net equity changesThe statement that shows all the changes of the net equity was adopted.
Accounting principles (a) Statement of compliance The Statutory Financial Statements 2011 represent the separate financial statements of the Parent Company Permasteelisa S.p.A. and have been prepared according to IFRS International Accounting Standards issued by the International Accounting Standards Board (“IASB”) and endorsed by the European Union. IFRS is understood to include also the International Accounting Standards (“IAS”) that are currently in force in addition to the interpretations made available by the International Financial Reporting Interpretations Committee (“IFRIC”), previously known as the Standing Interpretations Committee (“SIC”).According to the European Regulation n. 1606 dated 19 July 2002, the Company adopted the International Accounting Standards (“IFRS”) issued by the International Accounting Standards Board (“IASB”) for the preparation of the separate financial statements and for the preparation of the Consolidated Financial Statements too.These Statutory Financial Statements were prepared in accordance with the accounting standards described
Notes to the Statutory Financial Statements

132
in the paragraphs below, namely the same standards that were used to prepare the Statutory Financial Statements as at 31 December 2010, except for those described in this section, paragraph y).
(b) Basis of preparationThe financial statements are presented in Euro, rounded to the nearest thousand. They are prepared on the historical cost basis except for the following assets and liabilities are stated at their fair value: derivative financial instruments, financial instruments held for trading, financial instruments classified as available-for-sale.The preparation of financial statements in conformity with IFRS requires management to make judgments, estimates and assumptions that affect the application of policies and reported amounts of assets and liabilities, income and expenses. The estimates and associated assumptions are based on historical experience and various other factors that are believed to be reasonable under the circumstances, the results of which form the basis of making the judgments about carrying values of assets and liabilities that are not readily apparent from other sources. Actual results may differ from these estimates. The estimates and underlying assumptions are reviewed on an ongoing basis. Revisions to accounting estimates are recognised in the period in which the estimate is revised if the revision affects only that period, or in the period of the revision and future periods if the revision affects both current and future periods.The accounting principles exposed in the following paragraphs have been consistently applied for all the periods included in this Statutory Financial Statements.
(c) Foreign currency(i) Foreign currency transactionsTransactions in foreign currencies are translated at the foreign exchange rate ruling at the date of the transaction. Monetary assets and liabilities denominated in foreign currencies at the balance sheet date are translated to Euro at the foreign exchange rate ruling at that date. Foreign exchange differences arising on this translation are recognised in the income statement. Non-monetary assets and liabilities that are measured in terms of historical cost in a foreign currency are translated using the exchange rate at the date of the transaction. Non-monetary assets and liabilities denominated in foreign currencies that are stated at fair value are translated to Euro at foreign exchange rates ruling at the dates the fair value was determined.
The exchange rates used for the closing as at 31 December 2011 and the comparative exchange rates of the previous year are as follows:
31 December 2011 31 December 2010
Currency
Exchange rate atthe balance sheet date
Average exchange rate
of the year
Exchange rate atthe balance sheet date
Average exchange rate
of the year
Thai Bath 40.991 42.424725 40.17 42.082392
Danish Krone 7.4342 7.450676 7.4535 7.447215
Norwegian Krone 7.754 7.793318 7.8 8.006036
Dubai Dirham 4.75237 5.111683 4.90781 4.873223
Australian Dollar 1.2723 1.348158 1.3136 1.444175
Canadian Dollar 1.3215 1.375641 1.3322 1.366506
Hong Kong Dollar 10.051 10.834008 10.3856 10.307694
Singapore Dollar 1.6819 1.749067 1.7136 1.808008
Taiwan Dollar 39.1835 40.885375 39.0438 41.775892
Usa Dollar 1.2939 1.39171 1.3362 1.326799
Hungarian Forint 314.58 279.309083 277.95 275.3565
Swiss Franc 1.2156 1.233984 1.2504 1.382265
Croatian Kuna 7.537 7.438383 7.383 7.288738
Pataca Macau 10.3504 11.153175 10.7014 10.609908
Philippine Peso 56.754 60.259108 58.3 59.802092
Chinese Renminbi 8.1588 8.996063 8.822 8.980513
Malayan Ringitt 4.1055 4.255263 4.095 4.273333
Notes to the Statutory Financial StatementsStatutory Financial Statements
2011ANNUALREPORT

133
Riyal Qatar 4.71164 5.067698 4.86375 4.829833
Riyal Saudi Arabia 4.85236 5.219397 5.0106 4.975708
Russian Ruble 41.765 40.879717 40.82 40.277975
Indian Rupia 68.713 64.866875 59.758 60.631833
Israeli Shekel 4.9453 4.976054 4.73775 4.949723
Pound Sterling 0.8353 0.867768 0.86075 0.858238
Korean Won 1,498.69 1,541.0467 1,499.06 1,532.5125
Japanese Yen 100.2 111.020833 108.65 116.455167
Polish Zloty 4.458 4.118705 3.975 3.994963
(d) Derivative financial instrumentsThe Company uses derivative financial instruments (generally forward exchange contracts and swaps) only to hedge its exposure to foreign currency risk, to commodities risk and interest risk coming from its operating and financial activities in currencies other than Euro.According to its treasury policy, the Company does not hold or issue derivative financial instruments for trading purposes. Anyway, derivative financial instruments for which the criterion to record the operations as hedging operations are not respected, are recorded as trading instruments.Derivative financial instruments are recognised initially at cost. Subsequent to initial recognition, derivative financial instruments are stated at fair value. The gain or loss on re-measurement to fair value is recognised immediately in profit or loss account.However, where derivatives qualify for hedge accounting, recognition of any resultant gain or loss depends on the nature of the item being hedged (see the accounting policy described in e).The fair value of forward exchange contracts is their quoted market price at the balance sheet date, being the present value of the quoted forward price.
(e) Hedging(i) Cash flow hedging (foreign currency risk)The Company uses derivative financial instruments to hedge its exposure to foreign currency risk coming from its operating and financial activities in currency other than Euro.In particular, the Company uses derivative financial instruments to hedge the foreign currency risk related to the contracts work-in-progress cash flows. When the Company acquires a job whose future cash flows are denominated in foreign currency, specific forward exchange contracts or swaps on foreign currency are concluded to hedge the foreign currency risk existing on those future cash flows; therefore these hedging operations are related to highly probable future transactions as the job that is hedged is effectively acquired when the hedging contract or contracts are concluded. Considering the length of the Company contracts, the estimation of the timing of the future cash flows is very difficult and subject to changes that can be also relevant; as a consequence, the Company policy consists in making an initial hedging of future cash flows based on a rough estimation of the future cash flows timing and subsequently in:- rolling over the forward exchange contracts or swaps on foreign currency if at the expiry date the correspondent cash flows related to the job does not occur;- in concluding another forward exchange contract or swap on foreign currency, of opposite sign and same expiry date of the existing hedging contracts, if the cash flow related to the job occurs in advance with respect to the expiry date of the existing hedging contracts.The gains and losses deriving from the roll-over operation of these derivative financial instruments and from their evaluation at fair value are recognised directly in the net equity in a specific reserve for the effective part; these gains and losses are removed from the net equity and recorded in the income statement in the same period or periods during which the hedged forecast transaction affects income statement; they are included in the operating revenues or operating expenses if related to hedging operations of job contracts cash flows.The ineffective part of any gain or loss is recognized immediately in the financial components of the income statement.The Company does not measure the prospective effectiveness of its hedging operations as, on the basis of the method used for hedging the future cash flows related to contracts work-in-progress in foreign currency, the Company considers that it always included in the range requested by IAS 39 (80%-125%); any ineffectiveness can occur retrospectively only if the roll-over operations or the closing in advance of a
Statutory Financial StatementsNotes to the Statutory Financial Statements

134
forward exchange contract or swap on foreign currency are not performed correctly; the measurement of the retrospective ineffectiveness is therefore made continuously monitoring that these cases do not occur.If the hedged transaction is no longer expected to take place, the cumulative unrealised gains or losses recognized in the net equity are recognized immediately in the income statement as financial components.Finally, according to the Company policy the foreign currency risk hedging is made on the spot rate; as a consequence, the difference between spot rate and forward rate recorded when a roll-over operation is performed and the interest component included in the fair value of the forward contracts or swaps on foreign currency, are always recorded in the income statement in the financial components as hedging expenses/revenues, regardless whether the contract does or does not comply with the requirements for being considered as such.
(ii) Hedge of monetary assets and liabilitiesThe Company uses derivative financial instruments also to hedge economically the foreign exchange exposure of a recognised monetary asset or liability as the loans in foreign currency; in this case no hedge accounting is applied and any gain or loss on the hedging instrument is recognised in the income statement.
(iii) Cash flow hedging (Commodities Risk)The Company uses derivative financial instruments also to hedge price risk on commodities coming from its operating activities.In particular, the Company uses derivative financial instruments to hedge the price risk related to aluminum purchase for the contracts work-in-progress. When the Company acquires a job whose future cash flows are related to aluminum purchase, specific forward exchange contracts or swaps on foreign currency are concluded to hedge the price risk existing on this commodity; therefore these hedging operations are related to highly probable future transactions as the job that is hedged, with regard to the aluminum purchase, is effectively acquired when the hedging contract or contracts are concluded. In consideration of the variability of the price of aluminum, the aim of hedging is to freeze this price already since the acquisition of the order itself; subsequently, as the aluminum order as well as the relevant price are agreed with the supplier, the Company shall complete the aluminum forward purchase by completing a transaction of opposite sign. If, upon expiry of the transaction, the order has not been defined yet for the supplier, the hedging contract(s) shall be rolled over.The gains and losses deriving from the regulation of the operations on maturity, including the effect of the possible roll-over operation of these derivative financial instruments and from their evaluation at fair value are recognised directly in the net equity in a specific reserve for the effective part; these gains and losses are removed from the net equity and recorded in the income statement in the same period or periods during which the hedged forecast transaction affects income statement (arrival of the goods); they are included in the operating expenses.The ineffective part of any profit or loss is recognised immediately in the financial components of the income statement.The Company does not measure the prospective effectiveness of its hedging operations as, on the basis of the method used for hedging of the price risk on the future cash flows payments related to aluminum purchases on contracts work-in-progress, the Company considers that it always included in the range requested by IAS 39 (80%-125%); any ineffectiveness can occur retrospectively only if the roll-over operations or the closing in advance of an hedging contract by operation of the opposite sign when the order to the supplier is fixed are not performed correctly; the measurement of the retrospective ineffectiveness is therefore made continuously monitoring that these cases do not occur.If the hedged transaction is no longer expected to take place, the accumulated losses or profits on the accumulated price difference entered in the net equity are recognized immediately in the income statement as financial components.
Finally, according to the Company policy the price risk on commodities is made on the spot rate; as a consequence, the difference between spot rate and forward rate recorded when a roll-over operation is performed and the interest component included in the fair value of the forward contracts or swaps on foreign currency, are always recorded in the income statement in the financial components as hedging expenses/revenues, regardless whether the contract does or does not comply with the requirements for being considered as such.
Notes to the Statutory Financial StatementsStatutory Financial Statements
2011ANNUALREPORT

135
(f) Tangible assets (i) Owned tangible assetsItems of property, plant and equipment are stated at cost less accumulated depreciation (depreciation criteria are reported below) and impairment losses (see accounting policy n). The cost of self-constructed assets includes the cost of materials, direct labour, and the initial estimate, where relevant, of the costs of dismantling and removing the items and restoring the site on which they are located, and an appropriate proportion of production overheads.Where parts of an item of property, plant and equipment have different useful lives, they are accounted for as separate items of property, plant and equipment according to the “component approach”.
(ii) Subsequent costs The Company recognises in the carrying amount of an item of property, plant and equipment the cost of replacing part of such an item when that cost is incurred if it is probable that the future economic benefits embodied with the item will flow to the Company and the cost of the item can be measured reliably. All other costs are recognised in the income statement as an expense as incurred.
(iii) DepreciationDepreciation is charged to the income statement on a straight-line basis over the estimated useful lives of each part of an item of property, plant and equipment. Depreciation is applied from the date the tangible assets are available for use. Land is not depreciated. The estimated useful lives are as follows:
buildings 20-40 years plant and machinery 5-25 years equipment 4-5 years other assets 4-8 years
The useful lives and the residual value, if significant, are annually revised.
(g) Intangible assets (i) Research and developmentExpenditure on research activities, undertaken with the prospect of gaining new scientific or technical knowledge and understanding, is recognised in the income statement as an expense as incurred.Expenditure on development activities, whereby research findings are applied to a plan or design for the production of new or substantially improved products and processes, is capitalised if the product or process is technically and commercially feasible and the Company has sufficient resources to complete development. The expenditure capitalised includes the cost of materials, direct labour and an appropriate proportion of overheads.Other development expenditure is recognised in the income statement as an expense as incurred.Capitalised development expenditure is stated at cost less accumulated amortization (amortization criteria are reported below) and impairment losses (see accounting policy n).
(ii) Other intangible assetsOther intangible assets that are acquired by the Company are stated at cost less accumulated amortization (amortization criteria are reported below) and impairment losses (see accounting policy n). Expenditure on internally generated goodwill and brands is recognised in the income statement as an expense as incurred.
(iii) Subsequent expenditureSubsequent expenditure on capitalised intangible assets is capitalised only when it increases the future economic benefits embodied in the specific asset to which it relates. All other expenditure is expensed as incurred.
(iv) AmortizationAmortization is charged to the income statement on a straight-line basis over the estimated useful lives of intangible assets unless such lives are indefinite. Goodwill, intangible assets with an indefinite useful life
Statutory Financial StatementsNotes to the Statutory Financial Statements
136
and intangible assets not yet available to be used are systematically tested for impairment at each balance sheet date. Other intangible assets are amortised from the date they are available for use. The estimated useful lives are as follows:
rights to use intellectual property (software) 3-5 years capitalized development costs 5 years backlog on the basis of the economical development customer relationship 20 years
(h) Investments in subsidiaries and associate companiesInvestments in subsidiaries and associate companies are stated at cost adjusted for any impairment losses.Any positive difference, arising on acquisition, between the purchase cost and the fair value of net assets acquired by the Company in the investee company is, accordingly, included in the carrying amount of the investment.Investments in subsidiaries and associate companies are tested annually, or more often if necessary, for impairment. Where evidence of impairment exists, an impairment loss is recognized directly in the income statement. If the company’s share of losses of the investee exceeds the carrying amount of the investment and if the company has an obligation or intention to cover these losses, the company’s interest is reduced to zero and a liability is recognized for its share of the additional losses. If the impairment loss subsequently no longer exists or is reduced, a reversal is recognized in the income statement up to the limit of the cost of the investment.
(i) Trade receivables to third parties Trade receivables are recognised initially at fair value and subsequently recorded at the amortised cost, using the effective interest method, net of impairment losses related to amounts considered recoverable, recorded as provision. The estimation of the recoverable amounts is based of future expected cash flows.Trade receivables, whose expiry date is within ordinary trade terms, are not discounted.
(j) Contracts work-in-progressContracts work-in-progress are reported in accordance with the progress stage (or completion percentage) of the works, according to which the costs, revenues, and margin are recognised based on the progress of the productive activity. The policy adopted by the Company is the completion percentage determined by applying the “incurred cost” (cost to cost) criterion.The valuation reflects the best estimate of the contracts made as at the reporting date. Periodically, the assumptions underlying the evaluations are updated. Any economic effect is recorded in the year in which the updates have been made.The contract revenues include the payments agreed upon by contract, work changes, price revision, incentives, and any claims, to the extent that these are likely to be reliably valuated. In particular, the valuation of claims was guided, based on certain technical and legal analysis, towards the positive results that could reasonably be achieved from disputes with the customers.The contracts costs include all the costs that refer directly to the project, the costs that may be attributed to the contract activity in general and that may be allocated to the said project, in addition to any other costs that may be specifically charged to the customer based on the contractual clauses.The contract costs also include the pre-operative costs, which is to say the costs incurred in the initial phase of the contract before the construction activity is began (costs or preparing, tenders, design costs, costs for organization and start-up of production, construction site installation costs) and the post-operative costs that are incurred after the contract is closed (removal of the construction site, return of plant/equipment to base, etc.).Should the completion of a project be forecast to lead to a loss, this shall be recognised in its entirety in the year in which it may be reasonably expected.The contracts in progress are set out net of any depreciation fund and/or final losses, as well as the progress billings for the contract being carried out.This analysis is carried out on a contract by contract basis: should the difference be positive (due to contracts in progress greater than the amounts of the progress billings), it is classified among the assets (contracts work-in-progress); on the other hand, should the difference be negative, it is classified among the liabilities
2011ANNUALREPORT
Notes to the Statutory Financial StatementsStatutory Financial Statements

137
(liabilities for contracts work-in-progress).Should the final losses fund for the individual contract exceed the value of the work entered in the assets, this excess is classified under the provision for risks and charges.Contracts with payment denominated in foreign currency other than the functional currency (Euro for the Company) are valuated by converting the accrued share of payments determined based on the completion percentage method, at the exchange rate ruling at the reporting date for the portion yet not invoiced, and at the exchange rate ruling at the transaction date for the portion already invoiced.
(k) Inventories Inventories are stated at the lower of cost and net realisable value. Net realisable value is the estimated selling price in the ordinary course of business, less the estimated costs of completion and selling expenses. The cost determining method selected as a Company principle is the weighted average cost and includes expenditure incurred in acquiring the inventories and bringing them to their existing location and condition. In the case of manufactured inventories and works in progress, cost includes an appropriate share of overheads based on normal operating capacity.
(l) Other financial assets Other financial assets that the Company intends and is able to hold until maturity are recorded at the fair value of the initial consideration given in exchange plus the related transaction costs. Subsequently, they are valued on an amortised-cost basis using the original effective interest method.Financial assets are derecognised when, following their sale or settlement, the Company is no longer involved in their management and has transferred all risks and rewards of ownership.
(m) Cash and cash equivalentsCash and cash equivalents include bank and post current accounts and deposits. Bank overdrafts, advances and other short-term loans which are repayable on demand and form an integral part of the Company’s cash managements are considered as components of cash surplus or deficit for cash flow statement purposes.
(n) Impairment of tangible and intangible assetsThe carrying amounts of tangible and intangible are reviewed at each balance sheet date to determine whether there is any indication of impairment. If any such indication exists, the asset’s recoverable amount is estimated. Even if there are no indication of impairment, for goodwill, assets that have an indefinite useful life and intangible assets that are not yet available for use, the recoverable amount is estimated at each balance sheet date.An impairment loss is recognised whenever the carrying amount of an asset or its cash-generating unit exceeds its recoverable amount. Impairment losses are recognised in the income statement.Impairment losses recognised in respect of cash-generating units are allocated first to reduce the carrying amount of any goodwill allocated to cash-generating units (group of units) and then, to reduce the carrying amount of the other assets in the unit (group of units) on a pro rata basis.
(i) Calculation of recoverable amountThe recoverable amount of an asset is the greater of their net selling price and value in use. In assessing value in use, the estimated future cash flows are discounted to their present value using a pre-tax discount rate that reflects current market assessments of the time value of money and the risks specific to the asset. For an asset that does not generate largely independent cash inflows, the recoverable amount is determined for the cash-generating unit to which the asset belongs.
(ii) Reversal of impairmentAn impairment loss, except if in respect of goodwill, is reversed and recorded in the income statement, only if the reasons for the impairment loss cease to exist.An impairment loss is reversed only to the extent that the asset’s carrying amount does not exceed the carrying amount that would have been determined, net of depreciation or amortization, if no impairment loss had been recognised.
Statutory Financial StatementsNotes to the Statutory Financial Statements
138
(o) Equity(i) Share capitalShare capital includes the subscribed and paid up Company’s share capital.
(ii) DividendsDividends are recognised as a liability in the period in which they are declared.
(iii) Treasury shares Treasury shares are entered as write-down of the shareholder’s equity. The original cost of treasury shares and the income arising from their subsequent sale, if pertinent, are entered as movements in the shareholder’s equity.
(p) Amounts payable to banks and other financial creditors Amounts payable to banks and other financial creditors are recognised initially at fair value less attributable transaction costs. Subsequent to initial recognition, they are stated at amortised cost with any difference between cost and redemption value being recognised in the income statement over the period of the borrowings or loans on an effective interest basis.
(q) Pension funds and other employee benefits(i) Defined contribution plansObligations for contributions to defined contribution pension plans are recognised as an expense in the income statement as incurred.
(ii) Severance indemnity fundThe severance indemnity fund, showed in the statement of financial position, compulsory for the Italian Group companies according to law n. 297/1982, exclusively refers to the amount accrued before 2007; it is considered under IFRS a defined benefit plan and therefore it is calculated according to the method described in the previous paragraph.The Company’s net obligation in respect of defined benefit pension plans is calculated separately for each plan by estimating the amount of future benefit that employees have earned in return for their service in the current and prior periods; that benefit is discounted to determine its present value, and the fair value of any plan assets is deducted. The discount rate is the yield at the balance sheet date on AAA credit rated bonds that have maturity dates approximating to the terms of the Company’s obligations. The calculation is performed by a qualified actuary using the projected unit credit method.When the benefits of a plan are improved, the portion of the increased benefit relating to past service by employees is recognised as an expense in the income statement on a straight-line basis over the average period until the benefits become vested. To the extent that the benefits vest immediately, the expense is recognised immediately in the income statement. All actuarial gains and losses are recognized immediately in the income statement as the Company decided to not adopt the “corridor approach”.Following to the reform on complementary pension funds with special reference to the companies with at least 50 employees, the severance indemnity accrued from 1 January 2007 is directly allocated to complementary pension funds or to INPS (Italian National Institute for Social insurance), in compliance with the employees’ choices; consequently, according to IAS 19, obligations towards INPS and contributions to complementary pension funds take on the nature of defined contribution plan.
(iii) Other long-term benefits The Company’s net obligation in respect of other long-term service benefits, other than pension plans, is the amount of future benefit that employees have earned in return for their service in the current and prior periods. The obligation is calculated using the projected unit credit method and is discounted to its present value and the fair value of any related assets is deducted. The discount rate is the yield at the balance sheet date on AAA credit rated bonds that have maturity dates approximating to the terms of the Company’s obligations.
(r) Provision for risks and chargesA provision is recognised in the statement of financial position when the Company has a present legal or
2011ANNUALREPORT
Notes to the Statutory Financial StatementsStatutory Financial Statements
139
constructive obligation as a result of a past event, and it is probable that an outflow of economic benefits will be required to settle the obligation and a reliable estimation of the obligation amount can be done.Provisions are recorded on the basis of the best estimation of the amount that the Company would pay to settle the obligation or to transfer it to third parties at the reporting period.If the effect is material, provisions are determined by discounting the expected future cash flows at a pre-tax rate that reflects current market assessments of the time value of money and, where appropriate, the risks specific to the liability.
(s) Trade payables to third parties Trade payables are recorded at the amortised cost, using the effective interest method. Trade payables, whose expiry dates are within the ordinary trade terms, are not discounted.
(t) Other financial liabilities The other financial liabilities are initially recorded at cost, net of any transaction costs directly attributable to their creation. Following initial recording, financial liabilities are valued on an amortised-cost basis using the effective interest method.Financial liabilities are derecognised when, following their sale or settlement, the Company is no longer involved in their management and has transferred all risks and rewards of ownership.
(u) Revenue recognition(i) Contracts work-in-progressAs soon as the outcome of a contract can be estimated reliably, contract revenue and expenses are recognised in the income statement in proportion to the stage of completion of the contract that is calculated as based on the between costs effectively incurred and total costs included in the contract budget. An expected loss on a contract is recognised immediately in the income statement.
(ii) Goods sold and services rendered Revenue from the sale of goods is recognised in the income statement when the significant risks and rewards of ownership have been transferred to the buyer. Revenue from services rendered is recognised in the income statement in proportion to the stage of completion of the transaction at the balance sheet date. The stage of completion is assessed checking the work performed. No revenue is recognised if there are significant uncertainties regarding recovery of the consideration due, associated costs or the possible return of goods.
(v) Expenses(i) Operating lease payments
Payments made under operating leases are recognised in the income statement on a straight-line basis over the term of the lease. Lease incentives received are recognised in the income statement as an integral part of the total lease expense.
(ii) Net financial expensesNet financing costs comprise interest payable on borrowings calculated using the effective interest rate method, dividends, foreign exchange gains and losses except for those related to cash flow hedging operations that are included in the operating revenues or expenses, and premiums and discounts related to all forward exchange contracts and swaps on foreign currency. Interest income is recognised in the income statement as it accrues, using the effective interest method. Dividends income is recognised in the income statement on the date the entity’s right to receive payments is established. The interest expense component of finance lease payments is recognised in the income statement using the effective interest rate method. Borrowing costs that are directly attributable to the acquisition, construction or production of qualifying assets (as defined under IAS 23 – Borrowing Costs), which are assets that necessarily
Statutory Financial StatementsNotes to the Statutory Financial Statements

140
take a substantial period of time to get ready for their intended use or sale, are capitalised and amortised over the useful life of the class of assets to which they refer.All other borrowing costs are expensed when incurred.
(w) Income taxIncome tax on the profit or loss for the year comprises current and deferred tax. Income tax is recognised in the income statement except to the extent that it relates to items recognised directly in equity, in which case it is recognised in equity. Current tax is the expected tax payable on the taxable income for the year, using tax rates enacted or substantially enacted at the balance sheet date, and any adjustment to tax payable in respect of previous years.Deferred tax is provided using the balance sheet liability method, providing for temporary differences between the carrying amounts of assets and liabilities for financial reporting purposes and the amounts used for taxation purposes.The following temporary differences are not provided for:
goodwill not deductible for tax purposes; the initial recognition of assets or liabilities that affect neither accounting nor taxable profit; differences relating to investments in subsidiaries to the extent that they will probably not reverse
in the foreseeable future.
The amount of deferred tax provided is based on the expected manner of realisation or settlement of the carrying amount of assets and liabilities, using tax rates enacted or substantively enacted at the balance sheet date.A deferred tax asset is recognised only to the extent that it is probable that future taxable profits will be available against which the asset can be utilised. Deferred tax assets are reduced to the extent that it is no longer probable that the related tax benefit will be realised.Additional income taxes that arise from the distribution of dividends are recognised at the same time as the liability to pay the related dividend.Additional income taxes arising from the distribution of dividends are recognised when the liability associated to the payment of the same dividend is acknowledged. This is justified by the fact that the Company is able to manage the time plan for the distribution of the reserves and it is quite possible that they will not be distributed in the foreseeable future.Permasteelisa S.p.A. and its Italian subsidiaries Permasteelisa Interiors S.r.l., Permasteelisa Impianti S.r.l. has elected to take part in the domestic tax consolidation program pursuant to Articles 117/129 of the Consolidated Income Tax Act (T.U.I.R.); the election was made for a three-year period beginning in 2005. The election was renewed for three-year period 2008-2010; during 2010, following to the acquisition of Permasteelisa S.p.A. by Terre Alte S.p.A., the company Montrachet S.p.A., holding company of Terre Alte S.p.A., chose to take part in the domestic tax consolidation program for the three-year period 2010-2012 with the joining of all its subsidiaries and consequently the interruption of the previous election made by Permasteelisa S.p.A.Permasteelisa S.p.A acts as the consolidating company in this program and calculates a single taxable base for the group of companies taking part, enabling benefits to be realized from the offsetting of taxable income and tax losses in a single tax return. Each company participating in the consolidation transfers its taxable income or tax loss to the consolidating company. Permasteelisa S.p.A. recognizes receivables from companies contributing taxable income, corresponding to the amount of IRES (corporate income tax) paid on its behalf. In the case of a company contributing a tax loss to the consolidation, Permasteelisa S.p.A. recognizes a payable to that company for the amount of the loss actually set off at group level.
(x) Non-current assets held for sale and discontinued operationsImmediately before classification as held for sale, the measurement of the assets (and all assets and liabilities in a disposal group) is brought up-to-date in accordance with applicable IFRS. Then, on initial classification as held for sale, non-current assets and disposal groups are recognised at the lower of carrying amount and fair value less costs to sell.Impairment losses on initial classification as held for sale are included in profit or loss, even when there is a revaluation. The same applies to gains and losses on subsequent re-measurement. A discontinued operation is a component of the Company’s business that represents a separate major line
2011ANNUALREPORT
Notes to the Statutory Financial StatementsStatutory Financial Statements

141
of business or geographical area of operations or is a subsidiary acquired exclusively with a view to resale.Classification as a discontinued operation occurs upon disposal or when the operation meets the criteria to be classified as held for sale, if earlier. A disposal group that is to be abandoned may also qualify as discontinued operation.
(y) New accounting principlesAccounting standards, amendments and interpretations applied since 1 January 2011
On 4 November 2009, the IASB issued a revised version of IAS 24 - Related Party Disclosures that simplifies the disclosure requirements for government-related entities and clarifies the definition of a related party. Application of this amendment did not have any significant effects on the measurement of items in the Group’s financial statements and had only limited effects on the disclosures for related party transactions provided in these consolidated financial statements.
Accounting standards, amendments and interpretations effective from 1 January 2011 but
not applicable to the Company
The following amendments, improvements and interpretations have also been issued and are effective from 1 January 2011; these relate to matters that were not applicable to the Company at the date of these financial statements but which may affect the accounting for future transactions or arrangements:
Financial Instruments: Presentation, Classification of Rights Issues: an amendment to IAS 32; Prepayments of a Minimum Funding Requirement: an amendment to IFRIC 14; IFRIC 19 - Extinguishing Financial Liabilities with Equity Instruments; Improvements to IAS/IFRS (2010).
Accounting standards and amendments not yet applicable and not early adopted by the
Company
Except for the amendments to IFRS 7 - Financial Instruments: Disclosures issued on 7 October 2011 described below, the European Union had not yet completed its endorsement process for these standards and amendments at the date of these consolidated financial statements.
On 12 November 2009, the IASB issued a new standard IFRS 9 - Financial Instruments that was subsequently amended. This standard, having an effective date for mandatory adoption of 1 January 2015 retrospectively, represents the completion of the first part of a project to replace IAS 39 and introduces new requirements for the classification and measurement of financial assets and financial liabilities. The new standard uses a single approach to determine whether a financial asset is measured at amortised cost or fair value, replacing the many different rules in IAS 39. The approach in IFRS 9 is based on how an entity manages its financial instruments and the contractual cash flow characteristics of the financial assets. The most significant effect of the standard regarding the classification and measurement of financial liabilities relates to the accounting for changes in fair value attributable to changes in the credit risk of financial liabilities designated as at fair value through profit or loss. Under the new standard these changes are recognised in other comprehensive income and are not subsequently reclassified to profit or loss.
On 20 December 2010, the IASB issued an amendment to IAS 12 - Income Taxes which clarify the accounting for deferred tax relating to investment properties measured at fair value. The amendment introduces the presumption that the carrying amount of deferred taxes relating to investment properties measured at fair value under IAS 40 will be recovered through sale. As a result of the amendments, SIC-21 - Income Taxes - Recovery of Revalued Non-Depreciable Assets no longer applies. These amendments are effective retrospectively from 1 January 2012.
On 12 May 2011, the IASB issued IFRS 10 - Consolidated Financial Statements replacing SIC-12 - Consolidation - Special Purpose Entities and parts of IAS 27 - Consolidated and Separate Financial Statements (subsequently reissued as IAS 27 - Separate Financial Statements which addresses the accounting treatment of investments in separate financial statements). The new standard builds on existing principles by identifying the concept of control as the determining factor in whether an entity should be included in the consolidated financial statements of the parent company. The standard provides additional
Statutory Financial StatementsNotes to the Statutory Financial Statements

142
guidance to assist in the determination of control where this is difficult to assess. The standard is effective retrospectively from 1 January 2013.
On 12 May 2011, the IASB issued IFRS 11 - Joint Arrangements superseding IAS 31 - Interests in Joint Ventures and SIC-13 - Jointly-controlled Entities - Non-Monetary Contributions by Venturers. The new standard provides the criteria for identifying joint arrangements by focusing on the rights and obligations of the arrangement rather than its legal form and requires a single method to account for interests in jointly-controlled entities, the equity method. The standard is effective retrospectively from 1 January 2013. Following the issue of the new standard, IAS 28 - Investments in Associates has been amended to include accounting for investments in jointly-controlled entities in its scope of application (from the effective date of the standard).
On 12 May 2011, the IASB issued IFRS 12 - Disclosure of Interests in Other Entities, a new and comprehensive standard on disclosure requirements for all forms of interests in other entities, including subsidiaries, joint arrangements, associates, special purpose vehicles and other unconsolidated vehicles. The standard is effective for annual periods beginning after 1 January 2013.
On 12 May 2011, the IASB issued IFRS 13 - Fair Value Measurement, clarifying the determination of the fair value for the purpose of the financial statements and applying to all IFRSs permitting or requiring a fair value measurement or the presentation of disclosures based on fair value. The standard is effective prospectively from 1 January 2013.
On 16 June 2011, the IASB issued an amendment to IAS 1 - Presentation of Financial Statements requiring companies to group together items within other comprehensive income that may be reclassified to the profit or loss section of the income statement. The amendment is applicable for periods beginning on or after 1 July 2012.
On 16 June 2011, the IASB issued an amended version of IAS 19 - Employee Benefits. The amendments make improvements to the previous version by eliminating the option to defer the recognition of gains and losses, known as the “corridor method”, and by requiring the whole of the fund’s deficit or surplus to be presented in the statement of financial position, the components of cost relating to service and net interest to be recognised in profit or loss and actuarial gains and losses arising from the remeasurement of assets and liabilities at each balance sheet date to be recognised in other comprehensive income. In addition, the return on assets included in net interest costs must now be calculated using the discount rate applicable to liabilities and no longer the expected return on the assets. The amendments also introduce the requirement for additional disclosures to be provided in the notes. The amended version of IAS 19 is applicable on a retrospective basis from 1 January 2013.
On 16 December 2011, the IASB issued certain amendments to IAS 32 - Financial Instruments: Presentation to clarify the application of certain offsetting criteria for financial assets and financial liabilities in IAS 32. The amendments are effective for annual periods beginning on or after 1 January 2014 and are required to be applied retrospectively.
On 16 December 2011, the IASB issued certain amendments to IFRS 7 - Financial Instruments: Disclosures. The amendments require information about the effect or potential effect of netting arrangements for financial assets and liabilities on an entity’s financial position. Entities are required to apply the amendments for annual reporting periods beginning on or after January 1, 2013, and interim periods within those annual periods. The required disclosures should be provided retrospectively.
Finally, on 7 October 2010, the IASB issued amendments to IFRS 7 - Financial Instruments: Disclosures. The amendments will enable users of financial statements to improve their understanding of transfers (“derecognition”) of financial assets, including an understanding of the possible effects of any risks that may remain with the entity that transferred the assets. The amendments also require additional disclosures if a disproportionate amount of a transfer transaction is undertaken at the end of a reporting period. Entities are required to apply the amendments for annual periods beginning on or after 1 July 2011. Application of this amendment is not expected to have any effects on the measurement of items in the financial statements.
2011ANNUALREPORT
Notes to the Statutory Financial StatementsStatutory Financial Statements

143
Tour FirstParis \ France
Ph.
: Ann
e Th
omes
- A
genc
e Le
Squ
are
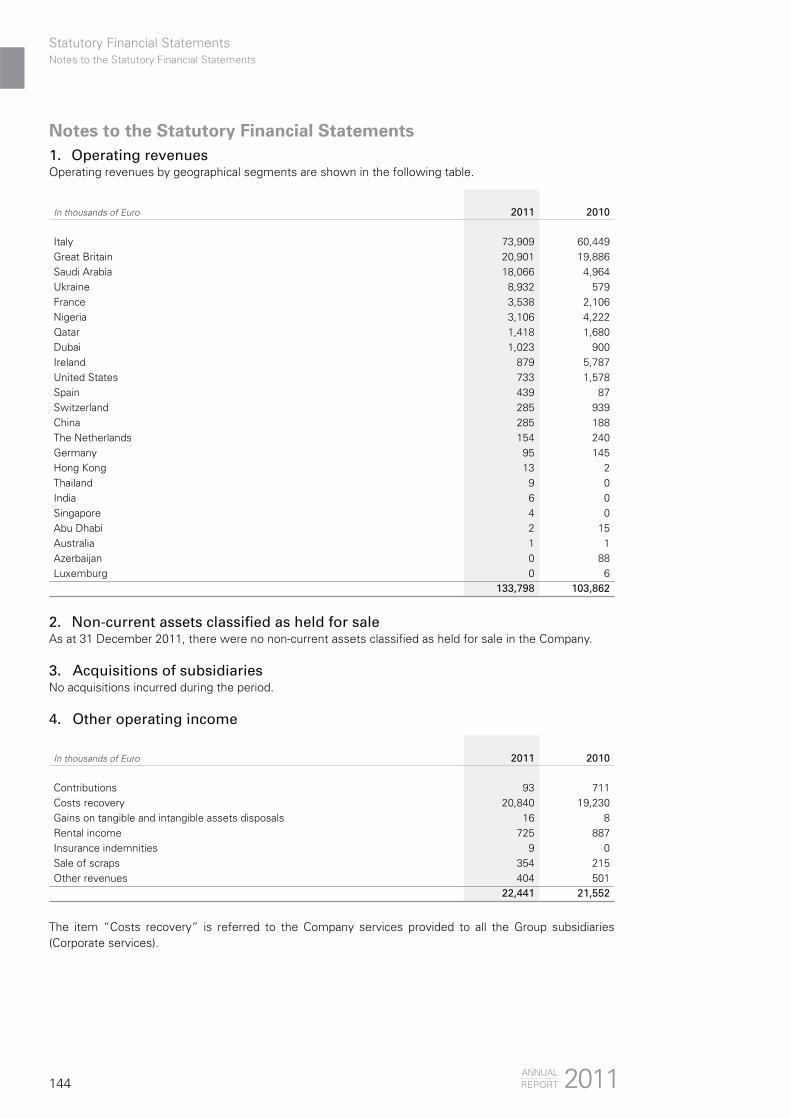
144
1. Operating revenuesOperating revenues by geographical segments are shown in the following table.
In thousands of Euro 2011 2010
Italy 73,909 60,449Great Britain 20,901 19,886Saudi Arabia 18,066 4,964Ukraine 8,932 579France 3,538 2,106Nigeria 3,106 4,222Qatar 1,418 1,680Dubai 1,023 900Ireland 879 5,787United States 733 1,578Spain 439 87Switzerland 285 939China 285 188The Netherlands 154 240Germany 95 145Hong Kong 13 2Thailand 9 0India 6 0Singapore 4 0Abu Dhabi 2 15Australia 1 1Azerbaijan 0 88Luxemburg 0 6
133,798 103,862
2. Non-current assets classified as held for saleAs at 31 December 2011, there were no non-current assets classified as held for sale in the Company.
3. Acquisitions of subsidiariesNo acquisitions incurred during the period.
4. Other operating income
In thousands of Euro 2011 2010
Contributions 93 711Costs recovery 20,840 19,230Gains on tangible and intangible assets disposals 16 8Rental income 725 887Insurance indemnities 9 0Sale of scraps 354 215Other revenues 404 501
22,441 21,552
The item “Costs recovery” is referred to the Company services provided to all the Group subsidiaries (Corporate services).
Notes to the Statutory Financial Statements
2011ANNUALREPORT
Notes to the Statutory Financial StatementsStatutory Financial Statements
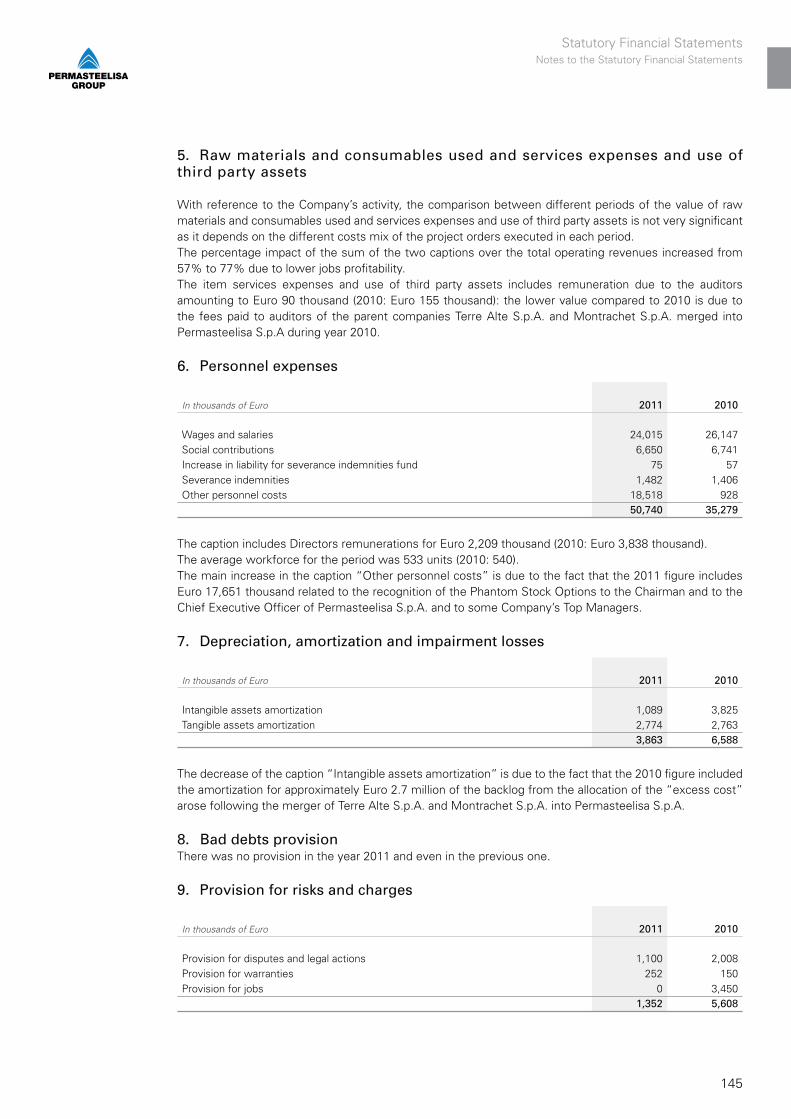
145
5. Raw materials and consumables used and services expenses and use of third party assets
With reference to the Company’s activity, the comparison between different periods of the value of raw materials and consumables used and services expenses and use of third party assets is not very significant as it depends on the different costs mix of the project orders executed in each period. The percentage impact of the sum of the two captions over the total operating revenues increased from 57% to 77% due to lower jobs profitability.The item services expenses and use of third party assets includes remuneration due to the auditors amounting to Euro 90 thousand (2010: Euro 155 thousand): the lower value compared to 2010 is due to the fees paid to auditors of the parent companies Terre Alte S.p.A. and Montrachet S.p.A. merged into Permasteelisa S.p.A during year 2010.
6. Personnel expenses
In thousands of Euro 2011 2010
Wages and salaries 24,015 26,147 Social contributions 6,650 6,741 Increase in liability for severance indemnities fund 75 57 Severance indemnities 1,482 1,406 Other personnel costs 18,518 928
50,740 35,279
The caption includes Directors remunerations for Euro 2,209 thousand (2010: Euro 3,838 thousand).The average workforce for the period was 533 units (2010: 540).The main increase in the caption “Other personnel costs” is due to the fact that the 2011 figure includes Euro 17,651 thousand related to the recognition of the Phantom Stock Options to the Chairman and to the Chief Executive Officer of Permasteelisa S.p.A. and to some Company’s Top Managers.
7. Depreciation, amortization and impairment losses
In thousands of Euro 2011 2010
Intangible assets amortization 1,089 3,825Tangible assets amortization 2,774 2,763
3,863 6,588
The decrease of the caption “Intangible assets amortization” is due to the fact that the 2010 figure included the amortization for approximately Euro 2.7 million of the backlog from the allocation of the “excess cost” arose following the merger of Terre Alte S.p.A. and Montrachet S.p.A. into Permasteelisa S.p.A.
8. Bad debts provisionThere was no provision in the year 2011 and even in the previous one.
9. Provision for risks and charges
In thousands of Euro 2011 2010
Provision for disputes and legal actions 1,100 2,008Provision for warranties 252 150Provision for jobs 0 3,450
1,352 5,608
Statutory Financial StatementsNotes to the Statutory Financial Statements
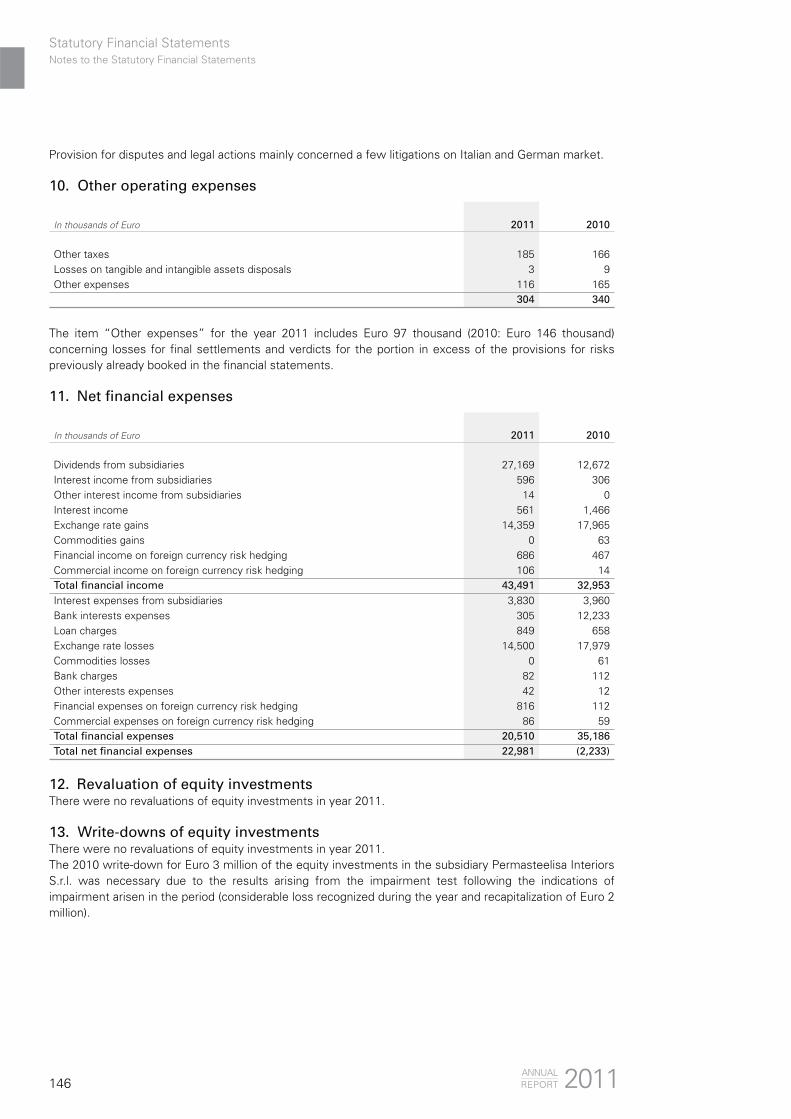
146
Provision for disputes and legal actions mainly concerned a few litigations on Italian and German market.
10. Other operating expenses
In thousands of Euro 2011 2010
Other taxes 185 166Losses on tangible and intangible assets disposals 3 9Other expenses 116 165
304 340
The item “Other expenses” for the year 2011 includes Euro 97 thousand (2010: Euro 146 thousand) concerning losses for final settlements and verdicts for the portion in excess of the provisions for risks previously already booked in the financial statements.
11. Net financial expenses
In thousands of Euro 2011 2010
Dividends from subsidiaries 27,169 12,672Interest income from subsidiaries 596 306Other interest income from subsidiaries 14 0Interest income 561 1,466Exchange rate gains 14,359 17,965Commodities gains 0 63Financial income on foreign currency risk hedging 686 467Commercial income on foreign currency risk hedging 106 14Total financial income 43,491 32,953Interest expenses from subsidiaries 3,830 3,960Bank interests expenses 305 12,233Loan charges 849 658Exchange rate losses 14,500 17,979Commodities losses 0 61Bank charges 82 112Other interests expenses 42 12Financial expenses on foreign currency risk hedging 816 112Commercial expenses on foreign currency risk hedging 86 59Total financial expenses 20,510 35,186Total net financial expenses 22,981 (2,233)
12. Revaluation of equity investmentsThere were no revaluations of equity investments in year 2011.
13. Write-downs of equity investmentsThere were no revaluations of equity investments in year 2011.The 2010 write-down for Euro 3 million of the equity investments in the subsidiary Permasteelisa Interiors S.r.l. was necessary due to the results arising from the impairment test following the indications of impairment arisen in the period (considerable loss recognized during the year and recapitalization of Euro 2 million).
2011ANNUALREPORT
Notes to the Statutory Financial StatementsStatutory Financial Statements
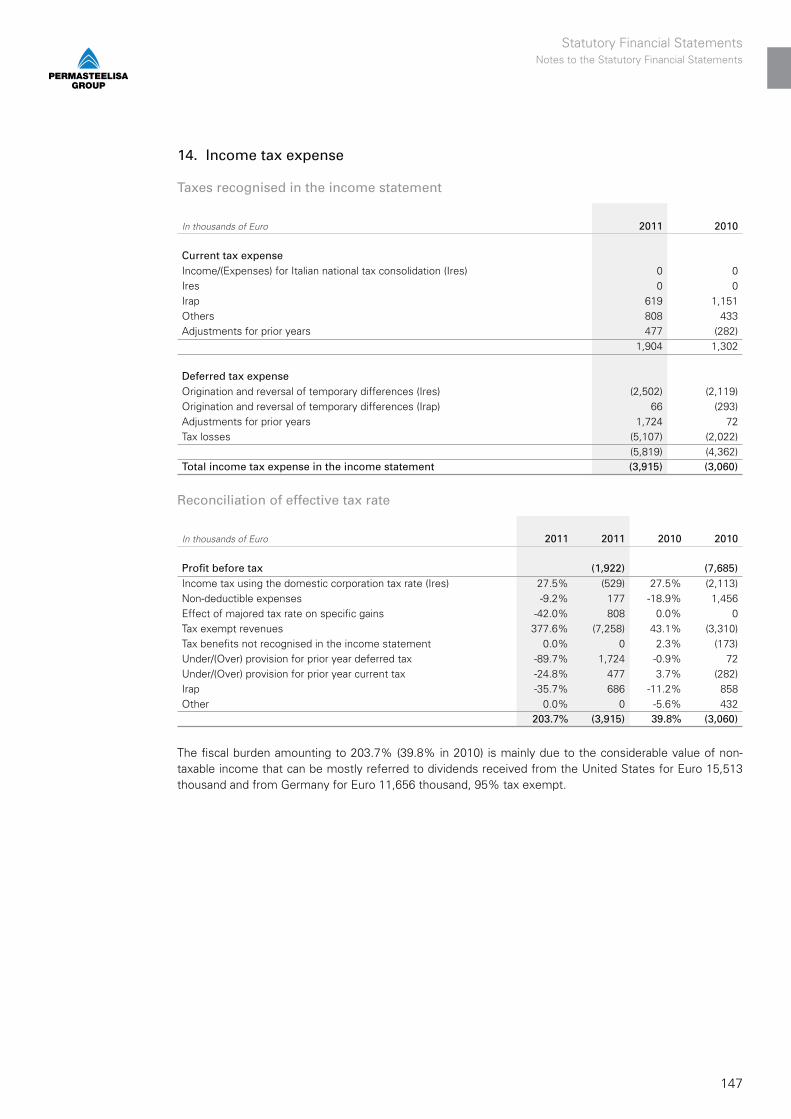
147
14. Income tax expense
Taxes recognised in the income statement
In thousands of Euro 2011 2010
Current tax expense Income/(Expenses) for Italian national tax consolidation (Ires) 0 0Ires 0 0Irap 619 1,151Others 808 433Adjustments for prior years 477 (282)
1,904 1,302
Deferred tax expense Origination and reversal of temporary differences (Ires) (2,502) (2,119)Origination and reversal of temporary differences (Irap) 66 (293)Adjustments for prior years 1,724 72Tax losses (5,107) (2,022)
(5,819) (4,362)Total income tax expense in the income statement (3,915) (3,060)
Reconciliation of effective tax rate
In thousands of Euro 2011 2011 2010 2010
Profit before tax (1,922) (7,685)Income tax using the domestic corporation tax rate (Ires) 27.5% (529) 27.5% (2,113)Non-deductible expenses -9.2% 177 -18.9% 1,456Effect of majored tax rate on specific gains -42.0% 808 0.0% 0Tax exempt revenues 377.6% (7,258) 43.1% (3,310)Tax benefits not recognised in the income statement 0.0% 0 2.3% (173)Under/(Over) provision for prior year deferred tax -89.7% 1,724 -0.9% 72Under/(Over) provision for prior year current tax -24.8% 477 3.7% (282)Irap -35.7% 686 -11.2% 858Other 0.0% 0 -5.6% 432
203.7% (3,915) 39.8% (3,060)
The fiscal burden amounting to 203.7% (39.8% in 2010) is mainly due to the considerable value of non-taxable income that can be mostly referred to dividends received from the United States for Euro 15,513 thousand and from Germany for Euro 11,656 thousand, 95% tax exempt.
Statutory Financial StatementsNotes to the Statutory Financial Statements

148
15. Intangible assets
In thousands of Euro
Development costs
Rights to use intellectual
property
Otherintangible
assets
Intangible assets in progress and
advances
Total
Balance at 1 January 2010 90 1,514 7,792 1,342 10,738Acquisitions 828 1,334 2,162Other increases 348 348Other decreases (348) (348)Amortization (46) (582) (3,197) (3,825)Balance at 31 December 2010 44 2,108 4,595 2,328 9,075
Carrying amounts
At 1 January 2010 attributable to:Cost 581 5,775 10,523 1,342 18,221
Accumulated amortization (491) (4,261) (2,731) 0 (7,483)90 1,514 7,792 1,342 10,738
At 31 December 2010 attributable to:Cost 581 6,950 10,523 2,328 20,382
Accumulated amortization (537) (4,842) (5,928) 0 (11,307)44 2,108 4,595 2,328 9,075
In thousands of Euro
Development costs
Rights to use intellectual
property
Otherintangible
assets
Intangible assets in progress and
advances
Total
Balance at 1 January 2011 44 2,108 4,595 2,328 9,075Acquisitions 281 958 1,239Other increases 544 544Other decreases (544) (544)Amortization (44) (775) (270) (1,089)Balance at 31 December 2011 0 2,158 4,325 2,742 9,225
Carrying amounts
At 1 January 2011 attributable to:Cost 581 6,950 10,523 2,328 20,382
Accumulated amortization (537) (4,842) (5,928) 0 (11,307)44 2,108 4,595 2,328 9,075
At 31 December 2011 attributable to:Cost 581 7,776 10,523 2,742 21,622
Accumulated amortization (581) (5,618) (6,198) 0 (12,397)(0) 2,158 4,325 2,742 9,225
The increase for the period in the software category under the item “Rights to use intellectual property” is mainly due to the costs incurred for other development on SAP applications and for the purchase of new licenses for Euro 132 thousand; other licences for the technical department for Euro 45 thousand were also purchased, the development of S70 technology and of the internet web site was completed for respectively Euro 30 thousand and for Euro 31 thousand, while Euro 34 thousand was spent to improve the company network security.The main increases in the category “Intangible assets and advances” are mainly due for Euro 464 thousand to the ending of PMF project (Pemasteelisa Moving Forward) to create an integrated product planning and engineering tool; the amount of approximately Euro 292 thousand is related to the main project supplier,
2011ANNUALREPORT
Notes to the Statutory Financial StatementsStatutory Financial Statements
149
AUTODESK, and for approximately Euro 172 thousand to other suppliers; other increases are due for approximately Euro 216 thousand to the migration into SAP corporate system of the German subsidiary Gartner and for Euro 28 thousand to the ending of the migration into SAP corporate system of the Middle Eastern subsidiaries; at last other increases are due for Euro 111 thousand to the document management into SAP, for Euro 66 thousand to various developments on SAP system, for Euro 45 thousand to Virtual Laboratory project and for Euro 28 thousand to the continuing of the common domain system project.
Impairment losses and subsequent reversalThe management considered that, with respect to 31 December 2010, no specific impairment losses occurred which would have led the Company to measure the recoverable value of intangible assets through the relevant impairment test.
Statutory Financial StatementsNotes to the Statutory Financial Statements
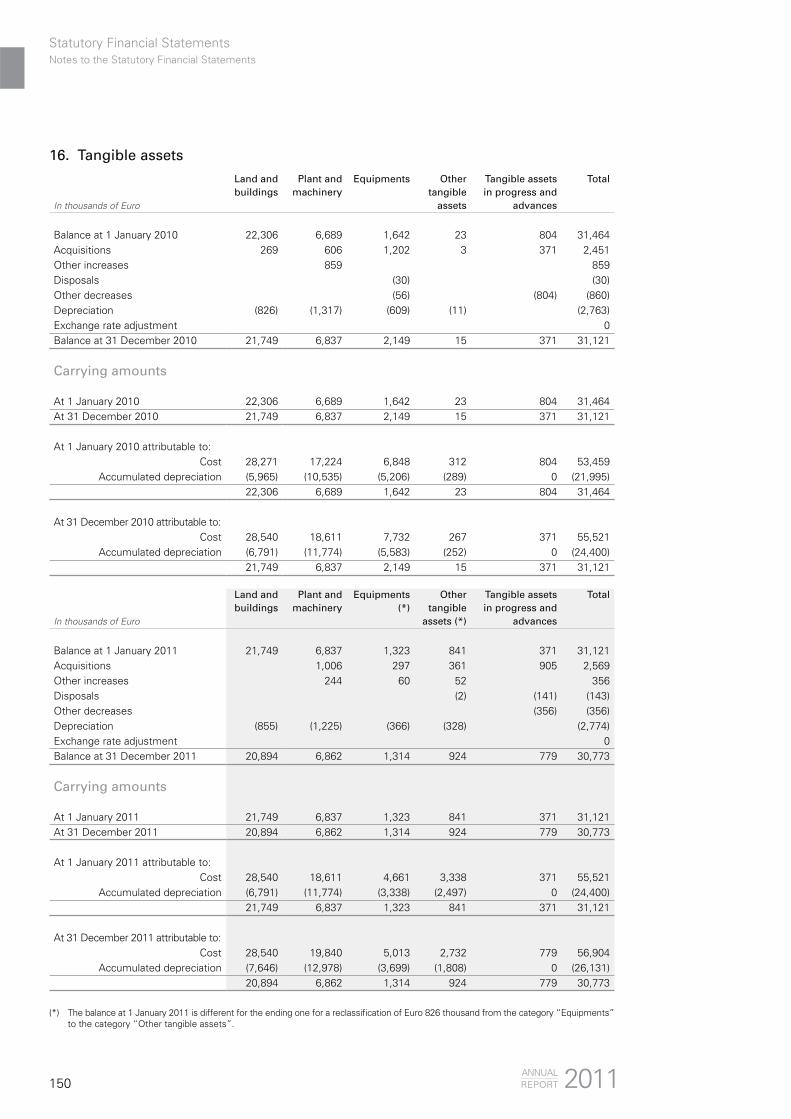
150
16. Tangible assets
In thousands of Euro
Land and buildings
Plant and machinery
Equipments Other tangible
assets
Tangible assets in progress and
advances
Total
Balance at 1 January 2010 22,306 6,689 1,642 23 804 31,464 Acquisitions 269 606 1,202 3 371 2,451Other increases 859 859Disposals (30) (30)Other decreases (56) (804) (860)Depreciation (826) (1,317) (609) (11) (2,763)Exchange rate adjustment 0Balance at 31 December 2010 21,749 6,837 2,149 15 371 31,121
Carrying amounts
At 1 January 2010 22,306 6,689 1,642 23 804 31,464At 31 December 2010 21,749 6,837 2,149 15 371 31,121
At 1 January 2010 attributable to:Cost 28,271 17,224 6,848 312 804 53,459
Accumulated depreciation (5,965) (10,535) (5,206) (289) 0 (21,995)22,306 6,689 1,642 23 804 31,464
At 31 December 2010 attributable to:Cost 28,540 18,611 7,732 267 371 55,521
Accumulated depreciation (6,791) (11,774) (5,583) (252) 0 (24,400)21,749 6,837 2,149 15 371 31,121
In thousands of Euro
Land and buildings
Plant and machinery
Equipments (*)
Other tangible
assets (*)
Tangible assets in progress and
advances
Total
Balance at 1 January 2011 21,749 6,837 1,323 841 371 31,121 Acquisitions 1,006 297 361 905 2,569Other increases 244 60 52 356Disposals (2) (141) (143)Other decreases (356) (356)Depreciation (855) (1,225) (366) (328) (2,774)Exchange rate adjustment 0Balance at 31 December 2011 20,894 6,862 1,314 924 779 30,773
Carrying amounts
At 1 January 2011 21,749 6,837 1,323 841 371 31,121At 31 December 2011 20,894 6,862 1,314 924 779 30,773
At 1 January 2011 attributable to:Cost 28,540 18,611 4,661 3,338 371 55,521
Accumulated depreciation (6,791) (11,774) (3,338) (2,497) 0 (24,400) 21,749 6,837 1,323 841 371 31,121
At 31 December 2011 attributable to:Cost 28,540 19,840 5,013 2,732 779 56,904
Accumulated depreciation (7,646) (12,978) (3,699) (1,808) 0 (26,131) 20,894 6,862 1,314 924 779 30,773
(*) The balance at 1 January 2011 is different for the ending one for a reclassification of Euro 826 thousand from the category “Equipments” to the category “Other tangible assets”.
2011ANNUALREPORT
Notes to the Statutory Financial StatementsStatutory Financial Statements

151
The investments as regards:- “Plant and Machinery” to the purchase of 2 numerically control machine tools (Euro 432 thousand),
to the purchase of equipment for the production plant as beader, suction cup assemblies or electrospindles (Euro 201 thousand), to the improvement of electrical and air conditioning plant (Euro 11 thousand), to the installation of the access control system (Euro 102 thousand), to the improvement of the fire system of the plant in Vittorio Veneto (Euro 110 thousand) and for the residual part to improvements made at the plant (air vents, loading and unloading areas etc…) and to equipments for the TestLab (climatic chamber);
- “Equipments” mainly to the purchase of furnitures and fittings (approximately Euro 74 thousand) and to the costs for the new reception (Euro 53 thousand), for the sunscreens (Euro 75 thousand), and for the residual part to the purchase of equipments for the production department (riveters, trans pallets, jib crane etc…);
- “Other tangible assets” to the investments for workstation and laptop (Euro 249 thousand), for server (Euro 75 thousand) and for other hardware (Euro 37 thousand);
- “Tangible assets in progress and advances” mainly to work for the “revamping” of the cogenerator engine and the heating plant (Euro 362 thousand), to the purchase of the first part of a serigraphy line for the research and development project named “Organic Photovoltaics” through the Dyepower consortium (Euro 298 thousand) and for the purchase of hardware (server, switch etc…) yet to be installed (Euro 245 thousand).
Impairment losses and subsequent reversalAt the reporting date there have not been particular indications of impairment losses related to tangible assets.
Leased plant and machineryThe Company has no leased plant and machinery.
Tangible assets in progress As at 31 December 2011 the tangible assets under construction mainly refer to the “revamping” of the cogenerator plant (approximately Euro 340 thousand) and to the serigraphy line and the glasses coupling (approximately 299 thousand).
Other informationAs at 31 December 2011 the Company does not have mortgages on buildings or other tangible assets.
17. Equity investments in subsidiaries The Company has the following equity investments in subsidiaries:
% ownership Carrying amount
Country 31 December 2011
31 December 2010
31 December 2011
31 December 2010
Permasteelisa Impianti S.r.l. Italy 100.00% 100.00% 1,007 1,007 Josef Gartner GmbH Germany 100.00% 100.00% 151,544 151,544 Permasteelisa Espana S.A.U. Spain 100.00% 100.00% 2,560 2,560 Permasteelisa France S.a.s. France 100.00% 100.00% 1,462 1,462 Permasteelisa North America Corp. United States 100.00% 100.00% 33,884 33,884 Permasteelisa Interiors S.r.l. Italy 100.00% 100.00% 3,162 3,162 Permasteelisa UK Ltd. Great Britain 100.00% 100.00% 754 754 Permasteelisa Ireland Ltd. Ireland 100.00% 100.00% 0 0Permasteelisa Pacific Holdings Ltd. Singapore 54.25% 54.25% 38,104 38,104 Scheldebow B.V. The Netherlands 100.00% 100.00% 86,133 86,133 Permasteelisa Epitoipari KFT (*) Hungary 100.00% 100.00% 15 15 RI.ISA d.o.o Croatia 99.00% 99.00% 76 76
318,701 318,701
(*) Winding - up.
Statutory Financial StatementsNotes to the Statutory Financial Statements
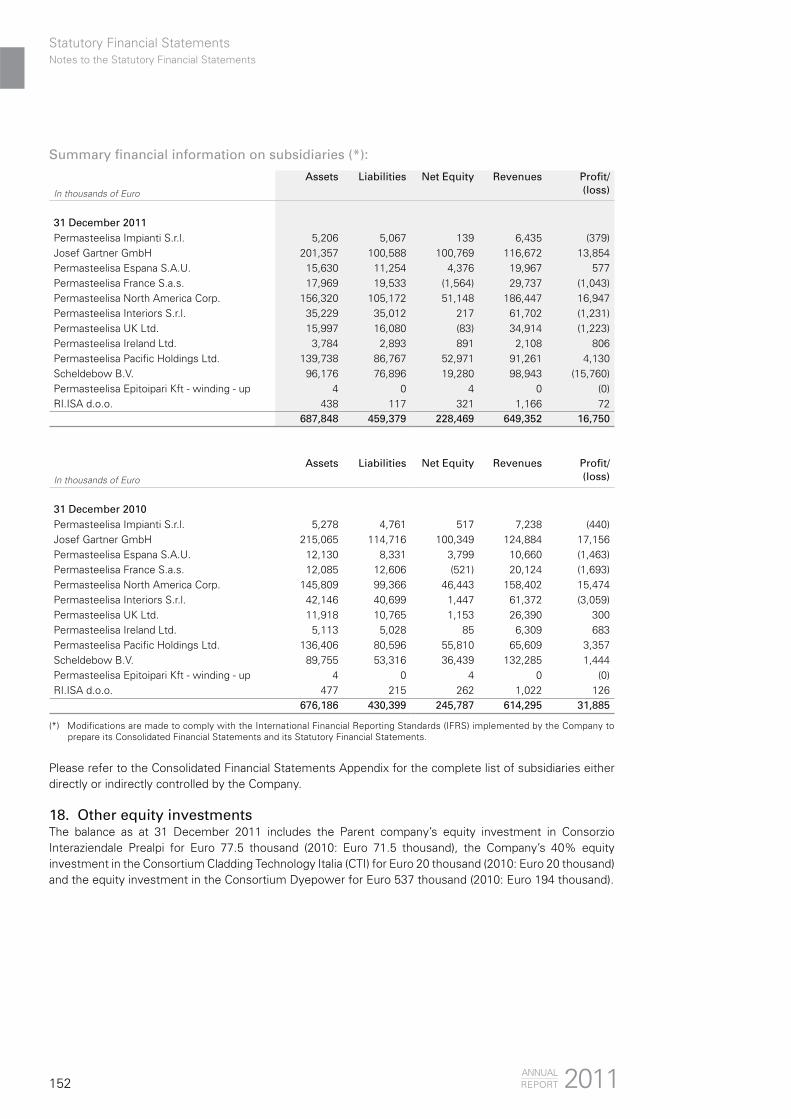
152
Summary financial information on subsidiaries (*):
In thousands of Euro
Assets Liabilities Net Equity Revenues Profit/(loss)
31 December 2011Permasteelisa Impianti S.r.l. 5,206 5,067 139 6,435 (379)Josef Gartner GmbH 201,357 100,588 100,769 116,672 13,854Permasteelisa Espana S.A.U. 15,630 11,254 4,376 19,967 577Permasteelisa France S.a.s. 17,969 19,533 (1,564) 29,737 (1,043)Permasteelisa North America Corp. 156,320 105,172 51,148 186,447 16,947Permasteelisa Interiors S.r.l. 35,229 35,012 217 61,702 (1,231)Permasteelisa UK Ltd. 15,997 16,080 (83) 34,914 (1,223)Permasteelisa Ireland Ltd. 3,784 2,893 891 2,108 806Permasteelisa Pacific Holdings Ltd. 139,738 86,767 52,971 91,261 4,130Scheldebow B.V. 96,176 76,896 19,280 98,943 (15,760)Permasteelisa Epitoipari Kft - winding - up 4 0 4 0 (0)RI.ISA d.o.o. 438 117 321 1,166 72
687,848 459,379 228,469 649,352 16,750
In thousands of Euro
Assets Liabilities Net Equity Revenues Profit/(loss)
31 December 2010Permasteelisa Impianti S.r.l. 5,278 4,761 517 7,238 (440)Josef Gartner GmbH 215,065 114,716 100,349 124,884 17,156Permasteelisa Espana S.A.U. 12,130 8,331 3,799 10,660 (1,463)Permasteelisa France S.a.s. 12,085 12,606 (521) 20,124 (1,693)Permasteelisa North America Corp. 145,809 99,366 46,443 158,402 15,474Permasteelisa Interiors S.r.l. 42,146 40,699 1,447 61,372 (3,059)Permasteelisa UK Ltd. 11,918 10,765 1,153 26,390 300Permasteelisa Ireland Ltd. 5,113 5,028 85 6,309 683Permasteelisa Pacific Holdings Ltd. 136,406 80,596 55,810 65,609 3,357Scheldebow B.V. 89,755 53,316 36,439 132,285 1,444Permasteelisa Epitoipari Kft - winding - up 4 0 4 0 (0)RI.ISA d.o.o. 477 215 262 1,022 126
676,186 430,399 245,787 614,295 31,885
(*) Modifications are made to comply with the International Financial Reporting Standards (IFRS) implemented by the Company to prepare its Consolidated Financial Statements and its Statutory Financial Statements.
Please refer to the Consolidated Financial Statements Appendix for the complete list of subsidiaries either directly or indirectly controlled by the Company.
18. Other equity investmentsThe balance as at 31 December 2011 includes the Parent company’s equity investment in Consorzio Interaziendale Prealpi for Euro 77.5 thousand (2010: Euro 71.5 thousand), the Company’s 40% equity investment in the Consortium Cladding Technology Italia (CTI) for Euro 20 thousand (2010: Euro 20 thousand) and the equity investment in the Consortium Dyepower for Euro 537 thousand (2010: Euro 194 thousand).
2011ANNUALREPORT
Notes to the Statutory Financial StatementsStatutory Financial Statements

153
19. Deferred tax assets and liabilitiesDeferred tax assets and liabilities are attributable to:
Assets (-) Liabilities (+) Net (-)
In thousands of Euro 2011 2010 2011 2010 2011 2010
Tangible assets 0 0 66 66 66 66Intangible assets (5) (5) 1,358 1,435 1,353 1,430Trade receivables (558) (558) 0 0 (558) (558)Provision for risks and charges (3,994) (4,606) 103 103 (3,891) (4,503)Hedging (277) 0 0 4 (277) 4Other items (3,147) (176) 9,762 9,762 6,615 9,586Tax value of loss carry-forwards (5,405) (2,022) 0 0 (5,405) (2,022)Tax (assets)/liabilities (13,386) (7,367) 11,289 11,370 (2,097) 4,003Set off 0 0 0 0 0 0Net tax (assets)/liabilities (13,386) (7,367) 11,289 11,370 (2,097) 4,003
Movement in deferred tax assets and liabilities during the year
In thousands of Euro
Balance 1 January
2010
Recognised in income statement
Recognised in equity
Other changes
Balance 31 December
2010
Tangible assets 66 0 0 0 66Intangible assets 2,351 (921) 0 0 1,430Trade receivables (558) 0 0 0 (558)Provision for risks and charges (3,062) (1,441) 0 0 (4,503)Hedging (27) 0 4 27 4Other items 9,563 23 0 0 9,586Tax value of loss carry-forwards 0 (2,022) 0 0 (2,022)
8,332 (4,361) 4 27 4,003
In thousands of Euro
Balance 1 January
2011
Recognised in income statement
Recognised in equity
Other changes
Balance 31 December
2011
Tangible assets 66 0 0 0 66Intangible assets 1,430 (77) 0 0 1,353Trade receivables (558) 0 0 0 (558)Provision for risks and charges (4,503) 612 0 0 (3,891)Hedging 4 0 (312) 31 (277)Other items 9,586 (2,971) 0 0 6,615Tax value of loss carry-forwards (2,022) (3,383) 0 0 (5,405)
4,003 (5,819) (312) 31 (2,097)
Statutory Financial StatementsNotes to the Statutory Financial Statements

154
20. Asset for contract work-in-progress, inventories and advances from customers
Assets for contracts work-in-progress and inventories
In thousands of Euro31 December
201131 December
2010
Assets for contracts work-in-progress 10,474 19,129 Raw materials and consumables used 196 170Advances 38 23
10,708 19,322
Liabilities for contracts work-in-progress and advances from customers
In thousands of Euro31 December
201131 December
2010
Liabilities for contracts work-in-progress 6,022 3,347Advances from customers 952 4,458
6,974 7,805
Contract work-in-progress
In thousands of Euro31 December
201131 December
2010
Costs incurred on uncompleted contracts 331,700 275,016 Estimated earnings 60,224 71,666 Less billings to date (387,472) (330,900)
4,452 15,782
Assets for contracts work-in-progress 10,474 19,129 Liabilities for contracts work-in-progress (6,022) (3,347)
4,452 15,782
21. Trade receivables from third parties
In thousands of Euro31 December
201131 December
2010
Trade receivables from third parties 34,618 26,969Bad debts provision (3,189) (3,212)
31,429 23,757
As at 31 December 2011 trade receivables include guarantee retentions for Euro 6,593 thousand (Euro 3,403 thousand as at 31 December 2010) related to contracts work-in-progress, of which Euro 2,848 thousand expiring within one year. Foreign currency balances included in trade receivables from third parties mainly concern CHF 86,396 (2010: CHF 19,796) corresponding to Euro 71,073 (2010: Euro 15,832) and SGD 23,816 (related to the company Global Tech Design Pte, subsidiary sold during year 2010) corresponding to Euro 14,160 at the year-end currency exchange rate.The following table shows the changes of the provision for bad debts during the year 2011.
In thousands of Euro31 December
201131 December
2010
Balance at 1 January 3,212 3,212Utilizations (23) 0Reversal 0 0Provisions 0 0Balance at 31 December 3,189 3,212
2011ANNUALREPORT
Notes to the Statutory Financial StatementsStatutory Financial Statements

155
22. Amounts receivables from subsidiaries
In thousands of Euro31 December
201131 December
2010
Trade receivables - currentBleu Tech Montreal Inc. 98 82Permasteelisa Philippines Inc. 34 35Permasteelisa Impianti S.r.l. 128 206Permasteelisa Gartner Saudi Arabia Llc. 705 11Gartner Contracting Co. Ltd. 177 188Gartner Steel and Glass GmbH 100 139Global Architectural Co. Ltd. 648 238Global Wall Malaysia Sdn. Bhd. 25 38Josef Gartner & Co. (HK) Ltd. 344 435Josef Gartner & Co. UK Ltd. 114 237Josef Gartner Curtain Wall (Shanghai) Ltd. 146 202Josef Gartner Curtain Wall (Suzhou) Ltd. 87 34Josef Gartner GmbH 816 1,008Josef Gartner (Macau) Ltd. 2 2Permasteelisa Gartner Qatar Llc 291 536Josef Gartner Switzerland AG 19 17Permasteelisa Espana S.A.U. 233 183Permasteelisa France S.a.s. 2,101 678Permasteelisa Gartner Middle East Llc 8,136 4,124Permasteelisa North America Corp. 1,425 1,267Permasteelisa Hong Kong Limited 498 525Permasteelisa (India) Private Limited 928 471Permasteelisa Interiors S.r.l. 1,146 1,220Permasteelisa Ireland Ltd. 29 757Permasteelisa Japan K.K. 194 194Permasteelisa Macau Limited 7 (13)Permasteelisa Pacific Holdings Ltd. 689 723Permasteelisa PTY Limited 290 271Permasteelisa Taiwan Ltd. 51 52Permasteelisa Project (Thailand) Ltd. 27 4Permasteelisa UK Ltd. 8,356 1,211RI.ISA D.o.o. 41 18Scheldebouw B.V. 1,234 1,440Tower Installation Llc. 47 120Commercial exchange rate adjustment 203 (14)
29,369 16,639
Financial receivables - currentPermasteelisa Impianti S.r.l. 999 1,501Permasteelisa Espana S.A.U. 1,931 3,773Permasteelisa France S.a.s. 5,990 401Permasteelisa Gartner Middle East Llc 305 0Permasteelisa Interiors S.r.l. 4,512 11,167Permasteelisa North America Corp. 84 0Permasteelisa Pacific Holdings Ltd. 0 3,906Scheldebouw B.V. 22,426 5,942Financial exchange rate adjustment 381 166
36,628 26,856
Medium/long term loans (current position)RI.ISA D.o.o. 0 118Financial exchange rate adjustment 0 0
0 11836,628 26,974
Statutory Financial StatementsNotes to the Statutory Financial Statements
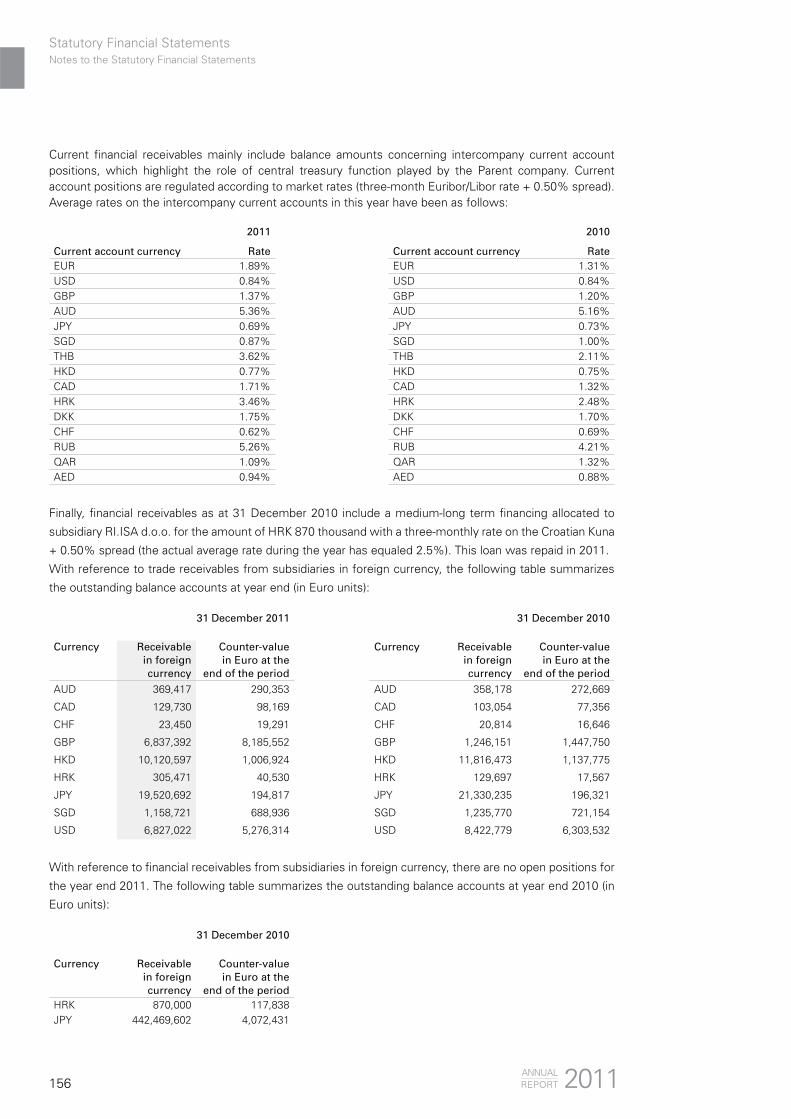
156
Current financial receivables mainly include balance amounts concerning intercompany current account positions, which highlight the role of central treasury function played by the Parent company. Current account positions are regulated according to market rates (three-month Euribor/Libor rate + 0.50% spread). Average rates on the intercompany current accounts in this year have been as follows:
2011 2010
Current account currency Rate Current account currency RateEUR 1.89% EUR 1.31%USD 0.84% USD 0.84%GBP 1.37% GBP 1.20%AUD 5.36% AUD 5.16%JPY 0.69% JPY 0.73%SGD 0.87% SGD 1.00%THB 3.62% THB 2.11%HKD 0.77% HKD 0.75%CAD 1.71% CAD 1.32%HRK 3.46% HRK 2.48%DKK 1.75% DKK 1.70%CHF 0.62% CHF 0.69%RUB 5.26% RUB 4.21%QAR 1.09% QAR 1.32%AED 0.94% AED 0.88%
Finally, financial receivables as at 31 December 2010 include a medium-long term financing allocated to
subsidiary RI.ISA d.o.o. for the amount of HRK 870 thousand with a three-monthly rate on the Croatian Kuna
+ 0.50% spread (the actual average rate during the year has equaled 2.5%). This loan was repaid in 2011.
With reference to trade receivables from subsidiaries in foreign currency, the following table summarizes
the outstanding balance accounts at year end (in Euro units):
31 December 2011 31 December 2010
Currency Receivable in foreign currency
Counter-valuein Euro at the
end of the period
Currency Receivable in foreign currency
Counter-valuein Euro at the
end of the periodAUD 369,417 290,353 AUD 358,178 272,669
CAD 129,730 98,169 CAD 103,054 77,356
CHF 23,450 19,291 CHF 20,814 16,646
GBP 6,837,392 8,185,552 GBP 1,246,151 1,447,750
HKD 10,120,597 1,006,924 HKD 11,816,473 1,137,775
HRK 305,471 40,530 HRK 129,697 17,567
JPY 19,520,692 194,817 JPY 21,330,235 196,321
SGD 1,158,721 688,936 SGD 1,235,770 721,154
USD 6,827,022 5,276,314 USD 8,422,779 6,303,532
With reference to financial receivables from subsidiaries in foreign currency, there are no open positions for
the year end 2011. The following table summarizes the outstanding balance accounts at year end 2010 (in
Euro units):
31 December 2010
Currency Receivable in foreign currency
Counter-valuein Euro at the
end of the periodHRK 870,000 117,838JPY 442,469,602 4,072,431
2011ANNUALREPORT
Notes to the Statutory Financial StatementsStatutory Financial Statements
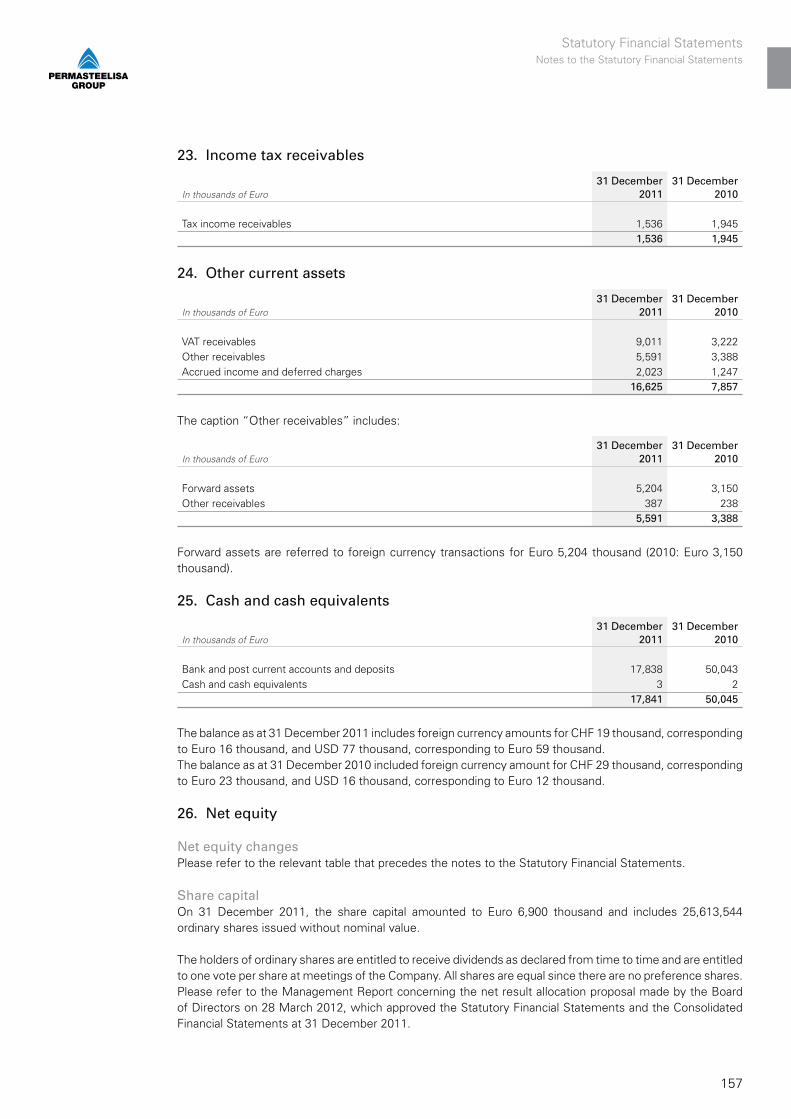
157
23. Income tax receivables
In thousands of Euro31 December
201131 December
2010
Tax income receivables 1,536 1,945 1,536 1,945
24. Other current assets
In thousands of Euro31 December
201131 December
2010
VAT receivables 9,011 3,222 Other receivables 5,591 3,388 Accrued income and deferred charges 2,023 1,247
16,625 7,857
The caption “Other receivables” includes:
In thousands of Euro31 December
201131 December
2010
Forward assets 5,204 3,150 Other receivables 387 238
5,591 3,388
Forward assets are referred to foreign currency transactions for Euro 5,204 thousand (2010: Euro 3,150 thousand).
25. Cash and cash equivalents
In thousands of Euro31 December
201131 December
2010
Bank and post current accounts and deposits 17,838 50,043 Cash and cash equivalents 3 2
17,841 50,045
The balance as at 31 December 2011 includes foreign currency amounts for CHF 19 thousand, corresponding to Euro 16 thousand, and USD 77 thousand, corresponding to Euro 59 thousand.The balance as at 31 December 2010 included foreign currency amount for CHF 29 thousand, corresponding to Euro 23 thousand, and USD 16 thousand, corresponding to Euro 12 thousand.
26. Net equity
Net equity changesPlease refer to the relevant table that precedes the notes to the Statutory Financial Statements.
Share capitalOn 31 December 2011, the share capital amounted to Euro 6,900 thousand and includes 25,613,544 ordinary shares issued without nominal value.
The holders of ordinary shares are entitled to receive dividends as declared from time to time and are entitled to one vote per share at meetings of the Company. All shares are equal since there are no preference shares.Please refer to the Management Report concerning the net result allocation proposal made by the Board of Directors on 28 March 2012, which approved the Statutory Financial Statements and the Consolidated Financial Statements at 31 December 2011.
Statutory Financial StatementsNotes to the Statutory Financial Statements
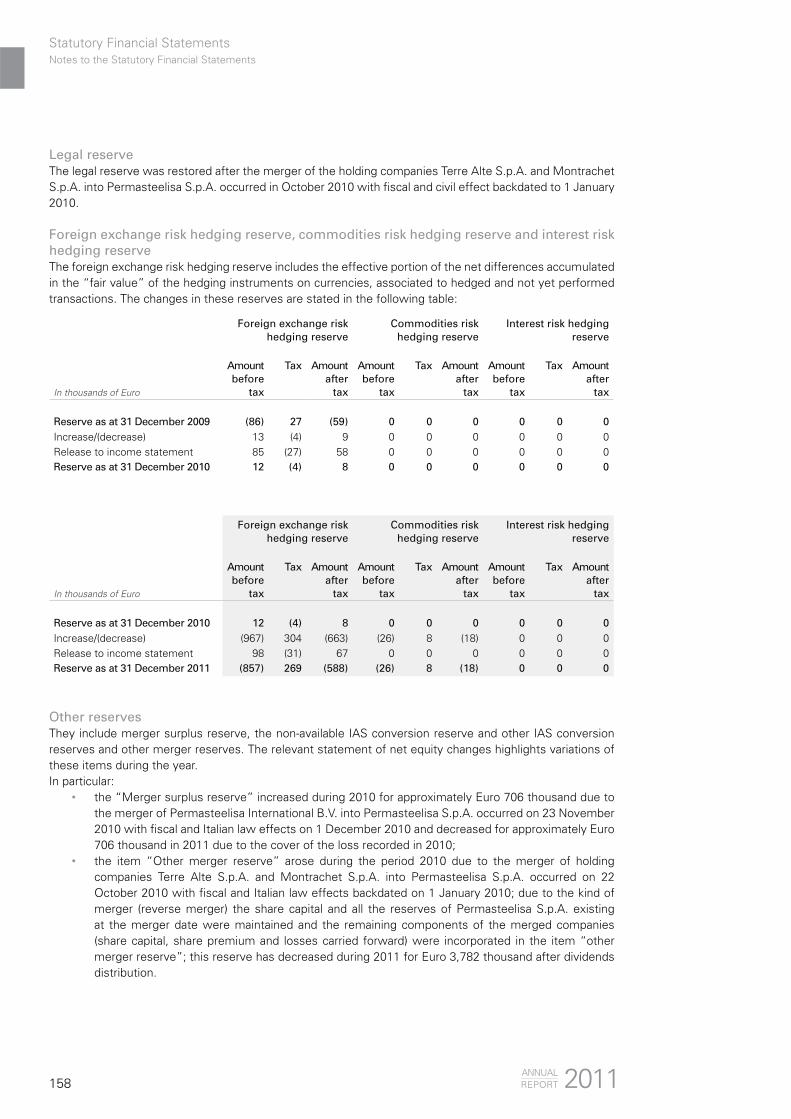
158
Legal reserveThe legal reserve was restored after the merger of the holding companies Terre Alte S.p.A. and Montrachet S.p.A. into Permasteelisa S.p.A. occurred in October 2010 with fiscal and civil effect backdated to 1 January 2010.
Foreign exchange risk hedging reserve, commodities risk hedging reserve and interest risk hedging reserveThe foreign exchange risk hedging reserve includes the effective portion of the net differences accumulated in the “fair value” of the hedging instruments on currencies, associated to hedged and not yet performed transactions. The changes in these reserves are stated in the following table:
Foreign exchange risk hedging reserve
Commodities risk hedging reserve
Interest risk hedging reserve
In thousands of Euro
Amount before
tax
Tax Amount after
tax
Amount before
tax
Tax Amount after
tax
Amount before
tax
Tax Amount after
tax
Reserve as at 31 December 2009 (86) 27 (59) 0 0 0 0 0 0Increase/(decrease) 13 (4) 9 0 0 0 0 0 0Release to income statement 85 (27) 58 0 0 0 0 0 0Reserve as at 31 December 2010 12 (4) 8 0 0 0 0 0 0
Foreign exchange risk hedging reserve
Commodities risk hedging reserve
Interest risk hedging reserve
In thousands of Euro
Amount before
tax
Tax Amount after
tax
Amount before
tax
Tax Amount after
tax
Amount before
tax
Tax Amount after
tax
Reserve as at 31 December 2010 12 (4) 8 0 0 0 0 0 0Increase/(decrease) (967) 304 (663) (26) 8 (18) 0 0 0Release to income statement 98 (31) 67 0 0 0 0 0 0Reserve as at 31 December 2011 (857) 269 (588) (26) 8 (18) 0 0 0
Other reservesThey include merger surplus reserve, the non-available IAS conversion reserve and other IAS conversion reserves and other merger reserves. The relevant statement of net equity changes highlights variations of these items during the year.In particular:
the “Merger surplus reserve” increased during 2010 for approximately Euro 706 thousand due to the merger of Permasteelisa International B.V. into Permasteelisa S.p.A. occurred on 23 November 2010 with fiscal and Italian law effects on 1 December 2010 and decreased for approximately Euro 706 thousand in 2011 due to the cover of the loss recorded in 2010;
the item “Other merger reserve” arose during the period 2010 due to the merger of holding companies Terre Alte S.p.A. and Montrachet S.p.A. into Permasteelisa S.p.A. occurred on 22 October 2010 with fiscal and Italian law effects backdated on 1 January 2010; due to the kind of merger (reverse merger) the share capital and all the reserves of Permasteelisa S.p.A. existing at the merger date were maintained and the remaining components of the merged companies (share capital, share premium and losses carried forward) were incorporated in the item “other merger reserve”; this reserve has decreased during 2011 for Euro 3,782 thousand after dividends distribution.
2011ANNUALREPORT
Notes to the Statutory Financial StatementsStatutory Financial Statements
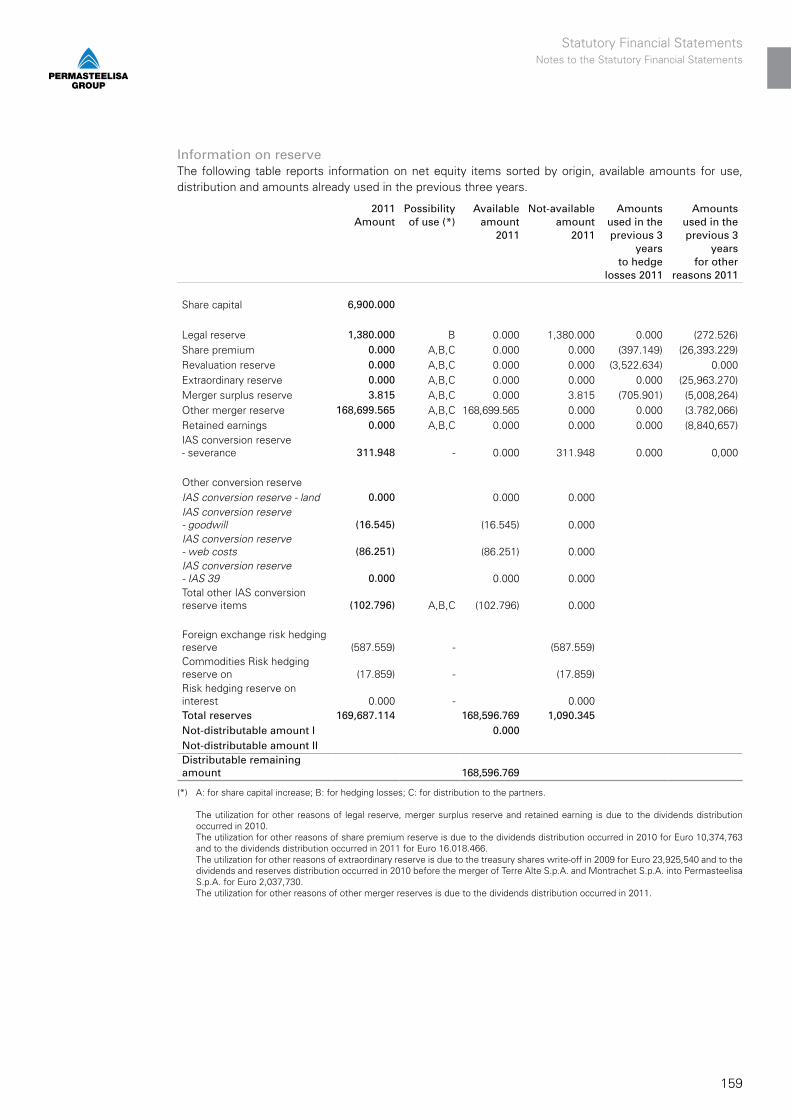
159
Information on reserveThe following table reports information on net equity items sorted by origin, available amounts for use, distribution and amounts already used in the previous three years.
2011Amount
Possibility of use (*)
Available amount
2011
Not-available amount
2011
Amounts used in the previous 3
yearsto hedge
losses 2011
Amounts used in the previous 3
years for other
reasons 2011
Share capital 6,900.000
Legal reserve 1,380.000 B 0.000 1,380.000 0.000 (272.526)Share premium 0.000 A,B,C 0.000 0.000 (397.149) (26,393.229)Revaluation reserve 0.000 A,B,C 0.000 0.000 (3,522.634) 0.000Extraordinary reserve 0.000 A,B,C 0.000 0.000 0.000 (25,963.270)Merger surplus reserve 3.815 A,B,C 0.000 3.815 (705.901) (5,008,264)Other merger reserve 168,699.565 A,B,C 168,699.565 0.000 0.000 (3.782,066)Retained earnings 0.000 A,B,C 0.000 0.000 0.000 (8,840,657)IAS conversion reserve- severance 311.948 - 0.000 311.948 0.000 0,000
Other conversion reserveIAS conversion reserve - land 0.000 0.000 0.000IAS conversion reserve- goodwill (16.545) (16.545) 0.000IAS conversion reserve- web costs (86.251) (86.251) 0.000IAS conversion reserve- IAS 39 0.000 0.000 0.000Total other IAS conversion reserve items (102.796) A,B,C (102.796) 0.000
Foreign exchange risk hedging reserve (587.559) - (587.559)Commodities Risk hedging reserve on (17.859) - (17.859)Risk hedging reserve on interest 0.000 - 0.000Total reserves 169,687.114 168,596.769 1,090.345Not-distributable amount I 0.000Not-distributable amount II Distributable remaining amount 168,596.769
(*) A: for share capital increase; B: for hedging losses; C: for distribution to the partners.
The utilization for other reasons of legal reserve, merger surplus reserve and retained earning is due to the dividends distribution occurred in 2010.The utilization for other reasons of share premium reserve is due to the dividends distribution occurred in 2010 for Euro 10,374,763 and to the dividends distribution occurred in 2011 for Euro 16.018.466.The utilization for other reasons of extraordinary reserve is due to the treasury shares write-off in 2009 for Euro 23,925,540 and to the dividends and reserves distribution occurred in 2010 before the merger of Terre Alte S.p.A. and Montrachet S.p.A. into Permasteelisa S.p.A. for Euro 2,037,730.The utilization for other reasons of other merger reserves is due to the dividends distribution occurred in 2011.
Statutory Financial StatementsNotes to the Statutory Financial Statements

160
Capital management In the area of capital management, the Company aims at adding value for the Shareholders, safeguard the continuity of the business and support the development of the Group. The Company has thus tried to keep a suitable capitalisation level to enable both the achievement of a suitable return on capital for the Shareholders and ensure the accessibility in economic terms of external financing sources, also by achieving a suitable rating. The Company constantly monitors its level of indebtedness in reference to the net equity and especially the net level of indebtedness and the cash generation from operations. To this end, the Company pursues the ongoing improvement of profitability in its business areas. It may also sell part of its own assets to reduce the value of debt, while the Board of Directors may suggest to the Shareholders’ Meeting to reduce or increase the share capital or, if legally viable, distribute the reserves. In this framework the Company also proceeds to buying back treasury shares, clearly within the limits authorised by the Shareholders’ Meeting, following the same approach aimed at adding value compatible with the aims of achieving a balanced financial standing and improve the rating. The capital is understood to be the value added by the Shareholders (share capital and the share-premium reserve, net of the value of the treasury share, if any), and generated by the Company in terms of the results achieved by the management (legal reserve and retained earnings, included the results for the year), excluding the profit and loss entered directly into the net equity, except for the revaluation reserve, the merger surplus reserve and the IAS/IFRS conversion reserve.
27. Amounts payable to banks and other financial creditors
In thousand Euro31 December
201131 December
2010
Amounts payable to banks and other financial creditors non-currentMedium/long term bank loans 0 0
0 0
Amounts payable to banks and other financial creditors currentMedium/long term bank loans 0 0Bank current accounts, advances and other short term loans 50,013 23
50,013 23
As at 31 December 2011 there are no medium/long term loans as in the previous period.Since the Group financial position is constantly positive, the Company is able to finance itself by its subsidiaries through the existing intercompany current accounts; however, in 2011 it also has drawn to bank loans related two contracts for credit lines on a revolving basis, set up to cover cash flow needs.A first loan was granted by Monte dei Paschi di Siena for a maximum amount of Euro 75 million. The contract lasts for three years with ending due on December 2013. This credit line, to be used in one or more solutions, has determined the payment of up-front commissions and it is characterized by the application of fees on the used (or not used) amount.On 2 November 2011, for a period of 6 months, this credit line has been used for an amount of Euro 30 million at a six-monthly Euribor rate + spread.The contract includes the obligation to comply with specific financial covenants related to:
ratio between the total consolidated gross financial debt and consolidated Ebitda; ratio between the consolidated Ebitda and net consolidated financial expenses; ratio between the total consolidated gross financial debt and net tangible consolidated equity; net tangible consolidated equity.
As at 31 December 2011, there was full compliance to the financial covenants required.A second loan was granted by Cassa di Risparmio del Veneto for a total amount of Euro 50 million. The contract lasts for three years with ending due on 27 June 2014. This credit line, to be used in one or more solutions, has determined the payment of up-front commissions and it is characterized by the application of fees on the used (or not used) amount.On 9 November 2011, for a period of 3 months, this credit line has been used for an amount of Euro 20 million at a three-monthly Euribor rate + spread.
2011ANNUALREPORT
Notes to the Statutory Financial StatementsStatutory Financial Statements

161
The contract includes the obligation to comply with specific financial covenants related to:
ratio between the gross financial debt and Ebitda; ratio between the Ebitda and net financial expenses; ratio between the net financial debt and equity.
As at 31 December 2011, there was full compliance to the financial covenants required.
As to the mortgages on real estate or other fixed assets owned by the Company, please refer to note 35.
Net financial position
In thousand of Euro31 December
201131 December
2010
Cash and cash equivalents 17,841 50,045 Financial receivables from subsidiaries 36,628 26,974 Financial payables to subsidiaries (186,484) (241,912)Amounts payables to bank (50,013) (23)Net financial position - short term (182,028) (164,916)
Financial receivables from subsidiaries 0 0Financial payables to subsidiaries 0 0Amounts payables to bank 0 0Net financial position - medium/long term 0 0Total net financial position (182,028) (164,916)
The average rates recorded by the Company during the period are as follows:a) current account deposits: 1.576% (2010: 0.688%);b) short-term loans: 2.912% (never been used during the year 2010);c) mortgages and medium- long-term loans: never been used during the year 2011 (2010: 1.516%).
The actual average rate over overall indebtness stood at 2.875% (2010: 1.516%).The variation increase of loan costs is basically related to the rates trend recorded in 2011. Indeed the 3-month Euribor stood at a yearly average of 1.408% against the 0.811% of 2010 while the 6-month Euribor recorded an average of 1.656% against 1.082% in 2010.
28. Severance indemnity fund
In thousand Euro31 December
201131 December
2010
Present value of the defined benefit obligation 1,767 1,821 Unrecognised actuarial gains and losses 0 0Recognised liability for severance indemnity fund 1,767 1,821
Movements of the severance indemnity fund
In thousand of Euro31 December
201131 December
2010
Net recognised liability at 1 January 1,821 1,914Payments (128) (159)Movements 0 9Expenses recognised in the income statement 74 57Net recognised liability at 31 December 1,767 1,821
Statutory Financial StatementsNotes to the Statutory Financial Statements
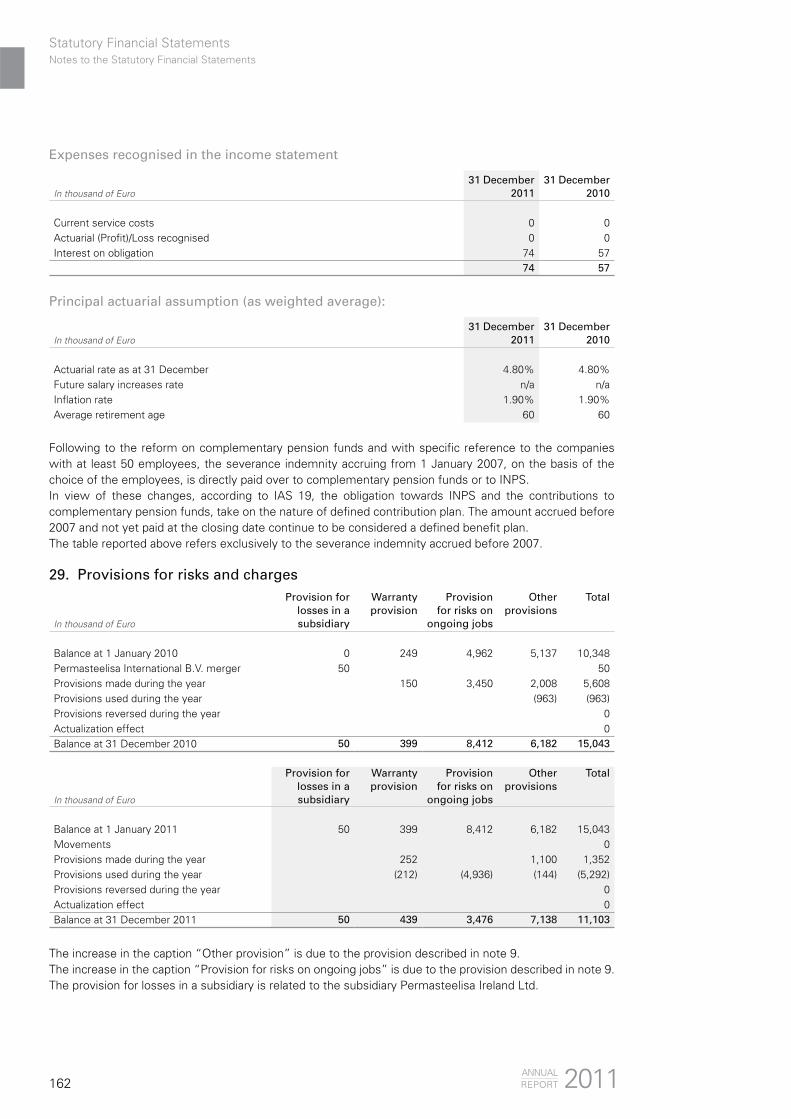
162
Expenses recognised in the income statement
In thousand of Euro31 December
201131 December
2010
Current service costs 0 0Actuarial (Profit)/Loss recognised 0 0Interest on obligation 74 57
74 57
Principal actuarial assumption (as weighted average):
In thousand of Euro31 December
201131 December
2010
Actuarial rate as at 31 December 4.80% 4.80%Future salary increases rate n/a n/aInflation rate 1.90% 1.90%Average retirement age 60 60
Following to the reform on complementary pension funds and with specific reference to the companies with at least 50 employees, the severance indemnity accruing from 1 January 2007, on the basis of the choice of the employees, is directly paid over to complementary pension funds or to INPS.In view of these changes, according to IAS 19, the obligation towards INPS and the contributions to complementary pension funds, take on the nature of defined contribution plan. The amount accrued before 2007 and not yet paid at the closing date continue to be considered a defined benefit plan.The table reported above refers exclusively to the severance indemnity accrued before 2007.
29. Provisions for risks and charges
In thousand of Euro
Provision for losses in asubsidiary
Warranty provision
Provision for risks on
ongoing jobs
Other provisions
Total
Balance at 1 January 2010 0 249 4,962 5,137 10,348 Permasteelisa International B.V. merger 50 50Provisions made during the year 150 3,450 2,008 5,608Provisions used during the year (963) (963)Provisions reversed during the year 0Actualization effect 0Balance at 31 December 2010 50 399 8,412 6,182 15,043
In thousand of Euro
Provision for losses in asubsidiary
Warranty provision
Provision for risks on
ongoing jobs
Other provisions
Total
Balance at 1 January 2011 50 399 8,412 6,182 15,043Movements 0Provisions made during the year 252 1,100 1,352Provisions used during the year (212) (4,936) (144) (5,292)Provisions reversed during the year 0Actualization effect 0Balance at 31 December 2011 50 439 3,476 7,138 11,103
The increase in the caption “Other provision” is due to the provision described in note 9.The increase in the caption “Provision for risks on ongoing jobs” is due to the provision described in note 9.The provision for losses in a subsidiary is related to the subsidiary Permasteelisa Ireland Ltd.
2011ANNUALREPORT
Notes to the Statutory Financial StatementsStatutory Financial Statements
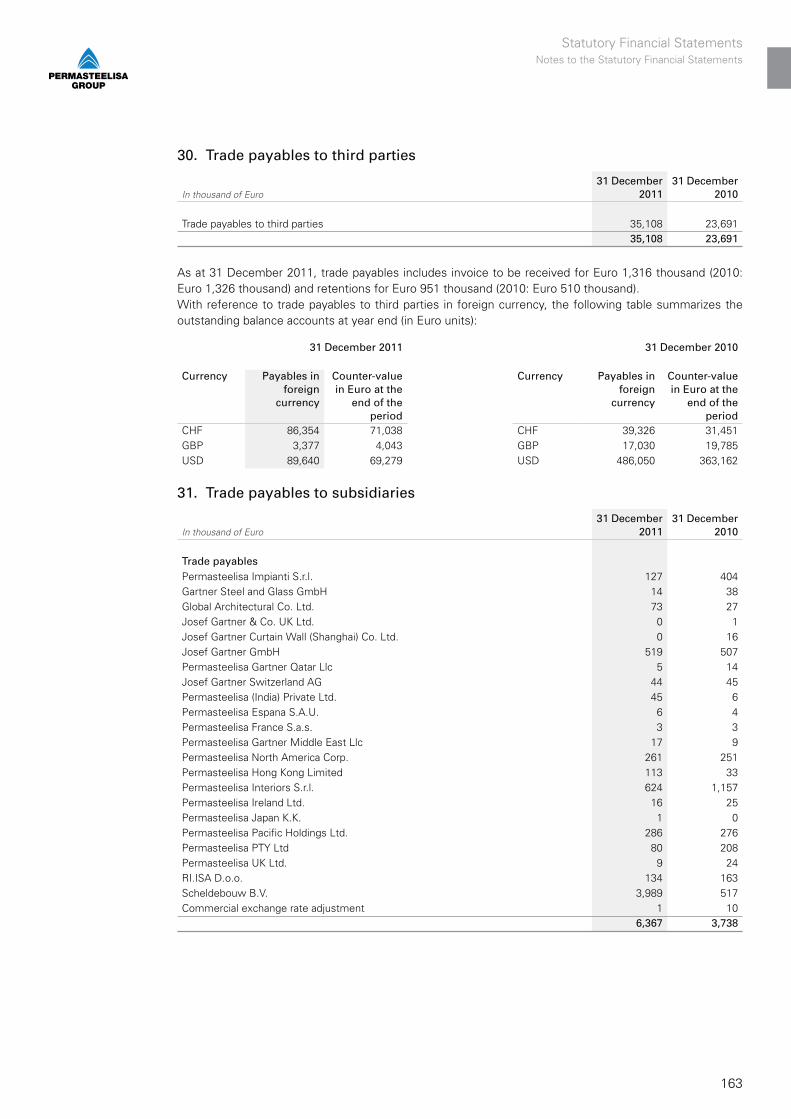
163
30. Trade payables to third parties
In thousand of Euro31 December
201131 December
2010
Trade payables to third parties 35,108 23,691 35,108 23,691
As at 31 December 2011, trade payables includes invoice to be received for Euro 1,316 thousand (2010: Euro 1,326 thousand) and retentions for Euro 951 thousand (2010: Euro 510 thousand).With reference to trade payables to third parties in foreign currency, the following table summarizes the outstanding balance accounts at year end (in Euro units):
31 December 2011 31 December 2010
Currency Payables inforeign
currency
Counter-value in Euro at the
end of the period
Currency Payables inforeign
currency
Counter-value in Euro at the
end of the period
CHF 86,354 71,038 CHF 39,326 31,451GBP 3,377 4,043 GBP 17,030 19,785USD 89,640 69,279 USD 486,050 363,162
31. Trade payables to subsidiaries
In thousand of Euro31 December
201131 December
2010
Trade payablesPermasteelisa Impianti S.r.l. 127 404Gartner Steel and Glass GmbH 14 38Global Architectural Co. Ltd. 73 27Josef Gartner & Co. UK Ltd. 0 1Josef Gartner Curtain Wall (Shanghai) Co. Ltd. 0 16Josef Gartner GmbH 519 507Permasteelisa Gartner Qatar Llc 5 14Josef Gartner Switzerland AG 44 45Permasteelisa (India) Private Ltd. 45 6Permasteelisa Espana S.A.U. 6 4Permasteelisa France S.a.s. 3 3Permasteelisa Gartner Middle East Llc 17 9Permasteelisa North America Corp. 261 251Permasteelisa Hong Kong Limited 113 33Permasteelisa Interiors S.r.l. 624 1,157Permasteelisa Ireland Ltd. 16 25Permasteelisa Japan K.K. 1 0Permasteelisa Pacific Holdings Ltd. 286 276Permasteelisa PTY Ltd 80 208Permasteelisa UK Ltd. 9 24RI.ISA D.o.o. 134 163Scheldebouw B.V. 3,989 517Commercial exchange rate adjustment 1 10
6,367 3,738
Statutory Financial StatementsNotes to the Statutory Financial Statements

164
Financial payablesJosef Gartner GmbH 89,660 123,131Permasteelisa Ireland Ltd. 2,957 3,952Permasteelisa North America Corp. 31,998 42,073Permasteelisa Gartner Middle East Llc 0 2,053Permasteelisa Gartner Qatar Llc 439 7,595Permasteelisa Pacific Holdings Ltd. 46,732 49,744Permasteelisa UK Ltd. 3,713 6,012Exchange rate adjustment 10,985 7,352
186,484 241,912
As far as financial payables are concerned, the same as for financial receivables as per note 22 applies.With reference to trade payables to subsidiaries in foreign currency, the following table summarizes the outstanding balance accounts at year end (in Euro units):
31 December 2011 31 December 2010
Currency Payables inforeign
currency
Counter-value in Euro at the
end of the period
Currency Payables inforeign
currency
Counter-value in Euro at the
end of the period
AUD 370,199 290,968 AUD 542,946 413,327CHF 53,805 44,262 CHF 56,633 45,292GBP 656,937 786,468 GBP 8,417 9,778CNY 0 0 CNY 15,981 1,811HKD 675,356 67,193 HKD 711,773 68,535JPY 201,790 2,014 JPY 187,035 1,721SGD 33,633 19,997 SGD 63,367 36,979USD 414,176 320,099 USD 382,162 286,006
With reference to financial payables to subsidiaries in foreign currency, the following table summarizes the outstanding balance accounts at year end (in Euro units):
31 December 2011 31 December 2010
Currency Payables inforeign
currency
Counter-value in Euro at the
end of the period
Currency Payables inforeign
currency
Counter-value in Euro at the
end of the period
AUD 17,950,336 14,108,572 AUD 19,866,193 15,123,472CAD 250,000 189,179 CAD 2,000,000 1,501,276GBP 3,156,992 3,779,470 GBP 5,229,871 6,075,946HKD 215,626,384 21,453,227 HKD 188,485,313 18,148,717JPY 77,482,383 773,277 JPY 0 0SGD 17,755,747 10,556,958 SGD 28,654,502 16,721,815USD 54,650,946 42,237,380 USD 76,508,847 57,258,529
32. Other current liabilities
In thousand of Euro31 December
201131 December
2010
Employees taxation payables 1,395 1,442Amounts payable to social agencies 3,994 2,334 Amounts payable to employees 9,439 4,162 Other liabilities 14,028 2,703 Accrued liabilities and deferred income 314 44
29,170 10,685
2011ANNUALREPORT
Notes to the Statutory Financial StatementsStatutory Financial Statements
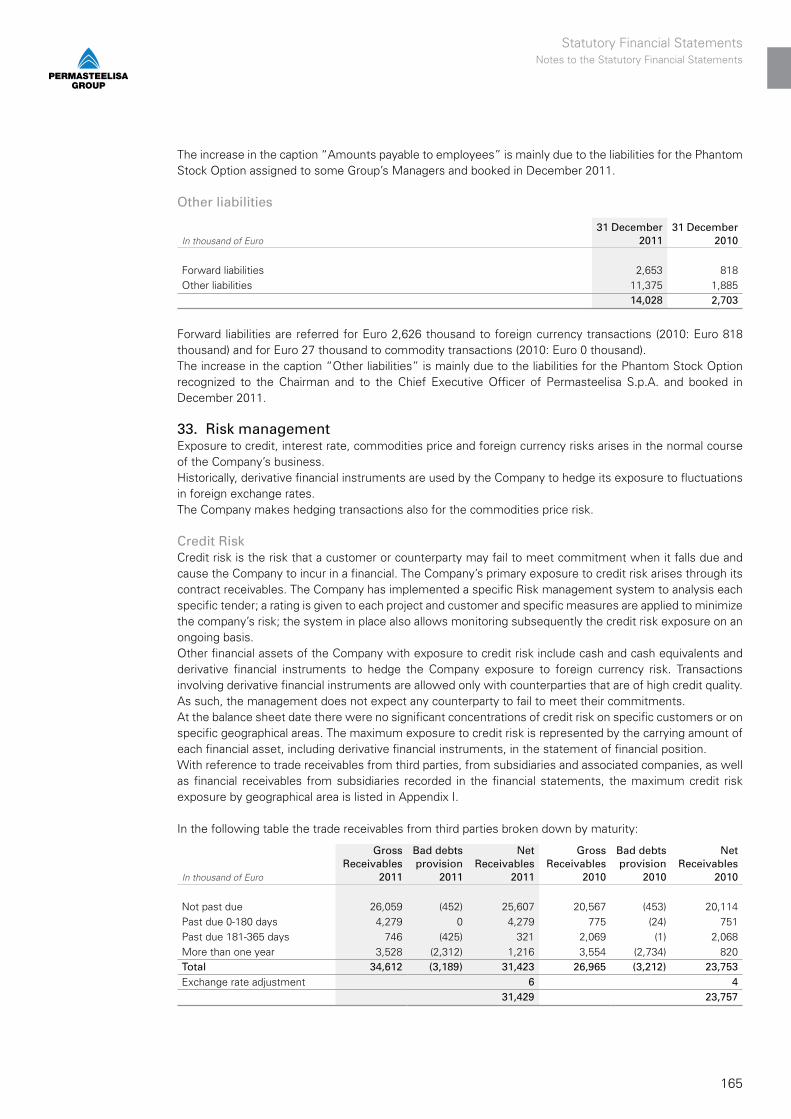
165
The increase in the caption “Amounts payable to employees” is mainly due to the liabilities for the Phantom Stock Option assigned to some Group’s Managers and booked in December 2011.
Other liabilities
In thousand of Euro31 December
201131 December
2010
Forward liabilities 2,653 818 Other liabilities 11,375 1,885
14,028 2,703
Forward liabilities are referred for Euro 2,626 thousand to foreign currency transactions (2010: Euro 818 thousand) and for Euro 27 thousand to commodity transactions (2010: Euro 0 thousand). The increase in the caption “Other liabilities” is mainly due to the liabilities for the Phantom Stock Option recognized to the Chairman and to the Chief Executive Officer of Permasteelisa S.p.A. and booked in December 2011.
33. Risk managementExposure to credit, interest rate, commodities price and foreign currency risks arises in the normal course of the Company’s business.Historically, derivative financial instruments are used by the Company to hedge its exposure to fluctuations in foreign exchange rates.The Company makes hedging transactions also for the commodities price risk.
Credit RiskCredit risk is the risk that a customer or counterparty may fail to meet commitment when it falls due and cause the Company to incur in a financial. The Company’s primary exposure to credit risk arises through its contract receivables. The Company has implemented a specific Risk management system to analysis each specific tender; a rating is given to each project and customer and specific measures are applied to minimize the company’s risk; the system in place also allows monitoring subsequently the credit risk exposure on an ongoing basis.Other financial assets of the Company with exposure to credit risk include cash and cash equivalents and derivative financial instruments to hedge the Company exposure to foreign currency risk. Transactions involving derivative financial instruments are allowed only with counterparties that are of high credit quality. As such, the management does not expect any counterparty to fail to meet their commitments.At the balance sheet date there were no significant concentrations of credit risk on specific customers or on specific geographical areas. The maximum exposure to credit risk is represented by the carrying amount of each financial asset, including derivative financial instruments, in the statement of financial position.With reference to trade receivables from third parties, from subsidiaries and associated companies, as well as financial receivables from subsidiaries recorded in the financial statements, the maximum credit risk exposure by geographical area is listed in Appendix I.
In the following table the trade receivables from third parties broken down by maturity:
In thousand of Euro
Gross Receivables
2011
Bad debts provision
2011
Net Receivables
2011
Gross Receivables
2010
Bad debts provision
2010
Net Receivables
2010
Not past due 26,059 (452) 25,607 20,567 (453) 20,114Past due 0-180 days 4,279 0 4,279 775 (24) 751Past due 181-365 days 746 (425) 321 2,069 (1) 2,068More than one year 3,528 (2,312) 1,216 3,554 (2,734) 820Total 34,612 (3,189) 31,423 26,965 (3,212) 23,753Exchange rate adjustment 6 4
31,429 23,757
Statutory Financial StatementsNotes to the Statutory Financial Statements
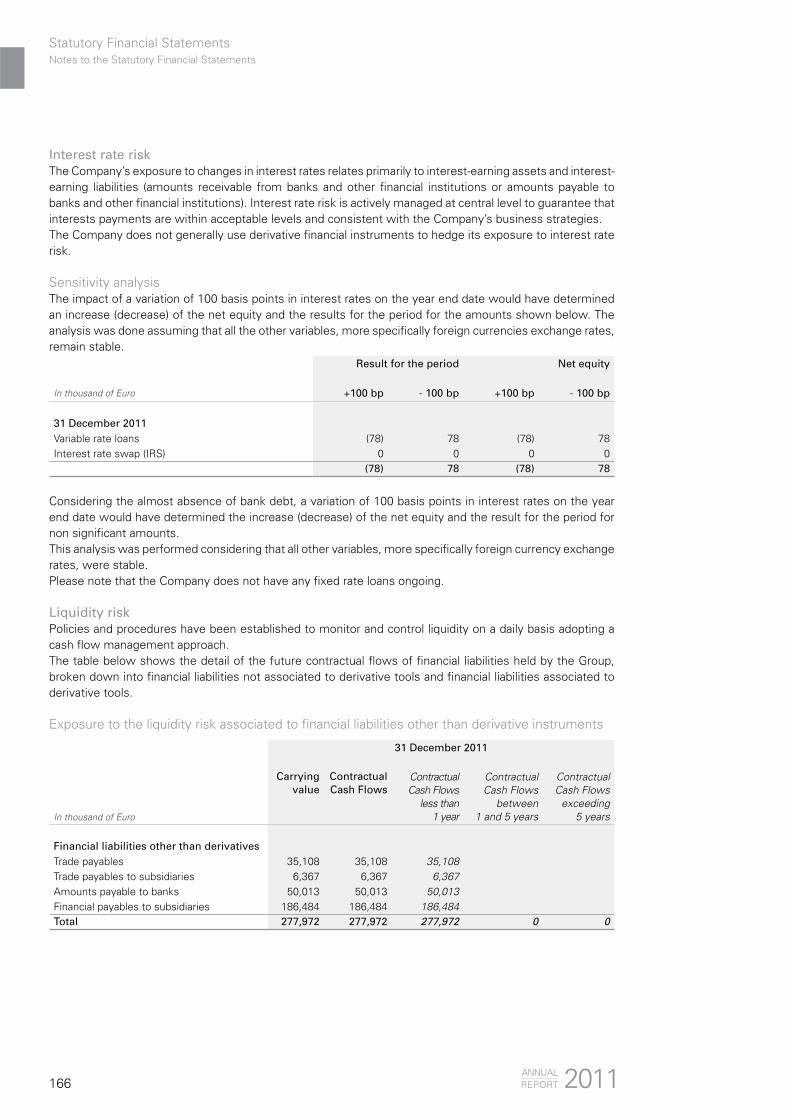
166
Interest rate riskThe Company’s exposure to changes in interest rates relates primarily to interest-earning assets and interest-earning liabilities (amounts receivable from banks and other financial institutions or amounts payable to banks and other financial institutions). Interest rate risk is actively managed at central level to guarantee that interests payments are within acceptable levels and consistent with the Company’s business strategies.The Company does not generally use derivative financial instruments to hedge its exposure to interest rate risk.
Sensitivity analysisThe impact of a variation of 100 basis points in interest rates on the year end date would have determined an increase (decrease) of the net equity and the results for the period for the amounts shown below. The analysis was done assuming that all the other variables, more specifically foreign currencies exchange rates, remain stable.
Result for the period Net equity
In thousand of Euro +100 bp - 100 bp +100 bp - 100 bp
31 December 2011Variable rate loans (78) 78 (78) 78Interest rate swap (IRS) 0 0 0 0
(78) 78 (78) 78
Considering the almost absence of bank debt, a variation of 100 basis points in interest rates on the year end date would have determined the increase (decrease) of the net equity and the result for the period for non significant amounts. This analysis was performed considering that all other variables, more specifically foreign currency exchange rates, were stable. Please note that the Company does not have any fixed rate loans ongoing.
Liquidity riskPolicies and procedures have been established to monitor and control liquidity on a daily basis adopting a cash flow management approach.The table below shows the detail of the future contractual flows of financial liabilities held by the Group, broken down into financial liabilities not associated to derivative tools and financial liabilities associated to derivative tools.
Exposure to the liquidity risk associated to financial liabilities other than derivative instruments
31 December 2011
In thousand of Euro
Carrying value
Contractual Cash Flows
Contractual Cash Flows
less than1 year
Contractual Cash Flows
between1 and 5 years
Contractual Cash Flows
exceeding5 years
Financial liabilities other than derivativesTrade payables 35,108 35,108 35,108Trade payables to subsidiaries 6,367 6,367 6,367Amounts payable to banks 50,013 50,013 50,013Financial payables to subsidiaries 186,484 186,484 186,484Total 277,972 277,972 277,972 0 0
2011ANNUALREPORT
Notes to the Statutory Financial StatementsStatutory Financial Statements
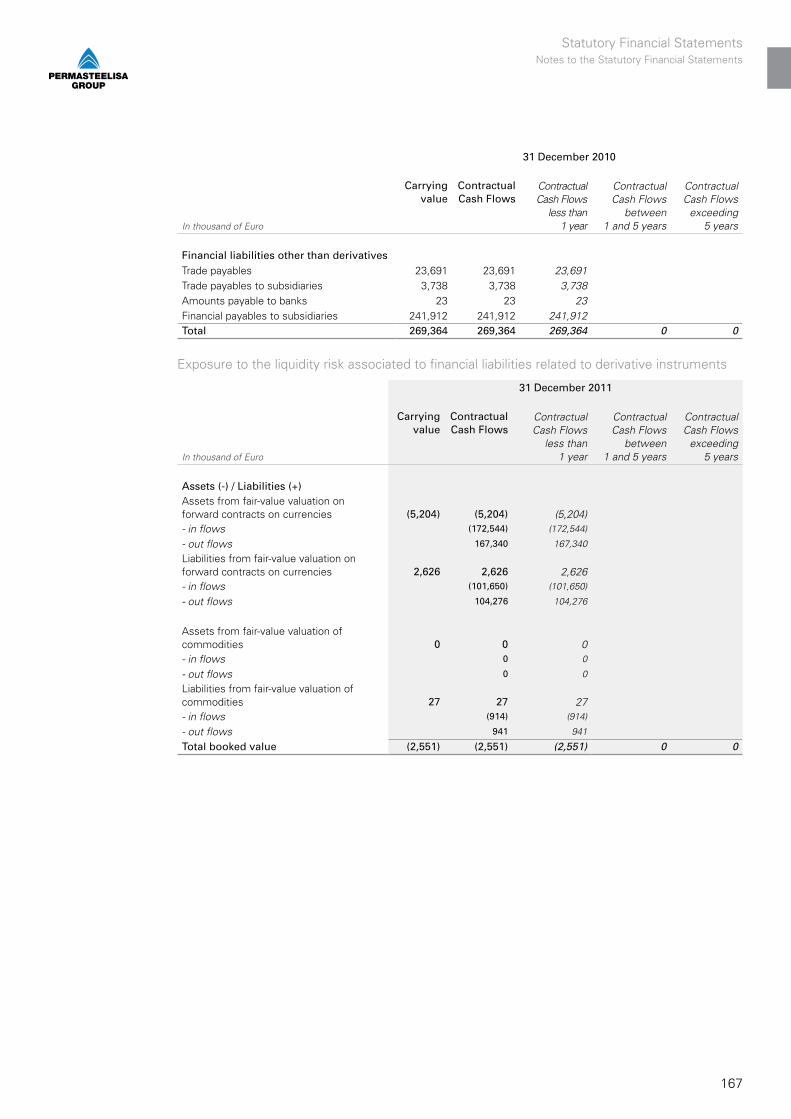
167
31 December 2010
In thousand of Euro
Carrying value
Contractual Cash Flows
Contractual Cash Flows
less than1 year
Contractual Cash Flows
between1 and 5 years
Contractual Cash Flows
exceeding5 years
Financial liabilities other than derivativesTrade payables 23,691 23,691 23,691Trade payables to subsidiaries 3,738 3,738 3,738Amounts payable to banks 23 23 23Financial payables to subsidiaries 241,912 241,912 241,912Total 269,364 269,364 269,364 0 0
Exposure to the liquidity risk associated to financial liabilities related to derivative instruments
31 December 2011
In thousand of Euro
Carrying value
Contractual Cash Flows
Contractual Cash Flows
less than1 year
Contractual Cash Flows
between1 and 5 years
Contractual Cash Flows
exceeding5 years
Assets (-) / Liabilities (+)Assets from fair-value valuation onforward contracts on currencies (5,204) (5,204) (5,204)- in flows (172,544) (172,544)
- out flows 167,340 167,340
Liabilities from fair-value valuation on forward contracts on currencies 2,626 2,626 2,626- in flows (101,650) (101,650)
- out flows 104,276 104,276
Assets from fair-value valuation ofcommodities 0 0 0- in flows 0 0
- out flows 0 0
Liabilities from fair-value valuation ofcommodities 27 27 27- in flows (914) (914)
- out flows 941 941
Total booked value (2,551) (2,551) (2,551) 0 0
Statutory Financial StatementsNotes to the Statutory Financial Statements
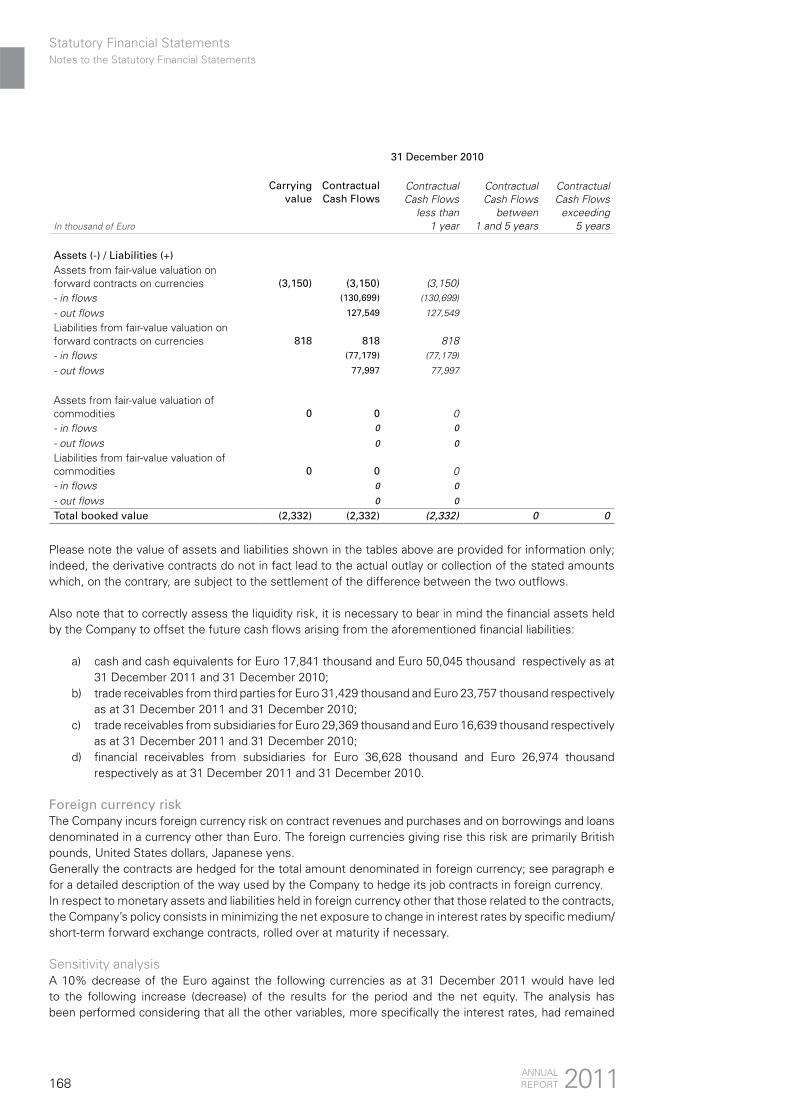
168
31 December 2010
In thousand of Euro
Carrying value
Contractual Cash Flows
Contractual Cash Flows
less than1 year
Contractual Cash Flows
between1 and 5 years
Contractual Cash Flows
exceeding5 years
Assets (-) / Liabilities (+)Assets from fair-value valuation onforward contracts on currencies (3,150) (3,150) (3,150)
- in flows (130,699) (130,699) - out flows 127,549 127,549 Liabilities from fair-value valuation on forward contracts on currencies 818 818 818
- in flows (77,179) (77,179) - out flows 77,997 77,997
Assets from fair-value valuation ofcommodities 0 0 0
- in flows 0 0 - out flows 0 0 Liabilities from fair-value valuation ofcommodities 0 0 0
- in flows 0 0 - out flows 0 0 Total booked value (2,332) (2,332) (2,332) 0 0
Please note the value of assets and liabilities shown in the tables above are provided for information only; indeed, the derivative contracts do not in fact lead to the actual outlay or collection of the stated amounts which, on the contrary, are subject to the settlement of the difference between the two outflows.
Also note that to correctly assess the liquidity risk, it is necessary to bear in mind the financial assets held by the Company to offset the future cash flows arising from the aforementioned financial liabilities:
a) cash and cash equivalents for Euro 17,841 thousand and Euro 50,045 thousand respectively as at 31 December 2011 and 31 December 2010;
b) trade receivables from third parties for Euro 31,429 thousand and Euro 23,757 thousand respectively as at 31 December 2011 and 31 December 2010;
c) trade receivables from subsidiaries for Euro 29,369 thousand and Euro 16,639 thousand respectively as at 31 December 2011 and 31 December 2010;
d) financial receivables from subsidiaries for Euro 36,628 thousand and Euro 26,974 thousand respectively as at 31 December 2011 and 31 December 2010.
Foreign currency riskThe Company incurs foreign currency risk on contract revenues and purchases and on borrowings and loans denominated in a currency other than Euro. The foreign currencies giving rise this risk are primarily British pounds, United States dollars, Japanese yens.Generally the contracts are hedged for the total amount denominated in foreign currency; see paragraph e for a detailed description of the way used by the Company to hedge its job contracts in foreign currency.In respect to monetary assets and liabilities held in foreign currency other that those related to the contracts, the Company’s policy consists in minimizing the net exposure to change in interest rates by specific medium/short-term forward exchange contracts, rolled over at maturity if necessary.
Sensitivity analysisA 10% decrease of the Euro against the following currencies as at 31 December 2011 would have led to the following increase (decrease) of the results for the period and the net equity. The analysis has been performed considering that all the other variables, more specifically the interest rates, had remained
2011ANNUALREPORT
Notes to the Statutory Financial StatementsStatutory Financial Statements

169
constant. The analysis was performed on the same basis compared to the previous period.
In thousand of EuroResult for the period
Net equity
31 December 2011GBP 11 11USD 77 77HKD 97 97SGD 9 9AUD (17) (17)YEN 19 19Others (2) (2)
194 194
In thousand of EuroResult for the period
Net equity
31 December 2010GBP 49 49USD 189 189HKD 99 99SGD 70 70AUD (14) (14)YEN 19 19Others 20 20
432 432
A 10% increase of the Euro against the following currencies as respectively at 31 December 2011 and 31 December 2010 would have led to the same but opposite effect, again supposing that all other variables had remained constant.
Please note that the analysis did not take into account receivables, payables and future trade flows against which the hedging operations were performed. It is reasonable to believe that the variation of the exchange rates may lead to an opposite financial effect for this item, for a same or higher amount, on the hedged transactions.
Commodities price riskThe Company has a price risk exposure, including the relevant foreign exchange risk, particularly on aluminum purchases, which are one of the main work order cost items.As far as managing the aluminum price risk is concerned, the Company’s policy is oriented towards minimizing the need to resort to financial markets for hedging, by conducting relations with the suppliers in order to fix the price for specific time frames. However, in the past the rather swinging trend of the aluminum price has encouraged the Company to launch a limited and selective aluminum price hedging policy for a few specific orders, where freezing the price with the supplier, for the whole period of the order, was merely impossible or not immediate in any case.For a detailed description of the Company’s practices of commodity hedging management on its own orders, please refer to paragraph “Accounting principle” included at the beginning of the notes.
Fair valueThere are no financial assets or liabilities whose fair value significantly differs from their carrying amount.
Fair value hierarchyIFRS 7 requires financial instruments recognized at fair value in the statement of financial position to be classified on the basis of a hierarchy that reflects the significance of the inputs used in determining fair value. This hierarchical classification applies the following levels:
Statutory Financial StatementsNotes to the Statutory Financial Statements
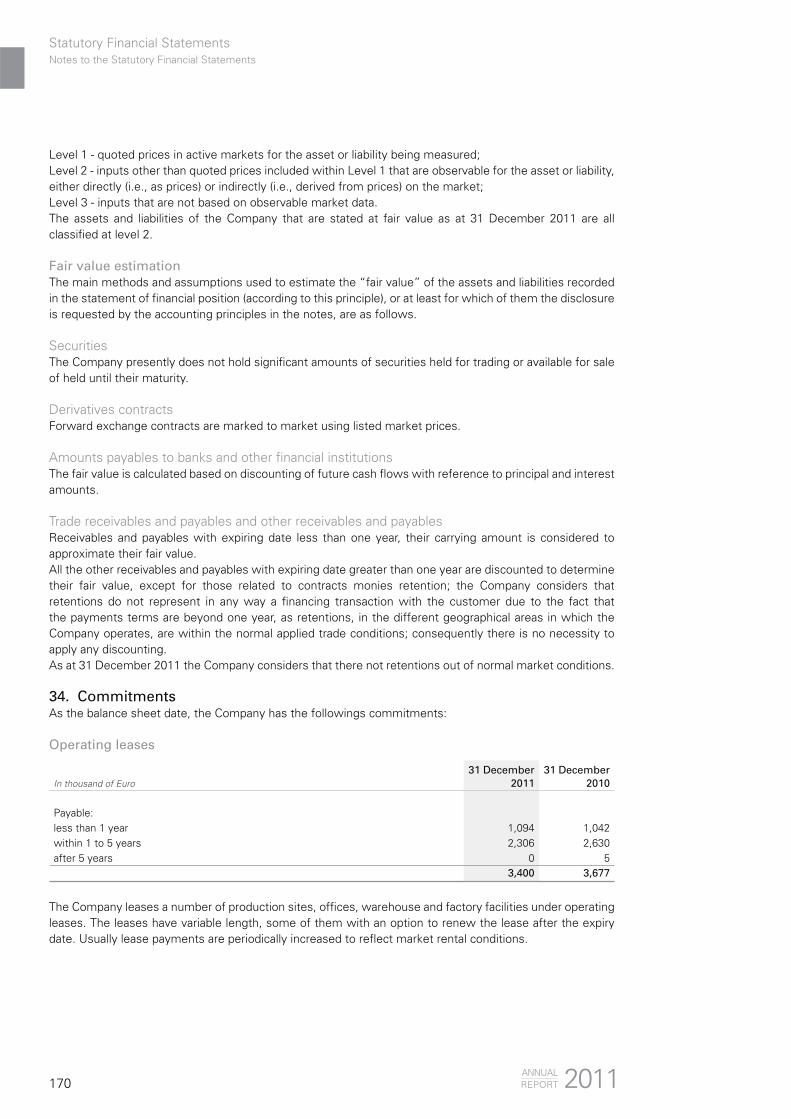
170
Level 1 - quoted prices in active markets for the asset or liability being measured;Level 2 - inputs other than quoted prices included within Level 1 that are observable for the asset or liability, either directly (i.e., as prices) or indirectly (i.e., derived from prices) on the market;Level 3 - inputs that are not based on observable market data.The assets and liabilities of the Company that are stated at fair value as at 31 December 2011 are all classified at level 2.
Fair value estimationThe main methods and assumptions used to estimate the “fair value” of the assets and liabilities recorded in the statement of financial position (according to this principle), or at least for which of them the disclosure is requested by the accounting principles in the notes, are as follows.
SecuritiesThe Company presently does not hold significant amounts of securities held for trading or available for sale of held until their maturity.
Derivatives contractsForward exchange contracts are marked to market using listed market prices.
Amounts payables to banks and other financial institutionsThe fair value is calculated based on discounting of future cash flows with reference to principal and interest amounts.
Trade receivables and payables and other receivables and payablesReceivables and payables with expiring date less than one year, their carrying amount is considered to approximate their fair value.All the other receivables and payables with expiring date greater than one year are discounted to determine their fair value, except for those related to contracts monies retention; the Company considers that retentions do not represent in any way a financing transaction with the customer due to the fact that the payments terms are beyond one year, as retentions, in the different geographical areas in which the Company operates, are within the normal applied trade conditions; consequently there is no necessity to apply any discounting.As at 31 December 2011 the Company considers that there not retentions out of normal market conditions.
34. CommitmentsAs the balance sheet date, the Company has the followings commitments:
Operating leases
In thousand of Euro31 December
201131 December
2010
Payable:less than 1 year 1,094 1,042within 1 to 5 years 2,306 2,630after 5 years 0 5
3,400 3,677
The Company leases a number of production sites, offices, warehouse and factory facilities under operating leases. The leases have variable length, some of them with an option to renew the lease after the expiry date. Usually lease payments are periodically increased to reflect market rental conditions.
2011ANNUALREPORT
Notes to the Statutory Financial StatementsStatutory Financial Statements

171
Forward contracts
In thousand of Euro31 December
201131 December
2010
Commitments for forward foreign exchange contracts 269,043 206,218Commitments for forward contracts on commodities 940 0
269,983 206,218
Commitments for forward foreign exchange contracts (buy) 152,505 133,455 Commitments for forward foreign exchange contracts (sell) 116,538 72,763
269,043 206,218
Commitments for forward contracts on commodities (buy) 940 0Commitments for forward contracts on commodities (sell) 0 0
940 0
As described in the section on the accounting standards, hedging derivative transactions on foreign currencies and commodities are assessed at their “fair value”.As at 31 December 2011 the assessment of the fair value of currency hedging brought to the entry of profit for Euro 5,204 thousand (2010: Euro 3,150 thousand) and a loss for Euro 2,626 thousand (2010: Euro 818 thousand) booked respectively under the items forward assets (note 24) and forward liabilities (note 32). Note that the stated amounts of Euro 4,918 thousand (2010: Euro 2,111 thousand) and Euro 1,186 thousand (2010: Euro 346 thousand) refer, respectively, to the valuation of financial currency hedging transactions, namely those covering foreign currency assets and liabilities of financial nature. On the same date, the fair valuation of hedging transactions on commodities led to the entry of profit for Euro 0 thousand (2010: Euro 0 thousand) and a loss for Euro 27 thousand (2010: Euro 0 thousand).
Other commitmentsAs at 31 December 2011 the Company has no other significant commitments to highlight.
35. Contingent assets and liabilitiesAt the balance sheet date, the Company has provided the following guarantees in respect of third parties:
In thousand of Euro31 December
201131 December
2010
Counter guarantees to banks and insurances mainly in respect of successfulperformance of job orders 383,391 334,465 Guarantees to insurances mainly in respect of successful performance of job orders 136 136 Guarantees to banks mainly in respect of successful performance of job orders 34,194 11,032 Guarantees in respect of the request of VAT refund and other payment guarantees 4,187 5,179
Guarantees to banks/insurances for credit lines to subsidiaries 922,429 674,133 Guarantees to banks/insurances for credit lines used by the parent company and by the subsidiaries 71,943 71,236
1,416,280 1,096,181
The Company has no mortgages at the end of the period.
Statutory Financial StatementsNotes to the Statutory Financial Statements

172
36. Transaction with related parties
Relationships with subsidiaries During the year, the Company entered into significant relationships with direct and indirect subsidiaries, concerning trade and financial transactions entered into as part of the normal management activities usually regulated by market conditions.As far as the financial effects of these transactions, they are already described in explanatory notes 22 and 31 on payables and receivables concerning subsidiaries. The following is a summary table highlighting the impact of these positions on financial statement items of the same nature.
In thousand of Euro
31 December 2011
TotalVersus
third parties %Related parties %
Trade receivables 60,798 31,429 52% 29,369 48%Financial receivables - current 36,628 0 0% 36,628 100%Trade payables 41,475 35,108 85% 6,367 15%Financial payables - current 186,484 0 0% 186,484 100%Other payables 29,170 14,272 49% 14,897 51%
In thousand of Euro
31 December 2010
TotalVersus
third parties %Related parties %
Trade receivables 40,396 22,292 55% 18,104 45%Financial receivables - current 26,974 0 0% 26,974 100%Trade payables 27,429 23,691 86% 3,738 14%Financial payables - current 241,935 23 0% 241,912 100%Other payables 10,686 10,021 94% 665 6%
As far as the economic effects of these relations, they are included in the relevant column “Related parties” of the income statement, and they are detailed in the following table which also highlights the impact of these positions on the financial statement item total they belong to.
2011ANNUALREPORT
Notes to the Statutory Financial StatementsStatutory Financial Statements

173
Operating revenues to subsidiaries
In thousand of Euro31 December
201131 December
2010
Bleu Tech Montreal Inc. 188 0.1% 124 0.1%Permasteelisa Philippines Inc. 99 0.1% 73 0.1%Permasteelisa Impianti S.r.l. 443 0.3% 617 0.6%Gartner Contracting Co. Ltd. 334 0.2% 329 0.3%Gartner Steel and Glass GmbH 211 0.2% 233 0.2%Global Architectural Co. Ltd. 412 0.3% 398 0.4%Global Wall Malaysia Sdn. Bhd. 40 0.0% 14 0.0%Josef Gartner & Co. (HK) Ltd. 571 0.4% 352 0.3%Josef Gartner & Co. UK Ltd. 276 0.2% 421 0.4%Josef Gartner Curtain Wall (Shanghai) Co. Ltd. 247 0.2% 194 0.2%Josef Gartner Curtain Wall (Suzhou) Ltd. 303 0.2% 32 0.0%Josef Gartner GmbH 1,668 1.3% 2,059 2.0%Josef Gartner (Macau) Ltd. 3 0.0% 2 0.0%Permasteelisa Gartner Qatar Llc 2,012 1.5% 2,451 2.4%Josef Gartner Switzerland AG 52 0.0% 27 0.0%Permasteelisa (India) Private Limited 540 0.4% 470 0.5%Permasteelisa Espana S.A.U. 707 0.5% 336 0.3%Permasteelisa France S.a.s. 2,632 2.0% 2,749 2.6%Permasteelisa Gartner Middle East Llc 16,977 12.7% 6,901 6.6%Permasteelisa Gartner Saudi Arabia Llc 4,455 3.3% 11 0.0%Permasteelisa North America Corp. 3,339 2.5% 2,244 2.2%Permasteelisa Hong Kong Limited 932 0.7% 904 0.9%Permasteelisa Interiors S.r.l. 3,349 2.5% 3,531 3.4%Permasteelisa International B.V. (*) 0 0.0% 9 0.0%Permasteelisa Ireland Ltd. 90 0.1% 2,071 2.0%Permasteelisa Japan K.K. 527 0.4% 257 0.2%Permasteelisa Macau Limited 21 0.0% 29 0.0%Permasteelisa Pacific Holdings Ltd. 1,396 1.0% 1,315 1.3%Permasteelisa Polska Sp.zo.o. (**) 0 0.0% 9 0.0%Permasteelisa PTY Limited 540 0.4% 535 0.5%Permasteelisa Project (Thailand) Ltd. 35 0.0% 6 0.0%Permasteelisa Taiwan Ltd. 1 0.0% 0 0.0%Permasteelisa UK Ltd. 22,640 17.0% 13,566 13.1%RI.ISA D.o.o. 78 0.1% 63 0.1%Scheldebouw B.V. 2,455 1.8% 3,402 3.3%Tower Installation Llc. 79 0.1% 221 0.2%Total 67,652 50.5% 45,955 44.2%Total operating revenues 133,798 100.0% 103,862 100.0%
(*) Company merged into Permasteelisa S.p.A. during year 2010.(**) Company wound-up during 2010.
Statutory Financial StatementsNotes to the Statutory Financial Statements
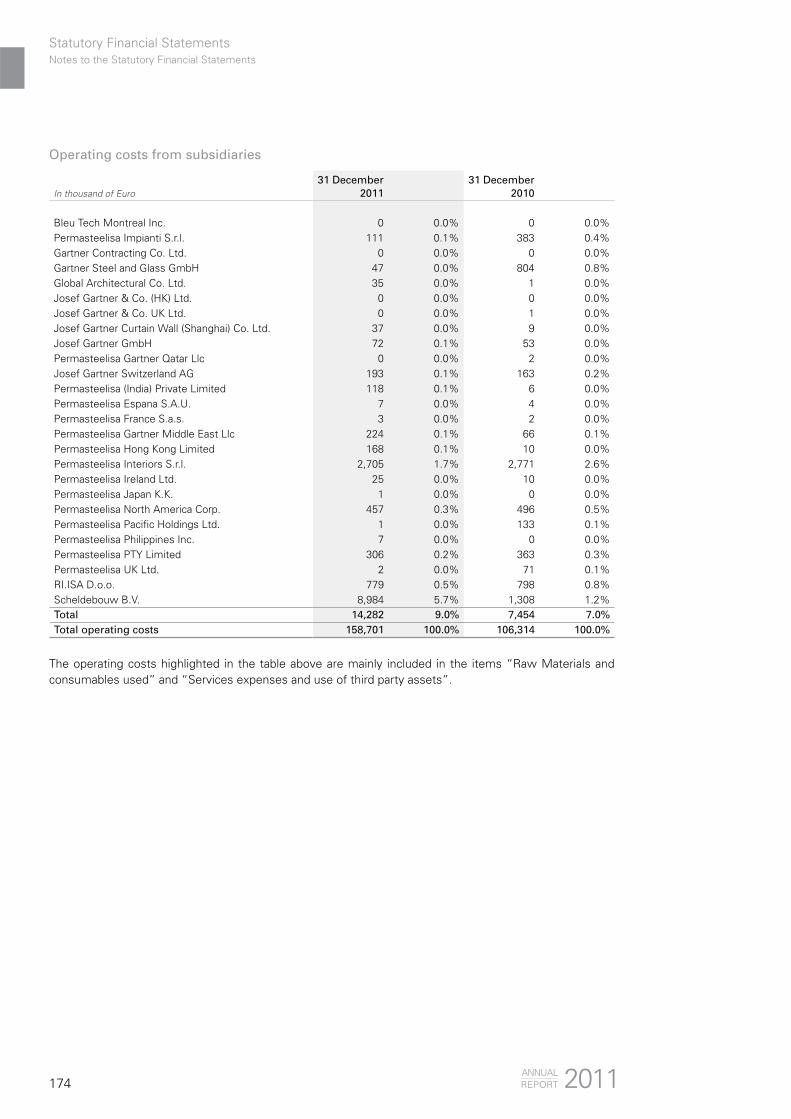
174
Operating costs from subsidiaries
In thousand of Euro31 December
201131 December
2010
Bleu Tech Montreal Inc. 0 0.0% 0 0.0%Permasteelisa Impianti S.r.l. 111 0.1% 383 0.4%Gartner Contracting Co. Ltd. 0 0.0% 0 0.0%Gartner Steel and Glass GmbH 47 0.0% 804 0.8%Global Architectural Co. Ltd. 35 0.0% 1 0.0%Josef Gartner & Co. (HK) Ltd. 0 0.0% 0 0.0%Josef Gartner & Co. UK Ltd. 0 0.0% 1 0.0%Josef Gartner Curtain Wall (Shanghai) Co. Ltd. 37 0.0% 9 0.0%Josef Gartner GmbH 72 0.1% 53 0.0%Permasteelisa Gartner Qatar Llc 0 0.0% 2 0.0%Josef Gartner Switzerland AG 193 0.1% 163 0.2%Permasteelisa (India) Private Limited 118 0.1% 6 0.0%Permasteelisa Espana S.A.U. 7 0.0% 4 0.0%Permasteelisa France S.a.s. 3 0.0% 2 0.0%Permasteelisa Gartner Middle East Llc 224 0.1% 66 0.1%Permasteelisa Hong Kong Limited 168 0.1% 10 0.0%Permasteelisa Interiors S.r.l. 2,705 1.7% 2,771 2.6%Permasteelisa Ireland Ltd. 25 0.0% 10 0.0%Permasteelisa Japan K.K. 1 0.0% 0 0.0%Permasteelisa North America Corp. 457 0.3% 496 0.5%Permasteelisa Pacific Holdings Ltd. 1 0.0% 133 0.1%Permasteelisa Philippines Inc. 7 0.0% 0 0.0%Permasteelisa PTY Limited 306 0.2% 363 0.3%Permasteelisa UK Ltd. 2 0.0% 71 0.1%RI.ISA D.o.o. 779 0.5% 798 0.8%Scheldebouw B.V. 8,984 5.7% 1,308 1.2%Total 14,282 9.0% 7,454 7.0%Total operating costs 158,701 100.0% 106,314 100.0%
The operating costs highlighted in the table above are mainly included in the items “Raw Materials and consumables used” and “Services expenses and use of third party assets”.
2011ANNUALREPORT
Notes to the Statutory Financial StatementsStatutory Financial Statements

175
Financial income to subsidiaries
In thousand of Euro31 December
201131 December
2010
Permasteelisa Impianti S.r.l. 26 0.1% 12 0.0%Gartner Contracting Co., Limited 2 0.0% 0 0.0%Josef Gartner & Co. (HK) Ltd. 2 0.0% 0 0.0%Josef Gartner (Macau) Ltd. 1 0.0% 0 0.0%Josef Gartner GmbH 11,656 26.8% 0 0.0%Permasteelisa Gartner Qatar Llc 0 0.0% 2 0.0%Permasteelisa Espana S.A.U. 76 0.2% 66 0.2%Permasteelisa France S.a.s. 69 0.2% 45 0.1%Permasteelisa Gartner Middle East Llc 6 0.0% 42 0.1%Permasteelisa North America Corp. 15,513 35.7% 12,672 38.5%Permasteelisa Hong Kong Ltd. 2 0.0% 0 0.0%Permasteelisa Interiors S.r.l. 198 0.5% 127 0.4%Permasteelisa Macau Limited 1 0.0% 0 0.0%Permasteelisa Pacific Holdings Ltd. 8 0.0% 2 0.0%Permasteelisa PTY Limited 2 0.0% 0 0.0%Permasteelisa UK Ltd. 2 0.0% 0 0.0%RI.ISA D.o.o. 3 0.0% 3 0.0%Scheldebouw B.V. 212 0.5% 8 0.0%Total 27,779 64.0% 12,979 39.3%Total financial income 43,491 100.0% 32,952 100.0%
Financial expenses from subsidiaries
In thousand of Euro31 December
201131 December
2010
Permasteelisa Impianti S.r.l. 0 0.0% 0 0.0%Permasteelisa Gartner Qatar Llc 0 0.0% 14 0.0%Josef Gartner GmbH 2,203 10.7% 1,668 4.7%Permasteelisa Espana S.A.U. 0 0.0% 0 0.0%Permasteelisa France S.a.s. 0 0.0% 1 0.0%Permasteelisa Gartner Middle East Llc 14 0.1% 0 0.0%Permasteelisa Gartner Qatar Llc 54 0.3% 0 0.0%Permasteelisa North America Corp. 421 2.1% 470 1.3%Permasteelisa International B.V. (*) 0 0.0% 172 0.5%Permasteelisa Ireland Ltd. 59 0.3% 61 0.2%Permasteelisa Pacific Holdings Ltd. 1,022 5.0% 836 2.4%Permasteelisa UK Ltd. 56 0.3% 4 0.0%RI.ISA D.o.o. 0 0.0% 0 0.0%Scheldebouw B.V. 0 0.0% 733 2.1%Total 3,829 18.8% 3,959 11.3%Total financial expenses 20,510 100.0% 35,186 100.0%
(*) Company merged into Permasteelisa S.p.A. during 2010.
Please note that there were no items deriving from the Italian national tax consolidation in year 2011 and 2010.
Other relationships with other related partiesExpenses incurred for the members of the Board of Directors and for the Group’s managers with strategic responsibilities are included under “Personnel expenses” and they amount to Euro 19,730,946 (2010: Euro 5,404,690) whereas remuneration for Auditors is included in item “Services expenses and use of third-party assets” and they amount to Euro 90,000 (2010: Euro 155,088).
Statutory Financial StatementsNotes to the Statutory Financial Statements

176
As at 31 December 2011 the Company showed a debit balance towards other related parties of Euro 14,897,229 (2010: Euro 664,868).
This balance was included in the summary table of receivables and payables items with respect to related parties, as shown at the beginning of this explanatory note.
During the year, the Company has not entered directly into relations with related parties other than its subsidiaries:
Group Company Transaction type Related party
Revenue/(Cost) in Euro
2011
Receivable/ (Payable)in Euro as at
31 December 2011
Permasteelisa S.p.A.Sale of secretary and domicile services
Davide Croff (Chairman of Permasteelisa S.p.A.'s Board of Directors) 45,000.00 57,600.00
Permasteelisa S.p.A. Sale of rental services
Nicola Greco (Permasteelisa S.p.A.'s Ceo) 9,168.38 20.46
Permasteelisa S.p.A. Costs backcharge
Barioli Alessandro (Manager of Permasteelisa S.p.A.) 426.47 248.62
Permasteelisa S.p.A. Costs backchargeAgolzer Arturo (Manager of Permasteelisa S.p.A.) 759.13 254.10
Permasteelisa S.p.A. Costs backchargeCrose Daniele (Manager of Permasteelisa S.p.A.) 352.14 117.46
Permasteelisa S.p.A. Costs backchargeFerraro Antimo (Manager of Permasteelisa S.p.A.) 211.32 90.14
Permasteelisa S.p.A. Costs backcharge
Primicerio Alfredo (Manager of Permasteelisa S.p.A.) 887.76 261.24
Permasteelisa S.p.A. Costs backcharge
Mangiarotti Massimo (Manager of Permasteelisa S.p.A.) 5,381.13 1,564.50
Permasteelisa S.p.A. Costs backchargeCordioli Marcello (Manager of Permasteelisa S.p.A.) 15.20 16.33
Permasteelisa S.p.A. Costs backchargeBarizza Marco (Manager of Permasteelisa S.p.A.) 96.44 103.63
Permasteelisa S.p.A. Costs backcharge
Mauro Alessandro (Manager of Permasteelisa S.p.A.) 437.26 469.88
Permasteelisa S.p.A. Costs backchargeLixil Corporation(Direct shareholder) 2,900.66 2,900.66
Permasteelisa S.p.A. Costs backchargeJS Group Corporation (Ultimate shareholder) 25,000.00 30,250.00
Permasteelisa S.p.A.Offices rental services purchase
Fondazione Ugo e Olga Levi Onlus (*) (294,132.50) 0.00
Permasteelisa S.p.A.
Supply of restructuring and other structural works (receivable acquired from the subsidiary Permasteelisa Interiors S.r.l.)
Fondazione Ugo e Olga Levi Onlus (*) 0.00 1,040,316.13
Permasteelisa S.p.A.
Set off of receivables/ payables existing between the parties (interests income)
Fondazione Ugo e Olga Levi Onlus (*) 43,722.94 43,722.94
revenue/ receivable 134,358.83 1,177,936.09cost/payable (294,132.50) 0.00
(*) Davide Croff and Nicola Greco, respectively President and Chief Executive Officer of Permasteelisa S.p.A., are members of the Board of Directors of the foundation.
2011ANNUALREPORT
Notes to the Statutory Financial StatementsStatutory Financial Statements
177
The transaction with the President Davide Croff, concerns the domiciliation and secretary service given by the Company for Milan’s offices.The transactions with Foundation Ugo and Olga Levi Onlus, concern:
a) as regards the first in the list, the lease contract for Venice’s offices that provides an annual fee of Euro 290,000 for 6 years with ISTAT adjustment;
b) as regards the second in the list, the receivable given by the subsidiary Permasteelisa Interiors S.r.l. for the restoration of the façade of the venetian palace leased by Permasteelisa S.p.A and committed by Foundation Ugo and Olga Levi Onlus to Permasteelisa Interiors S.r.l.;
c) as regards the third in the list, the receivable for interests related to the settlement agreement between payables on rent (point a) and receivables on restoration of the façade of the venetian palace (point b).
These transactions are regulated at normal market conditions.
Transactions with key management personnelThe remuneration of top managers having a key function within the Company amounted in total to Euro 19,437 thousand (2010: Euro 5,085 thousand), of which Euro 12,704 thousand (2010: Euro 3,518 thousand) can be referred to specific members of the Company’s Board of Directors, Euro 4,308 thousand (2010: Euro 733 thousand) concern Managers with Holding functions and Euro 2,425 thousand (2010: Euro 834 thousand) for the Company’s Country Manager functions.
37. Emoluments of Statutory AuditorsThe fees of Statutory Auditors amount to Euro 152 thousand, of which Euro 127 thousand for audit services, Euro 0 thousand for tax services and Euro 25 thousand for other services related to the preparation of the limited review of the Consolidated Financial Statement as at 30 September 2011.
38. Positions or transactions deriving from unconventional and/or unusual operationsThere are no positions or transactions deriving from unconventional and/or unusual operations to highlight.
39. Subsequent eventsNo major events have occurred after the end of the financial year.
Statutory Financial StatementsNotes to the Statutory Financial Statements

178
Receivables and payables, included in the Statement of financial position as at 31 December 2011, are reported in the following tables broken down by geographical area:
a) trade receivables from third parties;b) trade receivables from subsidiaries;c) financial receivables from subsidiaries;d) trade payables to third parties;e) trade payables from subsidiaries;f) financial payables from subsidiaries.
Trade receivables from third parties
In thousands of Euro31 December
201131 December
2010
Belgium 84 244France 2 0Germany 1,201 0Japan 33 0Italy 30,091 23,497Singapore 14 12Switzerland 4 4
31,429 23,757
Trade receivables from subsidiaries
In thousands of Euro31 December
201131 December
2010
Saudi Arabia 727 11Australia 290 273Canada 98 82China 238 232Croatia 41 18Dubai 8,156 4,137Philippines 34 35France 2,101 678Germany 916 1,147Japan 194 194Great Britain 8,622 1,448Hong Kong 1,020 1,148India 928 471Ireland 29 757Italy 1,275 1,426Macau 9 (10)Malaysia 25 38The Netherlands 1,234 1,439Qatar 292 513Singapore 689 725Spain 233 183United States 1,473 1,383Switzerland 19 17Taiwan 51 52Thailand 675 242
29,369 16,639
Appendix to the Statutory Financial Statements
Appendix I: Receivables and payables broken down by geographical area
2011ANNUALREPORT
Appendix I: Receivables and payables broken down by geographical areaStatutory Financial Statements

179
Financial receivables from subsidiaries
In thousands of Euro31 December
201131 December
2010
Croatia 0 118Dubai 958 0 France 5,990 401Italy 5,511 12,668The Netherlands 22,426 5,942Singapore 0 4,072Spain 1,932 3,773United States (189) 0
36,628 26,974
Trade payables to third parties
In thousands of Euro31 December
201131 December
2010
Austria 127 97Belgium 90 90China 0 1Croatia 1 18Egypt 0 2Finland 7 0France 318 166Germany 501 829Ghana 13 0Greece 441 97Ireland 42 354Italy 33,022 21,566Luxemburg 8 0The Netherlands 2 31Great Britain 50 70Romania 34 0Slovenia 9 16Spain 160 4United States 89 24Switzerland 110 338Thailand 0 (12)Ukraine 84 0
35,108 23,691
Statutory Financial StatementsAppendix I: Receivables and payables broken down by geographical area
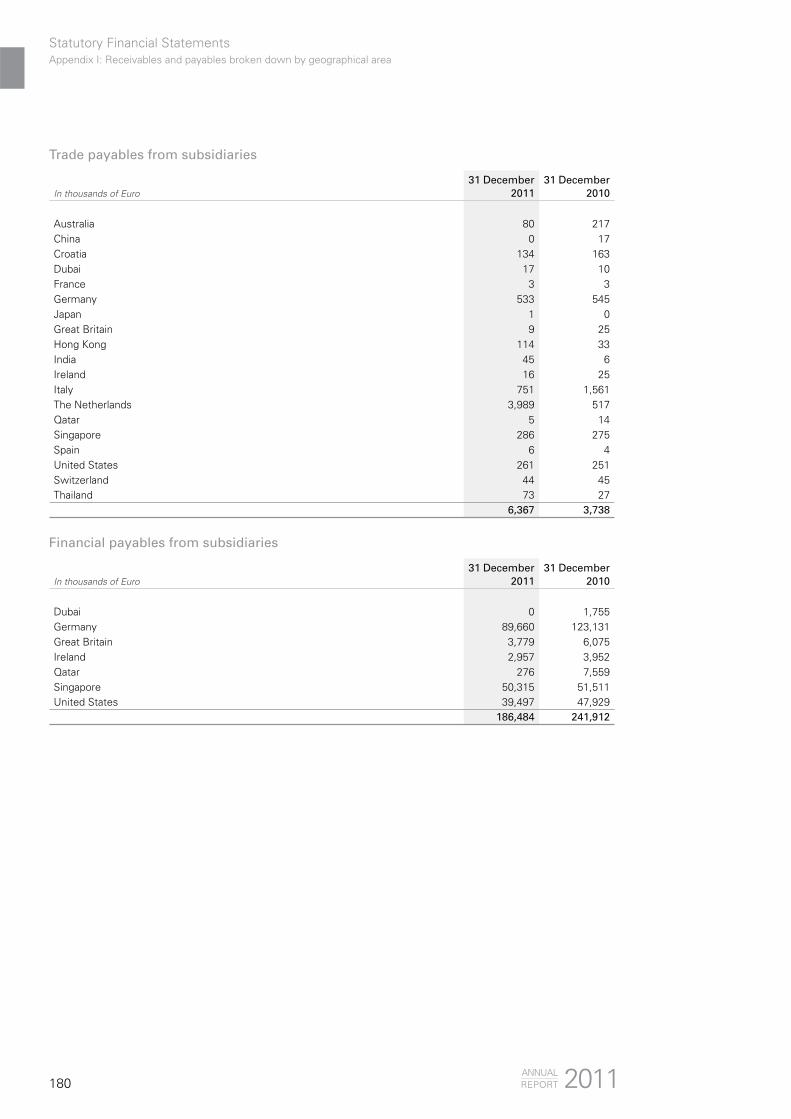
180
Trade payables from subsidiaries
In thousands of Euro31 December
201131 December
2010
Australia 80 217China 0 17Croatia 134 163Dubai 17 10France 3 3Germany 533 545Japan 1 0Great Britain 9 25Hong Kong 114 33India 45 6Ireland 16 25Italy 751 1,561The Netherlands 3,989 517Qatar 5 14Singapore 286 275Spain 6 4United States 261 251Switzerland 44 45Thailand 73 27
6,367 3,738
Financial payables from subsidiaries
In thousands of Euro31 December
201131 December
2010
Dubai 0 1,755Germany 89,660 123,131Great Britain 3,779 6,075Ireland 2,957 3,952Qatar 276 7,559Singapore 50,315 51,511United States 39,497 47,929
186,484 241,912
2011ANNUALREPORT
Statutory Financial StatementsAppendix I: Receivables and payables broken down by geographical area

New Surgical UnitConegliano Hospital
Treviso \ Italy

182
AttachmentsAuditors’ report on the Consolidated Financial Statements
2011ANNUALREPORT

183
AttachmentsAuditors’ report on the Consolidated Financial Statements

184
AttachmentsAuditors’ report on the Statutory Financial Statements
2011ANNUALREPORT
185
AttachmentsAuditors’ report on the Statutory Financial Statements

Attachments
(COMPLIMENTARY TRANSLATION)
Permasteelisa S.p.A.
FINANCIAL STATEMENTS OF YEAR 2011
REPORT OF THE BOARD OF STATUTORY AUDITORS,
PURSUANT TO ARTICLE 2429 OF THE ITALIAN CIVIL CODE
To the Shareholders’ Meeting of Permasteelisa S.p.A.
Dear Sole Shareholder,
this Board of Statutory Auditors, in its current composition, was appointed by the Shareholders’ Meeting of December 6, 2011, following to the resignation of the Board of Statutory Auditors in charge until that date. This report is therefore drawn up having regard to the supervisory activities carried out mostly by the Board of Statutory Auditors in its previous composition.
During the financial year ended on December 31, 2011, the Board of Statutory Auditors has met to perform the activity provided for by art. 2403 of the Italian Civil Code. The activity has been inspired by the Rules of Practice as recommended by the Italian Chartered Accountants Association. This activity has been acknowledged in the minutes of the four meetings held during the financial year, in which has been examined both the ordinary and the extraordinary transactions, the intercompany transactions and the related parties transactions.
The Board of Statutory Auditors attended the nine meetings of the Board of Directors and the six meetings of the Shareholders’ Meeting held during the financial year; the Board of Statutory Auditors has convened meetings and telephone conversations with the representatives of PricewaterhouseCoopers S.p.A., the Company’s auditing firm.
During the financial year the Board of Statutory Auditors has received information from the Directors about the overall operating performance and its predictable outlook and about the operations of greater importance, size or characteristics, made by the Company; in relation to this we can reasonably ensure that the actions taken are in compliance with the law and with the Articles of Association and are not manifestly imprudent, risky, in potential conflict of interest nor in conflict with the decision taken by the Shareholders’ Meeting nor able to compromise the integrity of the Company’s equity.
The Board of Statutory Auditors has acquired knowledge and supervised on the adequacy of the organizational structure of the Company, also trough the collection of information, and has evaluated the adequacy of the administrative and accounting system and also the reliability of the latter to correctly represent the management operations, through the collection of information and with the exam of Company’s documents. In relation to this, there has been no significant events to report.
During the periodic inspections, the Board of Statutory Auditors has held specific meetings with the heads of the administration, corporate affairs, finance and personnel functions and collected information from the auditing firm by acknowledging the periodic audits reports carried out by the latter, which found no significant events to report.
To date no complaints pursuant to art. 2408 of the Italian Civil Code, nor any kind of petition have been received by us.
Report of the Board of Statutory Auditors
2011ANNUALREPORT186
2
In the course of the supervision activity, as described above, there has been no additional significant events to be mentioned in this report.
We examined the Draft Financial Statements of the Company for the financial year ended on December 31, 2011, prepared in accordance with the International Financial Reporting Standards, approved by the Board of Directors on March 28, 2012, and regularly communicated to us together with the explanatory notes. The Board of Statutory Auditors has no duty to perform substantial checks on the Financial Statements, so we supervised on their general structure, on their general compliance with the law and with the International Financial Reporting Standards as far as its formation and structure are concerned. In relation to this, we have nothing to report.
We consented to the record in the Balance Sheet’s assets of costs for patents and intellectual property for a value of Euro 2.16 million. The increase of these assets, compared to the previous financial year, is due to external acquisitions for Euro 281 thousand and to other increase for Euro 544 thousand. We also report that, according to the amortization plan, in the Balance Sheet are no longer recorded research and development costs. In relation to the intangible assets in general, we note that no impairment tests were performed to evaluate the future recoverability of the amounts recorded, this because the Directors believed that were no significant syntoms of impairment other than those already indicated in the Financial Statements for the previous year; in this respect we recommend to monitor the recoverability of the above amounts during the financial year 2012.
The auditing firm PricewaterhouseCoopers S.p.A. released on April 11, 2012 its report to the Financial Statements pursuant to art. 14 of Legislative Decree no. 39/2010; this report contains an assessment of compliance of the Financial Statements to the law and the International Financial Reporting Standards.
Given the above, as far as our competence and duties are concerned we find no reason to oppose to the approval of the Financial Statements as of December 31, 2011 as prepared by the Board of Directors, which show a profit for the year of Euro 1.992.546. In the absence of a proposal of the Directors about the allocation of the above mentioned profit, we have no observation to make.
Milan, April 12, 2012
The Board of Statutory Auditors
Signed: Eugenio Romita
Signed: Antonella Alfonsi
Signed: Roberto Spada
AttachmentsReport of the Board of Statutory Auditors
187


Front and Back CoverTamar Development ProjectHong Kong \ P. R. of ChinaPhoto: Stuart Woods