annual report ‐ 2011 ‐12 -...
TRANSCRIPT

1
ANNUAL REPORT ‐ 2011 ‐12
1. GENERAL INFORMATION ABOUT THE KVK 1.1. Name and address of KVK with phone, fax and e‐mail
Address Telephone E mail
Office FAX
Shri Hanumantharaya Educational & Charitable Society, Krishi Vigyan Kendra, Yagantipalle (P) Banaganapalle (M) Kurnool (Dt.) A.P.
9394444439 08515200340
‐‐‐‐ [email protected] [email protected]
1.2 .Name and address of host organization with phone, fax and e‐mail
Address Telephone E mail
Office FAX
Shri Hanumantharaya Educational & Charitable Society, Krishi Vigyan Kendra, Yagantipalle (P) Banaganapalle (M) Kurnool (Dt.) A.P.
9394444439 ‐‐‐‐ [email protected]
1.3. Name of the Programme Coordinator with phone & mobile No
Name Telephone / Contact
Residence Mobile Email
Smt.G.Dhanalakshmi 08142117677 9440607424 [email protected]
1.4. Year of sanction: 1989

2
1.5. Staff Position (as on 31st March‐2012)
Sl. No.
Sanctioned post Name of the incumbent
Designation Discipline Pay Scale
Present basic (Rs)
Date of joining
Permanent /Temporary
Category (SC/ST/ OBC/ Others)
1 Programme Coordinator
G.Dhanalakshmi Programme Coordinator Home Science 28,790‐00 36,790‐00 3‐4‐2003 Permanent OC
2 Subject Matter Specialist
K.Venkata Ramanaiah
SMS (Soil Science)
Soil Science 23,470‐00 28,870‐00 10‐7‐1996 Permanent BC
3 Subject Matter Specialist
M.Sudhakar SMS(Agronomy)
Agronomy 23,470‐00 28,870‐00 23‐9‐1996 Permanent OC
4 Subject Matter Specialist
D.Balaraju SMS(Plant Protection)
Plant Protection 19,310‐00 24,710‐00 4‐4‐2003 Permanent OC
5 Subject Matter Specialist
K.Rajeswar Reddy SMS Horticulture
Horticulture 15,600‐00 21,000‐00 1‐10‐2008 Permanent OC
6 Subject Matter Specialist
A.Krishna Murthy SMS(Animal Husbandry)
Animal Husbandry 15,600‐00 21,000‐00 20‐6‐2010 Permanent OC
7 Programme Assistant
K.Lakshmi Priya Programme Asst.(Home Science)
Home Science 16,600‐00
20,140‐00 18‐6‐1996 Permanent BC
8 Accountant / Superintendent
Y.V.Rama Subbaiah
Accountant Supt. Accountant Supt. 17,010‐00
20,520‐00 1‐1‐1996 Permanent OC
9 Jr.Asst. cum Typist (SK)
B.V.M.V.Prasad Rao
Jr. Asst. cum Typist Jr. Asst. cum Typist 11,900‐00 13,810‐00 21‐3‐1990 Permanent BC
10 Jr. Asst cum Typist (Against Jr. Steno)
S.Md. Khasim Jr. Asst cum Typist (Against post of Jr. Steno)
Jr. Asst cum Typist (Against post of Jr. Steno)
11,900‐00
13,810‐00 6‐4‐1990 Permanent OC
11 Driver Iqbal Basha Driver cum Mechanic Driver cum Mechanic 9,480‐00 11,090‐00 20‐9‐1995 Permanent OC
12 Driver D.Obulesu Driver cum Mechanic Driver cum Mechanic 8,860‐00 10,520‐00 1‐8‐1996 Permanent SC
13 Attender P.Raghava Reddy Attender Attender 7,220‐00 9,020‐00 2‐11‐1990 Permanent OC
14 Watchman T.P.Gurappa Watchman Watchman 6,690‐00 8,490‐00 30‐12‐94 Permanent BC
15 Cook T.Rajeswari Cook Cook 6,690‐00 8,490‐00 20‐9‐1995 Permanent BC
16 Farm Attendent A.Rama Subbaiah Farm Attendent Farm Attendent 6,690‐00 8,490‐00 1‐10‐1996 Permanent BC

3
1.6. Total land with KVK (in ha) : 20 ha
S. No.
Item Area (ha)
1. Under Buildings 2 2. Under Demonstration Units 13. Under Crops 10 4. Orchard/Agro‐forestry 4 5. Others (specify) 3
1.7. Infrastructural Development:
A) Buildings
S. No.
Name of building
Source of
funding
StageComplete Incomplete
CompletionDate
Plinth area (Sq.m)
Expenditure (Rs.)
Starting Date
Plinth area (Sq.m)
Status of construction
1. Administrative Building
ICAR 1994 7040 7.59 1990‐91
2. Farmers Hostel ICAR 1994 4040 8.0 1990‐91
3. Staff Quarters(6)
ICAR 1998 5710 32.27 1992‐93
4. Demonstration Units (2)
ICAR 1992‐93 4150 6.5 1992‐93
5 Fencing ICAR 2005‐06 6.5 2004‐05 6 Rain Water
harvesting system
‐ ‐ ‐ ‐
7 Threshing floor ‐ ‐ ‐ ‐ 8 Farm godown ICAR 2005‐06 112.5 5.28 2005‐06 9 Soil Testing
Laboratory ICAR 2004‐05 112.5 8.59 2004‐05
B) Vehicles
Type of vehicle Year of purchase
Cost (Rs.) Total km. Run
Present status
TATA Sumo
2009 6,00,000‐00 40,831 KM OK
Mahindra & Mahindra Tractor
2005 3,54,522‐00 24,798 (hrs) OK
Motorcycle (Sujiki) 1996 33,090‐00 5,25,695 KM Condemned
Motorcycle (Honda) 2002 45,576‐00 18,904 KM OK
Motorcycle (Suzuki MAX‐100) 2002 34,100‐00 73,005 KM OK
TVS XL‐Super 2002 17,900‐00 38,892 KM OK

4
C) Equipments & AV aids
Name of the equipment
Year of purchase
Cost (Rs.) Present status
Tape Recorder 1990 2,600‐00 OK
Over Head Projector 1991 6,200‐00 OK
Slide Projector 1991 7,168‐00 OK
Ahuja Micro phone Set 1994 9,500‐00 OK
Television 1994 19,999‐00 OK
Video Casette Recorder 1996 19,000‐00 OK
Ahuja Portable wireless Amplifier 2003 9,927‐00 OK
Cordless micro phone 2003 5,804‐00 OK
Collar Mike 2005 5,800‐00 OK
Digital Camera Kodak 2005 19,800‐00 Obsolete
Digital Camera Nikon 2005 15,100‐00 Obsolete
L.C.D 2005 1,00,000‐00 OK
1.8. A). Details SAC meeting conducted in the year‐ Rabi‐2011
Sl. No.
Date Name and Designation of Participants Salient Recommendations
Action taken
1 6‐8‐2010
1. Dr.M.R.Sreenivasulu, Special Officer, SHE&CS
2. Dr.Sankar Reddy, ADR,RARS, Nandyal.
3. Sri.Venkateswarlu, Joiint Director of Agriculture, Kurnool. 4. Dr.K.V.Subba Rao, DDA (FTC),
Nandyal. 5. Sri K.Satyanarayana, Project Manager, CCF, Koilkuntla. 6. Dr.Y.Narasimhudu, Principal Scientist, RARS, Nandyala. 7. Sri K.Pandu Prakash, Additional Project Director,
* Popularization of Redgram + Korra cropping system. * Popularization of post emergence weedicide in paddy sown with drum seeder. * Demonstration for minikits to be conducted in Association with
*It is included in kharif action plan 2011. * Demonstrations with post emergence weedicide under progress. * Conducting Cotton, Bengalgram and groundnut minikits with collaboration of RARS.

5
Agricultural. (DWMA), Kurnool. 8. Sri. B.R.Gangawar, Senior Techical Officer, NHRDF, Kurnool 9. Dr.Y.Rama Reddy, Senior Scientist, RARS, Nandyal. 10. Dr.Saralamma, Coordinator, DAATTC, Kurnool. 11. Sri D.Naveen Kumar, Horticulture Officer. 12. Sri Krishnudu, Farmer, Yagantipalle. 13. Sri Thulasi Eswar Reddy, Farmer, Nandavaram.
RARS.
Details of SAC meeting held For Kharif,2012
Sl.
No.
Date Name and Designation of
Participants
Salient
Recommendations
Action taken
1.
8‐2‐
2011
1. Dr.Y.Padmalatha, Associate Director of Research, RARS, Nandyal
2. Dr.K.Anand Singh, Deputy Director of Extension, ANGRAU, Hyderabad.
3. Dr. M.R.Sreenivasulu, Retd. ADR & Special Officer, SHE&CS
4. Dr. S.Saralamma, Coordinator, DAATTC, Kurnool
5. Dr. Y. Narasimhulu, Programme Coordinator, KVK, Banavasi
6. Sri.P.Wilson, ADA, AFT, Nandyal
7. Sri.U.Somasunder, R.A.(Plant Protection), KVK, Banavasi
8. S.Vijaya Bhaskar Reddy, Yagantipalle (V), Banaganapalle (M)
9. M.Krishnudu, Yagantipalle (V), Banaganapalle (M)
10. T.Rama Subba Reddy, Sanjamala
11. M.Raghunath Reddy, Kaipa, Banaganapalle (M)
12. D.Chinnapa Reddy,
Soil properties to be furnished along with yield particulars in demonstration on Reclamation of sodic soils.
Sprinkler irrigation in Bengal Gram may be tested in more locations.
Promotion of micro irrigation systems in horticultural crops.
Awareness to be created on high P content soils of Kurnool district.
More number of vocational trainings may be conducted.
Organized demonstrations on Zinc management in Paddy.
Seed production was taken up with Korra var.SIA‐3085 and supplied to the farmers
Awareness and training programmes were organized.

6
Banaganapalle 13. A.Padmavathi, Banaganapalle
14. M.V>Krishna Reddy, Kalugotla
15. M.Subramanyam, Yagantipalle, Banaganapalle (M)
16. B.Venkata Subba Reddy, Yagantipalle (V), Banaganapalle
17. K.Vijayalakshmi, Pandurangapuram, Nandyal (M)
18. A.Padmavathi, Pandurangapuram, Nandyal (M)
2. DETAILS OF DISTRICT (2011‐12) 2.1 Major farming systems/enterprises (based on the analysis made by the KVK)
S. No
Farming system/enterprise
1 Agriculture + Horticulture
2 Agriculture + Dairy
3 Agriculture + Horticulture + Dairy
4 Agriculture + Horticulture + Pastural Culture
2.2 Description of Agro‐climatic Zone & major agro ecological situations
(based on soil and topography)
S. No
Agro‐climatic Zone Characteristics
1 Scarce rain fall zone Low, scanty and erratic rainfall due to which
7
successful crop production with good yields
unexpectable and dry land agriculture is
predominant with a variety of rainfed crops in
the zone.
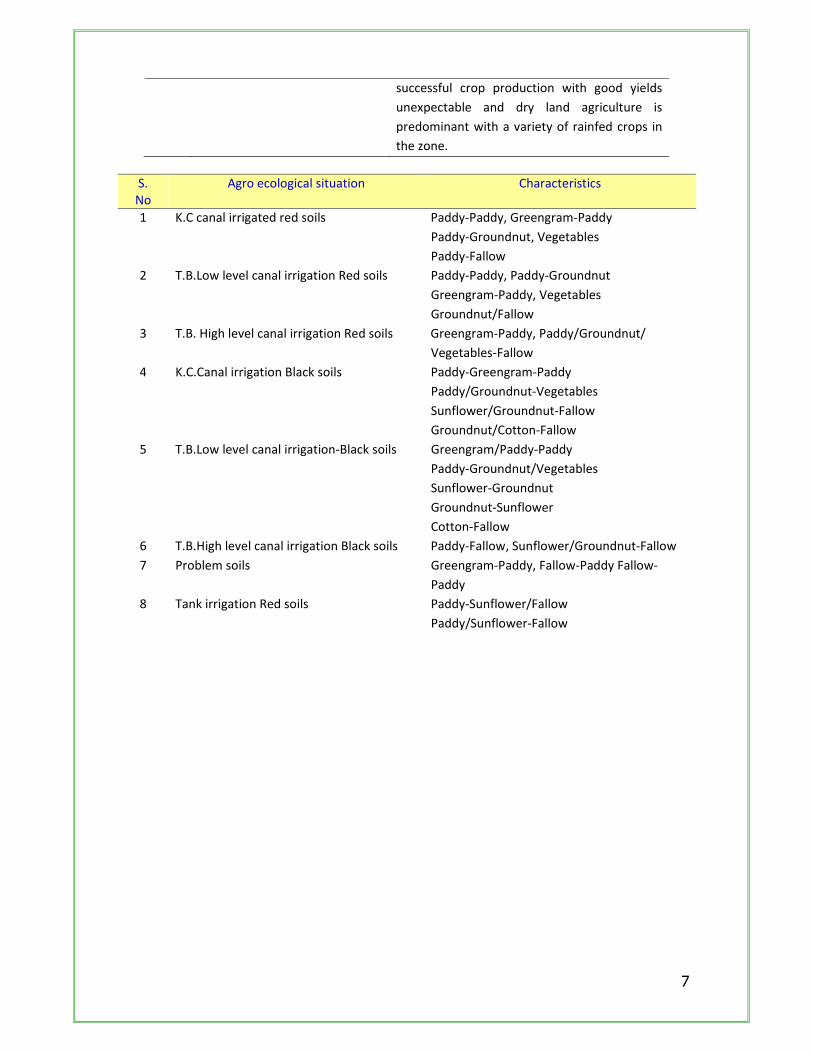
S. No
Agro ecological situation Characteristics
1 K.C canal irrigated red soils Paddy‐Paddy, Greengram‐Paddy
Paddy‐Groundnut, Vegetables
Paddy‐Fallow
2 T.B.Low level canal irrigation Red soils Paddy‐Paddy, Paddy‐Groundnut
Greengram‐Paddy, Vegetables
Groundnut/Fallow
3 T.B. High level canal irrigation Red soils Greengram‐Paddy, Paddy/Groundnut/
Vegetables‐Fallow
4 K.C.Canal irrigation Black soils Paddy‐Greengram‐Paddy
Paddy/Groundnut‐Vegetables
Sunflower/Groundnut‐Fallow
Groundnut/Cotton‐Fallow
5 T.B.Low level canal irrigation‐Black soils Greengram/Paddy‐Paddy
Paddy‐Groundnut/Vegetables
Sunflower‐Groundnut
Groundnut‐Sunflower
Cotton‐Fallow
6 T.B.High level canal irrigation Black soils Paddy‐Fallow, Sunflower/Groundnut‐Fallow
7 Problem soils Greengram‐Paddy, Fallow‐Paddy Fallow‐
Paddy
8 Tank irrigation Red soils Paddy‐Sunflower/Fallow
Paddy/Sunflower‐Fallow

8
9 Tank irrigation Black soils Paddy‐Paddy/Groundnut Sunflower‐Fallow,
Fallow‐Paddy/Groundnut/Sunflower
10 Well irrigation Red soils Paddy‐Paddy/Sunflower/Groundnut
Sunflower‐Groundnut/Greengram
Groundnut – Groundnut/Sunflower
Cotton/Onion‐Fallow
11 Well irrigation Black soils Paddy‐Paddy/Sunflower/Groundnut
Sunflower/Vegetables
Cotton/Onion/Chillies‐Fallow
12 Rainfed Red soils Sunflower, Groundnut+Redgram
Groundnut+Jowar, Cotton
Cotton+Redgra, Jowar, Korra, Redgram‐
Fallow
13 Rainfed‐Black soils Paddy‐Fallow
Sunflower/Bengalgram/Coriander fallow
Jowar/Bengalgram/Tabacco
Jowar/Groundnut/Cotton‐Fallow
2.3 Soil type/s
S. No
Soil type Characteristics Area in lakh ha
1 Black cotton soils Heavy and deep to very deep belonging to vertisols. 3.69
2 Red earths Clayey sub soil (association of alfisols and
inceptisols)
1.29
3 Red earths Loamy sub soil i.e chalkas (association of inceptisols
and alfisols)
3.18
4 Red sandy loam soils Dubbas & Chalkas (association of entisols,
inceptisols and alfisols)‐Light textured soils, poor
water holding capacity, poor fertility
0.54
5 Problem soils (Saline/sodic)
High pH more than 9.0 1.04
6 Rock land and others Undulated sloppy lands. Very shallow soils. 0.47

9
2.4. Area, Production and Productivity of major crops cultivated in the district Kharif ‐2011
S.
No
Crop Normal
areas
Area sown
(ha)
Production
(Qtl)
Productivity
(Qtl /ha)
1 Rice 88159 76637 3019948 3687
2 Jowar 6938 6363 261057 2129
3 Bajra 7947 5269 ‐ ‐
4 Maize 14598 14705 631364 5833
5 Ragi ‐ ‐ ‐ ‐
6 Minor Millets (Korra) 7866 9815 5000 ‐
7 Redgram 39171 41027 193736 631
8 Greengram 4372 900 11954 680
9 Blackgram 4653 2688 18147 585
10 Horsegram ‐ ‐ ‐ ‐
11 Other Pulses ‐ ‐ ‐ ‐
12 Groundnut 187510 86618 2093013 573
13 Sesamum 118 26 ‐ ‐
14 Castor 29391 100183 263602 728
15 Sunflower 54436 11339 302671 612
16 Soybean 183 149
17 Cotton 31874 79718 74140 (bales) 340
18 Mesta 130 70 ‐ ‐
19 Chillies 12087 13381 359662 3215
20 Sugarcane 1584 3248 ‐ ‐
21 Onion 14313 23342 2512188 18115
22 Turmeric 1239 4474 ‐ ‐
23 Others (Tobacco) 1835 104 ‐ ‐

10
Rabi ‐2011
S.
No
Crop Normal areas Area sown (ha) Production
(Qtl)
Productivity
(Qtl /ha)
1 Paddy 27245 9851 1092656 2775
2 Wheat 622 224 ‐ ‐
3 Jowar 60162 68863 1252679 2134
4 Bajra 465 610 ‐ ‐
5 Maize 3396 6507 416055 7784
6 Minor Millets 154 77 ‐ ‐
7 Redgram 1187 837 47678 1145
8 Greengram 519 1052 ‐ ‐
9 Blackgram 4603 8584 17630 480
10 Horsegram 1247 1119 6202 495
11 Bengalgram 226826 205499 4271722 1751
12 Other pulses 120 ‐ ‐ ‐
13 Groundnut 25286 17882 576581 2415
14 Sunflower 84485 28378 983236 1974
15 Safflower 624 697 ‐ ‐
16 Sesamum 487 283 ‐ ‐
17 Rape seed
mustard
4125 1689
18 Chillies 602 1210 22863 2725
19 Coriander 5788 3217 51688 595
20 Tobacco 11134 8777 178694 1135
21 Cotton ‐ 76 ‐ ‐
22 Onion 1816 3067 426170 23174
23 Others 519 12589 ‐ ‐
2.5. Weather data 2010‐11
Month Rainfall (mm) Temperature 0 C Relative Humidity
(%) Maximum Minimum
Apr ‐10 ‐
May‐10 ‐
Jun ‐10 77
Jul ‐10 177
Aug ‐10 135
Sep ‐10 126
Oct ‐10 114
Nov‐10 28
Dec ‐10 7
Jan ‐11 3
Feb ‐11 ‐
Mar ‐11 ‐

11
2.6. Production and productivity of livestock, Poultry, Fisheries etc. in the district
Category Population Production Productivity
Cattle Crossbred 3167 3.98 lakh
metric tonnes of milk
6‐8 lt Indigenous 514259 1.5‐2.5 Buffalo 646453 2‐3
Sheep Crossbred ‐ 19,087 metric
tonnes of meat
12.5 kg Indigenous 1391474
Goats 607907Pigs 13,474 Crossbred Indigenous Rabbits Poultry Hens 2,74,957 857 lakh No.s
eggs
Desi 6,41,218 60‐70 eggs Improved 3,35,127 245‐260 eggs Ducks 651 Turkey and others
Category Area Production Productivity
Fish Marine Inland Prawn Scampi Shrimp
2.6 Details of Operational area / Villages (2011‐12)
S.
No.
Taluk Name of the block
Name of the
village
Major crops & enterprises
Major problem identified
Identified Thrust Areas
1
Banaganapalle
Nandyal
Bhanumukkala
Paddy
Indiscriminate use of pesticides
Bio intensive pest management in rice
2 Bethamcherla
Nandyal Embai Onion Indiscriminate use of Pesticides
IPM in Onion

12
3
Koilkuntla
Nandyal
Kalugotla
Bengal gram
Dairy
Low yields in bengalgram
Wilt and dry root rot and s.exigua in bengalgram
Management of soil borne diseases with application of Trichoderma viridi as seed treatment and soil application and management of S.exigua with newer chemicals.
4 Owk Nandyal K.Sunkesula Chillies High cost of plant protection
IPM in chillies
5 Banaganapalle
Nandyal Rallakothuru
Pathapadu
Yerragudi
Yagantipalle
Applapuram
Nandavaram
Banumukkala
Groundnut
Redgram
Rice
Rice
Mango
Low productivity in groundnut
Low productivity in redgram
Low productivity in rice –rice system
Indiscriminate and excess application of NPK
Low yields
Management of Stemrot
IPM in groundnut
Introduction of drought tolerant varieties.
Demonstration on improved varieties of groundnut.
Integrated crop management in redgram
Introduction of rice based cropping systems (rice‐Maize and rice‐sunflower)
Soil test based nutrient management.
INM
6
Allagadda
Dornipadu Dornipadu
Ramachandrapuram
Ammereddy
Nagar
Bagyanagarm
Kondapuram
Rice
Indiscriminate and excess application of NPK
Soil test based nutrient management

13
2.7 Priority/thrust areas
Crop/Enterprise Thrust area
Seed Production Addressing the scarcity of quality seed :
Availability of quality seed to the farmer is one of the major constraint farmer
is facing every year. They are depending on the private market / government
agencies for their seed requirements. The supply is not meeting the demand in
time and more over farmers are being cheated by different agencies with
spurious seed. Awareness should be created about the production of own seed
by the farmer. For this, seed village concept is required at least in direct
varieties in crops like paddy, red gram, desi cotton, Bengal gram, which have
huge demand in the market has to be promoted.
Sunflower, Groundnut & Bengal gram
Promotion of SulphurNutrition in Oil seed crops like Sunflower, Groundnut
and pulse crops like Bengalgram.
The data collected in the district reveal that most of the oil seed farmers are
applying DAP both as basal and as top dress, which supplies only N and P.
Farmers are not aware of the use of Sulphur, which improves oil content in the
seeds, which is the basis for price of the produce in the market. Sulphur usage
can be promoted by use of SSP in place of DAP, to supply Sulphur to the soil in
addition to Phosphorus in economical way. Gypsum is promoted as a cheap
source of sulphur in Bengal gram
Sunflower Improving productivity of sunflower:
Sunflower is grown in an area of 64489 ha in Kharif and 94928lakh ha in rabi in
normal conditions in the district The major gap identified in sunflower
cultivation is non adoption of optimum spacing (60 x 30 cm). The other critical
gap is the application of boron at ray floret stage. Farmers are used to a spacing
of 30 x solid row, resulting in moisture stress to crop, ultimately suffering in
yield losses. Hence awareness should be created among the farming
community about the cultivation of sunflower with optimum spacing and
thinning and application of Boron at ray floret stage. This can be taken up on a
wider scale through mass campaigns, TV programmes, Radio programmes and
print media. The problem is being addressed by Krishi Vigyan Kendra through
demonstrations and FLDs in adopted villages.
14
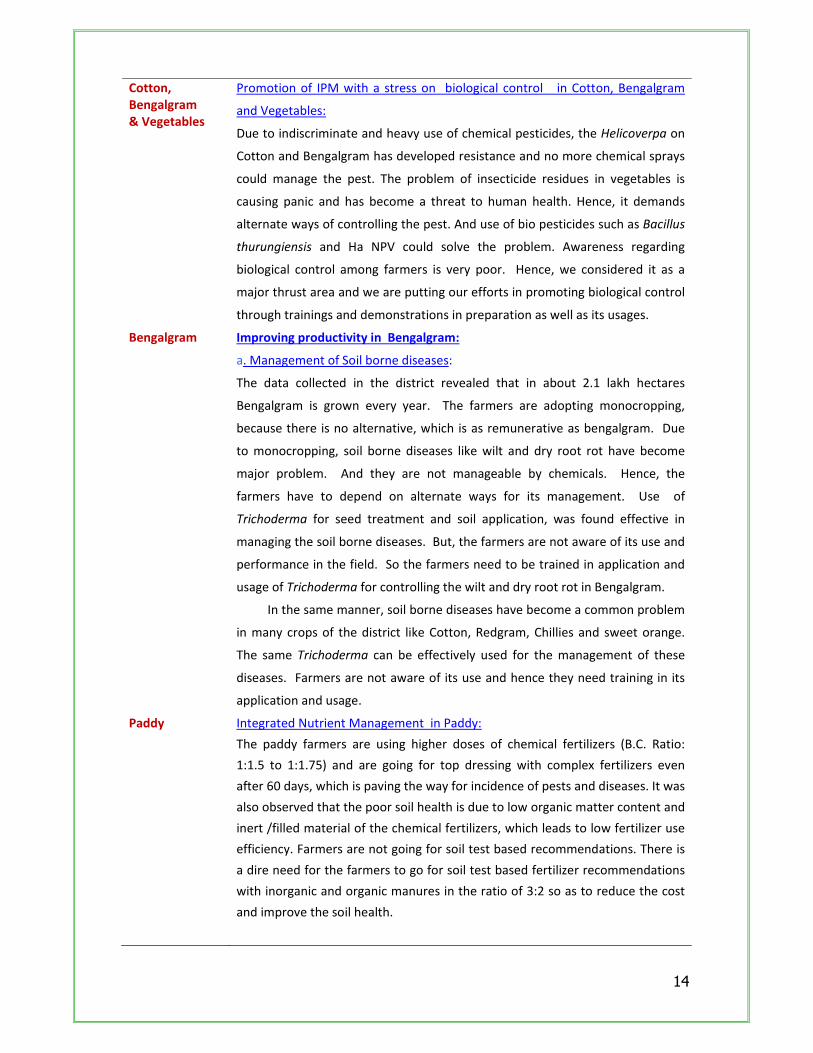
Cotton, Bengalgram & Vegetables
Promotion of IPM with a stress on biological control in Cotton, Bengalgram
and Vegetables:
Due to indiscriminate and heavy use of chemical pesticides, the Helicoverpa on
Cotton and Bengalgram has developed resistance and no more chemical sprays
could manage the pest. The problem of insecticide residues in vegetables is
causing panic and has become a threat to human health. Hence, it demands
alternate ways of controlling the pest. And use of bio pesticides such as Bacillus
thurungiensis and Ha NPV could solve the problem. Awareness regarding
biological control among farmers is very poor. Hence, we considered it as a
major thrust area and we are putting our efforts in promoting biological control
through trainings and demonstrations in preparation as well as its usages.
Bengalgram Improving productivity in Bengalgram:
a. Management of Soil borne diseases:
The data collected in the district revealed that in about 2.1 lakh hectares
Bengalgram is grown every year. The farmers are adopting monocropping,
because there is no alternative, which is as remunerative as bengalgram. Due
to monocropping, soil borne diseases like wilt and dry root rot have become
major problem. And they are not manageable by chemicals. Hence, the
farmers have to depend on alternate ways for its management. Use of
Trichoderma for seed treatment and soil application, was found effective in
managing the soil borne diseases. But, the farmers are not aware of its use and
performance in the field. So the farmers need to be trained in application and
usage of Trichoderma for controlling the wilt and dry root rot in Bengalgram.
In the same manner, soil borne diseases have become a common problem
in many crops of the district like Cotton, Redgram, Chillies and sweet orange.
The same Trichoderma can be effectively used for the management of these
diseases. Farmers are not aware of its use and hence they need training in its
application and usage.
Paddy Integrated Nutrient Management in Paddy:
The paddy farmers are using higher doses of chemical fertilizers (B.C. Ratio:
1:1.5 to 1:1.75) and are going for top dressing with complex fertilizers even
after 60 days, which is paving the way for incidence of pests and diseases. It was
also observed that the poor soil health is due to low organic matter content and
inert /filled material of the chemical fertilizers, which leads to low fertilizer use
efficiency. Farmers are not going for soil test based recommendations. There is
a dire need for the farmers to go for soil test based fertilizer recommendations
with inorganic and organic manures in the ratio of 3:2 so as to reduce the cost
and improve the soil health.
15
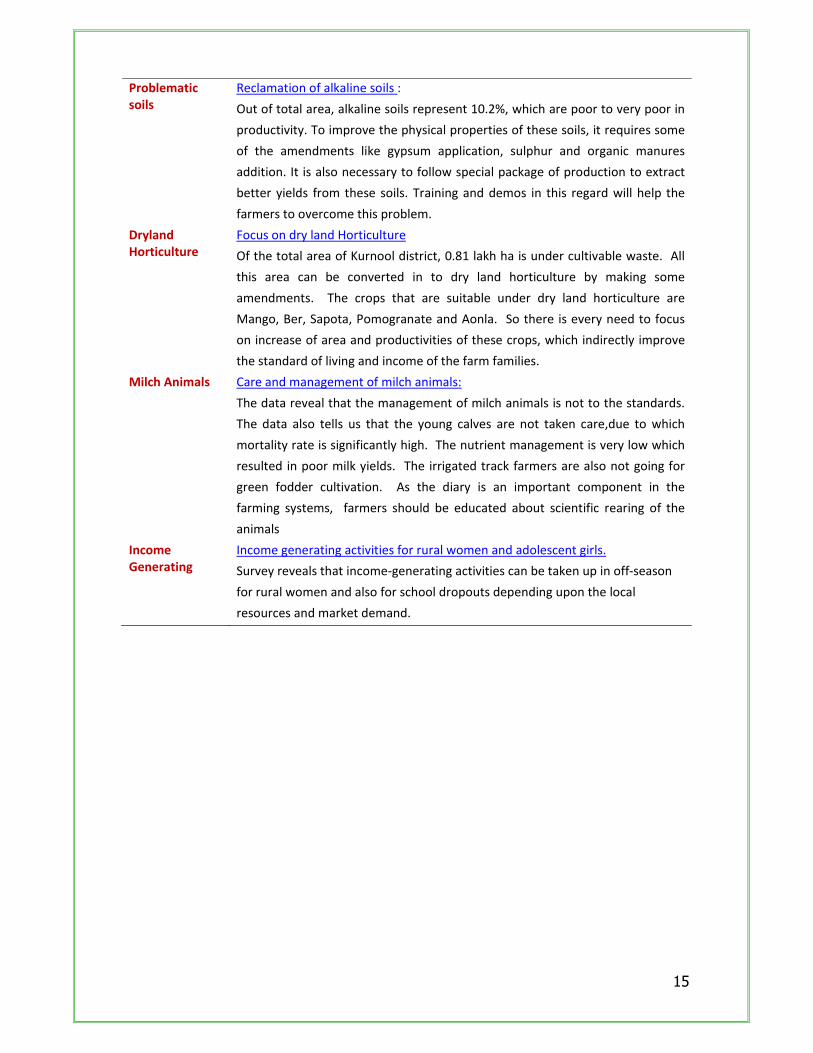
Problematic soils
Reclamation of alkaline soils :
Out of total area, alkaline soils represent 10.2%, which are poor to very poor in
productivity. To improve the physical properties of these soils, it requires some
of the amendments like gypsum application, sulphur and organic manures
addition. It is also necessary to follow special package of production to extract
better yields from these soils. Training and demos in this regard will help the
farmers to overcome this problem.
Dryland Horticulture
Focus on dry land Horticulture
Of the total area of Kurnool district, 0.81 lakh ha is under cultivable waste. All
this area can be converted in to dry land horticulture by making some
amendments. The crops that are suitable under dry land horticulture are
Mango, Ber, Sapota, Pomogranate and Aonla. So there is every need to focus
on increase of area and productivities of these crops, which indirectly improve
the standard of living and income of the farm families.
Milch Animals Care and management of milch animals:
The data reveal that the management of milch animals is not to the standards.
The data also tells us that the young calves are not taken care,due to which
mortality rate is significantly high. The nutrient management is very low which
resulted in poor milk yields. The irrigated track farmers are also not going for
green fodder cultivation. As the diary is an important component in the
farming systems, farmers should be educated about scientific rearing of the
animals
Income Generating
Income generating activities for rural women and adolescent girls.
Survey reveals that income‐generating activities can be taken up in off‐season
for rural women and also for school dropouts depending upon the local
resources and market demand.

16
3. TECHNICAL ACHIEVEMENTS
3.A. Details of target and achievements of mandatory activities by KVK during 2010‐11
OFT (Technology Assessment and Refinement) FLD (Oilseeds, Pulses, Cotton, Other Crops/Enterprises)
1 2
Number of OFTs Number of Farmers Number of FLDs Number of Farmers Targets Achievement Targets Achievement Targets Achievement Targets Achievement
16 16 80 80 27 27 270 270
Training (including sponsored, vocational and other trainings carried under Rainwater Harvesting Unit)
Extension Activities
3 4
Number of Courses Number of Participants Number of activities
Number of participants
Clientele Targets Achievement Targets Achievement T A T A
Farmers
70 70 1750 2341 7 7 350 454
Rural youth
9 9 200 218
Extn. Functio.
9 9 225 347
Seed Production (Qtl.) Planting material (Nos.)
5 6
Target Achievement Target Achievement
Paddy JGL‐3844 30.0 32.70
NDLR‐7 45.0 57.00 NDLR‐8 10.00 6.90 5204‐200.0 232.50 Arboreum Cotton –Yaganti ‐3.00 2.00 Groundnut K‐9 10.00 3.20 Groundnut –farmers fields‐K6 500.00 Blackgram –LBG‐645 farmers fields 500.00

17
3.B. Abstract of interventions undertaken
S. No
Thrust area
Crop/
Enterprise
Identified Problem
Interventions Title of OFT if
any Title of FLD if any Title of Training
if any Title of
training for extension personnel if
any
Extension activities
Supply of seeds, planting materials
etc.
1 Promotion of IPM with Stress on Bio control
Rice Increasing cost of plant protection and pesticide residues in grain and straw
Bio‐ intensive Integrated Pest Management
IPM in rice & sustainable pest management methods
‐ ‐
Groundnut Stemroot,LLS, Helicoverpa,RHC
Management of stemrot
IPM in Groundnut
IPM in Groundnut
‐ ‐ ‐
Bengalgram Soil borne diseases & S.exigua
Management of S.exigua with newer chemicals.
Management of soil borne diseases in bengalgram
IPM in bengalgram
‐ ‐ ‐
Redgram Helicoverpa and wilt ‐ IPM in redgram IPM and sustainable methods of plant protection
‐ ‐ ‐
Chillies Thrips and powdery mildew
‐ IPM in chillies IPM in chillies ‐ ‐ ‐
2 INM Sunflower Low productivity due to poor seed set and test weight.
‐ Nutrient Management .
Integrated nutrient management
‐ Field day Supply of sulphur and borax.
Rice Increased cost of production due to indiscriminate and imbalance use of chemical fertilizers .
Nutrient Management based on Soil Test Crop Response formula
Soil sampling and soil test based nutrient management
‐ Field day Supply of Vermi compost..

18
3 Reclamation Problematic soils
Poor physico ‐chemical properties and Low productivity.
‐ ‐ Reclamation of sodic soils with gypsum under irrigated condition.
‐ ‐ Supply of gypsum
4 Improving the productivity
Bengalgram Low yields with local varieties Balanced nutrient management
‐ Varietal demo Nutrient Management based on Soil Test Crop Response formula
Production technology Soil sampling and soil test based nutrient management
‐ Field dayLiterature on production technology
Supply of improved variety JG‐11 seed
Redgram Low yields with local varieties
‐ Varietal demo Production technology
‐ Supply of improved variety PRG‐158
Groundnut Low yields with local varieties
‐ Varietal demo Production technology
‐do‐ Supply of seed of K‐6, TPT‐25.
5 Non‐usage of Sulphur
Bengalgram Low yields due to non‐application of sulphur
‐ Sulphur nutrition ‐do‐ ‐ Field day Sulphur @ 25kg/ha
6 Improving productivity under rainfed situation
Seteria Bengalgram
Low productivity with monocropping
‐ Double cropping Cropping systems
‐ ‐ Supply of korra seed
7 Improving productivity of rainfed Cotton
Arboreum Cotton
Low yields due to use of local varieties
‐ Varietal demonstration
Production technology
‐ ‐ Supply of seed & PP chemicals

19
3.1 Achievements on technologies assessed and refined A.1 Abstract of the number of technologies assessed* in respect of crops/enterprises
Thematic areas Cereals Oilseeds Pulses Commercial
Crops Vegetables Fruits Flower
Plantation crops
Tuber Crops
TOTAL
Varietal Evaluation 1 2 1 4
Seed / Plant production
Weed Management
Integrated Crop Management
Integrated Nutrient Management
1
1
2
Integrated Farming System
Mushroom cultivation
Drudgery reduction
Farm machineries
Value addition
Integrated Pest Management 1 1 2
Integrated Disease Management
1 1
Resource conservation technology 1 1 1 3
Small Scale income generating enterprises
TOTAL 2 4 2 1 1 1 1 12
* Any new technology, which may offer solution to a location specific problem but not tested earlier in a given micro situation.

20
A.2. Abstract of the number of technologies refined* in respect of crops/enterprises (Kharif‐2011,Rabi & Summer 2011‐12)
Thematic areas Cereals Oilseeds Pulses Commercial
Crops Vegetables Fruits Flower
Plantation
crops
Tuber
Crops TOTAL
Varietal Evaluation
Seed / Plant
production
Weed Management
Integrated Crop
Management
Integrated Nutrient
Management
Integrated Farming
System
Mushroom cultivation
Drudgery reduction
Farm machineries
Post Harvest
Technology
Integrated Pest
Management
Integrated Disease
Management
Resource conservation
technology
Small Scale income
generating enterprises
TOTAL
* Technology that is refined in collaboration with ICAR/SAU Scientists for improving its effectiveness.

21
A.3. Abstract of the number of technologies assessed in respect of livestock / enterprises
Thematic areas Cattle Poultry Sheep Goat Piggery Rabbitary Fisheries TOTAL
Evaluation of Breeds 1 1
Nutrition Management 1 1
Disease of Management ‐
Value Addition ‐
Production and
Management
‐
Feed and Fodder 1 1 2
Small Scale income
generating enterprises
TOTAL 2 2 4
A.4. Abstract on the number of technologies refined in respect of livestock / enterprises
Thematic areas Cattle Poultry Sheep Goat Piggery Rabbitry Fisheries TOTAL
Evaluation of Breeds
Nutrition Management
Disease of Management
Value Addition
Production and
Management
Feed and Fodder
Small Scale income
generating enterprises
TOTAL
22
B. Details of each On Farm Trial to be furnished in the following format
A. Technology Assessment:
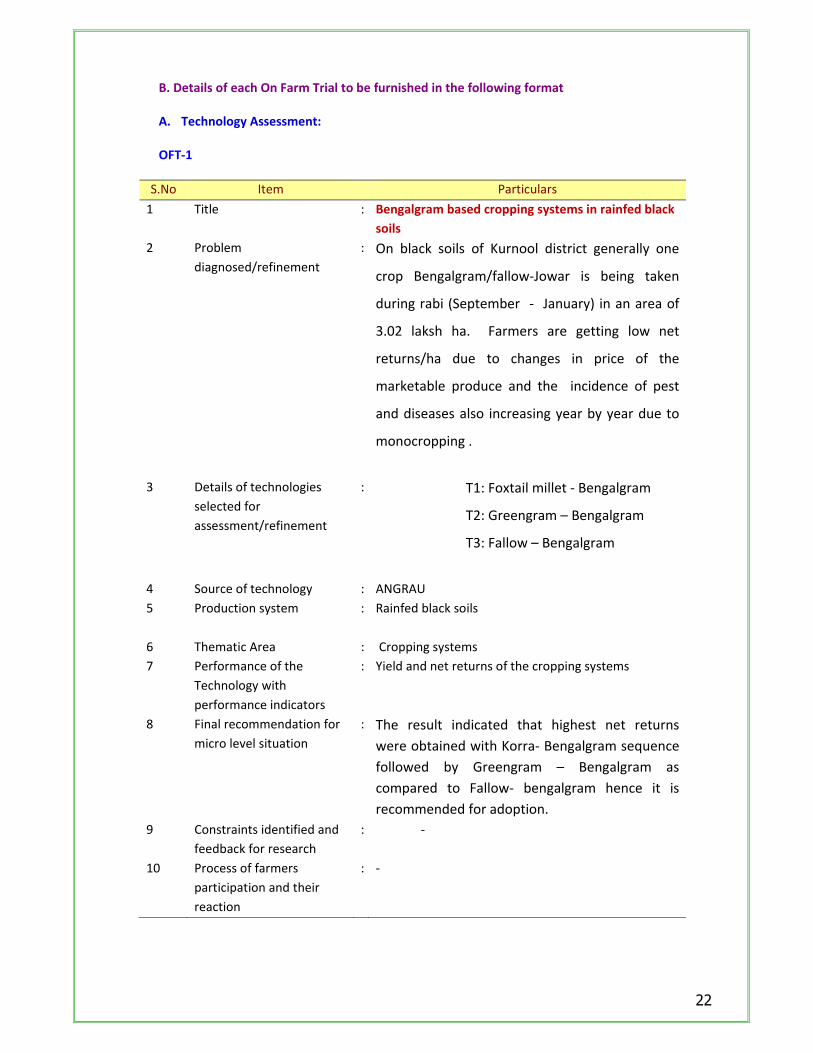
OFT‐1
S.No Item Particulars
1 Title : Bengalgram based cropping systems in rainfed black
soils
2 Problem
diagnosed/refinement
: On black soils of Kurnool district generally one
crop Bengalgram/fallow‐Jowar is being taken
during rabi (September ‐ January) in an area of
3.02 laksh ha. Farmers are getting low net
returns/ha due to changes in price of the
marketable produce and the incidence of pest
and diseases also increasing year by year due to
monocropping .
3 Details of technologies
selected for
assessment/refinement
: T1: Foxtail millet ‐ Bengalgram
T2: Greengram – Bengalgram
T3: Fallow – Bengalgram
4 Source of technology : ANGRAU
5 Production system
: Rainfed black soils
6 Thematic Area : Cropping systems
7 Performance of the
Technology with
performance indicators
: Yield and net returns of the cropping systems
8 Final recommendation for
micro level situation
: The result indicated that highest net returns
were obtained with Korra‐ Bengalgram sequence
followed by Greengram – Bengalgram as
compared to Fallow‐ bengalgram hence it is
recommended for adoption.
9 Constraints identified and
feedback for research
: ‐
10 Process of farmers
participation and their
reaction
: ‐

23
Crop/ enterprise
Farming situation
Problem Diagnosed Title of OFT
No. of trials*
Technology Assessed/ refined
Parameters of assessment
Data on the parameter
Results of assessment
Feedback from the farmer
1 2 3 4 5 6 7 8 9 10
Cropping system
Rainfed . On black soils of Kurnool district generally one crop Bengalgram/fallow‐Jowar is being taken during rabi September ‐ January) in an area of 3.02 laksh ha. Farmers are getting low net returns/ha due to Monocropping
Bengalgram based cropping systems in rainfed black soils
5 Korra‐ bengalgram
Net returnsRs/ha
32738‐00 The result indicated that highest net returns was obtained with Korra‐ Bengalgram sequence followed by Greengram – Bengalgram as compared to Fallow‐ bengalgram hence it is recommended for adoption
.
Additional income Rs/ha
6568-00
Greengram- bengalgram Fallow- bengalgram
Net returnsRs/ha Additional income Rs/ha . Net returnsRs/ha Additional income Rs/ha
26909-00 739-00 26170-00
Technology Assessed Production per unit Net Return (Profit) in Rs./unit BC Ratio
11 12 13 14
Korra- bengalgram
Greengram- bengalgram
Fallow- bengalgram
1660 -1156 kg/ha
487 -1175 kg/ha
1287 kg/ha
32738-00
26909-00
26170-00
1:2.2
1:1.8
1:2.0

24
OFT 2:
S.No Item Particulars
1 Title : Performance of groundnut varieties in rainfed situation
2 Problem
diagnosed/refinement
: Low yields in groundnut due to moisture stress at critical
stages.
3 Details of technologies
selected for
assessment/refinement
: T1‐TMV‐2
T2‐ICGV‐91114
K9
TG‐37A
4 Source of technology : Groundnut varieties developed by ANGRAU and ICRISAT
5 Production system
: Red soils ,rainfed
6 Thematic Area : Varietal evaluation for rainfed situation
7 Performance of the
Technology with
performance indicators
: No. of pods per plant
Shelling percentage
Yield / ha
8 Final recommendation
for micro level situation
: The result indicated that highest yield was recorded with
K9 (804 kg/ha) followed by ICGV‐91114 and TG‐37A, as
compared to TMV‐2, hence it is recommended for
adoption.
9 Constraints identified
and feedback for
research
: ‐
10 Process of farmers
participation and their
reaction
: ‐

25
crop/ enterprise
Farming situation
Problem Diagnosed
Title of OFT
No. of trials*
Technology Assessed/ refined
Parameters of assessment
Data on the parameter
Results of assessment
Feedback from the farmer
1 2 3 4 5 6 7 8 9 10
Groundnut Rainfed Low yields due to low moisture stress at critical stages.
Performance of Groundnut varieties under rainfed situation
5 TMV‐2 * No. of pods /plant *Shelling percentage * yield /ha.
6.2 63.5 608kg/ha
The results indicated that K9 has recorded highest yield (1428 Kg/ha) followed by TG‐37A and ICGV‐91114 as compared to TMV‐2 due to its tolerance to drought.
.
ICGV‐91114
* No. of pods /plant *Shelling percentage * yield /ha.
7.2 68.8 787kg/ha
K9
* No. of pods /plant *Shelling percentage * yield /ha.
7.6 69.6 804 Kg/ha
TG‐37A * No. of *pods /plant Shelling percentage * yield /ha.
6.7 68.0 738 kg/ha
Technology Assessed Production per unit Net Return (Profit) in Rs./unit BC Ratio 11 12 13 14
TMV‐2 608kg/ha 6860‐00 1:1.33
ICGV‐91114 787kg/ha 14915‐00 1:1.72
K9 804kg/ha 15680‐00 1:1.76
TG‐37A 738 kg/ha 12710‐00 1:1.62

26
OFT 3:
S.No Item Particulars
1 Title : Evaluation of new bengalgram varieties suitable for
Kurnool district
2 Problem
diagnosed/refinement
: In bengalgram JG 11 variety being cultivated over larger
area year after year which is leading to incidence of soil
borne diseases, resulting in loss in yield. Hence, to
promote other high yielding varieties of bengalgram with
tolerance or disease resistance, the present trial is
proposed.
3 Details of technologies
selected for
assessment/refinement
: T1 – Farmers Practice (JG 11)
T2 – JG – 130
T3 – Digvijay
4 Source of technology : Bengalgram varieties developed by ANGRAU and ICRISAT
5 Production system
: Rainfed, Black soils
6 Thematic Area : Varietal evaluation
7 Performance of the
Technology with
performance indicators
: Results showed that there is no significant difference
between Digvijay 1788 kg/ha and JG11(1749 kg/ha) and
no. of pods per plant (54.7.) (51.8) respectively compared
to JG‐130.
8 Final recommendation
for micro level situation
: ‐
9 Constraints identified
and feedback for
research
: ‐
10 Process of farmers
participation and their
reaction
: Farmers participated in planning execution, monitoring,
evaluation of Varieties and their opinion towards the
performance and, adoptability etc. of the improved
varieties was assessed.

27
crop/
enterprise
Farming situation
Problem Diagnosed
Title of OFT
No. of trials*
Technology Assessed/ refined
Parameters of assessment
Data on the parameter
Results of assessment
Feedback from the farmer
1 2 3 4 5 6 7 8 9 10
Bengalgram Rainfed Low productivity of local varieties
Varietal evaluation
5 1. Digvijay No. of branches/plant, No. of pods/plant, Yield Kg/ha
7.8 54.7 1788
Results showed
that there is no
significant
difference
between
Digvijay 1788
kg/ha and
JG11(1749
kg/ha) and no.
of pods per
plant (54.7.)
(51.8)
respectively
compared to JG‐
130.
.
2. JG‐11 No. of
branches/plant,
No. of
pods/plant,
Yield Kg/ha
7.0 51.8 1749
3. JG‐130 No. of
branches/plant,
No. of
pods/plant,
Yield Kg/
7.2 45.6 1454
Technology Assessed Production per unit Net Return (Profit) in Rs. / unit BC Ratio
11 12 13 14
1. Digvijay 1788 45680‐00 1:3.7
2. JG‐11 1749 44315‐00 1:3.6
3. JG‐130 1454 33990‐00 1:3.0

28
OFT 4:
S.No Item Particulars
1 Title : Direct seeding V/s Transplanting in paddy
2 Problem
diagnosed/refinement
: High cost of cultivation due to labour scarcity and
increased labour wages in paddy transplanting method
3 Details of technologies
selected for
assessment/refinement
: T1: Direct seeding with drum seeder
T2: Manual transplanting
4 Source of technology : DRR
5 Production system
: Low land ‐ irrigated
6 Thematic Area : Resource conservation
7 Performance of the
Technology with
performance indicators
: Numbers of hills/sqm
Number of tillers/sqm
Yield kg/ha
Cost of treatment/ha
8 Final recommendation
for micro level situation
: The results indicated that 5.2% increased over manual
transplanting method. The major difference between
two methods was saving of labour charges in direct
seeding with drum seeder, which is Rs.500/‐/ha against
4500‐00 in manual transplanting method.
9 Constraints identified
and feedback for
research
: ‐
10 Process of farmers
participation and their
reaction
: ‐

29
crop/ enterprise
Farming situation
Problem Diagnosed
Title of OFT
No. of trials*
Technology Assessed/ refined
Parameters of assessment
Data on the parameter
Results of assessment
Feedback from the farmer
1 2 3 4 5 6 7 8 9 10
Paddy Irrigated High cost of
cultivation
due to
labour
scarcity and
increased
labour
wages in
paddy
transplanting
method
Direct
seeding V/s
Transplanting
in paddy
5 T1: Direct
seeding with
drum seeder
* No.of hills
/sqm
* No.of
tillers/hills
* cost of
treatments
* Yield
kg/ha
37.1
14.83
500‐00
7174kg/ha
The result
indicated that
5.2% increased
over manual
transplanting
method. The
major
difference
between two
methods in the
cost of
cultivation was
saving of
labour charges
to a tune of Rs.
4200‐00 per ha
with drum
seeder.
.
T2:Manual
transplanting
* No.of hills
/sqm
* No.of
tillers/hills
* cost of
treatments
* Yield
kg/ha.
27.4
17.16
4500.00
6815kg/ha
Technology Assessed Production per unit Net Return (Profit) in Rs. / unit BC Ratio 11 12 13 14
T1: Direct seeding with drum seeder 7174 Kg/ha 41531‐00 1:2.04
T2:Manual transplanting 6815 kg/ha 33463‐00 1:1.76

30
OFT 5:
S.No Item Particulars
1 Title : Performance of Blackgram Varieties under rainfed black
soils ( Scarce rainfall zone)
2 Problem
diagnosed/refinement
: In Kurnool district bengalgram being cultivated in black
soils in an area of 2.5 lakhs ha under rainfed situation.
Due to stagnation in market price for the last three years
net returns are reduced. So farmers are searching for a
remunarative crop. Hence there is need to suggest
better alternate crop to Bengalgram
3 Details of technologies
selected for
assessment/refinement
: T1 –LBG‐645
T2 – LBG‐752
T3 – PU‐31
4 Source of technology : Varieties developed by ANGRAU
5 Production system
: Rainfed, Black soils
6 Thematic Area : Varietal evaluation
7 Performance of the
Technology with
performance indicators
: The results indicated that the among the Varieties LBG‐
752 has recorded highest Yield (1446 Kg/ha) followed
by PU‐31(1407 Kg/ha). .
8 Final recommendation
for micro level situation
: ‐
9 Constraints identified
and feedback for
research
: ‐
10 Process of farmers
participation and their
reaction
: Farmers were participated in planning execution,
monitoring, evaluation of Varieties and their reaction
towards the performance and, adoptability etc. of the
improved varieties were assessed.

31
crop/ enterpri
se
Farming situatio
n
Problem Diagnosed
Title of OFT
No. of
trials*
Technology Assessed/ refined
Parameters of
assessment
Data on the
parameter
Results of
assessment
Feedback from the
farmer 1 2 3 4 5 6 7 8 9 10
Black gram
Rainfed
Low productivity of local varieties
Varietal evaluation
5 LBG 645 Yield Kg/ha
1357 The
results
indicated
that the
among
the
Varieties
LBG‐752
has
recorded
highest
Yield
(1446
Kg/ha)
followed
by PU‐
31(1407
Kg/ha).
. LBG 752 Yield
Kg/ha
1446
PU 31 Yield
Kg/
1407
Technology Assessed Production per unit
Net Return (Profit) in Rs. / unit
BC Ratio
11 12 13 14 1. LBG‐752 1446 39232‐00 1:2.8
2. PU‐31 1407 34780‐00 1:2.6
3. LBG‐645 1357 35494‐00 1:2.7

OFT 6:
S.No Item Particulars
1 Title : Management of stem rot in Groundnut
2 Problem
diagnosed/refinement
: Stem rot is causing considerable loss to groundnut yields
every year in Kurnool district, especially in alfisols. The
disease is endemic and effective management of the
disease is the need of the hour.
3 Details of technologies
selected for
assessment/refinement
: ANGRAU has recommended the strategy to combat stem
rot disease of groundnut. But it has not been practiced in
farmers fields due to lack of awareness on cause and
intensity of the problem and the management strategy.
Hence, the present trial is conducted to assess the
recommendation in the farmers field.
T1 – Farmers practice – Spraying Carbendazim @ 1g/lt or
Hexaconazole @ 2 ml/lt after noticing the disease.
T2 – Recommended Practice‐
Application of T.viride @ 5 kg/ha impregnated
and incubated with FYM, before sowing
Spraying Hexaconazole @ 2 ml/lt @ 70 DAS.
4 Source of technology : ANGRAU
5 Production system
: Rainfed ‐ redsoils
6 Thematic Area : Integrated Disease Management
7 Performance of the
Technology with
performance indicators
: 1. Stem rot (%)
2. Cost of treatment
3. Yield (q/ha)
4. C: B Ratio
8 Final recommendation
for micro level situation
: ‐
9 Constraints identified
and feedback for
research
: ‐
10 Process of farmers
participation and their
reaction
: Active participation of farmers in diagnosis of the disease
and spraying fungicide and application of T.viride
impregnated FYM.

33
Technology Assessed Production per unit Net Return (Profit) in Rs. / unit BC Ratio11 12 13 14
T1: Farmers practice – spray carbendazim @ 1g/lt or Hexaconazole @ 2 ml/lt
772 kg/ha 2132‐00 1:1.09
T2: Recommended practice – T.v@ 5kg/ha + spray Hexaconazole @ 2 ml/lt on incidence of LLS.
810 kg/ha 2810‐00 1:1.12
crop/ enterprise
Farming situation
Problem Diagnosed
Title of OFT
No. of trials*
Technology Assessed/ refined
Parameters of assessment
Data on the parameter
Results of assessment
Feedback from the farmer
1 2 3 4 5 6 7 8 9 10
Groundnut Rainfed
red soils
Low yields
due to
regular
incidence
of stem rot
Management
of stemrot in
groundnut
5 T1 – Farmers practice – Spraying Carbendazim @ 1g/lt or Hexaconazole @ 2 ml/lt
* Stem rot %
*Cost of
treatment
* yield /ha.
0.70
650‐00
772 kg/ha
The result
indicated that
recommended
practice gives
better yield (810
kg/ha) compared
to farmers
practice (772
kg/ha). The stem
rot disease was at
its minimal in
both the
treatments.
.
T2 – Recommended Practice‐
Application of T.viride @ 5kg/ha impregnated and incubated with FYM.
Spraying Hexaconazole @ 2 ml/lt for management of LLS @ 70 DAS.
* Stem rot %
*Cost of
treatment
* yield /ha.
0.55
1200‐00
810 kg/ha

34
OFT 7:
S. No. Item Particulars
1 Title : Management of sucking pests in B.t. cotton 2 Problem
diagnosed/refinement
: Due to shift in pest scenario on B.t. cotton, for the past two years sucking pest incidence is assuming importance in Kurnool district and it has become cause of concern in bt. Cotton production.
3 Details of technologies
selected for
assessment/refinement
: Assessment: Recommended module of sucking pest management in B.t. cotton will be assessed against indiscriminate use of pesticides followed by farmers. T1 – Farmers practice – Indiscriminate use of pesticides. T2 – Recommended –
Seed treatment with Imidacloprid 70 WS @ 5g/kg
Maize/Sorghum as barrier crop.
Yellow sticky traps 10/ac.
Stem application with Mono (1:4) or Imidacloprid (1:20)
at 20,40 & 60 DAS.
Need based pesticide spraying – Imidacloprid @0.4 ml/lt
or Acetamaprid @ 0.2 g/lt or Thiomethoxam @ 0.2 g/lt
or Fipronil @ 2 ml/lt
4 Source of technology : ANGRAU 5 Production system
: ID – Black soils
6 Thematic Area : Integrated Pest Management7 Performance of the
Technology with
performance indicators
: 1. Incidence of Jassids, Aphids, Whiteflies.
2. Cost of treatments (Rs./ha)
3. Yield (q/ha).
4. C: B Ratio
8 Final recommendation for
micro level situation
: ‐
9 Constraints identified and
feedback for research
: Stem applicators not available locally.
10 Process of farmers
participation and their
reaction
: Farmers participated in diagnosis of the pest and pest stages, convinced by the efficiency of stem application with monocrotophos.

35
Crop/ enterprise
Farming situation
Problem Diagnosed
Title of OFT
No. of trials*
Technology Assessed/ refined
Parameters of assessment
Data on the
parameter
Results of assessment
Feedback from the farmer
1 2 3 4 5 6 7 8 9 10
Bt.Cotton Rainfed Black Soil
Incidence of sucking pests in Bt.cotton result in considerable loss of the crop.
Management of sucking pests in B.t. cotton
5 T1 – Farmer practice – Indiscriminate use of insecticides
*Cost of Plant protection (Rs./ha) *Incidence of Jassids/Aphids
Yield kg/ha
5164 3.31/pt 5.53% 1971
There was a saving of Rs.1800/‐ha in cost of plant protection, with 9.06% increase in cotton yield.
Effective control of sucking pests is seen with stem application compared to sprayed fields.
T2 –Technology assessed – ANGRAU recommended practice
* Cost of Plant protection (Rs./ha) *Incidence of Jassids/Aphids
Yield kg/ha
3364 0.93/pt. 1.04% 2150
Production per unit (Kg/ha) Net Return (Profit) in Rs. / ha BC Ratio
13 14 15
1971 30,693‐00 1:1.63
2150 39,779‐00 1:1.86

36
OFT 8:
S. No. Item Particulars
1 Title : Evaluation of Bio Intensive Pest Management module (BIPM) for rice pests and diseases.
2 Problem
diagnosed/refinement
: In Kurnool district, the major pests of rice are Leaf folder, BPH, Stem borer and among diseases Blast is important and causing potential damage to crop, for which farmers are indiscriminately using pesticides, which even remain as residues in final produce, which reduces immunity of consumers on long run.
3 Details of technologies
selected for
assessment/refinement
: Assessment of Bio‐Intensive Pest Management package. T1 – Farmer practice – Indiscriminate use of insecticides and fungicides. T2 – Technology assessed – BIPM
o Seed treatment with Pseudomonas fluorescens @
8 g/kg.
o Release of Trichogramma japonicum @ 1
lakh/ha.
o Bird perches @ 10/ha.
o Apply Beauveria bassiana 1013 spores/ha against
sucking pests.
o Spray Bt @ 1 kg/ha.
o Need based application of 5% NSKE.
4 Source of technology : ANGRAU 5 Production system : Irrigated 6 Thematic Area : Integrated Pest Management 7 Performance of the
Technology with
performance indicators
: 1. Leaf damage % and dead hearts before and 7 days after
each spray.
2. Disease incidence as per standard scales.
3. Yield (Q/ha).
4. C:B Ratio
8 Final recommendation for
micro level situation
: With BIPM, pest and diseases could be effectively controlled at lower cost compared to farmers practice in addition to quality produce.
9 Constraints identified and
feedback for research
: The methods are tedious to adopt and slow in action.+
10 Process of farmers
participation and their
reaction
: Farmers actively involved in diagnosis, selection of method of application, application, observations and enumeration of results and found satisfaction with the efficacy of BIPM.

37
Crop/ enterpri
se
Farming situation
Problem Diagnose
d
Title of OFT
No. of
trials*
Technology Assessed/refined
Parameters of
assessment
Data on the
parameter
Results of assessmen
t
Feedback from the
farmer
1 2 3 4 5 6 7 8 9 10
Rice Irrigated
Incidence of Leaf folder, BPH, Stem borer and Blast are causing potential damage to crop
Evaluation of Bio Intensive Pest Management module (BIPM) for rice pests and diseases
7 T1 – Farmer practice – Indiscriminate use of insecticides and fungicides.
*Cost of Plant protection *Leaf folder damage *Blast incidence
4000/ha 4.35% 2.8%
With BIPM, pest and diseases could be effectively controlled at lower cost compared to farmers practice in addition to quality produce
The method involves physical risk, but gives better control of pests and diseases as most of methods are prophylactically taken up.
T2 – Technology assessed – BIPM
*Cost of Plant protection *Leaf folder damage *Blast incidence
2350/ha 3.95% 2.57%
Performance of BIPM in Rice for three years:
Year Leaf folder (%)
Blast (%) Cost of Plant Protection (Rs/ha)
Yield (kg/ha)
C:B Ratio
OFT FP OFT FP OFT FP OFT FP OFT FP
2009‐10 3.1 5.5 2.2 3.4 2730 3426 6863 6469 3.4 3.1 2010‐11 2.9 6.4 4.6 9.8 1713 2875 5953 5644 2.4 2.18 2011‐12 3.95 4.35 2.57 2.80 2350 4000 6304 6131 1.3 1.37
Avg. 3.31 5.41 3.12 5.33 2264 3434 6373 6081 2.36 2.21
Production per unit (Kg/ha)
Net Return (Profit) in Rs. / ha
BC Ratio
13 14 15
6131 17,072‐00 1:1.30 6304 20,798‐00 1:1.37

38
OFT‐9
S.No Item Particulars
1 Title : Nutrient management in Sunflower based on STCR
equation under rainfed situation
2 Problem diagnosed/refinement : Sunflower yields are declining due to blanket and
imbalanced used of chemical fertilizers. Soil test based
nutrient application helps to realize higher response
ratio and benefit cost ratio as the nutrients are applied
in proportion to the magnitude of the deficiency of a
particular nutrient and the correction of the nutrient
imbalances in soil helps to harness the synergistic
effects of balanced fertilization.
3 Details of technologies selected for
assessment/refinement
: T1 (Farmer’s practice)
T2 (STCR for 15q/ha)
4 Source of technology : All India Coordinated project on Soil Test crop response.
STCR formula developed for scarce rainfall zone, RARS
Nandyal.
5 Production system : Rainfed black soils (Clay loams)
6 Thematic Area : Soil testing
7 Performance of the Technology
with performance indicators
: Yield (q/ha)
8 Final recommendation for micro
level situation
: The result indicated that highest yield (1022kg/ha) was
recorded in T‐2 (NPK:69‐66‐23kg/ha) when compared
with T1 (NPK:32‐58‐0kg/ha) hence it is recommended
for adoption.
9 Constraints identified and feedback
for research
:
10 Process of farmers participation
and their reaction
: Pre seasonal training on soil sampling and testing,
fertilizer application and mid seasonal field visits finally
field days were organized at initial stages, but balanced
fertilizer usage is more effective with low cost.

39
Crop/
enterprise
Farming situation
Problem Diagnosed
Title of OFT
No. of trials*
Technology Assessed/ refined
Parameters of assessment
Data on the parameter
Results of assessment
Feedback from the farmer
1 2 3 4 5 6 7 8 9 10
Sunflower Rainfed black soil
Sunflower yields are declining due to blanket and imbalanced use of chemical fertilizers
Nutrient management in Sunflower based on STCR equation under rainfed situation
5 Farmers’ practice NPK:32‐58‐0kg/ha
* Yield Kg/ha
860 The result indicated that highest yield was recorded in T2 over T1
STCR based nutrient application is more effective to get higher yields . T2
NPK:69‐66‐23kg/ha
* Yield Kg/ha
1022
Technology Assessed Production per unit Net Return (Profit) in Rs. / unit BC Ratio
11 12 13 14
T1 ‐Farmers’ practice 860 Kg/ha 15509 3.01
T2 ‐STCR 1022 kg/ha 18869 3.16

40
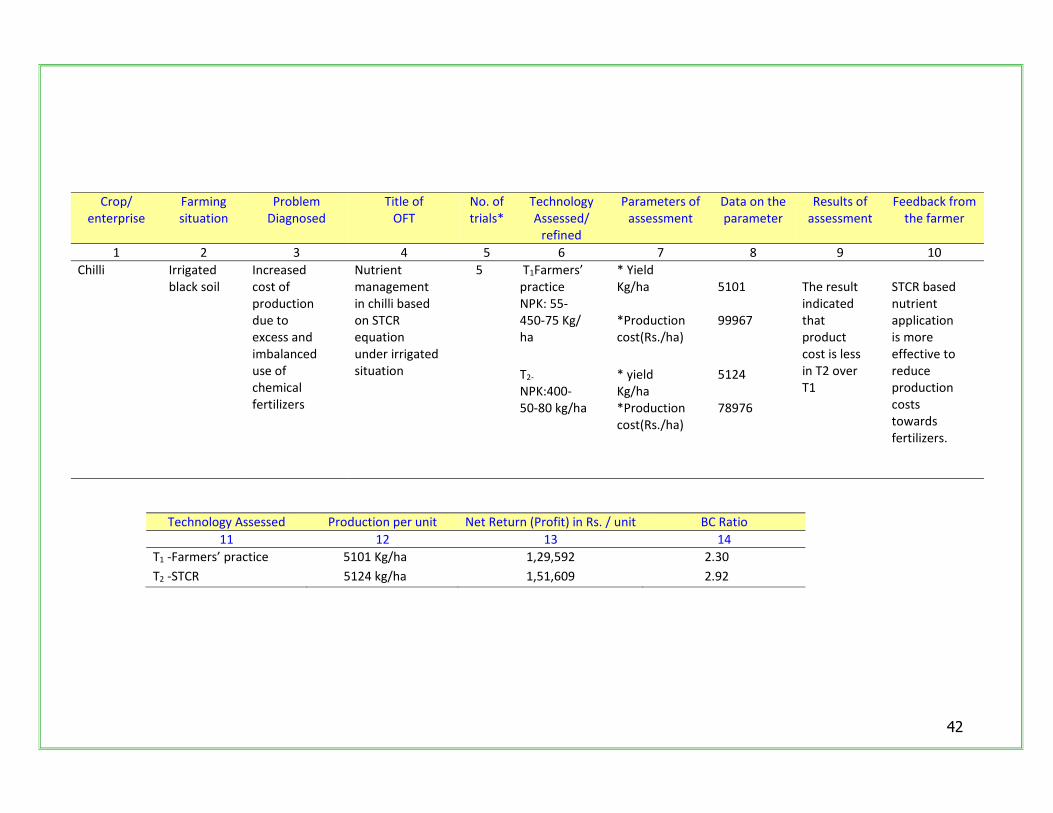
OFT‐10 S.No. Item Particulars
1 Title : Nutrient management in chilli based on STCR
equation under irrigated situation
2 Problem diagnosed/refinement : Chilli is one of the major vegetable crop being
cultivated in Kurnool district under both rainfed and
ID condition. Its yields are declining due to
indiscriminate and imbalanced usage of chemical
fertilizers. Soil test based nutrient application helps
to realize higher response ratio and benefit: cost
ratio as the nutrients are applied in proportion to the
magnitude of the deficiency of a particular nutrient
and the correction of the nutrient imbalances in soil
helps to harness the synergistic effects of balanced
fertilization Fertilizer application based on
quantitative approaches such as Soil test crop
response (STCR) can assist in improving yields,
nutrient use efficiency and reducing the cost of
production.
3 Details of technologies selected for
assessment/refinement
: T1 ‐ N1P1K1( Farmers Practice)
T2‐ N2P2K2 (STCR for
50q/ha)
4 Source of technology : All India Coordinated project on Soil Test Crop
Response. STCR formula developed for Guntur,
Ongole and Vijayawada and Khammam districts.
Now it is taken up for assessment in scarce
rainfall zone,Nandyal.
5 Production system : Irrigated black soils (Clay loams)
6 Thematic Area : Soil testing
7 Performance of the Technology
with performance indicators
: Yield (q/ha)
Production cost(Rs./ha)
8 Final recommendation for micro
level situation
: The result indicated that highest yield (5124kg/ha) was
recorded in T‐2 (NPK:400‐50‐80 kg/ha) when compared
with T1 (5101kg/ha) (NPK:55‐450‐75Kg/ ha) hence it
may be continued for 2 more years
9 Constraints identified and
feedback for research
:
10 Process of farmers participation
and their reaction
: Pre seasonal training on soil sampling and testing,
fertilizer application and mid seasonal field visits finally
field days were organized at initial stages, but balanced
fertilizer usage is more effective with low cost.

42
Crop/ enterprise
Farming situation
Problem Diagnosed
Title of OFT
No. of trials*
Technology Assessed/ refined
Parameters of assessment
Data on the parameter
Results of assessment
Feedback from the farmer
1 2 3 4 5 6 7 8 9 10
Chilli Irrigated black soil
Increased cost of production due to excess and imbalanced use of chemical fertilizers
Nutrient management in chilli based on STCR equation under irrigated situation
5 T1Farmers’ practice NPK: 55‐450‐75 Kg/ ha
* Yield Kg/ha *Production cost(Rs./ha)
5101 99967
The result indicated that product cost is less in T2 over T1
STCR based nutrient application is more effective to reduce production costs towards fertilizers.
T2‐ NPK:400‐50‐80 kg/ha
* yield Kg/ha *Production cost(Rs./ha)
5124 78976
Technology Assessed Production per unit Net Return (Profit) in Rs. / unit BC Ratio
11 12 13 14
T1 ‐Farmers’ practice 5101 Kg/ha 1,29,592 2.30
T2 ‐STCR 5124 kg/ha 1,51,609 2.92

43
OFT 11:
1 Title of on‐farm trials : High density planting in tissue culture Banana.
2 Problem diagnosed /identified : Low plant density due to adoption of wider spacing
which ultimately results in low yield.
3 Details of technologies selected
for assessment/refinement
: T1 – Farmers Practice ‐Spacing ( 1.8 m. x1.8 m.)
T2 – Spacing ‐1.8mt.x1.5m
4 Source of technology : IIHR
5 Production system and
thematic area
: Irrigated sandy loams
6 Thematic area : High density planting
7 Performance of the Technology
with performance indicators
: Bunch weight (Kg)
No. of days for bunch initiation
Yield / ha
8 Final recommendation for
micro level situation
: By adopting the 1.8mt x1.5 mt. spacing farmer can get
higher number of bunches per unit area
9 Constraints identified and
feedback for research
: Inter culture operations are difficult
10 Process of farmers
participation and their reaction
: While planting it is difficult to follow two different spacing
S.No Item Particulars

44
Crop/ enterprise
Farming situation
Problem Diagnosed
Title of OFT
No. of trials*
Technology Assessed/ refined
Parameters of assessment
Data on the parameter
Results of assessment
Feedback from the farmer
1 2 3 4 5 6 7 8 9 10
Tissue Culture Banana
Irrigated
Low plant density due to adoption of wider spacing which ultimately results in low yield.
High density planting , in tissue culture Banana.
5 T1 Farmers practice 1.8 X 1.8m
* Yield /ha.
75.27 ton/ha
Due to high density planting, 14.19% increased yield over farmers practice was recorded.
Due to high density planting, Rs.55,000/ha more income was obtained over farmers practice.
T2. 1.8 X 1.5m * Yield /ha.
89.38 ton/ha
Production per unit (kg/ha) Net Return (Profit) in Rs. / unit BC Ratio
13 14 15
75.27 283075.00 4.0:1
89.38 341544.00 4.2:1

45
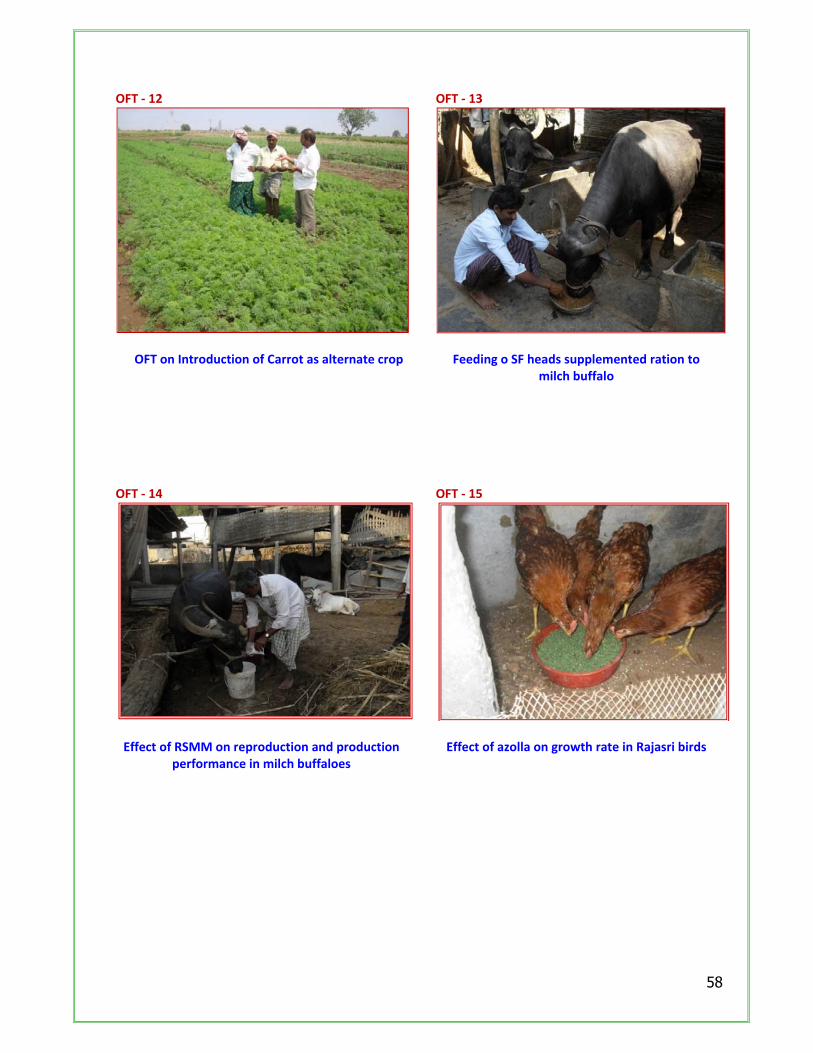
S.No Item Particulars
1 Title : Introduction of Carrot crop as alternative to traditional
rabi vegetables.
2 Problem
diagnosed/refinement
: Continuous cultivation of traditional crops like Tomato is
creating glut in the market by which its production is
becoming uneconomical. Hence, carrot as an alternate
crop to tomato may be introduced.
3 Details of technologies
selected for
assessment/refinement
: T1: Farmers practice (Tomato)
T2: Alternate crop ‐ Carrot
4 Source of technology : APHU
5 Production system
: Irrigated Sandy loam
6 Thematic Area : Introduction of high value crop
7 Performance of the
Technology with
performance indicators
: Duration of the crop
Yield (kg/ha)
Net returns (Rs./ha)
8 Final recommendation for
micro level situation
: Results indicates that net returns are more in carrot and
it was observed that the duration of the crop and
incidence of pest and diseases is less in comparison with
tomato.
9 Constraints identified and
feedback for research
: ‐
10 Process of farmers
participation and their
reaction
: ‐

46
crop/
enterprise
Farming
situation
Problem
Diagnosed
Title of
OFT
No. of
trials*
Technology
Assessed/
refined
Parameters of
assessment
Data on
the
parameter
Results of
assessment
Feedback
from the
farmer
1 2 3 4 5 6 7 8 9 10
Carrot Irrigated Less profits from the traditional vegetables in local market due to frequent glut
Introduction of carrot as alternate crop
5 T1 : Farmers practice (Tomato)
* Yield /ha. * Net returns (Rs./ha)
42100 kg/ha 1,34,250/-
Net returns are high with carrot and its duration is also less.
Incidence of pests and diseases is less compared to tomato.
T2. : Carrot
* Yield /ha. * Net returns (Rs./ha)
28530 kg/ha 1,86,780/-
Technology Assessed Production per unit Net Return (Profit) in Rs. / unit BC Ratio 11 12 13 14
T1: Tomato 42100 kg/ha 1,34,250/‐ 1:2.76
T2: Carrot 28530 kg/ha 1,86,780/‐ 1:2.90

47
OFT‐13
S.No Item Particulars
1 Title : Effect of feeding of Sunflower heads supplemented
ration on milk production in milch buffaloes.
2 Problem
diagnosed/refinement
: The milk production of milch animals is less due to
a. Poor feeding
b. Lack of concentrates in the feed.
3 Details of technologies
selected for
assessment/refinement
: T1: Farmers practice (feeding of Rice bran)
T2: Feeding of SF heads supplemented ration
4 Source of technology : S.V. Veterinary University
5 Production system
: Milch Buffaloes
6 Thematic Area : Utilization of Agricultural By products
7 Performance of the
Technology with
performance indicators
: Milk yield
Net returns
8 Final recommendation for
micro level situation
: The results indicated that 9.38% increased milk
production by feeding SF heads supplemented ration
over farmers method of rice bran feeding. Difference of
Rs.3414/‐ on net profit was observed in T2 over T1.
9 Constraints identified and
feedback for research
: ‐
10 Process of farmers
participation and their
reaction
: ‐

48
crop/
enterprise
Farming
situation
Problem
Diagnosed
Title of
OFT
No. of
trials*
Technology
Assessed/
refined
Parameters of
assessment
Data on the
parameter
Results of
assessment
Feedback
from the
farmer
1 2 3 4 5 6 7 8 9 10
Dairy Mixed
farming
The milk
production
of milch
buffaloes is
low due to
imbalance
feeding,
low
proteins in
the diet.
Effect of SF
heads
supplemented
ration on milk
production of
milch buffaloes.
5 T1: Farmers
practice
(feeding of Rice
bran)
Milk
production
(120 days)
697.3 lt. (T1)
762.8 lt.(T2)
The results
indicated that
9.38%
increased milk
production and
12.69%
increase in fat
by feeding SF
heads
supplemented
ration over
farmers
method
Difference of
Rs.3414/‐ on
net profit was
observed in T2
over T1.
.
T2: Feeding of
SF heads
supplemented
ration (30%SF +
70 concentrates
of 18% CP)
Fat% 6.3 (T1)
7.1 (T2)
Technology Assessed Production per unit Net Return (Profit) in Rs. / unit BC Ratio11 12 13 14
T1: Farmers practice (feeding of Rice bran)
697.3 lt 15630 1:3.39
T2: Feeding of SF heads supplemented ration 762.8 lt 19044 1:5.95
49
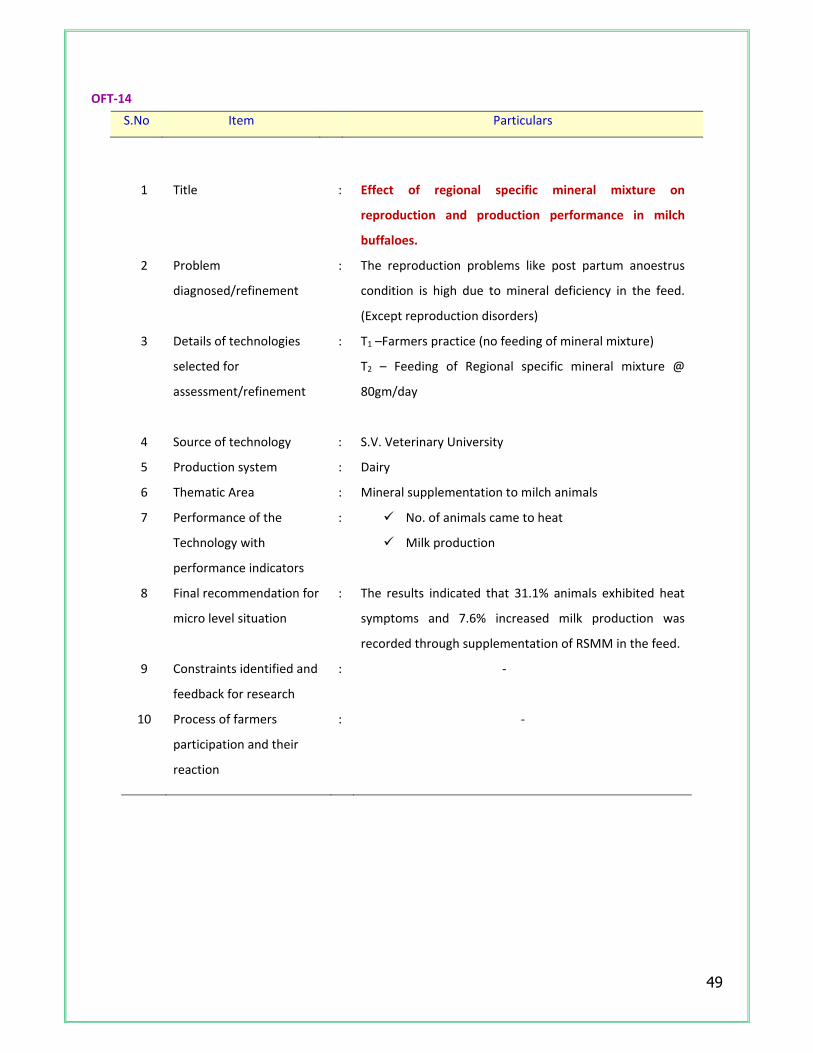
OFT‐14
S.No Item Particulars
1 Title : Effect of regional specific mineral mixture on
reproduction and production performance in milch
buffaloes.
2 Problem
diagnosed/refinement
: The reproduction problems like post partum anoestrus
condition is high due to mineral deficiency in the feed.
(Except reproduction disorders)
3 Details of technologies
selected for
assessment/refinement
: T1 –Farmers practice (no feeding of mineral mixture)
T2 – Feeding of Regional specific mineral mixture @
80gm/day
4 Source of technology : S.V. Veterinary University
5 Production system : Dairy
6 Thematic Area : Mineral supplementation to milch animals
7 Performance of the
Technology with
performance indicators
: No. of animals came to heat
Milk production
8 Final recommendation for
micro level situation
: The results indicated that 31.1% animals exhibited heat
symptoms and 7.6% increased milk production was
recorded through supplementation of RSMM in the feed.
9 Constraints identified and
feedback for research
: ‐
10 Process of farmers
participation and their
reaction
: ‐

50
crop/
enterprise
Farming
situation
Problem
Diagnosed
Title of
OFT
No. of
trials*
Technology
Assessed/
refined
Parameters of
assessment
Data on the
parameter
Results of
assessment
Feedback
from the
farmer
1 2 3 4 5 6 7 8 9 10
Dairy Mixed
farming
Post partum
anoestrus
condition is
high in milch
buffaloes due
to mineral
deficiency
(Except
reproduction
disorders)
Effect of RSMM
on reproduction
and production
performance in
milch buffaloes.
45
animals
T1: Farmers
practice (No
feeding of
mineral mixture)
No. of
animals
responded
14 (31.1%) The results
indicated that
31.1% animals
exhibited heat
symptoms and
7.6% increased
milk production
was recorded
through
supplementation
of RSMM in the
feed.
.
T2: Feeding of
regional specific
mineral mixture
@ 8gm/day)
Milk
production
(90 days)
426.2 (T1)
458.6 (T2)
Technology Assessed Production per unit Net Return (Profit) in Rs. / unit BC Ratio
11 12 13 14
T1 – Farmers practice 426.2 l 8826.00 1:3.22
T2 –Farmers practice + RSMM @ 80g/day 458.6 l 9798.00 1:3.47
Treatment period 1‐10 days 11‐20 days 21‐30days 1‐2 months 2 ‐3 months
Animals responded 1 (7.14%) 7 (50%) 3 (7.5%) 3 (7.5%) ‐
51
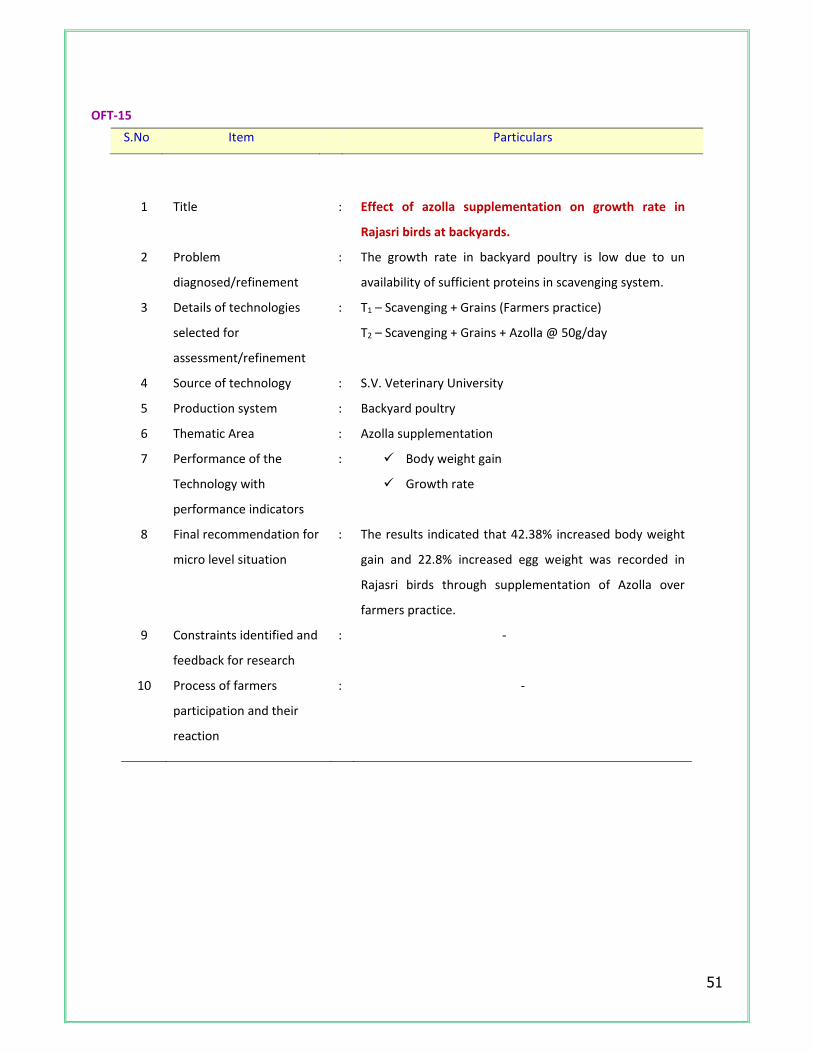
OFT‐15
S.No Item Particulars
1 Title : Effect of azolla supplementation on growth rate in
Rajasri birds at backyards.
2 Problem
diagnosed/refinement
: The growth rate in backyard poultry is low due to un
availability of sufficient proteins in scavenging system.
3 Details of technologies
selected for
assessment/refinement
: T1 – Scavenging + Grains (Farmers practice)
T2 – Scavenging + Grains + Azolla @ 50g/day
4 Source of technology : S.V. Veterinary University
5 Production system : Backyard poultry
6 Thematic Area : Azolla supplementation
7 Performance of the
Technology with
performance indicators
: Body weight gain
Growth rate
8 Final recommendation for
micro level situation
: The results indicated that 42.38% increased body weight
gain and 22.8% increased egg weight was recorded in
Rajasri birds through supplementation of Azolla over
farmers practice.
9 Constraints identified and
feedback for research
: ‐
10 Process of farmers
participation and their
reaction
: ‐

52
Crop/
enterprise
Farming situation
Problem Diagnosed Title ofOFT
No. of trials*
Technology Assessed/ refined
Parameters of
assessment
Data on the parameter
Results of assessment Feedback from the farmer
1 2 3 4 5 6 7 8 9 10
Poultry Mixed farming
The growth rate in low due to non availability of sufficient protein food in scavenging system of backyard poultry
Effect of azolla on growth rate in Backyard poultry
50 birds
T1 – Scavenging + grain feeding
Initial body weight
431.72 gm469.9 gm
The results indicated that 42.38% increased body weight gain in Rajasri birds by supplementation of azolla in the feed and 22.8% increased egg weight recorded.
.
T2 –Scavenging +Grain feeding + 50grams azolla/day
Final body weight (6
months)
1433.9 gm 1896.9 gm
Body weight gain
(in 150 days)
1002.2gm 1427.0gm
Egg weight
40.2gm
49.4gm
Technology Assessed Production per unit Net Return (Profit) in Rs. / unit BC Ratio
11 12 13 14
T1 – Scavenging + Grains 1002.2gm 150.33 1:1.48
T2 –Scavenging + Grains + Azolla @50g/day 1427.0gm 189.05 1:1.93

53
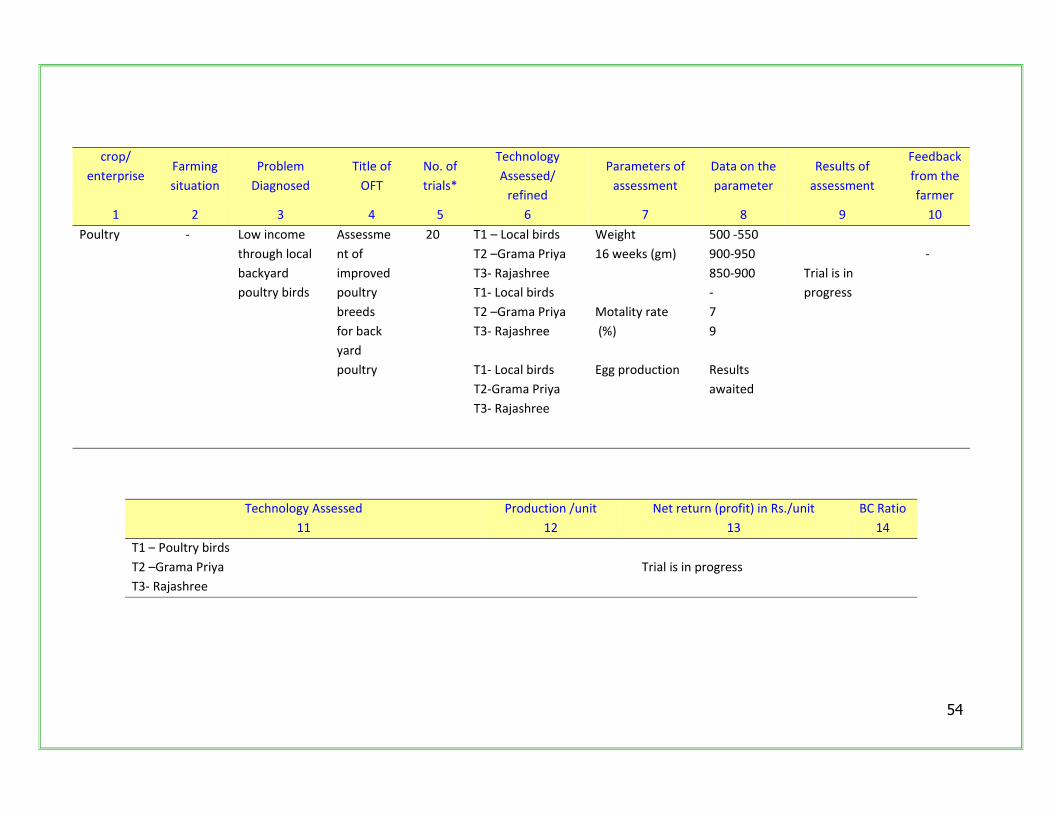
OFT‐16
S.No Item Particulars
1 Title : Assessment of improved poultry breeds for back yard
poultry
2 Problem
diagnosed/refinement
: Low income through local backyard poultry birds
3 Details of technologies
selected for
assessment/refinement
: T1 – local birds
T2 – Grama priya
T3 ‐ Rajashree
4 Source of technology : ANGRAU & PDP, Rajendranagar, Hyderabad.
5 Production system
: Poultry birds
6 Thematic Area : Poultry management
7 Performance of the
Technology with
performance indicators
: Weight
Mortality Rate
Egg production
8 Final recommendation for
micro level situation
: The results awaited
9 Constraints identified and
feedback for research
: ‐
10 Process of farmers
participation and their
reaction
: ‐
54
crop/
enterprise
Farming
situation
Problem
Diagnosed
Title of
OFT
No. of
trials*
Technology
Assessed/
refined
Parameters of
assessment
Data on the
parameter
Results of
assessment
Feedback
from the
farmer
1 2 3 4 5 6 7 8 9 10
Poultry ‐ Low income
through local
backyard
poultry birds
Assessme
nt of
improved
poultry
breeds
for back
yard
poultry
20 T1 – Local birds
T2 –Grama Priya
T3‐ Rajashree
Weight
16 weeks (gm)
Motality rate
(%)
Egg production
500 ‐550
900‐950
850‐900
Trial is in
progress
‐
T1‐ Local birds
T2 –Grama Priya
T3‐ Rajashree
‐
7
9
T1‐ Local birds
T2‐Grama Priya
T3‐ Rajashree
Results
awaited
Technology Assessed Production /unit Net return (profit) in Rs./unit BC Ratio
11 12 13 14
T1 – Poultry birds
Trial is in progress
T2 –Grama Priya
T3‐ Rajashree

55
OFT ‐ 1
Korra before Bengalgram Greengram before Bengalgram OFT ‐ 2
OFT ‐ 3
Field visit to OFT on Groundnut varieties OFT on Bengalgram varieties

56
OFT ‐ 4 OFT ‐ 5
Field visit to OFT on Direct seeding in Rice Performance of Blackgram varities in rainfed situation
OFT ‐6
OFT ‐ 7
Visit to OFT on Management of stem rot in G.nut Visit to OFT on Management sucking pests in B.t.
cotton

57
OFT ‐ 8 OFT ‐ 9
OFT on Bio Intensive pest management in Rice
OFT on Nutrient management in Sunflower
based on STCR OFT ‐ 10
OFT ‐ 11
OFT on Nutrient management in Chillis
based on STCR OFT on spacing in Banana
58
OFT ‐ 12 OFT ‐ 13
OFT on Introduction of Carrot as alternate crop
Feeding o SF heads supplemented ration to
milch buffalo OFT ‐ 14
OFT ‐ 15
Effect of RSMM on reproduction and production performance in milch buffaloes
Effect of azolla on growth rate in Rajasri birds

59
3.2 Achievements of Frontline Demonstrations
a. Follow‐up for results of FLDs implemented during previous years List of technologies demonstrated during previous year and popularized during 2011‐12 and recommended for large scale adoption in the district
S. No
Crop/ Enterprise
Thematic Area*
Technology demonstrated
Details of popularization
methods suggested to the Extension
system
Horizontal spread of technology
No. of villages
No. of farmers
Area in ha
1 Groundnut Varietal Evaluation
Varietal Demonstration in Groundnut with K6, K9 & ICGV 91114
Demonstrations, Exposure visits, Field Days, Seed village Concept.
35 3400 18000
2 Bengalgram Varietal Evaluation
Varietal Demonstration in Bengalgram with Jaki‐9218
Demonstrations, Exposure visits, Field Days Seed village Concept
22 2700 16000
3 Cotton
Integrated Crop management
Arboreum Cotton (whole package) Varieties i.e, Srinandi & Yaganti
Demonstrations, Exposure visits, Field Days, Seed village Concept
5 270 650
4 Paddy Resource conservation
Direct Seeding Demonstrations, Exposure visits, and Field Days
10 480 950
5 Paddy Paddy
Resource conservation Nutrient management
Zero tillage STCR
Demonstrations, Exposure visits, and Field Days Demonstrations, Exposure visits, and Field Days
8
15
225
496
730
1055
6 7
Bt Cotton Bt Cotton
Nutrient management ICM
Foliar nutrition Spacing
Demonstrations, Exposure visits, and Field Days Demonstrations, Exposure visits, and Field Days
8 7
650
260
1650
1350
8 Groundnut IPM IPM in Groundnut
Trainings Field visits Mobile SMS
10 160 750
60
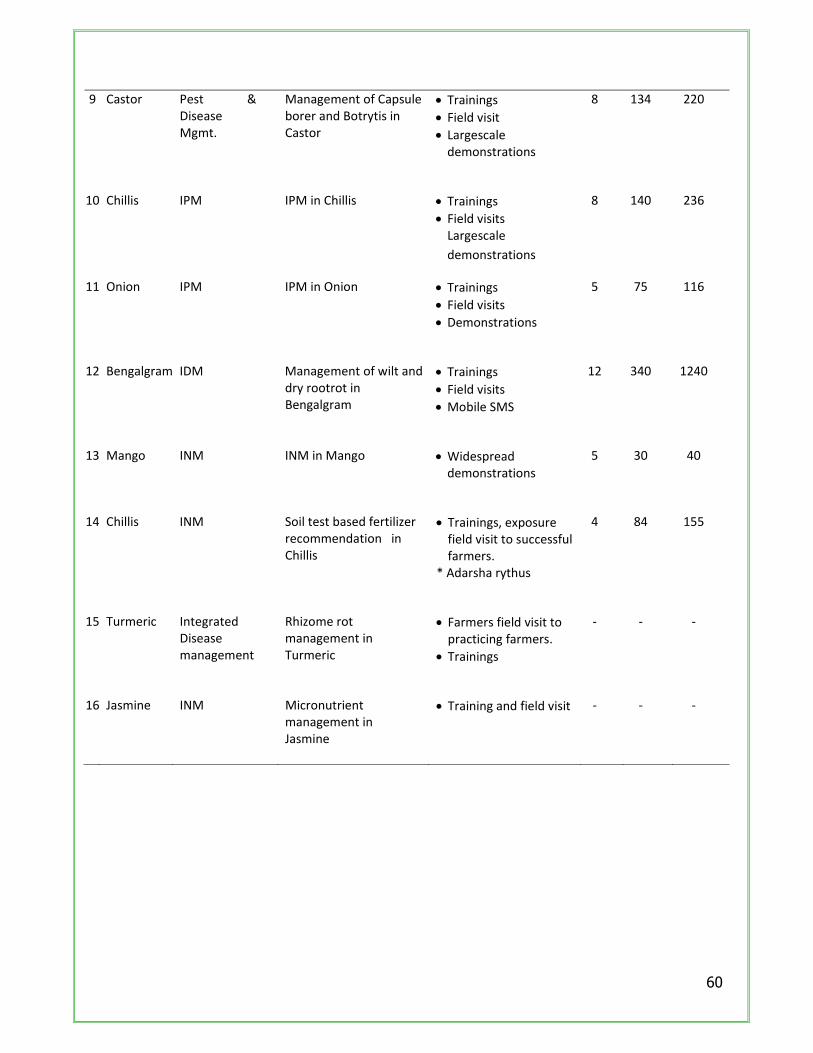
9 Castor Pest & Disease Mgmt.
Management of Capsule borer and Botrytis in Castor
Trainings Field visit Largescale demonstrations
8 134 220
10 Chillis IPM IPM in Chillis Trainings Field visits Largescale
demonstrations
8 140 236
11 Onion IPM IPM in Onion Trainings Field visits Demonstrations
5 75 116
12 Bengalgram IDM Management of wilt and dry rootrot in Bengalgram
Trainings Field visits Mobile SMS
12 340 1240
13 Mango INM INM in Mango Widespread demonstrations
5 30 40
14 Chillis INM Soil test based fertilizer recommendation in Chillis
Trainings, exposure field visit to successful farmers.
* Adarsha rythus
4 84 155
15 Turmeric Integrated Disease management
Rhizome rot management in Turmeric
Farmers field visit to practicing farmers.
Trainings
‐ ‐ ‐
16 Jasmine INM Micronutrient management in Jasmine
Training and field visit ‐ ‐ ‐


62
Details of FLDs implemented during 2011‐12 (Information is to be furnished in the following three tables for each category i.e. cereals, horticultural crops, oilseeds, pulses, cotton and commercial crops.)
Sl. No.
Crop Thematic area
Technology Demonstrated
Season year
Area (ha) No. of farmers/ demonstration
Reasons for shortfall
Pro Actu SC/S Other Total
1 Redgram ICM Varietal K-2011 12 12 5 25 30 2 Bengalgram ICM Varietal K-2011 12 12 6 24 30
Other Demonstrations
1 Rice Weed management IWM K-2011 4 4 3 7 10
2
Rice Varietal BPT 2270 K 2011 4 4 2 8 10
3 Bt.Cotton Nutrient management Foliar nutrition K-2010 4 4 3 7 10 4 Castor Hybrids performance
PCH-11 K-2011 4 4 6 4 10
5 Arboreum cotton Varietal Yaganti K - 2011 4 4 5 5 10 6 Maize Resource conservation Zero tillage Ri-2011 4 4 3 7 10
7 Rice Nutrient Management
STCR K–2011 4 4 4 6 10
8 B.t. Cotton Integrated Nutrient Management
INM K‐2011 4 4 3 7 10
9 Rice Micronutrient Management
Foliar application of Zinc 0.2%
K‐2011 4 4 3 7 10
10 Rice Reclamation of sodic soils
Gypsum as per soil test
K‐2011 4 4 4 6 10
11 Bengalgram Nutrient Management
STCR Rabi‐11 4 4 3 7 10
12 Groundnut IPM IPM in Groundnut K –11 4 4 3 7 10 13 Castor Pest & Disease Mgmt. Management of Capsule
borer and Botrytis in Castor
K – 11 4 4 3 7 10
14 Chillis IPM IPM in Chillis K‐11 4 4 4 6 10 15 Onion IPM IPM in Onion R‐11 4 4 2 8 10

63
16 Bengalgram IDM Management of wilt and dry root rot in Bengalgram
R‐11 4 4 4 6 10
17 Mango INM INM in Mango K‐11 4 4 ‐ 15 15 18 Chillis INM Soil test based fertilizer
recommendation in Chillis
K‐11 4 4 2 8 10
19 Turmeric Integrated Disease management
Rhizome rot management in Turmeric
K‐11 4 4 3 7 10
20 Jasmine INM Micronutrient management in Jasmine
K‐11 2 2 01 09 10
21 Tomato Protected Nursery Raising
Raising of vegetable nursery in pro trays
R‐11 2 2 01 04 05
Details of farming situation
Crop Season Farming situation
(RF/Irrigated)
Soil type Status of soil Previous crop
Sowing date Harvest date
Seasonal rainfall (mm)
No. of
rainy days
N P K
Redgram K‐2011
Rainfed Redsoil L Med High Jowar Last week of july
1st Week of January
Bengal gram
R‐2011
Rainfed Black soil
L High High Jowar 2nd week of October
3rd week of January
Other Demonstrations
Rice
K‐2011
Irrigated Black soil
L High High Paddy 2nd to 3rd week of August.
Last week of Decm.
Rice K–2011
Irrigated Black soil
L Med High Paddy 2nd FN of August 1st FN of Jan
Bt.Cotton K‐2011
Irrigated Black soil
L Med High Maize 2nd to 3rd week of August.
Last week

64
of Jan. Castor
K‐2011
Irrigated Black soil
L Med High Jowar 1st week of Jan. 1st week of May
Arboreum cotton
K – 2011
I.D. Redsoil L Low Med Cotton 1st Wk of April Last week of Nov.
Maize R‐2011
Irrigated Black soil
L High High Paddy 1st wk of Jan Last wk of April
Paddy Kharif ‐11
Irrigated Black soil
L H M to H
Paddy 2nd to 3rd week of August.
Last week of December.
Bt.
Cotton
Kharif ‐11
ID Black soil
L H M to H
Sunflower 2nd‐3rd week of July
last week of Dec.
Paddy Kharif ‐11
Irrigated Black soil
L H M to H
Paddy 2nd to 3rd week of August.
Last week of December.
Paddy Kharif ‐11
Irrigated Black soil
L H M to H
Paddy 2nd to 3rd week of August.
Lastweek of December.
Bengalgram Rabi11 Rainfed Black L H M to H
Bengalgram 3nd week of Oct.
3rd week of Jan..
G.nut K‐2011 Rainfed Redsoil L M M G.nut Last wk of July Last wk of Oct.
Castor K‐2011 Rainfed Black Medium Medium High Jowar 1st week of August.
4th week of Jan
Chillis K‐2011 ID Black Low High High Onion 1st week of August.
4th week of March
Onion R‐2011 ID Red Low Med Med Chillis 1st week of Nov 1st week of March
‐
Bengalgram R‐2011 Rainfed Black Low Med High Jowar 2nd week of Oct 3rd week of Jan Mango K‐11 ID Red Low Low Medium ‐ ‐ ‐Chillis K‐11 ID Red/Black Medium Medium High Maize 1st week of Aug. 4th week of
March. Turmeric K‐11 ID Red/Black Low High High Turmeric 3rd week of June 4th week of

65
March Jasmine K‐11 ID Red Low Medium Medium ‐ ‐ ‐ Tomato R‐11 ID Red Low Medium Medium Jowar
Performance of FLD
Sl. No.
Crop Technology Demonstrated
Variety No. of Farmers
Area (ha.)
Demo. Yield Qtl/ha Yield of
local Check Qtl./ha
Increase in yield (%)
Data on parameter in relation to technology demonstrated
H L A Demo Local
1 2 3 4 5 6 7 8 9 10 11 12 13
1 Redgram Component technologies
LRG‐41 15 6.0 1445 1187 1298 1063 22.1
PRG 158 15 6.0 1062 912 965 780 23.7 2 Bengalgram Component JAKI 9218
Rainfed 15 6.0 1690 1437 1584 1304 21.4 50.4 pods/plant 45.6 pods/plant
JAKI 9218 I.D.
15 6.0 2190 1900 2031 1632 24.4 54.8 pods/plant 48.3 pods/plant
Other demonstrations
1. Rice Weedmanagent BPT‐5204 10 4 7537 6843 7195 6936 3.7 82.5(WCE) 4450(Cost on weeding)
68.66 Weeds/m2 5400‐00
2 Rice Varietal BPT 2270 10 4 8062 7416 7775 6911 12.53 Bt. Cotton Foliar Nutrition NCS‐145 10 4 2190 1715 1905 1776 7.2 57.8 Bolls/plant 45.6 Bolls/p 4 Castor Hybrid evaluation PCH 111 10 4 1090 892 993 787 26.1 5.66 spikes
(54.9 Capsules) 4.56 spikes (43.8 Capsules)
5 Arboreum cotton
Varietal Yaganti 10 4 1837 1595 1687 1472 22.9
6 Maize Resource Conservation
Zero Tillage 10 4 7000 6125 6590 6424 2.5
7 Paddy STCR BPT‐5204 10 4 78.85 76.22 77.60 77.41 ‐ The cost on chemical fertilizers and yield
The cost on chemical fertilizers and yield

66
8 Bt. Cotton INM Mallika‐Bt 10 4 25.35 23.15 24.11 22.60 6.7 C.P and yield C.P and yield 9 Paddy Zinc management BPT‐5204 10 4 68.94 65.39 67.49 62.70 7.64 C.P and yield C.P and yield 10 Paddy Reclamation of
sodic soils BPT‐5204 10 4 68.80 56.44 63.71 54.26 17.41 pH and Yield pH and Yield
11 Bengalgram STCR JG‐11 10 4 16.55 14.63 15.67 15.39 1.83 The cost on chemical fertilizers and yield
The cost on chemical fertilizers and yield
12 Groundnut IPM in Groundnut K‐6 10 4 8.60 6.40 7.20 6.88 4.65 Cost of PP 825/‐ha
1375/‐ha
13 Castor Management of Capsule borer and Botrytis in Castor
Haritha 10 4 14.50 7.50 11.38 9.30 22.36 Cost of PP 2000/‐ha
4125/‐ha
14
Chillis IPM in Chillis LCA 334 10 4 62.50 51.50 56.43 52.75 6.97 Cost of PP 9150/ha
14500/‐/ha
15 Onion IPM in Onion ALR 10 4 220.0 270.0 240.13 225.5 6.48 Cost of PP 7375/‐ha
10500/‐/ha
16 Bengalgram Management of wilt and dry rootrot in Bengalgram
JG 11 10 4 18.00 14.50 16.06 15.10 6.35 Cost of PP 2575/ha
2325/‐/ha
17 Mango INM in Mango Baneshan 10 4 65.2 48.2 61.7 48.6 26.9 ‐ ‐ 18 Chillis Soil test based
fertilizer recommendation in Chillis
LCA 334 10 4 54.60 48.30 49.25 42.50 15.9 Fert. Cost in demo reduced by Rs.8750/‐ ha
‐
19 Turmeric Rhizome rot management in Turmeric
Mydukur 10 4 70.45 66.20 67.05 61.33 9.32 Rhizome rot incidence was low .
‐
20 Jasmine Micronutrient management in Jasmine
10 2 45.30 40.65 42.20 39.87 5.84 ‐ ‐
21 Tomato Raising of vegetable nursery in pro trays
Siri 9005 5 2 685.0 525.0 523.0 413.0 26.6 No. of pickings 18
No. of pickings 14

67
22 Ram Lambs
Feeding of concrete feed
Nellore brown
10 100 lambs
24.3 20.8 22.59 20.6 41.8 Body weight gain Demo.‐ 8.31
5.86
23 Calves Feeding of calf starter
Graded murrah
10 20 76.1 54.0 65.05 57.6 19.82 34.15 28.5
24 Pre‐ weaned lambs
Supplementation of minerals through salt licks
Nellore Brown
10 100 lambs
14.3 10.1 12.22 11.35 17.18 7.16 6.11
25 Fodder Haylage making with jowar straw and feeding to buffaloes Milk production (90 days)
Graded murrah
10 10 433.9 322.5 378.2 353.8 6.9 ‐ ‐
Economic Impact (continuation of previous table) S.No.
Average Cost of cultivation (Rs./ha) Average Gross Return (Rs./ha) Average Net Return (Profit) (Rs./ha)
Benefit‐Cost Ratio (Gross Return /
Gross Cost) Demonstration Local Check Demonstratio
n Local Check Demonstration Local Check
14 15 16 17 18 19 20
1 14575‐00 13625‐00 33775‐00 27300‐00 19200‐00 13675‐00 1:2.31 / 2.0
14575‐00 13625‐00 45430‐00 37205‐00 30855‐00 23580‐00 1:3.1/2.7
2 16900‐00 16114‐00 55440‐00 45640‐00 38540‐00 29526‐00 1:3.2/2.8
17400‐00 17114‐00 71085‐00 57120‐00 53685‐00 40006‐00 1:4.0/3.2
Other Demonstrations
1 45925‐00 46875‐00 81543‐00 78608‐00 35618‐00 31733‐00 1:1.77/1.67
2 44675‐00 45362‐00 88116‐00 78324‐00 43441‐00 32962‐00 1:1.97/1.72
3 23097‐00 21842‐00 66675‐00 62160‐00 43578‐00 40318‐00 1:2.88/2.84
4 15000‐00 15000‐00 34755‐00 27545‐00 19755‐00 12545‐00 1:2.10/1.83

68
5 10875‐00 10250‐00 67480‐00 58880‐00 56605‐00 48630‐00 1:6.2/5.7
6 20625‐00 24250‐00 62605‐00 61028‐00 41980‐00 36778‐00 1:3.0/2.5
7 37862‐00 45048‐00 87923‐00 87710‐00 50061‐00 42662‐00 2.32/1.95
8 33224‐00 39761‐00 84375‐00 79104‐00 51151‐00 39343‐00 2.54/1.99
9 38604‐00 38204‐00 76461‐00 71033‐00 37857‐00 32929‐00 1.98/1.86
10 39880‐00 39684‐00 72181‐00 61480‐00 32301‐00 21796‐00 1.81/1.55
11 15017‐00 18126‐00 54842‐00 53855‐00 39825‐00 35729‐00 3.65/2.97
12 20825‐00 21375‐00 23040‐00 22016‐00 2215‐00 641‐00 1:1.10 /1.03
13 16688‐00 18813‐00 45500‐00 37200‐00 28813‐00 18388‐00 1:2.73/1:1.98
14 97650‐00 111800‐00 236985‐00 221550‐00 139335‐00 109750‐00 1:2.43/1:1.98
15 74750‐00 77878‐00 96050‐00 90200‐00 21300‐00 12325‐00 1:1.28/1:1.16
16 19325‐00 19075‐00 51385‐00 48308‐00 32060‐00 29233‐00 1:2.66/1:2.53
17 48200‐00 51100‐00 123400‐00 97200‐00 75200‐00 46100‐00 1:2.56/1:1.9
18 112500‐00 128570‐00 246250‐00 212500‐00 133750‐00 83930‐00 1:2.1/1:1.6
19 212500‐00 225000‐00 201150‐0 183975‐00 ‐11350‐00 ‐41025‐00 1:0.9/1:0.8
20 138723‐00 140434‐00 379800‐00 358830‐00 241077‐00 218396‐00 1:2.7/1:2.5
21 88000‐00 89325‐00 261500‐00 206280‐00 173500‐00 120955‐00 1:2.9/1:2.3
22 1125‐00 750‐00 3420‐00 2370‐00 2295‐00 1620‐00 1:3.04/1:3.16
23 700‐00 600‐00 1432‐00 1222‐00 732‐00 622‐00 1:2.04/1:2.03
24 270‐00 225‐00 1496‐00 900‐00 1226‐00 675‐00 1:5.54/1:4.0
25 ‐ ‐ ‐ ‐ ‐ ‐ ‐

69
Analytical Review of component demonstrations (details of each component for rain fed / irrigated situations to be given separately for each season)
Crop Season Component Farming situation
Average yield (q/ha)
Local check (q/ha)
Percentage increase in productivity over local
check Redgram Kharif‐2011 ICM on LRG‐41 Protective
Irrigation 1298 1063 22.1
ICM on PRG 158 Rainfed 965 780 23.7
Bengalgram Rabi 11 ICM on Jaki 9218 Rianfed 1584 1304 21.4
ICM on Jaki 9218 I.D. 2031 1632 24.4
Other demonstrations
Rice K‐2011 Weed management Irrigated 7195 6936 3.5 Rice K – 2011 Varietal Irrigated 7775 6911 12.5 B.t. Cotton K‐2011 Foliar Nutrition Irrigated 1905 1776 7.2 Castor K‐2011 Hybrid Evaluation Rainfed 1993 787 26.1Arboreum cotton K‐2011 Varietal Irrigated 1687 1472 22.9 Maize R‐2011 Resource Conservation Irrigated 6590 6424 2.5 Paddy Kharif‐11 Nutrient Management
based on STCR Irrigated 77.60 77.41 Cost of production reduced
towards chemical fertilizers is Rs. 7186/ha,
Bt.Cotton Kharif‐11 Integrated Nutrient Management
ID 24.11 22.60 6.7
Paddy Kharif‐11 Zinc management Irrigated 67.49 62.70 7.64Paddy Kharif‐11 Reclamation of sodic
soils Irrigated 63.71 54.26 17.41
Bengalgram Rabi‐11‐12 Nutrient Management based on STCR
Rainfed 15.67 15.39 Cost of production reduced towards chemical fertilizers is Rs. 3109/ha,
G.Nut K‐11 IPM on K‐6 Rainfed 7.20 6.88 4.65% increased yield with a saving of Rs. 550/‐ha on cost of PP.

70
Castor K‐11 Mgmt of botrytis and capsule borer
Rainfed 11.38 9.30 22.36% increased yield with a saving of Rs.2125/‐ha on cost of PP
Chillis K‐11 IPM in Chillis ID 56.43 52.75 6.97% increased yield with a saving of Rs. 5350/‐ on cost of PP.
Onion R‐11 IPM in Onion ID 240.13 225.5 6.48% increased yield with a saving of Rs. 3125/‐ ha on cost of PP
Bengalgram R‐11 Mgmt. of wilt and dry root rot
Rainfed 16.06 15.10 6.37% increased yield with additional cost of Rs.250/‐ ha on cost of PP.
Mango K‐11 INM in Mango ID 61.7 48.6 26.9% increased yield due to INM
Chilli K‐11 STBFR in Chillis ID 49.25 42.5 15.9% increased yield with a saving of Rs. 8750/‐ ha on cost of fertilizers.
Turmeric K‐11 Rhizome rot management
ID 67.05 61.32 9.32% increased yield obtained in demo.
Jasmine K‐11 Micronutrient management
ID 42.20 39.87 5.84% increased yield obtained in demo.
Tomato K‐11 Rising tomato seedlings in pro trays
ID 523.0 413.0 26.2% increased yield obtained in demo.
Ram Lambs Feeding of concrete feed
22.59 20.6 41.8
Calves Feeding of calf starter 65.05 57.6 19.82Pre‐ weaned lambs
Supplementation of minerals through salt licks
12.22 11.35 17.18
Fodder Haylage making with jowar straw and feeding to buffaloes Milk production (90 days)
378.2 353.8 6.9

71
REDGRAM:
The results indicated the redgram variety PRG‐158 with component technologies (Improved variety, seed
treatment, pre‐emergence application of pendimethalin against weeds, Siol test based fertilizer application,
Sulphur @20 kg/ha and IPM measures against Helicoverpa and Maruca) has recorded 23.7% increased yield over
local check in under rainfed situation with additional net returns of Rs.6475‐00 /ha and the variety LRG‐41 has
recorded 22.1% increased yield over local check with protective irrigation and additional net returns of Rs.8225
/ha was obtained.
BENGALGRAM:
In Bengalgram variety JAKI‐9218 with component technologies (Improved variety,seed treatment, pre‐
emergence application of pendimethalin against weeds, Soil test based fertilizer application, Sulphur @20 kg/ha
and IPM measures against Helicoverpa and S.exigua) has recorded 21.4 and 24.4 per cent increased yield in
medium black soils under rainfed situation and with protective irrigation respectively.
Economics of demonstration and local check plots indicated that the with cultivation of JAKI 9218 with
improved technologies, additional returns of Rs 9800/‐and Rs.13965/ha were obtained with BC ratio of
1:3.2/2.8 and 1:4.0/3.2 under rain fed and with protective irrigation respectively .
FLDs OTHER THAN OILSEEDS AND PULSES:
1. Weed Management in Paddy: FLDs on Weed management were taken up in an area of 4ha at Yagantipalli
Village with post–emergence application Bispyribac sodium80 ml /acre + one hand weeding at 40 DAT. The
results indicated that 82.50 per cent weed control efficiency , saving of Rs 950/‐ ha on manual weeding and
additional returns of Rs 3884‐/‐ per ha was obtained
2. Demonstration on Paddy Variety BPT‐2270:
During kharif‐11 five demonstrations was organized on Paddy Variety BPT‐2270 at Mukkamalla, Yagatipapalli
and peddabodanam villages . The result indicated that paddy variety BPT‐2270 was recorded 12.5% increased
yield over local check with additional returns of Rs 9789/ha was obtained.
3.Foliar nutrition in Bt cotton
During khair‐11 FLDs were taken up at Banumukkala village of Banaganapalle mandal. Foliar nutrition with
19:19:19, multi “K” and boron was taken up at 75, 85, 95 and 105 DAS. The results clearly indicated that the
higher boll retention and also reducing the boll shedding and increased the yield by 7.2 percent.
4. Demonstration on Castor Hybrid PCH‐111
During kharif‐11 five demonstrations were organized with Castor Hybrid PCH‐222 at Amadala village. The results
indicated that the PCH‐111 hybrid has recorded 26.1% increased yield over private hybrid under rainfed
situation. The superior performance of PCH‐111 can be attributed to lengthy spike, more no.of capsules per
spike and higher test of seed.

72
5.Demonstration on Arboreum cotton Var Yaganti: During kharif‐11 five demonstrations on Arboreum cotton
variety “Yaganti” was organized at Thammarajupalle village. The result indicated that Yaganti variety ICM was
recorded 22.9% increased yield over local check under irrigated conditions.
6.Demonstration on Zero tillage maize : During Rabi, 2011 10 demonstrations of 0.4 ha each were organized on
Zero tillage maize after rice crop in Bhanumukkala village of Banaganapalle mandal and Motkur village of
Nandyal mandal. The result indicated that there is a saving of Rs. 5202/‐ per ha because of saving on preparatory
cultivation and timely sowing compared to farmers practice.
7.Nutrient management in rice based on STCR equation: The results indicated that the average grain yield of
paddy under STCR was higher (7760Kg/ha) than the grain yield produced under controlled practice
(7741Kg/ha).Gross and net income were high in demonstration plots (Rs.87923 ha‐1 and Rs. 50061 ha‐
1,respectively) as compared to controlled practice (Rs.87710 ha‐1 and Rs.42662 ha‐1,respectively). It was also
observed that an amount of Rs.7399/ha was realized as additional income due to low production costs in
demonstrations. Benefit‐cost ratio was also high in demonstrations (1:2.32) as compared to check (1:1.95) due
to low cost production.
8.INM in Bt. Cotton: Ten demonstrations were organized on INM at Dornipadu village of Dornipadu mandal .
The average yield of Bt.Cotton under INM approach was higher (2411Kg/ha) than yield produced under farmer’s
practice(2260Kg/ha). It was also observed that an amount of Rs.11808/ha was realized as additional income
due to low cost of production and yield increments in demonstrations. Benefit‐cost ratio was high in INM
demonstrations(1:2.54) as compared to farmers practice (1:1.99) due to low cost of production and higher gross
income.
9.Zinc Management in rice : Ten Demonstrations were organized on Zinc management in rice at Yagantipalle
village of Banaganapalle mandal.The average yield of rice under Zinc foliar application was high (6749Kg/ha) as
compared to farmer’s practice (6270Kg/ha) . An amount of Rs. 4918/ha was realized as additional income due
to low production costs and yield increments in demonstrations. Benefit‐cost ratio was high in demonstrations
(1:1.98) as compared to farmers practice (1:1.87) due to low cost of Production and higher gross income.
10.Reclamation of sodic soils: The results revealed that the average grain yield of paddy under reclamation was
higher (6371Kg/ha) than the grain yield produced under controlled practice (5426Kg/ha).Gross and net income
were high in demonstration plots (Rs.72181 ha‐1 and Rs.32301 ha‐1,respectively) as compared to controlled
practice (Rs.61480 ha‐1 and Rs.21796 ha‐1, respectively).It was also observed that an amount of Rs.10505/ha
was realized as additional income due to low cost of production and yield increments (17.41%) in
demonstrations. Benefit‐cost ratio was also high in demonstrations (1:1.81) as compared to check (1:1.55) .
11.Nutrient management in Bengalgram based on STCR equation : Ten Demonstrations were organized on
nutrient management in bengalgram at I.Kothapet village of Banaganapalle mandal.The average yield of
bengalgram under STCR based application was high (1567Kg/ha) as compared to farmer’s practice
(1539Kg/ha) . An amount of Rs. 4096/ha was realized as additional income due to low production costs and

73
yield increments in demonstrations. Benefit‐cost ratio was high in demonstrations (1:3.65) as compared to
farmers practice (1:2.97) due to low cost of Production and higher gross income.
12. IPM in G.nut: The demo was conducted at Yerragudi village of Banaganapalle mandal. The results indicated
that there is no significant difference between the yields of farmers practice (688 kg/ha) and demonstration (720
kg/ha), mainly due to drought prevailed during pod formation and pod filling stages of the crop. The incidence of
leaf folder and jassids in FLD were (2.9% and 3.5/plant) lower compared to farmers practice (5.24 % and
6.08/plant).
13.Management of Capsule borer and botrytis in Castor : The demo was conducted at Yagantipalle village of
Banaganapalle mandal. The results indicated that in Demo there is 22.31% increased yield in Castor (1138 kg/ha)
compared to farmers practice (930 kg/ha), which is mainly attributed to management of Botrytis and Capsule
borer in time. The incidence of Capsule borer was reduced by 42.5% in Demo (1.26 larvae/plant) over farmers
practice (2.9 larvae/plant) and Botrytis disease was reduced by 54.43% in Demo (13.1% ) over control (5.97%).
14.IPM in Chillis : The Demo was conducted at K. Sunkesula village of Owk mandal. The yields in IPM (5643
kg/ha) demonstrations were 6.97% more compared to farmers practice (5275 kg/ha), in addition to saving of Rs.
5350/‐ per ha. on cost of plant protection.
15.IPM in Onion : The demo was conducted at Emboi village of Bethamcherla mandal. The results indicated that
in demo there is 6.48% increased yield with a saving of Rs.3125/‐ per ha on cost of Plant Protection.
16.Management of Wilt and Dry root rot in Bengalgram : The demo was conducted at Kalugotla village of
Koilakuntla mandal. The demo gave 6.35% higher yield (1606 kg/ha) than farmers practice (1510 kg/ha). Wilt
incidence in demo (5.1%) was 15.7% less than farmers practice (5.9%), where as Dry root rot incidence was
reduced by 34% in demo (4.1%) compared to farmers practice (5.5%), with an additional cost of Rs.250/‐ per ha
on Plant Protection.

74
Technical Feedback on the demonstrated technologies:
S. No
Feed Back
1 Redgram:
The redgram variety PRG‐158 being its short duration, it is suitable for red soil situations.
It is suitable for intercrop in groundnut
The incidence of wilt is significantly less in PRG‐158 compared to local check.
The redgram variety LRG‐41 being its Long duration, it is suitable for Medium black under
rainfed situations.
Moderately tolerant to Helicoverpa pod borer.
Pods are brick red in colour. seeds dark red and bold.
2 Bengalgram:
Plant height, no. of branches/plant, No. of pods/plant were more in JAKI‐9218
It matures 5‐7 days earlier than Annegiri
The incidence of wilt is comparatively less than local check..
Plant was bushy with basal branching habit.
Research on development of desi varieties with short duration has to be strengthened
Development of varieties tolerant to pod borer complex.
Development of transgenics particularly for resistance to pod borer.
3 STCR based nutrient management in rice:
The status of phosphorus was more than 100 kg./ha in all demonstration fields. Hence
Phosphorus was not applied in demonstrations.
Cost on chemical fertilizers was less (Rs 7186/‐ per ha) than farmer practice.
Nutrient use efficiency (kg grain‐ /kg‐1 nutrient) was high in STCR (29.5) as compared to farmers
practice (17.28) .
4 INM in Bt. Cotton
Soil test based nutrient management helped in fertilizer cost reduction
(Rs.6537 ha‐1) in demonstrations.
Foliar application of Secondary nutrient( Mg) and micronutrients like zinc and boron gave
higher yield in demonstrations (24.11 q ha‐1)than farmers practice (22.60 q ha‐1)
5 Zinc Management in Rice
Foliar application of chelated zinc performed equally as basal application.
Zinc deficiency correction gave higher yield than control

75
6 Reclamation of Sodic Soils
Application of gypsum in soil where pH is more than 8.7 have more yield advantage(17.41%)
than controlled plots.
pH of soil is lower in demonstrations than control after reclamation (0.35 to 0.4 is reduced
over the initial soil pH).
7 Nutrient Management in Bengalgram based on STCR
Application of phosphorus is reduced
Potassium is required as per STCR
Cost on chemical fertilizers was reduced (Rs 1196/‐ per ha)
Farmers reaction on Specific technologies
S. No Feed Back
1
Castor:
The Castor hybrid PCH‐111 gave significant yield increase (26.1%) over non
descriptive Private hybrids under rainfed situation.
The percentage of male flowers was less in PCH‐111
No of Spikes, capsules per plant were more.
2 Integrated weed management in Rice:
Cost on manual weeding was reduced (Rs 950/‐ per ha)
Weed control efficiency was 82.5%
Weed density was less in demo plot up to 40DAT
Due to less crop weed competition 3.5% yield increase was observed.
3 Foliar Nutrition in Bt. Cotton:
Higher boll retention was observed in demonstration plot with spraying of
19:19:19 @ 1.5% at 75 & 85 DAS multi ‘K’ @ 1.5% and Boron 0.1% at 95 & 105
DAS.
Additional returns of Rs.3260‐00 was obtained.
4 Zero tillage in Maize & Sunflower:
Cost on preparatory cultivation was reduced to Rs 2500‐3000/ha
Timely sowing is possible
Additional returns of Rs 5202/‐ha was obtained
Rice‐Maize, Rice‐ sunflower system under zero tillage was profitable where
water is not sufficient to take up rice‐rice under
well /canal irrigation.

76
5
STCR in Rice and Bengalgram
Farmers were satisfied with crop performances and expressed that Soil test
based nutrient management is a viable technology in Rice and Bengalgram
,because of low cost of chemical fertilizers , without reduction in yield .
Pest incidence was less in demonstration plots than farmers practice fields.
They realized that they are resorting to higher expenditure on fertilizers in
absence of soil testing of their fields. They are now willing to adopt the STCR
technology in succeeding seasons for raising crops.
6 Zinc management in Rice
Foliar application of zinc is more economic than basal.
7 Reclamation of Alkaline Soils
Reclamation of alkaline soils will improves soil physical properties and
productivity.
8 IPM in Groundnut
With seed treatment for collar rot and sucking pests, higher seed rates can be
avoided as the plant stand will be good.
Spraying of Neem oil immediately after observing adult moth activity in the field
will reduce the incidence of Helicoverpa.
Border crop of Jowar will increase the predator activity in the field.
9. Management of Botrytis and Capsule Borer in Castor
Spraying Carbendazim before and after rainfall, will considerably reduce the
incidence of botrytis and thus loss.
10. IPM in chillis
Seed treatment with TSOP and Imidacloprid 70 WS, will reduce the chance of
virus infection upto 100 days of cropping period.
Use of Fipronil granules in the nursery will give protection to chilli crop from
thrips upto 30 days of transplantation.
11 IPM in onion
Use of Yellow sticky traps in Onion will reduce the incidence of Thrips.
Use of sticker like Sandovit alongwith spray solution will increase the efficacy of
chemical sprayed.
12 Management of Wilt and Dry root rot in Bengalgram

77
Seed treatment with T.viride @ 10g/kg along with FYM powder offer the food
source for germinating T.viride and ensure its better establishment in the soil.
Extension and Training activities under FLD
S. No.
Activity No. of activities organized
Date Number of participants
Remarks
1 Field days 2 21‐12‐11
8‐1‐2012
18‐1‐2012
126
75
86
2 Farmers
Training
5 22‐6‐2011
18‐7‐2011
14‐9‐2011
8‐10‐2011
7‐12‐2011.
35
42
30
28
32
3 Media
coverage
1
4 5.
Training for
extension
functionaries
Literature
1
1
21‐12‐2011

78
Front Line Demonstrations
Field visit to Demo On ICM in Redgram Field visit to Demo on ICM on JAKI 9218 Bengalgram
Demonstrations other than Oilseeds & Pulses
1.Demo on Foliar nutrition in Bt. cotton 2.Demo on Zero tillage Maize

79
3.Demo on performance of mungari cotton variety
– Yaganti. 4.Demo on evaluation of Castor hybrid PCH 111
5.Demo on performance of Rice variety BPT 2270 6.Demo on weed management in rice

80
7.Demo on STCR based fertilizer mgmt. in Rice 8.Demo on INM in B.t. Cotton
9.Demo on Zinc management in rice 10. Demo on STCR based fertilizer mgmt. in Bengalgram
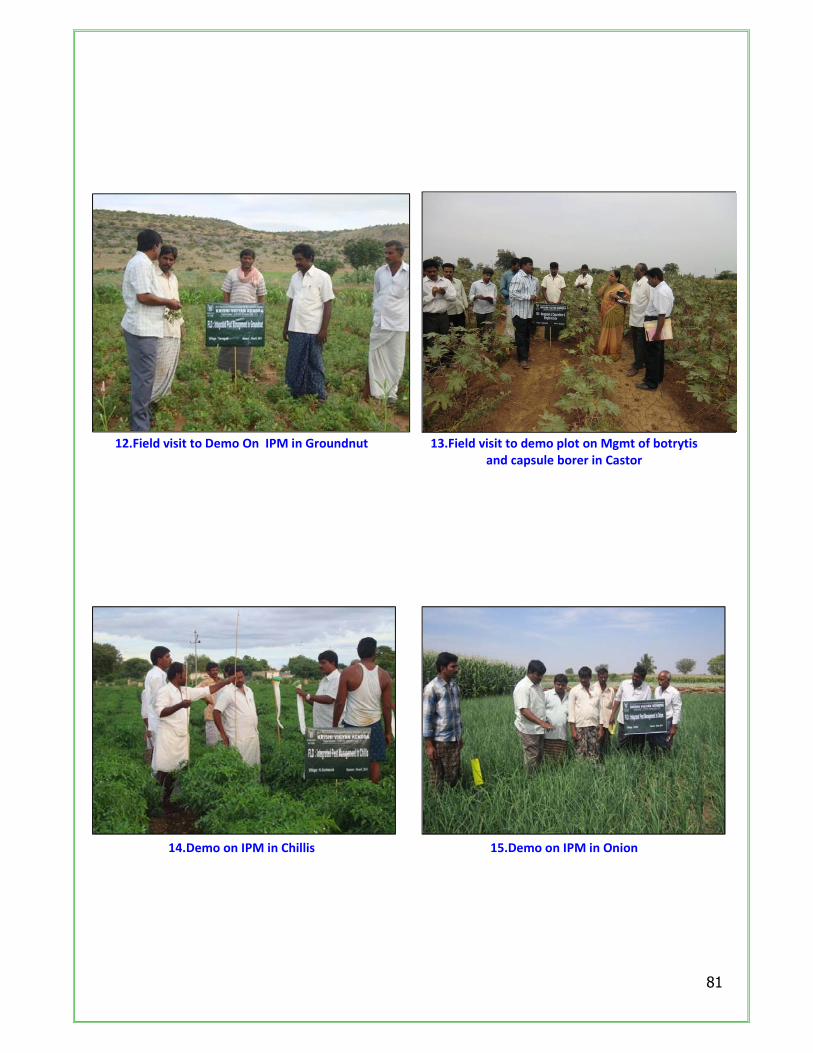
81
12.Field visit to Demo On IPM in Groundnut 13.Field visit to demo plot on Mgmt of botrytis and capsule borer in Castor
14.Demo on IPM in Chillis 15.Demo on IPM in Onion

82
16.Demo On Bio Priming in Bengalgram 17. Demo on INM in Mango
18.Demo on STBFR in Chillis 19. Rhizome rot management in Turmeric

83
20. Micronutrient management in Jasmine 21.Demo on nursery raising in Protrays
22.Feeding of calf starter to buffalo calves 23.Supplementation of minerals to lambs through
salt licks

84
24.Feeding of concentrates to Ram lambs 25.Demo on Reclamation of sodic soils in Rice
26. Demo on Bhendi cutter for reducing drudgery
27.Demo on wheel hoes for reducing drudgery

85
(i) Farm Implements
Name of the implement
Crop No. of farmers
Area (ha)
Performance parameters / indicators
* Data on parameter in relation to technology
demonstrated
% change in the
parameter
Remarks
Demo Local check
Wheel hoes Jowar 5 2.0 Labour required/ acre/day
3 8 62.5 Rs. 400/day saving.
Cost of weeding/
acre/day (Rs.)
240 640 62.5
Bhendi Cutter Bhendi 10 4.0 Qty. harvested in
kgs/day/person
61.6 52.4 17.5 Rs. 140/day saving.
Cost on Labour /day
210 350 40%
* Field efficiency, labour saving etc.

86
(ii) Livestock Enterprises
Enterprise Breed No. of farmers
No. of animals, poultry birds etc.
Performance parameters / indicators
* Data on parameter in relation to technology demonstrated
% change in the parameter
Remarks
Demon. Local check
Calves Graded murrah
10 20 Body weight gainkg/90days
34.15 28.5 19.8
Lambs Nellore Brown
10 100 Body weight gain/90days
7.16 6.11 17.18
Ram lambs Nellore Brown
10 100 Body weight gain/90days
8.31 5.86 41.8
Fodder Haylage making
10 10 Milk yield/90days
378.2 353.8 6.9
* Milk production, meat production, egg production, reduction in disease incidence etc. (iii) Other Enterprises
Enterprise Variety/ breed/Species/ others
No. of farmers
No. of Units
Performance parameters / indicators
Data on parameter in relation to technology demonstrated
% change in the parameter
Remarks
Demo Local check

87
3.3 Achievements on Training (Including the sponsored, vocational, FLD and trainings under Rainwater
Harvesting Unit):
A) ON Campus
Thematic area No. of courses
Participants
Others SC/ST Grand Total
Male Female Total Male Female Total Male Female Total
(A) Farmers & Farm Women
I Crop Production Weed Management 1 18 ‐ 18 7 ‐ 7 25 ‐ 25 Cropping Systems 1 14 ‐ 14 6 5 11 20 5 25 Seed production 1 30 ‐ 30 8 ‐ 8 38 ‐ 38 Integrated Crop Management
9 244 ‐ 244 124 ‐ 124 368 ‐ 368
II Horticulture
a) Vegetable Crops Production of low volume and high value crops
1 22 ‐ 22 5 ‐ 5 27 ‐ 27
Nursery raising 1 19 ‐ 19 8 ‐ 8 27 ‐ 27 b) Fruits Micro irrigation systems of orchards
1 63 8 71 12 3 15 75 11 86
g) Medicinal and Aromatic Plants
Production and management technology
2 64 ‐ 64 12 ‐ 12 76 ‐ 76
III Soil Health and Fertility Management
Integrated Nutrient Management
1 20 ‐ 20 5 ‐ 5 25 ‐ 25
Management of Problematic soils
1 20 ‐ 20 4 ‐ 4 24 ‐ 24
Nutrient Use Efficiency
1 20 ‐ 20 5 ‐ 5 25 ‐ 25
Soil and Water Testing
3 106 ‐ 106 22 ‐ 22 128 ‐ 128
IV Livestock Production and Management
Poultry Management
1 ‐ 13 13 ‐ 7 7 ‐ 20 20

88
V Home Science/Women empowerment
Household food security by kitchen gardening and nutrition gardening
1 ‐ 13 13 ‐ 4 4 ‐ 17 17
Value addition 1 ‐ 26 26 ‐ 12 12 ‐ 38 38 Location specific drudgery reduction technologies
1 ‐ 34 34 ‐ 5 5 ‐ 39 39
VII Plant Protection Integrated Pest Management
2 55 ‐ 55 16 ‐ 16 71 ‐ 71
Bio‐control of pests and diseases
5 112 ‐ 112 29 ‐ 29 141 ‐ 141
TOTAL 34 807 94 901 263 36 299 1070 130 1200
(B) RURAL YOUTH Biopesticides production
1 23 ‐ 23 2 ‐ 2 25 ‐ 25
Production of organic inputs
1 21 ‐ 21 4 ‐ 4 25 ‐ 25
Microirrigation 1 18 ‐ 18 8 ‐ 8 26 ‐ 26 Dairying 1 15 ‐ 15 6 ‐ 6 21 ‐ 21 Sheep and goat rearing
1 25 ‐ 25 3 ‐ 3 28 ‐ 28
Hand made paperbag making
1 8 17 25 6 8 14 14 25 39
TOTAL 6 110 17 127 29 8 37 139 25 164
(C) Extension Personnel
Soil and Water testing
2 45 ‐ 45 ‐ ‐ ‐ 45 ‐ 45
Livestock feed and fodder production
1 7 1 8 ‐ ‐ ‐ 7 1 8
Women and Child care
1 ‐ 19 19 ‐ 6 6 ‐ 25 25
Production and use of organic inputs
2 95 20 115 ‐ ‐ ‐ 95 20 115
TOTAL 6 147 40 187 6 6 147 46 193
Grand Total 46 1064 151 1215 292 50 342 1356 201 1557

89
B) OFF Campus
Thematic area No. of courses
Participants
Others SC/ST Grand Total
Male Female Total Male Female Total Male Female Total
(A) Farmers & Farm Women
I Crop Production Weed Management
1 16 ‐ 16 9 ‐ 9 25 ‐ 25
Resource Conservation Technologies
1 35 6 41 8 ‐ 8 43 6 49
Integrated Crop Management
5 77 50 127 68 ‐ 68 145 50 195
II Horticulture
a) Vegetable Crops INM in chillies 1 17 ‐ 17 8 ‐ 8 25 ‐ 25 b) Fruits Training and Pruning
3 79 ‐ 79 21 ‐ 21 100 ‐ 100
Cultivation of Fruits
2 30 ‐ 30 8 ‐ 8 38 ‐ 38
Micronutrient management
1 16 ‐ 16 2 ‐ 2 18 ‐ 18
Flowers Micronutrient management
1 15 ‐ 15 4 ‐ 4 19 ‐ 19
III Soil Health and Fertility Management
Soil and Water Testing
5 195 ‐ 195 24 ‐ 24 219 ‐ 219
IV Livestock Production and Management
Dairy Management
2 35 ‐ 35 12 ‐ 12 47 ‐ 47
Poultry Management 3 11 19 30 ‐ 53 53 11 72 83 Disease Management
1 17 ‐ 17 3 ‐ 3 20 ‐ 20
Feed management 2 28 ‐ 28 7 ‐ 7 35 ‐ 35

90
V Home Science/Women empowerment
Design and development of low/minimum cost diet
1 ‐ 15 15 ‐ 11 11 ‐ 26 26
Value addition 4 ‐ 72 72 ‐ 48 48 ‐ 120 120 Income generation activities for empowerment of rural Women
Women and child care
1 ‐ 21 21 ‐ 8 8 ‐ 29 29
VII Plant Protection
Integrated Pest Management
2 30 ‐ 30 14 ‐ 14 44 ‐ 44
Bio‐control of pests and diseases
2 37 ‐ 37 21 ‐ 21 58 ‐ 58
TOTAL 36 610 183 793 202 120 322 812 303 1115
(B) RURAL YOUTH Tailoring and Stitching
2 ‐ 33 33 ‐ 22 22 ‐ 55 55
Fabric paining 1 ‐ 18 18 ‐ 7 7 ‐ 25 25
TOTAL 3 51 51 ‐ 29 29 80 80
(C) Extension Personnel
Productivity enhancement in field crops
2 56 8 64 25 ‐ 25 81 8 89
Integrated Pest Management
1 38 13 51 10 4 14 48 17 65
TOTAL 3 94 21 115 35 4 39 129 25 154
Grand Total 42 704 255 959 237 153 390 941 408 1349

91
C) Consolidated table (ON and OFF Campus)
Thematic area No. of courses
Participants
Others SC/ST Grand Total
Male Female Total Male Female Total Male Female Total
(A) Farmers & Farm Women
I Crop Production Weed Management
2 34 ‐ 34 16 ‐ 16 50 ‐ 50
Resource Conservation Technologies
1 35 6 41 8 ‐ 8 49 ‐ 49
Cropping Systems 1 14 ‐ 14 6 5 11 20 5 25Seed production 1 30 ‐ 30 8 ‐ 8 38 ‐ 38 Integrated Crop Management
16 321 50 371 192 ‐ 192 513 50 563
II Horticulture
a) Vegetable Crops Nursery raising 1 6 ‐ 6 6 ‐ 6 12 ‐ 12INM in chillies 1 18 ‐ 18 3 ‐ 3 21 ‐ 21 b) Fruits Training and Pruning
1 25 ‐ 25 ‐ ‐ ‐ 25 ‐ 25
Rejuvenation of old orchards
1 18 ‐ 18 1 ‐ 1 19 ‐ 19
Flowers Nutrient management in jasmine
1 13 2 15 1 ‐ 1 16 ‐ 16
Production technology of hybrid mary gold
1 4 ‐ 4 11 ‐ 11 15 ‐ 15
III Soil Health and Fertility Management
Integrated Nutrient Management
1 20 ‐ 20 5 ‐ 5 25 ‐ 25
Management of Problematic soils
1 20 ‐ 20 4 ‐ 4 24 ‐ 24
Nutrient Use Efficiency
1 20 ‐ 20 5 ‐ 5 25 ‐ 25
Soil and Water Testing
8 301 ‐ 301 46 ‐ 46 347 ‐ 347

92
IV Livestock Production and Management
Dairy Management 2 35 ‐ 35 12 ‐ 12 47 ‐ 47 Poultry Management
4 29 32 61 8 60 68 37 92 129
Disease Management
1 17 ‐ 17 3 ‐ 3 20 ‐ 20
Feed management 2 28 ‐ 28 7 ‐ 7 35 ‐ 35V Home Science/Women empowerment
Household food security by kitchen gardening and nutrition gardening
1 ‐ 15 15 ‐ 11 11 ‐ 26 26
Design and development of low/minimum cost diet
1 ‐ 13 13 ‐ 4 4 ‐ 17 17
Value addition 5 ‐ 98 98 ‐ 60 60 ‐ 158 158Location specific drudgery reduction technologies
2 ‐ 34 34 ‐ 5 5 ‐ 39 39
Women and child care
1 ‐ 21 21 ‐ 8 8 ‐ 29 29
VII Plant Protection
Integrated Pest Management
4 85 ‐ 85 30 ‐ 30 115 ‐ 115
Bio‐control of pests and diseases
9 149 ‐ 149 50 ‐ 50 199 ‐ 199
TOTAL 70 1435 277 1712 473 156 629 1908 433 2341
(B) RURAL YOUTH Bio‐pesticides production
1 23 ‐ 23 2 ‐ 2 25 ‐ 25
Production of organic inputs
1 21 ‐ 21 4 ‐ 4 25 ‐ 25
Dairying 1 15 ‐ 15 6 ‐ 6 21 ‐ 21 Sheep and goat rearing
1 25 ‐ 25 3 ‐ 3 28 ‐ 28
Tailoring and Stitching
2 ‐ 33 33 ‐ 22 22 ‐ 55 55
Rural Crafts‐ Handmade paperbag making
2 8 17 25 6 8 14 14 25 39
Fabric painting 1 ‐ 18 18 ‐ 7 7 ‐ 25 25
TOTAL 9 92 68 160 21 37 58 113 105 218

93
(C) Extension Personnel
Productivity enhancement in field crops
2 56 8 64 25 ‐ 25 81 8 89
Integrated Pest Management
1 38 13 51 10 4 14 48 17 65
Soil and Water testing
2 45 ‐ 45 ‐ ‐ ‐ 45 ‐ 45
Livestock feed and fodder production
1 7 1 8 ‐ ‐ ‐ 7 1 8
Women and Child care
1 ‐ 19 19 ‐ 6 6 ‐ 25 25
Production and use of organic inputs
2 95 20 115 ‐ ‐ ‐ 95 20 115
TOTAL 9 241 61 302 35 10 45 276 71 347
Grand total 88 1768 406 2174 529 203 732 2297 609 2906
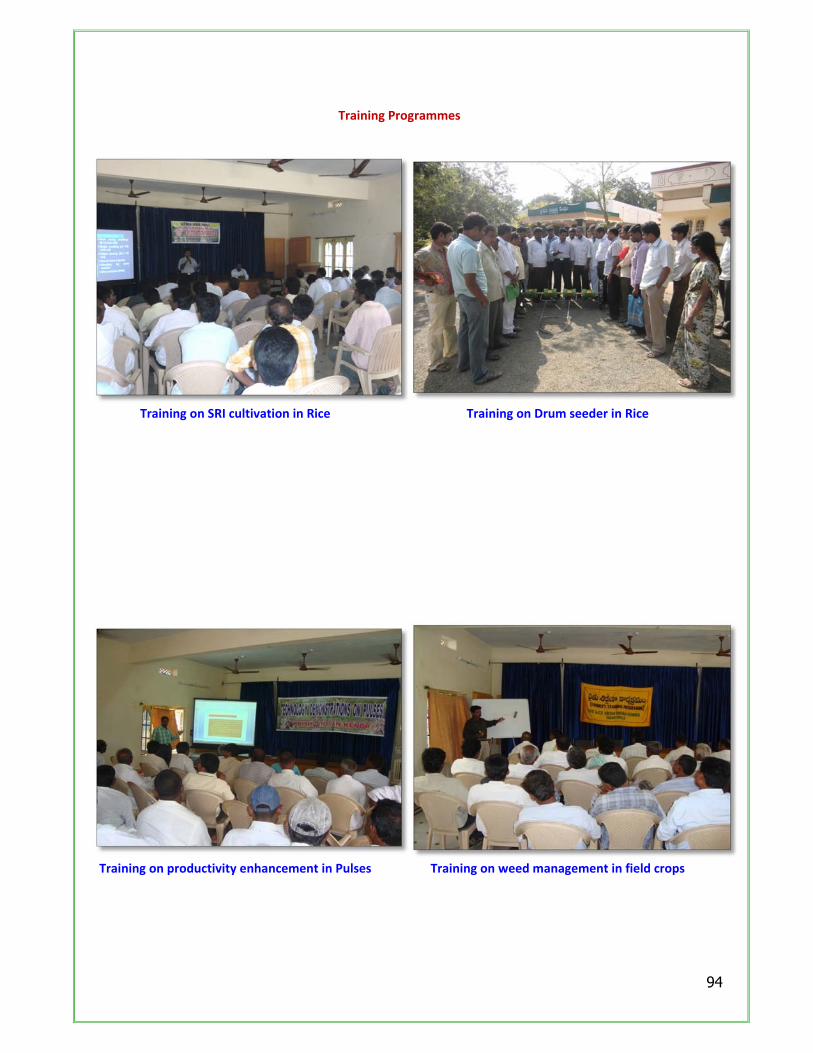
94
Training Programmes
Training on SRI cultivation in Rice Training on Drum seeder in Rice
Training on productivity enhancement in Pulses Training on weed management in field crops

95
Training Programmes
Training on Vermicomposting Training on Soil testing to high school students
Training on NADEP Composting to AOs & ADAs Training on STCR based fertilizer use in Rice

96
Training Programmes
Training on IPM in Onion Training on Biopriming in Bengalgram
Training on IPM in B.t. cotton Training on Seed treatment

97
Training Programmes
Training on pruning techniques in Mango Training on vegetable cultivation
Training on cultivation of medicinal plants Training on alternate vegetable crops in Rabi

98
Training Programmes
Training on care and management of milch
animals Training on silage and haylage making
Training on Fodder production Training on backyard poultry management

99
Training Programmes
Training to mothers on Adolescent and child
nutrition Training farm women on preparation of value
added products with millets
Training farm women on drudgery reducing
implements Training programme on hand made paper bag
preparation

100
Annexures
A. KVK funded: Agronomy
Date Clientele Title of the training programme
Discipline Thematic area Durationin days
Venue (Off / On
Campus)
Number of other
participants
Number of SC/ST
Total number of participants
M F T M F T M F T
10.6.11 PFM Crops and cropping system for dry land black soils/red soils
Agronomy Crop & cropping system
1 On 14 ‐
14 6 5‐
11 20 5 25
28.7.11
PFM Production technologies in rice with special reference to direct seeding with drum seeder
‐do‐ ICM 1 On 28 ‐ 28 15 ‐ 15 43 ‐ 43
30.8.2011 PFM Low cost production technologies in rainfed oil seeds.
‐do‐ ICM 1 OFF 27 ‐ 27 8 ‐ 8 35 ‐ 35
7.9.2011 PFM Integrated weed management in practices in rainfed crops
‐do‐ Weed management
1 On 18 ‐ 18 7 ‐ 7 25 ‐ 25
24‐9‐2011
PFM Critical technologies for enhancing yield in rabi pulses
‐do‐ Integrated crop management
1 On 18 ‐ 18 3 ‐ 3 21 ‐ 21
4.12‐2011 PFM Production technologies in Redgram and Bengalgram
‐do‐ Weed management
1 Off 16 ‐ 16 9 ‐ 9 25 ‐ 25
8.12.11 PFM Seed production technology and importance of seed village concepts
‐do‐ Seed production
1 On 30 ‐ 30 8 ‐ 8 38 ‐ 38
17‐12‐2011
PFM Rice based cropping systems with reference to Zero tillage concept.
do Resource conservation
1 Off 35 6 41 8 ‐ 8 49 ‐ 49

101
Sub Total 8 186 6 192 64 5 69 250 11 261

102
Plant Protection
S.
No
Date Client
(PF/RY/EF)
Title Discipline Thematic
area
Duration
(days)
Venue
(Off/On
campus)
No. of Participants Sponsoring
Agency Others SC/ST Total
M F T M F T M F T
1 06.07.11 PF Non chemical
pest
management
methods for
chillis and
paddy
‐do‐ Bio
control
1 Off 25 ‐ 25 13 ‐ 13 38 ‐ 38 KVK
2 26.07.11 PF Non Chemical
pest
management
strategies for
rice and
redgram
‐do‐ Biocontrol 1 On 26 ‐ 26 7 ‐ 7 33 ‐ 33 KVK
3 27.09.11 PF IPM in Onion ‐do‐ IPM 1 On 17 ‐ 17 4 ‐ 4 21 ‐ 21 KVK
4 28.09.11 PF BIPM in Rice ‐do‐ Biocontrol 1 On 18 ‐ 18 3 ‐ 3 21 ‐ 21 KVK
5 15.10.11 PF BIPM in rice
and redgram
‐do‐ Biocontrol 1 On 15 ‐ 15 4 ‐ 4 19 ‐ 19 KVK
6 17.10.11 PF Use of
biopesticides
in bengalgram
‐do‐ Biocontrol 1 Off 12 ‐ 12 8 ‐ 8 20 ‐ 20 KVK
7 02.11.11 PF Diagnosis and
management
of pests and
diseases in
Chillis
‐do‐ IPM 1 Off 11 ‐ 11 6 ‐ 6 17 ‐ 17 KVK

103
8 07.01.12 PF Non chemical
pest
management
strategies for
rice and
redgram
‐do‐ Biocontrol 1 On 22 ‐ 22 6 ‐ 6 28 ‐ 28 KVK
TOTAL 8 146 ‐ 146 51 ‐ 51 197 ‐ 197
9 18.6.11 RY Use of neem
and other
botanical
extracts for
crop
protection.
Plant
Protection
Biocontrol 1 On 23 ‐ 23 2 ‐ 2 25 ‐ 25 KVK
Sub Total 9 169 ‐ 169 53 ‐ 53 222 ‐ 222

104
Soil Science
S. No
Date Client (PF/RY/EF)
Title Discipline Thematic area
Duration (days)
Venue (Off/On campus)
No. of Participants Sponsoring Agency Others SC/ST Total
M F T M F T M F T
1 22.4.2011 PFM Soil Sampling procedure and Soil test based nutrient management
Soil
Science
Soil testing 1 On 24 ‐ 24 5 ‐ 5 29 29 KVK
2 09‐05‐11 PFM Reclamation of problematic soils
‐do‐ Reclamation 2 On 20 ‐ 20 4 ‐ 4 24 24 KVK
3 20‐06‐11 PFM Methods to improve fertilizers use efficiency
‐do‐ Nutrient
use
efficiency
1 On 20 ‐ 20 5 ‐ 5 25 25 KVK
4 09‐08‐11 PFM Integrated nutrient management
‐do‐ INM 1 On 20 ‐ 20 5 ‐ 5 25 25 KVK
7 18‐11‐11 PFM Soil Test based fertilizers usage in major crops
‐do‐ Soil testing 1 On 21 ‐ 21 6 6 27 27 KVK
Sub total 105 ‐ 105 25 ‐ 25 130 ‐ 130
9 14‐10‐11 RY Preparation of organic inputs
‐do‐ Organic
inputs
3 On 21 ‐ 21 4 ‐ 4 25 ‐ 25 KVK
Sub total 21 ‐ 21 4 ‐ 4 25 ‐ 25
10 03‐09‐11 EF Soil sampling, testing, Interpretation of results.
‐do‐ Soil testing 1 On 25 ‐ 25 ‐ ‐ ‐ 25 25 KVK
11 14‐10‐11 EF Soil sampling, testing and interpretation
‐do‐ Soil testing 1 20 ‐ 20 ‐ ‐ ‐ 20 ‐ 20 KVK
Sub total 45 0 45 ‐ ‐ ‐ 45 0 45
Grand total 171 0 171 29 29 200 0 200

105
Horticulture
S. No.
Date Client (PF/RY/EF)
Title Discipline Thematic area Duration (days)
Venue (Off/On campus)
No. of Participants Sponsoring Agency Others SC/ST Total
M F T M F T M F T
1 8.07.11 PFM Cultivation of medicinal plants
Horti
culture
Medicinal &
Aromatic
plants
1 On 19 ‐ 19 3 ‐ 3 22 22 KVK
2 15.7.11 PFM Micronutrient management in Jasmine
‐do‐ Micronutrient
management
in flowers
1 Off 15 ‐ 15 4 ‐ 4 19 19 KVK
3 11.8.11 PFM Mango Cultivation
‐do‐ Training &
Pruning
1 Off 15 ‐ 15 5 ‐ 5 20 ‐ 20 KVK
4 18.9.11 PFM Chilli Cultivation ‐do‐ INM 1 Off 17 ‐ 17 8 ‐ 8 25 ‐ 25 KVK
5 12.10.11 PFM Cultivation of Tissue culture Banana
‐do‐ Cultivation of
fruit crops
1 Off 14 ‐ 14 6 6 20 ‐ 20 KVK
6 8.11.11 PFM Nursery raising in pro trays
‐do‐ Nursery
management
1 On 19 ‐ 19 8 ‐ 8 27 ‐ 27 KVK
7 15.12.11 PFM Cultivation of cool season vegetables
‐do‐ Production of low volume and high value crops
1 On 22 ‐ 22 5 ‐ 5 27 ‐ 27 KVK
8 20.1.12 PFM Cultivation of sweet orange
‐do‐ Cultivation of
fruit crops
1 Off 16 ‐ 16 2 ‐ 2 18 ‐ 18 KVK
9 12.2.12 PFM Micronutrient management in Papaya
‐do‐ Micronutrient
management
in fruit crops
1 Off 16 ‐ 16 2 ‐ 2 18 ‐ 18 KVK
Sub total 153 ‐ 153 43 ‐ 43 196 ‐ 196
10 7.3.12 RY Drip irrigation in vegetable crops
‐do‐ Micro
irrigation
1 On 18 ‐ 18 8 ‐ 8 26 ‐ 26 KVK
Sub total 18 ‐ 18 8 ‐ 8 26 ‐ 26

106
Grand total 171 ‐ 171 51 ‐ 51 222 ‐ 222
Animal Husbandry
Date Clientele Title of the training programme
Discipline Thematic area Durationin days
Venue (Off / On
Campus)
No. of other participants
Number of SC/ST
Total number of participants
M F T M F T M F T
25.05.11 PFM Preventive measures against contagious diseases in Livestock
Animal Husbandry
Diseases management
1 Off 12 ‐ 12 8 ‐ 8 20 ‐ 20
21.06.11 PFM Technologies to improve reproductive efficiency in cattle and buffaloes
‐do‐ Diary management
1 Off 15 ‐ 15 7 ‐ 7 22 ‐ 22
30.07.11 PFM Cultivation of different fodder varieties
‐do‐ Feed management
1 Off 12 ‐ 12 3 ‐ 3 15 ‐ 15
08.09.11 PFM Backyard poultry management
‐do‐ Feed management
1 On 19 ‐ 19 6 ‐ 6 25 ‐ 25
06.11.11 PFM Rearing of improved poultry breeds at backyard
‐do‐ Poultry management
1 Off 12 ‐ 12 5 ‐ 5 17 ‐ 17
19.12.11 PFM Scientific methods of calf rearing
‐do‐ Dairy management
1 Off 15 ‐ 15 5 ‐ 5 20 ‐ 20
13.02.12 PFM Utilization of agricultural by products as feed for livestock
‐do‐ Feed management
1 Off 17 ‐ 17 3 ‐ 3 20 ‐ 20
30.03.12 PFF Management of Backyard poultry
‐do‐ Poultry management
3 Off ‐ ‐ ‐ ‐ 44 44 ‐ 44 44
24‐28 August’11
RY Preparation of balanced ration with locally available ingredients
‐do‐ Feed managment
3 On 17 ‐ 17 4 ‐ 4 21 ‐ 21
19‐21.10.11 RY Ram lamb production ‐do‐ Sheep management
On 23 ‐ 23 5 ‐ 5 28 ‐ 28
30.09.11 EF Feeding management of dairy animal for better
‐do‐ Feed management
1 On 7 1 8 ‐ ‐ ‐ 7 1 8

107
production
Sub Total 13 149 1 150 46 44 90 195 45 240
Home Science
Date Clientele Title of the training
programme
Discipline
Thematic area Duration
in days
Venue
(Off / On
Campus)
Number of
other
participants
Number of
SC/ST
Total number
of
participants
M F T M F T M F T
24.6.11 PFF Awareness among
pregnant and lactating
women on nutritional
deficiency disorders
Home
Science
Household food
security and kitchen
gardening, women
and child care.
1 Off ‐ 21 21 ‐ 8 8 ‐ 29 29
28.6.11 PFF Awareness among
dolescent girs and
children on nutritional
deficiency disorders
‐do‐ Design and
development of low
cost minimum diet
House hold food
security
1 Off ‐ 15 15 ‐ 11 11 ‐ 26 26
20.9.11 PFF Prepareation of value
added products with
millets
‐do‐ Value addition 1 Off ‐ 24 24 ‐ 12 12 ‐ 36 36
18.10.11 PFF Drudgery reducing
implements for farm
women
‐do‐ Location specific
drudgery reduction
technologies
1 On ‐ 34 34 ‐ 5 5 ‐ 39 39
20.10.11 PFF Value added with
millets
‐do‐ Value Addition 1 On ‐ 26 26 ‐ 12 12 ‐ 38 38
28.11.12 PFF Back yard poultry
management with
improved poultry
breeds
‐do‐ Back yard Poultry 1 Off ‐ 13 13 ‐ 9 9 ‐ 22 22
15.3.12 PFF Preservation of fruits ‐do‐ I.G.Activites for 1 Off ‐ 17 17 ‐ 13 13 ‐ 30 30

108
i.e, Jams and squashes
preparation for SHGs
empowerment of rural
women

109
20.3.12 PFF Preservation of Vegetables i.e, Pickle making as
entrepreneuring activity for SHGs
‐
do‐
I.G. Activities for
empowerment of rural
women
1 Off ‐ 14 14 ‐ 11 11 ‐ 25 25
22.3.212 PFF Preparation of Sundried products for SHGs as
I.G.Acitivity
‐
do‐
I.G.Activites for
empowerment of rural
women
1 Off ‐ 17 17 ‐ 12 12 ‐ 29 29
25.8.11
to
27.8.11
EFF Capsule training programme on pre school creative
activities, value added products with Jowar and
preparation of low cost pre school educational
materials for AWWs & Supervisors
‐
do‐
Women and child care
Low cost and nutrient
efficient diet designing
3 On ‐ 19 19 ‐ 6 6 ‐ 25 25
TOTAL 200 200 99 99 299 299

110
D) Vocational training programmes for Rural Youth
Discipline :Home Science
Crop / Enterprise
Date Training title* Identified Thrust Area
Duration (days)
No. of Participants Self employed after training Number of persons employed else where
Male Female Total Type of units
Number of units
Number of persons employed
Women Empowerment
29.6.11 To 28.9.11
Longduration vocational skill training programme on Tailoring
I.G Activity 90 ‐ 25 25 Individual 19 19 ‐
25.7.11 To 29.7.11
Hand made paper bag making
I.G Activity 5 14 25 39 Individual 5 5 2
26.9.11 To 5.11.11
Skill training programme on Fabric Painting
I.G Activity 45 ‐ 25 25 Individual 9 9 3
3.2.12 To 4.5.12
Long duration Vocational skill training programme on Tailoring
I.G Activity 90 ‐ 30 30 ‐ ‐ ‐ ‐
Total 14 105 119 33 33 5

111
E. Sponsored Training Programmes Agronomy
S. No
Date Title
Discipline Thematic
area Duration (days)
Client (PF/RY/EF)
No.of courses
No. of Participants Sponsoring Agency
Amount of fund received (Rs.)
Others SC/ST Total
M F T M F T M F T 1 2 3 4 5 6 7 8 9
3.12.11 28-1.12 28-2-
12 3.3.12 12.3.
12 14.3.12 17.3.12 27.3.12 28.3-
12
SRI:” cultivation in rice
Agronomy ICM 1 PFM 9 175 50 225 135 ‐ 135 310 50 360 ATMA 72000‐
10 10‐5‐
11
Improved production technologies in Rice , Groundnut, Sunflower, Maize and Redgram.
‐do‐ 2 EF 2 56 8 64 25 ‐ 25 56 8 89 Dept Agrl. ‐‐
11 31‐05‐
11
Improved production technologies in Groundnut, and Redgram.
1 PFM 1 38 ‐ 38 12 ‐ 12 50 ‐ 50 CLRC

112
12 27‐12‐
11
Do‐ 1 PFM 1 35 ‐ 35 15 ‐ 15 50 ‐ 50 CLRC
Sub Total 13 304 58 362 187 ‐ 187 491 58 549

113
Plant Protection
S. No
Date Title Discipline Thematic area
Duration (days)
Client (PF/RY/EF)
No.of courses
No. of Participants Sponsoring Agency
Amount of fund received (Rs.)
Others SC/ST Total
M F T M F T M F T
1 09.05.11 IPM in rice,
redgram,
maize and
sunflower
and use of
biopesticides
in plant
protection.
Plant Protection
IPM 1 EF 1 38 13 51 10 4 14 48 17 65 Dept, of
Agri.
‐
2 31.05.11 Low cost
plant
protection
technologies
in Rice,
Redgram,
Castor and
G.nut
Plant protection
IPM 1 PF 1 38 ‐ 38 12 ‐ 12 50 ‐ 50 CLRC, Ymgr. ‐
3 30.8.11 IPM in rice,
B.t.cotton,
maize and
Jowar
Plant protection
IPM 1 PF 1 19 ‐ 19 8 ‐ 8 27 ‐ 27 NGO ‐
4 11.01.12 BIPM in Rice Plant protection
Biocontrol 1 PF 1 31 ‐ 31 9 ‐ 9 40 ‐ 40 ATMA 5000/‐
Total 4 4 126 13 139 39 4 43 165 17 182

114
Discipline : Soil Science
S. No
Date Title Discipline
Thematic area
Duration
(days)
Client (PF/RY/EF)
No.of courses
No. of Participants Sponsoring
Agency
Amount of fund
received (Rs.)
Others SC/ST Total
M F T M F T M F T
1 22‐12‐11 & 28.12.11
Soil Test based fertilizers usage in major crops
Soil Science
Soil
testing
1 PFM on 61 0 61 11 11 72 72 CLRC
2 9.12.11 Preparation of organic inputs viz. Vermicompost and NADEP compost
Soil Science
Organic
inputs
1 EF On 45 10 55 ‐ 45 10 55 Dept.
of Agri.
3 21,23,26,28, &30th of Sept.
Nutrient management in rice based on STCR equation (Sponsored by NABARD)
Soil Science
Soil
testing
1 PFM off 195 ‐ 195 24 ‐ 24 195 24 219 NABAR
D
25,000
4 10‐2‐12 Preparation of organic inputs viz. Vermicompost andNADEP compost.
Soil Science
Organic
inputs
1 EF On 50 10 60 50 10 60 Dept.
of Agri.
TOTAL 351 20 371 35 35 362 44 406

115
Discipline : Horticulture
S. No
Date Title Discipline Thematic area
Duration
(days)
Client(PF/RY/EF)
No.ofcourses
No. of Participants Sponsoring
Agency
Amount of fund
received (Rs.)
Others SC/ST Total
M F T M F T M F T
1 12.8.11 16.8.11
Canopy management in Mango
Horticulture
Training & Pruning
1 PFM 2 64 ‐ 64 16 ‐ 16 80 ‐ 80 Dept.
of Hort
‐
2 9.11.11 Awareness program on micro irrigation
‐do‐ Microirrigation
1 PFM 1 63 8 71 12 3 15 75 11 86 APMIP ‐
3 13.1.12 Cultivation of Aswagandha as alternate to traditional rainfed crops
‐do‐ Medicinal & Aromatic plants
1 PFM 1 45 ‐ 45 9 ‐ 9 54 ‐ 54 APMAB ‐
Total 172 8 180 37 3 40 209 11 220

116
Discipline : Home Science
S. No
Date Title Discipline Thematic area
Client(PF/ RY/ EF)
No. of
Courses
No. of Participants Sponsoring Agency
Amount of
fund received (Rs)
Other SC/ST Total
M F T M F T M F T
1 8.12.11 Value addition to minor millets and entrepreneurial opportunities
Home Science
House hold food security Value addition
PFF 1 ‐ 13 13 ‐ 4 4 ‐ 17 17 FTC,Nandyal 3,000/‐
2 3.2.12 To 4.5.12
Long duration Vocational skill training programme on Tailoring under Kishora Shakthi Yojana
Home Science
I.G.ACtivity RYF 1 ‐ 17 17 ‐ 13 13 ‐ 30 30 ICDS,B’Palle 63,000/‐
Total 2 30 30 17 17 47 47

117
3.4. Extension Activities (including activities of FLD programmes)
S. No. Nature of Extension Activity
Purpose/ topic and Date
No. of activities
Participants
Farmers (Others)(I)
SC/ST (Farmers) (II)
Extension Officials(III)
Grand Total(I+II+III)
M F Total M F Total M F Total M F Total
1 Field Day 6.4.2010 Zero tillage Maize
1 22 ‐ 22 8 ‐ 8 ‐ ‐ ‐ 30 30
2 Field Day 18.12.10 STCR in Rice
1 78 ‐ 78 19 ‐ 19 ‐ ‐ ‐ 97 ‐ 97
3 Field day
4 Kisan Mela 1 78 ‐ 78 22 ‐ 22 ‐ ‐ ‐ 100 ‐ 100
5 Kisan Mela
6 Kisan Ghosthi Soil testing
5 498 498 98 98 6 5 11 602 5 607
7 Exhibition 4
8 Film Show 6
9 Method Demonstrations
7
10 Farmers Seminar
11 Workshop 1
12 Group meetings 5 81 ‐ 81 32 ‐ 32 ‐ ‐ ‐ 81 ‐ 81
13 Lectures delivered as resource persons
14 Newspaper coverage 8
15 Radio talks 7
16 TV talks 2
17 Popular articles 4
18 Extension Literature 6
19 Advisory Services
20 Scientific visit to farmers field
782
558 ‐ 558 224 ‐ 224 ‐ ‐ ‐ 782 ‐ 782
21 Farmers visit to KVK 2129 1556 ‐ 1556 573 ‐ 573 ‐ ‐ ‐ ‐ ‐ 2129

118
S. No.
Nature of Extension Activity
Purpose/ topic and Date
No. of activities
Participants
Farmers (Others)(I)
SC/ST (Farmers)(II)
Extension Officials(III)
Grand Total(I+II+III)
Male Female Total Male Female Total Male Female Total Male Female Total
22 Diagnostic visits
23 Exposure visits 3 85 ‐ 85 17 ‐ 17 ‐ ‐ ‐ 102 ‐ 102
24 Ex‐trainees Sammelan
25 Soil health Camp 5 275 ‐ 275 33 ‐ 33 6 ‐ 6 314 ‐ 314
26 Animal Health Camp
4
27 Agri mobile SMS 66 ‐ ‐ ‐ ‐ ‐ ‐ ‐ ‐ ‐ ‐ ‐ 18972
28 Soil test campaigns April‐10 May‐10
17 852 123 975 975
29 Farm Science Club Conveners meet
30 Self Help Group Conveners meetings
31 Mahila Mandals Conveners meetings
32 Celebration of important days (specify) 1.World Food Day
Food Prices from Crisis to Stability
1
‐
58
58
‐
30
30
‐
10
10
‐
98
98
2.International Womens Day
Empower women to avoid Poverty and hunger
1 ‐ 63 63 ‐ 37 37 ‐ 12 12 ‐ 112 112
3.National Nutrition Week
Importance of balanced diets and awareness on micro nutrient deficiencies
1 ‐ 15 15 ‐ 17 17 ‐ 36 36 ‐ 68 68
33 Homestead nutritional gardens
To raise green leafy and other vegetables in the backyards of farm families
146

119
Field day in Castor hybrid PCH‐111 Field day in Redgram
Field day in Paddy Farmers visit to vermicompost unit
Method demonstration on seed treatment Method demonstration on stem application in cotton
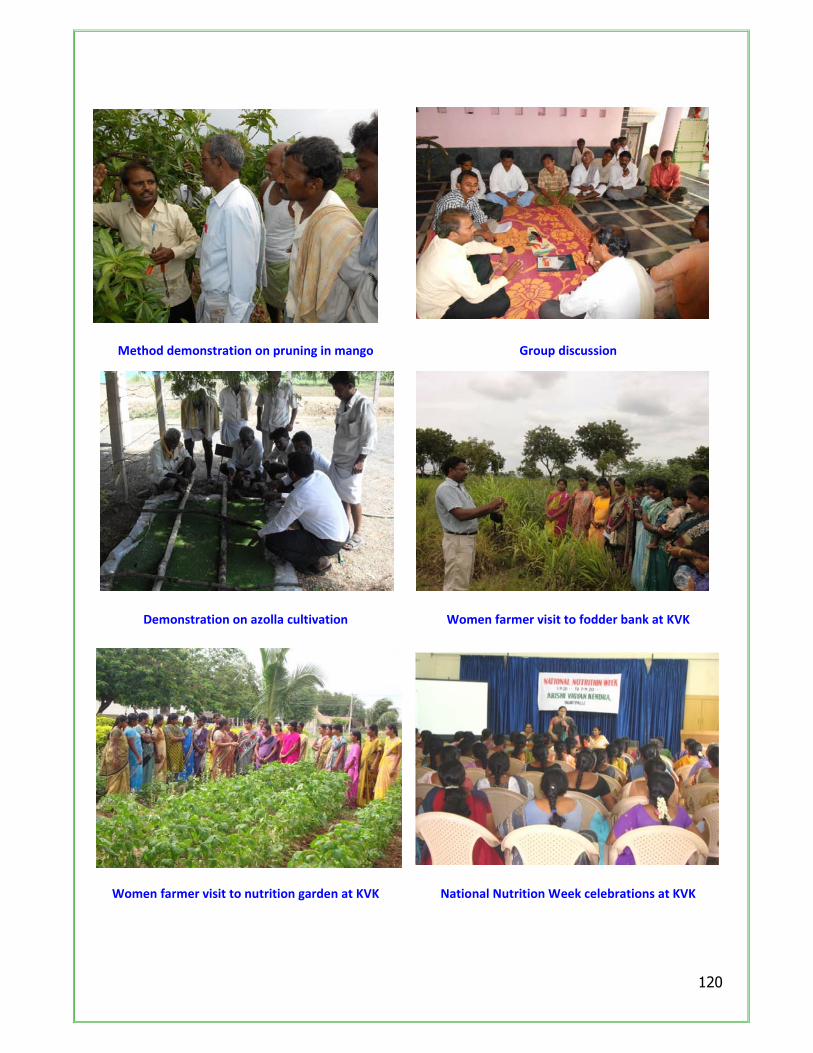
120
Method demonstration on pruning in mango Group discussion
Demonstration on azolla cultivation Women farmer visit to fodder bank at KVK
Women farmer visit to nutrition garden at KVK National Nutrition Week celebrations at KVK

121
3.5 Production and supply of Technological products
SEED MATERIALS
Major group/ class
Crop Variety Quantity (Qtl.) Value (Rs) Provided to No of Farmers
Cereals Paddy JGL‐3844 40.00 78,000‐00 65
NDLR‐7 65.00 1,30,000‐00 150
BPT‐5204 450.00 6,50,000‐00 800
Oilseeds Castor PCH 111 9.00 2,25,000‐00 200
Pulses Redgram LRG 41 5.00 25,000‐00 75
Summary
S.No. Major group/ class Quantity (qtl.) Value (Rs) Provided to No of Farmers
1 Cereals 555.00 8,58,000‐00 10152 Oilseeds 9.00 2,25,000‐00 2003 Pulses 5.00 25,000‐00 75 TOTAL 569.00 11,08,000‐00 1290
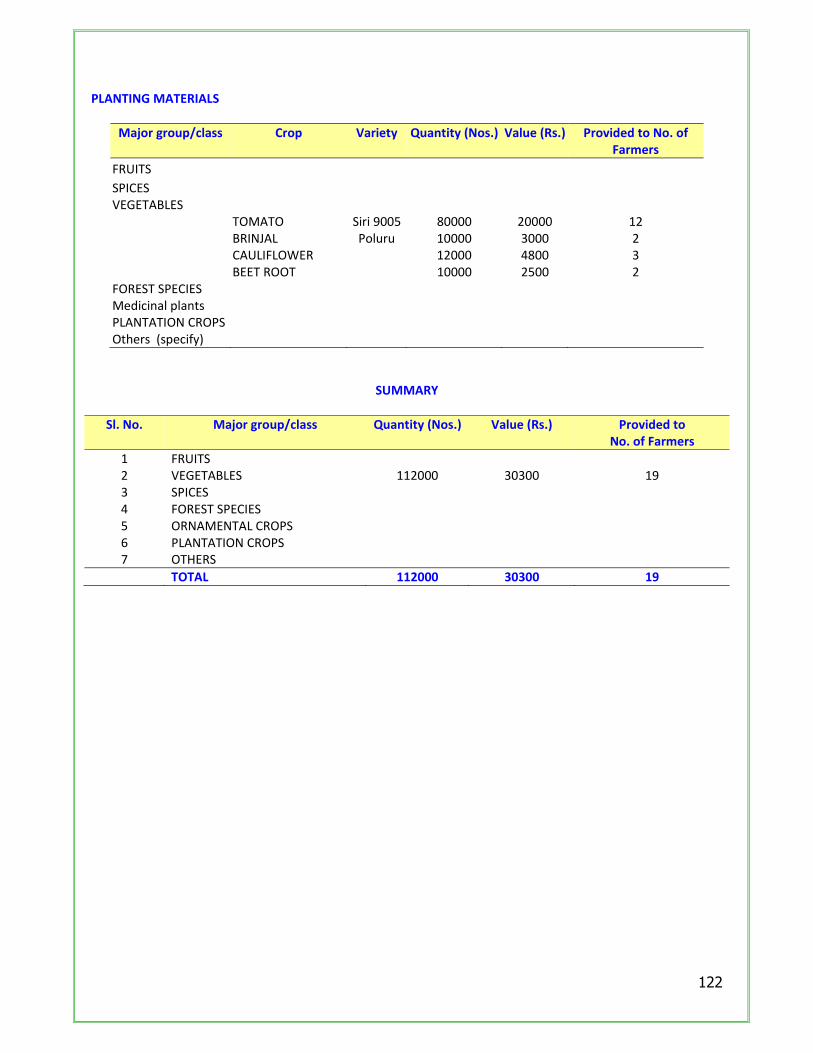
122
PLANTING MATERIALS
Major group/class Crop Variety Quantity (Nos.) Value (Rs.) Provided to No. of Farmers
FRUITS
SPICES VEGETABLES TOMATO Siri 9005 80000 20000 12 BRINJAL Poluru 10000 3000 2 CAULIFLOWER 12000 4800 3 BEET ROOT 10000 2500 2 FOREST SPECIES Medicinal plants PLANTATION CROPS Others (specify)
SUMMARY
Sl. No. Major group/class Quantity (Nos.) Value (Rs.) Provided to No. of Farmers
1 FRUITS 2 VEGETABLES 112000 30300 19 3 SPICES 4 FOREST SPECIES 5 ORNAMENTAL CROPS 6 PLANTATION CROPS 7 OTHERS
TOTAL 112000 30300 19

123
BIO PRODUCTS
Major group/class Product Name Species Quantity Value (Rs.) Provided to No. of Farmers
No (kg)
BIOAGENTS BIOFERTILIZERS Vermicompost Eudrilus eugini ‐ 1,08,000 4,32,000‐00 165 Earth worms Eudrilus eugini
‐ 1,980 91,000‐00 25
Total 1,09,980 5,23,000‐00 190
BIO PESTICIDES
1 Pseudomonas P.fluorescens ‐ 545 78,600‐00 1402 Trichoderma T.viride ‐ 903 90,300‐00 2823 Neem powder ‐ ‐ 3800 57,000‐00 18
Total 5,248 2,25,900‐00 430
SUMMARY
Sl. No.
Product Name Species Quantity
Value (Rs.) Provided to No. of Farmers
Nos (kg)
1 BIOAGENTS
2 BIO FERTILIZERS ‐ ‐ 1,09,980 5,23,000‐00 190
3 BIO PESTICIDE ‐ ‐ 5,248 2,25,900‐00 430
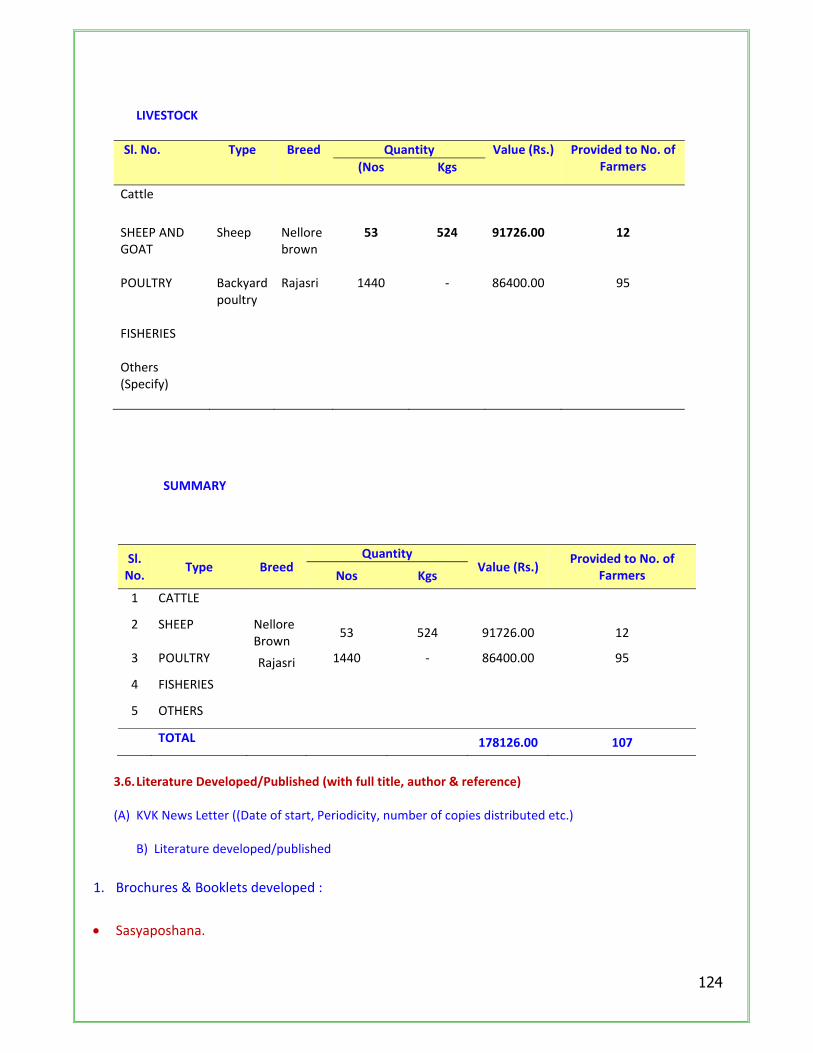
124
LIVESTOCK
Sl. No. Type Breed Quantity Value (Rs.) Provided to No. of Farmers (Nos Kgs
Cattle
SHEEP AND GOAT
Sheep Nellore brown
53 524 91726.00 12
POULTRY Backyard
poultry Rajasri 1440 ‐ 86400.00 95
FISHERIES Others (Specify)
SUMMARY
Sl. No.
Type Breed Quantity
Value (Rs.) Provided to No. of
Farmers Nos Kgs
1 CATTLE
2 SHEEP Nellore Brown
53 524 91726.00 12
3 POULTRY Rajasri 1440 ‐ 86400.00 95
4 FISHERIES
5 OTHERS
TOTAL 178126.00 107
3.6. Literature Developed/Published (with full title, author & reference)
(A) KVK News Letter ((Date of start, Periodicity, number of copies distributed etc.)
B) Literature developed/published
1. Brochures & Booklets developed :
Sasyaposhana.

125
2. Articles and Scientific Publications:
A article entitled "Soil test crop response (STCR) based nutrient application in irrigated rice domains of Kurnool district of Andhra Pradesh" was published in International Journal on Agricultural Sciences Vol. I (1st Issue), pp.55‐61, 2011
An article on “Micro‐nutrient status and their management in KC Canal command areas of Kurnool district of Andhra Pradesh” published in International Journal on Agricultural Sciences Vol. I (3rd Issue), pp.335‐340, 2011.
An article on “Soil quality assessment under different soil management practices” is published in proceedings of 99 th session of the Indian Science Congress, section of Environmental sciences,2012
pp.59. and presented in 99 th session of the Indian Science Congress from 3rd to 7th January,2012
at Bhubaneswar, Odisha.
3.Popular articles
Care and management of Sheep and Poultry during summer
A.Krishna Murthy and G.Dhanalakshmi
Annadata, May’11 Page no.12‐13
Effective utilization of dry fodder A.Krishna Murthy and G.Dhanalakshmi
Annadata, May’11 Page no.22‐23
Green fodders‐Nutritive values A.Krishna Murthy and G.Dhanalakshmi
Annadata, July’11 Page No.46‐48
Management of sheep at different stages A.Krishna Murthy and G.Dhanalakshmi
Annadata, February’12
Page No.30‐33 Drum seeder technology
Zero tillage Nutritive value of green leafy vegetables
Azolla cultivation
Mushroom production Red gram cultivation Mungari cotton cultivation
Amla for Health
Total
Grand TOTAL
(C) Details of Electronic Media Produced
S. No.
Type of media (CD / VCD / DVD / Audio‐Cassette)
Title of the programme Number
Nil

126
3.7. Success stories/Case studies, if any (two or three pages write‐up on each case with suitable action photographs)
5. Soil test based nutrient application in rice for reduced costs of production.
Rice (Oryza sativa L.) is one of the main staple cereal food crops in the world. In 2007 about 650 million
metric tones of unmilled rice was produced globally on about 157 million ha (FAO, 2008). KC canal and TBLLC
command area is the most potential belt for paddy cultivation in Kurnool district of Andhra Pradesh. Paddy is
being cultivated nearly in one lakh hectares in both Kharif and rabi seasons. In order to get highest yields
farmers resorted to excess use of chemical fertilizers which leads to adverse effects on soil and crop with
nutrient toxicity and deficiency either by over use or inadequate use, which in turn increases the production
costs, subsidies on chemical fertilizers and environmental degradation.
Soil test based nutrient application helps to avoid wasteful expenditure on irrational nutrient application
and realize higher benefit: cost ratio as the nutrients applied are in proportion to the magnitude of the
deficiency of a particular nutrient and correction of the nutrient imbalances in soil.
One hundred and thirty frontline demonstrations were organized in farmer’s fields from the year 2007
to 2009 and soil samples (0~0.15m depth) were collected and analyzed at soil testing laboratory, KVK,
Yagantipalle before implementation of demonstrations.
RESULTS:
Soil characteristics:
The soils were neutral to moderate alkali in reaction with pH varying from 7.27 to 8.1 and EC ranged from 0.29
to 0.96 dsm‐1. The organic carbon content varied from 0.32 % to 0.98 %. Texture of the surface soil varied from
sandy clay loam to clay loam. The soils were low to medium in N (ranging from 38 to 238 kg/ha kg/ha), medium
to high in P (ranging from 54 to 469 kg/ha) and medium to high in K (from 152 to 831 kg/ha). Though these soils
are considered to be fertile, they are deficient in nitrogen in all mandals but moderately high with available
phosphorus and potassium in all mandals.
Nutrient Application:
Based on soil test results the farmers of demonstration plots applied lower doses of N‐P‐K (230‐19‐59 Kg./ha,
respectively) as compared to farmer’s practice (317‐190‐62 Kg./ha, respectively ) which is reflected in cost of
production.
Yield and Economics of front line demonstrations:
S.No Item Demonstration (STCR) Farmers practice
1 Mean yield of paddy grain (Kg./ha) 7402 6950
2 Cost of production per hectare (Rs.) 33968 40134
3 Gross returns per hectare (Rs.) 103239 109559
4 Net returns per hectare (Rs.) 75592 63105
5 C:B ratio 1:3.23 1:2.57

127
IMPACT OF STCR:
Additional income: Farmers of demonstration plots realized additional income of Rs.12487 per hectare over
farmer’s practice due to low cost of production and yield increments in demonstrations.
Farmer’s feed back
Farmers were satisfied with crop performances and expressed that Soil test based nutrient management in
rice is a viable technology, because of less cost on chemical fertilizers and without reduction in yield compared
to their own practice. They finally realized that they are incurring higher expenditure on fertilizers in the absence
of soil testing of their fields. Many farmers have come forward to adopt this methodology in their fields.
Extent of Adoption: So far STCR based nutrient management was by adopted 253 farmers of TBLLC and KC canal
command villages covering 500 ha. It was observed that reduction in cost on fertilizers is around Rs.30.0 lakh
with an additional income of Rs.60.0 lakh due to adoption of soil test based nutrient management in rice.
6. VERMI COMPOSTING TECHNOLOGY
The long term and increased usage of chemicals without adequate organic manures has not only
aggravated multi nutrient deficiencies in soil plant system but also deteriorate soil health and created
environmental pollution. Vermitechnology is an eco‐friendly, low cost and effective way to recycle any
agricultural animal residues. The application of vermi compost not only adds plant nutrients and growth
regulators but also improves soil physical properties, microbial population and carbon content of soil. The total
farm yard manure requirement is higher than its availability so vermi technology is an alternative method to
fulfill the requirement and the whole process ensured part time job to the rural people. Vermi technology is
simple low cost, low energy biotechnology of multiplying earthworms and bioconversion of organic waste
materials into vermicastings through earthworm consumption by providing them optimum conditions in every
household, every village and every town.
As KVK is nodal agency for vermiculture/vermicomposting, trainings were imparted to all beneficiaries of
the vermiculture units, Agriculture Extension Officers, Mandal Agriculture Officers and Asst. Directors of
Agriculture of the district on preparation of vermicompost and its application. The details of vermicompost units
established in Kurnool district are furnished in table‐1

128
Table.1 Status of vermi compost units in Kurnool district from 2005‐06 to 2010‐11
S. No.
Year Vermicompost production
(Tonnes) at KVK
Earth worms supplied by KVK (Kgs)
No. of units established at village level
1 2005‐06 29.73 10404 139
2 2006‐07 40.00 13275 177
3 2007‐08 30.56 6311 85
4 2008‐09 34.96 5635 76
5 2009‐10 27.93 5879 78
6 2010‐11 47.80 2720 36
7 2011‐12 108 1980 25
Total 318.98 46204 616
KVK established eight vermicomposting units on the campus since 2003 (Each unit size is 50x24 ft.) and
319 tones of vermicompost was produced and supplied to 698 farmers @ Rs.4‐00/per Kg. for various crops.
Besides this 46.2 tones of earthworms (including filled material) supplied to 616 farmers of the district for
establishing 616 vermicompost units (5‐10 tones/annum/unit capacity) at farmer level covering all mandals of
the district with coordination of Dept. of Agriculture, Dept. of Horticulture, ATMA, NWDPRA and some of the
NGO’s of the district. Some of the vermiculture /vermicomposting beneficiaries were selling the compost and
earth warms to other farmers and getting Rs.20,000/‐ to 25,000/‐ annum and some of them are using
vermicompost for their crops and reducing cost of production @ Rs.1500‐00 to 2,000‐00/ha.
8. LRG‐41 A promising Helicoverpa tolerant variety
Red gram is one of the major legume crops in Kurnool District grown in 33,000 ha under rainfed
conditions during khairif. The crop is also grown during September–October with supplemental irrigations.
Previously farmers used to cultivate LRG‐30 variety which was affected with Helicoverapa armigera at flowering
to pod development stage. Non adoption of control measures lea to severe pod damage and finally very poor
yields were obtained.Some farmers spent an amount of Rs 2500 to 3000/ha on plant protection.
Keeping in view the problem, KVK introduced LRG‐41 Red gram variety, which is tolerant to Helicoverapa
with yield potential of 20‐22 Q/ha. Kvk organized 50 front line demonstrations with LRG‐41 variety in different
village’s i.e Palukur, Nandavaram, Aluru, & Panyam. The results indicated that the yields and tolerance to
Helicoverapa was good and farmers were impressed with performance of LRG‐41. During the crop period field
days were also organized in the villages in order to educate the farmers.

129
Comparative performance of LRG‐41 V/s LRG‐30
Year Mean yield Kg ha
% increased in yield LRG‐41 LRG‐30
2005 1212 880 37.2
2006 1081 780 38.5
2007 1134 933 21.5
The results indicated that on an averageLRG‐41 recorded 32.4% increased yield over LRG‐30. By
cultivating this variety farmer obtained an additional income of Rs.18,000 and also Rs.1200‐1500/ha savings on
Crop Protection. These results encouraged the farmers towards this variety. During subsequent years LRG‐41
variety completely replaced LRG‐30 variety in these villages.
To popularize and cater to the needs of farmers, seed production of LRG‐41 variety was taken up at KVK
farm and seed supplied to the farmers. Area under LRG‐41 through intervention of KVK is 2300 ha.
Direct sown paddy with Drum seeder ‐ A success story:
Transplantation is one of the component involving labour, time and money in cultivation of paddy. Due
to scarcity of labor in peak season sowings are often delayed resulting in yield reduction due to transplanting of
aged seedling and also running short of time for second crop. Changed scenario of resources availability was
noticed by the farming community and it lead KVK for introduction of conservation technologies which can be
feasible viable and adoptable. Thus drum seeder was chosen for on farm testing in kharif 2008. Eight rowdrum
seeder from TNAU was brought and on farm testing was organized in 2 ha with 5 farmers besides on station trail
at kvk farm in 2008‐09 and 2009‐10 and 2010‐11.
As seeing is believing farmers were invited to kvk on the day of sowing to build their confidence. Hands
on experience was gained by them and sowing with drum seeder was done despite of the disagreement with
the fellow farmers. Capacity building on use of weedicides was also done to arrest the weed growth which is a
major constraint in direct sown paddy. Duration of the crop reduced by 15 days(135 days) and the yield was
enhanced by 10%.This created confidence among them during the first year it self which lead to adoption of
this technology in rabi season.
Based upon the success, farmers from nearby villages have purchased five drum seeder from TNAU,
Coimbatore for their use with the facilitation of KVK .This technology has attracted all categories of farmers
due to easy operation, less weight, line sowing with less seed rate ( 15 kg / acre) more tillers, early maturity etc.,
apart from savings in transplanting cost. This paved the way for usage of cono weeder for weeding.
Drum seeder sowing is the only unique technology which was spread horizontally with out entering
into demonstrations.

130
Yield particulars of direct seeding with drum seeder
Title of OFT Technology
assessed
Data on Yield parameters Result of assessment
Drum seeder Transplanting
Direct seeding V/s Transplanting
Direct seeding with drumseeder
No of hills/sq m—38.8
Tillers/hill18.8
Cost of treatment‐Rs 300/
Yield‐7690 kg/ha
No of hills/sqm‐22.6
Tillers/hill‐23.4
Cost of the treatment‐4500
Yield‐6965 kg/ha
Results show 10.4% increase yield over transplanting. Labour saving was by Rs 4300/ha
WOMEN IN DAIRY
Introduction of Perennial Fodder Grasses:: Whole Village Approach
Introduction: Andhra Pradesh accounts 8.4% of the national dairy animal population and produces 7.6% of the
country’s milk. Andhra Pradesh’s milk production comes from farms of less than 2hacs with 1 to 4 dairy animals.
More than 70% of rural people own dairy as it provides higher share of household income among rural families
especially for women it became an important lively hoods besides Agriculture.
Background: Dairy Activity became one of the major enterpreneuring activity and it is mainly shoulded by the
women like cleaning sheds, cleaning animals, feeding animals, milking, etc and they are also spending 1½ to 2
hours daily in searching green fodder. This prolonged searching daily shows negative impact on their personal
health i.e leg pains, backaches, headaches, scratches on legs and hands, hair loss and finally effects quality time
spending on taking care of family members and household works.
Though the dairy activity was taken up by the rural folk as major income generating activity, but they are
not aware of scientific management practices for milch animals which leads to poor milk yield, poor fat percent,
poor animal health leads to poor returns / income and are spending 60 to 70% on feeding of milch animals from
the dairy source of income and also 30‐40 kgs of green fodder is required per animal per day for high milk yield
and better health of the animal.
Intervention: KVK initially in 1998,1999 started motivating farm women to turn towards cultivation of fodder
jowar i.e SSG 59‐3 in 0.2 hac each for 58 no and 49 farm women raised SSG‐898 in 0.2 hac each in Sadhukottam
and Battulurupadu villages.
Slowly women were convinced to shift to the perennial fodder grasses by noticing negative impact on
their personal health and found that they had less leisure time to relax because of their dual work in farm and
home.

131
KVK organized 11 Training programmes for 262 farm women and explained the importance on
cultivation of green fodder to reduce drudgery and to increase milk yield. Women were also convinced by taking
them to the exposure visit to green fodder fields at farmer fields and also to the Regional Animal Husbandry
Training Centre, Banavasi.
After the Training Programmes and Exposure Visits, Demonstrations on cultivation of green fodder i.e.
APBN‐1 fodder variety was taken up in 2007‐08 & 2008‐09. Initial demonstrations @ 25‐30 cents each with 10
women from Yagantipalle, 10 women from Mettupalli and 10 women from pathapadu villages came forward to
raise green fodder as there is no practice of cultivation of green fodder in Yagantipalle, Mettupalle and
pathapadu villages
Impact:
Initially started with 25‐30 cents by each farm women. After completion of farm work while coming back
home in the evening they used to bring fodder from their own fields. This saves time in searching green fodder
(11/2 to 2hrs), energy and reducing drudgery for farm women. By seeing its advantages in reducing drudgery
while searching fodder and increase in milk yield adoption of cultivation of green fodder has taken up
tremendously by 40 to 50 fellow farm women by taking strips from neighbors by convincing family heads.
The initial establishment of green fodder was 4hacs in each village @ 0.2 ha/unit. At present the area
increased up to 10hac in each village. Now the yagantipalle, mettupalle and pathapadu villages became
community fodder plots with APBN‐1 fodder variety.
Economic Benefit :
The cultivation of Green Fodder also helped in increasing family income by increasing average milk yield
from 3.5lts to 4.3lts per day and increase in fat percent i.e 5.6 to 6.5. With the increase in milk yield and fat
percent the average monthly income of the families raised from Rs.1,446 to Rs 2,039 per month..
Feed Back:
Women of these villages expressed that green fodder cultivation changed their life styles in reducing drudgery in
searching fodder, saves time, energy and spending quality time for the house hold work and they also found
leisure time for productive work. These women motivated other women to take up and managed fodder in a
better way this has revolutionalized the dairy farming of that area. With easily accessible and promising
availability of green fodder women came forward in purchasing buffaloes by taking loans from their SHG groups
for better income supplementation to the family
Table‐ I : Average Increase in Fat percent/day
Village Before Adoption of Green Fodder After Adoption of Green Fodder
Yagantipalle 5.6 6.3
Mittapalle 5.4 6.2
Pathapadu 5.7 6.5

132
Table‐ II: Average Increase in Milk Yield/day
Village Before adoption of green fodder After adoption of green fodder
Yagantipalle 3.5 4.3
Mittapalle 3.3 4.5
Pathapadu 3.6 4.6
Table‐ III: Increased no.of Milch Animals with the Guaranteed Availability of Green Fodder
Village Before Adoption of Green Fodder After Adoption of Green Fodder
Yagantipalle 1200 1800
Mittapalle 600 1000
Pathapadu 1400 2100
Table‐ IV: Increase in milk production /day
Village Before Adoption of Green Fodder After Adoption of Green Fodder
Yagantipalle 1200 1800
Mittapalle 600 1000
Pathapadu 1400 2100
Table‐ V: Horizontal spread of Technology
Village Initial demo`s No.of women
adopted
Yagantipalle 10 55
Mittapalle 10 40
Pathapadu 10 45

133
Promotion of Millet products through SHGs.
Introduction:
Jowar is an important traditional millet crop in Andhra Pradesh growing in sizeable area. Particularly in
Kurnool district Jowar is grown in an area of 75226 ha. It is a nutritious millet with good amount of dietary fibre
and essential minerals compared to rice and wheat. The grain is rich in starch (70%), Protein (11%) , Fat (1.9%)
and dietary fibre and minerals. The added advantage of the grain is the slow digestability and it is good diet for
the diabetic patients. The consumption of Jowar is limited to traditional recipies i.e. roti and sangati. To increase
the consumption of jowar, diversified and value added products are essential that deliver convenience, taste,
texture, colour and shelf stability at an economical cost. In this scenario, there is a need to develop and diversify
different value added products with jowar according to the choice and taste of the consumer. Women
participation is very much crucial in promotion and popularization of any kind of food products. To generate
income among the rural women folk, involving SHGs, a product of local traditional innovation is now to be
manufactured and marketed. The decentralized, small scale house hold based economy of food production and
food processing is huge in aggregate. It also generates livelihoods for the economic sustainability of rural
women.
Background:
Women play a vital role in food security and they personally involve in food preparation and ensure basic
nutrition and food need of the households. As the majority of the rural women were formed into SHGs and
taking up various entrepreneurial and income generating activities, with the help of various line departments,
banks, agencies and NGOs, any technology or intervention taken up by them will have wider access and
acceptability. Hence, KVK has involved SHGs in promotion of Jowar Products and selected Sri Kalki Bhagawan
Podupu group of Pandurangapuram village of Nandyal mandal.
Intervention:
KVK organized 14 Training programmes and method demonstrations on value added products with jowar i.e,
Breakfast, Lunch and Ready to eat Snack items for 162 farm women of Yagantipalle, Battulurupadu,
Nandavaram, Banaganapalle, Kalugotla, Sadhukottam, Madasupalle, Koilakuntla etc. The consumption of value
added products was restricted to roti and sangati only, because of non availability of Jowar bi products like
dehulled flour and ravva. Establishment of dehullers and flour mills at village level is needed to make the bi
products available to the consumers. Keeping this in view, KVK has Planned to promote preparation of jowar bi
products i.e, Jowar fine, Bold ravva and flour, by involving local SHGs and supporting them with machinery and
giving technical knowhow. The SHGs were encouraged to market the bi products by tapping local avenues like
word of mouth among friends and relatives, weekly shandys, rythu bazaars, super markets and local grocery
shops.

134
Impact:
Initially two women members of the SHG have come forward to start the jowar bi products preparation, by
procuring 10 quintals of Jowar to start with. Seeing the acceptance and demand from the local community and
near by villages, they increased the scale to 150 quintals, with the financial support from Mahila Bank and Bank
Linkage, the group had. By seeing the success and profitability of the unit, another 3 women of the group have
joined hands and now they are planning to expand the business, with prior orders from super markets and
shops.
Economic Benefit :
Cost of Production for 10 quintals (per month) of Jowar bi products
S.No. Item Quantity Cost (Rs.) Total cost for 6
months (60 qtls)
1 Jowar 1000 kg 15,000‐00 90,000‐00
2 Labour 80 man days @ 100/‐ per day 8,000‐00 48,000‐00
3 Packing Q.S. 800‐00 4,800‐00
4 Electricity charges 15 units/ quintal
(@ 7/‐ per unit)
1,050‐00 6,300‐00
5 Rent for building Rs. 500/‐ 500‐00 3,000‐00
6 Interest on capital invested
@ 12% p.a.
Rs. 25,000‐00 250‐00 1,500‐00
Total cost of production /month (10 qtls) 25,600‐00 1,53,600‐00
The unit is producing 10 quintals of Jowar bi products (3 types) per month and the cumulative
production and gross income for 6 months is as under :
S.
No.
Jowar Bi Product Quantity produced Cost per Kg Gross Income
(Rs.)
1 Jowar bold Ravva 3900 40 1,56,000‐00
2 Jowar fine Ravva 900 35 31,500‐00
3 Jowar flour 780 30 23,400‐00
4 Jowar Bran 420 15 6,300‐00
Total 6000 2,17,200‐00
Economics of the enterprise:
S. No. Item Amount (Rs.)
1 Gross Income from sale of bi products (60 qtls) 2,17,200‐00
2 Cost of production for 60 qtls 1,53,600‐00
3 Net income 63,600‐00
4 BCR 1 : 1.41
A net income of Rs 63,600 is obtained, in addition to their earning as labour for this activity.

135
Feed Back:
With ready acceptance and bulk requirement from the consumers, there is a lot of demand for these jowar bi
products. As the raw materials are easily available in the villages, procurement is easy. As the awareness on use
of millet products is increasing among consumers, jowar bi products consumption is increasing along with other
millet products like ragi and korra. The technology of preparation of millet products from KVK has come in right
time and helped the SHG members to catch up the arising demand for jowar products.
3.8 Give details of innovative methodology/technology developed and used for Transfer of Technology during the year
3.9 Give details of indigenous technology practiced by the farmers in the KVK operational area which can
be considered for technology development (in detail with suitable photographs)
S. No.
Crop / Enterprise
ITK Practiced Purpose of ITK
1 Chillis Using wet gunny bags drenched with Jaggery solution to
attract the Spodoptera larvae.
To manage
Spodoptera in chillis
2 Redgram When the plants were shaken vigorously, the larvae
feeding on pods will dislodge and fall onto the blanket
laid under the plants. Then, the larvae will be collected
and destroyed.
To manage
Helicoverpa in
Redgram
3 Redgram When Jaggery solution is sprayed on the crop, black ants
were attracted to the plants and all the egg and larval
stages were seen eaten away by the ants.
To manage
Helicoverpa in
Redgram
4 Paddy When 1.5 lt Neem oil is mixed with 25 kg sand and
applied in 1 acre after reducing the water in the field, in
48 hours all the BPH were seen flushed out from the field
and pungent smell of neem oil persists in the field for 5
days.
To control BPH in
Paddy
5 Paddy Cattle dung & Urine were putrified for 4 nights and to
the filtrate, 200 g of Asafoetida powder is mixed and
sprayed for Blast in Paddy. It was found stopped from
spreading further.
To Manage Blast in
Paddy
3.10 Indicate the specific training need analysis tools/methodology followed for
Identification of courses for farmers/farm women
o Baseline survey o Family survey o PRA o Group discussion
For Rural Youth o Group discussion o PRA o Through interaction with farmers clubs

136
3.11 Field activities i. Number of villages adopted ‐ 10 ii. No. of farm families selected 50 iii. No. of survey /PRA conducted ‐ 10
3.12. Activities of Soil and Water Testing Laboratory
Status of establishment of Lab
1. Year of establishment : 2005
2. List of equipments purchased with amount :
Sl. No Name of the Equipment Qty. Cost
1 Digital pH Meter 1 7,080‐00
2 P based EC‐TDS Analyser 1 13,680‐00
3 Scanning Visible Spectrophotometer 1 36,800‐00
4 P based Flamephotometer 1 30,400‐00
5 Nephelometer 1 7,600‐00
6 Electronic KEL Plus Automatic Microprocessor (Digestion
system)
1 79,200‐00
7 Electronic Superior Automatic Microprocessor based
Distillation system
1 1,42,300‐00
8 Electronic Laboratory Shaker 1 57,350‐00
9 Mettler Electronic Analytical Balance 1 91,843‐00
10 INDION two bed portable Deioniazer 1
1
45,900‐00
11 INDION portable mixed bed Deionizer
12 Atomic Absorption spectrophotometer 1 8,11,108‐00
Total 13,23,261‐00
3. Details of samples analyzed so far:
Details No. of Samples No. of Farmers No. of Villages Amount realized
(Rs. In Lakhs)
Soil Samples 2684 1975 315 5.345
Water Samples 299 299 83 0.215
Plant Samples 64 64 2 0.384
Petiole Samples
Total 3047 2338 400 5.944

137
4.0 IMPACT 4.1. Impact of KVK activities (Not to be restricted for reporting period).
Name of specific technology/skill transferred
No. of participants
% of adoption Change in income (Rs.)Before
(Rs./Unit) After
(Rs./Unit)
Nutrient Management in rice based on STCR
438 66 47990/ha 57839/ha
4.2. Cases of large scale adoption (Please furnish detailed information for each case) 4.3 Details of impact analysis of KVK activities carried out during the reporting period 5.0 LINKAGES 5.1 Functional linkage with different organizations
S.No. Name of organization Nature of linkage
1 FTC, Nandyal Advisory board member, Krishi Vigyan Kendra as
resource persons
2 RARS, Nandyal Technical support to Krishi Vigyan Kendra
3 ATMA, Kurnool GB member, AMC member and stakeholder of ATMA
4 DAATTC DLCC member & technical support from DAATTC
5 Dept. of Agriculture Advisory member for NWDPRA & programs, supply of
earthworms and organic farming.
6 Local NGOs Technical support by KVK
7 Agri Biotech Foundation Spawn production of milky mushrooms & establishment
of jowar bakery unit.
8 Department of Women Development &
Child Welfare
Training Programmes to Extension Functionaries
10 NABARD Conducting training programmes and demonstrations
11 Department of Animal
Husbandry
Organising, Health camps and Technical support

138
5.2 List special programmes under taken by the KVK, which have been financed by State Govt./Other Agencies
Name of the scheme Date/ Month of
initiation Funding agency Amount (Rs.)
Training programme to extension functionaries
April,2011 Women Development & Child Welfare
9,47,434‐00
Demonstration and training programmes and extension activities
April, 2011 ATMA 8,00,000‐00
Soil test crop response based nutrient application in rice under FTTF scheme
April‐2011 NABARD 3,46,500‐00
5.3 Details of linkage with ATMA a) Is ATMA implemented in your district : Yes
S. No. Programme Nature of linkage Remarks
1 Training Programme
Financial support from ATMA
2 Demonstrations
3 Exposure visit
4 Kisan ghosti
5 Technology assessment & refinement
5.4 Give details of programmes implemented under National Horticultural Mission
S. No. Programme Nature of linkage Constraints if any
NIL
5.5 Nature of linkage with National Fisheries Development Board
S. No. Programme Nature of linkage Remarks
NIL

139
6. PERFORMANCE OF INFRASTRUCTURE IN KVK 6.1 Performance of demonstration units (other than instructional farm)
Sl. No.
Demo Unit
Year of estt.
Area Details of production Amount (Rs.) Net income Variety Produce Qty.
tones Cost of inputs
Gross income
1 Vermi composting unit
2003 ‐ Udrilus eugeni
Vermi compost
108 2,10,000‐00
4,32,000 3,13,000
Earthworms 1.98
91,000
2 IBRC 2010 ‐ PseudomonasTrichoderma Neem Powder
PseudomonasTrichoderma Neem Powder
5.048 1,11,533 2,25,900 1,14,367
S. No.
Demo Unit
Year of estt.
Area Details of production Amount (Rs.) Remarks Variety Produce Qty. Cost of
inputs Gross income
1 Dyeing & Printing
1999 ‐ ‐ Cotton sarees 15 2025‐00 3750‐00 ‐
Organdi Sarees
29 5220‐00 8700‐00 ‐
Supernet patch work sarees
15 7500‐00 11250‐00
6.2 Performance of instructional farm (Crops) including seed production
Name of the crop
Date of sowing
Date of harvest
Area (ha)
Details of production Amount (Rs.) Remarks
Variety Type of Produce
Qty. Cost of inputs
Gross income
Cereals Rice 1 St
wk of July
3 rd wk of Nov
0.8 JGL‐3844
Seed 40 32,000 78000
1 St wk of July
3 rd wk of Nov
2.0 NDLR‐7 Seed 65 70,0000 1,30,000
1 St wk of July
1 St wk of Dec
5.0 BPT‐5204
Seed 450 3,50,000 6,50,000
Pulses Pigeonpea Last
wk of July
2nd wk of Jan
0.6 LRG‐41
Seed 5 10,000 25,000
Oilseeds castor Ist wk
of Oct 2 nd wk of April
1.0 PCH‐111
Seed 9 1,10,000 2,25,000

140
6.3 Performance of production Units (bio‐agents / bio pesticides/ bio fertilizers etc.,)
Sl. No.
Name of the Product
Qty tonnes.
Amount (Rs.) Remarks
Cost of inputs Gross income
1 Vermicompost 108
2,10,000‐00
4,32,000‐00
2 Earthworms 1.98 91,000‐00
3. Pseudomonas 0.545 1,11,533‐00 78,600‐00
4. Trichoderma 0.903 90,300‐00
5. Neem powder 3.6 57,000‐00
Total 109.98 3,21,533‐00 7,48,900‐00
6.4 Performance of instructional farm (livestock and fisheries production)
Sl. No
Name of the animal / bird /
aquatics
Details of production Amount (Rs.) Remarks
Breed Type of Produce
Qty. Cost of inputs
Gross income
6.5 Rainwater Harvesting Training programmes conducted by using Rainwater Harvesting DemonstrationUnit
Date Title of the training course
Client (PF/RY /EF)
No. of Courses
No. of Participants including SC/ST
No. of SC/STParticipants
Male Female Total Male Female Total

141
6.5 Utilization of hostel facilities Accommodation available (No. of beds) : 40
Months Title of the training course/Purpose of stay No. of trainees stayed
Trainee days (days stayed)
Reason for short fall (if any)
April‐11 30 90 30 90
Total 60 180
May,11 25 75
Total 25 75
June,11 30 60
Total 30 60
July,11 22 66 30 90 25 75 25 50
Total 102 281
Aug,11
Total
Sep,11 72 72
Total 72 72
Oct,11 52 260
Total 52 260
Nov,11 114 228
Total 114 228
Dec,11 201 603
Total 201 603
Jan,12 45 45
Total 45 45
Feb,12 210 420
Total 210 420
Mar,12 270 540
Total 270 540
Grand total 1251 2954

142
7. FINANCIAL PERFORMANCE 7.1 Details of KVK Bank accounts
Bank account Name of the Bank Location Account Number
With Host Institute
With KVK
Main A/C Andhra Bank Banaganapalle SB 005910011006023
Revolving Fund ‐do‐ ‐do‐ SB 005910011006024
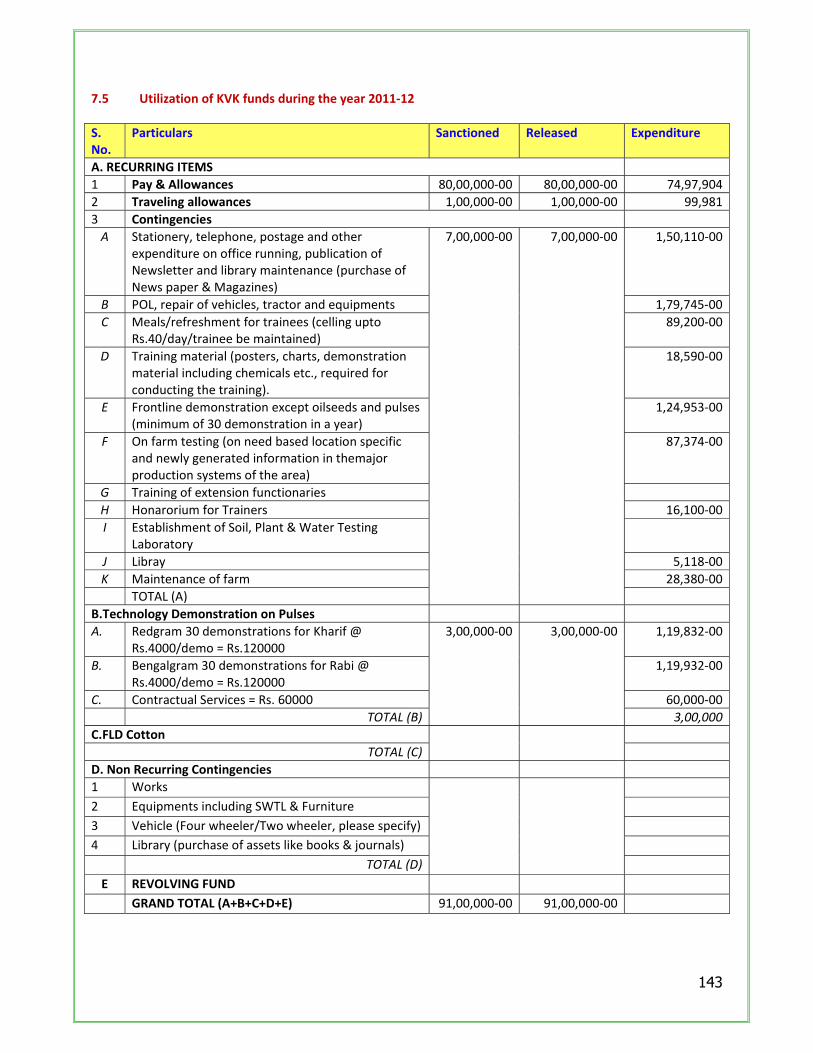
143
7.5 Utilization of KVK funds during the year 2011‐12
S. No.
Particulars Sanctioned Released Expenditure
A. RECURRING ITEMS
1 Pay & Allowances 80,00,000‐00 80,00,000‐00 74,97,904
2 Traveling allowances 1,00,000‐00 1,00,000‐00 99,981
3 Contingencies
A Stationery, telephone, postage and other expenditure on office running, publication of Newsletter and library maintenance (purchase of News paper & Magazines)
7,00,000‐00 7,00,000‐00 1,50,110‐00
B POL, repair of vehicles, tractor and equipments 1,79,745‐00
C Meals/refreshment for trainees (celling upto Rs.40/day/trainee be maintained)
89,200‐00
D Training material (posters, charts, demonstration material including chemicals etc., required for conducting the training).
18,590‐00
E Frontline demonstration except oilseeds and pulses (minimum of 30 demonstration in a year)
1,24,953‐00
F On farm testing (on need based location specific and newly generated information in themajor production systems of the area)
87,374‐00
G Training of extension functionaries
H Honarorium for Trainers 16,100‐00
I Establishment of Soil, Plant & Water Testing Laboratory
J Libray 5,118‐00
K Maintenance of farm 28,380‐00
TOTAL (A)
B.Technology Demonstration on Pulses
A. Redgram 30 demonstrations for Kharif @ Rs.4000/demo = Rs.120000
3,00,000‐00 3,00,000‐00 1,19,832‐00
B. Bengalgram 30 demonstrations for Rabi @ Rs.4000/demo = Rs.120000
1,19,932‐00
C. Contractual Services = Rs. 60000 60,000‐00
TOTAL (B) 3,00,000
C.FLD Cotton
TOTAL (C)
D. Non Recurring Contingencies
1 Works
2 Equipments including SWTL & Furniture
3 Vehicle (Four wheeler/Two wheeler, please specify)
4 Library (purchase of assets like books & journals)
TOTAL (D)
E REVOLVING FUND
GRAND TOTAL (A+B+C+D+E) 91,00,000‐00 91,00,000‐00

144
7.5 Status of revolving fund (Rs. in lakhs) for the three years
Year Opening balance as on
1st April
Income during the year
Expenditure during the year
Net balance in hand as on 1st April
of each year
April 2009 to Mar, 2010 23,33,199‐00 18,07,142‐00 8,80,920‐00 32,59,421‐00
April 2010 to Mar, 2011 32,59,421‐00 25,57,064‐00 17,14,507‐00 41,01,978‐00
April 2011 to Mar, 2012 41,01,978‐00 39,34,975‐00 37,64,788‐00 42,72,165‐00
8.0 Please include information which has not been reflected above (write in detail). 8.1 Constraints (a) Administrative
(b) Financial
(c) Technical
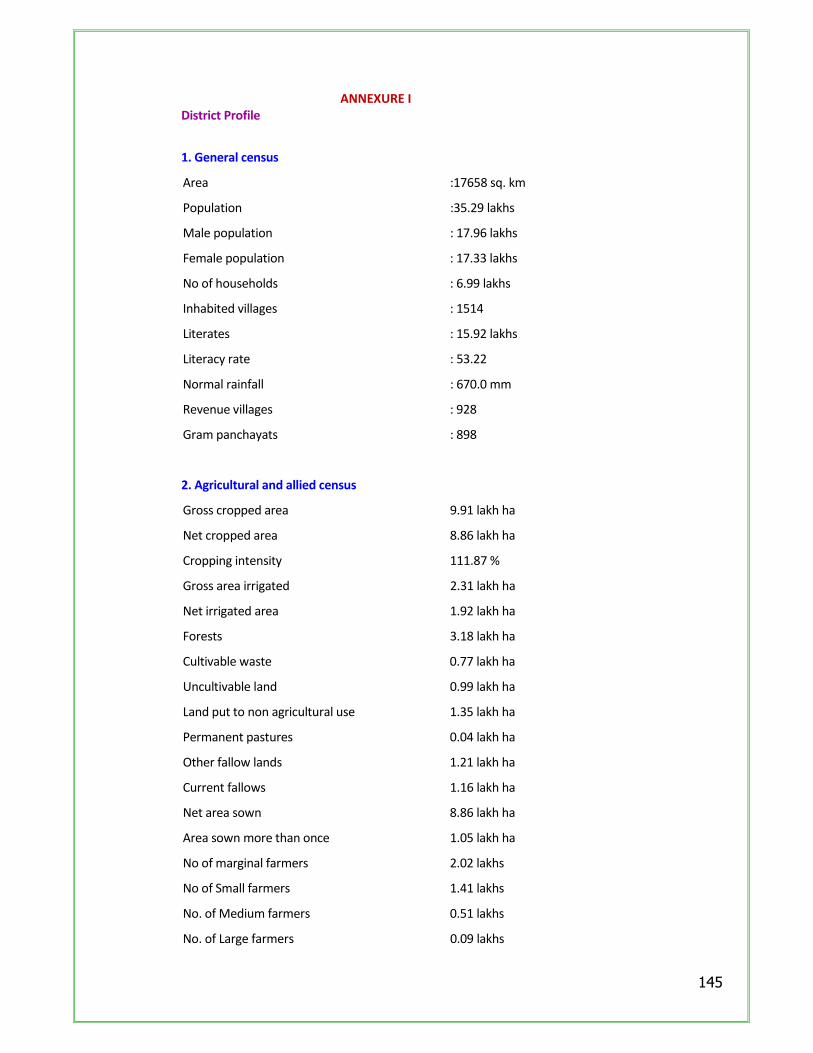
145
ANNEXURE I District Profile
1. General census
Area :17658 sq. km
Population :35.29 lakhs
Male population : 17.96 lakhs
Female population : 17.33 lakhs
No of households : 6.99 lakhs
Inhabited villages : 1514
Literates : 15.92 lakhs
Literacy rate : 53.22
Normal rainfall : 670.0 mm
Revenue villages : 928
Gram panchayats : 898
2. Agricultural and allied census
Gross cropped area 9.91 lakh ha
Net cropped area 8.86 lakh ha
Cropping intensity 111.87 %
Gross area irrigated 2.31 lakh ha
Net irrigated area 1.92 lakh ha
Forests 3.18 lakh ha
Cultivable waste 0.77 lakh ha
Uncultivable land 0.99 lakh ha
Land put to non agricultural use 1.35 lakh ha
Permanent pastures 0.04 lakh ha
Other fallow lands 1.21 lakh ha
Current fallows 1.16 lakh ha
Net area sown 8.86 lakh ha
Area sown more than once 1.05 lakh ha
No of marginal farmers 2.02 lakhs
No of Small farmers 1.41 lakhs
No. of Medium farmers 0.51 lakhs
No. of Large farmers 0.09 lakhs

146
Cultivators 3.64 lakhs
Agricultural labour 6.25 lakhs
Livestock population 24.44 lakhs
Rural livestock units 218
Cattle population 4.29 lakhs
No of Buffaloes 4.59 lakhs
Sheep 11.49 lakhs
Goat 3.87 lakhs
Pigs 13.47 lakhs
Poultry 11.79 lakhs
Ducks 507
3. Agro‐climatic zones
Scarce rainfall zone Low scanty and erratic rainfall due to which successful crop production with good yields is unexpectable and dryland agriculture is predominant with a variety of rainfed crops in the zone.
4. Agro‐ecosystems
K.C.Canal irrigated red soils
T.B.Low level canal irrigation red soils
T.B.High level canal irrigation black soils
K.C.Canal irrigation blacksoils
T.B.Low level canal irrigation black soils
T.B.high level canal irrigation black soils
Problem soils
Tank irrigation red soils
Tank irrigation black soils
Well irrigation red soils
Rainfed red soils
Rainfed black soils
5. Major and micro‐farming systems
S. No Farming system/ Enterprise
1 Agriculture + Horticulture
2 Agriculture + Dairy
3 Agriculture + Horticulture + Dairy
4 Agriculture + Horticulture + Pastural culture

147
6.Major production systems :
Paddy‐ Paddy,
Greengram‐ Paddy,
Paddy‐ Groundnut/ vegetables
Paddy‐fallow
Paddy/Groundnut/vegetables‐fallow
Paddy‐ Greengram‐ Paddy,
Paddy/Groundnut‐ vegetables
Sunflower/ Groundnut‐ fallow
Groundnut/ Cotton‐ fallow
Sunflower‐ Groundnut
Groundnut‐ Sunflower
Cotton‐fallow
Paddy‐ Sunflower
Cotton/Onion‐ fallow
Cotton/Onion/ Chillies‐ fallow
Sunflower‐ Groundnut+ Redgram
Groundnut+ Jowar, Cotton
Cotton+ redgram/ Korra/ Redgram‐fallow
Jowar/Bengalgram/Tobacco‐ fallow
Jowar‐fallow
Groundnut‐fallow
7.Major agriculture and allied enterprises
Agriculture
Horticulture
Floriculture
Olericulture
Silviculture
Pastoral culture
Dairy farming
Pisciculture
Sheep farming
Goatry

148
Agro‐ecosystem Analysis of the focus/target area
1.Names of villages, focus area, target area etc.
Farming situation Name of the village Focus area Target area
Rainfed black soils
Manekurthi
Groundnut‐200 ha Cotton‐ 40 ha Bengalgram ‐800 ha
Groundnut‐ Cotton‐ Bengalgram
Rainfed red soils Aluru Aluru
Tank irrigation black soils
Jalaknur
T.B. Low level canal irrigation black soils
Yemmiganur Kadimetla
2. Survey methods used (survey by questionnaire, PRA, RRA, etc.)
Questionnaire: Primary and secondary data about the villages was collected through a pre scheduled
questionnaire by gathering a group of farmers. Information about the management practices being followed and
technology used was collected from individual farmers through semi structured interview schedule.
3. Various techniques used and brief documentation of process involved in applying the techniques used like
release transect, resource map, etc.
Resource map: Villagers were involved in a transect walk along the pathways of the village and later on a social
map was drawn to know the resources available in and around the villages.
4.Analysis and conclusions
Rainfed red soils:
Major crops are Sunflower, Groundnut, Jowar and Redgram Specific constraints are poor soil fertility and water
retentivity, late rains, drought and frequent dry spells. Production constraints are improper spacing, non usage
of recommended fertilizers , high doses of pesticides. Potentials identified are rainfed greengram to enrich soils,
encourage inter crops against failures.
Rainfed black soils:
Major crops are Bengalgram & Cotton. Specific constraints are erratic rainfall, drought, frequent dry spells and
terminal drought in bengalgram and jowar. Production constraints are improper spacing, non usage of
recommended fertilizers , high doses of pesticides. Potentials identified are rainfed greengram to enrich soils,
encourage inter crops against failures.

149
TBP LLC canal irrigated black soils:
Main crops are Groundnut, Sunflower, Paddy: Specific constraints are late and uncertain release of water due to
erratic rainfall, non availability of water in tail end areas. Production constraints are poor pod filling in groundnut.
Potentials identified are double cropping in tail end areas and growing of off – season vegetables.
TBP LLC canal irrigated red soils:
Main crops are Paddy, Groundnut and vegetables like Onion Chillies and Tomato. Specific constraints are soils
poor in organic carbon content, water problem in tail end areas due to erratic rainfall leading to non availability of
water in critical crop stages. Production constraints are high N&P application in paddy, poor pod filling in
groundnut. Potentials identified are greengram or green manure crop preceding paddy to enrich soil and kharif
pulse crop in the follow areas.
5.List of location specific problems and brief description of frequency and extent/ intensity/severity of
each problem
Rainfed red soils: The area being mostly rainfed, farmers were found to be non aware of moisture conservation
measures, methods of fertilizer application, appropriate spacing etc.
Need based plant protection measures are not adopted.
Traditional varieties are cultivated. Crop rotation is not followed.
Groundnut:
o Proper plant population not maintained.
o Usage of local variety for a long time.
o Improper fertilizer management.
o Lack of knowledge on usage of bio pesticides.
Rainfed black soils:
Mungari cotton:
o Proper spacing not adopted.
o Non awareness of IPM measures.
Bengalgram:
o No practice of growing preceding crop to Bengalgram.
o Latest improved varieties not adopted.
o Proper management practices not followed.
o IPM techniques not adopted.
TBP LLC canal irrigated red soils:
Improved and high yielding varieties not grown.
Indiscriminate usage of fertilizers.
Recommended spacing and plant population not followed.
Timely and proper plant protection measures not adopted.

150
Paddy:
High doses of fertilizers being applied.
IPM techniques not adopted.
Groundnut:
Improved varieties not adopted.
IPM measures not followed.
Non usage of micronutrients.
Tank irrigation black soils:
Chillis:
Indiscriminate usage of pesticides.
Direct sowing of seed. No nursery management.

151