annual report 2010 - khushhali...annual report 2010 and the journey continues… with more than two...
TRANSCRIPT

Annual Report 2010


A N N U A L R E P O R T 2 0 1 0
and the journey continues…With more than two and a half millionmicrof inance relat ionships, acomprehensive network of branchesacross the rural and urban divides ofPakistan, new banking products and
services and above all the happinessand joy of all those individuals whoare living a better life because of ourpromise of spreading prosperity, todaywe believe we have been successful
in moving close to our destination.But for us, it is not the end. In fact, itis just the beginning. We still have togo a long way till we fulfill our promiseof prosperity on all accounts.
11th Annual Report

Initialized in 2000, Khushhalibank was established as a part of the Government of Islamic Republic of Pakistan'sPoverty Reduction Strategy and its Microfinance Sector Development Program. With its headquarters in Islamabad,Khushhalibank operates under the supervision of the State Bank of Pakistan and fifteen commercial banks asshareholders.
Prologue

Starting its journey in 2000, Khushhalibank celebrated its tenth anniversary in August 2010. Poised to reduce povertyand uplift the status of low-income populace by catalyzing the environment for microfinance banking in the country,Khushhalibank has been successful in bringing a positive change in the lives of millions. These ten years have clearlywitnessed the unprecedented impact of micro loans and allied financial products and services in opening up newopportunities for low-income households to access financial services for enhancing their incomes and securing abetter future for their families.
With over two and a half million loans serviced across Pakistan, Khushhalibank has truly fulfilled its promise ofensuring ‘prosperity on all accounts’ and is fully geared to continue with the same spirit in the years ahead.
A decade of prosperity
A N N U A L R E P O R T 2 0 1 0
To be a premier financial institution within the microfinance industry.
Vision
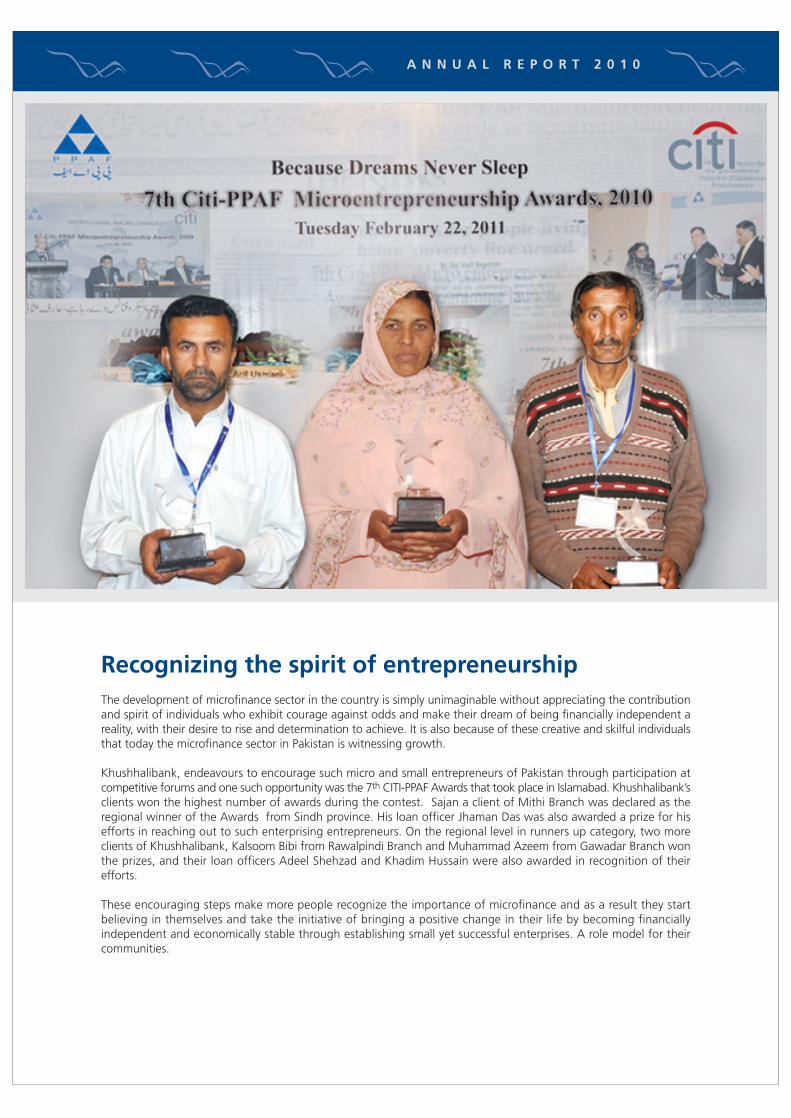
The development of microfinance sector in the country is simply unimaginable without appreciating the contributionand spirit of individuals who exhibit courage against odds and make their dream of being financially independent areality, with their desire to rise and determination to achieve. It is also because of these creative and skilful individualsthat today the microfinance sector in Pakistan is witnessing growth.
Khushhalibank, endeavours to encourage such micro and small entrepreneurs of Pakistan through participation atcompetitive forums and one such opportunity was the 7th CITI-PPAF Awards that took place in Islamabad. Khushhalibank’sclients won the highest number of awards during the contest. Sajan a client of Mithi Branch was declared as theregional winner of the Awards from Sindh province. His loan officer Jhaman Das was also awarded a prize for hisefforts in reaching out to such enterprising entrepreneurs. On the regional level in runners up category, two moreclients of Khushhalibank, Kalsoom Bibi from Rawalpindi Branch and Muhammad Azeem from Gawadar Branch wonthe prizes, and their loan officers Adeel Shehzad and Khadim Hussain were also awarded in recognition of theirefforts.
These encouraging steps make more people recognize the importance of microfinance and as a result they startbelieving in themselves and take the initiative of bringing a positive change in their life by becoming financiallyindependent and economically stable through establishing small yet successful enterprises. A role model for theircommunities.
Recognizing the spirit of entrepreneurship
A N N U A L R E P O R T 2 0 1 0

To strengthen the economic base of low-income populace across Pakistan by improving their accessibility to financialservices.
By supporting a diverse product suite with exemplary service and by deploying cost efficient next generation deliverysystems, we intend achieving our core objective of outreach and sustainability.
Mission

Khushhalibank is not just about providing micro-loans to individuals belonging to low-income segment of society.It’s also not only about providing complete range of financial services to those who are unbanked. It’s about a promiseof reforming lives; rebuilding communities and reshaping futures by collective yet focused efforts leading to a povertyfree and financially independent society.
The Business Revitalization Program is yet another step in the same direction. This program has been designed toprovide immediate assistance to businesses affected by terrorism, natural disaster or calamity.Funded by the United States Agency for International Development, the Program provides grants to traders /businessowners to compensate for the loss of business. So far, grants have been disbursed to the traders of Bolton Marketwho lost their businesses during the riots of December 28, 2009 in Karachi, and the people of Hunza Nagar Districtwho suffered damages by the devastating Atta’abad lake landslide of January 4, 2010.
This is part of a commitment made by United States Agency for International Development and Khushhalibank torevitalize businesses and restore livelihoods with the support of local communities and associations.
Restoring businesses, rebuilding lives
A N N U A L R E P O R T 2 0 1 0
ValuesEmpower
Excel
Ethics

Khushhalibank celebrated induction of 100th batch of trainee officers, coinciding with the Bank’s 10th anniversary.Right from the outset, the Bank has pursued a transparent and merit based recruitment and selection policy. Thestrategy has been to provide job opportunities to local quality graduates drawn from territories contiguous to ourbranch operations and build a pool of “Home Grown Talent”. It is by virtue of this strategy that today from functionalleadership positions, through middle management and down to grass root level, the vast majority of employees arehome grown. They are attuned to microfinance business culture and have a better pulse of microfinance customer.During the last 10 years, the Bank has grown in terms of clients and business, supported by a robust structure anddelivery platform. To keep up with these developments, it is essential to have a regular stream of staff at the entrylevel to recoup the requirement emerging from growth and replacements.
Building a home grown pool of talent
A N N U A L R E P O R T 2 0 1 0

Annual Report 2010

Contents
Corporate Information
President’s Review
Directors’ Report to the Shareholders 2010
Auditors’ Report to the Members
Balance Sheet as at December 31, 2010
Profit and Loss Account for the year ended December 31, 2010
Cash Flow Statement for the year ended December 31, 2010
Statement of Changes in Equity for the year ended December 31, 2010
Notes to the Financial Statements for the year ended December 31, 2010
Branch Network
01
02
04
06
07
08
09
10
11
39
A N N U A L R E P O R T 2 0 1 0


Corporate Information
Head Office94 West, Fourth Floor, Jinnah Avenue, Blue Area, PO Box. 3111, Islamabad-Pakistan.Tel: +92-51-111 092 092, Fax: +92-51-924 5120, web: www.khushhalibank.com.pk
Board of Directors
PresidentMuhammad Ghalib Nishtar
DirectorsZakir MahmoodM. R. MehkariM. U. A. UsmaniRashid Akhtar ChughtaiAtif Aslam BajwaM. Ghalib Nishtar
Audit CommitteeM. R. MehkariM. U. A. UsmaniRashid Akhtar Chughtai
Company SecretarySaleem Akhtar Bhatti
Share RegistrarCentral Depository Company of Pakistan Ltd.CDC House, 99-B, Block ‘B’ S.M.C.H.S.Main Shahra-e-Faisal, Karachi - 74400.
Tel: +92-21-111 111 500Fax: +92-21-343 26031Web: www.cdcpakistan.com
AuditorsA. F. Ferguson & Co.Chartered Accountants3rd Floor, PIA Building49-West, Eagle Plaza, Fazlul Haq RoadBlue Area, Islamabad.
Tel: +92-51-227 3457-60Fax: +92-51-227 7924E-mail: [email protected]
Legal AdvisorsSamdani & Qureshi32-A, Street 38Main Nazimuddin RoadSector F-10/4, Isalmabad.
Tel: +92-51-211 1595-8Fax: +92-51-210 8011E-mail: [email protected]
Tax ConsultantsErnst & Young Ford Rhodes Sidat HyderChartered Accountants75-West, Eagle Plaza, Fazlul Haq RoadBlue Area, Islamabad.
Tel: +92-51-287 0290-92Fax: +92-51-287 0293Web: www.ey.com/pk
01
A N N U A L R E P O R T 2 0 1 0

02
President’s ReviewBackground
Microfinance continues to evolve across the globe as amajor supplier of financial services to low incomehouseholds and has achieved a significant milestone ofreaching nearly 100 million clients over the last twodecades.
Simultaneously, with the passage of time the microfinanceIndustry continues to move on a maturity curve graduallymaking a transition from a donor driven developmentoriented Intervention towards commercialization andmainstreaming into the formal financial system. Theemergence of regulated microfinance banking Institutionsthat are providing not just micro credit but a full rangeof financial services is an important development. TheInstitutional mechanisms need to be supervised by aregulatory framework aligned with market mechanismsthat provide sustainable options for growth andcompetition for the future.
Pakistan’s microfinance Industry has progressed well overthe past decade driven under a conducive policyenvironment of the Government of Pakistan and theregulatory & supervisory framework of the central bankthat encourages and supports commercial microfinancewhile promoting private sector participation andinstitutional diversity.
The State Bank of Pakistan Strategic Framework forSustainable Microfinance in Pakistan 2010-15 provides aroad map for the development of microfinance in thecountry and promotes market based financial servicesthat meet the diverse needs of the poor and low incomesegments with a strategic focus on the following elements:
■ Improving the quality of growth through promotinginclusive financial services with up scaling creditoperations.
■ Promoting innovation to achieve rapid scale andreduce operating costs.
■ Promoting organizational development througheffective governance and professional managementat strategic, middle and operational levels.
■ Improving sector discipline through consumerprotection policies, financial literacy programs andexploring options to bring non-regulated Micro FinanceInstitutions under a minimum regulatory cover.
The Microfinance sector has reached a level of 2 millionborrowers but is over the past two years witnessing aslowdown in micro credit growth while pursuing a morebalanced expansion in terms of depositors and Insurancepolicy holders as an outcome of strategic changesintroduced by respective Institutions in response to evolvingregulatory environment.
Khushhalibank remains the largest player amongst the
microfinance banks in Pakistan.
The Institutional reforms undertaken at Khushhalibankover the last three years or more have aligned the bankwell with the policy framework within the country.
The year in review witnessed a number of new Initiativesthat include acquisition of a core banking system,diversification of funding to commercial sources &commencement of deposit mobilization drive for retaildeposits a well as pursuing avenues for generation of feebased services
However, a major challenge in the year was the floods ofAugust last year that affected our portfolio in our primarybusiness areas in south Punjab, Sindh and parts of KP.This has had an impact on revenues and profitability ascompared to our plans but the impact has been mitigatedto a large extent by close coordination efforts with theaffected clients and rescheduling of portfolios during2010.The overhang of the situation is expected to continueinto the next year.
Restructuring of our distribution network with closure ofbranches in low potential areas and opening of newbranches in potential areas was pursued during the yearwhile focusing on strengthening our internal controlenvironment which reflected improvement in terms ofinternal & external reviews.
Business performance Indicators
We recorded a profit before tax of PKR 188 million forthe year 2010 which is lower than last year’s of PKR 252million primarily as a result of fall in non-core grant Incomefrom PKR 250 million to PKR 98 million.
The bank continues to pursue a sustainable growth strategywith reliance on core business reducing grants/subsidiesand the overall sustainability indicators reflect improvementfrom 99% last year to 105% in 2010.
The devastating floods of August 2010 affected a largepart of the branches and business in some of the mostpotential areas of the country, and correspondinglysuppressed growth in portfolio and revenues. However,a comprehensive risk mitigation mechanism is in place tomonitor and address the situation and was successful incurtailing the impact to a large extent in 2010 and effortswill continue in the next year as well.
The conversion of branches to full service banking continuesas per plan while simultaneously moving onto a new corebanking platform providing capability to develop newproducts & services and pursue new business avenues.This is supplemented by strengthening of our businessfaculties resulting in upsurge in retail deposits that willprovide funding at competitive costs for future growthand profitability.
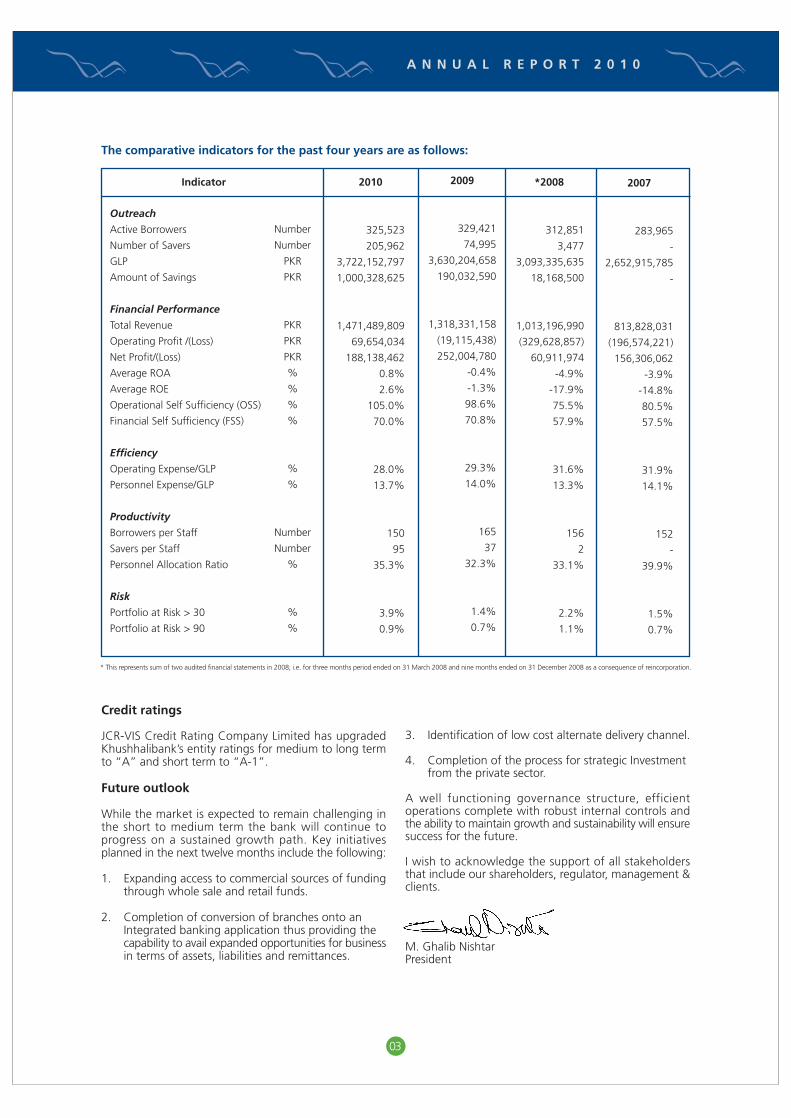
Credit ratings
JCR-VIS Credit Rating Company Limited has upgradedKhushhalibank’s entity ratings for medium to long termto “A” and short term to “A-1”.
Future outlook
While the market is expected to remain challenging inthe short to medium term the bank will continue toprogress on a sustained growth path. Key initiativesplanned in the next twelve months include the following:
1. Expanding access to commercial sources of fundingthrough whole sale and retail funds.
2. Completion of conversion of branches onto an Integrated banking application thus providing the capability to avail expanded opportunities for businessin terms of assets, liabilities and remittances.
3. Identification of low cost alternate delivery channel.
4. Completion of the process for strategic Investment from the private sector.
A well functioning governance structure, efficientoperations complete with robust internal controls andthe ability to maintain growth and sustainability will ensuresuccess for the future.
I wish to acknowledge the support of all stakeholdersthat include our shareholders, regulator, management &clients.
M. Ghalib NishtarPresident
03
Outreach
Active Borrowers
Number of Savers
GLP
Amount of Savings
Financial Performance
Total Revenue
Operating Profit /(Loss)
Net Profit/(Loss)
Average ROA
Average ROE
Operational Self Sufficiency (OSS)
Financial Self Sufficiency (FSS)
Efficiency
Operating Expense/GLP
Personnel Expense/GLP
Productivity
Borrowers per Staff
Savers per Staff
Personnel Allocation Ratio
Risk
Portfolio at Risk > 30
Portfolio at Risk > 90
Number
Number
PKR
PKR
PKR
PKR
PKR
%
%
%
%
%
%
Number
Number
%
%
%
2010
325,523
205,962
3,722,152,797
1,000,328,625
1,471,489,809
69,654,034
188,138,462
0.8%
2.6%
105.0%
70.0%
28.0%
13.7%
150
95
35.3%
3.9%
0.9%
2009
329,421
74,995
3,630,204,658
190,032,590
1,318,331,158
(19,115,438)
252,004,780
-0.4%
-1.3%
98.6%
70.8%
29.3%
14.0%
165
37
32.3%
1.4%
0.7%
*2008
312,851
3,477
3,093,335,635
18,168,500
1,013,196,990
(329,628,857)
60,911,974
-4.9%
-17.9%
75.5%
57.9%
31.6%
13.3%
156
2
33.1%
2.2%
1.1%
2007
283,965
-
2,652,915,785
-
813,828,031
(196,574,221)
156,306,062
-3.9%
-14.8%
80.5%
57.5%
31.9%
14.1%
152
-
39.9%
1.5%
0.7%
* This represents sum of two audited financial statements in 2008; i.e. for three months period ended on 31 March 2008 and nine months ended on 31 December 2008 as a consequence of reincorporation.
The comparative indicators for the past four years are as follows:
Indicator
A N N U A L R E P O R T 2 0 1 0

Directors’ Report to the Shareholders: 2010On behalf of the Board of Directors, I am pleased topresent the audited financial statements and Auditors’Report thereon, for the year ended December 31, 2010.
Corporate Reporting Framework
The Bank has adopted corporate governance practicesand the Directors are pleased to inform that:
1. The financial statements prepared by the managementof the Bank presents a true and fair view of the stateof its affairs, operational results, cash flows andchanges in equity.
2. Proper books of accounts of the company have beenmaintained.
3. Appropriate accounting policies have been consistentlyapplied in preparation of financial statements.
4. The company has followed international accountingstandards(as applicable in Pakistan) in the preparationof accounts and there is no departure from the saidstandards.
5. As a continuous process, efforts are made to effectivelyimplement the internal control system. The issuesidentified during the review process are rectifiedthrough appropriate corrective actions thereby furtherstrengthening the internal control environment.
6. There are no doubts about the Bank’s ability tocontinue as a going concern.
7. The Board has constituted Audit Committeecomprising of non - executive members which hasdefined terms of reference. Risk Managementpolicy framework has also been approved bythe Board. The Board has met four times duringthe year.
The Auditors’ Report is annexed to the financial statements.
CGAP Compliant Reporting
The Consultative Group to Assist the Poor (CGAP); aconsortium of international public and private housed atthe ; has issued two guidelines to enhance transparentreporting for microfinance institutions i.e. disclosureguidelines for financial reporting and definitions of selectedfinancial terms, ratios and adjustments.
The Bank in its financial statements as at December 31,2010, has complied with the above stated two sets ofguidelines. The CGAP disclosures and ratios are presentedin addition to the requirements of SBP BSD circular 11dated December 30, 2003.
Performance Review
The Bank continues to maintain its position as a largestmicrofinance bank in Pakistan.
The Bank posted a profit before tax of PKR 188m asagainst profit of PKR 252m last year.
The decline in profits result as dependency on non-corebanking activities continues to fall and grant income hasreduced to PKR98m (2009: PKR 250m). Also; interestincome remained suppressed due to impact of non-performing portfolio of flood affected branches. The Bankhas prudently enhanced the level of general provisionfrom 1.5% to 2% of the outstanding loan portfolio inorder to cater for any probable loan losses.
However; the Bank is pursuing a sustainable growthstrategy as approved by the Board of Directors reducingdependence on grant and subsidies. Consequently; theOperational Self Sufficiency (OSS) indicator together withstable outreach target remained the key business objectiveduring the year. The Bank’s OSS (without taking intoaccount grants and cost subsidies) has improved to 105%at the year end as operating profit increased to PKR90m(2009: PKR1m).
In pursuance of the Bank’s strategy of generating lowcost funding for business growth and expansion; the Bankhas accelerated liability drive initially within forty fullservice banking outlets which has helped to scale up itsdeposit base to nearly PKR1b (2009: PKR 190m) at theyear end.
Conversely; the Bank’s advances portfolio was maintainedat PKR 3.62b (2009: PKR3.56b) as growth of portfoliowas curtailed due to devastation of floods in July 2010.
The results of operations under review are presentedbelow;
04
2010Rupees
2009Rupees
174,160,834209,041,695
383,202,529
245,640,26761,657,534
307,297,801
34,832,167
17,416,083
8,708,042
8,708,042
69,664,334
313,538,195
49,128,053
24,264,627
12,282,013
12,282,013
98,256,106
209,041,695

Pattern of Shareholding
The Pattern of shareholding of the Bank as at December 31, 2010 as required under section 236 of the CompaniesOrdinance 1984 is as follows:
05
A N N U A L R E P O R T 2 0 1 0
Credit Ratings
JCR-VIS Credit Rating Company Limited has upgradedKhushhalibank’s entity ratings for medium to long termto “A” and short term to “A-1”.
According to the JCR-VIS these rating reflect good creditquality and adequate protection factors.
Earning Per Share
Basic earning per share has been disclosed under note30 of the financial statements.
Capital Adequacy
As of December 31, 2010 the Bank’s capital adequacyratio (CAR) measure at 44% (2009:41%) as against themandatory requirement of 15% under the PrudentialRegulations (PR) for Microfinance Banks.
Auditors
The present auditors of the company A. F. Ferguson &Co, Chartered Accountants retire and being eligible,
offered themselves for re-appointment in the forthcomingAnnual General Meeting. The Board of Directors on thesuggestion of the Audit Committee recommends A. F.Ferguson & Co, Chartered Accountants for theappointment of next term.
Appreciation and Acknowledgement
On behalf of the Board of the Bank, I would like to expressmy sincere appreciation to the State Bank of Pakistan fortheir guidance and support; to the shareholders andcustomers for their patronage; and to the employees fortheir commitment.
ChairmanMarch 4, 2011

Auditors’ Report to the Members
We have audited the annexed balance sheet of Khushhali Bank Limited (the Bank) as at December 31, 2010 and therelated profit and loss account, cash flow statement and statement of changes in equity together with the notesforming part thereof, for the year then ended and we state that we have obtained all the information and explanationswhich, to the best of our knowledge and belief, were necessary for the proposes of our audit.
It is the responsibility of the Bank’s management to establish and maintain a system of internal control, and prepareand present the above said statements in conformity with the approved accounting standards and the requirementsof the Microfinance Institutions Ordinance, 2001 and the Companies Ordinance, 1984. Our responsibility is to expressan opinion on these statements based on our audit.
We conduct our audit in accordance with the auditing standards as applicable in Pakistan. These standards requirethat we plan and perform the audit to obtain reasonable assurance about whether the above said statements arefree of any material misstatement. An audit includes examining on a test basis, evidence supporting the amountsand disclosures in the above said statements. An audit also includes assessing the accounting policies and significantestimates made by management, as well as evaluating the overall presentation of the above said statements. Webelieve that our audit provides a reasonable basis for our opinion and, after due verification, we report that:
a) in our opinion, proper books of accounts have been kept by the Bank as required by the Companies Ordinance,1984;
b) in our opinion:
i) the balance sheet and profit and loss account together with the notes thereon have been drawn up inconformity with the Microfinance Institutions Ordinance, 2001 and Companies Ordinance, 1984 and arein agreement with the books of accounts and are further in accordance with accounting policies consistentlyapplied;
ii) the expenditure incurred during the year was for the propose of the Bank’s business; and
iii) the business conducted, investments made and the expenditure incurred during the year were in accordancewith the objects of the Bank;
c) in our opinion and to the best of our information and according to the explanations given to us, thebalance sheet, profit and loss account, cash flow statement and statement of changes in equity together withthe notes forming part thereof conform with approved accounting standards as applicable in Pakistan, and, givethe information required by the Microfinance Institutions Ordinance, 2001 and Companies Ordinance 1984, inthe manner so required and respectively give a true and fair view of the state of the Bank’s affairs as atDecember 31, 2010 and of the profit, its cash flows and changes in equity for the year then ended; and
d) in our opinion, no Zakat was deductible at source under the Zakat and Ushr Ordinance 1980 (xvii of 1980).
Islamabad:March 04, 2011
A. F. Ferguson & Co.Chartered Accountants
Name of the audit engagement partner: Kalimuddin Ghauri
06

PRESIDENT CHAIRMAN DIRECTOR DIRECTOR
Balance Sheet as at December 31, 2010
Note 2010Rupees
2009Rupees
07
A N N U A L R E P O R T 2 0 1 0

Profit and Loss Account for the year ended December 31, 2010
PRESIDENT CHAIRMAN DIRECTOR DIRECTOR
Mark-up/ return/ interest earned Mark-up/ return/ interest expensed
Net mark-up/ interest income
Provision against non-performing loans,advances and other assetsBad debts written off directly
Net mark-up/ interest income after provisions
NON MARK-UP/ NON INTEREST INCOMEFee, commission and brokerage incomeOther incomeTotal non mark-up/ non interest income
NON MARK-UP/ NON INTEREST EXPENSESAdministrative expensesOther chargesTotal non-mark-up/ non interest expense
PROFIT BEFORE TAXATIONTaxation - Current
PROFIT AFTER TAXATIONUnappropriated profit brought forward
Profit available for appropriation
APPROPRIATIONS:
Transfer to:
Statutory Reserve
Microfinance Social Development Fund
Depositors' Protection Fund
Risk Mitigation Fund
UNAPPROPRIATED PROFIT CARRIED FORWARD
EARNINGS PER SHARE
The annexed notes from 1 to 39 form an integral part of these financial statements.
20 21
10.5,1210.6
2223
2425
26.2
5.11
5.15
5.15
5.15
30
Note
1,082,724,962256,875,073
825,849,889
96,240,514-
96,240,514
729,609,375
190,177,731316,548,683 506,726,414
1,236,335,789
979,051,0545,279,955
984,331,009
252,004,7806,364,513
245,640,26761,657,534
307,297,801
49,128,053
24,564,027
12,282,013
12,282,013
98,256,106
209,041,695
1.44
2009Rupees
1,221,037,366260,551,582
960,485,784
113,064,596 -
113,064,596
847,421,188
176,725,475192,211,396368,936,871
1,216,358,059
1,024,433,8283,785,769
1,028,219,597
188,138,46213,977,628
174,160,834209,041,695
383,202,529
34,832,167
17,416,083
8,708,042
8,708,042
69,664,334
313,538,195
1.02
2010Rupees
08

A N N U A L R E P O R T 2 0 1 0
252,004,780
66,533,313(17,952,685)
516,99995,280,967
(312,667)(20,661,163)
(258,233,601)(35,651,257)
263,108,534959,547
26,215,725119,803,712
371,808,492
(399,459,544)(638,291,681)(209,988,887)
(1,247,740,112)
171,864,090(15,029,265)
(1,090,905,287)(719,096,795)
264,686,431(2,485,819)
(268,556,077)(24,122,909)
(749,575,169)
(1,636,593,100)1,856,099,600
(97,903,636)23,940,181
145,543,045
(106,072,360)(363,729,480)
-28,070,416
(441,731,424)
(1,045,763,548)
1,610,786,855
565,023,307
188,138,462
67,604,939(6,463,085)7,784,612
112,205,012 -
(20,180,369)(194,489,341)
(1,450,974)265,266,890
859,58426,676,167
257,813,435
445,951,897
(412,462,240)(177,667,881)232,096,947(358,033,174)
810,296,035 (52,110,554)400,152,307846,104,204
216,794,0852,627,872
(254,108,505)(25,675,439)
785,742,217
(1,484,696,300)1,198,354,800
(52,085,563)21,620,743
(316,806,320)
67,363,356 (363,729,480)
2,750,0004,183,230
(289,432,894)
179,503,003
565,023,307
744,526,310
Profit before taxationAdjustments for:
Depreciation and amortizationAmortization of deferred grantAmortization of premium on investments held to maturityProvision against non-performing advancesGain on sale of investmentsGain on sale of operating fixed assetsInterest on investments and deposit accountsGrant incomeFinancial chargesProvision against other assetsProvision for gratuity
(Increase)/decrease in operating assetsLending to financial institutionsAdvancesOther assets (excluding advance taxation)
Increase/(decrease) in operating liabilitiesDeposits and other accountsOther liabilities
Cash flow from operations
Interest receivedIncome taxes paidFinancial charges paidGratuity paid
Net cash flow from operating activities
CASH FLOW FROM INVESTING ACTIVITIES
Investments made during the yearInvestments encashed during the yearPurchase of operating fixed assetsSale proceeds against fixed assetsNet cash flow from investing activities
CASH FLOW FROM FINANCING ACTIVITIES
Borrowings from financial institutionsRepayment of Government of Pakistan LoanGrant from SBI SA Micro SavingsGrant from United State Agency for International Development (USAID)
Net cash used in financing activities
Net increase/(decrease) in cash and cash equivalents
Cash and cash equivalents at beginning of the year
Cash and cash equivalents at end of the year 27
The annexed notes from 1 to 39 form an integral part of these financial statements.
2010Rupees
2009Rupees
CASH FLOW FROM OPERATING ACTIVITIES
Note
Cash Flow Statement for the year ended December 31, 2010
PRESIDENT CHAIRMAN DIRECTOR DIRECTOR
09

PRES
IDEN
TC
HA
IRM
AN
DIR
ECTO
RD
IREC
TOR
Bala
nce
as a
t D
ecem
ber
31, 2
008
Prof
it fo
r th
e ye
ar a
fter
tax
atio
n
Tran
sfer
to:
Stat
utor
y Re
serv
e
Mic
rofin
ance
Soc
ial D
evel
opm
ent
Fund
Risk
Miti
gatio
n Fu
nd
Dep
osito
rs' P
rote
ctio
n Fu
nd
Bala
nce
as a
t D
ecem
ber
31, 2
009
Prof
it fo
r th
e ye
ar a
fter
tax
atio
n
Tran
sfer
to:
Stat
utor
y Re
serv
e
Mic
rofin
ance
Soc
ial D
evel
opm
ent
Fund
Risk
Miti
gatio
n Fu
nd
Dep
osito
rs' P
rote
ctio
n Fu
nd
Bala
nce
as a
t D
ecem
ber
31, 2
010
The
anne
xed
note
s 1
to 3
9 fo
rm a
n in
tegr
al p
art
of t
hese
fin
anci
al s
tate
men
ts.
Shar
e C
apit
alSt
atu
tory
Res
erve
Cap
ital
Res
erve
Res
erve
fo
r C
on
tin
gen
cies
U
nap
pro
pri
ated
Pro
fit
Tota
l
Rupe
esRu
pees
Stat
emen
t o
f C
han
ges
in E
qu
ity
for
the
year
en
ded
Dec
emb
er 3
1, 2
010
60,
643,
340 -
49,
128,
053 - - -
109
,771
,393 -
34,
832,
167 - - -
144
,603
,560
24,
255,
224 - - - - -
24,
255,
224 - - - - -
24,
255,
224
28,
385,
353 - - - - -
28,
385,
353 - - - - -
28,
385,
353
61,
657,
534
245
,640
,267
(49,
128,
053)
(24,
564,
027)
(12,
282,
013)
(12,
282,
013)
209
,041
,695
174
,160
,834
(34,
832,
167)
(17,
416,
083)
(8,7
08,0
42)
(8,7
08,0
42)
313,
538,
195
1,8
79,9
41,4
51
245
,640
,267 -
(24,
564,
027)
(12,
282,
013)
(12,
282,
013)
2,0
76,4
53,6
65
174
,160
,834 -
(17,
416,
083)
(8,7
08,0
42)
(8,7
08,0
42)
2,2
15,7
82,3
32
1,7
05,0
00,0
00 - - - - -
1,7
05,0
00,0
00 - - - - -
1,70
5,00
0,00
0
10

A N N U A L R E P O R T 2 0 1 0
Notes to the Financial Statements for the year ended December 31, 2010
1. STATUS AND NATURE OF BUSINESS
Khushhali Bank (KB) came into existence with the promulgation of the Khushhali Bank Ordinance, 2000 as acorporate body with limited liability on August 4, 2000. It commenced its business with the issuance of licenseby the State Bank of Pakistan (SBP) on August 11, 2000. KB was established to mobilize funds for providingmicrofinance services to poor persons, particularly poor women for mitigating poverty and promoting social welfareand economic justice through community building and social mobilization with the ultimate objective of povertyalleviation.
In year 2008, the Government of Pakistan (GoP) signed Improving Access to Financial Service Program (IAFSP)with Asian Development Bank. In pursuance of the requirements of IAFSP, all microfinance institutions in Pakistanincluding KB need to operate under Microfinance Institutions Ordinance, 2001.
Consequently, SBP prepared a conversion structure for KB which was agreed by the Ministry of Finance GoP. SBPvide its letter dated November 15, 2007 advised KB to proceed with conversion process which primarily requiredKB’s registration with the Securities and Exchange Commission of Pakistan (SECP). Accordingly, an applicationfor incorporation of Khushhali Bank Limited (the Bank) was submitted to SECP on February 15, 2008. SubsequentlySECP on February 28, 2008 issued Certificate of Incorporation of the Bank under the Companies Ordinance, 1984.
SBP vide its letter dated March 18, 2008, under section 47 of the Khushhali Bank Ordinance, 2000 sanctioned ascheme for transfer of assets, liabilities and undertakings of KB into the Bank with effect from April 1, 2008, amicrofinance institution licensed under Microfinance Institutions Ordinance, 2001.
In accordance with the scheme of conversion all assets and liabilities of KB were transferred to the Bank at theirrespective book values based on the audited accounts of KB as of March 31, 2008. Accordingly, the first financialstatements of the Bank were prepared for nine months period ended on December 31, 2008.
The Bank’s registered office and principal place of business is situated at 94-West Jinnah Avenue, Blue Area,Islamabad. The Bank has 109 branches in operation as at December 31, 2010 (December 31, 2009: 107 branches)and is licensed to operate nationwide.
2. BASIS OF PRESENTATION
These financial statements have been presented in accordance with the requirements of format prescribed by theSBP Banking Supervision Department (BSD) Circular number 11 dated December 30, 2003. Additional disclosureshave been presented in compliance with Microfinance Consensus Guidelines issued by Consultative Group toAssist the Poor (CGAP) July, 2003.
3. STATEMENT OF COMPLIANCE
These financial statements have been prepared in accordance with the approved accounting standards as applicablein Pakistan, requirements of the Companies Ordinance, 1984 and Microfinance Institutions Ordinance, 2001.Approved accounting standards comprise of such International Financial Reporting Standards (IFRSs) issued bythe International Accounting Standard Board (IASB) as are notified under the Companies Ordinance, 1984,provisions of and directives issued under the Companies Ordinance, 1984, and Microfinance Institutions Ordinance,2001 or directives issued by SECP and the SBP.
SBP has clarified that International Accounting Standard 39, “Financial Instruments: Recognition and Measurement”and International Accounting Standard 40, “Investment Property" are not applicable to the Bank. Accordingly,the requirements of these Standards have not been considered in the preparation of these financial statements.
3.1 Standards, amendments and interpretations effective in 2010 but not relevant
The following standards, amendments and interpretations to published standards are mandatory for accountingperiods beginning on or after January 1, 2010 but they are not relevant to the Bank's operations.
IFRS 1IFRS 2IFRS 3IFRS 4
First-time adoption of International Financial Reporting StandardsShare-based paymentBusiness combinationsInsurance contracts
11
Changes in existing decommissioning, restoration and similar liabilitiesMembers' shares in co-operative entities and similar instrumentsRights to interest arising from decommissioning, restoration and environmental rehabilitation fundsLiabilities arising from participating in a specific market-waste electrical and electronic equipmentApplying restatement approach under IAS 29 Financial reporting in hyperinflationary economiesReassessment of embedded derivativesInterim financial reporting and impairmentService concession arrangementsCustomer loyalty programmesAgreements for the construction of real estateHedges of a net investment in a foreign operationDistribution of non-cash assets to ownersTransfer of assets from customers
IFRIC 1IFRIC 2IFRIC 5IFRIC 6IFRIC 7IFRIC 9IFRIC 10IFRIC 12IFRIC 13IFRIC 15IFRIC 16IFRIC 17IFRIC 18
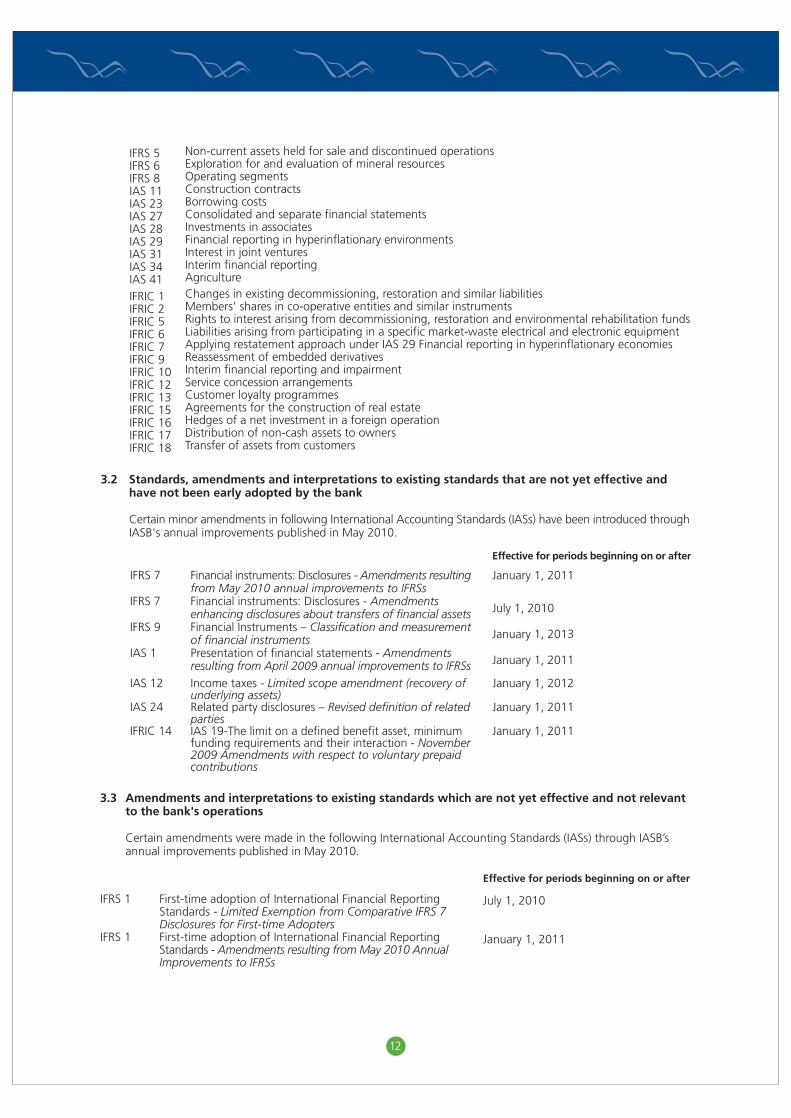
3.2 Standards, amendments and interpretations to existing standards that are not yet effective and have not been early adopted by the bank
Certain minor amendments in following International Accounting Standards (IASs) have been introduced throughIASB's annual improvements published in May 2010.
IFRS 7
IFRS 7
IFRS 9
IAS 1
Effective for periods beginning on or after
January 1, 2011
July 1, 2010
January 1, 2013
January 1, 2011
Financial instruments: Disclosures - Amendments resultingfrom May 2010 annual improvements to IFRSsFinancial instruments: Disclosures - Amendmentsenhancing disclosures about transfers of financial assetsFinancial Instruments – Classification and measurementof financial instrumentsPresentation of financial statements - Amendmentsresulting from April 2009 annual improvements to IFRSs
IAS 12
IAS 24
IFRIC 14
January 1, 2012
January 1, 2011
January 1, 2011
Income taxes - Limited scope amendment (recovery ofunderlying assets)Related party disclosures – Revised definition of relatedpartiesIAS 19-The limit on a defined benefit asset, minimumfunding requirements and their interaction - November2009 Amendments with respect to voluntary prepaidcontributions
Non-current assets held for sale and discontinued operationsExploration for and evaluation of mineral resourcesOperating segmentsConstruction contractsBorrowing costsConsolidated and separate financial statementsInvestments in associatesFinancial reporting in hyperinflationary environmentsInterest in joint venturesInterim financial reportingAgriculture
IFRS 5IFRS 6IFRS 8IAS 11IAS 23IAS 27IAS 28IAS 29IAS 31IAS 34IAS 41
3.3 Amendments and interpretations to existing standards which are not yet effective and not relevant to the bank's operations
Certain amendments were made in the following International Accounting Standards (IASs) through IASB’s annual improvements published in May 2010.
IFRS 1
IFRS 1
First-time adoption of International Financial ReportingStandards - Limited Exemption from Comparative IFRS 7Disclosures for First-time AdoptersFirst-time adoption of International Financial ReportingStandards - Amendments resulting from May 2010 AnnualImprovements to IFRSs
Effective for periods beginning on or after
July 1, 2010
January 1, 2011
12

A N N U A L R E P O R T 2 0 1 0
4. BASIS OF MEASUREMENT
These financial statements have been prepared under the historical cost convention as modified for obligationsunder employee retirement benefits, which are measured at present value and investments available for sale,which are measured at mark-to-market basis.
The preparation of financial statements in conformity with approved accounting standards, as applicable inPakistan, requires the use of certain accounting estimates and judgments in application of accounting policies.The area involving a high degree of judgment or complexity, or areas where assumptions and estimates aresignificant to the financial statements, are disclosed in note 5.25.
5. SUMMARY OF SIGNIFICANT ACCOUNTING POLICIES
5.1 Cash and cash equivalents
Cash and cash equivalents comprise of cash in hand, balances with treasury banks, balances with other banksand call money lending.
5.2 Sale and repurchase agreements
Securities sold under repurchase agreement (repo) are retained in the financial statements as investments and aliability for consideration received is included in borrowings. Conversely, consideration for securities purchasedunder resale agreement (reverse repo) is included in lending to financial institutions. The difference between,sale and repurchase, purchase and resale price is treated as mark-up / return expensed and earned, as the casemay be. Repo and reverse repo balances are reflected under borrowings from and lending to financial institutionsrespectively.
5.3 Investments
All purchases and sale of investments are recognized using settlement date accounting. Settlement date is thedate on which investments are delivered to or by the Bank. All investments are derecognized when the right toreceive economic benefits from the investments has expired or has been transferred and the Bank has transferredsubstantially all the risks and rewards of ownership.
Investments are classified as follows:
Held for trading investments
These represent securities acquired with the intention to trade by taking advantage of short-term market/ interestrate movements. These are measured at mark-to-market and surplus/ deficit arising on revaluation of ‘held fortrading’ investments is taken to profit and loss account.
IFRS 1
IFRS 1
IFRS 3
IAS 27
IAS 32
IAS 34
IFRIC 13
IFRIC 19
First-time adoption of International Financial ReportingStandards - Replacement of 'fixed dates' for certainexceptions with 'the date of transition to IFRSs'First-time adoption of International Financial ReportingStandards - Additional exemption for entities ceasing tosuffer from severe hyperinflationBusiness combinations - Amendments resulting from May2010 Annual Improvements to IFRSsConsolidated and separate financial statements -Amendments resulting from May 2010 AnnualImprovements to IFRSsFinancial instruments: Presentation - Amendments relatingto classification of rights issuesInterim financial reporting - Amendments resulting fromMay 2010 Annual Improvements to IFRSsCustomer loyalty programmes - Amendments resultingfrom May 2010 Annual Improvements to IFRSsExtinguishing Financial Liabilities with Equity Instruments
Effective for periods beginning on or after
July 1, 2010
July 1, 2010
July 1, 2010
July 1, 2010
February 1, 2010
January 1, 2011
January 1, 2011
July 1, 2010
13
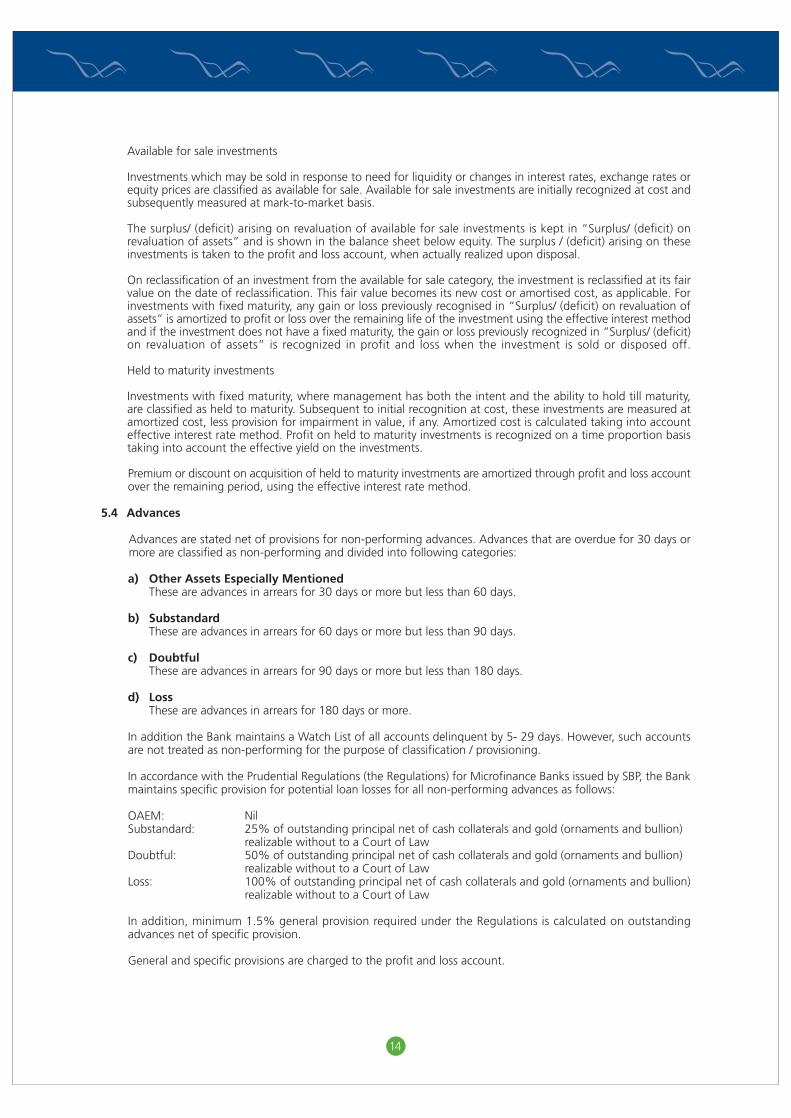
Premium or discount on acquisition of held to maturity investments are amortized through profit and loss accountover the remaining period, using the effective interest rate method.
5.4 Advances
Advances are stated net of provisions for non-performing advances. Advances that are overdue for 30 days ormore are classified as non-performing and divided into following categories:
a) Other Assets Especially MentionedThese are advances in arrears for 30 days or more but less than 60 days.
b) SubstandardThese are advances in arrears for 60 days or more but less than 90 days.
c) DoubtfulThese are advances in arrears for 90 days or more but less than 180 days.
d) LossThese are advances in arrears for 180 days or more.
In addition the Bank maintains a Watch List of all accounts delinquent by 5- 29 days. However, such accountsare not treated as non-performing for the purpose of classification / provisioning.
In accordance with the Prudential Regulations (the Regulations) for Microfinance Banks issued by SBP, the Bankmaintains specific provision for potential loan losses for all non-performing advances as follows:
OAEM: NilSubstandard: 25% of outstanding principal net of cash collaterals and gold (ornaments and bullion)
realizable without to a Court of LawDoubtful: 50% of outstanding principal net of cash collaterals and gold (ornaments and bullion)
realizable without to a Court of LawLoss: 100% of outstanding principal net of cash collaterals and gold (ornaments and bullion) realizable without to a Court of Law
In addition, minimum 1.5% general provision required under the Regulations is calculated on outstandingadvances net of specific provision.
General and specific provisions are charged to the profit and loss account.
Available for sale investments
Investments which may be sold in response to need for liquidity or changes in interest rates, exchange rates orequity prices are classified as available for sale. Available for sale investments are initially recognized at cost andsubsequently measured at mark-to-market basis.
The surplus/ (deficit) arising on revaluation of available for sale investments is kept in “Surplus/ (deficit) onrevaluation of assets” and is shown in the balance sheet below equity. The surplus / (deficit) arising on theseinvestments is taken to the profit and loss account, when actually realized upon disposal.
On reclassification of an investment from the available for sale category, the investment is reclassified at its fairvalue on the date of reclassification. This fair value becomes its new cost or amortised cost, as applicable. Forinvestments with fixed maturity, any gain or loss previously recognised in “Surplus/ (deficit) on revaluation ofassets” is amortized to profit or loss over the remaining life of the investment using the effective interest methodand if the investment does not have a fixed maturity, the gain or loss previously recognized in “Surplus/ (deficit)on revaluation of assets” is recognized in profit and loss when the investment is sold or disposed off.
Held to maturity investments
Investments with fixed maturity, where management has both the intent and the ability to hold till maturity,are classified as held to maturity. Subsequent to initial recognition at cost, these investments are measured atamortized cost, less provision for impairment in value, if any. Amortized cost is calculated taking into accounteffective interest rate method. Profit on held to maturity investments is recognized on a time proportion basistaking into account the effective yield on the investments.
14

A N N U A L R E P O R T 2 0 1 0
In accordance with the Regulations, non-performing advances are written-off one month after the loan iscategorized as Loss. However, the Bank continues its efforts for recovery of the written-off balances.
Under exceptional circumstances management reschedules repayment terms for clients who have sufferedcatastrophic events and who appear willing and able to fully repay their loans. The classification made as perthe State Bank of Pakistan’s prudential regulation is not changed due to such rescheduling. The accrued markuptill the date of rescheduling is received prior to such rescheduling.
5.5 Operating fixed assets
Property and equipment
Property and equipment are stated at cost less accumulated depreciation and accumulated impairment losses,if any. Cost includes expenditure that is directly attributable to the acquisition of the asset and the costs ofdismantling and removing the items and restoring the site on which they are located, if any.
Depreciation is charged on the straight line basis at rates specified in note 11.1 to the financial statements, soas to write off the cost of assets over their estimated useful lives. Depreciation is charged on additions anddeletions based on number of months the assets are available for use.
Subsequent costs are included in the assets carrying amount when it is probable that future economic benefitsassociated with the item will flow to the Bank and the cost of the item can be measured reliably. Carryingamount of the replaced part is derecognized. All other repair and maintenance are charged to income duringthe period.
Gain and losses on disposal of an item of property and equipment are determined by comparing the proceedsfrom disposal with the carrying amounts of fixed asset and are recognized within "other income" in the profitand loss account.
Intangible assets
An intangible asset is recognized if it is probable that the future economic benefits that are attributable to theasset will flow to the enterprise and that the cost of such asset can also be measured reliably. These are statedat cost less accumulated amortization and impairment losses, if any.
Intangible assets comprise of computer software and related applications. Intangible assets are amortized overtheir estimated useful lives at rate specified in note 11.2.1 to the financial statements. Subsequent expenditureis capitalized only when it increases the future economic benefit embodied in the specific asset to which itrelates. All other expenditure is recognized in profit and loss account as incurred.
5.6 Impairment
The carrying amounts of the Banks’ non-financial assets are reviewed at each reporting date to determinewhether there is any indication of impairment. If any such indication exists then the asset’s recoverable amountis estimated.
An impairment loss is recognized if the carrying amount of an asset or its cash-generating unit exceeds itsrecoverable amount. A cash-generating unit is the smallest identifiable asset group that generates cash flowsthat largely are independent from other assets and groups. Impairment losses are recognized in profit or lossaccount. Impairment losses recognized in respect of cash-generating units are allocated first to reduce thecarrying amount of any goodwill allocated to the units and then to reduce the carrying amount of the otherassets in the unit (group of units) on a pro rata basis.
The recoverable amount of an asset or cash-generating unit is the greater of its value in use and its fair valueless costs to sell. In assessing value in use, the estimated future cash flows are discounted to their present valueusing a pre-tax discount rate that reflects current market assessments of the time value of money and the risksspecific to the asset.
5.7 Deposits
Deposits are initially recorded at the amount of proceeds received. Mark-up accrued on deposits, if any isrecognised separately as part of other liabilities, and is charged to the profit and loss account over the period.
5.8 Taxation
Current
Current tax is the tax payable on the taxable income for the year, using tax rates enacted or substantively
15

enacted at the reporting date, taking into account tax credits, rebates and tax losses, if any, and any adjustmentto tax payable in respect of previous years.
Deferred
Deferred tax is accounted for on all major taxable temporary differences between the carrying amounts of assetsfor financial reporting purposes and their taxation base. A deferred tax asset is recognized only to the extentthat it is probable that future taxable profits will be available against which the asset can be utilized. Deferredtax assets are reduced to the extent that it is no longer probable that the related tax benefit will be realized.At each balance sheet date, the Bank reassesses the carrying and the unrecognized amount of deferred taxassets.
Deferred tax assets and liabilities are calculated at the rate that are expected to apply to the period when theasset is realised or the liability is settled, based on the tax rates (and tax laws) that have been enacted orsubstantively enacted by the balance sheet date.
Deferred tax, on revaluation of investments, if any, is recognized as an adjustment to surplus/ (deficit) arisingon such revaluation.
5.9 Employee benefits
Salaries, wages and benefits are accrued in the period in which the associated services are rendered by employeesof the Bank. The accounting policy for post retirement benefit- gratuity is described below:
Post retirement benefit
The Bank operates an approved gratuity scheme for all eligible employees completing the minimum qualifyingperiod of service as specified by the employee rules. Provision is made annually to cover obligations under thescheme in accordance with the actuarial recommendations. Relevant details are given in note 15.1 to the financialstatements.
Actuarial gain and losses in excess of ten percent (10%) of the present value of the defined benefit obligationare recognized over the expected average future working lives of the employees participating in the scheme.
The amount recognized in the balance sheet date represents the present value of the defined benefit obligationadjusted for unrecognized actuarial gains and losses.
5.10 Mark-up bearing borrowings
Mark-up bearing borrowings are recognized initially at cost being the fair value of consideration received, lessattributable transaction costs. Subsequent to initial recognition mark-up bearing borrowings are stated at originalcost less subsequent repayments.
5.11 Statutory reserve
In compliance with the Regulations, the Bank is required to maintain a statutory reserve to which an appropriationequivalent to 20% of the profit after tax is made till such time the reserve fund equals the paid up capital ofthe Bank. However, thereafter, the contribution is reduced to 5% of the profit after tax.
5.12 Capital reserve
Pursuant to the Scheme of conversion, as fully explained in note 1 to the financial statements, the unappropriatedprofit of KB has been treated as Capital reserve of the Bank.
5.13 Cash reserve and liquidity
In compliance with the regulations, the Bank maintains a cash reserve equivalent to not less than 5% of its timeand demand liabilities in a current account opened with the State Bank of Pakistan. In addition to the cashreserve it also maintains liquidity equivalent to at least 10% of its time and demand liabilities in the form ofliquid assets i.e. cash, gold and unencumbered approved securities.
5.14 Reserve for contingencies
Reserve for contingencies was created for risk assets comprising advances, as a matter of prudence and tocomply with the additional requirements of Asian Development Bank (ADB) for the first five years of KB operationswhich were completed on February 6, 2006.
16

A N N U A L R E P O R T 2 0 1 0
5.15 Contributions
In compliance with the Regulations, the Bank contributes towards the following funds held by SBP;
Microfinance Social Development Fund: 10% of profit after taxDepositor’s Protection Fund: 5% of profit after tax
In addition to above the Bank also contributes 5% of its profit after tax to Risk Mitigation Fund being maintainedwith SBP in pursuance of the requirements of the Sub-Loan agreement with SBP.
5.16 Grants
Grants that compensate the Bank for expenses incurred are recognised in the profit and loss account as otheroperating income on a systematic basis in the same periods in which the expenses are incurred.
Grants that compensate the Bank for the cost of an asset are recognized in the profit and loss account as otheroperating income on a systematic basis over the useful life of the asset.
The grant related to an asset is recognised in the balance sheet initially as deferred income when there isreasonable assurance that it will be received and that the Bank will comply with the conditions attached to it.
5.17 Revenue recognition
Mark-up/ return on advances is recognized on accrual/ time proportion basis, except for income, if any, whichwarrants suspension in compliance with the Regulations. Mark-up recoverable on non-performing advances isrecognized on a receipt basis in accordance with the requirements of the Regulations. Loan processing fee isrecognized as income on the approval of loan application of borrowers.
Mark-up/ return on investments is recognised on time proportion basis using effective interest method. Wheredebt securities are purchased at premium or discount, those premiums/ discounts are amortised through theprofit and loss account over the remaining period of maturity.
Income from interbank deposits in saving accounts is recognized in the profit and loss account as it accruesusing the effective interest method.
Gains and losses on sale of investments are included in profit and loss account currently.
Gains and losses on sale of operating fixed assets are recognised in the profit and loss account.
5.18 Borrowing costs
Mark up, interest and other charges on borrowings are charged to income in the period in which they areincurred.
5.19 Operating leases
Operating lease rentals are recorded in profit and loss account on a time proportion basis over the term of thelease arrangements.
5.20 Financial instruments
Financial assets and liabilities are recognized when the Bank becomes a party to the contractual provisions ofthe instrument. These are derecognized when the Bank ceases to be the party to the contractual provisions ofthe instrument.
All financial assets and liabilities are initially measured at cost which is the fair value of the consideration givenand received respectively. These financial assets and liabilities are subsequently measured at fair value, amortisedcost or cost, as the case may be.
Financial assets
Financial assets are cash and balances with SBP and NBP, balances with other banks, lending to financialinstitutions, investments, advances and other receivables. Advances are stated at their nominal value as reducedby appropriate provisions against non-performing advances, while other financial assets excluding investmentsare stated at cost. Investments classified as available for sale are valued at mark-to-market basis and investmentsclassified as held to maturity are stated at amortized cost.
17

Financial liabilities
Financial liabilities are classified according to the substance of the contractual arrangement entered into. Financialliabilities include borrowings and other liabilities which are stated at their nominal value. Financial charges areaccounted for on accrual basis.
Any gain or loss on the recognition and derecognition of the financial assets and liabilities is included in thenet profit and loss for the period in which it arises.
5.21 Impairment – Financial Assets
A financial asset is considered to be impaired if objective evidence indicates that one or more events have hada negative effect on the estimated future cash flows of that asset.
An impairment loss in respect of a financial asset measured at amortized cost is calculated as the differencebetween its carrying amount, and the present value of the estimated future cash flows discounted at the originaleffective interest rate.
Individually significant financial assets are tested for impairment on an individual basis. The remaining financialassets are assessed collectively in groups that share similar credit risk characteristics. All impairment losses arerecognized in profit or loss.
An impairment loss is reversed if the reversal can be related objectively to an event occurring after the impairmentloss was recognized. For financial assets measured at amortized cost and the reversal is recognized in profit andloss account.
5.22 Off-setting
Financial assets and financial liabilities and tax assets and tax liabilities are only off-set and the net amount isreported in the financial statements when there is a legally enforceable right to set off the recognized amountand the Bank intends either to settle on net basis or to realize the assets and to settle the liabilities simultaneously.Income and expense items of such assets and liabilities are also off-set and the net amount is reported in thefinancial statements.
5.23 Foreign currencies
Transactions in foreign currencies are recorded at the approximate rates of exchange ruling on the date of thetransaction. All monetary assets and liabilities denominated in foreign currencies are translated into PKR at therate of exchange ruling on the balance sheet date and exchange differences, if any, are charged to profit andloss account for the year.
5.24 Provisions
Provisions are recognized when the Bank has a legal or constructive obligation as a result of past events, it ispossible that an outflow of resources embodying economic benefits will be required to settle the obligation andreliable estimate of the amount can be made.
5.25 Use of Critical accounting estimates and judgments
The preparation of financial statements in conformity with approved accounting standards as applicable inPakistan requires the use of certain accounting estimates. It also requires management to exercise its judgmentin the process of applying the Bank's accounting policies. The Bank uses estimates and assumptions concerningthe future. The resulting accounting estimate will, by definition, seldom equal the related actual results. Estimatesand judgments are continually evaluated and are based on historical experience and other factors, includingexpectations of future events that are believed to be reasonable under the circumstances. The areas whereassumptions and estimates are significant to the Bank's financial statements or where judgment was exercisedin application of accounting policies are as follows:
a) classification of investments.b) provision against advances.c) useful life of operating fixed assets.d) income taxes.e) staff retirement benefits.
18

A N N U A L R E P O R T 2 0 1 0
8. LENDING TO FINANCIAL INSTITUTIONS
Repurchase agreement lending (reverse repo) 8.1 811,921,784 399,459,544
Clean lending 8.2 100,000,000 100,000,000Less: Provision for impairment 100,000,000 100,000,000
- - 811,921,784 399,459,544
8.1 This represents reverse repo at the rate of 12.50% and 12.70% per annum ( 2009: 12.10%) maturing onJanuary 3, 2011 and January 5, 2011 (2009: January 4, 2010).
8.1.1 Securities held as collateral against lending to financial institutions
6.1 This represents balance maintained with SBP to meet the requirement of maintaining minimum balance equivalent to 5% (2009: 5%) of the Bank's time and demand liabilities in accordance with regulation 6A ofthe Regulations.
6.2 This represent balances held across the network for the purpose of lending to borrowers and recoveriesfrom customers, which carry an interest rate of 5% (2009: 5%) per annum.
7.1 This represent balances held across the network for the purpose of lending to borrowers and recoveries fromcustomers, which carry interest rates ranging from 5% to 10.55% (2009: 5% to 11% ) per annum. This alsoincludes Term Deposit Receipts amounting to Rs. Nil (2009 : Rs. 300 million) with local commercial bankscarrying interest rates ranging Nil (2009:12.25% to 13.25% ) per annum with maturity Nil (2009: up to onemonth).
7. BALANCES WITH OTHER BANKS/ NBFIs/ MFBs
In Pakistan Local currency current accounts 424,870,487 131,775,147 Local currency deposit accounts 7.1 156,543,810 340,617,687 Foreign currency current account - 13,450,760
581,414,297 485,843,594
2010Rupees
2009Rupees
Note
2010Rupees
2009Rupees
Note
2010Rupees
Further givenas collateralHeld by Bank Total
2009Rupees
Further givenas collateralHeld by Bank Total
824,000,000 - 824,000,00Market Treasury Bills (T-Bills)
Note 2010 2009 Rupees Rupees
6. CASH AND BALANCES WITH SBP AND NBP
Cash in hand Local currency 65,899,409 40,731,544
Balances with State Bank of Pakistan (SBP) in: Local currency current accounts 6.1 73,741,966 23,518,667
Balances with National Bank of Pakistan (NBP) in: Local currency current accounts 21,023,219 8,195,956
Local currency deposit accounts 6.2 2,447,419 6,733,546
23,470,638 14,929,502
163,112,013 79,179,713
19
412,000,000 - 412,000,000

8.2 This represents amount placed with Innovative Housing Finance Limited (IHFL) formerly, Crescent StandardInvestment Bank Limited. The amount was initially given as a clean lending and was being rolled over onmaturity dates due to liquidity problems of IHFL. On June 30, 2007, the Bank entered into an agreement withIHFL under which the principal amount was restructured for a period of seven years, with two years graceperiod, from the date of the agreement. Pursuant to the agreement, the principal is repayable by IHFL in 10equal biannual installments, starting from December 31, 2009. IHFL is also required to pay markup on quarterlybasis at the rate of 5% per annum calculated on the outstanding principal after the expiry of the grace period.On the due date of the first instalment, IHFL defaulted its first payment due to liquidty problems. Moreover,the Bank has fully provided the investment as advised by SBP. The Securities and Exchange Commisison ofPakistan has superceded the Board of Directors of IHFL in January 2010 and appointed its administrator torevive the IHFL.
9.1 This represents T-Bills purchased for the year ranging from 82 days to 364 days (2009: 182 days to 364 days)having yield interest ranging from 12.10% to 13.35% (2009: 12.15% to 13.25%) per annum. T-Bills amountingto Rs. Nil (2009: Rs. 167 million) are given as collateral against borrowings (note - 14.3).
9.2 In compliance with the requirements of the Regulations, available for sale investments have been valued onmark-to market basis and the resulting (deficit) / surplus is kept in a separate account and is shown below theshareholders' equity in the balance sheet.
9.3 This represents 10 year PIBs with maturity in 2011 having yield interest ranging from 12% to 13% (2009: 12%to 13%) per annum, receivable on semi-annual basis. Market value of held to maturity PIBs at year end wasRs. 338 million (2009: Rs. 334 million). PIBs amounting to Rs. 202 million (2009: Nil) are given as collateralagainst borrowings (note - 14.3)
9. INVESTMENTS - NET OF PROVISIONS
Federal Government SecuritiesAvailable for sale securities
Market Treasury Bills (T-Bills) 9.1 895,493,800 609,152,300Add: (Deficit) / Surplus on revaluation of
available for sale securities 9.2 (534,059) 1,506,460 894,959,741 610,658,760
Held to maturity investments
Pakistan Investment Bonds (PIBs) 9.3 357,830,325 365,614,937
1,252,790,066 976,273,697
2010Rupees
2009Rupees
Note
10. ADVANCES - NET OF PROVISIONS 2010 2009
Loan type Note No. of loans Amount No. of loans Amount outstanding outstanding outstanding outstanding
Rupees Rupees
Micro credit 10.1 325,523 3,722,152,797 329,421 3,630,204,658Less: Provisions held
Specific provision 10.2 9,820 (28,004,701) 9,661 (18,646,565)General provision 10.3 324,112 (72,737,776) 328,281 (55,610,642)
(100,742,477) (74,257,207)
Advances - net of provisions 3,621,410,320 3,555,947,451
10.1 This includes 784 rescheduled micro credit advances having aggregate value of Rs.11.22 million (2009: Nil)related to flood affected branches.
20

A N N U A L R E P O R T 2 0 1 0
10.2 This includes provision of Rs. 0.86 million (2009: Nil) against micro credit advances rescheduled during the year,related to flood affected branches, in accordance with SBP's circular number MFD 4 dated November 2, 2010.
10.3 General provision is maintained at the rate of 2% of micro credit advances net of specific provision. The ratehas been increased for the current year from 1.5% to 2% approximately, to prudently manage credit risk relatedto micro credit advances of flood affected branches.
10.4 Particulars of non-performing advances
Advances include Rs. 146.02 million (2009: Rs. 50.33 million) which, as detailed below, have been placed undernon-performing status.
10.7 Portfolio quality report
The Bank's main measure of loan delinquency is an aged portfolio-at-risk ratio. Loans are separated into classesdepending on the number of days they are over-due. For each of such class of loan, the outstanding principalbalance of such loan is divided by the outstanding principal balance of the gross loan portfolio before deductingallowance for non-performing advances. Loans are considered overdue if any payment has fallen due andremained unpaid. Loans payment are applied first to any interest due, then to any instalment of principal thatis due but unpaid, beginning with the earliest such instalment. The number of days of delay is based on thedue date of the earliest loan instalment that has not been fully paid. The Bank does not charge late paymentsurcharge / penalty on overdue advances into principal.
10.5 Particulars of provisions against non-performing advances
10.6 Particulars of write offs
Against provisionsDirectly charged to profit and loss account
2009Rupees
2010Rupees
85,719,742-
85,719,742
101,422,658-
101,422,658
2010 2009Amount Provisions Provisions Amount Provisions Provisions
Category of classification outstanding required held outstanding required held Rupees Rupees
OAEMSub-StandardDoubtfulLossTotal
83,702,027 28,735,564 25,515,694 8,062,963
146,016,248
- 7,183,891
12,757,847 8,062,963
28,004,701
- 7,183,891
12,757,847 8,062,963
28,004,701
13,885,048 10,831,936 19,355,982 6,260,590
50,333,556
- 2,707,984 9,677,991 6,260,590
18,646,565
- 2,707,984 9,677,991 6,260,590
18,646,565
Balance at beginning of the yearCharge for the yearAmounts written offBalance at end of the year
18,646,56595,077,878
(85,719,742) 28,004,701
55,610,64217,127,134
- 72,737,776
74,257,207112,205,012 (85,719,742) 100,742,477
29,440,47090,628,753
(101,422,658) 18,646,565
50,958,4284,652,214
- 55,610,642
80,398,89895,280,967
(101,422,658) 74,257,207
Normal Loans
Current1 - 29 days late30 - 59 days late60 - 89 days late90 - 179 days lateMore than 179 days late
Amount Rupees Portfolio at Risk
3,562,624,254 17,246,848 13,885,048 10,831,936 19,355,982 6,260,590
3,630,204,658
-0.48%0.38%0.30%0.53%0.17%1.86%
2010 2009
-2.25%2.09%0.68%0.69%0.22%5.93%
3,490,737,750 83,711,428 77,618,714 25,282,496 25,515,694 8,062,963
3,710,929,045
Amount Rupees Portfolio at Risk
21

Current1 - 29 days late30 - 59 days late60 - 89 days late90 - 179 days lateMore than 179 days late
Amount Rupees Portfolio at Risk
- - - - - - -
- - - - - - -
2010 2009
-0.04%0.16%0.09%
- -
0.29%
25,000 1,662,371 6,083,313 3,453,068
- -
11,223,752
Amount Rupees Portfolio at Risk
10.8 Current recovery ratio
The Bank measures loan delinquency using a current recovery ratio. The numerator of this ratio is total cashpayments of principal and interest received during the reporting period (including prepayments and late payments).The denominator is total payments of principal and interest that fell due for the first time during the reportingperiod, as per the terms of the original loan contract (regardless of any subsequent negotiations). Penalty interestis not included in the numerator or denominator of the ratio.
Annual loss rate for the year is 0% (2009: 0%) computed using the following formula. The actual loss rateis below 0% due to early repayments of principal outstanding.
ALR = (1 - CR) / T x 2where:ALR is the annual loss rateCR is the collection rate in decimal formT is the loan term expressed in years
Period1st quarter2nd quarter3rd quarter4th quarterJanuary - December
2010136.7%132.9%126.6%138.0%133.6%
2009138.8%143.3%133.9%162.9%144.7%
Current Recovery Ratio
10.8.1 Current recovery ratios are calculated and reported on a quarterly basis. These ratios are prepared and presentedusing the portfolio indicators reports prepared by the management. The numerator of this ratio is total cashpayments of principal and service charge received during the reporting period. The denominator is the total loansfalling due during the period along with the payments in arrears at the start of the period including service charge.
10.9 Loan loss allowance
Normal loans
Current1 - 29 days late30 - 59 days late60 - 89 days late90 - 179 days lateMore than 179 days late
Renegotiated loansCurrent1 - 29 days late30 - 59 days late60 - 89 days late90 - 179 days lateMore than 179 days late
Share oftotal
93.8%2.2%2.1%0.7%0.7%0.2%
0.0%0.0%0.2%0.1%
- -
100%
Rupees
3,490,737,750 83,711,428 77,618,714 25,282,496 25,515,694 8,062,963
25,000 1,662,371 6,083,313 3,453,068
- -
3,722,152,797
Share oftotal
- - -
22.6%45.6%28.8%
- - -
3.0% - -
100%
Rupees
- - -
6,320,624 12,757,847 8,062,963
- - -
863,267 - -
28,004,701
Share oftotal
98.1%0.5%0.4%0.3%0.5%0.2%
- - - - - -
100%
Rupees
3,562,624,254 17,246,848 13,885,048 10,831,936 19,355,982 6,260,590
- - - - - -
3,630,204,658
Share oftotal
- - -
14.5%51.9%33.6%
- - - - - -
100%
Rupees
- - -
2,707,984 9,677,991 6,260,590
- - - - - -
18,646,565
Outstanding loanportfolio (principal)
Allowance forloan loss
Outstanding loanportfolio (principal)
Allowance forloan loss
2010 2009
22
Rescheduled Loans

A N N U A L R E P O R T 2 0 1 0
11. OPERATING FIXED ASSETS
Property and equipment Intangible assets
2009Rupees
2010Rupees
161,974,9646,743,722
168,718,686
175,718,5769,959,858
185,678,434
Note
11.111.2
11.1 Property and equipment
Furniture andfixtures
Electrical andoffice
equipment
Computerequipment
Rupees
Vehicles Total
Cost
Opening CostAdditions during the yearDisposals during the yearBalance as at December 31, 2009
Balance as at January 1, 2010Additions during the yearDisposals during the yearBalance as at December 31, 2010
Depreciation
Opening accumulated depreciationDepreciation charge for the yearDisposals during the yearBalance as at December 31, 2009
Balance as at January 1, 2010Depreciation charge for the yearDisposals during the yearBalance as at December 31, 2010
Carrying value
20092010
Rates of depreciation per annum
77,373,884 20,425,398 (4,080,720) 93,718,562
93,718,562 17,011,568 (2,810,484)
107,919,646
23,246,820 8,434,104
(2,063,941) 29,616,983
29,616,983 10,102,958 (1,604,379)
38,115,562
64,101,579 69,804,084
10%
82,714,634 27,200,567 (5,957,596)
103,957,605
103,957,605 17,109,779 (2,942,287)
118,125,097
47,101,537 15,223,770 (5,443,201) 56,882,106
56,882,106 15,768,552 (2,743,547)
69,907,111
47,075,499 48,217,986
20%
70,437,567 43,492,406 (2,629,495)
111,300,478
111,300,478 12,657,199 (2,914,095)
121,043,582
48,616,910 15,926,772 (2,576,579) 61,967,103
61,967,103 25,260,314 (2,912,316)
84,315,101
49,333,375 36,728,481
33.33%
307,366,957 2,494
(37,478,664)
269,890,787
269,890,787 1,905,610
(37,810,982) 233,985,415
269,139,908 22,328,984
(36,786,228)
254,682,664
254,682,664 9,855,572
(37,777,234)
226,761,002
15,208,123 7,224,413
25%
537,893,042 91,120,865
(50,146,475) 578,867,432
578,867,432 48,684,156
(46,477,848) 581,073,740
388,105,175 61,913,630
(46,869,949) 403,148,856
403,148,856 60,987,396
(45,037,476)
419,098,776
175,718,576 161,974,964
11.1.1 Depreciation for the year includes Rs. 6.46 million (2009 : Rs. 17.95 million) being the depreciation charged on assetsacquired as grant, as explained in detail in note 18.1 and 23.1 to the financial statements.
11.1.2 The gross carrying amount of fully depreciated property and equipment that are still in use is Rs. 282.47 million (2009:Rs. 263.57 million).
11.1.3 Details of fixed assets disposed with the original cost or book value in excess of Rs.1 million or Rs. 250,000 respectively;whichever is less; are as under:
Particulars
Toyota HiluxToyota HiluxToyota HiluxHonda Civic VTI Oriel
Cost
2,267,450 2,267,450 2,267,450 1,128,610
Book valueRupees
1 1 1
21,392
Sale Proceed
925,000 970,000 845,000 805,000
Mode of disposal
AuctionAuctionAuctionAuction
Particulars ofpurchaser / (insurer)
Mr. Muhammad ShahidMr. Aurangzeb KhanMr. Dil Sheeraz KhanMr. Sheikh Muhammad Ali
23

11.2 Intangible assetsComputer softwareCostBalance as at the beginning of the yearAdditions during the yearDisposals during the yearBalance as at the end of the year
Amortization
Balance as at the beginning of the yearCharge for the yearDisposals during the yearBalance as at the end of the year
Carrying value
14,717,092 6,782,771
(1,207,841) 20,292,022
(6,917,830) (4,619,683) 1,205,349
(10,332,164)
9,959,858
20,292,022 3,401,407
- 23,693,429
(10,332,164) (6,617,543)
- (16,949,707)
6,743,722
11.2.1 Amortization is charged on straight line basis @ 33.33 % per annum, starting from the month the asset is availablefor use.
11.2.2 The gross carrying amount of fully amortized intangible assets that are still in use is Rs. 4.4 million (2009: Rs.4.05million)
2009Rupees
2010Rupees
12. OTHER ASSETS
Mark-up accruedLess: suspended markup on non-performing advances
Interest receivable on investments and bank depositsLoans and advances - unsecured, considered good
Employees Suppliers
DepositsPrepaymentsAdvance taxation - net of provision Receivable from Microfinance Social Development Fund 23.2Receivable from Emergency Livelihood Restoration Fund for:
Equity support 12.1Operational cost support 23.3Community group formation 23.3
Receivable from USAID 23.1Insurance claims receivableReceivable from SBP 12.2Other receivables
Less: provisions held against classified other assets
Opening provision Provision for the year Receivables written off against provision
312,774,716 (6,643,527)
306,131,189 42,554,911
64,442,211 8,985,953
73,428,164 743,345
43,788,073 40,564,887
150,035,943
162,621,000 56,010,853 18,519,600
237,151,4535,838,841 3,294,143
- 3,341,143
906,872,092
6,033,916 959,547
(5,518,040)
1,475,423 905,396,669
2010Rupees
2009Rupees
Note
366,295,282 (21,154,747) 345,140,535 20,250,167
79,885,179 18,758,987 98,644,166 2,040,895
49,855,825 23,959,387 79,843,051
- - - -
3,106,585 4,761,709 8,701,146 4,045,440
640,348,906
1,475,423859,584
(1,291,374)
1,043,633 639,305,273
24

A N N U A L R E P O R T 2 0 1 0
12.1 This represents amount paid on behalf of Emergency Livelihood Restoration Programme (ELRP) launched by GoPduring February 2006. The objective of ELRP was to revive local economies and reduce dependence on relief toaffected households of October 8, 2005 earthquake. For the purposes of ELRP, Earthquake Livelihood RestorationFund (ELRF) was established by SBP and the Bank was designated as implementing agency which utilized itsorganizational structure, personnel etc and collaborated with service providers for immediate outreach to theearthquake affected households.
In accordance with the provision of the ELRF Rules; an equity support of Rs.12,000 per household was paid asgrant to the earthquake affected households on behalf of ELRP in addition to soft loan of Rs. 3,000 by the Bankfor economic revival of the earthquake affected households.
The ELRP completed its tenure on July 31, 2009 and the Bank has received final claim from SBP in May 2010.
12.2 This represents amount to be reimbursed by SBP, vide SMEFD circular No. 11 of 2010, in pursuance of PrimeMinister's announcement of fiscal relief Package to rehabilitate the economic life in Khyber Pakhtunkhawa, FATAand PATA and subsequent release of budgetary allocation by the Ministry of Finance, Government of Pakistanon account of interest /mark-up rate differential.
13. DEPOSITS AND OTHER ACCOUNTS
Fixed deposits 13.2Current accounts
13.1 Particulars of deposits by ownership
Individual depositors Institutional depositors
13.2 This represent term deposits having tenure of 1 to 12 months carrying interest rates ranging from 6%to 11% per annum (2009: 6% to 10%).
NoteNo of
AccountsAmountRupees
2009No of
AccountsAmountRupees
2010
2,043 203,919
205,962
205,936 26
205,962
197,594,000 802,734,625
1,000,328,625
963,878,408 36,450,217
1,000,328,625
644 74,351 74,995
74,995 -
74,995
56,610,000 133,422,590
190,032,590
190,032,590 -
190,032,590
14. BORROWINGS
UnsecuredBorrowing from banks/ financial institutions outside Pakistan 14.1 3,637,294,792 4,001,024,272Borrowings from banks/ financial institutions in Pakistan 14.2 25,000,000 -
SecuredBorrowing from banks/financial institutions in Pakistan 14.3 200,000,000 157,636,644
3,862,294,792 4,158,660,916
2010Rupees
2009Rupees
Note
14.1 This represent receipts/ reimbursements up to eighty percent (80%) of outreach loan disbursements againstcredit facility under the Subsidiary Loan and Grant Agreement entered between the Bank and the Governmentof Pakistan (GoP) in pursuance of Loan Agreement (Special Operations) - Microfinance Sector DevelopmentProject, Loan #1806 between Asian Development Bank (ADB) and Islamic Republic of Pakistan. By February2006, the Bank utilized SDR 52.51 million against total credit line amounting to SDR 52.57 million under theaforesaid loan agreement.
The Bank is liable to repay the principal amount of the loan to GoP, over a period of 20 years including a graceperiod of 8 years, commencing from May 1, 2009, through bi-annual equal installments. The principal repayableis the aggregate equivalent of the amounts drawn by the Bank from the loan account for sub-loan expressedin PKR, determined as of the respective dates of the withdrawal, while the GoP shall bear the foreign exchangerisk.
25

14.4 Quarterly average borrowing
An analysis of monthly average borrowings for the four quarters is as under,1st Quarter2nd Quarter3rd Quarter4th Quarter
14.5 Loan repayment schedule
Loan principal at year endAverage during the year (quarterly)Annual interest expense
2010Rupees
4,201,024,272 4,079,781,112 4,019,159,532 3,906,249,705
3,862,294,792 4,051,553,655
255,047,492
2009Rupees
4,364,753,752 4,243,510,592 4,182,889,012 4,114,191,400
4,158,660,916 4,226,336,189
254,146,064
The interest is being paid on bi-annual basis charged at the rate equal to weighted average cost of depositsduring the preceding six months in the banking industry as calculated by SBP. The interest rates used for thetwo bi-annual payments during the year were determined to be 5.88% and 5.97% (2009: 6.02% and 6.11%)per annum.
14.2 This represent interbank money market borrowings carrying interest rates of 14% (2009: Nil) per annumrepayable on January 6, 2011.
14.3 This represent interbank money market borrowings for two years carrying interest rate ranging from 13.96%to 14.77% (2009: 12.25%) per annum and are repayable in two equal installments in the last year i.e. onJuly 2011 and January 2012 (2009: January 21, 2010). These borrowings are secured against PIBs amountingto Rs.202 million and charge over current assets, receivables, book debt for Rs. 100 million (2009: Securedagainst T Bills amounting to Rs. 167 million ).
49,919,534 2,761,793
31,874,175 504,920
3,299,39117,416,083 8,708,042 8,708,042 6,942,000
17,192,370 3,762,769 5,676,100
156,765,219
41,243,341 560,364
38,487,813 -
2,298,66324,564,02712,282,013 12,282,013 7,524,000 9,681,624 5,142,955 8,098,443
162,165,256
Interest payable on borrowingsInterest payable on depositsAccrued expensesBills payablePayable to defined benefit plan - gratuity 15.1Contribution payable to Microfinance Social Development FundContribution payable to Risk Mitigation FundContribution payable to Depositors' Protection FundPayable to service providersPayable to suppliersProvision for Workers Welfare FundOther payables
15. OTHER LIABILITIES2009
Rupees2010
RupeesNote
15.1 Payable to defined benefit plan - gratuity
Disclosures related to Employees Gratuity Fund are given below:
i) Amounts recognised in the balance sheet
Present value of defined benefit obligationsFair value of plan assetsDeficitUnrecognized actuarial gain/(loss)
Net liability
95,792,693 (92,704,801)
3,087,892 (789,229)
2,298,663
118,869,107 (119,117,075)
(247,968) 3,547,359 3,299,391
26

A N N U A L R E P O R T 2 0 1 0
vii) The latest actuarial valuation was carried out at December 31, 2010. The significant assumptions used for actuarial valuation are as follows:
Discount rate Expected rate of increase in salariesMortality rateAverage expected remaining working life of employees
viii) Amounts for the current and previous year
Present value of defined benefit obligation Fair value of plan assets Deficit/surplus Experience adjustments on plan liabilities Experience adjustments on plan assets
ix) Expected contribution of the Company to the defined benefit gratuity fund for the year ending December 31, 2011 is Rs. 28,346,711.
ii) Amounts recognized in the profit and loss account
Current service costInterest costExpected return on plan assets
iii) Changes in present value of defined benefit obligation
Opening defined benefit obligationExpense for the yearBenefits paid during the yearActuarial (gain)/ lossClosing defined benefit obligation
iv) Changes in fair value of plan assets
Opening fair value of plan assetsExpected return on plan assetsContributions paid during the yearBenefit paid during the yearActuarial gain/(loss) on plan assetsClosing fair value of plan assets
v) Actual return on plan assets
Expected return on plan assetsActuarial loss/(gain) on plan assets
vi) Major categories of plan assets
Investments in T-BillsAccrued interestCash at bank
201013%12%
EFU 1961-66 11 years
200912%13%
EFU 1961-66 11 years
Rupees
(95,792,693) 92,704,801 (3,087,892) 4,250,442 (431,898)
Rupees
(118,869,107) 119,117,075
247,968 3,070,390 1,266,198
26,305,620 11,495,123
(11,124,576)26,676,167
95,792,693 37,800,743
(11,653,939) (3,070,390)
118,869,107
92,704,801 11,124,576 25,675,439
(11,653,939) 1,266,198
119,117,075
11,124,576 1,266,198
12,390,774
117,098,000 992,496
1,026,579 119,117,075
25,493,682 10,724,216
(10,002,173)26,215,725
71,494,772 36,217,898 (7,669,535) (4,250,442) 95,792,693
66,681,152 10,002,173 24,122,909 (7,669,535)
(431,898) 92,704,801
10,002,173 (431,898)
9,570,275
89,491,500 1,582,208 1,631,093
92,704,801
27
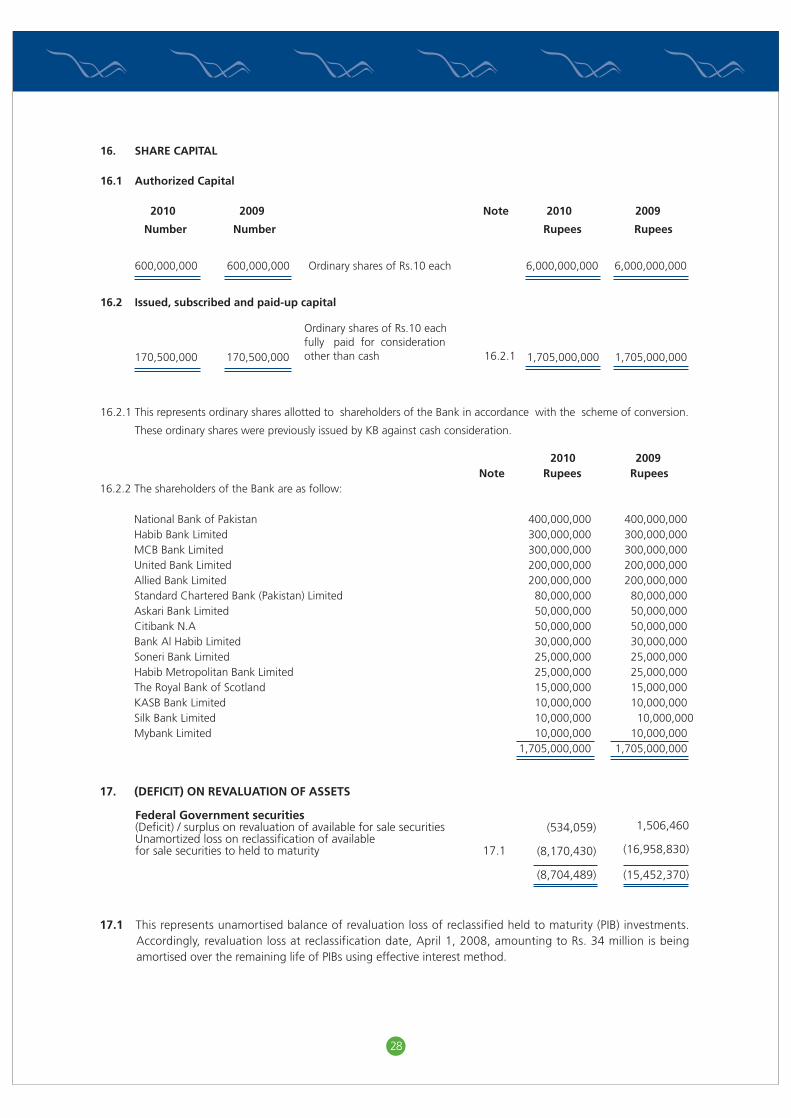
Ordinary shares of Rs.10 eachfully paid for considerationother than cash 16.2.1
16. SHARE CAPITAL
16.1 Authorized Capital
2010 2009 Note 2010 2009
Number Number Rupees Rupees
600,000,000 600,000,000 Ordinary shares of Rs.10 each 6,000,000,000 6,000,000,000
16.2 Issued, subscribed and paid-up capital
170,500,000 170,500,000 1,705,000,000 1,705,000,000
16.2.1 This represents ordinary shares allotted to shareholders of the Bank in accordance with the scheme of conversion.
These ordinary shares were previously issued by KB against cash consideration.
2010 2009 Note Rupees Rupees
16.2.2 The shareholders of the Bank are as follow:
National Bank of Pakistan 400,000,000 400,000,000Habib Bank Limited 300,000,000 300,000,000MCB Bank Limited 300,000,000 300,000,000United Bank Limited 200,000,000 200,000,000Allied Bank Limited 200,000,000 200,000,000Standard Chartered Bank (Pakistan) Limited 80,000,000 80,000,000Askari Bank Limited 50,000,000 50,000,000Citibank N.A 50,000,000 50,000,000Bank Al Habib Limited 30,000,000 30,000,000Soneri Bank Limited 25,000,000 25,000,000Habib Metropolitan Bank Limited 25,000,000 25,000,000The Royal Bank of Scotland 15,000,000 15,000,000KASB Bank Limited 10,000,000 10,000,000Silk Bank Limited 10,000,000 10,000,000Mybank Limited 10,000,000 10,000,000
1,705,000,000 1,705,000,000
17. (DEFICIT) ON REVALUATION OF ASSETS
Federal Government securities(Deficit) / surplus on revaluation of available for sale securitiesUnamortized loss on reclassification of availablefor sale securities to held to maturity 17.1
(534,059)
(8,170,430)
(8,704,489)
1,506,460
(16,958,830)
(15,452,370)
17.1 This represents unamortised balance of revaluation loss of reclassified held to maturity (PIB) investments.Accordingly, revaluation loss at reclassification date, April 1, 2008, amounting to Rs. 34 million is beingamortised over the remaining life of PIBs using effective interest method.
28

A N N U A L R E P O R T 2 0 1 0
Note 2010 2009Rupees Rupees
18. DEFERRED GRANTS
Grant from GoP 18.1 251,589,232 251,589,232Less: Grant amortized
upto March 31, 2008 (229,033,917) (229,033,917) for nine months ended December 31, 2008 (13,264,640) (13,264,640)
for the year 2009 (6,004,178) (6,004,178) for the year 2010 (1,590,387) -
1,696,110 3,286,497
Grant from USAID 23.1 98,374,901 98,374,901Less: Grant amortized upto March 31, 2008 (57,990,871) (57,990,871)
for nine months ended December 31, 2008 (15,802,975) (15,802,975) for the year 2009 (11,948,507) (11,948,507) for the year 2010 (4,872,698) -
7,759,850 12,632,548Grant from SBI SA Micro Savings 18.2 2,750,000 -
12,205,960 15,919,045
18.1 This represents grant from GoP for assets acquired for institutional strengthening of the Bank, under theSubsidiary Loan and Grant Agreement (SLGA) entered with GoP in pursuance of Loan Agreement (SpecialOperations) - Microfinance Sector Development Project (MSDP), Loan #1806 between ADB and Islamic Republicof Pakistan. MSDP has completed its tenure on June 30, 2007. The Bank has received reimbursements fromSBP for all pending claims.
18.2 On September 24, 2010 the Bank entered into a two year grant agreement with Shore Bank International Ltd.(SBI) to improve the capacity of the Bank for delivering saving products more effectively, profitably and at anenhanced scale. SBI shall provide financial assistance of US$ 300 thousands in the form of grant to the Bank,in order to procure and implement an interim banking application from Sidat Hyder Morshed Associates (SHMA)named Bank Essential (BE).
Accordingly, an amount of Rs. 2.75 million (2009: Nil) was reimbursed by SBI to the Bank based on paymentsmade to SHMA for the banking application.
19. MEMORANDUM/ OFF BALANCE SHEET ITEMS
19.1 There are no contingent liabilities at the year end (2009: Nil).
19.2 Commitments for capital expenditure amounting to Rs. 17.79 million (2009: Rs. 23.15 million) are outstandingas at December 31, 2010.
19.3 Commitments for 12,545 micro credit advances amounting to Rs. 188.64 million (2009: Nil) are outstandingas at December 31, 2010, which are approved but not disbursed.
20. MARK-UP/ RETURN/INTEREST EARNED
Mark-up on advances(Less)/Add: Suspended markup on non-performing advances
Interest on investment in Government Securities Interest on deposit accounts /placements with otherbanks / financial institutions /mutual funds
1,041,059,245 (14,511,220)
1,026,548,025 105,971,830
88,517,511 1,221,037,366
822,763,226 1,728,135
824,491,361 132,895,624
125,337,977 1,082,724,962
2009Rupees
2010Rupees
Note
29

21. MARK-UP/ RETURN/ INTEREST EXPENSED
Interest on borrowings from: Asian Development Bank Financial institutionsDeposits
22. FEE, COMMISSION AND BROKERAGE INCOME
Account opening feeMicro-credit application processing fee Other commission
23. OTHER INCOME
Amortization of deferred grants 18Re-imbursement of cost share- USAID project 23.1Re-imbursement from MSDF 23.2Grant/subsidies from ELRF 23.3Gain on disposal of fixed assetsOthers 23.4
226,358,123 28,689,369 5,504,090
260,551,582
253,564,091 2,641,022
669,960 256,875,073
7,344,000 167,835,740
1,545,735 176,725,475
3,091,400 185,759,800
1,326,531 190,177,731
6,463,085 1,450,974
90,390,000 -
20,180,369 73,726,968
192,211,396
17,952,685 35,651,257 98,148,000 98,707,113 20,661,163 45,428,465
316,548,683
23.1 On September 30, 2003, the Bank entered into an agreement with USAID, for developing non-bankableterritories for financial services in Sindh and Baluchistan. Subsequently in September 2005, the scope of thegrant was expanded to include seven FATA territories, whereby USAID revised its contribution from US Dollar7.042 million to US Dollar 11.052 million while the total project cost was revised from US Dollar 9.371 millionto US Dollar 14.142 million. Sindh and Baluchistan project period ended on September 30, 2008 while FATAproject period ended on September 30, 2009. The cost share of USAID project was reimbursable to the Bankon monthly basis.
On February 6, 2010, the Bank entered into another agreement with USAID under the title of "BusinessRevitalization Program" for an aggregate value of US$ 13 million. The program supported affected of twodisasters; i.e. the incidents of; Bolton market which occurred on December 28, 2009 whereby shops were setablaze in vandalism, in reaction to suicide attack on the major Ashura mourning procession on M.A JinnahRoad - Karachi and the second on January 4, 2010, whereby a devastating landslide created a lake on theHunza River in Northern Pakistan.
Under the subject agreement; the Bank was appointed as an executing agency for disbursement of grantmoney to the affected of above referred disasters and was entitled to recover direct and indirect implementationcost of the Program under the provisions of the agreement.
Accordingly an amount of Rs. 3.36 million (2009: Nil) was liquidated by the Bank under the agreement fromUSAID during the year.
23.2 This represent claims lodged by the Bank with Microfinance Social Development Fund (MSDF) for reimbursementof client acquisition cost incurred by the Bank under the Loan Agreement (Special Operations) - MicrofinanceSector Development Project, Loan #1806 between ADB and Islamic Republic of Pakistan.
23.3 This represents amount recognized as receivable from Emergency Livelihood Restoration Programme (ELRP).The Bank was the designated implementing agency and utilized its organizational structure, personnel andcollaborated with service providers for immediate outreach to earthquake affected households. In compensationof cost incurred by the Bank, it was entitled to claim a composite figure of US Dollar 50 per household. UnderELRF Rules, 2006, the Bank was also eligible to claim Rs. 1,200 per person for delivery of financial and non-financial services to community groups. Each community group comprises of 5 person.
The Programme completed its tenure on July 31, 2009 and the Bank has received final claim from SBP in May2010.
23.4 This includes an amount of Rs. 57.68 million (2009: Rs 37.69 million) received during the year against previouslyrecognized bad debts.
2009Rupees
2010Rupees
Note
30
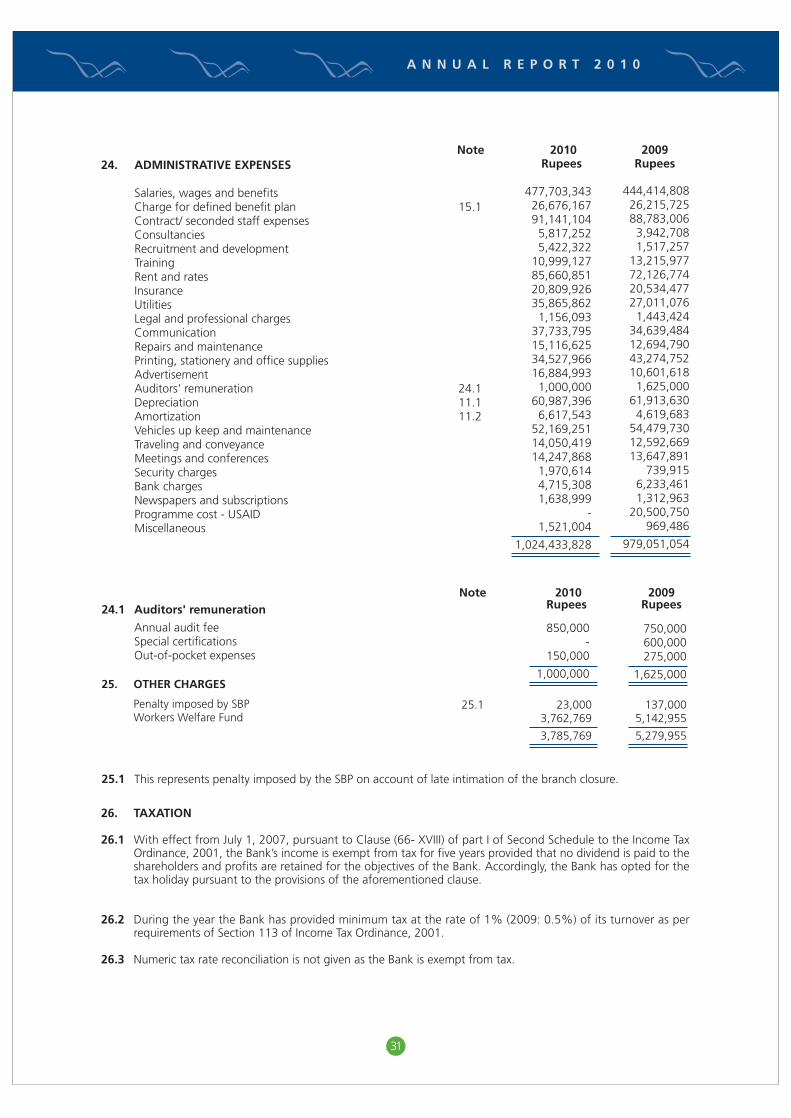
A N N U A L R E P O R T 2 0 1 0
24. ADMINISTRATIVE EXPENSES
Salaries, wages and benefitsCharge for defined benefit plan 15.1Contract/ seconded staff expensesConsultanciesRecruitment and developmentTrainingRent and ratesInsuranceUtilitiesLegal and professional chargesCommunicationRepairs and maintenancePrinting, stationery and office suppliesAdvertisementAuditors' remuneration 24.1Depreciation 11.1Amortization 11.2Vehicles up keep and maintenanceTraveling and conveyanceMeetings and conferencesSecurity chargesBank chargesNewspapers and subscriptionsProgramme cost - USAIDMiscellaneous
477,703,343 26,676,167 91,141,104 5,817,252 5,422,322
10,999,127 85,660,851 20,809,926 35,865,862 1,156,093
37,733,795 15,116,625 34,527,966 16,884,993 1,000,000
60,987,396 6,617,543
52,169,251 14,050,419 14,247,868 1,970,614 4,715,308 1,638,999
- 1,521,004
1,024,433,828
444,414,808 26,215,725 88,783,006 3,942,708 1,517,257
13,215,977 72,126,774 20,534,477 27,011,076 1,443,424
34,639,484 12,694,790 43,274,752 10,601,618 1,625,000
61,913,630 4,619,683
54,479,730 12,592,669 13,647,891
739,915 6,233,461 1,312,963
20,500,750 969,486
979,051,054
2009Rupees
2010Rupees
Note
26. TAXATION
26.1 With effect from July 1, 2007, pursuant to Clause (66- XVIII) of part I of Second Schedule to the Income TaxOrdinance, 2001, the Bank’s income is exempt from tax for five years provided that no dividend is paid to theshareholders and profits are retained for the objectives of the Bank. Accordingly, the Bank has opted for thetax holiday pursuant to the provisions of the aforementioned clause.
26.2 During the year the Bank has provided minimum tax at the rate of 1% (2009: 0.5%) of its turnover as perrequirements of Section 113 of Income Tax Ordinance, 2001.
26.3 Numeric tax rate reconciliation is not given as the Bank is exempt from tax.
25. OTHER CHARGES
Penalty imposed by SBPWorkers Welfare Fund
23,000 3,762,769
3,785,769
137,000 5,142,955
5,279,955
25.1
25.1 This represents penalty imposed by the SBP on account of late intimation of the branch closure.
850,000 -
150,000
1,000,000
750,000 600,000 275,000
1,625,000
24.1 Auditors' remuneration
Annual audit feeSpecial certifications Out-of-pocket expenses
2009Rupees
2010Rupees
Note
31

27. CASH AND CASH EQUIVALENTS
Cash and balances with SBP and NBPBalances with other banks
2010Rupees
163,112,013 581,414,297
744,526,310
2009Rupees
79,179,713 485,843,594
565,023,307
31. REMUNERATION OF PRESIDENT, DIRECTORS AND EXECUTIVES
Managerial remunerationCharge for defined benefitplan/GratuityRent and house maintenanceUtilitiesMedicalConveyanceBonus Others
Total
Number of person(s)
President2010
DirectorsRupees
Executives President DirectorsRupees
Executives
2009
2,763,876
331,071 1,243,740
276,384 17,279
286,323 - -
4,918,673
1
-
- - - - - -
66,660
66,660
5
38,346,594
4,667,752 17,255,992 3,834,686 3,455,080
11,925,606 3,688,841
681,516
83,856,067
33
2,763,876
347,858 1,243,740
276,384 50,777
245,349 - -
4,927,984
1
-
- - - - - -
47,960
47,960
5
33,852,424
4,270,802 15,233,608 3,385,271 3,320,202 9,519,368 1,577,751
292,875
71,452,301
29
28. NUMBER OF EMPLOYEES
Credit sales staff Permanent Banking / support staff Permanent Contractual
Total number of employees at the end of the year
29. NUMBER OF BRANCHES
Total branches at beginning of the year Add: Opened during the year / periodLess: Closed / merged during the year
Total branches at the end of the year
30. EARNINGS PER SHARE
Profit for the year after tax (Rupees)
Shares outstanding during the year (Numbers)
Earnings per share- basic and diluted (Rupees)
There is no dilutive effect on the basic earnings per share of the Bank.
764
629 770
1,399
2,163
107 11 9
109
174,160,834
170,500,000
1.02
647
574 781
1,355
2,002
114 - 7
107
245,640,267
170,500,000
1.44
2010 2009
32

A N N U A L R E P O R T 2 0 1 0
32. SCHEDULE OF MATURITY DISTRIBUTION OF MARKET RATE ASSETS AND LIABILITIES AS AT DECEMBER 31, 2010
RupeesMarket rate assets
AdvancesInvestmentsBalances with SBP and NBP - deposit accountsBalances with other banks - deposit accountsLending to financial institutions
Total market rate assets
Other non-earning assets
Cash in handBalances with SBP and NBP - current accountsBalances with other banks - current accountsOther assetsOperating fixed assets
Total non-earning assets
Total assets
Market rate liabilities
Borrowing from ADBBorrowings from financial institutions
Total market rate liabilities
Other non-cost bearing liabilities
Deposits and other accountsOther liabilities
Total non-cost bearing liabilities
Total liabilities
Net assets
3,621,410,320 1,252,790,066
2,447,419 156,543,810 811,921,784
5,845,113,399
65,899,409 94,765,185
424,870,487 639,305,273 168,718,686
1,393,559,040
7,238,672,439
3,637,294,792 225,000,000
3,862,294,792
1,000,328,625 156,765,219
1,157,093,844
5,019,388,636
2,219,283,803
149,062,880 149,606,226
2,447,419 156,543,810 811,921,784
1,269,582,119
65,899,409 94,765,185
424,870,487 89,090,877 5,474,436
680,100,394
1,949,682,513
- 25,000,000
25,000,000
844,739,625 66,258,177
910,997,802
935,997,802
1,013,684,711
1,919,463,619 745,353,515
- - -
2,664,817,134
- - -
415,927,638 27,372,180
443,299,818
3,108,116,952
181,864,740 -
181,864,740
71,130,000 85,354,030
156,484,030
338,348,770
2,769,768,182
1,552,883,821 357,830,325
- - -
1,910,714,146
- - -
88,015,758 32,846,616
120,862,374
2,031,576,520
181,864,740 100,000,000
281,864,740
84,459,000 5,153,012
89,612,012
371,476,752
1,660,099,768
- - - - -
-
- - -
46,271,000 103,025,454
149,296,454
149,296,454
3,273,565,312 100,000,000
3,373,565,312
- -
-
3,373,565,312
(3,224,268,858)
TOTALUPTO
1 MONTH
OVER1 MONTH UPTO
6 MONTHS
OVER6 MONTHS
UPTO 1 YEAR
OVERONE YEAR
31.1 The President is provided with a Bank maintained car.
31.2 Executives mean employees, other than the chief executive and directors, whose basic salary exceed fivehundred thousand rupees in a financial year.
33
1,705,000,000 144,603,560 24,255,224
313,538,195 28,385,353 (8,704,489) 12,205,960
2,219,283,803
Represented by:Share capital Statutory reserve Capital reserveUnappropriated profitReserve for contingencies Deficit on revaluation of assetsDeferred grants
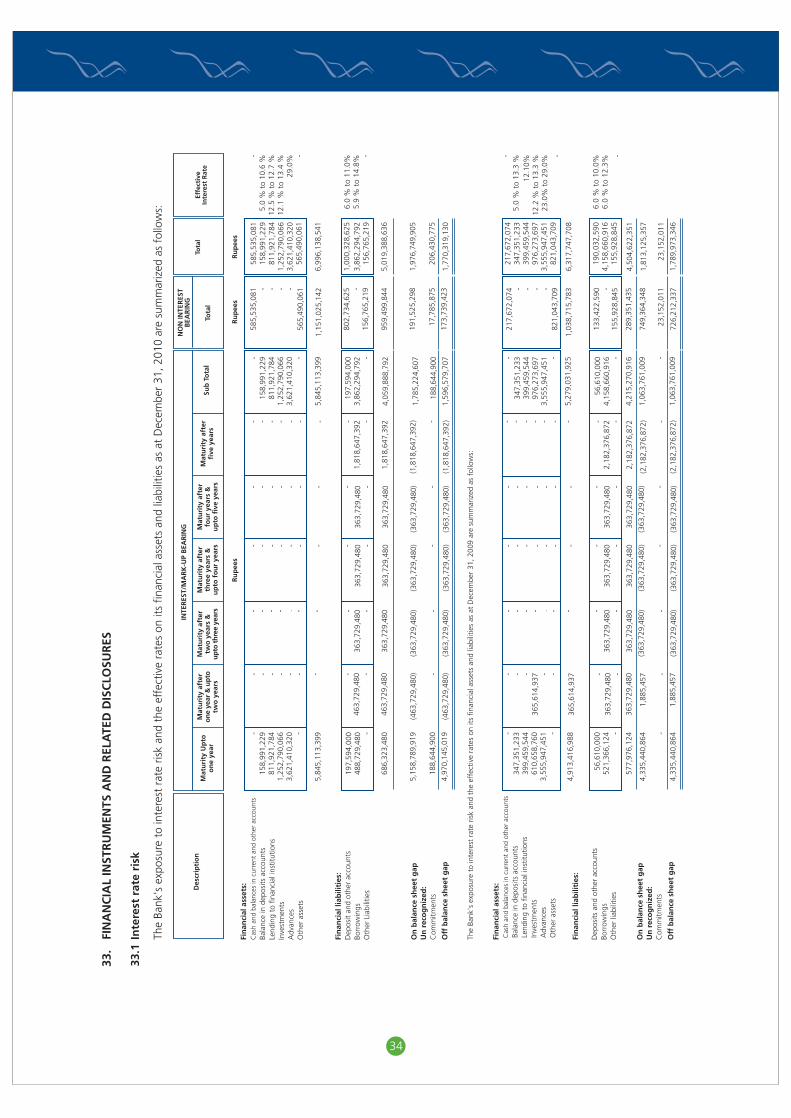
33.
FIN
AN
CIA
L IN
STR
UM
ENTS
AN
D R
ELA
TED
DIS
CLO
SUR
ES
33.1
Inte
rest
rat
e ri
sk
The
Bank
's e
xpos
ure
to in
tere
st r
ate
risk
and
the
effe
ctiv
e ra
tes
on it
s fin
anci
al a
sset
s an
d lia
bilit
ies
as a
t D
ecem
ber
31, 2
010
are
sum
mar
ized
as
follo
ws:
Des
crip
tio
n
NO
N IN
TER
EST
BEA
RIN
G
Mat
uri
ty U
pto
on
e ye
ar
Mat
uri
ty a
fter
on
e ye
ar &
up
totw
o y
ears
Mat
uri
ty a
fter
two
yea
rs &
upto
thr
ee y
ears
Mat
uri
ty a
fter
thre
e ye
ars
&u
pto
fo
ur
year
s
Mat
uri
ty a
fter
fou
r ye
ars
&u
pto
fiv
e ye
ars
Sub
To
tal
Tota
lTo
tal
Effe
ctiv
eIn
tere
st R
ate
Mat
uri
ty a
fter
five
yea
rs
INTE
RES
T/M
AR
K-U
P B
EAR
ING
Ru
pee
sR
up
ees
Ru
pee
s
- 1
58,9
91,2
29 8
11,9
21,7
84 1
,252
,790
,066
3,6
21,4
10,3
20 -
5,84
5,11
3,39
9
197
,594
,000
488
,729
,480 -
686
,323
,480
5,1
58,7
89,9
19
188
,644
,900
4,9
70,1
45,0
19 - 3
47,3
51,2
33 3
99,4
59,5
44 6
10,6
58,7
60 3
,555
,947
,451 -
4,91
3,41
6,98
8
56,
610,
000
521
,366
,124 -
577
,976
,124
4,3
35,4
40,8
64 -
4,3
35,4
40,8
64
- - - - - - - - 4
63,7
29,4
80 -
463
,729
,480
(463
,729
,480
) -
(463
,729
,480
) - - - 3
65,6
14,9
37 - -
365,
614,
937 -
363
,729
,480 -
363
,729
,480
1,8
85,4
57 - 1
,885
,457
- - - - - - - - 3
63,7
29,4
80 -
363
,729
,480
(363
,729
,480
) -
(363
,729
,480
) - - - - - - - - 3
63,7
29,4
80 -
363
,729
,480
(363
,729
,480
) -
(363
,729
,480
)
- - - - . - - - 3
63,7
29,4
80 -
363
,729
,480
(363
,729
,480
) -
(363
,729
,480
) - - - - . - - - 3
63,7
29,4
80 -
363
,729
,480
(363
,729
,480
) -
(363
,729
,480
)
- - - - - - - - 1
,818
,647
,392 -
1,8
18,6
47,3
92
(1,8
18,6
47,3
92) -
(1,8
18,6
47,3
92) - - - - - - - -
2,1
82,3
76,8
72 -
2,1
82,3
76,8
72
(2,1
82,3
76,8
72) -
(2,1
82,3
76,8
72)
- 1
58,9
91,2
29 8
11,9
21,7
84 1
,252
,790
,066
3,6
21,4
10,3
20 -
5,84
5,11
3,39
9
197
,594
,000
3,8
62,2
94,7
92 -
4,0
59,8
88,7
92
1,7
85,2
24,6
07
188
,644
,900
1,5
96,5
79,7
07 - 3
47,3
51,2
33 3
99,4
59,5
44 9
76,2
73,6
97 3
,555
,947
,451 -
5,2
79,0
31,9
25
56,6
10,0
00 4
,158
,660
,916 -
4,2
15,2
70,9
16
1,0
63,7
61,0
09 -
1,0
63,7
61,0
09
585
,535
,081 - - - -
565
,490
,061
1,15
1,02
5,14
2
802
,734
,625 -
156
,765
,219
959
,499
,844
191
,525
,298
17,
785,
875
173
,739
,423
217
,672
,074 - - - -
821
,043
,709
1,03
8,71
5,78
3
133
,422
,590 -
155
,928
,845
289,
351,
435
749
,364
,348
23,
152,
011
726
,212
,337
585
,535
,081
158
,991
,229
811
,921
,784
1,2
52,7
90,0
66 3
,621
,410
,320
565
,490
,061
6,99
6,13
8,54
1
1,0
00,3
28,6
25 3
,862
,294
,792
156
,765
,219
5,0
19,3
88,6
36
1,97
6,74
9,90
5
206
,430
,775
1,7
70,3
19,1
30
217
,672
,074
347
,351
,233
399
,459
,544
976
,273
,697
3,5
55,9
47,4
51 8
21,0
43,7
09
6,31
7,74
7,70
8
190
,032
,590
4,1
58,6
60,9
16 1
55,9
28,8
45
4,50
4,62
2,35
1
1,8
13,1
25,3
57
23,
152,
011
1,7
89,9
73,3
46
-5.
0 %
to
10.6
%12
.5 %
to
12.7
%12
.1 %
to
13.4
%29
.0% -
6.0
% t
o 11
.0%
5.9
% t
o 14
.8% - -
5.0
% t
o 13
.3 %
12.1
0%12
.2 %
to
13.3
%23
.0%
to
29.0
% -
6.0
% t
o 10
.0%
6.0
% t
o 12
.3% -
- - - - - - - - 3
63,7
29,4
80 -
363
,729
,480
(363
,729
,480
) -
(363
,729
,480
) - - - - - - - - 3
63,7
29,4
80 -
363
,729
,480
(363
,729
,480
) -
(363
,729
,480
)
34

A N N U A L R E P O R T 2 0 1 0
33.2 Market risk
The Bank's interest rates exposure comprises those originating from investing and lending activities. The Assetsand Liability Management Committee of the Bank monitors and manages the interest rate risk with theobjective of limiting the potential adverse effect on the profitability of the Bank.
33.3 Concentration of credit risk
Credit risk is the risk that one party to a financial instrument will fail to discharge an obligation and causethe other party to incur a financial loss. The Bank is exposed to credit related losses in the event of non-performance by counter parties.
The Bank seeks to manage the credit risk by attempting to diversify the lending activities to avoid undueconcentration of risks with customers in specific locations or activities. The Bank controls this risk throughcredit appraisals, assessing the credit-worthiness of customers. A provision for potential loan losses is maintainedas required by the Regulations. Further, the community organizations are structured in a way to exert socialpressure on the borrowers to perform their obligations.
33.4 Liquidity risk
Liquidity risk is the risk that the Bank will encounter difficulty in raising funds to meet its net fundingrequirements. The Bank attempts to manage this risk by having adequate credit lines in place and maintainingsufficient liquidity at branch level to meet anticipated funding requirements.
33.5 Fair value of financial instruments
The carrying value of all financial assets and liabilities reflected in the financial statements approximate theirfair values, except held to maturity assets which are carried at amortized cost.
34. RELATED PARTY TRANSACTIONS
The Bank's related parties comprise of directors, key management personnel, shareholders and entities overwhich the directors are able to exercise significant influence and employee gratuity fund. The detail of Bank'sshareholders is given in note 16.2.2 while remuneration of key personnel is disclosed in note 31 to the financialstatements. Detail of transactions with the Bank's shareholders and employee retirement benefit fund, duringthe year under normal commercial banking terms and balances outstanding at the year end are as follows:
Transactions with shareholder banks during the year
Profit earned on deposit accountsBank chargesLending to shareholder banksRepayment of lendingInterest income on lendingInvestments in shareholder banksLending from shareholder banksRepayment of lending from shareholder banksInterest expense on lending from shareholder banks
Contributions to gratuity fund
Balances outstanding at the year end
Bank balances with shareholder banksTDR placements with shareholder banksSecured /Repo Borrowings with shareholder banksInvestment in shareholder banksInterest receivable on bank deposits with shareholder banksInterest payable on term finance/repo borrowings from shareholder bankAdvances receivable from executivesBalance payable to gratuity fund
7,297,240 4,392,497
31,330,245,781 31,249,883,797
28,625,425 1,044,000,000
200,000,000 157,636,644 28,670,191
14,021,500
5,131,604 6,033,619
32,066,278,974 32,566,278,974
71,343,535 1,653,000,000
157,636,644 263,709,004
2,641,020
16,453,374
2010Rupees
2009Rupees
548,628,193 -
200,000,000 419,000,000
408,270 14,483,070 17,523,554 3,299,391
197,990,275 300,000,000 157,636,644 575,000,000
224,259 581,973
10,284,138 2,298,663
35

35. CAPITAL RISK MANAGEMENT
The Bank’s objectives when managing its capital are:
a) To comply with the capital requirements set by the SBP;b) To safeguard the Bank’s ability to continue as a going concern so that it can continue to provide
returns for shareholders and benefits for other stakeholders; andc) To maintain a strong capital base to support the development of its business.
Number of Microcredit BranchesNumber of Full Service BranchesTotal Branches of the Bank
Human ResourceTotal number of permanent staff - Credit salesTotal number of permanent staff - Banking / supportTotal number of contractual staff - Banking / supportTotal staff strength of the Bank
Micro-finance casesNumber of active cases at year endNumber of loans disbursed during the yearAverage number of active borrowers for the year
69 40
109
764 629 770
2,163
2010Number325,523 337,163 327,472
67 40
107
647 574 781
2,002
2009Number329,421 404,580 321,136
2010 2009Offices
2010Rupees
3,722,152,797 4,541,032,800
231,390,047 85,719,742
100,742,477
2009Rupees
3,630,204,6584,980,316,240
67,580,404 101,422,658 74,257,207
Microcredit advances receivableTotal disbursements for the year
Portfolio QualityPortfolio at riskPortfolio written offLoan loss reserve
Capital requirements applicable to the Bank are set out under Microfinance Institutions Ordinance, 2001. Theserequirements are put in place to ensure sufficient solvency margins. The Bank manages its capital requirementby assessing its capital structure against required capital level on regular basis. Currently the Bank has paid upcapital of Rs. 1.705 billion. The minimum paid up capital requirement applicable to the Bank is Rs. 500 million.The bank has maintained capital adequacy ratio in accordance with regulation No. 4 of the Regulations whichstates that the Bank shall maintain capital equivalent to at least 15% of its risk-weighted assets.
The Bank will continue to maintain the required regulatory capital either through its risk management strategiesor by increasing the capital in line with the business and capital needs.
36. GENERAL INFORMATION
The following information is included in these financial statements to facilitate the calculation of financial ratios presented in note 37.
Average loan sizesAverage outstanding loan sizeAverage gross loan portfolio
Information about the Bank's assets/ liabilitiesTotal assetsCurrent assetsFixed assetsAverage total assetsCurrent liabilitiesKBL equity
11,020 3,361,770,147
6,587,779,102 5,996,205,935
185,678,434 6,636,760,757
873,563,970 2,061,001,295
2009Rupees
2010Rupees
11,434 3,676,178,728
7,238,672,439 7,023,682,753
168,718,686 6,913,225,771 1,645,823,324 2,207,077,843
36
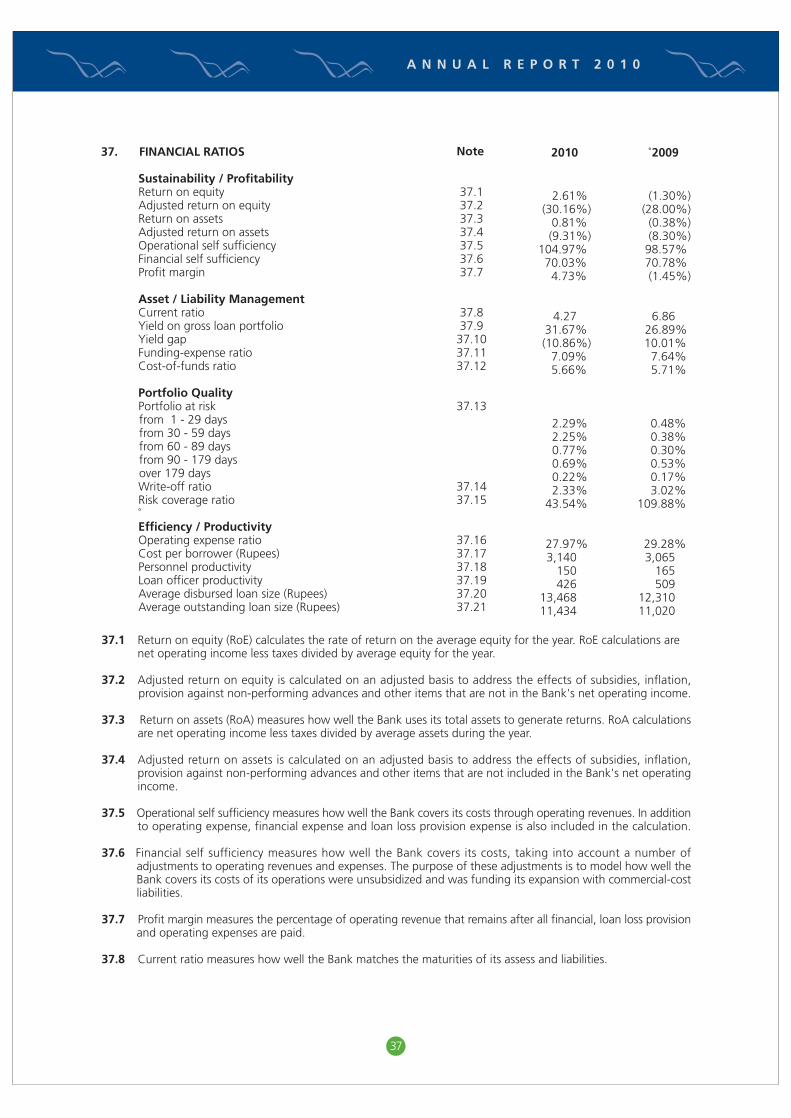
A N N U A L R E P O R T 2 0 1 0
37. FINANCIAL RATIOS
Sustainability / ProfitabilityReturn on equity 37.1Adjusted return on equity 37.2Return on assets 37.3Adjusted return on assets 37.4Operational self sufficiency 37.5Financial self sufficiency 37.6Profit margin 37.7
Asset / Liability ManagementCurrent ratio 37.8Yield on gross loan portfolio 37.9Yield gap 37.10Funding-expense ratio 37.11Cost-of-funds ratio 37.12
Portfolio QualityPortfolio at risk 37.13from 1 - 29 daysfrom 30 - 59 daysfrom 60 - 89 daysfrom 90 - 179 daysover 179 daysWrite-off ratio 37.14Risk coverage ratio 37.15 Efficiency / ProductivityOperating expense ratio 37.16Cost per borrower (Rupees) 37.17Personnel productivity 37.18Loan officer productivity 37.19Average disbursed loan size (Rupees) 37.20Average outstanding loan size (Rupees) 37.21
(1.30%)(28.00%)(0.38%)(8.30%)
98.57%70.78%(1.45%)
6.8626.89%10.01%7.64%5.71%
0.48%0.38%0.30%0.53%0.17%3.02%
109.88%
29.28% 3,065
165 509
12,310 11,020
2010 2009Note
37.1 Return on equity (RoE) calculates the rate of return on the average equity for the year. RoE calculations are net operating income less taxes divided by average equity for the year.
37.2 Adjusted return on equity is calculated on an adjusted basis to address the effects of subsidies, inflation,provision against non-performing advances and other items that are not in the Bank's net operating income.
37.3 Return on assets (RoA) measures how well the Bank uses its total assets to generate returns. RoA calculationsare net operating income less taxes divided by average assets during the year.
37.4 Adjusted return on assets is calculated on an adjusted basis to address the effects of subsidies, inflation,provision against non-performing advances and other items that are not included in the Bank's net operatingincome.
37.5 Operational self sufficiency measures how well the Bank covers its costs through operating revenues. In additionto operating expense, financial expense and loan loss provision expense is also included in the calculation.
37.6 Financial self sufficiency measures how well the Bank covers its costs, taking into account a number ofadjustments to operating revenues and expenses. The purpose of these adjustments is to model how well theBank covers its costs of its operations were unsubsidized and was funding its expansion with commercial-costliabilities.
37.7 Profit margin measures the percentage of operating revenue that remains after all financial, loan loss provisionand operating expenses are paid.
37.8 Current ratio measures how well the Bank matches the maturities of its assess and liabilities.
37
2.61%(30.16%)
0.81%(9.31%)
104.97%70.03%4.73%
4.2731.67%(10.86%)
7.09%5.66%
2.29%2.25%0.77%0.69%0.22%2.33%
43.54%
27.97% 3,140
150 426
13,468 11,434

37.9 Yield on gross loan portfolio indicates the gross loan portfolio's ability to generate cash financial revenue frominterest, fees and commission. It does not include any revenues that have been accrued but not paid in cash,or any non-cash revenues in the form of post-dated cheques, seized but unsold collateral, etc.
37.10 Yield gap compares revenue actually received in cash with revenue expected from microcredit advances.
37.11 Funding-expense ratio shows the blended interest rate the Bank is paying to fund its financial assets. This ratiocan be compared with yield on the gross microcredit advances to determine the interest margin.
37.12 Cost-of-funds ratio gives a blended interest rate for all of the Bank's funding liabilities. Funding liabilities donot include interest payable or interest on loans to finance fixed assets.
37.13 Portfolio at risk ratio is the most accepted measure of portfolio quality. Portfolio at risk is the outstandingamount of all loans that have one or more installments of principal past due by certain number of days.Rescheduled loans are also included in the calculation.
37.14 Write-off ratio represents the percentage of the Bank's microcredit advances that have been removed fromthe balance of the gross microcredit advances because they are unlikely to be repaid.
37.15 Risk coverage ratio shows how much of the portfolio at risk is covered by the Bank's provision against non-performing advances. It is an indicator of how prepared the Bank is to absorb loan losses in the worst casescenario.
37.16 Operating expense ratio is the most commonly used efficiency indicator for Microfinance Banks. It includesall administrative and personnel expenses.
37.17 Cost per borrower provides a meaningful measure of efficiency for the Bank, by determining the average costof maintaining an active borrower.
37.18 Personnel productivity measures the overall productivity of total the Bank's human resources in managingclients who have an outstanding loan balance and are thereby contributing to the financial revenue of theBank
37.19 Loan officer productivity measures the average case load of each loan officer.
37.20 Average disbursed loan size measures the average loan size that is disbursed to clients.
37.21 Average outstanding loan size measures the average outstanding microcredit balance by client, which maybe significantly less than the average disbursed loan size.
38. DATE OF APPROVAL
These financial statements were approved by the Board of Directors of the Bank in their meeting held onMarch 04, 2011 .
39. GENERAL
Previous periods figures have been rearranged and reclassified wherever necessary for the purpose of comparison.Account captions as prescribed by BSD circular No. 11 dated December 30, 2003 issued by the SBP in respectof which no amounts are outstanding have not been reproduced in these financial statements.
PRESIDENT CHAIRMAN DIRECTOR DIRECTOR
38

A N N U A L R E P O R T 2 0 1 0
Lahore09 Ferozepur Road, Near MuzangChungi, Lahore.Tel: 042-7534789, Fax: 042-7534808
SheikhupuraShop # 435, Gujranwala Road,Near Batti Chowk, Sheikhupura.Tel: 056-3813565, Fax: 056-3813564
Gujrat1st Floor, Faisal Plaza, G.T. Road, Gujrat.Tel: 053-3521426, Fax: 053-3521426
KamokiNeelum Cinema, GT Road,Tehsil Kamoke, District Gujranwala.Tel: 055-6811141, Fax: 055-6420171
GujranwalaGround Floor, Chughtai Center,Main G.T Road, Shaheenabad,Gujranwala.Tel: 055-9200842, Fax: 055-9200843
HaroonabadPlot # 221, Main Bazar, Haroonabad.Tel: 063-2256495
SialkotBASF Building, Main Defence Road,Near Sublime Chowk, Sialkot.Tel: 052-3253208, Fax: 052-3253208
Toba Tek SinghAl Aziz Centre, Share Kot Road,Toba Tek Singh.Tel: 0462-517513, Fax: 0462-514618
HafizabadShop # B1-185, Garhi Awan, KassokeRoad, Hafizabad.Tel: 0547-541123, Fax: 0547-541123
PakpattanPakpattan Club, Club Road, Pakpattan.Tel: 0457-353559, Fax: 0457-352559
HasilpurKhata No. 34/29, Plot Adjacent HondaMotocycle Showroom,Near Bus Stand,Main Bahawalpur Road, Hasilpur.Tel: 062-2449936
Faisalabad1st Floor, Jinnah Center, Jinnah Colony,Faisalabad.Tel: 041-9200780, Fax: 041- 9200779
NarowalUsman Plaza, Circular Road,Moore Saddiq Pura, Narowal.Tel: 054-2414267
OkaraPlot No. 4033/8, M.A. Jinnah Road,Okara.Tel: 0442-550003, Fax: 0442-550004
WazirabadYousaf Market, First Floor,AC Road, Tehsil Wazirabad.Tel: 055-6609120, Fax: 055-6609118
ChishtianPlot # 47, Block "C", Qazi Wala Road,Adjacent College Road, Chishtian.Tel: 063-2500031
HassanabdalPlot #, B-I-69, Khasra # 2534, MohallahMilad Nagar, Near Civil Hospital,Main Hazara Road, Hassanabdal.Tel: 057-2523109
JhangSiddiq Center, Park Street, Near DCHouse, Civil Lines, Saddar, Jhang.Tel: 0477-620986
KasurMain Chowk, District Courts, KachehriRoad, Sultani Market, Kasur.Tel: 049-2773201, Fax: 049-2773202
JhelumFlat # 03, 1st Floor, Soldier Arcade,Civil Lines, Jhelum.Tel: 0544- 9270309, Fax: 0544-9270322
SargodhaGround Floor, Zahoor Plaza, Noori Gate,Sargodha.Tel: 048-9230557/ 0483-740861Fax: 048-9230558
BhalwalSugar Mill / Ajnala Road, Bhalwal.Tel: 048-6642431, Fax: 048-6642571
ShujahabadJalal Pur Road, Opp. KB Stand,Shujahabad.Tel: 061-4396006
LodhranShop No. 2&3, Ghalla Mandi, Lodhran.Tel: 0608-9200142, Fax: 0608-9200141
Multan63-A,1st Floor, NIPCO House,Abdali Road, Multan.Tel: 061- 4783057, Fax: 061-4782356
Sahiwal276/B-1, 1st Floor, Alflah Tower,Jinnah Road (High Street), Sahiwal.Tel: 040-9200501-2, Fax: 040-9200503
FatehjangShop # 3, Ground Floor, Ittehad Plaza,Pindi Road, Fatehjang.Tel: 057-2212132
ChakwalShop # MCB 4/1785, Rawalpindi Road.Chakwal.Tel: 0543-540864, Fax: 0543-540864
KhushabPlot No. 221, Block No. 4, CollegeChowk, Jauharabad, Khushab.Tel: 0454-920014, Fax: 0454-920013
Qadirpur RawanG.T. Road, Qadirpur Rawan, Distt.Multan.Tel: 061-4578668
Ahmedpur EastGround Floor, Unique Plaza, KLP Road,Near Uch Bypass, Ahmedpur East.Tel: 062-2272450
Bahawalpur1-B,1st Floor, Model Town ‘B’, GhallaMandi Road, Bahawalpur.Tel: 062-2889612, Fax: 062- 2731775
RawalpindiRopyal Brothers Plaza,Property No. B-130, Main Murree Road,Chandni Chowk, Satellite Town,Rawalpindi.Tel: 051-4842548 /9290930Fax: 051-9290562
Mandi BahaudinFarooq Plaza, Link Kachehri Road,Mandi Bahaudin.Tel: 0546-5009800, Fax: 0546-521002
MianwaliPAF Road, Chah Gull Khanwala,Mianwali.Tel: 0459-920029, Fax: 0459-920030
KhanewalHouse # 1, Street # 1, Block 2,RCA Chowk, Khanewal.Tel: 065-9200255, Fax: 065-9200256
KhanpurPlot # 309-310, Model Town “A”,Near Bank Alfalah, Khanpur.Tel: 068-5028283, Fax: 068-5576822
Liaqatpur3-Housing Scheme, 87-Bank Road,Liaqatpur.Tel: 068-5792599.
Branch Network Punjab
39

Rahim Yar Khan29/30 Canal Bank Road, Opps.Jamiat ul Farooq, Rahim Yar Khan.Tel: 068-5001899, Fax: 068-5879772
Dera Ghazi KhanBlock 18/2557, Near Microwave Tower(NTC), Jampur Road, Dera Ghazi Khan.Tel: 064-9260535, Fax: 064-2474034
Khairpur TamewaliMain Bahawalpur Road,Opposite Chand Restaurant,Tehsil Khairpur Tamewali, DistrictBahawalpur.Tel: 062-2261010
RajanpurKamran Market,Opposite Jamia Sheikh Darkhasti,Indus Highway, Rajanpur.Tel: 0604-690120, Fax: 0604-689513
Kot Addu/MuzaffargarhOpposite Faisal Motors,Near PSO Pump, Main G.T Road, KotAddu.Tel: 066-2243952, Fax: 066-2243852
I.J.P Road-RawalpindiCB # 1, Bilal Center, I.J.P Road, NearBritish Homes Colony, Rawalpindi.Tel: 051-5472717
PasrurKhasra No. 480, Faisal Colony,Main Sialkot Pasrur Road,Near General Bus Stand,Pasrur.Tel: 052-6442247
Karor Lal EssanKhasra No. 0289, Sewag Plaza,Opposite PTCL Exchange,Fateh Pur Road, Karor Lal Essan,District Leyyah.Tel: 0606-810505
Taunsa SharifVohova Road, Taunsa Sharif.Tel: 0642-2601395, Fax: 0642-2016499
JampurMoza Tatar Wala, Indus Highway,Opposite Canal Rest House, Jampur.Tel: 604-568650-332427
LeyyahPlot # 405/B, 2nd Chaubara Road,Near Muslim Commercial Bank, Leyyah.Tel: 0606-414705, Fax: 0606-414506
BhakkarPlot # 155/2, Club Road, Bhakkar.Tel: 0453-9200087, Fax: 0453-9200088
PattokiShop # 02, Tariq Center, Halla Road,Pattoki.Tel: 049-4421350
ChichawatniAhata No.1974, Block No.14, StreetNo.1, Fawara Chowk, Chichawatni.Tel: 405481415
BurewalaFirst Floor 3-C,Opposite Telephone Exchange, MultanRoad, Burewala.Tel: 067-3354157/58
BahawalnagarPlot # 358, Jail Road, Jinnah Colony,Bahawalnagar.Tel: 063-9240115, Fax: 063-9240116
FazilpurKhata No. 27, Opposite Truck Adda,Main Indus Highway, Fazilpur.Tel: 0604-309921, Fax: 0604-309921
VehariPlot # E/8, Main Karkhana Bazar,Near Askari Bank Limited, Vehari.Tel: 067-3360306, Fax: 067-3360307
TibbiMain Bazar, Near Telephone Exchange,Tibbi.Tel: 064-2609456
Arifwala31-A, Chowk Purana Dakhana, Arifwala.Tel: 0457-830541
Jalalpur PirwalaPlot # 64 /1, Al-Mahmood ShoppingCentre, Permat Road, Tehsil Jalalpur,District Multan.Tel: 0614-212199
Khyber Pakhtoonkhwa
PeshawarGround Floor, Hurmaz Plaza,Tehkal Payan, University Road.Tel: 091-9218366/5840388Fax: 091-5840377
Abbotabad1st Floor, Silk Plaza, Supply Bazar,Mansehra Road,Abbotabad.Tel: 0992-343108/343109Fax: 0992-335313
Malakand AgencyTahir plaza, Main Bazar, Batkhela,Malakand Agency.Tel: 0932-415039Fax: 0932-415239
SwabiRehman Market,Swabi Mardan Road, Swabi.Tel: 0938-330075Fax: 0938-223212
MardanCB 445/A- 2, Saddar Bazar, The Mall,Mardan Cantt. Mardan.Tel: 0937-9230445/9230447Fax: 0937-9230446
HaripurPankad Area, Shahrah-e-Hazara, Haripur.Tel: 0995-610181, Fax: 0995615281
CharsadaM G Plaza, Tangi Road, Charsada.Tel: 091-6515724, Fax: 091-6515489
Dera Ismail KhanAl-Zaman Building, Near Siraj MedicalCenter, West Circular Road,Dera Ismail Khan.Tel: 0966-732029, Fax: 0966-711382
Swat (Mingora)First Floor, Shahzad Plaza, Mukan Bagh,Saidu Sharif Road, Mingora.Tel: 0946-7240417, Fax: 0946-9240418
MansehraAbid Khan Plaza, Near Kauho Ziarat,Shinkiari Road, Mansehra.Tel: 0997-920046, Fax: 0997-920047
KohatSamad Plaza, Behzadi Chakarkot, BannuRoad, Kohat.Tel: 0922-522875, Fax: 0922-522876
NowsheraArmy Welfare Shop,1st Floor, DaewooTerminal, Nowshera.Tel: 0923-9220203
40

A N N U A L R E P O R T 2 0 1 0
Sindh
KarachiShowroom # 03, Saba Palace,Plot # 29-A, Block-06, P.E.C.H.S,Main Shahrah-e-Faisal, Karachi.Tel: 021-34305018-21
Baldia TownPlot # A3/10 (Commercial),Shahrah-e-Waqas, Saeed Abad,Baldia Town, Karachi.Tel: 021-32811655, Fax: 021-32811655
HyderabadShop # 2-3, Defence Plaza,Thandi Sarak,Hyderabad.Tel: 022-2784349, Fax: 022-2786621
Nashero FerozeNational Highway, Nashero Feroze.Tel: 0242- 481275, Fax: 0242- 481274
SangharChoudhary Corner,Main Nawabshah Road,Sanghar.Tel: 0235-800161Fax: 0235-543439
BadinAdjacent Abbasi Hospital,Main DCO Chowk,Karachi Road, Badin.Tel: 029-7862330, Fax: 029-7810149
NawabshahHouse No. A-306,Paro Hospital Road,Otaq Quarter, Nawabshah.Tel: 0244-370093, Fax: 0244-370094
MithiShop No. 2&3, Satyani Shopping Centre,Main Naukot Road, Mithi,Distt.Tharparkar.Tel: 023-2262304, Fax: 023-2262305
MirpurkhasPlot # 7, Ward-A, MP Colony,Main Umar Kot Road, Mirpurkhas.Tel: 0233-873276, Fax: 0233-873163
KhairpurNear National Saving Center,Main Katchary Road, Khairpur.Tel: 0243-714064, Fax: 0243-714065
ShikarpurSattari Building, Plot # 23/34/5,Station Road, Shikarpur.Tel: 0726-920161, Fax: 0726-920162
Tando AllahyarMain Mirpurkhas Road,Adjacent Main Eid Gah,Tando Allahyar.Tel: 022-3892875, Fax: 022-3892874
DaherkiHaq Plaza, Main GT Road,Dahriki Dist, Ghotki.Tel: 0723-643834, Fax: 0723-643834
ThattaShop # 5, Al-Shahbaz Shops,National Highway, Thatta.Tel: 0298-550783, Fax: 0298-550784
SukkurPlot Serial # 274,Opposite Total Petrol Pump,Military Road, Sukkur.Tel: 071-5633237-38, Fax: 071-5633240
LarkanaH #.1588, Jan Mohd Jonejo Road,Near Jarral Shah Bukhari, Larkana.Tel: 0741-4044580, Fax: 0741-4044578
BadehShop No.1-3, Mohallah Pyaro KhanSariyo, Main Badeh Naseerabad Road,Badeh, Tehsil Dokri, District Larkana.
DaduPlot # 629, Main Road, Adjacent toGovt. Girls High School, Dadu.Tel: 025-9200084, Fax: 025-9200085
HalaPlot # 824, Old Main National Highway,Adjacent Babi-Nooh Situated at Hala.Tel: 022-3332350
RohriGround Floor, Plot # B-2181/06/01,Main GT Road, Rohri.Tel: 071-5651127, Fax: 071-5651127
JacobabadMain Quetta Road, Near Tikundo Park,Jacobabad.Tel: 0722-652001, Fax: 0722-650302
GhotkiSada Bahar Shopping Center, Near BilalMosque, Main GT Road, Ghotki.Tel: 0723-600239, Fax: 0723-600240
Tando Muhammad KhanMain Hyderabad Badin Road, AdjacentBus Stop, Tando Muhammad Khan.Tel: 022-3342738, Fax: 022-3342833
Pannu AqilNear Eid Gah, Baiji Chowk, Pannu AqilDist Sukkur.Tel: 071-5692033, Fax: 071-5692062
Wagan/KambarOpposite Sui Southern Gas CompanyLimited, Kambar.Tel: 074-4212230, Fax: 074-4212230
ThulNear ZTBL, Main Kandhkot Road,Tehsil Thul, Dist. Jacobabad.Tel: 0722-610117, Fax: 0722-610363
RanipurNear Mazhar Model School, NationalHighway, Ranipur City, District KhairpurMirs.Tel: 0243-730229, Fax: 0243-730230
RatoderoMain Bus Stand Chowk, Ratodero,Dist. Larkana.Tel: 074-4088943, Fax: 074-4088189
Baluchistan
QuettaShop # 2, Usman Complex, Hali RoadQuetta.Tel: 081-9201537Fax: 081-9201528
Sibi80-A, Block-4, Jinnah Road,Sibi.Tel: 0831-9230059Fax: 0831-412949
NasirabadLabor Chowk, Quetta Road,Dera Murad Jamali,Nasirabad.Tel: 0838-711337, Fax: 0838-711338
GawadarShop # 01, Ashraf Complex,East Block , Airport Road, Near JawedComplex, Gawadar.Tel: 0864-211764
JafferabadMain Quetta Road, Near Railway Station,Jafferabad.Tel: 0838-510034, Fax: 0838-510034
41

Azad Jammu & Kashmir
MuzaffarabadRaza Building, Poultry Farm Road,Opposite AJK University, Muzaffarabad.Tel: 058810-42700, Fax: 058810-42710
BaghGround Floor, Al-Noor Plaza,College Road, Bagh, AJK.Tel: 05823-920023, Fax: 05823-920024
RawlakotAnmol Plaza, Opposite Firdous Clinic,CMH Road, Rawlakot.Tel: 05824-920193, Fax: 05824-443245
Federally Administered Tribal Areas
Mohmand AgencyHaji Dilawar Market, Main Mandi Road,Main Bazar, Ghalnai, Mohmand Agency.Tel: 0924-290052Fax: 0924-290106
Bajour AgencyCar Park Hotel,Opposite Civil Colony, Khar,Bajour Agency.Tel: 0942-221250, Fax: 0942-221110
42


Khushhali Bank Limited, 94 West, Fourth Floor, Jinnah Avenue, Blue Area, PO Box 3111, Islamabad-Pakistan.