annual report 2010 - european central bank · · 2018-01-312010 european central bank en annual...
TRANSCRIPT
201020102010201020102010201020102010201020102010
2010
A NNUAL REPORT2010
EU
RO
PEA
N C
EN
TR
AL B
AN
K
AN
NU
AL R
EP
OR
TEN
ANNUAL REPORT2010
In 2011 all ECB publications
feature a motif taken from the
€100 banknote.

© European Central Bank, 2011
AddressKaiserstrasse 29
60311 Frankfurt am Main
Germany
Postal addressPostfach 16 03 19
60066 Frankfurt am Main
Germany
Telephone +49 69 1344 0
Websitehttp://www.ecb.europa.eu
Fax +49 69 1344 6000
All rights reserved. Reproduction for educational and non-commerc ia l purposes i s permitted provided that the source is acknowledged.
Photographs:Andreas BöttcherESKQISOCHROM.com Robert Metsch Walter Vorjohann
The cut-off date for the data included in this report was 25 February 2011.
ISSN 1561-4573 (print)
ISSN 1725-2865 (online)
3ECB
Annual Report2010
CONTENTS
FOREWORD 9
CHAPTER 1
ECONOMIC DEVELOPMENTS
AND MONETARY POLICY
1 MONETARY POLICY DECISIONS 16
2 MONETARY, FINANCIAL AND ECONOMIC
DEVELOPMENTS 24
2.1 The global macroeconomic
environment 24
2.2 Monetary and fi nancial
developments 29
2.3 Price and cost developments 53
2.4 Output, demand and labour
market developments 61
2.5 Fiscal developments 71
2.6 Exchange rates and balance
of payments developments 77
3 ECONOMIC AND MONETARY
DEVELOPMENTS IN NON-EURO
AREA EU MEMBER STATES 82
CHAPTER 2
CENTRAL BANK OPERATIONS AND ACTIVITIES
1 MONETARY POLICY OPERATIONS,
FOREIGN EXCHANGE OPERATIONS
AND INVESTMENT ACTIVITIES 92
1.1 Open market operations
and standing facilities 92
1.2 Foreign exchange operations
and operations with other
central banks 99
1.3 The Securities Markets
Programme 100
1.4 The Covered Bond Purchase
Programme 100
1.5 Investment activities 101
2 PAYMENT AND SECURITIES
SETTLEMENT SYSTEMS 104
2.1 The TARGET2 system 104
2.2 TARGET2-Securities 106
2.3 Settlement procedures
for collateral 107
3 BANKNOTES AND COINS 109
3.1 The circulation of banknotes and
coins and the handling of currency 109
3.2 Banknote counterfeiting
and counterfeit deterrence 110
3.3 Banknote production and issuance 111
4 STATISTICS 114
4.1 New and enhanced euro area
statistics 114
4.2 Other statistical developments 114
4.3 Statistical needs resulting
from the fi nancial crisis 115
5 ECONOMIC RESEARCH 117
5.1 Research priorities and
achievements 117
5.2 Dissemination of research:
publications and conferences 118
6 OTHER TASKS AND ACTIVITIES 120
6.1 Compliance with the prohibition
of monetary fi nancing and
privileged access 120
6.2 Advisory functions 120
6.3 Administration of the borrowing
and lending operations
of the European Union and the
European Financial Stability
Facility, and the pooled bilateral
loans for the benefi t of the
Hellenic Republic 124
6.4 Eurosystem reserve
management services 125
CHAPTER 3
ENTRY OF ESTONIA INTO THE EURO AREA
1 ECONOMIC AND MONETARY
DEVELOPMENTS IN ESTONIA 128
2 LEGAL ASPECTS OF THE INTEGRATION
OF EESTI PANK INTO THE EUROSYSTEM 132
3 OPERATIONAL ASPECTS OF THE
INTEGRATION OF EESTI PANK INTO THE
EUROSYSTEM 133
4 THE CASH CHANGEOVER IN ESTONIA 134
4ECB Annual Report2010
CHAPTER 4
FINANCIAL STABILITY AND INTEGRATION
1 FINANCIAL STABILITY 138
1.1 Financial stability monitoring 138
1.2 Financial stability arrangements 140
2 FINANCIAL REGULATION
AND SUPERVISION 142
2.1 Banking 142
2.2 Securities 143
2.3 Accounting 144
3 FINANCIAL INTEGRATION 146
4 OVERSIGHT OF PAYMENT SYSTEMS
AND MARKET INFRASTRUCTURE 150
4.1 Large-value payment systems and
infrastructure service providers 150
4.2 Retail payment systems
and instruments 152
4.3 Securities and derivatives
clearing and settlement 152
4.4 Other activities 153
CHAPTER 5
EUROPEAN ISSUES
1 POLICY ISSUES 156
2 INSTITUTIONAL ISSUES 159
3 IMPROVING ECONOMIC GOVERNANCE
IN THE EU 160
4 DEVELOPMENTS IN AND RELATIONS
WITH EU CANDIDATE COUNTRIES 161
CHAPTER 6
TASKS CONCERNING THE FUNCTIONING OF
THE EUROPEAN SYSTEMIC RISK BOARD (ESRB)
1 INSTITUTIONAL FRAMEWORK 164
2 ACTIVITIES OF THE ESRB PREPARATORY
SECRETARIAT 166
3 ANALYTICAL, STATISTICAL, LOGISTICAL AND
ADMINISTRATIVE SUPPORT TO THE ESRB 167
CHAPTER 7
INTERNATIONAL ISSUES
1 KEY DEVELOPMENTS IN THE
INTERNATIONAL MONETARY SYSTEM 172
2 COOPERATION WITH COUNTRIES
OUTSIDE THE EU 176
CHAPTER 8
ACCOUNTABILITY
1 ACCOUNTABILITY VIS-À-VIS
THE GENERAL PUBLIC AND
THE EUROPEAN PARLIAMENT 180
2 SELECTED TOPICS RAISED AT MEETINGS
WITH THE EUROPEAN PARLIAMENT 181
CHAPTER 9
EXTERNAL COMMUNICATION
1 COMMUNICATION POLICY 184
2 COMMUNICATION ACTIVITIES 185
CHAPTER 10
INSTITUTIONAL FRAMEWORK, ORGANISATION
AND ANNUAL ACCOUNTS
1 DECISION-MAKING BODIES AND
CORPORATE GOVERNANCE OF THE ECB 190
1.1 The Eurosystem and the European
System of Central Banks 190
1.2 The Governing Council 191
1.3 The Executive Board 194
1.4 The General Council 196
1.5 Eurosystem/ESCB committees,
the Budget Committee,
the Human Resources Conference
and the Eurosystem IT Steering
Committee 197
1.6 Corporate governance 198
2 ORGANISATIONAL DEVELOPMENTS 201
2.1 Human resources management 201
2.2 Staff relations and social dialogue 202
2.3 New ECB premises 202
5ECB
Annual Report2010
2.4 The Eurosystem Procurement
Coordination Offi ce 203
2.5 Environmental issues 203
2.6 Information technology service
management 203
3 THE HUMAN RESOURCES CONFERENCE 205
4 ESCB SOCIAL DIALOGUE 206
5 ANNUAL ACCOUNTS OF THE ECB 208
Management report for the year
ending 31 December 2010 209
Balance Sheet as at 31 December 2010 214
Profi t and Loss Account for the year
ending 31 December 2010 216
Accounting policies 217
Notes on the Balance Sheet 222
Notes on the Profi t and Loss Account 236
Auditor’s report 239
Note on profi t distribution/allocation
of losses 241
6 CONSOLIDATED BALANCE SHEET
OF THE EUROSYSTEM AS AT
31 DECEMBER 2010 242
ANNEXES
LEGAL INSTRUMENTS ADOPTED BY THE ECB 246
OPINIONS ADOPTED BY THE ECB 249
CHRONOLOGY OF MONETARY POLICY
MEASURES OF THE EUROSYSTEM 257
OVERVIEW OF THE ECB’S COMMUNICATION
RELATED TO THE PROVISION OF LIQUIDITY 260
PUBLICATIONS PRODUCED BY THE
EUROPEAN CENTRAL BANK 265
GLOSSARY 266
LIST OF BOXES
Non-standard measures in 2010 1 17
Chart Government bond spreads
in 2010 and early 2011 18
C2 omparing recent developments in MFI
loans to the non-fi nancial private sector
with previous episodes of economic
decline and recovery 33
Chart A Annual growth of real MFI
loans to the non-fi nancial
private sector during major
slowdowns and recoveries
since 1990 33
Chart B Annual growth of real GDP
during major slowdowns
and recoveries since 1990 34
Chart C Annual growth of real MFI
loans to households during
major slowdowns and
recoveries since 1990 34
Chart D Annual growth of real
MFI loans to non-fi nancial
corporations during major
slowdowns and recoveries
since 1990 35
Developments in market-based measures 3
of infl ation expectations in 2010 41
Chart A Break-even infl ation and
infl ation-linked swap rates 42
Chart B Changes in break-even
infl ation rates and changes
in nominal and real yields
in 2010 42
Chart C Decomposition of long-term
forward break-even infl ation
rates based on a term
structure model 42
Chart D Five-year forward
break-even infl ation rates
fi ve years ahead for the
euro area and the United States 43
Interpreting survey indicators of credit 4
standards on loans to enterprises 49
Chart A Changes in credit standards
applied to the approval of
loans or credit lines to enterprises 50
Chart B Availability of bank loans
to euro area fi rms 51
Chart C Restrictive and expansive
credit standard regimes and
credit standards on loans
to euro area non-fi nancial
corporations 51
6ECB Annual Report2010
The5 dynamics of commodity prices
and their impact on HICP infl ation 55
Chart A Commodity price
developments 55
Table Pass-through of crude oil
prices to HICP energy prices 56
Chart B Industrial raw materials
and producer prices for
intermediate goods 57
Euro area household saving behaviour 6 63
Chart A Household income,
consumption and saving 63
Chart B Household net fi nancial worth 64
Recent labour market developments 7
in the euro area and the United States:
the main differences and a historical
perspective 68
Chart Euro area and US
employment developments 68
Table Labour market indicators
in the euro area
and the United States 69
Macroeconomic costs and benefi ts 8
of fi scal consolidation 75
Statistical implications of the 9
enlargement of the euro area
to include Estonia 130
The ESCB Macro-prudential 10
Research Network 168
LIST OF TABLES
1 Price developments 54
2 Labour cost indicators 59
3 Composition of real GDP growth 61
4 Labour market developments 67
5 Fiscal positions in the euro area
and euro area countries 72
6 Excessive defi cit procedures
in the euro area countries 73
7 Real GDP growth in the non-euro
area EU Member States
and the euro area 82
8 HICP infl ation in the non-euro
area EU Member States
and the euro area 83
9 Fiscal positions in the non-euro
area EU Member States
and the euro area 84
10 Balance of payments of the
non-euro area EU Member States
and the euro area 85
11 Offi cial monetary policy strategies
of the non-euro area
EU Member States 88
12 Payment traffi c in TARGET2 104
13 Allocation of euro banknote
production in 2010 112
14 Main economic indicators
for Estonia 128
LIST OF CHARTS
1 ECB interest rates and the euro
overnight interest rate 16
2 Interest rates since the
intensifi cation of the fi nancial crisis 17
3 Main developments in major
industrialised economies 24
4 Main developments
in commodity prices 28
5 M3 and loans to the private sector 29
6 Main components of M3 30
7 MFI interest rates on short-term
deposits and a money market
interest rate 30
8 Sectoral deposits 31
9 Counterparts of M3 31
10 Three-month EUREPO,
EURIBOR and overnight
index swap 37
11 ECB interest rates and the
overnight interest rate 37
12 Long-term government bond yields 38
13 Government bond spreads
of selected euro area countries 40
14 Euro area zero coupon break-even
infl ation rates 41
15 Major stock market indices 44
16 MFI loans to households 45
17 Interest rates on lending to
households and non-fi nancial
corporations 46
18 Household debt and interest
payments 46
19 Real cost of the external fi nancing
of euro area non-fi nancial
corporations 47

7ECB
Annual Report2010
20 External fi nancing of non-fi nancial
corporations broken down
by instrument 48
21 Profi t ratios of listed euro area
non-fi nancial corporations 49
22 Debt ratios of non-fi nancial
corporations 52
23 Breakdown of HICP infl ation:
main components 53
24 Contributions to HICP infl ation
from main components 54
25 Breakdown of industrial producer
prices 59
26 Sectoral compensation
per employee 60
27 Euro area labour costs 60
28 Decomposition of the
GDP defl ator 60
29 Residential property price
developments in the euro area 61
30 Contributions to quarterly real
GDP growth 62
31 Confi dence indicators 62
32 Industrial production growth
and contributions 66
33 Unemployment 67
34 Fiscal developments
in the euro area 74
35 Patterns in exchange rates
and implied volatilities 77
36 Euro nominal and real effective
exchange rates 78
37 Current account balance
and its components 79
38 Euro area exports volume
to selected trading partners 79
39 Euro area direct and portfolio
investment 80
40 Main items of the
fi nancial account 80
41 Developments in ERM II
EU currencies 86
42 Developments in non-ERM II
EU currencies vis-à-vis the euro 87
43 Key ECB interest rates and the
EONIA 92
44 Liquidity factors in the euro area
in 2010 94
45 Outstanding volume of monetary
policy operations 95
46 Eligible collateral by asset type 97
47 Collateral put forward in
Eurosystem credit operations
versus outstanding credit in
monetary policy operations 97
48 Breakdown of assets
(including credit claims) put
forward as collateral by asset type 98
49 Number of euro banknotes
in circulation between 2002
and 2010 109
50 Value of euro banknotes
in circulation between 2002
and 2010 109
51 Number of euro banknotes
in circulation between 2002
and 2010 by denomination 110
52 Number of counterfeit euro
banknotes recovered from
circulation between 2002
and 2010 111
53 Breakdown of counterfeit euro
banknotes by denomination
in 2010 111

8ECB Annual Report2010
COUNTRIES OTHERS
BE Belgium BIS Bank for International Settlements
BG Bulgaria BPM5 IMF Balance of Payments
CZ Czech Republic Manual (5th edition)
DK Denmark c.i.f. cost, insurance and freight at
DE Germany the importer’s border
EE Estonia CPI Consumer Price Index
IE Ireland ECB European Central Bank
GR Greece EEA European Economic Area
ES Spain EER effective exchange rate
FR France EMI European Monetary Institute
IT Italy EMU Economic and Monetary Union
CY Cyprus ESA 95 European System of Accounts 1995
LV Latvia ESCB European System of Central Banks
LT Lithuania EU European Union
LU Luxembourg EUR euro
HU Hungary f.o.b. free on board at the exporter’s border
MT Malta GDP gross domestic product
NL Netherlands HICP Harmonised Index of Consumer Prices
AT Austria ILO International Labour Organization
PL Poland IMF International Monetary Fund
PT Portugal MFI monetary fi nancial institution
RO Romania NCB national central bank
SI Slovenia OECD Organisation for Economic
SK Slovakia Co-operation and Development
FI Finland PPI Producer Price Index
SE Sweden ULCM unit labour costs in manufacturing
UK United Kingdom
JP Japan In accordance with EU practice, the EU MemberUS United States States are listed in this report using the alphabetical order of the country names in the national languages.
Unless stated otherwise, all references in this report to Treaty article numbers refl ect the numbering in effect since the Treaty of Lisbon entered into force on 1 December 2009.
ABBREVIATIONS

FOREWORD
10ECB Annual Report2010
In 2010 monetary policy operated in an
environment characterised by the economic
recovery in the euro area on the one hand and
a persistence of tensions in fi nancial markets
on the other. The recovery in the real economy
during 2010 turned out to be somewhat
stronger than expected. This was partly
related to the recovery in the world economy,
but domestic developments also contributed
to the prevailing positive momentum. Overall,
euro area real GDP increased by around 1.7%
in 2010, following a decline of 4.1% in 2009.
As regards prices, infl ation rates increased
in the course of 2010, mainly refl ecting rises
in global commodity prices. At the same time,
underlying domestic infl ationary pressures
remained moderate. As a consequence,
the average annual infl ation rate rose to 1.6%
in 2010, up from 0.3% in 2009.
In this environment, in 2010 and early 2011
the Governing Council kept the rate on the
main refi nancing operations unchanged at
the historically low level of 1% that was set
in May 2009. This was consistent with its
assessment that the medium-term outlook for
infl ation remained in line with price stability
in 2010. More favourable growth expectations
and short-term infl ation dynamics were thus
not seen as threatening price stability in the
medium term. Money and credit developments
confi rmed the assessment that infl ationary
pressures beyond the short term should remain
contained. Infl ation expectations remained
fi rmly anchored in line with the Governing
Council’s aim of keeping infl ation rates
below, but close to, 2% over the medium term.
This refl ects favourably on the high degree
of credibility of the ECB’s monetary policy.
With regard to the non-standard monetary
policy measures taken by the Eurosystem in
response to the fi nancial crisis, improvements in
fi nancial market conditions in 2009 and the fi rst
few months of 2010 allowed the ECB to reduce
its intermediation role. Acute fi nancial tensions
resurfaced in May. These developments could
be interpreted as resulting from growing market
concerns about the sustainability of public
fi nances, especially in Greece, with clear signs of
contagion affecting other euro area government
bond markets. Liquidity in those segments
of the euro secondary debt market dried up.
Moreover, rating revisions and price declines
implied frequent margin calls and the downward
revaluation of the assets of the banking system,
leading to sudden and sharp reductions in the
value of banks’ collateral. Eventually, private
repurchase agreement markets were affected.
Money market spreads widened again, while
volumes in the overnight segment declined,
bid-ask spreads widened, and the covered bond
market, as well as the corporate bond market, was
affected. In response, the Governing Council
reintroduced some non-standard measures that
had already been phased out or were scheduled
to be phased out. In particular, the Eurosystem
decided to maintain the fi xed rate tender
procedure with full allotment in the regular
three-month longer-term refi nancing operations
11ECB
Annual Report2010
for the period from end-May to end-December,
and announced a new six-month refi nancing
operation with full allotment that took place in
May. Moreover, the temporary liquidity swap
lines with the US Federal Reserve System
were also resumed and a Securities Markets
Programme was launched. This programme
has enabled the Eurosystem to intervene in
bond markets to help restore a more appropriate
functioning of the monetary policy transmission
mechanism in the case of dysfunctional market
segments. The liquidity effects stemming from
these purchases have been fully neutralised by
weekly liquidity-absorbing operations.
***
Regarding fi nancial reform, signifi cant steps
were undertaken in 2010 to increase the
resilience of the fi nancial sector. At the global
level, the ambitious agenda agreed upon
by the G20 ministers and governors gave
the impetus for the milestones achieved.
The agreement reached by the Basel Committee
and approved by the Group of Governors and
Heads of Supervision on the Basel III package
constitutes a substantial strengthening of the
capital and liquidity requirements for banks,
forming a cornerstone of the new prudential
framework. The ECB fully supports the new
framework and is of the view that the agreed
gradual implementation of the Basel III
package should be a key priority.
Another important strand of work for
strengthening the resilience of the fi nancial
system has been the work by the Financial
Stability Board in developing an integrated
framework to reduce the risks and externalities
associated with systemically important
fi nancial institutions. The ECB, being a
member of the Financial Stability Board,
considers it important that a proper framework
is developed that ensures a high degree of
international consistency, thus promoting a
level playing fi eld and minimising the risk of
regulatory arbitrage.
The reform of the framework for crisis
prevention, management and resolution
gained momentum in 2010. This reform aims
at implementing an EU policy coordination
framework and enhancing the EU’s regulatory
framework. The ECB has actively contributed
to this work and the Eurosystem supported the
development of an EU resolution framework.
The establishment of the European Systemic
Risk Board (ESRB) on 16 December 2010
marked a major milestone in terms of Europe
learning lessons from the crisis. The ESRB will
conduct macro-prudential oversight in the EU,
identify, assess and prioritise systemic risks,
and issue warnings and recommendations under
an “act or explain” regime. Together with the
new European Supervisory Authorities (ESAs)
and the national supervisory authorities, the
ESRB forms part of the new European System
of Financial Supervision (ESFS). The ECB
ensures the Secretariat of the ESRB and
provides the ESRB with analytical, statistical,
logistical and administrative support. The
preparatory work for the ESRB at the ECB
started with the setting-up of the ESRB
Preparatory Secretariat on 1 March 2010.
The decision-making body of the ESRB held
its fi rst meeting on 20 January 2011.
The ECB continued to contribute to the key
policy and regulatory initiatives aimed at
enhancing the stability of fi nancial market
infrastructures, in particular as regards
over-the-counter derivatives. In April 2010
the ECB published a report on the lessons
learned from the fi nancial crisis with regard to
the functioning of European fi nancial market
infrastructures. Furthermore, an assessment
of systemically important payment systems
conducted by central banks showed that
business continuity and crisis communication
arrangements are maintained at high standards
by the respective system operators. In addition,
the ECB continued to act as a catalyst for private
sector activities by facilitating collective action.
With regard to the Single Euro Payments Area
12ECB Annual Report2010
(SEPA), the ECB strongly supported the work
of European legislators to create the necessary
momentum to complete the SEPA project.
The envisaged regulation establishing end
dates for the migration to SEPA, under which
the usage of national payment instruments will
be discontinued, is key to ensuring the timely
and smooth adoption of SEPA.
In the fi eld of central bank services, the
Eurosystem operates the large-value payment
system TARGET2. The single platform of
TARGET2 facilitates the real-time gross
settlement of transactions in euro and enables
23 EU central banks and their respective
user communities to benefi t from the same
comprehensive and advanced services.
Substantial progress was made in 2010 on
the Eurosystem’s programme for a new
multi-currency securities settlement solution
called TARGET2-Securities (T2S). Key policy
issues were advanced or fi nalised during
the year, with, for example, the decision on
the pricing policy and the establishment of a
governance framework laying down the ways
in which the Eurosystem, non-euro area central
banks, central securities depositories and
market participants will be able to participate in
the future development and operation of T2S.
Work also progressed on the establishment of
a single platform (CCBM2) for Eurosystem
collateral mobilisation. This system, which
is planned to go live in 2013, will allow
the Eurosystem to provide effi cient and
cost-optimised collateral management and
enhanced liquidity management services to
Eurosystem counterparties.
***
Turning to organisational issues, the ECB had
1,421.5 full-time equivalent positions at the
end of 2010, compared with 1,385.5 positions
at the end of 2009. The increase is mainly
due to the new tasks assigned to the ECB in
relation to the ESRB Secretariat and support
for the ESRB more generally. The members of
staff of the ECB come from all 27 EU Member
States and are recruited by means of open
selection campaigns to fi ll vacancies published
on the ECB’s website. In line with the ECB’s
mobility policy, 204 members of staff moved
internally to other positions in 2010, while
eight members of staff were seconded to other
organisations for external work experience and
36 were granted unpaid leave to study or take
up employment with other organisations or for
personal reasons. The continuous acquisition
and development of skills and competencies by
all members of staff remained a cornerstone of
the ECB’s human resources strategy.
Developments related to corporate culture
focused on diversity and professional ethics.
The ECB is fully committed to diversity and
has made its policy public. An enhanced Ethics
Framework for the members of staff of the
ECB entered into force in 2010.
The ceremonial laying of the foundation
stone on 19 May 2010 marked the offi cial
start of the main construction works for the
new ECB premises. At the beginning of 2010
the respective public tender procedures were
successfully fi nalised and the contracts for
work representing around 80% of the calculated
construction costs were awarded within the
envisaged budget. The completion date for the
new premises is scheduled for the end of 2013.
Regarding its fi nancial accounts, the ECB earned
a surplus of €1.33 billion in 2010, compared
with a surplus of €2.22 billion in 2009. The
Governing Council decided to transfer, as at
31 December 2010, an amount of €1.16 billion
to the provision for foreign exchange rate,
interest rate, credit and gold price risks, thereby
increasing it to its ceiling of €5.18 billion,
which was the value of the ECB’s capital
paid up by the euro area NCBs as at that date.

13ECB
Annual Report2010
The size of this provision is reviewed annually.
The ECB’s net profi t for 2010, following the
transfer to the provision, was €170 million.
This amount was distributed to the euro area
NCBs in proportion to their paid-up shares in
the ECB’s capital.
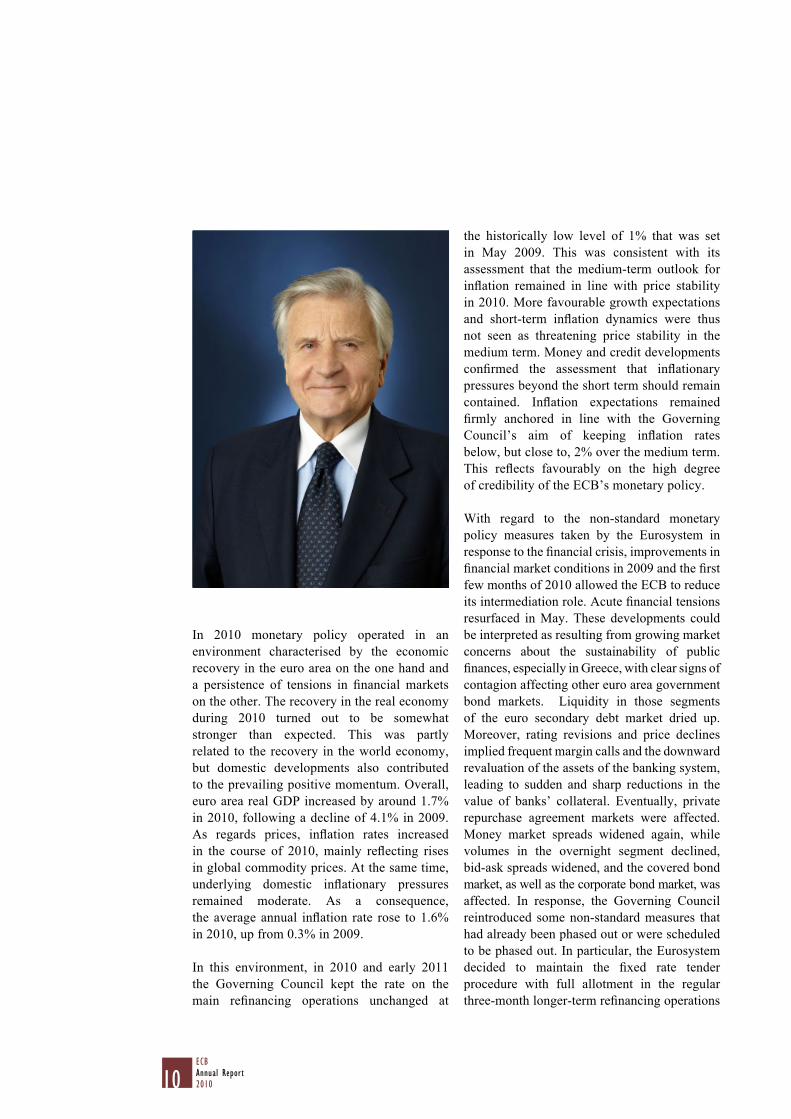
Frankfurt am Main, March 2011
Jean-Claude Trichet

The new ECB premises: view from the east, with the city centre of Frankfurt am Main in the background.
CHAPTER 1
ECONOMIC DEVELOPMENTS AND
MONETARY POLICY

16ECBAnnual Report2010
In 2010 the Eurosystem was once again faced
with a very challenging environment, with
renewed tensions in fi nancial markets. Severe
stress was observed in some euro area bond
markets, particularly from May 2010, refl ecting
the sovereign debt crisis. On the positive side,
the outlook for infl ation remained moderate, with
neither defl ationary nor infl ationary pressures
over the policy-relevant horizon. HICP infl ation
increased gradually over the year and stood at
1.6% on average in 2010, against 0.3% in 2009.
Developments in economic growth were
relatively favourable in 2010, especially taking
into account the severe economic downturn in
2009, with data releases and surveys in the course
of the year generally indicating a somewhat better
economic performance than had been expected.
In this environment, the Governing Council
viewed the accommodative monetary policy
stance as appropriate and therefore left the key
ECB interest rates unchanged at the historically
low levels that they reached in May 2009. The
interest rate on the main refi nancing operations
stood at 1.00% throughout 2010, the rate on
the deposit facility at 0.25% and the rate on the
marginal lending facility at 1.75% (see Chart 1).
Taking a closer look at interest rate
developments since the fi nancial crisis
intensifi ed following the collapse of the
US fi nancial institution Lehman Brothers
on 15 September 2008, some key dates
introducing a new phase of the fi nancial crisis
can be highlighted (see Chart 2).
Positive developments in the functioning of
the money market in the course of 2009 paved
the way for some of the non-standard measures
taken to enhance the functioning of the monetary
policy transmission mechanism to be phased
out in early 2010. However, in May 2010 a new
episode of the crisis started to unfold. As market
concerns about the sustainability of public
fi nances increased, particularly in some euro
area countries, bond markets in these countries
became severely dysfunctional. In view of the
role of government bond markets in the monetary
policy transmission mechanism, the ECB
launched its Securities Markets Programme and
reintroduced some of the non-standard measures
that had been phased out in the preceding months
(see Box 1). The Securities Markets Programme,
like all other non-standard measures adopted
since October 2008 during the period of acute
fi nancial market tensions, is, by construction,
temporary in nature, and is fully consistent with
the mandate of maintaining price stability in the
medium term.
1 MONETARY POLICY DECISIONS
Chart 1 ECB interest rates and the euro overnight interest rate
(percentages per annum; daily data)
1
2
3
4
5
6
7
1
2
3
4
5
6
7
0 0
minimum bid rate/fixed rate in the main refinancing operations
interest rate on the deposit facility
overnight interest rate (EONIA)
interest rate on the marginal lending facility
1999 2001 2003 2005 2007 2009 2011
Sources: ECB and Thomson Reuters.

17ECB
Annual Report2010
Chart 2 Interest rates since the intensification of the financial crisis
(percentages per annum; daily data)
0
1
2
3
4
5
6
0
1
2
3
4
5
67 May 2010:
Start of the
sovereign debt crisis
3 Dec. 2009:
Initiation of
the phasing-out
of non-standard
measures
15 Sep. 2008: Intensification of the financial crisis
fixed rate in the main refinancing operations
interest rate on the deposit facilityovernight interest rate (EONIA)
interest rate on the marginal lending facility
Aug. Dec. Dec.
2008
Apr. Aug. Dec.
2009
Apr.
2010
Aug.
Sources: ECB and Thomson Reuters.
Box 1
NON-STANDARD MEASURES IN 2010 1
The ECB’s non-standard monetary policy measures have been an extraordinary response to
exceptional circumstances. They are, by construction, temporary in nature. Indeed, in early
2010 some non-standard measures that were no longer needed were phased out, as had been
decided by the Governing Council in December 2009, on the back of improved conditions in
fi nancial markets and evidence that the monetary policy transmission mechanism was working
more normally again. Specifi cally, the Governing Council decided in December 2009: that
the 12-month longer-term refi nancing operation (LTRO) in that month would be the last one
with that maturity; that only one more six-month LTRO would be conducted (in March 2010);
and that the supplementary three-month LTROs would be discontinued. Furthermore,
in coordination with other central banks, the ECB discontinued the temporary foreign currency
liquidity-providing operations in February 2010. Moreover, in March 2010 it was decided to return
to a variable rate tender procedure in the three-month LTROs. Finally, the Covered Bond Purchase
Programme, which was initiated in May 2009 for a one-year period, was completed in June 2010,
after the Eurosystem had bought €60 billion of euro-denominated euro area covered bonds as
planned. At the same time, other elements of the ECB’s enhanced credit support, such as the use of
the fi xed rate full allotment procedure in main refi nancing operations, remained in place.
In spring 2010 tensions re-emerged in certain segments of the fi nancial markets, in particular in
some euro area government bond markets. Spreads for the ten-year government bonds of some euro
1 More information on the ECB’s response to the fi nancial crisis, from the start of the crisis to early September 2010, can be found in the
article entitled “The ECB’s response to the fi nancial crisis”, Monthly Bulletin, ECB, October 2010.

18ECBAnnual Report2010
area countries relative to German government
bonds started to increase very quickly (see
the chart). This was mainly driven by increased
market concerns about the sustainability of
public fi nances in some euro area countries,
in view of rising government defi cits and debt.
The widening of spreads accelerated in April
and early May 2010, and on 6 and 7 May they
reached levels unprecedented since the start
of EMU.2 This led euro area governments
to announce a comprehensive package of
measures, including the European Financial
Stability Facility, on 9 May.
In this context, on 10 May 2010 the Eurosystem
announced the launch of the Securities
Markets Programme. Under this programme,
Eurosystem interventions can be carried
out in the euro area public and private debt
securities markets, with the aim of ensuring
depth and liquidity in dysfunctional market
segments and restoring the proper functioning
of the monetary policy transmission
mechanism. The government bond markets
play an essential role in the monetary policy
transmission process, operating through the
following channels.
Interest rates on government bonds are –
usually one of the main determinants
of the interest rates that fi nancial and
non-fi nancial fi rms have to pay when
issuing their bonds (the “price channel”).
When bond markets are severely
disrupted, the short-term interest rates
of the central bank are no longer passed
on to the appropriate degree to longer-
term rates that are relevant to decisions
of households and fi rms, and, hence,
to prices.
The sharply lower bond prices that are implied by the much higher longer-term interest rates –
on account of disrupted bond markets cause signifi cant losses in the portfolios of fi nancial and
non-fi nancial sectors; this would reduce banks’ ability to provide loans to the economy
(the “balance sheet channel”).
2 For more information, see the box entitled “Developments in fi nancial markets in early May”, Monthly Bulletin, ECB, June 2010.
Government bond spreads in 2010 and early 2011
(percentage points)
0
250
500
750
1,000
0
250
500
750
1,000
Jan. Mar. May July Sep. Jan.Nov.2010 2011
Spain
Greece
Ireland Italy
Portugal
0
25
50
75
100
125
150
0
25
50
75
100
125
150
Jan. Mar. May July Sep. Jan.Nov.2010 2011
Austria
France
Netherlands
Belgium
Finland
Source: Thomson Reuters.
Notes: Spreads refl ect yields on ten-year government bonds
against the yield on a ten-year German government bond.
No comparable data are available for the euro area countries not
shown in the chart.
19ECB
Annual Report2010
Exceptionally low liquidity in government bond markets would constrain the use of –
government bonds as collateral in refi nancing operations, thereby also hindering banks’
supply of loans (the “liquidity channel”).
Therefore, the decision to start intervening in bond markets was taken in order to help maintain
the appropriate transmission of monetary policy to the real economy in the euro area by
addressing the malfunctioning of some segments of the securities markets. In accordance with
the provisions of the Treaty, any Eurosystem purchases of government bonds have been strictly
limited to secondary markets.
Following the statements by euro area governments and by the ECB on 9 and 10 May 2010,
tensions in fi nancial markets abated for a short period of time, before spreads started widening
again in a number of countries in the remainder of the year.
The increase in liquidity as a result of the bond purchases made in the context of the Securities
Markets Programme is fully sterilised by means of specifi c operations to reabsorb it,
as it is not the aim of the programme to inject additional liquidity into the banking system.
The prevailing level of liquidity and the money market rates (in other words, the monetary
policy stance) are therefore not affected by the programme, which consequently poses no
infl ationary risks. At the end of 2010 the Eurosystem had intervened in bond markets for an
amount of €73.5 billion and had absorbed liquidity in the money market for exactly the
same amount.
In addition to implementing this new non-standard measure, on 3 May 2010 the ECB suspended
the application of the minimum credit rating threshold in the collateral eligibility requirements
in the case of bonds issued or guaranteed by the Greek government after the joint EU and
IMF programme for Greece had been fi nalised. Furthermore, in early May it reintroduced
some of the non-standard measures that had been withdrawn earlier, in order to avoid negative
spillovers from domestic sovereign bond markets to other fi nancial markets. There was a risk
that the normal functioning of markets could become impaired, notably the initial link in the
monetary policy transmission mechanism between the central bank and credit institutions.
In turn, this could have seriously impaired the ability of banks, which are the primary source
of fi nancing in the euro area, to provide credit to the real economy. In particular, the Eurosystem
reintroduced the fi xed rate tender procedure with full allotment in the regular three-month
LTROs for the period starting at the end of May, and a new six-month refi nancing operation
with full allotment was conducted in May. The temporary liquidity swap lines with the Federal
Reserve System were also resumed.
Given the continuing tensions in some government bond market segments and continued high
uncertainty, the Governing Council decided in its meetings in September and December 2010 that
all longer-term Eurosystem refi nancing operations to be allotted in the last quarter of 2010 and
the fi rst quarter of 2011 respectively would be conducted as fi xed rate tender procedures with full
allotment. The rates in these LTROs were fi xed at the average of the rates on the main refi nancing
operations over the life of the respective LTRO. Throughout 2010 the main refi nancing operations
were conducted at fi xed rates with full allotment.

20ECBAnnual Report2010
Following the sharp contraction experienced
in 2008-09, euro area economic growth
turned positive again at the end of 2009 and
continued to grow in 2010. Quarterly real
GDP growth rates in the fi rst half of 2010
were better than expected, refl ecting in part
considerable support from fi scal stimuli and the
accommodative monetary policy stance, as well
as the rebound in global economic activity.
In line with expectations, economic growth
moderated somewhat in the second half of the
year, while the underlying momentum of the
euro area recovery remained positive. Overall,
euro area real GDP increased by around
1.7% in 2010 after having contracted by 4.1%
in 2009.
Infl ationary pressures remained moderate
in 2010, with some upward pressure emerging
at the end of the year and in early 2011.
The average annual infl ation rate in 2010 stood
at 1.6%. Month-on-month developments in the
infl ation rate were noteworthy, as annual HICP
infl ation gradually increased in 2010, rising from
a low of 0.9% in February to 2.2% in December.
The gradual increase in HICP infl ation mainly
refl ected developments in commodity prices,
driven by the global economic recovery and by
base effects. Market-based and survey-based
measures of long-term infl ation expectations
remained broadly anchored at levels consistent
with the Governing Council’s aim of keeping
infl ation rates below, but close to, 2% in the
medium term.
The pace of monetary expansion in the euro area
gradually increased in 2010. M3 growth,
however, remained low, at an average rate of
0.6% in 2010. This supported the assessment
that the underlying pace of monetary expansion
was moderate and that infl ationary pressures
over the medium term were contained.
The monetary analysis used as a basis for the
analysis and assessment of money and credit
developments has been greatly enhanced over
time and this has deepened the ECB’s medium-
term-oriented monetary policy strategy.1
THE GRADUAL ECONOMIC RECOVERY
AND THE PHASING-OUT OF SOME
NON-STANDARD MEASURES
Looking at monetary policy decisions in 2010
in more detail, information and analyses that
had become available at the beginning of
the year indicated that a moderate economic
recovery was under way in the euro area,
in part supported by temporary factors.
Moreover, the recovery was likely to be
uneven. In particular, economic growth rates
and infl ation developments diverged somewhat
across euro area countries, although to a lesser
extent than in 2009. The divergence mainly
resulted from the ongoing rebalancing processes
within the euro area, being the mirror image of
the unsustainable growth patterns observed in
some countries before the crisis.
Macroeconomic forecasts and projections for
the euro area remained broadly unchanged
in spring 2010. The March 2010 ECB staff
macroeconomic projections foresaw annual real
GDP growth in a range between 0.4% and 1.2%
in 2010 and between 0.5% and 2.5% in 2011.
Price developments were expected to remain
subdued over the policy-relevant horizon, with
HICP infl ation projected to be between 0.8%
and 1.6% in 2010, and between 0.9% and 2.1%
in 2011.
The cross-check of the outcome of the economic
analysis with the signals from the monetary
analysis continued to confi rm the assessment
of low infl ationary pressures over the medium
term. The growth rates of money and credit
remained low, although the growth rate of
money somewhat overstated the deceleration
in the underlying pace of monetary expansion
owing to the steep slope of the yield curve,
which caused shifts out of M3.
For more information, see the article entitled “Enhancing 1
monetary analysis”, Monthly Bulletin, ECB, November 2010;
and Papademos, L. and Stark, J. (eds.), Enhancing monetary analysis, ECB, 2010.

21ECB
Annual Report2010
At the start of 2010 the Governing Council began
to gradually phase out liquidity measures that
were no longer needed to the same extent as in
the past, in accordance with the decisions taken
in December 2009. In particular, the number of
longer-term refi nancing operations was reduced.
These steps were taken against the background
of improving conditions in fi nancial markets,
including the money market, in the course of
2009. However, the Eurosystem continued to
provide extraordinary liquidity support to the
banking system of the euro area, facilitating
the provision of credit to the euro area economy
in an environment of continuing uncertainty.
As a result, the overnight interest rate continued
to stand close to the rate on the deposit facility,
as it had done ever since the introduction of the
fi xed rate tender procedure with full allotment
in October 2008. Prior to that, very short-term
money market interest rates had been steered
primarily by the minimum bid rate on the main
refi nancing operations.
THE CRISIS IN SOME SOVEREIGN BOND MARKETS
FROM MAY 2010
High government defi cits, rapidly increasing
government debt-to-GDP ratios and rising
contingent liabilities on account of guarantees
for banks set the stage for a reintensifi cation of
the fi nancial crisis. Market pressure had already
been building up towards the end of 2009 and in
early 2010, but it culminated in early May 2010,
with the spreads of some euro area sovereign
bonds against the German benchmark bond
reaching levels not seen since the introduction
of the euro. This was particularly the case for
the yield on Greek government bonds, which
reached very high levels compared with the
German benchmark bond, but yields on the
bonds of some other governments were also
affected. In view of the role of government bond
markets in the transmission of monetary policy
to the economy and, ultimately, prices, the ECB
launched its Securities Markets Programme,
enabling the Eurosystem to purchase public and
private bonds.
Macroeconomic developments in the fi rst half of
2010 were more favourable than expected, in spite
of the impact of the sovereign debt crisis. These
positive developments generally led to substantial
upward revisions of macroeconomic forecasts
and projections for the euro area published later
in the year, including the June 2010 Eurosystem
staff macroeconomic projections. At the same
time, the remainder of the year was expected
to witness somewhat lower growth rates,
albeit with a positive underlying momentum.
In the September 2010 ECB staff projections,
annual real GDP growth was expected to
be between 1.4% and 1.8% in 2010, and
between 0.5% and 2.4% in 2011. This implied
a substantial upward revision for 2010 compared
with the June 2010 Eurosystem staff projections,
which had included growth projections of
between 0.7% and 1.3% for 2010.
Improving macroeconomic conditions were
accompanied by more favourable credit
developments. In the autumn of 2010 it became
increasingly clear that a turning point in the
annual growth rate of loans to the private sector
had been reached earlier in the year. While the
annual growth rate of loans to households had
already reached a turning point in the third
quarter of 2009, the annual growth rate of loans
to non-fi nancial corporations did not become
less negative until the latter part of 2010.
This pattern was broadly consistent with the
lagged response of developments in loans to
non-fi nancial corporations to economic activity
over the business cycle that had been observed
in past cycles.
After broadly stabilising in the fi rst half of 2010,
the euro overnight index average (EONIA)
increased slightly in the second half of the year,
on account of a gradual reduction in the amount
of excess liquidity. Given that in this period the
ECB continued to supply unlimited amounts of
liquidity to MFIs, against eligible collateral, at
the fi xed rate applied in the main refi nancing
operations, the developments in the EONIA
were demand-driven. Therefore, they were
not to be taken as a sign of a tightening of the
monetary policy stance. Rather, the reduction in
banks’ demand for Eurosystem fi nancing could
be interpreted as refl ecting improved access to
22ECBAnnual Report2010
market-based funding, such as bank securities
and interbank lending.
Towards the end of 2010 tensions intensifi ed
again in certain bond markets, refl ecting
increased concerns about the sustainability of
public fi nances in some euro area countries, in
part related to the need for fi nancial support for
ailing banking systems, but to some extent also
pointing to uncertainty about various aspects
of European sovereign crisis prevention and
resolution mechanisms. Once again, yields
on some government bonds rose sharply.
The concurrent deterioration in the funding
conditions of a number of banks led to an
increase in recourse to the liquidity supplied by
the Eurosystem.
The tensions in some segments of the fi nancial
markets, and their potential spillover to the euro
area real economy, created additional downside
risks to the economic outlook reported in the
December 2010 Eurosystem staff projections,
which was largely unchanged from the outlook
for 2010 and 2011 reported in the September
2010 ECB staff projections. In the view of
the Governing Council, risks to the economic
outlook were tilted to the downside, with
uncertainty remaining elevated. In addition to the
fi nancial market tensions, downside risks related
to renewed increases in oil and other commodity
prices, protectionist pressures and the possibility
of a disorderly correction of global imbalances.
On the other hand, global trade could grow
more rapidly than expected, thereby supporting
euro area exports. At the same time, the level
of business confi dence in the euro area remained
relatively high.
As regards price developments, the
December 2010 Eurosystem staff projections
foresaw annual HICP infl ation in a range
between 1.3% and 2.3% in 2011. Risks to the
outlook for price stability were seen by the
Governing Council as being broadly balanced,
with higher increases in prices expected in the
months ahead. Upside risks related, in particular,
to developments in energy and non-energy
commodity prices. Furthermore, increases in
indirect taxes and administered prices could
be greater than expected, owing to the need for
fi scal consolidation in the coming years.
Against this background, the Governing
Council decided in early September and early
December 2010 to continue to conduct the main
refi nancing operations and the special-term
refi nancing operations with a maturity of
one maintenance period as fi xed rate tender
procedures with full allotment in the quarter
ahead. As a result, the modalities of these
refi nancing operations remained the same
as those applied in May 2010. Furthermore,
the Governing Council decided in the
same meetings to conduct the three-month
longer-term refi nancing operations allotted in
the last quarter of 2010 and the fi rst quarter
of 2011 as fi xed rate tender procedures with
full allotment. The rates in these operations
were fi xed at the average of the rates on the
main refi nancing operations over the life of the
respective operation.
At the beginning of 2011 infl ation rates
continued to rise, mainly refl ecting higher
commodity prices. In March 2011 the
Governing Council concluded on the basis of the
economic analysis that risks to the outlook for
price developments were on the upside, while
the underlying pace of monetary expansion
remained moderate. The underlying momentum
of economic activity in the euro area remained
positive, but uncertainty remained elevated.
Strong vigilance was warranted with a view
to containing upside risks to price stability. It
was considered essential that the recent rise in
infl ation should not give rise to broad-based
infl ationary pressures over the medium term,
and the Governing Council remained prepared
to act in a fi rm and timely manner to ensure that
upside risks to price stability over the medium
term would not materialise. The continued
fi rm anchoring of infl ation expectations was
considered to be of the essence.
The Governing Council also decided to continue
conducting the main refi nancing operations as
fi xed rate tender procedures with full allotment,
23ECB
Annual Report2010
for as long as necessary, and at least until
12 July 2011. This procedure also remained in
use for the special-term refi nancing operations,
which would continue to be conducted for
as long as needed, and at least until the end
of the second quarter of 2011. Furthermore,
the Governing Council decided to continue
conducting the three-month longer-term
refi nancing operations allotted in the second
quarter of 2011 as fi xed rate tender procedures
with full allotment.
24ECBAnnual Report2010
2.1 THE GLOBAL MACROECONOMIC
ENVIRONMENT
GLOBAL RECOVERY CONTINUED IN 2010
In 2010 global economic activity continued
to recover from the severe recession recorded
during the global fi nancial crisis. Particularly in
the fi rst half of the year, the economic upturn was
sustained by monetary and fi scal policy stimulus
measures, some further normalisation of global
fi nancing conditions and improvements in
consumer and business confi dence. In addition,
a prolonged inventory cycle supported the global
economic recovery, as fi rms rebuilt their stocks in
response to a more favourable global economic
outlook. In fact, the restocking contributed
signifi cantly to GDP growth in major economies
over this period. Accordingly, the global
composite Purchasing Managers’ Index (PMI)
continued to recover in early 2010 and reached
a peak of 57.7 in April, which was above the
levels prevailing just before the intensifi cation of
the global economic crisis after the collapse of
Lehman Brothers in September 2008. The overall
improvement in the economic situation and
the rebound in activity – which was led by the
manufacturing sector – was accompanied by
a strong recovery in world trade, as refl ected
in very buoyant export and import growth
rates, particularly in the fi rst half of the year.
However, the pace of the recovery was rather
uneven across regions. In advanced economies,
the upturn remained fairly modest. At the same
time, emerging economies, particularly in Asia,
led the global recovery, even raising concerns
about overheating pressures in several countries.
Global employment indicators also gradually
improved in the course of the year, following
widespread job losses throughout the preceding
two years.
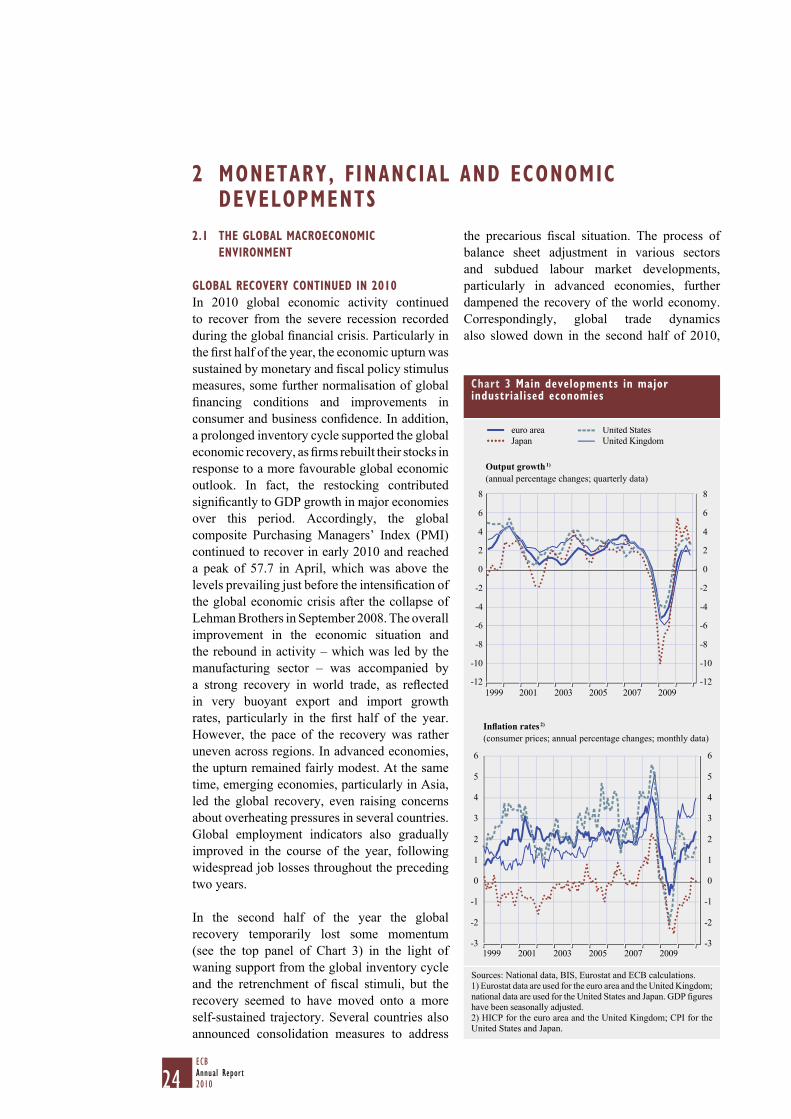
In the second half of the year the global
recovery temporarily lost some momentum
(see the top panel of Chart 3) in the light of
waning support from the global inventory cycle
and the retrenchment of fi scal stimuli, but the
recovery seemed to have moved onto a more
self-sustained trajectory. Several countries also
announced consolidation measures to address
the precarious fi scal situation. The process of
balance sheet adjustment in various sectors
and subdued labour market developments,
particularly in advanced economies, further
dampened the recovery of the world economy.
Correspondingly, global trade dynamics
also slowed down in the second half of 2010,
2 MONETARY, FINANCIAL AND ECONOMIC DEVELOPMENTS
Chart 3 Main developments in major industrialised economies
United States
Japan
euro area
United Kingdom
Output growth 1)
(annual percentage changes; quarterly data)
-12
-10
-8
-6
-4
-2
0
2
4
6
8
-12
-10
-8
-6
-4
-2
0
2
4
6
8
1999 2001 2003 2005 2007 2009
Infl ation rates 2)
(consumer prices; annual percentage changes; monthly data)
-3
-2
-1
0
1
2
3
4
5
6
-3
-2
-1
0
1
2
3
4
5
6
1999 2001 2003 2005 2007 2009
Sources: National data, BIS, Eurostat and ECB calculations.
1) Eurostat data are used for the euro area and the United Kingdom;
national data are used for the United States and Japan. GDP fi gures
have been seasonally adjusted.
2) HICP for the euro area and the United Kingdom; CPI for the
United States and Japan.

25ECB
Annual Report2010
expanding at a slower pace than in the fi rst
six months. However, available information
suggests that the growth momentum picked up
again at the turn of the year.
In spite of a gradual increase in commodity
prices, mostly in the second half of the year,
infl ationary pressures in advanced economies
remained subdued in 2010 (see the bottom panel
of Chart 3) – with some notable exceptions,
such as the United Kingdom – on account of
well-anchored infl ation expectations and the
prevailing spare capacity. This contrasted with
dynamic emerging markets where infl ationary
pressures were more pronounced, partly on
account of higher commodity prices, as well
as rising capacity constraints. Amid persisting
concerns regarding infl ation resulting from
overheating, several central banks in emerging
economies decided to withdraw some of the
exceptional liquidity measures introduced in
response to the crisis and to tighten their monetary
policy stances. According to the latest available
data, headline annual consumer price infl ation in
the OECD area declined gradually during 2010,
from a peak of just above 2% in January 2010
to 1.6% in August, before edging up again to stand
at 2.1% in December. This is also consistent with
developments in the PMI for input prices, which
also increased in the second half of 2010 and in
January 2011 stood at the highest level in almost
two and a half years. Higher food and energy
prices contributed to this increase. Excluding
food and energy, annual consumer price infl ation
in the OECD area declined throughout the year,
from 1.6% at the beginning of 2010 to 1.2% in
December.
UNITED STATES
In the United States, the economy continued
to recover in 2010. A modest cyclical upswing
gained traction, with the support of substantial
macroeconomic policy stimuli and a gradual
improvement in fi nancial conditions. Real
GDP expanded at a rate of 2.8%, following
a 2.6% contraction in 2009. The recovery
in private domestic demand was slow by
historical standards, refl ecting subdued growth
in consumer spending. Household consumption
remained constrained by high unemployment,
low confi dence and continuing efforts to
repair stretched balance sheets. A strong
rebound in business investment in equipment
and software was an important driver of the
recovery, underpinned by improving access to
credit, as well as solid corporate profi tability
against the background of cost-cutting measures
implemented during the downturn. Growth
was also supported by temporary factors such
as government policies enacted to foster the
economic recovery and the restocking of
inventories. In net terms, trade subtracted from
GDP growth in 2010 as the rebound in imports
outpaced that in exports. Having contracted
sharply during the recession, the current account
defi cit widened modestly with the onset of the
recovery and averaged 3.3% of GDP in the fi rst
three quarters of 2010, up from 2.7% in 2009.
The housing sector failed to improve: after
tentatively increasing in the fi rst half of the year,
housing activity and prices weakened again in
the second half following the expiration of some
housing support initiatives.
In the context of a modest economic recovery,
price developments remained subdued as
upward cost pressures were limited by the
persistent slack in product and labour markets.
The annual change in the CPI for 2010 rose
to 1.6%, from -0.4% the year before, on account
of rising energy costs. Excluding food and
energy, CPI infl ation continued to slow and
averaged 1.0% for the whole year, down from
1.7% in 2009.
The Federal Open Market Committee (FOMC)
of the Federal Reserve System kept its target for
the federal funds rate unchanged within a range
of 0% to 0.25% throughout 2010 and continued
to anticipate that economic conditions would
be likely to warrant exceptionally low levels
for the federal funds rate for an extended
period. Although the special liquidity facilities
created to support markets during the crisis
were closed and the large-scale purchases of
mortgage-related assets were concluded by
mid-2010, in August 2010 the FOMC decided
to maintain the Federal Reserve’s holdings of

26ECBAnnual Report2010
securities at their current level by reinvesting
principal payments from agency debt and agency
mortgage-backed securities in longer-term
Treasury securities. It also decided to continue
to roll over the Federal Reserve’s holdings
of Treasury securities as they mature. Later,
in November 2010 the FOMC announced its
intention to purchase a further USD 600 billion
of longer-term Treasury securities by the end of
the second quarter of 2011 in order to promote a
stronger pace of economic recovery.
As regards fi scal policy, the federal budget defi cit
narrowed slightly to 8.9% of GDP in the 2010
fi scal year – which ended in September 2010 –
compared with 10% in the previous year.
This led to a further increase in the federal
debt held by the public to 62% at the end of
the 2010 fi scal year, from 53% in the previous
fi scal year. In the context of high defi cits,
rising federal debt and the further enactment
of fi scal stimuli (totalling USD 858 billion) in
the short term, a report by the President’s Fiscal
Commission was issued in December 2010
with concrete proposals on how to address
medium-term fi scal challenges and achieve
fi scal sustainability over the long run.
CANADA
Economic activity in Canada picked up rapidly
in early 2010, after emerging from the recession
in mid-2009, supported by solid domestic
demand, macroeconomic stimuli and a rebound
in exports. By the third quarter of 2010, however,
the recovery had lost momentum owing to a
slowdown in construction activity, coupled with a
negative net trade contribution to growth. Labour
market conditions were relatively favourable, as
they continued to improve gradually in parallel
with the evolving economic upturn. However,
despite declining to 7.6% in December 2010
(the lowest level since January 2009),
the unemployment rate remained well above
its pre-recession levels. Economic activity
continued to be supported by a low interest rate
environment (despite the Bank of Canada having
taken steps towards a tighter policy stance from
mid-2010), stable fi nancial market conditions
and a resilient banking system, which allowed
for a continued fl ow of credit to businesses and
households. Turning to price developments,
headline and core CPI infl ation stayed within the
central bank’s target infl ation range of 1% to 3%.
Annual headline CPI infl ation trended upwards
in the second half of 2010 and stood at 2.4% in
December, refl ecting the impact of higher energy
and food prices, while core infl ation was 1.5% in
December, following a gentle deceleration in the
course of 2010.
JAPAN
In Japan, the economic recovery continued
during the fi rst three quarters of 2010, supported
by the implementation of accommodative
monetary policy and a substantial fi scal
stimulus. The improvement in the economic
situation in Japan was also aided by strong
global demand, in particular from the Asian
emerging economies, especially in the fi rst
half of 2010. In the second half of the year
the contribution from the external sector
declined, owing to the moderation of world
trade growth, while domestic spending remained
fi rm. However, towards the end of the year,
as a result of volatility in domestic spending
following the withdrawal of the government
stimulus, the economic recovery in Japan hit
a soft patch, resulting in a deterioration in
business sentiment. Labour market conditions
improved somewhat over 2010, although the
unemployment rate remained rather high by
historical standards.
As regards price developments, consumer prices
fell throughout most of 2010 on a year-on-year
basis, owing to substantial slack in the economy.
In October, however, annual CPI infl ation turned
positive for the fi rst time in almost two years,
driven partly by an increase in tax on cigarettes
and higher commodity prices, while annual CPI
infl ation excluding food and energy, although
moderating, continued its defl ationary trend.
Throughout 2010 the Bank of Japan maintained
an accommodative monetary stance in order
to stimulate the economy and fi ght defl ation,
lowering its uncollateralised overnight call
rate to between 0% and 0.1% in October 2010
27ECB
Annual Report2010
and establishing other measures such as a new
asset purchase programme, as well as extending
the fi xed rate fund-supplying operation. On
15 September 2010 the Japanese authorities
intervened in the foreign exchange market for
the fi rst time since March 2004 in order to curb
the appreciation of the yen.
EMERGING ASIA
Emerging Asia’s resilience to the global
economic and fi nancial crisis was demonstrated
by very strong economic performance across
the region in 2010, with an area-wide GDP
growth rate of 9.1%. While supportive fi scal and
monetary policies were gradually withdrawn
and the contribution of net exports declined in
the second half of the year, domestic private
demand and, notably, gross fi xed investment
took over as the main drivers of economic
growth, especially in India and Indonesia.
Overall economic performance remained robust
in the second half of 2010, although the pace of
expansion slowed down somewhat compared
with the previous six months.
After recording very low consumer price
infl ation rates in 2009, infl ationary pressures
increased markedly during 2010. Annual
CPI infl ation for the region stood at 5% in
December 2010, mainly on account of rising
food and commodity prices. Most central banks
in the region started to tighten their monetary
stances in the second half of 2010, reducing the
monetary stimuli introduced in the previous year.
Given emerging Asia’s strong macroeconomic
performance and the declining risk aversion
of international investors, the region also
experienced a major rebound in capital
infl ows. A number of countries intervened in
currency markets to stem the ensuing currency
appreciation pressures, and also introduced
capital controls and macro-prudential measures.
In China, real GDP growth accelerated to 10.3%
in 2010, from 9.2% in 2009. The vigorous
economic performance refl ected increasing
contributions from private investment and net
exports, which counterbalanced the negative
impact of the gradual withdrawal of policy
stimuli. However, the relative contribution
of consumption to growth decreased and the
current account surplus widened in nominal
terms in 2010, evidence of the persistence of
internal and external imbalances. Infl ationary
pressures increased during the year, with CPI
infl ation reaching 4.6% in annual terms in
December, mainly on account of rising food
prices. Property price pressures emerged against
the background of ample liquidity, ongoing
loose credit conditions and negative real interest
rates on deposits. The authorities reacted by
tightening their policy stance in the second part
of the year. Among other things, this resulted in
stricter quantitative limits on credit and increases
in lending and deposit rates. Larger capital
infl ows, particularly in the last quarter of 2010,
fuelled a rapid increase in foreign exchange
reserves, which reached USD 2.85 trillion
by the end of 2010. On 19 June 2010 China
returned to a more fl exible exchange rate
arrangement for the renminbi, which appreciated
by 3.6% against the US dollar and by 4.7% in
real effective terms (CPI-defl ated) in 2010.
LATIN AMERICA
In Latin America, economic activity continued
to recover rapidly in 2010. GDP growth was
particularly robust in the fi rst half of the year,
mainly owing to buoyant domestic demand
which more than offset the outstanding
negative contribution of external demand (about
3 percentage points in the third quarter) to GDP
growth. Thereafter, the growth momentum slowed
down somewhat as policy stimulus measures
were withdrawn and foreign demand weakened.
In year-on-year terms, real GDP for the region as
a whole increased by 6.0% on average in the fi rst
three quarters of 2010. Gross capital formation,
including inventory accumulation, and private
consumption were the main drivers of regional
growth. Investment was spurred on by the
improved growth outlook, the rise in commodity
prices, the decline in real interest rates and the
greater availability of fi nancing, which, in some
countries, was enhanced by lending by public
banks. Private consumption growth was sustained
by a rapid recovery in confi dence, as well as
employment and real wages.
28ECBAnnual Report2010
In early 2010, notwithstanding sizeable
differences across countries, infl ation in
most of the countries with infl ation-targeting
arrangements moved signifi cantly closer to the
respective target value. However, in the context
of strong growth in economic activity and rising
commodity prices, infl ationary pressures started
to rise later in the year and some countries
began to reverse part of the monetary stimuli
deployed during the crisis. From April onwards
several central banks in the region initiated a
cycle of offi cial interest rate rises. As global
fi nancial conditions continued to improve and
risk appetite returned, spreads on credit default
swaps on Latin American sovereign debt
narrowed, stock prices increased signifi cantly
and fi nancial fl ows returned, resulting in
currency appreciations. In late 2010, given that
higher interest rates would risk fuelling strong
capital infl ows and owing to uncertainty relating
to global economic developments, the process
of tightening policy rates was interrupted in
some countries and a number of measures to
stem large capital infl ows were introduced
(e.g. reserve accumulation, macro-prudential
policies and capital controls).
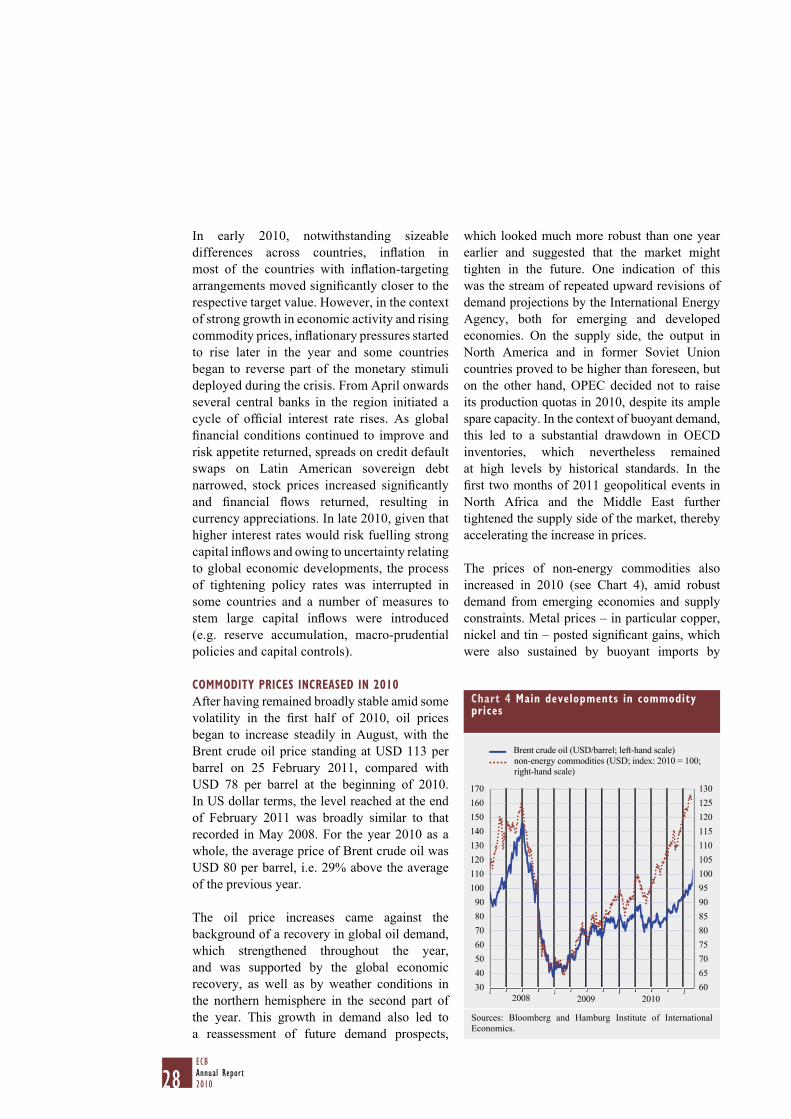
COMMODITY PRICES INCREASED IN 2010
After having remained broadly stable amid some
volatility in the fi rst half of 2010, oil prices
began to increase steadily in August, with the
Brent crude oil price standing at USD 113 per
barrel on 25 February 2011, compared with
USD 78 per barrel at the beginning of 2010.
In US dollar terms, the level reached at the end
of February 2011 was broadly similar to that
recorded in May 2008. For the year 2010 as a
whole, the average price of Brent crude oil was
USD 80 per barrel, i.e. 29% above the average
of the previous year.
The oil price increases came against the
background of a recovery in global oil demand,
which strengthened throughout the year,
and was supported by the global economic
recovery, as well as by weather conditions in
the northern hemisphere in the second part of
the year. This growth in demand also led to
a reassessment of future demand prospects,
which looked much more robust than one year
earlier and suggested that the market might
tighten in the future. One indication of this
was the stream of repeated upward revisions of
demand projections by the International Energy
Agency, both for emerging and developed
economies. On the supply side, the output in
North America and in former Soviet Union
countries proved to be higher than foreseen, but
on the other hand, OPEC decided not to raise
its production quotas in 2010, despite its ample
spare capacity. In the context of buoyant demand,
this led to a substantial drawdown in OECD
inventories, which nevertheless remained
at high levels by historical standards. In the
fi rst two months of 2011 geopolitical events in
North Africa and the Middle East further
tightened the supply side of the market, thereby
accelerating the increase in prices.
The prices of non-energy commodities also
increased in 2010 (see Chart 4), amid robust
demand from emerging economies and supply
constraints. Metal prices – in particular copper,
nickel and tin – posted signifi cant gains, which
were also sustained by buoyant imports by
Chart 4 Main developments in commodity prices
30
40
50
60
70
80
90
100
110
120
130
140
150
160
170
60
65
70
75
80
85
90
95
100
105
110
115
120
125
130
2008 2009 2010
Brent crude oil (USD/barrel; left-hand scale)
non-energy commodities (USD; index: 2010 = 100;
right-hand scale)
Sources: Bloomberg and Hamburg Institute of International
Economics.
29ECB
Annual Report2010
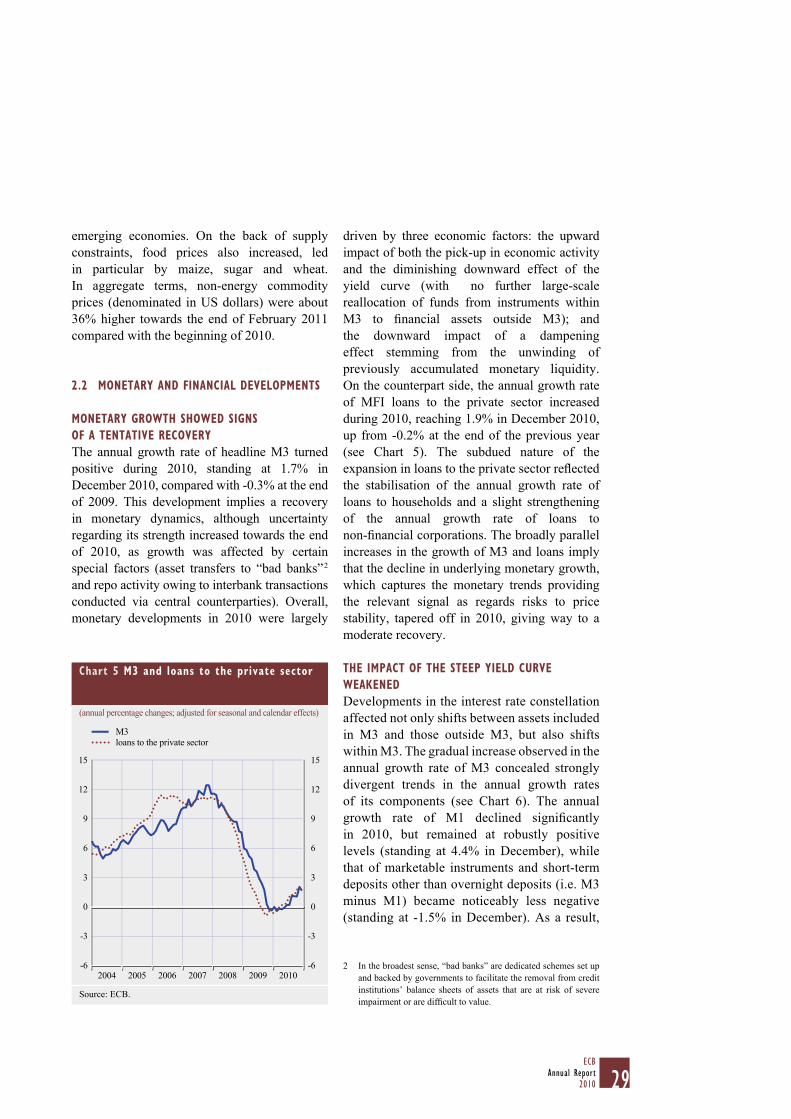
emerging economies. On the back of supply
constraints, food prices also increased, led
in particular by maize, sugar and wheat.
In aggregate terms, non-energy commodity
prices (denominated in US dollars) were about
36% higher towards the end of February 2011
compared with the beginning of 2010.
2.2 MONETARY AND FINANCIAL DEVELOPMENTS
MONETARY GROWTH SHOWED SIGNS
OF A TENTATIVE RECOVERY
The annual growth rate of headline M3 turned
positive during 2010, standing at 1.7% in
December 2010, compared with -0.3% at the end
of 2009. This development implies a recovery
in monetary dynamics, although uncertainty
regarding its strength increased towards the end
of 2010, as growth was affected by certain
special factors (asset transfers to “bad banks” 2
and repo activity owing to interbank transactions
conducted via central counterparties). Overall,
monetary developments in 2010 were largely
driven by three economic factors: the upward
impact of both the pick-up in economic activity
and the diminishing downward effect of the
yield curve (with no further large-scale
reallocation of funds from instruments within
M3 to fi nancial assets outside M3); and
the downward impact of a dampening
effect stemming from the unwinding of
previously accumulated monetary liquidity.
On the counterpart side, the annual growth rate
of MFI loans to the private sector increased
during 2010, reaching 1.9% in December 2010,
up from -0.2% at the end of the previous year
(see Chart 5). The subdued nature of the
expansion in loans to the private sector refl ected
the stabilisation of the annual growth rate of
loans to households and a slight strengthening
of the annual growth rate of loans to
non-fi nancial corporations. The broadly parallel
increases in the growth of M3 and loans imply
that the decline in underlying monetary growth,
which captures the monetary trends providing
the relevant signal as regards risks to price
stability, tapered off in 2010, giving way to a
moderate recovery.
THE IMPACT OF THE STEEP YIELD CURVE
WEAKENED
Developments in the interest rate constellation
affected not only shifts between assets included
in M3 and those outside M3, but also shifts
within M3. The gradual increase observed in the
annual growth rate of M3 concealed strongly
divergent trends in the annual growth rates
of its components (see Chart 6). The annual
growth rate of M1 declined signifi cantly
in 2010, but remained at robustly positive
levels (standing at 4.4% in December), while
that of marketable instruments and short-term
deposits other than overnight deposits (i.e. M3
minus M1) became noticeably less negative
(standing at -1.5% in December). As a result,
In the broadest sense, “bad banks” are dedicated schemes set up 2
and backed by governments to facilitate the removal from credit
institutions’ balance sheets of assets that are at risk of severe
impairment or are diffi cult to value.
Chart 5 M3 and loans to the private sector
(annual percentage changes; adjusted for seasonal and calendar effects)
-6
-3
0
3
6
9
12
15
-6
-3
0
3
6
9
12
15
2010
M3
loans to the private sector
2004 2005 2006 2007 2008 2009
Source: ECB.

30ECBAnnual Report2010
the gap between these growth rates narrowed
signifi cantly to stand at 6.1 percentage points in
December, down from 22.0 percentage points at
the end of 2009. This largely refl ected interest
rate developments (see Chart 7). The interest
rate on overnight deposits remained broadly
stable in 2010, while the remuneration of
deposits with an agreed maturity of up to two
years increased noticeably and the interest
rate on deposits redeemable at notice of up
to three months increased marginally. As a
result, the opportunity cost of holding the
most liquid deposit contained in M3 increased
and the rebalancing within M3 in favour
of such deposits waned. The impact of the
steep yield curve weakened in 2010, halting
large-scale shifts into fi nancial assets outside
M3, which had mainly come at the expense
of marketable instruments and short-term
deposits other than overnight deposits.
Consequently, the annual growth rates of
these assets became less negative. The annual
growth rate of marketable instruments was also
boosted by increased repo activity, especially
towards the end of the year, which largely
refl ected interbank transactions conducted via
central counterparties (which are classifi ed as
non-monetary fi nancial intermediaries other
than insurance corporations and pension funds
(referred to as “OFIs”)).
TRENDS IN SECTORAL MONEY HOLDINGS
REMAINED DIVERGENT
The broadest aggregation of M3 components
for which sectoral information is reported is
short-term deposits and repurchase agreements
(hereafter referred to as “M3 deposits”).
The turnaround observed in the annual growth
rate of M3 deposits in 2010 largely refl ected
a particularly strong contribution by OFIs.
The annual growth rate of OFIs’ holdings of
M3 deposits increased signifi cantly to stand at
10.8% in December, compared with -3.1% at
the end of 2009. This increase largely refl ected
strong interbank repo transactions in the second
and fourth quarters, as well as increasingly
strong infl ows for overnight deposits in the fi rst
three quarters of the year.
Chart 6 Main components of M3
(annual percentage changes; adjusted for seasonal and calendar effects)
-15
-10
-5
0
5
10
15
20
25
-15
-10
-5
0
5
10
15
20
25
2010
M1
other short-term deposits (M2-M1)
marketable instruments (M3-M2)
2004 2005 2006 2007 2008 2009
Source: ECB.
Chart 7 MFI interest rates on short-term deposits and a money market interest rate
(percentages per annum)
0
1
2
3
4
5
6
0
1
2
3
4
5
6
2010
overnight deposits
deposits with an agreed maturity of up to two years
deposits redeemable at notice of up to three months
three-month EURIBOR
2004 2005 2006 2007 2008 2009
Source: ECB.
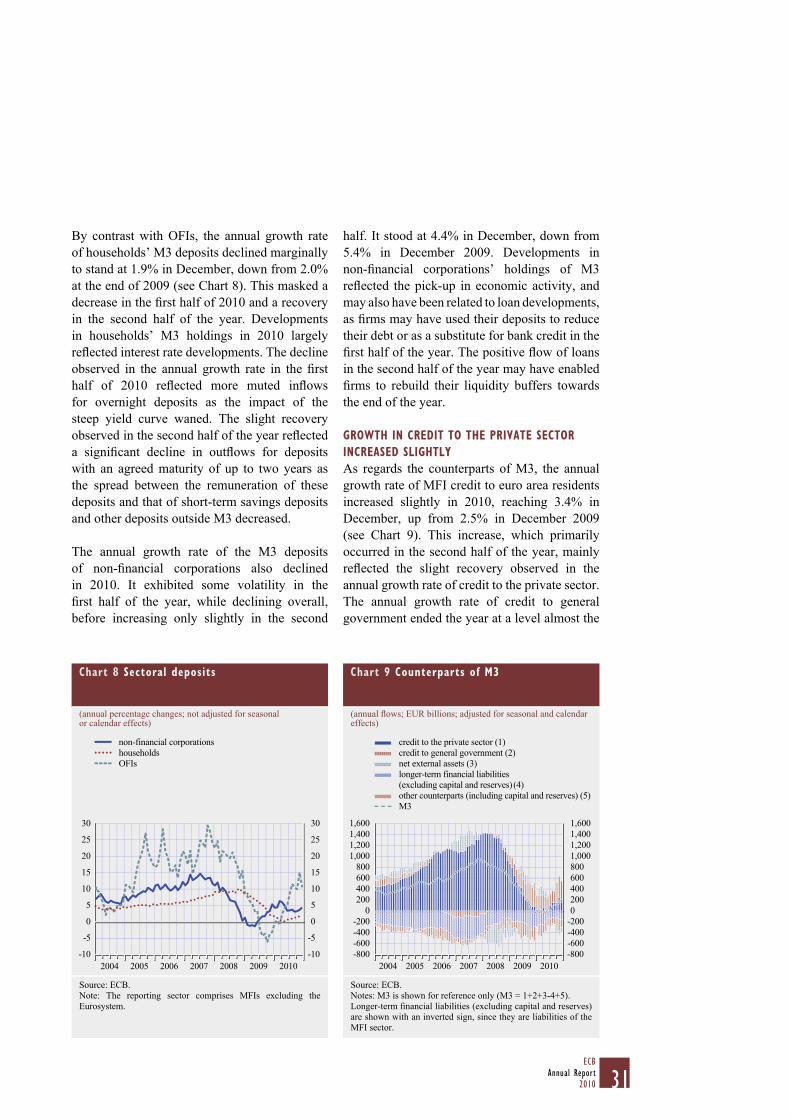
31ECB
Annual Report2010
By contrast with OFIs, the annual growth rate
of households’ M3 deposits declined marginally
to stand at 1.9% in December, down from 2.0%
at the end of 2009 (see Chart 8). This masked a
decrease in the fi rst half of 2010 and a recovery
in the second half of the year. Developments
in households’ M3 holdings in 2010 largely
refl ected interest rate developments. The decline
observed in the annual growth rate in the fi rst
half of 2010 refl ected more muted infl ows
for overnight deposits as the impact of the
steep yield curve waned. The slight recovery
observed in the second half of the year refl ected
a signifi cant decline in outfl ows for deposits
with an agreed maturity of up to two years as
the spread between the remuneration of these
deposits and that of short-term savings deposits
and other deposits outside M3 decreased.
The annual growth rate of the M3 deposits
of non-fi nancial corporations also declined
in 2010. It exhibited some volatility in the
fi rst half of the year, while declining overall,
before increasing only slightly in the second
half. It stood at 4.4% in December, down from
5.4% in December 2009. Developments in
non-fi nancial corporations’ holdings of M3
refl ected the pick-up in economic activity, and
may also have been related to loan developments,
as fi rms may have used their deposits to reduce
their debt or as a substitute for bank credit in the
fi rst half of the year. The positive fl ow of loans
in the second half of the year may have enabled
fi rms to rebuild their liquidity buffers towards
the end of the year.
GROWTH IN CREDIT TO THE PRIVATE SECTOR
INCREASED SLIGHTLY
As regards the counterparts of M3, the annual
growth rate of MFI credit to euro area residents
increased slightly in 2010, reaching 3.4% in
December, up from 2.5% in December 2009
(see Chart 9). This increase, which primarily
occurred in the second half of the year, mainly
refl ected the slight recovery observed in the
annual growth rate of credit to the private sector.
The annual growth rate of credit to general
government ended the year at a level almost the
Chart 8 Sectoral deposits
(annual percentage changes; not adjusted for seasonal or calendar effects)
-10
-5
0
5
10
15
20
25
30
-10
-5
0
5
10
15
20
25
30
20102004 2005 2006 2007 2008 2009
non-financial corporations
households
OFIs
Source: ECB.
Note: The reporting sector comprises MFIs excluding the
Eurosystem.
Chart 9 Counterparts of M3
(annual fl ows; EUR billions; adjusted for seasonal and calendar effects)
-800
-600
-400
-200
0
200
400
600
800
1,000
1,200
1,400
1,600
-800
-600
-400
-200
0
200
400
600
800
1,000
1,200
1,400
1,600
20102004 2005 2006 2007 2008 2009
credit to the private sector (1)
credit to general government (2)
net external assets (3)
longer-term financial liabilities
(excluding capital and reserves) (4)
other counterparts (including capital and reserves) (5)
M3
Source: ECB.
Notes: M3 is shown for reference only (M3 = 1+2+3-4+5).
Longer-term fi nancial liabilities (excluding capital and reserves)
are shown with an inverted sign, since they are liabilities of the
MFI sector.

32ECBAnnual Report2010
same as that recorded at the end of 2009, despite
declining for most of 2010. This decline
refl ected MFIs scaling back their purchases of
government securities, in the absence of any
further steepening of the yield curve and in light
of market tensions. This trend was reversed in
the fourth quarter of the year, when credit to
general government increased sharply as a
consequence of MFI assets being transferred to
“bad banks”.3
The slight recovery in the growth of credit to
the private sector mainly refl ected the slow but
steady strengthening observed in the annual
growth rate of loans. By contrast, the annual
growth rate of MFIs’ holdings of private sector
securities other than shares declined further in
the fi rst half of 2010 owing to the lower level of
securitisation activity. Such activity recovered
slightly in the second half of the year, partially
refl ecting asset transfers between MFIs and
“bad banks”, contributing to the stabilisation of
MFIs’ holdings of private sector securities other
than shares.
The annual growth rate of MFI loans to the
private sector, the largest component of credit
to the private sector, increased gradually from
the marginally negative rate recorded at the end
of 2009 to stand at 1.9% in December 2010
(see Chart 5). This would be consistent with a
modest recovery in loan demand and would
also be supported by available evidence on the
evolution of credit standards. In this respect,
the euro area bank lending survey suggests that
supply-side infl uences weakened in the course
of the year. Given the low level of securitisation
activity, the difference between the headline
annual growth rate of loans to the private
sector and the growth rate adjusted for the
derecognition of loans from MFI balance sheets
was modest in 2010.
At the sectoral level, the recovery in the
annual growth rate of loans to the private
sector is attributable primarily to lending to the
non-fi nancial private sector – i.e. households and
non-fi nancial corporations. In December 2010
the annual growth rate of loans to households
stood at 2.9% (up from 1.3% at the end
of 2009), compared with -0.2% for lending to
non-fi nancial corporations (up from -2.2% in
December 2009). The annual growth rate of
loans to OFIs increased progressively in the
second half of the year, but this development
was attributable mainly to an increase in
interbank repurchase agreements traded
via central counterparties, which result in a
commensurate increase in MFI loans to these
fi nancial intermediaries.
The recovery in private sector loan growth
in the fi rst half of the year was accounted for
mainly by developments in loans to households,
which were driven almost entirely by a recovery
in loans for house purchase. This coincided with
an upturn in the annual growth rate of euro area
residential property prices. The continuation of
the recovery in loans to the non-fi nancial private
sector in the second half of the year was due
mainly to the turnaround observed in the annual
growth of loans to non-fi nancial corporations
(albeit the growth rate remained negative).
Adjusting for the derecognition of loans from
MFIs’ balance sheets – which largely refl ected
transfers to “bad banks” – the annual growth
rate of loans to non-fi nancial corporations would
have turned positive in 2010.
Overall, developments in loans to the
non-fi nancial private sector in 2010 remained
broadly consistent with business cycle
regularities. The turning point in the growth of
loans to households typically takes place early
in the economic cycle, while that of loans to
non-fi nancial corporations tends to lag behind
it. Quarterly data on the annual growth rate of
loans to non-fi nancial corporations indicate that
its turning point occurred in the second quarter
of 2010, following that of loans to households
one year earlier. In line with previous episodes,
the improvement seen in lending to non-fi nancial
corporations in 2010 is likely to have been related
to the growth observed in corporate investment and
For further details, see the box entitled “Revisiting the impact 3
of asset transfers to ‘bad banks’ on MFI credit to the euro area
private sector”, Monthly Bulletin, ECB, January 2011.
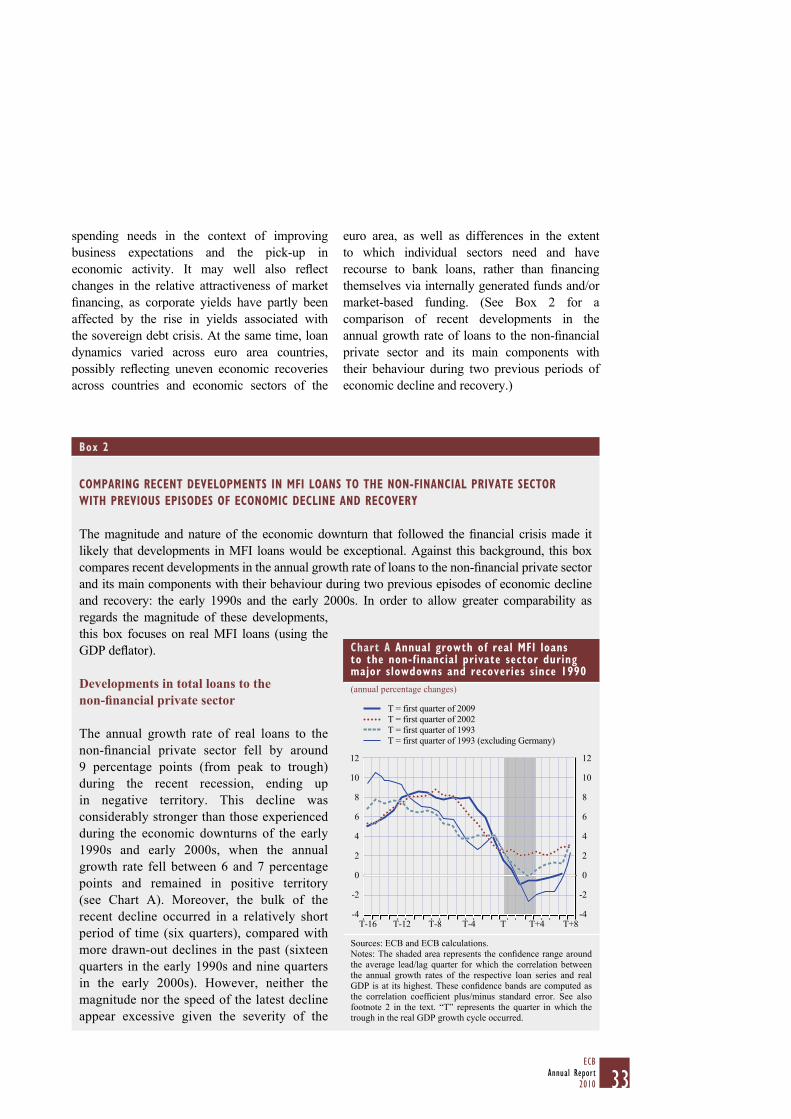
33ECB
Annual Report2010
spending needs in the context of improving
business expectations and the pick-up in
economic activity. It may well also refl ect
changes in the relative attractiveness of market
fi nancing, as corporate yields have partly been
affected by the rise in yields associated with
the sovereign debt crisis. At the same time, loan
dynamics varied across euro area countries,
possibly refl ecting uneven economic recoveries
across countries and economic sectors of the
euro area, as well as differences in the extent
to which individual sectors need and have
recourse to bank loans, rather than fi nancing
themselves via internally generated funds and/or
market-based funding. (See Box 2 for a
comparison of recent developments in the
annual growth rate of loans to the non-fi nancial
private sector and its main components with
their behaviour during two previous periods of
economic decline and recovery.)
Box 2
COMPARING RECENT DEVELOPMENTS IN MFI LOANS TO THE NON-FINANCIAL PRIVATE SECTOR
WITH PREVIOUS EPISODES OF ECONOMIC DECLINE AND RECOVERY
The magnitude and nature of the economic downturn that followed the fi nancial crisis made it
likely that developments in MFI loans would be exceptional. Against this background, this box
compares recent developments in the annual growth rate of loans to the non-fi nancial private sector
and its main components with their behaviour during two previous episodes of economic decline
and recovery: the early 1990s and the early 2000s. In order to allow greater comparability as
regards the magnitude of these developments,
this box focuses on real MFI loans (using the
GDP defl ator).
Developments in total loans to the non-fi nancial private sector
The annual growth rate of real loans to the
non-fi nancial private sector fell by around
9 percentage points (from peak to trough)
during the recent recession, ending up
in negative territory. This decline was
considerably stronger than those experienced
during the economic downturns of the early
1990s and early 2000s, when the annual
growth rate fell between 6 and 7 percentage
points and remained in positive territory
(see Chart A). Moreover, the bulk of the
recent decline occurred in a relatively short
period of time (six quarters), compared with
more drawn-out declines in the past (sixteen
quarters in the early 1990s and nine quarters
in the early 2000s). However, neither the
magnitude nor the speed of the latest decline
appear excessive given the severity of the
Chart A Annual growth of real MFI loans to the non-financial private sector during major slowdowns and recoveries since 1990
(annual percentage changes)
-4
-2
0
2
4
6
8
10
12
-4
-2
0
2
4
6
8
10
12
T-16 T-12 T-8 T-4 T T+4 T+8
T = first quarter of 2009
T = first quarter of 2002
T = first quarter of 1993
T = first quarter of 1993 (excluding Germany)
Sources: ECB and ECB calculations.
Notes: The shaded area represents the confi dence range around
the average lead/lag quarter for which the correlation between
the annual growth rates of the respective loan series and real
GDP is at its highest. These confi dence bands are computed as
the correlation coeffi cient plus/minus standard error. See also
footnote 2 in the text. “T” represents the quarter in which the
trough in the real GDP growth cycle occurred.
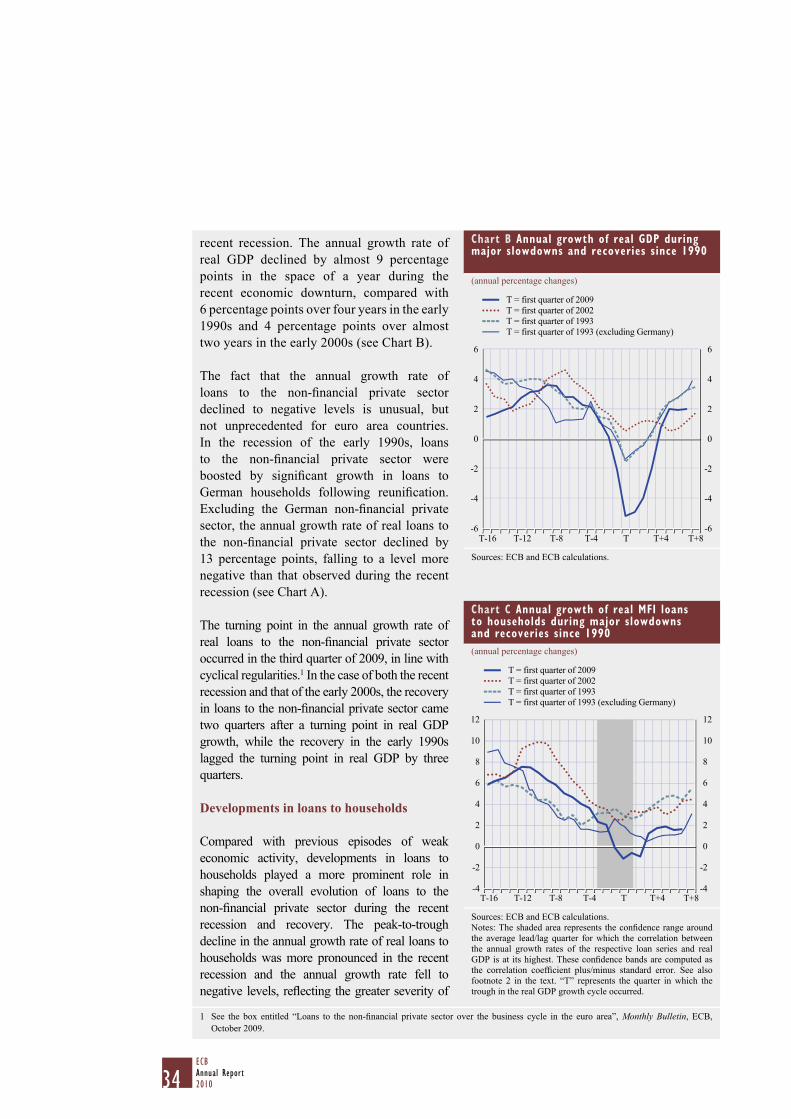
34ECBAnnual Report2010
recent recession. The annual growth rate of
real GDP declined by almost 9 percentage
points in the space of a year during the
recent economic downturn, compared with
6 percentage points over four years in the early
1990s and 4 percentage points over almost
two years in the early 2000s (see Chart B).
The fact that the annual growth rate of
loans to the non-fi nancial private sector
declined to negative levels is unusual, but
not unprecedented for euro area countries.
In the recession of the early 1990s, loans
to the non-fi nancial private sector were
boosted by signifi cant growth in loans to
German households following reunifi cation.
Excluding the German non-fi nancial private
sector, the annual growth rate of real loans to
the non-fi nancial private sector declined by
13 percentage points, falling to a level more
negative than that observed during the recent
recession (see Chart A).
The turning point in the annual growth rate of
real loans to the non-fi nancial private sector
occurred in the third quarter of 2009, in line with
cyclical regularities.1 In the case of both the recent
recession and that of the early 2000s, the recovery
in loans to the non-fi nancial private sector came
two quarters after a turning point in real GDP
growth, while the recovery in the early 1990s
lagged the turning point in real GDP by three
quarters.
Developments in loans to households
Compared with previous episodes of weak
economic activity, developments in loans to
households played a more prominent role in
shaping the overall evolution of loans to the
non-fi nancial private sector during the recent
recession and recovery. The peak-to-trough
decline in the annual growth rate of real loans to
households was more pronounced in the recent
recession and the annual growth rate fell to
negative levels, refl ecting the greater severity of
1 See the box entitled “Loans to the non-fi nancial private sector over the business cycle in the euro area”, Monthly Bulletin, ECB,
October 2009.
Chart B Annual growth of real GDP during major slowdowns and recoveries since 1990
(annual percentage changes)
-6
-4
-2
0
2
4
6
-6
-4
-2
0
2
4
6
T = first quarter of 2009
T = first quarter of 2002
T = first quarter of 1993
T = first quarter of 1993 (excluding Germany)
T-16 T-12 T-8 T-4 T T+4 T+8
Sources: ECB and ECB calculations.
Chart C Annual growth of real MFI loans to households during major slowdowns and recoveries since 1990
(annual percentage changes)
-4
-2
0
2
4
6
8
10
12
-4
-2
0
2
4
6
8
10
12
T+8
T = first quarter of 2009
T = first quarter of 2002
T = first quarter of 1993
T = first quarter of 1993 (excluding Germany)
T-16 T-12 T-8 T-4 T T+4
Sources: ECB and ECB calculations.
Notes: The shaded area represents the confi dence range around
the average lead/lag quarter for which the correlation between
the annual growth rates of the respective loan series and real
GDP is at its highest. These confi dence bands are computed as
the correlation coeffi cient plus/minus standard error. See also
footnote 2 in the text. “T” represents the quarter in which the
trough in the real GDP growth cycle occurred.

35ECB
Annual Report2010
the slowdown in the housing market (see Chart C). The turning point in the annual growth rate of real
loans to households occurred in the third quarter of 2009, two quarters after the recovery in the annual
growth rate of real GDP. This was somewhat later than in the other two periods considered and is not
in line with the relationship typically observed between real loans to households and real GDP.
However, a relatively late turning point in the annual growth rate of real loans to households
is not unprecedented. In the early 1990s, a clear turning point in the annual growth rate of real
loans to non-German euro area households was not seen until three quarters after the recovery
in the annual growth rate of real GDP. That period was also characterised by declining house
prices, following signifi cant booms in a number of euro area countries, indicating that the
delayed recoveries may, in both cases, refl ect some rebalancing of balance sheets on the part of
households and banks. In each of the periods considered, the recovery in the annual growth rate
of real loans to households was driven by loans for house purchase.
Developments in loans to non-fi nancial corporations
The overall trend in the annual growth rate of loans to non-fi nancial corporations during the
recent episode was broadly similar to those of previous episodes (see Chart D). However, the
magnitude of the decline was more severe, as
the annual growth rate of loans to non-fi nancial
corporations fell by 15 percentage points from
peak to trough, compared with declines of
10 percentage points and 12 percentage points
in the early 1990s and early 2000s respectively.
The signifi cant decline in real lending to
non-fi nancial corporations during the recent
recession refl ects the substantial decline
observed in economic activity, particularly in
the construction and real estate sectors, as well
as increased recourse to market-based sources
of fi nancing.2 These sectors are relatively
loan-intensive and had been a key driver of
lending to euro area non-fi nancial corporations
owing to strong housing booms in various euro
area countries in recent years.
The turning point in the annual growth rate
of real loans to non-fi nancial corporations
occurred in early 2010, four quarters after
the recovery in the annual growth rate of real
GDP. This is broadly in line with historical
regularities, albeit slightly later than in the
two previous episodes considered. Although
the annual growth rate of real loans to
non-fi nancial corporations remained slightly
2 See Box 2, entitled “Real estate developments in the euro area and their impact on loans to the private sector”, Monthly Bulletin, ECB,
May 2010.
Chart D Annual growth of real MFI loans to non-financial corporations during major slowdowns and recoveries since 1990
(annual percentage changes)
-6
-4
-2
0
2
4
6
8
10
12
14
-6
-4
-2
0
2
4
6
8
10
12
14
T-16 T-12 T-8 T-4 T T+4 T+8
T = first quarter of 2009
T = first quarter of 2002
T = first quarter of 1993
T = first quarter of 1993 (excluding Germany)
Sources: ECB and ECB calculations.
Notes: The shaded area represents the confi dence range around
the average lead/lag quarter for which the correlation between
the annual growth rates of the respective loan series and real
GDP is at its highest. These confi dence bands are computed as
the correlation coeffi cient plus/minus standard error. See also
footnote 2 in the text. “T” represents the quarter in which the
trough in the real GDP growth cycle occurred.

36ECBAnnual Report2010
Of the other counterparts of M3, the annual
growth rate of MFI longer-term fi nancial liabilities
(excluding capital and reserves) held by the
money-holding sector declined noticeably in the
course of the year to stand at 3.0% in December,
down from 6.0% at the end of 2009. This was
visible mainly for longer-term deposits (i.e. both
deposits redeemable at notice of over three months
and deposits with an agreed maturity of over two
years), but also for longer-term MFI debt securities
(i.e. those with a maturity of over two years).
The deceleration observed for longer-term deposits
is likely to have refl ected the fact that their
remuneration became less attractive as a result
of the slight fl attening of the yield curve in the
course of the year, while that seen for longer-term
securities may have been related to the perception
of a higher level of risk for MFI securities.
Finally, the net external position of euro area MFIs
recorded a further decline in 2010, decreasing by
€89 billion. This was the result of a negative fl ow
for external assets, which exceeded the decline
observed in external liabilities. On balance, this
means that the money-holding sector’s interaction
with the rest of the world via euro area MFIs
resulted in a net capital infl ow.
MONEY MARKET CONDITIONS IMPROVED
DESPITE SOME VOLATILITY
In 2010 the behaviour of euro area money
market interest rates was affected by various
factors. Overall, the Eurosystem continued to
provide extraordinary liquidity support to euro
area banks. Given the improvements observed
in fi nancial market conditions in the course
of 2009, the Eurosystem began, in early 2010,
to gradually phase out those non-standard
monetary policy measures that were no longer
deemed necessary, with the average maturity of
liquidity-providing operations being shortened
as a result. However, the sovereign debt crisis in
May caused severe tensions in the government
bond markets of some euro area countries, with
adverse effects on the transmission mechanism
for monetary policy, as refl ected in higher levels
of perceived liquidity and credit risk. With
the aim of addressing the malfunctioning of
securities markets and restoring an appropriate
transmission mechanism for monetary policy,
the Eurosystem launched the Securities Markets
Programme and reactivated some of the non-
standard measures that it had previously phased
out. Box 1 describes the non-standard measures
employed in 2010, which were essential in
limiting contagion as regards money market
rates. In the second half of 2010 the automatic
phasing-out of non-standard measures via the
expiry of six-month and one-year longer-term
refi nancing operations led to lower levels of
excess liquidity and higher money market rates.
Secured and unsecured money market interest
rates declined somewhat across all maturities
negative at the end of 2010, its recovery was faster and stronger than in the early 1990s. As in
previous periods, the upturn in loan dynamics was driven by a noticeable improvement in the
annual growth rate of short-term loans.
Conclusion
The magnitude of the recent decline in the annual growth rate of loans to the non-fi nancial private
sector was substantial in absolute terms. However, it is consistent with past economic downturns
when relative declines in real GDP are considered. Developments in the annual growth rate of
real loans to households were slightly unusual, with that growth rate declining relatively strongly
to stand at negative levels and its turning point lagging the recovery in the annual growth rate
of real GDP. Both of these aspects are likely to refl ect the specifi c role of the housing market in
the recent recession. Overall, developments in real MFI loans to the non-fi nancial private sector
were broadly in line with behaviour observed during previous periods of economic decline and
recovery.

37ECB
Annual Report2010
in the fi rst quarter of 2010, before increasing
substantially over the remainder of the year.
More specifi cally, looking at three-month
unsecured rates, the three-month EURIBOR
stood close to 0.70% at the beginning of
January 2010, declined to 0.63% at the end
of March, and then increased to 1.09% on
25 February 2011 (see Chart 10). As regards
the secured segment of the money market, the
three-month EUREPO stood at around 0.40%
at the beginning of January 2010, before
decreasing slightly in the fi rst quarter of the year
to stand at 0.34% at the end of March. It then
increased strongly to peak at 0.80% in early
November, before declining to around 0.56% in
early January 2011, and it then increased again
to stand at 0.81% on 25 February.
As a result of these developments, volatility
was observed throughout the year in the
spread between secured and unsecured money
market rates, which stood somewhat lower on
25 February 2011 than at the beginning of
January 2010. However, it remained relatively
high by historical standards. Over the course
of 2010 and early 2011 the spread between
the three-month EURIBOR and the three-
month EUREPO fl uctuated between 23 and
46 basis points, starting 2010 at around 30 basis
points and standing at 28 basis points on
25 February 2011 (see Chart 10).
Looking at very short-term money market rates,
developments in the EONIA in 2010 largely
refl ect the fact that the Eurosystem continued the
generous liquidity support provided to euro area
banks since October 2008. With few exceptions,
the EONIA remained, in the presence of
substantial excess liquidity, well below the
fi xed rate in the Eurosystem’s main refi nancing
operations and LTROs and close to the rate on
the deposit facility (see Chart 11). Towards
the end of June, as the six-month and one-year
LTROs matured and banks chose not to fully
roll over the maturing liquidity, excess liquidity
declined and the EONIA began to display
Chart 11 ECB interest rates and the overnight interest rate
(percentages per annum; daily data)
0.0
0.5
1.0
1.5
2.0
2.5
3.5
3.0
0.0
0.5
1.0
1.5
2.0
2.5
3.5
3.0
interest rate on the marginal lending facilityfixed rate in the main refinancing operationsovernight interest rate (EONIA)interest rate on the deposit facility
Jan. Apr. July Oct. Jan.2010 2011
Sources: ECB, Bloomberg and Thomson Reuters.
Chart 10 Three-month EUREPO, EURIBOR and overnight index swap
(percentages per annum; spread in basis points; daily data)
0.0
0.2
0.4
0.6
0.8
1.0
1.2
0
20
40
60
80
100
120
three-month EUREPO (left-hand scale)
three-month EURIBOR (left-hand scale)
three-month overnight index swap (left-hand scale)
spread between three-month EURIBOR
and three-month EUREPO (right-hand scale)
Jan. Jan.20112010
Oct.JulyApr.
Sources: ECB, Bloomberg and Thomson Reuters.
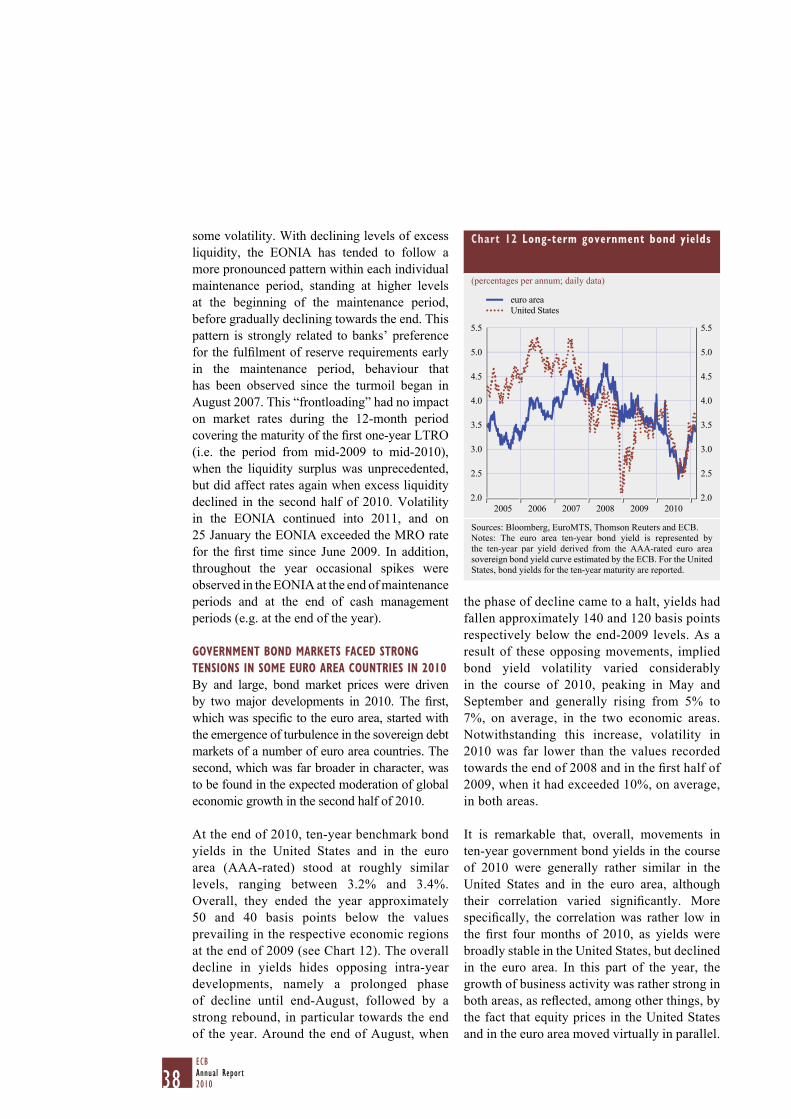
38ECBAnnual Report2010
some volatility. With declining levels of excess
liquidity, the EONIA has tended to follow a
more pronounced pattern within each individual
maintenance period, standing at higher levels
at the beginning of the maintenance period,
before gradually declining towards the end. This
pattern is strongly related to banks’ preference
for the fulfi lment of reserve requirements early
in the maintenance period, behaviour that
has been observed since the turmoil began in
August 2007. This “frontloading” had no impact
on market rates during the 12-month period
covering the maturity of the fi rst one-year LTRO
(i.e. the period from mid-2009 to mid-2010),
when the liquidity surplus was unprecedented,
but did affect rates again when excess liquidity
declined in the second half of 2010. Volatility
in the EONIA continued into 2011, and on
25 January the EONIA exceeded the MRO rate
for the fi rst time since June 2009. In addition,
throughout the year occasional spikes were
observed in the EONIA at the end of maintenance
periods and at the end of cash management
periods (e.g. at the end of the year).
GOVERNMENT BOND MARKETS FACED STRONG
TENSIONS IN SOME EURO AREA COUNTRIES IN 2010
By and large, bond market prices were driven
by two major developments in 2010. The fi rst,
which was specifi c to the euro area, started with
the emergence of turbulence in the sovereign debt
markets of a number of euro area countries. The
second, which was far broader in character, was
to be found in the expected moderation of global
economic growth in the second half of 2010.
At the end of 2010, ten-year benchmark bond
yields in the United States and in the euro
area (AAA-rated) stood at roughly similar
levels, ranging between 3.2% and 3.4%.
Overall, they ended the year approximately
50 and 40 basis points below the values
prevailing in the respective economic regions
at the end of 2009 (see Chart 12). The overall
decline in yields hides opposing intra-year
developments, namely a prolonged phase
of decline until end-August, followed by a
strong rebound, in particular towards the end
of the year. Around the end of August, when
the phase of decline came to a halt, yields had
fallen approximately 140 and 120 basis points
respectively below the end-2009 levels. As a
result of these opposing movements, implied
bond yield volatility varied considerably
in the course of 2010, peaking in May and
September and generally rising from 5% to
7%, on average, in the two economic areas.
Notwithstanding this increase, volatility in
2010 was far lower than the values recorded
towards the end of 2008 and in the fi rst half of
2009, when it had exceeded 10%, on average,
in both areas.
It is remarkable that, overall, movements in
ten-year government bond yields in the course
of 2010 were generally rather similar in the
United States and in the euro area, although
their correlation varied signifi cantly. More
specifi cally, the correlation was rather low in
the fi rst four months of 2010, as yields were
broadly stable in the United States, but declined
in the euro area. In this part of the year, the
growth of business activity was rather strong in
both areas, as refl ected, among other things, by
the fact that equity prices in the United States
and in the euro area moved virtually in parallel.
Chart 12 Long-term government bond yields
(percentages per annum; daily data)
2.0
2.5
3.0
3.5
4.0
4.5
5.0
5.5
2.0
2.5
3.0
3.5
4.0
4.5
5.0
5.5
euro area
United States
2005 2006 2007 2008 2009 2010
Sources: Bloomberg, EuroMTS, Thomson Reuters and ECB.
Notes: The euro area ten-year bond yield is represented by
the ten-year par yield derived from the AAA-rated euro area
sovereign bond yield curve estimated by the ECB. For the United
States, bond yields for the ten-year maturity are reported.
39ECB
Annual Report2010
In the same period, however, AAA-rated euro
area government bond yields were being pushed
downwards by fl ight-to-safety considerations
that stemmed from the aforementioned
turbulence on some euro area sovereign debt
markets, while US yields rose in refl ection of the
ongoing economic expansion. In the remainder
of the year, especially as of July, when yields
converged to similar values in the two economic
areas and started to move in tandem, the
correlation increased. In fact, a reassessment
of the strength of the economic recovery in the
United States and temporarily lower turbulence
in the euro area sovereign debt market worked
towards more synchronous movements in bond
yields on the two sides of the Atlantic. Near the
end of the year, however, when global economic
activity was perceived to be picking up again, as
signalled by, among other things, an increase in
the Global PMI in December, US ten-year bond
yields edged up more rapidly than those in the
euro area. This development was mirrored in the
equity markets, with the US equity prices rising
at a far faster pace, possibly refl ecting market
concerns that European fi nancial institutions, in
particular, could suffer capital losses on account
of the tensions that were again appearing on the
euro area sovereign debt market.
Turning more specifi cally to the movements
recorded in the course of the year, between
approximately mid-November 2009 and early
April 2010 government bond markets in the
United States and in the euro area developed
along somewhat different lines, with yields
rising by approximately 50 basis points in the
United States, while those in the euro area
declined by around 25 points. In this part of
the year, monetary policy rates on both sides
of the Atlantic were expected to remain at
low levels for an extended period of time,
while macroeconomic releases confi rmed
that the recovery in growth was robust. Given
these developments, the opposing movements
recorded by long-term bond yields in the two
areas can be explained primarily by intensifying
market concerns about the sustainability of
fi scal positions in some euro area countries, a
development which generally exerted downward
pressure on the yields of the highest-rated euro
area government bonds.
As of the beginning of April government bond
yields in the United States started to decline as
well. The pace of the decline in the US yields in
this period was rather strong, so that the yield
differential between the two areas fell from
some 60 basis points at the end of March to
around zero at the end of June. While economic
developments in the euro area continued to
be favourable and confi dence indicators were
improving overall, AAA-rated long-term
euro area government yields declined amid
the intensifi cation of the turmoil in European
sovereign debt markets. The turbulence
eased somewhat after an EU support package
for Greece was agreed on the weekend of
10-11 April, but it increased again in subsequent
days when the downgrading of the sovereign
debt of both Greece and Portugal – to speculative
grade in the case of the former – contributed
to the emergence of a crisis of confi dence in
the sustainability of the Greek fi scal position.
The lack of confi dence, in turn, fuelled an
extensive reallocation of funds to AAA-rated
euro area or US government bonds that eventually
culminated in the large-scale fl ight-to-safety
behaviour of investors on 6 and 7 May. It has
to be noted that the yield on Greek ten-year
bonds had already risen relative to that of
corresponding German bonds in the fi rst
quarter of 2010, but yields had generally
remained stable in the other euro area countries,
as contagion risk had remained rather subdued.
The situation changed signifi cantly at the
beginning of April when, looking beyond
Greece, yields also edged upwards in Ireland
and Portugal, as well as – to a lesser extent – in
Spain, Italy and Belgium. The deterioration in
the perceived debt sustainability of selected euro
area countries in this period was well evidenced
by the spreads on sovereign credit default swaps
(CDSs), instruments used by investors to protect
themselves against sovereign default risk.
Conditions improved noticeably in the
course of May, on account of unprecedented
measures taken at the EU level. Among these

40ECBAnnual Report2010
were the decisions on the European Financial
Stabilisation Mechanism and the European
Financial Stability Facility, as well as several
measures announced by the Eurosystem on
10 May to restore an appropriate monetary
policy transmission mechanism, including the
Securities Markets Programme, which paved the
way for interventions in private and public debt
securities markets in the euro area. Additional
support for the euro area bond market in the
course of July may also have originated from
the publication of the results of the EU-wide
stress tests and related information on banks’
sovereign debt exposures. However, tensions
did not subside completely, as was shown by,
among other things, a continuing rise in yields
in a number of euro area countries, despite
the further decline of German bond yields.
The latter may have been related not only to
fl ight-to-safety considerations, but also to
increasing signs of a slowdown in economic
activity in the euro area and, particularly, in the
United States, mainly evidenced by a renewed
deterioration of the housing and labour markets
there. The decelerating US business cycle, in
fact, affected market sentiment in a number of
other major economies and triggered strong
capital fl ows into those government bond
markets that were perceived to be less risky,
also leading to expectations of a second round
of quantitative easing measures.
In the last quarter of the year yields began
to rise on both sides of the Atlantic. The
generally increasing yields in this period
were consistent with the return to a more
benign economic outlook, which was more
clear-cut in the euro area than in the
United States, where macroeconomic releases
were positive overall, but also exhibited a
great deal of heterogeneity. Compared with
AAA-rated long-term sovereign debt, the yields
on the bonds of most lower-rated euro area
sovereign issuers recorded far sharper increases
and much higher intra-period volatility in the
last quarter of the year. Ten-year government
bond spreads vis-à-vis German bonds rose
especially markedly in the case of Ireland, namely
by 280 basis points between the beginning
of September and the end of November, as
market participants focused attention on this
country on account of their growing concerns
about the fi scal burden associated with the Irish
government’s support for its fi nancial sector.
The tensions also moved to Portugal and Spain,
where spreads vis-à-vis German yields rose by
110 and 105 basis points respectively in the
same period, while spillovers to other countries
such as Greece, Italy and Belgium were limited,
with spreads there rising by only 7, 42 and
65 basis points respectively (see Chart 13).
Heightened market concerns in this fi nal part of
the year translated into an increase in implied
bond yield volatility in both the United States
and the euro area.
Relative to both nominal yields and
developments in 2009, real yields fl uctuated
signifi cantly less in 2010 and generally
remained broadly stable at around 1.5% in
the euro area. They declined by 50 basis
points between January and September, but
that decrease was reversed in full thereafter.
The subsequent rise mirrored a more robust
Chart 13 Government bond spreads of selected euro area countries
(basis points; daily data)
-100
0
100
200
300
400
500
600
700
800
900
1,000
1,100
-100
0
100
200
300
400
500
600
700
800
900
1,000
1,100
BE
ES
FR
GR
IE
IT
PT
2005 2006 2007 2008 2009 2010
Source: Thomson Reuters.
Note: Yield spread between ten-year government bonds and
the corresponding German government bond.
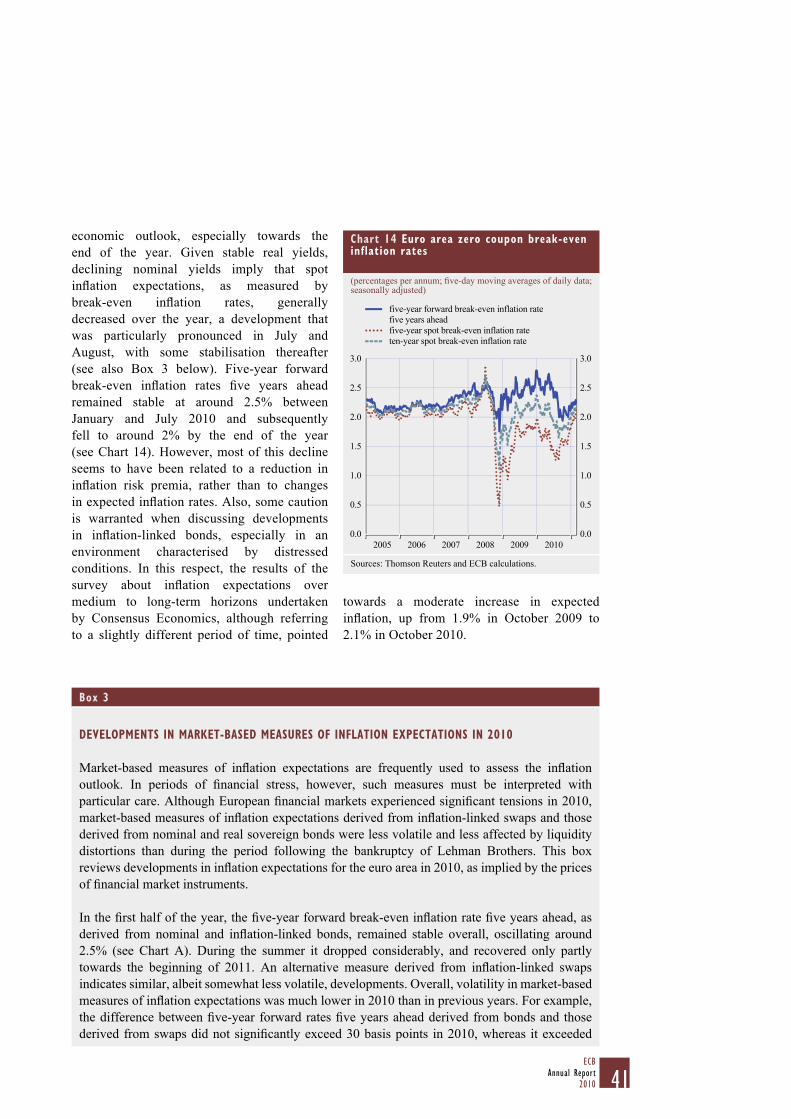
41ECB
Annual Report2010
economic outlook, especially towards the
end of the year. Given stable real yields,
declining nominal yields imply that spot
infl ation expectations, as measured by
break-even infl ation rates, generally
decreased over the year, a development that
was particularly pronounced in July and
August, with some stabilisation thereafter
(see also Box 3 below). Five-year forward
break-even infl ation rates fi ve years ahead
remained stable at around 2.5% between
January and July 2010 and subsequently
fell to around 2% by the end of the year
(see Chart 14). However, most of this decline
seems to have been related to a reduction in
infl ation risk premia, rather than to changes
in expected infl ation rates. Also, some caution
is warranted when discussing developments
in infl ation-linked bonds, especially in an
environment characterised by distressed
conditions. In this respect, the results of the
survey about infl ation expectations over
medium to long-term horizons undertaken
by Consensus Economics, although referring
to a slightly different period of time, pointed
towards a moderate increase in expected
infl ation, up from 1.9% in October 2009 to
2.1% in October 2010.
Box 3
DEVELOPMENTS IN MARKET-BASED MEASURES OF INFLATION EXPECTATIONS IN 2010
Market-based measures of infl ation expectations are frequently used to assess the infl ation
outlook. In periods of fi nancial stress, however, such measures must be interpreted with
particular care. Although European fi nancial markets experienced signifi cant tensions in 2010,
market-based measures of infl ation expectations derived from infl ation-linked swaps and those
derived from nominal and real sovereign bonds were less volatile and less affected by liquidity
distortions than during the period following the bankruptcy of Lehman Brothers. This box
reviews developments in infl ation expectations for the euro area in 2010, as implied by the prices
of fi nancial market instruments.
In the fi rst half of the year, the fi ve-year forward break-even infl ation rate fi ve years ahead, as
derived from nominal and infl ation-linked bonds, remained stable overall, oscillating around
2.5% (see Chart A). During the summer it dropped considerably, and recovered only partly
towards the beginning of 2011. An alternative measure derived from infl ation-linked swaps
indicates similar, albeit somewhat less volatile, developments. Overall, volatility in market-based
measures of infl ation expectations was much lower in 2010 than in previous years. For example,
the difference between fi ve-year forward rates fi ve years ahead derived from bonds and those
derived from swaps did not signifi cantly exceed 30 basis points in 2010, whereas it exceeded
Chart 14 Euro area zero coupon break-even inflation rates
(percentages per annum; fi ve-day moving averages of daily data; seasonally adjusted)
0.0
0.5
1.0
1.5
2.0
2.5
3.0
0.0
0.5
1.0
1.5
2.0
2.5
3.0
five-year forward break-even inflation rate
five years ahead
five-year spot break-even inflation rate
ten-year spot break-even inflation rate
2005 2006 2007 2008 2009 2010
Sources: Thomson Reuters and ECB calculations.
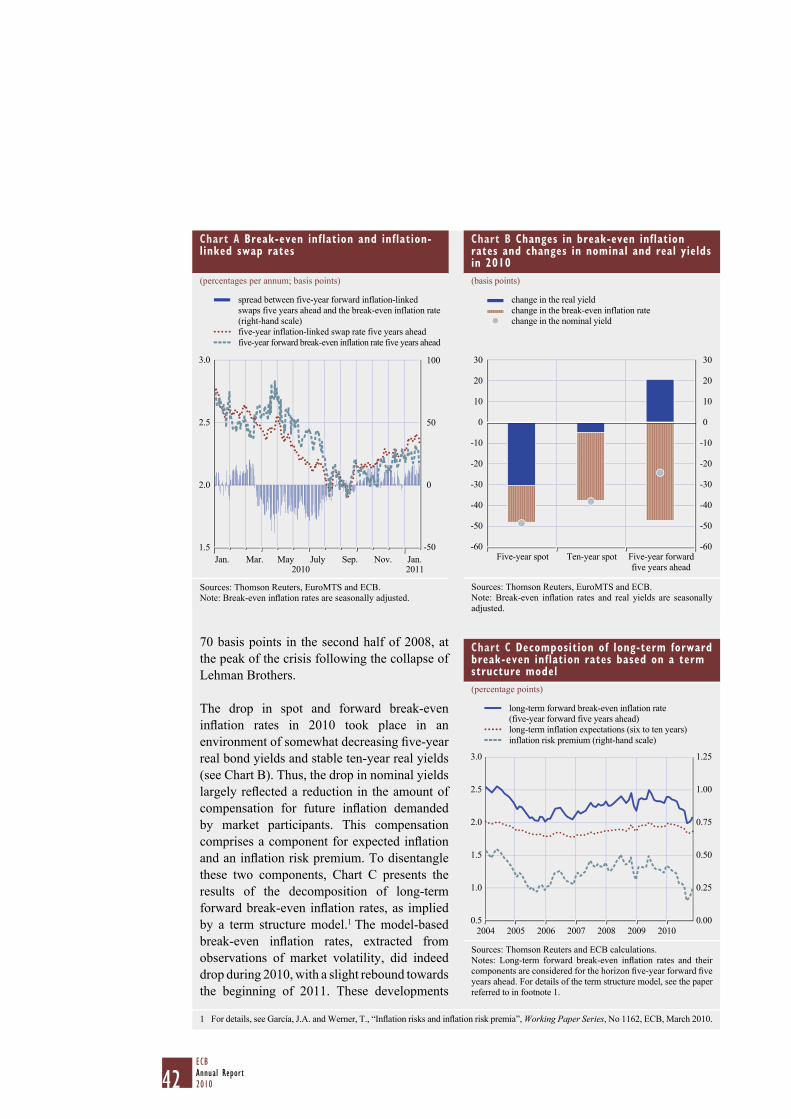
42ECBAnnual Report2010
70 basis points in the second half of 2008, at
the peak of the crisis following the collapse of
Lehman Brothers.
The drop in spot and forward break-even
infl ation rates in 2010 took place in an
environment of somewhat decreasing fi ve-year
real bond yields and stable ten-year real yields
(see Chart B). Thus, the drop in nominal yields
largely refl ected a reduction in the amount of
compensation for future infl ation demanded
by market participants. This compensation
comprises a component for expected infl ation
and an infl ation risk premium. To disentangle
these two components, Chart C presents the
results of the decomposition of long-term
forward break-even infl ation rates, as implied
by a term structure model.1 The model-based
break-even infl ation rates, extracted from
observations of market volatility, did indeed
drop during 2010, with a slight rebound towards
the beginning of 2011. These developments
1 For details, see García, J.A. and Werner, T., “Infl ation risks and infl ation risk premia”, Working Paper Series, No 1162, ECB, March 2010.
Chart A Break-even inflation and inflation-linked swap rates
(percentages per annum; basis points)
1.5
2.0
2.5
3.0
-50
0
50
100
spread between five-year forward inflation-linked
swaps five years ahead and the break-even inflation rate
(right-hand scale)
five-year inflation-linked swap rate five years ahead
five-year forward break-even inflation rate five years ahead
May Nov.Jan. Mar. July Sep. Jan.2010 2011
Sources: Thomson Reuters, EuroMTS and ECB.
Note: Break-even infl ation rates are seasonally adjusted.
Chart B Changes in break-even inflation rates and changes in nominal and real yields in 2010
(basis points)
-60
-50
-40
-30
-20
-10
0
10
20
30
-60
-50
-40
-30
-20
-10
0
10
20
30
Five-year spot Ten-year spot Five-year forward
five years ahead
change in the real yield
change in the break-even inflation ratechange in the nominal yield
Sources: Thomson Reuters, EuroMTS and ECB.
Note: Break-even infl ation rates and real yields are seasonally
adjusted.
Chart C Decomposition of long-term forward break-even inflation rates based on a term structure model
(percentage points)
0.00
0.25
0.50
0.75
1.00
1.25
0.5
1.0
1.5
2.0
2.5
3.0
2004 2005 2006 2007 20092008 2010
long-term forward break-even inflation rate
(five-year forward five years ahead)
long-term inflation expectations (six to ten years)
inflation risk premium (right-hand scale)
Sources: Thomson Reuters and ECB calculations.
Notes: Long-term forward break-even infl ation rates and their
components are considered for the horizon fi ve-year forward fi ve
years ahead. For details of the term structure model, see the paper
referred to in footnote 1.

43ECB
Annual Report2010
In the fi rst two months of 2011 long-term
AAA-rated government bond yields in the euro
area increased slightly, to above the levels
prevailing at the end of 2010, while those in the
United States remained broadly stable around
those values. The broad stability of long-term
yields in both economic areas in the fi rst two
months of 2011 hides some relatively large
oscillations. In fact, yields reached a relative
peak in early February, on account of positive
economic releases and decreasing tensions
within the euro area, which was almost fully
reversed in the remainder of the month, also
owing to increased geopolitical risks. Within the
euro area, ten-year yield differentials vis-à-vis
corresponding German yields narrowed further
in the fi rst two months of 2011, refl ecting,
among other factors, market participants’
expectations of a possible extension of the
scope and size of the EFSF, as well as debt
auctions that encountered higher than expected
demand.
THE SPEED OF THE RECOVERY IN EURO AREA
STOCK PRICES DECREASED IN 2010
While the gains posted by equity indices in
both the United States and the euro area were
comparable in 2009 (approximately 23.5% in
both cases), developments in the two areas were
rather different in 2010. With a growth rate of
almost 13%, the performance of the US index
was signifi cantly better than the broadly fl at
outcome for the euro area index (see Chart 15).
Notwithstanding the divergent developments
recorded for 2010 as a whole, equity prices in
both economic regions moved clearly sideways
over the year, with gains and losses, relative
to end-2009, reaching the order of 10%, so
that there were signifi cant swings in realised
volatility. Refl ecting these swings, as well as
were largely due to changes in the infl ation risk
premium, rather than to changes in infl ation
expectations per se, which remained broadly
stable and close to their long-term average.
This conclusion is also confi rmed by longer-
term survey-based infl ation expectations for
the euro area, which remained fairly stable in
2010.
Break-even infl ation rates in the euro area
were somewhat more stable than in the
United States in 2010 (see Chart D). While
the decrease from May to August 2010 was
part of a broad development that was also
observed in US indicators, the stabilisation of
long-term forward rates seen in the euro area
in the latter part of the year and early 2011 was
not observed in the United States.
Overall, market-based indicators of infl ation
expectations for the euro area suggest that
the compensation for infl ation and infl ation
risk demanded by market participants over
the medium to longer term decreased in 2010, especially during the summer months. This
development was largely caused by a decline in the infl ation risk premium, while infl ation
expectations remained broadly stable around their long-term average and fi rmly anchored in line
with the ECB’s objective of maintaining price stability in the medium term.
Chart D Five-year forward break-even inflation rates five years ahead for the euro area and the United States
(percentages per annum)
1.75
2.00
2.25
2.50
2.75
3.00
3.25
3.50
1.75
2.00
2.25
2.50
2.75
3.00
3.25
3.50
May Nov.
euro areaUnited States
Jan. Mar. July Sep. Jan.2010 2011
Sources: Thomson Reuters, Federal Reserve Board and ECB
calculations.

44ECBAnnual Report2010
developments in investors’ expectations about
future tensions, implied equity price volatility
also varied considerably throughout 2010, with
a peak of close to 35% (annualised, on average,
across the two economic areas) around the
end of May. The volatility peak in 2010 was
far lower than that between December 2008
and March 2009. Overall, throughout 2010 the
future development of stock prices in the euro
area was perceived to be more uncertain than
that in the United States.
After positive developments in the latter part
of 2009, equity prices in both the United States
and the euro area declined in January and February
2010, possibly also because sentiment was
increasingly infl uenced by the ongoing turbulence
in the euro area sovereign debt market. In the euro
area, the most pronounced decline in prices was
recorded by the stocks of fi nancial fi rms, whereas
the performance in other sectors was rather mixed
and no clear patterns emerged. In the United States,
by contrast, the fi nancial sector fared much
better, especially on account of the robust
earnings growth reported by major banks. When
debt-related concerns faded, stock prices in both
economic areas again rose until approximately
the beginning of May, reaching the highest
levels since November 2008. These positive
developments were also fuelled by data releases
showing supportive economic developments
in the fi rst quarter of the year, as well as by an
increase in the rate of growth of earnings, which –
although remaining in negative territory – started
to show the fi rst signs of a recovery from very
depressed conditions. For the companies listed in
the Dow Jones EURO STOXX index, earnings
growth moved from -40% in November 2009
to -22% in February 2010, while earnings
expectations over the subsequent 12 months stood
at a robust 27% on the latter date.
As debt-related tensions again escalated within
the euro area in May, rising global risk aversion
routed funds towards the markets for German and
US government bonds, which were perceived to
be relatively safer assets. As a result, massive
sell-offs affected the international equity
markets, overshadowing the positive
contribution from favourable economic data
releases, and prices declined signifi cantly in
both areas. As was also the case in January and
February, euro area fi nancial stock prices were
the fi rst to be affected by the emerging tensions,
refl ecting concerns about possible write-downs
on banks’ holdings of euro area government
debt securities. However, the intensity of the
turbulence recorded in this period also led to a
decline in non-fi nancial stock prices both in the
euro area and in the United States.
Overall, between May and August, equity indices
continued to oscillate in a narrow range, refl ecting
fl uctuations in market sentiment and risk aversion.
While easing tensions and more moderate
expectations about future volatility made it
possible for equity prices to initially recover
the losses recorded in early May, there were
subsequently renewed losses as global growth
began to lose momentum and market participants
again focused attention on debt-related
problems in selected euro area countries.
Over the same period, market expectations
regarding the growth of earnings 12 months
Chart 15 Major stock market indices
(indices rebased to 100 on 1 January 2010; daily data)
40
60
80
100
120
140
160
180
40
60
80
100
120
140
160
180
2005 2006 2007 2008 2009 2010
euro areaUnited States
Japan
Source: Thomson Reuters.
Note: The indices used are the Dow Jones EURO STOXX broad
index for the euro area, the Standard & Poor’s 500 index for the
United States and the Nikkei 225 index for Japan.

45ECB
Annual Report2010
ahead remained soundly positive at a rate
above 20% in both the United States and the
euro area, so that the decline in equity prices
predominantly refl ected a risk-related channel,
which outweighed the positive contribution of
favourable developments in expected dividends.
In the closing quarter of the year broad
equity indices rose on both sides of the
Atlantic. In the United States, stock market
developments were driven by mixed,
but generally positive, economic news and
evidence of favourable developments in earnings
across listed companies in the third quarter of the
year. At the same time, this positive effect may
have been partly offset by investors’ uncertainty
about the sustainability of the US recovery. In
the euro area, the positive growth momentum
supported equity prices, while rising long-term
interest rates, as well as renewed sovereign debt
market tensions, may have had a negative impact.
However, the negative feedback from tensions
in the European sovereign debt market to the
European stock market in this period remained
confi ned to the fi nancial sector of those countries
in which the turbulence had been highest,
while other sectors and countries continued to
enjoy the support of solid growth expectations.
In fact, stock market investors continued to
price in a fairly positive outlook for most
corporate sectors other than the fi nancial
sector, and the decline in bank stock prices in
Greece was, moreover, several times greater
than that recorded for the French and German
banking sectors. Overall, euro area fi nancial
stock prices decreased by around 15% in 2010,
while non-fi nancial stock prices increased by
7.5%. Over the same period, fi nancial stock prices
in the United States rose by 11%, while prices of
non-fi nancial stocks there gained around 15%.
In the fi rst two months of 2011 equity prices
rose in both the euro area and the United
States. Unlike in the second half of 2010,
however, when US equity prices grew by twice
as much as in the euro area, the gains in the
fi rst two months of 2011 were broadly similar
in the two economic areas, namely around
5%. Developments in equity prices refl ected
primarily profi t announcements which were
generally better than anticipated by market
participants, as well as continuing improvements
in the economic outlook in both economic
areas.
HOUSEHOLD BORROWING LEVELLED OFF
The annual growth rate of total loans to
households increased further in 2010, albeit at
a moderate pace, standing at an estimated 2.8%
in the fourth quarter of the year. This mainly
refl ected developments in MFI loans to
households, while the annual growth rate of
non-MFI loans declined further in 2010, largely
refl ecting the lower degree of securitisation.
Loans for house purchase remained the main
driver of growth in MFI loans to households.
The annual growth rate of mortgage loans
stood at 3.7% in December 2010, up from 1.5%
in December 2009 (see Chart 16). However,
the magnitude of the infl ows stabilised in
the second half of the year. Developments in
mortgage loans mirrored trends in residential
property prices, which saw moderate increases
in 2010 following signifi cant declines in 2009.
They were also in line with the information
reported by the euro area bank lending survey,
Chart 16 MFI loans to households
(annual percentage changes)
-2
0
2
4
6
8
10
12
14
-2
0
2
4
6
8
10
12
14
2004 2005 2006 2007 2008 2009 2010
total
lending for house purchase
consumer credit
other lending
Source: ECB.
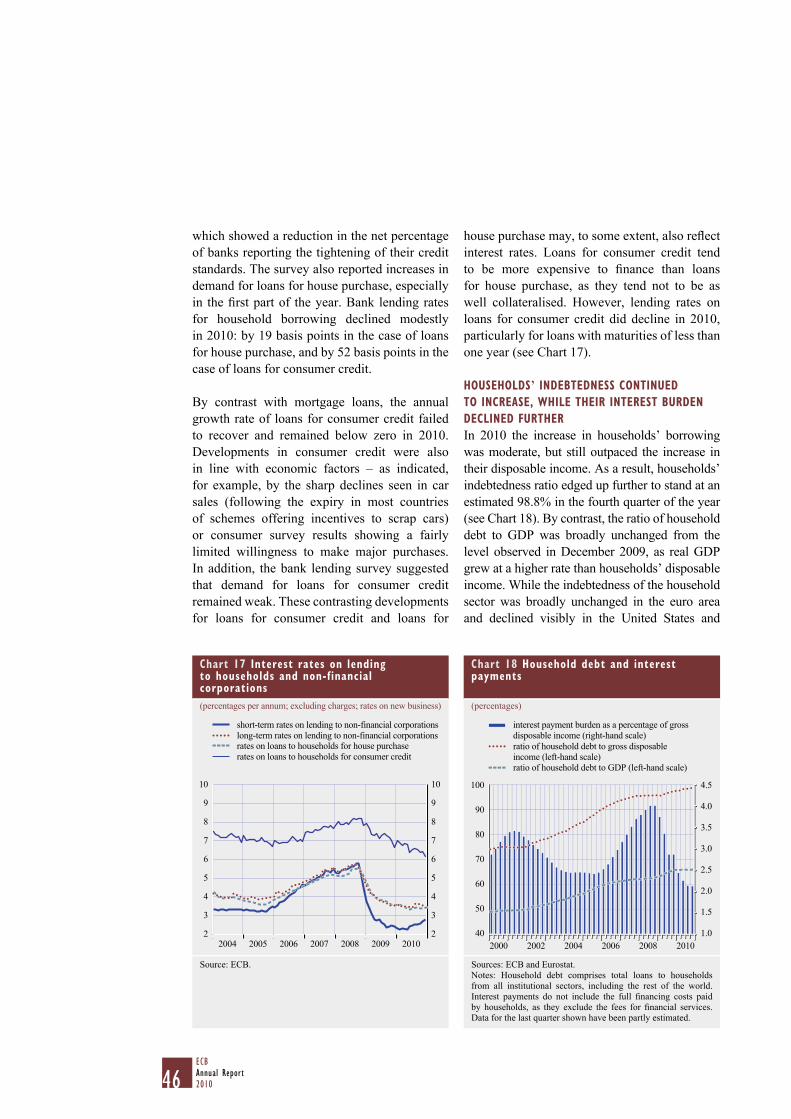
46ECBAnnual Report2010
which showed a reduction in the net percentage
of banks reporting the tightening of their credit
standards. The survey also reported increases in
demand for loans for house purchase, especially
in the fi rst part of the year. Bank lending rates
for household borrowing declined modestly
in 2010: by 19 basis points in the case of loans
for house purchase, and by 52 basis points in the
case of loans for consumer credit.
By contrast with mortgage loans, the annual
growth rate of loans for consumer credit failed
to recover and remained below zero in 2010.
Developments in consumer credit were also
in line with economic factors – as indicated,
for example, by the sharp declines seen in car
sales (following the expiry in most countries
of schemes offering incentives to scrap cars)
or consumer survey results showing a fairly
limited willingness to make major purchases.
In addition, the bank lending survey suggested
that demand for loans for consumer credit
remained weak. These contrasting developments
for loans for consumer credit and loans for
house purchase may, to some extent, also refl ect
interest rates. Loans for consumer credit tend
to be more expensive to fi nance than loans
for house purchase, as they tend not to be as
well collateralised. However, lending rates on
loans for consumer credit did decline in 2010,
particularly for loans with maturities of less than
one year (see Chart 17).
HOUSEHOLDS’ INDEBTEDNESS CONTINUED
TO INCREASE, WHILE THEIR INTEREST BURDEN
DECLINED FURTHER
In 2010 the increase in households’ borrowing
was moderate, but still outpaced the increase in
their disposable income. As a result, households’
indebtedness ratio edged up further to stand at an
estimated 98.8% in the fourth quarter of the year
(see Chart 18). By contrast, the ratio of household
debt to GDP was broadly unchanged from the
level observed in December 2009, as real GDP
grew at a higher rate than households’ disposable
income. While the indebtedness of the household
sector was broadly unchanged in the euro area
and declined visibly in the United States and
Chart 17 Interest rates on lending to households and non-financial corporations
(percentages per annum; excluding charges; rates on new business)
2
3
4
5
6
7
8
9
10
2
3
4
5
6
7
8
9
10
2004 2005 2006 2007 2008 2009 2010
short-term rates on lending to non-financial corporations
long-term rates on lending to non-financial corporationsrates on loans to households for house purchase
rates on loans to households for consumer credit
Source: ECB.
Chart 18 Household debt and interest payments
(percentages)
40
50
60
70
80
90
100
1.0
1.5
2.0
2.5
3.0
3.5
4.0
4.5
interest payment burden as a percentage of gross
disposable income (right-hand scale)
ratio of household debt to gross disposable
income (left-hand scale)
ratio of household debt to GDP (left-hand scale)
2000 2002 2004 2006 2008 2010
Sources: ECB and Eurostat.
Notes: Household debt comprises total loans to households
from all institutional sectors, including the rest of the world.
Interest payments do not include the full fi nancing costs paid
by households, as they exclude the fees for fi nancial services.
Data for the last quarter shown have been partly estimated.
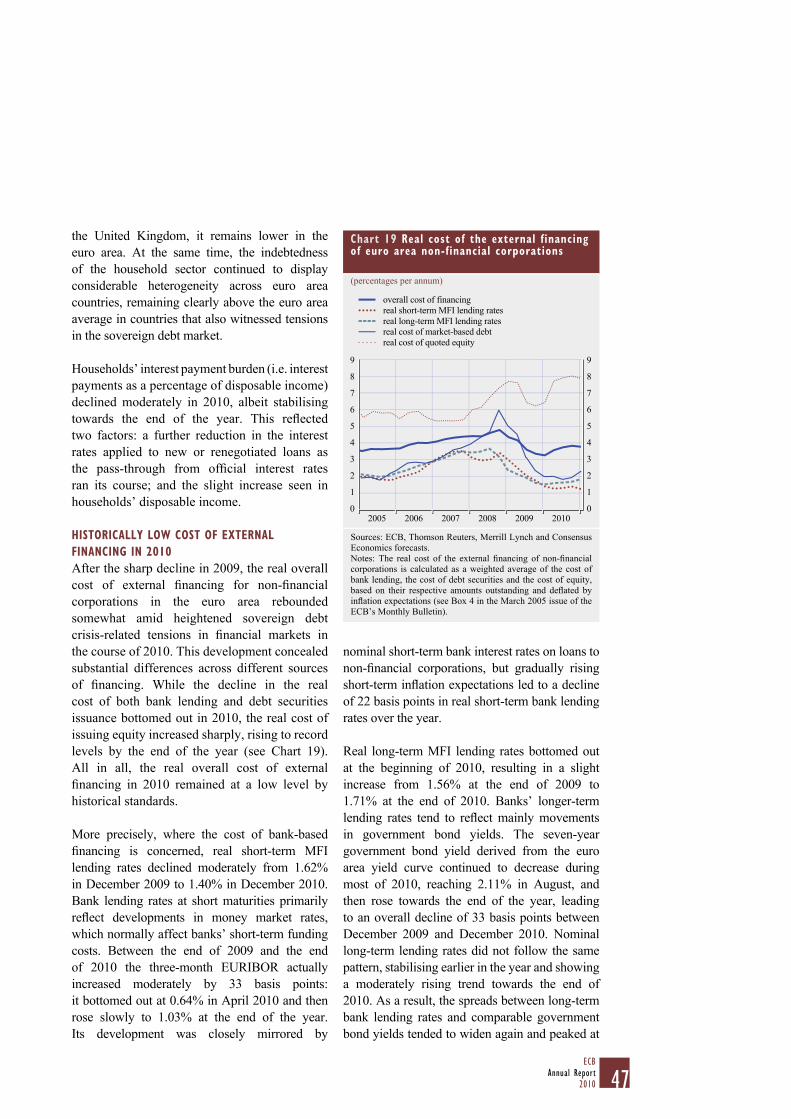
47ECB
Annual Report2010
the United Kingdom, it remains lower in the
euro area. At the same time, the indebtedness
of the household sector continued to display
considerable heterogeneity across euro area
countries, remaining clearly above the euro area
average in countries that also witnessed tensions
in the sovereign debt market.
Households’ interest payment burden (i.e. interest
payments as a percentage of disposable income)
declined moderately in 2010, albeit stabilising
towards the end of the year. This refl ected
two factors: a further reduction in the interest
rates applied to new or renegotiated loans as
the pass-through from offi cial interest rates
ran its course; and the slight increase seen in
households’ disposable income.
HISTORICALLY LOW COST OF EXTERNAL
FINANCING IN 2010
After the sharp decline in 2009, the real overall
cost of external fi nancing for non-fi nancial
corporations in the euro area rebounded
somewhat amid heightened sovereign debt
crisis-related tensions in fi nancial markets in
the course of 2010. This development concealed
substantial differences across different sources
of fi nancing. While the decline in the real
cost of both bank lending and debt securities
issuance bottomed out in 2010, the real cost of
issuing equity increased sharply, rising to record
levels by the end of the year (see Chart 19).
All in all, the real overall cost of external
fi nancing in 2010 remained at a low level by
historical standards.
More precisely, where the cost of bank-based
fi nancing is concerned, real short-term MFI
lending rates declined moderately from 1.62%
in December 2009 to 1.40% in December 2010.
Bank lending rates at short maturities primarily
refl ect developments in money market rates,
which normally affect banks’ short-term funding
costs. Between the end of 2009 and the end
of 2010 the three-month EURIBOR actually
increased moderately by 33 basis points:
it bottomed out at 0.64% in April 2010 and then
rose slowly to 1.03% at the end of the year.
Its development was closely mirrored by
nominal short-term bank interest rates on loans to
non-fi nancial corporations, but gradually rising
short-term infl ation expectations led to a decline
of 22 basis points in real short-term bank lending
rates over the year.
Real long-term MFI lending rates bottomed out
at the beginning of 2010, resulting in a slight
increase from 1.56% at the end of 2009 to
1.71% at the end of 2010. Banks’ longer-term
lending rates tend to refl ect mainly movements
in government bond yields. The seven-year
government bond yield derived from the euro
area yield curve continued to decrease during
most of 2010, reaching 2.11% in August, and
then rose towards the end of the year, leading
to an overall decline of 33 basis points between
December 2009 and December 2010. Nominal
long-term lending rates did not follow the same
pattern, stabilising earlier in the year and showing
a moderately rising trend towards the end of
2010. As a result, the spreads between long-term
bank lending rates and comparable government
bond yields tended to widen again and peaked at
Chart 19 Real cost of the external financing of euro area non-financial corporations
(percentages per annum)
0
1
2
3
4
5
6
7
8
9
0
1
2
3
4
5
6
7
8
9
2005 2006 2007 2008 2009 2010
overall cost of financing
real short-term MFI lending rates
real long-term MFI lending rates
real cost of market-based debt
real cost of quoted equity
Sources: ECB, Thomson Reuters, Merrill Lynch and Consensus
Economics forecasts.
Notes: The real cost of the external fi nancing of non-fi nancial
corporations is calculated as a weighted average of the cost of
bank lending, the cost of debt securities and the cost of equity,
based on their respective amounts outstanding and defl ated by
infl ation expectations (see Box 4 in the March 2005 issue of the
ECB’s Monthly Bulletin).
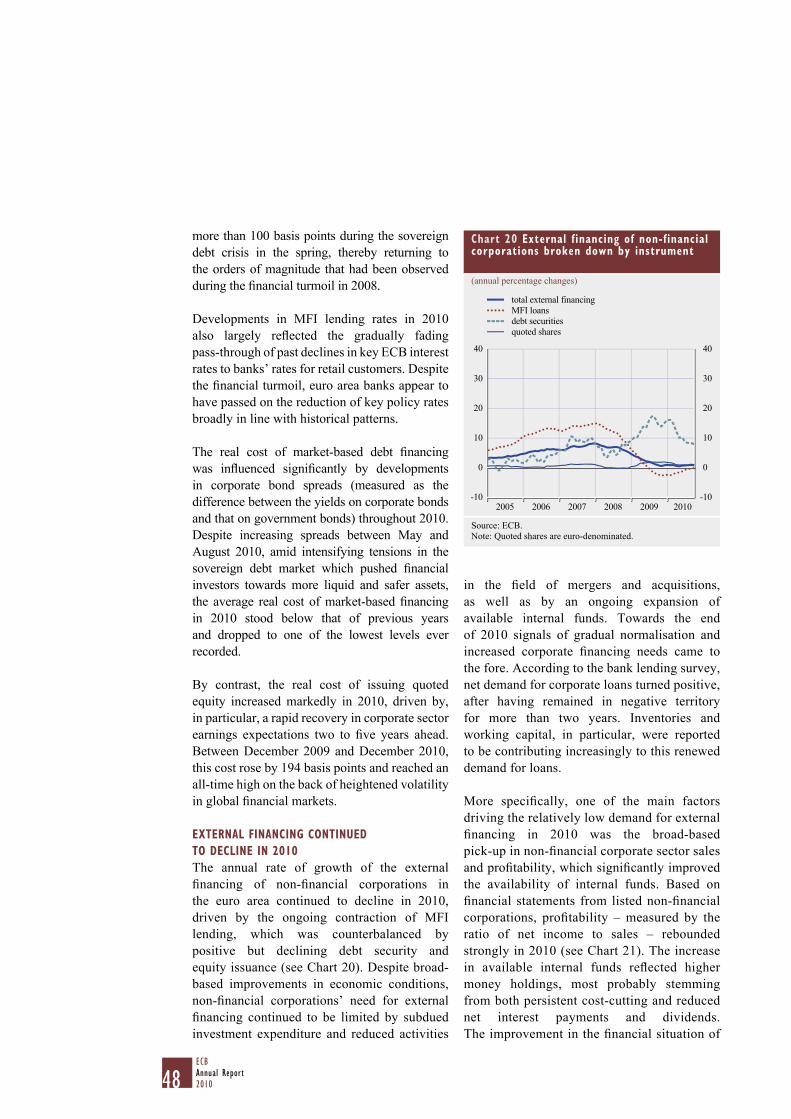
48ECBAnnual Report2010
more than 100 basis points during the sovereign
debt crisis in the spring, thereby returning to
the orders of magnitude that had been observed
during the fi nancial turmoil in 2008.
Developments in MFI lending rates in 2010
also largely refl ected the gradually fading
pass-through of past declines in key ECB interest
rates to banks’ rates for retail customers. Despite
the fi nancial turmoil, euro area banks appear to
have passed on the reduction of key policy rates
broadly in line with historical patterns.
The real cost of market-based debt fi nancing
was infl uenced signifi cantly by developments
in corporate bond spreads (measured as the
difference between the yields on corporate bonds
and that on government bonds) throughout 2010.
Despite increasing spreads between May and
August 2010, amid intensifying tensions in the
sovereign debt market which pushed fi nancial
investors towards more liquid and safer assets,
the average real cost of market-based fi nancing
in 2010 stood below that of previous years
and dropped to one of the lowest levels ever
recorded.
By contrast, the real cost of issuing quoted
equity increased markedly in 2010, driven by,
in particular, a rapid recovery in corporate sector
earnings expectations two to fi ve years ahead.
Between December 2009 and December 2010,
this cost rose by 194 basis points and reached an
all-time high on the back of heightened volatility
in global fi nancial markets.
EXTERNAL FINANCING CONTINUED
TO DECLINE IN 2010
The annual rate of growth of the external
fi nancing of non-fi nancial corporations in
the euro area continued to decline in 2010,
driven by the ongoing contraction of MFI
lending, which was counterbalanced by
positive but declining debt security and
equity issuance (see Chart 20). Despite broad-
based improvements in economic conditions,
non-fi nancial corporations’ need for external
fi nancing continued to be limited by subdued
investment expenditure and reduced activities
in the fi eld of mergers and acquisitions,
as well as by an ongoing expansion of
available internal funds. Towards the end
of 2010 signals of gradual normalisation and
increased corporate fi nancing needs came to
the fore. According to the bank lending survey,
net demand for corporate loans turned positive,
after having remained in negative territory
for more than two years. Inventories and
working capital, in particular, were reported
to be contributing increasingly to this renewed
demand for loans.
More specifi cally, one of the main factors
driving the relatively low demand for external
fi nancing in 2010 was the broad-based
pick-up in non-fi nancial corporate sector sales
and profi tability, which signifi cantly improved
the availability of internal funds. Based on
fi nancial statements from listed non-fi nancial
corporations, profi tability – measured by the
ratio of net income to sales – rebounded
strongly in 2010 (see Chart 21). The increase
in available internal funds refl ected higher
money holdings, most probably stemming
from both persistent cost-cutting and reduced
net interest payments and dividends.
The improvement in the fi nancial situation of
Chart 20 External financing of non-financial corporations broken down by instrument
(annual percentage changes)
-10
0
10
20
30
40
-10
0
10
20
30
40
20102005 2006 2007 2008 2009
total external financing
MFI loans
debt securities
quoted shares
Source: ECB.
Note: Quoted shares are euro-denominated.
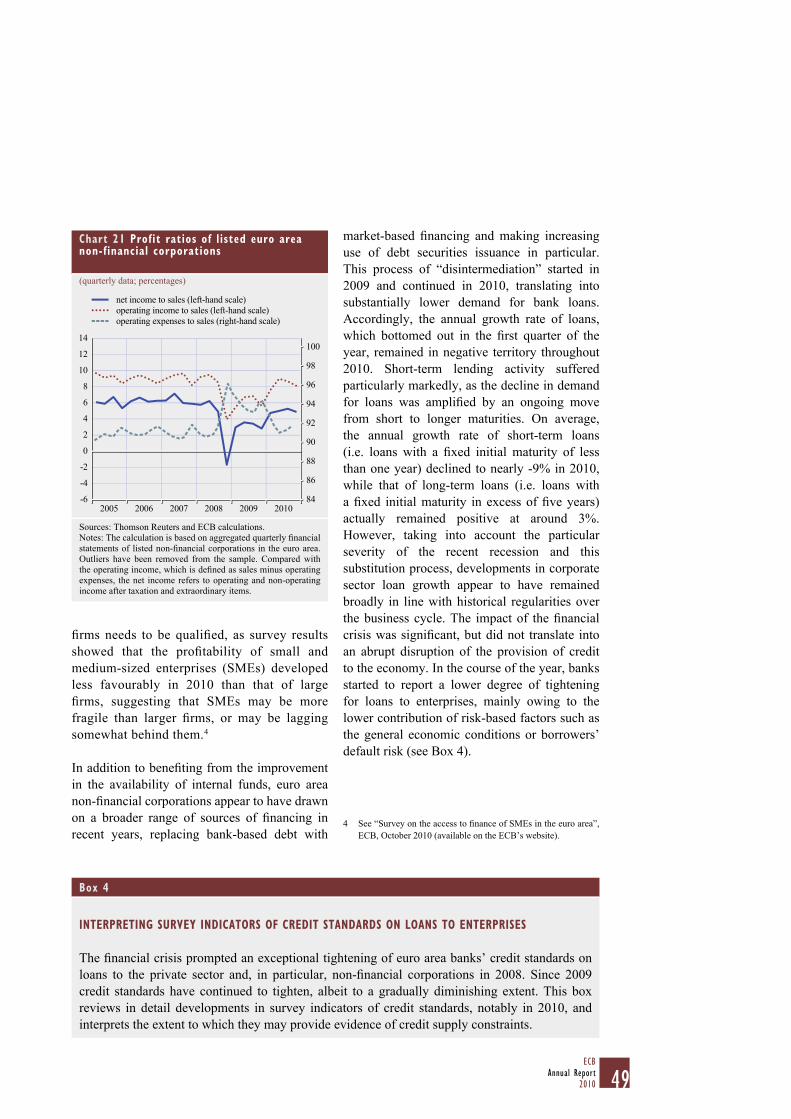
49ECB
Annual Report2010
fi rms needs to be qualifi ed, as survey results
showed that the profi tability of small and
medium-sized enterprises (SMEs) developed
less favourably in 2010 than that of large
fi rms, suggesting that SMEs may be more
fragile than larger fi rms, or may be lagging
somewhat behind them.4
In addition to benefi ting from the improvement
in the availability of internal funds, euro area
non-fi nancial corporations appear to have drawn
on a broader range of sources of fi nancing in
recent years, replacing bank-based debt with
market-based fi nancing and making increasing
use of debt securities issuance in particular.
This process of “disintermediation” started in
2009 and continued in 2010, translating into
substantially lower demand for bank loans.
Accordingly, the annual growth rate of loans,
which bottomed out in the fi rst quarter of the
year, remained in negative territory throughout
2010. Short-term lending activity suffered
particularly markedly, as the decline in demand
for loans was amplifi ed by an ongoing move
from short to longer maturities. On average,
the annual growth rate of short-term loans
(i.e. loans with a fi xed initial maturity of less
than one year) declined to nearly -9% in 2010,
while that of long-term loans (i.e. loans with
a fi xed initial maturity in excess of fi ve years)
actually remained positive at around 3%.
However, taking into account the particular
severity of the recent recession and this
substitution process, developments in corporate
sector loan growth appear to have remained
broadly in line with historical regularities over
the business cycle. The impact of the fi nancial
crisis was signifi cant, but did not translate into
an abrupt disruption of the provision of credit
to the economy. In the course of the year, banks
started to report a lower degree of tightening
for loans to enterprises, mainly owing to the
lower contribution of risk-based factors such as
the general economic conditions or borrowers’
default risk (see Box 4).
See “Survey on the access to fi nance of SMEs in the euro area”, 4
ECB, October 2010 (available on the ECB’s website).
Box 4
INTERPRETING SURVEY INDICATORS OF CREDIT STANDARDS ON LOANS TO ENTERPRISES
The fi nancial crisis prompted an exceptional tightening of euro area banks’ credit standards on
loans to the private sector and, in particular, non-fi nancial corporations in 2008. Since 2009
credit standards have continued to tighten, albeit to a gradually diminishing extent. This box
reviews in detail developments in survey indicators of credit standards, notably in 2010, and
interprets the extent to which they may provide evidence of credit supply constraints.
Chart 21 Profit ratios of listed euro area non-financial corporations
(quarterly data; percentages)
-6
-4
-2
0
2
4
6
8
10
12
14
84
86
88
90
92
94
96
98
100
20102005 2006 2007 2008 2009
net income to sales (left-hand scale)
operating income to sales (left-hand scale)
operating expenses to sales (right-hand scale)
Sources: Thomson Reuters and ECB calculations.
Notes: The calculation is based on aggregated quarterly fi nancial
statements of listed non-fi nancial corporations in the euro area.
Outliers have been removed from the sample. Compared with
the operating income, which is defi ned as sales minus operating
expenses, the net income refers to operating and non-operating
income after taxation and extraordinary items.
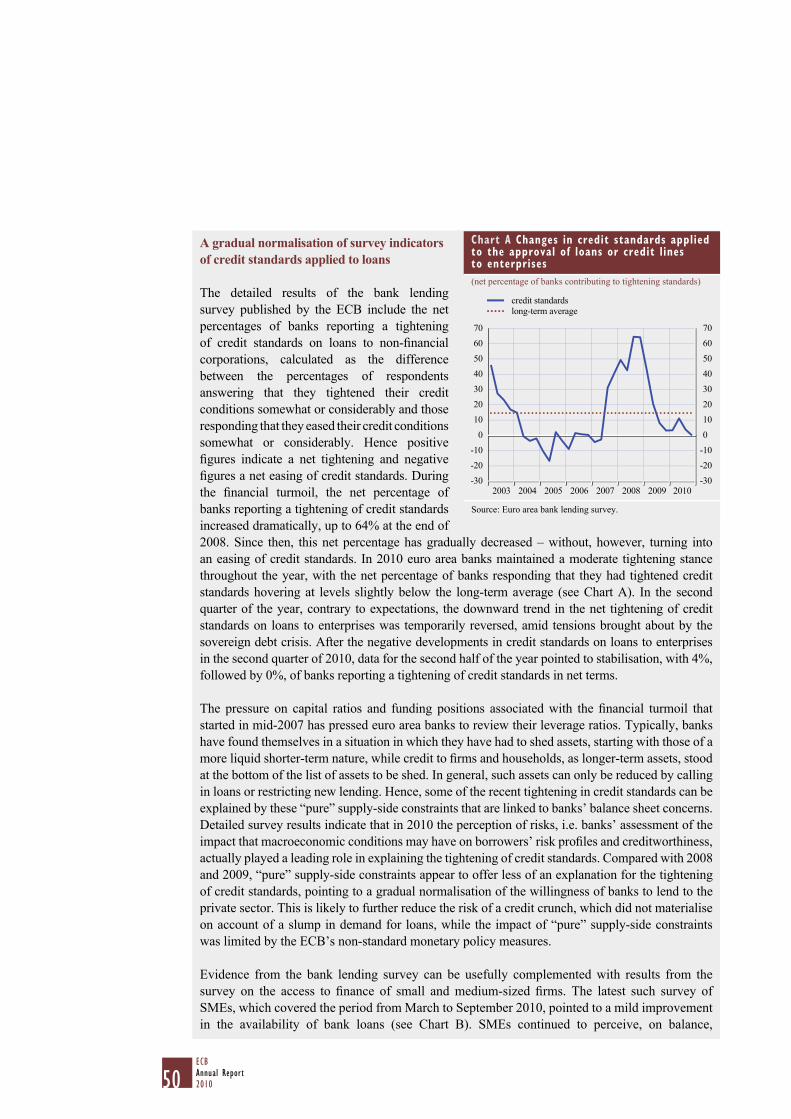
50ECBAnnual Report2010
A gradual normalisation of survey indicators of credit standards applied to loans
The detailed results of the bank lending
survey published by the ECB include the net
percentages of banks reporting a tightening
of credit standards on loans to non-fi nancial
corporations, calculated as the difference
between the percentages of respondents
answering that they tightened their credit
conditions somewhat or considerably and those
responding that they eased their credit conditions
somewhat or considerably. Hence positive
fi gures indicate a net tightening and negative
fi gures a net easing of credit standards. During
the fi nancial turmoil, the net percentage of
banks reporting a tightening of credit standards
increased dramatically, up to 64% at the end of
2008. Since then, this net percentage has gradually decreased – without, however, turning into
an easing of credit standards. In 2010 euro area banks maintained a moderate tightening stance
throughout the year, with the net percentage of banks responding that they had tightened credit
standards hovering at levels slightly below the long-term average (see Chart A). In the second
quarter of the year, contrary to expectations, the downward trend in the net tightening of credit
standards on loans to enterprises was temporarily reversed, amid tensions brought about by the
sovereign debt crisis. After the negative developments in credit standards on loans to enterprises
in the second quarter of 2010, data for the second half of the year pointed to stabilisation, with 4%,
followed by 0%, of banks reporting a tightening of credit standards in net terms.
The pressure on capital ratios and funding positions associated with the fi nancial turmoil that
started in mid-2007 has pressed euro area banks to review their leverage ratios. Typically, banks
have found themselves in a situation in which they have had to shed assets, starting with those of a
more liquid shorter-term nature, while credit to fi rms and households, as longer-term assets, stood
at the bottom of the list of assets to be shed. In general, such assets can only be reduced by calling
in loans or restricting new lending. Hence, some of the recent tightening in credit standards can be
explained by these “pure” supply-side constraints that are linked to banks’ balance sheet concerns.
Detailed survey results indicate that in 2010 the perception of risks, i.e. banks’ assessment of the
impact that macroeconomic conditions may have on borrowers’ risk profi les and creditworthiness,
actually played a leading role in explaining the tightening of credit standards. Compared with 2008
and 2009, “pure” supply-side constraints appear to offer less of an explanation for the tightening
of credit standards, pointing to a gradual normalisation of the willingness of banks to lend to the
private sector. This is likely to further reduce the risk of a credit crunch, which did not materialise
on account of a slump in demand for loans, while the impact of “pure” supply-side constraints
was limited by the ECB’s non-standard monetary policy measures.
Evidence from the bank lending survey can be usefully complemented with results from the
survey on the access to fi nance of small and medium-sized fi rms. The latest such survey of
SMEs, which covered the period from March to September 2010, pointed to a mild improvement
in the availability of bank loans (see Chart B). SMEs continued to perceive, on balance,
Chart A Changes in credit standards applied to the approval of loans or credit lines to enterprises
(net percentage of banks contributing to tightening standards)
-30
-20
-10
0
10
20
30
40
50
60
70
-30
-20
-10
0
10
20
30
40
50
60
70
credit standards
long-term average
2003 2004 2005 2006 2007 2008 2009 2010
Source: Euro area bank lending survey.
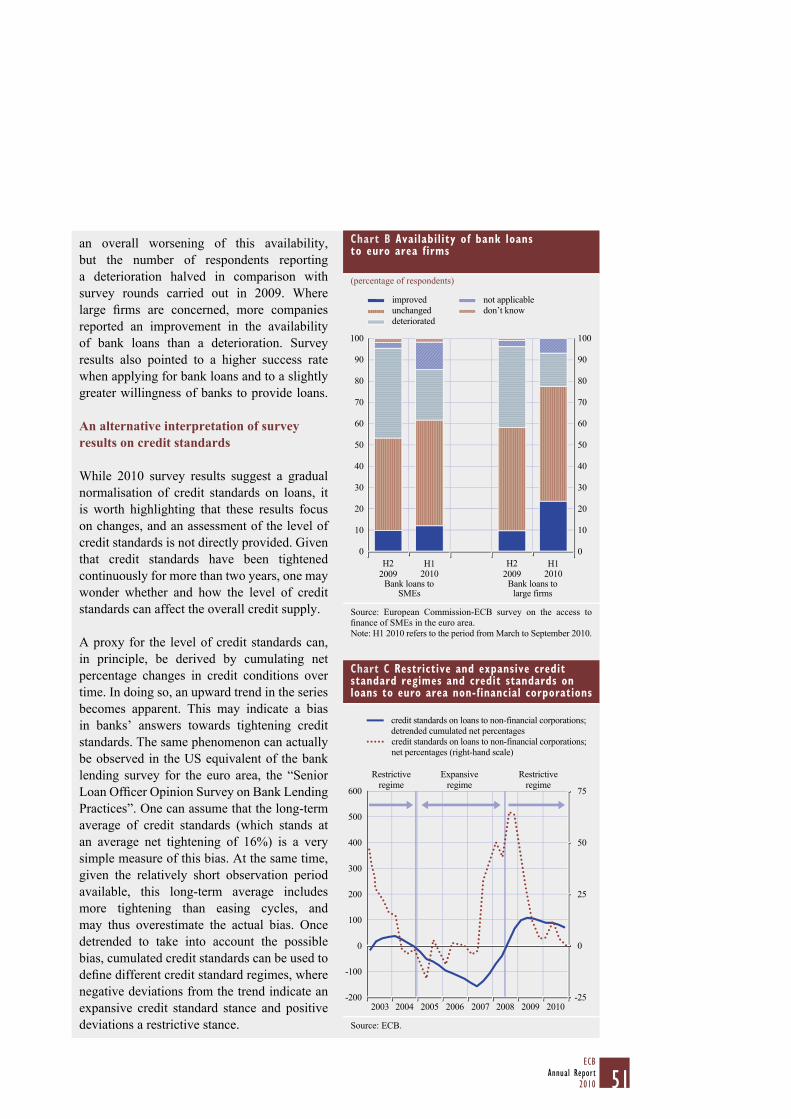
51ECB
Annual Report2010
an overall worsening of this availability,
but the number of respondents reporting
a deterioration halved in comparison with
survey rounds carried out in 2009. Where
large fi rms are concerned, more companies
reported an improvement in the availability
of bank loans than a deterioration. Survey
results also pointed to a higher success rate
when applying for bank loans and to a slightly
greater willingness of banks to provide loans.
An alternative interpretation of survey results on credit standards
While 2010 survey results suggest a gradual
normalisation of credit standards on loans, it
is worth highlighting that these results focus
on changes, and an assessment of the level of
credit standards is not directly provided. Given
that credit standards have been tightened
continuously for more than two years, one may
wonder whether and how the level of credit
standards can affect the overall credit supply.
A proxy for the level of credit standards can,
in principle, be derived by cumulating net
percentage changes in credit conditions over
time. In doing so, an upward trend in the series
becomes apparent. This may indicate a bias
in banks’ answers towards tightening credit
standards. The same phenomenon can actually
be observed in the US equivalent of the bank
lending survey for the euro area, the “Senior
Loan Offi cer Opinion Survey on Bank Lending
Practices”. One can assume that the long-term
average of credit standards (which stands at
an average net tightening of 16%) is a very
simple measure of this bias. At the same time,
given the relatively short observation period
available, this long-term average includes
more tightening than easing cycles, and
may thus overestimate the actual bias. Once
detrended to take into account the possible
bias, cumulated credit standards can be used to
defi ne different credit standard regimes, where
negative deviations from the trend indicate an
expansive credit standard stance and positive
deviations a restrictive stance.
Chart B Availability of bank loans to euro area firms
(percentage of respondents)
0
10
20
30
40
50
60
70
80
90
100
0
10
20
30
40
50
60
70
80
90
100
Bank loans tolarge firms
Bank loans toSMEs
don’t know
not applicable
deteriorated
unchanged
improved
H2
2009
H2
2009H1
2010H1
2010
Source: European Commission-ECB survey on the access to
fi nance of SMEs in the euro area.
Note: H1 2010 refers to the period from March to September 2010.
Chart C Restrictive and expansive credit standard regimes and credit standards on loans to euro area non-financial corporations
-200
-100
0
100
200
300
400
500
600
2010-25
0
25
50
75
credit standards on loans to non-financial corporations;
detrended cumulated net percentages
credit standards on loans to non-financial corporations;
net percentages (right-hand scale)
Restrictive
regime
Restrictive
regime
Expansive
regime
2003 2004 2005 2006 2007 2008 2009
Source: ECB.
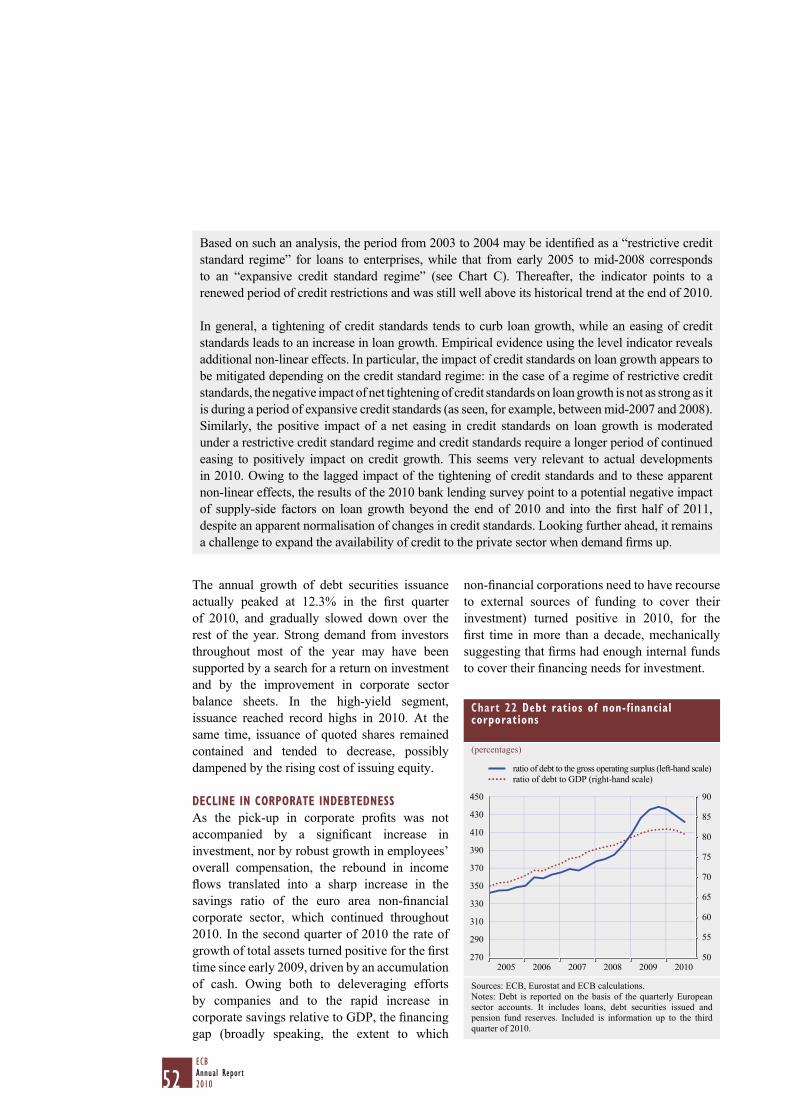
52ECBAnnual Report2010
The annual growth of debt securities issuance
actually peaked at 12.3% in the fi rst quarter
of 2010, and gradually slowed down over the
rest of the year. Strong demand from investors
throughout most of the year may have been
supported by a search for a return on investment
and by the improvement in corporate sector
balance sheets. In the high-yield segment,
issuance reached record highs in 2010. At the
same time, issuance of quoted shares remained
contained and tended to decrease, possibly
dampened by the rising cost of issuing equity.
DECLINE IN CORPORATE INDEBTEDNESS
As the pick-up in corporate profi ts was not
accompanied by a signifi cant increase in
investment, nor by robust growth in employees’
overall compensation, the rebound in income
fl ows translated into a sharp increase in the
savings ratio of the euro area non-fi nancial
corporate sector, which continued throughout
2010. In the second quarter of 2010 the rate of
growth of total assets turned positive for the fi rst
time since early 2009, driven by an accumulation
of cash. Owing both to deleveraging efforts
by companies and to the rapid increase in
corporate savings relative to GDP, the fi nancing
gap (broadly speaking, the extent to which
non-fi nancial corporations need to have recourse
to external sources of funding to cover their
investment) turned positive in 2010, for the
fi rst time in more than a decade, mechanically
suggesting that fi rms had enough internal funds
to cover their fi nancing needs for investment.
Based on such an analysis, the period from 2003 to 2004 may be identifi ed as a “restrictive credit
standard regime” for loans to enterprises, while that from early 2005 to mid-2008 corresponds
to an “expansive credit standard regime” (see Chart C). Thereafter, the indicator points to a
renewed period of credit restrictions and was still well above its historical trend at the end of 2010.
In general, a tightening of credit standards tends to curb loan growth, while an easing of credit
standards leads to an increase in loan growth. Empirical evidence using the level indicator reveals
additional non-linear effects. In particular, the impact of credit standards on loan growth appears to
be mitigated depending on the credit standard regime: in the case of a regime of restrictive credit
standards, the negative impact of net tightening of credit standards on loan growth is not as strong as it
is during a period of expansive credit standards (as seen, for example, between mid-2007 and 2008).
Similarly, the positive impact of a net easing in credit standards on loan growth is moderated
under a restrictive credit standard regime and credit standards require a longer period of continued
easing to positively impact on credit growth. This seems very relevant to actual developments
in 2010. Owing to the lagged impact of the tightening of credit standards and to these apparent
non-linear effects, the results of the 2010 bank lending survey point to a potential negative impact
of supply-side factors on loan growth beyond the end of 2010 and into the fi rst half of 2011,
despite an apparent normalisation of changes in credit standards. Looking further ahead, it remains
a challenge to expand the availability of credit to the private sector when demand fi rms up.
Chart 22 Debt ratios of non-financial corporations
(percentages)
270
290
310
330
350
370
390
410
430
450
50
55
60
65
70
75
80
85
90
ratio of debt to the gross operating surplus (left-hand scale)
ratio of debt to GDP (right-hand scale)
2005 2006 2007 2008 2009 2010
Sources: ECB, Eurostat and ECB calculations.
Notes: Debt is reported on the basis of the quarterly European
sector accounts. It includes loans, debt securities issued and
pension fund reserves. Included is information up to the third
quarter of 2010.
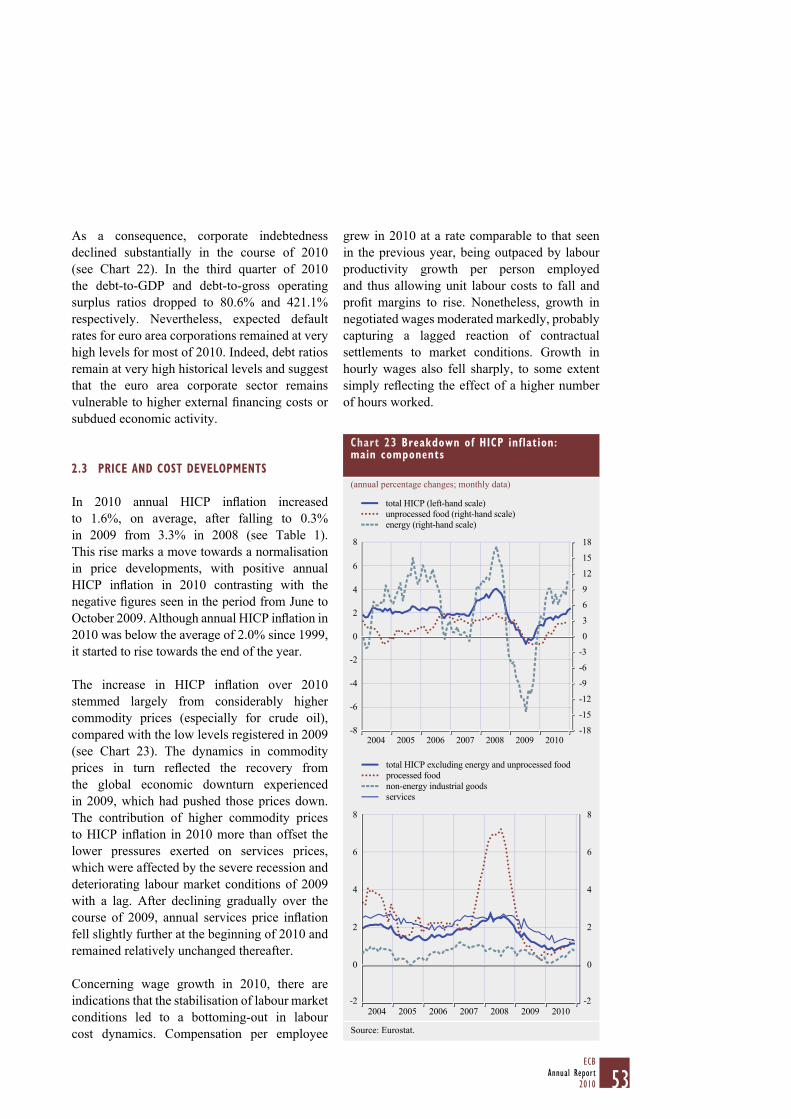
53ECB
Annual Report2010
As a consequence, corporate indebtedness
declined substantially in the course of 2010
(see Chart 22). In the third quarter of 2010
the debt-to-GDP and debt-to-gross operating
surplus ratios dropped to 80.6% and 421.1%
respectively. Nevertheless, expected default
rates for euro area corporations remained at very
high levels for most of 2010. Indeed, debt ratios
remain at very high historical levels and suggest
that the euro area corporate sector remains
vulnerable to higher external fi nancing costs or
subdued economic activity.
2.3 PRICE AND COST DEVELOPMENTS
In 2010 annual HICP infl ation increased
to 1.6%, on average, after falling to 0.3%
in 2009 from 3.3% in 2008 (see Table 1).
This rise marks a move towards a normalisation
in price developments, with positive annual
HICP infl ation in 2010 contrasting with the
negative fi gures seen in the period from June to
October 2009. Although annual HICP infl ation in
2010 was below the average of 2.0% since 1999,
it started to rise towards the end of the year.
The increase in HICP infl ation over 2010
stemmed largely from considerably higher
commodity prices (especially for crude oil),
compared with the low levels registered in 2009
(see Chart 23). The dynamics in commodity
prices in turn refl ected the recovery from
the global economic downturn experienced
in 2009, which had pushed those prices down.
The contribution of higher commodity prices
to HICP infl ation in 2010 more than offset the
lower pressures exerted on services prices,
which were affected by the severe recession and
deteriorating labour market conditions of 2009
with a lag. After declining gradually over the
course of 2009, annual services price infl ation
fell slightly further at the beginning of 2010 and
remained relatively unchanged thereafter.
Concerning wage growth in 2010, there are
indications that the stabilisation of labour market
conditions led to a bottoming-out in labour
cost dynamics. Compensation per employee
grew in 2010 at a rate comparable to that seen
in the previous year, being outpaced by labour
productivity growth per person employed
and thus allowing unit labour costs to fall and
profi t margins to rise. Nonetheless, growth in
negotiated wages moderated markedly, probably
capturing a lagged reaction of contractual
settlements to market conditions. Growth in
hourly wages also fell sharply, to some extent
simply refl ecting the effect of a higher number
of hours worked.
Chart 23 Breakdown of HICP inflation: main components
(annual percentage changes; monthly data)
-8
-6
-4
-2
0
2
4
6
8
-18
-15
-12
-9
-6
-3
0
3
6
9
12
15
18
total HICP (left-hand scale)
unprocessed food (right-hand scale)
energy (right-hand scale)
2010200920082007200620052004
-2
0
2
4
6
8
-2
0
2
4
6
8
total HICP excluding energy and unprocessed food
processed food
non-energy industrial goods
services
2004 2005 2006 2007 2008 2009 2010
Source: Eurostat.
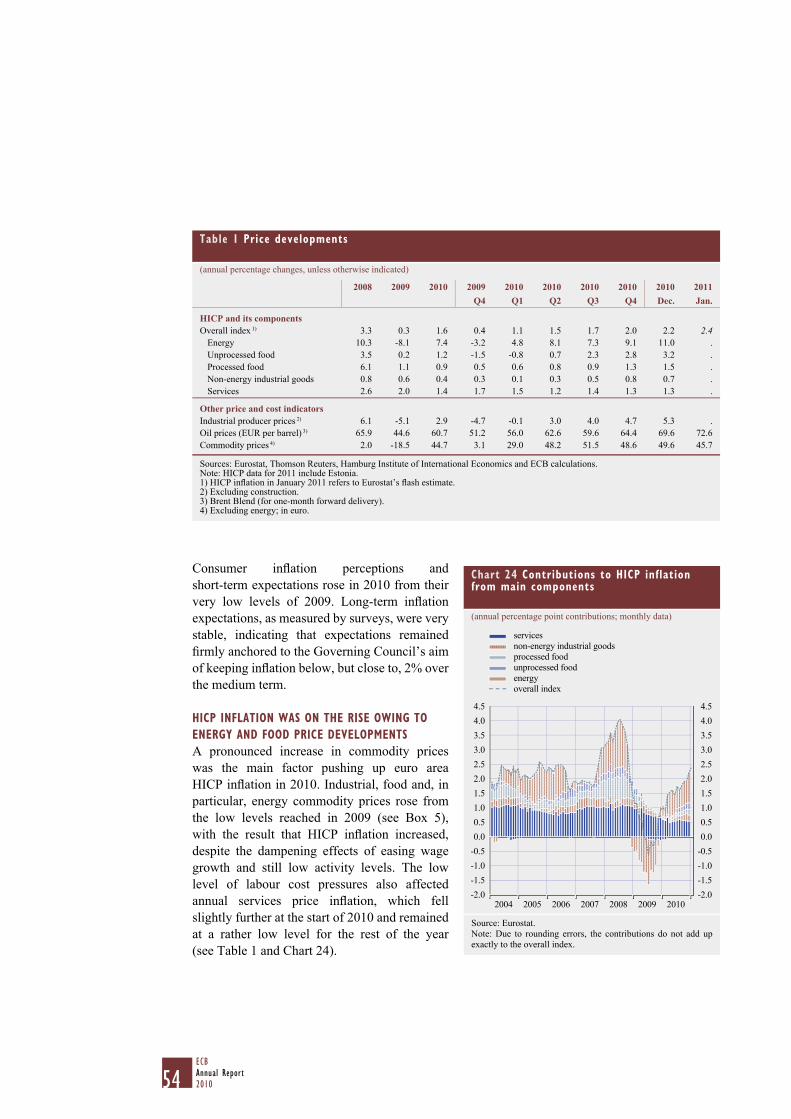
54ECBAnnual Report2010
Consumer infl ation perceptions and
short-term expectations rose in 2010 from their
very low levels of 2009. Long-term infl ation
expectations, as measured by surveys, were very
stable, indicating that expectations remained
fi rmly anchored to the Governing Council’s aim
of keeping infl ation below, but close to, 2% over
the medium term.
HICP INFLATION WAS ON THE RISE OWING TO
ENERGY AND FOOD PRICE DEVELOPMENTS
A pronounced increase in commodity prices
was the main factor pushing up euro area
HICP infl ation in 2010. Industrial, food and, in
particular, energy commodity prices rose from
the low levels reached in 2009 (see Box 5),
with the result that HICP infl ation increased,
despite the dampening effects of easing wage
growth and still low activity levels. The low
level of labour cost pressures also affected
annual services price infl ation, which fell
slightly further at the start of 2010 and remained
at a rather low level for the rest of the year
(see Table 1 and Chart 24).
Table 1 Price developments
(annual percentage changes, unless otherwise indicated)
2008 2009 2010 2009 2010 2010 2010 2010 2010 2011Q4 Q1 Q2 Q3 Q4 Dec. Jan.
HICP and its componentsOverall index 1) 3.3 0.3 1.6 0.4 1.1 1.5 1.7 2.0 2.2 2.4
Energy 10.3 -8.1 7.4 -3.2 4.8 8.1 7.3 9.1 11.0 .
Unprocessed food 3.5 0.2 1.2 -1.5 -0.8 0.7 2.3 2.8 3.2 .
Processed food 6.1 1.1 0.9 0.5 0.6 0.8 0.9 1.3 1.5 .
Non-energy industrial goods 0.8 0.6 0.4 0.3 0.1 0.3 0.5 0.8 0.7 .
Services 2.6 2.0 1.4 1.7 1.5 1.2 1.4 1.3 1.3 .
Other price and cost indicatorsIndustrial producer prices 2) 6.1 -5.1 2.9 -4.7 -0.1 3.0 4.0 4.7 5.3 .
Oil prices (EUR per barrel) 3) 65.9 44.6 60.7 51.2 56.0 62.6 59.6 64.4 69.6 72.6
Commodity prices 4) 2.0 -18.5 44.7 3.1 29.0 48.2 51.5 48.6 49.6 45.7
Sources: Eurostat, Thomson Reuters, Hamburg Institute of International Economics and ECB calculations.Note: HICP data for 2011 include Estonia.1) HICP infl ation in January 2011 refers to Eurostat’s fl ash estimate.2) Excluding construction.3) Brent Blend (for one-month forward delivery).4) Excluding energy; in euro.
Chart 24 Contributions to HICP inflation from main components
(annual percentage point contributions; monthly data)
-1.5
-2.0
-1.0
-0.5
0.0
0.5
1.0
1.5
2.0
2.5
3.0
3.5
4.0
4.5
-1.5
-2.0
-1.0
-0.5
0.0
0.5
1.0
1.5
2.0
2.5
3.0
3.5
4.0
4.5
services
non-energy industrial goods
processed food
unprocessed food
energy
overall index
2004 2005 2006 2007 2008 2009 2010
Source: Eurostat.
Note: Due to rounding errors, the contributions do not add up
exactly to the overall index.
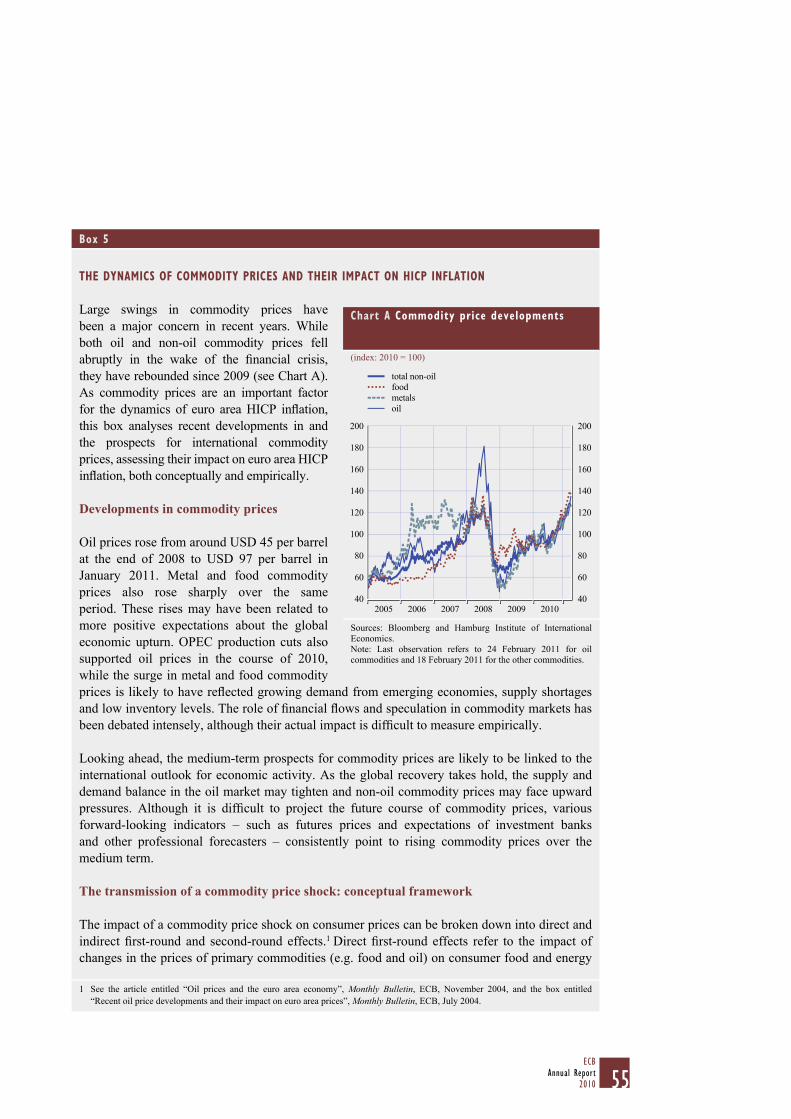
55ECB
Annual Report2010
Box 5
THE DYNAMICS OF COMMODITY PRICES AND THEIR IMPACT ON HICP INFLATION
Large swings in commodity prices have
been a major concern in recent years. While
both oil and non-oil commodity prices fell
abruptly in the wake of the fi nancial crisis,
they have rebounded since 2009 (see Chart A).
As commodity prices are an important factor
for the dynamics of euro area HICP infl ation,
this box analyses recent developments in and
the prospects for international commodity
prices, assessing their impact on euro area HICP
infl ation, both conceptually and empirically.
Developments in commodity prices
Oil prices rose from around USD 45 per barrel
at the end of 2008 to USD 97 per barrel in
January 2011. Metal and food commodity
prices also rose sharply over the same
period. These rises may have been related to
more positive expectations about the global
economic upturn. OPEC production cuts also
supported oil prices in the course of 2010,
while the surge in metal and food commodity
prices is likely to have refl ected growing demand from emerging economies, supply shortages
and low inventory levels. The role of fi nancial fl ows and speculation in commodity markets has
been debated intensely, although their actual impact is diffi cult to measure empirically.
Looking ahead, the medium-term prospects for commodity prices are likely to be linked to the
international outlook for economic activity. As the global recovery takes hold, the supply and
demand balance in the oil market may tighten and non-oil commodity prices may face upward
pressures. Although it is diffi cult to project the future course of commodity prices, various
forward-looking indicators – such as futures prices and expectations of investment banks
and other professional forecasters – consistently point to rising commodity prices over the
medium term.
The transmission of a commodity price shock: conceptual framework
The impact of a commodity price shock on consumer prices can be broken down into direct and
indirect fi rst-round and second-round effects.1 Direct fi rst-round effects refer to the impact of
changes in the prices of primary commodities (e.g. food and oil) on consumer food and energy
1 See the article entitled “Oil prices and the euro area economy”, Monthly Bulletin, ECB, November 2004, and the box entitled
“Recent oil price developments and their impact on euro area prices”, Monthly Bulletin, ECB, July 2004.
Chart A Commodity price developments
(index: 2010 = 100)
40
60
80
100
120
140
160
180
200
40
60
80
100
120
140
160
180
200
2005 2006 2007 2008 2009 2010
total non-oil
food
metals
oil
Sources: Bloomberg and Hamburg Institute of International
Economics.
Note: Last observation refers to 24 February 2011 for oil
commodities and 18 February 2011 for the other commodities.
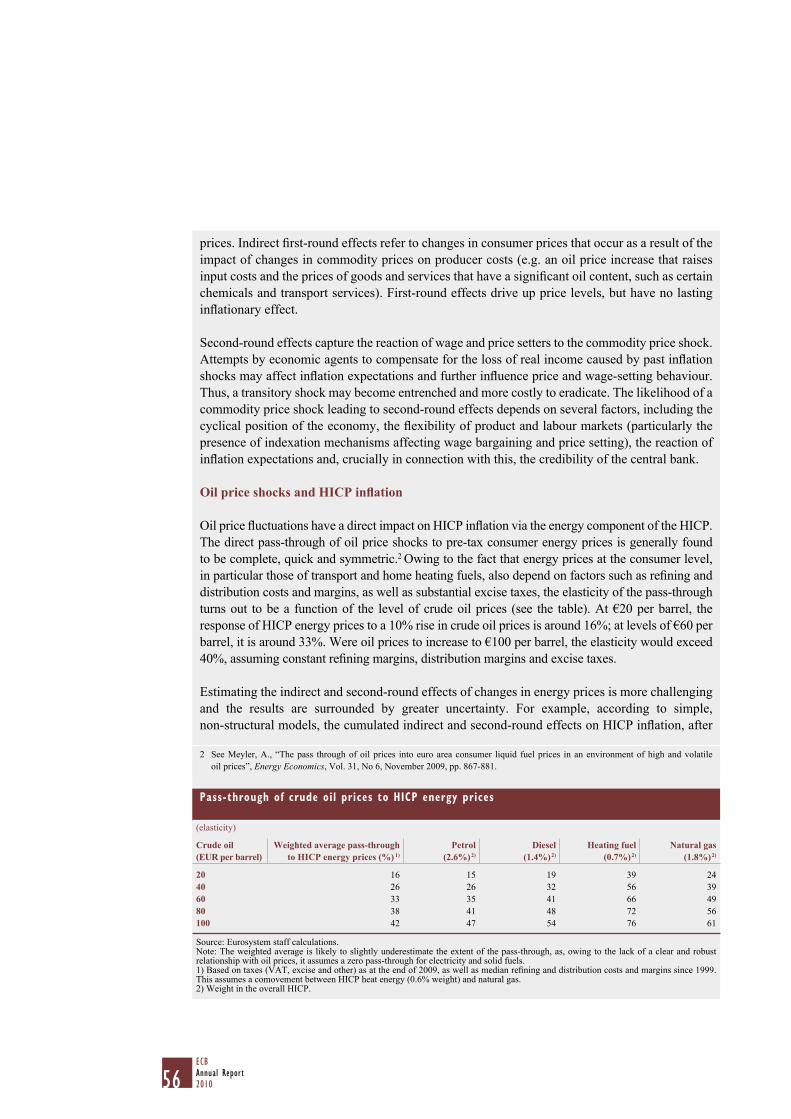
56ECBAnnual Report2010
prices. Indirect fi rst-round effects refer to changes in consumer prices that occur as a result of the
impact of changes in commodity prices on producer costs (e.g. an oil price increase that raises
input costs and the prices of goods and services that have a signifi cant oil content, such as certain
chemicals and transport services). First-round effects drive up price levels, but have no lasting
infl ationary effect.
Second-round effects capture the reaction of wage and price setters to the commodity price shock.
Attempts by economic agents to compensate for the loss of real income caused by past infl ation
shocks may affect infl ation expectations and further infl uence price and wage-setting behaviour.
Thus, a transitory shock may become entrenched and more costly to eradicate. The likelihood of a
commodity price shock leading to second-round effects depends on several factors, including the
cyclical position of the economy, the fl exibility of product and labour markets (particularly the
presence of indexation mechanisms affecting wage bargaining and price setting), the reaction of
infl ation expectations and, crucially in connection with this, the credibility of the central bank.
Oil price shocks and HICP infl ation
Oil price fl uctuations have a direct impact on HICP infl ation via the energy component of the HICP.
The direct pass-through of oil price shocks to pre-tax consumer energy prices is generally found
to be complete, quick and symmetric.2 Owing to the fact that energy prices at the consumer level,
in particular those of transport and home heating fuels, also depend on factors such as refi ning and
distribution costs and margins, as well as substantial excise taxes, the elasticity of the pass-through
turns out to be a function of the level of crude oil prices (see the table). At €20 per barrel, the
response of HICP energy prices to a 10% rise in crude oil prices is around 16%; at levels of €60 per
barrel, it is around 33%. Were oil prices to increase to €100 per barrel, the elasticity would exceed
40%, assuming constant refi ning margins, distribution margins and excise taxes.
Estimating the indirect and second-round effects of changes in energy prices is more challenging
and the results are surrounded by greater uncertainty. For example, according to simple,
non-structural models, the cumulated indirect and second-round effects on HICP infl ation, after
2 See Meyler, A., “The pass through of oil prices into euro area consumer liquid fuel prices in an environment of high and volatile
oil prices”, Energy Economics, Vol. 31, No 6, November 2009, pp. 867-881.
Pass-through of crude oil prices to HICP energy prices
(elasticity)
Crude oil (EUR per barrel)
Weighted average pass-through to HICP energy prices (%) 1)
Petrol (2.6%) 2)
Diesel (1.4%) 2)
Heating fuel (0.7%) 2)
Natural gas (1.8%) 2)
20 16 15 19 39 24
40 26 26 32 56 39
60 33 35 41 66 49
80 38 41 48 72 56
100 42 47 54 76 61
Source: Eurosystem staff calculations.Note: The weighted average is likely to slightly underestimate the extent of the pass-through, as, owing to the lack of a clear and robust relationship with oil prices, it assumes a zero pass-through for electricity and solid fuels.1) Based on taxes (VAT, excise and other) as at the end of 2009, as well as median refi ning and distribution costs and margins since 1999. This assumes a comovement between HICP heat energy (0.6% weight) and natural gas. 2) Weight in the overall HICP.
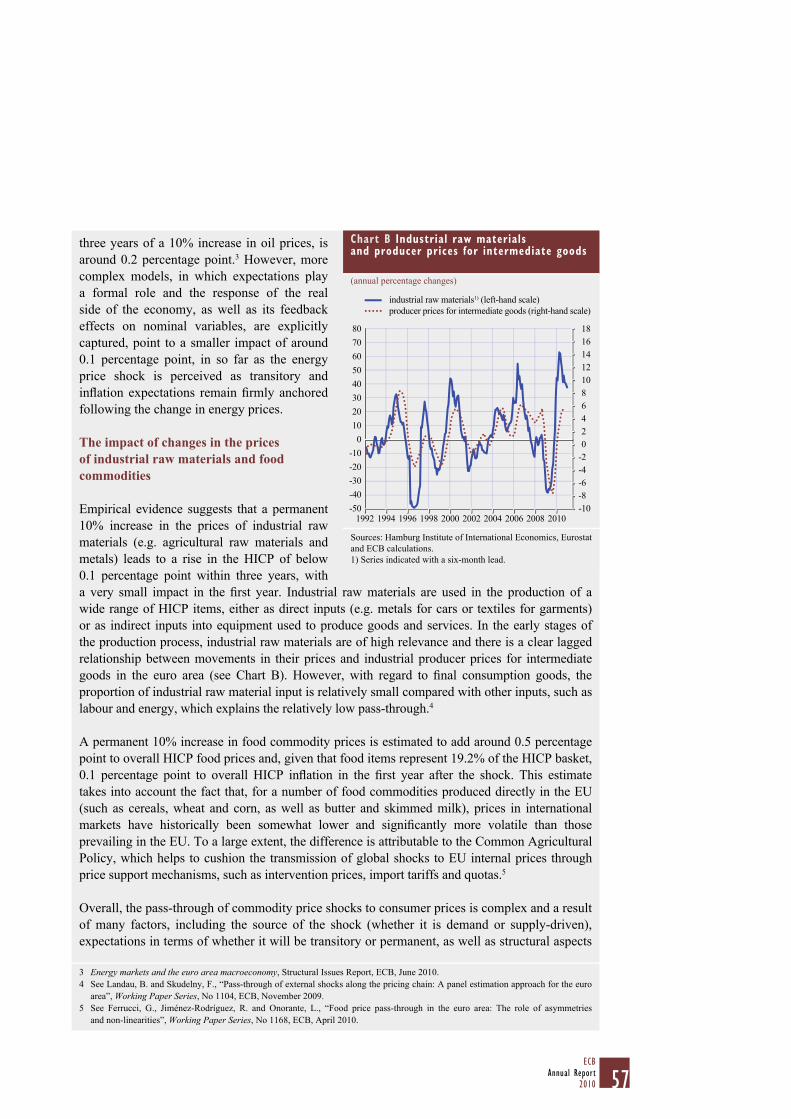
57ECB
Annual Report2010
three years of a 10% increase in oil prices, is
around 0.2 percentage point.3 However, more
complex models, in which expectations play
a formal role and the response of the real
side of the economy, as well as its feedback
effects on nominal variables, are explicitly
captured, point to a smaller impact of around
0.1 percentage point, in so far as the energy
price shock is perceived as transitory and
infl ation expectations remain fi rmly anchored
following the change in energy prices.
The impact of changes in the prices of industrial raw materials and food commodities
Empirical evidence suggests that a permanent
10% increase in the prices of industrial raw
materials (e.g. agricultural raw materials and
metals) leads to a rise in the HICP of below
0.1 percentage point within three years, with
a very small impact in the fi rst year. Industrial raw materials are used in the production of a
wide range of HICP items, either as direct inputs (e.g. metals for cars or textiles for garments)
or as indirect inputs into equipment used to produce goods and services. In the early stages of
the production process, industrial raw materials are of high relevance and there is a clear lagged
relationship between movements in their prices and industrial producer prices for intermediate
goods in the euro area (see Chart B). However, with regard to fi nal consumption goods, the
proportion of industrial raw material input is relatively small compared with other inputs, such as
labour and energy, which explains the relatively low pass-through.4
A permanent 10% increase in food commodity prices is estimated to add around 0.5 percentage
point to overall HICP food prices and, given that food items represent 19.2% of the HICP basket,
0.1 percentage point to overall HICP infl ation in the fi rst year after the shock. This estimate
takes into account the fact that, for a number of food commodities produced directly in the EU
(such as cereals, wheat and corn, as well as butter and skimmed milk), prices in international
markets have historically been somewhat lower and signifi cantly more volatile than those
prevailing in the EU. To a large extent, the difference is attributable to the Common Agricultural
Policy, which helps to cushion the transmission of global shocks to EU internal prices through
price support mechanisms, such as intervention prices, import tariffs and quotas.5
Overall, the pass-through of commodity price shocks to consumer prices is complex and a result
of many factors, including the source of the shock (whether it is demand or supply-driven),
expectations in terms of whether it will be transitory or permanent, as well as structural aspects
3 Energy markets and the euro area macroeconomy, Structural Issues Report, ECB, June 2010.
4 See Landau, B. and Skudelny, F., “Pass-through of external shocks along the pricing chain: A panel estimation approach for the euro
area”, Working Paper Series, No 1104, ECB, November 2009.
5 See Ferrucci, G., Jiménez-Rodríguez, R. and Onorante, L., “Food price pass-through in the euro area: The role of asymmetries
and non-linearities”, Working Paper Series, No 1168, ECB, April 2010.
Chart B Industrial raw materials and producer prices for intermediate goods
(annual percentage changes)
-50
-40
-30
-20
-10
0
10
20
30
40
50
60
70
80
-10
-8
-6
-4
-2
8
6
2
4
0
10
12
14
16
18
2010
industrial raw materials1) (left-hand scale)
producer prices for intermediate goods (right-hand scale)
1992 1994 1996 1998 2000 2002 2004 2006 2008
Sources: Hamburg Institute of International Economics, Eurostat
and ECB calculations.
1) Series indicated with a six-month lead.
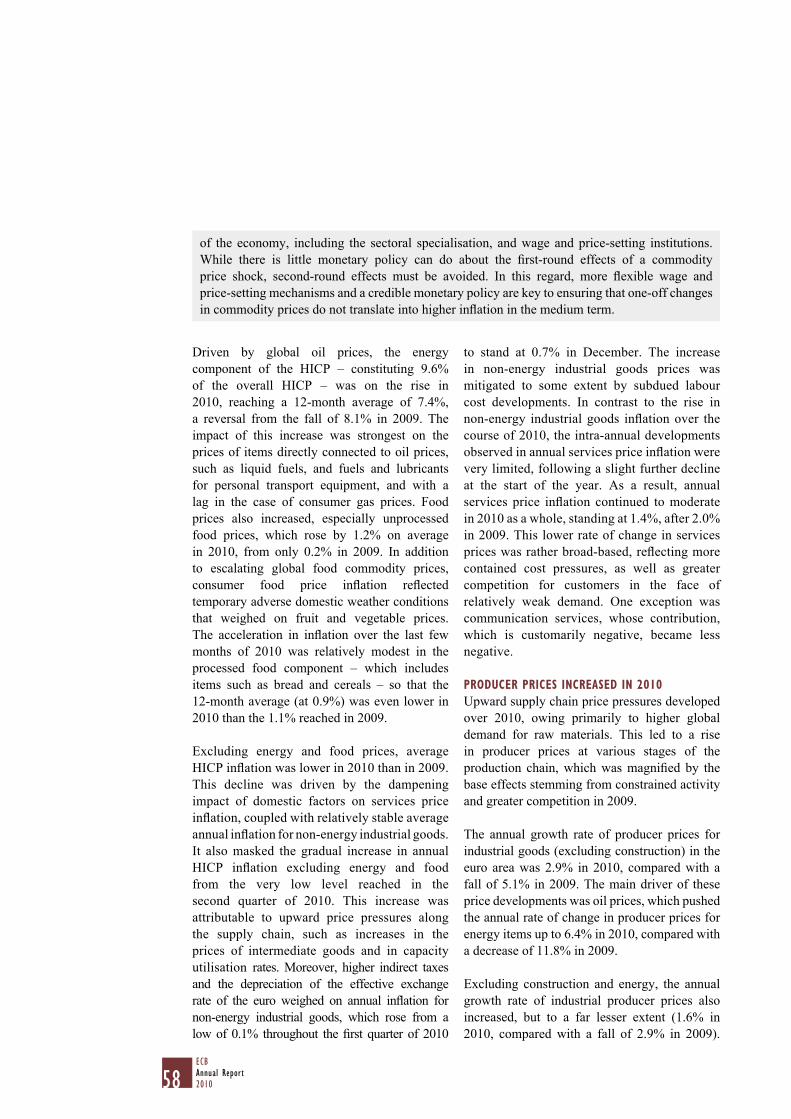
58ECBAnnual Report2010
Driven by global oil prices, the energy
component of the HICP – constituting 9.6%
of the overall HICP – was on the rise in
2010, reaching a 12-month average of 7.4%,
a reversal from the fall of 8.1% in 2009. The
impact of this increase was strongest on the
prices of items directly connected to oil prices,
such as liquid fuels, and fuels and lubricants
for personal transport equipment, and with a
lag in the case of consumer gas prices. Food
prices also increased, especially unprocessed
food prices, which rose by 1.2% on average
in 2010, from only 0.2% in 2009. In addition
to escalating global food commodity prices,
consumer food price infl ation refl ected
temporary adverse domestic weather conditions
that weighed on fruit and vegetable prices.
The acceleration in infl ation over the last few
months of 2010 was relatively modest in the
processed food component – which includes
items such as bread and cereals – so that the
12-month average (at 0.9%) was even lower in
2010 than the 1.1% reached in 2009.
Excluding energy and food prices, average
HICP infl ation was lower in 2010 than in 2009.
This decline was driven by the dampening
impact of domestic factors on services price
infl ation, coupled with relatively stable average
annual infl ation for non-energy industrial goods.
It also masked the gradual increase in annual
HICP infl ation excluding energy and food
from the very low level reached in the
second quarter of 2010. This increase was
attributable to upward price pressures along
the supply chain, such as increases in the
prices of intermediate goods and in capacity
utilisation rates. Moreover, higher indirect taxes
and the depreciation of the effective exchange
rate of the euro weighed on annual infl ation for
non-energy industrial goods, which rose from a
low of 0.1% throughout the fi rst quarter of 2010
to stand at 0.7% in December. The increase
in non-energy industrial goods prices was
mitigated to some extent by subdued labour
cost developments. In contrast to the rise in
non-energy industrial goods infl ation over the
course of 2010, the intra-annual developments
observed in annual services price infl ation were
very limited, following a slight further decline
at the start of the year. As a result, annual
services price infl ation continued to moderate
in 2010 as a whole, standing at 1.4%, after 2.0%
in 2009. This lower rate of change in services
prices was rather broad-based, refl ecting more
contained cost pressures, as well as greater
competition for customers in the face of
relatively weak demand. One exception was
communication services, whose contribution,
which is customarily negative, became less
negative.
PRODUCER PRICES INCREASED IN 2010
Upward supply chain price pressures developed
over 2010, owing primarily to higher global
demand for raw materials. This led to a rise
in producer prices at various stages of the
production chain, which was magnifi ed by the
base effects stemming from constrained activity
and greater competition in 2009.
The annual growth rate of producer prices for
industrial goods (excluding construction) in the
euro area was 2.9% in 2010, compared with a
fall of 5.1% in 2009. The main driver of these
price developments was oil prices, which pushed
the annual rate of change in producer prices for
energy items up to 6.4% in 2010, compared with
a decrease of 11.8% in 2009.
Excluding construction and energy, the annual
growth rate of industrial producer prices also
increased, but to a far lesser extent (1.6% in
2010, compared with a fall of 2.9% in 2009).
of the economy, including the sectoral specialisation, and wage and price-setting institutions.
While there is little monetary policy can do about the fi rst-round effects of a commodity
price shock, second-round effects must be avoided. In this regard, more fl exible wage and
price-setting mechanisms and a credible monetary policy are key to ensuring that one-off changes
in commodity prices do not translate into higher infl ation in the medium term.
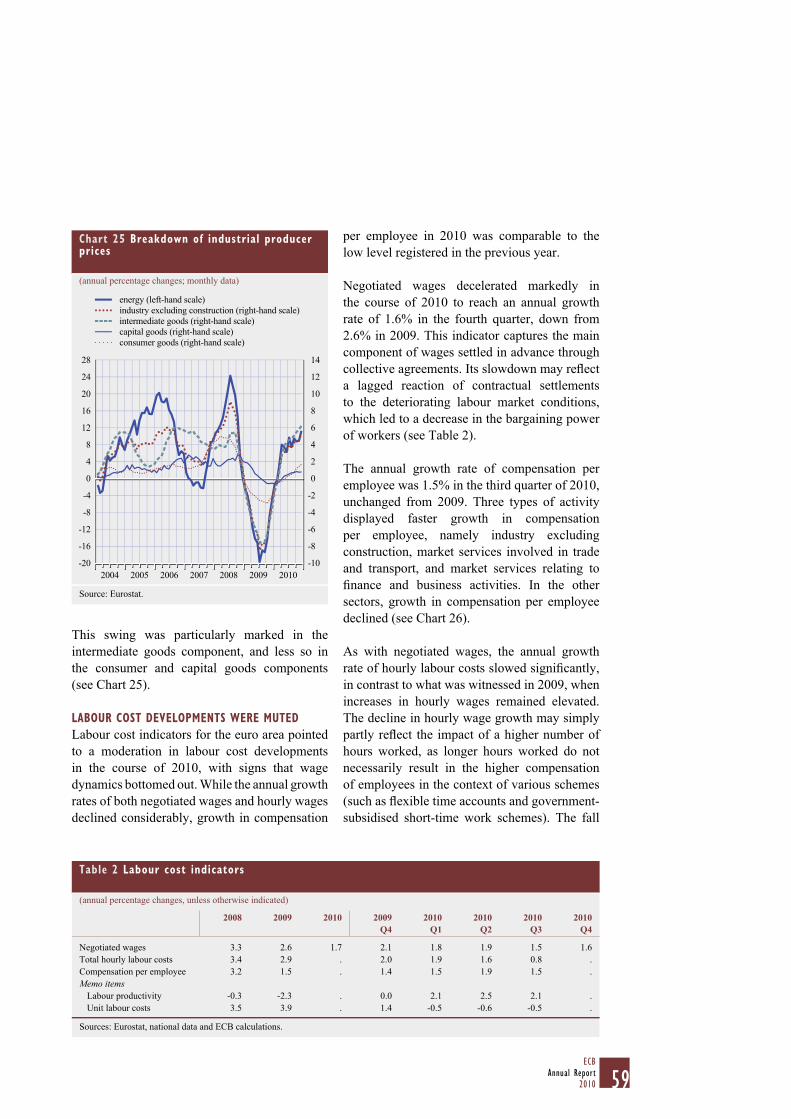
59ECB
Annual Report2010
This swing was particularly marked in the
intermediate goods component, and less so in
the consumer and capital goods components
(see Chart 25).
LABOUR COST DEVELOPMENTS WERE MUTED
Labour cost indicators for the euro area pointed
to a moderation in labour cost developments
in the course of 2010, with signs that wage
dynamics bottomed out. While the annual growth
rates of both negotiated wages and hourly wages
declined considerably, growth in compensation
per employee in 2010 was comparable to the
low level registered in the previous year.
Negotiated wages decelerated markedly in
the course of 2010 to reach an annual growth
rate of 1.6% in the fourth quarter, down from
2.6% in 2009. This indicator captures the main
component of wages settled in advance through
collective agreements. Its slowdown may refl ect
a lagged reaction of contractual settlements
to the deteriorating labour market conditions,
which led to a decrease in the bargaining power
of workers (see Table 2).
The annual growth rate of compensation per
employee was 1.5% in the third quarter of 2010,
unchanged from 2009. Three types of activity
displayed faster growth in compensation
per employee, namely industry excluding
construction, market services involved in trade
and transport, and market services relating to
fi nance and business activities. In the other
sectors, growth in compensation per employee
declined (see Chart 26).
As with negotiated wages, the annual growth
rate of hourly labour costs slowed signifi cantly,
in contrast to what was witnessed in 2009, when
increases in hourly wages remained elevated.
The decline in hourly wage growth may simply
partly refl ect the impact of a higher number of
hours worked, as longer hours worked do not
necessarily result in the higher compensation
of employees in the context of various schemes
(such as fl exible time accounts and government-
subsidised short-time work schemes). The fall
Table 2 Labour cost indicators
(annual percentage changes, unless otherwise indicated)
2008 2009 2010 2009Q4
2010Q1
2010Q2
2010Q3
2010Q4
Negotiated wages 3.3 2.6 1.7 2.1 1.8 1.9 1.5 1.6
Total hourly labour costs 3.4 2.9 . 2.0 1.9 1.6 0.8 .
Compensation per employee 3.2 1.5 . 1.4 1.5 1.9 1.5 .
Memo itemsLabour productivity -0.3 -2.3 . 0.0 2.1 2.5 2.1 .
Unit labour costs 3.5 3.9 . 1.4 -0.5 -0.6 -0.5 .
Sources: Eurostat, national data and ECB calculations.
Chart 25 Breakdown of industrial producer prices
(annual percentage changes; monthly data)
-20
-16
-12
-8
-4
0
4
8
12
16
20
24
28
-10
-8
-6
-4
-2
0
2
4
6
8
10
12
14
energy (left-hand scale)
industry excluding construction (right-hand scale)
intermediate goods (right-hand scale)
capital goods (right-hand scale)
consumer goods (right-hand scale)
2004 2005 2006 2007 2008 2009 2010
Source: Eurostat.

60ECBAnnual Report2010
in the annual growth rate of hourly labour costs
in the course of 2010 was driven by industrial
activities. In 2009 the latter sector exhibited the
highest hourly wage growth and made the most
intensive use of fl exible time measures.
Labour productivity growth per employee
exceeded the gains in compensation per
employee in the euro area, thus implying that
unit labour costs fell and that profi t margins
increased. Annual labour productivity growth
per employee rose to 2.2% on average in the
fi rst three quarters of 2010, compared with a
drop of 2.3% in 2009. Given the developments
in compensation per employee, unit labour costs
fell by 0.5% in the year to the third quarter of
2010, compared with a rise of 3.9% in 2009
(see Chart 27). Mirroring this decrease in unit
labour costs, operating margins recovered, with
the greater pricing power attested by the gradual
increase in the annual growth rate of the GDP
defl ator. This increase also refl ected a positive
contribution from the unit tax component from
the second quarter of 2010 (see Chart 28).
RESIDENTIAL PROPERTY PRICES ROSE
Euro area residential property prices, which are
not included in the HICP, increased by 2.4% in
the year to the third quarter of 2010, following
a decline of 2.9% in 2009 (see Chart 29).
However, the overall increase since the start of
2010 masks divergent developments across euro
Chart 27 Euro area labour costs
(annual percentage changes; quarterly data)
-4
-3
-2
-1
0
1
2
3
4
5
6
-4
-3
-2
-1
0
1
2
3
4
5
6
20102004 2005 2006 2007 2008 2009
unit labour costs
compensation per employee
labour productivity
Source: Eurostat.
Chart 28 Decomposition of the GDP deflator
(annual percentage changes; percentage points)
-2
-1
0
1
2
3
4
-2
-1
0
1
2
3
4
unit labour costs
unit profitunit tax
GDP deflator
2004 2005 2006 2007 2008 2009 2010
Source: Eurostat.
Chart 26 Sectoral compensation per employee
(annual percentage changes; quarterly data)
-1
0
1
2
3
4
5
6
-1
0
1
2
3
4
5
6
2004 2005 2006 2007 2008 2009 2010
industry excluding construction
construction
services
Sources: Eurostat and ECB calculations.

61ECB
Annual Report2010
area countries and regions, with some of them
continuing to experience declining house prices
in 2010.
DEVELOPMENTS IN INFLATION EXPECTATIONS
Data from professional forecasters show that
survey-based long-term infl ation expectations
(fi ve years ahead) were close to 2.0%, judging
from Consensus Economics, the Euro Zone
Barometer and the ECB Survey of Professional
Forecasters. According to the latter, point estimates
of infl ation for 2015 by forecasters pooled by the
ECB remained within a narrow range of 1.9%
to 2% during 2010. Market-based indicators,
such as break-even infl ation rates derived from
infl ation-linked bonds and comparable rates
extracted from infl ation-linked swaps, also
pointed to fi rmly anchored infl ation expectations.
2.4 OUTPUT, DEMAND AND LABOUR
MARKET DEVELOPMENTS
EURO AREA GDP RECOVERED IN 2010
Euro area real GDP expanded by 1.9% in the
year to the third quarter of 2010, following the
severe contraction of 4.1% in 2009 (see Table 3).
The recovery in activity in 2010 stemmed
from various sources. First, euro area exports
Chart 29 Residential property price developments in the euro area
(annual percentage changes; annual data)
2010-4
-3
-2
-1
0
1
2
3
4
5
6
7
8
9
-4
-3
-2
-1
0
1
2
3
4
5
6
7
8
9
residential property prices in nominal terms
19951991 2000 2005
Source: ECB calculations based on non-harmonised national data.
Note: Data for 2010 include data up to the third quarter.
Table 3 Composition of real GDP growth
(percentage changes, unless otherwise indicated; seasonally adjusted)
Annual rates 1) Quarterly rates 2)
2008 2009 2010 2009 Q4
2010 Q1
2010 Q2
2010 Q3
2010 Q4
2009 Q4
2010 Q1
2010 Q2
2010 Q3
2010 Q4
Real gross domestic product
of which:0.4 -4.1 . -2.0 0.8 2.0 1.9 2.0 0.2 0.4 1.0 0.3 0.3
Domestic demand 3) 0.4 -3.4 . -2.8 0.4 2.1 1.9 . -0.1 0.9 0.9 0.2 .
Private consumption 0.4 -1.1 . -0.4 0.4 0.6 1.0 . 0.3 0.3 0.2 0.1 .
Government consumption 2.4 2.4 . 1.7 1.1 0.6 0.4 . -0.1 0.1 0.1 0.4 .
Gross fi xed capital formation -0.8 -11.4 . -9.6 -5.0 -0.8 0.2 . -1.2 -0.4 2.0 -0.3 .
Changes in inventories 3), 4) -0.2 -0.8 . -0.8 1.0 1.7 1.2 . 0.0 0.7 0.4 0.1 .
Net exports 3) 0.1 -0.7 . 0.7 0.3 -0.1 0.0 . 0.3 -0.5 0.1 0.2 .
Exports 5) 1.0 -13.2 . -5.3 5.7 11.7 11.3 . 2.0 2.6 4.4 1.9 .
Imports 5) 0.8 -11.9 . -7.1 4.8 12.4 11.7 . 1.2 4.2 4.3 1.5 .
Real gross value added
of which:Industry (excluding construction) -2.2 -13.3 . -6.8 3.6 6.8 5.2 . 0.6 2.0 2.0 0.4 .
Construction -1.2 -5.9 . -5.8 -6.6 -4.2 -3.1 . -1.7 -1.6 0.8 -0.7 .
Purely market-related services 6) 1.5 -3.1 . -1.9 0.7 1.4 1.7 . 0.1 0.5 0.7 0.4 .
Sources: Eurostat and ECB calculations.Notes: The fi gures reported are seasonally and partly working day-adjusted, as not all euro area countries report quarterly national accounts series adjusted for the number of working days.1) Percentage change compared with the same period a year earlier.2) Percentage change compared with the previous quarter.3) As a contribution to real GDP growth; in percentage points.4) Including acquisitions less disposals of valuables.5) Imports and exports cover goods and services and include internal cross-border trade in the euro area. Since intra-euro area trade is not cancelled out in import and export fi gures used in national accounts, these data are not fully comparable with balance of payments data.6) Includes trade and repairs, hotels and restaurants, transport and communication, fi nancial intermediation, real estate, renting and business activities.

62ECBAnnual Report2010
were driven by the recovery in global activity
and demand. Second, inventories contributed
positively, especially in the fi rst half of the
year, as businesses slowed down the pace of
destocking. Third, domestic demand (excluding
inventories) showed a modest recovery, with
government consumption continuing to grow,
and private consumption and investment no
longer contracting as they had in 2009, but rather
growing slightly (in annual terms) in the third
quarter of 2010. The improvement in private
consumption and investment partly refl ected a rise
in confi dence from the previously very low levels.
The recovery in euro area economic activity
has also been supported by the accommodative
monetary policy stance and the measures adopted
to restore the functioning of the fi nancial system.
RISE IN GDP PREDOMINANTLY SUPPORTED BY
EXPORTS AND INVENTORIES
The economic expansion of 2010 was largely
driven by exports and inventories. Government
consumption continued to increase, while
both private consumption and investment
displayed moderate annual growth in the third
quarter of 2010, after contracting in 2009. The
positive contribution from inventories was
mostly limited to the fi rst half of the year, as
fi rms decided to destock more slowly than in
2009. Euro area exports benefi ted from the
improvement in the external environment
associated with the easing of the fi nancial
crisis. This was refl ected in stronger growth
in both developed and emerging countries.
The surge in foreign demand led to a particularly
sharp increase in exports in the course of 2010.
However, this did not result in a positive
contribution from net exports overall, owing
to the increase in imports, which proceeded at
a marginally faster pace. Private consumption
and investment resumed positive growth, but
did not fully recover from the impact of the
recent unprecedented fi nancial turmoil and the
economic recession (see Chart 30).
Growth in private consumption was positive,
at 1.0% in the year to the third quarter of
2010, following the contraction of 1.1% in
2009. This recovery was supported by real
disposable income growth and a decrease
in precautionary savings in view of reduced
uncertainty, owing to the gradual stabilisation
seen in the labour market. Wealth effects from
Chart 31 Confidence indicators
(percentage balances; seasonally adjusted)
-40
-35
-30
-25
-20
-15
-10
-5
0
5
10
15
-40
-35
-30
-25
-20
-15
-10
-5
0
5
10
15
2004 2005 2006 2007 2008 2009 2010
consumer confidence
industrial confidence
services confidence
Source: European Commission Business and Consumer Surveys.
Note: Data shown are calculated as deviations from the average
over the period since January 1985 for consumer and industrial
confi dence, and since April 1995 for services confi dence.
Chart 30 Contributions to quarterly real GDP growth
(quarterly percentage point contributions; seasonally adjusted)
-3.0
-2.5
-2.0
-1.5
-1.0
-0.5
0.0
0.5
1.0
1.5
-3.0
-2.5
-2.0
-1.5
-1.0
-0.5
0.0
0.5
1.0
1.5
real GDP 1)
changes in inventories
domestic demand (excluding inventories)
net exports
2004 2005 2006 2007 2008 2009 2010
Sources: Eurostat and ECB calculations.
1) Percentage change compared with the previous quarter.
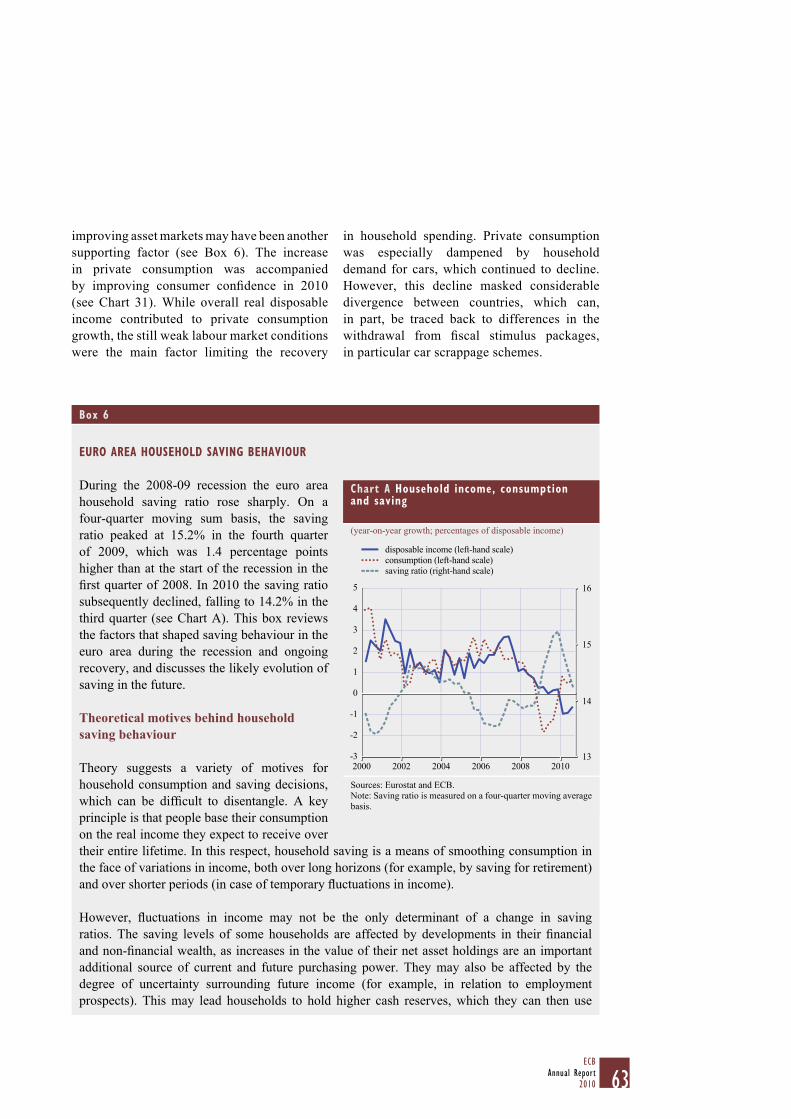
63ECB
Annual Report2010
improving asset markets may have been another
supporting factor (see Box 6). The increase
in private consumption was accompanied
by improving consumer confi dence in 2010
(see Chart 31). While overall real disposable
income contributed to private consumption
growth, the still weak labour market conditions
were the main factor limiting the recovery
in household spending. Private consumption
was especially dampened by household
demand for cars, which continued to decline.
However, this decline masked considerable
divergence between countries, which can,
in part, be traced back to differences in the
withdrawal from fi scal stimulus packages,
in particular car scrappage schemes.
Box 6
EURO AREA HOUSEHOLD SAVING BEHAVIOUR
During the 2008-09 recession the euro area
household saving ratio rose sharply. On a
four-quarter moving sum basis, the saving
ratio peaked at 15.2% in the fourth quarter
of 2009, which was 1.4 percentage points
higher than at the start of the recession in the
fi rst quarter of 2008. In 2010 the saving ratio
subsequently declined, falling to 14.2% in the
third quarter (see Chart A). This box reviews
the factors that shaped saving behaviour in the
euro area during the recession and ongoing
recovery, and discusses the likely evolution of
saving in the future.
Theoretical motives behind household saving behaviour
Theory suggests a variety of motives for
household consumption and saving decisions,
which can be diffi cult to disentangle. A key
principle is that people base their consumption
on the real income they expect to receive over
their entire lifetime. In this respect, household saving is a means of smoothing consumption in
the face of variations in income, both over long horizons (for example, by saving for retirement)
and over shorter periods (in case of temporary fl uctuations in income).
However, fl uctuations in income may not be the only determinant of a change in saving
ratios. The saving levels of some households are affected by developments in their fi nancial
and non-fi nancial wealth, as increases in the value of their net asset holdings are an important
additional source of current and future purchasing power. They may also be affected by the
degree of uncertainty surrounding future income (for example, in relation to employment
prospects). This may lead households to hold higher cash reserves, which they can then use
Chart A Household income, consumption and saving
(year-on-year growth; percentages of disposable income)
-3
-2
-1
0
1
2
3
4
5
13
14
15
16
disposable income (left-hand scale)
consumption (left-hand scale)
saving ratio (right-hand scale)
2000 2002 2004 2006 2008 2010
Sources: Eurostat and ECB.
Note: Saving ratio is measured on a four-quarter moving average
basis.
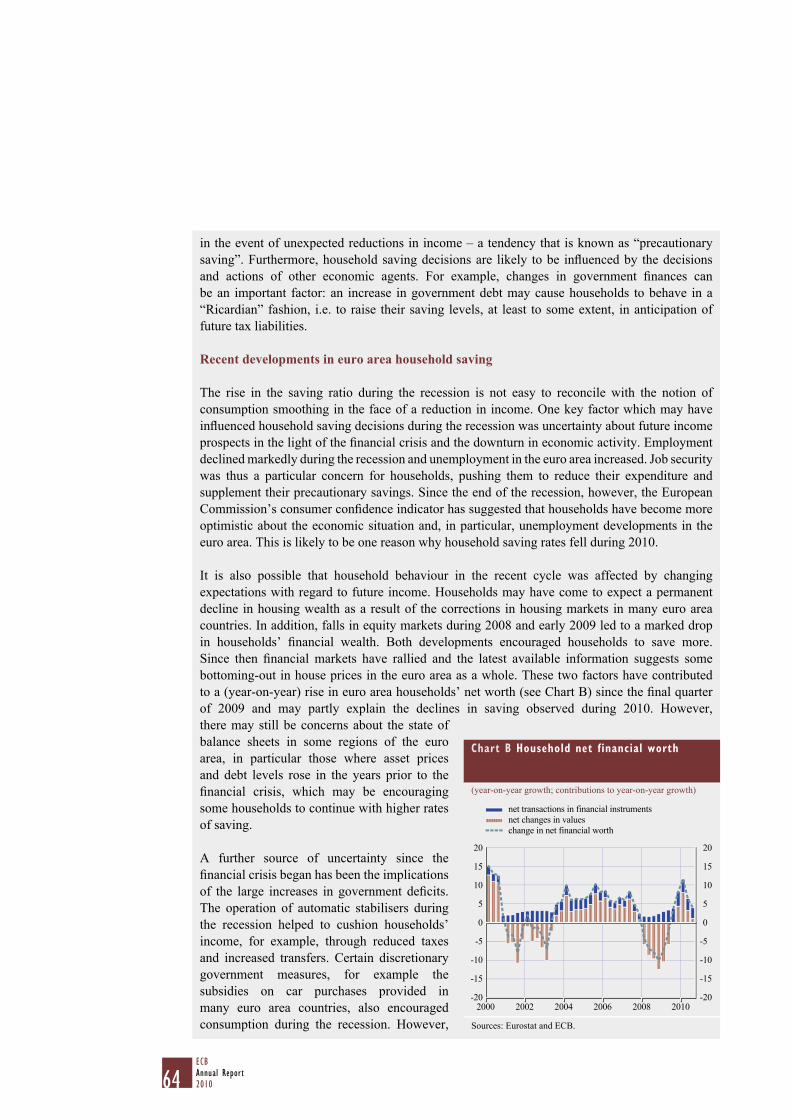
64ECBAnnual Report2010
in the event of unexpected reductions in income – a tendency that is known as “precautionary
saving”. Furthermore, household saving decisions are likely to be infl uenced by the decisions
and actions of other economic agents. For example, changes in government fi nances can
be an important factor: an increase in government debt may cause households to behave in a
“Ricardian” fashion, i.e. to raise their saving levels, at least to some extent, in anticipation of
future tax liabilities.
Recent developments in euro area household saving
The rise in the saving ratio during the recession is not easy to reconcile with the notion of
consumption smoothing in the face of a reduction in income. One key factor which may have
infl uenced household saving decisions during the recession was uncertainty about future income
prospects in the light of the fi nancial crisis and the downturn in economic activity. Employment
declined markedly during the recession and unemployment in the euro area increased. Job security
was thus a particular concern for households, pushing them to reduce their expenditure and
supplement their precautionary savings. Since the end of the recession, however, the European
Commission’s consumer confi dence indicator has suggested that households have become more
optimistic about the economic situation and, in particular, unemployment developments in the
euro area. This is likely to be one reason why household saving rates fell during 2010.
It is also possible that household behaviour in the recent cycle was affected by changing
expectations with regard to future income. Households may have come to expect a permanent
decline in housing wealth as a result of the corrections in housing markets in many euro area
countries. In addition, falls in equity markets during 2008 and early 2009 led to a marked drop
in households’ fi nancial wealth. Both developments encouraged households to save more.
Since then fi nancial markets have rallied and the latest available information suggests some
bottoming-out in house prices in the euro area as a whole. These two factors have contributed
to a (year-on-year) rise in euro area households’ net worth (see Chart B) since the fi nal quarter
of 2009 and may partly explain the declines in saving observed during 2010. However,
there may still be concerns about the state of
balance sheets in some regions of the euro
area, in particular those where asset prices
and debt levels rose in the years prior to the
fi nancial crisis, which may be encouraging
some households to continue with higher rates
of saving.
A further source of uncertainty since the
fi nancial crisis began has been the implications
of the large increases in government defi cits.
The operation of automatic stabilisers during
the recession helped to cushion households’
income, for example, through reduced taxes
and increased transfers. Certain discretionary
government measures, for example the
subsidies on car purchases provided in
many euro area countries, also encouraged
consumption during the recession. However,
Chart B Household net financial worth
(year-on-year growth; contributions to year-on-year growth)
-20
-15
-10
-5
0
5
10
15
20
-20
-15
-10
-5
0
5
10
15
20
2000 2002 2004 2006 2008 2010
net transactions in financial instruments
net changes in values
change in net financial worth
Sources: Eurostat and ECB.
65ECB
Annual Report2010
Government consumption growth continued
to support economic activity in 2010, but was
more moderate than in 2009. The moderation in
government consumption refl ected consolidation
efforts aimed at limiting the deterioration of
government budget balances.
Annual growth in total fi xed investment has been
on the rise, reaching a positive fi gure in the third
quarter of 2010. Firms returned to expansion
plans, given better business prospects, improving
order books and easier access to fi nancing.
This notwithstanding, the speed of the recovery
in investment has been rather limited. Growth in
construction investment was muted, refl ecting
housing market adjustments in a number of
euro area countries, following the steep declines
in house prices seen over the 2009 recession.
Non-construction investment remained subdued,
as this component was constrained by ongoing
balance sheet restructuring and a slow increase
in capacity utilisation.
Inventories played a prominent role in
explaining the improvement in real GDP growth
in the fi rst half of 2010. They contributed to the
quarterly rise in GDP in the fi rst and second
quarters of 2010 by an estimated 0.7 and
0.4 percentage point respectively. Behind the
activity observed in the fi rst half of 2010 were
decisions by businesses to destock more slowly
than in 2009, with the impact being felt in faster
deliveries along the supply chain. National
accounts data suggest that the improvement in
the overall implications for household saving rates would have depended on how households
viewed the longer-term implications of government debt fi nancing. The steep increase in
government debt levels, as well as projections implying that defi cits would remain high for a
sustained period, may have heightened household concerns about the fi scal outlook. Future fi scal
consolidation, either through tax increases or reduced government expenditure, affects household
income in the years ahead, which may have encouraged households to build up their savings in
advance. Such concerns may have been particularly prevalent during the periods of heightened
uncertainty about sovereign debt in fi nancial markets in early 2010 and also later in the year,
perhaps pushing saving levels higher than they might otherwise have been.
The outlook for household saving in the euro area
Following the declines in household saving during 2010, further modest falls in the euro area
household saving ratio are expected in the future, with households being prompted to pare
down their precautionary savings as the economic recovery gains traction and the labour market
continues to improve.
Nevertheless, uncertainty about the course of household saving remains high. On the downside,
a faster than expected recovery might improve confi dence, leading households to increase their
consumption and reduce the amount they save. However, it is also possible that the level of
household saving could remain persistently higher than before the downturn, if the crisis has
caused households to worry more than before about income prospects or pushed them to further
rebuild balance sheets and reduce their debt levels – the adjustment over the past three years
notwithstanding. In addition, following the bursting of bubbles in some asset markets, households
may now have a less optimistic assessment of future wealth developments. Finally, savings may
remain high if households are concerned about the implications for their future tax burden of
the high levels of government debt and the large government defi cits. Such concerns highlight
how important it is that euro area governments provide credible fi scal consolidation strategies to
correct the large fi scal imbalances that built up during the recession.

66ECBAnnual Report2010
inventories lost considerable momentum in the
third quarter of the year, when this component
of aggregate demand contributed 0.1 percentage
point to quarter-on-quarter real GDP growth.
Euro area exports of goods and services
increased sharply, by 11.3% in the year to the
third quarter of 2010, reversing a large fraction
of the losses incurred in 2009. This increase
was supported by both intra and extra-euro
area trade, and can be traced back to the strong
recovery in levels of global activity as the
tensions arising from the fi nancial crisis eased.
Given that imports also increased sharply,
the overall contribution to quarterly GDP
growth from net exports turned out to be
slightly negative over the fi rst three quarters
of 2010, with small positive contributions
registered in both the second and third
quarters. The increase in imports and exports
was relatively broad-based across major
product categories, with intermediate inputs
displaying particularly large percentage rises.
INDUSTRIAL PRODUCTION RECOVERED
Taking a sectoral perspective, the expansion in
output was predominantly driven by industrial
activity, with value added in industry (excluding
construction) rising by 5.2% in the year to
the third quarter of 2010, compared with an
increase of 1.7% for market-related services and
a decline of 3.1% for construction in the same
period. Capacity utilisation in the manufacturing
sector increased to 76.8% in 2010 as a whole
(according to survey data).
Output of intermediate goods recovered
particularly sharply in reaction to the slower
speed of destocking along the supply chain.
Production of capital goods also rose sharply,
benefi ting from stronger external demand and,
to a lesser extent, improving domestic economic
prospects (see Chart 32). Construction output
continued to contract, owing to housing market
adjustments in a number of euro area countries.
Overall, adverse developments in the residential
construction sector have more than outweighed
the contribution of infrastructure projects put
forward by governments.
LABOUR MARKET CONDITIONS EVENTUALLY
STABILISED
Following a sharp deterioration in 2009,
conditions in the euro area labour market began
to stabilise in the course of 2010 as employment
stopped falling and the rise in unemployment
rates lost momentum.
Euro area employment (measured in terms
of the number of persons employed) was, on
average, fl at in the fi rst three quarters of 2010,
marking a considerable improvement from
the fall of 1.8% in 2009 (see Table 4). During
the 2009 recession, many fi rms preferred
to hoard labour rather than face the costs
(in terms of human capital lost or severance
pay) associated with dismissing workers.
Since a large proportion of the employment
adjustment seen in 2009 took the form of cuts
in the number of hours worked per person, the
improvement over 2010 was greater in terms
of total hours worked than the number of
Chart 32 Industrial production growth and contributions
(growth rate and percentage point contributions; monthly data; seasonally adjusted)
-11-10-9-8-7-6-5-4-3-2-101234
-11-10-9-8-7-6-5-4-3-2-101234
2004 2005 2006 2007 2008 2009 2010
capital goods
consumer goods
intermediate goods
energy
total (excluding construction)
Sources: Eurostat and ECB calculations.
Note: Data shown are calculated as three-month moving
averages against the corresponding average three months earlier.
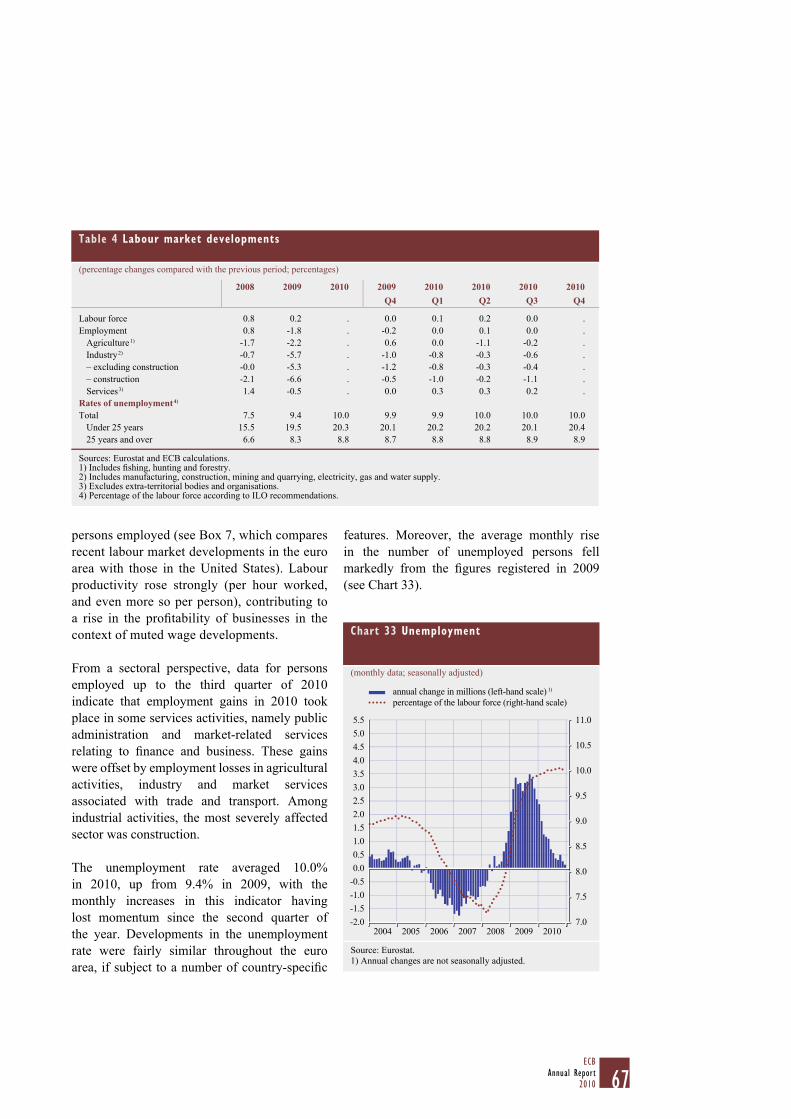
67ECB
Annual Report2010
Table 4 Labour market developments
(percentage changes compared with the previous period; percentages)
2008 2009 2010 2009 2010 2010 2010 2010Q4 Q1 Q2 Q3 Q4
Labour force 0.8 0.2 . 0.0 0.1 0.2 0.0 .
Employment 0.8 -1.8 . -0.2 0.0 0.1 0.0 .
Agriculture 1) -1.7 -2.2 . 0.6 0.0 -1.1 -0.2 .
Industry 2) -0.7 -5.7 . -1.0 -0.8 -0.3 -0.6 .
– excluding construction -0.0 -5.3 . -1.2 -0.8 -0.3 -0.4 .
– construction -2.1 -6.6 . -0.5 -1.0 -0.2 -1.1 .
Services 3) 1.4 -0.5 . 0.0 0.3 0.3 0.2 .
Rates of unemployment 4)
Total 7.5 9.4 10.0 9.9 9.9 10.0 10.0 10.0
Under 25 years 15.5 19.5 20.3 20.1 20.2 20.2 20.1 20.4
25 years and over 6.6 8.3 8.8 8.7 8.8 8.8 8.9 8.9
Sources: Eurostat and ECB calculations.1) Includes fi shing, hunting and forestry.2) Includes manufacturing, construction, mining and quarrying, electricity, gas and water supply.3) Excludes extra-territorial bodies and organisations.4) Percentage of the labour force according to ILO recommendations.
persons employed (see Box 7, which compares
recent labour market developments in the euro
area with those in the United States). Labour
productivity rose strongly (per hour worked,
and even more so per person), contributing to
a rise in the profi tability of businesses in the
context of muted wage developments.
From a sectoral perspective, data for persons
employed up to the third quarter of 2010
indicate that employment gains in 2010 took
place in some services activities, namely public
administration and market-related services
relating to fi nance and business. These gains
were offset by employment losses in agricultural
activities, industry and market services
associated with trade and transport. Among
industrial activities, the most severely affected
sector was construction.
The unemployment rate averaged 10.0%
in 2010, up from 9.4% in 2009, with the
monthly increases in this indicator having
lost momentum since the second quarter of
the year. Developments in the unemployment
rate were fairly similar throughout the euro
area, if subject to a number of country-specifi c
features. Moreover, the average monthly rise
in the number of unemployed persons fell
markedly from the fi gures registered in 2009
(see Chart 33).
Chart 33 Unemployment
(monthly data; seasonally adjusted)
-2.0
-1.5
-1.0
-0.5
0.0
0.5
1.0
1.5
2.0
2.5
3.0
3.5
4.0
4.5
5.0
5.5
7.0
7.5
8.0
8.5
9.0
9.5
10.0
10.5
11.0
2004 2005 2006 2007 2008 2009 2010
annual change in millions (left-hand scale) 1)
percentage of the labour force (right-hand scale)
Source: Eurostat.
1) Annual changes are not seasonally adjusted.

68ECBAnnual Report2010
Box 7
RECENT LABOUR MARKET DEVELOPMENTS IN THE EURO AREA AND THE UNITED STATES: THE MAIN
DIFFERENCES AND A HISTORICAL PERSPECTIVE
The latest recession, which was characterised by a severe slowdown in economic activity
relative to previous recessions, signifi cantly affected labour markets on both sides of the
Atlantic. Job losses were spread across a number of sectors of the economy, some of which,
such as construction and fi nancial services, were hit particularly hard in both the euro area and
the United States. Total hours worked declined sharply in both economic areas, although in the
United States a signifi cant part of the adjustment took place via job shedding, whereas in the
euro area a reduction in the average number of hours worked per week played a relatively major
role.1 While labour force participation remained fairly stable in the euro area, owing to labour
hoarding, it declined markedly in the United States, as many workers who lost their jobs have
left the labour market, refl ecting the lack of employment opportunities.
This box reviews recent labour market developments in the euro area and the United States by
discussing the evolution of selected indicators in the course of the recent recession, compared
with previous downturns since the early 1970s and the current recovery.
Strong adjustment in employment during the recession
During the recent recession, euro area
employment fell by around 2.7 million
(see the chart), or 0.8% (2.1% in terms of
total hours), as shown in the table. This
was associated with a 3.0% decline in
real GDP,2 which implies an elasticity of
around 0.25 (or 0.7 in terms of hours).
In other words, for each percentage point
drop in GDP, employment in the euro area
fell by 0.25 percentage point. The elasticity
of employment to GDP for the euro area
aggregate masks considerable heterogeneity
across countries, with Spain and Germany
at the two ends of the spectrum, having an
elasticity of 2.2 and 0.1 respectively.3 Job losses
persisted in the euro area, even as the economy
started to recover, until the end of 2009.
The impact of the downturn on employment
1 See the box entitled “A comparison of employment developments in the euro area and the United States”, Monthly Bulletin, ECB,
July 2010.
2 Unless stated otherwise, fi gures are computed as an average of (annualised) quarterly/monthly growth rates.
3 For more details about heterogeneity across euro area countries, see the article entitled “Labour market adjustments to the recession
in the euro area”, Monthly Bulletin, ECB, July 2010.
Euro area and US employment developments
(millions of persons)
120
125
130
135
140
145
150
120
125
130
135
140
145
150
1995
euro area
United States
1997 1999 20032001 2007 2009 20112005
Sources: Eurostat, Bureau of Labor Statistics and ECB
calculations.

69ECB
Annual Report2010
was signifi cantly stronger in the United States, where the level of employment (measured as
civilian employment) declined by about 5.9 million in the course of the recession.4 The 2.8%
decline in employment in the United States (4.2% in total hours) was associated with a 2.7%
decline in GDP, which translated into an elasticity of employment to changes in output of 1
(1.5 in terms of hours).
Compared with previous recessions since the early 1970s, the elasticity of employment to output
was broadly in line with historical standards in the United States, but it turned out to be much lower
in the euro area. In terms of hours worked, it was broadly comparable with previous recessions in
the United States and, to a lesser extent, the euro area. The change in the employment response in
the euro area partly refl ects the very extensive use of shorter working hours schemes instituted in
a number of euro area countries in a direct attempt to safeguard employment.
The recent recession has, however, had an impact on the labour market beyond the fall in
employment. The euro area unemployment rate rose from 7.2% in the fi rst quarter of 2008
to 9.3% at the end of the downturn in the second quarter of 2009, its highest level since the
third quarter of 1998. It increased even more dramatically in the United States, by around
5 percentage points from peak to trough, reaching 9.5% in the second quarter of 2009. In addition,
while the labour force participation rate in the euro area was fairly stable by historical standards,
in the United States it declined signifi cantly more than in previous recessions, suggesting that
the rate of unemployment may understate the degree of slack in the labour market. Moreover,
the sustained increase in unemployment translated into an increase in the share of total
4 The corresponding fi gure from peak to trough in employment (i.e. between the last quarter of 2007 and the last quarter of 2009)
was close to 8 million.
Labour market indicators in the euro area and the United States
(percentage changes; percentage points)
Current expansion Last recession Previous recessionsEuro area
United States
Euro area
United States
Euro area
United States
Population over 16 years old 0.4 0.9 0.4 0.9 0.7 1.1
Participation rate (percentages) 56.1 64.3 56.4 65.7 53.4 64.4Change in the participation rate -0.2 -0.9 0.0 -0.2 -0.3 -0.1
Unemployment rate (percentages) 9.8 9.4 9.3 9.5 9.5 7.9Change in the unemployment rate 0.3 -0.1 1.3 3.0 0.0 2.4
Unemployment: more than six months (percentage of total) 65.0 44.5 58.6 29.8 - 12.9Change in unemployment: more than six months 6.3 9.8 -4.0 6.8 - 2.6
Employment -0.5 -0.3 -0.8 -2.8 -0.6 -1.2
Total hours worked -0.5 0.3 -2.1 -4.2 0.9 -1.9
Employment to population ratio (percentages) 50.6 58.3 51.1 59.4 48.3 59.4Change in the employment to population ratio -0.4 -0.7 -0.7 -2.2 -0.7 -1.6
Unit labour costs -0.6 -0.9 4.4 1.7 10.8 6.3
Memo items:
Real gross domestic product 1.8 3.0 -3.0 -2.7 -0.6 -1.2
Average duration (in quarters) 4.0 5.0 5.0 6.0 8.0 4.0
Sources: Eurostat, OECD, European Commission, Bureau of Labor Statistics and ECB calculations. Notes: The dating of the cycles is taken from the National Bureau of Economic Research and the Centre for Economic Policy Research. Data on the current expansion are up to Q3 2010 for the euro area and up to Q4 2010 for the United States. Population refers to those over 15 years old in the United States. Unless stated otherwise, fi gures are computed as an average of (annualised) quarterly/monthly growth rates. The participation and employment rates are computed for the population above 16 and 15 years old respectively. Levels of participation, as well as employment and unemployment rates, are measured for the last quarter of the recovery and recession, rather than as an average, which is the case for changes and growth rates. Unit labour costs in the United States refer to the business sector.
70ECBAnnual Report2010
unemployment held by those unemployed for longer than six months to levels which are
exceptionally high by US standards, i.e. around 30% of the total number of unemployed.
The share held by long-term unemployment has historically been much higher in the euro area
than in the United States, but remained broadly unchanged in the recent recession at almost
59%. Over the recent recession, unit labour costs rose by 4.4% in the euro area (as, owing to
labour hoarding, labour costs did not decrease as much as value added), a much faster pace
than the 1.7% recorded for the United States, where employment downsizing led to a surge in
productivity and labour cost growth slowed substantially.5
Modest employment gains at the start of the recovery
Although it is too early to pass judgement on the current recovery from a labour market perspective,
it is nevertheless interesting to note some characteristic features of the ongoing adjustments.
As expected, given the typically lagged response of the labour market to a rise in economic activity,
the deterioration in the performance of the euro area labour market has, to some extent, continued
in the current recovery. Employment fell by 3.7 million between the second quarter of 2008 and
the end of 2009. According to data from the EU Labour Force Survey, euro area unemployment
fell to 9.8% of the total labour force in the third quarter of 2010, slightly below the peak observed
in the fi rst quarter of the year. Other signs of improvement emerging in the euro area are the
positive growth in hours worked, as well as the reversal of the rise in unit labour costs. The US
labour market situation started to improve at the beginning of 2010 (six months after the start of
the recovery), with modest gains in employment and a slight decline in the unemployment rate.
The improvement in the labour markets is also refl ected in developments in total hours worked, both
in the euro area and the United States (see the table). The unemployment rate in the United States
did not decline until the fi rst quarter of 2010, and has since remained broadly stable.
By contrast, it has continued to increase in the euro area, albeit at a slower pace in recent quarters.
This is indicative of the slow improvement in the labour market, in which job creation is currently
not suffi ciently strong to reduce the number of unemployed persons. Another aspect pointing to
the sluggishness of the labour market recovery is the fact that the labour force participation rate
has remained low. This is especially true in the United States, although there have been signs of
stabilisation in the last few months. At the same time, the share of total unemployment held by
those out of work for over six months has continued to grow, reaching historically high levels in
both the euro area and the United States (65% and just under 45% respectively – see the table).
In both cases, while the origin of this rise is mainly seen as cyclical, it implies a deterioration in
human capital, which may increase structural unemployment.
Overall, there have been some differences between labour market developments in the euro
area and those in the United States. Firstly, although the decline in activity was more marked
in the euro area than in the United States, the adjustment in the US labour market has been
more pronounced. With regard to labour input in particular, the adjustment in the euro area was
more to do with the number of hours worked per person than the number of persons employed –
partly due to the extensive use of shorter working hours schemes – while in the United States
it was, in relative terms, mainly accounted for by changes in the number of persons employed.
Secondly, given the magnitude of the fall in output, the adjustment in the euro area can be seen as
less marked than that observed in previous recessions, particularly regarding employment losses.
5 For a detailed comparison of wage developments in the euro area and the United States, see the box entitled “Wage developments in
the euro area and the United States during the recent economic downturn: a comparative analysis”, Monthly Bulletin, ECB, May 2010.
71ECB
Annual Report2010
2.5 FISCAL DEVELOPMENTS
STABILISATION OF EURO AREA GOVERNMENT
DEFICIT IN 2010
The shock of the recent fi nancial and economic
crisis resulted in sharp increases in government
defi cit-to-GDP and public debt-to-GDP ratios
and, in 2010, fi nancial market participants
questioned the sustainability of public fi nances
in some euro area countries. In response
to the unfolding sovereign debt crisis and
negative spillover effects, the most affected
countries implemented additional consolidation
and structural reform measures to restore
credibility. The crisis showed that ensuring
sound public fi nances is a prerequisite for
overall macroeconomic and fi nancial stability.
Following two years of sharp deterioration in
budgetary positions, the aggregate government
defi cit for the euro area stabilised in 2010, although
defi cit levels varied greatly among countries.
According to the European Commission’s
autumn economic forecast, published on
29 November 2010, the euro area average general
government defi cit ratio in 2010 was unchanged
from 2009 at 6.3% of GDP (see Table 5).
The stabilisation of the budget defi cit was in
part driven by a rebound in government revenue
growth in a context of stabilising macroeconomic
conditions, following the strong decline in
revenues in 2009. At the same time, growth
in government expenditure slowed down, as
the phasing-out of fi scal stimulus measures
implemented since end-2008 and new fi scal
consolidation measures offset the still relatively
strong growth in social payments, capital transfers
and interest payments. The expenditure restraint
was particularly pronounced in government
investment and compensation of government
employees, with cuts in public employment as
well as wage freezes or cuts in several countries.
In terms of ratios to GDP, both total government
revenue and total government expenditure were
broadly unchanged from 2009, at 44.4% and
50.8% respectively.
The Commission’s autumn 2010 fi scal forecasts
are, for most countries, more favourable than
the estimates presented in the updated stability
programmes, which were submitted between
December 2009 and March 2010. The latter
pointed to a higher defi cit for the euro area as
a whole, amounting to 6.6% of GDP in 2010
against 6.3% presented by the Commission
(see Table 5). In many cases, the more favourable
forecasts of the Commission refl ect stronger than
previously expected economic growth feeding into
higher tax receipts, while in the case of Portugal
the fulfi lment of the new government target is
mainly attributable to a sizeable one-off measure,
namely a transfer of the Portugal Telecom pension
fund to the civil servants’ pension system.
However, for some countries, the European
Commission defi cit forecasts are substantially
higher than expected in the stability programmes
or in the governments’ updated targets.
This is the case for Slovakia, owing to lower
than expected revenues, but also for Greece and
Ireland, which faced particularly large budgetary
imbalances in 2010.
By contrast, the US labour market has shown much larger declines in labour force participation
and signifi cant increases in the duration of unemployment, while employment losses were
broadly in line with previous recessions, after taking into account the depth of the fall in activity.
Despite a less pronounced deterioration in the labour market, the proportion of those unemployed
who have been out of work for more than six months has now reached exceptionally high levels
in the euro area, which calls for an effective policy response. Unless this is addressed in a timely
manner by active labour market policies and measures to promote lifelong learning, the risk of
human capital erosion associated with long spells of unemployment may lead to an increase in
structural unemployment. This would make it diffi cult to bring unemployment back down to
pre-recession levels as the recovery matures.
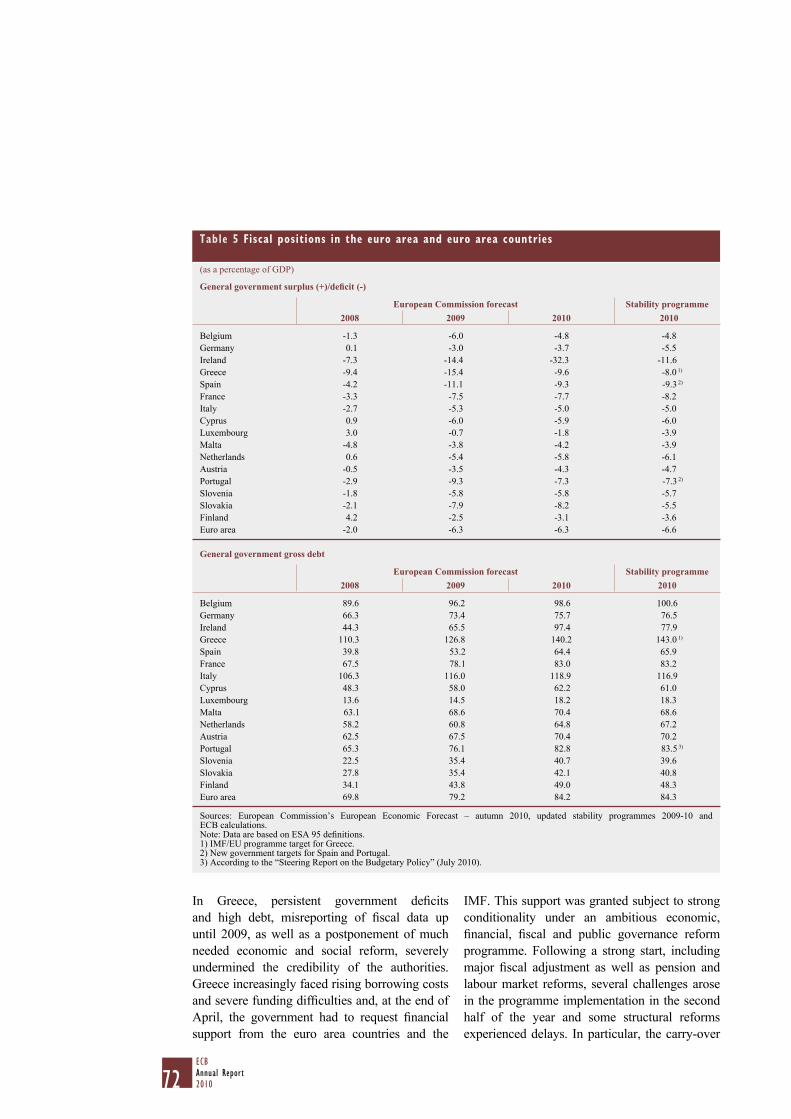
72ECBAnnual Report2010
In Greece, persistent government defi cits
and high debt, misreporting of fi scal data up
until 2009, as well as a postponement of much
needed economic and social reform, severely
undermined the credibility of the authorities.
Greece increasingly faced rising borrowing costs
and severe funding diffi culties and, at the end of
April, the government had to request fi nancial
support from the euro area countries and the
IMF. This support was granted subject to strong
conditionality under an ambitious economic,
fi nancial, fi scal and public governance reform
programme. Following a strong start, including
major fi scal adjustment as well as pension and
labour market reforms, several challenges arose
in the programme implementation in the second
half of the year and some structural reforms
experienced delays. In particular, the carry-over
Table 5 Fiscal positions in the euro area and euro area countries
(as a percentage of GDP)
General government surplus (+)/defi cit (-)
European Commission forecast Stability programme2008 2009 2010 2010
Belgium -1.3 -6.0 -4.8 -4.8
Germany 0.1 -3.0 -3.7 -5.5
Ireland -7.3 -14.4 -32.3 -11.6
Greece -9.4 -15.4 -9.6 -8.0 1)
Spain -4.2 -11.1 -9.3 -9.3 2)
France -3.3 -7.5 -7.7 -8.2
Italy -2.7 -5.3 -5.0 -5.0
Cyprus 0.9 -6.0 -5.9 -6.0
Luxembourg 3.0 -0.7 -1.8 -3.9
Malta -4.8 -3.8 -4.2 -3.9
Netherlands 0.6 -5.4 -5.8 -6.1
Austria -0.5 -3.5 -4.3 -4.7
Portugal -2.9 -9.3 -7.3 -7.3 2)
Slovenia -1.8 -5.8 -5.8 -5.7
Slovakia -2.1 -7.9 -8.2 -5.5
Finland 4.2 -2.5 -3.1 -3.6
Euro area -2.0 -6.3 -6.3 -6.6
General government gross debt
European Commission forecast Stability programme2008 2009 2010 2010
Belgium 89.6 96.2 98.6 100.6
Germany 66.3 73.4 75.7 76.5
Ireland 44.3 65.5 97.4 77.9
Greece 110.3 126.8 140.2 143.0 1)
Spain 39.8 53.2 64.4 65.9
France 67.5 78.1 83.0 83.2
Italy 106.3 116.0 118.9 116.9
Cyprus 48.3 58.0 62.2 61.0
Luxembourg 13.6 14.5 18.2 18.3
Malta 63.1 68.6 70.4 68.6
Netherlands 58.2 60.8 64.8 67.2
Austria 62.5 67.5 70.4 70.2
Portugal 65.3 76.1 82.8 83.5 3)
Slovenia 22.5 35.4 40.7 39.6
Slovakia 27.8 35.4 42.1 40.8
Finland 34.1 43.8 49.0 48.3
Euro area 69.8 79.2 84.2 84.3
Sources: European Commission’s European Economic Forecast – autumn 2010, updated stability programmes 2009-10 and ECB calculations.Note: Data are based on ESA 95 defi nitions.1) IMF/EU programme target for Greece.2) New government targets for Spain and Portugal.3) According to the “Steering Report on the Budgetary Policy” (July 2010).
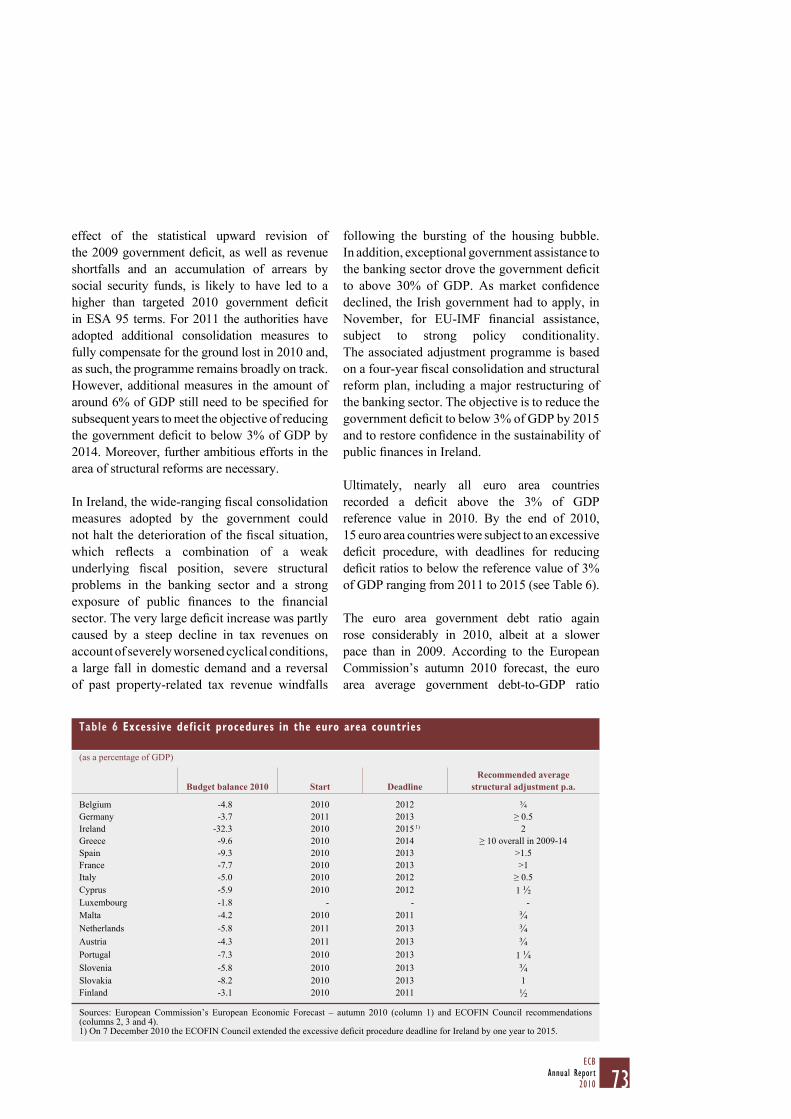
73ECB
Annual Report2010
effect of the statistical upward revision of
the 2009 government defi cit, as well as revenue
shortfalls and an accumulation of arrears by
social security funds, is likely to have led to a
higher than targeted 2010 government defi cit
in ESA 95 terms. For 2011 the authorities have
adopted additional consolidation measures to
fully compensate for the ground lost in 2010 and,
as such, the programme remains broadly on track.
However, additional measures in the amount of
around 6% of GDP still need to be specifi ed for
subsequent years to meet the objective of reducing
the government defi cit to below 3% of GDP by
2014. Moreover, further ambitious efforts in the
area of structural reforms are necessary.
In Ireland, the wide-ranging fi scal consolidation
measures adopted by the government could
not halt the deterioration of the fi scal situation,
which refl ects a combination of a weak
underlying fi scal position, severe structural
problems in the banking sector and a strong
exposure of public fi nances to the fi nancial
sector. The very large defi cit increase was partly
caused by a steep decline in tax revenues on
account of severely worsened cyclical conditions,
a large fall in domestic demand and a reversal
of past property-related tax revenue windfalls
following the bursting of the housing bubble.
In addition, exceptional government assistance to
the banking sector drove the government defi cit
to above 30% of GDP. As market confi dence
declined, the Irish government had to apply, in
November, for EU-IMF fi nancial assistance,
subject to strong policy conditionality.
The associated adjustment programme is based
on a four-year fi scal consolidation and structural
reform plan, including a major restructuring of
the banking sector. The objective is to reduce the
government defi cit to below 3% of GDP by 2015
and to restore confi dence in the sustainability of
public fi nances in Ireland.
Ultimately, nearly all euro area countries
recorded a defi cit above the 3% of GDP
reference value in 2010. By the end of 2010,
15 euro area countries were subject to an excessive
defi cit procedure, with deadlines for reducing
defi cit ratios to below the reference value of 3%
of GDP ranging from 2011 to 2015 (see Table 6).
The euro area government debt ratio again
rose considerably in 2010, albeit at a slower
pace than in 2009. According to the European
Commission’s autumn 2010 forecast, the euro
area average government debt-to-GDP ratio
Table 6 Excessive deficit procedures in the euro area countries
(as a percentage of GDP)
Budget balance 2010 Start DeadlineRecommended average
structural adjustment p.a.
Belgium -4.8 2010 2012 ¾
Germany -3.7 2011 2013 ≥ 0.5
Ireland -32.3 2010 2015 1) 2
Greece -9.6 2010 2014 ≥ 10 overall in 2009-14
Spain -9.3 2010 2013 >1.5
France -7.7 2010 2013 >1
Italy -5.0 2010 2012 ≥ 0.5
Cyprus -5.9 2010 2012 1 ½Luxembourg -1.8 - - -
Malta -4.2 2010 2011 ¾
Netherlands -5.8 2011 2013 ¾
Austria -4.3 2011 2013 ¾
Portugal -7.3 2010 2013 1 ¼
Slovenia -5.8 2010 2013 ¾Slovakia -8.2 2010 2013 1
Finland -3.1 2010 2011 ½
Sources: European Commission’s European Economic Forecast – autumn 2010 (column 1) and ECOFIN Council recommendations (columns 2, 3 and 4). 1) On 7 December 2010 the ECOFIN Council extended the excessive defi cit procedure deadline for Ireland by one year to 2015.
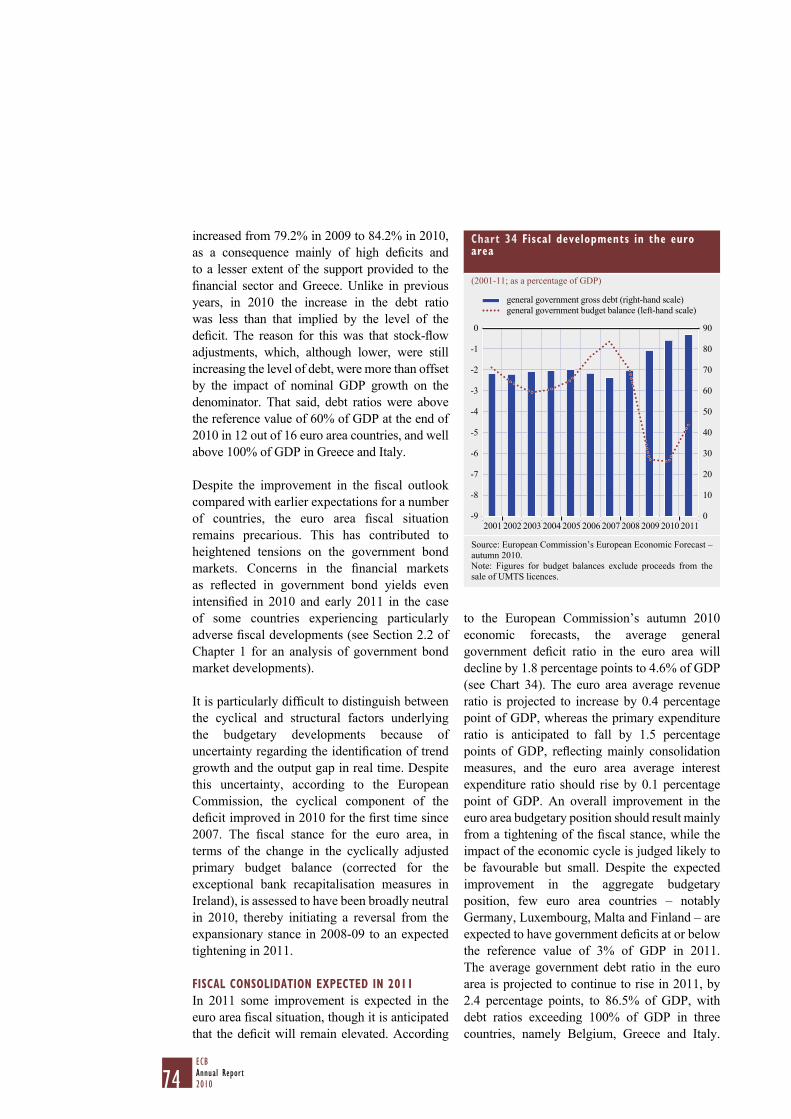
74ECBAnnual Report2010
increased from 79.2% in 2009 to 84.2% in 2010,
as a consequence mainly of high defi cits and
to a lesser extent of the support provided to the
fi nancial sector and Greece. Unlike in previous
years, in 2010 the increase in the debt ratio
was less than that implied by the level of the
defi cit. The reason for this was that stock-fl ow
adjustments, which, although lower, were still
increasing the level of debt, were more than offset
by the impact of nominal GDP growth on the
denominator. That said, debt ratios were above
the reference value of 60% of GDP at the end of
2010 in 12 out of 16 euro area countries, and well
above 100% of GDP in Greece and Italy.
Despite the improvement in the fi scal outlook
compared with earlier expectations for a number
of countries, the euro area fi scal situation
remains precarious. This has contributed to
heightened tensions on the government bond
markets. Concerns in the fi nancial markets
as refl ected in government bond yields even
intensifi ed in 2010 and early 2011 in the case
of some countries experiencing particularly
adverse fi scal developments (see Section 2.2 of
Chapter 1 for an analysis of government bond
market developments).
It is particularly diffi cult to distinguish between
the cyclical and structural factors underlying
the budgetary developments because of
uncertainty regarding the identifi cation of trend
growth and the output gap in real time. Despite
this uncertainty, according to the European
Commission, the cyclical component of the
defi cit improved in 2010 for the fi rst time since
2007. The fi scal stance for the euro area, in
terms of the change in the cyclically adjusted
primary budget balance (corrected for the
exceptional bank recapitalisation measures in
Ireland), is assessed to have been broadly neutral
in 2010, thereby initiating a reversal from the
expansionary stance in 2008-09 to an expected
tightening in 2011.
FISCAL CONSOLIDATION EXPECTED IN 2011
In 2011 some improvement is expected in the
euro area fi scal situation, though it is anticipated
that the defi cit will remain elevated. According
to the European Commission’s autumn 2010
economic forecasts, the average general
government defi cit ratio in the euro area will
decline by 1.8 percentage points to 4.6% of GDP
(see Chart 34). The euro area average revenue
ratio is projected to increase by 0.4 percentage
point of GDP, whereas the primary expenditure
ratio is anticipated to fall by 1.5 percentage
points of GDP, refl ecting mainly consolidation
measures, and the euro area average interest
expenditure ratio should rise by 0.1 percentage
point of GDP. An overall improvement in the
euro area budgetary position should result mainly
from a tightening of the fi scal stance, while the
impact of the economic cycle is judged likely to
be favourable but small. Despite the expected
improvement in the aggregate budgetary
position, few euro area countries – notably
Germany, Luxembourg, Malta and Finland – are
expected to have government defi cits at or below
the reference value of 3% of GDP in 2011.
The average government debt ratio in the euro
area is projected to continue to rise in 2011, by
2.4 percentage points, to 86.5% of GDP, with
debt ratios exceeding 100% of GDP in three
countries, namely Belgium, Greece and Italy.
Chart 34 Fiscal developments in the euro area
(2001-11; as a percentage of GDP)
-9
-8
-7
-6
-5
-4
-3
-2
-1
0
0
10
20
30
40
50
60
70
80
90
2001 2002 2003 2004 2005 2006 2007 2008 2009 2010 2011
general government gross debt (right-hand scale)
general government budget balance (left-hand scale)
Source: European Commission’s European Economic Forecast –
autumn 2010.
Note: Figures for budget balances exclude proceeds from the
sale of UMTS licences.
75ECB
Annual Report2010
In Ireland, the consolidation measures that
were adopted after the cut-off date for the
Commission’s forecasts are expected to keep the
debt ratio below 100% of GDP in 2011.
COMMITMENT TO FISCAL CONSOLIDATION
ESSENTIAL
On account of the still precarious fi scal situation
in a number of countries, the commitment
to fi scal consolidation needs to be sustained.
The fi scal consolidation set out in 2011 budgets
is a fi rst step in the right direction. However, the
scale of the present fi scal challenges requires
an ambitious multi-year consolidation effort
in most countries. Not least given the sharp
increase in expenditure ratios during the crisis,
a strong emphasis on structural expenditure
cuts, including a systematic reassessment of
the scope of public spending and the quality
of public fi nances, appears warranted in many
countries. This is all the more necessary in the
light of the current severe fi scal imbalances:
high sovereign debt ratios and the prospect of
a lower trend growth rate make more acute
the budgetary risks related to any further bank
restructuring and the projected future costs of
population ageing associated with unfunded
public pension systems and healthcare.
A credible and comprehensive reform strategy
also helps to sustain market confi dence, which
could be particularly important in countries with
vulnerable fi scal positions. Moreover, such a
strategy is likely to have a favourable impact
on fi nancing conditions in the longer run that
will offset the short-term costs in terms of lower
economic growth (see Box 8).
Box 8
MACROECONOMIC COSTS AND BENEFITS OF FISCAL CONSOLIDATION
Government defi cit-to-GDP and debt-to-GDP ratios have increased signifi cantly during the
economic and fi nancial crisis. Part of this increase is due to the automatic cyclical response
of government revenue and spending to macroeconomic developments and to other transitory
factors, such as temporary fi scal stimulus measures or government transfers to shore up the
banking sector. However, the crisis has led to a substantial downward revision of most estimates
of potential output, along with some losses in tax revenues (e.g. linked to property transactions),
which may be viewed as permanent. For this reason, the bulk of the government defi cits built
up during the crisis should be considered as structural. This implies that substantial fi scal
consolidation in the coming years is needed to put public fi nances on a sustainable footing.
It is widely accepted that fi scal consolidation is benefi cial for economic growth in the long
run. A reduction in government fi nancing needs leads to lower long-term interest rates, thereby
improving the fi nancing conditions of the private sector and stimulating productive investment.
For the government, a lower level of debt and associated interest payments frees up resources to
reduce distortionary taxes and fi nance more productive expenditure. Moreover, with sound fi scal
positions, households and fi rms can have confi dence in the government’s ability to help attenuate
economic fl uctuations through the operation of automatic stabilisers. Empirical studies across a
wide range of industrial countries and time periods provide evidence of the growth-inhibiting
effects of high government debt.1
1 The correlation between high debt and lower growth is established for a very long time period by Reinhart, C.M. and Rogoff, K.S.,
“Growth in a time of debt”, Working Paper Series, No 15639, National Bureau of Economic Research, 2010. For the euro area,
econometric evidence is presented by Checherita, C. and Rother, P., “The impact of high and growing debt on economic growth: an
empirical investigation for the euro area”, Working Paper Series, No 1237, ECB, 2010.

76ECBAnnual Report2010
The fi scal policy provisions of the Treaty and the
Stability and Growth Pact are essential to guide
policy-makers and underpin the trust of the public
and of fi nancial markets in the fi scal policies of
EMU. Governments must strictly adhere to the
deadlines and targets set in ECOFIN Council
recommendations, implementing all the planned
measures and being prepared to take additional
measures to meet targets if necessary. In this
regard, the measures that have been announced
By contrast, fi scal consolidation is usually characterised as having a dampening effect on
economic growth in the short run. Cuts in government consumption and investment directly
reduce aggregate spending, while higher taxes and lower government transfers reduce the
disposable income of households and fi rms. Most empirical evidence points to tax and spending
multipliers which are positive in the short to medium run, albeit declining over time. This is also
refl ected in the standard structural economic models used to analyse the economy and make
economic predictions for the short to medium term.2 However, under certain circumstances –
particularly when fi scal tightening implies moving from a (near) unsustainable to a (more)
sustainable fi scal position – it is possible that the traditional short-run “Keynesian” effects
of fi scal consolidation are signifi cantly dampened or even reversed. The theoretical case for
“non-Keynesian” effects in the short run rests on the idea that spending cuts or tax increases may
lead to an immediate offsetting increase in private consumption and investment if they give rise
to the expectation of lower taxes – and thus higher disposable income – in future. This idea is
closely related to the theory of “Ricardian equivalence”, according to which a rational private
sector should internalise the government’s budget constraint.
Notwithstanding the diffi culties involved in disentangling the impact of fi scal policy on the
economy from other factors, there is little empirical evidence to suggest that non-Keynesian
effects are dominant in normal economic times. The evidence nonetheless suggests that any
negative short-run effects of fi scal consolidation on economic growth are likely to be much
more muted when: i) the starting fi scal position is particularly precarious (giving rise to fi nancial
market concerns and high risk premia), ii) the private sector does not face credit constraints
(so households and fi rms are able to smooth their consumption and investment over time),
and iii) a favourable impact of fi scal consolidation on infl ation – and infl ation expectations –
allows for a more accommodative monetary (and exchange rate) policy.
However, empirical work based on data samples covering more “benign” periods are unlikely
to be a good guide for considering the impact of fi scal consolidation in the wake of a sovereign
debt crisis.3 A loss of confi dence in public fi nances would affect the holders of government debt,
such as banks, pension funds and individual investors, and thereby undermine fi nancial stability
and the outlook for the real economy. In these circumstances, it is simply not a viable option not
to announce and start to implement signifi cant fi scal adjustment. The counterfactual approach
of inaction in periods of high fi scal stress is not a sustainable alternative, since fi nancial market
tensions would escalate, in all likelihood providing a much worse growth outcome than that
resulting from fi scal consolidation. Indeed, postponing necessary fi scal consolidation only serves
to amplify diffi culties, possibly entailing a need for untimely harsh consolidation in the context
of foregone opportunities to create needed fi scal space.4
2 See the article entitled “The effectiveness of euro area fi scal policies”, Monthly Bulletin, ECB, July 2010.
3 For a discussion, see Rother, P., Schuknecht, L. and Stark, J., “The benefi ts of fi scal consolidation in uncharted waters”, Occasional Paper Series, No 121, ECB, 2010.
4 The concept of fi scal space, and its implications for debt sustainability and/or the onset of crisis, is outlined in Ostry et al.,
“Fiscal Space”, Staff Position Note, No 2010/11, IMF, September 2010.
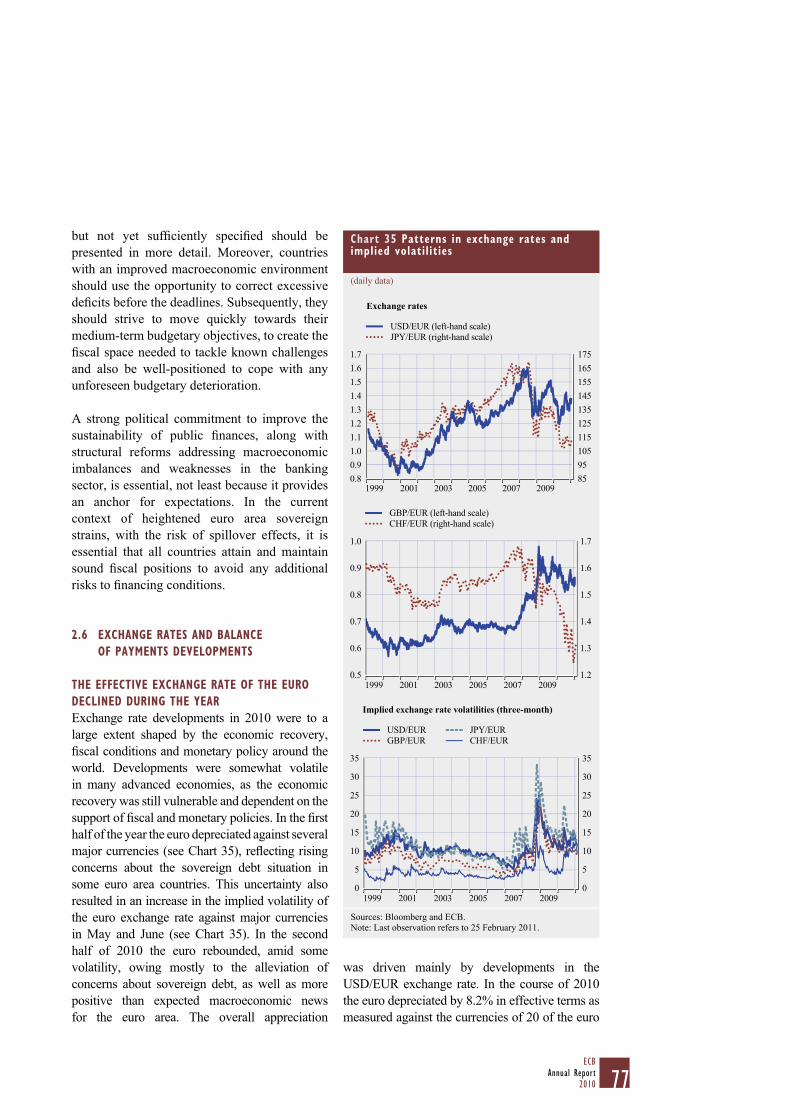
77ECB
Annual Report2010
but not yet suffi ciently specifi ed should be
presented in more detail. Moreover, countries
with an improved macroeconomic environment
should use the opportunity to correct excessive
defi cits before the deadlines. Subsequently, they
should strive to move quickly towards their
medium-term budgetary objectives, to create the
fi scal space needed to tackle known challenges
and also be well-positioned to cope with any
unforeseen budgetary deterioration.
A strong political commitment to improve the
sustainability of public fi nances, along with
structural reforms addressing macroeconomic
imbalances and weaknesses in the banking
sector, is essential, not least because it provides
an anchor for expectations. In the current
context of heightened euro area sovereign
strains, with the risk of spillover effects, it is
essential that all countries attain and maintain
sound fi scal positions to avoid any additional
risks to fi nancing conditions.
2.6 EXCHANGE RATES AND BALANCE
OF PAYMENTS DEVELOPMENTS
THE EFFECTIVE EXCHANGE RATE OF THE EURO
DECLINED DURING THE YEAR
Exchange rate developments in 2010 were to a
large extent shaped by the economic recovery,
fi scal conditions and monetary policy around the
world. Developments were somewhat volatile
in many advanced economies, as the economic
recovery was still vulnerable and dependent on the
support of fi scal and monetary policies. In the fi rst
half of the year the euro depreciated against several
major currencies (see Chart 35), refl ecting rising
concerns about the sovereign debt situation in
some euro area countries. This uncertainty also
resulted in an increase in the implied volatility of
the euro exchange rate against major currencies
in May and June (see Chart 35). In the second
half of 2010 the euro rebounded, amid some
volatility, owing mostly to the alleviation of
concerns about sovereign debt, as well as more
positive than expected macroeconomic news
for the euro area. The overall appreciation
was driven mainly by developments in the
USD/EUR exchange rate. In the course of 2010
the euro depreciated by 8.2% in effective terms as
measured against the currencies of 20 of the euro
Chart 35 Patterns in exchange rates and implied volatilities
(daily data)
Exchange rates
0.8
0.9
1.0
1.1
1.2
1.3
1.4
1.5
1.6
1.7
85
95
105
115
125
135
145
155
165
175
USD/EUR (left-hand scale)
JPY/EUR (right-hand scale)
1999 2001 2003 2005 2007 2009
0.5
0.6
0.7
0.8
0.9
1.0
1.2
1.3
1.4
1.5
1.6
1.7
GBP/EUR (left-hand scale)
CHF/EUR (right-hand scale)
1999 2001 2003 2005 2007 2009
Implied exchange rate volatilities (three-month)
0
5
10
15
20
25
30
35
0
5
10
15
20
25
30
35
1999 2001 2003 2005 2007 2009
JPY/EUR
CHF/EUR
USD/EUR
GBP/EUR
Sources: Bloomberg and ECB.
Note: Last observation refers to 25 February 2011.

78ECBAnnual Report2010
area’s important trading partners (see Chart 36).
As a consequence, the average level of the nominal
effective exchange rate in 2010 was 6.3% lower
compared with 2009. In 2010 the euro stood 5.5%
higher than the historical average since 1999.
On 31 December 2010 the euro traded at
USD 1.34, 7.3% lower than at the beginning of
2010 and 4.2% weaker than its 2009 average.
The depreciation of the euro vis-à-vis the
US dollar in the fi rst half of 2010 was driven
by a stronger macroeconomic recovery in the
United States than in the euro area in early 2010.
In the second half of 2010 the euro strengthened
against the US dollar in response to the approval
by the US authorities of an additional economic
stimulus.
In the fi rst half of 2010 the euro also continued
to depreciate vis-à-vis the Japanese yen,
completely reversing its appreciation in 2009
(see Chart 35). Throughout the remainder
of 2010 the bilateral JPY/EUR exchange
rate fl uctuated within a rather narrow range,
with the euro trading between JPY 105 and
JPY 115. On 31 December 2010 the euro
traded at JPY 108.65, 18.4% lower than at the
beginning of the year and 16.7% below its
average for 2009. Volatility in the JPY/EUR
exchange rate increased sharply in May and
June 2010, before declining in the second half
of 2010.
In 2010 the euro depreciated against the pound
sterling by 3.1%, from GBP 0.89 to GBP 0.86.
The euro depreciated against the pound sterling
in the fi rst half of 2010 amid market concerns
over fi scal sustainability in some euro area
countries. In the second half of the year the euro
recovered some of the earlier losses. By the end
of 2010 the euro bilateral exchange rate against
the pound sterling was still above its historical
average since 1999, owing to the appreciation
that occurred in 2008 and early 2009.
In 2010 the euro depreciated against the Swiss
franc by 15.7%. Until June 2010 the depreciation
was moderated as a result of interventions by the
Swiss National Bank. In the second half of 2010
the euro further depreciated against the Swiss
franc signifi cantly, amid some volatility.
Between the beginning of the year and
31 December 2010 the euro depreciated against
the Canadian dollar (by 11.9%), the Australian
dollar (by 17.9%) and the Norwegian krone
(by 6.0%), mainly owing to positive interest rate
differentials vis-à-vis the euro area. The euro
also depreciated against the Asian currencies that
are linked to the US dollar, namely the Chinese
renminbi (by 10.3%) and the Hong Kong dollar
(by 7.0%). The euro also depreciated vis-à-vis
the Korean won (by 10.7%).
The real effective exchange rate of the euro based
on different cost and price measures declined
in the fi rst half of 2010 and stabilised thereafter
(see Chart 36). By the end of 2010 the values of
the real effective exchange rates were very close
to their historical averages since 1999. The real
effective CPI-defl ated exchange rate was, on
average, 6.9% weaker in 2010 than in 2009.
Chart 36 Euro nominal and real effective exchange rates (EER-20)1)
(quarterly data; index: Q1 1999 = 100)
801999 2001 2003 2005 2007 2009
90
100
110
120
80
90
100
110
120
nominal
real, CPI-deflated
real, GDP-deflated
real, ULCT-deflated
Source: ECB.
1) An upward movement of the EER-20 indices represents an
appreciation of the euro. The latest observations are for the
fourth quarter of 2010 for “nominal” and “real, CPI-defl ated”
and the third quarter of 2010 for “real, GDP-defl ated” and “real,
ULCT-defl ated”, and are partly based on estimates. ULCT stands
for unit labour costs of the total economy.
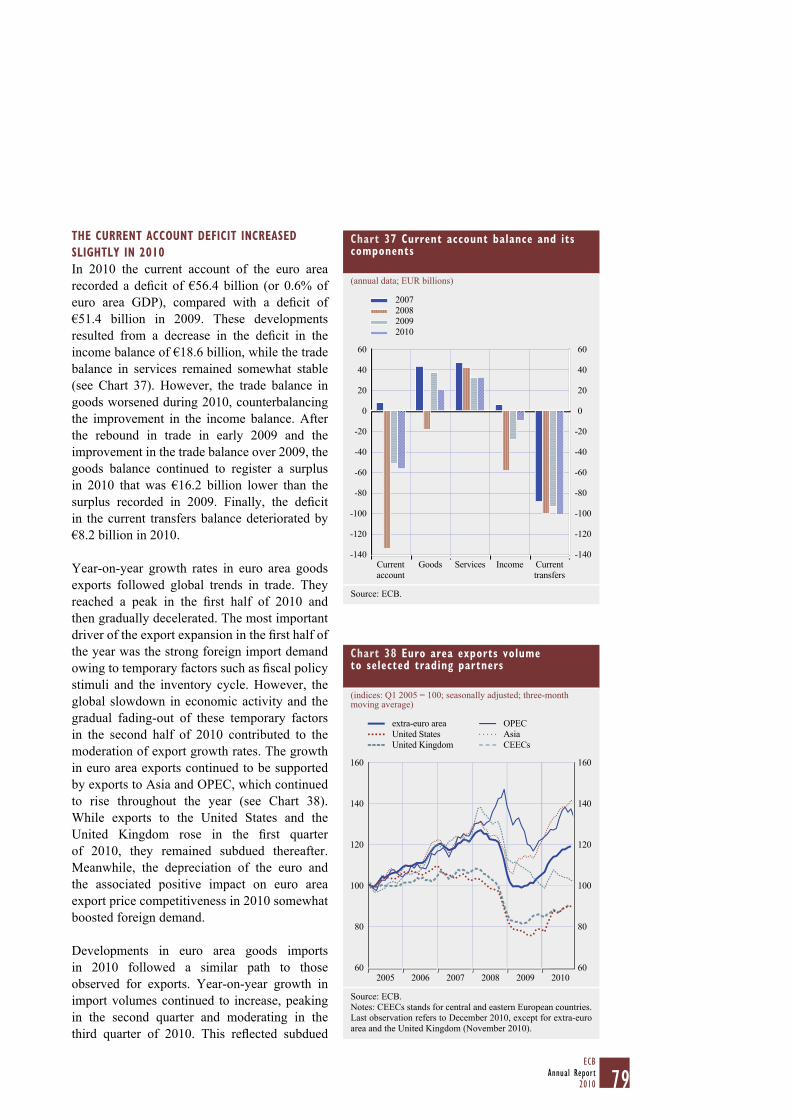
79ECB
Annual Report2010
THE CURRENT ACCOUNT DEFICIT INCREASED
SLIGHTLY IN 2010
In 2010 the current account of the euro area
recorded a defi cit of €56.4 billion (or 0.6% of
euro area GDP), compared with a defi cit of
€51.4 billion in 2009. These developments
resulted from a decrease in the defi cit in the
income balance of €18.6 billion, while the trade
balance in services remained somewhat stable
(see Chart 37). However, the trade balance in
goods worsened during 2010, counterbalancing
the improvement in the income balance. After
the rebound in trade in early 2009 and the
improvement in the trade balance over 2009, the
goods balance continued to register a surplus
in 2010 that was €16.2 billion lower than the
surplus recorded in 2009. Finally, the defi cit
in the current transfers balance deteriorated by
€8.2 billion in 2010.
Year-on-year growth rates in euro area goods
exports followed global trends in trade. They
reached a peak in the fi rst half of 2010 and
then gradually decelerated. The most important
driver of the export expansion in the fi rst half of
the year was the strong foreign import demand
owing to temporary factors such as fi scal policy
stimuli and the inventory cycle. However, the
global slowdown in economic activity and the
gradual fading-out of these temporary factors
in the second half of 2010 contributed to the
moderation of export growth rates. The growth
in euro area exports continued to be supported
by exports to Asia and OPEC, which continued
to rise throughout the year (see Chart 38).
While exports to the United States and the
United Kingdom rose in the fi rst quarter
of 2010, they remained subdued thereafter.
Meanwhile, the depreciation of the euro and
the associated positive impact on euro area
export price competitiveness in 2010 somewhat
boosted foreign demand.
Developments in euro area goods imports
in 2010 followed a similar path to those
observed for exports. Year-on-year growth in
import volumes continued to increase, peaking
in the second quarter and moderating in the
third quarter of 2010. This refl ected subdued
Chart 37 Current account balance and its components
(annual data; EUR billions)
-140
-120
-100
-80
-60
-40
-20
0
20
40
60
-140
-120
-100
-80
-60
-40
-20
0
20
40
60
Current
account
Goods Services Income Current
transfers
2007
2008
2009
2010
Source: ECB.
Chart 38 Euro area exports volume to selected trading partners
(indices: Q1 2005 = 100; seasonally adjusted; three-month moving average)
60
80
100
120
140
160
60
80
100
120
140
160
2005 2006 2007 2008 2009 2010
extra-euro area
United States
United Kingdom
OPEC
Asia
CEECs
Source: ECB.
Notes: CEECs stands for central and eastern European countries.
Last observation refers to December 2010, except for extra-euro
area and the United Kingdom (November 2010).
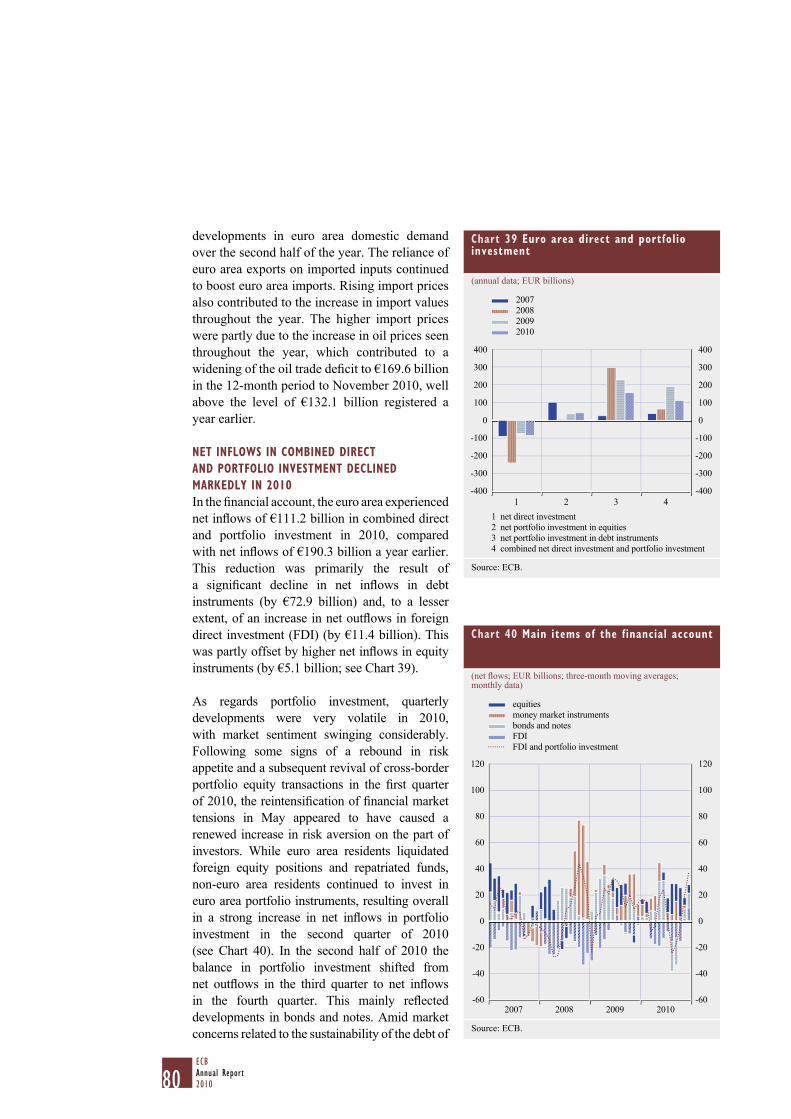
80ECBAnnual Report2010
developments in euro area domestic demand
over the second half of the year. The reliance of
euro area exports on imported inputs continued
to boost euro area imports. Rising import prices
also contributed to the increase in import values
throughout the year. The higher import prices
were partly due to the increase in oil prices seen
throughout the year, which contributed to a
widening of the oil trade defi cit to €169.6 billion
in the 12-month period to November 2010, well
above the level of €132.1 billion registered a
year earlier.
NET INFLOWS IN COMBINED DIRECT
AND PORTFOLIO INVESTMENT DECLINED
MARKEDLY IN 2010
In the fi nancial account, the euro area experienced
net infl ows of €111.2 billion in combined direct
and portfolio investment in 2010, compared
with net infl ows of €190.3 billion a year earlier.
This reduction was primarily the result of
a signifi cant decline in net infl ows in debt
instruments (by €72.9 billion) and, to a lesser
extent, of an increase in net outfl ows in foreign
direct investment (FDI) (by €11.4 billion). This
was partly offset by higher net infl ows in equity
instruments (by €5.1 billion; see Chart 39).
As regards portfolio investment, quarterly
developments were very volatile in 2010,
with market sentiment swinging considerably.
Following some signs of a rebound in risk
appetite and a subsequent revival of cross-border
portfolio equity transactions in the fi rst quarter
of 2010, the reintensifi cation of fi nancial market
tensions in May appeared to have caused a
renewed increase in risk aversion on the part of
investors. While euro area residents liquidated
foreign equity positions and repatriated funds,
non-euro area residents continued to invest in
euro area portfolio instruments, resulting overall
in a strong increase in net infl ows in portfolio
investment in the second quarter of 2010
(see Chart 40). In the second half of 2010 the
balance in portfolio investment shifted from
net outfl ows in the third quarter to net infl ows
in the fourth quarter. This mainly refl ected
developments in bonds and notes. Amid market
concerns related to the sustainability of the debt of
Chart 39 Euro area direct and portfolio investment
(annual data; EUR billions)
-400
-300
-200
-100
0
100
200
300
400
-400
-300
-200
-100
0
100
200
300
400
2007
2008
2009
2010
2 net portfolio investment in equities
3 net portfolio investment in debt instruments
4 combined net direct investment and portfolio investment
1 net direct investment
1 2 3 4
Source: ECB.
Chart 40 Main items of the financial account
(net fl ows; EUR billions; three-month moving averages; monthly data)
-60
-40
-20
0
20
40
60
80
100
120
-60
-40
-20
0
20
40
60
80
100
120
2010
equities
money market instruments
bonds and notes
FDI
FDI and portfolio investment
2007 2008 2009
Source: ECB.

81ECB
Annual Report2010
some euro area countries, non-residents sold euro
area bonds and notes in the third quarter, while
euro area residents increased their investment in
foreign bonds and notes. As fi nancial tensions
eased, non-residents resumed their purchases
of euro area bonds in the fourth quarter.
At the same time, the euro area recorded net
infl ows in equities in the second half of 2010,
amid increased interest in euro area equities by
foreign investors.
Direct investment activity remained relatively
subdued in 2010 as both euro area and foreign
companies decreased their investment in equity
capital. Higher net outfl ows in direct investment
in 2010 mainly refl ected developments in other
capital. While euro area companies increased
their fl ows of loans to their foreign affi liates,
foreign companies repatriated funds.
Data on the international investment position
of the euro area vis-à-vis the rest of the world,
available up to the third quarter of 2010, indicate
that the euro area recorded net liabilities of
€1,184 billion vis-à-vis the rest of the world
(representing 13.0% of euro area GDP), compared
with net liabilities of €1,448 billion (equal to
16.2% of euro area GDP) at the end of 2009.
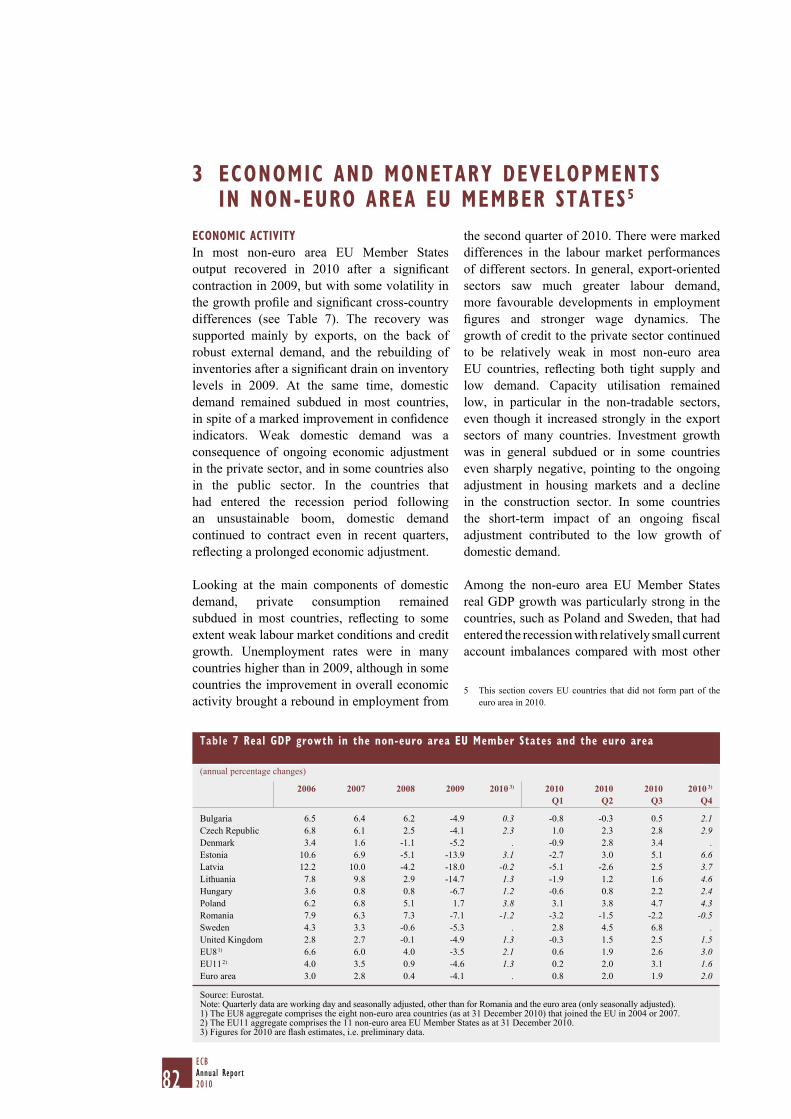
82ECBAnnual Report2010
3 ECONOMIC AND MONETARY DEVELOPMENTSIN NON-EURO AREA EU MEMBER STATES5
ECONOMIC ACTIVITY
In most non-euro area EU Member States
output recovered in 2010 after a signifi cant
contraction in 2009, but with some volatility in
the growth profi le and signifi cant cross-country
differences (see Table 7). The recovery was
supported mainly by exports, on the back of
robust external demand, and the rebuilding of
inventories after a signifi cant drain on inventory
levels in 2009. At the same time, domestic
demand remained subdued in most countries,
in spite of a marked improvement in confi dence
indicators. Weak domestic demand was a
consequence of ongoing economic adjustment
in the private sector, and in some countries also
in the public sector. In the countries that
had entered the recession period following
an unsustainable boom, domestic demand
continued to contract even in recent quarters,
refl ecting a prolonged economic adjustment.
Looking at the main components of domestic
demand, private consumption remained
subdued in most countries, refl ecting to some
extent weak labour market conditions and credit
growth. Unemployment rates were in many
countries higher than in 2009, although in some
countries the improvement in overall economic
activity brought a rebound in employment from
the second quarter of 2010. There were marked
differences in the labour market performances
of different sectors. In general, export-oriented
sectors saw much greater labour demand,
more favourable developments in employment
fi gures and stronger wage dynamics. The
growth of credit to the private sector continued
to be relatively weak in most non-euro area
EU countries, refl ecting both tight supply and
low demand. Capacity utilisation remained
low, in particular in the non-tradable sectors,
even though it increased strongly in the export
sectors of many countries. Investment growth
was in general subdued or in some countries
even sharply negative, pointing to the ongoing
adjustment in housing markets and a decline
in the construction sector. In some countries
the short-term impact of an ongoing fi scal
adjustment contributed to the low growth of
domestic demand.
Among the non-euro area EU Member States
real GDP growth was particularly strong in the
countries, such as Poland and Sweden, that had
entered the recession with relatively small current
account imbalances compared with most other
This section covers EU countries that did not form part of the 5
euro area in 2010.
Table 7 Real GDP growth in the non-euro area EU Member States and the euro area
(annual percentage changes)
2006 2007 2008 2009 2010 3) 2010Q1
2010Q2
2010Q3
2010 3)
Q4
Bulgaria 6.5 6.4 6.2 -4.9 0.3 -0.8 -0.3 0.5 2.1Czech Republic 6.8 6.1 2.5 -4.1 2.3 1.0 2.3 2.8 2.9Denmark 3.4 1.6 -1.1 -5.2 . -0.9 2.8 3.4 .Estonia 10.6 6.9 -5.1 -13.9 3.1 -2.7 3.0 5.1 6.6Latvia 12.2 10.0 -4.2 -18.0 -0.2 -5.1 -2.6 2.5 3.7Lithuania 7.8 9.8 2.9 -14.7 1.3 -1.9 1.2 1.6 4.6Hungary 3.6 0.8 0.8 -6.7 1.2 -0.6 0.8 2.2 2.4Poland 6.2 6.8 5.1 1.7 3.8 3.1 3.8 4.7 4.3Romania 7.9 6.3 7.3 -7.1 -1.2 -3.2 -1.5 -2.2 -0.5Sweden 4.3 3.3 -0.6 -5.3 . 2.8 4.5 6.8 .United Kingdom 2.8 2.7 -0.1 -4.9 1.3 -0.3 1.5 2.5 1.5EU8 1) 6.6 6.0 4.0 -3.5 2.1 0.6 1.9 2.6 3.0EU11 2) 4.0 3.5 0.9 -4.6 1.3 0.2 2.0 3.1 1.6Euro area 3.0 2.8 0.4 -4.1 . 0.8 2.0 1.9 2.0
Source: Eurostat.Note: Quarterly data are working day and seasonally adjusted, other than for Romania and the euro area (only seasonally adjusted).1) The EU8 aggregate comprises the eight non-euro area countries (as at 31 December 2010) that joined the EU in 2004 or 2007.2) The EU11 aggregate comprises the 11 non-euro area EU Member States as at 31 December 2010.3) Figures for 2010 are fl ash estimates, i.e. preliminary data.
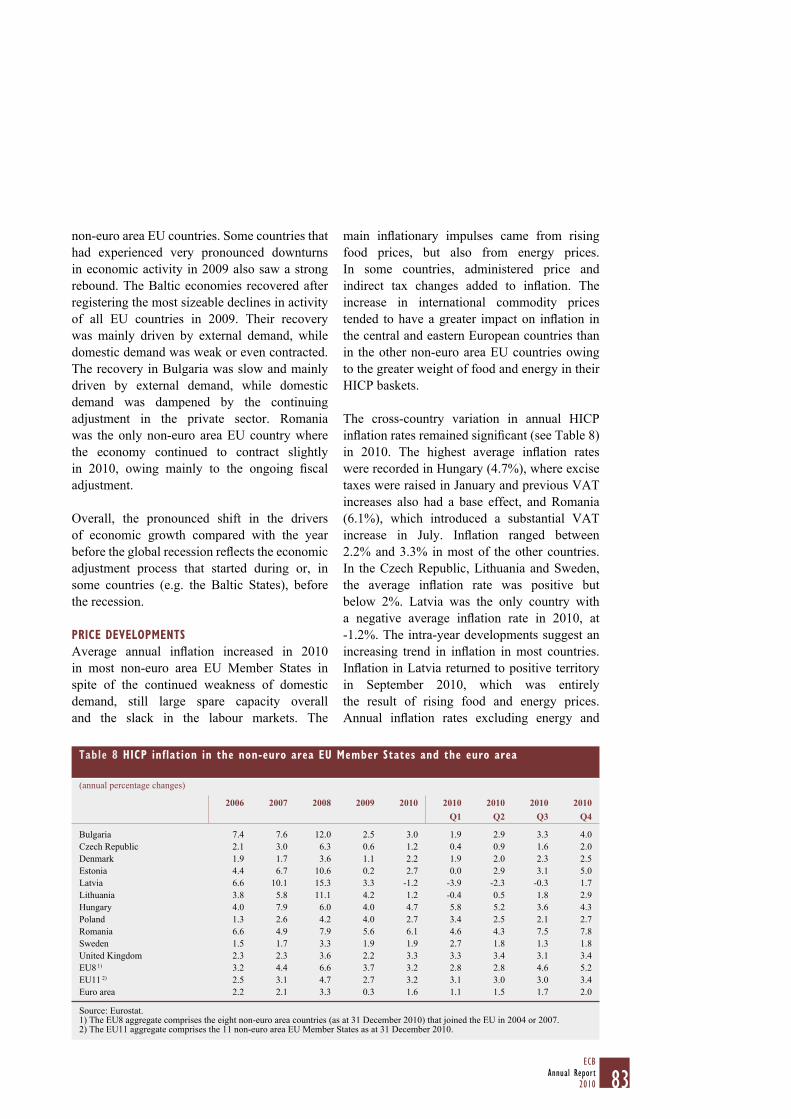
83ECB
Annual Report2010
non-euro area EU countries. Some countries that
had experienced very pronounced downturns
in economic activity in 2009 also saw a strong
rebound. The Baltic economies recovered after
registering the most sizeable declines in activity
of all EU countries in 2009. Their recovery
was mainly driven by external demand, while
domestic demand was weak or even contracted.
The recovery in Bulgaria was slow and mainly
driven by external demand, while domestic
demand was dampened by the continuing
adjustment in the private sector. Romania
was the only non-euro area EU country where
the economy continued to contract slightly
in 2010, owing mainly to the ongoing fi scal
adjustment.
Overall, the pronounced shift in the drivers
of economic growth compared with the year
before the global recession refl ects the economic
adjustment process that started during or, in
some countries (e.g. the Baltic States), before
the recession.
PRICE DEVELOPMENTS
Average annual infl ation increased in 2010
in most non-euro area EU Member States in
spite of the continued weakness of domestic
demand, still large spare capacity overall
and the slack in the labour markets. The
main infl ationary impulses came from rising
food prices, but also from energy prices.
In some countries, administered price and
indirect tax changes added to infl ation. The
increase in international commodity prices
tended to have a greater impact on infl ation in
the central and eastern European countries than
in the other non-euro area EU countries owing
to the greater weight of food and energy in their
HICP baskets.
The cross-country variation in annual HICP
infl ation rates remained signifi cant (see Table 8)
in 2010. The highest average infl ation rates
were recorded in Hungary (4.7%), where excise
taxes were raised in January and previous VAT
increases also had a base effect, and Romania
(6.1%), which introduced a substantial VAT
increase in July. Infl ation ranged between
2.2% and 3.3% in most of the other countries.
In the Czech Republic, Lithuania and Sweden,
the average infl ation rate was positive but
below 2%. Latvia was the only country with
a negative average infl ation rate in 2010, at
-1.2%. The intra-year developments suggest an
increasing trend in infl ation in most countries.
Infl ation in Latvia returned to positive territory
in September 2010, which was entirely
the result of rising food and energy prices.
Annual infl ation rates excluding energy and
Table 8 HICP inflation in the non-euro area EU Member States and the euro area
(annual percentage changes)
2006 2007 2008 2009 2010 2010 2010 2010 2010Q1 Q2 Q3 Q4
Bulgaria 7.4 7.6 12.0 2.5 3.0 1.9 2.9 3.3 4.0
Czech Republic 2.1 3.0 6.3 0.6 1.2 0.4 0.9 1.6 2.0
Denmark 1.9 1.7 3.6 1.1 2.2 1.9 2.0 2.3 2.5
Estonia 4.4 6.7 10.6 0.2 2.7 0.0 2.9 3.1 5.0
Latvia 6.6 10.1 15.3 3.3 -1.2 -3.9 -2.3 -0.3 1.7
Lithuania 3.8 5.8 11.1 4.2 1.2 -0.4 0.5 1.8 2.9
Hungary 4.0 7.9 6.0 4.0 4.7 5.8 5.2 3.6 4.3
Poland 1.3 2.6 4.2 4.0 2.7 3.4 2.5 2.1 2.7
Romania 6.6 4.9 7.9 5.6 6.1 4.6 4.3 7.5 7.8
Sweden 1.5 1.7 3.3 1.9 1.9 2.7 1.8 1.3 1.8
United Kingdom 2.3 2.3 3.6 2.2 3.3 3.3 3.4 3.1 3.4
EU8 1) 3.2 4.4 6.6 3.7 3.2 2.8 2.8 4.6 5.2
EU11 2) 2.5 3.1 4.7 2.7 3.2 3.1 3.0 3.0 3.4
Euro area 2.2 2.1 3.3 0.3 1.6 1.1 1.5 1.7 2.0
Source: Eurostat. 1) The EU8 aggregate comprises the eight non-euro area countries (as at 31 December 2010) that joined the EU in 2004 or 2007.2) The EU11 aggregate comprises the 11 non-euro area EU Member States as at 31 December 2010.
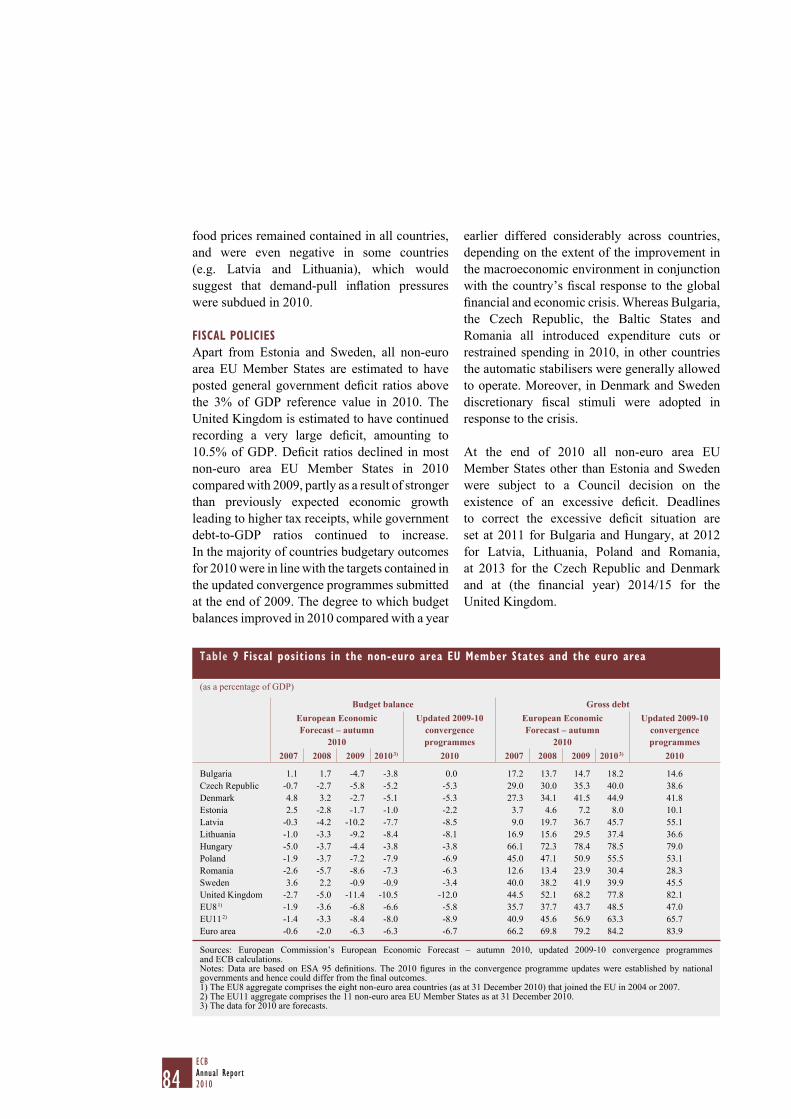
84ECBAnnual Report2010
food prices remained contained in all countries,
and were even negative in some countries
(e.g. Latvia and Lithuania), which would
suggest that demand-pull infl ation pressures
were subdued in 2010.
FISCAL POLICIES
Apart from Estonia and Sweden, all non-euro
area EU Member States are estimated to have
posted general government defi cit ratios above
the 3% of GDP reference value in 2010. The
United Kingdom is estimated to have continued
recording a very large defi cit, amounting to
10.5% of GDP. Defi cit ratios declined in most
non-euro area EU Member States in 2010
compared with 2009, partly as a result of stronger
than previously expected economic growth
leading to higher tax receipts, while government
debt-to-GDP ratios continued to increase.
In the majority of countries budgetary outcomes
for 2010 were in line with the targets contained in
the updated convergence programmes submitted
at the end of 2009. The degree to which budget
balances improved in 2010 compared with a year
earlier differed considerably across countries,
depending on the extent of the improvement in
the macroeconomic environment in conjunction
with the country’s fi scal response to the global
fi nancial and economic crisis. Whereas Bulgaria,
the Czech Republic, the Baltic States and
Romania all introduced expenditure cuts or
restrained spending in 2010, in other countries
the automatic stabilisers were generally allowed
to operate. Moreover, in Denmark and Sweden
discretionary fi scal stimuli were adopted in
response to the crisis.
At the end of 2010 all non-euro area EU
Member States other than Estonia and Sweden
were subject to a Council decision on the
existence of an excessive defi cit. Deadlines
to correct the excessive defi cit situation are
set at 2011 for Bulgaria and Hungary, at 2012
for Latvia, Lithuania, Poland and Romania,
at 2013 for the Czech Republic and Denmark
and at (the fi nancial year) 2014/15 for the
United Kingdom.
Table 9 Fiscal positions in the non-euro area EU Member States and the euro area
(as a percentage of GDP)
Budget balance Gross debtEuropean Economic Forecast – autumn
2010
Updated 2009-10 convergence programmes
European Economic Forecast – autumn
2010
Updated 2009-10 convergence programmes
2007 2008 2009 2010 3) 2010 2007 2008 2009 2010 3) 2010
Bulgaria 1.1 1.7 -4.7 -3.8 0.0 17.2 13.7 14.7 18.2 14.6
Czech Republic -0.7 -2.7 -5.8 -5.2 -5.3 29.0 30.0 35.3 40.0 38.6
Denmark 4.8 3.2 -2.7 -5.1 -5.3 27.3 34.1 41.5 44.9 41.8
Estonia 2.5 -2.8 -1.7 -1.0 -2.2 3.7 4.6 7.2 8.0 10.1
Latvia -0.3 -4.2 -10.2 -7.7 -8.5 9.0 19.7 36.7 45.7 55.1
Lithuania -1.0 -3.3 -9.2 -8.4 -8.1 16.9 15.6 29.5 37.4 36.6
Hungary -5.0 -3.7 -4.4 -3.8 -3.8 66.1 72.3 78.4 78.5 79.0
Poland -1.9 -3.7 -7.2 -7.9 -6.9 45.0 47.1 50.9 55.5 53.1
Romania -2.6 -5.7 -8.6 -7.3 -6.3 12.6 13.4 23.9 30.4 28.3
Sweden 3.6 2.2 -0.9 -0.9 -3.4 40.0 38.2 41.9 39.9 45.5
United Kingdom -2.7 -5.0 -11.4 -10.5 -12.0 44.5 52.1 68.2 77.8 82.1
EU8 1) -1.9 -3.6 -6.8 -6.6 -5.8 35.7 37.7 43.7 48.5 47.0
EU11 2) -1.4 -3.3 -8.4 -8.0 -8.9 40.9 45.6 56.9 63.3 65.7
Euro area -0.6 -2.0 -6.3 -6.3 -6.7 66.2 69.8 79.2 84.2 83.9
Sources: European Commission’s European Economic Forecast – autumn 2010, updated 2009-10 convergence programmes and ECB calculations.Notes: Data are based on ESA 95 defi nitions. The 2010 fi gures in the convergence programme updates were established by national governments and hence could differ from the fi nal outcomes.1) The EU8 aggregate comprises the eight non-euro area countries (as at 31 December 2010) that joined the EU in 2004 or 2007.2) The EU11 aggregate comprises the 11 non-euro area EU Member States as at 31 December 2010. 3) The data for 2010 are forecasts.
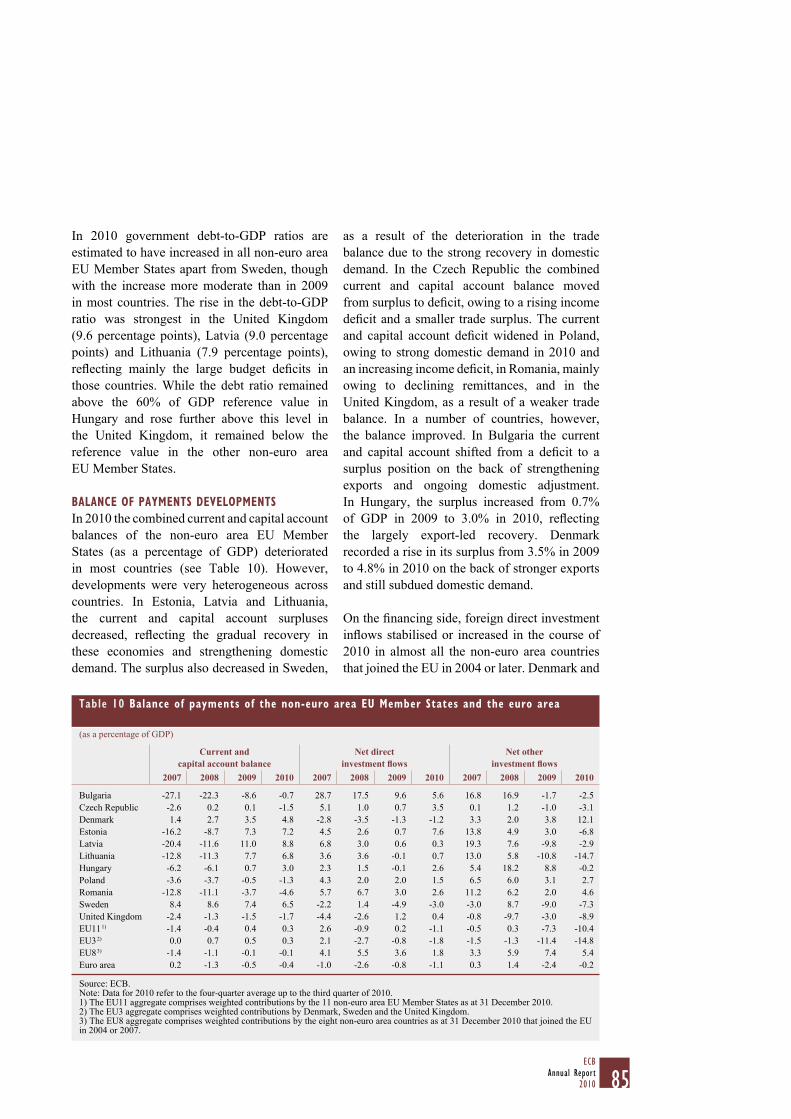
85ECB
Annual Report2010
In 2010 government debt-to-GDP ratios are
estimated to have increased in all non-euro area
EU Member States apart from Sweden, though
with the increase more moderate than in 2009
in most countries. The rise in the debt-to-GDP
ratio was strongest in the United Kingdom
(9.6 percentage points), Latvia (9.0 percentage
points) and Lithuania (7.9 percentage points),
refl ecting mainly the large budget defi cits in
those countries. While the debt ratio remained
above the 60% of GDP reference value in
Hungary and rose further above this level in
the United Kingdom, it remained below the
reference value in the other non-euro area
EU Member States.
BALANCE OF PAYMENTS DEVELOPMENTS
In 2010 the combined current and capital account
balances of the non-euro area EU Member
States (as a percentage of GDP) deteriorated
in most countries (see Table 10). However,
developments were very heterogeneous across
countries. In Estonia, Latvia and Lithuania,
the current and capital account surpluses
decreased, refl ecting the gradual recovery in
these economies and strengthening domestic
demand. The surplus also decreased in Sweden,
as a result of the deterioration in the trade
balance due to the strong recovery in domestic
demand. In the Czech Republic the combined
current and capital account balance moved
from surplus to defi cit, owing to a rising income
defi cit and a smaller trade surplus. The current
and capital account defi cit widened in Poland,
owing to strong domestic demand in 2010 and
an increasing income defi cit, in Romania, mainly
owing to declining remittances, and in the
United Kingdom, as a result of a weaker trade
balance. In a number of countries, however,
the balance improved. In Bulgaria the current
and capital account shifted from a defi cit to a
surplus position on the back of strengthening
exports and ongoing domestic adjustment.
In Hungary, the surplus increased from 0.7%
of GDP in 2009 to 3.0% in 2010, refl ecting
the largely export-led recovery. Denmark
recorded a rise in its surplus from 3.5% in 2009
to 4.8% in 2010 on the back of stronger exports
and still subdued domestic demand.
On the fi nancing side, foreign direct investment
infl ows stabilised or increased in the course of
2010 in almost all the non-euro area countries
that joined the EU in 2004 or later. Denmark and
Table 10 Balance of payments of the non-euro area EU Member States and the euro area
(as a percentage of GDP)
Current and capital account balance
Net directinvestment fl ows
Net otherinvestment fl ows
2007 2008 2009 2010 2007 2008 2009 2010 2007 2008 2009 2010
Bulgaria -27.1 -22.3 -8.6 -0.7 28.7 17.5 9.6 5.6 16.8 16.9 -1.7 -2.5
Czech Republic -2.6 0.2 0.1 -1.5 5.1 1.0 0.7 3.5 0.1 1.2 -1.0 -3.1
Denmark 1.4 2.7 3.5 4.8 -2.8 -3.5 -1.3 -1.2 3.3 2.0 3.8 12.1
Estonia -16.2 -8.7 7.3 7.2 4.5 2.6 0.7 7.6 13.8 4.9 3.0 -6.8
Latvia -20.4 -11.6 11.0 8.8 6.8 3.0 0.6 0.3 19.3 7.6 -9.8 -2.9
Lithuania -12.8 -11.3 7.7 6.8 3.6 3.6 -0.1 0.7 13.0 5.8 -10.8 -14.7
Hungary -6.2 -6.1 0.7 3.0 2.3 1.5 -0.1 2.6 5.4 18.2 8.8 -0.2
Poland -3.6 -3.7 -0.5 -1.3 4.3 2.0 2.0 1.5 6.5 6.0 3.1 2.7
Romania -12.8 -11.1 -3.7 -4.6 5.7 6.7 3.0 2.6 11.2 6.2 2.0 4.6
Sweden 8.4 8.6 7.4 6.5 -2.2 1.4 -4.9 -3.0 -3.0 8.7 -9.0 -7.3
United Kingdom -2.4 -1.3 -1.5 -1.7 -4.4 -2.6 1.2 0.4 -0.8 -9.7 -3.0 -8.9
EU11 1) -1.4 -0.4 0.4 0.3 2.6 -0.9 0.2 -1.1 -0.5 0.3 -7.3 -10.4
EU3 2) 0.0 0.7 0.5 0.3 2.1 -2.7 -0.8 -1.8 -1.5 -1.3 -11.4 -14.8
EU8 3) -1.4 -1.1 -0.1 -0.1 4.1 5.5 3.6 1.8 3.3 5.9 7.4 5.4
Euro area 0.2 -1.3 -0.5 -0.4 -1.0 -2.6 -0.8 -1.1 0.3 1.4 -2.4 -0.2
Source: ECB.Note: Data for 2010 refer to the four-quarter average up to the third quarter of 2010.1) The EU11 aggregate comprises weighted contributions by the 11 non-euro area EU Member States as at 31 December 2010.2) The EU3 aggregate comprises weighted contributions by Denmark, Sweden and the United Kingdom.3) The EU8 aggregate comprises weighted contributions by the eight non-euro area countries as at 31 December 2010 that joined the EU in 2004 or 2007.

86ECBAnnual Report2010
Sweden continued to be net exporters of
direct investment. Increases in the more stable
components of the fi nancing of the current
account were, in the Czech Republic, Lithuania
and Poland, accompanied by considerable
increases in net portfolio investment. As regards
other investment fl ows, many countries posted
further net outfl ows – mainly as a consequence
of a stronger deleveraging process. In Latvia
and Romania, private capital infl ows in 2010
continued to be supplemented by fi nancial
support programmes provided by international
organisations.
EXCHANGE RATE DEVELOPMENTS
Exchange rate developments in the non-euro
area EU Member States in 2010 were strongly
infl uenced by the exchange rate regimes of the
individual countries. The currencies of Denmark,
Estonia, Latvia and Lithuania participated in the
exchange rate mechanism II (ERM II). They were
subject to a standard fl uctuation band of ±15%
around their central rates against the euro, except for
the Danish krone, with a narrower band of ±2.25%
(see Chart 41). ERM II participation was, in some
cases, accompanied by unilateral commitments
on the part of the countries concerned to
maintain narrower fl uctuation bands or currency
board regimes. These unilateral commitments
place no additional obligations on the ECB.
In particular, the Estonian kroon and the
Lithuanian litas joined ERM II with their existing
currency board arrangements in place, while
the Latvian authorities decided to maintain the
exchange rate of the lats at its central rate against
the euro with a fl uctuation band of ±1%.
The Estonian kroon and the Lithuanian litas
stayed at their central rates during 2010.
The Latvian lats remained broadly stable within
the unilaterally set band of ±1% vis-à-vis
the euro, fl uctuating close to the weak limit
of the band. The lats did not come under
signifi cant pressure in 2010, refl ecting the
stabilisation of macroeconomic conditions
and improved investor sentiment vis-à-vis the
Latvian economy. The further compliance with
the conditions of the international fi nancial
assistance programme led by the EU and
the IMF also provided support and remains
fundamental to the credibility of the exchange
rate peg in the future.
Turning to the currencies of the non-euro area
EU Member States that did not participate
in ERM II, two groups of exchange rate
developments can be identifi ed. While the
Czech koruna, the Polish zloty, the Swedish
krona and the pound sterling continued to
appreciate vis-à-vis the euro, the Hungarian
forint and the Romanian leu were broadly stable
(see Chart 42). The Czech koruna, the Polish
zloty and the Swedish krona were supported by
the growth performance of those economies.
The pound sterling appreciated against the
euro overall, but the exchange rate was
highly volatile. With the exception of the
Chart 41 Developments in ERM II EU currencies
(daily data; deviation from the central rate in percentage points)
-2.5
-2.0
-1.5
-1.0
-0.5
0.0
0.5
1.0
1.5
2.0
2.5
-2.5
-2.0
-1.5
-1.0
-0.5
0.0
0.5
1.0
1.5
2.0
2.5
DKK
EEK
LVL
LTL
Jan. July Jan. July Jan. Jan.July2008 2009 2010 2011
Source: ECB.
Notes: A positive (negative) deviation from the central rate
against the euro implies that the currency is on the weak (strong)
side of the band. For the Danish krone, a fl uctuation band of
±2.25% applies. For all other currencies, the standard fl uctuation
band of ±15% applies. However, as part of a unilateral
commitment, the fl uctuation band for the Latvian lats is ±1%; for
the Lithuanian litas a currency board arrangement is maintained;
and for the Estonian kroon a currency board was in place until
Estonia’s adoption of the euro in January 2011. Last observation
refers to 25 February 2011.
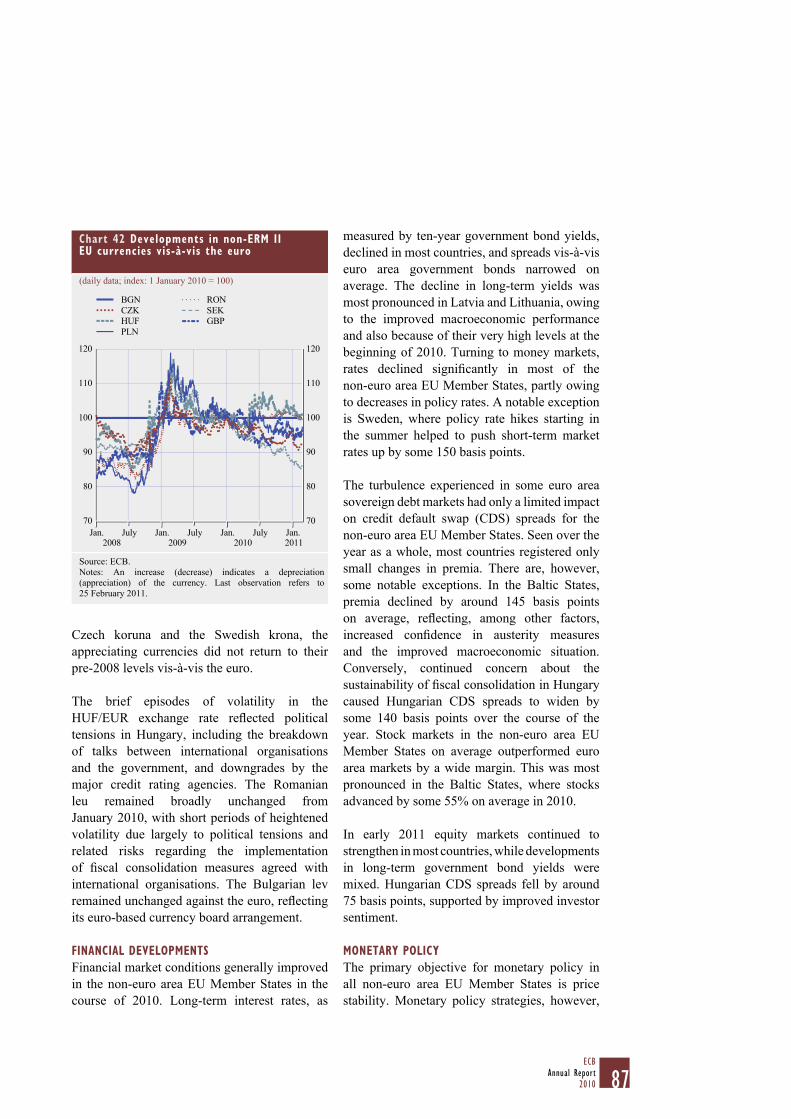
87ECB
Annual Report2010
Czech koruna and the Swedish krona, the
appreciating currencies did not return to their
pre-2008 levels vis-à-vis the euro.
The brief episodes of volatility in the
HUF/EUR exchange rate refl ected political
tensions in Hungary, including the breakdown
of talks between international organisations
and the government, and downgrades by the
major credit rating agencies. The Romanian
leu remained broadly unchanged from
January 2010, with short periods of heightened
volatility due largely to political tensions and
related risks regarding the implementation
of fi scal consolidation measures agreed with
international organisations. The Bulgarian lev
remained unchanged against the euro, refl ecting
its euro-based currency board arrangement.
FINANCIAL DEVELOPMENTS
Financial market conditions generally improved
in the non-euro area EU Member States in the
course of 2010. Long-term interest rates, as
measured by ten-year government bond yields,
declined in most countries, and spreads vis-à-vis
euro area government bonds narrowed on
average. The decline in long-term yields was
most pronounced in Latvia and Lithuania, owing
to the improved macroeconomic performance
and also because of their very high levels at the
beginning of 2010. Turning to money markets,
rates declined signifi cantly in most of the
non-euro area EU Member States, partly owing
to decreases in policy rates. A notable exception
is Sweden, where policy rate hikes starting in
the summer helped to push short-term market
rates up by some 150 basis points.
The turbulence experienced in some euro area
sovereign debt markets had only a limited impact
on credit default swap (CDS) spreads for the
non-euro area EU Member States. Seen over the
year as a whole, most countries registered only
small changes in premia. There are, however,
some notable exceptions. In the Baltic States,
premia declined by around 145 basis points
on average, refl ecting, among other factors,
increased confi dence in austerity measures
and the improved macroeconomic situation.
Conversely, continued concern about the
sustainability of fi scal consolidation in Hungary
caused Hungarian CDS spreads to widen by
some 140 basis points over the course of the
year. Stock markets in the non-euro area EU
Member States on average outperformed euro
area markets by a wide margin. This was most
pronounced in the Baltic States, where stocks
advanced by some 55% on average in 2010.
In early 2011 equity markets continued to
strengthen in most countries, while developments
in long-term government bond yields were
mixed. Hungarian CDS spreads fell by around
75 basis points, supported by improved investor
sentiment.
MONETARY POLICY
The primary objective for monetary policy in
all non-euro area EU Member States is price
stability. Monetary policy strategies, however,
Chart 42 Developments in non-ERM II EU currencies vis-à-vis the euro
(daily data; index: 1 January 2010 = 100)
70
80
90
100
120
70
80
90
100
120
110 110
Jan. Jan. Jan. Jan.July July July2008 2009 2010 2011
BGN
CZK
HUF
PLN
RON
SEK
GBP
Source: ECB.
Notes: An increase (decrease) indicates a depreciation
(appreciation) of the currency. Last observation refers to
25 February 2011.
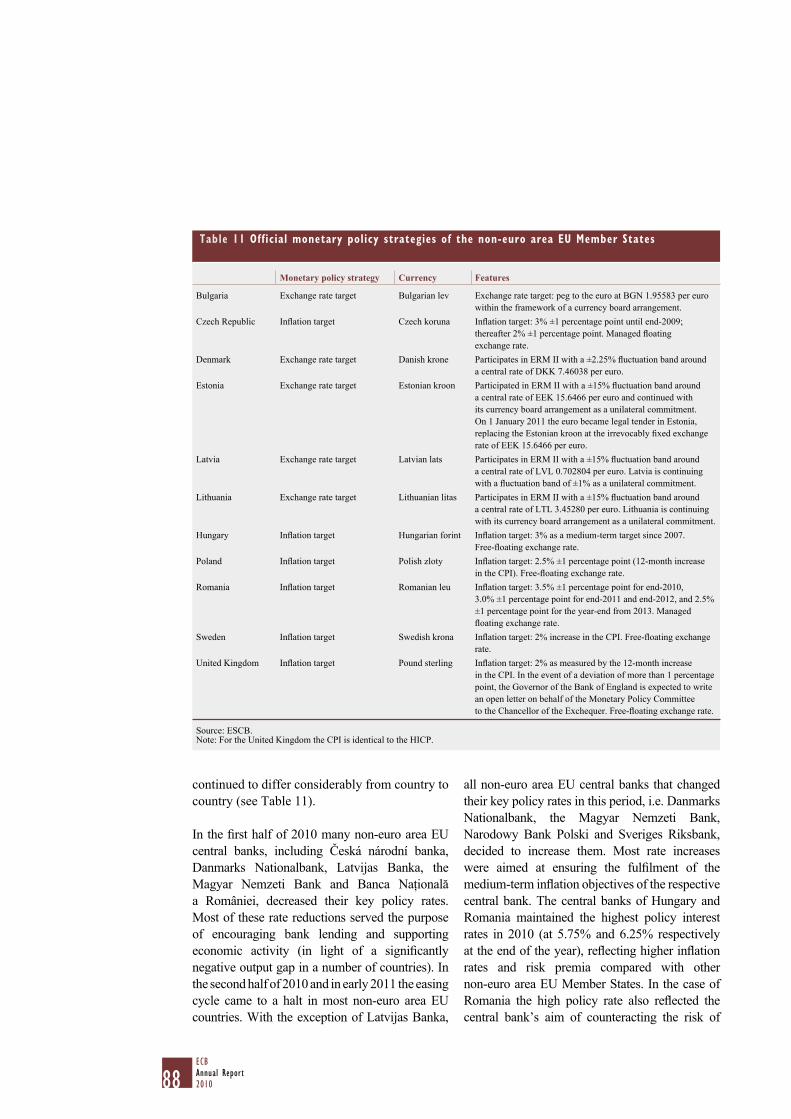
88ECBAnnual Report2010
continued to differ considerably from country to
country (see Table 11).
In the fi rst half of 2010 many non-euro area EU
central banks, including Česká národní banka,
Danmarks Nationalbank, Latvijas Banka, the
Magyar Nemzeti Bank and Banca Naţională
a României, decreased their key policy rates.
Most of these rate reductions served the purpose
of encouraging bank lending and supporting
economic activity (in light of a signifi cantly
negative output gap in a number of countries). In
the second half of 2010 and in early 2011 the easing
cycle came to a halt in most non-euro area EU
countries. With the exception of Latvijas Banka,
all non-euro area EU central banks that changed
their key policy rates in this period, i.e. Danmarks
Nationalbank, the Magyar Nemzeti Bank,
Narodowy Bank Polski and Sveriges Riksbank,
decided to increase them. Most rate increases
were aimed at ensuring the fulfi lment of the
medium-term infl ation objectives of the respective
central bank. The central banks of Hungary and
Romania maintained the highest policy interest
rates in 2010 (at 5.75% and 6.25% respectively
at the end of the year), refl ecting higher infl ation
rates and risk premia compared with other
non-euro area EU Member States. In the case of
Romania the high policy rate also refl ected the
central bank’s aim of counteracting the risk of
Table 11 Official monetary policy strategies of the non-euro area EU Member States
Monetary policy strategy Currency Features
Bulgaria Exchange rate target Bulgarian lev Exchange rate target: peg to the euro at BGN 1.95583 per euro
within the framework of a currency board arrangement.
Czech Republic Infl ation target Czech koruna Infl ation target: 3% ±1 percentage point until end-2009;
thereafter 2% ±1 percentage point. Managed fl oating
exchange rate.
Denmark Exchange rate target Danish krone Participates in ERM II with a ±2.25% fl uctuation band around
a central rate of DKK 7.46038 per euro.
Estonia Exchange rate target Estonian kroon Participated in ERM II with a ±15% fl uctuation band around
a central rate of EEK 15.6466 per euro and continued with
its currency board arrangement as a unilateral commitment.
On 1 January 2011 the euro became legal tender in Estonia,
replacing the Estonian kroon at the irrevocably fi xed exchange
rate of EEK 15.6466 per euro.
Latvia Exchange rate target Latvian lats Participates in ERM II with a ±15% fl uctuation band around
a central rate of LVL 0.702804 per euro. Latvia is continuing
with a fl uctuation band of ±1% as a unilateral commitment.
Lithuania Exchange rate target Lithuanian litas Participates in ERM II with a ±15% fl uctuation band around
a central rate of LTL 3.45280 per euro. Lithuania is continuing
with its currency board arrangement as a unilateral commitment.
Hungary Infl ation target Hungarian forint Infl ation target: 3% as a medium-term target since 2007.
Free-fl oating exchange rate.
Poland Infl ation target Polish zloty Infl ation target: 2.5% ±1 percentage point (12-month increase
in the CPI). Free-fl oating exchange rate.
Romania Infl ation target Romanian leu Infl ation target: 3.5% ±1 percentage point for end-2010,
3.0% ±1 percentage point for end-2011 and end-2012, and 2.5%
±1 percentage point for the year-end from 2013. Managed
fl oating exchange rate.
Sweden Infl ation target Swedish krona Infl ation target: 2% increase in the CPI. Free-fl oating exchange
rate.
United Kingdom Infl ation target Pound sterling Infl ation target: 2% as measured by the 12-month increase
in the CPI. In the event of a deviation of more than 1 percentage
point, the Governor of the Bank of England is expected to write
an open letter on behalf of the Monetary Policy Committee
to the Chancellor of the Exchequer. Free-fl oating exchange rate.
Source: ESCB.Note: For the United Kingdom the CPI is identical to the HICP.
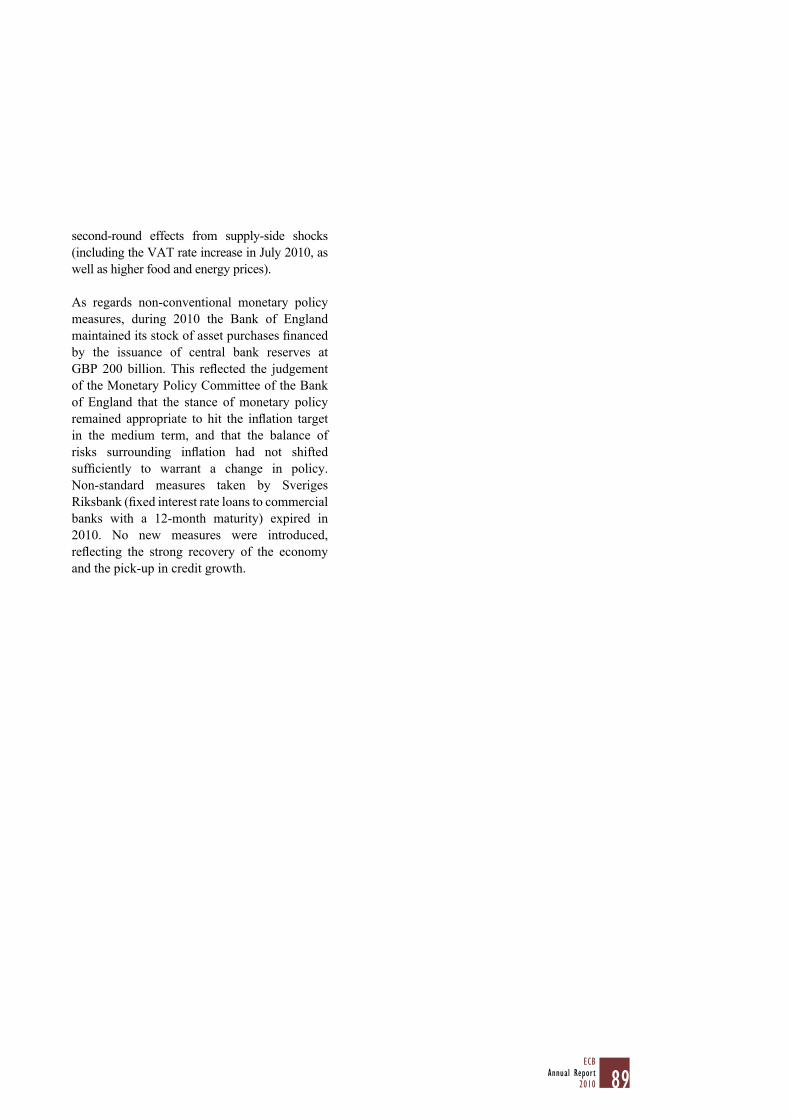
89ECB
Annual Report2010
second-round effects from supply-side shocks
(including the VAT rate increase in July 2010, as
well as higher food and energy prices).
As regards non-conventional monetary policy
measures, during 2010 the Bank of England
maintained its stock of asset purchases fi nanced
by the issuance of central bank reserves at
GBP 200 billion. This refl ected the judgement
of the Monetary Policy Committee of the Bank
of England that the stance of monetary policy
remained appropriate to hit the infl ation target
in the medium term, and that the balance of
risks surrounding infl ation had not shifted
suffi ciently to warrant a change in policy.
Non-standard measures taken by Sveriges
Riksbank (fi xed interest rate loans to commercial
banks with a 12-month maturity) expired in
2010. No new measures were introduced,
refl ecting the strong recovery of the economy
and the pick-up in credit growth.

The new ECB premises, designed by COOP HIMMELB(L)AU, are due to be completed by 2013. The ensemble will consist of
three main building elements, namely the double offi ce tower, the former Grossmarkthalle and the entrance building.

CHAPTER 2
CENTRAL BANKOPERATIONS
AND ACTIVITIES
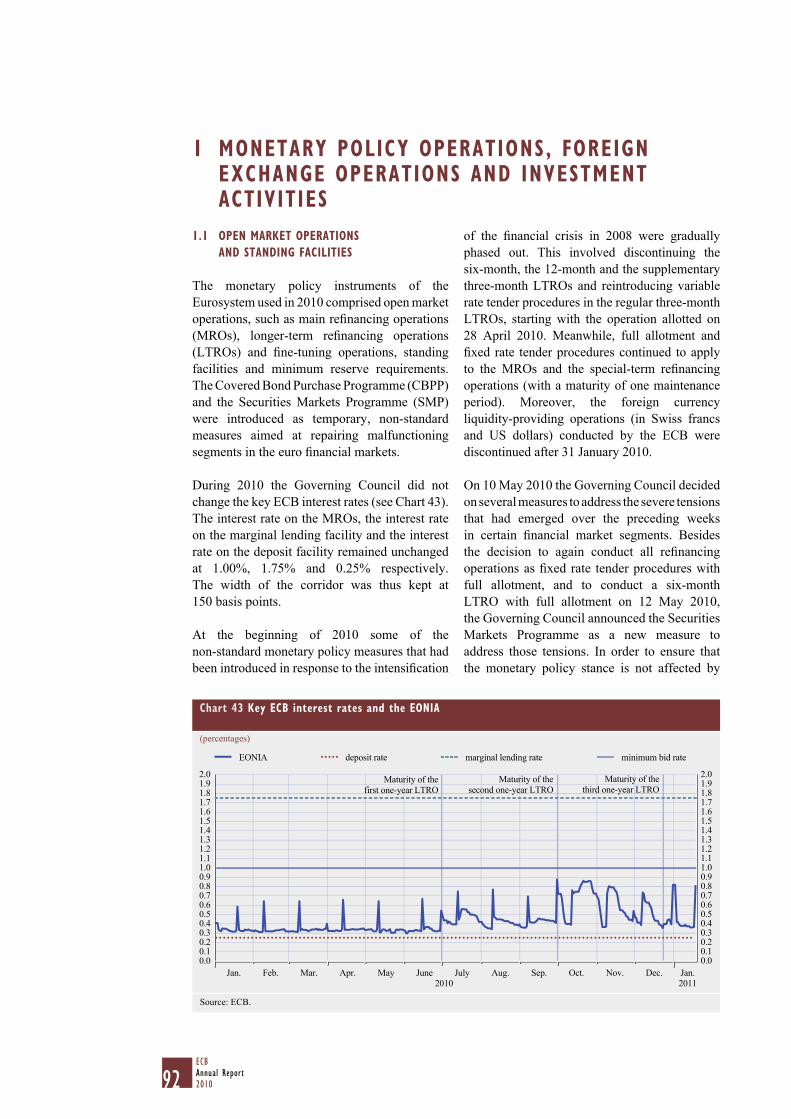
92ECBAnnual Report2010
1.1 OPEN MARKET OPERATIONS
AND STANDING FACILITIES
The monetary policy instruments of the
Eurosystem used in 2010 comprised open market
operations, such as main refi nancing operations
(MROs), longer-term refi nancing operations
(LTROs) and fi ne-tuning operations, standing
facilities and minimum reserve requirements.
The Covered Bond Purchase Programme (CBPP)
and the Securities Markets Programme (SMP)
were introduced as temporary, non-standard
measures aimed at repairing malfunctioning
segments in the euro fi nancial markets.
During 2010 the Governing Council did not
change the key ECB interest rates (see Chart 43).
The interest rate on the MROs, the interest rate
on the marginal lending facility and the interest
rate on the deposit facility remained unchanged
at 1.00%, 1.75% and 0.25% respectively.
The width of the corridor was thus kept at
150 basis points.
At the beginning of 2010 some of the
non-standard monetary policy measures that had
been introduced in response to the intensifi cation
of the fi nancial crisis in 2008 were gradually
phased out. This involved discontinuing the
six-month, the 12-month and the supplementary
three-month LTROs and reintroducing variable
rate tender procedures in the regular three-month
LTROs, starting with the operation allotted on
28 April 2010. Meanwhile, full allotment and
fi xed rate tender procedures continued to apply
to the MROs and the special-term refi nancing
operations (with a maturity of one maintenance
period). Moreover, the foreign currency
liquidity-providing operations (in Swiss francs
and US dollars) conducted by the ECB were
discontinued after 31 January 2010.
On 10 May 2010 the Governing Council decided
on several measures to address the severe tensions
that had emerged over the preceding weeks
in certain fi nancial market segments. Besides
the decision to again conduct all refi nancing
operations as fi xed rate tender procedures with
full allotment, and to conduct a six-month
LTRO with full allotment on 12 May 2010,
the Governing Council announced the Securities
Markets Programme as a new measure to
address those tensions. In order to ensure that
the monetary policy stance is not affected by
1 MONETARY POLICY OPERATIONS, FOREIGN EXCHANGE OPERATIONS AND INVESTMENT ACTIVITIES
Chart 43 Key ECB interest rates and the EONIA
(percentages)
0.00.10.20.30.40.50.60.70.80.91.01.11.21.31.41.51.61.71.81.92.0
0.00.10.20.30.40.50.60.70.80.91.01.11.21.31.41.51.61.71.81.92.0
Maturity of the
first one-year LTRO
Maturity of the
second one-year LTRO
Maturity of the
third one-year LTRO
2010 2011
EONIA deposit rate marginal lending rate minimum bid rate
Jan. Feb. Mar. Apr. May June July Aug. Sep. Oct. Nov. Dec. Jan.
Source: ECB.

93ECB
Annual Report2010
the interventions under the SMP, the liquidity
injected through the SMP is absorbed through
the weekly collection of fi xed-term deposits from
the banking sector. Moreover, the temporary
swap lines with the US Federal Reserve System,
which were discontinued after 31 January 2010,
were reactivated in May 2010, in coordination
with other central banks, and the ECB resumed
US dollar liquidity-providing operations.
LIQUIDITY NEEDS OF THE BANKING SYSTEM
When supplying liquidity through open market
operations, the Eurosystem usually takes into
account a daily assessment of the liquidity needs
of the consolidated euro area banking system.
These liquidity needs are determined by the
sum of minimum reserve requirements, excess
reserves and autonomous factors. Autonomous
factors are those items on the Eurosystem’s
balance sheet, such as banknotes in circulation
and government deposits, which have an impact
on credit institutions’ current account holdings
but are not under the direct control of the
Eurosystem’s liquidity management.
However, with the exception of the regular
LTRO allotted on 28 April 2010, all of the
Eurosystem’s regular refi nancing operations
in 2010 were conducted as fi xed rate tender
procedures with full allotment.1 As a
consequence, the outstanding volume of
refi nancing operations continued to be driven
not by the supply considerations of the
Eurosystem, but rather by the demand from
counterparties, thereby refl ecting their
underlying liquidity preferences. The level of
current accounts above the minimum reserve
requirement in 2010 stood on average at
€1.26 billion, which was higher than the level of
previous years (€1.03 billion in 2009 2 and
€1.07 billion in 2008).
During 2010 the euro area banking system
continued to borrow an aggregate surplus
of liquidity and to deposit it back with the
Eurosystem, paying the fi xed rate on the
main refi nancing operations and receiving the
rate on the deposit facility (which implied a
spread of 75 basis points). The daily average
net recourse to the deposit facility of the
Eurosystem – which can be seen as one measure
of the aggregate liquidity surplus – increased
from almost €180 billion in January 2010 to
nearly €300 billion in June 2010. Thereafter,
it declined signifi cantly and steadily to just
above €50 billion in December 2010.
The implicit decline in the aggregate liquidity
surplus during the second half of 2010 shows
that the reduction in the total outstanding
refi nancing brought about by the maturing
of the one-year LTROs – the fi rst on 1 July
(€442.2 billion), the second on 30 September
(€75.2 billion) and the third on 23 December
(€96.9 billion) – was not compensated for
by an equivalent increase in the outstanding
volumes of the shorter-term refi nancing
operations conducted with full allotment fi xed
rate tender procedures (see Chart 44). This can
be interpreted as evidence that counterparties’
precautionary demand for liquidity from the
Eurosystem eased throughout the year.
In 2010 the average daily liquidity needs of
the euro area banking system amounted to
€557 billion, 3.5% lower than in 2009. The main
reason for the decrease was the decline in
autonomous factors, by 9%, to €346 billion
on average. Minimum reserve requirements
slightly decreased on average in 2010, to
€212 billion, compared with €216 billion
in 2009 (see Chart 44).
MINIMUM RESERVE SYSTEM
Credit institutions in the euro area are required to
hold minimum reserves on current accounts with
the Eurosystem. As has been the case since 1999,
the minimum reserve requirements were equal to
2% of credit institutions’ reserve base in 2010 and
amounted to €212 billion on average, 2% lower
The LTRO allotted on 28 April 2010 was conducted with a 1
minimum bid rate of 1.00%. This was a technical and transitional
measure to avoid allotment rates below the fi xed rate in the MRO
in the presence of ample liquidity. The indicative allotment
amount for this operation was €15 billion; as only €4.845 billion
was bid, the ECB allotted all bids in full. The weighted average
rate of this LTRO was 1.15%.
Slightly revised fi gure compared with the Annual Report 2009.2
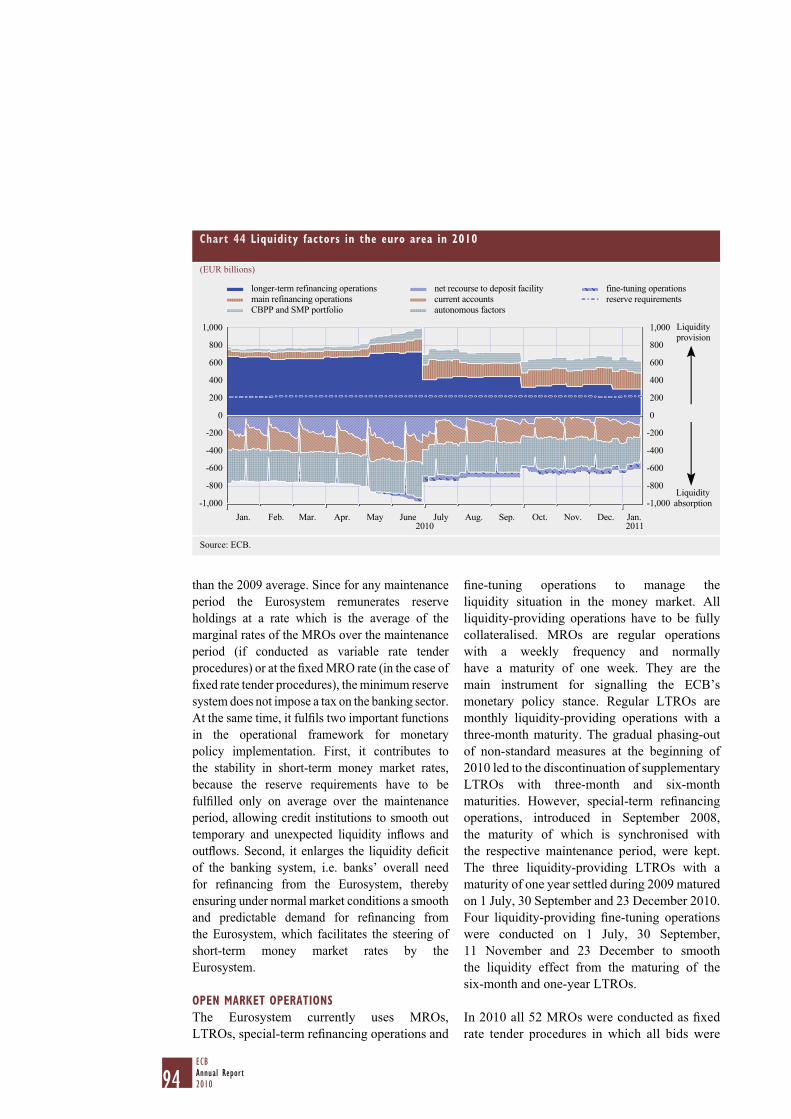
94ECBAnnual Report2010
than the 2009 average. Since for any maintenance
period the Eurosystem remunerates reserve
holdings at a rate which is the average of the
marginal rates of the MROs over the maintenance
period (if conducted as variable rate tender
procedures) or at the fi xed MRO rate (in the case of
fi xed rate tender procedures), the minimum reserve
system does not impose a tax on the banking sector.
At the same time, it fulfi ls two important functions
in the operational framework for monetary
policy implementation. First, it contributes to
the stability in short-term money market rates,
because the reserve requirements have to be
fulfi lled only on average over the maintenance
period, allowing credit institutions to smooth out
temporary and unexpected liquidity infl ows and
outfl ows. Second, it enlarges the liquidity defi cit
of the banking system, i.e. banks’ overall need
for refi nancing from the Eurosystem, thereby
ensuring under normal market conditions a smooth
and predictable demand for refi nancing from
the Eurosystem, which facilitates the steering of
short-term money market rates by the
Eurosystem.
OPEN MARKET OPERATIONS
The Eurosystem currently uses MROs,
LTROs, special-term refi nancing operations and
fi ne-tuning operations to manage the
liquidity situation in the money market. All
liquidity-providing operations have to be fully
collateralised. MROs are regular operations
with a weekly frequency and normally
have a maturity of one week. They are the
main instrument for signalling the ECB’s
monetary policy stance. Regular LTROs are
monthly liquidity-providing operations with a
three-month maturity. The gradual phasing-out
of non-standard measures at the beginning of
2010 led to the discontinuation of supplementary
LTROs with three-month and six-month
maturities. However, special-term refi nancing
operations, introduced in September 2008,
the maturity of which is synchronised with
the respective maintenance period, were kept.
The three liquidity-providing LTROs with a
maturity of one year settled during 2009 matured
on 1 July, 30 September and 23 December 2010.
Four liquidity-providing fi ne-tuning operations
were conducted on 1 July, 30 September,
11 November and 23 December to smooth
the liquidity effect from the maturing of the
six-month and one-year LTROs.
In 2010 all 52 MROs were conducted as fi xed
rate tender procedures in which all bids were
Chart 44 Liquidity factors in the euro area in 2010
(EUR billions)
-1,000
-800
-600
-400
-200
0
200
400
600
800
1,000
-1,000
-800
-600
-400
-200
0
200
400
600
800
1,000 Liquidity
provision
Liquidity
absorption
2010 2011Jan. Feb. Mar. Apr. May June July Aug. Sep. Oct. Nov. Dec. Jan.
longer-term refinancing operations
main refinancing operations
CBPP and SMP portfolio
net recourse to deposit facility
current accounts
autonomous factors
fine-tuning operations
reserve requirements
Source: ECB.

95ECB
Annual Report2010
satisfi ed. The number of eligible counterparties
increased to 2,267 in 2010, from 2,157 in 2009.
On average, 115 counterparties participated in
the MROs in 2010, compared with 401 in 2009.
The average volume allotted in the MROs was
€133.8 billion (see Chart 45), compared with
€149.8 billion in 2009. The average allotment
before the maturing of the fi rst one-year LTRO
(€88.4 billion) was about half the average
volume allotted during the second half of 2010
(€179.3 billion). In 2010 the lowest number of
counterparties (65) to participate in an MRO
was recorded in the operation that settled
on 3 March, and the lowest MRO volume
(€54 billion) was allotted in the operation that
settled on 6 January.
In the fi rst half of the year, before the fi rst
one-year LTRO matured, the daily average
outstanding volume of liquidity allotted
in the LTROs, supplementary LTROs and
special-term refi nancing operations was
€671 billion. In the second half of the year the
daily average fell to €431 billion before the
maturing of the second one-year LTRO on
30 September, and then decreased further to
€333 billion during the last quarter of the year
(see Chart 45).
Participation in the special-term refi nancing
operations (with a maturity equal to the length
of the reserve maintenance period) increased
signifi cantly in the course of the year, from
€5.7 billion allotted in January to €68 billion
allotted in December, with an eightfold increase
in counterparties’ participation (from 7 to 56).
Participation in the regular three-month LTROs
was rather volatile throughout 2010, from a
minimum of €2 billion allotted in March to a
maximum of €149 billion allotted in December
(an average of €45.1 billion). Finally, in the
two six-month operations settled on 1 April
and 13 May, counterparties participated for a
total of €18 billion and €36 billion respectively
(see Chart 45).
The Eurosystem central banks continued their
outright purchases of euro-denominated covered
bonds as part of the Covered Bond Purchase
Programme, which began on 6 July 2009.
The targeted amount of the CBPP of €60 billion,
purchased on the primary and secondary markets
over the 12-month life of the programme, was
reached on 30 June 2010. Together with the
SMP, €134.8 billion was provided in 2010
through outright purchases by the Eurosystem
(see Chart 45).
Chart 45 Outstanding volume of monetary policy operations
(EUR billions)
-500
-400
-300
-200
-100
0
100
200
300
400
500
600
700
800
900
1,000
-500
-400
-300
-200
-100
0
100
200
300
400
500
600
700
800
900
1,000
Jan. Feb. Mar. Apr. May June July Aug. Sep. Oct. Nov. Dec. Jan.
MROs and six-day fine-tuning operations
one-maintenance period LTROs
three-month LTROs
six-month LTROs
one-year LTROs
CBPP and SMP
liquidity-absorbing fine-tuning operations
net recourse to deposit facilityliquidity needs
2010 2011
Source: ECB.
96ECBAnnual Report2010
The ECB may conduct liquidity-providing and
liquidity-absorbing fi ne-tuning operations on
an ad hoc basis to manage liquidity conditions
in the market and to steer interest rates.
The Governing Council’s decision to
widen access to fi ne-tuning operations as of
6 October 2008 by granting eligibility to all
counterparties that are eligible to participate in
Eurosystem open market operations based on
standard tender procedures, and that additionally
fulfi l certain selection criteria specifi ed by the
respective NCBs, remained in effect in 2010.
In order to reabsorb the liquidity injected
through the Securities Markets Programme, the
ECB conducted liquidity-absorbing fi ne-tuning
operations to collect one-week fi xed-term
deposits for a weekly amount corresponding
to the settled size of the SMP itself. These
fi ne-tuning operations were carried out as variable
rate tender procedures with a maximum bid rate
of 1%. Moreover, the ECB conducted regular
fi ne-tuning operations to counter the liquidity
imbalance on the last day of the maintenance
periods. 12 liquidity-absorbing operations were
conducted, with a one-day maturity, as variable
rate tender procedures with a maximum bid rate
equal to the fi xed rate on the MROs. On average,
€232 billion was absorbed via these operations,
with 171 counterparties participating (see Chart 45).
STANDING FACILITIES
Counterparties may use the two standing
facilities on their own initiative to obtain
overnight liquidity against eligible collateral or
to place overnight deposits with the Eurosystem.
At the end of 2010, 2,395 counterparties had
access to the marginal lending facility and
2,789 counterparties had access to the deposit
facility.
The rates for these facilities provide a ceiling
and a fl oor for the overnight rate and therefore
perform an important function for monetary policy
implementation. The corridor formed by the rates
of the two standing facilities, with a width of
150 basis points, was kept symmetric around the
MRO rate, which was unchanged at 1.00%. This
was done to ensure that the rate on the deposit
facility remained above zero, thus maintaining
an incentive for counterparties to trade in the
unsecured overnight market.
The use of the deposit facility was kept at high
levels, in particular during the second quarter
of 2010, when a new record of €384.3 billion
was observed (on 11 June). The average daily
use of the deposit facility was €145.9 billion
(compared with €208.5 billion in the period
from 9 October until 31 December 2008 and
€109 billion in 2009). However, the use of
the deposit facility declined signifi cantly and
steadily throughout the second half of the year.
In 2010 recourse to the deposit facility followed
a broadly similar pattern during each reserve
maintenance period: the deposit facility amounts
were lower at the beginning of each period, but
increased subsequently as more counterparties
fulfi lled their reserve requirements.
The average daily recourse to the marginal
lending facility was €0.62 billion (compared
with €1 billion in 2009). This further decline may
confi rm a reduction in uncertainty about individual
banks’ liquidity needs, an improvement in the
functioning of the unsecured overnight interbank
market and, this year in particular, the ampleness
of allotments in the refi nancing operations.
ELIGIBLE ASSETS FOR MONETARY POLICY
OPERATIONS
As required by the Statute of the ESCB, and in
line with central bank practice worldwide, all
credit operations of the Eurosystem are based
on adequate collateral. The concept of adequacy
implies, fi rst, that the Eurosystem is to a large
extent protected from incurring losses in its
credit operations and, second, that suffi cient
collateral should be available to a wide set of
counterparties, so that the Eurosystem can provide
the amount of liquidity it deems necessary in its
monetary policy operations and as intraday credit
in payment system operations. To facilitate this,
the Eurosystem accepts a broad range of assets as
collateral in all its credit operations. This feature
of the Eurosystem’s collateral framework,
together with the fact that access to Eurosystem
open market operations is granted to a large pool

97ECB
Annual Report2010
of counterparties, has been key in supporting the
implementation of monetary policy in times of
stress. The inbuilt fl exibility of its operational
framework allowed the Eurosystem to provide
the necessary liquidity to address the impaired
functioning of the money market without
encountering widespread collateral constraints
during the fi nancial crisis. The temporary
measures to expand the list of eligible collateral
which were introduced at the end of 2008
remained in place until the end of 2010.
In 2010 the average amount of eligible collateral
increased by 7%, compared with 2009, to a total
of €14 trillion (see Chart 46). General government
debt, at €5.8 trillion, accounted for 41% of the total,
while the remainder of marketable collateral was
in the form of uncovered bank bonds (€2.7 trillion,
or 19%), covered bank bonds (€1.5 trillion, or
11%), corporate bonds (€1.5 trillion, or 11%),
asset-backed securities (ABSs; €1.3 trillion, or
9%), and other bonds (€0.6 trillion, or 4%), such
as those issued by supranational organisations.
The overall volume of marketable assets which
had become eligible as a result of the temporary
measures introduced in 2008 stood at €1.3 trillion
at the end of 2010. The list of eligible collateral
also includes non-marketable assets, mostly
credit claims (also referred to as “bank loans”).
In contrast to marketable assets, it is not possible
to assess the eligibility of credit claims as long
as they are not registered with the Eurosystem.
Therefore, the volume of potentially eligible
non-marketable assets cannot easily be measured.
Taking into account this caveat, the amount of
non-marketable assets deposited by counterparties
as collateral in Eurosystem credit operations
reached €0.4 trillion in 2010, representing 3% of
total eligible collateral in the Eurosystem. The
lower credit threshold temporarily introduced
to expand the list of eligible collateral was also
applied to non-marketable assets.
The average value of marketable and
non-marketable assets put forward by
counterparties as collateral in Eurosystem credit
operations slightly decreased, from €2,034 billion
in 2009 to €2,010 billion in 2010. This decrease
refl ected mainly the fact that counterparties had
on average lower liquidity needs throughout
2010. However, despite decreased liquidity
needs, counterparties kept, on aggregate,
similarly large additional amounts of collateral
Chart 46 Eligible collateral by asset type
(EUR billions; annual averages)
2,000
4,000
6,000
8,000
10,000
12,000
14,000
16,000
2005 2006 2007 2008 2009 2010
central government securities
regional government securities
uncovered bank bonds
covered bank bonds
corporate bonds
asset-backed securities
other marketable assets
non-marketable assets
0
2,000
4,000
6,000
8,000
10,000
12,000
14,000
16,000
0
Source: ECB.
Chart 47 Collateral put forward in Eurosystem credit operations versus outstanding credit in monetary policy operations 1)
(EUR billions)
500
1,000
1,500
2,000
2,500
0
500
1,000
1,500
2,000
2,500
02005 2006 2007 2008 2009 2010
total collateral put forward
of which: outstanding credit
peak outstanding credit
Source: ECB.
1) “Collateral put forward” refers to assets deposited as collateral
in countries operating a pooling system and assets used as
collateral in countries operating an earmarking system.
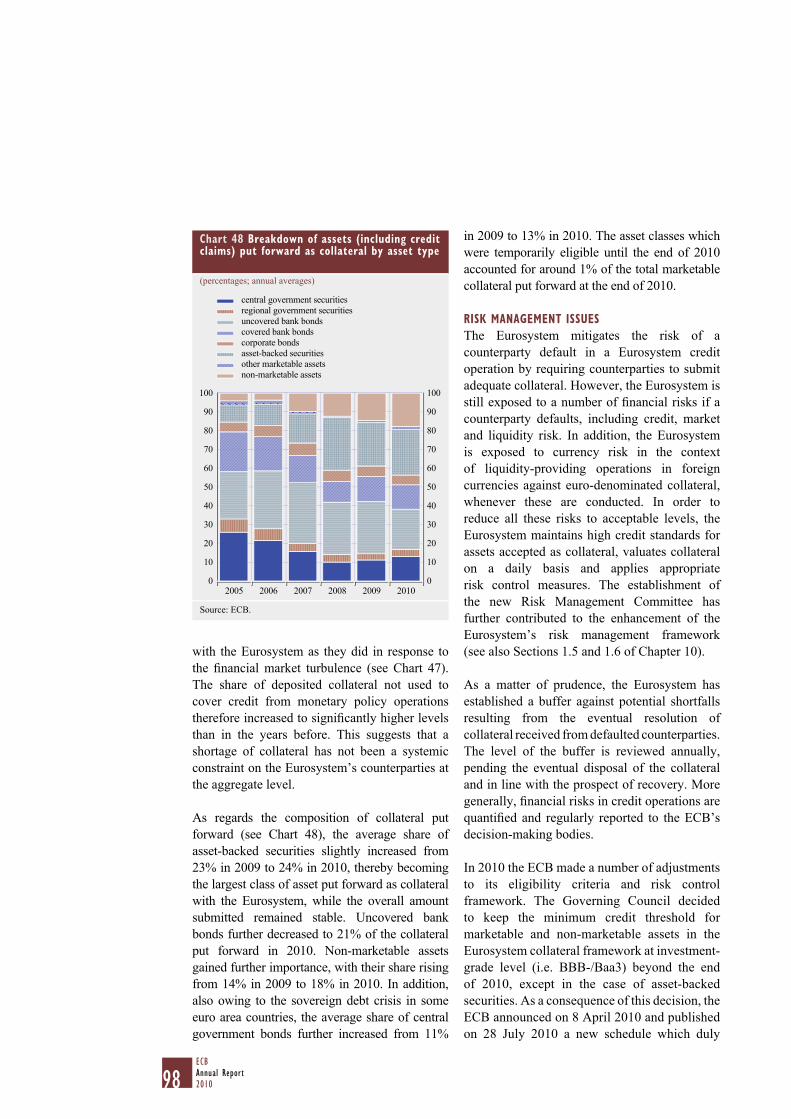
98ECBAnnual Report2010
with the Eurosystem as they did in response to
the fi nancial market turbulence (see Chart 47).
The share of deposited collateral not used to
cover credit from monetary policy operations
therefore increased to signifi cantly higher levels
than in the years before. This suggests that a
shortage of collateral has not been a systemic
constraint on the Eurosystem’s counterparties at
the aggregate level.
As regards the composition of collateral put
forward (see Chart 48), the average share of
asset-backed securities slightly increased from
23% in 2009 to 24% in 2010, thereby becoming
the largest class of asset put forward as collateral
with the Eurosystem, while the overall amount
submitted remained stable. Uncovered bank
bonds further decreased to 21% of the collateral
put forward in 2010. Non-marketable assets
gained further importance, with their share rising
from 14% in 2009 to 18% in 2010. In addition,
also owing to the sovereign debt crisis in some
euro area countries, the average share of central
government bonds further increased from 11%
in 2009 to 13% in 2010. The asset classes which
were temporarily eligible until the end of 2010
accounted for around 1% of the total marketable
collateral put forward at the end of 2010.
RISK MANAGEMENT ISSUES
The Eurosystem mitigates the risk of a
counterparty default in a Eurosystem credit
operation by requiring counterparties to submit
adequate collateral. However, the Eurosystem is
still exposed to a number of fi nancial risks if a
counterparty defaults, including credit, market
and liquidity risk. In addition, the Eurosystem
is exposed to currency risk in the context
of liquidity-providing operations in foreign
currencies against euro-denominated collateral,
whenever these are conducted. In order to
reduce all these risks to acceptable levels, the
Eurosystem maintains high credit standards for
assets accepted as collateral, valuates collateral
on a daily basis and applies appropriate
risk control measures. The establishment of
the new Risk Management Committee has
further contributed to the enhancement of the
Eurosystem’s risk management framework
(see also Sections 1.5 and 1.6 of Chapter 10).
As a matter of prudence, the Eurosystem has
established a buffer against potential shortfalls
resulting from the eventual resolution of
collateral received from defaulted counterparties.
The level of the buffer is reviewed annually,
pending the eventual disposal of the collateral
and in line with the prospect of recovery. More
generally, fi nancial risks in credit operations are
quantifi ed and regularly reported to the ECB’s
decision-making bodies.
In 2010 the ECB made a number of adjustments
to its eligibility criteria and risk control
framework. The Governing Council decided
to keep the minimum credit threshold for
marketable and non-marketable assets in the
Eurosystem collateral framework at investment-
grade level (i.e. BBB-/Baa3) beyond the end
of 2010, except in the case of asset-backed
securities. As a consequence of this decision, the
ECB announced on 8 April 2010 and published
on 28 July 2010 a new schedule which duly
Chart 48 Breakdown of assets (including credit claims) put forward as collateral by asset type
(percentages; annual averages)
0
10
20
30
40
50
60
70
80
90
100
0
10
20
30
40
50
60
70
80
90
100
2005 2006 2007 2008 2009 2010
central government securities
regional government securities
uncovered bank bonds
covered bank bonds
corporate bonds
asset-backed securities
other marketable assets
non-marketable assets
Source: ECB.
99ECB
Annual Report2010
graduates haircuts according to differences in
maturities, liquidity categories and the credit
quality of the assets concerned, based on an
updated assessment of the risk characteristics
of eligible assets and the actual use of eligible
assets by counterparties. Moreover, some
changes were introduced in the defi nition of
liquidity categories for marketable assets and
the application of additional valuation mark-
downs for theoretically valued assets. The new
schedule came into force on 1 January 2011.
On 3 May 2010 the Governing Council decided
to suspend, until further notice, the application
of the minimum credit rating threshold in
the collateral eligibility requirements for the
purposes of the Eurosystem’s credit operations
in the case of marketable debt instruments
issued or guaranteed by the Greek government.
This decision was, also from a risk management
perspective, a result of the positive assessment
of the Governing Council on the economic and
fi nancial adjustment programme negotiated with
the European Commission, in liaison with the
ECB, and the IMF and approved by the Greek
government, along with the strong commitment
of the Greek government to fully implement the
programme.
On 9 October 2010 the Governing Council
decided on a number of further adjustments
to the framework for the implementation of
monetary policy in the euro area. These changes
included clearer and more stringent provisions
for the eligibility of ABSs, the introduction of
additional exemptions from the prohibition of
close links, the enhancement of the formulation
regarding the suspension, limitation or exclusion
of counterparties and assets on the grounds
of prudence or a default, and clarifi cations
regarding the treatment of cases where the
counterparty fails to suffi ciently collateralise a
liquidity-providing operation.
With a view to increasing transparency with
regard to ABSs, thus making it possible to
make more informed risk assessments for such
assets and helping to restore confi dence in the
securitisation markets, the Governing Council
decided on 16 December 2010 to establish
loan-by-loan information requirements for
ABSs in the Eurosystem collateral framework.
The Governing Council intends to introduce the
loan-by-loan information requirements within
approximately 18 months of the aforementioned
date, fi rst for retail mortgage-backed securities
and thereafter gradually for other ABSs.
When the necessary data-handling infrastructure
to allow the processing, verifi cation and
transmission of the data has been established by
market participants, the provision of loan-by-loan
information will become an eligibility requirement
for the instruments concerned. The Eurosystem
will continue to accept securities not meeting the
new information criteria until the obligation to
submit loan-level data comes into force.
1.2 FOREIGN EXCHANGE OPERATIONS AND
OPERATIONS WITH OTHER CENTRAL BANKS
In 2010 the Eurosystem did not undertake any
interventions in the foreign exchange market.
Furthermore, the ECB did not undertake
any foreign exchange operations in the
currencies that participate in the exchange rate
mechanism II. The standing agreement between
the ECB and the IMF to facilitate the initiation
of special drawing right (SDR) transactions by
the IMF on behalf of the ECB with other SDR
holders was only activated on one occasion
in 2010.
The reciprocal currency arrangement (swap line)
that the ECB established with the US Federal
Reserve System in 2007 to counter strains in the
European US dollar funding markets expired
on 1 February 2010. In connection with the
US dollar Term Auction Facility of the Federal
Reserve System, and in close cooperation with
other central banks, the Eurosystem provided the
US dollar funding received via this swap line to
its counterparties against collateral eligible for
Eurosystem credit operations. In January 2010
the Eurosystem conducted four operations as
fi xed rate tender procedures with full allotment
and a seven-day maturity. The decision to let
100ECBAnnual Report2010
the liquidity swap line expire was taken against
the background of improving conditions on
fi nancial markets in 2009. On 10 May, however,
the temporary swap line was reactivated as part
of a package to address the severe tensions in
certain market segments that re-emerged in
connection with the sovereign debt crisis in some
euro area countries. In particular, the reactivation
was designed to help alleviate pressures in US
dollar funding markets and to prevent the spread
of strains to other markets. These operations
took the form of repurchase agreements and
were carried out as fi xed rate tender procedures
with full allotment. Between May 2010 and
25 February 2011 the Eurosystem conducted
32 operations with a seven-day maturity, as well
as one 14-day operation on 22 December and
one 84-day operation on 18 May.
The Eurosystem continued to provide Swiss
franc liquidity to its counterparties via four
swap operations with a seven-day maturity in
January 2010. These operations were conducted
in the form of EUR/CHF foreign exchange
swaps at a fi xed price and with a maximum
allotment amount, determined by the ECB in
coordination with the Swiss National Bank. On
18 January 2010 the ECB announced that the
Governing Council had decided, in agreement
with the Swiss National Bank, to stop conducting
one-week Swiss franc liquidity-providing swap
operations after 31 January 2010, against the
background of declining demand and improved
conditions in funding markets.
The ECB and the Bank of England announced
on 17 December 2010, within the framework
of central bank cooperation, a temporary
liquidity swap facility, under which the Bank
of England could provide, if necessary, up to
GBP 10 billion to the ECB in exchange for
euro. The agreement, which expires at the end
of September 2011, allows pounds sterling to be
made available to the Central Bank of Ireland
as a precautionary measure, for the purpose of
meeting any temporary liquidity needs of the
banking system in that currency. This swap
facility was not used in 2010.
On 31 December 2010 a liquidity-providing
repurchase transaction of €1.8 billion, with
a maturity of three days, was settled. This
transaction was conducted by the ECB in
connection with liquidity arrangements in place
with central banks outside the euro area.
1.3 THE SECURITIES MARKETS PROGRAMME
The Governing Council decided in May 2010 to
establish the Securities Markets Programme.
The objective of this temporary and ongoing
programme is to address the malfunctioning of
certain euro area debt securities market segments
and to ensure an appropriate monetary policy
transmission mechanism. In practice, the
programme is implemented by Eurosystem
portfolio managers carrying out purchases of
certain euro area debt securities in market
interventions. By 31 December 2010 the
Eurosystem had purchased securities under the
SMP with a total settlement amount of around
€73.5 billion.3
In order to reabsorb the liquidity injected
through the Securities Markets Programme, the
ECB conducted liquidity-absorbing fi ne-tuning
operations to collect one-week fi xed-term deposits
for a weekly amount corresponding to the settled
size of the SMP itself (see the “Open market
operations” section earlier in this chapter).
1.4 THE COVERED BOND PURCHASE PROGRAMME
At the end of June the purchases carried out
under another programme, the Covered Bond
Purchase Programme, were completed. The
Eurosystem purchased a nominal amount of
€60 billion under the CBPP over the one-year
period of its implementation, from 6 July 2009
to 30 June 2010. The aim of this programme,
More information on the SMP can be found in the ECB’s 3
press release of 10 May 2010, the ECB’s Decision of 14 May
2010 establishing a securities markets programme and the data
published as part of the weekly fi nancial statements of the
Eurosystem.
101ECB
Annual Report2010
which was one of the building blocks of the
ECB’s enhanced credit support approach, was
to contribute to the revival of the covered bond
market. One of the main signs of the success of
the CBPP is the noticeable reactivation of
primary market activity for covered bonds.
Between the announcement of the CBPP and its
termination, 175 CBPP-eligible new covered
bonds and 55 taps of existing CBPP-eligible
covered bonds were issued for an overall amount
of around €184 billion.4 Since March 2010 the
securities held under the CBPP have been made
available for lending on demand to eligible
counterparties against eligible collateral. While
this lending activity remained limited in terms
of amounts, it is considered useful for proper
market functioning that the securities held under
the CBPP are in principle available for lending.
1.5 INVESTMENT ACTIVITIES
The ECB’s investment activities other than
those related to the SMP and CBPP (see above)
are organised in such a way as to ensure that no
inside information about central bank policy
actions may be used when making investment
decisions. A set of rules and procedures
(known as a “Chinese wall”) ensures that
inside information about monetary and foreign
exchange policies of the ECB and of other
central banks does not reach the staff members
of the ECB’s Investment Division or the
staff members of the NCBs who are involved
in the ECB’s investment activities. Should
inside information be passed on to these staff
members, be it on purpose or not, the ECB’s
investment activities may be suspended in full
or in part, which means that the compositions of
the ECB’s investment portfolios compared with
their respective benchmarks are not allowed
to change.
FOREIGN RESERVE MANAGEMENT
The ECB’s foreign reserve portfolio was
originally set up through transfers of foreign
reserve assets from the euro area NCBs. Over
time, the composition of the portfolio refl ects
changes in the market value of the invested assets,
as well as foreign exchange and gold operations
of the ECB. The main purpose of the ECB’s
foreign reserves is to ensure that, whenever
needed, the Eurosystem has a suffi cient amount
of liquid resources for its foreign exchange
policy operations involving non-EU currencies.
The objectives for the management of the ECB’s
foreign reserves are, in order of importance,
liquidity, security and return.
The ECB’s foreign reserve portfolio consists of
US dollars, Japanese yen, gold and SDRs. The
US dollar and Japanese yen reserves are actively
managed by the ECB and those euro area NCBs
that wish to take part in this activity as agents
for the ECB. Since January 2006 a “currency
specialisation model” has been in operation to
increase the effi ciency of the ECB’s investment
operations. Under this scheme, each NCB which
wishes to be involved in ECB foreign reserve
management, or group of NCBs acting jointly
for this purpose, is as a rule allocated a share
in the US dollar or the Japanese yen portfolio.5
Eesti Pank expressed an interest in being
involved in ECB foreign reserve management
activities and established a pool together with
Suomen Pankki – Finlands Bank for carrying
out these activities together, whereby the two
NCBs jointly manage a portion of the ECB’s
Japanese yen portfolio on behalf of the ECB.
The value of the ECB’s net foreign reserve
assets 6 at current exchange rates and market
prices increased from €51 billion at end-2009 to
€60.6 billion at end-2010, of which €43.2 billion
was in foreign currencies (i.e. the Japanese yen
and the US dollar) and €17.4 billion was in
More information on the CBPP can be found in: the monthly 4
CBPP reports published between August 2009 and June 2010;
the box entitled “Covered bond market developments and the
covered bond purchase programme”, Monthly Bulletin, ECB,
August 2010; and “The impact of the Eurosystem’s covered bond
purchase programme on the primary and secondary markets”,
Occasional Paper Series, No 122, ECB, January 2011.
For more details, see the article entitled “Portfolio management at 5
the ECB”, Monthly Bulletin, ECB, April 2006.
Net foreign reserve assets are calculated as offi cial reserve assets 6
excluding the net, marked-to-market value of foreign currency
swaps, plus deposits in foreign currency with residents, minus
future predetermined net drains on foreign currency holdings
owing to repurchase and forward transactions. For detailed
information on the data sources, see the ECB’s website.

102ECBAnnual Report2010
gold and SDRs. Applying the exchange rates of
end-2010, US dollar-denominated assets
represented 76% of the foreign currency
reserves, while those denominated in Japanese
yen accounted for 24%. The 13% increase in the
value of the foreign currency portfolio mainly
refl ected the appreciation of the Japanese yen
(by 22.6%) and the US dollar (by 7.8%) versus
the euro over the year, as well as positive
contributions from the capital gains and interest
income generated by portfolio management
activities. The value of the gold and SDR
holdings increased by around 37%. This increase
was mostly due to the appreciation of gold by
around 38% in 2010, as measured in euro terms.
During 2010 the ECB’s gold holdings did not
change, but they increased at the start of 2011
when Eesti Pank transferred some gold to the
ECB as part of its transfer of foreign reserve
assets to the ECB.
In 2010 the list of eligible instruments in
which the ECB’s foreign reserve portfolio
can be invested was unchanged. In October an
automatic securities lending programme for the
ECB’s US dollar-denominated assets was started
on the portion of the portfolio managed by the
Deutsche Bundesbank on behalf of the ECB.
OWN FUNDS MANAGEMENT
The ECB’s own funds portfolio consists of
the invested counterpart of the ECB’s paid-up
capital, as well as amounts held in its general
reserve fund and its provision against foreign
exchange rate, interest rate and gold price risks.
The purpose of this portfolio is to provide the
ECB with income to help to cover its operating
expenses. The objective of its management
is to maximise expected returns, subject to a
no-loss constraint at a certain confi dence level.
The portfolio is invested in euro-denominated
fi xed income assets.
The value of the portfolio at current market
prices grew from €11.8 billion at end-2009 to
€13.3 billion at end-2010. The increase in market
value was due to the increase in the ECB’s
paid-up capital effective on 29 December 2010,
as well as to investment returns.
In 2010 the list of eligible instruments in which
the ECB’s own funds portfolio can be invested
was unchanged.
To comply with the strict Chinese wall in
place at the ECB, the implementation of the
CBPP and the SMP led to a partial freeze in the
investment activities related to the ECB’s own
funds portfolio in 2010.
RISK MANAGEMENT ISSUES
The fi nancial risks to which the ECB is
exposed in its investment activities are closely
monitored and measured in order to keep
them within the levels specifi ed by the ECB’s
decision-making bodies. For this purpose, a
detailed limit structure is in place and limits are
monitored daily. Regular reporting ensures that
all stakeholders are adequately informed of the
level of such risks.
In 2010 the ECB continued to enhance the IT
infrastructure supporting the risk management
framework for its investment operations. This
framework, which had been extended to cover
the portfolio of covered bonds purchased by
the ECB under the Covered Bond Purchase
Programme, now also covers the Securities
Markets Programme.
One of the indicators used to monitor market
risk is Value-at-Risk (VaR), which defi nes the
loss for a portfolio of assets that will not be
exceeded at the end of a specifi ed period of
time with a given probability. The value of this
indicator depends on a series of parameters used
for the calculation, in particular the confi dence
level, the length of the time horizon and the
sample used to estimate asset price volatility.
As an illustration, computing this indicator for the
ECB’s investment portfolio, the CBPP portfolio
and the SMP portfolio, on 31 December 2010,
using as parameters a 95% confi dence level, a
time horizon of one year, and a sample of one
year for asset price volatility, would result
in a VaR of €10.867 billion. Computing the
same indicator with a fi ve-year instead of a
one-year sample would result in a VaR of
€10.427 billion. The largest part of this market
103ECB
Annual Report2010
risk is due to currency and gold price risk.
The low levels of interest rate risk in the ECB’s
investment portfolios refl ect the fact that the
modifi ed duration of these portfolios remained
relatively low in 2010.
The overall level of risks faced by the ECB has
increased in view of the increased volatility in
foreign exchange rates, interest rates and gold
prices, as well as higher credit risk. This was
one of the main reasons why the ECB decided
to increase its subscribed capital by €5 billion
with effect from 29 December 2010. As the
maximum size of the ECB’s provision and
reserves is equal to the level of its paid-up
capital, this decision will allow the Governing
Council to augment the provision by an amount
equivalent to the capital increase, thus further
strengthening the fi nancial buffers of the ECB.

104ECBAnnual Report2010
2 PAYMENT AND SECURITIES SETTLEMENT SYSTEMS
The Eurosystem has the statutory task of
promoting the smooth operation of payment
systems. Payment systems and securities clearing
and settlement systems are fundamental
infrastructures that are necessary for the proper
functioning of market economies. They are
indispensable for the effi cient fl ow of payments
for goods, services and fi nancial assets, and
their smooth functioning is crucial for the
implementation of a central bank’s monetary
policy and for maintaining the stability of
and confi dence in the currency, the fi nancial
system and the economy in general. For the
performance of this task, the Eurosystem applies
three approaches: it takes on an operational role,
conducts oversight activities and acts as a catalyst
(for further details on the second and third of
these, see Sections 3 and 4 of Chapter 4).
In terms of its operational role, the Eurosystem,
according to the Statute of the ESCB, may
provide facilities to ensure effi cient and sound
clearing and payment systems. To this end, the
Eurosystem operates the TARGET2 system
and the correspondent central banking model
(CCBM), is in the process of establishing
TARGET2-Securities (T2S) and is developing
a new Collateral Central Bank Management
system (CCBM2).
2.1 THE TARGET2 SYSTEM
The Eurosystem operates the TARGET2
system for large-value and urgent payments in
euro. TARGET2 plays an important role in the
execution of the single monetary policy and the
functioning of the euro money market. It offers
a real-time settlement service in central bank
money and broad market coverage. It processes
large-value and urgent transactions without any
upper or lower limit on the value of payments and
has also attracted a variety of other payments.
The system is based on a single technical
infrastructure, the Single Shared Platform
(SSP). Three Eurosystem central banks – the
Banca d’Italia, the Banque de France and the
Deutsche Bundesbank – jointly provide the SSP
and operate it on behalf of the Eurosystem.
By December 2010 TARGET2 had 928 direct
participants. The overall number of banks
(including branches and subsidiaries) that can
be addressed worldwide through TARGET2
remained stable at some 52,000. In addition,
TARGET2 settled the cash positions of
67 ancillary systems.
TARGET2 OPERATIONS
The TARGET2 system functioned smoothly
in 2010 and settled a large number of euro
payments. The system’s market share increased
slightly, with 91% of the total value of payments
in euro large-value payment systems being
executed via TARGET2. In 2010 the system
processed a total of 88,591,926 transactions,
with a daily average of 343,380 transactions.
Compared with the previous year, the overall
volume of transactions was more or less
the same, rising only marginally, by 0.1%.
The total value of TARGET2 traffi c in 2010
was €593,194 billion, with an average daily
value of €2,299 billion. Compared with 2009,
the overall value of the transactions processed
by the system increased by 7.6%. Table 12
provides an overview of payment traffi c in the
TARGET2 system in 2010, comparing it with
traffi c in the previous year.
Table 12 Payment traffic in TARGET21)
Value (EUR billions)
2009 2010 Change (%)
TARGET2 overallTotal 551,174 593,194 7.6
Daily average 2,153 2,299 6.8
Volume (number of transactions)
2009 2010 Change (%)
TARGET2 overallTotal 88,517,321 88,591,926 0.1
Daily average 345,771 343,380 -0.7
Source: ECB. 1) There were 256 operating days in 2009 and 258 operating days in 2010.

105ECB
Annual Report2010
In 2010 the overall availability 7 of TARGET2
reached 99.68% and was affected only by
incidents occurring in relation to national
proprietary home accounting systems,8 while
the SSP itself achieved 100% availability. 100%
of the payments in the SSP were processed
within fi ve minutes. The system’s very positive
performance, which has improved continuously
since migration to TARGET2, met with the
satisfaction of participants.
COOPERATION WITH TARGET2 USERS
The Eurosystem maintains close relations with
TARGET2 users. Regular meetings were held
between the NCBs and national TARGET2 user
groups in 2010. In addition, joint meetings of the
Eurosystem Working Group on TARGET2 and
the TARGET Working Group of the European
credit sector associations took place on a
quarterly basis to discuss TARGET2 business
issues at the pan-European level. Strategic
issues were addressed in the Contact Group on
Euro Payments Strategy, a forum composed
of senior representatives from commercial and
central banks.
MANAGEMENT OF NEW SYSTEM RELEASES
The Eurosystem attaches the greatest importance
to the development of TARGET2 in order
to further increase the level of service offered
and to meet the needs of its participants.
In October 2010 the Eurosystem launched
a user consultation on a possible strategy
for improving TARGET2’s compliance with
ISO 20022 standards.
On 22 November 2010 the fourth release
of the SSP was implemented.9 The main
innovation of this release was the introduction
of internet-based access to TARGET2. This
consists of an alternative form of direct
access to the main services of TARGET2,
without, however, requiring connection to the
SWIFT network. The Eurosystem developed
internet-based access to meet the needs of small
and medium-sized banks.
In November 2010 the Eurosystem also fi nalised
the contents of the fi fth release, which is due
to be implemented on 21 November 2011.
This release will include the provision of a
network linking the participating central banks
that will give them direct access to the main
TARGET2 services in the event of a SWIFT
outage, as well as various other enhancements
requested by the user community.
COUNTRIES PARTICIPATING IN TARGET2
All euro area countries participate in TARGET2,
as its use is mandatory for the settlement of all
payment orders related to the Eurosystem’s
monetary policy operations. In 2002 the
Governing Council of the ECB confi rmed
the right of non-euro area EU central banks to
connect to the TARGET system on a voluntary
basis in order to facilitate the settlement
of euro-denominated transactions in these
countries. From a legal and business point
of view, each central bank is responsible
for managing its system component and for
maintaining relationships with its participants.
In addition, some fi nancial institutions located
in other EEA countries participate in TARGET2
via remote access.
At the current juncture 23 central banks of the
EU and their respective user communities are
connected to TARGET2: the 17 euro
area national central banks, the ECB and fi ve
national central banks from non-euro area
countries.10 In February 2010 Българска
народна банка (Bulgarian National Bank) and
its national user community connected to
TARGET2. Recently, contacts have been
established with Banca Naţională a României,
since it has expressed an interest in joining
TARGET2. Romania’s connection to
The level of availability is the extent to which participants were 7
able to use the TARGET2 system during their business hours
without incident.
Proprietary home accounting systems, in which some payment 8
transactions can be settled until May 2012, are operated by some
national central banks.
The system updates introduced in the fourth release were refl ected 9
in Guideline ECB/2010/12 of 15 September 2010 amending
Guideline ECB/2007/2 on a Trans-European Automated Real-
time Gross settlement Express Transfer system (TARGET2).
The Guideline also takes into account the technical changes
required following the entry into force of the Treaty.
Bulgaria, Denmark, Latvia, Lithuania and Poland.10
106ECBAnnual Report2010
TARGET2 is scheduled for July 2011,
following completion of the necessary
preparatory work.
2.2 TARGET2-SECURITIES
T2S is the future Eurosystem service for
securities settlement in central bank money
in Europe. The project is currently in the
development phase, and the settlement platform
is due to go live in September 2014. 30 central
securities depositories (CSDs) are presently
involved in the project and it is expected
that almost all traded securities in Europe
will be settled in T2S, leading to signifi cant
economies of scale and very low settlement
costs. By removing the distinction between
cross-border and domestic settlement, T2S will
constitute a major breakthrough in the creation
of an integrated capital market for Europe,
providing a solid basis for increasing effi ciency
and competition in the entire post-trading sector.
Although T2S is a Eurosystem initiative, it will
also settle securities transactions in currencies
other than the euro if the relevant central bank,
with the support of its market, gives its consent.
Much progress was achieved on the technical
side in 2010. The T2S user requirements were
fi nalised early on in the year, enabling four
Eurosystem central banks – the Deutsche
Bundesbank, the Banco de España, the Banque
de France and the Banca d’Italia – to begin the
IT software development work. T2S is now on
course to launch user testing in January 2014
and go live in September of the same year.
Signifi cant headway was made in 2010 on the
key policy aspects of the project, particularly
issues such as how T2S will be governed, how
much T2S will charge for the settlement of
securities transactions, how T2S will be legally
set up, and how participants will be able to
connect to T2S.
The governance of T2S is of central
importance to all T2S stakeholders. The four
main stakeholder groups are: i) the Eurosystem
as system owner and operator, ii) non-euro area
central banks which provide their currencies in
T2S, iii) CSDs which outsource their securities
accounts to T2S, and iv) market participants
more widely (i.e. banks, custodians, central
counterparties, etc.). In the proposed future
governance set-up, each of the groups will have
an appropriate degree of infl uence over T2S,
while at the same time facilitating a timely
decision-making process and ensuring safe and
effi cient infrastructure.
In November 2010 the Eurosystem came to
a decision on the prices for the future T2S
settlement services. After taking into account
the development and future running costs,
together with the expected settlement volumes
on the platform, the Eurosystem set the price
for the settlement of delivery-versus-payment
(DvP) instructions at 15 cent, provided that the
following conditions are fulfi lled: i) currencies
other than the euro add at least 20% to the
euro settlement volume, ii) the securities
settlement volume in the EU is no more than
10% lower than the volumes projected by the
T2S Programme Offi ce, which are based on
information provided by market participants,
and iii) the Eurosystem will not be charged VAT
for T2S services. This price will be fi xed for the
period from September 2014, when T2S is due
to go live, to December 2018. In order to provide
assurance to market participants about T2S
prices after 2018, the Governing Council has
made a commitment not to increase T2S fees by
more than 10% per year until September 2022.
Pricing DvP settlement instructions at a low
price of 15 cent each – a price which is identical
for both national and cross-border settlement –
means that even when including add-on charges
from CSDs and from connectivity charges,
the end-to-end price of settlement should
be lower than the current price of national
settlement anywhere in Europe. T2S will reduce
the cost of settling cross-border transactions by
around 90% on average. Combined with the
positive effects on competition across the whole
post-trading value chain, T2S will, therefore,
deliver a major boost to cost-effi ciency in
securities settlement throughout Europe.
107ECB
Annual Report2010
In 2010 substantial progress was also made on
the legal framework for T2S. On 21 April 2010
the Governing Council of the ECB adopted
the T2S Guideline.11 The T2S Guideline is the
cornerstone of the legal framework for T2S
and the basis for all other legal agreements to
be concluded in the future. It is binding for all
of the Eurosystem central banks, but does not
bestow any obligations on third parties.
The work carried out on governance and
pricing was also a key ingredient in the legal
work involved in negotiating the contractual
arrangements for T2S: negotiations between
the Eurosystem and those CSDs that intend
to use T2S, as well as negotiations between
the Eurosystem and those non-euro area
central banks that are considering making their
currencies available for settlement in T2S.
Once the negotiations with the CSDs have
been completed, the Governing Council of the
ECB will endorse the Framework Agreement
and then submit it to the CSDs for assessment
and signature by autumn 2011. Negotiations
on the Currency Participation Agreement with
the non-euro area central banks progressed
well during 2010 and it is anticipated that the
Governing Council will submit the Agreement
to non-euro area central banks in June 2011 for
assessment and signature by autumn 2011.
The Eurosystem has also been working on the
framework for the selection of external network
providers for T2S. These are the entities that
will provide the infrastructure to enable CSDs,
central banks and directly connected participants
to send instructions to – and receive messages
from – the T2S platform.
Finally, the T2S Programme Offi ce, with the
strong commitment and dedication of the T2S
Advisory Group, was heavily involved in
promoting the further harmonisation of
securities settlement across Europe.12
Participation in the European Commission’s
Clearing and Settlement Advisory Monitoring
Expert Group II, as well its successor, the Expert
Group on Market Infrastructures, ensures that
harmonisation activities in T2S are in line with
the overall public and private initiatives in the
fi eld.13 The T2S Advisory Group worked on the
implementation of the corporate action standards
on transaction management, the development of
the ISO messages for T2S, and the improvement
of cross-border shareholder transparency.
Progress has also been made in terms of the
harmonisation of the settlement fi nality rules for
CSDs participating in T2S. The T2S Advisory
Group also launched work to identify and
overcome any remaining obstacles to smooth
cross-border settlement in T2S. The outcome of
this work is essential to ensuring effi cient
processing in T2S. Furthermore, at the end of
2010 the T2S Advisory Group identifi ed key
priorities for further harmonisation work in the
coming years.
2.3 SETTLEMENT PROCEDURES FOR COLLATERAL
A common set of eligible assets may be used
to collateralise all types of Eurosystem credit
operation, not only at the domestic level but
also across national borders. The cross-border
settlement of collateral in the euro area is
conducted mainly via the CCBM and through
eligible links between euro area securities
settlement systems (SSSs). Whereas the fi rst
solution is provided by the Eurosystem, the
latter is a market-led initiative.
In December 2010 the amount of cross-border
collateral (including both marketable and
non-marketable assets) held by the Eurosystem
decreased to €762 billion, down from
€866 billion in December 2009. Overall, at the
end of 2010 cross-border collateral represented
35.0% of the total collateral provided to the
Eurosystem.
Guideline ECB/2010/2 of 21 April 2010 on TARGET2-11
Securities.
The T2S Advisory Group advises the decision-making bodies 12
of the ECB on both technical and policy issues concerning T2S.
The T2S Advisory Group consists of approximately 90 senior
representatives from national central banks, CSDs and market
participants which have signalled their interest in joining T2S.
For further details, see Section 3 of Chapter 4 on fi nancial 13
integration.

108ECBAnnual Report2010
EUROSYSTEM COLLATERAL MANAGEMENT
SERVICES
The CCBM remained the main channel
for transferring cross-border collateral in
Eurosystem monetary policy and intraday credit
operations in 2010, accounting for 24.1% of
the total collateral provided to the Eurosystem
in that year. Assets held in custody through the
CCBM decreased from €569 billion at the end
of 2009 to €507 billion at the end of 2010.
Commencing operations in 1999, the CCBM was
set up as an interim arrangement based on the
principle of minimum harmonisation. In order
to introduce a more harmonised level of service,
the Eurosystem decided in 2008 to launch
CCBM2, which is based on a single platform.
The development and operation of CCBM2 on
behalf of the Eurosystem was assigned to the
Nationale Bank van België/Banque Nationale
de Belgique and De Nederlandsche Bank.
CCBM2 will enhance harmonisation
and increase the effi ciency of collateral
mobilisation, as well as allowing Eurosystem
counterparties, particularly banks operating in
multiple countries, to optimise their collateral
use and improve their liquidity management.
Moreover, it will allow central banks to monitor
the collateral used in credit operations more
closely. The platform will be fully compatible
with TARGET2 and TARGET2-Securities.
Following approval by the Governing Council,
the major project milestones were announced
in October 2010. These include testing at the
central bank and market level in 2012 and going
live in 2013. Migration to CCBM2 is scheduled
to take place in two waves in the second and
third quarters of 2013.
ELIGIBLE LINKS BETWEEN NATIONAL SECURITIES
SETTLEMENT SYSTEMS
Cross-border collateral can also be mobilised by
using links between national SSSs. However,
such links are only eligible for Eurosystem
credit operations if they meet the Eurosystem’s
user standards. Once the securities have been
transferred to another SSS via eligible links,
they can be used through local procedures
in the same way as any domestic collateral.
The amount of collateral mobilised through
direct and relayed links decreased from
€129 billion in December 2009 to €109 billion at
the end of 2010. This accounted for 5.0% of the
total collateral (both cross-border and domestic)
held by the Eurosystem at the end of 2010,
compared with 5.7% at the end of 2009.
In 2010 no new eligible links were added to
the 54 direct and 7 relayed links already
available to counterparties.

109ECB
Annual Report2010
3 BANKNOTES AND COINS
3.1 THE CIRCULATION OF BANKNOTES AND
COINS AND THE HANDLING OF CURRENCY
DEMAND FOR EURO BANKNOTES AND COINS
At end-2010 there were 14.2 billion banknotes in
circulation, with a total value of €839.7 billion.
This compares with 13.6 billion banknotes,
with a total value of €806.4 billion,
at end-2009 (see Charts 49 and 50). In 2010
the annual growth rate of euro banknotes in
circulation, in terms of both value and volume, was
in the region of 4%. The €50 and €100 banknotes
showed the strongest growth, with annual
growth rates of 6.7% and 5.4% respectively at
end-December 2010, while the previously strong
demand for €500 banknotes slackened markedly,
with an annual growth rate of 2.1% being recorded
by the end of the year. By the end of 2010 the €50
banknote had the largest share in total circulation
in volume terms (39.2%), while the €500 banknote
had the largest share in terms of value (34.3%),
closely followed by the €50 banknote (33.0%).
Banknote demand from regions outside the euro
area, which is strongly focused on high-value
banknotes as a store of value, decreased slightly
in 2010. Although it remained constant from
mid-2009 to mid-2010, infl ows of euro cash
exceeded outfl ows in the second half of 2010.
This could be a result of a reversal of the earlier
hoarding of euro banknotes, which had been in
demand as a safe haven following the fi nancial
turmoil in 2008. It is estimated that 20-25% of
the euro banknotes in circulation in value terms
are used outside the euro area, especially in
neighbouring regions.
In 2010 the total number of euro coins in
circulation (i.e. net circulation excluding stocks
held by the euro area NCBs) increased by 6.2%
to stand at 92.9 billion, while their total value
rose by 4.5% to stand at €22.3 billion. With
a 61% share in the total volume of coins in
circulation, the number of low-value coins –
1, 2 and 5 cent coins – remained high.
Chart 49 Number of euro banknotes in circulation between 2002 and 2010
4
5
6
7
8
9
10
11
12
13
14
15
16
-10
-5
0
5
10
15
20
25
2002 2003 2004 2005 2006 2007 2008 2009 2010
annual growth rate (percentages; right-hand scale)
total number (billions; left-hand scale)
Source: ECB.
Chart 50 Value of euro banknotes in circulation between 2002 and 2010
100
200
300
400
500
600
700
800
900
0
10
20
30
40
50
60
2002 2003 2004 2005 2006 2007 2008 2009 2010
annual growth rate (percentages; right-hand scale)
total value (EUR billions; left-hand scale)
Source: ECB.
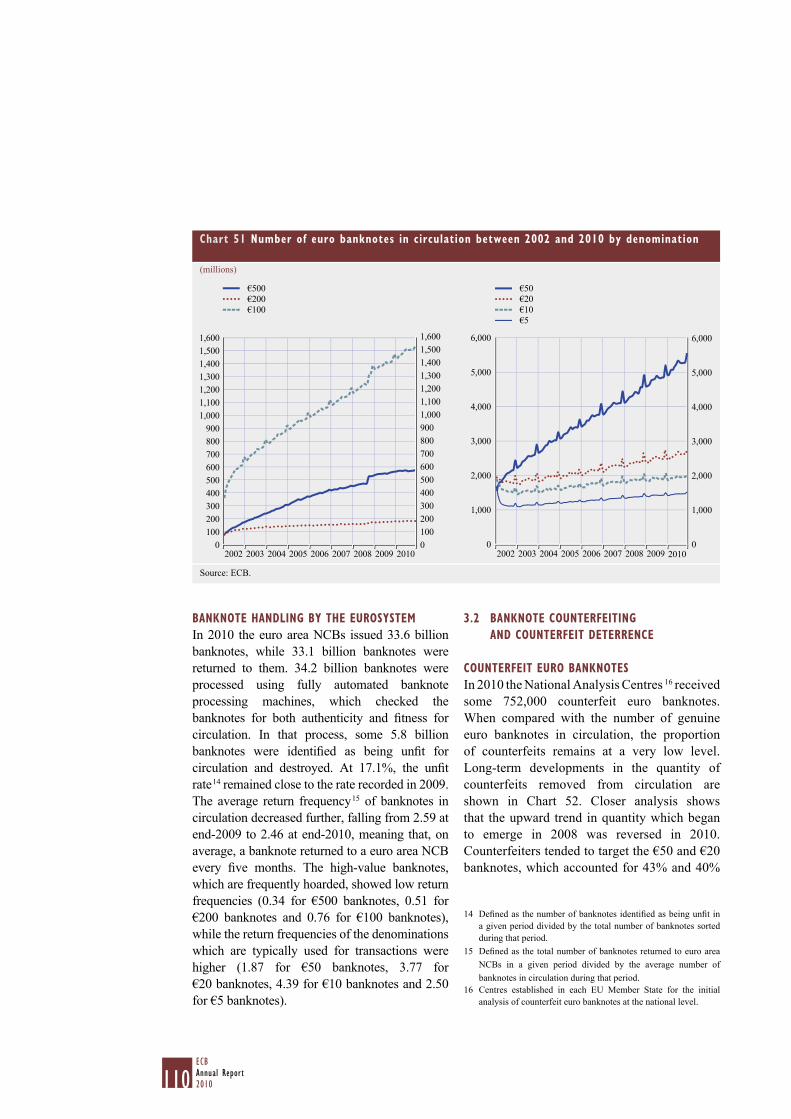
110ECBAnnual Report2010
BANKNOTE HANDLING BY THE EUROSYSTEM
In 2010 the euro area NCBs issued 33.6 billion
banknotes, while 33.1 billion banknotes were
returned to them. 34.2 billion banknotes were
processed using fully automated banknote
processing machines, which checked the
banknotes for both authenticity and fi tness for
circulation. In that process, some 5.8 billion
banknotes were identifi ed as being unfi t for
circulation and destroyed. At 17.1%, the unfi t
rate 14 remained close to the rate recorded in 2009.
The average return frequency 15 of banknotes in
circulation decreased further, falling from 2.59 at
end-2009 to 2.46 at end-2010, meaning that, on
average, a banknote returned to a euro area NCB
every fi ve months. The high-value banknotes,
which are frequently hoarded, showed low return
frequencies (0.34 for €500 banknotes, 0.51 for
€200 banknotes and 0.76 for €100 banknotes),
while the return frequencies of the denominations
which are typically used for transactions were
higher (1.87 for €50 banknotes, 3.77 for
€20 banknotes, 4.39 for €10 banknotes and 2.50
for €5 banknotes).
3.2 BANKNOTE COUNTERFEITING
AND COUNTERFEIT DETERRENCE
COUNTERFEIT EURO BANKNOTES
In 2010 the National Analysis Centres 16 received
some 752,000 counterfeit euro banknotes.
When compared with the number of genuine
euro banknotes in circulation, the proportion
of counterfeits remains at a very low level.
Long-term developments in the quantity of
counterfeits removed from circulation are
shown in Chart 52. Closer analysis shows
that the upward trend in quantity which began
to emerge in 2008 was reversed in 2010.
Counterfeiters tended to target the €50 and €20
banknotes, which accounted for 43% and 40%
Defi ned as the number of banknotes identifi ed as being unfi t in 14
a given period divided by the total number of banknotes sorted
during that period.
Defi ned as the total number of banknotes returned to euro area 15
NCBs in a given period divided by the average number of
banknotes in circulation during that period.
Centres established in each EU Member State for the initial 16
analysis of counterfeit euro banknotes at the national level.
Chart 51 Number of euro banknotes in circulation between 2002 and 2010 by denomination
(millions)
0
100
200
300
400
500
600
700
800
900
1,000
1,100
1,200
1,300
1,400
1,500
1,600
0
100
200
300
400
500
600
700
800
900
1,000
1,100
1,200
1,300
1,400
1,500
1,600
€100
€500
€200
2002 2003 2004 2005 2006 2007 2008 2009 2010 2002 2003 2004 2005 2006 2007 2008 2009 2010
€50
€20
€10
€5
0
1,000
2,000
3,000
4,000
5,000
6,000
0
1,000
2,000
3,000
4,000
5,000
6,000
Source: ECB.
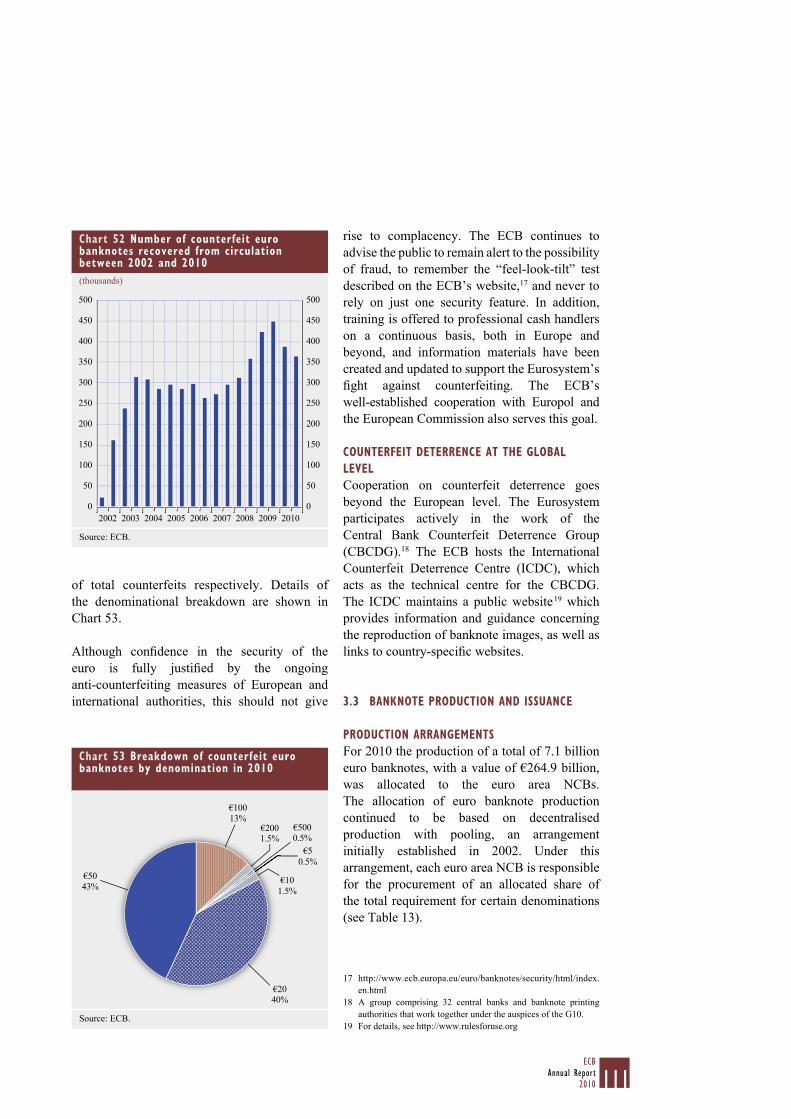
111ECB
Annual Report2010
of total counterfeits respectively. Details of
the denominational breakdown are shown in
Chart 53.
Although confi dence in the security of the
euro is fully justifi ed by the ongoing
anti-counterfeiting measures of European and
international authorities, this should not give
rise to complacency. The ECB continues to
advise the public to remain alert to the possibility
of fraud, to remember the “feel-look-tilt” test
described on the ECB’s website,17 and never to
rely on just one security feature. In addition,
training is offered to professional cash handlers
on a continuous basis, both in Europe and
beyond, and information materials have been
created and updated to support the Eurosystem’s
fi ght against counterfeiting. The ECB’s
well-established cooperation with Europol and
the European Commission also serves this goal.
COUNTERFEIT DETERRENCE AT THE GLOBAL
LEVEL
Cooperation on counterfeit deterrence goes
beyond the European level. The Eurosystem
participates actively in the work of the
Central Bank Counterfeit Deterrence Group
(CBCDG).18 The ECB hosts the International
Counterfeit Deterrence Centre (ICDC), which
acts as the technical centre for the CBCDG.
The ICDC maintains a public website 19 which
provides information and guidance concerning
the reproduction of banknote images, as well as
links to country-specifi c websites.
3.3 BANKNOTE PRODUCTION AND ISSUANCE
PRODUCTION ARRANGEMENTS
For 2010 the production of a total of 7.1 billion
euro banknotes, with a value of €264.9 billion,
was allocated to the euro area NCBs.
The allocation of euro banknote production
continued to be based on decentralised
production with pooling, an arrangement
initially established in 2002. Under this
arrangement, each euro area NCB is responsible
for the procurement of an allocated share of
the total requirement for certain denominations
(see Table 13).
http://www.ecb.europa.eu/euro/banknotes/security/html/index.17
en.html
A group comprising 32 central banks and banknote printing 18
authorities that work together under the auspices of the G10.
For details, see 19 http://www.rulesforuse.org
Chart 52 Number of counterfeit euro banknotes recovered from circulation between 2002 and 2010
(thousands)
0
50
100
150
200
250
300
350
400
450
500
0
50
100
150
200
250
300
350
400
450
500
2002 2003 2004 2005 2006 2007 2008 2009 2010
Source: ECB.
Chart 53 Breakdown of counterfeit euro banknotes by denomination in 2010
€100
13%€2001.5%
€5000.5%
€5
0.5%
€10
1.5%
€2040%
€50
43%
Source: ECB.
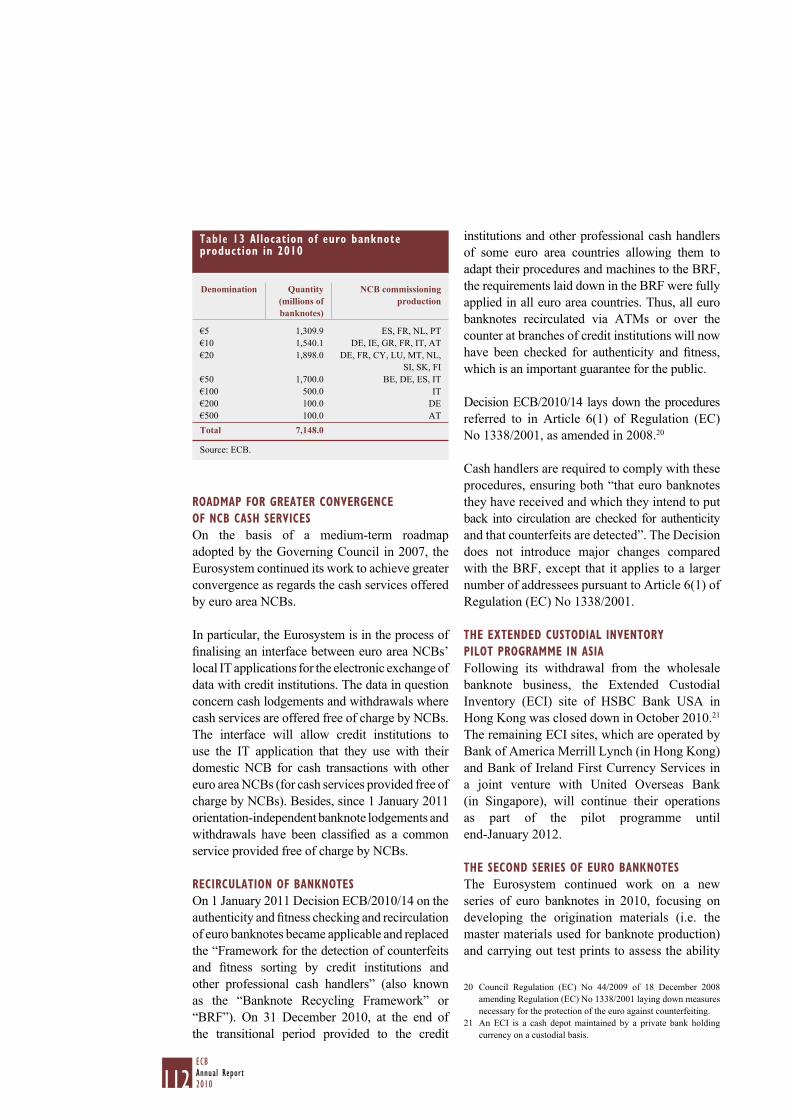
112ECBAnnual Report2010
ROADMAP FOR GREATER CONVERGENCE
OF NCB CASH SERVICES
On the basis of a medium-term roadmap
adopted by the Governing Council in 2007, the
Eurosystem continued its work to achieve greater
convergence as regards the cash services offered
by euro area NCBs.
In particular, the Eurosystem is in the process of
fi nalising an interface between euro area NCBs’
local IT applications for the electronic exchange of
data with credit institutions. The data in question
concern cash lodgements and withdrawals where
cash services are offered free of charge by NCBs.
The interface will allow credit institutions to
use the IT application that they use with their
domestic NCB for cash transactions with other
euro area NCBs (for cash services provided free of
charge by NCBs). Besides, since 1 January 2011
orientation-independent banknote lodgements and
withdrawals have been classifi ed as a common
service provided free of charge by NCBs.
RECIRCULATION OF BANKNOTES
On 1 January 2011 Decision ECB/2010/14 on the
authenticity and fi tness checking and recirculation
of euro banknotes became applicable and replaced
the “Framework for the detection of counterfeits
and fi tness sorting by credit institutions and
other professional cash handlers” (also known
as the “Banknote Recycling Framework” or
“BRF”). On 31 December 2010, at the end of
the transitional period provided to the credit
institutions and other professional cash handlers
of some euro area countries allowing them to
adapt their procedures and machines to the BRF,
the requirements laid down in the BRF were fully
applied in all euro area countries. Thus, all euro
banknotes recirculated via ATMs or over the
counter at branches of credit institutions will now
have been checked for authenticity and fi tness,
which is an important guarantee for the public.
Decision ECB/2010/14 lays down the procedures
referred to in Article 6(1) of Regulation (EC)
No 1338/2001, as amended in 2008.20
Cash handlers are required to comply with these
procedures, ensuring both “that euro banknotes
they have received and which they intend to put
back into circulation are checked for authenticity
and that counterfeits are detected”. The Decision
does not introduce major changes compared
with the BRF, except that it applies to a larger
number of addressees pursuant to Article 6(1) of
Regulation (EC) No 1338/2001.
THE EXTENDED CUSTODIAL INVENTORY
PILOT PROGRAMME IN ASIA
Following its withdrawal from the wholesale
banknote business, the Extended Custodial
Inventory (ECI) site of HSBC Bank USA in
Hong Kong was closed down in October 2010.21
The remaining ECI sites, which are operated by
Bank of America Merrill Lynch (in Hong Kong)
and Bank of Ireland First Currency Services in
a joint venture with United Overseas Bank
(in Singapore), will continue their operations
as part of the pilot programme until
end-January 2012.
THE SECOND SERIES OF EURO BANKNOTES
The Eurosystem continued work on a new
series of euro banknotes in 2010, focusing on
developing the origination materials (i.e. the
master materials used for banknote production)
and carrying out test prints to assess the ability
Council Regulation (EC) No 44/2009 of 18 December 2008 20
amending Regulation (EC) No 1338/2001 laying down measures
necessary for the protection of the euro against counterfeiting.
An ECI is a cash depot maintained by a private bank holding 21
currency on a custodial basis.
Table 13 Allocation of euro banknote production in 2010
Denomination Quantity (millions of banknotes)
NCB commissioning production
€5 1,309.9 ES, FR, NL, PT
€10 1,540.1 DE, IE, GR, FR, IT, AT
€20 1,898.0 DE, FR, CY, LU, MT, NL,
SI, SK, FI
€50 1,700.0 BE, DE, ES, IT
€100 500.0 IT
€200 100.0 DE
€500 100.0 AT
Total 7,148.0
Source: ECB.

113ECB
Annual Report2010
to produce the new banknotes in a large-scale
production environment. The new series will
retain the most important design elements from
the fi rst series of banknotes. The exact timing
and sequence of issuance will be determined at
a later stage. The Eurosystem will inform the
public, cash handlers and manufacturers well in
advance about the modalities of the introduction
of the new banknotes. Euro area NCBs will
redeem euro banknotes from the fi rst series for
an unlimited period of time.
114ECBAnnual Report2010
The ECB, assisted by the NCBs, develops,
collects, compiles and disseminates a wide range
of statistics which support the monetary policy
of the euro area and various tasks of the ESCB.
These statistics are also used extensively by
public authorities, fi nancial market participants,
the media and the general public. In 2010 regular
euro area statistics continued to be provided in a
smooth and timely manner,22 while signifi cant
efforts were devoted to further improving the
ESCB’s statistical framework in accordance
with the annually reviewed ESCB work
programme for European statistics. A particular
challenge in this respect was the fact that
growing data demands have placed considerable
pressure on the resources available to compilers.
One of the main work streams in 2010 concerned
fi nancial stability statistics. In this area, the
ECB, with the support of NCBs, carried out the
necessary preparations with a view to providing
statistical support to the European Systemic
Risk Board (ESRB) as of 1 January 2011
(see Chapter 6) and contributed, under the
auspices of the G20, to global initiatives
addressing statistical gaps identifi ed following
the fi nancial and economic crisis.
The implications of the fi nancial and economic
crisis as regards the production, use and
publication of statistics were the central theme
of both the Fifth ECB Conference on Statistics
and the international seminar hosted by the ECB
on World Statistics Day on 20 October 2010.
4.1 NEW AND ENHANCED EURO AREA STATISTICS
As a result of the statistical work conducted
in 2010, further euro area statistics were made
available, such as new statistics on MFI loans
to non-fi nancial corporations broken down
by branch of activity on the basis of the NACE
Rev. 2 classifi cation and new external debt
statistics for the euro area broken down by
sector and instrument. Data on the Short-Term
European Paper (STEP) initiative (see also
Section 3 of Chapter 4), a market initiative
fostering fi nancial integration in this market
segment, were also developed further. STEP
statistics, which have been published since
September 2006, were complemented in
September 2010 by the weekly publication
of outstanding amounts for individual STEP
programmes, including a breakdown by currency
of issuance.
In 2010 the implementation of enhanced
euro area statistics under the amended ECB
regulations on MFI balance sheet, MFI
interest rate and loan securitisation statistics
continued. Statistical reporting by fi nancial
vehicle corporations engaged in securitisation
transactions began in early 2010, and MFIs’
reporting of an extended statistical dataset for
balance sheet and interest rate statistics began
in mid-2010. These new data and related
indicators will provide more detailed breakdowns
(e.g. for collateralised loans and new loans to
non-fi nancial corporations) that will support
the enhancement of monetary analysis.
These statistics are due to be published for the
fi rst time in mid-2011 following an appropriate
data quality review by the ESCB.
4.2 OTHER STATISTICAL DEVELOPMENTS
In February and October 2010 the ECB
published the results of the second and third
waves of its biannual survey on euro area
fi rms’ access to fi nance, which was conducted
in cooperation with the European Commission.
This survey provides predominantly qualitative
evidence on the fi nancing conditions faced by
small and medium-sized fi rms compared with
large fi rms, and the results are broken down,
among other things, by fi rm size, type of
economic activity and fi rm age, with a country
breakdown provided for certain euro area
countries.
Further progress was made in 2010 with the
implementation of the Eurosystem’s survey
Statistics were released by means of 74 monthly, quarterly and 22
annual press releases, as well as being published in the Monthly
Bulletin, the Statistics Pocket Book and the ECB’s Statistical
Data Warehouse (see the statistics section of the ECB’s
website).
4 STATISTICS

115ECB
Annual Report2010
on household fi nance and consumption.
This survey is currently being conducted by the
NCBs of all euro area countries (in a few cases in
collaboration with national statistical institutes).
This survey aims to provide micro-level data on
households’ (fi nancial and real) assets and debts,
together with complementary information on
issues such as income, consumption, employment,
pension entitlements, savings and inheritance.
The public dissemination of aggregate indicators
for the whole of the euro area and the provision
of microdata to researchers is expected in the
second half of 2012.
Progress was also made towards establishing
the collection and compilation of statistics on
securities holdings on the basis of security-by-
security information. A pilot project to compile
experimental statistics on the basis of currently
available data is ongoing. Moreover, options
for developing a harmonised, cost-effi cient
steady-state solution are being investigated.
These data will allow the production of more
harmonised and higher-quality statistics and the
analysis of the securities holdings of institutional
sectors and sub-sectors at a granular level.
In the fi rst quarter of 2010 a quarterly list of
fi nancial vehicle corporations was published
for the fi rst time, complementing the daily list
of EU MFIs and the quarterly list of investment
funds, which the ESCB keeps up to date
and intends to transform into a fully fl edged
register of fi nancial institutions. The lists of
fi nancial vehicle corporations and investment
funds include a number of additional features
compared with the list of MFIs, in particular
security-by-security information (in the form
of ISIN codes) on the securities issued by
those institutions. This project is linked to the
development by the European Commission of
a statistical register of multinational fi rms, the
EuroGroups Register, in which steps are now
being taken to remove legal obstacles to the
mutual exchange of information for statistical
purposes.
The ECB continued its close cooperation
with other international organisations for
the development of international statistical
standards. Together with Eurostat, the ECB
focused mainly on the ongoing revision of the
ESA 95, which needs to be aligned with the
System of National Accounts 2008 and the
sixth edition of the IMF’s Balance of Payments
Manual. Together with the BIS and the IMF,
the ECB also published the second part of a
handbook on securities statistics, which covers
holdings of debt securities.
4.3 STATISTICAL NEEDS RESULTING FROM
THE FINANCIAL CRISIS
As a result of the fi nancial crisis, there has been
an increase, at both European and global level,
in user demand for statistics for the purposes
of fi nancial stability analysis. In addition to
the work referred to in previous sections,
a number of initiatives were conducted in 2010
with the aim of enabling the ECB to ensure the
performance of the secretariat function for the
ESRB and thereby provide the ESRB with the
necessary statistical and analytical support as
soon as it was established (see Chapter 6).
The ESCB also cooperates with supervisory
authorities with the aim of bridging and
reconciling statistical and supervisory
requirements. As a result of cooperation with the
Committee of European Banking Supervisors, a
new classifi cation system was published in 2010.
Over time, this will help to reduce the reporting
burden on entities that are required to provide
data to both the Eurosystem and supervisory
authorities. In addition, the reporting frequency of
the consolidated banking dataset, as published in
the ECB’s report on EU banking sector stability,
has been increased from annual to biannual for
a core set of banking indicators. The timeliness
and data content of the annual dataset have
also been enhanced. Moreover, the ECB has, in
close cooperation with the other members of the
Eurosystem, developed statistics on insurance
corporations and pension funds. These statistics
are based on existing sources, mostly supervisory
authorities – i.e. they do not require the collection
of new data from reporting agents. For the
116ECBAnnual Report2010
further development of these statistics, and in the
light of increasing user needs (for the purposes
of both macroeconomic and fi nancial stability
analysis), the ECB cooperates closely with
the European Insurance and Occupational
Pensions Authority, the successor of the
Committee of European Insurance and
Occupational Pensions Supervisors, in order
to ensure that future statistical reporting
requirements are consistent with Solvency II
and to minimise the reporting burden.
In the context of worldwide international
cooperation, the ECB participates in the
statistical initiatives supported by the fi nance
ministers and central bank governors of the
G20 with a view to identifying and addressing
information gaps. As a member of the
Inter-Agency Group on Economic and Financial
Statistics, it worked together with the BIS, the
European Commission (i.e. Eurostat), the IMF,
the OECD, the United Nations and the World
Bank to formulate an action plan submitted to
the G20 summit held in June 2010. That action
plan contains timetables for the implementation
of a number of recommendations on how
to address the measurement of risks in the
fi nancial sector, international fi nancial linkages
and the vulnerability of economies to shocks, as
well as the communication of offi cial statistics.
The ECB is also helping to enhance the
Principal Global Indicators website, which
focuses on the G20 economies.
117ECB
Annual Report2010
5 ECONOMIC RESEARCH
Consistent with the approach adopted throughout
the Eurosystem, the purpose of research activities
at the ECB is to: i) provide research results
relevant for the formulation of policy advice on
monetary policy and other Eurosystem tasks,
ii) maintain and use econometric models in order
to construct economic forecasts and projections
and compare the impact of alternative policy
choices, and iii) communicate with the
academic and research community, for example
through the publication of research results
in peer-reviewed scientifi c journals and
by participating in and organising research
conferences. In 2008 the ECB initiated a
multi-year revision of its research agenda in order
to absorb the lessons of the fi nancial crisis and its
aftermath. This later also included activities to
support the work of the ESRB. In 2010 a great deal
of effort was devoted to the analysis of fi nancial
issues, with a particular focus on constructing
and deploying tools for the purposes of
macro-prudential and systemic risk assessment.
5.1 RESEARCH PRIORITIES AND ACHIEVEMENTS
Economic research at the ECB is performed in a
decentralised manner: all business areas conduct
research projects according to their needs and
expertise. The Directorate General Research is
charged with coordinating this research work,
as well as producing high-quality research
itself. The Director General Research chairs
the Research Coordination Committee (RCC),
which aligns research activities at the ECB with
the requirements of the institution and the needs
of its policy processes. The RCC establishes
a set of priority areas each year and steers the
focus of research activities towards these areas.
The high-level research priorities established
for 2010 were unchanged from 2009,
namely: forecasting and model development;
enhancing monetary analysis; understanding
the transmission mechanism of monetary
policy; fi nancial stability and macro-prudential
supervision and regulation; the effi ciency
of the European fi nancial system; payment
and settlement issues; international linkages;
and fi scal issues. However, as regards the
implementation of these priorities, the number of
research activities on topics related to fi nancial
and macro-prudential issues was higher than
in previous years. In particular, emphasis was
placed on the development and deployment
of tools to monitor and assist decision-making
relating to fi nancial issues. The number of
research projects on enhancing monetary
analysis also saw a substantial increase.
Research on monetary analysis concentrated on
the development and use of quantitative tools to
assess monetary developments, with emphasis
on providing high-quality analytical input for
the preparation of policy decisions. In 2010
one focus of this research priority was on
the design of exit strategies for the current
non-standard measures and analysis of the
interaction between macroeconomic policies
and fi nancial stability. Two research forums
tackled these issues.23 Work in this area resulted
in the publication of a book entitled “Enhancing
monetary analysis”, which was edited by
Executive Board members Lucas Papademos
and Jürgen Stark.24
With regard to the monetary policy transmission
mechanism, projects were initiated or continued
on a variety of topics: asset price dynamics and
risk premia; the role of the banking sector; the
fi nancial decisions of non-fi nancial fi rms; and
diversity, competitiveness and adjustment at the
country level. Other projects continued from
previous years included the Household Finance
and Consumption Network,25 a Eurosystem
network established in 2009 which collects and
analyses micro-level information on a wide range
of household decisions, and an ECB research
forum on central bank communication policies.
Research forums are formal internal channels for sharing 23
experiences and the results of ECB research projects on a
specifi c topic.
http://www.ecb.europa.eu/pub/pdf/other/enhancingmonetary 24
analysis2010en.pdf
Research networks coordinate the research activities of 25
Eurosystem/ESCB researchers and help to disseminate results.
They may also involve external researchers.
118ECBAnnual Report2010
The links between fi nancial stability and
monetary policy were also explored, with a
focus on the development of fi nancial stability
indicators and analysis of the interaction between
fi nancial stability and overall macroeconomic
performance. The development of fi nancial
stability indicators includes work on early
warning models, stress-testing tools and models
of contagion and systemic risk. New areas of
research are being explored in order to enhance
existing models capturing the interaction
between fi nancial stability and macroeconomic
performance. Many projects in this area
fall under the umbrella of the new ESCB
Macro-prudential Research Network, which
was established in March 2010 (see Box 10 in
Chapter 6).
Research on the effi ciency of the fi nancial
system focused on understanding the money
market and improving the design of operational
frameworks, including analysis of exit strategies
and money market spreads.
The ECB continued research work on the Single
Euro Payments Area and TARGET2 under the
umbrella of the Payment Economics Network.26 A
conference on these topics was organised in 2010.
As regards the research priority relating
to international issues, the main areas of
interest were globalisation, fi nancial and trade
linkages, and the international role of the euro.
Globalisation and fi nancial and trade linkages
were the focus of two ECB research forums.
The discussion on trade linkages informs the
work carried out on tools to model trade fl ows
in the Eurosystem/ECB projections.
On the fi scal front, further work was undertaken
on the development of tools for the monitoring
and analysis of public fi nances and their
effi ciency and sustainability. A new research
topic in 2010 was the interaction between fi scal
and monetary policy, particularly during the
implementation of exit strategies.
5.2 DISSEMINATION OF RESEARCH:
PUBLICATIONS AND CONFERENCES
As in previous years, ECB staff research was
published in the ECB’s Working Paper Series
and Occasional Paper Series. 138 Working
Papers and 14 Occasional Papers were
published in 2010. A total of 104 Working
Papers were written or co-written by ECB
staff, a large number together with Eurosystem
economists, with the remainder being written
by external visitors attending conferences and
workshops, participating in research networks
or spending a prolonged period at the ECB
for the completion of a research project.27 As
is now the well-established norm, most of the
papers are eventually expected to be published
in leading peer-reviewed academic journals.
In 2010 ECB staff published more than
113 articles in academic journals. Furthermore,
in 2010 the ECB continued, together with a
large number of other central banks, to provide
editorial support for the International Journal of
Central Banking.
Another regular ECB publication is the Research
Bulletin, which is used to disseminate research
work of general interest to a wide audience.
Issues were published in March, June and
November 2010. Topics tackled included: the
reporting of results from the Wage Dynamics
Network; the analysis of fi scal stimulus;
fi nancial-related issues and their impact on
policy (e.g. analysis of risk as priced in markets,
bank lending standards and money markets
during the crisis); the incorporation of fi nancial
frictions in DSGE models; and the combination
of forecasts.28
Further information on this network can be found at 26
http://www.paymenteconomics.org
External researchers visit the ECB on an ad hoc basis or in the 27
context of formal programmes such as the Lamfalussy Research
Fellowship.
The full set of topics can be found at http://www.ecb.europa.eu/28
pub/scientifi c/resbull/html/index.en.html
119ECB
Annual Report2010
The ECB organised or co-organised
15 conferences and workshops on research
topics in 2010. Co-organised conferences
involved the Centre for Economic Policy
Research, the BIS and other central banks,
both within and outside the Eurosystem.
Furthermore, a large number of workshops and
seminars were organised to disseminate research
within the ECB. As in previous years, most of
the conferences and workshops were related to
specifi c research priorities. The programmes for
these events and the papers presented are
available on the ECB’s website.29
Another long-standing mechanism for the
dissemination of research is the organisation of
seminar series, of which two are of particular
relevance: the Joint Lunchtime Seminars,
co-organised with the Deutsche Bundesbank and
the Center for Financial Studies, and the Invited
Speaker Seminars. These two series comprise
weekly seminars, at which external researchers
are invited to present their recent work at the
ECB. The ECB also organises research seminars
outside the scope of these two series on a more
ad hoc basis.
http://www.ecb.europa.eu/events/conferences29

120ECBAnnual Report2010
6 OTHER TASKS AND ACTIVITIES
6.1 COMPLIANCE WITH THE PROHIBITION
OF MONETARY FINANCING
AND PRIVILEGED ACCESS
Pursuant to Article 271(d) of the Treaty,
the ECB is entrusted with the task of
monitoring the compliance of the 27 EU NCBs
and the ECB with the prohibitions implied by
Articles 123 and 124 of the Treaty and Council
Regulations (EC) Nos 3603/93 and 3604/93.
Article 123 prohibits the ECB and the NCBs
from providing overdraft facilities or any
other type of credit facility to governments
and EU institutions or bodies, as well as from
purchasing debt instruments directly from
them. Article 124 prohibits any measure,
not based on prudential considerations, which
establishes privileged access by governments
and EU institutions or bodies to fi nancial
institutions. In parallel with the Governing
Council, the European Commission monitors
Member States’ compliance with the above
provisions.
The ECB also monitors the EU central banks’
secondary market purchases of debt instruments
issued by the domestic public sector, the
public sector of other Member States and EU
institutions and bodies. According to the recitals
of Council Regulation (EC) No 3603/93, the
acquisition of public sector debt instruments
in the secondary market must not be used to
circumvent the objective of Article 123 of the
Treaty. Such purchases should not become
a form of indirect monetary fi nancing of the
public sector.
The monitoring exercise conducted for 2010
indicates that the following cases could be
seen as non-compliant with the provisions of
Articles 123 and 124 of the Treaty and the
related Council Regulations.
First, at the Banco de Portugal, there was
a placement of a seven-day deposit of
USD 12.5 million with a Portuguese public
sector bank on 13 May 2010. This was due
to an operational mistake. Second, advance
payments were made by De Nederlandsche
Bank in the context of the operation of the
Dutch deposit insurance scheme. Legislation
to make the Dutch deposit insurance scheme
compliant with the monetary financing
prohibition is necessary. Third, at the Central
Bank of Cyprus, remuneration of the current
account balance of the deposit guarantee
scheme took place above comparable market
rates, which is not in line with the objectives
of the monetary financing prohibition. In this
respect, the Central Bank of Cyprus reported
that it had taken a decision to remunerate this
account at market rates by the beginning of
2012. Fourth, the scheme for the remuneration
of government deposits at the Banca d’Italia
led to remuneration above comparable market
rates. In this respect, the Banca d’Italia
reported that the remuneration scheme is
currently being revised. The revision should
be finalised as soon as possible, in order to
be in line with the objectives of the monetary
financing prohibition.
In more general terms, it is worth recalling
that the prohibitions implied by Articles 123
and 124 of the Treaty need to be strictly
respected, even in case of a financial crisis.
6.2 ADVISORY FUNCTIONS
Articles 127(4) and 282(5) of the Treaty require
that the ECB be consulted on any proposed EU
or draft national legislation falling within its
fi elds of competence.30 All ECB opinions are
published on the ECB’s website. ECB opinions
on proposed EU legislation are also published
in the Offi cial Journal of the European Union.
In 2010 the ECB adopted 95 opinions on
proposed EU or draft national legislation
falling within the ECB’s fi elds of competence:
ten opinions were issued on proposed EU
legislation and 85 were issued on draft national
legislation. This compares with 100 opinions in
The United Kingdom is exempt from the consultation obligation, 30
pursuant to the Protocol on certain provisions relating to the
United Kingdom of Great Britain and Northern Ireland, which is
annexed to the Treaty, OJ C 83, 30.3.2010, p. 284.

121ECB
Annual Report2010
2009. A list of the opinions adopted in 2010 and
early 2011 is annexed to this Annual Report.
The ECB opinions issued at the request of the
Council, the European Parliament and the
European Commission concerned, inter alia,
the ongoing reform of economic governance
and fi nancial regulation, as well as legislation
on the introduction of the euro in Estonia and
the conversion rate between the euro and the
Estonian kroon 31 (see Chapter 3).
The ECB welcomed the European
Commission’s proposal to enhance the
quality of statistical reporting in the context
of the excessive defi cit procedure, which
is part of the Stability and Growth Pact,
as part of the continuing reform of economic
governance in the EU.32 In another opinion,33
the ECB welcomed a comprehensive package of
legislative proposals to strengthen the framework
for economic and budgetary surveillance in the
EU. These proposals included the introduction
of a framework for macroeconomic surveillance,
which the ECB particularly welcomed, as it
closes an important lacuna in the EU’s economic
governance. At the same time, the ECB called
on the EU legislator and the Member States
to take advantage of the ongoing legislative
process to strengthen economic governance
to the maximum extent allowed under the
Treaties. The ECB noted that the proposals
made should provide for greater automaticity
and suggested in particular that the Council,
or at least the Eurogroup, should, by means of a
declaration, commit itself, as a rule, to following
Commission proposals and recommendations
to continue procedures against non-compliant
Member States. The ECB also provided drafting
suggestions in respect of all proposals.
As regards the reform of supervision in the EU,
the ECB supported the objective of the proposed
“omnibus directive” amending 11 fi nancial
sector directives to ensure the proper functioning
of the European Supervisory Authorities (ESAs)
and the European Systemic Risk Board.34
The ECB’s drafting proposals focused on
matters of relevance to the ECB/ESCB and
the ESRB, such as the removal of legal
obstacles to information sharing between the
ECB/ESCB, the ESRB, the three ESAs and the
national supervisory authorities. The ECB also
commented on the necessary amendments to
the rules on the supplementary supervision of
fi nancial entities in a fi nancial conglomerate
in order to close certain supervisory gaps, for
example the inclusion of asset management
companies as part of fi nancial conglomerates
within the scope of the supervision.35
In the context of the post-crisis regulatory reform
of the fi nancial services market, the ECB issued
opinions on several proposals, including the
revision of regulatory capital requirements and
the regulation of credit rating agencies.36 The
ECB supported efforts to create a robust
regulatory framework in order to prevent future
fi nancial crises, while calling for the preservation
of a level playing fi eld and for global regulatory
convergence where feasible. The ECB stressed
the need to maintain sound risk assessment
practices for assets covered by the Eurosystem
collateral framework, including the possibility
for central banks to access loan-level information
on structured fi nance instruments. On the
proposed regulation on over-the-counter (OTC)
derivatives, central counterparties (CCPs) and
trade repositories, the ECB welcomed this step
towards implementing the G20 agreement of
September 2009 that standardised OTC
derivative contracts should be traded on
exchanges or electronic trading platforms where
appropriate and cleared through CCPs by the end
of 2012.37 Nevertheless, the ECB also expressed
a number of concerns, particularly about the lack
of consideration given to the ECB’s and NCBs’
oversight powers and regarding the provisions
on access to central bank facilities.
The ECB also responded to a signifi cant number
of consultations by national authorities, some of
CON/2010/52.31
CON/2010/28.32
CON/2011/13. See also Chapter 5 of this Annual Report.33
CON/2010/23.34
CON/2011/6.35
CON/2010/65 and CON/2010/82. 36
CON/2011/1.37

122ECBAnnual Report2010
which concerned developments in supervisory
structures in Ireland, Greece, France and
Austria.38 The ECB noted the merger of the
supervisory authorities in France and welcomed
the new Prudential Control Authority, which
is to be headed by the Governor of the Banque
de France.39 The proposed framework is likely
to enhance the Banque de France’s ability
to contribute to analytical support for the
ESRB. The ECB also welcomed the proposed
restructuring of the Central Bank and Financial
Services Authority of Ireland 40 so as to make the
central bank fully responsible for the supervision
of credit and fi nancial institutions. The ECB
made detailed observations on central bank
independence and the prohibition of monetary
fi nancing.
The ECB was also consulted on a number of
measures relating to fi nancial market stability,
some in connection with the fi nancial crisis.41
In particular, the ECB issued an opinion 42 on
the Greek draft law establishing the Financial
Stability Fund in order to maintain the stability
of the Greek banking system by means of
the recapitalisation of credit institutions.
The ECB welcomed the close links between the
Fund and the banking supervisory framework.
Taking into account the Bank of Greece’s
existing supervisory powers, the law should
ensure that capital adequacy requirements are
properly maintained. The ECB also welcomed
the initiating role of the Bank of Greece’s
Governor in the appointment of the Fund’s
board members.
Commenting on draft German legislation on
compensation systems in credit and fi nancial
institutions and insurance companies,43 the
ECB emphasised the general importance
of aligning the relevant requirements with
international standards and EU legislation to
avoid regulatory arbitrage and contribute to
limiting excessive risk-taking. Other opinions
on procedures for fi nancially distressed credit
institutions highlighted the importance of an
effi cient resolution regime for safeguarding the
stability of the fi nancial system.44 In its opinions
on a new winding-up regime for failing credit
institutions in Denmark 45 and the restructuring
of banks in Germany,46 the ECB welcomed the
further disengagement of the state in favour of
resolution regimes primarily based on fi nancing
by the credit institution sector. Where a crisis
situation requires the supplementary use of
public funds, the banking sector should be
called upon to reimburse the state. This should
promote additional market discipline and
address the risk of moral hazard. In its opinion
on draft amendments to state support measures
in Poland,47 the ECB expressed concern that
these measures would effectively be converted
into open-ended measures, contrary to the
requirement that national support measures
be temporary in nature. Avoiding the renewal
of a temporary regime would deprive the
prolongation of such a regime of the necessary
review with regard to monetary policy and
fi nancial stability aspects.
In the area of statistics, the ECB was consulted
on the establishment of the Hellenic Statistical
System and an independent statistical authority
in Greece.48 The ECB emphasised that the
credibility of budgetary surveillance in the EU –
and ultimately the credibility and the sound
functioning of Monetary Union – depends on
the reliable and timely compilation of statistics
relating to the excessive defi cit procedure, which
should be independent of political cycles.
CON/2010/30, CON/2010/48, CON/2010/33, CON/2010/4 and 38
CON/2010/57.
CON/2010/4.39
CON/2010/30 and CON/2010/48.40
CON/2010/3, CON/2010/7, CON/2010/10, CON/2010/11, 41
CON/2010/12, CON/2010/21, CON/2010/26, CON/2010/29,
CON/2010/31, CON/2010/35, CON/2010/41, CON/2010/45,
CON/2010/50, CON/2010/53, CON/2010/54, CON/2010/62,
CON/2010/63, CON/2010/64, CON/2010/71, CON/2010/75,
CON/2010/83, CON/2010/86, CON/2010/92, CON/2010/93 and
CON/2010/95.
CON/2010/54.42
CON/2010/41 and CON/2010/63.43
CON/2010/12, CON/2010/31 and CON/2010/35.44
CON/2010/45.45
CON/2010/83.46
CON/2010/95.47
CON/2010/17.48

123ECB
Annual Report2010
In its opinion on a new legal framework for the
production of national statistics in Estonia,49
the ECB stressed the importance of securing
the independence of the Estonian National
Statistical Institute, as this would be of particular
signifi cance for the smooth functioning of the
EMU framework following the adoption of the
euro.50
The ECB adopted several opinions concerning
the NCBs, including amendments to the statutes
of the Bulgarian, Danish, Estonian, Irish, French,
Lithuanian, Hungarian and Polish NCBs.51
The ECB noted that the uncertainty regarding
the legal status of Lietuvos bankas’ real property
undermines the NCB’s institutional and
fi nancial independence.52 The ECB welcomed
the increase in the Banque de France’s capital
and statutory reserve.53 A number of opinions
concerned the remuneration of NCB staff in
the context of legislation aimed at restoring
budgetary balance.54 The ECB welcomed the
efforts to achieve fi scal consolidation and
stressed that, to protect an NCB’s autonomy in
staff matters, the draft legislative provisions on
the remuneration of NCB staff must be decided
in close and effective cooperation with the NCB,
taking due account of the NCB’s views to ensure
its ongoing ability to independently perform the
tasks conferred on it by the Treaty, the Statute of
the ESCB and national legislation. In its opinion
concerning the Portuguese austerity measures,55
the ECB elaborated on the necessity of effective
cooperation and stressed that the absence of
such effective cooperation would constitute a
serious infringement of the principle of central
bank independence. With regard to Hungary,
the ECB voiced concerns regarding the frequent
changes to the Law on the Magyar Nemzeti
Bank, stating that a consideration in the context
of central bank independence is a stable legal
framework for the central bank, and cautioned
against measures seeking to infl uence the
Governor and the other members of the Magyar
Nemzeti Bank’s decision-making bodies in
contradiction of central bank independence
under Article 130 of the Treaty.56 The ECB
also noted that salary cuts for NCB staff must
comply with the prohibition of monetary
fi nancing under Article 123 of the Treaty.57
Since 2008 information regarding clear and
important cases 58 of non-compliance with the
obligation to consult the ECB on draft national
and EU legislation has also been included in the
Annual Report.
In 2010 the ECB recorded two such cases of
non-consultation on proposed EU legislation,
including one case in which the ECB issued an
opinion on its own initiative. The fi rst case of
non-consultation concerned a proposed
Commission regulation implementing Regulation
(EC) No 177/2008 on a common framework for
business registers for statistical purposes in the
context of the exchange of confi dential data
between Eurostat and central banks. 59 The ECB
considers that the Regulation is relevant to the
ECB’s cooperation with EU institutions, bodies,
offi ces and agencies for the collection of statistics
necessary to undertake the ESCB’s tasks under
Article 5 of the Statute of the ESCB and that it
should therefore have been consulted at an
appropriate stage in the legislative process.
The second case of non-consultation concerned
a proposal for a directive amending Directives
2006/48/EC and 2006/49/EC as regards capital
requirements for the trading book and for
CON/2010/2.49
The ECB was also consulted on several draft legislative measures 50
in connection with the preparations for the introduction of the
euro in Estonia. For details, see Section 2 of Chapter 3.
CON/2010/25, CON/2010/24, CON/2010/20, CON/2010/30, 51
CON/2010/48, CON/2010/44, CON/2010/42, CON/2010/56,
CON/2010/91 and CON/2010/37.
CON/2010/42.52
CON/2010/88.53
CON/2010/42, CON/2010/51, CON/2010/56, CON/2010/69 and 54
CON/2010/80.
CON/2010/80.55
CON/2010/91.56
CON/2010/51, CON/2010/69 and CON/2010/80. 57
The ECB understands “clear” to mean cases in which there 58
is no legal doubt that the ECB should have been consulted,
and “important” to mean cases: i) in which, if consultation
had taken place, the ECB would have made signifi cant critical
comments on the substance of the legislative proposal; or
ii) which are of general signifi cance to the ESCB.
Commission Regulation (EU) No 1097/2010 of 26 November 59
2010 implementing Regulation (EC) No 177/2008 of the European
Parliament and of the Council establishing a common framework
for business registers for statistical purposes, as regards the
exchange of confi dential data between the Commission (Eurostat)
and central banks, OJ L 312, 27.11.2010, p. 1.
124ECBAnnual Report2010
re-securitisations, and the supervisory review of
remuneration policies.60 The ECB had been
consulted on an earlier draft and issued an
opinion 61 on 12 November 2009. On 7 July 2010
the European Parliament adopted the directive,
which contained a number of amendments, and
the directive was then subject to the Council’s
formal adoption.62 In view of the obligation to
reconsult the ECB on important amendments to
proposed legislative acts falling within its fi elds
of competence, the ECB issued an opinion on
the amended proposal on its own initiative on
6 August 2010.63
In 2010 the ECB recorded ten cases of non-
consultation on draft national legislation
and issued one opinion on its own initiative.
The following fi ve cases were considered clear
and important.
The Bulgarian authorities failed to consult
the ECB on a law related to the composition
and functions of the Financial Supervision
Commission and, in particular, the parameters
of the Financial Stability Advisory Council,
a matter of general signifi cance to the ESCB.
The ECB was not consulted on a Portuguese law
assigning certain new tasks to the central bank.
The law is of general signifi cance to the ESCB,
as it relates to the fi nancial independence of the
NCB, and the ECB would have made signifi cant
critical comments.
With regard to fi nancial crisis-related measures,
the ECB was not consulted in three cases.
The Greek authorities failed to consult the ECB on
two occasions: fi rst, a draft law on the reform of the
public sector recruitment system, which affected
the Bank of Greece’s exclusive competence to
recruit a specifi c category of staff; and second,
a draft law providing, inter alia, for restrictions
in the recruitment of staff by public sector
entities, including the Bank of Greece, as a means
of containing the adverse effects of the ongoing
budgetary crisis. The Slovenian authorities failed
to consult the ECB on legislation related to the
provision of state guarantees and loans to credit
institutions. The ECB considers that these cases
are of general signifi cance to the ESCB, as they
concern the fi nancial crisis and rescue measures
undertaken by Member States.
As of 2010 information regarding clear and
repetitive cases of failure by Member States to
consult the ECB is also included in the Annual
Report. Repetitive cases are those where the
same Member State fails to consult the ECB at
least three times in two consecutive years, with
at least one case of non-consultation in each
year under consideration. The ECB recorded,
for both Greece and Hungary, two cases of
non-consultation on draft national legislation in
2009 and three cases in 2010.
6.3 ADMINISTRATION OF THE BORROWING AND
LENDING OPERATIONS OF THE EUROPEAN
UNION AND THE EUROPEAN FINANCIAL
STABILITY FACILITY, AND THE POOLED
BILATERAL LOANS FOR THE BENEFIT
OF THE HELLENIC REPUBLIC
In accordance with Article 141(2) of the Treaty,
Articles 17, 21.2, 43.1 and 46.1 of the Statute of
the ESCB and Article 9 of Council Regulation
(EC) No 332/2002 of 18 February 2002
as last amended by Council Regulation
(EC) No 431/2009 of 18 May 2009, the
ECB continues to have responsibility for
the administration of the borrowing and
lending operations of the European Union
under the medium-term fi nancial assistance
facility, as set out in Decision ECB/2003/14
of 7 November 2003 as amended by Decision
ECB/2009/17 of 19 June 2009. In 2010 the
ECB received four disbursement payments on
behalf of the EU and transferred these amounts
to the borrower countries (Romania and Latvia).
For eight of the loans under this facility, interest
payments became due and were processed
COM(2009) 362 fi nal.60
CON/2009/94.61
Directive 2010/76/EU of the European Parliament and of the 62
Council of 24 November 2010 amending Directives 2006/48/EC
and 2006/49/EC as regards capital requirements for the trading
book and for re-securitisations, and the supervisory review of
remuneration policies, OJ L 329, 14.12.2010, p. 3.
CON/2010/65. 63
125ECB
Annual Report2010
by the ECB accordingly. The total amount of
outstanding EU lending operations under the
medium-term fi nancial assistance facility as at
31 December 2010 was €12.1 billion.
In the context of the loan facility agreement
between the Member States whose currency is
the euro 64 and Kreditanstalt für Wiederaufbau
(KfW) 65 as lenders and the Hellenic Republic as
borrower and the Bank of Greece as agent to the
borrower, and pursuant to Articles 17 and 21.2
of the Statute of the ESCB and Article 2 of
Decision ECB/2010/4 of 10 May 2010, the ECB
is responsible for processing all related payments
on behalf of the lenders and the borrower.
In 2010 the ECB received two disbursement
payments from the lenders and transferred these
amounts to the borrower. For both loans, interest
payments became due and were processed by
the ECB accordingly. The balance outstanding
as at 31 December 2010 in respect of the pooled
bilateral loans for the benefi t of the Hellenic
Republic amounted to €21 billion.
In accordance with Articles 122(2) and
132(1) of the Treaty, Articles 17 and 21 of the
Statute of the ESCB, and Article 8 of Council
Regulation (EU) No 407/2010 of 11 May 2010,
the ECB is responsible for the administration
of the borrowing and lending operations of the
EU under the European Financial Stabilisation
Mechanism (EFSM). The ECB opened an
account for the European Commission in this
context in accordance with Article 2 of Decision
ECB/2010/17 of 14 October 2010. No operations
were carried out under the EFSM in 2010.
In accordance with Articles 17 and 21 of the
Statute of the ESCB (in conjunction with
Article 3(5) of the EFSF Framework Agreement),
the ECB is responsible for the administration of
European Financial Stability Facility (EFSF)
loans to Member States whose currency is the
euro. The ECB opened an account for the EFSF
in this context in accordance with Article 1
of Decision ECB/2010/15 of 21 September 2010.
No operations were carried out under the
EFSF in 2010.
6.4 EUROSYSTEM RESERVE MANAGEMENT
SERVICES
In 2010 a comprehensive set of services
continued to be offered within the framework
established in 2005 for the management of
Eurosystem customers’ euro-denominated
reserve assets. The complete set of services –
which is available to central banks, monetary
authorities and government agencies located
outside the euro area, as well as to international
organisations – is offered under harmonised
terms and conditions in line with general market
standards by individual Eurosystem central
banks (the Eurosystem service providers).
The ECB performs an overall coordinating
role, ensuring the smooth functioning of
the framework. The number of customers
maintaining a business relationship with
the Eurosystem remained stable over 2010.
With regard to the services themselves, there
were slight increases in customers’ total cash
balances (including deposits) and securities
holdings.
Other than the Hellenic Republic and the Federal Republic of 64
Germany.
Acting in the public interest, subject to the instructions of and 65
with the benefi t of the guarantee of the Federal Republic of
Germany.

View of the Grossmarkthalle from the south, prior to the start of the main construction works. The Grossmarkthalle, a listed
building, formerly housed Frankfurt’s wholesale fruit and vegetable market. It was built between 1926 and 1928 according to
the design of Professor Martin Elsaesser.
CHAPTER 3
ENTRY OF ESTONIA INTO THE EURO AREA

128ECBAnnual Report2010
1 ECONOMIC AND MONETARY DEVELOPMENTSIN ESTONIA
On 13 July 2010 the Council of the European
Union adopted a decision allowing Estonia
to adopt the euro as its currency from
1 January 2011, increasing the number of euro
area countries from 16 to 17. The Council’s
decision was based on the convergence reports
published by the ECB and the European
Commission in May 2010, and followed
discussions by the European Council, an opinion
of the European Parliament, a proposal from the
European Commission and a recommendation
by the Eurogroup. On the same day, the Council
also adopted a regulation fi xing the irrevocable
conversion rate between the Estonian kroon
and the euro. This conversion rate was set at
EEK 15.6466 to the euro. This was also the
central rate of the Estonian kroon throughout
the country’s membership of the exchange rate
mechanism II (ERM II).
For several years, Estonia was one of the EU’s
fastest-growing economies. However, the
strong economic expansion, with clear signs
of overheating throughout 2005-07, proved
unsustainable. In 2007 economic growth already
started to decelerate but remained strong.
Owing to these unsustainable macroeconomic
developments and the collapse of world trade,
Estonia experienced a pronounced turnaround
in economic activity and a severe contraction in
2009 (see Table 14). As a consequence, Estonia
underwent a signifi cant economic adjustment
that contributed to the unwinding of some of
the external and internal imbalances that had
built up in the years of very fast growth. In 2010
economic activity started to recover: annual
real GDP growth turned positive in the second
quarter of 2010 and stood at 6.6% in the fourth
quarter. Looking at external developments,
Estonia recorded a very large average defi cit
of 10% of GDP in the combined current and
capital account balance between 2000 and
2008. Correcting these large defi cits has been
a key feature of the necessary adjustment
process that Estonia has been undergoing
following the overheating period. After a strong
Table 14 Main economic indicators for Estonia
(annual percentage changes, unless otherwise indicated; period averages, unless otherwise indicated)
1999 2000 2001 2002 2003 2004 2005 2006 2007 2008 2009 2010
Real GDP growth -0.3 10.0 7.5 7.9 7.6 7.2 9.4 10.6 6.9 -5.1 -13.9 3.1 3)
Contribution to real GDP growth (in percentage points)
Domestic demand
(excluding inventories) -4.3 8.0 7.0 12.5 10.7 7.3 10.1 15.8 7.7 -7.3 -19.6 .
Net exports 5.3 -1.1 -2.9 -5.9 -2.7 -0.7 -0.5 -6.0 -5.6 5.7 11.3 .
HICP infl ation 3.1 3.9 5.6 3.6 1.4 3.0 4.1 4.4 6.7 10.6 0.2 2.7
Compensation per employee 9.1 14.5 9.6 9.1 11.7 12.2 10.9 14.1 24.6 10.1 -3.3 .
Nominal unit labour costs 4.6 2.5 2.9 2.4 5.3 4.6 3.4 8.7 17.4 16.3 1.1 .
GDP defl ator 7.5 4.5 5.3 3.3 4.2 3.6 5.5 8.3 10.5 7.2 -0.1 .
Import defl ator 1.4 5.8 2.0 -0.1 -0.2 1.5 3.3 4.1 3.3 5.9 -1.1 .
Unemployment rate
(percentage of labour force) 11.3 13.6 12.6 10.3 10.0 9.7 7.9 5.9 4.7 5.5 13.8 16.9
Total employment -4.4 -1.5 0.8 1.3 1.5 0.0 2.0 5.4 0.8 0.2 -9.9 .
Current and capital account
balance (percentage of GDP) -4.3 -4.9 -4.9 -10.1 -10.6 -10.6 -9.2 -13.2 -16.2 -8.7 7.3 .
General government balance
(percentage of GDP) 2) -3.5 -0.2 -0.1 0.3 1.7 1.6 1.6 2.4 2.5 -2.8 -1.7 -1.0
Public debt (percentage of GDP) 2) 6.0 5.1 4.8 5.7 5.6 5.0 4.6 4.4 3.7 4.6 7.2 8.0
Nominal three-month money
market rate (percentage) 7.8 5.7 5.3 3.9 2.9 2.5 2.4 3.2 4.9 6.7 5.9 1.6
Nominal exchange rate
against the euro 1) 15.6 15.6 15.6 15.6 15.6 15.6 15.6 15.6 15.6 15.6 15.6 15.6
Sources: ECB, Eurostat and European Commission. 1) Estonian kroon per euro. 2) European Commission, European Economic Forecast – autumn 2010.3) Flash estimate.
129ECB
Annual Report2010
fall in domestic demand, which led to lower
imports, the defi cit decreased and turned into
a surplus, which stood at 8.4% of GDP in the
third quarter of 2010.
The infl ation performance of the Estonian
economy over the past decade has been very
volatile. HICP infl ation, which had followed
a broadly downward trend between the
mid-1990s and 2003, started to rise in 2004 as
a result of hikes in administered prices, partly
related to EU accession, rising energy prices and
signs of overheating. In 2008, despite a sharp
slowdown in growth, infl ation continued to
increase and peaked at 10.6%, refl ecting the rise
in global commodity prices, tax harmonisation
measures and the lagged response of wages to
the changing economic environment. As the
economy edged further into recession, annual
infl ation declined rapidly and turned negative
during some months, reaching 0.2% on average
in 2009. In the second half of 2010 HICP
infl ation increased signifi cantly again, refl ecting
the impact of higher commodity prices in
world markets, increases in administered prices
and excise duties, as well as the recovery in
economic activity. For 2010 as a whole, HICP
infl ation stood at 2.7%.
Refl ecting the sharp economic adjustment of
recent years, Estonia’s unemployment rate is
currently high, standing at 13.6% on average in
the fourth quarter of 2010. While the Estonian
labour market is relatively fl exible, regional
differences in employment and unemployment
and skill mismatches continue to persist.
These factors contributed to high wage growth
over the period 2005-08. Weak economic
activity and the increase in unemployment have
supported the sharp deceleration of growth
in both private and public sector wages. This
adjustment is necessary to ensure that the
temporarily high level of unemployment in
Estonia does not become permanent.
Over the period from 2000 to 2009, Estonia
generally ran a sound fi scal policy, thereby
achieving budgets close to balance or in surplus
until 2007. Nevertheless, the general government
balance deteriorated in 2008 in conjunction with
the marked economic downturn. The public
defi cit increased to 2.8% of GDP in 2008
and then declined to 1.7% of GDP in 2009,
on account of signifi cant consolidation measures
undertaken by the government, which amounted
to around 9% of GDP (of which approximately
one-third are estimated to be of a temporary
nature). The defi cit was then among the lowest
of the euro area in 2009 and Estonia is one of
the few EU countries currently not subject
to an excessive defi cit procedure. The public
debt-to-GDP ratio stood at 7.2% of GDP in
2009. According to the European Commission,
in 2010 the Estonian public defi cit is likely to
decrease to 1.0% of GDP, while gross public
debt is projected at 8.0% of GDP. Looking
forward, additional consolidation measures
should be specifi ed in order to return to a surplus
position in line with the medium-term objective
by 2013, thereby allowing Estonia to maintain
its sustainable public fi nance position.
Economic and monetary policy choices
have played an important role in shaping the
convergence process of Estonia over the past
decade. With the adoption of a currency board
arrangement in 1992, the kroon was pegged fi rst
to the Deutsche Mark, and after 1999 it was
pegged to the euro. In addition, the orientation
of monetary policy towards the achievement
of price stability, as the primary objective of
monetary policy, was enshrined in the central
bank law in 2003. During the period 2005-08,
however, the monetary policy conditions in
Estonia under the currency board arrangement
became, overall, too expansionary. Despite
a relatively sound record of fi scal balances,
the country’s overall policy stance was not
suffi ciently tight to contain demand pressures
and support price stability. This led to excessive
credit growth and increases in asset prices,
notably in housing markets, with the resulting
imbalances being unwound in the context of a
severe adjustment recession.
The policy framework of Eesti Pank implied
that ECB interest rate decisions were directly
infl uencing the interest rate for the Estonian
130ECBAnnual Report2010
economy. For many years, money market
interest rates in Estonia had broadly followed
comparable euro area rates. However,
following the intensifi cation of the fi nancial
crisis in the autumn of 2008, risk premia rose,
market rates became increasingly detached
from euro area money markets and spreads
vis-à-vis the euro area increased. From
November 2009 money market spreads started
to narrow signifi cantly – refl ecting fi scal
consolidation efforts, a decline in global risk
aversion and changing market expectations
about Estonia’s prospects of adopting the
euro. Amid some fl uctuations, this narrowing
gradually led to the convergence of Estonian
money market interest rates with the euro area.
In order to fully reap the advantages of the
euro and to allow adjustment mechanisms to
operate effi ciently within the enlarged currency
area, Estonia needs to conduct economic
policies that are fully geared towards ensuring
the sustainability of the convergence process.
Ensuring a low-infl ation environment is crucial
in that respect. It is imperative that policy
areas other than monetary policy provide the
Estonian economy with the ability to cope with
potential country-specifi c shocks and avoid the
reoccurrence of macroeconomic imbalances.
Importantly, the Estonian authorities have
publicly underlined that their overarching goal
is to ensure an economic environment that is
conducive to sustainable output and employment
growth in the medium term, in the context of
balanced macroeconomic conditions, and price
stability. To this end, the Estonian authorities
need to be fi rmly committed to a framework
consisting of: i) further fi scal consolidation,
ii) continuing structural reform, and iii) a further
strengthening of fi nancial sector policies to
ensure fi nancial stability and avoid the build-up
of possible risks.
Box 9
STATISTICAL IMPLICATIONS OF THE ENLARGEMENT OF THE EURO AREA TO INCLUDE ESTONIA
Estonia’s entry into the euro area on 1 January 2011 is the fi fth occasion on which statistical
series for the euro area have had to be amended to include additional member countries
(Greece entered in 2001, Slovenia in 2007, Cyprus and Malta in 2008, and Slovakia in 2009).
The preparation of statistics for the enlarged euro area has been coordinated, where necessary,
with the European Commission.
The entry of Estonia into the euro area means that Estonian residents – both natural and legal
persons – have become residents of the euro area. This affects statistics recording transactions
(fl ows) and positions of euro area residents among themselves and vis-à-vis non-euro area
residents, such as monetary, balance of payments and international investment position statistics,
as well as fi nancial accounts. In these cases, transactions and positions between residents of
Estonia and other euro area residents must now be “consolidated” to ensure a proper defi nition of
euro area residency in all statistics concerned.
As of January 2011 Estonia has to meet all the statistical requirements of the ECB, i.e. to provide
fully harmonised and comparable national data.1 Since the preparatory work for new statistics
requires a long lead time, Eesti Pank and the ECB started the statistical preparations well before
Estonia joined the EU. After becoming a member of the ESCB in 2004, Eesti Pank intensifi ed
its preparations to fulfi l the requirements of the ECB in the fi elds of monetary and fi nancial
1 The statistical requirements of the ECB are summarised in the document “ECB statistics: an overview”, April 2010.
131ECB
Annual Report2010
statistics, external statistics, government fi nance statistics and fi nancial accounts. In addition,
it had to carry out the necessary preparations for the integration of Estonian credit institutions
into the ECB’s minimum reserve system and to fulfi l the relevant statistical requirements in
this area.
For the data reporters and NCBs of the other euro area countries, the enlargement of the euro
area means that since January 2011 they have to report transactions (or fl ows) and positions
vis-à-vis residents of Estonia as part of the euro area data, instead of transactions and positions
vis-à-vis non-euro area residents as they did earlier.
In addition, Estonia and all other euro area countries provided backdata with suffi cient
geographical and sectoral detail, dating back as far as 2004, the year Estonia joined the EU. These
historical data will enable the compilation of aggregates for the euro area in its new composition
for a few years before the enlargement.
Regarding the publication of euro area statistics, the ECB has granted users online access to
two sets of time series, one containing data for the current euro area (i.e. including Estonia) as
far back as available, and one linking the various compositions of the euro area, starting with the
11 countries in 1999.

132ECBAnnual Report2010
2 LEGAL ASPECTS OF THE INTEGRATIONOF EESTI PANK INTO THE EUROSYSTEM
Pursuant to Article 140 of the Treaty, the ECB
reviewed the statute of Eesti Pank and other
relevant Estonian legislation for compliance
with Article 131 of the Treaty. The ECB made
a favourable assessment of the compatibility of
Estonian legislation with the Treaty and with
the Statute of the ESCB, under the assumption
that further legislative amendments to Estonian
legislation would enter into force in time, as
stated in its Convergence Report published in
May 2010. The ECB noted that on 22 April 2010
the Estonian parliament adopted these legislative
amendments.
The ECB and Eesti Pank put in place a number of
legal instruments with a view to ensuring the
integration of Eesti Pank into the Eurosystem on
1 January 2011. The Eurosystem’s legal
framework was adapted as a consequence of the
decision taken by the ECOFIN Council on
13 July 2010 to abrogate the derogation of
Estonia.1 The ECB adopted the necessary legal
instruments to provide for the paying-up of the
remaining capital and the transfer of foreign
reserves to the ECB 2 and established the banknote
allocation key applying from 1 January 2011.3
Pursuant to Article 27.1 of the Statute of the
ESCB, the Governing Council adopted a
recommendation on Eesti Pank’s external
auditors for the annual accounts starting from the
fi nancial year 2011.4 The ECB also reviewed its
legal framework and introduced, where necessary,
amendments resulting from Eesti Pank’s
membership of the Eurosystem. This included a
review of Estonian legislation implementing the
Eurosystem’s legal framework for monetary
policy and TARGET2, which enabled Estonian
counterparties to participate in the Eurosystem’s
open market operations from 3 January 2011.
The ECB also adopted a decision on transitional
provisions for the application of minimum
reserves by the ECB following the introduction
of the euro in Estonia.5 Finally, the ERM II
Agreement 6 was terminated for Eesti Pank.
The introduction of the euro in Estonia and the
integration of its central bank into the Eurosystem
also required changes to some Estonian legal
instruments. The ECB was consulted on national
legislation governing the euro changeover,
rounding rules and currency circulation in Estonia,
as well as the minimum reserves framework.7
By the end of 2010 Eesti Pank’s law and statute
had been brought into line with recommendations
in the ECB’s 2004, 2006, 2008 and 2010
Convergence Reports. Eesti Pank consulted the
ECB on the draft amendments to the law and the
statute of Eesti Pank on 10 February 2010 and
the ECB adopted an opinion proposing certain
changes, which were refl ected in the fi nal
version of the law and the statute.8
The ECOFIN Council consulted the ECB on its
proposals to amend the Council Regulations 9
which enabled the introduction of the euro in
Estonia and determined the irrevocably fi xed
exchange rate of the euro vis-à-vis the Estonian
kroon.10 The ECB welcomed the proposed
regulations and noted that they would enable
the introduction of the euro as the currency of
Estonia following the abrogation of Estonia’s
derogation in accordance with the procedure set
out in Article 140(2) of the Treaty.
Council Decision 2010/416/EU of 13 July 2010 in accordance 1
with Article 140(2) of the Treaty on the adoption by Estonia of
the euro on 1 January 2011, OJ L 196, 28.7.2010, p. 24.
Decision ECB/2010/34 of 31 December 2010 on the paying-up 2
of capital, transfer of foreign reserve assets and contributions
by Eesti Pank to the European Central Bank’s reserves and
provisions, OJ L 11, 15.1.2011, p. 58.
Decision ECB/2010/29 of 13 December 2010 on the issue of 3
euro banknotes (recast), OJ L 35, 9.2.2011, p. 26.
Recommendation ECB/2010/16 of 8 October 2010 to the Council 4
of the European Union on the external auditors of Eesti Pank,
OJ C 282, 19.10.2010, p. 1.
Decision ECB/2010/18 of 26 October 2010 on transitional 5
provisions for the application of minimum reserves by the ECB
following the introduction of the euro in Estonia, OJ L 285,
30.10.2010, p. 37.
Agreement of 13 December 2010 between the ECB and the 6
national central banks of the Member States outside the euro area
amending the Agreement of 16 March 2006 between the ECB
and the national central banks of the Member States outside the
euro area laying down the operating procedures for an exchange
rate mechanism in stage three of economic and monetary union,
OJ C 5, 8.1.2011, p. 3.
CON/2010/16 and CON/2010/60.7
CON/2010/20.8
Council Regulation (EU) No 671/2010 of 13 July 2010 amending 9
Regulation (EC) No 2866/98 as regards the conversion rate to
the euro for Estonia, OJ L 196, 28.7.2010, p. 4, and Council
Regulation (EU) No 670/2010 of 13 July 2010 amending
Regulation (EC) No 974/98 as regards the introduction of the
euro in Estonia, OJ L 196, 2.7.2010, p. 1.
CON/2010/52.10
133ECB
Annual Report2010
3 OPERATIONAL ASPECTS OF THE INTEGRATION OF EESTI PANK INTO THE EUROSYSTEM
Following the ECOFIN Council’s decision
of 13 July 2010 on the adoption of the euro by
Estonia on 1 January 2011, the ECB conducted
technical preparations with a view to fully
integrating Eesti Pank into the Eurosystem.
In line with the provisions of the Treaty, Eesti
Pank joined the Eurosystem with exactly the same
rights and obligations as the NCBs of the EU
Member States that had already adopted the euro.
The technical preparations for the integration of
Eesti Pank into the Eurosystem covered a wide
range of areas, notably fi nancial reporting and
accounting, monetary policy operations, foreign
reserve management and foreign exchange
operations, payment systems, statistics and
banknote production. In the fi eld of operations,
preparations involved extensive testing of the
instruments, procedures and technical systems
for the implementation of monetary policy and
foreign exchange operations.
MONETARY POLICY OPERATIONS
Following the adoption of the euro by Estonia
on 1 January 2011, 18 Estonian credit
institutions, a list of which is published on
the ECB’s website, became subject to the
Eurosystem’s reserve requirements as from
that date. The entry of Estonia into the euro
area changed the liquidity conditions in the
Eurosystem only slightly. The aggregate reserve
requirements of euro area credit institutions
increased by less than 0.2% (€223 million). Net
autonomous liquidity factors in Estonia for the
period from 1 to 18 January 2011 were liquidity-
absorbing, increasing the liquidity needs of the
entire euro area banking sector by €1.1 billion
on average.
Given the liquidity surplus, Estonian
counterparties did not submit any bids in
the open market operations conducted at the
beginning of 2011, except for a small amount in
the operation that was settled on 19 January.
On entering the euro area, Eesti Pank also adopted
the collateral framework of the Eurosystem, but
reported no assets to be eligible for Eurosystem
credit operations as at 1 January 2011.
CONTRIBUTION TO THE ECB’S CAPITAL, RESERVES
AND FOREIGN RESERVE ASSETS
Eesti Pank’s total subscribed share amounts
to €19.3 million, equivalent to 0.1790% of the
ECB’s subscribed capital of €10.761 billion
as at 1 January 2011. Upon joining the ESCB
on 1 May 2004, Eesti Pank paid up 7% of its
share of the subscribed capital of the ECB as
a contribution to the ECB’s operational costs;
in conjunction with the ECB’s capital increase
on 29 December 2010 this contribution has
been reduced to 3.75%. In accordance with
Article 48.1 of the Statute of the ESCB,
Eesti Pank is asked to pay up the remaining
part of its subscription, which is equal to
€18.5 million. On 1 January 2011 Eesti Pank
paid up the fi rst instalment of its subscription,
equal to €12.6 million, and the rest of the
subscribed capital will be paid in two further
instalments.
At the beginning of 2011, in accordance with
Articles 30 and 48.1 of the Statute of the
ESCB, Eesti Pank, on the basis of its share of
the ECB’s subscribed capital, transferred to
the ECB foreign reserve assets equivalent to
a total of €145.9 million (85% in Japanese
yen-denominated assets and 15% in gold).
Eesti Pank has opted to conduct the operational
activities related to the management of its
share of the ECB’s Japanese yen reserve
assets in a pooled management arrangement
with Suomen Pankki – Finlands Bank. As a
result of the transfer of foreign reserve assets
to the ECB, Eesti Pank was credited with a
euro-denominated claim on the ECB in
accordance with Article 30.3 of the Statute of
the ESCB.

134ECBAnnual Report2010
4 THE CASH CHANGEOVER IN ESTONIA
THE LOGISTICS OF THE CASH CHANGEOVER
Following the abrogation of the derogation
for Estonia by the ECOFIN Council on
13 July 2010, Estonia adopted the euro as
its currency on 1 January 2011. The cash
changeover went smoothly and, following a
two-week period during which Estonian kroon
and euro cash circulated in parallel, the euro
banknotes and coins became the sole legal
tender in Estonia. Virtually all automated
teller machines (ATMs) only dispensed euro
banknotes as of 1 January 2011. The cash
changeover modalities had been laid down in
a changeover plan established jointly with the
relevant stakeholders.
Suomen Pankki – Finlands Bank, which acted as
the logistical counterpart, provided 44.9 million
banknotes worth €1.47 billion. Eesti Pank will
repay that loan in the form of banknotes in
2012. The banknotes to be commissioned by
Eesti Pank will carry the letter “D” in their serial
numbers. Eesti Pank procured 194 million euro
coins worth €58.4 million from the Mint of
Finland.
In terms of value, 13% of the borrowed euro
banknotes and nearly half of the procured euro
coins were frontloaded to the banking sector
for fi lling the ATMs and for sub-frontloading.
In addition, 700,000 starter kits each containing
euro coins with a value of €12.79 were produced
for distribution to the general public in order
to reduce the amount of change to be kept by
retailers in the fi rst few days of January.
In connection with the introduction of the euro
in Estonia, NCBs exchanged, free of charge,
Estonian kroons for euro at par value from
the fi rst working day of 2011 until
28 February 2011.11 The amount exchanged was
limited to €1,000 for any given party and
transaction on any one day. Furthermore, in
December 2010 individuals were able to
exchange kroons for euro free of charge at the
irrevocably fi xed exchange rate at all banks in
Estonia. Estonian post offi ces also took part in
the changeover process during the fi rst 15 days
of January to ensure cash supply in
rural areas.
From 1 January 2011, for a period of six months,
kroons can be exchanged for euro at the fi xed
exchange rate free of charge at all bank branches
providing cash services. Thereafter, from July to
December 2011, kroons can be exchanged for
euro at certain bank branches.
Eesti Pank will continue to redeem Estonian
kroon banknotes and coins for an unlimited
period of time.
THE INFORMATION CAMPAIGN ON THE
INTRODUCTION OF THE EURO
The ECB worked closely with Eesti Pank to
prepare a comprehensive information campaign
in preparation for the introduction of the euro.
The communication tools used in the campaign
took into account the experience gained in
past changeovers and included public opinion
surveys, different types of printed publication
and dedicated internet pages. For the fi rst time
since the Euro 2002 Information Campaign,
TV advertising was used (four adverts were
aired between November 2010 and mid-January
2011). The euro information campaign organised
by the ECB and Eesti Pank aimed to familiarise
cash handlers and the general public with the
visual appearance and security features of the
euro banknotes and coins, as well as with the
cash changeover arrangements. Communication
partners (mainly banks and public authorities)
were given access to the high-quality print
fi les of the ECB’s publications, which they
were able to adapt and use in their own
communication activities.
Following contacts with blind associations,
including the Estonian Blind Association, the
ECB developed a “talking card” for the visually
Article 52 of the Statute of the ESCB requires that the Governing 11
Council of the ECB take the necessary measures to ensure that
banknotes denominated in currencies with irrevocably fi xed
exchange rates to the euro are exchanged by the euro area NCBs
at par value. Against this background, the Governing Council
adopted a guideline on the exchange of such banknotes on
24 July 2006.

135ECB
Annual Report2010
impaired (an embedded MP3 fi le reads out basic
information requested on the changeover and
the euro cash).
To mark the launch of the euro information
campaign in Estonia, on 19 September 2010
a symbolic star containing euro banknotes
was handed over by President Trichet to
Governor Lipstok.

Interior view of the Grossmarkthalle’s concrete grid facade. The restoration of the Grossmarkthalle is an important aspect
of the construction works. The fundamental appearance of the building will be retained, with its facades and surfaces being
restored in line with the preservation order.

CHAPTER 4
F INANCIAL STABILITY AND INTEGRATION

138ECBAnnual Report2010
The Eurosystem contributes to the smooth
conduct of policies pursued by the competent
national authorities relating to the prudential
supervision of credit institutions and the
stability of the fi nancial system. It also provides
advice to these authorities and the European
Commission on the scope and implementation
of EU legislation in these fi elds. Following
the establishment of the European Systemic
Risk Board (ESRB) on 16 December 2010,
the new European supervisory framework came
into being on 1 January 2011 with the creation
of three European Supervisory Authorities
(ESAs) covering banks, securities markets,
and insurance and pension funds. This framework
will produce a substantial strengthening of
the European supervisory structure both at
the micro-prudential and, for the fi rst time,
at the macro-prudential level, as the ESRB has
been given a mandate to identify and prioritise
systemic risks to the EU fi nancial sector, to issue
warnings and, where appropriate, to suggest
recommendations for remedial action to contain
those risks. The ECB will “ensure the secretariat
of the ESRB and thereby provide analytical,
statistical, logistical and administrative support
to the ESRB” (see Chapter 6).1
1.1 FINANCIAL STABILITY MONITORING
1.1.1 THE EURO AREA BANKING SECTOR
The key activities of the ECB, in collaboration
with the ESCB’s Banking Supervision
Committee (BSC), are monitoring risks to
fi nancial stability and assessing the fi nancial
system’s shock-absorbing capacity.2 The main
focus of the analysis is on banks, as they remain
the primary fi nancial intermediaries in Europe.
However, owing to the increasing importance of
fi nancial markets, fi nancial infrastructures and
other fi nancial institutions, and their linkages
with banks, vulnerabilities in these components
of the fi nancial system also need to be monitored
by the ESCB.
During 2010 continued distress in the euro area
government bond and bank funding markets
tested market confi dence in the ability of the euro
area banking sector to deal with future risks.
However, the commitment of euro area countries
to undertake or accelerate fi scal consolidation, the
establishment of the European Financial
Stabilisation Mechanism (EFSM) and the
European Financial Stability Facility (EFSF),
the launch of the ECB’s Securities Markets
Programme (SMP) in May, under which
interventions are conducted in the euro area public
and private debt securities markets, and the overall
positive results of the EU-wide stress tests that
were announced in July all made important
contributions to the stabilisation of markets over
the summer.3 Moreover, the conclusion of an
agreement on a revision of the regulatory regimes
for internationally active banks (the Basel III
rules), to be implemented gradually over time so
that the banking sector can keep providing credit
to the economy, reduced uncertainty about the
future capital and liquidity needs of banks. These
developments notwithstanding, the overall
economic and fi nancial situation in the euro area
remained fraught with risks for fi nancial stability,
and concerns about the interplay between
sovereign debt problems and banking sector
vulnerabilities in some euro area countries re-
emerged in the second half of the year.4
Furthermore, the re-emergence of global
imbalances during 2010 represented another
important source of risks, along with the associated
high exchange rate volatility and the possibility of
disorderly unwinding of the imbalances.
Council Regulation (EU) No 1096/2010 of 17 November 2010, 1
OJ L 331, 15.12.2010, p. 162.
Since the end of 2004 the ECB has published its Financial 2
Stability Review, a semi-annual report on the stability of the
euro area fi nancial system. In 2010 it also published structural
indicators for the EU banking sector, its annual report on EU
banking sector stability and its annual report on EU banking
structures, which this year included an ad hoc appendix on the
profi tability of banks, “Beyond RoE: How to measure bank
performance”. These publications present the main fi ndings of
the monitoring by the BSC of the structure and stability of the
banking sector, and are available on the ECB’s website.
The EU-wide stress test exercise was coordinated by the 3
Committee of European Banking Supervisors (CEBS) in close
collaboration with the ECB and the European Commission.
Detailed descriptions of the methodology are available on
the websites of the CEBS and the ECB, and the results are
available on the websites of the CEBS and participating national
authorities.
This interplay culminated in Ireland applying for an EU/IMF 4
fi nancial support programme on 21 November.
1 FINANCIAL STABILITY
139ECB
Annual Report2010
Notably, developments in the euro area fi nancial
sector in 2010 pointed to signifi cant discrepancies
between member countries, which to a large
extent refl ected the ongoing process of correction
of past imbalances in some countries. In such an
environment, the timing and phasing of exits from
remaining public sector support measures posed
particular challenges for the euro area fi nancial
system. However, those measures will have to
be withdrawn over the medium term; otherwise
they would maintain an uneven playing fi eld
between banks and between countries. In the
meantime, the main risks continued to include the
possibility that concerns about the sustainability
of public fi nances would persist or even increase,
with a potential for further adverse feedback
loops between public fi nances and the fi nancial
sector. Although the adverse interaction between
vulnerabilities relating to economic growth, fi scal
imbalances and bank funding conditions was
particularly prevalent in only a limited number of
euro area countries, risks of contagion spreading
to other euro area countries remained.
Nonetheless, going forward, the central scenario
for euro area fi nancial stability is broadly
favourable, supported in part by a more benign
macroeconomic environment, by the increased
transparency of fi nancial institutions’ asset
exposures and by additional fi nancial backstop
mechanisms set up by euro area governments and
central banks. However, the degree of uncertainty
surrounding this outlook remains high.
The earnings of euro area large and complex
banking groups (LCBGs) started to recover
in the fi rst three quarters of 2010, mainly
driven by buoyant net interest income, lower
(albeit still high) average loan loss provisions,
and steady fee and commission income.
Net interest income continued to be supported
by the steep yield curve and the still relatively
wide margins applied by banks to new lending.
In addition, indications emerged that growth
in bank lending for house purchase may have
passed a turning point in mid-2010, albeit
with substantial differences between member
countries, while bank lending to non-fi nancial
corporations recovered far more sluggishly.
Finally, LCBGs benefi ted from a signifi cant
decrease in the cost of risk, due both to a positive
evolution of the credit cycle and to the economic
recovery (e.g. a stabilisation of default rates
and lower non-performing loans). However,
LCBGs experienced a remarkable drop in
trading revenues in the second quarter of 2010,
which was only partially reversed in the third
quarter. This was driven by lower trading
volumes, and many institutions continued to
post losses on some of their asset holdings.
The solvency ratios of LCBGs improved further
across the board in the fi rst three quarters
of 2010, supported by retained earnings and
banks’ efforts to raise capital. A setback to the
recent recovery in the profi tability of LCBGs
would adversely impact the provision of credit
to the real economy. Moreover, the recovery
in the quality of banks’ credit risk exposures
remains fragile in a number of countries.
1.1.2 OTHER FINANCIAL INSTITUTIONS
Turning to other fi nancial institutions,
the condition of the euro area insurance sector
stabilised in 2010. However, the performance
across insurers was varied and the moderate
economic activity continued to weigh on
underwriting performance. Insurers’ fi nancial
results were, however, supported by relatively
contained losses and stable investment income.
All in all, the profi tability of large insurers
remained stable throughout 2010. In addition,
capital positions also remained steady and
appeared, on average, to include a reasonable
amount of shock-absorption capacity.
Looking ahead, some risks and challenges for
the euro area insurance sector remain, and this
is contributing to some uncertainty about the
outlook. In particular, the low levels of yields on
AAA-rated government bonds continue to pose
challenges for insurers (and pension funds) that
have a large stock of guaranteed-return contracts
with guaranteed rates close to or above current
long-term risk-free rates. At the same time,
the moderate recovery in economic activity,
and the uncertainty surrounding it, is continuing
to weigh on the underwriting performance of
euro area insurers.
140ECBAnnual Report2010
The hedge fund sector continued to recover
in 2010. Average investment performances
were not as impressive as in 2009, but investors
continued to return to the sector and annual net
fl ows became positive again. However, investors
tended to prefer larger hedge funds, the growth of
which may also imply higher concomitant risks
to fi nancial stability. Furthermore, amid low
nominal interest rates and increasing tolerance
of counterparty credit risk across prime broker
banks, the limited data available on hedge fund
leverage pointed to a gradual releveraging of
the hedge fund sector with the associated higher
vulnerability to various leverage-related risks.
1.2 FINANCIAL STABILITY ARRANGEMENTS
In 2010 the EU launched a major overhaul
of the EU framework for crisis prevention,
management and resolution. The reform –
covering a time horizon of a few years, as laid
down in the ECOFIN Council conclusions of
18 May 2010 – focuses on three main areas of
work: i) the implementation of an EU policy
coordination framework, ii) the enhancement
of the EU regulatory framework, and iii) the
establishment of mechanisms to ensure that the
fi nancial sector bears the net cost of fi nancial
crises. The ECB has participated actively in all
three areas throughout the year.
In particular, the ECB supported the
implementation of a holistic EU-wide policy
coordination framework for crisis prevention,
management and resolution, implying a
stronger coordinating role for the ECOFIN
Council in fi nancial stability policies, as well
as the setting-up of coordination arrangements
for the clear articulation of the roles and
responsibilities of the various EU and national
bodies. In that context, the establishment of
cross-border stability groups (CBSGs) –
as defi ned in the 2008 memorandum of
understanding on cross-border fi nancial
stability 5 – for all large EU cross-border
fi nancial groups by mid-2011, accompanied
by the signing of cross-border cooperation
agreements (“Voluntary Specifi c Cooperation
Agreements”), was considered useful for
strengthening policy coordination on a bilateral/
multilateral basis.6
In the fi eld of regulation, in February 2010 the
Eurosystem contributed to the Commission’s
public consultation on an EU framework
for cross-border crisis management in the
banking sector.7 The Eurosystem supported the
Commission’s objective of taking the initiative
to develop an EU resolution framework and to
address obstacles to the effective management
of crises affecting EU cross-border fi nancial
institutions. The Eurosystem also suggested
several possible ways to address issues in
the areas of early intervention tools, intra-
group asset transfers, “bank resolution”8 and
insolvency.
In May 2010 the Commission published its
“Communication on bank resolution funds”,
suggesting the establishment of an EU-wide
network of prefunded schemes as the best use of
fi nancial levies to ensure that future bank
failures do not come at the cost of the taxpayers
or destabilise the fi nancial system. In the same
vein, the European Council agreed in June that
Member States should introduce systems of
levies and taxes on fi nancial institutions to
ensure fair burden-sharing and to create
incentives to contain systemic risk.9 In that
context, the ECB acknowledged the need to
See Memorandum of Understanding on Cooperation 5
between the Financial Supervisory Authorities, Central
Banks and Finance Ministries of the European Union on
Cross-Border Financial Stability (ECFIN/CEFCPE(2008)
REP/53106), Brussels, 1 June 2008.
On 17 August 2010 the fi rst CBSG – the Nordic-Baltic 6
Cross-Border Stability Group – was set up with the signing
of an agreement between the authorities of Denmark, Estonia,
Finland, Iceland, Latvia, Lithuania, Norway and Sweden.
On 20 October 2009 the European Commission launched a public 7
consultation on its communication entitled “An EU Framework
for Cross-Border Crisis Management in the Banking Sector”,
which addresses a range of issues in three main areas: i) early
intervention, ii) bank resolution, and iii) insolvency.
“Bank resolution” refers to measures taken by national resolution 8
authorities to manage a crisis in a banking institution, to contain
its impact on fi nancial stability and, where appropriate,
to facilitate an orderly winding-up of the whole or parts of the
institution.
With the exception of the Czech Republic, which reserved the 9
right not to introduce these measures.

141ECB
Annual Report2010
ensure the coordination of the various initiatives
already undertaken by countries to mitigate the
risk of competitive distortions arising between
national banking markets and of cross-border
cooperation being hampered during crises. For
this purpose, the ECB has actively contributed
to the work of the Economic and Financial
Committee (EFC) ad hoc working group on
crisis management by monitoring the different
systems of levies in the EU and providing
recommendations on possible options to address
short-term issues, such as double taxation and a
level playing fi eld.
In October 2010 the Commission released a
communication on “An EU Framework for
Crisis Management in the Financial Sector”
which sets out the main elements of the
reform that will be part of EU legislative
proposals in 2011. Beyond the immediate
priority of putting in place effi cient crisis
management arrangements in all Member States,
the communication also includes a “roadmap”
providing a longer-term view of some of the
major challenges which will need to be overcome
in order to ensure the smooth handling of crises.
The Eurosystem supports the proposal put
forward by the Commission aimed at enhancing
the EU regulatory framework for crisis
management and resolution. A comprehensive
crisis management framework would ensure,
inter alia, that, ultimately, resolution would be
a credible option, even in the case of a
systemically important cross-border institution.
The achievement of this goal requires not only a
more effective toolkit for authorities, but also
provisions that foster cooperation between
Member States in crisis situations. A public
consultation on the technical details of this
proposal was launched by the Commission
on 6 January 2011.10 In December 2010, in its
conclusions on crisis prevention, management
and resolution, the ECOFIN Council supported
the Commission in its forthcoming legislative
work, and invited the EFC to continue its
monitoring of national systems of levies and
taxes, in particular with regard to a level playing
fi eld and coordination.11
For further details, see the European Commission’s website 10
(http://ec.europa.eu).
Council conclusions on crisis prevention, management and 11
resolution, 3054th ECOFIN Council meeting, Brussels,
7 December 2010.
142ECBAnnual Report2010
2 FINANCIAL REGULATION AND SUPERVISION
2.1 BANKING
During 2010 banking regulation followed
the agenda set by the G20 at the London
and Pittsburgh summits in 2009 with the
fi nal objective of building a more resilient
fi nancial system that supports strong and stable
economic growth. To this end, the Group of
Governors and Heads of Supervision (GHOS),
the oversight body of the Basel Committee on
Banking Supervision, agreed on a substantial
strengthening of existing capital requirements
and the introduction of global liquidity risk
regulation.12 This reform package, commonly
referred to as “Basel III”, is a cornerstone of the
new international prudential framework.
The Basel III package includes a new defi nition
of regulatory capital which focuses on those
elements with the highest loss-absorbing
capacity, such as common equity and its
equivalents for non-joint stock companies.
In addition to this qualitative enhancement,
the amount of capital required has also been
increased signifi cantly. The new minimum
common equity Tier 1 ratio has been set at 4.5%
of risk-weighted assets, complemented by a
capital conservation buffer of 2.5% to withstand
future periods of stress. Together with other
Tier 1 and Tier 2 equity elements, the effective
total capital ratio will rise from the current 8% to
10.5% of risk-weighted assets. An additional
counter-cyclical buffer, to be activated in
circumstances of excessive credit growth, could
add up to 2.5% of risk-weighted assets,
depending on national developments in the credit
cycle. In response to the Commission’s
consultation on its proposal on counter-cyclical
capital buffers, the Eurosystem supported work
at the international and EU level with regard to
developing a counter-cyclical capital buffer
(CCB) mechanism and stressed the need
for consistent implementation at the EU and
international level. While ensuring a level
international playing fi eld by laying down the
requirements for the setting of CCBs in as much
detail as possible in the Capital Requirements
Directive (CRD) itself, the ESRB and the
European Banking Authority (EBA), in their
respective roles within the European supervisory
framework, could issue policy principles and
technical standards to specify additional
requirements that would allow the framework to
be responsive to the evolution of the fi nancial
system and the different shocks it faces.13
Moreover, in line with the mandate of the
G20, the risk-based requirements would
be supplemented with a transparent and
internationally comparable non-risk-based
leverage ratio.
The regulation of liquidity risk consists of two
key quantitative standards, focusing on limiting
misalignments in terms of short-term liquidity
needs and imposing a structural, longer-term
liquidity requirement with the aim of reducing
banks’ dependence on wholesale and other
volatile funding sources, and promoting
stable longer-term funding. To facilitate
the monitoring of the liquidity risks and the
exchange of information between supervisors,
the quantitative measures are supplemented
with a set of monitoring tools.
In line with these regulatory developments,
the European Commission launched two
consultations. The fi rst was launched in February
2010 and concerned proposed amendments
to the CRD regarding liquidity standards, the
defi nition of capital, leverage ratios, changes in
the treatment of counterparty credit risk, counter-
cyclical measures (including through-the-cycle
provisioning for expected credit losses), a single
rulebook and systemically important fi nancial
institutions (SIFIs). The second consultation,
For further information, see “Basel III: A global regulatory 12
framework for more resilient banks and banking systems” and
“Basel III: International framework for liquidity risk measurement,
standards and monitoring”, both published on 16 December 2010,
available on the BIS website (http://www.bis.org).
See “Countercyclical capital buffer – position of the Eurosystem 13
on the Commission’s consultation document”, available on the
ECB’s website.

143ECB
Annual Report2010
launched in October 2010, relates to the
introduction of a counter-cyclical buffer.
The ECB fully supports the GHOS agreement
and considers it a crucial step towards
successfully fulfi lling the G20 mandate.
The crisis clearly showed that measures to
make the fi nancial system more resilient should
be a key priority. Notwithstanding the costs
of regulatory reform, some of which are of a
transient nature, the new framework will benefi t
the global economy by substantially mitigating
the risks associated with future fi nancial crises.
Nonetheless, the ECB considers that the gradual
implementation of the package, envisaged over
the period 2013-19, will remain key and that
any further development has to be evaluated
against the set of measures already under way.
During the transition period, capital measures,
the liquidity ratios and the leverage ratio will
require careful assessment with regard to their
impact on particular business models, specifi c
banking sectors, fi nancial markets and economic
growth. At the same time, special attention will
have to be devoted to ensuring that the new rules
are implemented consistently across different
jurisdictions at the international level.
In line with the G20 mandate, the Financial
Stability Board (FSB) focused its efforts in 2010
on another strand of work, namely developing
a well-integrated framework to reduce the risks
and externalities associated with SIFIs. The new
framework will comprise the following building
blocks: i) tools for the effective resolution of
SIFIs, ii) more intensive and effective supervision
and oversight, iii) robust core fi nancial market
infrastructures to reduce contagion risk, and
iv) supplementary prudential and other
requirements to enhance loss absorbency.
In September 2010, in a press release following
the agreement on the calibration of the new
prudential regime, the GHOS remarked that SIFIs
should have loss-absorbing capacity beyond the
standards agreed in Basel III.
The ECB welcomes and supports the work
of the FSB in this important fi eld. Given the
global scale of the activities pursued by SIFIs,
it remains crucial that the regulatory community
cooperates closely, under the aegis of the FSB,
to ensure a high degree of international
consistency in this domain, in order to limit
potential deviations from a level playing fi eld
and minimise the risks of regulatory arbitrage.
2.2 SECURITIES
In 2010 work continued on hedge funds, credit
rating agencies (CRAs) and short-selling
regulation. The G20 reaffi rmed its commitment
to improving the oversight of hedge funds
and CRAs.14 At the European level, concerns
about the potential harm of short selling were
addressed by the Committee of European
Securities Regulators (CESR).15
As regards hedge funds, agreement 16 on
the Alternative Investment Fund Managers
Directive (AIFM Directive) was reached in the
Council in October, and on 11 November 2010
the European Parliament voted in favour of the
proposal. The objectives of the AIFM Directive
are, inter alia: to ensure that all managers of
alternative investment funds above a certain size
are subject to appropriate authorisation and
registration requirements; to improve risk
management and governance safeguards; to
enhance investor protection; and to design a
frame work for monitoring macro-prudential
risks. Subject to these requirements, AIFMs
would obtain a passport allowing them to market
funds to professional investors across the Single
Market. The Eurosystem contribution to the
European Commission’s consultation on hedge
funds strongly welcomed more transparency and
macro-prudential oversight of the hedge fund
industry and stressed that the introduction of a
comprehensive and harmonised regulatory
framework for AIFMs in the EU could act
The G-20 Toronto Summit Declaration14 , G20, 26-27 June 2010.
Proposal for a Pan-European Short Selling Disclosure Regime15 ,
CESR, March 2010.
Between the Council, the European Commission and the 16
European Parliament’s Economic and Monetary Affairs
Committee.
144ECBAnnual Report2010
as a fi rst step towards a global consensus.
Furthermore, it emphasised the importance of
continuing the international dialogue in order to
ensure a globally coordinated framework.17
With regard to CRAs, the European Commission
has issued a proposal to amend the existing CRA
Regulation.18 In its opinion on the proposal,19
the ECB broadly welcomed the measures aimed
at strengthening the regulatory framework,
in particular that granting comprehensive
powers to the European Securities and Markets
Authority (ESMA) as regards the registration
and surveillance of CRAs, and that concerning
increased transparency and competition in
the market for ratings of structured fi nance
instruments.
In response to concerns regarding the impact of
short selling in the extreme market conditions
created by the fi nancial crisis, regulatory
authorities around the world adopted a series of
measures. In Europe, the CESR proposed a
pan-European disclosure regime in March 2010.
The European Commission also published a
consultation document on 14 June 2010.
The Eurosystem’s reply of 5 August 2010
welcomed the proposed transparency regime for
EU shares. It was stressed that the ESMA,
together with other appropriate authorities,
should play a central role in emergency
situations, and that short-selling bans or
restrictions should be limited in time and scope
to exceptional circumstances. The Eurosystem
broadly supported their enforcement against
settlement failures of uncovered short selling
and the assignment of powers to competent
authorities to allow them to restrict short selling
temporarily. The Commission’s subsequent
proposal for a regulation was aimed at increasing
harmonisation, coordination and transparency,
as well as reducing systemic risks, risks to
market integrity and settlement risks.20
2.3 ACCOUNTING
The main developments in 2010 related to the
ongoing work of the Financial Accounting
Standards Board (FASB) and the International
Accounting Standards Board (IASB) in response
to the request of the G20 to address weaknesses
identifi ed in the wake of the fi nancial crisis and
to bring their standards more into line with one
another.
In response to the G20 request to improve the
involvement of interested stakeholders in the
standard-setting process, the IASB further
increased its outreach efforts with a view to
encouraging broad stakeholder involvement in
standard-setting.
In this context, on many occasions the ECB
provided views to the IASB on several key
accounting projects (notably the accounting of
fi nancial instruments) and, more generally, on the
convergence efforts of the FASB and the IASB.
In April 2010 the ECB provided comments on
the IASB suggestion to accommodate regulatory
concerns by introducing a “regulatory income
statement”. The ECB stressed the importance
of maintaining the good collaboration between
the IASB and regulators on the issues of fair
value measurement and forward-looking
provisioning within the accounting framework.
On the other hand, the ECB did not support the
introduction of a regulatory income statement,
since the disclosure requirements of the new
capital framework (Basel III) already address
the disclosure issues raised by the IASB in its
proposal and a regulatory income statement
could potentially create additional complexity
and uncertainty, and might result in confusion
on the market, which should be avoided.
Both the FASB and the IASB strengthened
their efforts to reduce the complexity of
European Commission’s consultation on hedge funds – 17
Eurosystem contribution, ECB, 25 February 2009.
Regulation (EC) No 1060/2009 of the European Parliament and 18
of the Council of 16 September 2009 on credit rating agencies.
Opinion of the European Central Bank of 19 November 2010 on 19
a proposal for a regulation of the European Parliament and of
the Council amending Regulation (EC) No 1060/2009 on credit
rating agencies (CON/2010/82).
Proposal for a regulation of the European Parliament and of the 20
Council on short selling and certain aspects of credit default
swaps, European Commission, 15 September 2010.

145ECB
Annual Report2010
current accounting for fi nancial instruments by
developing new standards on the classifi cation
and measurement of fi nancial instruments.
In 2010 the two boards continued their work
on strengthening the accounting recognition
of loan loss provisions (impairment). In this
regard, the ECB repeatedly conveyed its clear
support for a move towards an expected loss
model. In addition, the ECB continued to
contribute to the accounting work of the Basel
Committee, which is aimed, among other things,
at addressing the operational challenges posed by
the introduction of an expected loss approach.
146ECBAnnual Report2010
3 FINANCIAL INTEGRATION
The Eurosystem contributes to enhancing
European fi nancial integration by: i) raising
awareness of and monitoring fi nancial
integration, ii) acting as a catalyst for private
sector activities by facilitating collective action,
iii) giving advice on the legislative and regulatory
framework for the fi nancial system and direct
rule-making, and iv) providing central banking
services that foster fi nancial integration.
RAISING AWARENESS OF AND MONITORING
FINANCIAL INTEGRATION
In April 2010 the ECB published its fourth
annual report on “Financial integration in
Europe”.21 The main purpose of the report is
to contribute to the advancement of European
fi nancial integration and to raise public
awareness of the Eurosystem’s role in supporting
this process, providing information about the
state of integration and thus an empirical basis
for policy measures to further foster fi nancial
integration. The report fi rst assesses the state of
fi nancial integration, based on a set of indicators
that are also published semi-annually on the
ECB’s website. In 2010 these indicators were
further developed to include, for example, risk
indicators for the bond market. The report also
contains in-depth analyses of selected issues:
i) banking integration and supervision in the EU,
ii) European covered bonds, iii) harmonisation
in the post-trading sector, and iv) stability
implications of fi nancial market integration
and development. The report concludes with
an overview of the Eurosystem’s contribution
towards the achievement of more integrated
and developed fi nancial markets in Europe
during 2009.
The ECB continued its involvement in the
Research Network on Capital Markets and
Financial Integration in Europe, which brings
together academics, market participants,
policy-makers and central bankers, and is
run in cooperation with the Center for
Financial Studies at the University of
Frankfurt. The network’s 13th conference on
“Macro-prudential Regulation as an Approach to
Contain Systemic Risk: Economic Foundations,
Diagnostic Tools and Policy Instruments” took
place on 27 and 28 September 2010 in Frankfurt
and was hosted by the ECB. As in previous
years, the ECB awarded fi ve “Lamfalussy
Fellowships” to young researchers in the context
of the network. The network’s current priorities
are: i) fi nancial systems as risk managers,
risk distributors and risk creators, ii) the
integration and development of retail fi nancial
services and the promotion of innovative fi rms,
and iii) fi nancial modernisation and governance
and the integration of the European fi nancial
system into global capital markets.
ACTING AS A CATALYST FOR PRIVATE
SECTOR ACTIVITIES
SEPA
The Eurosystem continued to support the
Single Euro Payments Area (SEPA) initiative,
which aims to allow individuals, corporations
and public administrations to make cashless
payments in euro throughout the participating
countries from a single account using a single
set of payment instruments as easily, effi ciently
and safely as they can make them today at the
national level.
The Eurosystem published the seventh SEPA
Progress Report in October 2010.22 This report
provides an assessment of the progress achieved
in the implementation of SEPA since the
publication of the previous report in
November 2008, highlighting accomplishments
and pointing out defi ciencies. Furthermore,
in the annex to the report, the Eurosystem has
identifi ed a (non-exhaustive) list of milestones
that need to be attained between the
fourth quarter of 2010 and the end of 2013 in
order to facilitate the fi nalisation of SEPA
implementation and migration. The main
conclusions of the report relate to the migration
towards SEPA credit transfers (SCTs) and SEPA
direct debits (SDDs), cards, innovation and the
security of retail payments. For the latter, among
other things, the Eurosystem has established
Financial integration in Europe21 , ECB, April 2010.
Single Euro Payments Area: Seventh Progress Report – Beyond 22
theory into practice, ECB, October 2010, available on the
ECB’s website.
147ECB
Annual Report2010
a forum for monitoring market developments
and fostering the harmonisation of security
expectations in Europe. Furthermore, the
Eurosystem welcomed the European
Commission’s initiative to impose an end date
for migration by means of an EU regulation.23
The SEPA credit transfer scheme accounted for
13.9% of total euro credit transfer payments in
December 2010. In addition to the euro area
SCT indicator, national SCT indicators show
that the take-up of SCTs in individual countries
still varies considerably.24 Furthermore, since
the launch of the SEPA direct debit scheme in
November 2009, the use of SDDs has remained
fairly modest, amounting to well below 1% of
all euro direct debits in December 2010.
The introduction of the SCT and SDD
schemes has laid foundations on which further
innovations can be built, e.g. pan-European
online payment solutions, mobile payments and
e-invoicing. In 2010 the Eurosystem discussed
the status of the various initiatives in the fi eld of
innovative payments with market participants.
To this end, the ECB conducted an eSEPA
online survey in cooperation with NCBs to gain
an insight into the different solutions available
in various countries.
Further progress needs to be made,
in particular in the area of SEPA for
cards. One of the building blocks is the
completion of the migration of chip cards,
automated teller machines and point-of-sale
terminals to the EMV standard 25, for which
the industry set itself a deadline of the end of
2010. According to the SEPA card indicators,
a large number of countries have already
achieved 100% migration to EMV. In 2010 a
second meeting was held with stakeholders to
discuss a SEPA certifi cation framework for cards
and terminals with a view to achieving a single
evaluation and certifi cation process. Moreover,
the Eurosystem provided further clarity on the
principle of the separation of card schemes from
processing entities. The Eurosystem expects at
least one additional European card scheme to
emerge which meets its requirements and the
requirements of the other stakeholders to achieve
a competitive card market in SEPA; several
market initiatives are already under way and
their progress will continue to be monitored.
In March 2010 the Eurosystem and the European
Commission agreed on the creation of the SEPA
Council with the aim of addressing the need for
proper governance of the SEPA project and
increasing the involvement of end users.
This new overarching body is co-chaired by the
ECB and the European Commission and brings
together high-level representatives from the
supply and demand sides of the payments
market.26
SECURITIES MARKETS
The market for short-term paper in Europe
is largely domestic in nature. Since 2001 the
Short-Term European Paper (STEP) initiative,
pursued by market participants under the
auspices of the European Banking Federation
(EBF) and ACI – the Financial Markets
Association – and steered by the STEP Market
Committee, has promoted the integration of
the short-term debt securities market through
a voluntary core set of market standards and
practices which can be applied to issuance
programmes on existing markets such as the
Euro Commercial Paper (ECP) market or the
French commercial paper (TCN) market.
The Eurosystem has supported STEP in two
ways. First, until June 2010, on the basis of a
temporary arrangement, the Eurosystem assisted
the STEP Secretariat with the STEP-labelling of
programmes, although ultimate responsibility
For further details, see the section entitled “Advice on the 23
legislative and regulatory framework for the fi nancial system and
direct rule-making” later in this chapter.
A critical mass, i.e. a market share of more than 50%, has only 24
been achieved in Luxembourg and Cyprus. In a further three
countries (Slovenia, Belgium and Spain), the market share has
reached double fi gures.
The “EMV standard” is a set of specifi cations developed by 25
the consortium EMVCo, which is promoting the global
standardisation of electronic fi nancial transactions – in particular
the global interoperability of chip cards. “EMV” stands
for “Europay, MasterCard and Visa”.
For further details, please consult the SEPA Council’s website 26
(http://www.sepacouncil.eu).

148ECBAnnual Report2010
for granting and withdrawing the STEP label
always rested fully with the STEP Secretariat.
Since July 2010 the STEP Secretariat has
managed the labelling process on its own.
Second, the ECB provides statistics on the STEP
market (see Section 4 of Chapter 2).
STEP debt securities came through the fi nancial
market turmoil relatively unscathed and the
total amount outstanding in December 2010
was €411 billion, slightly above the total
amount outstanding one year earlier. The
steady development of the market is due to
the fact that STEP criteria can be applied to
other existing market programmes and that
STEP is accepted by the Eurosystem as a non-
regulated market for collateral purposes. The
decision of the ECB’s Governing Council in
October 2008 to temporarily expand the list of
assets eligible as collateral in Eurosystem credit
operations to include STEP securities issued by
credit institutions, i.e. certifi cates of deposit,
was discontinued as from 1 January 2011.
The STEP label was introduced in 2006,
and there were 173 active STEP-labelled
programmes in December 2010.
In 2010, to increase transparency in the area of
asset-backed securities (ABSs), the Eurosystem
launched a public consultation on introducing
an eligibility requirement for ABS originators
so as to provide loan-level data on the assets
underlying such instruments. The response
to the consultation was generally positive
and the ECB has continued to work towards
the implementation of such a requirement.
In December 2010 the Governing Council of
the ECB decided to establish loan-by-loan
information requirements for ABSs in the
Eurosystem collateral framework. A well-
functioning securitisation market, backed by
standardisation and enhanced transparency, will
contribute to the completeness of the European
fi nancial system and foster integration through
the improved comparability of instruments
across borders.
ADVICE ON THE LEGISLATIVE AND REGULATORY
FRAMEWORK FOR THE FINANCIAL SYSTEM
AND DIRECT RULE-MAKING
The ECB has continued to participate in
the European Commission’s Clearing and
Settlement Advisory Monitoring Expert
Group II (CESAME II) and its successor,
the Expert Group on Market Infrastructures
(EGMI). The EGMI has a mandate to contribute
to the development of an effi cient, safe and sound
post-trade market in the EU. This will be done by
giving advice to the European Commission on
various issues in relation to post-trade services
and market infrastructures in the EU. This work
is closely linked to the implementation of
TARGET2-Securities (T2S), the Eurosystem’s
planned platform for core, borderless and neutral
securities settlement services, and is aimed
at fostering harmonisation in the post-trade
environment.
Since harmonisation of the European legal
framework for payments forms the basis for
SEPA, the Eurosystem takes a strong interest in
EU legislation in this area. The Eurosystem has
repeatedly drawn attention to the need for an
ambitious but realistic end date to be set for the
migration to the SCT and SDD schemes in order
to reap the benefi ts of SEPA. The Eurosystem
has supported the Commission’s proposal to
impose an end date for migration to SCTs and
SDDs by means of an EU regulation.27 The
Eurosystem expects the SCT and SDD schemes
to become the credit transfer and direct debit
schemes used for euro payments in the EU.
After the migration end date, they will have
replaced national legacy credit transfer and
direct debit schemes for euro payments.
See the European Commission’s proposal for a regulation of the 27
European Parliament and of the Council establishing technical
requirements for credit transfers and direct debits in euros and
amending Regulation (EC) No 924/2009 (COM(2010) 775 fi nal),
available on the Commission’s website (http://ec.europa.eu).

149ECB
Annual Report2010
PROVIDING CENTRAL BANKING SERVICES WHICH
FOSTER FINANCIAL INTEGRATION
TARGET2, the second generation of the
Eurosystem’s large-value payment system,
is the fi rst market infrastructure to be completely
integrated and harmonised at the European
level. The Eurosystem has continued to make
enhancements to TARGET2 and implemented
a new release of the system in November 2010
(see Section 2.1 of Chapter 2).
T2S will have an important impact on the
harmonisation and integration of the post-
trading environment in Europe. T2S will remove
many of the “Giovannini barriers” 28 to cross-
border clearing and settlement by, among other
things: i) providing a single IT platform with a
common interface and a single messaging
protocol, ii) introducing a harmonised timetable
for all connected markets, and iii) extending a
single harmonised settlement model comprising
delivery versus payment in central bank money
to all national and cross-border transactions.
In 2010 several sub-groups of the T2S Advisory
Group comprising Eurosystem and industry
experts continued to work on the development
and implementation of standards and market
practices for the harmonisation of instructions
and processes in the context of T2S. As work on
implementing T2S has progressed, new areas
have regularly been identifi ed in which
harmonisation is required, and these have either
been tackled directly within the scope of the
project or referred to CESAME II or its
successor, the EGMI (see Section 2.2 of
Chapter 2), or to other relevant bodies.
Finally, in the area of collateral management,
work continued in 2010 on the establishment
of a single platform, Collateral Central Bank
Management (CCBM2), for euro area NCBs
with a view to consolidating and increasing
the effi ciency of the Eurosystem’s internal
systems and enhancing counterparties’ liquidity
management and collateral management
(see Section 2.3 of Chapter 2).
The “Giovannini barriers” are a number of barriers hindering the 28
integration of the EU clearing and settlement infrastructure as
identifi ed by the Giovannini Group, a group of fi nancial market
experts advising the European Commission. The specifi c barriers
identifi ed can be found in two reports by the Giovannini Group:
Cross-border Clearing and Settlement Arrangements in the European Union, November 2001, and Second Report on EU Clearing and Settlement Arrangements, April 2003. See also the
website of the European Commission (http://ec.europa.eu).
150ECBAnnual Report2010
4 OVERSIGHT OF PAYMENT SYSTEMS AND MARKET INFRASTRUCTURE
Payment and securities clearing and settlement
systems are fundamental infrastructures that
are necessary for the proper functioning of
market economies. They are indispensable
for the effi cient fl ow of payments for goods,
services and fi nancial assets, and their smooth
functioning is crucial for the implementation
of a central bank’s monetary policy and for
maintaining the stability of and confi dence in the
currency, the fi nancial system and the economy
in general. Promoting the smooth operation of
payment systems is a key task of the Eurosystem.
For the performance of this task, the Eurosystem
applies three approaches: it takes on an
operational role, conducts oversight activities
and acts as a catalyst.
Through its oversight function, the Eurosystem
aims to ensure the safety and effi ciency of
payment and securities settlement systems,
central counterparties processing the euro
and payment instruments, by monitoring
and assessing them and, where necessary,
inducing change.
In September 2010 the ECB published a book
entitled “The payment system – payments,
securities and derivatives and the role of the
Eurosystem” which gives a comprehensive
overview of key concepts in market
infrastructure, the euro area landscape and the
role of the Eurosystem, including, inter alia,
its oversight function.
4.1 LARGE-VALUE PAYMENT SYSTEMS AND
INFRASTRUCTURE SERVICE PROVIDERS
Large-value payment systems form the backbone
of the euro area market infrastructure and play
an important role for the stability and effi ciency
of the fi nancial sector and the overall economy.
The Eurosystem applies a well-defi ned
oversight policy framework to all large-value
payment systems that settle euro-denominated
transactions – both its own systems and those
that are privately operated. This framework
is based on the internationally accepted Core
Principles for Systemically Important Payment
Systems (CPSIPS), defi ned by the Committee
on Payment and Settlement Systems (CPSS)
and adopted by the Governing Council in 2001.
The CPSIPS are complemented by the Business
Continuity Oversight Expectations (BCOE)
for systemically important payment systems
which the Governing Council adopted in 2006,
giving the industry a deadline of June 2009 for
implementation.
The overall operational performance and
provision of services of the key payment
systems settling euro-denominated transactions
(TARGET2, EURO1 and the Continuous Linked
Settlement (CLS) system) and infrastructure
service providers (such as SWIFT) were stable
and resilient in 2010.
TARGET2
In 2010 the Eurosystem’s TARGET2 overseers
focused on the aspects of operational risk which,
according to the Risk-Based Prioritisation
Tool, 29 most warranted oversight attention.
Therefore, one of the main oversight activities
was the fi nalisation of the assessment against
the BCOE, which confi rmed that the business
continuity framework of TARGET2 is generally
well-established and ensures that a suffi ciently
high and consistent level of resilience is
achieved, although improvements to some
areas of the framework were recommended.
The overseers also discussed with the operator
the follow-up to the comprehensive assessment
carried out in 2009 and, in particular,
the recommendation related to the business
continuity framework. Moreover, in the context
of regular oversight activities, the methodology
for incident monitoring was revised.
In addition, a new TARGET2 software release
went live on 22 November 2010. Prior to
its launch, the overseers assessed the new
functionalities and, in particular, the provision
of internet access to TARGET2, against the
applicable CPSIPS. The overseers concluded
that, overall, the new release will not adversely
The Risk-Based Prioritisation Tool allows overseers to 29
concentrate on the components and areas that pose the highest
risks. The tool has been applied to TARGET2 since 2009.
151ECB
Annual Report2010
affect the compliance of TARGET2 with the
CPSIPS, and several of the changes eliminate
certain weaknesses of the system and will result
in better services for TARGET2 customers.
The TARGET2 Simulator, an analytical tool
based on payment data, was gradually rolled
out to the Eurosystem central banks as of
1 July 2010. Once fi ne-tuned, the tool will
enable overseers, in particular, to closely
replicate and stress-test the settlement process
of TARGET2, using a pan-European dataset of
TARGET2 activity, including all transactions,
liquidity information and participant
information.
EURO1
EURO1 is a large-value payment system
for cross-border and domestic transactions
in euro between banks operating in the EU.
It is operated by the EBA Clearing Company,
which was set up by the Euro Banking
Association. EURO1 works on a multilateral
net basis. The end-of-day positions of EURO1
participants are ultimately settled in central bank
money via the TARGET2 system, with the ECB
acting as the settlement agent.
Three main oversight activities relating to
EURO1 were performed in 2010. First, the
assessment of the system’s compliance with
the BCOE was completed. As a result of this
assessment, a few minor recommendations on
EURO1 were communicated to the EBA
Clearing Company for action, in order to
achieve full compliance with the BCOE.
Second, the ECB, in close cooperation with the
Deutsche Bundesbank, the Banco de España,
the Banque de France, the Banca d’Italia and
De Nederlandsche Bank, launched the process
for a full assessment of EURO1 against the
CPSIPS. Finally, the ECB, together with the
Banca d’Italia, assessed one major change that
was made to EURO1 in 2010. This comprised
the migration of its end-of-day settlement
process from the FIN-based Participant Interface
to the XML-based Ancillary System Interface
(ASI) in TARGET2. The oversight assessment
concluded that this migration will not adversely
affect the compliance of EURO1 with the
CPSIPS. Since 7 June 2010 EURO1 has been
successfully settling its daily activities via the
ASI in TARGET2. Overall, the EURO1 system
operated smoothly throughout 2010.
CONTINUOUS LINKED SETTLEMENT SYSTEM
The Continuous Linked Settlement system was
launched in September 2002 and is operated
by CLS Bank International (CLS Bank).
The system provides a multi-currency service for
the synchronous – i.e. payment-versus-payment
(PvP) – settlement of payment instructions
relating to foreign exchange transactions.
Through its PvP mechanism, CLS virtually
eliminates the principal risk associated with the
settlement of foreign exchange transactions.
CLS currently settles in 17 of the world’s
most traded currencies, including the euro,
the US dollar, the Japanese yen, the pound
sterling and the Swiss franc.
Given that CLS Bank is established in the United
States, the Federal Reserve System accepts
primary oversight responsibility for CLS under
a cooperative oversight arrangement involving
the G10 central banks and the central banks of
issue of currencies settled by CLS. The ECB,
in close cooperation with the euro area NCBs,
is part of this cooperative oversight arrangement
and has primary oversight responsibility for
settlement in euro by CLS.
In 2010 CLS cooperative oversight activities
focused mainly on the enhancement of CLS’
operational capacity (in response to the peaks
reached in May 2010 in terms of the number of
daily transactions) and the monitoring of new
business developments and initiatives by CLS.
SWIFT
SWIFT is important from a fi nancial stability
perspective, as it provides secure messaging
services to the fi nancial community in more
than 210 countries around the world. SWIFT
is a limited liability cooperative company
which is established in Belgium. Through its
participation in the G10 cooperative oversight
of SWIFT, the ECB contributes to various

152ECBAnnual Report2010
oversight activities carried out by the cooperative
oversight group, with the Nationale Bank
van België/Banque Nationale de Belgique
being the overseer with primary oversight
responsibility. In 2010 the group’s activities
focused on the implementation of the Distributed
Architecture programme aimed at redesigning
SWIFT’s technical architecture, mainly through
the implementation of two messaging zones
(European and transatlantic), the construction
of an additional operations centre in Europe
and the establishment of a new command and
control centre in Asia. Other major activities
performed in 2010 included reviewing the
operational performance and availability of
SWIFT’s services, monitoring new projects
that could potentially have an impact on the
confi dentiality, integrity and availability of
SWIFT’s critical services and reviewing the
possible impact on the resilience and availability
of messaging services of a cost optimisation
programme launched by SWIFT. The level of
availability of the SWIFTNet FIN network in
2010 was 99.99%.
4.2 RETAIL PAYMENT SYSTEMS
AND INSTRUMENTS
The Eurosystem also has oversight responsibility
for retail payment systems and payment
instruments.
STEP2 is a retail payment system for cross-
border payments operated by the EBA Clearing
Company, for which the ECB has primary
oversight responsibility. The ECB continued to
monitor STEP2 services in 2010, ensuring their
availability and smooth functioning. One major
development that took place in 2010 was the
deployment of a new multi-cycle functionality
for the SEPA credit transfer service that enables
STEP2 banks to exchange and settle SEPA
credit transfers several times a day.
In 2010 the Eurosystem made further progress
with the individual oversight assessments of
card payment schemes operating in the euro
area against its oversight standards for such
schemes, which were adopted in January 2008.
Following a peer review process, a report
on the overall results of the assessments is
expected to be published in 2011.
The Eurosystem has published the fi nal version
of the oversight frameworks for direct debit
and credit transfer schemes and will apply
these frameworks to the SEPA credit transfer
scheme and the SEPA direct debit scheme.
Individual NCBs may also elect to apply
these standards for the oversight of national
(non-SEPA) payment instruments, if they deem
it appropriate.
4.3 SECURITIES AND DERIVATIVES CLEARING
AND SETTLEMENT
The Eurosystem has a strong interest in the
smooth functioning of securities clearing and
settlement systems because failures in the
clearing, settlement and custody of securities used
as collateral for Eurosystem operations could
jeopardise the implementation of monetary policy,
the smooth functioning of payment systems and
the maintenance of fi nancial stability.
MARKET INFRASTRUCTURES FOR OTC DERIVATIVES
In response to the G20 commitments announced
at the Pittsburgh and Toronto summits to ensure
effective progress towards electronic trading
and the use of central counterparties (CCPs)
for standardised over-the-counter (OTC)
derivatives, as well as the reporting of all OTC
derivatives contracts to trade repositories,
extensive follow-up work was conducted
throughout 2010. This included legislative
initiatives in major jurisdictions – including,
notably, the EU and the United States – aiming
to establish mandatory obligations for the
central clearing of all eligible OTC derivatives,
the effective reporting of all contracts to
trade repositories and the establishment
of requirements to ensure the safety and
soundness of OTC derivatives infrastructures.
In the EU, where the common framework
for CCPs had previously been based on the
non-binding recommendations of the ESCB
153ECB
Annual Report2010
and the Committee of European Securities
Regulators, legislative efforts regarding OTC
derivatives infrastructures were complemented
by proposals for a broader set of common
rules for EU CCPs applicable to all types of
fi nancial product. The European Commission
issued a proposal for a regulation on OTC
derivatives, CCPs and trade repositories on
15 September 2010. The ECB was closely
involved in the development of this legislative
proposal. A Eurosystem contribution to a
Commission consultation on this matter was
issued in July 2010.
In order to support the convergence of legislative
approaches across jurisdictions, the international
standard-setting bodies have worked intensively
to develop common guidance for OTC derivatives
infrastructures. In May 2010 the CPSS and
the International Organization of Securities
Commissions (IOSCO) issued two documents for
public consultation: “Guidance on the application
of the 2004 CPSS-IOSCO Recommendations
for Central Counterparties to OTC derivatives
CCPs” and “Considerations for trade repositories
in OTC derivatives markets”. The results of this
work, which was co-chaired by the ECB, will
be incorporated in the CPSS-IOSCO general
review of the international standards for fi nancial
market infrastructures, and a draft of the revised
standards is expected to be issued for consultation
in early 2011. Given the global nature of OTC
derivatives markets and the consequent need
to preclude any possible scope for regulatory
arbitrage, it will be critical to ensure that all
national and regional legislation is implemented
in such a way as to ensure close congruence with
the CPSS-IOSCO standards.
To the same end, the Financial Stability
Board has developed proposals to ensure that
authorities take a common approach to the
implementation of the G20 recommendations
to promote standardisation, central clearing,
organised platform trading and the reporting of
OTC derivatives contracts to trade repositories.
The ECB participated in the FSB working group
that developed these proposals, which were
issued on 25 October 2010.
TARGET2-SECURITIES
TARGET2-Securities aims to provide a single,
borderless pool of securities and a core, neutral
settlement process.
More detailed information regarding the design
and the operational and legal framework of T2S
was published in the course of 2010, and the
Eurosystem held workshops with participants
from central banks and supervisors to explore
the criticality of T2S for payment infrastructures
and central securities depositories (CSDs) that
will use T2S services. Moreover, since T2S will
offer cross-border services to both euro area and
non-euro area CSDs and payment infrastructures,
a large number of supervisors, overseers and
central banks of issue of the currencies eligible to
be settled in T2S will have an interest in receiving
T2S data so that they can perform their statutory
duties. So far, all competent authorities have
supported the idea of establishing a cooperative
framework for the oversight and supervision of
T2S services. The cooperative framework under
discussion would not touch upon the statutory
powers of individual authorities over national
systems, or upon the enforcement of such powers.
T2S stakeholders will be informed as soon as the
details of the cooperative framework have been
agreed. A preliminary review of the T2S design
was launched during the development phase by
all the authorities involved.
4.4 OTHER ACTIVITIES
In September 2010 the ECB published a report
that summarises the results of a comprehensive
assessment of the implementation of the BCOE
by systemically important payment systems
operating in euro area countries. In addition
to TARGET2 and EURO1, the assessment
covered systemically important retail payment
systems. The results confi rmed that the
business continuity and crisis communication
arrangements of the assessed systems are
maintained at a high standard by the system
operators. Recommendations were issued to
address a number of identifi ed defi ciencies
which do not pose a signifi cant risk.

The Grossmarkthalle is to house a visitors’ centre, staff restaurant, cafeteria and conference rooms. These areas will be
integrated into the former market hall as a separate house-in-house system, necessitating a new and stronger structural
framework. The original hall fl oor and its substructures were therefore removed in 2010.

CHAPTER 5
EUROPEAN ISSUES

156ECBAnnual Report2010
In 2010 the ECB continued its regular
contacts with European institutions and fora,
in particular with the European Parliament,
the Eurogroup, the ECOFIN Council and the
European Commission. The President of the
ECB participated on a regular basis in meetings
of the Eurogroup, as well as in ECOFIN Council
meetings when matters relating to the objectives
and tasks of the ESCB were discussed. In
addition, the President of the ECB was invited
to attend meetings of the European Council, as
well as informal meetings at the level of Heads
of State or Government, when issues related to
the EU’s policy response to the economic and
fi nancial crisis were addressed. The President
of the Eurogroup and the Commissioner for
Economic and Monetary Affairs attended
meetings of the Governing Council when they
deemed it appropriate.
EU POLICY RESPONSE TO THE FINANCIAL CRISIS
The economic and fi nancial crisis entered a new
stage in early 2010 as fi scal imbalances in
certain euro area countries began to be refl ected
in increasing tensions in sovereign debt markets.
In particular, the rise in Greek sovereign debt
yields created a risk of negative spillover effects
that threatened to endanger the wider stability of
the euro area. In response, on 2 May 2010 euro
area countries agreed to activate, together with
the IMF, a three-year fi nancial support
programme for Greece.1 The fi nancial package
made available €80 billion of bilateral loans
from euro area countries and an IMF Stand-by
Arrangement of up to €30 billion. The
disbursement of funds was made conditional on
the Greek authorities implementing the
ambitious programme of fi scal adjustment and
comprehensive structural reforms negotiated by
the European Commission, in liaison with the
ECB, and the IMF.2 The ECB participated in the
related review missions to Greece together with
the European Commission and the IMF.
In spite of these measures, tensions in fi nancial
markets continued to mount and escalated
abruptly on 6 and 7 May 2010. In response, on
7 May the Heads of State or Government of
the euro area countries mandated the ECOFIN
Council to decide on a stabilisation mechanism
to preserve fi nancial stability in Europe.
On 9 May Member States agreed to establish
two general facilities to provide fi nancial support
to EU countries experiencing severe economic
or fi nancial disturbances. Firstly, the ECOFIN
Council adopted a Regulation setting up the
European Financial Stabilisation Mechanism
(EFSM), which allows the European Commission
to raise up to €60 billion on behalf of the EU for
providing fi nancial assistance to EU Member
States experiencing or threatened with serious
diffi culties caused by exceptional circumstances
beyond their control. Secondly, the euro area
Member States, on an intergovernmental basis,
established the European Financial Stability
Facility (EFSF). The EFSF was set up as a
limited liability company authorised to issue
debt securities, guaranteed up to a total of
€440 billion by euro area countries on a pro rata
basis, for lending to euro area countries. Loans
from the EFSM and the EFSF are subject to
strong conditionality and take place in the
context of joint programmes with the IMF, which
is expected to provide fi nancing amounting
to at least 50% of the EU/euro area contribution
to each programme.
On 21 November Ireland requested fi nancial
assistance from the IMF, the EU and the euro
area countries. The ECB welcomed this request
and concurred with the European Commission,
the ECOFIN Council and the Eurogroup that
providing assistance to Ireland was warranted to
safeguard fi nancial stability in the EU and in the
euro area. The programme was concluded with
the Irish authorities by the Commission and the
IMF, in liaison with the ECB, and is subject to
strong policy conditionality.
On 16 and 17 December the European Council
agreed to establish a European Stability
Mechanism (ESM) to replace the EFSF
and the EFSM from June 2013. The European
Slovakia decided not to participate in the programme.1
See Section 6.3 of Chapter 2 for the outstanding amount of loans 2
to Greece.
1 POLICY ISSUES
157ECB
Annual Report2010
Council called for euro area fi nance ministers
and the Commission to fi nalise work on an
intergovernmental arrangement to establish the
ESM by March 2011. Non-euro area countries
will, if they so wish, be involved in this work.
They may decide to participate in operations
conducted by the mechanism on an ad hoc basis.
The European Council agreed on the text of a
limited Treaty change to refl ect this decision,
which will be adopted via the simplifi ed revision
procedure.
THE STABILITY AND GROWTH PACT
On 16 February 2010 the ECOFIN Council took
decisions within the framework of fi scal
surveillance regarding two euro area countries
(Greece and Malta) and fi ve non-euro area
countries (Latvia, Lithuania, Hungary, Poland
and Romania). The Council extended the
deadline for correcting the countries’ excessive
defi cits from 2010 to 2011 in the case of Malta
and from 2011 to 2012 for Lithuania and
Romania, on account of a worse than expected
deterioration of their economies. With regard to
the two latter countries, the Council found on
19 October that action taken was adequate and
no additional steps in the excessive defi cit
procedures (EDPs) were needed at that stage.
Moreover, the Council assessed the action taken
by Latvia, Hungary and Poland and decided that
all three countries had up to that point acted in
accordance with the EDP recommendations and
that no additional steps were necessary.
Regarding Greece, the Council issued a
recommendation referring to the Broad
Economic Policy Guidelines and made it public.
Furthermore, it identifi ed a list of structural and
fi scal measures that Greece should adopt to
correct its excessive defi cit by 2012. Greece was
also invited to submit to the Council and the
European Commission a report spelling out the
measures in greater detail and providing the
implementation timeline for achieving the 2010
budgetary targets. Finally, Greece was required
to report regularly and publicly on the measures
taken.3
In May 2010, following considerable volatility
in sovereign debt markets, Member States
expressed their strong political commitment
to fi scal consolidation. In their statement of
7 May, the Heads of State or Government of the
euro area countries stressed their commitment
to ensuring the stability, unity and integrity of
the euro area and agreed to take all measures
needed to meet their fi scal targets in line with
EDP recommendations. In the conclusions of
the ECOFIN Council of 9 May, the Member
States reaffi rmed their strong commitment
to accelerating fi scal consolidation, where
warranted.
On 13 July the Council decided that excessive
defi cits existed in two further euro area countries
(Cyprus and Finland), as well as two non-euro
area countries (Bulgaria and Denmark), and
set deadlines (2011 for Bulgaria and Finland,
2012 for Cyprus and 2013 for Denmark) for
them to bring their general government defi cits
below the reference value of 3% of GDP. The
Council also assessed the action taken by 11 euro
area countries (Belgium, Germany, Ireland,
Spain, France, Italy, the Netherlands, Austria,
Portugal, Slovenia and Slovakia) and two
non-euro area countries (the Czech Republic and
the United Kingdom) subject to EDPs. It decided
that all countries had up to that point acted in
accordance with the EDP recommendations
and that no additional steps in the EDPs were
necessary at that stage. However, in the case
of Ireland, the Council decided on 7 December
to extend the deadline for the correction of
the excessive defi cit by one year, to 2015,
in view of unexpected adverse economic events
with major unfavourable consequences for
government fi nances.
Following these decisions, all Member States,
except Estonia, Luxembourg and Sweden, were
subject to EDPs, with deadlines for correction
ranging from 2011 to 2015.
The ECB welcomes the decisions regarding the
new EDPs. As for the assessment of effective
action, the structural adjustment in 2010 for
On 10 May 2010 the Council extended the deadline for the 3
correction of the excessive defi cit in Greece to 2014.
158ECBAnnual Report2010
some countries was somewhat smaller than
required in the Council recommendations, while
planned structural efforts also fell short of the
recommendations.
EUROPE 2020 STRATEGY
On 17 June 2010 the European Council
adopted “Europe 2020: a strategy for jobs and
smart, sustainable and inclusive growth”. The
strategy aims at raising potential growth and
provides a coherent framework for Member
States to implement structural reforms and
mobilise policies and instruments at the
EU level. It builds on the experiences of its
predecessor, the Lisbon strategy, and addresses
some of the weaknesses of the latter, notably
by strengthening the role of the European
Council and relying to a greater extent on
EU-level policy initiatives, in particular the
seven thematic “fl agship initiatives”. To guide
policy-making, the European Council has
set a number of quantitative targets to be
reached over the strategy’s horizon related to
employment, R&D, climate change and energy,
education and poverty. The Europe 2020
strategy will be implemented as of early 2011.
The ECB welcomes the changes in governance,
in particular the stronger role of the European
Council and the introduction of the “European
semester”. During the European semester
(the fi rst six months of a year), the European
Council will identify the main economic
challenges and give strategic advice on policies,
which Member States should take into account
in their policies. Moreover, the ECB welcomes
the introduction of new instruments such as the
EU-level thematic pillar, which will focus on
structural reforms in the fi elds of innovation and
R&D, energy and climate change, employment,
education and social inclusion. The EU-level
thematic pillar is supported by seven fl agship
initiatives proposed by the Commission, which
aim to support the reform efforts of Member
States in these areas, and should reinforce the
surveillance framework for Member States and
thus be conducive to achieving the strategy’s
goals. However, not all elements emphasised
in earlier discussions, such as the need to better
communicate the strategy, have been equally
fully developed. As before, the success of the
strategy will eventually hinge on the forceful
implementation of ambitious reform strategies
by Member States.
RELAUNCHING THE SINGLE MARKET
Efforts to complete the EU Single Market
gained fresh impetus in 2010. Mario Monti,
a former member of the European Commission
who was, inter alia, responsible for the internal
market, fi nancial services and taxation, was
invited by the President of the Commission,
José Manuel Barroso, to prepare a report on
the future of the Single Market, which he
presented in May 2010. The report called on the
EU Member States to overcome the apparent
“integration fatigue” and to drive economic
integration forward at the EU level. To this end,
the report puts forward a number of proposals,
including completing the Single Market for
services and enhancing citizens’ support for the
Single Market.
Following up on Mr Monti’s report, the
Commission in October 2010 proposed a
series of measures designed to relaunch the
Single Market in the form of a “Single Market
Act”. In line with the Europe 2020 strategy,
the ultimate goal of the Act is to stimulate
growth and boost employment in the Member
States. Following a public consultation, the
Commission is expected to present legislative
proposals in spring 2011. Among the proposed
priorities are the creation of an EU patent,
the access of small and medium-sized enterprises
to capital, and the mutual recognition of
professional qualifi cations. Moreover, there are
several initiatives that aim at reducing barriers to
electronic commerce and stimulating growth in
the digital economy. Together with the ongoing
implementation of the Services Directive in
Member States, these initiatives are important
steps towards deeper economic union and are
fully supported by the ECB.

159ECB
Annual Report2010
2 INSTITUTIONAL ISSUES
In November 2010 the reform of the EU
supervisory architecture was adopted by
the European Parliament and the Council.
Three new European Supervisory Authorities
were created to strengthen micro-prudential
supervision in the areas of banking
(the European Banking Authority), insurance and
occupational pensions (the European Insurance
and Occupational Pensions Authority), as well as
securities and markets (the European Securities
and Markets Authority), while the newly
created European Systemic Risk Board (ESRB)
will reinforce macro-prudential supervision.
The ECB is entrusted with the specifi c task of
ensuring the performance of the secretariat
function for the ESRB. Further information on
these issues can be found in Chapter 6.
160ECBAnnual Report2010
The economic and fi nancial crisis and the
turmoil in sovereign debt markets also
highlighted the challenges to the economic
governance of the euro area and the EU.
In response, the European Council, at its
meeting in March 2010, mandated its President,
Herman Van Rompuy, to establish, in cooperation
with the European Commission, a task force
with representatives of the Member States,
the rotating Council Presidency and the ECB to
make proposals to strengthen the EU surveillance
framework, in particular that for budgetary
surveillance, and to improve the crisis resolution
framework. In June 2010 the ECB presented a
number of proposals to strengthen decisively
governance and enforcement structures in the
economic policy framework of the euro area.
The task force report put forward proposals in
fi ve areas: greater fi scal discipline, broadening
economic surveillance to encompass
macroeconomic imbalances and competitiveness,
deeper and broader coordination (notably
during the European semester), a robust
framework for crisis management, as well
as stronger institutions for more effective
economic governance. In October 2010 the
European Council endorsed the task force report
and called for a “fast track” approach in the
adoption of secondary legislation needed for the
implementation of its recommendations.
In this context, the Commission had already
issued proposals in September 2010 relating to
the reform of the fi scal surveillance framework
and to the establishment of a new surveillance
mechanism to identify and correct emerging
macroeconomic imbalances within the EU and the
euro area. Moreover, on 28 and 29 October 2010,
the Heads of State or Government agreed on
the need for the Member States to establish
a permanent crisis management mechanism.
A limited Treaty change is foreseen.
While the proposals put forward by the
Commission represent a strengthening of the
existing framework for fi scal and macroeconomic
surveillance in the EU, they do not go as far as
the “quantum leap” called for by the Eurosystem
towards strengthening the institutional
foundations of EMU, and thus towards a deeper
economic union that is commensurate with the
degree of economic integration and
interdependency already achieved through
Monetary Union.4 The Eurosystem is particularly
concerned about insuffi cient automaticity in the
implementation of procedures and calls for the
introduction of political and reputational measures
on top of fi nancial sanctions to foster early
compliance with the surveillance framework.
Moreover, the quality and independence of
surveillance should be assessed by an independent
advisory body at EU level. In the fi eld of fi scal
surveillance, the room for discretion left to the
Council when assessing the existence of an
excessive defi cit or when assessing the debt
criterion should be reduced and consideration
should be given to reversing the changes to the
Stability and Growth Pact made in 2005, which
allowed Member States greater leeway under the
Pact. Moreover, requirements to achieve a
country’s medium-term budgetary objective
should be ambitious, in particular in Member
States with high government debt. To facilitate
compliance with their obligations under the Pact,
euro area countries should swiftly implement
strong national budgetary frameworks and
improve the quality of their government statistics.
With regard to the macroeconomic surveillance
procedure, the new system of mutual surveillance
would need to focus fi rmly on euro area countries
experiencing large current account defi cits,
signifi cant losses of competitiveness and high
levels of public and private debt, as well as
other vulnerabilities that could threaten the
stability of the euro area. The mutual surveillance
should involve transparent and effective trigger
mechanisms. It would be essential that the
assessments of macroeconomic imbalances and
recommendations for corrective action be given
broad publicity at all stages of the surveillance
process. An earlier and more gradual application
of fi nancial sanctions is needed to provide clear
incentives for appropriate macroeconomic policies.
Opinion of the European Central Bank of 16 February 2011 4
on economic governance reform in the European Union
(CON/2011/13).
3 IMPROVING ECONOMIC GOVERNANCE IN THE EU

161ECB
Annual Report2010
4 DEVELOPMENTS IN AND RELATIONS WITH EU CANDIDATE COUNTRIES
The ECB continued its policy dialogue with
the central banks of the EU candidate countries
through bilateral meetings and within the overall
institutional framework for the enlargement
process set up by the EU.
Accession negotiations with Croatia began in
October 2005. Negotiations on the 35 individual
chapters of the acquis communautaire were
started in June 2006 and continued to advance
towards their fi nal stage; by the end of 2010,
28 of them had been provisionally closed.
The ECB continued its fruitful relations with
the Croatian National Bank, in the context of
bilateral staff visits and an annual high-level
policy dialogue.
After opening accession negotiations with
Turkey in October 2005, the European
Commission started negotiations on the
individual chapters of the acquis communautaire
in June 2006, provisionally closing one chapter
in the same month. In December 2006 the
European Council decided, owing to the lack
of progress in the extension of the customs
union to the EU Member States, to suspend
talks for 8 out of the 35 chapters and to put the
provisional closing of any further chapters on
hold. At the end of 2010 negotiations were open
on 13 chapters and provisionally closed on one
chapter. The ECB continued its long-standing
high-level policy dialogue with the Central
Bank of the Republic of Turkey.
The former Yugoslav Republic of Macedonia
was granted candidate status in 2005. In
October 2009 the European Commission
recommended the opening of accession
negotiations. However, the starting date for
formal accession negotiations remains open,
as the European Council has postponed its
decision twice: in December 2009 and in
June 2010. Staff-level contacts between the
ECB and the National Bank of the Republic of
Macedonia remain strong.
Iceland became a candidate country on
17 June 2010. Accession negotiations were
formally opened on 27 July 2010 and the process
of screening Iceland’s legislation started in
November 2010. As Iceland is already a member
of the European Economic Area, its legislation
is already in line with EU legislation in several
important areas.
On 17 December 2010 the European Council
decided to grant Montenegro the status of
candidate country, as recommended by the
Commission in its opinion of 9 November 2010.
A decision on the date for opening accession
negotiations has not yet been made.

The foundation plate for the double offi ce tower is about three metres thick. Approximately 4,200 tonnes of steel were required
to reinforce the concrete.

CHAPTER 6
TASKS CONCERNING THE FUNCTIONING OF
THE EUROPEAN SYSTEMIC RISK BOARD (ESRB)

164ECBAnnual Report2010
1 INSTITUTIONAL FRAMEWORK
LEGAL FRAMEWORK AND MANDATE
The European Systemic Risk Board (ESRB) was
established on the basis of Regulation (EU)
No 1092/2010 of the European Parliament and
of the Council on European Union macro-
prudential oversight of the fi nancial system and
establishing a European Systemic Risk Board 1
and Council Regulation (EU) No 1096/2010
conferring specifi c tasks upon the European
Central Bank concerning the functioning of the
European Systemic Risk Board.2 The two
regulations entered into force on 16 December
2010, the day after their publication in the
Offi cial Journal of the European Union.
Together with the European Supervisory
Authorities (ESAs), established on
1 January 2011, the Joint Committee of the
European Supervisory Authorities, and the
national supervisory authorities composing the
ESAs, the ESRB is part of the European System
of Financial Supervision (ESFS), the purpose
of which is to ensure the supervision of the EU
fi nancial system.
Within the ESFS, the ESRB is an independent
body responsible for the macro-prudential
oversight of the EU fi nancial system.
It contributes to the prevention or mitigation
of systemic risks to fi nancial stability that
arise from developments within the fi nancial
system so as to avoid periods of widespread
fi nancial distress.
The ESRB is in charge of collecting and
analysing all the relevant and necessary
information, identifying and prioritising
systemic risks, and issuing warnings and
recommendations for remedial action in
response to the risks identifi ed. Warnings
and recommendations may be either public
or confi dential. They may be of a general or a
specifi c nature, and may be addressed to the
Union as a whole or to one or more Member
States, or to one or more of the ESAs, or to one
or more of the national supervisory authorities.
Recommendations may also be addressed to the
Commission in respect of the relevant Union
legislation.
The addressees of the recommendations must
communicate to the ESRB and to the Council
the actions undertaken in response to the
recommendations and must provide adequate
justifi cation for any inaction (“act or explain”).
If the ESRB decides that its recommendation
has not been followed, it shall, subject to
strict rules of confi dentiality, inform the
addressees, the Council and, where relevant,
the ESA concerned.
ESRB STRUCTURE
For the fi rst fi ve years of its existence, the
President of the ECB is the Chair of the ESRB.
The fi rst Vice-Chair of the ESRB is Mervyn King,
the Governor of the Bank of England, also for a
term of fi ve years. The second Vice-Chair of the
ESRB is the Chairperson of the Joint Committee
of the European Supervisory Authorities, i.e.
currently Andrea Enria as Chairperson of
the European Banking Authority, according to
the annual rotational scheme foreseen by the
legislation.
The structure of the ESRB comprises: the
General Board, the Steering Committee,
the Advisory Scientifi c Committee (ASC),
the Advisory Technical Committee (ATC)
and the Secretariat.
The General Board is the ESRB’s sole decision-
making body. It had its inaugural meeting on
20 January 2011. The Steering Committee,
which prepares in particular the meetings of
the General Board, and the ATC, which brings
together the same institutions as the General
Board and will provide advice and assistance
on issues relevant to the work of the ESRB, in
particular the regular review of fi nancial stability
conditions in the EU, have also started their
activities. For the other advisory committee,
the ASC, which will anchor the analysis of
academics in the policy activity of the ESRB,
the selection of members took place during the
Regulation (EU) No 1092/2010 of the European Parliament and 1
of the Council of 24 November 2010, OJ L 331, 15.12.2010, p. 1.
Council Regulation (EU) No 1096/2010 of 17 November 2010, 2
OJ L 331, 15.12.2010, p. 162.

165ECB
Annual Report2010
fi rst quarter of 2011 following the publication of
a call for expressions of interest in the Offi cial
Journal of the European Union. The Secretariat
is responsible for the day-to-day business of
the ESRB. It provides high-quality analytical,
statistical, logistical and administrative support
to the ESRB. It took over the staff and work
undertaken by the ESRB Preparatory Secretariat,
which was established in March 2010 (see also
Sections 2 and 3 of this chapter).
ACCOUNTABILITY
Various channels foreseen in Regulation
No 1092/2010 ensure the accountability of the
ESRB as an independent body.
Each year the ESRB Chair is invited to a
hearing in the European Parliament, marking
the publication of the ESRB’s annual report to
the European Parliament and the Council. In the
event of widespread fi nancial distress, additional
hearings can be held. All these hearings are
conducted separately from the monetary
dialogue between the European Parliament and
the President of the ECB.
The ESRB Chair holds confi dential discussions
on the ongoing activity of the ESRB at least
twice a year (and more often, if needed) with
the Chair and Vice-Chairs of the Economic and
Monetary Affairs Committee of the European
Parliament. An agreement is to be concluded
between both entities on the detailed modalities
regarding these meetings, with a view to
ensuring full confi dentiality.
The Chair and Vice-Chairs of the ESRB must
explain to the European Parliament, during a
public hearing, how they intend to discharge
their duties under Regulation No 1092/2010.
The Chair participated in a hearing on
7 February 2011.
The ESRB will also report in several forms to
the Council on warnings and recommendations
and their follow-up.
166ECBAnnual Report2010
The ESRB Preparatory Secretariat was set up
on 1 March 2010, on the basis of a decision
taken by the Executive Board, to prepare for
the establishment of the ESRB as foreseen in
the broad agreement reached by the ECOFIN
Council in December 2009. At the end of 2010
it had 22 permanent staff (of which 11 were
seconded from NCBs). Preparatory work was
conducted along the lines of a master plan with
three main strands of work dealing respectively
with procedures, policies and infrastructures.
Working relationships were established with
future ESRB members, including more than
fi fty national supervisory authorities and the
three Level 3 Committees, the forerunners of
the ESAs. Numerous exchanges took place
with the latter at the levels of staff, managers
and chairpeople. The Preparatory Secretariat
contributed to the setting-up and initial work of
two joint High Level Groups established by the
ECB and the three Level 3 Committees on the
cooperation between the ESAs and the ESRB,
dealing respectively with data exchange and a
range of tasks relevant to systemic risk.
In terms of procedures, work focused on
the preparations for the establishment of
the fi ve ESRB institutional components.
This included the preparation of drafts for:
i) a decision of the General Board of the ESRB
establishing the Rules of Procedure of the
ESRB, ii) a mandate for the Advisory Scientifi c
Committee and modalities for the selection of
its members, and iii) a mandate for the Advisory
Technical Committee and modalities for the
appointment of its Chair.
The Preparatory Secretariat also launched
preliminary work on a strategy to implement
the mandate of the ESRB for macro-prudential
oversight of the EU fi nancial system.
This included the preparation of a consultation
paper distributed among ESRB members, with
a view to facilitating a common understanding
of key concepts relating to the ESRB’s policy in
the important start-up phase, the organisation –
in cooperation with the Directorate General
Research – of seminars with high-ranking
academics, as well as the contribution to the
ECB’s positions on draft EU regulation.
A third stream of work consisted of establishing
the infrastructures for the analytical, statistical,
logistical and administrative support to the
ESRB. For instance, DARWIN (the ECB’s
document management system) was rolled out
to all the ESRB member institutions to allow
them to participate in ESRB tasks via secure
internet connections for more than 1,000 users.
In the same vein, the necessary steps were taken
to ensure that the ESRB, as soon as it started to
operate, had its own website 3 and that a logo
could be approved at the fi rst meeting of the
General Board.
http://www.esrb.europa.eu3
2 ACTIVITIES OF THE ESRB PREPARATORY SECRETARIAT

167ECB
Annual Report2010
“The ECB shall ensure a Secretariat, and
thereby provide analytical, statistical, logistical
and administrative support to the ESRB”.4
This support will, in particular, focus on
the regular monitoring, identifi cation and
assessment of EU-wide systemic risks, which
includes the development and enhancement of
analytical tools and methodologies, as well as
statistical efforts to fi ll data gaps identifi ed for
the purpose of conducting macro-prudential
analysis. Work was carried out in all these
domains in 2010 in order to prepare for the
establishment of the ESRB.
ANALYTICAL SUPPORT
The ECB provides its main analytical
contribution to the ESRB in the form of regular
monitoring and identifi cation of systemic
risks faced by the EU fi nancial system and
impact assessments of those risks, should they
materialise. In addition, at the request of the
ESRB, specifi c studies on systemic risk and
macro-prudential issues may be conducted by
the ECB on an ad hoc basis.
This regular contribution is based on ECB
expertise, building on the organisation
and infrastructure adopted for performing
the ECB’s fi nancial stability tasks.
The information base to support the analysis
also includes information collected through
stepped-up market intelligence efforts,
in particular to support the systemic risk
identifi cation process. Regular systemic risk
surveillance and assessment work also relies
on and benefi ts from information shared
among ESRB members, as well as feedback
and advice provided by its substructures
(e.g. the Steering Committee and the Advisory
Technical Committee). The main elements of
a conceptual framework for macro-prudential
oversight and the process that underpins these
core activities have been described in issues
of the ECB’s Financial Stability Review. 5
Preparatory work has been carried out to
establish procedures within the ECB to ensure
a smooth production process.
Systemic risk indicators and early warning
systems are important analytical tools
aiding the risk surveillance work of the ESRB.
The systemic risk assessment is supported,
in particular, by macro-stress-testing tools
and the analysis of propagation channels to
assess the potential severity of specifi c risks.
To provide the ESRB with the best possible
information, the analysis conducted and the
tools employed need to be of the highest quality.
As part of the preparatory work in this area, a
detailed stocktaking of available analytical tools
for macro-prudential analysis was undertaken
both at the ECB and at the ESCB level. In
addition, procedures were put in place to
coordinate the regular review of available tools,
with the objective of continuously improving
the analytical framework, and to develop new
analytical tools and fi ll identifi ed analytical gaps.
The ESCB Macro-prudential Research Network
plays a key role in this regard (see Box 10).
The ECB stands ready to provide technical input
to the preparation of ESRB recommendations
on regulatory matters or legislative initiatives, at
the request of the ESRB. This could include the
regular monitoring of developments in
regulatory or legislative areas of interest for the
ESRB. Moreover, the ESRB may request from
the ECB on an ad hoc basis the preparation of
analyses or studies regarding regulatory or legal
issues relevant to its mandate and tasks.
Furthermore, the ECB may provide technical
advice in relation to requests from EU
institutions and national authorities to the ESRB
to examine specifi c issues of relevance. 6
Council Regulation (EU) No 1096/2010 of 17 November 2010 4
conferring specifi c tasks upon the European Central Bank
concerning the functioning of the European Systemic Risk Board.
See, for example, the special features entitled “The concept of 5
systemic risk”, “Towards the European Systemic Risk Board”,
“Macro-prudential policy objectives and tools” and “Analytical
models and tools for the identifi cation and assessment of
systemic risks” in the December 2009 and June 2010 issues of
the ECB’s Financial Stability Review.
See Article 19(3) of Regulation (EU) No 1092/2010 on European 6
Union macro-prudential oversight of the fi nancial system and
establishing a European Systemic Risk Board.
3 ANALYTICAL, STATISTICAL, LOGISTICAL AND ADMINISTRATIVE SUPPORT TO THE ESRB
168ECBAnnual Report2010
Box 10
THE ESCB MACRO-PRUDENTIAL RESEARCH NETWORK
The new function of macro-prudential oversight assigned to central banks as a consequence of
the fi nancial crisis and the establishment of the European Systemic Risk Board have created
an urgent need for research in support of this new responsibility. To respond to this need,
the General Council of the ECB approved in March 2010 the establishment of the ESCB
Macro-prudential Research Network.
The objective of this research network is to conduct research on conceptual frameworks,
models and tools supporting macro-prudential oversight in the EU and to share research results.
The network has a mandate covering three broad areas of research.
The fi rst area of research is macro-fi nancial models linking fi nancial stability and the
performance of the economy. Standard macroeconomic models usually do not capture relevant
features of fi nancial instability (such as bank defaults, illiquidity, feedback effects, multivariate
extreme events and related non-linearities) and therefore fail to describe such situations, a
shortcoming that became evident during the recent fi nancial crisis. Moreover, most available
stress-testing models do not benefi t from frameworks that capture both sides of the two-way
interaction between fi nancial instability and economic performance, an important input for a
proper assessment of potential feedback effects in systemic risk. Therefore, the development
of models including these features would fi ll a gap in the research literature. Such models
may also provide the basis for developing frameworks to identify and assess macro-prudential
regulations and supervisory approaches, to analyse interactions between macro-prudential
supervision/regulation and other macroeconomic stabilisation policies and to strengthen
stress-testing models.
The second area of research deals with early warning systems and systemic risk indicators. The
network will contribute to the development of operational analytical tools that could be directly
used by the new macro-prudential bodies (such as the ESRB). Therefore, the work in this area has a
short to medium-term horizon. Emphasis will be placed, in particular, on early warning indicators,
models and systems taking into account differences in fi nancial structures across countries. The
research carried out in this area may also contribute to related initiatives at the global level.
The third area of research focuses on contagion risks. This work seeks a better understanding
of cross-border contagion risks in Europe. These risks may have increased signifi cantly over the
last decade due to fi nancial integration. Other objectives are to improve understanding of the role
of non-bank fi nancial institutions in contagion and spillovers (e.g. related to certain activities of
insurance companies or money market funds) and to better capture feedback effects amplifying
the transmission of instability. These effects may have been underestimated by existing bank
contagion simulation approaches.
The main deliverables of the network are research papers, workshops and conferences (including
interactions with researchers outside the ESCB). A fi rst conference related to the activity of the
network, which was organised by the ECB, the Centre for Economic Policy Research and the
Center for Financial Studies, was hosted by the ECB in September 2010. The network will report
its results in 2012.
169ECB
Annual Report2010
STATISTICAL SUPPORT
According to Article 2 of Council Regulation
(EU) No 1096/2010 conferring specifi c tasks
upon the European Central Bank concerning the
functioning of the European Systemic Risk
Board, the ECB provides statistical support to
the ESRB in accordance with Article 5 of the
Statute of the ESCB. 7
In view of the long lead times required to
defi ne, collect, compile and disseminate
harmonised statistics of suffi cient quality to
allow the performance of the tasks assigned
to the ESRB, the ECB started preparatory
work in 2010. In particular, the ECB carried
out a stocktaking exercise comparing data
requirements derived from fi nancial stability
analysis with data availability in order to identify
the data gaps and fi ll them wherever possible.
Moreover, the ESCB developed a procedure
for conducting ad hoc surveys in order to allow
timely responses to specifi c data requirements
of the ESRB.
This preparatory work had two objectives:
fi rst, to allow policy-relevant indicators to be
prepared for the ESRB decision-making body
and its committees, as from their establishment
in early 2011, based on a core set of available
statistics; and, second, to work towards the
development of a wide range of statistics
necessary from a longer-term perspective.
To ensure such statistical support to the ESRB,
close collaboration between the ECB and the
ESAs is key. This collaboration was already
intensive with the three Level 3 Committees,
the predecessors of the ESAs. Such close
cooperation aims to ensure a smooth and
effective two-way information fl ow between
the ESAs and the ESRB, which is also effi cient
in terms of the reporting burden, data content
and IT infrastructure. One of the key factors for
success is allowing an exchange of appropriate
and reliable information for the performance
of the respective tasks in accordance with
European legislation and strictly respecting the
data protection rules that safeguard confi dential
information.
Article 5 of the Statute of the ESCB provides the ECB, assisted 7
by the national central banks, with the legal powers to collect
statistical information for the performance of the ESCB’s tasks.

The foundations for the double offi ce tower were laid during 2010. At the same time the underground staff car park was
constructed adjacent to the basement of the double offi ce tower.

CHAPTER 7
INTERNATIONAL ISSUES

172ECBAnnual Report2010
1 KEY DEVELOPMENTS IN THE INTERNATIONAL MONETARY SYSTEM
SURVEILLANCE OF MACROECONOMIC POLICIES
IN THE GLOBAL ECONOMY
Given the high degree of economic and
fi nancial integration, developments in the global
economic environment are critically important
for the conduct of economic policy in the
euro area. As a result, the Eurosystem closely
monitors and analyses macroeconomic policies
and underlying developments in countries
outside the euro area. The ECB also plays an
important role in the process of international
multilateral surveillance of macroeconomic
policies, which takes place mainly at the
meetings of international organisations such as
the BIS – where the President of the ECB is a
member of the Board of Directors and chairs
several important meetings, and ECB Executive
Board members and staff are involved in many
working groups. The ECB also participates in
the relevant meetings of the IMF and the OECD,
as well as fora such as the G20 and G7 fi nance
ministers and central bank governors.
The international economic environment
in 2010 was characterised by an economic
recovery that differed substantially across
regions, with emerging Asia and Latin America
in the lead. The reduction of external imbalances
in surplus and defi cit economies observed
since the start of the fi nancial crisis and over
the course of 2009 slowed down in 2010 and
in some cases these imbalances began to grow
again, sparking concerns about prospective
protectionist tensions. The US current account
defi cit increased from 2.7% of GDP in 2009
to 3.2% of GDP in 2010, while oil exporters’
current account surplus increased from 5.2%
of GDP in 2009 to 6.6% of GDP in 2010.
China’s current account surplus continued to
decrease relative to GDP, falling from around
6% in 2009 to about 4.7% in 2010. However,
in absolute terms, the 2010 surplus was close
to the levels prevailing before the collapse of
Lehman Brothers in September 2008. As in
recent years, the euro area’s current account
was close to balance in 2010. Finally, Japan’s
surplus was equal to 3.1% of GDP in 2010,
slightly higher than in 2009, when it was 2.8%
of GDP.
The reduction of global imbalances since the start
of the fi nancial crisis has largely refl ected cyclical
and temporary factors linked to the crisis – such
as global deleveraging, a fall in private demand,
lower oil prices and corrections in fi nancial asset
prices – rather than structural factors. In terms of
structural factors that would help in substantially
reducing global imbalances, defi cit countries
should reduce fi scal defi cits and complete the
structural reform agenda. Similarly, surplus
economies could also contribute substantially by
increasing domestic consumption, by developing
more extensive social safety nets, by undertaking
fi nancial market reforms and by increasing
exchange rate fl exibility.
On various occasions in 2010 the Eurosystem
stressed the risks and distortions that would
ensue if global imbalances were to increase
again, and expressed support for a rebalancing
of global demand patterns. In particular, the
Eurosystem repeatedly called for policies
aimed at increasing private and public savings
in countries with current account defi cits, the
implementation of further structural reforms in
mature economies with relatively low potential
growth, and measures to increase domestic
demand in emerging market economies,
including improved capital allocation and a
better appreciation of risks. In the context
of the ongoing refl ections on improving the
international fi nancial architecture (see the
following section), the Eurosystem underlined
that such an improvement should not only foster
fi nancial market discipline, but also enhance
macroeconomic policy discipline. A strengthened
multilateral economic surveillance framework
should be able to ensure that economic policies,
especially in systemically important countries,
are stability-oriented and sustainable. Support for
a rebalancing of the global economy also came
from the G20 framework for strong, sustainable
and balanced growth.
Finally, the euro area itself is subject to
international policy surveillance exercises.
In 2010 the IMF conducted its regular review
of the monetary, fi nancial and economic
policies of the euro area, as a complement to its
173ECB
Annual Report2010
reviews of the individual euro area countries.
The IMF’s Article IV consultations provided an
opportunity for useful discussions between the
IMF and the ECB, the President of the Eurogroup
and the European Commission. Following
these discussions, the IMF produced a report
assessing the euro area policies.1 Similarly, the
OECD conducted its regular economic survey
of the euro area, with a view to identifying
the main economic developments in the area and
analysing policy options to address them.2
In 2010, for the fi rst time, two euro area countries
received assistance from the IMF. Major central
banks continued to provide liquidity assistance
to central banks of other countries, with liquidity
and credit support aimed at avoiding market
instability (see Chapter 2).
REFORMS IN THE INTERNATIONAL INSTITUTIONAL
SET-UP
Since the outbreak of the global fi nancial crisis,
the set-up and functioning of the international
monetary system have been an issue for the
international community. The G20 forum of
systemically important advanced and emerging
economies – where the ECB is part of the EU
membership – continued to foster international
cooperation, with the aim of strengthening and
safeguarding the global economic recovery
and promoting stronger, more sustainable and
balanced growth. At their fourth summit in
Toronto in June 2010, G20 leaders followed
up on the commitments made at their previous
meeting in Pittsburgh, where they had launched
the framework for strong, sustainable and
balanced growth. The aim of this framework
is to help manage the transition from crisis
response to a strong, sustainable and balanced
pattern of global growth, as well as to address
the global imbalances that contributed to the
fi nancial crisis. The framework foresees a
process of mutual assessment of how national
and regional policies and policy frameworks of
G20 members fi t together and whether they are
consistent with the framework’s objective. At
their Toronto summit, the leaders completed the
fi rst stage of this process and agreed on a number
of concrete commitments, e.g. by advanced
defi cit countries to take actions to boost national
savings and by surplus economies to undertake
reforms to reduce their reliance on external
demand and focus more on domestic sources of
growth. Emerging surplus economies committed
to undertake reforms to strengthen social safety
nets to help reduce precautionary savings and
stimulate private spending and to enhance
exchange rate fl exibility to refl ect underlying
economic fundamentals. Furthermore, all G20
members pledged to embark on structural
reforms to stimulate economic growth. In the
area of fi nancial regulation, G20 members
identifi ed a number of priority areas for further
work (see Chapter 4).
At their fi fth summit in Seoul in November 2010,
G20 leaders agreed on the Seoul Action Plan with
concrete policy commitments to make progress
towards meeting the objectives of the framework.
Moreover, they endorsed the outcomes of
a number of important work streams that had
been reached in preparation for this summit,
notably a reform of IMF quotas and governance,
as well as key building blocks for transforming
the fi nancial system by addressing the root
causes of the crisis (one of the building blocks
is the work of the Basel Committee on Banking
Supervision). Furthermore, G20 leaders showed
awareness that the G20 also has to address issues
concerning the large, non-represented group
of developing and low-income countries.
Following up on the commitment made by G20
leaders at their London summit in April 2009 to
increase resources available to international
fi nancial institutions, the IMF’s Executive Board
approved on 12 April 2010 a reform and
expansion of the New Arrangements to Borrow
(NAB).3 This reform will make the NAB more
Euro area policies: 2010 Article IV consultation – staff report1 ,
IMF Country Report No 10/221, July 2010.
OECD Economic Surveys: Euro Area 20102 , OECD,
December 2010.
The NAB are credit arrangements between the IMF and a number 3
of IMF member countries that provide supplementary resources
to the IMF, i.e. in addition to the Fund’s quota resources, in
circumstances in which there is a need for supplemental resources
“to forestall or cope with an impairment of the international
monetary system”.
174ECBAnnual Report2010
fl exible, broaden the participation from 26 to
39 countries, and increase the overall amount of
these credit lines to the Fund from SDR 34 billion
to SDR 367.5 billion. In the course of 2009
and 2010, a number of advanced and emerging
market economies pledged to enter into bilateral
borrowing and note purchase agreements with
the Fund amounting to SDR 196 billion.
Most bilateral agreements will be gradually
incorporated into the new NAB after it comes
into effect.
Agreement was also reached to considerably
increase the Fund’s quota resources. The
doubling of quotas, which will be accompanied
by a rollback of the NAB, is meant to ensure that
the Fund remains a quota-based institution. The
quota increase will also help to achieve a further
shift in quota shares from advanced countries
to dynamic emerging and developing countries,
in line with the objective to align quota shares
with members’ relative weight and role in the
global economy. A consensus was also reached
on the fi rst elements of a broader governance
reform. In that context, the IMF’s Articles of
Agreement will be amended to provide for
an all-elected Executive Board. In addition,
European advanced countries committed to
give up two seats on the IMF’s Executive Board
to foster the representation of emerging and
developing countries.
As part of the measures to support countries
during the fi nancial crisis, the IMF undertook a
number of signifi cant changes to its lending
toolkit. In this context, programme access and
the duration of the Fund’s Flexible Credit Line
(FCL) – a precautionary lending facility
introduced in 2009 for top-performing countries
with strong policy track records, which entails
only ex ante conditionality – were modifi ed in
August 2010.4 The August 2010 lending reform
also saw the creation of a new Precautionary
Credit Line (PCL). The PCL is designed for
Fund members with sound policies which
nonetheless do not meet the FCL’s high
qualifi cation requirements, thus being available
to a wider Fund membership.5
As part of the review of its mandate, the IMF
deliberated further on modernising surveillance
and strengthening its multilateral and fi nancial
dimensions. In a pilot project, fi ve economies
are to be examined for the external impact of
their policies, in “spillover reports”. The euro
area is one of these fi ve economies (along with
China, Japan, the United Kingdom and the
United States). Further progress was made in
strengthening fi nancial sector surveillance with
the decision to make the stability assessments
under the Financial Sector Assessment Programs
a mandatory part of annual IMF country
surveillance reports (Article IV reports) for
countries with systemically important fi nancial
sectors. 25 such countries have been identifi ed,
including nine in the euro area (Belgium,
Germany, Ireland, Spain, France, Italy,
Luxembourg, the Netherlands and Austria).
Also on the fi nancial side, the Early Warning
Exercise – an exercise in risk identifi cation,
born of the crisis and involving collaboration
between the IMF and the Financial Stability
Board – has become a regular feature of the
spring and annual IMF meetings.
As a result of the changes, FCL arrangements can now be 4
approved for either one year, or two years with an interim review
of qualifi cation after one year. Previously, arrangements were
either for six months, or one year with an interim review after
six months. The previously implicit cap on access of 1,000% of a
member’s IMF quota has been removed, with access decisions to
be based on individual country fi nancing needs. The procedures
leading up to the approval of the arrangement have also been
modifi ed, with earlier IMF Executive Board involvement now
envisaged to assess the contemplated level of access and its
impact on the IMF’s liquidity position. The nine qualifi cation
criteria used by both staff and the IMF Executive Board to
assess the merits of a country’s application for the FCL remain
unchanged, but a number of relevant indicators have been
added to each category in order to provide further guidelines on
compliance.
Qualifi cation will be assessed in fi ve broad areas, namely: 5
i) the external position and market access, ii) fi scal policy,
iii) monetary policy, iv) fi nancial sector soundness and
supervision, and v) data adequacy. While requiring strong
performance in most of these areas, the PCL allows access
to precautionary resources to members that have moderate
vulnerabilities in one or two of these areas. Other features of
the PCL include streamlined ex post conditions (which may or
may not include performance criteria), with progress in reducing
vulnerabilities monitored through semi-annual programme
reviews, and frontloaded access with up to 500% of quota made
available on approval of the arrangement, and up to a total of
1,000% of quota after 12 months.
175ECB
Annual Report2010
The international fi nancial community also
continued to promote mechanisms for crisis
prevention and orderly crisis resolution. In this
context, further progress was made by sovereign
debtors and their private creditors and investors
in implementing the “Principles for stable
capital fl ows and fair debt restructuring”, which
had been endorsed by G20 fi nance ministers
and central bank governors in 2004. The aim
of these principles, which are market-based and
voluntary, is to provide guidelines regarding
information-sharing, dialogue and close
cooperation. In an effort to increase further the
usefulness of these principles, agreement was
reached by the relevant parties in autumn 2010
on the benefi ts of broadening their applicability
beyond emerging market sovereign debtors and
their creditors.
176ECBAnnual Report2010
2 COOPERATION WITH COUNTRIES OUTSIDE THE EU
As in previous years, the Eurosystem organised
seminars and workshops with non-EU central
banks in order to foster policy dialogue.
In this respect, the ECB also actively participated
alongside the European Commission in the EU’s
macroeconomic dialogue with key emerging
market economies (e.g. Brazil, Egypt, India
and Russia) and EU neighbouring countries.
In addition, the technical assistance provided
by the Eurosystem remained an important tool
for strengthening the administrative capacity of
central banks outside the EU, especially in the
EU’s neighbouring regions, and for enhancing
compliance with European and international
standards.
POLICY DIALOGUE AND SURVEILLANCE
OF MACROECONOMIC POLICIES
IN THE GLOBAL ECONOMY
The Eurosystem and the Bank of Russia held their
sixth high-level seminar on 3-5 February 2011 in
Frankfurt, hosted by the ECB. The purpose of the
seminar was to further strengthen the dialogue
and enhance relations between the Eurosystem
and the Bank of Russia. Seminar discussions
focused on the Russian economy, on the role
of money and credit in the conduct of monetary
policy and on the new supervisory architecture
in the EU and Russia. Moreover, the President of
the ECB participated in the conference marking
the 150th anniversary of the Bank of Russia
in June 2010.
The sixth high-level Eurosystem seminar
with Mediterranean countries’ central banks –
co-organised by the ECB and the Central Bank of
Cyprus – took place on 27 and 28 October 2010
in Pafos. Governors reviewed challenges for
monetary policy in Mediterranean countries on
the way to economic recovery and discussed the
experience of Mediterranean countries under
fi xed exchange rate regimes, as well as the
impact of the global fi nancial turmoil on banking
sectors and fi nancial stability.
The Eurosystem held a second high-level
seminar with central banks and monetary
agencies of the member states of the Gulf
Cooperation Council (GCC),6 which was
co-organised by the ECB and the Banca d’Italia
and held on 29 and 30 June 2010 in Rome.
The seminar topics were economic and fi nancial
developments in the GCC countries and the euro
area, lessons from the fi nancial crisis for fi nancial
stability and banking supervision, and challenges
in monetary and exchange rate policy in
the GCC.
The fi fth high-level Eurosystem seminar with
Latin American central banks took place
on 10 December 2010 in Madrid and was
co-organised by the ECB and the Banco de
España. The seminar participants discussed the
following topics: global rebalancing, fi nancial
fl ows and global macro-prudential risks, and
global policy cooperation.
The ECB continued to deepen its cooperation
with the Chinese authorities. The President
of the ECB, the President of the Eurogroup
and the Commissioner for Economic and
Monetary Affairs (the “euro area troika”) met
the Chinese authorities for the third time on
5 October 2010 in Brussels. The discussion
focused mainly on exchange rate policies and
other issues of global importance. The relationship
with the People’s Bank of China (PBC) was
further strengthened. In 2010 the ECB-PBC
Working Group discussed a wide range of topics,
such as the rebalancing of global growth, asset
price bubbles and associated risks, fi nancial sector
reform and other international monetary issues.
The ECB also established contacts with China’s
main planning agency, the National Development
and Reform Commission, and with the Chinese
Academy of Social Sciences, which is one of the
most infl uential think-tanks in the country.
Finally, the fi fth high-level seminar of central
banks in the East Asia-Pacifi c region and the
euro area, organised by the ECB and the Reserve
Bank of Australia, was held in Sydney on
9 and 10 February 2010. The purpose of the
seminar was to review economic policies in
the aftermath of the fi nancial crisis, including
Bahrain, Kuwait, Oman, Qatar, Saudi Arabia and the United 6
Arab Emirates.
177ECB
Annual Report2010
exit strategies, the shape and structure of global
growth, the challenges posed by cross-border
banking and the prospect of strengthening
macro-prudential supervision.
TECHNICAL ASSISTANCE
With regard to technical assistance, the ECB
continued to deepen its relations with the western
Balkans and Turkey. On 19 January 2010 the
European Commission and the ECB, also on
behalf of 14 euro area NCBs,7 signed an
agreement to implement a two-year technical
assistance programme for EU candidates and
potential candidates. The aim of the programme
is to strengthen macro and micro-prudential
supervision in the western Balkans and in
Turkey. The programme is being implemented
by the ECB together with the partner NCBs and
in cooperation with international and European
institutions such as the Basel Committee
on Banking Supervision, the Committee of
European Banking Supervisors, the Financial
Stability Institute, the International Monetary
Fund and the World Bank. During the fi rst phase
of the programme, the Eurosystem organised
an intensive regional training programme on
macro and micro-prudential supervision for
some 150 core supervisors from the benefi ciary
institutions.8 The programme will also support
the implementation of specifi c national
measures, which were defi ned in agreement with
the IMF and the World Bank, partner NCBs
and benefi ciaries. Furthermore, region-wide
technical simulations on home-host cooperation
are foreseen.
On 1 April 2010 the ECB and seven euro area
NCBs 9 began an 18-month programme of
technical assistance with the Central Bank of
Bosnia and Herzegovina. The programme,
funded by the EU, supports the Central Bank of
Bosnia and Herzegovina in implementing EU
central banking standards and EU requirements in
preparation for the potential accession of Bosnia
and Herzegovina to the EU. The areas covered
are statistics, economic analysis and research,
fi nancial stability, legal requirements arising
from the acquis communautaire, information
technology and coordination of EU integration.
The ECB and 21 NCBs 10 also started supporting
the National Bank of Serbia on 1 February 2011
with an EU-funded programme. During its
two-year duration, the programme aims at
bringing central banking procedures and
practices closer to EU standards in the areas of
fi nancial sector supervision, legal harmonisation,
liberalisation of capital movements, foreign
exchange reserve management, monetary and
exchange rate operations, consumer protection
for fi nancial services, EU accession support,
economic analysis and research, statistics,
payment systems and fi nancial stability.
The technical cooperation programme with the
Bank of Russia, funded by the EU, continued.
The ECB, in partnership with eight euro area
NCBs 11 and in cooperation with the Financial
Supervisory Authority of Finland, provides
technical assistance in the areas of banking
supervision and internal audit. The aim is
to support the gradual implementation of
Basel II in Russia and to support the Bank of
Russia’s internal audit services with training
and information on Eurosystem internal audit
practices. The programme is running as planned
and will end on 31 March 2011.
Cooperation with the Central Bank of Egypt
continued throughout 2010 on an EU-funded
programme aiming at strengthening banking
supervision in Egypt to achieve compliance with
the basic components of the Basel II framework.
The programme involves experts from the ECB
and seven NCBs of the ESCB.12
The NCBs of Belgium, Greece, Spain, France, Italy, Cyprus, 7
Luxembourg, Malta, the Netherlands, Austria, Portugal,
Slovenia, Slovakia and Finland.
The central banks and supervisory authorities of Croatia, the 8
former Yugoslav Republic of Macedonia, Albania, Bosnia and
Herzegovina, Montenegro, Turkey, Serbia and Kosovo under
UN Security Council resolution 1244.
The NCBs of Germany, Greece, Spain, Italy, the Netherlands, 9
Austria and Slovenia.
The NCBs of Belgium, Bulgaria, the Czech Republic, Germany, 10
Estonia, Ireland, Greece, Spain, France, Cyprus, Luxembourg,
Hungary, the Netherlands, Austria, Poland, Portugal, Romania,
Slovenia, Slovakia, Finland and the United Kingdom.
The NCBs of Germany, Greece, Spain, France, Italy, 11
the Netherlands, Austria and Finland.
The NCBs of Bulgaria, the Czech Republic, Germany, Greece, 12
France, Italy and Romania.

Construction work is ongoing in the eastern wing building of the Grossmarkthalle. The former market hall will form an integral
part of the new ECB premises. To this end, construction and restoration works started in spring 2010.

CHAPTER 8
ACCOUNTABILITY
180ECBAnnual Report2010
Central bank independence has established itself
over the past few decades as an indispensable
element of the monetary policy regimes of
both mature and emerging economies. The
decision to grant central banks independence
is fi rmly grounded in economic theory and
empirical evidence, both of which show that
such a set-up is conducive to maintaining price
stability. At the same time, it is a founding
principle of democratic societies that any
independent institution bestowed with a public
function must be accountable to citizens and
their elected representatives. Accountability is
therefore an important counterpart of central
bank independence.
The Treaty lays down precise reporting
requirements for the ECB, which include the
publication of a quarterly report, a weekly
fi nancial statement and an annual report.
The ECB goes beyond these statutory
obligations in its regular reporting. For instance,
it publishes a Monthly Bulletin, rather than the
required quarterly report, and holds monthly
press conferences following the fi rst Governing
Council meeting of each month. The latter
continue to be a prime opportunity for the
ECB to explain in depth its assessment of the
economic situation and the rationale behind its
interest rate decisions. The ECB’s commitment
to accountability and transparency is also
illustrated by the many publications it released
in 2010 and the numerous speeches delivered
by the members of the Governing Council,
which dealt with a broad variety of topics of
relevance to the ECB’s tasks, ranging from the
extraordinary measures taken by the ECB in
May 2010 to the need for fi scal consolidation
and for the reform of economic governance.
The European Parliament, as the institution
which derives its legitimacy directly from the
citizens of the EU, plays the most important
institutional role in holding the ECB to account.
Since its establishment, the ECB has maintained
a close and fruitful dialogue with the European
Parliament. The President of the ECB continued
to report on the ECB’s monetary policy and
its other tasks during his quarterly hearings
before the European Parliament’s Committee
on Economic and Monetary Affairs (ECON).
In line with the provisions of the Treaty, he also
appeared before the plenary session of the
Parliament in November 2010 to present the
ECB’s Annual Report 2009.
Other members of the ECB’s Executive Board
also appeared before the European Parliament
on a number of occasions. The Vice-President
presented the ECB’s Annual Report 2009 to
ECON before it was presented in the plenary
session. Jürgen Stark held an exchange of
views with the members of ECON and
representatives of national parliaments on the
subject of economic recovery and exit strategies.
Lorenzo Bini Smaghi participated in a public
hearing organised by ECON on economic
governance. Gertrude Tumpel-Gugerell also
appeared before ECON to inform its members
about payment issues. In line with past practice,
a delegation from ECON visited the ECB
on 13 December 2010, in order to exchange
views with the members of the Executive
Board. In addition, the ECB hosted a visit
by the Special Committee on the Financial,
Economic and Social Crisis and by the
Committee on Employment and Social Affairs.
Members of these two committees thus had
the opportunity to discuss with Executive
Board members a wide range of issues, such as
recent economic and fi scal developments,
global imbalances and labour market reforms.
Finally, ECB staff presented the ECB’s 2010
Structural Issues Report on energy markets and
the euro area macroeconomy to European and
national parliamentarians.
1 ACCOUNTABILITY VIS-À-VIS THE GENERAL PUBLIC AND THE EUROPEAN PARLIAMENT
181ECB
Annual Report2010
During the various exchanges of views between
the members of the European Parliament and
ECB representatives, a wide range of issues
were addressed. Beyond macroeconomic
developments and the ECB’s monetary policy,
the main issues discussed concerned EU and
euro area economic governance and legislation
on fi nancial regulation and supervision.
REFORM OF EU AND EURO AREA
ECONOMIC GOVERNANCE
The reform of the economic governance
framework in the EU (see Chapter 5) featured
prominently in the discussions between the
ECB and the European Parliament. In the
own-initiative reports prepared by ECON
and the Special Committee on the Financial,
Economic and Social Crisis, the European
Parliament put forward recommendations
for measures and initiatives to be taken to
enhance the existing rules and procedures.
Among other things, it urged that the provisions
of the Stability and Growth Pact be strengthened,
and proposed the establishment of an effective
incentive and penalty mechanism. The European
Parliament debated the package of six legislative
proposals put forward by the Commission
on 29 September 2010 and, together with the
Council, entered into the relevant legislative
procedures in order to adopt them.
During his appearances before the European
Parliament, the President of the ECB called for
a quantum leap forward in the strengthening
of the economic governance of the EU, and in
particular of the euro area. He expressed his
full confi dence in the European Parliament’s
ability and willingness to pursue a resolutely
European approach to this matter. In addition,
ECB representatives provided expert advice to
the European Parliament on specifi c aspects of
the economic governance package.
EU FINANCIAL SECTOR REFORM
The European Parliament and the ECB
continued their intensive dialogue on matters
concerning fi nancial supervision and regulation.
The European Parliament and the Council
formally adopted the four legislative acts
establishing the European Systemic Risk Board
and the European Supervisory Authorities
(see Chapter 4).1
During his appearances before the European
Parliament, the President of the ECB welcomed
the instrumental role played by the European
Parliament in the pursuit of an ambitious
fi nancial supervisory reform with a true
European perspective. He also stressed the
importance of maintaining political momentum
in order to further implement the fi nancial
regulatory agenda.
As regards other fi nancial sector legislation,
the European Parliament’s activity – and its
discussions with ECB representatives – focused
on the Alternative Investment Fund Managers
Directive and the third revision of the Capital
Requirements Directive, as well as on legislation
on fi nancial conglomerates, deposit guarantee
schemes, credit rating agencies, short selling,
and over-the-counter derivatives and market
infrastructures. On all these issues, the President
of the ECB stressed the importance of
achieving a level playing fi eld and of avoiding
regulatory arbitrage. The ECB’s legal advice
on EU legislative proposals within its fi eld
of competence in the form of ECB opinions
(see Section 6.2 of Chapter 2) also served as a
source of technical advice to members of the
European Parliament.
In addition, the EU Council adopted a Regulation 1
(No 1096/2010) conferring specifi c tasks upon the European
Central Bank concerning the functioning of the European
Systemic Risk Board.
2 SELECTED TOPICS RAISED AT MEETINGS WITH THE EUROPEAN PARLIAMENT

The entrance building will create a functional and visual link between the Grossmarkthalle and the double offi ce tower. It will
intersect with the Grossmarkthalle to form a clearly identifi able entrance from the north side of the site on Sonnemannstrasse.
It will also house the press centre.
In preparation for the construction of the entrance building, three segments of the Grossmarkthalle’s roof were removed in
August 2010, with the agreement of the historic preservation authorities. The three concrete shells that were removed were
those that were damaged during the Second World War air raids and subsequently reconstructed in the 1950s.

CHAPTER 9
EXTERNAL COMMUNICATION
184ECBAnnual Report2010
1 COMMUNICATION POLICY
External communication at the ECB aims to
enhance the public’s understanding of the
ECB’s policies and decisions and, as such, is an
integral part of the ECB’s monetary policy and
its other tasks. Two key elements – openness and
transparency – guide the ECB’s communication
activities. Both contribute to the effectiveness,
effi ciency and credibility of the ECB’s monetary
policy and its other statutory tasks. They also
support the ECB’s efforts to give a full account
of its actions, as explained in more detail in
Chapter 8.
The ECB’s concept of real-time, regular and
comprehensive explanations of its monetary
policy assessment and decisions, which was
introduced in 1999, represents a uniquely
open and transparent approach to central
bank communication. Monetary policy
decisions are explained at a press conference
immediately after the Governing Council has
taken them. The President delivers a detailed
introductory statement at the press conference,
explaining the Governing Council’s decisions.
The President and Vice-President are then
at the media’s disposal to answer questions.
Since December 2004 decisions taken by the
Governing Council other than those setting
interest rates have also been published every
month on the websites of the Eurosystem
central banks.
ECB legal acts are made available in all the
offi cial languages of the EU, as are the
Governing Council’s monetary policy decisions,
the decisions taken by the Governing Council in
addition to decisions setting interest rates, and
the consolidated fi nancial statements of the
Eurosystem. 1 The ECB’s Annual Report is also
made available in full in all offi cial EU
languages. 2 The Convergence Report and the
quarterly issues of the ECB’s Monthly Bulletin
are made available either in full or in summary
form in all offi cial EU languages. 3 For the
purposes of public accountability and
transparency, the ECB publishes other
documentation in addition to the statutory
publications in some or all offi cial languages,
in particular press releases announcing
staff macroeconomic projections, policy
positions and information of relevance to the
general public. The preparation, publication
and distribution of the national language
versions of the ECB’s key publications
are undertaken in close collaboration with
the NCBs.
With the exception of Irish, for which a derogation is in effect 1
at the EU level.
With the exception of Irish (by EU derogation) and Maltese 2
(by agreement with the Central Bank of Malta, following the
lifting of the temporary EU derogation in May 2007).
See footnote 2.3
185ECB
Annual Report2010
The ECB addresses a variety of
audiences – fi nancial experts, the media,
governments, parliaments and the general
public – with varying levels of knowledge
regarding fi nance and economics. Its mandate
and decisions are therefore explained through
a range of communication tools and activities
which are constantly being refi ned in order to
make them as effective as possible, taking into
account the different audiences and the relevant
communication environments and needs.
In 2010 the ECB’s communication activities
focused, in particular, on explaining the events
and consequences of the global fi nancial and
economic crisis and the measures taken by the
ECB and the Eurosystem. The vast majority
of all public speeches delivered by members
of the Executive Board were related to this
issue. This topic also dominated the questions
and requests for information received from
the press, the public and visitors to the ECB.
The plans for setting up the European Systemic
Risk Board and defi ning its objectives and tasks,
including the ECB’s specifi c role in ensuring the
performance of the secretariat function for the
new body, also featured regularly in the ECB’s
communication activities.
The ECB publishes a number of regular and
periodic studies and reports. These include:
the Annual Report, which presents a review of
the ECB’s activities in the previous year and
thus contributes to the ECB’s accountability;
the Monthly Bulletin, which provides regular
updates on the ECB’s assessment of economic
and monetary developments and detailed
information underlying its decisions; and the
Financial Stability Review, which assesses the
stability of the euro area fi nancial system with
regard to its ability to absorb adverse shocks.
The ECB also provides a wide range of statistical
data, primarily by means of the Statistical Data
Warehouse and interactive charts on the ECB’s
website, but also in hard copy in the monthly
editions of the Statistics Pocket Book.
All members of the ECB’s Governing
Council contribute directly to enhancing
public knowledge and understanding of the
Eurosystem’s tasks and policies by giving
testimonies before the European Parliament and
national parliaments, delivering public speeches
and granting interviews to the media. In 2010
the President of the ECB and other members
of the Executive Board appeared before the
European Parliament a total of eight times
(for more details, see Chapter 8). Over the course
of the year Board members delivered around
200 speeches to a variety of audiences and granted
260 interviews to the media. They also had
many articles published in journals, magazines
and newspapers.
The euro area NCBs play an important
role in ensuring the dissemination, at the
national level, of Eurosystem information and
messages to the general public and interested
parties. They address a variety of national and
regional audiences in their own languages
and environments.
In 2010 the ECB organised 15 seminars for
journalists aimed at enhancing the knowledge
and understanding of the national and
international media as regards the ECB’s
mandate, tasks and activities. It organised
seminars on its own and in cooperation with the
NCBs, the European Commission, the European
Journalism Centre and other public authorities
and foundations.
The ECB welcomed approximately 13,000 visitors
to its premises in Frankfurt in 2010. Visitors
received fi rst-hand information in the form
of presentations given by ECB experts and
managers.
All documents published by the ECB and other
information about its various activities are
available on the ECB’s website. In 2010 the
website received 29 million visits (16% more
than in the previous year), 231 million pages
were viewed and 68 million documents were
downloaded. In December 2010 the ECB
launched, in cooperation with the NCBs,
two educational tools on central banking and
economics: “€CONOMIA – The Monetary Policy
2 COMMUNICATION ACTIVITIES

186ECBAnnual Report2010
Game” and “Infl ation Island”. In “€CONOMIA”,
players have to keep infl ation under control
by steering the key interest rate while taking
account of other economic parameters, such as
production growth, unemployment and monetary
growth. In “Infl ation Island”, a fi ctitious
economy, players can compare the benefi ts
of price stability with the harmful impact of
defl ation, high infl ation and hyperinfl ation.
The games are aimed at 18 to 25-year-olds with
little or no knowledge of economics and can be
downloaded from the ECB’s website and the
websites of most of the NCBs in all offi cial EU
languages.
In 2010 the ECB replied to around
100,000 enquiries from the public requesting
information on a number of issues related to the
ECB’s activities, policies and decisions.
A number of high-level international
conferences were organised in 2010, including
“The great fi nancial crisis: lessons for fi nancial
stability and monetary policy – a colloquium in
honour of Lucas Papademos” and the Sixth ECB
Central Banking Conference, which addressed
the topic “Approaches to monetary policy
revisited – lessons from the crisis”.
To prepare for Estonia joining the euro
area on 1 January 2011, a euro information
campaign was organised in 2010 by the ECB
and Eesti Pank to familiarise the people of
Estonia with the visual appearance and security
features of the euro banknotes and coins. The
communication tools used in the campaign
took into account the experience gained from
past changeovers and included public opinion
surveys, as many as 20 different types of
printed publication (1.6 million copies in
total) and dedicated internet pages. For the
fi rst time since the Euro 2002 Information
Campaign, TV advertising was used (four adverts
were aired between November 2010 and
mid-January 2011). Several press and public
relations events were held, including an ECB
media seminar in Frankfurt, as well as an
exhibition on the euro banknotes and coins
and a Euro Conference in Tallinn. To mark the
launch of the euro information campaign in
Estonia, on 19 September 2010 a symbolic star
containing euro banknotes was handed over by
President Trichet to Governor Lipstok in Tallinn.
In addition, as part of the communication
activities on banknotes, an exhibition featuring
a range of interactive elements and games was
organised in Berlin, Frankfurt, Luxembourg,
Warsaw and Tallinn, in cooperation with the
NCBs and other institutions, such as museums.
In 2010 the Cultural Days of the ECB were
dedicated to the Netherlands and organised
in cooperation with De Nederlandsche Bank.
22 events refl ecting the cultural diversity of the
Netherlands took place at well-known cultural
locations in Frankfurt from 20 October to
15 November. The Cultural Days initiative was
launched in 2003 with the aim of raising cultural
awareness and giving residents of the Frankfurt
area and visitors a fl avour of the culture of a
different EU Member State each year.


On 19 May 2010 the ECB marked the offi cial start of construction works for its new premises by laying the foundation stone
at the site of the former Grossmarkthalle in Frankfurt am Main. Together with Jean-Claude Trichet, President of the ECB, the
members of the Executive Board, the Governing Council and the General Council of the ECB, as well as Petra Roth, Lord
Mayor of the City of Frankfurt am Main, and Wolf D. Prix of COOP HIMMELB(L)AU, fi lled the foundation stone with a
set of the building plans, newspapers from all 27 EU Member States, sets of euro coins from the then 16 countries of the euro
area, a set of euro banknotes and a coin from the City of Frankfurt. The foundation stone was then sealed and moved into the
excavation pit where the double offi ce tower is to be built.

CHAPTER 10
INSTITUTIONAL FRAMEWORK,
ORGANISATION AND ANNUAL ACCOUNTS
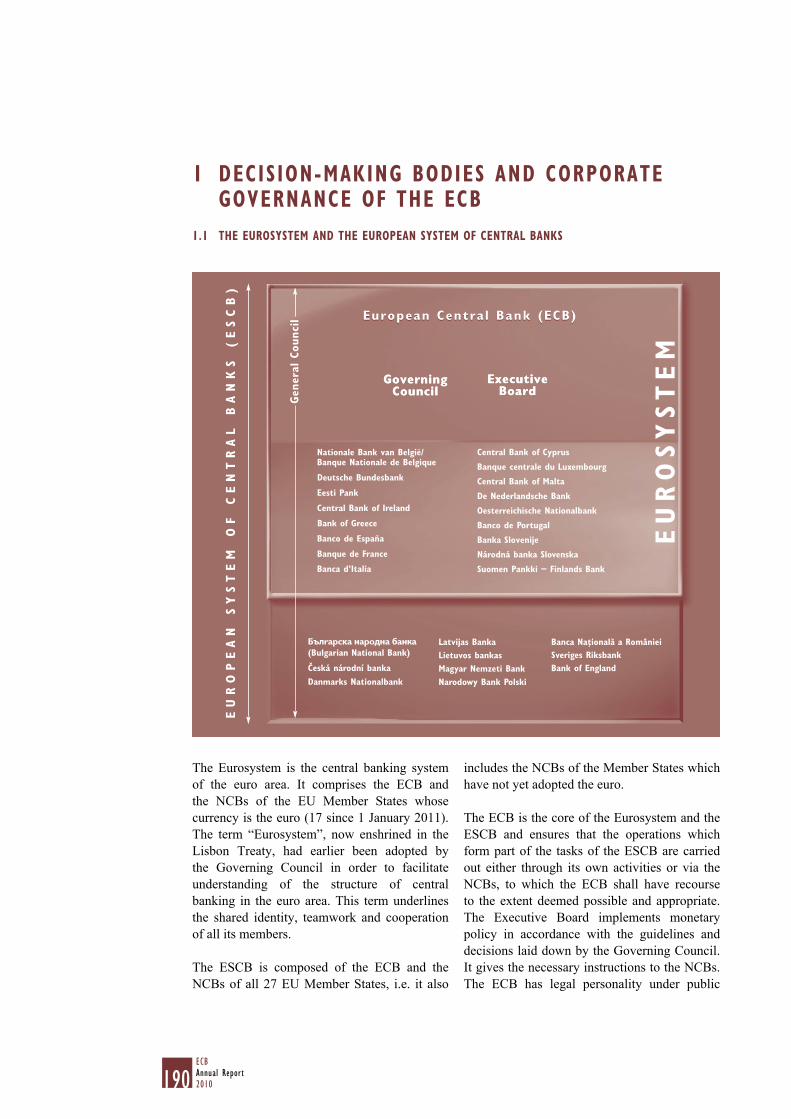
190ECBAnnual Report2010
1 DECISION-MAKING BODIES AND CORPORATE GOVERNANCE OF THE ECB
The Eurosystem is the central banking system
of the euro area. It comprises the ECB and
the NCBs of the EU Member States whose
currency is the euro (17 since 1 January 2011).
The term “Eurosystem”, now enshrined in the
Lisbon Treaty, had earlier been adopted by
the Governing Council in order to facilitate
understanding of the structure of central
banking in the euro area. This term underlines
the shared identity, teamwork and cooperation
of all its members.
The ESCB is composed of the ECB and the
NCBs of all 27 EU Member States, i.e. it also
includes the NCBs of the Member States which
have not yet adopted the euro.
The ECB is the core of the Eurosystem and the
ESCB and ensures that the operations which
form part of the tasks of the ESCB are carried
out either through its own activities or via the
NCBs, to which the ECB shall have recourse
to the extent deemed possible and appropriate.
The Executive Board implements monetary
policy in accordance with the guidelines and
decisions laid down by the Governing Council.
It gives the necessary instructions to the NCBs.
The ECB has legal personality under public
1.1 THE EUROSYSTEM AND THE EUROPEAN SYSTEM OF CENTRAL BANKS
GoverningCouncil
Genera
l Counci
l
Deutsche Bundesbank
Bank of Greece
Banco de España
Banque de France
Banque centrale du Luxembourg
De Nederlandsche Bank
Oesterreichische Nationalbank
Banco de Portugal
Suomen Pankki − Finlands Bank
Česká národní banka
Danmarks Nationalbank
Central Bank of Cyprus
Latvijas Banka
Lietuvos bankas
Magyar Nemzeti Bank
Central Bank of Malta
Narodowy Bank Polski
Národná banka Slovenska
Sveriges Riksbank
Bank of England
EU
RO
PE
AN
S
YS
TE
M
OF
C
EN
TR
AL
B
AN
KS
(
ES
CB
)
EU
RO
SY
ST
EM
Central Bank of Ireland
Banca d’Italia
Banka Slovenije
Banca Naţională a RomânieiБълrapcκa нapoднa бaнкa(Bulgarian National Bank)
European Centra l Bank (ECB)European Centra l Bank (ECB)
ExecutiveBoard
ExecutiveBoard
GoverningCouncil
Eesti Pank
Nationale Bank van België/Banque Nationale de Belgique
191ECB
Annual Report2010
international law. The Lisbon Treaty established
the ECB as an EU institution. However,
the institutional features of the ECB remain
unchanged.
Each NCB has legal personality according
to the law of its respective country. The euro
area NCBs, which form an integral part of the
Eurosystem, carry out the tasks conferred upon
the Eurosystem in accordance with the rules
established by the ECB’s decision-making
bodies. The NCBs also contribute to the work
of the Eurosystem and the ESCB through
their participation in the Eurosystem/ESCB
committees (see Section 1.5 of this chapter).
They may perform non-Eurosystem functions
on their own responsibility, unless the
Governing Council fi nds that such functions
interfere with the objectives and tasks of the
Eurosystem.
The Eurosystem and the ESCB are governed by
the decision-making bodies of the ECB: the
Governing Council and the Executive Board.
The General Council is constituted as a third
decision-making body of the ECB, for as long
as there are EU Member States which have not
yet adopted the euro. The functioning of the
decision-making bodies is governed by the
Treaty, the Statute of the ESCB and the relevant
Rules of Procedure.1 Decision-making within
the Eurosystem and the ESCB is centralised.
However, the ECB and the euro area NCBs
jointly contribute, strategically and operationally,
to attaining the common goals of the Eurosystem,
with due respect to the principle of
decentralisation in accordance with the Statute
of the ESCB.
1.2 THE GOVERNING COUNCIL
The Governing Council comprises the
members of the Executive Board of the ECB
and the governors of the NCBs of the Member
States which have adopted the euro. Its main
responsibilities, as laid down in the Treaty, are:
to adopt the guidelines and take the decisions –
necessary to ensure the performance of the
tasks entrusted to the Eurosystem;
to formulate the monetary policy of the –
euro area, including, as appropriate,
decisions relating to intermediate monetary
objectives, key interest rates and the supply
of reserves in the Eurosystem, and to
establish the necessary guidelines for their
implementation.
The Governing Council meets, as a rule, twice
a month at the ECB’s premises in Frankfurt
am Main, Germany. It conducts, inter alia, an
in-depth assessment of monetary and economic
developments and takes related decisions
specifi cally at its fi rst meeting of the month,
while the second meeting usually focuses on
issues related to other tasks and responsibilities
of the ECB and the Eurosystem. In 2010
one meeting was held outside Frankfurt, hosted
by the Banco de Portugal in Lisbon. In addition
to these meetings, the Governing Council may
also hold meetings by means of teleconference
or take decisions by written procedure.
When taking decisions on monetary policy and
on other tasks of the ECB and the Eurosystem,
the members of the Governing Council do not
act as national representatives, but in a fully
independent personal capacity. This is refl ected
by the principle of “one member, one vote”
applied within the Governing Council. In 2008
the Governing Council decided to continue its
existing voting regime – as provided for by
Article 10.2 of the Statute of the ESCB – and to
introduce a rotation system only when the
For the ECB’s Rules of Procedure, see: Decision ECB/2004/2 1
of 19 February 2004 adopting the Rules of Procedure of the
European Central Bank, OJ L 80, 18.3.2004, p. 33, as amended
by Decision ECB/2009/5 of 19 March 2009, OJ L 100, 18.4.2009,
p. 10; Decision ECB/2004/12 of 17 June 2004 adopting
the Rules of Procedure of the General Council of the ECB,
OJ L 230, 30.6.2004, p. 61; and Decision ECB/1999/7 of
12 October 1999 concerning the Rules of Procedure of the
Executive Board of the ECB, OJ L 314, 8.12.1999, p. 34. These
rules are also available on the ECB’s website.

192ECBAnnual Report2010
number of governors in the Governing Council
exceeds 18. In March 2009 the Governing
Council adopted a legal act which covers all
aspects of the implementation of the rotation
system.2 The legal act will enter into force when
the rotation system is implemented.
Decision ECB/2009/5 of 19 March 2009 amending Decision 2
ECB/2004/2 of 19 February 2004 adopting the Rules of
Procedure of the European Central Bank, OJ L 100, 18.4.2009,
p. 10. For a detailed description of the implementation modalities
of the rotation scheme, such as the order, period and rate of
rotation, see the article entitled “Rotation of voting rights in
the Governing Council of the ECB”, Monthly Bulletin, ECB,
July 2009.

193ECB
Annual Report2010
Jean-Claude Trichet President of the ECB
Vítor ConstâncioVice-President of the ECB
(from 1 June 2010)
Governor of the Banco de Portugal
(until 31 May 2010)
Lucas D. PapademosVice-President of the ECB
(until 31 May 2010)
Lorenzo Bini SmaghiMember of the Executive Board of the ECB
Michael C. BonelloGovernor of the Central Bank of Malta
Carlos CostaGovernor of the Banco de Portugal
(from 7 June 2010)
Mario DraghiGovernor of the Banca d’Italia
Miguel Fernández OrdóñezGovernor of the Banco de España
José Manuel González-PáramoMember of the Executive Board of the ECB
Patrick HonohanGovernor of the Central Bank of Ireland
Marko KranjecGovernor of Banka Slovenije
Erkki Liikanen Governor of Suomen Pankki –
Finlands Bank
Andres LipstokGovernor of Eesti Pank
(from 1 January 2011)
Jozef Makúch Governor of Národná banka Slovenska (from 12 January 2010)
Yves MerschGovernor of the Banque centrale
du Luxembourg
Ewald Nowotny
Governor of the Oesterreichische Nationalbank
Christian Noyer
Governor of the Banque de France
Athanasios OrphanidesGovernor of the Central Bank of Cyprus
George A. ProvopoulosGovernor of the Bank of Greece
Guy QuadenGovernor of the Nationale Bank van België/
Banque Nationale de Belgique
Ivan ŠramkoGovernor of Národná banka Slovenska (until 11 January 2010)
Jürgen StarkMember of the Executive Board of the ECB
Gertrude Tumpel-Gugerell Member of the Executive Board of the ECB
Axel A. WeberPresident of the Deutsche Bundesbank
Nout WellinkPresident of De Nederlandsche Bank
THE GOVERNING COUNCIL
Front row (from left to right): Erkki Liikanen, Marko Kranjec,
Athanasios Orphanides,
Vítor Constâncio, Jean-Claude Trichet,
Gertrude Tumpel-Gugerell,
Michael C. Bonello, Ewald Nowotny
Middle row (from left to right): Nout Wellink, Miguel Fernández
Ordóñez, Lorenzo Bini Smaghi,
Yves Mersch
Back row (from left to right): Christian Noyer, Carlos Costa,
Guy Quaden, Patrick Honohan,
Georgios Provopoulos, José Manuel
González-Páramo, Axel A. Weber,
Jürgen Stark
Note: Mario Draghi, Andres Lipstok
and Jozef Makúch were not available at
the time the photograph was taken.

194ECBAnnual Report2010
Jean-Claude TrichetPresident of the ECB
Vítor ConstâncioVice-President of the ECB
(from 1 June 2010)
Lucas D. PapademosVice-President of the ECB
(until 31 May 2010)
Lorenzo Bini SmaghiMember of the Executive Board of the ECB
José Manuel González-PáramoMember of the Executive Board of the ECB
Jürgen StarkMember of the Executive Board of the ECB
Gertrude Tumpel-Gugerell Member of the Executive Board of the ECB
1.3 THE EXECUTIVE BOARD
The Executive Board comprises the President
and the Vice-President of the ECB and four other
members appointed by the European Council,
acting by qualifi ed majority, after consultation
of the European Parliament and of the ECB.
The main responsibilities of the Executive Board,
which as a rule meets once a week, are:
to prepare the meetings of the Governing –
Council;
to implement the monetary policy of the –
euro area in accordance with the guidelines
and decisions laid down by the Governing
Council and, in doing so, to give the
necessary instructions to the euro area
NCBs;
to manage the current business of the ECB; –
to exercise certain powers delegated to it by –
the Governing Council, including some of a
regulatory nature.
The Executive Board is assisted by a
Management Committee in matters relating to
the ECB’s management, business planning and
annual budget process. The Management
Committee is composed of one Executive Board
member, who acts as Chairperson, and a number
of senior managers.
Back row (left to right):Lorenzo Bini Smaghi,
José Manuel González-Páramo,
Jürgen Stark
Front row (left to right):Gertrude Tumpel-Gugerell,
Jean-Claude Trichet,
Vítor Constâncio

Divisions: Archives, Library and Records ♦
Language Services ♦
Secretariat ♦
Divisions: Accounting and ♦
ProcurementAdministrative Services ♦
Financial Reporting ♦
and PolicyPremises ♦
Security ♦
Divisions: Euro Area Accounts and Economic Data ♦
External Statistics ♦
Monetary and Financial Statistics ♦
Statistical Information Services ♦
Statistics Development/Coordination ♦
Divisions: Currency ♦
DevelopmentCurrency ♦
Management
Divisions: Press and Information ♦
Publishing, Events ♦
and Protocol
Division: Fiscal Policies ♦
Directorate Economic DevelopmentsHans-Joachim KlöckersDivisions: Euro Area Macroeconomic ♦
Developments EU Countries ♦
External Developments ♦
Directorate Monetary PolicyPhilippe MoutotDivisions: Capital Markets/Financial Structure ♦
Monetary Policy Stance ♦
Monetary Policy Strategy ♦
Divisions: Financial Services Policy ♦
Financial Stability Assessment ♦
Financial Stability Surveillance ♦
Divisions: Budget, Controlling ♦
and OrganisationHR Policies and Staff Relations ♦
Recruitment and Compensation ♦
Risk Management ♦ 1
Divisions: Audit Missions ♦
Audit Services ♦
Divisions: EU Institutions and Fora ♦
EU Neighbouring Regions ♦
International Policy Analysis ♦
Divisions: Lawyer-Linguists ♦
Legal Advice ♦ 2
Divisions: Financial Operations Services ♦
Front Offi ce ♦
Investment ♦
Market Operations Analysis ♦
Market Operations Systems ♦
Divisions: Market Integration ♦
Oversight ♦
TARGET and Collateral ♦
Directorate General Research
Frank SmetsDeputy: Huw Pill
Directorate General Secretariat and Language ServicesPierre van der Haegen 3
Deputy: Klaus Riemke
Directorate General Statistics
Aurel SchubertDeputy: Werner Bier
Directorate General Administration
N.N.Deputy: Werner Studener Directorate
BanknotesTon Roos
Directorate Communications
Elisabeth Ardaillon-Poirier
Counsel to the Executive Board
Christian Thimann
ECB Representation in Washington, D.C.
Georges Pineau
Directorate General Financial Stability
Mauro GrandeDeputy: John FellDirectorate General
HR, Budget and Organisation
Steven KeuningDeputy: Chiara Zilioli
Directorate General Information Systems
Koenraad De GeestDeputy: Magi Clavé
Directorate General International and
European RelationsFrank Moss
Deputy: Gilles Noblet
Directorate General Legal Services
Antonio Sáinz de Vicuña
Directorate General Market OperationsFrancesco Papadia
Deputy: Ulrich Bindseil
Directorate General Payments and Market Infrastructure
Daniela RussoDeputy: Pierre Petit
Directorate General Economics
Wolfgang SchillDeputies: Hans-Joachim Klöckers,
Philippe Moutot
T2S ProgrammeJean-Michel Godeffroy
Divisions: Econometric Modelling ♦
Financial Research ♦
Monetary Policy Research ♦
1 Reports directly to the Executive Board.2 Includes the data protection function.3 Secretary to the Executive Board, the Governing Council
and the General Council.
Executive Board
Divisions: Analytical Domain ♦
ApplicationsEnterprise Systems ♦
Executional Domain ♦
ApplicationsInfrastructure and Operations ♦
Security and Architecture ♦
Directorate Internal Audit
Klaus Gressenbauer
Back row (left to right): Lorenzo Bini Smaghi, José Manuel González-Páramo, Jürgen Stark
Front row (left to right):Gertrude Tumpel-Gugerell, Jean-Claude Trichet (President), Vítor Constâncio (Vice-President)
Executive Board
Division: T2S Programme Offi ce ♦
ESRB Preparatory Secretariat
Francesco Mazzaferro
THE ORGANISATION CHART OF THE ECB
(as at 31 December 2010)

196ECBAnnual Report2010
Jean-Claude Trichet President of the ECB
Vítor ConstâncioVice-President of the ECB
(from 1 June 2010)
Governor of the Banco de Portugal
(until 31 May 2010)
Lucas D. Papademos
Vice-President of the ECB
(until 31 May 2010)
Marek BelkaPresident of Narodowy Bank Polski
(from 11 June 2010)
Nils Bernstein Governor of Danmarks Nationalbank
Michael C. Bonello Governor of the Central Bank of Malta
Carlos CostaGovernor of the Banco de Portugal
(from 7 June 2010)
Mario DraghiGovernor of the Banca d’Italia
Miguel Fernández OrdóñezGovernor of the Banco de España
Patrick HonohanGovernor of the Central Bank of Ireland
Stefan IngvesGovernor of Sveriges Riksbank
Mugur Constantin IsărescuGovernor of Banca Naţională a României
Ivan IskrovGovernor of Българска народна банка
(Bulgarian National Bank)
Mervyn King
Governor of the Bank of England
Marko KranjecGovernor of Banka Slovenije
Erkki LiikanenGovernor of Suomen Pankki – Finlands Bank
Andres Lipstok Governor of Eesti Pank
Jozef Makúch Governor of Národná banka Slovenska (from 12 January 2010)
Yves MerschGovernor of the Banque centrale du Luxembourg
Ewald NowotnyGovernor of the Oesterreichische Nationalbank
Christian Noyer Governor of the Banque de France
Athanasios OrphanidesGovernor of the Central Bank of Cyprus
1.4 THE GENERAL COUNCIL
The General Council is composed of the
President and the Vice-President of the ECB
and the governors of the NCBs of all 27 EU
Member States. It mainly carries out those tasks
taken over from the EMI which still have to be
performed by the ECB on account of the fact
that not all the Member States have adopted the
euro. In 2010 the General Council had its four
quarterly meetings, as well as one meeting for
the adoption of the ECB’s Convergence Report.
Front row (left to right):Ewald Nowotny, Erkki Liikanen,
Marko Kranjec, Patrick Honohan,
Vítor Constâncio, Jean-Claude Trichet,
Miguel Fernández Ordóñez,
Yves Mersch, Stefan Ingves
Middle row (left to right): Nout Wellink, Ilmārs Rimšēvičs,
Carlos Costa, Ivan Iskrov,
Athanasios Orphanides,
Miroslav Singer, Marek Belka,
Michael C. Bonello
Back row (left to right): András Simor, Guy Quaden,
Axel A. Weber, Christian Noyer,
Nils Bernstein, Georgios Provopoulos,
Reinoldijus Šarkinas,
Andres Lipstok,
Mugur Constantin Isărescu
Note: Mario Draghi, Mervyn King
and Jozef Makúch were not available
at the time the photograph was taken.
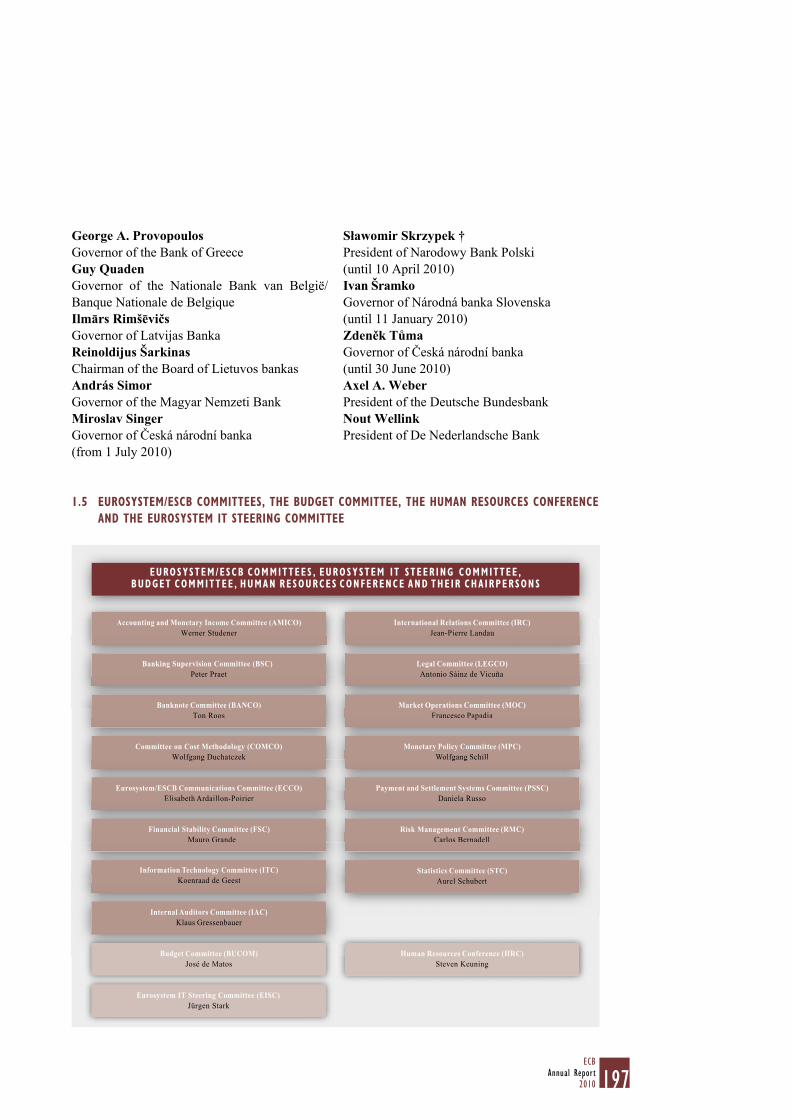
197ECB
Annual Report2010
George A. ProvopoulosGovernor of the Bank of Greece
Guy QuadenGovernor of the Nationale Bank van België/
Banque Nationale de Belgique
Ilmārs Rimšēvičs
Governor of Latvijas Banka
Reinoldijus ŠarkinasChairman of the Board of Lietuvos bankas
András Simor
Governor of the Magyar Nemzeti Bank
Miroslav SingerGovernor of Česká národní banka
(from 1 July 2010)
Sławomir Skrzypek †President of Narodowy Bank Polski
(until 10 April 2010)
Ivan Šramko
Governor of Národná banka Slovenska (until 11 January 2010)
Zdeněk TůmaGovernor of Česká národní banka
(until 30 June 2010)
Axel A. WeberPresident of the Deutsche Bundesbank
Nout WellinkPresident of De Nederlandsche Bank
1.5 EUROSYSTEM/ESCB COMMITTEES, THE BUDGET COMMITTEE, THE HUMAN RESOURCES CONFERENCE
AND THE EUROSYSTEM IT STEERING COMMITTEE
EUROSYSTEM/ESCB COMMITTEES , EUROSYSTEM IT STEER ING COMMITTEE ,BUDGET COMMITTEE , HUMAN RESOURCES CONFERENCE AND THE IR CHA IRPERSONS
International Relations Committee (IRC)Jean-Pierre LandauJean Pierre Landau
Legal Committee (LEGCO)Antonio Sáinz de VicuñaAntonio Sáinz de Vicuña
Market Operations Committee (MOC)Francesco PapadiaFrancesco Papadia
Monetary Policy Committee (MPC)Wolfgang SchillWolfgf ang Schill
Payment and Settlement Systems Committee (PSSC)Daniela RussoDaniela Russo
Risk Management Committee (RMC)Carlos Bernadell
Accounting and Monetary Income Committee (AMICO)Werner Studener
Carlos Bernadell
Statistics Committee (STC)Aurel Schubert
Werner Studener
Banking Supervision Committee (BSC)Peter Praet
Human Resources Conference (HRC)Steven Keuning
Peter Praet
Banknote Committee (BANCO)Ton RoosTon Roos
Committee on Cost Methodology (COMCO)Wolfgang DuchatczekWolfgang Duchatczek
Eurosystem/ESCB Communications Committee (ECCO)Elisabeth Ardaillon-PoirierElisabeth Ardaillon Poirier
Financial Stability Committee (FSC)Mauro GrandeMauro Grande
Information Technology Committee (ITC)Koenraad de Geest
Internal Auditors Committee (IAC)Klaus Gressenbauer
Budget Committee (BUCOM)José de Matos
Eurosystem IT Steering Committee (EISC)Jürgen Stark
198ECBAnnual Report2010
The Eurosystem/ESCB committees have
continued to play an important role in assisting
the ECB’s decision-making bodies in the
performance of their tasks. At the request of
both the Governing Council and the Executive
Board, the committees have provided expertise in
their fi elds of competence and have facilitated the
decision-making process. Membership of the
committees is usually restricted to staff of the
Eurosystem central banks. However, the NCBs
of the Member States which have not yet adopted
the euro take part in the meetings of a committee
whenever it deals with matters that fall within
the fi eld of competence of the General Council.
Where appropriate, other competent bodies,
such as national supervisory authorities in the
case of the Banking Supervision Committee,
may also be invited. On 16 September 2010 the
Risk Management Committee was established
to assist the Governing Council in ensuring
an appropriate level of protection for the
Eurosystem by managing and controlling the
risks originating from its market operations. On
16 December 2010 the Banking Supervision
Committee was dissolved following the
establishment of the European Systemic Risk
Board (see Chapter 6). As at 31 December 2010,
13 Eurosystem/ESCB committees had been
established under Article 9.1 of the Rules of
Procedure of the ECB. On 13 January 2011 the
Financial Stability Committee was established,
under the same article, to assist the Governing
Council in the fulfi lment of the ECB’s tasks
relating to fi nancial stability.
The Budget Committee, which was established
under Article 15 of the Rules of Procedure,
assists the Governing Council in matters related
to the ECB’s budget.
The Human Resources Conference was
established in 2005 under Article 9a of the
Rules of Procedure as a forum for the exchange
of experience, expertise and information among
Eurosystem/ESCB central banks in the fi eld of
human resources management.
The Eurosystem IT Steering Committee was
established in 2007 by the Governing Council,
with a mandate to steer continuous improvement
in the use of IT within the Eurosystem.
1.6 CORPORATE GOVERNANCE
In addition to the decision-making bodies, the
corporate governance of the ECB encompasses
a number of external and internal control layers,
two codes of conduct, an Ethics Framework
and rules concerning public access to ECB
documents.
EXTERNAL CONTROL LAYERS
The Statute of the ESCB provides for two
control layers, namely the external auditor,
which is appointed to audit the annual accounts
of the ECB (Article 27.1 of the Statute of the
ESCB), and the European Court of Auditors,
which examines the operational effi ciency of the
management of the ECB (Article 27.2).
The annual report of the European Court of
Auditors, together with the ECB’s reply, is
published on the ECB’s website and in the
Offi cial Journal of the European Union. In order
to reinforce public assurance as to the
independence of the ECB’s external auditor, the
principle of audit fi rm rotation is applied. 3 Good
practices for the selection and mandate of
external auditors, published on the ECB’s
website, provide high-level guidance for each
Eurosystem central bank when selecting external
auditors and determining their mandate.
The good practices also enable the Governing
Council to formulate its recommendations to the
Council on the basis of harmonised, consistent
and transparent selection criteria.
INTERNAL CONTROL LAYERS
The internal control structure of the ECB is based
on an approach in which each organisational
unit (section, division, directorate or directorate
general) is responsible for managing its own risks
and controls, as well as the effectiveness and
Following the conclusion of a tender procedure and in line with the 3
agreed practice of rotating audit fi rms, PricewaterhouseCoopers
Aktiengesellschaft Wirtschaftsprüfungsgesellschaft was appointed
as the ECB’s external auditor for the fi nancial years 2008-12.

199ECB
Annual Report2010
effi ciency of its operations. Each organisational
unit implements operational control procedures
within its area of responsibility in accordance
with the risk tolerance set ex ante by the
Executive Board. For example, a set of rules and
procedures – known as a “Chinese wall” – is in
place to prevent inside information originating
in the areas responsible for monetary policy
from reaching the areas responsible for the
management of the ECB’s foreign reserves and
own funds portfolio.
In 2010 the ECB further refi ned its approach
to operational risk management and continued,
together with the NCBs, to implement the
operational risk management framework for
Eurosystem tasks and processes. The business
areas of the ECB also updated their operational
risk assessments. The ECB regularly tests and
reviews the business continuity arrangements
for its critical operations. Furthermore, in
2010 the ECB reviewed its crisis management
framework and conducted a training programme
for the crisis management team. Following the
Governing Council’s approval of the roll-out of
the Eurosystem business continuity framework
in 2009, the procedures for a business
impact analysis at the Eurosystem level were
developed.
Moreover, in December 2010 the newly
established Risk Management Committee
(RMC) met for the fi rst time. One of its main
tasks is to provide for an integrated assessment
of all fi nancial risks that the Eurosystem faces
in its market operations, which include the
Eurosystem’s monetary policy and intraday
credit operations, foreign exchange operations,
as well as operations related to the management
of the ECB’s foreign reserves.
Independently from the internal control structure
and risk monitoring of the ECB, audit missions
are performed by the Directorate Internal Audit
under the direct responsibility of the Executive
Board. In accordance with the mandate defi ned
in the ECB Audit Charter,4 the ECB’s internal
auditors provide independent and objective
assurance and consulting services, bringing a
systematic approach to evaluating and improving
the effectiveness of risk management, control
and governance processes. The ECB’s internal
audit activities conform with the International
Standards for the Professional Practice of
Internal Auditing of the Institute of Internal
Auditors.
A Eurosystem/ESCB committee, the Internal
Auditors Committee, which is composed of
the heads of internal audit at the ECB and the
NCBs, is responsible for coordinating the
auditing of Eurosystem/ESCB joint projects and
operational systems.
An ECB Audit Committee further enhances
the corporate governance of the ECB and
the Eurosystem as a whole. It is composed of
three Governing Council members, with Erkki
Liikanen (Governor of Suomen Pankki –
Finlands Bank) as Chairman.
CODES OF CONDUCT
Two codes of conduct are applicable to the
members of the ECB’s decision-making bodies.
The fi rst code of conduct gives guidance to, and
sets ethical standards for, the members of the
Governing Council and their alternates when
exercising their functions as members of the
Governing Council. It refl ects their responsibility
to safeguard the integrity and reputation of the
Eurosystem and to maintain the effectiveness
of its operations.5 An Ethics Adviser has been
appointed by the Governing Council to provide
guidance to its members on aspects of
professional conduct. The second code is
the Supplementary Code of Ethics Criteria
for the members of the Executive Board.6
It complements the other code of conduct by
further detailing the ethical regime applicable
to members of the Executive Board.
This charter is published on the ECB’s website to foster the 4
transparency of audit arrangements in place at the ECB.
See the Code of Conduct for the members of the Governing 5
Council, OJ C 123, 24.5.2002, p. 9, its amendment, OJ C 10,
16.1.2007, p. 6, and the ECB’s website.
See the Supplementary Code of Ethics Criteria for the members 6
of the Executive Board of the ECB, OJ C 104, 23.4.2010, p. 8,
and the ECB’s website.

200ECBAnnual Report2010
On 1 April 2010 a comprehensive Ethics
Framework for members of staff of the ECB
entered into force.7 It consolidated and enhanced
the ethical rules applying to staff of the ECB as
laid down in the Conditions of Employment, the
Staff Rules and the former Code of Conduct of
the ECB.8 The Framework provides guidance
and sets ethics conventions, standards and
benchmarks. All staff are expected to maintain
high standards of professional ethical behaviour
in the performance of their duties, as well as in
their relations with NCBs, public authorities,
market participants, media representatives and
the public in general. An Ethics Offi cer
appointed by the Executive Board ensures a
consistent interpretation of the rules applicable
to Executive Board members and staff.
ANTI-FRAUD MEASURES
In 1999 the European Parliament and the
Council adopted a Regulation 9 to step up the
fi ght against fraud, corruption and any other
illegal activity detrimental to the Communities’
fi nancial interests. The Regulation provides,
inter alia, for the internal investigation of
suspected fraud by the European Anti-Fraud
Offi ce (OLAF) within the EU institutions,
bodies, offi ces and agencies. The OLAF
Regulation foresees that each of the latter adopt
decisions in order for OLAF to be able to carry
out its investigations within each of them. In
June 2004 the Governing Council adopted a
Decision 10 concerning the terms and conditions
for investigations by OLAF of the ECB, which
entered into force on 1 July 2004.
INTERNAL ECB ANTI-MONEY LAUNDERING/
COUNTER-TERRORIST FINANCING PROGRAMME
In 2007 the ECB established its internal
anti-money laundering (AML) and counter-
terrorist fi nancing (CTF) scheme. The design
of the AML/CTF provisions is in line with
the 40 recommendations and nine special
recommendations of the Financial Action Task
Force (FATF), to the extent that they are applicable
to the ECB’s operations. A compliance function
within the ECB identifi es, analyses and addresses
the risks associated with money laundering and
terrorist fi nancing for all relevant activities of
the ECB. In particular, ensuring compliance
with applicable AML/CTF legislation is part
of the process of assessing and monitoring the
eligibility of the ECB’s counterparties. In this
context, particular attention is paid to restrictive
measures adopted by the EU and public
statements issued by the FATF. An internal
reporting system complements the ECB’s
AML/CTF framework to ensure that all relevant
information is systematically collected and duly
communicated to the Executive Board.
PUBLIC ACCESS TO ECB DOCUMENTS
The ECB’s decision on public access to ECB
documents,11 adopted in March 2004, is in line
with the objectives and standards applied by
other EU institutions and bodies with regard to
public access to their documents. It enhances
transparency, while at the same time taking into
account the independence of the ECB and of the
NCBs and ensuring the confi dentiality of certain
matters specifi c to the performance of the ECB’s
tasks.12
In 2010 the number of public access requests
remained limited.
See Part 0 of the ECB Staff Rules containing the Ethics 7
Framework, OJ C 104, 23.4.2010, p. 3, and the ECB’s website.
See the former Code of Conduct of the European Central Bank 8
in accordance with Article 11.3 of the Rules of Procedure of the
European Central Bank, OJ C 76, 8.3.2001, p. 12.
Regulation (EC) No 1073/1999 of the European Parliament 9
and of the Council of 25 May 1999 concerning investigations
conducted by the European Anti-Fraud Offi ce (OLAF),
OJ L 136, 31.5.1999, p. 1.
Decision ECB/2004/11 concerning the terms and conditions 10
for European Anti-Fraud Offi ce investigations of the European
Central Bank, in relation to the prevention of fraud, corruption
and any other illegal activities detrimental to the European
Communities’ fi nancial interests and amending the Conditions
of Employment for Staff of the European Central Bank, OJ L 230,
30.6.2004, p. 56. This Decision was adopted in response
to the judgement of the European Court of Justice on 10 July
2003 in Case C-11/00 Commission v European Central Bank,
ECR I-7147.
Decision ECB/2004/3 on public access to European Central 11
Bank documents, OJ L 80, 18.3.2004, p. 42.
In line with the ECB’s commitment to openness and transparency, 12
the “Archives” section of the ECB’s website provides access to
historical documentation.
201ECB
Annual Report2010
ORGANISATIONAL DEVELOPMENTS2
2.1 HUMAN RESOURCES MANAGEMENT
In 2010 the ECB continued to develop and
implement human resources management
policies in four areas: corporate culture,
recruitment, professional development and
employment conditions.
CORPORATE CULTURE
In 2010 developments related to the corporate
culture of the ECB focused on diversity and
professional ethics. A number of activities were
initiated in order to raise awareness of the ECB’s
gender diversity objectives and embed them
more deeply in the regular human resources
operations. To mark the ECB’s commitment in
this respect, a public statement on diversity was
published on the ECB’s website. With regard to
professional ethics, an Ethics Framework for the
members of staff of the ECB entered into force
in 2010, as discussed in greater detail in the
previous section.
RECRUITMENT
On 31 December 2010 the actual full-time
equivalent number of staff holding employment
contracts with the ECB was 1,607 (1,563 on
31 December 2009).13 A total of 53 new fi xed-
term contracts (limited in nature or convertible
to permanent contracts) were offered in 2010.
By contrast, 28 members of staff employed on a
fi xed-term or permanent basis left the ECB
in 2010 (27 in 2009), following resignation or
retirement. Furthermore, to cover for absences
of less than one year, 128 short-term contracts
were issued during 2010 (in addition to some
contract extensions), while 140 short-term
contracts expired in the course of the year.
The ECB continued to offer short-term
contracts to staff from NCBs and international
organisations, thus fostering an ESCB-wide
team spirit and cooperation with international
organisations. On 31 December 2010,
158 employees from NCBs and international
organisations were working at the ECB on
various assignments, 12% more than in 2009.
In September 2010 the ECB welcomed the fi fth
intake of participants in its Graduate Programme.
The participants, who are recent graduates from
leading universities, have a broad educational
background and are each assigned to two
business areas on a rotational basis for a total
period of two years.
As in previous years, traineeship opportunities
were offered throughout the year to students
and graduates with backgrounds in economics,
statistics, business administration, law and
translation. The ECB published the rules
governing its traineeship programme on its
website in April 2010 in order to provide more
clarity on the eligibility criteria, assignment
duration, leave and medical coverage.
On 31 December 2010, 92 trainees were being
hosted by the ECB (12.8% more than in 2009).
The ECB also offered four fellowships as part
of the Wim Duisenberg Research Fellowship
Programme, which is open to leading
economists, and fi ve fellowships to young
researchers in the context of its Lamfalussy
Fellowship Programme.
PROFESSIONAL DEVELOPMENT
Mobility and staff development measures
continued to be the main tools for professional
development at the ECB.
The ECB’s internal mobility policy enables the
ECB to broaden staff awareness and to increase
synergies across business areas. The ECB’s
internal recruitment policy also aims to facilitate
internal mobility by placing emphasis on broad
competencies. In the course of 2010, 204 staff
members, including 37 managers and advisers,
moved internally to other positions, on either a
temporary or a long-term basis.
In addition to contracts based on full-time equivalent positions, 13
this fi gure includes, inter alia, short-term contracts awarded to
staff seconded from NCBs and international organisations and
contracts awarded to Graduate Programme participants.
202ECBAnnual Report2010
The ECB, like all ESCB central banks,
actively participates in the external work
experience scheme promoted by the Human
Resources Conference, which enables the
ECB to second staff to the 27 NCBs in the
EU or to relevant international organisations
(e.g. the IMF and the BIS) for periods of two
to twelve months. A total of eight members
of staff were seconded under this scheme
in 2010 (new cases). In addition, the ECB
granted unpaid leave, for up to three years,
to 36 members of staff (new cases). The total
number of staff members on unpaid leave at the
end of December 2010 was 45 (compared with
55 in 2009).
The ECB continued to promote the acquisition
and development of skills and the enhancement
of the competencies of management and staff.
In addition to numerous in-house training
opportunities, staff and management continued
to take up external training opportunities to
address individual training needs of a more
“technical” nature. They also benefi ted from
opportunities organised as part of ESCB training
programmes or training offered by the NCBs.
EMPLOYMENT CONDITIONS
The ECB’s employment conditions are
designed to be attractive and to balance the
needs of staff with those of the organisation.
The ECB is reviewing some of its working
time and leave provisions, with the aim of
further facilitating the processing of part-time
requests. At the end of 2010, 158 staff members
were working part-time, 10% less than in 2009.
The number of staff on unpaid parental leave as
at 31 December 2010 was 24 (compared with 28
in 2009). The teleworking pilot project launched
in 2008 continued during 2010. On average,
around 235 staff members teleworked each
month. In 2010 as a whole, 662 staff teleworked
at least once.
The ECB continued to support staff in the areas
of childcare and the reconciliation of work and
family commitments. Policies for parents with
children affected by serious illness or imperative
educational needs were enhanced to include
extended support for the parents of children
with learning disabilities or neuro-behavioural
development disorders.
2.2 STAFF RELATIONS AND SOCIAL DIALOGUE
The ECB fully recognises the importance of a
constructive dialogue with its staff. In 2010
the ECB consulted the staff representatives on
remuneration, employment, working conditions,
health and safety conditions, and pensions.
It continued to have a regular dialogue with
staff representatives on employment and
social matters.
A discussion with the recognised trade union
on the memorandum of understanding between
the ECB and the trade union is ongoing, with a
view to further enhancing the social dialogue at
the ECB.
2.3 NEW ECB PREMISES
The offi cial start of the main construction works
for the ECB’s new headquarters in Frankfurt’s
Ostend was marked by a ceremony on
19 May 2010 in which the foundation stone was
laid. In June the steel work for the foundations
for the double offi ce tower and the underground
staff car park began, followed by the concreting
works in July. By the beginning of 2011 the
two storeys of the underground staff car park
and the basement of the double offi ce tower had
been fi nalised, and the structural works on the
ground fl oor had started.
In parallel, the construction works began on the
former Grossmarkthalle building. In preparation
for the construction of the entrance building,
the facade and the three roof segments in the
western part of the former wholesale market
hall were removed. The basement of the market
hall was also removed, to be replaced by a
waterproof basement which will be able to
carry the weight of the new structural elements
203ECB
Annual Report2010
housing the ECB’s more public functions,
i.e. a visitors’ centre, conference area, cafeteria
and staff restaurant.
In close coordination with the historic
preservation authorities, the restoration works
for the former Grossmarkthalle also began in
spring 2010 with the careful restoration of the
brick facade and the ribbed concrete fl oor of
the eastern wing building. Thorough restoration
works on the substance of the building are
ongoing in order to preserve the structure of the
Grossmarkthalle.
In February 2011 the ECB awarded the
contract for the structural works for the double
offi ce tower to a new construction company.
The initial company Baresel GmbH completed
the structural works up to the ground fl oor,
with Ed. Züblin AG being engaged to carry
out the remainder. All construction works are
proceeding as planned. The date for completion
of the new premises remains unchanged and is
scheduled for the end of 2013, with the ECB
moving in thereafter, i.e. in 2014.
2.4 THE EUROSYSTEM PROCUREMENT
COORDINATION OFFICE
In 2010 the Eurosystem Procurement
Coordination Offi ce (EPCO) fi nalised two joint
procedures initiated in 2009: air transport for
ESCB meetings and global hotel agreements.
In addition, EPCO coordinated a number of
analyses initiated in 2009 which should either
be fi nalised or lead to joint procurements in
the coming months. The areas covered by such
analyses included market data providers and
rating agencies, offi ce supplies and standard IT
software tools. EPCO also continued to promote
the exchange of best practices in the fi eld of
procurement among central banks.
At its meeting on 15 December 2010 the
Governing Council took note of the document
“EPCO – Review of experience at the
half-way stage of the mandate (2008-2012)”,
which provided an opportunity to analyse the
experience gained in the fi rst half of EPCO’s
fi ve-year mandate and to reorient its activities
for the remainder of the mandate.
2.5 ENVIRONMENTAL ISSUES
The ECB is an environmentally aware institution.
It makes prudent use of natural resources in
order to preserve the quality of the environment
and to protect human health.
In 2010 the Environmental Management
System of the ECB was successfully certifi ed.
It complies with the international standard
EN ISO 14001 and the EU’s Eco-Management
and Audit Scheme. The ECB aims to
continuously improve the system and the ECB’s
environmental performance. A comparison
of the data for 2008 and 2009 revealed a 22%
reduction in carbon emissions over this period.
With the objective of further reducing the
ECB’s ecological footprint, a new environmental
programme has been launched for 2010-11.
The ECB has published an environmental
statement on its website providing detailed
information on the environmental performance
of the ECB.
Furthermore, the voluntary objectives of
the European Commission’s GreenBuilding
Programme are being applied in the construction
of the ECB’s new premises. This programme,
which was launched in 2004, aims to improve
energy effi ciency and extend the use of
renewable energies in non-residential buildings
in Europe.
2.6 INFORMATION TECHNOLOGY SERVICE
MANAGEMENT
The Directorate General Information Systems
completed the implementation of its new
organisational structure in 2010. Particular
attention was paid to strategy implementation,

204ECBAnnual Report2010
the work programme for 2010 and the
continuous improvement of processes following
the ISO certifi cations obtained in 2009.
Throughout the year, work focused on the
preparation of the IT services needed to support
the establishment of the European Systemic
Risk Board and the smooth entry of Estonia into
the euro area. As a consequence of the fi nancial
crisis, several applications underwent urgent
changes and had to be operated over extended
working hours and weekends.
Various projects were initiated to strengthen
the compliance of IT applications with
ESCB security policies. Steps were also
taken to modernise systems supporting the
implementation of monetary policy decisions and
to complete projects supporting administrative
processes.

205ECB
Annual Report2010
The activities of the Human Resources
Conference and its Task Force on Training and
Development covered several aspects of human
resources management in 2010, including ESCB
mobility.
The provision of ESCB training was further
extended by the roll-out of: i) the ESCB
Project Management Training Programme,
which consists of several modules on project
management methodology and soft skills
needed in a project environment, and ii) a
training course on audit report writing and
communication. For 2011 the training calendar
foresees a total of 57 sessions of ESCB training
activities, hosted by 22 central banks.
3 THE HUMAN RESOURCES CONFERENCE

206ECBAnnual Report2010
The ESCB Social Dialogue is a consultative
forum involving the ECB and employee
representatives from the central banks of the
ESCB and from European trade union
federations.14 Its purpose is to provide
information and foster exchanges of views on
issues that may have a major impact on
employment conditions at the central banks of
the ESCB. This information is provided in a
biannual newsletter and at meetings held in
Frankfurt twice a year.
In 2010 the ESCB Social Dialogue meetings
focused on fi nancial supervision, the
establishment of the European Systemic Risk
Board and the actions taken by the ECB in times
of crisis. Issues relating to banknote production
and circulation, market operations and payment
systems were also discussed.
The ad hoc working group on banknote
production and circulation continued to
address technical issues complementing those
discussed in the plenary meeting of the ESCB
Social Dialogue. The working group on the
ESCB Social Dialogue reconvened in May and
September and, among other things, identifi ed
possible items to be included in the agenda of
the ESCB Social Dialogue meetings.
The Standing Committee of European Central Bank Unions 14
(SCECBU), Union Network International – Europa (UNI-Europa
Finance) and the European Federation of Public Service Unions
(EPSU).
4 ESCB SOCIAL DIALOGUE


208ECBAnnual Report2010
5 ANNUAL ACCOUNTS OF THE ECB
209ECB
Annual Report2010
MANAGEMENT REPORT FOR THE YEAR ENDING 31 DECEMBER 2010
1 NATURE OF THE BUSINESS
The ECB’s activities in 2010 are described in
detail in the relevant chapters of the Annual
Report.
2 OBJECTIVES AND TASKS
The ECB’s objectives and tasks are described
in the Statute of the ESCB (Articles 2 and 3).
An overview of performance against these
objectives is included in the President’s
foreword to the Annual Report.
3 KEY RESOURCES, RISKS AND PROCESSES
GOVERNANCE OF THE ECB
The Executive Board, the Governing Council
and the General Council are the decision-making
bodies of the ECB.
The ECB’s governance framework includes
a variety of controls and audit measures.
For example, the European Court of Auditors
reviews the operational effi ciency of the
management of the ECB, while an external
auditor is appointed to audit the ECB’s Annual
Accounts. To reinforce the independence of the
external auditor, the ECB appoints a different
external audit fi rm every fi ve years. In order
to further strengthen the ECB’s corporate
governance, the Governing Council established
the ECB Audit Committee in 2007.
The ECB has, over time, established a set of
internal rules regarding the business practices
and standards of professional conduct to
be followed by all ECB staff. For example,
the Business Practice Handbook, which entered
into force in 2007 and is regularly updated,
provides information on business objectives
and practices in an accessible and user-friendly
manner, helping employees to meet their
professional obligations.
Within the internal control structure of the
ECB, each organisational unit is responsible
for managing its own risks and implementing
its own controls, as well as for the effectiveness
and effi ciency of its operations. In addition,
independent audit missions are performed by
the Directorate Internal Audit under the direct
responsibility of the Executive Board.
Further information relating to the governance
of the ECB is provided in Chapter 10 of the
Annual Report.
MEMBERS OF THE EXECUTIVE BOARD
The members of the Executive Board are
appointed from among persons of recognised
standing and professional experience in
monetary or banking matters by the European
Council, upon a recommendation from the
EU Council after it has consulted the European
Parliament and the Governing Council.
The terms and conditions of members’
employment are determined by the Governing
Council, based on a proposal from a committee
comprising three members appointed by
the Governing Council and three members
appointed by the EU Council.
The emoluments of the members of the
Executive Board are set out in note 32,
“Staff costs”, of the Annual Accounts.
EMPLOYEES
The ECB is fully cognisant of the importance of
developing sound human resources management
policies and of having a constructive dialogue
with its staff. In 2010 developments related
to the corporate culture of the ECB focused
on diversity and professional ethics. A new
comprehensive ethics framework for the staff
of the ECB entered into force on 1 April 2010.
The framework provides guidance and sets
ethics conventions, standards and benchmarks.
All staff are expected to maintain high standards
210ECBAnnual Report2010
of professional ethical behaviour in the
performance of their duties, as well as in their
relations with NCBs, public authorities, market
participants, media representatives and the
general public.
Mobility and staff development measures
continued to be the main tools for professional
development in 2010. Moreover, the ECB
continued to support staff in the areas of
childcare and the reconciliation of work and
family commitments.
The average number of staff (full-time
equivalents) holding contracts with the ECB 1
rose from 1,530 in 2009 to 1,565 in 2010.
At the end of 2010 1,607 staff were employed.
For further information, see note 32, “Staff
costs”, of the Annual Accounts and Section 2 of
Chapter 10 of the Annual Report which also
describes developments in the area of human
resources management in more detail.
INVESTMENT ACTIVITIES AND RISK MANAGEMENT
The ECB’s foreign reserves portfolio consists
of foreign reserve assets transferred to it by the
euro area NCBs in accordance with the provisions
of Article 30 of the Statute of the ESCB. The
main purpose of the ECB’s foreign reserves is
to ensure that, whenever needed, the Eurosystem
has a suffi cient amount of liquid resources for its
foreign exchange policy operations.
The ECB’s own funds portfolio refl ects the
investment of (a) its paid-up capital; (b) the
counterpart of the provision for foreign exchange
rate, interest rate, credit and gold price risks;
(c) the general reserve fund; and (d) income
accumulated on the portfolio in previous years.
Its purpose is primarily to provide the ECB with
income to contribute to covering its operating
expenses.
The ECB is exposed to fi nancial risks arising
in respect of both of the above-mentioned
portfolios. They include credit, market and
liquidity risks. The ECB closely monitors and
measures such risks and, where appropriate,
mitigates them through the implementation of
a risk management framework that includes,
in particular, a system of exposure limits.
The ECB’s investment activities and its
management of the associated risks are
described in greater detail in Chapter 2 of the
Annual Report.
BUDGET PROCESS
Spending against agreed budgets is monitored
regularly by the Executive Board, taking
into account the advice of the ECB’s internal
controlling function, and by the Governing
Council with the assistance of the Budget
Committee (BUCOM). BUCOM, composed
of ECB and euro area NCB experts, is a key
contributor to the ECB’s fi nancial governance
process. In accordance with Article 15 of the
ECB’s Rules of Procedure, BUCOM supports
the Governing Council by providing a detailed
evaluation of the ECB’s annual budget proposals
and requests for supplementary budget funding
by the Executive Board, prior to their submission
to the Governing Council for approval.
4 FINANCIAL RESOURCES
CAPITAL
Pursuant to the Statute of the ESCB, as well
as Council Regulation (EC) No 1009/2000 of
8 May 2000, the ECB decided in December 2010
to increase its subscribed capital by €5 billion,
from €5.8 billion to €10.8 billion.
This decision resulted from an assessment of
the adequacy of its statutory capital, which
was launched in 2009. The capital increase
was deemed appropriate in view of increased
volatility in foreign exchange rates, interest
rates and gold prices, as well as in view of the
ECB’s exposure to credit risk.
Staff on unpaid leave are excluded. This number includes staff 1
with permanent, fi xed or short-term contracts and the participants
in the ECB’s Graduate Programme. Staff on maternity or
long-term sick leave are also included.
211ECB
Annual Report2010
In order to smooth the transfer of capital to the
ECB, the Governing Council decided that the
euro area NCBs should pay their additional
capital contributions of €3,489,575,000 in three
equal annual instalments. On 29 December 2010
the NCBs of the euro area (in its composition as
at that date) paid €1,163,191,667 as their fi rst
instalment. The remaining two instalments will
be paid at the end of 2011 and 2012. Moreover,
the minimal percentage of the subscribed capital,
which the non-euro area NCBs are required
to pay as a contribution to the operational
costs of the ECB was reduced from 7.00% to
3.75%. Consequently, the capital paid up by
the non-euro area NCBs was slightly adjusted
and payments totalling €84,220 were made on
29 December 2010.
As a result of these payments, the ECB’s
paid-up capital amounted to €5,306 million on
31 December 2010, compared with €4,142 million
on 31 December 2009. Detailed information
on these changes is provided in note 17,
“Capital and reserves”, of the Annual Accounts.
PROVISION FOR FOREIGN EXCHANGE RATE,
INTEREST RATE, CREDIT AND GOLD PRICE RISKS
Since most of the ECB’s assets and liabilities
are periodically revalued at current market
exchange rates and security prices, the ECB’s
profi tability is strongly affected by exchange rate
exposures and, to a lesser extent, interest rate
exposures. These exposures stem mainly from
its holdings of gold and foreign reserve assets
denominated in US dollars and Japanese yen,
which are predominantly invested in interest-
bearing instruments.
In 2005, taking into account the ECB’s large
exposure to these risks and the size of its
revaluation accounts, the Governing Council
decided to establish a provision for foreign
exchange rate, interest rate and gold price risks.
In 2009, following the establishment of the
programme for the purchase of covered bonds
(see note 5, “Securities of euro area residents
denominated in euro”, of the Annual Accounts),
the Governing Council decided to extend
the scope of the risk provision to also cover
credit risk.
As at 31 December 2009 this provision amounted
to €4,020,445,722. In line with the Statute of
the ESCB, the risk provision together with any
amounts held in the ECB’s general reserve
fund may not exceed the value of the capital
paid up by the euro area NCBs. After taking
the results of its risk assessment into account,
the Governing Council decided to increase the
size of the risk provision to €5,183,637,388,
which, following the capital increase, represents
the current maximum allowed ceiling.
The size of and continuing requirement for this
provision is reviewed annually, taking a range of
factors into account, including in particular the
level of holdings of risk-bearing assets, the extent
of materialised risk exposures in the current
fi nancial year, projected results for the coming
year, and a risk assessment involving calculations
of Values at Risk (VaR) on risk-bearing assets,
which is applied consistently over time.
5 FINANCIAL RESULTS
FINANCIAL ACCOUNTS
Under Article 26.2 of the Statute of the ESCB,
the Annual Accounts of the ECB are drawn up
by the Executive Board, in accordance with
the principles established by the Governing
Council. The accounts are then approved by the
Governing Council and subsequently published.
FINANCIAL RESULT FOR 2010
In 2010 the net income of the ECB prior
to the transfer to the risk provision was
€1,334 million, compared with €2,218 million in
2009. The net profi t, amounting to €171 million
after this transfer, was distributed to the euro
area NCBs in March 2011.
212ECBAnnual Report2010
In 2010 net interest income amounted to
€1,422 million, compared with €1,547 million
in 2009. The decrease in net interest income was
mainly due to (a) the realisation of a net interest
expense from TARGET2 balances in 2010;
(b) lower net interest income on foreign reserve
assets that was due mainly to lower average
interest rates on US dollar-denominated assets
in 2010; and (c) a decrease in interest income on
the ECB’s share of euro banknotes in circulation,
which refl ected the fact that the average rate for
the Eurosystem’s main refi nancing operations
declined. These factors were partially offset
by the following: (a) additional income
generated on the securities purchased under the
Securities Markets Programme and the covered
bond purchase programme; (b) lower interest
expenses as a result of decreased balances with
the Swiss National Bank; and (c) a decrease in
the interest expense arising from the euro area
NCBs’ claims in respect of the foreign reserve
assets transferred by them to the ECB.
Net realised gains arising from fi nancial
operations decreased from €1,103 million in
2009 to €474 million in 2010, owing mainly to
(a) the fact that no gold sales were conducted
by the ECB in 2010, and (b) lower net realised
gains from security sales in 2010.
Write-downs amounted to €195 million in 2010,
compared with €38 million in 2009, mainly
owing to unrealised price losses on security
holdings which are shown on the Balance Sheet
at their market value as at end-2010.
As at end-2009 unrealised foreign exchange
gains, mainly arising on the US dollar portfolio
and the Japanese yen portfolio, amounted
to €2,070 million, and unrealised gold price
gains amounted to €8,418 million. In 2010 the
depreciation of the euro vis-à-vis the Japanese
yen and the US dollar resulted in an increase in
unrealised foreign exchange gains, which rose
to €6,271 million, while the rise in the price of
gold during 2010 led to unrealised gold price
gains amounting to €13,079 million. In line with
the Eurosystem’s accounting policies, these
gains were recorded in revaluation accounts.
Total administrative expenses of the ECB,
including depreciation, amounted to €415 million
in 2010, compared with €401 million in 2009.


214ECBAnnual Report2010
BALANCE SHEET AS AT 31 DECEMBER 2010
ASSETS NOTE
NUMBER
2010
€
2009
€
Gold and gold receivables 1 17,015,600,109 12,355,158,122
Claims on non-euro area residentsdenominated in foreign currency 2
Receivables from the IMF 2.1 414,722,811 346,455,675
Balances with banks and security
investments, external loans and other
external assets 2.2 39,298,995,950 35,109,527,121
39,713,718,761 35,455,982,796
Claims on euro area residentsdenominated in foreign currency 2.2 4,326,557,549 3,293,593,476
Claims on non-euro area residentsdenominated in euro 3
Balances with banks, security
investments and loans 3.1 1,800,000,000 0
Other claims on euro area creditinstitutions denominated in euro 4 33,368,000 5,000
Securities of euro area residents denominated in euro 5
Securities held for monetary
policy purposes 5.1 17,925,976,508 2,181,842,083
Intra-Eurosystem claims 6
Claims related to the allocation of euro
banknotes within the Eurosystem 6.1 67,176,191,390 64,513,307,300
Other claims within the Eurosystem (net) 13.2 0 6,359,967,425
67,176,191,390 70,873,274,725
Other assets 7
Tangible and intangible fi xed assets 7.1 281,925,625 221,886,920
Other fi nancial assets 7.2 13,249,960,731 11,816,451,684
Off-balance-sheet instruments revaluation
differences 7.3 147,260,366 20,951,426
Accruals and prepaid expenses 7.4 1,319,491,653 775,782,372
Sundry 7.5 532,963,278 1,003,035,232
15,531,601,653 13,838,107,634
Total assets 163,523,013,970 137,997,963,836

215ECB
Annual Report2010
LIABILITIES NOTE
NUMBER
2010
€
2009
€
Banknotes in circulation 8 67,176,191,390 64,513,307,300
Other liabilities to euro area credit institutions denominated in euro 9 33,363,000 0
Liabilities to other euro area residentsdenominated in euro 10
Other liabilities 10.1 1,072,000,000 1,056,000,000
Liabilities to non-euro area residents denominated in euro 11 1,201,602,021 9,515,160,271
Liabilities to non-euro area residents denominated in foreign currency 12
Deposits, balances and other liabilities 12.1 478,028,926 18,752,058
Intra-Eurosystem liabilities 13
Liabilities equivalent to the transfer of
foreign reserves 13.1 40,204,457,215 40,204,457,215
Other liabilities within the Eurosystem
(net) 13.2 21,225,255,926 0
61,429,713,141 40,204,457,215
Other liabilities 14
Off-balance-sheet instruments revaluation
differences 14.1 568,235,002 196,041,410
Accruals and income collected in advance 14.2 749,630,881 731,468,960
Sundry 14.3 494,466,366 409,204,389
1,812,332,249 1,336,714,759
Provisions 15 5,216,716,613 4,042,873,982
Revaluation accounts 16 19,626,699,159 10,915,251,958
Capital and reserves 17
Capital 17.1 5,305,536,076 4,142,260,189
Profi t for the year 170,831,395 2,253,186,104
Total liabilities 163,523,013,970 137,997,963,836

216ECBAnnual Report2010
PROFIT AND LOSS ACCOUNT FOR THE YEAR ENDING 31 DECEMBER 2010
NOTE
NUMBER
2010
€
2009
€
Interest income on foreign reserve assets 26.1 366,179,478 700,216,277
Interest income arising from the allocation
of euro banknotes within the Eurosystem 26.2 653,509,659 787,157,441
Other interest income 26.4 4,796,498,245 5,608,442,130
Interest income 5,816,187,382 7,095,815,848Remuneration of NCBs’ claims in respect
of foreign reserves transferred 26.3 (346,484,251) (443,045,045)
Other interest expense 26.4 (4,047,227,079) (5,105,724,953)
Interest expense (4,393,711,330) (5,548,769,998)
Net interest income 26 1,422,476,052 1,547,045,850
Realised gains/losses arising from
fi nancial operations 27 474,313,327 1,102,597,118
Write-downs on fi nancial assets and
positions 28 (195,213,437) (37,939,649)
Transfer to/from provisions for foreign
exchange rate, interest rate, credit
and gold price risks (1,163,191,667) 34,806,031
Net result of fi nancial operations,write-downs and risk provisions (884,091,777) 1,099,463,500
Net expense from fees and commissions 29 (1,409,017) (16,010)
Income from equity shares andparticipating interests 30 2,612,858 934,492
Other income 31 46,537,026 6,783,936
Total net income 586,125,142 2,654,211,768
Staff costs 32 (196,470,934) (187,314,707)
Administrative expenses 33 (196,636,534) (186,447,503)
Depreciation of tangible and intangible
fi xed assets(13,601,111) (21,042,602)
Banknote production services 34 (8,585,168) (6,220,852)
Profi t for the year 170,831,395 2,253,186,104
Frankfurt am Main, 22 February 2011
EUROPEAN CENTRAL BANK
Jean-Claude Trichet
President
217ECB
Annual Report2010
FORM AND PRESENTATION OF THE FINANCIAL
STATEMENTS
The fi nancial statements of the ECB have been
designed to present fairly the fi nancial position
of the ECB and the results of its operations.
They have been drawn up in accordance with
the following accounting policies, 2 which the
Governing Council of the ECB considers to
be appropriate to the nature of central bank
activity.
ACCOUNTING PRINCIPLES
The following accounting principles have
been applied: economic reality and transparency,
prudence, recognition of post-balance-sheet
events, materiality, going concern, the accruals
principle, consistency and comparability.
RECOGNITION OF ASSETS AND LIABILITIES
An asset or liability is only recognised in
the Balance Sheet when it is probable that
any associated future economic benefi t will
fl ow to or from the ECB, substantially all of
the associated risks and rewards have been
transferred to the ECB, and the cost or value of
the asset or the amount of the obligation can be
measured reliably.
BASIS OF ACCOUNTING
The accounts have been prepared on a historical
cost basis, modifi ed to include the market
valuation of marketable securities (other than
those classifi ed as held-to-maturity), gold and
all other on-balance-sheet and off-balance-sheet
assets and liabilities denominated in foreign
currency. Transactions in fi nancial assets and
liabilities are refl ected in the accounts on the
basis of the date on which they were settled.
With the exception of securities, transactions
in fi nancial instruments denominated in foreign
currency are recorded in off-balance-sheet
accounts on the trade date. At the settlement
date the off-balance-sheet entries are reversed
and transactions are booked on-balance-sheet.
Purchases and sales of foreign currency affect
the net foreign currency position on the trade
date, and realised results arising from sales are
also calculated on that date. Accrued interest,
premiums and discounts related to fi nancial
instruments denominated in foreign currency are
calculated and recorded daily, and the foreign
currency position is also affected daily by these
accruals.
GOLD AND FOREIGN CURRENCY ASSETS AND
LIABILITIES
Assets and liabilities denominated in foreign
currency are converted into euro at the
exchange rate prevailing on the balance sheet
date. Income and expenses are converted at the
exchange rate prevailing on the recording date.
The revaluation of foreign exchange assets
and liabilities, including on-balance-sheet and
off-balance-sheet instruments, is performed on a
currency-by-currency basis.
Revaluation to the market price for assets and
liabilities denominated in foreign currency
is treated separately from the exchange rate
revaluation.
Gold is valued at the market price prevailing at
the year-end. No distinction is made between
the price and currency revaluation differences
for gold. Instead, a single gold valuation is
accounted for on the basis of the price in euro
per fi ne ounce of gold, which, for the year
ending 31 December 2010, was derived from the
exchange rate of the euro against the US dollar
on 31 December 2010.
The special drawing right (SDR) is defi ned
in terms of a basket of currencies. To revalue
the ECB’s holdings of SDRs, the value of the
ACCOUNTING POLICIES1
Decision ECB/2006/17 of 10 November 2006, OJ L 348, 1
11.12.2006, p. 38, as amended, containing the detailed accounting
policies of the ECB, was repealed and replaced by Decision
ECB/2010/21 of 11 November 2010, OJ L 35, 9.2.2011, p. 1,
with effect from 31 December 2010.
These policies are consistent with the provisions of Article 26.4 2
of the Statute of the ESCB, which require a harmonised approach
to the rules governing the accounting and fi nancial reporting of
Eurosystem operations.
218ECBAnnual Report2010
SDR was calculated as a weighted sum of the
exchange rates of four major currencies (the
US dollar, euro, Japanese yen and pound sterling)
against the euro as at 31 December 2010.
SECURITIES
Marketable securities (other than those classifi ed
as held-to-maturity) and similar assets are valued
either at the mid-market prices or on the basis of
the relevant yield curve prevailing on the balance
sheet date, on a security-by-security basis. For
the year ending 31 December 2010, mid-market
prices on 30 December 2010 were used.
Marketable securities classifi ed as held-to-
maturity and illiquid equity shares are all valued
at cost subject to impairment.
INCOME RECOGNITION
Income and expenses are recognised in the
period in which they are earned or incurred.
Realised gains and losses arising from the sale of
foreign exchange, gold and securities are taken
to the Profi t and Loss Account. Such realised
gains and losses are calculated by reference to
the average cost of the respective asset.
Unrealised gains are not recognised as income
but are transferred directly to a revaluation
account.
Unrealised losses are taken to the Profi t and
Loss Account if, at the year-end, they exceed
previous revaluation gains registered in the
corresponding revaluation account. Unrealised
losses on any one security or currency or on
gold are not netted against unrealised gains on
other securities or currencies or gold. In the
event of an unrealised loss on any item taken to
the Profi t and Loss Account, the average cost of
that item is reduced to the year-end exchange
rate or market price.
Impairment losses are taken to the Profi t and
Loss Account and are not reversed in subsequent
years unless the impairment decreases and the
decrease can be related to an observable event
that occurred after the impairment was fi rst
recorded.
Premiums or discounts arising on purchased
securities, including those classifi ed as
held-to-maturity, are calculated and presented
as part of interest income and are amortised over
the remaining life of the securities.
REVERSE TRANSACTIONS
Reverse transactions are operations whereby
the ECB buys or sells assets under a repurchase
agreement or conducts credit operations against
collateral.
Under a repurchase agreement, securities are
sold for cash with a simultaneous agreement
to repurchase them from the counterparty at an
agreed price on a set future date. Repurchase
agreements are recorded as collateralised inward
deposits on the liability side of the Balance
Sheet and lead to an interest expense in the
Profi t and Loss Account. Securities sold under
such an agreement remain on the Balance Sheet
of the ECB.
Under a reverse repurchase agreement, securities
are bought for cash with a simultaneous
agreement to sell them back to the counterparty
at an agreed price on a set future date.
Reverse repurchase agreements are recorded
as collateralised loans on the asset side of the
Balance Sheet but are not included in the ECB’s
security holdings. They give rise to interest
income in the Profi t and Loss Account.
Reverse transactions (including security lending
transactions) conducted under an automated
security lending programme are recorded on the
Balance Sheet only where collateral is provided
in the form of cash placed on an account of
the ECB. In 2010 the ECB did not receive any
collateral in the form of cash in connection with
such transactions.
219ECB
Annual Report2010
OFF-BALANCE-SHEET INSTRUMENTS
Currency instruments, namely foreign exchange
forward transactions, forward legs of foreign
exchange swaps and other currency instruments
involving an exchange of one currency for
another at a future date, are included in the net
foreign currency position for the purpose of
calculating foreign exchange gains and losses.
Interest rate instruments are revalued on an item-
by-item basis. Daily changes in the variation
margin of open interest rate futures contracts
are recorded in the Profi t and Loss Account.
The valuation of forward transactions in securities
and of interest rate swaps is based on generally
accepted valuation methods using observable
market prices and rates, as well as discount factors
from the settlement dates to the valuation date.
POST-BALANCE-SHEET EVENTS
The values of assets and liabilities are adjusted
for events that occur between the annual balance
sheet date and the date on which the Governing
Council approves the fi nancial statements,
if such events materially affect the condition of
assets and liabilities at the balance sheet date.
Important post-balance-sheet events that do not
affect the condition of assets and liabilities at the
balance sheet date are disclosed in the notes.
INTRA-ESCB BALANCES/INTRA-EUROSYSTEM
BALANCES
Intra-ESCB transactions are cross-border
transactions that occur between two EU central
banks. Intra-ESCB transactions in euro are
primarily processed via TARGET2 – the
Trans-European Automated Real-time Gross
settlement Express Transfer system (see
Chapter 2 of the Annual Report) – and give rise
to bilateral balances in accounts held between
those EU central banks connected to TARGET2.
These bilateral balances are then assigned to the
ECB on a daily basis, leaving each NCB with a
single net bilateral position vis-à-vis the ECB
only. This position in the books of the ECB
represents the net claim or liability of each NCB
against the rest of the ESCB. Intra-Eurosystem
balances of euro area NCBs vis-à-vis the ECB
arising from TARGET2, as well as other
intra-Eurosystem balances denominated in euro
(e.g. interim profi t distributions to NCBs),
are presented on the Balance Sheet of the ECB
as a single net asset or liability position and
disclosed under “Other claims within the
Eurosystem (net)” or “Other liabilities within
the Eurosystem (net)”. Intra-ESCB balances of
non-euro area NCBs vis-à-vis the ECB, arising
from their participation in TARGET2, 3 are
disclosed under “Liabilities to non-euro area
residents denominated in euro”.
Intra-Eurosystem balances arising from
the allocation of euro banknotes within the
Eurosystem are included as a single net
asset under “Claims related to the allocation
of euro banknotes within the Eurosystem”
(see “Banknotes in circulation” in the notes on
accounting policies).
Intra-Eurosystem balances arising from the
transfer of foreign reserve assets to the ECB by
NCBs joining the Eurosystem are denominated
in euro and reported under “Liabilities equivalent
to the transfer of foreign reserves”.
TREATMENT OF FIXED ASSETS
Fixed assets, with the exception of land and works
of art, are valued at cost less depreciation. Land
and works of art are valued at cost. Depreciation
is calculated on a straight-line basis, beginning
in the quarter after acquisition and continuing
over the period for which the asset is expected to
be available for use, as follows:
As at 31 December 2010 the non-euro area NCBs participating in 3
TARGET2 were Българска народна банка (Bulgarian National
Bank), Danmarks Nationalbank, Eesti Pank, Latvijas Banka,
Lietuvos bankas and Narodowy Bank Polski.
Computers, related hardware
and software, and motor vehicles 4 years
Equipment, furniture and plant
in building 10 years
Fixed assets costing less than €10,000 Written off in the
year of acquisition
220ECBAnnual Report2010
The length of the depreciation period for
capitalised building and refurbishment
expenditure relating to the ECB’s existing
rented premises has been adjusted to ensure
that these assets are fully depreciated before the
ECB moves to its new premises.
Costs incurred in relation to the ECB’s new
premises are recorded under the heading
“Assets under construction” if they comply with
the capitalisation criteria. These costs will be
transferred to the relevant fi xed asset headings
once the assets are available for use. For the
depreciation of the ECB’s new premises, costs
will be assigned to the appropriate components
and depreciated in accordance with the estimated
useful lives of the assets.
THE ECB’S RETIREMENT PLAN AND OTHER
POST-EMPLOYMENT BENEFITS
The ECB operates a defi ned benefi t plan for
its staff. This is funded by assets held in a
long-term employee benefi t fund.
On 1 June 2009 a new Pension Scheme for both
existing staff and new entrants was introduced
with a view to ensuring the plan’s long-term
fi nancial sustainability. Under this new scheme,
the compulsory contributions of the ECB and
the staff were increased from 16.5% to 18% and
from 4.5% to 6% of basic salary respectively.
As was the case in the past, staff can continue to
make additional contributions under the new
scheme on a voluntary basis in a defi ned
contribution pillar that can be used to provide
additional benefi ts. 4The previous Retirement
Plan was frozen on 31 May 2009, and the related
rights acquired by existing staff were preserved.
BALANCE SHEET
The liability recognised in the Balance Sheet in
respect of the defi ned benefi t plan is the present
value of the defi ned benefi t obligation at the
balance sheet date, less the fair value of plan
assets used to fund the obligation, adjusted for
unrecognised actuarial gains or losses.
The defi ned benefi t obligation is calculated
annually by independent actuaries using the
projected unit credit method. The present value
of the defi ned benefi t obligation is calculated
by discounting the estimated future cash fl ows
using a rate which is determined by reference to
market yields at the balance sheet date on high
quality euro-denominated corporate bonds that
have similar terms of maturity to the term of the
pension obligation.
Actuarial gains and losses can arise from
experience adjustments (where actual outcomes
are different from the actuarial assumptions
previously made) and changes in actuarial
assumptions.
PROFIT AND LOSS ACCOUNT
The net amount charged to the Profi t and Loss
Account comprises:
the current service cost of the defi ned (a)
benefi ts accruing for the year;
interest at the discount rate on the defi ned (b)
benefi t obligation;
the expected return on plan assets held (c)
against the defi ned benefi t obligation;
any actuarial gains and losses arising from (d)
post-employment benefi ts, using a “10%
corridor” approach; and
any actuarial gains and losses arising from (e)
other long-term benefi ts, in their entirety.
“10% CORRIDOR” APPROACH
Net cumulative unrecognised actuarial gains
and losses on post-employment benefi ts
which exceed the greater of (a) 10% of the
The funds accumulated by a staff member through voluntary 4
contributions can be used at retirement to purchase an additional
pension. This pension is included in the defi ned benefi t obligation
from that point on.

221ECB
Annual Report2010
present value of the defi ned benefi t obligation
and (b) 10% of the fair value of plan assets
held against the defi ned benefi t obligation, are
amortised over the expected average remaining
working lives of the participating employees.
PENSIONS OF EXECUTIVE BOARD MEMBERS AND
OTHER POST-EMPLOYMENT OBLIGATIONS
Unfunded arrangements are in place for the
post-employment and other long-term benefi ts
of members of the Executive Board of the ECB
and for the disability benefi t provisions for staff.
The expected costs of these benefi ts are accrued
over the Executive Board/staff members’ terms
of offi ce/employment using an accounting
approach similar to that of defi ned benefi t
pension plans. Actuarial gains and losses are
recognised in the manner outlined under “Profi t
and Loss Account” above.
These obligations are valued annually by
independent actuaries to establish the appropriate
liability in the fi nancial statements.
BANKNOTES IN CIRCULATION
The ECB and the euro area NCBs, which
together comprise the Eurosystem, issue euro
banknotes. 5 The total value of euro banknotes
in circulation is allocated to the Eurosystem
central banks on the last working day of each
month in accordance with the banknote
allocation key. 6
The ECB has been allocated a share of 8% of
the total value of euro banknotes in circulation,
which is disclosed under the Balance Sheet
liability item “Banknotes in circulation”.
The ECB’s share of the total euro banknote
issue is backed by claims on the NCBs. These
claims, which bear interest, 7 are disclosed under
the sub-item “Intra-Eurosystem claims: claims
related to the allocation of euro banknotes
within the Eurosystem” (see “Intra-ESCB
balances/intra-Eurosystem balances” in the
notes on accounting policies). Interest income
on these claims is included in the item “Net
interest income”.
INTERIM PROFIT DISTRIBUTION
The ECB’s income on euro banknotes in
circulation and income arising from securities
purchased under the Securities Markets
Programme is due to the euro area NCBs
in the fi nancial year in which it accrues.
The ECB distributes this income in January
of the following year by means of an interim
profi t distribution. 8 It is distributed in full
unless the ECB’s net profi t for the year is less
than its income earned on euro banknotes in
circulation and securities purchased under the
Securities Markets Programme, and subject to
any decisions by the Governing Council to make
transfers to the provision for foreign exchange
rate, interest rate, credit and gold price risks.
The Governing Council may also decide to charge
costs incurred by the ECB in connection with the
issue and handling of euro banknotes against
income earned on euro banknotes in circulation.
OTHER ISSUES
Taking account of the ECB’s role as a central
bank, the Executive Board considers that the
publication of a cash fl ow statement would not
provide the readers of the fi nancial statements
with any additional relevant information.
In accordance with Article 27 of the
Statute of the ESCB, and on the basis of a
recommendation of the Governing Council,
the EU Council has approved the appointment
of PricewaterhouseCoopers Aktiengesellschaft
Wirtschaftsprüfungsgesellschaft as the external
auditors of the ECB for a fi ve-year period up to
the end of the fi nancial year 2012.
Decision ECB/2010/29 of 13 December 2010 on the issue of 5
euro banknotes (recast), OJ L 35, 9.2.2011, p. 26.
“Banknote allocation key” means the percentages that result from 6
taking into account the ECB’s share in the total euro banknote
issue and applying the subscribed capital key to the NCBs’ share
in that total.
Decision ECB/2010/23 of 25 November 2010 on the allocation of 7
monetary income of the national central banks of Member States
whose currency is the euro (recast), OJ L 35, 9.2.2011, p. 17.
Decision ECB/2010/24 of 25 November 2010 on the interim 8
distribution of the income of the European Central Bank on euro
banknotes in circulation and arising from securities purchased
under the Securities Markets Programme (recast), OJ L 6,
11.1.2011, p. 35.
222ECBAnnual Report2010
1 GOLD AND GOLD RECEIVABLES
As at 31 December 2010 the ECB held
16,122,143 ounces 9 of fi ne gold (2009:
16,122,146 ounces). This slight reduction was due
to weight differences arising under a substitution
programme that the ECB initiated in 2010.
The euro equivalent value of this holding increased
due to a signifi cant rise in the price of gold during
2010 (see “Gold and foreign currency assets and
liabilities” in the notes on accounting policies).
2 CLAIMS ON NON-EURO AREA AND EURO
AREA RESIDENTS DENOMINATED IN FOREIGN
CURRENCY
2.1 RECEIVABLES FROM THE IMF
This asset represents the ECB’s holdings of special
drawing rights (SDRs) as at 31 December 2010.
It arises as the result of a two-way SDR buying
and selling arrangement with the International
Monetary Fund (IMF), whereby the IMF is
authorised to arrange sales or purchases of
SDRs against euro, on behalf of the ECB,
within minimum and maximum holding levels.
For accounting purposes, SDRs are treated
as a foreign currency (see “Gold and foreign
currency assets and liabilities” in the notes on
accounting policies).
2.2 BALANCES WITH BANKS AND SECURITY
INVESTMENTS, EXTERNAL LOANS AND OTHER
EXTERNAL ASSETS; AND CLAIMS ON EURO
AREA RESIDENTS DENOMINATED IN FOREIGN
CURRENCY
These two items consist of balances with banks
and loans denominated in foreign currency,
and investments in securities denominated in
US dollars and Japanese yen.
Claims on euro area residents
2010
€
2009
€
Change
€
Current
accounts 3,522,840 677,846 2,844,994
Money
market
deposits 4,254,182,741 3,292,915,630 961,267,111
Reverse
repurchase
agreements 68,851,968 0 68,851,968
Total 4,326,557,549 3,293,593,476 1,032,964,073
The increase in the euro value of these positions
in 2010 was mainly due to the appreciation of
the US dollar and the Japanese yen against the
euro. Income received in 2010, primarily on
the US dollar portfolio, also contributed to the
increase in the total value of these items.
The ECB’s net foreign currency holdings of
US dollars and Japanese yen,10 as at
31 December 2010, were as follows:
Currency in millions
US dollars 43,952
Japanese yen 1,101,816
This corresponds to 501.5 tonnes.9
These holdings comprise assets minus liabilities denominated 10
in the given foreign currency that are subject to foreign
currency revaluation. They are included under the headings
“Claims on non-euro area residents denominated in foreign
currency”, “Claims on euro area residents denominated in
foreign currency”, “Accruals and prepaid expenses”, “Liabilities
to non-euro area residents denominated in foreign currency”,
“Off-balance-sheet instruments revaluation differences”
(liability side) and “Accruals and income collected in advance”,
also taking into account foreign exchange forward and swap
transactions under off-balance-sheet items. Price gains on
fi nancial instruments denominated in foreign currency arising as
a result of revaluations are not included.
NOTES ON THE BALANCE SHEET
Claims on non-euro area residents
2010
€
2009
€
Change
€
Current
accounts 1,415,134,235 845,908,975 569,225,260
Money
market
deposits 881,467,443 636,977,905 244,489,538
Claims on non-euro area residents
2010
€
2009
€
Change
€
Reverse
repurchase
agreements 54,632,540 0 54,632,540
Security
investments 36,947,761,732 33,626,640,241 3,321,121,491
Total 39,298,995,950 35,109,527,121 4,189,468,829
223ECB
Annual Report2010
3 CLAIMS ON NON-EURO AREA RESIDENTS
DENOMINATED IN EURO
3.1 BALANCES WITH BANKS, SECURITY
INVESTMENTS AND LOANS
As at 31 December 2010 this item consisted
of a claim on a non-euro area central bank in
connection with an agreement on repurchase
transactions established with the ECB. Under
this agreement the non-euro area central bank
can borrow euro against eligible collateral in
order to support its domestic liquidity-providing
operations.
4 OTHER CLAIMS ON EURO AREA CREDIT
INSTITUTIONS DENOMINATED IN EURO
As at 31 December 2010 this item consisted
mainly of an outstanding reverse repurchase
transaction, conducted in the context of
covered bond lending operations (see note 9,
“Other liabilities to euro area credit institutions
denominated in euro”).
5 SECURITIES OF EURO AREA RESIDENTS
DENOMINATED IN EURO
5.1 SECURITIES HELD FOR MONETARY POLICY
PURPOSES
As at 31 December 2009 this item consisted
of securities acquired by the ECB within the
scope of the covered bond purchase programme.
Under this programme, the ECB and the NCBs
purchased euro-denominated covered bonds
issued in the euro area. The purchases under this
programme were fully implemented by the end
of June 2010.
In May 2010 the Governing Council established
the Securities Markets Programme. Under this
programme, the ECB and the NCBs may purchase
euro area public and private debt securities in order
to address the malfunctioning of certain segments
of the euro area debt securities markets and to
restore the proper functioning of the monetary
policy transmission mechanism.
The ECB’s holdings of securities purchased
under both programmes at the end of 2010 were
as follows:
2010
€
2009
€
Change
€
Covered
bond
purchase
programme 4,823,413,246 2,181,842,083 2,641,571,163
Securities
Markets
Programme 13,102,563,262 0 13,102,563,262
Total 17,925,976,508 2,181,842,083 15,744,134,425
The Governing Council decided to classify the
securities purchased under both programmes as
held-to-maturity securities (see “Securities” in the
notes on accounting policies). As a result of the
impairment tests conducted as at 31 December 2010,
no impairments were recorded for these securities.
6 INTRA-EUROSYSTEM CLAIMS
6.1 CLAIMS RELATED TO THE ALLOCATION OF
EURO BANKNOTES WITHIN THE EUROSYSTEM
This item consists of the claims of the ECB
vis-à-vis the euro area NCBs relating to
the allocation of euro banknotes within the
Eurosystem (see “Banknotes in circulation” in
the notes on accounting policies).

224ECBAnnual Report2010
7 OTHER ASSETS
7.1 TANGIBLE AND INTANGIBLE FIXED ASSETS
These assets comprised the following items on
31 December 2010:
The increase in the category “Assets under
construction” is due mainly to activities related
to the ECB’s new premises.
In 2009 assets with a cost of €2.3 million were
included in the category “Other fi xed assets”.
In 2010 they were reclassifi ed under the heading
“Assets under construction” to refl ect their
current status. The comparative balance for
2009 has been adjusted accordingly.
7.2 OTHER FINANCIAL ASSETS
This item consists of the investment of the
ECB’s own funds 11 held as a direct counterpart
to the capital and reserves of the ECB, as well as
other fi nancial assets which include 3,211 shares
in the Bank for International Settlements (BIS)
at the acquisition cost of €41.8 million.
The main components of this item are
as follows:
The net increase in this item was due mainly
to the investment in the own funds portfolio of
amounts received from the NCBs as a result of
the increase in the ECB’s capital (see note 17,
“Capital and reserves”) and income received
in 2010.
7.3 OFF-BALANCE-SHEET INSTRUMENTS
REVALUATION DIFFERENCES
This item is composed mainly of valuation
changes in swap and forward transactions in
foreign currency that were outstanding on
31 December 2010 (see note 23, “Foreign
exchange swap and forward transactions”).
These valuation changes are the result of the
conversion of such transactions into their euro
equivalents at the exchange rates prevailing on
the balance sheet date, compared with the euro
values resulting from the conversion of the
transactions at the average cost of the respective
foreign currency on that date (see “Off-balance-
sheet instruments” and “Gold and foreign
currency assets and liabilities” in the notes on
accounting policies).
Valuation gains on outstanding interest rate
swap transactions are also included in this item
(see note 21, “Interest rate swaps”).
Repurchase agreements conducted in the context of the 11
management of the own funds portfolio are reported under
“Sundry” on the liabilities side (see note 14.3, “Sundry”).
2010
€
2009
€
Change
€
Cost Land and buildings 168,714,234 168,811,800 (97,566)
Computer hardware
and software 188,781,597 182,723,860 6,057,737
Equipment,
furniture, plant in
building and motor
vehicles 30,325,142 29,786,515 538,627
Assets under
construction 174,386,237 107,411,277 66,974,960
Other fi xed assets 1,525,084 1,415,991 109,093
Total cost 563,732,294 490,149,443 73,582,851
Accumulated depreciationLand and buildings (74,965,599) (70,731,976) (4,233,623)
Computer hardware
and software (177,760,956) (169,735,407) (8,025,549)
Equipment,
furniture, plant in
building and motor
vehicles (28,878,352) (27,593,378) (1,284,974)
Other fi xed assets (201,762) (201,762) 0
Total accumulated depreciation (281,806,669) (268,262,523) (13,544,146)
Net book value 281,925,625 221,886,920 60,038,705
2010
€
2009
€
Change
€
Current accounts
in euro 4,377,086 8,748,115 (4,371,029)
Securities
denominated
in euro 11,534,194,166 11,295,095,956 239,098,210
Reverse
repurchase
agreements
in euro 1,669,436,200 470,622,051 1,198,814,149
Other fi nancial
assets 41,953,279 41,985,562 (32,283)
Total 13,249,960,731 11,816,451,684 1,433,509,047

225ECB
Annual Report2010
7.4 ACCRUALS AND PREPAID EXPENSES
In 2010 this position included accrued interest
receivable on the TARGET2 balances due
from euro area NCBs for the fi nal month
of 2010, amounting to €364.7 million
(2009: €261.6 million), and accrued interest
receivable on the ECB’s claims related to
the allocation of euro banknotes within
the Eurosystem for the fi nal quarter of the
year (see “Banknotes in circulation” in the
notes on accounting policies), amounting to
€166.7 million (2009: €157.8 million).
Also included in this item is accrued coupon
interest on securities (see note 2.2, “Balances
with banks and security investments, external
loans and other external assets; and Claims
on euro area residents denominated in foreign
currency”, note 5, “Securities of euro area
residents denominated in euro”, and note 7.2,
“Other fi nancial assets”) as well as accrued
interest on other fi nancial assets.
7.5 SUNDRY
This item is composed mainly of positive
balances related to swap and forward transactions
in foreign currency that were outstanding on
31 December 2010 (see note 23, “Foreign
exchange swap and forward transactions”).
These balances arise from the conversion of
such transactions into their euro equivalents at
the respective currency’s average cost on the
balance sheet date, compared with the euro
values at which the transactions were initially
recorded (see “Off-balance-sheet instruments”
in the notes on accounting policies).
A claim against the German Federal Ministry of
Finance in respect of recoverable value added
tax and other indirect taxes paid is also included
under this heading. Such taxes are refundable
under the terms of Article 3 of the Protocol on
the privileges and immunities of the European
Union, which applies to the ECB by virtue of
Article 39 of the Statute of the ESCB.
8 BANKNOTES IN CIRCULATION
This item consists of the ECB’s share (8%)
of the total euro banknotes in circulation
(see “Banknotes in circulation” in the notes on
accounting policies).
9 OTHER LIABILITIES TO EURO AREA CREDIT
INSTITUTIONS DENOMINATED IN EURO
In 2010 the Governing Council decided that
the euro area central banks would make
available for lending bonds bought under the
covered bond purchase programme. The ECB
implemented these lending operations through
matched repurchase transactions, whereby
amounts received under repurchase agreements
are fully and simultaneously reinvested with the
same counterparty under a reverse repurchase
agreement (see note 4, “Other claims on euro
area credit institutions denominated in euro”).
As at 31 December 2010 a repurchase agreement
conducted in the context of the covered bond
lending operations with a value of €33.4 million
remained outstanding.
10 LIABILITIES TO OTHER EURO AREA
RESIDENTS DENOMINATED IN EURO
10.1 OTHER LIABILITIES
This item comprises deposits by members of
the Euro Banking Association (EBA) which are
used in order to provide the ECB with collateral
in respect of the EBA’s payments settled through
the TARGET2 system.
11 LIABILITIES TO NON-EURO AREA RESIDENTS
DENOMINATED IN EURO
As at 31 December 2010 these liabilities
consisted mainly of balances held with the
ECB by non-euro area NCBs arising from
transactions processed via the TARGET2 system
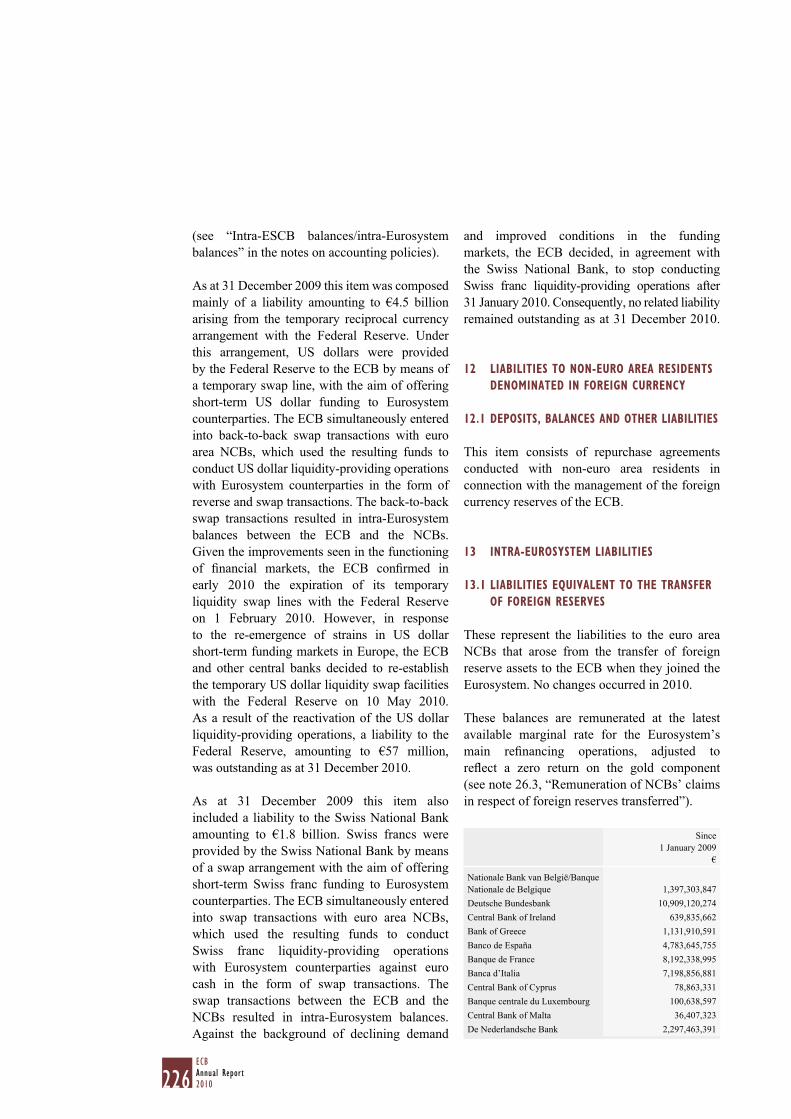
226ECBAnnual Report2010
(see “Intra-ESCB balances/intra-Eurosystem
balances” in the notes on accounting policies).
As at 31 December 2009 this item was composed
mainly of a liability amounting to €4.5 billion
arising from the temporary reciprocal currency
arrangement with the Federal Reserve. Under
this arrangement, US dollars were provided
by the Federal Reserve to the ECB by means of
a temporary swap line, with the aim of offering
short-term US dollar funding to Eurosystem
counterparties. The ECB simultaneously entered
into back-to-back swap transactions with euro
area NCBs, which used the resulting funds to
conduct US dollar liquidity-providing operations
with Eurosystem counterparties in the form of
reverse and swap transactions. The back-to-back
swap transactions resulted in intra-Eurosystem
balances between the ECB and the NCBs.
Given the improvements seen in the functioning
of fi nancial markets, the ECB confi rmed in
early 2010 the expiration of its temporary
liquidity swap lines with the Federal Reserve
on 1 February 2010. However, in response
to the re-emergence of strains in US dollar
short-term funding markets in Europe, the ECB
and other central banks decided to re-establish
the temporary US dollar liquidity swap facilities
with the Federal Reserve on 10 May 2010.
As a result of the reactivation of the US dollar
liquidity-providing operations, a liability to the
Federal Reserve, amounting to €57 million,
was outstanding as at 31 December 2010.
As at 31 December 2009 this item also
included a liability to the Swiss National Bank
amounting to €1.8 billion. Swiss francs were
provided by the Swiss National Bank by means
of a swap arrangement with the aim of offering
short-term Swiss franc funding to Eurosystem
counterparties. The ECB simultaneously entered
into swap transactions with euro area NCBs,
which used the resulting funds to conduct
Swiss franc liquidity-providing operations
with Eurosystem counterparties against euro
cash in the form of swap transactions. The
swap transactions between the ECB and the
NCBs resulted in intra-Eurosystem balances.
Against the background of declining demand
and improved conditions in the funding
markets, the ECB decided, in agreement with
the Swiss National Bank, to stop conducting
Swiss franc liquidity-providing operations after
31 January 2010. Consequently, no related liability
remained outstanding as at 31 December 2010.
12 LIABILITIES TO NON-EURO AREA RESIDENTS
DENOMINATED IN FOREIGN CURRENCY
12.1 DEPOSITS, BALANCES AND OTHER LIABILITIES
This item consists of repurchase agreements
conducted with non-euro area residents in
connection with the management of the foreign
currency reserves of the ECB.
13 INTRA-EUROSYSTEM LIABILITIES
13.1 LIABILITIES EQUIVALENT TO THE TRANSFER
OF FOREIGN RESERVES
These represent the liabilities to the euro area
NCBs that arose from the transfer of foreign
reserve assets to the ECB when they joined the
Eurosystem. No changes occurred in 2010.
These balances are remunerated at the latest
available marginal rate for the Eurosystem’s
main refi nancing operations, adjusted to
refl ect a zero return on the gold component
(see note 26.3, “Remuneration of NCBs’ claims
in respect of foreign reserves transferred”).
Since
1 January 2009
€
Nationale Bank van België/Banque
Nationale de Belgique 1,397,303,847
Deutsche Bundesbank 10,909,120,274
Central Bank of Ireland 639,835,662
Bank of Greece 1,131,910,591
Banco de España 4,783,645,755
Banque de France 8,192,338,995
Banca d’Italia 7,198,856,881
Central Bank of Cyprus 78,863,331
Banque centrale du Luxembourg 100,638,597
Central Bank of Malta 36,407,323
De Nederlandsche Bank 2,297,463,391
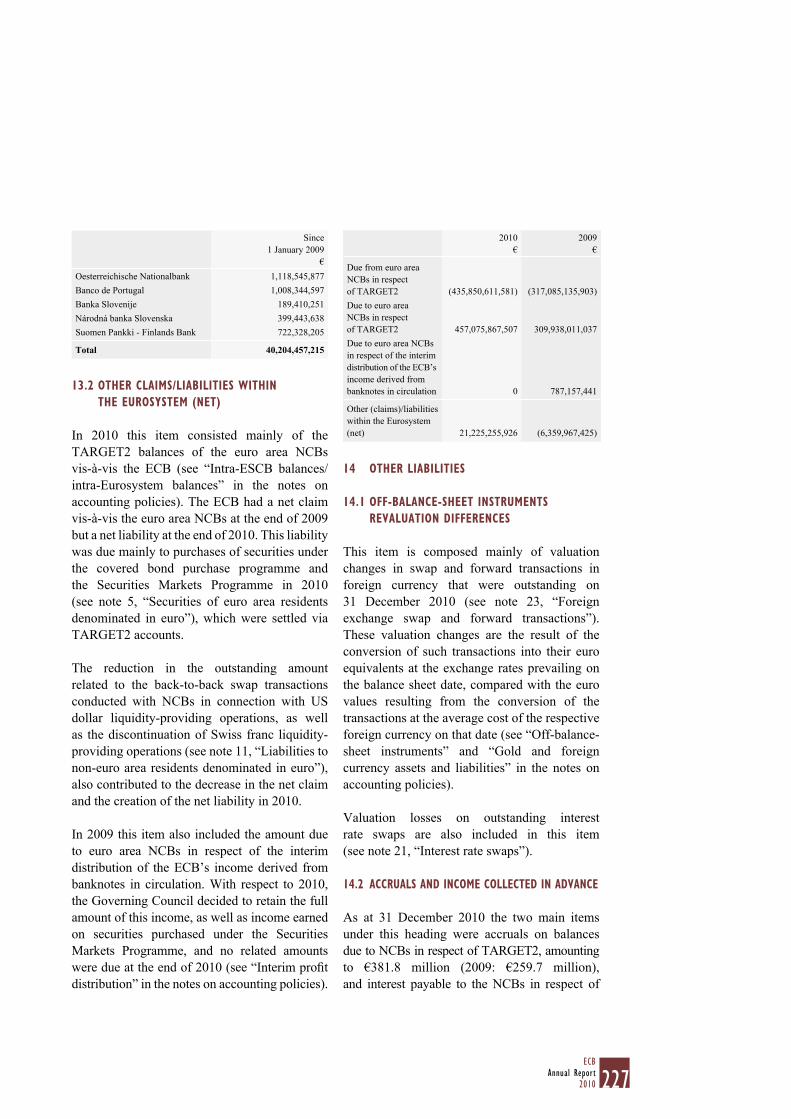
227ECB
Annual Report2010
13.2 OTHER CLAIMS/LIABILITIES WITHIN
THE EUROSYSTEM (NET)
In 2010 this item consisted mainly of the
TARGET2 balances of the euro area NCBs
vis-à-vis the ECB (see “Intra-ESCB balances/
intra-Eurosystem balances” in the notes on
accounting policies). The ECB had a net claim
vis-à-vis the euro area NCBs at the end of 2009
but a net liability at the end of 2010. This liability
was due mainly to purchases of securities under
the covered bond purchase programme and
the Securities Markets Programme in 2010
(see note 5, “Securities of euro area residents
denominated in euro”), which were settled via
TARGET2 accounts.
The reduction in the outstanding amount
related to the back-to-back swap transactions
conducted with NCBs in connection with US
dollar liquidity-providing operations, as well
as the discontinuation of Swiss franc liquidity-
providing operations (see note 11, “Liabilities to
non-euro area residents denominated in euro”),
also contributed to the decrease in the net claim
and the creation of the net liability in 2010.
In 2009 this item also included the amount due
to euro area NCBs in respect of the interim
distribution of the ECB’s income derived from
banknotes in circulation. With respect to 2010,
the Governing Council decided to retain the full
amount of this income, as well as income earned
on securities purchased under the Securities
Markets Programme, and no related amounts
were due at the end of 2010 (see “Interim profi t
distribution” in the notes on accounting policies).
14 OTHER LIABILITIES
14.1 OFF-BALANCE-SHEET INSTRUMENTS
REVALUATION DIFFERENCES
This item is composed mainly of valuation
changes in swap and forward transactions in
foreign currency that were outstanding on
31 December 2010 (see note 23, “Foreign
exchange swap and forward transactions”).
These valuation changes are the result of the
conversion of such transactions into their euro
equivalents at the exchange rates prevailing on
the balance sheet date, compared with the euro
values resulting from the conversion of the
transactions at the average cost of the respective
foreign currency on that date (see “Off-balance-
sheet instruments” and “Gold and foreign
currency assets and liabilities” in the notes on
accounting policies).
Valuation losses on outstanding interest
rate swaps are also included in this item
(see note 21, “Interest rate swaps”).
14.2 ACCRUALS AND INCOME COLLECTED IN ADVANCE
As at 31 December 2010 the two main items
under this heading were accruals on balances
due to NCBs in respect of TARGET2, amounting
to €381.8 million (2009: €259.7 million),
and interest payable to the NCBs in respect of
Since
1 January 2009
€
Oesterreichische Nationalbank 1,118,545,877
Banco de Portugal 1,008,344,597
Banka Slovenije 189,410,251
Národná banka Slovenska 399,443,638
Suomen Pankki - Finlands Bank 722,328,205
Total 40,204,457,215
2010
€
2009
€
Due from euro area
NCBs in respect
of TARGET2 (435,850,611,581) (317,085,135,903)
Due to euro area
NCBs in respect
of TARGET2 457,075,867,507 309,938,011,037
Due to euro area NCBs
in respect of the interim
distribution of the ECB’s
income derived from
banknotes in circulation 0 787,157,441
Other (claims)/liabilities
within the Eurosystem
(net) 21,225,255,926 (6,359,967,425)
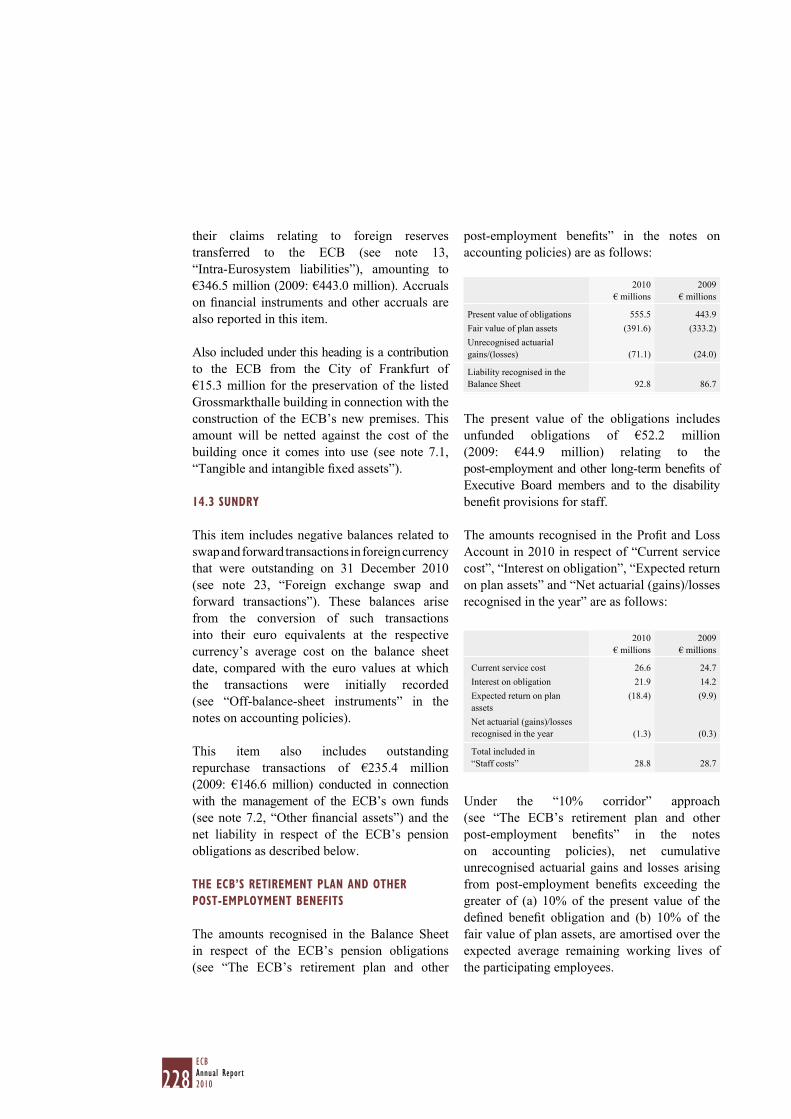
228ECBAnnual Report2010
their claims relating to foreign reserves
transferred to the ECB (see note 13,
“Intra-Eurosystem liabilities”), amounting to
€346.5 million (2009: €443.0 million). Accruals
on fi nancial instruments and other accruals are
also reported in this item.
Also included under this heading is a contribution
to the ECB from the City of Frankfurt of
€15.3 million for the preservation of the listed
Grossmarkthalle building in connection with the
construction of the ECB’s new premises. This
amount will be netted against the cost of the
building once it comes into use (see note 7.1,
“Tangible and intangible fi xed assets”).
14.3 SUNDRY
This item includes negative balances related to
swap and forward transactions in foreign currency
that were outstanding on 31 December 2010
(see note 23, “Foreign exchange swap and
forward transactions”). These balances arise
from the conversion of such transactions
into their euro equivalents at the respective
currency’s average cost on the balance sheet
date, compared with the euro values at which
the transactions were initially recorded
(see “Off-balance-sheet instruments” in the
notes on accounting policies).
This item also includes outstanding
repurchase transactions of €235.4 million
(2009: €146.6 million) conducted in connection
with the management of the ECB’s own funds
(see note 7.2, “Other fi nancial assets”) and the
net liability in respect of the ECB’s pension
obligations as described below.
THE ECB’S RETIREMENT PLAN AND OTHER
POST-EMPLOYMENT BENEFITS
The amounts recognised in the Balance Sheet
in respect of the ECB’s pension obligations
(see “The ECB’s retirement plan and other
post-employment benefi ts” in the notes on
accounting policies) are as follows:
The present value of the obligations includes
unfunded obligations of €52.2 million
(2009: €44.9 million) relating to the
post-employment and other long-term benefi ts of
Executive Board members and to the disability
benefi t provisions for staff.
The amounts recognised in the Profi t and Loss
Account in 2010 in respect of “Current service
cost”, “Interest on obligation”, “Expected return
on plan assets” and “Net actuarial (gains)/losses
recognised in the year” are as follows:
Under the “10% corridor” approach
(see “The ECB’s retirement plan and other
post-employment benefi ts” in the notes
on accounting policies), net cumulative
unrecognised actuarial gains and losses arising
from post-employment benefi ts exceeding the
greater of (a) 10% of the present value of the
defi ned benefi t obligation and (b) 10% of the
fair value of plan assets, are amortised over the
expected average remaining working lives of
the participating employees.
2010
€ millions
2009
€ millions
Present value of obligations 555.5 443.9
Fair value of plan assets (391.6) (333.2)
Unrecognised actuarial
gains/(losses) (71.1) (24.0)
Liability recognised in the
Balance Sheet 92.8 86.7
2010
€ millions
2009
€ millions
Current service cost 26.6 24.7
Interest on obligation 21.9 14.2
Expected return on plan
assets
(18.4) (9.9)
Net actuarial (gains)/losses
recognised in the year (1.3) (0.3)
Total included in
“Staff costs” 28.8 28.7
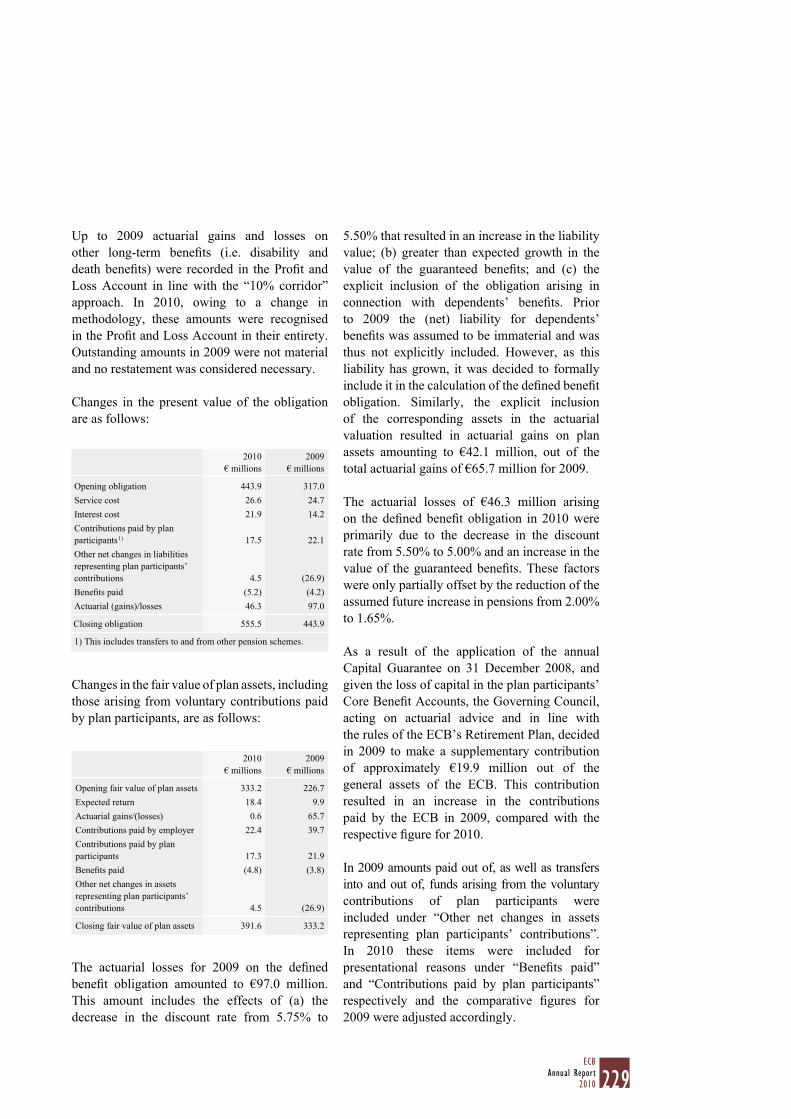
229ECB
Annual Report2010
Up to 2009 actuarial gains and losses on
other long-term benefi ts (i.e. disability and
death benefi ts) were recorded in the Profi t and
Loss Account in line with the “10% corridor”
approach. In 2010, owing to a change in
methodology, these amounts were recognised
in the Profi t and Loss Account in their entirety.
Outstanding amounts in 2009 were not material
and no restatement was considered necessary.
Changes in the present value of the obligation
are as follows:
Changes in the fair value of plan assets, including
those arising from voluntary contributions paid
by plan participants, are as follows:
The actuarial losses for 2009 on the defi ned
benefi t obligation amounted to €97.0 million.
This amount includes the effects of (a) the
decrease in the discount rate from 5.75% to
5.50% that resulted in an increase in the liability
value; (b) greater than expected growth in the
value of the guaranteed benefi ts; and (c) the
explicit inclusion of the obligation arising in
connection with dependents’ benefi ts. Prior
to 2009 the (net) liability for dependents’
benefi ts was assumed to be immaterial and was
thus not explicitly included. However, as this
liability has grown, it was decided to formally
include it in the calculation of the defi ned benefi t
obligation. Similarly, the explicit inclusion
of the corresponding assets in the actuarial
valuation resulted in actuarial gains on plan
assets amounting to €42.1 million, out of the
total actuarial gains of €65.7 million for 2009.
The actuarial losses of €46.3 million arising
on the defi ned benefi t obligation in 2010 were
primarily due to the decrease in the discount
rate from 5.50% to 5.00% and an increase in the
value of the guaranteed benefi ts. These factors
were only partially offset by the reduction of the
assumed future increase in pensions from 2.00%
to 1.65%.
As a result of the application of the annual
Capital Guarantee on 31 December 2008, and
given the loss of capital in the plan participants’
Core Benefi t Accounts, the Governing Council,
acting on actuarial advice and in line with
the rules of the ECB’s Retirement Plan, decided
in 2009 to make a supplementary contribution
of approximately €19.9 million out of the
general assets of the ECB. This contribution
resulted in an increase in the contributions
paid by the ECB in 2009, compared with the
respective fi gure for 2010.
In 2009 amounts paid out of, as well as transfers
into and out of, funds arising from the voluntary
contributions of plan participants were
included under “Other net changes in assets
representing plan participants’ contributions”.
In 2010 these items were included for
presentational reasons under “Benefi ts paid”
and “Contributions paid by plan participants”
respectively and the comparative fi gures for
2009 were adjusted accordingly.
2010
€ millions
2009
€ millions
Opening obligation 443.9 317.0
Service cost 26.6 24.7
Interest cost 21.9 14.2
Contributions paid by plan
participants 1) 17.5 22.1
Other net changes in liabilities
representing plan participants’
contributions 4.5 (26.9)
Benefi ts paid (5.2) (4.2)
Actuarial (gains)/losses 46.3 97.0
Closing obligation 555.5 443.9
1) This includes transfers to and from other pension schemes.
2010
€ millions
2009
€ millions
Opening fair value of plan assets 333.2 226.7
Expected return 18.4 9.9
Actuarial gains/(losses) 0.6 65.7
Contributions paid by employer 22.4 39.7
Contributions paid by plan
participants 17.3 21.9
Benefi ts paid (4.8) (3.8)
Other net changes in assets
representing plan participants’
contributions 4.5 (26.9)
Closing fair value of plan assets 391.6 333.2
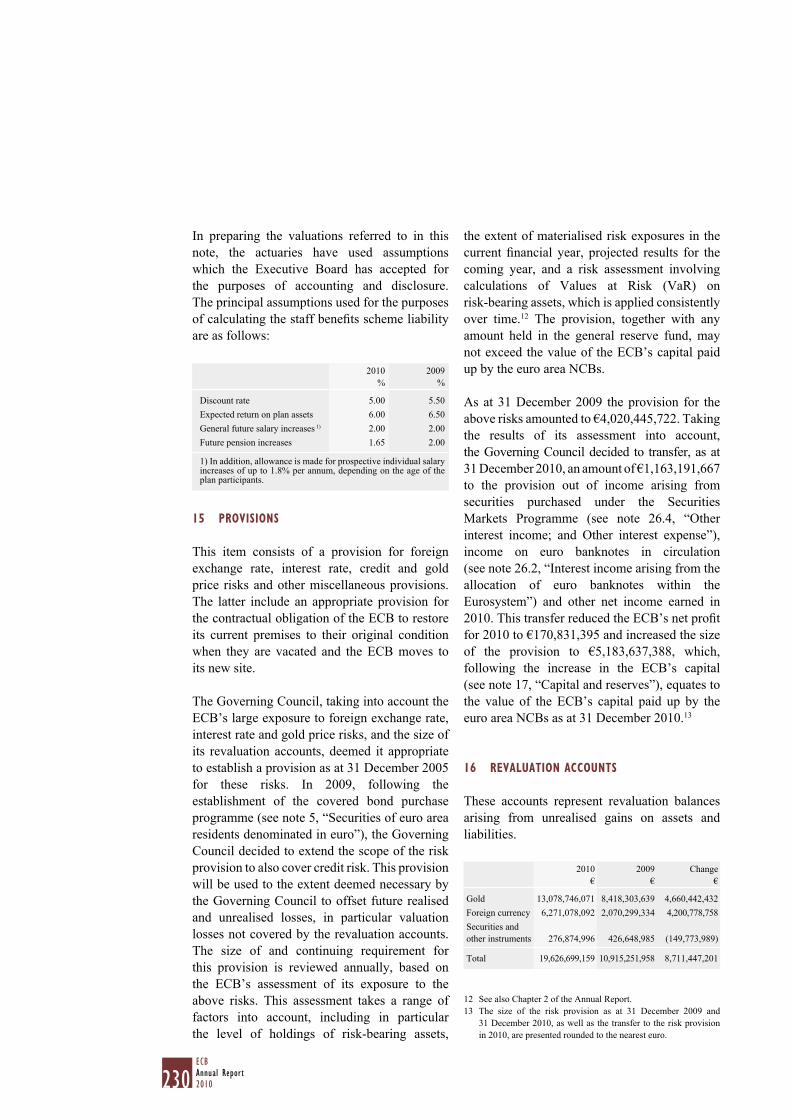
230ECBAnnual Report2010
In preparing the valuations referred to in this
note, the actuaries have used assumptions
which the Executive Board has accepted for
the purposes of accounting and disclosure.
The principal assumptions used for the purposes
of calculating the staff benefi ts scheme liability
are as follows:
15 PROVISIONS
This item consists of a provision for foreign
exchange rate, interest rate, credit and gold
price risks and other miscellaneous provisions.
The latter include an appropriate provision for
the contractual obligation of the ECB to restore
its current premises to their original condition
when they are vacated and the ECB moves to
its new site.
The Governing Council, taking into account the
ECB’s large exposure to foreign exchange rate,
interest rate and gold price risks, and the size of
its revaluation accounts, deemed it appropriate
to establish a provision as at 31 December 2005
for these risks. In 2009, following the
establishment of the covered bond purchase
programme (see note 5, “Securities of euro area
residents denominated in euro”), the Governing
Council decided to extend the scope of the risk
provision to also cover credit risk. This provision
will be used to the extent deemed necessary by
the Governing Council to offset future realised
and unrealised losses, in particular valuation
losses not covered by the revaluation accounts.
The size of and continuing requirement for
this provision is reviewed annually, based on
the ECB’s assessment of its exposure to the
above risks. This assessment takes a range of
factors into account, including in particular
the level of holdings of risk-bearing assets,
the extent of materialised risk exposures in the
current fi nancial year, projected results for the
coming year, and a risk assessment involving
calculations of Values at Risk (VaR) on
risk-bearing assets, which is applied consistently
over time.12 The provision, together with any
amount held in the general reserve fund, may
not exceed the value of the ECB’s capital paid
up by the euro area NCBs.
As at 31 December 2009 the provision for the
above risks amounted to €4,020,445,722. Taking
the results of its assessment into account,
the Governing Council decided to transfer, as at
31 December 2010, an amount of €1,163,191,667
to the provision out of income arising from
securities purchased under the Securities
Markets Programme (see note 26.4, “Other
interest income; and Other interest expense”),
income on euro banknotes in circulation
(see note 26.2, “Interest income arising from the
allocation of euro banknotes within the
Eurosystem”) and other net income earned in
2010. This transfer reduced the ECB’s net profi t
for 2010 to €170,831,395 and increased the size
of the provision to €5,183,637,388, which,
following the increase in the ECB’s capital
(see note 17, “Capital and reserves”), equates to
the value of the ECB’s capital paid up by the
euro area NCBs as at 31 December 2010.13
16 REVALUATION ACCOUNTS
These accounts represent revaluation balances
arising from unrealised gains on assets and
liabilities.
See also Chapter 2 of the Annual Report. 12
The size of the risk provision as at 31 December 2009 and 13
31 December 2010, as well as the transfer to the risk provision
in 2010, are presented rounded to the nearest euro.
2010
%
2009
%
Discount rate 5.00 5.50
Expected return on plan assets 6.00 6.50
General future salary increases 1) 2.00 2.00
Future pension increases 1.65 2.00
1) In addition, allowance is made for prospective individual salary increases of up to 1.8% per annum, depending on the age of the plan participants.
2010
€
2009
€
Change
€
Gold 13,078,746,071 8,418,303,639 4,660,442,432
Foreign currency 6,271,078,092 2,070,299,334 4,200,778,758
Securities and
other instruments 276,874,996 426,648,985 (149,773,989)
Total 19,626,699,159 10,915,251,958 8,711,447,201
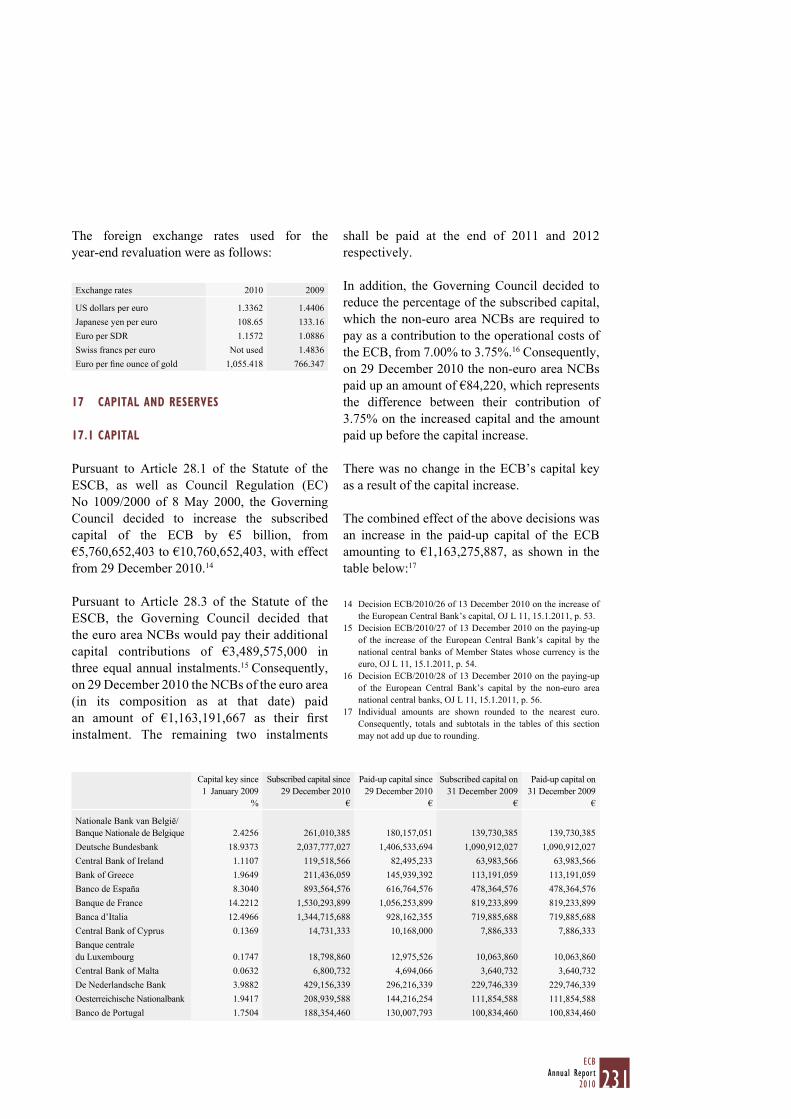
231ECB
Annual Report2010
The foreign exchange rates used for the
year-end revaluation were as follows:
17 CAPITAL AND RESERVES
17.1 CAPITAL
Pursuant to Article 28.1 of the Statute of the
ESCB, as well as Council Regulation (EC)
No 1009/2000 of 8 May 2000, the Governing
Council decided to increase the subscribed
capital of the ECB by €5 billion, from
€5,760,652,403 to €10,760,652,403, with effect
from 29 December 2010.14
Pursuant to Article 28.3 of the Statute of the
ESCB, the Governing Council decided that
the euro area NCBs would pay their additional
capital contributions of €3,489,575,000 in
three equal annual instalments.15 Consequently,
on 29 December 2010 the NCBs of the euro area
(in its composition as at that date) paid
an amount of €1,163,191,667 as their fi rst
instalment. The remaining two instalments
shall be paid at the end of 2011 and 2012
respectively.
In addition, the Governing Council decided to
reduce the percentage of the subscribed capital,
which the non-euro area NCBs are required to
pay as a contribution to the operational costs of
the ECB, from 7.00% to 3.75%.16 Consequently,
on 29 December 2010 the non-euro area NCBs
paid up an amount of €84,220, which represents
the difference between their contribution of
3.75% on the increased capital and the amount
paid up before the capital increase.
There was no change in the ECB’s capital key
as a result of the capital increase.
The combined effect of the above decisions was
an increase in the paid-up capital of the ECB
amounting to €1,163,275,887, as shown in the
table below:17
Decision ECB/2010/26 of 13 December 2010 on the increase of 14
the European Central Bank’s capital, OJ L 11, 15.1.2011, p. 53.
Decision ECB/2010/27 of 13 December 2010 on the paying-up 15
of the increase of the European Central Bank’s capital by the
national central banks of Member States whose currency is the
euro, OJ L 11, 15.1.2011, p. 54.
Decision ECB/2010/28 of 13 December 2010 on the paying-up 16
of the European Central Bank’s capital by the non-euro area
national central banks, OJ L 11, 15.1.2011, p. 56.
Individual amounts are shown rounded to the nearest euro. 17
Consequently, totals and subtotals in the tables of this section
may not add up due to rounding.
Exchange rates 2010 2009
US dollars per euro 1.3362 1.4406
Japanese yen per euro 108.65 133.16
Euro per SDR 1.1572 1.0886
Swiss francs per euro Not used 1.4836
Euro per fi ne ounce of gold 1,055.418 766.347
Capital key since
1 January 2009
%
Subscribed capital since
29 December 2010
€
Paid-up capital since
29 December 2010
€
Subscribed capital on
31 December 2009
€
Paid-up capital on
31 December 2009
€
Nationale Bank van België/
Banque Nationale de Belgique 2.4256 261,010,385 180,157,051 139,730,385 139,730,385
Deutsche Bundesbank 18.9373 2,037,777,027 1,406,533,694 1,090,912,027 1,090,912,027
Central Bank of Ireland 1.1107 119,518,566 82,495,233 63,983,566 63,983,566
Bank of Greece 1.9649 211,436,059 145,939,392 113,191,059 113,191,059
Banco de España 8.3040 893,564,576 616,764,576 478,364,576 478,364,576
Banque de France 14.2212 1,530,293,899 1,056,253,899 819,233,899 819,233,899
Banca d’Italia 12.4966 1,344,715,688 928,162,355 719,885,688 719,885,688
Central Bank of Cyprus 0.1369 14,731,333 10,168,000 7,886,333 7,886,333
Banque centrale
du Luxembourg 0.1747 18,798,860 12,975,526 10,063,860 10,063,860
Central Bank of Malta 0.0632 6,800,732 4,694,066 3,640,732 3,640,732
De Nederlandsche Bank 3.9882 429,156,339 296,216,339 229,746,339 229,746,339
Oesterreichische Nationalbank 1.9417 208,939,588 144,216,254 111,854,588 111,854,588
Banco de Portugal 1.7504 188,354,460 130,007,793 100,834,460 100,834,460
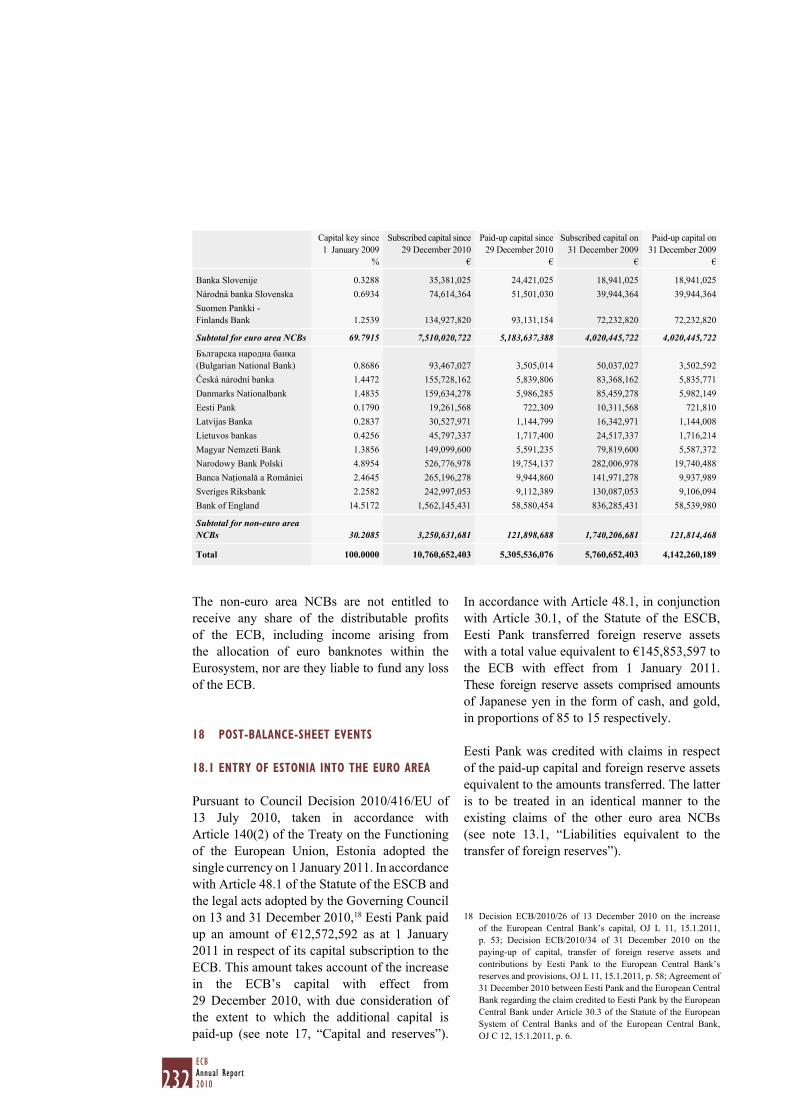
232ECBAnnual Report2010
The non-euro area NCBs are not entitled to
receive any share of the distributable profi ts
of the ECB, including income arising from
the allocation of euro banknotes within the
Eurosystem, nor are they liable to fund any loss
of the ECB.
18 POST-BALANCE-SHEET EVENTS
18.1 ENTRY OF ESTONIA INTO THE EURO AREA
Pursuant to Council Decision 2010/416/EU of
13 July 2010, taken in accordance with
Article 140(2) of the Treaty on the Functioning
of the European Union, Estonia adopted the
single currency on 1 January 2011. In accordance
with Article 48.1 of the Statute of the ESCB and
the legal acts adopted by the Governing Council
on 13 and 31 December 2010,18 Eesti Pank paid
up an amount of €12,572,592 as at 1 January
2011 in respect of its capital subscription to the
ECB. This amount takes account of the increase
in the ECB’s capital with effect from
29 December 2010, with due consideration of
the extent to which the additional capital is
paid-up (see note 17, “Capital and reserves”).
In accordance with Article 48.1, in conjunction
with Article 30.1, of the Statute of the ESCB,
Eesti Pank transferred foreign reserve assets
with a total value equivalent to €145,853,597 to
the ECB with effect from 1 January 2011.
These foreign reserve assets comprised amounts
of Japanese yen in the form of cash, and gold,
in proportions of 85 to 15 respectively.
Eesti Pank was credited with claims in respect
of the paid-up capital and foreign reserve assets
equivalent to the amounts transferred. The latter
is to be treated in an identical manner to the
existing claims of the other euro area NCBs
(see note 13.1, “Liabilities equivalent to the
transfer of foreign reserves”).
Decision ECB/2010/26 of 13 December 2010 on the increase 18
of the European Central Bank’s capital, OJ L 11, 15.1.2011,
p. 53; Decision ECB/2010/34 of 31 December 2010 on the
paying-up of capital, transfer of foreign reserve assets and
contributions by Eesti Pank to the European Central Bank’s
reserves and provisions, OJ L 11, 15.1.2011, p. 58; Agreement of
31 December 2010 between Eesti Pank and the European Central
Bank regarding the claim credited to Eesti Pank by the European
Central Bank under Article 30.3 of the Statute of the European
System of Central Banks and of the European Central Bank,
OJ C 12, 15.1.2011, p. 6.
Capital key since
1 January 2009
%
Subscribed capital since
29 December 2010
€
Paid-up capital since
29 December 2010
€
Subscribed capital on
31 December 2009
€
Paid-up capital on
31 December 2009
€
Banka Slovenije 0.3288 35,381,025 24,421,025 18,941,025 18,941,025
Národná banka Slovenska 0.6934 74,614,364 51,501,030 39,944,364 39,944,364
Suomen Pankki -
Finlands Bank 1.2539 134,927,820 93,131,154 72,232,820 72,232,820
Subtotal for euro area NCBs 69.7915 7,510,020,722 5,183,637,388 4,020,445,722 4,020,445,722
Българска народна банка
(Bulgarian National Bank) 0.8686 93,467,027 3,505,014 50,037,027 3,502,592
Česká národní banka 1.4472 155,728,162 5,839,806 83,368,162 5,835,771
Danmarks Nationalbank 1.4835 159,634,278 5,986,285 85,459,278 5,982,149
Eesti Pank 0.1790 19,261,568 722,309 10,311,568 721,810
Latvijas Banka 0.2837 30,527,971 1,144,799 16,342,971 1,144,008
Lietuvos bankas 0.4256 45,797,337 1,717,400 24,517,337 1,716,214
Magyar Nemzeti Bank 1.3856 149,099,600 5,591,235 79,819,600 5,587,372
Narodowy Bank Polski 4.8954 526,776,978 19,754,137 282,006,978 19,740,488
Banca Naţională a României 2.4645 265,196,278 9,944,860 141,971,278 9,937,989
Sveriges Riksbank 2.2582 242,997,053 9,112,389 130,087,053 9,106,094
Bank of England 14.5172 1,562,145,431 58,580,454 836,285,431 58,539,980
Subtotal for non-euro area NCBs 30.2085 3,250,631,681 121,898,688 1,740,206,681 121,814,468
Total 100.0000 10,760,652,403 5,305,536,076 5,760,652,403 4,142,260,189

233ECB
Annual Report2010
18.2 ADMINISTRATION OF THE EUROPEAN
FINANCIAL STABILISATION MECHANISM
AND THE EUROPEAN FINANCIAL STABILITY
FACILITY
The ECB has an operational role in the
administration of two European fi nancial
stability-related funding schemes established
in 2010 by the EU Council and the EU
Member States.
In accordance with Articles 122(2) and 132(1)
of the Treaty on the Functioning of the European
Union and Articles 17 and 21 of the Statute of
the ESCB, as well as Article 8 of Council
Regulation (EU) No 407/2010, the ECB
is responsible for the administration of the
borrowing and lending operations of the
EU under the European Financial Stabilisation
Mechanism. Under this scheme, loans to Ireland
for a total amount of €5 billion were outstanding
as at 22 February 2011.
In accordance with Articles 17 and 21 of the
Statute of the ESCB (in conjunction with
Article 3(5) of the Framework Agreement
between the European Financial Stability
Facility (EFSF) and the Member States whose
currency is the euro), the ECB is responsible
for the administration of EFSF loans to
Member States whose currency is the euro.
Under this scheme, loans to Ireland for a total
amount of €4.2 billion were outstanding as at
22 February 2011.
OFF-BALANCE-SHEET INSTRUMENTS
19 AUTOMATED SECURITY LENDING
PROGRAMMES
As part of the management of the ECB’s own
funds, the ECB has an automated security
lending programme agreement in place, whereby
an appointed agent enters into security lending
transactions on behalf of the ECB with a number
of counterparties, designated by the ECB as
eligible counterparties. Under this agreement,
reverse transactions with a value of €1.5 billion
(2009: €2.1 billion) were outstanding as at
31 December 2010.
In 2010, as part of the management of the
ECB’s foreign reserves, an appointed agent
entered into US dollar-denominated security
lending transactions with eligible counterparties
on behalf of the ECB. No transactions remained
outstanding as at 31 December 2010.
20 INTEREST RATE FUTURES
Interest rate futures are used as part of the
management of the ECB’s foreign reserves
and own funds. As at 31 December 2010 the
following transactions were outstanding:
21 INTEREST RATE SWAPS
Interest rate swap transactions with a contract
value of €742.4 million (2009: €724.4 million)
were outstanding as at 31 December 2010.
These transactions were conducted in the
context of the management of the ECB’s
foreign reserves.
22 FORWARD TRANSACTIONS IN SECURITIES
A forward purchase of a security in the
amount of €92 million remained outstanding
as at 31 December 2010. This transaction was
conducted in the context of the management of
the ECB’s foreign reserves.
Foreign
currency
interest rate
futures
2010
Contract value
€
2009
Contract value
€
Change
€
Purchases 458,539,141 541,523,368 (82,984,227)
Sales 1,251,682,536 2,706,847,703 (1,455,165,167)
Euro interest
rate futures
2010
Contract value
€
2009
Contract value
€
Change
€
Purchases 0 25,000,000 (25,000,000)
Sales 0 379,000,000 (379,000,000)

234ECBAnnual Report2010
23 FOREIGN EXCHANGE SWAP AND FORWARD
TRANSACTIONS
MANAGEMENT OF THE FOREIGN RESERVES
The following foreign exchange swap and
forward transactions remained outstanding,
in the context of the management of the ECB’s
foreign reserves, as at 31 December 2010:
LIQUIDITY-PROVIDING OPERATIONS
Forward claims on NCBs and liabilities to the
Federal Reserve, which arose in connection with
the provision of US dollar liquidity to Eurosystem
counterparties (see note 11, “Liabilities to
non-euro area residents denominated in euro”),
were outstanding on 31 December 2010.
24 ADMINISTRATION OF BORROWING
AND LENDING OPERATIONS
In accordance with Article 141(2) of the Treaty
on the Functioning of the European Union
and Articles 17, 21.2, 43.1 and 46.1 of the
Statute of the ESCB, together with Article 9
of Council Regulation (EC) No 332/2002 of
18 February 2002, as last amended by Council
Regulation (EC) No 431/2009 of 18 May 2009,
the ECB continues to be responsible for the
administration of the borrowing and lending
operations of the EU under the medium-term
fi nancial assistance mechanism. Under this
scheme, loans from the EU to Latvia, Hungary
and Romania for a total amount of €12.1 billion
were outstanding as at 31 December 2010.
In the context of the loan facility agreement
between the Member States whose currency is
the euro 19 and Kreditanstalt für Wiederaufbau,20
as lenders, the Hellenic Republic, as the
borrower, and the Bank of Greece, as the
agent of the borrower, and pursuant to
Articles 17 and 21.2 of the Statute of the ESCB,
as well as Article 2 of Decision ECB/2010/4,21
the ECB is responsible for processing all related
payments on behalf of the lenders and the
borrower. Under this scheme, pooled bilateral
loans for the benefi t of the Hellenic Republic
amounting to €21 billion were outstanding as at
31 December 2010.
25 PENDING LAWSUITS
An action for damages was brought against the
ECB before the Court of First Instance of the
European Communities (CFI) 22 by Document
Security Systems Inc. (DSSI), alleging that the
ECB had infringed a DSSI patent 23 in the
production of euro banknotes. The CFI
dismissed DSSI’s action for damages against
the ECB.24 The ECB is currently pursuing
actions to revoke the patent in certain national
jurisdictions and has already succeeded in
revoking it in a number of jurisdictions.
Furthermore, the ECB fi rmly maintains that it
has in no way infringed the patent, and will
consequently also enter a defence against any
infringement action brought by DSSI before any
competent national court.
Other than the Hellenic Republic and the Federal Republic of 19
Germany.
Acting in the public interest, subject to the instructions of and with 20
the benefi t of the guarantee of the Federal Republic of Germany.
Decision ECB/2010/4 of 10 May 2010 concerning the 21
management of pooled bilateral loans for the benefi t of the
Hellenic Republic and amending Decision ECB/2007/7, OJ L 119,
13.5.2010, p. 24.
Following the entry into force of the Treaty of Lisbon on 22
1 December 2009, the name of the Court of First Instance was
changed to the General Court.
DSSI’s European Patent No 0455 750 B1.23
Order of the Court of First Instance of 5 September 2007, 24
Case T-295/05. Available at www.curia.europa.eu.
Foreign exchange
swap and forward
transactions
2010
€
2009
€
Change
€
Claims 1,697,483,530 1,017,926,290 679,557,240
Liabilities 1,740,464,038 1,008,562,032 731,902,006

235ECB
Annual Report2010
As a result of the CFI’s dismissal of DSSI’s
action for damages against the ECB, as well as
the ECB’s successful actions to date in a number
of national jurisdictions to revoke national
portions of DSSI’s patent, the ECB remains
confi dent that the possibility of payments to
DSSI is remote. The ECB is actively monitoring
all developments in the continuing litigation.
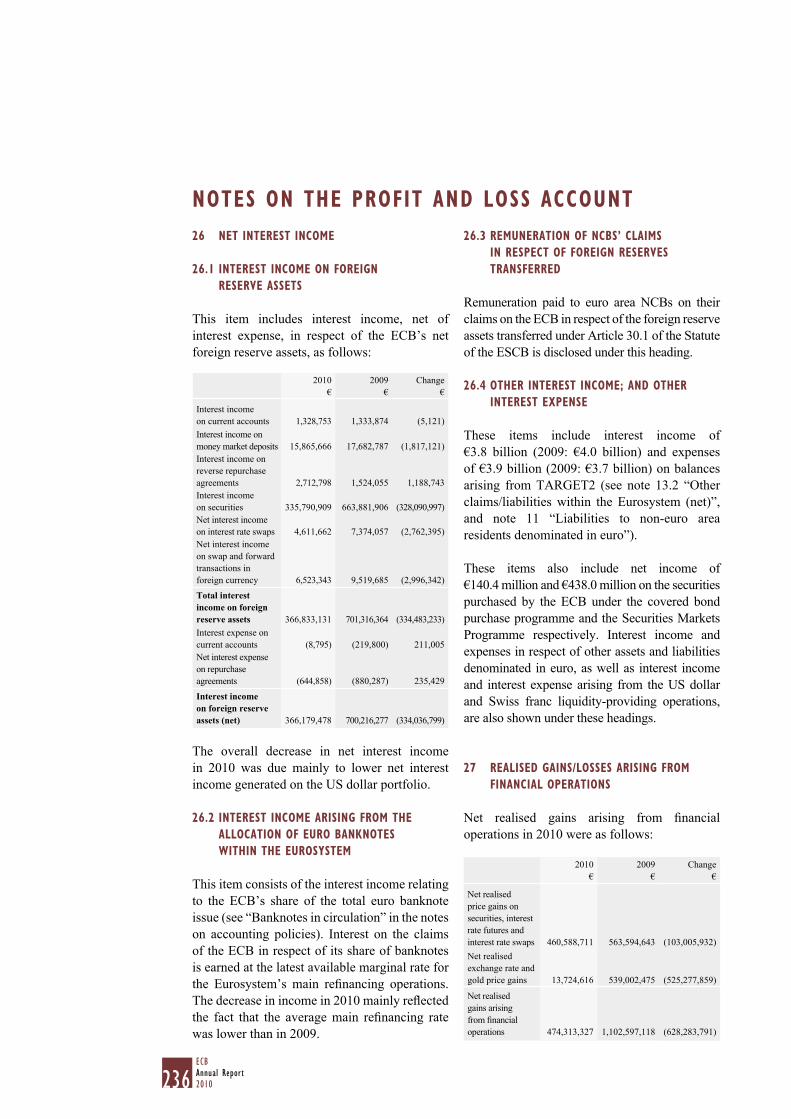
236ECBAnnual Report2010
NOTES ON THE PROFIT AND LOSS ACCOUNT
26 NET INTEREST INCOME
26.1 INTEREST INCOME ON FOREIGN
RESERVE ASSETS
This item includes interest income, net of
interest expense, in respect of the ECB’s net
foreign reserve assets, as follows:
The overall decrease in net interest income
in 2010 was due mainly to lower net interest
income generated on the US dollar portfolio.
26.2 INTEREST INCOME ARISING FROM THE
ALLOCATION OF EURO BANKNOTES
WITHIN THE EUROSYSTEM
This item consists of the interest income relating
to the ECB’s share of the total euro banknote
issue (see “Banknotes in circulation” in the notes
on accounting policies). Interest on the claims
of the ECB in respect of its share of banknotes
is earned at the latest available marginal rate for
the Eurosystem’s main refi nancing operations.
The decrease in income in 2010 mainly refl ected
the fact that the average main refi nancing rate
was lower than in 2009.
26.3 REMUNERATION OF NCBS’ CLAIMS
IN RESPECT OF FOREIGN RESERVES
TRANSFERRED
Remuneration paid to euro area NCBs on their
claims on the ECB in respect of the foreign reserve
assets transferred under Article 30.1 of the Statute
of the ESCB is disclosed under this heading.
26.4 OTHER INTEREST INCOME; AND OTHER
INTEREST EXPENSE
These items include interest income of
€3.8 billion (2009: €4.0 billion) and expenses
of €3.9 billion (2009: €3.7 billion) on balances
arising from TARGET2 (see note 13.2 “Other
claims/liabilities within the Eurosystem (net)”,
and note 11 “Liabilities to non-euro area
residents denominated in euro”).
These items also include net income of
€140.4 million and €438.0 million on the securities
purchased by the ECB under the covered bond
purchase programme and the Securities Markets
Programme respectively. Interest income and
expenses in respect of other assets and liabilities
denominated in euro, as well as interest income
and interest expense arising from the US dollar
and Swiss franc liquidity-providing operations,
are also shown under these headings.
27 REALISED GAINS/LOSSES ARISING FROM
FINANCIAL OPERATIONS
Net realised gains arising from fi nancial
operations in 2010 were as follows:
2010
€
2009
€
Change
€
Interest income
on current accounts 1,328,753 1,333,874 (5,121)
Interest income on
money market deposits 15,865,666 17,682,787 (1,817,121)
Interest income on
reverse repurchase
agreements 2,712,798 1,524,055 1,188,743
Interest income
on securities 335,790,909 663,881,906 (328,090,997)
Net interest income
on interest rate swaps 4,611,662 7,374,057 (2,762,395)
Net interest income
on swap and forward
transactions in
foreign currency 6,523,343 9,519,685 (2,996,342)
Total interest income on foreign reserve assets 366,833,131 701,316,364 (334,483,233)
Interest expense on
current accounts (8,795) (219,800) 211,005
Net interest expense
on repurchase
agreements (644,858) (880,287) 235,429
Interest income on foreign reserve assets (net) 366,179,478 700,216,277 (334,036,799)
2010
€
2009
€
Change
€
Net realised
price gains on
securities, interest
rate futures and
interest rate swaps 460,588,711 563,594,643 (103,005,932)
Net realised
exchange rate and
gold price gains 13,724,616 539,002,475 (525,277,859)
Net realised
gains arising
from fi nancial
operations 474,313,327 1,102,597,118 (628,283,791)

237ECB
Annual Report2010
In 2010 this item included net realised price
gains on sales of securities and net exchange
rate gains on foreign currency outfl ows.
In 2009 net realised exchange rate and gold
price gains arose, mainly owing to the sale of
1,141,248 ounces of fi ne gold in accordance
with the Central Bank Gold Agreement. In 2010
no such sales took place.
28 WRITE-DOWNS ON FINANCIAL ASSETS AND
POSITIONS
In 2010 this expense was due mainly to the
write-down of the acquisition cost of a number
of securities shown on the Balance Sheet to their
market value as at 30 December 2010.
29 NET EXPENSE FROM FEES AND COMMISSIONS
In 2010 income under this heading consisted
of penalties imposed on credit institutions for
non-compliance with the minimum reserve
requirements. Expenses relate to fees payable
on current accounts and in connection with
interest rate futures transactions (see note 20,
“Interest rate futures”).
30 INCOME FROM EQUITY SHARES AND
PARTICIPATING INTERESTS
Dividends received on shares which the ECB
holds in the BIS (see note 7.2, “Other fi nancial
assets”) are shown under this heading.
31 OTHER INCOME
Other miscellaneous income during the year
arose mainly from the accrued contributions
of the euro area NCBs to the costs incurred by
the ECB in connection with a major market
infrastructure project.
32 STAFF COSTS
Salaries, allowances, staff insurance and
other miscellaneous costs of €167.7 million
(2009: €158.6 million) are included under
this heading. Also included in this item is an
amount of €28.8 million (2009: €28.7 million)
recognised in connection with the ECB’s
retirement plan and other post-employment
benefi ts (see note 14.3, “Sundry”). Staff costs
of €1.3 million (2009: €1.2 million) incurred in
connection with the construction of the ECB’s
new premises have been capitalised and are
excluded from this item.
Salaries and allowances, including the
emoluments of holders of senior management
positions, are modelled in essence on, and are
comparable with, the remuneration scheme of
the European Union.
Members of the Executive Board receive a basic
salary and additional allowances for residence
and representation. In the case of the President,
an offi cial residence owned by the ECB is
provided in lieu of a residence allowance.
Subject to the Conditions of Employment for
Staff of the European Central Bank, members of
the Executive Board are entitled to household,
child and education allowances, depending on
2010
€
2009
€
Change
€
Unrealised price
losses on securities (184,247,603) (34,163,743) (150,083,860)
Unrealised price
losses on interest
rate swaps (10,963,861) (3,774,314) (7,189,547)
Unrealised exchange
rate losses (1,973) (1,592) (381)
Total write-downs (195,213,437) (37,939,649) (157,273,788)
2010
€
2009
€
Change
€
Income from fees and
commissions 110,661 679,416 (568,755)
Expenses relating to
fees and commissions (1,519,678) (695,426) (824,252)
Net expense from fees
and commissions (1,409,017) (16,010) (1,393,007)

238ECBAnnual Report2010
their individual circumstances. Basic salaries
are subject to a tax for the benefi t of the
European Union as well as to deductions in
respect of contributions to the pension, medical
and accident insurance schemes. Allowances are
non-taxable and non-pensionable.
Basic salaries paid to members of the Executive
Board in 2010 were as follows:
The total allowances paid to the members of the
Executive Board and the ECB’s contributions
to the medical and accident insurance schemes
on their behalf amounted to €660,731
(2009: €614,879), resulting in total emoluments
of €2,394,794 (2009: €2,314,859).
Transitional payments are made to former
members of the Executive Board for a limited
period after the end of their terms of offi ce.
In 2010 these payments and the ECB’s
contributions to the medical and accident
insurance schemes of former members
amounted to €34,868, while no such payments
or contributions were made in 2009. Pension
payments, including related allowances, to
former members of the Executive Board or their
dependents and contributions to the medical
and accident insurance schemes amounted to
€354,349 (2009: €348,410).
At the end of 2010 the actual full-time equivalent
number of staff holding contracts with the ECB
was 1,607, 25 including 156 with managerial
positions. The change in the number of staff
during 2010 was as follows:
33 ADMINISTRATIVE EXPENSES
These cover all other current expenses relating
to the renting and maintenance of premises,
goods and equipment of a non-capital nature,
professional fees and other services and supplies,
together with staff-related expenses including
recruitment, relocation, installation, training and
resettlement expenses.
34 BANKNOTE PRODUCTION SERVICES
This expense is mainly due to the cross-border
transportation of euro banknotes between banknote
printing works and NCBs, for the delivery of
new banknotes, and between NCBs, for the
compensation of shortages with surplus stocks.
These costs are borne centrally by the ECB.
Staff on unpaid leave are excluded. This number includes staff 25
with permanent, fi xed or short-term contracts and the participants
in the ECB’s Graduate Programme. Staff on maternity or
long-term sick leave are also included.
2010
€
2009
€
Jean-Claude Trichet (President) 367,863 360,612
Lucas D. Papademos (Vice-President
until May 2010) 131,370 309,096
Vítor Constâncio (Vice-President
since June 2010) 183,918 -
Gertrude Tumpel-Gugerell
(Board Member) 262,728 257,568
José Manuel González-Páramo
(Board Member) 262,728 257,568
Lorenzo Bini Smaghi (Board Member) 262,728 257,568
Jürgen Stark (Board Member) 262,728 257,568
Total 1,734,063 1,699,980
2010 2009
Total staff as at 1 January 1,563 1,536
Newcomers/change of contractual
status 328 320
Resignations/end of contract (302) (283)
Net increase/(decrease) due to
changes in part-time working patterns 18 (10)
Total staff as at 31 December 1,607 1,563
Average number of staff employed 1,565 1,530

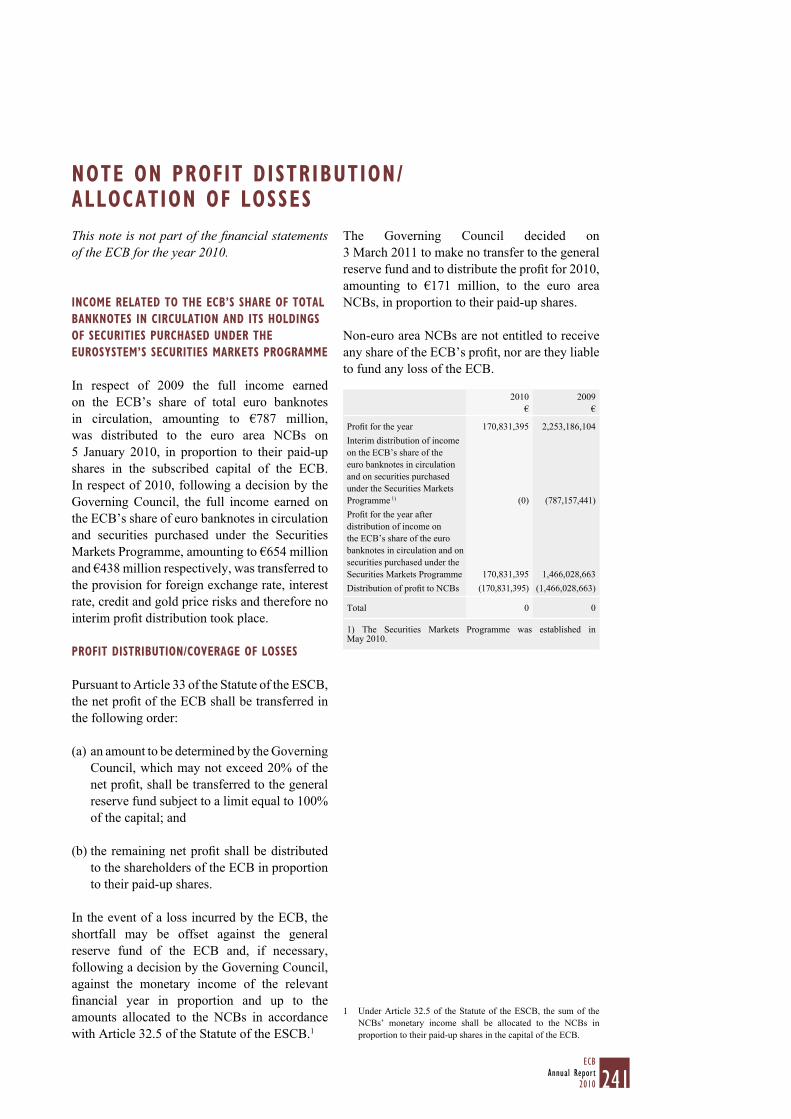
241ECB
Annual Report2010
This note is not part of the fi nancial statements of the ECB for the year 2010.
INCOME RELATED TO THE ECB’S SHARE OF TOTAL
BANKNOTES IN CIRCULATION AND ITS HOLDINGS
OF SECURITIES PURCHASED UNDER THE
EUROSYSTEM’S SECURITIES MARKETS PROGRAMME
In respect of 2009 the full income earned
on the ECB’s share of total euro banknotes
in circulation, amounting to €787 million,
was distributed to the euro area NCBs on
5 January 2010, in proportion to their paid-up
shares in the subscribed capital of the ECB.
In respect of 2010, following a decision by the
Governing Council, the full income earned on
the ECB’s share of euro banknotes in circulation
and securities purchased under the Securities
Markets Programme, amounting to €654 million
and €438 million respectively, was transferred to
the provision for foreign exchange rate, interest
rate, credit and gold price risks and therefore no
interim profi t distribution took place.
PROFIT DISTRIBUTION/COVERAGE OF LOSSES
Pursuant to Article 33 of the Statute of the ESCB,
the net profi t of the ECB shall be transferred in
the following order:
an amount to be determined by the Governing (a)
Council, which may not exceed 20% of the
net profi t, shall be transferred to the general
reserve fund subject to a limit equal to 100%
of the capital; and
the remaining net profi t shall be distributed (b)
to the shareholders of the ECB in proportion
to their paid-up shares.
In the event of a loss incurred by the ECB, the
shortfall may be offset against the general
reserve fund of the ECB and, if necessary,
following a decision by the Governing Council,
against the monetary income of the relevant
fi nancial year in proportion and up to the
amounts allocated to the NCBs in accordance
with Article 32.5 of the Statute of the ESCB.1
The Governing Council decided on
3 March 2011 to make no transfer to the general
reserve fund and to distribute the profi t for 2010,
amounting to €171 million, to the euro area
NCBs, in proportion to their paid-up shares.
Non-euro area NCBs are not entitled to receive
any share of the ECB’s profi t, nor are they liable
to fund any loss of the ECB.
Under Article 32.5 of the Statute of the ESCB, the sum of the 1
NCBs’ monetary income shall be allocated to the NCBs in
proportion to their paid-up shares in the capital of the ECB.
NOTE ON PROFIT DISTRIBUTION/ALLOCATION OF LOSSES
2010
€
2009
€
Profi t for the year 170,831,395 2,253,186,104
Interim distribution of income
on the ECB’s share of the
euro banknotes in circulation
and on securities purchased
under the Securities Markets
Programme 1) (0) (787,157,441)
Profi t for the year after
distribution of income on
the ECB’s share of the euro
banknotes in circulation and on
securities purchased under the
Securities Markets Programme 170,831,395 1,466,028,663
Distribution of profi t to NCBs (170,831,395) (1,466,028,663)
Total 0 0
1) The Securities Markets Programme was established in May 2010.

242ECBAnnual Report2010
6 CONSOLIDATED BALANCE SHEET OF THE EUROSYSTEM AS AT 31 DECEMBER 2010
(EUR MILLIONS)
ASSETS 31 DECEMBER
2010
31 DECEMBER
2009
1 Gold and gold receivables 367,402 266,919
2 Claims on non-euro area residentsdenominated in foreign currency 224,001 195,4792.1 Receivables from the IMF 71,319 62,799
2.2 Balances with banks and security investments,
external loans and other external assets 152,681 132,680
3 Claims on euro area residents denominated in foreign currency 26,940 32,151
4 Claims on non-euro area residents denominated in euro 22,603 15,1934.1 Balances with banks, security investments and loans 22,603 15,193
4.2 Claims arising from the credit facility under ERM II 0 0
5 Lending to euro area credit institutions relatedto monetary policy operations denominated in euro 546,747 749,8905.1 Main refi nancing operations 227,865 79,277
5.2 Longer-term refi nancing operations 298,217 669,297
5.3 Fine-tuning reverse operations 20,623 0
5.4 Structural reverse operations 0 0
5.5 Marginal lending facility 25 1,289
5.6 Credits related to margin calls 17 27
6 Other claims on euro area credit institutions denominated in euro 45,655 26,282
7 Securities of euro area residents denominated in euro 457,415 328,6527.1 Securities held for monetary policy purposes 134,829 28,782
7.2 Other securities 322,586 299,870
8 General government debt denominated in euro 34,954 36,171
9 Other assets 276,493 252,288
Total assets 2,002,210 1,903,024
Totals/subtotals may not add up due to rounding.

243ECB
Annual Report2010
LIABILITIES 31 DECEMBER
2010
31 DECEMBER
2009
1 Banknotes in circulation 839,702 806,522
2 Liabilities to euro area credit institutions related to monetary policy operations denominated in euro 378,008 395,6142.1 Current accounts (covering the minimum reserve system) 212,739 233,490
2.2 Deposit facility 104,458 162,117
2.3 Fixed-term deposits 60,784 0
2.4 Fine-tuning reverse operations 0 0
2.5 Deposits related to margin calls 27 6
3 Other liabilities to euro area credit institutions denominated in euro 2,808 340
4 Debt certifi cates issued 0 0
5 Liabilities to other euro area residents denominated in euro 79,792 129,7305.1 General government 71,685 120,495
5.2 Other liabilities 8,107 9,235
6 Liabilities to non-euro area residents denominated in euro 47,703 46,769
7 Liabilities to euro area residents denominated in foreign currency 1,995 4,032
8 Liabilities to non-euro area residents denominated in foreign currency 14,346 9,6168.1 Deposits, balances and other liabilities 14,346 9,616
8.2 Liabilities arising from the credit facility under ERM II 0 0
9 Counterpart of special drawing rights allocated by the IMF 54,480 51,249
10 Other liabilities 172,388 164,082
11 Revaluation accounts 331,510 220,101
12 Capital and reserves 79,479 74,969
Total liabilities 2,002,210 1,903,024


ANNEXES
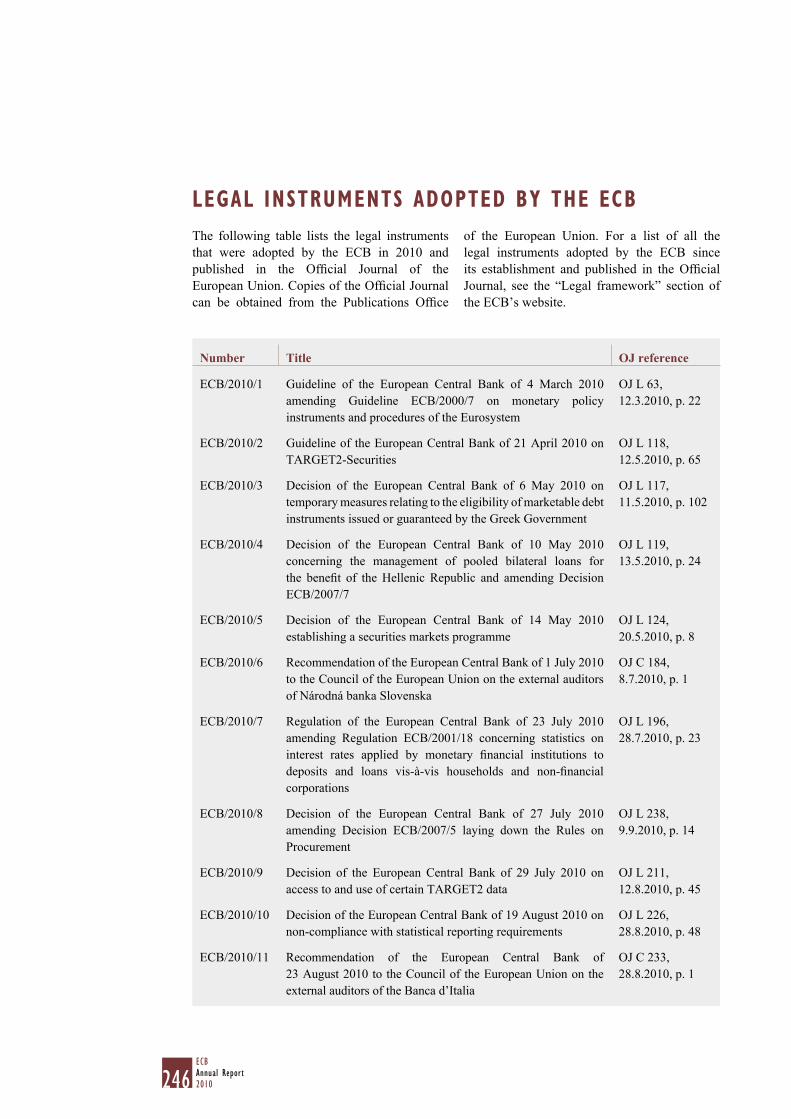
246ECBAnnual Report2010
LEGAL INSTRUMENTS ADOPTED BY THE ECB
The following table lists the legal instruments
that were adopted by the ECB in 2010 and
published in the Offi cial Journal of the
European Union. Copies of the Offi cial Journal
can be obtained from the Publications Offi ce
of the European Union. For a list of all the
legal instruments adopted by the ECB since
its establishment and published in the Offi cial
Journal, see the “Legal framework” section of
the ECB’s website.
Number Title OJ reference
ECB/2010/1 Guideline of the European Central Bank of 4 March 2010
amending Guideline ECB/2000/7 on monetary policy
instruments and procedures of the Eurosystem
OJ L 63,
12.3.2010, p. 22
ECB/2010/2 Guideline of the European Central Bank of 21 April 2010 on
TARGET2-Securities
OJ L 118,
12.5.2010, p. 65
ECB/2010/3 Decision of the European Central Bank of 6 May 2010 on
temporary measures relating to the eligibility of marketable debt
instruments issued or guaranteed by the Greek Government
OJ L 117,
11.5.2010, p. 102
ECB/2010/4 Decision of the European Central Bank of 10 May 2010
concerning the management of pooled bilateral loans for
the benefi t of the Hellenic Republic and amending Decision
ECB/2007/7
OJ L 119,
13.5.2010, p. 24
ECB/2010/5 Decision of the European Central Bank of 14 May 2010
establishing a securities markets programme
OJ L 124,
20.5.2010, p. 8
ECB/2010/6 Recommendation of the European Central Bank of 1 July 2010
to the Council of the European Union on the external auditors
of Národná banka Slovenska
OJ C 184,
8.7.2010, p. 1
ECB/2010/7 Regulation of the European Central Bank of 23 July 2010
amending Regulation ECB/2001/18 concerning statistics on
interest rates applied by monetary fi nancial institutions to
deposits and loans vis-à-vis households and non-fi nancial
corporations
OJ L 196,
28.7.2010, p. 23
ECB/2010/8 Decision of the European Central Bank of 27 July 2010
amending Decision ECB/2007/5 laying down the Rules on
Procurement
OJ L 238,
9.9.2010, p. 14
ECB/2010/9 Decision of the European Central Bank of 29 July 2010 on
access to and use of certain TARGET2 data
OJ L 211,
12.8.2010, p. 45
ECB/2010/10 Decision of the European Central Bank of 19 August 2010 on
non-compliance with statistical reporting requirements
OJ L 226,
28.8.2010, p. 48
ECB/2010/11 Recommendation of the European Central Bank of
23 August 2010 to the Council of the European Union on the
external auditors of the Banca d’Italia
OJ C 233,
28.8.2010, p. 1
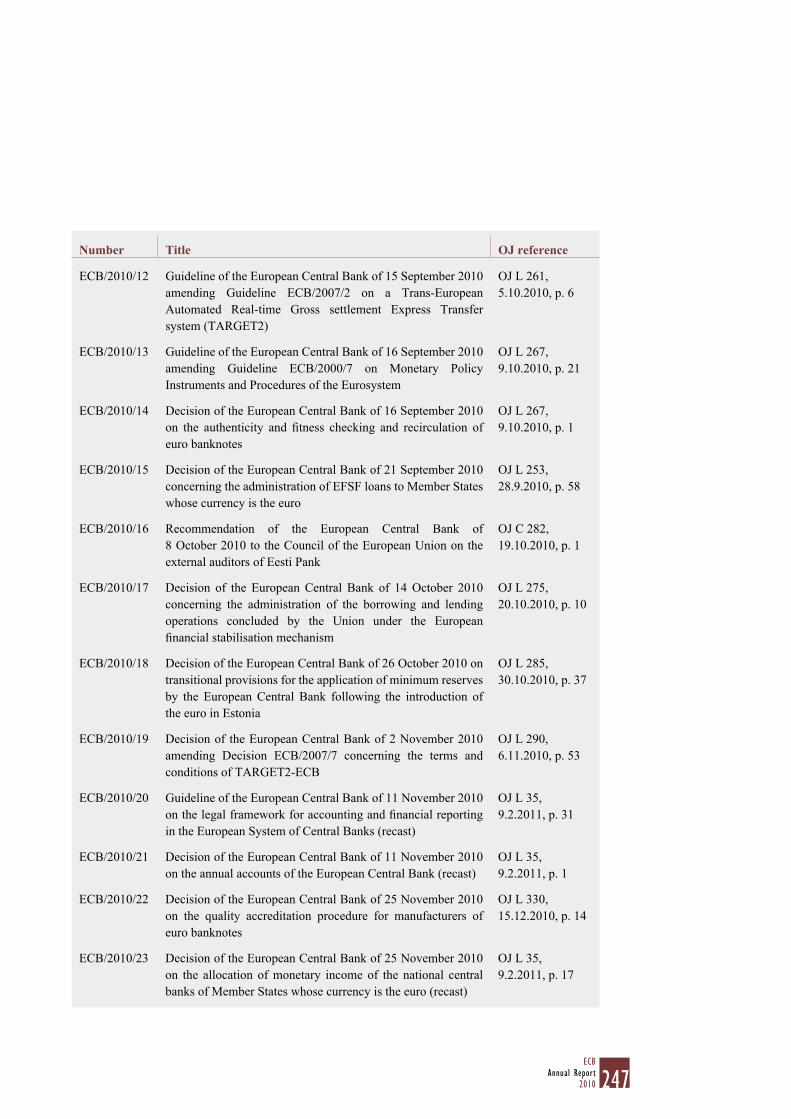
247ECB
Annual Report2010
Number Title OJ reference
ECB/2010/12 Guideline of the European Central Bank of 15 September 2010
amending Guideline ECB/2007/2 on a Trans-European
Automated Real-time Gross settlement Express Transfer
system (TARGET2)
OJ L 261,
5.10.2010, p. 6
ECB/2010/13 Guideline of the European Central Bank of 16 September 2010
amending Guideline ECB/2000/7 on Monetary Policy
Instruments and Procedures of the Eurosystem
OJ L 267,
9.10.2010, p. 21
ECB/2010/14 Decision of the European Central Bank of 16 September 2010
on the authenticity and fi tness checking and recirculation of
euro banknotes
OJ L 267,
9.10.2010, p. 1
ECB/2010/15 Decision of the European Central Bank of 21 September 2010
concerning the administration of EFSF loans to Member States
whose currency is the euro
OJ L 253,
28.9.2010, p. 58
ECB/2010/16 Recommendation of the European Central Bank of
8 October 2010 to the Council of the European Union on the
external auditors of Eesti Pank
OJ C 282,
19.10.2010, p. 1
ECB/2010/17 Decision of the European Central Bank of 14 October 2010
concerning the administration of the borrowing and lending
operations concluded by the Union under the European
fi nancial stabilisation mechanism
OJ L 275,
20.10.2010, p. 10
ECB/2010/18 Decision of the European Central Bank of 26 October 2010 on
transitional provisions for the application of minimum reserves
by the European Central Bank following the introduction of
the euro in Estonia
OJ L 285,
30.10.2010, p. 37
ECB/2010/19 Decision of the European Central Bank of 2 November 2010
amending Decision ECB/2007/7 concerning the terms and
conditions of TARGET2-ECB
OJ L 290,
6.11.2010, p. 53
ECB/2010/20 Guideline of the European Central Bank of 11 November 2010
on the legal framework for accounting and fi nancial reporting
in the European System of Central Banks (recast)
OJ L 35,
9.2.2011, p. 31
ECB/2010/21 Decision of the European Central Bank of 11 November 2010
on the annual accounts of the European Central Bank (recast)
OJ L 35,
9.2.2011, p. 1
ECB/2010/22 Decision of the European Central Bank of 25 November 2010
on the quality accreditation procedure for manufacturers of
euro banknotes
OJ L 330,
15.12.2010, p. 14
ECB/2010/23 Decision of the European Central Bank of 25 November 2010
on the allocation of monetary income of the national central
banks of Member States whose currency is the euro (recast)
OJ L 35,
9.2.2011, p. 17

248ECBAnnual Report2010
Number Title OJ reference
ECB/2010/24 Decision of the European Central Bank of 25 November 2010
on the interim distribution of the income of the European
Central Bank on euro banknotes in circulation and arising from
securities purchased under the securities markets programme
(recast)
OJ L 6,
11.1.2011, p. 35
ECB/2010/25 Decision of the European Central Bank of 29 November 2010
on the approval of the volume of coin issuance in 2011
OJ L 318,
4.12.2010, p. 52
ECB/2010/26 Decision of the European Central Bank of 13 December 2010
on the increase of the European Central Bank’s capital
OJ L 11,
15.1.2011, p. 53
ECB/2010/27 Decision of the European Central Bank of 13 December 2010
on the paying-up of the increase of the European Central Bank’s
capital by the national central banks of Member States whose
currency is the euro
OJ L 11,
15.1.2011, p. 54
ECB/2010/28 Decision of the European Central Bank of 13 December 2010
on the paying-up of the European Central Bank’s capital by the
non-euro area national central banks
OJ L 11,
15.1.2011, p. 56
ECB/2010/29 Decision of the European Central Bank of 13 December 2010
on the issue of euro banknotes (recast)
OJ L 35,
9.2.2011, p. 26
ECB/2010/30 Guideline of the European Central Bank of 13 December 2010
amending Guideline ECB/2000/7 on monetary policy
instruments and procedures of the Eurosystem
OJ L 336,
21.12.2010, p. 63
ECB/2010/31 Decision of the European Central Bank of 20 December 2010
concerning the opening of accounts for the processing of
payments in connection with EFSF loans to Member States
whose currency is the euro
OJ L 10,
14.1.2011, p. 7
ECB/2010/32 Decision of the European Central Bank of 22 December 2010
amending Decision ECB/2009/25 on the approval of the
volume of coin issuance in 2010
OJ L 343,
29.12.2010, p. 78
ECB/2010/33 Decision of the European Central Bank of 27 December 2010
on the transmission of confi dential data under the common
framework for business registers for statistical purposes
OJ L 6,
11.1.2011, p. 37
ECB/2010/34 Decision of the European Central Bank of 31 December 2010
on the paying-up of capital, transfer of foreign reserve assets
and contributions by Eesti Pank to the European Central Bank’s
reserves and provisions
OJ L 11,
15.1.2011, p. 58

249ECB
Annual Report2010
OPINIONS ADOPTED BY THE ECB
The following table lists the opinions adopted
by the ECB in 2010 and early 2011 under
Articles 127(4) and 282(5) of the Treaty
and Article 4 of the Statute of the ESCB.
For a list of all the opinions adopted by
the ECB since its establishment, see the
“Legal framework” section of the ECB’s
website.
(a) ECB opinions following a consultation by a European institution
Number 1 Originator Subject OJ reference
CON/2010/5 Council Three proposals for regulations of the
European Parliament and of the Council
establishing a European Banking Authority,
a European Insurance and Occupational
Pensions Authority and a European Securities
and Markets Authority
OJ C 13,
20.1.2010, p. 1
CON/2010/6 Council A proposal for a directive of the European
Parliament and of the Council amending
Directives 2003/71/EC and 2004/109/EC
OJ C 19,
26.1.2010, p. 1
CON/2010/19 European
Council
A Council recommendation on the appointment
of the Vice-President of the European Central
Bank
OJ C 58,
10.3.2010, p. 3
CON/2010/23 Council A proposal for a directive of the European
Parliament and of the Council amending
Directives 1998/26/EC, 2002/87/EC, 2003/6/EC,
2003/41/EC, 2003/71/EC, 2004/39/EC, 2004/109/
EC, 2005/60/EC, 2006/48/EC, 2006/49/EC,
and 2009/65/EC in respect of the powers of the
European Banking Authority, the European
Insurance and Occupational Pensions
Authority and the European Securities and
Markets Authority
OJ C 87,
1.4.2010, p. 1
CON/2010/28 Council A proposal for a Council regulation amending
Regulation (EC) No 479/2009 as regards the
quality of statistical data in the context of the
excessive defi cit procedure
OJ C 103,
22.4.2010, p. 1
CON/2010/52 Council A proposal for a Council regulation amending
Regulation (EC) No 974/98 as regards the
introduction of the euro in Estonia and a
proposal for a Council regulation amending
Regulation (EC) No 2866/98 as regards the
conversion rate to the euro for Estonia
OJ C 190,
14.7.2010, p. 1
1 Consultations are numbered in the order in which the Governing Council adopted them.

250ECBAnnual Report2010
Number 1 Originator Subject OJ reference
CON/2010/65 Own-initiative A proposal for a directive of the European
Parliament and of the Council amending
Directives 2006/48/EC and 2006/49/EC as
regards capital requirements for the trading
book and for re-securitisations, and the
supervisory review of remuneration policies
OJ C 223,
18.8.2010, p. 1
CON/2010/67 European
Commission
A proposal for a Commission regulation laying
down detailed rules for the implementation
of Council Regulation (EC) No 2494/95 as
regards minimum standards for the quality of
HICP weightings and repealing Commission
Regulation (EC) No 2454/97
OJ C 252,
18.9.2010, p. 1
CON/2010/72 European
Parliament
and the
Council
Two proposals for regulations on the
professional cross-border transportation of
euro cash by road between euro-area Member
States
OJ C 278,
15.10.2010, p. 1
CON/2010/82 Council A proposal for a regulation of the European
Parliament and of the Council amending
Regulation (EC) No 1060/2009 on credit
rating agencies
OJ C 337,
14.12.2010, p. 1
CON/2011/1 Council A proposal for a regulation of the European
Parliament and of the Council on OTC
derivatives, central counterparties and trade
repositories
OJ C 57,
23.2.2011, p. 1
CON/2011/6 Council A proposal for a Directive of the European
Parliament and of the Council amending
Directives 98/78/EC, 2002/87/EC and 2006/48
EC as regards the supplementary supervision of
fi nancial entities in a fi nancial conglomerate
OJ C 62,
26.2.2011, p. 1
CON/2011/8 Council A recommendation for a Council decision
on arrangements for the renegotiation of the
Monetary Agreement with the Principality of
Monaco
OJ C 60,
25.2.2011, p. 1
CON/2011/12 Council A proposal for a Directive of the European
Parliament and of the Council on deposit
guarantee schemes (recast) and a proposal for
a Directive amending Directive 97/9/EC of
the European Parliament and of the Council
on investor-compensation schemes
Not yet published
in the Offi cial Journal of the European Union
CON/2011/13 Council Economic governance reform in the European
Union
Not yet published
in the Offi cial Journal of the European Union
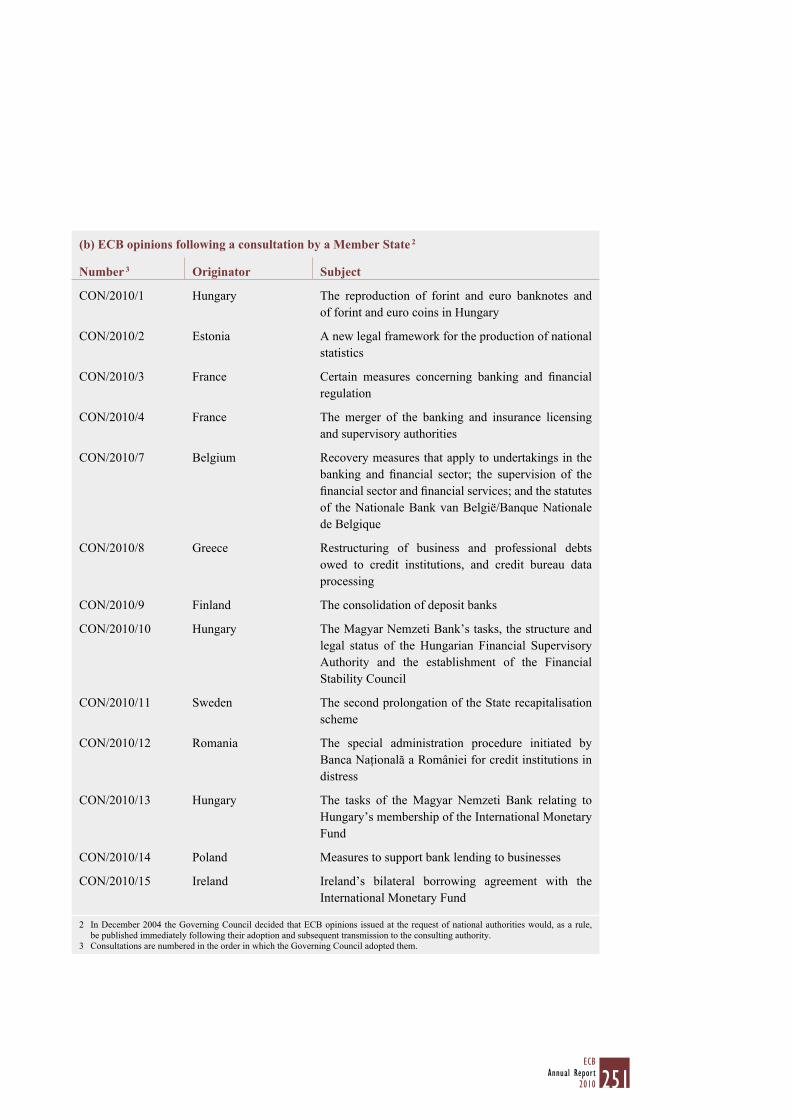
251ECB
Annual Report2010
(b) ECB opinions following a consultation by a Member State 2
Number 3 Originator Subject
CON/2010/1 Hungary The reproduction of forint and euro banknotes and
of forint and euro coins in Hungary
CON/2010/2 Estonia A new legal framework for the production of national
statistics
CON/2010/3 France Certain measures concerning banking and fi nancial
regulation
CON/2010/4 France The merger of the banking and insurance licensing
and supervisory authorities
CON/2010/7 Belgium Recovery measures that apply to undertakings in the
banking and fi nancial sector; the supervision of the
fi nancial sector and fi nancial services; and the statutes
of the Nationale Bank van België/Banque Nationale
de Belgique
CON/2010/8 Greece Restructuring of business and professional debts
owed to credit institutions, and credit bureau data
processing
CON/2010/9 Finland The consolidation of deposit banks
CON/2010/10 Hungary The Magyar Nemzeti Bank’s tasks, the structure and
legal status of the Hungarian Financial Supervisory
Authority and the establishment of the Financial
Stability Council
CON/2010/11 Sweden The second prolongation of the State recapitalisation
scheme
CON/2010/12 Romania The special administration procedure initiated by
Banca Naţională a României for credit institutions in
distress
CON/2010/13 Hungary The tasks of the Magyar Nemzeti Bank relating to
Hungary’s membership of the International Monetary
Fund
CON/2010/14 Poland Measures to support bank lending to businesses
CON/2010/15 Ireland Ireland’s bilateral borrowing agreement with the
International Monetary Fund
2 In December 2004 the Governing Council decided that ECB opinions issued at the request of national authorities would, as a rule,
be published immediately following their adoption and subsequent transmission to the consulting authority.
3 Consultations are numbered in the order in which the Governing Council adopted them.
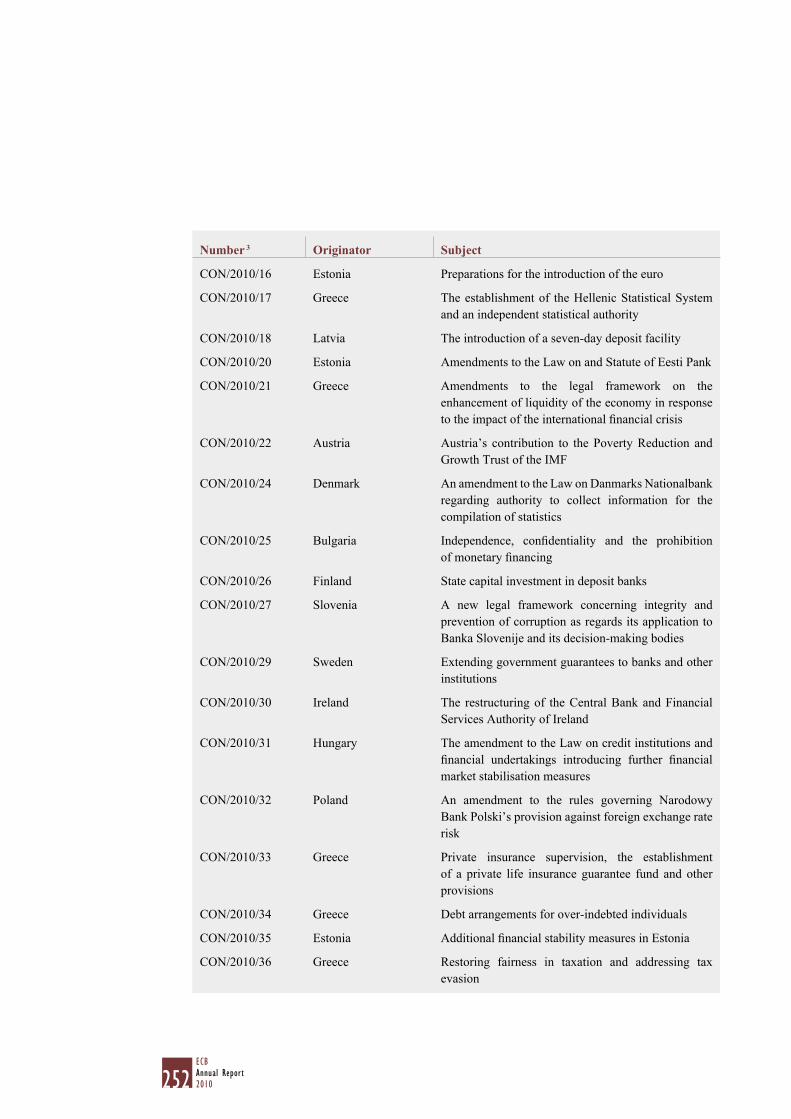
252ECBAnnual Report2010
Number 3 Originator Subject
CON/2010/16 Estonia Preparations for the introduction of the euro
CON/2010/17 Greece The establishment of the Hellenic Statistical System
and an independent statistical authority
CON/2010/18 Latvia The introduction of a seven-day deposit facility
CON/2010/20 Estonia Amendments to the Law on and Statute of Eesti Pank
CON/2010/21 Greece Amendments to the legal framework on the
enhancement of liquidity of the economy in response
to the impact of the international fi nancial crisis
CON/2010/22 Austria Austria’s contribution to the Poverty Reduction and
Growth Trust of the IMF
CON/2010/24 Denmark An amendment to the Law on Danmarks Nationalbank
regarding authority to collect information for the
compilation of statistics
CON/2010/25 Bulgaria Independence, confi dentiality and the prohibition
of monetary fi nancing
CON/2010/26 Finland State capital investment in deposit banks
CON/2010/27 Slovenia A new legal framework concerning integrity and
prevention of corruption as regards its application to
Banka Slovenije and its decision-making bodies
CON/2010/29 Sweden Extending government guarantees to banks and other
institutions
CON/2010/30 Ireland The restructuring of the Central Bank and Financial
Services Authority of Ireland
CON/2010/31 Hungary The amendment to the Law on credit institutions and
fi nancial undertakings introducing further fi nancial
market stabilisation measures
CON/2010/32 Poland An amendment to the rules governing Narodowy
Bank Polski’s provision against foreign exchange rate
risk
CON/2010/33 Greece Private insurance supervision, the establishment
of a private life insurance guarantee fund and other
provisions
CON/2010/34 Greece Debt arrangements for over-indebted individuals
CON/2010/35 Estonia Additional fi nancial stability measures in Estonia
CON/2010/36 Greece Restoring fairness in taxation and addressing tax
evasion
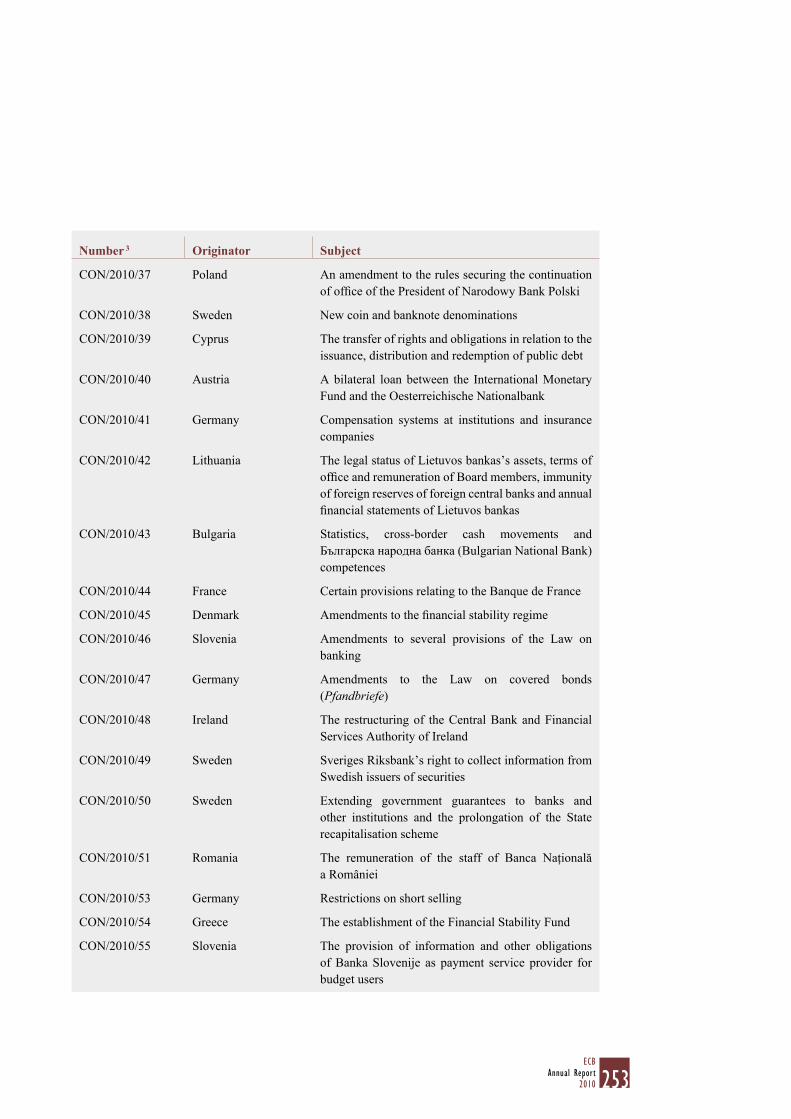
253ECB
Annual Report2010
Number 3 Originator Subject
CON/2010/37 Poland An amendment to the rules securing the continuation
of offi ce of the President of Narodowy Bank Polski
CON/2010/38 Sweden New coin and banknote denominations
CON/2010/39 Cyprus The transfer of rights and obligations in relation to the
issuance, distribution and redemption of public debt
CON/2010/40 Austria A bilateral loan between the International Monetary
Fund and the Oesterreichische Nationalbank
CON/2010/41 Germany Compensation systems at institutions and insurance
companies
CON/2010/42 Lithuania The legal status of Lietuvos bankas’s assets, terms of
offi ce and remuneration of Board members, immunity
of foreign reserves of foreign central banks and annual
fi nancial statements of Lietuvos bankas
CON/2010/43 Bulgaria Statistics, cross-border cash movements and
Българска народна банка (Bulgarian National Bank)
competences
CON/2010/44 France Certain provisions relating to the Banque de France
CON/2010/45 Denmark Amendments to the fi nancial stability regime
CON/2010/46 Slovenia Amendments to several provisions of the Law on
banking
CON/2010/47 Germany Amendments to the Law on covered bonds
(Pfandbriefe)
CON/2010/48 Ireland The restructuring of the Central Bank and Financial
Services Authority of Ireland
CON/2010/49 Sweden Sveriges Riksbank’s right to collect information from
Swedish issuers of securities
CON/2010/50 Sweden Extending government guarantees to banks and
other institutions and the prolongation of the State
recapitalisation scheme
CON/2010/51 Romania The remuneration of the staff of Banca Naţională
a României
CON/2010/53 Germany Restrictions on short selling
CON/2010/54 Greece The establishment of the Financial Stability Fund
CON/2010/55 Slovenia The provision of information and other obligations
of Banka Slovenije as payment service provider for
budget users
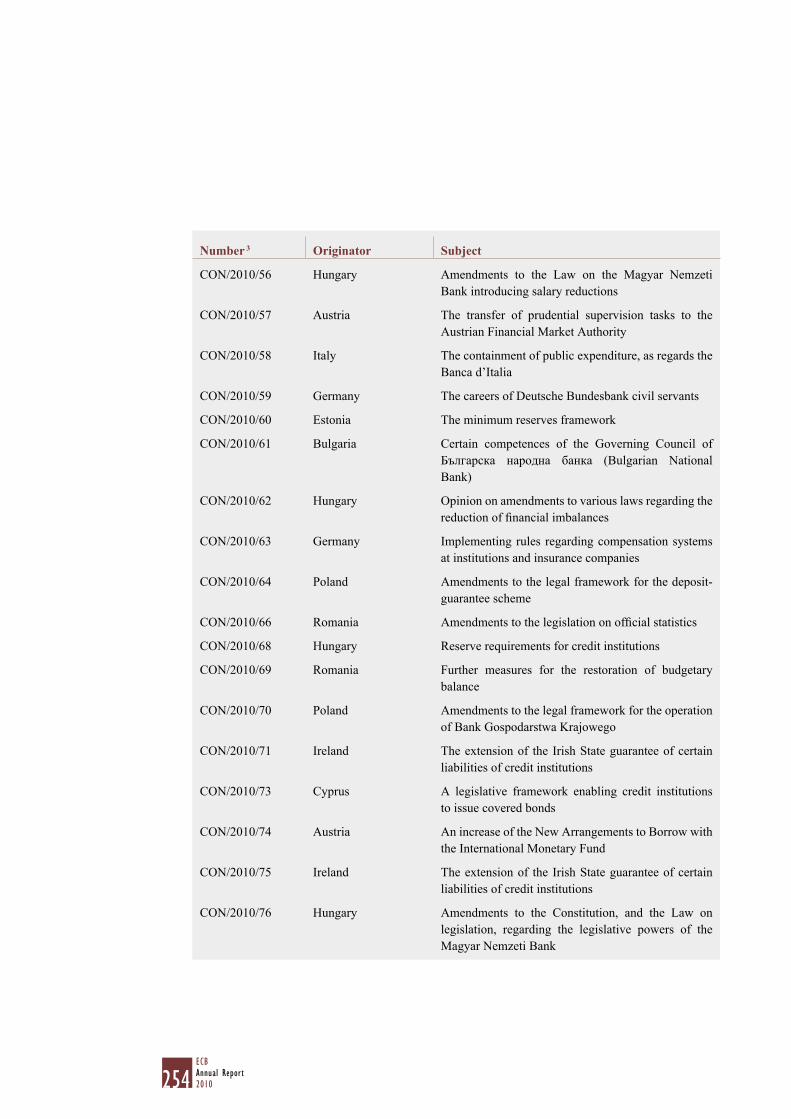
254ECBAnnual Report2010
Number 3 Originator Subject
CON/2010/56 Hungary Amendments to the Law on the Magyar Nemzeti
Bank introducing salary reductions
CON/2010/57 Austria The transfer of prudential supervision tasks to the
Austrian Financial Market Authority
CON/2010/58 Italy The containment of public expenditure, as regards the
Banca d’Italia
CON/2010/59 Germany The careers of Deutsche Bundesbank civil servants
CON/2010/60 Estonia The minimum reserves framework
CON/2010/61 Bulgaria Certain competences of the Governing Council of
Българска народна банка (Bulgarian National
Bank)
CON/2010/62 Hungary Opinion on amendments to various laws regarding the
reduction of fi nancial imbalances
CON/2010/63 Germany Implementing rules regarding compensation systems
at institutions and insurance companies
CON/2010/64 Poland Amendments to the legal framework for the deposit-
guarantee scheme
CON/2010/66 Romania Amendments to the legislation on offi cial statistics
CON/2010/68 Hungary Reserve requirements for credit institutions
CON/2010/69 Romania Further measures for the restoration of budgetary
balance
CON/2010/70 Poland Amendments to the legal framework for the operation
of Bank Gospodarstwa Krajowego
CON/2010/71 Ireland The extension of the Irish State guarantee of certain
liabilities of credit institutions
CON/2010/73 Cyprus A legislative framework enabling credit institutions
to issue covered bonds
CON/2010/74 Austria An increase of the New Arrangements to Borrow with
the International Monetary Fund
CON/2010/75 Ireland The extension of the Irish State guarantee of certain
liabilities of credit institutions
CON/2010/76 Hungary Amendments to the Constitution, and the Law on
legislation, regarding the legislative powers of the
Magyar Nemzeti Bank

255ECB
Annual Report2010
Number 3 Originator Subject
CON/2010/77 Latvia Amendments to the monetary policy operations
framework with a view to further harmonising it with
the Eurosystem
CON/2010/78 Luxembourg Amendments to the legislation on fi nancial collateral
arrangements as regards credit claims
CON/2010/79 Bulgaria Restrictions on cash payments
CON/2010/80 Portugal The Banco de Portugal’s staff remuneration and the
budget
CON/2010/81 Poland Building societies
CON/2010/83 Germany The restructuring of banks
CON/2010/84 Estonia The minimum reserves framework
CON/2010/85 Own-initiative The ratifi cation or implementation of a Postal Payment
Services Agreement
CON/2010/86 Romania The temporary holding of shares by credit institutions
in the course of fi nancial reconstructions or rescue
operations of undertakings
CON/2010/87 Greece Authenticity, fi tness checking and recirculation of
euro banknotes, and sanctions for the failure to protect
euro banknotes and coins against counterfeiting
CON/2010/88 France The increase of Banque de France’s capital and
statutory reserve
CON/2010/89 Slovakia Certain new provisions on cash currency circulation
CON/2010/90 Malta Authenticity, fi tness checking and recirculation
of euro banknotes
CON/2010/91 Hungary The appointment and dismissal of Monetary Council
members and the remuneration of the members of the
Magyar Nemzeti Bank’s Supervisory Board
CON/2010/92 Ireland Emergency stabilisation of credit institutions
CON/2010/93 Sweden Extending government guarantees to banks and
other institutions and the prolongation of the State
recapitalisation scheme
CON/2010/94 Hungary The Hungarian Financial Supervisory Authority and
its President’s legislative powers
CON/2010/95 Poland The extension of State Treasury support and
recapitalisation measures to fi nancial institutions
subject to a European Commission decision
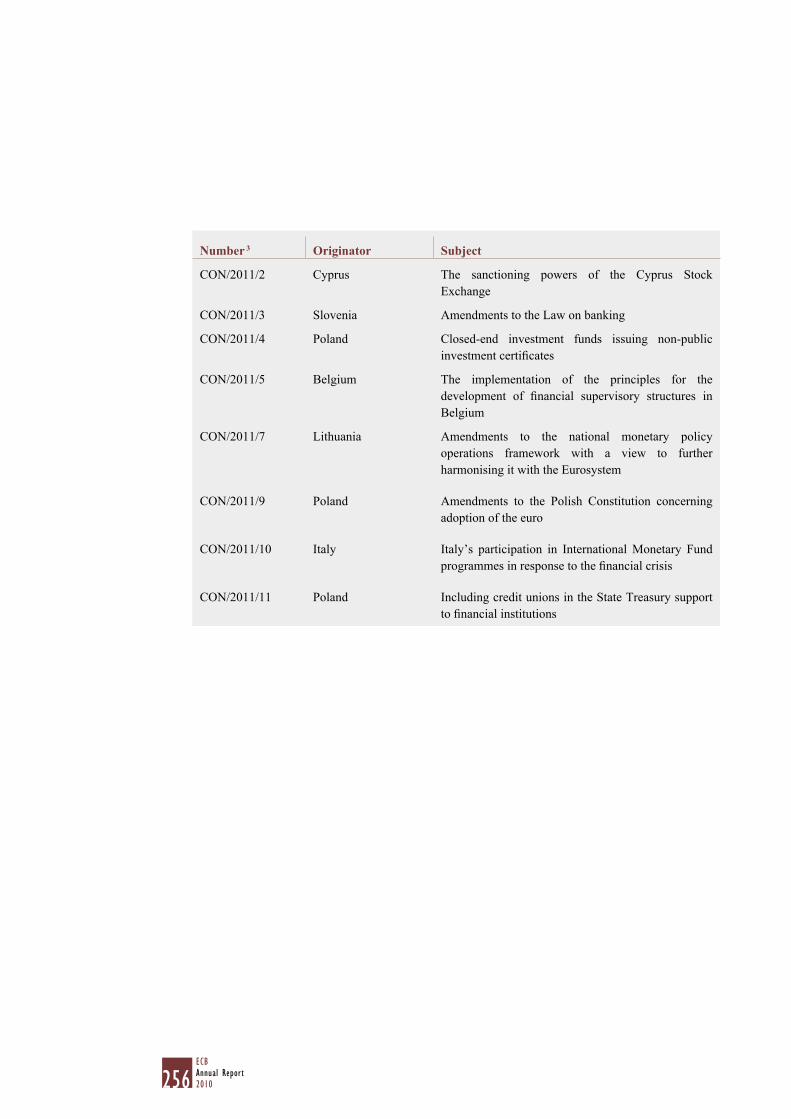
256ECBAnnual Report2010
Number 3 Originator Subject
CON/2011/2 Cyprus The sanctioning powers of the Cyprus Stock
Exchange
CON/2011/3 Slovenia Amendments to the Law on banking
CON/2011/4 Poland Closed-end investment funds issuing non-public
investment certifi cates
CON/2011/5 Belgium The implementation of the principles for the
development of fi nancial supervisory structures in
Belgium
CON/2011/7 Lithuania Amendments to the national monetary policy
operations framework with a view to further
harmonising it with the Eurosystem
CON/2011/9 Poland Amendments to the Polish Constitution concerning
adoption of the euro
CON/2011/10 Italy Italy’s participation in International Monetary Fund
programmes in response to the fi nancial crisis
CON/2011/11 Poland Including credit unions in the State Treasury support
to fi nancial institutions

257ECB
Annual Report2010
15 JANUARY 2009
The Governing Council of the ECB decides
to decrease the interest rate on the main
refi nancing operations by 50 basis points
to 2.00%, starting from the operations to
be settled on 21 January 2009. In addition,
it decides that the interest rates on the marginal
lending and the deposit facility will be 3.00%
and 1.00% respectively, with effect from
21 January 2009, in line with the decision of
18 December 2008.
5 FEBRUARY 2009
The Governing Council of the ECB decides
that the interest rate on the main refi nancing
operations and the interest rates on the marginal
lending facility and the deposit facility will
remain unchanged at 2.00%, 3.00% and 1.00%
respectively.
5 MARCH 2009
The Governing Council of the ECB decides
to decrease the interest rate on the main
refi nancing operations by 50 basis points
to 1.50%, starting from the operations to
be settled on 11 March 2009. In addition, it
decides that the interest rates on the marginal
lending and the deposit facility will be 2.50%
and 0.50% respectively, with effect from
11 March 2009.
Moreover, the Governing Council decides
to continue the fi xed rate tender procedure
with full allotment for all main refi nancing
operations, special-term refi nancing operations
and supplementary and regular longer-term
refi nancing operations for as long as needed,
and in any case beyond the end of 2009. In
addition, the Governing Council decides to
continue with the current frequency and maturity
profi le of supplementary longer-term refi nancing
operations and special-term refi nancing operations
for as long as needed, and in any case beyond
the end of 2009.
2 APRIL 2009
The Governing Council of the ECB decides
to decrease the interest rate on the main
refi nancing operations by 25 basis points to
1.25%, starting from the operations to be settled
on 8 April 2009. In addition, it decides that
the interest rates on the marginal lending and
the deposit facility will be 2.25% and 0.25%
respectively, with effect from 8 April 2009.
7 MAY 2009
The Governing Council of the ECB decides to
decrease the interest rate on the main refi nancing
operations by 25 basis points to 1.00%, starting
from the operation to be settled on 13 May 2009.
In addition, it decides to decrease the interest rate
on the marginal lending facility by 50 basis points
to 1.75% with effect from 13 May 2009, and
to leave the interest rate on the deposit facility
unchanged at 0.25%. In addition, the Governing
Council of the ECB decides to proceed with its
enhanced credit support approach. In particular,
it decides that the Eurosystem will conduct
liquidity-providing longer-term refi nancing
operations with a maturity of one year as fi xed rate
tender procedures with full allotment. In addition,
it decides in principle that the Eurosystem will
purchase euro-denominated covered bonds issued
in the euro area.
4 JUNE 2009
The Governing Council of the ECB decides
that the interest rate on the main refi nancing
operations and the interest rates on the marginal
lending facility and the deposit facility will
remain unchanged at 1.00%, 1.75% and 0.25%
respectively. In addition, the Governing Council
of the ECB decides upon the technical modalities
related to the purchase of euro-denominated
covered bonds issued in the euro area decided
on 7 May 2009.
CHRONOLOGY OF MONETARY POLICY MEASURES OF THE EUROSYSTEM1
The chronology of monetary policy measures taken by the 1
Eurosystem between 1999 and 2008 can be found in the ECB’s
Annual Report for the respective years.
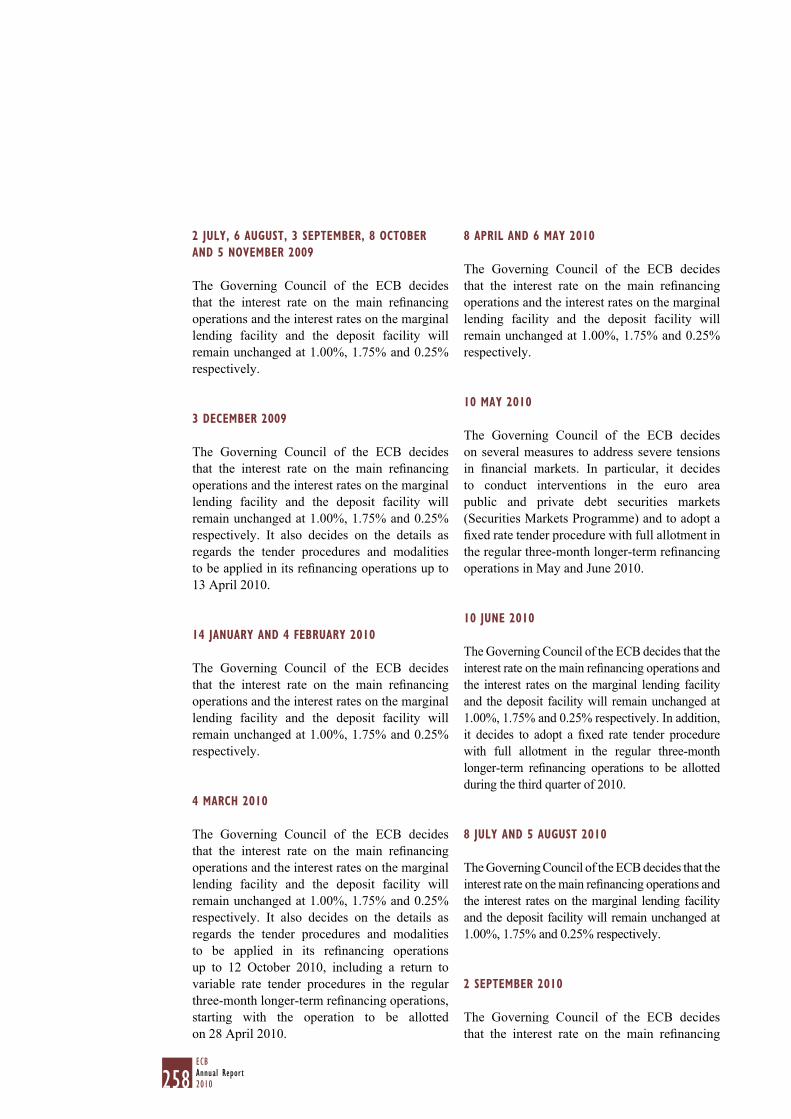
258ECBAnnual Report2010
2 JULY, 6 AUGUST, 3 SEPTEMBER, 8 OCTOBER
AND 5 NOVEMBER 2009
The Governing Council of the ECB decides
that the interest rate on the main refi nancing
operations and the interest rates on the marginal
lending facility and the deposit facility will
remain unchanged at 1.00%, 1.75% and 0.25%
respectively.
3 DECEMBER 2009
The Governing Council of the ECB decides
that the interest rate on the main refi nancing
operations and the interest rates on the marginal
lending facility and the deposit facility will
remain unchanged at 1.00%, 1.75% and 0.25%
respectively. It also decides on the details as
regards the tender procedures and modalities
to be applied in its refi nancing operations up to
13 April 2010.
14 JANUARY AND 4 FEBRUARY 2010
The Governing Council of the ECB decides
that the interest rate on the main refi nancing
operations and the interest rates on the marginal
lending facility and the deposit facility will
remain unchanged at 1.00%, 1.75% and 0.25%
respectively.
4 MARCH 2010
The Governing Council of the ECB decides
that the interest rate on the main refi nancing
operations and the interest rates on the marginal
lending facility and the deposit facility will
remain unchanged at 1.00%, 1.75% and 0.25%
respectively. It also decides on the details as
regards the tender procedures and modalities
to be applied in its refi nancing operations
up to 12 October 2010, including a return to
variable rate tender procedures in the regular
three-month longer-term refi nancing operations,
starting with the operation to be allotted
on 28 April 2010.
8 APRIL AND 6 MAY 2010
The Governing Council of the ECB decides
that the interest rate on the main refi nancing
operations and the interest rates on the marginal
lending facility and the deposit facility will
remain unchanged at 1.00%, 1.75% and 0.25%
respectively.
10 MAY 2010
The Governing Council of the ECB decides
on several measures to address severe tensions
in fi nancial markets. In particular, it decides
to conduct interventions in the euro area
public and private debt securities markets
(Securities Markets Programme) and to adopt a
fi xed rate tender procedure with full allotment in
the regular three-month longer-term refi nancing
operations in May and June 2010.
10 JUNE 2010
The Governing Council of the ECB decides that the
interest rate on the main refi nancing operations and
the interest rates on the marginal lending facility
and the deposit facility will remain unchanged at
1.00%, 1.75% and 0.25% respectively. In addition,
it decides to adopt a fi xed rate tender procedure
with full allotment in the regular three-month
longer-term refi nancing operations to be allotted
during the third quarter of 2010.
8 JULY AND 5 AUGUST 2010
The Governing Council of the ECB decides that the
interest rate on the main refi nancing operations and
the interest rates on the marginal lending facility
and the deposit facility will remain unchanged at
1.00%, 1.75% and 0.25% respectively.
2 SEPTEMBER 2010
The Governing Council of the ECB decides
that the interest rate on the main refi nancing
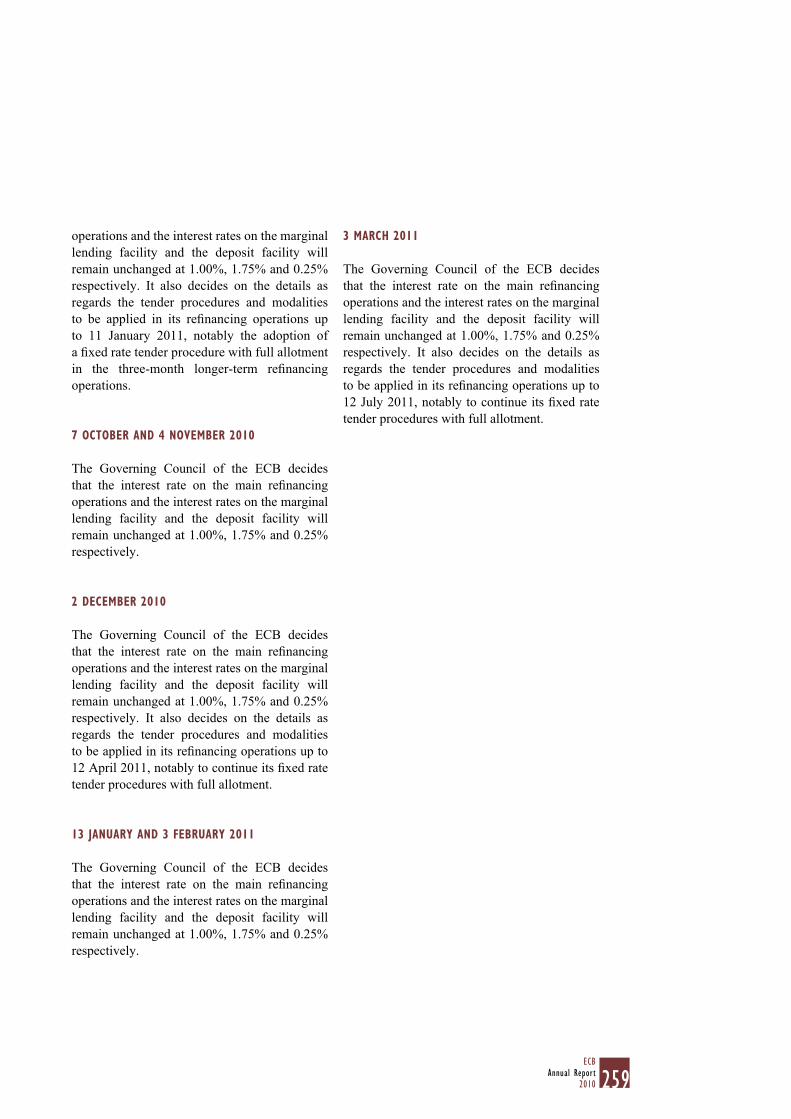
259ECB
Annual Report2010
operations and the interest rates on the marginal
lending facility and the deposit facility will
remain unchanged at 1.00%, 1.75% and 0.25%
respectively. It also decides on the details as
regards the tender procedures and modalities
to be applied in its refi nancing operations up
to 11 January 2011, notably the adoption of
a fi xed rate tender procedure with full allotment
in the three-month longer-term refi nancing
operations.
7 OCTOBER AND 4 NOVEMBER 2010
The Governing Council of the ECB decides
that the interest rate on the main refi nancing
operations and the interest rates on the marginal
lending facility and the deposit facility will
remain unchanged at 1.00%, 1.75% and 0.25%
respectively.
2 DECEMBER 2010
The Governing Council of the ECB decides
that the interest rate on the main refi nancing
operations and the interest rates on the marginal
lending facility and the deposit facility will
remain unchanged at 1.00%, 1.75% and 0.25%
respectively. It also decides on the details as
regards the tender procedures and modalities
to be applied in its refi nancing operations up to
12 April 2011, notably to continue its fi xed rate
tender procedures with full allotment.
13 JANUARY AND 3 FEBRUARY 2011
The Governing Council of the ECB decides
that the interest rate on the main refi nancing
operations and the interest rates on the marginal
lending facility and the deposit facility will
remain unchanged at 1.00%, 1.75% and 0.25%
respectively.
3 MARCH 2011
The Governing Council of the ECB decides
that the interest rate on the main refi nancing
operations and the interest rates on the marginal
lending facility and the deposit facility will
remain unchanged at 1.00%, 1.75% and 0.25%
respectively. It also decides on the details as
regards the tender procedures and modalities
to be applied in its refi nancing operations up to
12 July 2011, notably to continue its fi xed rate
tender procedures with full allotment.
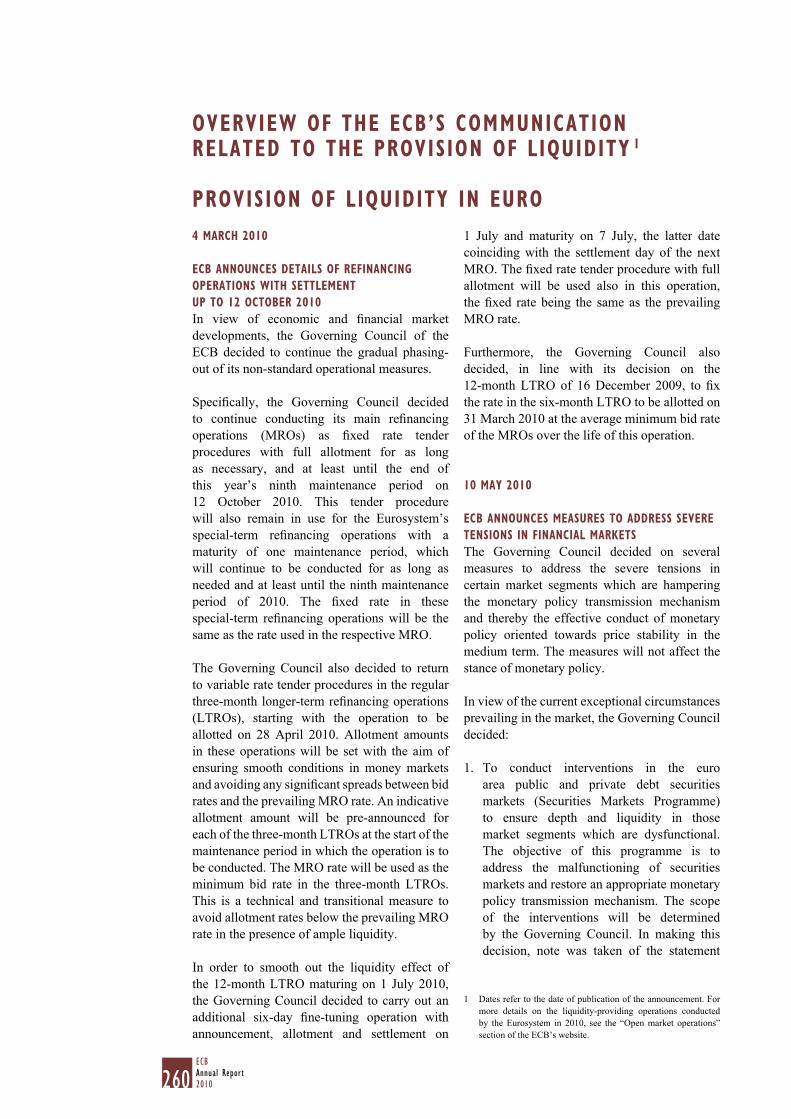
260ECBAnnual Report2010
4 MARCH 2010
ECB ANNOUNCES DETAILS OF REFINANCING
OPERATIONS WITH SETTLEMENT
UP TO 12 OCTOBER 2010
In view of economic and fi nancial market
developments, the Governing Council of the
ECB decided to continue the gradual phasing-
out of its non-standard operational measures.
Specifi cally, the Governing Council decided
to continue conducting its main refi nancing
operations (MROs) as fi xed rate tender
procedures with full allotment for as long
as necessary, and at least until the end of
this year’s ninth maintenance period on
12 October 2010. This tender procedure
will also remain in use for the Eurosystem’s
special-term refi nancing operations with a
maturity of one maintenance period, which
will continue to be conducted for as long as
needed and at least until the ninth maintenance
period of 2010. The fi xed rate in these
special-term refi nancing operations will be the
same as the rate used in the respective MRO.
The Governing Council also decided to return
to variable rate tender procedures in the regular
three-month longer-term refi nancing operations
(LTROs), starting with the operation to be
allotted on 28 April 2010. Allotment amounts
in these operations will be set with the aim of
ensuring smooth conditions in money markets
and avoiding any signifi cant spreads between bid
rates and the prevailing MRO rate. An indicative
allotment amount will be pre-announced for
each of the three-month LTROs at the start of the
maintenance period in which the operation is to
be conducted. The MRO rate will be used as the
minimum bid rate in the three-month LTROs.
This is a technical and transitional measure to
avoid allotment rates below the prevailing MRO
rate in the presence of ample liquidity.
In order to smooth out the liquidity effect of
the 12-month LTRO maturing on 1 July 2010,
the Governing Council decided to carry out an
additional six-day fi ne-tuning operation with
announcement, allotment and settlement on
1 July and maturity on 7 July, the latter date
coinciding with the settlement day of the next
MRO. The fi xed rate tender procedure with full
allotment will be used also in this operation,
the fi xed rate being the same as the prevailing
MRO rate.
Furthermore, the Governing Council also
decided, in line with its decision on the
12-month LTRO of 16 December 2009, to fi x
the rate in the six-month LTRO to be allotted on
31 March 2010 at the average minimum bid rate
of the MROs over the life of this operation.
10 MAY 2010
ECB ANNOUNCES MEASURES TO ADDRESS SEVERE
TENSIONS IN FINANCIAL MARKETS
The Governing Council decided on several
measures to address the severe tensions in
certain market segments which are hampering
the monetary policy transmission mechanism
and thereby the effective conduct of monetary
policy oriented towards price stability in the
medium term. The measures will not affect the
stance of monetary policy.
In view of the current exceptional circumstances
prevailing in the market, the Governing Council
decided:
To conduct interventions in the euro 1.
area public and private debt securities
markets (Securities Markets Programme)
to ensure depth and liquidity in those
market segments which are dysfunctional.
The objective of this programme is to
address the malfunctioning of securities
markets and restore an appropriate monetary
policy transmission mechanism. The scope
of the interventions will be determined
by the Governing Council. In making this
decision, note was taken of the statement
OVERVIEW OF THE ECB’S COMMUNICATION RELATED TO THE PROVISION OF LIQUIDITY 1
PROVISION OF LIQUIDITY IN EURO
Dates refer to the date of publication of the announcement. For 1
more details on the liquidity-providing operations conducted
by the Eurosystem in 2010, see the “Open market operations”
section of the ECB’s website.
261ECB
Annual Report2010
of the euro area governments that they
“will take all measures needed to meet
fi scal targets this year and the years ahead
in line with excessive defi cit procedures” and of the precise additional commitments
taken by some euro area governments to
accelerate fi scal consolidation and ensure
the sustainability of their public fi nances.
In order to sterilise the impact of the above
interventions, specifi c operations will be
conducted to reabsorb the liquidity injected
through the Securities Markets Programme.
This will ensure that the monetary policy
stance will not be affected.
To adopt a fi xed rate tender procedure with 2.
full allotment in the regular three-month
LTROs to be allotted on 26 May and
30 June 2010.
To conduct a six-month LTRO with full 3.
allotment on 12 May 2010, at a rate which
will be fi xed at the average minimum
bid rate of the MROs over the life of this
operation.
To reactivate, in coordination with other 4.
central banks, the temporary liquidity swap
lines with the Federal Reserve, and resume
US dollar liquidity-providing operations at
terms of seven and 84 days. These operations
will take the form of repurchase operations
against ECB-eligible collateral and will be
carried out as fi xed rate tenders with full
allotment. The fi rst operation will be carried
out on 11 May 2010.
10 JUNE 2010
ECB ANNOUNCES DETAILS OF LONGER-TERM
REFINANCING OPERATIONS IN THE THIRD
QUARTER OF 2010
The Governing Council decided to adopt a fi xed
rate tender procedure with full allotment in the
regular three-month LTROs to be allotted on
28 July, 25 August and 29 September 2010.
2 SEPTEMBER 2010
ECB ANNOUNCES DETAILS OF REFINANCING
OPERATIONS WITH SETTLEMENT FROM
17 OCTOBER 2010 TO 18 JANUARY 2011
The Governing Council decided to continue
to conduct its MROs as fi xed rate tender
procedures with full allotment for as long as
necessary, and at least until the end of this year’s
twelfth maintenance period on 18 January 2011.
The fi xed rate tender procedure with full
allotment will also remain in use for the special-
term refi nancing operations with a maturity of
one maintenance period, which will continue to
be conducted for as long as needed and at least
until the end of 2010. The fi xed rate in these
operations will be the same as the MRO rate
prevailing at the time.
Furthermore, the Governing Council decided
to conduct the three-month LTROs to be
settled on 28 October, 25 November and
23 December 2010 as fi xed rate tender
procedures with full allotment. The rates in
these three-month operations will be fi xed at the
average rate of the MROs over the life of the
respective LTRO.
The Governing Council also decided to carry out
three additional fi ne-tuning operations when the
remaining six-month and 12-month refi nancing
operations mature: one six-day operation with
announcement, allotment and settlement on
30 September 2010; one six-day operation with
announcement, allotment and settlement on
11 November 2010; and one 13-day operation
with announcement, allotment and settlement
on 23 December 2010. The fi xed rate tender
procedure with full allotment will also be used
in these three operations, the rate being the same
as the MRO rate prevailing at that time.

262ECBAnnual Report2010
2 DECEMBER 2010
ECB ANNOUNCES DETAILS OF REFINANCING
OPERATIONS WITH SETTLEMENT FROM
19 JANUARY TO 12 APRIL 2011
The Governing Council decided to continue
to conduct its MROs as fi xed rate tender
procedures with full allotment for as long as
necessary, and at least until the end of the third
maintenance period of 2011 on 12 April 2011.
This tender procedure will also remain in use
for the Eurosystem’s special-term refi nancing
operations with a maturity of one maintenance
period, which will continue to be conducted for
as long as needed, and at least until the end of
the fi rst quarter of 2011. The fi xed rate in these
special-term refi nancing operations will be the
same as the MRO rate prevailing at the time.
Furthermore, the Governing Council decided to
conduct the three-month LTROs to be allotted on
26 January, 23 February and 30 March 2011 as
fi xed rate tender procedures with full allotment.
The rates in these three-month operations will
be fi xed at the average rate of the MROs over
the life of the respective LTRO.
263ECB
Annual Report2010
PROVISION OF LIQUIDITY IN OTHER CURRENCIES AND AGREEMENTS WITH OTHER CENTRAL BANKS
18 JANUARY 2010
ECB DISCONTINUES THE SWISS FRANC
LIQUIDITY-PROVIDING OPERATIONS
The Governing Council decided, in agreement
with the Swiss National Bank, to stop conducting
one-week Swiss franc liquidity-providing swap
operations after 31 January 2010. This decision
was made against the background of declining
demand and improved conditions in the funding
markets.
27 JANUARY 2010
ECB AND OTHER CENTRAL BANKS DECIDE
TO DISCONTINUE THE TEMPORARY SWAP LINES
WITH THE FEDERAL RESERVE
In coordination with other central banks,
the ECB confi rmed the expiration of its
temporary liquidity swap lines with the Federal
Reserve on 1 February 2010. These lines, which
were established to counter pressures in global
funding markets, are no longer needed given
the improvements seen in the functioning of
fi nancial markets over the past year. Central
banks will continue to cooperate as needed.
In this context, the Governing Council decided,
in agreement with the Federal Reserve,
the Bank of England, the Bank of Japan and
the Swiss National Bank, to stop conducting
US dollar liquidity-providing operations after
31 January 2010.
10 MAY 2010
REACTIVATION OF US DOLLAR
LIQUIDITY-PROVIDING OPERATIONS
In response to the re-emergence of strains in US
dollar short-term funding markets in Europe,
the Bank of Canada, the Bank of England,
the European Central Bank, the Federal Reserve
and the Swiss National Bank announced the
re-establishment of temporary US dollar
liquidity swap facilities. These facilities are
designed to help improve liquidity conditions
in US dollar funding markets and to prevent
the spread of strains to other markets and other
fi nancial centres. The Bank of Japan will be
considering similar measures soon. Central
banks will continue to work together closely
as needed to address pressures in funding
markets.
The Governing Council decided to reactivate,
in coordination with other central banks,
the temporary liquidity swap lines with
the Federal Reserve, and resume US dollar
liquidity-providing operations at terms of seven
and 84 days. These operations will take the form
of repurchase operations against ECB-eligible
collateral and will be carried out as fi xed rate
tenders with full allotment. The fi rst operation
will be carried out on 11 May 2010.
ECB ANNOUNCES DETAILS REGARDING
THE REACTIVATION OF THE US DOLLAR
LIQUIDITY-PROVIDING OPERATIONS
Following the decision of the Governing
Council to reactivate the temporary swap line
with the Federal Reserve, the ECB announced
the operational details for its US dollar liquidity-
providing operations.
The operations will be carried out as fi xed rate
tenders with full allotment and will take the
form of repurchase operations against ECB-
eligible collateral.
The ECB decided to conduct:
Seven-day operations on a weekly basis. The –
fi rst operation will be held on 11 May 2010,
with settlement on 12 May 2010 and maturity
on 20 May 2010. Subsequent operations
will as a rule be conducted and allotted on
Wednesdays, for settlement on the following
business day.
An 84-day operation to be held on –
18 May 2010, with settlement on 20 May 2010
and maturity on 12 August 2010.
264ECBAnnual Report2010
17 DECEMBER 2010
ECB SIGNS SWAP FACILITY AGREEMENT
WITH THE BANK OF ENGLAND
Within the framework of central bank
cooperation, the ECB and the Bank of England
announced a temporary liquidity swap facility,
under which the Bank of England could provide,
if necessary, up to GBP 10 billion to the ECB in
exchange for euro. The agreement expires at the
end of September 2011.
The agreement allows pounds sterling to be
made available to the Central Bank of Ireland
as a precautionary measure, for the purpose of
meeting any temporary liquidity needs of the
banking system in that currency.
21 DECEMBER 2010
PROLONGATION OF US DOLLAR
LIQUIDITY-PROVIDING OPERATIONS
The Governing Council decided, in
coordination with the Bank of Canada, the
Bank of England, the Bank of Japan and the
Swiss National Bank, to extend the liquidity
swap arrangements with the Federal Reserve up
to 1 August 2011, and to continue to conduct
US dollar liquidity-providing operations with
a maturity of seven days. These Eurosystem
operations will continue to take the form
of repurchase operations against eligible
collateral and will be carried out as fi xed rate
tenders with full allotment. The next US dollar
liquidity-providing operation will be carried
out on 22 December 2010, with settlement on
23 December; by way of exception, however,
it will be conducted as a 14-day operation to
cover the year-end.

265ECB
Annual Report2010
The ECB produces a number of publications which provide information about its core activities:
monetary policy, statistics, payment and securities settlement systems, fi nancial stability and
supervision, international and European cooperation, and legal matters. These include the
following:
STATUTORY PUBLICATIONS
Annual Report –
Convergence Report –
Monthly Bulletin –
RESEARCH PAPERS
Legal Working Paper Series –
Occasional Paper Series –
Research Bulletin –
Working Paper Series –
OTHER/TASK-RELATED PUBLICATIONS
Enhancing monetary analysis –
Financial integration in Europe –
Financial Stability Review –
Statistics Pocket Book –
The European Central Bank: history, role and functions –
The international role of the euro –
The implementation of monetary policy in the euro area (“General Documentation”) –
The monetary policy of the ECB –
The payment system –
The ECB also publishes brochures and information materials on a variety of topics, such as the euro
banknotes and coins, as well as seminar and conference proceedings.
For a complete list of documents (in PDF format) published by the ECB and the European
Monetary Institute, the ECB’s forerunner from 1994 to 1998, please visit the ECB’s website at
http://www.ecb.europa.eu/pub/. Language codes indicate the languages in which each publication
is available.
Unless otherwise indicated, hard copies can be obtained or subscribed to free of charge, stock
permitting, by contacting [email protected]
PUBLICATIONS PRODUCED BY THEEUROPEAN CENTRAL BANK

266ECBAnnual Report2010
This glossary contains selected terms that are used in the Annual Report. A more comprehensive and detailed glossary can be found on the ECB’s website.
Balance of payments (b.o.p.): a statistical statement that summarises, for a specifi c period of time,
the economic transactions of an economy with the rest of the world. The transactions considered are:
those involving goods, services and income; those involving fi nancial claims on, and liabilities to,
the rest of the world; and those (such as debt forgiveness) that are classifi ed as transfers.
Bond market: the market in which longer-term debt securities are issued and traded.
Candidate countries: countries for which the EU has accepted an application for EU membership.
Currently, these are Croatia, Iceland, the former Yugoslav Republic of Macedonia, Montenegro
and Turkey.
Central counterparty (CCP): an entity that interposes itself, in one or more markets, between the
counterparties to the contracts traded, becoming the buyer to every seller and the seller to every
buyer and thereby guaranteeing the performance of open contracts.
Central government: the government as defi ned in the European System of Accounts 1995, but
excluding regional and local governments (see also general government).
Central securities depository (CSD): an entity that: i) enables securities transactions to be
processed and settled by book entry, ii) provides custodial services (e.g. the administration
of corporate actions and redemptions), and iii) plays an active role in ensuring the integrity of
securities issues. Securities can be held in a physical (but immobilised) form or in a dematerialised
form (whereby they exist only as electronic records).
Collateral: assets pledged or otherwise transferred (e.g. by credit institutions to central banks) as
a guarantee for the repayment of loans, as well as assets sold (e.g. by credit institutions to central
banks) under repurchase agreements.
Corporate governance: rules, procedures and processes according to which an organisation is
directed and controlled. The corporate governance structure specifi es the distribution of rights and
responsibilities among the different participants in the organisation – such as the board, managers,
shareholders and other stakeholders – and lays down the rules and procedures for decision-making.
Corporate profi tability: a measure of the earnings performance of corporations, mainly in
relation to their sales, assets or equity. There are a number of different corporate profi tability
ratios based on company fi nancial statements, such as the ratio of operating income (sales minus
operating expenses) to sales, the ratio of net income (operating and non-operating income, after
tax, depreciation and extraordinary items) to sales, the return on assets (relating net income to total
assets) and the return on equity (relating net income to shareholders’ funds). At the macroeconomic
level, the gross operating surplus, based on the national accounts, for instance in relation to
gross domestic product or value added, is often used as a measure of profi tability.
Correspondent central banking model (CCBM): a mechanism established by the European System of Central Banks with the aim of enabling counterparties to use eligible collateral in a
cross-border context. In the CCBM, NCBs act as custodians for one another. This means that each
GLOSSARY
267ECB
Annual Report2010
NCB has a securities account in its securities administration for each of the other NCBs and the
European Central Bank.
Cost of the external fi nancing of non-fi nancial corporations (real): the cost incurred by
non-fi nancial corporations when taking up new external funds. For euro area non-fi nancial
corporations, it is calculated as a weighted average of the cost of bank lending, the cost of debt securities and the cost of equity, based on the amounts outstanding (corrected for valuation effects)
and defl ated by infl ation expectations.
Council of the European Union (Council): the institution of the EU made up of representatives of
the governments of the EU Member States, normally the ministers responsible for the matters under
consideration, and the relevant European Commissioner (see also ECOFIN Council).
Counterparty: the opposite party in a fi nancial transaction (e.g. any party transacting with a
central bank).
Covered Bond Purchase Programme (CBPP): an ECB programme, based on the decision of the
Governing Council of the European Central Bank of 7 May 2009 to purchase euro-denominated
covered bonds issued in the euro area, in support of a specifi c fi nancial market segment that
is important for the funding of banks and was particularly affected by the fi nancial crisis.
The purchases under the programme were for a nominal value of €60 billion, and they were fully
implemented by 30 June 2010.
Credit institution: i) an undertaking whose business is to receive deposits or other repayable funds
from the public and to grant credit for its own account, or ii) an undertaking or any other legal
person, other than those under i), which issues means of payment in the form of electronic money.
Credit risk: the risk that a counterparty will not settle the full value of an obligation – neither
when it becomes due, nor at any time thereafter. Credit risk includes replacement cost risk and
principal risk. It also includes the risk of the settlement bank failing.
Debt (general government): the total gross debt (currency, deposits, loans and debt securities) at
nominal value outstanding at the end of the year and consolidated between and within the sectors of
general government.
Debt security: a promise on the part of the issuer (i.e. the borrower) to make one or more
payment(s) to the holder (the lender) on a specifi ed future date or dates. Such securities usually
carry a specifi c rate of interest (the coupon) and/or are sold at a discount to the amount that will
be repaid at maturity. Debt securities issued with an original maturity of more than one year are
classifi ed as long-term.
Debt-to-GDP ratio (general government): the ratio of debt to gross domestic product at
current market prices. It is the subject of one of the fi scal criteria laid down in Article 126(2) of the
Treaty to defi ne the existence of an excessive defi cit.
Defi cit (general government): the general government’s net borrowing, i.e. the difference
between total government revenue and total government expenditure.
268ECBAnnual Report2010
Defi cit-debt adjustment (general government): the difference between the general government budget balance (defi cit or surplus) and the change in debt.
Defi cit ratio (general government): the ratio of the defi cit to gross domestic product at
current market prices. It is the subject of one of the fi scal criteria laid down in Article 126(2) of
the Treaty to defi ne the existence of an excessive defi cit (see also excessive defi cit procedure).
It is also referred to as the budget defi cit ratio or the fi scal defi cit ratio.
Deposit facility: a standing facility of the Eurosystem which counterparties may use to make
overnight deposits at an NCB. Such deposits are remunerated at a pre-specifi ed interest rate
(see also key ECB interest rates).
Direct investment: cross-border investment for the purpose of obtaining a lasting interest in an
enterprise resident in another economy (assumed, in practice, for ownership of at least 10% of the
ordinary shares or voting power). Included are equity capital, reinvested earnings and other capital
associated with inter-company operations.
ECOFIN Council: the term often used to refer to the Council of the European Union meeting in
the composition of the ministers of economics and fi nance.
Economic analysis: one pillar of the European Central Bank’s framework for conducting a
comprehensive analysis of the risks to price stability, which forms the basis for the Governing
Council’s monetary policy decisions. The economic analysis focuses mainly on the assessment of
current economic and fi nancial developments and the implied short to medium-term risks to price
stability from the perspective of the interplay between supply and demand in goods, services and
factor markets at those horizons. Due attention is paid to the need to identify the nature of shocks
affecting the economy, their effects on cost and pricing behaviour, and the short to medium-term
prospects for their propagation in the economy (see also monetary analysis).
Economic and Financial Committee (EFC): a committee which contributes to the preparation
of the work of the ECOFIN Council and the European Commission. Its tasks include reviewing
the economic and fi nancial situation of both the Member States and the EU, and contributing to
budgetary surveillance.
Economic and Monetary Union (EMU): the process that led to the single currency, the euro, and
the single monetary policy in the euro area, as well as to the coordination of the economic policies
of the EU Member States. This process, as laid down in the Treaty, took place in three stages. Stage
Three, the fi nal stage, started on 1 January 1999 with the transfer of monetary competence to the
European Central Bank and the introduction of the euro. The cash changeover on 1 January 2002
completed the process of setting up EMU.
Effective exchange rate (EER) of the euro (nominal/real): a weighted average of the bilateral
euro exchange rates against the currencies of the euro area’s main trading partners. The European Central Bank publishes nominal EER indices for the euro against two groups of trading partners:
the EER-20 (comprising the 10 non-euro area EU Member States and 10 trading partners outside
the EU) and the EER-40 (composed of the EER-20 and 20 additional countries). The weights
used refl ect the share of each partner country in the euro area’s trade in manufactured goods and
account for competition in third markets. Real EERs are nominal EERs defl ated by a weighted

269ECB
Annual Report2010
average of foreign, relative to domestic, prices or costs. They are thus measures of price and
cost competitiveness.
EONIA (euro overnight index average): a measure of the effective interest rate prevailing in the euro
interbank overnight market. It is calculated as a weighted average of the interest rates on unsecured
overnight lending transactions denominated in euro, as reported by a panel of contributing banks.
Equities: securities representing ownership of a stake in a corporation. They comprise shares traded
on stock exchanges (quoted shares), unquoted shares and other forms of equity. Equities usually
produce income in the form of dividends.
Equity market: the market in which equities are issued and traded.
ERM II (exchange rate mechanism II): the exchange rate mechanism which provides the
framework for exchange rate policy cooperation between the euro area countries and the
non-euro area EU Member States. ERM II is a multilateral arrangement with fi xed, but adjustable,
central rates and a standard fl uctuation band of ±15%. Decisions concerning central rates and,
possibly, narrower fl uctuation bands are taken by mutual agreement between the EU Member State
concerned, the euro area countries, the European Central Bank (ECB) and the other EU Member
States participating in the mechanism. All participants in ERM II, including the ECB, have the right
to initiate a confi dential procedure aimed at changing the central rates (realignment).
EURIBOR (euro interbank offered rate): the rate at which a prime bank is willing to lend funds
in euro to another prime bank, as reported by a panel of contributing banks, computed daily for
interbank deposits with different maturities of up to 12 months.
Euro area: the area formed by the EU Member States whose currency is the euro and in which
a single monetary policy is conducted under the responsibility of the Governing Council of the
European Central Bank. The euro area currently comprises Belgium, Germany, Estonia, Ireland,
Greece, Spain, France, Italy, Cyprus, Luxembourg, Malta, the Netherlands, Austria, Portugal,
Slovenia, Slovakia and Finland.
Eurogroup: an informal gathering of the ministers of economics and fi nance of the EU Member
States whose currency is the euro. Its status is recognised under Article 137 of the Treaty and in
Protocol No 14. The European Commission and the European Central Bank are regularly invited
to take part in its meetings.
Europe 2020 strategy: the EU’s strategy for employment and smart, sustainable and inclusive
growth. It was adopted by the European Council in June 2010. Building on the Lisbon strategy, it
is intended to provide a coherent framework for EU Member States to implement structural reforms
aimed at raising potential growth and for mobilising EU policies and instruments.
European Central Bank (ECB): the ECB lies at the centre of the Eurosystem and the European
System of Central Banks (ESCB) and has its own legal personality in accordance with the
Treaty (Article 282(3)). It ensures that the tasks conferred upon the Eurosystem and the ESCB are
implemented either through its own activities or through those of the NCBs, pursuant to the Statute
of the ESCB. The ECB is governed by the Governing Council and the Executive Board, and, as a
third decision-making body, by the General Council.
270ECBAnnual Report2010
European Council: the institution of the EU consisting of the Heads of State or Government of
the EU Member States and, as non-voting members, the President of the European Commission
and the European Council’s own President. It provides the EU with the necessary impetus for its
development and defi nes the general political directions and priorities thereof. It does not have a
legislative function.
European Financial Stabilisation Mechanism (EFSM): an EU facility, based on Article 122(2) of
the Treaty, that allows the Commission to raise up to €60 billion on behalf of the EU for lending to EU
Member States experiencing, or being threatened with, exceptional circumstances beyond their control.
EFSM lending is subject to strong conditionality in the context of joint EU-IMF programmes.
European Financial Stability Facility (EFSF): a limited liability company established by the euro area
Member States, on an intergovernmental basis, for the purpose of providing loans to euro area
countries in fi nancial diffi culties. Such fi nancial assistance is subject to strong conditionality in
the context of joint EU-IMF programmes. EFSF loans are fi nanced through the issuance of debt securities, guaranteed up to a total of €440 billion by euro area countries on a pro rata basis.
European Monetary Institute (EMI): a temporary institution established at the start of Stage
Two of Economic and Monetary Union on 1 January 1994. It went into liquidation following the
establishment of the European Central Bank on 1 June 1998.
European System of Accounts 1995 (ESA 95): a comprehensive and integrated system of
macroeconomic accounts based on a set of internationally agreed statistical concepts, defi nitions,
classifi cations and accounting rules aimed at achieving a harmonised quantitative description of
the economies of the EU Member States. The ESA 95 is the EU’s version of the world System of
National Accounts 1993 (SNA 93).
European System of Central Banks (ESCB): composed of the European Central Bank
(ECB) and the NCBs of all 27 EU Member States, i.e. it includes, in addition to the members of
the Eurosystem, the NCBs of those Member States whose currency is not the euro. The ESCB
is governed by the Governing Council and the Executive Board of the ECB, and, as a third
decision-making body of the ECB, by the General Council.
European System of Financial Supervision (ESFS): the group of institutions in charge of ensuring
the supervision of the EU’s fi nancial system. It comprises the European Systemic Risk Board,
the three European Supervisory Authorities, the Joint Committee of the European Supervisory
Authorities, and the national supervisory authorities of the EU Member States.
European Systemic Risk Board (ESRB): an independent EU body responsible for the
macro-prudential oversight of the fi nancial system within the EU. It contributes to the prevention or
mitigation of systemic risks to fi nancial stability that arise from developments within the fi nancial
system, taking into account macroeconomic developments, so as to avoid periods of widespread
fi nancial distress.
Eurosystem: the central banking system of the euro area. It comprises the European Central Bank and the NCBs of the EU Member States whose currency is the euro.
Excessive defi cit procedure: the provision set out in Article 126 of the Treaty and specifi ed in
Protocol (No 12) on the excessive defi cit procedure requires EU Member States to maintain budgetary

271ECB
Annual Report2010
discipline, defi nes the criteria for a budgetary position to be considered an excessive defi cit and
regulates steps to be taken following the observation that the requirements for the budgetary balance
or government debt have not been fulfi lled. Article 126 is supplemented by Council Regulation
(EC) No 1467/97 of 7 July 1997 on speeding up and clarifying the implementation of the excessive
defi cit procedure (as amended by Council Regulation (EC) No 1056/2005 of 27 June 2005), which
is one element of the Stability and Growth Pact.
Executive Board: one of the decision-making bodies of the European Central Bank (ECB). It
comprises the President and the Vice-President of the ECB and four other members appointed by
the European Council, acting by a qualifi ed majority, on a recommendation from the Council of the European Union, after it has consulted the European Parliament and the ECB.
Financial stability: the condition in which the fi nancial system – comprising fi nancial
intermediaries, markets and market infrastructures – is capable of withstanding shocks and the
unravelling of fi nancial imbalances, thereby mitigating the likelihood of disruptions in the fi nancial
intermediation process which are severe enough to signifi cantly impair the allocation of savings to
profi table investment opportunities.
Fine-tuning operation: an open market operation executed by the Eurosystem in order to deal
with unexpected liquidity fl uctuations in the market. The frequency and maturity of fi ne-tuning
operations are not standardised.
Foreign exchange swap: simultaneous spot and forward transactions exchanging one currency
against another.
GDP defl ator: gross domestic product (GDP) expressed in current prices (nominal GDP) divided
by the volume of GDP (real GDP). It is also known as the implicit price defl ator of GDP.
General Council: one of the decision-making bodies of the European Central Bank (ECB). It
comprises the President and the Vice-President of the ECB and the governors of all the NCBs of the
European System of Central Banks.
General government: a sector defi ned in the European System of Accounts 1995 as comprising
resident entities that are engaged primarily in the production of non-market goods and services
intended for individual and collective consumption and/or in the redistribution of national income
and wealth. Included are central, regional and local government authorities, as well as social
security funds. Excluded are government-owned entities that conduct commercial operations, such
as public enterprises.
Governing Council: the supreme decision-making body of the European Central Bank (ECB). It
comprises all the members of the Executive Board of the ECB and the governors of the NCBs of
the EU Member States whose currency is the euro.
Gross domestic product (GDP): a measure of economic activity, namely the value of an economy’s
total output of goods and services, less intermediate consumption, plus net taxes on products
and imports, in a specifi ed period. GDP can be broken down by output, expenditure or income
components. The main expenditure aggregates that make up GDP are household fi nal consumption,
government fi nal consumption, gross fi xed capital formation, changes in inventories, and imports
and exports of goods and services (including intra-euro area trade).
272ECBAnnual Report2010
Gross operating surplus: the surplus (or defi cit) on the value of output of production activities
after the costs of intermediate consumption, compensation of employees and taxes less subsidies
on production have been deducted, but before payments and receipts of income related to the
borrowing/renting or owning of fi nancial and non-produced assets have been taken into account.
Harmonised Index of Consumer Prices (HICP): a measure of the development of consumer
prices that is compiled by Eurostat and harmonised for all EU Member States.
Implied volatility: the expected volatility (i.e. standard deviation) in the rates of change of the
price of an asset (e.g. a share or a bond). It can be derived from the asset’s price, its maturity date
and the exercise price of its options, as well as from a riskless rate of return, using an option pricing
model such as the Black-Scholes model.
International investment position (i.i.p.): the value and composition of an economy’s outstanding
net fi nancial claims on (or fi nancial liabilities to) the rest of the world.
Key ECB interest rates: the interest rates, set by the Governing Council, which refl ect the
monetary policy stance of the European Central Bank. They are the rates on the main refi nancing
operations, the marginal lending facility and the deposit facility.
Lisbon strategy: a comprehensive agenda of structural reforms aimed at transforming the EU into
“the most dynamic and competitive knowledge-based economy in the world”, launched in 2000 by
the Lisbon European Council. It has been replaced by the Europe 2020 strategy.
Longer-term refi nancing operation: a credit operation with a maturity of more than one week
that is executed by the Eurosystem in the form of reverse transactions. The regular monthly
operations have a maturity of three months. During the fi nancial crisis, supplementary operations
with maturities ranging from one maintenance period to one year were conducted, the frequency
of which varied.
M1: a narrow monetary aggregate that comprises currency in circulation plus overnight deposits
held with MFIs and central government (e.g. at the post offi ce or treasury).
M2: an intermediate monetary aggregate that comprises M1 plus deposits redeemable at a period
of notice of up to and including three months (i.e. short-term savings deposits) and deposits with an
agreed maturity of up to and including two years (i.e. short-term time deposits) held with MFIs and
central government.
M3: a broad monetary aggregate that comprises M2 plus marketable instruments, in particular
repurchase agreements, money market fund shares/units, and debt securities with a maturity of
up to and including two years issued by MFIs.
Main refi nancing operation: a regular open market operation executed by the Eurosystem in
the form of reverse transactions. Such operations are carried out through a weekly standard tender
procedure and normally have a maturity of one week.
273ECB
Annual Report2010
Maintenance period: the period over which credit institutions’ compliance with reserve requirements is calculated. The maintenance period begins on the settlement day of the fi rst main refi nancing operation following the meeting of the Governing Council at which the monthly
assessment of the monetary policy stance is pre-scheduled. The European Central Bank publishes
a calendar of the reserve maintenance periods at least three months before the start of the year.
Marginal lending facility: a standing facility of the Eurosystem which counterparties may
use to receive overnight credit from an NCB at a pre-specifi ed interest rate against eligible assets
(see also key ECB interest rates).
Market risk: the risk of losses (in both on and off-balance-sheet positions) arising from movements
in market prices.
MFI credit to euro area residents: MFI loans granted to non-MFI euro area residents (including
general government and the private sector) and MFI holdings of securities (shares, other equity
and debt securities) issued by non-MFI euro area residents.
MFI interest rates: the interest rates that are applied by resident credit institutions and other
MFIs, excluding central banks and money market funds, to euro-denominated deposits and loans
vis-à-vis households and non-fi nancial corporations resident in the euro area.
MFI longer-term fi nancial liabilities: deposits with an agreed maturity of over two years, deposits
redeemable at a period of notice of over three months, debt securities issued by euro area MFIs with
an original maturity of more than two years, and the capital and reserves of the euro area MFI sector.
MFIs (monetary fi nancial institutions): fi nancial institutions which together form the
money-issuing sector of the euro area. These include the Eurosystem, resident credit institutions
(as defi ned in EU law) and all other resident fi nancial institutions whose business is to receive
deposits and/or close substitutes for deposits from entities other than MFIs and, for their own
account (at least in economic terms), to grant credit and/or invest in securities. The latter group
consists predominantly of money market funds, i.e. funds that invest in short-term and low-risk
instruments, usually with a maturity of one year or less.
Minimum bid rate: the lower limit to the interest rates at which counterparties may submit bids
in the variable rate tenders.
Monetary analysis: one pillar of the European Central Bank’s framework for conducting a
comprehensive analysis of the risks to price stability, which forms the basis for the Governing Council’s monetary policy decisions. The monetary analysis helps to assess medium to
long-term trends in infl ation, in view of the close relationship between money and prices over
extended horizons. The monetary analysis takes into account developments in a wide range of
monetary indicators, including M3, its components and counterparts, notably credit, and various
measures of excess liquidity (see also economic analysis).
Monetary income: income accruing to the NCBs in the performance of the Eurosystem’s
monetary policy function, derived from assets earmarked in accordance with guidelines established
by the Governing Council and held against banknotes in circulation and deposit liabilities to
credit institutions.
274ECBAnnual Report2010
Money market: the market in which short-term funds are raised, invested and traded, using
instruments which generally have an original maturity of up to and including one year.
Non-standard measures: measures taken by the ECB to support the effectiveness and transmission
of interest rate decisions to the wider euro area economy in the context of a dysfunctional situation
in some fi nancial market segments and the fi nancial system more broadly.
OFIs (other fi nancial intermediaries): corporations or quasi-corporations (other than insurance
corporations or pension funds) that are engaged mainly in fi nancial intermediation by incurring
liabilities in forms other than currency, deposits and/or close substitutes for deposits from
institutional entities other than MFIs. OFIs include in particular corporations engaged primarily in
long-term fi nancing (such as fi nancial leasing), securitised asset holdings, other fi nancial holdings,
securities and derivatives dealing (on their own account), venture capital and development capital.
Open market operation: an operation executed on the initiative of the central bank in the fi nancial
market. With regard to their aims, regularity and procedures, Eurosystem open market operations
can be divided into four categories: main refi nancing operations; longer-term refi nancing
operations; fi ne-tuning operations; and structural operations. As for the instruments used, reverse transactions are the main open market instrument of the Eurosystem and can be employed in all
four categories of operation. In addition, the issuance of debt certifi cates and outright transactions
are available for structural operations, while outright transactions, foreign exchange swaps and the
collection of fi xed-term deposits are available for the conduct of fi ne-tuning operations.
Options: fi nancial instruments that give the owner the right, but not the obligation, to buy or sell
specifi c assets (e.g. a bond or a stock) at a predetermined price (the strike or exercise price) on or up
to a certain future date (the exercise or maturity date).
Portfolio investment: euro area residents’ net transactions and/or positions in securities issued
by non-residents of the euro area (“assets”) and non-residents’ net transactions and/or positions
in securities issued by euro area residents (“liabilities”). Included are equities and debt securities
(bonds and notes, and money market instruments), excluding amounts recorded in direct investment or reserve assets.
Price stability: the maintenance of price stability is the primary objective of the Eurosystem.
The Governing Council defi nes price stability as a year-on-year increase in the Harmonised Index
of Consumer Prices for the euro area of below 2%. The Governing Council has also made it clear
that, in the pursuit of price stability, it aims to maintain infl ation rates below, but close to, 2% over
the medium term.
Projections: the results of exercises conducted four times a year to project possible future
macroeconomic developments in the euro area. Eurosystem staff projections are published in June
and December, whereas European Central Bank (ECB) staff projections are published in March
and September. They form part of the economic analysis pillar of the monetary policy strategy of
the ECB and are thus one of several inputs into the Governing Council’s assessment of the risks to
price stability.
Real-time gross settlement (RTGS) system: a settlement system in which processing and
settlement take place on a transaction-by-transaction basis in real time (see also TARGET).

275ECB
Annual Report2010
Reference value for M3 growth: the annual growth rate of M3 over the medium term that is
consistent with the maintenance of price stability. At present, the reference value for annual M3
growth is 4½%.
Repurchase agreement: the process of borrowing money by combining the sale of an asset (usually
a fi xed income security) with the subsequent repurchase of that same asset on a specifi ed date for a
slightly higher specifi ed price (which refl ects the borrowing rate).
Reserve base: the sum of the eligible balance sheet items (in particular liabilities) that constitute
the basis for calculating the reserve requirement of a credit institution.
Reserve requirement: the minimum amount of reserves a credit institution is required to hold
with the Eurosystem over a predefi ned maintenance period. Compliance with the requirement
is determined on the basis of the average of the daily balances in the reserve accounts over the
maintenance period.
Retained securitisation: a situation in which securities issued in the context of a securitisation
transaction are bought back by the institution that originated the transaction (see also
securitisation).
Reverse transaction: an operation whereby the central bank buys or sells assets under a repurchase agreement or conducts credit operations against collateral.
Securities Markets Programme (SMP): an ECB programme for conducting interventions in the
euro area public and private debt securities markets to ensure depth and liquidity in dysfunctional
market segments with a view to restoring an appropriate monetary policy transmission mechanism.
Securities settlement system (SSS): a system which allows the transfer of securities, either free of
payment or against payment (delivery versus payment).
Securitisation: the pooling of fi nancial assets, such as residential mortgage loans, and their
subsequent sale to a special-purpose vehicle, which then issues fi xed income securities for sale to
investors. The principal and interest of these securities depend on the cash fl ows produced by the
pool of underlying fi nancial assets.
Settlement risk: the risk that settlement in a transfer system will not take place as expected, usually
owing to a party defaulting on one or more settlement obligations. This risk includes, in particular,
operational risks, credit risks and liquidity risks.
Stability and Growth Pact: intended to serve as a means of safeguarding sound government
fi nances in the EU Member States in order to strengthen the conditions for price stability and for
strong, sustainable growth conducive to employment creation. To this end, the Pact prescribes that
Member States specify medium-term budgetary objectives. It also contains concrete specifi cations
on the excessive defi cit procedure. The Pact consists of the Resolution of the Amsterdam European Council of 17 June 1997 on the Stability and Growth Pact and two Council Regulations, namely
i) Regulation (EC) No 1466/97 of 7 July 1997 on the strengthening of the surveillance of budgetary
positions and the surveillance and coordination of economic policies as amended by Regulation
(EC) No 1055/2005 of 27 June 2005, and ii) Regulation (EC) No 1467/97 of 7 July 1997 on
speeding up and clarifying the implementation of the excessive defi cit procedure as amended by
276ECBAnnual Report2010
Regulation (EC) No 1056/2005 of 27 June 2005. The Stability and Growth Pact is complemented
by the ECOFIN Council’s report entitled “Improving the implementation of the Stability and
Growth Pact”, which was endorsed by the Brussels European Council of 22 and 23 March 2005. It
is also complemented by a Code of Conduct entitled “Specifi cations on the implementation of the
Stability and Growth Pact and Guidelines on the format and content of stability and convergence
programmes”, which was endorsed by the ECOFIN Council on 11 October 2005.
Standing facility: a central bank credit facility available to counterparties at their own initiative.
The Eurosystem offers two overnight standing facilities: the marginal lending facility and the
deposit facility.
Straight-through processing (STP): the automated end-to-end processing of trades/payment
transfers – including, where relevant, the automated completion of confi rmation, matching and
generation of orders, clearing and settlement.
Systemic risk: the risk that the inability of one participant to meet its obligations in a system will
cause other participants to be unable to meet their obligations when they become due, potentially
with spillover effects (e.g. signifi cant liquidity or credit problems) threatening the stability of or
confi dence in the fi nancial system. That inability to meet obligations can be caused by operational
or fi nancial problems.
TARGET (Trans-European Automated Real-time Gross settlement Express Transfer system): the Eurosystem’s real-time gross settlement system for the euro. The fi rst-generation TARGET
system was replaced by TARGET2 in May 2008.
TARGET2: the second-generation TARGET system. It settles payments in euro in central bank
money and functions on the basis of a single shared IT platform, to which all payment orders are
submitted for processing.
TARGET2-Securities (T2S): the Eurosystem’s single technical platform enabling central securities depositories and NCBs to provide core, borderless and neutral securities settlement
services in central bank money in Europe.
Treaties: unless stated otherwise, all references in this report to the “Treaties” refer to both the
Treaty on the Functioning of the European Union and the Treaty on European Union.
Treaty: unless stated otherwise, all references in this report to the “Treaty” refer to the Treaty on
the Functioning of the European Union, and the references to article numbers refl ect the numbering
in effect since 1 December 2009.
Treaty of Lisbon (Lisbon Treaty): amends the EU’s two core treaties: the Treaty on European
Union and the Treaty establishing the European Community. The latter has been renamed the
Treaty on the Functioning of the European Union. The Treaty of Lisbon was signed in Lisbon on
13 December 2007 and entered into force on 1 December 2009.
