annual report 2009 - apollo investment corporation · 2018. 8. 9. · annual report 2009. to our...
TRANSCRIPT

A N N U A L R E P O R T 2 0 0 9

To Our Fellow Shareholders: It was truly an unprecedented twelve months for the financial markets and most financial businesses,including our own. Already nine months into a severe credit crunch, we began our fiscal year in April2008 on the back of severe strains in the capital markets resulting from the Bear Stearns situation. At that time, many undercapitalized, highly leveraged market participants were also strained as credit and asset liquidity were seemingly nonexistent. Given the circumstances, other investment andcommercial banks would soon face crises of their own, with many of the largest and best knownfinancial institutions forced to seek government support and/or business combinations. When LehmanBrothers filed for bankruptcy in September 2008, it had substantial punitive effects across the entirebanking system. Fortunately and since that time, swift government policies and actions appear to have stabilized the banking system and the financial markets. That said, we are cautiously optimisticabout the future… understanding that many industries and businesses continue to face significantfundamental challenges within an uncertain economy.
Results
Most investors saw significant absolute declines in the value of their investments during the twelve months ended March31, 2009. The U.S. economy had already been struggling and attempting to deal with a housing market crisis and a severeand ongoing credit crunch when a new standard for fair value accounting under SFAS 157 was adopted… ultimatelybrewing the perfect storm. Many leveraged companies and banks were soon fighting for their lives in an illiquid marketplace.Given AINV’s prudent and well-timed equity raise in May 2008, its consistent, conservative use of leverage, and its naturalliquidity through its portfolio of larger companies, AINV was able to withstand the significant mark-to-market unrealizeddepreciation as determined under the interpretive guidance of the new fair value accounting standard during the year endedMarch 31, 2009. This strategy also enabled AINV to avoid the credit facility covenant and capital ratio issues that threatenedseveral other financial companies. Accordingly, during the fiscal year ended March 31, 2009 and after taking into effect theadoption of SFAS 157, AINV’s total return measured on a net asset value basis was -28.2%, assuming reinvestment ofdividends. This compared to AINV’s public share price performance of -73.9% for the same period… in a market that wasseemingly filled with fear and confusion. That said, we take little solace in negative returns and will continue to avoidobstacles when possible, address any issues head on and ultimately strive to restore shareholder value.
Positive contributors to AINV’s net asset value based performance for the fiscal year included our investments in AngelicaCorporation, U.S. Investigations Services Inc., Delta Education, Collect America, HydroChem and Safety Products.Underperformers and negative contributors to net asset value based performance included Grand Prix Holdings(Innkeepers USA Trust), GS Prysmian, AMH/Associated Materials, Arbonne/Natural Products, Eurofresh Inc. andAdvanstar Inc. Since our IPO in April 2004 and through March 31, 2009, the average annual and cumulative totalreturns on a net asset value basis, assuming reinvestment of dividends was 3.3% and 17.7%, respectively. Shareholdersinvesting in AINV’s public shares over the same period had an average annual total return of -17.7% or -62.1%cumulatively, assuming reinvestment of dividends. In comparison, the performance of the S&P 500 Index and the Russell2000 Financial Services Index for the twelve months ended March 31, 2009 was -38.1% and -40.0%, respectively. Theiraverage annual and cumulative performance for the period April 2004 through March 31, 2009 was -5.0% and -22.6%,respectively, for the S&P 500 Index, and -8.1% and -34.4%, respectively, for the Russell 2000 Financial Services Index.We believe the performance of AINV’s public share price had dramatically underperformed AINV’s net asset value basedperformance through March 31, 2009 due to certain unfounded assumptions at that time over AINV’s ability to payfuture dividends to shareholders as well as concerns about possible AINV credit facility covenant violations… afterseemingly similar finance companies defaulted, among other factors. Furthermore, we expect those public perceptionswill abate over the near to medium term as public confidence grows with each passing quarter. Accordingly and asevidenced in our recent regulatory filings, public concerns over these issues appear to have been overstated.
Apollo Investment Corporation 2009 Annual | 1
Portfolio
For the fiscal year ended March 31, 2009, we selectively added $435 million in gross investments to our portfolio bringingtotal invested capital since our IPO to over $5.6 billion across 124 portfolio companies. At March 31, 2009, ourinvestment portfolio consisted of 72 portfolio companies valued at $2.4 billion. This compares to 71 portfolio companiesvalued at $3.2 billion at March 31, 2008. At March 31, 2009, our portfolio composition was comprised 27% in seniorsecured bank debt, 59% in subordinated debt, 4% in preferred stock, and 10% in common equity and warrants, ascompared to 22% in senior secured bank debt, 57% in subordinated debt, 6% in preferred stock, and 15% in commonequity and warrants at March 31, 2008. The weighted average yield on our debt portfolio was 11.7% at March 31, 2009as compared to 12.0% at March 31, 2008. The weighted average yield on our subordinated debt portfolio was 13.2% atMarch 31, 2009 as compared to 12.8% for the prior year while the weighted average yield on our senior secured bankdebt was 8.2% versus 10.0% at March 31, 2008. Decreases in LIBOR during the year remained well matched to AINV’slower borrowing costs leaving margins relatively flat during the year.
Liquidity and Capital Resources
On May 16, 2008, AINV closed on its most recent follow-on public equity offering of 22.3 million shares of commonstock at $17.11 per share raising approximately $369.6 million in net proceeds. In addition, AINV may generate furtherliquidity and capital resources through future periodic follow-on equity offerings, through accessing its senior secured,multi-currency $1.7 billion, five-year, revolving credit facility that matures in April 2011 or from cash flows fromoperations, investment sales of liquid assets or prepayments of senior and subordinated loans and income earned frominvestments. At March 31, 2009, AINV had $1.06 billion in borrowings outstanding on its credit facility and $0.64 billionof unused capacity. Given our asset coverage requirements, use of the capital resources available to us under ourrevolving credit facility has been significantly limited due to the effect of unrealized depreciation on our leverage ratio.Accordingly, and in light of the current inactivity within the equity capital markets, we currently expect any presentliquidity needs to be met from continued cash flows from operations and investment sales and prepayments, among otheractions. However, in the future, we will seek to raise additional equity or debt capital off our shelf registration, or throughother methods.
Outlook
As we enter the summer of 2009, we believe government policy and action to date has indeed returned a certain level ofconfidence to market participants. Evidence of increased capital markets activity and some initial “green shoots”evidencing the beginnings of a recovery are appealing and offer some comfort to us as we look ahead. While we continueto operate our business cautiously and prudently given the challenges that still exist, we remain disciplined and steadfast,looking forward to the investment opportunities that lie ahead. In closing, we would like to thank our entire team oftalented professionals for their dedication and commitment throughout an unprecedented year of broad economicchallenges. We would also like to thank our independent Board of Directors for their continued stewardship and support.Lastly, we would like to thank all of our long-term AINV shareholders for their unwavering support during a challengingyear for all. We look forward to rewarding your confidence in, and dedication to, us.
“Executing on a disciplined and consistent investment strategy and establishing a liquidity ladder ahead of the credit crunch has served AINV well.”
2 | Apollo Investment Corporation 2009 Annual
The information contained herein is not intended to be a forecast of future events, a guarantee of future results or investment advice. Views expressed may differ from thoseof the firm as a whole. More detailed information concerning risks can be found within the Form 10-K. Source: AINV and publicly available market data.
John Hannan James Zelter Patrick Dalton Richard Peteka
Chairman CEO President & COO CFO
UNITED STATESSECURITIES AND EXCHANGE COMMISSION
WASHINGTON, D.C. 20549
FORM 10-KÈ ANNUAL REPORT PURSUANT TO SECTION 13 OR 15(d) OF THE
SECURITIES EXCHANGE ACT OF 1934FOR THE FISCAL YEAR ENDEDMARCH 31, 2009
OR‘ TRANSITION REPORT PURSUANT TO SECTION 13 OR 15(d) OF THE
SECURITIES EXCHANGE ACT OF 1934FOR THE TRANSITION PERIOD FROM TO
COMMISSION FILE NUMBER: 814-00646
APOLLO INVESTMENT CORPORATION(Exact name of registrant as specified in its charter)
Maryland 52-2439556(State of Incorporation) (I.R.S. Employer Identification Number)
9 West 57th StreetNew York, N.Y. 10019
(Address of principal executive offices) (Zip Code)
Registrant’s telephone number, including area code: (212) 515-3450Securities registered pursuant to Section 12(b) of the Act:
Title of Each Class Name of Each Exchange on Which RegisteredCommon Stock, par value
$0.001 per shareThe NASDAQ Global Select Market
Securities registered pursuant to Section 12(g) of the Act: None
Indicate by check mark if the registrant is a well-known seasoned issuer, as defined in Rule 405 of the SecuritiesAct. Yes ‘ No ÈIndicate by check mark if the registrant is not required to file reports pursuant to Section 13 or Section 15(d) ofthe Act. Yes ‘ No ÈIndicate by check mark whether the Registrant (1) has filed all reports required to be filed by Section 13 or 15(d)of the Securities Exchange Act of 1934 during the preceding 12 months (or for such shorter period that theRegistrant was required to file such reports), and (2) has been subject to such filing requirements for the past 90days. Yes È No ‘Indicate by check mark whether the registrant has submitted electronically and posted on its corporate Web site,if any, every Interactive Data File required to be submitted and posted pursuant to Rule 405 of Regulation S-Tduring the preceding 12 months (or for such shorter period that the registrant was required to submit and postsuch files). Yes ‘ No ‘Indicate by check mark if disclosure of delinquent filers pursuant to Item 405 of Regulation S-K is not containedherein, and will not be contained, to the best of Registrant’s knowledge, in definitive proxy or informationstatements incorporated by reference in Part III of this Form 10-K or any amendment to this Form 10-K. ‘Indicate by check mark whether the registrant is a large accelerated filer, an accelerated filer, a non-acceleratedfiler, or a smaller reporting company. See the definitions of “large accelerated filer,” “accelerated filer” and“smaller reporting company” in Rule 12b-2 of the Exchange Act.
Large accelerated filer È Accelerated filer ‘Non-accelerated filer ‘ (Do not check if a smaller reporting company) Smaller reporting company ‘
Indicate by check mark whether the registrant is a shell company (as defined in Rule 12b-2 of theAct) Yes ‘ No ÈThe aggregate market value of common stock held by non-affiliates of the Registrant on September 30, 2008based on the closing price on that date of $17.05 on the NASDAQ Global Select Market was approximately $2.4billion. For the purposes of calculating this amount only, all directors and executive officers of the Registranthave been treated as affiliates. There were 142,221,335 shares of the Registrant’s common stock outstanding asof May 26, 2009.

APOLLO INVESTMENT CORPORATIONFORM 10-K
FOR THE FISCAL YEAR ENDEDMARCH 31, 2009TABLE OF CONTENTS
Page
PART I
Item 1. Business . . . . . . . . . . . . . . . . . . . . . . . . . . . . . . . . . . . . . . . . . . . . . . . . . . . . . . . . . . . . . . . . . . 1
Item 1A. Risk Factors . . . . . . . . . . . . . . . . . . . . . . . . . . . . . . . . . . . . . . . . . . . . . . . . . . . . . . . . . . . . . . . 9
Item 1B. Unresolved Staff Comments . . . . . . . . . . . . . . . . . . . . . . . . . . . . . . . . . . . . . . . . . . . . . . . . . . . 23
Item 2. Properties . . . . . . . . . . . . . . . . . . . . . . . . . . . . . . . . . . . . . . . . . . . . . . . . . . . . . . . . . . . . . . . . . 23
Item 3. Legal Proceedings . . . . . . . . . . . . . . . . . . . . . . . . . . . . . . . . . . . . . . . . . . . . . . . . . . . . . . . . . . . 23
Item 4. Submission of Matters to a Vote of Security Holders . . . . . . . . . . . . . . . . . . . . . . . . . . . . . . . 23
PART II
Item 5. Market for Registrant’s Common Equity, Related Stockholder Matters and Issuer Purchasesof Equity Securities . . . . . . . . . . . . . . . . . . . . . . . . . . . . . . . . . . . . . . . . . . . . . . . . . . . . . . . 24
Item 6. Selected Financial Data . . . . . . . . . . . . . . . . . . . . . . . . . . . . . . . . . . . . . . . . . . . . . . . . . . . . . . 27
Item 7. Management’s Discussion and Analysis of Financial Condition and Results ofOperations . . . . . . . . . . . . . . . . . . . . . . . . . . . . . . . . . . . . . . . . . . . . . . . . . . . . . . . . . . . . . . . 28
Item 7A. Quantitative and Qualitative Disclosures about Market Risk . . . . . . . . . . . . . . . . . . . . . . . . . 38
Item 8. Financial Statements and Supplementary Data . . . . . . . . . . . . . . . . . . . . . . . . . . . . . . . . . . . . 39
Item 9. Changes in and Disagreements with Accountants on Accounting and FinancialDisclosure . . . . . . . . . . . . . . . . . . . . . . . . . . . . . . . . . . . . . . . . . . . . . . . . . . . . . . . . . . . . . . . 74
Item 9A. Controls and Procedures . . . . . . . . . . . . . . . . . . . . . . . . . . . . . . . . . . . . . . . . . . . . . . . . . . . . . . 74
Item 9B. Other Information . . . . . . . . . . . . . . . . . . . . . . . . . . . . . . . . . . . . . . . . . . . . . . . . . . . . . . . . . . . 74
PART III
Item 10. Directors and Executive Officers of the Registrant . . . . . . . . . . . . . . . . . . . . . . . . . . . . . . . . . 75
Item 11. Executive Compensation . . . . . . . . . . . . . . . . . . . . . . . . . . . . . . . . . . . . . . . . . . . . . . . . . . . . . 78
Item 12. Security Ownership of Certain Beneficial Owners and Management and RelatedStockholder Matters . . . . . . . . . . . . . . . . . . . . . . . . . . . . . . . . . . . . . . . . . . . . . . . . . . . . . . . 79
Item 13. Certain Relationships and Related Transactions, and Director Independence . . . . . . . . . . . . . 81
Item 14. Principal Accountant Fees and Services . . . . . . . . . . . . . . . . . . . . . . . . . . . . . . . . . . . . . . . . . . 81
PART IV
Item 15. Exhibits and Financial Statement Schedules . . . . . . . . . . . . . . . . . . . . . . . . . . . . . . . . . . . . . . 83
Signatures . . . . . . . . . . . . . . . . . . . . . . . . . . . . . . . . . . . . . . . . . . . . . . . . . . . . . . . . . . . . . . . . . 84

PART I
Item 1. Business
Apollo Investment Corporation
Apollo Investment Corporation (“Apollo Investment”, the “Company” or “we”), a Maryland corporationorganized on February 2, 2004, is a closed-end, externally managed, non-diversified management investmentcompany that has elected to be treated as a business development company (“BDC”) under the InvestmentCompany Act of 1940 (the “1940 Act”). In addition, for tax purposes we have elected to be treated as a regulatedinvestment company, or RIC, under the Internal Revenue Code of 1986, as amended.
Our investment objective is to generate both current income and capital appreciation through debt and equityinvestments. We invest primarily in middle-market companies in the form of mezzanine and senior securedloans, as well as by making equity investments. From time to time, we may also invest in the securities of publiccompanies as well as public companies whose securities are thinly traded.
Our portfolio is comprised primarily of investments in long-term subordinated debt, referred to as mezzaninedebt, and senior secured loans of private middle-market companies, and from time to time includes equityinterests such as common stock, preferred stock, warrants or options. In this Form 10-K, we use the term“middle-market” to refer to companies with annual revenues between $50 million and $2 billion. While ourprimary focus is to generate both current income and capital appreciation through investments in U.S. senior andsubordinated loans, other debt securities and private equity, we may also invest a portion of the portfolio inopportunistic investments, including foreign securities.
Apollo Investment Management (“AIM”) is the investment adviser for the Company and an affiliate of ApolloGlobal Management, LLC (“AGM”). AGM and other affiliates manage other funds that may have investmentmandates that are similar, in whole or in part, with ours. AIM and its affiliates may determine that an investmentis appropriate both for us and for one or more of those other funds. In such event, depending on the availability ofsuch investment and other appropriate factors, AIM may determine that we should invest on a side-by-side basiswith one or more other funds. We may make all such investments subject to compliance with applicableregulations and interpretations, and our allocation procedures. In certain circumstances negotiated co-investmentsmay be made only if we receive an order from the SEC permitting us to do so. There can be no assurance thatany such order will be obtained.
During our fiscal year ended March 31, 2009, we invested $435 million across 12 new and 13 existing portfoliocompanies. This compares to investing $1.8 billion in 27 new and 15 existing portfolio companies for theprevious fiscal year ended March 31, 2008. Investments sold or prepaid during the fiscal year ended March 31,2009 totaled $340 million versus $714 million for the fiscal year ended March 31, 2008. Total invested capitalsince our initial public offering in April 2004 through March 31, 2009 is $5.6 billion. The weighted averageyields on our senior secured loan portfolio, subordinated debt portfolio and total debt portfolio at our current costbasis were 8.2%, 13.2% and 11.7%, respectively, at March 31, 2009. At March 31, 2008, the yields were 10.0%,12.8%, and 12.0%, respectively.
Our targeted investment size typically ranges between $20 million and $250 million, although this investmentsize may vary proportionately as the size of our available capital base changes. At March 31, 2009, our netportfolio consisted of 72 portfolio companies and was invested 27% in senior secured loans, 59% in subordinateddebt, 4% in preferred equity and 10% in common equity and warrants measured at fair value versus 71 portfoliocompanies invested 22% in senior secured loans, 57% in subordinated debt, 6% in preferred equity and 15% incommon equity and warrants at March 31, 2008.
Since the initial public offering of Apollo Investment in April 2004 and through March 31, 2009, invested capitaltotals $5.6 billion in 124 portfolio companies. Over the same period, Apollo Investment has also completedtransactions with more than 85 different financial sponsors.
1
Senior secured loans and European mezzanine loans typically accrue interest at variable rates determined on thebasis of a benchmark: LIBOR, EURIBOR, GBP LIBOR, or the prime rate, with stated maturities at originationthat typically range from 5 to 10 years. While subordinated debt issued within the United States will typicallyaccrue interest at fixed rates, some of these investments may include zero-coupon, PIK and/or step bonds thataccrue income on a constant yield to call or maturity basis. At March 31, 2009, 69% or $1.5 billion of ourinterest-bearing investment portfolio is fixed rate debt and 31% or $0.7 billion is floating rate debt, measured atfair value. At March 31, 2008, 62% or $1.6 billion of our interest-bearing investment portfolio was fixed ratedebt and 38% or $1.0 billion was floating rate debt.
Apollo Investment Management
AIM, our investment adviser, is led by a dedicated team of investment professionals. The investment committeeof AIM currently consists of John J. Hannan, the Chairman of our board of directors; James C. Zelter, our ChiefExecutive Officer and a Vice President of the general partner of AIM; Patrick J. Dalton, our President and ChiefOperating Officer of Apollo Investment and a Vice President and the Chief Investment Officer of the generalpartner of AIM; Rajay Bagaria, a Partner of AIM; and Justin Sendak, a Partner of AIM. The composition of theinvestment committee of AIM may change from time to time. AIM draws upon AGM’s 19 year history andbenefits from the broader firm’s significant capital markets, trading and research expertise developed throughinvestments in many core sectors in over 150 companies since inception.
Apollo Investment Administration
In addition to furnishing us with office facilities, equipment, and clerical, bookkeeping and record keepingservices, Apollo Investment Administration (“AIA” or “Apollo Administration”) also oversees our financialrecords as well as the preparation of our reports to stockholders and reports filed with the SEC. AIA oversees thedetermination and publication of our net asset value, oversees the preparation and filing of our tax returns, andgenerally monitors the payment of our expenses and the performance of administrative and professional servicesrendered to us by others. Furthermore, AIA provides on our behalf managerial assistance to those portfoliocompanies to which we are required to provide such assistance.
Operating and Regulatory Structure
Our investment activities are managed by AIM and supervised by our board of directors, a majority of whom areindependent of Apollo and its affiliates. AIM is an investment adviser that is registered under the InvestmentAdvisers Act of 1940. Under our investment advisory and management agreement, we pay AIM an annual basemanagement fee based on our gross assets as well as an incentive fee.
As a business development company, we are required to comply with certain regulatory requirements. Also,while we are permitted to finance investments using debt, our ability to use debt is limited in certain significantrespects. We have elected to be treated for federal income tax purposes as a regulated investment company(“RIC”) under Subchapter M of the Code.
Investments
Apollo Investment seeks to create a portfolio that includes primarily debt investments in mezzanine and seniorsecured loans and, to a lesser extent, private equity investments by generally investing approximately $20 millionto $250 million of capital, on average, in these securities of middle-market companies. The average investmentsize will vary as the size of our capital base varies. Our target portfolio will generally be more heavily weightedtoward mezzanine loans. Structurally, mezzanine loans usually rank subordinate in priority of payment to seniordebt, such as senior bank debt, and are often unsecured. As such, other creditors may rank senior to us in theevent of an insolvency. However, mezzanine loans rank senior to common and preferred equity in a borrowers’capital structure. Mezzanine loans may have a fixed or floating interest rate. Additional upside can be generated
2
from upfront fees, call protection including call premiums, equity co-investments or warrants. We believe thatmezzanine loans offer an attractive investment opportunity based upon their historic returns. Additionally, wemay acquire investments in the secondary market if we believe the risk-adjusted returns are attractive.
Our principal focus is to provide capital to middle-market companies in a variety of industries. We generally seekto target companies that generate positive free cash flows.
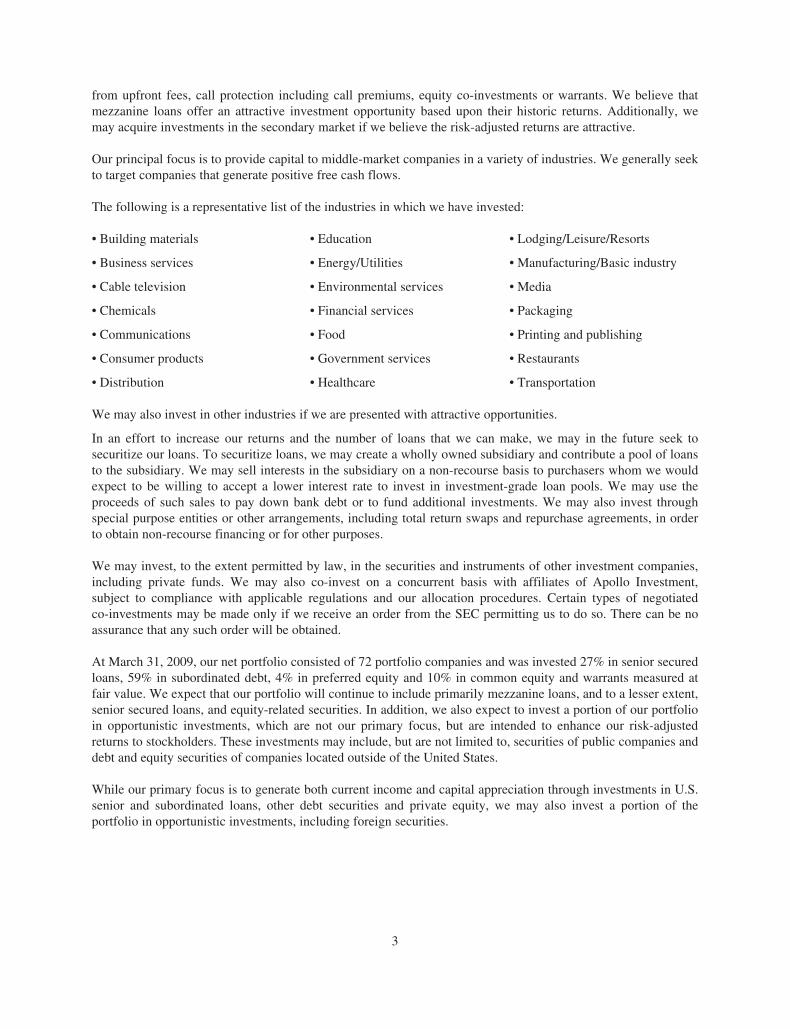
The following is a representative list of the industries in which we have invested:
• Building materials • Education • Lodging/Leisure/Resorts
• Business services • Energy/Utilities • Manufacturing/Basic industry
• Cable television • Environmental services • Media
• Chemicals • Financial services • Packaging
• Communications • Food • Printing and publishing
• Consumer products • Government services • Restaurants
• Distribution • Healthcare • Transportation
We may also invest in other industries if we are presented with attractive opportunities.
In an effort to increase our returns and the number of loans that we can make, we may in the future seek tosecuritize our loans. To securitize loans, we may create a wholly owned subsidiary and contribute a pool of loansto the subsidiary. We may sell interests in the subsidiary on a non-recourse basis to purchasers whom we wouldexpect to be willing to accept a lower interest rate to invest in investment-grade loan pools. We may use theproceeds of such sales to pay down bank debt or to fund additional investments. We may also invest throughspecial purpose entities or other arrangements, including total return swaps and repurchase agreements, in orderto obtain non-recourse financing or for other purposes.
We may invest, to the extent permitted by law, in the securities and instruments of other investment companies,including private funds. We may also co-invest on a concurrent basis with affiliates of Apollo Investment,subject to compliance with applicable regulations and our allocation procedures. Certain types of negotiatedco-investments may be made only if we receive an order from the SEC permitting us to do so. There can be noassurance that any such order will be obtained.
At March 31, 2009, our net portfolio consisted of 72 portfolio companies and was invested 27% in senior securedloans, 59% in subordinated debt, 4% in preferred equity and 10% in common equity and warrants measured atfair value. We expect that our portfolio will continue to include primarily mezzanine loans, and to a lesser extent,senior secured loans, and equity-related securities. In addition, we also expect to invest a portion of our portfolioin opportunistic investments, which are not our primary focus, but are intended to enhance our risk-adjustedreturns to stockholders. These investments may include, but are not limited to, securities of public companies anddebt and equity securities of companies located outside of the United States.
While our primary focus is to generate both current income and capital appreciation through investments in U.S.senior and subordinated loans, other debt securities and private equity, we may also invest a portion of theportfolio in opportunistic investments, including foreign securities.
3
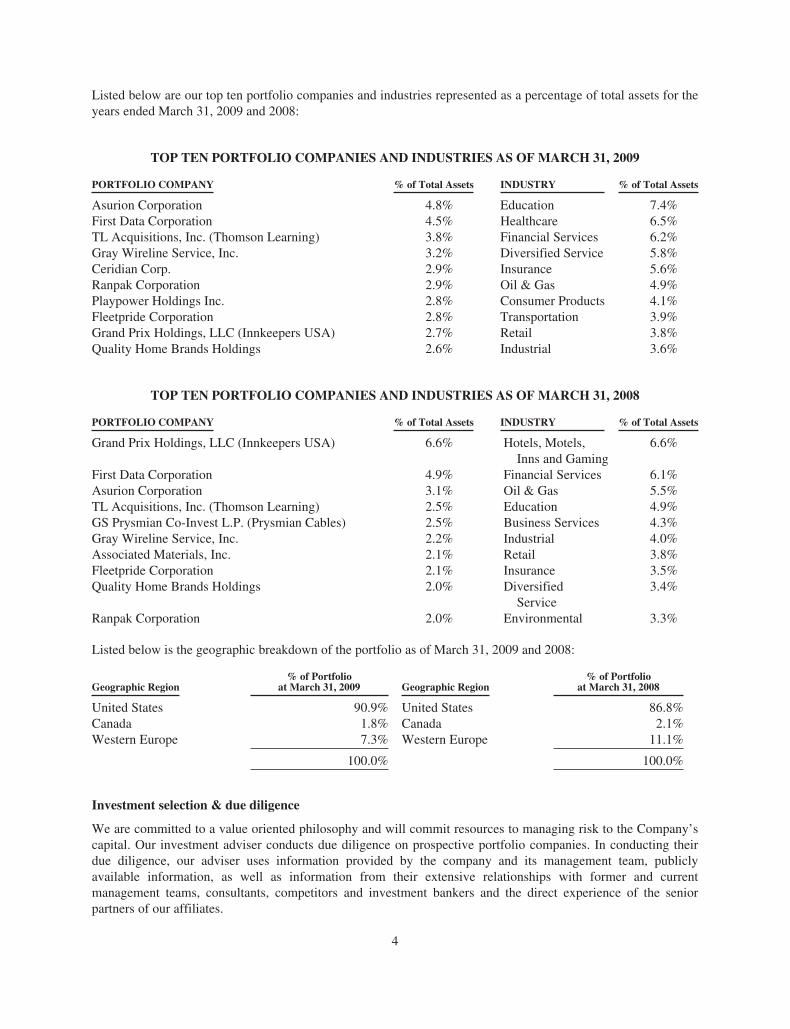
Listed below are our top ten portfolio companies and industries represented as a percentage of total assets for theyears ended March 31, 2009 and 2008:
TOP TEN PORTFOLIO COMPANIES AND INDUSTRIES AS OF MARCH 31, 2009
PORTFOLIO COMPANY % of Total Assets INDUSTRY % of Total Assets
Asurion Corporation 4.8% Education 7.4%First Data Corporation 4.5% Healthcare 6.5%TL Acquisitions, Inc. (Thomson Learning) 3.8% Financial Services 6.2%Gray Wireline Service, Inc. 3.2% Diversified Service 5.8%Ceridian Corp. 2.9% Insurance 5.6%Ranpak Corporation 2.9% Oil & Gas 4.9%Playpower Holdings Inc. 2.8% Consumer Products 4.1%Fleetpride Corporation 2.8% Transportation 3.9%Grand Prix Holdings, LLC (Innkeepers USA) 2.7% Retail 3.8%Quality Home Brands Holdings 2.6% Industrial 3.6%
TOP TEN PORTFOLIO COMPANIES AND INDUSTRIES AS OF MARCH 31, 2008
PORTFOLIO COMPANY % of Total Assets INDUSTRY % of Total Assets
Grand Prix Holdings, LLC (Innkeepers USA) 6.6% Hotels, Motels,Inns and Gaming
6.6%
First Data Corporation 4.9% Financial Services 6.1%Asurion Corporation 3.1% Oil & Gas 5.5%TL Acquisitions, Inc. (Thomson Learning) 2.5% Education 4.9%GS Prysmian Co-Invest L.P. (Prysmian Cables) 2.5% Business Services 4.3%Gray Wireline Service, Inc. 2.2% Industrial 4.0%Associated Materials, Inc. 2.1% Retail 3.8%Fleetpride Corporation 2.1% Insurance 3.5%Quality Home Brands Holdings 2.0% Diversified
Service3.4%
Ranpak Corporation 2.0% Environmental 3.3%
Listed below is the geographic breakdown of the portfolio as of March 31, 2009 and 2008:
Geographic Region% of Portfolio
at March 31, 2009 Geographic Region% of Portfolio
at March 31, 2008
United States 90.9% United States 86.8%Canada 1.8% Canada 2.1%Western Europe 7.3% Western Europe 11.1%
100.0% 100.0%
Investment selection & due diligence
We are committed to a value oriented philosophy and will commit resources to managing risk to the Company’scapital. Our investment adviser conducts due diligence on prospective portfolio companies. In conducting theirdue diligence, our adviser uses information provided by the company and its management team, publiclyavailable information, as well as information from their extensive relationships with former and currentmanagement teams, consultants, competitors and investment bankers and the direct experience of the seniorpartners of our affiliates.
4
Our investment adviser’s due diligence will typically include:
• review of historical and prospective financial information;
• on-site visits;
• interviews with management, employees, customers and vendors of the potential portfolio company;
• review of loan documents;
• background checks; and
• research relating to the company’s management, industry, markets, products and services, andcompetitors.
Upon the completion of due diligence and a decision to proceed with an investment in a company, theprofessionals leading the investment present the investment opportunity to our investment adviser’s investmentcommittee, which determines whether to pursue the potential investment. Additional due diligence with respectto any investment may be conducted on our behalf by attorneys and independent accountants (retained by suchportfolio company) prior to the closing of the investment, as well as other outside advisers, as appropriate.
Investment structure
Once we have determined that a prospective portfolio company is suitable for investment, we work with themanagement of that company and its other capital providers, including senior, junior and equity capital providers,to structure an investment.
We seek to structure our mezzanine investments primarily as unsecured, subordinated loans that provide forrelatively high interest rates that provide us with significant current interest income. These loans typically haveinterest-only payments in the early years, with amortization of principal deferred to the later years of themezzanine loans. In some cases, we may enter into loans that, by their terms, convert into equity or additionaldebt securities or defer payments of interest after our investment. Also, in some cases our mezzanine loans maybe collateralized by a subordinated lien on some or all of the assets of the borrower. Typically, our mezzanineloans have maturities of five to ten years.
We also seek to invest in portfolio companies in the form of senior secured loans. We expect these senior securedloans to have terms of three to ten years and may provide for deferred interest payments over the term of theloan. We generally seek to obtain security interests in the assets of our portfolio companies that serve ascollateral in support of the repayment of these loans. This collateral may take the form of first or second priorityliens on the assets of a portfolio company.
In the case of our mezzanine and senior secured loan investments, we seek to tailor the terms of the investment tothe facts and circumstances of the transaction and the prospective portfolio company, negotiating a structure thatprotects our rights and manages our risk while creating incentives for the portfolio company to achieve itsbusiness plan and improve its profitability. For example, in addition to seeking a senior position in the capitalstructure of our portfolio companies, we seek to limit the downside potential of our investments by:
• requiring an expected total return on our investments (including both interest and potential equityappreciation) that compensates us for credit risk;
• generally incorporating call protection into the investment structure; and
• negotiating covenants and information rights in connection with our investments that afford ourportfolio companies as much flexibility in managing their businesses as possible, consistent with ourgoal of preserving our capital. Such restrictions may include affirmative and negative covenants,default penalties, lien protection, change of control provisions and board rights, including eitherobservation or participation rights.
5
Our investments may include equity features, such as warrants or options to buy a minority interest in theportfolio company. Any warrants we receive with our debt securities generally require only a nominal cost toexercise, and thus, as a portfolio company appreciates in value, we may achieve additional investment returnfrom this equity interest. We may structure the warrants to provide provisions protecting our rights as a minority-interest holder, as well as puts, or rights to sell such securities back to the company, upon the occurrence ofspecified events. In many cases, we may also seek to obtain registration rights in connection with these equityinterests, which may include demand and “piggyback” registration rights.
We expect to hold most of our investments to maturity or repayment, but we may sell certain of our investmentsearlier, including, if a liquidity event takes place such as the sale or recapitalization or worsening of credit qualityof a portfolio company.
Managerial assistance
As a business development company, we offer, and must provide upon request, managerial assistance to ourportfolio companies. This assistance could involve, among other things, monitoring the operations of ourportfolio companies, participating in board and management meetings, consulting with and advising officers ofportfolio companies and providing other organizational and financial guidance. We may receive fees for theseservices. Apollo Administration provides such managerial assistance on our behalf to portfolio companies thatrequest this assistance.
Ongoing relationships with portfolio companies
Monitoring
Apollo Investment Management monitors our portfolio companies on an ongoing basis. AIM monitors thefinancial trends of each portfolio company to determine if each is meeting its respective business plans and toassess the appropriate course of action for each company.
AIM has several methods of evaluating and monitoring the performance and fair value of our investments, whichcan include, but are not limited to, the following:
• Assessment of success in adhering to portfolio company’s business plan and compliance withcovenants;
• Periodic and regular contact with portfolio company management and, if appropriate, the financial orstrategic sponsor, to discuss financial position, requirements and accomplishments;
• Comparisons to other portfolio companies in the industry;
• Attendance at and participation in board meetings; and
• Review of monthly and quarterly financial statements and financial projections for portfoliocompanies.
In addition to various risk management and monitoring tools, AIM also uses an investment rating system tocharacterize and monitor our expected level of returns on each investment in our portfolio.
6
We use an investment rating scale of 1 to 5. The following is a description of the conditions associated with eachinvestment rating:
InvestmentRating Summary Description
1 Capital gain expected2 Full return of principal and interest or dividend expected, with the portfolio company
performing in accordance with our analysis of its business3 Full return of principal and interest or dividend expected, but the portfolio company
requires closer monitoring4 Some loss of interest, dividend or capital appreciation expected, but still expecting an
overall positive internal rate of return on the investment5 Loss of interest or dividend and some loss of principal investment expected, which would
result in an overall negative internal rate of return on the investment
AIM monitors and, when appropriate, changes the investment ratings assigned to each investment in ourportfolio. In connection with our valuation process, AIM reviews these investment ratings on a quarterly basis,and our board of directors affirms such ratings.
Valuation Process
The following is a description of the steps we take each quarter to determine the value of our portfolio. Many ofour portfolio investments are recorded at fair value as determined in good faith by or under the direction of ourboard of directors pursuant to a written valuation policy and a consistently applied valuation process utilizing theinput of our investment adviser, independent valuation firms and the audit committee. Investments for whichmarket quotations are readily available are recorded in our financial statements at such market quotations if theyare deemed to represent fair value. Market quotations may be deemed not to represent fair value where AIMbelieves that facts and circumstances applicable to an issuer, a seller or purchaser or the market for a particularsecurity causes current market quotes not to reflect the fair value of the security, among other reasons. Examplesof these events could include cases in which material events are announced after the close of the market on whicha security is primarily traded, when a security trades infrequently causing a quoted purchase or sale price tobecome stale or in the event of a “fire sale” by a distressed seller.
With respect to investments for which market quotations are not readily available or when such marketquotations are deemed not to represent fair value, our board of directors has approved a multi-step valuationprocess each quarter, as described below:
(1) our quarterly valuation process begins with each portfolio company or investment being initiallyvalued by the investment professionals of our investment adviser responsible for the portfolio investment;
(2) preliminary valuation conclusions are then documented and discussed with senior management ofour investment adviser;
(3) independent valuation firms engaged by our board of directors conduct independent appraisals andreview our investment adviser’s preliminary valuations and make their own independent assessment;
(4) the audit committee of the board of directors reviews the preliminary valuation of our investmentadviser and that of the independent valuation firm and responds to the valuation recommendation of theindependent valuation firm to reflect any comments; and
(5) the board of directors discusses valuations and determines the fair value of each investment in ourportfolio in good faith based on the input of our investment adviser, the respective independent valuationfirm and the audit committee.
7
When we make investments that involve deferrals of interest payable to us, any increase in the value of theinvestment due to the accrual or receipt of payment of interest is allocated to the increase in the cost basis of theinvestment, rather than to capital appreciation or gain.
Competition
Our primary competitors in providing financing to middle-market companies include public and private funds,commercial and investment banks, commercial financing companies, and, to the extent they provide analternative form of financing, private equity funds. Additionally, because competition for investmentopportunities generally has increased among alternative investment vehicles, such as hedge funds, those entitieshave begun to invest in areas they have not traditionally invested in, including investments in middle-marketcompanies. Some of our existing and potential competitors are substantially larger and have considerably greaterfinancial, technical and marketing resources than we do. For example, some competitors may have a lower costof funds and access to funding sources that are not available to us. In addition, some of our competitors may havehigher risk tolerances or different risk assessments, which could allow them to consider a wider variety ofinvestments and establish more relationships than we. Furthermore, many of our competitors are not subject tothe regulatory restrictions that the 1940 Act imposes on us as a business development company. We also expectto use the industry information of Apollo’s investment professionals to which we have access to assessinvestment risks and determine appropriate pricing for our investments in portfolio companies. In addition, webelieve that the relationships of the senior managers of AIM and those of our affiliates enable us to learn about,and compete effectively for, financing opportunities with attractive middle-market companies in the industries inwhich we seek to invest.
Staffing
The Company has a chief financial officer and a chief compliance officer and, to the extent necessary, they havehired and will continue to hire additional personnel. These individuals are employees of Apollo Administrationand perform their respective functions under the terms of the administration agreement. Certain of our otherexecutive officers are managing partners of our investment adviser. Our day-to-day investment operations aremanaged by our investment adviser. AIM has hired and will continue to hire additional investment professionalsin the future. In addition, we reimburse Apollo Administration for our allocable portion of expenses incurred byit in performing its obligations under the administration agreement, including rent and our allocable portion ofthe cost of our chief financial officer and chief compliance officer and their respective staffs.
Sarbanes-Oxley Act of 2002
The Sarbanes-Oxley Act of 2002 imposes a wide variety of regulatory requirements on publicly-held companiesand their insiders. Many of these requirements affect us. For example:
• Pursuant to Rule 13a-14 of the 1934 Act, our Chief Executive Officer and Chief Financial Officer mustcertify the accuracy of the financial statements contained in our periodic reports;
• Pursuant to Item 307 of Regulation S-K, our periodic reports must disclose our conclusions about theeffectiveness of our disclosure controls and procedures;
• Pursuant to Rule 13a-15 of the 1934 Act, our management must prepare a report regarding itsassessment of our internal control over financial reporting; and
• Pursuant to Item 308 of Regulation S-K and Rule 13a-15 of the 1934 Act, our periodic reports mustdisclose whether there were significant changes in our internal controls or in other factors that couldsignificantly affect these controls subsequent to the date of their evaluation, including any correctiveactions with regard to significant deficiencies and material weaknesses.
8
The Sarbanes-Oxley Act requires us to review our current policies and procedures to determine whether wecomply with the Sarbanes-Oxley Act and the regulations promulgated thereunder. We will continue to monitorour compliance with all regulations that are adopted under the Sarbanes-Oxley Act and will take actionsnecessary to ensure that we are in compliance therewith.
You may read and copy any materials we file with the SEC at the SEC’s Public Reference Room at 100 F Street,NE, Washington, DC 20549, on official business days during the hours of 10:00 am to 3:00 pm. You may obtaininformation on the operation of the Public Reference Room by calling the SEC at 1-800-SEC-0330. The SECmaintains an Internet site that contains reports, proxy and information statements, and other informationregarding issuers that file electronically with the SEC. The address of that site is (http://www.sec.gov).
Our internet address is www.apolloic.com. We make available free of charge on our website our annual report onForm 10-K, quarterly reports on Form 10-Q, current reports on Form 8-K and amendments to those reports assoon as reasonably practicable after we electronically file such material with, or furnish it to, the SEC.Information contained on our website is not incorporated by reference into this annual report on Form 10-K, andyou should not consider information contained on our website to be part of this annual report on Form 10-K.
Item 1A. Risk Factors
Investing in Apollo Investment involves a number of significant risks related to our business, structure,investments and investment in our common stock. As a result, there can be no assurance that we will achieve ourinvestment objective.
CERTAIN RISKS IN THE CURRENT ENVIRONMENT
Capital markets are currently in a period of disruption and instability. These market conditions havematerially and adversely affected debt and equity capital markets in the United States and abroad, whichhas had and could continue to result in a negative impact on our business and operations.
We believe that beginning in 2007 and through 2008, the global capital markets were in a period of disruption asevidenced by a lack of liquidity in the debt capital markets, significant write-offs in the financial services sector,the re-pricing of credit risk in the broadly syndicated credit market and the failure of certain major financialinstitutions and have remained as such through the date of this filing. Despite actions of the United States federalgovernment and foreign governments, these events have contributed to worsening general economic conditionsthat are materially and adversely impacting the broader financial and credit markets and reducing the availabilityof debt and equity capital for the market as a whole and financial services firms in particular. These conditionscould continue for a prolonged period of time or worsen in the future. While these conditions persist, we andother companies in the financial services sector may be required to, or may choose to, seek access to alternativemarkets for debt and equity capital. Equity capital may be difficult to raise because, subject to some limitedexceptions, we are not generally able to issue and sell our common stock at a price below net asset value pershare. In addition, the debt capital that will be available, if at all, may be at a higher cost, and on less favorableterms and conditions in the future. Conversely, our portfolio companies may not be able to service or refinancetheir debt, which could materially and adversely affect our financial condition as we would experience reducedincome or even losses. The inability to raise capital and the risk of portfolio company defaults may have anegative effect on our business, financial condition and results of operations.
RISKS RELATING TO OUR BUSINESS AND STRUCTURE
We may suffer credit losses.
Investment in small and middle-market companies is highly speculative and involves a high degree of risk ofcredit loss. These risks are likely to increase during economic recession, such as the US and many othereconomies have been experiencing.
9
We are dependent upon Apollo Investment Management’s key personnel for our future success and upontheir access to Apollo’s investment professionals and partners.
We depend on the diligence, skill and network of business contacts of the senior management of AIM. Membersof our senior management may depart at any time. We also depend, to a significant extent, on AIM’s access tothe investment professionals and partners of Apollo and the information and deal flow generated by the Apolloinvestment professionals in the course of their investment and portfolio management activities. The seniormanagement of AIM evaluates, negotiates, structures, closes and monitors our investments. Our future successdepends on the continued service of the senior management team of AIM. The departure of any senior managersof AIM, or of a significant number of the investment professionals or partners of Apollo, could have a materialadverse effect on our ability to achieve our investment objective. In addition, we can offer no assurance that AIMwill remain our investment adviser or that we will continue to have access to Apollo’s partners and investmentprofessionals or its information and deal flow.
Our financial condition and results of operation depend on our ability to manage future growth effectively.
Our ability to achieve our investment objective depends, in part, on our ability to grow, which depends, in turn,on AIM’s ability to identify, invest in and monitor companies that meet our investment criteria. Accomplishingthis result on a cost-effective basis is largely a function of AIM’s structuring of the investment process, its abilityto provide competent, attentive and efficient services to us and our access to financing on acceptable terms. Thesenior management team of AIM has substantial responsibilities under the investment advisory and managementagreement, and with respect to certain members, in connection with their roles as officers of other Apollo funds.
They may also be called upon to provide managerial assistance to our portfolio companies. These demands ontheir time may distract them or slow the rate of investment. In order to grow, we and AIM need to hire, train,supervise and manage new employees. Any failure to manage our future growth effectively could have a materialadverse effect on our business, financial condition and results of operations.
We operate in a highly competitive market for investment opportunities.
A number of entities compete with us to make the types of investments that we make. We compete with publicand private funds, commercial and investment banks, commercial financing companies, and, to the extent theyprovide an alternative form of financing, private equity funds. Additionally, because competition for investmentopportunities generally has increased in recent years among alternative investment vehicles, such as hedge funds,those entities have begun to invest in areas they have not traditionally invested in. As a result of these entrants,competition for investment opportunities intensified in recent years and may intensify further in the future. Someof our existing and potential competitors are substantially larger and have considerably greater financial,technical and marketing resources than we do. For example, some competitors may have a lower cost of fundsand access to funding sources that are not available to us. In addition, some of our competitors may have higherrisk tolerances or different risk assessments, which could allow them to consider a wider variety of investmentsand establish more relationships than us. Furthermore, many of our competitors are not subject to the regulatoryrestrictions and valuation requirements that the 1940 Act imposes on us as a BDC. We cannot assure you that thecompetitive pressures we face will not have a material adverse effect on our business, financial condition andresults of operations. Also, as a result of this existing and potentially increasing competition, we may not be ableto take advantage of attractive investment opportunities from time to time, and we can offer no assurance that wewill be able to identify and make investments that are consistent with our investment objective.
We do not seek to compete primarily based on the interest rates we offer, and we believe that some of ourcompetitors make loans with interest rates that are comparable to or lower than the rates we offer.
We may lose investment opportunities if we do not match our competitors’ pricing, terms and structure. If wematch our competitors’ pricing, terms and structure, we may experience decreased net interest income andincreased risk of credit loss.
10
Any failure on our part to maintain our status as a BDC would reduce our operating flexibility.
If we do not remain a BDC, we might be regulated as a closed-end investment company under the 1940 Act,which would subject us to substantially more regulatory restrictions under the 1940 Act and correspondinglydecrease our operating flexibility.
We will be subject to corporate-level income tax if we are unable to qualify as a Regulated InvestmentCompany (“RIC”).
To qualify as a RIC under the Code, we must meet certain source-of-income, asset diversification and annualdistribution requirements. The annual distribution requirement for a RIC is satisfied if we distribute at least 90%of our ordinary income and realized net short-term capital gains in excess of realized net long-term capital losses,if any, to our stockholders on an annual basis. To the extent we use debt financing, we are subject to certain assetcoverage ratio requirements and other financial covenants under loan and credit agreements, and could in somecircumstances also become subject to such requirements under the 1940 Act, that could, under certaincircumstances, restrict us from making distributions necessary to qualify as a RIC. If we are unable to obtain cashfrom other sources, we may fail to qualify as a RIC and, thus, may be subject to corporate-level income tax. Toqualify as a RIC, we must also meet certain asset diversification requirements at the end of each calendar quarter.Failure to meet these tests may result in our having to dispose of certain investments quickly in order to preventthe loss of RIC status. Because most of our investments are in private companies, any such dispositions could bemade at disadvantageous prices and may result in substantial losses. If we fail to qualify as a RIC for any reasonand become subject to corporate-level income tax, the resulting corporate-level taxes could substantially reduceour net assets, the amount of income available for distribution and the amount of our distributions. Such a failurewould have a material adverse effect on us and our stockholders.
We may have difficulty paying our required distributions if we recognize income before or withoutreceiving cash representing such income.
For federal income tax purposes, we include in income certain amounts that we have not yet received in cash,such as original issue discount, which may arise if we receive warrants in connection with the making of a loanor possibly in other circumstances, or payment-in-kind interest, which represents contractual interest added to theloan balance and due at the end of the loan term. Such original issue discount, which could be significant relativeto our overall investment activities, or increases in loan balances as a result of payment-in-kind arrangements areincluded in income before we receive any corresponding cash payments. We also may be required to include inincome certain other amounts that we do not receive in cash.
That part of the incentive fee payable by us that relates to our net investment income is computed and paid onincome that may include interest that has been accrued but not yet received in cash. If a portfolio companydefaults on a loan, it is possible that accrued interest previously used in the calculation of the incentive fee willbecome uncollectible. Consequently, while we may make incentive fee payments on income accruals that wemay not collect in the future and with respect to which we do not have a formal clawback right against ourinvestment adviser per se, the amount of accrued income written off in any period will reduce the income in theperiod in which such write-off was taken and thereby reduce such period’s incentive fee payment.
Since in certain cases we may recognize income before or without receiving cash representing such income, wemay have difficulty meeting the tax requirement to distribute at least 90% of our ordinary income and realizednet short-term capital gains in excess of realized net long-term capital losses, if any, to maintain our status as aRIC. Accordingly, we may have to sell some of our investments at times we would not consider advantageous,raise additional debt or equity capital or reduce new investment originations in order to meet distribution and/orleverage requirements.
11
Regulations governing our operation as a BDC affect our ability to, and the way in which we raiseadditional capital.
We may issue debt securities or preferred stock and/or borrow money from banks or other financial institutions,which we refer to collectively as “senior securities,” up to the maximum amount permitted by the 1940 Act.Under the provisions of the 1940 Act, we are permitted, as a BDC, to issue senior securities only in amounts suchthat our asset coverage, as defined in the 1940 Act, equals at least 200% after each issuance of senior securities.If the value of our assets declines, we may be unable to satisfy this test. If that happens, the contractualarrangements governing these securities may require us to sell a portion of our investments and, depending on thenature of our leverage, repay a portion of our indebtedness at a time when such sales may be disadvantageous.
BDCs may issue and sell common stock at a price below net asset value per share only in limited circumstances,one of which is during the one-year period after stockholder approval. In August 2008, our stockholdersapproved a plan so that we may, in one or more public or private offerings of our common stock, sell orotherwise issue shares of our common stock at a price below the then current net asset value per share, subject tocertain conditions including parameters on the level of permissible dilution, approval of the sale by a majority ofour independent directors and a requirement that the sale price be not less than approximately the market price ofthe shares of our common stock at specified times, less the expenses of the sale. We may ask our stockholders foradditional approvals from year to year. There is no assurance such approvals will be obtained.
In the event we sell, or otherwise issue, shares of our common stock at a price below net asset value per share,existing stockholders will experience net asset value dilution and the investors who acquire shares in suchoffering may thereafter experience the same type of dilution from subsequent offerings at a discount. Forexample, if we sell an additional 10% of our common shares at a 5% discount from net asset value, a stockholderwho does not participate in that offering for its proportionate interest will suffer net asset value dilution of up to0.5% or $5 per $1000 of net asset value.
We currently use borrowed funds to make investments and are exposed to the typical risks associated withleverage.
We are exposed to increased risk of loss due to our use of debt to make investments. A decrease in the value ofour investments will have a greater negative impact on the value of our common stock than if we did not usedebt. Our ability to pay dividends will be restricted if we fail to satisfy certain of our asset coverage ratios andother financial covenants and any amounts that we use to service our indebtedness are not available for dividendsto our common stockholders.
The agreements governing our revolving credit facility require us to comply with certain financial andoperational covenants. These covenants require us to, among other things, maintain certain financial ratios,including asset coverage, minimum shareholder equity and liquidity. As of March 31, 2009, we were incompliance with these covenants. However, our continued compliance with these covenants depends on manyfactors, some of which are beyond our control. For example, during the year ended March 31, 2009, netunrealized depreciation in our portfolio increased and, given the further deterioration in the capital markets andpricing levels subsequent to this period, net unrealized depreciation in our portfolio may continue to increase inthe future. Absent an amendment to our revolving credit facility, continued unrealized depreciation in ourinvestment portfolio could result in non-compliance with certain covenants.
Accordingly, there are no assurances that we will continue to comply with these covenants. Failure to complywith these covenants would result in a default which, if we were unable to obtain a waiver from the lenders,could accelerate repayment under the facilities and thereby have a material adverse impact on our liquidity,financial condition, results of operations and ability to pay dividends.
Our current and future debt securities are and may be governed by an indenture or other instrument containingcovenants restricting our operating flexibility. We, and indirectly our stockholders, bear the cost of issuing and
12
servicing such securities. Any convertible or exchangeable securities that we issue in the future may have rights,preferences and privileges more favorable than those of our common stock.
We fund a portion of our investments with borrowed money, which magnifies the potential for gain or losson amounts invested and may increase the risk of investing in us.
Borrowings and other types of financing, also known as leverage, magnify the potential for gain or loss onamounts invested and, therefore, increase the risks associated with investing in our securities. Our lenders havefixed dollar claims on our assets that are superior to the claims of our common stockholders or any preferredstockholders. If the value of our assets increases, then leveraging would cause the net asset value to increasemore sharply than it would have had we not leveraged. Conversely, if the value of our assets decreases,leveraging would cause net asset value to decline more sharply than it otherwise would have had we notleveraged. Similarly, any increase in our income in excess of consolidated interest payable on the borrowed fundswould cause our net income to increase more than it would without the leverage, while any decrease in ourincome would cause net income to decline more sharply than it would have had we not borrowed. Such a declinecould negatively affect our ability to make common stock dividend payments. Leverage is generally considered aspeculative investment technique.
We may in the future determine to fund a portion of our investments with preferred stock, which wouldmagnify the potential for gain or loss and the risks of investing in us in the same way as our borrowings.
Preferred stock, which is another form of leverage, has the same risks to our common stockholders as borrowingsbecause the dividends on any preferred stock we issue must be cumulative. Payment of such dividends andrepayment of the liquidation preference of such preferred stock must take preference over any dividends or otherpayments to our common stockholders, and preferred stockholders are not subject to any of our expenses orlosses and are not entitled to participate in any income or appreciation in excess of their stated preference.
Changes in interest rates may affect our cost of capital and net investment income.
Because we borrow money, and may issue preferred stock to finance investments, our net investment income willdepend, in part, upon the difference between the rate at which we borrow funds or pay dividends on preferredstock and the rate at which we invest these funds. As a result, we can offer no assurance that a significant changein market interest rates will not have a material adverse effect on our net investment income. In periods of risinginterest rates, our cost of funds would increase, except to the extent we issue fixed rate debt or preferred stock,which could reduce our net investment income. Our long-term fixed-rate investments are financed primarily withequity and long-term debt. We may use interest rate risk management techniques in an effort to limit ourexposure to interest rate fluctuations. Such techniques may include various interest rate hedging activities to theextent permitted by the 1940 Act. Interest rate hedging activities do not protect against credit risk. We haveanalyzed the potential impact of changes in interest rates on interest income net of interest expense. Assumingthat the balance sheet were to remain constant from March 31, 2009 and no actions were taken to alter theexisting interest rate sensitivity, a hypothetical immediate 1% change in interest rates would not materially affectour net investment income over a one-year horizon. Although management believes that this is indicative of oursensitivity to interest rate changes, it does not adjust for potential changes in credit quality, size and compositionof the assets on the balance sheet and other business developments that could affect net increase in net assetsresulting from operations, or net income. Accordingly, no assurances can be given that actual results would notdiffer materially from the potential outcome simulated by this estimate.
You should also be aware that a rise in the general level of interest rates can be expected to lead to higher interestrates we receive on many of our debt investments. Accordingly, an increase in interest rates would make it easierfor us to meet or exceed the performance threshold and may result in a substantial increase in the amount ofincentive fees payable to our investment adviser with respect to pre-incentive fee net investment income.
13

We may need to raise additional capital to grow because we must distribute most of our income.
We may need additional capital to fund growth in our investments. We have issued equity securities and haveborrowed from financial institutions. A reduction in the availability of new capital could limit our ability to grow.We must distribute at least 90% of our ordinary income and realized net short-term capital gains in excess ofrealized net long-term capital losses, if any, to our stockholders to maintain our regulated investment companystatus. As a result, such earnings are not available to fund investment originations. We expect to continue toborrow from financial institutions and issue additional debt and equity securities. If we fail to obtain funds fromsuch sources or from other sources to fund our investments, it could limit our ability to grow, which may have anadverse effect on the value of our securities. In addition, as a BDC, our ability to borrow or issue additionalpreferred stock may be restricted if our total assets are less than 200% of our total borrowings and preferredstock.
Many of our portfolio investments are recorded at fair value as determined in good faith by our board ofdirectors and, as a result, there is uncertainty as to the value of our portfolio investments.
A large percentage of our portfolio investments are not publicly traded. The fair value of these investments maynot be readily determinable. We value these investments quarterly at fair value (based on FAS 157, itscorresponding guidance and the principal markets in which these investments trade) as determined in good faithby our board of directors pursuant to a written valuation policy and a consistently applied valuation processutilizing the input of our investment adviser, independent valuation firms and the audit committee. Our board ofdirectors utilizes the services of independent valuation firms to aid it in determining the fair value of theseinvestments. The types of factors that may be considered in fair value pricing of these investments include thenature and realizable value of any collateral, the portfolio company’s ability to make payments and its earnings,the markets in which the portfolio company does business, comparison to more liquid securities, indices andother market-related inputs, discounted cash flow, our principal market, and other relevant factors. Because suchvaluations, and particularly valuations of private securities and private companies, are inherently uncertain, mayfluctuate over short periods of time and may be based on estimates, our determinations of fair value may differmaterially from the values that would have been used if a readily available market for these investments existedand may differ materially from the amounts we realize on any disposition of such investments. Our net assetvalue could be adversely affected if our determinations regarding the fair value of these investments werematerially higher than the values that we ultimately realize upon the disposal of such investments.
In addition, decreases in the market values or fair values of our investments are recorded as unrealizeddepreciation. The continuing unprecedented declines in prices and liquidity in the debt markets have resulted insignificant net unrealized depreciation in our portfolio. The effect of all of these factors on our portfolio hasreduced our NAV by increasing net unrealized depreciation in our portfolio. Subsequent to December 31, 2008and through our fiscal year end March 31, 2009, conditions in the debt and equity markets have continued todeteriorate and pricing levels have continued to decline. As a result, depending on market conditions, we couldincur substantial realized losses and may continue to suffer additional unrealized losses in future periods, whichcould have a material adverse impact on our business, financial condition and results of operations.
The lack of liquidity in our investments may adversely affect our business.
We generally make investments in private companies. Substantially all of these securities are subject to legal andother restrictions on resale or are otherwise less liquid than publicly traded securities. The illiquidity of ourinvestments may make it difficult for us to sell such investments if the need arises. In addition, if we are requiredto liquidate all or a portion of our portfolio quickly, we may realize significantly less than the value at which wehave previously recorded our investments. In addition, we may face other restrictions on our ability to liquidatean investment in a portfolio company to the extent that we or an affiliated manager of Apollo has materialnon-public information regarding such portfolio company.
14
We may experience fluctuations in our periodic results.
We could experience fluctuations in our periodic operating results due to a number of factors, including theinterest rates payable on the debt securities we acquire, the default rate on such securities, the level of ourexpenses including the interest rates payable on our borrowings, the dividend rates on preferred stock we issue,variations in and the timing of the recognition of realized and unrealized gains or losses, the degree to which weencounter competition in our markets and general economic conditions. As a result of these factors, results forany period should not be relied upon as being indicative of performance in future periods.
There are significant potential conflicts of interest which could adversely affect our investment returns.
Our executive officers and directors, and the partners of our investment adviser, AIM, serve or may serve asofficers, directors or principals of entities that operate in the same or a related line of business as we do or ofinvestment funds managed by our affiliates. Accordingly, they may have obligations to investors in those entities,the fulfillment of which might not be in the best interests of us or our stockholders. Moreover, we note that,notwithstanding the difference in principal investment objectives between us and other Apollo funds, such otherApollo sponsored funds, including new affiliated potential pooled investment vehicles or managed accounts notyet established (whether managed or sponsored by those Apollo affiliates or AIM itself), have and may from timeto time have overlapping investment objectives with us and, accordingly, invest in, whether principally orsecondarily, asset classes similar to those targeted by us. To the extent such other investment vehicles haveoverlapping investment objectives, the scope of opportunities otherwise available to us may be adversely affectedand/or reduced. As a result, the partners of AIM may face conflicts in their time management and commitmentsas well as in the allocation of investment opportunities to other Apollo funds. In addition, in the event suchinvestment opportunities are allocated among us and other investment vehicles managed or sponsored by, oraffiliated with, AIM our desired investment portfolio may be adversely affected. Although AIM endeavors toallocate investment opportunities in a fair and equitable manner, it is possible that we may not be given theopportunity to participate in certain investments made by investment funds managed by AIM or investmentmanagers affiliated with AIM.
There are no information barriers amongst Apollo and certain of its affiliates. If AIM were to receive materialnon-public information about a particular company, or have an interest in investing in a particular company,Apollo or certain of its affiliates may be prevented from investing in such company. Conversely, if Apollo orcertain of its affiliates were to receive material non-public information about a particular company, or have aninterest in investing in a particular company, we may be prevented from investing in such company.
AIM and/or its affiliates and investment managers may determine that an investment is appropriate both for usand for one or more other funds. In such event, depending on the availability of such investment and otherappropriate factors, AIM may determine that we should invest on a side-by-side basis with one or more otherfunds. We may make all such investments subject to compliance with applicable regulations and interpretations,and our allocation procedures. In certain circumstances negotiated co-investments may be made only if wereceive an order from the SEC permitting us to do so. There can be no assurance that any such order will beobtained.
In the course of our investing activities, we pay management and incentive fees to AIM, and reimburse AIM forcertain expenses it incurs. As a result, investors in our common stock invest on a “gross” basis and receivedistributions on a “net” basis after expenses, resulting in, among other things, a lower rate of return than onemight achieve through direct investments. As a result of this arrangement, there may be times when themanagement team of AIM has interests that differ from those of our common stockholders, giving rise to aconflict.
AIM receives a quarterly incentive fee based, in part, on our pre-incentive fee income, if any, for the immediatelypreceding calendar quarter. This incentive fee will not be payable to the Investment Adviser unless thepre-incentive net investment income exceeds 1.75% for the quarter. To the extent we or AIM are able to exert
15
influence over our portfolio companies, the quarterly pre-incentive fee may provide AIM with an incentive toinduce our portfolio companies to prepay interest or other obligations in certain circumstances.
We have entered into a royalty-free license agreement with Apollo, pursuant to which Apollo has agreed to grantus a non-exclusive license to use the name “Apollo.” Under the license agreement, we have the right to use the“Apollo” name for so long as AIM or one of its affiliates remains our investment adviser. In addition, we rentoffice space from AIA, an affiliate of AIM, and pay Apollo Administration our allocable portion of overhead andother expenses incurred by AIA in performing its obligations under the administration agreement, including ourallocable portion of the cost of our Chief Financial Officer and Chief Compliance Officer and their respectivestaffs, which can create conflicts of interest that our board of directors must monitor.
In the past following periods of volatility in the market price of a company’s securities, securities classaction litigation has, from time to time, been brought against that company.
If our stock price fluctuates significantly, we may be the target of securities litigation in the future. Securitieslitigation could result in substantial costs and divert management’s attention and resources from our business.
Changes in laws or regulations governing our operations may adversely affect our business.
We and our portfolio companies are subject to regulation by laws at the local, state and federal levels. These lawsand regulations, as well as their interpretation, may be changed from time to time. Accordingly, any change inthese laws or regulations could have a material adverse affect on our business.
Provisions of the Maryland General Corporation Law and of our charter and bylaws could deter takeoverattempts and have an adverse impact on the price of our common stock.
The Maryland General Corporation Law, our charter and our bylaws contain provisions that may discourage,delay or make more difficult a change in control of Apollo Investment or the removal of our directors. We aresubject to the Maryland Business Combination Act, subject to any applicable requirements of the 1940 Act. Ourboard of directors has adopted a resolution exempting from the Business Combination Act any businesscombination between us and any other person, subject to prior approval of such business combination by ourboard of directors, including approval by a majority of our disinterested directors. If the resolution exemptingbusiness combinations is repealed or our board of directors does not approve a business combination, theBusiness Combination Act may discourage third parties from trying to acquire control of us and increase thedifficulty of consummating such an offer. Our bylaws exempt from the Maryland Control Share Acquisition Actacquisitions of our common stock by any person. If we amend our bylaws to repeal the exemption from theControl Share Acquisition Act, the Control Share Acquisition Act also may make it more difficult for a thirdparty to obtain control of us and increase the difficulty of consummating such an offer.
We have also adopted other measures that may make it difficult for a third party to obtain control of us, includingprovisions of our charter classifying our board of directors in three classes serving staggered three-year terms,and provisions of our charter authorizing our board of directors to classify or reclassify shares of our stock in oneor more classes or series, to cause the issuance of additional shares of our stock, and to amend our charter,without stockholder approval, to increase or decrease the number of shares of stock that we have authority toissue. These provisions, as well as other provisions of our charter and bylaws, may delay, defer or prevent atransaction or a change in control that might otherwise be in the best interests of our stockholders.
RISKS RELATED TO OUR INVESTMENTS
Our investments in prospective portfolio companies may be risky, and you could lose all or part of yourinvestment.
Investment in middle-market companies involves a number of significant risks. Middle-market companies mayhave limited financial resources and may be unable to meet their obligations under their debt securities that we
16
hold, which may be accompanied by a deterioration in the value of any collateral and a reduction in thelikelihood of us realizing any guarantees we may have obtained in connection with our investment. In addition,they typically have shorter operating histories, narrower product lines and smaller market shares than largerbusinesses, which tend to render them more vulnerable to competitors’ actions and market conditions, as well asgeneral economic downturns. Middle-market companies are more likely to depend on the management talentsand efforts of a small group of persons; therefore, the death, disability, resignation or termination of one or moreof these persons could have a material adverse impact on our portfolio company and, in turn, on us. Middle-market companies also generally have less predictable operating results, may from time to time be parties tolitigation, may be engaged in rapidly changing businesses with products subject to a substantial risk ofobsolescence, and may require substantial additional capital to support their operations, finance expansion ormaintain their competitive position. In addition, our executive officers, directors and our investment adviser may,in the ordinary course of business, be named as defendants in litigation arising from our investments in theportfolio companies.
We invest primarily in mezzanine debt and senior secured loans and we may not realize gains from ourequity investments.
When we invest in mezzanine and senior secured loans, we have and may continue to acquire warrants or otherequity securities as well. In addition, we may invest directly in the equity securities of portfolio companies. Ourgoal is ultimately to dispose of such equity interests and realize gains upon our disposition of such interests.However, the equity interests we receive may not appreciate in value and, in fact, may decline in value.Accordingly, we may not be able to realize gains from our equity interests, and any gains that we do realize onthe disposition of any equity interests may not be sufficient to offset any other losses we experience.
Economic recessions or downturns could impair our portfolio companies and harm our operating results.
The US and most other economies have entered a recessionary period, which may be prolonged and severe.Many of our portfolio companies may be susceptible to economic slowdowns or recessions and may be unable torepay our loans during these periods. Therefore, our non-performing assets are likely to increase and the value ofour portfolio is likely to decrease during these periods. Adverse economic conditions also may decrease the valueof collateral securing some of our loans and the value of our equity investments. Economic slowdowns orrecessions could lead to financial losses in our portfolio and a decrease in revenues, net income and assets.Unfavorable economic conditions also could increase our funding costs, limit our access to the capital markets orresult in a decision by lenders not to extend credit to us. These events could prevent us from increasinginvestments and harm our operating results.
A portfolio company’s failure to satisfy financial or operating covenants imposed by us or other lenders couldlead to defaults and, potentially, termination of its loans and foreclosure on its secured assets, which could triggercross-defaults under other agreements and jeopardize our portfolio company’s ability to meet its obligationsunder the debt securities that we hold. We may incur expenses to the extent necessary to seek recovery upondefault or to negotiate new terms with a defaulting portfolio company. In addition, if one of our portfoliocompanies were to go bankrupt, even though we or one of our affiliates may have structured our interest as seniordebt, depending on the facts and circumstances, including the extent to which we actually provided managerialassistance to that portfolio company, a bankruptcy court might re-characterize our debt holding and subordinateall or a portion of our claim to that of other creditors.
Our ability to invest in public companies may be limited in certain circumstances.
As a BDC, we must not acquire any assets other than “qualifying assets” specified in the 1940 Act unless, at thetime the acquisition is made, at least 70% of our total assets are qualifying assets (with certain limitedexceptions) Subject to certain exceptions for follow-on investments and distressed companies, an investment inan issuer that has outstanding securities listed on a national securities exchange may be treated as qualifyingassets only if such issuer has a market capitalization that is less than $250 million at the time of such investment.
17
Our portfolio contains a limited number of portfolio companies, which subjects us to a greater risk ofsignificant loss if any of these companies defaults on its obligations under any of its debt securities.
A consequence of the limited number of investments in our portfolio is that the aggregate returns we realize maybe significantly adversely affected if one or more of our significant portfolio company investments performpoorly or if we need to write down the value of any one significant investment. Beyond our income taxdiversification requirements, we do not have fixed guidelines for diversification, and our portfolio could containrelatively few portfolio companies.
Our failure to make follow-on investments in our portfolio companies could impair the value of ourportfolio.
Following an initial investment in a portfolio company, we may make additional investments in that portfoliocompany as “follow-on” investments, in order to: (1) increase or maintain in whole or in part our equityownership percentage; (2) exercise warrants, options or convertible securities that were acquired in the originalor subsequent financing or (3) attempt to preserve or enhance the value of our investment.
We may elect not to make follow-on investments, may be constrained in our ability to employ available funds orotherwise may lack sufficient funds to make those investments. We have the discretion to make any follow-oninvestments, subject to the availability of capital resources. The failure to make follow-on investments may, insome circumstances, jeopardize the continued viability of a portfolio company and our initial investment, or mayresult in a missed opportunity for us to increase our participation in a successful operation. Even if we havesufficient capital to make a desired follow-on investment, we may elect not to make a follow-on investmentbecause we may not want to increase our concentration of risk, because we prefer other opportunities, or becausewe are inhibited by compliance with BDC requirements or the desire to maintain our tax status.
When we do not hold controlling equity interests in our portfolio companies, we may not be in a position toexercise control over our portfolio companies or to prevent decisions by management of our portfoliocompanies that could decrease the value of our investments.
We do not generally take controlling equity positions in our portfolio companies. To the extent that we do nothold a controlling equity interest in a portfolio company, we are subject to the risk that a portfolio company maymake business decisions with which we disagree, and the stockholders and management of a portfolio companymay take risks or otherwise act in ways that are adverse to our interests. Due to the lack of liquidity for the debtand equity investments that we typically hold in our portfolio companies, we may not be able to dispose of ourinvestments in the event we disagree with the actions of a portfolio company, and may therefore suffer a decreasein the value of our investments.
An investment strategy focused primarily on privately-held companies presents certain challenges,including the lack of available information about these companies, a dependence on the talents and effortsof only a few key portfolio company personnel and a greater vulnerability to economic downturns.
We have invested and will continue to invest primarily in privately-held companies. Generally, little publicinformation exists about these companies, and we are required to rely on the ability of AIM’s investmentprofessionals to obtain adequate information to evaluate the potential returns from investing in these companies.
If we are unable to uncover all material information about these companies, we may not make a fully informedinvestment decision, and we may lose money on our investments. Also, privately-held companies frequently haveless diverse product lines and smaller market presence than public company competitors, which often are larger.These factors could affect our investment returns.
18
Our portfolio companies may incur debt that ranks equally with, or senior to, our investments in suchcompanies.
We have invested and intend to invest primarily in mezzanine and senior debt securities issued by our portfoliocompanies. The portfolio companies usually have, or may be permitted to incur, other debt that ranks equallywith, or senior to, the debt securities in which we invest. By their terms, such debt instruments may provide thatthe holders are entitled to receive payment of interest or principal on or before the dates on which we are entitledto receive payments in respect of the debt securities in which we invest. Also, in the event of insolvency,liquidation, dissolution, reorganization or bankruptcy of a portfolio company, holders of debt instruments rankingsenior to our investment in that portfolio company would typically be entitled to receive payment in full beforewe receive any distribution in respect of our investment. After repaying such senior creditors, such portfoliocompany may not have any remaining assets to use for repaying its obligation to us. In the case of debt rankingequally with debt securities in which we invest, we would have to share on an equal basis any distributions withother creditors holding such debt in the event of an insolvency, liquidation, dissolution, reorganization orbankruptcy of the relevant portfolio company. In addition, we may not be in a position to control any portfoliocompany by investing in its debt securities. As a result, we are subject to the risk that a portfolio company inwhich we invest may make business decisions with which we disagree and the management of such company, asrepresentatives of the holders of their common equity, may take risks or otherwise act in ways that do not serveour interests as debt investors.
Our incentive fee may induce AIM to make certain investments, including speculative investments.
The incentive fee payable by us to AIM may create an incentive for AIM to make investments on our behalf thatare risky or more speculative than would be the case in the absence of such compensation arrangement. The wayin which the incentive fee payable to AIM is determined, which is calculated separately in two components as apercentage of the income (subject to a performance threshold) and as a percentage of the realized gain oninvested capital, may encourage our investment adviser to use leverage to increase the return on our investments.Under certain circumstances, the use of leverage may increase the likelihood of default, which would disfavor theholders of our common stock, including investors in offerings of common stock, securities convertible into ourcommon stock or warrants representing rights to purchase our common stock or securities convertible into ourcommon stock. In addition, AIM receives the incentive fee based, in part, upon net capital gains realized on ourinvestments. Unlike the portion of the incentive fee based on income, there is no performance thresholdapplicable to the portion of the incentive fee based on net capital gains. As a result, AIM may have a tendency toinvest more in investments that are likely to result in capital gains as compared to income producing securities.Such a practice could result in our investing in more speculative securities than would otherwise be the case,which could result in higher investment losses, particularly during economic downturns.
The incentive fee payable by us to AIM also may create an incentive for AIM to invest on our behalf ininstruments that have a deferred interest feature. Under these investments, we would accrue the interest over thelife of the investment but would not receive the cash income from the investment until the end of the term. Ournet investment income used to calculate the income portion of our investment fee, however, includes accruedinterest. Thus, while a portion of this incentive fee would be based on income that we have not yet received incash and with respect to which we do not have a formal clawback right against our investment adviser per se, theamount of accrued income to the extent written off in any period will reduce the income in the period in whichsuch write-off was taken and thereby reduce such period’s incentive fee payment.
We may invest, to the extent permitted by law, in the securities and instruments of other investment companies,including private funds, and, to the extent we so invest, will bear our ratable share of any such investmentcompany’s expenses, including management and performance fees. We will also remain obligated to paymanagement and incentive fees to AIM with respect to the assets invested in the securities and instruments ofother investment companies. With respect to each of these investments, each of our common stockholders willbear his or her share of the management and incentive fee of AIM as well as indirectly bearing the managementand performance fees and other expenses of any investment companies in which we invest.
19
We may be obligated to pay our investment adviser incentive compensation even if we incur a loss.
Our investment adviser is entitled to incentive compensation for each fiscal quarter in an amount equal to apercentage of the excess of our pre-incentive fee net investment income for that quarter (before deductingincentive compensation, net operating losses and certain other items) above a performance threshold for thatquarter. Accordingly, since the performance threshold is based on a percentage of our net asset value, decreasesin our net asset value make it easier to achieve the performance threshold. Our pre-incentive fee net investmentincome for incentive compensation purposes excludes realized and unrealized capital losses or depreciation thatwe may incur in the fiscal quarter, even if such capital losses or depreciation result in a net loss on our statementof operations for that quarter. Thus, we may be required to pay our manager incentive compensation for a fiscalquarter even if there is a decline in the value of our portfolio or we incur a net loss for that quarter.
Our investments in foreign securities may involve significant risks in addition to the risks inherent inU.S. investments.
Our investment strategy contemplates that a portion of our investments may be in securities of foreigncompanies. Investing in foreign companies may expose us to additional risks not typically associated withinvesting in U.S. companies. These risks include changes in exchange control regulations, political and socialinstability, expropriation, imposition of foreign taxes, less liquid markets and less available information than isgenerally the case in the United States, higher transaction costs, less government supervision of exchanges,brokers and issuers, less developed bankruptcy laws, difficulty in enforcing contractual obligations, lack ofuniform accounting and auditing standards and greater price volatility.
Although most of our investments are denominated in U.S. dollars, our investments that are denominated in aforeign currency are subject to the risk that the value of a particular currency may change in relation to one ormore other currencies. Among the factors that may affect currency values are trade balances, the level of short-term interest rates, differences in relative values of similar assets in different currencies, long-term opportunitiesfor investment and capital appreciation, and political developments. We may employ hedging techniques tominimize these risks, but we can offer no assurance that we will, in fact, hedge currency risk or, that if we do,such strategies will be effective.
Hedging transactions may expose us to additional risks.
If we engage in hedging transactions, we may expose ourselves to risks associated with such transactions. Wemay utilize instruments such as forward contracts, currency options and interest rate swaps, caps, collars andfloors to seek to hedge against fluctuations in the relative values of our portfolio positions from changes incurrency exchange rates and market interest rates. Hedging against a decline in the values of our portfoliopositions does not eliminate the possibility of fluctuations in the values of such positions or prevent losses if thevalues of such positions decline. However, such hedging can establish other positions designed to gain fromthose same developments, thereby offsetting the decline in the value of such portfolio positions. Such hedgingtransactions may also limit the opportunity for gain if the values of the underlying portfolio positions shouldincrease. Moreover, it may not be possible to hedge against an exchange rate or interest rate fluctuation that is sogenerally anticipated that we are not able to enter into a hedging transaction at an acceptable price.
While we may enter into transactions to seek to reduce currency exchange rate and interest rate risks,unanticipated changes in currency exchange rates or interest rates may result in poorer overall investmentperformance than if we had not engaged in any such hedging transactions. In addition, the degree of correlationbetween price movements of the instruments used in a hedging strategy and price movements in the portfoliopositions being hedged may vary. Moreover, for a variety of reasons, we may not seek to establish a perfectcorrelation between such hedging instruments and the portfolio holdings being hedged. Any such imperfectcorrelation may prevent us from achieving the intended hedge and expose us to risk of loss. In addition, it maynot be possible to hedge fully or perfectly against currency fluctuations affecting the value of securitiesdenominated in non-U.S. currencies because the value of those securities is likely to fluctuate as a result offactors not related to currency fluctuations.
20
RISKS RELATED TO ISSUANCE OF OUR PREFERRED STOCK
An investment in our preferred stock should not constitute a complete investment program.
If we issue preferred stock, the net asset value and market value of our common stock may become morevolatile.
We cannot assure that the issuance of preferred stock would result in a higher yield or return to the holders of thecommon stock. The issuance of preferred stock would likely cause the net asset value and market value of thecommon stock to become more volatile. If the dividend rate on the preferred stock were to approach the net rateof return on our investment portfolio, the benefit of leverage to the holders of the common stock would bereduced. If the dividend rate on the preferred stock were to exceed the net rate of return on our portfolio, theleverage would result in a lower rate of return to the holders of common stock than if we had not issued preferredstock. Any decline in the net asset value of our investments would be borne entirely by the holders of commonstock. Therefore, if the market value of our portfolio were to decline, the leverage would result in a greaterdecrease in net asset value to the holders of common stock than if we were not leveraged through the issuance ofpreferred stock. This greater net asset value decrease would also tend to cause a greater decline in the marketprice for the common stock. We might be in danger of failing to maintain the required asset coverage of thepreferred stock or of losing our ratings on the preferred stock or, in an extreme case, our current investmentincome might not be sufficient to meet the dividend requirements on the preferred stock. In order to counteractsuch an event, we might need to liquidate investments in order to fund redemption of some or all of the preferredstock. In addition, we would pay (and the holders of common stock would bear) all costs and expenses relating tothe issuance and ongoing maintenance of the preferred stock, including higher advisory fees if our total returnexceeds the dividend rate on the preferred stock. Holders of preferred stock may have different interests thanholders of common stock and may at times have disproportionate influence over our affairs.
Holders of any preferred stock we might issue would have the right to elect members of the board ofdirectors and class voting rights on certain matters.
Holders of any preferred stock we might issue, voting separately as a single class, would have the right to electtwo members of the board of directors at all times and in the event dividends become two full years in arrearswould have the right to elect a majority of the directors until such arrearage is completely eliminated. In addition,preferred stockholders have class voting rights on certain matters, including changes in fundamental investmentrestrictions and conversion to open-end status, and accordingly can veto any such changes. Restrictions imposedon the declarations and payment of dividends or other distributions to the holders of our common stock andpreferred stock, both by the 1940 Act and by requirements imposed by rating agencies or the terms of our creditfacilities, might impair our ability to maintain our qualification as a RIC for federal income tax purposes. Whilewe would intend to redeem our preferred stock to the extent necessary to enable us to distribute our income asrequired to maintain our qualification as a RIC, there can be no assurance that such actions could be effected intime to meet the tax requirements.
RISKS RELATING TO AN INVESTMENT IN OUR COMMON STOCK
Investing in our securities involves a high degree of risk and is highly speculative.
The investments we make in accordance with our investment objective may result in a higher amount of risk thanalternative investment options and volatility or loss of principal. Our investments in portfolio companies may behighly speculative and aggressive, therefore, an investment in our securities may not be suitable for someonewith a low risk tolerance.
21
There is a risk that investors in our equity securities may not receive dividends or that our dividends maynot grow over time and that investors in our debt securities may not receive all of the interest income towhich they are entitled.
We intend to make distributions on a quarterly basis to our stockholders out of assets legally available fordistribution. We cannot assure you that we will achieve investment results that will allow us to make a specifiedlevel of cash distributions or year-to-year increases in cash distributions. In addition, due to the asset coveragetest applicable to us as a business development company, we may in the future be limited in our ability to makedistributions. Also, our revolving credit facility may limit our ability to declare dividends if we default undercertain provisions. If we do not distribute a certain percentage of our income annually, we will suffer adverse taxconsequences, including possible loss of the tax benefits available to us as a RIC. In addition, in accordance withU.S. generally accepted accounting principles and tax regulations, we include in income certain amounts that wehave not yet received in cash, such as contractual payment-in-kind interest, which represents contractual interestadded to the loan balance that becomes due at the end of the loan term, or the accrual of original issue or marketdiscount. Since we may recognize income before or without receiving cash representing such income, we mayhave difficulty meeting the requirement to distribute at least 90% of our investment company taxable income incash to obtain tax benefits as a RIC.
If we do not distribute at least 98% of our annual taxable income (excluding net long-term capital gains retainedor deemed to be distributed) in the year earned, we generally will be required to pay an excise tax on amountscarried over and distributed to stockholders in the next year equal to 4% of the amount by which 98% of ourannual taxable income available for distribution exceeds the distributions from such income for the current year.
Finally, if more stockholders opt to receive cash dividends rather than participate in our dividend reinvestmentplan, we may be forced to liquidate some of our investments and raise cash in order to make cash dividendpayments.
Our shares may trade at discounts from net asset value or at premiums that are unsustainable over thelong term.
Shares of business development companies may trade at a market price that is less than the net asset value that isattributable to those shares. The possibility that our shares of common stock will trade at a discount from netasset value or at a premium that is unsustainable over the long term are separate and distinct from the risk thatour net asset value will decrease. It is not possible to predict whether shares will trade at, above, or below netasset value.
The market price of our securities may fluctuate significantly.
The market price and liquidity of the market for our securities may be significantly affected by numerous factors,some of which are beyond our control and may not be directly related to our operating performance. Thesefactors include:
• volatility in the market price and trading volume of securities of business development companies orother companies in our sector, which are not necessarily related to the operating performance of thesecompanies;
• changes in regulatory policies or tax guidelines, particularly with respect to RICs or businessdevelopment companies;
• loss of RIC status;
• changes in earnings or variations in operating results;
• changes in the value of our portfolio of investments;
• any shortfall in revenue or net income or any increase in losses from levels expected by investors orsecurities analysts;
22

• departure of AIM’s key personnel;
• operating performance of companies comparable to us;
• general economic trends and other external factors; and
• loss of a major funding source.
We may be unable to invest the net proceeds raised from offerings on acceptable terms, which would harmour financial condition and operating results.
Until we identify new investment opportunities, we intend to either invest the net proceeds of future offerings ininterest-bearing deposits or other short-term instruments or use the net proceeds from such offerings to reducethen-outstanding obligations under our credit facility. We cannot assure you that we will be able to find enoughappropriate investments that meet our investment criteria or that any investment we complete using the proceedsfrom an offering will produce a sufficient return.
Sales of substantial amounts of our securities may have an adverse effect on the market price of oursecurities.
Sales of substantial amounts of our securities, or the availability of such securities for sale, could adversely affectthe prevailing market prices for our securities. If this occurs and continues, it could impair our ability to raiseadditional capital through the sale of securities should we desire to do so.
Stockholders may experience dilution in their ownership percentage if they do not participate in ourdividend reinvestment plan.
All dividends declared in cash payable to stockholders that are participants in our dividend reinvestment plan aregenerally automatically reinvested in shares of our common stock. As a result, stockholders that do notparticipate in the dividend reinvestment plan may experience dilution over time. Stockholders who do not elect toreceive dividends in shares of common stock may experience accretion to the net asset value of their shares if ourshares are trading at a premium and dilution if our shares are trading at a discount. The level of accretion ordiscount would depend on various factors, including the proportion of our stockholders who participate in theplan, the level of premium or discount at which our shares are trading and the amount of the dividend payable toa stockholder.
Item 1B. Unresolved Staff Comments
None
Item 2. Properties
As of March 31, 2009, we do not own any real estate or other physical properties materially important to ouroperation. Our administrative and principal executive offices are located at 730 Fifth Avenue, New York, NY10019 and 9 West 57th Street, New York, NY 10019, respectively. We believe that our office facilities aresuitable and adequate for our business as it is contemplated to be conducted.
Item 3. Legal Proceedings
As of March 31, 2009, we were not subject to any material pending legal proceedings.
Item 4. Submission of Matters to a Vote of Security Holders
No matters were submitted to a vote of security holders during our fourth fiscal quarter ended March 31, 2009.
23

PART II
Item 5. Market for Registrant’s Common Equity, Related Stockholder Matters and Issuer Purchases ofEquity Securities
PRICE RANGE OF COMMON STOCK
Our common stock is traded on the NASDAQ Global Select Market under the symbol “AINV.” The followingtable lists the high and low closing sale price for our common stock, the closing sale price as a percentage of netasset value, or NAV and quarterly dividends per share since shares of our common stock began being regularlyquoted on NASDAQ.
NAV(1)
Closing Sales Price
Premium orDiscount ofHigh SalesPrice toNAV(2)
Premium orDiscount ofLow SalesPrice toNAV(2)
DeclaredDividendsHigh Low
Fiscal Year Ending March 31, 2009Fourth Fiscal Quarter . . . . . . . . . . . . . . . . . . . . . $ 9.82 $ 9.76 $ 2.05 99% 21% $0.260Third Fiscal Quarter . . . . . . . . . . . . . . . . . . . . . . $ 9.87 $15.85 $ 6.08 161% 62% $0.520Second Fiscal Quarter . . . . . . . . . . . . . . . . . . . . . $13.73 $17.99 $13.11 131% 95% $0.520First Fiscal Quarter . . . . . . . . . . . . . . . . . . . . . . . $15.93 $18.59 $14.33 117% 90% $0.520
Fiscal Year Ending March 31, 2008Fourth Fiscal Quarter . . . . . . . . . . . . . . . . . . . . . $15.83 $16.70 $14.21 105% 90% $0.520Third Fiscal Quarter . . . . . . . . . . . . . . . . . . . . . . $17.71 $21.81 $16.32 123% 92% $0.520Second Fiscal Quarter . . . . . . . . . . . . . . . . . . . . . $18.44 $22.90 $19.50 124% 106% $0.520First Fiscal Quarter . . . . . . . . . . . . . . . . . . . . . . . $19.09 $24.13 $21.37 126% 112% $0.510
(1) NAV per share is determined as of the last day in the relevant quarter and therefore may not reflect the NAVper share on the date of the high and low sales prices. The NAVs shown are based on outstanding shares atthe end of each period.
(2) Calculated as of the respective high or low closing sales price divided by the quarter end NAV.
While our common stock has from time to time traded in excess of our net asset value, there can be no assurance,however, that it will trade at such a premium (to net asset value) in the future. The last reported closing marketprice of our common stock on May 15, 2009 was $5.78 per share. As of May 15, 2009, we had 108 stockholdersof record.
DIVIDENDS
We intend to continue to distribute quarterly dividends to our stockholders. Our quarterly dividends, if any, willbe determined by our board of directors.
We have elected to be taxed as a RIC under Subchapter M of the Internal Revenue Code of 1986. To maintainour RIC status, we must distribute at least 90% of our ordinary income and realized net short-term capital gainsin excess of realized net long-term capital losses, if any, out of the assets legally available for distribution. Inaddition, although we currently intend to distribute realized net capital gains (i.e., net long-term capital gains inexcess of short-term capital losses), if any, at least annually, out of the assets legally available for suchdistributions, we may in the future decide to retain such capital gains for investment.
We maintain an “opt out” dividend reinvestment plan for our common stockholders. As a result, if we declare adividend, then stockholders’ cash dividends will be automatically reinvested in additional shares of our commonstock, unless they specifically “opt out” of the dividend reinvestment plan so as to receive cash dividends.
24
We may not be able to achieve operating results that will allow us to make dividends and distributions at aspecific level or to increase the amount of these dividends and distributions from time to time. In addition, wemay be limited in our ability to make dividends and distributions due to the asset coverage test for borrowingswhen applicable to us as a business development company under the 1940 Act and due to provisions in currentand future credit facilities. If we do not distribute a certain percentage of our income annually, we will sufferadverse tax consequences, including possible loss of our RIC status. We cannot assure stockholders that they willreceive any dividends and distributions or dividends and distributions at a particular level.
All dividends declared in cash payable to stockholders that are participants in our dividend reinvestment plan aregenerally automatically reinvested in shares of our common stock. As a result, stockholders that do notparticipate in the dividend reinvestment plan may experience dilution over time. Stockholders who do not elect toreceive dividends in shares of common stock may experience accretion to the net asset value of their shares if ourshares are trading at a premium and dilution if our shares are trading at a discount. The level of accretion ordiscount would depend on various factors, including the proportion of our stockholders who participate in theplan, the level of premium or discount at which our shares are trading and the amount of the dividend payable toa stockholder.
The following table lists the quarterly dividends per share from our common stock for the past two fiscal years.
Declared Dividends
Fiscal Year Ending March 31, 2009Fourth Fiscal Quarter . . . . . . . . . . . . . . . . . . . . . . . . . . . . . . . . . . . . . . . . . . . . . . . . . . . . . . . . . . $0.26Third Fiscal Quarter . . . . . . . . . . . . . . . . . . . . . . . . . . . . . . . . . . . . . . . . . . . . . . . . . . . . . . . . . . . $0.52Second Fiscal Quarter . . . . . . . . . . . . . . . . . . . . . . . . . . . . . . . . . . . . . . . . . . . . . . . . . . . . . . . . . . $0.52First Fiscal Quarter . . . . . . . . . . . . . . . . . . . . . . . . . . . . . . . . . . . . . . . . . . . . . . . . . . . . . . . . . . . . $0.52
Fiscal Year Ending March 31, 2008Fourth Fiscal Quarter . . . . . . . . . . . . . . . . . . . . . . . . . . . . . . . . . . . . . . . . . . . . . . . . . . . . . . . . . . $0.52Third Fiscal Quarter . . . . . . . . . . . . . . . . . . . . . . . . . . . . . . . . . . . . . . . . . . . . . . . . . . . . . . . . . . . $0.52Second Fiscal Quarter . . . . . . . . . . . . . . . . . . . . . . . . . . . . . . . . . . . . . . . . . . . . . . . . . . . . . . . . . . $0.52First Fiscal Quarter . . . . . . . . . . . . . . . . . . . . . . . . . . . . . . . . . . . . . . . . . . . . . . . . . . . . . . . . . . . . $0.51
Recent Sale of Unregistered Securities
We did not engage in any sales of unregistered securities during the fiscal year ended March 31, 2009.
25
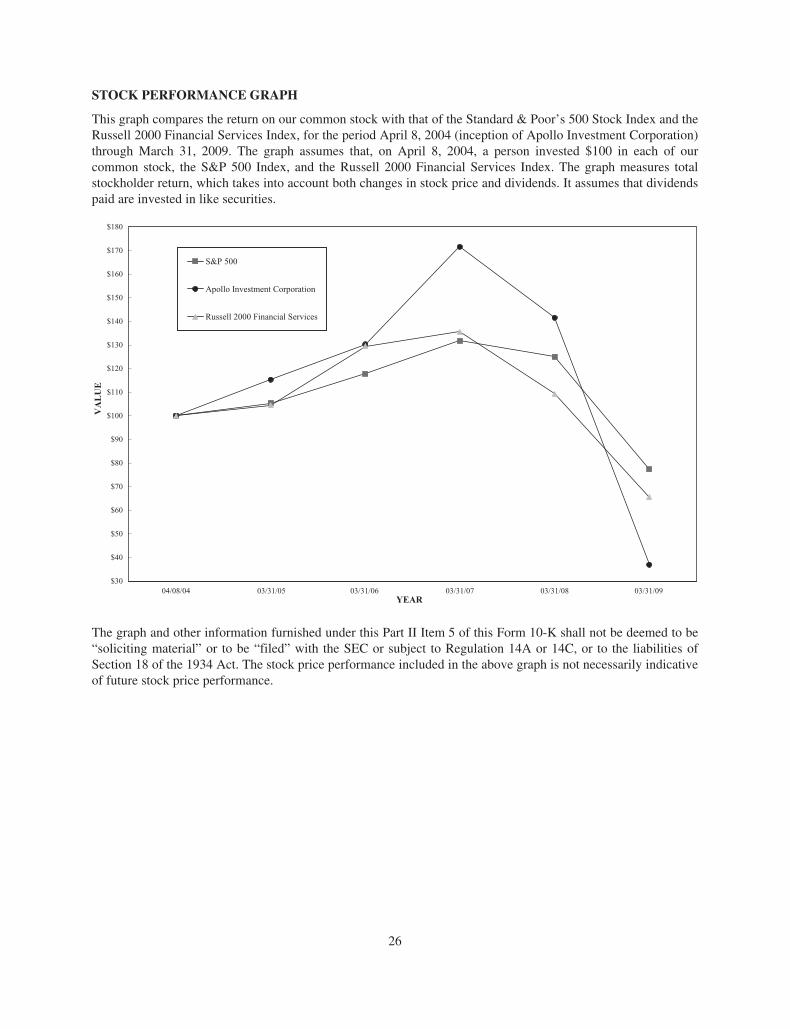
STOCK PERFORMANCE GRAPH
This graph compares the return on our common stock with that of the Standard & Poor’s 500 Stock Index and theRussell 2000 Financial Services Index, for the period April 8, 2004 (inception of Apollo Investment Corporation)through March 31, 2009. The graph assumes that, on April 8, 2004, a person invested $100 in each of ourcommon stock, the S&P 500 Index, and the Russell 2000 Financial Services Index. The graph measures totalstockholder return, which takes into account both changes in stock price and dividends. It assumes that dividendspaid are invested in like securities.
$30
$40
$50
$60
$70
$80
$90
$100
$110
$120
$130
$140
$150
$160
$170
$180
VA
LU
E
S&P 500
Apollo Investment Corporation
Russell 2000 Financial Services
YEAR04/08/04 03/31/0603/31/05 03/31/07 03/31/08 03/31/09
The graph and other information furnished under this Part II Item 5 of this Form 10-K shall not be deemed to be“soliciting material” or to be “filed” with the SEC or subject to Regulation 14A or 14C, or to the liabilities ofSection 18 of the 1934 Act. The stock price performance included in the above graph is not necessarily indicativeof future stock price performance.
26

Item 6. Selected Financial Data
The Statement of Operations, Per Share and Balance Sheet data for the fiscal years ended March 31, 2009, 2008,2007, 2006 and the period ended March 31, 2005 are derived from our financial statements which have beenaudited by PricewaterhouseCoopers LLP, our independent registered public accounting firm. This selectedfinancial data should be read in conjunction with our financial statements and related notes thereto and“Management’s Discussion and Analysis of Financial Condition and Results of Operations” included elsewherein this report.
For the Year Ended March 31,(dollar amounts in thousands,
except per share data) For the PeriodApril 8, 2004* through
March 31, 2005Statement of Operations Data: 2009 2008 2007 2006
Total Investment Income . . . . . . . . . $ 377,304 $ 357,878 $ 266,101 $ 152,827 $ 47,833Net Expenses (including taxes) . . . . $ 170,973 $ 156,272 $ 140,783 $ 63,684 $ 22,380Net Investment Income . . . . . . . . . . $ 206,331 $ 201,606 $ 125,318 $ 89,143 $ 25,453Net Realized and Unrealized Gains(Losses) . . . . . . . . . . . . . . . . . . . . $ (818,210) $ (235,044) $ 186,848 $ 31,244 $ 18,692
Net Increase (Decrease) in NetAssets Resulting fromOperations . . . . . . . . . . . . . . . . . . $ (611,879) $ (33,438) $ 312,166 $ 120,387 $ 44,145
Per Share Data:Net Asset Value . . . . . . . . . . . . . . . . $ 9.82 $ 15.83 $ 17.87 $ 15.15 $ 14.27Net Increase (Decrease) in NetAssets Resulting fromOperations . . . . . . . . . . . . . . . . . . $ (4.39) $ (0.30) $ 3.64 $ 1.90 $ 0.71
Distributions Declared . . . . . . . . . . . $ 1.820 $ 2.070 $ 1.930 $ 1.630 $ 0.485
Balance Sheet Data:Total Assets . . . . . . . . . . . . . . . . . . . $2,548,639 $3,724,324 $3,523,218 $2,511,074 $1,733,384Borrowings Outstanding . . . . . . . . . $1,057,601 $1,639,122 $ 492,312 $ 323,852 $ 0Total Net Assets . . . . . . . . . . . . . . . . $1,396,138 $1,897,908 $1,849,748 $1,229,855 $ 892,886
Other Data:Total Return(1) . . . . . . . . . . . . . . . . . (73.9)% (17.5)% 31.7% 12.9% 15.3%Number of Portfolio Companies atPeriod End . . . . . . . . . . . . . . . . . . 72 71 57 46 35
Total Portfolio Investments for thePeriod . . . . . . . . . . . . . . . . . . . . . . $ 434,995 $1,755,913 $1,446,730 $1,110,371 $ 894,335
Investment Sales and Prepaymentsfor the Period . . . . . . . . . . . . . . . . $ 339,724 $ 714,225 $ 845,485 $ 452,325 $ 71,730
Weighted Average Yield on DebtPortfolio at Period End . . . . . . . . . 11.7% 12.0% 13.1% 13.1% 10.5%
* Commencement of operations(1) Total return is based on the change in market price per share and takes into account dividends and
distributions, if any, reinvested in accordance with Apollo Investment’s dividend reinvestment plan. Totalreturn is not annualized.
27
Item 7. Management’s Discussion and Analysis of Financial Condition and Results of Operations
The following analysis of our financial condition and results of operations should be read in conjunction with ourfinancial statements and the notes thereto contained elsewhere in this report.
Some of the statements in this report constitute forward-looking statements, which relate to future events or ourfuture performance or financial condition. The forward-looking statements contained herein involve risks anduncertainties, including statements as to:
• our future operating results;
• our business prospects and the prospects of our portfolio companies;
• the impact of investments that we expect to make;
• our contractual arrangements and relationships with third parties;
• the dependence of our future success on the general economy and its impact on the industries in whichwe invest;
• the ability of our portfolio companies to achieve their objectives;
• our expected financings and investments;
• the adequacy of our cash resources and working capital; and
• the timing of cash flows, if any, from the operations of our portfolio companies.
We generally use words such as “anticipates,” “believes,” “expects,” “intends” and similar expressions toidentify forward-looking statements. Our actual results could differ materially from those projected in theforward-looking statements for any reason, including the factors set forth in “Risk Factors” and elsewhere in thisreport.
We have based the forward-looking statements included in this report on information available to us on the dateof this report, and we assume no obligation to update any such forward-looking statements. Although weundertake no obligation to revise or update any forward-looking statements, whether as a result of newinformation, future events or otherwise, you are advised to consult any additional disclosures that we may makedirectly to you or through reports that we in the future may file with the SEC, including any annual reports onForm 10-K, quarterly reports on Form 10-Q and current reports on Form 8-K.
OVERVIEW
Apollo Investment was incorporated under the Maryland General Corporation Law in February 2004. We haveelected to be treated as a BDC under the 1940 Act. As such, we are required to comply with certain regulatoryrequirements. For instance, we generally have to invest at least 70% of our total assets in “qualifying assets,”including securities of private or thinly traded public U.S. companies, cash equivalents, U.S. governmentsecurities and high-quality debt investments that mature in one year or less. In addition, for federal income taxpurposes we have elected to be treated as a RIC under Subchapter M of the Internal Revenue Code of 1986, asamended. Pursuant to this election and assuming we qualify as a RIC, we generally do not have to pay corporate-level federal income taxes on any income we distribute to our stockholders. Apollo Investment commencedoperations on April 8, 2004 upon completion of its initial public offering that raised $870 million in net proceedsselling 62 million shares of its common stock at a price of $15.00 per share. Since then, and through March 31,2009, we have raised approximately $1.4 billion in net proceeds from additional offerings of common stock.
Investments
Our level of investment activity can and does vary substantially from period to period depending on manyfactors, including the amount of debt and equity capital available to middle market companies, the level ofmerger and acquisition activity for such companies, the general economic environment and the competitive
28
environment for the types of investments we make. As a business development company, we must not acquireany assets other than “qualifying assets” specified in the 1940 Act unless, at the time the acquisition is made, atleast 70% of our total assets are qualifying assets (with certain limited exceptions). Qualifying assets includeinvestments in “eligible portfolio companies.” Pursuant to rules adopted in 2006, the SEC expanded thedefinition of “eligible portfolio company” to include certain public companies that do not have any securitieslisted on a national securities exchange. The SEC recently adopted an additional new rule under the 1940 Act toexpand the definition of “eligible portfolio company” to include companies whose securities are listed on anational securities exchange but whose market capitalization is less than $250 million. This new rule becameeffective July 21, 2008.
Revenue
We generate revenue primarily in the form of interest and dividend income from the debt and preferred securitieswe hold and capital gains, if any, on investment securities that we may acquire in portfolio companies. Our debtinvestments, whether in the form of mezzanine or senior secured loans, generally have a stated term of five to tenyears and bear interest at a fixed rate or a floating rate usually determined on the basis of a benchmark: LIBOR,EURIBOR, GBP LIBOR, or the prime rate. While U.S. subordinated debt and corporate notes typically accrueinterest at fixed rates, some of these investments may include zero coupon, payment-in-kind (“PIK”) and/orstep-up bonds that accrue income on a constant yield to call or maturity basis. Interest on debt securities isgenerally payable quarterly or semiannually. In some cases, some of our investments provide for deferred interestpayments or PIK. The principal amount of the debt securities and any accrued but unpaid interest generallybecomes due at the maturity date. In addition, we may generate revenue in the form of dividends paid to us oncommon equity investments as well as revenue in the form of commitment, origination, structuring fees, fees forproviding managerial assistance and, if applicable, consulting fees, etc.
Expenses
All investment professionals of the investment adviser and their staff, when and to the extent engaged inproviding investment advisory and management services to us, and the compensation and routine overheadexpenses of that personnel which is allocable to those services are provided and paid for by AIM. We bear allother costs and expenses of our operations and transactions, including those relating to:
• investment advisory and management fees;
• expenses incurred by AIM payable to third parties, including agents, consultants or other advisors, inmonitoring our financial and legal affairs and in monitoring our investments and performing duediligence on our prospective portfolio companies;
• calculation of our net asset value (including the cost and expenses of any independent valuation firm);
• direct costs and expenses of administration, including independent registered public accounting andlegal costs;
• costs of preparing and filing reports or other documents with the SEC;
• interest payable on debt, if any, incurred to finance our investments;
• offerings of our common stock and other securities;
• registration and listing fees;
• fees payable to third parties, including agents, consultants or other advisors, relating to, or associatedwith, evaluating and making investments;
• transfer agent and custodial fees;
• taxes;
• independent directors’ fees and expenses;
29
• marketing and distribution-related expenses;
• the costs of any reports, proxy statements or other notices to stockholders, including printing andpostage costs;
• our allocable portion of the fidelity bond, directors and officers/errors and omissions liabilityinsurance, and any other insurance premiums;
• organization and offering; and
• all other expenses incurred by us or the Administrator in connection with administering our business,such as our allocable portion of overhead under the administration agreement, including rent and ourallocable portion of the cost of our chief financial officer and chief compliance officer and theirrespective staffs.
We expect our general and administrative operating expenses related to our ongoing operations to increasemoderately in dollar terms. During periods of asset growth, we expect our general and administrative operatingexpenses to decline as a percentage of our total assets and increase during periods of asset declines. Incentivefees, interest expense and costs relating to future offerings of securities, among others, may also increase orreduce overall operating expenses based on portfolio performance, benchmarks LIBOR and EURIBOR, andofferings of our securities relative to comparative periods, among other factors.
Portfolio and Investment Activity
During our fiscal year ended March 31, 2009, we invested $435 million across 12 new and 13 existing portfoliocompanies. This compares to investing $1.8 billion in 27 new and 15 existing portfolio companies for theprevious fiscal year ended March 31, 2008. Investments sold or prepaid during the fiscal year ended March 31,2009 totaled $340 million versus $714 million for the fiscal year ended March 31, 2008.
At March 31, 2009, our net portfolio consisted of 72 portfolio companies and was invested 27% in senior securedloans, 59% in subordinated debt, 4% in preferred equity and 10% in common equity and warrants measured atfair value versus 71 portfolio companies invested 22% in senior secured loans, 57% in subordinated debt, 6% inpreferred equity and 15% in common equity and warrants at March 31, 2008.
The weighted average yields on our senior secured loan portfolio, subordinated debt portfolio and total debtportfolio at our current cost basis were 8.2%, 13.2% and 11.7%, respectively, at March 31, 2009. At March 31,2008, the yields were 10.0%, 12.8%, and 12.0%, respectively.
Since the initial public offering of Apollo Investment Corporation in April 2004 and through March 31, 2009,invested capital totals $5.6 billion in 124 portfolio companies. Over the same period, Apollo Investment has alsocompleted transactions with more than 85 different financial sponsors.
Senior secured loans and European mezzanine loans typically accrue interest at variable rates determined on thebasis of a benchmark: LIBOR, EURIBOR, GBP LIBOR, or the prime rate, with stated maturities at originationthat typically range from 5 to 10 years. While subordinated debt issued within the United States will typicallyaccrue interest at fixed rates, some of these investments may include zero-coupon, PIK and/or step bonds thataccrue income on a constant yield to call or maturity basis. At March 31, 2009, 69% or $1.5 billion of ourinterest-bearing investment portfolio is fixed rate debt and 31% or $0.7 billion is floating rate debt, measured atfair value. At March 31, 2008, 62% or $1.6 billion of our interest-bearing investment portfolio was fixed ratedebt and 38% or $1.0 billion was floating rate debt.
CRITICAL ACCOUNTING POLICIES
Our discussion and analysis of our financial condition and results of operations are based upon our financialstatements, which have been prepared in accordance with accounting principles generally accepted in the UnitedStates of America, or GAAP. The preparation of these financial statements requires management to make
30
estimates and assumptions that affect the reported amounts of assets, liabilities, revenues and expenses. Changesin the economic environment, financial markets and any other parameters used in determining such estimatescould cause actual results to differ materially. In addition to the discussion below, our critical accounting policiesare further described in the notes to the financial statements.
Valuation of Portfolio Investments
Under procedures established by our Board of Directors, we value investments, including certain subordinateddebt, senior secured debt and other debt securities with maturities greater than 60 days, for which marketquotations are readily available, at such market quotations (unless they are deemed not to represent fair value).We typically obtain market quotations from at least two brokers or dealers (if available, otherwise from aprincipal market maker or a primary market dealer or other independent pricing service). We utilize mid-marketpricing as a practical expedient for fair value unless a different point within the range is more representative. Ifand when market quotations are deemed not to represent fair value, we typically utilize independent third partyvaluation firms to assist us in determining fair value. Given the general market dislocation, the lack of tradingactivity and the forced sellers we noted in the market during the fiscal year ended March 31, 2009, our researchand diligence concluded that the limited but available market quotations on a number of performing oroutperforming credits may not be representative of fair value under generally accepted accounting principles inthe U.S. Accordingly, such investments went through our multi-step valuation process as described below. Ineach case, our independent valuation firms considered observable market inputs together with significantunobservable inputs in arriving at their valuation recommendations for such Level 3 categorized assets.Investments maturing in 60 days or less are valued at cost plus accreted discount, or minus amortized premium,which approximates fair value. Debt and equity securities that are not publicly traded or whose market quotationsare not readily available are valued at fair value as determined in good faith by or under the direction of ourBoard of Directors. Such determination of fair values may involve subjective judgments and estimates.
With respect to investments for which market quotations are not readily available or when such marketquotations are deemed not to represent fair value, our board of directors has approved a multi-step valuationprocess each quarter, as described below:
(1) our quarterly valuation process begins with each portfolio company or investment being initiallyvalued by the investment professionals of our investment adviser responsible for the portfolio investment;
(2) preliminary valuation conclusions are then documented and discussed with senior management ofour investment adviser;
(3) independent valuation firms engaged by our board of directors conduct independent appraisals andreview our investment adviser’s preliminary valuations and make their own independent assessment;
(4) the audit committee of the board of directors reviews the preliminary valuation of our investmentadviser and that of the independent valuation firm and responds to the valuation recommendation of theindependent valuation firm to reflect any comments; and
(5) the board of directors discusses valuations and determines the fair value of each investment in ourportfolio in good faith based on the input of our investment adviser, the respective independent valuationfirm and the audit committee.
Investments are valued utilizing a market approach, an income approach, or both approaches, as appropriate. Themarket approach uses prices and other relevant information generated by market transactions involving identicalor comparable assets or liabilities (including a business). The income approach uses valuation techniques toconvert future amounts (for example, cash flows or earnings) to a single present amount (discounted). Themeasurement is based on the value indicated by current market expectations about those future amounts. Infollowing these approaches, the types of factors that we may take into account in fair value pricing ourinvestments include, as relevant: available current market data, including relevant and applicable market trading
31
and transaction comparables, applicable market yields and multiples, security covenants, call protectionprovisions, information rights, the nature and realizable value of any collateral, the portfolio company’s ability tomake payments, its earnings and discounted cash flows, the markets in which the portfolio company doesbusiness, comparisons of financial ratios of peer companies that are public, M&A comparables, our principalmarket (as the reporting entity) and enterprise values, among other factors.
In September, 2006, the Financial Accounting Standards Board issued Statement of Financial AccountingStandards (“SFAS”) 157, Fair Value Measurements. This statement defines fair value, establishes a frameworkfor measuring fair value in GAAP, and expands disclosures about fair value measurements. This statement waseffective for financial statements issued for fiscal years beginning after November 15, 2007, and interim periodswithin those years. We adopted this statement for our first fiscal quarter ended June 30, 2008.
SFAS No. 157 classifies the inputs used to measure these fair values into the following hierarchy:
Level 1: Quoted prices in active markets for identical assets or liabilities, accessible by the Company at themeasurement date.
Level 2: Quoted prices for similar assets or liabilities in active markets, or quoted prices for identical orsimilar assets or liabilities in markets that are not active, or other observable inputs other than quoted prices.
Level 3: Unobservable inputs for the asset or liability.
In all cases, the level in the fair value hierarchy within which the fair value measurement in its entirety falls hasbeen determined based on the lowest level of input that is significant to the fair value measurement. Ourassessment of the significance of a particular input to the fair value measurement in its entirety requires judgmentand considers factors specific to each investment.
On October 10, 2008, FASB Staff Position 157-3—Determining the Fair Value of a Financial Asset When theMarket for That Asset is Not Active (“FAS 157-3”) was issued. FAS 157-3 provides examples of how todetermine fair value in a market that is not active. FAS 157-3 did not change the fair value measurementprinciples set forth in FAS 157. Furthermore, on April 9, 2009, FASB Staff Position 157-4—Determining FairValue When the Volume and Level of Activity for the Asset or Liability Have Significantly Decreased andIdentifying Transactions That Are Not Orderly (“FAS 157-4”) was issued. FAS 157-4 provides additionalguidance for estimating fair value in accordance with SFAS 157 when the volume and level of activity for theasset or liability have significantly decreased. FAS 157-4 also includes guidance on identifying circumstancesthat indicate a transaction is not orderly. According to FAS 157-4, in the above circumstances, more analysis andsignificant adjustments to transactions or quoted prices may be necessary to estimate fair value. FAS 157-4 iseffective for periods ending after June 15, 2009. We are currently reviewing FAS 157-4 and the future impact, ifany, it will have on our financial position or results of operations.
Revenue Recognition
We record interest and dividend income on an accrual basis to the extent that we expect to collect such amounts.Some of our loans and securities may have contractual PIK interest or dividends, which represents contractualinterest or dividends accrued and added to the balance that generally becomes due at maturity. On such loans andsecurities, we may not accrue PIK income if the portfolio company’s performance indicates that the PIK incomeis not collectible, among other factors. We do not accrue as a receivable interest or dividends on loans andsecurities if we have reason to doubt our ability to collect such income. Loan origination fees, original issuediscount, and market discount are capitalized and we amortize such amounts as interest income. Upon theprepayment of a loan or security, any unamortized loan origination fees are recorded as interest income. Werecord prepayment premiums on loans and securities as interest income when we receive such amounts.
32
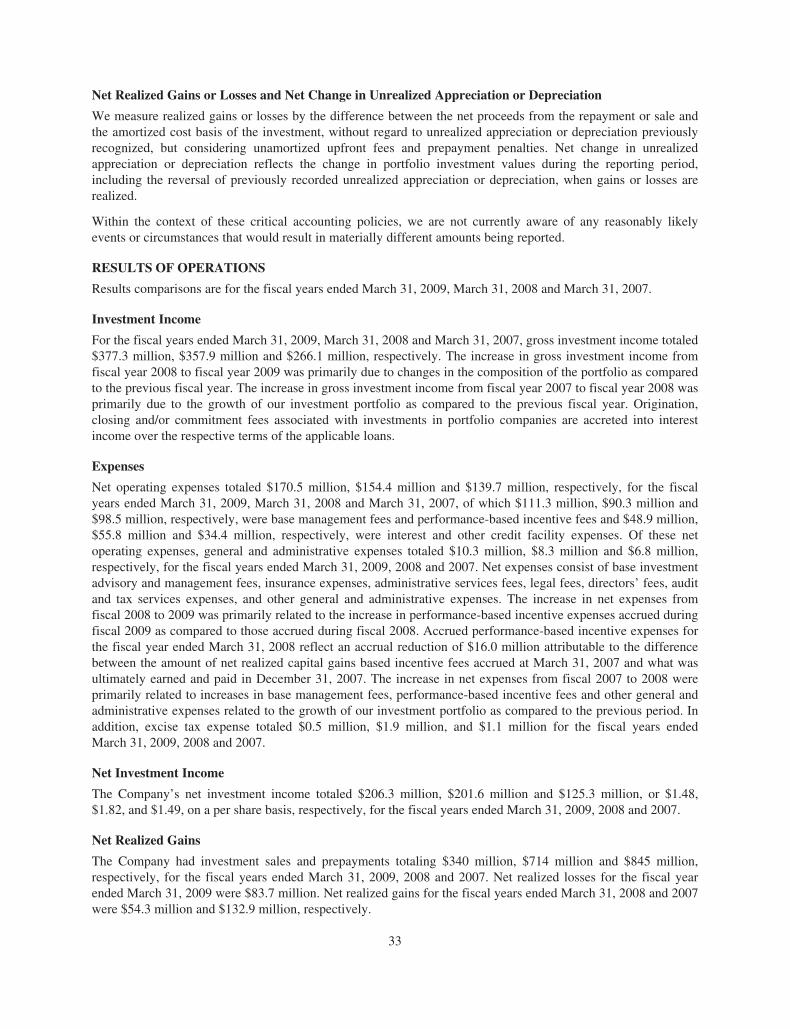
Net Realized Gains or Losses and Net Change in Unrealized Appreciation or Depreciation
We measure realized gains or losses by the difference between the net proceeds from the repayment or sale andthe amortized cost basis of the investment, without regard to unrealized appreciation or depreciation previouslyrecognized, but considering unamortized upfront fees and prepayment penalties. Net change in unrealizedappreciation or depreciation reflects the change in portfolio investment values during the reporting period,including the reversal of previously recorded unrealized appreciation or depreciation, when gains or losses arerealized.
Within the context of these critical accounting policies, we are not currently aware of any reasonably likelyevents or circumstances that would result in materially different amounts being reported.
RESULTS OF OPERATIONS
Results comparisons are for the fiscal years ended March 31, 2009, March 31, 2008 and March 31, 2007.
Investment Income
For the fiscal years ended March 31, 2009, March 31, 2008 and March 31, 2007, gross investment income totaled$377.3 million, $357.9 million and $266.1 million, respectively. The increase in gross investment income fromfiscal year 2008 to fiscal year 2009 was primarily due to changes in the composition of the portfolio as comparedto the previous fiscal year. The increase in gross investment income from fiscal year 2007 to fiscal year 2008 wasprimarily due to the growth of our investment portfolio as compared to the previous fiscal year. Origination,closing and/or commitment fees associated with investments in portfolio companies are accreted into interestincome over the respective terms of the applicable loans.
Expenses
Net operating expenses totaled $170.5 million, $154.4 million and $139.7 million, respectively, for the fiscalyears ended March 31, 2009, March 31, 2008 and March 31, 2007, of which $111.3 million, $90.3 million and$98.5 million, respectively, were base management fees and performance-based incentive fees and $48.9 million,$55.8 million and $34.4 million, respectively, were interest and other credit facility expenses. Of these netoperating expenses, general and administrative expenses totaled $10.3 million, $8.3 million and $6.8 million,respectively, for the fiscal years ended March 31, 2009, 2008 and 2007. Net expenses consist of base investmentadvisory and management fees, insurance expenses, administrative services fees, legal fees, directors’ fees, auditand tax services expenses, and other general and administrative expenses. The increase in net expenses fromfiscal 2008 to 2009 was primarily related to the increase in performance-based incentive expenses accrued duringfiscal 2009 as compared to those accrued during fiscal 2008. Accrued performance-based incentive expenses forthe fiscal year ended March 31, 2008 reflect an accrual reduction of $16.0 million attributable to the differencebetween the amount of net realized capital gains based incentive fees accrued at March 31, 2007 and what wasultimately earned and paid in December 31, 2007. The increase in net expenses from fiscal 2007 to 2008 wereprimarily related to increases in base management fees, performance-based incentive fees and other general andadministrative expenses related to the growth of our investment portfolio as compared to the previous period. Inaddition, excise tax expense totaled $0.5 million, $1.9 million, and $1.1 million for the fiscal years endedMarch 31, 2009, 2008 and 2007.
Net Investment Income
The Company’s net investment income totaled $206.3 million, $201.6 million and $125.3 million, or $1.48,$1.82, and $1.49, on a per share basis, respectively, for the fiscal years ended March 31, 2009, 2008 and 2007.
Net Realized Gains
The Company had investment sales and prepayments totaling $340 million, $714 million and $845 million,respectively, for the fiscal years ended March 31, 2009, 2008 and 2007. Net realized losses for the fiscal yearended March 31, 2009 were $83.7 million. Net realized gains for the fiscal years ended March 31, 2008 and 2007were $54.3 million and $132.9 million, respectively.
33

Net Unrealized Appreciation (Depreciation) on Investments, Cash Equivalents and Foreign Currencies
For the fiscal years ended March 31, 2009 and 2008, net change in unrealized depreciation on the Company’sinvestments, cash equivalents, foreign currencies and other assets and liabilities totaled $734.5 million and$289.3 million, respectively. For the fiscal year ended March 31, 2007, net change in unrealized appreciation onthe Company’s investments, cash equivalents, foreign currencies and other assets and liabilities totaled $54.0million. A material increase in unrealized depreciation was recognized for the most recent fiscal year fromsignificantly lower fair value determinations on many of our investments. Lower fair values were drivenprimarily from the general market dislocation, the illiquid capital markets, and the current market expectationsfor pricing increased credit risk and default assumptions.
Net Increase (Decrease) in Net Assets From Operations
For the fiscal years ended March 31, 2009 and 2008, the Company had a net decrease in net assets resulting fromoperations of $611.9 million and $33.4 million, respectively. For the fiscal year ended March 31, 2007, theCompany had a net increase in net assets resulting from operations of $312.2 million. The loss per share was$4.39 and $0.30 for the years ended March 31, 2009 and 2008, respectively. For the year ended March 31, 2007,earnings per share were $3.64.
LIQUIDITY AND CAPITAL RESOURCES
The Company’s liquidity and capital resources are generated and generally available through periodic follow-onequity offerings, through its senior secured, multi-currency $1.7 billion, five-year, revolving credit facilitymaturing in April 2011, through investments in special purpose entities in which we hold and finance particularinvestments on a non-recourse basis, as well as from cash flows from operations, investment sales of liquid assetsand prepayments of senior and subordinated loans and income earned from investments and cash equivalents. AtMarch 31, 2009, the Company had $1.06 billion in borrowings outstanding and $0.64 billion of unused capacity.Given our asset coverage requirements, use of the capital resources available to us has been significantlycurtailed due to the effect of unrealized depreciation on our leverage ratio. In addition, we currently expect anypresent liquidity needs to be met from continued cash flows from operations and investment sales andprepayments, among other actions. In the future, the Company may raise additional equity or debt capital off itsshelf registration, among other considerations. The primary use of funds will be investments in portfoliocompanies, cash distributions to our stockholders, reductions in debt outstanding and other general corporatepurposes. On May 16, 2008, the Company closed on its most recent follow-on public equity offering of 22.3million shares of common stock at $17.11 per share raising approximately $369.6 million in net proceeds.
Payments due by Period (dollars in millions)
TotalLess than1 year 1-3 years 3-5 years
More than5 years
Senior Secured Revolving Credit Facility(1) . . . . . . . . . . . . . . $1,058 $— $1,058 $— $—
(1) At March 31, 2009, $642 million remained unused under our senior secured revolving credit facility. Pricingof our credit facility is 100 basis points over LIBOR.
34
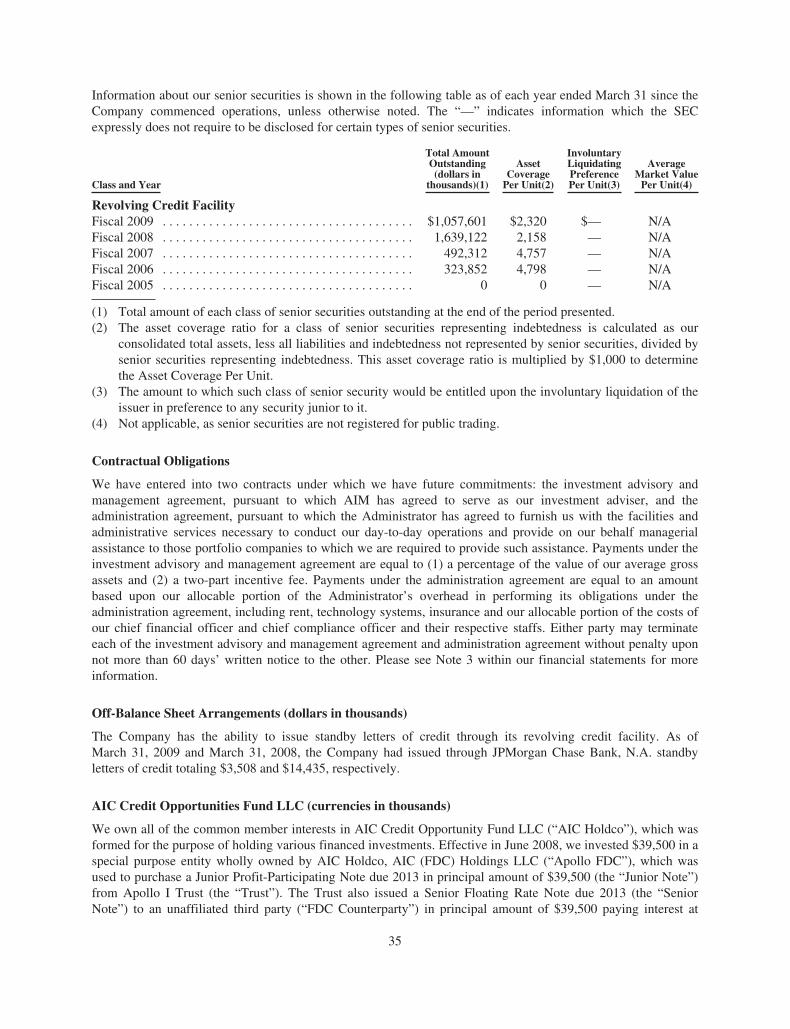
Information about our senior securities is shown in the following table as of each year ended March 31 since theCompany commenced operations, unless otherwise noted. The “—” indicates information which the SECexpressly does not require to be disclosed for certain types of senior securities.
Class and Year
Total AmountOutstanding(dollars in
thousands)(1)
AssetCoveragePer Unit(2)
InvoluntaryLiquidatingPreferencePer Unit(3)
AverageMarket ValuePer Unit(4)
Revolving Credit FacilityFiscal 2009 . . . . . . . . . . . . . . . . . . . . . . . . . . . . . . . . . . . . . . $1,057,601 $2,320 $— N/AFiscal 2008 . . . . . . . . . . . . . . . . . . . . . . . . . . . . . . . . . . . . . . 1,639,122 2,158 — N/AFiscal 2007 . . . . . . . . . . . . . . . . . . . . . . . . . . . . . . . . . . . . . . 492,312 4,757 — N/AFiscal 2006 . . . . . . . . . . . . . . . . . . . . . . . . . . . . . . . . . . . . . . 323,852 4,798 — N/AFiscal 2005 . . . . . . . . . . . . . . . . . . . . . . . . . . . . . . . . . . . . . . 0 0 — N/A
(1) Total amount of each class of senior securities outstanding at the end of the period presented.(2) The asset coverage ratio for a class of senior securities representing indebtedness is calculated as our
consolidated total assets, less all liabilities and indebtedness not represented by senior securities, divided bysenior securities representing indebtedness. This asset coverage ratio is multiplied by $1,000 to determinethe Asset Coverage Per Unit.
(3) The amount to which such class of senior security would be entitled upon the involuntary liquidation of theissuer in preference to any security junior to it.
(4) Not applicable, as senior securities are not registered for public trading.
Contractual Obligations
We have entered into two contracts under which we have future commitments: the investment advisory andmanagement agreement, pursuant to which AIM has agreed to serve as our investment adviser, and theadministration agreement, pursuant to which the Administrator has agreed to furnish us with the facilities andadministrative services necessary to conduct our day-to-day operations and provide on our behalf managerialassistance to those portfolio companies to which we are required to provide such assistance. Payments under theinvestment advisory and management agreement are equal to (1) a percentage of the value of our average grossassets and (2) a two-part incentive fee. Payments under the administration agreement are equal to an amountbased upon our allocable portion of the Administrator’s overhead in performing its obligations under theadministration agreement, including rent, technology systems, insurance and our allocable portion of the costs ofour chief financial officer and chief compliance officer and their respective staffs. Either party may terminateeach of the investment advisory and management agreement and administration agreement without penalty uponnot more than 60 days’ written notice to the other. Please see Note 3 within our financial statements for moreinformation.
Off-Balance Sheet Arrangements (dollars in thousands)
The Company has the ability to issue standby letters of credit through its revolving credit facility. As ofMarch 31, 2009 and March 31, 2008, the Company had issued through JPMorgan Chase Bank, N.A. standbyletters of credit totaling $3,508 and $14,435, respectively.
AIC Credit Opportunities Fund LLC (currencies in thousands)
We own all of the common member interests in AIC Credit Opportunity Fund LLC (“AIC Holdco”), which wasformed for the purpose of holding various financed investments. Effective in June 2008, we invested $39,500 in aspecial purpose entity wholly owned by AIC Holdco, AIC (FDC) Holdings LLC (“Apollo FDC”), which wasused to purchase a Junior Profit-Participating Note due 2013 in principal amount of $39,500 (the “Junior Note”)from Apollo I Trust (the “Trust”). The Trust also issued a Senior Floating Rate Note due 2013 (the “SeniorNote”) to an unaffiliated third party (“FDC Counterparty”) in principal amount of $39,500 paying interest at
35
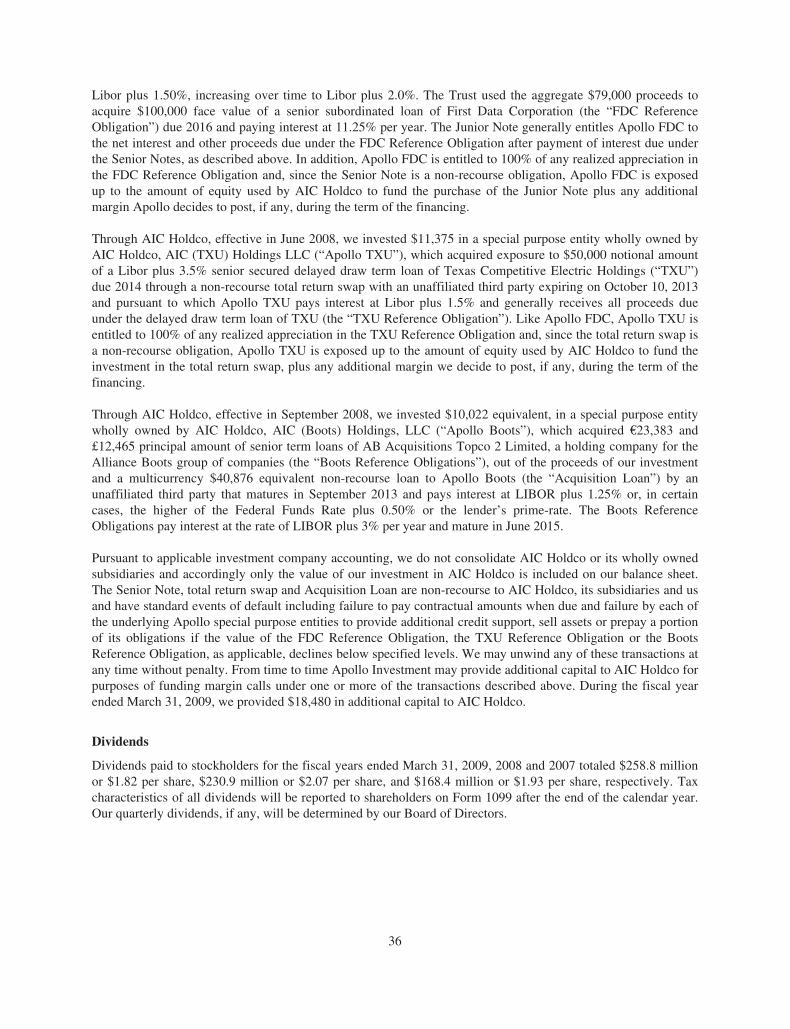
Libor plus 1.50%, increasing over time to Libor plus 2.0%. The Trust used the aggregate $79,000 proceeds toacquire $100,000 face value of a senior subordinated loan of First Data Corporation (the “FDC ReferenceObligation”) due 2016 and paying interest at 11.25% per year. The Junior Note generally entitles Apollo FDC tothe net interest and other proceeds due under the FDC Reference Obligation after payment of interest due underthe Senior Notes, as described above. In addition, Apollo FDC is entitled to 100% of any realized appreciation inthe FDC Reference Obligation and, since the Senior Note is a non-recourse obligation, Apollo FDC is exposedup to the amount of equity used by AIC Holdco to fund the purchase of the Junior Note plus any additionalmargin Apollo decides to post, if any, during the term of the financing.
Through AIC Holdco, effective in June 2008, we invested $11,375 in a special purpose entity wholly owned byAIC Holdco, AIC (TXU) Holdings LLC (“Apollo TXU”), which acquired exposure to $50,000 notional amountof a Libor plus 3.5% senior secured delayed draw term loan of Texas Competitive Electric Holdings (“TXU”)due 2014 through a non-recourse total return swap with an unaffiliated third party expiring on October 10, 2013and pursuant to which Apollo TXU pays interest at Libor plus 1.5% and generally receives all proceeds dueunder the delayed draw term loan of TXU (the “TXU Reference Obligation”). Like Apollo FDC, Apollo TXU isentitled to 100% of any realized appreciation in the TXU Reference Obligation and, since the total return swap isa non-recourse obligation, Apollo TXU is exposed up to the amount of equity used by AIC Holdco to fund theinvestment in the total return swap, plus any additional margin we decide to post, if any, during the term of thefinancing.
Through AIC Holdco, effective in September 2008, we invested $10,022 equivalent, in a special purpose entitywholly owned by AIC Holdco, AIC (Boots) Holdings, LLC (“Apollo Boots”), which acquired €23,383 and£12,465 principal amount of senior term loans of AB Acquisitions Topco 2 Limited, a holding company for theAlliance Boots group of companies (the “Boots Reference Obligations”), out of the proceeds of our investmentand a multicurrency $40,876 equivalent non-recourse loan to Apollo Boots (the “Acquisition Loan”) by anunaffiliated third party that matures in September 2013 and pays interest at LIBOR plus 1.25% or, in certaincases, the higher of the Federal Funds Rate plus 0.50% or the lender’s prime-rate. The Boots ReferenceObligations pay interest at the rate of LIBOR plus 3% per year and mature in June 2015.
Pursuant to applicable investment company accounting, we do not consolidate AIC Holdco or its wholly ownedsubsidiaries and accordingly only the value of our investment in AIC Holdco is included on our balance sheet.The Senior Note, total return swap and Acquisition Loan are non-recourse to AIC Holdco, its subsidiaries and usand have standard events of default including failure to pay contractual amounts when due and failure by each ofthe underlying Apollo special purpose entities to provide additional credit support, sell assets or prepay a portionof its obligations if the value of the FDC Reference Obligation, the TXU Reference Obligation or the BootsReference Obligation, as applicable, declines below specified levels. We may unwind any of these transactions atany time without penalty. From time to time Apollo Investment may provide additional capital to AIC Holdco forpurposes of funding margin calls under one or more of the transactions described above. During the fiscal yearended March 31, 2009, we provided $18,480 in additional capital to AIC Holdco.
Dividends
Dividends paid to stockholders for the fiscal years ended March 31, 2009, 2008 and 2007 totaled $258.8 millionor $1.82 per share, $230.9 million or $2.07 per share, and $168.4 million or $1.93 per share, respectively. Taxcharacteristics of all dividends will be reported to shareholders on Form 1099 after the end of the calendar year.Our quarterly dividends, if any, will be determined by our Board of Directors.
36
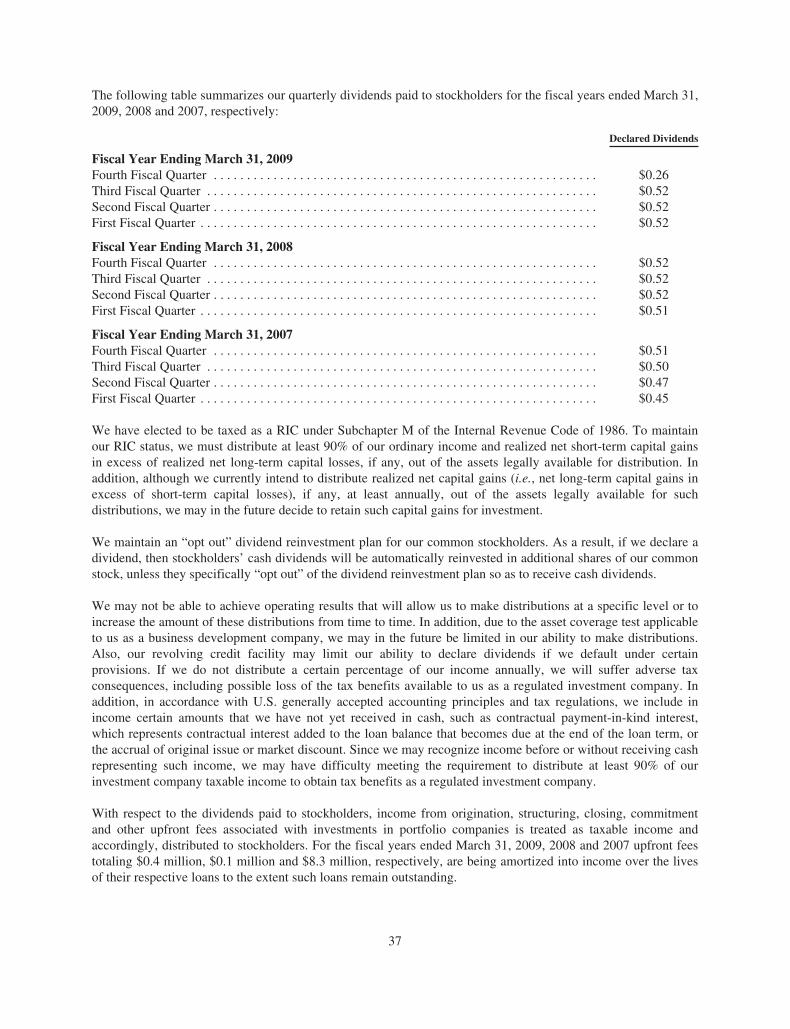
The following table summarizes our quarterly dividends paid to stockholders for the fiscal years ended March 31,2009, 2008 and 2007, respectively:
Declared Dividends
Fiscal Year Ending March 31, 2009Fourth Fiscal Quarter . . . . . . . . . . . . . . . . . . . . . . . . . . . . . . . . . . . . . . . . . . . . . . . . . . . . . . . . . . $0.26Third Fiscal Quarter . . . . . . . . . . . . . . . . . . . . . . . . . . . . . . . . . . . . . . . . . . . . . . . . . . . . . . . . . . . $0.52Second Fiscal Quarter . . . . . . . . . . . . . . . . . . . . . . . . . . . . . . . . . . . . . . . . . . . . . . . . . . . . . . . . . . $0.52First Fiscal Quarter . . . . . . . . . . . . . . . . . . . . . . . . . . . . . . . . . . . . . . . . . . . . . . . . . . . . . . . . . . . . $0.52
Fiscal Year Ending March 31, 2008Fourth Fiscal Quarter . . . . . . . . . . . . . . . . . . . . . . . . . . . . . . . . . . . . . . . . . . . . . . . . . . . . . . . . . . $0.52Third Fiscal Quarter . . . . . . . . . . . . . . . . . . . . . . . . . . . . . . . . . . . . . . . . . . . . . . . . . . . . . . . . . . . $0.52Second Fiscal Quarter . . . . . . . . . . . . . . . . . . . . . . . . . . . . . . . . . . . . . . . . . . . . . . . . . . . . . . . . . . $0.52First Fiscal Quarter . . . . . . . . . . . . . . . . . . . . . . . . . . . . . . . . . . . . . . . . . . . . . . . . . . . . . . . . . . . . $0.51
Fiscal Year Ending March 31, 2007Fourth Fiscal Quarter . . . . . . . . . . . . . . . . . . . . . . . . . . . . . . . . . . . . . . . . . . . . . . . . . . . . . . . . . . $0.51Third Fiscal Quarter . . . . . . . . . . . . . . . . . . . . . . . . . . . . . . . . . . . . . . . . . . . . . . . . . . . . . . . . . . . $0.50Second Fiscal Quarter . . . . . . . . . . . . . . . . . . . . . . . . . . . . . . . . . . . . . . . . . . . . . . . . . . . . . . . . . . $0.47First Fiscal Quarter . . . . . . . . . . . . . . . . . . . . . . . . . . . . . . . . . . . . . . . . . . . . . . . . . . . . . . . . . . . . $0.45
We have elected to be taxed as a RIC under Subchapter M of the Internal Revenue Code of 1986. To maintainour RIC status, we must distribute at least 90% of our ordinary income and realized net short-term capital gainsin excess of realized net long-term capital losses, if any, out of the assets legally available for distribution. Inaddition, although we currently intend to distribute realized net capital gains (i.e., net long-term capital gains inexcess of short-term capital losses), if any, at least annually, out of the assets legally available for suchdistributions, we may in the future decide to retain such capital gains for investment.
We maintain an “opt out” dividend reinvestment plan for our common stockholders. As a result, if we declare adividend, then stockholders’ cash dividends will be automatically reinvested in additional shares of our commonstock, unless they specifically “opt out” of the dividend reinvestment plan so as to receive cash dividends.
We may not be able to achieve operating results that will allow us to make distributions at a specific level or toincrease the amount of these distributions from time to time. In addition, due to the asset coverage test applicableto us as a business development company, we may in the future be limited in our ability to make distributions.Also, our revolving credit facility may limit our ability to declare dividends if we default under certainprovisions. If we do not distribute a certain percentage of our income annually, we will suffer adverse taxconsequences, including possible loss of the tax benefits available to us as a regulated investment company. Inaddition, in accordance with U.S. generally accepted accounting principles and tax regulations, we include inincome certain amounts that we have not yet received in cash, such as contractual payment-in-kind interest,which represents contractual interest added to the loan balance that becomes due at the end of the loan term, orthe accrual of original issue or market discount. Since we may recognize income before or without receiving cashrepresenting such income, we may have difficulty meeting the requirement to distribute at least 90% of ourinvestment company taxable income to obtain tax benefits as a regulated investment company.
With respect to the dividends paid to stockholders, income from origination, structuring, closing, commitmentand other upfront fees associated with investments in portfolio companies is treated as taxable income andaccordingly, distributed to stockholders. For the fiscal years ended March 31, 2009, 2008 and 2007 upfront feestotaling $0.4 million, $0.1 million and $8.3 million, respectively, are being amortized into income over the livesof their respective loans to the extent such loans remain outstanding.
37

Item 7A. Quantitative and Qualitative Disclosure about Market Risk
We are subject to financial market risks, including changes in interest rates. During the fiscal year endedMarch 31, 2009, many of the loans in our portfolio had floating interest rates. These loans are usually based onfloating LIBOR and typically have durations of one to six months after which they reset to current marketinterest rates. As the percentage of our U.S. mezzanine and other subordinated loans increase as a percentage ofour total investments, we expect that more of the loans in our portfolio will have fixed rates. At March 31, 2009,our floating-rate assets and floating-rate liabilities were closely matched. As such, a change in interest rateswould not have a material effect on our net investment income. However, we may hedge against interest ratefluctuations from time-to-time by using standard hedging instruments such as futures, options and forwardcontracts subject to the requirements of the 1940 Act. While hedging activities may insulate us against adversechanges in interest rates, they may also limit our ability to participate in the benefits of lower interest rates withrespect to our portfolio of investments. During the fiscal year ended March 31, 2009, we did not engage ininterest rate hedging activities.
38
Item 8. Financial Statements and Supplementary Data
Index to Financial Statements
Management’s Report on Internal Control over Financial Reporting . . . . . . . . . . . . . . . . . . . . . . . . . . . . . . . . 40
Report of Independent Registered Public Accounting Firm . . . . . . . . . . . . . . . . . . . . . . . . . . . . . . . . . . . . . . . . 41
Statement of Assets & Liabilities as of March 31, 2009 and March 31, 2008 . . . . . . . . . . . . . . . . . . . . . . . . . . 42
Statement of Operations for the years ended March 31, 2009, March 31, 2008 and March 31, 2007 . . . . . . . . 43
Statement of Changes in Net Assets for the years ended March 31, 2009, March 31, 2008 and March 31,2007 . . . . . . . . . . . . . . . . . . . . . . . . . . . . . . . . . . . . . . . . . . . . . . . . . . . . . . . . . . . . . . . . . . . . . . . . . . . . . . . . . 44
Statement of Cash Flows for the years ended March 31, 2009, March 31, 2008 and March 31, 2007 . . . . . . . 45
Schedule of Investments as of March 31, 2009 and March 31, 2008 . . . . . . . . . . . . . . . . . . . . . . . . . . . . . . . . . 46
Notes to Financial Statements . . . . . . . . . . . . . . . . . . . . . . . . . . . . . . . . . . . . . . . . . . . . . . . . . . . . . . . . . . . . . . . 60
39
MANAGEMENT’S REPORT ON INTERNAL CONTROL OVER FINANCIAL REPORTING
Management is responsible for establishing and maintaining adequate internal control over financial reporting,and for performing an assessment of the effectiveness of internal control over financial reporting as of March 31,2009. Internal control over financial reporting is a process designed to provide reasonable assurance regardingthe reliability of financial reporting and the preparation of financial statements for external purposes inaccordance with generally accepted accounting principles. The Company’s internal control over financialreporting includes those policies and procedures that (i) pertain to assets of the company; (ii) provide reasonableassurance that transactions are recorded as necessary to permit preparation of financial statements in accordancewith generally accepted accounting principles, and that receipts and expenditures of the company are being madeonly in accordance with authorizations of management and directors of the company; and (iii) provide reasonableassurance regarding prevention or timely detection of unauthorized acquisition, use, or disposition of thecompany’s assets that could have a material effect on the financial statements.
Management performed an assessment of the effectiveness of the Company’s internal control over financialreporting as of March 31, 2009 based upon criteria in Internal Control — Integrated Framework issued by theCommittee of Sponsoring Organizations of the Treadway Commission (“COSO”). Based on our assessment,management determined that the Company’s internal control over financial reporting was effective as ofMarch 31, 2009 based on the criteria on Internal Control — Integrated Framework issued by COSO.
The effectiveness of the Company’s internal control over financial reporting as of March 31, 2009 has beenaudited by PricewaterhouseCoopers LLP, an independent registered public accounting firm, as stated in theirreport which appears herein.
40
Report of Independent Registered Public Accounting Firm
To the Board of Directors and Shareholders ofApollo Investment Corporation:
In our opinion, the accompanying statements of assets and liabilities including the schedules of investments, andthe related statements of operations, changes in net assets, cash flows, and financial highlights present fairly, inall material respects, the financial position of Apollo Investment Corporation (“the Company”) at March 31,2009 and March 31, 2008, and the results of its operations, the changes in net assets, and its cash flows for eachof the three years in the period ended March 31, 2009, and the financial highlights for each of the periodspresented in conformity with accounting principles generally accepted in the United States of America. Also inour opinion, the Company maintained, in all material respects, effective internal control over financial reportingas of March 31, 2009, based on criteria established in Internal Control—Integrated Framework issued by theCommittee of Sponsoring Organizations of the Treadway Commission (COSO). The Company’s management isresponsible for these financial statements, for maintaining effective internal control over financial reporting andfor its assessment of the effectiveness of internal control over financial reporting, included in Management’sReport on Internal Control over Financial Reporting appearing on page 37 of the annual report to shareholders.Our responsibility is to express opinions on these financial statements and on the Company’s internal controlover financial reporting based on our integrated audits. We conducted our audits in accordance with the standardsof the Public Company Accounting Oversight Board (United States). Those standards require that we plan andperform the audits to obtain reasonable assurance about whether the financial statements are free of materialmisstatement and whether effective internal control over financial reporting was maintained in all materialrespects. Our audits of the financial statements included examining, on a test basis, evidence supporting theamounts and disclosures in the financial statements, assessing the accounting principles used and significantestimates made by management, and evaluating the overall financial statement presentation. Our audit of internalcontrol over financial reporting included obtaining an understanding of internal control over financial reporting,assessing the risk that a material weakness exists, and testing and evaluating the design and operatingeffectiveness of internal control based on the assessed risk. Our audits also included performing such otherprocedures as we considered necessary in the circumstances. We believe that our audits provide a reasonablebasis for our opinions.
A company’s internal control over financial reporting is a process designed to provide reasonable assuranceregarding the reliability of financial reporting and the preparation of financial statements for external purposes inaccordance with generally accepted accounting principles. A company’s internal control over financial reportingincludes those policies and procedures that (i) pertain to the maintenance of records that, in reasonable detail,accurately and fairly reflect the transactions and dispositions of the assets of the company; (ii) provide reasonableassurance that transactions are recorded as necessary to permit preparation of financial statements in accordancewith generally accepted accounting principles, and that receipts and expenditures of the company are being madeonly in accordance with authorizations of management and directors of the company; and (iii) provide reasonableassurance regarding prevention or timely detection of unauthorized acquisition, use, or disposition of thecompany’s assets that could have a material effect on the financial statements.
Because of its inherent limitations, internal control over financial reporting may not prevent or detectmisstatements. Also, projections of any evaluation of effectiveness to future periods are subject to the risk thatcontrols may become inadequate because of changes in conditions, or that the degree of compliance with thepolicies or procedures may deteriorate.
/s/ PricewaterhouseCoopers LLPNew York, New YorkMay 29, 2009
41
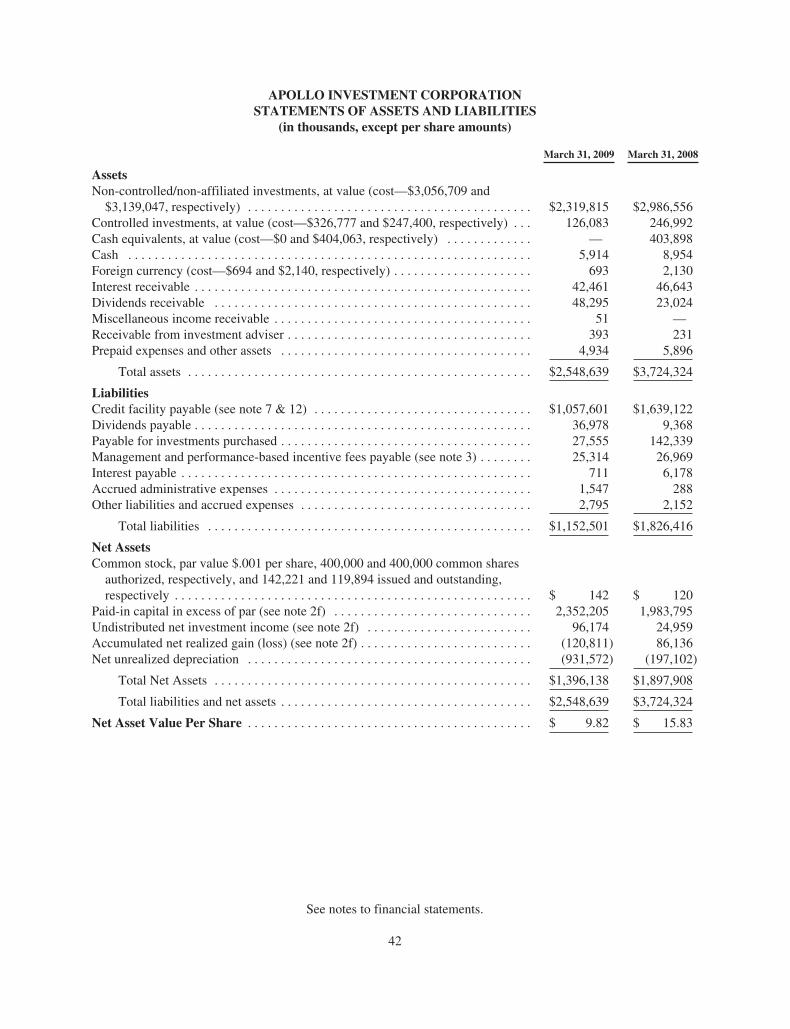
APOLLO INVESTMENT CORPORATIONSTATEMENTS OF ASSETS AND LIABILITIES
(in thousands, except per share amounts)
March 31, 2009 March 31, 2008
AssetsNon-controlled/non-affiliated investments, at value (cost—$3,056,709 and$3,139,047, respectively) . . . . . . . . . . . . . . . . . . . . . . . . . . . . . . . . . . . . . . . . . . . $2,319,815 $2,986,556
Controlled investments, at value (cost—$326,777 and $247,400, respectively) . . . 126,083 246,992Cash equivalents, at value (cost—$0 and $404,063, respectively) . . . . . . . . . . . . . — 403,898Cash . . . . . . . . . . . . . . . . . . . . . . . . . . . . . . . . . . . . . . . . . . . . . . . . . . . . . . . . . . . . . 5,914 8,954Foreign currency (cost—$694 and $2,140, respectively) . . . . . . . . . . . . . . . . . . . . . 693 2,130Interest receivable . . . . . . . . . . . . . . . . . . . . . . . . . . . . . . . . . . . . . . . . . . . . . . . . . . . 42,461 46,643Dividends receivable . . . . . . . . . . . . . . . . . . . . . . . . . . . . . . . . . . . . . . . . . . . . . . . . 48,295 23,024Miscellaneous income receivable . . . . . . . . . . . . . . . . . . . . . . . . . . . . . . . . . . . . . . . 51 —Receivable from investment adviser . . . . . . . . . . . . . . . . . . . . . . . . . . . . . . . . . . . . . 393 231Prepaid expenses and other assets . . . . . . . . . . . . . . . . . . . . . . . . . . . . . . . . . . . . . . 4,934 5,896
Total assets . . . . . . . . . . . . . . . . . . . . . . . . . . . . . . . . . . . . . . . . . . . . . . . . . . . . $2,548,639 $3,724,324
LiabilitiesCredit facility payable (see note 7 & 12) . . . . . . . . . . . . . . . . . . . . . . . . . . . . . . . . . $1,057,601 $1,639,122Dividends payable . . . . . . . . . . . . . . . . . . . . . . . . . . . . . . . . . . . . . . . . . . . . . . . . . . . 36,978 9,368Payable for investments purchased . . . . . . . . . . . . . . . . . . . . . . . . . . . . . . . . . . . . . . 27,555 142,339Management and performance-based incentive fees payable (see note 3) . . . . . . . . 25,314 26,969Interest payable . . . . . . . . . . . . . . . . . . . . . . . . . . . . . . . . . . . . . . . . . . . . . . . . . . . . . 711 6,178Accrued administrative expenses . . . . . . . . . . . . . . . . . . . . . . . . . . . . . . . . . . . . . . . 1,547 288Other liabilities and accrued expenses . . . . . . . . . . . . . . . . . . . . . . . . . . . . . . . . . . . 2,795 2,152
Total liabilities . . . . . . . . . . . . . . . . . . . . . . . . . . . . . . . . . . . . . . . . . . . . . . . . . $1,152,501 $1,826,416
Net AssetsCommon stock, par value $.001 per share, 400,000 and 400,000 common sharesauthorized, respectively, and 142,221 and 119,894 issued and outstanding,respectively . . . . . . . . . . . . . . . . . . . . . . . . . . . . . . . . . . . . . . . . . . . . . . . . . . . . . . $ 142 $ 120
Paid-in capital in excess of par (see note 2f) . . . . . . . . . . . . . . . . . . . . . . . . . . . . . . 2,352,205 1,983,795Undistributed net investment income (see note 2f) . . . . . . . . . . . . . . . . . . . . . . . . . 96,174 24,959Accumulated net realized gain (loss) (see note 2f) . . . . . . . . . . . . . . . . . . . . . . . . . . (120,811) 86,136Net unrealized depreciation . . . . . . . . . . . . . . . . . . . . . . . . . . . . . . . . . . . . . . . . . . . (931,572) (197,102)
Total Net Assets . . . . . . . . . . . . . . . . . . . . . . . . . . . . . . . . . . . . . . . . . . . . . . . . $1,396,138 $1,897,908
Total liabilities and net assets . . . . . . . . . . . . . . . . . . . . . . . . . . . . . . . . . . . . . . $2,548,639 $3,724,324
Net Asset Value Per Share . . . . . . . . . . . . . . . . . . . . . . . . . . . . . . . . . . . . . . . . . . . $ 9.82 $ 15.83
See notes to financial statements.
42
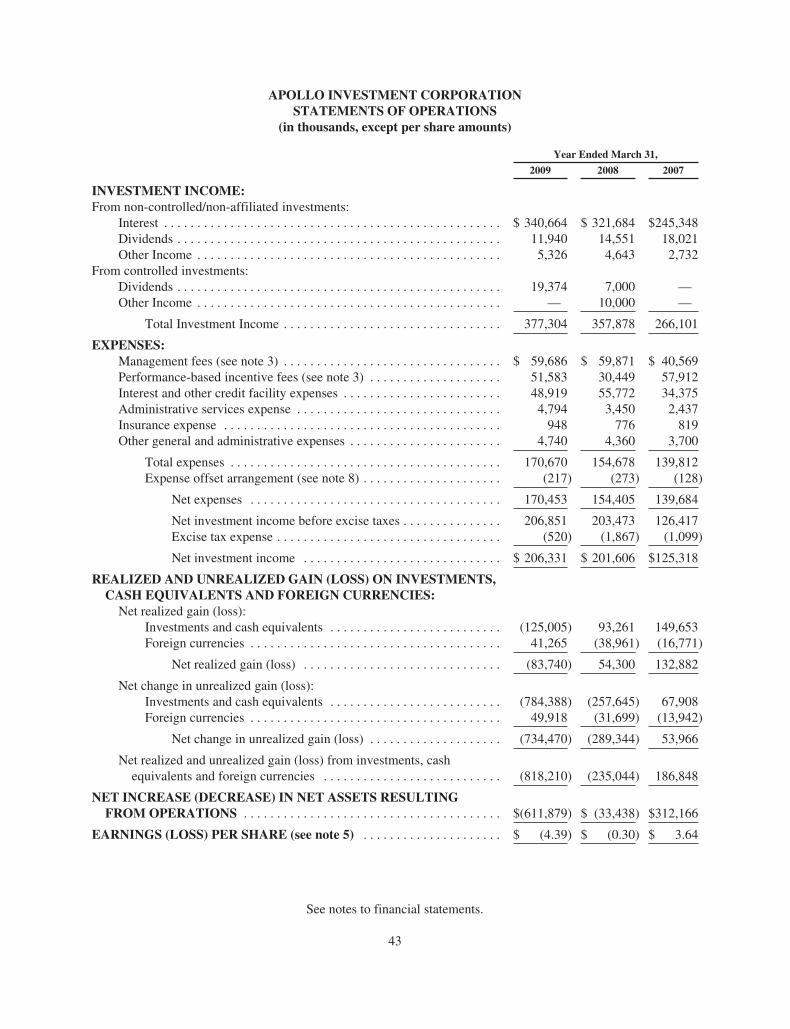
APOLLO INVESTMENT CORPORATIONSTATEMENTS OF OPERATIONS
(in thousands, except per share amounts)
Year Ended March 31,
2009 2008 2007
INVESTMENT INCOME:From non-controlled/non-affiliated investments:
Interest . . . . . . . . . . . . . . . . . . . . . . . . . . . . . . . . . . . . . . . . . . . . . . . . . . . $ 340,664 $ 321,684 $245,348Dividends . . . . . . . . . . . . . . . . . . . . . . . . . . . . . . . . . . . . . . . . . . . . . . . . . 11,940 14,551 18,021Other Income . . . . . . . . . . . . . . . . . . . . . . . . . . . . . . . . . . . . . . . . . . . . . . 5,326 4,643 2,732
From controlled investments:Dividends . . . . . . . . . . . . . . . . . . . . . . . . . . . . . . . . . . . . . . . . . . . . . . . . . 19,374 7,000 —Other Income . . . . . . . . . . . . . . . . . . . . . . . . . . . . . . . . . . . . . . . . . . . . . . — 10,000 —
Total Investment Income . . . . . . . . . . . . . . . . . . . . . . . . . . . . . . . . . 377,304 357,878 266,101
EXPENSES:Management fees (see note 3) . . . . . . . . . . . . . . . . . . . . . . . . . . . . . . . . . $ 59,686 $ 59,871 $ 40,569Performance-based incentive fees (see note 3) . . . . . . . . . . . . . . . . . . . . 51,583 30,449 57,912Interest and other credit facility expenses . . . . . . . . . . . . . . . . . . . . . . . . 48,919 55,772 34,375Administrative services expense . . . . . . . . . . . . . . . . . . . . . . . . . . . . . . . 4,794 3,450 2,437Insurance expense . . . . . . . . . . . . . . . . . . . . . . . . . . . . . . . . . . . . . . . . . . 948 776 819Other general and administrative expenses . . . . . . . . . . . . . . . . . . . . . . . 4,740 4,360 3,700
Total expenses . . . . . . . . . . . . . . . . . . . . . . . . . . . . . . . . . . . . . . . . . 170,670 154,678 139,812Expense offset arrangement (see note 8) . . . . . . . . . . . . . . . . . . . . . (217) (273) (128)
Net expenses . . . . . . . . . . . . . . . . . . . . . . . . . . . . . . . . . . . . . . 170,453 154,405 139,684
Net investment income before excise taxes . . . . . . . . . . . . . . . 206,851 203,473 126,417Excise tax expense . . . . . . . . . . . . . . . . . . . . . . . . . . . . . . . . . . (520) (1,867) (1,099)
Net investment income . . . . . . . . . . . . . . . . . . . . . . . . . . . . . . $ 206,331 $ 201,606 $125,318
REALIZED AND UNREALIZED GAIN (LOSS) ON INVESTMENTS,CASH EQUIVALENTS AND FOREIGN CURRENCIES:Net realized gain (loss):
Investments and cash equivalents . . . . . . . . . . . . . . . . . . . . . . . . . . (125,005) 93,261 149,653Foreign currencies . . . . . . . . . . . . . . . . . . . . . . . . . . . . . . . . . . . . . . 41,265 (38,961) (16,771)
Net realized gain (loss) . . . . . . . . . . . . . . . . . . . . . . . . . . . . . . (83,740) 54,300 132,882
Net change in unrealized gain (loss):Investments and cash equivalents . . . . . . . . . . . . . . . . . . . . . . . . . . (784,388) (257,645) 67,908Foreign currencies . . . . . . . . . . . . . . . . . . . . . . . . . . . . . . . . . . . . . . 49,918 (31,699) (13,942)
Net change in unrealized gain (loss) . . . . . . . . . . . . . . . . . . . . (734,470) (289,344) 53,966
Net realized and unrealized gain (loss) from investments, cashequivalents and foreign currencies . . . . . . . . . . . . . . . . . . . . . . . . . . . (818,210) (235,044) 186,848
NET INCREASE (DECREASE) IN NET ASSETS RESULTINGFROM OPERATIONS . . . . . . . . . . . . . . . . . . . . . . . . . . . . . . . . . . . . . . . $(611,879) $ (33,438) $312,166
EARNINGS (LOSS) PER SHARE (see note 5) . . . . . . . . . . . . . . . . . . . . . $ (4.39) $ (0.30) $ 3.64
See notes to financial statements.
43

APOLLO INVESTMENT CORPORATIONSTATEMENTS OF CHANGES IN NET ASSETS
(in thousands, except shares)
Year Ended March 31,
2009 2008 2007
Increase (Decrease) in net assets from operations:Net investment income . . . . . . . . . . . . . . . . . . . . . . . . . . . . . . . . $ 206,331 $ 201,606 $ 125,318Net realized gains (loss) . . . . . . . . . . . . . . . . . . . . . . . . . . . . . . . (83,740) 54,300 132,882Net change in unrealized gain (loss) . . . . . . . . . . . . . . . . . . . . . . (734,470) (289,344) 53,966
Net increase (decrease) in net assets resulting fromoperations . . . . . . . . . . . . . . . . . . . . . . . . . . . . . . . . . . . . (611,879) (33,438) 312,166
Dividends and distributions to stockholders (see note 13): . . . . . . (258,843) (230,889) (168,449)
Capital share transactions:Net proceeds from shares sold . . . . . . . . . . . . . . . . . . . . . . . . . . 369,589 285,545 443,605Less offering costs . . . . . . . . . . . . . . . . . . . . . . . . . . . . . . . . . . . . (637) (461) (986)Reinvestment of dividends . . . . . . . . . . . . . . . . . . . . . . . . . . . . . — 27,403 33,557
Net increase in net assets from capital sharetransactions . . . . . . . . . . . . . . . . . . . . . . . . . . . . . . . . . . . 368,952 312,487 476,176
Total increase (decrease) in net assets: . . . . . . . . . . . . . . . . . . . . . . (501,770) 48,160 619,893Net assets at beginning of period . . . . . . . . . . . . . . . . . . . . . . . . 1,897,908 1,849,748 1,229,855
Net assets at end of period . . . . . . . . . . . . . . . . . . . . . . . . . . . . . . $ 1,396,138 $ 1,897,908 $ 1,849,748
Capital share activityShares sold . . . . . . . . . . . . . . . . . . . . . . . . . . . . . . . . . . . . . . . . . . 22,327,500 14,950,000 20,700,000Shares issued from reinvestment of dividends . . . . . . . . . . . . . . — 1,436,069 1,615,812
Net increase in capital share activity . . . . . . . . . . . . . . . . . . 22,327,500 16,386,069 22,315,812
See notes to financial statements.
44
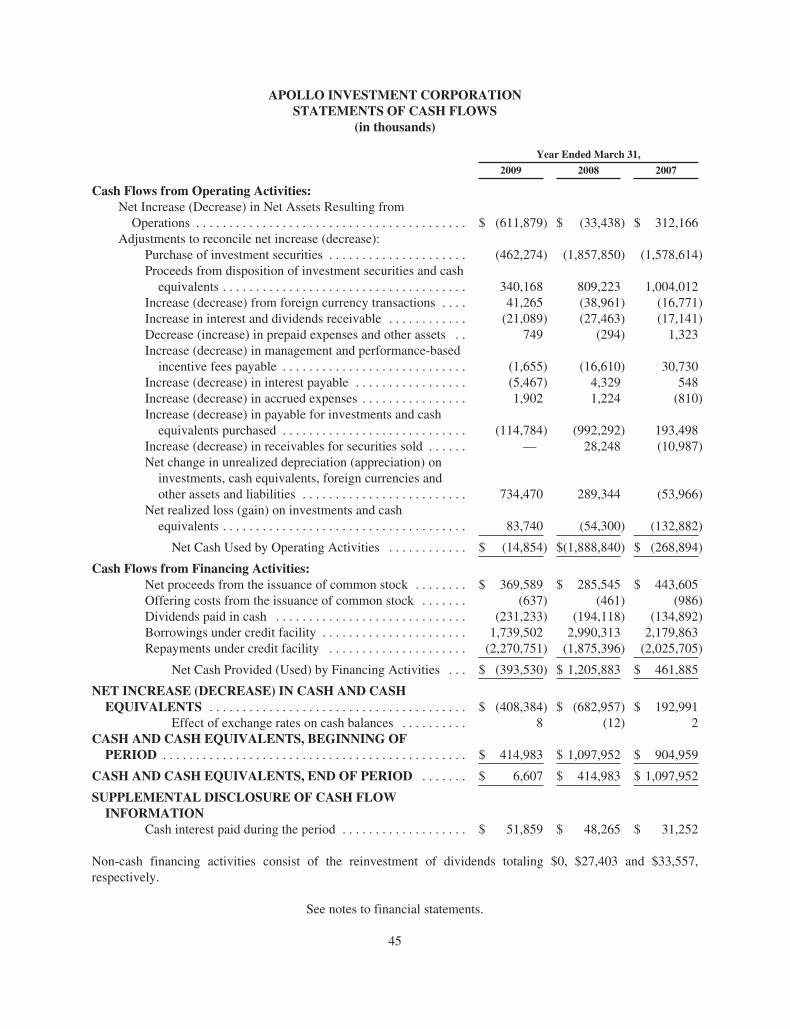
APOLLO INVESTMENT CORPORATIONSTATEMENTS OF CASH FLOWS
(in thousands)
Year Ended March 31,
2009 2008 2007
Cash Flows from Operating Activities:Net Increase (Decrease) in Net Assets Resulting fromOperations . . . . . . . . . . . . . . . . . . . . . . . . . . . . . . . . . . . . . . . . . $ (611,879) $ (33,438) $ 312,166
Adjustments to reconcile net increase (decrease):Purchase of investment securities . . . . . . . . . . . . . . . . . . . . . (462,274) (1,857,850) (1,578,614)Proceeds from disposition of investment securities and cashequivalents . . . . . . . . . . . . . . . . . . . . . . . . . . . . . . . . . . . . . 340,168 809,223 1,004,012
Increase (decrease) from foreign currency transactions . . . . 41,265 (38,961) (16,771)Increase in interest and dividends receivable . . . . . . . . . . . . (21,089) (27,463) (17,141)Decrease (increase) in prepaid expenses and other assets . . 749 (294) 1,323Increase (decrease) in management and performance-basedincentive fees payable . . . . . . . . . . . . . . . . . . . . . . . . . . . . (1,655) (16,610) 30,730
Increase (decrease) in interest payable . . . . . . . . . . . . . . . . . (5,467) 4,329 548Increase (decrease) in accrued expenses . . . . . . . . . . . . . . . . 1,902 1,224 (810)Increase (decrease) in payable for investments and cashequivalents purchased . . . . . . . . . . . . . . . . . . . . . . . . . . . . (114,784) (992,292) 193,498
Increase (decrease) in receivables for securities sold . . . . . . — 28,248 (10,987)Net change in unrealized depreciation (appreciation) oninvestments, cash equivalents, foreign currencies andother assets and liabilities . . . . . . . . . . . . . . . . . . . . . . . . . 734,470 289,344 (53,966)
Net realized loss (gain) on investments and cashequivalents . . . . . . . . . . . . . . . . . . . . . . . . . . . . . . . . . . . . . 83,740 (54,300) (132,882)
Net Cash Used by Operating Activities . . . . . . . . . . . . $ (14,854) $(1,888,840) $ (268,894)
Cash Flows from Financing Activities:Net proceeds from the issuance of common stock . . . . . . . . $ 369,589 $ 285,545 $ 443,605Offering costs from the issuance of common stock . . . . . . . (637) (461) (986)Dividends paid in cash . . . . . . . . . . . . . . . . . . . . . . . . . . . . . (231,233) (194,118) (134,892)Borrowings under credit facility . . . . . . . . . . . . . . . . . . . . . . 1,739,502 2,990,313 2,179,863Repayments under credit facility . . . . . . . . . . . . . . . . . . . . . (2,270,751) (1,875,396) (2,025,705)
Net Cash Provided (Used) by Financing Activities . . . $ (393,530) $ 1,205,883 $ 461,885
NET INCREASE (DECREASE) IN CASH AND CASHEQUIVALENTS . . . . . . . . . . . . . . . . . . . . . . . . . . . . . . . . . . . . . . . $ (408,384) $ (682,957) $ 192,991
Effect of exchange rates on cash balances . . . . . . . . . . 8 (12) 2CASH AND CASH EQUIVALENTS, BEGINNING OFPERIOD . . . . . . . . . . . . . . . . . . . . . . . . . . . . . . . . . . . . . . . . . . . . . . $ 414,983 $ 1,097,952 $ 904,959
CASH AND CASH EQUIVALENTS, END OF PERIOD . . . . . . . $ 6,607 $ 414,983 $ 1,097,952
SUPPLEMENTAL DISCLOSURE OF CASH FLOWINFORMATION
Cash interest paid during the period . . . . . . . . . . . . . . . . . . . $ 51,859 $ 48,265 $ 31,252
Non-cash financing activities consist of the reinvestment of dividends totaling $0, $27,403 and $33,557,respectively.
See notes to financial statements.
45
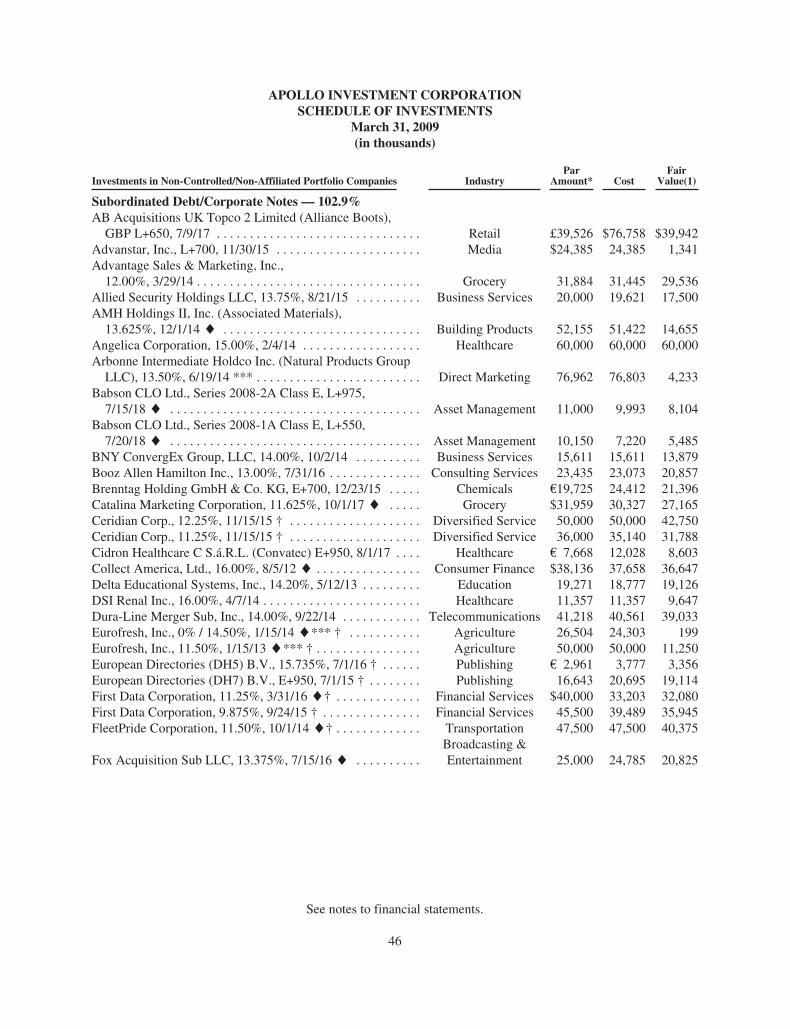
APOLLO INVESTMENT CORPORATIONSCHEDULE OF INVESTMENTS
March 31, 2009(in thousands)
Investments in Non-Controlled/Non-Affiliated Portfolio Companies IndustryPar
Amount* CostFair
Value(1)
Subordinated Debt/Corporate Notes — 102.9%AB Acquisitions UK Topco 2 Limited (Alliance Boots),GBP L+650, 7/9/17 . . . . . . . . . . . . . . . . . . . . . . . . . . . . . . . Retail £39,526 $76,758 $39,942
Advanstar, Inc., L+700, 11/30/15 . . . . . . . . . . . . . . . . . . . . . . Media $24,385 24,385 1,341Advantage Sales & Marketing, Inc.,12.00%, 3/29/14 . . . . . . . . . . . . . . . . . . . . . . . . . . . . . . . . . . Grocery 31,884 31,445 29,536
Allied Security Holdings LLC, 13.75%, 8/21/15 . . . . . . . . . . Business Services 20,000 19,621 17,500AMH Holdings II, Inc. (Associated Materials),13.625%, 12/1/14/ . . . . . . . . . . . . . . . . . . . . . . . . . . . . . . Building Products 52,155 51,422 14,655
Angelica Corporation, 15.00%, 2/4/14 . . . . . . . . . . . . . . . . . . Healthcare 60,000 60,000 60,000Arbonne Intermediate Holdco Inc. (Natural Products GroupLLC), 13.50%, 6/19/14 *** . . . . . . . . . . . . . . . . . . . . . . . . . Direct Marketing 76,962 76,803 4,233
Babson CLO Ltd., Series 2008-2A Class E, L+975,7/15/18/ . . . . . . . . . . . . . . . . . . . . . . . . . . . . . . . . . . . . . . Asset Management 11,000 9,993 8,104
Babson CLO Ltd., Series 2008-1A Class E, L+550,7/20/18/ . . . . . . . . . . . . . . . . . . . . . . . . . . . . . . . . . . . . . . Asset Management 10,150 7,220 5,485
BNY ConvergEx Group, LLC, 14.00%, 10/2/14 . . . . . . . . . . Business Services 15,611 15,611 13,879Booz Allen Hamilton Inc., 13.00%, 7/31/16 . . . . . . . . . . . . . . Consulting Services 23,435 23,073 20,857Brenntag Holding GmbH & Co. KG, E+700, 12/23/15 . . . . . Chemicals €19,725 24,412 21,396Catalina Marketing Corporation, 11.625%, 10/1/17/ . . . . . Grocery $31,959 30,327 27,165Ceridian Corp., 12.25%, 11/15/15 † . . . . . . . . . . . . . . . . . . . . Diversified Service 50,000 50,000 42,750Ceridian Corp., 11.25%, 11/15/15 † . . . . . . . . . . . . . . . . . . . . Diversified Service 36,000 35,140 31,788Cidron Healthcare C S.á.R.L. (Convatec) E+950, 8/1/17 . . . . Healthcare € 7,668 12,028 8,603Collect America, Ltd., 16.00%, 8/5/12/ . . . . . . . . . . . . . . . . Consumer Finance $38,136 37,658 36,647Delta Educational Systems, Inc., 14.20%, 5/12/13 . . . . . . . . . Education 19,271 18,777 19,126DSI Renal Inc., 16.00%, 4/7/14 . . . . . . . . . . . . . . . . . . . . . . . . Healthcare 11,357 11,357 9,647Dura-Line Merger Sub, Inc., 14.00%, 9/22/14 . . . . . . . . . . . . Telecommunications 41,218 40,561 39,033Eurofresh, Inc., 0% / 14.50%, 1/15/14/*** † . . . . . . . . . . . Agriculture 26,504 24,303 199Eurofresh, Inc., 11.50%, 1/15/13/*** † . . . . . . . . . . . . . . . . Agriculture 50,000 50,000 11,250European Directories (DH5) B.V., 15.735%, 7/1/16 † . . . . . . Publishing € 2,961 3,777 3,356European Directories (DH7) B.V., E+950, 7/1/15 † . . . . . . . . Publishing 16,643 20,695 19,114First Data Corporation, 11.25%, 3/31/16/† . . . . . . . . . . . . . Financial Services $40,000 33,203 32,080First Data Corporation, 9.875%, 9/24/15 † . . . . . . . . . . . . . . . Financial Services 45,500 39,489 35,945FleetPride Corporation, 11.50%, 10/1/14/† . . . . . . . . . . . . . Transportation 47,500 47,500 40,375
Fox Acquisition Sub LLC, 13.375%, 7/15/16/ . . . . . . . . . .Broadcasting &Entertainment 25,000 24,785 20,825
See notes to financial statements.
46
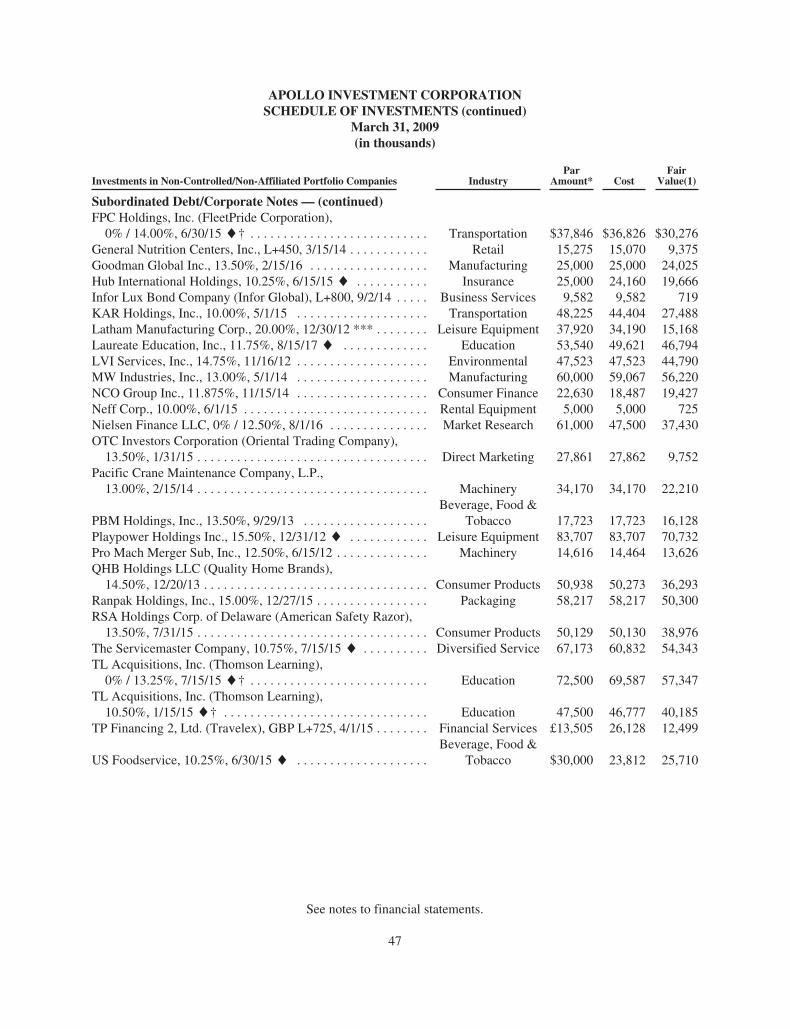
APOLLO INVESTMENT CORPORATIONSCHEDULE OF INVESTMENTS (continued)
March 31, 2009(in thousands)
Investments in Non-Controlled/Non-Affiliated Portfolio Companies IndustryPar
Amount* CostFair
Value(1)
Subordinated Debt/Corporate Notes — (continued)FPC Holdings, Inc. (FleetPride Corporation),0% / 14.00%, 6/30/15/† . . . . . . . . . . . . . . . . . . . . . . . . . . . Transportation $37,846 $36,826 $30,276
General Nutrition Centers, Inc., L+450, 3/15/14 . . . . . . . . . . . . Retail 15,275 15,070 9,375Goodman Global Inc., 13.50%, 2/15/16 . . . . . . . . . . . . . . . . . . Manufacturing 25,000 25,000 24,025Hub International Holdings, 10.25%, 6/15/15/ . . . . . . . . . . . Insurance 25,000 24,160 19,666Infor Lux Bond Company (Infor Global), L+800, 9/2/14 . . . . . Business Services 9,582 9,582 719KAR Holdings, Inc., 10.00%, 5/1/15 . . . . . . . . . . . . . . . . . . . . Transportation 48,225 44,404 27,488Latham Manufacturing Corp., 20.00%, 12/30/12 *** . . . . . . . . Leisure Equipment 37,920 34,190 15,168Laureate Education, Inc., 11.75%, 8/15/17/ . . . . . . . . . . . . . Education 53,540 49,621 46,794LVI Services, Inc., 14.75%, 11/16/12 . . . . . . . . . . . . . . . . . . . . Environmental 47,523 47,523 44,790MW Industries, Inc., 13.00%, 5/1/14 . . . . . . . . . . . . . . . . . . . . Manufacturing 60,000 59,067 56,220NCO Group Inc., 11.875%, 11/15/14 . . . . . . . . . . . . . . . . . . . . Consumer Finance 22,630 18,487 19,427Neff Corp., 10.00%, 6/1/15 . . . . . . . . . . . . . . . . . . . . . . . . . . . . Rental Equipment 5,000 5,000 725Nielsen Finance LLC, 0% / 12.50%, 8/1/16 . . . . . . . . . . . . . . . Market Research 61,000 47,500 37,430OTC Investors Corporation (Oriental Trading Company),13.50%, 1/31/15 . . . . . . . . . . . . . . . . . . . . . . . . . . . . . . . . . . . Direct Marketing 27,861 27,862 9,752
Pacific Crane Maintenance Company, L.P.,13.00%, 2/15/14 . . . . . . . . . . . . . . . . . . . . . . . . . . . . . . . . . . . Machinery 34,170 34,170 22,210
PBM Holdings, Inc., 13.50%, 9/29/13 . . . . . . . . . . . . . . . . . . .Beverage, Food &
Tobacco 17,723 17,723 16,128Playpower Holdings Inc., 15.50%, 12/31/12/ . . . . . . . . . . . . Leisure Equipment 83,707 83,707 70,732Pro Mach Merger Sub, Inc., 12.50%, 6/15/12 . . . . . . . . . . . . . . Machinery 14,616 14,464 13,626QHB Holdings LLC (Quality Home Brands),14.50%, 12/20/13 . . . . . . . . . . . . . . . . . . . . . . . . . . . . . . . . . . Consumer Products 50,938 50,273 36,293
Ranpak Holdings, Inc., 15.00%, 12/27/15 . . . . . . . . . . . . . . . . . Packaging 58,217 58,217 50,300RSA Holdings Corp. of Delaware (American Safety Razor),13.50%, 7/31/15 . . . . . . . . . . . . . . . . . . . . . . . . . . . . . . . . . . . Consumer Products 50,129 50,130 38,976
The Servicemaster Company, 10.75%, 7/15/15/ . . . . . . . . . . Diversified Service 67,173 60,832 54,343TL Acquisitions, Inc. (Thomson Learning),0% / 13.25%, 7/15/15/† . . . . . . . . . . . . . . . . . . . . . . . . . . . Education 72,500 69,587 57,347
TL Acquisitions, Inc. (Thomson Learning),10.50%, 1/15/15/† . . . . . . . . . . . . . . . . . . . . . . . . . . . . . . . Education 47,500 46,777 40,185
TP Financing 2, Ltd. (Travelex), GBP L+725, 4/1/15 . . . . . . . . Financial Services £13,505 26,128 12,499
US Foodservice, 10.25%, 6/30/15/ . . . . . . . . . . . . . . . . . . . .Beverage, Food &
Tobacco $30,000 23,812 25,710
See notes to financial statements.
47
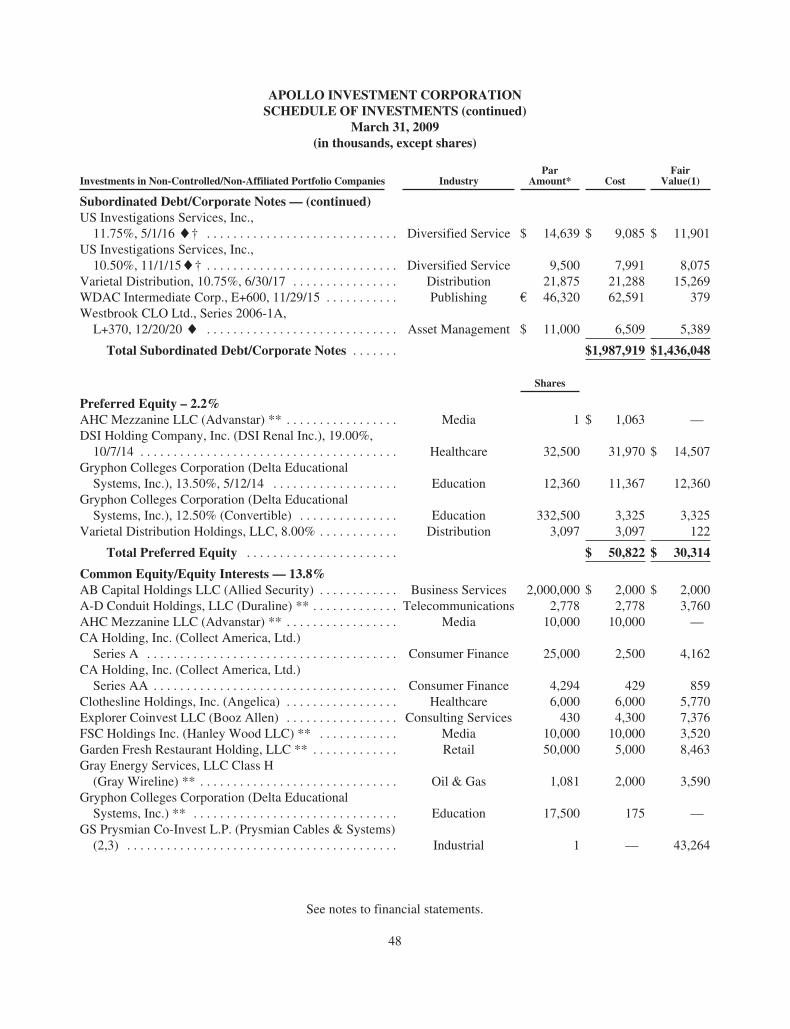
APOLLO INVESTMENT CORPORATIONSCHEDULE OF INVESTMENTS (continued)
March 31, 2009(in thousands, except shares)
Investments in Non-Controlled/Non-Affiliated Portfolio Companies IndustryPar
Amount* CostFair
Value(1)
Subordinated Debt/Corporate Notes — (continued)US Investigations Services, Inc.,11.75%, 5/1/16/† . . . . . . . . . . . . . . . . . . . . . . . . . . . . . Diversified Service $ 14,639 $ 9,085 $ 11,901
US Investigations Services, Inc.,10.50%, 11/1/15/† . . . . . . . . . . . . . . . . . . . . . . . . . . . . . Diversified Service 9,500 7,991 8,075
Varietal Distribution, 10.75%, 6/30/17 . . . . . . . . . . . . . . . . Distribution 21,875 21,288 15,269WDAC Intermediate Corp., E+600, 11/29/15 . . . . . . . . . . . Publishing € 46,320 62,591 379Westbrook CLO Ltd., Series 2006-1A,L+370, 12/20/20/ . . . . . . . . . . . . . . . . . . . . . . . . . . . . . Asset Management $ 11,000 6,509 5,389
Total Subordinated Debt/Corporate Notes . . . . . . . $1,987,919 $1,436,048
Shares
Preferred Equity – 2.2%AHC Mezzanine LLC (Advanstar) ** . . . . . . . . . . . . . . . . . Media 1 $ 1,063 —DSI Holding Company, Inc. (DSI Renal Inc.), 19.00%,10/7/14 . . . . . . . . . . . . . . . . . . . . . . . . . . . . . . . . . . . . . . . Healthcare 32,500 31,970 $ 14,507
Gryphon Colleges Corporation (Delta EducationalSystems, Inc.), 13.50%, 5/12/14 . . . . . . . . . . . . . . . . . . . Education 12,360 11,367 12,360
Gryphon Colleges Corporation (Delta EducationalSystems, Inc.), 12.50% (Convertible) . . . . . . . . . . . . . . . Education 332,500 3,325 3,325
Varietal Distribution Holdings, LLC, 8.00% . . . . . . . . . . . . Distribution 3,097 3,097 122
Total Preferred Equity . . . . . . . . . . . . . . . . . . . . . . . $ 50,822 $ 30,314
Common Equity/Equity Interests — 13.8%AB Capital Holdings LLC (Allied Security) . . . . . . . . . . . . Business Services 2,000,000 $ 2,000 $ 2,000A-D Conduit Holdings, LLC (Duraline) ** . . . . . . . . . . . . . Telecommunications 2,778 2,778 3,760AHC Mezzanine LLC (Advanstar) ** . . . . . . . . . . . . . . . . . Media 10,000 10,000 —CA Holding, Inc. (Collect America, Ltd.)Series A . . . . . . . . . . . . . . . . . . . . . . . . . . . . . . . . . . . . . . Consumer Finance 25,000 2,500 4,162
CA Holding, Inc. (Collect America, Ltd.)Series AA . . . . . . . . . . . . . . . . . . . . . . . . . . . . . . . . . . . . . Consumer Finance 4,294 429 859
Clothesline Holdings, Inc. (Angelica) . . . . . . . . . . . . . . . . . Healthcare 6,000 6,000 5,770Explorer Coinvest LLC (Booz Allen) . . . . . . . . . . . . . . . . . Consulting Services 430 4,300 7,376FSC Holdings Inc. (Hanley Wood LLC) ** . . . . . . . . . . . . Media 10,000 10,000 3,520Garden Fresh Restaurant Holding, LLC ** . . . . . . . . . . . . . Retail 50,000 5,000 8,463Gray Energy Services, LLC Class H(Gray Wireline) ** . . . . . . . . . . . . . . . . . . . . . . . . . . . . . . Oil & Gas 1,081 2,000 3,590
Gryphon Colleges Corporation (Delta EducationalSystems, Inc.) ** . . . . . . . . . . . . . . . . . . . . . . . . . . . . . . . Education 17,500 175 —
GS Prysmian Co-Invest L.P. (Prysmian Cables & Systems)(2,3) . . . . . . . . . . . . . . . . . . . . . . . . . . . . . . . . . . . . . . . . . Industrial 1 — 43,264
See notes to financial statements.
48
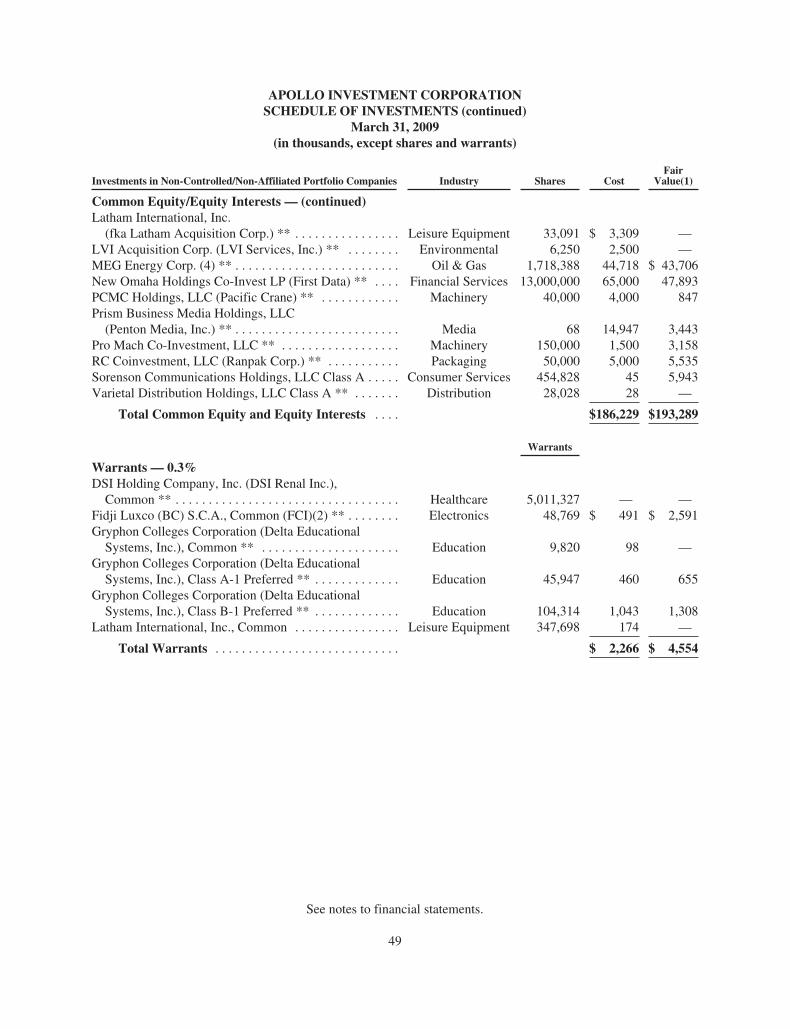
APOLLO INVESTMENT CORPORATIONSCHEDULE OF INVESTMENTS (continued)
March 31, 2009(in thousands, except shares and warrants)
Investments in Non-Controlled/Non-Affiliated Portfolio Companies Industry Shares CostFair
Value(1)
Common Equity/Equity Interests — (continued)Latham International, Inc.(fka Latham Acquisition Corp.) ** . . . . . . . . . . . . . . . . Leisure Equipment 33,091 $ 3,309 —
LVI Acquisition Corp. (LVI Services, Inc.) ** . . . . . . . . Environmental 6,250 2,500 —MEG Energy Corp. (4) ** . . . . . . . . . . . . . . . . . . . . . . . . . Oil & Gas 1,718,388 44,718 $ 43,706New Omaha Holdings Co-Invest LP (First Data) ** . . . . Financial Services 13,000,000 65,000 47,893PCMC Holdings, LLC (Pacific Crane) ** . . . . . . . . . . . . Machinery 40,000 4,000 847Prism Business Media Holdings, LLC(Penton Media, Inc.) ** . . . . . . . . . . . . . . . . . . . . . . . . . Media 68 14,947 3,443
Pro Mach Co-Investment, LLC ** . . . . . . . . . . . . . . . . . . Machinery 150,000 1,500 3,158RC Coinvestment, LLC (Ranpak Corp.) ** . . . . . . . . . . . Packaging 50,000 5,000 5,535Sorenson Communications Holdings, LLC Class A . . . . . Consumer Services 454,828 45 5,943Varietal Distribution Holdings, LLC Class A ** . . . . . . . Distribution 28,028 28 —
Total Common Equity and Equity Interests . . . . $186,229 $193,289
Warrants
Warrants — 0.3%DSI Holding Company, Inc. (DSI Renal Inc.),Common ** . . . . . . . . . . . . . . . . . . . . . . . . . . . . . . . . . . Healthcare 5,011,327 — —
Fidji Luxco (BC) S.C.A., Common (FCI)(2) ** . . . . . . . . Electronics 48,769 $ 491 $ 2,591Gryphon Colleges Corporation (Delta EducationalSystems, Inc.), Common ** . . . . . . . . . . . . . . . . . . . . . Education 9,820 98 —
Gryphon Colleges Corporation (Delta EducationalSystems, Inc.), Class A-1 Preferred ** . . . . . . . . . . . . . Education 45,947 460 655
Gryphon Colleges Corporation (Delta EducationalSystems, Inc.), Class B-1 Preferred ** . . . . . . . . . . . . . Education 104,314 1,043 1,308
Latham International, Inc., Common . . . . . . . . . . . . . . . . Leisure Equipment 347,698 174 —
Total Warrants . . . . . . . . . . . . . . . . . . . . . . . . . . . . $ 2,266 $ 4,554
See notes to financial statements.
49
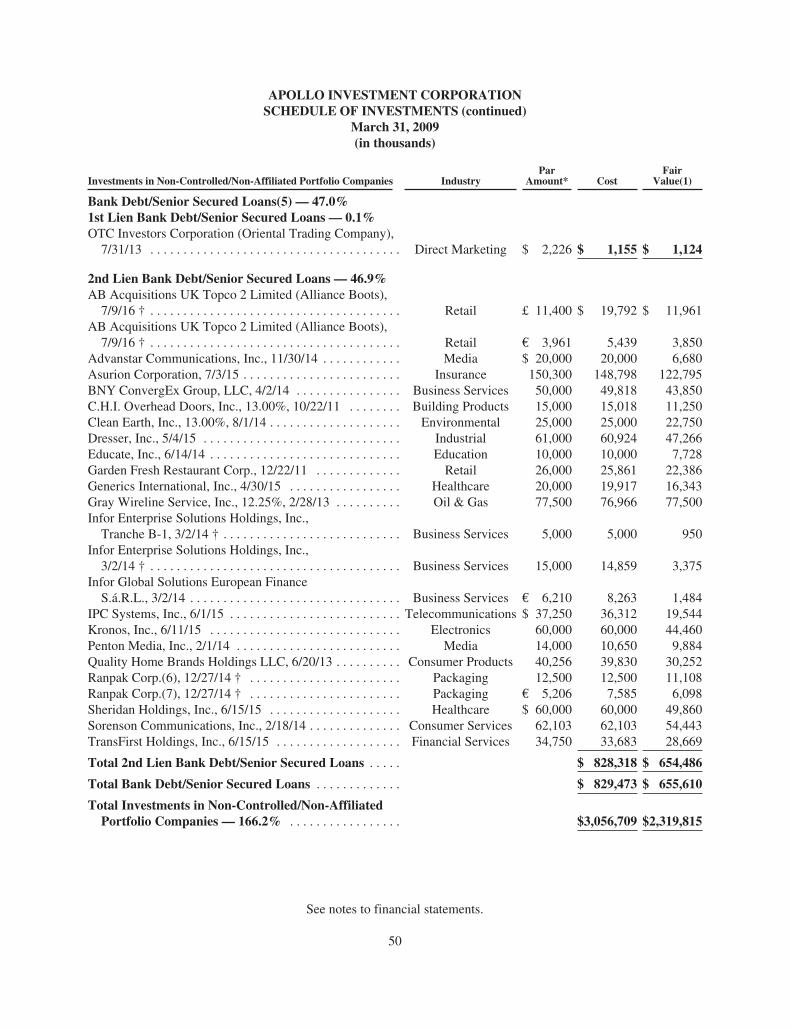
APOLLO INVESTMENT CORPORATIONSCHEDULE OF INVESTMENTS (continued)
March 31, 2009(in thousands)
Investments in Non-Controlled/Non-Affiliated Portfolio Companies IndustryPar
Amount* CostFair
Value(1)
Bank Debt/Senior Secured Loans(5) — 47.0%1st Lien Bank Debt/Senior Secured Loans — 0.1%OTC Investors Corporation (Oriental Trading Company),7/31/13 . . . . . . . . . . . . . . . . . . . . . . . . . . . . . . . . . . . . . . Direct Marketing $ 2,226 $ 1,155 $ 1,124
2nd Lien Bank Debt/Senior Secured Loans — 46.9%AB Acquisitions UK Topco 2 Limited (Alliance Boots),7/9/16 † . . . . . . . . . . . . . . . . . . . . . . . . . . . . . . . . . . . . . . Retail £ 11,400 $ 19,792 $ 11,961
AB Acquisitions UK Topco 2 Limited (Alliance Boots),7/9/16 † . . . . . . . . . . . . . . . . . . . . . . . . . . . . . . . . . . . . . . Retail € 3,961 5,439 3,850
Advanstar Communications, Inc., 11/30/14 . . . . . . . . . . . . Media $ 20,000 20,000 6,680Asurion Corporation, 7/3/15 . . . . . . . . . . . . . . . . . . . . . . . . Insurance 150,300 148,798 122,795BNY ConvergEx Group, LLC, 4/2/14 . . . . . . . . . . . . . . . . Business Services 50,000 49,818 43,850C.H.I. Overhead Doors, Inc., 13.00%, 10/22/11 . . . . . . . . Building Products 15,000 15,018 11,250Clean Earth, Inc., 13.00%, 8/1/14 . . . . . . . . . . . . . . . . . . . . Environmental 25,000 25,000 22,750Dresser, Inc., 5/4/15 . . . . . . . . . . . . . . . . . . . . . . . . . . . . . . Industrial 61,000 60,924 47,266Educate, Inc., 6/14/14 . . . . . . . . . . . . . . . . . . . . . . . . . . . . . Education 10,000 10,000 7,728Garden Fresh Restaurant Corp., 12/22/11 . . . . . . . . . . . . . Retail 26,000 25,861 22,386Generics International, Inc., 4/30/15 . . . . . . . . . . . . . . . . . Healthcare 20,000 19,917 16,343Gray Wireline Service, Inc., 12.25%, 2/28/13 . . . . . . . . . . Oil & Gas 77,500 76,966 77,500Infor Enterprise Solutions Holdings, Inc.,Tranche B-1, 3/2/14 † . . . . . . . . . . . . . . . . . . . . . . . . . . . Business Services 5,000 5,000 950
Infor Enterprise Solutions Holdings, Inc.,3/2/14 † . . . . . . . . . . . . . . . . . . . . . . . . . . . . . . . . . . . . . . Business Services 15,000 14,859 3,375
Infor Global Solutions European FinanceS.á.R.L., 3/2/14 . . . . . . . . . . . . . . . . . . . . . . . . . . . . . . . . Business Services € 6,210 8,263 1,484
IPC Systems, Inc., 6/1/15 . . . . . . . . . . . . . . . . . . . . . . . . . . Telecommunications $ 37,250 36,312 19,544Kronos, Inc., 6/11/15 . . . . . . . . . . . . . . . . . . . . . . . . . . . . . Electronics 60,000 60,000 44,460Penton Media, Inc., 2/1/14 . . . . . . . . . . . . . . . . . . . . . . . . . Media 14,000 10,650 9,884Quality Home Brands Holdings LLC, 6/20/13 . . . . . . . . . . Consumer Products 40,256 39,830 30,252Ranpak Corp.(6), 12/27/14 † . . . . . . . . . . . . . . . . . . . . . . . Packaging 12,500 12,500 11,108Ranpak Corp.(7), 12/27/14 † . . . . . . . . . . . . . . . . . . . . . . . Packaging € 5,206 7,585 6,098Sheridan Holdings, Inc., 6/15/15 . . . . . . . . . . . . . . . . . . . . Healthcare $ 60,000 60,000 49,860Sorenson Communications, Inc., 2/18/14 . . . . . . . . . . . . . . Consumer Services 62,103 62,103 54,443TransFirst Holdings, Inc., 6/15/15 . . . . . . . . . . . . . . . . . . . Financial Services 34,750 33,683 28,669
Total 2nd Lien Bank Debt/Senior Secured Loans . . . . . $ 828,318 $ 654,486
Total Bank Debt/Senior Secured Loans . . . . . . . . . . . . . $ 829,473 $ 655,610
Total Investments in Non-Controlled/Non-AffiliatedPortfolio Companies — 166.2% . . . . . . . . . . . . . . . . . $3,056,709 $2,319,815
See notes to financial statements.
50
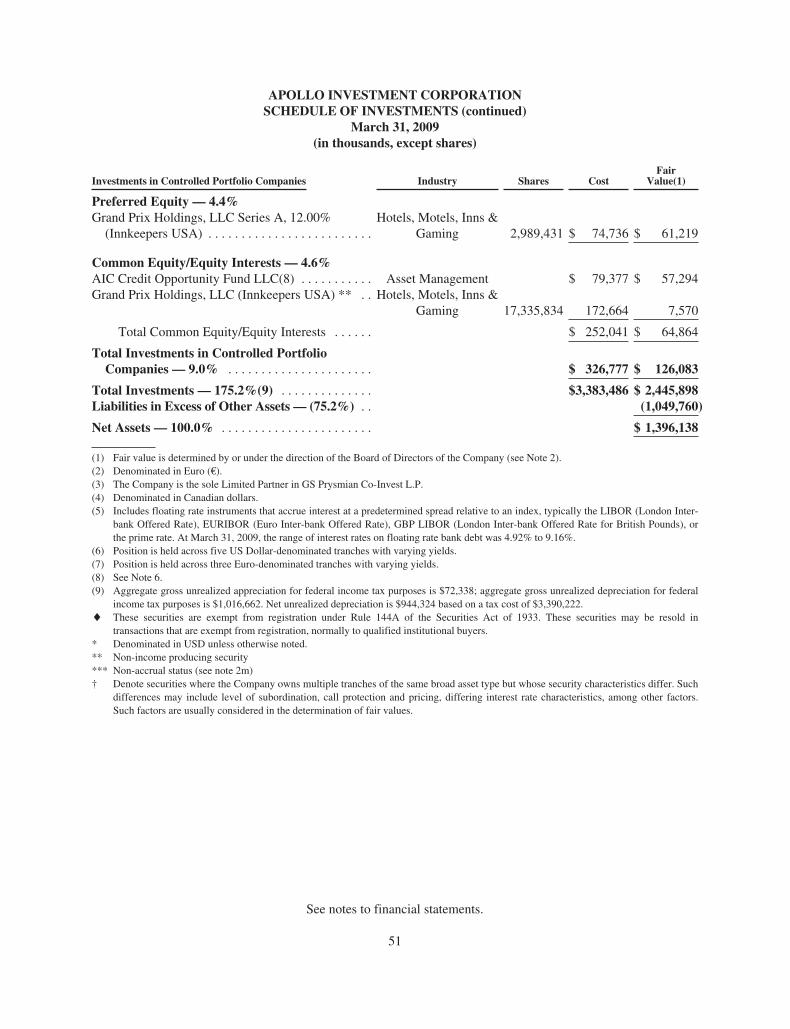
APOLLO INVESTMENT CORPORATIONSCHEDULE OF INVESTMENTS (continued)
March 31, 2009(in thousands, except shares)
Investments in Controlled Portfolio Companies Industry Shares CostFair
Value(1)
Preferred Equity — 4.4%Grand Prix Holdings, LLC Series A, 12.00%(Innkeepers USA) . . . . . . . . . . . . . . . . . . . . . . . . .
Hotels, Motels, Inns &Gaming 2,989,431 $ 74,736 $ 61,219
Common Equity/Equity Interests — 4.6%AIC Credit Opportunity Fund LLC(8) . . . . . . . . . . . Asset Management $ 79,377 $ 57,294Grand Prix Holdings, LLC (Innkeepers USA) ** . . Hotels, Motels, Inns &
Gaming 17,335,834 172,664 7,570
Total Common Equity/Equity Interests . . . . . . $ 252,041 $ 64,864
Total Investments in Controlled PortfolioCompanies — 9.0% . . . . . . . . . . . . . . . . . . . . . . $ 326,777 $ 126,083
Total Investments — 175.2%(9) . . . . . . . . . . . . . . $3,383,486 $ 2,445,898Liabilities in Excess of Other Assets — (75.2%) . . (1,049,760)
Net Assets — 100.0% . . . . . . . . . . . . . . . . . . . . . . . $ 1,396,138
(1) Fair value is determined by or under the direction of the Board of Directors of the Company (see Note 2).(2) Denominated in Euro (€).(3) The Company is the sole Limited Partner in GS Prysmian Co-Invest L.P.(4) Denominated in Canadian dollars.(5) Includes floating rate instruments that accrue interest at a predetermined spread relative to an index, typically the LIBOR (London Inter-
bank Offered Rate), EURIBOR (Euro Inter-bank Offered Rate), GBP LIBOR (London Inter-bank Offered Rate for British Pounds), orthe prime rate. At March 31, 2009, the range of interest rates on floating rate bank debt was 4.92% to 9.16%.
(6) Position is held across five US Dollar-denominated tranches with varying yields.(7) Position is held across three Euro-denominated tranches with varying yields.(8) See Note 6.(9) Aggregate gross unrealized appreciation for federal income tax purposes is $72,338; aggregate gross unrealized depreciation for federal
income tax purposes is $1,016,662. Net unrealized depreciation is $944,324 based on a tax cost of $3,390,222./ These securities are exempt from registration under Rule 144A of the Securities Act of 1933. These securities may be resold in
transactions that are exempt from registration, normally to qualified institutional buyers.* Denominated in USD unless otherwise noted.** Non-income producing security*** Non-accrual status (see note 2m)† Denote securities where the Company owns multiple tranches of the same broad asset type but whose security characteristics differ. Such
differences may include level of subordination, call protection and pricing, differing interest rate characteristics, among other factors.Such factors are usually considered in the determination of fair values.
See notes to financial statements.
51
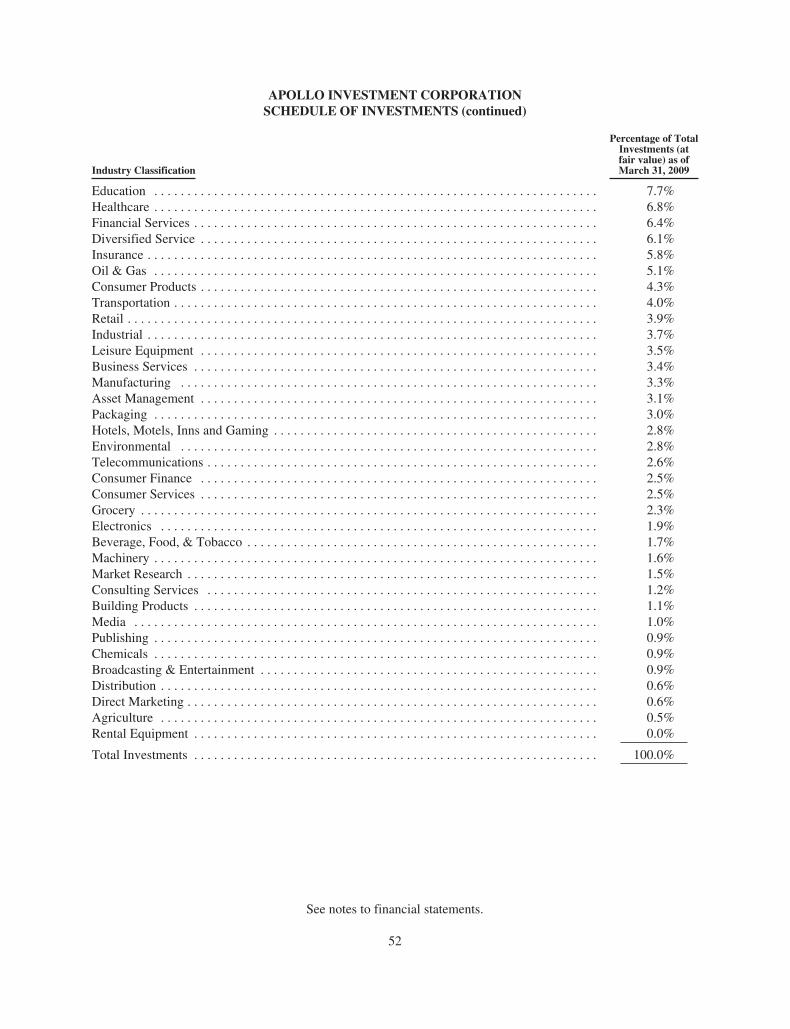
APOLLO INVESTMENT CORPORATIONSCHEDULE OF INVESTMENTS (continued)
Industry Classification
Percentage of TotalInvestments (atfair value) as ofMarch 31, 2009
Education . . . . . . . . . . . . . . . . . . . . . . . . . . . . . . . . . . . . . . . . . . . . . . . . . . . . . . . . . . . . . . . . . . . 7.7%Healthcare . . . . . . . . . . . . . . . . . . . . . . . . . . . . . . . . . . . . . . . . . . . . . . . . . . . . . . . . . . . . . . . . . . . 6.8%Financial Services . . . . . . . . . . . . . . . . . . . . . . . . . . . . . . . . . . . . . . . . . . . . . . . . . . . . . . . . . . . . . 6.4%Diversified Service . . . . . . . . . . . . . . . . . . . . . . . . . . . . . . . . . . . . . . . . . . . . . . . . . . . . . . . . . . . . 6.1%Insurance . . . . . . . . . . . . . . . . . . . . . . . . . . . . . . . . . . . . . . . . . . . . . . . . . . . . . . . . . . . . . . . . . . . . 5.8%Oil & Gas . . . . . . . . . . . . . . . . . . . . . . . . . . . . . . . . . . . . . . . . . . . . . . . . . . . . . . . . . . . . . . . . . . . 5.1%Consumer Products . . . . . . . . . . . . . . . . . . . . . . . . . . . . . . . . . . . . . . . . . . . . . . . . . . . . . . . . . . . . 4.3%Transportation . . . . . . . . . . . . . . . . . . . . . . . . . . . . . . . . . . . . . . . . . . . . . . . . . . . . . . . . . . . . . . . . 4.0%Retail . . . . . . . . . . . . . . . . . . . . . . . . . . . . . . . . . . . . . . . . . . . . . . . . . . . . . . . . . . . . . . . . . . . . . . . 3.9%Industrial . . . . . . . . . . . . . . . . . . . . . . . . . . . . . . . . . . . . . . . . . . . . . . . . . . . . . . . . . . . . . . . . . . . . 3.7%Leisure Equipment . . . . . . . . . . . . . . . . . . . . . . . . . . . . . . . . . . . . . . . . . . . . . . . . . . . . . . . . . . . . 3.5%Business Services . . . . . . . . . . . . . . . . . . . . . . . . . . . . . . . . . . . . . . . . . . . . . . . . . . . . . . . . . . . . . 3.4%Manufacturing . . . . . . . . . . . . . . . . . . . . . . . . . . . . . . . . . . . . . . . . . . . . . . . . . . . . . . . . . . . . . . . 3.3%Asset Management . . . . . . . . . . . . . . . . . . . . . . . . . . . . . . . . . . . . . . . . . . . . . . . . . . . . . . . . . . . . 3.1%Packaging . . . . . . . . . . . . . . . . . . . . . . . . . . . . . . . . . . . . . . . . . . . . . . . . . . . . . . . . . . . . . . . . . . . 3.0%Hotels, Motels, Inns and Gaming . . . . . . . . . . . . . . . . . . . . . . . . . . . . . . . . . . . . . . . . . . . . . . . . . 2.8%Environmental . . . . . . . . . . . . . . . . . . . . . . . . . . . . . . . . . . . . . . . . . . . . . . . . . . . . . . . . . . . . . . . 2.8%Telecommunications . . . . . . . . . . . . . . . . . . . . . . . . . . . . . . . . . . . . . . . . . . . . . . . . . . . . . . . . . . . 2.6%Consumer Finance . . . . . . . . . . . . . . . . . . . . . . . . . . . . . . . . . . . . . . . . . . . . . . . . . . . . . . . . . . . . 2.5%Consumer Services . . . . . . . . . . . . . . . . . . . . . . . . . . . . . . . . . . . . . . . . . . . . . . . . . . . . . . . . . . . . 2.5%Grocery . . . . . . . . . . . . . . . . . . . . . . . . . . . . . . . . . . . . . . . . . . . . . . . . . . . . . . . . . . . . . . . . . . . . . 2.3%Electronics . . . . . . . . . . . . . . . . . . . . . . . . . . . . . . . . . . . . . . . . . . . . . . . . . . . . . . . . . . . . . . . . . . 1.9%Beverage, Food, & Tobacco . . . . . . . . . . . . . . . . . . . . . . . . . . . . . . . . . . . . . . . . . . . . . . . . . . . . . 1.7%Machinery . . . . . . . . . . . . . . . . . . . . . . . . . . . . . . . . . . . . . . . . . . . . . . . . . . . . . . . . . . . . . . . . . . . 1.6%Market Research . . . . . . . . . . . . . . . . . . . . . . . . . . . . . . . . . . . . . . . . . . . . . . . . . . . . . . . . . . . . . . 1.5%Consulting Services . . . . . . . . . . . . . . . . . . . . . . . . . . . . . . . . . . . . . . . . . . . . . . . . . . . . . . . . . . . 1.2%Building Products . . . . . . . . . . . . . . . . . . . . . . . . . . . . . . . . . . . . . . . . . . . . . . . . . . . . . . . . . . . . . 1.1%Media . . . . . . . . . . . . . . . . . . . . . . . . . . . . . . . . . . . . . . . . . . . . . . . . . . . . . . . . . . . . . . . . . . . . . . 1.0%Publishing . . . . . . . . . . . . . . . . . . . . . . . . . . . . . . . . . . . . . . . . . . . . . . . . . . . . . . . . . . . . . . . . . . . 0.9%Chemicals . . . . . . . . . . . . . . . . . . . . . . . . . . . . . . . . . . . . . . . . . . . . . . . . . . . . . . . . . . . . . . . . . . . 0.9%Broadcasting & Entertainment . . . . . . . . . . . . . . . . . . . . . . . . . . . . . . . . . . . . . . . . . . . . . . . . . . . 0.9%Distribution . . . . . . . . . . . . . . . . . . . . . . . . . . . . . . . . . . . . . . . . . . . . . . . . . . . . . . . . . . . . . . . . . . 0.6%Direct Marketing . . . . . . . . . . . . . . . . . . . . . . . . . . . . . . . . . . . . . . . . . . . . . . . . . . . . . . . . . . . . . . 0.6%Agriculture . . . . . . . . . . . . . . . . . . . . . . . . . . . . . . . . . . . . . . . . . . . . . . . . . . . . . . . . . . . . . . . . . . 0.5%Rental Equipment . . . . . . . . . . . . . . . . . . . . . . . . . . . . . . . . . . . . . . . . . . . . . . . . . . . . . . . . . . . . . 0.0%
Total Investments . . . . . . . . . . . . . . . . . . . . . . . . . . . . . . . . . . . . . . . . . . . . . . . . . . . . . . . . . . . . . 100.0%
See notes to financial statements.
52
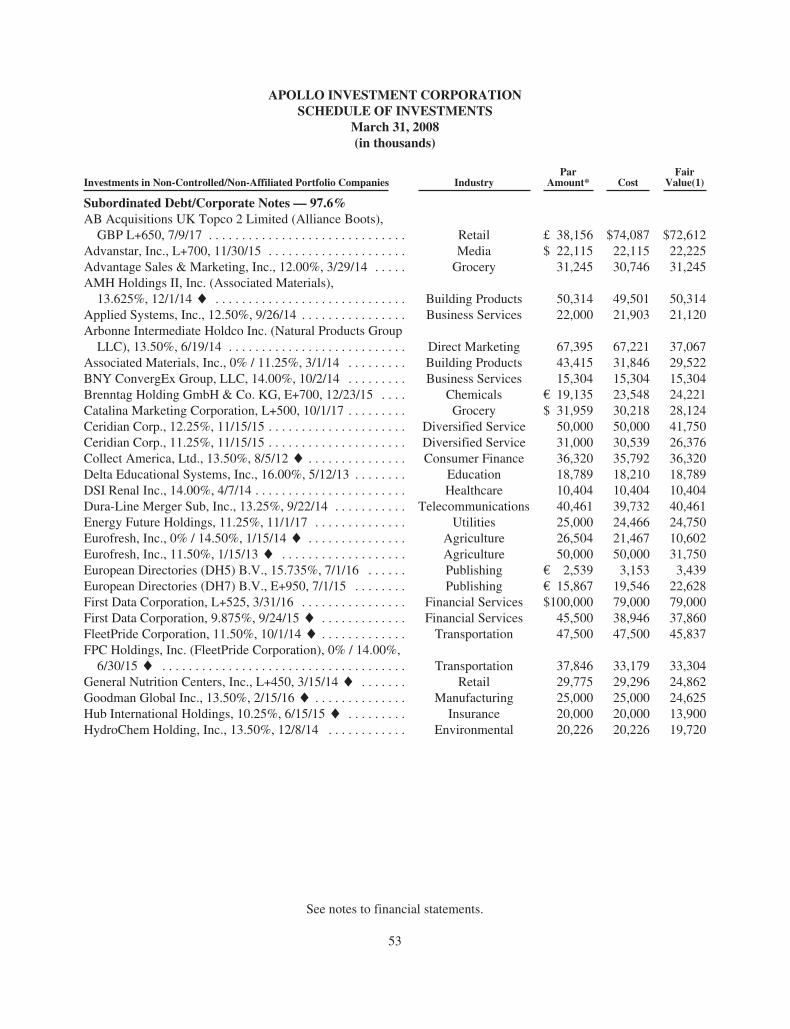
APOLLO INVESTMENT CORPORATIONSCHEDULE OF INVESTMENTS
March 31, 2008(in thousands)
Investments in Non-Controlled/Non-Affiliated Portfolio Companies IndustryPar
Amount* CostFair
Value(1)
Subordinated Debt/Corporate Notes — 97.6%AB Acquisitions UK Topco 2 Limited (Alliance Boots),GBP L+650, 7/9/17 . . . . . . . . . . . . . . . . . . . . . . . . . . . . . . Retail £ 38,156 $74,087 $72,612
Advanstar, Inc., L+700, 11/30/15 . . . . . . . . . . . . . . . . . . . . . Media $ 22,115 22,115 22,225Advantage Sales & Marketing, Inc., 12.00%, 3/29/14 . . . . . Grocery 31,245 30,746 31,245AMH Holdings II, Inc. (Associated Materials),13.625%, 12/1/14/ . . . . . . . . . . . . . . . . . . . . . . . . . . . . . Building Products 50,314 49,501 50,314
Applied Systems, Inc., 12.50%, 9/26/14 . . . . . . . . . . . . . . . . Business Services 22,000 21,903 21,120Arbonne Intermediate Holdco Inc. (Natural Products GroupLLC), 13.50%, 6/19/14 . . . . . . . . . . . . . . . . . . . . . . . . . . . Direct Marketing 67,395 67,221 37,067
Associated Materials, Inc., 0% / 11.25%, 3/1/14 . . . . . . . . . Building Products 43,415 31,846 29,522BNY ConvergEx Group, LLC, 14.00%, 10/2/14 . . . . . . . . . Business Services 15,304 15,304 15,304Brenntag Holding GmbH & Co. KG, E+700, 12/23/15 . . . . Chemicals € 19,135 23,548 24,221Catalina Marketing Corporation, L+500, 10/1/17 . . . . . . . . . Grocery $ 31,959 30,218 28,124Ceridian Corp., 12.25%, 11/15/15 . . . . . . . . . . . . . . . . . . . . . Diversified Service 50,000 50,000 41,750Ceridian Corp., 11.25%, 11/15/15 . . . . . . . . . . . . . . . . . . . . . Diversified Service 31,000 30,539 26,376Collect America, Ltd., 13.50%, 8/5/12/ . . . . . . . . . . . . . . . Consumer Finance 36,320 35,792 36,320Delta Educational Systems, Inc., 16.00%, 5/12/13 . . . . . . . . Education 18,789 18,210 18,789DSI Renal Inc., 14.00%, 4/7/14 . . . . . . . . . . . . . . . . . . . . . . . Healthcare 10,404 10,404 10,404Dura-Line Merger Sub, Inc., 13.25%, 9/22/14 . . . . . . . . . . . Telecommunications 40,461 39,732 40,461Energy Future Holdings, 11.25%, 11/1/17 . . . . . . . . . . . . . . Utilities 25,000 24,466 24,750Eurofresh, Inc., 0% / 14.50%, 1/15/14/ . . . . . . . . . . . . . . . Agriculture 26,504 21,467 10,602Eurofresh, Inc., 11.50%, 1/15/13/ . . . . . . . . . . . . . . . . . . . Agriculture 50,000 50,000 31,750European Directories (DH5) B.V., 15.735%, 7/1/16 . . . . . . Publishing € 2,539 3,153 3,439European Directories (DH7) B.V., E+950, 7/1/15 . . . . . . . . Publishing € 15,867 19,546 22,628First Data Corporation, L+525, 3/31/16 . . . . . . . . . . . . . . . . Financial Services $100,000 79,000 79,000First Data Corporation, 9.875%, 9/24/15/ . . . . . . . . . . . . . Financial Services 45,500 38,946 37,860FleetPride Corporation, 11.50%, 10/1/14/ . . . . . . . . . . . . . Transportation 47,500 47,500 45,837FPC Holdings, Inc. (FleetPride Corporation), 0% / 14.00%,6/30/15/ . . . . . . . . . . . . . . . . . . . . . . . . . . . . . . . . . . . . . Transportation 37,846 33,179 33,304
General Nutrition Centers, Inc., L+450, 3/15/14/ . . . . . . . Retail 29,775 29,296 24,862Goodman Global Inc., 13.50%, 2/15/16/ . . . . . . . . . . . . . . Manufacturing 25,000 25,000 24,625Hub International Holdings, 10.25%, 6/15/15/ . . . . . . . . . Insurance 20,000 20,000 13,900HydroChem Holding, Inc., 13.50%, 12/8/14 . . . . . . . . . . . . Environmental 20,226 20,226 19,720
See notes to financial statements.
53
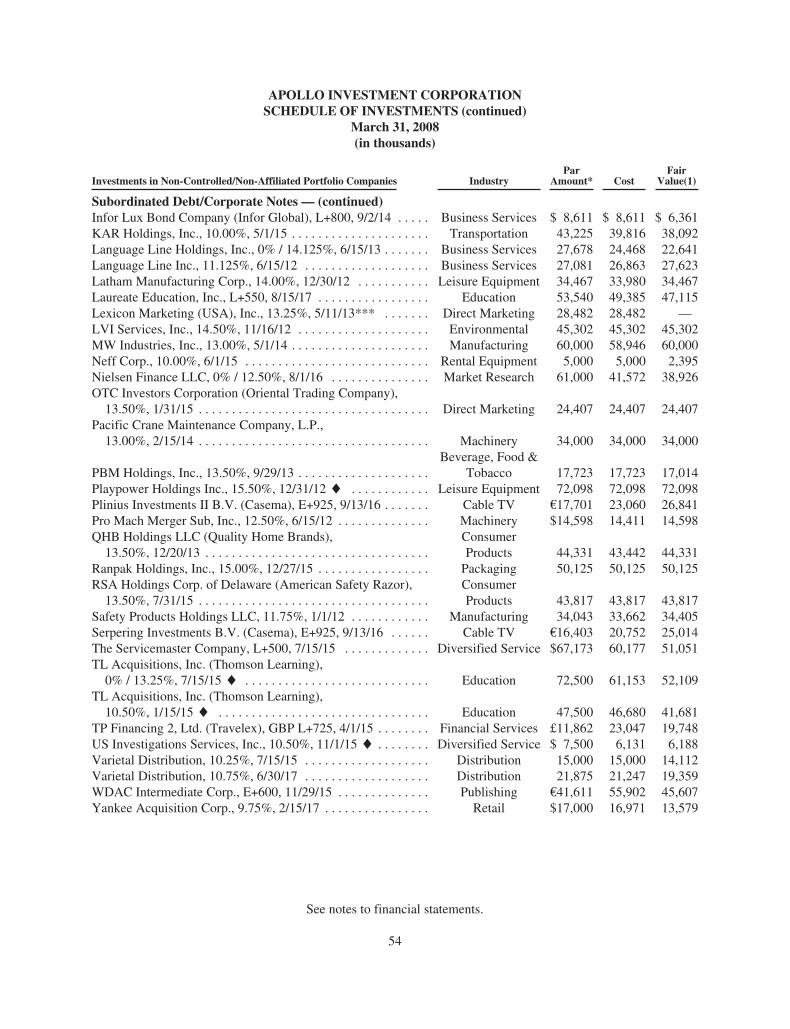
APOLLO INVESTMENT CORPORATIONSCHEDULE OF INVESTMENTS (continued)
March 31, 2008(in thousands)
Investments in Non-Controlled/Non-Affiliated Portfolio Companies IndustryPar
Amount* CostFair
Value(1)
Subordinated Debt/Corporate Notes — (continued)Infor Lux Bond Company (Infor Global), L+800, 9/2/14 . . . . . Business Services $ 8,611 $ 8,611 $ 6,361KAR Holdings, Inc., 10.00%, 5/1/15 . . . . . . . . . . . . . . . . . . . . . Transportation 43,225 39,816 38,092Language Line Holdings, Inc., 0% / 14.125%, 6/15/13 . . . . . . . Business Services 27,678 24,468 22,641Language Line Inc., 11.125%, 6/15/12 . . . . . . . . . . . . . . . . . . . Business Services 27,081 26,863 27,623Latham Manufacturing Corp., 14.00%, 12/30/12 . . . . . . . . . . . Leisure Equipment 34,467 33,980 34,467Laureate Education, Inc., L+550, 8/15/17 . . . . . . . . . . . . . . . . . Education 53,540 49,385 47,115Lexicon Marketing (USA), Inc., 13.25%, 5/11/13*** . . . . . . . Direct Marketing 28,482 28,482 —LVI Services, Inc., 14.50%, 11/16/12 . . . . . . . . . . . . . . . . . . . . Environmental 45,302 45,302 45,302MW Industries, Inc., 13.00%, 5/1/14 . . . . . . . . . . . . . . . . . . . . . Manufacturing 60,000 58,946 60,000Neff Corp., 10.00%, 6/1/15 . . . . . . . . . . . . . . . . . . . . . . . . . . . . Rental Equipment 5,000 5,000 2,395Nielsen Finance LLC, 0% / 12.50%, 8/1/16 . . . . . . . . . . . . . . . Market Research 61,000 41,572 38,926OTC Investors Corporation (Oriental Trading Company),13.50%, 1/31/15 . . . . . . . . . . . . . . . . . . . . . . . . . . . . . . . . . . . Direct Marketing 24,407 24,407 24,407
Pacific Crane Maintenance Company, L.P.,13.00%, 2/15/14 . . . . . . . . . . . . . . . . . . . . . . . . . . . . . . . . . . . Machinery 34,000 34,000 34,000
PBM Holdings, Inc., 13.50%, 9/29/13 . . . . . . . . . . . . . . . . . . . .Beverage, Food &
Tobacco 17,723 17,723 17,014Playpower Holdings Inc., 15.50%, 12/31/12/ . . . . . . . . . . . . Leisure Equipment 72,098 72,098 72,098Plinius Investments II B.V. (Casema), E+925, 9/13/16 . . . . . . . Cable TV €17,701 23,060 26,841Pro Mach Merger Sub, Inc., 12.50%, 6/15/12 . . . . . . . . . . . . . . Machinery $14,598 14,411 14,598QHB Holdings LLC (Quality Home Brands),13.50%, 12/20/13 . . . . . . . . . . . . . . . . . . . . . . . . . . . . . . . . . .
ConsumerProducts 44,331 43,442 44,331
Ranpak Holdings, Inc., 15.00%, 12/27/15 . . . . . . . . . . . . . . . . . Packaging 50,125 50,125 50,125RSA Holdings Corp. of Delaware (American Safety Razor),13.50%, 7/31/15 . . . . . . . . . . . . . . . . . . . . . . . . . . . . . . . . . . .
ConsumerProducts 43,817 43,817 43,817
Safety Products Holdings LLC, 11.75%, 1/1/12 . . . . . . . . . . . . Manufacturing 34,043 33,662 34,405Serpering Investments B.V. (Casema), E+925, 9/13/16 . . . . . . Cable TV €16,403 20,752 25,014The Servicemaster Company, L+500, 7/15/15 . . . . . . . . . . . . . Diversified Service $67,173 60,177 51,051TL Acquisitions, Inc. (Thomson Learning),0% / 13.25%, 7/15/15/ . . . . . . . . . . . . . . . . . . . . . . . . . . . . Education 72,500 61,153 52,109
TL Acquisitions, Inc. (Thomson Learning),10.50%, 1/15/15/ . . . . . . . . . . . . . . . . . . . . . . . . . . . . . . . . Education 47,500 46,680 41,681
TP Financing 2, Ltd. (Travelex), GBP L+725, 4/1/15 . . . . . . . . Financial Services £11,862 23,047 19,748US Investigations Services, Inc., 10.50%, 11/1/15/ . . . . . . . . Diversified Service $ 7,500 6,131 6,188Varietal Distribution, 10.25%, 7/15/15 . . . . . . . . . . . . . . . . . . . Distribution 15,000 15,000 14,112Varietal Distribution, 10.75%, 6/30/17 . . . . . . . . . . . . . . . . . . . Distribution 21,875 21,247 19,359WDAC Intermediate Corp., E+600, 11/29/15 . . . . . . . . . . . . . . Publishing €41,611 55,902 45,607Yankee Acquisition Corp., 9.75%, 2/15/17 . . . . . . . . . . . . . . . . Retail $17,000 16,971 13,579
See notes to financial statements.
54

APOLLO INVESTMENT CORPORATIONSCHEDULE OF INVESTMENTS (continued)
March 31, 2008(in thousands, except shares)
Investments in Non-Controlled/Non-Affiliated Portfolio Companies IndustryPar
Amount* CostFair
Value(1)
Subordinated Debt/Corporate Notes — (continued)Yankee Acquisition Corp., 8.50%, 2/15/15 . . . . . . . . . . . . Retail $ 1,915 $ 1,546 $ 1,558
Total Subordinated Debt/Corporate Notes . . . . . . . $2,010,721 $1,852,695
Shares
Preferred Equity — 5.6%DSI Holding Company, Inc. (DSI Renal Inc.),15.00%, 10/7/14 . . . . . . . . . . . . . . . . . . . . . . . . . . . . . . . Healthcare 32,500 $ 31,875 $ 32,500
Exco Resources, Inc., 7.00% / 9.00% (Convertible) . . . . . . Oil & Gas 975 9,750 10,871Exco Resources, Inc., 7.00% / 9.00% Hybrid(Convertible) . . . . . . . . . . . . . . . . . . . . . . . . . . . . . . . . . . Oil & Gas 4,025 40,250 44,879
Gryphon Colleges Corporation (Delta EducationalSystems, Inc.), 13.50%, 5/12/14 . . . . . . . . . . . . . . . . . . . Education 12,360 11,180 12,360
Gryphon Colleges Corporation (Delta EducationalSystems, Inc.), 12.50% (Convertible) . . . . . . . . . . . . . . . Education 3,325 3,325 1,369
LVI Acquisition Corp. (LVI Services, Inc.), 14.00% . . . . . Environmental 1,875 1,875 529Varietal Distribution Holdings, LLC, 8.00% . . . . . . . . . . . Distribution 3,097 3,097 3,097
Total Preferred Equity . . . . . . . . . . . . . . . . . . . . . . . $ 101,352 $ 105,605
Common Equity/Partnership Interests — 15.5%A-D Conduit Holdings, LLC (Duraline) ** . . . . . . . . . . . . Telecommunications 2,778 $ 2,778 $ 3,730AHC Mezzanine LLC (Advanstar) . . . . . . . . . . . . . . . . . . . Media 10,000 10,000 9,000CA Holding, Inc. (Collect America, Ltd.) . . . . . . . . . . . . . Consumer Finance 25,000 2,500 3,720DTPI Holdings, Inc. (American Asphalt & Grading) ** . . Infrastructure 200,000 2,000 —FSC Holdings Inc. (Hanley Wood LLC) ** . . . . . . . . . . . . Media 10,000 10,000 10,000Garden Fresh Restaurant Holding, LLC ** . . . . . . . . . . . . Retail 50,000 5,000 4,832Gray Energy Services, LLC Class H (GrayWireline) ** . . . . . . . . . . . . . . . . . . . . . . . . . . . . . . . . . . . Oil & Gas 1,081 2,000 3,540
Gryphon Colleges Corporation (Delta EducationalSystems, Inc.) ** . . . . . . . . . . . . . . . . . . . . . . . . . . . . . . . Education 175 175 —
GS Prysmian Co-Invest L.P. (Prysmian Cables &Systems) (2,3) . . . . . . . . . . . . . . . . . . . . . . . . . . . . . . . . . Industrial — 93,073
Latham International, Inc.(fka Latham Acquisition Corp.) ** . . . . . . . . . . . . . . . . . . . Leisure Equipment 33,091 3,309 1,127LM Acquisition Ltd. (Lexicon Marketing Inc.) ** . . . . . . . Direct Marketing 10,000 10,000 —LVI Acquisition Corp. (LVI Services, Inc.) ** . . . . . . . . . Environmental 6,250 625 —MEG Energy Corp. (4) ** . . . . . . . . . . . . . . . . . . . . . . . . . . Oil & Gas 1,718,388 44,718 68,665New Omaha Holdings Co-Invest LP (First Data) . . . . . . . . Financial Services 13,000,000 65,000 65,000PCMC Holdings, LLC (Pacific Crane) . . . . . . . . . . . . . . . . Machinery 40,000 4,000 3,607
See notes to financial statements.
55
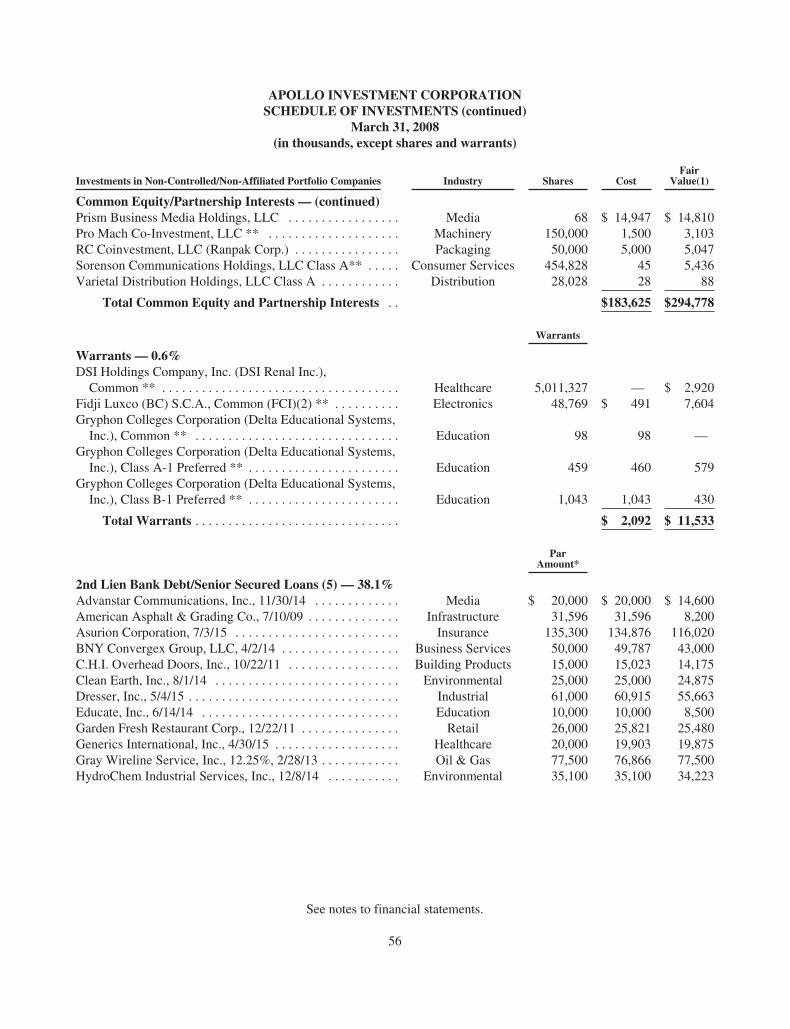
APOLLO INVESTMENT CORPORATIONSCHEDULE OF INVESTMENTS (continued)
March 31, 2008(in thousands, except shares and warrants)
Investments in Non-Controlled/Non-Affiliated Portfolio Companies Industry Shares CostFair
Value(1)
Common Equity/Partnership Interests — (continued)Prism Business Media Holdings, LLC . . . . . . . . . . . . . . . . . Media 68 $ 14,947 $ 14,810Pro Mach Co-Investment, LLC ** . . . . . . . . . . . . . . . . . . . . Machinery 150,000 1,500 3,103RC Coinvestment, LLC (Ranpak Corp.) . . . . . . . . . . . . . . . . Packaging 50,000 5,000 5,047Sorenson Communications Holdings, LLC Class A** . . . . . Consumer Services 454,828 45 5,436Varietal Distribution Holdings, LLC Class A . . . . . . . . . . . . Distribution 28,028 28 88
Total Common Equity and Partnership Interests . . $183,625 $294,778
Warrants
Warrants — 0.6%DSI Holdings Company, Inc. (DSI Renal Inc.),Common ** . . . . . . . . . . . . . . . . . . . . . . . . . . . . . . . . . . . . Healthcare 5,011,327 — $ 2,920
Fidji Luxco (BC) S.C.A., Common (FCI)(2) ** . . . . . . . . . . Electronics 48,769 $ 491 7,604Gryphon Colleges Corporation (Delta Educational Systems,Inc.), Common ** . . . . . . . . . . . . . . . . . . . . . . . . . . . . . . . Education 98 98 —
Gryphon Colleges Corporation (Delta Educational Systems,Inc.), Class A-1 Preferred ** . . . . . . . . . . . . . . . . . . . . . . . Education 459 460 579
Gryphon Colleges Corporation (Delta Educational Systems,Inc.), Class B-1 Preferred ** . . . . . . . . . . . . . . . . . . . . . . . Education 1,043 1,043 430
Total Warrants . . . . . . . . . . . . . . . . . . . . . . . . . . . . . . . $ 2,092 $ 11,533
ParAmount*
2nd Lien Bank Debt/Senior Secured Loans (5) — 38.1%Advanstar Communications, Inc., 11/30/14 . . . . . . . . . . . . . Media $ 20,000 $ 20,000 $ 14,600American Asphalt & Grading Co., 7/10/09 . . . . . . . . . . . . . . Infrastructure 31,596 31,596 8,200Asurion Corporation, 7/3/15 . . . . . . . . . . . . . . . . . . . . . . . . . Insurance 135,300 134,876 116,020BNY Convergex Group, LLC, 4/2/14 . . . . . . . . . . . . . . . . . . Business Services 50,000 49,787 43,000C.H.I. Overhead Doors, Inc., 10/22/11 . . . . . . . . . . . . . . . . . Building Products 15,000 15,023 14,175Clean Earth, Inc., 8/1/14 . . . . . . . . . . . . . . . . . . . . . . . . . . . . Environmental 25,000 25,000 24,875Dresser, Inc., 5/4/15 . . . . . . . . . . . . . . . . . . . . . . . . . . . . . . . . Industrial 61,000 60,915 55,663Educate, Inc., 6/14/14 . . . . . . . . . . . . . . . . . . . . . . . . . . . . . . Education 10,000 10,000 8,500Garden Fresh Restaurant Corp., 12/22/11 . . . . . . . . . . . . . . . Retail 26,000 25,821 25,480Generics International, Inc., 4/30/15 . . . . . . . . . . . . . . . . . . . Healthcare 20,000 19,903 19,875Gray Wireline Service, Inc., 12.25%, 2/28/13 . . . . . . . . . . . . Oil & Gas 77,500 76,866 77,500HydroChem Industrial Services, Inc., 12/8/14 . . . . . . . . . . . Environmental 35,100 35,100 34,223
See notes to financial statements.
56
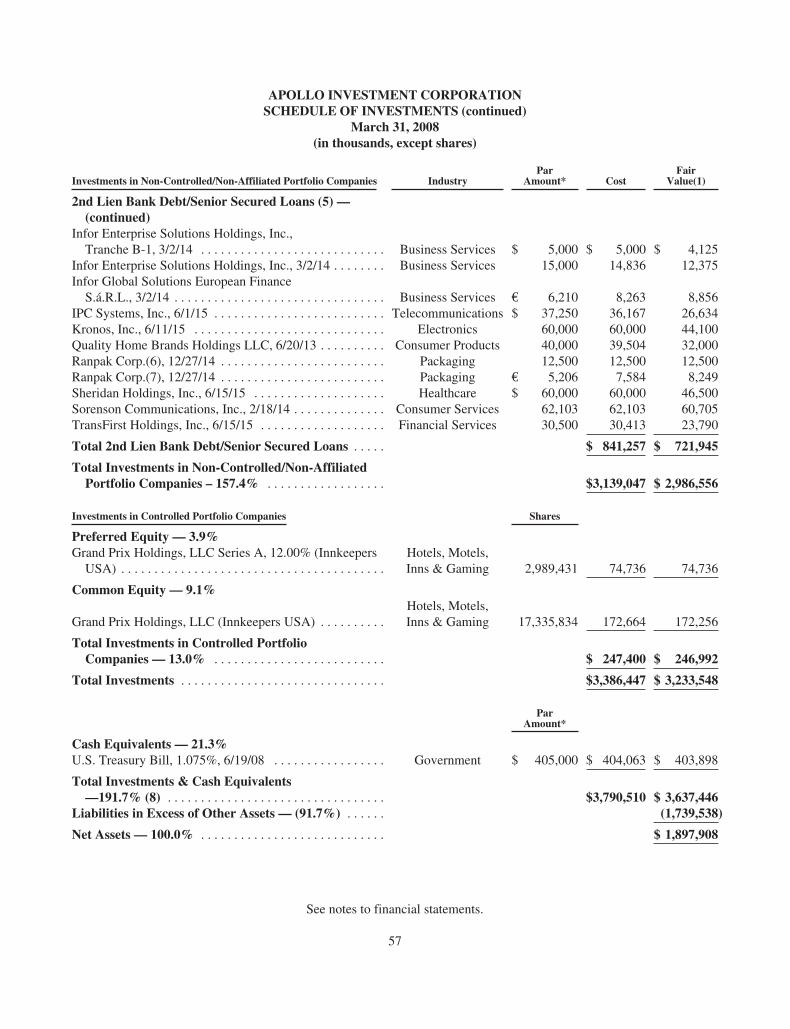
APOLLO INVESTMENT CORPORATIONSCHEDULE OF INVESTMENTS (continued)
March 31, 2008(in thousands, except shares)
Investments in Non-Controlled/Non-Affiliated Portfolio Companies IndustryPar
Amount* CostFair
Value(1)
2nd Lien Bank Debt/Senior Secured Loans (5) —(continued)
Infor Enterprise Solutions Holdings, Inc.,Tranche B-1, 3/2/14 . . . . . . . . . . . . . . . . . . . . . . . . . . . . Business Services $ 5,000 $ 5,000 $ 4,125
Infor Enterprise Solutions Holdings, Inc., 3/2/14 . . . . . . . . Business Services 15,000 14,836 12,375Infor Global Solutions European FinanceS.á.R.L., 3/2/14 . . . . . . . . . . . . . . . . . . . . . . . . . . . . . . . . Business Services € 6,210 8,263 8,856
IPC Systems, Inc., 6/1/15 . . . . . . . . . . . . . . . . . . . . . . . . . . Telecommunications $ 37,250 36,167 26,634Kronos, Inc., 6/11/15 . . . . . . . . . . . . . . . . . . . . . . . . . . . . . Electronics 60,000 60,000 44,100Quality Home Brands Holdings LLC, 6/20/13 . . . . . . . . . . Consumer Products 40,000 39,504 32,000Ranpak Corp.(6), 12/27/14 . . . . . . . . . . . . . . . . . . . . . . . . . Packaging 12,500 12,500 12,500Ranpak Corp.(7), 12/27/14 . . . . . . . . . . . . . . . . . . . . . . . . . Packaging € 5,206 7,584 8,249Sheridan Holdings, Inc., 6/15/15 . . . . . . . . . . . . . . . . . . . . Healthcare $ 60,000 60,000 46,500Sorenson Communications, Inc., 2/18/14 . . . . . . . . . . . . . . Consumer Services 62,103 62,103 60,705TransFirst Holdings, Inc., 6/15/15 . . . . . . . . . . . . . . . . . . . Financial Services 30,500 30,413 23,790
Total 2nd Lien Bank Debt/Senior Secured Loans . . . . . $ 841,257 $ 721,945
Total Investments in Non-Controlled/Non-AffiliatedPortfolio Companies – 157.4% . . . . . . . . . . . . . . . . . . $3,139,047 $ 2,986,556
Investments in Controlled Portfolio Companies Shares
Preferred Equity — 3.9%Grand Prix Holdings, LLC Series A, 12.00% (InnkeepersUSA) . . . . . . . . . . . . . . . . . . . . . . . . . . . . . . . . . . . . . . . .
Hotels, Motels,Inns & Gaming 2,989,431 74,736 74,736
Common Equity — 9.1%
Grand Prix Holdings, LLC (Innkeepers USA) . . . . . . . . . .Hotels, Motels,Inns & Gaming 17,335,834 172,664 172,256
Total Investments in Controlled PortfolioCompanies — 13.0% . . . . . . . . . . . . . . . . . . . . . . . . . . $ 247,400 $ 246,992
Total Investments . . . . . . . . . . . . . . . . . . . . . . . . . . . . . . . $3,386,447 $ 3,233,548
ParAmount*
Cash Equivalents — 21.3%U.S. Treasury Bill, 1.075%, 6/19/08 . . . . . . . . . . . . . . . . . Government $ 405,000 $ 404,063 $ 403,898
Total Investments & Cash Equivalents—191.7% (8) . . . . . . . . . . . . . . . . . . . . . . . . . . . . . . . . . $3,790,510 $ 3,637,446
Liabilities in Excess of Other Assets — (91.7%) . . . . . . (1,739,538)
Net Assets — 100.0% . . . . . . . . . . . . . . . . . . . . . . . . . . . . $ 1,897,908
See notes to financial statements.
57
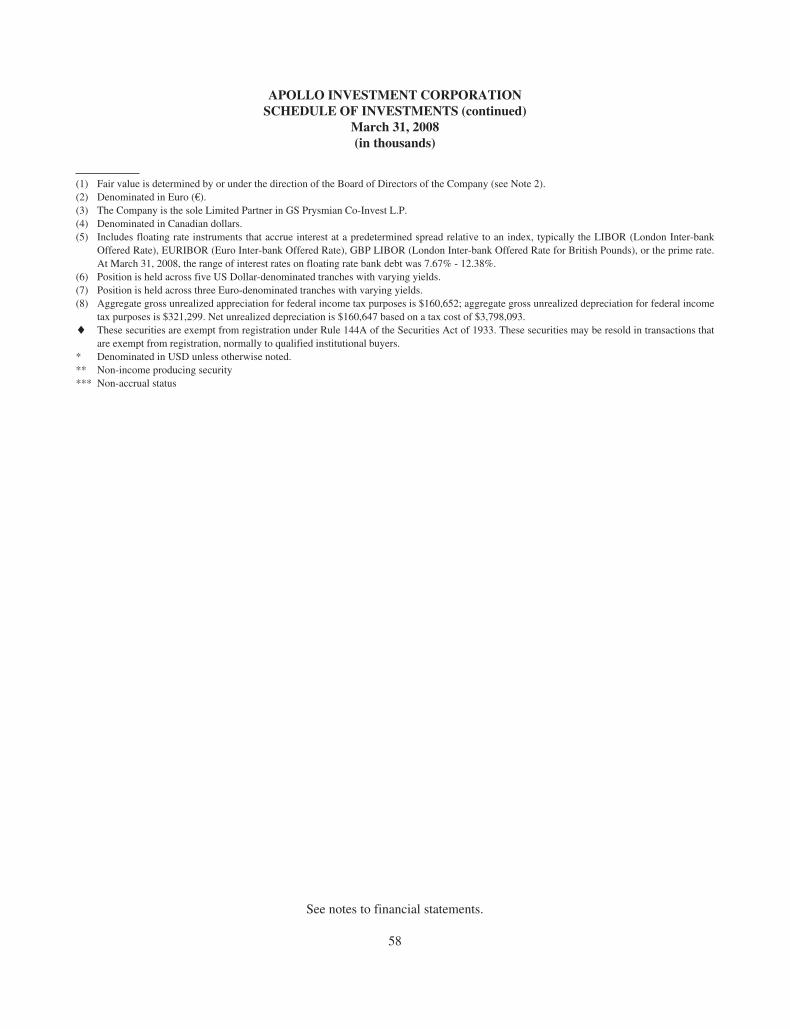
APOLLO INVESTMENT CORPORATIONSCHEDULE OF INVESTMENTS (continued)
March 31, 2008(in thousands)
(1) Fair value is determined by or under the direction of the Board of Directors of the Company (see Note 2).(2) Denominated in Euro (€).(3) The Company is the sole Limited Partner in GS Prysmian Co-Invest L.P.(4) Denominated in Canadian dollars.(5) Includes floating rate instruments that accrue interest at a predetermined spread relative to an index, typically the LIBOR (London Inter-bank
Offered Rate), EURIBOR (Euro Inter-bank Offered Rate), GBP LIBOR (London Inter-bank Offered Rate for British Pounds), or the prime rate.At March 31, 2008, the range of interest rates on floating rate bank debt was 7.67% - 12.38%.
(6) Position is held across five US Dollar-denominated tranches with varying yields.(7) Position is held across three Euro-denominated tranches with varying yields.(8) Aggregate gross unrealized appreciation for federal income tax purposes is $160,652; aggregate gross unrealized depreciation for federal income
tax purposes is $321,299. Net unrealized depreciation is $160,647 based on a tax cost of $3,798,093./ These securities are exempt from registration under Rule 144A of the Securities Act of 1933. These securities may be resold in transactions that
are exempt from registration, normally to qualified institutional buyers.* Denominated in USD unless otherwise noted.** Non-income producing security*** Non-accrual status
See notes to financial statements.
58
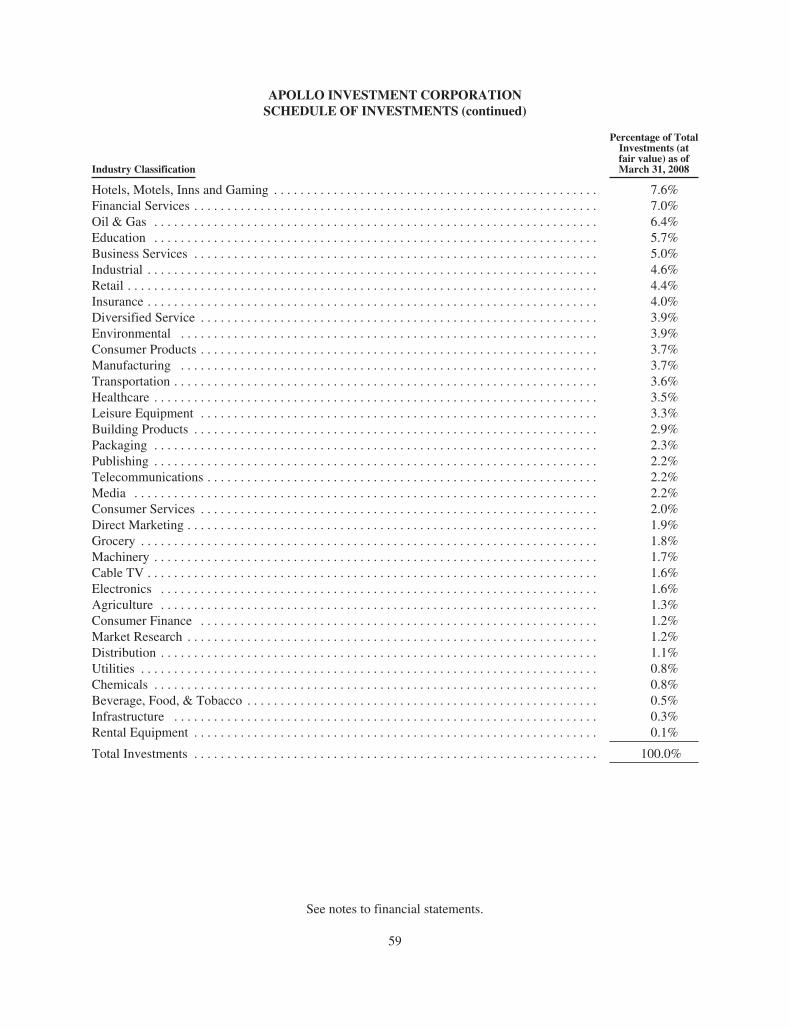
APOLLO INVESTMENT CORPORATIONSCHEDULE OF INVESTMENTS (continued)
Industry Classification
Percentage of TotalInvestments (atfair value) as ofMarch 31, 2008
Hotels, Motels, Inns and Gaming . . . . . . . . . . . . . . . . . . . . . . . . . . . . . . . . . . . . . . . . . . . . . . . . . 7.6%Financial Services . . . . . . . . . . . . . . . . . . . . . . . . . . . . . . . . . . . . . . . . . . . . . . . . . . . . . . . . . . . . . 7.0%Oil & Gas . . . . . . . . . . . . . . . . . . . . . . . . . . . . . . . . . . . . . . . . . . . . . . . . . . . . . . . . . . . . . . . . . . . 6.4%Education . . . . . . . . . . . . . . . . . . . . . . . . . . . . . . . . . . . . . . . . . . . . . . . . . . . . . . . . . . . . . . . . . . . 5.7%Business Services . . . . . . . . . . . . . . . . . . . . . . . . . . . . . . . . . . . . . . . . . . . . . . . . . . . . . . . . . . . . . 5.0%Industrial . . . . . . . . . . . . . . . . . . . . . . . . . . . . . . . . . . . . . . . . . . . . . . . . . . . . . . . . . . . . . . . . . . . . 4.6%Retail . . . . . . . . . . . . . . . . . . . . . . . . . . . . . . . . . . . . . . . . . . . . . . . . . . . . . . . . . . . . . . . . . . . . . . . 4.4%Insurance . . . . . . . . . . . . . . . . . . . . . . . . . . . . . . . . . . . . . . . . . . . . . . . . . . . . . . . . . . . . . . . . . . . . 4.0%Diversified Service . . . . . . . . . . . . . . . . . . . . . . . . . . . . . . . . . . . . . . . . . . . . . . . . . . . . . . . . . . . . 3.9%Environmental . . . . . . . . . . . . . . . . . . . . . . . . . . . . . . . . . . . . . . . . . . . . . . . . . . . . . . . . . . . . . . . 3.9%Consumer Products . . . . . . . . . . . . . . . . . . . . . . . . . . . . . . . . . . . . . . . . . . . . . . . . . . . . . . . . . . . . 3.7%Manufacturing . . . . . . . . . . . . . . . . . . . . . . . . . . . . . . . . . . . . . . . . . . . . . . . . . . . . . . . . . . . . . . . 3.7%Transportation . . . . . . . . . . . . . . . . . . . . . . . . . . . . . . . . . . . . . . . . . . . . . . . . . . . . . . . . . . . . . . . . 3.6%Healthcare . . . . . . . . . . . . . . . . . . . . . . . . . . . . . . . . . . . . . . . . . . . . . . . . . . . . . . . . . . . . . . . . . . . 3.5%Leisure Equipment . . . . . . . . . . . . . . . . . . . . . . . . . . . . . . . . . . . . . . . . . . . . . . . . . . . . . . . . . . . . 3.3%Building Products . . . . . . . . . . . . . . . . . . . . . . . . . . . . . . . . . . . . . . . . . . . . . . . . . . . . . . . . . . . . . 2.9%Packaging . . . . . . . . . . . . . . . . . . . . . . . . . . . . . . . . . . . . . . . . . . . . . . . . . . . . . . . . . . . . . . . . . . . 2.3%Publishing . . . . . . . . . . . . . . . . . . . . . . . . . . . . . . . . . . . . . . . . . . . . . . . . . . . . . . . . . . . . . . . . . . . 2.2%Telecommunications . . . . . . . . . . . . . . . . . . . . . . . . . . . . . . . . . . . . . . . . . . . . . . . . . . . . . . . . . . . 2.2%Media . . . . . . . . . . . . . . . . . . . . . . . . . . . . . . . . . . . . . . . . . . . . . . . . . . . . . . . . . . . . . . . . . . . . . . 2.2%Consumer Services . . . . . . . . . . . . . . . . . . . . . . . . . . . . . . . . . . . . . . . . . . . . . . . . . . . . . . . . . . . . 2.0%Direct Marketing . . . . . . . . . . . . . . . . . . . . . . . . . . . . . . . . . . . . . . . . . . . . . . . . . . . . . . . . . . . . . . 1.9%Grocery . . . . . . . . . . . . . . . . . . . . . . . . . . . . . . . . . . . . . . . . . . . . . . . . . . . . . . . . . . . . . . . . . . . . . 1.8%Machinery . . . . . . . . . . . . . . . . . . . . . . . . . . . . . . . . . . . . . . . . . . . . . . . . . . . . . . . . . . . . . . . . . . . 1.7%Cable TV . . . . . . . . . . . . . . . . . . . . . . . . . . . . . . . . . . . . . . . . . . . . . . . . . . . . . . . . . . . . . . . . . . . . 1.6%Electronics . . . . . . . . . . . . . . . . . . . . . . . . . . . . . . . . . . . . . . . . . . . . . . . . . . . . . . . . . . . . . . . . . . 1.6%Agriculture . . . . . . . . . . . . . . . . . . . . . . . . . . . . . . . . . . . . . . . . . . . . . . . . . . . . . . . . . . . . . . . . . . 1.3%Consumer Finance . . . . . . . . . . . . . . . . . . . . . . . . . . . . . . . . . . . . . . . . . . . . . . . . . . . . . . . . . . . . 1.2%Market Research . . . . . . . . . . . . . . . . . . . . . . . . . . . . . . . . . . . . . . . . . . . . . . . . . . . . . . . . . . . . . . 1.2%Distribution . . . . . . . . . . . . . . . . . . . . . . . . . . . . . . . . . . . . . . . . . . . . . . . . . . . . . . . . . . . . . . . . . . 1.1%Utilities . . . . . . . . . . . . . . . . . . . . . . . . . . . . . . . . . . . . . . . . . . . . . . . . . . . . . . . . . . . . . . . . . . . . . 0.8%Chemicals . . . . . . . . . . . . . . . . . . . . . . . . . . . . . . . . . . . . . . . . . . . . . . . . . . . . . . . . . . . . . . . . . . . 0.8%Beverage, Food, & Tobacco . . . . . . . . . . . . . . . . . . . . . . . . . . . . . . . . . . . . . . . . . . . . . . . . . . . . . 0.5%Infrastructure . . . . . . . . . . . . . . . . . . . . . . . . . . . . . . . . . . . . . . . . . . . . . . . . . . . . . . . . . . . . . . . . 0.3%Rental Equipment . . . . . . . . . . . . . . . . . . . . . . . . . . . . . . . . . . . . . . . . . . . . . . . . . . . . . . . . . . . . . 0.1%
Total Investments . . . . . . . . . . . . . . . . . . . . . . . . . . . . . . . . . . . . . . . . . . . . . . . . . . . . . . . . . . . . . 100.0%
See notes to financial statements.
59
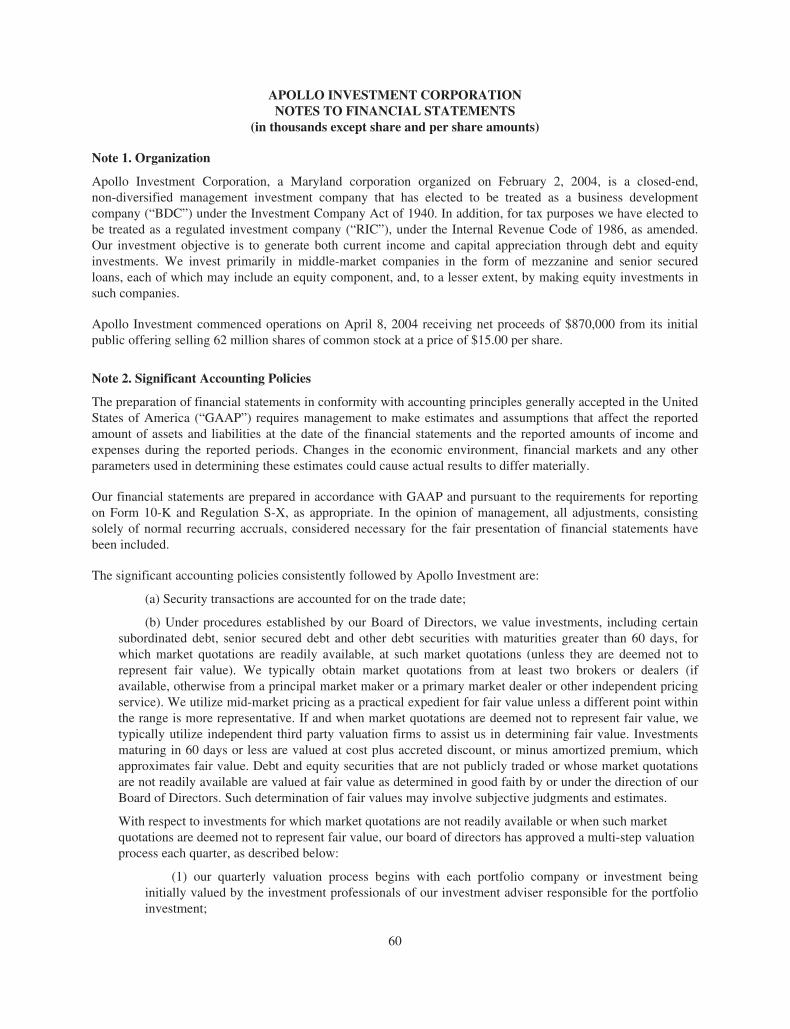
APOLLO INVESTMENT CORPORATIONNOTES TO FINANCIAL STATEMENTS
(in thousands except share and per share amounts)
Note 1. Organization
Apollo Investment Corporation, a Maryland corporation organized on February 2, 2004, is a closed-end,non-diversified management investment company that has elected to be treated as a business developmentcompany (“BDC”) under the Investment Company Act of 1940. In addition, for tax purposes we have elected tobe treated as a regulated investment company (“RIC”), under the Internal Revenue Code of 1986, as amended.Our investment objective is to generate both current income and capital appreciation through debt and equityinvestments. We invest primarily in middle-market companies in the form of mezzanine and senior securedloans, each of which may include an equity component, and, to a lesser extent, by making equity investments insuch companies.
Apollo Investment commenced operations on April 8, 2004 receiving net proceeds of $870,000 from its initialpublic offering selling 62 million shares of common stock at a price of $15.00 per share.
Note 2. Significant Accounting Policies
The preparation of financial statements in conformity with accounting principles generally accepted in the UnitedStates of America (“GAAP”) requires management to make estimates and assumptions that affect the reportedamount of assets and liabilities at the date of the financial statements and the reported amounts of income andexpenses during the reported periods. Changes in the economic environment, financial markets and any otherparameters used in determining these estimates could cause actual results to differ materially.
Our financial statements are prepared in accordance with GAAP and pursuant to the requirements for reportingon Form 10-K and Regulation S-X, as appropriate. In the opinion of management, all adjustments, consistingsolely of normal recurring accruals, considered necessary for the fair presentation of financial statements havebeen included.
The significant accounting policies consistently followed by Apollo Investment are:
(a) Security transactions are accounted for on the trade date;
(b) Under procedures established by our Board of Directors, we value investments, including certainsubordinated debt, senior secured debt and other debt securities with maturities greater than 60 days, forwhich market quotations are readily available, at such market quotations (unless they are deemed not torepresent fair value). We typically obtain market quotations from at least two brokers or dealers (ifavailable, otherwise from a principal market maker or a primary market dealer or other independent pricingservice). We utilize mid-market pricing as a practical expedient for fair value unless a different point withinthe range is more representative. If and when market quotations are deemed not to represent fair value, wetypically utilize independent third party valuation firms to assist us in determining fair value. Investmentsmaturing in 60 days or less are valued at cost plus accreted discount, or minus amortized premium, whichapproximates fair value. Debt and equity securities that are not publicly traded or whose market quotationsare not readily available are valued at fair value as determined in good faith by or under the direction of ourBoard of Directors. Such determination of fair values may involve subjective judgments and estimates.
With respect to investments for which market quotations are not readily available or when such marketquotations are deemed not to represent fair value, our board of directors has approved a multi-step valuationprocess each quarter, as described below:
(1) our quarterly valuation process begins with each portfolio company or investment beinginitially valued by the investment professionals of our investment adviser responsible for the portfolioinvestment;
60
APOLLO INVESTMENT CORPORATIONNOTES TO FINANCIAL STATEMENTS (continued)(in thousands except share and per share amounts)
(2) preliminary valuation conclusions are then documented and discussed with senior managementof our investment adviser;
(3) independent valuation firms engaged by our board of directors conduct independent appraisalsand review our investment adviser’s preliminary valuations and make their own independentassessment;
(4) the audit committee of the board of directors reviews the preliminary valuation of ourinvestment adviser and that of the independent valuation firm and responds to the valuationrecommendation of the independent valuation firm to reflect any comments; and
(5) the board of directors discusses valuations and determines the fair value of each investment inour portfolio in good faith based on the input of our investment adviser, the respective independentvaluation firm and the audit committee.
Investments are valued utilizing a market approach, an income approach, or both approaches, as appropriate.The market approach uses prices and other relevant information generated by market transactions involvingidentical or comparable assets or liabilities (including a business). The income approach uses valuationtechniques to convert future amounts (for example, cash flows or earnings) to a single present amount(discounted). The measurement is based on the value indicated by current market expectations about thosefuture amounts. In following these approaches, the types of factors that we may take into account in fairvalue pricing our investments include, as relevant: available current market data, including relevant andapplicable market trading and transaction comparables, applicable market yields and multiples, securitycovenants, call protection provisions, information rights, the nature and realizable value of any collateral,the portfolio company’s ability to make payments, its earnings and discounted cash flows, the markets inwhich the portfolio company does business, comparisons of financial ratios of peer companies that arepublic, M&A comparables, our principal market (as the reporting entity) and enterprise values, among otherfactors.
In September, 2006, the Financial Accounting Standards Board issued Statement of Financial AccountingStandards (“SFAS”) 157, Fair Value Measurements. This statement defines fair value, establishes aframework for measuring fair value in GAAP, and expands disclosures about fair value measurements. Thisstatement was effective for financial statements issued for fiscal years beginning after November 15, 2007,and interim periods within those years. We adopted this statement for our first fiscal quarter ended June 30,2008.
SFAS No. 157 classifies the inputs used to measure these fair values into the following hierarchy:
Level 1: Quoted prices in active markets for identical assets or liabilities, accessible by the Company atthe measurement date.
Level 2: Quoted prices for similar assets or liabilities in active markets, or quoted prices for identical orsimilar assets or liabilities in markets that are not active, or other observable inputs other than quotedprices.
Level 3: Unobservable inputs for the asset or liability.
In all cases, the level in the fair value hierarchy within which the fair value measurement in its entirety fallshas been determined based on the lowest level of input that is significant to the fair value measurement. Ourassessment of the significance of a particular input to the fair value measurement in its entirety requiresjudgment and considers factors specific to each investment.
61
APOLLO INVESTMENT CORPORATIONNOTES TO FINANCIAL STATEMENTS (continued)(in thousands except share and per share amounts)
On October 10, 2008, FASB Staff Position 157-3—Determining the Fair Value of a Financial Asset Whenthe Market for That Asset is Not Active (“FAS 157-3”) was issued. FAS 157-3 provides examples of how todetermine fair value in a market that is not active. FAS 157-3 did not change the fair value measurementprinciples set forth in FAS 157. Furthermore, on April 9, 2009, FASB Staff Position 157-4—DeterminingFair Value When the Volume and Level of Activity for the Asset or Liability Have Significantly Decreasedand Identifying Transactions That Are Not Orderly (“FAS 157-4”) was issued. FAS 157-4 providesadditional guidance for estimating fair value in accordance with SFAS 157 when the volume and level ofactivity for the asset or liability have significantly decreased. FAS 157-4 also includes guidance onidentifying circumstances that indicate a transaction is not orderly. According to FAS 157-4, in the abovecircumstances, more analysis and significant adjustments to transaction or quoted prices may be necessaryto estimate fair value. FAS 157-4 is effective for periods ending after June 15, 2009. We are currentlyreviewing FAS 157-4 and the future impact, if any, it will have on our financial position or results ofoperations.
(c) Gains or losses on the sale of investments are calculated by using the specific identification method.
(d) Interest income, adjusted for amortization of premium and accretion of discount, is recorded on anaccrual basis. Origination and/or commitment fees associated with debt investments in portfolio companiesare accreted into interest income over the respective terms of the applicable loans. Upon the prepayment of aloan or debt security, any prepayment penalties and unamortized loan origination and/or commitment feesare recorded as interest income. Structuring fees are recorded as other income when earned.
(e) The Company intends to comply with the applicable provisions of the Internal Revenue Code of1986, as amended, pertaining to regulated investment companies to make distributions of taxable incomesufficient to relieve it of substantially all Federal income taxes. The Company, at its discretion, may carryforward taxable income in excess of calendar year distributions and pay a 4% excise tax on this income. TheCompany will accrue excise tax on estimated excess taxable income as required.
(f) Book and tax basis differences relating to stockholder dividends and distributions and otherpermanent book and tax differences are reclassified among the Company’s capital accounts. In addition, thecharacter of income and gains to be distributed is determined in accordance with income tax regulations thatmay differ from accounting principles generally accepted in the United States of America; accordingly, atMarch 31, 2009, $123,207 was reclassified on our balance sheet between accumulated net realized gain(loss) and undistributed net investment income and $520 was reclassified on our balance sheet betweenundistributed net investment income and paid-in capital in excess of par. Total earnings and net asset valueare not affected;
(g) Dividends and distributions to common stockholders are recorded as of the record date. The amountto be paid out as a dividend is determined by the Board of Directors each quarter. Net realized capital gains,if any, are distributed or deemed distributed at least annually.
(h) In accordance with Regulation S-X and the AICPA Audit and Accounting Guide for InvestmentCompanies, the Company does not consolidate its interest in any company other than in investmentcompany subsidiaries and controlled operating companies substantially all of whose business consists ofproviding services to the Company. Consequently, the Company does not consolidate special purposeentities through which it holds investments subject to financing with third parties. See note 6.
(i) The accounting records of the Company are maintained in U.S. dollars. All assets and liabilitiesdenominated in foreign currencies are translated into U.S. dollars based on the rate of exchange of suchcurrencies against U.S. dollars on the date of valuation. The Company does not isolate that portion of theresults of operations resulting from changes in foreign exchange rates on investments from the fluctuationsarising from changes in market prices of securities held. Such fluctuations are included with the net realizedand unrealized gain or loss from investments. The Company’s investments in foreign securities may involve
62
APOLLO INVESTMENT CORPORATIONNOTES TO FINANCIAL STATEMENTS (continued)(in thousands except share and per share amounts)
certain risks such as foreign exchange restrictions, expropriation, taxation or other political, social oreconomic risks, all of which could affect the market and/or credit risk of the investment. In addition,changes in the relationship of foreign currencies to the U.S. dollar can significantly affect the value of theseinvestments and therefore the earnings of the Company.
(j) The Company may enter into forward exchange contracts in order to hedge against foreign currencyrisk. These contracts are marked-to-market by recognizing the difference between the contract exchange rateand the current market rate as unrealized appreciation or depreciation. Realized gains or losses arerecognized when contracts are settled.
(k) The Company records origination expenses related to its multi-currency revolving credit facility asprepaid assets. These expenses are deferred and amortized using the straight-line method over the stated lifeof the facility.
(l) The Company records registration expenses related to Shelf filings as prepaid assets. Theseexpenses are charged as a reduction of capital upon utilization, in accordance with the AICPA Audit andAccounting Guide for Investment Companies.
(m) Loans are generally placed on non-accrual status when principal or interest payments are past due30 days or more and/or when there is reasonable doubt that principal or interest will be collected. Accrued,uncapitalized interest is generally reversed when a loan is placed on non-accrual status. Interest paymentsreceived on non-accrual loans may be recognized as income or applied to principal depending uponmanagement’s judgment. Non-accrual loans are restored to accrual status when past due principal andinterest is paid and in management’s judgment, are likely to remain current.
(n) In June 2006, the Financial Accounting Standards Board issued FASB Interpretation No. (“FIN”)48, Accounting for Uncertainty in Income Taxes. FIN 48 was effective for financial statements issued forfiscal years beginning after December 15, 2006. FIN 48 clarifies the accounting for uncertainty in incometaxes recognized in an enterprise’s financial statements in accordance with FASB Statement No. 109,Accounting for Income Taxes. FIN 48 prescribes a recognition threshold and measurement attribute for thefinancial statement recognition and measurement of a tax position taken or expected to be taken in a taxreturn. This interpretation requires recognition of the impact of a tax position if that position is more likelythan not to be sustained upon examination, including resolution of any related appeals or litigationprocesses, based on the technical merits of the position. In addition, FIN 48 provides measurement guidancewhereby a tax position that meets the more-likely-than-not recognition threshold is calculated to determinethe amount of benefit to recognize in the financial statements. FIN 48 was adopted on April 1, 2007 and didnot have a material impact on the Company’s financial condition or results of operations. If the tax lawrequires interest and/or penalties to be paid on an underpayment of income taxes, interest and penalties willbe classified as income taxes on our financial statements, if applicable.
Note 3. Agreements
Apollo Investment has an Investment Advisory and Management Agreement with the Investment Adviser, AIM,under which the Investment Adviser, subject to the overall supervision of Apollo Investment’s Board ofDirectors, will manage the day-to-day operations of, and provide investment advisory services to, ApolloInvestment. For providing these services, the Investment Adviser receives a fee from Apollo Investment,consisting of two components—a base management fee and an incentive fee. The base management fee isdetermined by taking the average value of Apollo Investment’s gross assets at the end of the two most recentlycompleted calendar quarters calculated at an annual rate of 2.00%. The incentive fee has two parts, as follows:one part is calculated and payable quarterly in arrears based on Apollo Investment’s pre-incentive fee net
63
APOLLO INVESTMENT CORPORATIONNOTES TO FINANCIAL STATEMENTS (continued)(in thousands except share and per share amounts)
investment income for the immediately preceding calendar quarter. For this purpose, pre-incentive fee netinvestment income means interest income, dividend income and any other income including any other fees (otherthan fees for providing managerial assistance), such as commitment, origination, structuring, diligence andconsulting fees or other fees that we receive from portfolio companies) accrued during the calendar quarter,minus Apollo Investment’s operating expenses for the quarter (including the base management fee, any expensespayable under the Administration Agreement, and any interest expense and dividends paid on any issued andoutstanding preferred stock, but excluding the incentive fee). Pre-incentive fee net investment income does notinclude any realized capital gains computed net of all realized capital losses and unrealized capital depreciation.Pre-incentive fee net investment income, expressed as a rate of return on the value of Apollo Investment’s netassets at the end of the immediately preceding calendar quarter, is compared to the rate of 1.75% per quarter (7%annualized). Our net investment income used to calculate this part of the incentive fee is also included in theamount of our gross assets used to calculate the 2% base management fee. Apollo Investment pays theInvestment Adviser an incentive fee with respect to Apollo Investment’s pre-incentive fee net investment incomein each calendar quarter as follows: (1) no incentive fee in any calendar quarter in which Apollo Investment’spre-incentive fee net investment income does not exceed 1.75%, which we commonly refer to as the performancethreshold; (2) 100% of Apollo Investment’s pre-incentive fee net investment income with respect to that portionof such pre-incentive fee net investment income, if any, that exceeds 1.75% but does not exceed 2.1875% in anycalendar quarter; and (3) 20% of the amount of Apollo Investment’s pre-incentive fee net investment income, ifany, that exceeds 2.1875% in any calendar quarter. These calculations are appropriately pro rated for any periodof less than three months. The effect of the fee calculation described above is that if pre-incentive fee netinvestment income is equal to or exceeds 2.1875%, the Investment Adviser will receive a fee of 20% of ApolloInvestment’s pre-incentive fee net investment income for the quarter. The second part of the incentive fee isdetermined and payable in arrears as of the end of each calendar year (or upon termination of the InvestmentAdvisory and Management Agreement, as-of the termination date) and will equal 20% of Apollo Investment’scumulative realized capital gains less cumulative realized capital losses, unrealized capital depreciation(unrealized depreciation on a gross investment-by-investment basis at the end of each calendar year) and allcapital gains upon which prior performance-based capital gains incentive fee payments were previously made tothe Investment Adviser.
For the fiscal years ended March 31, 2009, 2008 and 2007, the Investment Adviser accrued $59,686, $59,871 and$40,569, respectively, in base investment advisory and management fees and $51,583, $30,449 and $57,912,respectively, in performance-based incentive fees from Apollo Investment.
Apollo Investment has also entered into an Administration Agreement with Apollo Investment Administration,LLC (the “Administrator”) under which the Administrator provides administrative services for ApolloInvestment. For providing these services, facilities and personnel, Apollo Investment reimburses theAdministrator for Apollo Investment’s allocable portion of overhead and other expenses incurred by theAdministrator in performing its obligations under the Administration Agreement, including rent and ApolloInvestment’s allocable portion of its chief financial officer and chief compliance officer and their respectivestaffs. The Administrator will also provide, on Apollo Investment’s behalf, managerial assistance to thoseportfolio companies to which Apollo Investment is required to provide such assistance.
At the fiscal years ended March 31, 2009, 2008 and 2007, the Administrator was reimbursed $3,247, $3,162 and$2,237, respectively, from Apollo Investment on the $4,794, $3,450 and $2,437, respectively, of expensesaccrued under the Administration Agreement.
On April 14, 2005, Apollo Investment entered into an $800,000 Senior Secured Revolving Credit Agreement (the“Facility”), among Apollo Investment, the lenders party thereto and JPMorgan Chase Bank, N.A. (“JPMorgan”),
64
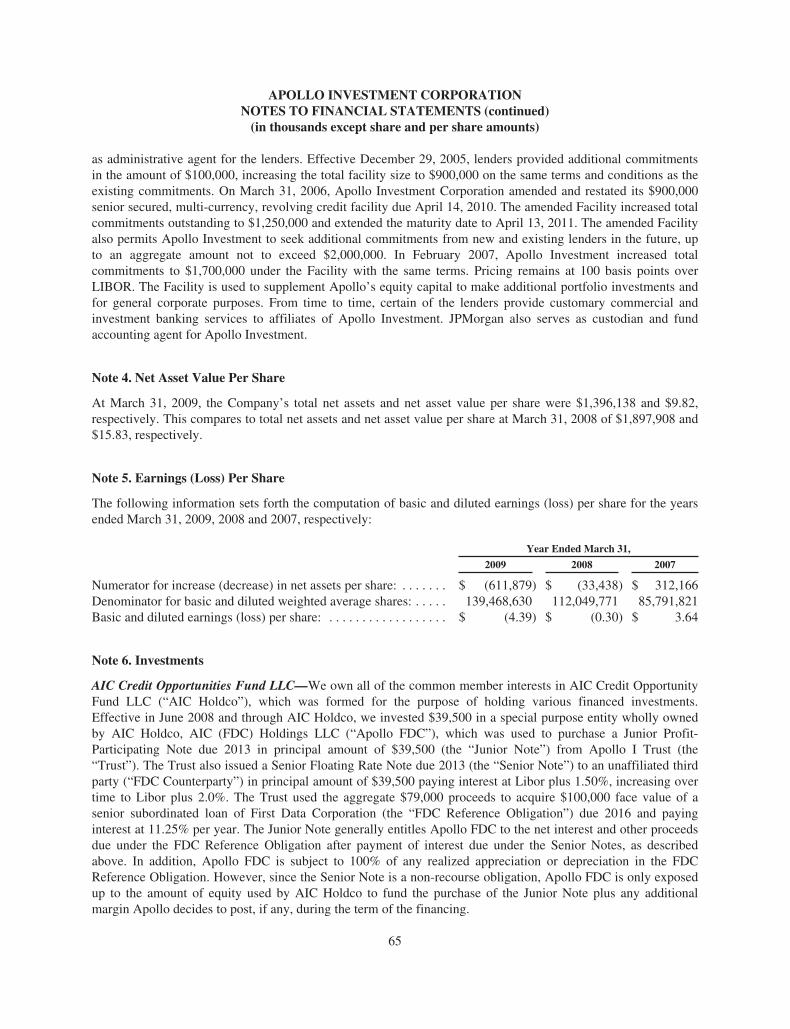
APOLLO INVESTMENT CORPORATIONNOTES TO FINANCIAL STATEMENTS (continued)(in thousands except share and per share amounts)
as administrative agent for the lenders. Effective December 29, 2005, lenders provided additional commitmentsin the amount of $100,000, increasing the total facility size to $900,000 on the same terms and conditions as theexisting commitments. On March 31, 2006, Apollo Investment Corporation amended and restated its $900,000senior secured, multi-currency, revolving credit facility due April 14, 2010. The amended Facility increased totalcommitments outstanding to $1,250,000 and extended the maturity date to April 13, 2011. The amended Facilityalso permits Apollo Investment to seek additional commitments from new and existing lenders in the future, upto an aggregate amount not to exceed $2,000,000. In February 2007, Apollo Investment increased totalcommitments to $1,700,000 under the Facility with the same terms. Pricing remains at 100 basis points overLIBOR. The Facility is used to supplement Apollo’s equity capital to make additional portfolio investments andfor general corporate purposes. From time to time, certain of the lenders provide customary commercial andinvestment banking services to affiliates of Apollo Investment. JPMorgan also serves as custodian and fundaccounting agent for Apollo Investment.
Note 4. Net Asset Value Per Share
At March 31, 2009, the Company’s total net assets and net asset value per share were $1,396,138 and $9.82,respectively. This compares to total net assets and net asset value per share at March 31, 2008 of $1,897,908 and$15.83, respectively.
Note 5. Earnings (Loss) Per Share
The following information sets forth the computation of basic and diluted earnings (loss) per share for the yearsended March 31, 2009, 2008 and 2007, respectively:
Year Ended March 31,
2009 2008 2007
Numerator for increase (decrease) in net assets per share: . . . . . . . $ (611,879) $ (33,438) $ 312,166Denominator for basic and diluted weighted average shares: . . . . . 139,468,630 112,049,771 85,791,821Basic and diluted earnings (loss) per share: . . . . . . . . . . . . . . . . . . $ (4.39) $ (0.30) $ 3.64
Note 6. Investments
AIC Credit Opportunities Fund LLC—We own all of the common member interests in AIC Credit OpportunityFund LLC (“AIC Holdco”), which was formed for the purpose of holding various financed investments.Effective in June 2008 and through AIC Holdco, we invested $39,500 in a special purpose entity wholly ownedby AIC Holdco, AIC (FDC) Holdings LLC (“Apollo FDC”), which was used to purchase a Junior Profit-Participating Note due 2013 in principal amount of $39,500 (the “Junior Note”) from Apollo I Trust (the“Trust”). The Trust also issued a Senior Floating Rate Note due 2013 (the “Senior Note”) to an unaffiliated thirdparty (“FDC Counterparty”) in principal amount of $39,500 paying interest at Libor plus 1.50%, increasing overtime to Libor plus 2.0%. The Trust used the aggregate $79,000 proceeds to acquire $100,000 face value of asenior subordinated loan of First Data Corporation (the “FDC Reference Obligation”) due 2016 and payinginterest at 11.25% per year. The Junior Note generally entitles Apollo FDC to the net interest and other proceedsdue under the FDC Reference Obligation after payment of interest due under the Senior Notes, as describedabove. In addition, Apollo FDC is subject to 100% of any realized appreciation or depreciation in the FDCReference Obligation. However, since the Senior Note is a non-recourse obligation, Apollo FDC is only exposedup to the amount of equity used by AIC Holdco to fund the purchase of the Junior Note plus any additionalmargin Apollo decides to post, if any, during the term of the financing.
65
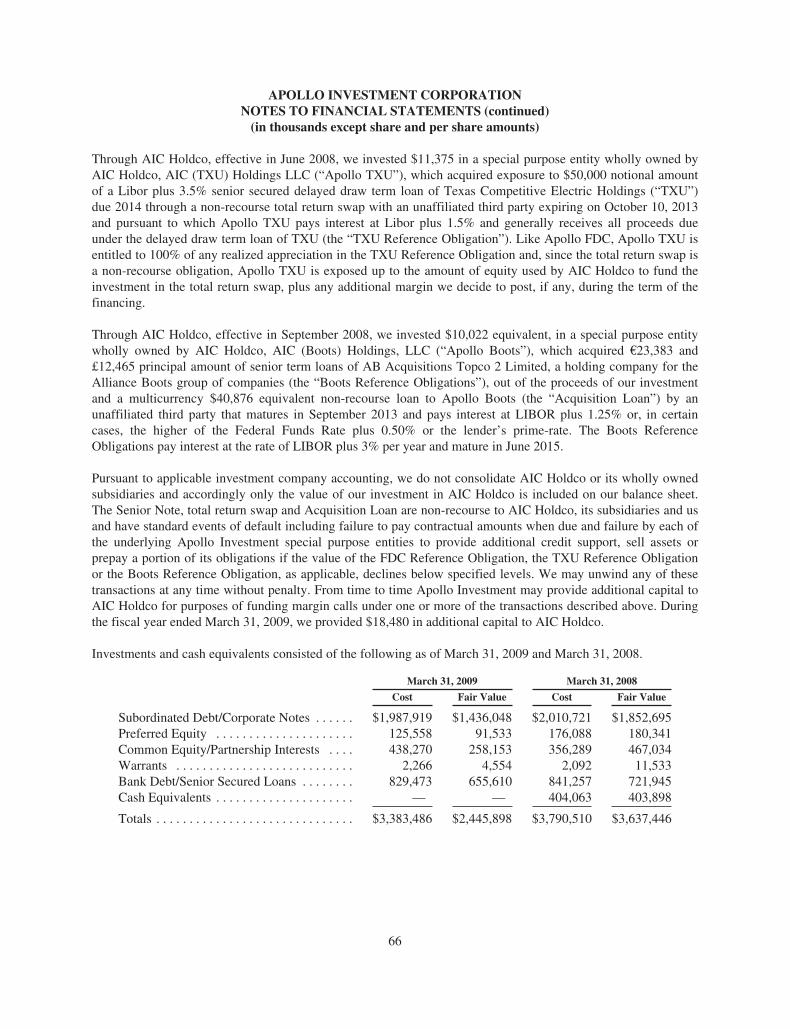
APOLLO INVESTMENT CORPORATIONNOTES TO FINANCIAL STATEMENTS (continued)(in thousands except share and per share amounts)
Through AIC Holdco, effective in June 2008, we invested $11,375 in a special purpose entity wholly owned byAIC Holdco, AIC (TXU) Holdings LLC (“Apollo TXU”), which acquired exposure to $50,000 notional amountof a Libor plus 3.5% senior secured delayed draw term loan of Texas Competitive Electric Holdings (“TXU”)due 2014 through a non-recourse total return swap with an unaffiliated third party expiring on October 10, 2013and pursuant to which Apollo TXU pays interest at Libor plus 1.5% and generally receives all proceeds dueunder the delayed draw term loan of TXU (the “TXU Reference Obligation”). Like Apollo FDC, Apollo TXU isentitled to 100% of any realized appreciation in the TXU Reference Obligation and, since the total return swap isa non-recourse obligation, Apollo TXU is exposed up to the amount of equity used by AIC Holdco to fund theinvestment in the total return swap, plus any additional margin we decide to post, if any, during the term of thefinancing.
Through AIC Holdco, effective in September 2008, we invested $10,022 equivalent, in a special purpose entitywholly owned by AIC Holdco, AIC (Boots) Holdings, LLC (“Apollo Boots”), which acquired €23,383 and£12,465 principal amount of senior term loans of AB Acquisitions Topco 2 Limited, a holding company for theAlliance Boots group of companies (the “Boots Reference Obligations”), out of the proceeds of our investmentand a multicurrency $40,876 equivalent non-recourse loan to Apollo Boots (the “Acquisition Loan”) by anunaffiliated third party that matures in September 2013 and pays interest at LIBOR plus 1.25% or, in certaincases, the higher of the Federal Funds Rate plus 0.50% or the lender’s prime-rate. The Boots ReferenceObligations pay interest at the rate of LIBOR plus 3% per year and mature in June 2015.
Pursuant to applicable investment company accounting, we do not consolidate AIC Holdco or its wholly ownedsubsidiaries and accordingly only the value of our investment in AIC Holdco is included on our balance sheet.The Senior Note, total return swap and Acquisition Loan are non-recourse to AIC Holdco, its subsidiaries and usand have standard events of default including failure to pay contractual amounts when due and failure by each ofthe underlying Apollo Investment special purpose entities to provide additional credit support, sell assets orprepay a portion of its obligations if the value of the FDC Reference Obligation, the TXU Reference Obligationor the Boots Reference Obligation, as applicable, declines below specified levels. We may unwind any of thesetransactions at any time without penalty. From time to time Apollo Investment may provide additional capital toAIC Holdco for purposes of funding margin calls under one or more of the transactions described above. Duringthe fiscal year ended March 31, 2009, we provided $18,480 in additional capital to AIC Holdco.
Investments and cash equivalents consisted of the following as of March 31, 2009 and March 31, 2008.
March 31, 2009 March 31, 2008
Cost Fair Value Cost Fair Value
Subordinated Debt/Corporate Notes . . . . . . $1,987,919 $1,436,048 $2,010,721 $1,852,695Preferred Equity . . . . . . . . . . . . . . . . . . . . . 125,558 91,533 176,088 180,341Common Equity/Partnership Interests . . . . 438,270 258,153 356,289 467,034Warrants . . . . . . . . . . . . . . . . . . . . . . . . . . . 2,266 4,554 2,092 11,533Bank Debt/Senior Secured Loans . . . . . . . . 829,473 655,610 841,257 721,945Cash Equivalents . . . . . . . . . . . . . . . . . . . . . — — 404,063 403,898
Totals . . . . . . . . . . . . . . . . . . . . . . . . . . . . . . $3,383,486 $2,445,898 $3,790,510 $3,637,446
66

APOLLO INVESTMENT CORPORATIONNOTES TO FINANCIAL STATEMENTS (continued)(in thousands except share and per share amounts)
At March 31, 2009, our investments and cash equivalents were categorized as follows in the fair value hierarchyfor SFAS No. 157 purposes:
Fair Value Measurement at Reporting Date Using:
DescriptionMarch 31,
2009
Quoted Prices inActive Marketsfor Identical
Assets(Level 1)
SignificantOther
ObservableInputs(Level 2)
SignificantUnobservable
Inputs(Level 3)
Cash Equivalents . . . . . . . . . . . . . . . . . . . . . . . . . $ — $— $— $ —Total Investments . . . . . . . . . . . . . . . . . . . . . . . . . 2,445,898 — — 2,445,898
Total Investments and Cash Equivalents . . . . . . . $2,445,898 $— $— $2,445,898
The following chart shows the components of change in our investments categorized as Level 3, for the fiscalyear ended March 31, 2009.
Fair Value MeasurementsUsing Significant
Unobservable Inputs(Level 3)
Beginning Balance, March 31, 2008 . . . . . . . . . . . . . . . . . . . . . . . . . . . . . . . . . . . . . . . . . . $3,233,548Total realized gains or losses included in earnings . . . . . . . . . . . . . . . . . . . . . . . . . . . . . . . (124,971)Total unrealized gains or losses included in earnings . . . . . . . . . . . . . . . . . . . . . . . . . . . . . (784,689)Purchases, including capitalized PIK interest(1) . . . . . . . . . . . . . . . . . . . . . . . . . . . . . . . . . 462,144Sales . . . . . . . . . . . . . . . . . . . . . . . . . . . . . . . . . . . . . . . . . . . . . . . . . . . . . . . . . . . . . . . . . . . (340,134)Transfer in and/or out of Level 3 . . . . . . . . . . . . . . . . . . . . . . . . . . . . . . . . . . . . . . . . . . . . . —
Ending Balance, March 31, 2009 . . . . . . . . . . . . . . . . . . . . . . . . . . . . . . . . . . . . . . . . . . . . $2,445,898
The amount of total gains or losses for the period included in earnings attributable to thechange in unrealized gains or losses relating to our Level 3 assets still held at thereporting date and reported within the net change in unrealized gains or losses oninvestments in our Statement of Operations. . . . . . . . . . . . . . . . . . . . . . . . . . . . . . . . . . . $ (847,080)
(1) Includes amortization of approximately $31,359
67
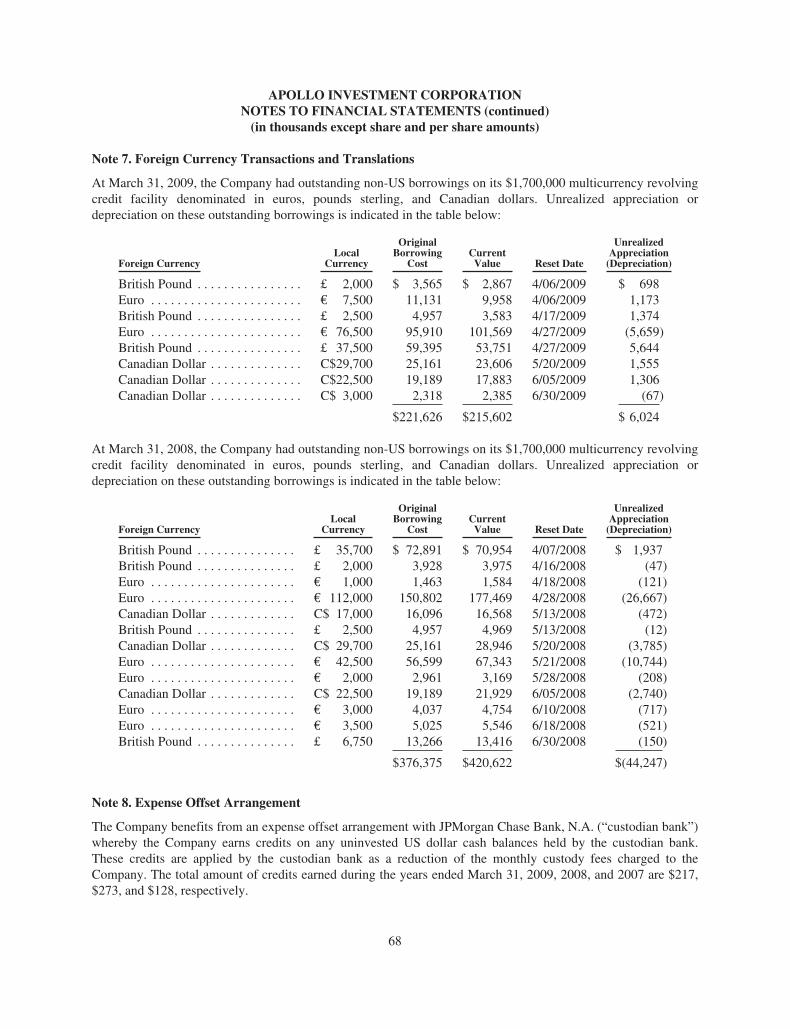
APOLLO INVESTMENT CORPORATIONNOTES TO FINANCIAL STATEMENTS (continued)(in thousands except share and per share amounts)
Note 7. Foreign Currency Transactions and Translations
At March 31, 2009, the Company had outstanding non-US borrowings on its $1,700,000 multicurrency revolvingcredit facility denominated in euros, pounds sterling, and Canadian dollars. Unrealized appreciation ordepreciation on these outstanding borrowings is indicated in the table below:
Foreign CurrencyLocal
Currency
OriginalBorrowing
CostCurrentValue Reset Date
UnrealizedAppreciation(Depreciation)
British Pound . . . . . . . . . . . . . . . . £ 2,000 $ 3,565 $ 2,867 4/06/2009 $ 698Euro . . . . . . . . . . . . . . . . . . . . . . . € 7,500 11,131 9,958 4/06/2009 1,173British Pound . . . . . . . . . . . . . . . . £ 2,500 4,957 3,583 4/17/2009 1,374Euro . . . . . . . . . . . . . . . . . . . . . . . € 76,500 95,910 101,569 4/27/2009 (5,659)British Pound . . . . . . . . . . . . . . . . £ 37,500 59,395 53,751 4/27/2009 5,644Canadian Dollar . . . . . . . . . . . . . . C$29,700 25,161 23,606 5/20/2009 1,555Canadian Dollar . . . . . . . . . . . . . . C$22,500 19,189 17,883 6/05/2009 1,306Canadian Dollar . . . . . . . . . . . . . . C$ 3,000 2,318 2,385 6/30/2009 (67)
$221,626 $215,602 $ 6,024
At March 31, 2008, the Company had outstanding non-US borrowings on its $1,700,000 multicurrency revolvingcredit facility denominated in euros, pounds sterling, and Canadian dollars. Unrealized appreciation ordepreciation on these outstanding borrowings is indicated in the table below:
Foreign CurrencyLocal
Currency
OriginalBorrowing
CostCurrentValue Reset Date
UnrealizedAppreciation(Depreciation)
British Pound . . . . . . . . . . . . . . . £ 35,700 $ 72,891 $ 70,954 4/07/2008 $ 1,937British Pound . . . . . . . . . . . . . . . £ 2,000 3,928 3,975 4/16/2008 (47)Euro . . . . . . . . . . . . . . . . . . . . . . € 1,000 1,463 1,584 4/18/2008 (121)Euro . . . . . . . . . . . . . . . . . . . . . . € 112,000 150,802 177,469 4/28/2008 (26,667)Canadian Dollar . . . . . . . . . . . . . C$ 17,000 16,096 16,568 5/13/2008 (472)British Pound . . . . . . . . . . . . . . . £ 2,500 4,957 4,969 5/13/2008 (12)Canadian Dollar . . . . . . . . . . . . . C$ 29,700 25,161 28,946 5/20/2008 (3,785)Euro . . . . . . . . . . . . . . . . . . . . . . € 42,500 56,599 67,343 5/21/2008 (10,744)Euro . . . . . . . . . . . . . . . . . . . . . . € 2,000 2,961 3,169 5/28/2008 (208)Canadian Dollar . . . . . . . . . . . . . C$ 22,500 19,189 21,929 6/05/2008 (2,740)Euro . . . . . . . . . . . . . . . . . . . . . . € 3,000 4,037 4,754 6/10/2008 (717)Euro . . . . . . . . . . . . . . . . . . . . . . € 3,500 5,025 5,546 6/18/2008 (521)British Pound . . . . . . . . . . . . . . . £ 6,750 13,266 13,416 6/30/2008 (150)
$376,375 $420,622 $(44,247)
Note 8. Expense Offset Arrangement
The Company benefits from an expense offset arrangement with JPMorgan Chase Bank, N.A. (“custodian bank”)whereby the Company earns credits on any uninvested US dollar cash balances held by the custodian bank.These credits are applied by the custodian bank as a reduction of the monthly custody fees charged to theCompany. The total amount of credits earned during the years ended March 31, 2009, 2008, and 2007 are $217,$273, and $128, respectively.
68
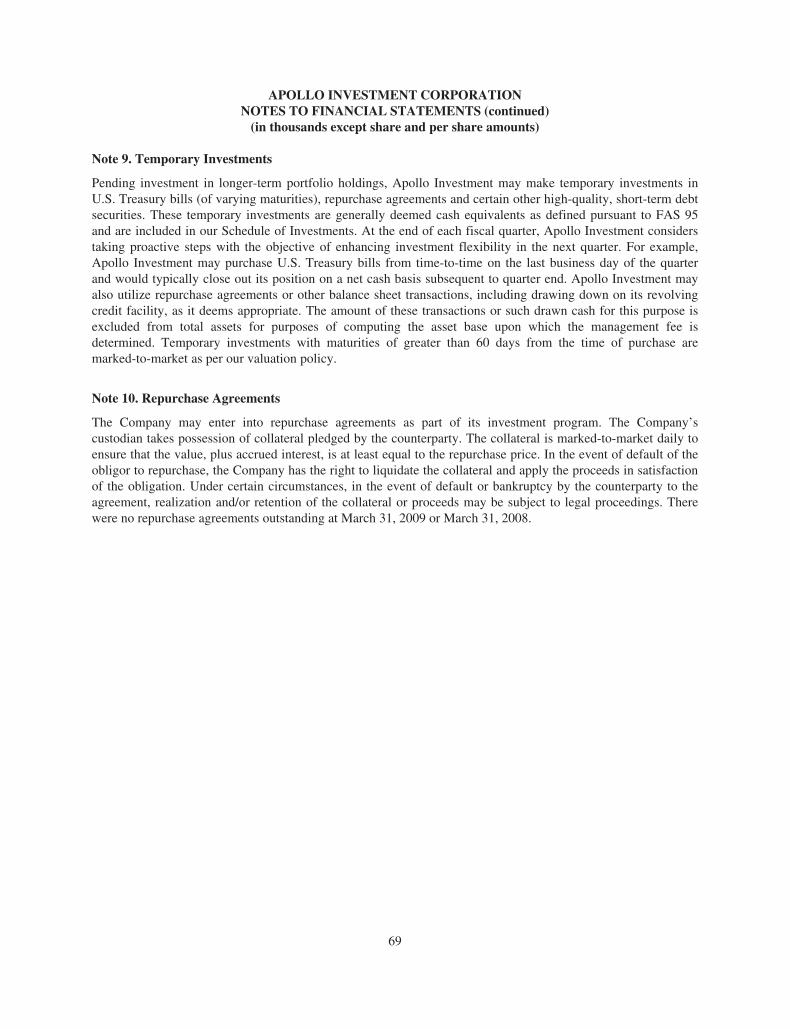
APOLLO INVESTMENT CORPORATIONNOTES TO FINANCIAL STATEMENTS (continued)(in thousands except share and per share amounts)
Note 9. Temporary Investments
Pending investment in longer-term portfolio holdings, Apollo Investment may make temporary investments inU.S. Treasury bills (of varying maturities), repurchase agreements and certain other high-quality, short-term debtsecurities. These temporary investments are generally deemed cash equivalents as defined pursuant to FAS 95and are included in our Schedule of Investments. At the end of each fiscal quarter, Apollo Investment considerstaking proactive steps with the objective of enhancing investment flexibility in the next quarter. For example,Apollo Investment may purchase U.S. Treasury bills from time-to-time on the last business day of the quarterand would typically close out its position on a net cash basis subsequent to quarter end. Apollo Investment mayalso utilize repurchase agreements or other balance sheet transactions, including drawing down on its revolvingcredit facility, as it deems appropriate. The amount of these transactions or such drawn cash for this purpose isexcluded from total assets for purposes of computing the asset base upon which the management fee isdetermined. Temporary investments with maturities of greater than 60 days from the time of purchase aremarked-to-market as per our valuation policy.
Note 10. Repurchase Agreements
The Company may enter into repurchase agreements as part of its investment program. The Company’scustodian takes possession of collateral pledged by the counterparty. The collateral is marked-to-market daily toensure that the value, plus accrued interest, is at least equal to the repurchase price. In the event of default of theobligor to repurchase, the Company has the right to liquidate the collateral and apply the proceeds in satisfactionof the obligation. Under certain circumstances, in the event of default or bankruptcy by the counterparty to theagreement, realization and/or retention of the collateral or proceeds may be subject to legal proceedings. Therewere no repurchase agreements outstanding at March 31, 2009 or March 31, 2008.
69
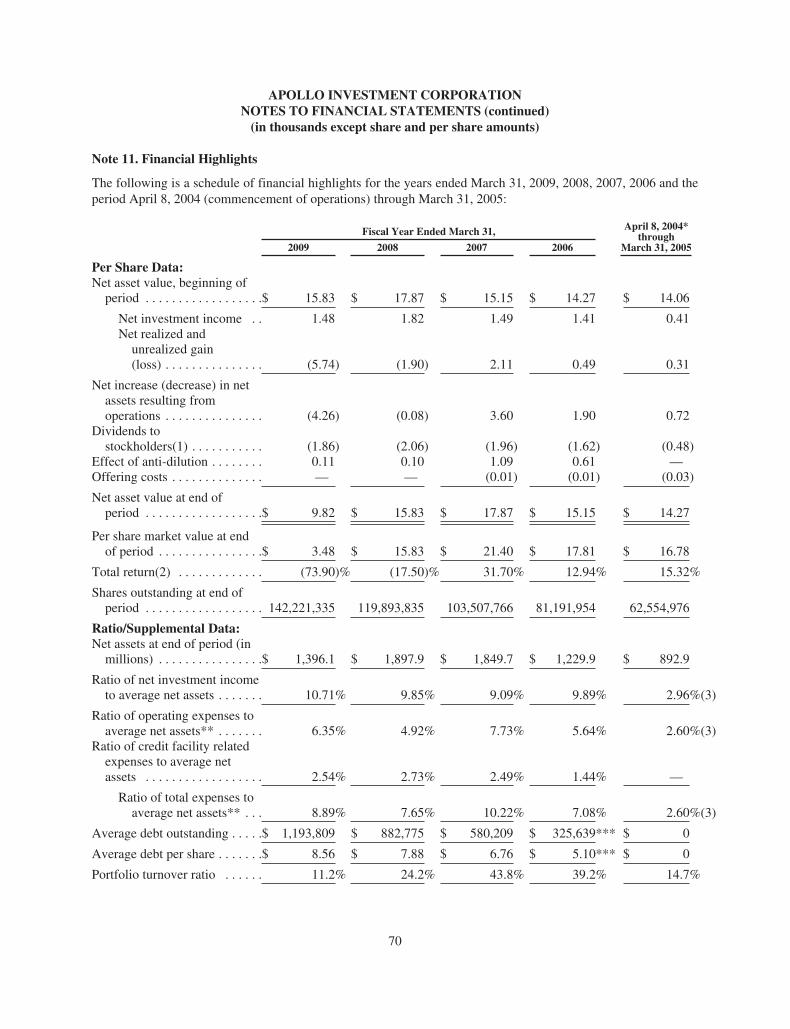
APOLLO INVESTMENT CORPORATIONNOTES TO FINANCIAL STATEMENTS (continued)(in thousands except share and per share amounts)
Note 11. Financial Highlights
The following is a schedule of financial highlights for the years ended March 31, 2009, 2008, 2007, 2006 and theperiod April 8, 2004 (commencement of operations) through March 31, 2005:
Fiscal Year Ended March 31, April 8, 2004*through
March 31, 20052009 2008 2007 2006
Per Share Data:Net asset value, beginning ofperiod . . . . . . . . . . . . . . . . . .$ 15.83 $ 17.87 $ 15.15 $ 14.27 $ 14.06
Net investment income . . 1.48 1.82 1.49 1.41 0.41Net realized andunrealized gain(loss) . . . . . . . . . . . . . . . (5.74) (1.90) 2.11 0.49 0.31
Net increase (decrease) in netassets resulting fromoperations . . . . . . . . . . . . . . . (4.26) (0.08) 3.60 1.90 0.72
Dividends tostockholders(1) . . . . . . . . . . . (1.86) (2.06) (1.96) (1.62) (0.48)
Effect of anti-dilution . . . . . . . . 0.11 0.10 1.09 0.61 —Offering costs . . . . . . . . . . . . . . — — (0.01) (0.01) (0.03)
Net asset value at end ofperiod . . . . . . . . . . . . . . . . . .$ 9.82 $ 15.83 $ 17.87 $ 15.15 $ 14.27
Per share market value at endof period . . . . . . . . . . . . . . . .$ 3.48 $ 15.83 $ 21.40 $ 17.81 $ 16.78
Total return(2) . . . . . . . . . . . . . (73.90)% (17.50)% 31.70% 12.94% 15.32%
Shares outstanding at end ofperiod . . . . . . . . . . . . . . . . . . 142,221,335 119,893,835 103,507,766 81,191,954 62,554,976
Ratio/Supplemental Data:Net assets at end of period (inmillions) . . . . . . . . . . . . . . . .$ 1,396.1 $ 1,897.9 $ 1,849.7 $ 1,229.9 $ 892.9
Ratio of net investment incometo average net assets . . . . . . . 10.71% 9.85% 9.09% 9.89% 2.96%(3)
Ratio of operating expenses toaverage net assets** . . . . . . . 6.35% 4.92% 7.73% 5.64% 2.60%(3)
Ratio of credit facility relatedexpenses to average netassets . . . . . . . . . . . . . . . . . . 2.54% 2.73% 2.49% 1.44% —
Ratio of total expenses toaverage net assets** . . . 8.89% 7.65% 10.22% 7.08% 2.60%(3)
Average debt outstanding . . . . .$ 1,193,809 $ 882,775 $ 580,209 $ 325,639*** $ 0
Average debt per share . . . . . . .$ 8.56 $ 7.88 $ 6.76 $ 5.10*** $ 0
Portfolio turnover ratio . . . . . . 11.2% 24.2% 43.8% 39.2% 14.7%
70
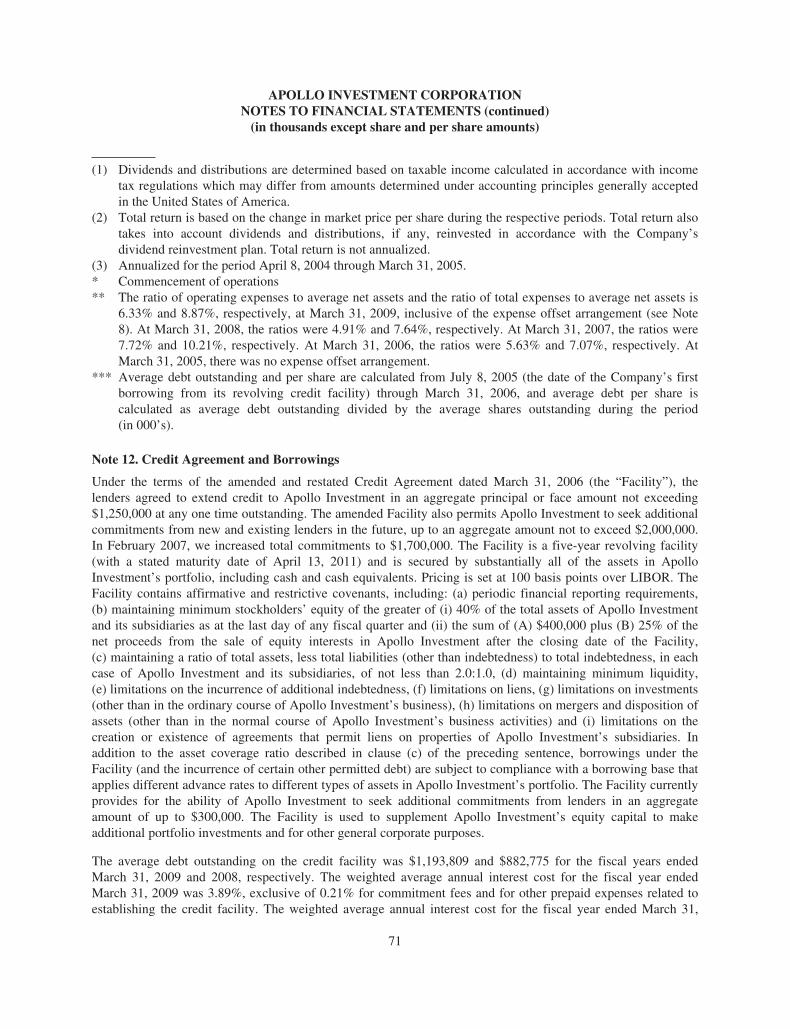
APOLLO INVESTMENT CORPORATIONNOTES TO FINANCIAL STATEMENTS (continued)(in thousands except share and per share amounts)
(1) Dividends and distributions are determined based on taxable income calculated in accordance with incometax regulations which may differ from amounts determined under accounting principles generally acceptedin the United States of America.
(2) Total return is based on the change in market price per share during the respective periods. Total return alsotakes into account dividends and distributions, if any, reinvested in accordance with the Company’sdividend reinvestment plan. Total return is not annualized.
(3) Annualized for the period April 8, 2004 through March 31, 2005.* Commencement of operations** The ratio of operating expenses to average net assets and the ratio of total expenses to average net assets is
6.33% and 8.87%, respectively, at March 31, 2009, inclusive of the expense offset arrangement (see Note8). At March 31, 2008, the ratios were 4.91% and 7.64%, respectively. At March 31, 2007, the ratios were7.72% and 10.21%, respectively. At March 31, 2006, the ratios were 5.63% and 7.07%, respectively. AtMarch 31, 2005, there was no expense offset arrangement.
*** Average debt outstanding and per share are calculated from July 8, 2005 (the date of the Company’s firstborrowing from its revolving credit facility) through March 31, 2006, and average debt per share iscalculated as average debt outstanding divided by the average shares outstanding during the period(in 000’s).
Note 12. Credit Agreement and Borrowings
Under the terms of the amended and restated Credit Agreement dated March 31, 2006 (the “Facility”), thelenders agreed to extend credit to Apollo Investment in an aggregate principal or face amount not exceeding$1,250,000 at any one time outstanding. The amended Facility also permits Apollo Investment to seek additionalcommitments from new and existing lenders in the future, up to an aggregate amount not to exceed $2,000,000.In February 2007, we increased total commitments to $1,700,000. The Facility is a five-year revolving facility(with a stated maturity date of April 13, 2011) and is secured by substantially all of the assets in ApolloInvestment’s portfolio, including cash and cash equivalents. Pricing is set at 100 basis points over LIBOR. TheFacility contains affirmative and restrictive covenants, including: (a) periodic financial reporting requirements,(b) maintaining minimum stockholders’ equity of the greater of (i) 40% of the total assets of Apollo Investmentand its subsidiaries as at the last day of any fiscal quarter and (ii) the sum of (A) $400,000 plus (B) 25% of thenet proceeds from the sale of equity interests in Apollo Investment after the closing date of the Facility,(c) maintaining a ratio of total assets, less total liabilities (other than indebtedness) to total indebtedness, in eachcase of Apollo Investment and its subsidiaries, of not less than 2.0:1.0, (d) maintaining minimum liquidity,(e) limitations on the incurrence of additional indebtedness, (f) limitations on liens, (g) limitations on investments(other than in the ordinary course of Apollo Investment’s business), (h) limitations on mergers and disposition ofassets (other than in the normal course of Apollo Investment’s business activities) and (i) limitations on thecreation or existence of agreements that permit liens on properties of Apollo Investment’s subsidiaries. Inaddition to the asset coverage ratio described in clause (c) of the preceding sentence, borrowings under theFacility (and the incurrence of certain other permitted debt) are subject to compliance with a borrowing base thatapplies different advance rates to different types of assets in Apollo Investment’s portfolio. The Facility currentlyprovides for the ability of Apollo Investment to seek additional commitments from lenders in an aggregateamount of up to $300,000. The Facility is used to supplement Apollo Investment’s equity capital to makeadditional portfolio investments and for other general corporate purposes.
The average debt outstanding on the credit facility was $1,193,809 and $882,775 for the fiscal years endedMarch 31, 2009 and 2008, respectively. The weighted average annual interest cost for the fiscal year endedMarch 31, 2009 was 3.89%, exclusive of 0.21% for commitment fees and for other prepaid expenses related toestablishing the credit facility. The weighted average annual interest cost for the fiscal year ended March 31,
71
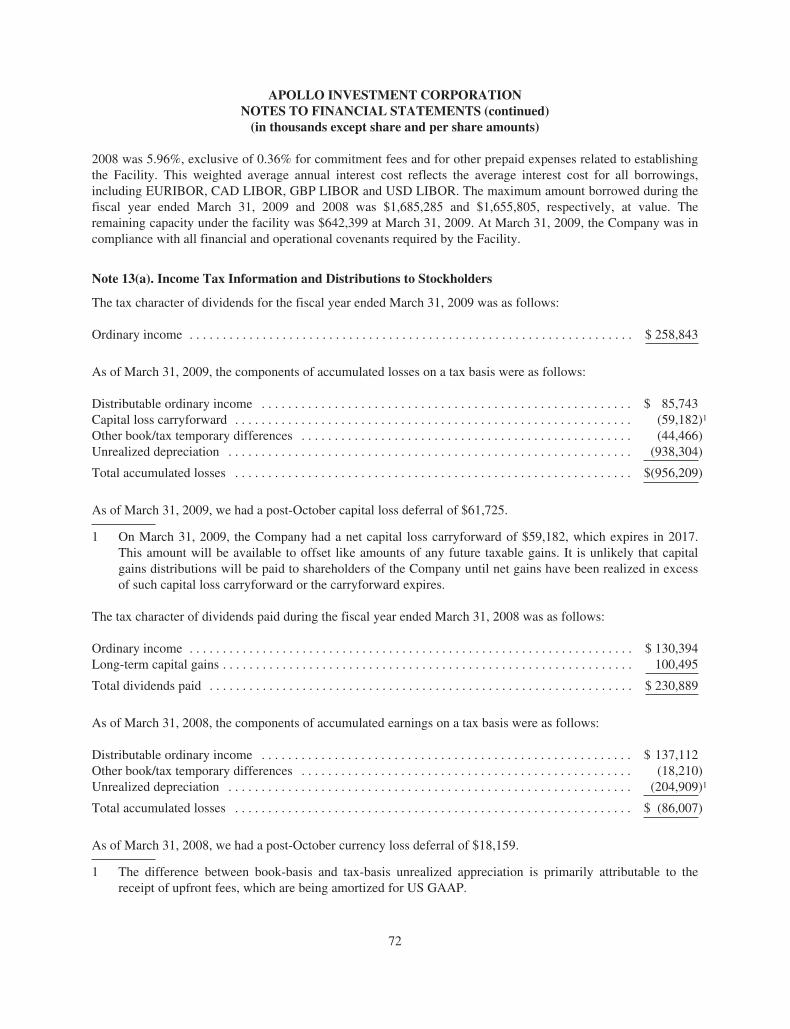
APOLLO INVESTMENT CORPORATIONNOTES TO FINANCIAL STATEMENTS (continued)(in thousands except share and per share amounts)
2008 was 5.96%, exclusive of 0.36% for commitment fees and for other prepaid expenses related to establishingthe Facility. This weighted average annual interest cost reflects the average interest cost for all borrowings,including EURIBOR, CAD LIBOR, GBP LIBOR and USD LIBOR. The maximum amount borrowed during thefiscal year ended March 31, 2009 and 2008 was $1,685,285 and $1,655,805, respectively, at value. Theremaining capacity under the facility was $642,399 at March 31, 2009. At March 31, 2009, the Company was incompliance with all financial and operational covenants required by the Facility.
Note 13(a). Income Tax Information and Distributions to Stockholders
The tax character of dividends for the fiscal year ended March 31, 2009 was as follows:
Ordinary income . . . . . . . . . . . . . . . . . . . . . . . . . . . . . . . . . . . . . . . . . . . . . . . . . . . . . . . . . . . . . . . . . . . $ 258,843
As of March 31, 2009, the components of accumulated losses on a tax basis were as follows:
Distributable ordinary income . . . . . . . . . . . . . . . . . . . . . . . . . . . . . . . . . . . . . . . . . . . . . . . . . . . . . . . . $ 85,743Capital loss carryforward . . . . . . . . . . . . . . . . . . . . . . . . . . . . . . . . . . . . . . . . . . . . . . . . . . . . . . . . . . . . (59,182)1
Other book/tax temporary differences . . . . . . . . . . . . . . . . . . . . . . . . . . . . . . . . . . . . . . . . . . . . . . . . . . (44,466)Unrealized depreciation . . . . . . . . . . . . . . . . . . . . . . . . . . . . . . . . . . . . . . . . . . . . . . . . . . . . . . . . . . . . . (938,304)
Total accumulated losses . . . . . . . . . . . . . . . . . . . . . . . . . . . . . . . . . . . . . . . . . . . . . . . . . . . . . . . . . . . . $(956,209)
As of March 31, 2009, we had a post-October capital loss deferral of $61,725.
1 On March 31, 2009, the Company had a net capital loss carryforward of $59,182, which expires in 2017.This amount will be available to offset like amounts of any future taxable gains. It is unlikely that capitalgains distributions will be paid to shareholders of the Company until net gains have been realized in excessof such capital loss carryforward or the carryforward expires.
The tax character of dividends paid during the fiscal year ended March 31, 2008 was as follows:
Ordinary income . . . . . . . . . . . . . . . . . . . . . . . . . . . . . . . . . . . . . . . . . . . . . . . . . . . . . . . . . . . . . . . . . . . $ 130,394Long-term capital gains . . . . . . . . . . . . . . . . . . . . . . . . . . . . . . . . . . . . . . . . . . . . . . . . . . . . . . . . . . . . . . 100,495
Total dividends paid . . . . . . . . . . . . . . . . . . . . . . . . . . . . . . . . . . . . . . . . . . . . . . . . . . . . . . . . . . . . . . . . $ 230,889
As of March 31, 2008, the components of accumulated earnings on a tax basis were as follows:
Distributable ordinary income . . . . . . . . . . . . . . . . . . . . . . . . . . . . . . . . . . . . . . . . . . . . . . . . . . . . . . . . $ 137,112Other book/tax temporary differences . . . . . . . . . . . . . . . . . . . . . . . . . . . . . . . . . . . . . . . . . . . . . . . . . . (18,210)Unrealized depreciation . . . . . . . . . . . . . . . . . . . . . . . . . . . . . . . . . . . . . . . . . . . . . . . . . . . . . . . . . . . . . (204,909)1
Total accumulated losses . . . . . . . . . . . . . . . . . . . . . . . . . . . . . . . . . . . . . . . . . . . . . . . . . . . . . . . . . . . . $ (86,007)
As of March 31, 2008, we had a post-October currency loss deferral of $18,159.
1 The difference between book-basis and tax-basis unrealized appreciation is primarily attributable to thereceipt of upfront fees, which are being amortized for US GAAP.
72
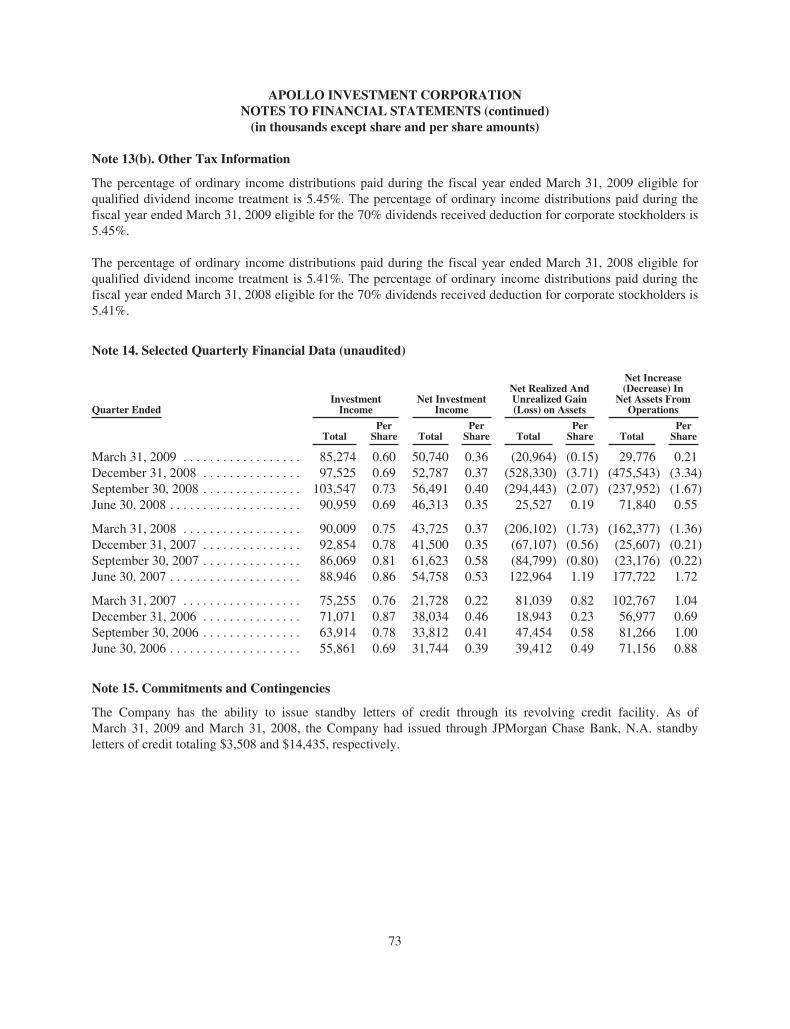
APOLLO INVESTMENT CORPORATIONNOTES TO FINANCIAL STATEMENTS (continued)(in thousands except share and per share amounts)
Note 13(b). Other Tax Information
The percentage of ordinary income distributions paid during the fiscal year ended March 31, 2009 eligible forqualified dividend income treatment is 5.45%. The percentage of ordinary income distributions paid during thefiscal year ended March 31, 2009 eligible for the 70% dividends received deduction for corporate stockholders is5.45%.
The percentage of ordinary income distributions paid during the fiscal year ended March 31, 2008 eligible forqualified dividend income treatment is 5.41%. The percentage of ordinary income distributions paid during thefiscal year ended March 31, 2008 eligible for the 70% dividends received deduction for corporate stockholders is5.41%.
Note 14. Selected Quarterly Financial Data (unaudited)
Quarter EndedInvestmentIncome
Net InvestmentIncome
Net Realized AndUnrealized Gain(Loss) on Assets
Net Increase(Decrease) In
Net Assets FromOperations
TotalPerShare Total
PerShare Total
PerShare Total
PerShare
March 31, 2009 . . . . . . . . . . . . . . . . . . 85,274 0.60 50,740 0.36 (20,964) (0.15) 29,776 0.21December 31, 2008 . . . . . . . . . . . . . . . 97,525 0.69 52,787 0.37 (528,330) (3.71) (475,543) (3.34)September 30, 2008 . . . . . . . . . . . . . . . 103,547 0.73 56,491 0.40 (294,443) (2.07) (237,952) (1.67)June 30, 2008 . . . . . . . . . . . . . . . . . . . . 90,959 0.69 46,313 0.35 25,527 0.19 71,840 0.55
March 31, 2008 . . . . . . . . . . . . . . . . . . 90,009 0.75 43,725 0.37 (206,102) (1.73) (162,377) (1.36)December 31, 2007 . . . . . . . . . . . . . . . 92,854 0.78 41,500 0.35 (67,107) (0.56) (25,607) (0.21)September 30, 2007 . . . . . . . . . . . . . . . 86,069 0.81 61,623 0.58 (84,799) (0.80) (23,176) (0.22)June 30, 2007 . . . . . . . . . . . . . . . . . . . . 88,946 0.86 54,758 0.53 122,964 1.19 177,722 1.72
March 31, 2007 . . . . . . . . . . . . . . . . . . 75,255 0.76 21,728 0.22 81,039 0.82 102,767 1.04December 31, 2006 . . . . . . . . . . . . . . . 71,071 0.87 38,034 0.46 18,943 0.23 56,977 0.69September 30, 2006 . . . . . . . . . . . . . . . 63,914 0.78 33,812 0.41 47,454 0.58 81,266 1.00June 30, 2006 . . . . . . . . . . . . . . . . . . . . 55,861 0.69 31,744 0.39 39,412 0.49 71,156 0.88
Note 15. Commitments and Contingencies
The Company has the ability to issue standby letters of credit through its revolving credit facility. As ofMarch 31, 2009 and March 31, 2008, the Company had issued through JPMorgan Chase Bank, N.A. standbyletters of credit totaling $3,508 and $14,435, respectively.
73
Item 9. Changes in and Disagreements with Accountants on Accounting and Financial Disclosure
None
Item 9A. Controls and Procedures
(a) Evaluation of Disclosure Controls and Procedures
As of March 31, 2009 (the end of the period covered by this report), we, including our Chief Executive Officerand Chief Financial Officer, evaluated the effectiveness of the design and operation of our disclosure controlsand procedures (as defined in Rule 13a-15(e) of the 1934 Act). Based on that evaluation, our management,including the Chief Executive Officer and Chief Financial Officer, concluded that our disclosure controls andprocedures were effective and provided reasonable assurance that information required to be disclosed in ourperiodic SEC filings is recorded, processed, summarized and reported within the time periods specified in theSEC’s rules and forms, and that such information is accumulated and communicated to our management,including our Chief Executive Officer and Chief Financial Officer, as appropriate, to allow timely decisionsregarding required disclosure. However, in evaluating the disclosure controls and procedures, managementrecognized that any controls and procedures, no matter how well designed and operated can provide onlyreasonable assurance of achieving the desired control objectives, and management necessarily was required toapply its judgment in evaluating the cost-benefit relationship of such possible controls and procedures.
(b) Management’s Report on Internal Control Over Financial Reporting
Management’s Report on Internal Control Over Financial Reporting, which appears on page 36 of this Form 10-K,is incorporated by reference herein.
(c) Attestation Report of the Independent Registered Public Accounting Firm
Our independent registered public accounting firm, PricewaterhouseCoopers LLP, has issued an attestation reporton management’s assessment of the Company’s internal control over financial reporting, which is set forth aboveunder the heading “Report of Independent Registered Public Accounting Firm” in Item 8.
(d) Changes in Internal Controls Over Financial Reporting
Management has not identified any change in the Company’s internal control over financing reporting thatoccurred during the fourth fiscal quarter of 2009 that has materially affected, or is reasonably likely to materiallyaffect, the Company’s internal control over financial reporting.
Item 9B. Other Information
None
74
PART III
Item 10. Directors and Executive Officers of the Registrant
MANAGEMENT
Our business and affairs are managed under the direction of our board of directors. The board of directorscurrently consists of eight members, six of whom are not “interested persons” of Apollo Investment as defined inSection 2(a)(19) of the 1940 Act. We refer to these individuals as our independent directors. Our board ofdirectors elects our officers, who serve at the discretion of the board of directors.
BOARD OF DIRECTORS
Under our charter, our directors are divided into three classes. Each class of directors holds office for a three yearterm. At each annual meeting of our stockholders, the successors to the class of directors whose terms expire atsuch meeting will be elected to hold office for a term expiring at the annual meeting of stockholders held in thethird year following the year of their election. Each director holds office for the term to which he or she is electedand until his or her successor is duly elected and qualifies.
Directors
Information regarding the board of directors is as follows:
Name Age PositionDirectorSince
Expirationof Term
Interested Directors
John J. Hannan 56 Chairman of the Board 2004 2009
James C. Zelter 46 Chief Executive Officer & Director 2008 2009
Independent Directors
Ashok Bakhru 67 Director 2008 2009
Claudine B. Malone 73 Director 2007 2011
Frank C. Puleo 63 Director 2008 2011
Carl Spielvogel 80 Director 2004 2011
Elliot Stein, Jr. 60 Director 2004 2010
Bradley J. Wechsler 57 Director 2004 2010
The address for each director is c/o Apollo Investment Corporation, 9 West 57th Street, New York, NY 10019.
Executive officers who are not directors
Information regarding our executive officers who are not directors is as follows:
Name Age Position
Richard L. Peteka 47 Chief Financial Officer and Treasurer
Patrick J. Dalton 40 President and Chief Operating Officer
John J. Suydam 49 Vice President and Chief Legal Officer
Gordon E. Swartz 62 Chief Compliance Officer and Secretary
The address for each executive officer is c/o Apollo Investment Corporation, 9 West 57th Street, New York,NY 10019.
75
Biographical information
Directors
Our directors have been divided into two groups—interested directors and independent directors. Interesteddirectors are interested persons as defined in the 1940 Act.
Independent directors
Ashok Bakhru (67) Director. Mr. Bakhru became a director of Apollo Investment Corporation on October 16,2008. Mr. Bakhru currently serves as the Chairman of the Board of the Goldman Sachs Group of Mutual Funds.Previously Mr. Bakhru was the Chief Financial Officer and Chief Administrative Officer of Coty Inc. in NewYork City. Prior to that he served at Scott Paper Company in Philadelphia, where he held several seniormanagement positions including Senior Vice President and Financial Officer roles. Mr. Bakhru also serves on theGoverning Council of the Independent Directors Council and the Advisory Board of BoardIQ an investmentpublication. He has been actively involved with Cornell University, having served on its Council andAdministrative Board over the past several years.
Claudine B. Malone (73) Director. Ms. Malone became a director of Apollo Investment on April 17, 2007.Ms. Malone is the President and Chief Executive Officer of Financial & Management Consulting Inc. ofMcLean, Virginia. She also currently serves as a director of Novell, Inc. and Aviva Life Insurance Company(USA). Previously, Ms. Malone was Chairman of the Board of the Federal Reserve Bank of Richmond from1996 to 1999. She served as a visiting professor at the Colgate-Darden Business School of the University ofVirginia from 1984 to 1987, an adjunct professor of the School of Business Administration at GeorgetownUniversity from 1982 to 1984 and an assistant and associate professor at the Harvard Graduate School ofBusiness Administration from 1972 to 1981.
Frank C. Puleo (63) Director. Mr. Puleo became a director of Apollo Investment on February 4, 2008.Mr. Puleo currently serves as a Director of Commercial Industrial Finance Corp., Capital Markets Engineering &Trading Holdings, LLC, and SLM Corp. Previously Mr. Puleo was a partner at Milbank, Tweed, Hadley &McCloy LLP where he advised clients on structured finance transactions, bank and bank holding companyregulatory and securities law matters. Mr. Puleo became a partner of Milbank, Tweed, Hadley & McCloy LLP in1978 and Co-Chair of the firm’s Global Finance Group in 1995 until retiring at the end of 2006. He was amember of the firm’s Executive Committee from 1982 to 1991 and from 1996 to 2002. Mr. Puleo served as aLecturer at Columbia University School of Law from 1997 to 2001.
Carl Spielvogel (80) Director. Ambassador Spielvogel became a director of Apollo Investment in March 2004.Amb. Spielvogel has been Chairman and Chief Executive Officer of Carl Spielvogel Associates, Inc., aninternational management and counseling company, from 1997 to 2000, and from 2001 to present. In 2000-2001,Amb. Spielvogel served as U.S. Ambassador to the Slovak Republic, based in Bratislava, Slovakia. From 1994 to1997, Amb. Spielvogel was Chairman and Chief Executive Officer of the United Auto Group, Inc., one of thefirst publicly-owned auto dealership groups. Earlier, Amb. Spielvogel was Chairman and Chief Executive Officerof Backer Spielvogel Bates Worldwide, a global marketing communications company from 1985 to 1994. Amb.Spielvogel currently is a director of the Interactive Data Corporation, Inc. He is also a trustee to the MetropolitanMuseum of Art; a member of the board of Trustees and Chairman of the Business Council of the Asia Society; amember of the board of trustees of Lincoln Center for the Performing Arts; a member of the Council on ForeignRelations, and a member of the board of trustees of the Institute for the Study of Europe, at Columbia University,and a member of the Executive Committee of the Council of American Ambassadors.
Elliot Stein, Jr. (60) Director. Mr. Stein became a director of Apollo Investment in March 2004. Mr. Stein hasserved as chairman of Caribbean International News Corporation since 1985. He is also a managing director ofCommonwealth Capital Partners as well as various private companies including Cloud Solutions LLC andCohere Communications. Mr. Stein is a trustee of Claremont Graduate University and the New SchoolUniversity. He is a member of the Council on Foreign Relations.
76
Bradley J. Wechsler (57) Director. Mr. Wechsler became a director of Apollo Investment in April 2004.Mr. Wechsler has been the Co-Chairman and Co-Chief Executive Officer of IMAX Corporation since May,1996. Previously Mr. Wechsler has had several executive positions in the entertainment industry and was apartner in the entertainment and media practice for a New York-based investment bank. Mr. Wechsler is a Vice-Chairman of the board of the NYU Hospital and Medical Center, a member of the Executive Committee andchairs its Finance Committee. In addition, he sits on the boards of The American Museum of the Moving Image,the Ethical Culture Fieldston Schools and Math for America.
Interested directors
John J. Hannan (56) Chairman of the board of directors of Apollo Investment. Mr. Hannan became a Directorof Apollo Investment in March 2004 and was elected as Chairman of the board of directors in August 2006.Mr. Hannan has served on Apollo Investment Management’s investment committee since February 2006.Mr. Hannan, a senior partner of Apollo Management, L.P., co-founded Apollo Management, L.P. in 1990 andApollo Real Estate Advisors, L.P. (an investment manager affiliated with Apollo’s real estate investment funds)in 1993.
James C. Zelter (46) Chief Executive Officer and Director of Apollo Investment. Mr. Zelter joined Apollo in2006. He is the Managing Partner of Apollo Capital Management (“ACM”). The funds in the ACM platforminclude: Apollo Strategic Value Fund, AP Investment Europe, Apollo Asia Opportunity Fund and ApolloEuropean Principal Finance Fund. ACM also includes Apollo Investment Management, L.P. the investmentmanager to Apollo Investment Corporation, a public company whose shares trade on the NASDAQ. In addition,Mr. Zelter is a Director and the Chief Executive Officer of Apollo Investment Corporation. Prior to joiningApollo, Mr. Zelter was with Citigroup and its predecessor companies from 1994 to 2006. From 2003 to 2005,Mr. Zelter was Chief Investment Officer of Citigroup Alternative Investments, and prior to that he wasresponsible for the firm’s Global High Yield franchise.
Executive officers who are not directors
Patrick J. Dalton: (40) President and Chief Operating Officer of Apollo Investment. Mr. Dalton joined AIM inJune 2004 as a partner and a member of AIM’s Investment Committee. He became an executive officer of ApolloInvestment in November 2006. Mr. Dalton is also the Chief Investment Officer of AIM. Before joining theCorporation, Mr. Dalton was a Vice President with Goldman, Sachs & Co.’s Principal Investment Area with afocus on mezzanine investing from 2000 through 2004.
Richard L. Peteka (47) Chief Financial Officer and Treasurer of Apollo Investment. Mr. Peteka joined ApolloInvestment in June 2004 as its Chief Financial Officer and Treasurer. Prior to joining the firm, he was ChiefFinancial Officer and Treasurer of various closed-end and open-end registered investment companies forCitigroup Asset Management. He joined Citigroup Asset Management as a Director in July 1999.
John J. Suydam (49) Vice President and Chief Legal Officer of Apollo Investment. Mr. Suydam joined Apollo in2006. From 2002-2006, Mr. Suydam was a partner at O’Melveny & Myers LLP where he served as head ofMergers & Acquisitions and co-head of the Corporate Department. Prior to that time, Mr. Suydam served aschairman of the law firm O’Sullivan, LLP which specialized in representing private equityinvestors. Mr. Suydam serves on the board of directors of the Big Apple Circus. Mr. Suydam received his JDfrom New York University and graduated magna cum laude with a BA in History from the State University ofNew York at Albany.
Gordon E. Swartz (62) Chief Compliance Officer and Secretary of Apollo Investment. Mr. Swartz became theChief Compliance Officer of Apollo Investment in October 2004. Prior to joining Apollo Investment, Mr. Swartzwas an Associate General Counsel of Citigroup Asset Management.
77
The Audit Committee
The Audit Committee operates pursuant to an Audit Committee Charter approved by the Board of Directors. Thecharter sets forth the responsibilities of the Audit Committee, which include selecting or retaining each year anindependent registered public accounting firm (the “auditors”) to audit the accounts and records of the Company;reviewing and discussing with management and the auditors the annual audited financial statements of theCompany, including disclosures made in management’s discussion and analysis, and recommending to the Boardof Directors whether the audited financial statements should be included in the Company’s annual report onForm 10-K; reviewing and discussing with management and the auditors the Company’s quarterly financialstatements prior to the filings of its quarterly reports on Form 10-Q; pre-approving the auditors’ engagement torender audit and/or permissible non-audit services; and evaluating the qualifications, performance andindependence of the auditors. The Audit Committee is presently composed of six persons: Messrs. Bakhru,Puleo, Spielvogel, Stein, Wechsler, and Ms. Malone, all of whom are independent directors and are otherwiseconsidered independent under the listing standards of NASDAQ Marketplace Rule 5605(a)(2). The Company’sBoard of Directors has determined that Mr. Bakhru and Ms. Malone each is an “audit committee financialexpert” as that term is defined under Item 401 of Regulation S-K under the Securities Exchange Act of 1934, asamended, (the “Exchange Act”). The Audit Committee Charter is available on the Company’s website(www.apolloic.com).
Section 16(a) Beneficial Ownership Reporting Compliance
Pursuant to Section 16(a) of the Exchange Act, the Company’s directors and executive officers, and any personsholding more than 10% of its common stock, are required to report their beneficial ownership and any changestherein to the Securities and Exchange Commission and the Company. Specific due dates for those reports havebeen established, and the Company is required to report herein any failure to file such reports by those due dates.Based on the Company’s review of Forms 3, 4 and 5 filed by such persons and information provided by theCompany’s directors and officers, the Company believes that during the fiscal year ended March 31, 2009, allSection 16(a) filing requirements applicable to such persons were met in a timely manner.
Code of Conduct
We have adopted a code of conduct for all our directors and employees, including our Chief Executive Officerand Chief Financial Officer, as required under Item 406 of Regulation S-K under the Exchange Act and thelisting standards of NASDAQ Marketplace Rule 5610. The code of conduct is available on our website located atwww.apolloic.com. You may also read and copy the code of conduct at the SEC’s Public Reference Room inWashington, D.C. You may obtain information on operations of the Public Reference Room by calling the SECat (202) 942-8090. In addition, the code of conduct will be available on the EDGAR Database on the SECInternet site at http://www.sec.gov. You may also obtain copies of the code of conduct, after paying a duplicatingfee, by electronic request at the following email address: [email protected], or by writing to the SEC’s PublicReference Section, 450 5th Street, NW, Washington, D.C. 20549.
Item 11. Executive Compensation
COMPENSATION DISCUSSION AND ANALYSIS
Apollo Investment Corporation does not currently have any employees. The executive officers of the companyare either employees of our investment adviser, Apollo Investment Management (“adviser”), or ouradministrator, Apollo Investment Administration (“administrator”). The adviser and administrator providenecessary services to the business, pursuant to the terms of our investment advisory and management agreementand our administration agreement. Our day-to-day investment operations are managed by our investment adviser.Most of the services necessary for the origination and administration of our investment portfolio are provided byinvestment professionals employed by the adviser. In addition, we reimburse the administrator for our allocableportion of expenses incurred by it in performing its obligations under the administration agreement, including ourallocable portion of the cost of our chief financial officer, chief compliance officer and their respective staffs.
78
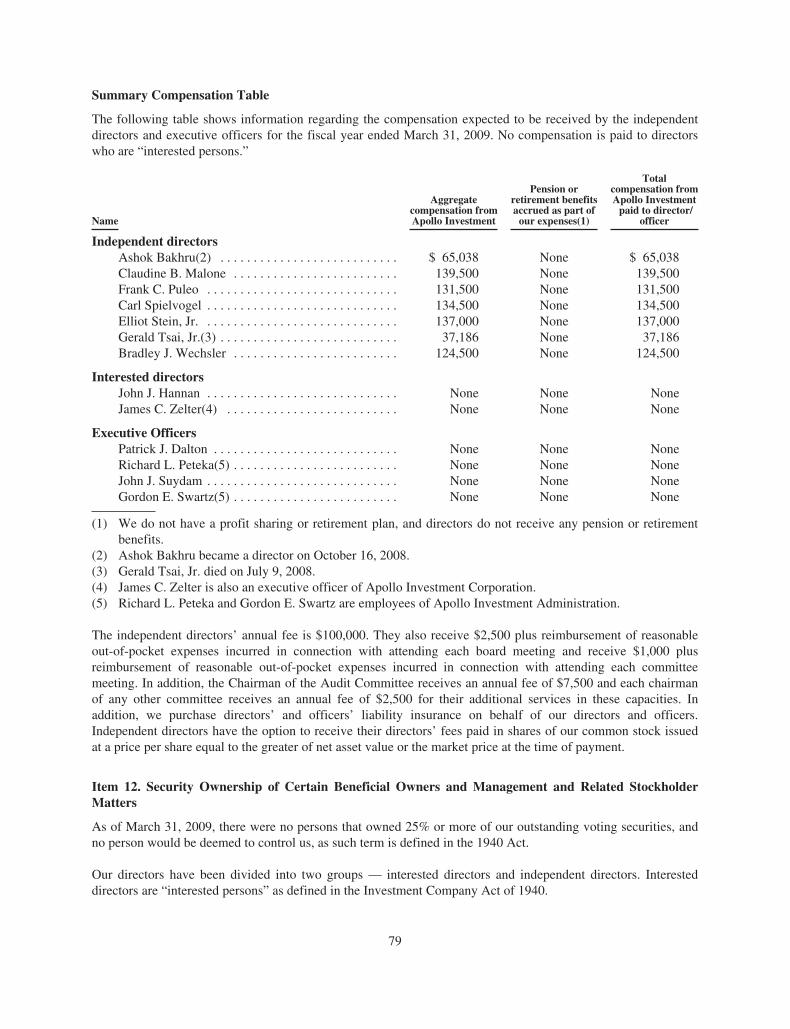
Summary Compensation Table
The following table shows information regarding the compensation expected to be received by the independentdirectors and executive officers for the fiscal year ended March 31, 2009. No compensation is paid to directorswho are “interested persons.”
Name
Aggregatecompensation fromApollo Investment
Pension orretirement benefitsaccrued as part ofour expenses(1)
Totalcompensation fromApollo Investmentpaid to director/
officer
Independent directorsAshok Bakhru(2) . . . . . . . . . . . . . . . . . . . . . . . . . . . $ 65,038 None $ 65,038Claudine B. Malone . . . . . . . . . . . . . . . . . . . . . . . . . 139,500 None 139,500Frank C. Puleo . . . . . . . . . . . . . . . . . . . . . . . . . . . . . 131,500 None 131,500Carl Spielvogel . . . . . . . . . . . . . . . . . . . . . . . . . . . . . 134,500 None 134,500Elliot Stein, Jr. . . . . . . . . . . . . . . . . . . . . . . . . . . . . . 137,000 None 137,000Gerald Tsai, Jr.(3) . . . . . . . . . . . . . . . . . . . . . . . . . . . 37,186 None 37,186Bradley J. Wechsler . . . . . . . . . . . . . . . . . . . . . . . . . 124,500 None 124,500
Interested directorsJohn J. Hannan . . . . . . . . . . . . . . . . . . . . . . . . . . . . . None None NoneJames C. Zelter(4) . . . . . . . . . . . . . . . . . . . . . . . . . . None None None
Executive OfficersPatrick J. Dalton . . . . . . . . . . . . . . . . . . . . . . . . . . . . None None NoneRichard L. Peteka(5) . . . . . . . . . . . . . . . . . . . . . . . . . None None NoneJohn J. Suydam . . . . . . . . . . . . . . . . . . . . . . . . . . . . . None None NoneGordon E. Swartz(5) . . . . . . . . . . . . . . . . . . . . . . . . . None None None
(1) We do not have a profit sharing or retirement plan, and directors do not receive any pension or retirementbenefits.
(2) Ashok Bakhru became a director on October 16, 2008.(3) Gerald Tsai, Jr. died on July 9, 2008.(4) James C. Zelter is also an executive officer of Apollo Investment Corporation.(5) Richard L. Peteka and Gordon E. Swartz are employees of Apollo Investment Administration.
The independent directors’ annual fee is $100,000. They also receive $2,500 plus reimbursement of reasonableout-of-pocket expenses incurred in connection with attending each board meeting and receive $1,000 plusreimbursement of reasonable out-of-pocket expenses incurred in connection with attending each committeemeeting. In addition, the Chairman of the Audit Committee receives an annual fee of $7,500 and each chairmanof any other committee receives an annual fee of $2,500 for their additional services in these capacities. Inaddition, we purchase directors’ and officers’ liability insurance on behalf of our directors and officers.Independent directors have the option to receive their directors’ fees paid in shares of our common stock issuedat a price per share equal to the greater of net asset value or the market price at the time of payment.
Item 12. Security Ownership of Certain Beneficial Owners and Management and Related StockholderMatters
As of March 31, 2009, there were no persons that owned 25% or more of our outstanding voting securities, andno person would be deemed to control us, as such term is defined in the 1940 Act.
Our directors have been divided into two groups — interested directors and independent directors. Interesteddirectors are “interested persons” as defined in the Investment Company Act of 1940.
79
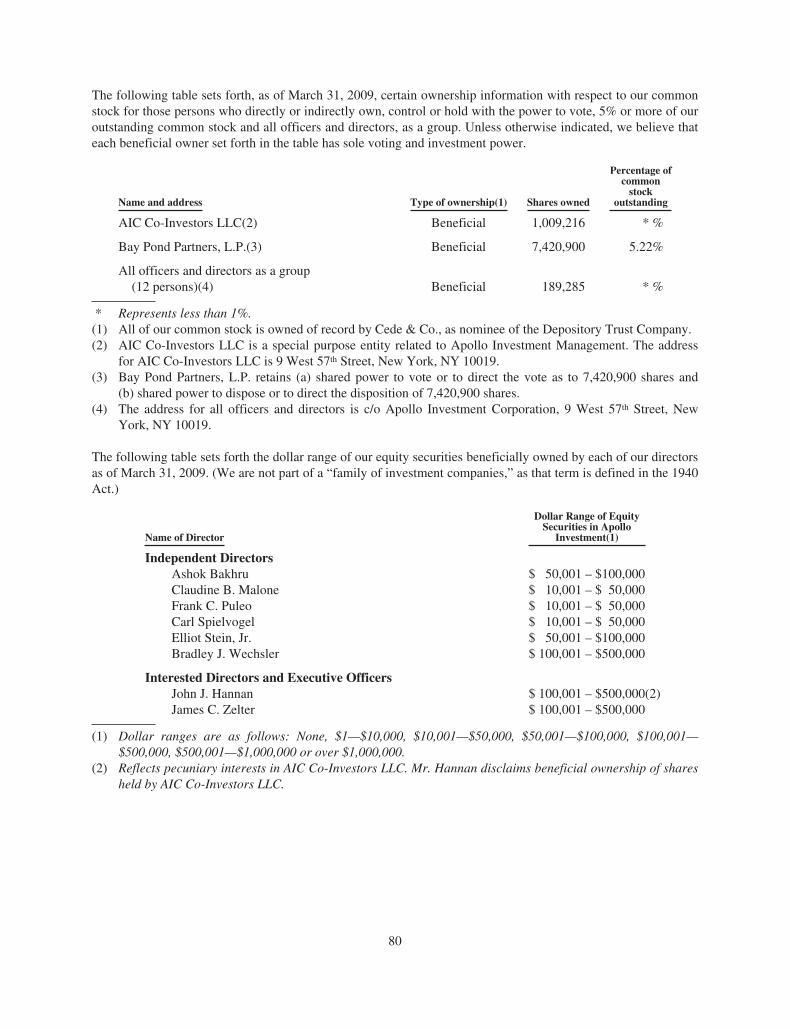
The following table sets forth, as of March 31, 2009, certain ownership information with respect to our commonstock for those persons who directly or indirectly own, control or hold with the power to vote, 5% or more of ouroutstanding common stock and all officers and directors, as a group. Unless otherwise indicated, we believe thateach beneficial owner set forth in the table has sole voting and investment power.
Name and address Type of ownership(1) Shares owned
Percentage ofcommonstock
outstanding
AIC Co-Investors LLC(2) Beneficial 1,009,216 * %
Bay Pond Partners, L.P.(3) Beneficial 7,420,900 5.22%
All officers and directors as a group(12 persons)(4) Beneficial 189,285 * %
* Represents less than 1%.(1) All of our common stock is owned of record by Cede & Co., as nominee of the Depository Trust Company.(2) AIC Co-Investors LLC is a special purpose entity related to Apollo Investment Management. The address
for AIC Co-Investors LLC is 9 West 57th Street, New York, NY 10019.(3) Bay Pond Partners, L.P. retains (a) shared power to vote or to direct the vote as to 7,420,900 shares and
(b) shared power to dispose or to direct the disposition of 7,420,900 shares.(4) The address for all officers and directors is c/o Apollo Investment Corporation, 9 West 57th Street, New
York, NY 10019.
The following table sets forth the dollar range of our equity securities beneficially owned by each of our directorsas of March 31, 2009. (We are not part of a “family of investment companies,” as that term is defined in the 1940Act.)
Name of Director
Dollar Range of EquitySecurities in Apollo
Investment(1)
Independent DirectorsAshok Bakhru $ 50,001 – $100,000Claudine B. Malone $ 10,001 – $ 50,000Frank C. Puleo $ 10,001 – $ 50,000Carl Spielvogel $ 10,001 – $ 50,000Elliot Stein, Jr. $ 50,001 – $100,000Bradley J. Wechsler $ 100,001 – $500,000
Interested Directors and Executive OfficersJohn J. Hannan $ 100,001 – $500,000(2)James C. Zelter $ 100,001 – $500,000
(1) Dollar ranges are as follows: None, $1—$10,000, $10,001—$50,000, $50,001—$100,000, $100,001—$500,000, $500,001—$1,000,000 or over $1,000,000.
(2) Reflects pecuniary interests in AIC Co-Investors LLC. Mr. Hannan disclaims beneficial ownership of sharesheld by AIC Co-Investors LLC.
80
Item 13. Certain Relationships and Related Transactions, and Director Independence
We have entered into an investment advisory and management agreement with AIM. Certain of our seniorofficers and our chairman of the Board of Directors have ownership and financial interests in AIM. Certain of oursenior officers also serve as principals of other investment managers affiliated with AIM that may in the futuremanage investment funds with investment objectives similar to ours. In addition, our executive officers anddirectors and the partners of our investment adviser, AIM, serve or may serve as officers, directors or principalsof entities that operate in the same or related line of business as we do, or of investment funds managed by itsaffiliates, although we may not be given the opportunity to participate in certain investments made by investmentfunds managed by advisers affiliated with AIM. However, our investment adviser and its affiliates intend toallocate investment opportunities in a fair and equitable manner consistent with our investment objectives andstrategies so that we are not disadvantaged in relation to any other client.
We have entered into a royalty-free license agreement with AIM, pursuant to which AIM has agreed to grant us anon-exclusive license to use the name “Apollo.” Under the license agreement, we have the right to use the“Apollo” name for so long as AIM or one of its affiliates remains our investment adviser. In addition, we rentoffice space from Apollo Administration, an affiliate of AIM, and pay Apollo Administration our allocableportion of overhead and other expenses incurred by Apollo Administration in performing its obligations underour administration agreement with Apollo Administration, including our allocable portion of the cost of our chieffinancial officer and chief compliance officer and their respective staffs, which can create conflicts of interestthat our Board of Directors must monitor. We may invest, to the extent permitted by law, on a concurrent basiswith affiliates of AIM, subject to compliance with applicable regulations and our allocation procedures.
Further information relating to relationships and director independence is hereby incorporated by reference fromour 2009 Proxy Statement under the caption “Certain Relationships and Transactions.”
Item 14. Principal Accountant Fees and Services
The audit committee of the board of directors selected PricewaterhouseCoopers LLP as independent auditors forthe Company for the fiscal year ending March 31, 2009. PricewaterhouseCoopers LLP has confirmed that theyare independent accountants with respect to the Company within the meaning of the Securities Acts administeredby the Securities and Exchange Commission and the requirements of the Independence Standards Board.
Audit Fees: Audit fees consist of fees billed for professional services rendered for the audit of our year-endfinancial statements and services that are normally provided by PricewaterhouseCoopers LLP in connection withstatutory and regulatory filings. Audit fees billed during the fiscal years ending March 31, 2009 and March 31,2008 were $637,000 and $360,000, respectively.
Audit-Related Fees: Audit-related services consist of fees billed for assurance and related services that arereasonably related to the performance of the audit or review of our financial statements and are not reportedunder “Audit Fees.” These services include attest services that are not required by statute or regulation andconsultations concerning financial accounting and reporting standards. Audit-related fees billed during the fiscalyears ending March 31, 2009 and March 31, 2008 were $253,000 and $37,975, respectively.
Tax Services Fees: Tax services fees consist of fees billed for professional tax services. These services alsoinclude assistance regarding federal, state, and local tax compliance. Tax services and fees billed during the fiscalyears ending March 31, 2009 and March 31, 2008 were $30,000 and $36,200, respectively, which representedwork related to preparation of tax returns, our RIC qualification, excise tax distribution requirements, formextensions, etc.
81
All Other Fees: Other fees would include fees for products and services other than the services reported above.
The Audit Committee of the board of directors of Apollo Investment Corporation operates under a written charteradopted by the board of directors. Management is responsible for the Company’s internal controls and thefinancial reporting process. The independent auditors are responsible for performing an independent audit of theCompany’s financial statements in accordance with auditing standards generally accepted in the United Statesand expressing an opinion on the conformity of those audited financial statements in accordance with accountingprinciples generally accepted in the United States. The Audit Committee’s responsibility is to monitor andoversee these processes. The Audit Committee is also directly responsible for the appointment, compensation andoversight of the Company’s independent auditors.
The Audit Committee has established a pre-approval policy that describes the permitted audit, audit-related, taxand other services to be provided by PricewaterhouseCoopers LLP, the Company’s independent auditor. Thepolicy requires that the Audit Committee pre-approve the audit and non-audit services performed by theindependent auditor in order to assure that the provision of such service does not impair the auditor’sindependence.
Any requests for audit, audit-related, tax and other services that have not received general pre-approval must besubmitted to the Audit Committee for specific pre-approval, and cannot commence until such approval has beengranted. Normally, pre-approval is provided at regularly scheduled meetings of the Audit Committee. However,the Audit Committee may delegate pre-approval authority to one or more of its members. The member ormembers to whom such authority is delegated shall report any pre-approval decisions to the Audit Committee atits next scheduled meeting. The Audit Committee does not delegate its responsibilities to pre-approve servicesperformed by the independent auditor to management.
The Audit Committee has reviewed the audited financial statements and met and held discussions withmanagement regarding the audited financial statements. Management has represented to the Audit Committeethat the Company’s financial statements were prepared in accordance with accounting principles generallyaccepted in the United States.
The Audit Committee has discussed with PricewaterhouseCoopers LLP, the Company’s independent auditors,matters required to be discussed by Statement of Auditing Standards No. 114 (communication with those chargedwith governance). The Audit Committee received and reviewed the written report on required communications.
Based on the Audit Committee’s discussion with management and the independent auditors, the AuditCommittee’s review of the audited financial statements, the representations of management and the report of theindependent auditors to the Audit Committee, the Audit Committee has recommended that the board of directorsinclude the audited financial statements in the Company’s Annual Report on Form 10-K for the fiscal year endedMarch 31, 2009 for filing with the Securities and Exchange Commission. The Audit Committee has alsoappointed PricewaterhouseCoopers LLP to serve as independent auditors for the fiscal year ended March 31,2010.
82
PART IV
Item 15. Exhibits and Financial Statement Schedules
(a)(1) Financial Statements.
Refer to Item 8 above.
(a)(2) Financial Statement Schedules
None.
(a)(3) Exhibits
3.1(a) Articles of Amendment(1)
3.1(b) Articles of Amendment and Restatement(2)
3.2 Second Amended and Restated Bylaws*
4.1 Form of Stock Certificate(3)
10.1(a) Investment Advisory Management Agreement between Registrant and Apollo InvestmentManagement, L.P.(2)
10.1(b) Supplement to the Investment Advisory Management Agreement between Registrant and ApolloInvestment Management, L.P.(4)
10.2 Administration Agreement between Registrant and Apollo Investment Administration, LLC(2)
10.3 Dividend Reinvestment Plan(4)
10.4 Custodian Agreement(2)
10.5 License Agreement between the Registrant and Apollo Management, L.P.(2)
10.6 Form of Transfer Agency and Service Agreement(2)
10.7 Amended and Restated Senior Secured Revolving Credit Agreement(5)
11.1 Statement regarding computation of per share earnings*
14.1 Code of Conduct(6)
31.1 Certification of Chief Executive Officer Pursuant to Rule 13a-14(a) under the SecuritiesExchange Act of 1934.*
31.2 Certification of Chief Financial Officer Pursuant to Rule 13a-14(a) under the SecuritiesExchange Act of 1934.*
32.1 Certification of Chief Executive Officer Pursuant to Section 906 of the Sarbanes-Oxley Act of2002 (18 U. S. C. 1350).*
32.2 Certification of Chief Financial Officer Pursuant to Section 906 of the Sarbanes-Oxley Act of2002 (18 U. S. C. 1350).*
* Filed herewith.(1) Incorporated by reference from the Registrant’s pre-effective Amendment No. 1 to the Registration
Statement under the Securities Act of 1933, as amended, on Form N-2, filed on June 20, 2005.(2) Incorporated by reference from the Registrant’s pre-effective Amendment No. 3 to the Registration
Statement under the Securities Act of 1933, as amended, on Form N-2, filed on April 1, 2004.(3) Incorporated by reference from the Registrant’s pre-effective Amendment No. 1 to the Registration
Statement under the Securities Act of 1933, as amended, on Form N-2, filed on March 12, 2004.(4) Incorporated by reference from the Registrant’s Form 10-K, filed on June 12, 2006.(5) Incorporated by reference from the Registrant’s Form 8-K filed on April 4, 2006.(6) Incorporated by reference from the Registrant’s Form 10-K, filed on May 29, 2008.
83
Signatures
Pursuant to the requirements of Section 13 or 15(d) of the Securities Exchange Act of 1934, the registrant hasduly caused this report to be signed on its behalf by the undersigned, thereunto duly authorized.
APOLLO INVESTMENT CORPORATION
By: /s/ James C. Zelter
James C. ZelterChief Executive OfficerJune 1, 2009
Pursuant to the requirements of the Securities Exchange Act of 1934, this report has been signed below by thefollowing persons on behalf of the registrant and in the capacities and on the dates indicated.
SIGNATURE TITLE DATE
/s/ James C. Zelter
James C. Zelter
Chief Executive Officer (principalexecutive officer)
June 1, 2009
/s/ Richard L. Peteka
Richard L. Peteka
Chief Financial Officer andTreasurer
(principal financial andaccounting officer)
June 1, 2009
/s/ Patrick J. Dalton
Patrick J. Dalton
President and Chief OperatingOfficer
June 1, 2009
/s/ John J. Hannan
John J. Hannan
Chairman of the Board,Director
June 1, 2009
/s/ Ashok Bakhru
Ashok Bakhru
Director June 1, 2009
/s/ Claudine B. Malone
Claudine B. Malone
Director June 1, 2009
/s/ Frank C. Puleo
Frank C. Puleo
Director June 1, 2009
/s/ Carl Spielvogel
Carl Spielvogel
Director June 1, 2009
/s/ Elliot Stein, Jr.
Elliot Stein, Jr.
Director June 1, 2009
/s/ Bradley J. Wechsler
Bradley J. Wechsler
Director June 1, 2009
84

[THIS PAGE INTENTIONALLY LEFT BLANK]

[THIS PAGE INTENTIONALLY LEFT BLANK]
Directors
John J. HannanChairman of the Board of Directors of Apollo Investment Corporation and Senior Partner of Apollo Investment Management, L.P
Ashok N. BakhruChairman of the Board of the Goldman SachsGroup of Mutual Funds
Claudine B. MalonePresident and Chief Executive Officer ofFinancial & Management Consulting Inc.
Frank C. PuleoDirector of Commercial Industrial FinanceCorporation, Capital Markets Engineering & Trading Holdings, LLC, and SLM Corporation
Carl SpielvogelChairman and Chief Executive Officer ofCarl Spielvogel Associates, Inc.
Elliot Stein, Jr.Chairman of Caribbean International NewsCorporation and Private Investor
Bradley J. WechslerCo-Chairman and Co-Chief Executive Officer ofIMAX Corporation
James C. ZelterChief Executive Officer of Apollo Investment Corporation and Managing Partner of Apollo Capital Management
Officers
James C. ZelterChief Executive Officer of Apollo Investment Corporation and Managing Partner of Apollo Capital Management
Patrick J. DaltonPresident and Chief Operating Officer
Richard L. Peteka Chief Financial Officer and Treasurer
John J. SuydamVice President and Chief Legal Officer
Gordon E. Swartz Chief Compliance Officer and Secretary
Apollo Investment CorporationCorporate Information
Other Information
Stock Exchange ListingApollo Investment Corporation trades on The NASDAQGlobal Select Market under the symbol “AINV.”
Dividend Reinvestment PlanThe Company’s dividend reinvestment plan provides for the reinvestment of your dividends and distributions automatically. For more information, contact the plan administrator at P.O.Box 922, Wall Street Station, New York, NY 10269-0560 or by calling the plan administrator’s Interactive Voice ResponseSystem at 888.777.0324.
Investment AdviserApollo Investment Management, L.P.9 West 57th StreetNew York, NY 10019
Independent Registered Public Accounting FirmPricewaterhouseCoopers LLP300 Madison AvenueNew York, NY 10017
Transfer AgentAmerican Stock Transfer and Trust Company59 Maiden LaneNew York, NY 10038
For More InformationPlease call 212.515.3450
Cert no. SCS-COC-00648

Apollo Investment Corporation | 9 West 57th Street | New York, NY 10019