annual report 2008 - st barbara
TRANSCRIPT

Exit Print Contents Previous Start End Next
Annual Report 2008

Exit Print Contents Previous Start End NextAnnual Report 2008
Who are we Highlights Chairman’s Letter
Managing Director’s Report
Operations & Development
Exploration Finance Environment, Safety & Social Responsibility
Management Corporate Governance
Financial Report
Shareholder Information
Corporate DirectoryCorporate Directory
Reserves & Resources
* An Australian focused gold explorer, developer and producer.
* Key assets include gold mines and associated infrastructure at Southern Cross and Leonora – two of the three richest endowed gold provinces in Western Australia.
* Landbank of 18,000 square kilometres throughout Australia, including significant under-explored areas in the Southern Cross and Leonora districts in proximity to the Company’s existing infrastructure.
* Established production track record with over 500,000 ounces of gold produced in aggregate over the last three years.
* Reserves of 3.1 million ounces and Resources of 10.6 million ounces of gold at 30 June 2008.
ContentsWho we are 1Highlights 2Chairman’s Letter 3Managing Director’s Report 4Operations & Development 6Reserves & Resources 10Exploration 12Finance 14Environment, Safety & Social Responsibility 16Management 18Corporate Governance 19Financial Report 23Shareholder Information 91Corporate Directory 92
St Barbara Limited ABN 36 009 165 066
Who we are
1

Exit Print Contents Previous Start End NextAnnual Report 2008
Who are we Highlights Chairman’s Letter
Managing Director’s Report
Operations & Development
Exploration Finance Environment, Safety & Social Responsibility
Management Corporate Governance
Financial Report
Shareholder Information
Corporate DirectoryCorporate Directory
Reserves & Resources
Successful development of Gwalia at Leonora • Gwalia’s 1.2 million tonnes per annum
processing plant and associated infrastructure refurbished and now in the commissioning phase, with gold production about to commence.
• Over $170 million invested over three years to redevelop the Gwalia mine, which has an estimated mine life of more than nine years.
• Hoover Decline at Gwalia developed to a vertical depth of 1,030 metres below surface. Ore production is underway from West Lode in the Gwalia Intermediates zone.
Growth profile • Ore Reserves total 3.1 million ounces
at 30 June 2008, a 43% increase from June 2007, after allowing for depletion.
• Capacity to further leverage off existing infrastructure at Southern Cross and Leonora.
• Targeted gold production of 295,000-315,000 ounces in FY09, a more than 80% increase from FY08.
Unhedged gold producer• No committed gold deliveries,
maximising exposure to favourable movements in the spot gold price.
Exploration upside• At Tower Hill, 2 kilometres from
the Gwalia mill, high-grade reserves of 323,000 ounces at 4.7g/t are established. This high-grade deposit has true width intersections of 40m @ 6.0g/t and 30m @ 7.2g/t at depths of 250-300 metres. The deposit remains open at depth and exploration drilling is continuing.
• Jaccoletti is a potential high-grade underground resource, 1.5 kilometres from the Marvel Loch plant. Significant intersections include 54m @ 8.1g/t from 243m, 21m @ 12.2g/t from 317m and 18m @ 7.6g/t from 244m.
• Strong focus on establishment and extension of higher-grade underground reserves in proximity to existing production infrastructure.
• Extensive land bank prospective for gold including over 4,000 square kilometres at Southern Cross and Leonora which have a combined gold endowment of 25 million ounces.
Highlights Chairman’s Letter
Dear Fellow Shareholder
The recommencement of gold production from the historic Gwalia mine at Leonora heralds the next phase in the growth of St Barbara as a significant Australian gold explorer, developer and producer.
The Hoover Decline has reached the top of the Gwalia Deeps reserves, 1,030 metres below surface with the first ore production stopes from West Lode in the Intermediates zone now being accessed, and mining of ore stopes from Gwalia Deeps to commence in December 2008. The refurbished treatment plant is currently being commissioned.
The Board again visited the Leonora and Southern Cross Operations during the year and reviewed activities including safety practices, at both sites. Significant progress has been made in the development of these operations, especially the increase in ore reserves.
The 2008 fiscal year has been challenging. In the second half, the financial markets experienced volatility levels not seen for a long time, with even greater fluctuations since year-end. St Barbara’s share price and in turn, shareholder wealth, have been severely impacted. While we cannot control the volatility in the financial markets, all at St Barbara are working hard to ensure that our operations are robust, and that costs
are contained as we seek to deliver on our stated targets while implementing our long-term growth strategy to expand and extend the lives of existing operations through the successful exploration and discovery of new ore bodies.
We are competing for labour, energy and supplies in the highly competitive Western Australian market which is heavily impacted by demand from iron ore and oil and gas projects. As a direct consequence, labour costs have increased, the available pool of skilled labour is stretched and quality assurance issues are arising in the provision of supplies, contractor maintenance and capital works. St Barbara remains vigilant in all these areas and continues to attract high calibre employees across all levels of the business.
During the year, Hank Tuten retired after six years as a Non Executive Director. We thank Hank for his contribution to the re-emergence of St Barbara since mid 2004. I am pleased to welcome Robert Rae as a Non Executive Director. Robert has significant experience in investment banking and corporate areas. The Company has established a broad, international shareholder base, with approximately 65% of shares now held by institutional investors.
In July 2008, the Company completed a $120 million equity capital raising. We are focused on using these funds prudently in the current environment while sustaining an adequate level of exploration to enable the continuing growth of existing operations.
The Company has extended its corporate governance practices, in keeping with its S&P ASX 200 index status, and has adopted the revised ASX Corporate Governance Principles and Recommendations.
On behalf of the Board, I express our appreciation to management and employees for their loyalty, effort and dedication during what has been a challenging year.
Colin Wise Chairman 29 September 2008
2 stbarbara.com.au 3
Exit Print Contents Previous Start End NextAnnual Report 2008
Who are we Highlights Chairman’s Letter
Managing Director’s Report
Operations & Development
Exploration Finance Environment, Safety & Social Responsibility
Management Corporate Governance
Financial Report
Shareholder Information
Corporate DirectoryCorporate Directory
Reserves & Resources
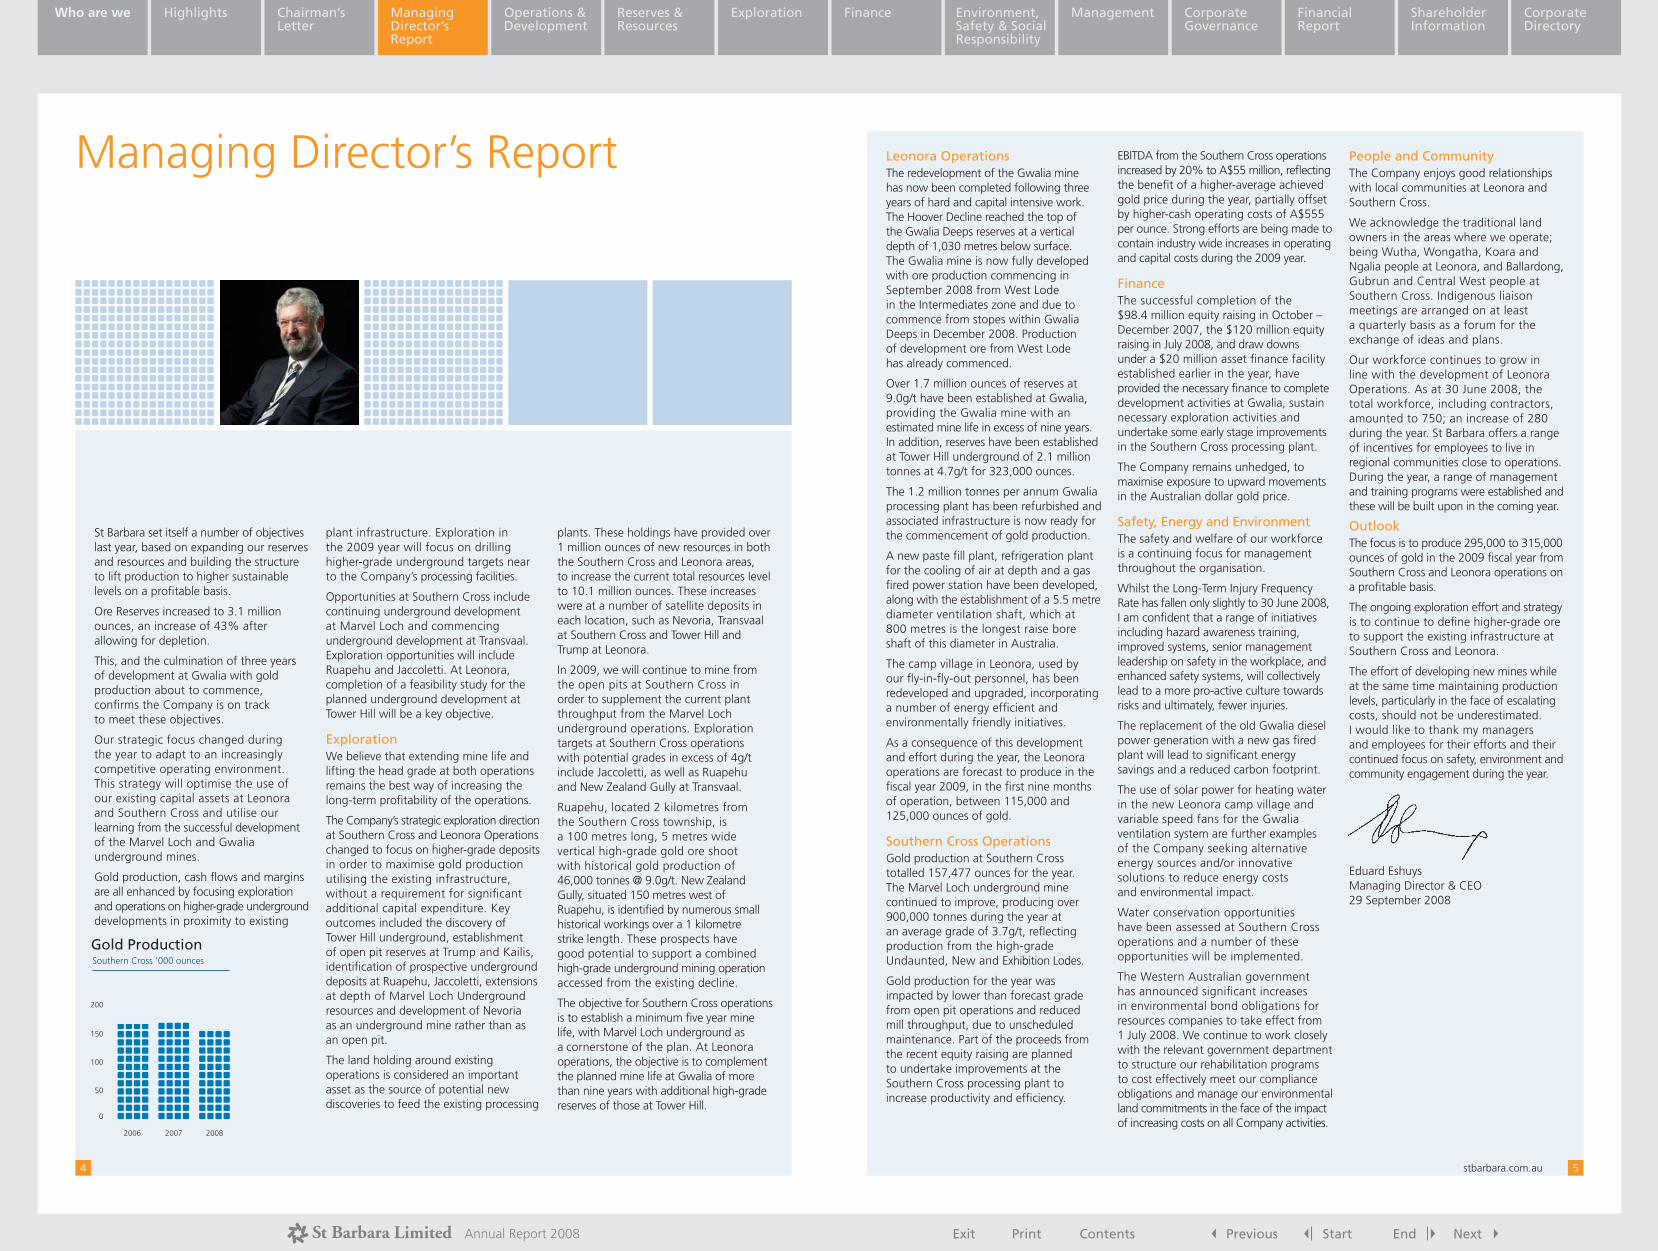
Gold ProductionSouthern Cross ‘000 ounces
200
150
100
50
0
2006 2007 2008
Managing Director’s Report
St Barbara set itself a number of objectives last year, based on expanding our reserves and resources and building the structure to lift production to higher sustainable levels on a profitable basis.
Ore Reserves increased to 3.1 million ounces, an increase of 43% after allowing for depletion.
This, and the culmination of three years of development at Gwalia with gold production about to commence, confirms the Company is on track to meet these objectives.
Our strategic focus changed during the year to adapt to an increasingly competitive operating environment. This strategy will optimise the use of our existing capital assets at Leonora and Southern Cross and utilise our learning from the successful development of the Marvel Loch and Gwalia underground mines.
Gold production, cash flows and margins are all enhanced by focusing exploration and operations on higher-grade underground developments in proximity to existing
plant infrastructure. Exploration in the 2009 year will focus on drilling higher-grade underground targets near to the Company’s processing facilities.
Opportunities at Southern Cross include continuing underground development at Marvel Loch and commencing underground development at Transvaal. Exploration opportunities will include Ruapehu and Jaccoletti. At Leonora, completion of a feasibility study for the planned underground development at Tower Hill will be a key objective.
ExplorationWe believe that extending mine life and lifting the head grade at both operations remains the best way of increasing the long-term profitability of the operations.
The Company’s strategic exploration direction at Southern Cross and Leonora Operations changed to focus on higher-grade deposits in order to maximise gold production utilising the existing infrastructure, without a requirement for significant additional capital expenditure. Key outcomes included the discovery of Tower Hill underground, establishment of open pit reserves at Trump and Kailis, identification of prospective underground deposits at Ruapehu, Jaccoletti, extensions at depth of Marvel Loch Underground resources and development of Nevoria as an underground mine rather than as an open pit.
The land holding around existing operations is considered an important asset as the source of potential new discoveries to feed the existing processing
plants. These holdings have provided over 1 million ounces of new resources in both the Southern Cross and Leonora areas, to increase the current total resources level to 10.1 million ounces. These increases were at a number of satellite deposits in each location, such as Nevoria, Transvaal at Southern Cross and Tower Hill and Trump at Leonora.
In 2009, we will continue to mine from the open pits at Southern Cross in order to supplement the current plant throughput from the Marvel Loch underground operations. Exploration targets at Southern Cross operations with potential grades in excess of 4g/t include Jaccoletti, as well as Ruapehu and New Zealand Gully at Transvaal.
Ruapehu, located 2 kilometres from the Southern Cross township, is a 100 metres long, 5 metres wide vertical high-grade gold ore shoot with historical gold production of 46,000 tonnes @ 9.0g/t. New Zealand Gully, situated 150 metres west of Ruapehu, is identified by numerous small historical workings over a 1 kilometre strike length. These prospects have good potential to support a combined high-grade underground mining operation accessed from the existing decline.
The objective for Southern Cross operations is to establish a minimum five year mine life, with Marvel Loch underground as a cornerstone of the plan. At Leonora operations, the objective is to complement the planned mine life at Gwalia of more than nine years with additional high-grade reserves of those at Tower Hill.
Leonora Operations The redevelopment of the Gwalia mine has now been completed following three years of hard and capital intensive work. The Hoover Decline reached the top of the Gwalia Deeps reserves at a vertical depth of 1,030 metres below surface. The Gwalia mine is now fully developed with ore production commencing in September 2008 from West Lode in the Intermediates zone and due to commence from stopes within Gwalia Deeps in December 2008. Production of development ore from West Lode has already commenced.
Over 1.7 million ounces of reserves at 9.0g/t have been established at Gwalia, providing the Gwalia mine with an estimated mine life in excess of nine years. In addition, reserves have been established at Tower Hill underground of 2.1 million tonnes at 4.7g/t for 323,000 ounces.
The 1.2 million tonnes per annum Gwalia processing plant has been refurbished and associated infrastructure is now ready for the commencement of gold production.
A new paste fill plant, refrigeration plant for the cooling of air at depth and a gas fired power station have been developed, along with the establishment of a 5.5 metre diameter ventilation shaft, which at 800 metres is the longest raise bore shaft of this diameter in Australia.
The camp village in Leonora, used by our fly-in-fly-out personnel, has been redeveloped and upgraded, incorporating a number of energy efficient and environmentally friendly initiatives.
As a consequence of this development and effort during the year, the Leonora operations are forecast to produce in the fiscal year 2009, in the first nine months of operation, between 115,000 and 125,000 ounces of gold.
Southern Cross OperationsGold production at Southern Cross totalled 157,477 ounces for the year. The Marvel Loch underground mine continued to improve, producing over 900,000 tonnes during the year at an average grade of 3.7g/t, reflecting production from the high-grade Undaunted, New and Exhibition Lodes.
Gold production for the year was impacted by lower than forecast grade from open pit operations and reduced mill throughput, due to unscheduled maintenance. Part of the proceeds from the recent equity raising are planned to undertake improvements at the Southern Cross processing plant to increase productivity and efficiency.
EBITDA from the Southern Cross operations increased by 20% to A$55 million, reflecting the benefit of a higher-average achieved gold price during the year, partially offset by higher-cash operating costs of A$555 per ounce. Strong efforts are being made to contain industry wide increases in operating and capital costs during the 2009 year.
FinanceThe successful completion of the $98.4 million equity raising in October – December 2007, the $120 million equity raising in July 2008, and draw downs under a $20 million asset finance facility established earlier in the year, have provided the necessary finance to complete development activities at Gwalia, sustain necessary exploration activities and undertake some early stage improvements in the Southern Cross processing plant.
The Company remains unhedged, to maximise exposure to upward movements in the Australian dollar gold price.
Safety, Energy and EnvironmentThe safety and welfare of our workforce is a continuing focus for management throughout the organisation.
Whilst the Long-Term Injury Frequency Rate has fallen only slightly to 30 June 2008, I am confident that a range of initiatives including hazard awareness training, improved systems, senior management leadership on safety in the workplace, and enhanced safety systems, will collectively lead to a more pro-active culture towards risks and ultimately, fewer injuries.
The replacement of the old Gwalia diesel power generation with a new gas fired plant will lead to significant energy savings and a reduced carbon footprint.
The use of solar power for heating water in the new Leonora camp village and variable speed fans for the Gwalia ventilation system are further examples of the Company seeking alternative energy sources and/or innovative solutions to reduce energy costs and environmental impact.
Water conservation opportunities have been assessed at Southern Cross operations and a number of these opportunities will be implemented.
The Western Australian government has announced significant increases in environmental bond obligations for resources companies to take effect from 1 July 2008. We continue to work closely with the relevant government department to structure our rehabilitation programs to cost effectively meet our compliance obligations and manage our environmental land commitments in the face of the impact of increasing costs on all Company activities.
People and CommunityThe Company enjoys good relationships with local communities at Leonora and Southern Cross.
We acknowledge the traditional land owners in the areas where we operate; being Wutha, Wongatha, Koara and Ngalia people at Leonora, and Ballardong, Gubrun and Central West people at Southern Cross. Indigenous liaison meetings are arranged on at least a quarterly basis as a forum for the exchange of ideas and plans.
Our workforce continues to grow in line with the development of Leonora Operations. As at 30 June 2008, the total workforce, including contractors, amounted to 750; an increase of 280 during the year. St Barbara offers a range of incentives for employees to live in regional communities close to operations. During the year, a range of management and training programs were established and these will be built upon in the coming year.
OutlookThe focus is to produce 295,000 to 315,000 ounces of gold in the 2009 fiscal year from Southern Cross and Leonora operations on a profitable basis.
The ongoing exploration effort and strategy is to continue to define higher-grade ore to support the existing infrastructure at Southern Cross and Leonora.
The effort of developing new mines while at the same time maintaining production levels, particularly in the face of escalating costs, should not be underestimated. I would like to thank my managers and employees for their efforts and their continued focus on safety, environment and community engagement during the year.
Eduard Eshuys Managing Director & CEO 29 September 2008
4 stbarbara.com.au 5

Exit Print Contents Previous Start End NextAnnual Report 2008
Who are we Highlights Chairman’s Letter
Managing Director’s Report
Operations & Development
Exploration Finance Environment, Safety & Social Responsibility
Management Corporate Governance
Financial Report
Shareholder Information
Corporate DirectoryCorporate Directory
Reserves & Resources
Operations & Development
Southern Cross• Southern Cross operations produced
157,477 ounces of gold for the year
• Gold sold for an average price of A$907 per ounce
• Cash operating costs of A$555 per ounce and in line with revised forecast for the year
• Marvel Loch Underground produced 900,000 tonnes of ore, an increase of 49% from the prior year production of 603,000 tonnes of ore
Southern Cross OperationsSt Barbara’s Southern Cross operations are centred at Marvel Loch, 30km south of the town of Southern Cross and 360km east of Perth, Western Australia. The Southern Cross belt has an endowment including past production and current resources of approximately 12 million ounces and is predominantly held by St Barbara. Four deposits in the district have produced more than 1 million ounces each. Mineralisation is hosted within shear zones at contacts between mafics and sediments, and within banded iron-formations.
The gold treatment plant is based at the Marvel Loch underground mine. The treatment plant processed 2.2 million tonnes in the 2008 financial year at a grade of 2.5 g/t. Throughput was lower than expected due to unscheduled maintenance in the crushing and milling circuits in the second half of the financial year. As a consequence, Run of Mine (ROM) stockpiles increased at 30 June 2008 to 306,000 @ 1.9g/t for 18,000 contained ounces which will be processed in the 2009 fiscal year. Gold production for the full year was lower than expected mainly due to the lower throughput and lower than forecast gold grades. In the 2009 financial year $10 million is set aside for further upgrading the plant, including tailings facilities, gold room and crushing circuit.
Marvel LochThe Marvel Loch underground mine is the cornerstone of St Barbara’s Southern Cross operations. Gold mineralisation extends over a 1.3 kilometre strike length, has been identified to depths of over 700 metres below surface and remains open at depth. High-grade mineralisation is localised in quartz-veined shear zones near a mafic/ultramafic sediment interface.
The ore body comprises multiple lodes, those currently being mined include:
• Sherwood and Undaunted at the northern end;
• Exhibition at the centre; and
• East and New at the southern end.
The introduction of new trucks, drilling equipment and increased mine working faces contributed to an increase of
production from 603,000t in the 2007 financial year to 900,000t in the 2008 financial year.
Open Pit ProductionOpen pit production was mainly sourced from Hercules, GVG and Nevoria. Mining of the Hercules open pit deposit was completed in the first half of the 2008 fiscal year.
Subsequent to completion of Hercules, a number of small open pits were mined in the nearby GVG area, followed by commencement of open pit mining at Norton (part of the Nevoria system) in June 2008. GVG open pits included Tenacious Pig, Bronco South and Grand National. Total open pit production for the year was 1.6 million tonnes @ 1.7g/t for a total of 90,000 ounces.
OutlookThe focus of exploration and development at Southern Cross has shifted towards higher-grade underground deposits (including Marvel Loch Underground) to maximise gold production without needing to expand the treatment plant.
In the 2009 financial year, mine production is planned from Marvel Loch Underground, and Transvaal, supplemented by the processing of stock piles.
A number of other targets, including Ruapehu and New Zealand Gully at Transvaal as well as Jaccoletti and GVG in proximity to existing infrastructure, will be drilled during the coming year.
Southern Cross production is forecast to be in the range of 180,000 and 190,000 ounces of gold for the 2009 fiscal year.
Southern Cross Operations Above: Marvel Loch, Southern Cross
Right: Gold pour at Southern Cross
stbarbara.com.au6 stbarbara.com.au 7

Exit Print Contents Previous Start End NextAnnual Report 2008
Who are we Highlights Chairman’s Letter
Managing Director’s Report
Operations & Development
Exploration Finance Environment, Safety & Social Responsibility
Management Corporate Governance
Financial Report
Shareholder Information
Corporate DirectoryCorporate Directory
Reserves & Resources
Continued
Operations & Development
OutlookTargeted gold production for the 2009 fiscal year from Leonora Operations is in the range of 115,000 – 125,000 ounces, including production from Gwalia Deeps and West Lode underground deposits as well as Trump and Kailis open pit deposits.
A feasibility study is currently underway into the mining of Tower Hill as an underground deposit. Reserves as at 30 June 2008 were estimated as 2.1 million tonnes @ 4.7g/t for 323,000 ounces. In addition, drilling is currently underway to further extend these higher-grade reserves at depth. The reserve definition, extension and development strategy is for Tower Hill to complement gold production from Gwalia over a number of years.
Leonora• Hoover Decline reached the top
of the reserves at a vertical depth of 1030 metres below surface
• Gwalia processing plant and associated infrastructure on schedule for commencement of gold production
• Production of stope ore from West Lode has commenced
• Grade control drilling for the stope production at Gwalia Deeps for the year ahead has been completed
• Open pit mining at Trump to supplement Gwalia Deeps production has commenced
Leonora OperationsThe Leonora operations are located 200 kilometres north of Kalgoorlie. Gwalia is a world-class ore body, with historical production and current resources exceeding 8 million ounces of gold.
Gold production from Gwalia is about to recommence. Based on ore reserves of 1.7 million ounces as at June 2008, Gwalia has an estimated mine life in excess of 9 years.
Development activities during the year continued and included:
• The Hoover Decline reached the top of the reserves in the June 2008 quarter and the Barden decline was commenced underground to provide access for development of the first series of ore production stopes from Gwalia Deeps;
• Development of a 5.5 metre diameter ventilation shaft, which at 800 metres is the longest raise bore shaft of this diameter in Australia; and
• Refurbishment of the 1.2 million tonnes per annum Gwalia mill and other infrastructure projects which are now close to completion. These include a new paste fill plant, refrigeration plant and gas fired power station.
Grade control drilling of Gwalia Deeps has been completed for stope production for the 2009 fiscal year. Some development ore has been loaded on the run-of-mine pad prior to the full commissioning of the mill. Commissioning of part of the mill circuit began in July and gold production is about to commence.
The Gwalia mine is forecast to achieve an annual gold production rate of 200,000 ounces before 2011.
The total pre-commissioning capital expenditure for the Gwalia mine during the year was $118 million. The major items were mining development ($57 million), processing plant and bore fields ($37 million) and infrastructure ($17 million).
Leonora Operations Above: Pumping station, Gwalia underground
Right: Processing plant, Leonora
stbarbara.com.au8 stbarbara.com.au 9

Exit Print Contents Previous Start End NextAnnual Report 2008
Who are we Highlights Chairman’s Letter
Managing Director’s Report
Operations & Development
Exploration Finance Environment, Safety & Social Responsibility
Management Corporate Governance
Financial Report
Shareholder Information
Corporate DirectoryCorporate Directory
Reserves & Resources
Notes – General1) All data is rounded to two significant figures. Discrepancies in summations will occur due to rounding.2) These resources have been compiled and estimated under the direction of Mr Ben Bartlett.3) Mr Bartlett has sufficient experience relevant to the style of mineralisation and type of deposits under consideration and to the activities which
they undertook to qualify as Competent Persons as defined in the “Australasian Code for Reporting of Mineral Resources and Ore Reserves”. He has consented to the inclusion in the report of the matters based on his information in the form and context in which they appear.
4) The Tower Hill resource estimate is calculated using a 0.6g/t cut-off within an optimised $1,500 pit shell, and a 2.8g/t cut-off below the optimised pit shell.
5) The Transvaal mineral resource estimate is calculated using a graduated cut off grade of 0.5 to 0.9g/t in oxide and 0.7 to 1.0g/t in fresh within an optimised $1,500 pit shell and a 2.0g/t cut-off below the optimised pit shell.
6) Resource variance to the March 2008 quarterly include, Marvel Loch (-61,000 oz) Mine depletion, Nevoria (-5,000 oz) Mine depletion, GVG/Sth Burbidge (+7,000 oz) Pakistani resource, Tower Hill (-41,000oz) Infill drilling of inferred areas and Transvaal (+590,000) and Gwalia Intermediates (-218,501) reclassification of inferred resources within remanent mining areas.
7) All numbers have been rounded, tonnes (10,000) and ounces (1,000). 8) Some apparent discrepancies in summations will occur due to rounding.9) Leonora Other – McGraths OC, Kailis, Trump, Harbour Lights, Tamoola s/pile, Royal Arthur Bore, Rainbow.10) Southern Cross Other – Axehandle, North Edwards Find, Cornishman OC (SBM 51%), New Zealand Gully, Various Stockpiles, Redwing, Yilgarn Star.
Notes – General:1) The ore reserve estimates used a gold price of $950/oz and $800/oz for ounces mined prior to and post June 2010.2) All data is rounded to two significant figures. Discrepancies and summations will occur due to rounding.
Notes – Southern Cross:1) Information in this report that relates to Southern Cross Ore Reserves is based on information compiled by Mr. Jacobus Kirsten, Mr. Sam Larritt,
and Mr. Peter Fairfield who are members of the Australasian Institute of Mining and Metallurgy. Mr. Kirsten, Mr. Larritt and Mr. Fairfield are full-time employees of St Barbara Limited. Mr. Kirsten, Mr. Larritt, and Mr. Fairfield have sufficient experience relevant to the style of mineralisation, type of deposit under considerations and for the activity being undertaken to qualify as Competent Persons as defined by the 2004 edition of the ‘Australasian Code for Reporting of Mineral Resources and Ore Reserves’. Mr. Kirsten, Mr. Larritt, and Mr. Fairfield consent to the inclusion in the report of the matters based on their information in the form and context in which it appears.
Notes – Leonora1) Information in this report that relates to Leonora Ore Reserves is based on information compiled by Mr. Jacobus Kirsten, Mr. Peter Fairfield and
Mr Per Scrimshaw who are members of the Australasian Institute of Mining and Metallurgy. Mr Kirsten, Mr. Fairfield are full-time employees of St Barbara Limited. Mr Scrimshaw is a consultant to St Barbara Limited. Mr. Kirsten, Mr. Donald, Mr. Fairfield and Mr. Scrimshaw have sufficient experience relevant to the style of mineralisation, type of deposit under considerations and for the activity being undertaken to qualify as Competent Persons as defined by the 2004 edition of the ‘Australasian Code for Reporting of Mineral Resources and Ore Reserves’. Mr. Kirsten, Mr. Fairfield and Mr. Scrimshaw consent to the inclusion in the report of the matters based on their information in the form and context in which it appears.
2) The Gwalia Deeps reserve is based on information as at 30 March 2008.
Mineral Resource Statement at 30 June 2008
Region Project
Measured Indicated Inferred Total
Tonnes (k)
Au g/t
k oz Tonnes (k)
Au g/t
k oz Tonnes (k)
Au g/t
k oz Tonnes (k)
Au g/t
k oz
Southern Cross Marvel Loch 2,800 3.5 318 4,380 3.5 497 100 5.3 17 7,280 3.6 832
Nevoria 0 0 0 4,190 3.6 484 630 3.9 80 4,820 3.6 564
Transvaal 0 0 0 2,410 4.1 319 2,290 4.3 315 4,700 4.2 634
GVG Lode 1 0 0 0 1,200 2.5 98 0 0 0 1,200 2.5 98
Other (7) 340 1.8 20 5,350 1.8 309 3,700 2.0 235 9,390 1.9 564
Total Southern Cross 3,140 3.3 338 17,530 3.0 1,707 6,720 3.0 647 27,390 3.1 2,692
Leonora Gwalia Deeps 0 0 0 10,440 8.4 2,835 1,930 11.6 720 12,370 8.9 3,555
Gwalia Int & West Lode
0 0 0 210 4.1 28 1,350 5.9 255 1,560 5.6 283
Tarmoola 12,000 0.9 347 46,000 1.2 1,775 0 0 0 58,000 1.1 2,122
Tower Hill 0 0 0 18,760 2.2 1,318 380 4.0 49 19,140 2.2 1,367
Other (7) 990 1.0 33 4,270 1.6 216 2,860 3.1 288 8,120 2.1 537
Total Leonora 12,990 0.9 380 79,680 2.4 6,172 6,520 6.3 1,312 99,190 2.5 7,864
Total All Regions 16,130 1.4 718 97,210 2.5 7,879 13,240 4.6 1,959 126,580 2.6 10,556
Proven and Probable Reserves Statement as at 30 June 2008
Proven Probable Total
Region kT Au g/t Koz kT Au g/t koz kT Au g/t koz
Southern Cross
Marvel Loch underground 1,597 3.2 166 2,945 3.2 304 4,542 3.2 470
Nevoria underground 1,786 3.7 210 1,786 3.7 210
Nevoria open pit 699 2.7 61 699 2.7 61
GVG – open pits 752 1.4 34 752 1.4 34
Transvaal – open pit 471 4.7 71 471 4.7 71
Other 338 1.8 30 1,389 0.8 35 1,727 1.2 65
Total Southern Cross 1,935 3.2 196 8,042 2.8 715 9,977 2.8 911
Leonora
Gwalia underground 5,990 9 1,730 5,990 9 1,730
Gwalia West lode underground
140 2.9 13 140 2.9 13
Trump open pit 402 2.0 25 402 2.0 25
Kailis open pit 602 3.5 67 602 3.5 67
Tower Hill underground 2,144 4.7 323 2,144 4.7 323
Total Leonora 9,278 7.2 2,158 9,278 7.2 2,158
Total All Regions 1,935 3.2 196 17,320 5.2 2,873 19,255 5.0 3,069
Reserves & Resources
stbarbara.com.au10 stbarbara.com.au 11

Exit Print Contents Previous Start End NextAnnual Report 2008
Who are we Highlights Chairman’s Letter
Managing Director’s Report
Operations & Development
Exploration Finance Environment, Safety & Social Responsibility
Management Corporate Governance
Financial Report
Shareholder Information
Corporate DirectoryCorporate Directory
Reserves & Resources
strong. There is considerable potential to increase resources at depth.
In detail, resource definition drilling of the Undaunted Lode has confirmed the continuity of high-grade mineralisation below the currently defined reserves. Reserves currently extend to 445 metres below surface. However, significant results including 13.2 metres at 7.4 g/t from 650 metres below surface and 22.7 metres at 8.9 g/t at 751 metres below surface clearly confirm continuity with depth below current reserves. Encouraging intersections were also obtained from extensions to East Lode.
NevoriaDuring the year, a resource and reserve were established within the mineralised banded-iron formations at Nevoria. Open pit mining has commenced at Norton on the eastern end of the deposit. Underground reserves of 1.7 million tonnes at 3.7g/t for 210,000 ounces were established. Development of Nevoria is scheduled to commence during the December quarter 2008.
TransvaalTransvaal is located 30 kilometres north of the Marvel Loch plant and comprises a series of deposits previously mined from open-cut and underground. Drilling of the eastern line of Transvaal was completed as part of a program to estimate open pit resources to 150 metres below surface. A reserve and resource were established, with mineralisation remaining open at depth. Metallurgical test work to date suggests metallurgical recoveries of 70 – 80% and studies will be initiated to optimise the
recoveries from the series of deposits through the Marvel Loch plant. Other opportunities within Transvaal include Ruapehu and New Zealand Gully.
Jaccoletti Jaccoletti is located approximately 1.5 kilometres from the Marvel Loch plant and associated infrastructure. Jaccoletti, which has a strike length of approximately 1.6 kilometres, is located on a shear parallel to the Marvel Loch structure and has been mined historically as both an open pit and an underground operation. Total historic production was approximately 90,000 ounces of gold from shallow depths.
The potential for a high-grade underground resource at Jaccoletti has been upgraded by recent drilling results that have defined a steep south-east plunging sediment-hosted ore shoot with true widths in excess of 20 metres and a strike length of 50 – 80 metres.
GVG Lode 1 Gold mineralisation at GVG Lode 1 is associated with a pipe-like quartz-veined sulphide shoot approximately 80 metres in diameter. The deposit has previously been mined, as an open pit to 105 metres below surface, and underground to 230 metres below surface, with a decline developed to 300 metres below surface. This deposit was previously mined from underground to 200 metres below surface, producing 1 million tonnes at 4.2g/t for 140,000 contained ounces. Diamond drilling from surface has commenced to extend the GVG Lode 1 resource to 800 metres below surface.
Base MetalsDiamond drilling along strike from the Teutonic Bore and Jaguar Copper-Zinc deposits at Leonora has intersected strongly altered mafic and felsic volcanic rocks hosting a number of sulphidic chert and shale horizons. The intensity of alteration reflects a dynamic system and supports the potential for discovery of concealed deposits of high-grade copper and zinc in the area.
During the year, drilling for nickel sulphide mineralisation at Sullivans, Leonora intersected a narrow interval of disseminated sulphides at the base of the ultramafic sequence. This ultramafic sequence and the geological setting are conducive for hosting massive nickel sulphide deposits. Further drilling is planned.
GreenfieldsSt Barbara currently has a land bank outside Western Australia of approximately 10,000 square kilometres, dedicated to the search for the next generation of mineral discoveries. A limited portion of the exploration budget of $1.5 million for the 2009 financial year will be allocated for greenfields exploration of the highest ranked targets. Most of the targets are buried under cover and will require initial geophysical surveys to define targets. The greenfields targets have resulted from comprehensive analysis over the last two years by an experienced exploration team of regional geophysical, geological and geochemical data integrated with past exploration activity results.
Ore Reserves• Ore Reserves increased to
3.1 million ounces as at 30 June 2008, after allowing for depletion, an increase of 43%
• Southern Cross Proven and Probable Ore Reserves estimate increased from 603,000 ounces to 911,000 ounces as a result of drilling at Nevoria and Transvaal
• The Leonora Proven and Probable Ore Reserves increased from 1.7 million ounces to 2.2 million ounces through the delineation of Probable Reserves at Tower Hill for 323,000 ounces and the addition of open-pit Probable Reserves at Kailis and Trump for 92,000 ounces
Mineral Resources• Total Mineral Resources (including
Reserves) at 30 June 2008 are 127 million tonnes at 2.6 g/t gold for 10.6 million ounces
• Measured and Indicated Resources are 8.6 million ounces
StrategyExploration during the 2008 financial year focused on adding to reserves and resources close to existing infrastructure at Leonora and Southern Cross Operations.
Key outcomes included the definition of Tower Hill underground reserves, establishment of open pit reserves at Trump and Kailis at Leonora and identification of prospective underground deposits at Transvaal, Jaccoletti and GVG Lode 1 and extensions at depth and within the existing mine infrastructure of Marvel Loch Underground resources at Southern Cross.
Strategically, the Company has decided to focus on higher-grade deposits at both Southern Cross and Leonora Operations to maximise gold production from the existing infrastructure without requiring significant additional capital expenditure.
Leonora Gold endowment of the Leonora region is substantial, with past production and remaining resources and reserves on St Barbara tenements totalling 13.5 million ounces of gold.
GwaliaThe Gwalia lodes consist of high-grade resources to a depth of 1,800 metres below surface. However, gold mineralisation has been intersected to 1,900 metres below surface and the ore body remains open at depth.
Tower Hill During the year extensive drilling at Tower Hill established an underground reserve of 2.1 million tonnes at 4.7g/t of 323,000 ounces. A decision to develop the Tower Hill reserves awaits the completion of a feasibility
study. Indicative planning is to bring Tower Hill into production in the 2010 financial year. Drilling is underway to extend these higher-grade reserves within the existing resource envelope, based on a refined geological model.
TarmoolaTarmoola has a resource of 2.1 million ounces. Exploration at Tarmoola has focused on extending the high-grade mineralisation on the eastern flank of the granite and delineating further high-grade lodes suitable for underground development. Recent drilling has returned encouraging intersections on the granite carapace, extending up to 800 metres north of the pit. A new structural model is being developed to better predict these high-grade domains. Further work will be required to consider the viability of a high-grade underground development.
Southern CrossSt Barbara controls the larger majority of the Southern Cross – Forrestania greenstone belt, over a length of some 200 kilometres, and has a total gold endowment of over 12 million ounces. A comprehensive study of deposit styles, structural associations, the effectiveness of previous exploration and targeting was completed, producing some 51 gold targets within St Barbara’s tenure. These targets have been ranked, further assessed and will be considered for future exploration.
Marvel Loch UndergroundMarvel Loch Underground has been mined for a number of years and comprises a number of steeply-plunging quartz-veined lodes, with thicknesses of up to 30 metres. Vertical continuity of the deposits is
Exploration
Southern Cross Coreyard Drilling at Tower Hill
stbarbara.com.au12 stbarbara.com.au 13

Exit Print Contents Previous Start End NextAnnual Report 2008
Who are we Highlights Chairman’s Letter
Managing Director’s Report
Operations & Development
Exploration Finance Environment, Safety & Social Responsibility
Management Corporate Governance
Financial Report
Shareholder Information
Corporate DirectoryCorporate Directory
Reserves & Resources
Finance
60
50
40
30
20
10
0
2006 2007 2008
EBITDASouthern Cross Operations $M
150
120
90
60
30
0
2006 2007 2008
Gold Sales Revenue$M
$4.9 million. The loss recognised in the year comprised the cumulative loss taken directly to the investment fair value equity reserve in prior years and the current year movement in fair value of the listed investments.
OtherCorporate administration costs for the year totalled $22.7 million (2007: $19.8 million), which included expenses related to the corporate office, rates and taxes associated with the Company’s landholdings, compliance costs and operations support and technical services. Royalty costs totalled $6.2 million (2007: $5.5 million) for the year, comprising corporate and government royalties.
Tax ExpenseThe Company did not pay any income tax during the year (2007: Nil).
Financial PositionAs at 30 June 2008, net current assets decreased to $40.3 million (2007: $89.4 million) due mainly to the lower cash balance. Subsequent to balance date, the Company received $54.5 million, after transaction costs, from the retail component of the renounceable accelerated pro-rata entitlement offer. Higher trade and other payables were offset by an increase in inventories and other receivables. As at 30 June 2008, restricted cash of $20.6 million (2007: $8.1 million), which represented cash held on deposit as security for bank guarantees, was reported in the balance sheet as a current other receivable. The working capital balance as at 30 June 2008, excluding the current deferred mining asset and restricted cash, was $3.8 million (2007: $58.0 million).
Total non-current assets increased by $191.9 million during the year to $324.5 million (2007: $132.6 million). The increase in non-current assets was attributable to capitalised development expenditure at Southern Cross and Gwalia, an increase in property, plant and equipment and the higher fair value of premiums on purchased put options. The increase in property, plant and equipment was due
mainly to the refurbishment of the processing plant and surface infrastructure at Gwalia.
Non current liabilities increased to $128.1 million (2007: $127.0 million) with non current interest bearing borrowings of $98.6 million (2007: $97.7 million) as at 30 June 2008, comprising mainly the balance on the convertible notes of $97.7 million (2007: $96.5 million).
Excluding the debt associated with the convertible notes, total debt was $3.3 million.
Cash FlowOperating activities
Net cash flow from operating activities for the year was $25.0 million (2007: $26.4 million). An increase in receipts from the sale of gold reflected the benefit of a higher average achieved gold price during the year. Payments to suppliers and employees were $8.0 million higher than the prior year, reflecting the impact of increased operating costs, higher ore stockpiles due to reduced mill throughput in the June 2008 quarter, and expenses associated with the development of Leonora Operations.
Interest received of $5.2 million (2007: $3.0 million) was higher than in the prior year due to higher cash balances during the year, as a result of the convertible notes issued in June 2007 and the equity raising in the first half of the 2008 financial year. The interest paid in the year of $8.0 million was in respect of the convertible notes.
Investing activities
Cash flow used in investing activities amounted to $222.0 million (2007: $110.7 million) and was mainly in the following major areas:
• Mines under construction at Gwalia – $68.7 million;
• Mine development expenditure at Southern Cross operations – $51.7 million;
• Purchase of property, plant and equipment, principally at Gwalia – $60.7 million; and
• Exploration expenditure – $37.0 million.
Development activities at Gwalia during the year focused on continuation of the Hoover decline, the commencement of the Barden decline to access the first series of ore production stopes in Gwalia Deeps and construction of mine infrastructure, including the refurbishment of the processing plant. Total pre-commissioning capital expenditure for the year was $117.7 million, comprising mine development of $57.0 million, mine infrastructure of $11.8 million and plant and equipment of $48.9 million.
Mine development expenditure at Southern Cross operations comprised deferred waste-stripping and operating development of $8.1 million and mine development expenditure for Marvel Loch and the open pits of $43.6 million.
Financing activitiesCash flow from financing activities totalled $145.1 million (2007: $92.3 million), which included net proceeds from equity raisings during the year of $161.7 million. Transaction costs associated with the equity raisings totalled $5.4 million for the year. Cash flow from financing activities included a movement in restricted cash of $12.5 million (2007: $7.5 million).
Proceeds from the fully-underwritten retail component of the 2 for 7 renounceable accelerated pro-rata entitlement offer totalling $54.5 million, after transaction costs, was received on 17 July 2008 and is therefore not recognised in the 30 June 2008 financial statements.
• EBITDA from Southern Cross operations increased by 20% to A$55 million
• Average gold price achieved of A$907 per ounce, up by 16%
• Capital raisings of A$161.7 million to fund development of Gwalia and support operations
• Cash at bank at 30 June 2008 of A$56.1 million, including restricted cash of A$20.6 million
• Cash from the retail component of the 2 for 7 renounceable accelerated pro-rata entitlement offer of $54.5 million received post 30 June 2008
• Total debt, excluding Convertible Notes, of A$3.3 million
Revenue and SalesGold sales revenue was generated from the sale of 157,278 (2007: 167,065) ounces at an average gold price of A$907 (2006: A$780) per ounce.
Other revenue of $4.8 million (2007: $3.5 million) comprised mainly interest earned during the year of $5.1 million (2007: $3.2 million), of which $1.4 million was capitalised.
EBITDAEBITDA from the Southern Cross operations was $55.0 million (2007: $45.7 million), reflecting the benefit of the higher gold price. The total cash operating cost of A$555 per ounce at Southern Cross operations was higher compared to the previous year cost of A$508 per ounce, due to increased mining costs associated with underground and open pit production and higher processing costs. EBITDA for the Group was $12.3 million (2007: $28.4 million), which included an exploration charge of $28.5 million (2007: $8.8 million).
ExplorationTotal exploration expenditure during the year was $37.0 million (2007: $23.7 million), of which $8.4 million was capitalised. The higher level of exploration expenditure was due to the focus on increasing resources and reserves to underpin long-term production at Southern Cross and Leonora.
As at 30 June 2008, mineral resources increased to 10.6 million ounces (2007: 8.4 million ounces) and ore reserves increased, after depletion, to 3.1 million ounces (2007: 2.3 million ounces).
The Company policy in relation to accounting for exploration supports capitalisation of expenditure where it results in an increase in reserves and it is likely to be recouped from successful development and exploitation of the area of interest, or alternatively, by its sale. Capitalised exploration expenditure during the year related mainly to Marvel Loch, Transvaal, Nevoria and Trump/Kailis. As at 30 June 2008, a feasibility study into
developing Tower Hill as an underground deposit had not been completed, and as a result all exploration expenditure at Tower Hill was expensed. During the year, the exploration strategy changed to concentrate on higher-grade reserves in proximity to existing infrastructure.
Depreciation and AmortisationDepreciation and amortisation totalled $30.8 million (2007: $30.0 million) for the year. The depreciation and amortisation charge for the year was $207 per ounce (2007: $175 per ounce), which reflects the impact of increased capital expenditure at Marvel Loch and waste stripping at the open pit operations at Southern Cross.
Finance costsNet finance costs increased to $3 million (2007: $2.7 million) in the year due mainly to higher interest expense associated with the convertible notes. During the year interest paid of $6.6 million was capitalised to mines under construction.
Financial instrumentsNet gains on gold put options of $16.8 million comprised $3.1 million of realised losses (2007: realised gain of $4.3 million) associated with put option premiums to cover Southern Cross production in the year, and $19.9 million of unrealised gains on put options covering future production (2007: unrealised gain of $2.3 million). The $19.9 million unrealised gain on the purchased put options represents an increase in the fair value, calculated as at 30 June 2008, of $15.5 million for the A$700 per ounce and $4.4 million for the A$800 per ounce put options.
The A$700 per ounce put options were originally acquired in 2007 to secure the investment decision to redevelop the Gwalia mine and infrastructure.
Available for sale financial assetsDuring the financial year the Company recognised the cumulative decline in the fair value of listed investments, principally the Company’s 10% investment in Bendigo Mining Limited, as an impairment loss in the income statement totalling
(A$million) FY2008 FY2007 FY2006
Gold Sales Revenue 142.4 130.4 114.9
Other Revenue and Income 5.8 15.1 24.8
Total Revenue 148.2 145.5 139.7
EBITDA 12.3 28.4 13.6
EBIT (18.4) (1.6) 4.0
Net Profit (loss) after tax (17.3) (2.9) 6.0
stbarbara.com.au14 stbarbara.com.au 15

Exit Print Contents Previous Start End NextAnnual Report 2008
Who are we Highlights Chairman’s Letter
Managing Director’s Report
Operations & Development
Exploration Finance Environment, Safety & Social Responsibility
Management Corporate Governance
Financial Report
Shareholder Information
Corporate DirectoryCorporate Directory
Reserves & Resources
EnvironmentWater is a key element of the environment in which we operate and efficient water usage is a key focus at all our operations. The Southern Cross Operation Water Task Force was formed to develop water management strategies to identify and secure new water resources to support existing operations and proposed expansion plans. St Barbara is also engaged in discussions with the Western Australian Water Corporation to develop a Water Efficiency Management Plan (WEMP), and identify opportunities to reduce water use. The Company submitted an Assessment and Reporting Schedule to the Energy Efficiency Opportunities office outlining the proposed actions planned to be undertaken during the year to reduce energy usage by the Company.
We are also working on a number of initiatives to reduce the greenhouse footprint and have submitted the first annual progress report to the Greenhouse Challenge Plus Programme.
The new environmentally friendly Leonora village features a number of water saving initiatives including low flow shower heads with shower timers, low water consumption native plant species and grey water used for watering gardens via drip irrigation. A solar water heating system has also been installed to improve energy efficiencies.
RehabilitationThe rehabilitation programme for the year focused on completing the final stages of rehabilitation at the Triad and Hercules waste dumps at Southern Cross Operations and an extensive seeding program was implemented. Additional waste and capping material from GVG, Hercules, Tenacious Pig and Grand National were used to complete capping of the GVG tailings dam.
Approximately 90% of the rehabilitation of the Tower Hill drill sites has also been completed.
The Western Australian Department of Industry and Resources is progressively applying increased rehabilitation bonding rates with effect from 1 July 2008, to projects in the State.
The Company is working closely with the Department to develop cost effective rehabilitation programs to improve legacy sites and sensibly manage our bond obligations.
Health and SafetyThe strategic focus in health and safety throughout the year has been to promote a cultural shift towards pro-active hazard and risk identification and management, compared to the previous reactive responses to safety incidences.
Whilst statistically the Company’s safety performance improved compared to the previous year, there is still room for significant improvement. The Lost Time Injury Frequency Rate fell to 4.5 (2007: 4.7).
A Corporate Health and Safety team was established during the year to support Operations. A Safety Improvement Plan has been approved for implementation by the Health and Safety Committee of the Board, and a Safety Management System is progressively being implemented.
Safety systems are supported by a series of training programmes being rolled out across the Company.
A new safety monitoring system, InControl, has been implemented to improve the recording and management of hazards, incidents and site-based training.
Integral to improving the safety awareness culture, has been the promotion of visible leadership on safety in the workplace. Senior management and all Directors have participated in workplace safety inspections at site.
The health of our employees is also important and is supported by a systematic health-awareness program run at all Company sites. Employees also have available a free counselling service should the need arise.
During the year, the exploration and Leonora mining teams achieved a safety record of 15 consecutive months without a single lost-time injury. The challenge is now for the remaining operating personnel to achieve the same result, and for the exploration and Leonora mining teams to maintain their safety performance.
Our vision of Zero Harm is still the main focus with the ultimate goal to reduce and eliminate all injuries.
Social ResponsibilitySt Barbara is committed to conducting its activities in a socially responsible manner that is designed to respect the environment in which we operate, as well as the environment of the local communities with whom we interact. The Company acknowledges the traditional landholders in areas where we operate, and holds regular community consultation meetings with the local communities to discuss future exploration programs, environmental impact, indigenous issues and other local matters.
We continue to aim to maintain broad-based, ongoing community support for our activities and build relationships with the local communities. During the year, we continued to support the Leonora district by sponsoring the Leonora Foundation Day and providing funding for the development of a purpose built learning centre at the local kindergarten.
At Southern Cross, the Company engaged with the local school for a tree planting/rehabilitation programme at one of its projects.
St Barbara continues to support the Royal Flying Doctor Service and acknowledges its critical role in rural and regional Australia.
Environment, Safety & Social Responsibility
New camp village at Leonora Sheltered benches at Leonora District High School sponsored by St Barbara
stbarbara.com.au16 stbarbara.com.au 17

Exit Print Contents Previous Start End NextAnnual Report 2008
Who are we Highlights Chairman’s Letter
Managing Director’s Report
Operations & Development
Exploration Finance Environment, Safety & Social Responsibility
Management Corporate Governance
Financial Report
Shareholder Information
Corporate DirectoryCorporate Directory
Reserves & Resources
Management
Corporate Governance is the process by which companies are directed and managed. Strong corporate governance is expected to aid effective management and decision making. St Barbara is committed to sustaining and improving corporate governance systems.
In August 2007, the ASX Corporate Governance Council reviewed and updated its Corporate Governance Principles and Recommendations. Although the new Principles and Recommendations are due to come into effect for the financial year ending 30 June 2009, the ASX Corporate Governance Council has encouraged companies to make an early transition to the revised Principles and Recommendations and the Company has adopted and implemented them in this report.
As part of St Barbara’s regular review of its policies and practices, the Company has assessed its practices against the new ASX Recommendations. During the last year, St Barbara has made modifications and improvements to its policies to reflect both these recommendations, the increased size of the Company and St Barbara’s incorporation into the S&P/ASX 200. St Barbara’s position with respect to the relevant ASX Recommendations is described below.
St Barbara’s new website contains an expanded range of information on governance practices and policies including Charters for the Board and all Board Committees. The web address is www.stbarbara.com.au
Principle 1: Lay solid foundations for management and oversightThe role of the Board is to represent shareholders, provide strategic guidance to, and effective oversight of, management, foster a culture of good governance, and promote a safe and healthy working environment within the Company.
In performing its role, the Board at all times will endeavour to act:
i) in a manner designed to create and continue to build sustainable value for shareholders;
ii) in recognition of its overriding responsibility to act honestly, fairly and in accordance with the law in serving the interests of the Company, its shareholders, employees, and as appropriate, other stakeholders;
iii) in accordance with the duties and obligations imposed upon Directors by the Company’s Constitution and applicable law; and
iv) with integrity and objectivity, consistent with ‘best practice’ ethical, professional and related standards.
The specific responsibilities of the Board are described in the Board Charter.
Executive manager evaluation
The Board has established a Remuneration Committee, which provides recommendations and direction for the Company’s remuneration practices. It utilises independent expert advice and surveys to benchmark executive remuneration, packaging, and remuneration practices across the Company. The Committee ensures that a significant proportion of each executive’s remuneration is linked
to his or her performance through short and long-term incentives and the Company’s performance relative to its peers. Performance reviews are conducted at least annually and were undertaken during the 2008 financial year.
Principle 2: Structure the Board to add valueIndependence
It is Board policy that a majority, of Non-executive Directors, including the Chairman, should be independent and free of any relationship that may conflict with the interests of the Company. The Board defines ‘independence’ in accordance with the ASX Recommendations. Each of the current Non-executive Directors is independent. The Chairman is an independent Non-executive Director.
Mr Tuten resigned as a Non-executive director during the year. During this time, he was considered an associate of a substantial shareholder of the Company and was not classified as ‘independent’ within the meaning given to that term in the ASX Recommendations. Save for this association, Mr Tuten was, in all other material respects, independent.
In order to ensure that any ‘interests’ of a Director in a matter to be considered by the Board are known by each Director, each Director has contracted with the Company to disclose any relationships, duties or interests held that may give rise to a potential conflict. Directors are required to adhere strictly to constraints on their participation and voting in relation to any matters in which they have or may have a conflict of interest.
Corporate Governance
Garth Campbell-Cowan
B.Com, Dip-Applied Finance & Investments, FCA
Chief Financial Officer
Garth was appointed in September 2006 and is responsible for finance, treasury, taxation, reporting and business analysis, corporate planning and capital management. He has repositioned the finance team to focus on developing financial reporting systems and controls to assist with the Company’s growth. He has also established a treasury function. Prior to joining St Barbara, he was Director of Corporate Accounting at Telstra and has held finance leadership roles with WMC and Newcrest Mining.
George Viska
Chief Operating Officer and General Manager – Development
George has been appointed Acting Chief Operating Officer on an interim basis. The role involves growing existing production and ensuring development of future production opportunities is achieved.
As General Manager – Development, George and the development team provide strategic input into special projects and new developments. Specifically, George is responsible for overseeing surface infrastructure works at Gwalia.
The development team also provides support to the operations, including cost and variance analysis as well as co-ordinating operational budgets and forecasts.
Ross Kennedy
B.Com, Grad.Dip-Company Secretarial Practice, ACA, FTIA, FAICD, M AusIMM, ACIS
General Manager – Corporate Services & Company Secretary
Ross has been with St Barbara since 2004. The role of GM Corporate Services is to provide leadership on corporate standards and promote business improvement through HR initiatives and information technology systems. Corporate Services comprises a team of specialists to support the business across Human Resources, Information Technology and Communications, Legal and Contracts, Insurance and Risk Management. The Company Secretariat is responsible for statutory compliance with Company law and stock exchange listing rules, in Australia and overseas, as well as organisation of Board related matters.
Dr Adrian McArthur
B.Sc Geology (Hons) PhD Science
General Manager – Exploration
Adrian has been appointed General Manager – Exploration on an interim basis.
Adrian has wide experience in exploration, resource delineation and project generation roles for gold, nickel and copper-zinc mineralisation. After completing his PhD at Monash University in 1995, he has worked with successful teams at WMC, Goldfields Australia, Consolidated Minerals, and LionOre. He has been involved with projects at advanced to grassroots stages regionally across Australia, Africa and Asia. Adrian joined St Barbara in June 2006 to manage base metal programs and was appointed Chief Geologist and Acting GM Exploration on 1 July 2008.
Shane McLeay
B.Eng Mining (Hons)
General Manager – Leonora Operations
Shane is responsible for the Operations at Leonora having joined St Barbara in June 2006 with the initial responsibility of managing the project to develop the Gwalia redevelopment. He is a Mining Engineer with extensive operational and project experience in the mining industry and previously held the positions of Operations Manager for RUC Mining Contractors, Mining Superintendent of MPI’s Coolgardie Gold Operations and has had senior operational roles with Goldfields Mine Management at Otter-Juan and MPI at Black Swan Nickel. During the year, Shane was promoted to General Manager – Leonora Operations.
Kerry Payne
B.Eng Mining (Hon)
General Manager – Southern Cross Operations
Kerry has been appointed General Manager – Southern Cross Operations on an interim basis and is responsible for operations at Southern Cross. He is instrumental in leading the site based team in meeting safety, environment and production objectives and maximising the return on the assets.
Prior to joining St Barbara in 2006, Kerry held operational management roles with Newmont-Jundee in both underground and open cut operations. Kerry also has extensive mining engineering experience having worked for WMC, Sons of Gwalia, Western Metals and Aberfoyle Resources.
Peter Fairfield
B.Eng (Mining)
General Manager – Technical Services
Peter leads the technical services team that is focussed on technical evaluation and development of mining opportunities and to provide input for strategic planning. Working closely with our mine sites, the team also provides technical support to continually develop and grow existing operations. Prior to joining St Barbara in November 2007, Peter worked in operational and technical roles with WMC, Pasminco and AMC Consultants in Australia and overseas.
Delphine Cassidy
B.Bus (Accounting), MBA
General Manager – Investor Relations
Delphine joined St Barbara in late 2007 and is responsible for managing all external communications with the media and investment community. Her role is to develop a strategic investor relations programme that ensures the investment community is fully informed on the Company’s performance and underlying value. Delphine was previously at AWB Limited as Head of Investor Relations and held other finance and management roles in the organisation.
stbarbara.com.au18 stbarbara.com.au 19

Exit Print Contents Previous Start End NextAnnual Report 2008
Who are we Highlights Chairman’s Letter
Managing Director’s Report
Operations & Development
Exploration Finance Environment, Safety & Social Responsibility
Management Corporate Governance
Financial Report
Shareholder Information
Corporate DirectoryCorporate Directory
Reserves & Resources
Composition and Nomination to Board
St Barbara’s Board currently comprises six Directors – the Managing Director and five Non-executive Directors.
St Barbara does not have a nomination committee. Having regard to the importance of Board appointments and the size of the Company the Board retains this responsibility. The nomination of all new Directors including the Managing Director is considered by the full Board. Although there is no specific process of director selection detailed in the Board Charter, on deciding to appoint a director to the Board, the Board evaluates its skill needs and engages a well respected search firm to assist and advise the Board on identifying and selecting candidates. The assessment process includes interviews by the majority of Board members. The Board assesses the nominees against a range of specific criteria, including their experience, professional skills, potential conflicts of interest, the requirement for independence and the existing collective skill sets of the Board.
Details of each Director’s skills, qualifications, experience, relevant expertise and period of office are set out in pages 27 and 28.
The Board considered the issue of Board performance during the year and will again review Board and Director performance during the 2009 financial year. Independent expert remuneration advice was sought in determining remuneration for the Chair, Managing Director and CEO and Non-executive Directors for the 2009 financial year.
Board structure
The Board has established a number of Board Committees to facilitate the execution of its responsibilities. The Committees provide a forum for a more detailed analysis of key issues and interaction with management. Each Committee reports its deliberations to the next following Board meeting. The current Committees are:
Remuneration Committee
Members: Barbara Gibson (Chair), Doug Bailey, Eduard Eshuys, Robert Rae, Colin Wise.
Function: The Committee assists and advises the Board in relation to the remuneration of the Managing Director/ CEO, his senior executive direct reports, employees of the Company, consultants/contractors who are engaged to perform management or executive responsibilities, and Non-executive Directors.
Audit Committee
Members: Doug Bailey (Chair), Phil Lockyer, Robert Rae, Colin Wise.
Function: The Committee assists and advises the Board in discharging its responsibilities in relation to financial reporting, financial risk management, evaluating the effectiveness of the financial control environment and oversight of the external audit function. During the year, the Audit Committee Charter was expanded to include oversight of the process of determination of Ore Reserves. Matters relating to the assessment and supervision of non-financial business risks and compliance are covered directly by the Board.
Health and Safety Committee
Members: Phil Lockyer (Chair), Eduard Eshuys, Barbara Gibson, Colin Wise.
Function: The Committee assists and advises the Board in relation to safety and health issues, including in particular:
• in conjunction with Management, the promotion of a safety conscious culture throughout the Company;
• overseeing the function and effectiveness of the Health and Safety Management Committee; and
• recommending to the Board outcomes on H&S policy, plans, compliance and issues.
Details of the number of meetings of the Board and each Committee during the year, and each Director’s attendance at those meetings, are set out on page 29 of this report.
Director participation
Directors visit St Barbara’s mining operations at least once per annum and meet with management on a regular basis to gain a better understanding of the Company’s business.
Independent professional advice and access to Company information.
As specified in the Board Charter and letter of appointment, Directors have right of access to all relevant Company information and to the Company’s executives and, subject to prior consultation with the Chairman, may seek independent advice from a suitably qualified adviser at St Barbara’s expense.
Principle 3: Promote ethical and responsible decision makingThe Board and the Company’s employees are expected to uphold the highest levels of integrity and professional behaviour in their relationships with all of the Company’s stakeholders. The Company does not have a specific Code of Conduct as the Company has instead a range of specific codes and policies governing Board and employee behaviour. The Company specifically has procedures that cover trading in St Barbara’s securities and conflicts of interest for Directors. A register of Director interests is maintained.
Employees are accountable for their conduct under a range of Company policies and procedures, including an Occupational Health and Safety Policy, an Equal Opportunity Policy and Environment Policy, a policy on the Use of Computer Facilities and others. The Company does not have a general written code of ethics or behaviour but employees are made aware of acceptable behaviour through on-going training and development and contact with senior management. The Company Secretary is responsible for investigating any reports of unethical practices and reporting outcomes to the Managing Director and CEO or the Board, as appropriate.
Trading in St Barbara shares
To safeguard against insider trading, St Barbara’s Dealing in Securities Policy prohibits Directors and employees from trading St Barbara securities if they are aware of any information not in the public domain that would be expected to have a material effect on the price of Company securities.
Dealing in Company shares by Directors, Officers and Employees is governed by a ‘Dealings in Securities’ Policy. This policy allows for a 30-day trading window commencing from the business day following significant public announcements, provided the Company is not then in possession of undisclosed potentially price sensitive information.
St Barbara discloses to the ASX any transaction conducted by the Directors in St Barbara securities in accordance with ASX Listing Rules.
Principle 4: Safeguard integrity in financial reportingThe Board has established an Audit Committee and its Charter, is available on the Company’s website. The Charter was updated during the year and complies with recommendations of the ASX. During the year, the Audit Committee Charter was expanded to include oversight of the processes for determination of Ore Reserves.
The Audit Charter covers the principles governing the relationship with the external auditors, although not the specifics governing selection of auditors and rotation of audit partners. The Company changed audit firms with the approval of shareholders during the 2007 financial year. The Committee considers that KPMG’s process of partner rotation is sufficient to maintain independence of external auditors.
Principle 5: Make timely and balanced disclosureSt Barbara seeks to provide relevant up-to-date information to its shareholders and the broader investment community
in accordance with the continuous disclosure requirements under the ASX Listing Rules.
The Board has implemented a Continuous Disclosure Policy to ensure that information considered material by the Company is immediately lodged with the ASX as soon as practicable. Other relevant information, including Company presentations, updates by senior management and commentary on financial results, are also disclosed to the ASX and through the Company website.
Principle 6: Respect the rights of shareholdersDuring the year, the Company updated its website to provide more information to shareholders and to facilitate the distribution of Company ASX releases electronically. Communication to shareholders is facilitated by the production of the Annual Report, Quarterly Reports, public announcements and the posting of ASX releases on St Barbara’s website immediately after their disclosure on the ASX. There is no specific communications policy, as considering the size of the shareholder base, the current announcement procedures and distribution methods, the Company believes shareholders have the opportunity to be fully informed of Company activities. St Barbara appointed a General Manager Investor Relations during the year who is continuing to facilitate the Company’s communication with shareholders.
In addition, all shareholders are encouraged to attend the Annual General Meeting of Shareholders and use the opportunity to ask questions. Questions can be lodged prior to the meeting by completing the relevant form accompanying the notice
Corporate GovernanceContinued
stbarbara.com.au20 stbarbara.com.au 21

Exit Print Contents Previous Start End NextAnnual Report 2008
Who are we Highlights Chairman’s Letter
Managing Director’s Report
Operations & Development
Exploration Finance Environment, Safety & Social Responsibility
Management Corporate Governance
Financial Report
Shareholder Information
Corporate DirectoryCorporate Directory
Reserves & Resources
of meeting. The Company makes every endeavour to respond to these questions. The external auditor attends the meeting and is available to answer questions.
Principle 7: Recognise and manage riskThe Board believes that risk management and compliance are fundamental to sound management, and that oversight of such matters is an important responsibility of the Board.
The financial reporting and control mechanisms are assessed during the year by management, the Audit Committee and the external auditors. The Board has received assurances from the Managing Director and the Chief Financial Officer to the Board that the declaration provided in accordance with section 295A of the Corporations Act 2001 (Cth) in relation to the Company’s financial statements is founded on a sound system of risk management and internal control and that the system is operating effectively in all material respects in relation to financial reporting risks.
The Company also has policies in place dealing with risks in the areas of Health and Safety, Environment and Employee Relations. Management has regularly informed the Board about risks within the business and the effectiveness of the Company’s management of those risks during the 2008 financial year.
The Company is commencing an enterprise wide risk and opportunity assessment during the 2009 financial year and has engaged an expert firm to assist. The two year project is expected to deliver
enhanced risk and opportunity reporting and control mechanisms, which are designed to ensure that strategic, operational, legal, reputational and financial risks and opportunities are identified, assessed and managed. All material business risks will be evaluated as part of the Enterprise Wide Risk and Opportunity Assessment program.
Principle 8: Remunerate fairly and responsiblyThe Remuneration Committee Charter was reviewed and updated during the year.
Board Remuneration
The remuneration of the Non-executive Directors is fixed rather than variable. There are no retirement benefits paid to Non-executive Directors.
Executive Remuneration
The Remuneration Committee provides recommendations and direction for the Company’s remuneration policies. The Committee ensures that a significant proportion of each executive’s remuneration is linked to his or her performance and the Company’s performance. This remuneration has both short and long-term components. Incentives are aligned to achievement of specific targets and goals and may also be linked to St Barbara’s longer term performance. The Company has recently implemented a policy prohibiting executives from entering into transactions, which hedge or protect the unvested portion of any equity-based remuneration entitlements.
Key components of senior manager contracts, including details of potential termination payments are set out in on pages 37. Further details in relation to Director and Executive remuneration are set out in the Remuneration Report on pages 29 to 38.
Corporate GovernanceContinued
stbarbara.com.au22 stbarbara.com.au 23
Directors’ Report 24
Financial Report 40
Income Statements 41
Balance Sheets 42
Statements of Recognised Income and Expense 43
Cash Flow Statements 44
Notes to the Financial Statements 45
Directors’ Declaration 88
Independent Audit Report 89
Shareholder Information 91
Corporate Directory 92
Financial Report

Exit Print Contents Previous Start End NextAnnual Report 2008
Who are we Highlights Chairman’s Letter
Managing Director’s Report
Operations & Development
Exploration Finance Environment, Safety & Social Responsibility
Management Corporate Governance
Financial Report
Shareholder Information
Corporate DirectoryCorporate Directory
Reserves & Resources
stbarbara.com.au24 stbarbara.com.au 25
Review of OperationsThe Company’s strategic focus during the year continued to be the achievement of profitable production and the extension of the mine life at the Southern Cross operations, development of operations at Gwalia and to explore for gold close to existing operations at Southern Cross and Leonora, as well as for nickel, copper and zinc; all within Australia.
Financial performance
Total sales revenue of $143,129,000 (2007:$130,911,000) was generated mainly from gold sales of 157,278 (2007:167,065) ounces at the Southern Cross operations at an average achieved gold price of A$907 (2007:A$780) per ounce. Production at Southern Cross totalled 157,477 (2007:171,182) ounces for the year; from the Marvel Loch underground mine and a number of open pits including Hercules, Grand National, Norton (Nevoria) and GVG. A summary of the production performance for the year ended 30 June 2008 is provided in the table below.
Details of 2008 Production Performance
Total
2007/08Total
2006/07
Open Pit Ore Mined t 1,593,797 903,000
Grade g/t 1.7 2.7
Underground Ore Mined t 900,049 603,000
Grade g/t 3.7 4.0
Ore Milled t 2,231,237 2,228,000
Grade g/t 2.5 2.6
Recovery % 88 92
Gold Production oz 157,477 171,182
Cash Operating Cost A$/oz 555 508
The production from Marvel Loch increased to a record 900,000 tonnes, compensating for the lower grades from open pits. As a result of reduced Mill throughput in the fourth quarter of the financial year, Run of Mine (ROM) stockpiles of underground and open pit ore increased to 306,000 tonnes at an average grade of 1.9g/t for 18,700 contained ounces as at 30 June 2008. The lower gold production in the 2008 financial year was attributable mainly to the reduced mill throughput at Southern Cross operations in the second half of the year.
Other revenue of $4,846,000 (2007: $3,495,000) comprised mainly interest earned during the year of $5,053,000 (2007: $3,213,000), of which $1,371,000 was capitalised.
Total cash operating costs and per unit cash operating costs at Southern Cross operations were higher in the year compared to the prior year, due to increased mining costs associated with underground and open pit production and higher processing costs. Total cash operating costs were $87,350,000 (2007: $84,647,000), with the unit cash operating cost for the year at $555 (2007: $508) per ounce.
Exploration expensed in the income statement in the year totalled $28,531,000 (2007: $8,775,000), with total exploration expenditure amounting to $36,962,000 (2007: $23,718,000). The Company policy in relation to accounting for exploration supports capitalisation of expenditure where it results in an increase in reserves and is likely to be recouped from successful development and exploitation of the area of interest, or alternatively, by its sale. Capitalised exploration expenditure during the year related mainly to Marvel Loch, Transvaal, Nevoria and Trump/Kailis. As at balance date a feasibility study into developing Tower Hill as an underground deposit had not been completed. All exploration expenditure at Tower Hill was expensed during the year. The higher level of exploration expenditure during the year, compared to the prior year, was attributable to Tower Hill and the focus on increasing resources and reserves to underpin long term production at Southern Cross and Leonora.
Corporate administration costs for the year totalled $22,730,000 (2007: $19,770,000), which includes expenses related to the corporate office, rates and taxes associated with the Company’s landholdings, compliance costs and operations support and technical services.
Depreciation and amortisation of fixed assets and capitalised mine development totalled $30,779,000 (2007: $29,980,000) for the year. The higher depreciation and amortisation charge in the year was attributable to increased mine development at Marvel Loch and waste stripping at the open pit operations at Southern Cross.
Net finance costs increased to $3,008,000 (2007: $2,650,000) in the year due mainly to higher interest expense associated with the convertible notes. During the year interest paid of $6,640,000 was capitalised to mines under construction.
Net gains on gold put options comprised $3,132,000 of realised losses (2007: realised gain of $4,342,000) associated with gold put option premiums to cover Southern Cross production in the year, and $19,966,000 of unrealised gains on gold put options covering future production (2007: unrealised gain of $2,346,000). The realised loss represents the fair value of put option premiums expensed in relation to gold put options that matured during the current year. The unrealised gain on the gold put options represents an increase in the year in the fair value, calculated as at 30 June 2008.
During the year the Company recognised the cumulative decline in the fair value of listed investments, classified as available for sale financial assets, as an impairment loss in the income statement totalling $4,876,000. The loss recognised in the year comprised the cumulative loss taken directly to the investment fair value equity reserve in prior years and the current year movement in fair value of the listed investments. The listed investments were mainly the Company’s investment in Bendigo Mining Limited.
Financial position
As at 30 June 2008 net current assets decreased to $40,277,000 (2007: $89,440,000) due mainly to a lower cash balance. Higher trade and other payables were offset by an increase in inventories and other receivables. As at 30 June 2008 other receivables included restricted cash of $20,597,000
The Directors present their report on the consolidated entity “St Barbara Group”, consisting of St Barbara Limited and the entities it controlled at the end of, or during, the financial year ended 30 June 2008.
DirectorsThe following persons were Directors of St Barbara Limited at any time during the year and up to the date of this report:
S J C Wise Chairman
E Eshuys Managing Director & CEO
D W Bailey Non-executive director
B J Gibson Non-executive director
P C Lockyer Non-executive director
R K Rae Non-executive director Appointed 9 April 2008
H G Tuten Non-executive director Resigned 21 January 2008
Principal ActivitiesDuring the year the principal activities of the consolidated entity were mining and the sale of gold, mineral exploration, development and investments. There were no significant changes in the nature of activities of the consolidated entity during the year.
DividendsThere were no dividends paid or declared during the financial year.
Consolidated ResultsThe result reported by the consolidated entity for the year ended 30 June 2008 was a net loss after tax of $17,333,000 (2007: net loss of $2,894,000). The result for the year was after a net benefit from realised and unrealised gains on gold put options of $16,834,000 (2007: gain of $6,688,000), an exploration charge of $28,531,000 (2007: $8,775,000) and an unrealised loss on available for sale assets of $4,876,000 (2007: Nil). The consolidated revenues and result for the year is summarised as follows:
30 June 08 $’000
30 June 07 $’000
Sales revenue 143,129 130,911
Profit on sale of available for sale assets 155 11,071
Interest earned 3,682 3,213
Other 1,204 321
Total revenue 148,170 145,516
EBITDA 12,340 28,364
EBIT (18,439) (1,616)
Loss after tax attributable to members of the Company for the year (17,333) (2,894)
Directors’ ReportFor the year ended 30 June 2008
Directors’ ReportFor the year ended 30 June 2008

Exit Print Contents Previous Start End NextAnnual Report 2008
Who are we Highlights Chairman’s Letter
Managing Director’s Report
Operations & Development
Exploration Finance Environment, Safety & Social Responsibility
Management Corporate Governance
Financial Report
Shareholder Information
Corporate DirectoryCorporate Directory
Reserves & Resources
stbarbara.com.au26 stbarbara.com.au 27
Regulatory EnvironmentThe Company’s mining activities are all in Western Australia, and are governed by Western Australian legislation, including the Mining Act 1978, the Mines Safety and Inspection Act 1994, Dangerous Goods Safety Act 2004 and other mining related and subsidiary legislation. The consolidated entity is subject to significant environmental regulation, including the Western Australian Environmental Protection Act 1986, Contaminated Sites Act 2003, Wildlife Conservation Act 1950 and the Commonwealth Environmental Protection and Biodiversity Conservation Act 1999, as well as safety compliance in respect of its mining and exploration activities
Information on DirectorsS J Colin Wise LL.B, FAICD, FAusIMM Chairman – Non Executive
Mr Wise is an experienced corporate lawyer, consultant and company director with significant expertise in the mining and exploration industry and corporate sector. He spent 24 years with WMC Limited, 10 of which as General Counsel and subsequently, 4 years as Counsel to a New York law firm. He has had extensive practical experience in Australia and internationally with a wide range of corporate, operational and legal matters.
He is a Fellow of both the Australian Institute of Company Directors and the Australasian Institute of Mining and Metallurgy. He was formerly a Non Executive Director of Southern Health, the largest health care service in Victoria and is currently a member of the Advisory Board to the Dean of Medicine, Nursing and Health Sciences at Monash University.
Other current public company directorships Nil
Former public company directorships in last 3 years Nil
Special responsibilities Chairman of the Board Member of the Remuneration, Audit and Health & Safety Committees
Interest in shares and options Mr Wise has a relevant interest in 6,463,724 fully paid ordinary shares of the Company.
Eduard Eshuys B.Sc, FAICD, FAusIMM Managing Director and Chief Executive Officer
Mr Eshuys is a geologist with 38 years of experience in mineral exploration, development and operation of gold and nickel mines in Australia. He has a credible record in exploration having led the exploration teams that discovered several major gold deposits, including Plutonic, Bronzewing and Jundee. He brought Bronzewing and Jundee as well as the Cawse Nickel mine into production. Mr Eshuys was awarded the Geological Society of Australia’s Joe Harms medal for distinction in exploration success and project development in 1996. He is a Fellow of both the Australian Institute of Company Directors and the Australian Institute of Mining and Metallurgy.
Other current public company directorships Nil
Former public company directorships in last 3 years Nil
Special responsibilities Member of the Remuneration and Health & Safety Committees
Interest in shares and options Mr Eshuys has a relevant interest in 5,967,403 fully paid ordinary shares and holds 5,000,000 executive options to acquire fully paid ordinary shares as detailed later in this Report.
Douglas W Bailey, BBus (Acc), CPA, ACIS Non Executive Director
Mr Bailey was the Chief Financial Officer of Woodside Petroleum Ltd between 2002 and 2004 and previously, was an Executive Director of Ashton Mining Limited from 1990 to 2000, including the last 3 years as Chief Executive Officer. He also was a Non Executive Director of Aurora Gold Ltd for the period 1993-2000.
Other current public company directorships Nil
Former public company directorships in last 3 years Nil
Special responsibilities Chairman of the Audit Committee Member of the Remuneration Committee
Interest in shares and options Mr Bailey has a relevant interest in 138,777 fully paid ordinary shares and 850,000 Convertible Notes of the Company.
Barbara J Gibson B.Sc, FTSE, MAICD Non Executive Director
Ms Gibson possesses a broad range of business management experience. Ms Gibson was formerly the General Manager Chemicals Group of Orica Limited, a member of the Orica Group Executive and a Director of Incitec Pivot Limited. She is a Fellow of the Australian Academy of Technical Sciences and Engineering, and is a recipient of the Australian Centenary Medal in 2001 for service to Australian society in medical technology.
Other current public company directorships Biota Holdings Limited Penrice Soda Holdings Limited
Former public company directorships in last 3 years Incitec Pivot Limited
Special responsibilities Chair of the Remuneration Committee Member of the Health & Safety Committee
Interest in shares and options Ms Gibson has a relevant interest in 195,984 fully paid ordinary shares of the Company.
(2007: $8,115,000), which represented cash held on deposit as security for bank guarantees. The working capital balance as at 30 June 2008, excluding the current deferred mining asset and restricted cash, was $3,757,000 (2007: $58,058,000).
Total non current assets increased by $191,901,000 during the year to $324,480,000 (2007: $132,579,000). The increase in non current assets was attributable to capitalised development expenditure at Southern Cross and Gwalia, capitalised exploration expenditure, an increase in property, plant and equipment and the higher fair value of premiums on purchased put options.
Non current liabilities increased to $128,093,000 (2007: $127,018,000) mainly as a result of the amortisation of the convertible notes transaction costs. Non current interest bearing borrowings totalled $98,570,000 (2007: $97,662,000) as at 30 June 2008, comprising mainly the balance on the convertible notes of $97,679,000 (2007: $96,481,000).
Cash flows
Cash flow from operating activities for the year was $24,992,000 (2007: $26,445,000). An increase in receipts from customers reflects the benefit of a higher average achieved gold price during the year. Payments to suppliers and employees were $8,044,000 higher than the prior year, reflecting the impact of increased operating costs and higher ore stockpiles due to reduced mill throughput in the June 2008 quarter. Interest received of $5,181,000 (2007: $2,979,000) was higher than in the prior year due to higher cash balances during the year as a result of the convertible notes issued in June 2007 and the equity raising in the first half of the 2008 financial year. The interest paid in the year of $8,000,000 was in respect of the convertible notes.
Cash flow used in investing activities amounted to $221,970,000 (2007: $110,719,000) and was mainly in the following major areas:
Mines under construction at Gwalia – $68,721,000;
Mine development expenditure at Southern Cross operations – $51,666,000;
Purchase of property, plant and equipment, principally at Gwalia – $60,664,000; and
Exploration expenditure – $36,962,000.
Development activities at Gwalia during the year focussed on continuation of the Hoover decline, the commencement of the Barden decline to access the first series of ore production stopes in the Deeps and construction of mine infrastructure, including the refurbishment of the processing plant. The total pre-commissioning capital expenditure for the year was $117,667,000, comprising mine development of $56,997,000, mine infrastructure of $11,724,000 and plant and equipment of $48,946,000.
Cash flow from financing activities totalled $145,126,000 (2007: $92,307,000), which included net proceeds from
•
•
•
•
equity raisings during the year of $161,741,000. Transaction costs associated with the equity raisings totalled $5,417,000 for the year. Cash flow from financing activities included a movement in restricted cash of $12,482,000 (2007: $7,468,000).
Significant Changes in the State of AffairsThe significant changes in the state of affairs of the Company during the financial year are as follows:
a) Gwalia Development
Total pre-commissioning capital expenditure covering underground development, mine infrastructure and refurbishment of the plant was $117,667,000 in the year.
b) Changes in issued capital
In October 2007 the Company received proceeds from the issue of new shares of $75,920,000, before transaction costs. A total of 120,507,335 new shares were issued at a issue price of $0.63 per share.
In December 2007 the Company received proceeds of $22,301,000, before transaction costs, from the issue of new shares to eligible shareholders pursuant to a share purchase plan. A total of 35,511,707 new shares were issued at an issue price of $0.63 per share.
In June 2008 the Company received proceeds of $63,520,000, before transaction costs, from the issue of 158,799,282 new shares pursuant to a 2 for 7 fully underwritten renounceable accelerated pro-rata entitlement offer to institutional shareholders and an institutional placement. The issue price of the new shares was $0.40 per share.
In July 2008 the Company received proceeds of $56,125,000, before transaction costs, from the issue of 140,312,045 new shares pursuant to the retail component of the 2 to 7 fully underwritten renounceable accelerated pro-rata entitlement offer at an issue price of $0.40 per share.
The total of new shares issued during the year was 314,818,324 shares.
c) Operating loss for the year
The consolidated entity reported a net loss for the year of $17,333,000, which increased accumulated losses to $132,320,000.
Likely Developments and Expected Results of OperationsCompletion of the development of Gwalia and commencement of mining operations at Leonora is a key focus for the Company in the 2008/09 financial year. Exploration drilling at Southern Cross and Leonora continues to be focused on increasing reserves to underpin profitable production for long life operations.
Directors’ ReportFor the year ended 30 June 2008
Directors’ ReportFor the year ended 30 June 2008
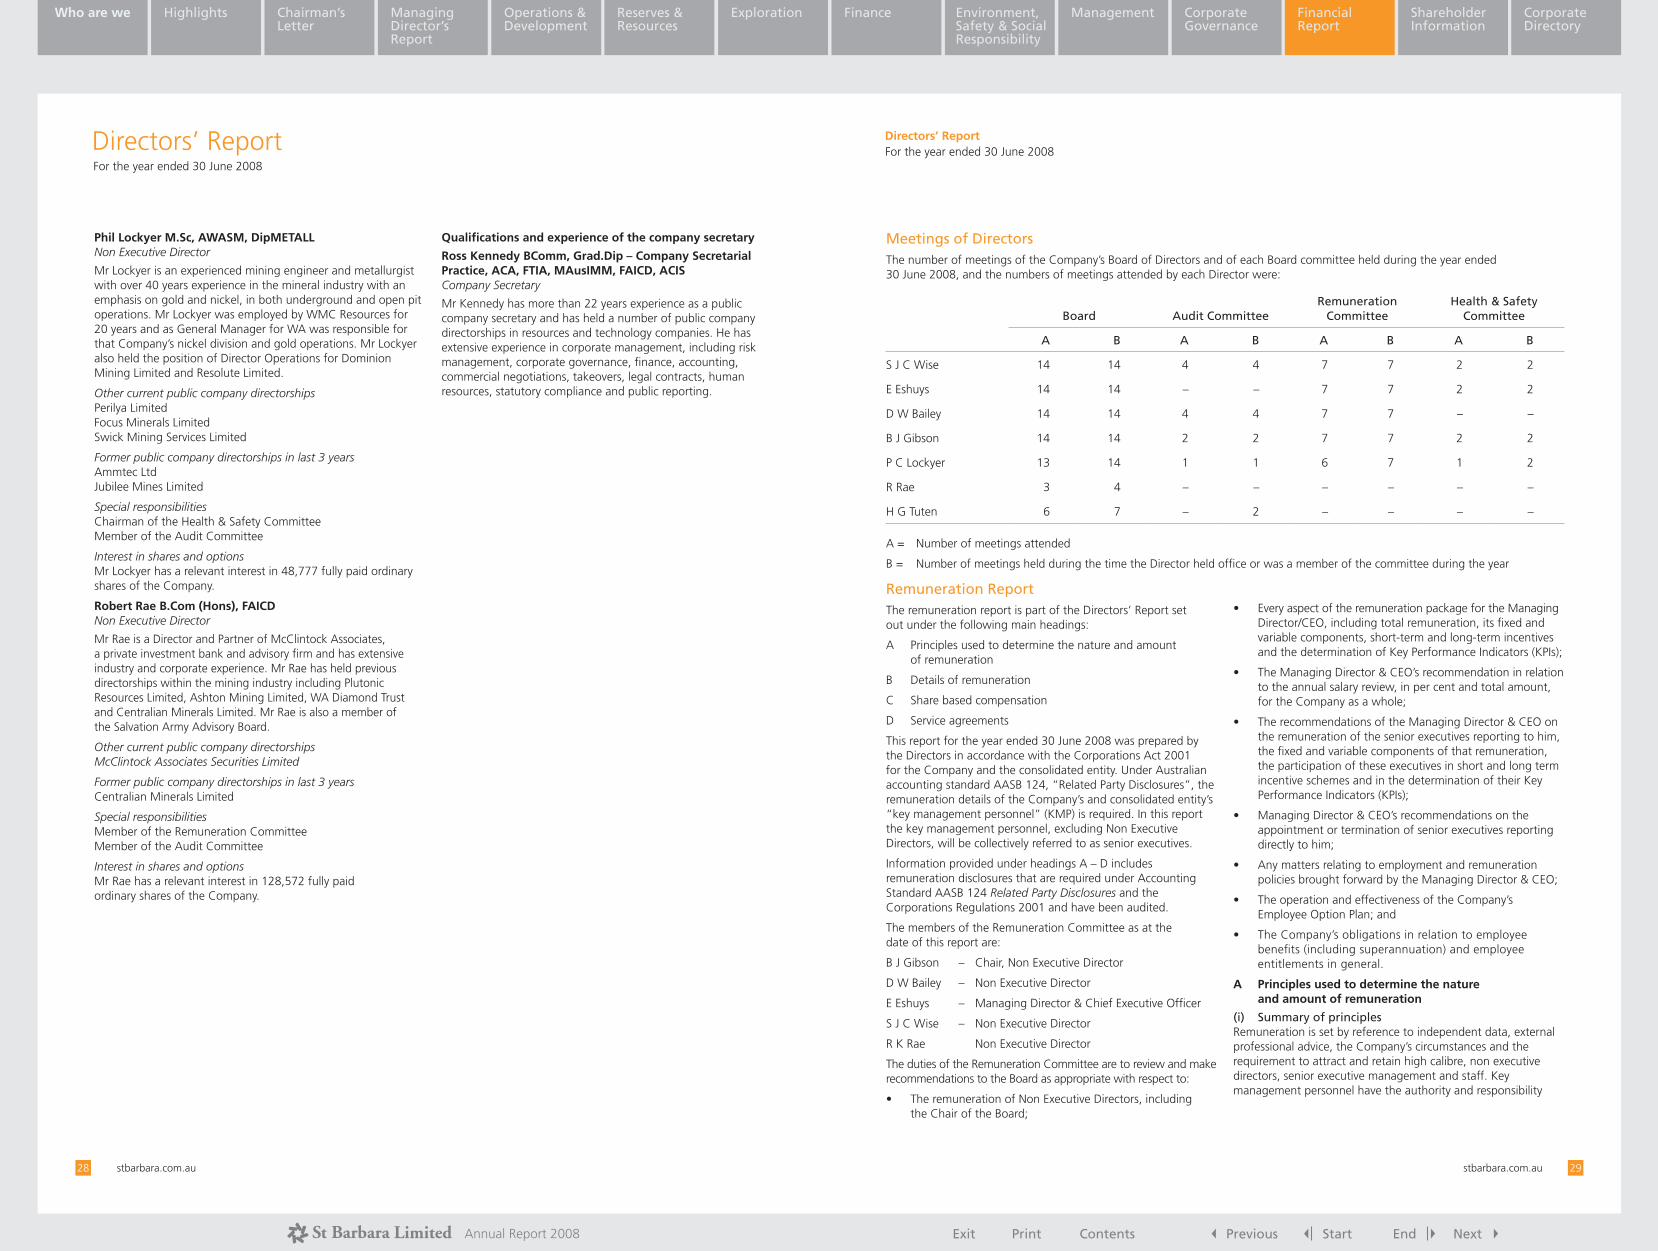
Exit Print Contents Previous Start End NextAnnual Report 2008
Who are we Highlights Chairman’s Letter
Managing Director’s Report
Operations & Development
Exploration Finance Environment, Safety & Social Responsibility
Management Corporate Governance
Financial Report
Shareholder Information
Corporate DirectoryCorporate Directory
Reserves & Resources
stbarbara.com.au28 stbarbara.com.au 29
Remuneration ReportThe remuneration report is part of the Directors’ Report set out under the following main headings:
A Principles used to determine the nature and amount of remuneration
B Details of remuneration
C Share based compensation
D Service agreements
This report for the year ended 30 June 2008 was prepared by the Directors in accordance with the Corporations Act 2001 for the Company and the consolidated entity. Under Australian accounting standard AASB 124, “Related Party Disclosures”, the remuneration details of the Company’s and consolidated entity’s “key management personnel” (KMP) is required. In this report the key management personnel, excluding Non Executive Directors, will be collectively referred to as senior executives.
Information provided under headings A – D includes remuneration disclosures that are required under Accounting Standard AASB 124 Related Party Disclosures and the Corporations Regulations 2001 and have been audited.
The members of the Remuneration Committee as at the date of this report are:
B J Gibson – Chair, Non Executive Director
D W Bailey – Non Executive Director
E Eshuys – Managing Director & Chief Executive Officer
S J C Wise – Non Executive Director
R K Rae Non Executive Director
The duties of the Remuneration Committee are to review and make recommendations to the Board as appropriate with respect to:
The remuneration of Non Executive Directors, including the Chair of the Board;
•
Every aspect of the remuneration package for the Managing Director/CEO, including total remuneration, its fixed and variable components, short-term and long-term incentives and the determination of Key Performance Indicators (KPIs);
The Managing Director & CEO’s recommendation in relation to the annual salary review, in per cent and total amount, for the Company as a whole;
The recommendations of the Managing Director & CEO on the remuneration of the senior executives reporting to him, the fixed and variable components of that remuneration, the participation of these executives in short and long term incentive schemes and in the determination of their Key Performance Indicators (KPIs);
Managing Director & CEO’s recommendations on the appointment or termination of senior executives reporting directly to him;
Any matters relating to employment and remuneration policies brought forward by the Managing Director & CEO;
The operation and effectiveness of the Company’s Employee Option Plan; and
The Company’s obligations in relation to employee benefits (including superannuation) and employee entitlements in general.
A Principles used to determine the nature and amount of remuneration
(i) Summary of principlesRemuneration is set by reference to independent data, external professional advice, the Company’s circumstances and the requirement to attract and retain high calibre, non executive directors, senior executive management and staff. Key management personnel have the authority and responsibility
•
•
•
•
•
•
•
Meetings of DirectorsThe number of meetings of the Company’s Board of Directors and of each Board committee held during the year ended 30 June 2008, and the numbers of meetings attended by each Director were:
Board Audit CommitteeRemuneration
CommitteeHealth & Safety
Committee
A B A B A B A B
S J C Wise 14 14 4 4 7 7 2 2
E Eshuys 14 14 – – 7 7 2 2
D W Bailey 14 14 4 4 7 7 – –
B J Gibson 14 14 2 2 7 7 2 2
P C Lockyer 13 14 1 1 6 7 1 2
R Rae 3 4 – – – – – –
H G Tuten 6 7 – 2 – – – –
A = Number of meetings attended
B = Number of meetings held during the time the Director held office or was a member of the committee during the year
Phil Lockyer M.Sc, AWASM, DipMETALL Non Executive Director
Mr Lockyer is an experienced mining engineer and metallurgist with over 40 years experience in the mineral industry with an emphasis on gold and nickel, in both underground and open pit operations. Mr Lockyer was employed by WMC Resources for 20 years and as General Manager for WA was responsible for that Company’s nickel division and gold operations. Mr Lockyer also held the position of Director Operations for Dominion Mining Limited and Resolute Limited.
Other current public company directorships Perilya Limited Focus Minerals Limited Swick Mining Services Limited
Former public company directorships in last 3 years Ammtec Ltd Jubilee Mines Limited
Special responsibilities Chairman of the Health & Safety Committee Member of the Audit Committee
Interest in shares and options Mr Lockyer has a relevant interest in 48,777 fully paid ordinary shares of the Company.
Robert Rae B.Com (Hons), FAICD Non Executive Director
Mr Rae is a Director and Partner of McClintock Associates, a private investment bank and advisory firm and has extensive industry and corporate experience. Mr Rae has held previous directorships within the mining industry including Plutonic Resources Limited, Ashton Mining Limited, WA Diamond Trust and Centralian Minerals Limited. Mr Rae is also a member of the Salvation Army Advisory Board.
Other current public company directorships McClintock Associates Securities Limited
Former public company directorships in last 3 years Centralian Minerals Limited
Special responsibilities Member of the Remuneration Committee Member of the Audit Committee
Interest in shares and options Mr Rae has a relevant interest in 128,572 fully paid ordinary shares of the Company.
Qualifications and experience of the company secretary
Ross Kennedy BComm, Grad.Dip – Company Secretarial Practice, ACA, FTIA, MAusIMM, FAICD, ACIS Company Secretary
Mr Kennedy has more than 22 years experience as a public company secretary and has held a number of public company directorships in resources and technology companies. He has extensive experience in corporate management, including risk management, corporate governance, finance, accounting, commercial negotiations, takeovers, legal contracts, human resources, statutory compliance and public reporting.
Directors’ ReportFor the year ended 30 June 2008
Directors’ ReportFor the year ended 30 June 2008

Exit Print Contents Previous Start End NextAnnual Report 2008
Who are we Highlights Chairman’s Letter
Managing Director’s Report
Operations & Development
Exploration Finance Environment, Safety & Social Responsibility
Management Corporate Governance
Financial Report
Shareholder Information
Corporate DirectoryCorporate Directory
Reserves & Resources
stbarbara.com.au30 stbarbara.com.au 31
(a) Fixed remuneration(i) Base salaryThe base salary is influenced by the scope of the role and the knowledge, skills and experience required for the position. External remuneration consultants provide analysis and advice to ensure the base salary is competitive for a comparable role.
Base salary for senior executives is reviewed annually as part of the Company’s overall remuneration review process and is assessed against the Company’s and the individual’s performance. A senior executive’s salary is also reviewed on promotion.
(ii) SuperannuationIn addition to statutory superannuation contributions, senior executives may elect to contribute additional amounts, subject to legislative requirements.
(iii) BenefitsSenior executives receive benefits, including car parking, living away from home allowances, and payment for certain professional memberships.
(b) Short term incentives (STI)
The STI is an annual “at risk” component of remuneration for the senior executives and is payable in cash. The objective of the STI is to remunerate senior executives for achieving annual business targets and their own individual performance targets. The STI payment to senior executives is based on achievements measured against key performance indicators (KPIs). The maximum STI opportunity varies according to the role. KPIs require performance in improving operational effectiveness and the achievement of strategic financial and non-financial measures, linked to the drivers of performance in current and future reporting periods.
The Remuneration Committee is responsible for assessing the extent to which the KPIs of the Managing Director/CEO and senior executives have been achieved. To assist in making this assessment, the Committee receives detailed reports and presentations on the performance of the business from the Managing Director/CEO and external remuneration consultants as required.
The Remuneration Committee recommends for Board approval the STI to be paid to the Managing Director/ CEO and senior executives.
(c) Long term incentives (LTI)
The Company has in previous years granted options over ordinary shares of the Company as long term incentives. There were no options granted in the year ended 30 June 2008.
Refer page 35 for further information.
B Details of remuneration
(i) Remuneration paidDetails of the remuneration of Directors and the senior executives of the Company and the Group are set out in the following tables.
The Directors of the Company and the Group during the year ended 30 June 2008 were:
S J C Wise Chairman
E Eshuys Managing Director & CEO
D W Bailey Non-executive director
B J Gibson Non-executive director
P C Lockyer Non-executive director
R Rae Non-executive director Appointed 9 April 2008
H G Tuten Non-executive director Resigned 21 January 2008
The senior executives with the authority and responsibility for planning, directing and controlling the activities of the Company and the Group during the year ended 30 June 2008, were:
Eduard Eshuys Managing Director & CEO
Ian Bird Chief Operating Officer Resigned 4 July 2008
Garth Campbell-Cowan Chief Financial Officer
Ross Kennedy General Manager Corporate Services/Company Secretary
Peter Thompson General Manager Exploration Resigned 4 July 2008
George Viska General Manager Gwalia Surface Development
•
•
•
•
•
•
•
•
•
•
•
•
•
Remuneration Report cont.
In consultation with external remuneration consultants, the Company has structured an executive remuneration framework that is market competitive and complementary to the remuneration strategy of the organisation.
The objective of the Company’s senior executive remuneration framework is to ensure that reward for performance is competitive and appropriate for the results delivered. The framework aligns senior executive remuneration with achievement of operating and strategic objectives and the creation of value for shareholders, and conforms with market best practice for delivery of remuneration. The Board ensures that senior executive remuneration satisfies the following key criteria for good remuneration governance practices:
reasonableness and competitiveness
alignment with shareholders’ interests
performance linkage/alignment of executive compensation
transparency.
Alignment to shareholders’ interests is structured through:
recognising the achievement of pre-determined performance targets
attracting and retaining high calibre senior executives.
Alignment to senior executives’ interests is structured through:
ensuring that remuneration is competitive in order to attract and retain talent
recognising capability and experience
recognising performance
recognising contribution to growth in shareholder wealth
providing a clear structure for earning remuneration.
The framework provides a mix of fixed and variable remuneration, and a blend of short and long term incentives.
(ii) Non Executive Directors’ feesNon Executive Directors’ fees are determined within an aggregate Directors’ fee pool limit, which is periodically recommended for approval by shareholders. The maximum fees payable to Non Executive Directors are currently $750,000 per annum in aggregate (approved by shareholders in November 2005).
•
•
•
•
•
•
•
•
•
•
•
Fees paid to Non Executive Directors are set at levels which reflect both the responsibilities of, and the time commitments required from, each Non Executive Director to discharge his or her duties. Non Executive Directors’ fees are reviewed annually by the Board, guided by the advice of independent remuneration consultants to ensure fees are appropriate for the duties performed and in line with the market. The fees paid to Non Executive Directors are not linked to the performance of the Company in order to maintain their independence and impartiality. Directors’ remuneration is inclusive of committee fees.
The Chairman’s fee is determined independently based on comparative roles and responsibilities in the external market for companies comparable with St Barbara Limited. The Chairman is not present at any discussions relating to the determination of his own remuneration.
Since 1 October 2005 Non Executive Directors are able to elect to receive all or part of their remuneration (with a 20% minimum) in St Barbara Limited shares, which are acquired on market pursuant to a Non Executive Director Share Plan.
(iii) Retirement allowances for DirectorsNon Executive Directors are not entitled to retirement allowances.
(iv) Senior executive remunerationSenior executive remuneration comprises both a fixed component and an at risk component, which is intended to remunerate senior executives for increasing shareholder value and for achieving financial targets and business strategies. It is also designed to attract and retain high calibre executives. The remuneration of senior executives has three components:
fixed remuneration, comprising base salary (which is calculated on a total cost basis and includes any fringe benefits tax charges related to employee benefits), employer contributions to superannuation and other defined benefits;
short term performance incentives; and
long term incentives.
The aggregate of the three components comprises a senior executive’s total remuneration.
•
•
•
Remuneration Report cont.
for planning, directing and controlling the activities of the Company and the Group. Key Management Personnel comprise the directors of the Company and senior executives of the Company and the Group, including the five most highly remunerated executives. Set out in the table below is an overview of the elements of remuneration. A more detailed discussion of each element is contained in this report.
Elements of remunerationNon Executive Directors
Senior Executives
Discussion in Report
Fixed remuneration Fees Page 30
Salary Pages 30 – 31
Superannuation Page 31
Other benefits Page 31
At risk remuneration Short term incentives Page 31
Long term incentives Page 31
Post employment Termination payments Page 37
Directors’ ReportFor the year ended 30 June 2008
Directors’ ReportFor the year ended 30 June 2008

Exit Print Contents Previous Start End NextAnnual Report 2008
Who are we Highlights Chairman’s Letter
Managing Director’s Report
Operations & Development
Exploration Finance Environment, Safety & Social Responsibility
Management Corporate Governance
Financial Report
Shareholder Information
Corporate DirectoryCorporate Directory
Reserves & Resources
stbarbara.com.au32 stbarbara.com.au 33
Directors’ ReportFor the year ended 30 June 2008
Directors’ ReportFor the year ended 30 June 2008
Remuneration Report cont.
2008 Short-term benefits Post-employment benefits
Name
Cash salary &
feesSTI
payment
Non- monetary
benefits Other Super-
annuation
Long Service Leave(4)
Share-based
payments: options(3) Total
Propor- tion of
total perf- ormance related
Value of options as % of
total$ $ $ $ $ $ $ $
Non Executive Directors
S J C Wise (Chairman)(1) 115,046 – – – 4,954 – – 120,000 – –
D W Bailey 64,220 – – – 5,780 – – 70,000 – –
B J Gibson 14,408 – – – 1,297 – – 15,705 – –
P C Lockyer 34,354 – – – 3,092 – – 37,446 – –
R Knight 32,110 – – – 3,372 – – 35,482 – –
H G Tuten(2) – – – – – – – – – –
M K Wheatley 5,704 – – – 481 – – 6,185 – –
Total Non Executive Directors 265,842 – – – 18,976 – – 284,818
Executive Director
E Eshuys 520,945 255,000 2,574 25,000(5) 12,684 16,751 159,644 992,598 25.7% 16.1%
Other key management personnel
I Bird(4) 97,753 26,250 544 140,000(4) 3,372 4,449 86,278 358,646 7.3% 24.1%
G Campbell-Cowan 251,348 105,000 1,346 – 10,220 3,874 468,233 840,021 12.5% 55.7%
R Kennedy 191,877 60,000 1,559 15,000(5) 17,269 6,628 – 292,333 20.5% –
M Reed(7) 270,600 – 618 – 24,354 – – 295,572 – –
P Thompson 201,835 55,000 1,559 – 18,165 6,630 – 283,189 19.4% –
G Viska 270,102 – 1,080 20,800(5) 12,659 4,261 – 308,902 – –
Total senior executives 1,804,460 501,250 9,280 200,800 98,723 42,593 714,155 3,371,261
(1) S J C Wise elected in lieu of receiving directors’ fees as salary to participate in the Non Executive Directors’ Share Plan from 1 July 2006 to and including 31 December 2006. (2) HG Tuten elects not to receive directors’ fees. (3) The value of options disclosed as remuneration is the portion of the fair value of the options recognised in this reporting period. (4) Represents a sign on payment (5) Living away from home allowance. For E Eshuys and R Kennedy these payments ceased on 31 December 2006. (6) Represents the long service leave expense accrued for the period. (7) Mr Reed resigned as Acting Chief Operating Officer on 27 April 2007.
Remuneration Report cont.
2008 Short-term benefits Post-employment benefits
Name
Cash salary &
feesSTI
payment
Non- monetary
benefits Other Super-
annuation
Long Service Leave(4)
Share-based
payments: options(3) Total
Propor- tion of
total perf- ormance related
Value of options as % of
total$ $ $ $ $ $ $ $
Non Executive Directors
S J C Wise (Chairman) 141,870 – – – 13,129 – – 154,999 – –
D W Bailey 73,395 – – – 6,606 – – 80,001 – –
B J Gibson(1) 73,395 – – – 6,606 – – 80,001 – –
P C Lockyer 73,395 – – – 6,606 – – 80,001 – –
R Rae 16,718 – – – 1,505 – – 18,223 – –
H G Tuten(2) – – – – – – – – – –
Total Non Executive Directors 378,773 – – – 34,450 – – 413,223
Executive Director
E Eshuys 636,871 125,000 2,223 – 13,129 28,353 103,404 908,980 13.8% 11.4%
Other key management personnel
I Bird(5)(6) 386,870 10,000 2,223 – 13,129 – – 412,222 2.4% –
G Campbell-Cowan 336,870 72,500 2,223 – 13,129 4,707 273,358 702,787 10.3% 38.9%
G Viska 284,492 22,500 1,174 23,015(7) 12,072 7,465 – 350,718 6.4% –
R Kennedy 236,870 63,400 2,223 – 13,129 9,421 – 325,043 19.5% –
P Thompson(5) 236,870 32,500 2,223 – 13,129 5,835 – 290,557 11.2% –
Total senior executives 2,118,843 325,900 12,289 23,015 77,717 55,781 376,762 2,990,307
(1) B Gibson elected in lieu of receiving Directors fees as salary to participate in the Non-executive Directors’ Share Plan from 1 October 2007 up to, and including, 31 March 2008. (2) HG Tuten elected not to receive directors’ fees. Mr Tuten resigned on 21 January 2008. (3) The value of options disclosed as remuneration is the portion of the fair value of the options recognised in the reporting period. These options were granted in previous years pursuant to terms approved by shareholders. (4) Represents the long service leave expense accrued for the period. (5) Mr Bird and Mr Thompson resigned on 4 July 2008. (6) The value of options issued to Mr Bird in 2007 has not been included in remuneration on the basis that these options lapsed following his resignation effective 4 July 2008, and no amount was recognised in the reporting period. (7) Living away from home allowance.

Exit Print Contents Previous Start End NextAnnual Report 2008
Who are we Highlights Chairman’s Letter
Managing Director’s Report
Operations & Development
Exploration Finance Environment, Safety & Social Responsibility
Management Corporate Governance
Financial Report
Shareholder Information
Corporate DirectoryCorporate Directory
Reserves & Resources
stbarbara.com.au34 stbarbara.com.au 35
The table below provides the share price performance of the Company’s shares in the 2008 financial year and the previous four financial years.
Shareholder wealth 2008 2007 2006 2005 2004
Period end share price
(cents per share)
37
49
57
10
5
Average share price for
the year (cents per share) 64 54 40 7 7
During the current financial year, the Company’s daily closing share price traded in a range of 35 to 89 cents per share (2007: 43 to 64 cents per share).
C Share based compensation
(i) OptionsExecutive Options issued to Mr Eshuys were approved by shareholders at the 2004 Annual General Meeting. All other options were granted under the St Barbara Limited Employee Option Plan, which was approved by shareholders at the 2001 Annual General Meeting of shareholders. All full time employees are eligible to participate in the plan.
Details on options over ordinary shares in the Company that were granted as compensation to each senior executive during the financial year and details of options that vested in the financial year are as follows:
2008
Number of options granted
during 2008 Grant date
Fair value per option at
grant date
Cents per share
Exercise price per option
Cents per share Expiry date
Number of options
vested during 2008
E Eshuys – – – – – 5,000,000
I Bird(1) – – – – – –
G Campbell-Cowan – – – – – 1,000,000
(1) Mr Bird resigned with effect from 4 July 2008 and as a result 2,000,000 options granted on 26 March 2007 have lapsed.
2007
Number of options granted
during 2007 Grant date
Fair value per option at
grant date
Cents per share
Exercise price per option
Cents per share Expiry date
Number of options
vested during 2007
E Eshuys – – – – – 10,000,000
I Bird 2,000,0001 26 Mar 2007 39.4 49.0 26 Mar 2012 –
G Campbell-Cowan 2,000,0002 11 Sept 2006 39.0 49.6 11 Sept 2011 –
(1) 50% of options are exercisable on the second anniversary of employment, and 50% on the third anniversary of employment
(2) 50% of options are exercisable on the first anniversary of employment, and 50% on the second anniversary of employment
Remuneration Report cont.
(ii) Cash bonuses included in remuneration (short term incentive)The table below provides the percentage of fixed remuneration which senior executives did earn under the short term incentive (STI), based on relevant performance measures having been met.
2008Maximum potential
STI
Actual STI included in
remuneration
% of maximum Tier 1
performance earned
% of maximum potential STI
earned
% of maximum potential STI
forfeited
Tier 1 Target
$
Tier 2 Target
$
$
$
E Eshuys 240,000 350,000 125,000 42% 21% 79%
Ian Bird 100,000 200,000 10,000 10% 3% 97%
G Campbell-Cowan 100,000 200,000 72,500 60% 24% 76%
R Kennedy 80,000 120,000 63,400 48% 32% 68%
P Thompson 80,000 120,000 32,500 41% 16% 84%
G Viska 50,000 75,000 22,500 45% 18% 82%
Tier 1 target performance represents challenging but achievable levels of performance. The performance measures vary depending on the individual executive’s position, and include both financial and non financial measures.
Tier 2 target performance requires significant performance above and beyond normal expectations and if achieved is anticipated to result in a substantial improvement in key operational areas, financial results, and/or the financial position of the Company.
Amounts included in remuneration as actual cash STI for the financial year represent the amounts accrued in relation to the 2008 financial year, based on achievement of personal goals and satisfaction of specified performance criteria. No additional amounts vest in future years in respect of the bonus schemes for the 2008 financial year.
(iii) Performance of St Barbara LimitedIn considering the Group’s performance and improvement in shareholder wealth, consideration is given to the following measures in respect of the current financial year and the previous four financial years:
Earnings
2008
$
2007
$
2006
$
2005
$
2004
$
Sales revenue 143,129,000 130,911,000 115,263,000 46,553,000 21,972,000
EBITDA 12,340,000 28,364,000 13,577,000 15,051,000 (23,004,000)
Net profit/(loss) after tax(1) (17,333,000) (2,894,000) 6,019,000 6,831,000 (24,315,000)
(1) Net profit amounts for years 2004 to 2005 were calculated in accordance with previous Australian Generally Accepted Accounting Principles. Net profit amounts for 2006 to 2008 were calculated in accordance with the Australian equivalents of International Financial Reporting Standards (A-IFRS) adopted by the Australian Accounting Standards Board.
Remuneration Report cont.
Directors’ ReportFor the year ended 30 June 2008
Directors’ ReportFor the year ended 30 June 2008

Exit Print Contents Previous Start End NextAnnual Report 2008
Who are we Highlights Chairman’s Letter
Managing Director’s Report
Operations & Development
Exploration Finance Environment, Safety & Social Responsibility
Management Corporate Governance
Financial Report
Shareholder Information
Corporate DirectoryCorporate Directory
Reserves & Resources
stbarbara.com.au36 stbarbara.com.au 37
A The minimum value of options yet to vest is $nil as the performance of service criteria may not be met and consequently the option may not vest.
B The maximum value of the options yet to vest represents the amount of the grant date fair value of the options that is still to be expensed in the income statement.
D Service agreements
Remuneration and other terms of employment for the Managing Director and CEO and the senior executives are formalised in service agreements. These agreements provide, where applicable, for the provision of performance related cash bonuses, other benefits including allowances, and participation in the St Barbara Limited Executive Option and Employee Option Plans. Other major provisions of the agreements relating to remuneration are set out below.
All contracts with senior executives may be terminated early by either party giving the required notice and subject to termination payments as detailed below.
E Eshuys – Managing Director & CEO
Term of agreement – permanent employee to 31 December 2009.
The Company may terminate the contract at an earlier date by paying Mr Eshuys 12 months’ salary, together with the balance of unpaid salary to the end of the contract, except in the case of gross misconduct. Mr Eshuys may terminate the contract by giving 4 months’ notice at any time after 31 January 2009.
I Bird – Chief Operating Officer
Term of agreement – permanent employee commencement 26 March 2007.
Mr Bird resigned with effect from 4 July 2008. A termination payment was made to Mr Bird equal to 12 months base salary and superannuation.
G Campbell-Cowan – Chief Financial Officer
Term of agreement – permanent employee commencement 11 September 2006.
Payment of a termination benefit on early termination
•
•
•
•
•
•
by the Company, other than for gross misconduct, four weeks of base salary and superannuation, plus an additional 1 week’s payment of base salary and superannuation if Mr Campbell-Cowan is over 45 years of age and has completed 2 years of continuous service.
R Kennedy – General Manager of Corporate Services/Company Secretary
Term of agreement – permanent employee commencement 29 September 2004.
Payment of a termination benefit on early termination by the Company, other than for gross misconduct, equal to 6 months base salary and superannuation.
P Thompson, General Manager Exploration
Term of agreement – permanent employee commencement 24 January 2005.
Mr Thompson resigned with effect from 4 July 2008. A termination payment was made to Mr Thompson equal to 12 months base salary and superannuation.
G Viska, General Manager Commercial
Term of agreement – permanent employee commencement 1 August 2005
Payment of a termination benefit on early termination by the Company, other than for gross misconduct, one month of base salary and superannuation plus an additional one week’s payment of base salary and superannuation after two years service.
Loans to Directors and executives
There were no loans to Directors or executives during the year.
Auditor IndependenceA copy of the Auditor’s Independence Declaration required under section 307C of the Corporations Act 2001 is set out on page 39. During the year additional accounting advice services were provided by KPMG (refer Note 24 to the financial statements). The Directors are satisfied that the provision of these services did not impair the auditor’s independence.
•
•
•
•
•
•
Options granted Value yet to vest
Number Date% vested
in year
% forfeited
in year
Financial years grant
vests
Minimum
(A)
$
Maximum
(B)
$
E Eshuys 5,000,000 23 Dec 2004 100 – 30 June 2008 Nil –
5,000,000 23 Dec 2004 – – 30 June 2009 Nil 11,901
I Bird (1) 1,000,000 26 Mar 2007 – – 30 June 2009 Nil –
1,000,000 26 Mar 2007 – – 30 June 2010 Nil –
G Campbell-Cowan 1,000,000 11 Sept 2006 100 – 30 June 2008 Nil –
1,000,000 11 Sept 2006 – – 30 June 2009 Nil 38,966
(1) I Bird resigned with effect from 4 July 2008 and options granted have lapsed.
Remuneration Report cont.
No options have been granted since the end of the financial year. The options were provided at no cost to the senior executives. The vesting of options is subject to a continuing service condition as at each vesting date.
All options expire on the earlier of their expiry date, thirty days after resignation or twelve months after retirement or retrenchment.
Options granted under the plan carry no dividend or voting rights. When exercisable, each option is convertible into one ordinary share.
The assessed fair value at grant date of options granted to the individuals is allocated equally over the period from grant date to vesting date, and the amount is included in the remuneration tables in section B. Fair values at grant date are independently determined using a Black Scholes option pricing model that takes into account the exercise price (ordinarily linked to the average closing market price for the 5 business days immediately preceding the grant date), the term of the option, the share price at grant date and expected price volatility of the underlying share, no expected dividend yield and the risk free interest rate for the term of the option.
Further information on the options is set out in Note 35 to the Financial Statements.
(ii) Exercise of options grantedDuring the financial year the following shares were issued on the exercise of options previously granted as compensation:
2008Number of
shares issuedAmount paid
Cents per share
E Eshuys 5,000,000 11.8
2007Number of
shares issuedAmount paid
Cents per share
E Eshuys 10,000,000 4.72
E Eshuys 5,000,000 15.0
R Kennedy 1,000,000 8.0
(iii) Analysis of movements in options
2008 A B C
Granted in year
$
Exercised in year
$
Lapsed in year
$
Total option
value in year
$
E Eshuys – 1,975,000 – 1,975,000
I Bird – – – –
G Campbell-Cowan
– – – –
A The value of options granted in the year is the fair value of the options calculated at grant date using a binominal option-pricing model. The total value of the options granted is included in the table above. This amount is allocated to remuneration over the vesting period.
B The value of options exercised during the year is calculated as the market price of shares of the Company on the Australian Securities Exchange as at close of trading on the day the options were exercised after deducting the price paid to exercise the option.
C The value of the options that lapsed during the year represents the benefit forgone and is calculated at the date
the option lapsed using a binominal option-pricing model.
(iv) Analysis of options granted as compensation
As a result of the 2 for 7 pro-rata accelerated renounceable entitlement offer to shareholders announced on 10 June 2008 and pursuant to the formula contained in the Australian Securities Exchange Listing Rule 6.22.2 and the terms of the St Barbara Employee and Executive Option Plans, the exercise price of unlisted options was adjusted down. The adjusted option exercise price for the senior executives is set out as follows:
Exercise Price
Adjusted Exercise
Price
Options to Exercise /
Vest
Cents per share
Cents per share
E Eshuys 15.0 11.8 5,000,000
I Bird 52.2 49.0 2,000,000
G Campbell-Cowan 52.8 49.6 2,000,000
Remuneration Report cont.
Directors’ ReportFor the year ended 30 June 2008
Directors’ ReportFor the year ended 30 June 2008

Exit Print Contents Previous Start End NextAnnual Report 2008
Who are we Highlights Chairman’s Letter
Managing Director’s Report
Operations & Development
Exploration Finance Environment, Safety & Social Responsibility
Management Corporate Governance
Financial Report
Shareholder Information
Corporate DirectoryCorporate Directory
Reserves & Resources
stbarbara.com.au38 stbarbara.com.au 39
Auditors’ Independence DeclarationIndemnification and Insurance of OfficersThe Company indemnifies all Directors of the Company named in this report, and a number of former Directors (including Mr Richard Knight, Mr Hank Tuten and Mr Mark Wheatley), and current and former executive officers of the Company and its controlled entities against all liabilities to persons (other than the Company or a related body corporate) which arise out of the performance of their normal duties as Director or executive officer, unless the liability relates to conduct involving bad faith. The Company also has a policy to indemnify the Directors and executive officers against all costs and expenses incurred in defending an action that falls within the scope of the indemnity and any resulting payments.
During the year the Company paid an insurance premium for the policy. The contract of insurance prohibits disclosure of the amount of the premium and the nature of the liabilities insured under the policy.
During the year the Company also paid the premium on a Personal Accident insurance policy on behalf of directors, to insure them for travel while on Company business.
Proceedings on Behalf of the CompanyNo person has applied to the Court under section 237 of the Corporations Act 2001 for leave to bring proceedings on behalf of the Company, or to intervene in any proceedings to which the Company is a party, for the purpose of taking responsibility on behalf of the Company for all or part of those proceedings.
No proceedings have been brought or intervened in on behalf of the Company with leave of the Court under section 237 of the Corporations Act 2001.
Environmental ManagementThe Company regards compliance with environmental regulations as the minimum performance standard for its operations. The Company’s operations in Western Australia are subject to environmental regulation under both Commonwealth and State legislation.
There were a total of seven non-compliances registered and externally reported for the Southern Cross operations during the 2008 financial year. At Leonora there were three non-compliances registered and externally reported. Formal reporting of these incidents did not generate any additional requirements or investigations from regulators, and environmental impacts are managed through ongoing mitigation and monitoring procedures.
Non-audit ServicesDuring the year the Company did employ the auditor on assignments additional to their statutory audit duties. Details of the amounts paid or payable to the auditor, KPMG, for audit and non-audit services provided during the year are set out in Note 24 to the financial statements.
The Board of Directors has considered the position and, in accordance with the advice received from the Audit Committee, is satisfied that the provision of non-audit services during the year is compatible with the general standard of independence for auditors imposed by the Corporations Act 2001. The Directors are satisfied that the provision of non-audit services
by the auditor, as set out in note 24 to the financial statements, did not compromise the auditor independence requirements of the Corporations Act 2001 for the following reasons:
All non-audit services have been reviewed by the Audit Committee to ensure they do not impact the impartiality and objectivity of the auditor;
None of the services undermine the general principles relating to auditor independence as set out in APES 110 Code of Ethics for Professional Accountants; and
The Audit Committee submits annually to the Board a formal written report detailing the nature and amount of any non-audit services rendered by KPMG during the most recent financial year and an explanation of why the provision of these services is compatible with auditor independence. If applicable, the Audit Committee recommends that the Board take appropriate action in response to the Audit Committee’s report to satisfy itself of the independence of KPMG.
Events Occurring After the End of the Financial YearThe Directors are not aware of any matter or circumstance that has arisen since the end of the financial year that, in their opinion, has significantly affected or may significantly affect in future years the Company’s operations, the results of those operations or the state of affairs, except for the following:
(i) The proceeds from the fully underwritten retail component of the renounceable accelerated pro-rata entitlement offer totalling $54,518,000, after transaction costs, was received on 17 July 2008 in accordance with an underwriting agreement signed on 10 June 2008. The financial statements as at 30 June 2008 did not recognise any balance in relation to these proceeds.
(ii) A loan facility agreement was signed with GE Commercial Finance on 13 August 2008 for a $20,000,000 equipment line facility. This facility is to be used to fund the construction and acquisition of certain infrastructure assets at Gwalia. The facility is secured against the equipment being financed and is repayable over 48 months.
Rounding of AmountsSt Barbara Limited is a Company of the kind referred to in Class Order 98/100 approved by the Australian Securities and Investments Commission and issued pursuant to section 341(1) of the Corporations Act 2001. As a result, amounts in this Directors’ Report and the accompanying Financial Report have been rounded to the nearest thousand dollars, except where otherwise indicated.
This report is made in accordance with a resolution of Directors.
For and on behalf of the Board Dated at Melbourne this 28th day of August 2008
Eduard Eshuys Managing Director & CEO
•
•
•
Directors’ ReportFor the year ended 30 June 2008
Directors’ ReportFor the year ended 30 June 2008

Exit Print Contents Previous Start End NextAnnual Report 2008
Who are we Highlights Chairman’s Letter
Managing Director’s Report
Operations & Development
Exploration Finance Environment, Safety & Social Responsibility
Management Corporate Governance
Financial Report
Shareholder Information
Corporate DirectoryCorporate Directory
Reserves & Resources
stbarbara.com.au40 stbarbara.com.au 41
Consolidated Parent Entity
Notes2008
$’0002007 $’000
2008 $’000
2007 $’000
Revenue from continuing operations 5 143,129 130,911 143,129 130,911
Mine operating costs (84,486) (82,065) (84,486) (82,065)
Gross profit 58,643 48,846 58,643 48,846
Other revenue 5 4,846 3,495 4,846 3,495
Other income 6 195 11,110 280 11,110
Exploration expensed (28,531) (8,775) (28,531) (8,775)
Corporate administration costs (22,730) (19,770) (22,730) (19,770)
Royalties (6,162) (5,501) (6,162) (5,501)
Depreciation and amortisation 7 (30,779) (29,980) (30,779) (29,980)
Other expenditure (2,197) (4,516) (2,197) (4,516)
Operating loss (26,715) (5,091) (26,630) (5,091)
Finance costs 7 (3,008) (2,650) (3,008) (2,650)
Net realised/unrealised gains on derivatives 16,834 6,688 16,834 6,688
Unrealised loss on available for sale assets (4,876) – (4,876) –
Loss before income tax (17,765) (1,053) (17,680) (1,053)
Income tax benefit/(expense) 8 432 (1,841) 432 (1,841)
Loss after income tax (17,333) (2,894) (17,248) (2,894)
Earnings per share for loss attributable to the ordinary equity holders of the Company:
Basic loss per share (cents per share) 34 (1.66) (0.35)
Diluted loss per share (cents per share) 34 (1.66) (0.34)
The above Income Statements should be read in conjunction with the accompanying notes.
Income StatementsFor the year ended 30 June 2008
This financial report covers both St Barbara Limited (formerly St Barbara Mines Limited) as an individual entity and the consolidated entity consisting of St Barbara Limited and its subsidiaries. The financial report is presented in the Australian currency.
St Barbara Limited is a company limited by shares, incorporated and domiciled in Australia. Its registered office is:
St Barbara Limited Level 21, 90 Collins St Melbourne VIC 3000
A description of the nature of the consolidated entity’s operations and its principal activities is included in the review of operations and activities in the directors’ report, which is not part of this financial report.
The financial report was authorised for issue by the directors on 28 August 2008. The Company has the power to amend and reissue the financial report.
Financial ReportFor the year ended 30 June 2008

Exit Print Contents Previous Start End NextAnnual Report 2008
Who are we Highlights Chairman’s Letter
Managing Director’s Report
Operations & Development
Exploration Finance Environment, Safety & Social Responsibility
Management Corporate Governance
Financial Report
Shareholder Information
Corporate DirectoryCorporate Directory
Reserves & Resources
stbarbara.com.au42 stbarbara.com.au 43
Statements of Recognised Income and ExpenseFor the year ended 30 June 2008
Consolidated Parent Entity
2008 $’000
2007 $’000
2008 $’000
2007 $’000
Changes in fair value of available for sale financial assets, net of tax
– (7,799) – (7,799)
Changes in fair value of cash flow hedges, net of tax – 3,521 – 3,521
Income and expense recognised directly in equity – (4,278) – (4,278)
Loss for the year (17,333) (2,894) (17,248) (2,894)
Total recognised income and expense for the year (17,333) (7,172) (17,248) (7,172)
Attributable to equity holders of the company (17,333) (7,172) (17,248) (7,172)
The above Statements of Recognised Income and Expense should be read in conjunction with the accompanying notes.
Consolidated Parent Entity
Notes2008
$’0002007 $’000
2008 $’000
2007 $’000
Assets
Current assets
Cash and cash equivalents 9 35,517 87,369 35,517 87,369
Trade and other receivables 10 32,285 16,714 32,287 17,490
Inventories 11 21,038 7,551 21,038 7,551
Derivative financial assets 12 203 2,511 203 2,511
Deferred mining costs 13 15,923 23,267 15,923 23,267
Total current assets 104,966 137,412 104,968 138,188
Non-current assets
Available for sale financial assets 14 13,941 17,381 13,941 17,381
Property, plant and equipment 16 72,788 16,006 72,788 15,147
Deferred mining costs 13 16,139 – 16,139 –
Exploration and evaluation 17 25,778 18,188 25,778 18,188
Mine properties 17 161,187 70,365 161,187 70,365
Derivative financial assets 12 34,647 10,639 34,647 10,639
Other financial assets 18 – – 178 178
Total non-current assets 324,480 132,579 324,658 131,898
Total assets 429,446 269,991 429,626 270,086
Liabilities
Current liabilities
Trade and other payables 19 59,273 44,025 70,674 55,426
Interest bearing borrowings 20 2,367 2,149 2,367 2,149
Provisions 21 3,049 1,798 3,049 1,798
Total current liabilities 64,689 47,972 76,090 59,373
Non-current liabilities
Interest bearing borrowings 20 98,570 97,662 98,570 97,662
Provisions 21 29,523 29,356 29,523 29,356
Total non-current liabilities 128,093 127,018 128,093 127,018
Total liabilities 192,782 174,990 204,183 186,391
Net Assets 236,664 95,001 225,443 83,695
Equity
Contributed equity 22 366,466 208,231 366,466 208,231
Reserves 23(a) 2,518 1,757 2,518 1,757
Accumulated losses 23(b) (132,320) (114,987) (143,541) (126,293)
Total equity 236,664 95,001 225,443 83,695
The above Balance Sheets should be read in conjunction with the accompanying notes.
Balance SheetsAs at 30 June 2008

Exit Print Contents Previous Start End NextAnnual Report 2008
Who are we Highlights Chairman’s Letter
Managing Director’s Report
Operations & Development
Exploration Finance Environment, Safety & Social Responsibility
Management Corporate Governance
Financial Report
Shareholder Information
Corporate DirectoryCorporate Directory
Reserves & Resources
stbarbara.com.au44 stbarbara.com.au 45
Note 1 Summary of Significant Accounting Policies
St Barbara Limited (the “Company”) is a company domiciled in Australia. The consolidated financial statements of the Company as at and for the year ended 30 June 2008 comprise the Company and its subsidiaries (together referred to as the “Group”), and the Group’s interest in associates and jointly controlled entities. The Group is primarily involved in the exploration and mining of gold.
The principal accounting policies adopted in the preparation of the financial report are set out below. These policies have been consistently applied to all the years presented, unless otherwise stated. The financial report includes separate financial statements for St Barbara Limited as an individual entity and the consolidated entity consisting of St Barbara Limited and its subsidiaries.
(a) Basis of preparation
Statement of compliance
The financial report is a general purpose financial report which has been prepared in accordance with Australian Accounting Standards (AASBs) (including Australian Interpretations) adopted by the Australian Accounting Standards Board (AASB) and the Corporations Act 2001. Where required by accounting standards comparative figures have been adjusted to conform to changes in presentation in the current year. The consolidated financial report of the Group and the financial report of the Company comply with International Financial Reporting Standards (IFRSs) and interpretations adopted by the International Accounting Standards Board.
The financial statements were approved by the Board of Directors on 27 August 2008.
Historical cost convention
These financial statements have been prepared under the historical cost convention, as modified by the revaluation of available-for-sale financial assets at fair value, and financial assets and liabilities (including derivative instruments) held at fair value through profit or loss.
Critical accounting estimates
The preparation of financial statements requires management to make judgements, estimates and assumptions that affect the application of accounting policies and the reported amount of assets, liabilities, income and expenses. Actual results may differ from these estimates. The estimates and underlying assumptions are reviewed on an ongoing basis. Revisions to accounting estimates are recognised in the period in which the estimate is revised and in any future periods affected. The areas involving a higher degree of judgement or complexity, or areas where assumptions and estimates are significant to the financial statements, are disclosed in Note 3.
(b) Principles of consolidation
(i) SubsidiariesThe consolidated financial statements incorporate the assets and liabilities of all subsidiaries of St Barbara Limited (‘’Company’’ or ‘’parent entity’’) as at 30 June 2008 and the results of all subsidiaries for the year then ended. St Barbara Limited and its subsidiaries together are referred to in this financial report as the Group or the consolidated entity.
Subsidiaries are all those entities (including special purpose entities) over which the Group has the power to govern the financial and operating policies so as to obtain benefits from its activities, generally accompanying a shareholding of more than one-half of the voting rights. The existence and effect of potential voting rights that are currently exercisable or convertible are considered when assessing whether the Group controls another entity.
Subsidiaries are consolidated from the date on which control commences until the date control ceases.
Intercompany transactions, balances and unrealised gains on transactions between Group companies are eliminated. Unrealised losses are also eliminated unless the transaction provides evidence of the impairment of the asset transferred. Accounting policies of subsidiaries have been changed where necessary to ensure consistency with the policies adopted by the Group.
Investments in subsidiaries are accounted for at cost in the individual financial statements of St Barbara Limited.
(ii) Associates and joint controlled entitiesAssociates are all entities over which the Group has significant influence but not control, generally accompanying a shareholding of between 20% and 50% of voting rights. An interest in an associate and a jointly controlled entity is accounted for in the consolidated financial statements using the equity method and is carried at cost by the parent entity. Under the equity method, the share of the profits or losses of the partnership is recognised in the income statement, and the share of movements in reserves is recognised in reserves in the balance sheet.
Profits or losses on transactions establishing the joint venture entity and transactions with the joint venture are eliminated to the extent of the Group’s ownership interest until such time as they are realised by the joint venture entity on consumption or sale, unless they relate to an unrealised loss that provides evidence of the impairment of an asset transferred.
(iii) Jointly controlled operations and assetsDetails of unincorporated joint ventures and jointly controlled assets are set out in Note 30.
Where material, the proportionate interests in the assets, liabilities and expenses of a joint venture activity are incorporated in the financial statements under the appropriate headings.
(c) Segment reporting
A business segment is a group of assets and operations engaged in providing products or services that are subject to risks and returns that are different to those of other business segments. A geographical segment is engaged in providing products or services within a particular economic environment and is subject to risks and returns that are different from those of segments operating in other economic environments.
(d) Foreign currency translation
(i) Functional and presentation currencyThe consolidated financial statements are presented in Australian dollars, which is St Barbara Limited’s functional and presentation currency.
Notes to the Financial StatementsFor the year ended 30 June 2008
Consolidated Parent Entity
Notes2008
$’0002007
$’0002008
$’0002007 $’000
Cash Flows From Operating Activities:
Receipts from customers (inclusive of GST) 142,672 130,438 142,672 130,438
Payments to suppliers and employees (inclusive of GST) (114,379) (106,335) (114,379) (106,335)
Interest received 5,181 2,979 5,181 2,979
Interest paid (8,000) – (8,000) –
Finance charges – finance leases (262) (163) (262) (163)
Borrowing costs paid (220) (474) (220) (474)
Net cash inflow from operating activities 32 24,992 26,445 24,992 26,445
Cash Flows From Investing Activities:
Proceeds from sale of property, plant and equipment 14 1,089 14 1,089
Proceeds from sale of options in listed securities – 330 – 330
Proceeds from sale of subsidiary 1,000 – 1,000 –
Proceeds on sale of available for sale financial assets – 29,546 – 29,546
Payments for property, plant and equipment (60,664) (5,362) (60,664) (5,362)
Payments for investments in available for sale financial assets – (18,922) – (18,922)
Payments for development of mining properties (51,666) (50,424) (51,666) (50,424)
Payments in respect of mines under construction (68,721) (37,851) (68,721) (37,851)
Payments for tenements and land (105) (586) (105) (586)
Exploration and Evaluation expenditure (36,962) (23,718) (36,962) (23,718)
Payments for derivatives (386) – (386) –
Put option premiums paid (4,480) (4,821) (4,480) (4,821)
Net cash outflow from investing activities (221,970) (110,719) (221,970) (110,719)
Cash Flows From Financing Activities:
Proceeds from issue of shares on conversion of options 1,446 2,098 1,446 2,098
Proceeds from borrowings: – finance leases 276 1,558 276 1,558
– insurance premium funding 2,330 2,160 2,330 2,160
Proceeds from issue of convertible notes – 100,000 – 100,000
Payments for convertible notes transaction costs (114) (3,298) (114) (3,298)
Proceeds from equity raisings 161,741 – 161,741 –
Payments for equity raising transaction costs (5,417) – (5,417) –
Share buy backs – (874) – (874)
Movement in unclaimed monies (12) 581 (12) 581
Movement in restricted cash (12,482) (7,468) (12,482) (7,468)
Principal repayments: – finance leases (456) (656) (456) (656)
– insurance premium funding (2,186) (1,794) (2,186) (1,794)
Net cash inflow from financing activities 145,126 92,307 145,126 92,307
Net increase/(decrease) in cash & cash equivalents (51,852) 8,033 (51,852) 8,033
Cash and cash equivalents at the beginning of the year 87,369 79,336 87,369 79,336
Cash & cash equivalents at the end of the year 9 35,517 87,369 35,517 87,369
The above Cash Flow Statements should be read in conjunction with the accompanying notes.
Cash Flow StatementsFor the year ended 30 June 2008
Exit Print Contents Previous Start End NextAnnual Report 2008
Who are we Highlights Chairman’s Letter
Managing Director’s Report
Operations & Development
Exploration Finance Environment, Safety & Social Responsibility
Management Corporate Governance
Financial Report
Shareholder Information
Corporate DirectoryCorporate Directory
Reserves & Resources
stbarbara.com.au46 stbarbara.com.au 47
(g) Deferred mining expenditure
Certain mining costs, principally those that relate to the stripping of waste and operating development, which provide access so that future economically recoverable ore can be mined, are deferred in the balance sheet as deferred mining. Waste removal costs incurred in the development of a mine before production commences are capitalised as part of the mine development costs, which are subsequently depreciated over the life of the operation.
Removal of waste incurred once an operation commences production is capitalised as mine development costs. A proportion of the development and production waste costs are charged to the income statement as an operating cost. These costs are taken to production costs on the basis that each ounce of ore produced bears the same average cost of waste removal per ounce of ore, as determined by the waste to ore ratio derived from the current mine plan. The waste to ore ratio and the remaining life of the mine are regularly assessed to ensure the carrying value and the rate of deferral is appropriate.
(h) Taxes
(i) Income taxThe income tax expense or revenue for the year is the tax payable on the current period’s taxable income using the income tax rate applicable at the reporting date, adjusted by changes in deferred tax assets and liabilities attributable to temporary differences between the tax bases of assets and liabilities and their carrying amounts in the financial statements, and by changes to unused tax losses.
Deferred tax assets are recognised for deductible temporary differences and carry forward unused tax losses only if it is probable that future taxable amounts will be available to utilise those temporary differences and losses.
Current and deferred tax balances attributable to amounts recognised directly in equity are also recognised directly in equity.
The Company and its wholly owned Australian entities have not yet elected to implement the tax consolidation legislation.
(ii) Goods and Services Tax (GST)Revenues, expenses and assets are recognised net of the amount of associated GST, unless the GST incurred is not recoverable from the taxation authority. In this case it is recognised as part of the cost of acquisition of the asset or as part of the expense.
Receivables and payables are stated inclusive of the amount of GST receivable or payable. The net amount of GST recoverable from, or payable to, the taxation authority is included with other receivables or payables in the balance sheet.
Cash flows are presented on a gross basis. The GST components of cash flows arising from investing or financing activities which are recoverable from, or payable to, the taxation authority are presented as an operating cash flow.
(i) Leases
Leases of property, plant and equipment where the Group has substantially all the risks and rewards of ownership are classified as finance leases. Finance leases are capitalised at inception of the lease at the lower of the fair value of the leased property and the present value of the minimum future lease payments. The corresponding rental obligations, net of finance charges,
are included in other long term payables. Each lease payment is allocated between the liability and finance charges so as to achieve a constant rate on the finance balance outstanding. The interest element of the finance cost is charged to the income statement over the lease period so as to produce a constant periodic rate of interest on the remaining balance of the liability for each period. The property, plant and equipment acquired under finance leases is depreciated over the shorter of the asset’s useful life and the lease term.
Leases in which a significant portion of the risks and rewards of ownership are retained by the lessor are classified as operating leases. Payments made under operating leases (net of any incentives received from the lessor) are charged to the income statement on a straight-line basis over the period of the lease.
(j) Business combinations
The purchase method of accounting is used to account for all acquisitions of assets (including business combinations) regardless of whether equity instruments or other assets are acquired. Cost is measured as the fair value of the assets given, shares issued or liabilities incurred or assumed at the date of exchange plus costs directly attributable to the acquisition. Where equity instruments are issued in an acquisition, the value of the instruments is their published market price as at the date of exchange unless, in rare circumstances, it can be demonstrated that the published price at the date of exchange is an unreliable indicator of fair value and that other evidence and valuation methods provide a more reliable measure of fair value. Transaction costs arising on the issue of equity instruments are recognised directly in equity.
Identifiable assets acquired and liabilities and contingent liabilities assumed in a business combination are measured initially at their fair values at the acquisition date, irrespective of the extent of any minority interest. The excess of the cost of acquisition over the fair value of the Group’s share of the identifiable net assets acquired is recorded as goodwill. If the cost of acquisition is less than the fair value of the net assets of the subsidiary acquired, the difference is recognised directly in the income statement, but only after a reassessment of the identification and measurement of the net assets acquired.
Where settlement of any part of cash consideration is deferred, the amounts payable in the future are discounted to their present value as at the date of exchange. The discount rate used is the entity’s incremental borrowing rate, being the rate at which a similar borrowing could be obtained from an independent financier under comparable terms and conditions.
(k) Impairment of assets
The carrying value of all assets are reviewed half yearly to determine whether there is an indication of impairment. Where an indicator of impairment exists, a formal estimate of the recoverable amount is made. An impairment loss is recognised for the amount by which the asset’s carrying amount exceeds its recoverable amount. The recoverable amount is the higher of an asset’s fair value less costs to sell and value in use. In assessing value in use, the estimated future cash flows are discounted to their present value. For the purposes of assessing impairment, assets are grouped at the lowest levels for which there are separately identifiable cash inflows, largely independent of the cash inflows from other assets or groups of assets (cash-generating units).
Notes to the Financial StatementsFor the year ended 30 June 2008
Note 1 Summary of Significant Accounting Policies cont.
(d) Foreign currency translation cont.
(ii) Transactions and balancesForeign currency transactions are translated into the functional currency using the exchange rates prevailing at the dates of the transactions. Foreign exchange gains and losses resulting from the settlement of such transactions and from the translation at year end exchange rates of monetary assets and liabilities denominated in foreign currencies are recognised in the income statement, except when deferred in equity as qualifying cash flow hedges and qualifying net investment hedges.
Translation differences on non monetary financial assets and liabilities are reported as part of the fair value gain or loss. Translation differences on non monetary financial assets and liabilities such as equities held at fair value through profit or loss are recognised in the income statement as part of the fair value gain or loss. Translation differences on non monetary financial assets, such as equities classified as available for sale financial assets, are included in the fair value reserve in equity.
(e) Revenue recognition
Revenue is measured at the fair value of the consideration received or receivable. Amounts disclosed as revenue are net of amounts collected on behalf of third parties. The Group recognises revenue when the significant risks and rewards of ownership have been transferred to the buyer, the amount of revenue can be reliably measured, and the associated costs and possible return of goods can be estimated reliably, and it is probable that future economic benefits will flow to the Group. Revenue is recognised for the major business activities as follows:
(i) Product salesAmounts are recognised as sales revenue when there has been a transfer of risk to a customer, and:
the product is in a form suitable for delivery and no further processing is required by, or on behalf of, the Group;
the quantity, quality and selling price of the product can be determined with reasonable accuracy; and
the product has been despatched to the metals refinery and is no longer under the physical control of the Group, or the metals refinery has formally acknowledged legal ownership of the product, including all inherent risks.
Gains and losses, including premiums paid or received, in respect of forward sales, options and other deferred delivery arrangements which hedge anticipated revenues from future production are deferred and included in sales revenue when the hedged proceeds are received.
(ii) Interest incomeInterest income is recognised on a time proportion basis using the effective interest method.
(iii) DividendsDividends are recognised as revenue when the right to receive payment is established.
(iv) Gains on disposal of available-for-sale financial assetsRevenue is recognised when the risks and rewards of ownership have been transferred, which is usually considered to occur on settlement.
•
•
•
(f) Exploration and evaluation/Mine properties
(i) Exploration, evaluation and feasibility expenditureAll exploration and evaluation expenditure incurred up to establishment of reserves is expensed as incurred. From the point in time when reserves are established, exploration and evaluation expenditure is capitalised and carried forward in the financial statements, in respect of areas of interest for which the rights of tenure are current and where such costs are expected to be recouped through successful development and exploitation of the area of interest, or alternatively, by its sale.
Exploration and evaluation expenditure consists of an accumulation of acquisition costs and direct exploration and evaluation costs incurred, together with an allocation of directly related overhead expenditure.
Feasibility expenditure represents costs related to the preparation and completion of a feasibility study to enable a development decision to be made in relation to that area of interest. Feasibility expenditures are expensed as incurred until a decision has been made to develop the area of interest.
Exploration and evaluation assets are assessed for impairment if (i) sufficient data exists to determine technical feasibility and commercial viability, and (ii) facts and circumstances suggest that the carrying amount exceeds the recoverable amount (see impairment policy, Note 1(k)). For the purpose of impairment testing, exploration and evaluation assets are allocated to cash-generating units to which the exploration activity relates.
When an area of interest is abandoned, or the Directors determine it is not commercial, accumulated costs in respect of that area are written off in the period the decision is made.
(ii) Mines under constructionMine development expenditure is accumulated separately for each area of interest in which economically recoverable reserves have been identified. This expenditure includes direct costs of construction, an appropriate allocation of overheads and borrowing costs capitalised during construction. Once a development decision has been taken, all past and future capitalised exploration, evaluation and feasibility expenditure in respect of the area of interest is aggregated with the costs of construction and classified under non-current assets as mine development.
(iii) Mine developmentMine development represents the acquisition cost and/or accumulated exploration, evaluation and development expenditure in respect of areas of interest in which mining has commenced.
When further development expenditure is incurred in respect of a mine development after the commencement of production, such expenditure is carried forward as part of the mine development only when substantial future economic benefits are thereby established, otherwise such expenditure is classified as part of production and expensed as incurred.
Mine development costs are deferred until commercial production commences, at which time they are amortised on a unit-of-production basis over mineable reserves. The calculation of amortisation takes into account future costs which will be incurred to develop all the mineable reserves. Changes to mineable reserves are applied from the beginning of the reporting period and the amortisation charge is adjusted from the beginning of the period.
Notes to the Financial StatementsFor the year ended 30 June 2008
Note 1 Summary of Significant Accounting Policies cont.

Exit Print Contents Previous Start End NextAnnual Report 2008
Who are we Highlights Chairman’s Letter
Managing Director’s Report
Operations & Development
Exploration Finance Environment, Safety & Social Responsibility
Management Corporate Governance
Financial Report
Shareholder Information
Corporate DirectoryCorporate Directory
Reserves & Resources
stbarbara.com.au48 stbarbara.com.au 49
(q) Derivative financial instruments cont.
The Group designates certain derivatives as either (1) hedges of the fair value of recognised assets or liabilities or a firm commitment (fair value hedge); or (2) hedges of the cash flows of recognised assets and liabilities and highly probable forecast transactions (cash flow hedges).
The Group documents at the inception of the hedging transaction the relationship between hedging instruments and hedged items, as well as its risk management objective and strategy for undertaking various hedge transactions. The Group also documents its assessment, both at hedge inception and on an ongoing basis, of whether the derivatives that are used in hedging transactions have been, and will continue to be, highly effective in offsetting changes in fair values or cash flows of hedged items.
The fair values of various derivative financial instruments used for hedging purposes are disclosed in Note 12. Movements in the hedging reserve in shareholders’ equity are shown in Note 23.
(i) Cash flow hedgeThe fair value of option contracts comprises intrinsic value, that is, the extent to which the option is in the money due to spot prices falling below the option strike price, and time value.
The effective portion of changes in the fair value of derivatives that are designated and qualify as cash flow hedges is recognised in equity in the hedging reserve. The gain or loss relating to the ineffective portion and time value is recognised immediately in the income statement.
Amounts accumulated in equity are recycled in the income statement in the periods when the hedged item will affect profit or loss (for instance, when the forecast sale that is hedged takes place). The gain or loss relating to the effective portion of the financial instrument hedging Australian dollar gold sales is recognised in the income statement within ‘gold sales revenue’.
When a hedging instrument expires or is sold or terminated, or when a hedge no longer meets the criteria for hedge accounting, any cumulative gain or loss existing in equity at that time remains in equity and is recognised when the forecast transaction is ultimately recognised in the income statement. When a forecast transaction is no longer expected to occur, the cumulative gain or loss that was reported in equity is immediately transferred to the income statement.
(ii) Derivatives that do not qualify for hedge accountingCertain derivative instruments do not qualify for hedge accounting. Changes in the fair value of any derivative instrument that does not qualify for hedge accounting are recognised immediately in the income statement.
(r) Compound financial instruments
Compound financial instruments issued by the Group comprise convertible notes that can be converted to share capital at the option of the holder, and the number of shares to be issued does not vary with changes in the fair value of the notes.
The liability component of a compound financial instrument is recognised initially at the fair value of a similar liability that does not have an equity conversion option. The equity component is recognised initially at the difference between the fair value of the compound financial instrument as a whole and the fair value of the liability component. Any directly attributable transaction costs are allocated to the liability and equity components in proportion to their initial carrying amounts.
Subsequent to initial recognition, the liability component of a compound financial instrument is measured at amortised cost using the effective interest method, unless it is designated at fair value through profit and loss. The equity component of a compound financial instrument is not remeasured subsequent to initial recognition.
(s) Fair value estimation
The fair value of financial assets and financial liabilities must be estimated for recognition and measurement, or for disclosure purposes.
The fair value of financial instruments traded in active markets (such as publicly traded derivatives, and trading and available for sale securities) is based on quoted market prices at the balance sheet date. The quoted market price used for financial assets held by the Group is the current bid price; the appropriate quoted market price for financial liabilities is the current ask price.
The fair value of financial instruments that are not traded in an active market (for example, over the counter derivatives) is determined using generally accepted valuation techniques. The Group uses a variety of methods and makes assumptions that are based on market conditions existing at each balance date.
The nominal value less estimated credit adjustments of trade receivables and payables are assumed to approximate their fair values. The fair value of financial liabilities for disclosure purposes is estimated by discounting the future contractual cash flows at the current market interest rate that is available to the Group for similar financial instruments.
(t) Property, plant and equipment
Buildings, plant and equipment are stated at historical cost less accumulated depreciation. Historical cost includes expenditure that is directly attributable to the acquisition of the items. Cost may also include transfers from equity of any gains/losses on qualifying cash flow hedges of foreign currency purchases of property, plant and equipment.
Subsequent costs are included in the asset’s carrying amount or recognised as a separate asset, as appropriate, only when it is probable that future economic benefits associated with the item will flow to the Group and the cost of the item can be measured reliably. All other repairs and maintenance are charged to the income statement during the financial period in which they are incurred.
Depreciation of assets is calculated using the straight line method to allocate the cost or revalue amounts, net of residual values, over their estimated useful lives, as follows:
– Buildings 10 years – Plant and equipment 3-10 years
Where the carrying value of an asset is less than its estimated residual value, no depreciation is charged. The assets’ residual values and useful lives are reviewed, and adjusted if appropriate, at each balance sheet date.
An asset’s carrying amount is written down immediately to its recoverable amount, if the asset’s carrying amount is greater than its estimated recoverable amount (Note 1(k)).
Gains and losses on disposal are determined by comparing proceeds with carrying amount. These are included in the income statement when realised.
Notes to the Financial StatementsFor the year ended 30 June 2008
Note 1 Summary of Significant Accounting Policies cont.
(l) Cash and cash equivalents
For cash flow statement presentation purposes, cash and cash equivalents include cash on hand, deposits held at call with financial institutions, other short term, highly liquid investments with original maturities of three months or less that are readily convertible to known amounts of cash and which are subject to an insignificant risk of changes in value, and bank overdrafts. Bank overdrafts are shown within borrowings in current liabilities on the balance sheet.
(m) Trade receivables
Trade receivables are recognised initially at fair value and subsequently measured at amortised cost, less provision for doubtful debts. Trade receivables are usually due for settlement no more than 30 days from the date of recognition.
Collectability of trade receivables is reviewed on an ongoing basis. Debts which are known to be uncollectable are written off. A provision for doubtful receivables is established when there is objective evidence that the Group will not be able to collect all amounts due according to the original terms of receivables. The amount of the provision is the difference between the asset’s carrying amount and the present value of estimated future cash flows, discounted at the effective interest rate. The amount of the provision is recognised in the income statement.
Funds placed on deposit with financial institutions to secure bank guarantees are classified in the balance sheet as other receivables.
(n) Inventories
Raw materials and stores, ore stockpiles and work-in-progress and finished gold stocks are valued at the lower of cost and net realisable value.
Cost comprises direct materials, direct labour and an appropriate proportion of variable and fixed overhead expenditure relating to mining activities, the latter being allocated on the basis of normal operating capacity. Costs are assigned to individual items of inventory on the basis of weighted average costs. Net realisable value is the estimated selling price in the ordinary course of business, less the estimated costs of completion and the estimated costs necessary to make the sale.
(o) Non-current assets held for sale
Non-current assets are classified as held for sale and stated at the lower of their carrying amount and fair value, less costs to sell, if their carrying amount is to be recovered principally through a sale transaction rather than through continued use.
An impairment loss is recognised for any initial or subsequent write down of the asset to fair value less costs to sell. A gain is recognised for any subsequent increases in fair value less costs to sell an asset, but not in excess of any cumulative impairment loss previously recognised. A gain or loss not previously recognised by the date of the sale of the non-current asset is recognised at the date of de-recognition.
Non-current assets are not depreciated or amortised while they are classified as held for sale.
Non-current assets classified as held for sale are presented separately from the other assets in the balance sheet.
(p) Investments and other financial assets
The Group classifies its investments and other financial assets in the following categories: financial assets at fair value through profit or loss, loans and receivables, held-to-maturity investments, and available-for-sale financial assets. The classification depends on the purpose for which the investments were acquired. Management determines the classification of its investments at initial recognition and re-evaluates this designation at each reporting date.
Investments and other financial assets are recognised initially at fair value plus, for assets not at fair value through profit and loss, any directly attributable transaction costs, except as described below. Subsequent to initial recognition, investments and other financial assets are measured as described below.
(i) Financial assets at fair value through profit or lossFinancial assets at fair value through profit or loss are financial assets held for trading, which were acquired principally for the purpose of selling in the short term with the intention of making a profit. Derivatives are also categorised as held for trading, unless they are designated as hedges. Financial assets at fair value through profit or loss are measured at fair value and changes therein are recognised in the income statement. Upon initial recognition, attributable transaction costs are recognised in the income statement when incurred.
(ii) Loans and receivablesLoans and receivables are non derivative financial assets with fixed or determinable payments that are not quoted in an active market. They arise when the Group provides money, goods or services directly to a debtor with no intention of selling the receivable. They are included in current assets, except for those with maturities greater than 12 months after the balance sheet date, which are classified as non-current assets. Loans and receivables are included in receivables in the balance sheet and are shown in Note 10.
Loans and receivables are measured at amortised cost using the effective interest method, less any impairment losses.
(iii) Available-for-sale financial assets Available for sale financial assets, comprising principally marketable equity securities, are non derivative financial assets that are either designated in this category or not classified in any of the other categories. They are included in non current assets, unless management intends to dispose of the investment within 12 months of the balance sheet date.
Subsequent to initial recognition, available-for-sale financial assets are measured at fair value and changes therein, other than impairment losses, are recognised as a separate component of equity net of attributable tax. When an asset is de-recognised the cumulative gain or loss in equity is transferred to the income statement.
(q) Derivative financial instruments
The Group holds derivative financial instruments to hedge its Australian dollar gold price risk exposures. Derivatives are initially recognised at fair value on the date a derivative contract is entered into and are subsequently remeasured to fair value at each reporting date. The accounting for subsequent changes in fair value depends on whether the derivative is designated as a hedging instrument, and if so, the nature of the item being hedged.
Notes to the Financial StatementsFor the year ended 30 June 2008
Note 1 Summary of Significant Accounting Policies cont.

Exit Print Contents Previous Start End NextAnnual Report 2008
Who are we Highlights Chairman’s Letter
Managing Director’s Report
Operations & Development
Exploration Finance Environment, Safety & Social Responsibility
Management Corporate Governance
Financial Report
Shareholder Information
Corporate DirectoryCorporate Directory
Reserves & Resources
stbarbara.com.au50 stbarbara.com.au 51
(z) Contributed equity
Ordinary shares are classified as equity.
Incremental costs directly attributable to the issue of new shares or options are shown in equity as a deduction, from the proceeds. Incremental costs directly attributable to the issue of new shares or options, or for the acquisition of a business, are included in the cost of the acquisition as part of the purchase consideration.
If the entity reacquires its own equity instruments, e.g. as the result of a share buy-back, those instruments are deducted from equity and the associated shares are cancelled. No gain or loss is recognised in the income statement and the consideration paid including any directly attributable incremental costs is recognised directly in equity.
(aa) Earnings per share
(i) Basic earnings per shareBasic earnings per share is calculated by dividing the profit attributable to equity holders of the Company, excluding any costs of servicing equity other than ordinary shares, by the weighted average number of ordinary shares outstanding during the reporting period, adjusted for bonus elements in ordinary shares issued during the reporting period.
(ii) Diluted earnings per shareDiluted earnings per share adjusts the figures used in the determination of basic earnings per share to take into account the after income tax effect of interest and other financing costs associated with dilutive potential ordinary shares and the weighted average number of shares assumed to have been issued for no consideration in relation to dilutive potential ordinary shares.
(ab) Restricted cash
Funds placed on deposit with financial institutions to secure bank guarantees are classified as current receivables.
(ac) Rehabilitation and mine closure
The consolidated entity has obligations to dismantle, remove, restore and rehabilitate certain items of property, plant and equipment.
Under AASB 116 Property, Plant and Equipment, the cost of an asset must include any estimated costs of dismantling and removing the asset and restoring the site on which it is located. The capitalised rehabilitation and mine closure costs are depreciated (along with the other costs included in the asset) over the asset’s useful life.
AASB 137 Provisions, Contingent Liabilities and Contingent Assets requires a provision to be made for the estimated cost of rehabilitation and restoration of areas disturbed during mining operations up to reporting date but not yet rehabilitated. Provision has been made in full for all the disturbed areas at the reporting date based on current estimates of costs to rehabilitate such areas, discounted to their present value based on expected future cash flows. The estimated cost of rehabilitation includes the current cost of contouring, topsoiling and revegetation to meet legislative requirements. Changes in estimates are dealt with on a prospective basis as they arise.
There is some uncertainty as to the amount of rehabilitation obligations that will be incurred due to the impact of changes in environmental legislation and many other factors, including future developments, changes in technology and price increases.
At each reporting date the rehabilitation liability is remeasured in line with changes in the timing and /or amounts of the costs to be incurred and discount rates. The liability is adjusted for changes in estimates. Adjustments to the estimated amount and timing of future rehabilitation and restoration cash flows are a normal occurrence in light of the significant judgments and estimates involved.
As the value of the provision represents the discounted value of the present obligation to restore, dismantle and rehabilitate, the increase in the provision due to the passage of time is recognised as a borrowing cost.
(ad) Rounding of amounts
The company is of a kind referred to in Class Order 98/0100, issued by the Australian Securities and Investments Commission, relating to the “rounding off” of amounts in the financial report. Amounts in the financial report have been rounded off in accordance with that Class Order to the nearest thousand dollars, or in certain cases, the nearest dollar.
(ae) New accounting standards and interpretations
Certain new accounting standards and interpretations have been published that are not mandatory for the 30 June 2008 date. The Group’s and the parent entity’s assessment of the impact of these new standards and interpretations is set out below:
(i) Revised AASB 3 Business Combinations changes the application of acquisition accounting for business combinations and the accounting for non-controlling (minority) interests. Key changes include: the immediate expensing of all transaction costs; measurement of contingent consideration at acquisition date with subsequent changes through the income statement; measurement of non-controlling (minority) interests at full fair value or the proportionate share of the fair value of the underlying net assets; guidance on issues such as reacquired rights and vendor indemnities; and the inclusion of combination by contract alone and those involving mutuals. The revised standard becomes mandatory for the Group’s 30 June 2010 financial statements. The Group has not yet determined the potential effect of the revised standard on the Group’s financial report.
(ii) AASB 8 Operating Segments introduces the “management approach” to segment reporting. AASB 8, which becomes mandatory for the Group’s 30 June 2010 financial statements, will require the disclosure of segment information based on the internal reports regularly reviewed by the Group’s Chief Operating Decision Maker in order to assess each segment’s performance and to allocate resources to them.
(iii) Revised AASB 101 Presentation of Financial Statements introduces as a financial statement the “statement of comprehensive income”. The revised standard does not change the recognition, measurement or disclosure of transactions and events that are required by other AASBs. The revised AASB 101 will become mandatory for the Group’s 30 June 2010 financial statements. The Group has not yet determined the potential effect of the revised standard on the Group’s disclosures.
(iv) Revised AASB 123 Borrowing Costs removes the option to expense borrowing costs and requires that an entity capitalise borrowing costs directly to the acquisition, construction or production of a qualifying asset as part of the cost of that asset. The revised AASB 123 will become mandatory for the Group’s 30 June 2010 financial statements. The Group has not yet determined the potential effect of the revised standard on future earnings.
Notes to the Financial StatementsFor the year ended 30 June 2008
Note 1 Summary of Significant Accounting Policies cont.
(u) Trade and other payables
These amounts represent liabilities for goods and services provided to the Group prior to the end of the financial year, which remains unpaid as at reporting date. The amounts are unsecured and are usually paid within 30 days from the end of the month of recognition.
(v) Borrowings
Borrowings, including the liability component of the Group’s convertible debt, are initially recognised at fair value, net of transaction costs incurred. Borrowings are subsequently measured at amortised cost. Any difference between the proceeds (net of transaction costs) and the redemption amount is recognised in the income statement over the period of the borrowings using the effective interest method. Fees paid on the establishment of loan facilities, which are not incremental costs relating to the actual draw down of the facility, are recognised as prepayments and amortised on a straight line basis over the term of the facility.
The fair value of the liability portion of convertible debt is determined using a market interest rate for an equivalent non-convertible debt. This amount is recorded as a liability on an amortised cost basis until extinguished on conversion or maturity of the debt. The remainder of the proceeds is allocated to the conversion option. This is recognised and included in shareholders’ equity, net of income tax effects.
Borrowings are classified as current liabilities unless the Group has an unconditional right to defer settlement of the liability for at least 12 months after the balance sheet date.
(w) Borrowing costs
Borrowing costs incurred for the construction of any qualifying asset are capitalised during the period of time it is required to complete and prepare the asset for its intended use or sale. Other borrowing costs are recognised as expenses in the period in which they are incurred.
(x) Provisions
Provisions for legal claims and rehabilitation and restoration costs are recognised when the Group has a present legal or constructive obligation as a result of past events, it is more likely than not that an outflow of resources will be required to settle the obligation, and the amount has been reliably estimated. Provisions are not recognised for future operating losses.
Where there are a number of similar obligations, the likelihood that an outflow will be required in settlement is determined by considering the class of obligations as a whole. A provision is recognised even if the likelihood of an outflow with respect to any one item included in the same class of obligations may be small.
Provisions are measured at the present value of management’s best estimate of the expenditure required to settle the present obligation at the balance sheet date. The discount rate used to determine the present value reflects current market assessments of the time value of money and the risks specific to the liability. The increase in the provision due to the passage of time is recognised as interest expense.
(y) Employee benefits
(i) Wages and salaries, and annual leaveLiabilities for wages and salaries, including non-monetary benefits and annual leave expected to be paid within 12 months of the reporting date are recognised in other payables in respect of employees’ services up to the reporting date and are measured at the amounts expected to be paid, including expected on-costs, when the liabilities are settled.
(ii) Long service leaveThe liability for long service leave is recognised in the provision for employee benefits and measured as the present value of expected future payments to be made, plus expected on-costs, in respect of services provided by employees up to the reporting date. Consideration is given to the expected future wage and salary levels, experience of employee departures and periods of service. Expected future payments are discounted using market yields at the reporting date on national government bonds with terms to maturity and currency that match, as closely as possible, the estimated future cash outflows.
(iii) Share-based paymentsShare-based compensation benefits are provided to employees via the St Barbara Limited Employees’ Option Plan and shareholder approved executive options. Information relating to these schemes is set out in Note 35.
The fair value of Executive Options and options granted under the St Barbara Limited Employees’ Option Plan is recognised as an employee benefit expense with a corresponding increase in equity. The fair value is measured at grant date and recognised over the period during which the employees become unconditionally entitled to the options. The amount recognised is adjusted at each reporting date to reflect the actual number of share options not expected to vest.
The fair value at grant date is independently determined using a Black-Scholes option pricing model that takes into account the exercise price, the term of the option, the vesting and performance criteria, the impact of dilution, the non-tradeable nature of the option, the share price at grant date and expected price volatility of the underlying share, the expected dividend yield and the risk-free interest rate for the term of the option.
Upon the exercise of options, the balance of the share-based payments reserve relating to those options is transferred to share capital.
(iv) Retirement benefit obligationsContributions to defined contribution funds are recognised as an expense as they are due and become payable. Prepaid contributions are recognised as an asset to the extent that a cash refund or a reduction in future payments is available.
The Group has no obligations in respect of defined benefit funds.
(v) Executive bonusesSenior executives may be eligible for annual bonuses subject to achievement of Key Performance Indicators, as recommended by the Remuneration Committee and approved by the Board of Directors. The Group recognises a liability and an expense for bonuses in the reporting period during which the service was provided by the employee.
Notes to the Financial StatementsFor the year ended 30 June 2008
Note 1 Summary of Significant Accounting Policies cont.
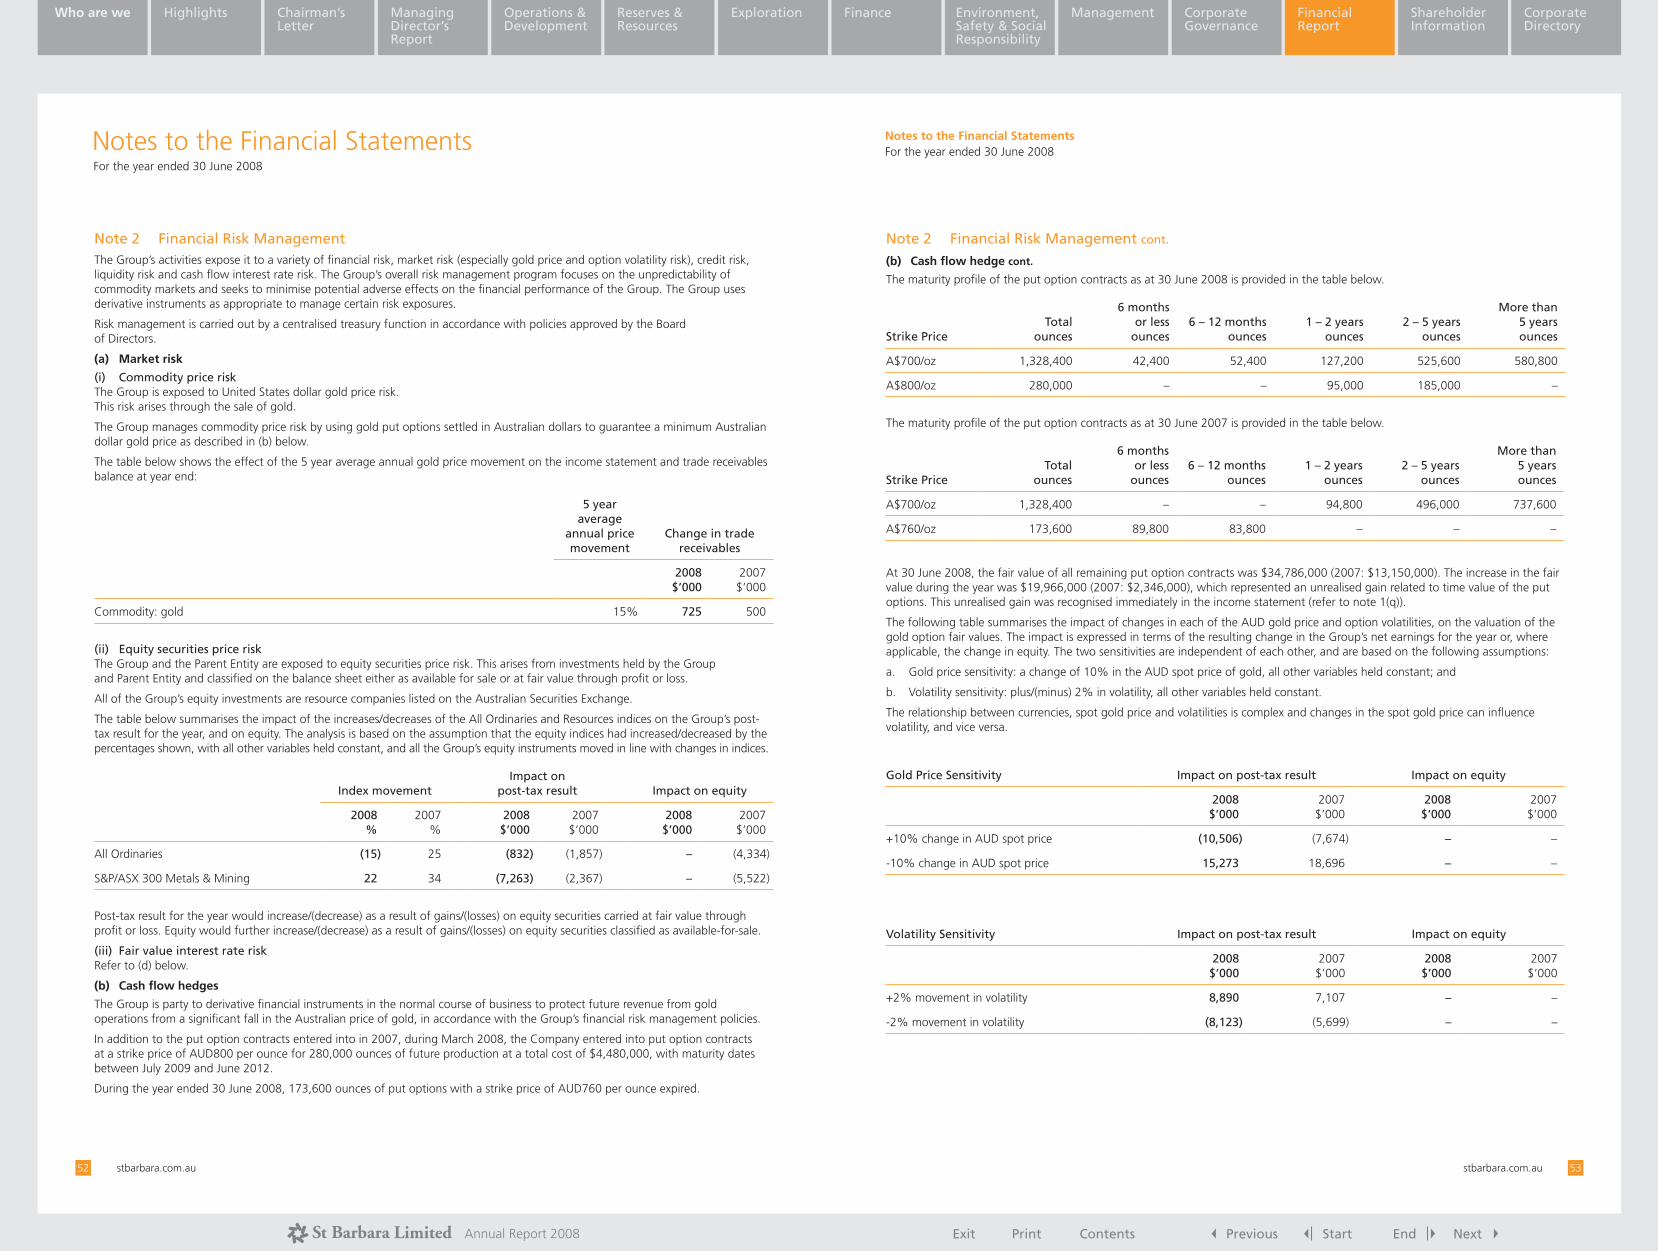
Exit Print Contents Previous Start End NextAnnual Report 2008
Who are we Highlights Chairman’s Letter
Managing Director’s Report
Operations & Development
Exploration Finance Environment, Safety & Social Responsibility
Management Corporate Governance
Financial Report
Shareholder Information
Corporate DirectoryCorporate Directory
Reserves & Resources
stbarbara.com.au52 stbarbara.com.au 53
(b) Cash flow hedge cont.
The maturity profile of the put option contracts as at 30 June 2008 is provided in the table below.
Strike PriceTotal
ounces
6 months or less
ounces6 – 12 months
ounces1 – 2 years
ounces2 – 5 years
ounces
More than 5 years ounces
A$700/oz 1,328,400 42,400 52,400 127,200 525,600 580,800
A$800/oz 280,000 – – 95,000 185,000 –
The maturity profile of the put option contracts as at 30 June 2007 is provided in the table below.
Strike PriceTotal
ounces
6 months or less
ounces6 – 12 months
ounces1 – 2 years
ounces2 – 5 years
ounces
More than 5 years ounces
A$700/oz 1,328,400 – – 94,800 496,000 737,600
A$760/oz 173,600 89,800 83,800 – – –
At 30 June 2008, the fair value of all remaining put option contracts was $34,786,000 (2007: $13,150,000). The increase in the fair value during the year was $19,966,000 (2007: $2,346,000), which represented an unrealised gain related to time value of the put options. This unrealised gain was recognised immediately in the income statement (refer to note 1(q)).
The following table summarises the impact of changes in each of the AUD gold price and option volatilities, on the valuation of the gold option fair values. The impact is expressed in terms of the resulting change in the Group’s net earnings for the year or, where applicable, the change in equity. The two sensitivities are independent of each other, and are based on the following assumptions:
a. Gold price sensitivity: a change of 10% in the AUD spot price of gold, all other variables held constant; and
b. Volatility sensitivity: plus/(minus) 2% in volatility, all other variables held constant.
The relationship between currencies, spot gold price and volatilities is complex and changes in the spot gold price can influence volatility, and vice versa.
Gold Price Sensitivity Impact on post-tax result Impact on equity
2008 $’000
2007 $’000
2008 $’000
2007 $’000
+10% change in AUD spot price (10,506) (7,674) – –
-10% change in AUD spot price 15,273 18,696 – –
Volatility Sensitivity Impact on post-tax result Impact on equity
2008 $’000
2007 $’000
2008 $’000
2007 $’000
+2% movement in volatility 8,890 7,107 – –
-2% movement in volatility (8,123) (5,699) – –
Note 2 Financial Risk Management cont.Note 2 Financial Risk ManagementThe Group’s activities expose it to a variety of financial risk, market risk (especially gold price and option volatility risk), credit risk, liquidity risk and cash flow interest rate risk. The Group’s overall risk management program focuses on the unpredictability of commodity markets and seeks to minimise potential adverse effects on the financial performance of the Group. The Group uses derivative instruments as appropriate to manage certain risk exposures.
Risk management is carried out by a centralised treasury function in accordance with policies approved by the Board of Directors.
(a) Market risk
(i) Commodity price riskThe Group is exposed to United States dollar gold price risk. This risk arises through the sale of gold.
The Group manages commodity price risk by using gold put options settled in Australian dollars to guarantee a minimum Australian dollar gold price as described in (b) below.
The table below shows the effect of the 5 year average annual gold price movement on the income statement and trade receivables balance at year end:
5 year average
annual price movement
Change in trade receivables
2008 $’000
2007 $’000
Commodity: gold 15% 725 500
(ii) Equity securities price riskThe Group and the Parent Entity are exposed to equity securities price risk. This arises from investments held by the Group and Parent Entity and classified on the balance sheet either as available for sale or at fair value through profit or loss.
All of the Group’s equity investments are resource companies listed on the Australian Securities Exchange.
The table below summarises the impact of the increases/decreases of the All Ordinaries and Resources indices on the Group’s post-tax result for the year, and on equity. The analysis is based on the assumption that the equity indices had increased/decreased by the percentages shown, with all other variables held constant, and all the Group’s equity instruments moved in line with changes in indices.
Index movementImpact on
post-tax result Impact on equity
2008 %
2007 %
2008 $’000
2007 $’000
2008 $’000
2007 $’000
All Ordinaries (15) 25 (832) (1,857) – (4,334)
S&P/ASX 300 Metals & Mining 22 34 (7,263) (2,367) – (5,522)
Post-tax result for the year would increase/(decrease) as a result of gains/(losses) on equity securities carried at fair value through profit or loss. Equity would further increase/(decrease) as a result of gains/(losses) on equity securities classified as available-for-sale.
(iii) Fair value interest rate riskRefer to (d) below.
(b) Cash flow hedges
The Group is party to derivative financial instruments in the normal course of business to protect future revenue from gold operations from a significant fall in the Australian price of gold, in accordance with the Group’s financial risk management policies.
In addition to the put option contracts entered into in 2007, during March 2008, the Company entered into put option contracts at a strike price of AUD800 per ounce for 280,000 ounces of future production at a total cost of $4,480,000, with maturity dates between July 2009 and June 2012.
During the year ended 30 June 2008, 173,600 ounces of put options with a strike price of AUD760 per ounce expired.
Notes to the Financial StatementsFor the year ended 30 June 2008Notes to the Financial Statements
For the year ended 30 June 2008

Exit Print Contents Previous Start End NextAnnual Report 2008
Who are we Highlights Chairman’s Letter
Managing Director’s Report
Operations & Development
Exploration Finance Environment, Safety & Social Responsibility
Management Corporate Governance
Financial Report
Shareholder Information
Corporate DirectoryCorporate Directory
Reserves & Resources
stbarbara.com.au54 stbarbara.com.au 55
(e) Liquidity risk cont.
Maturities of financial liabilities
The table below analyses the Group’s financial liabilities. The amounts disclosed in the table are the contractual undiscounted cash flows.
Maturity of financial liabilities – 2008
$‘000Less than 6 months
6 – 12 months
Between 1 and 5
yearsOver 5
years
Total contractual cash flows
Carrying amount
Convertible notes(1) 4,000 4,000 108,000 – 116,000 100,000
Finance lease liabilities 351 307 869 – 1,527 1,495
Insurance premium funding liability 1,212 606 – – 1,818 1,763
Trade and other payables 59,273 – – – 59,273 59,273
64,836 4,913 108,869 – 178,618 162,531
(1) The Convertible notes are due on 4 June 2012 and are convertible into fully paid ordinary shares of the Company at the election of the holder. On 4 June 2010, the holders of the convertible notes have the right to require repayment of the principal plus accrued interest.
Maturity of financial liabilities – 2007
$’000Less than 6 months
6 – 12 months
Between 1 and 5
yearsOver 5
years
Total contractual cash flows
Carrying amount
Convertible notes(1) 4,000 4,000 116,000 – 124,000 100,000
Finance lease liabilities 310 286 1,156 – 1,752 1,710
Insurance funding liability 1,122 561 – – 1,683 1,620
Trade and other payables 44,025 – – – 44,025 44,025
49,457 4,847 117,156 – 171,460 147,355
(1) The Convertible notes are due on 4 June 2012 and are convertible into fully paid ordinary shares of the Company at the election of the holder. On 4 June 2010, the holders of the convertible notes have the right to require repayment of principal plus accrued interest in respect of all or a portion of the notes.
(f) Cash flow and fair value interest rate risk
The Group’s main interest rate risk arises from long-term borrowings. Borrowings issued at variable rates expose the Group to cash flow interest rate risk. Borrowings issued at fixed rates expose the Group to fair value interest rate risk. The Group’s interest rate policy does not require a fixed and pre-determined proportion of its interest rate exposure to be hedged. Any decision to hedge interest rate risk will be assessed at the inception of each floating rate debt facility in relation to the overall Group exposure, the prevailing interest rate market, and any funding counterparty requirements.
At 30 June 2008, 100% of the Group’s borrowings were issued at a fixed rate (2007: 100%). Refer Note 15 for the Group’s exposure to interest rate risk.
(g) Foreign exchange risk
The Group operates in Australia, and as such has minimum exposure to foreign exchange risk. Transactions performed in foreign currencies are immaterial.
Note 2 Financial Risk Management cont.
(c) Credit risk
Credit risk is the risk that a counterparty will not meet its obligations under a financial instrument or customer contract. The Group is exposed to credit risk from its operating activities (primarily customer receivables) and from its financing and hedging activities, including deposits and derivatives contracts with banks and financial institutions.
The maximum exposure to credit risk at the reporting date is the carrying amount of the financial assets, other than available for sale assets.
Credit risks related to receivables
The Group has no significant concentrations of receivables related credit risk, with revenues primarily derived from gold sales direct to refiners. Based on historic rates of default, the Group believes that no impairment has occurred with respect to trade receivables, which includes the amount owed by the Group’s most significant customer. The Group’s most significant customer accounts for $5,001,000 of the trade receivables carrying amount at 30 June 2008 (2007: $3,448,000). None of the trade receivables at 30 June 2008 were past due.
Credit risks related to cash deposits and derivatives
Credit risk from balances with banks and financial institutions and derivative counterparties is managed by the centralised Treasury function in accordance with Board approved policy. Investments of surplus funds are only made with approved counterparties (minimum credit rating of “AA-”) and with credit ratings assigned to each counterparty and there is a financial limit on funds placed with any single counterparty.
No material exposure is considered to exist by virtue of the possible non performance of the counterparties to financial instruments.
(d) Capital management
The Group’s total capital is defined as total shareholders’ funds plus net debt.
Consolidated capital2008 $’000
2007 $’000
Total shareholders’ funds 236,664 95,001
Borrowings 100,937 99,811
Cash and cash equivalents (35,517) (87,369)
Total capital 302,084 107,443
The Group does not have a target debt/equity ratio. There were no changes in the Group’s approach to capital management during the year.
The Group is not subject to externally imposed capital requirements other than normal banking requirements.
Borrowings include $100,000,000 of convertible notes on issue. The holder of each Note has the right to convert such Note into shares of the Company at any time during a specified conversion period. The notes have a maturity date of 4 June 2012 and Note holders have the right to require the Company to repurchase all or a portion of their notes on 4 June 2010. In addition, in the event of a default the Company may be required to pay all amounts then due in accordance with the terms and conditions of the notes. While the notes remain outstanding, the Group is not to incur any financial indebtedness, subject to certain exceptions set out in the terms of the notes.
(e) Liquidity risk
Prudent liquidity risk management requires maintaining sufficient cash and marketable securities, the availability of funding through an adequate amount of committed credit facilities and the ability to close out market positions.
The Group manages liquidity risk by continuously monitoring forecast and actual cash flows and matching maturity profiles of financial assets and liabilities.
Surplus funds are only invested in instruments that are tradeable in highly liquid markets.
Note 2 Financial Risk Management cont.
Notes to the Financial StatementsFor the year ended 30 June 2008Notes to the Financial Statements
For the year ended 30 June 2008

Exit Print Contents Previous Start End NextAnnual Report 2008
Who are we Highlights Chairman’s Letter
Managing Director’s Report
Operations & Development
Exploration Finance Environment, Safety & Social Responsibility
Management Corporate Governance
Financial Report
Shareholder Information
Corporate DirectoryCorporate Directory
Reserves & Resources
stbarbara.com.au56 stbarbara.com.au 57
Estimating the quantity and/or grade of reserves requires the size, shape and depth of ore bodies to be determined by analysing geological data. This process may require complex and difficult geological judgements and calculations to interpret the data.
The consolidated entity determines and reports ore reserves under the Australian Code for Reporting of Mineral Resource and Ore Reserves December 2004, known as the JORC Code. The JORC Code requires the use of reasonable investment assumptions to calculate reserves. Due to the fact that economic assumptions used to estimate reserves change from period to period, and geological data is generated during the course of operations, estimates of reserves may change from period to period. Changes in reported reserves may affect the consolidated entity’s financial results and financial position in a number of ways, including:
Asset carrying values may be impacted due to changes in estimated future cash flows.
Depreciation and amortisation charged in the income statement may change where such charges are calculated using the units of production basis.
Waste stripping costs deferred in the balance sheet or charged in the income statement may change due to a revision in stripping ratios.
Decommissioning, site restoration and environmental provisions may change where changes in estimated reserves affect expectations about the timing or cost of these activities.
(ii) Units of production method of amortisationThe consolidated entity applies the units of production method for amortisation of its life of mine specific assets, which results in an amortisation charge proportional to the depletion of the anticipated remaining life of mine production. These calculations require the use of estimates and assumptions in relation to reserves and resources, metallurgy and the complexity of future capital development requirements; changes to these estimates and assumptions will impact the amortisation charge in the income statement and asset carrying values.
(iii) Impairment of assetsThe recoverable amount of each Cash Generating Unit (CGU) is determined as the higher of value-in-use and fair value less costs to sell, in accordance with accounting policy 1(k). These calculations require the use of estimates, which have been outlined in accounting policy 1(k). Value-in-use is generally determined as the present value of the estimated future cash flows. Present values are determined using a risk adjusted discount rate appropriate to the risks inherent in the asset.
Given the nature of the consolidated entity’s mining activities, future changes in long term assumptions upon which these estimates are based may give rise to a material adjustment to the carrying value of the CGU. This could lead to the recognition of impairment losses in the future. The inter-relationships of the significant assumptions upon which estimated future cash flows are based, however, are such that it is impracticable to disclose the extent of the possible effects of a change in a key assumption in isolation.
Future cash flow estimates are based on expected production volumes, the short and long term forecasts of the Australian dollar gold price, ore reserves, operating costs, future capital expenditure and restoration and rehabilitation costs. Management is required to make these estimates and assumptions, which are subject to risk and uncertainty. As a result there is a possibility that changes in circumstances will alter these projections, which could impact on the recoverable amount of the assets. In such circumstances some or all of the carrying value of the assets may be impaired, giving rise to an impairment charge in the income statement.
(iv) Exploration and evaluation expenditureAs set out in Note 1(f) exploration and evaluation expenditure is capitalised where reserves have been established for an area of interest and it is considered likely to be recoverable from future exploitation or sale. The accounting policy requires management to make certain estimates and assumptions as to future events and circumstances, in particular whether an economically viable extraction operation can be established. These estimates and assumptions may change as new information becomes available. If, after having capitalised the expenditure under the accounting policy, a judgement is made that recovery of the expenditure is unlikely, the relevant capitalised amount will be written off to the income statement.
(v) Rehabilitation and mine closure provisionsAs set out in Note 1(x), the value of these provisions represents the discounted value of the present obligation to restore, dismantle and rehabilitate each site. Significant judgement is required in determining the provisions for mine rehabilitation and closure as there are many transactions and other factors that will affect the ultimate costs necessary to rehabilitate the mine sites. The discounted value reflects a combination of management’s best estimate of the cost of performing the work required, the timing of the cash flows and the discount rate.
A change in any, or a combination of, the key assumptions used to determine the provisions could have a material impact on the carrying value of the provisions (refer to Note 21). The provision recognised for each site is reviewed at each reporting date and updated based on the facts and circumstances available at the time. Changes to the estimated future costs for operating sites are recognised in the balance sheet by adjusting both the restoration and rehabilitation asset and provision.
(vi) Derivative financial instrumentsThe consolidated entity assesses the fair value of its purchased gold put options at each reporting date. Premiums for purchased gold put option contracts with an aggregate fair value of $34,786,000 as at 30 June 2008 have been designated as effective hedges and accounted for in accordance with Note 1(q). As at 30 June 2008, the put options had no intrinsic value. Movements in the time value of $19,966,000 was been recorded as a fair value adjustment directly in the income statement.
•
•
•
•
Note 3 Critical Accounting Estimates and Judgements cont.
(h) Fair value estimation
On-Balance Sheet
The net fair value of cash and cash equivalents and non-interest bearing monetary financial assets and financial liabilities of the Group approximates their carrying value. The net fair value of other monetary financial assets and financial liabilities is based upon market prices.
Off-Balance Sheet
The Group has potential financial liabilities that may arise from certain contingencies disclosed in Note 25. As explained in that note, no material losses are anticipated in respect of any of those contingencies and the net fair value disclosed is the Directors’ estimate of amounts which would be payable by the consolidated entity as consideration for the assumption of those contingencies by another party.
Fair values
The carrying amounts and the net fair values of financial assets and liabilities of the Group at balance date are:
2008 2007
Carrying Amount
$’000
Net Fair Value $’000
Carrying Amount
$’000
Net Fair Value $’000
Financial assets
– Cash and cash equivalents 35,517 35,517 87,369 87,369
– Restricted cash 20,597 20,597 8,115 8,115
– Receivables 9,457 9,457 6,722 6,722
– Available for sale financial assets 13,941 13,941 17,381 17,381
– Gold put options 34,786 34,786 13,150 13,150
– Listed options 64 64 – –
114,362 114,362 132,737 132,737
Financial liabilities
– Payables 59,273 59,273 44,025 44,025
– Convertible notes (1) 100,000 92,469 100,000 99,663
– Other loans 3,258 3,258 3,330 3,330
162,531 155,000 147,355 147,018
(1) The fair value of the convertible notes was determined on the basis that the notes will be in issue until their maturity date of 4 June 2012.
Note 3 Critical Accounting Estimates and JudgementsThe preparation of financial statements requires management to make judgements, estimates and assumptions that affect the application of accounting policies and the reported amounts of assets, liabilities, income and expenses. Actual results may differ from these estimates under different assumptions and conditions. Estimates and judgements are continually evaluated and are based on historical experience and on various other factors, including expectations of future events that are believed to be reasonable under the circumstances. Revisions to accounting estimates are recognised in the period in which the estimate is changed and in any future periods affected.
The Company has identified the following critical accounting policies under which significant judgements, estimates and assumptions are made, and where actual results may differ from these estimates under different assumptions and conditions that could materially affect financial results or financial position reported in future periods.
(i) Ore reserve estimatesReserves are estimates of the amount of gold product that can be economically extracted from the consolidated entity’s properties. In order to calculate reserves, estimates and assumptions are required about a range of geological, technical and economic factors, including quantities, grades, production techniques, recovery rates, production costs, future capital requirements, short and long term commodity prices and exchange rates.
Note 2 Financial Risk Management cont.
Notes to the Financial StatementsFor the year ended 30 June 2008Notes to the Financial Statements
For the year ended 30 June 2008

Exit Print Contents Previous Start End NextAnnual Report 2008
Who are we Highlights Chairman’s Letter
Managing Director’s Report
Operations & Development
Exploration Finance Environment, Safety & Social Responsibility
Management Corporate Governance
Financial Report
Shareholder Information
Corporate DirectoryCorporate Directory
Reserves & Resources
stbarbara.com.au58 stbarbara.com.au 59
Note 7 Expenses
Consolidated Parent entity
2008 $’000
2007 $’000
2008 $’000
2007 $’000
Profit/(loss) before income tax includes the following specific expenses:
Depreciation
Plant and equipment 1,199 542 1,199 542
Amortisation
Mine development costs 18,217 15,999 18,217 15,999
Deferred waste stripping 11,046 12,920 11,046 12,920
Plant/equipment finance leases 317 519 317 519
29,580 29,438 29,580 29,438
Total depreciation & amortisation 30,779 29,980 30,779 29,980
Finance Costs
Interest paid/payable 151 73 151 73
Interest on convertible notes 8,000 570 8,000 570
Borrowing costs 220 474 220 474
Finance lease 111 90 111 90
Provisions: unwinding of discount 1,166 2,013 1,166 2,013
Interest capitalised (6,640) (570) (6,640) (570)
3,008 2,650 3,008 2,650
Employee related expenses
Contributions to defined contribution superannuation 2,095 1,569 2,095 1,569
Equity settled share-based payments 475 1,719 475 1,719
2,570 3,288 2,570 3,288
Rental expense relating to operating leases
Lease payments 942 865 942 865
Notes to the Financial StatementsFor the year ended 30 June 2008
Fair values have been determined based on market observable data at the reporting date, using valuations provided by the counterparties to the put options. These calculations require the use of estimates and assumptions. Changes in assumptions in relation to gold prices and volatilities could have a material impact on the fair valuation attributed to the gold put options at reporting date. When these assumptions change in the future the differences will impact the hedging reserve and/or income statement in the period in which the change occurs.
(vii) Deferred taxThe consolidated entity has not recognised a net deferred tax asset of $24,950,000 as at 30 June 2008 (2007: $21,288,000) on the basis that the ability to utilise the temporary differences and tax losses is not probable as at the reporting date.
Note 4 Segment InformationThe consolidated entity operates predominantly in the minerals exploration and mining industry in Australia.
The consolidated entity’s head office is in Australia.
Note 5 Revenue
Consolidated Parent entity
2008 $’000
2007 $’000
2008 $’000
2007 $’000
Sales revenue-continuing operations
Sale of gold 142,394 130,371 142,394 130,371
Sale of silver 735 540 735 540
143,129 130,911 143,129 130,911
Other revenue
Interest revenue 5,053 3,213 5,053 3,213
Interest revenue capitalised (1,371) – (1,371) –
Sub-lease rental 305 101 305 101
Royalties 859 181 859 181
4,846 3,495 4,846 3,495
Total revenue 147,975 134,406 147,975 134,406
Note 6 Other Income
Consolidated Parent entity
2008 $’000
2007 $’000
2008 $’000
2007 $’000
Profit on sale of assets 14 1,078 14 1,078
Profit on sale of available for sale financial assets – 9,993 – 9,993
Profit on sale of investment 141 – 226 –
Other 40 39 40 39
195 11,110 280 11,110
Notes to the Financial StatementsFor the year ended 30 June 2008
Note 3 Critical Accounting Estimates and Judgements cont.
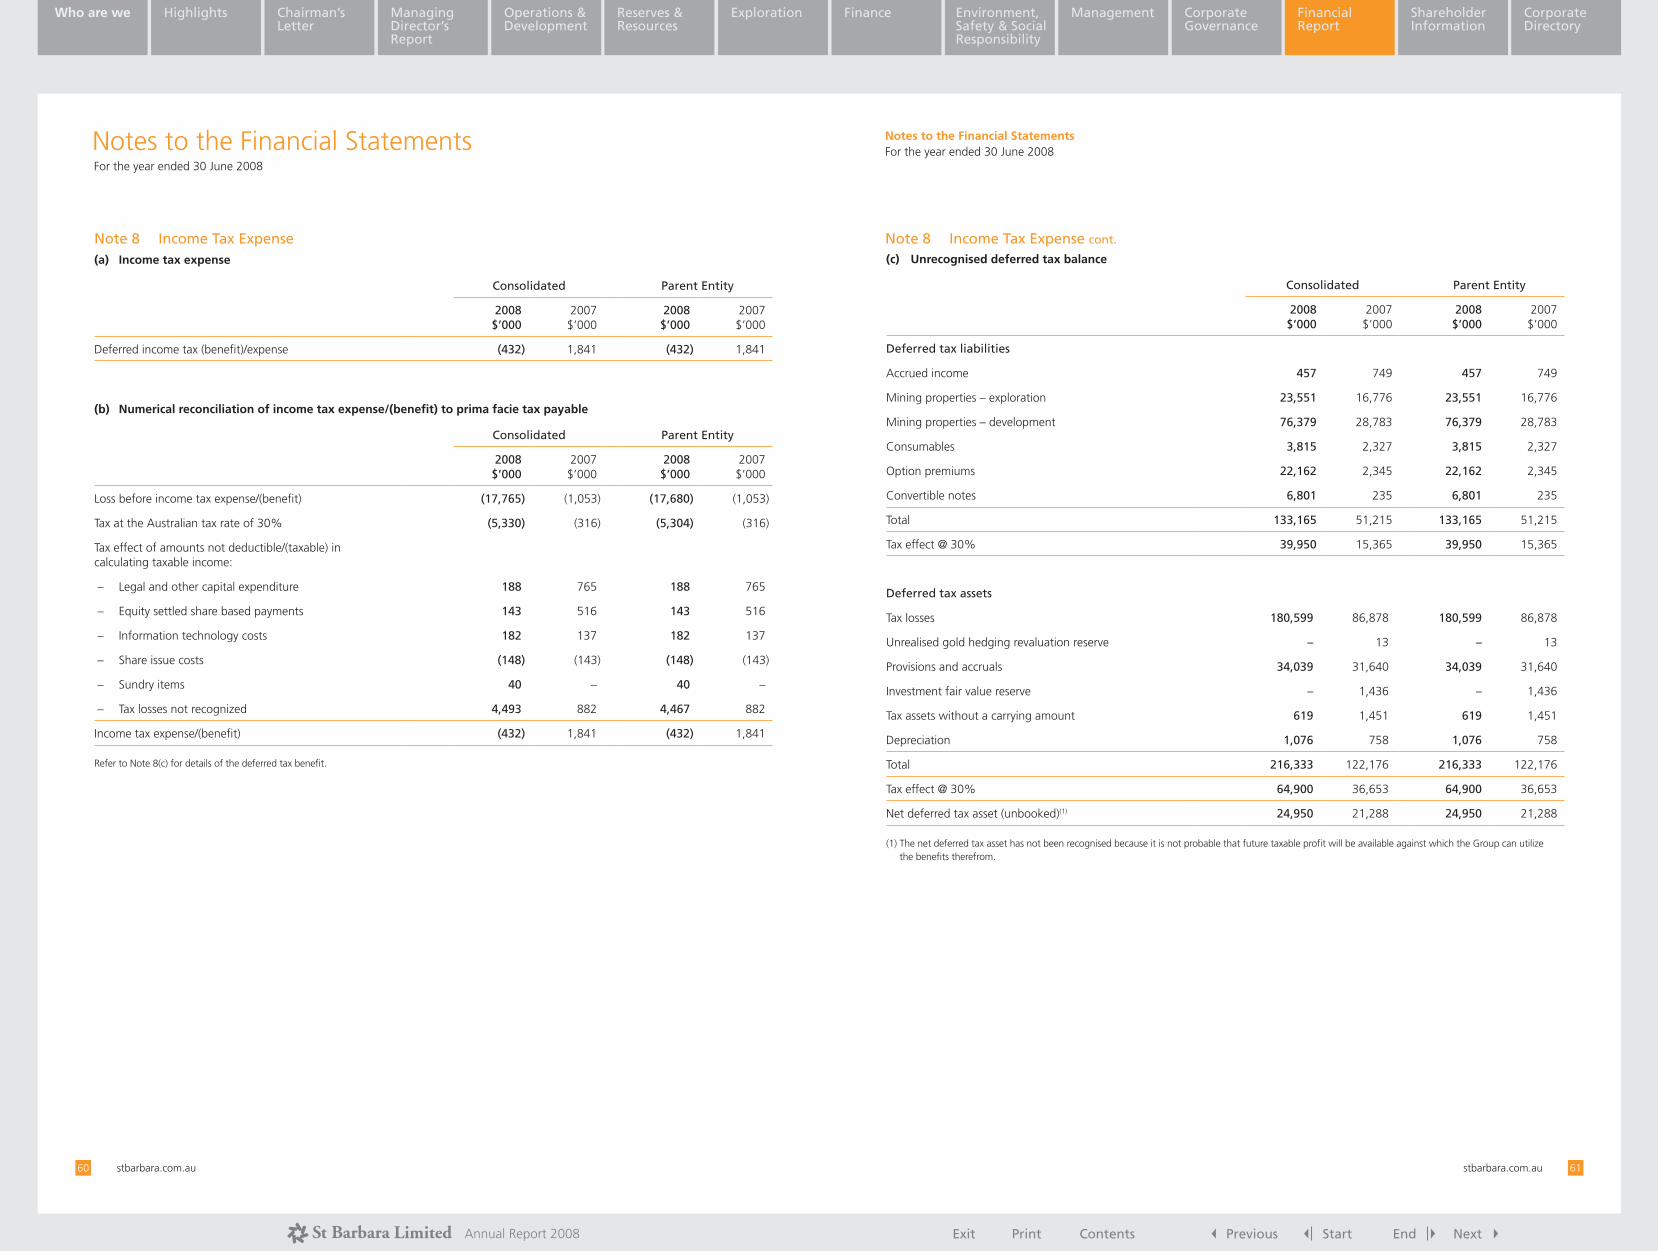
Exit Print Contents Previous Start End NextAnnual Report 2008
Who are we Highlights Chairman’s Letter
Managing Director’s Report
Operations & Development
Exploration Finance Environment, Safety & Social Responsibility
Management Corporate Governance
Financial Report
Shareholder Information
Corporate DirectoryCorporate Directory
Reserves & Resources
stbarbara.com.au60 stbarbara.com.au 61
(c) Unrecognised deferred tax balance
Consolidated Parent Entity
2008 $’000
2007 $’000
2008 $’000
2007 $’000
Deferred tax liabilities
Accrued income 457 749 457 749
Mining properties – exploration 23,551 16,776 23,551 16,776
Mining properties – development 76,379 28,783 76,379 28,783
Consumables 3,815 2,327 3,815 2,327
Option premiums 22,162 2,345 22,162 2,345
Convertible notes 6,801 235 6,801 235
Total 133,165 51,215 133,165 51,215
Tax effect @ 30% 39,950 15,365 39,950 15,365
Deferred tax assets
Tax losses 180,599 86,878 180,599 86,878
Unrealised gold hedging revaluation reserve – 13 – 13
Provisions and accruals 34,039 31,640 34,039 31,640
Investment fair value reserve – 1,436 – 1,436
Tax assets without a carrying amount 619 1,451 619 1,451
Depreciation 1,076 758 1,076 758
Total 216,333 122,176 216,333 122,176
Tax effect @ 30% 64,900 36,653 64,900 36,653
Net deferred tax asset (unbooked)(1) 24,950 21,288 24,950 21,288
(1) The net deferred tax asset has not been recognised because it is not probable that future taxable profit will be available against which the Group can utilize the benefits therefrom.
Notes to the Financial StatementsFor the year ended 30 June 2008
Note 8 Income Tax Expense cont.Note 8 Income Tax Expense(a) Income tax expense
Consolidated Parent Entity
2008 $’000
2007 $’000
2008 $’000
2007 $’000
Deferred income tax (benefit)/expense (432) 1,841 (432) 1,841
(b) Numerical reconciliation of income tax expense/(benefit) to prima facie tax payable
Consolidated Parent Entity
2008 $’000
2007 $’000
2008 $’000
2007 $’000
Loss before income tax expense/(benefit) (17,765) (1,053) (17,680) (1,053)
Tax at the Australian tax rate of 30% (5,330) (316) (5,304) (316)
Tax effect of amounts not deductible/(taxable) in calculating taxable income:
– Legal and other capital expenditure 188 765 188 765
– Equity settled share based payments 143 516 143 516
– Information technology costs 182 137 182 137
– Share issue costs (148) (143) (148) (143)
– Sundry items 40 – 40 –
– Tax losses not recognized 4,493 882 4,467 882
Income tax expense/(benefit) (432) 1,841 (432) 1,841
Refer to Note 8(c) for details of the deferred tax benefit.
Notes to the Financial StatementsFor the year ended 30 June 2008

Exit Print Contents Previous Start End NextAnnual Report 2008
Who are we Highlights Chairman’s Letter
Managing Director’s Report
Operations & Development
Exploration Finance Environment, Safety & Social Responsibility
Management Corporate Governance
Financial Report
Shareholder Information
Corporate DirectoryCorporate Directory
Reserves & Resources
stbarbara.com.au62 stbarbara.com.au 63
Note 11 Inventories
Consolidated Parent entity
2008 $’000
2007 $’000
2008 $’000
2007 $’000
Consumables 3,864 2,334 3,864 2,334
Ore stockpiles 12,725 1,194 12,725 1,194
Gold in circuit 4,449 4,023 4,449 4,023
21,038 7,551 21,038 7,551
(a) Lower of cost and net realisable value
Ore stockpiles of $12,725,000 at 30 June 2008 (2007: $1,194,000) are valued at net realisable value.
Note 12 Derivative Financial Assets
Consolidated Parent entity
2008 $’000
2007 $’000
2008 $’000
2007 $’000
Current assets
Fair value of gold option premiums 139 2,511 139 2,511
Listed options at fair market value 64 – 64 –
203 2,511 203 2,511
Non-current assets
Fair value of gold option premiums 34,647 10,639 34,647 10,639
(a) Instruments used by the Group
Refer to Note 2 ‘Financial Risk Management’ for details on instruments used by the Group. The Group is party to derivative financial instruments in the normal course of business in order to protect future segment revenue from gold operations from a significant fall in the Australian price of gold, in accordance with the Group’s financial risk management policies (refer to Note 2).
At 30 June 2008, the total fair value of put option contracts was $34,786,000. Refer Note 2 for the maturity profile of remaining put option contracts.
Notes to the Financial StatementsFor the year ended 30 June 2008
Note 9 Cash and Cash Equivalents
Consolidated Parent entity
2008 $’000
2007 $’000
2008 $’000
2007 $’000
Cash at bank and on hand 7,517 26,620 7,517 26,620
Deposits at call 28,000 60,749 28,000 60,749
35,517 87,369 35,517 87,369
(a) Cash at bank and on hand
Cash at bank at 30 June 2008 invested “at call” was earning interest at an average rate of 7.23% per annum.
(b) Deposits
The deposits at 30 June 2008 invested at call were earning interest rates of between 7.20% and 8.00% per annum.
Note 10 Trade and Other Receivables
Consolidated Parent entity
2008 $’000
2007 $’000
2008 $’000
2007 $’000
Current assets
Trade receivables 5,031 3,449 5,031 3,449
Subsidiary loans – – 852 1,896
Provision for non-recovery – – (850) (1,120)
– – 2 776
Other receivables 4,426 3,273 4,426 3,273
Restricted cash(1) 20,597 8,115 20,597 8,115
Prepayments 2,231 1,877 2,231 1,877
32,285 16,714 32,287 17,490
(1) Restricted cash is cash placed on deposit to secure bank guarantees in respect of obligations entered into for office rental obligations and environmental performance bonds issued in favour of the Western Australian Department of Industry and Resources. These deposits earned interest at an average interest rate of 7.57%.
(a) Effective interest rates and credit risk
Information concerning the effective interest rate and credit risk of receivables is set out in Note 15.
Notes to the Financial StatementsFor the year ended 30 June 2008

Exit Print Contents Previous Start End NextAnnual Report 2008
Who are we Highlights Chairman’s Letter
Managing Director’s Report
Operations & Development
Exploration Finance Environment, Safety & Social Responsibility
Management Corporate Governance
Financial Report
Shareholder Information
Corporate DirectoryCorporate Directory
Reserves & Resources
stbarbara.com.au64 stbarbara.com.au 65
Note 15 Financial Instruments(a) Credit Risk Exposures
Refer Note 2 for the Group’s exposure to credit risk.
(b) Interest Rate Risk Exposures
The Group’s exposure to interest rate risk and the effective weighted average interest rate by maturity periods is set out in the following tables. Exposures arise predominantly from assets and liabilities bearing variable interest rates as the consolidated entity intends to hold fixed rate assets and liabilities to maturity.
2008 Fixed Interest Maturing in
Financial assets
Floating Interest
rate $’000
1 year or less $’000
Over 1 to 5 years $’000
Non- interest bearing
$’000Total $’000
Cash and cash equivalents 7,517 28,000 – – 35,517
Restricted cash and cash equivalents – 20,597 – – 20,597
Receivables – – – 9,457 9,457
Available for sale financial assets – – – 13,941 13,941
Fair value of gold option premiums – – – 34,786 34,786
Listed options at fair market value – – – 64 64
7,517 48,597 – 58,248 114,362
Weighted average interest rate 7.24% 7.60%
Financial liabilities
Trade and other creditors – – – 59,273 59,273
Finance Lease liabilities – 566 801 128 1,495
Convertible notes – – 100,000 – 100,000
Other loans – 1,763 – – 1,763
– 2,329 100,801 59,401 162,531
Weighted average interest rate 7.56% 8.00%
Net financial assets/(liabilities) 7,517 46,268 (100,801) (1,153) (48,169)
Notes to the Financial StatementsFor the year ended 30 June 2008
Note 13 Deferred Mining Costs
Consolidated Parent entity
2008 $’000
2007 $’000
2008 $’000
2007 $’000
Current
Deferred waste stripping 31,053 20,306 31,053 20,306
Amortisation of deferred waste (23,966) (12,920) (23,966) (12,920)
7,087 7,386 7,087 7,386
Deferred operating development 8,836 15,881 8,836 15,881
15,923 23,267 15,923 23,267
Non-current
Deferred operating development 16,139 – 16,139 –
Note 14 Available-for-sale Financial Assets
Consolidated Parent entity
2008 $’000
2007 $’000
2008 $’000
2007 $’000
Non-current
At beginning of year 17,381 29,510 17,381 29,510
Additions – 18,922 – 18,922
Disposals – (29,546) – (29,546)
Revaluation loss recognised in the income statement (3,440) – (3,440) –
Revaluation loss taken to equity – (1,505) – (1,505)
At end of year 13,941 17,381 13,941 17,381
(a) Listed securities
Available-for-sale financial assets as at 30 June 2008 consisted of companies listed on the Australian Securities Exchange.
Notes to the Financial StatementsFor the year ended 30 June 2008

Exit Print Contents Previous Start End NextAnnual Report 2008
Who are we Highlights Chairman’s Letter
Managing Director’s Report
Operations & Development
Exploration Finance Environment, Safety & Social Responsibility
Management Corporate Governance
Financial Report
Shareholder Information
Corporate DirectoryCorporate Directory
Reserves & Resources
stbarbara.com.au66 stbarbara.com.au 67
Note 16 Property, Plant and Equipment
Consolidated Parent entity
2008 $’000
2007 $’000
2008 $’000
2007 $’000
Non-current
Land 507 1,366 507 507
Housing & site buildings 1,869 1,500 1,869 1,500
Plant and equipment 73,963 15,175 73,963 15,175
Accumulated depreciation (3,551) (2,035) (3,551) (2,035)
Total 72,788 16,006 72,788 15,147
Reconciliation of the carrying amounts for each class of property, plant and equipment is set out below:
Land
At the beginning of the year 1,366 859 507 –
Additions – 507 – 507
Disposals (859) – – –
Write off of assets – – – –
At the end of the year 507 1,366 507 507
Housing & site buildings
At the beginning of the year 1,500 1,500 1,500 1,500
Additions 369 – 369 –
At the end of the year 1,869 1,500 1,869 1,500
Plant and equipment
At the beginning of the year 13,140 7,632 13,140 7,632
Transfer to inventory (1,218) – (1,218) –
Transfer from inventory – 1,218 – 1,218
Additions 60,006 5,362 60,006 5,362
Disposals – (11) – (11)
Depreciation (1,516) (1,061) (1,516) (1,061)
At the end of the year 70,412 13,140 70,412 13,140
Total 72,788 16,006 72,788 15,147
(a) Security
As at 30 June 2008, plant and equipment with a carrying value of $1,098,000 is held as security for finance leases (Note 20).
In accordance with the security arrangements in relation to commercial facilities, all remaining assets of the Group have been pledged as security to the Commonwealth Bank of Australia. The Commonwealth Bank does not have the right to sell or re-pledge the assets other than in an event of default. During the year and as at 30 June 2008 there were no events of default.
Notes to the Financial StatementsFor the year ended 30 June 2008
(b) Interest Rate Risk Exposures cont.
2007 Fixed Interest Maturing in
Financial assets
Floating Interest
rate $’000
1 year or less $’000
Over 1 to 5 years $’000
Non-interest bearing
$’000Total $’000
Cash and cash equivalents 26,620 60,749 – – 87,369
Restricted cash and cash equivalents – 8,115 – – 8,115
Receivables – – – 6,722 6,722
Available for sale financial assets – – – 17,381 17,381
Fair value of gold option premiums – – – 13,150 13,150
26,620 68,864 – 37,253 132,737
Weighted average interest rate 6.21% 6.32%
Financial liabilities
Trade and other creditors – – – 44,025 44,025
Lease liabilities – 493 1,053 164 1,710
Convertible notes – – 100,000 – 100,000
Other loans – 1,620 – – 1,620
– 2,113 101,053 44,189 147,355
Weighted average interest rate 8.44% 8.00%
Net financial assets/(liabilities) 26,620 66,751 (101,053) (6,936) (14,618)
Notes to the Financial StatementsFor the year ended 30 June 2008
Note 15 Financial Instruments cont.

Exit Print Contents Previous Start End NextAnnual Report 2008
Who are we Highlights Chairman’s Letter
Managing Director’s Report
Operations & Development
Exploration Finance Environment, Safety & Social Responsibility
Management Corporate Governance
Financial Report
Shareholder Information
Corporate DirectoryCorporate Directory
Reserves & Resources
stbarbara.com.au68 stbarbara.com.au 69
Note 18 Other Financial Assets
Consolidated Parent entity
Non-current2008 $’000
2007 $’000
2008 $’000
2007 $’000
Other financial assets – – 178 178
Other financial assets represent the Parent entity’s investment in wholly owned subsidiaries. Refer Note 28 for further detail.
Note 19 Trade and Other Payables
Consolidated Parent entity
2008 $’000
2007 $’000
2008 $’000
2007 $’000
Current
Trade payables 56,627 35,929 56,627 35,929
Loans from subsidiaries – – 11,401 11,401
Other payables 2,646 8,096 2,646 8,096
59,273 44,025 70,674 55,426
Note 20 Interest Bearing Borrowings
Consolidated Parent entity
2008 $’000
2007 $’000
2008 $’000
2007 $’000
Current
Secured
Lease liabilities (Note 26) 604 529 604 529
Unsecured
Insurance premium funding 1,763 1,620 1,763 1,620
2,367 2,149 2,367 2,149
Non-current
Secured
Lease liabilities (Note 26) 891 1,181 891 1,181
Unsecured
Convertible notes 100,000 100,000 100,000 100,000
Convertible notes transaction costs (2,321) (3,519) (2,321) (3,519)
98,570 97,662 98,570 97,662
(a) Insurance premium funding
The Company finances its annual insurance premiums using unsecured premium funding.
Notes to the Financial StatementsFor the year ended 30 June 2008
Note 17 Mine Properties/exploration and Evaluation
Consolidated Parent Entity
Non-current2008
$’000 2007
$’000 2008
$’000 2007
$’000
Mine Properties – development
At beginning of the year 25,850 10,834 25,850 10,834
Direct expenditure 32,113 29,469 32,113 29,469
Transferred from exploration and evaluation 946 1,781 946 1,781
New rehabilitation obligations 1,438 – 1,438 –
Adjustment to rehabilitation provision (760) (235) (760) (235)
Amortisation for the year (18,217) (15,999) (18,217) (15,999)
At end of the year 41,370 25,850 41,370 25,850
Mines Under Construction(1)
At beginning of the year 44,515 6,094 44,515 6,094
Direct expenditure 68,721 37,851 68,721 37,851
Capitalised amortisation of convertible notes transaction costs 1,312 – 1,312
Net borrowing costs capitalised 5,269 570 5,269 570
At end of the year 119,817 44,515 119,817 44,515
Total Mine Properties 161,187 70,365 161,187 70,365
(1) Mines under construction represent pre-production expenditure at Gwalia.
Consolidated Parent Entity
Non-current2008
$’000 2007
$’000 2008
$’000 2007
$’000
Exploration and evaluation
At beginning of the year 18,188 1,916 18,188 1,916
Acquired tenements 125 79 125 79
Tenements written off (20) (135) (20) (135)
Expenditure capitalised for the year 8,431 18,109 8,431 18,109
Transferred to mine properties (946) (1,781) (946) (1,781)
At end of the year 25,778 18,188 25,778 18,188
Notes to the Financial StatementsFor the year ended 30 June 2008

Exit Print Contents Previous Start End NextAnnual Report 2008
Who are we Highlights Chairman’s Letter
Managing Director’s Report
Operations & Development
Exploration Finance Environment, Safety & Social Responsibility
Management Corporate Governance
Financial Report
Shareholder Information
Corporate DirectoryCorporate Directory
Reserves & Resources
stbarbara.com.au70 stbarbara.com.au 71
Note 21 Provisions
Consolidated Parent entity
2008 $’000
2007 $’000
2008 $’000
2007 $’000
Current
Employee benefits – annual leave 1,712 1,209 1,712 1,209
Employee benefits – long service leave 231 63 231 63
Employee benefits – other 1,106 526 1,106 526
3,049 1,798 3,049 1,798
Non-current
Provision for rehabilitation 28,812 28,900 28,812 28,900
Employee benefits – long service leave 711 456 711 456
29,523 29,356 29,523 29,356
Movements in Provisions
Consolidated Parent Entity
2008 $’000
2007 $’000
2008 $’000
2007 $’000
Non-current
Rehabilitation
Balance at start of year 28,900 27,951 28,900 27,951
Additional provision for new activities 1,438 – 1,438 –
Unwinding of discount 1,166 2,013 1,166 2,013
Expenditure incurred (1,932) (829) (1,932) (829)
Adjustment on re-estimation (760) (235) (760) (235)
Balance at end of year 28,812 28,900 28,812 28,900
Notes to the Financial StatementsFor the year ended 30 June 2008
(b) Interest rate risk exposures
Details of the Group’s exposure to interest rate changes on borrowings are set out in Note 15.
(c) Convertible notes
On 4 June 2007, the Company issued $100,000,000 of convertible notes at a coupon rate of 8% payable 6 monthly in arrears. Unless previously redeemed, converted, or purchased and cancelled, the notes will be redeemed on 4 June 2012 at 100% of their principal amount. Holders of the convertible notes are able to redeem all or some of the notes at the principal amount together with any accrued interest on the third anniversary of issue (4 June 2010). The convertible notes transaction costs represent bank commission, legal fees and other costs associated with the issue and are amortised over a three year period. The amortised amount is capitalised to the mines under construction and upon completion of development will be charged to the income statement.
Following the announcement on 10 June 2008 to raise $120 million via a 2 for 7 pro-rata renounceable entitlement offer and placement, the conversion price of the convertible notes was adjusted per the Rules of the SGX-ST Mainboard, the ASX Listing Rules and the Terms and Conditions of the notes. The conversion price was adjusted from $0.7261 to $0.67.
(d) Set-off of assets and liabilities
The parent entity has established a legal right of set-off with a financial institution over cash on deposit to secure the issue of bank guarantees for the purpose of environmental performance bonds and rental obligations. At 30 June 2008 restricted cash for this purpose amounted to $20,597,000 (2007: $8,115,000).
Notes to the Financial StatementsFor the year ended 30 June 2008
Note 20 Interest Bearing Borrowings cont.

Exit Print Contents Previous Start End NextAnnual Report 2008
Who are we Highlights Chairman’s Letter
Managing Director’s Report
Operations & Development
Exploration Finance Environment, Safety & Social Responsibility
Management Corporate Governance
Financial Report
Shareholder Information
Corporate DirectoryCorporate Directory
Reserves & Resources
stbarbara.com.au72 stbarbara.com.au 73
Note 23 Reserves and Accumulated Losses(a) Reserves
Consolidated Parent Entity
2008 $’000
2007 $’000
2008 $’000
2007 $’000
Reserves
Share based payment reserve 2,086 2,330 2,086 2,330
Investment fair value reserve – (1,005) – (1,005)
Convertible note liability reserve 432 432 432 432
2,518 1,757 2,518 1,757
Share based payment reserve
Balance at start of year 2,330 1,660 2,330 1,660
Option expense 475 1,719 475 1,719
Options exercised (719) (986) (719) (986)
Options expired – (63) – (63)
Balance at end of year 2,086 2,330 2,086 2,330
Investments fair value reserve
Balance at start of year (1,005) 6,794 (1,005) 6,794
Transfer on disposal – (9,644) – (9,644)
Fair value adjustments taken to the income statement
1,437 – 1,437 –
Fair value adjustments – (1,505) – (1,505)
Tax effect of fair value adjustment @ 30% (432) 3,350 (432) 3,350
Balance at end of year – (1,005) – (1,005)
(b) Accumulated losses
Movements in accumulated losses were as follows:
Consolidated Parent Entity
2008 $’000
2007 $’000
2008 $’000
2007 $’000
Balance at start of year (114,987) (112,093) (126,293) (123,399)
Loss attributable to members of the Company (17,333) (2,894) (17,248) (2,894)
Balance at end of year (132,320) (114,987) (143,541) (126,293)
(c) Investment fair value reserve
Changes in the fair value arising on translation of investments, such as equities, classified as available-for-sale financial assets, are taken to the available-for-sale investments revaluation reserve, as described in Note 1(p). Amounts are recognised in the income statement when the associated assets are sold or impaired. During the year the cumulative loss recognised in the reserve in prior years, together with the movements in fair value for the year, was recognised in the income statement.
(d) Share based payments reserve
The share based payments reserve is used to recognise the fair value of options issued to executives and employees but not exercised.
(e) Convertible note liability reserve
The convertible note liability reserve represents an IFRS adjustment on the conversion of the RCF convertible note in 2006.
Notes to the Financial StatementsFor the year ended 30 June 2008
Note 22 Contributed Equity(a) Share capital
Parent entity Parent entity
2008 Shares
2007 Shares
2008 $’000
2007 $’000
Ordinary shares – fully paid 1,158,423,891 836,555,567 366,466 208,231
(b) Movements in ordinary share capital:
Date Details NotesNumber
of shares
Issue price (cents/ share) $’000
1 July 2006 Opening balance 819,390,567 205,815
Plus Shares issued on exercise of options (i) 18,665,000 11 2,098
Plus Transfer of Option Reserve on conversion of options – 986
Less Share buybacks (ii) (1,500,000) 45 (668)
30 June 2007 836,555,567 208,231
Plus Institutional placement (iii) 120,507,335 63 75,920
Transaction costs on institutional placement – (2,605)
Plus Share Purchase Plan (iv) 35,511,707 63 22,301
Transaction costs on share purchase plan – (669)
Plus Entitlement offer (v) 158,799,282 40 63,520
Transaction costs on entitlement offer – (2,397)
Plus Shares issued on exercise of options (i) 7,050,000 21 1,446
Transfer of Option Reserve on conversion of options – 719
1,158,423,891 366,466
(i) Shares issued on exercise of unlisted options held by executives and employees.(ii) On market buyback of shares.(iii) Institutional placement on 1 November 2007.(iv) Share Purchase Plan on 11 December 2007.(v) Entitlement Offer represents a 2 for 7 renounceable accelerated entitlement offer to shareholders
and an institutional placement announced on 10 June 2008.
(c) Ordinary shares
Ordinary shares entitle the holder to participate in dividends and the proceeds on winding up of the Company in proportion to the number of and amounts paid on the shares held.
On a show of hands every holder of ordinary shares present at a meeting in person or by proxy, is entitled to one vote, and upon a poll each share is entitled to one vote.
(d) Options
Information relating to the St Barbara Employee Option Plan and Executive Options, including details of options issued, exercised and lapsed during the financial year and options outstanding at the end of the financial year, is set out in Note 35.
Notes to the Financial StatementsFor the year ended 30 June 2008
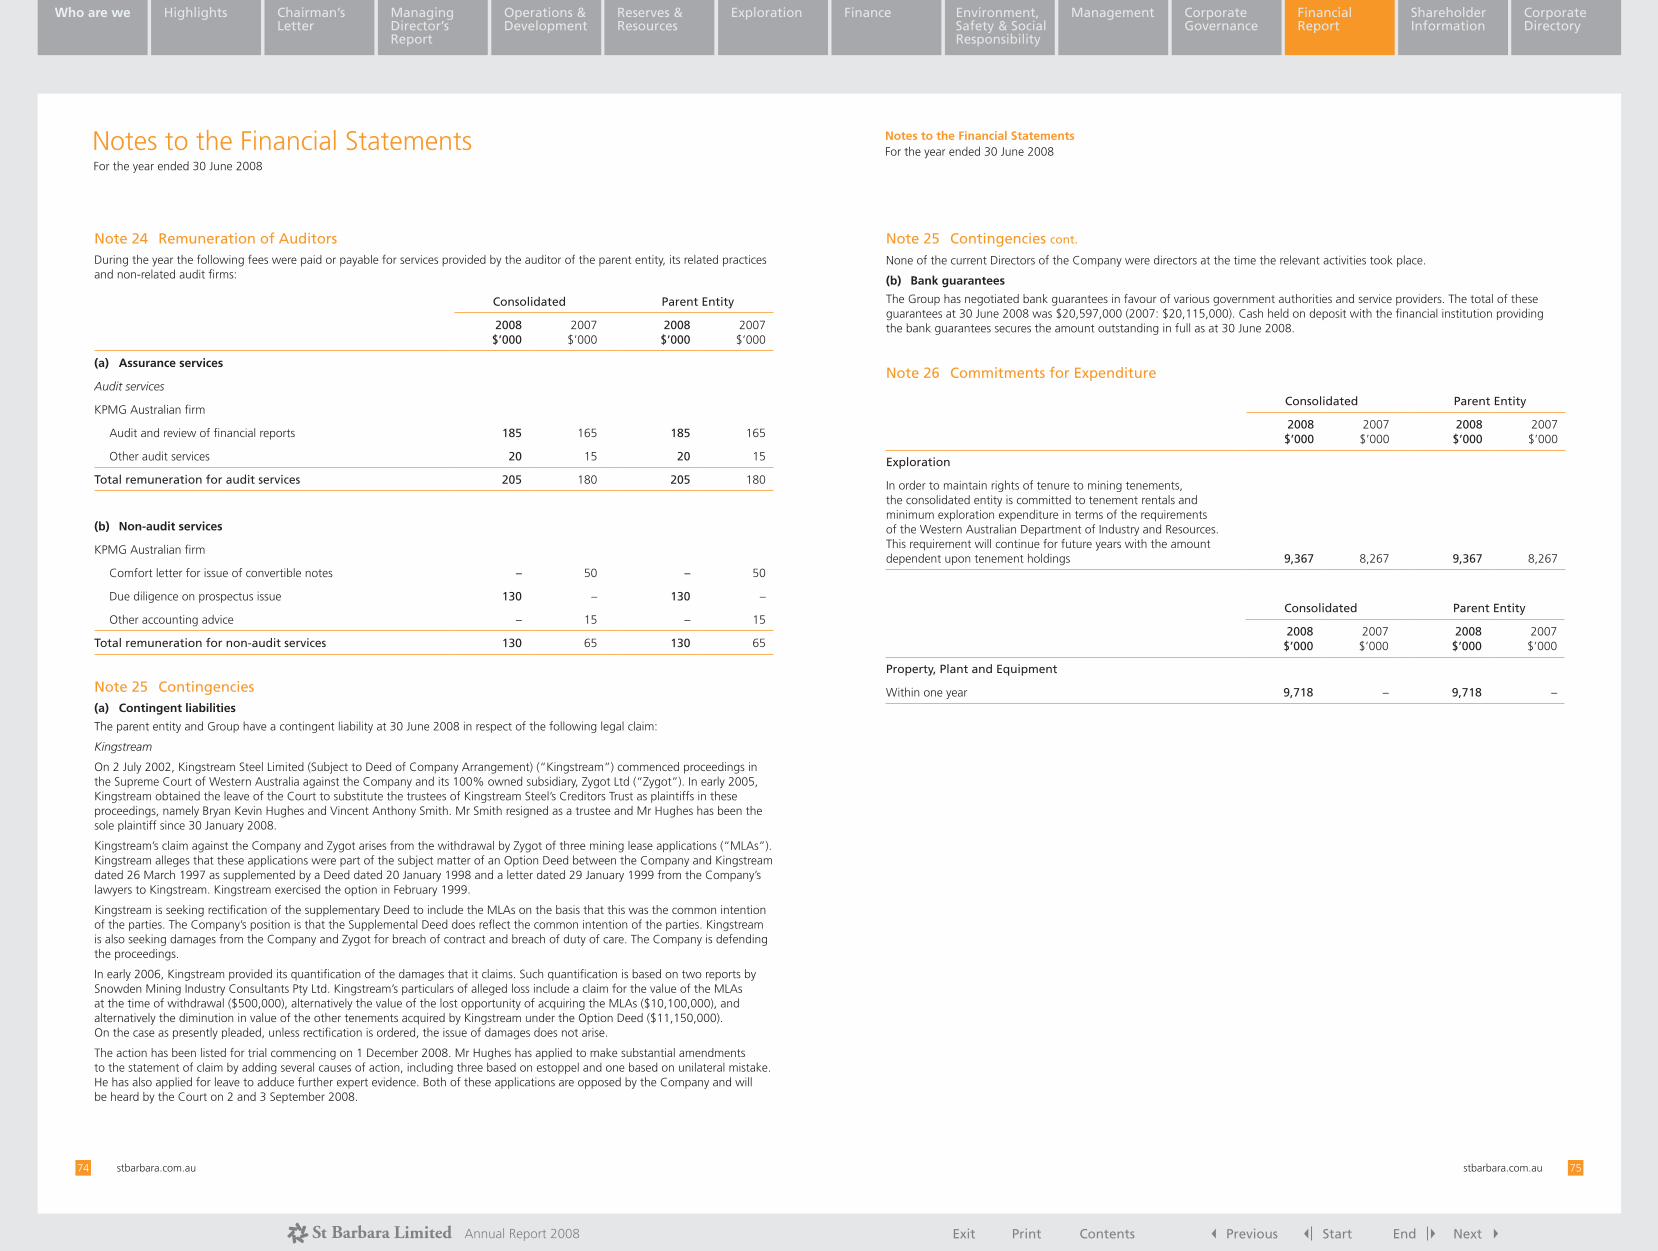
Exit Print Contents Previous Start End NextAnnual Report 2008
Who are we Highlights Chairman’s Letter
Managing Director’s Report
Operations & Development
Exploration Finance Environment, Safety & Social Responsibility
Management Corporate Governance
Financial Report
Shareholder Information
Corporate DirectoryCorporate Directory
Reserves & Resources
stbarbara.com.au74 stbarbara.com.au 75
None of the current Directors of the Company were directors at the time the relevant activities took place.
(b) Bank guarantees
The Group has negotiated bank guarantees in favour of various government authorities and service providers. The total of these guarantees at 30 June 2008 was $20,597,000 (2007: $20,115,000). Cash held on deposit with the financial institution providing the bank guarantees secures the amount outstanding in full as at 30 June 2008.
Note 26 Commitments for Expenditure
Consolidated Parent Entity
2008 $’000
2007 $’000
2008 $’000
2007 $’000
Exploration
In order to maintain rights of tenure to mining tenements, the consolidated entity is committed to tenement rentals and minimum exploration expenditure in terms of the requirements of the Western Australian Department of Industry and Resources. This requirement will continue for future years with the amount dependent upon tenement holdings 9,367 8,267 9,367 8,267
Consolidated Parent Entity
2008 $’000
2007 $’000
2008 $’000
2007 $’000
Property, Plant and Equipment
Within one year 9,718 – 9,718 –
Notes to the Financial StatementsFor the year ended 30 June 2008
Note 25 Contingencies cont.Note 24 Remuneration of AuditorsDuring the year the following fees were paid or payable for services provided by the auditor of the parent entity, its related practices and non-related audit firms:
Consolidated Parent Entity
2008 $’000
2007 $’000
2008 $’000
2007 $’000
(a) Assurance services
Audit services
KPMG Australian firm
Audit and review of financial reports 185 165 185 165
Other audit services 20 15 20 15
Total remuneration for audit services 205 180 205 180
(b) Non-audit services
KPMG Australian firm
Comfort letter for issue of convertible notes – 50 – 50
Due diligence on prospectus issue 130 – 130 –
Other accounting advice – 15 – 15
Total remuneration for non-audit services 130 65 130 65
Note 25 Contingencies(a) Contingent liabilities
The parent entity and Group have a contingent liability at 30 June 2008 in respect of the following legal claim:
Kingstream
On 2 July 2002, Kingstream Steel Limited (Subject to Deed of Company Arrangement) (“Kingstream”) commenced proceedings in the Supreme Court of Western Australia against the Company and its 100% owned subsidiary, Zygot Ltd (“Zygot”). In early 2005, Kingstream obtained the leave of the Court to substitute the trustees of Kingstream Steel’s Creditors Trust as plaintiffs in these proceedings, namely Bryan Kevin Hughes and Vincent Anthony Smith. Mr Smith resigned as a trustee and Mr Hughes has been the sole plaintiff since 30 January 2008.
Kingstream’s claim against the Company and Zygot arises from the withdrawal by Zygot of three mining lease applications (“MLAs”). Kingstream alleges that these applications were part of the subject matter of an Option Deed between the Company and Kingstream dated 26 March 1997 as supplemented by a Deed dated 20 January 1998 and a letter dated 29 January 1999 from the Company’s lawyers to Kingstream. Kingstream exercised the option in February 1999.
Kingstream is seeking rectification of the supplementary Deed to include the MLAs on the basis that this was the common intention of the parties. The Company’s position is that the Supplemental Deed does reflect the common intention of the parties. Kingstream is also seeking damages from the Company and Zygot for breach of contract and breach of duty of care. The Company is defending the proceedings.
In early 2006, Kingstream provided its quantification of the damages that it claims. Such quantification is based on two reports by Snowden Mining Industry Consultants Pty Ltd. Kingstream’s particulars of alleged loss include a claim for the value of the MLAs at the time of withdrawal ($500,000), alternatively the value of the lost opportunity of acquiring the MLAs ($10,100,000), and alternatively the diminution in value of the other tenements acquired by Kingstream under the Option Deed ($11,150,000). On the case as presently pleaded, unless rectification is ordered, the issue of damages does not arise.
The action has been listed for trial commencing on 1 December 2008. Mr Hughes has applied to make substantial amendments to the statement of claim by adding several causes of action, including three based on estoppel and one based on unilateral mistake. He has also applied for leave to adduce further expert evidence. Both of these applications are opposed by the Company and will be heard by the Court on 2 and 3 September 2008.
Notes to the Financial StatementsFor the year ended 30 June 2008

Exit Print Contents Previous Start End NextAnnual Report 2008
Who are we Highlights Chairman’s Letter
Managing Director’s Report
Operations & Development
Exploration Finance Environment, Safety & Social Responsibility
Management Corporate Governance
Financial Report
Shareholder Information
Corporate DirectoryCorporate Directory
Reserves & Resources
stbarbara.com.au76 stbarbara.com.au 77
Note 27 Related Party Transactions(a) Directors and specified executives
Disclosures relating to Directors and specified executives are set out in Note 36.
(b) Transactions with entities in the wholly-owned group
St Barbara Limited is the parent entity in the wholly-owned group comprising the Company and its wholly-owned subsidiaries.
During the year the Company did not transact with any entities in the wholly-owned group (2007: $ Nil) . Net receivables from subsidiaries amounted to $2,000 (2007: $776,000). The Company provided accounting and administrative assistance free of charge to all of its wholly-owned subsidiaries.
Loans payable to and advanced from wholly-owned subsidiaries to the Company are interest free, and payable on demand.
(c) Amounts receivable from and payable to entities in the wholly-owned group and controlled entities
Company
2008 $’000
2007 $’000
Aggregate amounts receivable at balance date from:
Entities in the wholly-owned group 852 1,896
Less provision for doubtful receivables (850) (1,120)
2 776
Aggregate amounts payable at balance date to: Entities in the wholly-owned group
11,401 11,401
(d) Guarantees
Subsidiary companies have guaranteed the parent entity’s obligations under the bank guarantee facility provided by Commonwealth Bank of Australia.
(e) Terms and conditions
Outstanding balances are unsecured, interest free and are repayable in cash on demand.
(f) Amounts receivable from Director related entities
At 30 June 2008, there were no amounts receivable from Director related entities.
(g) Other Transactions with Directors of the Company and their Director related entities
During the year ended 30 June 2008, there were no other transaction with Directors of the Company and their
Director related entities.
Notes to the Financial StatementsFor the year ended 30 June 2008
Consolidated Parent Entity
2008 $’000
2007 $’000
2008 $’000
2007 $’000
Finance Lease Commitments
Payable not later than one year 658 596 658 596
Payable later than one year, not later than five years 869 1,156 869 1,156
1,527 1,752 1,527 1,752
Future finance charges (160) (206) (160) (206)
Recognised as a liability 1,367 1,546 1,367 1,546
Lease incentives on non-cancellable operating leases included in lease liabilities 128 164 128 164
Total lease liabilities 1,495 1,710 1,495 1,710
Current (Note 20) 604 529 604 529
Non-current (Note 20) 891 1,181 891 1,181
1,495 1,710 1,495 1,710
These finance lease commitments relate to plant and equipment, and are based on the cost of the assets and are payable over a period of up to 48 months.
Consolidated Parent Entity
2008 $’000
2007 $’000
2008 $’000
2007 $’000
Analysis of Non-Cancellable Operating Lease Commitments
Payable not later than one year 877 773 877 773
Payable later than one year, not later than five years 1,958 2,629 1,958 2,629
2,835 3,402 2,835 3,402
The non-cancellable operating lease commitments are the net rental payments associated with rental properties. At 30 June 2008 $128,000 (2007: $164,000) was recognised as a liability for a lease incentive received.
Consolidated Parent Entity
2008 $’000
2007 $’000
2008 $’000
2007 $’000
Analysis of Non-Cancellable Operating Sub-lease receipts
Receivable not later than one year 229 182 229 182
Payable later than one year, not later than five years 487 540 487 540
716 722 716 722
Sub-lease rental is associated with the sub-letting of office premises rented by the Company.
Notes to the Financial StatementsFor the year ended 30 June 2008
Note 26 Commitments for Expenditure cont.

Exit Print Contents Previous Start End NextAnnual Report 2008
Who are we Highlights Chairman’s Letter
Managing Director’s Report
Operations & Development
Exploration Finance Environment, Safety & Social Responsibility
Management Corporate Governance
Financial Report
Shareholder Information
Corporate DirectoryCorporate Directory
Reserves & Resources
stbarbara.com.au78 stbarbara.com.au 79
Note 30 Interests in Joint Ventures(a) Jointly controlled assets
Joint VentureJune 2008 Equity %
June 2007 Equity % Joint Venturers
WESTERN AUSTRALIA
Leonora Region
Mount Newman – Victory 87% 87% Astro Diamond Mines N.L.
Sandy Soak 91% 91% Hunter Resources Pty Ltd
Melita(1) 80% 60% Dalrymple Resources N.L.
Weebo 20% 20% Plutonic Operations Limited
McEast/Pipeline 80% 80% Cheperon Gold Partnership
Mt George 51% 51% Trevor John Dixon
Black Cat100%, diluting
to 40%100%, diluting
to 40% Terrain Minerals Ltd
Pumping Station earning 70% – Teck Cominco Australia Pty Ltd
Southern Cross Region
Cornishman Exploration 51% 51% Troy Resources NL
Cornishman Mining 51% 51% Troy Resources NL
Silver Phantom 70% 70% Bellriver Pty Ltd
South Rankin 75% 75% Comet Resources Limited
Copperhead 51% 51% Troy Resources NL
Cheritons Find 90% 90% Audax Resources NL
Southern Cross earning 60% earning 60% Troy Resources NL, Aminta Pty Ltd
Kalgoorlie Region
New Mexico 40% 40% Tasman Exploration Pty Ltd
Golden Mile South(1) earning 51% earning 51% Golden Mile South Pty Ltd
Murchison Region
Cue(2) – 20% Cougar Metals NL
SOUTH AUSTRALIA
Coober Pedy 12.61% 12.61% Newmont Exploration Pty Ltd, Sabatica Pty Ltd
(1) The Company’s interest has increased to 80% as, per the terms of the agreement, Dalrymple’s interest become 20% free-carried until a decision to mine is made, and they do not elect to contribute 40%. Dalrymple has not elected to contribute 40% until mining recommences.
(2) The Company relinquished it’s 20% interest to Cougar Metals NL.
As at 30 June 2008 there was no joint venture assets recorded in the balance sheet (2007: Nil).
Notes to the Financial StatementsFor the year ended 30 June 2008
Note 28 Controlled EntitiesThe consolidated entity consists of the Company and its wholly-owned controlled entities as follows.
Equity holdingCost of Company’s
investment
Name of entityClass of Shares
June 2008 %
June 2007 %
June 2008 $’000
June 2007 $’000
Australian Eagle Oil Co Pty Ltd Ordinary 100 100 178 178
St Barbara Pastoral Co. Pty Ltd(1) Ordinary – 100 – –
Capvern Pty Ltd Ordinary 100 100 – –
Eagle Group Management Pty Ltd Ordinary 100 100 – –
Murchison Gold Pty Ltd Ordinary 100 100 – –
Kingkara Pty Ltd Ordinary 100 100 – –
Oakjade Pty Ltd Ordinary 100 100 – –
Regalkey Holdings Pty Ltd Ordinary 100 100 – –
Silkwest Holdings Pty Ltd Ordinary 100 100 – –
Sixteenth Ossa Pty Ltd Ordinary 100 100 – –
Vafitu Pty Ltd Ordinary 100 100 – –
Zygot Pty Ltd Ordinary 100 100 – –
178 178
Each company in the consolidated entity was incorporated in Australia.
(1) St Barbara Pastoral Co. Pty Ltd and associated land holdings were sold in May 2008. Refer Note 29 for details on the disposal.
Note 29 Disposal of Controlled EntityDuring May 2008, the Group disposed of St Barbara Pastoral Co. Pty Ltd (“SBP”), a 100% owned subsidiary. SBP was a dormant company which held land with a carrying value of $859,000, which held no strategic value to the Company.
(a) Effect of the disposal on the financial position of the consolidated Group
2008 $’000
Disposal of property, plant and equipment (859)
Consideration received, settled in cash 1,000
Gain on sale of disposal 141
Notes to the Financial StatementsFor the year ended 30 June 2008
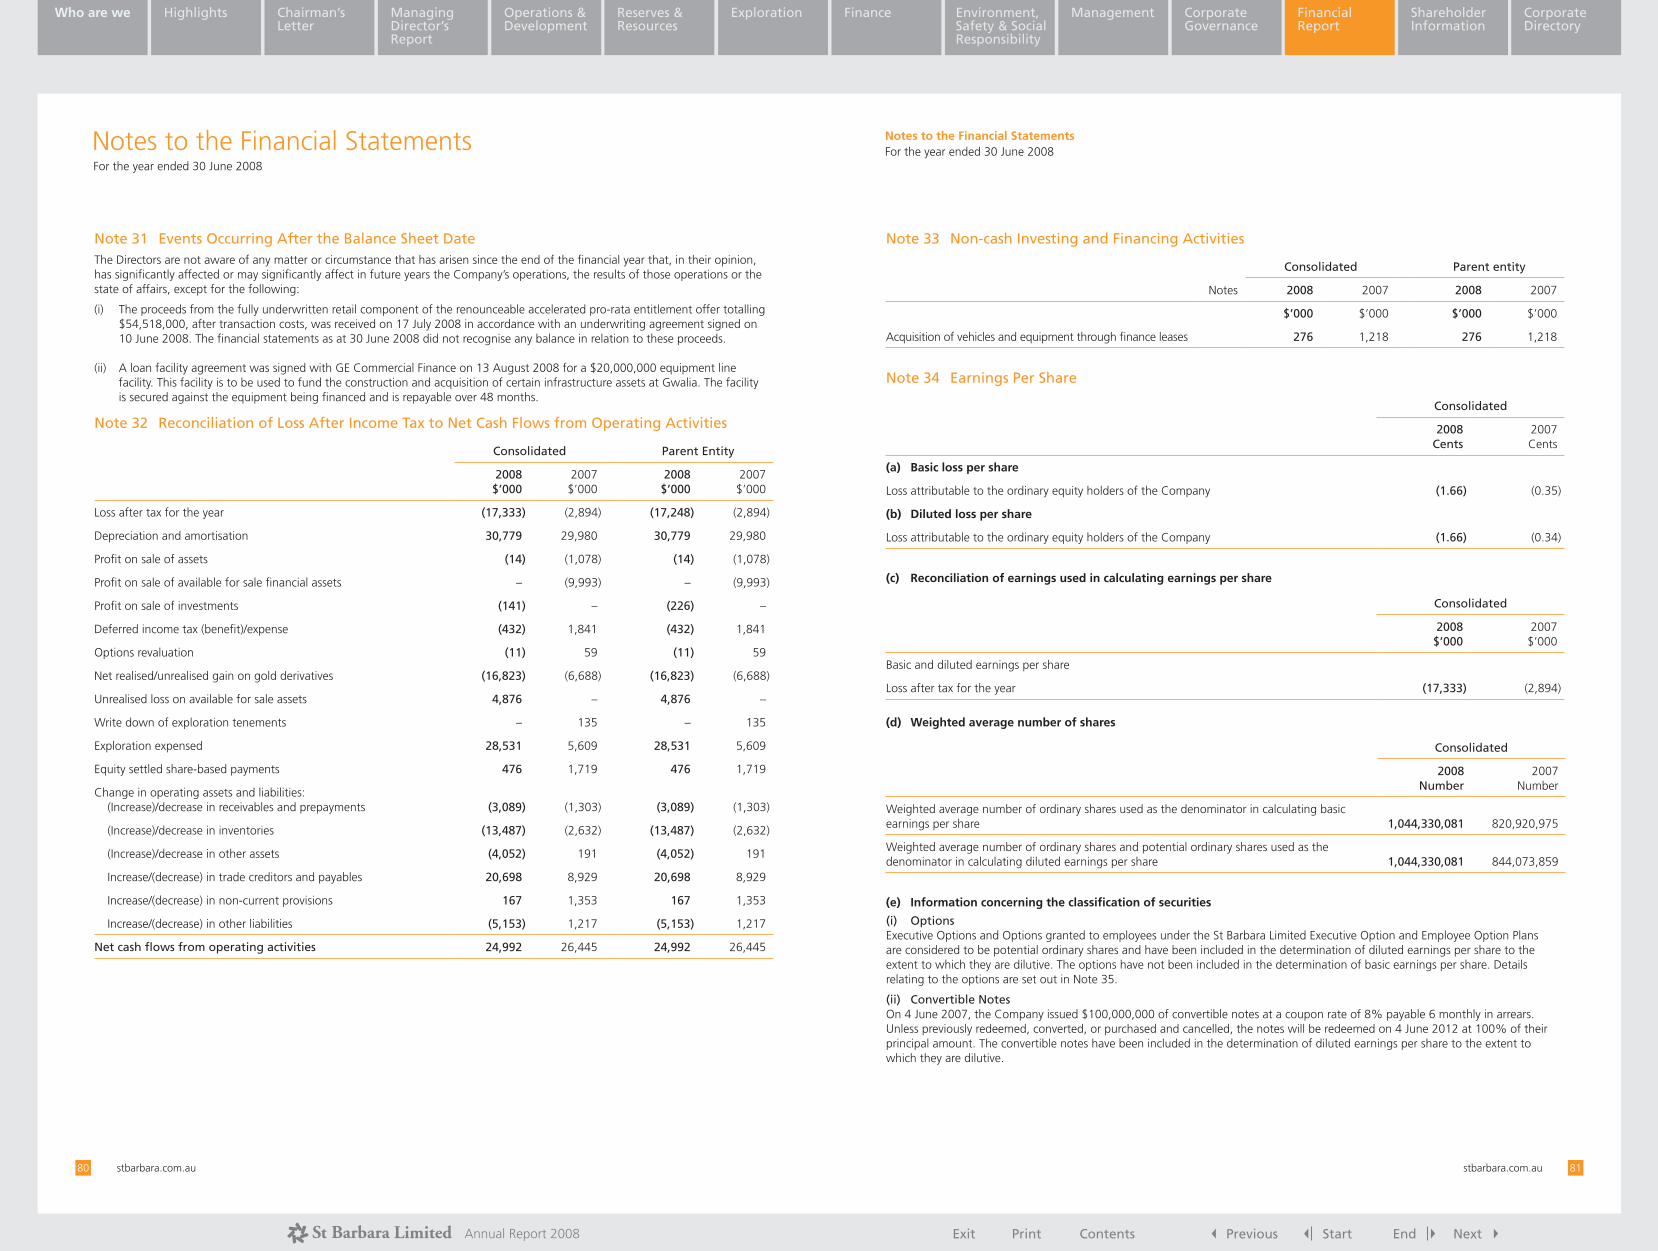
Exit Print Contents Previous Start End NextAnnual Report 2008
Who are we Highlights Chairman’s Letter
Managing Director’s Report
Operations & Development
Exploration Finance Environment, Safety & Social Responsibility
Management Corporate Governance
Financial Report
Shareholder Information
Corporate DirectoryCorporate Directory
Reserves & Resources
stbarbara.com.au80 stbarbara.com.au 81
Note 33 Non-cash Investing and Financing Activities
Consolidated Parent entity
Notes 2008 2007 2008 2007
$’000 $’000 $’000 $’000
Acquisition of vehicles and equipment through finance leases 276 1,218 276 1,218
Note 34 Earnings Per Share
Consolidated
2008 Cents
2007 Cents
(a) Basic loss per share
Loss attributable to the ordinary equity holders of the Company (1.66) (0.35)
(b) Diluted loss per share
Loss attributable to the ordinary equity holders of the Company (1.66) (0.34)
(c) Reconciliation of earnings used in calculating earnings per share
Consolidated
2008 $’000
2007 $’000
Basic and diluted earnings per share
Loss after tax for the year (17,333) (2,894)
(d) Weighted average number of shares
Consolidated
2008 Number
2007 Number
Weighted average number of ordinary shares used as the denominator in calculating basic earnings per share 1,044,330,081 820,920,975
Weighted average number of ordinary shares and potential ordinary shares used as the denominator in calculating diluted earnings per share 1,044,330,081 844,073,859
(e) Information concerning the classification of securities
(i) OptionsExecutive Options and Options granted to employees under the St Barbara Limited Executive Option and Employee Option Plans are considered to be potential ordinary shares and have been included in the determination of diluted earnings per share to the extent to which they are dilutive. The options have not been included in the determination of basic earnings per share. Details relating to the options are set out in Note 35.
(ii) Convertible NotesOn 4 June 2007, the Company issued $100,000,000 of convertible notes at a coupon rate of 8% payable 6 monthly in arrears. Unless previously redeemed, converted, or purchased and cancelled, the notes will be redeemed on 4 June 2012 at 100% of their principal amount. The convertible notes have been included in the determination of diluted earnings per share to the extent to which they are dilutive.
Notes to the Financial StatementsFor the year ended 30 June 2008
Note 31 Events Occurring After the Balance Sheet DateThe Directors are not aware of any matter or circumstance that has arisen since the end of the financial year that, in their opinion, has significantly affected or may significantly affect in future years the Company’s operations, the results of those operations or the state of affairs, except for the following:
(i) The proceeds from the fully underwritten retail component of the renounceable accelerated pro-rata entitlement offer totalling $54,518,000, after transaction costs, was received on 17 July 2008 in accordance with an underwriting agreement signed on 10 June 2008. The financial statements as at 30 June 2008 did not recognise any balance in relation to these proceeds.
(ii) A loan facility agreement was signed with GE Commercial Finance on 13 August 2008 for a $20,000,000 equipment line facility. This facility is to be used to fund the construction and acquisition of certain infrastructure assets at Gwalia. The facility is secured against the equipment being financed and is repayable over 48 months.
Note 32 Reconciliation of Loss After Income Tax to Net Cash Flows from Operating Activities
Consolidated Parent Entity
2008 $’000
2007 $’000
2008 $’000
2007 $’000
Loss after tax for the year (17,333) (2,894) (17,248) (2,894)
Depreciation and amortisation 30,779 29,980 30,779 29,980
Profit on sale of assets (14) (1,078) (14) (1,078)
Profit on sale of available for sale financial assets – (9,993) – (9,993)
Profit on sale of investments (141) – (226) –
Deferred income tax (benefit)/expense (432) 1,841 (432) 1,841
Options revaluation (11) 59 (11) 59
Net realised/unrealised gain on gold derivatives (16,823) (6,688) (16,823) (6,688)
Unrealised loss on available for sale assets 4,876 – 4,876 –
Write down of exploration tenements – 135 – 135
Exploration expensed 28,531 5,609 28,531 5,609
Equity settled share-based payments 476 1,719 476 1,719
Change in operating assets and liabilities: (Increase)/decrease in receivables and prepayments (3,089) (1,303) (3,089) (1,303)
(Increase)/decrease in inventories (13,487) (2,632) (13,487) (2,632)
(Increase)/decrease in other assets (4,052) 191 (4,052) 191
Increase/(decrease) in trade creditors and payables 20,698 8,929 20,698 8,929
Increase/(decrease) in non-current provisions 167 1,353 167 1,353
Increase/(decrease) in other liabilities (5,153) 1,217 (5,153) 1,217
Net cash flows from operating activities 24,992 26,445 24,992 26,445
Notes to the Financial StatementsFor the year ended 30 June 2008

Exit Print Contents Previous Start End NextAnnual Report 2008
Who are we Highlights Chairman’s Letter
Managing Director’s Report
Operations & Development
Exploration Finance Environment, Safety & Social Responsibility
Management Corporate Governance
Financial Report
Shareholder Information
Corporate DirectoryCorporate Directory
Reserves & Resources
stbarbara.com.au82 stbarbara.com.au 83
Grant DateExpiry Date
Exercise Price
Balance at start of
the year Number
Granted during
the year Number
Exercised during
the year Number
Expired during
the year Number
Balance at end of the year Number
Exercisable at end of the year Number
Consolidated and parent entity – 2007
26-Apr-02 26-Apr-07 $0.3500 1,000,000 – 825,000 175,000 – –
17-Jan-03 17-Jan-08 $0.3500 75,000 – – 75,000 – –
2-Dec-04 2-Dec-07 $0.0800 1,000,000 – 1,000,000 – – –
23-Dec-04 23-Dec-09 $0.0472 10,000,000 – 10,000,000 – – –
23-Dec-04 23-Dec-09 $0.1500 5,000,000 – 5,000,000 – – –
23-Dec-04 23-Dec-09 $0.1500 5,000,000 – – – 5,000,000 –
23-Dec-04 23-Dec-10 $0.1500 5,000,000 – – – 5,000,000 –
17-Jan-06 17-Jan-09 $0.4900 1,000,000 – – 1,000,000 – –
12-Sep-05 12-Sep-10 $0.2300 1,000,000 – 1,000,000 – – –
30-Sep-05 30-Sep-10 $0.3300 4,250,000 – 840,000 500,000 2,910,000 1,285,000
1-Jul-06 30-Jun-11 $0.5230 – 3,250,000 – 1,500,000 1,750,000 –
11-Sep-06 11-Sep-11 $0.5280 – 3,000,000 – – 3,000,000 –
1-Dec-06 1-Dec-11 $0.5810 – 500,000 – – 500,000 –
26-Mar-07 26-Mar-12 $0.5210 – 2,000,000 – – 2,000,000 –
Total 33,325,000 8,750,000 18,665,000 3,250,000 20,160,000 1,285,000
Weighted average exercise price 0.16 0.53 0.11 0.47 0.31 0.33
No options were forfeited during the periods covered by the above tables.
The weighted average remaining contractual life of share options outstanding at the end of the year was 3.4 years (2007 – 4.0 years).
No options were granted during the year ended 30 June 2008.
Following the release of the prospectus dated 10 June 2008 for the $120 million Entitlement Offer and Placement, the exercise price of the unlisted options was adjusted pursuant to the formula contained in ASX Listing Rule 6.22.2. The adjustments were as follows:
Grant Date No. of options
Original Exercise
Price
Adjusted Exercise
Price
23 December 04 10,000,000 $0.150 $0.118
30 September 05 1,250,000 $0.330 $0.298
01 July 06 1,750,000 $0.523 $0.491
11 September 06 2,360,000 $0.528 $0.496
01 December 2006 500,000 $0.581 $0.549
26 March 07 2,000,000 $0.522 $0.490
21 May 2007 1,000,000 $0.544 $0.512
Notes to the Financial StatementsFor the year ended 30 June 2008
Note 35 Share-based Payments cont.Note 35 Share-based Payments(a) Employee Option Plan
The establishment of the St Barbara Limited Employee Option Plan was approved by shareholders at the 2001 Annual General Meeting. Options are granted under the plan for no consideration. Options are granted for a three to five year period. Ordinarily, 50% of each new tranche vests and is exercisable after each of the first two anniversaries of the date of grant.
Options granted under the plan carry no dividend or voting rights.
When exercisable, each option is convertible into one ordinary share.
Mr Eshuys, the Managing Director and Chief Executive Officer, has been issued options under the Executive Option Plan.
Set out below are summaries of options granted to employees under the St Barbara Limited Employee Option Plan and Executive Option Plan approved by shareholders:
Grant DateExpiry
DateExercise
Price
Balance at start of
the year Number
Granted during
the year Number
Exercised during
the year Number
Expired during
the year Number
Balance at end of the year Number
Exercisable at end of the year Number
Consolidated and parent entity – 2008
23-Dec-04 23-Dec-10 $0.118 5,000,000 – 5,000,000 – – –
23-Dec-04 23-Dec-11 $0.118 5,000,000 – – – 5,000,000(1) –
30-Sep-05 30-Sep-10 $0.330 1,660,000 – 1,660,000 – – –
30-Sep-05 30-Sep-10 $0.298 1,250,000 – 250,000 – 1,000,000 1,000,000
01-Jul-06 30-Jun-11 $0.491 1,750,000 – – – 1,750,000 875,000
11-Sep-06 11-Sep-11 $0.528 640,000 – 140,000 500,000 – –
11-Sep-06 11-Sep-11 $0.496 2,360,000 – – – 2,360,000 1,360,000
01-Dec-06 01-Dec-11 $0.549 500,000 – – – 500,000 –
26-Mar-07 26-Mar-12 $0.490 2,000,000 _ – – 2,000,000(2) –
21-May-07 21-May-12 $0.512 – 1,000,000 – – 1,000,000(3) –
Total 20,160,000 1,000,000 7,050,000 500,000 13,610,000 3,235,000
Weighted average exercise price 0.28 0.51 0.18 0.53 0.34 0.43
(1) Options vest on 14 September 2008. (2) 50% of options vest on 26 March 2009, 50% vest on 26 March 2010. (3) 50% of options vest on 21 May 2009, 50% vest on 21 May 2010.
Notes to the Financial StatementsFor the year ended 30 June 2008

Exit Print Contents Previous Start End NextAnnual Report 2008
Who are we Highlights Chairman’s Letter
Managing Director’s Report
Operations & Development
Exploration Finance Environment, Safety & Social Responsibility
Management Corporate Governance
Financial Report
Shareholder Information
Corporate DirectoryCorporate Directory
Reserves & Resources
stbarbara.com.au84 stbarbara.com.au 85
(d) Equity Instrument Disclosures Relating to Key Management Personnel
(i) Options provided as remuneration and shares issued on exercise of such optionsDetails of options provided as remuneration and shares issued on the exercise of such options, together with terms and conditions of the options, can be found in Section C of the remuneration report on pages 35 to 37. There were no new issues of options during the year.
(ii) Option holdingsThe numbers of options over ordinary shares in the Company held during the financial year by each Director of St Barbara Limited and other key management personnel of the Group, including their related parties, are set out below:
2008 Name
Balance at the start of the year
Granted during
the year as compensation
Exercised during
the year
Other changes
during the year
Balance at the end
of the year
Vested and exercisable at the end
of the year
Executive Director
E Eshuys 10,000,000 – 5,000,000 – 5,000,000 –
Other key management personnel
I Bird(1) 2,000,000 – – – 2,000,000 –
G Campbell-Cowan 2,000,000 – – – 2,000,000 1,000,000
R Kennedy – – – – – –
P Thompson – – – – – –
G Viska – – – – – –
(1) Mr Bird resigned from the Company with effect from 4 July 2008 and the options granted to him on 26 March 2007 have lapsed.
2007 Name
Balance at the start of the year
Granted during
the year as compensation
Exercised during
the year
Other changes
during the year
Balance at the end
of the year
Vested and exercisable at the end
of the year
Executive Director
E Eshuys 25,000,000 – 15,000,000 – 10,000,000 –
Other key management personnel
I Bird – 2,000,000 – – 2,000,000 –
G Campbell-Cowan – 2,000,000 – – 2,000,000 –
R Kennedy 1,000,000 – 1,000,000 – – –
P Thompson – – – – – –
G Viska – – – – – –
Notes to the Financial StatementsFor the year ended 30 June 2008
Note 36 Key Management Personnel Disclosures cont.
(b) Expenses arising from share-based payment transactions
Total expenses arising from equity settled share-based payment transactions recognised during the year as part of the employee benefit expenses were as follows:
Consolidated Parent entity
2008 $’000
2007 $’000
2008 $’000
2007 $’000
Options issued under employee option plan 475 1,719 475 1,719
Note 36 Key Management Personnel Disclosures(a) Directors
The following persons were Directors of St Barbara Limited during the financial year:
S J C Wise Chairman
E Eshuys Managing Director & CEO
D W Bailey Non-executive director
B J Gibson Non-executive director
P C Lockyer Non-executive director
R K Rae Non-executive director Appointed 9 April 2008
H G Tuten Non-executive director Resigned 21 January 2008
(b) Other key management personnel disclosures
The following persons also had authority and responsibility for planning, directing and controlling the activities of the Group, directly or indirectly, during the financial year:
Ian Bird Chief Operating Officer Resigned 4 July 2008
Garth Campbell-Cowan Chief Financial Officer
Ross Kennedy General Manager Corporate Services/ Company Secretary
Peter Thompson General Manager Exploration Resigned 4 July 2008
George Viska General Manager Gwalia Surface Development
(c) Key Management Personnel Compensation
Consolidated Parent entity
2008 2007 2008 2007
Short term employee benefits 2,480,048 2,515,790 2,480,048 2,515,790
Post employment benefits 77,718 98,723 77,718 98,723
Long Service Leave 55,780 42,593 55,780 42,593
Share-based payments 376,762 714,155 376,762 714,155
2,990,308 3,371,261 2,990,308 3,371,261
•
•
•
•
•
•
•
•
•
•
•
•
Notes to the Financial StatementsFor the year ended 30 June 2008
Note 35 Share-based Payments cont.
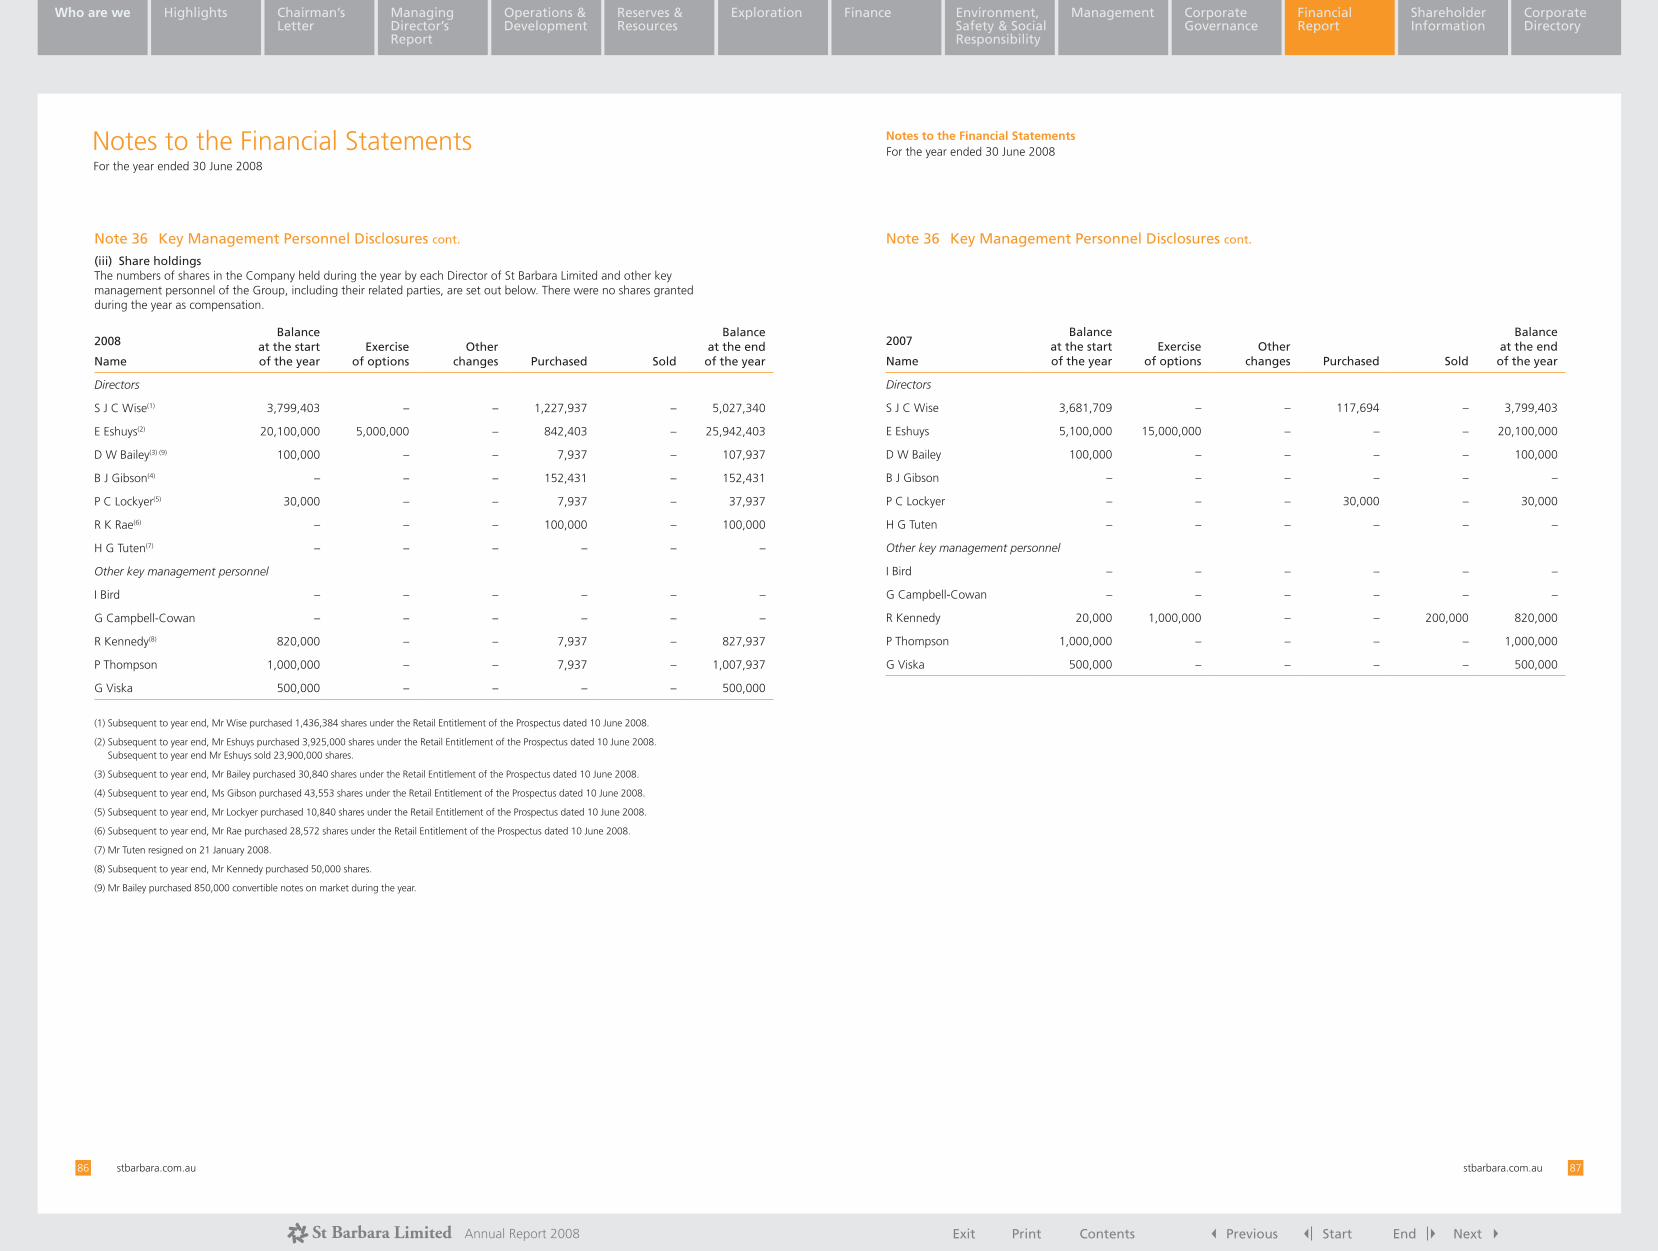
Exit Print Contents Previous Start End NextAnnual Report 2008
Who are we Highlights Chairman’s Letter
Managing Director’s Report
Operations & Development
Exploration Finance Environment, Safety & Social Responsibility
Management Corporate Governance
Financial Report
Shareholder Information
Corporate DirectoryCorporate Directory
Reserves & Resources
stbarbara.com.au86 stbarbara.com.au 87
2007
Name
Balance at the start of the year
Exercise of options
Other changes Purchased Sold
Balance at the end of the year
Directors
S J C Wise 3,681,709 – – 117,694 – 3,799,403
E Eshuys 5,100,000 15,000,000 – – – 20,100,000
D W Bailey 100,000 – – – – 100,000
B J Gibson – – – – – –
P C Lockyer – – – 30,000 – 30,000
H G Tuten – – – – – –
Other key management personnel
I Bird – – – – – –
G Campbell-Cowan – – – – – –
R Kennedy 20,000 1,000,000 – – 200,000 820,000
P Thompson 1,000,000 – – – – 1,000,000
G Viska 500,000 – – – – 500,000
Notes to the Financial StatementsFor the year ended 30 June 2008
Note 36 Key Management Personnel Disclosures cont.
(iii) Share holdingsThe numbers of shares in the Company held during the year by each Director of St Barbara Limited and other key management personnel of the Group, including their related parties, are set out below. There were no shares granted during the year as compensation.
2008
Name
Balance at the start of the year
Exercise of options
Other changes Purchased Sold
Balance at the end
of the year
Directors
S J C Wise(1) 3,799,403 – – 1,227,937 – 5,027,340
E Eshuys(2) 20,100,000 5,000,000 – 842,403 – 25,942,403
D W Bailey(3) (9) 100,000 – – 7,937 – 107,937
B J Gibson(4) – – – 152,431 – 152,431
P C Lockyer(5) 30,000 – – 7,937 – 37,937
R K Rae(6) – – – 100,000 – 100,000
H G Tuten(7) – – – – – –
Other key management personnel
I Bird – – – – – –
G Campbell-Cowan – – – – – –
R Kennedy(8) 820,000 – – 7,937 – 827,937
P Thompson 1,000,000 – – 7,937 – 1,007,937
G Viska 500,000 – – – – 500,000
(1) Subsequent to year end, Mr Wise purchased 1,436,384 shares under the Retail Entitlement of the Prospectus dated 10 June 2008.
(2) Subsequent to year end, Mr Eshuys purchased 3,925,000 shares under the Retail Entitlement of the Prospectus dated 10 June 2008. Subsequent to year end Mr Eshuys sold 23,900,000 shares.
(3) Subsequent to year end, Mr Bailey purchased 30,840 shares under the Retail Entitlement of the Prospectus dated 10 June 2008.
(4) Subsequent to year end, Ms Gibson purchased 43,553 shares under the Retail Entitlement of the Prospectus dated 10 June 2008.
(5) Subsequent to year end, Mr Lockyer purchased 10,840 shares under the Retail Entitlement of the Prospectus dated 10 June 2008.
(6) Subsequent to year end, Mr Rae purchased 28,572 shares under the Retail Entitlement of the Prospectus dated 10 June 2008.
(7) Mr Tuten resigned on 21 January 2008.
(8) Subsequent to year end, Mr Kennedy purchased 50,000 shares.
(9) Mr Bailey purchased 850,000 convertible notes on market during the year.
Notes to the Financial StatementsFor the year ended 30 June 2008
Note 36 Key Management Personnel Disclosures cont.

Exit Print Contents Previous Start End NextAnnual Report 2008
Who are we Highlights Chairman’s Letter
Managing Director’s Report
Operations & Development
Exploration Finance Environment, Safety & Social Responsibility
Management Corporate Governance
Financial Report
Shareholder Information
Corporate DirectoryCorporate Directory
Reserves & Resources
stbarbara.com.au88 stbarbara.com.au 89
Independent Audit Report
In the Directors’ opinion:
(a) the financial statements and notes set out on pages 23 to 88 are in accordance with the Corporations Act 2001, including:
i) complying with Accounting Standards, the Corporations Regulations 2001 and other mandatory professional reporting requirements; and
ii) giving a true and fair view of the Company’s and consolidated entity’s financial position as at 30 June 2008 and of its performance, as represented by the results of their operations, changes in equity and their cash flows, for the financial year ended on that date; and
(b) there are reasonable grounds to believe that the Company will be able to pay its debts as and when they become due and payable; and
(c) the audited remuneration disclosures set out on pages 29 to 37 of the Directors’ report comply with Accounting Standards AASB 124 Related Party Disclosures and the Corporations Regulations 2001.
The Directors have been given the declarations by the chief executive officer and chief financial officer required by section 295A of the Corporations Act 2001.
This declaration is made in accordance with a resolution of the Directors.
Eduard Eshuys Managing Director and CEO Melbourne 28 August 2008
Directors’ Declaration

Exit Print Contents Previous Start End NextAnnual Report 2008
Who are we Highlights Chairman’s Letter
Managing Director’s Report
Operations & Development
Exploration Finance Environment, Safety & Social Responsibility
Management Corporate Governance
Financial Report
Shareholder Information
Corporate DirectoryCorporate Directory
Reserves & Resources
stbarbara.com.au90 stbarbara.com.au 91
Independent Audit Report Shareholder Information
Details of Shareholders As at 23 September 2008
Twenty largest registered shareholdersShares held % of Total
1 J P Morgan Nominees Australia 217,547,344 16.752 HSBC Custody Nominees (Australia) Limited 171,308,012 13.193 National Nominees Limited 142,575,235 10.984 ANZ Nominees Limited 141,469,132 10.895 Macquarie Capital Advisors Limited 114,554,066 8.826 Resource Capital Fund IV LP 30,000,000 2.317 Citicorp Nominees Pty Limited 16,300,609 1.268 HSBC Custody Nominees (Australia) Limited – <GSCO ECSA> 10,414,286 0.809 UBS Wealth Management Australia Nominees Pty Limited 9,760,407 0.7510 Woodross Nominees Pty Limited 9,018,000 0.6911 Three Crowns Investments Pty Limited 7,446,097 0.5712 Citicorp Nominees Pty Limited <CWLTH Bank Off Super A/C> 6,505,610 0.5013 Northwest Accounting Pty Limited 5,607,937 0.4314 Mr Eduard Eshuys 4,632,937 0.3615 Merrill Lynch (Australia) Nominees Pty Limited 4,573,860 0.3516 NEFCO Nominees Pty Limited 4,500,000 0.3517 Queensland Investment Corporation 3,905,104 0.3018 Invia Custodian Pty Limited 3,502,858 0.2719 Comsec Nominees Pty Limited 3,296,479 0.2520 Miroma Investment Inc 3,160,000 0.24
Substantial ShareholdersHolder No. of Securities % of TotalMacquarie Group Limited 133,694,049 10.29M&G Group 130,082,024 10.01Vanguard Precious Metals & Mining Fund 87,000,000 8.75JPMorgan Chase & Co 58,097,789 6.07
Distribution of ShareholdingsNumber held Number of shareholders Number of shares1 – 1,000 931 535,2571,001 – 5,000 2,504 7,843,5255,001 – 10,000 2,285 19,005,64310,001 – 100,000 4,626 146,130,644100,001 and over 655 1,125,220,867
11,001 1,298,735,936The total number of shareholders will less than a marketable parcel was 1,192.
Directors’ interestsAs at the date of the Directors’ Report, the direct or indirect interest of each Director of the Company in the issued securities of the Company, or in related corporation, was as follows:
Shares Held Convertible Notes HeldS J C Wise 6,463,724 –E Eshuys 5,967,403 –D W Bailey 138,777 Notes with a face value of A$850,000, convertible
into 1,268,657 fully paid ordinary shares (based on a conversion price of A$0.67)
B J Gibson 195,984 –P C Lockyer 48,777 –R K Rae 128,572 –

Exit Print Contents Previous Start End NextAnnual Report 2008
Who are we Highlights Chairman’s Letter
Managing Director’s Report
Operations & Development
Exploration Finance Environment, Safety & Social Responsibility
Management Corporate Governance
Financial Report
Shareholder Information
Corporate DirectoryCorporate Directory
Reserves & Resources
stbarbara.com.au92
DESIGN: COLLIER & ASSOCIATES THE STRATEGIC DESIGN COMPANY #13360
This report is printed on Monza Satin produced with 55% recycled fibre (25% post consumer and 30% pre consumer) and FSC Certified pulp, which ensures that all virgin pulp is derived from well-managed forests, and is manufactured by an ISO 14001 certified mill. Monza Recycled is an FSC Mixed Source Certified Paper.
Corporate Directory
Board of DirectorsColin Wise (Non Executive Chairman)
Eduard Eshuys (Managing Director and CEO)
Douglas Bailey (Non Executive Director)
Barbara Gibson (Non Executive Director)
Phillip Lockyer (Non Executive Director)
Robert Rae (Non Executive Director)
Company SecretaryRoss Kennedy
Registered OfficeLevel 21, 90 Collins Street Melbourne VIC 3000 Telephone: +61 3 8660 1900 Facsimile: +61 3 8660 1999 Email: [email protected] Website: www.stbarbara.com.au
Share RegistryComputershare Limited GPO Box 2975 Melbourne VIC 3001 Telephone: +1300 653 935
+61 3 9415 4356Facsimile: +61 3 9415 2500
BankersCommonwealth Bank of Australia 385 Bourke Street Melbourne VIC 3000
AuditorsKPMG 147 Collins Street Melbourne VIC 3000
SolicitorsFreehills QV1 Building 250 St Georgeís Terrace Perth WA 6000
Stock Exchange ListingShares in St Barbara Limited are quoted on the Australian Securities Exchange Limited
Ticker symbol: SBM

Exit Print Contents Previous Start End Next
Annual Report 2008