annual report 2007 - zonebourse.com · luis ladaria (agro commodities distribution) rafael sanchez...
TRANSCRIPT
A N N U A L R E P O RT 2 0 0 7
Table of Contents
Mission Statement . . . . . . . . . . . . . . . . . . . . . . . . . . . . 2
Key figures relating to the group’s development . . . 3
Board of directors. . . . . . . . . . . . . . . . . . . . . . . . . . . . . 4
Financial timetable . . . . . . . . . . . . . . . . . . . . . . . . . . . . 5
Evolution of the share price. . . . . . . . . . . . . . . . . . . . . 5
Corporate Governance . . . . . . . . . . . . . . . . . . . . . . . . 6
Group activities. . . . . . . . . . . . . . . . . . . . . . . . . . . . . . . 9
Contribution to the consolidated result . . . . . . . . . . 12
Geographical contribution to the
consolidated result . . . . . . . . . . . . . . . . . . . . . . . . 13
Annual Report of the Board
of Directors . . . . . . . . . . . . . . . . . . . . . . . . . . . .17
Crop protection . . . . . . . . . . . . . . . . . . . . . . . . . 18
Crop nutrition. . . . . . . . . . . . . . . . . . . . . . . . . . . 19
Industrial chemicals and environment . . . . . . . 20
Agro commodities distribution . . . . . . . . . . . . 21
Logistics . . . . . . . . . . . . . . . . . . . . . . . . . . . . . . . 21
Energy. . . . . . . . . . . . . . . . . . . . . . . . . . . . . . . . . 22
Real estate property . . . . . . . . . . . . . . . . . . . . . 23
Income statement . . . . . . . . . . . . . . . . . . . . . . . 24
Developments in the first quarter of 2008. . . . 25
Distribution of profits . . . . . . . . . . . . . . . . . . . . 26
Appointments . . . . . . . . . . . . . . . . . . . . . . . . . . 26
Annexe to the management report . . . . . . . . . 27
Consolidated figures. . . . . . . . . . . . . . . . . . . . . .29
Consolidated income statement . . . . . . . . . . . 31
Consolidated balance sheet. . . . . . . . . . . . . . . 32
Consolidated cash flow statement. . . . . . . . . . 34
Consolidated statement of changes in
shareholder´s equity . . . . . . . . . . . . . . . . . . . 35
Notes to the consolidated financial
statements . . . . . . . . . . . . . . . . . . . . . . . . . . 43
Statutory Accounts . . . . . . . . . . . . . . . . . . . . . . .61
Balance sheet after distribution . . . . . . . . . . . . 62
Income statement . . . . . . . . . . . . . . . . . . . . . . . 64
Limited Company (S.A.)
500, Avenue Louise
1050 Brussels
NN.0403 085 280
Ordinary General Meeting June 17, 2008
2SAPEC ANNUAL REPORT 2007
MISSION STATEMENT
Mission Statement
Formed in 1926 as a mining and chemical company, Sapec expanded its activities into various industrial and
service sectors covering the whole of the Iberian Peninsula, developing the perspective of an industrial holding
group controlling the management of various activities.
As an investor, the Sapec Group pays particular attention to generating added value by pursuing the following
objectives:
to manage a diversified portfolio of activities, capitalising, at present, on the Group’s knowledge and know how
in the field of agriculture, chemical products, animal nutrition, services with a logistical component and in the
energy generation, utilizing renewable resources primarily in the Iberian geographical area;
to develop sustainable competitive advantages through the acquisition of a leadership position or, by exploiting
niche markets in sectors offering potential growth.
This policy is implemented by:
systematically and closely monitoring the divisions in which the Group has investments;
managing the divisions as autonomous profit centres, responsible for their own cash flow in the context of yield
requirements being able to count on the Group’s support which may also include financial solutions.
This policy is an expression of the objective of increasing the company’s share value as well as ensuring a stable
and continuous dividend growth.

3SAPEC ANNUAL REPORT 2007
KEY FIGURES
Key figures relating to the group’s development
GLOBAL DATA (M€) Belgian reporting standards (1) IFRS
2003 2004 2004 2005 2006 2007
Turnover 428.8 532.0 538.2 514.9 516.4 572.5
Operating profit (2) 6.2 10.4 21.1 22.4 15.2 23.6
Net consolidated profit 9.2 10.3 11.3 13.3 10.4 22.4
Net consolidated profit - group share 8.4 9.5 10.8 12.1 7.4 20.7
EBITDA (recurrent) (3) 16.1 17.5 30.2 34.0 26.8 34.8
Shareholder’s equity (after distribution) 95.1 99.8 97.6 106.5 111.0 127.4
Total balance sheet 357.9 359.2 306.1 367.2 405.2 570.6
CONSOLIDATED DATA PER SHARE (€) Belgian reporting standards (1) IFRS
2003 2004 2004 2005 2006 2007
Number of shares 1,355,000 1,355,000 1,355,000 1,355,000 1,355,000 1,355,000
Shareholder’s equity after distribution 70.2 73.6 72.0 78.6 81.9 94.0
Operating profit (2) 4.6 7.7 15.5 16.5 11.2 17.4
Net profit group - share 6.2 7.0 8.0 9.0 5.5 15.3
Operating cash flow 11.9 13.0 23.7 24.7 19.8 25.7
Dividend common shares (gross) 1.75 1.95 1.95 2.1 2.1 2.7
Pay out on operating profit 38.0% 25.3% 12.6% 12.7% 18.7% 15.5%
Pay out on net consolidated
profit - group share 28.2% 27.7% 24.4% 23.3% 38.2% 17.6%
(1) The figures concerning 2003 and 2004 were prepared in accordance with the Belgian accounting standards, with the exception of the amorti-
sations of the consolidation differences, which were withdrawn. For 2004, the year of the transition, the primary difference concerns the profits
and losses from the real estate activity, for which the operational profits and losses were considered an exceptional result sheltered from the
Belgian standards.
(2) For the years 2003 to 2004, it corresponds to the former designation of «operational result».
(3) The figures for 2004 to 2007 do not consider the amounts of a non-recurrent nature that would normally have been considered exceptional
under the Belgian standards.
4SAPEC ANNUAL REPORT 2007
Board of directorsEduardo Catroga * Chairman
Antoine Velge * Managing Director
Philippe de Broqueville Director
Manuel Fernando Espírito Santo Director
Jean-Marie Laurent Josi Director
Xavier Scheyven Director
Günter Strauss Director
Christian Varin Director
Patricia Velge Director
Board secretaryEric van Innis *
Chief Financial OfficerJoão Sinde *
Division managersJoão Estrela (Crop Protection)
Eric van Innis (Crop Nutrition)
Fernando Gamboa (Industrial Chemicals and Environment)
José Martins Pereira (Logistics)
Luis Ladaria (Agro Commodities Distribution)
Rafael Sanchez Castillo (Energy)
Statutory auditorMazars & Guérard
Company Auditor No. 221
88, rue Gachard 1050 Bruxelles
Represented by Mr. Xavier Doyen
* Members of the Executive Committee
BOARD OF DIRECTORS

5SAPEC ANNUAL REPORT 2007
FINANCIAL TIMETABLE
Financial timetable
June 17, 2008 General Meeting 2007 financial year
June 23, 2008 Dividend Payment
September 1, 2008 Publication of half-yearly results
March 31, 2009 Publication of annual results
June 16, 2009 General Meeting 2008 financial year
Evolution of the share price in Euros
2002 2003 2004 2005 2006 2007
Ordinary shares min 31.4 39.1 44.8 67.0 82.5 90.3
max 44.5 52 72.5 96.2 97.0 114.3
Closing 31/12 ord. 43.0 46.5 72.5 93.1 90.0 102.5
Total number of shares as at 31/12 1,355,000 1,355,000 1,355,000 1,355,000 1,355,000 1,355,000
Market Capitalization 31/12 (k€) 58,265 63,008 98,238 126,151 121,950 138,888
SAPEC Shareholders No. shares Total number of shares 1,355,000
Financière Frédéric Jacobs S.A. 113,661
Soclinpar S.A. 17,969
LHI S.A. 610,973
BES Investimento S.A. (ex. ESSI) 14,179
Cobepa S.A. 204,950
Alcatel Bell Pensioenfonds VZW 42,000
Stock exchange 351,268
8.4%1.3%
3.1%45.1%
1.1%
15.1%
25.9%
SAPEC Versus Belgian all Shares
Bel 20
Brussels all shares SAPEC BEL 20
1/07
2/07
3/07
4/07
5/07
6/07
7/07
7/07
8/07
9/07
10/0
7
11/0
7
12/0
7
130,00
125,00
120,00
115,00
110,00
105,00
100,00
95,00
90,00
85,00
6SAPEC ANNUAL REPORT 2007
CORPORATE GOVERNANCE
Corporate governance
The company adheres to the Belgian Code of Corporate Governance (Lippens Code). The company’s Corporate Gover-
nance Charter entered into force on 21 June 2006. However, the implementation of its principles takes into account
the specific structure of the shareholder equity, in view of the fact that the majority family stake has ensured the
company’s stability for over eighty years.
Composition of the Board of DirectorsThe Board consists of 9 members divided Expiration du mandat
Into the following categories:
Eduardo Catroga (Chairman) AUG 2011(*)
Antoine Velge (Managing Director) AUG 2011(*)
Xavier Scheyven AUG 2009
Manuel Fernando Espírito Santo AUG 2010
Patricia Velge AUG 2009
(Five directors proposed by the majority Group)
Christian Varin AUG 2010
Jean-Marie Laurent-Josi AUG 2010
(Two directors proposed by the Cobepa Group)
Philippe de Broqueville AUG 2011(*)
Günter Strauss AUG 2010
(Two independent directors)
(*) subject to the approval of the General Meeting
The Chairman and the Managing Director are chosen from among the appointed directors by proposal of the majority
Group. The duration of the term of office of the directors is laid down in the company’s articles of association at a
maximum of 6 years. At present the terms of office run for three years.
Mission and functioning of the Board of DirectorsThe Board meets four times a year on a regular basis or whenever company is interests require it to do so.
As a general rule, the Board:
- Determines the company’s strategy and values and approves the plans and budgets;
- Decides on significant financial transactions, acquisitions and disinvestments;
- Ensures the setting up of the appropriate structures procedures and controls to achieve the aims of the company
and manage the risks;
- Supervises the performance of daily management;
- Ensures effective communication with the shareholders and other interested parties.
In 2007, the Board met five times.
The decisions are taken by a majority of votes, with the Chairman having the casting vote in the event of a tie.
The company is considered to be validly represented by two directors. It can also be validly represented by special
representatives within the limits of the power of attorney granted to them.

7SAPEC ANNUAL REPORT 2007
CORPORATE GOVERNANCE
The Board set up from among its members two consultative committees:
- An Audit Committee, responsible for auditing the financial statements, for managing the risks and the effectiveness
of the internal and external audits;
- An Appointments and Remuneration Committee responsible for proposing to the Board the appointments and re-
munerations of the directors and senior management.
Daily management of the companyThe Board of Directors may delegate part of its powers to a managing director (or even two). Within the framework of
this delegation of powers, the managing director has been entrusted with the following main tasks:
- Responsibility for the daily management of the company and the supervision of the subsidiaries;
- Ensuring the effective organisation of the company and of its subsidiaries;
- Evaluating senior management and submitting proposals to the Remuneration Committee with regard to its development
and remuneration;
- Making investment/disinvestment decisions of under EUR 1 million;
- Preparing and submitting to the Board of Directors important decisions to be taken and performance reporting on the
performance of the mission;
- Implementing the decisions of the Board of Directors.
To help the managing director to coordinate the activities of senior management, he is assisted by an Executive
Committee, usually consisting of general managers within the Group and its subsidiaries. The Managing Director is
ultimately accountable to the Board of Directors for the company’s daily management.
The Executive Committee meets monthly in the presence of the Chairman of the Board of Directors.
Shareholder structure and publicityAs at January 1 2008, the issued capital amounts to EUR 36,600,000, represented by 1,355,000 ordinary shares,
including 22,682 shares with strip, in accordance with the legislation.
Also in accordance with the legislation and the company’s articles of association, all shareholders who hold more
than 3% of the securities and then 5% or a multiple of this percentage, must send a declaration of transparency to
the company.
Annual General MeetingsThe ordinary general meeting takes place on the third Tuesday of June at 11 a.m. at the company’s head office.
If an extraordinary general meeting proves to be necessary, the Board of Directors shall try to hold it immediately
after the ordinary general meeting.
The general meeting deliberates in line with the agenda laid down in the letter convening the meeting.
The letters convening the meetings and organisation of meetings shall comply with the memorandum and articles of
association and the legal provisions of the Company Code.
The vote is public and is held by a show of hands. The counting of the votes and the result are given immediately.
The minutes of the general meeting are drawn up and signed by the shareholders who wish to do so at the end of
the meeting.
8SAPEC ANNUAL REPORT 2007
CORPORATE GOVERNANCE
Dividend policyThe company’s dividend policy seeks to find a balance between the yield for the shareholders and the availability
of resources to finance the development of its activities.
DerogationThe company departs from the Code (Lippens Code) on the following principles:
- The group of directors, elected by the family shareholders, is able to dominate the decisions;
- The company communicates the total remunerations paid to the members of the Board of Directors;
- The term of office of the directors can be renewed several times.
The entire Corporate Governance Charter, with detailed explanations about these derogations, may be consulted on
the company’s web site : www.sapec.be.
Financial communicationIn view of the very significant international development of its activities, the Group has chosen English as the only
language of communication, with French remaining the administrative legal language.
From now on, the annual report will be drawn up in English, with a French version being available on request from the
company’s head office.
Relations with the dominant shareholdersThere is an agreement between Cobepa and the majority Group.
AuditorsThe Auditor is the firm Mazars & Guérard, represented by Mr Xavier Doyen, Company Auditor.

9SAPEC ANNUAL REPORT 2007
GROUP ACTIVITIES
Group Activities
The Sapec Group comprises six businesses and an accessory real estate activity:
This business consists of the amination, solid and liquid formulation,
packaging and distribution in the Iberian Peninsula of phytosanitary
products earmarked for crop protection. The product portfolio mainly
consists of generic products distributed under the brand names of the
subsidiary companies, Sapec Agro (PT) and Selectis in Portugal and
Sapec Agro (ES) and Tradecorp in Spain. Together, the four companies
make Sapec third operator in the crop protection sector in the Iberian
Peninsula, after the multinationals. The Group operates a factory in
this sector of activity, located in Setúbal (PT) and two logistics centers
in Spain (Valence and Albacete).
This activity covers the production, including the synthesis of
a chelated agent and sale of a range of nutritional elements
and enriching agents with a high added value earmarked for
agriculture, in particular horticulture, viticulture, floriculture and
fruiticulture.
The main components of the range are liquid and solid trace
elements (chelates), bio stimulants (humic acids and amino
acids) as well as acidity and/or salinity correctors.
The production is based in Spain on two different sites and the products are sold in various geographical zones via
a direct commercial presence as the Iberian Peninsula, Europe, the Middle East, Mexico, Brazil and Colombia or
through agreement with local distributors in more than 55 countries worldwide.
This business incorporates the production, the packaging and
distribution in Portugal of chemical products to industry in general
and to the construction, car, manufacturing paper, environmental and
chemical sectors in particular. This activity is pursued through Sapec
Química, which operates industrial and logistical platforms in Setúbal,
covering Southern Portugal and in Ovar, covering Northern Portugal.
In the environement sector Sapec has set up the company CITRI
(Integrated industrial non-hazardous wastetreatment centre) in
Setúbal, specializing in recycling and disposal of non-toxic industrial
waste. New projects in this expanding sector are in development,
including in hazardous waste sector.
An identical center for hazardous waste will start during 2008.
Sapec holds in this project 34.1%
10SAPEC ANNUAL REPORT 2007
GROUP ACTIVITIES
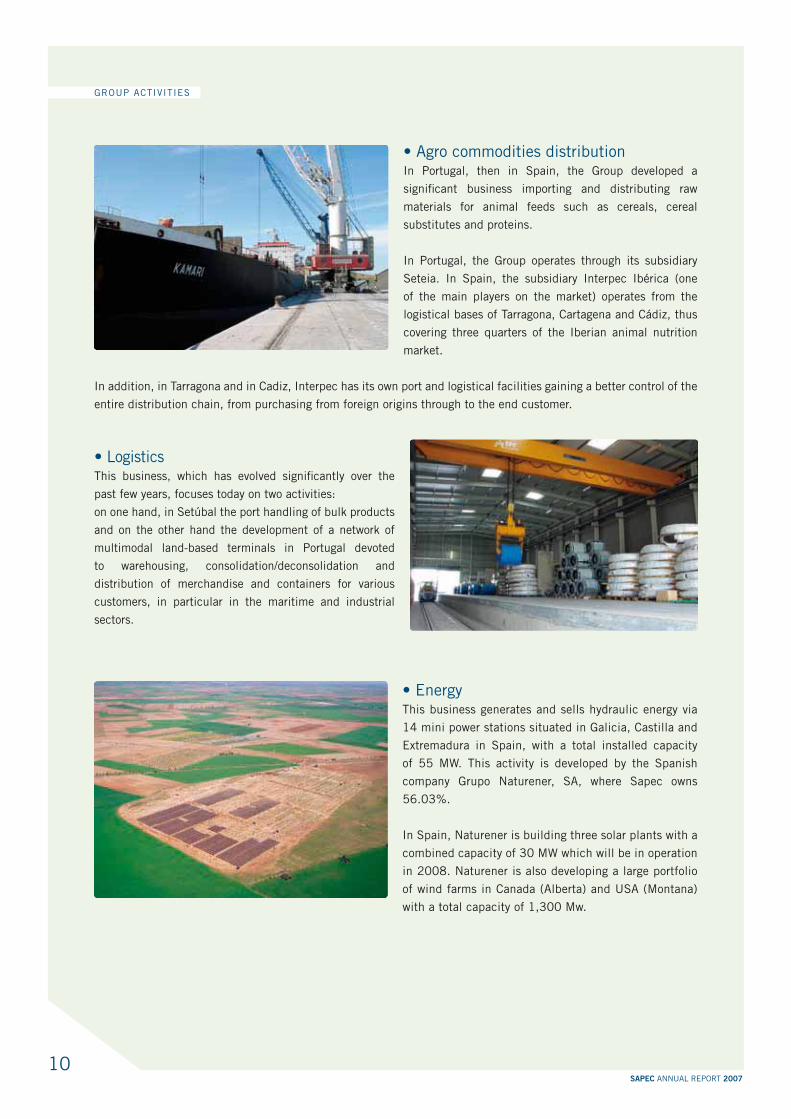
In Portugal, then in Spain, the Group developed a
significant business importing and distributing raw
materials for animal feeds such as cereals, cereal
substitutes and proteins.
In Portugal, the Group operates through its subsidiary
Seteia. In Spain, the subsidiary Interpec Ibérica (one
of the main players on the market) operates from the
logistical bases of Tarragona, Cartagena and Cádiz, thus
covering three quarters of the Iberian animal nutrition
market.
In addition, in Tarragona and in Cadiz, Interpec has its own port and logistical facilities gaining a better control of the
entire distribution chain, from purchasing from foreign origins through to the end customer.
LogisticsThis business, which has evolved significantly over the
past few years, focuses today on two activities:
on one hand, in Setúbal the port handling of bulk products
and on the other hand the development of a network of
multimodal land-based terminals in Portugal devoted
to warehousing, consolidation/deconsolidation and
distribution of mer chan dise and containers for various
customers, in particular in the maritime and industrial
sectors.
This business generates and sells hydraulic energy via
14 mini power stations situated in Galicia, Castilla and
Extremadura in Spain, with a total installed capacity
of 55 MW. This activity is developed by the Spanish
company Grupo Naturener, SA, where Sapec owns
56.03%.
In Spain, Naturener is building three solar plants with a
combined capacity of 30 MW which will be in operation
in 2008. Naturener is also developing a large portfolio
of wind farms in Canada (Alberta) and USA (Montana)
with a total capacity of 1,300 Mw.
11SAPEC ANNUAL REPORT 2007
GROUP ACTIVITIES
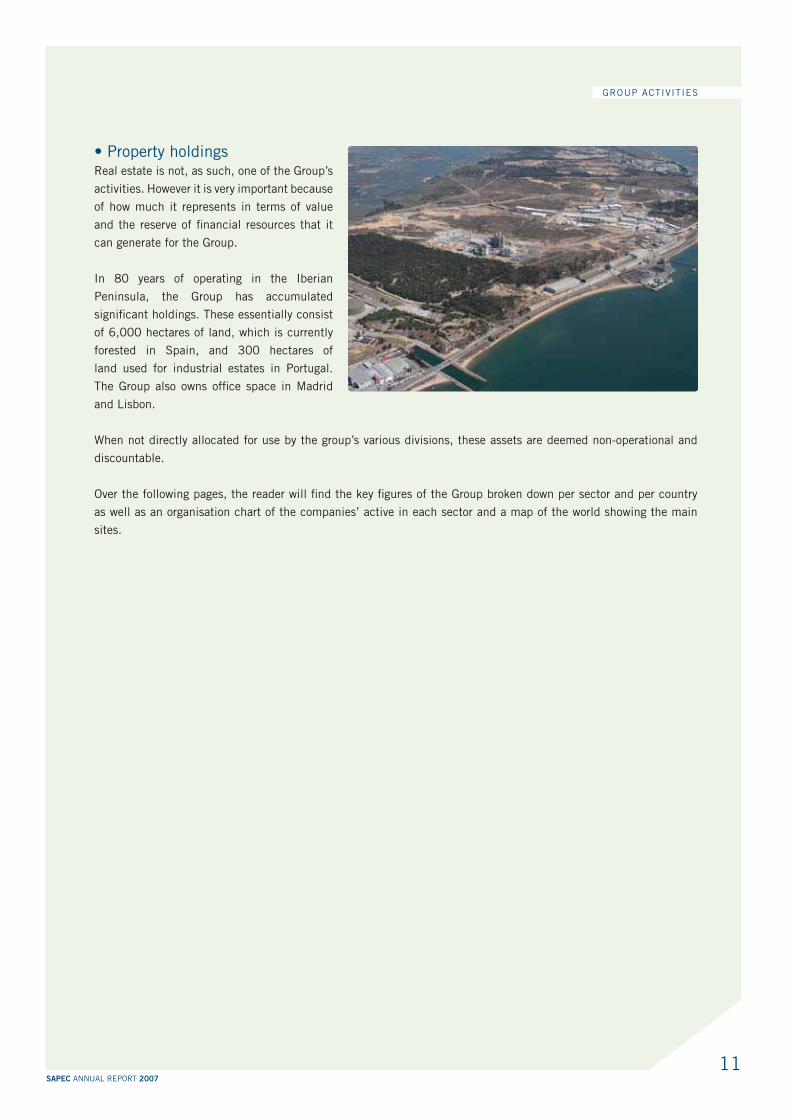
Real estate is not, as such, one of the Group’s
activities. However it is very important because
of how much it represents in terms of value
and the reserve of financial resources that it
can generate for the Group.
In 80 years of operating in the Iberian
Peninsula, the Group has accumulated
significant holdings. These essentially consist
of 6,000 hectares of land, which is currently
forested in Spain, and 300 hectares of
land used for industrial estates in Portugal.
The Group also owns office space in Madrid
and Lisbon.
When not directly allocated for use by the group’s various divisions, these assets are deemed non-operational and
discountable.
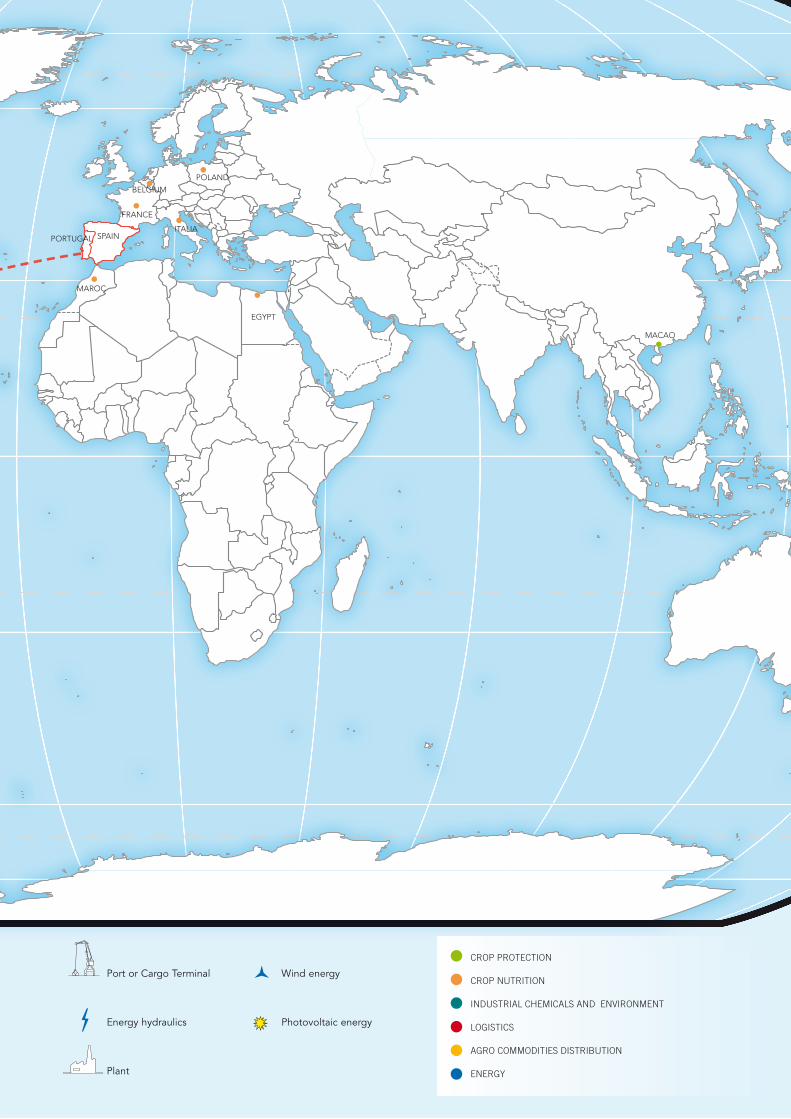
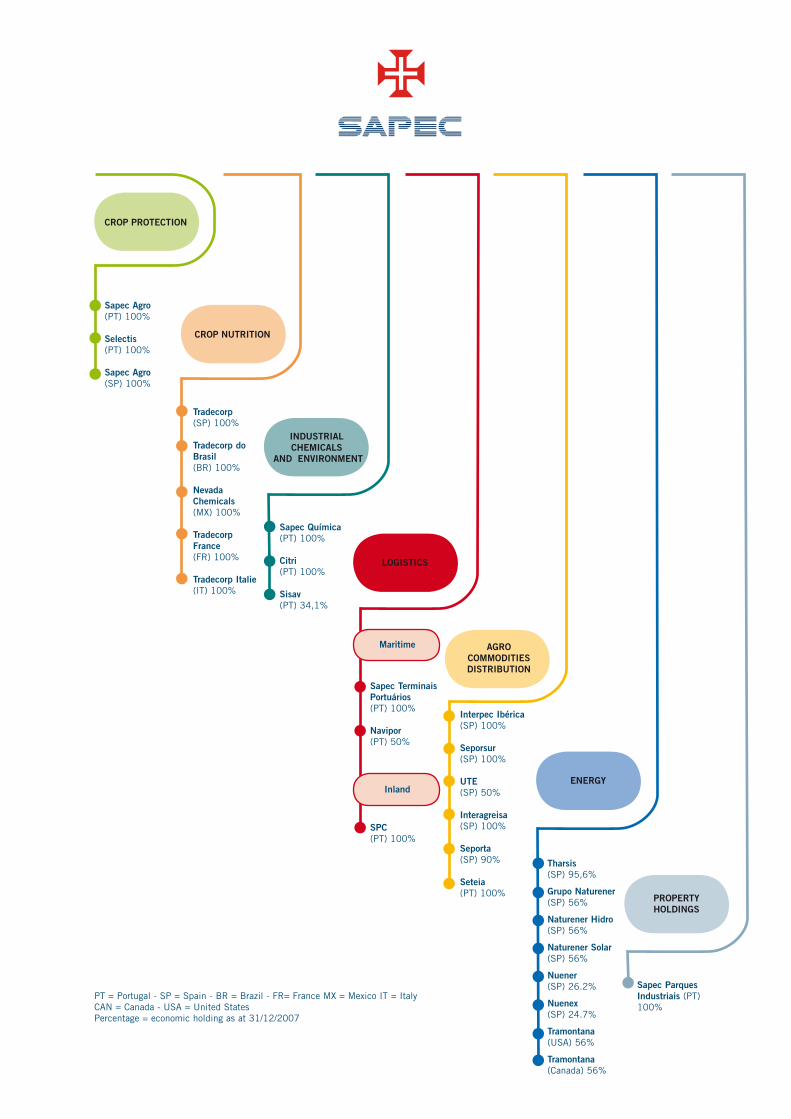
Over the following pages, the reader will find the key figures of the Group broken down per sector and per country
as well as an organisation chart of the companies’ active in each sector and a map of the world showing the main
sites.
12SAPEC ANNUAL REPORT 2007
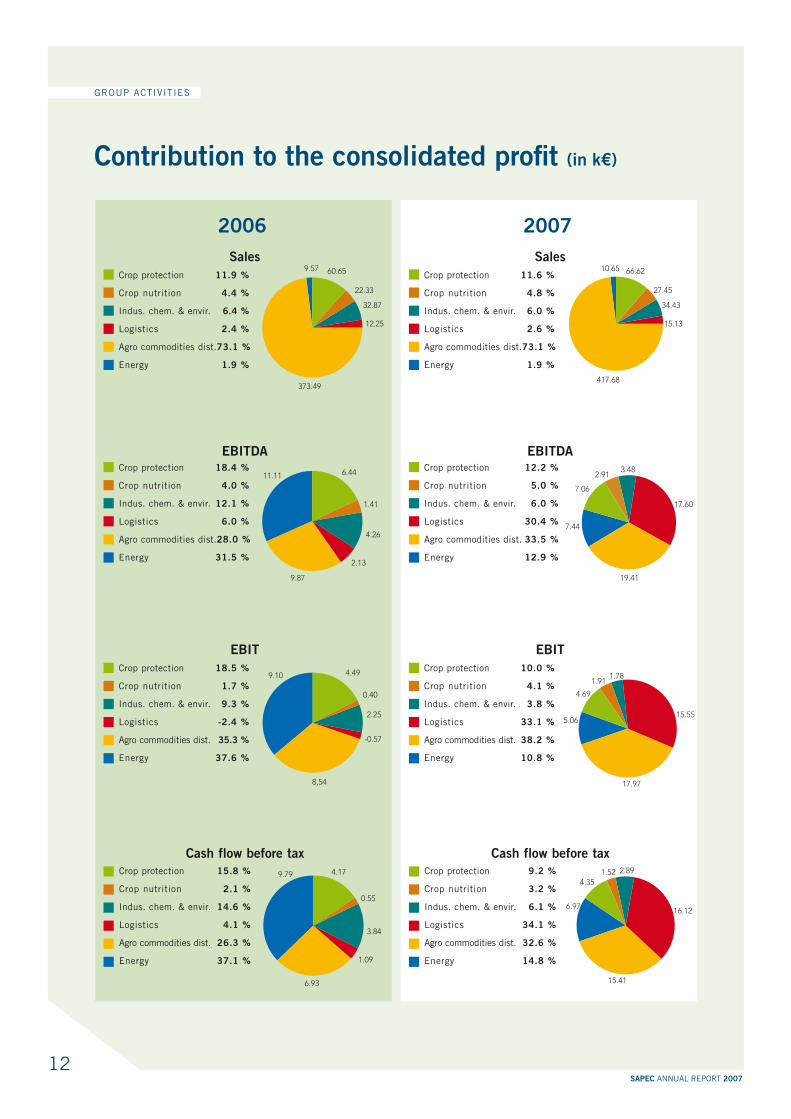
Contribution to the consolidated profit (in k€)
Sales
Crop protection 11.9 %
Crop nutrition 4.4 %
Indus. chem. & envir. 6.4 %
Logistics 2.4 %
Agro commodities dist. 73.1 %
Energy 1.9 %
60.65
22.33
32.87
12.25
373.49
9.57
EBITDACrop protection 18.4 %
Crop nutrition 4.0 %
Indus. chem. & envir. 12.1 %
Logistics 6.0 %
Agro commodities dist. 28.0 %
Energy 31.5 %
6.44
1.41
4.26
9.87
2.13
11.11
EBIT
Crop protection 18.5 %
Crop nutrition 1.7 %
Indus. chem. & envir. 9.3 %
Logistics -2.4 %
Agro commodities dist. 35.3 %
Energy 37.6 %
-0.57
8,54
9.10 4.49
0.40
2.25
Cash flow before tax
Crop protection 15.8 %
Crop nutrition 2.1 %
Indus. chem. & envir. 14.6 %
Logistics 4.1 %
Agro commodities dist. 26.3 %
Energy 37.1 %
3.84
1.09
6.93
9.79 4.17
0.55
2006
Sales
Crop protection 11.6 %
Crop nutrition 4.8 %
Indus. chem. & envir. 6.0 %
Logistics 2.6 %
Agro commodities dist. 73.1 %
Energy 1.9 %
EBITDACrop protection 12.2 %
Crop nutrition 5.0 %
Indus. chem. & envir. 6.0 %
Logistics 30.4 %
Agro commodities dist. 33.5 %
Energy 12.9 %
EBIT
Crop protection 10.0 %
Crop nutrition 4.1 %
Indus. chem. & envir. 3.8 %
Logistics 33.1 %
Agro commodities dist. 38.2 %
Energy 10.8 %
Cash flow before tax
Crop protection 9.2 %
Crop nutrition 3.2 %
Indus. chem. & envir. 6.1 %
Logistics 34.1 %
Agro commodities dist. 32.6 %
Energy 14.8 %
2007
66.62
27.45
34.43
15.13
417.68
10.65
1.91
17.97
5.06
4.69
1.78
15.55
4.35
6.97
15.41
1.52 2.89
16.12
2.91
17.60
3.48
19.41
7.44
7.06
GROUP ACTIVITIES
13SAPEC ANNUAL REPORT 2007
100
90
80
70
60
50
40
30
20
10
0
100
90
80
70
60
50
40
30
20
10
0
100
90
80
70
60
50
40
30
20
10
0
100
90
80
70
60
50
40
30
20
10
0
100
90
80
70
60
50
40
30
20
10
0
100
90
80
70
60
50
40
30
20
10
0
100
90
80
70
60
50
40
30
20
10
0
100
90
80
70
60
50
40
30
20
10
0
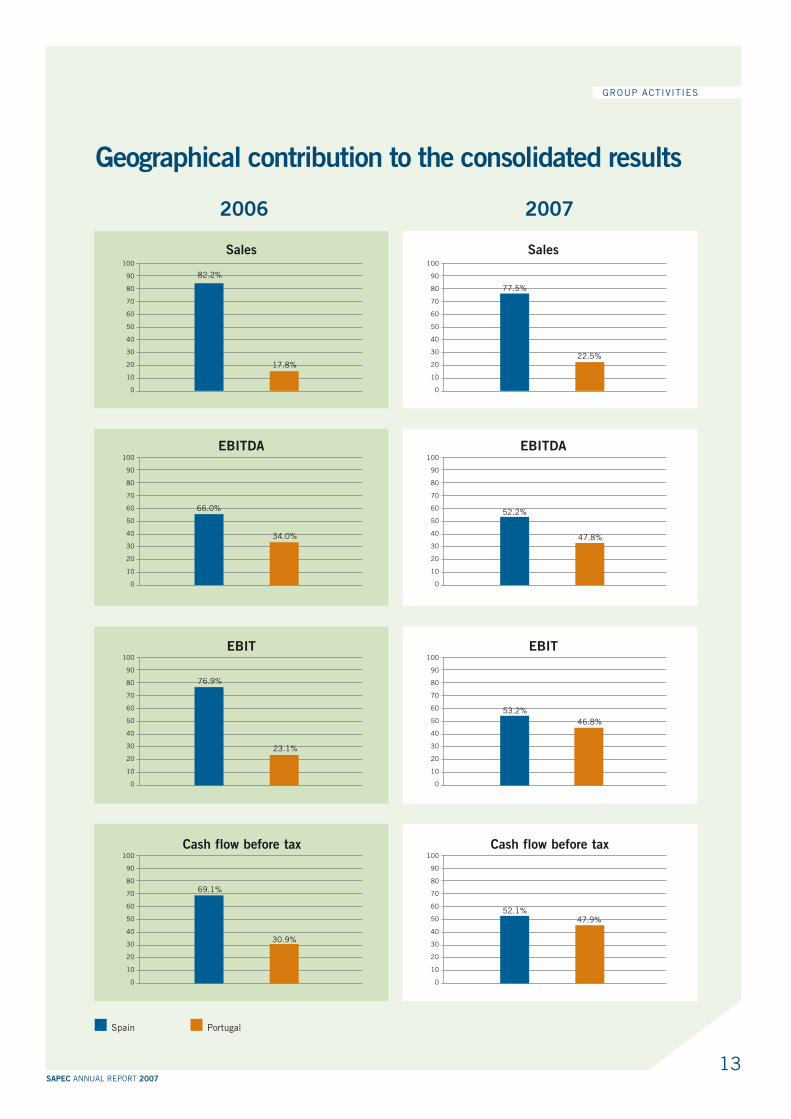
66.0%
76.9%
23.1%
69.1%
30.9%
77.5%
22.5%
53.2%
46.8%
52.1%47.9%
82.2%
52.2%
17.8%
47.8%34.0%
Geographical contribution to the consolidated results
Spain Portugal
GROUP ACTIVITIES
2006 2007
Sales
EBITDA
EBIT
Cash flow before tax
Sales
EBITDA
EBIT
Cash flow before tax
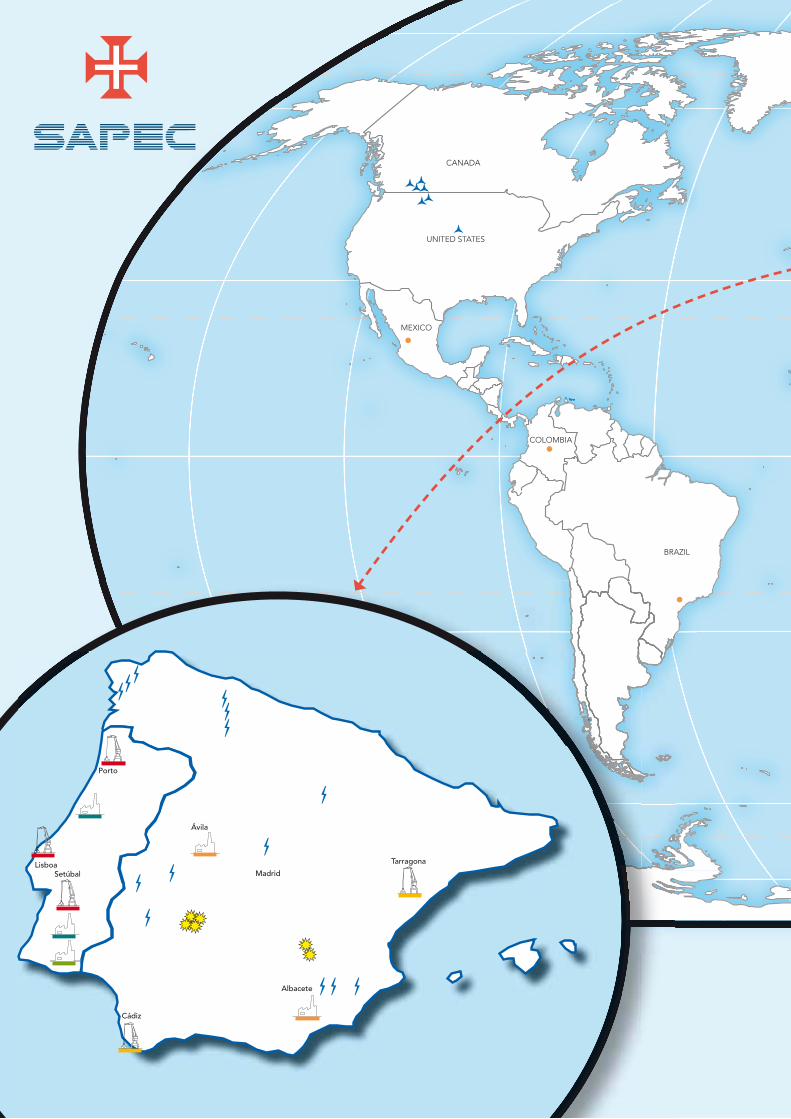
Porto
LisboaSetúbal
Ávila
Madrid
Albacete
Cádiz
Tarragona
BRAZIL
COLOMBIA
UNITED STATES
MEXICO
CANADA
Port or Cargo Terminal
Energy hydraulics
Plant
Wind energy
Photovoltaic energy
CROP PROTECTION
CROP NUTRITION
INDUSTRIAL CHEMICALS AND ENVIRONMENT
LOGISTICS
AGRO COMMODITIES DISTRIBUTION
ENERGY
POLAND
ITALIA
BELGIUM
FRANCE
SPAIN
MAROC
EGYPT
MACAO
PORTUGAL
CROP PROTECTION
CROP NUTRITION
INDUSTRIAL
CHEMICALS
AND ENVIRONMENT
LOGISTICS
AGRO
COMMODITIES
DISTRIBUTION
ENERGY
PROPERTY
HOLDINGS
Sapec Agro
(PT) 100%
Selectis
(PT) 100%
Sapec Agro
(SP) 100%
Tradecorp
(SP) 100%
Tradecorp do
Brasil
(BR) 100%
Nevada
Chemicals
(MX) 100%
Tradecorp
France
(FR) 100%
Tradecorp Italie
(IT) 100%
Sapec Química
(PT) 100%
Citri
(PT) 100%
Sisav
(PT) 34,1%
Maritime
Inland
Sapec Terminais
Portuários
(PT) 100%
Navipor
(PT) 50%
SPC
(PT) 100%
Interpec Ibérica
(SP) 100%
Seporsur
(SP) 100%
UTE
(SP) 50%
Interagreisa
(SP) 100%
Seporta
(SP) 90%
Seteia
(PT) 100%
Tharsis
(SP) 95,6%
Grupo Naturener
(SP) 56%
Naturener Hidro
(SP) 56%
Naturener Solar
(SP) 56%
Nuener
(SP) 26.2%
Nuenex
(SP) 24.7%
Tramontana
(USA) 56%
Tramontana
(Canada) 56%
Sapec Parques
Industriais (PT)
100%
PT = Portugal - SP = Spain - BR = Brazil - FR= France MX = Mexico IT = Italy
CAN = Canada - USA = United States
Percentage = economic holding as at 31/12/2007

17SAPEC ANNUAL REPORT 2007
MANAGEMENT REPORT
Management Report of the Board of Directors the business activities and the consolidated results of the Sapec Group in 2007
The operating income, after a rather difficult 2006 for all the activities of the Sapec Group, experienced a strong
improvement in 2007, thanks principally to an exceptional year in the agro commodities distribution sector.
The recording of a significant capital gains further to the sale of lands of the logistical platform near Lisbon allowed
the Group’s total results to progress noticeably and reach a record level.
The principal worldwide indicators (population growth, increase in living standards in China and in India, replacement
of part of the mineral-based fuels with plant-based fuels, massive needs for biomass) lead us to believe that we are
entering a cycle where the prices of agricultural products will remain high and the demand for “production inputs”
for agriculture will remain significant. Prices will also be more volatile given the amounts of money invested by the
funds on the principal agricultural commodities markets.
This cycle should last at least until the recomposition of strategic levels of world stocks, which will necessitate one
or two record harvests in order to re-balance supply and demand. Insofar as 90% of the group’s turnover is linked to
the agricultural and food processing sector, this favourable cycle is positive for us; farmers are regaining confidence
and the increase in cash flows will make it possible to dynamise the investments in this sector.
In crop protection, the distribution channels were able in this favourable context to dispose of surplus of stocks
and our subsidiaries were once again able, in the Iberian Peninsula, to increase our market share in this sector
noticeably.
In crop nutrition, the increase in sales was good, especially outside of the Iberian Peninsula where our various
subsidiaries and sales offices made good progress.
In industrial chemical products, the year was “flat”, consumption remains low pending a stronger recovery of industrial
activity in Portugal. Different projects and options are under study in order to try to redimension this sector of activity,
whose critical mass is still too low.
In the environmental sector, treatment and re-use of industrial wastes, the year confirmed the flourishing nature of
this activity in Portugal; several development projects are being analysed.
In agro commodities distribution our activity, in this context of rising prices, was steady and profitable throughout
the year, enabling this activity and its port subsidiaries to experience a record year in terms of results. This sector of
activity contributed the most to the improvement of the Group’s operating income in 2007. The activity of our port
terminals in Spain also developed very positively.
In logistics, the activity of our port terminal in Setubal was very steady, making it possible to exceed the one million
tonnes of unloaded products. The level of productivity increased significantly, allowing a noticeable progress in the
operating income. For the multi-modal platforms, in spite of a year still in deficit, the performance showed a net
improvement further to the reorganisation plan established in 2006. As forecast, 2008 should be a positive year for
this activity.
In the renewable energies sector, 2007 was the year for defining the strategic models for our subsidiary Naturener.
This company is becoming a significant player in the sector both in Spain and in North America, with wind farms
and photovoltaic projects in the pipeline, to be built over 2008-2011, which represents around 20 times its current
installed capacity in hydroelectricity.
Given the very significant impact for our group of this investment not linked to our traditional activities, we are
presenting to you for the first time a pro forma balance sheet and profit and loss account of the group separating
traditional activities and energy.
18SAPEC ANNUAL REPORT 2007
Crop protection
In the Iberian Peninsula the market for crop protection products at distribution level expe-
rienced an increase of ± 5% on 2006.
The distribution benefited from the favourable climate to dispose of surplus of stocks ac-
cumulated since 2005. Consumption at agricultural level was sustained and it is estimated
that the average level of stocks at distribution level at the end of 2007 was reduced by
nearly 15% in comparison with the end of 2006.
In spite of the favourable agricultural context and contrary to what is happening with the majority of the other agricultural
inputs, the selling prices of crop protection have remained under pressure, negatively affecting the margins, principally in
Spain. The fact that significant quantities of products, which were going to lose their permit for sale in the course of 2007
(further to the entry into effect of the European review) were put on this market at discounted prices, and the struggle of the
multinationals against the constant increase of market share of generic products, explain this atypical trend. We think that
these factors are cyclical and that starting in 2008 a recovery of the margins should be possible.
In Portugal, SAPEC Agro achieved a turnover of 25,305 k€ in 2007 compared with 23,742 k€ in 2006, thus consolidating
its market share.
Further to measures taken, the amount of outstanding customer liabilities experienced a favourable development during the
course of the final quarter of the year and makes it possible to forecast a noticeable improvement for 2008 in the average
time of payments, which remained too long throughout the year 2007.
SELECTIS achieved a level of sales of 6,964 k€ in 2007 compared with 6,244 k€ in 2006, thus slightly increasing its
market share.
The SAPEC Group, through its two subsidiaries, remains the largest player in Portugal on the crop protection market, achie-
ving 32,269 k€ of sales, which is a 32% market share.
In Spain our two subsidiaries SAPEC Agro (E) and TRADECORP saw their sales increasing by 13% and 14%, respectively,
in comparison with 2006.
Our turnover reached 34,667 k€ in 2007 compared with 30,669 k€ in 2006, enabling the SAPEC Group to see its market
share to grow again in 2007.
The pressure on the prices and the margins was strongest in Spain, leading to an erosion in the average gross margin of 1.6%.
Overall on the Iberian Peninsula, the market having increased by 5%, our sales went from 60,647 k€ in 2006 to 66,620 k€
in 2007, that is, an increase of 10%, thus enabling the Group to strengthen its position and become the third largest player
in this sector.
In spite of the growth in sales and the slight improvement of the EBIT, the operating result (before taxes) of the sector did
not increase in comparison with 2006 (2,167 k€ in 2006 compared with 2,249 k€ in 2007). The financial costs went from
2,263 k€ in 2006 to 2,703 k€ in 2007; the average outstanding customers liabilities still too high, and the increase in the
cost of money are the explanations for this.
The operational cash flow (before taxes) went from 4,173 k€ in 2006 to 4,354 k€ in 2007.
Within the framework of the European approval system, which makes it compulsory to license and register every active ingre-
dient used in agriculture, a programme of investment over three years was approved in order to allow this sector to register on
its behalf, at European level, the principal active ingredients that make up its product portfolio.
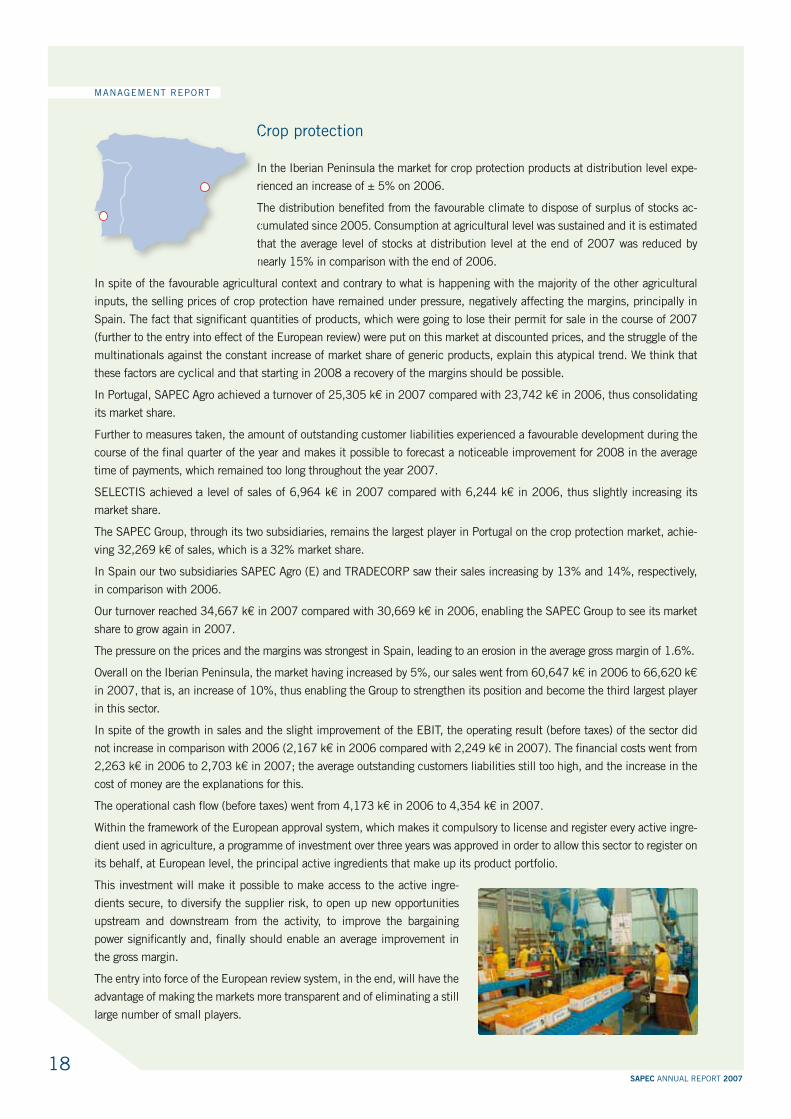
This investment will make it possible to make access to the active ingre-
dients secure, to diversify the supplier risk, to open up new opportunities
upstream and downstream from the activity, to improve the bargaining
power significantly and, finally should enable an average improvement in
the gross margin.
The entry into force of the European review system, in the end, will have the
advantage of making the markets more transparent and of eliminating a still
large number of small players.
C
I
r
T
c
t
n
MANAGEMENT REPORT
19SAPEC ANNUAL REPORT 2007
Crop nutrition
In the Iberian Peninsula we estimate that
in terms of volume the market must have
grown ± 5%. The markets for citrus fruits and
horticultural products have suffered from imports
coming from the Middle East and the Maghreb.
However, vineyards, olive trees, fruit growing and
everything connected with grains is flourishing.
On the Iberian market we sell these products through three
commercial networks: SAPEC Agro in Portugal, Tradecorp and
SAPEC Agro (SP) in Spain. Our network outperformed the market, as
our sales increased 11% in comparison with 2006, that is 9,105 k€
compared with 8,219 k€ in 2006, the introduction of new products
and the focus on sales at TRADECORP are the principal explanations
for this.
The average gross margin remained stable in comparison with 2006,
but remains noticeably below the average gross margin achieved internationally. The Spanish market, the number one
world market, is very competitive. In spite of all this, we feel, in view of the favourable context and depending on a
dynamic strategy of differentiation, that there is potential for improvement.
Internationally, the growth of sales in comparison with 2006 was 30% and the average gross margin, in spite of the
weakness of the dollar, increased by more than two points.
launch of new products in the North.
and the average gross margin experienced significant progress, improving by nearly five points in comparison with
2006.
improvement in the average gross margin, and the setting up of the sales structure is continuing and will make it
possible to ensure a better growth rate in the coming years.
terms of quantity (more than 100%) and quality (margins, guarantees and payment terms), a new sales team
is already operational and the potential of this market is being confirmed. A loss of 488 k€ was entered in the
accounts as the balance of the reorganisation carried out in 2007.
had growth of 29%.
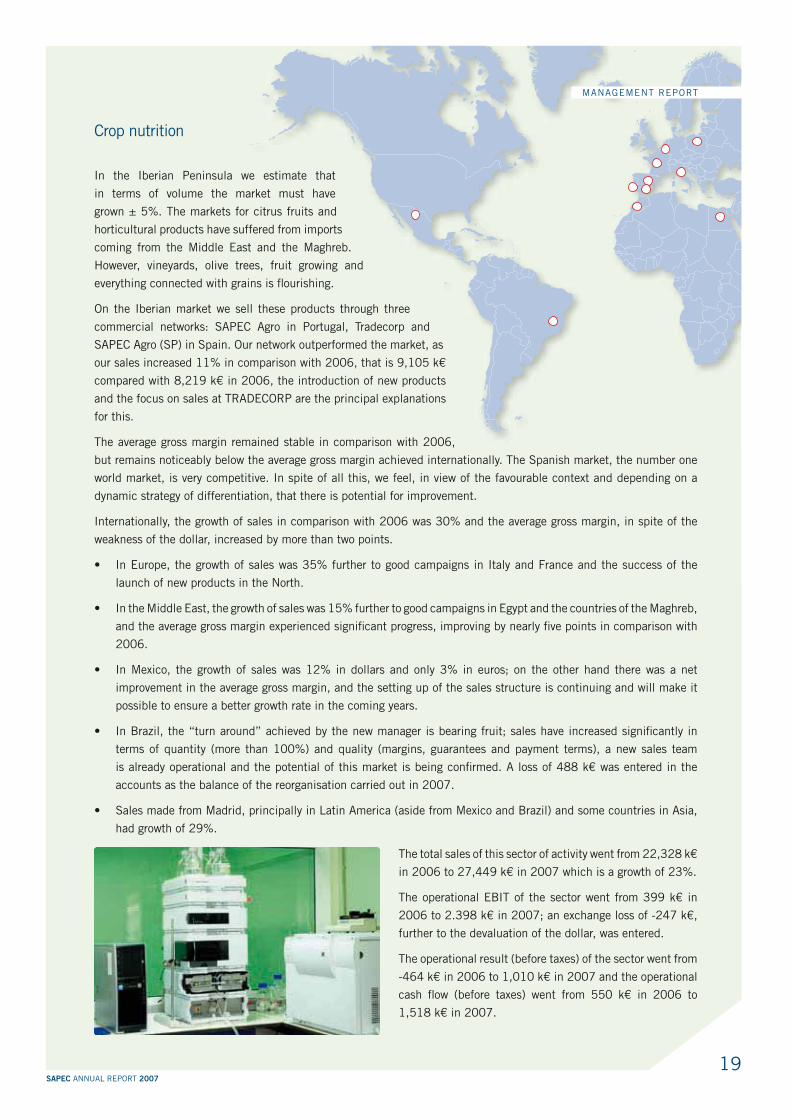
The total sales of this sector of activity went from 22,328 k€
in 2006 to 27,449 k€ in 2007 which is a growth of 23%.
The operational EBIT of the sector went from 399 k€ in
2006 to 2.398 k€ in 2007; an exchange loss of -247 k€,
further to the devaluation of the dollar, was entered.
The operational result (before taxes) of the sector went from
-464 k€ in 2006 to 1,010 k€ in 2007 and the operational
cash flow (before taxes) went from 550 k€ in 2006 to
1,518 k€ in 2007.
MANAGEMENT REPORT
20SAPEC ANNUAL REPORT 2007
Industrial chemicals and environment
In industrial chemical products in Portugal, the market remains weak. There was a timid
recovery in consumption, but the constant increase in the prices of raw materials could not
be completely passed on to the market in 2007, which caused an erosion of the average
gross margin. In the polymers sector, dominated by a network of small family businesses,
prudence must be exercised in the analysis of the solvency of potential customers.
An exceptional strengthening of 1,161 k€ of provision for customers of doubtful liabilities was implemented to cover
a set of small customers, and principally, the court-ordered bankruptcy of a major customer, whose total debt amounts
to 1,250 k€.
This activity therefore experienced sales that are slightly higher in terms of volume and in value than those of 2006
(+4%), i.e. 87,816 tonnes in 2007 compared with 84,440 tonnes in 2006 and 31,125 k€ in 2007 compared with
30,046 k€ in 2006.
The average gross margin experience a slight erosion of 0.6% in comparison with 2006.
New products were launched and others are under study in the area of elastomers and conventional products.
Two players and traditional competitors have been put up for sale by their shareholders and we have analysed the two
dossiers.
With the shareholders of one of the two companies we have reached an agreement on the buyout of a major part of the
company’s business.
This business is complementary to ours and represents a turnover of more than 14,000 k€ an a potential EBITDA of
more than 900 k€ per year.
The acquisition will therefore enable us to significantly increase our market share in this sector, enlarge the customer
portfolio and enter into new industrial markets. The due diligence is under way.
The environment (CITRI activity) again experienced a good year. The tonnes of non-toxic industrial wastes received for
disposal were on the increase, i.e. 125,798 tonnes in 2007 compared with 105,720 tonnes in 2006. Prices stayed at
a good level throughout the year with the result that the turnover for this activity increased from 4,503 k€ in 2006 to
5,475 k€ in 2007.
The production on an industrial scale of a secondary fuel from the residue received started up, and nearly 5,000 tonnes
of this type of fuel have already been sold.
The operational and structural costs are in line with the objec-
tives.
The EBITDA in 2007 is placed at 2,815 k€ compared with
2,196 k€ in 2006 and the EBIT at 1,807 k€ at 2007 com-
pared with 1,028 k€ in 2006.
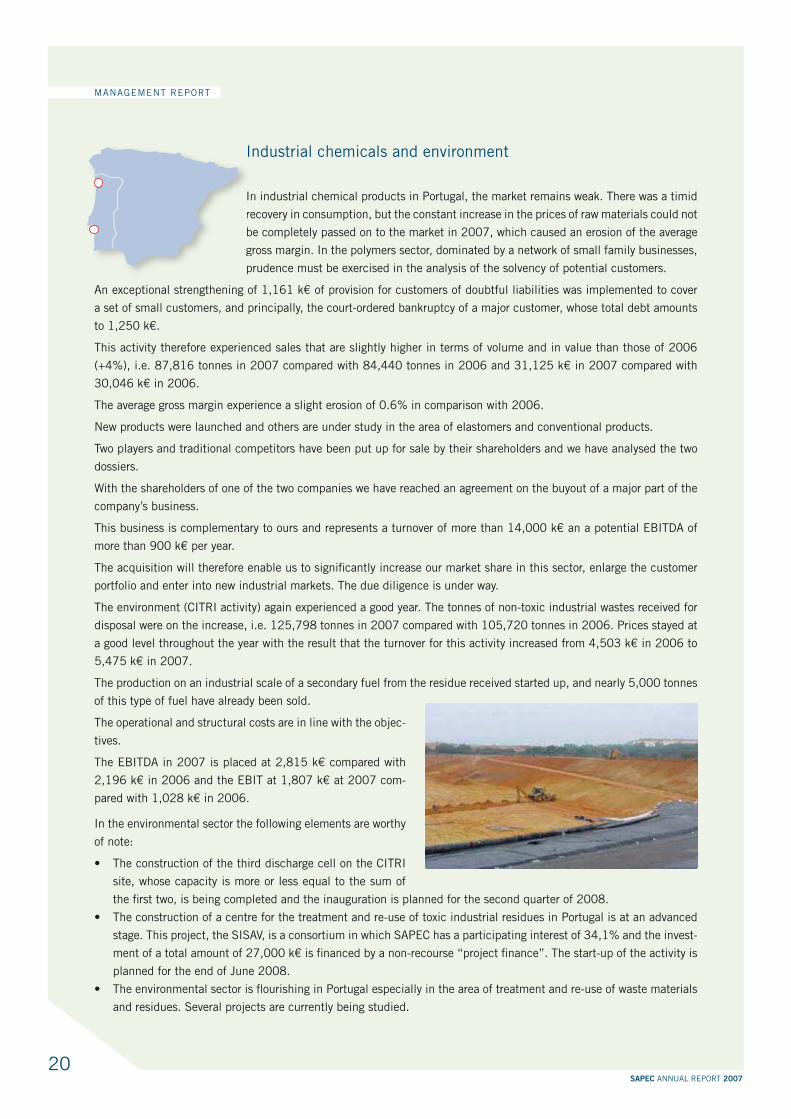
In the environmental sector the following elements are worthy
of note:
site, whose capacity is more or less equal to the sum of
the first two, is being completed and the inauguration is planned for the second quarter of 2008.
stage. This project, the SISAV, is a consortium in which SAPEC has a participating interest of 34,1% and the invest-
ment of a total amount of 27,000 k€ is financed by a non-recourse “project finance”. The start-up of the activity is
planned for the end of June 2008.
and residues. Several projects are currently being studied.
In
In
re
be
gr
p
MANAGEMENT REPORT

21SAPEC ANNUAL REPORT 2007
For the sector as a whole, the operating income (before tax) and after establishment of the exceptional provision went
from 1,868 k€ in 2006 to 1,180 k€ in 2007 and the operational cash flow (before) went from 3,842 k€ in 2006 to
2,887 k€ in 2007.
Agro commodities distribution
Interpec Ibérica in Spain broadly anticipated, then followed the rise in the prices of
agricultural raw materials, having thus cleared record pre-tax profits of 10.7 M€. Good
decisions taken at the right time in respect of both products and shipping allowed us to
achieve this figure.
The volumes handled were slightly lower than those for 2006, at significantly higher prices.
We were voluntarily selective during the second half of the year since the risks of “non-fulfilment” are higher in a market
that is so volatile. Since the beginning of 2008, we have noticed a drop in consumption; many meat producers have
not succeeded in earning money against the backdrop of rising prices for animal feed and prefer to send their livestock
to slaughter.
Although certain products (and freight in general) have experienced a downward correction from 20 to 30% since the
beginning of the year, the quotations remain high. We are anticipating the continuation of this situation in the medium
term, as long as the worldwide strategic stocks of agro commodities have not been reconstituted.
Our port subsidiaries Seporta and Seporsur performed very well. Aside from food processing products, Seporsur un-
loaded more than 1 million tonnes of clinker, tripling the volume unloaded in 2006.
Seporta also increased its activity and its income in comparison with 2006.
In Cadiz (Seporsur) we are in the process of building an instal-
lation for the storage of vegetable oils intended for the biodiesel
market. It should be operational in the month of April 2008 and
will make it possible to further diversify our range of products and
customers.
Our commercial subsidiary in Portugal, Seteia, also performed well
and succeeded in increasing its market share and its income.
We are analysing a project for a bioethanol production plant from
maize, in association with a local partners, to be installed on our
land in Setúbal. No definitive decision, , will be taken as long as
the Portuguese legislative framework is not final and positive for this
project, for which the investment could be on the order of 80 M€.
Logistics
The Group’s logistics sector today consists of a land sector (multi-usage and multi-
modal platforms) and a port sector (bulk terminal at Setúbal and 50% of Navipor,
port subsidiary specialising in Roll-on/Roll-off at Setúbal as well).
In the land sector in an economic context that is still troubled in Portugal, sales
increased by 12% in comparison with 2006 thanks to the reshaping of the sales
teams. The container segment was relatively weak, compensated by the groupage and logistics activity. It was still
not possible to reach the “breakeven-point” in 2007.
The sale, in the form of a “sale-partial rent-back” of the Lisbon terminal (Póvoa), allowed SPC to record a very signi-
ficant capital gain and noticeably reduce its debt and its net investment. The R.O.I. for this activity should improve
MANAGEMENT REPORT
22SAPEC ANNUAL REPORT 2007
noticeably in 2008. On the other hand, the opening of the new terminal in concession with the Portuguese railways
in Lisbon will make it possible to stimulate the railway activity between Lisbon and Valongo (Porto) benefiting the
two terminals. Economic activity in Portugal remained weak in 2007, but certain recent signs lead us to hope for a
better 2008.
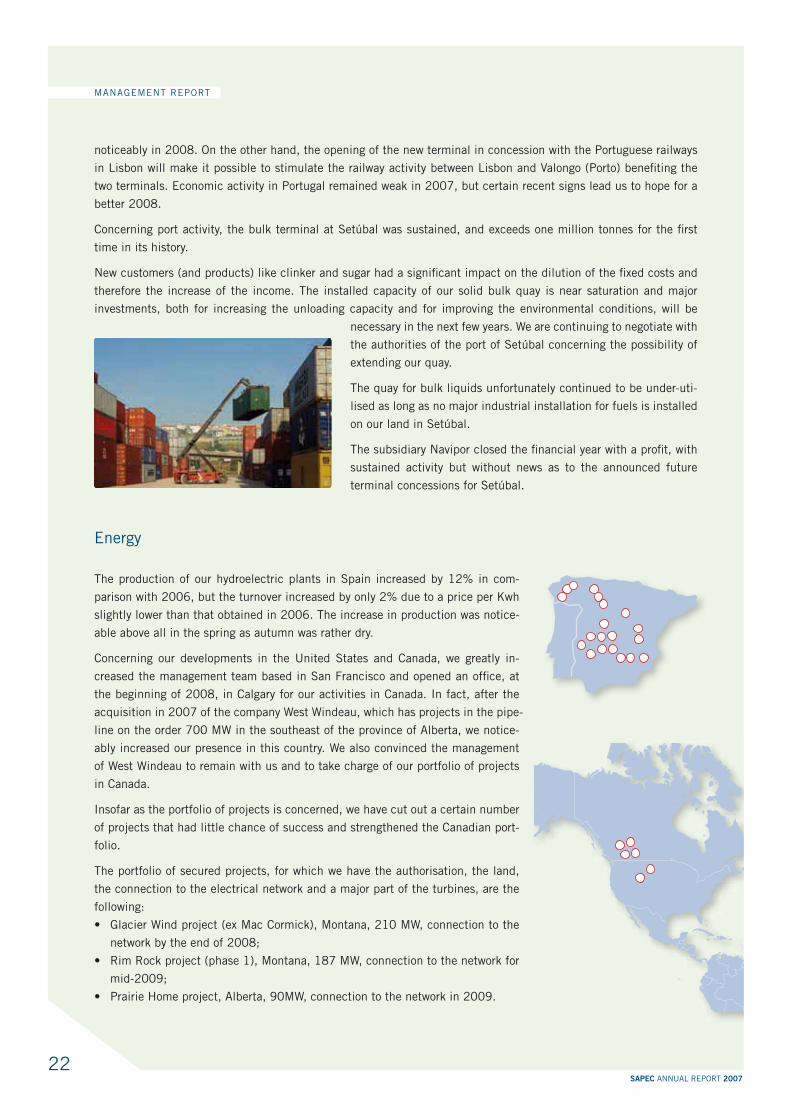
Concerning port activity, the bulk terminal at Setúbal was sustained, and exceeds one million tonnes for the first
time in its history.
New customers (and products) like clinker and sugar had a significant impact on the dilution of the fixed costs and
therefore the increase of the income. The installed capacity of our solid bulk quay is near saturation and major
investments, both for increasing the unloading capacity and for improving the environmental conditions, will be
necessary in the next few years. We are continuing to negotiate with
the authorities of the port of Setúbal concerning the possibility of
extending our quay.
The quay for bulk liquids unfortunately continued to be under-uti-
lised as long as no major industrial installation for fuels is installed
on our land in Setúbal.
The subsidiary Navipor closed the financial year with a profit, with
sustained activity but without news as to the announced future
terminal concessions for Setúbal.
Energy
The production of our hydroelectric plants in Spain increased by 12% in com-
parison with 2006, but the turnover increased by only 2% due to a price per Kwh
slightly lower than that obtained in 2006. The increase in production was notice-
able above all in the spring as autumn was rather dry.
Concerning our developments in the United States and Canada, we greatly in-
creased the management team based in San Francisco and opened an office, at
the beginning of 2008, in Calgary for our activities in Canada. In fact, after the
acquisition in 2007 of the company West Windeau, which has projects in the pipe-
line on the order 700 MW in the southeast of the province of Alberta, we notice-
ably increased our presence in this country. We also convinced the management
of West Windeau to remain with us and to take charge of our portfolio of projects
in Canada.
Insofar as the portfolio of projects is concerned, we have cut out a certain number
of projects that had little chance of success and strengthened the Canadian port-
folio.
The portfolio of secured projects, for which we have the authorisation, the land,
the connection to the electrical network and a major part of the turbines, are the
following:
network by the end of 2008;
mid-2009;
MANAGEMENT REPORT
23SAPEC ANNUAL REPORT 2007
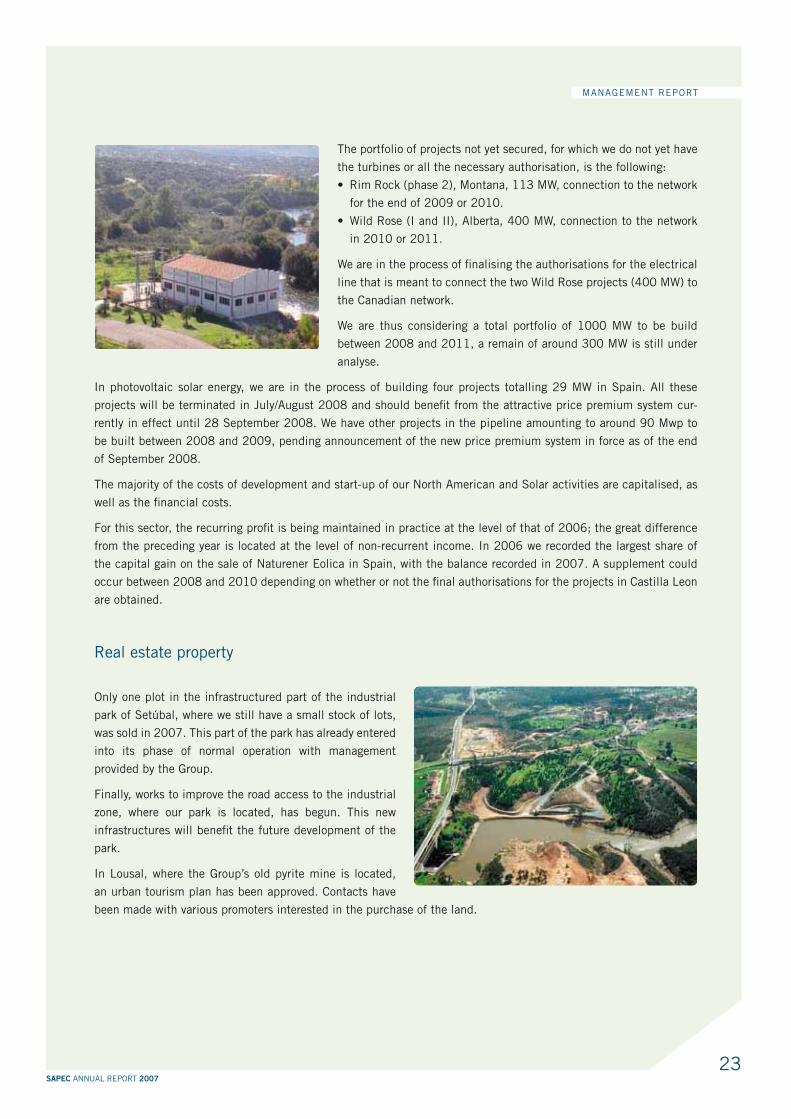
The portfolio of projects not yet secured, for which we do not yet have
the turbines or all the necessary authorisation, is the following:
for the end of 2009 or 2010.
in 2010 or 2011.
We are in the process of finalising the authorisations for the electrical
line that is meant to connect the two Wild Rose projects (400 MW) to
the Canadian network.
We are thus considering a total portfolio of 1000 MW to be build
between 2008 and 2011, a remain of around 300 MW is still under
analyse.
In photovoltaic solar energy, we are in the process of building four projects totalling 29 MW in Spain. All these
projects will be terminated in July/August 2008 and should benefit from the attractive price premium system cur-
rently in effect until 28 September 2008. We have other projects in the pipeline amounting to around 90 Mwp to
be built between 2008 and 2009, pending announcement of the new price premium system in force as of the end
of September 2008.
The majority of the costs of development and start-up of our North American and Solar activities are capitalised, as
well as the financial costs.
For this sector, the recurring profit is being maintained in practice at the level of that of 2006; the great difference
from the preceding year is located at the level of non-recurrent income. In 2006 we recorded the largest share of
the capital gain on the sale of Naturener Eolica in Spain, with the balance recorded in 2007. A supplement could
occur between 2008 and 2010 depending on whether or not the final authorisations for the projects in Castilla Leon
are obtained.
Real estate property
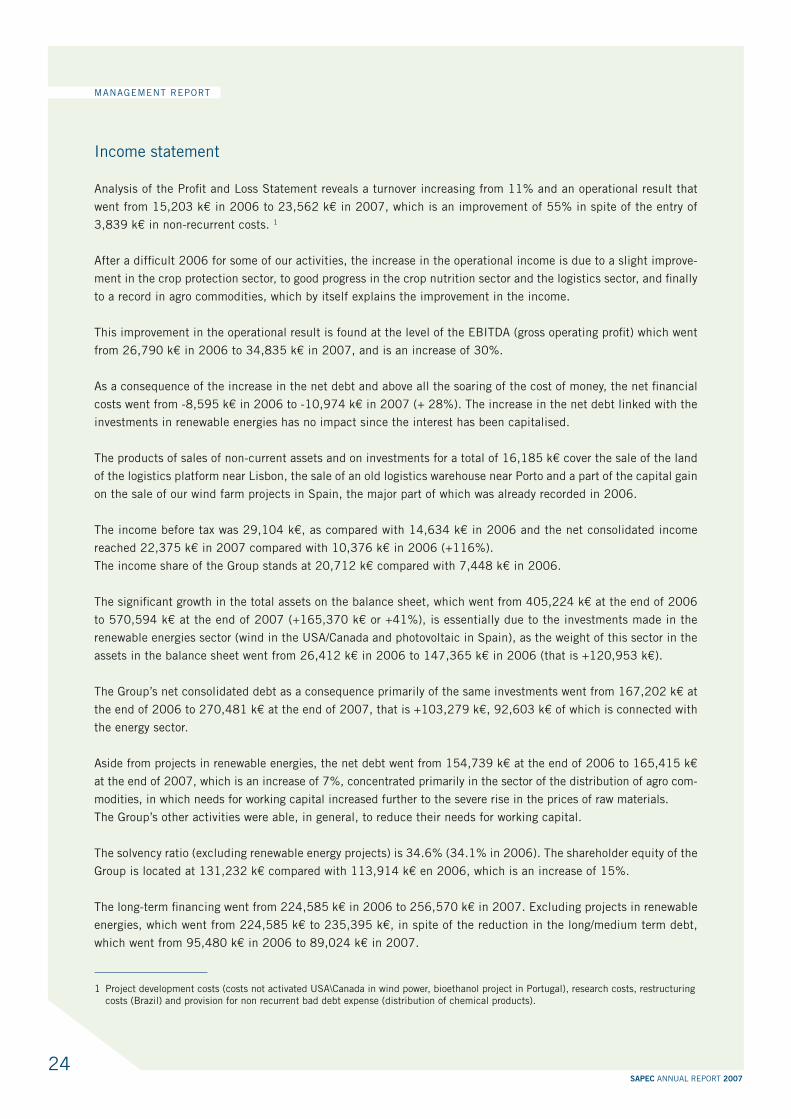
Only one plot in the infrastructured part of the industrial
park of Setúbal, where we still have a small stock of lots,
was sold in 2007. This part of the park has already entered
into its phase of normal operation with management
provided by the Group.
Finally, works to improve the road access to the industrial
zone, where our park is located, has begun. This new
infrastructures will benefit the future development of the
park.
In Lousal, where the Group’s old pyrite mine is located,
an urban tourism plan has been approved. Contacts have
been made with various promoters interested in the purchase of the land.
MANAGEMENT REPORT
24SAPEC ANNUAL REPORT 2007
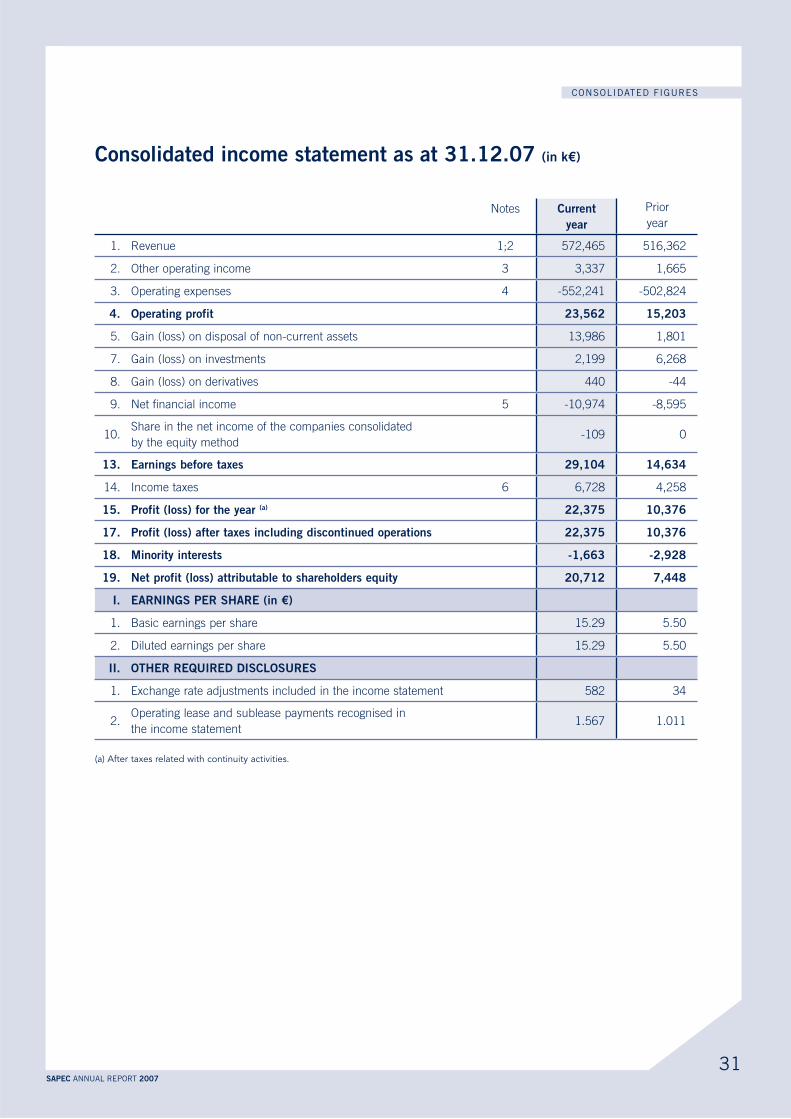
Income statement
Analysis of the Profit and Loss Statement reveals a turnover increasing from 11% and an operational result that
went from 15,203 k€ in 2006 to 23,562 k€ in 2007, which is an improvement of 55% in spite of the entry of
3,839 k€ in non-recurrent costs. 1
After a difficult 2006 for some of our activities, the increase in the operational income is due to a slight improve-
ment in the crop protection sector, to good progress in the crop nutrition sector and the logistics sector, and finally
to a record in agro commodities, which by itself explains the improvement in the income.
This improvement in the operational result is found at the level of the EBITDA (gross operating profit) which went
from 26,790 k€ in 2006 to 34,835 k€ in 2007, and is an increase of 30%.
As a consequence of the increase in the net debt and above all the soaring of the cost of money, the net financial
costs went from -8,595 k€ in 2006 to -10,974 k€ in 2007 (+ 28%). The increase in the net debt linked with the
investments in renewable energies has no impact since the interest has been capitalised.
The products of sales of non-current assets and on investments for a total of 16,185 k€ cover the sale of the land
of the logistics platform near Lisbon, the sale of an old logistics warehouse near Porto and a part of the capital gain
on the sale of our wind farm projects in Spain, the major part of which was already recorded in 2006.
The income before tax was 29,104 k€, as compared with 14,634 k€ in 2006 and the net consolidated income
reached 22,375 k€ in 2007 compared with 10,376 k€ in 2006 (+116%).
The income share of the Group stands at 20,712 k€ compared with 7,448 k€ in 2006.
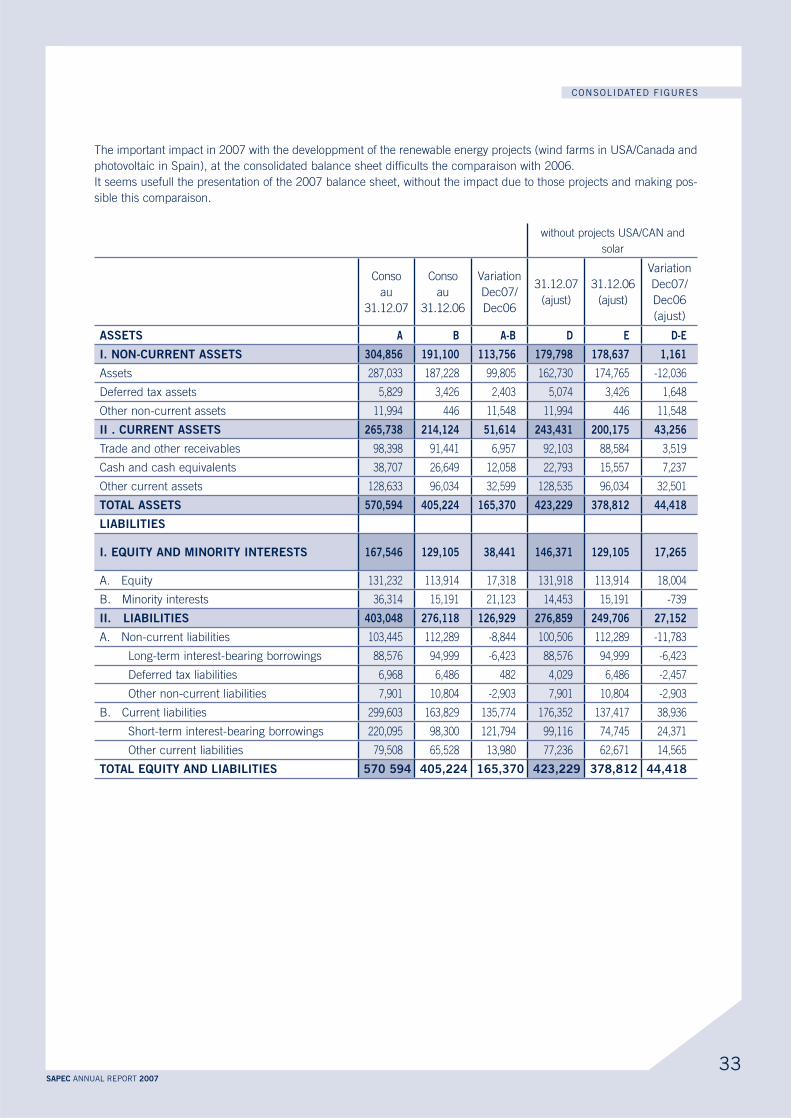
The significant growth in the total assets on the balance sheet, which went from 405,224 k€ at the end of 2006
to 570,594 k€ at the end of 2007 (+165,370 k€ or +41%), is essentially due to the investments made in the
renewable energies sector (wind in the USA/Canada and photovoltaic in Spain), as the weight of this sector in the
assets in the balance sheet went from 26,412 k€ in 2006 to 147,365 k€ in 2006 (that is +120,953 k€).
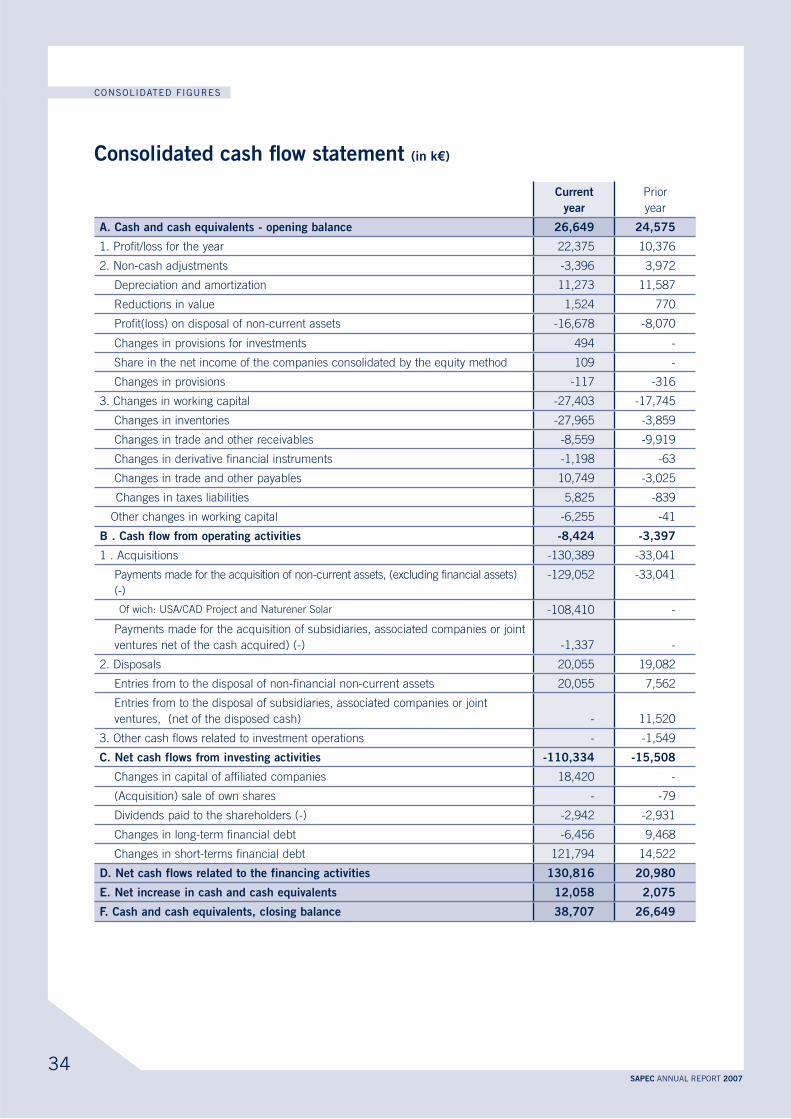
The Group’s net consolidated debt as a consequence primarily of the same investments went from 167,202 k€ at
the end of 2006 to 270,481 k€ at the end of 2007, that is +103,279 k€, 92,603 k€ of which is connected with
the energy sector.
Aside from projects in renewable energies, the net debt went from 154,739 k€ at the end of 2006 to 165,415 k€
at the end of 2007, which is an increase of 7%, concentrated primarily in the sector of the distribution of agro com-
modities, in which needs for working capital increased further to the severe rise in the prices of raw materials.
The Group’s other activities were able, in general, to reduce their needs for working capital.
The solvency ratio (excluding renewable energy projects) is 34.6% (34.1% in 2006). The shareholder equity of the
Group is located at 131,232 k€ compared with 113,914 k€ en 2006, which is an increase of 15%.
The long-term financing went from 224,585 k€ in 2006 to 256,570 k€ in 2007. Excluding projects in renewable
energies, which went from 224,585 k€ to 235,395 k€, in spite of the reduction in the long/medium term debt,
which went from 95,480 k€ in 2006 to 89,024 k€ in 2007.
MANAGEMENT REPORT
1 Project development costs (costs not activated USA\Canada in wind power, bioethanol project in Portugal), research costs, restructuring
costs (Brazil) and provision for non recurrent bad debt expense (distribution of chemical products).
25SAPEC ANNUAL REPORT 2007
The reduction of this debt originates from the reduction in the leasing of 2,850 k€, further to the sale of the plots
of land in Póvoa in Portugal and the short-term reclassifying of the bonded debt of 10,492 k€, which will mature
in September 2008. The negotiations for its replacement are already under way.
In compliance with legal obligations, the Group advises that it is maintaining a contract for share liquidity with a
banking institution charged with its discretionary management. On the date of 31/12/07, the Group held 881 own
shares, acquired in respect of the decision of the General Assembly of 19/06/2007.
Developments in the first quarter of 2008
The agricultural and food processing sectors are experiencing a favourable cycle which should benefit our activities con-
nected with these sectors. In crop protection, growth in the market share is still possible in Spain and continuing the
improvement in the working capital remains the principal objective in Portugal. In crop nutrition, international growth will
be able to continue as the result of investments in commercial structures and developments of new products completed.
In agro commodities distribution, the year 2007 was completely exceptional, because all the factors were positive. The
first quarter is giving positive indications; however, the year 2008 should be normal for this sector.
In the logistics sector, business remains sustained at the beginning of 2008, which is the result of the new commercial
dynamics established by this subsidiary.
As regards the industrial chemical products and environment sector, the acquisition of the business of the competing
company should be concretized soon and will have a positive impact already in 2008. The SISAV project (environment)
will be able to start up in June 2008.
In wind energy, the construction of the Glacier Wind project, Montana, is in the start-up stage.
In photovoltaic energy in Spain, the construction of the first four projects totalling 29 MW is under way.
In order to finance these projects, the shareholders of Naturener contributed 180 M€ in the form of an increase of capital
in October 2007 and March 2008. Sapec S.A. obtained a medium-term bank loan in March 2008 to finance the Group’s
part of capital increase, for an amount of around 80 M€.
In this sector and as a shareholder of Naturener, Sapec is studying the various options for its strategy. These could lead to
the entrance of new partners, the disposal of our stakes or the sale of one or other branch of this sector.
The first quarter is developing in line with our prospects, however it is too early to make concrete.
MANAGEMENT REPORT
26SAPEC ANNUAL REPORT 2007
MANAGEMENT REPORT
Distribution of profits
The net profit of the company Sapec S.A. amounts to 3,550.5 k€.
The balance for distribution amounts to 23,552.9 k€.
The Board of Directors proposes the balance to be distributed as follow:
Dividends 3,697.4 k€
Directors emoluments 108.9 k€
Carried forward 19,746.6 k€
We will also propose to the meeting, by separate vote, to give a discharge to the Board Members for their management
and to the Auditor for his inspection assignment.
Appointments
We call your atttention that the mandates of Mr Eduardo Catroga, Mr Antoine Velge and Mr Philippe de Broqueville
will expire at the date of the general meeting of June 17, 2008.
These Board Members can be re-elected, and we propose that you renew their mandates for a duration of three years,
that is until the general meeting of 2011.
27SAPEC ANNUAL REPORT 2007
Annexe to the management report
Financial risk management
The management of financial risks is an integral part of the Group’s management.
The Board of Directors defines the financial policy and the Management Committee establishes the respective
objectives.
Within the scope of its operational activities, the Group is exposed to the risks of the market (exchange rates, raw
materials and interest rates), of credit and of payments. In keeping with the policies and objectives established, the
Group undertakes operations with financial derivative instruments exclusively within the framework of operational
transactions of assets, liabilities or of anticipated operations.
The market risks arise essentially from the exposure to monetary fluctuations, in particular vis-à-vis the American
dollar, the Brazilian réal and the Mexican peso, from the interest rates and from the prices of raw materials.
For certain raw materials connected with the business activity, the Group also uses instruments for covering
fluctuations of the various quotations.
Insofar as the risk of the raw materials is concerned, principally in the business activity, it arises basically from
movements on the world market connected with purchasing programmes of soy and cereal grains. The risk is
attenuated through appropriate actions on the various quotation markets. The covering of this risk is managed by the
concerned companies of the Group, through the adoption of appropriate covering instruments.
The interest rate risk arises from the cash flows connected with loans at variable interest. This type of risk is
controlled as much as possible through the use of derivative instruments, basically of the “options”, “FRA’s” and
“swaps” type.
The credit risk arises from the failure by third parties to meet their contractual undertakings arising from bailments
of availability, from the purchase of financial derivative instruments or from the portfolio of commercial loans.
The credit risk connected with the management of the availabilities or of the financial derivative instruments is
minimised by the choice of entities with a high financial rating.
The credit risk connected with commercial transactions is controlled by setting up systems for analysing the financial
capacities of the customers to which credit ceilings are assigned, and by subscribing to credit-insurance policies with
institutions with a high financial rating, any time it is possible or feasible.
The risk of a lack of liquidity, associated with the difficulties some companies in the Group have in satisfying their
financial obligations, is resolved by a Central Accounts Department which gives a guarantee to make the entries of
cash and the maturity dates of loans and other financial obligations coincide, and for the systematic and sustainable
maintenance of a certain volume of rapidly mobilisable liquid assets.
The management of the financing debts is done by the Central Accounts Department, in such a way that it does not
experience any difficulty in refinancing its operations.
MANAGEMENT REPORT
28SAPEC ANNUAL REPORT 2007
Environmental risks
The production and stocking sites of the Group, as well as the transport of the products, especially for the chemical
products, for the treatment of industrial residues and for the port activities, are exposed to the risks of environmental
contamination.
The Group systematically seeks to have the best technical solutions available for the installations/equipment, that is
for the handling, the storing and transport of the products.
Cumulatively, insurance policies are systematically taken out each time that this proves necessary and possible
(certain cases are not covered by the insurers or reinsurers), whether the contamination is accidental or progressive
(case of CITRI).
MANAGEMENT REPORT
29SAPEC ANNUAL REPORT 2007
CONSOLIDATED FIGURES
Consolidated figures

30SAPEC ANNUAL REPORT 2007
CONSOLIDATED FIGURES
31SAPEC ANNUAL REPORT 2007
CONSOLIDATED FIGURES
(in k€)
Notes Current Prior
year
1. Revenue 1;2 572,465 516,362
2. Other operating income 3 3,337 1,665
3. Operating expenses 4 -552,241 -502,824
5. Gain (loss) on disposal of non-current assets 13,986 1,801
7. Gain (loss) on investments 2,199 6,268
8. Gain (loss) on derivatives 440 -44
9. Net financial income 5 -10,974 -8,595
10.Share in the net income of the companies consolidated
by the equity method -109 0
14. Income taxes 6 6,728 4,258
(a)
1. Basic earnings per share 15.29 5.50
2. Diluted earnings per share 15.29 5.50
1. Exchange rate adjustments included in the income statement 582 34
2.Operating lease and sublease payments recognised in
the income statement1.567 1.011
(a) After taxes related with continuity activities.

32SAPEC ANNUAL REPORT 2007
CONSOLIDATED FIGURES
(in k€)
ASSETS Notes Current Prior
year
1. Tangible assets 7 235,931 149,691
2. Investment property 8 1,344 1,345
3. Intangible assets 9 49,014 36,193
4. Financial assets 10 744 0
5. Deferred tax asset 11 5,829 3,426
6. Other non-current financial assets 12 424 371
7. Derivative financial instruments 0 75
9. Other non-current assets 13 11,570 0
11. Inventories 14 122,122 90,230
12. Other current financial assets 1,028 2,610
13. Derivative financial instruments 15 216 766
14. Tax receivables 400 485
15. Trade and other receivables 16 98,398 91,441
17. Cash and cash equivalents 17;20 38,707 26,649
18. Other current assets 4,867 1,943
Notes Current Prior
year
A. EQUITY 131,232 113,914
1. Capital 18 43,727 43,727
Issued capital 7,127 7,127
Share premiums 36,600 36,600
2. Consolidated reserves 87,595 70,266
3. Own shares 19 -90 -79
B. Minority interests 36,314 15,191
5. Long-term interest-bearing borrowings 20 88,576 94,999
6. Long-term non-interest-bearing borrowings 447 481
7. Deferred income 21 1,647 1,905
8. Long-term provisions 22 3,552 4,212
10. Deferred tax liabilities 11 6,968 6,486
11. Non-current trade and other payables 0 2,017
12. Other non-current liabilities 2,254 2,188
C
13. Short-term interest-bearing borrowings 20 220,095 98,300
14. Short-term non-interest-bearing borrowings 70 70
15. Deferred income 21 531 590
17. Derivative financial instruments 15 236 2,059
18. Income tax payable 9,294 4,198
19. Trade and other payables 23 59,825 48,752
20. Other current liabilities 9,552 9,860
33SAPEC ANNUAL REPORT 2007
CONSOLIDATED FIGURES
The important impact in 2007 with the developpment of the renewable energy projects (wind farms in USA/Canada and
photovoltaic in Spain), at the consolidated balance sheet difficults the comparaison with 2006.
It seems usefull the presentation of the 2007 balance sheet, without the impact due to those projects and making pos-
sible this comparaison.
without projects USA/CAN and
solar
Conso
au
31.12.07
Conso
au
31.12.06
Variation
Dec07/
Dec06
31.12.07
(ajust)
31.12.06
(ajust)
Variation
Dec07/
Dec06
(ajust)
ASSETS A E
Assets 287,033 187,228 99,805 162,730 174,765 -12,036
Deferred tax assets 5,829 3,426 2,403 5,074 3,426 1,648
Other non-current assets 11,994 446 11,548 11,994 446 11,548
Trade and other receivables 98,398 91,441 6,957 92,103 88,584 3,519
Cash and cash equivalents 38,707 26,649 12,058 22,793 15,557 7,237
Other current assets 128,633 96,034 32,599 128,535 96,034 32,501
A. Equity 131,232 113,914 17,318 131,918 113,914 18,004
B. Minority interests 36,314 15,191 21,123 14,453 15,191 -739
A. Non-current liabilities 103,445 112,289 -8,844 100,506 112,289 -11,783
Long-term interest-bearing borrowings 88,576 94,999 -6,423 88,576 94,999 -6,423
Deferred tax liabilities 6,968 6,486 482 4,029 6,486 -2,457
Other non-current liabilities 7,901 10,804 -2,903 7,901 10,804 -2,903
B. Current liabilities 299,603 163,829 135,774 176,352 137,417 38,936
Short-term interest-bearing borrowings 220,095 98,300 121,794 99,116 74,745 24,371
Other current liabilities 79,508 65,528 13,980 77,236 62,671 14,565
34SAPEC ANNUAL REPORT 2007
CONSOLIDATED FIGURES
(in k€)
Current Prior
year
1. Profit/loss for the year 22,375 10,376
2. Non-cash adjustments -3,396 3,972
Depreciation and amortization 11,273 11,587
Reductions in value 1,524 770
Profit(loss) on disposal of non-current assets -16,678 -8,070
Changes in provisions for investments 494 -
Share in the net income of the companies consolidated by the equity method 109 -
Changes in provisions -117 -316
3. Changes in working capital -27,403 -17,745
Changes in inventories -27,965 -3,859
Changes in trade and other receivables -8,559 -9,919
Changes in derivative financial instruments -1,198 -63
Changes in trade and other payables 10,749 -3,025
Changes in taxes liabilities 5,825 -839
Other changes in working capital -6,255 -41
1 . Acquisitions -130,389 -33,041
Payments made for the acquisition of non-current assets, (excluding financial assets)
(-)
-129,052 -33,041
Of wich: USA/CAD Project and Naturener Solar -108,410 -
Payments made for the acquisition of subsidiaries, associated companies or joint
ventures net of the cash acquired) (-) -1,337 -
2. Disposals 20,055 19,082
Entries from to the disposal of non-financial non-current assets 20,055 7,562
Entries from to the disposal of subsidiaries, associated companies or joint
ventures, (net of the disposed cash) - 11,520
3. Other cash flows related to investment operations - -1,549
Changes in capital of affiliated companies 18,420 -
(Acquisition) sale of own shares - -79
Dividends paid to the shareholders (-) -2,942 -2,931
Changes in long-term financial debt -6,456 9,468
Changes in short-terms financial debt 121,794 14,522
35SAPEC ANNUAL REPORT 2007
CONSOLIDATED FIGURES
Capi
tal
0 0 0
Net profit for the period 7,448 7,448 2,928 10,376
Dividends -2,936 -2,936 -902 -3,838
Operations with own shares 4 -79 -75 -75
Other 1 1 -4,373 -4,372
0 0 -79
Net profit for the period 20,712 20,712 1,663 22,375
Dividends -2,942 -2,942 -2,942
Operations with own shares 11 -11 - -
Profit/loss on the conversion of foreign currencies - - -261 - - - -261 -165 -425
of which: appreciations in value (depreciations in value) of
revaluation of assets-261 -261 -165 -425
Increase of capital - 18,420 18,420
Other -191 -191 1,204 1,013
0
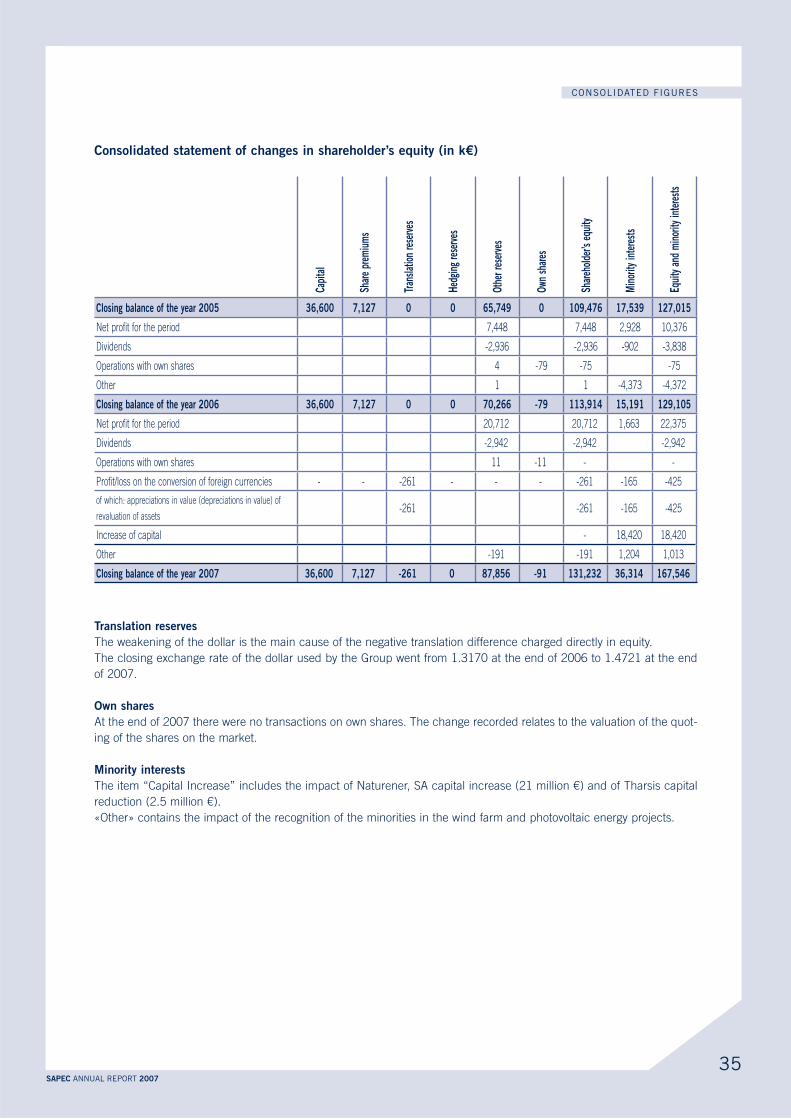
The weakening of the dollar is the main cause of the negative translation difference charged directly in equity.
The closing exchange rate of the dollar used by the Group went from 1.3170 at the end of 2006 to 1.4721 at the end
of 2007.
At the end of 2007 there were no transactions on own shares. The change recorded relates to the valuation of the quot-
ing of the shares on the market.
The item “Capital Increase” includes the impact of Naturener, SA capital increase (21 million €) and of Tharsis capital
reduction (2.5 million €).
«Other» contains the impact of the recognition of the minorities in the wind farm and photovoltaic energy projects.
36SAPEC ANNUAL REPORT 2007
CONSOLIDATED FIGURES
The main accounting policies adopted to prepare the consolidated accounts are set as follows:
The consolidated accounts have been prepared in accordance with the international accounting standards (IFRSInternational
Financial Reporting Standards) and with the interpretations published by the interpretation committee of the IASB, as they
apply on the reporting date.
Furthermore, the financial statements include all the information required by the 7th directive of the European Union.
The IFRS were adopted for the first time for the consolidated accounts of the 2005 financial year. The 2004 accounts have
been restated to allow comparison.
For the financial year, the Group adopted the rules that came into effect in 2007 (IFRS 7). The application of this new rule provoked
the publication of additional information about the financial instruments.
The Group decided no to apply any rule before the date of it coming into force.
The companies controlled by the Group (control is understood to mean the power to influence the financial and operational
policies of a company in order to obtain benefits from its activities) are consolidated according to the global integration
method.
All of the intra-group balances and transactions are eliminated.
The companies over which the Group exercises with a limited number of associates a joint control (joint control is understood
to mean the sharing via a contractual agreement of the control of an economic activity), are consolidated according to the
proportional integration method.
Holdings in companies in which the Group exercises a notable influence (notable influence is understood to mean the power
to participate in the decisions relating to the financial and operational policy of the company held, without however exercising
control over these policies) are accounted for using the equity method.
Currency operations are converted into euro at the transaction rate. At the end of the period, the monetary elements
are converted at the closing rate as well as the non monetary elements that are the subject of specific hedging. The
resulting exchange adjustments are entered in the income statement.
Non monetary assets and liabilities valued at historical cost and registered in foreign currencies are converted at
the rate of exchange in force on the date of the transaction. The resulting differences in conversion are recorded in
shareholder’s equity accounts under a specific heading (differences in conversion).
Within the framework of the consolidation, the assets and liabilities of the foreign entities are converted in to euro at
the closing rate. The results are converted into euro at the average rate of the period.
The goodwill represents the difference between the acquisition cost and the Group’s share in the fair value of the identifiable
assets and liabilities of a subsidiary, associate, or a joint venture, on the acquisition date.
The goodwill is not depreciated but is the subject of an annual depreciation test (impairment test), which is carried out
more frequently if there is some indication of impairment losses.
Any impairment losses of the goodwill are presented in the income statement and can be the subject of recoveries.
In the event of a surplus in the acquirer’s share of interests in the fair value of the assets, liabilities and contingent
liabilities acquired compared with the cost, this surplus is immediately recognised in the income statement of the
acquisition period.
37SAPEC ANNUAL REPORT 2007
CONSOLIDATED FIGURES
The intangible assets are recognised at their acquisition value, less the accumulated depreciations and any depreciations in value.
They are recognised if it is probable that future economic benefits arising from the asset will go to the company and if the cost of
this asset can be reliably measured.
The intangible fixed assets are amortised on a straight-line basis over their estimated useful lives. The estimated useful lives are as
follows:
- Licences, patents and similar rights: 15 years
- IT software: 3 years
- Concessions: the contractual duration.
The research costs are charged to the period during which they were incurred.
The development costs are activities if and only if all the conditions set out below are fulfilled:
proven) ;
The development costs activated are amortised on a straight-line basis over their useful lives.
The tangible assets are recognised in the balance sheet at their historical value less accumulated depreciations and
impairment losses.
The subsequent expenditure relating to tangible fixed assets are only entered as an asset if it can be clearly demon-
strated that this leads to an increase in the future economic benefits expected from the use of the tangible fixed asset.
Borrowing costs directly attributable to the acquisition or production of an asset are added to the cost of this asset until is ready for
use if the amount of the investment is higher than 2,5 mio€ or if the construction/production period is higher than one year.
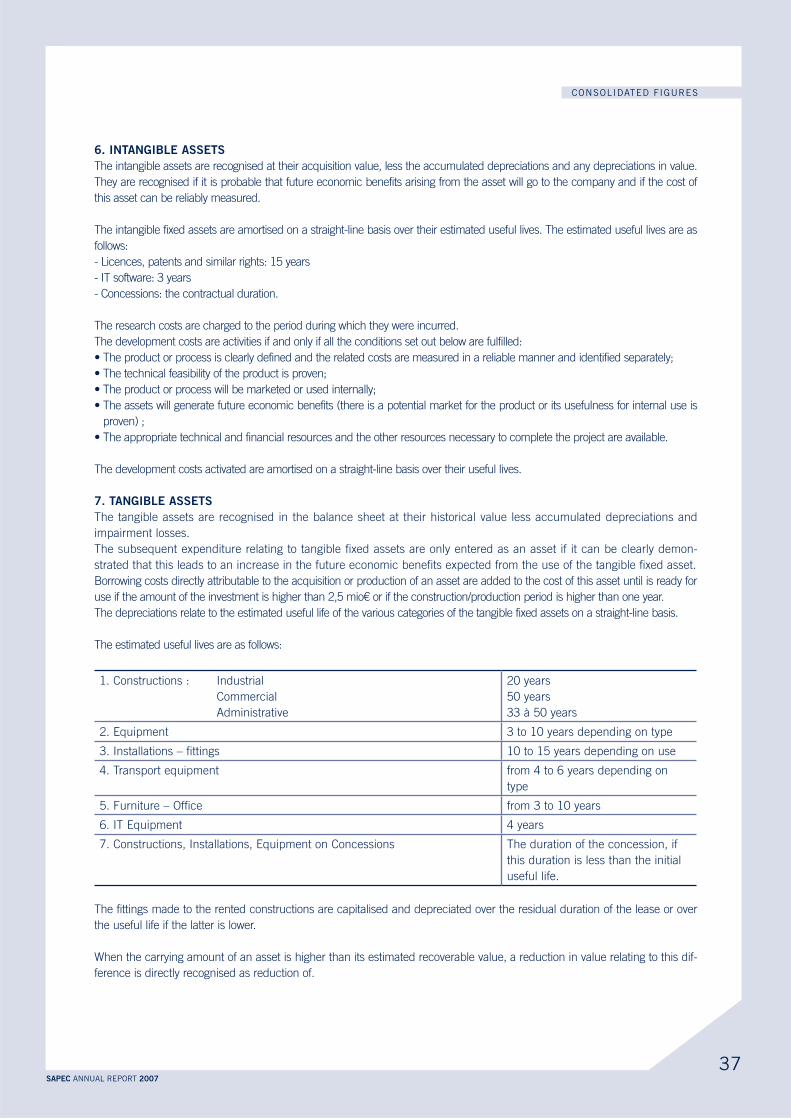
The depreciations relate to the estimated useful life of the various categories of the tangible fixed assets on a straight-line basis.
The estimated useful lives are as follows:
1. Constructions : Industrial
Commercial
Administrative
20 years
50 years
33 à 50 years
2. Equipment 3 to 10 years depending on type
3. Installations – fittings 10 to 15 years depending on use
4. Transport equipment from 4 to 6 years depending on
type
5. Furniture – Office from 3 to 10 years
6. IT Equipment 4 years
7. Constructions, Installations, Equipment on Concessions The duration of the concession, if
this duration is less than the initial
useful life.
The fittings made to the rented constructions are capitalised and depreciated over the residual duration of the lease or over
the useful life if the latter is lower.
When the carrying amount of an asset is higher than its estimated recoverable value, a reduction in value relating to this dif-
ference is directly recognised as reduction of.
38SAPEC ANNUAL REPORT 2007
CONSOLIDATED FIGURES
The assets held as finance leases (finance leases are understood to mean leases whose aim is to transfer to the lessee almost
all of the risks and benefits inherent to the ownership of an asset, with ownership being transferred or otherwise at the expiry
of the lease) are recorded in the balance sheet at their fair value or at the present value of the minimum payments linked to
the leases if lower.
The corresponding obligation is recognised in the financial liabilities. The finance costs, which represent the difference
between all of the lease obligations and the fair value of the assets, are entered into the income statement over the duration
of the lease.
Subsidies relating to the purchases of tangible fixed assets are recognised in the « deferred income » item of the balance
sheet.
The subsidy is charged as a income at the same rate as the depreciation of the fixed assets to which it relates.
The inventories are measured at the lower of cost (commodities and merchandise) or cost price (goods in progress and finished
products) and net realisable value. The value of the inventories is generally determined by applying the weighted average cost
method.
In view of the specific nature of the trading activities, the stocks in this sector are measured at their fair value on the reporting date,
less the marketing costs yet to be committed.
The costs of the stocks include the acquisition, processing and other costs incurred to transport the stocks to the place and in the
condition in which they are found. The processing costs of the stocks include the costs directly linked to the units produced, such
as direct labour. They also include the systematic affectation of the general fixed and variable productions costs that are incurred to
transform the commodities into end products. The fixed production overheads are the indirect production costs that remain relatively
constant independently of the volume of production, such as depreciation and the maintenance of the buildings and of the industrial
equipment and the management and administration costs of the factory. The variable production costs are the indirect production
costs that vary directly or almost directly according to the production volume such as indirect commodities and indirect labour.
Trade receivables are measured at their nominal value, less the non recoverable estimated amounts.
The group makes a distinction between two categories of financial assets – short-term investments: the assets held until maturity
and the assets available for sale.
The assets held until maturity are non-derived financial assets that have fixed or defined payments, a fixed maturity date and that
the company has the express intention and the means of holding until maturity date, other being than those designated as assets
available for sale and those defined as loans and accounts receivable.
The assets available for sale are non designated as available for sale not categorised in any other category of financial assets.
The assets held until their maturity are recognised initially at their fair value which is normally the transaction price.
On each closing date, these assets are recognised at their depreciated cost according to the effective interest rate method. They are,
moreover subject to the impairment test.
At their initial recognition, these assets are recognised at the fair value which is normally the transaction price.
On each closing date, these assets are recognised at their fair value unless they are equity instruments not listed on an active market
and whose fair value cannot be estimated in a reliable manner. These instruments are then measured at cost.
39SAPEC ANNUAL REPORT 2007
CONSOLIDATED FIGURES
The variations in fair value are recognised directly in equity capital and if applicable, the income from interest that includes
the actuarial depreciation of the premiums and depreciations, remain recognised in the result.
The assets available for sale are subject to impairment testing on each closing date. The eventual depreciation resulting
from it is recognised in the income statement. If these are shares that are classified among the assets available for sale,
any reduction in the fair value stated on closing dates following depreciation is recognised in the income statement. Any
subsequent appreciation of the fair value is not entered into the income statement. If these are debt instruments classified
among the assets available for sale, any subsequent appreciation of the fair value is recognised in the income statement
up to the previously recognised depreciation.
Cash and cash equivalents include cash on hand and demand deposits, the short term investments and highly liquid invest-
ments that are readily convertible to known amounts of cash, which are subject to an insignificant risk of changes in value.
They are recognised in the balance sheet at their nominal value.
The group uses derivative financial instruments mainly in order to reduce the risks linked to the unfavourable fluctuations
in interest rates, exchange rates and commodity prices. The group does not hold and does not issue derivative financial
instruments for commercial or speculative purposes.
The derivative financial instruments are measured at the fair vale. The recognition of non realised losses or profits depends
on the nature of the element covered.
When the derivative financial instrument is considered to hedge the exposure to the cash flow variations which (i) is attributable
to a specific risk linked to a recognised asset or liability (for example to all or part of the future interest payments on a variable rate
liability) or a highly probable foreseen transaction and (ii) could affect the result, the share of the profit or of the loss on the hedging
instrument that is considered to provide effective hedging must be directly recognised in equity capital, via the equity capital vari-
ation table. The ineffective share of the profit or of the loss on the hedging instrument must be recognised in the result. When the
derivative financial instrument is considered to hedge exposure to the variations in the fair value of a recognised asset or liability or a
firm non recognised commitment, or an identified share of this asset, of this liability or this firm commitment, which is attributable to
a specific risk and which can affect the result, the profit or the loss resulting from the restatement of the hedging instrument at the
fair value must be recognised in the result.
The profit or the loss on the element hedged attributable to the hedged risk must adjust the carrying amount of the
hedged element and be recognised in the result, even when the hedged element is furthermore measured at cost or is
a financial asset available for sale.
If the hedging accounting conditions are not met, the variations in the fair value of the derivative financial instruments are
recognised in the income statement.
A provision is constituted when the Group has a legal or implicit obligation, on the balance sheet date:
The commitments arising from restructuring companies are recognised if a formalised and detailed restructuring plan has
been drawn up and if such restructuring has started or has been announced to the persons concerned.
In accordance with IAS 36, on each closing date, if there is any indication that an asset has lost value and if the recover-
able value of this asset is lower than its carrying amount, an impairment loss is recognised in the charges of the income
statement unless another international standard disposes otherwise.
40SAPEC ANNUAL REPORT 2007
CONSOLIDATED FIGURES
The income taxes for the period cover the current taxes and the deferred taxes. They are charged to the income statement unless
they relate to elements recorded directly in equity capital, in which case they are recognised in the equity capital.
The current taxes refer to the taxes to be paid on the profit for the period, calculated at the rate in force and the adjustments relating
to prior years.
The deferred tax assets and liabilities must be measured at the tax rates whose application is expected over the period during which
the asset will be realised or the liability settled, on the basis of the tax rates (and the tax regulations) that have been adopted or almost
adopted on the closing date.
The deferred tax assets are only recorded when it is probable that taxable profits will be realised to which the deferred tax assets
can be imputed.
Supplementary taxes on the profit arising from the distribution of dividends are recognised at the same time as the obligation to pay
the corresponding dividend.
The business unit information is drawn up according to the business units of activity of the Group (1st level segmentation) and the
large geographical regions (2nd level segmentation).
The business units of activity are: crop protection, crop nutrition, industrial chemicals and environment, agro commodities distribu-
tion, logistics and energy.
The geographical regions are: Portugal, Spain and export.
An revenue is recognised when it is probable that it will be acquired and its amount can be reliably measured.
The turnover is constituted by the sales to third parties, less the commercial deductions. It is registered in the income statement
when the significant risks and benefits inherent to the ownership of the goods are transferred to the buyer.
The dividends are recorded in the income statement when the right of the shareholder to receive the payment is established.
The income from interest is recognized in the income statement prorata temporis, in view of the effective interest rate of the
investment.
The contingent assets are not recognised but are presented in the disclosures if the economic benefit is probable.
The contingent liabilities are not recognised but presented in the disclosures.
The own shares are recorded as reduction of the equity capital. No profit or loss must be recognised in the result in the event of the
purchase, sale, issue or cancellation of these treasury shares. These profits or losses must be presented in the financial statements
as a variation in the consolidated equity capital.
The dividends are recognised in the liabilities for the period during which they are declared.
Certain of the group’s companies grant their personnel defined retirement benefits. For these companies, a pension fund has been
set up to guarantee the future pensions to the beneficiaries.
This responsibility of these companies is restated annually by the insurance company that manages the fund. If it looks that the
capitalisation is insufficient, the companies concerned are obliged to make contributions to top up the pension fund and these
amounts are charged to the income statement.
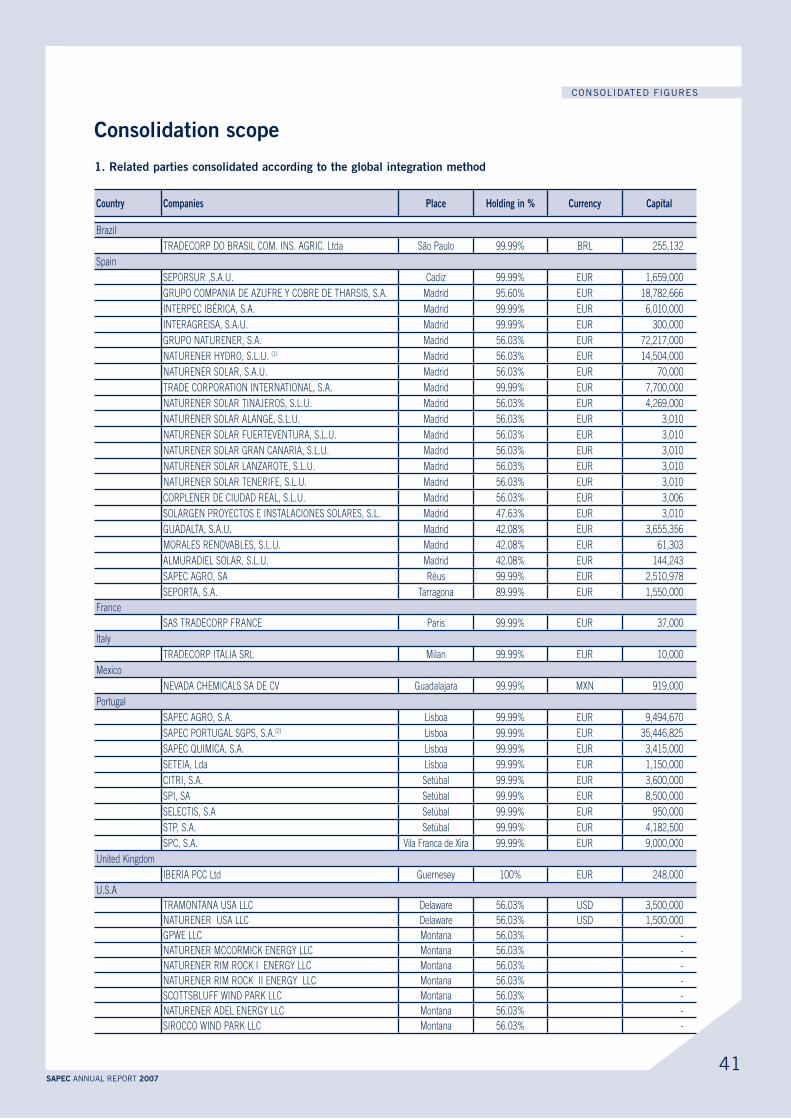
41SAPEC ANNUAL REPORT 2007
CONSOLIDATED FIGURES
Capital
Brazil
TRADECORP DO BRASIL COM. INS. AGRIC. Ltda São Paulo 99.99% BRL 255,132
Spain
SEPORSUR ,S.A.U. Cadiz 99.99% EUR 1,659,000
GRUPO COMPANIA DE AZUFRE Y COBRE DE THARSIS, S.A. Madrid 95.60% EUR 18,782,666
INTERPEC IBÉRICA, S.A. Madrid 99.99% EUR 6,010,000
INTERAGREISA, S.A.U. Madrid 99.99% EUR 300,000
GRUPO NATURENER, S.A. Madrid 56.03% EUR 72,217,000
NATURENER HYDRO, S.L.U. (1) Madrid 56.03% EUR 14,504,000
NATURENER SOLAR, S.A.U. Madrid 56.03% EUR 70,000
TRADE CORPORATION INTERNATIONAL, S.A. Madrid 99.99% EUR 7,700,000
NATURENER SOLAR TINAJEROS, S.L.U. Madrid 56.03% EUR 4,269,000
NATURENER SOLAR ALANGE, S.L.U. Madrid 56.03% EUR 3,010
NATURENER SOLAR FUERTEVENTURA, S.L.U. Madrid 56.03% EUR 3,010
NATURENER SOLAR GRAN CANARIA, S.L.U. Madrid 56.03% EUR 3,010
NATURENER SOLAR LANZAROTE, S.L.U. Madrid 56.03% EUR 3,010
NATURENER SOLAR TENERIFE, S.L.U. Madrid 56.03% EUR 3,010
CORPLENER DE CIUDAD REAL, S.L.U. Madrid 56.03% EUR 3,006
SOLARGEN PROYECTOS E INSTALACIONES SOLARES, S.L. Madrid 47.63% EUR 3,010
GUADALTA, S.A.U. Madrid 42.08% EUR 3,655,356
MORALES RENOVABLES, S.L.U. Madrid 42.08% EUR 61,303
ALMURADIEL SOLAR, S.L.U. Madrid 42.08% EUR 144,243
SAPEC AGRO, SA Réus 99.99% EUR 2,510,978
SEPORTA, S.A. Tarragona 89.99% EUR 1,550,000
France
SAS TRADECORP FRANCE Paris 99.99% EUR 37,000
Italy
TRADECORP ITALIA SRL Milan 99.99% EUR 10,000
Mexico
NEVADA CHEMICALS SA DE CV Guadalajara 99.99% MXN 919,000
Portugal
SAPEC AGRO, S.A. Lisboa 99.99% EUR 9,494,670
SAPEC PORTUGAL SGPS, S.A.(2) Lisboa 99.99% EUR 35,446,825
SAPEC QUIMICA, S.A. Lisboa 99.99% EUR 3,415,000
SETEIA, Lda Lisboa 99.99% EUR 1,150,000
CITRI, S.A. Setúbal 99.99% EUR 3,600,000
SPI, SA Setúbal 99.99% EUR 8,500,000
SELECTIS, S.A Setúbal 99.99% EUR 950,000
STP, S.A. Setúbal 99.99% EUR 4,182,500
SPC, S.A. Vila Franca de Xira 99.99% EUR 9,000,000
United Kingdom
IBERIA PCC Ltd Guernesey 100% EUR 248,000
U.S.A
TRAMONTANA USA LLC Delaware 56.03% USD 3,500,000
NATURENER USA LLC Delaware 56.03% USD 1,500,000
GPWE LLC Montana 56.03% -
NATURENER MCCORMICK ENERGY LLC Montana 56.03% -
NATURENER RIM ROCK I ENERGY LLC Montana 56.03% -
NATURENER RIM ROCK II ENERGY LLC Montana 56.03% -
SCOTTSBLUFF WIND PARK LLC Montana 56.03% -
NATURENER ADEL ENERGY LLC Montana 56.03% -
SIROCCO WIND PARK LLC Montana 56.03% -

42SAPEC ANNUAL REPORT 2007
CONSOLIDATED FIGURES
Capital
Canada
TRAMONTANA CANADA INC British Columbia 56.03% CAD 9,240,000
NATURENER ENERGY CANADA INC Alberta 56.03% CAD 7,000,000
NATURENER WEST RALEY ENERGY INC Alberta 28.58% -
NATURENER PRAIRE HOME ENERGY INC Alberta 36.81% -
CASTLE ROCK RIDGE WIND ENERGY INC Alberta 56.03% -
NATURENER WESTFIELD ENERGY INC Alberta 39.61% -
YAGOS WIND ENERGY INC Alberta 34.18% -
NATURENER SOUTHRIDGE ENERGY INC Alberta 56.03% -
NATURENER WILD ROSE I ENERGY INC Alberta 56.03% CAD 200
NATURENER WILD ROSE II ENERGY INC Alberta 56.03% -
NATURENER WILD ROSE III ENERGY INC Alberta 56.03% -
NATURENER EAST PALLISER ENERGY INC Alberta 56.03% -
ENERGY LOGICS USA INC Delaware 56.03% -
Capital
Portugal
NAVIPOR, Lda Setúbal 49.99% EUR 1,375,000
Spain
NUENEX GESTIÓN DE ENERGÍA, S.L. Madrid 24.65% EUR 100,000
NEW ENERGY GENERATION, S.A. Madrid 26.22% EUR 600,000
ESTIVADORA GADITANA, UTE Cadiz 49.99% EUR 100,000
Capital
Portugal
SISAV, SA Lisboa 34.13% EUR 2 500 000
Capital
Entrée dans le périmètre
NATURENER SOLAR, S.A.U. Madrid 56.03% EUR 70,000
NATURENER SOLAR TINAJEROS, S.L.U. Madrid 56.03% EUR 4,269,000
NATURENER SOLAR ALANGE, S.L.U. Madrid 56.03% EUR 3,010
NATURENER SOLAR FUERTEVENTURA, S.L.U. Madrid 56.03% EUR 3,010
NATURENER SOLAR GRAN CANARIA, S.L.U. Madrid 56.03% EUR 3,010
NATURENER SOLAR LANZAROTE, S.L.U. Madrid 56.03% EUR 3,010
NATURENER SOLAR TENERIFE, S.L.U. Madrid 56.03% EUR 3,010
CORPLENER DE CIUDAD REAL, S.L.U. Madrid 56.03% EUR 3,006
SOLARGEN PROYECTOS E INSTALACIONES SOLARES, S.L. Madrid 47.63% EUR 3,010
GUADALTA, S.A.U. Madrid 42.08% EUR 3,655,356
MORALES RENOVABLES, S.L.U. Madrid 42.08% EUR 61,303
ALMURADIEL SOLAR, S.L.U. Madrid 42.08% EUR 144,243
INTERAGREISA, S.A.U. Madrid 99.90% EUR 300,000
ESTIVADORA GADITANA, UTE Cadiz 49.99% EUR 100,000
SISAV, SA Lisboa 34.13% EUR 2,500,000
NATURENER WILD ROSE I ENERGY INC Alberta 56.03% CAD 200
NATURENER WILD ROSE II ENERGY INC Alberta 56.03%
NATURENER WILD ROSE III ENERGY INC Alberta 56.03%
NATURENER EAST PALLISER ENERGY INC Alberta 56.03%
(1) Naturener Hydro, S.L.U. was created by contribution of the hydraulic activity of the company Naturener, S.A. (which changed its name for
Grupo Natunerer, S.A.)
(2) The company Horticrop, Lda. was merged with Sapec Portugal SGPS, S.A. in January 2007.
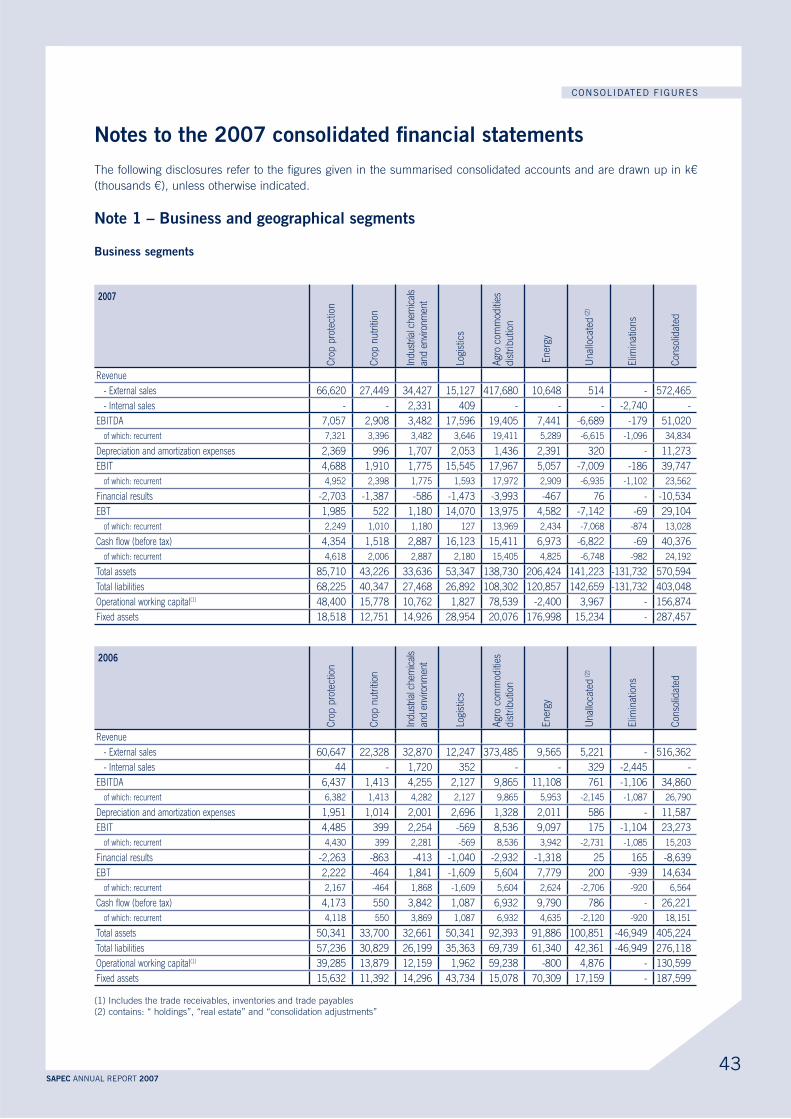
43SAPEC ANNUAL REPORT 2007
CONSOLIDATED FIGURES
The following disclosures refer to the figures given in the summarised consolidated accounts and are drawn up in k€
(thousands €), unless otherwise indicated.
2007
Cro
p p
rote
ctio
n
Cro
p n
utr
ition
Indu
stria
l che
mic
als
and
envi
ronm
ent
Logi
stic
s
Agr
o co
mm
oditi
es
dis
trib
utio
n
En
ergy
Un
allo
cate
d (
2)
Elim
inat
ion
s
Con
solid
ated
Revenue
- External sales 66,620 27,449 34,427 15,127 417,680 10,648 514 - 572,465
- Internal sales - - 2,331 409 - - - -2,740 -
EBITDA 7,057 2,908 3,482 17,596 19,405 7,441 -6,689 -179 51,020
of which: recurrent 7,321 3,396 3,482 3,646 19,411 5,289 -6,615 -1,096 34,834
Depreciation and amortization expenses 2,369 996 1,707 2,053 1,436 2,391 320 - 11,273
EBIT 4,688 1,910 1,775 15,545 17,967 5,057 -7,009 -186 39,747
of which: recurrent 4,952 2,398 1,775 1,593 17,972 2,909 -6,935 -1,102 23,562
Financial results -2,703 -1,387 -586 -1,473 -3,993 -467 76 - -10,534
EBT 1,985 522 1,180 14,070 13,975 4,582 -7,142 -69 29,104
of which: recurrent 2,249 1,010 1,180 127 13,969 2,434 -7,068 -874 13,028
Cash flow (before tax) 4,354 1,518 2,887 16,123 15,411 6,973 -6,822 -69 40,376
of which: recurrent 4,618 2,006 2,887 2,180 15,405 4,825 -6,748 -982 24,192
Total assets 85,710 43,226 33,636 53,347 138,730 206,424 141,223 -131,732 570,594
Total liabilities 68,225 40,347 27,468 26,892 108,302 120,857 142,659 -131,732 403,048
Operational working capital(1) 48,400 15,778 10,762 1,827 78,539 -2,400 3,967 - 156,874
Fixed assets 18,518 12,751 14,926 28,954 20,076 176,998 15,234 - 287,457
Cro
p p
rote
ctio
n
Cro
p n
utr
ition
Indu
stria
l che
mic
als
and
envi
ronm
ent
Logi
stic
s
Agr
o co
mm
oditi
es
dis
trib
utio
n
En
ergy
Un
allo
cate
d (
2)
Elim
inat
ion
s
Con
solid
ated
Revenue
- External sales 60,647 22,328 32,870 12,247 373,485 9,565 5,221 - 516,362
- Internal sales 44 - 1,720 352 - - 329 -2,445 -
EBITDA 6,437 1,413 4,255 2,127 9,865 11,108 761 -1,106 34,860
of which: recurrent 6,382 1,413 4,282 2,127 9,865 5,953 -2,145 -1,087 26,790
Depreciation and amortization expenses 1,951 1,014 2,001 2,696 1,328 2,011 586 - 11,587
EBIT 4,485 399 2,254 -569 8,536 9,097 175 -1,104 23,273
of which: recurrent 4,430 399 2,281 -569 8,536 3,942 -2,731 -1,085 15,203
Financial results -2,263 -863 -413 -1,040 -2,932 -1,318 25 165 -8,639
EBT 2,222 -464 1,841 -1,609 5,604 7,779 200 -939 14,634
of which: recurrent 2,167 -464 1,868 -1,609 5,604 2,624 -2,706 -920 6,564
Cash flow (before tax) 4,173 550 3,842 1,087 6,932 9,790 786 - 26,221
of which: recurrent 4,118 550 3,869 1,087 6,932 4,635 -2,120 -920 18,151
Total assets 50,341 33,700 32,661 50,341 92,393 91,886 100,851 -46,949 405,224
Total liabilities 57,236 30,829 26,199 35,363 69,739 61,340 42,361 -46,949 276,118
Operational working capital(1) 39,285 13,879 12,159 1,962 59,238 -800 4,876 - 130,599
Fixed assets 15,632 11,392 14,296 43,734 15,078 70,309 17,159 - 187,599
(1) Includes the trade receivables, inventories and trade payables
(2) contains: “ holdings”, “real estate” and “consolidation adjustments”

44SAPEC ANNUAL REPORT 2007
CONSOLIDATED FIGURES
2007 Portugal Spain Consolidated
Revenue
- External sales 129,006 438,042 5,417 0 - 572,465
- Internal sales 25,356 5,179 0 2,009 -32,544 -
EBITDA 25,786 29,497 -70 -6,131 1,938 51,020
of which: recurrent 11,696 26,813 -70 -5,543 1,938 34,834
Depreciation and amortization expenses 5,790 5,282 89 112 - 11,273
EBIT 19,996 24,216 -159 -6,242 1,938 39,747
of which: recurrent 5,906 21,531 -159 -5,654 1,938 23,562
Financial results -5,494 -7,104 345 1,719 - -10,534
EBT 15,739 18,619 186 -4,646 -794 29,104
of which: recurrent 1,649 15,934 186 -4,057 684 13,028
Cash flow (before tax) 21,528 23,901 275 -4,534 -794 40,376
of which: recurrent 7,439 21,216 275 -3,944 -794 24,192
Total assets 151,665 279,759 5,643 253,964 -120,436 570,594
Fixed assets 58,956 134,639 330 93,532 - 287,457
Portugal Spain Consolidated
Revenue
- External sales 91,633 420,291 3,653 785 - 516,362
- Internal sales 20,622 2,494 - 210 -23,326 -
EBITDA 11,937 23,363 -229 -211 - 34,860
of which: recurrent 8,923 18,418 -236 -315 - 26,790
Depreciation and amortization expenses 6,499 4,984 89 15 - 11,587
EBIT 5,438 18,379 -319 -225 - 23,273
of which: recurrent 2,423 13,434 -326 -328 - 15,203
Financial results -4,091 -5,322 -276 1,050 - -8,639
EBT 1,346 13,057 -594 825 - 14,634
of which: recurrent -1,668 8,112 -602 722 - 6,564
Cash flow (before tax) 7,846 18,040 -505 840 - 26,221
of which: recurrent 4,831 13,096 -512 736 - 18,151
Total assets 182,028 223,416 36,325 75,065 -111,610 405,224
Fixed assets 80,634 90,473 15,985 507 - 187,599
(1) contains : « holding », « consolidation adjustments » and «wind farm».
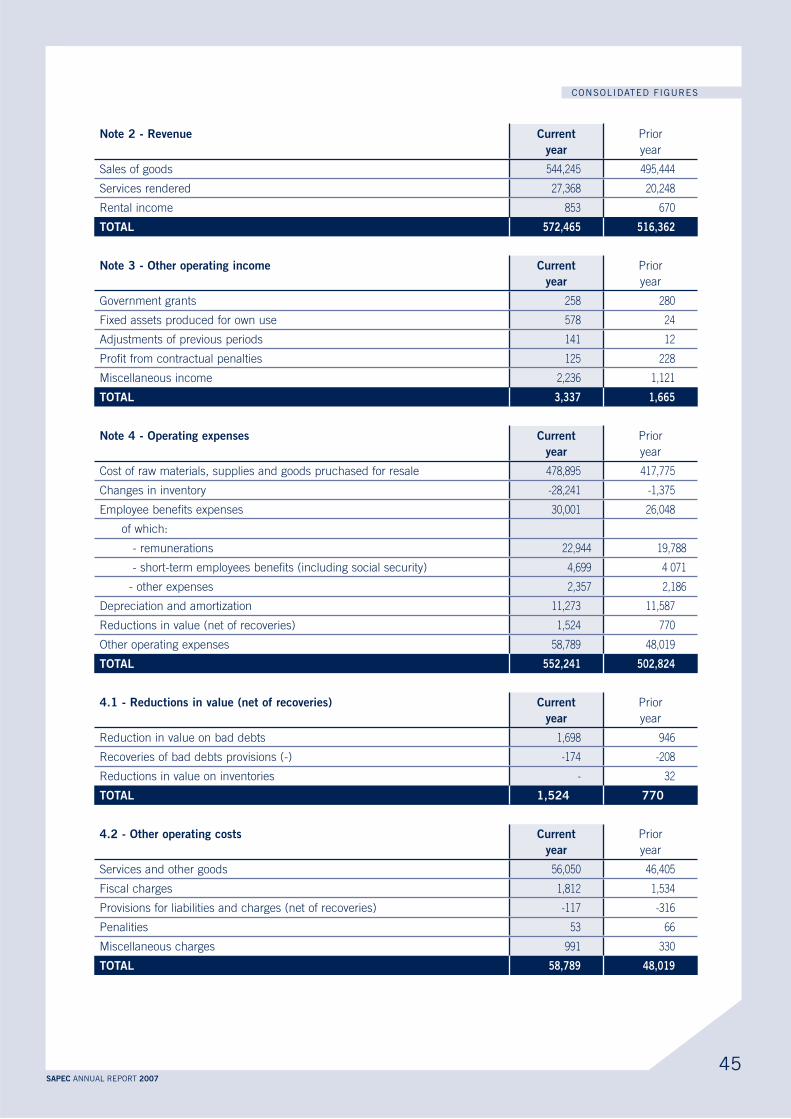
45SAPEC ANNUAL REPORT 2007
CONSOLIDATED FIGURES
Current Prior
year
Sales of goods 544,245 495,444
Services rendered 27,368 20,248
Rental income 853 670
Current Prior
year
Government grants 258 280
Fixed assets produced for own use 578 24
Adjustments of previous periods 141 12
Profit from contractual penalties 125 228
Miscellaneous income 2,236 1,121
Current Prior
year
Cost of raw materials, supplies and goods pruchased for resale 478,895 417,775
Changes in inventory -28,241 -1,375
Employee benefits expenses 30,001 26,048
of which:
- remunerations 22,944 19,788
- short-term employees benefits (including social security) 4,699 4 071
- other expenses 2,357 2,186
Depreciation and amortization 11,273 11,587
Reductions in value (net of recoveries) 1,524 770
Other operating expenses 58,789 48,019
Current Prior
year
Reduction in value on bad debts 1,698 946
Recoveries of bad debts provisions (-) -174 -208
Reductions in value on inventories - 32
770
Current Prior
year
Services and other goods 56,050 46,405
Fiscal charges 1,812 1,534
Provisions for liabilities and charges (net of recoveries) -117 -316
Penalities 53 66
Miscellaneous charges 991 330
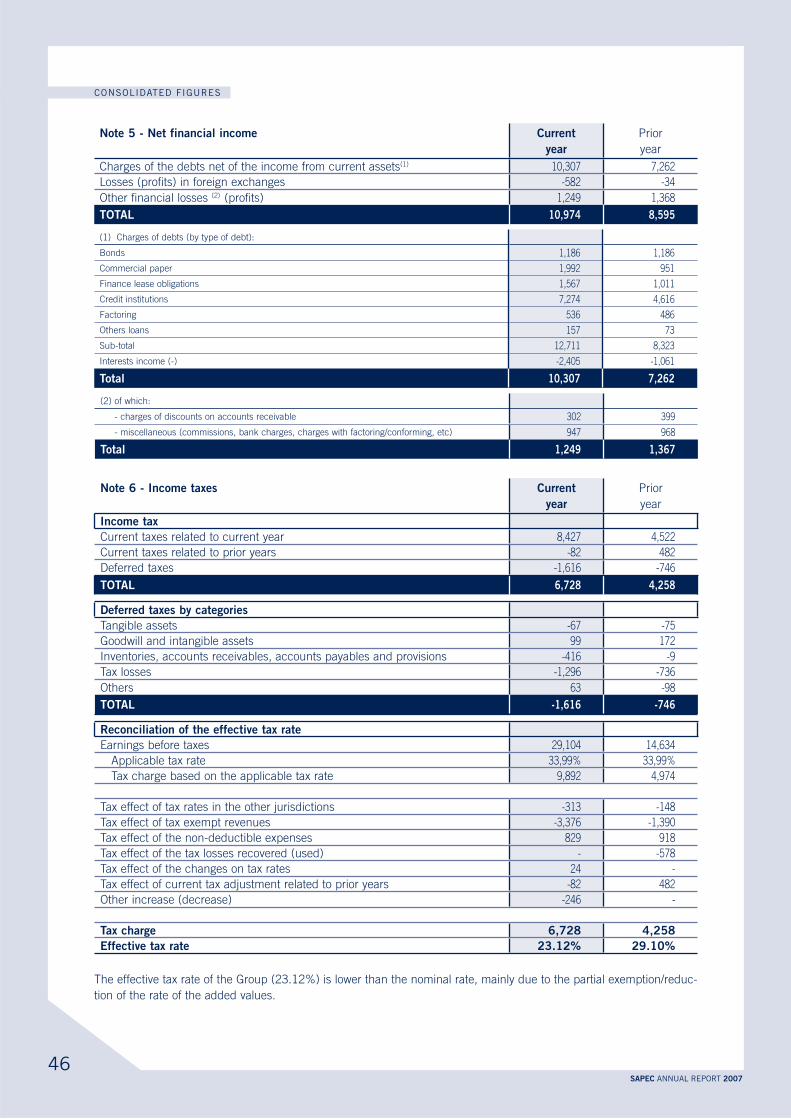
46SAPEC ANNUAL REPORT 2007
CONSOLIDATED FIGURES
Current Prior
year
Charges of the debts net of the income from current assets(1) 10,307 7,262
Losses (profits) in foreign exchanges -582 -34
Other financial losses (2) (profits) 1,249 1,368
(1) Charges of debts (by type of debt):
Bonds 1,186 1,186
Commercial paper 1,992 951
Finance lease obligations 1,567 1,011
Credit institutions 7,274 4,616
Factoring 536 486
Others loans 157 73
Sub-total 12,711 8,323
Interests income (-) -2,405 -1,061
Total
(2) of which:
- charges of discounts on accounts receivable 302 399
- miscellaneous (commissions, bank charges, charges with factoring/conforming, etc) 947 968
Total
Current Prior
year
Current taxes related to current year 8,427 4,522
Current taxes related to prior years -82 482
Deferred taxes -1,616 -746
Tangible assets -67 -75
Goodwill and intangible assets 99 172
Inventories, accounts receivables, accounts payables and provisions -416 -9
Tax losses -1,296 -736
Others 63 -98
Earnings before taxes 29,104 14,634
Applicable tax rate 33,99% 33,99%
Tax charge based on the applicable tax rate 9,892 4,974
Tax effect of tax rates in the other jurisdictions -313 -148
Tax effect of tax exempt revenues -3,376 -1,390
Tax effect of the non-deductible expenses 829 918
Tax effect of the tax losses recovered (used) - -578
Tax effect of the changes on tax rates 24 -
Tax effect of current tax adjustment related to prior years -82 482
Other increase (decrease) -246 -
The effective tax rate of the Group (23.12%) is lower than the nominal rate, mainly due to the partial exemption/reduc-
tion of the rate of the added values.
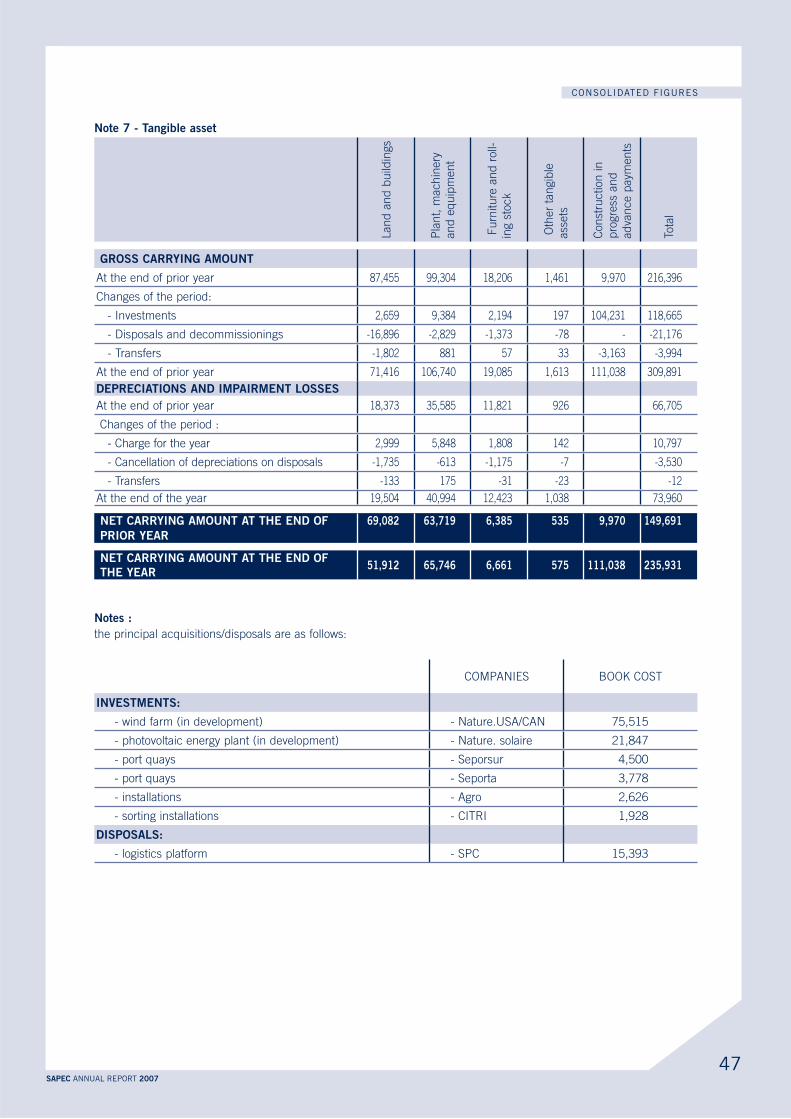
47SAPEC ANNUAL REPORT 2007
CONSOLIDATED FIGURES
Lan
d a
nd
bu
ildin
gs
Pla
nt,
mach
inery
an
d e
qu
ipm
en
t
Fu
rnitu
re a
nd
roll-
ing s
tock
Oth
er
tan
gib
le
ass
ets
Con
stru
ction
in
pro
gre
ss a
nd
ad
van
ce p
aym
en
ts
Tota
l
At the end of prior year 87,455 99,304 18,206 1,461 9,970 216,396
Changes of the period:
- Investments 2,659 9,384 2,194 197 104,231 118,665
- Disposals and decommissionings -16,896 -2,829 -1,373 -78 - -21,176
- Transfers -1,802 881 57 33 -3,163 -3,994
At the end of prior year 71,416 106,740 19,085 1,613 111,038 309,891
At the end of prior year 18,373 35,585 11,821 926 66,705
Changes of the period :
- Charge for the year 2,999 5,848 1,808 142 10,797
- Cancellation of depreciations on disposals -1,735 -613 -1,175 -7 -3,530
- Transfers -133 175 -31 -23 -12
At the end of the year 19,504 40,994 12,423 1,038 73,960
the principal acquisitions/disposals are as follows:
COMPANIES BOOK COST
- wind farm (in development) - Nature.USA/CAN 75,515
- photovoltaic energy plant (in development) - Nature. solaire 21,847
- port quays - Seporsur 4,500
- port quays - Seporta 3,778
- installations - Agro 2,626
- sorting installations - CITRI 1,928
- logistics platform - SPC 15,393

48SAPEC ANNUAL REPORT 2007
CONSOLIDATED FIGURES
Lan
d a
nd
bu
ildin
gs
Pla
nt,
mach
inery
an
d e
qu
ipm
en
t
Fu
rnitu
re a
nd
rolli
ng s
tock
Tota
l
Net carrying amount of finance leases included in tangi-
ble assets15,697 21,004 2,691 39,391
Gross value of totally depreciated tangible assets in use 5,296 7,116 6,297 18,709
Value of tangible assets uses as collectible guarantee for
loans and mortgages- 34,447 - 34,447
Land
Oth
er
inve
stm
ent
build
ings
Tota
l at
his
torical
cost
At the end of prior year 1,305 54 1,359
Changes of the period:
- Investments - - -
- Disposals and decommissionings - - -
At the end of the year 1,305 54 1,359
At the end of prior year - 14 14
Changes of the period:
- Charge for the year - 1 1
At the end of the year -
(1) The investment properties are recognised at historical cost.
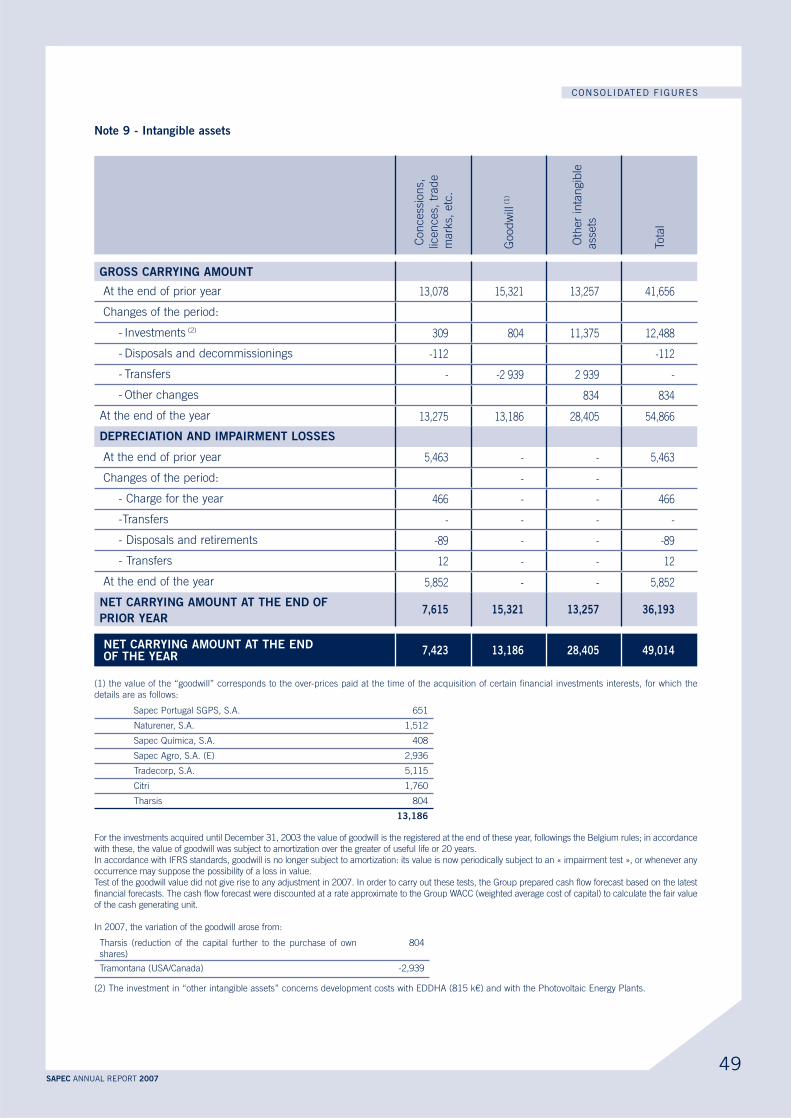
49SAPEC ANNUAL REPORT 2007
CONSOLIDATED FIGURES
Con
cess
ion
s,
licen
ces,
tra
de
mark
s, e
tc.
Good
will
(1
)
Oth
er
inta
ngib
le
ass
ets
Tota
l
At the end of prior year 13,078 15,321 13,257 41,656
Changes of the period:
- Investments (2) 309 804 11,375 12,488
- Disposals and decommissionings -112 -112
- Transfers - -2 939 2 939 -
- Other changes 834 834
At the end of the year 13,275 13,186 28,405 54,866
At the end of prior year 5,463 - - 5,463
Changes of the period: - -
- Charge for the year 466 - - 466
-Transfers - - - -
- Disposals and retirements -89 - - -89
- Transfers 12 - - 12
At the end of the year 5,852 - - 5,852
(1) the value of the “goodwill” corresponds to the over-prices paid at the time of the acquisition of certain financial investments interests, for which the
details are as follows:
Sapec Portugal SGPS, S.A. 651
Naturener, S.A. 1,512
Sapec Química, S.A. 408
Sapec Agro, S.A. (E) 2,936
Tradecorp, S.A. 5,115
Citri 1,760
Tharsis 804
For the investments acquired until December 31, 2003 the value of goodwill is the registered at the end of these year, followings the Belgium rules; in accordance
with these, the value of goodwill was subject to amortization over the greater of useful life or 20 years.
In accordance with IFRS standards, goodwill is no longer subject to amortization: its value is now periodically subject to an « impairment test », or whenever any
occurrence may suppose the possibility of a loss in value.
Test of the goodwill value did not give rise to any adjustment in 2007. In order to carry out these tests, the Group prepared cash flow forecast based on the latest
financial forecasts. The cash flow forecast were discounted at a rate approximate to the Group WACC (weighted average cost of capital) to calculate the fair value
of the cash generating unit.
In 2007, the variation of the goodwill arose from:
Tharsis (reduction of the capital further to the purchase of own
shares)
804
Tramontana (USA/Canada) -2,939
(2) The investment in “other intangible assets” concerns development costs with EDDHA (815 k€) and with the Photovoltaic Energy Plants.
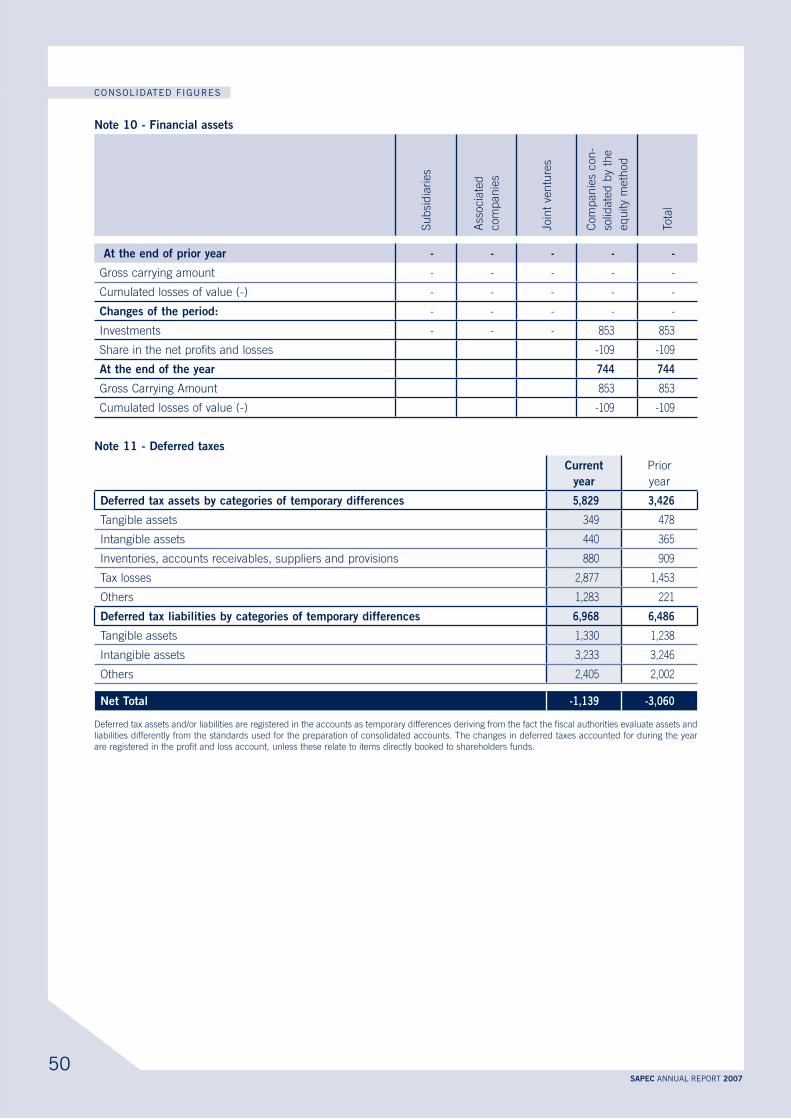
50SAPEC ANNUAL REPORT 2007
CONSOLIDATED FIGURES
Su
bsi
dia
ries
Ass
ocia
ted
com
pan
ies
Join
t ve
ntu
res
Com
pan
ies
con
-
solid
ate
d b
y th
e
eq
uity
meth
od
Tota
l
- - - - -
Gross carrying amount - - - - -
Cumulated losses of value (-) - - - - -
- - - - -
Investments - - - 853 853
Share in the net profits and losses -109 -109
744 744
Gross Carrying Amount 853 853
Cumulated losses of value (-) -109 -109
Current Prior
year
Tangible assets 349 478
Intangible assets 440 365
Inventories, accounts receivables, suppliers and provisions 880 909
Tax losses 2,877 1,453
Others 1,283 221
Tangible assets 1,330 1,238
Intangible assets 3,233 3,246
Others 2,405 2,002
Deferred tax assets and/or liabilities are registered in the accounts as temporary differences deriving from the fact the fiscal authorities evaluate assets and
liabilities differently from the standards used for the preparation of consolidated accounts. The changes in deferred taxes accounted for during the year
are registered in the profit and loss account, unless these relate to items directly booked to shareholders funds.
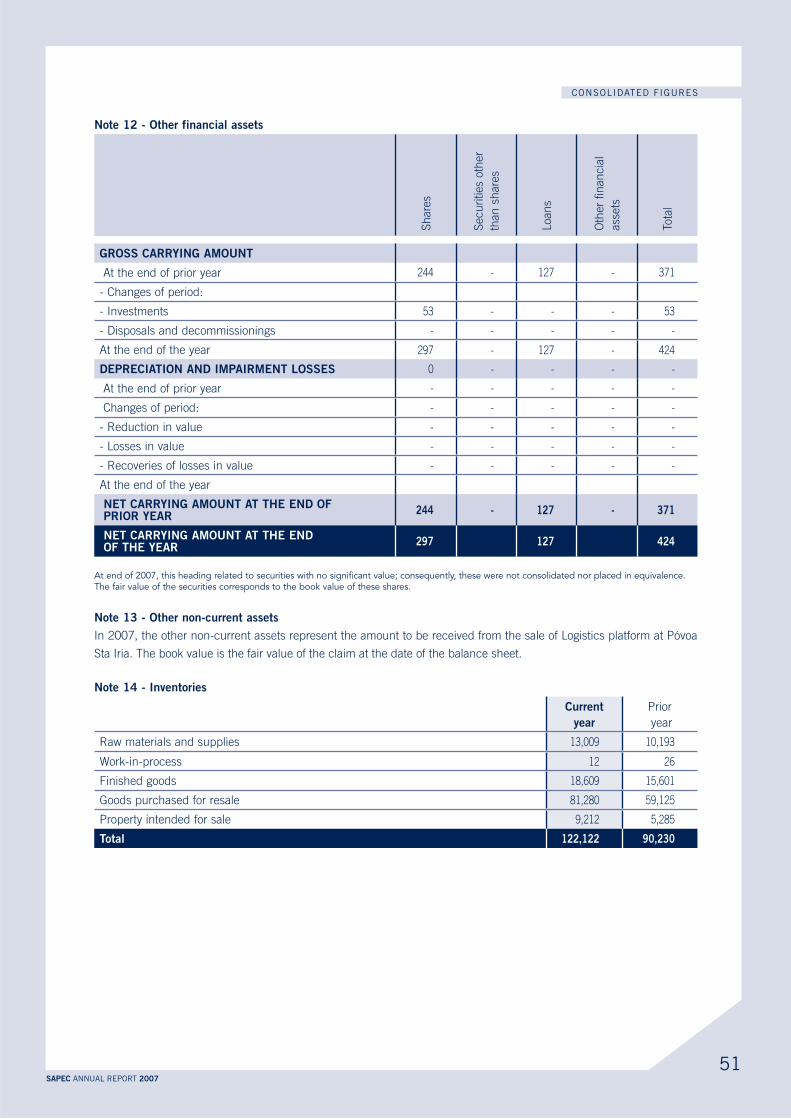
51SAPEC ANNUAL REPORT 2007
CONSOLIDATED FIGURES
Sh
are
s
Secu
rities
oth
er
than
sh
are
s
Loan
s
Oth
er
fin
an
cia
l
ass
ets
Tota
l
At the end of prior year 244 - 127 - 371
- Changes of period:
- Investments 53 - - - 53
- Disposals and decommissionings - - - - -
At the end of the year 297 - 127 - 424
0 - - - -
At the end of prior year - - - - -
Changes of period: - - - - -
- Reduction in value - - - - -
- Losses in value - - - - -
- Recoveries of losses in value - - - - -
At the end of the year
244 - -
297 424
At end of 2007, this heading related to securities with no significant value; consequently, these were not consolidated nor placed in equivalence.The fair value of the securities corresponds to the book value of these shares.
In 2007, the other non-current assets represent the amount to be received from the sale of Logistics platform at Póvoa
Sta Iria. The book value is the fair value of the claim at the date of the balance sheet.
Current Prior
year
Raw materials and supplies 13,009 10,193
Work-in-process 12 26
Finished goods 18,609 15,601
Goods purchased for resale 81,280 59,125
Property intended for sale 9,212 5,285
Total

52SAPEC ANNUAL REPORT 2007
CONSOLIDATED FIGURES
Within the framework of its operational activities, the Group is exposed to risks from exchange rates, interest rates and
prices of raw materials (see annexe to the Management Report – Financial risk management). In order to cover against
these risks, the Group uses selected derivatives. However, the required criteria to apply hedging accounting according to
the IFRS standards are not met, and the impact of these operations was directly registered on income statement.
For certain positions in raw materials connected with the trading activity, the Group used instruments (especially futures
and swaps) to reduce the risk of price fluctuations.
In December 2007, the Group maintained open positions (buy and sell commitments), futures and options on raw
materials and freights contracts for 737.3 million € (290.2 million € in 2006).
The adopted policy for covering exchange rate risks includes systematically covering of the risk of transactional exchange
rates and monitoring the possible covering of exchange rate positions generated by the activities on the basis of the
expected flows. The Group does not specifically cover the exchange rate risk connected with the profits and losses of
subsidiaries whose operating currency is not the EUR.
Concerning the management of the transactional exchange risk (buying or selling by a company in the Group in a cur-
rency other than its functional currency), the Group’s exposure essentialy linked to the EUR/USD risk.
In 2007, the Group is coveried at a limit of 100.6 million USD (14.8 million USD in 2006).
The derivatives that are used to cover the exchange rate risks are forwards and options. The open positions in options at
the end of December 2007 were as following:
The management of the interest rate risk is carried out centrally at Group level and the amount of the existing cover at
the end of 2007 was not significant.
At december 31, a limit around 34 millions EUR ( 35 million EUR in 2006) of the Group’s debt was fixed rate interest.
For the sensivity analysis, an increase (decrease) of 1% on the interest rate would be expressed in an increase (decrease)
of charges of 1.6 million EUR (0.99 million EUR in 2006).

53SAPEC ANNUAL REPORT 2007
CONSOLIDATED FIGURES
Prior year
Fair value Contratctual
or notional
amounts
Fair value Notional or
contractual
amount
Interest rate derivatives:
- Futurs and swaps 284 57,500
Foreign exchange contracts:
- options _ euro / dollar 216 61,137 557 12,650
Interest rate derivatives:
- Futurs and swaps 119 50,000 1,661 90,000
Foreign exchange contracts:
- euro / dollar 91 4,002 235 7,541
- options _ euro / dollar 26 4,750 163 6,000
Derivative financial instruments - assets:
- Maturity in en 2007 766 35,150
- Maturity in en 2008 216 61,137 75 35,000
Derivative financial instruments - liabilities:
- Maturity in en 2007 2,059 103,541
- Maturity in en 2008 236 58,752
Current Prior
year
Trade receivables 78,841 74,500
Other receivables 19,557 16,941
Total
In 2007, trade receivables represents 50 days of sales (53 in 2006) and its book value reflects the fair value at closing
date balance sheet.
The Group’s exposure to credit risk is controlled by a very rigid policy of credit concession and by taking out credit insur-
ance policies in agreement with the established in the “Financial risk management”.
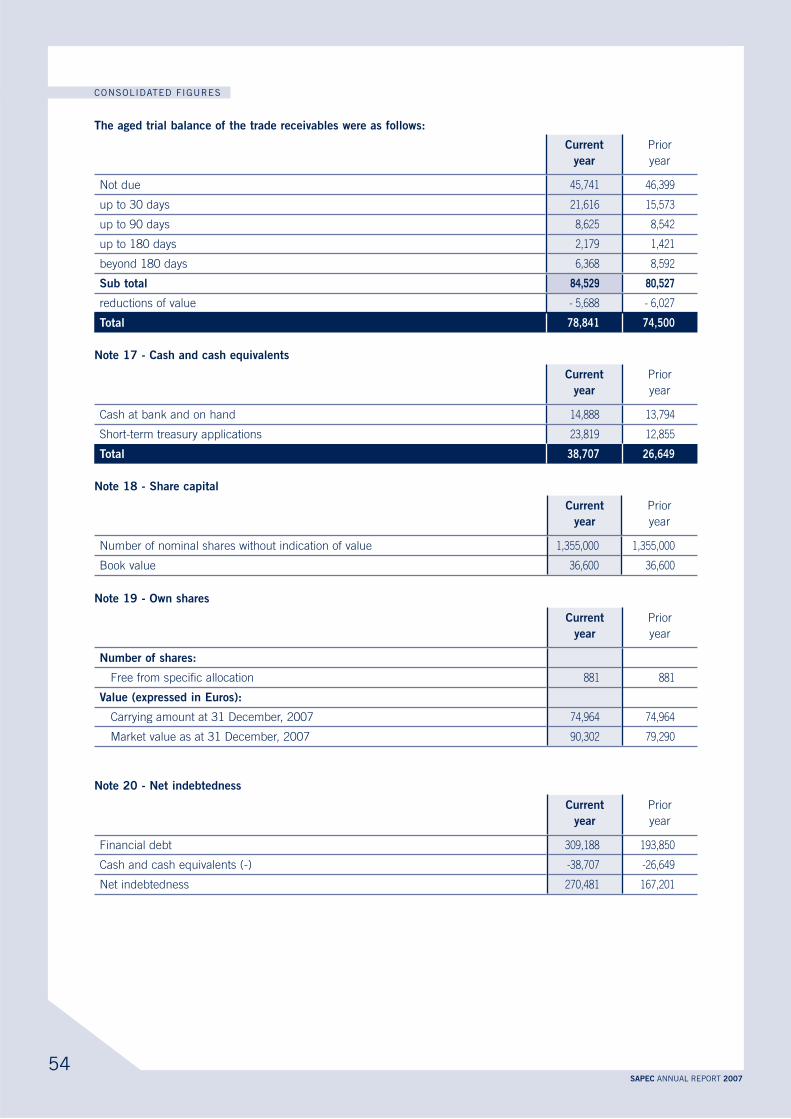
54SAPEC ANNUAL REPORT 2007
CONSOLIDATED FIGURES
Current Prior
year
Not due 45,741 46,399
up to 30 days 21,616 15,573
up to 90 days 8,625 8,542
up to 180 days 2,179 1,421
beyond 180 days 6,368 8,592
84,529 80,527
reductions of value - 5,688 - 6,027
Total
Current Prior
year
Cash at bank and on hand 14,888 13,794
Short-term treasury applications 23,819 12,855
Total
Current Prior
year
Number of nominal shares without indication of value 1,355,000 1,355,000
Book value 36,600 36,600
Current Prior
year
Free from specific allocation 881 881
Carrying amount at 31 December, 2007 74,964 74,964
Market value as at 31 December, 2007 90,302 79,290
Current Prior
year
Financial debt 309,188 193,850
Cash and cash equivalents (-) -38,707 -26,649
Net indebtedness 270,481 167,201
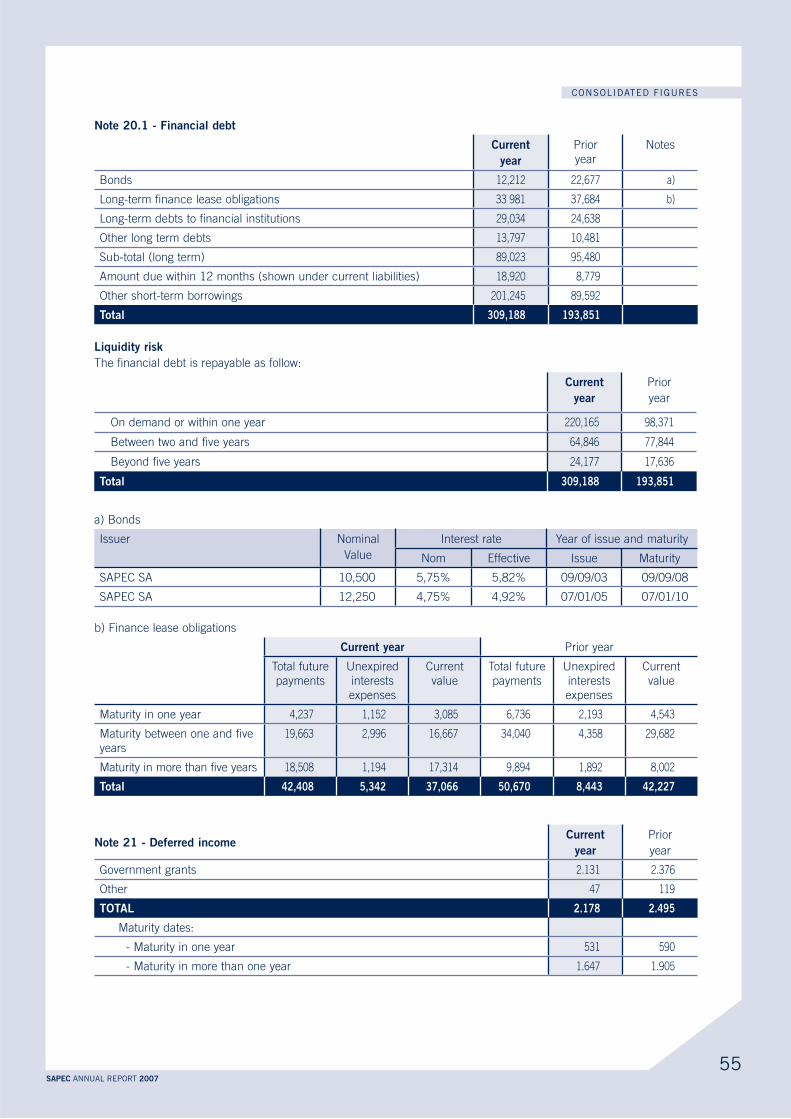
55SAPEC ANNUAL REPORT 2007
CONSOLIDATED FIGURES
Current Prior
year
Notes
Bonds 12,212 22,677 a)
Long-term finance lease obligations 33 981 37,684 b)
Long-term debts to financial institutions 29,034 24,638
Other long term debts 13,797 10,481
Sub-total (long term) 89,023 95,480
Amount due within 12 months (shown under current liabilities) 18,920 8,779
Other short-term borrowings 201,245 89,592
Total
The financial debt is repayable as follow:
Current Prior
year
On demand or within one year 220,165 98,371
Between two and five years 64,846 77,844
Beyond five years 24,177 17,636
Total
a) Bonds
Issuer Nominal
Value
Interest rate Year of issue and maturity
Nom Effective Issue Maturity
SAPEC SA 10,500 5,75% 5,82% 09/09/03 09/09/08
SAPEC SA 12,250 4,75% 4,92% 07/01/05 07/01/10
b) Finance lease obligations
Prior year
Total future
payments
Unexpired
interests
expenses
Current
value
Total future
payments
Unexpired
interests
expenses
Current
value
Maturity in one year 4,237 1,152 3,085 6,736 2,193 4,543
Maturity between one and five
years
19,663 2,996 16,667 34,040 4,358 29,682
Maturity in more than five years 18,508 1,194 17,314 9,894 1,892 8,002
Total
Current Prior
year
Government grants 2.131 2.376
Other 47 119
Maturity dates:
- Maturity in one year 531 590
- Maturity in more than one year 1.647 1.905
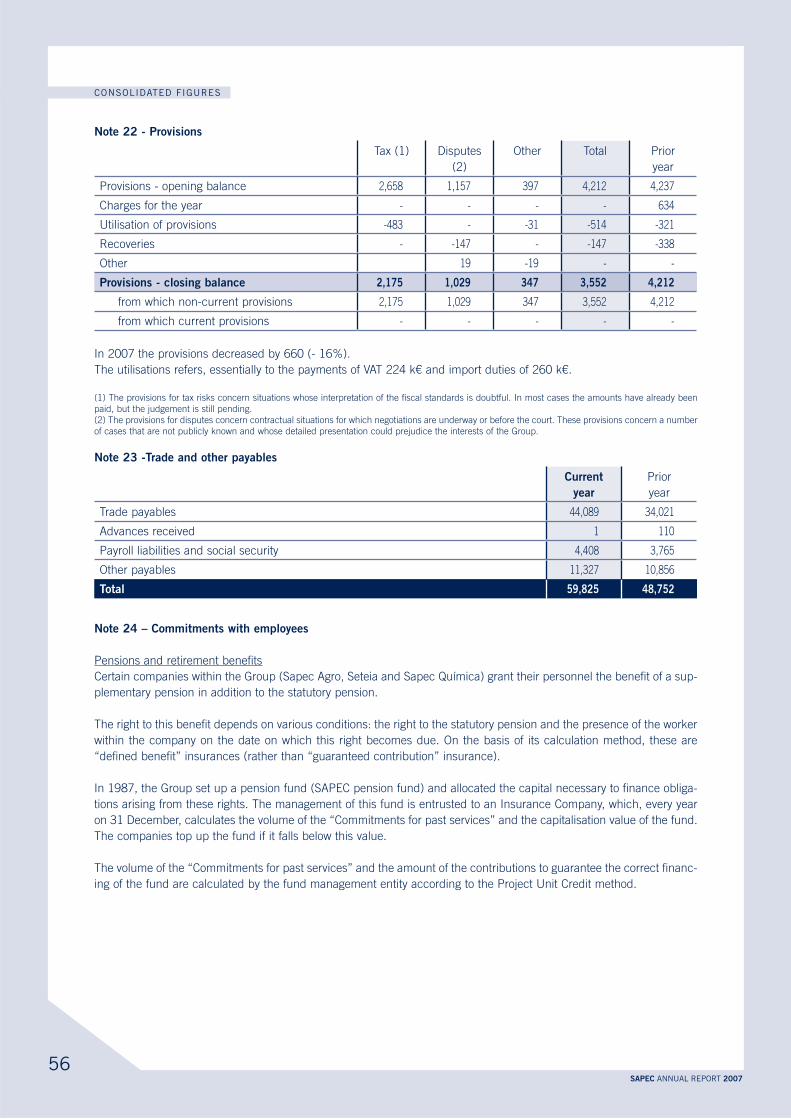
56SAPEC ANNUAL REPORT 2007
CONSOLIDATED FIGURES
Tax (1) Disputes
(2)
Other Total Prior
year
Provisions - opening balance 2,658 1,157 397 4,212 4,237
Charges for the year - - - - 634
Utilisation of provisions -483 - -31 -514 -321
Recoveries - -147 - -147 -338
Other 19 -19 - -
from which non-current provisions 2,175 1,029 347 3,552 4,212
from which current provisions - - - - -
In 2007 the provisions decreased by 660 (- 16%).
The utilisations refers, essentially to the payments of VAT 224 k€ and import duties of 260 k€.
(1) The provisions for tax risks concern situations whose interpretation of the fiscal standards is doubtful. In most cases the amounts have already been
paid, but the judgement is still pending.
(2) The provisions for disputes concern contractual situations for which negotiations are underway or before the court. These provisions concern a number
of cases that are not publicly known and whose detailed presentation could prejudice the interests of the Group.
Current Prior
year
Trade payables 44,089 34,021
Advances received 1 110
Payroll liabilities and social security 4,408 3,765
Other payables 11,327 10,856
Total
Pensions and retirement benefits
Certain companies within the Group (Sapec Agro, Seteia and Sapec Química) grant their personnel the benefit of a sup-
plementary pension in addition to the statutory pension.
The right to this benefit depends on various conditions: the right to the statutory pension and the presence of the worker
within the company on the date on which this right becomes due. On the basis of its calculation method, these are
“defined benefit” insurances (rather than “guaranteed contribution” insurance).
In 1987, the Group set up a pension fund (SAPEC pension fund) and allocated the capital necessary to finance obliga-
tions arising from these rights. The management of this fund is entrusted to an Insurance Company, which, every year
on 31 December, calculates the volume of the “Commitments for past services” and the capitalisation value of the fund.
The companies top up the fund if it falls below this value.
The volume of the “Commitments for past services” and the amount of the contributions to guarantee the correct financ-
ing of the fund are calculated by the fund management entity according to the Project Unit Credit method.
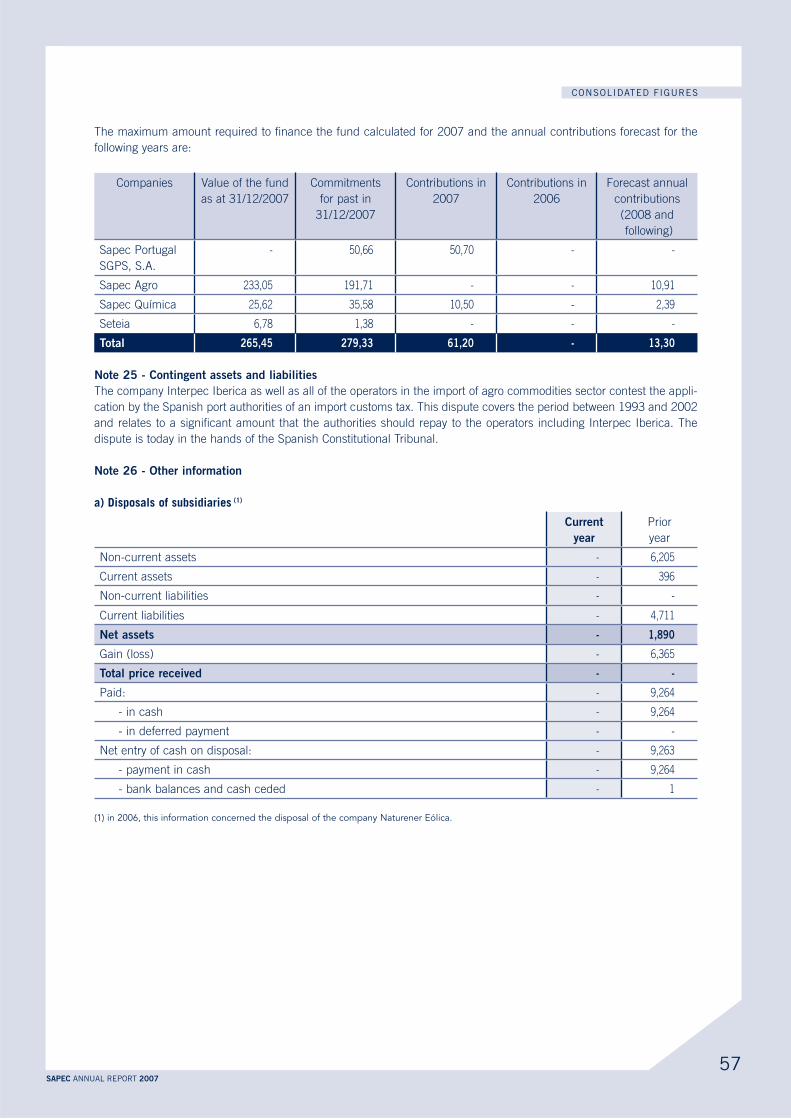
57SAPEC ANNUAL REPORT 2007
CONSOLIDATED FIGURES
The maximum amount required to finance the fund calculated for 2007 and the annual contributions forecast for the
following years are:
Companies Value of the fund
as at 31/12/2007
Commitments
for past in
31/12/2007
Contributions in
2007
Contributions in
2006
Forecast annual
contributions
(2008 and
following)
Sapec Portugal
SGPS, S.A.
- 50,66 50,70 - -
Sapec Agro 233,05 191,71 - - 10,91
Sapec Química 25,62 35,58 10,50 - 2,39
Seteia 6,78 1,38 - - -
Total -
The company Interpec Iberica as well as all of the operators in the import of agro commodities sector contest the appli-
cation by the Spanish port authorities of an import customs tax. This dispute covers the period between 1993 and 2002
and relates to a significant amount that the authorities should repay to the operators including Interpec Iberica. The
dispute is today in the hands of the Spanish Constitutional Tribunal.
a) Disposals of subsidiaries (1)
Current Prior
year
Non-current assets - 6,205
Current assets - 396
Non-current liabilities - -
Current liabilities - 4,711
-
Gain (loss) - 6,365
- -
Paid: - 9,264
- in cash - 9,264
- in deferred payment - -
Net entry of cash on disposal: - 9,263
- payment in cash - 9,264
- bank balances and cash ceded - 1
(1) in 2006, this information concerned the disposal of the company Naturener Eólica.
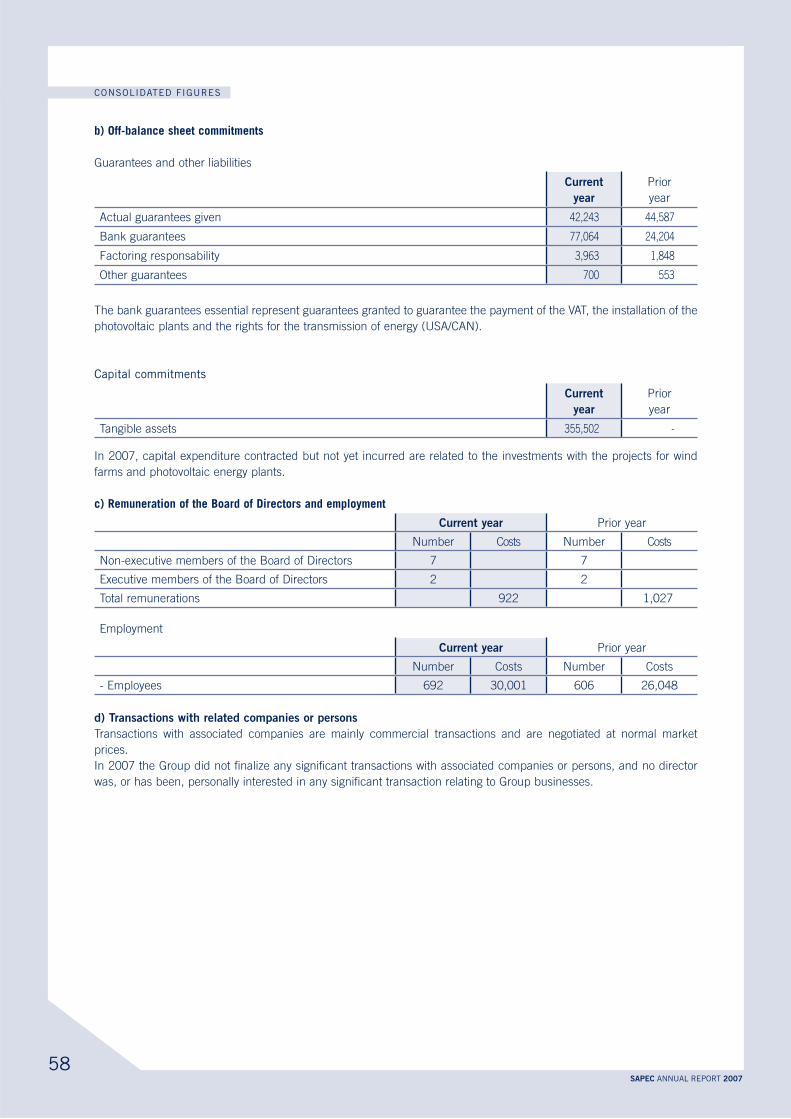
58SAPEC ANNUAL REPORT 2007
CONSOLIDATED FIGURES
b) Off-balance sheet commitments
Guarantees and other liabilities
Current Prior
year
Actual guarantees given 42,243 44,587
Bank guarantees 77,064 24,204
Factoring responsability 3,963 1,848
Other guarantees 700 553
The bank guarantees essential represent guarantees granted to guarantee the payment of the VAT, the installation of the
photovoltaic plants and the rights for the transmission of energy (USA/CAN).
Capital commitments
Current Prior
year
Tangible assets 355,502 -
In 2007, capital expenditure contracted but not yet incurred are related to the investments with the projects for wind
farms and photovoltaic energy plants.
c) Remuneration of the Board of Directors and employment
Prior year
Number Costs Number Costs
Non-executive members of the Board of Directors 7 7
Executive members of the Board of Directors 2 2
Total remunerations 922 1,027
Employment
Prior year
Number Costs Number Costs
- Employees 692 30,001 606 26,048
Transactions with associated companies are mainly commercial transactions and are negotiated at normal market
prices.
In 2007 the Group did not finalize any significant transactions with associated companies or persons, and no director
was, or has been, personally interested in any significant transaction relating to Group businesses.
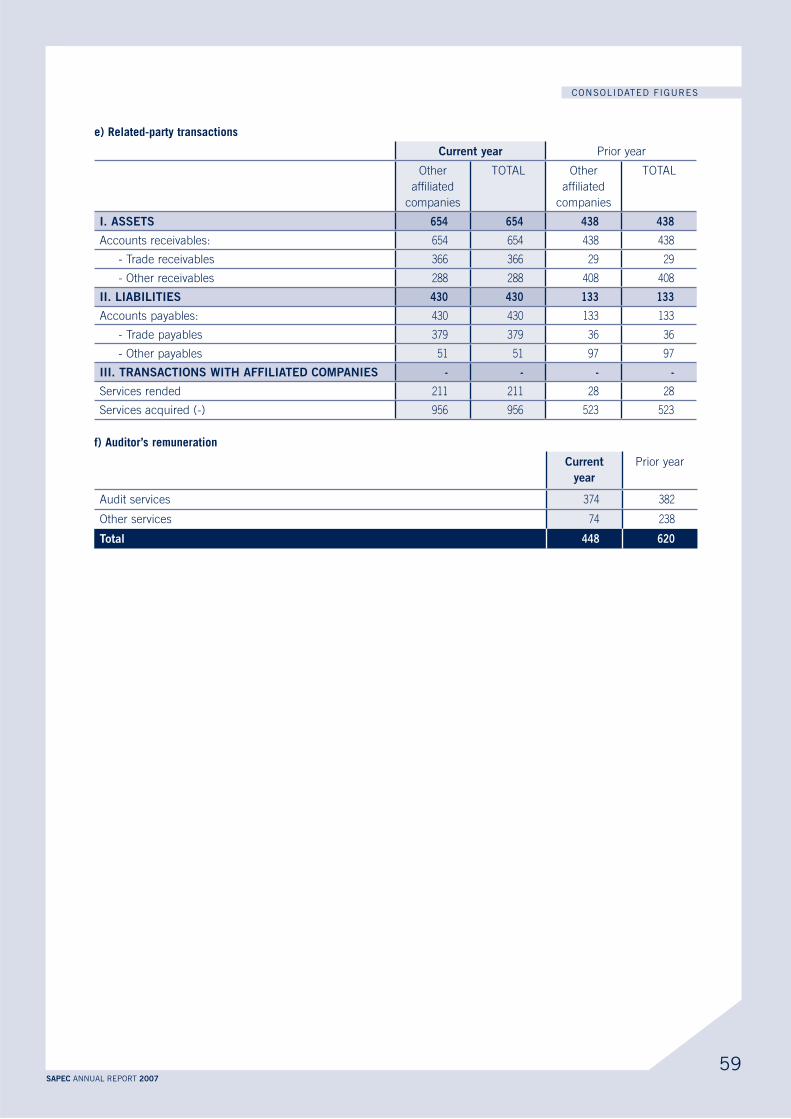
59SAPEC ANNUAL REPORT 2007
CONSOLIDATED FIGURES
e) Related-party transactions
Prior year
Other
affiliated
companies
TOTAL Other
affiliated
companies
TOTAL
Accounts receivables: 654 654 438 438
- Trade receivables 366 366 29 29
- Other receivables 288 288 408 408
Accounts payables: 430 430 133 133
- Trade payables 379 379 36 36
- Other payables 51 51 97 97
- - - -
Services rended 211 211 28 28
Services acquired (-) 956 956 523 523
f) Auditor’s remuneration
Current Prior year
Audit services 374 382
Other services 74 238
Total
60SAPEC ANNUAL REPORT 2007
CONSOLIDATED FIGURES
Company number: BE 0403.085.280
As required by law and the company’s articles of association, we report to you in the context of our appointment as statutory auditor. This
report includes our opinion on the consolidated accounts and the required additional disclosure..
We have audited the consolidated accounts of SAPEC SA and its subsidiaries (the “Group”) as of and for the year ended December 31,
2007, prepared in accordance with International Financial Reporting Standards, as adopted by the European Union, and with the legal and
regulatory requirements applicable on quoted companies in Belgium. These consolidated accounts comprise the consolidated balance
sheet as of December 31, 2007 and the consolidated statements of income, changes in shareholders’ equity and cash flows for the year
then ended, as well as the summary of significant accounting policies and other explanatory notes. The total of the consolidated balance
sheet amounts to EUR 570.594 (000) and the consolidated statement of income shows a profit for the year (group share) of EUR 20.712
(000).
The company’s board of directors is responsible for the preparation of the consolidated accounts. This responsibility includes: designing,
implementing and maintaining internal control relevant to the preparation and fair presentation of consolidated accounts that are free from
material misstatement, whether due to fraud or error; selecting and applying appropriate accounting policies; and making accounting
estimates that are reasonable in the circumstances.
Our responsibility is to express an opinion on these consolidated accounts based on our audit. We conducted our audit in accordance with
the legal requirements applicable in Belgium and with Belgian auditing standards, as issued by the “Institut des Reviseurs d’Entreprises/
Instituut der Bedrijfsrevisoren”. Those auditing standards require that we plan and perform the audit to obtain reasonable assurance about
whether the consolidated accounts are free of material misstatement.
In accordance with the auditing standards referred to above, we have carried out procedures to obtain audit evidence about the amounts
and disclosures in the consolidated accounts. The selection of these procedures is a matter for our judgment, as is the assessment of
the risk that the consolidated accounts contain material misstatements, whether due to fraud or error. In making those risk assessments,
we have considered the Group’s internal control relating to the preparation and fair presentation of the consolidated accounts, in order to
design audit procedures that were appropriate in the circumstances, but not for the purpose of expressing an opinion on the effectiveness
of the Group’s internal control. We have also evaluated the appropriateness of the accounting policies used and the reasonableness of
accounting estimates made by management, as well as the presentation of the consolidated accounts taken as a whole. Finally, we have
obtained from the board of directors and Group officials the explanations and information necessary for our audit. We believe that the audit
evidence we have obtained provides a reasonable basis for our opinion.
In our opinion, the consolidated accounts give a true and fair view of the Group’s net worth and financial position as of December 31, 2007
and of its results and cash flows for the year then ended in accordance with International Financial Reporting Standards, as adopted by
the European Union, and with the legal and regulatory requirements applicable on quoted companies in Belgium.
The company’s board of directors is responsible for the preparation and content of the management report on the consolidated
accounts.
Our responsibility is to include in our report the following additional remark, which does not have any effect on our opinion on the consoli-
dated accounts:
− the management report deals with the information required by the law and is consistent with the consolidated accounts. However,
we are not in a position to express an opinion on the description of the principal risks and uncertainties facing the companies
included in the consolidation, the state of their affairs, their forecast development or the significant influence of certain events on
their future development.
Nevertheless, we can confirm that the information provided is not in obvious contradiction with the information we have acquired in the
context of our appointment.
Brussels, April 15, 2008
MAZARS & GUERARD - REVISEURS D’ENTREPRISES
Statutory Auditor
Represented by
X. DOYEN

STATUTORY ACCOUNTS
61SAPEC ANNUAL REPORT 2007
The statutory annual accounts of Sapec S.A.
are presented in summary format.
In accordance with the articles 98 and 100 of the Belgium companies code,
the management report of the Board of Directors,
the annual accounts of SAPEC S.A. as well as the Auditor’s Report
will be filed with the National Bank of Belgium.
These documents are available on request from:
500, Avenue Louise
1050 Bruxelles
The statutory auditor’s report is unqualified and certifies that the statutory accounts of SAPEC S.A.
for the year ending give the true and fair view of the financial position and results of the Company
in accordance with all legal and regulatory dispositions.
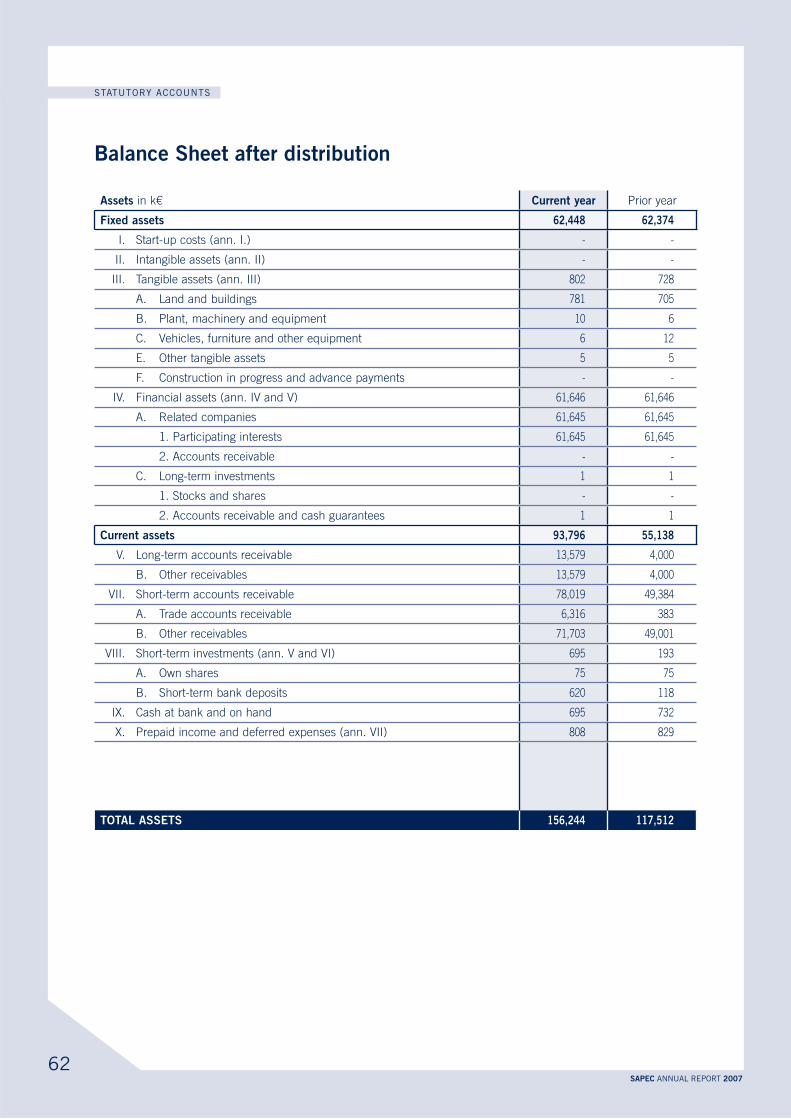
STATUTORY ACCOUNTS
62SAPEC ANNUAL REPORT 2007
Assets in k€ Prior year
I. Start-up costs (ann. I.) - -
II. Intangible assets (ann. II) - -
III. Tangible assets (ann. III) 802 728
A. Land and buildings 781 705
B. Plant, machinery and equipment 10 6
C. Vehicles, furniture and other equipment 6 12
E. Other tangible assets 5 5
F. Construction in progress and advance payments - -
IV. Financial assets (ann. IV and V) 61,646 61,646
A. Related companies 61,645 61,645
1. Participating interests 61,645 61,645
2. Accounts receivable - -
C. Long-term investments 1 1
1. Stocks and shares - -
2. Accounts receivable and cash guarantees 1 1
Current assets
V. Long-term accounts receivable 13,579 4,000
B. Other receivables 13,579 4,000
VII. Short-term accounts receivable 78,019 49,384
A. Trade accounts receivable 6,316 383
B. Other receivables 71,703 49,001
VIII. Short-term investments (ann. V and VI) 695 193
A. Own shares 75 75
B. Short-term bank deposits 620 118
IX. Cash at bank and on hand 695 732
X. Prepaid income and deferred expenses (ann. VII) 808 829
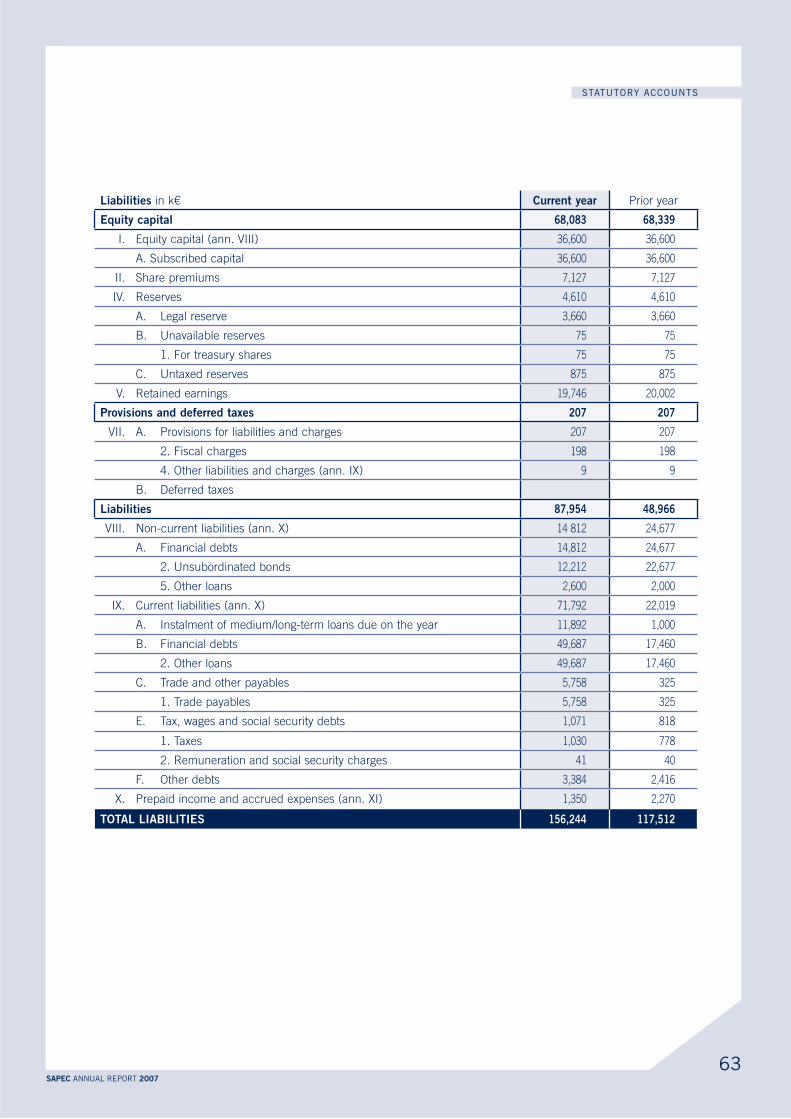
STATUTORY ACCOUNTS
63SAPEC ANNUAL REPORT 2007
in k€ Prior year
I. Equity capital (ann. VIII) 36,600 36,600
A. Subscribed capital 36,600 36,600
II. Share premiums 7,127 7,127
IV. Reserves 4,610 4,610
A. Legal reserve 3,660 3,660
B. Unavailable reserves 75 75
1. For treasury shares 75 75
C. Untaxed reserves 875 875
V. Retained earnings 19,746 20,002
207 207
VII. A. Provisions for liabilities and charges 207 207
2. Fiscal charges 198 198
4. Other liabilities and charges (ann. IX) 9 9
B. Deferred taxes
VIII. Non-current liabilities (ann. X) 14 812 24,677
A. Financial debts 14,812 24,677
2. Unsubordinated bonds 12,212 22,677
5. Other loans 2,600 2,000
IX. Current liabilities (ann. X) 71,792 22,019
A. Instalment of medium/long-term loans due on the year 11,892 1,000
B. Financial debts 49,687 17,460
2. Other loans 49,687 17,460
C. Trade and other payables 5,758 325
1. Trade payables 5,758 325
E. Tax, wages and social security debts 1,071 818
1. Taxes 1,030 778
2. Remuneration and social security charges 41 40
F. Other debts 3,384 2,416
X. Prepaid income and accrued expenses (ann. XI) 1,350 2,270
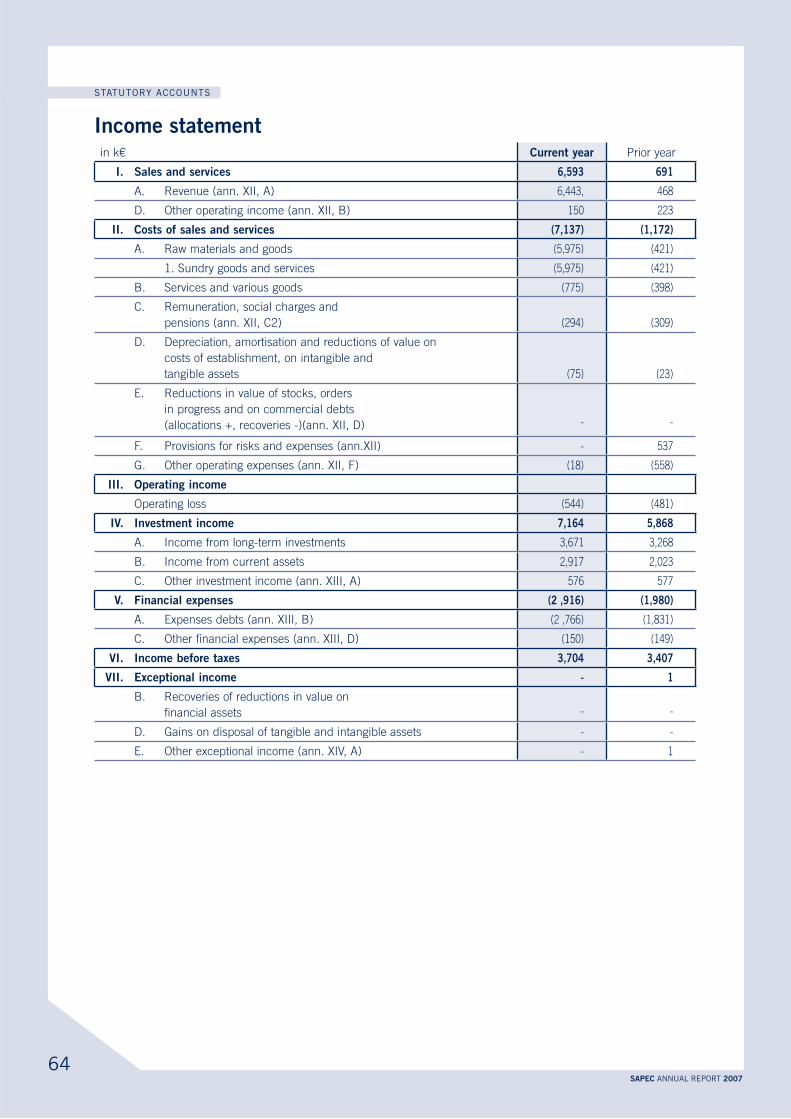
STATUTORY ACCOUNTS
64SAPEC ANNUAL REPORT 2007
in k€ Prior year
A. Revenue (ann. XII, A) 6,443, 468
D. Other operating income (ann. XII, B) 150 223
A. Raw materials and goods (5,975) (421)
1. Sundry goods and services (5,975) (421)
B. Services and various goods (775) (398)
C. Remuneration, social charges and
pensions (ann. XII, C2) (294) (309)
D. Depreciation, amortisation and reductions of value on
costs of establishment, on intangible and
tangible assets (75) (23)
E. Reductions in value of stocks, orders
in progress and on commercial debts
(allocations +, recoveries -)(ann. XII, D) - -
F. Provisions for risks and expenses (ann.XII) - 537
G. Other operating expenses (ann. XII, F) (18) (558)
Operating loss (544) (481)
A. Income from long-term investments 3,671 3,268
B. Income from current assets 2,917 2,023
C. Other investment income (ann. XIII, A) 576 577
A. Expenses debts (ann. XIII, B) (2 ,766) (1,831)
C. Other financial expenses (ann. XIII, D) (150) (149)
-
B. Recoveries of reductions in value on
financial assets - -
D. Gains on disposal of tangible and intangible assets - -
E. Other exceptional income (ann. XIV, A) - 1
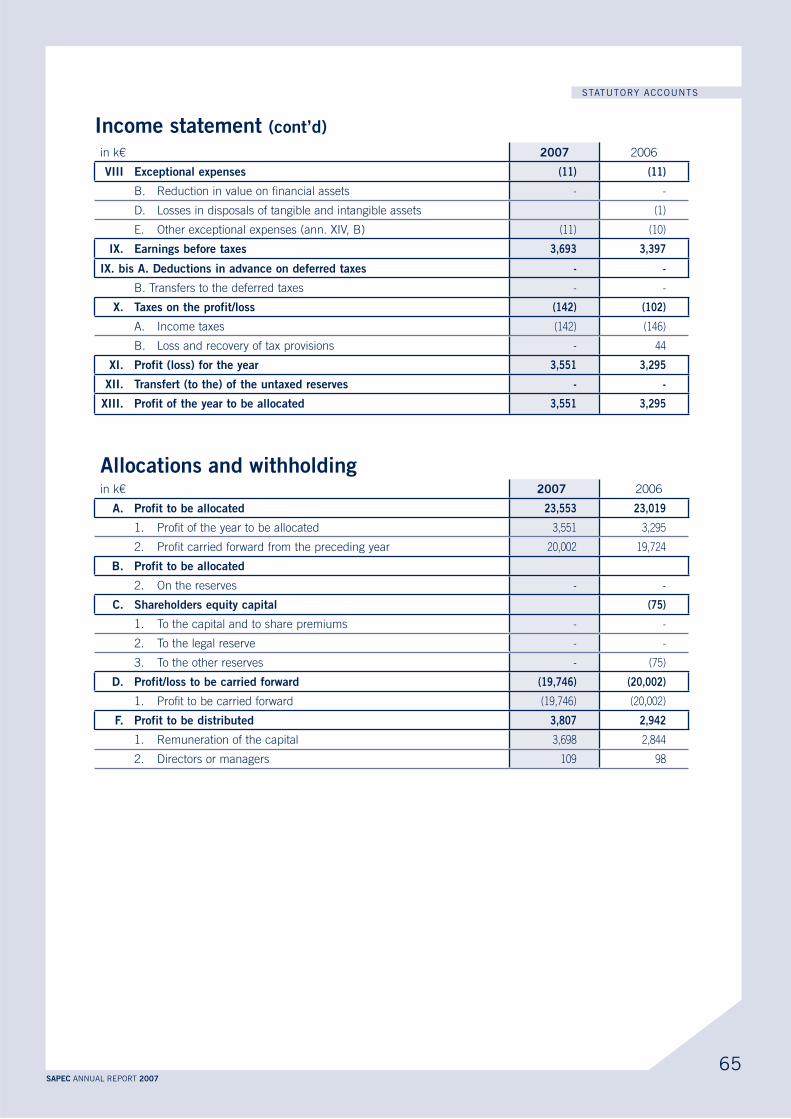
STATUTORY ACCOUNTS
65SAPEC ANNUAL REPORT 2007
in k€ 2007 2006
B. Reduction in value on financial assets - -
D. Losses in disposals of tangible and intangible assets (1)
E. Other exceptional expenses (ann. XIV, B) (11) (10)
- -
B. Transfers to the deferred taxes - -
A. Income taxes (142) (146)
B. Loss and recovery of tax provisions - 44
- -
in k€ 2007 2006
1. Profit of the year to be allocated 3,551 3,295
2. Profit carried forward from the preceding year 20,002 19,724
2. On the reserves - -
1. To the capital and to share premiums - -
2. To the legal reserve - -
3. To the other reserves - (75)
1. Profit to be carried forward (19,746) (20,002)
1. Remuneration of the capital 3,698 2,844
2. Directors or managers 109 98
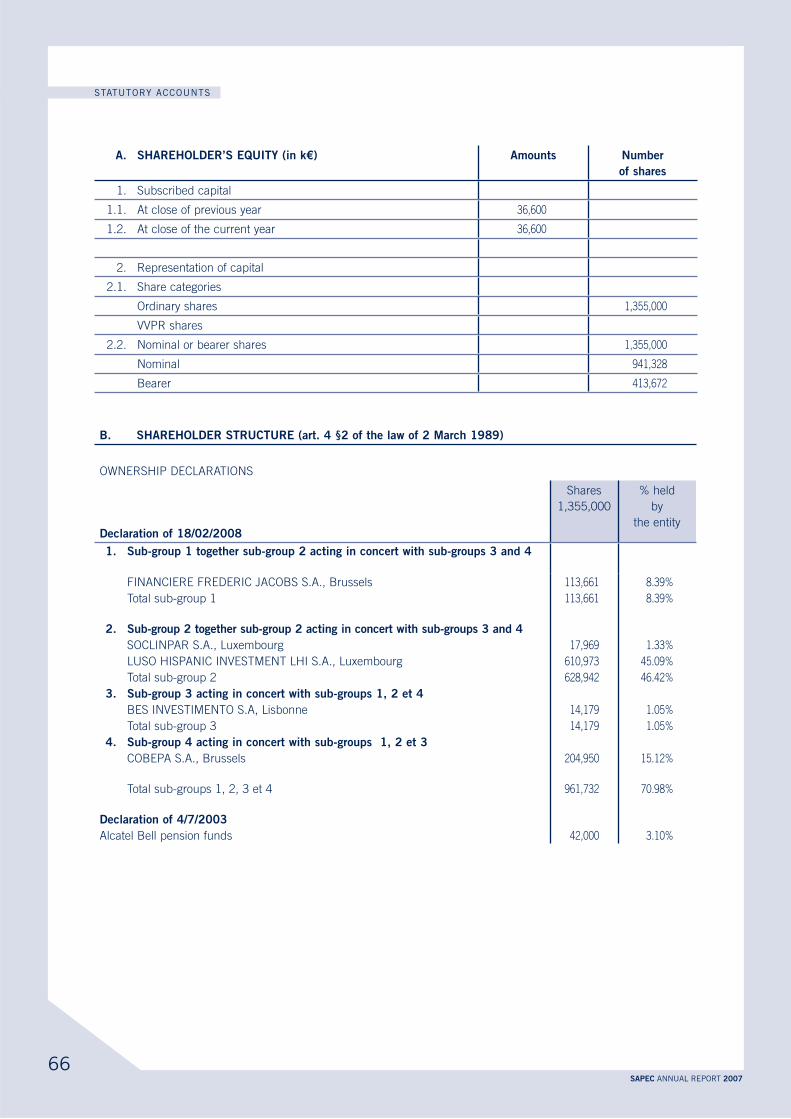
STATUTORY ACCOUNTS
66SAPEC ANNUAL REPORT 2007
1. Subscribed capital
1.1. At close of previous year 36,600
1.2. At close of the current year 36,600
2. Representation of capital
2.1. Share categories
Ordinary shares 1,355,000
VVPR shares
2.2. Nominal or bearer shares 1,355,000
Nominal 941,328
Bearer 413,672
OWNERSHIP DECLARATIONS
Shares
1,355,000
% held
by
the entity
FINANCIERE FREDERIC JACOBS S.A., Brussels 113,661 8.39%
Total sub-group 1 113,661 8.39%
SOCLINPAR S.A., Luxembourg 17,969 1.33%
LUSO HISPANIC INVESTMENT LHI S.A., Luxembourg 610,973 45.09%
Total sub-group 2 628,942 46.42%
BES INVESTIMENTO S.A, Lisbonne 14,179 1.05%
Total sub-group 3 14,179 1.05%
COBEPA S.A., Brussels 204,950 15.12%
Total sub-groups 1, 2, 3 et 4 961,732 70.98%
Alcatel Bell pension funds 42,000 3.10%
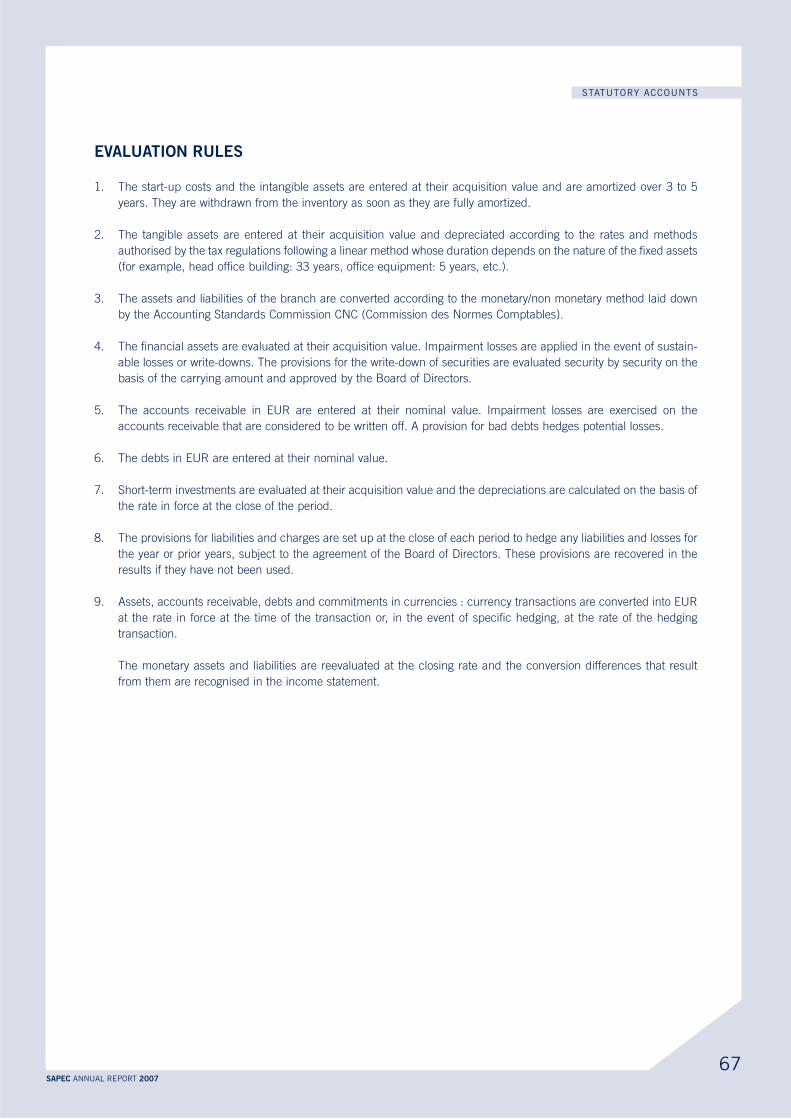
STATUTORY ACCOUNTS
67SAPEC ANNUAL REPORT 2007
1. The start-up costs and the intangible assets are entered at their acquisition value and are amortized over 3 to 5
years. They are withdrawn from the inventory as soon as they are fully amortized.
2. The tangible assets are entered at their acquisition value and depreciated according to the rates and methods
authorised by the tax regulations following a linear method whose duration depends on the nature of the fixed assets
(for example, head office building: 33 years, office equipment: 5 years, etc.).
3. The assets and liabilities of the branch are converted according to the monetary/non monetary method laid down
by the Accounting Standards Commission CNC (Commission des Normes Comptables).
4. The financial assets are evaluated at their acquisition value. Impairment losses are applied in the event of sustain-
able losses or write-downs. The provisions for the write-down of securities are evaluated security by security on the
basis of the carrying amount and approved by the Board of Directors.
5. The accounts receivable in EUR are entered at their nominal value. Impairment losses are exercised on the
accounts receivable that are considered to be written off. A provision for bad debts hedges potential losses.
6. The debts in EUR are entered at their nominal value.
7. Short-term investments are evaluated at their acquisition value and the depreciations are calculated on the basis of
the rate in force at the close of the period.
8. The provisions for liabilities and charges are set up at the close of each period to hedge any liabilities and losses for
the year or prior years, subject to the agreement of the Board of Directors. These provisions are recovered in the
results if they have not been used.
9. Assets, accounts receivable, debts and commitments in currencies : currency transactions are converted into EUR
at the rate in force at the time of the transaction or, in the event of specific hedging, at the rate of the hedging
transaction.
The monetary assets and liabilities are reevaluated at the closing rate and the conversion differences that result
from them are recognised in the income statement.
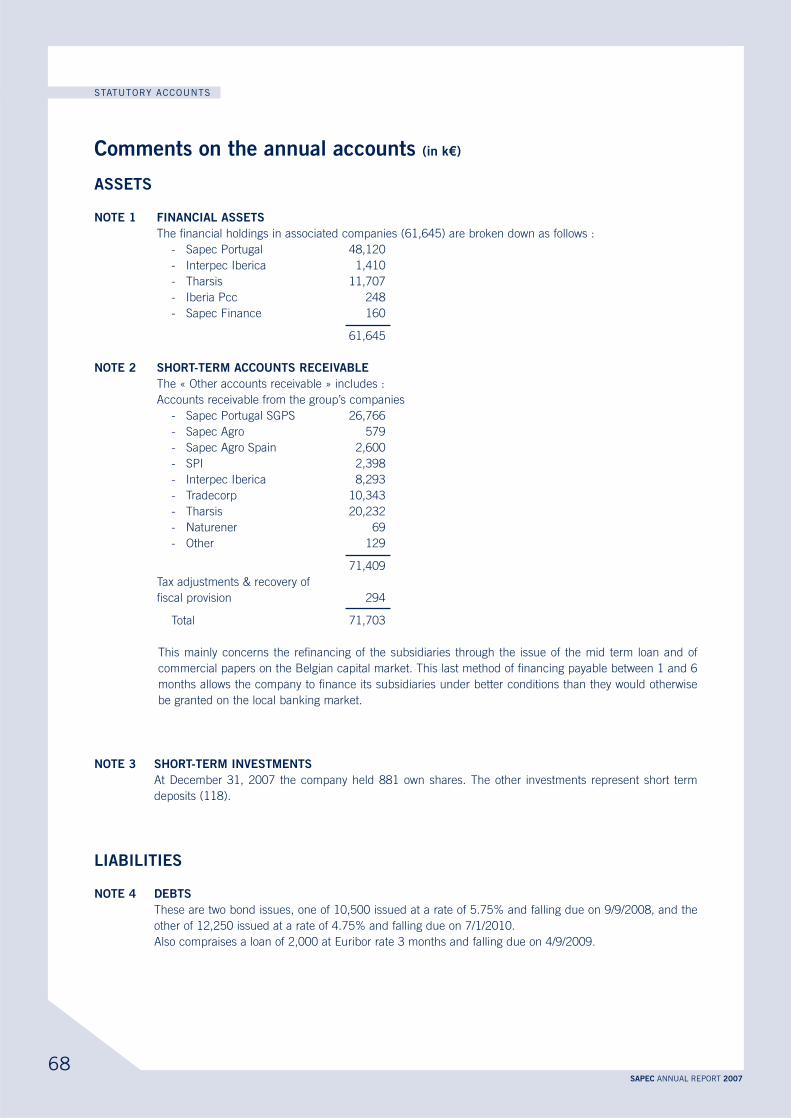
STATUTORY ACCOUNTS
68SAPEC ANNUAL REPORT 2007
(in k€)
ASSETS
The financial holdings in associated companies (61,645) are broken down as follows :
- Sapec Portugal 48,120
- Interpec Iberica 1,410
- Tharsis 11,707
- Iberia Pcc 248
- Sapec Finance 160
61,645
The « Other accounts receivable » includes :
Accounts receivable from the group’s companies
- Sapec Portugal SGPS 26,766
- Sapec Agro 579
- Sapec Agro Spain 2,600
- SPI 2,398
- Interpec Iberica 8,293
- Tradecorp 10,343
- Tharsis 20,232
- Naturener 69
- Other 129
71,409
Tax adjustments & recovery of
fiscal provision 294
Total 71,703
This mainly concerns the refinancing of the subsidiaries through the issue of the mid term loan and of
commercial papers on the Belgian capital market. This last method of financing payable between 1 and 6
months allows the company to finance its subsidiaries under better conditions than they would otherwise
be granted on the local banking market.
At December 31, 2007 the company held 881 own shares. The other investments represent short term
deposits (118).
These are two bond issues, one of 10,500 issued at a rate of 5.75% and falling due on 9/9/2008, and the
other of 12,250 issued at a rate of 4.75% and falling due on 7/1/2010.
Also compraises a loan of 2,000 at Euribor rate 3 months and falling due on 4/9/2009.
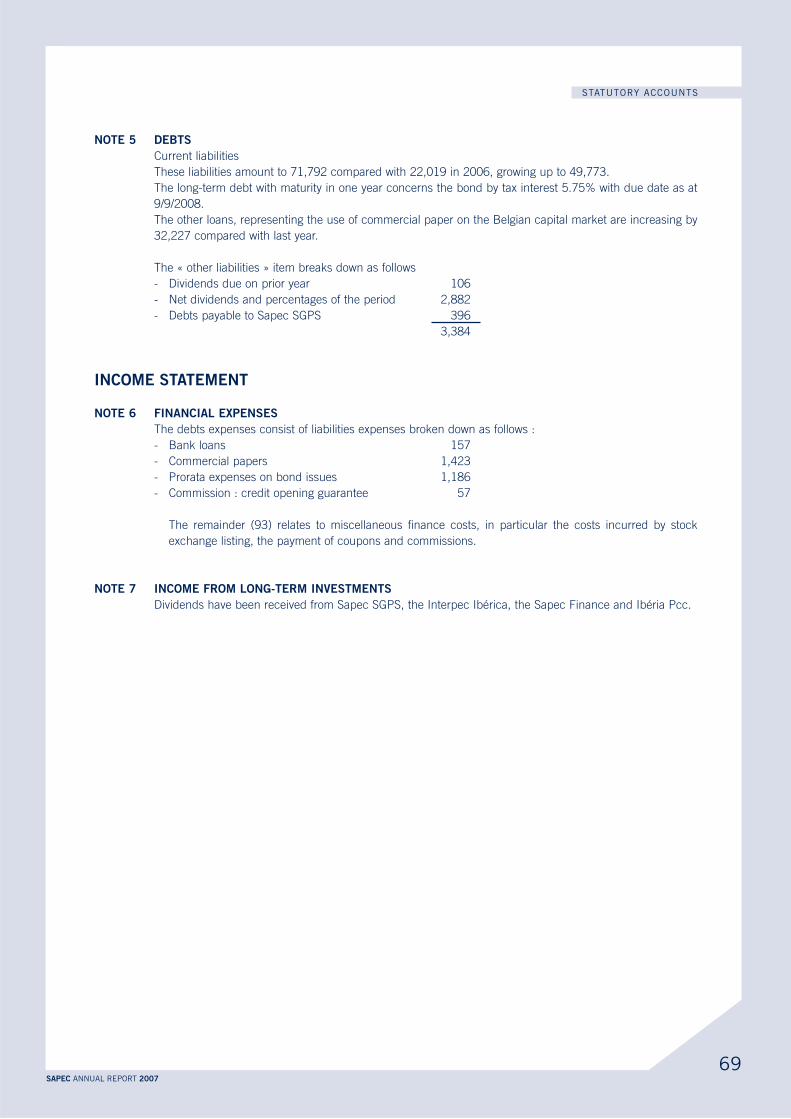
STATUTORY ACCOUNTS
69SAPEC ANNUAL REPORT 2007
Current liabilities
These liabilities amount to 71,792 compared with 22,019 in 2006, growing up to 49,773.
The long-term debt with maturity in one year concerns the bond by tax interest 5.75% with due date as at
9/9/2008.
The other loans, representing the use of commercial paper on the Belgian capital market are increasing by
32,227 compared with last year.
The « other liabilities » item breaks down as follows
- Dividends due on prior year 106
- Net dividends and percentages of the period 2,882
- Debts payable to Sapec SGPS 396
3,384
The debts expenses consist of liabilities expenses broken down as follows :
- Bank loans 157
- Commercial papers 1,423
- Prorata expenses on bond issues 1,186
- Commission : credit opening guarantee 57
The remainder (93) relates to miscellaneous finance costs, in particular the costs incurred by stock
exchange listing, the payment of coupons and commissions.
Dividends have been received from Sapec SGPS, the Interpec Ibérica, the Sapec Finance and Ibéria Pcc.


How to contact us?
Sapec S.A.
500 Avenue Louise, b. 6
1050 Brussels
Tel.: + 32 (0)2 513 92 58
Fax: + 32 (0)2 512 20 90
E-mail : [email protected]
Site : www.sapec.be
VAT: BE403 085 280
Brussels Trade Register N° 626
Investor relations and financial disclosure
Antoine Velge
Eric van Innis
Published by
Antoine Velge
Tel. : + 32 (0)2 513 92 58
Fax : + 32 (0)2 512 20 90
Annual report
Ce rapport annuel est également disponible en français
Layout and design
www.inextremis.be
Printing
Impresor