annual report. 2007 annual report analyst presentation, 27 th march 2008 occhiello
TRANSCRIPT

Annual Report

2007 Annual Report
Analyst Presentation, 27th March 2008
occhiello

Hera has approved the 5th annual report with a positive growth implying over the last 5 years +18.8% Ebitda cagr and +23.9% Net Profit cagr.
2007 Organic Growth was driven by tariff progression (in Water and Waste businesses), by successful electricity cross selling and by energy trading activities enhancement.
Synergy and efficiency gains have been in line with expectations also thanks to past mergers.
Internal growth drivers allowed to fully offset the “one off” negative effect of the mild winter of H1 and the full impact of Del. 134/’06 AEEG in Gas sales prices.
Year 2007 in a nutshell
SAT merger, performed in 2007, will start contributing from January 1st 2008.
4 New plants completion in 2007: CCGT of Teverola (400MW), CCGT of Sparanise (800MW) and WTE of Ferrara entered into operation in 2007. WTE of Forlì was almost completed at year end and is currently entering into operations.
Bottom line results enhanced by one off benefits on deferred tax and by corporate tax rates cut.
BoD has proposed a dividend distribution in line with last year (8 €c per share).
2007 Group Results 1
Organic growth and “one off” tax benefit enhanced bottom line
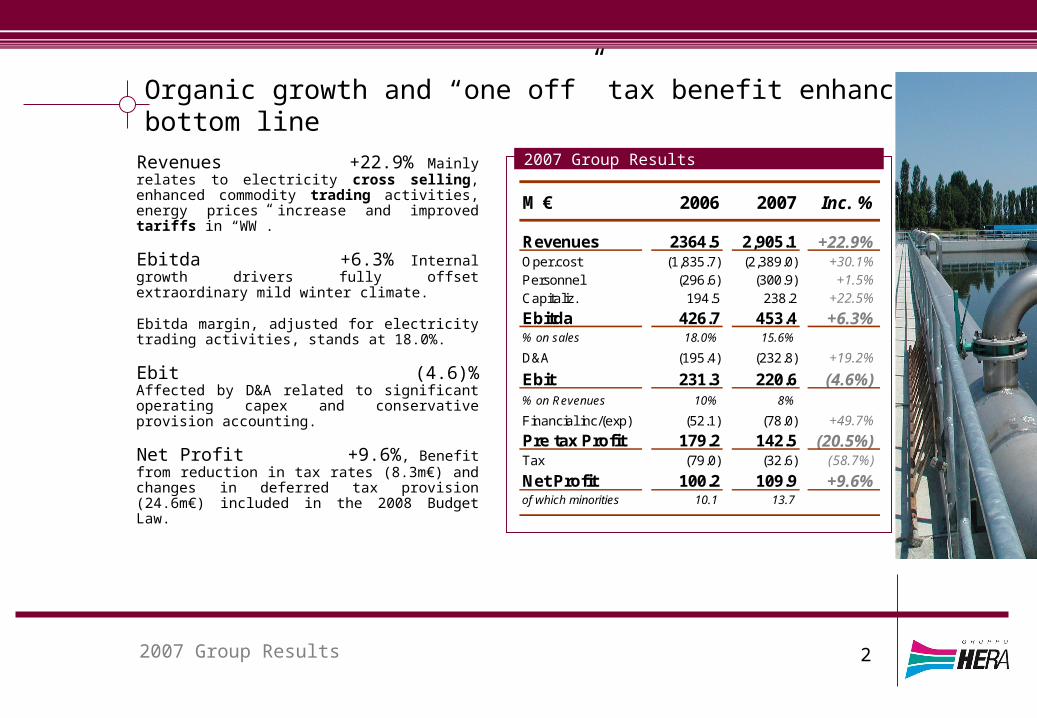
2007 Group ResultsRevenues +22.9% Mainly relates to electricity cross selling, enhanced commodity trading activities, energy prices increase and improved tariffs in “WW”.
Ebitda +6.3% Internal growth drivers fully offset extraordinary mild winter climate.
Ebitda margin, adjusted for electricity trading activities, stands at 18.0%.
Ebit (4.6)% Affected by D&A related to significant operating capex and conservative provision accounting.
Net Profit +9.6%, Benefit from reduction in tax rates (8.3m€) and changes in deferred tax provision (24.6m€) included in the 2008 Budget Law.
2007 Group Results
M € 2006 2007 Inc. %
Revenues 2364.5 2,905.1 +22.9%Oper.cost (1,835.7) (2,389.0) +30.1%Personnel (296.6) (300.9) +1.5%Capitaliz. 194.5 238.2 +22.5%
Ebitda 426.7 453.4 +6.3%% on sales 18.0% 15.6%
D&A (195.4) (232.8) +19.2%
Ebit 231.3 220.6 (4.6%)% on Revenues 10% 8%
Financial inc/(exp) (52.1) (78.0) +49.7%
Pre tax Profit 179.2 142.5 (20.5%)Tax (79.0) (32.6) (58.7%)
Net Profit 100.2 109.9 +9.6%of which minorities 10.1 13.7
2

H2 2007 Ebitda back to double digit growth rates
2007 growth in line with expectations
2007 results, underpinned by internal growth, highlight positive growth which would have reached +54 m€ (substantially without M&A and accounting the Del. 134/’06 on gas prices) not considering the extraordinary H1 mild winter effect (-27 m€).
SAT and Aspes Multiservizi-Megas full mergers, accomplished in 2007, will be accounted from 1st January 2008.
Ebitda back to double digit growth rate
H2 2007 Group Ebitda growth rates were back to track record also thanks to more “normal” weather conditions.
2007 Normalised Ebitda
2007 Group Results
(1.9)%
+12.7%+10.9%
+4.8%
Q1 Q2 Q3
2007 Ebitda Growth by quarters
Q4
426.5 +26.9 453.4+27.0 480.4
300
350
400
450
500
2006 Syn &Org.G.
2007 H1 climateeffect
2007Normalised
3
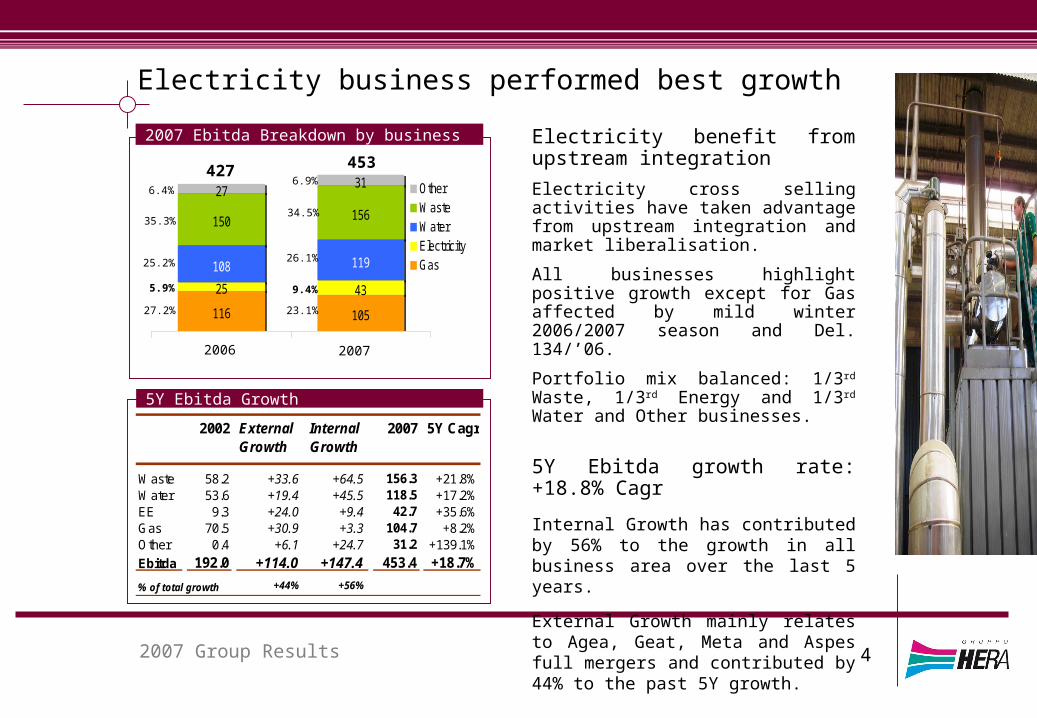
Electricity benefit from upstream integration
Electricity cross selling activities have taken advantage from upstream integration and market liberalisation.
All businesses highlight positive growth except for Gas affected by mild winter 2006/2007 season and Del. 134/’06.
Portfolio mix balanced: 1/3rd Waste, 1/3rd Energy and 1/3rd Water and Other businesses.
5Y Ebitda growth rate: +18.8% Cagr
Internal Growth has contributed by 56% to the growth in all business area over the last 5 years.
External Growth mainly relates to Agea, Geat, Meta and Aspes full mergers and contributed by 44% to the past 5Y growth.
116 105
25 43
108 119
150 156
2731
OtherWasteWaterElectricityGas
Electricity business performed best growth
2007 Ebitda Breakdown by business
2007 Group Results
427
27.2%
5.9%
25.2%
35.3%
6.4%
453
23.1%
9.4%
26.1%
34.5%
6.9%
5Y Ebitda Growth
2006 2007
2002 External Growth
Internal Growth
2007 5Y Cagr
Waste 58.2 +33.6 +64.5 156.3 +21.8%Water 53.6 +19.4 +45.5 118.5 +17.2%EE 9.3 +24.0 +9.4 42.7 +35.6%Gas 70.5 +30.9 +3.3 104.7 +8.2%Other 0.4 +6.1 +24.7 31.2 +139.1%
Ebitda 192.0 +114.0 +147.4 453.4 +18.7%
% of total growth +44% +56%
4
Waste: Waiting for new WTE contribution
Waste Management Ebitda
Ebitda Drivers
2007 Group Results
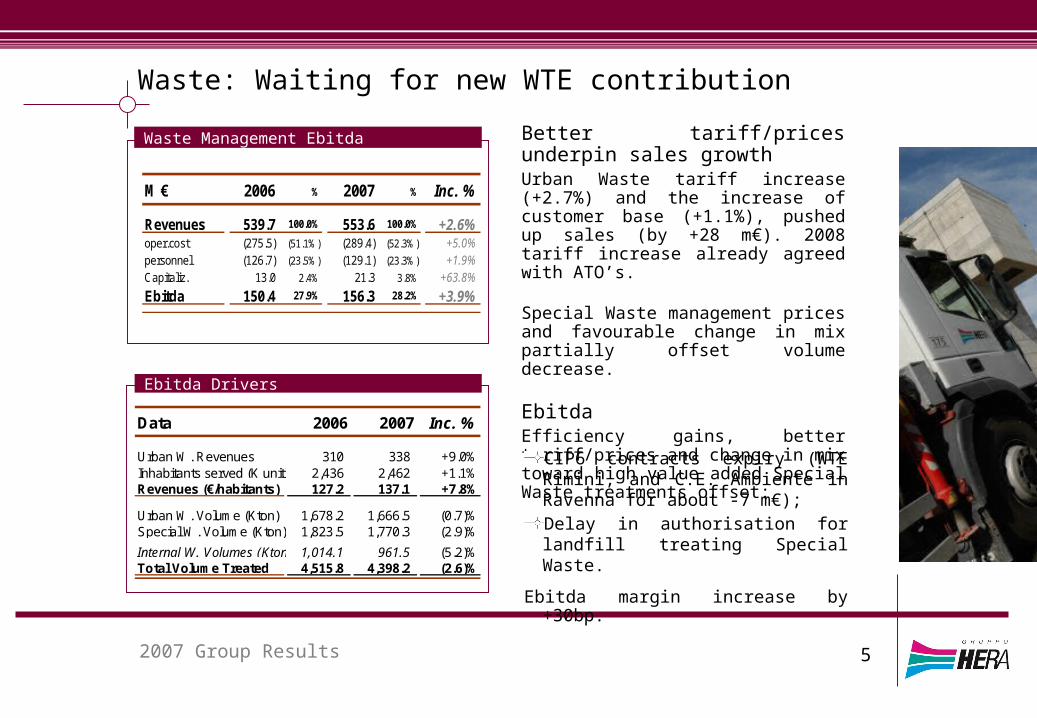
Better tariff/prices underpin sales growthUrban Waste tariff increase (+2.7%) and the increase of customer base (+1.1%), pushed up sales (by +28 m€). 2008 tariff increase already agreed with ATO’s.
Special Waste management prices and favourable change in mix partially offset volume decrease.
EbitdaEfficiency gains, better tariff/prices and change in mix toward high value added Special Waste treatments offset:
CIP6 contracts expiry (WTE Rimini, and C.E. Ambiente in Ravenna for about -7 m€);Delay in authorisation for landfill treating Special Waste.
Ebitda margin increase by +30bp.
M € 2006 % 2007 % Inc. %
Revenues 539.7 100.0% 553.6 100.0% +2.6%oper.cost (275.5) (51.1%) (289.4) (52.3%) +5.0%personnel (126.7) (23.5%) (129.1) (23.3%) +1.9%Capitaliz. 13.0 2.4% 21.3 3.8% +63.8%
Ebitda 150.4 27.9% 156.3 28.2% +3.9%
Data 2006 2007 Inc. %
Urban W. Revenues 310 338 +9.0%Inhabitants served (K unit) 2,436 2,462 +1.1%Revenues (€/habitants) 127.2 137.1 +7.8%
Urban W. Volume (Kton) 1,678.2 1,666.5 (0.7)%Special W. Volume (Kton) 1,823.5 1,770.3 (2.9)%
Internal W. Volumes (Kton) 1,014.1 961.5 (5.2)%Total Volume Treated 4,515.8 4,398.2 (2.6)%
5
Water Management Ebitda
2007 Group Results
Water: progression in Ebitda margins
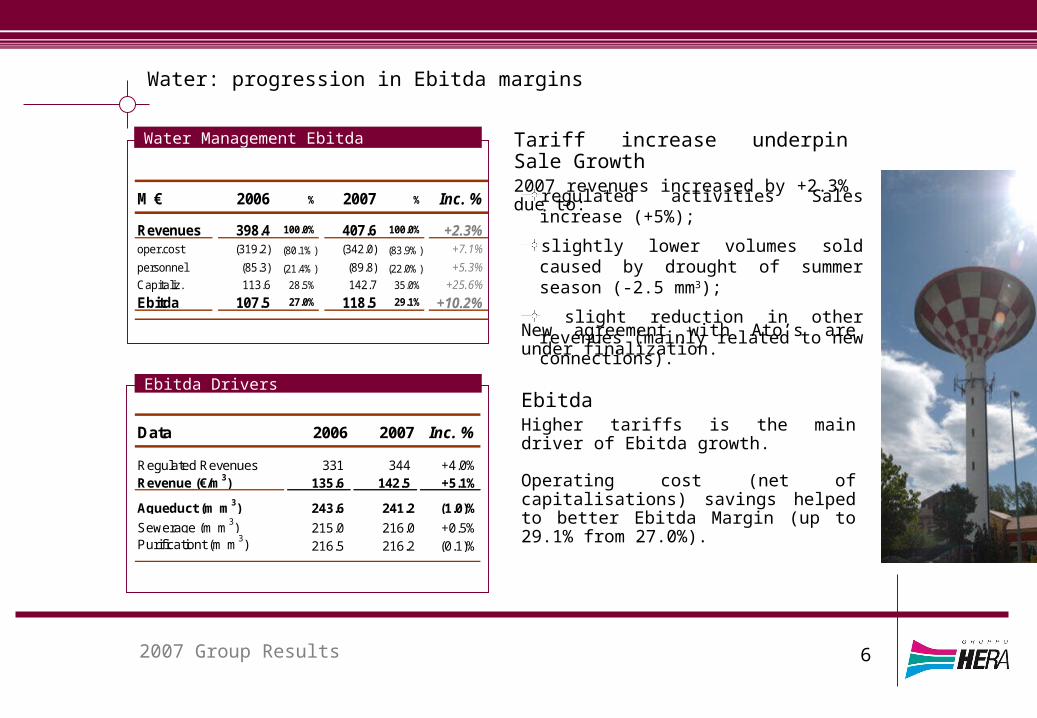
regulated activities Sales increase (+5%);
slightly lower volumes sold caused by drought of summer season (-2.5 mm3);
slight reduction in other revenues (mainly related to new connections).
Ebitda Drivers
Tariff increase underpin Sale Growth2007 revenues increased by +2.3% due to:
New agreement with Ato’s are under finalization.
EbitdaHigher tariffs is the main driver of Ebitda growth.
Operating cost (net of capitalisations) savings helped to better Ebitda Margin (up to 29.1% from 27.0%).
M € 2006 % 2007 % Inc. %
Revenues 398.4 100.0% 407.6 100.0% +2.3%oper.cost (319.2) (80.1%) (342.0) (83.9%) +7.1%
personnel (85.3) (21.4%) (89.8) (22.0%) +5.3%
Capitaliz. 113.6 28.5% 142.7 35.0% +25.6%
Ebitda 107.5 27.0% 118.5 29.1% +10.2%
Data 2006 2007 Inc. %
Regulated Revenues 331 344 +4.0%Revenue (€/m3) 135.6 142.5 +5.1%
Aqueduct (m m3) 243.6 241.2 (1.0)%
Sewerage (m m3) 215.0 216.0 +0.5%Purificationt (m m3) 216.5 216.2 (0.1)%
6

59.1
4.4
44.644.9
2.4 4.1
53.3
8.0
Q1 Q2 Q3 Q4
2006
2007
Gas Ebitda
2007 Ebitda by Quarters
2007 Group Results
Gas: Warm Q1 significantly affected performance
Volume affected by mild winter season
Sales are underpinned by higher gas prices and increased Distribution avg. revenues (benefiting from better price cap).
Q4 increase in volume distributed/sold reduced mild winter effect ( ~-160 mm3 Y/Y).
Ebitda Lower volumes sold/distrib. (~-9.0m€) and Del.134/’06 AEEG effects (~-9.0m€), on full year basis, offset increased distribution tariffs and improved performance of activities.
M € 2006 % 2007 % Inc. %
Revenues 987.6 100.0% 922.0 100.0% (6.6%)oper.cost (856.9) (86.8%) (810.5) (87.9%) (5.4%)
personnel (44.1) (4.5%) (39.5) (4.3%) (10.4%)
Capitaliz. 29.5 3.0% 32.7 3.5% +10.8%
Ebitda 116.1 11.8% 104.7 11.4% (9.8%)
7
Electricity Ebitda
2007 Group Results
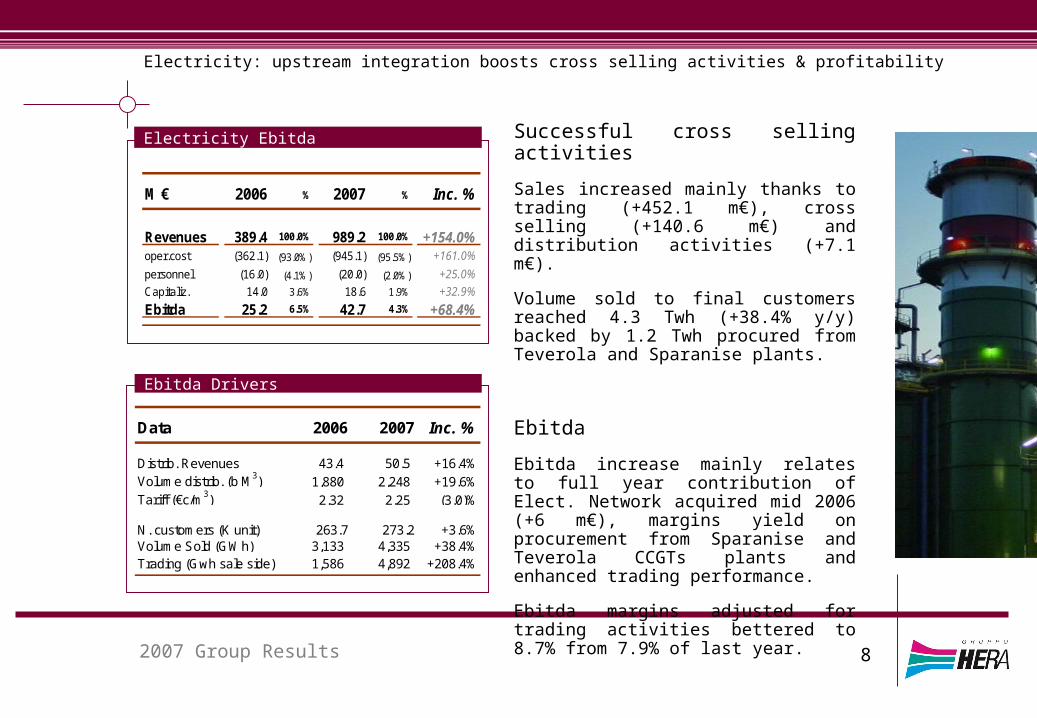
Electricity: upstream integration boosts cross selling activities & profitability
Successful cross selling activities
Sales increased mainly thanks to trading (+452.1 m€), cross selling (+140.6 m€) and distribution activities (+7.1 m€).
Volume sold to final customers reached 4.3 Twh (+38.4% y/y) backed by 1.2 Twh procured from Teverola and Sparanise plants.
Ebitda
Ebitda increase mainly relates to full year contribution of Elect. Network acquired mid 2006 (+6 m€), margins yield on procurement from Sparanise and Teverola CCGTs plants and enhanced trading performance.
Ebitda margins adjusted for trading activities bettered to 8.7% from 7.9% of last year.
Ebitda Drivers
M € 2006 % 2007 % Inc. %
Revenues 389.4 100.0% 989.2 100.0% +154.0%oper.cost (362.1) (93.0%) (945.1) (95.5%) +161.0%
personnel (16.0) (4.1%) (20.0) (2.0%) +25.0%
Capitaliz. 14.0 3.6% 18.6 1.9% +32.9%
Ebitda 25.2 6.5% 42.7 4.3% +68.4%
Data 2006 2007 Inc. %
Distrib. Revenues 43.4 50.5 +16.4%Volume distrib. (b M3) 1,880 2,248 +19.6%Tariff (€c/m3) 2.32 2.25 (3.0)%
N. customers (K unit) 263.7 273.2 +3.6%Volume Sold (GWh) 3,133 4,335 +38.4%Trading (Gwh sale side) 1,586 4,892 +208.4%
8

Other Businesses: Efficiency gains offset mild winter effects
Other businesses Ebitda
2007 Group Results
Revenues
Revenues substantially unchanged despite the negative impact on District Heating of mild winter season record in H1.
Micro-cogeneration units have been completed and positively contributed to year end results.
Ebitda
Positive effect of efficiency gains and organic growth (Heat management and micro generation units) more than offset District Heating lower results driving up Ebitda margins to 19.5% from 16.8%.
Ebitda Drivers
M € 2006 % 2007 % Inc. %
Revenues 163.1 100.0% 160.4 100.0% (1.7%)oper.cost (135.6) (83.1%) (129.6) (80.8%) (4.4%)personnel (24.5) (15.0%) (22.6) (14.1%) (7.8%)
Capitaliz. 24.4 14.9% 23.0 14.4% (5.7%)
Ebitda 27.4 16.8% 31.2 19.5% +13.9%
Data 2006 2007 Inc. %
District Heating (Gwht) 425.9 391.5 (8.1)%
Public Lighting (K unit) 309.1 319.1 +3.3%
9

2007 results benefit from:
Reduction of corporate tax rates (IRES from 33% to 27.5% and IRAP from 4.25% to 3.9%) will provide recurrent benefits in future. On 2007 account these reductions provide a positive result of 8.3 m€.
2008 Budget law provides the option to settle future tax caused by differences in civil/fiscal D&A. Hera opted to settle deferred tax due paying a “substitute tax” obtaining a positive effect of 24.6 m€ (“Write off” on Deferred tax provisions accrued in past years).
Cash out of payments will be diluted over the next 3 years.
Tax Benefit from reduced corporate tax rate and deferred tax
Taxes
2007 Group Results
Tax (m€) 2006 2007 Effect
Taxes 79.0 32.6 (46.4)of which:Pretax profit change (13.5)Corporate tax rate cut (8.3)Substitutive tax (24.6)
Ebitda (46.4)
10

2007 Capex and Investments
2007 Group Results
Operating Capex
Waste: WTE new plants are progressing (about 61% of waste capex refer to these new plants).
Water: 2007 was last year of first regulatory period with some extraordinary capex.
Gas & Electricity: capex relates to extension of the network and to Imola Co-generation plant (33.5 m€).
Other: Mainly relates to District Heating and Heat Management businesses.
Financial Investments
Financial Investment were mainly related to Teverola CCGT, Flamenergy and Galsi investments.
2007 focused on development capex
M € 2006 2007
Waste 88.8 166.2Water 100.2 131.4Gas 25.4 31.7Electricity 14.8 49.2Other 35.4 35.0Holding 56.5 50.4Financial invest. 183.7 7.8Capex & Inv. 504.8 471.7
2007 Maint. and Develop. capex
278.7
471.7
193
Devolpm. Capex Maint. Capex 2007 Capex
11

2007 Group Cash Flows
Positive Operating cash flow with remarkable operating capex
Positive cash flow from operations partially funded capex and investments (by 471.7m€).
Net Financial Debts 1.424 m€
2007 Debt restructuring achieved primarely through the emission of 100 m€ “Put Bond” (Euribor -29 bp for first 3 years and 4.59% fixed rate plus credit spread Hera from the 3rd year onwards) and 200 m€ “Extendable Put Bond” (Euribor -45 bp for first 5 years and 4.85% fixed rate plus credit spread Hera from the 5th year onwards).
Net financial Debts is predominantly long term debt (about 10 year).
2007 Group Results
*includes Hera Spa dividends (81.3 m€) and dividends distributed by Group companies (FEA e.g.).
*
M € 2007
Net Profit 109.9D&A 206.3
FFO 316.2NWC 48.1Provisions (50.0)
Operating C.F. 314.3Capex & Inv. (471.8)
Asset Disposal 0.0
Free C.F. (157.5)2006 Dividends (89.7)Other Net Equity ch. (3.6)
Ch. in Net Debt (250.8)
Net Debt (1,424.1)
12

Deployment of 2010 Business Plan
2007-2010 Ebitda by business (m€)
Business Plan
Further steps on upstream integration (energy and Waste businesses)
Effective 2008 commercial campaign
New initiatives on renewables
Full integration of SAT and Megas
105 12143
73119
163
156
26731
47
OtherWasteWaterElectricityGas
2007 E2010
453
670
2007 achievements
23.1%
9.4%
26.1%
34.5%
6.9%
18.1%
10.9%
24.3%
39.9%
6.9%
13
0.30.4
0.2
0.3
0.4
0.3
VNG
TAG & GasreleaseOther contracts
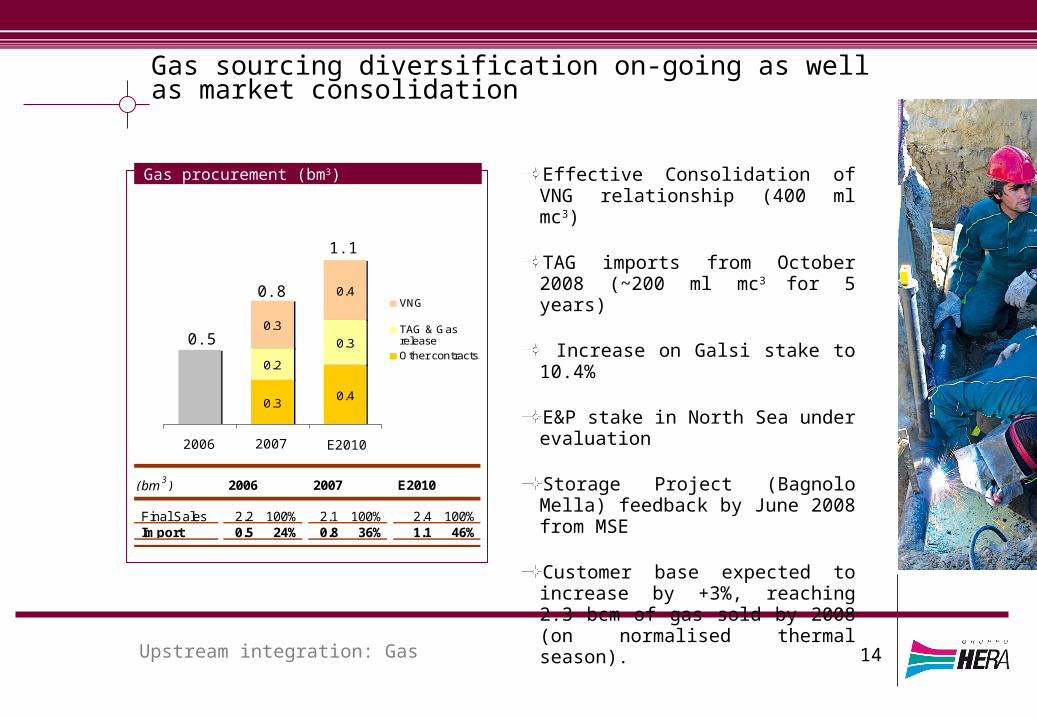
Gas sourcing diversification on-going as well as market consolidation
Gas procurement (bm3)
Upstream integration: Gas
Effective Consolidation of VNG relationship (400 ml mc3)
TAG imports from October 2008 (~200 ml mc3 for 5 years)
Increase on Galsi stake to 10.4%
E&P stake in North Sea under evaluation
Storage Project (Bagnolo Mella) feedback by June 2008 from MSE
Customer base expected to increase by +3%, reaching 2.3 bcm of gas sold by 2008 (on normalised thermal season).
2007 E2010
0.8
1.1
0.5
2006
(bm 3 ) 2006 2007 E2010
Final Sales 2.2 100% 2.1 100% 2.4 100%Import 0.5 24% 0.8 36% 1.1 46%
14
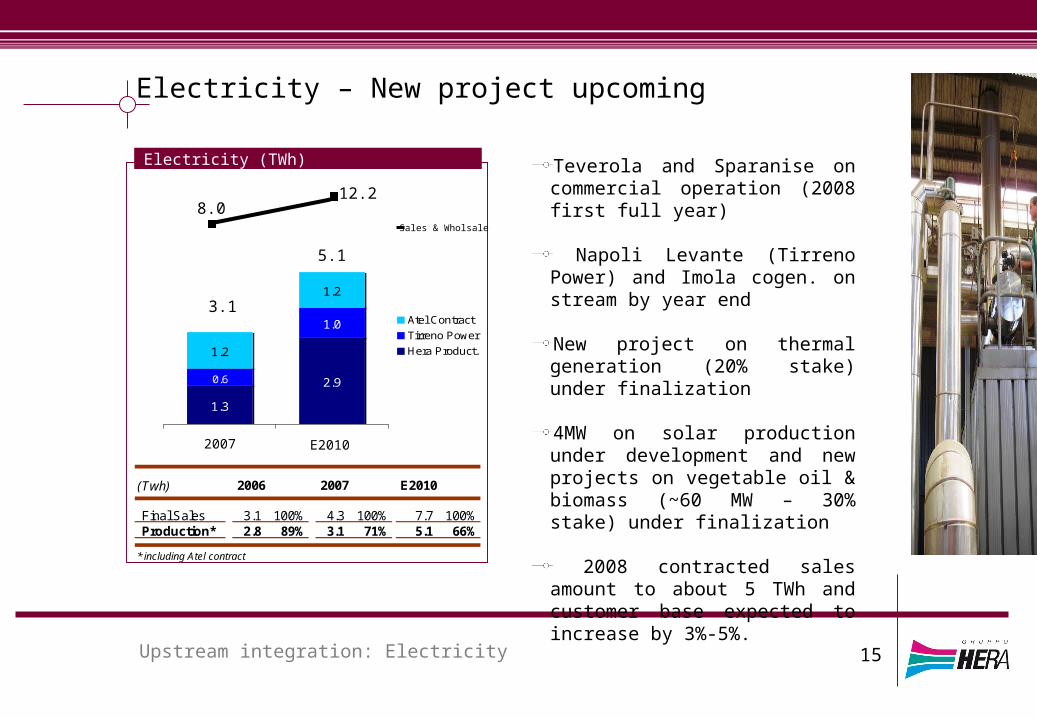
Electricity – New project upcoming
Electricity (TWh)
Upstream integration: Electricity
Teverola and Sparanise on commercial operation (2008 first full year)
Napoli Levante (Tirreno Power) and Imola cogen. on stream by year end
New project on thermal generation (20% stake) under finalization
4MW on solar production under development and new projects on vegetable oil & biomass (~60 MW – 30% stake) under finalization
2008 contracted sales amount to about 5 TWh and customer base expected to increase by 3%-5%.
1.3
2.9
1.0
1.2
1.2
0.6
Atel Contract
Tirreno Power
Hera Product.
2007 E2010
3.1
5.1
(Twh) 2006 2007 E2010
Final Sales 3.1 100% 4.3 100% 7.7 100%Production* 2.8 89% 3.1 71% 5.1 66%
* including Atel contract
Sales & Wholsale
12.28.0
15

Achievements in Waste business
New WTE
Achievements in Waste business
Ferrara WTE plant started in November 2007.
Forlì WTE completed.
Other new WTE are progressing (Modena WTE is progressing).
>Agreements with ATO’s on 2008 urban waste tariff.
Sizable “Full service“ contracts for Special Waste treatment are currently under finalisation.
New WTE Authorisation Construction(48 months) (avg 18 months)
WTE Ferrara
WTE Forlì
WTE Modena 80%
WTE Rimini 98%
WTE Modena (rev.) 5%
100% 100%
100% 100%
100%
20%
100%
New WTE Capacity Ownership
WTE Ferrara 13 MW 100%
WTE Forlì 11MW 100%
WTE Modena 19 MW 100%
WTE Rimini 11 MW 100%
WTE Modena (rev.) 6 MW 100%
16

Other recent changes
Recent changes
CO2 – New allocation plan will not cause significant impacts up to 2011
Energy saving-2008 new targets on white certificates already achieved, including initiatives ongoing
Return on new Water investments from 7% to 7.2% from 2008
Green certificate from District Heating refer to Imola cogen. and 3-4 initiatives in the territory (requests to be submitted by year end 2008)
17

2007 results were in line with budgets and highlights Group portfolio mix to overcome extraordinary negative climate conditions.
Upstream integration strategy improved liberalised electricity supply activities.
Regulated activities were positively affected by tariff increases (except for electricity distribution).
4 new plants out of 7 have been completed.
Dividend proposed confirms 8 €c per share.
Plan execution is progressing and the new “2007-2011” is already in progress.
Closing remarks
2007 Group Results 18