annual report 2005 - sharedatagrindrod limited annual report2005 3 group profile grindrod limited is...
TRANSCRIPT
W3IB0003 Grindrod Cover 06/04/2006 2:28 PM Page 1
Composite
C M Y CM MY CY CMY K
GRINDRODLIMITED
w w w . g r i n d r o d . c o . z a
GR
IND
RO
D LIM
ITE
D A
NN
UA
L RE
PO
RT
20
05
Ef fect ive s t rateg ies for susta ined
performance and growth
GRINDRODLIMITED
A N N U A L R E P O R T 2 0 0 5

W3IB0003 Grindrod Cover 06/04/2006 2:28 PM Page 2
Composite
C M Y CM MY CY CMY K
Contents Terms and ExpressionsPage
Mission 1
Strategic objectives 1
Group structure 2
Group profile 3
Group operational highlights 4
Group financial highlights 5
Chairman’s report 6
Chief executive officer’s report 8
Directorate 12
Group financial review 16
Operational reviews 21
Corporate governance 36
Social performance 44
Corporate social investment 50
Stakeholder engagement 51
Environmental performance 52
Directors’ responsibility for financial reporting 55
Company secretary’s certificate 55
Report of the independent auditors 56
Directors’ report 57
Accounting policies 61
Balance sheets 68
Income statements 69
Statement of changes in equity 70
Cash flow statements 71
Segmental analysis 72
Transition to International Financial Reporting Standards 73
Notes to the financial statements 78
Loan funds 110
Interests in subsidiaries 111
Value added statement 112
Share performance 113
Analysis of ordinary shareholders 114
Analysis of preference shareholders 116
Corporate information 117
Shareholders’ diary for 2006 118
Notice of meeting 119
Form of proxy attached
Terms and expressions ibc
BAREBOAT CHARTERCharter party where the charterer hires a ship without
crew and the charterer takes responsibility for the ship
maintenance, crewing and insurance as though the vessel
was owned by the charterer
BREAKBULKDry, loose cargo
BULK CARRIERShip designed to carry dry, loose cargoes in bulk
BUNKERSA ships fuel
CAPESIZE BULK CARRIERBulk carrier between 100 000 and 180 000 dwt
CHARTERDocument evidencing a contract between shipowner
and charterer or cargo owner and the shipowner and
disponent owner
CHARTERERThe hirer of a vessel from the owner either for a period of
time or a voyage
CHARTER PARTYConditions under which a charterer hires a vessel
CHEMICAL TANKERSA tanker, usually not larger than 40 000 dwt, designed to
carry numerous bulk liquid chemical products, often in
stainless steel tanks, in isolated compartments (also
termed “parcels”)
CONTAINERSHIP
Ship designed to carry containerised cargo
DEADWEIGHT or DWTThe greatest weight of cargo, stores and all other
consumables on the ship that a ship can carry expressed
in metric tonnes
GRINDROD LIMITED ANNUAL REPORT 2005 GRINDROD LIMITED ANNUAL REPORT 2005
HANDYSIZE BULK CARRIERBulk carrier between 10 000 and 40 000 dwt
HANDYMAX BULK CARRIERBulk carrier between 40 000 and 60 000 dwt
LINER SHIPPING OPERATIONSOperators who trade ships according to a schedule
between specified ports
OFFHIREWhen a ship is temporarily out of operation in accordance
with the terms of the relevant charter party with a loss of
agreed hire as a result (downtime)
OPERATORAn operator who trades in ships and cargo
PANAMAX BULK CARRIERBulk carrier with a maximum beam of 32.2 metres and of
between 60 000 and 100 000 dwt
PRODUCTS TANKERA tanker designed to carry refined petroleum products in
bulk in multiple tanks
SHIPPING POOL/JOINT SERVICES AGREEMENTAn organised group of ship owners and/or charterers
where there is a pooling of resources for the purpose of
flexible and commercial operation of ships
TECHNICAL MANAGEMENTManagement of the marine operations maintenance,
crewing, storing and insurance of the ship
TIME CHARTERCharter party where the charterer hires a ship which is
crewed, maintained and ready for operation for an agreed
time period
TEU (TWENTY FOOT EQUIVALENT UNIT)The standard length of a container and the measurement
used to determine the container carrying capacity of
a ship

GRINDROD LIMITED ANNUAL REPORT 2005 1
Mission
The group’s main strategic objectives, reviewed annually by the executive committee and
endorsed by the Grindrod Limited board, are as follows:
Shipping Services
• Ensure a solid platform of earnings and a low level of risk by fixing out a portion of the
group’s fleet.
• Achieve favourable spot earnings on ships operated in specialised sectors.
• Look for restocking opportunities in lower shipping markets.
• Where appropriate sell ships at favourable prices to lock in value.
Trading, Freight and Financial Services
• Non-shipping activities to provide one-third of the group’s income.
• Expand bulk product trading to new markets.
• Continue the expansion of landfreight logistics through ports, terminals, road, rail and
logistical services.
• Grow the group’s banking operation.
Shipping Services
• To be a world respected shipping company operating from a predominantly international base.
Trading, Freight and Financial Services
• To be a leading bulk product trader operating from a local and international base.
• To be the largest and first choice Southern African land, sea, air and rail logistics service
provider by operating from an empowered South African base.
• To be a leading provider of financial services through an empowered bank.
Strategic Objectives
1
W3IB00003 Grindrod INSIDE 06/04/2006 2:23 PM Page 1
GRINDROD LIMITED ANNUAL REPORT 20052
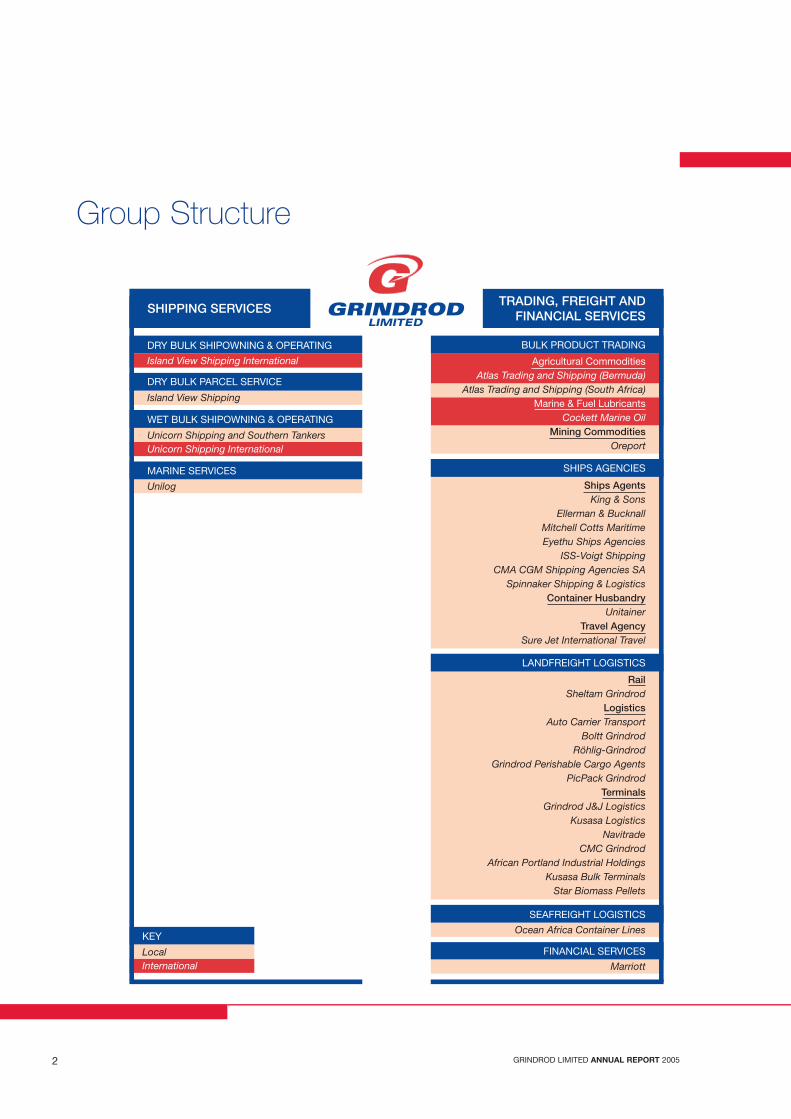
Group Structure
BULK PRODUCT TRADING
Agricultural CommoditiesAtlas Trading and Shipping (Bermuda)
Atlas Trading and Shipping (South Africa)Marine & Fuel Lubricants
Cockett Marine OilMining Commodities
Oreport
LANDFREIGHT LOGISTICS
RailSheltam Grindrod
LogisticsAuto Carrier Transport
Boltt GrindrodRöhlig-Grindrod
Grindrod Perishable Cargo AgentsPicPack Grindrod
TerminalsGrindrod J&J Logistics
Kusasa LogisticsNavitrade
CMC GrindrodAfrican Portland Industrial Holdings
Kusasa Bulk TerminalsStar Biomass Pellets
SHIPS AGENCIES
Ships AgentsKing & Sons
Ellerman & BucknallMitchell Cotts MaritimeEyethu Ships Agencies
ISS-Voigt ShippingCMA CGM Shipping Agencies SA
Spinnaker Shipping & LogisticsContainer Husbandry
UnitainerTravel Agency
Sure Jet International Travel
KEY
LocalInternational
DRY BULK SHIPOWNING & OPERATING
Island View Shipping International
DRY BULK PARCEL SERVICE
Island View Shipping
MARINE SERVICES
Unilog
WET BULK SHIPOWNING & OPERATING
Unicorn Shipping and Southern TankersUnicorn Shipping International
SHIPPING SERVICESTRADING, FREIGHT AND
FINANCIAL SERVICES
SEAFREIGHT LOGISTICS
Ocean Africa Container Lines
Marriott
FINANCIAL SERVICES
W3IB00003 Grindrod INSIDE 06/04/2006 2:23 PM Page 2
GRINDROD LIMITED ANNUAL REPORT 2005 3
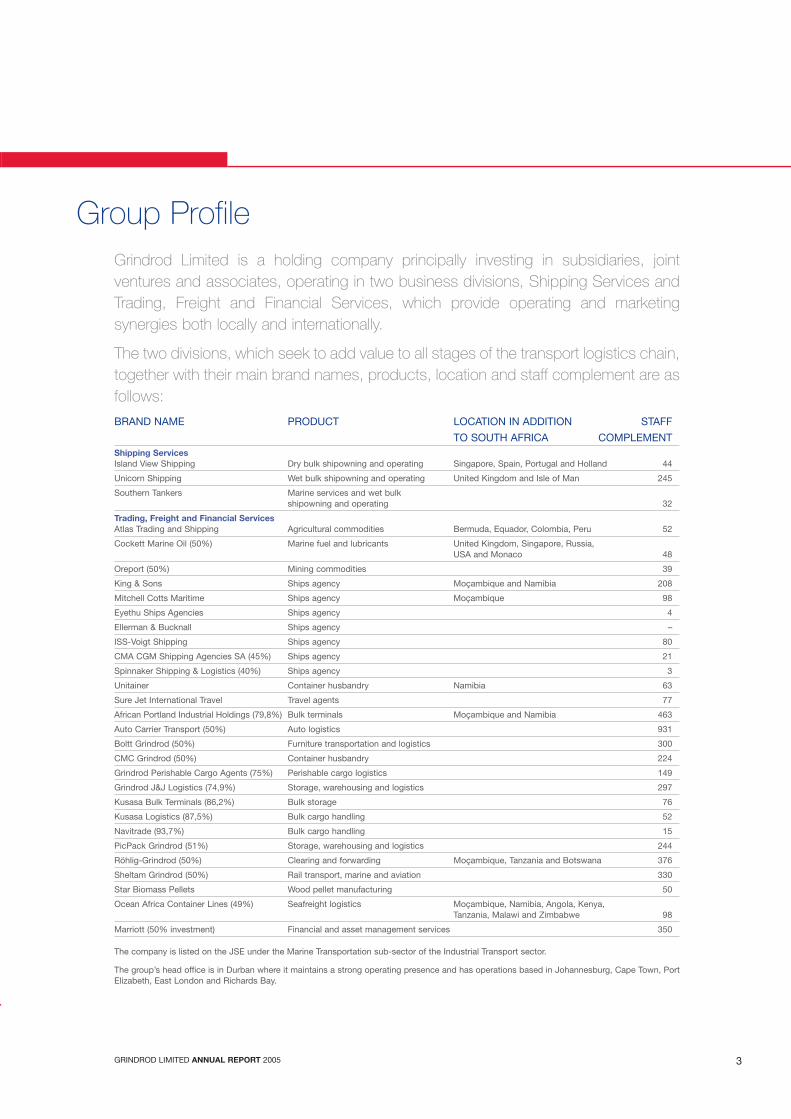
Group ProfileGrindrod Limited is a holding company principally investing in subsidiaries, jointventures and associates, operating in two business divisions, Shipping Services andTrading, Freight and Financial Services, which provide operating and marketingsynergies both locally and internationally.
The two divisions, which seek to add value to all stages of the transport logistics chain,together with their main brand names, products, location and staff complement are asfollows:
BRAND NAME PRODUCT LOCATION IN ADDITION STAFF
TO SOUTH AFRICA COMPLEMENTShipping ServicesIsland View Shipping Dry bulk shipowning and operating Singapore, Spain, Portugal and Holland 44
Unicorn Shipping Wet bulk shipowning and operating United Kingdom and Isle of Man 245
Southern Tankers Marine services and wet bulk shipowning and operating 32
Trading, Freight and Financial ServicesAtlas Trading and Shipping Agricultural commodities Bermuda, Equador, Colombia, Peru 52
Cockett Marine Oil (50%) Marine fuel and lubricants United Kingdom, Singapore, Russia, USA and Monaco 48
Oreport (50%) Mining commodities 39
King & Sons Ships agency Moçambique and Namibia 208
Mitchell Cotts Maritime Ships agency Moçambique 98
Eyethu Ships Agencies Ships agency 4
Ellerman & Bucknall Ships agency –
ISS-Voigt Shipping Ships agency 80
CMA CGM Shipping Agencies SA (45%) Ships agency 21
Spinnaker Shipping & Logistics (40%) Ships agency 3
Unitainer Container husbandry Namibia 63
Sure Jet International Travel Travel agents 77
African Portland Industrial Holdings (79,8%) Bulk terminals Moçambique and Namibia 463
Auto Carrier Transport (50%) Auto logistics 931
Boltt Grindrod (50%) Furniture transportation and logistics 300
CMC Grindrod (50%) Container husbandry 224
Grindrod Perishable Cargo Agents (75%) Perishable cargo logistics 149
Grindrod J&J Logistics (74,9%) Storage, warehousing and logistics 297
Kusasa Bulk Terminals (86,2%) Bulk storage 76
Kusasa Logistics (87,5%) Bulk cargo handling 52
Navitrade (93,7%) Bulk cargo handling 15
PicPack Grindrod (51%) Storage, warehousing and logistics 244
Röhlig-Grindrod (50%) Clearing and forwarding Moçambique, Tanzania and Botswana 376
Sheltam Grindrod (50%) Rail transport, marine and aviation 330
Star Biomass Pellets Wood pellet manufacturing 50
Ocean Africa Container Lines (49%) Seafreight logistics Moçambique, Namibia, Angola, Kenya, Tanzania, Malawi and Zimbabwe 98
Marriott (50% investment) Financial and asset management services 350
The company is listed on the JSE under the Marine Transportation sub-sector of the Industrial Transport sector.
The group’s head office is in Durban where it maintains a strong operating presence and has operations based in Johannesburg, Cape Town, PortElizabeth, East London and Richards Bay.
W3IB00003 Grindrod INSIDE 06/04/2006 2:23 PM Page 3

GRINDROD LIMITED ANNUAL REPORT 20054
Group Operational Highlights• 56% increase in profit attributable to ordinary shareholders
• 53% increase in headline earnings per share
• 49% increase in annual dividend
• 115% increase in cash generated from operations
• Owned and chartered ship fleet expansion at low cost
• Favourable spot earnings on ships operated
• 61% of fleet contracted out for 2006
• Contracted shipping profit of US$49 million for 2006
• Expansion of warehousing capacity
• Entry into coal terminal and rail businesses
• Establishment of a bulk product trading division
• Sale of Marriott asset and property management
0
200
400
600
800
1000
1400
2001 2002 2003 2004 2005
1200
Revenue (R millions)
0
1000
2000
3000
4000
5000
7000
8000
2001 2002 2003 2004 2005
6000
0
10
20
30
40
50
60
2001 2002 2003 2004 2005
Dividends per share (cents)Headline earningsper share (cents)
0
20
40
60
100
140
180
200
2001 2002 2003 2004 2005
160
120
80
Year-end ordinaryshare price (cents)
0
200
400
600
1000
1400
2001 2002 2003 2004 2005
1200
800
Net worth per shareat market value (cents)
Total assets (R millions)
0
1000
6000
2001 2002 2003 2004 2005
4000
3000
2000
5000
Group Financial Highlights
W3IB00003 Grindrod INSIDE 06/04/2006 2:23 PM Page 4

GRINDROD LIMITED ANNUAL REPORT 2005 5
Group Financial Highlights2005 2004
Financial resultsRevenue (Rm) 7 449 2 974
Operating profit before interest and taxation (Rm) 925 602
Profit attributable to ordinary shareholders (Rm) 851 546
Financial ratiosInterest bearing debt to total shareholders’ interests (%) 33,0 53,3
Return on ordinary shareholders’ funds (%) 74,6 75,7
Return on net assets (%) 37,1 37,7
Operating margin (%) 12,4 20,2
Operating margin excluding bulk product trading (%) 24,2 20,2
Ordinary share performanceEarnings per share (cents) 185,7 121,3
Headline earnings per share (cents) 185,3 121,4
Cash earnings per share (cents) 214,4 164,5
Dividends per share– preference (cents) 303,8 –
– ordinary (cents) 52,0 35,0
Closing share price at year end – preference (cents) 11 650,0 –
– ordinary (cents) 1 300,0 790,0
Market capitalisation at year end (Rm) 6 583,6 3 591,4
– preference shares (Rm) 582,5 –
– ordinary shares (Rm) 6 001,1 3 591,4
Ordinary dividends per share include a final dividend of 32 cents (2004: 25 cents) that, in accordance with the
International Financial Reporting Standards (IFRS), has not been provided for.
Shipping Services
Trading, Freight andFinancial Services
Segmental Result beforeInterest and Taxation Segmental Equity
W3IB00003 Grindrod INSIDE 06/04/2006 2:23 PM Page 5
GRINDROD LIMITED ANNUAL REPORT 20056
Chairman’s Report
Further diversification of the group took place during the year under review, with the most notable development beingthe introduction of a bulk product trading arm which complements the shipping activities. Acquisitions were also madein the landside activities as well as an increase in warehousing and terminal capacity within existing businesses.
Shipping markets remained relatively high during the year, although bulk shipping markets did decline in the second halfof 2005. The group, however, continued to manage its exposure to markets through a diversification of activities withinthe dry and wet sectors and the container market, and through the fixing of charters and cargo contracts.
Business EnvironmentDuring 2005 the South African economy had its strongest economic growth since the early 1980s. Interest and inflationrates are at their lowest level for many years. While the strong Rand continues to impact on the group’s financial results,this has been counteracted by the strong shipping markets.
From an international perspective there has been significant economic upturn, driven mainly by China, Japan, India and other developing economies. This has been achieved against the backdrop of increasing interest rates and highenergy prices.
Financial ReviewThe group has reported record earnings of R851 million compared to R546 million in 2004. The board has maintained a3,5 dividend cover and a final dividend of 32 cents per ordinary share has been declared, bringing the total for the yearto 52 cents compared to 35 cents for the previous year.
EquityOn 27 July 2005 shareholders approved the creation of cumulative, non-redeemable, non-participating, non-convertiblepreference shares. The initial offer of 5 000 000 shares was issued and listed in 2005 and the balance of 2 500 000shares on 17 February 2006. This has provided additional permanent capital of R754 million for the group.
Shareholders also approved a 5 for 1 share subdivision which took effect on 31 October 2005. The share split wasundertaken to increase the liquidity of the share and to align the price with the group’s peers on the JSE. Theseobjectives have been achieved.
Group Activities
The past year has been another record year with the group reporting the best financialresults in its history. The group has grown substantially and is well positioned in themid cap sector of the JSE with a market capitalisation of R6,5 billion. A solid platformof strong cash flows and good low cost assets present further exciting opportunitiesfor the future of the group.
W3IB00003 Grindrod INSIDE 06/04/2006 2:23 PM Page 6

GRINDROD LIMITED ANNUAL REPORT 2005 7
SustainabilityThe group continued to place high emphasis on ensuring that it complied in all material respects with King II CorporateGovernance Guidelines. It also continues to ensure that the business is conducted with discipline, integrity, transparencyand with increasing focus on its social responsibility. A comprehensive board charter is in place which commits thedirectors to uphold these principles.
The board recognises that it carries the ultimate responsibility for risk management within Grindrod and a significantportion of board time is set aside to ensure that correct processes have been designed to assess and monitor thegroup’s risk position. The increased diversity of operations has necessitated further development and integration of riskmanagement structures during the year.
Significant progress was made during the year in terms of developing and reporting on material environmental, socialand economic sustainability key performance indicators (KPI) for our business. There is more disclosure in this year’sreport on this aspect of our business included in Corporate Governance, Stakeholder Engagement, SocialPerformance, Environmental Performance and Corporate Social Investment sections. The group is committed tocontinual improvement in this area, in line with global best practice, and in this regard the group is following thedevelopment of the Global Reporting Initiative’s (GRI) new ‘G3’ set of guidelines. Our intention is to use the revisedguidelines, due out in October 2006, insofar as they apply to our business, as the basis for developing our ownsustainability KPI for future reporting cycles.
Black Economic EmpowermentThe group is a signatory to the Maritime Empowerment Charter and is totally committed to the process of broad-basedempowerment within the group. External accreditation is currently in process and further progress has been made toempower both shipping and landfreight operations in South Africa.
DirectorateJohn Hall retired during the past year and has not been replaced, as additional non-executive appointments were madeat the end of 2004. We are extremely appreciative of the contribution made by John on the board.
The board comprises eight non-executive and seven executive directors and there is a strong balance of knowledge,skill and appropriate experience in line with best corporate governance practice.
AppreciationThe board and all employees are extremely proud of the group’s achievements in 2005. Grindrod was honoured with theSunday Times/Business Times Top Company Award for the second year running, the 2005 Financial Mail Top Companyas well as winning the listed corporate sector of the Standard Bank KZN Business Growth Awards. In addition, thecompany was awarded the number one ranking of public shipping companies worldwide by Marine Money International,a leading global ship finance publication. These achievements have raised Grindrod’s profile in the financial andinvestment markets, and certainly would not have been possible without the commitment and vision of an extremelyexperienced executive management team and the support of their staff.
I commend the group chief executive officer and his team on these outstanding achievements. I also extend my thanksto the non-executive directors for their wise counsel and involvement in the affairs of the group.
W M GrindrodChairman
Durban22 February 2006
W3IB00003 Grindrod INSIDE 06/04/2006 2:23 PM Page 7

GRINDROD LIMITED ANNUAL REPORT 20058
The strong base developed in previous years continued to reap rewards with a
53% growth in headline earnings per share to R1,85. Shipping Services was again the
major contributor to group profits from its diversified fleet of new, low cost ships, while
Trading, Freight and Financial Services had good profit growth from a low base.
Trading Environment
Shipping markets continued to remain at high levels during the year with some decline in the dry bulk markets being
offset to some degree by stronger product and chemical tanker markets. China was again the major driver of shipping
demand, but India, Japan and a resilient USA economy also contributed. Ship newbuildings, delivered during the year,
kept shipping rates in check, but factors such as scrapping of old ships, new regulatory requirements, shortages of oil
refining capacity and the expected continued economic growth from the world’s major economies continue to keep
shipping markets at historically high levels.
The predominantly Southern African based landfreight logistics environment was very buoyant, mainly as a result of the
strong local economy and the increased import and export requirements. Demand for agricultural and mining
commodities was firm as a result of the strong local and world economies.
Financial
This annual report has been prepared in accordance with IFRS. IFRS and the revised IAS 39 Financial Instruments and
IAS 17 Operating Leases were adopted with effect from 1 January 2005. The effect of the adoption of IFRS, IAS 39 and
IAS 17 is set out in the Statement of Changes in Equity and reconciliation of previous SA Accounting Standards to IFRS
included in this report. The previous year’s figures have been restated for the effects of IFRS, IAS 39 and IAS 17.
Group revenue was 150% up on last year due to increased business activities, the acquisition of the bulk product trading
businesses and the consolidation of Röhlig-Grindrod which was previously equity accounted. Operating margins have
reduced due to the inclusion of these low margin businesses.
Chief Executive Officer’s Report
W3IB00003 Grindrod INSIDE 06/04/2006 2:23 PM Page 8

GRINDROD LIMITED ANNUAL REPORT 2005 9
Investment of R1,7 billion was made in ship acquisitions, bulk product trading operations and landfreight expansion.
Due to the strong operating cash flows and the issue of R488 million in preference shares, net borrowings only increased
from R628 million at 31 December 2004 to R878 million at 31 December 2005. The group’s debt:equity ratio has
improved from 53% to 33% as a result of good earnings and the preference share issue.
Although the group’s share price is trading at a premium to book net asset value (NAV), there is substantial unrecognised
value in owned ships, ship charters and options as well as in our freight and financial operations. The group’s mark to
market value per share is R13, which provides shareholders with assurance that the share price is underpinned by
asset value.
Included in current assets are the carrying values of a product tanker which has been contracted to be sold, a 50%
interest in two handysize bulk carriers which are likely to be disposed of during the year and the interest in Marriott’s
property and asset management businesses, which have been sold subject to Competition Commission approval.
Strategy
The group will continue to ensure that a substantial portion of the fleet is fixed out either on time charter or through
contracts of affreightment, but will continue to target spot earnings in specialised sectors. Expansion of Shipping
Services will only be pursued against contracted income or in specific niche markets as current pricing on ships is still
high. Restocking opportunities will be considered in lower shipping markets, but ship sales will be considered at
favourable prices to lock in value.
During the year, in line with the group’s strategy to expand its non-shipping operations, the following acquisitions
were made:
• African Portland Industrial Holdings, a bulk terminal operator in Namibia and Moçambique
• 50% of Sheltam Rail, a locomotive operator
• Additional warehousing facilities in Grindrod J&J Logistics
• Sea Munye’s bulk product warehousing operations in Richards Bay
• Shareholding in Röhlig-Grindrod was increased from 42,5% to 50%
In line with the group’s strategy a number of group companies expanded their operations. These expansions are dealt
with in more detail in the Operational Reviews section of this report.
Subsequent to year end, a joint venture with Lauritzen Cool Logistics to provide South African perishable goods logistics
services was concluded.
W3IB00003 Grindrod INSIDE 06/04/2006 2:23 PM Page 9

GRINDROD LIMITED ANNUAL REPORT 200510
The group’s strategy is to increase the profit contribution from freight operations through the acquisition or development
of complementary businesses to ensure that a full range of services is provided to our customers.
The group will focus on expanding its non-shipping operations, particularly in the following areas:
• Bulk product trading
• Ports
• Terminals
• Rail
• Logistics
• Banking
It is the intention that non-shipping operations will contribute at least one third of group profits in the future.
Capital Commitments
Capital expenditure and commitments of the group are:
Description Capital expenditure Capital commitments
R000 2005 2006 2007 Thereafter
Ships 489 900 343 991 626 446 337 762
Property, plant and equipment 158 235 194 381 1 000 –
648 135 538 372 627 446 337 762
Investment in new businesses 1 056 245 – – –
Total 1 704 380 538 372 627 446 337 762
Capital commitments will be funded by cash reserves, cash generated from operations and bank financing facilities.
Prospects
Dry bulk shipping markets are expected to be at lower levels in 2006 and the Rand/US Dollar exchange rate is forecast
to be at similar levels to 2005. However, as a result of an expanded, low cost, diversified fleet of ships, the high level of
contracted income, the anticipated strong performance by the non-shipping operations and profits from re-investment
of cash generated, the board expects that the group will achieve growth in earnings for the year to December 2006.
Directorate and Secretary
The names of the directors and secretary appear on pages 12 to 15 and 117.
Chief Executive Officer’s Report (continued)
W3IB00003 Grindrod INSIDE 06/04/2006 2:23 PM Page 10
GRINDROD LIMITED ANNUAL REPORT 2005 1111
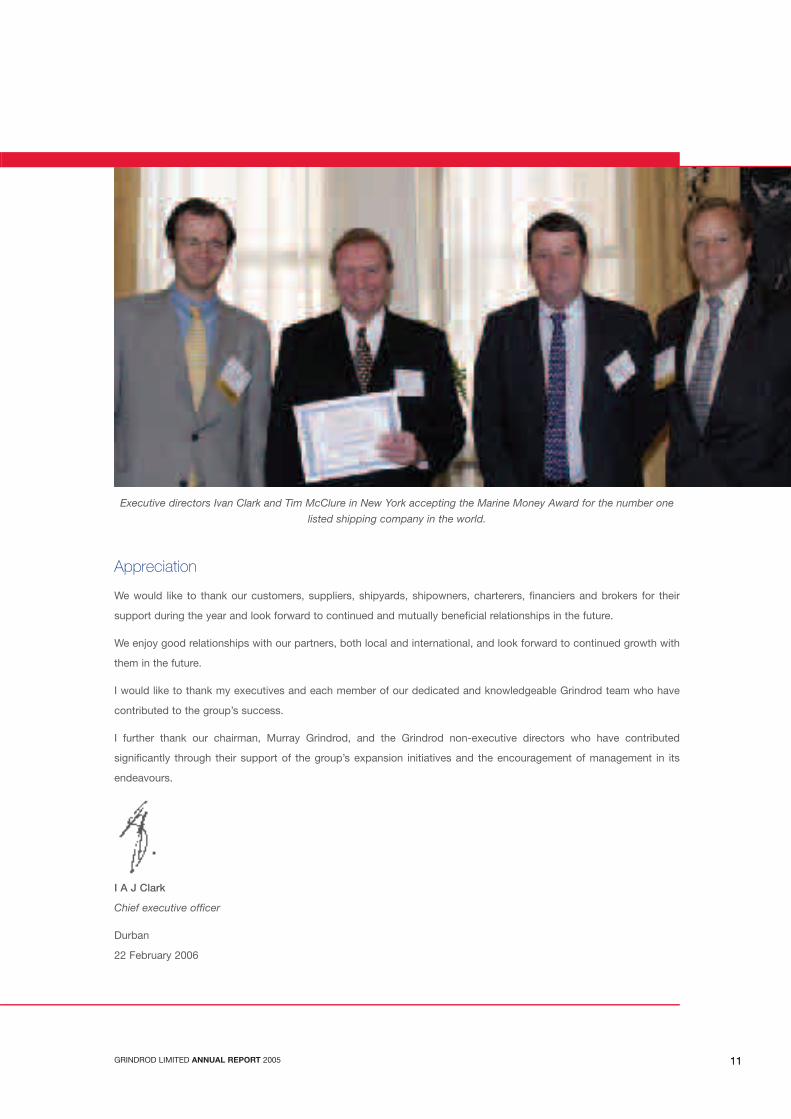
Appreciation
We would like to thank our customers, suppliers, shipyards, shipowners, charterers, financiers and brokers for their
support during the year and look forward to continued and mutually beneficial relationships in the future.
We enjoy good relationships with our partners, both local and international, and look forward to continued growth with
them in the future.
I would like to thank my executives and each member of our dedicated and knowledgeable Grindrod team who have
contributed to the group’s success.
I further thank our chairman, Murray Grindrod, and the Grindrod non-executive directors who have contributed
significantly through their support of the group’s expansion initiatives and the encouragement of management in its
endeavours.
I A J Clark
Chief executive officer
Durban
22 February 2006
Executive directors Ivan Clark and Tim McClure in New York accepting the Marine Money Award for the number one
listed shipping company in the world.
W3IB00003 Grindrod INSIDE 06/04/2006 2:23 PM Page 11

GRINDROD LIMITED ANNUAL REPORT 200512
Directorate NON-EXECUTIVE
W M GRINDROD (70) – BA; DEcon (hc)
Chairman
Appointed 1966 ■ ◆ ●
Career commenced with group in 1957. Currently chairman of RMBT Holdings Limited
and non-executive director of Marriott Holdings Limited, Marriott Corporate Property
Bank Limited and Sea Containers Limited. Has previously served as a non-executive
director of major listed companies, which include Sanlam Limited and Anglo Alpha
Limited. Past president of SA Shipowners’ Association.
D R D WHITE (69)
Deputy chairman
Appointed 1991 ■ ◆
Attorney practising in commercial and corporate law.
Served as deputy chairman since 1998. Senior partner at Garlicke & Bousfield
1989 – 2002. Currently practises as an executive consultant to the law firm.
H ADAMS (53)
Appointed 2000
Consulting engineer ▲
Deputy chairman of SunWest, Table Bay Hotel and Proman Project Managers. Chairman
of ASCH Consulting Engineers. Has diversified business interests in engineering,
project management, leisure and gaming.
S M GOUNDEN (Dr) (47) – BEng; PhD
Appointed 2004
Professional engineer ▲ ●
Chairman and CEO of Bateman BV, a global process engineering company responsible
for its operations worldwide. Having initiated the concept of public/private sector
partnerships, he was a lead player in major government privatisation transactions.
Currently serves as a director of various companies which includes Anglo American
South Africa.
W3IB00003 Grindrod INSIDE 06/04/2006 2:23 PM Page 12

GRINDROD LIMITED ANNUAL REPORT 2005 13
I M GROVES (60) – CA(SA)
Appointed 1986 ▲ ◆ ●
Previous managing director of the group. Retired from position in 1999. 35 years’
experience in the transport industry. Non-executive director of Value Group Limited,
Tiger Wheels Limited, Marriott Holdings Limited, Marriott Corporate Property Bank
Limited and Marriott Property Fund Managers (Pty) Limited. Past president of
SA Shipowners’ Association.
N MTSHOTSHISA (61) – BCur (Unisa)
Appointed 2004
Business consultant ▲
Chairman of Telkom SA Limited, Majweng Resources, Eco Electrical (Pty) Limited and
Arch Equity (Pty) Limited and director of Links Capital (Pty) Limited and Mvelaphanda
Resources. Former chairman of e-TV and director National Association of Democratic
Lawyers. Previously a director of I.D.C., MossGas, Soekor and other organisations.
R A NORTON (67) – BA; MA
Appointed 1998 ▲ ◆ ●
Consultant to financial business
Non-executive director of Marriott Corporate Property Bank Limited, Illovo Sugar
Limited and chairman of SA Retail Properties Limited. Considerable experience as an
executive in commerce. Past president of the JSE.
R J H WHITLEY (65) – CA(SA)
Appointed 2002 ■
Previous partner in Ernst & Young, auditing firm. Currently has own accounting practice
in Pietermaritzburg. He is also responsible for the management of certain shareholders’
interests in Grindrod.
KEY
■ Not independent ▲ Independent
◆ Audit Committee ● Remuneration/Nomination Committee
13
W3IB00003 Grindrod INSIDE 06/04/2006 2:24 PM Page 13

GRINDROD LIMITED ANNUAL REPORT 200514
Directorate EXECUTIVE
I A J CLARK (62) – CA(SA)
Chief executive officerAppointed 1993
Appointed group managing director in 1999. Employed by the group in 1977 and held
various senior financial and executive positions in the shipping division. Presently
chairman of major subsidiary companies and non-executive director of RMBT Holdings
Limited, Marriott Corporate Property Bank Limited, Marriott Holdings Limited and
Marine Shipping Mutual Insurance Company Limited (United Kingdom). Past president
of SA Shipowners’ Association and SA branch of Institute of Chartered Shipbrokers.
Title changed to chief executive officer in 2005.
J G JONES (55)
Appointed 2002
Employed 1969. Has 36 years’ experience in freight and ships agency business.
Currently chief executive of ships agency division and director of various divisional
subsidiary companies.
T J T McCLURE (55) – Dip M Law
Appointed 2002
Master mariner
Employed 1999. Managing director of Island View Shipping which position he also held
when the business was acquired from Tiger Brands in 1999. Director of major local and
international subsidiaries and UK Freight Demurrage & Defence Association (United
Kingdom). President of SA branch of Institute of Chartered Shipbrokers.
A K OLIVIER (45) – CA(SA)
Appointed 1999
Employed in 1986 in the shipping division where he has held senior treasury and
financial posts. Currently chief executive of Unicorn Shipping. Director of local and
international subsidiary companies. Deputy chairman of The United Kingdom Mutual
Steamship Assurance (Bermuda) Limited.
D A RENNIE (45)Appointed 2002Master mariner
Employed in 1978. Considerable seafaring and seafreight logistics experience andcurrently managing director of Ocean Africa Container Lines (Pty) Limited, a jointoperation with Safmarine which services African coastal feeder and regional shippingneeds. Director of Grindrod group subsidiaries, chairman of the Container LineOperators Forum and co-chairman of the South African Container Terminals Advisory Board.
W3IB00003 Grindrod INSIDE 06/04/2006 2:24 PM Page 14

GRINDROD LIMITED ANNUAL REPORT 2005 15
R A YOUNG (57) – CEng (UK); BCom
Chartered marine engineer
Employed in 1965. Appointed director of Unicorn Shipping 1990. Considerable
seafaring and shipbuilding experience. Executive responsible for group’s marine
operations. Director of various subsidiary companies. Vice president and past president
of SA Shipowners’ Association.
D A POLKINGHORNE (43) – B.COM, MA (OXON)
Appointed to Grindrod Executive Committee in 2005
Employed by the Marriott Group in 1999. Currently managing director of Marriott
Corporate Property Bank Limited. Extensive corporate and investment banking
experience.
A F STEWART (41) – CA(SA)
Group financial director
Appointed 2003
Employed in 2000 as financial manager of Unicorn Shipping, also responsible for group
taxation and treasury function. Promoted to group financial manager in 2002. Director
of major subsidiary companies within the group.
L R STUART-HILL (42) – CA(SA)
Appointed 1999
Employed 1993. Previous financial director, now responsible for landfreight logistics
division. Director of various subsidiaries within this division and non-executive director
of Marriott Asset Management (Pty) Limited and Marriott Property Services (Pty)
Limited.
The Grindrod executive committee, responsible for the day-to-day management of the group, comprises the sevenexecutive directors, the Unicorn Shipping marine director and the managing director of Marriott Corporate Property Bank Limited
W3IB00003 Grindrod INSIDE 06/04/2006 2:24 PM Page 15
GRINDROD LIMITED ANNUAL REPORT 200516
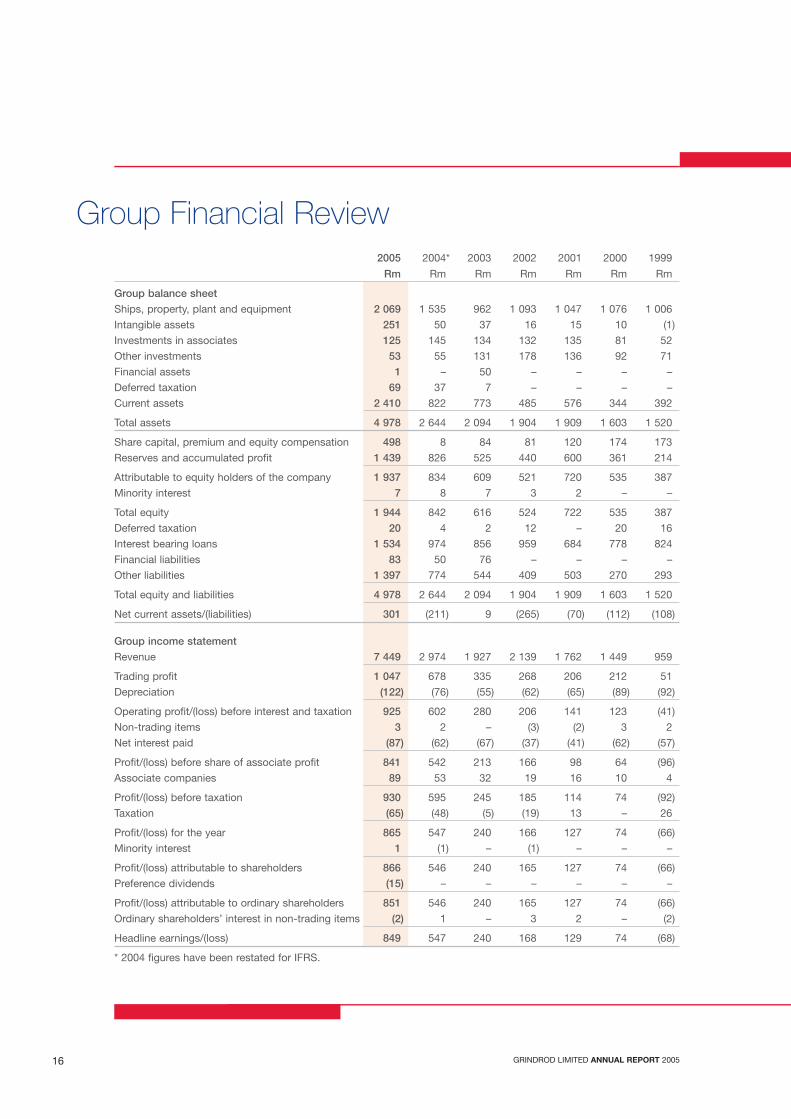
Group Financial Review2005 2004* 2003 2002 2001 2000 1999
Rm Rm Rm Rm Rm Rm Rm
Group balance sheet
Ships, property, plant and equipment 2 069 1 535 962 1 093 1 047 1 076 1 006
Intangible assets 251 50 37 16 15 10 (1)
Investments in associates 125 145 134 132 135 81 52
Other investments 53 55 131 178 136 92 71
Financial assets 1 – 50 – – – –
Deferred taxation 69 37 7 – – – –
Current assets 2 410 822 773 485 576 344 392
Total assets 4 978 2 644 2 094 1 904 1 909 1 603 1 520
Share capital, premium and equity compensation 498 8 84 81 120 174 173
Reserves and accumulated profit 1 439 826 525 440 600 361 214
Attributable to equity holders of the company 1 937 834 609 521 720 535 387
Minority interest 7 8 7 3 2 – –
Total equity 1 944 842 616 524 722 535 387
Deferred taxation 20 4 2 12 – 20 16
Interest bearing loans 1 534 974 856 959 684 778 824
Financial liabilities 83 50 76 – – – –
Other liabilities 1 397 774 544 409 503 270 293
Total equity and liabilities 4 978 2 644 2 094 1 904 1 909 1 603 1 520
Net current assets/(liabilities) 301 (211) 9 (265) (70) (112) (108)
Group income statement
Revenue 7 449 2 974 1 927 2 139 1 762 1 449 959
Trading profit 1 047 678 335 268 206 212 51
Depreciation (122) (76) (55) (62) (65) (89) (92)
Operating profit/(loss) before interest and taxation 925 602 280 206 141 123 (41)
Non-trading items 3 2 – (3) (2) 3 2
Net interest paid (87) (62) (67) (37) (41) (62) (57)
Profit/(loss) before share of associate profit 841 542 213 166 98 64 (96)
Associate companies 89 53 32 19 16 10 4
Profit/(loss) before taxation 930 595 245 185 114 74 (92)
Taxation (65) (48) (5) (19) 13 – 26
Profit/(loss) for the year 865 547 240 166 127 74 (66)
Minority interest 1 (1) – (1) – – –
Profit/(loss) attributable to shareholders 866 546 240 165 127 74 (66)
Preference dividends (15) – – – – – –
Profit/(loss) attributable to ordinary shareholders 851 546 240 165 127 74 (66)
Ordinary shareholders’ interest in non-trading items (2) 1 – 3 2 – (2)
Headline earnings/(loss) 849 547 240 168 129 74 (68)
* 2004 figures have been restated for IFRS.
W3IB00003 Grindrod INSIDE 06/04/2006 2:24 PM Page 16

GRINDROD LIMITED ANNUAL REPORT 2005 17
2005 2004* 2003 2002 2001 2000 1999
Objectives Rm Rm Rm Rm Rm Rm Rm
Group cash flow
Cash available from operations 1 239 568 151 28 258 126 3
Net dividends paid (201) (61) (30) (28) (25) (6) (12)
Cash retained from/(absorbed by) operations 1 038 507 121 – 233 120 (9)
Proceeds on disposal of property, plant and
equipment, investments and other items 16 121 481 77 287 38 75
Cash available for investment 1 054 628 602 77 520 158 66
Cash invested (1 704) (581) (348) (237) (93) (62) (141)
Net finance (raised)/repaid (650) 47 254 (160) 427 96 (75)
2005 2004 2003 2002 2001 2000 1999
Ordinary share performance
Number of ordinary shares in issue
net of treasury shares (000s) 461 626 454 610 480 685 472 483 496 645 570 845 570 380
Weighted average ordinary shares
on which earnings/(loss) per share
are based (000s) 458 490 450 220 477 710 480 862 527 675 570 400 570 365
Earnings/(loss) per share (cents) 185,7 121,3 50,2 34,4 24,1 13,0 (11,6)
Headline earnings/(loss) per share (cents) 185,3 121,4 50,2 35,0 24,5 13,1 (11,9)
Cash earnings/(loss) per share (cents) 214,4 164,5 46,1 33,9 31,3 16,3 (7,0)
Dividends per share (cents) 52,0 35,0 12,0 8,0 5,6 4,0 –
Dividend cover (times) 3,5 3,4 4,2 4,2 4,1 3,3 –
Cash dividend cover (times) 4,1 4,7 3,8 4,1 5,3 4,1 –
Net worth per share at book value (cents) 314,0 183,0 127,0 110,0 145,0 94,0 68,0
Net worth per share at market value (cents) 1 299,0 795,0 553,0 104,0 150,0 89,0 42,0
Profitability
Operating margin (%) 12,4 20,2 14,5 9,6 8,0 8,6 (4,1)
Operating margin excluding bulk product
trading (%) 24,2 20.2 14,5 9,6 8,0 8,6 (4,1)
Return on net assets (%) 37,1 37,7 19,9 14,7 11,0 10,6 (2,7)
Return on ordinary shareholders’ funds (%) 17,5 74,6 75,7 42,4 26,7 20,2 16,1 (15,9)
Return on market value (%) 18,4 25,6 42,0 26,8 20,3 19,9 (22,9)
Effective rate of taxation (%) 7,0 8,1 1,8 10,4 (13,1) 0,2 27,1
* 2004 figures have been restated for IFRS.
W3IB00003 Grindrod INSIDE 06/04/2006 2:24 PM Page 17

GRINDROD LIMITED ANNUAL REPORT 200518
Group Financial Review (continued)
Objectives 2005 2004* 2003 2002 2001 2000 1999
Leverage and liquidity
Total liabilities to total shareholders’
interests (%) 130,2 156,3 125,6 184,5 98,8 155,9 233,5
Interest bearing debt to total
shareholders' interests (%) 100,0 33,0 53,3 61,0 106,6 29,2 105,5 157,8
Interest bearing debt to total
shareholders’ interests net of
working capital (%) 15,8 86,2 48,1 116,7 51,3 113,6 166,3
Interest cover (times) 3,0 10,7 9,9 4,2 5,6 3,4 2,0 (0,7)
Cash flow to total liabilities (%) 20,0 37,1 47,5 22,1 15,2 18,7 12,7 (3,9)
Current ratio 1,0 1,3 0,9 1,0 0,6 1,0 0,9 0,9
Employees
Number of employees – subsidiaries 2 322 1 516 1 139 965 822 1 113 1 860
– joint ventures 2 248 1 180 889 835 850 397 –
Revenue per employee (R000) 2 162 1 412 1 215 1 547 1 389 1 104 515
Assets per employee (R000) 1 445 1 255 1 321 1 377 1 531 1 222 817
* 2004 figures have been restated for IFRS.
Prior years figures have been restated for the 5 for 1 share split
DefinitionsNumber of shares and earnings per shareEarnings per share are calculated on profit attributable to ordinary shareholders and the weighted average number ofshares in issue during the period under review. Headline earnings per share are calculated after adjustment for non-trading items.
Cash earnings per shareCash available from operations including taxation paid and dividends received, excluding movement in working capitaldivided by the weighted average number of shares in issue during the period under review.
Net worth per share at book valueTotal equity less preference share equity divided by the total number of ordinary shares in issue.
Net worth per share at market valueTotal equity less preference share equity adjusted by mark to market value of owned ships, ship charters, ship optionsand other group operations, divided by the total number of ordinary shares in issue.
Operating marginOperating profit before interest and taxation expressed as a percentage of revenue.
Operating margin excluding bulk product tradingOperating margin before interest and taxation, excluding bulk product trading expressed as a percentage of revenue,excluding bulk product trading revenue.
Return on net assetsOperating profit before interest and taxation, including non-trading items and share of associate companies profit,expressed as a percentage of average net assets.
W3IB00003 Grindrod INSIDE 06/04/2006 2:24 PM Page 18
GRINDROD LIMITED ANNUAL REPORT 2005 19
Net assetsTotal assets excluding deferred taxation, less current liabilities, excluding short-term and current portion of long-termborrowings.
Return on ordinary shareholders’ fundsProfit attributable to ordinary shareholders expressed as a percentage of average ordinary shareholders’ funds.
Interest bearing debtInterest bearing loans after netting off bank balances, other investments and non-current assets held for sale.
Total liabilitiesOther liabilities, after netting off financial assets and financial liabilities, and interest bearing debt.
Interest coverOperating profit before interest and taxation, including non-trading items, divided by net interest paid.
Cash flow to total liabilitiesCash flow (profit after taxation plus depreciation, deferred taxation and other non-cash items) expressed as apercentage of total liabilities.
Current ratioCurrent assets divided by current liabilities, excluding current portion of long-term assets and liabilities.
Revenue/assets per employeeTotal revenue/assets divided by the number of employees, including 50% of the joint venture employees.
W3IB00003 Grindrod INSIDE 06/04/2006 2:24 PM Page 19
20
W3IB00003 Grindrod INSIDE 06/04/2006 2:24 PM Page 20

GRINDROD LIMITED ANNUAL REPORT 2005 21
Operational Reviews
GRINDROD LIMITED ANNUAL REPORT 2005
Shipping Services
The group’s shipping activities are undertaken locally by Island View Shipping
(Pty) Limited, Unicorn Shipping, a division of Grindrod (South Africa) (Pty)
Limited and Southern Tankers (Pty) Limited, and internationally by Island View
Shipping International Pte Limited and Unicorn Shipping International Limited.
2005 2004
Revenue (Rm) 2 868 2 479
Total assets (Rm) 2 146 1 911
Attributable earnings (R000) 762 519 494 647
Number of employees
– subsidiaries 321 344
Number of ships operated
– owned 11 8
– average number on long-term charter 25 23
– average number on short-term charter 9 13
The group has once again benefited from an outstanding performance by its
Shipping Services, which accounted for 89% of the group’s earnings.
In 2005, despite the lower dry bulk markets, revenue increased by 16% as a
result of a weaker Rand and the larger fleet.
US Dollar earnings were 14% higher than the prior year, but the effect of the
weaker Rand throughout the year resulted in Rand earnings growth on
translation of 54%.
Net capital expenditure of R262 million was incurred in the fleet expansion
programme.
The group owns, and charters in under long-term contracts, ships for
employment in a number of shipping markets. The ships are either time
chartered out on short to medium-term contracts or utilised to move cargoes for
shippers through a mix of spot to medium-term freight contracts. In addition, a
number of ships are chartered in on short-term contracts to service freight
commitments. A large portion of the group’s fleet is employed through pooling
arrangements with major international partners.
W3IB00003 Grindrod INSIDE 06/04/2006 2:24 PM Page 21
GRINDROD LIMITED ANNUAL REPORT 200522
Operational Reviews (continued)
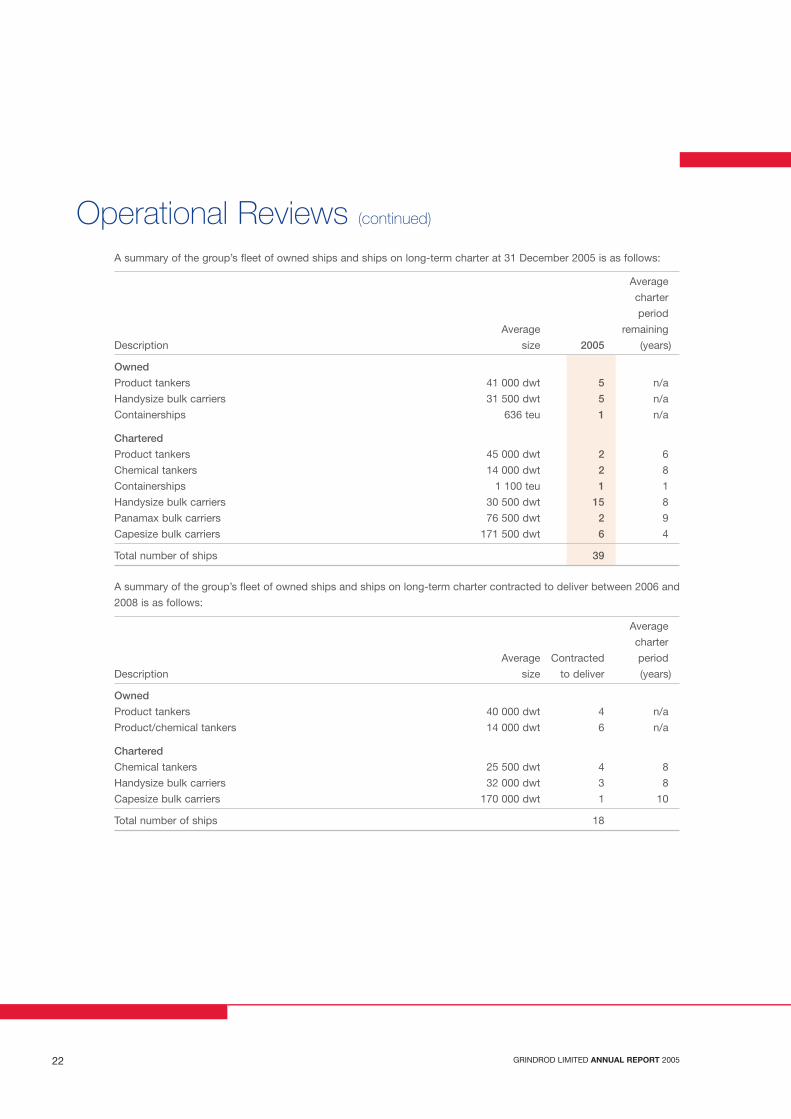
A summary of the group’s fleet of owned ships and ships on long-term charter at 31 December 2005 is as follows:
Average
charter
period
Average remaining
Description size 2005 (years)
Owned
Product tankers 41 000 dwt 5 n/a
Handysize bulk carriers 31 500 dwt 5 n/a
Containerships 636 teu 1 n/a
Chartered
Product tankers 45 000 dwt 2 6
Chemical tankers 14 000 dwt 2 8
Containerships 1 100 teu 1 1
Handysize bulk carriers 30 500 dwt 15 8
Panamax bulk carriers 76 500 dwt 2 9
Capesize bulk carriers 171 500 dwt 6 4
Total number of ships 39
A summary of the group’s fleet of owned ships and ships on long-term charter contracted to deliver between 2006 and
2008 is as follows:
Average
charter
Average Contracted period
Description size to deliver (years)
Owned
Product tankers 40 000 dwt 4 n/a
Product/chemical tankers 14 000 dwt 6 n/a
Chartered
Chemical tankers 25 500 dwt 4 8
Handysize bulk carriers 32 000 dwt 3 8
Capesize bulk carriers 170 000 dwt 1 10
Total number of ships 18
W3IB00003 Grindrod INSIDE 06/04/2006 2:24 PM Page 22

GRINDROD LIMITED ANNUAL REPORT 2005 23
An analysis of the profit by ship category is as follows:
Container- Total
Bulk carriers Tankers ships 2005
Handysize Capesize Panamax Product Chemical
Average number of owned/long-term
chartered ships trading during the year 17,3 6,8 1,7 6,5 2,0 1,5 35,7
Average daily cost (US$) 7 700 18 000 8 600 12 400 10 400 8 400 10 700
Average daily revenue (US$) 18 000 26 700 20 600 19 800 11 600 11 400 19 500
Contribution (US$ million) 65,0 21,6 7,4 17,6 0,9 1,7 114,2
Trading profit on ship sale (US$ million) 9,8
Ship contribution (US$ million) 124,0
Rm
Rand contribution at R6,38/US$ 791
Other shipping costs (5)
Taxation (23)
Attributable income per segmental analysis 763
W3IB00003 Grindrod INSIDE 06/04/2006 2:25 PM Page 23

GRINDROD LIMITED ANNUAL REPORT 200524
Operational Reviews (continued)
Island View Shipping (IVS) has offices in South Africa, Singapore, Spain, Portugal and
Holland and, through its partnership with J Lauritzen, associate offices in Denmark and the
United States. IVS concentrates on the shipment of dry bulk cargoes in the global shipping
market in handysize, panamax and capesize vessels, carrying approximately 18 million
tonnes per annum. Vessels are either owned or on charter, both long and short-term.
The joint freighting agreement with J Lauritzen consists of approximately 50 modern
handysize vessels trading globally. Due to the low fleet cost these vessels have performed
well in 2005. During the year IVS delivered five vessels into the venture, increasing its
contribution of ships to 40%.
The handysize parcel service is based in Durban and schedules 8 to 12 vessels per month
from Southern Africa to the North West Continent, Mediterranean, United Kingdom and the
United States. This service carries a wide variety of bulk cargoes, including ferrochrome,
chrome ore, alloys, mineral sands, concentrates, grains, vermiculite and fluorspar and in
addition, breakbulk cargoes such as steels, aluminium and granite. Ships are chartered in to
service the forward cargo base. During the year to further enhance the service IVS entered
into an agreement with Navalmar to jointly operate a fleet of four handymax multi-purpose
vessels.
The panamax and capesize operations are based in Singapore. The panamaxes have been
chartered out at favourable rates for four years. During the year the capesize operation
added to its forward cargo base, creating a better balanced and hedged business, and took
advantage of the firm market to secure good earnings for the year.
W3IB00003 Grindrod INSIDE 06/04/2006 2:25 PM Page 24
GRINDROD LIMITED ANNUAL REPORT 2005 25
With operations based in South Africa, the United Kingdom and the Isle of Man, Unicorn
Shipping owns and operates product tankers, chemical tankers, handysize bulk carriers and
feeder containerships.
Unicorn Shipping owns ships with a book value of R1,4 billion and has ships on order to the
value of R1,5 billion.
During the year Unicorn Shipping purchased three ships – a 636 teu feeder containership, a
30 650 dwt handysize bulk carrier and a 6 000 dwt products tanker, all to service its
Southern African requirements.
One additional 40 000 dwt product tanker, two 12 800 dwt product tankers and two 16 500
dwt product tankers were ordered during the year, bringing Unicorn’s newbuilding order
book to 10. These ships will deliver between 2006 and 2008.
A 40 000 dwt product tanker newbuilding was sold on delivery from the Korean shipyard.
Unicorn’s product tankers are employed on medium-term charter to oil majors or in the
Dorado product tanker pool, while the chemical tankers are employed in the Stolt Tankers
joint service pool. Dorado has its base in the United States and Stolt in Holland.
Southern Tankers is a black economic empowerment company owned 18,75% by Holgoun
Maritime Consortium, 6,25% by an employee trust and the balance by Grindrod.
Southern Tankers focuses on the oil majors’ shipping requirements in Southern Africa and
has reached agreement to purchase Unilog, a group marine procurement business which
holds the agency for a number of specialist marine products.
SHIPPING
W3IB00003 Grindrod INSIDE 06/04/2006 2:25 PM Page 25

26
W3IB00003 Grindrod INSIDE 06/04/2006 2:25 PM Page 26

GRINDROD LIMITED ANNUAL REPORT 2005 27
Operational Reviews (continued)
Trading, Freight and Financial Services
The bulk product trading activities are undertaken by Grindrod (South Africa)(Pty) Limited locally, and Grindrod Trading and Shipping Limited internationally.
The freight management activities are undertaken by Grindrod FreightInvestments (Pty) Limited and its subsidiaries and Ocean Africa Container Lines(Pty) Limited. The financial services are undertaken by the Marriott Group.
2005 2004
Revenue (Rm) 4 582 495Total assets (Rm) 2 833 732Attributable earnings (R000) 88 705 51 543Number of employees
– subsidiaries 2 001 1 172– joint ventures 2 248 1 180
Number of ships operated – average number on charter 9 8
The Trading, Freight and Financial Services division reported a 72% growth inearnings over the prior year.
During the year, there was major expansion with the establishment of the bulkproduct trading operations and acquisition/investment in landfreight logistics,namely African Portland Industrial Holdings, Sheltam Rail, Grindrod J&JLogistics, Kusasa Bulk Terminals and Röhlig-Grindrod.
The increase in revenue is as a result of the investments that took place duringthe year as well as from increased business activities. 82% of revenue arosefrom bulk product trading.
Bulk product trading has performed well since the acquisition and is expectedto contribute significantly to group profits in the future.
Grindrod ships agencies traded well in a competitive market and improved itscontribution to the division’s profits.
The landfreight logistics operations had a mixed year, with strong performancesfrom the established operations being offset by the turnaround costs incurredby the more recent acquisitions. Subsequent to year end, a joint venture withLauritzen Cool Logistics, a provider of South African perishable goods logisticsservices, was concluded.
Ocean Africa Container Lines, the group’s seafreight logistics partnership withSafmarine, had an excellent year with good earnings growth.
Marriott, the group’s investment in banking, property management and assetmanagement, performed well during the year.
The group’s strategy is to increase the profit contribution from Trading, Freightand Financial Services through the acquisition or development ofcomplementary businesses to ensure that a full range of services is provided toour customers.
2005 Analysis of Trading,Freight and Financial Servicescontribution beforegroup costs
Ships Agency
Landfreight Logistics
Seafreight Logistics
Financial Services
Trading Services
W3IB00003 Grindrod INSIDE 06/04/2006 2:25 PM Page 27
GRINDROD LIMITED ANNUAL REPORT 200528
Operational Reviews (continued)
Bulk Product Trading
During the year the group established a bulk product trading division with Atlas Trading and
Shipping (agricultural commodities), and the acquisition of 50% of Cockett Marine Oil
(marine bunker fuels) and 50% of Oreport (mining commodities).
Atlas commenced trading during the year. This marked the group’s first entry into the trading
of commodities.
With offices in South Africa, Bermuda, Peru, Columbia and Equador, raw materials such as
maize, wheat, oilseeds and oilseed meals are sourced across the globe and sold to
customers in selected markets. Core activities include origination of agricultural
commodities, chartering of vessels, delivery logistics and merchandising at destination.
Grindrod purchased a 50% equity holding in Equus Investments Limited. Equus is the UK
based parent company of the international marine bunker and lubricant supplier, Cockett
Marine Oil Limited.
Cockett Marine Oil is one of the world’s leading specialists in the broking and trading of
marine fuels and lubricants supplying in excess of five million tonnes per annum. It also acts
as physical supplier in certain strategic locations. The head office is based in Petts Wood,
London, United Kingdom, with subsidiary offices in Monaco, South Africa, Singapore,
Russia and the USA and representative offices in Brazil and Cyprus.
The bunker market is global and the Cockett Marine Oil Group is a truly international trading
and supply group. Its client base includes some of the largest and most well known names
in the shipping industry, from container lines, bulk carriers, tanker fleets and cruise operators
to fishing vessels, coasters, private yacht owners and military vessels.
Cockett Marine Oil is one of the oldest (celebrating its 25th anniversary this year) and well
respected names in its field and has extremely knowledgeable and experienced staff.
A 50% shareholding in Oreport was acquired during the year through its holding company
Seascape Commodities (Pty) Limited. Oreport, based in Johannesburg, is an international
marketing organisation specialising in the worldwide procurement, physical movement and
distribution of mining commodities. The company provides a completely managed process
from the materials point of origin through to delivery to the final purchaser and collection of
payment. The products which Oreport presently handles include steel, stainless steel, bulk
ferro alloys, noble alloys, coal, coke, mineral sands, pig iron, ore and mill rolls. Oreport is
ISO 9001:2000 accredited and since its inception over 20 years ago has grown its
international agency base to include many well-known and respected suppliers.
ATLASTRADING & SHIPPING
W3IB00003 Grindrod INSIDE 06/04/2006 2:25 PM Page 28
GRINDROD LIMITED ANNUAL REPORT 2005 29
Grindrod Ships Agencies
The ships agency business continues to provide agency services to a number of respected
liner and non-liner principals. The client base is located around the globe and includes some
of the largest and most respected ship owners and operators in the world. It operates under
the brand names King & Sons, Mitchell Cotts Maritime, Eyethu Ships Agencies, ISS-Voigt
Shipping and Ellerman & Bucknall.
The ships agencies division also comprises the partnerships in CMA CGM Shipping
Agencies SA and Spinnaker Shipping & Logistics and the travel agency Sure Jet
International Travel.
King & Sons operates in all ports of South Africa, Moçambique and Namibia and was the
first South African ships agency to be awarded ISO 9002 accreditation. Its ships agency
services include vessel husbandry, landside management of cargoes, NVOCC (non-vessel
owning container carriers) services and container logistics and leasing. King & Sons
celebrates its 125th anniversary in 2006.
In addition to ships agency it also buys, sells and leases second-hand containers through
the Unitainer brand name and offers storage, cleaning and pre-trip facilities for tank
containers through its facilities close to the port of Durban. Through Kingsway Marine it also
offers rail and road transport facilities to the hinterland of South Africa and its neighbouring
states.
Ellerman & Bucknall specialises in the operational support of fishing fleets trading
predominantly within the Western Cape and Namibia regions. It is also the designated agent
for numerous cruise line operators, attending to vessel berthing, husbandry and the
embarkation management of passengers.
Mitchell Cotts Maritime is an internationally recognised and respected ships agency. It offers
services at all ports in South Africa, Walvis Bay in Namibia and is also represented in
Moçambique, Malawi, Zimbabwe, Botswana and Swaziland.
The agency has committed to the ISO 9002 Quality Assurance Standard. Services include
vessel husbandry, cargo superintending, computerised freight and documentation
management and the full spectrum of container logistics. Mitchell Cotts Maritime has
operated in Southern Africa for over 100 years.
W3IB00003 Grindrod INSIDE 06/04/2006 2:25 PM Page 29

GRINDROD LIMITED ANNUAL REPORT 200530
Operational Reviews (continued)
Eyethu Ships Agencies, a joint venture with Chris Magagula, is one of the key contributors
to the black empowerment charter in the maritime sector.
The agency provides local and international markets with ships agency services in the
shipment of bulk and breakbulk cargo, both liquid and dry, along the South African coast.
Eyethu received the Top Maritime Empowerment Business of the Year Award presented by
the Department of Transport in 2004 and 2005.
ISS-Voigt Shipping is a multi-disciplined ships agency with offices in all the major South
African ports. It is also represented in Moçambique and Namibia. The company is an
ISO 9002 accredited company.
The agency is a leading service provider to the bulk grain, sugar, coal, fertiliser and oil
shipping markets and is active in the reefer and project cargo arena. It is the nominated
agent for numerous naval attachés. ISS-Voigt is the South African representative for the
worldwide Inchcape network of agencies.
CMA CGM Shipping Agencies SA is a partnership with CMA CGM, the world’s third largest
container operator. CMA CGM Shipping Agencies SA are the exclusive agents for
CMA CGM, which now incorporates Delmas Shipping.
Spinnaker Shipping & Logistics is a partnership with shareholders of Asia Navigation of
Singapore, offers the full range of agency, clearing and forwarding and logistical services.
Grindrod International Travel, trading as Sure Jet International Travel, specialises in quality
travel agency services to the corporate market. It operates branches in Durban, Westville,
Richards Bay, Johannesburg and Cape Town.
The company has a conference and corporate incentive division headquartered in Durban.
SPINNAKERSHIPPING & LOGISTICS
W3IB00003 Grindrod INSIDE 06/04/2006 2:25 PM Page 30

GRINDROD LIMITED ANNUAL REPORT 2005 31
Landfreight Logistics
With the acquisitions and expansions of existing businesses during the past year, landfreight
has been streamlined into three operating divisions focused on specific areas within the
logistics arena. These are Logistics, Rail and Terminals. In addition to this the group strategy
is to further develop ports related opportunities in Southern Africa.
Logistics
Auto Carrier Transport, a 50% joint venture with David Taylor, is the largest transporter of
vehicles in South Africa and supplies distribution and logistical services to South African car
manufacturers and importers. Integral to the company’s service is the electronic interface
with its clients, which includes a vehicle tracking system accommodating real time tracking
of vehicles, web based user interface, advanced electronic data interchange interfacing and
automated messaging.
The company is an ISO 9001:2000 certified company and is highly respected in the industry
for customer service, risk management, and the ability to meet deadlines with quality
delivery. Auto logistics are undertaken primarily by road carriers, as well as by rail, sea or
self-drive options throughout Southern Africa.
The company continues to invest in carrying capacity. 2006 is expected to see further fleet
expansion on top of the 2005 expansion, in order to meet the demands of a growing market
as well as keeping the age profile of the fleet at optimum levels. Vehicle storage capacity at
Durban has also been significantly expanded during the year through the extension of
owned facilities at Southgate Industrial Park.
Subsequent to the reporting date the group acquired the remaining 50% interest in the
company, subject to Competition Commission approval.
Boltt Grindrod is a 50% joint venture between Grindrod and Boltt, with partners Deon
Augustyn and Rui Campos of Boltt in executive management. The company specialises in
total supply chain solutions to the manufacturers, importers and retailers of furniture across
the office, hospitality and domestic furniture segments within the Southern African region.
Hubs are situated in all major centres. The joint venture commenced in December 2004, and
Boltt Grindrod has moved quickly to expand its fleet and warehousing capacity during the
year, against growth in its contracted customer base.
W3IB00003 Grindrod INSIDE 06/04/2006 2:25 PM Page 31
GRINDROD LIMITED ANNUAL REPORT 200532
Operational Reviews (continued)
The group’s clearing and forwarding business under the brand name Röhlig-Grindrod
continues to be one of South Africa’s major forwarders, enjoying strong relationships with a
wide range of top-class customers. With the retirement of Peter Krafft, the group increased
its shareholding in Röhlig-Grindrod during the year and now operates this business as a
50% joint venture with Röhlig & Co Internationale. Röhlig-Grindrod offers a full freight
forwarding and logistical service for import, export and domestic customers through
airfreight and seafreight. The company continues to invest in both people and information
systems through which it monitors the shipping and documentation process at each critical
path to ensure control of trading activities and provide management information for
customers.
Grindrod Perishable Cargo Agents specialise in perishable exports and imports by air and
sea as well as domestic freight. During the year it very successfully extended its activities in
express services for the local market. The company is the largest South African airfreight
forwarding agent, measured by turnover with airlines, and has held the number one
International Air Transport Association position in excess of 25 years. The company’s
groundside network and direct airport accessibility provides immediacy and integrity of the
cold chain for perishable products such as flowers, fruit, meat, livestock, pharmaceuticals,
exotic seafood, fish and general dry cargoes destined for the domestic, regional and
international markets.
Subsequent to the reporting date the group increased its shareholding in Grindrod
Perishable Cargo Agents from 75% to 100%.
PicPack Grindrod is a joint venture with Pieter van der Merwe, providing warehousing (both
on and off site), and the full spectrum of distribution services on a national basis. Its
customers are primarily blue-chip companies focused on high-end consumer durables.
During the year the company started executing its strategy of expanding capacity in people,
regional offices, warehousing and fleet.
W3IB00003 Grindrod INSIDE 06/04/2006 2:25 PM Page 32
GRINDROD LIMITED ANNUAL REPORT 2005 33
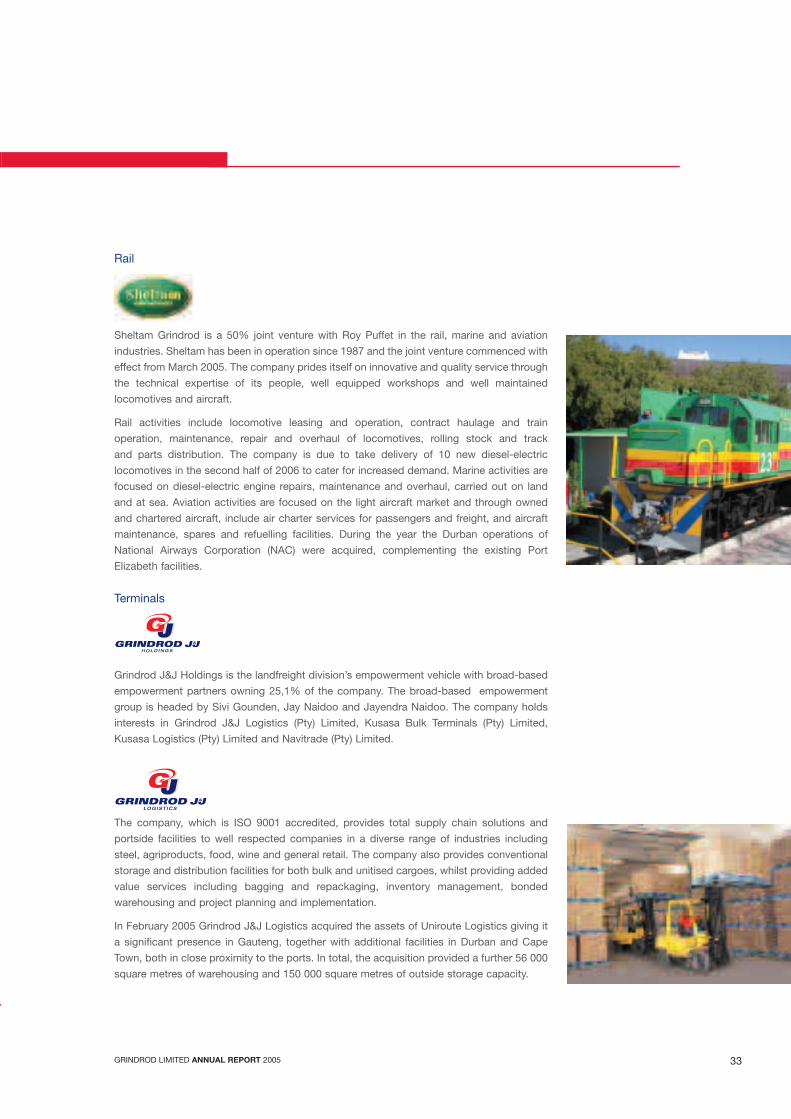
Rail
Sheltam Grindrod is a 50% joint venture with Roy Puffet in the rail, marine and aviation
industries. Sheltam has been in operation since 1987 and the joint venture commenced with
effect from March 2005. The company prides itself on innovative and quality service through
the technical expertise of its people, well equipped workshops and well maintained
locomotives and aircraft.
Rail activities include locomotive leasing and operation, contract haulage and train
operation, maintenance, repair and overhaul of locomotives, rolling stock and track
and parts distribution. The company is due to take delivery of 10 new diesel-electric
locomotives in the second half of 2006 to cater for increased demand. Marine activities are
focused on diesel-electric engine repairs, maintenance and overhaul, carried out on land
and at sea. Aviation activities are focused on the light aircraft market and through owned
and chartered aircraft, include air charter services for passengers and freight, and aircraft
maintenance, spares and refuelling facilities. During the year the Durban operations of
National Airways Corporation (NAC) were acquired, complementing the existing Port
Elizabeth facilities.
Terminals
Grindrod J&J Holdings is the landfreight division’s empowerment vehicle with broad-based
empowerment partners owning 25,1% of the company. The broad-based empowerment
group is headed by Sivi Gounden, Jay Naidoo and Jayendra Naidoo. The company holds
interests in Grindrod J&J Logistics (Pty) Limited, Kusasa Bulk Terminals (Pty) Limited,
Kusasa Logistics (Pty) Limited and Navitrade (Pty) Limited.
The company, which is ISO 9001 accredited, provides total supply chain solutions and
portside facilities to well respected companies in a diverse range of industries including
steel, agriproducts, food, wine and general retail. The company also provides conventional
storage and distribution facilities for both bulk and unitised cargoes, whilst providing added
value services including bagging and repackaging, inventory management, bonded
warehousing and project planning and implementation.
In February 2005 Grindrod J&J Logistics acquired the assets of Uniroute Logistics giving it
a significant presence in Gauteng, together with additional facilities in Durban and Cape
Town, both in close proximity to the ports. In total, the acquisition provided a further 56 000
square metres of warehousing and 150 000 square metres of outside storage capacity.
H O L D I N G S
W3IB00003 Grindrod INSIDE 06/04/2006 2:25 PM Page 33

GRINDROD LIMITED ANNUAL REPORT 200534
Operational Reviews (continued)
Kusasa Bulk Terminals is a landside terminal providing bagging and silo infrastructure for themovement of heavy mineral product for export through the port at Richards Bay. Product isstored in dedicated storage silos, ensuring that refined material is stored at optimumconditions to prevent contamination. The storage facility is connected via a dedicated andowned conveyor system allowing direct loading of ships. During the year the companyacquired the operations of Sea Munye, a bulk storage facility in Richards Bay with storagefacilities for 150 000 tonnes and capacity for 650 000 tonnes material handling annually. Thecompany also commissioned a newly constructed warehouse with a storage capacity of55 000 cubic metres.
Kusasa Logistics provides logistical services for the handling and movement of heavymineral sands through the beneficiation process from mine to finished product. Thisincludes management of pre-export storage and shipping in Richards Bay.
Navitrade, a greenfield enterprise, provides a rail truck tippler, handling facility and bulklogistics solutions for a major client in Richards Bay.
CMC Grindrod is a 50% joint venture with CMC (Confreight Cargo Management Centre (Pty)Limited) providing container storage, handling and repair facilities on a national basis.Reefer, cold store and full container storage of reefers is also provided in Durban. Thecompany is strategically positioned at all main centres in South Africa and is recognised forits equipment handling throughput, multi-disciplined skills and employment of state-of-the-art information technology.
Star Biomass Pellets, situated in KwaZulu-Natal, is a wood pellet manufacturing operation.Waste sawmill residues are compressed, through a non-polluting manufacturing process,resulting in a product identified as densified biomass fuel, which is a renewable source ofclean energy. The final product is exported to Europe where contracts for the sale of theproduct have been secured. The group increased its holding in Star Biomass Pellets to100% during the year.
Capital expenditure has been planned in 2006 in order to increase the productioncapabilities.
W3IB00003 Grindrod INSIDE 06/04/2006 2:25 PM Page 34
GRINDROD LIMITED ANNUAL REPORT 2005 35
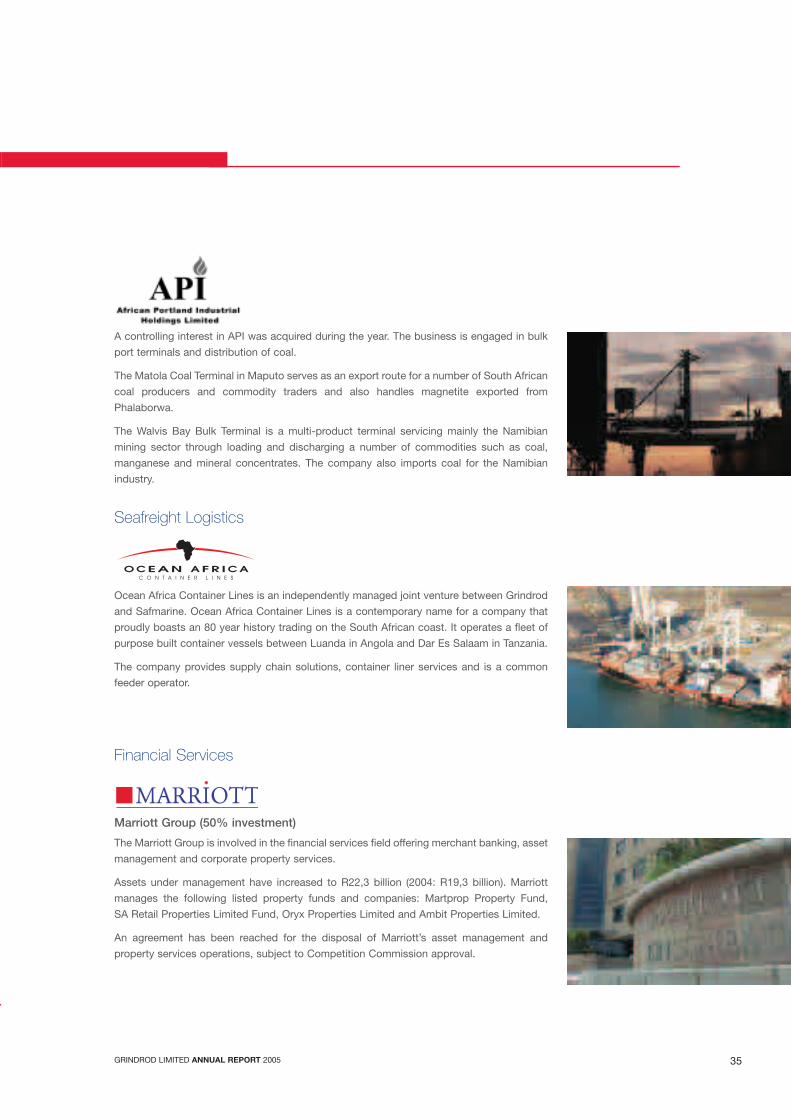
A controlling interest in API was acquired during the year. The business is engaged in bulk
port terminals and distribution of coal.
The Matola Coal Terminal in Maputo serves as an export route for a number of South African
coal producers and commodity traders and also handles magnetite exported from
Phalaborwa.
The Walvis Bay Bulk Terminal is a multi-product terminal servicing mainly the Namibian
mining sector through loading and discharging a number of commodities such as coal,
manganese and mineral concentrates. The company also imports coal for the Namibian
industry.
Seafreight Logistics
Ocean Africa Container Lines is an independently managed joint venture between Grindrod
and Safmarine. Ocean Africa Container Lines is a contemporary name for a company that
proudly boasts an 80 year history trading on the South African coast. It operates a fleet of
purpose built container vessels between Luanda in Angola and Dar Es Salaam in Tanzania.
The company provides supply chain solutions, container liner services and is a common
feeder operator.
Financial Services
Marriott Group (50% investment)
The Marriott Group is involved in the financial services field offering merchant banking, asset
management and corporate property services.
Assets under management have increased to R22,3 billion (2004: R19,3 billion). Marriott
manages the following listed property funds and companies: Martprop Property Fund,
SA Retail Properties Limited Fund, Oryx Properties Limited and Ambit Properties Limited.
An agreement has been reached for the disposal of Marriott’s asset management and
property services operations, subject to Competition Commission approval.
W3IB00003 Grindrod INSIDE 06/04/2006 2:25 PM Page 35
GRINDROD LIMITED ANNUAL REPORT 200536
The Grindrod group is fully committed to the principles of transparency, fairness, integrity and accountability reflected
in good corporate governance practice.
The board is of the opinion that the group complies, in all material respects, with the principles and code of conduct
incorporated in the King Report and JSE Limited (JSE) Listings Requirements.
Board of Directors
The Grindrod board comprises 15 directors, seven of whom serve as executive directors. The non-executive directors
comprise individuals with a balance of skills and commercial experience. Five of the eight non-executive directors are
independent. Details of the non-executive and the executive directors are shown on pages 12 to 15 of this report. The
board meets at least four times a year and has a dynamic board charter covering the scope of its responsibilities. The
board is required to annually review its operations against the charter framework. In terms of the charter the board
assumes ultimate responsibility for leadership and strategic direction of the group, and is accountable to stakeholders
for performance. To this end it maintains effective control of the group and considers annually the group business plan,
risk management, its operating and capital budgets and performance criteria of the executive management.
The quorum for board meetings is eight directors.
The role and function of chairman and chief executive officer are separate in the Grindrod group. The chairman,
W M Grindrod is a non-executive director who, by nature of his shareholding is not independent.
The Grindrod executive committee, presently consisting of the chief executive officer as chairman, the executive
directors, the Unicorn Shipping marine director and the managing director of Marriott Corporate Property Bank Limited,
are responsible for the operational management of the group. This team operates within group limits of authority
approved by the Grindrod Limited board.
The board is supplied with all relevant information and has unrestricted access to all group information, records,
documents and property, which enables the directors to adequately discharge their responsibilities. The information
needs are well defined and non-executive directors have full access to management and the company secretary. Non-
executive directors may in appropriate circumstances take independent professional advice at the company’s expense.
At each annual general meeting at least one third of the directors retire by rotation from the
board. Directors retiring in this manner may offer themselves for re-election. By convention
executive directors retire from the board at 63 years of age, whilst non-executive directors
retire at the annual general meeting following their 70th birthday. This may, however, be
extended at the discretion of the board. In the case of the present chairman it has been
agreed to extend his term, subject to shareholder re-election, to the first annual general
meeting following his 72nd birthday in 2008.
The boards of directors of major local and offshore operating subsidiaries comprise
executive directors/senior management, and those abroad include independent non-
executive directors.
Corporate Governance
W3IB00003 Grindrod INSIDE 06/04/2006 2:25 PM Page 36

GRINDROD LIMITED ANNUAL REPORT 2005 37
Directors and Officers’ Share Dealings
Directors and officers’ are not permitted to deal, directly or indirectly, in the shares of the company during the periodfrom the end of the interim and annual reporting periods to the announcement of the interim and annual results or duringany period when they are aware of any negotiations or details which may affect the share price, or during the timedeclared as a prohibited period in terms of the JSE Listings Requirements. The company secretary communicates on aregular basis with the board regarding the status of dealing in the company’s shares.
Directors are required to notify the company secretary in writing immediately following any transaction involving thecompany’s shares. The JSE is advised of these notifications and they are tabled at the following board meeting.
Board Committees
The board has an audit committee and a remuneration/nomination committee to assist it in ensuring good corporategovernance. Members and the chairmen of these committees are appointed by the board.
Audit Committee
The group audit committee provides an important function of reviewing internal controls, risk procedures and financialresults. It comprises non-executive directors and include the chairman of the board of directors. The deputy chairmanof the group, D R D White, is chairman of the committee. The audit committee satisfies its responsibility in line withspecific terms of reference and is accountable to the board, which receives minutes of its meetings and a report on theproceedings. The internal and external auditors have full access to the committee.
The committee meets with management and the internal and external auditors at least three times a year to review theeffectiveness of the management information systems and other systems of internal control, including the internal auditfunction, the scope of the external and internal audits and to assess the auditors’ findings. The committee reviews theaccounting policies of the group, the interim and annual financial statements and announcements.
The committee also establishes the principles by which the external auditors are used for non-audit services.
An internal audit charter was adopted during the past year which defined the function, responsibility and authority of thegroup’s internal audit activity.
The audit committee met three times during the year and attendance was as follows:
16 Feb 18 May 11 Aug2005 2005 2005
D R D White ✓ ✓ ✓
W M Grindrod ✓ ✓ ✓
I M Groves ✓ ✓ ✓
R A Norton ✓ ✓ ✓
W3IB00003 Grindrod INSIDE 06/04/2006 2:25 PM Page 37
GRINDROD LIMITED ANNUAL REPORT 200538
Remuneration/Nomination Committee
The remuneration philosophy of the group is to offer compensation that will attract, retain and motivate employees withthe necessary skills and potential to achieve business goals.
The committee has formal terms of reference approved by the board. The committee is responsible for the assessmentand approval of a broad remuneration strategy for the group. In particular, it reviews and determines the remunerationpackages of the executive directors of Grindrod with the aim of ensuring that they are adequately compensated for theircontribution to growth in operational and financial performance. It also recommends the granting of share options toexecutive directors and senior employees of the group and the level of fees paid to non-executive directors.
Executive directors’ remuneration consists of a total guaranteed amount (including cash and benefits), short-termincentive bonuses and share options. Short-term incentive bonuses are based on group performance and individualobjectives which are company/division-focused. Directors’ remuneration is reviewed annually and are guided by marketsurvey reports and advice from credible remuneration consultants. Remuneration details are given on page 96 of this report.
The chief executive officer does not participate in committee discussions concerning his remuneration or the terms andconditions of his employment.
The committee is also responsible for making recommendations to the board in respect of new director appointments,the composition of the board, taking skills/experience and demographics into account, and the evaluation ofperformance of directors retiring by rotation.
The members of the remuneration/nomination committee are all non-executive directors. On 22 November 2005 S M Gounden was appointed to replace J C Hall who retired as a director. R A Norton is chairman of the committee.
The remuneration/nomination committee met twice during the year and attendance was as follows:
16 Feb 22 Nov2005 2005
R A Norton ✓ ✓
W M Grindrod ✓ ✓
I M Groves ✓ ✓
J C Hall * ✓
* Retired on 25 May 2005
Corporate Governance (continued)
W3IB00003 Grindrod INSIDE 06/04/2006 2:25 PM Page 38

GRINDROD LIMITED ANNUAL REPORT 2005 39
Board Attendance
The board met seven times during the year and attendance was as follows:
Quarterly Special Special Quarterly Quarterly Quarterly Special
23 Feb 4 Apr 15 Apr 25 May 17 Aug 23 Nov 5 Dec
2005 2005 2005 2005 2005 2005 2005
H Adams ✓ # ✓ ✓
I A J Clark ✓ ✓ ✓ ✓ ✓ ✓ ✓
S M Gounden ✓ # # ✓ ✓ ✓ #
W M Grindrod ✓ ✓ ✓ ✓ ✓ ✓ ✓
I M Groves ✓ # ✓ ✓ ✓ ✓ #
J C Hall * ✓ ✓ ✓
J G Jones ✓ ✓ ✓ ✓ ✓ ✓ ✓
T J T McClure ✓ ✓ ✓ ✓ ✓ ✓ ✓
N Mtshotshisa ✓ # # ✓ ✓
R A Norton ✓ ✓ ✓ ✓ ✓ ✓ ✓
A K Olivier ✓ # ✓ ✓ ✓ #
D A Rennie ✓ ✓ ✓ ✓ ✓ ✓ ✓
A F Stewart ✓ ✓ ✓ ✓ ✓ ✓
L R Stuart-Hill ✓ ✓ ✓ ✓ ✓ ✓ ✓
D R D White ✓ ✓ ✓ ✓ ✓ ✓ ✓
R J H Whitley ✓ ✓ ✓ ✓ ✓ ✓ ✓
# Indicates meeting participation via a conference call facility
* Retired on 25 May 2005
Investor Relations and Shareholder Communication
The primary responsibility of the group to investors has been to maximise shareholder value. This has been achieved
with considerable success. The group communicates its strategy, performance and vision through regular presentations
to investors, analysts, employees and other stakeholders. The group website (www.grindrod.co.za) is also used for this
purpose.
Grindrod was awarded ‘The Most Improved Communicator’ by the Investor Analyst Society in 2005.
W3IB00003 Grindrod INSIDE 06/04/2006 2:25 PM Page 39
GRINDROD LIMITED ANNUAL REPORT 200540
Financial Statements
The directors are responsible for overseeing the preparation and the final approval of the group interim and annual
financial statements. The auditors are responsible for auditing the financial statements and giving their opinion thereon,
in the course of executing their statutory duties. The directors believe that suitable accounting policies, consistently
applied and supported by reasonable and prudent judgements and estimates, have been used in the preparation of the
financial statements, which fairly present the state of the group. In this process, appropriate accounting standards have
been applied and adequate accounting records maintained. The going concern basis has been adopted in preparing the
annual financial statements. Based on the historical financial performance of the group, ready access to financial
resources and financial forecasts, the directors see no reason to believe that the group will not continue to be a going
concern in the foreseeable future.
Internal Controls
The board is responsible for the group’s internal financial and operational control systems. The internal control systems
are designed to provide reasonable assurance against material misstatement and loss. The principle features of the
group’s internal financial controls are:
• an organisational structure comprising clearly defined reporting lines, responsibilities and levels of authority;
• a system of financial planning, budgeting and reporting which enables performance to be monitored against
pre-determined objectives;
• an operating structure that requires that borrowing and other financial facilities are approved in terms of a mandate
by the board and that they remain within pre-determined ratios;
• business plans and budgets that are reviewed and approved by the board; and
• risk models that determine the financial impact of capital expenditure and long-term charter of ships against pre-
determined benchmarks.
Internal Audit
Grindrod Limited, being a holding company, has no internal audit. Each of the main operating subsidiaries has its own
internal audit function, performed internally in conjunction with auditors from Deloitte & Touche (the partner-in-charge
being independent of the external audit). Ocean Africa Container Lines and Marriott have their own independent internal
audit functions.
An internal audit charter was developed and implemented by the board during the year.
The function of an internal audit is to independently appraise and examine the activities of the
business and thereby assist management in the effective discharge of their duties. The scope
is to review the systems of internal control and the reliability and integrity of financial and
operational information. The focus of internal audit flows predominantly from the identification
of high risk areas from the risk management process.
Risk Management
The board sets the group risk strategy policies in liaison with the executive directors and
senior management and decides the group’s appetite or tolerance for risk – the risks Grindrod
Limited will or will not take in the pursuit of its goals and objectives.
The board is responsible for risk management and the responsibility to ensure that an effective
process is implemented to identify risk, measure its potential impact and activate whatever is
Corporate Governance (continued)
W3IB00003 Grindrod INSIDE 06/04/2006 2:26 PM Page 40

GRINDROD LIMITED ANNUAL REPORT 2005 41
necessary to proactively manage such risks. The board is also responsible for determining the effectiveness of the
process. Besides the quarterly assessments of risk at board meetings, a separate annual meeting of the board that
focuses on the review of group risk management process is also held. The board has not appointed a separate risk
committee.
Executive and operational management are accountable to the board for designing, implementing and monitoring the
process of risk management and integrating it into the day-to-day activities of the group. Group risk management
facilitates risk reviews at all subsidiary and joint venture companies. This includes detailed reviews of all risk areas, legal
compliance, contracts and insurance policies.
Group insurance risks are reviewed by the group risk management and independent brokers, together with executive
management. An insurance policy statement has been adopted by the board to provide guidelines of minimum
requirements to management. The board is provided with a summary of the annual review of group insurances.
The following business risks have been identified as significant to the group:
Risk Type Management of Risk
Financial risks
Decline in world shipping markets Management continually assesses shipping markets utilising their own
experience and detailed research. Risks are managed through careful
timing of fixed charters and entry into markets and diversification of risk.
The board has set risk measurement benchmarks and the group’s risk
model, reflecting the exposure to shipping risk, is regularly updated and
its status reported to the board at each quarterly meeting. An annual
review of the risk model’s assumptions and the benchmarks used is also
undertaken.
Offhire of ships chartered out or loss Although limited offhire insurance for ships is in place, it is generally
of owned ships expensive and consequently management of this risk includes ensuring
that high maintenance and safety standards are complied with.
Provision is also made in the budgeting process for possible offhire to
minimise the effect of any lost charter income on the group’s results.
Lost income as a result of the loss of an owned ship is not insured but
would generally be recovered as owned ships are insured in excess of
replacement values.
Offhire of ships chartered in ‘Loss of profits’ or ‘increased costs in working’ insurance is generally
expensive. Potential loss of revenue and increased charter rates, which
could result from the offhire of a ship chartered in by the group, is
managed proactively by ensuring that capacity is maintained and that
replacement tonnage is found as soon as possible.
Price fluctuations of physical commodities The bulk product trading division uses derivatives and other instruments
and futures on open positions to manage this risk. The board has adopted a commodity position
trading policy which includes a Value at Risk measurement of all open
positions due within a year, stress testing, stop losses and formal
weekly reporting on open positions against limits to executive
management. A customised computer-trading platform has also been
introduced.
W3IB00003 Grindrod INSIDE 06/04/2006 2:26 PM Page 41
GRINDROD LIMITED ANNUAL REPORT 200542
Risk Type Management of Risk
Rand/US Dollar exchange rate strengthens A detailed report of the group’s foreign exchange exposure is reviewed
or remains strong quarterly by the board. The net monetary exposure affecting the income
statement is due mainly to Rand loans raised by US Dollar denominated
companies and US Dollar cash in Rand companies.
Fraud Fraud risk factors and internal controls are regularly reviewed and
assessed through the group’s risk management and internal audit
process, as determined by the audit committee and the board.
High or increased bunker fuel prices The risk of bunker fuel price fluctuations against fixed freight revenue is
managed through the inclusion of bunker price adjustment clauses in
contracts or bunker price hedges where appropriate.
Bad debts/charter defaults Internal controls require a thorough credit approval process and regular
management review. In some cases credit guarantee insurance is
required to be taken out. The effectiveness of controls is assessed
through the group’s internal audit process, as determined by the audit
committee. Charter counterparties are thoroughly investigated and third
party advice is provided to ensure that only well known, secure
charterers are contracted.
Claims resulting from non-compliance Non-compliance with relevant legislation could have a significant
with legislation financial and/or reputational impact on the group. Such legislation and
amendments are regularly reviewed by management, external
consultants and internal audit to ensure compliance.
Failure to properly manage acquisitions of Management ensures that a due diligence is carried out, assets
new businesses and the purchase of and liabilities are correctly valued and that all agreements contain
shares in other companies the necessary warranties, representations and indemnities.
Financial claims from contractual exposures Internal controls are in place to minimise claims for damages in respect
of cargo claims and negligence. In addition, adequate insurance cover
is taken in the event that a claim arises.
Loss or breakdown of key assets Management plays a key role in ensuring that adequate insurance cover
is held for all key assets. Where necessary, such insurance has been
extended to business interruption cover. Management also ensures that
strategic spare parts are held in store for certain equipment and that
high maintenance standards are upheld.
Non-financial risks
Occurrence of environmental disasters This is particularly relevant to the group’s shipping operations. The
application of high level safety standards and use of modern, high-
specification ships greatly reduces this risk. A more detailed review of
the group’s environmental policy is set out in the Environmental
Responsibility section of this report. The environmental incident risk is
insured through specialist marine liability underwriters.
Corporate Governance (continued)
W3IB00003 Grindrod INSIDE 06/04/2006 2:26 PM Page 42

GRINDROD LIMITED ANNUAL REPORT 2005 43
Risk Type Management of Risk
Industrial action This is managed by following the appropriate human resources and
industrial relations procedures and encouraging a culture of open
communication within the group. There has been no major industrial
action during the course of the year.
Loss of customers All group companies strive to provide high quality service at competitive
rates and to maintain excellent relationships with their customers.
Where possible, management have entered into long-term contracts
with major customers.
Loss of key staff This risk is managed by ensuring competitive income packages, a
progressive work environment, career growth opportunities and
succession planning.
IT system failure Effective management of the IT function significantly reduces the
likelihood of this risk occurring.
Corporate Governance Practices
The group has sound corporate governance practices and procedures in place, which are continually reviewed to ensure
that the board fulfils its responsibilities to shareholders.
Ethics
The group is committed to providing quality products and outstanding service to customers and believes that a high
standard of ethical behaviour is paramount to achieving this. The group has a code of ethics which is being reviewed in
consultation with the Ethics Institute of South Africa, of which the company is an organisational member. The code is
designed to raise ethical awareness, act as a guide in day-to-day decisions and to help assure customers and suppliers
of the integrity of the group companies with which they deal.
An important element of the induction process is to communicate to new employees the group’s values, standards and
compliance procedures. These include integrity and creditability, honouring obligations, promoting the development of
employees and high attention to customer relations and service.
A Unicorn tanker, the Oranjemund, on expedition to the Antarctic to refuel Greenpeace vessels.
W3IB00003 Grindrod INSIDE 06/04/2006 2:26 PM Page 43

GRINDROD LIMITED ANNUAL REPORT 200544
This section focuses on internal social performance. External social performance is covered in the stakeholder
engagement and Corporate Social Investment sections that follow.
Management Approach
Grindrod’s strategic aspirations ultimately lie in the hands of its people. Highly motivated teams of professional and
skilled employees are paramount to the success of each of its companies.
Essential ingredients for Grindrod’s success include a safe working environment where employees are treated with
dignity and respect, where communication is open, honest and courteous, where ethical standards are high, and equity
is a reality.
Staff Complements
Business growth and acquisitions have increased the number of group employees (permanent and temporary)
worldwide from 3 705 in December 2004 to 5 042 at December 2005.
The table below provides a breakdown of the number of employees per country:
South Africa 4 422 Equador 3
Moçambique 470 Monaco 3
Namibia 39 Tanzania 2
United Kingdom 25 Germany 1
Singapore 11 Zimbabwe 1
Russia 8 Seafarers – Angola 8
United States of America 5 – Namibia 7
Bermuda 5 – Philippines 17
Peru 4 – Poland 11 43
Of the 5 042 employees, 2 322 are employed in subsidiary companies, 2 248 by joint ventures and 472 by associate
companies.
Recruitment
Although group companies usually try to fill vacant positions from in-house, it is sometimes necessary to recruit staff
from external sources to complement the available competencies.
The majority of group companies have adopted a fair and equitable competency based assessment tool to guide
recruitment. Positions are carefully analysed to determine the requisite competencies. Interviews are designed to gather
information to determine how a candidate will perform and whether they are adequately qualified for the position.
Benefits
Employee benefit structures provide for retirement, health care, disability insurance, bursaries for employee’s children
and financial assistance to meet their further education and housing needs.
During the year, the trustees of the Grindrod Pension Fund agreed to enhance pensions that had been outsourced, by
10% due to the poor performance of those annuities over the past few years.
Social Performance
W3IB00003 Grindrod INSIDE 06/04/2006 2:26 PM Page 44

GRINDROD LIMITED ANNUAL REPORT 2005 45
Remuneration
Group companies’ remuneration levels are determined by market rates for the particular industry sector in which they
operate. The levels of basic remuneration are reviewed annually based on market movements as reported in various
surveys.
Employment positions are evaluated using recognised job evaluation systems. Salary scales are determined using a
unified pay structure which identifies a minimum and maximum range for each position. Individual performance systems
determine the actual pay-level within a particular grade.
A number of incentive bonus schemes have been implemented in group companies. These schemes reward exceptional
performance and are structured around profit targets and specific individual objectives.
The group’s salary/wage bill for the reporting year per occupation level for temporary and permanent staff was as
follows:
Occupational Permanent Temporary Total
Level R000 R000 R000
Top management 43 057 590 43 647
Senior management 62 474 545 63 019
Middle management 69 594 340 69 934
Skilled 144 153 2 402 146 555
Semi skilled 75 890 3 284 79 174
Least skilled 25 806 3 583 29 389
Total 420 974 10 744 431 718
Labour/Management Relations
The group follows the approach of consultation for the mutual benefit of the companies, management and employees.
Freedom of association and dissociation is acknowledged and where employees have appropriate representation,
recognition agreements are entered into.
Where there is no union recognition, formal and informal communication fora have been established. These fora promote
both upward and downward communication and employees have the opportunity to clarify issues relating to
company/division and branch matters.
The group realises the effect that restructuring of operations can have on employees and ensures that extensive and
effective consultations are conducted when this occurs.
Disciplinary and Grievance Procedures
Group companies’ policies provide for formal disciplinary and grievance procedures. Behavioural standards are
documented as conduct, performance or disciplinary codes, and these are communicated to all employees.
In minor cases of misconduct a written warning is given, subject to an investigation of the facts and based on the
balance of probability. For more serious offences, a fair and unbiased disciplinary hearing is conducted. All employees
who go through the disciplinary procedure are permitted to be represented by another employee of his/her choice. A
formal appeal procedure is in place for dismissals.
A formal grievance procedure exists to enable employees to communicate grievances to management and to obtain the
earliest possible resolution.
W3IB00003 Grindrod INSIDE 06/04/2006 2:26 PM Page 45

GRINDROD LIMITED ANNUAL REPORT 200546
Social Performance (continued)
Occupational Health and Safety
All group companies recognise their duty as employers to ensure the health, safety and welfare of all employees. Senior
officials in each operation are required to ensure that all legal requirements are complied with. Where legislation does
not exist, company best practices are identified and implemented.
A number of group companies utilise an external source to conduct health and safety audits and those who do not are
encouraged to do so.
Major contractors (e.g. shipyards) are audited in terms of safety, health and environmental (SHE) performance. There
have been cases where dealings with contractors have been terminated on the emergence of poor (SHE) standards
following an audit.
The group’s shipbuilding technical specifications specifically ban the use of asbestos in the ships’ construction. This has
been the case for all ships built for the group within the past 20 years.
High continuity levels amongst seafarers is a major contributing factor to Unicorn Shipping’s excellent operational and
safety record. In the year under review, the product tanker fleet exceeded two million safe-working hours. There were
no serious injuries and no time was lost as a result of shipboard injuries during 2005 (refer to graph below).
In 2005 a total of R652 000 was invested in health and safety measures and health and safety audits. The figure in 2004
was R240 000.
Unfortunately, such measures did not prevent the deaths of two employees, in separate incidents, at a manufacturing
plant. Every effort is being made to ensure that adequate preventative measures are implemented in order that the
group’s high safety standards are maintained.
HIV/AIDS
Grindrod acknowledges the enormity of the HIV/Aids epidemic and the severe social and economic implications of the
disease. A policy that encourages education and training and ensures fair, compassionate and non-discriminatory
treatment of those who may be affected by the disease is in place.
Group companies have made contributions to HIV/Aids awareness programmes and support to HIV/Aids care centres.
0.0
0.5
1.0
2.5
3.0
4.0
4.5
2002 2003 2004 2005
1.5
2.0
3.5
Lost time injury
Total injuries
Unicorn Shipping injury frequency rate
No.
of
inju
ries
per
1 m
illio
n ho
urs
W3IB00003 Grindrod INSIDE 06/04/2006 2:26 PM Page 46

GRINDROD LIMITED ANNUAL REPORT 2005 47
Broad-Based Black Economic Empowerment
Grindrod recognises that it is necessary and desirable for the future of South Africa to increase the effective participation
of the majority of the country’s citizens in the economy. To this end it supports initiatives taken by the Department of
Trade and Industry and the various industry sectors to promote broad-based black economic empowerment.
The 10 year targets set by the Codes of Good Practice have been adopted by each group company and are measured
by means of a balanced scorecard as provided by the appropriate industry in which they operate. As the majority of
group companies fall within the Maritime Transport and Services industry, Grindrod has modelled its strategy on the
guidelines issued by this industry’s charter.
Consultants have recently been appointed by the group to prepare generic scorecards for each South African group
company. Once these have been completed, a consolidated score card will be prepared for Grindrod Limited.
The 10 year targets are as follows:
Equity Ownership • 25,1% black voting rights
Management & Control • 40% black representation
Employment Equity • 50% black representation – middle to senior management
Skills Development • 3% of payroll expended on training
• 3% of workforce as ‘learners’
Preferential Procurement • 50% of discretionary procurement from black owned and
empowered suppliers
Enterprise Development • 5% of NAV invested in black empowerment
• 5% non-monetary investment
Residual • 3% of net profit on industry specific initiated to facilitate the inclusion
of black people. Includes social development.
Employment Equity
All group companies have adopted an employment equity policy that promotes equal opportunity and fair treatment in
employment through the elimination of any discriminatory practices and prejudices, and creates an environment in
which every employee has an opportunity for advancement. Consultation committees consisting of individuals from
different races, genders and occupational levels have been established and meet on a regular basis.
A developmental approach is taken to affirmative action with the focus on promoting education and training to assist
previously disadvantaged individuals to occupy more skilled and responsible positions within the group.
The current elements of equity have been analysed, plans and goals have been established and equity reports are
submitted in accordance with the Employment Equity Act No. 55 of 1998.
W3IB00003 Grindrod INSIDE 06/04/2006 2:26 PM Page 47
GRINDROD LIMITED ANNUAL REPORT 200548
The group’s current demographic profile of permanent employees in South African companies per occupational level is
tabled below:
Occupational African Coloured Indian White Total Total
Level M F M F M F M F M F Permanent
Top management 3 3 1 65 5 70 5 75
Senior management 5 1 1 1 12 127 19 145 21 166
Middle management 19 10 19 4 46 10 244 64 328 88 416
Skilled 515 61 92 42 190 70 204 243 1 001 416 1 417
Semi skilled 671 66 82 72 133 139 87 225 973 502 1 475
Least skilled 412 59 33 10 3 13 15 461 84 545
Total 1 625 197 228 129 385 219 740 571 2 978 1 116 4 094
% per race group 44,5% 8,7% 14,8% 32,0% 100,0%
Skills Development
Grindrod companies are committed to the development of all their employees and to this end support the government’s
initiatives aimed at promoting training, education and development. The principle of ‘learning through experience’, as
well as formal training, is adhered to throughout the group.
Training needs are identified and documented in the form of ‘work place skills plans’. These plans and ‘implementation’
reports are submitted to the relevant Sector Education and Training Authorities (SETAs). Grants have been received from
the various SETA Chambers for training completed.
Grindrod spent R5 million on training and development of their employees in 2005. 1 870 employees attended courses.
The following table gives an overview of the type of formal training courses which employees attended and the number
of group participants.
Course Programme No. of Attendees % Black
Driver & forklift driver 376 95
Computer 98 81
Employment equity 28 57
Team building 235 62
Cargo handling 76 76
Management & supervisory skills 111 72
Group companies have introduced ‘learnership’ programmes targeting unemployed
candidates with the ultimate goal of skills upliftment to support the national skills
development strategy in South Africa. In 2005 a total of 51 people completed programmes.
Of these, 46 (90%) were black.
In addition to the above employees with professional qualifications, are encouraged to keep
abreast of developments in their particular fields by attending seminars, conferences and
training courses. Financial assistance is given to employees for tertiary education.
The Unicorn Seafarers Training School based in Maydon Wharf, Durban, continues to
provide valuable support and demonstrates the group’s commitment to skills development
and job creation for South African seafarers. 1 681 seafarers completed training courses at
Social Performance (continued)
W3IB00003 Grindrod INSIDE 06/04/2006 2:26 PM Page 48
GRINDROD LIMITED ANNUAL REPORT 2005 49
the school in 2005. Courses include seamanship, shipboard familiarisation, safety, proficiency in survival craft, first aid
at sea, petroleum tanker safety and chemical tanker safety. All courses are internationally recognised in terms of
IMO Standards of Training, Certification & Watchkeeping.
Unicorn’s Cadet Training Scheme commenced in the 1960s and South African deck and engineering officers of all races
have been trained since the mid 1970s. There are currently 53 cadets undergoing training, 49 of these are black and
there are 20 females from different race groups.
Preferential Procurement
Group companies continue to support the participation of previously disadvantaged groups in the South African
economy by continuously seeking to procure goods and services from entrepreneurs drawn from previously
disadvantaged societies and from suppliers with a satisfactory black economic empowerment (BEE) rating.
A verification agency is currently analysing all suppliers to determine their BEE status. This will enable group companies
to identify their current level of affirmative procurement.
Enterprise Development
Grindrod, its subsidiaries and joint venture companies continually seek opportunities to enter into sustainable joint
ventures (and other forms of alliances) with credible black owned or black empowered enterprises.
W3IB00003 Grindrod INSIDE 06/04/2006 2:26 PM Page 49

GRINDROD LIMITED ANNUAL REPORT 200550
During 2005 an increased emphasis was placed on the corporate social investment (CSI) initiatives which have mainlybeen focused in the following broad categories:
• Environment • Community, welfare and health• Education and training • Business development
In assessing the various appeals received, the policy taken was to favour those aligned within the industries andcommunities that the group is involved in and where it has a physical presence.
The group spent approximately R1,1 million during 2005 on external initiatives. The group has commenced a review ofCSI programmes aimed at maximising the social and environmental impacts of contributions.
EnvironmentGrindrod sponsors WWF South Africa (World Wide Fund for Nature) and the KZN Conservation Trust through itsassociation as a member.
The company is very sensitive to the marine environment in which it operates and various new opportunities forinvolvement in marine conservation programmes are being explored.
The group has recently entered into an agreement with Computershare in terms of which a portion of the shareholderregistration fee for electronic communication with shareholders will be directed to Food and Trees for Africa.
Education/TrainingThe full spectrum of internal programmes related to education, training and development within the group is referred toin the skills development sub-section of the report.
Financial support was provided to a number of external educational institutions and funds, including:
• Walter Sisulu Scholarship Fund • New Forest High School (maritime studies)• Project Build (construction of school facilities) • Bel Porta Foundation (school for mentally challenged)• Simonstown High School (maritime studies)
Community, Welfare and HealthGrindrod is proudly associated with the African Rainbow expedition led by the modern-day adventurer Kingsley Holgate.Its mission was to distribute mosquito nets as a precaution against malaria on the Moçambique coast, as far as theSomali border. The task was successfully accomplished by the expedition team with the financial support of Grindrod.
Group companies again participated in the Habitat for Humanity housing project during the past year. Finance, as wellas the hands-on involvement of employees, contributed to the building of low cost houses in Durban.
The group is committed to numerous HIV/Aids initiatives and also contributes to several health-related institutions.
The company has a long-term association with the International Sailors’ Society (SouthernAfrica), which provides spiritual and practical support to both local and internationalseafarers.
Grindrod continues to support local charities and community welfare organisations as part ofits social responsibility programme. The majority of operating divisions and joint venturecompanies within the group have their own programmes in this regard.
The National Sea Rescue Institute (NSRI) is a very appropriate operation in the context ofGrindrod’s shipping activities and receives continued support. Grindrod also allocatedresources towards the search for the yacht, Moquini and its crew, which went missing offMadagascar during the year.
Business DevelopmentWith regard to national business associations, Grindrod remains a member of the SouthAfrican Chamber of Commerce (SACOB) and is associated with the National BusinessInitiative (NBI). The latter organisation uses resources to fund a diverse range of sustainabledevelopment programmes aimed at employment creation, education and skills development.
Corporate Social Investment
W3IB00003 Grindrod INSIDE 06/04/2006 2:26 PM Page 50

GRINDROD LIMITED ANNUAL REPORT 2005 51
As a rapidly growing group with increasing influence in society, Grindrod is committed to maintaining sustainable
relationships that are built on trust. The company therefore values its ongoing engagement with key stakeholder groups
both within and outside the company.
The group has a policy of involving stakeholders in key sustainability issues and any feedback received from
stakeholders that is of a material nature is discussed at executive level and brought to the board’s attention.
Highlights of stakeholder engagement for the year under review are summarised in the table below:
Key Stakeholder Groups Examples of Engagement
Shareholders • Annual general meeting. Two additional general meetings were held in 2005 to deal
with material corporate actions.
• Presentations to investors in Durban, Johannesburg and Cape Town after each half
year.
• One-on-one meetings with major investors. Presentations/meetings with analysts in
the United Kingdom and the USA.
• Response to approaches from the media for information and interviews with key
personnel.
Customers • Collective meetings with partners and key customers are held at least annually in
Cape Town, Johannesburg and Durban.
• Cross-marketing function within the group.
Media • Grindrod was awarded the “Most Improved Communicator” award by the Investor
Analyst Society.
• Media briefings on our website are posted: www.grindrod.co.za.
Government authorities • In the last year Grindrod executives met with the South African Minister of Transport,
and regulators the CEO and COO of Transnet, the CEO of Spoornet, the CEO of the South African
Port Operations (SAPO) and the CEO of the South African National Ports Authority
(NPA).
• Engagement with the South African Department of Trade and Industry regarding the
new South African shipping tonnage tax system.
Non-governmental • Interaction with and membership of Ethics SA.
organisations, communities • Active participation in the Maritime BEE Steering Committee, the Container Liner
and other industry interest Operators Forum, the Association of Shipping Lines and the South African
groups Container Terminal Advisory Board (SACTAB).
• Company specific interaction with NGOs in terms of corporate social investment
programmes.
Trade unions • Grindrod J&J Logistics is our most labour intensive business. The company has
committees and reporting structures in place to engage with the South African
Freight and Dock Workers Union and the South African Transport and Allied Workers
Union.
Staff • Staff are kept abreast of corporate and people developments within the group via
internal newsletters, company intranets and internal memorandums.
• Grindrod makes its bi-annual presentations to investors and analysts available to
staff via the company intranet.
Stakeholder Engagement
W3IB00003 Grindrod INSIDE 06/04/2006 2:26 PM Page 51
GRINDROD LIMITED ANNUAL REPORT 200552
Environmental PerformanceGrindrod has undertaken to report publicly on the material aspects of its environmental performance. Given the maritimebias of our business, material environmental risks are predominantly related to shipping operations.
Grindrod is committed to adhering to world class maritime environmental management standards and has an impressive record of marine pollution prevention, efficient use of natural resources and generally minimising theenvironmental impacts of its operations.
Two Unicorn tankers (Stolt Ntaba and Stolt Ntombi) received prestigious environmental achievement awards in 2005from the Chamber of Shipping of America for having operated a total of four years in environmental excellence.
In 2005 Grindrod conducted a review of environmental performance monitoring and reporting across the group. As aresult, environmental key performance indicators (KPI) are being refined.
Management ApproachEnvironmental management throughout the group is guided by a board-approved policy (www.grindrod.co.za/about_environment.aspx). The board requires and monitors that each of the subsidiaries maintains and strictly complieswith their own environmental policies, that they operate with due care and that they comply fully with the letter and spiritof all relevant codes and regulations governing their activities.
There is a clearly defined structure for environmental management within the group. Targets are set for managing directmaterial environmental impacts, conducting assessments and reporting on these at group level.
All operations, including land-based facilities Kusasa, Navitrade and Star Biomass, that could potentially have materialenvironmental impacts, have dedicated safety, health and environmental (SHE) managers or SHE and quality (SHEQ)managers. Personal key performance area (KPA) measures for all of the SHEQ key personnel include the proactive andresponsible management of material risks, as determined by risk assessments conducted periodically for their specificoperations.
Environmental Management SystemsAll vessels utilise integrated SHEQ management systems (driven by ISO 9001:2000) for dealing with significant potentialrisks. All new acquisitions (both land-based facilities and ships) must be fully compliant with the relevant regulations(including specific maritime regulations in terms of new ships).
Unicorn Shipping, enjoys ISO 9001:2000 accreditation by Det Norske Veritas (DNV), a highly regarded internationalaccreditation agency. In addition, Unicorn Shipping vessels hold Documents of Compliance issued in terms ofInternational Maritime Organisation legislation, by the Maritime Coastguard Agency of the United Kingdom, and by themaritime authorities of the governments of Liberia and Panama.
The bulk land-based terminals, Kusasa, Navitrade and Star Biomass, are in the process of implementing ISO 14001environmental management systems. The aim is to have the first of these systems certified before the end of the currentfinancial year.
Sheltam Grindrod holds a 2005 Railway Safety Regulator Permit, fully integrated with their ISO and SHEQ Systems.Three of Sheltam Grindrod’s divisions are currently ISO 9001:2000 certified and the environmental management policyis compliant with ISO 14001. Certification is currently being obtained in this regard.
Safer Oceans – Proactive Marine Pollution PreventionMarine pollution prevention starts before the ships enter the water. Acknowledging the potential risks posed by shipdesigns that simply satisfy current legislative requirements, Unicorn Shipping consistently sets new ship design andconstruction benchmarks for the construction of new vessels that will also satisfy anticipated future legislation.
All ships built by Unicorn Shipping since 1996 are double-hulled, and constructed of materials designed to minimisecorrosion and promote robustness and longevity. Crucial machinery and navigation equipment is duplicated to minimisethe risk of incidents or accidents. Grindrod also remains abreast of technological innovations with regard to maritime
W3IB00003 Grindrod INSIDE 06/04/2006 2:26 PM Page 52
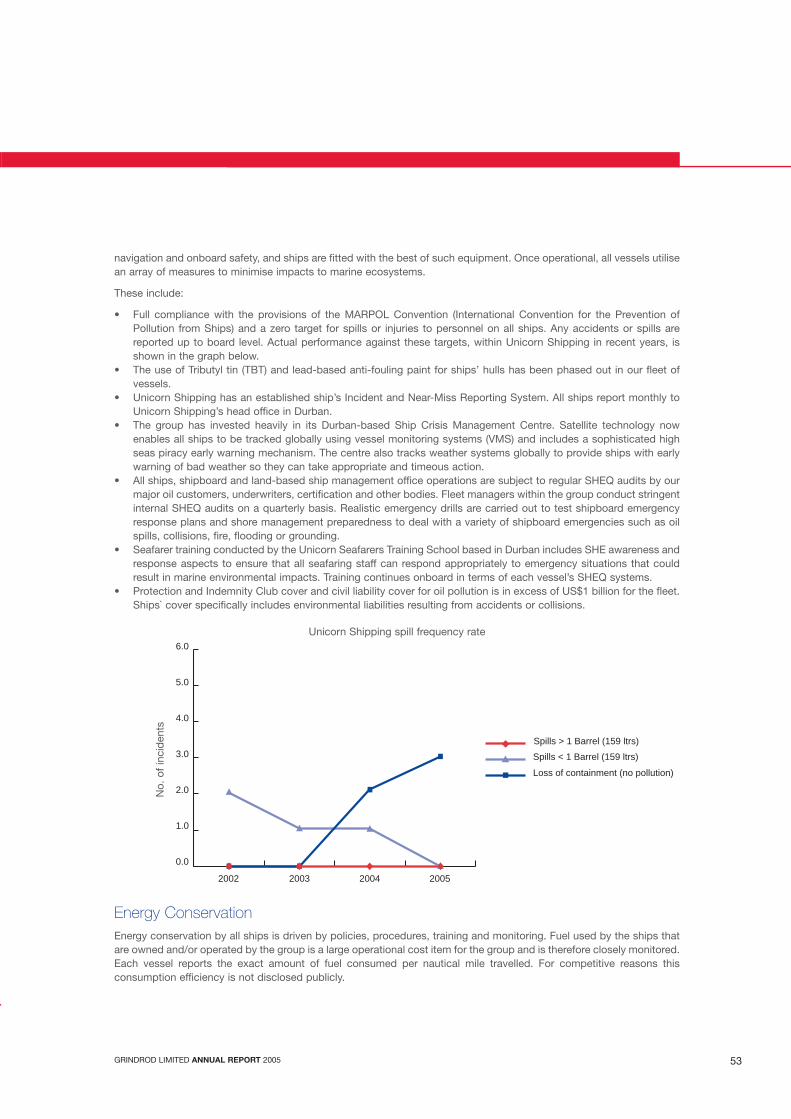
GRINDROD LIMITED ANNUAL REPORT 2005 53
navigation and onboard safety, and ships are fitted with the best of such equipment. Once operational, all vessels utilisean array of measures to minimise impacts to marine ecosystems.
These include:
• Full compliance with the provisions of the MARPOL Convention (International Convention for the Prevention ofPollution from Ships) and a zero target for spills or injuries to personnel on all ships. Any accidents or spills arereported up to board level. Actual performance against these targets, within Unicorn Shipping in recent years, isshown in the graph below.
• The use of Tributyl tin (TBT) and lead-based anti-fouling paint for ships’ hulls has been phased out in our fleet ofvessels.
• Unicorn Shipping has an established ship’s Incident and Near-Miss Reporting System. All ships report monthly toUnicorn Shipping’s head office in Durban.
• The group has invested heavily in its Durban-based Ship Crisis Management Centre. Satellite technology nowenables all ships to be tracked globally using vessel monitoring systems (VMS) and includes a sophisticated highseas piracy early warning mechanism. The centre also tracks weather systems globally to provide ships with earlywarning of bad weather so they can take appropriate and timeous action.
• All ships, shipboard and land-based ship management office operations are subject to regular SHEQ audits by ourmajor oil customers, underwriters, certification and other bodies. Fleet managers within the group conduct stringentinternal SHEQ audits on a quarterly basis. Realistic emergency drills are carried out to test shipboard emergencyresponse plans and shore management preparedness to deal with a variety of shipboard emergencies such as oilspills, collisions, fire, flooding or grounding.
• Seafarer training conducted by the Unicorn Seafarers Training School based in Durban includes SHE awareness andresponse aspects to ensure that all seafaring staff can respond appropriately to emergency situations that couldresult in marine environmental impacts. Training continues onboard in terms of each vessel’s SHEQ systems.
• Protection and Indemnity Club cover and civil liability cover for oil pollution is in excess of US$1 billion for the fleet.Ships` cover specifically includes environmental liabilities resulting from accidents or collisions.
Energy ConservationEnergy conservation by all ships is driven by policies, procedures, training and monitoring. Fuel used by the ships thatare owned and/or operated by the group is a large operational cost item for the group and is therefore closely monitored.Each vessel reports the exact amount of fuel consumed per nautical mile travelled. For competitive reasons thisconsumption efficiency is not disclosed publicly.
0.0
1.0
2.0
3.0
4.0
5.0
6.0
2002 2003 2004 2005
Spills > 1 Barrel (159 ltrs)
Spills < 1 Barrel (159 ltrs)
Loss of containment (no pollution)
Unicorn Shipping spill frequency rate
No.
of
inci
den
ts
W3IB00003 Grindrod INSIDE 06/04/2006 2:26 PM Page 53
GRINDROD LIMITED ANNUAL REPORT 200554
The group is constantly looking for ways to conserve energy through ship and engine design innovation and bymaintaining a strict maintenance programme. Onboard electricity generation on most Unicorn ships is automaticallycontrolled by a computer-based power management system.
The efficient use of non-renewable energy is addressed by equipping the ships with waste-heat recovery plants, theoptimisation of the diesel propulsion and auxiliary engines and, on certain ships, steam-generation by burning recoveredwaste oil and sludge.
Water ConservationAlthough water consumption is not considered a material environmental impact, Unicorn vessels are fitted withevaporators and produce fresh water from sea water, minimising the need to take on fresh water when in port.
Emissions, Effluents and WasteAll ships comply with Annex VI of MARPOL, which deals with air pollution from ships. Currently, 66% of Unicorn’s fleetis fitted with the latest marine diesel engines that produce reduced levels of sulphur oxides (SOx) and nitrogen oxides(NO2). This proportion is set to increase as all new vessels purchased will meet this requirement. Chemical tankers areprovided with vapour-return systems that prevent cargo vapours from being released into the atmosphere.
The consumption and emission of ozone-depleting refrigerants on vessels is monitored and reported monthly. Onboardrefrigerant is predominantly CFC-free R404A.
Solid waste and waste oils are separated onboard and, where possible, incinerated in strict compliance with MARPOL.Waste that cannot be incinerated is landed ashore for appropriate disposal by the local authorities. This includes allplastics, as well as ash from plastic incineration. Any waste that may contain heavy metals is not incinerated onboard.Volumes (in m3) of solid waste incinerated, disposed of at sea (in accordance with MARPOL) and sent ashore, ismonitored monthly.
As vessels trade worldwide, it is not practicable to audit solid waste disposal sites. However, all Unicorn ships maintaingarbage logs (for solid waste) and safe disposal receipts for any solid waste landed.
Most ships are equipped with non water-based vacuum-operated sewage treatment plants, minimising discharge ofeffluent at sea.
Each vessel has a Ballast Management Plan to ensure that ballast water discharged at sea is in full compliance withInternational Maritime Organisation (IMO) requirements.
Each vessel reports monthly on oil releases. During the year in review there were no significant (greater than 100 litres)accidental releases of oil.
Dust abatement forms part of the onboard SHEQ management systems, or the ISO 14001 environmental managementsystems in the case of land-based storage and loading facilities.
Grindrod upheld its policy of not transporting hazardous waste.
Environmental ComplianceThere were no material incidents of, and fines or non-monetary sanctions for, non-compliance with applicableenvironmental regulations during the year in review. Environmental impacts that may have resulted from the accidentalsinking of the chartered-in containership Umfolozi in September 2005, when it was struck by another vessel whenleaving Walvis Bay harbour, Namibia, were averted by the rapid and effective containment of all the oil and fuel onboard.
Environmental Performance (continued)
W3IB00003 Grindrod INSIDE 06/04/2006 2:26 PM Page 54
GRINDROD LIMITED ANNUAL REPORT 2005 55
The directors of the group are responsible for the maintenance of adequate accounting records and the preparation and
integrity of the annual financial statements and related information. The annual financial statements have been prepared
in accordance with International Financial Reporting Standards (IFRS). The group’s independent external auditors,
Deloitte & Touche, have audited the annual financial statements and their unqualified report appears on page 56.
The directors are also responsible for the systems of internal control. These are designed to provide reasonable, but not
absolute, assurance as to the reliability of the annual financial statements, to adequately safeguard, verify and maintain
accountability of assets, and to prevent and detect material mis-statement and loss. The systems are implemented and
monitored by suitably trained personnel with an appropriate segregation of authority and duties. Nothing has come to
the attention of the directors to indicate that any material breakdown in the functioning of these controls, procedures
and systems has occurred during the year under review.
The annual financial statements are prepared on a going concern basis. Nothing has come to the attention of the
directors to indicate that the group will not remain a going concern for the foreseeable future.
The annual financial statements set out on pages 57 to 111 were approved by the board of directors on
22 February 2006 and are signed on their behalf by:
W M Grindrod I A J Clark
Chairman Chief executive officer
Directors’ Responsibility for Financial Reporting
I, C A S Robertson, company secretary of Grindrod Limited, certify that, to the best of my knowledge and belief, all
returns required of a public company have, in respect of the year under review, been lodged with the Registrar of
Companies and that all such returns are true, correct and up to date.
C A S Robertson
Company Secretary
Durban
22 February 2006
Company Secretary’s Certificate
W3IB00003 Grindrod INSIDE 06/04/2006 2:26 PM Page 55
GRINDROD LIMITED ANNUAL REPORT 200556
TO THE MEMBERS OF GRINDROD LIMITED
We have audited the annual financial statements and group annual financial statements set out on pages 57 to 111 for
the year ended 31 December 2005. These financial statements are the responsibility of the company’s directors. Our
responsibility is to express an opinion on these financial statements based on our audit.
We conducted our audit in accordance with International Standards on Auditing. Those standards require that we plan
and perform the audit to obtain reasonable assurance about whether the financial statements are free of material mis-
statement. An audit includes examining, on a test basis, evidence supporting the amounts and disclosures in the
financial statements. An audit also includes assessing the accounting principles used and significant estimates made
by management, as well as evaluating the overall financial statement presentation. We believe that our audit provides a
reasonable basis for our opinion.
In our opinion, the financial statements present fairly, in all material respects, the financial position of the company and
the group at 31 December 2005 and the results of their operations and cash flows for the year then ended in accordance
with International Financial Reporting Standards and in the manner required by the Companies Act of South Africa.
Deloitte & Touche
Registered Accountants and Auditors
Chartered Accountants (SA)
Durban
22 February 2006
Report of the Independent Auditors
W3IB00003 Grindrod INSIDE 06/04/2006 2:26 PM Page 56

GRINDROD LIMITED ANNUAL REPORT 2005 57
Directors’ ReportThe directors have pleasure in presenting their annual report which forms part of the annual financial statements of the
company and of the group for the year ended 31 December 2005.
Nature of Business
The nature of the group’s business is set out under group profile on page 3.
Financial Results
The profit attributable to ordinary shareholders amounted to R851,2 million (2004: R546,2 million) which represents
earnings per share of 185,7 cents (2004: 121,3 cents). All comparative information has been restated for the impact of
the subdivision of shares, the adoption of IFRS, IAS 39 and IAS 17.
Share Capital
Details of the authorised and issued shares are shown on page 87 and the share analysis is shown on pages 114 to 116.
The directors propose that the authority granted to them to control the unissued shares and to issue new shares for cash
be renewed.
At a general meeting held on 27 July 2005, shareholders approved the creation of 7 500 000 cumulative, non-
redeemable, non-participating, non-convertible preference shares with a par value of 0,031 cent each. 5 000 000 of
these shares were issued on 22 August 2005 at R100 per share.
The directors also obtained approval from shareholders at a general meeting held on 19 October 2005 to subdivide the
ordinary share on a 5 for 1 basis. The subdivision was effective as at 31 October 2005 when the number of ordinary
shares increased from 92 181 852 to 460 909 260.
During the year, pursuant to the authority granted to directors at the annual general meeting held on 25 May 2005, the
group repurchased 183 050 ordinary shares in the company at an average price of R12,19 per share totalling
R2,23 million. These shares were cancelled and restored to the status of authorised share capital.
The directors propose that the general authority granted to them to repurchase ordinary shares as opportunities present
themselves, be renewed at the forthcoming annual general meeting.
The issued share capital increased by 7 018 450 shares as a result of the allotment and issue of new shares in terms of
the Grindrod Limited share option scheme offset by the repurchase and cancellation of shares.
Subsequent to the end of the financial year, on 17 February 2006 the remaining 2 500 000 preference shares were issued
at R110,54 per share, inclusive of the unearned dividend income.
Share Option Scheme
Grindrod has a share option scheme as an incentive to the senior executive employees of the group. At the annual
general meeting in May 2005 it was resolved that the unissued shares in the share capital of the company reserved
for the purpose of the share option scheme continue to be placed under the control of the directors. The aggregate
number of shares which are reserved for the scheme, together with the shares under option, is 90 000 000. These
shares represent 3,3% of the authorised share capital and approximately 19,5% of the issued share capital as at
31 December 2005.
During the year, 4 000 000 options were granted at 1251 cents per ordinary share.
W3IB00003 Grindrod INSIDE 06/04/2006 2:26 PM Page 57
GRINDROD LIMITED ANNUAL REPORT 200558
Directors’ Report (continued)
After taking into account options which have lapsed and options withdrawn in respect of retired employees and
employees who have left the group, the balance of the options which have been granted is 69 650 000 shares
(equivalent to 15,1% of the issued share capital). Options in respect of 43 350 000 shares have been exercised and
issued, leaving 26 300 000 shares (equivalent to 5,7% of the issued share capital) still under option in terms of the
scheme at 31 December 2005. The options are exercisable at the market prices ruling on the dates the options were
granted and vary from 30 cents to 1251 cents per ordinary share and at varying dates before November 2015.
7 201 500 ordinary shares were allotted during the year in terms of the scheme for a consideration of R3 453 022.
Details of share options granted but not exercised are:
Number of Subscription
Date option granted Expiry date ordinary shares price (cents)
13.12.1999 13.12.2009 860 000 30
03.05.2000 03.05.2010 1 160 000 30
23.11.2000 23.11.2010 1 500 000 48
19.01.2001 19.01.2011 390 000 53
01.03.2001 01.03.2011 6 830 000 58
01.08.2001 01.08.2011 510 000 61
25.03.2002 25.03.2012 1 520 000 110
18.07.2002 18.07.2012 1 280 000 110
04.02.2003 04.02.2013 1 500 000 128
26.11.2003 26.11.2013 6 250 000 239
27.05.2004 27.05.2014 500 000 380
23.11.2005 23.11.2015 4 000 000 1 251
26 300 000
The number of ordinary shares and subscription price have been restated to give effect to the subdivision for
comparison purposes.
Subsidiary Companies
Information on subsidiary and associate companies is contained on pages 111 and 80 respectively. Reviews of the
businesses and performance of the main operating subsidiary companies are covered in the operational reviews on
pages 21 to 35.
Special Resolutions
A renewal of authority for the company or its subsidiaries to repurchase its own shares was obtained at the 2005 annual
general meeting.
There have been no special resolutions other than those referred to in this report passed by the company or its
subsidiaries, the nature of which might be significant to members in their appreciation of the state of affairs of the group.
Employee Retirement Benefit Plans
Details of the group’s employee retirement benefit plans are separately disclosed in note 13.
W3IB00003 Grindrod INSIDE 06/04/2006 2:26 PM Page 58
GRINDROD LIMITED ANNUAL REPORT 2005 59
Directors’ Interests in the CompanyAt 31 December 2005, directors held ordinary shares in the company as set out below:
The ordinary shareholdings of directors in respect of 2004 have been restated to give effect to the 5 for 1 subdivisionfor comparison purposes.
2005 2004Beneficial Non-Beneficial Beneficial Non-Beneficial
Director Direct Indirect Direct Indirect Direct Indirect Direct Indirect
W M Grindrod (1) *76 249 559 2 135 000 76 249 065 2 135 000D R D White 50 000 28 345 50 000 28 345I A J Clark 3 717 000 12 188 045 3 950 500 16 554 545S M Gounden 100I M Groves (2) *5 450 000 5 534 000J G Jones 100 000T J T McClure (3) *3 330 000 3 040 000A K Olivier 2 953 250 1 000 4 603 250D A Rennie (4) *1 070 000 1 120 000A F Stewart 260 000 130 000L R Stuart-Hill 2 087 195 4 632 695R J H Whitley 2 866 425 2 866 425
Aggregate 3 767 000 103 688 149 5 030 770 4 000 500 111 863 555 5 029 770
* Zero cost collar options have been entered into in respect of the following shares included in the above shareholdings:
Put Strike (R) Call Strike (R)
(1) 3 333 335 9,51 22,07 Expiry date 31 August 20093 333 335 9,83 20,98 Expiry date 30 October 20093 333 330 10,16 19,89 Expiry date 30 December 2009
(2) 750 000 10,61 13,19 Expiry date 30 September 2007500 000 12,50 15,53 Expiry date 23 November 2007
1 000 000 14,15 16,77 Expiry date 23 November 2007(3) 1 000 000 10,82 13,42 Expiry date 12 September 2007
750 000 11,12 13,79 Expiry date 1 October 2007750 000 11,12 16,12 Expiry date 30 September 2008
(4) 1 000 000 10,83 13,28 Expiry date 22 September 2007
At 31 December 2005, directors held preference shares in the company as set out below:
2005Beneficial Non-Beneficial
Director Direct Indirect Direct Indirect
W M Grindrod 100 000I A J Clark 491 500I M Groves 15 000J G Jones 10 000A K Olivier 8 500D A Rennie 10 000
Aggregate 635 000
These ordinary and preference shareholdings were unchanged at 22 February 2006.
W3IB00003 Grindrod INSIDE 06/04/2006 2:26 PM Page 59

GRINDROD LIMITED ANNUAL REPORT 200560
Dividends
The directors have declared a final dividend of 32 cents per ordinary share (2004: 25 cents). Dividends paid or payable
in respect of the year were as follows:
Last day to Trading ex Amount
Date of trade cum dividend Record Payment per share Amount
declaration dividend commences date date (cents) R000
Interim 26.07.2005 20.08.2005 23.08.2005 27.08.2005 30.08.2005 20 92 182
Final 22.02.2006 10.03.2006 13.03.2006 17.03.2006 20.03.2006 32 148 613
The directors have also declared a dividend of R3,038 per preference share (2004: nil) which will be paid on the same
day as the final ordinary dividend referred to above.
Holding Company
Grindrod Limited had no holding company at 31 December 2005.
Subsequent Events
No material change has taken place in the affairs of the group between the end of the financial year and the date of this
report apart from the further issue of preference shares referred to earlier in this report.
Directors’ Report (continued)
W3IB00003 Grindrod INSIDE 06/04/2006 2:26 PM Page 60

GRINDROD LIMITED ANNUAL REPORT 2005 61
Accounting PoliciesThe financial statements were prepared in accordance with IFRS for the first time. Thedisclosures required by IFRS 1 concerning the transition from SA GAAP to IFRS areset out on pages 73 to 77. The principal accounting policies adopted are set out below:
Basis of ConsolidationThe consolidated financial statements incorporate the financial statements of the company and entities controlled bythe company (its subsidiaries) acquired up to 31 December each year. Control is achieved where the company has thepower to govern the financial and operating policies of the acquired entity so as to obtain benefits from its activities.
The assets and liabilities and contingent liabilities of a subsidiary are measured at their fair values at the date ofacquisition. Any excess of the cost of acquisition over the fair values of the identifiable net assets acquired is recognisedas goodwill.
Any deficiency of the cost of acquisition below the fair values of the identifiable net assets acquired, such as a discounton acquisition, is credited to profit and loss in the period of acquisition. The interest of minority shareholders is statedat the minority’s proportion of the fair values of the assets and liabilities recognised. Subsequently, any losses applicableto the minority interest in excess of the minority interest are allocated against the interests of the parent.
The results of subsidiaries acquired or disposed of during the year are included in the consolidated income statementfrom the effective date of acquisition or up to the effective date of disposal, as appropriate.
Where necessary, adjustments are made to the financial statements of subsidiaries to bring the accounting policies usedin line with those used by the group.
All material inter-company balances and transactions are eliminated.
Associate CompaniesThe consolidated financial statements incorporate the assets, liabilities, income and expenses of associates using theequity method of accounting from the acquisition date to the disposal date, except when the investment is classified asheld for sale, in which case it is accounted for as non-current assets held for sale. The carrying amount of suchinvestments is reduced to recognise any decline, other than a temporary decline, in the value of individual investments.Losses of associates in excess of the group’s interest are not recognised unless there is a binding obligation tocontribute to the losses.
Goodwill arising on the acquisition of associates is accounted for in accordance with the accounting policy for goodwillas set out below, but is included in the carrying amount of the associate.
Where a group entity transacts with an associate of the group, unrealised profits and losses are eliminated to the extentof the group’s interest in the relevant associate.
Joint VenturesA joint venture is a contractual arrangement whereby the group and other parties undertake an economic activity that is subject to joint control. The group reports its interests in jointly controlled entities using proportionateconsolidation, except when the investment is classified as held for sale, in which case it is accounted for as non-currentassets held for sale and discontinued operations. The group’s share of the assets, liabilities, income and expenses of jointly controlled entities are combined with the equivalent items in the consolidated financial statements on a line-by-line basis.
Any goodwill arising on the acquisition of the group’s interest in a jointly controlled entity is accounted for in accordancewith the group’s accounting policy for goodwill arising on the acquisition of a subsidiary.
Where the group transacts with its jointly controlled entities, unrealised profits and losses are eliminated to the extentof the group’s interest in the joint venture.
W3IB00003 Grindrod INSIDE 06/04/2006 2:26 PM Page 61

GRINDROD LIMITED ANNUAL REPORT 200562
Accounting Policies (continued)
Translation of Financial Statements Prepared in Foreign CurrenciesA foreign entity is a foreign operation, the activities of which are not an integral part of those of the reporting enterprise.Balance sheets of consolidated foreign entities are translated into South African currency at rates of exchange ruling atthe year end. Profits and losses arising on the translation of the opening net investments and retained earnings of foreigncurrency denominated subsidiaries are included in non-distributable reserves. Previously deferred foreign currencytranslation gains are recognised in income in the period in which the net investment in the foreign entity is disposed ofor when the permanent loan funding is repaid.
Goodwill and fair value adjustments arising on the acquisition of a foreign entity are treated as assets and liabilities ofthe foreign entity and translated at the closing rate.
The financial statements of foreign operations that are integral to the operations of the reporting enterprise are translatedin terms of the accounting policy on foreign currencies.
Foreign CurrenciesThe functional currency of each entity within the group is determined based on the currency of the primary economicenvironment in which that entity operates. Transactions in currencies other than the entity’s functional currency arerecognised at the rates of exchange ruling on the date of the transaction.
Monetary assets and liabilities denominated in such currencies are translated at the rates ruling at the balance sheet date.
Gains and losses arising on exchange differences are recognised in profit or loss.
Deferred TaxationDeferred tax is recognised using the balance sheet liability method for all temporary differences, unless specificallyexempt, at the tax rates that have been enacted or substantially enacted at the balance sheet date.
A deferred tax asset represents the amount of income taxes recoverable in future periods in respect of deductibletemporary differences, the carry forward of unused tax losses and the carry forward of unused tax credits, includingunused credits for secondary tax on dividends. Deferred tax assets are only recognised to the extent that it is probablethat taxable profits will be available against which deductible temporary differences can be utilised.
Deferred tax liabilities are recognised for taxable temporary differences, unless specifically exempt.
Deferred tax assets and liabilities are not recognised if the temporary difference arises from goodwill or from the initialrecognition (other than in a business combination) of other assets and liabilities in a transaction that affects neithertaxable income nor accounting profit.
Ships, Property, Plant and EquipmentShips are reflected at their effective net cost after all financing arrangements have been concluded. The useful life of aship ranges from 25 to 30 years. Ships are depreciated on a straight-line basis to an estimated residual value over itsuseful life to the group. Borrowing costs incurred in the financing of the acquisition of ships prior to their delivery arecapitalised to the cost of the ship.
Equipment, plant and vehicles are reflected at cost and are depreciated over their estimated useful lives to estimatedresidual values, on a straight-line basis as follows:
Aircraft 5 yearsLocomotives 15 yearsPlant and machinery 5 – 20 yearsInformation technology equipment 3 – 5 yearsVehicles 3 – 10 years
W3IB00003 Grindrod INSIDE 06/04/2006 2:26 PM Page 62
GRINDROD LIMITED ANNUAL REPORT 2005 63
Depreciation commences when the assets are ready for their intended use. Where significant parts of an item havedifferent useful lives to the item itself, these parts are depreciated over their estimated useful lives. The methods ofdepreciation, useful lives and residual values are reviewed annually.
Freehold land is reflected at cost and is not depreciated. Buildings are reflected at cost and depreciated to estimatedresidual value over their useful life to the group, currently estimated at 50 years from the date of acquisition. Where theestimated residual value exceeds the cost, depreciation is not provided.
Expenditure relating to leasehold properties is capitalised and depreciated over the period of the lease, or 25 years,whichever is the lesser period.
Leased AssetsClassificationLeases are classified as finance leases whenever the terms of the lease transfer substantially all the risks and rewardsof ownership to the lessee. All other leases are classified as operating leases.
In the capacity of a lessorAmounts due from lessees under finance leases are recorded as receivables at the amount of the group’s net investmentin the leases. Finance lease income is allocated to accounting periods so as to reflect a constant periodic rate of returnon the group’s net investment outstanding in respect of the leases.
Rental income from operating leases is recognised on a straight-line basis over the term of the relevant lease.
In the capacity of a lesseeAssets held under finance leases are recognised as assets of the group at their fair value or, if lower, at the present value of the minimum lease payments, each determined at the inception of the lease. The correspondingliability to the lessor is included in the balance sheet as a finance lease obligation. Lease payments are apportionedbetween finance charges and reduction of the lease obligation so as to achieve a constant rate of interest on theremaining balance of the liability. Finance charges are charged directly against income, unless they are directlyattributable to qualifying assets, in which case they are capitalised in accordance with the group’s general policy onborrowing costs.
Rentals payable under operating leases are charged to income on a straight-line basis over the term of the relevantlease. Benefits received and receivable as an incentive to enter into an operating lease are also spread on a straight-linebasis over the lease term.
Impairment of AssetsAt each balance sheet date, the group reviews the carrying amounts of its tangible and intangible assets to determinewhether there is any indication that those assets have suffered an impairment loss. If any such indication exists, therecoverable amount of the asset is estimated in order to determine the extent of the impairment loss, if any. Where theasset does not generate cash flows that are independent from other assets, the group estimates the recoverable amountof the cash-generating unit to which the asset belongs. An intangible asset with an indefinite useful life is tested forimpairment annually and whenever there is an indication that the asset may be impaired.
Recoverable amount, is the higher of fair value less costs to sell and value-in-use. In assessing value-in-use, theestimated future cash flows are discounted to their present value using a pre-tax discount rate that reflects currentmarket assessments of the time value of money and the risks specific to the asset for which the estimates of future cashflows have not been adjusted. If the recoverable amount of an asset, or cash-generating unit, is estimated to be lessthan its carrying amount, the carrying amount of the asset or cash-generating unit, is reduced to its recoverable amount.An impairment loss is recognised as an expense immediately, unless the relevant asset is carried at a revalued amount,in which case the impairment loss is treated as a revaluation decrease.
W3IB00003 Grindrod INSIDE 06/04/2006 2:26 PM Page 63
GRINDROD LIMITED ANNUAL REPORT 200564
Where an impairment loss subsequently reverses, the carrying amount of the asset or cash-generating unit, is increasedto the revised estimate of its recoverable amount, in order that the increased carrying amount does not exceed thecarrying amount that would have been determined had no impairment loss been recognised for the asset or cash-generating unit, in prior years.
A reversal of an impairment loss is recognised as income immediately, unless the relevant asset is carried at a revaluedamount, in which case the reversal of the impairment loss is treated as a revaluation increase.
Intangible AssetsGoodwillGoodwill arising on consolidation represents the excess of the cost of acquisition over the group’s interest in the fairvalue of the identifiable assets and liabilities of a subsidiary, associate or jointly controlled entity at the date ofacquisition.
Goodwill is recognised as an asset and reviewed for impairment at least annually. Any impairment is recognisedimmediately in profit or loss and is not subsequently reversed.
On disposal of a subsidiary, associate or jointly controlled entity, the attributable amount of goodwill is included in thedetermination of the profit or loss on disposal.
Goodwill arising on acquisitions before the date of transition to IFRS has been retained at the previous SA GAAPamounts subject to being tested for impairment at that date.
If, on a business combination, the fair value of the group’s interest in the identifiable assets, liabilities and contingentliabilities exceeds the cost of acquisition, this excess is recognised in profit or loss immediately. For businesscombinations for which the agreement date was before 31 March 2004, this was called negative goodwill and presentedas a negative asset. This amount has since been transferred to retained income on 1 January 2004.
Other intangible assetsIntangible assets are initially recognised at cost if acquired separately or internally generated, or at fair value if acquiredas part of a business combination. If assessed as having an indefinite useful life, it is not amortised but tested forimpairment annually and impaired if necessary. If assessed as having a finite useful life, it is amortised over their usefullives using a straight-line basis, and tested for impairment if there is an indication that they may be impaired.
InventoryInventory which includes merchandise, bunkers on board ships and other consumable stores is valued at the lower ofcost and net realisable value. Cost is determined on a weighted average and first in first out basis. Spares on boardships are charged against income when issued to the ships and are not brought to account at the balance sheet date.
When inventories are sold, the carrying amount is recognised as part of cost of sales. Any write-down of inventories tonet realisable value and all losses of inventories or reversals of previous write-downs or losses are recognised in cost ofsales in the period the write-down, loss or reversal occurs.
Agricultural and other commodities are valued at fair value less costs to sell. When such inventories are measured atfair value less costs to sell, changes in fair value less costs to sell are recognised in profit or loss in the period of the change.
Voyage ResultsThe results of voyages completed during the period and a percentage of the results of uncompleted voyages at the yearend are included in the income statement. Results of uncompleted voyages are included based on estimated voyageresult and voyage time elapsed.
Anticipated exceptional losses on uncompleted voyages are provided for in full.
Accounting Policies (continued)
W3IB00003 Grindrod INSIDE 06/04/2006 2:26 PM Page 64

GRINDROD LIMITED ANNUAL REPORT 2005 65
Revenue RecognitionRevenue is measured at the fair value of the consideration received or receivable and represents amounts receivable forgoods and services provided in the normal course of business, net of discounts, VAT and other sales related taxes.
Sales of goods are recognised when goods are delivered and title has passed.
Dividend income from investments is recognised when the shareholders’ rights to receive payment have beenestablished.
Financial InstrumentsFinancial instruments recognised on the balance sheet include investments, trade and other receivables, cash and cashequivalents, trade and other payables, interest bearing debt and hedges relating to future commitments. Financialinstruments are initially measured at cost, which includes transaction costs, when the group is party to a contractualarrangement. Subsequent measurement of financial instruments is set out below.
Derivative instrumentsThe group’s use of derivative instruments which have a cash flow impact are limited to forward exchange contracts,cross currency and interest rate swaps, futures, options and forward freight swap agreements. Derivatives aresubsequently measured at fair value. Any gain or loss on forward exchange contracts relating to foreign currencydenominated assets, liabilities and hedges is recognised in income unless the contracts are designated as cash flow hedges.
Changes in the fair value of derivative financial instruments that are designated and effective as cash flow hedges arerecognised directly in equity. Amounts deferred in equity are recognised in the income statement in the same period inwhich the hedged firm commitment or forecasted transaction affects net profit or loss.
Changes in the fair value of derivative financial instruments that do not qualify for hedge accounting are recognised inthe income statement as they arise.
InvestmentsInvestments in subsidiaries, joint ventures and associates are recorded at cost, less impairments. Loans and financelease receivables are recorded at amortised cost. Other investments are shown at fair value and gains and losses arerecognised in income.
Trade and other receivablesShort duration receivables with no stated interest rate are measured at original invoice amount less provision for doubtful debts.
Cash and cash equivalentsCash and cash equivalents are measured at cost which is equivalent to fair value.
EquityEquity instruments issued by the company are recorded at the proceeds received, net of direct issue costs.
Financial liabilitiesFinancial liabilities other than derivatives are recognised at their original debt value less principal payments.
Trade and other payablesTrade payables are not interest bearing and are stated at their nominal value.
OffsetFinancial assets and financial liabilities are only offset if there is a legal right to offset and there is an intention either tosettle on a net basis or to realise the asset and settle the liability simultaneously.
W3IB00003 Grindrod INSIDE 06/04/2006 2:26 PM Page 65
GRINDROD LIMITED ANNUAL REPORT 200566
ProvisionsProvisions are recognised when the group has a present obligation for which it is probable that an outflow of resourceswill be required and where a reliable estimate can be made of the amount.
Full provision is made for the present obligations of the unavoidable future costs of fulfilling the terms of onerous shipcharter contracts or contracts of affreightment to which the group is committed.
Segmental ReportingThe principal segments of the group have been identified on a primary basis by business segment which isrepresentative of the internal structure used for management reporting.
All segment revenue and expenses are directly attributable to the segments. Segment assets include all operating assetsused by a segment, and consist principally of ships, property, plant and equipment, as well as current assets. Segmentliabilities include all operating liabilities and consist principally of trade creditors. These assets and liabilities are alldirectly attributable to the segments.
Employee BenefitsThe group operates a defined benefit pension fund as well as two defined contribution provident funds.
Current contributions to the group’s defined contribution funds are charged against income when incurred. The cost ofproviding benefits to the group’s defined benefit fund and the obligation in respect of post retirement medical aid aredetermined and provided using the projected unit credit actuarial valuation method. Contribution rates to the definedbenefit fund are adjusted for any unfavourable experience adjustments. Favourable experience adjustments are retainedwithin the fund. Actuarial surpluses are brought to account in the group’s financial statements only when it is clear thateconomic benefits will be available to the group.
The group’s estimated liability in respect of post retirement medical benefits have been fully provided for in the balance sheet.
The group operates a share option scheme. The proceeds on share options are credited to share capital when exercised.
The expected cost of profit-sharing and bonus payments is recognised as an expense when there is a legal orconstructive obligation to make such payments as a result of past performance
Share Based PaymentsThe group has applied the requirement of IFRS 2 Share Based Payments. In accordance with the transitional provisions, IFRS 2 has been applied to all equity instruments issued after 7 November 2002 that had not vested as of 1 January 2005.
The group issues equity-settled share based payments to certain employees. These share based payments aremeasured at fair value at the date of the grant and is expensed on a straight-line basis over the vesting period, basedon the group’s estimate of shares that will eventually vest.
Fair value is measured by use of an actuarial model. The expected life used in the model has been adjusted, based onmanagement’s best estimate, for the effects of non-transferability, exercise restrictions, and behavioural considerations.
Non-Current Assets Held for SaleNon-current assets or disposal groups are classified as held for sale if the carrying amount will be recovered principallythrough sale rather than through continuing use. This condition is regarded as met only when the sale is highly probable,the assets or disposal group are available for immediate sale in its present condition and management is committed tothe sale which should be expected to qualify for recognition as a completed sale within one year from the date of theclassification.
Accounting Policies (continued)
W3IB00003 Grindrod INSIDE 06/04/2006 2:26 PM Page 66
GRINDROD LIMITED ANNUAL REPORT 2005 67
Immediately prior to being classified as held for sale the carrying amount of assets and liabilities are measured inaccordance with the applicable standard. After classification as held for sale it is measured at the lower of the carryingamount and fair value less costs to sell and therefore not depreciated. An impairment loss is recognised in profit or lossfor any initial and subsequent write-down of the asset and disposal group to fair value less costs to sell. A gain for anysubsequent increase in fair value less costs to sell is recognised in profit or loss to the extent that it is not in excess ofthe cumulative impairment loss previously recognised.
Government GrantsGovernment grants towards staff re-training costs are recognised as income over the periods necessary to match themwith the related costs and are deducted in reporting the related expense.
TaxationThe charge for current tax is based on the results for the year as adjusted for income that is exempt and expenses thatare not deductible using tax rates that are applicable to the taxable income.
Deferred tax is recognised in profit or loss except when it relates to items credited or charged directly to equity, in whichcase it is also recognised in equity.
Critical Judgements in Applying the Group’s Accounting PoliciesIn the process of applying the group’s accounting policies, management has made the following judgements thatpotentially have the most significant effect on the amounts recognised in the financial statements.
Onerous contract provisionsFull provision is made for the present obligations of the unavoidable future costs of fulfilling the terms of onerous shipcharter contracts or contracts of affreightment to which the group is committed.
Due to the volatility of revenue and certain costs in respect of a subsidiary of the group, a period of one year is takeninto account, as any estimate beyond this is considered unreliable.
Deferred taxationDeferred tax assets representing the carry forward of unused tax losses are only recognised to the extent that it isprobable that taxable profits will be available in the future. In instances where there is no contracted income, the raisingof the deferred tax asset is limited to the next three years’ budgeted taxable profit due to the uncertainty of estimatingprofits more than three years hence.
Impairment of investment and goodwillDetermining whether investments and goodwill is impaired requires an estimation of the value-in-use of the cashgenerating units of the investments and to which goodwill has been allocated. The value-in-use calculation requires theentities to estimate the future cash flows expected and a suitable discount rate in order to calculate the present value.
In respect of a subsidiary of the group that has incurred losses in recent periods, the investments and goodwill has notbeen impaired as substantial investment in and commissioning of plant will take place during 2006 and a contract witha major customer has recently been re-negotiated. This is expected to return the company to profitability.
W3IB00003 Grindrod INSIDE 06/04/2006 2:26 PM Page 67
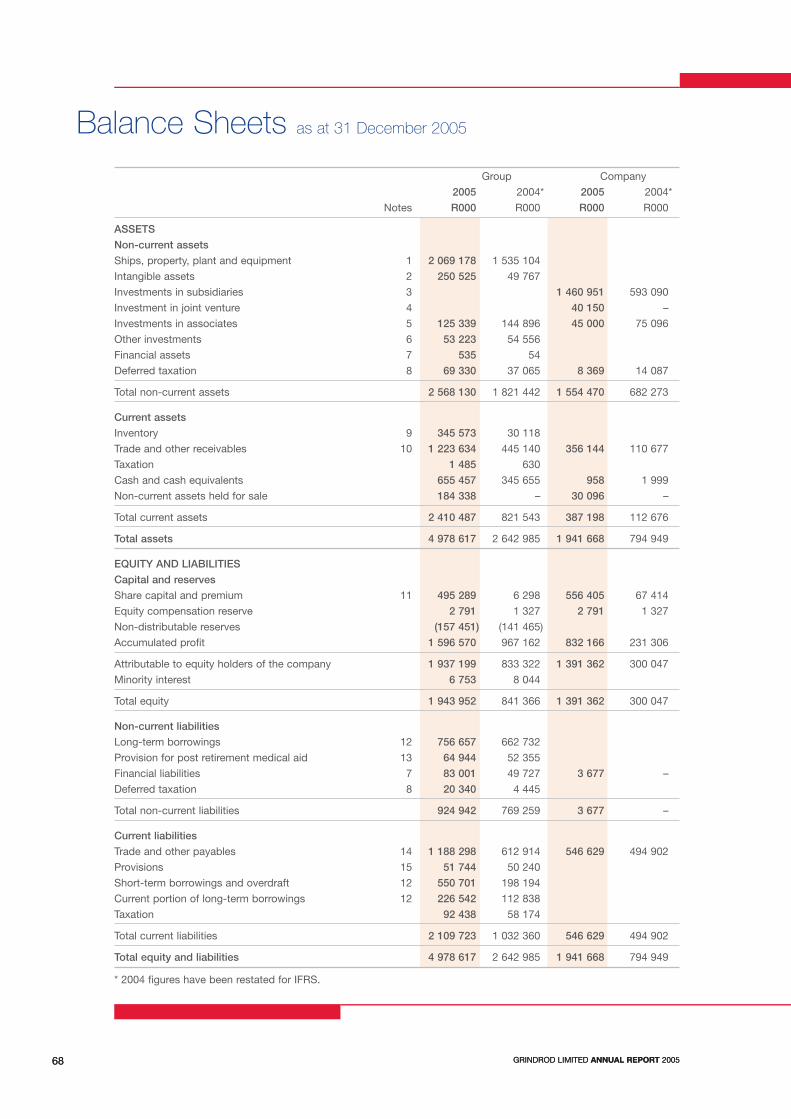
GRINDROD LIMITED ANNUAL REPORT 200568
Group Company
2005 2004* 2005 2004*
Notes R000 R000 R000 R000
ASSETS
Non-current assets
Ships, property, plant and equipment 1 2 069 178 1 535 104
Intangible assets 2 250 525 49 767
Investments in subsidiaries 3 1 460 951 593 090
Investment in joint venture 4 40 150 –
Investments in associates 5 125 339 144 896 45 000 75 096
Other investments 6 53 223 54 556
Financial assets 7 535 54
Deferred taxation 8 69 330 37 065 8 369 14 087
Total non-current assets 2 568 130 1 821 442 1 554 470 682 273
Current assets
Inventory 9 345 573 30 118
Trade and other receivables 10 1 223 634 445 140 356 144 110 677
Taxation 1 485 630
Cash and cash equivalents 655 457 345 655 958 1 999
Non-current assets held for sale 184 338 – 30 096 –
Total current assets 2 410 487 821 543 387 198 112 676
Total assets 4 978 617 2 642 985 1 941 668 794 949
EQUITY AND LIABILITIES
Capital and reserves
Share capital and premium 11 495 289 6 298 556 405 67 414
Equity compensation reserve 2 791 1 327 2 791 1 327
Non-distributable reserves (157 451) (141 465)
Accumulated profit 1 596 570 967 162 832 166 231 306
Attributable to equity holders of the company 1 937 199 833 322 1 391 362 300 047
Minority interest 6 753 8 044
Total equity 1 943 952 841 366 1 391 362 300 047
Non-current liabilities
Long-term borrowings 12 756 657 662 732
Provision for post retirement medical aid 13 64 944 52 355
Financial liabilities 7 83 001 49 727 3 677 –
Deferred taxation 8 20 340 4 445
Total non-current liabilities 924 942 769 259 3 677 –
Current liabilities
Trade and other payables 14 1 188 298 612 914 546 629 494 902
Provisions 15 51 744 50 240
Short-term borrowings and overdraft 12 550 701 198 194
Current portion of long-term borrowings 12 226 542 112 838
Taxation 92 438 58 174
Total current liabilities 2 109 723 1 032 360 546 629 494 902
Total equity and liabilities 4 978 617 2 642 985 1 941 668 794 949
* 2004 figures have been restated for IFRS.
Balance Sheets as at 31 December 2005
GRINDROD LIMITED ANNUAL REPORT 200568
W3IB00003 Grindrod INSIDE 06/04/2006 2:26 PM Page 68

GRINDROD LIMITED ANNUAL REPORT 2005 69
Group Company
2005 2004* 2005 2004*
Notes R000 R000 R000 R000
Revenue 16 7 449 145 2 974 325 837 741 260 151
Other income 17 198 668 81 043
Operating expenses 17 (6 600 471) (2 377 258) (9 576) (2 524)
Trading profit 1 047 342 678 110 828 165 257 627
Depreciation 17 (121 705) (75 835)
Operating profit before interest and taxation 925 637 602 275 828 165 257 627
Non-trading items 18 3 451 2 036 – (137)
Interest received 19 53 859 38 129 93 568
Interest paid 19 (140 639) (100 327) – (2 048)
Profit before share of associate companies profit 842 308 542 113 828 258 256 010
Share of associate companies profit before taxation 88 544 52 760
Profit before taxation 930 852 594 873 828 258 256 010
Taxation 20 (65 152) (47 966) (5 718) 14 087
Profit for the year 865 700 546 907 822 540 270 097
Attributable to:
Equity holders of the parent 21 866 430 546 190 822 540 270 097
Minority interest (730) 717
865 700 546 907 822 540 270 097
Earnings per share (cents) 21
Basic 185,7 121,3
Diluted 178,6 115,4
* 2004 figures have been restated for IFRS.
Income Statements for the year ended 31 December 2005
GRINDROD LIMITED ANNUAL REPORT 2005
W3IB00003 Grindrod INSIDE 06/04/2006 2:26 PM Page 69
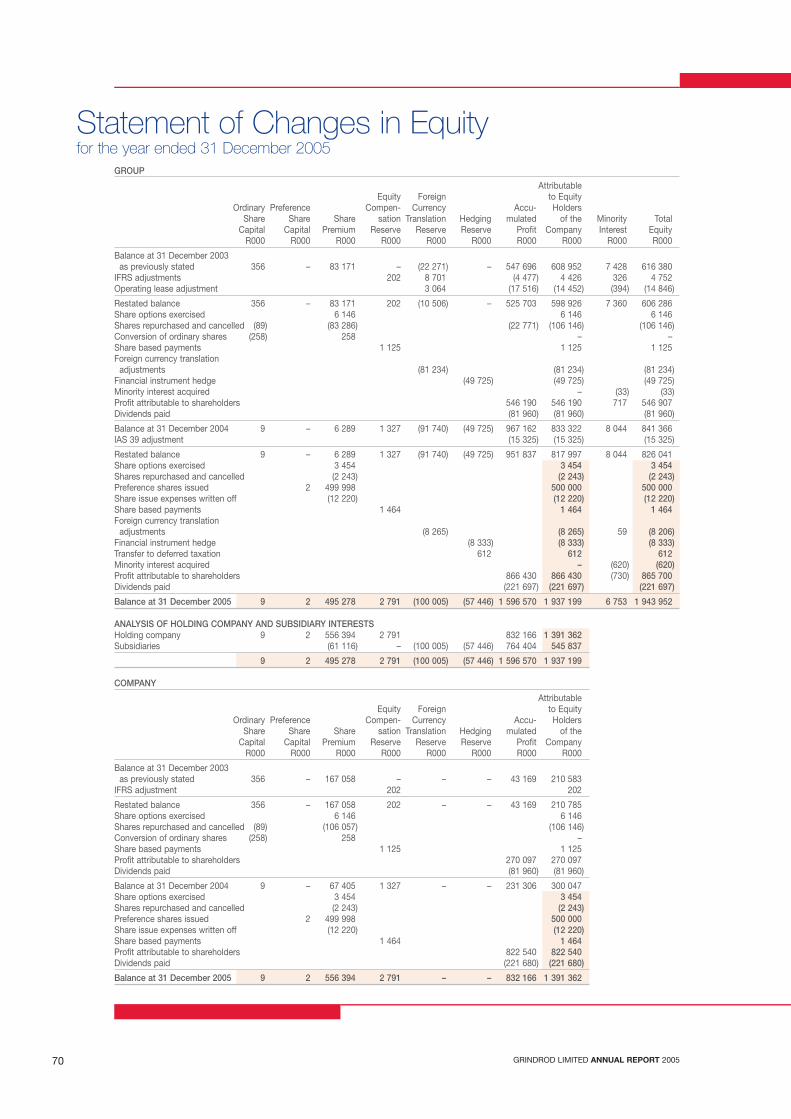
GRINDROD LIMITED ANNUAL REPORT 200570
GROUP
AttributableEquity Foreign to Equity
Ordinary Preference Compen- Currency Accu- HoldersShare Share Share sation Translation Hedging mulated of the Minority Total
Capital Capital Premium Reserve Reserve Reserve Profit Company Interest EquityR000 R000 R000 R000 R000 R000 R000 R000 R000 R000
Balance at 31 December 2003 as previously stated 356 – 83 171 – (22 271) – 547 696 608 952 7 428 616 380
IFRS adjustments 202 8 701 (4 477) 4 426 326 4 752 Operating lease adjustment 3 064 (17 516) (14 452) (394) (14 846)
Restated balance 356 – 83 171 202 (10 506) – 525 703 598 926 7 360 606 286 Share options exercised 6 146 6 146 6 146 Shares repurchased and cancelled (89) (83 286) (22 771) (106 146) (106 146)Conversion of ordinary shares (258) 258 – – Share based payments 1 125 1 125 1 125 Foreign currency translation
adjustments (81 234) (81 234) (81 234)Financial instrument hedge (49 725) (49 725) (49 725)Minority interest acquired – (33) (33)Profit attributable to shareholders 546 190 546 190 717 546 907 Dividends paid (81 960) (81 960) (81 960)
Balance at 31 December 2004 9 – 6 289 1 327 (91 740) (49 725) 967 162 833 322 8 044 841 366 IAS 39 adjustment (15 325) (15 325) (15 325)
Restated balance 9 – 6 289 1 327 (91 740) (49 725) 951 837 817 997 8 044 826 041 Share options exercised 3 454 3 454 3 454Shares repurchased and cancelled (2 243) (2 243) (2 243)Preference shares issued 2 499 998 500 000 500 000 Share issue expenses written off (12 220) (12 220) (12 220)Share based payments 1 464 1 464 1 464 Foreign currency translation
adjustments (8 265) (8 265) 59 (8 206)Financial instrument hedge (8 333) (8 333) (8 333)Transfer to deferred taxation 612 612 612 Minority interest acquired – (620) (620)Profit attributable to shareholders 866 430 866 430 (730) 865 700 Dividends paid (221 697) (221 697) (221 697)
Balance at 31 December 2005 9 2 495 278 2 791 (100 005) (57 446) 1 596 570 1 937 199 6 753 1 943 952
ANALYSIS OF HOLDING COMPANY AND SUBSIDIARY INTERESTSHolding company 9 2 556 394 2 791 832 166 1 391 362 Subsidiaries (61 116) – (100 005) (57 446) 764 404 545 837
9 2 495 278 2 791 (100 005) (57 446) 1 596 570 1 937 199
COMPANY
AttributableEquity Foreign to Equity
Ordinary Preference Compen- Currency Accu- HoldersShare Share Share sation Translation Hedging mulated of the
Capital Capital Premium Reserve Reserve Reserve Profit CompanyR000 R000 R000 R000 R000 R000 R000 R000
Balance at 31 December 2003 as previously stated 356 – 167 058 – – – 43 169 210 583
IFRS adjustment 202 202
Restated balance 356 – 167 058 202 – – 43 169 210 785 Share options exercised 6 146 6 146 Shares repurchased and cancelled (89) (106 057) (106 146)Conversion of ordinary shares (258) 258 – Share based payments 1 125 1 125 Profit attributable to shareholders 270 097 270 097 Dividends paid (81 960) (81 960)
Balance at 31 December 2004 9 – 67 405 1 327 – – 231 306 300 047Share options exercised 3 454 3 454Shares repurchased and cancelled (2 243) (2 243)Preference shares issued 2 499 998 500 000 Share issue expenses written off (12 220) (12 220)Share based payments 1 464 1 464 Profit attributable to shareholders 822 540 822 540 Dividends paid (221 680) (221 680)
Balance at 31 December 2005 9 2 556 394 2 791 – – 832 166 1 391 362
Statement of Changes in Equity for the year ended 31 December 2005
W3IB00003 Grindrod INSIDE 06/04/2006 2:26 PM Page 70

GRINDROD LIMITED ANNUAL REPORT 2005 71
Group Company
2005 2004* 2005 2004*
Notes R000 R000 R000 R000
OPERATING ACTIVITIES
Cash receipts from charter hire 1 331 711 1 350 609
Cash receipts from freight 1 523 547 1 154 447
Cash receipts from invoiced sales 3 824 455 428 811
Other 14 728 10 360
Cash receipts from customers 6 694 441 2 944 227
Cash payments to suppliers and employees (5 326 964) (2 308 265) (5 379) (1 762)
Cash generated from/(utilised in) operations 30.1 1 367 477 635 962 (5 379) (1 762)
Interest received 53 859 38 129 93 568
Interest paid (149 915) (102 472) – (2 048)
Dividends received 5 274 21 344 159 584 199 786
Dividends paid 30.2 (206 508) (81 960) (206 491) (81 960)
Taxation paid (32 251) (3 766)
Net cash flows from/(used in) operating activities 1 037 936 507 237 (52 193) 114 584
INVESTING ACTIVITIES
Ships, property, plant and equipment acquired 30.3 (648 135) (558 963)
Replacement of ships, property, plant and equipment (13 972) (3 993)
Additions to ships, property, plant and equipment (634 163) (554 970)
Acquisition of investments – (13 192) (40 151) –
Acquisition of subsidiaries and joint ventures 30.4 (906 417) (4 162)
Proceeds from disposal of property,
plant and equipment 13 666 4 021
Proceeds from disposal of investments 575 96 877 – 9 212
Acquisition of intangible assets (139 294) –
Capital receipts from finance lease – 18 233
Loans repaid by associate companies 2 378 1 772
Loans advanced to joint ventures (10 534) (4 545)
Net advances to subsidiaries (397 688) (96 425)
Net cash flows used in investing activities (1 687 761) (459 959) (437 839) (87 213)
FINANCING ACTIVITIES
Proceeds from issue of ordinary share capital 3 454 6 146 3 454 6 146
Proceeds from issue of preference share capital 487 780 – 487 780 –
Repurchase of ordinary share capital (2 243) (106 146) (2 243) (106 146)
Long-term borrowings raised 459 011 487 994
Payment of capital portion of long-term borrowings (352 079) (229 079)
Short-term loan raised/(repaid) 129 192 (129 711)
Net cash flows from/(used in) financing activities 725 115 29 204 488 991 (100 000)
Net increase/(decrease) in cash and cash equivalents 75 290 76 482 (1 041) (72 629)
Cash and cash equivalents at beginning of period 257 297 189 150 1 999 74 628
Difference arising on translation 14 984 (8 335)
Cash and cash equivalents at end of period 30.5 347 571 257 297 958 1 999
* 2004 figures have been restated for IFRS.
Cash Flow Statements for the year ended 31 December 2005
W3IB00003 Grindrod INSIDE 06/04/2006 2:26 PM Page 71

GRINDROD LIMITED ANNUAL REPORT 200572
Trading, Freight and
Business Segments Shipping Services Financial Services Group
2005 2004* 2005 2004* 2005 2004*
R000 R000 R000 R000 R000 R000
Revenue – External 2 867 560 2 479 479 4 581 585 494 846 7 449 145 2 974 325
Revenue – Internal 540 218 242 842 1 891 651 34 699 2 431 869 277 541
Trading profit 923 850 625 151 123 492 52 959 1 047 342 678 110
Depreciation (69 991) (44 165) (51 714) (31 670) (121 705) (75 835)
Operating profit 853 859 580 986 71 778 21 289 925 637 602 275
Non-trading items (439) (1 776) 3 890 3 812 3 451 2 036
Share of associate companies
profit before taxation – – 88 544 52 760 88 544 52 760
Segment result excluding
interest and taxation 853 420 579 210 164 212 77 861 1 017 632 657 071
Interest received 14 074 5 578 39 785 32 551 53 859 38 129
Interest paid (74 550) (55 835) (66 089) (44 492) (140 639) (100 327)
Taxation (22 830) (34 306) (42 322) (13 660) (65 152) (47 966)
Profit for the year 770 114 494 647 95 586 52 260 865 700 546 907
Minority interest – – 730 (717) 730 (717)
Profit attributable to shareholders 770 114 494 647 96 316 51 543 866 430 546 190
Preference dividends (7 595) – (7 611) – (15 206) –
Profit attributable to ordinary
shareholders 762 519 494 647 88 705 51 543 851 224 546 190
Capital expenditure 494 659 502 797 153 476 56 166 648 135 558 963
Segment assets 2 145 872 1 910 515 2 832 745 732 470 4 978 617 2 642 985
Segment liabilities excluding
interest bearing debt (569 587) (380 243) (931 178) (349 102) (1 500 765) (729 345)
Geographic Segments USA/Bermuda South America Middle East
2005 2004* 2005 2004* 2005 2004*
R000 R000 R000 R000 R000 R000
Revenue – External 1 142 029 – 163 955 – 80 044 –
Capital expenditure – – – – – –
Segment assets 424 650 – 22 – 1 947 –
United Kingdom/ Singapore/Asia/
Europe/Isle of Man Far East Southern Africa Group
2005 2004* 2005 2004* 2005 2004* 2005 2004*
R000 R000 R000 R000 R000 R000 R000 R000
Revenue – External 724 619 195 996 1 849 249 426 246 3 489 249 2 352 083 7 449 145 2 974 325
Capital expenditure 420 864 417 919 705 403 226 566 140 641 648 135 558 963
Segment assets 1 505 506 1 546 171 720 430 140 303 2 326 062 956 511 4 978 617 2 642 985
* 2004 figures have been restated for IFRS.
Segmental Analysis for the year ended 31 December 2005
W3IB00003 Grindrod INSIDE 06/04/2006 2:26 PM Page 72
GRINDROD LIMITED ANNUAL REPORT 2005 73
For the year ended 31 December 2004, the group prepared its financial statements under South African Statements of
Generally Accepted Accounting Practice (SA GAAP). In accordance with the JSE Limited (JSE) Listings Requirements,
the group is required to prepare its annual financial statements in accordance with IFRS (and revised SA GAAP effective
for financial periods commencing on or after 1 January 2005) for the year ended 31 December 2005. IFRS refers to the
application of International Accounting Standards (IAS) and IFRS.
This requirement applies to all listed companies for financial reporting periods beginning on or after 1 January 2005 and,
consequently, 31 December 2005 is the group’s first published annual financial statements under IFRS. As the group
publishes comparative information for one year, the date of transition to IFRS is 1 January 2004, which represents the
start of the earliest period of comparative information presented.
In order to explain how the group’s reported performance and financial position are impacted by IFRS, the group has
restated information previously published under SA GAAP to the equivalent basis under IFRS. This restatement follows
the guidelines set out in IFRS 1 First-time Adoption of International Financial Reporting Standards (IFRS 1).
The date of transition to IFRS for the group is 1 January 2004 and therefore as required by IFRS 1, the group’s
opening balance sheet at 1 January 2004 has been restated to reflect all existing IFRS statements applicable at
31 December 2005. However, IFRS 1 allows a number of exemptions to this retrospective application principle upon
adoption of IFRS.
Where estimates have previously been made under SA GAAP, consistent estimates after adjustments to reflect any
differences in accounting policies have been made for the same date on transition to IFRS.
The group has adopted the following transitional arrangements:
IFRS 2 Share Based Payments
The group has elected not apply the provisions of IFRS 2 Share Based Payments to its equity-settled share options
granted on or before 7 November 2002, or to options granted after the date but which had vested prior to
1 January 2005.
IFRS 3 Business Combinations
The group has elected not to retrospectively apply the requirements of IFRS 3 Business Combinations for business
combinations that occurred prior to 31 March 2004 and consequently no adjustment has been made for historical
business combinations.
IAS 39 (revised) Financial Instruments: Recognition and Measurement
IAS 39 (revised) Financial Instruments: Recognition and Measurement permits the adjustment to accumulated profit
relating to the adoption of IAS 39, to be made at either the date of transition or at the effective date of the revised
standard, which is 1 January 2005. The group has opted to effect this adjustment at 1 January 2005.
Transition to IFRS
W3IB00003 Grindrod INSIDE 06/04/2006 2:26 PM Page 73
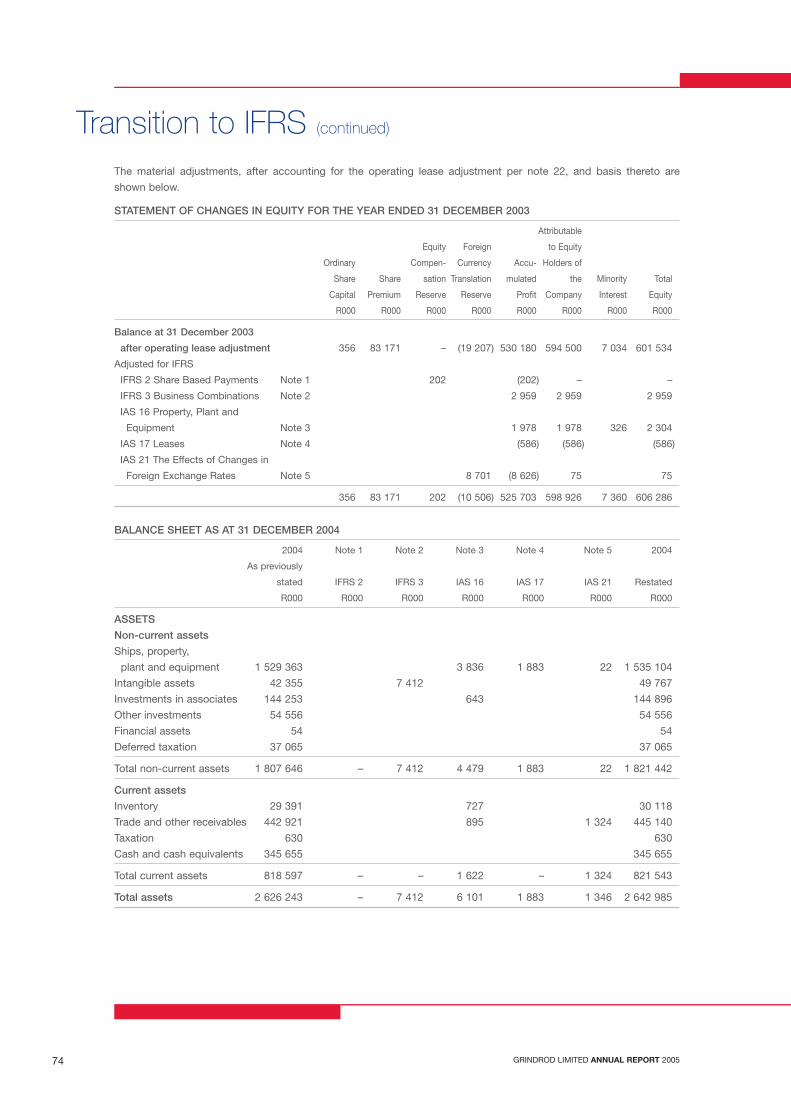
GRINDROD LIMITED ANNUAL REPORT 200574
The material adjustments, after accounting for the operating lease adjustment per note 22, and basis thereto are
shown below.
STATEMENT OF CHANGES IN EQUITY FOR THE YEAR ENDED 31 DECEMBER 2003
Attributable
Equity Foreign to Equity
Ordinary Compen- Currency Accu- Holders of
Share Share sation Translation mulated the Minority Total
Capital Premium Reserve Reserve Profit Company Interest Equity
R000 R000 R000 R000 R000 R000 R000 R000
Balance at 31 December 2003
after operating lease adjustment 356 83 171 – (19 207) 530 180 594 500 7 034 601 534
Adjusted for IFRS
IFRS 2 Share Based Payments Note 1 202 (202) – –
IFRS 3 Business Combinations Note 2 2 959 2 959 2 959
IAS 16 Property, Plant and
Equipment Note 3 1 978 1 978 326 2 304
IAS 17 Leases Note 4 (586) (586) (586)
IAS 21 The Effects of Changes in
Foreign Exchange Rates Note 5 8 701 (8 626) 75 75
356 83 171 202 (10 506) 525 703 598 926 7 360 606 286
BALANCE SHEET AS AT 31 DECEMBER 2004
2004 Note 1 Note 2 Note 3 Note 4 Note 5 2004
As previously
stated IFRS 2 IFRS 3 IAS 16 IAS 17 IAS 21 Restated
R000 R000 R000 R000 R000 R000 R000
ASSETS
Non-current assets
Ships, property,
plant and equipment 1 529 363 3 836 1 883 22 1 535 104
Intangible assets 42 355 7 412 49 767
Investments in associates 144 253 643 144 896
Other investments 54 556 54 556
Financial assets 54 54
Deferred taxation 37 065 37 065
Total non-current assets 1 807 646 – 7 412 4 479 1 883 22 1 821 442
Current assets
Inventory 29 391 727 30 118
Trade and other receivables 442 921 895 1 324 445 140
Taxation 630 630
Cash and cash equivalents 345 655 345 655
Total current assets 818 597 – – 1 622 – 1 324 821 543
Total assets 2 626 243 – 7 412 6 101 1 883 1 346 2 642 985
Transition to IFRS (continued)
W3IB00003 Grindrod INSIDE 06/04/2006 2:26 PM Page 74

GRINDROD LIMITED ANNUAL REPORT 2005 75
BALANCE SHEET AS AT 31 DECEMBER 2004 (continued)
2004 Note 1 Note 2 Note 3 Note 4 Note 5 2004
As previously
stated IFRS 2 IFRS 3 IAS 16 IAS 17 IAS 21 Restated
R000 R000 R000 R000 R000 R000 R000
EQUITY AND LIABILITIES
Capital and reserves
Share capital 6 298 6 298
Equity compensation reserve – 1 327 1 327
Non-distributable reserves (150 799) 134 9 200 (141 465)
Accumulated profit 965 232 (1 327) 7 412 4 339 (643) (7 851) 967 162
Attributable to equity
holders of the company 820 731 – 7 412 4 473 (643) 1 349 833 322
Minority interest 7 461 583 8 044
Total equity 828 192 – 7 412 5 056 (643) 1 349 841 366
Non-current liabilities
Long-term borrowings 660 373 2 359 662 732
Provision for post
retirement medical aid 52 355 52 355
Financial liabilities 49 727 49 727
Deferred taxation 3 675 1 045 (275) 4 445
Total non-current liabilities 766 130 – – 1 045 2 084 – 769 259
Current liabilities
Trade and other payables 612 917 (3) 612 914
Provisions 50 240 50 240
Short-term borrowings
and overdraft 198 194 198 194
Current portion of long-term
borrowings 112 396 442 112 838
Taxation 58 174 58 174
Total current liabilities 1 031 921 – – – 442 (3) 1 032 360
Total equity and liabilities 2 626 243 – 7 412 6 101 1 883 1 346 2 642 985
W3IB00003 Grindrod INSIDE 06/04/2006 2:26 PM Page 75
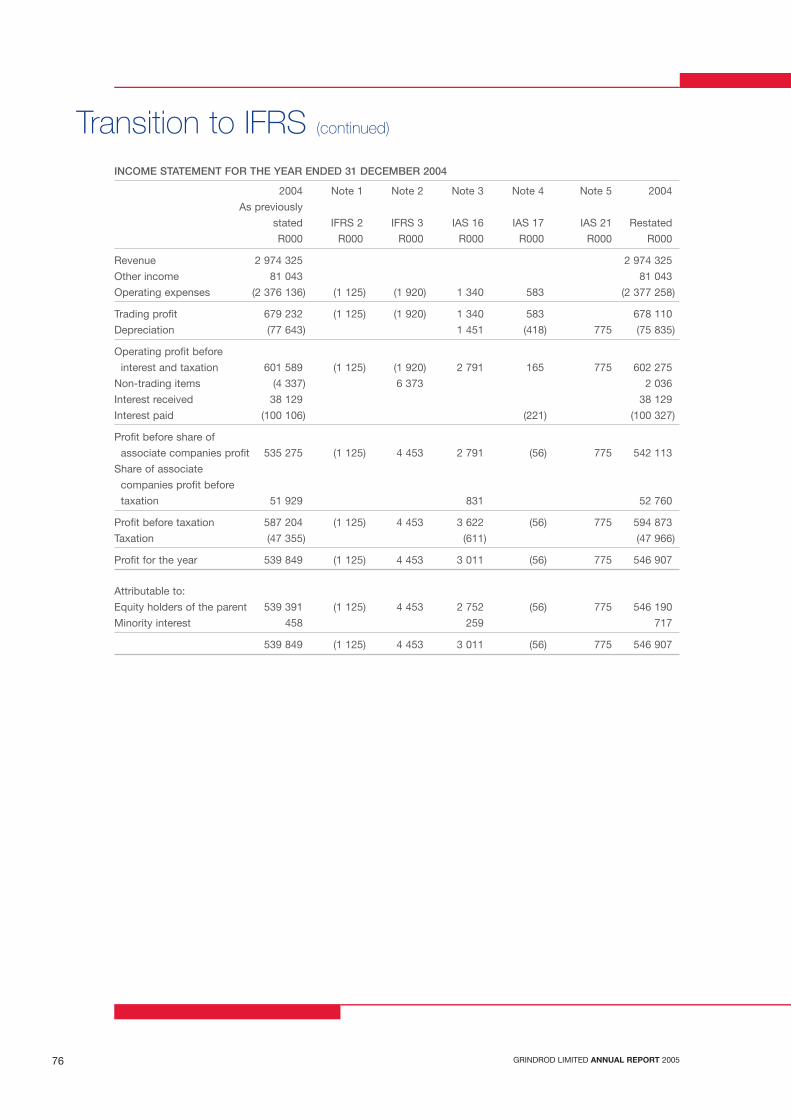
GRINDROD LIMITED ANNUAL REPORT 200576
INCOME STATEMENT FOR THE YEAR ENDED 31 DECEMBER 2004
2004 Note 1 Note 2 Note 3 Note 4 Note 5 2004
As previously
stated IFRS 2 IFRS 3 IAS 16 IAS 17 IAS 21 Restated
R000 R000 R000 R000 R000 R000 R000
Revenue 2 974 325 2 974 325
Other income 81 043 81 043
Operating expenses (2 376 136) (1 125) (1 920) 1 340 583 (2 377 258)
Trading profit 679 232 (1 125) (1 920) 1 340 583 678 110
Depreciation (77 643) 1 451 (418) 775 (75 835)
Operating profit before
interest and taxation 601 589 (1 125) (1 920) 2 791 165 775 602 275
Non-trading items (4 337) 6 373 2 036
Interest received 38 129 38 129
Interest paid (100 106) (221) (100 327)
Profit before share of
associate companies profit 535 275 (1 125) 4 453 2 791 (56) 775 542 113
Share of associate
companies profit before
taxation 51 929 831 52 760
Profit before taxation 587 204 (1 125) 4 453 3 622 (56) 775 594 873
Taxation (47 355) (611) (47 966)
Profit for the year 539 849 (1 125) 4 453 3 011 (56) 775 546 907
Attributable to:
Equity holders of the parent 539 391 (1 125) 4 453 2 752 (56) 775 546 190
Minority interest 458 259 717
539 849 (1 125) 4 453 3 011 (56) 775 546 907
Transition to IFRS (continued)
W3IB00003 Grindrod INSIDE 06/04/2006 2:26 PM Page 76

GRINDROD LIMITED ANNUAL REPORT 2005 77
Note 1: IFRS 2 Share Based Payments
The group grants options to employees under an employee share incentive scheme. Costs incurred in administering the
scheme were expensed immediately. No further costs were incurred, other than a dilution in earnings per share when
the shares were issued. In accordance with the requirements of IFRS 2, the group has recognised an expense in the
income statement, with a corresponding credit to equity, representing the fair value of outstanding employee share
options with regard to its equity-settled scheme. The fair value at the date of granting the options is charged to income
over the relevant option vesting periods, adjusted to reflect actual and expected levels of vesting.
Note 2: IFRS 3 Business Combinations
Previously the group recognised acquired goodwill at cost and amortised it on a straight-line basis over its expected
useful life. Goodwill was subject to review for indications of impairment and any impairment losses were recognised in
the income statement. IFRS 3 requires that goodwill is not amortised but is subject to impairment reviews, both annually
and when indications are that the carrying value may not be recoverable. Negative goodwill is no longer recognised on
the balance sheet but in the income statement as it arises.
The 2004 goodwill amortisation previously recognised in the income statement has been reversed, resulting in a
corresponding increase in equity. All goodwill has been tested for impairment at 1 January 2004, 31 December 2004 and
31 December 2005 in accordance with IFRS with further impairment being recognised on transition. Negative goodwill
that was previously recognised on the balance sheet at the transition date was released to reserves.
Note 3: IAS 16 (revised) Property, Plant and Equipment
Previously property, plant and equipment were measured at cost less accumulated depreciation and impairment losses.
The revised IAS 16 amendments that impact the group relate to the componentisation of the group’s ships, locomotives
and other plant and equipment and the revised requirement for an annual review of the residual value and useful lives
of assets. These changes affect the annual depreciation charge to the income statement.
Note 4: IAS 17 Leases
IAS 17 requires that leases be classified at inception. With regard to the land and buildings elements of a lease, the land
and buildings are considered separately for the purposes of lease classification. Land with an indefinite economic life
has been classified as an operating lease unless title is expected to pass to the group by the end of the lease term. The
buildings element is classified as a finance or operating lease in accordance with the standard.
Note 5: IAS 21 The Effects of Changes in Foreign Exchange Rates
IAS 21 requires the group to determine the functional currency for all entities and the distinction between foreign entities
or intergrated operations. An entity, which has a non-Rand functional currency, is translated at the closing exchange rate
and the differences arising are reported directly to equity, whilst all other entities classified as having a Rand functional
currency report foreign currency translation differences in the income statement.
W3IB00003 Grindrod INSIDE 06/04/2006 2:26 PM Page 77
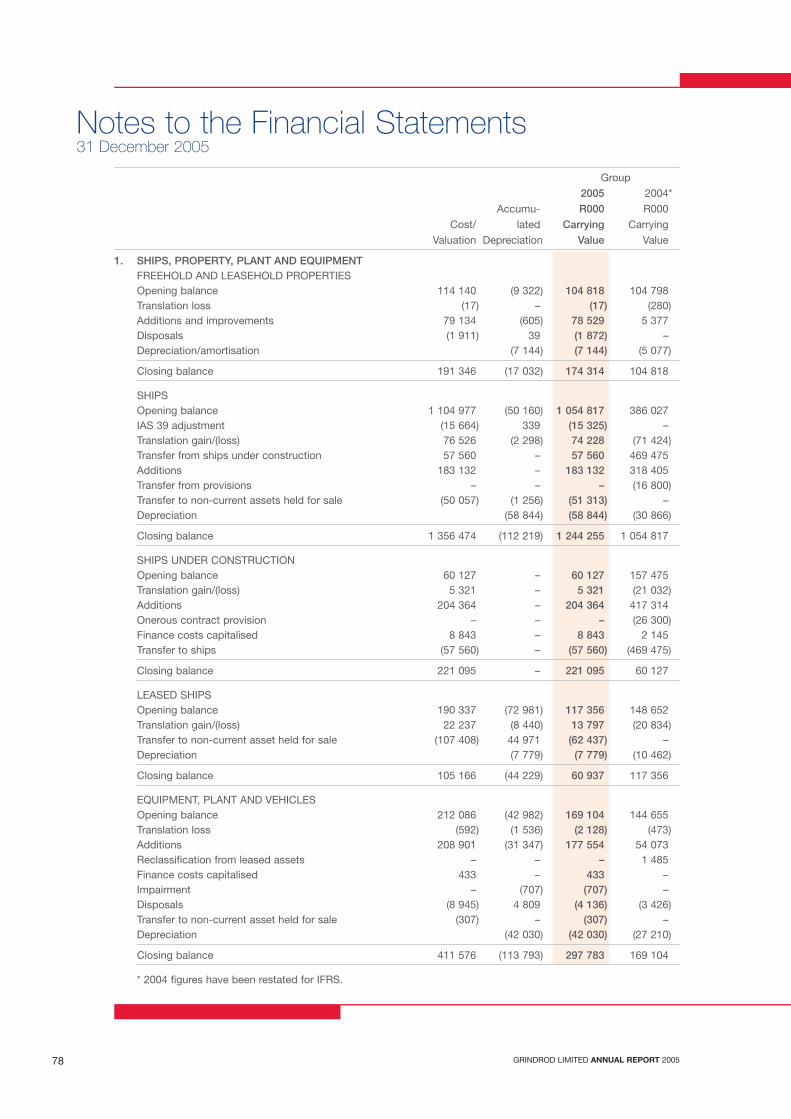
GRINDROD LIMITED ANNUAL REPORT 200578
Group
2005 2004*
Accumu- R000 R000
Cost/ lated Carrying Carrying
Valuation Depreciation Value Value
1. SHIPS, PROPERTY, PLANT AND EQUIPMENTFREEHOLD AND LEASEHOLD PROPERTIESOpening balance 114 140 (9 322) 104 818 104 798 Translation loss (17) – (17) (280)Additions and improvements 79 134 (605) 78 529 5 377 Disposals (1 911) 39 (1 872) – Depreciation/amortisation (7 144) (7 144) (5 077)
Closing balance 191 346 (17 032) 174 314 104 818
SHIPSOpening balance 1 104 977 (50 160) 1 054 817 386 027 IAS 39 adjustment (15 664) 339 (15 325) – Translation gain/(loss) 76 526 (2 298) 74 228 (71 424)Transfer from ships under construction 57 560 – 57 560 469 475 Additions 183 132 – 183 132 318 405 Transfer from provisions – – – (16 800)Transfer to non-current assets held for sale (50 057) (1 256) (51 313) – Depreciation (58 844) (58 844) (30 866)
Closing balance 1 356 474 (112 219) 1 244 255 1 054 817
SHIPS UNDER CONSTRUCTIONOpening balance 60 127 – 60 127 157 475 Translation gain/(loss) 5 321 – 5 321 (21 032)Additions 204 364 – 204 364 417 314 Onerous contract provision – – – (26 300)Finance costs capitalised 8 843 – 8 843 2 145 Transfer to ships (57 560) – (57 560) (469 475)
Closing balance 221 095 – 221 095 60 127
LEASED SHIPSOpening balance 190 337 (72 981) 117 356 148 652 Translation gain/(loss) 22 237 (8 440) 13 797 (20 834)Transfer to non-current asset held for sale (107 408) 44 971 (62 437) – Depreciation (7 779) (7 779) (10 462)
Closing balance 105 166 (44 229) 60 937 117 356
EQUIPMENT, PLANT AND VEHICLESOpening balance 212 086 (42 982) 169 104 144 655 Translation loss (592) (1 536) (2 128) (473)Additions 208 901 (31 347) 177 554 54 073 Reclassification from leased assets – – – 1 485 Finance costs capitalised 433 – 433 – Impairment – (707) (707) – Disposals (8 945) 4 809 (4 136) (3 426)Transfer to non-current asset held for sale (307) – (307) – Depreciation (42 030) (42 030) (27 210)
Closing balance 411 576 (113 793) 297 783 169 104
* 2004 figures have been restated for IFRS.
Notes to the Financial Statements31 December 2005
W3IB00003 Grindrod INSIDE 06/04/2006 2:26 PM Page 78
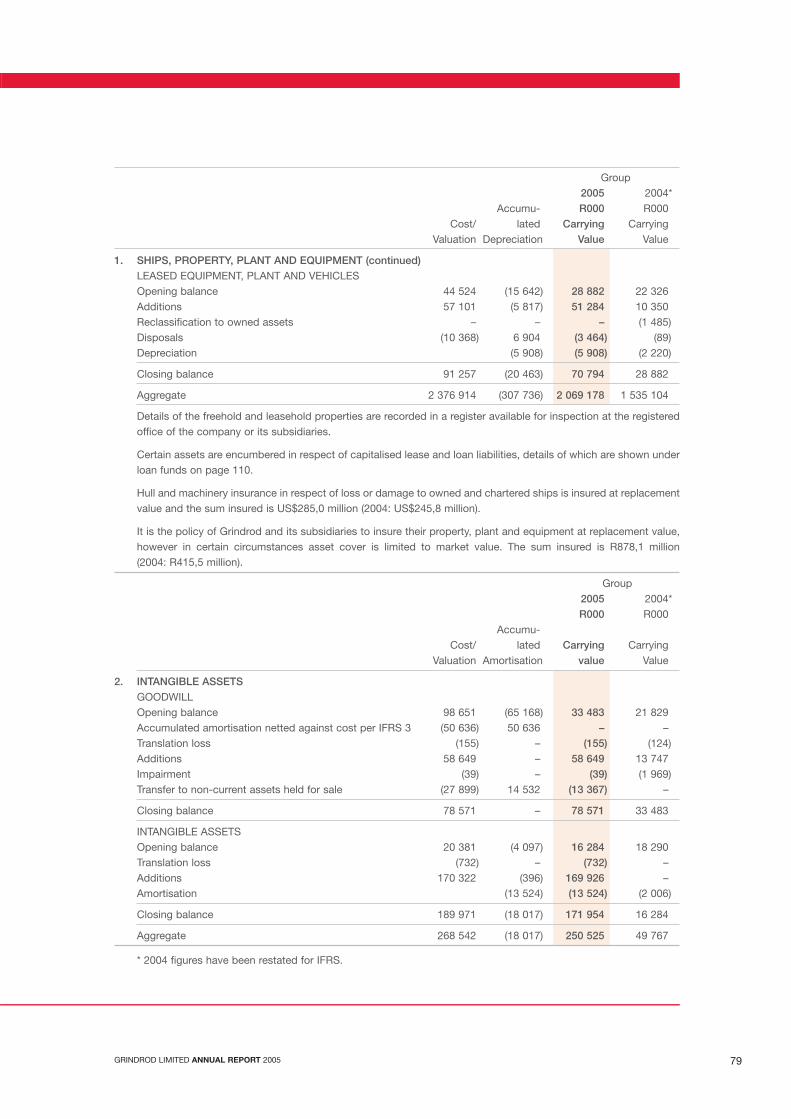
GRINDROD LIMITED ANNUAL REPORT 2005 79
Group2005 2004*
Accumu- R000 R000 Cost/ lated Carrying Carrying
Valuation Depreciation Value Value
1. SHIPS, PROPERTY, PLANT AND EQUIPMENT (continued)LEASED EQUIPMENT, PLANT AND VEHICLESOpening balance 44 524 (15 642) 28 882 22 326 Additions 57 101 (5 817) 51 284 10 350 Reclassification to owned assets – – – (1 485)Disposals (10 368) 6 904 (3 464) (89)Depreciation (5 908) (5 908) (2 220)
Closing balance 91 257 (20 463) 70 794 28 882
Aggregate 2 376 914 (307 736) 2 069 178 1 535 104
Details of the freehold and leasehold properties are recorded in a register available for inspection at the registeredoffice of the company or its subsidiaries.
Certain assets are encumbered in respect of capitalised lease and loan liabilities, details of which are shown underloan funds on page 110.
Hull and machinery insurance in respect of loss or damage to owned and chartered ships is insured at replacementvalue and the sum insured is US$285,0 million (2004: US$245,8 million).
It is the policy of Grindrod and its subsidiaries to insure their property, plant and equipment at replacement value,however in certain circumstances asset cover is limited to market value. The sum insured is R878,1 million (2004: R415,5 million).
Group2005 2004* R000 R000
Accumu-Cost/ lated Carrying Carrying
Valuation Amortisation value Value
2. INTANGIBLE ASSETSGOODWILLOpening balance 98 651 (65 168) 33 483 21 829 Accumulated amortisation netted against cost per IFRS 3 (50 636) 50 636 – – Translation loss (155) – (155) (124)Additions 58 649 – 58 649 13 747 Impairment (39) – (39) (1 969)Transfer to non-current assets held for sale (27 899) 14 532 (13 367) –
Closing balance 78 571 – 78 571 33 483
INTANGIBLE ASSETSOpening balance 20 381 (4 097) 16 284 18 290 Translation loss (732) – (732) – Additions 170 322 (396) 169 926 – Amortisation (13 524) (13 524) (2 006)
Closing balance 189 971 (18 017) 171 954 16 284
Aggregate 268 542 (18 017) 250 525 49 767
* 2004 figures have been restated for IFRS.
W3IB00003 Grindrod INSIDE 06/04/2006 2:26 PM Page 79

GRINDROD LIMITED ANNUAL REPORT 200580
Company
2005 2004*
R000 R000
3. INVESTMENTS IN SUBSIDIARIES
Shares at cost 1 458 160 591 763
Share based payments 2 791 1 327
1 460 951 593 090
Details of the investments in subsidiaries are shown on the schedule of
interest in subsidiaries on page 111.
4. INVESTMENT IN JOINT VENTURE
Shares at cost 40 150 –
40 150 –
Details of the investments in joint ventures are shown on page 104.
Effective Group Company
holding 2005 2004* 2005 2004*
% R000 R000 R000 R000
5. INVESTMENTS IN ASSOCIATES
UNLISTED
RMBT Holdings Limited
Cost of investment 50 75 096 75 096 75 096 75 096
Goodwill (27 899) (27 899)
Fair value of identifiable net assets at date of acquisition 47 197 47 197 75 096 75 096
Transfer to non-current assets held for sale (2 197) – (30 096) –
45 000 47 197 45 000 75 096
Röhlig-Grindrod (Pty) Limited
Cost of investment – 6 605
Loan account – 4 250
Ocean Africa Container Lines (Pty) Limited
Cost of investment 49 7 089 7 089
Other investments 1 030 535
Translation gain 31 –
Transfer to non-current assets held for sale (294) –
52 856 65 676 45 000 75 096
Attributable share of accumulated profit 72 483 79 220
Attributable share of accumulated profit 140 179 79 220
Attributable share of accumulated profit acquired 298 –
Transfer to non-current assets held for sale (54 423) –
Röhlig-Grindrod (Pty) Limited now a joint venture (13 571) –
125 339 144 896 45 000 75 096
Directors’ valuation 258 080 297 146 169 500 169 500
* 2004 figures have been restated for IFRS.
Notes to the Financial Statements (continued)31 December 2005
W3IB00003 Grindrod INSIDE 06/04/2006 2:26 PM Page 80
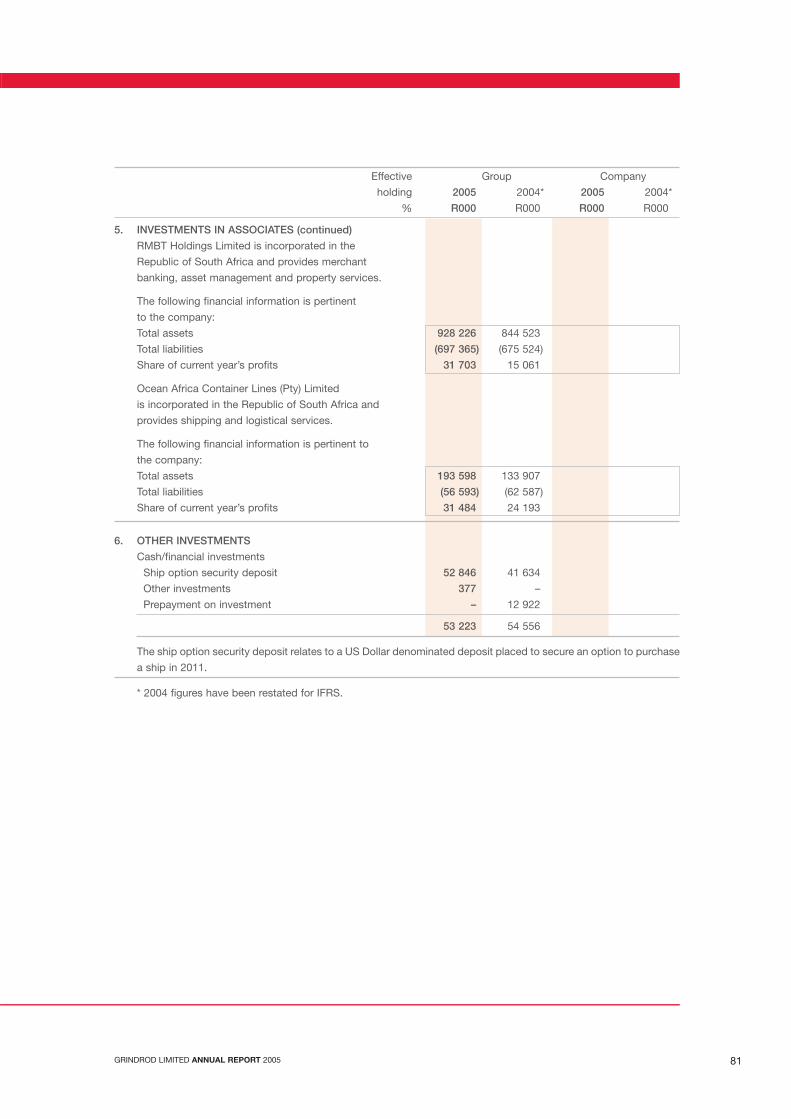
GRINDROD LIMITED ANNUAL REPORT 2005 81
Effective Group Company
holding 2005 2004* 2005 2004*
% R000 R000 R000 R000
5. INVESTMENTS IN ASSOCIATES (continued)
RMBT Holdings Limited is incorporated in the
Republic of South Africa and provides merchant
banking, asset management and property services.
The following financial information is pertinent
to the company:
Total assets 928 226 844 523
Total liabilities (697 365) (675 524)
Share of current year’s profits 31 703 15 061
Ocean Africa Container Lines (Pty) Limited
is incorporated in the Republic of South Africa and
provides shipping and logistical services.
The following financial information is pertinent to
the company:
Total assets 193 598 133 907
Total liabilities (56 593) (62 587)
Share of current year’s profits 31 484 24 193
6. OTHER INVESTMENTS
Cash/financial investments
Ship option security deposit 52 846 41 634
Other investments 377 –
Prepayment on investment – 12 922
53 223 54 556
The ship option security deposit relates to a US Dollar denominated deposit placed to secure an option to purchase
a ship in 2011.
* 2004 figures have been restated for IFRS.
W3IB00003 Grindrod INSIDE 06/04/2006 2:26 PM Page 81

GRINDROD LIMITED ANNUAL REPORT 200582
7. FINANCIAL INSTRUMENTSThe group’s financial instruments consist mainly of cash deposits, long-term loans, trade and other receivables andpayables. Derivative instruments are used by the group for hedging purposes. Hedging instruments used by thegroup comprise forward exchange contracts, cross currency and interest rate swaps.
FOREIGN CURRENCY RISKIn terms of group policy, foreign loan liabilities are not covered using forward exchange contracts as these arecovered by a natural hedge against the underlying assets.
The group’s policy is to cover forward all trade commitments that are not hedged by a foreign currency revenuestream and to cover the Rand funded element of capital commitments.
Monetary items are converted to Rands at the rate of exchange ruling at the financial reporting date. Derivativeinstruments are valued with reference to forward exchange rates from the year end to settlement date, as providedby independent financial institutions.
FOREIGN CURRENCY BALANCESThe uncovered foreign currency denominated balances at 31 December were as follows:
Group2005 2005 2004* 2004*
US$000 R000 US$000 R000
Ship option security deposit 8 735 52 846 7 369 41 634Loans (89 947) (567 566) (25 844) (146 018)Trade and other receivables 733 4 625 601 3 396Trade and other payables (2 073) (13 081) (165) (932)Bank balances 48 025 303 038 37 037 209 259
(34 527) (220 138) 18 998 107 339
In addition, a proportionally consolidated US Dollar joint venture has uncovered Rand liabilities as follows:Capitalised finance leases secured by ships 13 706 86 485 17 926 101 282
DERIVATIVE INSTRUMENTSForward Exchange ContractsThe group had entered into the following forward exchange contracts which are accounted for as fair value hedgeswith gains/losses thereon taken to the income statement. The amounts represent the net Rand equivalents ofcommitments to purchase and sell foreign currencies. The average rates shown include the cost of forward cover.
2005 2004* Contract value Contract value
Asset/ Asset/Ave (Liability) Ave (Liability)
FOREIGN CURRENCY rate US$000 R000 R000 rate US$000 R000 R000
Purchase Dollars 6.67 (2 589) (17 274) (623) 9.40 (36 674) (344 836) (133 047)Sell Dollars 6.38 293 1 868 4 6.61 36 674 242 546 30 757
(2 296) (15 406) (619) – (102 290) (102 290)
Purchase Euro, sell Dollars – – – – 7.56 392 525 56
Purchase GBP, sell Dollars – – – – 10.92 107 207 (2)
€000 R000 R000 €000 R000 R000Purchase Euros 7.97 (936) (7 464) (384) – – – –
£000 R000 R000 £000 R000 R000Purchase GBP 11.65 94 1 095 (60) – – – –
JPY000 R000 R000 JPY000 R000 R000Purchase JPY 18.18 600 33 – – – – –
* 2004 figures have been restated for IFRS.
Notes to the Financial Statements (continued)31 December 2005
W3IB00003 Grindrod INSIDE 06/04/2006 2:26 PM Page 82

GRINDROD LIMITED ANNUAL REPORT 2005 83
7. FINANCIAL INSTRUMENTS (continued)The group has entered into the following forward exchange contracts to hedge future commitments to be enteredinto which includes the purchase of two ships to be delivered in 2006 and 2007 respectively, the purchase of certainlocomotives to be delivered in 2006 and the purchase of certain commodities to be made in 2006 and 2007. Theexposure to Rand/US Dollar exchange rate fluctuations has been designated and qualifies as a hedge in line withthe group’s accounting policy thereon.
2005 2004* Contract value Contract value
Asset/ Asset/Ave (Liability) Ave (Liability)
FOREIGN CURRENCY rate US$000 R000 R000 rate US$000 R000 R000
Purchase Dollars 6.87 (120 508) (828 346) (60 807) 8.36 20 000 167 270 (47 094)Sell Dollars 6.38 8 143 51 935 535 – – – –
(112 365) (776 411) (60 272) 20 000 167 270 (47 094)
Cross Currency SwapsThe group has entered into the following cross currency swaps on certain US Dollar loans which create a Rand loanobligation. The cross currency swaps have been designated and qualify as hedges in line with the group’saccounting policy thereon. This results in more cost effective Rand financing compared to entering the Randmarkets directly.
2005 2004*Asset/ Asset/
Nominal value (Liability) (Liability)MATURITY DATE US$000 R000 R000 R000
4 March 2014 10 000 65 050 (645) (812)17 June 2014 10 000 61 346 (599) (717)20 December 2014 10 000 57 725 (681) (706)
30 000 184 121 (1 925) (2 235)
The group has entered into a further cross currency swap on a US Dollar loan which creates a Euro loan obligation.The loss on this instrument is accounted for through the income statement, the details of which are:
2005 2004*Asset/ Asset/
Nominal value (Liability) (Liability)MATURITY DATE US$000 R000 R000 R000
31 January 2006 355 2 240 (10) –
Other Derivatives
2005 2004*Ave Asset/ Asset/
Type of strike Contract value (Liability) (Liability)FOREIGN CURRENCY instrument price US$000 R000 R000 R000
EmbeddedSell Dollars derivative 6.86 1 876 12 877 910 –Sell Dollars Options 6.75 1 177 7 948 521 –
3 053 20 825 1 431 –
* 2004 figures have been restated for IFRS.
W3IB00003 Grindrod INSIDE 06/04/2006 2:26 PM Page 83

GRINDROD LIMITED ANNUAL REPORT 200584
7. FINANCIAL INSTRUMENTS (continued)
Futures
The group has entered into certain futures in order to commercially hedge the price risk in respect of commodity
contracts which mature between 22 January 2006 and 22 December 2006. These contracts are treated as fair value
hedges and (gains)/losses thereon are recognised in the income statement. The contracted firm commitments or
highly probable underlying customer transactions are then fair valued, resulting in an offsetting (gain)/loss in the
income statement and a corresponding asset/(liability) on the balance sheet. The (gains)/losses on open futures
positions are cash settled daily through the margin account and are already included in net cash balances. As a
result, the balance sheet does not reflect an offsetting financial asset/(liability). Details of the group’s dealings in
futures are as follows:
2005 2004*
Financial (Gain)/ (Gain)/
Contract Asset/ Loss re- Loss re-
Tonnage value (Liability) cognised cognised
COMMODITY R000 R000 R000 R000
White maize 3 300 3 342 (354) –
White maize (1 300) (1 390) 34 –
Yellow maize (4 400) (3 933) 116 –
Yellow maize 3 900 3 480 (189) –
Corn 39 967 17 157 (336) –
Soya bean meal 72 150 99 117 (18 639) –
Soya bean (14 500) (20 709) 593 –
Wheat (116 050) (104 045) (1 498) –
Wheat (3 100) (7 307) 1 750 –
Mark to market settled through margin account (18 523) –
Contracted firm commitment/highly probable
underlying transactions at fair value (18 523) 18 523 –
(18 523) – –
INTEREST RATE RISK
The group monitors its exposure to fluctuating interest rates and generally enters into contracts that are linked to
market rates relative to the currency of the asset or liability. The group makes use of derivative instruments, such
as interest rate swaps to manage this exposure, from time to time.
The interest rate profile of the group is summarised as follows: 2005 2004*
R000 R000
Loans linked to LIBOR 419 419 320 932
Loans linked to SA money market 394 822 418 501
Short-term borrowings linked to SA money market 550 701 198 194
Loans with a fixed interest rate 168 959 36 137
1 533 901 973 764
Full details of the interest rate profile of long-term borrowings is set out in the schedule of loan funds on page 110.
* 2004 figures have been restated for IFRS.
Notes to the Financial Statements (continued)31 December 2005
W3IB00003 Grindrod INSIDE 06/04/2006 2:26 PM Page 84
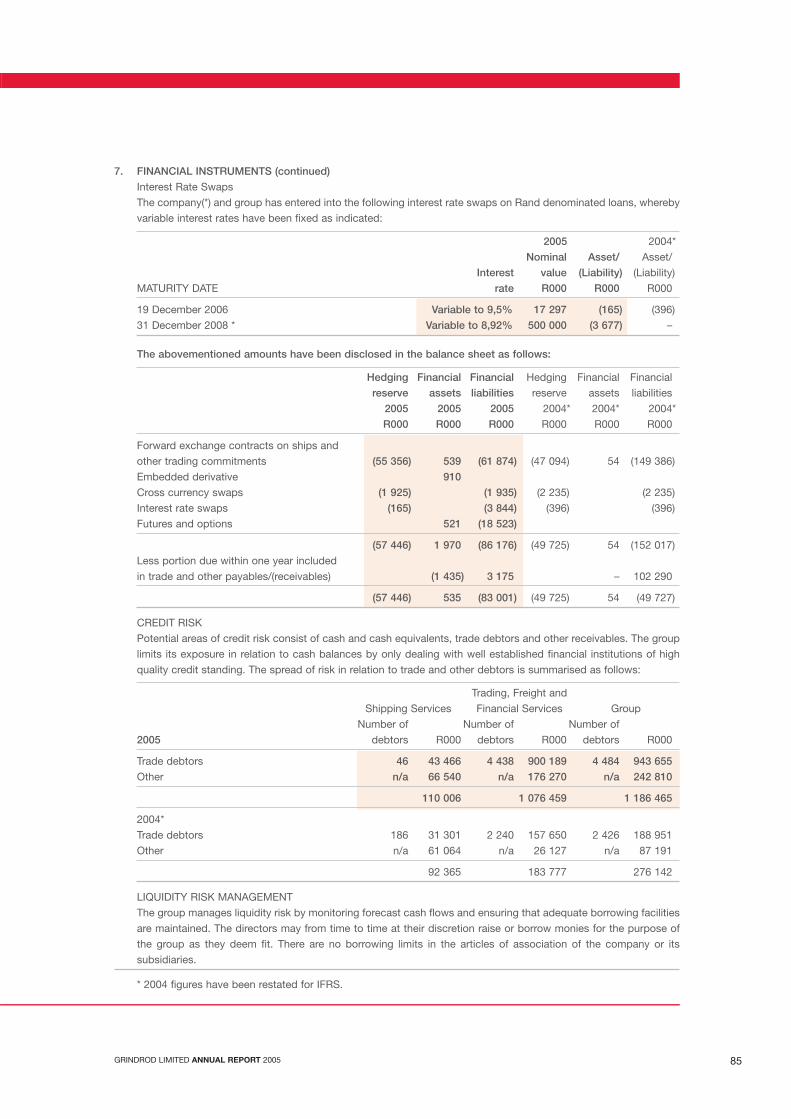
GRINDROD LIMITED ANNUAL REPORT 2005 85
7. FINANCIAL INSTRUMENTS (continued)
Interest Rate Swaps
The company(*) and group has entered into the following interest rate swaps on Rand denominated loans, whereby
variable interest rates have been fixed as indicated:
2005 2004*
Nominal Asset/ Asset/
Interest value (Liability) (Liability)
MATURITY DATE rate R000 R000 R000
19 December 2006 Variable to 9,5% 17 297 (165) (396)
31 December 2008 * Variable to 8,92% 500 000 (3 677) –
The abovementioned amounts have been disclosed in the balance sheet as follows:
Hedging Financial Financial Hedging Financial Financial
reserve assets liabilities reserve assets liabilities
2005 2005 2005 2004* 2004* 2004*
R000 R000 R000 R000 R000 R000
Forward exchange contracts on ships and
other trading commitments (55 356) 539 (61 874) (47 094) 54 (149 386)
Embedded derivative 910
Cross currency swaps (1 925) (1 935) (2 235) (2 235)
Interest rate swaps (165) (3 844) (396) (396)
Futures and options 521 (18 523)
(57 446) 1 970 (86 176) (49 725) 54 (152 017)
Less portion due within one year included
in trade and other payables/(receivables) (1 435) 3 175 – 102 290
(57 446) 535 (83 001) (49 725) 54 (49 727)
CREDIT RISK
Potential areas of credit risk consist of cash and cash equivalents, trade debtors and other receivables. The group
limits its exposure in relation to cash balances by only dealing with well established financial institutions of high
quality credit standing. The spread of risk in relation to trade and other debtors is summarised as follows:
Trading, Freight and
Shipping Services Financial Services Group
Number of Number of Number of
2005 debtors R000 debtors R000 debtors R000
Trade debtors 46 43 466 4 438 900 189 4 484 943 655
Other n/a 66 540 n/a 176 270 n/a 242 810
110 006 1 076 459 1 186 465
2004*
Trade debtors 186 31 301 2 240 157 650 2 426 188 951
Other n/a 61 064 n/a 26 127 n/a 87 191
92 365 183 777 276 142
LIQUIDITY RISK MANAGEMENT
The group manages liquidity risk by monitoring forecast cash flows and ensuring that adequate borrowing facilities
are maintained. The directors may from time to time at their discretion raise or borrow monies for the purpose of
the group as they deem fit. There are no borrowing limits in the articles of association of the company or its
subsidiaries.
* 2004 figures have been restated for IFRS.
W3IB00003 Grindrod INSIDE 06/04/2006 2:26 PM Page 85

GRINDROD LIMITED ANNUAL REPORT 200586
Group Company
2005 2004* 2005 2004*
R000 R000 R000 R000
8. DEFERRED TAXATION
Deferred taxation analysed by major category:
Capital allowances (37 543) (14 234)
Other temporary differences 47 542 18 895
STC credits 8 369 18 647 8 369 14 087
Estimated taxation losses 30 622 9 312
48 990 32 620 8 369 14 087
Reconciliation of deferred taxation:
Opening balance 32 620 11 362 14 087 –
Income statement effect 10 732 20 725 (5 718) 14 087
Transfer from non-distributable reserve 612 –
Translation adjustment 343 –
Purchase of subsidiaries and joint ventures 4 683 533
Closing balance 48 990 32 620 8 369 14 087
Comprising:
Deferred taxation assets 69 330 37 065 8 369 14 087
Deferred taxation liabilities (20 340) (4 445)
48 990 32 620 8 369 14 087
9. INVENTORY
Bunkers and other consumables 22 649 15 076
Agricultural commodities 269 689 –
Other commodities 25 870 –
Merchandise and containers 27 365 15 042
345 573 30 118
The fair value less costs to sell of the agricultural and other
commodities inventory amounts to R295 559 000 (2004: Nil).
10. TRADE AND OTHER RECEIVABLES
Trade debtors 943 655 188 951
Prepayments 83 415 141 960
Amounts due from subsidiaries 356 144 50 312
Loans to joint ventures
Shareholders loans 35 550 8 632
Other loans 150 18 406
Current portion of financial asset (note 7) 1 435 –
Other receivables 159 429 87 191 – 60 365
1 223 634 445 140 356 144 110 677
Trade debtors amounting to R132 279 000 (2004: R84 830 000) have been ceded to two financial institutions in
order to secure overdraft facilities.
The shareholders’ loans to joint ventures do not bear interest and there are no fixed repayment terms. The other
loans to joint ventures bear interest at prime (2003: prime and prime + 2%).
* 2004 figures have been restated for IFRS.
Notes to the Financial Statements (continued)31 December 2005
W3IB00003 Grindrod INSIDE 06/04/2006 2:26 PM Page 86
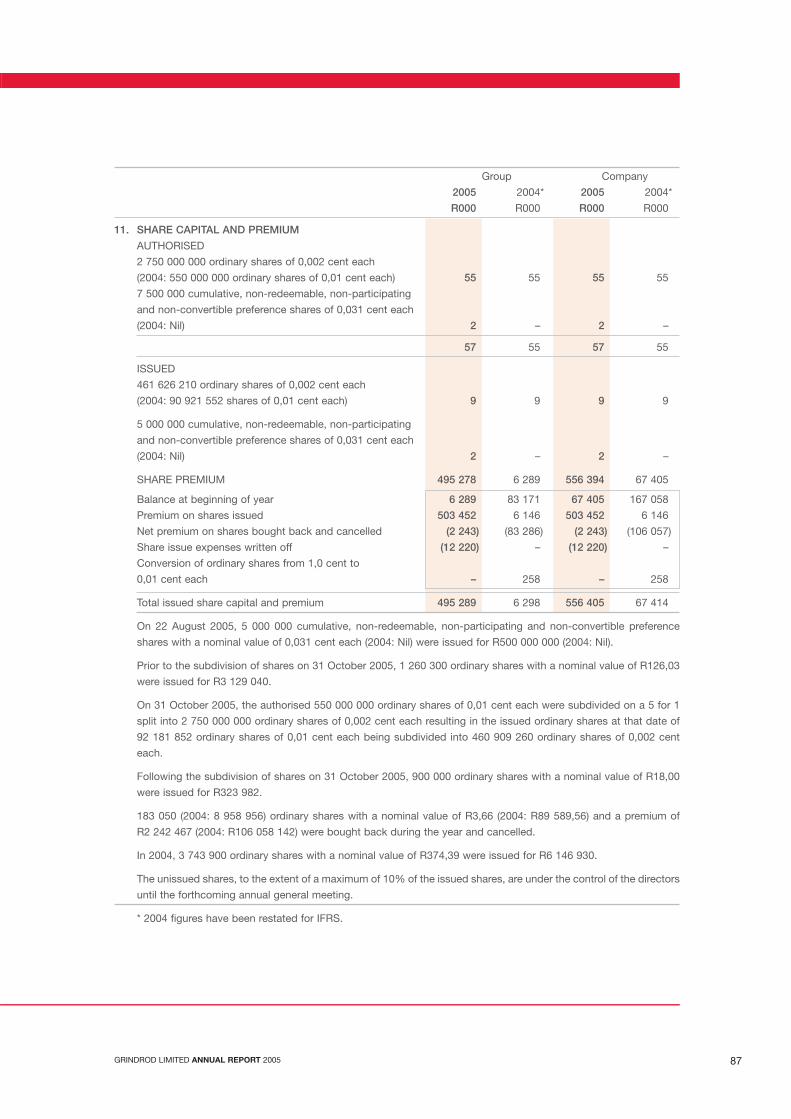
GRINDROD LIMITED ANNUAL REPORT 2005 87
Group Company
2005 2004* 2005 2004*
R000 R000 R000 R000
11. SHARE CAPITAL AND PREMIUM
AUTHORISED
2 750 000 000 ordinary shares of 0,002 cent each
(2004: 550 000 000 ordinary shares of 0,01 cent each) 55 55 55 55
7 500 000 cumulative, non-redeemable, non-participating
and non-convertible preference shares of 0,031 cent each
(2004: Nil) 2 – 2 –
57 55 57 55
ISSUED
461 626 210 ordinary shares of 0,002 cent each
(2004: 90 921 552 shares of 0,01 cent each) 9 9 9 9
5 000 000 cumulative, non-redeemable, non-participating
and non-convertible preference shares of 0,031 cent each
(2004: Nil) 2 – 2 –
SHARE PREMIUM 495 278 6 289 556 394 67 405
Balance at beginning of year 6 289 83 171 67 405 167 058
Premium on shares issued 503 452 6 146 503 452 6 146
Net premium on shares bought back and cancelled (2 243) (83 286) (2 243) (106 057)
Share issue expenses written off (12 220) – (12 220) –
Conversion of ordinary shares from 1,0 cent to
0,01 cent each – 258 – 258
Total issued share capital and premium 495 289 6 298 556 405 67 414
On 22 August 2005, 5 000 000 cumulative, non-redeemable, non-participating and non-convertible preference
shares with a nominal value of 0,031 cent each (2004: Nil) were issued for R500 000 000 (2004: Nil).
Prior to the subdivision of shares on 31 October 2005, 1 260 300 ordinary shares with a nominal value of R126,03
were issued for R3 129 040.
On 31 October 2005, the authorised 550 000 000 ordinary shares of 0,01 cent each were subdivided on a 5 for 1
split into 2 750 000 000 ordinary shares of 0,002 cent each resulting in the issued ordinary shares at that date of
92 181 852 ordinary shares of 0,01 cent each being subdivided into 460 909 260 ordinary shares of 0,002 cent
each.
Following the subdivision of shares on 31 October 2005, 900 000 ordinary shares with a nominal value of R18,00
were issued for R323 982.
183 050 (2004: 8 958 956) ordinary shares with a nominal value of R3,66 (2004: R89 589,56) and a premium of
R2 242 467 (2004: R106 058 142) were bought back during the year and cancelled.
In 2004, 3 743 900 ordinary shares with a nominal value of R374,39 were issued for R6 146 930.
The unissued shares, to the extent of a maximum of 10% of the issued shares, are under the control of the directors
until the forthcoming annual general meeting.
* 2004 figures have been restated for IFRS.
W3IB00003 Grindrod INSIDE 06/04/2006 2:26 PM Page 87

GRINDROD LIMITED ANNUAL REPORT 200588
Group Company
2005 2004* 2005 2004*
R000 R000 R000 R000
12. INTEREST-BEARING DEBT
Long and medium-term financing 756 657 662 732
Aggregate amount repayable within one year 226 542 112 838
Aggregate loans 983 199 775 570
Short-term borrowings and overdraft 550 701 198 194
1 533 900 973 764
Group assets of R1 515 406 000 (2004: R1 346 716 000)
are pledged as security for loans of R983 199 000
(2004: R715 570 000).
Details of the long and medium-term financing are shown
on the schedule of loan funds on page 110.
13. EMPLOYEE BENEFIT OBLIGATIONS
PROVISION FOR POST RETIREMENT MEDICAL AID
The group subsidises the medical aid contributions of
certain retired employees and has an obligation to
subsidise contributions of certain current employees
when they reach retirement.
The amounts recognised in the financial statements in
this respect are as follows:
Recognised liability at beginning of the year 52 355 49 790
Recognised as an expense in the current year 12 636 6 263
Interest on obligation 5 066 5 796
Current service cost 1 900 556
Actuarial loss/(gain) recognised 5 670 (89)
Contributions paid (3 246) (3 994)
Acquisition on purchase of business 3 199 296
Present value of unfunded obligations recognised
as a liability at end of the year 64 944 52 355
There are no unrecognised actuarial gains or losses.
The principal actuarial assumptions applied in the
determination of fair values include:
Health care cost inflation 6,5% 10%
Discount rate 8,5% 12%
Continuation at retirement 75% 75%
An actuarial valuation was undertaken during 2005.
* 2004 figures have been restated for IFRS.
Notes to the Financial Statements (continued)31 December 2005
W3IB00003 Grindrod INSIDE 06/04/2006 2:26 PM Page 88

GRINDROD LIMITED ANNUAL REPORT 2005 89
Group Company
2005 2004* 2005 2004*
R000 R000 R000 R000
13. EMPLOYEE BENEFIT OBLIGATIONS (continued)
RETIREMENT BENEFIT PLANS
The group provides privately administered pension and
provident funds for all permanent employees except
those who belong to an external fund, industry pension
fund or provident scheme. All eligible employees are
members of either defined benefit or defined
contribution plans which are governed by the South
African Pensions Fund Act 1956.
An actuarial valuation was completed of the privately
administered pension fund at 1 April 2003 and in the
opinion of the actuary the fund was in a sound financial
position.
The funded status of the Pension Fund related to
service prior to 1 April 2003 is as follows:
Actuarial value of assets 63 848 63 848
Present value of liabilities accrued to 1 April 2003 (44 578) (44 578)
Unrecognised surplus 19 270 19 270
The next actuarial valuation is due to be completed at
1 April 2006. The employer’s contribution to all
retirement benefit plans are charged against income
when incurred.
The group has not recognised the fund’s surplus
pending the finalisation of the surplus apportionment
exercise in terms of the Pensions Funds Second
Amendment Act 2001.
14. TRADE AND OTHER PAYABLES
Trade creditors 575 711 150 835
Accrued expenses 328 391 259 413 1 025 11 105
Operating lease accrual 70 691 35 894
Other payables 195 124 64 482
Shareholders for dividends – preference shares 15 206 – 15 189 –
Amounts due to subsidiaries 530 415 483 797
Current portion of financial liabilities (note 7) 3 175 102 290
1 188 298 612 914 546 629 494 902
* 2004 figures have been restated for IFRS.
W3IB00003 Grindrod INSIDE 06/04/2006 2:26 PM Page 89
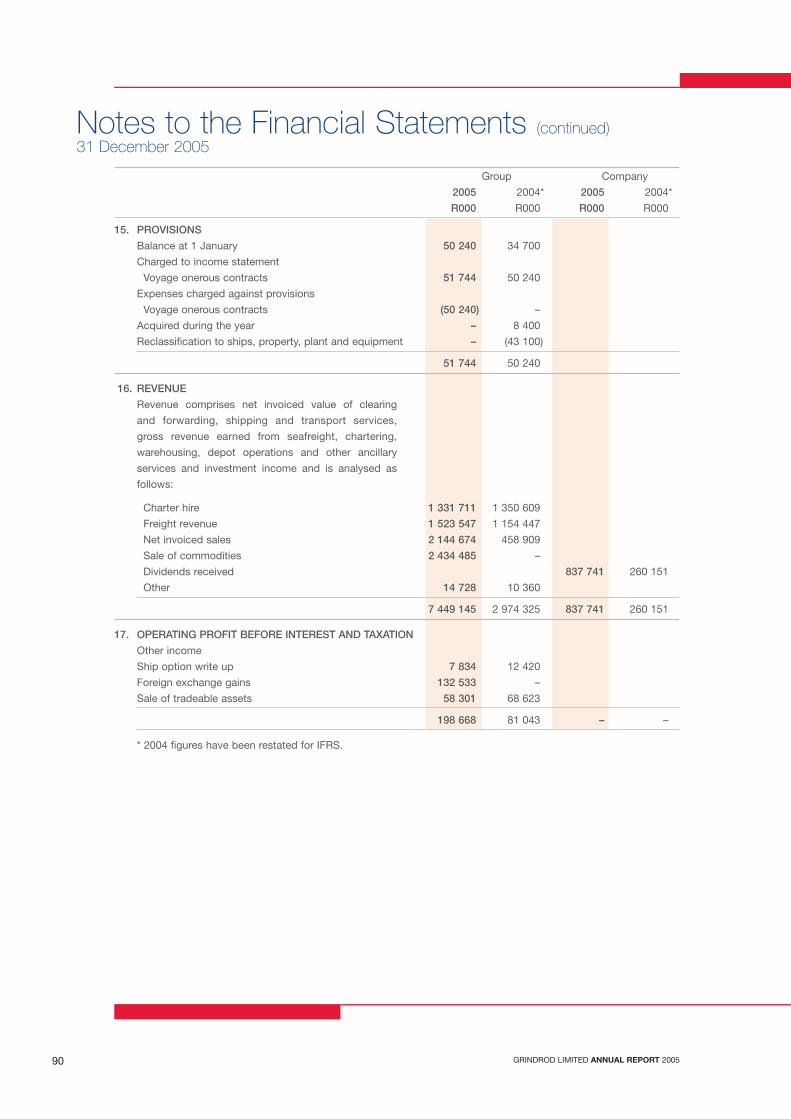
GRINDROD LIMITED ANNUAL REPORT 200590
Group Company
2005 2004* 2005 2004*
R000 R000 R000 R000
15. PROVISIONS
Balance at 1 January 50 240 34 700
Charged to income statement
Voyage onerous contracts 51 744 50 240
Expenses charged against provisions
Voyage onerous contracts (50 240) –
Acquired during the year – 8 400
Reclassification to ships, property, plant and equipment – (43 100)
51 744 50 240
16. REVENUE
Revenue comprises net invoiced value of clearing
and forwarding, shipping and transport services,
gross revenue earned from seafreight, chartering,
warehousing, depot operations and other ancillary
services and investment income and is analysed as
follows:
Charter hire 1 331 711 1 350 609
Freight revenue 1 523 547 1 154 447
Net invoiced sales 2 144 674 458 909
Sale of commodities 2 434 485 –
Dividends received 837 741 260 151
Other 14 728 10 360
7 449 145 2 974 325 837 741 260 151
17. OPERATING PROFIT BEFORE INTEREST AND TAXATION
Other income
Ship option write up 7 834 12 420
Foreign exchange gains 132 533 –
Sale of tradeable assets 58 301 68 623
198 668 81 043 – –
* 2004 figures have been restated for IFRS.
Notes to the Financial Statements (continued)31 December 2005
W3IB00003 Grindrod INSIDE 06/04/2006 2:26 PM Page 90
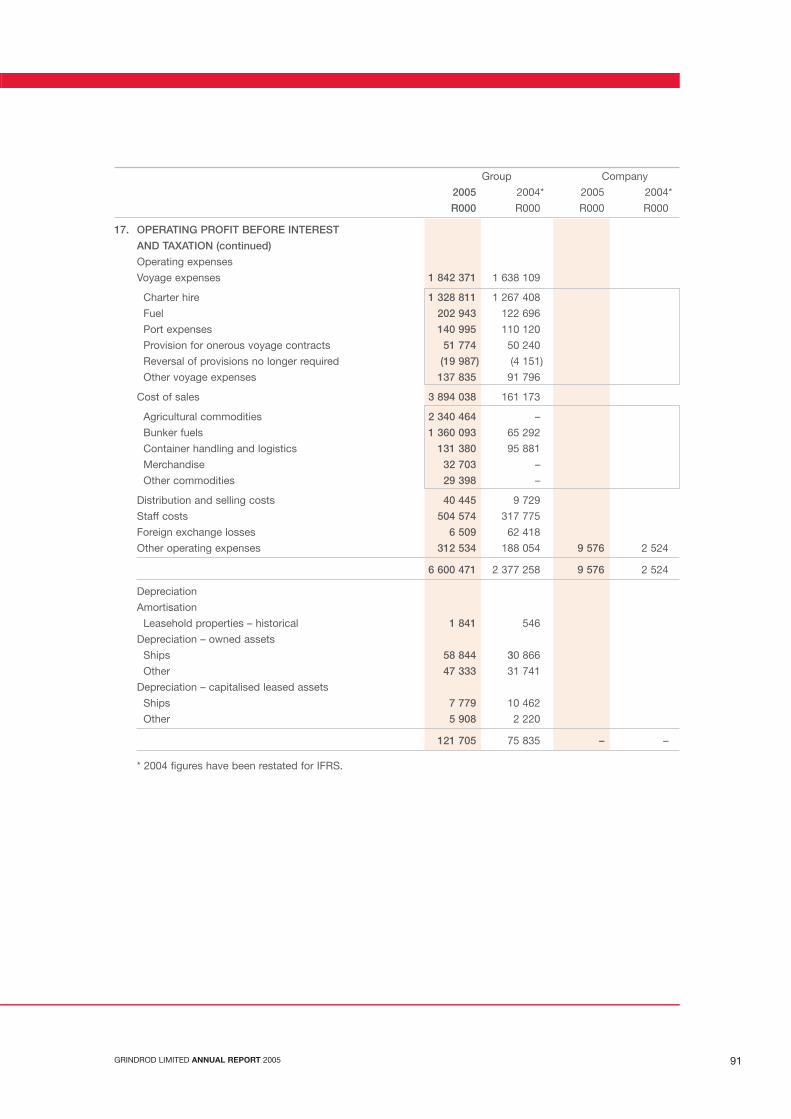
GRINDROD LIMITED ANNUAL REPORT 2005 91
Group Company
2005 2004* 2005 2004*
R000 R000 R000 R000
17. OPERATING PROFIT BEFORE INTEREST
AND TAXATION (continued)
Operating expenses
Voyage expenses 1 842 371 1 638 109
Charter hire 1 328 811 1 267 408
Fuel 202 943 122 696
Port expenses 140 995 110 120
Provision for onerous voyage contracts 51 774 50 240
Reversal of provisions no longer required (19 987) (4 151)
Other voyage expenses 137 835 91 796
Cost of sales 3 894 038 161 173
Agricultural commodities 2 340 464 –
Bunker fuels 1 360 093 65 292
Container handling and logistics 131 380 95 881
Merchandise 32 703 –
Other commodities 29 398 –
Distribution and selling costs 40 445 9 729
Staff costs 504 574 317 775
Foreign exchange losses 6 509 62 418
Other operating expenses 312 534 188 054 9 576 2 524
6 600 471 2 377 258 9 576 2 524
Depreciation
Amortisation
Leasehold properties – historical 1 841 546
Depreciation – owned assets
Ships 58 844 30 866
Other 47 333 31 741
Depreciation – capitalised leased assets
Ships 7 779 10 462
Other 5 908 2 220
121 705 75 835 – –
* 2004 figures have been restated for IFRS.
W3IB00003 Grindrod INSIDE 06/04/2006 2:26 PM Page 91

GRINDROD LIMITED ANNUAL REPORT 200592
Group Company
2005 2004* 2005 2004*
R000 R000 R000 R000
17. OPERATING PROFIT BEFORE INTEREST
AND TAXATION (continued)
The above costs are arrived at after including:
Auditors’ remuneration
Audit fees – current year provision 7 073 4 034 511 27
Prior year underprovision 634 207 115 3
Fees for other services 1 612 1 049 24 –
Expenses 23 20
9 342 5 310 650 30
Operating lease rentals
Land and buildings 86 298 39 978
Ships 1 756 486 1 254 199
Other 11 094 11 042
1 853 878 1 305 219 – –
Professional fees
Administrative 339 1 570 – 2
Managerial 4 304 331
Technical 3 754 255 132
8 397 2 156 132 2
Amortisation of intangible assets 13 524 2 006
18. NON-TRADING ITEMS
Impairment of property, plant and equipment (707)
Impairment of goodwill (39) (1 969)
Impairment of investment – (137)
Profit on sale of investments 115 3 499
Profit on sale of property, plant and equipment 4 082 506
3 451 2 036 – (137)
The non-trading items have no effect on taxation. The
minority’s share of the profit on sale of property, plant and
equipment is R504 000 (2004: R18 000).
19. FINANCE COSTS
Interest received 53 859 38 129 93 568
Net interest paid (140 639) (100 327) – (2 048)
Interest paid (149 915) (102 472) – (2 048)
Interest capitalised 9 276 2 145
(86 780) (62 198) 93 (1 480)
* 2004 figures have been restated for IFRS.
Notes to the Financial Statements (continued)31 December 2005
W3IB00003 Grindrod INSIDE 06/04/2006 2:26 PM Page 92

GRINDROD LIMITED ANNUAL REPORT 2005 93
Group Company
2005 2004* 2005 2004*
R000 R000 R000 R000
20. TAXATION
SOUTH AFRICAN NORMAL TAX
Current
On income for the year (50 302) (49 088)
Prior year adjustment 52 (9 528)
Secondary tax on companies (STC) (221) –
Deferred
On income for the year 14 429 2 155
Change in tax rate (1 088) –
Prior year adjustment 7 358 (77)
On STC credits (10 278) 18 647 (5 718) 14 087
FOREIGN
Current
On income for the year (3 408) (881)
Prior year adjustment 306 –
Deferred
On income for the year 311 –
ASSOCIATE COMPANIES
Current
On income for the year (22 256) (9 194)
Deferred
On income for the year (55) –
(65 152) (47 966) (5 718) 14 087
EFFECTIVE RATE OF TAXATION % % % %
Normal rate of taxation 29,0 30,0 29,0 30,0
Adjusted for:
Current year tax losses utilised (1,2) (1,2)
Exempt income (0,9) (0,7) (29,3) (30,5)
Non-taxable foreign items (21,4) (19,7)
Non-allowable items 1,1 1,4 0,3 0,5
Deferred tax on STC credits 1,1 (3,4) 0,7 (5,5)
Change in tax rate 0,1 –
Prior year adjustment (0,8) 1,7
Effective rate of taxation 7,0 8,1 0,7 (5,5)
Subsidiary companies have estimated tax losses of R260 166 000 (2004: R142 581 000) of which R92 996 000
(2004: R31 041 000) has been utilised in the calculation of deferred taxation.
* 2004 figures have been restated for IFRS.
W3IB00003 Grindrod INSIDE 06/04/2006 2:26 PM Page 93
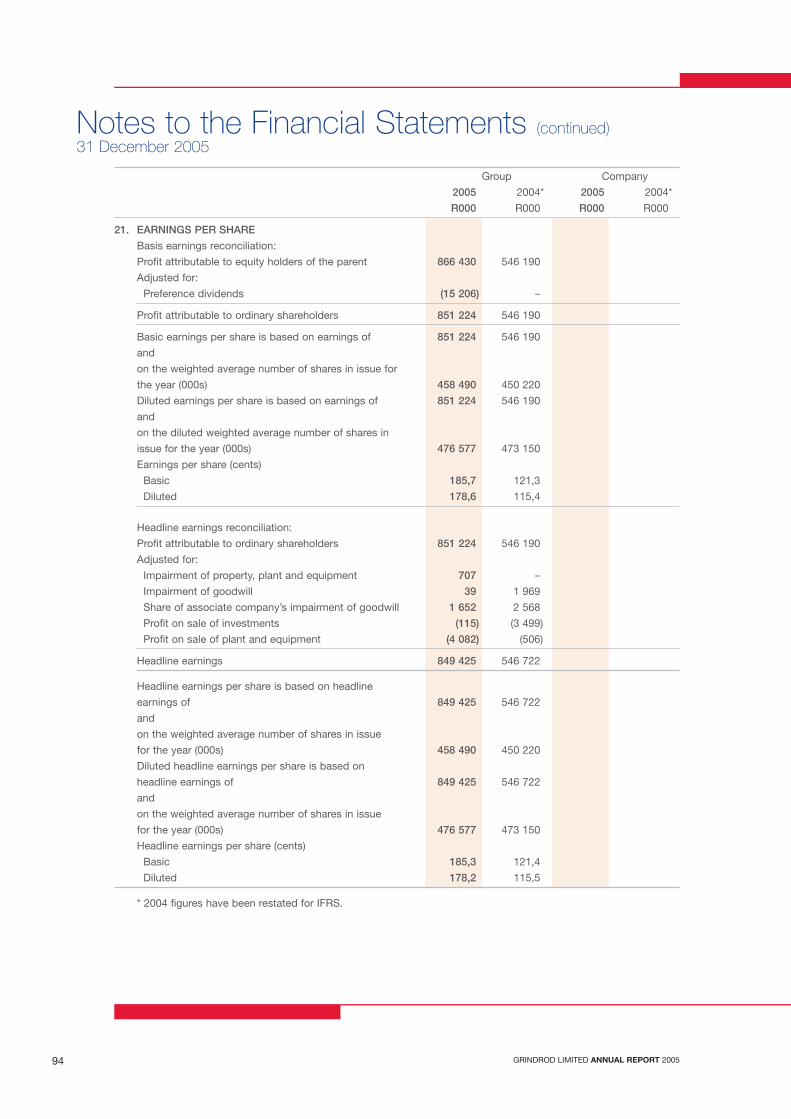
GRINDROD LIMITED ANNUAL REPORT 200594
Group Company
2005 2004* 2005 2004*
R000 R000 R000 R000
21. EARNINGS PER SHARE
Basis earnings reconciliation:
Profit attributable to equity holders of the parent 866 430 546 190
Adjusted for:
Preference dividends (15 206) –
Profit attributable to ordinary shareholders 851 224 546 190
Basic earnings per share is based on earnings of 851 224 546 190
and
on the weighted average number of shares in issue for
the year (000s) 458 490 450 220
Diluted earnings per share is based on earnings of 851 224 546 190
and
on the diluted weighted average number of shares in
issue for the year (000s) 476 577 473 150
Earnings per share (cents)
Basic 185,7 121,3
Diluted 178,6 115,4
Headline earnings reconciliation:
Profit attributable to ordinary shareholders 851 224 546 190
Adjusted for:
Impairment of property, plant and equipment 707 –
Impairment of goodwill 39 1 969
Share of associate company’s impairment of goodwill 1 652 2 568
Profit on sale of investments (115) (3 499)
Profit on sale of plant and equipment (4 082) (506)
Headline earnings 849 425 546 722
Headline earnings per share is based on headline
earnings of 849 425 546 722
and
on the weighted average number of shares in issue
for the year (000s) 458 490 450 220
Diluted headline earnings per share is based on
headline earnings of 849 425 546 722
and
on the weighted average number of shares in issue
for the year (000s) 476 577 473 150
Headline earnings per share (cents)
Basic 185,3 121,4
Diluted 178,2 115,5
* 2004 figures have been restated for IFRS.
Notes to the Financial Statements (continued)31 December 2005
W3IB00003 Grindrod INSIDE 06/04/2006 2:26 PM Page 94
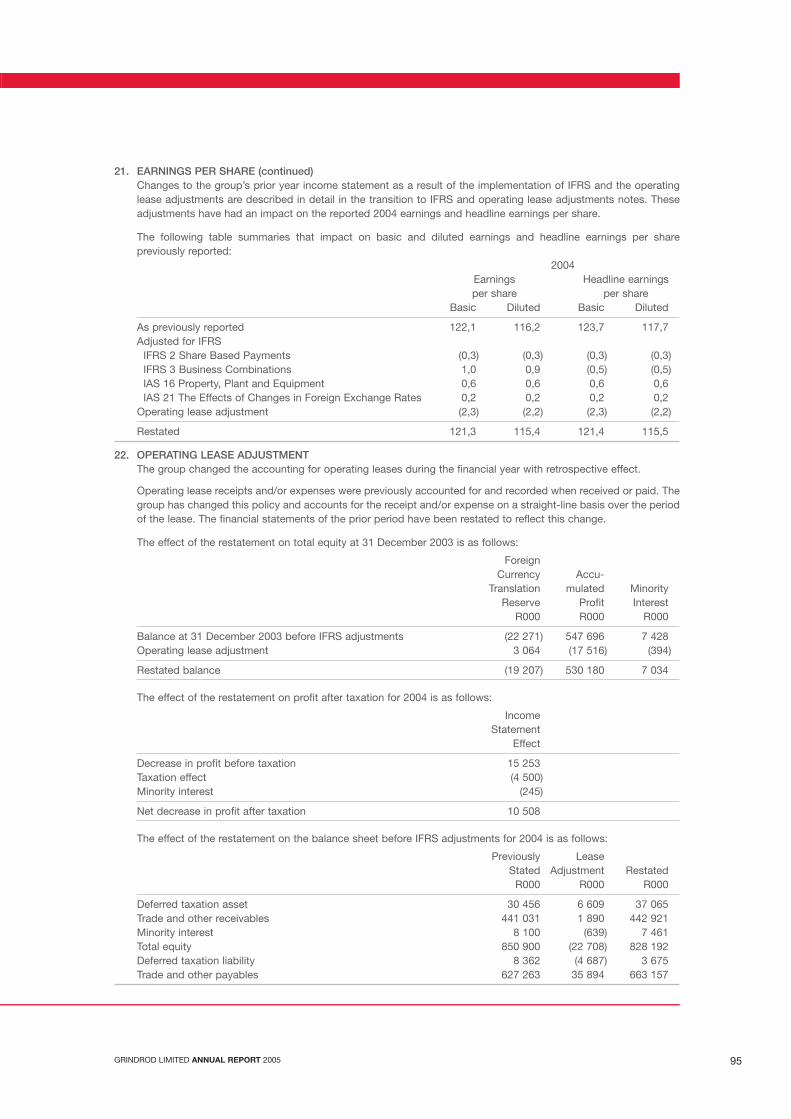
GRINDROD LIMITED ANNUAL REPORT 2005 95
21. EARNINGS PER SHARE (continued)Changes to the group’s prior year income statement as a result of the implementation of IFRS and the operatinglease adjustments are described in detail in the transition to IFRS and operating lease adjustments notes. Theseadjustments have had an impact on the reported 2004 earnings and headline earnings per share.
The following table summaries that impact on basic and diluted earnings and headline earnings per sharepreviously reported:
2004Earnings Headline earnings per share per share
Basic Diluted Basic Diluted
As previously reported 122,1 116,2 123,7 117,7Adjusted for IFRS
IFRS 2 Share Based Payments (0,3) (0,3) (0,3) (0,3)IFRS 3 Business Combinations 1,0 0,9 (0,5) (0,5)IAS 16 Property, Plant and Equipment 0,6 0,6 0,6 0,6IAS 21 The Effects of Changes in Foreign Exchange Rates 0,2 0,2 0,2 0,2
Operating lease adjustment (2,3) (2,2) (2,3) (2,2)
Restated 121,3 115,4 121,4 115,5
22. OPERATING LEASE ADJUSTMENTThe group changed the accounting for operating leases during the financial year with retrospective effect.
Operating lease receipts and/or expenses were previously accounted for and recorded when received or paid. Thegroup has changed this policy and accounts for the receipt and/or expense on a straight-line basis over the periodof the lease. The financial statements of the prior period have been restated to reflect this change.
The effect of the restatement on total equity at 31 December 2003 is as follows:
Foreign Currency Accu-
Translation mulated MinorityReserve Profit Interest
R000 R000 R000
Balance at 31 December 2003 before IFRS adjustments (22 271) 547 696 7 428 Operating lease adjustment 3 064 (17 516) (394)
Restated balance (19 207) 530 180 7 034
The effect of the restatement on profit after taxation for 2004 is as follows:
Income Statement
Effect
Decrease in profit before taxation 15 253 Taxation effect (4 500)Minority interest (245)
Net decrease in profit after taxation 10 508
The effect of the restatement on the balance sheet before IFRS adjustments for 2004 is as follows:
Previously LeaseStated Adjustment Restated
R000 R000 R000
Deferred taxation asset 30 456 6 609 37 065 Trade and other receivables 441 031 1 890 442 921 Minority interest 8 100 (639) 7 461 Total equity 850 900 (22 708) 828 192 Deferred taxation liability 8 362 (4 687) 3 675 Trade and other payables 627 263 35 894 663 157
W3IB00003 Grindrod INSIDE 06/04/2006 2:26 PM Page 95

GRINDROD LIMITED ANNUAL REPORT 200596
23. DIRECTORS’ EMOLUMENTS AND INTERESTS
The remuneration paid to directors of the company, whilst in office, during the year ended 31 December 2005 is as
follows:
Retirement
Com- Basic Per- Medical & Share
Directors mittee Remu- formance Other Option Total Total
Fees Fees neration Bonus Benefits Gains 2005 2004*
R000 R000 R000 R000 R000 R000 R000 R000
Non-executive directors
W M Grindrod (Chairman) 190 38 228 203
D R D White (Deputy chairman) 90 27 117 103
H Adams 80 80 70
I M Groves 80 38 118 127
S M Gounden 80 80 –
J C Hall CBE (Retired 25 May 2005) 33 7 40 85
N E Mtshotshisa 80 80 –
R A Norton 80 44 124 110
R J H Whitley 80 80 70
From the company 947 768
Non-executive directors
W M Grindrod 145 145 172
I M Groves 53 53 35
Executive directors
I A J Clark 2 535 3 375 350 4 088 10 348 7 163
J G Jones 1 418 1 672 422 2 888 6 400 5 164
T J T McClure 1 514 7 819 ** 457 2 343 12 133 15 657
A K Olivier 1 774 2 451 743 2 520 7 488 8 446
D A Rennie 1 470 1 672 1 215 3 740 8 097 4 916
A F Stewart 1 283 1 100 442 3 948 6 773 2 015
L R Stuart-Hill 1 613 1 800 595 2 126 6 134 6 163
From the subsidiaries 57 571 49 731
Total emoluments 58 518 50 499
** This includes R4 819 000 (2004: R1 719 333) paid in terms of a contractual arrangement entered into on
acquisition of Island View Shipping.
* 2004 figures have been restated for IFRS.
Notes to the Financial Statements (continued)31 December 2005
W3IB00003 Grindrod INSIDE 06/04/2006 2:26 PM Page 96

GRINDROD LIMITED ANNUAL REPORT 2005 97
23. DIRECTORS’ EMOLUMENTS AND INTERESTS (continued)
Price
Options Options at which
granted exercised options Option
Options at during the during the exercised Options at price Vesting Expiry
Director 01.01.2005 year year (cents) 31.12.2005 (cents) dates dates
I A J Clark 400 000 200 000 30 200 000 30 13.12.2006 13.12.2009
300 000 100 000 30 100 000 30 03.05.2006 03.05.2010
100 000 30 03.05.2007 03.05.2010
500 000 100 000 110 100 000 110 25.03.2006 25.03.2012
100 000 110 25.03.2007 25.03.2012
100 000 110 25.03.2008 25.03.2012
100 000 110 25.03.2009 25.03.2012
1 000 000 200 000 239 26.11.2006 26.11.2013
200 000 239 26.11.2007 26.11.2013
200 000 239 26.11.2008 26.11.2013
200 000 239 26.11.2009 26.11.2013
200 000 239 26.11.2010 26.11.2013
500 000 100 000 380 27.05.2007 27.05.2014
100 000 380 27.05.2008 27.05.2014
100 000 380 27.05.2009 27.05.2014
100 000 380 27.05.2010 27.05.2014
100 000 380 27.05.2011 27.05.2014
750 000 150 000 1251 23.11.2008 23.11.2015
150 000 1251 23.11.2009 23.11.2015
150 000 1251 23.11.2010 23.11.2015
150 000 1251 23.11.2011 23.11.2015
150 000 1251 23.11.2012 23.11.2015
J G Jones 200 000 100 000 30 100 000 30 13.12.2006 13.12.2009
120 000 40 000 30 40 000 30 03.05.2006 03.05.2010
40 000 30 03.05.2007 03.05.2010
600 000 150 000 58 150 000 58 01.03.2006 01.03.2011
150 000 58 01.03.2007 01.03.2011
150 000 58 01.03.2008 01.03.2011
750 000 150 000 239 26.11.2006 26.11.2013
150 000 239 26.11.2007 26.11.2013
150 000 239 26.11.2008 26.11.2013
150 000 239 26.11.2009 26.11.2013
150 000 239 26.11.2010 26.11.2013
500 000 100 000 1251 23.11.2008 23.11.2015
100 000 1251 23.11.2009 23.11.2015
100 000 1251 23.11.2010 23.11.2015
100 000 1251 23.11.2011 23.11.2015
100 000 1251 23.11.2012 23.11.2015
W3IB00003 Grindrod INSIDE 06/04/2006 2:26 PM Page 97
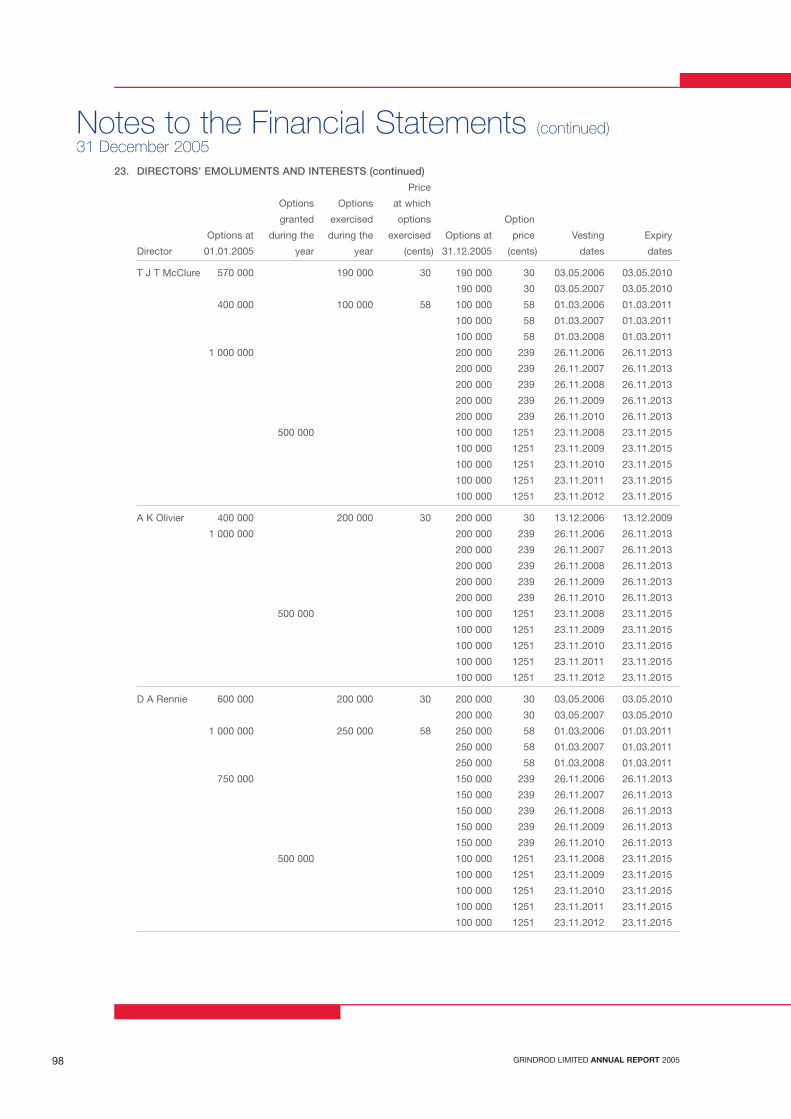
GRINDROD LIMITED ANNUAL REPORT 200598
Notes to the Financial Statements (continued)31 December 2005
23. DIRECTORS’ EMOLUMENTS AND INTERESTS (continued)
Price
Options Options at which
granted exercised options Option
Options at during the during the exercised Options at price Vesting Expiry
Director 01.01.2005 year year (cents) 31.12.2005 (cents) dates dates
T J T McClure 570 000 190 000 30 190 000 30 03.05.2006 03.05.2010
190 000 30 03.05.2007 03.05.2010
400 000 100 000 58 100 000 58 01.03.2006 01.03.2011
100 000 58 01.03.2007 01.03.2011
100 000 58 01.03.2008 01.03.2011
1 000 000 200 000 239 26.11.2006 26.11.2013
200 000 239 26.11.2007 26.11.2013
200 000 239 26.11.2008 26.11.2013
200 000 239 26.11.2009 26.11.2013
200 000 239 26.11.2010 26.11.2013
500 000 100 000 1251 23.11.2008 23.11.2015
100 000 1251 23.11.2009 23.11.2015
100 000 1251 23.11.2010 23.11.2015
100 000 1251 23.11.2011 23.11.2015
100 000 1251 23.11.2012 23.11.2015
A K Olivier 400 000 200 000 30 200 000 30 13.12.2006 13.12.2009
1 000 000 200 000 239 26.11.2006 26.11.2013
200 000 239 26.11.2007 26.11.2013
200 000 239 26.11.2008 26.11.2013
200 000 239 26.11.2009 26.11.2013
200 000 239 26.11.2010 26.11.2013
500 000 100 000 1251 23.11.2008 23.11.2015
100 000 1251 23.11.2009 23.11.2015
100 000 1251 23.11.2010 23.11.2015
100 000 1251 23.11.2011 23.11.2015
100 000 1251 23.11.2012 23.11.2015
D A Rennie 600 000 200 000 30 200 000 30 03.05.2006 03.05.2010
200 000 30 03.05.2007 03.05.2010
1 000 000 250 000 58 250 000 58 01.03.2006 01.03.2011
250 000 58 01.03.2007 01.03.2011
250 000 58 01.03.2008 01.03.2011
750 000 150 000 239 26.11.2006 26.11.2013
150 000 239 26.11.2007 26.11.2013
150 000 239 26.11.2008 26.11.2013
150 000 239 26.11.2009 26.11.2013
150 000 239 26.11.2010 26.11.2013
500 000 100 000 1251 23.11.2008 23.11.2015
100 000 1251 23.11.2009 23.11.2015
100 000 1251 23.11.2010 23.11.2015
100 000 1251 23.11.2011 23.11.2015
100 000 1251 23.11.2012 23.11.2015
W3IB00003 Grindrod INSIDE 06/04/2006 2:26 PM Page 98
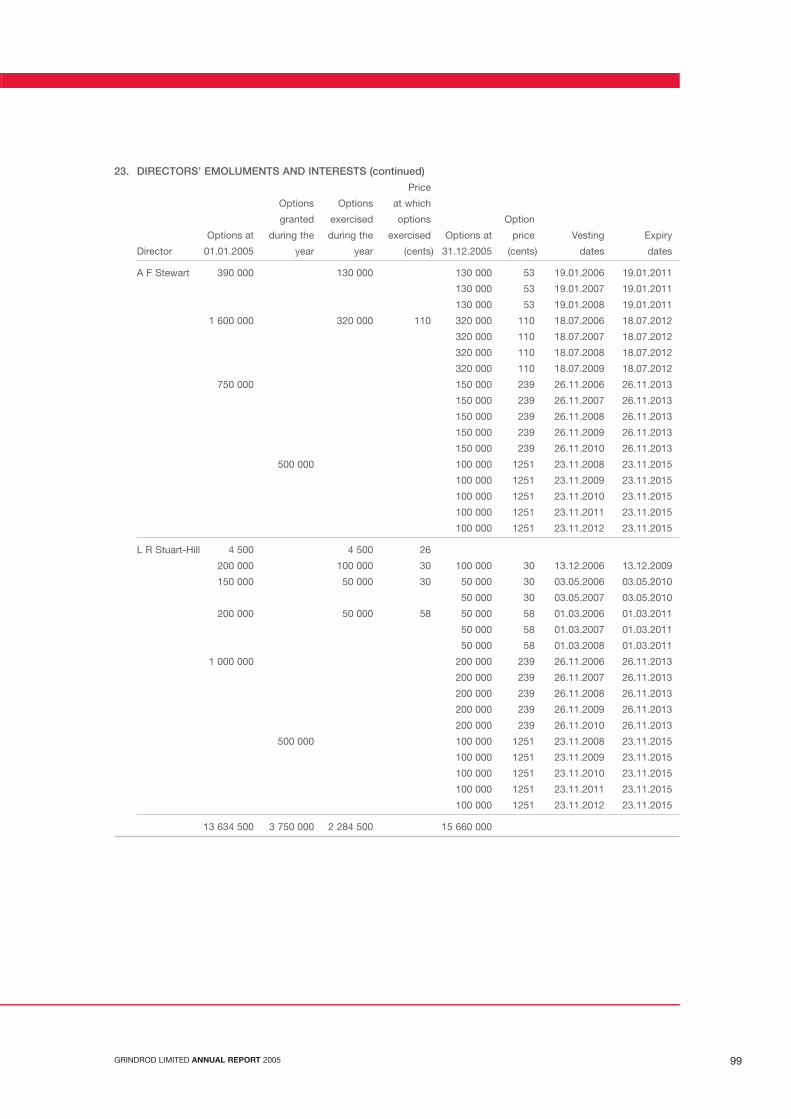
GRINDROD LIMITED ANNUAL REPORT 2005 99
23. DIRECTORS’ EMOLUMENTS AND INTERESTS (continued)
Price
Options Options at which
granted exercised options Option
Options at during the during the exercised Options at price Vesting Expiry
Director 01.01.2005 year year (cents) 31.12.2005 (cents) dates dates
A F Stewart 390 000 130 000 130 000 53 19.01.2006 19.01.2011
130 000 53 19.01.2007 19.01.2011
130 000 53 19.01.2008 19.01.2011
1 600 000 320 000 110 320 000 110 18.07.2006 18.07.2012
320 000 110 18.07.2007 18.07.2012
320 000 110 18.07.2008 18.07.2012
320 000 110 18.07.2009 18.07.2012
750 000 150 000 239 26.11.2006 26.11.2013
150 000 239 26.11.2007 26.11.2013
150 000 239 26.11.2008 26.11.2013
150 000 239 26.11.2009 26.11.2013
150 000 239 26.11.2010 26.11.2013
500 000 100 000 1251 23.11.2008 23.11.2015
100 000 1251 23.11.2009 23.11.2015
100 000 1251 23.11.2010 23.11.2015
100 000 1251 23.11.2011 23.11.2015
100 000 1251 23.11.2012 23.11.2015
L R Stuart-Hill 4 500 4 500 26
200 000 100 000 30 100 000 30 13.12.2006 13.12.2009
150 000 50 000 30 50 000 30 03.05.2006 03.05.2010
50 000 30 03.05.2007 03.05.2010
200 000 50 000 58 50 000 58 01.03.2006 01.03.2011
50 000 58 01.03.2007 01.03.2011
50 000 58 01.03.2008 01.03.2011
1 000 000 200 000 239 26.11.2006 26.11.2013
200 000 239 26.11.2007 26.11.2013
200 000 239 26.11.2008 26.11.2013
200 000 239 26.11.2009 26.11.2013
200 000 239 26.11.2010 26.11.2013
500 000 100 000 1251 23.11.2008 23.11.2015
100 000 1251 23.11.2009 23.11.2015
100 000 1251 23.11.2010 23.11.2015
100 000 1251 23.11.2011 23.11.2015
100 000 1251 23.11.2012 23.11.2015
13 634 500 3 750 000 2 284 500 15 660 000
W3IB00003 Grindrod INSIDE 06/04/2006 2:26 PM Page 99
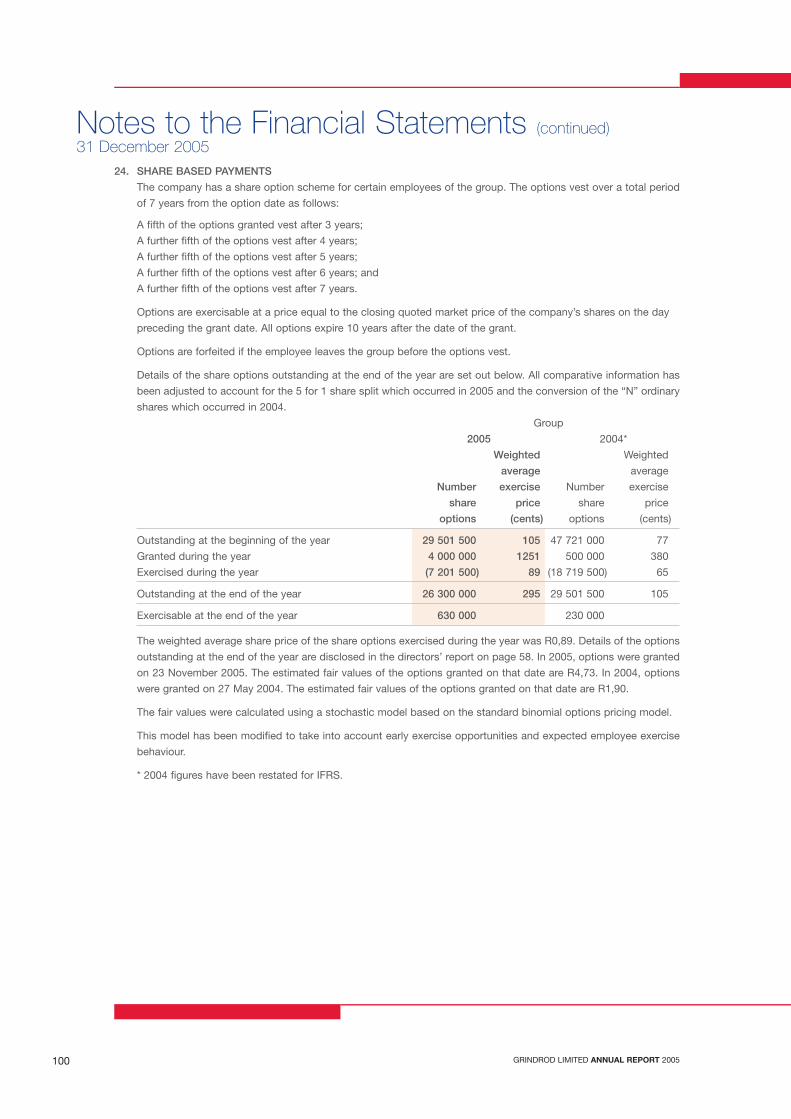
GRINDROD LIMITED ANNUAL REPORT 2005100
Notes to the Financial Statements (continued)31 December 2005
24. SHARE BASED PAYMENTS
The company has a share option scheme for certain employees of the group. The options vest over a total period
of 7 years from the option date as follows:
A fifth of the options granted vest after 3 years;
A further fifth of the options vest after 4 years;
A further fifth of the options vest after 5 years;
A further fifth of the options vest after 6 years; and
A further fifth of the options vest after 7 years.
Options are exercisable at a price equal to the closing quoted market price of the company’s shares on the day
preceding the grant date. All options expire 10 years after the date of the grant.
Options are forfeited if the employee leaves the group before the options vest.
Details of the share options outstanding at the end of the year are set out below. All comparative information has
been adjusted to account for the 5 for 1 share split which occurred in 2005 and the conversion of the “N” ordinary
shares which occurred in 2004.
Group
2005 2004*
Weighted Weighted
average average
Number exercise Number exercise
share price share price
options (cents) options (cents)
Outstanding at the beginning of the year 29 501 500 105 47 721 000 77
Granted during the year 4 000 000 1251 500 000 380
Exercised during the year (7 201 500) 89 (18 719 500) 65
Outstanding at the end of the year 26 300 000 295 29 501 500 105
Exercisable at the end of the year 630 000 230 000
The weighted average share price of the share options exercised during the year was R0,89. Details of the options
outstanding at the end of the year are disclosed in the directors’ report on page 58. In 2005, options were granted
on 23 November 2005. The estimated fair values of the options granted on that date are R4,73. In 2004, options
were granted on 27 May 2004. The estimated fair values of the options granted on that date are R1,90.
The fair values were calculated using a stochastic model based on the standard binomial options pricing model.
This model has been modified to take into account early exercise opportunities and expected employee exercise
behaviour.
* 2004 figures have been restated for IFRS.
W3IB00003 Grindrod INSIDE 06/04/2006 2:26 PM Page 100
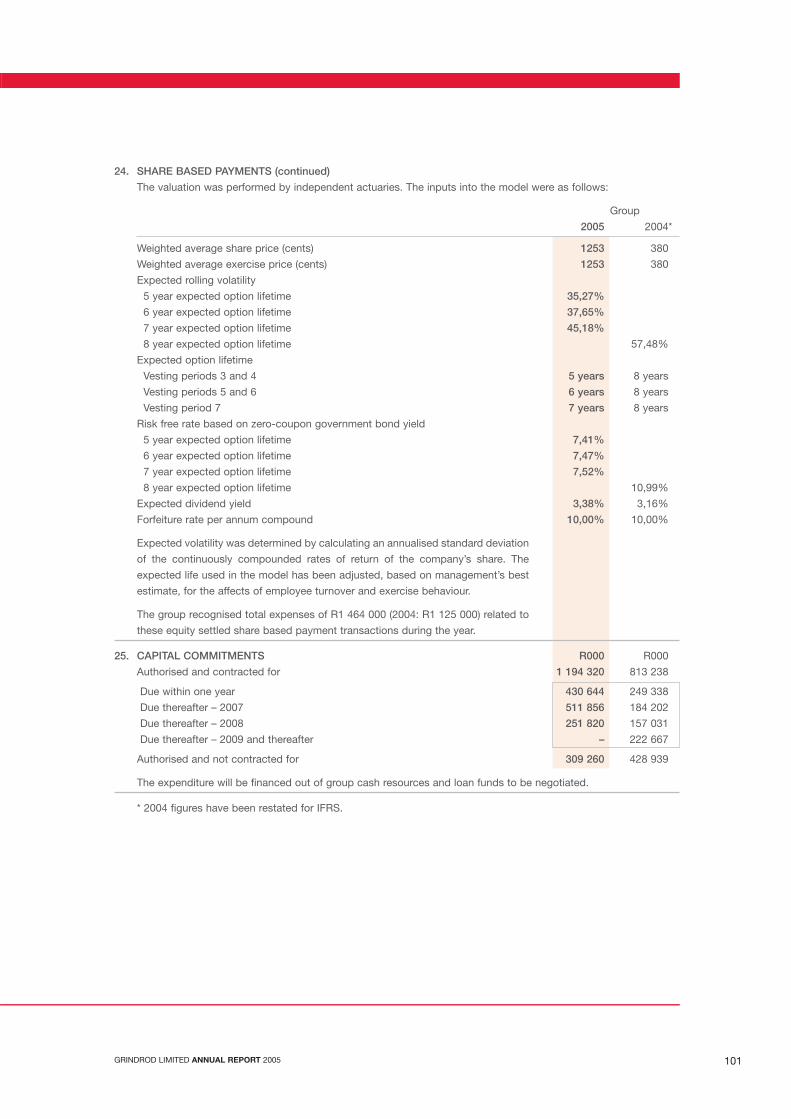
GRINDROD LIMITED ANNUAL REPORT 2005 101
24. SHARE BASED PAYMENTS (continued)
The valuation was performed by independent actuaries. The inputs into the model were as follows:
Group
2005 2004*
Weighted average share price (cents) 1253 380
Weighted average exercise price (cents) 1253 380
Expected rolling volatility
5 year expected option lifetime 35,27%
6 year expected option lifetime 37,65%
7 year expected option lifetime 45,18%
8 year expected option lifetime 57,48%
Expected option lifetime
Vesting periods 3 and 4 5 years 8 years
Vesting periods 5 and 6 6 years 8 years
Vesting period 7 7 years 8 years
Risk free rate based on zero-coupon government bond yield
5 year expected option lifetime 7,41%
6 year expected option lifetime 7,47%
7 year expected option lifetime 7,52%
8 year expected option lifetime 10,99%
Expected dividend yield 3,38% 3,16%
Forfeiture rate per annum compound 10,00% 10,00%
Expected volatility was determined by calculating an annualised standard deviation
of the continuously compounded rates of return of the company’s share. The
expected life used in the model has been adjusted, based on management’s best
estimate, for the affects of employee turnover and exercise behaviour.
The group recognised total expenses of R1 464 000 (2004: R1 125 000) related to
these equity settled share based payment transactions during the year.
25. CAPITAL COMMITMENTS R000 R000
Authorised and contracted for 1 194 320 813 238
Due within one year 430 644 249 338
Due thereafter – 2007 511 856 184 202
Due thereafter – 2008 251 820 157 031
Due thereafter – 2009 and thereafter – 222 667
Authorised and not contracted for 309 260 428 939
The expenditure will be financed out of group cash resources and loan funds to be negotiated.
* 2004 figures have been restated for IFRS.
W3IB00003 Grindrod INSIDE 06/04/2006 2:26 PM Page 101

GRINDROD LIMITED ANNUAL REPORT 2005102
26. CONTINGENT LIABILITIES
The company has guaranteed loans and facilities of subsidiaries amounting to R1 904 618 000
(2004: R931 214 000) of which R787 017 000 (2004: R566 391 000) had been utilised at year end.
The company has guaranteed charter hire payments of a subsidiary amounting to R152 453 000
(2004: R179 298 000). The charter hire payments are due by the subsidiary in equal amounts from years
2006 to 2008.
In addition the company has guaranteed the liabilities of two subsidiaries amounting to R550 000 000
(2004: R230 000 000).
Financial guarantee contracts are accounted for as insurance contracts and consequently are measured initially at
cost and thereafter in accordance with IAS 37 Provisions, Contingent Liabilities and Contingent Assets.
Certain subsidiaries have been served a petition with respect to a business acquired during the year. Legal counsel
have advised that the claim is unlikely to succeed.
Group
2005 2005 2004 2004
Year End Average Year End Average
Rates Rates Rates Rates
27. FOREIGN CURRENCY DENOMINATED ITEMS
All foreign currency denominated items are translated
in terms of the group’s policies.
At 31 December exchange rates used on conversion were:
US Dollar 6,31 6,38 5,65 6,47
Euro 7,48 7,95 7,71 7,70
Pound Sterling 10,86 11,62 10,91 11,08
Swedish Kroner 1,26 1,27 1,18 1,15
Australian Dollar 4,63 4,57 4,35 4,76
Danish Kroner 0,99 1,01 0,97 0,93
Japanese Yen 0,05 0,05 0,05 0,06
1 year 2 – 5 years >5 years Group
R000 R000 R000 R000
28. LEASES AND SHIPCHARTERS
28.1 OPERATING LEASES AND SHIP CHARTERS
28.1.1 Receivables
The minimum future lease and charter payments
receivable under non-cancellable operating leases
and charter party agreements are as follows:
2005
Land and buildings 7 038 9 486 – 16 524
Ships 598 204 816 472 – 1 414 676
605 242 825 958 – 1 431 200
2004*
Land and buildings 7 862 9 490 – 17 352
Ships 354 881 300 115 – 654 996
Plant and equipment 1 770 – – 1 770
364 513 309 605 – 674 118
* 2004 figures have been restated for IFRS.
Notes to the Financial Statements (continued)31 December 2005
W3IB00003 Grindrod INSIDE 06/04/2006 2:26 PM Page 102
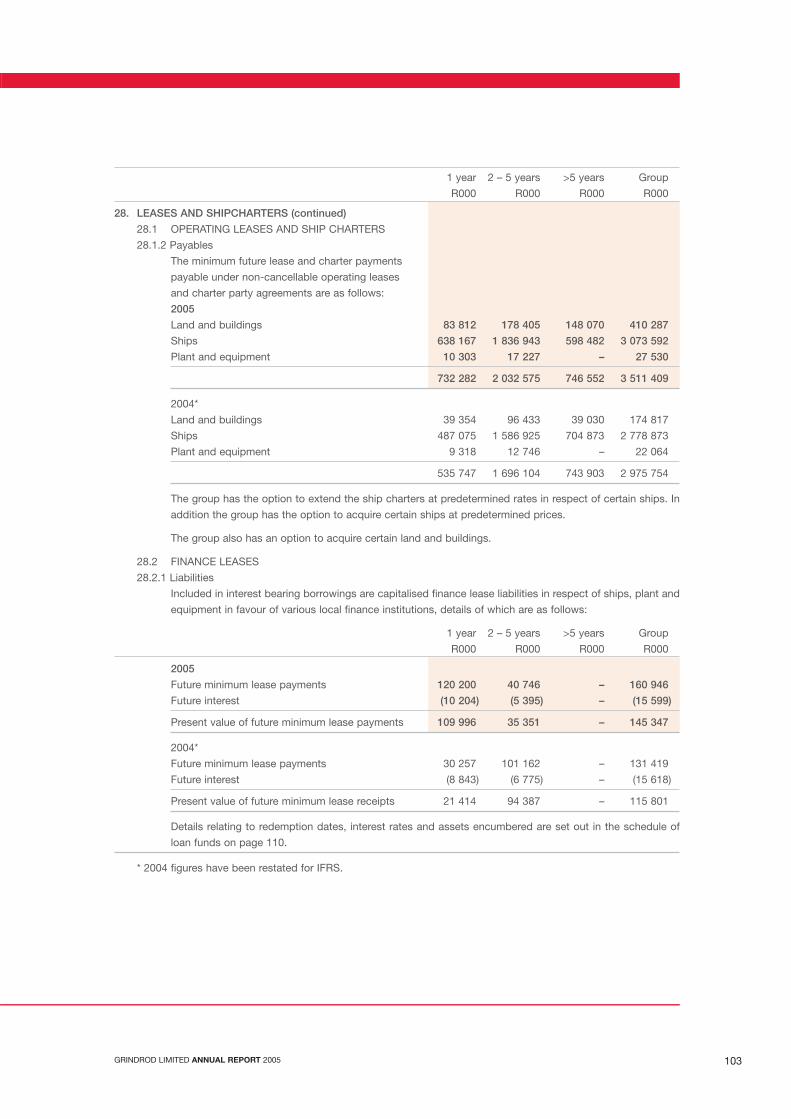
GRINDROD LIMITED ANNUAL REPORT 2005 103
1 year 2 – 5 years >5 years Group
R000 R000 R000 R000
28. LEASES AND SHIPCHARTERS (continued)
28.1 OPERATING LEASES AND SHIP CHARTERS
28.1.2 Payables
The minimum future lease and charter payments
payable under non-cancellable operating leases
and charter party agreements are as follows:
2005
Land and buildings 83 812 178 405 148 070 410 287
Ships 638 167 1 836 943 598 482 3 073 592
Plant and equipment 10 303 17 227 – 27 530
732 282 2 032 575 746 552 3 511 409
2004*
Land and buildings 39 354 96 433 39 030 174 817
Ships 487 075 1 586 925 704 873 2 778 873
Plant and equipment 9 318 12 746 – 22 064
535 747 1 696 104 743 903 2 975 754
The group has the option to extend the ship charters at predetermined rates in respect of certain ships. In
addition the group has the option to acquire certain ships at predetermined prices.
The group also has an option to acquire certain land and buildings.
28.2 FINANCE LEASES
28.2.1 Liabilities
Included in interest bearing borrowings are capitalised finance lease liabilities in respect of ships, plant and
equipment in favour of various local finance institutions, details of which are as follows:
1 year 2 – 5 years >5 years Group
R000 R000 R000 R000
2005
Future minimum lease payments 120 200 40 746 – 160 946
Future interest (10 204) (5 395) – (15 599)
Present value of future minimum lease payments 109 996 35 351 – 145 347
2004*
Future minimum lease payments 30 257 101 162 – 131 419
Future interest (8 843) (6 775) – (15 618)
Present value of future minimum lease receipts 21 414 94 387 – 115 801
Details relating to redemption dates, interest rates and assets encumbered are set out in the schedule of
loan funds on page 110.
* 2004 figures have been restated for IFRS.
W3IB00003 Grindrod INSIDE 06/04/2006 2:26 PM Page 103
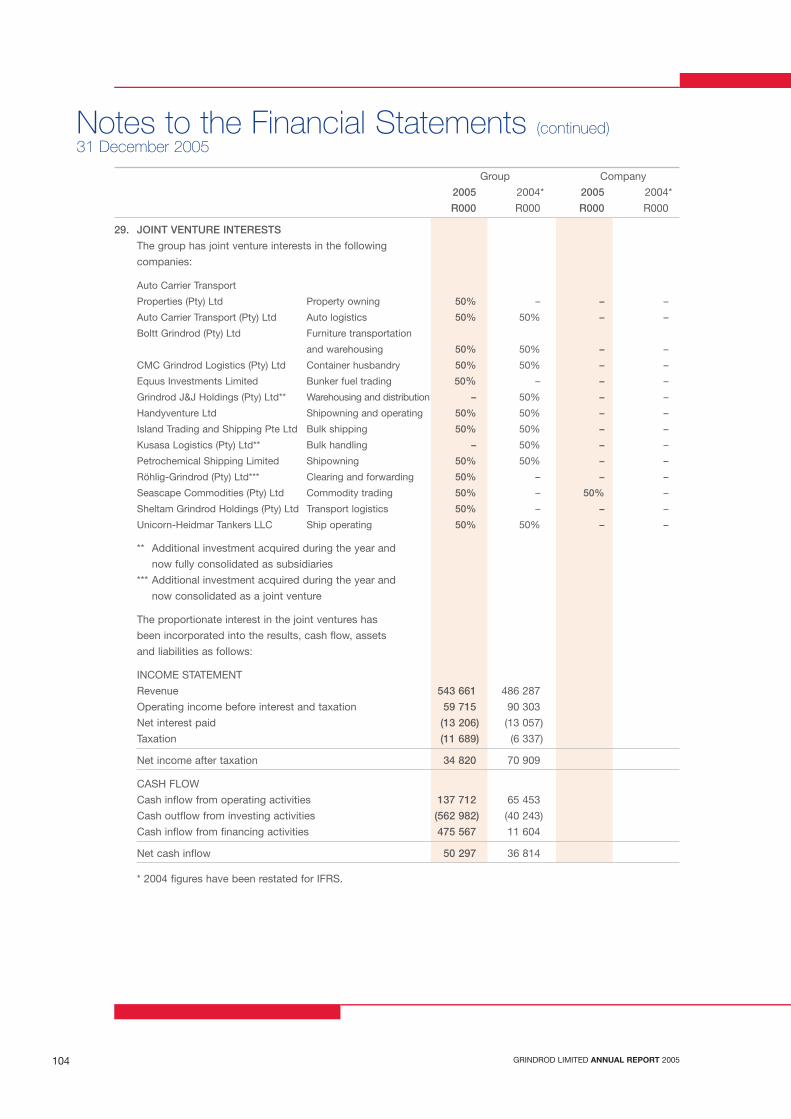
GRINDROD LIMITED ANNUAL REPORT 2005104
Group Company
2005 2004* 2005 2004*
R000 R000 R000 R000
29. JOINT VENTURE INTERESTS
The group has joint venture interests in the following
companies:
Auto Carrier Transport
Properties (Pty) Ltd Property owning 50% – – –
Auto Carrier Transport (Pty) Ltd Auto logistics 50% 50% – –
Boltt Grindrod (Pty) Ltd Furniture transportation
and warehousing 50% 50% – –
CMC Grindrod Logistics (Pty) Ltd Container husbandry 50% 50% – –
Equus Investments Limited Bunker fuel trading 50% – – –
Grindrod J&J Holdings (Pty) Ltd** Warehousing and distribution – 50% – –
Handyventure Ltd Shipowning and operating 50% 50% – –
Island Trading and Shipping Pte Ltd Bulk shipping 50% 50% – –
Kusasa Logistics (Pty) Ltd** Bulk handling – 50% – –
Petrochemical Shipping Limited Shipowning 50% 50% – –
Röhlig-Grindrod (Pty) Ltd*** Clearing and forwarding 50% – – –
Seascape Commodities (Pty) Ltd Commodity trading 50% – 50% –
Sheltam Grindrod Holdings (Pty) Ltd Transport logistics 50% – – –
Unicorn-Heidmar Tankers LLC Ship operating 50% 50% – –
** Additional investment acquired during the year and
now fully consolidated as subsidiaries
*** Additional investment acquired during the year and
now consolidated as a joint venture
The proportionate interest in the joint ventures has
been incorporated into the results, cash flow, assets
and liabilities as follows:
INCOME STATEMENT
Revenue 543 661 486 287
Operating income before interest and taxation 59 715 90 303
Net interest paid (13 206) (13 057)
Taxation (11 689) (6 337)
Net income after taxation 34 820 70 909
CASH FLOW
Cash inflow from operating activities 137 712 65 453
Cash outflow from investing activities (562 982) (40 243)
Cash inflow from financing activities 475 567 11 604
Net cash inflow 50 297 36 814
* 2004 figures have been restated for IFRS.
Notes to the Financial Statements (continued)31 December 2005
W3IB00003 Grindrod INSIDE 06/04/2006 2:26 PM Page 104
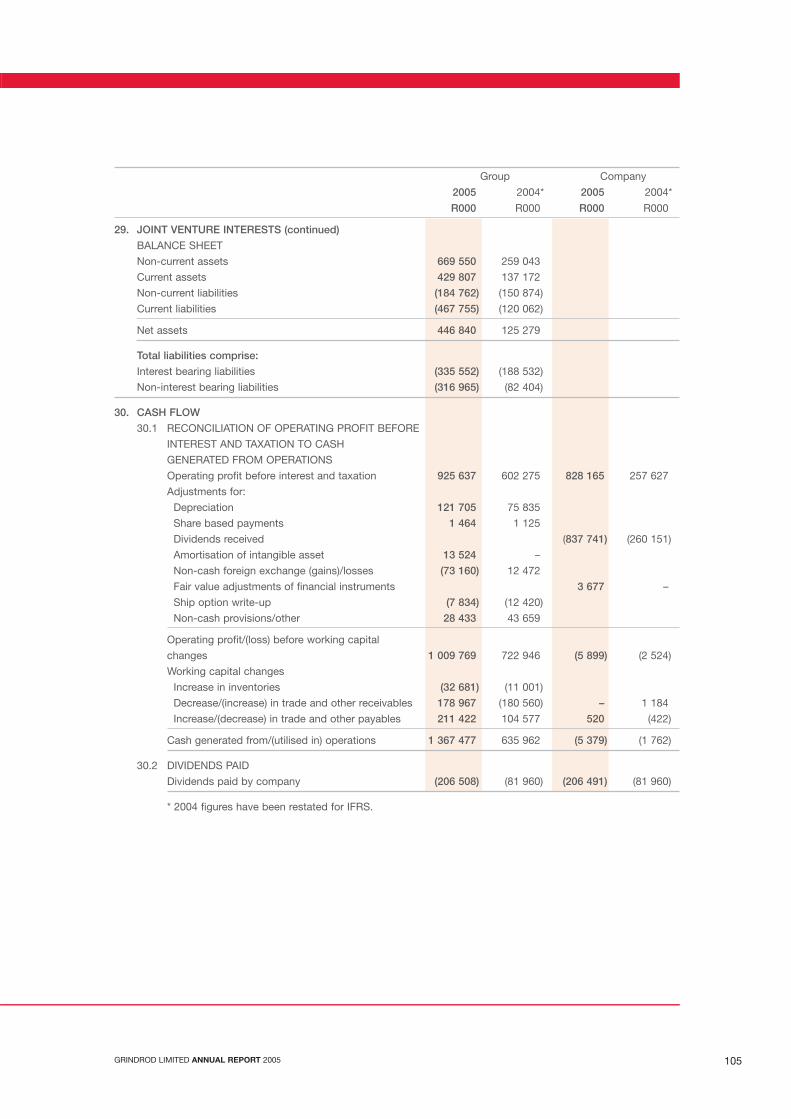
GRINDROD LIMITED ANNUAL REPORT 2005 105
Group Company
2005 2004* 2005 2004*
R000 R000 R000 R000
29. JOINT VENTURE INTERESTS (continued)
BALANCE SHEET
Non-current assets 669 550 259 043
Current assets 429 807 137 172
Non-current liabilities (184 762) (150 874)
Current liabilities (467 755) (120 062)
Net assets 446 840 125 279
Total liabilities comprise:
Interest bearing liabilities (335 552) (188 532)
Non-interest bearing liabilities (316 965) (82 404)
30. CASH FLOW
30.1 RECONCILIATION OF OPERATING PROFIT BEFORE
INTEREST AND TAXATION TO CASH
GENERATED FROM OPERATIONS
Operating profit before interest and taxation 925 637 602 275 828 165 257 627
Adjustments for:
Depreciation 121 705 75 835
Share based payments 1 464 1 125
Dividends received (837 741) (260 151)
Amortisation of intangible asset 13 524 –
Non-cash foreign exchange (gains)/losses (73 160) 12 472
Fair value adjustments of financial instruments 3 677 –
Ship option write-up (7 834) (12 420)
Non-cash provisions/other 28 433 43 659
Operating profit/(loss) before working capital
changes 1 009 769 722 946 (5 899) (2 524)
Working capital changes
Increase in inventories (32 681) (11 001)
Decrease/(increase) in trade and other receivables 178 967 (180 560) – 1 184
Increase/(decrease) in trade and other payables 211 422 104 577 520 (422)
Cash generated from/(utilised in) operations 1 367 477 635 962 (5 379) (1 762)
30.2 DIVIDENDS PAID
Dividends paid by company (206 508) (81 960) (206 491) (81 960)
* 2004 figures have been restated for IFRS.
W3IB00003 Grindrod INSIDE 06/04/2006 2:26 PM Page 105

GRINDROD LIMITED ANNUAL REPORT 2005106
Group Company
2005 2004* 2005 2004*
R000 R000 R000 R000
30. CASH FLOW (continued)
30.3 SHIPS, PROPERTY, PLANT AND EQUIPMENT
ACQUIRED
Additions per ships, property, plant and
equipment (note 1) (694 863) (803 218)
Less ships, property, plant and equipment
acquired on acquisition of subsidiaries 149 019 83 242
Less embedded derivative adjustment on ship
construction contracts – 235 130
Add settlement of forward exchange
contracts for ships (102 291) (74 117)
Cash flow on acquisition of ships, property, plant
and equipment (648 135) (558 963) – –
30.4 ACQUISITION OF SUBSIDIARIES AND
JOINT VENTURES
During the year the group acquired additional
interests in subsidiaries and joint ventures
as follows:
Ships, property, plant and equipment (149 019) (83 242)
Working capital (788 832) 13 791
Cash and bank 855 (8 755)
Long-term liabilities 83 842 78 496
Minority interest (620) (33)
Deferred taxation (4 603) (533)
Taxation liabilities 8 691 1 106
Goodwill and intangible assets (68 798) (13 747)
Total purchase price (918 484) (12 917) – –
Less cash and cash equivalents (855) 8 755
Less prepayment on investment 2004 12 922 –
Cash flow on acquisition net of cash acquired (906 417) (4 162) – –
30.5 CASH AND CASH EQUIVALENTS
Cash and cash equivalents included in the cash
flow comprise the following balance sheet
amounts:
Bank balances and cash 739 522 345 655 958 1 999
Bank overdrafts (391 951) (88 358)
347 571 257 297 958 1 999
* 2004 figures have been restated for IFRS.
Notes to the Financial Statements (continued)31 December 2005
W3IB00003 Grindrod INSIDE 06/04/2006 2:26 PM Page 106

GRINDROD LIMITED ANNUAL REPORT 2005 107
31. ACQUISITION OF SUBSIDIARIES AND JOINT VENTURES
During the year the group acquired the following material additional interests:
Company % acquired Date of acquisition
African Portland Industrial Holdings Ltd 80% 1 February
Atlas Trading & Shipping 100% 10 May
Equus Investments Ltd 50% 1 July
Seascape Commodities (Pty) Ltd 50% 1 November
The cash consideration for the businesses acquired totalled R918,5 million and the incremental profit recognised
was R16,0 million.
Net assets acquired in the transactions and the goodwill/intangible asset arising, are as follows:
Acquirees
carrying
amount
before Fair value
combination adjustments Fair value
Net assets acquired R000 R000 R000
Ships, property, plant and equipment 129 019 20 000 149 019
Goodwill and intangible assets 7 650 7 650
Working capital 786 467 2 365 788 832
Cash and bank (855) (855)
Long-term liabilities (83 842) (83 842)
Minority interest 620 620
Deferred taxation 4 603 4 603
Taxation liabilities (8 691) (8 691)
Total 834 971 22 365 857 336
Goodwill and intangible assets arising on acquisition 61 148
918 484
The goodwill arising on the acquisition of these business is attributable to the anticipated profitability of the
businesses.
Provisional accounting has been applied to the acquisition of African Portland Industrial Holdings Limited, and the
fair values of the acquired assets will be finalised within 12 months from date of acquisition.
W3IB00003 Grindrod INSIDE 06/04/2006 2:26 PM Page 107

GRINDROD LIMITED ANNUAL REPORT 2005108
32. RELATED PARTY TRANSACTIONS
During the year the group, in the ordinary course of business, entered into various transactions with associate
and joint venture companies. These transactions occurred under terms that are no more or less favourable than
those arranged with third party companies. Details of the material transactions are set out below. Intra group
transactions are eliminated on consolidation.
Group
Influence Amounts
holders Joint due by
in the group Associates ventures related party
R000 R000 R000 R000
2005
Goods and services sold to:
CMA CGM Shipping Agencies South Africa (Pty) Ltd 628 68
CMC Grindrod (Pty) Ltd 2 895 15
Ocean Africa Container Lines (Pty) Ltd 93 629 3 164
Petrochemical Shipping Ltd 546 –
Röhlig-Grindrod (Pty) Ltd 1 795 363
Spinnaker Shipping & Logistics (Pty) Ltd 113 9
Other transactions:
Nicolle Shipping (Pty) Ltd 456 –
456 94 370 5 236 3 619
2004
Goods and services sold to:
CMA CGM Shipping Agencies South Africa (Pty) Ltd 50 22
CMC Grindrod (Pty) Ltd 26 –
Ocean Africa Container Lines (Pty) Ltd 60 172 1 693
Petrochemical Shipping Ltd 1 294 –
Röhlig-Grindrod (Pty) Ltd 979 231
Spinnaker Shipping & Logistics (Pty) Ltd 155 –
Other transactions:
Nicolle Shipping (Pty) Ltd 383 –
383 61 356 1 320 1 946
Notes to the Financial Statements (continued)31 December 2005
W3IB00003 Grindrod INSIDE 06/04/2006 2:26 PM Page 108
GRINDROD LIMITED ANNUAL REPORT 2005 109
32. RELATED PARTY TRANSACTIONS (continued)
Associates
Details of material investments in associates are set out in note 5. Dividends received from associate companies
amounted to R5 274 000 (2004: R21 344 000).
Joint ventures
Details of interests in joint ventures are set out in notes 4 and 29.
Subsidiaries
Details of investments in subsidiaries are set out in note 3 and in the schedule of interest in subsidiaries on
page 111. The company received dividends of R832 467 000 (2004: R254 779 460) from subsidiaries in the
current year.
Directors
Details of directors’ interests in the company and directors’ emoluments are set out in the directors report and note
23 respectively.
Shareholders
The principal shareholders of the company are detailed in the share analysis schedule on pages 114 to 115.
W3IB00003 Grindrod INSIDE 06/04/2006 2:26 PM Page 109
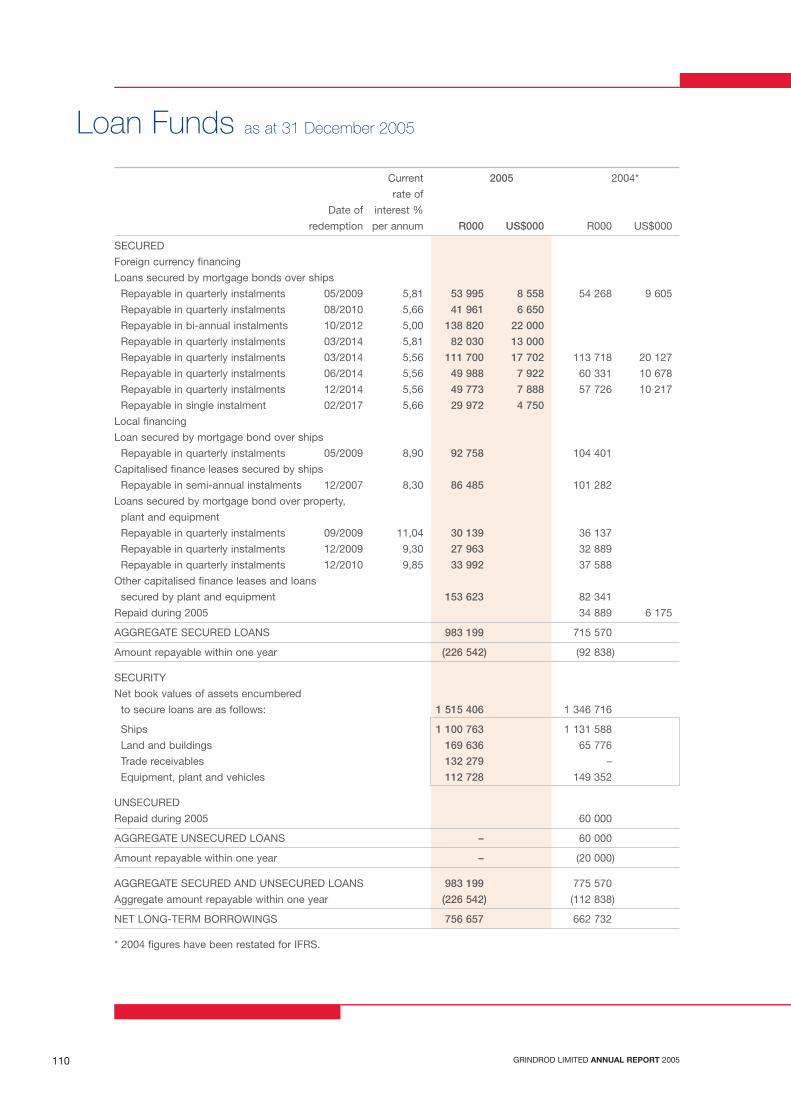
GRINDROD LIMITED ANNUAL REPORT 2005110
Loan Funds as at 31 December 2005
Current 2005 2004*
rate of
Date of interest %
redemption per annum R000 US$000 R000 US$000
SECURED
Foreign currency financing
Loans secured by mortgage bonds over ships
Repayable in quarterly instalments 05/2009 5,81 53 995 8 558 54 268 9 605
Repayable in quarterly instalments 08/2010 5,66 41 961 6 650
Repayable in bi-annual instalments 10/2012 5,00 138 820 22 000
Repayable in quarterly instalments 03/2014 5,81 82 030 13 000
Repayable in quarterly instalments 03/2014 5,56 111 700 17 702 113 718 20 127
Repayable in quarterly instalments 06/2014 5,56 49 988 7 922 60 331 10 678
Repayable in quarterly instalments 12/2014 5,56 49 773 7 888 57 726 10 217
Repayable in single instalment 02/2017 5,66 29 972 4 750
Local financing
Loan secured by mortgage bond over ships
Repayable in quarterly instalments 05/2009 8,90 92 758 104 401
Capitalised finance leases secured by ships
Repayable in semi-annual instalments 12/2007 8,30 86 485 101 282
Loans secured by mortgage bond over property,
plant and equipment
Repayable in quarterly instalments 09/2009 11,04 30 139 36 137
Repayable in quarterly instalments 12/2009 9,30 27 963 32 889
Repayable in quarterly instalments 12/2010 9,85 33 992 37 588
Other capitalised finance leases and loans
secured by plant and equipment 153 623 82 341
Repaid during 2005 34 889 6 175
AGGREGATE SECURED LOANS 983 199 715 570
Amount repayable within one year (226 542) (92 838)
SECURITY
Net book values of assets encumbered
to secure loans are as follows: 1 515 406 1 346 716
Ships 1 100 763 1 131 588
Land and buildings 169 636 65 776
Trade receivables 132 279 –
Equipment, plant and vehicles 112 728 149 352
UNSECURED
Repaid during 2005 60 000
AGGREGATE UNSECURED LOANS – 60 000
Amount repayable within one year – (20 000)
AGGREGATE SECURED AND UNSECURED LOANS 983 199 775 570
Aggregate amount repayable within one year (226 542) (112 838)
NET LONG-TERM BORROWINGS 756 657 662 732
* 2004 figures have been restated for IFRS.
W3IB00003 Grindrod INSIDE 06/04/2006 2:26 PM Page 110

GRINDROD LIMITED ANNUAL REPORT 2005 111
Interests in Subsidiaries as at 31 December 2005
Nature of Investments Share Based
Business Share Effective Shares at Payments Loan to
** Capital Holding Original Cost to Employees Subsidiary
2005 2004* 2005 2004* 2005 2004* 2005 2004* 2005 2004*
R000 R000 % % R000 R000 R000 R000 R000 R000
INCORPORATED IN SOUTH AFRICA
Grindrod Freight Investments (Pty) Limited F 1 158 1 158 100 100 35 900 35 900 613 285 318 489 –
Grindrod Management Services (Pty) Limited G – – 100 100 – – 1 142 491 21 948 41 214
Grindrod & Company (Pty) Limited D 67 67 100 100 9 164 9 164
Grindrod International Travel (Pty) Limited T 43 43 100 100 1 432 1 432 1 511 –
Grindrod Property Leasing (Pty) Limited G – – 100 100 – – 1 552 –
Grincor Shipping Holdings Limited G 23 23 100 100 144 451 144 450
Unicorn Shipping (Pty) Limited S – – 100 100 – – 21 21
Island View Shipping (Pty) Limited S 5 5 100 100 5 000 5 000 575 313
ISS-Voigt Shipping (Pty) Limited F 10 000 10 000 100 100 – –
Seasure Insurance Brokers (Pty) Limited I – – 100 100 – – 576 –
Southern Tankers (Pty) Limited S 10 10 100 100 7 521 7 521 3 085 3 085
Grindrod (South Africa) (Pty) Limited S 204 204 100 100 82 050 82 050 162 162
Unicorn Shipping Holdings Limited S 1 500 1 500 100 100 146 895 156 534 2 803 –
Unicorn Shipping Operations (Pty) Limited S – – 100 100 – –
Grindrod Shipping (SA) (Pty) Limited S 1 – 81 – 1 –
INCORPORATED IN BRITISH VIRGIN ISLANDS
Swallow Enterprises Incorporated G 415 415 100 100 415 415 5 689 5 992
INCORPORATED IN ISLE OF MAN
Grindrod International Limited S 32 000 – 100 100 1 025 331 149 297 299 76 470 –
INTEREST IN SUBSIDIARIES (note 3) 1 458 160 591 763 2 791 1 327 356 144 50 312
** Nature of Business
D – Dormant
F – Freight and Financial Services
G – Group and Property Services
I – Insurance
S – Shipping Services
T – Travel
W3IB00003 Grindrod INSIDE 06/04/2006 2:26 PM Page 111
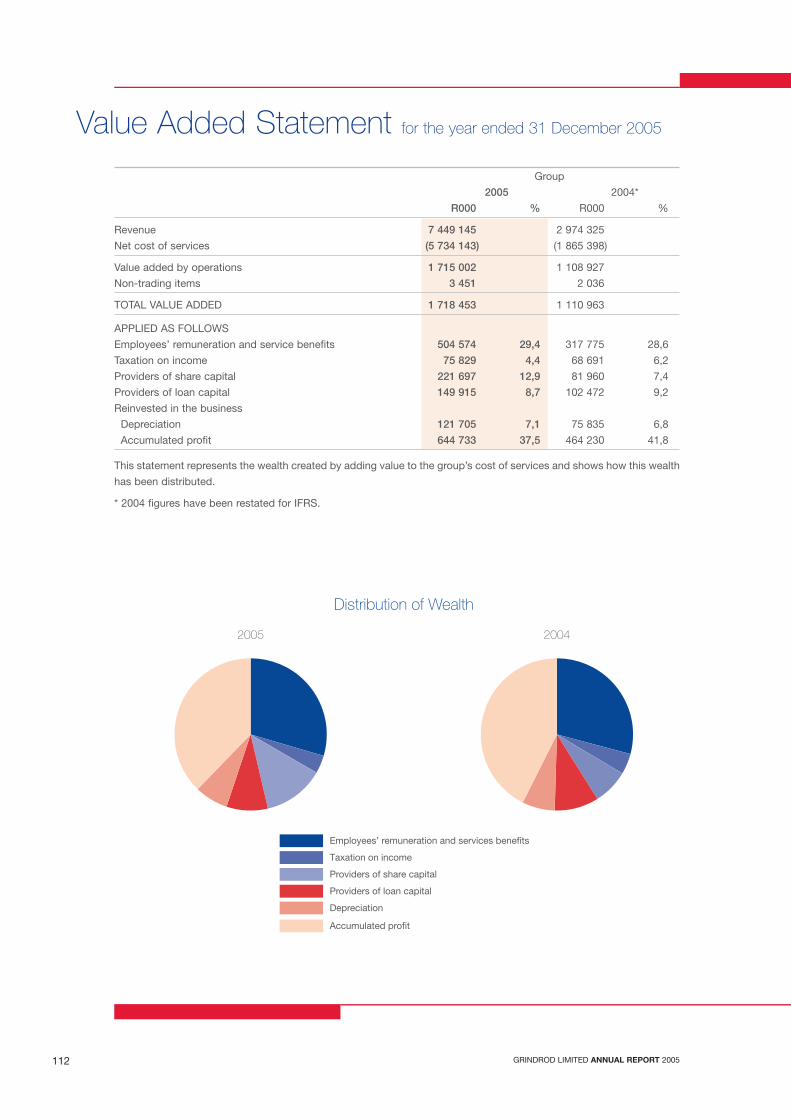
GRINDROD LIMITED ANNUAL REPORT 2005112
Group
2005 2004*
R000 % R000 %
Revenue 7 449 145 2 974 325
Net cost of services (5 734 143) (1 865 398)
Value added by operations 1 715 002 1 108 927
Non-trading items 3 451 2 036
TOTAL VALUE ADDED 1 718 453 1 110 963
APPLIED AS FOLLOWS
Employees’ remuneration and service benefits 504 574 29,4 317 775 28,6
Taxation on income 75 829 4,4 68 691 6,2
Providers of share capital 221 697 12,9 81 960 7,4
Providers of loan capital 149 915 8,7 102 472 9,2
Reinvested in the business
Depreciation 121 705 7,1 75 835 6,8
Accumulated profit 644 733 37,5 464 230 41,8
This statement represents the wealth created by adding value to the group’s cost of services and shows how this wealth
has been distributed.
* 2004 figures have been restated for IFRS.
Value Added Statement for the year ended 31 December 2005
Distribution of Wealth
2005
Employees’ remuneration and services benefits
Taxation on income
Providers of share capital
Providers of loan capital
Depreciation
Accumulated profit
2004
W3IB00003 Grindrod INSIDE 06/04/2006 2:26 PM Page 112
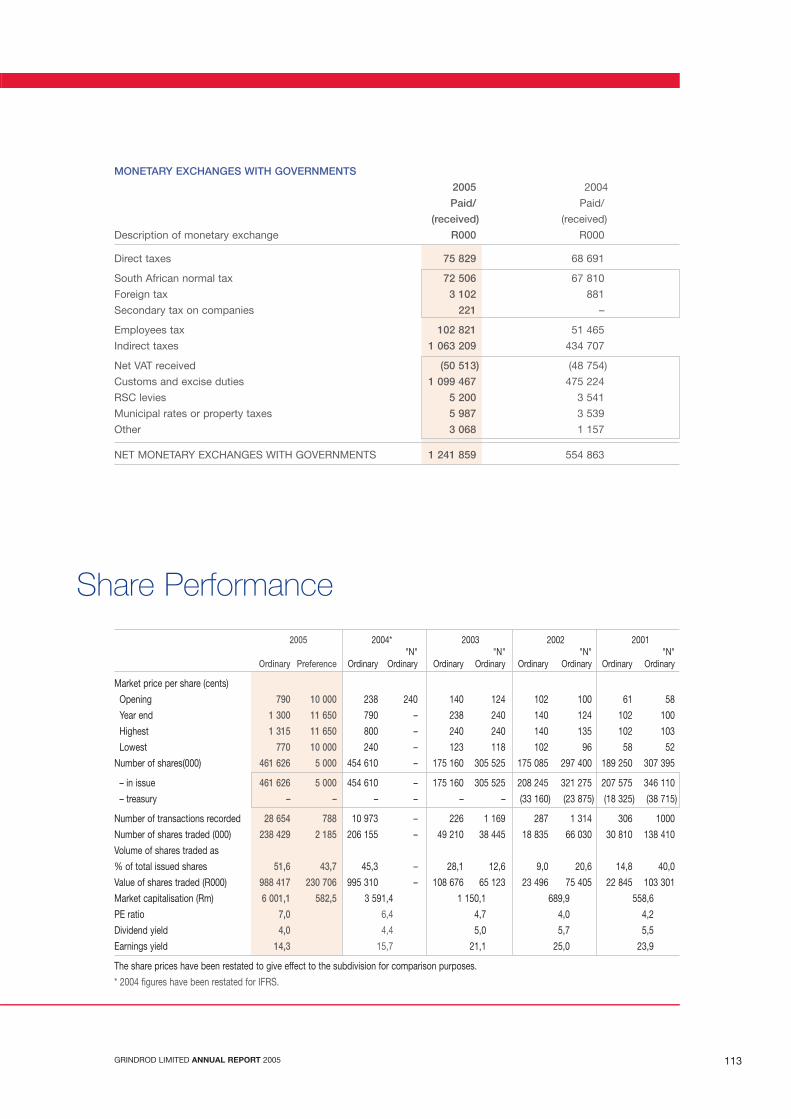
GRINDROD LIMITED ANNUAL REPORT 2005 113
2005 2004* 2003 2002 2001"N" "N" "N" "N"
Ordinary Preference Ordinary Ordinary Ordinary Ordinary Ordinary Ordinary Ordinary Ordinary
Market price per share (cents)
Opening 790 10 000 238 240 140 124 102 100 61 58
Year end 1 300 11 650 790 – 238 240 140 124 102 100
Highest 1 315 11 650 800 – 240 240 140 135 102 103
Lowest 770 10 000 240 – 123 118 102 96 58 52
Number of shares(000) 461 626 5 000 454 610 – 175 160 305 525 175 085 297 400 189 250 307 395
– in issue 461 626 5 000 454 610 – 175 160 305 525 208 245 321 275 207 575 346 110
– treasury – – – – – – (33 160) (23 875) (18 325) (38 715)
Number of transactions recorded 28 654 788 10 973 – 226 1 169 287 1 314 306 1000
Number of shares traded (000) 238 429 2 185 206 155 – 49 210 38 445 18 835 66 030 30 810 138 410
Volume of shares traded as
% of total issued shares 51,6 43,7 45,3 – 28,1 12,6 9,0 20,6 14,8 40,0
Value of shares traded (R000) 988 417 230 706 995 310 – 108 676 65 123 23 496 75 405 22 845 103 301
Market capitalisation (Rm) 6 001,1 582,5 3 591,4 1 150,1 689,9 558,6
PE ratio 7,0 6,4 4,7 4,0 4,2
Dividend yield 4,0 4,4 5,0 5,7 5,5
Earnings yield 14,3 15,7 21,1 25,0 23,9
The share prices have been restated to give effect to the subdivision for comparison purposes.
* 2004 figures have been restated for IFRS.
Share Performance
MONETARY EXCHANGES WITH GOVERNMENTS
2005 2004
Paid/ Paid/
(received) (received)
Description of monetary exchange R000 R000
Direct taxes 75 829 68 691
South African normal tax 72 506 67 810
Foreign tax 3 102 881
Secondary tax on companies 221 –
Employees tax 102 821 51 465
Indirect taxes 1 063 209 434 707
Net VAT received (50 513) (48 754)
Customs and excise duties 1 099 467 475 224
RSC levies 5 200 3 541
Municipal rates or property taxes 5 987 3 539
Other 3 068 1 157
NET MONETARY EXCHANGES WITH GOVERNMENTS 1 241 859 554 863
W3IB00003 Grindrod INSIDE 06/04/2006 2:26 PM Page 113

GRINDROD LIMITED ANNUAL REPORT 2005114
Number of % of Number of % of
Shareholders Shareholders Shares Shares
SHAREHOLDERS’ SPREAD1 – 5 000 shares 6 208 63,2 14 495 034 3,1
5 001 – 10 000 shares 1 488 15,1 12 074 432 2,6 10 001 – 50 000 shares 1 524 15,5 35 854 444 7,8 50 001 – 100 000 shares 266 2,7 19 839 895 4,3 Over 100 001 shares 345 3,5 379 362 405 82,2
9 831 100,0 461 626 210 100,0
Non-public shareholders– directors 15 0,2 110 061 574 23,8 – directors' associates 14 0,1 14 736 750 3,2
Public shareholders 9 802 99,7 336 827 886 73,0
9 831 100,0 461 626 210 100,0
INVESTOR PROFILEBanks 76 0,8 35 083 555 7,6 Pension Funds 134 1,4 31 310 199 6,8 Growth Funds & Unit Trusts 203 2,0 37 310 405 8,1 Nominee Companies & Trusts 1 277 13,0 34 794 849 7,5 Investment Companies 15 0,1 32 512 874 7,0 Insurance Companies 29 0,3 27 340 132 5,9 Medical Aid Schemes 5 0,1 77 365 0,0 Public Companies 10 0,1 467 555 0,1 Private Companies 311 3,2 145 734 871 31,6 Other Corporations 154 1,6 2 214 053 0,5 Close Corporations 202 2,0 3 610 072 0,8 Individuals 7 415 75,4 111 170 280 24,1
9 831 100,0 461 626 210 100,0
TOP 20 BENEFICIAL SHAREHOLDERSW M Grindrod 76 249 559 16,5 B Morrison 33 125 420 7,2 Old Mutual Group 26 609 676 5,8 M Lawson 25 925 600 5,6 I A J Clark 15 905 045 3,4 Metropolitan 15 496 176 3,4 Liberty Group 13 752 605 3,0 Standard Bank 9 771 535 2,1 Public Investment Corporation 8 502 290 1,8 Investment Solutions 7 297 398 1,6 Nedbank Group 6 301 608 1,4 Investec 6 101 855 1,3 I M Groves 5 450 000 1,2 A Morrison 5 350 000 1,2 Transnet Pension Fund 4 559 600 1,0 Stanlib Funds 4 366 965 0,9 Eskom Pension & Provident Fund 4 163 955 0,9 Ellerine Brothers 3 500 000 0,8 A Lawson 3 220 320 0,7 A K Olivier 2 954 250 0,6
278 603 857 60,4
Analysis of Ordinary Shareholdersat 31 December 2005
W3IB00003 Grindrod INSIDE 06/04/2006 2:26 PM Page 114
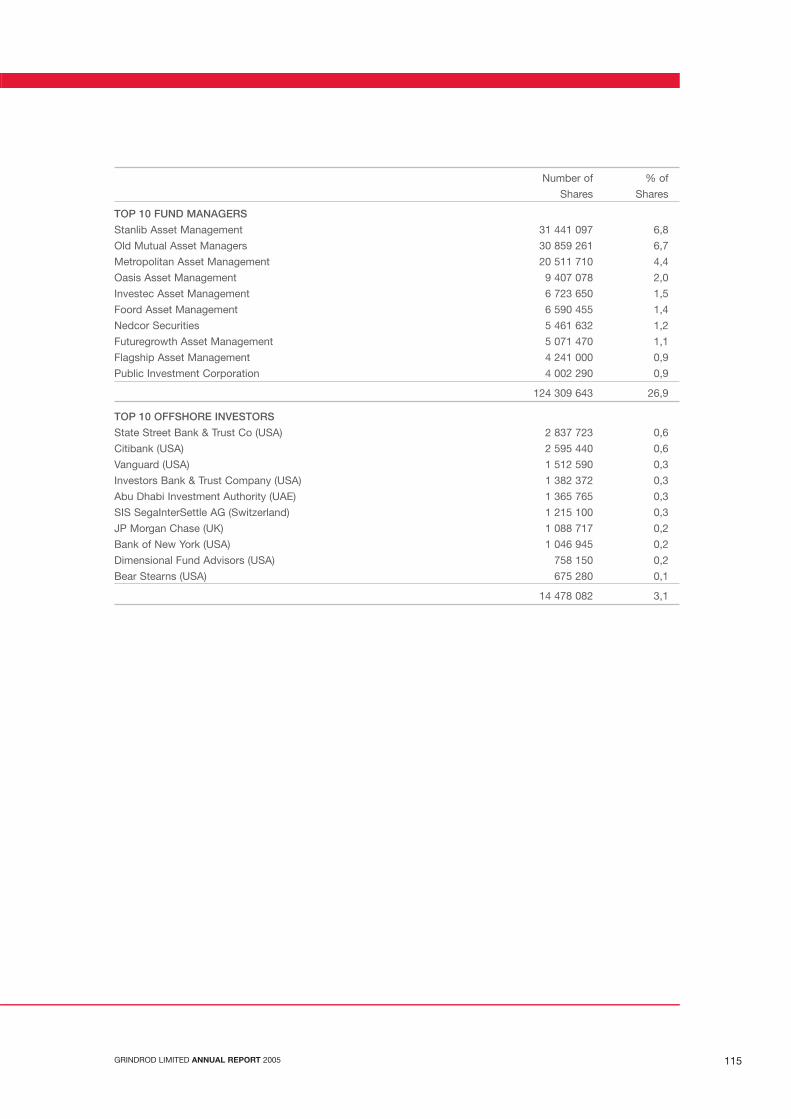
GRINDROD LIMITED ANNUAL REPORT 2005 115
Number of % of
Shares Shares
TOP 10 FUND MANAGERS
Stanlib Asset Management 31 441 097 6,8
Old Mutual Asset Managers 30 859 261 6,7
Metropolitan Asset Management 20 511 710 4,4
Oasis Asset Management 9 407 078 2,0
Investec Asset Management 6 723 650 1,5
Foord Asset Management 6 590 455 1,4
Nedcor Securities 5 461 632 1,2
Futuregrowth Asset Management 5 071 470 1,1
Flagship Asset Management 4 241 000 0,9
Public Investment Corporation 4 002 290 0,9
124 309 643 26,9
TOP 10 OFFSHORE INVESTORS
State Street Bank & Trust Co (USA) 2 837 723 0,6
Citibank (USA) 2 595 440 0,6
Vanguard (USA) 1 512 590 0,3
Investors Bank & Trust Company (USA) 1 382 372 0,3
Abu Dhabi Investment Authority (UAE) 1 365 765 0,3
SIS SegaInterSettle AG (Switzerland) 1 215 100 0,3
JP Morgan Chase (UK) 1 088 717 0,2
Bank of New York (USA) 1 046 945 0,2
Dimensional Fund Advisors (USA) 758 150 0,2
Bear Stearns (USA) 675 280 0,1
14 478 082 3,1
W3IB00003 Grindrod INSIDE 06/04/2006 2:26 PM Page 115
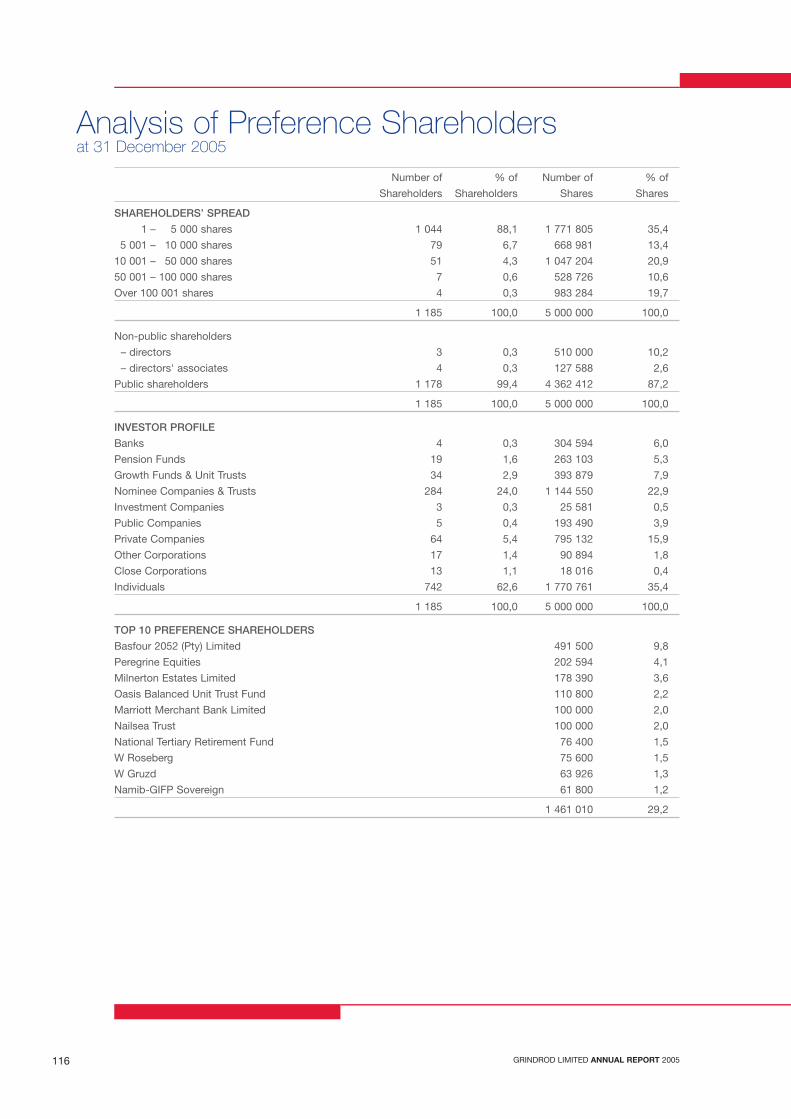
GRINDROD LIMITED ANNUAL REPORT 2005116
Number of % of Number of % of
Shareholders Shareholders Shares Shares
SHAREHOLDERS’ SPREAD
1 – 5 000 shares 1 044 88,1 1 771 805 35,4
5 001 – 10 000 shares 79 6,7 668 981 13,4
10 001 – 50 000 shares 51 4,3 1 047 204 20,9
50 001 – 100 000 shares 7 0,6 528 726 10,6
Over 100 001 shares 4 0,3 983 284 19,7
1 185 100,0 5 000 000 100,0
Non-public shareholders
– directors 3 0,3 510 000 10,2
– directors' associates 4 0,3 127 588 2,6
Public shareholders 1 178 99,4 4 362 412 87,2
1 185 100,0 5 000 000 100,0
INVESTOR PROFILE
Banks 4 0,3 304 594 6,0
Pension Funds 19 1,6 263 103 5,3
Growth Funds & Unit Trusts 34 2,9 393 879 7,9
Nominee Companies & Trusts 284 24,0 1 144 550 22,9
Investment Companies 3 0,3 25 581 0,5
Public Companies 5 0,4 193 490 3,9
Private Companies 64 5,4 795 132 15,9
Other Corporations 17 1,4 90 894 1,8
Close Corporations 13 1,1 18 016 0,4
Individuals 742 62,6 1 770 761 35,4
1 185 100,0 5 000 000 100,0
TOP 10 PREFERENCE SHAREHOLDERS
Basfour 2052 (Pty) Limited 491 500 9,8
Peregrine Equities 202 594 4,1
Milnerton Estates Limited 178 390 3,6
Oasis Balanced Unit Trust Fund 110 800 2,2
Marriott Merchant Bank Limited 100 000 2,0
Nailsea Trust 100 000 2,0
National Tertiary Retirement Fund 76 400 1,5
W Roseberg 75 600 1,5
W Gruzd 63 926 1,3
Namib-GIFP Sovereign 61 800 1,2
1 461 010 29,2
Analysis of Preference Shareholdersat 31 December 2005
W3IB00003 Grindrod INSIDE 06/04/2006 2:26 PM Page 116
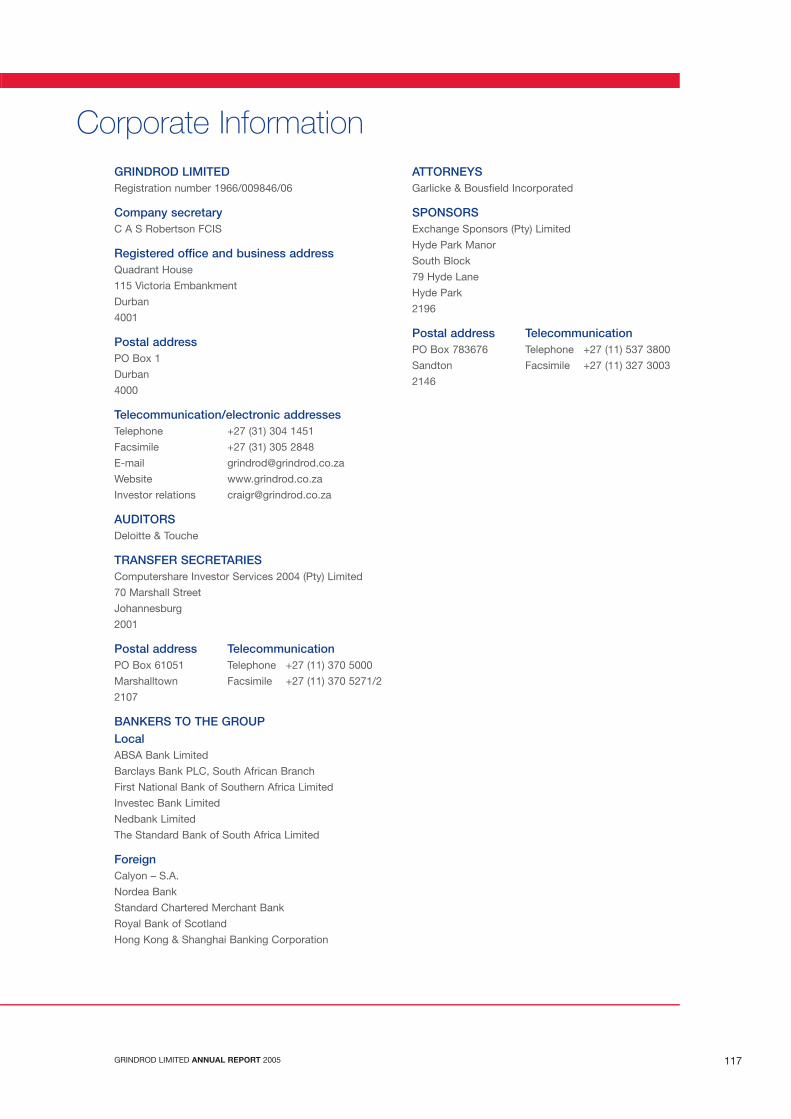
GRINDROD LIMITED ANNUAL REPORT 2005 117
GRINDROD LIMITEDRegistration number 1966/009846/06
Company secretaryC A S Robertson FCIS
Registered office and business addressQuadrant House
115 Victoria Embankment
Durban
4001
Postal addressPO Box 1
Durban
4000
Telecommunication/electronic addressesTelephone +27 (31) 304 1451
Facsimile +27 (31) 305 2848
E-mail [email protected]
Website www.grindrod.co.za
Investor relations [email protected]
AUDITORSDeloitte & Touche
TRANSFER SECRETARIESComputershare Investor Services 2004 (Pty) Limited
70 Marshall Street
Johannesburg
2001
Postal address TelecommunicationPO Box 61051 Telephone +27 (11) 370 5000
Marshalltown Facsimile +27 (11) 370 5271/2
2107
BANKERS TO THE GROUPLocalABSA Bank Limited
Barclays Bank PLC, South African Branch
First National Bank of Southern Africa Limited
Investec Bank Limited
Nedbank Limited
The Standard Bank of South Africa Limited
ForeignCalyon – S.A.
Nordea Bank
Standard Chartered Merchant Bank
Royal Bank of Scotland
Hong Kong & Shanghai Banking Corporation
ATTORNEYSGarlicke & Bousfield Incorporated
SPONSORSExchange Sponsors (Pty) Limited
Hyde Park Manor
South Block
79 Hyde Lane
Hyde Park
2196
Postal address TelecommunicationPO Box 783676 Telephone +27 (11) 537 3800
Sandton Facsimile +27 (11) 327 3003
2146
Corporate Information
W3IB00003 Grindrod INSIDE 06/04/2006 2:26 PM Page 117
GRINDROD LIMITED ANNUAL REPORT 2005118
Financial year end 31 December
Annual general meeting 24 May
Notice of annual general meeting and form of proxy
are included in the annual report
Reports and profit statements
Results and dividend announcement for the year February
Annual report and financial statements April
Interim report August
Dividends
Final March
Interim September
Shareholders’ Diary for 2006
W3IB00003 Grindrod INSIDE 06/04/2006 2:26 PM Page 118
GRINDROD LIMITED ANNUAL REPORT 2005 119
NOTICE IS HEREBY GIVEN THAT THE THIRTY NINTH ANNUAL GENERAL MEETING OF MEMBERS OF GRINDROD
LIMITED WILL BE HELD IN THE BOARDROOM, 1ST FLOOR, QUADRANT HOUSE, 115 VICTORIA EMBANKMENT,
DURBAN ON WEDNESDAY 24 MAY 2006 AT 14H30 FOR THE FOLLOWING PURPOSES:
1. To receive and adopt the audited financial statements for the year ended 31 December 2005.
2. To re-elect retiring directors in accordance with the articles of association. Motions for re-election will be moved
individually.
In accordance with article 59 of the articles of association Messrs H Adams, I A J Clark, W M Grindrod, A K Olivier
and A F Stewart and retire by rotation and being eligible, offer themselves for re-election. The credentials of these
directors are provided on pages 12 to 15 of the annual report.
3 To consider and confirm the directors fees paid for the year ended 31 December 2005 as set out in note 23 to the
annual financial statements.
4 To consider and approve the fees to the non-executive directors for the periods 1 January 2006 to 30 June 2006
and 1 July 2006 to 30 June 2007, respectively as set out below:
01.01.2006 to 01.07.2006 to
30.06.2006 30.06.2007
R R
Board
Chairman 105 000 210 000
Deputy chairman 50 000 100 000
Director 45 000 90 000
Audit Committee
Chairman 15 000 30 000
Member 12 250 24 500
Remuneration Committee
Chairman 14 250 28 500
Member 12 000 24 000
5. To confirm the appointment of the auditors, Deloitte & Touche for the ensuing year.
6. To authorise the directors to determine the remuneration of the auditors for the past year’s audit.
As special business, to consider and if deemed fit, pass with or without modification the following special and
ordinary resolutions
7. Special resolution 1
“Resolved that the directors of the company be and are hereby authorised, by way of a general approval, to
repurchase on behalf of the company, ordinary shares of 0,002 cent each (“ordinary shares”) issued by the company,
in terms of sections 85 to 90 of the Companies Act, 1973 (Act 61 of 1973), as amended, and in terms of the Listings
Requirements of JSE Limited (“JSE”) being that:
– any such repurchase of ordinary shares shall be implemented on the open market of the JSE;
– this general authority shall only be valid until the company’s next annual general meeting; provided that it shall
not extend beyond 15 months from the date of passing of this special resolution;
– an announcement will be published for every 3% of the ordinary shares in issue, in aggregate, repurchased by
the company, containing full details of such acquisitions in accordance with section 5.79 of the Listings
Requirements;
Notice of Meeting
W3IB00003 Grindrod INSIDE 06/04/2006 2:26 PM Page 119
GRINDROD LIMITED ANNUAL REPORT 2005120
– in terms of this general approval, the acquisition of ordinary shares in any one financial year may not exceed, in
aggregate, 20% of the company’s issued share capital of that class, at the time that approval is granted, and
the acquisition of shares by a subsidiary of the company may not exceed 10% in the aggregate, in any one
financial year, of the number of issued shares of the company of that class;
– in determining the price at which ordinary shares issued by the company are repurchased by it in terms of this
general approval, the maximum premium at which such ordinary shares may be repurchased is 10% of the
weighted average of the market value at which such ordinary shares are traded, respectively, on the JSE as
determined over the five trading days immediately preceding the day on which the transaction was agreed;
– the company may only undertake a repurchase of shares if, after such repurchase, it still complies with
paragraphs 3.37 to 3.41 of the Listings Requirements concerning shareholder spread requirements; and
– the company or its subsidiary may not repurchase shares during a prohibited period as defined in paragraph
3.67 of the Listings Requirements.”
Reason and effect of Special Resolution 1
The reason for and the effect of the special resolution is that the general approval for the company to acquire its
own shares which was renewed by special resolution at the annual general meeting of 25 May 2005 will lapse at this
annual general meeting and this special resolution will renew that authority which will then remain in effect until the
next succeeding annual general meeting, providing that this shall not extend beyond 15 months from the date of the
special resolution.
8. Ordinary resolutions
8.1 Ordinary resolution 1:
“Resolved that the unissued ordinary shares in the capital of the company reserved for the purpose of the
company’s share option scheme, continue to be placed under the control of the directors, who shall be
authorised to issue these shares at such times and on such terms as they may determine.”
8.2 Ordinary resolution 2:
“Resolved that, after providing for the shares reserved for the purpose of the company’s share option scheme,
the balance of the unissued ordinary shares in the capital of the company continue to be placed under the
control of the directors who are hereby authorised, in accordance with the provisions of section 221 of the
Companies Act, 1973, to allot and issue these shares at such times and on such terms as they may determine,
subject to the Listings Requirements of the JSE, and provided any shares issued in terms of this authority for
cash or otherwise, shall not exceed 10% of the company’s issued share capital.”
8.3 Ordinary resolution 3:
“Resolved that, subject to not less than 75% of the votes of those shareholders present in person or by proxy
and entitled to vote being cast in favour of this resolution, the directors are authorised by way of a general
authority to issue all or any of the authorised but unissued ordinary shares in the capital of the company for cash,
as and when suitable opportunities arise subject to the following limitations:
– the securities issued shall be of a class already in issue;
– that a press announcement giving full details, including the impact on net asset value and earnings per
share, will be published at the time of any issue representing, on a cumulative basis within one year, 5% or
more of the number of shares of that class in issue prior to the issues;
– that issues in the aggregate in terms of this authority will not exceed 10% of the number of shares in the
company’s issued share capital of each relevant class in any one financial year;
Notice of Meeting (continued)
W3IB00003 Grindrod INSIDE 06/04/2006 2:26 PM Page 120

GRINDROD LIMITED ANNUAL REPORT 2005 121
– in determining the price at which an issue of ordinary shares will be made in terms of this authority, the
maximum discount permitted will be 10% of the weighted average traded price of the shares of that class,
over the thirty business days prior to the date that the price of the issue is determined or agreed by the
directors of the company;
– that any such issue will only be made to public shareholders as defined in the Listings Requirements of the
JSE, and not to related parties; and
– this general authority shall only be valid until the company’s next annual general meeting; provided that it
shall not extend beyond 15 months from the date of passing of this resolution.”
8.4 Ordinary resolution 4:
“Resolved that the allotment and issue of ordinary shares to the directors referred to below, insofar as they
exercise their options granted on 23 November 2003 in terms of the company’s share option scheme, be
approved in terms of Section 222(1)(a) of the Companies Act, 1973 as amended:
Number of
options granted
I A J Clark 1 000 000
A K Olivier 1 000 000
L R Stuart-Hill 1 000 000
T J T McClure 1 000 000
D A Rennie 750 000
J G Jones 750 000
A F Stewart 750 000 ”
8.5 Ordinary resolution 5:
“Resolved that the directors of the Company shall be entitled to pay by way of a reduction of the share premium
account, in lieu of a dividend, an amount equal to the amount which the directors of the Company would have
declared and paid out of profits in respect of the company’s interim and final dividends for the financial year
ending 31 December 2006, subject to the following conditions:
– in terms of paragraph 5.86 of the JSE Listing Requirements, any general payment will not exceed 20% of
the Company’s issued share capital.
– this general authority shall be valid until the company’s next annual general meeting, provided that it shall
not extend beyond 15 months from the date of passing of this ordinary resolution number 5”.
9. To transact such other business as may be transacted at an annual general meeting.
The directors, after considering the maximum number of shares which may be repurchased and the price at which
such repurchases may take place pursuant to the general repurchase approval and the effect of the general
repayment, are of the opinion that:
– the company and the group will be able to pay its debts in the ordinary course of business for a period of 12
months after the date of the Notice of the Annual General Meeting;
– the consolidated assets of the company and the group, fairly valued in accordance with International Financial
Reporting Standards (IFRS), will be in excess of the consolidated liabilities of the company and the group after
the repurchase for a period of 12 months after the date of the Notice of the Annual General Meeting; and
– the share capital and reserves of the company and the group will be adequate for ordinary business purposes
for a period of 12 months after the date of Notice of the Annual General Meeting; and
– the working capital available to the company and the group will be adequate for the purposes of the business
of the company and the group for the period of 12 months after the date of Notice of the Annual General
Meeting.
W3IB00003 Grindrod INSIDE 06/04/2006 2:26 PM Page 121

GRINDROD LIMITED ANNUAL REPORT 2005122
Information related to JSE Listings Requirement 11.26 can be found in the annual report on the page references
below
Page no.
Directors and management 12
Responsibility statement 55
Directors’ interests in securities 59
Material change 60
Share capital of the company 87
Litigation statement 102
Major shareholders 114
Preference shareholders
Preference shareholders are entitled to receive copies of correspondence related to all shareholder meetings. It is to be
noted that in respect of the annual general meeting to be held on 24 May 2006, preference shareholders are entitled to
attend the meeting and to vote together with ordinary shareholders in respect of special resolution 1 and ordinary
resolution 5 related to a general authority to repurchase ordinary shares and authority to distribute share premium in lieu
of dividend, respectively.
Proxies
A member registered as such (either as the holder of shares in certificated form and whose name is reflected in the
register of company members, or as the holder of shares in dematerialised form and whose name is reflected in a sub-
register maintained by a CSDP) is entitled to appoint one or more proxies to attend, speak and, on a poll, vote in his/her
stead should he/she be unable to attend the annual general meeting, but wishes to be represented thereat. A proxy need
not be a member of the company. Proxy forms should be forwarded to reach the office of the Transfer Secretaries,
Computershare Investor Services 2004 (Pty) Limited, Ground Floor, 70 Marshall Street, Johannesburg, 2001 (P O Box
61051, Marshalltown, 2107) at least 48 hours before the commencement of the meeting. Shareholders who have
dematerialised their shares in Grindrod such that their holdings are no longer recorded in their own names should
arrange with their CSDP or broker for the necessary authority to attend the annual general meeting. Should they be
unable, or do not wish to attend but wish to be represented at the meeting, they should provide their CSDP or broker
with their voting instructions in terms of the agreements entered into between the shareholder and CSDP or broker
concerned.
BY ORDER OF THE BOARD
C A S Robertson
Group Secretary
Durban
11 April 2006
Notice of Meeting (continued)
Designed by
PRINTED BY INCE (PTY) LTD
W3IB00003 Grindrod INSIDE 06/04/2006 2:26 PM Page 122
GRINDROD LIMITED ANNUAL REPORT 2005
GRINDROD LIMITED(Incorporated in the Republic of South Africa)(Registration number 1966/009846/06)(Share code: GND & GNDP ISIN: ZAE 000072328 & ZAE 000071106)(“the Company”)
(To be used by certificated shareholders and dematerialised shareholders with own name registration)
For use at the annual general meeting of shareholders of the Company to be held in the Boardroom, 1st Floor, QuadrantHouse, 115 Victoria Embankment, Durban at 14h30 on Wednesday 24 May 2006.
I/We (BLOCK LETTERS)
of
being the registered holder/s of ordinary shares
in the capital of the Company hereby appoint:
1. of or failing him/her,
2. of or failing him/her,
3. the chairman of the annual general meeting,
as my/our proxy to vote for me/us and on my/our behalf at the annual general meeting of the Company to be held inthe Boardroom, 1st Floor, Quadrant House, 115 Victoria Embankment, Durban at 14h30 on Wednesday 24 May 2006and at any adjournment thereof as follows:
RESOLUTION IN FAVOUR OF AGAINST ABSTAIN
1. Approval of annual financial statements
2. Re-election of directors retiring by rotation
2.1 H Adams
2.2 I A J Clark
2.3 W M Grindrod
2.4 A K Olivier
2.5 A F Stewart
3 Confirm the directors fees for the year to 31.12.2005
4 Approve the fees to non-executive directors to 30.06.2007
5. Confirmation of appointment of auditors
6. Remuneration of the auditors
7. Renewal of authority to repurchase own shares
8.1 Directors authority to issue shares reserved forthe share option scheme
8.2 General authority for directors to issue shares
8.3 Authority to directors to issue shares for cash
8.4 Authority to allot shares excercised in terms of the share option scheme by executive directors
8.5 General authority to distribute from share premium account in lieu of dividends
(Indicate instruction by a “X” in the space provided)
Unless otherwise instructed, my proxy may vote as he/she thinks fit.
A member entitled to attend and vote at the abovementioned meeting is entitled to appoint a proxy to attend, speakand vote in his stead. The proxy need not be a member of the company.
Signed this day of 2006
Signature/s
REGISTERED OFFICE TRANSFER SECRETARIESQuadrant House Computershare Investor Services 2004 (Pty) Limited115 Victoria Embankment Ground Floor, 70 Marshall StreetDurban, 4001 Johannesburg, 2001(PO Box 1, Durban, 4000) (PO Box 61051, Marshalltown, 2107)
Form of Proxy
GRINDRODLIMITED
W3IB00003 Grindrod INSIDE 06/04/2006 2:26 PM Page 123
GRINDROD LIMITED ANNUAL REPORT 2005
Notes
1. Only shareholders who are recorded in the register of members of the company who have not dematerialised their
shares or who hold dematerialised shares in their own name must complete the form of proxy or alternatively attend
the meeting.
Beneficial shareholders whose shares are not registered in their own name but in the name of another, e.g. a
nominee, must not complete the form of proxy or attend the meeting unless a proxy is issued to them by the
registered shareholder. Beneficial shareholders who are not also registered shareholders should contact the
registered shareholder to issue instructions on voting or to obtain a proxy to attend the meeting.
2. A shareholder may insert the name of a proxy or the names of two alternative proxies of the shareholder’s choice in
the space/s provided, with or without deleting “the chairman of the annual general meeting”. The person whose
name appears first on the form of proxy and who is present at the annual general meeting will be entitled to act as
proxy to the exclusion of those whose names follow.
3. Any deletion, alteration or correction to this form of proxy must be initialled by the signatory/ies.
4. Documentary evidence establishing the authority of a person signing this form of proxy in a representative capacity
must be attached to this form of proxy unless previously recorded by the company.
5. Forms of proxy must be lodged at, or posted to, the registered office of the Transfer Secretaries, Computershare
Investor Services 2004 (Pty) Limited, Ground Floor, 70 Marshall Street, Johannesburg, 2001 (PO Box 61051,
Marshalltown, 2107) to be received by not later than 14h30 on Monday 22 May 2006.
6. The completion and lodging of this form of proxy will not preclude the shareholder from attending the annual general
meeting and speaking and voting in person thereat to the exclusion of any proxy appointed in terms hereof should
such shareholder wish to do so.
7. The chairman of the annual general meeting may reject or accept any form of proxy which is completed and/or
received other than in accordance with these notes.
8. A form of proxy shall be deemed to include the rights to demand or join in demanding a poll.
9. Shareholders, who have either dematerialised their company shareholdings (such that these holdings are no longer
recorded in their own names in the sub-registers maintained by Central Securities Depository Participants (CSDP’s),
are not company members as defined. Such shareholders who wish to attend the company’s annual general
meeting should arrange with their CSDP’s or brokers for the necessary authority to attend the annual general
meeting. Such shareholders who are unable, or do not wish, to attend the annual general meeting, but wish to be
represented thereat, should provide their CSDP or brokers with their voting instructions in sufficient time to enable
the CSDP’s or brokers to lodge forms of proxy or appoint a representative for the meeting.
W3IB00003 Grindrod INSIDE 06/04/2006 2:26 PM Page 124
W3IB0003 Grindrod Cover 06/04/2006 2:28 PM Page 2
Composite
C M Y CM MY CY CMY K
Contents Terms and ExpressionsPage
Mission 1
Strategic objectives 1
Group structure 2
Group profile 3
Group operational highlights 4
Group financial highlights 5
Chairman’s report 6
Chief executive officer’s report 8
Directorate 12
Group financial review 16
Operational reviews 21
Corporate governance 36
Social performance 44
Corporate social investment 50
Stakeholder engagement 51
Environmental performance 52
Directors’ responsibility for financial reporting 55
Company secretary’s certificate 55
Report of the independent auditors 56
Directors’ report 57
Accounting policies 61
Balance sheets 68
Income statements 69
Statement of changes in equity 70
Cash flow statements 71
Segmental analysis 72
Transition to International Financial Reporting Standards 73
Notes to the financial statements 78
Loan funds 110
Interests in subsidiaries 111
Value added statement 112
Share performance 113
Analysis of ordinary shareholders 114
Analysis of preference shareholders 116
Corporate information 117
Shareholders’ diary for 2006 118
Notice of meeting 119
Form of proxy attached
Terms and expressions ibc
BAREBOAT CHARTERCharter party where the charterer hires a ship without
crew and the charterer takes responsibility for the ship
maintenance, crewing and insurance as though the vessel
was owned by the charterer
BREAKBULKDry, loose cargo
BULK CARRIERShip designed to carry dry, loose cargoes in bulk
BUNKERSA ships fuel
CAPESIZE BULK CARRIERBulk carrier between 100 000 and 180 000 dwt
CHARTERDocument evidencing a contract between shipowner
and charterer or cargo owner and the shipowner and
disponent owner
CHARTERERThe hirer of a vessel from the owner either for a period of
time or a voyage
CHARTER PARTYConditions under which a charterer hires a vessel
CHEMICAL TANKERSA tanker, usually not larger than 40 000 dwt, designed to
carry numerous bulk liquid chemical products, often in
stainless steel tanks, in isolated compartments (also
termed “parcels”)
CONTAINERSHIP
Ship designed to carry containerised cargo
DEADWEIGHT or DWTThe greatest weight of cargo, stores and all other
consumables on the ship that a ship can carry expressed
in metric tonnes
GRINDROD LIMITED ANNUAL REPORT 2005 GRINDROD LIMITED ANNUAL REPORT 2005
HANDYSIZE BULK CARRIERBulk carrier between 10 000 and 40 000 dwt
HANDYMAX BULK CARRIERBulk carrier between 40 000 and 60 000 dwt
LINER SHIPPING OPERATIONSOperators who trade ships according to a schedule
between specified ports
OFFHIREWhen a ship is temporarily out of operation in accordance
with the terms of the relevant charter party with a loss of
agreed hire as a result (downtime)
OPERATORAn operator who trades in ships and cargo
PANAMAX BULK CARRIERBulk carrier with a maximum beam of 32.2 metres and of
between 60 000 and 100 000 dwt
PRODUCTS TANKERA tanker designed to carry refined petroleum products in
bulk in multiple tanks
SHIPPING POOL/JOINT SERVICES AGREEMENTAn organised group of ship owners and/or charterers
where there is a pooling of resources for the purpose of
flexible and commercial operation of ships
TECHNICAL MANAGEMENTManagement of the marine operations maintenance,
crewing, storing and insurance of the ship
TIME CHARTERCharter party where the charterer hires a ship which is
crewed, maintained and ready for operation for an agreed
time period
TEU (TWENTY FOOT EQUIVALENT UNIT)The standard length of a container and the measurement
used to determine the container carrying capacity of
a ship
W3IB0003 Grindrod Cover 06/04/2006 2:28 PM Page 1
Composite
C M Y CM MY CY CMY K
GRINDRODLIMITED
w w w . g r i n d r o d . c o . z a
GR
IND
RO
D LIM
ITE
D A
NN
UA
L RE
PO
RT
20
05
Ef fect ive s t rateg ies for susta ined
performance and growth
GRINDRODLIMITED
A N N U A L R E P O R T 2005