annual report 2003 - alfa laval
TRANSCRIPT
Annual Report 2003
An
nu
al Rep
ort 2003
Alfa L
aval

Highlights of the year2003 in brief
Under the flap:
Alfa Laval in two minutes
2 A stable and positive trend President’s comments
4 Up 57 percent in 2003 The Alfa Laval share
6 Business principles built on trustBusiness concept, business principlesand goals
8 Six gears for profitable growthGrowth strategy
10 The stable platform …Our technologies
12 … that is constantly developingResearch & Development
14 Better order intake in all customer segmentsThe Equipment Division
18 bioKinetics creates possibilities todevelop Life Science segmentThe Process Technology Division
22 Continued growthParts & Service
24 Further improvement in delivery reliabilityThe Operations Division
26 Optimizing knowledge and skills Human Resources
28 Board of Directors’ Report
34 Seven-year overview
36 Consolidated cash-flow statement
38 Consolidated income statement
42 Consolidated balance sheet
45 Changes in consolidated equity capital
47 Parent Company financial statements
50 Comments to the accounts
55 Risk management
60 Notes to the accounts
86 Proposed disposition of earnings
87 Audit Report
88 Board of Directors and Group management
90 Board of Directors92 Group Management
94 Corporate governance
96 Financial information in 2004
97 Annual General Meeting
Under the flap:
Definitions
Contents
Cover:
Unzip the taste! The tomato – beloved in kitchens round the world for its color, shape and taste. It isalso a key raw material of the food processing industry, since tomatoes form the basis of sauces, soupsand – obviously – the ubiquitous ketchup. Alfa Laval’s separators, heat exchangers and equipment forfluid handling play a key role in transforming ripe, delicious tomatoes into high-quality products, just asin many other sensitive and complex food-related processes. Alfa Laval cooperates closely with thefood processing industry to bring out the inner characteristics of their products. Alfa Laval unzips taste,for consumers to enjoy!
MSEK %
0
3 000
6 000
9 000
12 000
15 000
4
6
8
10
12
14
030201009998 0
1 500
1 000
500
2 000
2 500MSEK
030201009998
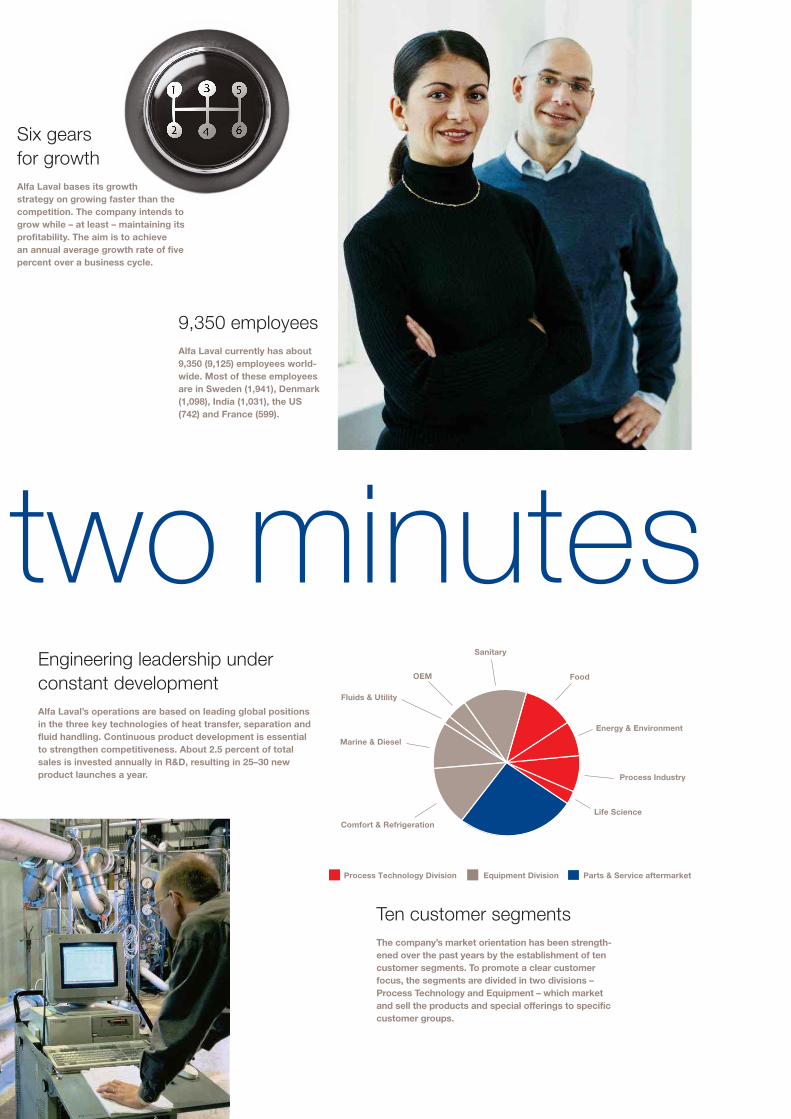
120 years youngGustaf de Laval was a great technical geniuswhose inventions include the centrifugal sep-arator and the first functional steam turbine.During his lifetime, he registered 92 patentsand started 37 companies. In 1883, he and hispartner, Oscar Lamm Jr., established the com-pany AB Separator, the forerunner of today’sAlfa Laval.
100 countriesAlfa Laval’s products are sold inapproximately 100 countries, ofwhich 50 through its own salesorganizations. The company has20 large production units (twelvein Europe, six in Asia and two inthe US), and 70 service centers.
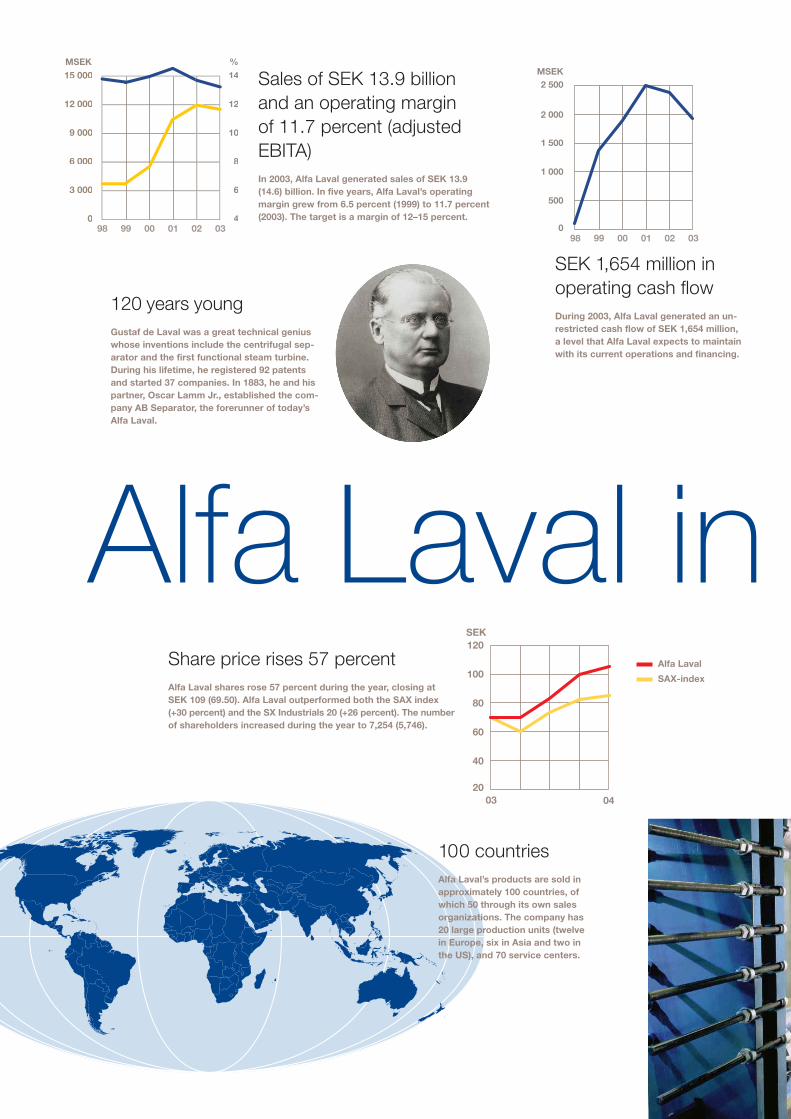
Sales of SEK 13.9 billionand an operating margin of 11.7 percent (adjustedEBITA) In 2003, Alfa Laval generated sales of SEK 13.9(14.6) billion. In five years, Alfa Laval’s operatingmargin grew from 6.5 percent (1999) to 11.7 percent(2003). The target is a margin of 12–15 percent.
Alfa Laval in twShare price rises 57 percentAlfa Laval shares rose 57 percent during the year, closing atSEK 109 (69.50). Alfa Laval outperformed both the SAX index(+30 percent) and the SX Industrials 20 (+26 percent). The numberof shareholders increased during the year to 7,254 (5,746).
SEK 1,654 million in operating cash flowDuring 2003, Alfa Laval generated an un-restricted cash flow of SEK 1,654 million, a level that Alfa Laval expects to maintainwith its current operations and financing.
20
40
60
80
100
120
0403
SEK
Alfa Laval
SAX-index
Process Technology Division Equipment Division Parts & Service aftermarket
Energy & Environment
Food
Life Science
Process Industry
Marine & Diesel
OEM
Sanitary
Comfort & Refrigeration
Fluids & Utility
n two minutes
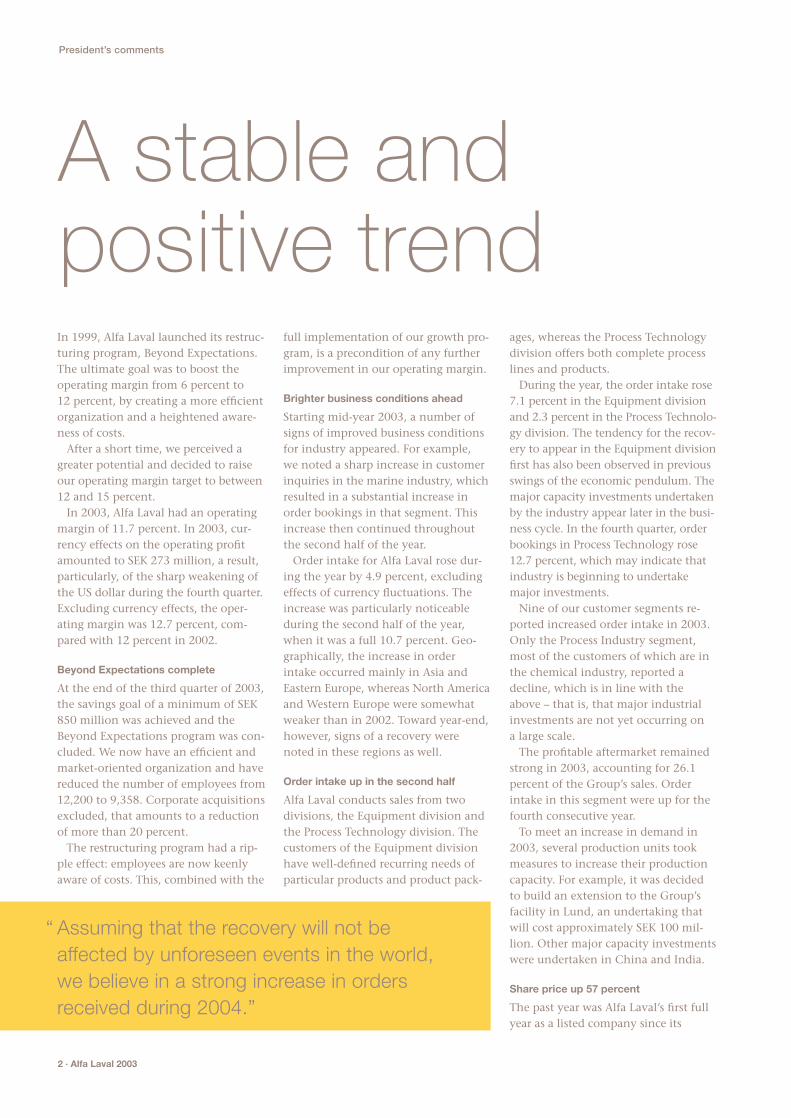
9,350 employeesAlfa Laval currently has about9,350 (9,125) employees world-wide. Most of these employeesare in Sweden (1,941), Denmark(1,098), India (1,031), the US(742) and France (599).
Engineering leadership under constant developmentAlfa Laval’s operations are based on leading global positionsin the three key technologies of heat transfer, separation andfluid handling. Continuous product development is essentialto strengthen competitiveness. About 2.5 percent of totalsales is invested annually in R&D, resulting in 25–30 newproduct launches a year.
Ten customer segmentsThe company’s market orientation has been strength-ened over the past years by the establishment of tencustomer segments. To promote a clear customerfocus, the segments are divided in two divisions –Process Technology and Equipment – which marketand sell the products and special offerings to specificcustomer groups.
Six gears for growthAlfa Laval bases its growthstrategy on growing faster than thecompetition. The company intends togrow while – at least – maintaining itsprofitability. The aim is to achieve an annual average growth rate of fivepercent over a business cycle.

– Alfa Laval acquired bioKinetics, a division of the North Ameri-
can Kinetics Group, Inc. The company is prominent in high-
tech integrated process solutions for the biotechnology and
pharmaceutical industries. In 2002, the company had sales
of about SEK 550 million and about 400 employees.
– Alfa Laval acquired the Denmark-based Toftejorg Group,
the market leader in advanced equipment for tank cleaning
with a focus on the marine and food processing industries.
In 2002, Toftejorg had sales of about SEK 210 million,
and approximately 100 employees.
– It was decided to invest approximately SEK 100 million in
the production of plate heat exchangers in Lund.
– The company launched AlfaNova™, a wholly new type of
compact heat exchanger that tolerates both high tempera-
tures and major stresses – a characteristic that broadens the
range of potential applications and, consequently, the market.
– Anders Narvinger was elected Chairman at the Annual Gen-
eral Meeting.
– The Board proposes a dividend of SEK 4.00 (2.00) per share
for 2003.
– The principal owner, Industri Kapital, reduced its holding from
26.9 percent to 17.9 percent.
2003Key events in
Amounts in SEK M unless otherwise stated 2003 2002 2001
Order intake 14,145 14,675 15,894
Net sales 13,909 14,595 15,830
Adjusted EBITDA1) 1,920 2,087 2,138
Adjusted EBITA 2) 1,627 1,755 1,738
Operating margin (adjusted EBITA 2) ), % 11.7 12.0 11.0
Profit/loss after financial items 817 372 42
Return on capital employed, % 21.3 20.2 18.5
Return on shareholders’ equity, % 13.2 2.7 2.5
Earnings per share, SEK 5.78 1.41 0.96
Equity per share, SEK 43.8 40.4 38.5
Cash flow per share 0.26 0.65 0.50
Equity ratio, % 33.3 29.2 8.2
Debt/equity ratio, multiple 0.49 0.78 5.38
Average number of employees (unit) 3) 9,358 9,125 9,259
1) Adjusted EBITA – Earnings before interest, taxes, depreciation, amortization of goodwill and consolidated surplus
values, and items affecting comparability.
2) Adjusted EBITA – Earnings before interest, taxes, amortization of goodwill and consolidated surplus values, and
items affecting comparability.
3) Average number of employees at the end of the period. Compared with 2002 companies with 457 employees
were acquired.
In 1999, Alfa Laval launched its restruc-turing program, Beyond Expectations.The ultimate goal was to boost theoperating margin from 6 percent to 12 percent, by creating a more efficientorganization and a heightened aware-ness of costs.
After a short time, we perceived agreater potential and decided to raiseour operating margin target to between12 and 15 percent.
In 2003, Alfa Laval had an operatingmargin of 11.7 percent. In 2003, cur-rency effects on the operating profitamounted to SEK 273 million, a result,particularly, of the sharp weakening ofthe US dollar during the fourth quarter.Excluding currency effects, the oper-ating margin was 12.7 percent, com-pared with 12 percent in 2002.
Beyond Expectations complete
At the end of the third quarter of 2003,the savings goal of a minimum of SEK850 million was achieved and theBeyond Expectations program was con-cluded. We now have an efficient andmarket-oriented organization and havereduced the number of employees from12,200 to 9,358. Corporate acquisitionsexcluded, that amounts to a reductionof more than 20 percent.
The restructuring program had a rip-ple effect: employees are now keenlyaware of costs. This, combined with the
full implementation of our growth pro-gram, is a precondition of any furtherimprovement in our operating margin.
Brighter business conditions ahead
Starting mid-year 2003, a number ofsigns of improved business conditionsfor industry appeared. For example, we noted a sharp increase in customerinquiries in the marine industry, whichresulted in a substantial increase inorder bookings in that segment. Thisincrease then continued throughoutthe second half of the year.
Order intake for Alfa Laval rose dur-ing the year by 4.9 percent, excludingeffects of currency fluctuations. Theincrease was particularly noticeableduring the second half of the year,when it was a full 10.7 percent. Geo-graphically, the increase in orderintake occurred mainly in Asia andEastern Europe, whereas North Americaand Western Europe were somewhatweaker than in 2002. Toward year-end,however, signs of a recovery werenoted in these regions as well.
Order intake up in the second half
Alfa Laval conducts sales from twodivisions, the Equipment division andthe Process Technology division. Thecustomers of the Equipment divisionhave well-defined recurring needs ofparticular products and product pack-
2 · Alfa Laval 2003
President’s comments
“ Assuming that the recovery will not be affected by unforeseen events in the world, we believe in a strong increase in ordersreceived during 2004.”
A stable andpositive trend
ages, whereas the Process Technologydivision offers both complete processlines and products.
During the year, the order intake rose7.1 percent in the Equipment divisionand 2.3 percent in the Process Technolo-gy division. The tendency for the recov-ery to appear in the Equipment divisionfirst has also been observed in previousswings of the economic pendulum. Themajor capacity investments undertakenby the industry appear later in the busi-ness cycle. In the fourth quarter, orderbookings in Process Technology rose12.7 percent, which may indicate thatindustry is beginning to undertakemajor investments.
Nine of our customer segments re-ported increased order intake in 2003.Only the Process Industry segment,most of the customers of which are inthe chemical industry, reported a decline, which is in line with theabove – that is, that major industrialinvestments are not yet occurring on a large scale.
The profitable aftermarket remainedstrong in 2003, accounting for 26.1percent of the Group’s sales. Orderintake in this segment were up for thefourth consecutive year.
To meet an increase in demand in2003, several production units tookmeasures to increase their productioncapacity. For example, it was decidedto build an extension to the Group’sfacility in Lund, an undertaking thatwill cost approximately SEK 100 mil-lion. Other major capacity investmentswere undertaken in China and India.
Share price up 57 percent
The past year was Alfa Laval’s first fullyear as a listed company since its
Growth strategy
To create growth, Alfa Laval employs astructured strategy based on six gears,each of which is designed to increasegrowth (read more about this strategyon page 8 and 9). The aim is to achieveannual growth rate of 5 percent over a complete business cycle.
In 2003, Alfa Laval carried out twoacquisitions: the Danish Toftejorg, a specialist company in tank cleaning andan attractive supplemental acquisition;and the American company, bioKinetics,operating in the growing Life Sciencesegment.
Acquisitions are a key part of the company’s growth strategy. Alfa Lavalcontinuously evaluates attractiveprospective acquisitions, particularly inthe Life Science and Water Management,but also within a broader spectrum inwhich acquisitions involve supplemen-tal products.
Outlook for 2004
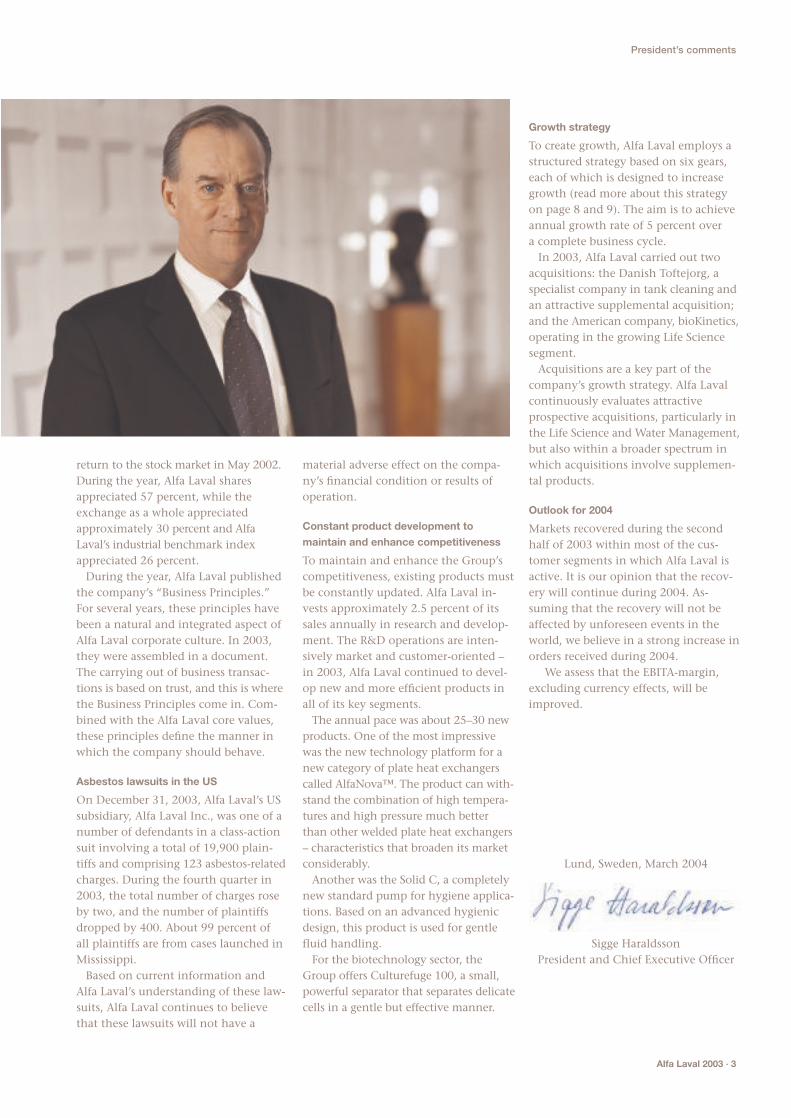
Markets recovered during the secondhalf of 2003 within most of the cus-tomer segments in which Alfa Laval isactive. It is our opinion that the recov-ery will continue during 2004. As-suming that the recovery will not beaffected by unforeseen events in theworld, we believe in a strong increase inorders received during 2004.
We assess that the EBITA-margin,excluding currency effects, will beimproved.
return to the stock market in May 2002.During the year, Alfa Laval sharesappreciated 57 percent, while theexchange as a whole appreciatedapproximately 30 percent and AlfaLaval’s industrial benchmark indexappreciated 26 percent.
During the year, Alfa Laval publishedthe company’s “Business Principles.”For several years, these principles havebeen a natural and integrated aspect ofAlfa Laval corporate culture. In 2003,they were assembled in a document.The carrying out of business transac-tions is based on trust, and this is wherethe Business Principles come in. Com-bined with the Alfa Laval core values,these principles define the manner inwhich the company should behave.
Asbestos lawsuits in the US
On December 31, 2003, Alfa Laval’s USsubsidiary, Alfa Laval Inc., was one of anumber of defendants in a class-actionsuit involving a total of 19,900 plain-tiffs and comprising 123 asbestos-relatedcharges. During the fourth quarter in2003, the total number of charges roseby two, and the number of plaintiffsdropped by 400. About 99 percent ofall plaintiffs are from cases launched inMississippi.
Based on current information andAlfa Laval’s understanding of these law-suits, Alfa Laval continues to believethat these lawsuits will not have a
material adverse effect on the compa-ny’s financial condition or results ofoperation.
Constant product development to
maintain and enhance competitiveness
To maintain and enhance the Group’scompetitiveness, existing products mustbe constantly updated. Alfa Laval in-vests approximately 2.5 percent of itssales annually in research and develop-ment. The R&D operations are inten-sively market and customer-oriented –in 2003, Alfa Laval continued to devel-op new and more efficient products inall of its key segments.
The annual pace was about 25–30 newproducts. One of the most impressivewas the new technology platform for anew category of plate heat exchangerscalled AlfaNova™. The product can with-stand the combination of high tempera-tures and high pressure much betterthan other welded plate heat exchangers– characteristics that broaden its marketconsiderably.
Another was the Solid C, a completelynew standard pump for hygiene applica-tions. Based on an advanced hygienicdesign, this product is used for gentlefluid handling.
For the biotechnology sector, theGroup offers Culturefuge 100, a small,powerful separator that separates delicatecells in a gentle but effective manner.
Alfa Laval 2003 · 3
President’s comments
Sigge HaraldssonPresident and Chief Executive Officer
Lund, Sweden, March 2004
Volume of shares tradedSX20 IndustrySAX All Share indexAlfa Laval
DecNovOctSepAugJulyJuneMayAprMarFebJanS
OU
RC
E:
SIX
/HA
LLV
AR
SS
ON
&H
ALV
AR
SS
ON
SEK No. of shares, 000s
2003
Volume of shares tradedSX20 Industry SAX All Share indexAlfa Laval
SO
UR
CE
: S
IX/H
AL
LVA
RS
SO
N&
HA
LVA
RS
SO
N
SEK No. of shares, 000s
20032002
40
60
80
100
120
0
5,000
10,000
15,000
20,000
25,000
30,000
35,000
DecNovOctSepAugJulyJuneMayAprMarFebJanDecNovOctSepAugJulyJune
40
60
80
100
120
0
5,000
10,000
15,000
20,000
25,000
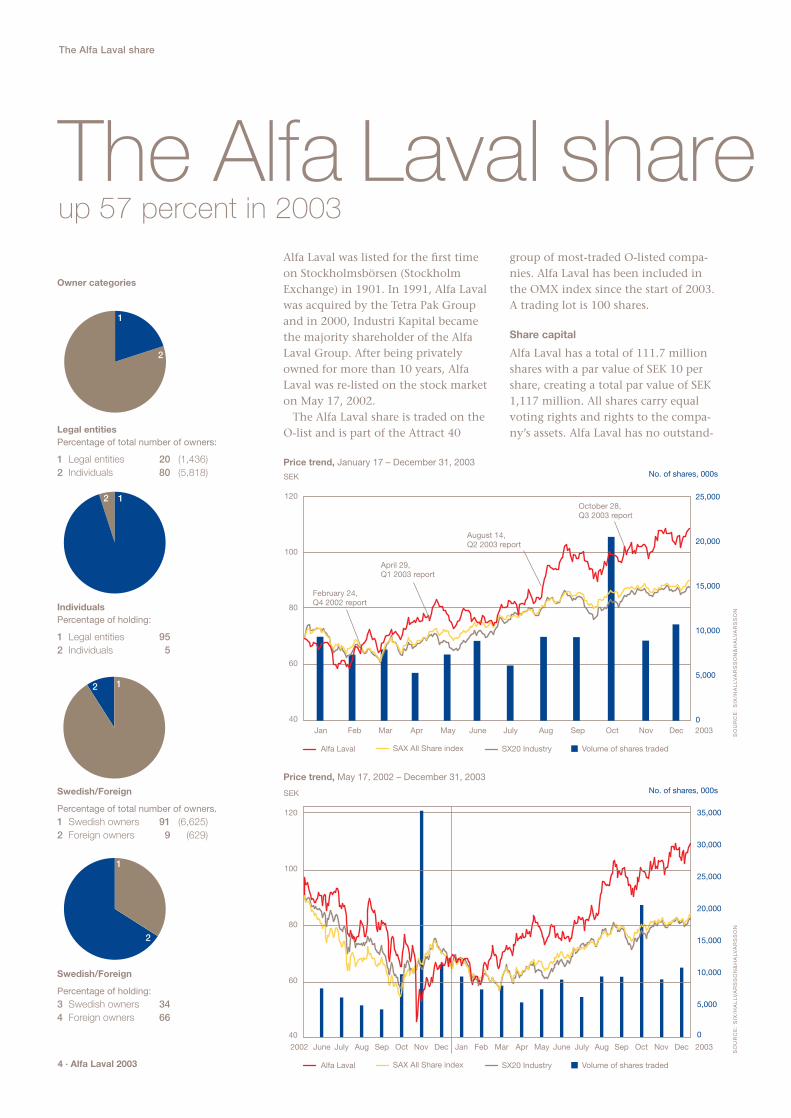
February 24, Q4 2002 report
April 29, Q1 2003 report
August 14, Q2 2003 report
October 28, Q3 2003 report
Price trend, January 17 – December 31, 2003
Price trend, May 17, 2002 – December 31, 2003
4 · Alfa Laval 2003
The Alfa Laval share
The Alfa Laval share up 57 percent in 2003
Alfa Laval was listed for the first timeon Stockholmsbörsen (StockholmExchange) in 1901. In 1991, Alfa Lavalwas acquired by the Tetra Pak Groupand in 2000, Industri Kapital becamethe majority shareholder of the AlfaLaval Group. After being privatelyowned for more than 10 years, AlfaLaval was re-listed on the stock marketon May 17, 2002.
The Alfa Laval share is traded on theO-list and is part of the Attract 40
group of most-traded O-listed compa-nies. Alfa Laval has been included inthe OMX index since the start of 2003.A trading lot is 100 shares.
Share capital
Alfa Laval has a total of 111.7 millionshares with a par value of SEK 10 pershare, creating a total par value of SEK1,117 million. All shares carry equalvoting rights and rights to the compa-ny’s assets. Alfa Laval has no outstand-
12
1
2
1
2
12
Swedish/Foreign
Percentage of holding:3 Swedish owners 344 Foreign owners 66
Swedish/Foreign
Percentage of total number of owners. 1 Swedish owners 91 (6,625)2 Foreign owners 9 (629)
IndividualsPercentage of holding:
1 Legal entities 952 Individuals 5
Legal entitiesPercentage of total number of owners:
1 Legal entities 20 (1,436)2 Individuals 80 (5,818)
Owner categories

Ownership distribution by size at December 31, 2003
Holdings Number of Number of shares Holdings, %shareholders
1 – 500 5,030 937,901 0.84501 – 1,000 846 743,656 0.67
1,001 – 5,000 812 2,059,588 1.845,001 – 10,000 185 1,415,434 1.27
10,001 – 15,000 69 886,813 0.7915,001 – 20,000 50 884,389 0.7920,001 – 262 104,744,212 93.80
Total 7,254 111,671,993 100.00
ing options or other equity-relatedinstruments, so there is no potentialdilution effect.
Share performance
In 2003, Alfa Laval shares appreciatedby 57 percent. This can be comparedwith the stock market as a whole, theSAX All Share Index, which rose 30percent, and the industry index, SX20Industry, which rose 26 percent. Thehighest quotation of the year for AlfaLaval, SEK 110, was reached in Decem-ber. The lowest, SEK 58, was reached inFebruary.
A total of 108 million shares changedowners, corresponding to a value ofSEK 9.2 billion. This corresponds to a turnover rate* of approximately 96 percent. In comparison, turnoverrates for the stock market as a whole in 2003 amounted to 124 percent andto 78 percent on the O-list.
The average size of transactions wasaround 2,190 (5,300) shares and a totalof slightly less than 200 (140) transac-tions, on average, were carried out pertrading day.
Dividend
The dividend is subject to regulationsof the Swedish Companies Act andgeneral market practices, and may onlybe allotted following a decision by theAnnual General Meeting.
The Board of Directors of Alfa Lavalintends to propose a dividend thatreflects the Group’s development,financial position and estimated capi-tal needs.
For 2003, the Board has proposed tothe Annual General Meeting a divi-dend of SEK 4.00 (2.00).
Alfa Laval shareholders
At year-end, the company had a totalof 7,254 (5,746) shareholders. OnDecember 31, 2003, Industri Kapitaland Tetra Laval BV were the two largestowners. On October 29, Industri Kapi-tal reduced its holding to 17.9 percent.Combined, the ten largest shareholdersown approximately 60 percent of thetotal number of shares.
Shareholder information update
We provide regular updates on thecompany on our website,www.alfalaval.com. Here you can alsofind the latest information regardingAlfa Laval’s performance on the stockmarket.
The 10 major owners/asset managers at December 31, 2003
Number of shares Capital %
Industri Kapital 2000 Fund 20,015,628 17.92Tetra Laval BV 19,744,014 17.68Third AP Fund 5,072,407 4.54State Street Bank and Trust (US) 4,577,164 4.09Fourth AP Fund 4,291,700 3.84Robur Funds 3,849,529 3.44Fidelity Funds (Luxembourg) 2,819,800 2.52Lannebo Funds 2,523,995 2.26MSF Mutual Funds (US) 2,228,400 1.99First AP Fund 1,914,800 1.71Others 44,634,556 40.01
Total 111,671,993 100.00
16
3
45
2
Geographic division of ownership(Free float, excluding Industri Kapital and Tetra Laval), %
1 Sweden 522 US 203 UK 94 Luxembourg 65 Norway 26 Others 11
0
3
6
200320022001 200320022001
Cash flow per share, SEK2001: 0.502002: 0.652003: 0.26
Earnings per share, SEK 2001: 0.962002: 1.412003: 5.78
30
40
50
200320022001
Equity per share, SEK2001: 38.52002: 40.42003: 43.8
* Turnover rate is calculated as the total number of shares traded in one year, relativeto the total number of shares outstanding.
0.8
0.6
0.4
0.2
0.0

6 · Alfa Laval 2003
Business concept, business principles and goals
Business principles built on trust
Alfa Laval’s daily work is inspired byconstant effort to increase added valuefor customers. Satisfied customers cre-ate a company with competitive, con-tinuous value growth for shareholders.
A distinct business concept
“To optimize the performance of ourcustomers’ processes. Time and timeagain.”
For 120 years, Alfa Laval has providedproducts of the highest quality. To staysuccessful, however, something more isneeded – an extra value important tothe company’s customers. This is whatthe business concept is all about.
This is a demanding concept, butAlfa Laval probably has greater experi-ence and knowledge about its processsegments than any other company inthe world.
The foundation of Alfa Laval’s busi-ness concept is its customers. To make
in which the company should behave.Company management places greatemphasis on the importance of com-plying with these principles, and willfollow them up via the internal auditfunction.
Alfa Laval’s four business principles
1. Environment
“Optimizing the use of natural resources is our business.”
Alfa Laval and the company’s productsmake a significant contribution toreducing the environment impact ofindustrial processes.
2. Social
“Respect for human rights is fundamental.”
Alfa Laval respects human rights andthe widely differing social cultures inwhich it operates and to which itdelivers its products and services.
3. Business integrity
“High ethical standards guide our conduct.”
Alfa Laval’s approach to businessdevelopment is based on honesty,integrity and respect for others.
4. Transparency
“Our commitment to open dialogue builds trust.”
While Alfa Laval believes in forthrightcommunications, at the same time, thecompany is careful not to release infor-mation that is commercially sensitiveor valuable.
a company sustainable and successful,customers must continuously be pro-vided added value.
Alfa Laval must be an attractive long-term investment. Shareholders want tominimize the risk of their investments,which Alfa Laval does for them by con-tinuously improving its appeal – espe-cially as an employer, a supplier and acustomer.
Alfa Laval’s business principles
are built on trust
During the year, Alfa Laval publishedits Business Principles. For several years,these principles have been a naturaland integral part of Alfa Laval corpo-rate culture. In 2003, they were assem-bled in a document.
The carrying out of business transac-tions is based on trust, and this iswhere the Business Principles come in.Combined with the Alfa Laval core val-ues, these principles define the manner

-6
0
6
200320022001
5
0
12–15
0
15
200320022001
20
0
25
200320022001
Volume growth, %
2001: 3.42002: -2.32003: 3.6
EBITA margin, %2001: 11.02002: 12.02003: 11.7
Return on capital employed, %
2001: 18.52002: 20.22003: 21.3
Volume growth
Goal : Average of 5 percent over
a business cycle.
The goal will be achieved through a combi-
nation of organic growth and acquired
growth. The underlying organic growth of
Alfa Laval’s markets is estimated at around
two percent.
EBITA* in relation to sales
Goal : 12–15 percent.
The goal is to reach an EBITA margin of
12–15 percent of sales. The lower end of
the target range applies during economic
downturns while the upper end applies
during periods of expansion.
Return on capital employed
Goal : 20 percent.
Despite substantial goodwill and allocated
surplus values, ROCE should reach
20 percent. This level is established with
the low tied-up capital in mind, and as a
result of the current profitability and the
goal of further improving profitability.
Financial goals
Alfa Laval 2003 · 7
Business concept, business principles and goals
(*EBITA= Operating profit before amortization of
goodwill and depreciation of other step-up values)
Financial standardsAs a supplement to the aforementioned objectives, the standards for a number of relevant
financial key ratios that will help Alfa Laval meet the financial goals are described below.
unrestricted cash flow will generate a sub-
stantial amount, regardless of the debt/
equity ratio, but within the framework of the
guidelines for debt/equity ratio that the com-
pany has established.
Investments
Goal : approximately 2.5 percent of sales.
Outcome 2003 : 1.9
For existing operations, Alfa Laval’s objective
is to maintain investments in fixed assets at a
level corresponding to about 2.5 percent of
sales. This corresponds to depreciation
according to plan. The purpose of this stan-
dard is to allow some scope for replacement
investments and create a capacity expansion
in line with organic growth for the Group’s
current key products.
Debt/equity ratio
Goal : below 1.0.
Outcome 2003 : 0.49
As a standard, Alfa Laval aims to have a
debt/equity ratio that, in the long term, will
be lower than 1.0 – that is, the company’s
borrowed capital may not amount to more
than 100 percent of the book value of its
shareholders’ equity. Debt/equity ratio may
increase in connection with major acquisi-
tions but this has to be viewed as temporary
since cash flow and profits are expected to
offset this effect.
Cash flow from current operations
Goal : 10–14 percent of sales.
Outcome 2003 : 11.9
The standard is set slightly lower than the
target operating-margin, adjusted EBITA,
because organic growth normally results in
an increase in tied-up working capital. The

Acquisitions and divestments since 1998(Companies and sales volume*)
Acq
uisi
tio
nsD
ives
tmen
ts
19991998 2000
*Refers to the year prior to divestment or acquisition.
Growth strategy
Six gearsfor profitable growth
During the second half of 2002, AlfaLaval launched a growth strategy. Thebasic philosophy is to grow faster thanthe market, and maintain profitabilityduring growth.
Alfa Laval’s strategy for profitable growth
is based on the following six gears:
1. Strong growth from current productsand services
Close cooperation with customers tounderstand and satisfy their require-ments will ensure that the grow wehave had in the past, based on our keyproducts, will be strengthened in thefuture. Examples of how Alfa Lavalapplies this gear include the weldedplate heat exchanger Compabloc andthe intelligent valve, ThinkTop.
2. Market-driven research and development
One of the cornerstones of Alfa Laval’ssuccess has been to be the marketleader in our key technologies. Themission of the company’s R&D organi-zation is to improve current productsand make them even more competitivein the market. Our customer segment-based organization will furtherstrengthen our dialog with customers.Examples include AlfaCond (see page 12)and AlfaNova (see page 13).
3. The new marketing organization, with ten focused customer segments
Since the marketing organization focus-es on customer segments while simulta-neously working with the company’sentire product range, it can work moreclosely with customers and help im-prove customers’ processes. We haveone face for every customer, and caneffectively add value for the customer.
An example of this is the acquisitionin 2003 of the Danish Toftejorg, whichproduces products for tank cleaning –products that add to Alfa Laval’s rangeof food and marine-related products.
4. Aftermarket
The aftermarket offers considerable pos-sibilities for further growth. We have alarge base of installed equipment andsystems, and through our global net-work of workshops and personnel, weare well equipped to manage this serv-ice. Our product range has increasedsubstantially, and service contracts, particularly, are now playing a moreimportant role.
5. New marketing concepts
We are constantly looking for new waysto improve our service to help customersto optimize their processes. It is a matterof looking at things in different ways,being cost-driven instead of product-driven. Two examples are Octopus –groundbreaking software for optimizingthe operation of decanter centrifuges(read more on page 20) – and Alfdex –an innovative solution for cleaningcrankcase gases from diesel engines,based on the separation of oil dropletsand particles from the gases (see page 13).
6. New key products
Identifying and adding, within theframework of our strategy, not onlysupplementary products but also newkey products is a step that can providean extra boost to growth. It enables us
Acquisition criteria
Alfa Laval has established the followingfinancial criteria for acquisitions:
Supplementary acquisitions
(such as the Danish-based Toftejorg):
The acquisition price may be no morethan eight times EBITA.
The operations must contribute posi-tively to the Group’s cash flow andearnings per share, within not morethan 18 months.
Strategic acquisitions (such as the Danish-based DSS):
The operations must contribute posi-tively to the Group’s cash flow andearnings per share within no more than24–36 months.
Auto
mat
ion
Bus
ines
s Ar
ea
SEK
1,11
5 M
Vica
rb G
roup
, Fra
nce
SEK
425
M
Scan
dibr
ew, D
enm
ark
SEK
67
M
Kva
erne
r Het
land
, Nor
way
SEK
57
M
Dor
r Oliv
er, U
S
SEK
127
M
Sepa
rato
r Div
isio
n
of W
ytw
orna
Spr
zeta
Pola
ndSE
K 2
0 M
Cel
leco
SEK
654
M
Ther
mot
echn
ikSE
K 4
9 M
Car
dina
lSE
K 3
9 M
Tetr
a Pa
k D
ivis
ion
of In
dian
sub
sidi
ary
SEK
47
M Airc
oil
SEK
51
M

Alfa Laval 2003 · 9
2001 2002 2003
Growth strategy
to further increase our product offeringand be a more complete and an evenmore valuable partner. Examples of thisgear include the acquisition in 2002 ofDanish Separations Systems (DSS), acompany that develops, manufacturesand sells membrane filters.
Annual volume growth of about 5 percent
Alfa Laval expects that these six gearswill result in the company growing byan average of about five percent peryear over a complete business cycle,including acquired and organic growth.Alfa Laval’s markets are expected togrow by about two percent per yearover a complete business cycle.
Strategy for acquisitions and alliances
Alfa Laval’s business concept of opti-mizing the performance of our cus-tomers’ processes, time and again, isalso the basis of our acquisition/alliancestrategy.
This means that we must undertakeacquisitions/alliances:
– that strengthen our existing key products
– of new key products
– around products that complementour current products and that canstrengthen the customer offering that our customer segments make.
Two areas on which Alfa Laval is focus-ing are Life Science and Water Manage-ment – robustly expanding marketsthat already use Alfa Laval’s key prod-ucts. Life Science comprises mainly thepharmaceutical and biotechnologyindustries. In 1999–2002, the annualgrowth of this area was eleven percent,and it is expected to continue to growat the same rate for the next few years.
Water Management includes equip-ment and systems for water, waste waterand sludge – a market that investsapproximately SEK 13,000 million per
year in equipment and service, andthat is expected to grow by slightlyover ten percent per year until 2007.Trends such as more stringent environ-mental legislation, tighter purificationrequirements on companies and greaterhygiene are expected to exert furtherimpetus on this development.
Alfa Laval’s public listing in thespring of 2002, and the financialstrength that resulted from it,have made growth throughacquisitions an attractiveprospect. Since the list-ing, the Group hasmade the followingacquisitions:
• bioKinetics, US, withsales of approxi-mately SEK 550 million in 2002. Thecompany is market-leading in the NorthAmerican market for inte-grated process solutions inbiotechnology and the pharma-ceutical industry.
• Toftejorg, Denmark, with sales ofapproximately SEK 210 million in2002. The company is market-leadingin equipment for advanced tankcleaning, and fits in well in theMarine and Diesel and Sanitary cus-tomer segments.
• Danish Separation Systems, (DSS), Denmark, with sales of approximatelySEK 90 million in 2001. Specialists inmembrane filtration, the establishedsolution for separating small parti-cles, particularly in biotechnology,pharmaceutical and food industries.
To enable the Group to proceed withacquisitions and form alliances in a systematic and efficient manner, in2002 Alfa Laval instituted the specialfunction, Business Development.
An a
dditi
onal
13 p
erce
nt o
f
shar
e ca
pita
l
of A
lfa L
aval
Indi
a
DSS
, Den
mar
k
SEK
90
M
Tofte
jorg
, Den
mar
k
SEK
210
M
bioK
inet
ics,
US
SEK
550
M
Rem
a C
ontro
lSE
K 6
8 M
Indu
stria
l Flo
wSE
K 6
56 M
Alfa Laval’s strategy for growth is structuredin six gears, which willprovide an annual vol-ume growth averaging five percent annually.
spiral heat exchangers and air heatexchangers. The plate heat exchanger isthe main product and has many appli-cations. Alfa Laval estimates that it hada combined market share of approxi-mately 36 percent in 2003. Spiral heatexchangers are used in the pulp industryand in waste treatment. Air heat ex-changers are used for air conditioningand refrigeration.
There is a clear tendency in the pro-cessing industry to switch from tradi-tional shell-and-tube heat exchangers tocompact heat exchanges such as plateheat exchangers because the latter savespace and energy and provide bettermaintenance security than shell-and-tube heat exchangers.
Alfa Laval’s largest competitors in thisarea are Tranter/ SWEP (US), Invensys-APV (UK) and MG Technologies/GEAEcoflex (Germany).
Separation
Ever since the company was formed in1883 to capitalize on Gustaf de Laval’sinvention, the cream separator, the sep-aration technology has been a centralpart of the operations. The technologyis currently used to separate liquids fromother liquids and solid particles fromliquids. The separators are used in anumber of industrial processes withinthe food processing and chemical indus-tries, on ships, to purify fuel and lubri-cating oil, on oil rigs, to separate oil andwater, in the mechanical engineeringindustry, to purify industrial fluids, andin industrial and municipal wastewatertreatment plants. Alfa Laval is a globalmarket leader in centrifugal separation,according to the company’s estimates,in 2003 its share of the global marketfor all separation products combinedwas 24 percent.
10 · Alfa Laval 2003
The stableplatform…
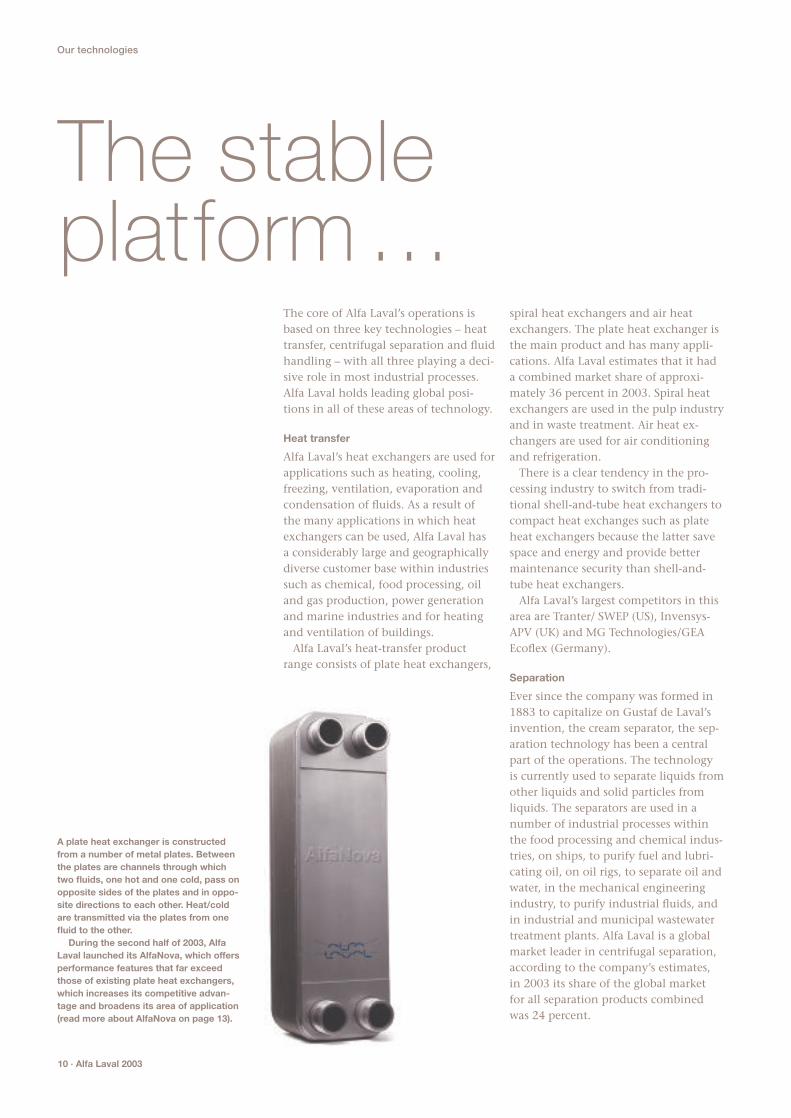
A plate heat exchanger is constructedfrom a number of metal plates. Betweenthe plates are channels through whichtwo fluids, one hot and one cold, pass onopposite sides of the plates and in oppo-site directions to each other. Heat/coldare transmitted via the plates from onefluid to the other.
During the second half of 2003, AlfaLaval launched its AlfaNova, which offersperformance features that far exceedthose of existing plate heat exchangers,which increases its competitive advan-tage and broadens its area of application(read more about AlfaNova on page 13).
Our technologies
The core of Alfa Laval’s operations isbased on three key technologies – heattransfer, centrifugal separation and fluidhandling – with all three playing a deci-sive role in most industrial processes.Alfa Laval holds leading global posi-tions in all of these areas of technology.
Heat transfer
Alfa Laval’s heat exchangers are used forapplications such as heating, cooling,freezing, ventilation, evaporation andcondensation of fluids. As a result of the many applications in which heatexchangers can be used, Alfa Laval has a considerably large and geographicallydiverse customer base within industriessuch as chemical, food processing, oiland gas production, power generationand marine industries and for heatingand ventilation of buildings.
Alfa Laval’s heat-transfer productrange consists of plate heat exchangers,

Alfa Laval 2003 · 11
personal care products. Alfa Laval is amarket leader in fluid handling with anestimated global market share of tenpercent in 2003.
There are three types of high-sanitarypumps:• Centrifugal pumps, which combines
high efficiency with careful producttreatment.
• Rotary lobe pumps, which are used tofacilitate the flow of low-viscosity fluids that require a high standard ofhygiene.
• Liquid-ring pumps, which have a widerange of applications.
Valves are used to regulate and redirectliquid flows. Alfa Laval’s mixproof valvesare delivered as a complete package ofsolutions, complemented by intelligentregulating equipment. Butterfly valvesare suitable for very liquid products andseat valves are characterized by a fewmovable parts and are used, for example,as stop or divert valves.
Alfa Laval’s main competitors in thisarea are: MG Technologies/GEA (Germany), Invensys/APV (UK), Waukesha/Cherry Burrell (US) and ITT Industries (US).
High-speed separators and decantercentrifuges are Alfa Laval’s dominantproducts within centrifugal separation.High-speed separators are primarily usedfor separating fluids. A decanter cen-trifuge is a horizontal separation tech-nique that uses a slower speed than thehigh-speed separation technique. It ismainly applied in the separation of arelatively higher solid content. Forexample, decanter centrifuges are usedin dewatering in wastewater treatmentplants.
As a key supplement to its own rangeof separator products, Alfa Laval in 2002brought the membrane filtration systeminto the company through the acquisi-tion of Danish Separation Systems A/S(DSS). Membrane filtration is theaccepted industry standard for sepa-rating less dense particles, which is agrowing need within the food, biotech-nology and pharmaceutical industries.
Alfa Laval’s largest competitors in thisarea are: MG Technologies/GEA West-falia Separator (Germany), Andritz(Andritz Bird, US and Andritz Guinard,France), Mitsubishi Kakoki Kaiska (Japan),Pieralisi (Italy) and Flottweg (Germany).
Fluid handling
Transporting and regulating fluids in asafe and efficient manner is vital forindustries. Alfa Laval focuses its compe-tence on fluid handling, where thedemand for hygiene is high. The com-pany’s pumps, valves and installationmaterial are used in fluid-handlingapplications such as in the productionof beverages, dairy products, food,pharmaceutical products, health and
One of the productslaunched by Alfa Laval in2003 in the key technologyof fluid handling is theSolid C – a completely newstandard pump for hygieneapplications. Solid C isbased on an advanceddesign for careful handlingof fluids.
Our technologies
Due to the centrifugal force in the separators,the fluid/particles with the greatest density collect in the outer periphery of the separatorbowl, and the fluid with the lower density in thecenter of the bowl. Both fluid phases are thendischarged through separate outlets.
In 2003, Alfa Laval launched its Culturefuge100, which is used in the biotechnology sectorto efficiently separate the most important partsof cells, so that new drugs may be produced.Read more about Culturefuge 100 on page 13.

12 · Alfa Laval 2003
Research & Development
To boost market potential in the exist-ing operations, Alfa Laval can broadenits offering by adding products suitablefor other capacities, pressures and tem-peratures. Enhancing growth prospectmay also involve producing versions ofnew material, and to automate andintegrate intelligent functions in theproducts, such as measuring and re-introducing information, or analyzingand forecasting.
Over the past few years, the com-pany’s commitment to research anddevelopment has resulted in the fol-lowing products:
AlfaCond
First purpose-built plate condenser in
the world
AlfaCond is the first plate condenser inthe world, purpose-built for the marketfor condensation of vapors at low pres-sure. What makes this product specialis its size, and the placement of theinput and output steam channels, con-densation and cooling water.
The Alfa Laval brand has been associat-ed with innovation for over 100 years.An ongoing, consistent commitment toResearch & Development (R&D) hasbeen critical in building, strengtheningand developing the company’s globalmarket leadership. Alfa Laval’s R&D isdistinctly customer-oriented, with theaim of devoloping better solutions forthe customer.
Total R&D expenses amounted toSEK 368 million (355) in 2003 – that is,approximately 2.6 (2.4) percent of theGroup’s total sales. The Group hasabout 290 employees and four centerswithin R&D. The Process TechnologyDivision and the Equipment Divisionhave their own R&D functions for over-seeing their respective customer seg-ment and funnel resources to areaswhere there is most growth potential.Such areas include biotechnology andwastewater treatment.
25 – 30 new products annually
Alfa Laval’s R&D operations are basedon a long-term commitment to basicresearch, focusing primarily on stream-ing technology and heat transfer. Thecompany launches 25–30 new productsannually.
Alfa Laval holds more than 200 patentson its own products, and the brandname Alfa Laval is registered in around100 countries.
Steady product renewals
sharpen competitive edge
To remain competitive and stay in busi-ness, Alfa Laval needs to constantlyupgrade its products to cope with thechanging demands and needs of cus-tomers. This often involves relativelyminor adjustments that could lead tomajor improvements for customers.
...that is constantly developing
0
1
2
3
03020100
R&D investments in percentage of net sales
2000: 2.92001: 2.22002: 2.42003: 2.6
0
250
500
03020100
R&D investments in SEK M
2000: 441 2001: 3412002: 3552003: 368
Research & Development within Alfa Laval is carried out in four research centers. Thepictures shows the facility in Tumba, Sweden.

Alfa Laval 2003 · 13
Research & Development
tion to improving performance, mini-mizes the need for installed electricity,improves process control and reducesthe need for maintenance.
Alfdex
An innovative solution for cleaning
crankcase gases
Alfdex, an innovative solution for clean-ing exhaust fumes from diesel engines byseparating oil drops and particles fromcrankcase gases. The market potential forthe products is believed to be very large:in the next few years, environmental legislation in both the EU and the USwill regulate levels of exhaust emissionsfrom heavy vehicles much more sharplythan is the case today.
Alfdex is a project in which Alfa Lavalcooperates, on market terms, with theSwedish listed company, Haldex.
The compact design saves space andreduces shipping and installationcosts. One market segment that hasshown great interest in AlfaCond is the fishing industry.
AlfaNova
A new technology with better
temperature and pressure tolerance
Many researchers believe that heat exchangers made from only one material are the way of the future.Here, Alfa Laval is well advanced inthis area. AlfaNova is a completelynew plate heat exchanger made froma single material: stainless steel.
The actual brazed material in combi-nation with the manufacturing tech-nique is patented. AlfaNova toleratesthe combination of high temperatureand high pressure better than otherbrazed plate heat exchangers. Thesecharacteristics broaden the market forthe product. New areas of applicationinclude processors that involve the use of ammonia.
Culturefuge 100
Separates delicate cells carefully
and effectively
Culturefuge 100 is a small, powerfulseparator for the biotechnology sector.Many new biological products are pro-duced from delicate organisms that aredifficult to separate so that the keyparts of the cells are not destroyed.Culturefuge 100 separates the delicatecells carefully and effectively. Theproduct is aimed at the most advancedsegment of the Life Science market:customers that develop monoclonalantibodies. Monoclonal antibodies arebecoming increasingly important inthe diagnosis and treatment of tumorsand the development of new vaccines.
Aldec G2
Improves performance by up to 30 percent
Aldec G2 is a new generation ofdecanters that improve performanceby up to 30 percent. It is based on anew platform that represents a techni-cal advance in sludge treatmentdecanters. Aldec G2 carries out sludgethickening and dewatering.
Aldec G2 has a gearbox that, in addi-
14 · Alfa Laval 2003Equ
ipm
ent
In 2003, order intake increased in allfive market segments of the EquipmentDivision. Comfort & Refrigeration, Fluids & Utilities and OEM were allstronger than 2002 throughout theyear, while order intake in Sanitary wasparticularly strong during the secondhalf of the year. In 2003, an interestingchange in the market occurred in theMarine & Diesel segment. Order intakewas weak in the beginning of the year,but improved at the end of the firsthalf of the year. After a sharp accelera-tion in June, the increased order intakeremained at a high level throughoutthe second half of the year. The favor-able trend was most apparent in themarine market, which was bolsteredalmost exclusively by ship-buildingactivity in Asia.
The Equipment Division is organizedin five customer segments: Sanitary,Comfort & Refrigeration, Marine &Diesel, Fluids & Utility and OEM. Theaftermarket, Parts & Service, is animportant segment, which is coveredseparately on pages 22 and 23. TheEquipment Division posted net sales ofSEK 7,842 million (8,130) in 2003, or56 (56) percent of Alfa Laval’s totalsales. The number of employees in thedivision was about 2,000 (about 2,100).
Focus on growth markets
The Equipment Division offers a widerange of products to customers thathave a well-defined, recurring and reg-ular need for Alfa Laval’s products.Sales are generated mainly through sys-tems builders, contractors and OEMcompanies as well as through distribu-tion and retail outlets – that is, to cus-tomers other than the end-customersor users of the products. The division
focuses on increasing value for cus-tomers by providing a high level ofaccessibility for products worldwidethrough increased sales and distribu-tion channels, product development in cooperation with customers and customer adaption through moduleconcept.
The Equipment Division’s strategy isto maintain and strengthen its leadingglobal positions by identifying newproduct applications in segments withfavorable growth prospects.
Sanitary
Focus on sales channels yielded
volume growth
For the Sanitary segment, 2003 repre-sented an increase in order intake com-pared with the preceding year.
The strategy developed by the divi-sion, involving a focus on external saleschannels, was successful, producing avolume increase.
During the year, the segment alsoentered into four alliances to reach itsgoal of being “the best company to dobusiness with.”
Integrating Toftejorg was a major pri-ority during the year. The tank cleaningproducts are now an integrated part ofthe segment’s offering to customers.
The bulk of sales within the Sanitarysegment is generated in the beverage,dairy, food processing, pharmaceuticaland biotechnology industries, all ofwhich have stringent hygiene and safe-ty requirements. Alfa Laval’s pumps,valves, separators, heat exchangers,installation material and tank equip-ment are used in manufacturing liquidand viscous food products, as well aspharmaceutical and hygiene products.
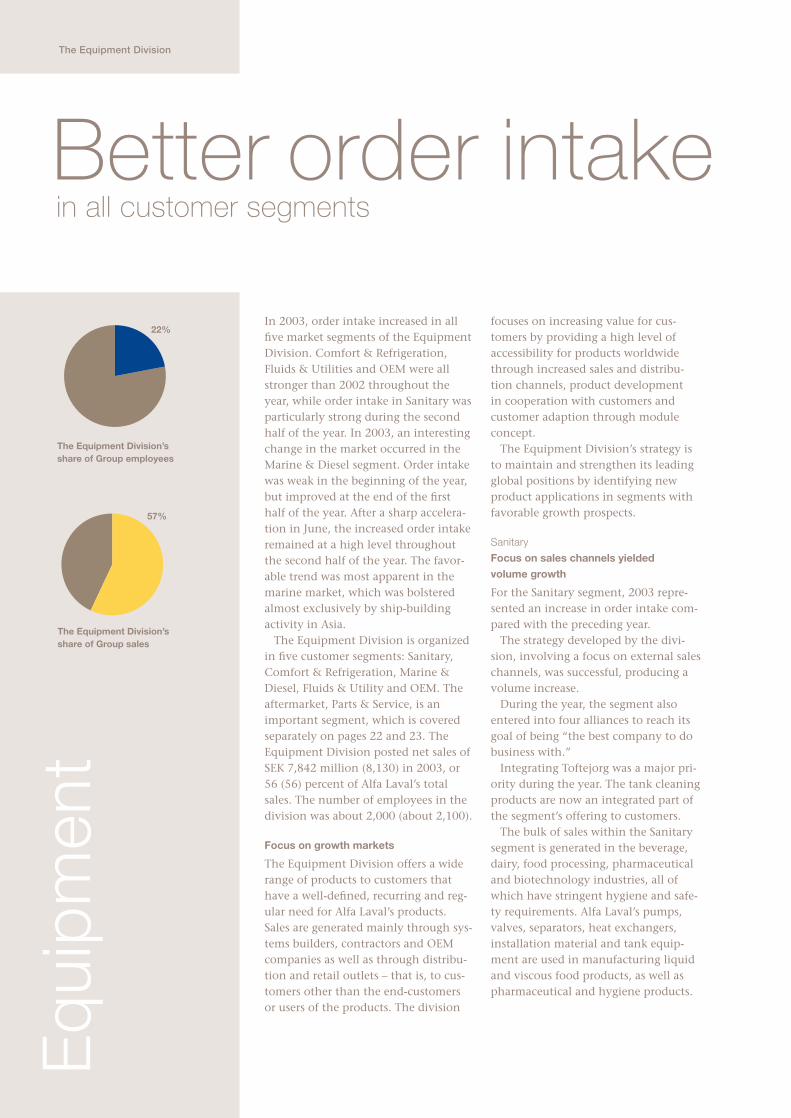
The Equipment Division’sshare of Group employees
57 %
22 %
The Equipment Division’sshare of Group sales
Better order intake in all customer segments
The Equipment Division
57%
22%
Alfa Laval 2003 · 15
The Equipment Division
The US is the primary market of thesegment. Tetra Pak, a leading supplierof processing and packaging systemsfor the food and beverage industry, isan important customer for the Sanitarysegment. Alfa Laval’s products are inte-gral components in the productionplants sold by Tetra Pak.
Comfort & Refrigeration
Strong trend in Russia and China is
ongoing
Order intake in Comfort & Refrigera-tion were better than in 2002, mainlybecause of the ongoing strong trend inRussia and China. Moreover, the focuson sales channels had favorable resultsin this segment as well. The launch ofthe new platform for welded plate heatexchangers, AlfaNova, was well received.
In the Comfort & Refrigeration seg-ment, Alfa Laval sells a broad assort-ment of heat exchangers used in sys-tems for district heating, district cool-ing and air conditioning of factories,offices and shopping malls, as well asfor maintaining cold and frozen fooddisplay counters and ice rinks at theproper temperatures.
The plate heat exchanger is the mainproduct for these applications. Theproduct range consists of welded plateheat exchangers, which can cope withextremely high pressure, half-weldedunits and small brazed heat exchangers
that are easy to use for a variety ofheating and cooling applications. AlfaLaval also supplies air-cooling heatexchangers for air conditioning andrefrigeration as well as shell-and-tubeheat exchangers for evaporation andcondensation.
Alfa Laval sells heat exchangers to abroad spectrum of customers rangingfrom large multinational companies tosmall, local installation firms. Some ofthe major customers are Climespace,York, Mycom and Uppsala Energi. East-ern Europe, where several countriesstill use obsolete district heating, is animportant and growing market forComfort & Refrigeration whose com-pact, efficient solutions replace the old,energy-consuming systems.
Marine & Diesel
Major increase in order intake
Alfa Laval’s order intake within theMarine & Diesel segment was betterthan in 2002, mainly on account of increased activity among shipyards inAsia.
Moreover, the segment implementeda key account management team totake care of its largest diesel customer,Finland-based Wärtsilä, increasing bothits proximity to the customer and thelevel of service it provides.
Integration of the Danish companyToftejorg was highly satisfactory. New
030201
Net sales, SEK M2001: 8,5762002: 8,1302003: 7,842
030201
Operating profit, SEK M2001: 1,0842002: 1,0782003: 1,011
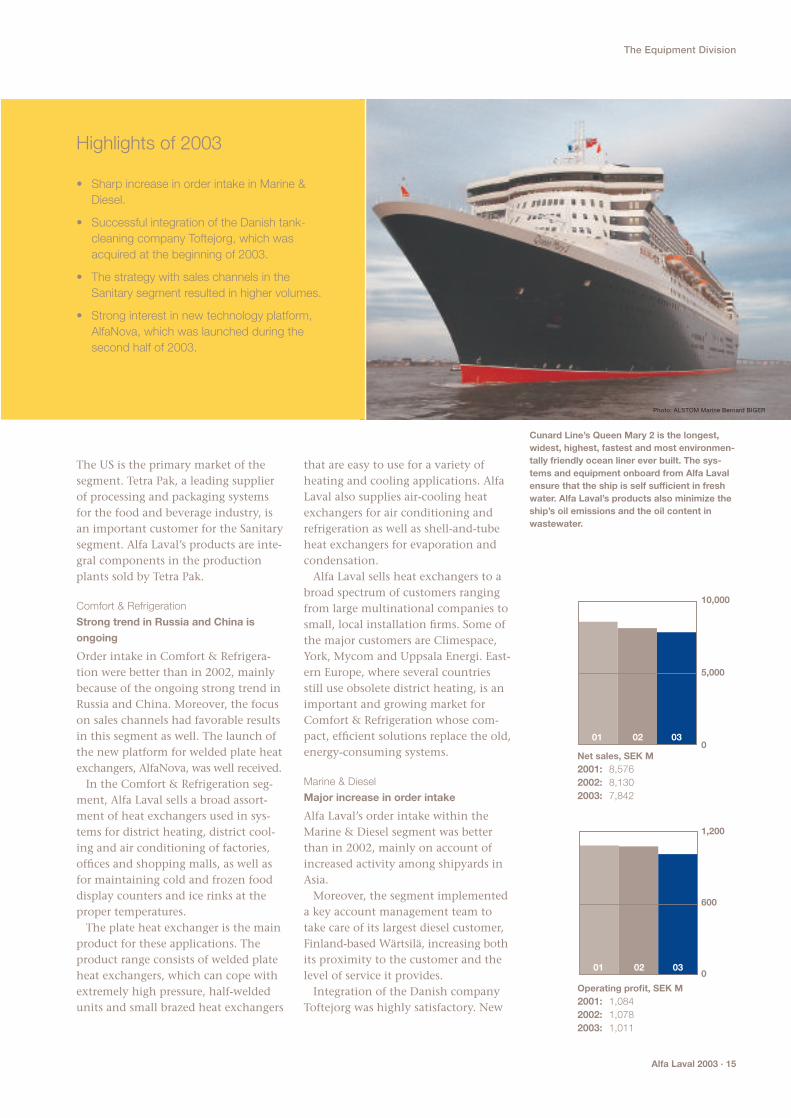
Cunard Line’s Queen Mary 2 is the longest,widest, highest, fastest and most environmen-tally friendly ocean liner ever built. The sys-tems and equipment onboard from Alfa Lavalensure that the ship is self sufficient in freshwater. Alfa Laval’s products also minimize theship’s oil emissions and the oil content inwastewater.
Highlights of 2003
• Sharp increase in order intake in Marine &Diesel.
• Successful integration of the Danish tank-cleaning company Toftejorg, which wasacquired at the beginning of 2003.
• The strategy with sales channels in the Sanitary segment resulted in higher volumes.
• Strong interest in new technology platform,AlfaNova, which was launched during thesecond half of 2003.
10,000
5,000
0
1,200
600
0
Photo: ALSTOM Marine Bernard BIGER

16 · Alfa Laval 2003
The Equipment Division
sales of equipment for tank cleaning in the marine market rose 30 percentover 2002.
In Marine & Diesel, Alfa Laval is a sig-nificant equipment supplier to ship-yards and diesel-engine manufacturers.Approximately two-thirds of all theships in the world that are in service areequipped with Alfa Laval products.Their applications include fuel andlubricating oil cleaning processes,engine cooling, water purification andpurification of sludge and oil-contain-ing water. The list of customers includesHyundai, MHI, Fincantieri, Wärtsiläand MAN/B&W.
Alfa Laval has steadily strengthenedits position in the marine segment bylaunching new products and solutionsthat help shipowners improve theiroperating finances and meet increasing-ly stringent environment-protectionrequirements
Fluids & Utility
Favorable trend in automotive
industry in Asia and France
Order intake was better than in 2002.The improvement was particularlyapparent in Asia and Latin America.The trend was also favorable in Centraland Eastern Europe, while North Ameri-ca remained at the same level as 2002and Western Europe and the Nordiccountries declined.
During the year, order intake increasedparticularly in the automotive industry,in both Asia and France. Moreover,AlfaPure, a series of separator modulesdeveloped primarily to purify cuttingand cleaning fluids, was developed fur-ther, making it now even simpler to use.
While currently a small segmentwithin Alfa Laval, Fluids & Utility hasenormous growth potential. Nearly allmanufacturing industries use all sorts offluids in their production, liquids thatneed to be cleaned and temperature-controlled in order to attain a highlevel of operational security. Such fluidsrange from lubricating oil for machinesto purified fluids for turning and waterfor washing the manufactured prod-ucts. With Alfa Laval’s separators, costlyoil and fluids are cleaned and recycled,helping to trim operating costs and pro-tect the environment.
The customer base comprises compa-nies in the automotive, metal, electron-ic and plastic manufacturing sectorssuch as GM, Daimler-Chrysler, IBM and Rolls Royce.
OEM (Original Equipment Manufacturers)
US breakthrough for plate heat
exchangers in air-conditioning plants
Order intake improved compared with2002, partly owing to a breakthroughin the American market for plate heatexchangers in air-conditioning systems.In 2003, Alfa Laval was awarded one ofthe largest-ever contracts in this area.
Moreover, sales of small welded heatexchangers continued to grow, increas-ing by nearly 50 percent in the pasttwo years.
Also in this segment, the launch ofthe new brazed plate exchanger,AlfaNova, was well received, establish-ing the potential for a broadening ofthe customer base.
In the OEM customer segment, AlfaLaval has close relationships with man-ufacturers of diesel engines, air-condi-tioning units, air compressors, air dryersand boilers. These customers integratethe company’s products, such as smallbrazed heat exchangers, into theirunits. Alfa Laval’s goal is to build part-nerships with these manufacturers forjoint development of new products.Some of the customers include Vaillant,Caterpillar and Carrier.
After developing a product in accor-dance with the customer’s specifica-tions, Alfa Laval often signs a supplycontract for large volumes covering sev-eral years. The Group delivers its prod-ucts to customers direct from the pro-duction plants. This shortens lead times,cuts costs, and limits risks for errors aswell as saves marketing resources in theorganization.
Geographic distribution of the Equipment Division sales, %1 Sweden2 Rest of EU3 Rest of Europe4 US5 Rest of North America6 Latin America7 Asia8 Other
1
2
3
45
6
12
6
4
56
7
8
3
Segment distribution of the Equipment Division sales, %1 Marine & Diesel2 Sanitary3 Comfort & Refrigeration 4 Fluids & Utility5 OEM6 Parts & Service

Alfa Laval 2003 · 17
The Equipment Division
“Based on our experience, we thinkthat Alfa Laval’s intelligent valves arecentral to successful production inan operation like ours.”
Jan Koopman, Sara Lee/DE
Sara Lee/DE, with headquarters in the Netherlands, is a subsidiary of Chica-
go based Sara Lee Corporation. Sara Lee/DE is the largest operator world-
wide in the out-of-home coffee market.
When a significant growth in this market was evident, Sara Lee/DE
developed a unique high-speed coffee system for professional use, based
on concentrated liquid coffee. In 1998 the company enlarged an existing
plant for such coffee in Joure in the Netherlands. Another plant is now
under construction in Suffolk, Virginia in the United States. Due to their
excellent performance during a test in the Joure plant, Alfa Laval’s Unique
mix-proof valves and ThinkTop intelligent valve control units will also be
installed at the heart of the new US plant.
Jan Koopman, manager Technical Engineering of Manufacturing Tech-
nology at Sara Lee/DE in Joure was impressed by the high-IQ valve control
technology already when it was demonstrated to him the first time. “Alfa
Laval’s solution satisfies our needs best. Getting back reliable information
data and early warnings for preventive maintenance is vital in a production
facility that has to operate 24 hours a day, seven days a week,” he says.

Pro
cess
Tech
nolo
gy
The Process Technology Division
In 2003, order intake in the ProcessTechnology Division was somewhatbetter than in 2002, excluding currencyeffects, due to a favorable trend in thefourth quarter. Food Technology postedsteady growth while Energy & Environ-ment first reversed the negative trend of2002 a way along into the year. ForProcess Industry, 2003 developed weak-ly, but petrochemical investmentsgained pace toward the end of the year.In Life Science, order intake was some-what weaker, but as a result of theacquisition of the American company,bioKinetics, in the fourth quarter, thesegment reported a plus.
The Process Technology Divisionoperates within four customer-orientedsegments: Process Industry, Food Tech-nology, Energy & Environment and Life Science. The aftermarket, Parts &Service, is an important segment whichis presented separately on pages 22 and23. In 2003, the division posted sales ofSEK 5,994 million (6,377), or 43 (44)percent of the total sales of the AlfaLaval Group. The number of employeesin the division was approximately 2,980(approximately 2,700).
Customized solutions enhance efficiency
in customers’ processes
The Process Technology Division servescustomers who require solutions that, toa greater or lesser extent, have been spe-cially adapted to improve the efficiencyof their processes. The division’s salesare mostly effected through the Group’sown sales companies. Alfa Laval com-bines expertise in its key technologieswith thorough knowledge of its cus-tomers’ processes and offers packagesolutions ranging from single productsto systems and turnkey solutions, aswell as efficient customer service.
Food Technology
Major projects within vegetable oils
contributed to a stronger performance
Order intake within Food Technologyimproved compared with 2002, primar-ily due to favorable developments inChina, India and the Ukraine.
During 2003, developments withinvegetable oil processes were favorableand the segment received several majorproject orders.
Developments have also been favor-able with regard to decanters forprocesses within the beverage industry.
Alfa Laval has a strong position as asupplier of process solutions to thebeverage and food industries.
The solutions are used in the produc-tion of beer, wine, vegetable oils andmeat and fish proteins. Since Alfa Lavallaid the foundations for its strong posi-tion within the dairy industry 120 yearsago, the company has accumulated anextensive knowledge of processes forseparating, heating, cooling, pumpingand controlling various foodstuffs.
Alfa Laval’s growth in the breweryarea exceeds market growth. The com-pany has developed close relations withits customers, including many of theworld’s largest brewery groups. Specialmodules have been developed in coop-eration with the brewing industry forprocesses such as pasteurization, mix-ing, wort boiling and deaeration. Thebrewing industry performed slightlyweaker in 2003 than the precedingyear, although 2002 was an exception-ally strong year, particularly in EasternEurope.
Customers served by Food Technolo-gy include such multinational groupsas Cargill, ADM, Heineken andAnheuser-Busch.
The Process Technology Division’sshare of Group employees
43 %
32 %
The Process Technology Division’sshare of Group sales
bioKinetics creates possibilities to develop the Life Science segment
43%
32%

Alfa Laval 2003 · 19
The Process Technology Division
Highlights of 2003
• Acquisition of American bioKinetics infourth quarter of 2003.
• Several major projects in vegetable oilscontributed to the favorable trend inFood Technology.
• Recovered market share in the environ-mental area.
• Strong growth in membrane technology.
Process Industry
Weak in 2003, but strong growth in the
chemical sector in Asia and Eastern
Europe
Order intake in the Process Industrywas weaker than in 2002, which ismainly attributable to a continuingoverall low level of investment in West-ern Europe and the US as well as glob-ally, in the starch area.
Otherwise, the chemical sector inAsia and Eastern Europe reported a bet-ter order intake, and the petrochemicalsector recovered.
The results of the focus on so-called2-phase applications have begun toyield results, with compact heatexchangers replacing existing techno-logy for condensation, reboiling andevaporation.
The launching of AlfaCond, the firstpurpose-built plate condenser (readmore on page 12) attracted great interestin the market.
Within the Process Industry, AlfaLaval’s solutions are used by a largenumber of customers for producingpetrochemical products, plastics, poly-mers, metals, minerals, ethanol, starch,paper and sugar, among other products.
Heat exchangers play a key role forcost-efficient production in processesthat demand large amounts of energy.Compact heat exchangers have enor-mous potential, as they can often
replace conventional shell-and-tubeheat exchangers, enhancing efficiencyand producing major savings in bothspace and installation and service costs.
Alfa Laval has many well-known customers in the process industry, suchas BASF, Bayer, DuPont, Cargill, Proctor& Gamble and International Paper.
Energy & Environment
Downward trend halted, due mainly to
strong order intake in environmental
sector
Order intake in 2003 started out weak.However, the downward trend washalted and weak growth was reportedfor the full year, mainly as a result ofthe favorable trend in the environmen-tal area and to a certain extent in theenergy area. However, the decline ininvestments in the cyclical oil and gasmarket continued.
In the environmental area, thelaunching of the new decanter, AldecG2, was a key event. Alfa Laval reportedan increase in order bookings, despitethe market’s weak growth, mainly as a result of recovered market share. During the year, Alfa Laval had a strongposition in the UK, and strengthenedits market positions in China.
In the power industry, the NorthAmerican market continued to bestrained. However, Alfa Laval was ableto offset this to a large extent through
Net sales, SEK M2001: 6,872 2002: 6,3772003: 5,994
Operating profit, SEK M2001: 4732002: 5212003: 352
030201
030201
10,000
5,000
0
1,200
600
0
During 2003 the North American com-pany bioKinetics was acquired. Theirmain products are modular designsthat mainly focus on mammalian cellcultures. The picture shows a bufferhold system at Hemosol, a Toronto-based company developing artificialblood products.

20 · Alfa Laval 2003
The Process Technology Division
Sewage treatment is becoming more self-regulating and automated. Octopus
from Alfa Laval is the first self-optimizing system in the sludge dewatering
business. It can be described as a decanter autopilot that optimizes the
decanter’s operation around the clock.
The wastewater treatment plant in Almere in the Netherlands treats 30,000
cubic metres of sewage every day. The plant produces secondary sludge that
is dewatered in decanter centrifuges. The sludge that Almere delivers to the
incineration company has a dry solids content of between 18 and 22 percent.
By contrast, before entering the decanter, the sludge has a concentration of
2.5 percent dry solids.
“With Octopus, we can set minimum and maximum levels for all relevant
process parameters and optimize our costs,” says Ben Roelfzema environmental
manager at the Dutch Water Board Zuiderzeeland that owns and operates the
plant in Almere. “And the Octopus system adjusts these by itself.”
With the help of Octopus, the Almere plant has made substantial savings
through more efficient sludge dewatering and through decreased use of polymer
and fresh water. Another significant benefit is constant, good quality of the
centrate (separated water in the dewatering process).
“The only way to save money in the wastewater treatment business is by automating the whole process.”
Ben Roelfzema,
Dutch Water Board, Zuiderzeeland

Alfa Laval 2003 · 21
The Process Technology Division
major projects in Asia, Russia and theMiddle East.
Market conditions in the Oil & Gasmarket continued to be tight, resultingin fewer projects, despite the high priceof oil. Investments in land-based drill-ing gave encouraging signals.
Alfa Laval’s products, modules andsystems are of great importance in theenergy sector, both in the extraction ofenergy sources such as oil and gas andin the production of energy in powerplants. The company also has a strongposition in the environmental area as asupplier of equipment for sludge pro-cessing at wastewater treatment plants.
For the Oil & Gas industry, Alfa Lavalsupplies solutions for drilling and pro-duction of crude oil and gas, fresh-water production and treatment of oil-contaminated water. Power plantapplications involve the use of separa-tors for effective cleaning of lubricat-ing oils and fuel oils, including heavyoil and crude oil, compact heatexchangers for heating and coolingpurposes, and systems capable ofdesalinating large volumes of seawater.
As a result of more stringent environ-mental legislation, the need for effi-cient handling of wastewater andsludge is increasing. The company supplies systems that reduce the vol-ume of wastewater, so that it can betreated more efficiently. The customersinclude municipalities, private watercompanies, major international con-tractors and the paper, food, chemicalsand other industries.
The customers within the Energy &Environment segment include Shell,Petrobras, Statoil, General Electric,China Nuclear Corp., Thames Waterand the City of Chicago.
Life Science
Acquisition of US-based bioKinetics
creates development possibilities
Order intake in Life Science increasedin 2003, as a result of the acquisitionof the American company, bioKinetics.bioKinetics targets the biotechnologyand pharmaceutical industries, and itsmain products are process modules,focusing on mammalian cell cultures.bioKinetics currently operates in NorthAmerica. Combining the resources ofbioKinetics with Alfa Laval’s marketpresence will give Alfa Laval greateraccess to the European and Asian mar-kets. In 2002, bioKinetics posted salesof SEK 550 million and had approxi-mately 400 employees. Its customersinclude leading pharmaceutical andbiotechnology companies such asAmgen and IDEX.
Alfa Laval also ranks among pioneersin the development of advanced sepa-rators for the increasing production ofpharmaceuticals based on mammaliancells. Having acquired the Danish com-pany, DDS, in 2002, Alfa Laval cannow combine membrane filtration andcentrifugal separation. The productsare mutually complementary, andmembrane filtration technique hasalready been further developed and itsareas of application increased.
Life Science, which is a growing areaof operations within Alfa Laval, servesthe pharmaceutical, biotechnology,fermentation and health foods indus-tries. The company has developed anumber of products and solutions thatmeet the stringent safety and hygienerequirements applied by the superviso-ry authorities and the industries. Prod-ucts aimed at this market include cen-trifugal separators for advanced cellseparation, heat exchangers for con-densation and sterilization, and pumpsand valves for precise transport andflow control.
Life Science’s customer list includesmany of the major pharmaceuticalsgroups, such as Eli Lilly, GlaxoSmith-Kline and Genentech.
12
3
4
5
Segment distribution of sales in the ProcessTechnology Division1 Life Science2 Process Industry3 Energy & Environment4 Food Technology5 Parts & Service
Geographic distributionof sales in the ProcessTechnology Division1 Sweden2 Rest of EU3 Rest of Europe4 US5 Rest of North America6 Latin America7 Asia8 Other
1 26
45
6
7
8
3

22 · Alfa Laval 2003
Food Processing and HVAC postedstrong growth. The large installedbase of plate heat exchangers, separa-tors, pumps and valves demandsactive support in terms of spare partsand service from sales channels, in allindustrial applications.
New organization, new culture
Alfa Laval’s organization, based oncustomer-oriented divisions, has alsoaffected Parts & Service. The compa-ny’s sales outlets now have a jointorganization for this business, encom-passing Alfa Laval’s entire productoffering. This, combined with raisingthe competence and status of servicemanagers and staff, has resulted in anew culture and new perspective onservice. The new motto is to becomea genuine partner to customers, tap-ping the company’s skills and know-how to help them maintain and trimprocesses so they become as efficientand safe as possible – all these withthe view of improving profitability.
A large installed base of products
with long life spans
The large and expanding installedbase of products forms the solid plat-form for Parts & Service. Further-more, the products have long life-times, with heat exchangers having a typical lifetime of 5 to 20 years andseparators having a typical life span of10 to 20 years. Alfa Laval has a globalnetwork of about 70 service centersthat makes spare parts and servicesavailable to customers everywhere.
In 2003, Alfa Laval’s aftermarket con-tinued to grow, accounting for 26 per-cent of the Group’s total sales in theyear. Over the past few years, anincreasing proportion of Alfa Laval’srevenue has come from Parts & Service.In 1999, these operations comprised 22percent of Group sales.
Establishment of many new
service agreements
In 2003, Alfa Laval continued to devel-op the Parts & Service business in themore mature markets particularly inEurope and the US, to generate moreperformance agreements, therebystrengthening its long-term relation-ships with both large and small cus-tomers. During the year, Alfa Lavalsigned several new performance agree-ments, mostly with customers with anestablished fleet of separators. The per-formance agreements represent a majorbusiness potential for Alfa Laval.
During the year, the trend of sales wasfavorable in both Central and EasternEurope and Asia. This trend will have a favorable effect on the aftermarket. A large part of the growth is related togrowth in Alfa Laval’s installed machinefleet, but it is also due to the fact thatthe organization is continually develop-ing, is increasingly effective in its busi-ness development activities, and hasbroadened its offering to customers.
Strong trend in the marine area, in both
spare parts and service
Alfa Laval’s strong growth in the globalmarine market continued, both in spareparts and service. This applies particu-larly to original parts distributed fromAlfa Laval’s global network and supportfrom technical service centers.
Parts & Service
Continued growth
20
25
30
03020100
Parts & Service share of Group’s total sales, %
Percentage of Group’s employeesemployed in Parts & Service
26 %
17 %
Percentage of Group sales generatedthrough Parts & Service
Par
ts&
Ser
vice
2000: 232001: 25
2002: 272003: 26
26%
17%
Alfa Laval 2003 · 23
Parts & Service
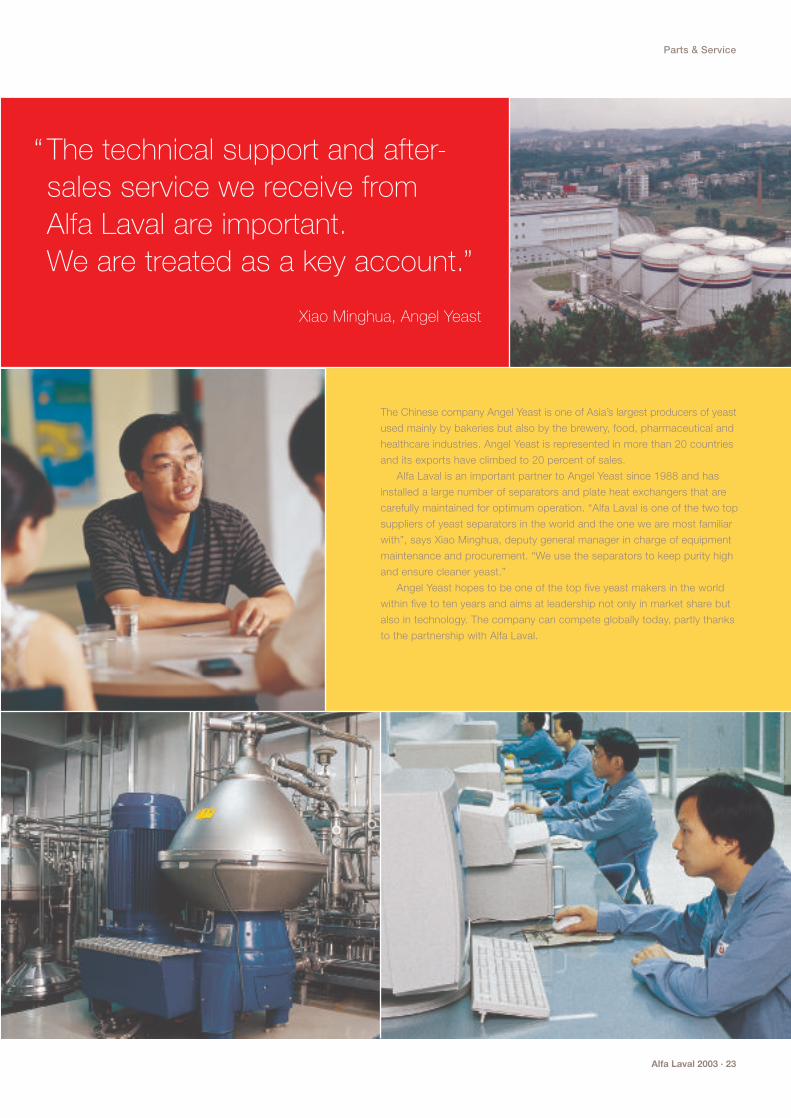
The Chinese company Angel Yeast is one of Asia’s largest producers of yeast
used mainly by bakeries but also by the brewery, food, pharmaceutical and
healthcare industries. Angel Yeast is represented in more than 20 countries
and its exports have climbed to 20 percent of sales.
Alfa Laval is an important partner to Angel Yeast since 1988 and has
installed a large number of separators and plate heat exchangers that are
carefully maintained for optimum operation. “Alfa Laval is one of the two top
suppliers of yeast separators in the world and the one we are most familiar
with”, says Xiao Minghua, deputy general manager in charge of equipment
maintenance and procurement. “We use the separators to keep purity high
and ensure cleaner yeast.”
Angel Yeast hopes to be one of the top five yeast makers in the world
within five to ten years and aims at leadership not only in market share but
also in technology. The company can compete globally today, partly thanks
to the partnership with Alfa Laval.
“ The technical support and after-sales service we receive from Alfa Laval are important. We are treated as a key account.”
Xiao Minghua, Angel Yeast

The Operations Division’sshare of Group employees
42 %
Ope
ratio
nsThe Operations Division
Further improvement in
delivery reliabilityManufacturing
Preparing for growth
Alfa Laval has 3,900 production employ-ees and 20* large manufacturing units,of which 12 are in Europe, six in Asiaand two in the US. During the past sev-eral years, global production has concen-trated on fewer, product-specialized fac-tories that are localized according to twocriteria: proximity to the market andcost benefits. High-value productsrequiring advanced technical know-howare manufactured in production centerslocated mainly in Western Europe, theUS and Japan.
In 2003, several production units wereengaged in preparing their capacity tocope with a higher order intake. It wasdecided to build an extension onto thefacility in Lund, which would costapproximately SEK 100 million, to boost
The Operations Division is a centralizedfunction that performs all manufacturing,purchasing and logistics functions with-in Alfa Laval. In centralizing these func-tions, the company aims to optimizedelivery reliability for customers,increase productivity, reduce operatingcosts and exploit economies of scale.
Alfa Laval believes it is necessary tohave a global perspective and coordi-nate purchasing, manufacturing andlogistics in order to create a reliableaccess to the company’s products in theworld market.
Focus on SixSigma
In 2003, the division launched a newfocus on SixSigma at its production units in Lund and Ronneby in Sweden.Toward the end of the year, the companybegan to introduce SixSigma at its unitsin Kolding, Denmark, and Alonte, Italy.
During the year, the production unitin Lund used SixSigma in its improve-ment activities – with favorable results.The target for 2003 was to save SEK 6million with the help of SixSigma. Atotal of SEK 6.4 million in cost savingswas the outcome.
To follow up process stability – a cen-tral concept of SixSigma – the unitintroduced a measurement databasethat measures the number of errors permillion runs. Once a month, the unitcarries out measurements of 55 parame-ters – for example, discards from a pressline, bottlenecks in key machines, latedeliveries and delays from suppliers.
Considerable effort has been devotedto identifying the right parameters andways of measuring them.
* Pertains to the largest production plants.The Grouphas a number of other manufacturing facilities.
42%

Alfa Laval 2003 · 25
The Operations Division
Highlights of 2003
• Further improvement in delivery reliability,particularly in the Sanitary segment in the US.
• Focus on SixSigma, starting at the Swedishunits in Lund and Ronneby.
• Investments to prepare for higher orderintake, and decision to extend productionfacility in Lund for approximately SEK 100million.
• Launching of new cost-savings phase in production purchasing, to achieve furtherimprovements and savings.
capacity and improve logistics. Workon the addition, which started duringthe second half of 2003, is expected tobe complete during the second quarterof 2005. The costs of the investmentwill be charged mainly to 2004. Othermajor capacity investments were under-taken in China and India.
Logistics
Improved delivery structure in the US
Efforts to introduce the One4AL systemin Western Europe continued. One4ALis a system that simplifies the flow fromorder to delivery and invoicing in acomprehensive manner. The systemmakes it possible to distribute goodsdirectly from the factory to the cus-tomer. Order processing, booking,delivery and invoicing occur in an inte-grated, transparent process so that salescompanies and customers can easilytrack the flow. Apart from offering better service to customers, the systemfrees up valuable sales and marketingresources in the sales companies.
One of the largest projects in theOperations Division in 2003 was thestreamlining of the delivery chain inthe US, particularly in the Sanitary segment. In 2003, the segment focusedparticularly on streamlining control ofthe delivery chain, including order andlogistics solutions. A joint project withthe sales company, this effort in combi-nation with a review of the product
program and supplier developmentresulted in a clear improvement in thecompany’s delivery capability in NorthAmerica.
New distribution centers were openedin Japan and China to supply Asia withproducts and spare parts. In Kolding,Denmark, preparation commenced forthe startup in 2004 of a new logistics system for the entire logistics function.The aim of the new system is to furtherimprove the delivery capability andstreamline distribution.
Purchasing
Volume advantages through
fewer suppliers
The company has centralized purchasingby assigning six units for the variousraw-material groups to be in charge ofdeveloping suppliers and handling con-tracts. Apart from reducing the numberof suppliers and deliveries, a relocationprocess, patterned after that of manufac-turing, is under way.
In 2003, the division also introduced atool box to enable units to review andimprove suppliers’ delivery reliability ina systematic way. The purchasing organi-zation introduced systems to promotecontinuous improvement, focusing on anumber of key parameters, to increasecompetitiveness.
In 2003, Alfa Laval acquired the Danish company Tofte-jorg; the specialist and mar-ket leader in advanced tankcleaning equipment. The pictures shows how all fin-ished Toftejorg products areput through a rigorous test-ing process to ensure thatthey meet the company’suncompromising standards.

26 · Alfa Laval 2003
Human Resources
Optimizing
knowledge and skills– time and time again
Alfa Laval University
Alfa Laval’s business concept is “To optimize the performance of our cus-tomers’ processes. Time and time again.”In line with this, the goal of Alfa LavalUniversity is “To optimize the knowledgeand skills of our employees. Time andtime again.”
University structure
Alfa Laval University is an umbrellaterm for all training activities withinthe Alfa Laval Group. Much of theinternal training is held in Sweden andDenmark, where many R&D centersand business units are located, althoughextensive training is also conducted inother parts of the world. The majorityof training is led by specialists and linemanagers as part of their regular duties.Internal training is supplemented withcourses that use external instructorsand mentors.
To ensure that training efforts withinAlfa Laval University support theGroup’s business concept and strate-gies, a board has been appointed tosupport and inspire the University. Theboard comprises four members of AlfaLaval’s executive management and twoexternal university professors. Havingexternal board members enables AlfaLaval University to stay betterinformed about the best educationalprograms in the market and aboutdevelopments within other industriesand academic institutions.
Alfa Laval University is divided intothree faculties, each focusing on a dif-ferent core area of expertise:• Sales and marketing• Technology• Management
Alfa Laval University – activities in 2003
The primary focus in 2003 was on theGroup’s growth strategy. As a result, Alfa Laval University developed furthertraining to support this strategy and alsodesigned new processes and trainingprograms.
The Intellectual Potential
Together with Carl-Henric Nilsson,Assistant Professor at Lund University,Alfa Laval continued to develop “TheIntellectual Potential” during 2003 (formore detailed information, please seethe Annual Report for 2002). The Intel-lectual Potential is a tool for identifyingthe development needs linked to anindividual segment’s growth strategy.
The Intellectual Potential asks fivequestions related to a business unit’sglobal business linked to its strategy.
• Do we have the right people with theright skills?
• Are our business processes sufficientfor the company to achieve its strate-gic goals?
• Is our organization innovative enough?• Do we have sound relationships
with customers, suppliers and strategic partners?
• How productive is our organization?
The Intellectual Potential is a task-ori-ented method whereby the managementof the business unit follows a three-stepprocess:
• Strategy follow-up. Take action to ensurethat everyone understands the strate-gy, believes in it and receives the nec-essary support from management.
• Review key processes in the entire valuechain. Take action to eliminate anyknowledge gaps or misunderstandings.
1
2
Gender division, %1 Men 802 Women 20
Geographic distribution(Average number of employees in 2003)
Ten largest countries1 Sweden 1,9412 Denmark 1,0983 India 1,0314 US 7425 France 5996 Italy 4847 China 4118 UK 3349 Germany 25610 Russia 235
Other 2,063Total 9,194
0302010099
Average number of employees1999: 11,6962000: 11,0012001: 9,6932002: 9,2922003: 9,194
12,000
10,000
8,000

Alfa Laval 2003 · 27
• Identify the indicators that showwhether each part of the businessprocess is working satisfactorily. Takeaction in the form of skills develop-ment initiatives or personnel changesin any areas where performance isunsatisfactory.
Accelerator
A new tool that is mandatory for allsalespeople. The process, used to plansales activities, sums up individual salesactivities and goals and specifies whichskills development initiatives arerequired. Sales activities and resultswithin a sales company can be summa-rized using standardized Key Perfor-mance Indicators (KPIs).
Connect
Connect is a new market planningprocess that ensures that sales activitiesat the sales companies and individualactivity plans in Accelerator are linkedto the growth strategy. At the sametime, Connect ensures that perceivedmarket opportunities are communi-cated back to the relevant segment sothat business planning and strategiescan be continually developed. During2003, Connect was introduced in allsegments and sales companies globally.
Training for new sales recruits
Training for new sales recruits is held inSweden on a quarterly basis. Every newmember of the sales organization isprovided with an opportunity to hearand discuss the Group’s strategy direct-ly with the President and other mem-bers of executive management and keyemployees. New sales recruits are giventheoretical and practical training inhow to use Accelerator to plan theirsales activities. They then take part in atailor-made training program on howto plan sales activities for the specificproduct and applications they areexpected to sell. During 2003, 65 newlyrecruited salespersons were trained inthis manner.
Sales and technical training for
experienced sales personnel
This is the largest part of the training.In 2003, 112 courses were held withinthe Group for a total of 1,056 partici-
Human Resources
pants from 41 countries. The averagelength of the training was three days.During 2002 and 2003, the effectivenessof this training was evaluated andimprovements implemented. All coursesare now evaluated in accordance withstandardized criteria and the feedback isthen used in the training and selectionof teachers.
Dialogue for growth
Managers and specialists are appointedto form a working committee that meetsto discuss and solve growth-related prob-lems and opportunities. Each meeting isattended by a representative of the exec-utive management and a representativefrom a company from another industrythat has handled and utilized similargrowth opportunities. Three “Dialoguesfor Growth” were held in 2003.
Number of employees
The Alfa Laval Group had a total of9,358 employees at December 31, 2003,an increase of 233 compared with a yearearlier. In 2003, 457 employees joinedthe Group through acquisitions.
0302010099
Sales per employee, SEK M1999: 1.23 2000: 1.37 2001: 1.63 2002: 1.57 2003: 1.51
* Average no. of employees.
2.0
1.0
0.0

Leadership on the seven seas
Message in a bottle: More than half of the ships in the world are equipped with Alfa Laval products
and solutions. For the benefit of the ship itself: cleaning, conditioning and handling of fuel and lube
oil. For the benefit of passengers and crew: purification of sea water, and air-conditioning systems
to create the perfect climate on board. For the benefit of the environment: effective tank cleaning,
advanced waste management, and economies in the use of energy.
But Alfa Laval’s involvement in the marine industry goes further than that. Alfa Laval has a
worldwide network for marine service in all major ports and provides the necessary assistance for
ship owners who want their fleet to be moving full steam ahead.
28 · Alfa Laval 2003

Alfa Laval AB (publ) Annual report 2003
Board of
ReportDirectors’
Alfa Laval 2003 · 29

30 · Alfa Laval 2003
The Board of Directors and the President of Alfa LavalAB (publ) hereby submit their annual report for the yearof operation January 1, 2003 to December 31, 2003.
Alfa Laval AB is a public limited liabilitycompany. The seat of the Board is inLund and the company is registered inSweden under corporate registrationnumber 556587-8054. The visitingaddress of the head office is Rudeboks-vägen 1 in Lund and the postal addressis Box 73, 221 00 Lund, Sweden.
Ownership and legal structure
Alfa Laval AB (publ) is the parent com-pany of the Alfa Laval Group.
The company had 7,254 (5,746) share-holders on December 31, 2003. The twolargest owners are Industri Kapital andTetra Laval, where 17.9 (26.9) percentare owned by the partnerships that arecontrolled by Industri Kapital 2000 Ltd,United Kingdom and 17.7 (17.7) per-cent are owned by Tetra Laval B.V., the Netherlands. On October 29, 2003Industri Kapital has decreased the own-ership in Alfa Laval by 9.0 percentageunits from 26.9 percent. Next to the two largest owners there are eight insti-tutional investors with ownership in the range of 4.5 to 1.7 percent. Theseten largest owners own 60.1 percent ofthe shares.
Operations
The Alfa Laval Group is engaged in thedevelopment, production and sales ofproducts and systems based on threemain technologies: separation/filtration,heat transfer and fluid handling. AlfaLaval’s primary segments are the twodivisions “Equipment” and “ProcessTechnology”, where the sales and mar-keting activities are performed. Thedivisions are based on ten customer segments. The customer segments thatbelong to the Equipment division pur-chase products whereas the customersegments that belong to Process Tech-
nology purchase systems for the pro-cessing industry. The Group also has acommon function “Operations” forprocurement, production and logistics.The Group’s secondary segments aregeographical markets.
Sale of business
On December 5, 2003 an asset purchaseagreement was signed between the sub-sidiary Tri-Lad Inc. in Canada and localmanagement of the company wherebyall non-financial assets were sold tolocal management. The closing date isJanuary 30, 2004. Tri-Lad Inc. is sellingequipment to the oil and gas industryand was a non-core activity within Alfa Laval. It has been up for sale sinceseveral years.
The divestment of the operationcalled Industrial Flow was made onApril 2, 2001. The sales price was SEK330.6 million. In the annual report for2001, a realised gain of SEK 10.0 mil-lion was recognised. A few activitiesremained before the divestment couldbe completed. During September 2002a final settlement was made with thebuyer, resulting in an increase of therealised gain by SEK 14.0 million.These items have been reported ascomparison distortion items. During2000, Industrial Flow had net sales ofSEK 655.5 million and 689 employees.
Sale of real estate
On February 26, 2003 the property inNewmarket in Canada was sold for SEK 20.0 million, with a realised gainof SEK 3.6 million. In connection withthe construction of a new headquarterbuilding in Lund a piece of land wassold to the new landlord for SEK 3.8million with a realised gain of SEK 2.0million. These disposals are reported as
comparison distortion items in theincome statement. The sale of theproperty in Kenosha in Wisconsin hasbeen delayed due to the situation onthe real estate market in the US. Otherproperties in Spain, Brazil, Canada,Denmark, Wales and Peru are alsoplanned for sale.
The sale of the property in Warmin-ster, the United States was completedin March 2002 at a price of SEK 62.1million and with a realised loss of SEK -43.2 million. The real estate inJohannesburg in South Africa wasdivested in May 2001. The sales pricewas SEK 13.6 million resulting in arealised loss of SEK -0.3 million. Thesale of the real estate in Glinde in Germany was completed in October2001 at a price of SEK 196.4 million,with a realised loss of SEK -8.3 million.In addition, some smaller properties in Spain and Sweden and one condo-minium in Sweden were sold in 2001for a total of SEK 14.2 million, with arealised gain of SEK 3.9 million.
Purchase of business
On October 2, 2003, Alfa Laval acquiredthe Life Science division, bioKinetics,from Kinetics Group Inc. in the US for SEK 215 million corresponding toapproximately six times expected EBITfor 2003. The Kinetics Group Inc. wastaken private in August 2000 in an in-vestor led buy-out from United StatesFilter Corporation.
bioKinetics is a North Americanleader in technology-driven integratedprocess solutions for the biotech andpharmaceutical industries. bioKinetics’main products are modular designsthat mainly focus on mammalian cellcultures. These modules are predomi-nantly bioreactor modules, but also

Alfa Laval 2003 · 31
modules for cell harvesting, purificationand bio-deactivation. In the bioKineticscustomer base leading pharmaceuticaland biotech companies such as Amgen,IDEC, Lonza and Merck can be found.
Life Science, defined as pharmaceuticaland biotech, is a market where Alfa Lavalalready today is active with all coreproducts. However, as the Life Sciencemarket shows a very high growth AlfaLaval has to secure that the potential iscaptured. The operations are reportedas a part of the Process TechnologyDivision.
bioKinetics is headquartered inPhiladelphia, PA with additional opera-tions in North Carolina and Californiain the US and Toronto in Canada. Thedifference between the purchase pricepaid and the net assets acquired is SEK143.6 million. SEK 22.3 million of thishas been allocated to patents and un-patented know-how, while the residualSEK 121.3 million has been allocated to goodwill. The goodwill is amortisedover 10 years. bioKinetics has approx400 employees and net sales of approx-imately SEK 550 million.
As earlier communicated Alfa Lavalsuspects irregularities in the accountingwith regard to revenue recognition forcertain customer projects in bioKinetics.Alfa Laval has therefore initiated a fur-ther investigation specifically address-ing the suspected irregularities. Thepreliminary findings from this inves-tigation support the suspicions. AlfaLaval has as a consequence decided to initiate new negotiations with theformer owner Kinetics Group Inc.
On January 31, 2003, the DanishToftejorg A/S Group was acquired, witheffect from January 1, 2003. The opera-tions cover R&D, assembly and sales of advanced tank cleaning equipment,targeting the Food and Marine indus-tries. In addition to the operations inDenmark, the Toftejorg Group hadsales companies in Sweden, Norway,Germany, the UK, France, Singapore,the United States and its own represen-tation in South Korea. The operationsare integrated into the Equipment Division. The difference between thepurchase price paid and the net assetsacquired is SEK 33.9 million. SEK 0.9million of this has been allocated to aproperty in the US, while the residual
SEK 33.0 million has been allocated togoodwill. The goodwill is amortisedover 10 years. Toftejorg has annualsales of about SEK 210 million andapproximately 100 employees.
On September 4, 2002, Alfa Lavalacquired Danish Separation Systems A/S,specialists within membrane filtrationin the biotechnology, pharmaceuticaland food industries. The differencebetween the purchase price paid andthe net assets acquired was SEK 110.1million. This has entirely been allocatedto goodwill. This goodwill is amortisedover 20 years. The company has annualsales of about SEK 90 million and 65employees within R&D, manufacturingand sales.
A public offering for an additional 25 percent of the share capital in AlfaLaval (India) Ltd was made on July 14,2001. The offering to the minorityshareholders was a requirement accord-ing to law as a consequence of thechange of majority owner of Alfa Laval.The offering expired on August 14,2001 and resulted in Alfa Laval acquir-ing an additional 2.4 million sharescorresponding to 13.1 percent of thetotal number of shares. After the acqui-sition, Alfa Laval's shareholding is 64.1percent. The purchase of the additionalshares resulted in a cash payment ofSEK 87.3 million. The differencebetween the purchase price paid andthe net assets acquired was SEK 39.2million. This has been allocated togoodwill in its entirety. This goodwill is amortised over 20 years. During2001, Alfa Laval (India) Ltd had exter-nal net sales of SEK 530.8 million andon average 1,003 employees.
Orders received
Orders received amounted to SEK 3,750.4(3,501.4) million for the fourth quarter.Excluding exchange rate variations, theorder intake for the Group was 15.7percent higher than the fourth quarterlast year.
Orders received amounted to SEK14,145.3 (14,674.8) (15,893.9) millionduring 2003. Excluding exchange ratevariations, the order intake for theGroup was 4.9 percent higher than lastyear. Orders received from the aftermarket Parts & Service grew in absoluteterms for the fourth consecutive year
and were 26.1 (26.8) percent of thegroup's total orders received.
Order backlog
The order backlog at December 31,2003 was SEK 4,021.1 (4,340.1) million.Excluding exchange rate variations,the order backlog was 6.4 percenthigher than the order backlog at theend of 2002.
Net sales
Net sales of the Alfa Laval Groupamounted to SEK 4,086.3 (4,175.1) mil-lion for the fourth quarter of this year.Excluding exchange rate variations, theinvoicing was 6.6 percent higher thanthe fourth quarter last year.
Net sales of the Alfa Laval Groupamounted to SEK 13,909.3 (14,594.9)(15,829.6) million during 2003.Excluding exchange rate variations,the invoicing was 3.6 percent higherthan last year.
Segment reporting
Alfa Laval’s primary segments are thetwo divisions “Equipment” and “ProcessTechnology”. The divisions are basedon a split into a number of customersegments. The customer segments thatbelong to the Equipment division purchase products whereas the cus-tomer segments that belong to ProcessTechnology purchase systems for theprocessing industry. In addition, theGroup has a common function “Oper-ations” for procurement, manufactur-ing and logistics.
Divisional reporting
EQUIPMENT DIVISION
The Equipment division consists of sixcustomer segments: Comfort & Refrig-eration, Fluids & Utility Equipment,Marine & Diesel, OEM (Original Equip-ment Manufacturers), Sanitary Equip-ment and the aftermarket segmentParts & Service.
Orders received and net sales (all comments are after adjustment for exchange rate fluctuations)
Orders received increased by 7.1 percentand net sales increased by 3.7 percentduring 2003 compared to last year.
All customer segments in the Equip-ment division, have reported anincrease in orders during 2003 com-

32 · Alfa Laval 2003
pared to 2002. Orders received for thefourth quarter 2003 were well above thefourth quarter last year for all segmentsgiving an increase for the quarter of16.8 percent for the division as a whole.The organic growth in the fourth quar-ter was 14.9 percent.
Applications such as marine, comfortand industrial original equipment man-ufacturers have shown a strong demandduring most of the year. Channels inthe Sanitary segment such as contractorsand end-users have also developed well.
Parts & Service has continued to growalso in the last quarter of 2003. Thegrowth came out of industrial applica-tions as well as marine.
As orders exceeded sales, the divisionwill start 2004 with an order backloggreater than the opening backlog for2003. This is general for all segments,but the increase is greater for marine.
Operating income
Operating income was SEK 1,010.9(1,098.8) million in 2003. The decreasein operating income during 2003 isdue to higher gross margin by SEK 27.7million (out of which fx-transactiondifferences of about SEK -79.5 million),higher costs for research and develop-ment by SEK -10.0 million and forother overhead by SEK -38.1 millionand a negative translation impact fromexchange rates by SEK -67.5 million.The increase in other overhead islinked to the acquisition of Toftejorg.
PROCESS TECHNOLOGY DIVISION
The Process Technology division con-sists of five customer segments: Energy& Environment, Food Technology, LifeScience, Process Industry and the after-market segment Parts & Service.
Orders received and net sales (all comments are after adjustment for exchange rate fluctuations)
Orders received increased by 2.3 per-cent and net sales increased by 3.6 per-cent during 2003 compared to lastyear. The increase in orders as well assales was largely coming from theacquisition of bioKinetics.
The division reported an increase inorders during the fourth quarter of 8.1percent exclusive of acquisitions com-pared to the corresponding period lastyear. This is seen as a definite change
in demand for all capital sales segmentsexcept Process Industry. Includingacquisitions orders received increased by12.7 percent during the fourth quarter.
For the full year 2003 all segments butProcess Industry have reported growth.Applications like vegetable oil, environ-ment and beverages have reported themost significant increases in orderscompared to 2002. Parts & Service hasreported another year of growth.
As orders exceeded sales, the openingbacklog for 2004 is greater than thebacklog going into 2003.
Operating income
Operating income was SEK 351.5 (537.5)million in 2003. The decrease in oper-ating income during 2003 is due tolower gross margin by SEK -187.3 mil-lion (consisting of fx-transaction differ-ences of about SEK -72.5 million andthe remainder a combination of lowervolume, changed mix and price), high-er costs for research and developmentby SEK -1.8 million and lower costs forother overhead by SEK 54.2 millionand a negative translation impact fromexchange rates by SEK -51.1 million.
OPERATIONS DIVISION AND OTHER
Operations are responsible for procure-ment, production and logistics. Otheris referring to corporate overhead andnon-core businesses.
Operating income was SEK -229.5 (-387.6) million in 2003. The increasein operating income during 2003 is dueto higher gross margin by SEK 33.7 million, contributions to Alfa LavalPension fund with SEK 48.9 million, areceivable on insurance captive (prop-erty and business interruption insur-ance) brought to income with SEK 18.0million and lower costs for other over-head by SEK 57.5 million.
Reporting by geographical markets
The Group’s secondary segments aregeographical markets. All commentsare after considering exchange ratevariations.
Orders received
Orders received increased in Centraland Eastern Europe and Asia andincreased somewhat in North Americaand Latin America during 2003. Oceania
and Africa reported decreased ordersreceived, whereas the orders receivedfor Western Europe and the Nordiccountries were slightly below the levelof last year.
Net sales
The invoicing increased in Central andEastern Europe, Asia, Latin Americaand Africa and increased somewhat inOceania during 2003. Net sales inWestern Europe were unchanged,whereas North America was below andthe Nordic countries slightly below thelevel of last year.
Personnel
The parent company does not haveany employees.
The Group has on average had 9,194(9,292) (9,693) employees. At the endof December 2002 the Group had 9,125employees. The number of employeeswas 9,358 on December 31, 2003. Theincrease compared to 2002 is due to the acquisitions of bioKinetics with356 employees and Toftejorg with 87employees at the end of 2003.
The distribution of employees percountry and per municipality in Swedenand between men and women can befound in Note 2 in the notes to thefinancial statements. The specificationof salaries, wages, remunerations, socialcosts and pension costs are provided in Note 3 in the notes to the financialstatements.
Research and development
As the result of an intensive and con-sistent commitment over many yearsto research and development, AlfaLaval has achieved a world-leadingposition within the areas of separationand heat transfer. The product devel-opment within fluid handling hasresulted in a strong position withinthe market for a number of products.In order to strengthen the Group’sposition and to support the organicgrowth, by identifying new applica-tions for existing products as well asdeveloping new products, research and development is an activity of highpriority. Research and development isconducted at approximately twentyfacilities around the world.

Alfa Laval 2003 · 33
The costs for research and developmenthas amounted to SEK 368.1 (355.2) (341.4)million, corresponding to 2.6 percent(2.4 percent) (2.2 percent) of net sales.At constant exchange rates, this repre-sents an increase by SEK 14.2 millionor 4.0 percent between 2003 and 2002.
Environment
The subsidiary, Alfa Laval Corporate AB,is involved in operational activities thatare subject to an obligation to reportand compulsory licensing according toSwedish environmental legislation.The permits mainly relate to the man-ufacturing of heat exchangers in Lundand Ronneby and the manufacturingof separators in Tumba and Eskilstuna.The external environment is effectedthrough limited discharges into the airand water and through waste and noise.
The foreign manufacturing sites with-in the Alfa Laval Group are engaged in operational activities with a similareffect on the external environment. Towhat extent this activity is subject toan obligation to report and/or compul-sory licensing according to local envi-ronmental legislation varies from coun-try to country. Alfa Laval has an overallintention to operate well within thelimits that are set by local legislation.
Asbestos-related lawsuits
in the United States
Alfa Laval’s subsidiary in the US, AlfaLaval Inc., was as of December 31,2003 named as co-defendant in a totalof 123 asbestos-related lawsuits with atotal of approximately 19,900 plain-tiffs. The lawsuits filed in Mississippiaccount for approximately 99 percentof all plaintiffs.
Alfa Laval strongly believes theclaims against the company are with-out merit and intends to vigorouslycontest each lawsuit.
After thorough investigations AlfaLaval continues to believe that poten-tial claims in connection with asbestosrelated lawsuits against Alfa Laval Inc.will be covered by insurance policies.Furthermore, primary insurance poli-cies issued in favour of Alfa Laval Inc.provide for coverage of its defence costs.
During the fourth quarter 2003 AlfaLaval Inc. has been named as co-defen-
dant in an additional nine lawsuitswith a total of 13 plaintiffs. During thefourth quarter seven lawsuits involvingapproximately 400 plaintiffs have beenresolved. This gives a grand total of 70 lawsuits that have been resolved.
Based on current information andAlfa Laval’s understanding of these law-suits, Alfa Laval continues to believethat these lawsuits will not have amaterial adverse effect on the compa-ny’s financial condition or results ofoperation.
Result for the parent company
The parent company’s result afterfinancial items was SEK 0.7 (-87.9) (-331.3) million, out of which compari-son distortion costs were SEK - (-14.1) (-) million, net interests were SEK 6.0(-94.2) (-244.4) million, realised andunrealised exchange rate gains andlosses SEK -0.1 (24.7) (-84.4) millionand fees to the Board and other administration costs the remaining SEK -5.2 (-4.3) (-2.5) million. Tax onreceived Group contribution was SEK171.8 (15.0) (-) million and deferredtax on unused tax losses SEK 4.5 (-) (-)million. Net income for the year wasSEK 177.0 (-72.9) (-331.3) million.
Unrestricted equity capital for
the parent company and the Group
The unrestricted equity capital of AlfaLaval AB (publ) was SEK 1,069.0 (673.7)(1,457.8) million.
The unrestricted equity capital of theAlfa Laval Group was SEK 891.2 (511.2)(1,407.8) million. The proposed dispo-sitions of earnings for the subsidiariessuggest transfers to restricted equitycapital of SEK 54.3 (22.0) (60.7) mil-lion. After deduction for this, the netavailable for distribution is thus SEK836.9 (489.2) (1,347.1) million.
Proposed disposition of earnings
The Board of Directors propose a divi-dend of SEK 4.00 (2.00) (-) per sharecorresponding to SEK 446.7 (223,3) (-)million and that the remaining incomeof SEK 622.3 (450.3) (1,457.7) millionbe carried forward, see page 86.
Events after the balance sheet date
The balance sheets and the income
statements will be adopted at the Annu-al General Meeting of shareholders onApril 27, 2004.
In a press release on January 27, 2004,the President and Chief Executive Offi-cer Sigge Haraldsson has communicatedhis intention to retire in October 2004.
The nomination committee proposesthat Gunilla Berg is elected as a memberof the Board and that Sigge Haraldssonis not re-elected at the coming AnnualGeneral Meeting.
Outlook 2004
In the fourth quarter and full year 2003report issued on February 16, 2004, thePresident and Chief Executive OfficerSigge Haraldsson stated:
“Markets recovered during the secondhalf of 2003 within most of the cus-tomer segments in which Alfa Laval isactive. It is our opinion that the recoverywill continue during 2004. Assumingthat the recovery will not be affected by unforeseen events in the world, webelieve in a strong increase in ordersreceived during 2004.
We assess that the EBITA-margin,excluding currency effects, will beimproved.”
Date for the next financial report
The interim report for the first quarter2004 will be published on April 27, 2004.

34 · Alfa Laval 2003
Successor Predecessor
Alfa Laval Alfa Laval Alfa Laval Alfa Laval Alfa Laval Alfa Laval Alfa Laval
pro forma Holding Holding Holding
SEK millions, unless otherwise stated 2003 2002 2001 2000 1999 1998 1997
PROFIT AND LOSS INFORMATION
Net sales 13,909.3 14,594.9 15,829.6 15,012.3 14,405.4 14,733.6 15,676.4
Comparison distortion items 5.6 -29.2 5.3 129.9 29.8 497.2 236.3
Operating income 1,138.5 1,219.5 1,231.4 810.1 248.9 772.4 562.5
Financial net -321.1 -542.6 -1,189.6 -1,106.6 -132.9 -204.8 -394.3
Result after financial items 817.4 372.1 41.8 -296.5 116.0 567.6 168.2
Minority share in subsidiaries’ income -41.6 -33.6 -32.0 -47.6 -26.7 -15.6 4.0
Taxes -130.0 -218.3 26.3 -60.6 -333.3 39.7 -278.8
NET INCOME FOR THE YEAR 645.8 120.2 36.1 -404.7 -244.0 591.6 -120.1
Balance sheet information
Goodwill 3,098.5 3,369.0 3,372.9 3,314.2 1,692.2 2,069.1 2,758.8
Other intangible assets 1,101.5 1,334.3 1,640.4 1,805.4 22.9 24.8 32.6
Property, plant and equipment 2,756.5 3,082.7 3,598.9 4,111.8 2,882.5 2,913.0 3,070.0
Financial long-term assets 670.7 751.9 1,102.4 1,094.5 324.4 635.1 135.9
Inventories 2,217.8 2,279.0 2,623.9 2,882.0 2,930.4 3,321.1 3,432.3
Current receivables 3,631.3 3,590.3 4,333.7 4,353.3 3,891.1 4,037.6 4,883.4
Current deposits 658.6 414.3 293.3 595.5 283.1 95.7 163.9
Cash and bank 554.6 605.9 666.4 634.5 677.0 550.7 506.2
TOTAL ASSETS 14,689.5 15,427.3 17,631.8 18,791.2 12,703.5 13,647.1 14,983.1
Equity capital 4,897.0 4,512.3 1,445.1 1,312.3 3,342.6 3,652.1 2,967.4
Minority interest 104.2 108.2 131.8 169.5 147.7 119.0 173.0
Provisions for pensions etc. 754.8 720.6 774.9 658.3 520.5 671.8 745.8
Provisions for taxes 817.0 990.3 1,143.6 1,413.1 199.1 182.0 240.0
Other provisions 891.2 989.3 1,063.2 1,179.1 949.7 0.0 0.0
Long-term liabilities 3,491.8 4,233.4 8,321.4 8,899.3 449.3 2,957.4 3,313.0
Current liabilities 3,733.5 3,873.3 4,751.6 5,159.6 7,094.7 6,064.8 7,543.9
TOTAL EQUITY CAP. & LIAB. 14,689.5 15,427.3 17,631.8 18,791.2 12,703.5 13,647.1 14,983.1
Seven-year overview

Alfa Laval 2003 · 35
SE
VE
N-Y
EA
R O
VE
RV
IEW
Successor Predecessor
Alfa Laval Alfa Laval Alfa Laval Alfa Laval Alfa Laval Alfa Laval Alfa Laval
pro forma Holding Holding Holding
SEK millions, unless otherwise stated 2003 2002 2001 2000 1999 1998 1997
KEY RATIOS
Orders received 14,145.3 14,674.8 15,893.9 15,374.4 13,896.8 13,865.7 14,551.3
Order backlog at year end 4,021.1 4,340.1 4,313.5 4,063.0 3,532.0 3,906.7 4,362.9
EBITA 1,632.6 1,726.2 1,743.3 1,289.8 964.0 1,462.1 1,252.2
EBITDA 1,925.7 2,057.5 2,143.6 1,756.0 1,439.8 1,957.9 1,776.6
EBITA-margin, % 11.7 11.8 11.0 8.6 6.7 9.9 8.0
EBITDA-margin, % 13.8 14.1 13.5 11.7 10.0 13.3 11.3
Adjusted EBITA 1,627.0 1,755.4 1,738.0 1,159.9 934.2 964.9 1,015.9
Adjusted EBITDA 1,920.1 2,086.7 2,138.3 1,626.1 1,410.0 1,460.7 1,540.3
Adjusted EBITA-margin, % 11.7 12.0 11.0 7.7 6.5 6.5 6.5
Adjusted EBITDA-margin, % 13.8 14.3 13.5 10.8 9.8 9.9 9.8
Profit margin, % 5.9 2.5 0.3 -2.0 0.8 3.9 1.1
Excl. Goodwill and step-up values:
Capital turnover rate, times 5.0 4.4 4.1 3.4 3.2 3.4 3.7
Capital employed 2,807.2 3,283.0 3,901.0 4,385.1 4,475.8 4,367.0 4,281.7
Return on capital employed, % 58.2 52.6 44.7 29.4 21.5 33.5 29.2
Incl. Goodwill and step-up values:
Capital turnover rate, times 1.8 1.7 1.7 1.9 2.3 2.2 2.4
Capital employed 7,667.2 8,564.5 9,401.2 8,010.8 6,356.5 6,781.0 6,631.4
Return on capital employed, % 21.3 20.2 18.5 16.1 15.2 21.6 18.9
Return on equity capital, % 13.2 2.7 2.5 -30.8 -7.3 16.2 -4.0
Solidity, % 33.3 29.2 8.2 7.0 26.3 26.8 19.8
Net debt 2,401.1 3,498.5 7,777.5 8,422.4 2,854.5 2,808.7 4,079.5
Debt ratio, times 0.49 0.78 5.38 6.42 0.85 0.77 1.37
Interest coverage ratio, times 5.0 3.0 1.9 1.6 5.9 6.2 4.1
Cash flow from:
operating activities 1,653.5 1,923.8 1,998.7 1,630.4 1,324.4 558.5 -491.5
investing activities -457.4 -547.8 114.9 -8,284.0 -599.5 -189.2 -3,168.9
financing activities -1,167.2 -1,320.3 -2,095.0 6,617.9 -586.4 -324.8 3,420.5
Investments 258.5 276.7 274.9 311.7 431.2 438.4 485.9
Average number of employees 9,194 9,292 9,693 11,001 11,696 12,613 13,704
Earnings per share, SEK 5.78 1.41 0.96 -10.79 -19.52 47.30 -4.00
Cash earnings per share, SEK 0.26 0.65 0.50 -0.95 11.08 3.56 -7.99

36 · Alfa Laval 2003
Consolidated cash-flow statements
Jan 1– Dec 31 Jan 1– Dec 31 Jan 1– Dec 31Amounts in SEK millions Note 2003 2002 2001
Cash flow from operating activities
Operating income 1,138.5 1,219.5 1,231.4
Adjustment for depreciation 787.2 838.0 912.2
Adjustment for other non-cash items 22.1 35.0 3.9
1,947.8 2,092.5 2,147.4
Taxes paid -268.6 -396.2 -462.9
Cash flow from operations before working capital 1,679.2 1,696.3 1,684.5
Changes in working capital:
(Increase)/decrease of current receivables -25.4 339.3 230.3(Increase)/decrease of inventories -17.2 140.4 263.1Increase/(decrease) of liabilities 16.9 -252.2 -179.1
-25,7 227,5 314,2
Cash flow from operating activities 1,653.5 1,923.8 1,998.7
Cash flow from investing activities
Investments in fixed assets -258.5 -276.7 -274.9
Divestment of fixed assets 40.1 120.7 336.2
Additional purchase price - -367.5 -
Acquisition of businesses 24 -289.5 -135.7 -58.5
Reduction of purchase price 24 - 81.6 76.3
Divestment of businesses 24 - - 281.6
Provisions 50.5 29.8 -245.8
Cash flow from investing activities -457.4 -547.8 114.9
Cash flow from financing activities
Financial net, paid -231.1 -973.3 -697.0
New issue of shares - 3,136.6 -
Dividends -223.3 - -
(Increase)/decrease of other financial assets -256.9 -84.2 306.6
Capitalised financing costs, acquisition loans - -39.7 -
Increase/(decrease) of liabilities to credit institutions 27 -455.9 -3,359.6 -1,704.6
Cash flow from financing activities -1,167.2 -1,320.3 -2,095.0
Net increase (decrease) in cash and bank 28,9 55,7 18,7
Cash and bank at the beginning of the year 605.9 666.4 634.5
Translation difference in cash and bank -80.2 -116.2 13.2
Cash and bank at the end of the period 23 554.6 605.9 666.4
Cash flow per share, SEK 0.26 0.65 0.50
Average number of shares* 111,671,993 85,482,322 37,496,325
* The average number of shares has been changed through split and new issue of shares. See a specification in the statement over “Changes in consolidated equity capital”.

Alfa Laval 2003 · 37
For further comments on certain indi-vidual lines in the cash-flow statements,reference is made to Notes 23, 24 and 27.
Cash flow
Cash flow from operating and invest-ing activities amounted to SEK 1,196.1(1,376.0) (2,113.6) million during 2003,out of which divestments generatedcash of SEK 40.1 (120.7) (617.8) million.
Adjustment for other non-cash items
Other non-cash items are mainly refer-ring to realised gains and losses in con-nection with sale of assets. These haveto be eliminated since the cash impactof divestments of fixed assets and busi-nesses are reported separately undercash flow from investing activities. Theother non-cash items are in addition tothe non-cash impact of depreciationson the line above.
Working capital
Working capital increased by SEK 25.7million during 2003. The correspon-ding figure for 2002 and 2001 was adecrease by SEK 227.5 and 314.2 mil-lion respectively.
Investments
Investments in property, plant andequipment amounted to SEK 258.5(276.7) (274.9) million during 2003.Among the larger investments during2002 can be mentioned an expansionof the production facility in Richmond,Virginia in the US and capacity invest-ments for manufacturing of brazedheat exchangers. In connection withthe Group’s restructuring programme a number of factories have been closedand fixed asset have been redistrib-uted, which has resulted in a relativelylower investment level. Depreciation,excluding allocated step-up values,amounted to SEK 293.1 (331.3) (400.3)million during the year.
Additional purchase price
In connection with the IPO in 2002 an
CO
NS
OL
IDA
TE
D C
AS
H-F
LO
W S
TAT
EM
EN
TS
Comments to the consolidated cash-flow statements
additional purchase price of EUR 40.0million, corresponding to SEK 367.5million, was paid to Tetra Laval BV forthe original acquisition on August 24,2000 of the Alfa Laval Holding ABGroup. This has entirely been reportedas goodwill in the Group and is amor-tised over the same period as the origi-nal acquisition.
Acquisitions and disposals
For a further analysis of the impact onthe cash flow by acquisitions and dis-posals, see Note 24.
Purchase price reimbursement
The Alfa Laval Group has received SEK- (81.6) (76.3) million from Tetra LavalBV as a reduction of the purchase pricefor the acquisition of the Alfa LavalHolding AB Group. The reduction isrelated to the guarantees issued by thevendor in relation to taxes. The amounthas not had an impact on the goodwillfor the acquisition but has instead beenreported against the increased tax costthat the Group has experienced afterthe acquisition. The amount receivedduring 2002 constitutes a final settle-ment with Tetra Laval concerning theseguarantees.
New issue of shares
See the statement over “Changes inconsolidated equity capital” for a furtherdescription of the capitalisation of thecompany.
Cash earnings per share
Cash earnings per share are SEK 0.26(0.65) (0.50). The cash flows from oper-ating activities calculated per share areSEK 14.81 (22.51) (53.30). Cash flowsper share have been calculated basedon the average number of shares,which has been changed through splitand new issue of shares to 111,671,993(85,482,322) (37,496,325). There is nodilution effect since all warrants wereexercised in 2002, see Note 4.

38 · Alfa Laval 2003
Consolidated income statement
* The average number of shares has been changed through split and new issue of shares. See a specification in the statement over “Changes in consolidated equity capital”.
Jan 1– Dec 31 Jan 1– Dec 31 Jan 1– Dec 31Amounts in SEK millions Note 2003 2002 2001
Net sales 1 13,909.3 14,594.9 15,829.6
Cost of goods sold 9 -8,976.3 -9,262.2 -10,348.0
Gross profit 1 4,933.0 5,332.7 5,481.6
Sales costs 2, 3, 7 -2,245.8 -2,115.1 -2,442.6
Administration costs 2, 3, 6, 9 -870.1 -1,030.7 -789.2
Research and development costs -368.1 -355.2 -341.4
Comparison distortion items 8 5.6 -29.2 5.3
Other operating income 242.4 268.7 389.1
Other operating costs 9 -367.2 -664.0 -893.3
Amortisation of goodwill 9, 10 -191.3 -187.7 -178.0
Operating income 1,138.5 1,219.5 1,231.4
Dividends 11 6.9 7.8 9.6
Interest income 12 267.5 351.4 238.0
Interest expense 12 -595.5 -901.8 -1,437.2
Comparison distortion items 27 - -304.8 -
Result after financial items 817.4 372.1 41.8
Minority share in subsidiaries’ income 13 -41.6 -33.6 -32.0
Taxes on this year’s result 14 -110.2 -185.7 60.9
Other taxes 14 -19.8 -32.6 -34.6
Net income for the year 645.8 120.2 36.1
Earnings per share, SEK 5.78 1.41 0.96
Average number of shares * 111,671,993 85,482,322 37,496,325

Alfa Laval 2003 · 39
CO
NS
OL
IDA
TE
D IN
CO
ME
STA
TE
ME
NT
to SEK 1,627.0 (1,755.4) (1,738.0) mil-lion. The adjusted EBITA margin was11.7 (12.0) (11.0) percent. The adjustedresult after tax, excluding amortisationof goodwill and step-up values and thecorresponding tax, is SEK 9.34 (6.17)per share.
Compared with last year Alfa Lavalhas been affected negatively during2003 by exchange rate differences,both through translation differencesand through the net exposure whentrading in foreign currencies. The nega-tive effect on adjusted EBITA has beencalculated to totally about SEK 273(130) million, where of SEK 121 (80)million represent translation differ-ences, for the full year 2003 comparedwith last year. The main reason hasbeen the depreciation of the USD com-pared with SEK. The effect of theexchange rate variations has been lim-ited through exchange rate hedgingand through the distribution of thecompany’s financial debts in relationto its net assets in different currencies.
Net commercial exchange differenceshave amounted to SEK 268.8 (284.8)(137.7) million. These arise in connec-tion with delivery of goods and otheroperational activities and have therebyaffected the operating result.
A change programme called “BeyondExpectations” was introduced during1999. The restructuring programme hasbeen ahead of plan and was alreadyafter the third quarter 2003 on the levelexpected at the end of 2003. Based onachieving the estimated savings ofmore than SEK 850 million, the pro-gramme was closed after the third quar-ter. At the end of 2002, the achievedsavings amounted to about SEK 775million. In the income statement for 2003 there are savings correspon-ding to approximately SEK 800 (670)(450) million.
The year generated a gross profit ofSEK 4,933.0 (5,332.7) (5,481.6) mil-lion. Excluding the amortisation ofSEK 302.8 (319.0) (333.9) million onstep-up values, the adjusted gross prof-it is SEK 5,235.8 (5,651.7) (5,815.5)million. This corresponds to 37.6(38.7) percent of net sales.
Sales and administration expensesamounted to SEK 3,115.9 (3,145.8)(3,231.8) million. Excluding exchangerate variations, these expenses were 2.7percent higher than last year. However,excluding acquired activities sales andadministration expenses were on aboutthe same level as last year.
The costs for research and develop-ment have amounted to SEK 368.1(355.2) (341.4) million, correspondingto 2.6 percent (2.4 percent) (2.2 percent)of net sales. At constant exchange rates,this represents an increase by SEK 14.2million or 4.0.percent between 2003and 2002.
Adjusted EBITDA amounted to SEK1,920.1 (2,086.7) (2,138.3) million forthe year. The adjusted EBITA amounted
Comments to the consolidated income statement
For comments on the individual lines in the income statement, reference is madeto Notes 1 to 14 and Note 27. For comments on the segments, see note 1.
As a basis for comments on the various main items of the income statement,please find a comparison between the last three years:
Income statement analysis* Oct 1–Dec 31 Oct 1–Dec 31 Oct 1–Dec 31 Jan 1– Dec 31 Jan 1– Dec 31 Jan 1– Dec 31
SEK millions 2003 2002 2001 2003 2002 2001
Net sales 4,086.3 4,175.1 4,738.6 13,909.3 14,594.9 15,829.6
Adjusted gross profit 1,385.0 1,539.1 1,679.5 5,235.8 5,651.7 5,815.5- in % of net sales 33.9 36.9 35.4 37.6 38.7 36.7
Expenses -846.5 -922.3 -1,080.2 -3,315.7 -3,565.0 -3,677.2- in % of net sales 20.7 22.1 22.8 23.8 24.4 23.2
Adjusted EBITDA 538.5 616.8 599.3 1,920.1 2,086.7 2,138.3- in % of net sales 13.2 14.8 12.6 13.8 14.3 13.5
Depreciation -75.5 -81.8 -103.3 -293.1 -331.3 -400.3
Adjusted EBITA 463.0 535.0 496.0 1,627.0 1,755.4 1,738.0- in % of net sales 11.3 12.8 10.5 11.7 12.0 11.0
Amortisation of goodwill ** -124.5 -125.9 -127.9 -494.1 -506.7 -511.9
Comparison distortion items 2.0 -0.7 5.3 5.6 -29.2 5.3
EBIT 340.5 408.4 373.4 1,138.5 1,219.5 1,231.4
* For definitions, see backcover. ** Including amortisation of step-up values.
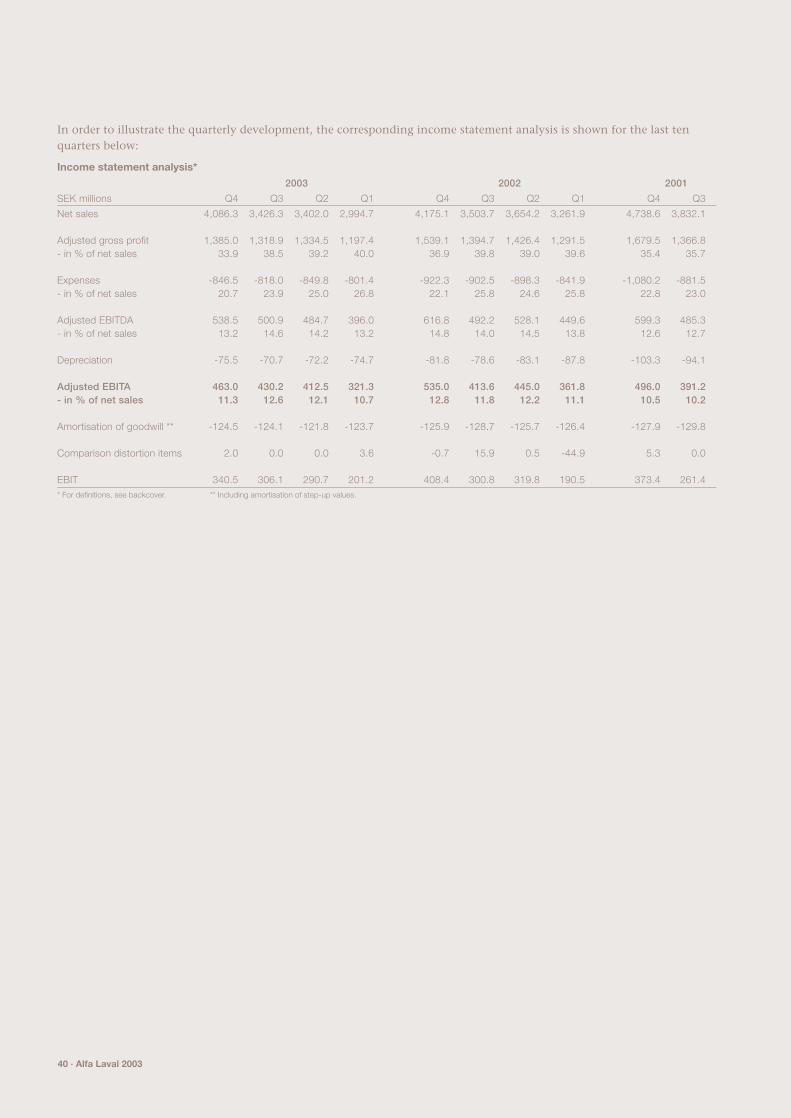
40 · Alfa Laval 2003
Income statement analysis*
2003 2002 2001
SEK millions Q4 Q3 Q2 Q1 Q4 Q3 Q2 Q1 Q4 Q3
Net sales 4,086.3 3,426.3 3,402.0 2,994.7 4,175.1 3,503.7 3,654.2 3,261.9 4,738.6 3,832.1
Adjusted gross profit 1,385.0 1,318.9 1,334.5 1,197.4 1,539.1 1,394.7 1,426.4 1,291.5 1,679.5 1,366.8- in % of net sales 33.9 38.5 39.2 40.0 36.9 39.8 39.0 39.6 35.4 35.7
Expenses -846.5 -818.0 -849.8 -801.4 -922.3 -902.5 -898.3 -841.9 -1,080.2 -881.5- in % of net sales 20.7 23.9 25.0 26.8 22.1 25.8 24.6 25.8 22.8 23.0
Adjusted EBITDA 538.5 500.9 484.7 396.0 616.8 492.2 528.1 449.6 599.3 485.3- in % of net sales 13.2 14.6 14.2 13.2 14.8 14.0 14.5 13.8 12.6 12.7
Depreciation -75.5 -70.7 -72.2 -74.7 -81.8 -78.6 -83.1 -87.8 -103.3 -94.1
Adjusted EBITA 463.0 430.2 412.5 321.3 535.0 413.6 445.0 361.8 496.0 391.2- in % of net sales 11.3 12.6 12.1 10.7 12.8 11.8 12.2 11.1 10.5 10.2
Amortisation of goodwill ** -124.5 -124.1 -121.8 -123.7 -125.9 -128.7 -125.7 -126.4 -127.9 -129.8
Comparison distortion items 2.0 0.0 0.0 3.6 -0.7 15.9 0.5 -44.9 5.3 0.0
EBIT 340.5 306.1 290.7 201.2 408.4 300.8 319.8 190.5 373.4 261.4* For definitions, see backcover. ** Including amortisation of step-up values.
In order to illustrate the quarterly development, the corresponding income statement analysis is shown for the last tenquarters below:

The result has been affected by compar-ison distortion items of SEK 5.6 (-29.2)(5.3) million, which are specified below.
On February 26, 2003 the property in Newmarket, Canada was sold for SEK 20.0 million, with a realised gain of SEK 3.6 million. In connection withthe construction of a new headquarterbuilding in Lund a piece of land wassold to the new landlord for SEK 3.8million with a realised gain of SEK 2.0million.
The sale of the property in Warmin-ster, the United States was completed at the end of March 2002 at a price ofSEK 62.1 million and with a realisedloss of SEK -43.2 million. The divest-ment of the operation called IndustrialFlow was made on April 2, 2001. In theannual report for 2001, a realised gainof SEK 10.0 million was recognised.A few activities remained before thedivestment could be completed. DuringSeptember 2002 a final settlement was made with the buyer, resulting in an increase of the realised gain bySEK 14.0 million.
During 2001 the following propertieswere sold. The real estate in Johannes-burg in South Africa was divested inMay. The sales price was SEK 13.6 mil-lion resulting in a realised loss of SEK -0.3 million. The sale of the real estatein Glinde in Germany was completedin October for a price of SEK 196.4
million, with a realised loss of SEK -8.3 million. In addition, some smallerproperties in Spain and Sweden andone condominium in Sweden weresold for a total of SEK 14.2 million,with a realised gain of SEK 3.9 million.
The financial net has amounted toSEK -259.5 (-593.8) (-959.9) million,excluding realised and unrealisedexchange rate losses and gains. Themain elements of costs were intereston debt to the banking syndicate ofSEK -115.6 (-228.3) (-369.4) million,interest on the bond loan of SEK -132.0(-219.4) (-253.3) million, interest onthe loan from Tetra Laval Finance Ltdof SEK - (-97.1) (-244.5) million and a net of dividends and other interestincome and interest costs of SEK -11.9 (-49.0) (-92.7) million. Thedecrease in interests to the bankingsyndicate between 2003 and 2002 ismainly due the cancellation of the previous interest rate swaps that wererequested by the previous bankingsyndicate. The decrease in interests on the bond loan is due to the largeamortisation during 2002.
The net of realised and unrealisedexchange rate differences amounts toSEK -61.6 (51.3) (-229.7) million, outof which SEK -20.5 (130.4) million inthe fourth quarter.
In connection with the dissolutionof the pre-IPO capital structure in
2002, the income statement wascharged with non-recurring financialcosts of SEK -304.8 million. These consisted of the reversal of capitalisedfinancing costs of totally SEK -219.6million in connection with the repay-ment of the loan from Tetra LavalFinance Ltd, the replacement of theprevious syndicated loans and theamortisation of the bond loan as wellas the premium of SEK -85.2 million at the repayment of 35 percent of thebond loan of EUR 220 million.
The result after financial items wasSEK 817.4 (372.1) (41.8) million.
Income taxes were SEK -110.2 (-185.7)(60.9) million.
Earnings per share
Earnings per share are SEK 5.78 (1.41)(0.96). Earnings per share have beencalculated based on the average num-ber of shares, which has been changedthrough split and new issue of sharesto 111,671,993 (85,482,322)(37,496,325). Any dilution does notexist since all warrants have been exer-cised, see Note 4.
Alfa Laval 2003 · 41

42 · Alfa Laval 2003
Consolidated balance sheet
ASSETS
Amounts in SEK millions Note 2003 2002
Fixed assets
Intangible assets 15, 16
Concessions, patents, licenses, trademarks
and similar rights 1,100.8 1,333.6
Renting and similar rights 0.7 0.7
Goodwill 3,098.5 3,369.0
4,200.0 4,703.3
Property, plant and equipment 15, 17
Real estate 1,171.2 1,309.9
Machinery and other technical installations 858.5 990.1
Equipment, tools and installations 668.6 742.0
Construction in progress and advances to suppliers
concerning property, plant and equipment 58.2 40.8
2,756.5 3,082.7
Financial long-term assets
Other long-term securities 18 22.5 53.1
Pension assets 25 126.7 106.8
Capitalised financing costs, acquisition loans 44.6 58.0
Deferred tax asset 476.9 534.1
670.7 751.9
Total fixed assets 7,627.2 8,537.9
Current assets
Inventories 19 2,217.8 2,279.0
Current receivables
Accounts receivable 20 2,463.3 2,504.0
Other receivables 21 1,070.4 973.9
Prepaid costs and accrued income 85.4 100.2
Capitalised financing costs, acquisition loans 12.2 12.2
3,631.3 3,590.3
Current deposits
Other current deposits 22 658.6 414.3
Cash and bank 23 554.6 605.9
Total current assets 7,062.3 6,889.4
TOTAL ASSETS 14,689.5 15,427.3
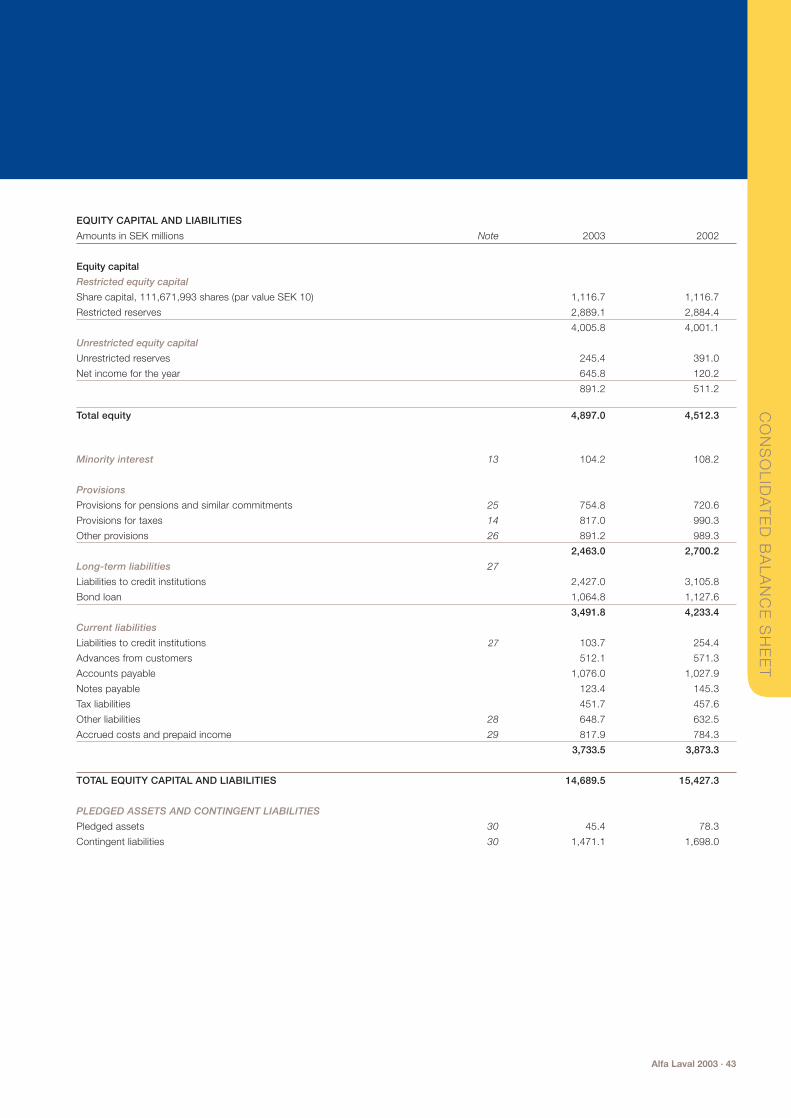
Alfa Laval 2003 · 43
EQUITY CAPITAL AND LIABILITIES
Amounts in SEK millions Note 2003 2002
Equity capital
Restricted equity capital
Share capital, 111,671,993 shares (par value SEK 10) 1,116.7 1,116.7
Restricted reserves 2,889.1 2,884.4
4,005.8 4,001.1
Unrestricted equity capital
Unrestricted reserves 245.4 391.0
Net income for the year 645.8 120.2
891.2 511.2
Total equity 4,897.0 4,512.3
Minority interest 13 104.2 108.2
Provisions
Provisions for pensions and similar commitments 25 754.8 720.6
Provisions for taxes 14 817.0 990.3
Other provisions 26 891.2 989.3
2,463.0 2,700.2
Long-term liabilities 27
Liabilities to credit institutions 2,427.0 3,105.8
Bond loan 1,064.8 1,127.6
3,491.8 4,233.4
Current liabilities
Liabilities to credit institutions 27 103.7 254.4
Advances from customers 512.1 571.3
Accounts payable 1,076.0 1,027.9
Notes payable 123.4 145.3
Tax liabilities 451.7 457.6
Other liabilities 28 648.7 632.5
Accrued costs and prepaid income 29 817.9 784.3
3,733.5 3,873.3
TOTAL EQUITY CAPITAL AND LIABILITIES 14,689.5 15,427.3
PLEDGED ASSETS AND CONTINGENT LIABILITIES
Pledged assets 30 45.4 78.3
Contingent liabilities 30 1,471.1 1,698.0
CO
NS
OL
IDA
TE
D B
AL
AN
CE
SH
EE
T

Development of market prices for Alfa Laval’s bond loan
44 · Alfa Laval 2003
Comments on the consolidated balance sheet
For comments on the individual lines inthe balance sheet, reference is made toNotes 13 to 33. For comments on thesegments, see Note 1.
Development of market prices for
Alfa Laval’s bond loan
On November 9, 2000 Alfa Laval issueda bond loan of EUR 220 million. SeeNote 27. The development of the marketprices for the bonds has been as follows:
The development of the market pricesfor the bonds is depending on thedevelopment of the market rates andthe confidence in Alfa Laval.
Capital employed
The capital employed including good-will and step-up values amounted to SEK 7,667.2 (8,564.5) million at theend of the year.
Return on capital employed
The return on capital employed includ-ing goodwill and step-up values amount-ed to 21.3 (20.2) percent during 2003.
Capital turnover rate
The capital turnover rate calculated onthe average capital employed includinggoodwill and step-up values amountedto 1.8 (1.7) times for the year.
Return on equity capital
The net income for the year in relationto equity capital was 13.2 (2.7) percent.Due to the new issue of shares in May2002, the equity capital for 2002 hasbeen calculated as the average equitycapital after the new issue of shares.
Solidity
The solidity, that is the equity capitalin relation to total assets, was 33.3(29.2) percent at the end of the year.
Net debt
The net debt was SEK 2,401.1 (3,498.5)million at the end of the year.
Debt ratio
The debt ratio, that is the net debt inrelation to equity capital, was 0.49(0.78) times at the end of December.
90
95
100
105
110
115
120
125
2001 2002 2003 2004

Alfa Laval 2003 · 45
Changes in consolidated equity capital
Share Restricted Unrestricted Amounts in SEK millions capital equity equity Total
2001
Transfer between restricted equity and
unrestricted equity in Group companies - 36.9 -36.9 0.0
Translation difference - - 96.7 96.7
Net income for 2001 - - 36.1 36.1
As of December 31, 2001 0.4 36.9 1,407.8 1,445.1
2002
New issue of shares 366.8 2,769.8 - 3,136.6
Bonus issue of shares 749.5 - -749.5 0.0
Transfer between restricted equity and
unrestricted equity in Group companies - 76.9 -76.9 0.0
Translation difference - 0.8 -190.4 -189.6
Net income for 2002 - - 120.2 120.2
As of December 31, 2002 1,116.7 2,884.4 511.2 4,512.3
2003
Dividends - - -223.3 -223.3
Transfer between restricted equity and
unrestricted equity in Group companies - 4.3 -4.3 0.0
Translation difference - 0.4 -38.2 -37.8
Net income for 2003 - - 645.8 645.8
As of December 31, 2003 1,116.7 2,889.1 891.2 4,897.0
Specification of changes in number of shares and share capital
Change in Total Change in Total number number equity equity
Year Event Date of shares of shares capital capital
2000 Company formation March 27, 2000 10,000,000 10,000,000 0.1 0.1
New issue of shares August 24, 2000 27,496,325 37,496,325 0.3 0,.4
2002
Bonus issue of shares May 3, 2002 37,496,325 74,992,650 0.4 0.7
Bonus issue of shares May 16, 2002 - - 749.2 749.9
New issue of shares May 16, 2002 3,712,310 78,704,960 37.1 787.0
New issue of shares May 17, 2002 32,967,033 111,671,993 329.7 1,116.7
Specification of accumulated translation differences reported against equity capital
The change has
been affected by Year Change Accumulated Explanation to change hedging measures of
Formation of the Group
2000 -94.0 -94.0 The EUR was appreciated by 6 %, which affected the EUR based acquisition loans -312.5
2001 96.7 2.7 The USD was appreciated by 10.7 % -105.5
2002 -189.6 -186.9 The USD was depreciated by 16.7 % 164.9
2003 -37.8 -224.7 The USD was depreciated by 17.5 % 140.3
CH
AN
GE
S IN
CO
NS
OL
IDA
TE
D E
QU
ITY
CA
PITA
L
46 · Alfa Laval 2003
Comments on changes inconsolidated equity capital
The share capital of SEK 1,116,719,930(1,116,719,930) is divided among111,671,993 (111,671,993) shares at par value SEK 10 (10).
At an extraordinary shareholders’meeting on April 8, 2002 it was decidedto increase the share capital by SEK374,963 through a transfer of SEK374,963 from unrestricted equitycapital. The bonus issue of shares wasimplemented so that shareholdersreceived one new share for each oldshare. The reconciliation day for thebonus issue of shares was May 3, 2002.
The shareholders’ meeting decided –in consideration of the planned initialpublic offering – to change the Articlesof Association, such that the companyis a public company. It was also decidedthat the par value of each share shouldbe changed to SEK 10 and that the lim-its for the company’s share capital shallbe a minimum of SEK 745,000,000 anda maximum of SEK 2,980,000,000.
The shareholders’ meeting also decidedthat the company’s share capital shouldbe increased by SEK 749,176,574,through a transfer of SEK 749,176,574from unrestricted equity capital. Thebonus issue of shares was implementedthrough an increase of the par value ofeach share by SEK 9.99 to SEK 10.
At the new issue of shares in connec-tion with the IPO in 2002, 32,967,033new shares were issued, which increasedthe share capital by SEK 329,670,330.The subscription price was SEK 91.This means that the equity capitalincreased by SEK 3,000,000,003 whichafter deduction for transaction costs ofSEK 84,181,048 means a net increaseby SEK 2,915,818,955. Before the IPO,Alfa Laval management executed all3,712,310 warrants, which means acorresponding increase of the numberof shares and an increase of the sharecapital by SEK 37,123,100. The sub-scription price was SEK 59.48, whichmeans an increase of the equity capitalby SEK 220,793,851. In total the equitycapital increased by SEK 3,136,612,806.
The proposed dispositions of earn-ings for the subsidiaries suggest trans-fers to restricted equity capital of SEK54.3 (22.0) (60.7) million. After deduc-tion for this, the net available fordistribution is thus SEK 836.9 (489.2)(1,347.1) million.
The possibilities to distribute un-appropriated profits from foreign sub-sidiaries are limited in certain countriesdue to currency regulations and otherlegislation.
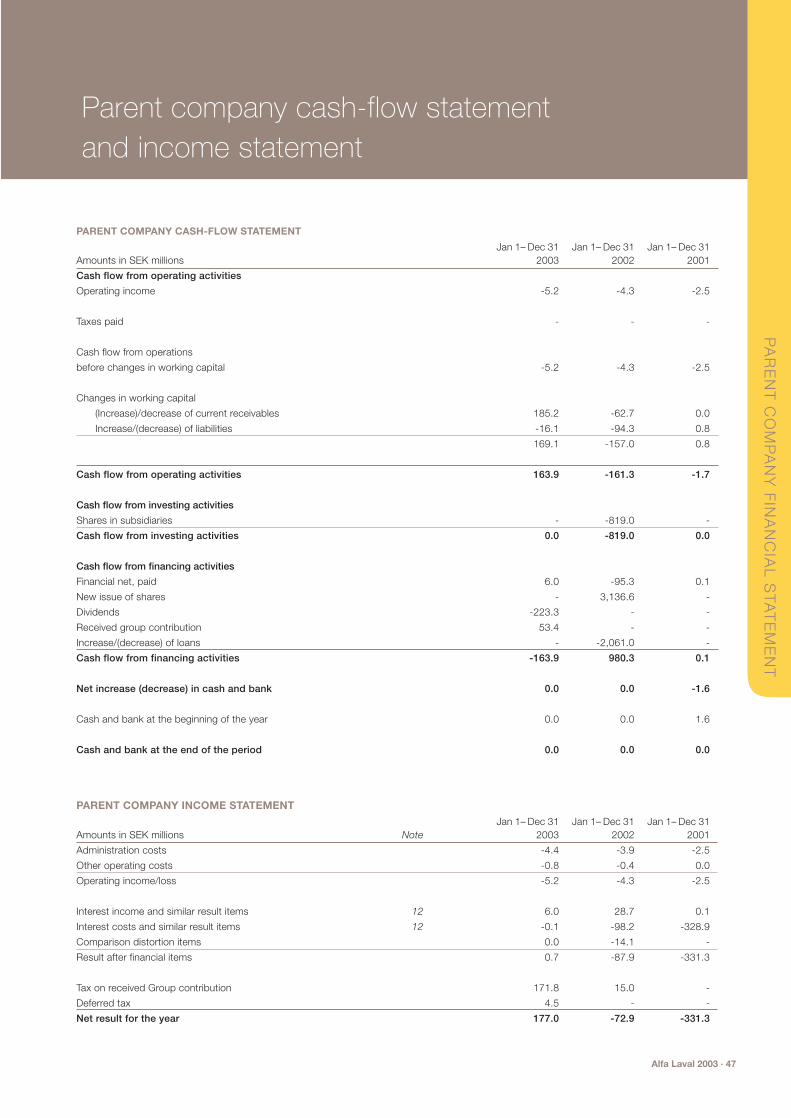
Alfa Laval 2003 · 47
Parent company cash-flow statementand income statement
PARENT COMPANY CASH-FLOW STATEMENT
Jan 1– Dec 31 Jan 1– Dec 31 Jan 1– Dec 31Amounts in SEK millions 2003 2002 2001
Cash flow from operating activities
Operating income -5.2 -4.3 -2.5
Taxes paid - - -
Cash flow from operations
before changes in working capital -5.2 -4.3 -2.5
Changes in working capital
(Increase)/decrease of current receivables 185.2 -62.7 0.0
Increase/(decrease) of liabilities -16.1 -94.3 0.8
169.1 -157.0 0.8
Cash flow from operating activities 163.9 -161.3 -1.7
Cash flow from investing activities
Shares in subsidiaries - -819.0 -
Cash flow from investing activities 0.0 -819.0 0.0
Cash flow from financing activities
Financial net, paid 6.0 -95.3 0.1
New issue of shares - 3,136.6 -
Dividends -223.3 - -
Received group contribution 53.4 - -
Increase/(decrease) of loans - -2,061.0 -
Cash flow from financing activities -163.9 980.3 0.1
Net increase (decrease) in cash and bank 0.0 0.0 -1.6
Cash and bank at the beginning of the year 0.0 0.0 1.6
Cash and bank at the end of the period 0.0 0.0 0.0
PARENT COMPANY INCOME STATEMENT
Jan 1– Dec 31 Jan 1– Dec 31 Jan 1– Dec 31Amounts in SEK millions Note 2003 2002 2001
Administration costs -4.4 -3.9 -2.5
Other operating costs -0.8 -0.4 0.0
Operating income/loss -5.2 -4.3 -2.5
Interest income and similar result items 12 6.0 28.7 0.1
Interest costs and similar result items 12 -0.1 -98.2 -328.9
Comparison distortion items 0.0 -14.1 -
Result after financial items 0.7 -87.9 -331.3
Tax on received Group contribution 171.8 15.0 -
Deferred tax 4.5 - -
Net result for the year 177.0 -72.9 -331.3
PA
RE
NT
CO
MP
AN
Y F
INA
NC
IAL
STA
TE
ME
NT
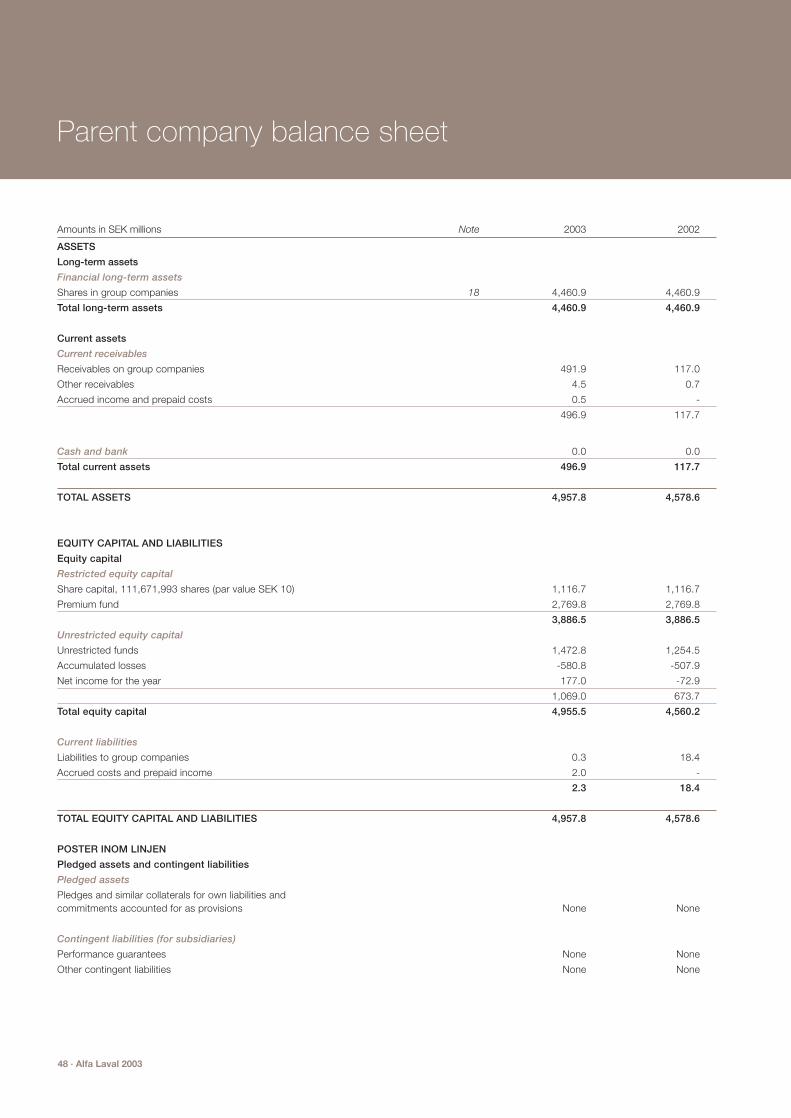
48 · Alfa Laval 2003
Parent company balance sheet
Amounts in SEK millions Note 2003 2002
ASSETS
Long-term assets
Financial long-term assets
Shares in group companies 18 4,460.9 4,460.9
Total long-term assets 4,460.9 4,460.9
Current assets
Current receivables
Receivables on group companies 491.9 117.0
Other receivables 4.5 0.7
Accrued income and prepaid costs 0.5 -
496.9 117.7
Cash and bank 0.0 0.0
Total current assets 496.9 117.7
TOTAL ASSETS 4,957.8 4,578.6
EQUITY CAPITAL AND LIABILITIES
Equity capital
Restricted equity capital
Share capital, 111,671,993 shares (par value SEK 10) 1,116.7 1,116.7
Premium fund 2,769.8 2,769.8
3,886.5 3,886.5
Unrestricted equity capital
Unrestricted funds 1,472.8 1,254.5
Accumulated losses -580.8 -507.9
Net income for the year 177.0 -72.9
1,069.0 673.7
Total equity capital 4,955.5 4,560.2
Current liabilities
Liabilities to group companies 0.3 18.4
Accrued costs and prepaid income 2.0 -
2.3 18.4
TOTAL EQUITY CAPITAL AND LIABILITIES 4,957.8 4,578.6
POSTER INOM LINJEN
Pledged assets and contingent liabilities
Pledged assets
Pledges and similar collaterals for own liabilities and commitments accounted for as provisions None None
Contingent liabilities (for subsidiaries)
Performance guarantees None None
Other contingent liabilities None None

Alfa Laval 2003 · 49
Parent company’s equity capital
Share Restricted Unrestricted Parent company Alfa Laval AB (publ) capital equity equity Total
2001
Net result 2001 - - -331.3 -331.3
As of December 31, 2001 0.4 0.0 1,457.8 1,458.2
2002
New issues of shares 366.8 2,769.8 - 3,136.6
Bonus issue of shares 749.5 - -749.5 0.0
Group contribution - - 53.4 53.4
Tax on received Group contribution - - -15.0 -15.0
Net result 2002 - - -72.9 -72.9
As of December 31, 2002 1,116.7 2,769.8 673.7 4,560.2
2003
Dividends - - -223.3 -223.3
Group contribution - - 613.4 613.4
Tax on received Group contribution - - -171.8 -171.8
Net result 2003 - - 177.0 177.0
As of December 31, 2003 1,116.7 2,769.8 1,069.0 4,955.5
The share capital of SEK 1,116,719,930(1,116,719,930) is divided among111,671,993 (111,671,993) shares atpar value SEK 10 (10).
At an extraordinary shareholders’meeting on April 8, 2002 it was decid-ed to increase the share capital by SEK374,963 through a transfer of SEK374,963 from unrestricted equitycapital. The bonus issue of shares wasimplemented so that shareholdersreceived one new share for each oldshare. The reconciliation day for thebonus issue of shares was May 3, 2002.
The shareholders’ meeting decided –in consideration of the planned initialpublic offering – to change the Articlesof Association, such that the companyis a public company. It was also decid-ed that the par value of each shareshould be changed to SEK 10 and thatthe limits for the company’s share cap-ital shall be a minimum of
SEK 745,000,000 and a maximum ofSEK 2,980,000,000.
The shareholders’ meeting also decid-ed that the company’s share capitalshould be increased by SEK749,176,574, through a transfer of SEK749,176,574 from unrestricted equitycapital. The bonus issue of shares wasimplemented through an increase ofthe par value of each share by SEK 9.99to SEK 10.
At the new issue of shares in connec-tion with the IPO in 2002, 32,967,033new shares were issued, whichincreased the share capital by SEK329,670,330. The subscription pricewas SEK 91. This means that the equitycapital increased by SEK 3,000,000,003,which after deduction for transactioncosts of SEK 84,181,048 means a netincrease by SEK 2,915,818,955. Beforethe IPO, Alfa Laval management exe-cuted all 3,712,310 warrants, which
means a corresponding increase of thenumber of shares and an increase ofthe share capital by SEK 37,123,100.The subscription price was SEK 59.48,which means an increase of the equitycapital by SEK 220,793,851. In totalthe equity capital increased by SEK3,136,612,806.

50 · Alfa Laval 2003
Notes to the financial statements
Amounts in SEK millions, unless other-wise stated.
Applied recommendations/General
Alfa Laval follows Swedish GAAP asexpressed in law, recommendationsissued by accounting bodies and rele-vant good accounting practice. This dif-fers in certain respects from US GAAP,see Note 35.
Alfa Laval follows the recommenda-tions issued by the Financial Account-ing Standards Council in Sweden andhas strived for early implementation ofthe recommendations, that is prior towhen they must be applied. To theextent that recommendations from theCouncil have not yet been issued corre-sponding to already issued Internation-al Accounting Standards, the IAS state-ment has been applied instead. This isreferring to IAS 19 Employee Benefitsfor 2000 and 2001 and IAS 14 SegmentReporting for 2001. A comparison hasbeen made with the draft recommenda-tions issued by the Council, which haveonly been available in 2001 and 2002respectively.
Alfa Laval does not report the depre-ciation on goodwill distributed on thedifferent functions in the income state-ment since almost the entire goodwilldepreciation is referring to the goodwillthat appeared in a leveraged buy outtransaction in 2000. The comparabilitywith other companies will be severelysuffering if the goodwill depreciation is allocated to the income statementfunctions. For this reason the goodwilldepreciation is isolated to a specificallyidentified item. The specific financialconstruction used in the ownershipchange will otherwise result in a mis-leading income reporting during twodecades. The change of ownership in2000 in fact meant that the net assetsof Alfa Laval were re-valued to marketvalue, which does not apply generallyfor other listed companies. In anticipa-tion of the new international account-ing statements, where goodwill is notdepreciated but instead tested for im-pairment, the current treatment avoids
any problem with comparabilitybetween years.
Implementation of International Financial
Reporting Standards (IFRS)
International Financial Reporting Stan-dards (IFRS) will be the new name forall new International Accounting Stan-dards. IFRS are still issued by the Inter-national Accounting Standards Board(IASB) (previously Council). IFRS 1 cov-ers the transitional provisions for theimplementation of IFRS. All companieswithin the European Union are obligedto change to IFRS as of January 1, 2005.
Already in 2000 Alfa Laval started toimplement the International Account-ing Standards (IAS) issued by IASB andtranslated and adapted to Swedish legis-lation by the Financial Accounting Stan-dards Council in Sweden. Since there aresome minor differences between theSwedish recommendations and IAS,Alfa Laval has never claimed to be fol-lowing IAS. Technically this means thatAlfa Laval will be a first time applicantunder IFRS 1 in 2005. The adoption toIFRS is however already in place sinceAlfa Laval has implemented all relevantIAS standards, except IAS 39. This state-ment will be implemented once IASBhas issued the updated IAS 39.
Changed/implemented accounting
principles
During 2003 RR27 “Financial Instru-ments: Disclosure and Presentation”has been implemented. This has notintroduced any major changes oramendments to the disclosure andpresentation in 2002. Chapter 5 § 18bin Swedish Annual Report’s Acts (ÅRL)“Gender among managers” has alsobeen implemented. The definition ofmembers of the Board and managers is not at all as clear as in the Industryand Commerce Stock Exchange Com-mittee’s statement concerning execu-tive officers below. For this reason, several measures have been supplied in order to enlighten the subject.
During 2002 RR26 Events after thebalance sheet date was implemented.
The updated statement by the Industryand Commerce Stock Exchange Com-mittee on information about remunera-tions to executive officers (approvedduring 2002) was also implementedduring 2002.
During 2001 RR15 Intangible Assets,RR21 Borrowing Costs, RR22 Presenta-tion of Financial Statements and RR23Related Party Disclosures were imple-mented. Segment reporting is from thesame point in time reported accordingto IAS 14 in the absence of a Swedishrecommendation at the time (currentlyRR25 Segment Reporting – business andgeographical segments).
The application of these new account-ing standards has not resulted in anychange of accounting principles andhas therefore not resulted in any effecton income or equity capital for 2003,2002 or 2001.
During 2000, considerable work wasdevoted to the implementation of newaccounting standards. As of the closingfor 2000, deferred tax is accounted foraccording to RR9, impairments accord-ing to RR17, revenue recognition onlarge projects according to RR10 andprovisions, contingent liabilities andcontingent assets according to RR16. As of the same date, employee benefitsare accounted for according to IAS 19in the absence of a Swedish standard(currently RR29 Employee Benefits).The effect on equity of the changes inaccounting principles for income taxesand pensions amounted to an increaseof SEK 225 million for the predecessorthe Alfa Laval Holding Group for 1999.Since the effect on the equity becauseof changed accounting principleschanges the opening equity, the netasset value that was acquired by thenew group increased correspondingly.Because the acquired equity is fullyeliminated, the above adjustment toequity does not appear in the new AlfaLaval Group.

Alfa Laval 2003 · 51
Implementation of the Swedish Financial
Accounting Standards Council’s recom-
mendations before they become effective
RR22 Presentation of Financial State-ments, RR25 Segment Reporting –business and geographical segmentsand RR26 Events After the BalanceSheet Date become effective on Janu-ary 1, 2003. RR29 Employee Benefitsbecome effective on January 1, 2004.Earlier application of all these recom-mendations is encouraged and theGroup has also applied them earlier as described above.
The Swedish Financial AccountingStandards Council’s recommendationsRR 1:00 Business combinations, RR15Intangible Assets, RR16 Provisions,Contingent Liabilities and ContingentAssets, RR17 Impairment of Assets,RR21 Borrowing Costs and RR23 Relat-ed Party Disclosures became effectiveon January 1, 2002. Earlier applicationwas encouraged and the Group hasapplied these recommendations during2001 or 2000 as described above.
Critical accounting principles
The Financial Accounting StandardsBoard in the US has issued Statement of Financial Accounting Standards No.142, Goodwill and Other IntangibleAssets. FAS 142 requires that goodwill,including previously existing goodwill,and intangible assets with indefiniteuseful lives not be amortised; theseassets should be tested for impairmentannually. Goodwill and intangible assetswith indefinite useful lives will nolonger be tested for impairment underFAS 121, Accounting for the Impairmentof Long-Lived Assets and for Long-LivedAssets to be Disposed Of. The group hasadopted the provisions of FAS 142 as ofJanuary 1, 2002 in the US GAAP recon-ciliation. The effect of FAS 142 can beconsiderable for the Group if the prof-itability within the Group or parts of theGroup goes down in the future, sincethis could trigger a substantial impair-ment write down of the goodwill. Sucha write down will affect the net incomeand thereby the position of the Groupaccording to US GAAP.
According to RR17 impairments onassets including goodwill shall be calcu-lated if there is any indication that the
value of the asset has decreased. This is different to FAS 142, which requiresthat the impairment test must be madeannually irregardless of whether there is an indication or not. If a FAS 142 cal-culation shows an impairment, this canhowever be seen as such an indicationthat could trigger a write down even inthe part of the financial reporting thatis regulated by the recommendationsfrom the Financial Accounting Stan-dards Council.
The Group’s reporting of provisionsaccording to RR16 means that SEK 891.2(989.3) million is reported as other pro-visions. This constitutes 6.1 (6.4) per-cent of the Group’s assets and is impor-tant for the assessment of the Group’sfinancial position, not the least sinceprovisions normally are based on esti-mates of costs and risks. If the account-ing principles for provision would bechanged sometime in the future, thiscould have a substantial impact on theGroup’s financial position.
Advertising costs
Advertising costs are expensed asincurred.
Borrowing costs
Borrowing costs are accounted foraccording to the main principle in RR21Borrowing costs, which means that theborrowing costs are charged to the prof-it and loss in the period to which theyrelate. This means, among other things,that transaction costs that arise in con-nection with raising a loan are capita-lised and amortised over the maturityof the loan.
Business combinations – consolidation
principles (including associates and
joint ventures)
The consolidated financial statementshave been prepared according to theRR1:00 recommendation issued by theFinancial Accounting Standards Councilin Sweden.
For the period after August 24, 2000,the consolidated financial statementsinclude the parent company Alfa LavalAB (publ) and the subsidiaries in whichit holds more than 50 percent during theperiod. For the period up to August 24,2000, the consolidated financial state-
ments include the parent company AlfaLaval Holding AB and the subsidiariesin which it holds more than 50 percentduring the period.
The consolidated balance sheet hasbeen prepared in accordance with thepurchase method, which means thatthe book value of shares in the sub-sidiaries is eliminated from the reportedequity capital in the subsidiaries at thetime of their acquisition. Accordingly,the unrestricted reserves in the sub-sidiaries at the time of acquisition arenot included in the consolidated un-restricted reserves. Alfa Laval owns 50 percent in three different joint ven-tures: Rolls Laval Heat Exchangers Ltdwith Rolls Royce as partner, HyneticsInc. with Hyclone Inc. as partner andGigantissimo 2444 AB with Haldex aspartner. These companies are consoli-dated according to the proportionalconsolidation method in RR14 JointVentures. The Group has only one com-pany that fulfils the definition of anassociate in RR13 Accounting forInvestments in Associates, that is thatthe ownership is between 20 and 50percent, namely Dalian Haven Auto-mation Co Ltd. This company is totallydormant. Since its net assets are notmaterial, it is not consolidated.
The difference between the purchaseprice paid and the net assets of theacquired companies, with deduction forrestructuring provisions, is allocated tothe step-up values related to each typeof asset, with any remainder accountedfor as goodwill.
The foreign subsidiaries have beentranslated using the current method.This means that assets and liabilities aretranslated at closing exchange rates andincome and expenses are translated atthe year’s average exchange rate. Thetranslation difference that arises is aresult of the fact that net assets in for-eign companies are translated at onerate at the beginning of the year andanother at year-end and that the resultis translated at average rate. The trans-lation differences are charged againstequity capital.
Comparison distortion items
Items that do not have any link to thenormal operations of the Group or that
NO
TE
S T
O T
HE
FIN
AN
CIA
L S
TAT
EM
EN
TS

52 · Alfa Laval 2003
are of a non-recurring nature are classi-fied as comparison distortion items. A reporting together with other itemsin the income statement would havegiven a comparison distortion effectthat would have made it difficult tojudge the development of the ordinaryoperations from an outside viewer.Comparison distortion items affectingoperating income are reported as a partof operating income, while comparisondistortion items affecting the result afterfinancial items are reported as a part ofthe financial net. Comparison distortionitems on each level are reported net inthe income statement if the items beingincluded in the netting are not material,see RR22 Presentation of FinancialStatements item 27 and 32 and theSwedish Annual Report’s Act (ÅRL)chapter 3 § 4.
Employee benefits
Employee benefits are reported accord-ing to RR29. The main difference com-pared with previous reporting (1999and earlier) has been the reporting fordefined benefit pension plans. The pres-ent value of the benefit obligations inthe defined benefit plans is decidedthrough yearly actuarial calculationsmade by independent actuaries. Theplan assets are valued at market value.
The net plan asset or liability is arrived at in the following way:
+ The present value of the defined benefit
obligation at December 31
+ any actuarial gains not recognised
- any actuarial losses not recognised
- any past service costs not yet recognised
- the fair value of the plan assets at Dec. 31
= a net liability if positive / a net asset if negative
If the calculation gives a net asset, thelower of this asset and the sum of anycumulative unrecognised net actuariallosses and past service costs and thepresent value of refunds or reductionsin future contributions is reported asthe net plan asset.
If the net cumulative unrecognisedactuarial gains and losses at the end ofthe previous year is outside a ten percentcorridor calculated on the greater of the present value of the defined benefitobligation or the fair value of the planassets, then the excess is recognised
over the remaining service period ofthe employees participating in the plan.
The Swedish ITP-plan is seen as a“multi-employer plan” that is treated as a defined contribution plan accord-ing to item 30 in RR29.
Events after the balance sheet date
Events after the balance sheet date arereported according to RR26 under aseparate heading in the Board of Direc-tors’ report.
Financial instruments
During 2003 RR27 “Financial Instru-ments: Disclosure and Presentation”has been implemented. This has notintroduced any major changes oramendments to the disclosure andpresentation in 2002. RR27 is based on IAS 32 and describes how financialinstruments are presented in the bal-ance sheet and the required disclosuresto enable a reader of financial reportsto understand how the financial instru-ment is influencing the income state-ment, balance sheet and cash flow of acompany. It does not regulate when afinancial instrument is reported in orremoved from the balance sheet or thevaluation of financial instruments. Thiswill instead be covered by IAS 39.
Financial instruments are valued atacquisition value. If a derivative instru-ment has been used to fix the exchangerate to be used for settling a commercialor financial receivable or liability, thebalance sheet item is valued at the for-ward rate. The accrued interest rate forloans is valued including the effect ofinterest rate swaps. Derivative instru-ments covering projected flows are notreported until maturity and this iswhere the effect of IAS 39 will be mostapparent.
The Group uses a limited number offinancial instruments to hedge currencyrates or interests. These include curren-cy forward contracts, currency options,interest-rate swaps and interest-forwardcontracts. To demonstrate the exposure,the outstanding contracts are presentedin the financial risk section. If possible,loans are raised in the currencies thatmatch the net investment in each cur-rency. The fair value of financial instru-ments is shown in Note 34.
Fixed assets (tangible and intangible)
Assets have been accounted for at cost,net after deduction of accumulateddepreciation according to plan. Depre-ciation according to plan is based onthe assets’ acquisition values and iscalculated according to estimated eco-nomic lives of the assets.
The following depreciation periods have been used:
Computer programs, computers 3.3 years
Office equipment 4 years
Vehicles 5 years
Machinery and equipment 7–14 years
Land improvements 20 years
Buildings 25–33 years
The Predecessor Alfa Laval Holding ABIntangible assets 10 years
Goodwill, harmonisation 5 years
Goodwill, other 10 years
The Successor: Alfa Laval AB (publ)
Patents and trademarks 20 years
Step-up values, technology 7.5 years
Goodwill, strategic 20 years
Goodwill, other 10 years
The acquisition of the Alfa Laval Hold-ing AB Group and Danish SeparationSystems A/S are considered as strategicacquisitions where the intangibleassets have a lifetime of more than 20years. The acquisition of Toftejorg andbioKinetics are complimentary to theexisting business. The reason why thedepreciation period is more than fiveyears also for these acquisitions is thatToftejorg has a strong position in tankcleaning equipment and bioKineticshas a powerful modular process con-cept, both of which are perceived tohave economic life expectancies ofmuch more than five years.
Any additions to the purchase pricein connection with investments infixed assets or acquisitions of business-es are amortised over the same periodas the original purchase price. Thismeans that the time when the asset isfully depreciated is identical regardlessof when payments are made. This is areflection of the fact that the estimatedeconomic live of the asset is the same.
Upon sale or scrapping of assets, theresults are calculated in relation to the net book value after depreciationaccording to plan. The result on sales is included in operating income.

Alfa Laval 2003 · 53
When there are indications that thevalue of a fixed asset has decreased,there is a valuation made if it must bewritten down according to RR17. If thereported value is higher than the netrealisable value, a write down is madethat burdens net income. When assetsare up for sale, for instance items of realestate, a clear indication of the net real-isable value is received that can trigger awrite down.
Income Taxes
Income taxes are reported in accordancewith RR9 Income Taxes.
Current tax is the amount of incometaxes payable (recoverable) in respect ofthe taxable profit (tax loss) for a period.Current tax liabilities (receivables) forthe current and prior periods are meas-ured at the amount expected to be paidto (recovered from) the tax authorities,using the tax rates (and tax laws) thathave been enacted or substantivelyenacted by the balance sheet date. Inessence, this means that current tax iscalculated according to the rules thatapply in the countries where the profitwas generated.
Deferred tax liabilities are the amountsof income taxes payable in future peri-ods in respect of taxable temporary differences. Deferred tax liabilities arerecognised for all taxable temporarydifferences, except for goodwill andcertain other items.
Deferred tax assets are the amounts of income taxes recoverable in futureperiods in respect of: (a) deductibletemporary differences; (b) the carry-for-ward of unused tax losses; and (c) thecarry-forward of unused tax credits.Deferred tax assets are recognised forall deductible temporary differences tothe extent that it is probable (>50 per-cent) that taxable profit will be avail-able against which the deductible temporary difference can be utilised.Deferred tax assets are recognised forthe carry-forward of unused tax lossesand unused tax credits to the extentthat it is probable (>50 percent) thatfuture taxable profit will be availableagainst which the unused tax lossesand unused tax credits can be utilised.Deferred tax assets and liabilities aremeasured at the tax rates that areexpected to apply to the period when
the asset is realised or the liability is set-tled, based on tax rates (and tax laws)that have been enacted or substantivelyenacted by the balance sheet date.
If it is not any longer probable thatsufficient taxable profits will be avail-able against which a deferred tax assetcan be utilised, then the deferred taxasset is reduced by increasing the valua-tion allowance accordingly.
Inflationary accounting
Subsidiaries in highly inflationarycountries report their closings in thefunctional hard currency that is validin each country, which in all cases isUSD. Colombia, Indonesia, Mexico,Russia, Turkey and Venezuela are re-garded as highly inflationary countries.
Inventories
The Group’s inventory has beenaccounted for after elimination of inter-company gains. The inventory has beenvalued according to the “First-In-First-Out” (FIFO) method at the lowest ofcost or net realisable value, taking intoaccount obsolescence.
This means that raw material and purchased components normally arevalued at the acquisition cost, unlessthe market price has fallen. Work inprogress is valued at the sum of directmaterial and direct labour costs with a mark-up for the product’s share incapital costs in the manufacturing andother indirect manufacturing costsbased on a forecasted assumption onthe capacity utilisation in the factory.Finished goods are normally valued atthe delivery value (i.e. at cost) from thefactory if the delivery is forthcoming.Spare parts that can be in the inventoryduring longer periods of time are nor-mally valued at net realisable value.Out of the total inventory, the valua-tion at net realisable value thereforeconstitutes a considerable part.
Leasing
Leasing is accounted for in accordancewith RR6:99 Leasing agreements.
When Alfa Laval is the lessor, leasedassets that are regarded as financial leases are accounted for as a financialreceivable from the lessee in the balancesheet. The leasing fee received from the lessee is accounted for as financial
income calculated as interest on theoutstanding receivable and as amortisa-tion of the receivable.
When Alfa Laval is the lessee, leasedassets that are regarded as financial leas-es are accounted for as capitalised assetsand a corresponding financial payableto the lessor in the balance sheet. Theleasing fee to the lessor is accounted for as financial cost calculated as inter-est on the outstanding payable and asamortisation of the payable. Deprecia-tion according to plan is done in thesame manner as purchased assets.
Leased assets regarded as operationalleases are not capitalised. The leasingfees are expensed as incurred.
Long-term construction projects
Revenue for projects is recognised usingthe percentage of completion method inRR10 Construction projects. This meansthat when the outcome of a construc-tion project can be calculated reliably,the revenue and the costs related to theproject are recognised in relation of thepercentage of completion at the balancesheet date. An estimated loss is recog-nised immediately. The percentage ofcompletion for a construction project isnormally established through the rela-tionship between incurred project costsfor work performed at the closing dateand the estimated total project costs.
Other operating income and other
operating costs
Other operating income in the incomestatement relates to commission, royal-ty and license income. Other operatingcosts refer mainly to restructuring costsand to royalty costs.
Provisions
The Group is applying RR16 for thereporting of provisions, contingent liabilities and contingent assets.
A provision is recognised when, andonly when:• there is a present legal or constructive
obligation as a result of past events;• it is probable that a cost will be
incurred in settling the obligation;and
• a reliable estimate can be made of theamount of the obligation.

54 · Alfa Laval 2003
The amount recognised as a provisionis the best estimate of the cost requiredto settle the present obligation at thebalance sheet date.
In measuring the provision:• risks and uncertainties are taken into
account;• the provisions are discounted, where
the effect of the time value of moneyis material. When discounting is used,the increase of the provision overtime is recognised as an interest cost;
• future events, such as changes in law and technology, are taken intoaccount where there is sufficientobjective evidence that they willoccur; and
• gains from the expected disposal of assets are not taken into account,even if the expected disposal is closely linked to the event giving rise to the provision.
If a reimbursement of some or all of the costs to settle a provision isexpected (e.g. through insurance con-tracts, indemnity clauses or supplier’swarranties), the reimbursement isrecognised:• when, and only when, it is virtually
certain that the reimbursement willbe received if the obligation is settled.The amount recognised for the reimbursement must not exceed the amount of the provision; and
• as a separate asset (gross). In theincome statement, however, theincome related to the reimbursementis netted against the cost for the pro-vision.
Provisions are reviewed at each balancesheet date and adjusted to reflect thecurrent best estimate. If it is no longerprobable that a cost to settle the obliga-tion will be incurred, the provision isreversed.
A provision must only be used for thepurpose it was originally recognised for.Provisions are not recognised for futureoperating losses. An expectation offuture operating losses is though anindication that certain assets of theoperation may be impaired. If a con-tract is onerous, the present obliga-tion under the contract is recognisedand measured as a provision.
A provision for restructuring costs isrecognised only when the general
recognition criteria are met. A con-structive obligation to restructure arisesonly when there is:• a detailed formal plan for the
restructuring, identifying at least:a) the business or part of a business
concerned;b)the principal locations affected;c) the location, function and approxi-
mate number of employees whowill be compensated for terminat-ing their services;
d)the costs that will be undertaken;and
e) when the plan will be implemented;and
• a valid expectation in those affectedthat the restructuring will be carriedout.
A management or board decision torestructure does not give rise to a con-structive obligation at the balancesheet date unless the company has,before the balance sheet date:• started to implement the restructur-
ing plan; or• communicated the restructuring plan
to those affected by it in a sufficientlyspecific manner to raise a valid expec-tation in them that the restructuringwill happen.
When a restructuring involves the saleof an operation, no obligation arisesfor the sale until the company is com-mitted to the sale, i.e. through a bind-ing sales agreement.
A restructuring provision onlyincludes the direct costs arising fromthe restructuring, which are those thatare both:• necessarily entailed by the restructur-
ing; and• not associated with the ongoing
activities of the company.
Research & Development
Research & Development costs arecharged to the income statement inthe year in which they are incurred.RR15 Intangible Assets requires devel-opment costs to be capitalised if cer-tain requirements are fulfilled. Thedevelopment costs within Alfa Lavaldo normally not meet the require-ments for capitalisation according toRR15 Intangible Assets.
Revenue recognition
Revenue recognition is made accordingto RR11 Revenue. Sales revenue forproducts and services is recognised atthe time of delivery. Net sales are refer-ring to sales value less sales taxes, can-cellations and discounts. Long-termconstruction projects are accounted forthrough the percentage of completionmethod.
Sick leave in Sweden
The Swedish Annual Report’s Acts (ÅRL)requires the sick leave among Swedishemployees to be reported split on differ-ent specifically defined categories. Thisis a way to get focus on the contempo-rary problem of high sick leave rates andif certain employers are having a high ora low sick rate within the company. Thespecification is found in Note 2.
Transactions in foreign currencies
Receivables and liabilities denominatedin foreign currencies have been valuedat year-end rates of exchange or at therate fixed by forward contract. Withinthe parent company there were nounrealised exchange gains on long-termreceivables and liabilities that have notbeen possible to offset against unrealisedexchange losses within the same curren-cy. Unrealised exchange gains on short-term receivables and liabilities are, how-ever, included in the result.
Within the Group, exchange gainsand losses on loans denominated inforeign currencies that finance acquisi-tions of foreign subsidiaries are trans-ferred to unrestricted equity if theloans act as a hedge to the acquirednet assets. In the parent company, theexchange differences are reported inthe income statement.

Currency contracts are entered intocontinuously during the year with twelve months being the maximumduration. This means that the compa-ny experiences the effects from themarket currency rate movements witha varying degree of delay.
If the currency rates between SEK andthe most important foreign currenciesare changed by +/-10 percent it has thefollowing effect on operating income,if no hedging measures are taken:
RIS
K M
AN
AG
EM
EN
T
Alfa Laval 2003 · 55
Financial instruments
Financial risks are referring to financialinstruments. Alfa Laval has the follow-ing instruments: cash, deposits, bankloans, the bond loan and a limitednumber of derivative instruments tohedge currency rates or interests. Theseinclude currency forward contracts,currency options, interest-rate swapsand interest-forward contracts.
Financial policy
In order to control and limit the finan-cial risks, the Board of the Group hasestablished a financial policy. TheGroup has an aversive attitude towardfinancial risks. This is expressed in thepolicy. It establishes the distribution ofresponsibility between the local com-panies and the central finance func-tion in Alfa Laval Treasury Internation-al AB, what financial risks the Groupcan accept and how the risks should belimited.
Price risk
There are three different types of pricerisks: currency risk, interest risk andmarket risk. See below.
Currency risk
Transaction exposure
The Group is principally exposed tocurrency risk from potential changesin contracted and projected flows ofpayments and receipts. The objectiveof foreign exchange risk managementis to reduce the impact of foreignexchange movements on the Group’sincome and financial position.
The Group normally has a naturalrisk coverage through the sale as wellas costs in local currencies. The finan-cial policy states that the local compa-nies are responsible for identifying andhedging exchange rate exposures onall commercial flows via Alfa LavalTreasury International. Contract basedexposures must be fully hedged. Inaddition, the balance of projectedflows the next 12 months must behedged to at least 50 percent. The
Financial risks
Exchange rate change against SEK
2003 2002 2001
In SEK millions +10% -10% +10% -10% +10% -10%
Effect on operating income
without hedging measure
USD 97 -97 101 -101 117 -117
EUR 152 -152 154 -154 125 -125
DKK -127 127 -135 135 -147 147
Other USD related currencies 46 -46 29 -29 25 -25
Other 39 -39 58 -58 80 -80
Total 207 -207 207 -207 200 -200
remaining part of the projected flowscan be partially hedged after conferringwith the Group’s central finance func-tion. Alfa Laval Treasury Internationalcan add to or reduce the total hedginginitiated by the local companies in thecurrencies that Alfa Laval has commer-
cial exposure up to but not exceeding100 percent of one year’s commercialexposure for each currency.
The Group’s net exposure in differ-ent currencies before and after deriva-tives during 2003 has amounted to:
Net exposure per currency during 2003
2,000
1,500
1,000
500
0
-500
-1,000
-1,500
-2,000
-2,500EUR USD SE Asia CAD AUD DKK SEK
SEK in millions
before derivatives
after derivatives

56 · Alfa Laval 2003
Translation exposure
When the subsidiaries’ balance sheets inlocal currency are translated into SEK atranslation difference arises that is dueto the current year being translated at adifferent closing rate than last year andthat the income statement is translatedat the average rate during the yearwhereas the balance sheet is translatedat the closing rate at December 31. Thetranslation differences are reported inthe unrestricted equity capital. Thetranslation exposure consists of the riskthat the translation difference repre-sents in relation to changes in the equi-ty capital. The risk is largest for the cur-rencies where the Group has the largestnet assets and where the exchange ratemovements against SEK are largest.
The translation differences are acentral responsibility and are managedby distributing the loans on differentcurrencies based on the net assets ineach currency and through currencyforward contracts. Loans taken in thesame currency as there are net assets in
the Group, decrease these net assetsand thereby decrease the translationexposure.
Interest risk
By interest risk is meant how changesin the interest level affect the financialnet of the Group and how the value offinancial instruments vary due tochanges in market interest rates. TheGroup attempts to manage interest-raterisk by matching fixed interest periodsof financial assets and liabilities andthrough the use of derivative financialinstruments such as interest-rate swaps.
The financial policy states that theinterest rate risk and duration are meas-ured by each main currency. The interestduration for the loans must be betweenzero and three months for 66 percentof the loans and between six and 36months for 33 percent of the loans.
The loan with the new banking syn-dicate accrues interest at floating rate.The Group has chosen to hedge 22 (64)(69) percent of the loan, with a dura-
tion of nine months. The subordinatedloan from Tetra Laval Finance Ltdaccrued interest at fixed rate, but hasnow been repaid. The bond loanaccrues interest at fixed rate. Com-bined, this means that the Group has a comparably low interest risk.
Calculated on an overall increase ofmarket rates by 100 interest points (1 percentage unit), the interest costs of the Group would increase by aboutSEK 17 (16) (18) million. The reasonwhy this amount has not decreased dueto the decreased loans is that the partof the loans that is affected by floatingrates has increased after the cancella-tion of the interest rate swap.
Market risk
Market risk is defined as the risk forchanges in the value of a financialinstrument due to changed marketprices. For all financial instruments,except the bond loan, the price riskonly consists of currency risk and inter-est risk. For the bond loan there is amarket risk, but as long as a marketvalue that is higher than the bookedvalue does not have to be reported inthe balance sheet, this does not presenta problem. IAS 39 will not change thereporting of the bond loan since it willstill be valued at its acquisition value.
Liquidity risk
Liquidity risk is defined as the risk thatthe Group would incur increased costsdue to lack of liquid funds. The loanfacility with the banking syndicate con-sists of two parts. The first part is anamortisation free loan of originally EUR423.9 million. This has been reduced toEUR 263.7 million through voluntaryamortisation of EUR 87.4 million andreduction through exchange rate move-ments of EUR 72.8 million. The otherpart is a revolving working capital facility of EUR 150 million, which wasunutilised as of December 31, 2003.Alfa Laval has initiated negotiationswith the banking syndicate in order to
2003 2002 2001
Original Original OriginalIn millions currency SEK currency SEK currency SEK
Outflows
EUR -275.7 -2,499.0 -188.8 -1,729.4 -104.7 -973.8
USD -161.5 -1,171.3 -190.2 -1,672.1 -173.1 -1,827.0
DKK -750.3 -913.8 -558.0 -688.2 -6.3 -7.8
HKD - - -173.3 -195.3 -51.6 -69.9
NOK -165.8 -178.5 -133.3 -167.5 -146.0 -170.7
JPY -765.7 -51.9 -1,713.3 -126.2 -2,094.3 -168.8
CAD -17.8 -98.5 -7.7 -42.9 -18.4 -121.4
GBP -7.6 -97.5 -0.9 -13.6 -6.4 -98.2
Other -70.2 -84.2 -61.6
Total -5,080.7 -4,719.4 -3,499.2
Inflows
SEK 5,172.8 5,172.8 4,832.8 4,832.8 3,362.7 3,362.7
SGD 7.2 30.6 5.4 27.3 22.0 125.5
Other 4.9 10.6 -
Total 5,208.3 4,870.7 3,488.2
Net exposure 127.6 151.3 -11.0
Outstanding currency forward contracts and currency options for the Groupamounted to the following at the end of the year:

Alfa Laval 2003 · 57
convert the whole loan to a revolvingfacility potentially combined with aSEK based short-term commercial paperprogramme. A commercial paper pro-gramme requires an official credit rat-ing and generally means lower interestrates but without any guarantees forsustained financing. This is then cov-ered by the extended revolving facility.
Cash flow risk
Cash flow risk is defined as the risk thatthe size of future cash flows linked tofinancial instruments is fluctuating.This risk is mostly linked to changedinterest and currency rates. To theextent that this is perceived as a prob-lem, different derivative instrumentsare used to fix rates. See description ofexposure and hedging measures underinterest risk.
Refinancing risk
Refinancing risk is defined as the riskthat the refinancing of maturing loansbecomes difficult or costly. The loans of the Group are mainly long term andonly mature when the agreed loan peri-od expires. This means that the Groupduring the foreseeable future does notneed to refinance maturing loans. Theloan facility with the banking syndi-cate consists of two parts. The first partis an amortisation free loan of originallyEUR 423.9 million. This has been re-duced to EUR 263.7 million throughvoluntary amortisation of EUR 87.4million and reduction through exchangerate movements of EUR 72.8 million.The other part is a revolving workingcapital facility of EUR 150 million,which was unutilised as of December 31,2003. The maturity of this combinedfacility is five years. The bond loanmatures only in 2010. Alfa Laval hasinitiated negotiations with the bankingsyndicate in order to convert the wholeloan to a revolving facility potentiallycombined with a SEK based short-termcommercial paper programme. A com-mercial paper programme requires an
official credit rating and generallymeans lower interest rates but withoutany guarantees for sustained financing.This is then covered by the extendedrevolving facility.
Counterparty risks
Financial instruments that potentiallysubject the Group to significant con-centrations of credit risk consist princi-pally of cash, deposits and derivatives.
The Group maintains cash and bankand short and long-term investmentswith various financial institutionsapproved by the Group. These finan-cial institutions are located in majorcountries throughout the world andthe Group’s policy is designed to limitexposures to any one institution. Therisk for a counterparty not fulfilling its commitments is limited throughthe selection of financially solid coun-terparties and by limiting the engage-ment per counterparty. The Group performs periodic evaluations of therelative credit standing of those finan-cial institutions that are considered in its investment strategy. The Groupdoes not require collateral on thesefinancial instruments.
The Group is exposed to credit risk in the event of non-performance bycounterparties to derivative instru-ments. The Group limits this exposureby diversifying among counterpartieswith high credit ratings and by limit-ing the volume of transactions witheach counter party.
In total it is the Group’s opinion thatthe counterparty risks are limited.

58 · Alfa Laval 2003
Operational risks
mental legislation, to restore land atpreviously or currently owned industrialsites, to arrange more effective waistdisposal, to obtain prolonged or newconcessions etc. The Group has anambition to be well within the bound-aries that local legislation sets, whichshould reduce the risks. The operationsof the Group are not considered to havea significant environmental impact.
Political risk
Political risk is the risk that the author-ities, in the countries where the Groupis operating, by political decisions oradministration make continued opera-tions difficult, expensive or impossiblefor the Group. The Group is mainlyoperating in countries where the politi-cal risk is considered to be negligible or minor. The operations that are per-formed in countries where the politicalrisk is deemed to be higher are notmaterial.
Risk for and in connection with litigations
This risk pertains to the costs the Groupmay incur in managing litigations, costsin connection with settlements andcosts for imposed penalties. The Groupis involved in a few litigations, mainlywith customers. Any estimated loss risksare fully provided for.
Some of the Group’s subsidiaries areinvolved in two so-called Desert Stormlitigations, where war veterans from thePersian Gulf war have sued a large num-ber of companies that are alleged tohave delivered equipment to Iraq. Thelawsuits, which were initiated in 1994,claim damages in excess of USD 1,000million each. In Alfa Laval’s opinion,adequate guarantees have been receivedfrom Tetra Laval, covering possible lossesrelated to these litigations.
Alfa Laval’s subsidiary in the US, Alfa Laval Inc., was as of December 31,2003 named as co-defendant in a totalof 123 asbestos-related lawsuits with atotal of approximately 19,900 plain-tiffs. The lawsuits filed in Mississippi
Risk for bad debts
The risk for bad debts is referring tothe risk that the customer cannot payfor delivered goods due to financialdifficulties. The Group sells to a largenumber of customers in countries allover the world. That some of these cus-tomers from time to time face paymentproblems or go bankrupt is unfortu-nately part of reality in an operation ofAlfa Laval’s magnitude. All customersexcept Tetra Laval represent less than 1 percent of net sales and thereby rep-resent a limited risk. Alfa Laval regular-ly collects credit information on newcustomers and, if needed, on old cus-tomers. Earlier payment habits have animpact on the acceptance of new orders.On markets with political or financialrisks, the Group strives to attain creditinsurance solutions. The Group’s costsfor bad debts are SEK 42.2 (32.2) (78.6)million.
Risk for claims
The risk for claims refers to the costsAlfa Laval would incur to rectify faultsin products or systems and possiblecosts for penalties. Alfa Laval strives tominimize these costs through an ISOcertified quality assurance. The majorrisks for claim costs appear in connec-tion with new technical solutions andnew applications. The risks are limitedthrough extensive tests at the manu-facturing site and at the customer site.The Group’s claim costs have amount-ed to SEK 151.5 (204.0) (154.3) million.
Risk connected to technical development
This risk refers to the risk that somecompetitor develops a new technicalsolution that makes Alfa Laval’s prod-ucts technically obsolete and thereforedifficult to sell. Alfa Laval addressesthis risk by a deliberate investment inresearch and development aiming atbeing in the absolute frontline of tech-nical development.
Economic risk
Competition
The Group operates in competitivemarkets. The implemented split indivisions based on customer segmentsis a further step in the efforts to addressthis competition. The restructuringprogramme being implemented givesthe Group a cost level that is verycompetitive.
Business climate
In an overall economic downturn theGroup tends to be affected with a delayof six to twelve months depending oncustomer segment. The same applieswith an economic upturn. The factthat the Group is operating on a largenumber of geographical markets andwithin a wide range of customer seg-ments means a diversification that limits the effects of fluctuations in thebusiness climate. Historically, fluctua-tions in the business climate have notgenerated decreases in orders receivedby more than ten percent.
Prices of raw material
The Group depends on deliveries ofstainless steel, carbon steel, copper andtitanium etc for the manufacture ofproducts. The prices in some of thesemarkets are volatile and the supply oftitanium has occasionally been limited.There is a limited number of possiblesuppliers of titanium. The risk forseverely increased prices or limitedsupply constitutes serious risks for theoperations. The possibilities to pass onhigher input prices to an end customervary from time to time and betweendifferent markets depending on thecompetition. The Group is addressingthis risk by securing long-term supplycommitments and through fixed pricesfrom the suppliers during six to twelvemonths.
Environmental risks
This risk relates to the costs that theGroup may incur to reduce emissionsaccording to new or stricter environ-

Alfa Laval 2003 · 59
account for approximately 99 percentof all plaintiffs.
Alfa Laval strongly believes the claimsagainst the company are without meritand intends to vigorously contest eachlawsuit.
After thorough investigations AlfaLaval continues to believe that potentialclaims in connection with asbestosrelated lawsuits against Alfa Laval Inc.will be covered by insurance policies.Furthermore, primary insurance policiesissued in favour of Alfa Laval Inc. pro-vide for coverage of its defence costs.
During the fourth quarter 2003 AlfaLaval Inc. has been named as co-defen-dant in an additional nine lawsuitswith a total of thirteen plaintiffs. Dur-ing the fourth quarter seven lawsuitsinvolving approximately 400 plaintiffshave been resolved. This gives a grandtotal of 70 lawsuits that have beenresolved.
Based on current information andAlfa Laval’s understanding of these lawsuits, Alfa Laval continues to believethat these lawsuits will not have amaterial adverse effect on the com-pany’s financial condition or results of operation.
Risk for technically related damages
This risk refers to the costs Alfa Lavalmay incur in connection with a prod-uct delivered by the Group breakingdown and causing damages to life andproperty. The main risk in this contextconcerns high-speed separators, due tothe large forces that are involved whenthe bowl in the separator spins with avery high number of revolutions. In abreakdown the damages can be exten-sive. Alfa Laval addresses these risksthrough extensive testing and an ISOcertified quality assurance. The Grouphas product liability insurance. Thenumber of damages is low and fewdamages have occurred historically.
Insurance risks
These risks refer to the costs that AlfaLaval may incur due to an inadequate
insurance coverage for property, busi-ness interruption, liability, transport,life and pensions. The Group strives tomaintain an insurance coverage thatkeeps the risk level at an acceptablelevel for a Group of Alfa Laval’s sizeand is still cost efficient. At the sametime a continuous work is going on tominimise the risks in the operationsthrough proactive measures.
Risks connected to credit terms
This risk is referring to the limited free-dom of action that can be imposed on the Group through restrictions connected to credit terms in loanagreements. The loan agreement withthe new banking syndicate does notcontain any such restrictions.

Note 1. Segment reporting
Alfa Laval’s primary segments are the two divisions “Equipment” and “ProcessTechnology”. The divisions are based on a split into a number of customer seg-ments. The customer segments that belong to the Equipment division purchaseproducts whereas the customer segments that belong to Process Technologypurchase systems for the processing industry. The Equipment division consistsof six customer segments: Comfort & Refrigeration, Fluids & Utility, Equipment,
Notes
60 · Alfa Laval 2003
Divisional reporting
Consolidated, Orders receivedSEK in millions 2003 2002 2001
Equipment 8,069.9 8,092.6 8,557.9
Process Technology 5,990.6 6,488.1 7,026.9
Operations and other 84.8 94.1 96.1
Subtotal 14,145.3 14,674.8 15,680.9
Divested - - 213.0
Total 14,145.3 14,674.8 15,893.9
Consolidated, Order backlog
SEK in millions 2003 2002 2001
Equipment 1,598.9 1,564.5 1,648.3
Process Technology 2,398.0 2,752.6 2,654.7
Operations and other 24.2 23.0 9.5
Subtotal 4,021.1 4,340.1 4,312.5
Divested - - 1.0
Total 4,021.1 4,340.1 4,313.5
Marine & Diesel, OEM (Original Equipment Manufacturers), Sanitary Equipmentand the aftermarket segment Parts & Service. The Process Technology divisionconsists of five customer segments: Energy & Environment, Food Technology,Life Science, Process Industry and the aftermarket segment Parts & Service.
Operations are responsible for procurement, production and logistics. Otheris referring to corporate overhead and non-core businesses.
Consolidated, Net sales
SEK in millions 2003 2002 2001
Equipment 7,841.8 8,129.6 8,576.2
Process Technology 5,993.6 6,377.1 6,872.0
Operations and other 73.9 88.2 169.4
Subtotal 13,909.3 14,594.9 15,617.6
Divested - - 212.0
Total 13,909.3 14,594.9 15,829.6
Consolidated, Operating income
SEK in millions 2003 2002 2001
Equipment 1,010.9 1,098.8 1,083.6
Process Technology 351.5 537.5 472.7
Operations and other -229.5 -387.6 -321.0
Subtotal 1,132.9 1,248.7 1,235.3
Comparison distortion items 5.6 -29.2 5.3
Divested - - -9.2
Total 1,138.5 1,219.5 1,231.4
Consolidated Assets LiabilitiesSEK in millions 2003 2002 2003 2002Equipment 4,529.7 4,392.6 1,318.3 1,085.6
Process Technology 3,791.4 4,160.3 1,019.9 1,142.3
Operations and other 4,130.1 4,738.0 1,689.8 1,983.9
Subtotal 12,451.2 13,290.9 4,028.0 4,211.8
Divested - - - -
Subtotal 12,451.2 13,290.9 4,028.0 4,211.8
Corporate 2,238.3 2,136.4 5,660.3 6,595.1
Total 14,689.5 15,427.3 9,688.3 10,806.9
Corporate refers to balance sheet items that are interest bearing or are related to taxes.
Consolidated Investments Depreciation
SEK in millions 2003 2002 2001 2003 2002 2001
Equipment 25.1 24.8 31.5 236.6 250.5 261.9
Process Technology 33.4 33.7 38.0 224.0 236.2 248.6
Operations and other 200.0 218.2 205.4 326.6 351.3 395.2
Subtotal 258.5 276.7 274.9 787.2 838.0 905.8
Divested - - - - - 6.4
Total 258.5 276.7 274.9 787.2 838.0 912.2
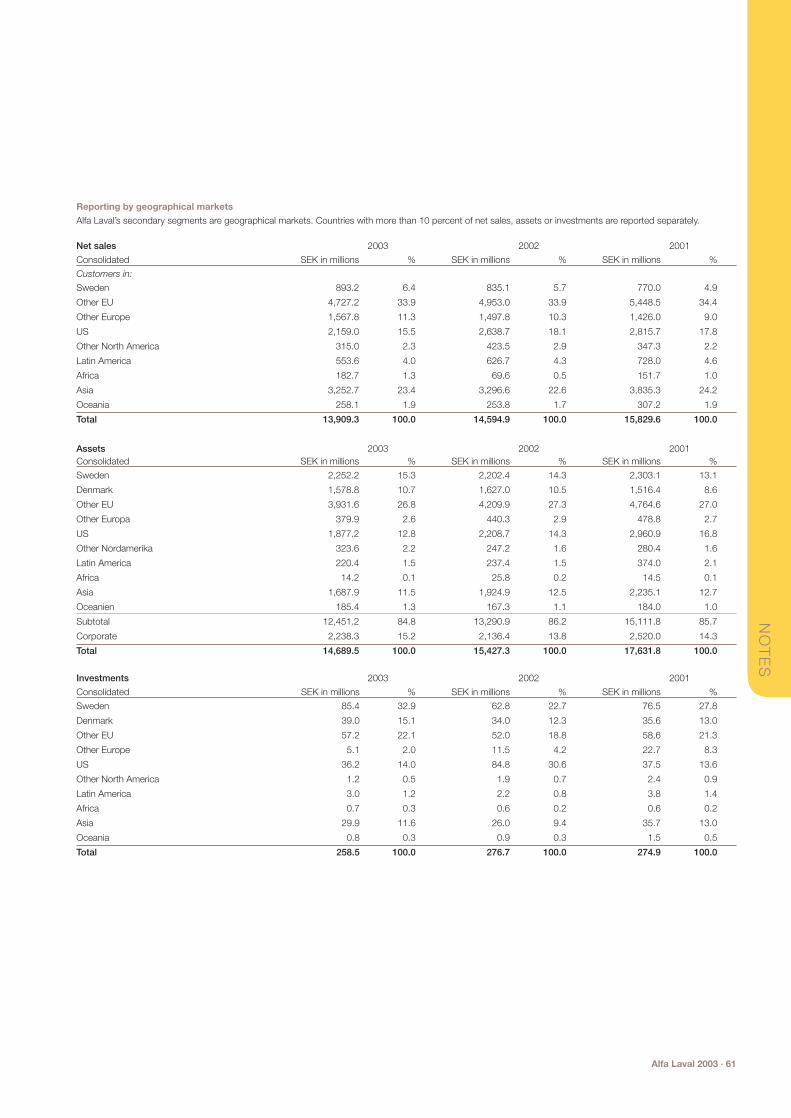
Alfa Laval 2003 · 61
NO
TE
S
Reporting by geographical markets
Alfa Laval’s secondary segments are geographical markets. Countries with more than 10 percent of net sales, assets or investments are reported separately.
Net sales 2003 2002 2001
Consolidated SEK in millions % SEK in millions % SEK in millions %
Customers in:
Sweden 893.2 6.4 835.1 5.7 770.0 4.9
Other EU 4,727.2 33.9 4,953.0 33.9 5,448.5 34.4
Other Europe 1,567.8 11.3 1,497.8 10.3 1,426.0 9.0
US 2,159.0 15.5 2,638.7 18.1 2,815.7 17.8
Other North America 315.0 2.3 423.5 2.9 347.3 2.2
Latin America 553.6 4.0 626.7 4.3 728.0 4.6
Africa 182.7 1.3 69.6 0.5 151.7 1.0
Asia 3,252.7 23.4 3,296.6 22.6 3,835.3 24.2
Oceania 258.1 1.9 253.8 1.7 307.2 1.9
Total 13,909.3 100.0 14,594.9 100.0 15,829.6 100.0
Assets 2003 2002 2001Consolidated SEK in millions % SEK in millions % SEK in millions %
Sweden 2,252.2 15.3 2,202.4 14.3 2,303.1 13.1
Denmark 1,578.8 10.7 1,627.0 10.5 1,516.4 8.6
Other EU 3,931.6 26.8 4,209.9 27.3 4,764.6 27.0
Other Europa 379.9 2.6 440.3 2.9 478.8 2.7
US 1,877.2 12.8 2,208.7 14.3 2,960.9 16.8
Other Nordamerika 323.6 2.2 247.2 1.6 280.4 1.6
Latin America 220.4 1.5 237.4 1.5 374.0 2.1
Africa 14.2 0.1 25.8 0.2 14.5 0.1
Asia 1,687.9 11.5 1,924.9 12.5 2,235.1 12.7
Oceanien 185.4 1.3 167.3 1.1 184.0 1.0
Subtotal 12,451.2 84.8 13,290.9 86.2 15,111.8 85.7
Corporate 2,238.3 15.2 2,136.4 13.8 2,520.0 14.3
Total 14,689.5 100.0 15,427.3 100.0 17,631.8 100.0
Investments 2003 2002 2001
Consolidated SEK in millions % SEK in millions % SEK in millions %
Sweden 85.4 32.9 62.8 22.7 76.5 27.8
Denmark 39.0 15.1 34.0 12.3 35.6 13.0
Other EU 57.2 22.1 52.0 18.8 58.6 21.3
Other Europe 5.1 2.0 11.5 4.2 22.7 8.3
US 36.2 14.0 84.8 30.6 37.5 13.6
Other North America 1.2 0.5 1.9 0.7 2.4 0.9
Latin America 3.0 1.2 2.2 0.8 3.8 1.4
Africa 0.7 0.3 0.6 0.2 0.6 0.2
Asia 29.9 11.6 26.0 9.4 35.7 13.0
Oceania 0.8 0.3 0.9 0.3 1.5 0.5
Total 258.5 100.0 276.7 100.0 274.9 100.0

62 · Alfa Laval 2003
Average number of employees – in Sweden by municipality
Employees in Sweden 2003 2002 2001
Botkyrka 482 483 476
Eskilstuna 179 175 181
Göteborg 13 2 2
Lund 965 951 873
Malmö 3 3 3
Ronneby 234 240 215
Stockholm 3 3 10
Other municipalities* 62 34 33
Total 1,941 1,891 1,793
* Municipalities with less than 10 employees and employees at branch officesabroad.
Sick leave among Swedish employees
Sick leave in percent of total normal working hours for each categoryConsolidated 2003
Sick leave for:
all employees 4.5
all employees during 60 consecutive days or more 2.8
female employees 6.0
male employees 4.2
employees at the age of 29 or younger 2.3
employees between 30 and 49 years of age 4.1
employees at the age of 50 or more 6.0
Distribution of men /women among managers
2003
Consolidated Number Male Female
Board members (excluding deputies) 12 83.3% 16.7%
President and other executive officers 10 100.0% 0.0%
Managers in Sweden 226 85.8% 14.2%
Managers outside Sweden 724 86.9% 13.1%
Managers total 950 86.6% 13.4%
Employees in Sweden 1,941 79.8% 20.2%
Employees outside Sweden 7,253 80.2% 19.8%
Employees total 9,194 80.1% 19.9%
After the Annual General Meeting in April 2004, the percentage of femalemembers of the Board is expected to reach 25.0 percent.
Average number of employees – by country
Number of Total number female employees of employees
Consolidated 2003 2002 2001 2003 2002 2001
Argentina 8 6 20 35 31 37Australia 19 21 22 66 72 84Belgium 28 23 30 128 134 140Brazil 21 23 27 104 111 122Bulgaria 4 4 6 14 14 15Canada 59 28 27 150 111 121Chile 5 4 4 22 21 19Colombia 5 2 2 12 10 10Denmark 269 253 227 1,098 1,054 978Estonia 2 2 2 4 4 5Philippines 3 3 4 21 21 21Finland 28 28 32 111 111 117France 119 120 121 599 610 620United Arab Emirates 7 7 8 50 49 48Greece 5 12 13 11 34 37Hong Kong 7 15 14 18 44 61India 32 29 29 1,031 1,042 1,101Indonesia 13 13 15 68 73 73Iran 2 2 1 9 9 7Italy 69 63 69 484 488 506Japan 31 41 47 158 165 184China 88 75 90 411 378 353Korea 15 15 16 75 77 68Latvia 5 4 4 8 7 7Lithuania 4 4 3 4 4 4Malaysia 25 24 19 70 68 72Mexico 5 9 13 40 50 62Netherlands 17 32 19 107 108 110Norway 15 16 17 54 60 74New Zeeland 4 6 7 27 32 34Peru 6 6 6 23 26 30Poland 24 25 29 117 123 122Portugal 3 3 3 13 14 14Romania 5 5 7 12 16 19Russia 98 112 100 235 244 244Switzerland 2 2 2 15 15 15Singapore 21 21 21 48 46 49Slovakia 1 1 1 9 11 9Spain 31 33 32 202 210 218UK* 53 55 80 334 344 519Sweden 392 347 306 1,941 1,891 1,793South Africa 9 9 9 37 38 39Taiwan 12 12 12 32 32 32Thailand 13 13 13 38 37 36Czech Republic 14 13 14 59 58 54Turkey 8 7 8 30 28 29Germany 51 56 64 256 256 347Hungary 5 5 5 24 26 28US 154 172 222 742 849 966Venezuela 4 4 4 17 15 17Austria 6 6 4 21 21 23Total for the group 1,826 1,791 1,850 9,194 9,292 9,693
* of which employed by the joint venture Rolls Laval 0 1 21
Note 2. Average number of employees – total
Number of female employees Total number of employees
Consolidated 2003 2002 2001 2003 2002 2001
Parent company - - - - - -
Subsidiaries in Sweden (8) 392 347 306 1,941 1,891 1,793
Total in Sweden (8) 392 347 306 1,941 1,891 1,793
Total abroad (80) 1,434 1,444 1,544 7,253 7,401 7,900
Total for the group (88) 1,826 1,791 1,850 9,194 9,292 9,693
The figures in brackets in the text column state how many companies had employees as well as salaries and remunerations in 2003.

Alfa Laval 2003 · 63
Salaries and remunerations – by country
Board of Directors, Presidents OtherConsolidated, and Vice Presidents employeesSEK in millions 2003 2002 2001 2003 2002 2001
Argentina 0.6 0.5 1.1 2.8 3.6 10.1
Australia 2.7 2.6 2.4 20.2 19.9 21.6
Belgium 3.1 3.3 3.7 52.3 48.8 46.4
Brazil 1.3 1.1 1.4 13.0 16.4 22.2
Bulgaria 0.3 0.2 0.2 1.4 1.1 1.1
Canada 3.5 3.3 4.0 59.0 41.5 43.8
Chile 0.0 0.0 0.0 2.7 3.2 5.5
Colombia 0.5 0.4 0.5 0.9 0.9 1.0
Denmark 11.9 9.1 8.3 527.9 409.0 431.9
Estonia 0.0 0.0 0.0 0.2 0.5 0.7
Philippines 0.4 0.4 0.3 1.5 1.8 1.8
Finland 2.5 2.6 2.2 38.7 38.8 40.0
France 2.8 3.4 4.2 180.5 178.0 173.9
United Arab Emirates 1.2 1.7 1.4 10.5 14.5 13.6
Greece 0.0 0.0 0.0 3.8 10.6 10.6
Hong Kong 2.8 3.4 3.5 14.2 22.7 25.5
India 1.5 1.2 1.2 36.4 39.7 39.7
Indonesia 0.6 0.5 0.5 4.3 4.6 4.5
Iran 0.0 0.0 0.0 6.5 4.1 3.6
Italy 3.1 4.5 4.1 133.4 125.2 134.3
Japan 6.9 8.8 8.4 77.3 84.9 115.2
China 0.0 0.0 0.0 28.7 21.6 19.9
Korea 1.3 1.0 0.8 19.4 19.9 18.9
Latvia 0.5 0.4 0.4 1.0 1.0 0.9
Lithuania 0.0 0.0 0.0 0.7 0.7 0.7
Malaysia 1.4 1.5 1.4 9.3 10.5 11.9
Mexico 1.5 1.7 5.4 8.8 11.1 13.0
Netherlands 2.6 2.3 2.1 45.9 46.4 46.0
Norway 1.6 1.3 1.3 29.3 36.4 37.3
New Zeeland 0.6 0.4 0.0 6.6 7.7 8.4
Peru 0.6 1.1 1.1 2.9 3.7 6.1
Poland 2.4 4.0 3.7 11.9 14.1 15.0
Portugal 0.4 1.8 1.8 3.3 3.2 3.0
Romania 0.0 0.0 0.0 1.6 2.3 2.5
Russia 0.0 1.4 1.3 24.3 25.8 27.6
Switzerland 1.5 1.9 1.7 10.3 10.5 9.9
Singapore 1.4 1.4 1.8 10.3 11.8 11.2
Slovakia 0.0 0.1 0.0 1.1 1.2 1.4
Spain 1.8 1.8 1.1 67.4 64.0 69.5
UK 0.0 4.8 6.0 114.9 124.7 176.8
Sweden 22.5 21.6 27.6 715.7 676.4 629.6
South Africa 1.6 0.6 0.6 7.4 6.0 6.7
Taiwan 0.7 0.9 0.9 6.6 7.9 8.9
Thailand 1.1 1.3 1.1 3.9 4.4 4.5
Czech Republic 0.7 0.8 0.7 7.1 7.0 5.9
Turkey 1.4 1.1 0.9 6.6 5.1 4.7
Germany 7.3 13.9 11.8 136.3 133.7 168.5
Hungary 0.8 0.7 0.5 2.9 3.4 3.2
US 20.4 17.0 17.5 404.0 475.6 591.8
Venezuela 0.0 0.0 0.0 2.5 2.0 2.3
Austria 1.0 1.7 1.7 9.1 8.2 9.2
Total for the group 120.8 133.8 141.0 2,887.3 2,815.9 3,062.7
Note 3. Salaries and remunerations – total
Consolidated, SEK in millions 2003 2002 2001
Board of Directors, Presidents and Vice Presidents 120.8 133.8 141.0
of which, bonus 20.7 18.3 23.8
Other 2,887.3 2,815.9 3,062.7
Total salaries and remunerations 3,008.1 2,949.7 3,203.7
Social security costs 609.6 548.5 550.9
Pension costs, defined benefit plans 157.9 161.9 85.9
Pension costs, defined premium plans 206.1 222.8 267.7
Total costs of personnel 3,981.7 3,883.0 4,108.2
The Group’s pension costs and pension liabilities relating to the Board of Direc-tors, presidents and vice presidents amounts to SEK 33.8 (46.8) (31.2) millionand SEK 339.0 (346.9) (376.4) million respectively. SEK 201.3 (223.0) (246.1)million of the pension liabilities is covered by the Alfa Laval Pension Fund.
Chief Executive Officer/Managing DirectorThe Chief Executive Officer and Managing Director Sigge Haraldsson receives aremuneration of SEK 5,076,417 (5,098,854) (5,352,173), of which bonus wasSEK - (-) (200,000) .The bonus refers to bonus paid during the year.
Sigge Haraldsson has an agreement on early retirement that gives him theoption to enter into early retirement at his request from the age of 60 or to enterinto early retirement at the request of the company from the age of 55. In apress release on January 27, 2004 Sigge Haraldsson communicated his inten-tion to retire in accordance with the agreement in connection with his sixtiethbirthday in October 2004. The agreement provides a pension level of 50 percentof the salary at the time of retirement if he enters into early retirement betweenthe age of 55 and 58 and 70 percent of the salary if he enters into early retire-ment after the age of 58. At early retirement, the company maintains the pay-ments of pension premiums as if the employment had lasted until the age of 65.
For the part of the salary that is above the ITP plan’s 30 price base amounts(one price base amount equals SEK 38,600), the old age pension after 65 ispaid with 52.5 percent of the salary up to 80 price base amounts and abovethat with 32.5 percent and family pension with 16.25 percent of the salary. Hehas a special family pension that represents a life long supplement between theold age pension and the family pension according to ITP. During the year, AlfaLaval has recorded costs for pension premiums of SEK 4.9 (7.2) (7.3) million, ofwhich SEK 1.7 (3.4) (3.4) million relates to premiums for early retirement that arepaid during a short period of time. There is no separate agreement on sever-ance pay.
Board of DirectorsThe Chairman of the Board receives a remuneration of SEK 600,000 (500,000)(500,000) per year. He does not have any agreement on future retirement orseverance pay with Alfa Laval.
For 2003, the Board of Directors receive a total fee of SEK 2,225,000(2,250,000) (2,250,000), which is distributed among the members elected at theAnnual General Meeting.
Other executive officersOther executive officers are the nine members of Group Management in addi-tion to the Chief Executive Officer. Their remunerations amount to SEK 20.8(21.3) (22.1) million, of which bonuses were SEK 4.5 (4.1) (2.7) million. Thebonus refers to bonus paid during the year.
For these executive officers, early retirement can be offered from the age of60. The agreement normally gives a pension level of 75 percent of the salary atthe time of retirement up to 30 price base amounts and above that 50 percentof the salary. Old age pension after 65 and family pension according to ITP doalso include the part of the salary above the ITP plan’s 30 price base amounts.They have a special family pension that represents a supplement between theold age pension and the family pension according to ITP. In addition to that theymay exchange salary and bonus for a temporary old age and family pension.
Alfa Laval has made commitments for severance pay to a limited group ofsenior executives. The commitments are restricted to a maximum amount oftwo annual salaries. The commitments define the conditions that must be ful-filled in order for them to become valid.
Decision procedures for remunerations to Group ManagementThe remunerations to the Chief Executive Officer/Managing Director and othermembers of Group Management are decided in the remunerations’ committeewithin the Board.
The principle used when deciding the remunerations to executive officers isthat the remuneration is mainly based on a fixed monthly salary, with an optionfor a company car and in addition to that a floating remuneration in the form of a yearly bonus up to 30 percent of the salary. The size of the resulting bonusdepends on the outcome of a number of financial measurements and the resultof special projects, all compared with the objectives that have been establishedfor the year.

64 · Alfa Laval 2003
Note 6. Information on auditors’ fee
During 2000 quotations were taken in from four of the large international auditfirms. After a selection process, Ernst & Young were given the assignment to bethe Group’s auditors as of year 2000 and four years ahead. Ernst & Young werealready the Group’s main auditors and audited the consolidated group and mostof the subsidiaries.
At the beginning of 2004, new quotations were taken in from four of the largeinternational audit firms. The purpose with the selection process is to assign theauditors for the Group for the coming four years.
Fees and expense compensation, Consolidated, SEK in millions 2003 2002 2001
Audit
Ernst & Young 10.9 12.7 10.2
Other audit firms 1.1 1.1 2.7
Total 12.0 13.8 12.9
Fees and expense compensation, Consolidated, SEK in millions 2003 2002 2001
Other projects
Ernst & Young 2.7 2.8 7.2
Other audit firms 4.8 6.6 5.3
Total 7.5 9.4 12.5
An audit includes examining the financial statements, assessing the accountingprinciples used and significant estimates made by management, as well asevaluating the overall financial statement presentation. It also includes anexamination in order to give an opinion on the Board’s discharge from liability. All other assignments are defined as other projects.
Note 4. Equity compensation benefits The shares held by management at the end of 2001 were linked to warrants tosubscribe for new ordinary shares. The warrants had been acquired at marketvalue, based on the transaction on August 24, 2000. The warrants could be exer-cised in the event of a trade sale, flotation or the tenth anniversary of August 24,2000. The warrants were issued in nine tranches, each of which was exercisableat a predefined rate of return on Industri Kapital's investment in Alfa Laval. Thehigher this rate of return, the more warrants could be exercised. The warrantmeant that a new share could be acquired at a price fixed in advance based onthe value on August 24, 2000, increased by 11 percent per year. The total num-ber of shares that could be subscribed for at a maximum outcome was1,859,748, which corresponded to an increase of the number of shares by 4.96percent. Of this, Group Management held 1,129,896 warrants and members ofthe Board that were not part of Group Management held 158,250 warrants. Theremaining part was held by employees.
At the IPO on May 17, 2002 all warrants could be exercised. No warrants wereoutstanding at the end of 2002. In connection with the subscription, Group Man-agement and almost 50 other senior executives have been committed to hold theoriginally acquired as well as the newly subscribed shares for a period of 270 daysafter the IPO on May 17, 2002 and at least until the press release for the full-year2002 was published, which occurred on February 24, 2003. The number ofshares that it was necessary to sell in order to acquire the new shares as well aspay the tax on the corresponding realised gain were, however, allowed to be sold.This is the reason why the sum of number of shares and warrants at December31, 2001 despite the selling restriction can be higher than the holding at the endof December 2002.
Alfa Laval reported the payments of SEK 3.6 million received for the warrantsas a deposit from the shareholders at the end of 2001. When the warrants wereexercised, the corresponding credit was transferred to equity capital.
Note 5. Information about the members of the Board and the workprocedures of the Board
The members of the Board of DirectorsThe Board presently has 12 members including the Chairman. Seven of thesewere elected at the Annual General Meeting on June 1, 2001 and one at theAnnual General Meeting on April 8, 2002. The Board also has four members,with deputies, elected by the trade unions.
Name Member since Born Function
Anders Narvinger May 2003 1948 ChairmanBjörn Savén August 2000 1950 Deputy ChairmanPer Olov Jakobsson December 2000 1942 MemberArne Kastö December 2000 1948 MemberSusanna Holmqvist Norrby May 2003 1967 MemberJan Nilsson December 2000 1952 MemberFinn Rausing August 2000 1955 MemberJörn Rausing August 2000 1960 MemberChristian Salamon August 2000 1961 MemberWaldemar Schmidt August 2000 1940 MemberLena Olving Öhberg May 2002 1956 MemberSigge Haraldsson August 2000 1944 Member,
Managing DirectorMagnus Christersson May 2003 1973 Deputy memberGunnar Karlsson December 2000 1941 Deputy memberKalevi Houtari December 2000 1951 Deputy memberSalvador Pay Ortiz May 2002 1940 Deputy member
Thomas Oldér has left the Board in March 2003 and has been replaced at theAnnual General Meeting in May 2003 by Anders Narvinger as Chairman of theBoard. Linda Karlsson has left as member during the year and has beenreplaced by Susanna Holmqvist Norrby as representative for CF. Åke Klintin,representative for SIF, has left as deputy member during the year and has beenreplaced by Magnus Christersson as representative for CF.
For a presentation of the members of the Board, see pages 90–91.
Work procedures of the Board The Board has held twelve (thirteen) (eight) meetings during 2003. The Boardhas issued rules of procedures for the Board of Directors and an instructionregarding the allocation of work between the Board of Directors and the Manag-ing Director. The rules of procedure establish, among other things, how oftenthe Board of Directors shall meet and how the work shall be organised.
During 2001 the Board appointed a remuneration committee, consisting ofthe Chairman, Björn Savén and Jörn Rausing, with Sigge Haraldsson as pre-senting. The committee shall handle remuneration matters for the members ofGroup Management.
Matters that the Board has been discussing during the year include liquidityand funding, share and ownership developments, dividends, asbestos litigations,larger capacity investments and development projects, acquisition of businesses,purchase and divestment of real estate, internal audit, external audit planningand the strategic positioning of the Group.
Since the Group has a bond loan that is registered with the Securities andExchange Commission (SEC) in the US, the question of appointing an auditcommittee according to the “Sarbanes-Oxley Act” has been discussed. TheBoard has chosen not to appoint an audit committee since the judgement isthat the financial reporting and control within the Group, the Group’s policiesconcerning internal control, the external and internal audit and the reporting tothe Board in these matters are such that a special audit committee within theBoard would not increase the Board’s insight and control over the operations. At two Board meetings during 2003 the Board has received reports from andmet the external auditors of the Group. At one Board meeting during 2003, theBoard has received reports from and met the internal auditor of the Group.
Section 407 of the “Sarbanes-Oxley Act” requires the company to disclosewhether it has a financial expert on the audit committee. The Board has decidednot to elect a financial expert. The Board has approved a pre-approval policy forall auditing and non-auditing services provided by audit firms in accordance withSection 202 of the “Sarbanes-Oxley Act”. The Board has also established acode of ethics for senior financial officers based on the requirements in section406 of the “Sarbanes-Oxley Act”.

Alfa Laval 2003 · 65
Note 7. Advertising costs
Advertising costs have amounted to SEK 47.3 (40.0) (53.9) million. These refer tocosts for advertisements in newspapers and technical press, participation in tradefairs, brochures and for year 2001 the building of the Alfa Laval trademark and thenew logotype.
On February 26, 2003 the property in Newmarket in Canada was sold for SEK20.0 million, with a realised gain of SEK 3.6 million. In connection with the con-struction of a new headquarter building in Lund a piece of land was sold to thenew landlord for SEK 3.8 million with a realised gain of SEK 2.0 million.
The sale of the property in Warminster, the United States was completed inMarch 2002 at a price of SEK 62.1 million and with a realised loss of SEK -43.2million.
During 2001 the following properties were sold. The real estate in Johannes-burg in South Africa was divested in May. The sales price was SEK 13.6 millionresulting in a realised loss of SEK -0.3 million. The sale of the real estate inGlinde in Germany was completed in October for a price of SEK 196.4 million,with a realised loss of SEK -8.3 million. In addition, some smaller properties inSpain and Sweden and one condominium in Sweden were sold for a total ofSEK 14.2 million, with a realised gain of SEK 3.9 million.
The divestment of the operation called Industrial Flow was made on April 2,2001. The sales price was SEK 330.6 million. In the annual report for 2001, a realised gain of SEK 10.0 million was recognised. A few activities remainedbefore the divestment could be completed. During September 2002 a final set-tlement was made with the buyer, resulting in an increase of the realised gain bySEK 14.0 million.
Note 8. Comparison distortion items
Consolidated, SEK in millions 2003 2002 2001
Sale of real estate 5.6 -43.2 -4.7
Sale of Industrial Flow - 14.0 10.0
Total 5.6 -29.2 5.3
Note 9. Depreciation by function
Consolidated, SEK in millions 2003 2002 2001
Cost of goods sold -455.9 -478.0 -499.8
Sales -50.8 -60.1 -68.7
Administration -72.8 -97.9 -145.3
Research and development -7.2 -7.5 -8.6
Other income and costs -9.2 -6.8 -11.8
Goodwill -191.3 -187.7 -178.0
Total -787.2 -838.0 -912.2
Note 10. Depreciation by type of assets
Consolidated, SEK in millions 2003 2002 2001
Goodwill -191.3 -187.7 -178.0
Patents, trademarks, etc. -204.7 -208.3 -214.6
Machinery and equipment -316.1 -351.4 -403.6
Financial leasing machinery and equipment -4.7 -7.8 -10.9
Buildings and ground installations -70.4 -82.8 -105.1
Total -787.2 -838.0 -912.2
Note 11. Result from other securities and receivables accounted for as fixed assets
Consolidated, SEK in millions 2003 2002 2001
Dividends from other 6.9 7.8 9.6
Total 6.9 7.8 9.6
Note 12. Interest income/costs and similar result items
Consolidated, SEK in millions 2003 2002 2001Interest income
Financial leasing
External companies 0.8 0.1 0.0
Other interest
External companies 132.9 143.4 108.0
Exchange gains
Unrealised 42.6 46.6 76.9
Realised 91.2 161.3 53.0
Total 267.5 351.4 238.0
Interest costsFinancial leasing
External companies -1.4 -2.7 -1.7
Other interest
External companies -398.8 -742.5 -1,075.9
Exchange loss
Unrealised -101.9 -26.0 -329.2
Realised -93.4 -130.6 -30.4
Total -595.5 -901.8 -1,437.2
In the Group, reported net exchange differences of SEK 194.8 (164.9) (-105.5)million relating to debts in foreign currencies have been charged to unrestrictedequity. These debts finance the acquisition of shares in foreign subsidiaries andact as a hedge to the acquired net assets. Since 2003 the amount is chargedwith tax, due to the estimated absorption of tax losses in Sweden, resulting in anet after tax equity impact of SEK 140.3 million. In the parent company, theexchange differences are taken to the income statement.
Parent company, SEK in millions 2003 2002 2001
Interest income
Other interestExternal companies 0.0 - 0.1
Subsidiaries 6.0 4.0 0.0
Exchange gains
Unrealised - 0.3 -
Realised - 24.4 0.0
Total 6.0 28.7 0.1
Interest costsOther interest
External companies 0.0 -98.2 -244.5
Exchange loss
Unrealised - - -84.4
Realised -0.1 0.0 0.0
Total -0.1 -98.2 -328.9
Note 13. Minority interest
The minority share in subsidiaries’ result and minority interests in the balancesheet relate to four subsidiaries in India and Russia where minority owners exist.

66 · Alfa Laval 2003
Since 2003 the equity hedge is charged with tax, due to the estimated absorption of tax losses in Sweden. For 2002 and earlier this means that the tax effect calcu-lated on result before minority interests and tax has been adjusted. Tax losses and tax credits for 2003 are referring to used tax losses in Sweden.
Temporary differences exist when there is a difference between the book value and the tax base of assets and liabilities. The Group’s temporary differences haveresulted in a deferred tax asset or a deferred tax liability relating to the following assets and liabilities:
2003 2002Deferred Deferred Deferred Deferred
Consolidated, SEK in millions tax asset tax liability tax asset tax liability
Intangible assets 51.3 338.3 71.5 422.3
Tangible assets 45.8 404.9 10.0 471.1
Inventory 79.5 18.0 44.4 27.7
Other current assets 3.7 1.2 11.3 2.5
Financial assets - - 4.5 -
Short term liabilities 332.8 65.4 373.9 40.8Tax losses and tax credits * 12.5 - 19.3 -
Other 2.9 40.8 11.5 38.2
Subtotal 528.5 868.6 546.4 1,002.6
Possible to net -51.6 -51.6 -12.3 -12.3
Total 476.9 817.0 534.1 990.3
* The Group has reported a deferred tax asset on unused tax losses and tax grants of SEK 41.0 (61.4) million. These unused tax losses and tax grants are essentially notrestricted in time.
Tax rates in percentageConsolidated 2003 2002 2001
India 37 37 36
Iran 40 40 12
Singapore 22 22 25
France 35 35 34
Greece 35 35 38
Italy 38 38 40
Chile 16 16 15
China 11 11 3
Korea 29 29 28
United Arab Emirates 0 7 4
Switzerland 24 24 28
Tax rates in percentageConsolidated 2003 2002 2001
Turkey 30 28 33
Russia 24 24 35
Latvia 22 22 25
Lithuania 15 15 24
Canada 37 39 35
Peru 27 25 25
Belgium 34 40 40
Bulgaria 24 20 20
Slovakia 25 29 29
Czech Republic 28 31 31
Poland 19 28 28
The nominal tax rate has changed in the following countries during 2003 to 2001.
Note 14. Taxes on this year’s result and other taxes for the Group Consolidated, SEK in millions 2003 2002 2001
The major components of the Group’s tax costs:
Current tax cost -341.6 -336.0 -396.9
Adjustment for current taxes on prior periods 38.1 72.1 84.8
Deferred tax costs/income on changes in temporary differences 153.3 95.0 374.6
Deferred tax costs/income on changes in tax rates or new taxes -14.0 3.4 12.0
Tax income from previously unrecognised tax losses or tax credits on temporary differences of prior periods 40.4 6.0 1.3
Deferred tax income from previously unrecognised tax losses or tax credits on temporary differences of prior periods 30.6 0.3 0.7
Deferred tax cost from the write down or reversal of a previous write down of a deferred tax asset -17.0 -26.5 -15.6
Other taxes -19.8 -32.6 -34.6
Total tax cost -130.0 -218.3 26.3
The difference between the tax costs of the group and the tax cost based upon applicable tax rates, can be explained as follows:
Result before minority interests and tax 817.4 372.1 41.8
Tax according to applicable tax rates -194.9 -133.6 -14.6Tax effect of:
Non-deductible effect of depreciation of goodwill -63.1 -61.9 -58.7
Equity hedge (tax effect not booked prior to 2003) - -46.2 29.5
Non-deductible costs -26.8 -127.1 -198.7
Non-taxable income 44.2 131.4 119.8
Differences between reported official depreciation and depreciation according to tax rules -16.0 -7.2 -7.4
Differences between reported other official appropriations and other appropriations according to tax rules -50.8 -40.7 12.1
Tax losses and tax credits 159.1 2.8 42.5
Other -19.8 -7.9 17.0
Adjustment for current tax on prior periods 38.1 72.1 84.8
Total tax costs -130.0 -218.3 26.3
In the Group there are temporary differences and unused tax losses and tax credits of SEK 1,317.4 (2,197.1) million that have not resulted in corresponding deferredtax assets, since these are not likely to be used.
The Group’s normal effective tax rate is approximately 33 (33) percent based on taxable result, and it is calculated as a weighted average based on each sub-sidiary’s part of the result before tax. Due to the large tax losses the actual tax rate was 13.5 percent during 2003.

Alfa Laval 2003 · 67
Alfa Laval 2003
Allocated Opening Planned Translation- ClosingSEK in millions August 24, 2000 balance Acquired Realised amortisation difference balance
Buildings 1,058.5 604.8 0.9 -0.1 -26.0 -25.8 553.8
Land and land improvements -228.4 -129.9 - -0.7 - 20.4 -110.2
Machinery 548.3 443.7 - - -56.7 -17.2 369.8
Equipment 452.1 361.2 - - -29.3 -21.0 310.9
Construction in progress 15.9 - - - - - -
Inventory 340.2 - - - - - -
Patent and trademarks 461.3 408.3 22.3 - -22.3 -30.1 378.2
Technology 1,279.8 891.9 - - -168.5 -40.3 683.1
Research and development 53.6 - - - - - -
Capital gain (Industrial Flow) 41.8 - - - - - -
Subtotal step-up values 4,023.1 2,580.0 23.2 -0.8 -302.8 -114.0 2,185.6
Goodwill 3,276.6 3,369.0 7.6 - -184.8 -234.0 2,957.8
Goodwill related to the acquisition of
Toftejorg - 33.0 - -3.3 -0.4 29.3
bioKinetics - 121.3 - -3.2 -6.7 111.4
Subtotal goodwill 3,369,0 161.9 - -191.3 -241.1 3,098.5
Total 7,299.7 5,949.0 185.1 -0,8 -494.1 -355.1 5,284.1
When Industri Kapital acquired the Alfa Laval Group from Tetra Laval on August 24,2000, the acquisition value for the shares was SEK 8,213.8 million. Below isshown a summary of the goodwill and the group step-up or step down values
that the acquisition resulted in per type of asset at August 24, 2000 and atDecember 31, 2003. The goodwill is amortised over 20 years. The correspon-ding presentation by asset type is found in Notes 16 and 17.
Note 15. Goodwill and step-up values related to the acquisition on August 24, 2000
For assets sold, net gains or losses are recognised on the costs basis includingany related step-up value. Construction in process was transferred to machineryin 2001.
In connection with the IPO in 2002 an additional purchase price of EUR 40.0million, corresponding to SEK 367.5 million, was paid to Tetra Laval BV for theoriginal acquisition on August 24, 2000 of the Alfa Laval Holding AB Group. Thishas been reported entirely as goodwill in the Group and is amortised over thesame period as the original acquisition. As the acquisition of 13,1 percent of Alfa Laval (India) Ltd was contingent on the change of ownership on August 24,2000, the resulting goodwill is presented together with the goodwill thatappeared at the acquisition on August 24, 2000.
The difference between the purchase price paid and the net assets acquired
Note 16. Intangible fixed assets
Consolidated, SEK in millions 2003 2002
Concessions, patents, licenses, trademarks and similar rights
Opening balance, accumulated acquisition values 2,132.8 1,993.8
Purchases 5.0 0.6
Acquisition of businesses 22.3 0.0
Sales/disposals 0.0 -2.4
Reclassifications - -13.5
Step-up values, patents and trademarks 21.0 -
Translation difference for the year -104.4 154.3
Closing balance, accumulated acquisition values 2,076.7 2,132.8
Opening balance, accumulated depreciation -799.2 -353.8
Sales/disposals - 2.4
Reclassifications 0.0 10.8
Depreciation of step-up value, patent & trademarks -22.3 -24.1
Depreciation of step-up value, technology -168.5 -177.2
Depreciation for the year -13.8 -6.9
Translation difference for the year 27.9 -250.4
Closing balance, accumulated depreciation -975.9 -799.2
Closing balance, net book value 1,100.8 1,333.6
Goodwill
Opening balance, accumulated acquisition values 3,768.6 3,611.7
Goodwill in connection with acquisition of businesses 161.9 102.4
Additional purchase price - 367.5
Translation difference for the year -276.7 -313.0
Closing balance, accumulated acquisition values 3,653.8 3,768.6
Opening balance, accumulated depreciation -399.6 -238.8
Depreciation for the year -191.3 -187.7
Translation difference for the year 35.6 26.9
Closing balance, accumulated depreciation -555.3 -399.6
Closing balance, net book value 3,098.5 3,369.0
Renting rights and similar rights
Opening balance, accumulated acquisition values 1.1 0.6
Purchases 0.1 0.1
Reclassifications - 0.4
Translation difference for the year 0.0 0.0
Closing balance, accumulated acquisition values 1.2 1.1
Opening balance, accumulated depreciation -0.4 -0.2
Reclassifications - -0.2
Depreciation for the year -0.1 -0.1
Translation difference for the year 0.0 0.1
Closing balance, accumulated depreciation -0.5 -0.4
Closing balance, net book value 0.7 0.7
in Toftejorg is SEK 33.9 million. SEK 0.9 million of this has been allocated to aproperty in the US, while the residual SEK 33.0 million has been allocated togoodwill. The goodwill is amortised over 10 years.
The difference between the purchase price paid and the net assets acquiredin bioKinetics is SEK 143.6 million. SEK 22.3 million of this has been allocatedto patents and un-patented know-how, while the residual SEK 121.3 million hasbeen allocated to goodwill. The goodwill is amortised over 10 years.
The remaining increase of SEK 7.6 million in goodwill is related to the acquisi-tion of Danish Separation Systems A/S in 2002.
There is no deferred tax liability calculated on the goodwill. The deferred taxliability on the other step-up values is SEK 686.3 (826.7) million.

68 · Alfa Laval 2003
Note 17. Property, plant and equipment
Consolidated, SEK in millions 2003 2002
Real estate
Opening balance, accumulated acquisition values 1,971.2 2,305.0
Purchases 13.6 12.0
Acquisition of businesses 9.0 17.9
Sales/disposal -46.3 -158.5
Reclassifications 29.8 29.1
Realisation of step-up values due to sale -0.8 8.5
Translation difference for the year -147.9 -242.8
Closing balance, accumulated acquisition values 1,828.6 1,971.2
Opening balance, accumulated depreciation -750.7 -916.0
Sales/disposals 6.6 75.6
Acquisition of businesses -2.3 -1.3
Reclassifications -3.9 47.7
Depreciation of step-up value -26.0 -27.5
Depreciation for the year -43.6 -54.6
Translation difference for the year 74.5 125.4
Closing balance, accumulated depreciation -745.4 -750.7
Opening balance, accumulated revaluations, net 89.4 90.0
Reclassifications -0.6 0.0
Revaluation for the year 0.0 0.1
Depreciation for the year on revaluations -0.8 -0.7
Closing balance, accumulated revaluations, net 88.0 89.4
Closing balance, net book value 1,171.2 1,309.9
Machinery and other technical installations
Opening balance, accumulated acquisition values 2,611.6 2,828.1
Purchases 85.1 97.6
Acquisition of businesses 14.1 6.6
Sales/disposal -40.4 -157.0
Reclassifications -10.4 56.9
Translation difference for the year -159.2 -220.6
Closing balance, accumulated acquisition values 2,500.8 2,611.6
Opening balance, accumulated depreciation -1,628.5 -1,690.3
Sales/disposals 37.4 132.2
Acquisition of businesses - -2.5
Reclassifications 8.2 -27.6
Depreciation of step-up value -56.7 -59.0
Depreciation for the year -116.1 -130.2
Translation difference for the year 110.4 148.9
Closing balance, accumulated depreciation -1,645.3 -1,628.5
Closing balance, net book value 855.5 983.1
Equipment, tools and installations
Opening balance, accumulated acquisition values 2,024.6 2,288.1
Purchases 71.9 71.6
Acquisition of businesses 25.2 3.9
Sales/disposal -71.6 -150.3
Reclassifications 26.2 -59.6
Translation difference for the year -107.2 -129.1
Closing balance, accumulated acquisition values 1,969.1 2,024.6
Opening balance, accumulated depreciation -1,317.3 -1,411.4
Sales/disposals 67.2 127.4
Acquisition of businesses -11.7 -2.1
Reclassifications 5.8 47.6
Depreciation of step-up value -29.3 -31.3
Depreciation for the year -113.7 -130.5
Translation difference for the year 74.0 83.0
Closing balance, accumulated depreciation -1,325.0 -1,317.3
Consolidated, SEK in millions 2003 2002
Equipment, tools and installations (continued)
Opening balance, accumulated revaluations, net 15.9 16.9
Sales/disposals -1.3 -0.2
Reclassifications -0.2 -0.5
Revaluation for the year 0.1 0.1
Depreciation for the year on revaluations -0.3 -0.4
Closing balance, accumulated revaluations, net 14.2 15.9
Closing balance, net book value 658.3 723.2
Construction in progress and advances to suppliers concerning property, plant and equipment
Opening balance, accumulated acquisition values 40.8 57.9
Purchases 76.1 93.7
Sales/disposal -0.2 -1.2
Reclassifications -52.5 -103.9
Translation difference for the year -6.0 -5.7
Closing balance, accumulated acquisition values 58.2 40.8
Closing balance, net book value 58.2 40.8
Leased machinery
Opening balance, accumulated acquisition values 14.1 13.2
Purchases - 0.2
Acquisition of businesses - 7.2
Sales/disposal -5.6 -6.2
Translation difference for the year -0.2 -0.3
Closing balance, accumulated acquisition values 8,3 14,1
Opening balance, accumulated depreciation -7.1 -4.4
Sales/disposals 3.1 3.3
Acquisition of businesses - -3.1
Depreciation for the year -1.4 -3.0
Translation difference for the year 0.1 0.1
Closing balance, accumulated depreciation -5.3 -7.1
Closing balance, net book value 3.0 7.0
Leased equipment, tools and installations
Opening balance, accumulated acquisition values 44.7 58.8
Purchases 6.7 0.9
Acquisition of businesses 0.6 0.0
Sales/disposal -10.5 -11.2
Reclassifications -15.3 0.2
Translation difference for the year -3.6 -4.0
Closing balance, accumulated acquisition values 22.6 44.7
Opening balance, accumulated depreciation -25.9 -37.1
Sales/disposals 9.1 8.8
Acquisition of businesses -0.2 0.0
Reclassifications 6.5 4.4
Depreciation for the year -3.3 -4.8
Translation difference for the year 1.5 2.8
Closing balance, accumulated depreciation -12.3 -25.9
Closing balance, net book value 10.3 18.8
Leased machinery and equipment relate to fixed assets which are leased andwhere the leasing agreement has been considered to be a financial lease. Thesefinancial leases are capitalised in the balance sheet.
The tax assessment value of the Swedish real estate at December 31, 2003amounted to SEK 124.5 (122.6) million, out of which SEK 47.2 (47.2) millionreferred to land and land improvements and SEK 77.3 (75.4) million buildings.The book values of the Swedish real estate amounted to SEK 72.6 (57.2) mil-lion, out of which land and land improvements were SEK 18.7 (9.1) million andbuildings were SEK 53.9 (48.1) million.

Note 18. Financial long-term assetsConsolidated Parent company
SEK in millions 2003 2002 2003 2002
Shares in subsidiaries - - 4,460.9 4,460.9
Shares in other companies 22.5 53.1 - -
Total 22.5 53.1 4,460.9 4,460.9
Alfa Laval 2003 · 69
Specification of shares in subsidiariesRegistration Number Share of Book value,
Company name number Domicile of shares capital, % SEK in millions
Alfa Laval AB 556587-8054 LundAlfa Laval Special Finance AB 556587-8062 Lund 100 4,460.9
Alfa Laval Holding AB 556025-2792 Lund 100 0.0
Alfa Laval Holding AB 556025-2792 Lund 12,500,000 100 0.0Alfa Laval NV Maarssen 227,754 100 0.0
Alfa Laval Inc Newmarket 1,000,000 67 0.0Alfa Laval S.A. DE C.V. Tlalnepantla 45,057,057 100 0.0Alfa Laval S.A. San Isidro 699 100 0.0Alfa Laval Ltda Sao Paulo 100 0.0
Roston do Brasil Ltda Sao Paulo 5,249 100 0.0Alfa Laval S.A.C.I. Santiago 2,735 100 0.0Alfa Laval S.A. Bogota 12,195 100 0.0Alfa Laval S.A. Lima 4,346,832 100 0.0Alfa Laval Venezolana S.A. Caracas 10,000 100 0.0
Alfa Laval Oilfield C.A. Caracas 203 81 0.0Alfa Laval Phe Co Ltd Jiang Yin 100 0.0Alfa Laval Flow Equipment (Kunshan) Co Ltd Jiangsu 100 0.0Alfa Laval (Shanghai) Technologies Co Ltd Shanghai 100 0.0Alfa Laval Taiwan Ltd Taipei 1,499,994 100 0.0Alfa Laval (Hong Kong) Ltd Hong Kong 79,999 100 0.0Alfa Laval (China) Ltd Hong Kong 9,999 100 0.0PT Alfa Laval Separatama Jakarta 1,000 80 0.0Alfa Laval Iran Ltd Teheran 2,199 100 0.0Alfa Laval KK Tokyo 1,200,000 100 0.0Alfa Laval Industry (PVT) Ltd Lahore 119,110 100 0.0Alfa Laval Philippines Inc Makati 72,000 100 0.0Alfa Laval Singapore Pte Ltd Singapore 5,000,000 100 0.0Alfa Laval (Thailand) Ltd Bangkok 792,000 100 0.0Alfa Laval Middle East Ltd Nicosia 40,000 100 0.0Alfa Laval Benelux NV/SA Brussels 33 811 100 0.0Alfa Laval Slovakia S.R.O. Bratislava 1 0.0Cetetherm SR spol S.R.O. Liptovsky Mikulas 15 0.0Alfa Laval Spol S.R.O. Hradec Kralove 20 0.0Cetetherm S.R.O. Prague 5 0.0Alfa Laval Denmark Holding A/S Kolding 100 0.0
Alfa Laval Kolding A/S Kolding 100,000 100 0.0Alfa Laval Nordic A/S Rödovre 1 100 0.0Alfa Laval Copenhagen A/S Söborg 1 100 0.0Alfa Laval Nakskov A/S Nakskov 1 100 0.0Alfa Laval Tank Equipment A/S Ishoej 1 100 0.0
Alfa Laval Tank Equipment AB Gothenburg 100,000 100 0.0Gunclean Toftejorg Pte Ltd Singapore 300,000 100 0.0
Alfa Laval Ltd Sofia 100 100 0.0Alfa Laval Nordic OY Espoo 20,000 100 0.0
Cetetherm OY Tuusula 5,000 100 0.0Alfa Laval Nederland B.V. Maarssen 10,000 100 0.0
Alfa Laval Benelux B.V. Maarssen 1,475 100 0.0Alfa Laval Merco B.V. Hoofddorp 1,475 100 0.0
Alfa Laval Holding A/S Oslo 520,000 100 0.0Alfa Laval Nordic A/S Oslo 10,000 100 0.0
Alfa Laval Tank Equipment AS Billingstad 7,500 100 0.0CTC Ronneby AB 556092-3194 Ronneby 138 000 100 0.0Alfa Laval ExCell AB 556306-2404 Skogstorp 2,500 100 0.0Alfa Laval Nordic AB 556243-2061 Tumba 1,000 100 0.0Cetetherm AB 556058-3162 Ronneby 20,000 100 0.0Alfa Laval Corporate AB 556007-7785 Lund 13,920,000 100 0.0
Alfa Laval (India) Ltd Poona 9,261,889 64 0.0Skansen Engineering & Consultancy Co Ltd Poona 50,000 64 0.0
Alfa Laval Korea Ltd Seoul 3,640,000 100 0.0Alfa Laval (Malaysia) Sdn Bhd Shah Alam 10,000 100 0.0Mosgormash Alfa Laval Moloko Moscow 55 0.0Alfa Laval Oilfield C.A. Caracas 47 19 0.0
Alfa Laval Treasury International AB 556432-2484 Lund 50,000 100 0.0Alfa Laval Europe AB 556128-7847 Lund 500 100 0.0Alfa Laval Lund AB 556016-8642 Lund 100 100 0.0Alfa Laval International Engineering AB 556039-8934 Lund 4,500 100 0.0

70 · Alfa Laval 2003
Specification of shares in subsidiaries (continued)Registration Number Share of Book value,
Company name number Domicile of shares capital, % SEK in millions
Alfa Laval Tumba AB 556021-3893 Tumba 1,000 100 0.0Bitec Enterprise AG Volketswil 97,900 100 0.0Alfa Laval Dis Ticaret Ltd Sti Istanbul 27,001,755 99 0.0OÜ Cetetherm Tallinn 100 100 0.0Alfa Laval SIA Riga 125 100 0.0SIA Cetetherm Riga 200 100 0.0Alfa Laval UAB Ltd Vilnius 2,009 100 0.0UAB Cetetherm Vilnius 100 100 0.0Alfa Laval Australia Pty Ltd Homebush 2,088,076 100 0.0
Alfa Laval Pty Ltd Homebush 3,500,000 100 0.0Alfa Laval New Zealand Ltd Hamilton 1,000 100 0.0
Alfa Laval Holding BV Maarssen 70,000,000 100 0.0Alfa Laval (Pty) Ltd Isando 2,000 100 0.0Alfa Laval Slovakia S.R.O. Bratislava 99 0.0Cetetherm SR spol S.R.O. Liptovsky Mikulas 85 0.0Alfa Laval Spol S.R.O. Hradec Kralove 80 0.0Cetetherm S.R.O. Prague 95 0.0Alfa Laval France SAS Les Clayes 920,000 100 0.0
Alfa Laval SAS Les Clayes 560,000 100 0.0Alfa Laval Moatti SNC Les Clayes 24,000 100 0.0Alfa Laval Spiral SNC Nevers 79,999 100 0.0
MCD SAS Guny 71,300 100 0.0Alfa Laval Vicarb SAS Grenoble 200,000 100 0.0
Canada Inc Newmarket 480,000 100 0.0Alfa Laval Inc Newmarket 481,600 33 0.0
SCI du Companil Grenoble 32,165 100 0.0Cetetherm SA Lyon 150,000 100 0.0
Alfa Laval Holding GmbH Glinde 100 0.0Alfa Laval Mid Europe GmbH Wiener Neudorf 100 0.0Alfa Laval Mid Europe GmbH Glinde 1 100 0.0
Alfa Laval Tank Equipment GmbH Glinde 1 100 0.0Cetetherm Wärmetauschersysteme GmbH Glinde 1 100 0.0Alfa Laval Mid Europe AG Dietlikon 647 100 0.0
Alfa Laval AEBE Holargos 10,000 100 0.0Alfa Laval Kft Budapest 1 100 0.0Cetetherm – Vicarb Hungary Kft Budapest 100 0.0Alfa Laval SpA Monza 1,930,500 99 0.0Alfa Laval Polska Sp.z.o.o. Warsaw 6,862 100 0.0Cetetherm Polska Sp.z.o.o. Warsaw 100 0.0Wytwornia Separator Krakow Sp.z.o.o. Krakow 100 0.0Alfa Laval (Portugal) Ltd Linda-A-Velha 1 0.0Alfa Laval SRL Bucharest 61,435 100 0.0Alfa Laval Iberia SA Madrid 100 0.0
Alfa Laval (Portugal) Ltd Linda-A-Velha 1 99 0.0Alfa Laval Dis Ticaret Ltd Sti Istanbul 1 1 0.0Alfa Laval Holdings Ltd Camberley 28,107,000 100 0.0
Alfa Laval 2000 Camberley 28,106 100 0.0Alfa Laval Ltd Camberley 12,710,000 100 0.0
Alfa Laval Finance Co Ltd Camberley 856,000 100 0.0Alfa Laval Oilfield Ltd Aberdeen 500,000 100 0.0Alfa Laval Flow Ltd Sutton Coldfield 100 100 0.0Alfa Laval Pumps Ltd Eastbourne 100 100 0.0Alfa Laval Thermal Ltd Camberley 1,000 100 0.0Alfa Laval Separation Ltd Camberley 375,000 100 0.0Rolls Laval Heat Exchangers Ltd Wolverhampton 5,000 50 0.0Toftejorg Ltd Camberley 50,000 100 0.0
Alfa Laval USA Inc Kenosha 100 0.0Alfa Laval US Holding Inc Kenosha 180 100 0.0
Alfa Laval Inc Kenosha 44,000 100 0.0Tri-Lad Inc Brantford 4,000 100 0.0bioKinetics Inc Philadelphia 100 100 0.0
Kinetics Modular Systems Inc Toronto 1,800 100 0.0Kinetics Engineering P C Durham 100 100 0.0Hynetics Inc Logan 50 0.0
Alfa Laval US Treasury Inc Kenosha 1,000 100 0.0AO Alfa Laval Potok Koroljov 31,057,529 100 0.0OÜ Alfa Laval Tallinn 1 100 0.0
Gigantissimo 2444 AB 50 0.0Alfa Laval SpA Monza 1 0.0Total 4,460.9
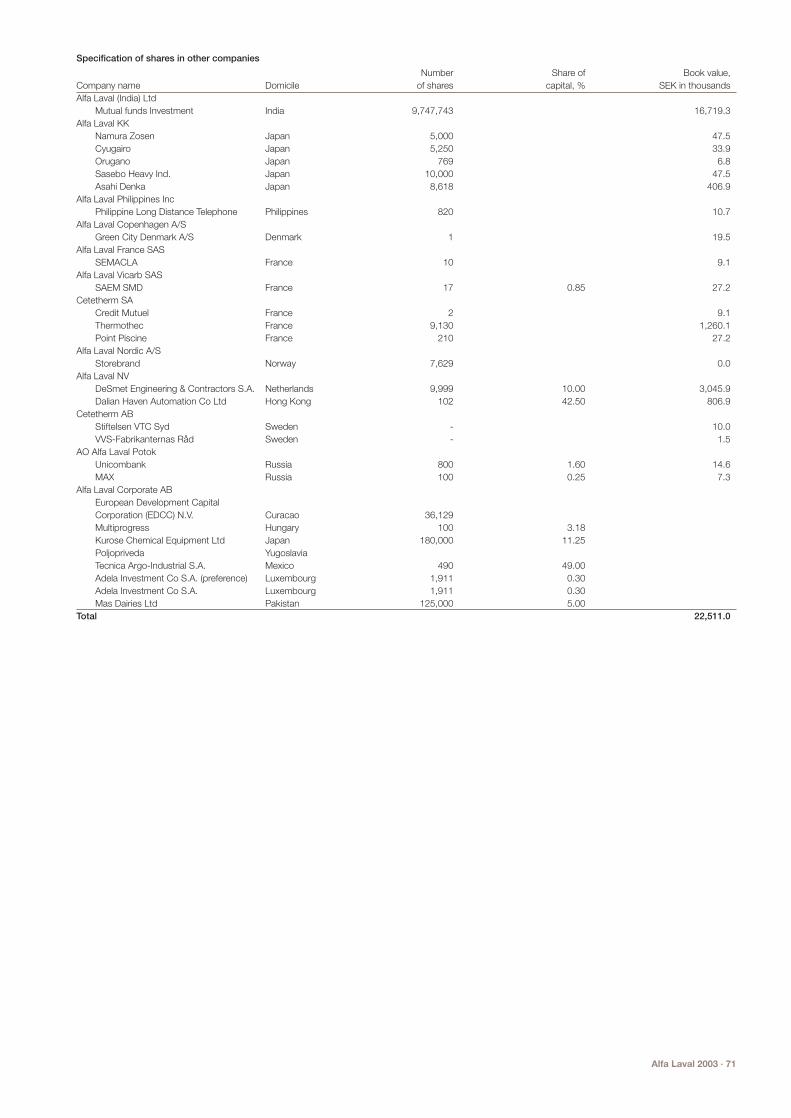
Alfa Laval 2003 · 71
Specification of shares in other companies
Number Share of Book value, Company name Domicile of shares capital, % SEK in thousandsAlfa Laval (India) Ltd
Mutual funds Investment India 9,747,743 16,719.3Alfa Laval KK
Namura Zosen Japan 5,000 47.5Cyugairo Japan 5,250 33.9Orugano Japan 769 6.8Sasebo Heavy Ind. Japan 10,000 47.5Asahi Denka Japan 8,618 406.9
Alfa Laval Philippines IncPhilippine Long Distance Telephone Philippines 820 10.7
Alfa Laval Copenhagen A/SGreen City Denmark A/S Denmark 1 19.5
Alfa Laval France SASSEMACLA France 10 9.1
Alfa Laval Vicarb SASSAEM SMD France 17 0.85 27.2
Cetetherm SACredit Mutuel France 2 9.1Thermothec France 9,130 1,260.1Point Piscine France 210 27.2
Alfa Laval Nordic A/SStorebrand Norway 7,629 0.0
Alfa Laval NVDeSmet Engineering & Contractors S.A. Netherlands 9,999 10.00 3,045.9Dalian Haven Automation Co Ltd Hong Kong 102 42.50 806.9
Cetetherm ABStiftelsen VTC Syd Sweden - 10.0VVS-Fabrikanternas Råd Sweden - 1.5
AO Alfa Laval PotokUnicombank Russia 800 1.60 14.6MAX Russia 100 0.25 7.3
Alfa Laval Corporate ABEuropean Development CapitalCorporation (EDCC) N.V. Curacao 36,129Multiprogress Hungary 100 3.18Kurose Chemical Equipment Ltd Japan 180,000 11.25Poljopriveda YugoslaviaTecnica Argo-Industrial S.A. Mexico 490 49.00Adela Investment Co S.A. (preference) Luxembourg 1,911 0.30Adela Investment Co S.A. Luxembourg 1,911 0.30Mas Dairies Ltd Pakistan 125,000 5.00
Total 22,511.0

72 · Alfa Laval 2003
Note 20. Accounts receivable
Accounts receivable with a maturity exceeding one year of SEK 120.9 (127.7) million have not been accounted for as fixed assets as they are not intended for permanentuse. Accounts receivable are reported net of provisions for bad debts. The provision for bad debts amounts to and has changed as follows:
Bad Debts
Consolidated, SEK in millions New provisionsand increase Unused Change
Translation- of existing Amounts amounts due toYear January 1 difference provisions used reversed discounting December 31
2002 301.6 -17.3 71.8 -73.5 -39.6 -0.7 242.3
2003 242.3 -15.6 72.3 -72.5 -30.1 0.0 196.4
Note 23. Cash and bank
The item cash and bank in the balance sheet and in the cash-flow statement is mainly relating to bank deposits. Cash and bank includes a bank deposit in thepublicly listed subsidiary Alfa Laval (India) Ltd of about SEK 30.8 (55.2) million. The company is not a wholly owned subsidiary of the Alfa Laval Group. It is ownedto 64.1 percent.
Note 21. Other short-term receivables
Consolidated, SEK in millions 2003 2002
Notes receivable 263.2 283.2
Tax receivable 336.8 334.9
Financial leasing receivables 0.0 0.0
Other receivables 470.4 355.8
Total 1,070.4 973.9
Of which, receivables not due within one year
Notes receivable 44.3 7.1
Other receivables 18.8 13.6
Total 63.1 20.7
Note 22. Other current deposits
Consolidated, SEK in millions 2003 2002
Loan receivables 573.9 253.4
Bonds and other securities 78.0 88.6
Other deposits 6.7 72.3
658.6 414.3
Of which, deposits not due within one year
Loans receivable 35.9 8.4
Other deposits 5.2 5.3
Note 19. Inventories
Consolidated, SEK in millions 2003 2002
Raw materials and consumables 654.5 694.4
Work in progress 592.3 655.2
Finished goods & goods for resale, new sales 622.7 570.3
Finished goods & goods for resale, spare parts 307.5 330.7
Advance payments to suppliers 40.8 28.4
Total 2,217.8 2,279.0
The provision for obsolescence amounts to and has changed as follows:
Obsolescence
Consolidated, SEK in millions New provisionsand increase Unused Change
Translation- of existing Amounts amounts due toYear January 1 difference provisions used reversed discounting December 31
2002 570.4 -56.8 112.0 -103.7 -22.9 0.0 499.0
2003 499.0 -36.4 104.3 -87.9 -10.1 0.0 468.9
The Group’s inventories have been accounted for after deduction for inter-company gains in inventory due to internal sales within the Group. The inter-companyprofit reserve at the end of 2003 amounts to SEK 135.8 (136.7) million.
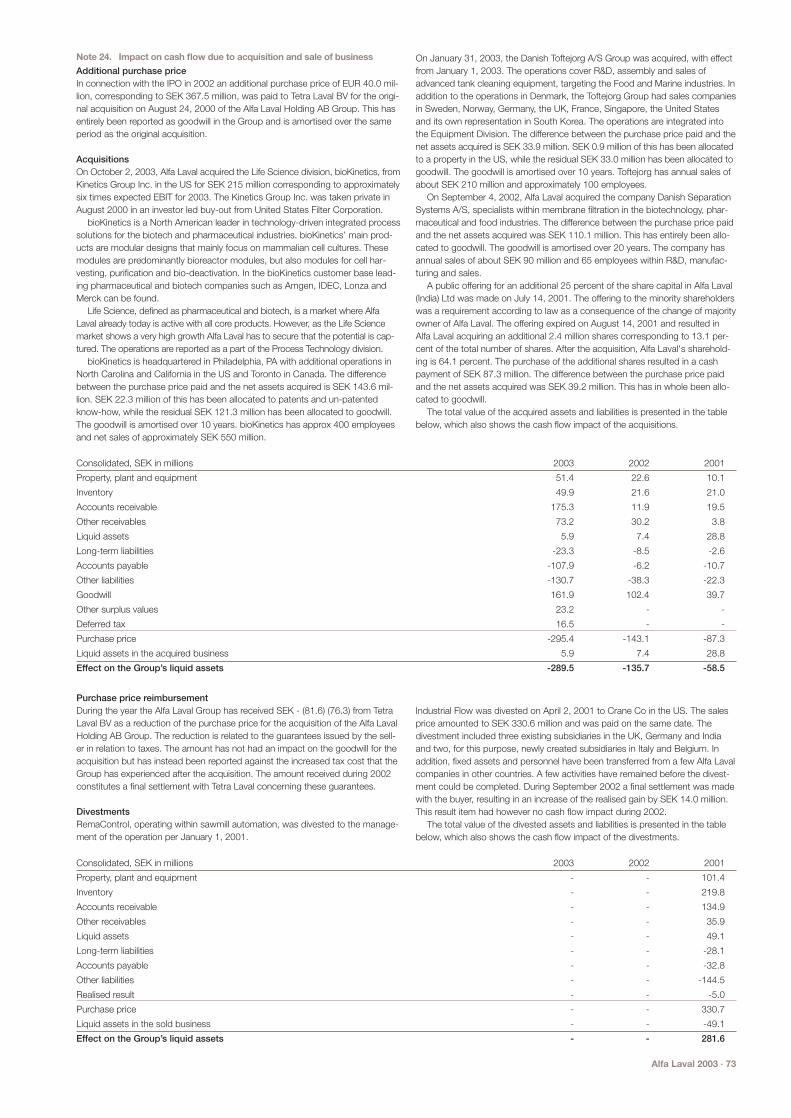
Alfa Laval 2003 · 73
Consolidated, SEK in millions 2003 2002 2001
Property, plant and equipment 51.4 22.6 10.1
Inventory 49.9 21.6 21.0
Accounts receivable 175.3 11.9 19.5
Other receivables 73.2 30.2 3.8
Liquid assets 5.9 7.4 28.8
Long-term liabilities -23.3 -8.5 -2.6
Accounts payable -107.9 -6.2 -10.7
Other liabilities -130.7 -38.3 -22.3
Goodwill 161.9 102.4 39.7
Other surplus values 23.2 - -
Deferred tax 16.5 - -
Purchase price -295.4 -143.1 -87.3
Liquid assets in the acquired business 5.9 7.4 28.8
Effect on the Group’s liquid assets -289.5 -135.7 -58.5
Consolidated, SEK in millions 2003 2002 2001
Property, plant and equipment - - 101.4
Inventory - - 219.8
Accounts receivable - - 134.9
Other receivables - - 35.9
Liquid assets - - 49.1
Long-term liabilities - - -28.1
Accounts payable - - -32.8
Other liabilities - - -144.5
Realised result - - -5.0
Purchase price - - 330.7
Liquid assets in the sold business - - -49.1
Effect on the Group’s liquid assets - - 281.6
Note 24. Impact on cash flow due to acquisition and sale of business
Additional purchase priceIn connection with the IPO in 2002 an additional purchase price of EUR 40.0 mil-lion, corresponding to SEK 367.5 million, was paid to Tetra Laval BV for the origi-nal acquisition on August 24, 2000 of the Alfa Laval Holding AB Group. This hasentirely been reported as goodwill in the Group and is amortised over the sameperiod as the original acquisition.
AcquisitionsOn October 2, 2003, Alfa Laval acquired the Life Science division, bioKinetics, fromKinetics Group Inc. in the US for SEK 215 million corresponding to approximatelysix times expected EBIT for 2003. The Kinetics Group Inc. was taken private inAugust 2000 in an investor led buy-out from United States Filter Corporation.
bioKinetics is a North American leader in technology-driven integrated processsolutions for the biotech and pharmaceutical industries. bioKinetics’ main prod-ucts are modular designs that mainly focus on mammalian cell cultures. Thesemodules are predominantly bioreactor modules, but also modules for cell har-vesting, purification and bio-deactivation. In the bioKinetics customer base lead-ing pharmaceutical and biotech companies such as Amgen, IDEC, Lonza andMerck can be found.
Life Science, defined as pharmaceutical and biotech, is a market where AlfaLaval already today is active with all core products. However, as the Life Sciencemarket shows a very high growth Alfa Laval has to secure that the potential is cap-tured. The operations are reported as a part of the Process Technology division.
bioKinetics is headquartered in Philadelphia, PA with additional operations inNorth Carolina and California in the US and Toronto in Canada. The differencebetween the purchase price paid and the net assets acquired is SEK 143.6 mil-lion. SEK 22.3 million of this has been allocated to patents and un-patentedknow-how, while the residual SEK 121.3 million has been allocated to goodwill.The goodwill is amortised over 10 years. bioKinetics has approx 400 employeesand net sales of approximately SEK 550 million.
Purchase price reimbursementDuring the year the Alfa Laval Group has received SEK - (81.6) (76.3) from TetraLaval BV as a reduction of the purchase price for the acquisition of the Alfa LavalHolding AB Group. The reduction is related to the guarantees issued by the sell-er in relation to taxes. The amount has not had an impact on the goodwill for theacquisition but has instead been reported against the increased tax cost that theGroup has experienced after the acquisition. The amount received during 2002constitutes a final settlement with Tetra Laval concerning these guarantees.
DivestmentsRemaControl, operating within sawmill automation, was divested to the manage-ment of the operation per January 1, 2001.
On January 31, 2003, the Danish Toftejorg A/S Group was acquired, with effectfrom January 1, 2003. The operations cover R&D, assembly and sales ofadvanced tank cleaning equipment, targeting the Food and Marine industries. Inaddition to the operations in Denmark, the Toftejorg Group had sales companiesin Sweden, Norway, Germany, the UK, France, Singapore, the United Statesand its own representation in South Korea. The operations are integrated intothe Equipment Division. The difference between the purchase price paid and thenet assets acquired is SEK 33.9 million. SEK 0.9 million of this has been allocatedto a property in the US, while the residual SEK 33.0 million has been allocated togoodwill. The goodwill is amortised over 10 years. Toftejorg has annual sales ofabout SEK 210 million and approximately 100 employees.
On September 4, 2002, Alfa Laval acquired the company Danish SeparationSystems A/S, specialists within membrane filtration in the biotechnology, phar-maceutical and food industries. The difference between the purchase price paidand the net assets acquired was SEK 110.1 million. This has entirely been allo-cated to goodwill. The goodwill is amortised over 20 years. The company hasannual sales of about SEK 90 million and 65 employees within R&D, manufac-turing and sales.
A public offering for an additional 25 percent of the share capital in Alfa Laval(India) Ltd was made on July 14, 2001. The offering to the minority shareholderswas a requirement according to law as a consequence of the change of majorityowner of Alfa Laval. The offering expired on August 14, 2001 and resulted inAlfa Laval acquiring an additional 2.4 million shares corresponding to 13.1 per-cent of the total number of shares. After the acquisition, Alfa Laval's sharehold-ing is 64.1 percent. The purchase of the additional shares resulted in a cashpayment of SEK 87.3 million. The difference between the purchase price paidand the net assets acquired was SEK 39.2 million. This has in whole been allo-cated to goodwill.
The total value of the acquired assets and liabilities is presented in the tablebelow, which also shows the cash flow impact of the acquisitions.
Industrial Flow was divested on April 2, 2001 to Crane Co in the US. The salesprice amounted to SEK 330.6 million and was paid on the same date. Thedivestment included three existing subsidiaries in the UK, Germany and Indiaand two, for this purpose, newly created subsidiaries in Italy and Belgium. Inaddition, fixed assets and personnel have been transferred from a few Alfa Lavalcompanies in other countries. A few activities have remained before the divest-ment could be completed. During September 2002 a final settlement was madewith the buyer, resulting in an increase of the realised gain by SEK 14.0 million.This result item had however no cash flow impact during 2002.
The total value of the divested assets and liabilities is presented in the tablebelow, which also shows the cash flow impact of the divestments.

74 · Alfa Laval 2003
Note 25. Defined benefit obligations
The Group has defined benefit commitments to employees and former employees and their survivors. The benefits are referring to old age pension, survivor’spension, disability pension, health care and severance pay.
Defined benefit plans are in place in Austria, Belgium, Canada, France, Germany, Japan, Norway, South Africa, Sweden, Taiwan, the United Kingdom and theUnited States. Some plans have been closed for new participants and replaced by defined contribution plans for new employees.
Consolidated, SEK in millions 2003 2002 2001
(-) liability/(+) asset
Present value of the defined benefit obligation, unfunded -808.3 -833.2 -721.2
Present value of the defined benefit obligation, funded -2,552.7 -2,196.1 -2,462.3
Present value of the defined benefit obligation at year end -3,361.0 -3,029.3 -3,183.5
Unrecognised actuarial losses 971.5 567.6 204.3
Unrecognised past service cost 5.1 0.9 47.9
Fair value of plan assets 1,761.5 1,853.1 2,338.2
Defined benefit liability -622.9 -607.7 -593.1
Less amount disallowed -5.2 -6.1 -6.4
Net defined benefit liability -628.1 -613.8 -599.5
(-) cost/(+) income
Current service cost -31.0 -49.0 -59.6
Interest cost -145.8 -171.0 -178.3
Expected return on plan assets 144.2 90.3 146.4
Recognised actuarial losses -80.6 -82.4 -109.3
Recognised past service cost -52.0 -8.2 -
Effect of any curtailments or settlements -1.3 67.7 42.1
Net plan cost -166.5 -152.6 -158.7
(-) liability/(+) asset
Change in present value of the defined benefit liability:
Present value of defined benefit liability at January 1 -3,029.3 -3,183.5 -2,742.7
Translation difference 410.3 226.3 -290.6
Current service cost -31.0 -49.0 -59.6
Interest cost -145.8 -171.0 -178.3
Employee contributions -8.0 -5.9 -9.0
Current year change in actuarial losses -677.8 -82.4 -109.3
Recognised past service cost -52.0 -8.2 -
Effect of any curtailments or settlements -1.3 67.7 42.1
Benefit payments 173.9 176.7 163.9
Present value of defined benefit liability at December 31 -3,361.0 -3,029.3 -3,183.5
(-) liability/(+) asset
Change in plan assets:
Fair value of plan assets at January 1 1,853.1 2,338.2 2,168.7
Translation difference -229.3 -222.6 259.8
Employer contributions 67.6 71.4 44.7
Employee contributions 8.0 5.9 9.0
Actual return on plan assets 236.0 -163.1 19.9
Benefit payments -173.9 -176.7 -163.9
Fair value at December 31 1,761.5 1,853.1 2,338.2
(-) liability/(+) asset
Change in defined benefit liability/asset
Defined benefit liability/asset at January 1 -613.8 -599.5 -493.7
Translation difference 104.5 71.9 -37.4
Net plan cost -166.5 -152.6 -158.7
Employer contributions 67.6 71.4 44.7
Change in unrecognised actuarial gains/losses -18.5 -7.3 46.2
Change in unrecognised past service cost 0.0 0.6 0.6
Change in disallowed asset amount -1.4 1.7 -1.2
Defined benefit liability/asset at December 31 -628.1 -613.8 -599.5

Alfa Laval 2003 · 75
Note 26. Other provisionsNew provisions
and increase Unused ChangeTranslation- of existing Amounts amounts due to
Consolidated, SEK in millions January 1 difference provisions used reversed discounting December 31
2002
Claims & warranty 384.3 -24.4 239.9 -144.5 -35.9 -5.7 413.7
Deferred costs 141.5 -2.0 28.3 -41.4 -22.4 - 104.0
Restructuring 293.8 -13.7 56.6 -117.3 -12.3 - 207.1
Onerous contracts 23.9 -0.4 - -11.2 -2.8 - 9.5
Environmental 7.3 -1.2 - -2.9 - - 3.2
Litigations 109.8 -0.4 36.5 -27.9 -2.0 - 116.0
Other 102.6 -6.2 84.3 -34.9 -10.0 - 135.8
1,063.2 -48.3 445.6 -380.1 -85.4 -5.7 989.3
2003
Claims & warranty 413.7 -19.8 181.1 -149.1 -29.6 - 396.3
Deferred costs 104.0 -1.3 22.2 -18.2 -15.3 - 91.4
Restructuring 207.1 -5.5 61.1 -100.8 -6.2 - 155.7
Onerous contracts 9.5 - 4.0 -3.5 - - 10.0
Environmental 3.2 -0.6 - -1.3 - - 1.3
Litigations 116.0 -0.4 17.8 -17.2 -1.3 - 114.9
Other 135.8 -9.5 63.9 -61.1 -7.5 - 121.6
989.3 -37.1 350.1 -351.2 -59.9 - 891.2
Unused amounts reversed refer to, among other items, sold companies, changed classifications and reversals of provisions made on an estimated basis.In connection with the acquisition on August 24, 2000, a restructuring provision of SEK 407.9 million was established. This pertained to such restructuring measures
that were triggered by the change of ownership and that Alfa Laval management has committed to implement. The costs are mainly referring to redundancies in con-nection with the close down of manufacturing sites, rationalisation of the logistics function and introduction of a customer segment based organisation with changedorder processes. At the end of 2003, SEK - (50.9) million remains of this acquisition provision.
The provisions for restructuring are affecting slightly less than 160 (175) employees.
Note 25. (Continued) Defined benefit obligations
Consolidated, SEK in millions 2003 2002 2001
(-) liability/(+) asset
Assets
Fair value of plan assets 1,761.5 1,853.1 2,338.2
Less amount disallowed -5.2 -6.1 -6.4
1,756.3 1,847.0 2,331.8
Netting -1,629.6 -1,740.2 -2,156.4
Assets in balance sheet 126.7 106.8 175.4
Liabilities
Present value of the defined benefit obligation at year end -3,361.0 -3,029.3 -3,183.5
Unrecognised actuarial gains (less losses) 971.5 567.6 204.3
Unrecognised past service costs 5.1 0.9 47.9
-2,384.4 -2,460.8 -2,931.3
Netting 1,629.6 1,740.2 2,156.4
Provision in balance sheet -754.8 -720.6 -774.9
The more significant actuarial assumptions that have been used at the year-end are, %:
Consolidated 2003 2002 2001
Discount rate 6 7 7
Expected return on investment 8 8 8
Expected wage increase 4 4 4
Change in health care costs 9 9 9
Change of index for future increase of remunerations 4 4 4
Changes in the health care costs have a significant impact on the costs and the level of the obligations for defined benefit obligations. If the health care costs changeby one percent, it gives the following profit and loss effect calculated on the conditions as of the end of 2003:
2003 2002
Consolidated, SEK in millions 1 % increase 1 % decrease 1 % increase 1 % decrease
Effect on:
Current service costs and interest costs -12.8 10.6 -11.9 10.1
Present value of the defined benefit obligation -159.0 127.9 -131.2 108.7

76 · Alfa Laval 2003
When raising the syndicated loans in August 2000, Alfa Laval was obliged tohedge at least 66 percent of the loans to a fixed interest rate. Vis-à-vis the newsyndicate there is no such obligation. As per the end of December 2003, 22 (64)(69) percent is, however, hedged.
Transaction costs totalling SEK 27.3 (35.1) (194.4) million have been capi-talised and are being amortised over the maturity of the loan. The current year’scost for the fee amortisation is SEK -7.8 (-16.8) (-29.2) million. An additional costof SEK - (-182.2) (-) million is reported as comparison distorting as a part of theSEK - (-219.6) (-) million.
The loan is linked to three financial covenants that must be fulfilled throughoutthe life of the loan. These covenants refer to the relationship between net debtand EBITDA, the interest coverage ratio and the debt ratio. If the covenants arenot fulfilled, the banking syndicate is entitled to demand immediate repayment ofthe loans, provided that the breach is not temporary. Alfa Laval has fulfilled thecovenants with a good margin ever since the loans were raised in May 2002.
Bond loanOn August 24, 2000, Alfa Laval Special Finance AB borrowed EUR 220 millionfrom Donaldsson, Lufkin & Jenrette and UBS Warburg. On November 9, 2000,this loan was replaced by a bond loan placed with institutional investors of EUR220 million. It was registered with the Stock Exchange in Luxembourg in Decem-ber 2000. In July 2001, the loan was registered with the SEC (Securities andExchange Commission) in the US. The loan accrues interest at 12.125 percentand falls due 2010. Interest payments are due May 15 and November 15 eachyear. Since the bond is denominated in EUR all payments are made in EUR.Transaction costs totalling SEK 29.2 (35.1) (70.7) million have been capitalisedand are being amortised over the maturity of the loan. The current year’s cost for the fee amortisation is SEK -5.9 (-12.3) (-8.0) million. An additional cost ofSEK - (-23.3) (-) million is reported as comparison distorting as a part of the SEK - (-219.6) (-) million.
During 2003, Alfa Laval has re-purchased bonds at the prevailing market ratefor a total face value of SEK 50.6 (181.5) million. The difference between thehigher market value and the face value was SEK 9.7 (23.3) million, which hasbeen reported as an interest cost. The bond loan accrues interest at 12.125 per-cent, which is considerably more than the Group’s current cost for other externalfinancing.
Before November 15, 2003 up to 35 percent of the principal amount could beredeemed with the proceeds of a public equity offering. A corresponding postIPO-redemption was made on June 24, 2002, where 35 percent of the bondloan of EUR 220 million was amortised. This corresponded to EUR 77.0 millionor SEK 703.6 million. This was made at a premium of 12.125 percent correspon-ding to one year’s interest, which amounted to SEK 85.2 million. The cost wasreported as a comparison distortion financial cost.
Prior to November 15, 2005 all, but not part of, the notes may be redeemedat a premium plus accrued and unpaid interest. At any time on or after Novem-ber 15, 2005 all or part of the notes are redeemable at the following redemptionprices plus accrued and unpaid interest:
Year starting Percentage
November 15, 2005 106.063
November 15, 2006 104.042
November 15, 2007 102.021
November 15, 2008 and thereafter 100.000
The loans are distributed among currencies as follows:
Consolidated, SEK in millions Short-term Long-termCurrency 2003 2002 2003 2002
CAD 3.7 12.4 - -
DKK 2.1 69.3 13.7 398.7
EUR 55.3 78.7 1,074.1 1,472.0
GBP 1.8 14.3 216.3 164.9
INR - - 10.5 -
JPY 1.0 14.8 248.6 173.1
PLN 17.1 30.5 - -
SEK 5.4 6.0 - 175.1
USD 12.2 27.8 1,925.3 1,838.0
Other 5.1 0.6 3.3 11.6
Total 103.7 254.4 3,491.8 4,233.4
Of which, not due within five years: 1,064.8 1,127.7
Note 27. LoansConsolidated, SEK in millions 2003 2002 2001
Subordinated loan from Tetra Laval Finance Ltd - - 2,085.6
Credit institutions 2,530.7 3,360.2 4,573.1
Bond loan 1,064.8 1,127.6 2,045.3
Capitalised financial leases 13.6 24.7 26.9
Interest-bearing pension liabilities 5.2 6.1 6.4
Total debt 3,614.3 4,518.7 8,737.2
Cash, bank and current deposits 1,213.2 1,020.2 959.7
Net debt 2,401.1 3,498.5 7,777.5
As a consequence of the IPO of Alfa Laval in 2002, the structure of the financialdebt changed considerably. The costs for the change of the structure were of anon-recurring nature.
In connection with the repayment of the loan from Tetra Laval Finance Ltd, thereplacement of the previous syndicated loans and the amortisation of the bondloan, capitalised financing costs of totally SEK - (219.6) million were reversed.This cost was reported as a comparison distortion financial cost.
Total bank borrowings amount to SEK 2,530.7 (3,360.2) (4,573.1) million atthe end of the year. The total financial indebtedness including leasing and interestbearing pension liabilities amounts to SEK 3,614.3 (4,518.7) (8,737.2) million.
Net financial debt amounts to SEK 2,401.1 (3,498.5) (7,777.5) million at theend of the year.
Subordinated loan from Tetra Laval Finance LtdOn May 23, 2002, the loan from Tetra Laval Finance Ltd was repaid.
Tetra Laval BV granted a subordinated loan on August 24, 2000 of SEK - (-)(1,859.4) million. The loan was later transferred to Tetra Laval Finance Ltd. Itaccrued interest at 12 percent annually and fell due 2010 or at an earlier datewhen Alfa Laval AB experienced a fundamental change in its ownership. Thelatter happened on May 17, 2002 in connection with the IPO. The interest felldue at the same time as the loan and was meanwhile capitalised every year onAugust 24 together with the principal amount. On May 23, 2002 the capitalisedinterest was SEK 226.2 million and the accrued interest was SEK 186.9 million.Transaction costs of totally SEK - (-) (16.7) million were capitalised and amortisedover the maturity of the loan. The cost for the fee amortisation was SEK - (-0.4) (-1.6) million. An additional cost of SEK - (-14.1) (-) million was reported as com-parison distorting as a part of the SEK - (-219.6) (-) million.
Loan from credit institutionsOn January 27 and December 30, 2003 a voluntary amortisation of SEK 223.1million and SEK 23.9 million respectively was made on the syndicated loan.
On May 28, 2002, the loans from the previous banking syndicate led by SEBwere replaced by loans from a new banking syndicate, arranged by SEB andSHB, at terms that better reflect the financial position of Alfa Laval after the newissue of shares. During the period January 1 and May 28, 2002, the old loanswere amortised by SEK 323.4 million. After May 28, 2002 the new loans havebeen amortised by SEK 551.3 million during 2002.
The loan facility with the banking syndicate consists of two parts. The first partis an amortisation free loan of originally EUR 423.9 million. This has been reducedto EUR 263.7 million through voluntary amortisation of EUR 87.4 million andreduction through exchange rate movements of EUR 72.8 million. The other partis a revolving working capital facility of EUR 150 million, which was unutilised asof December 31, 2003. Alfa Laval has initiated negotiations with the bankingsyndicate in order to convert the whole loan to a revolving facility potentiallycombined with a SEK based short-term commercial paper programme. A com-mercial paper programme requires an official credit rating and generally meanslower interest rates but without any guarantees for sustained financing. This isthen covered by the extended revolving facility.
The syndicated loans amounted to SEK 2,390.2 (3,064.7) (4,064.7) million.The maturity of the new loan is five years. The average interest and currencyduration including derivatives is 3.5 months at the end of 2003. The interest isbased on applicable IBOR plus a mark up based on the relation between netdebt and EBITDA. The mark up is 95 points if the quota is larger than 2.75 and80 points if the quota is less than or equal to 2.75, but higher than 1.75 and 65points if the quota is less than or equal to 1.75. The mark up is currently 65 (80)interest points. At the end of 2003 the loans are accruing interest in the range of0.72 – 4.60 percent (0.86 – 4.82 percent) (1.59 –7.92 percent). The average inter-est rate at the end of 2003 was 1.96 (5.58) (6.49) percent. The large decrease inaverage interest rates between 2003 and 2002 is due the cancellation of the pre-vious interest rate swaps that were requested by the previous banking syndicate.

Alfa Laval 2003 · 77
Note 30. Pledged assets and contingent liabilities
Consolidated, SEK in millions 2003 2002
Pledged assets
Other pledges and similar commitments 45.4 78.3
Total 45.4 78.3
Contingent Liabilities
Discounted bills 113.7 164.5
Performance guarantees 688.4 798.0
Other contingent liabilities 669.0 735.5
Total 1,471.1 1,698.0
In the new syndicate loan there are no pledges or restrictions. Other contingentliabilities are among other items referring to leased assets.
Note 31. Transactions with related party
Tetra Pak within the Tetra Laval Group is Alfa Laval’s single largest customer with5.7 (5.7) (4.9) percent of net sales. In June 1999, Tetra Pak entered into a pur-chasing agreement with Alfa Laval that governs the distribution, research anddevelopment, market sales and information, use of trademarks and intellectualproperty. The following areas shall be agreed upon from time to time betweenrepresentatives of the parties: products that are subject to the agreement,prices and discounts of such products, geographical markets and productareas where Tetra Pak is Alfa Laval’s preferred distributor, the right of Tetra Pakto affix its trademarks to Alfa Laval products, sales goals for Tetra Pak in definedgeographical markets, products and technologies that are the focus of jointresearch and development and the ownership rights of the research and devel-opment result and use of market and sales information. The agreement aims atthe applications within liquid food where Tetra Pak has a natural market pres-ence through the deliveries of packaging equipment and packaging material.
The agreement was prolonged by two years from December 31, 2003. It hasa 12-month period of notice. The prices that Tetra Pak receives are not lowerthan the prices that Alfa Laval would obtain from a comparable third party. Theprices are fixed on a calendar year basis.
Alfa Laval has purchased services from Tetra Laval Group Transport & Travelto optimise forwarding, freight and delivery terms and purchase forwarding,freight and person transportation until March 31, 2003 for SEK 0.3 (2.2) (1.6)million. In addition, Alfa Laval purchases facilities management services relatingto the real estate in Lund in Sweden from Tetra Pak Business Support AB forSEK 3.3 (3.3) (3.0) million. Alfa Laval rents premises to Tetra Pak and DeLaval inRussia and in Germany for SEK 13.6 (13.8) (4.8) million.
The Board of Directors for Alfa Laval AB has two representatives from TetraLaval – Jörn Rausing and Finn Rausing.
At year-end, Alfa Laval has the following balance items against companieswithin the Tetra Laval group (Tetra Pak and DeLaval).
Consolidated, SEK in millions 2003 2002
Assets:Accounts receivable 47.3 48.8
Other receivables 78.9 79.1
Liabilities:Accounts payable 11.3 3.8
Other liabilities 2.5 0.4
Alfa Laval has had the following transactions with companies within the TetraLaval group (Tetra Pak and DeLaval).
Consolidated, SEK in millions 2003 2002 2001
Income statement:Net sales 789.8 830.0 777.9
Other operating income 13.6 13.8 4.8
Other operating costs -3.6 -5.5 -4.6
Interest costs - -97.1 -242.9
Additional purchase price, increasing goodwill - 367.5 -
Purchase price reimbursement leading to
reduced tax costs/increased tax liabilities - 81.6 76.3
Note 29. Accrued costs and prepaid income Consolidated, SEK in millions 2003 2002
Accruals for social security 146.9 130.4
Reserve for severance pay 212.2 208.9
Accrued interest expenses 27.7 22.2
Other accrued expenses and prepaid income 431.1 422.8
Total 817.9 784.3
Of which, accrued costs and
prepaid income not due within one year
Accruals for social security 21.0 18.0
Reserve for severance pay 119.8 119.1
Other accrued expenses and prepaid income 7.7 6.1
Total 148.5 143.2
Note 28. Other liabilities Consolidated, SEK in millions 2003 2002
Financial lessee payable 13.6 24.7
Other non-interest bearing liabilities 635.1 607.8
Total 648.7 632.5

78 · Alfa Laval 2003
Note 34. Fair value of financial instruments
For certain instruments, including cash and bank, other current deposits,accounts receivable, trade accounts payable and short-term debt, the carryingvalues approximate fair values as the majority of these instruments have shortmaturity periods. Obligations under capital leases are carried at amounts approx-imating their fair values since the discount rate applicable to lease contracts inderiving the net present value of lease payments approximates market rates.
The average interest and currency duration including derivatives is 3.5 monthsfor the syndicated loans at the end of 2003. The majority of the syndicated loanswere rolled with new interest rates during December. In total, this means thatthe carrying value approximates the fair value. The fair value of the bond loan isarrived at by applying the market rate at the last trading date in December.
The estimated fair values of the Group’s long-term debt as of December 31 areshown below:
2003 2002Consolidated, Carrying Fair Carrying FairSEK in millions value value value value
Syndicated bank loans 2,390.2 2,390.2 3,064.7 3,064.7
Bond loan 1,064.8 1,283.2 1,127.6 1,268.6
Note 33. Leasing
Alfa Laval has entered into non-cancellable operating leases mainly relating to premises and finance lease agreements regarding machinery and equipment with leas-ing periods of 1–20 years. The leasing fees for non-cancellable operating leases for premises were SEK 207.4 (232.9) (258.8) million. During the year, the Group hasentered into finance leases with a capitalised value of SEK 6.7 (1.1) million. See Note 17 for information on the capitalised value of finance leases.
The future minimum leasing fees concerning non-cancellable operating leases, distributed on maturity dates, amount to:
Consolidated, SEK in millions Operating leases
Year 2003 2002 2001
2001 N/A N/A N/A
2002 N/A N/A 82.5
2003 N/A 96.0 62.1
2004 77.3 75.5 41.5
2005 64.7 58.4 29.7
2006 47.0 31.1 16.7
2007 29.2 18.7 0.0
2008 20.2 0.0 0.0
Senare 35.8 48.5 46.7
Total 274.2 328.2 279.2
The future minimum leasing fees concerning financial leasing agreements and their net present value, distributed on maturity dates, amount to:
Financial leases Present value of financial leases
Year 2003 2002 2001 2003 2002 2001
2001 N/A N/A N/A N/A N/A N/A
2002 N/A N/A 17.4 N/A N/A 16.5
2003 N/A 11.3 6.2 N/A 10.6 5.2
2004 7.1 6.0 2.9 6.8 5.5 2.1
2005 3.2 4.0 0.3 3.0 3.5 0.2
2006 2.0 2.5 0.0 1.8 2.1 -
2007 0.9 0.9 - 0.8 0.8 -
2008 0.4 - - 0.3 - -
Later - - - - - -
Total 13.6 24.7 26.8 12.7 22.5 24.0
The fair values of the Group’s foreign currency contracts and interest-rate swapsare estimated based on dealer quotes, quoted market prices of comparable con-tracts, adjusted through interpolation where necessary for maturity differences, or ifthere are no relevant comparable contracts, on pricing models or formulas usingcurrent assumptions.
The fair values of the Group’s derivative financial instruments as of December 31 were:
2003 2002Consolidated, Nominal Fair Nominal FairSEK in millions amount value amount value
Forward exchange contracts 8,286.0 127.6 9,033.7 151.3
Currency options 90.7 0.2 - -
Interest-rate swaps - - 1,951.8 -61.1
Note 32. Work in progress
Consolidated, SEK in millions 2003 2002 2001
Gross amount of project sales revenue recognised in the period 467.6 357.4 635.8
Aggregated amount of costs incurred and recognised profits
(including deduction for reported losses) 599.0 390.5 692.0
Advances received 219.9 179.4 145.2
Retentions 42.4 11.4 10.4
Gross amount due from customers for plant projects 175.2 80.8 77.7
Gross amount due to customers for plant projects 0.7 0.7 0.0
Consolidated, SEK in millions

Alfa Laval 2003 · 79
Note 35. Reconciliation to US GAAP
Consolidated, SEK in millions Note 2003 2002 2001
Net income/(loss) under Swedish GAAP 645.8 120.2 36.1
US GAAP adjustments:
Goodwill and other intangibles with indefinite useful lives a 191.3 187.7 -
Leveraged buy-out accounting b 7.1 2.1 15.0
Derivative instruments and hedge accounting c 266.7 271.2 -49.5
Tooling costs d -4.4 11.0 15.3
Capitalised software e -16.7 -20.2 -6.4
Provisions f - - -0.1
Other g -0.3 -0.3 -0.3
Deferred taxes
Tax effect of US GAAP adjustments h -67.6 -26.7 14.3
Sum of adjustments 376.1 424.8 -11.7
Net income under US GAAP before change in accounting principles 1,021.9 545.0 24.4
Presented as:
Net income from continuing operations before change in accounting principles 1,021.9 545.0 24.4
Net income under US GAAP before change in accounting principles 1,021.9 545.0 24.4
Effect of change in accounting principles, net of tax c - - -61.9
Net income under US GAAP 1,021.9 545.0 -37.5
Earnings per share (SEK) 9.15 6.38 -1.00
Average number of shares 111,671,993 85,482,322 37,496,325
Consolidated, SEK in millions Note 2003 2002
Equity capital under Swedish GAAP 4,897.0 4,512.3
US GAAP adjustments:
Goodwill and other intangibles with indefinite useful lives a 365.3 187.7
Leveraged buy-out accounting b 403.8 444.2
Derivative instruments and hedge accounting c 98.1 26.3
Tooling costs d 91.4 95.7
Capitalised software e 5.8 22.5
Provisions f - -
Other g 4.8 5.1
Deferred taxes -
Tax effect of US GAAP adjustments i -67.6 -26.7
Sum of adjustments 901.6 754.8
Shareholder’s equity under US GAAP 5,798.6 5,267.1

80 · Alfa Laval 2003
Consolidated, SEK in millions
As per balance sheet on December 31, 2000 1,684.3
2001
Translation difference 268.3
Net income for 2001 according to US GAAP -37.5
As per balance sheet on December 31, 2001 1,915.1
2002
New issue of shares 3,136.6
Translation difference -329.6
Net income for 2002 according to US GAAP 545.0
As per balance sheet on December 31, 2002 5,267.1
2003
Dividend -223.3
Translation difference -267.1
Net income for 2003 according to US GAAP 1,021.9
As per balance sheet on December 31, 2003 5,798.6
Change in consolidated equity capitalaccording to US GAAP

Alfa Laval 2003 · 81
lated in accordance with US GAAP asof December 31, 2001) ceased to beamortised, but is instead tested forimpairment. In addition, intangibleassets totalling approximately SEK 594million relating to in-place workforcecalculated for US GAAP purposes, aswell as approximately SEK 208 millionof related deferred tax liabilities, havebeen reclassified as goodwill.
An impairment test has been per-formed at the end of 2003 indicatingthat there is not any need to writedown the goodwill.
b) Leveraged buy-out accounting
In August 2000 Alfa Laval Holding ABand its subsidiaries (the predecessor)was acquired by a newly formed entity,resulting in a change in control. Priorto the transaction, the predecessor wasowned 100 percent by Tetra Laval BV,part of the Tetra Laval Group. Subse-quent to the transaction, the predeces-sor ceased to exist and the newly
Comments to the US GAAP reconciliation
Alfa Laval’s basis in the net assets of Alfa Laval Holding
Consolidated, SEK in millions
Fair value of Alfa Laval Holding on August 23, 2000 10,087.0
Predecessor basis of Alfa Laval Holding on August 23, 2000 5,592.0
63.2 percent interest in fair value of Alfa Laval Holding of new investors in Alfa Laval AB 6,374.0
36.8 percent interest in predecessor basis of Alfa Laval Holding of old investors in Alfa Laval AB 2,058.0
8,432.0
Percentage 83.6
a) Goodwill and other intangibles
Goodwill and other intangibles withindefinite useful lives
“The Financial Accounting StandardsBoard” issued “Statement of FinancialAccounting Standards” No. 142, “Good-will and Other Intangible Assets” (FAS 142) in July 2001. The Statementis effective for fiscal years beginningafter December 15, 2001. FAS 142requires that goodwill, including previ-ously existing goodwill, and intangibleassets with indefinite useful lives notbe amortised; these assets should betested for impairment annually. Good-will and intangible assets with indefi-nite useful lives are no longer tested forimpairment under FAS 121, “Account-ing for the Impairment of Long-LivedAssets and for Long-Lived Assets to beDisposed Of”. The Company has adopted the provisions of FAS 142 as of January 1 2002.
Upon adoption of the new standard,goodwill of SEK 3,217.4 million (calcu-
formed company, Alfa Laval AB, wasowned 36.8 percent by Tetra Laval BV,62.5 percent by Industri Kapital and0.7 percent by management. For USGAAP purposes, this transaction as de-scribed in the Board of Directors’ reportmust be accounted for as a leveragedbuy-out transaction in accordancewith Emerging Issues Task Force (EITF)Abstract 88-16 because the transactionwas carried out via a series of highlyleveraged transactions through thecreation of a newly formed entity thatacquired 100 percent of the predecessorand resulting in the former shareholdermaintaining a minority interest in thenewly formed entity.
For US GAAP purposes, Alfa Laval’sbasis in the net assets of Alfa LavalHolding consists of 83.6 percent fairvalue and 16.4 percent predecessorbasis calculated as shown below:
For US GAAP purposes, the individualassets acquired in the transaction werestepped up by 83.6 percent of the differ-ence between book value and fair value.The difference between the fair valueadjustments recorded and the purchaseprice was recorded as a debit directly toequity.
In its Swedish GAAP financial state-ments, Alfa Laval recorded the acquisi-tion of Alfa Laval Holding as a purchasefor cash consideration of SEK 8,214 mil-lion plus other consideration and trans-action costs for an aggregate purchaseprice of SEK 8,286 million in exchangefor 100 percent of Alfa Laval Holding.This purchase price excludes the valueof the Alfa Laval AB shares issued toTetra Laval BV because this was consid-
ered to be a transaction betweenshareholders which should not bereflected in the issuer’s consolidatedfinancial statements in accordancewith Swedish GAAP. For US GAAP pur-poses, Tetra Laval BV’s carryover basisin Alfa Laval Holding through its 36.8percent interest in Alfa Laval AB mustbe considered in purchase accounting.Accordingly, the purchase price for USGAAP purposes includes the SEK 1,800million value of the Alfa Laval ABshares issued to Tetra Laval BV as partof the overall consideration paid inexchange for 100 percent of Alfa LavalHolding.
The result of applying leveraged buy-out accounting to the transaction inaccordance with US GAAP is that the
step-up in the value the net assetsacquired to fair value has been limitedto the extent of the new owners’ inter-est in Alfa Laval AB. In addition to thedifferences related to leveraged buy-outaccounting, the values of the net assetsacquired differ for US GAAP purposesbecause certain intangible assets includ-ing workforce and customer relation-ships must be valued separately in accor-dance with US GAAP, but such items donot meet the definition of intangibleassets in accordance with Swedish GAAPand such value is thus recorded as good-will under Swedish GAAP.
The combined effect of the SEK 1,800million higher purchase price for USGAAP purposes and the limitation ofthe fair value step-up in accordance

82 · Alfa Laval 2003
with EITF 88-16 results in a netincrease to equity on the acquisitiondate for US GAAP as compared toSwedish GAAP because the credit toequity related to the higher purchaseprice more than offsets the debit toequity related to the EITF 88-16 limi-tations of the fair value step-up.
During 2001 the Group completedthe exercise of pushing down the fairvalue step-up adjustments related tothe transaction into the local curren-cies of the entities to which the step-up adjustments relate. For presenta-tion under Swedish GAAP the recalcu-lated balances, adjusted for the step-up values of the related assets andequity, have been recorded as a restate-ment of the balances previously report-ed at December 31, 2000.
For US GAAP purposes the adjust-ment related to pushing down thestep-up values into local currencieswould not be presented by restatingthe prior year financial statements.Instead, the foreign currency changewould be included in 2001 as a com-ponent of other comprehensiveincome. The 2000 US GAAP reconcili-ation of income and equity includeadjustments to reverse the impact ofthe restatement recorded for SwedishGAAP purposes. The 2001 US GAAPreconciliation of equity includes anadjustment for the foreign currencytranslation impact recorded in 2000for Swedish GAAP purposes.
c) Derivative instruments and hedge
accounting
Under Swedish GAAP, unrealised gainsand losses on forward exchange andother derivative contracts undertakento hedge current and anticipatedtransactions are generally deferredand reported when they mature alongwith the underlying transactions oranticipated future cash flows to whichthey relate.
In January 2001 Financial AccountingStandards No. 133, “Accounting forDerivative Instruments and HedgingActivities” (“FAS 133”) as amended byFAS 137 and FAS 138, became effectivefor the Group. FAS 133 establishes anew model for accounting for deriva-tives and hedging activities and super-sedes and amends a number of previousstandards. Upon initial application, allderivatives must be recognised in thebalance sheet as either assets or liabili-ties and measured at fair value. In addi-tion, all hedging relationships must bereassessed and documented pursuant tothe provisions of FAS 133.
Prior to the effective date of FAS 133,US GAAP accounting for foreignexchange contracts was governed byFinancial Accounting Standards No. 52,“Foreign Currency Translation” (FAS52), which allows for foreign exchangecontracts to be reported as hedges onlyto the extent that they are specificallymatched to underlying firm commit-ments. Otherwise, such contracts aremarked to market and recorded on thebalance sheet, with unrealised gainsand losses included in the reportedresults of each year.
Under FAS 133, the accounting forchanges in the fair value (i.e. gains andlosses) of a derivative financial instru-ment depends on whether it has beendesignated and qualifies as part of ahedging relationship and further on thetype of hedging relationship. Changesin fair value of derivatives not qualify-ing as hedges are reported in income.
As a result of adoption of Statement133, the Group recognises all derivativefinancial instruments, such as interest-rate swap contracts and foreign exchangecontracts, in the consolidated financialstatements at fair values regardless ofthe purpose or intent for holding theinstrument. Upon initial adoption ofFAS 133 the Group recognised a cumu-lative effect of accounting change of
The US GAAP reconciliation items can be summarized as follows:ConsolidatedSEK in millions 2003 2002 2001
Hedges of net investments in foreign subsidiaries under Swedish GAAP not qualifying for hedging under FAS 133 194.8 164.9 -105.5
Change in fair market value of interest-rate swaps not recognized under Swedish GAAP 61.1 50.0 -15.8
Change in fair market value of foreign exchange derivatives not recognized under Swedish GAAP 10.8 56.3 71.8
Total 266.7 271.2 -49.5
SEK 61.9 million (net of tax benefit ofSEK 33.0 million) in the income state-ment related to the fair value of inter-est-rate swap contracts in existence asof January 1, 2001. Gains and lossesrecognised on derivative financialinstruments subsequent to initialadoption of FAS 133 are recognised infinancial income or expense for pur-poses of presentation under US GAAP.
For periods prior to adoption of FAS 133, the Group was not able underFAS 52 to account for any of its deriva-tive foreign exchange contracts ashedges as these contracts did not relateto underlying firm commitments andtherefore the adoption of FAS 133 didnot result in a translation adjustmentrelated to these instruments.
The Group has issued long-termdebt in various currencies that forSwedish GAAP purposes are consideredto be hedges of its net investment incertain foreign subsidiaries. According-ly, the change in value of the long-term debt related to currency fluctua-tions has been reported directly inequity as a foreign currency translationadjustment as an offset to the transla-tion adjustments resulting from theconsolidation of its foreign susidiaries.During 2000 and earlier, this treatmentwas consistent with US GAAP underFAS 52. Upon adoption of FAS 133 forUS GAAP purposes in 2001, the long-term debt used to hedge the net invest-ment in foreign subsidiaries must meetstrict documentation and effectivenesscriteria in order to be accounted for aspart of the foreign currency translationadjustment. Because such criteria havenot been met, the change in value ofthe long-term debt because of currencyfluctuations is reported in earnings forUS GAAP purposes.
The US GAAP reconciliation itemscan be summarized as follows.

Alfa Laval 2003 · 83
d) Tooling costs
Under Swedish GAAP, the Group gener-ally expenses the cost of replacementtools acquired. Under US GAAP, signifi-cant tooling costs are capitalised asincurred and amortised on the straight-line basis over their estimated econom-ic lives of three years.
e) Capitalised software
Under prior Swedish GAAP, the cost todevelop computer software for internaluse is expensed as incurred. TheAccounting Standards Executive Com-mittee issued Statement of Position(“SOP”) No. 98-1, “Accounting for theCosts of Computer Software Developedor Obtained for Internal Use”. SOP No.98-1 is effective for financial state-ments for fiscal years beginning afterDecember 15, 1998; however, earlyadoption is encouraged. For US GAAPpurposes, the Group has adopted SOP 98-1 with effect from January 1,1995 and has capitalised direct costs of developing software for internal use.Amortisation of these assets is calculat-ed on the straight-line method overtheir estimated economic lives of threeyears.
f) Provisions
As of December 31, 2001, the US GAAPdifferences for provisions relate prima-rily to different methods used to calcu-late reserves for inventory, receivablesand compensated absences.
g) Other
Under Swedish GAAP, certain realestate assets are stated at estimated fairvalue. The revalued amounts of depre-ciable assets are depreciated over theirestimated useful lives. The revaluationof assets is not permitted under USGAAP. Upon the transaction describedin b, the fixed assets were adjusted totheir fair values, eliminating the effectof past revaluations. For US GAAP pur-poses, fixed asset values that have been
revalued after the transaction havebeen restated at historical cost based onthe purchase accounting adjustments,net of corresponding adjustments foraccumulated depreciation. Adjustmentsto periodic depreciation charges havealso been reflected.
Under Swedish GAAP, research anddevelopment expenses related to proj-ects that are funded by a governmentaffiliated body are deferred and record-ed as an intangible asset. Under USGAAP, research and development costsare expensed as and when incurred.
Under prior Swedish GAAP interestrelated to long-term construction proj-ects was not required to be capitalised.US GAAP requires that interest incurredduring long-term construction projectsmust be capitalised and included aspart of the cost of the asset.
Under Swedish GAAP, short-termloans for which management has theability to refinance are classified asnon-current liabilities. For US GAAP,such liabilities are classified as current.
Under Swedish GAAP, the propor-tionate consolidation method is anacceptable method of accounting forjoint ventures. Under US GAAP, jointventures must be accounted for usingthe equity method. This difference inaccounting does not result in anyadjustment to net shareholder’s equityor net income. The effect of using theproportionate consolidation methoddoes not have a material impact on anyindividual income statement or balancesheet item.
As of December 31, 2003 the Grouphad sold receivables with recoursetotalling SEK 113.7 (164.5) million.These are disclosed as discounted billsin the footnote describing contingentliabilities. Under US GAAP, the recourseprovisions prevent the transaction frombeing reported as a sale. Accordingly,the receivables would be kept on thebalance sheet, and a loan would bereported for the amount of cash
received. The loss on the sale was notmaterial, and this transaction results inno significant impact on US GAAPequity.
In 2000 Alfa Laval AB issued war-rants to management to purchase com-mon stock of Alfa Laval AB. Manage-ment paid fair market value in cash forthe warrants based on an fair value cal-culation using the Black-Scholes optionpricing model. The Group has electedto use the fair value method in accor-dance with Statement of FinancialAccounting Standards No. 123“Accounting for Stock-Based Compen-sation” (“FAS 123”) which requires thefair value of stock compensation grantsto be recognized over the vesting periodof the grants. Under the terms of thewarrant agreement, management wasrequired to pay the fair value deter-mined for the warrants and accordinglythere would be no compensationexpense associated with the warrantsfor either Swedish GAAP or US GAAP.
In August 2001 the US FinancialAccounting Standards Board issued FAS144. The standard supersedes FAS 121and parts of Accounting PrinciplesBoard Opinion 30 regarding accountingfor the impairment or disposal of long-lived assets. FAS 144 requires long-livedassets held for disposal to be measuredat the lower of carrying amount or fairvalues less costs to sell and providesnew guidance regarding presentation ofassets to be disposed. Within Alfa Lavalthese assets are mainly relating to realestate and more precisely to propertiesin the United States, Spain, Brazil,Canada, Denmark, Wales and Peru arealso planned for sale. Accounting underFAS 144 does not mean any differencecompared to Swedish GAAP. US GAAPis however requiring a reporting ofassets for sale according to the below:
Assets for sale
Consolidated 2003 2002
SEK in millions Carrying value Fair value Carrying value Fair value
Real estate for sale 169.1 403.2 78.1 125.5

The components of income (loss) before taxes under US GAAP are as follows: Consolidated, SEK in millions 2003 2002 2001
Swedish 744.0 228.8 161.5
Foreign 474.8 564.6 -291.9
Total 1,218.8 793.4 -130.4
The tax cost under US GAAP is composed of the following:Consolidated, SEK in millions 2003 2002 2001
Current:
Swedish -7.0 -4.2 -24.4
Foreign -276.0 -282.3 -319.6
Deferred:
Swedish 5.3 -20.4 77.4
Foreign 80.8 58.6 359.4
Total -196.9 -248.3 92.8
84 · Alfa Laval 2003
Cash Flow Information
The definitions of “cash flows” differbetween Swedish GAAP and US GAAP.Cash flow under Swedish GAAP repre-sents increases or decreases in “cash,”which is comprised of cash on handand in banks. Under US GAAP, cashflow represents increases or decreasesin “cash and cash equivalents,” whichinclude short-term, highly liquid in-vestments with remaining maturitiesof less than 90 days when acquired,and exclude overdrafts.
There are also certain differences inthe classification of items within thecash flow statement between SwedishGAAP and US GAAP. Both Swedish
GAAP and US GAAP segregate cashflows between operating activities,investing activities and financingactivities, however, certain items areincluded in different categories forSwedish GAAP compared to US GAAP.
Cash flows from servicing offinance, and returns on investmentswould be, with the exception of anyinterest paid but capitalized, includedas cash flows from operating activitiesunder US GAAP. In addition, changesin provisions and changes in assetsand liabilities because of foreign cur-rency transaction gains or losseswould be included as cash flows fromoperating activities under US GAAP.
Other comprehensive income (loss)
FAS No. 130, “Reporting Comprehen-sive Income” establishes standards forreporting comprehensive loss and itscomponents in financial statements.Comprehensive income and loss asdefined, includes all changes in equity(net assets) during each financial peri-od from non-owner sources. On a USGAAP basis, the only item included inother comprehensive income and lossthat is excluded from net income iscurrency translation adjustment. Thereare no tax effects relating to this item.Comprehensive income is not a requireddisclosure under Swedish GAAP.
In June 2002 the US FinancialAccounting Standards Board issuedFAS 146 “Accounting for Costs Associ-ated with Exit or Disposal Activities”.It nullifies Emerging Issues Task Force(EITF) Issue 94-3 “Liability Recogni-tion for Certain Employee Termina-tion Benefits and Other Costs to Exitan Activity”. The principal differencebetween FAS 146 and Issue 94-3relates to its requirements for recogni-tion of a liability for a cost associated
with an exit or disposal activity. FAS146 requires a liability for a cost associ-ated with an exit or disposal activity be recognised when the liability isincurred. Under Issue 94-3 a liabilityfor an exit cost was recognised at thedate of an entity’s commitment to anexit plan. FAS 146 also establishes thatfair value is the objective for initialmeasurement of the liability. FAS 146is effective for exit or disposal activitiesinitiated after December 31, 2002. Alfa
Laval has not been involved in anyexit or disposal activities during 2003that affects the provisions at year-end.
i) Deferred taxes
As of January 1, 2000 the Group adopt-ed IAS 12 with a view toward meetingboth IAS and US GAAP requirements.Accordingly, the Group has applied theliability method and has recordeddeferred taxes in accordance with bothIAS 12 and FAS 109.
Comprehensive income under US GAAP is presented as follows:
Consolidated, SEK in millions 2003 2002 2001
According to US GAAP:
Net income 1,021.9 545.0 -37.5
Foreign currency translation -267.1 -329.6 268.3
Comprehensive income 754.8 215.4 230.8
Accumulated comprehensive income under US GAAP is presented as follows:
Consolidated, SEK in millions 2003 2002 2001
According to US GAAP:
Accumulated net income 909.8 -112.1 -657.1
Foreign currency translation -583.5 -316.4 13.2
Accumulated comprehensive income 326.3 -428.5 -643.9

Alfa Laval 2003 · 85
Recently issued accounting
pronouncements
EITF 00-21
In November 2002, the EmergingIssues Task Force (“EITF”) reached afinal consensus on EITF 00-21, “Rev-enue Arrangements with MultipleDeliverables.” The scope provisions ofEITF 00-21 were slightly modified inMay 2003. EITF 00-21 addresses certainaspects of the accounting for revenuearrangements with multiple deliver-ables by a vendor. EITF 00-21 outlinesan approach to determine when a rev-enue arrangement that contains multi-ple deliverables should be divided intoseparate units of accounting and, ifseparation is appropriate, how thearrangement consideration should beallocated to the identified accountingunits. The Company is required andplans to adopt the provisions of EITF00-21, effective for fiscal periods begin-ning after June 15, 2003. To accom-plish this, the Company must identifyand determine the fair value of thecomponent deliverables. Alfa Lavaldoes not expect the adoption of EITF00-21 to have a material impact on itsresults of operations, financial positionand cash flows.
FIN 46
In January 2003, the FASB issued FIN46, “Consolidation of Variable InterestEntities – an interpretation of ARB No.51,” which clarifies the application ofthe consolidation rules to certain vari-able interest entities. FIN 46 estab-lished a new multi-step model for theconsolidation of variable interest enti-ties when a Company has a controllingfinancial interest based either on vot-ing interests or variable interests. Con-solidation based on variable interests isrequired by the primary beneficiary ifthe equity investors lack essential char-acteristics of a controlling financialinterest or if the equity investment atrisk is not sufficient for the entity tofinance its activities without additionalsubordinated financial support fromother parties. FIN 46 also provides dis-closure requirements related to signifi-cant investments in variable interestentities, whether or not those entitiesare consolidated. On October 9, 2003,the FASB issued FASB Staff Position FIN46-6 (“FSP FIN 46-6”), “Effective Dateof FASB Interpretation No. 46, Consoli-dation of Variable Interest Entities.”FSP FIN 46-6 defers the effective date
for applying the provisions of FIN 46for interests held by public entities invariable interest entities or potentialvariable interest entities created beforeFebruary 1, 2003. Alfa Laval does nothave any variable interest entities andis thus not affected by FIN 46.
FAS 149
In April 2003, the Financial Account-ing Standards Board issued Statementof Financial Accounting Standards No.149, “Amendment of Statement 133on Derivative Instruments and Hedg-ing Activities” (“SFAS 149”). This State-ment codifies certain decisions madeby the FASB as part of the DerivativesImplementation Group process byamending and clarifying the scope andimplementation guidance of FASBStatement No. 133, for similar account-ing treatment of contracts with compa-rable characteristics. SFAS No. 149 iseffective for contracts entered into ormodified after June 30, 2003, and forhedging relationships designated afterJune 30, 2003. The adoption of SFASNo. 149 did not have a material impacton the results of operations, financialposition and cash flows.

86 · Alfa Laval 2003
Proposed disposition of earnings
The unrestricted equity in Alfa Laval AB (publ) is SEK:
Unrestricted equity capital 450,348,031
Received Group contribution, net after tax 441,637,891
Net income for 2003 177,013,3321,068,999,254
Lund, March 1, 2004
Anders Narvinger Björn Savén
Chairman Deputy Chairman
Per Olov Jakobsson Arne Kastö Susanna Holmqvist Norrby
Jan Nilsson Finn Rausing Jörn Rausing
Christian Salamon Waldemar Schmidt Lena Olving Öhberg
Sigge Haraldsson
Managing Director
The income available for disposition by the shareholders at the Annual GeneralMeeting is restricted by the consolidated net available for distribution of SEK 836.9million.
The Board of Directors propose a dividend of SEK 4.00 (2.00) per share correspon-ding to SEK 446,687,972 (223,343,986) and that the remaining income of SEK622,311,282 (450,348,031) be carried forward.

Alfa Laval 2003 · 87
Audit ReportTo the general meeting of the shareholders of Alfa Laval AB (publ.) Corporate identity number 556587-8054.
We have audited the annual accounts,the consolidated accounts, the account-ing records and the administration ofthe board of directors of Alfa Laval AB (publ.) for the year 2003. Theseaccounts and the administration ofthe company are the responsibility ofthe board of directors. Our responsi-bility is to express an opinion on theannual accounts, the consolidatedaccounts and the administrationbased on our audit.
We conduct our audit in accordancewith generally accepted auditing stan-dards in Sweden. Those standardsrequire that we plan and perform theaudit to obtain reasonable assurancethat the annual accounts and the con-solidated accounts are free of materialmisstatement. An audit includesexamining, on a test basis, evidencesupporting the amounts and disclo-
sures in the accounts. An audit alsoincludes assessing the accountingprinciples used and their applicationby the board of directors and signifi-cant estimates made by the board ofdirectors, as well as evaluating theoverall presentation of information inthe annual accounts and the consoli-dated accounts. As a basis for ouropinion concerning discharge fromliability, we examined significant deci-sions, actions taken and circumstancesof the company in order to be able todetermine the liability, if any, to thecompany of any board member. Wealso examined whether any boardmember has, in any other way, actedin contravention of the CompaniesAct, the Annual Account Act or theArticles of Association. We believethat our audit provides a reasonablebasis for our opinion set out below.
The annual accounts and the consol-idated accounts have been preparedin accordance with the AnnualAccount Act and, thereby, give a trueand fair view of the company’s andthe group’s financial position andresults of operations in accordancewith generally accepted accountingprinciples in Sweden.
We recommend to the generalmeeting of the shareholders that theincome statement and the balancesheet of the parent company and thegroup be adopted, that the profit forthe parent company be dealt with inaccordance with the proposal in theadministration report and that themembers of the board of directors bedischarged from liability for thefinancial year.
Malmö, March 1, 2004
Anders Scherman Ingvar GanestamAuthorized Public Accountant Authorized Public Accountant
PR
OP
OS
ED
DIS
PO
SIT
ION
OF
EA
RN
ING
S &
AU
DIT
RE
PO
RT

Springtime for a new medical era
Biotech.The key behind developing a new generation of medicines. Now there’s abetter hope that we will be able to cure diseases that up till now have been consideredincurable. These new therapeutics are derived from mammalian cell cultures. This putsextreme demands on precision, safety and cleanliness in the production process. AlfaLaval is working hand in hand with the biopharm industry to develop techniques andequipment to satisfy this sensitive task, and it’s a gigantic challenge. During the nextfew years some 500 new drugs will move from clinical trials to commercialisation.
88 · Alfa Laval 2003

Alfa Laval 2003 · 89
Board of Directorsand Group
Management

1
23
4
5
6
90 · Alfa Laval 2003
Board of Directors
Anders Narvinger (1)
Chairman since 2003.
Born: 1948. President of Teknikföreta-gen. Chairman of Trelleborg AB,Exportrådet, the Lund University ofTechnology and Ireco Holding AB.Board member of the Volvo Car Cor-poration. Number of shares: 4,000*.
Björn Savén (2)
Deputy chairman since 2000.
Born: 1950. President of Industri Kapital. Chairman of KCI KonecranesInternational Oy. Deputy chairman of Dynea Oy, Sydsvenska Kemi AB and the German-Swedish Chamber of Commerce. Board member of Gardena AG.
Board of DirectorsChristian Salamon (6)
Board member since 2000.
Born: 1961. Director of Industri Kapi-tal. Board member of Oriflame Cos-metics SA, Arca Systems InternationalAB, Intrum Justitia AB and Telefos AB.
Waldemar Schmidt (7)
Board member since 2000.
Born: 1940. Former president and chiefexecutive officer of the ISS Group.Chairman of Superfos Industries A/S,Thrane & Thrane A/S and TholstrupCheese Holding. Board Member ofGroup 4 Falck A/S and F Group A/S,Enodis plc and Welzorg n.v. Number of shares: 16,749*.
Lena Olving (3)
Board member since 2002.
Born: 1956. Senior Vice President ofVolvo Car Corporation, responsible forQuality.
Finn Rausing (4)
Board member since 2000.
Born: 1955. Board member of the TetraLaval Group and De Laval Holding AB.Chairman of R.R. Institute of AppliedEconomics AB. Board member ofSwedeship Marine AB.
Jörn Rausing (5)
Board member since 2000.
Born: 1960. Head of Mergers andAcquisitions (M&A) in the Tetra LavalGroup. Board member of the TetraLaval Group, DeLaval Holding AB andOcado Ltd.

7
8
910
11
12
Alfa Laval 2003 · 91
Board of Directors
Arne Kastö (11)
Union representative since 2000.
Born: 1948. Employed by Alfa Lavalsince 1980. Union representative ofthe Swedish Union of Clerical andTechnical Employees in Industry (Sif).
Jan Nilsson (12)
Union representative since 2000.
Born: 1952. Employed by Alfa Lavalsince 1974. Union representative of theSwedish Metal Workers Union (Metall).
Susanna Norrby (10)
Union representative since 2003.
Born: 1967. Alfa Laval employee since 1992. Union representative of the Swedish Association of Graduate Engineers (CF).
Deputy members
Kalevi Huotari
Deputy union representative since 2000.
Born: 1951. Employed by Alfa Lavalsince 1973. Deputy union representa-tive of the Swedish Metal WorkersUnion (Metall).
Sigge Haraldsson (8)
Board member since 2000.
Born: 1944. Employed by Alfa Lavalsince 1997. Served as member of theTetra Pak Group Management from1993 until October 1997, responsiblefor the Fibre Packaging Division. Priorto this held various positions withinthe Alfa Laval Group. Board member ofHans Stahle’s Minnesfond. Number ofshares: 153,874*.
Per Olov Jacobsson (9)
Union representative since 2003.
Born: 1942. Alfa Laval employee since1959. Union representative of theAssociation of Management and Pro-fessional Staff (Ledarna).
Gunnar Karlsson
Deputy union representative since 2000.
Born: 1941. Employed by Alfa Lavalsubsidiary Cetetherm AB since 1962.Deputy union representative of theAssociation of Management and Pro-fessional Staff (Ledarna).
Magnus Christersson
Deputy union representative since 2003.
Born: 1973. Employed by Alfa Lavalsince 1999. Deputy union representa-tive of the Swedish Association ofGraduate Engineers (CF).
Salvador Pay-Ortiz
Deputy union representative since 2002
Born: 1940. Employed at Alfa Lavalsince 1965. Deputy union representa-tive of the Swedish Union of Clericaland Technical Employees in Industry(Sif).
* As of December 31, 2003.

92 · Alfa Laval 2003
Group Management
Sigge Haraldsson (1)
President and Chief Executive Officer
Born: 1944. Employed by Alfa Lavalsince 1997. Served as member of theTetra Pak Group Management from1993 until October 1997, responsiblefor the Fibre Packaging Division. Priorto this held various positions withinthe Alfa Laval Group. Board member ofHans Stahle’s Minnesfond. Number ofshares: 153,874*.
Sigge Haraldsson has a contract that pro-vides him the possibility to retire fromAlfa Laval with pension at age 60, that is,in October 2004. On January 27 SiggeHaraldsson announced that he will retirein accordance with this contract.
Thomas Thuresson (2)
Executive Vice President, Chief Financial Officer
Born: 1957. Employed by Alfa Lavalsince 1988 and has served in his cur-rent role since 1995. Former controllerof Flow business area and Group con-troller of the Alfa Laval Group. Num-ber of shares: 56,094*.
Göran Mathiasson (3)
President, the Operations Division
Born: 1953. Employed by Alfa Lavalsince 1979. Göran Mathiasson hasbeen president of the Operations Divi-sion since April 2003. Previously incharge of Alfa Laval manufacturingand prior to that, of thermal technolo-gy, including research and develop-ment, production development, system development and purchasing.Number of shares: 13,648*.
GroupManagement
12
6
9
10

Alfa Laval 2003 · 93
Group Management
* As of December 31, 2003.
Ulf Granstrand (5)
President, the Process Technology Division
Born: 1947. Employed by Alfa Lavalsince 1975. Ulf Granstrand has beenresponsible for the Process TechnologyDivision since 2003. Previously incharge of the Operations Division,parts of the regional sales operationsand head of the Thermal business area.Number of shares: 91,572*.
Peter Leifland (6)
Executive Vice President in charge of the
Asia, Oceania and South America Region
Born: 1954. Employed by Alfa Lavalsince 1985. Peter Leifland has been incharge of the region since 1999. For-merly president of Alfa Laval Interna-tional Engineering AB. Number ofshares: 114,716*.
Per-Erik Lindquist (7)
Executive Vice President in charge of the
Europe Region
Born: 1960. Employed by Alfa Lavalsince 2001. Per-Erik Lindquist has beenin charge of the Europe region since2001. Previously president of Scania inBelgium. Number of shares: 58,261*.
David Ford (8)
Senior Vice President, Human Resources
Born: 1954. Employed by Alfa Lavalsince 1993. David Ford has served inhis current position since joining AlfaLaval in 1993. Former human resourcesmanager of Tetra Pak in the UK. Num-ber of shares: 58,711*.
Peter Torstensson (9)
Vice President, Corporate Communications
Born: 1955. Employed by Alfa Lavalsince 1999. Peter Torstensson hasserved in his current position sincejoining Alfa Laval in 1999. Formerlypresident of Borstahusen Informations-design. Number of shares: 31,555*.
Nils Olof Björk (10)
Senior Vice President,
Corporate Development
Born: 1947. Employed by Alfa Lavalsince 1975. Nils Olof Björk has servedin his current position since 2002. Previously head of Thermal in Canada,marketing director of Alfa Laval inLund and head of Alfa Laval Thermal in Asia. Number of shares: 15,944*.
Svante Karlsson (4)
President, the Equipment Division
Born: 1955. Employed by Alfa Lavalsince 1984. Svante Karlsson has beenPresident of the Equipment Divisionsince 2001. Former head of the Ther-mal business area. Before that was President of the Marine and Powerbusiness segment. Number of shares:53,986*.
3
4
5 7
8
94 · Alfa Laval 2003
As stipulated by the company’s Articlesof Association, the object of Alfa Laval’s(publ) operations is to carry out thedevelopment, manufacture and sale ofequipment and plants, primarily in theareas of separation, heat transfer andflow technology, manage real estateand chattels and carry on related opera-tions, either directly or through sub-sidiaries or joint-venture companies, in Sweden and abroad.
Annual General Meeting 2003
The Annual General Meeting of 2003took place on May 8, 2003 in Lund,Sweden. The Meeting appointed a Boardof Directors based on proposals fromthe nominations committee. Sigge Haraldsson, Lena Olving, Christian Salamon, Björn Savén, WaldemarSchmidt, Finn Rausing and Jörn Rausingwere re-elected to the Board. AndersNarvinger was elected as a new memberof the Board (see page 90–91 for presen-tation of Board members).
The Annual General Meeting voted toaccept the Board proposal of a dividend ofSEK 2.00 per share for the 2002 fiscal year.
The Annual General Meeting alsodecided that the fee paid to Board mem-bers shall be SEK 2,225,000, to be dis-tributed by the Board among its mem-bers. The auditors fee will be paid inaccordance with the contract betweenAlfa Laval AB and Ernst & Young AB(see also Note 6, page 64).
Independent Board members
Both Anders Narvinger, Lena Olvingand Waldemar Schmidt are independ-ent of the company’s largest owners.Moreover, all Board members, apartfrom Sigge Haraldsson, who is the Presi-dent and CEO of Alfa Laval, are inde-pendent in relation to the company.
Nominations committee
The task of the nominations committeeis to prepare and present proposals forthe Annual General Meeting regardingthe election of Board members and,where applicable, auditors, as well asthe fees to be paid to members of theBoard and to the auditors.
By decision of the Annual GeneralMeeting of 2003, every year during thefourth quarter, the Chairman of theBoard must summon company’s largestowners, who are then entitled to appointthe members of the nominations com-mittee. Should any of these sharehold-ers refrain from exercising this right, the next shareholder in decreasingorder shall be asked, until five membershave been appointed. The names of thenominations committee members shallbe announced as soon as they havebeen appointed. The Board Chairmanshall be eligible to be appointed as amember of the committee and as itschairman.
In accordance with the above proce-dure, Alfa Laval’s largest owners haveformed the following nominationscommittee for the 2004 Annual GeneralMeeting: Björn Fransson, the Fourth APFund, Anders Narvinger, Chairman ofAlfa Laval, Tomas Nicolin, the Third APFund, Marianne Nilsson, Robur AB,Finn Rausing, Tetra Laval, and ChristianSalamon, Industri Kapital.
Anders Narvinger was appointed chair-man of the nominations committee.
The Board of Directors and its duties
To the extent that it is appointed by theAnnual General Meeting, the Board ofDirectors shall consist of not fewer thanfour and not more than ten Boardmembers, and have not more than fourdeputy Board members. Board members
Corporategovernance

Alfa Laval 2003 · 95
and,where applicable, deputy Boardmembers, are elected annually at theAnnual General Meeting for the periodup to the close of the next Annual Gen-eral Meeting.
In 2003, the Board held twelve (thir-teen) meetings. In 2003, the Board estab-lished procedure to govern its ownactivities and instructions regarding theallocation of duties between the Boardand the president. The procedure stipu-lates how often the Board should con-vene and how Board work should beorganized.
The instructions specify what financialreports must be provided to the Boardto enable it to assess the Group’s finan-cial situation.
The Board appoints the President andconvenes General Meetings. The Boardholds at least four regular meetingsannually and extra meetings may beheld in addition to these.
Among other actions during the year,the Board established a number of rulesand policies for improved corporategovernance as a consequence of regis-tration with the SEC (Securities andExchange Commission), including aCode of Ethics for certain senior execu-tives, a disclosure control and proce-dures policy as well as an audit andnon-audit services pre-approval policy.The Board also held an extra strategymeeting.
The Group’s Executive Vice Presidentand CFO Thomas Thuresson was co-opted to the Board during the year.
The Board established a finance poli-cy to provide distinct limits for thecompany’s financing and financial riskmanagement. Among other points, thepolicy defines the scope of currencyhedging, interest-rate management andthe distribution of responsibility formanagement of financial issues.
The Chairman
At a statutory meeting of the Board ofDirectors of Alfa Laval, held on May 8,2003, Anders Narvinger was appointedChairman of the Board and Björn SavénVice Chairman. The Board Chairmanmonitors the development of the oper-ations and ensures that the other mem-bers regularly receive the necessaryinformation to perform the work of the
Board at a consistent level of qualityand in compliance with the SwedishCompanies Act. In 2003, the Chairmancompleted and evaluation of the workof the Board and presented this evalua-tion to the nominations committee.
In cooperation with the company’sBoard of Directors, nominations com-mittee and management, the Chair-man also initiated the procurement ofaudit services for the next four-yearperiod (2004–2007).An evaluation of the company’s/Group’ssenior excutives and succession plan-ning has also been launched upon theinitiative of the Chairman.
Compensation committee
Alfa Laval’s compensation committee,which is appointed within the Board,currently consists of Anders Narvinger,Chairman, Björn Savén and Jörn Rausing. The committee’s task is toestablish the level of compensation tobe paid to the president and seniorexecutives.
Audit committee
The entire Board of Directors of AlfaLaval comprises the company’s auditcommittee. Due to the nature of theGroup’s financial reporting and follow-up routines, guidelines for internalcontrol, external and internal auditand reporting to the Board on suchissues, it is believed that a special auditcommittee within the Board would notincrease the Board’s insight into andcontrol over the operations. The com-pany’s external auditors have reportedto the Board at three Board meetings in2003. The internal audit function wasre-established in 2003 in cooperationwith the KPMG audit company, andhas submitted reports to the Board ontwo occasions during the year. Theinternal audit function reports directlyto the Board.
The President and senior management
of the Group
The President of Alfa Laval AB, who isalso the CEO of the Alfa Laval Group,leads the Group in its daily operationsand ensures that the Board receivesnecessary background and decision-making information. It is the Presi-
dent’s responsibility to ensure that thecompany’s accounting complies withapplicable legislation and regulations.
The Group management team con-sists of the CEO and the individualsappointed, as proposed by the chiefexecutive officer, by the Board. Themanagement team currently consists of ten individuals, who are presentedon pages 92–93.
The members of the managementteam are in charge of the daily opera-tions in their respective areas and forthe Alfa Laval Group as a whole.Unrecorded meetings with all or partsof the Group management team takeplace at regular intervals throughoutthe year. In 2003, the managementteam also held nine recorded meetings.
In addition to the above, operationalreviews are held on a quarterly basiswith divisional or regional management.These reviews deals with the company’sbusiness position, earnings, earnings fore-cast for the next 12 months and issuesspecific to the various operational sectors.
Auditors
No fewer than one and no more thantwo auditors, and not more than twodeputy auditors, are appointed whererelevant at the Annual General Meetingfor the period extending until the closeof the Annual General Meeting held inthe fourth fiscal year after the electionof auditors. Auditors, and where appli-cable deputy auditors, appointed shallbe Authorized Public Auditors or regis-tered auditing companies.
At a Special General Meeting in 2000,the auditors Ingvar Ganestam, AndersScherman, Håkan Olsson and KerstinMouchard as deputy auditors, allemployed at Ernst & Young AB, wereappointed for a mandate period extend-ing to the close of the Annual GeneralMeeting in the spring of 2004.
Security and Exchange Commission
(SEC)/Sarbanes Oxley Act
In conjunction with the issuance of ahigh-yield bond in autumn 2000, AlfaLaval registered with SEC in the US.Alfa Laval has thus agreed to complywith legislation known as the SarbanesOxley Act, the primary intent of whichis to improve corporate governance.
CO
RP
OR
AT
E G
OV
ER
NA
NC
E

96 · Alfa Laval 2003
Financial information in 2004Alfa Laval will publish financial reports during 2004 on the following dates:
First-quarter report 2004 April 27Annual General Meeting in Lund April 27Second-quarter report 2004 August 16Capital Market Day During SeptemberThird-quarter report 2004 October 22
Analysts tracking Alfa Laval
ABG Sundahl Collier Anders JegersAlfred Berg Gustaf LindskogCarnegie Oscar StjerngrenCAI-Chevreux Patrik SjöblomCredit Suisse First Boston Patrick MarshallDanske Securities Søren SamsøeDeutsche Bank Kenneth TollEnskilda Securities Anders ErikssonEvli Bank Michael AnderssonHagströmer & Qviberg Lars GlemstedtHandelsbanken Capital Markets Mikael SensHuman Securities Mattias ErikssonJP Morgan Julia VareskoKaupthing Bank Peder FrölénLehman Brothers Brian HallNordea Securities Johan WettergrenSwedbank Mats LissUBS Warburg Mikael JäfsÖhmans Anders Roslund
Shareholder information
Mikael Sjöblom, Investor Relations ManagerTel: +46-46-36 74 82Mobile: +46-0709-78 74 82e-mail: [email protected]
Production: Alfa Laval AB, Investor Relations/Corporate Communications / Ehrenstråhle & Co Prepress: Reptil Print: Trosa Tryckeri
Annual General Meeting
The Annual General Meeting of Alfa Laval AB (publ) will beheld on Tuesday, April 27, at 4:00 p.m at the Scandic StarHotel, Glimmervägen 5, Lund, Sweden. Light refreshmentswill be offered after the Meeting.
AGM program
1:30 p.m. Bus departs Star Hotel to Alfa Laval’s production facility in Lund
3:00 p.m. Refreshments served prior to Annual General Meeting
3:30 p.m. Registration begins4:00 p.m. Meeting opens
Notification of participation
Shareholders who wish to participate in the Meeting andobtain voting rights must be entered in the share registermaintained by the Swedish Securities Register Center (VPCAB) not later than Friday, April 16, 2004, and register theirintention to participate – possibly along with an assistant –not later than Wednesday, April 21, 2004 at 12:00 p.m.
Shareholders whose shares are held in trust have to tem-porarily re-register their shares in their own names not laterthan April 16. The shareholder must inform the trusteeabout this in good time before the deadline.
Notification of participation shall be made to:
• Alfa Laval AB, Group staff Legal, Box 73, SE-221 00 Lund,Sweden
• By e-mail to [email protected]• By fax to +46-46-37 71 87• On the website: www.alfalaval.com• By phone, No. +46-46-36 72 22, 36 65 26, or 36 65 00.
Shareholders shall state their name, personal ID number andtelephone number on their notice of participation. If partici-pation is by proxy, this power of attorney or authorizationshall be submitted to the company prior to the Meeting.
Dividend
The Board of Directors and the President propose to theAnnual General Meeting that a dividend of SEK 4.00 pershare be paid and that the record date for this dividendshould be Friday April 30, 2003. If the Meeting approves the proposal, the dividend will be distributed by VPC onWednesday May 5, 2004.
However, the record date and dividend payment date may be postponed due to the technical procedures requiredfor executing the payment.
Tour of production facility in Lund
Prior to the Annual General Meeting there will be an oppor-tunity to view production of plate heat exchangers at theplant in Lund. The tour begins with a gathering at the StarHotel in Lund not later than 1:30 p.m. Buses will transportvisitors to the production facility and then back to theAnnual General Meeting.
Registration to participate in the tour must be made inconjunction with notification to participate in the Meeting.The number of participants in the tour is limited.

Net salesRevenues from goods sold and services per-formed that are part of the ordinary opera-tions of the Group, after deduction for givendiscounts, value added tax and other taxdirectly linked to the sales.
Comparison distortion itemsItems that do not have any link to the normaloperations of the Group or that are of a non-recurring nature, where a reporting togetherwith other items in the income statementwould have given a comparison distortioneffect that would have made it difficult tojudge the development of the ordinary opera-tions from an outside viewer.
Orders receivedIncoming orders during the year, calculated inthe same way as net sales. The orders recei-ved give an indication of the current demandfor the Group's products and services, thatwith a varying delay appear in net sales.
Order backlog at year-endIncoming orders that not yet have been invoi-ced. The order backlog at the end of the yearis equal to the sum of the order backlog at thebeginning of the year plus the orders receivedduring the year less the net sales for the year.It gives an indication of how the net sales canbe expected to develop in the future.
EBITA“Earnings Before Interest, Taxes and Amorti-sation” or operating income before amortisa-tion of goodwill and other step-up values.This measure of result is fully comparableover time independent of the financing costsand the amortisation of goodwill and otherstep-up values that from time to time burdenthe Group.
EBITDA“Earnings Before Interest, Taxes, Depreciationand Amortisation” or operating income beforedepreciation and amortisation of goodwill andother step-up values. This measure of resultis fully comparable over time independent ofthe financing costs and the amortisation ofgoodwill and other step-up values that fromtime to time burden the Group.
EBITA-margin %Operating income before amortisation ofgoodwill and other step-up values (EBITA) inrelation to net sales, expressed in percent.
EBITDA-margin %Operating income before depreciation andamortisation of goodwill and other step-upvalues (EBITDA) in relation to net sales,expressed in percent.
Adjusted EBITASame as EBITA, but adjusted for comparisondistortion items.
Adjusted EBITDASame as EBITDA, but adjusted for compari-son distortion items.
Adjusted EBITA-margin %Same as EBITA-margin, but adjusted forcomparison distortion items.
Adjusted EBITDA-margin %Same as EBITDA-margin, but adjusted forcomparison distortion items.
Profit margin %Result after financial items in relation to netsales, expressed in percent.
Capital turnover rate, timesNet sales in relation to average capitalemployed, expressed as a multiple of capitalemployed. Shown excluding and includinggoodwill and step-up values and the corres-ponding deferred tax liability.
Capital employedTotal assets less liquid funds, capitalisedfinancing costs, other long-term securities,accrued interest income, operating liabilitiesand other non-interest bearing liabilities, including tax and deferred tax, but excludingaccrued interest costs. Shown excluding andincluding goodwill and step-up values and thecorresponding deferred tax liability. Shows thecapital that is used in the operations. Thecapital employed for the Group differs fromthe net capital for the segments concerningtaxes, deferred taxes and pensions.
Return on capital employed %EBITA in relation to average capital employed,expressed in percent. Shown excluding andincluding goodwill and step-up values and thecorresponding deferred tax liability.
Return on equity capital %Net income for the year in relation to equitycapital, expressed in percent. Due to thechange of ownership during 2000, a calcula-tion of the return in relation to average equitycapital will not be representative.
Solidity %Equity capital in relation to total assets,expressed in percent.
Net debtInterest-bearing liabilities including interest-bearing pension liabilities and capitalisedfinance leases less liquid funds.
Debt ratio, timesNet debt in relation to equity capital, expressed as a multiple of equity capital.
Interest coverage ratio, timesEBITDA plus financial net increased by inter-est costs in relation to interest costs.Expressed as a multiple of interest costs.Gives an expression for the Group’s ability to pay interest. The reason EBITDA is used as the starting point is that this forms thestarting point for a cash flow perspective onthe ability to pay interest.
Cash flow from operating activitiesShows the Group’s cash flow from operatingactivities, that is the cash flow generated inthe daily operational activities.
Cash flow from investing activitiesShows the Group’s cash flow from investingactivities, that is the cash flow generated bymainly the Group’s divestments and acquisi-tions of businesses and divestments of realestate.
Cash flow from financing activitiesShows the Group’s cash flow from financingactivities, that is mainly the cash flow impactof the Group’s loans in terms of interest pay-ments and amortisation.
InvestmentsInvestments represent an important compo-nent in the cash flow for the Group. The levelof investments during a couple of years givesa picture of the capacity build up in theGroup. In connection with the Group’s chan-ge programme, a number of factories havebeen closed and fixed assets have beenpossible to redistribute, which has resulted ina relatively lower level of investments.
Average number of employeesThe costs that are related to the number ofemployees represent a large part of the totalcosts for the Group. The development of theaverage number of employees over time inrelation to the development of the net salestherefore gives and indication of the costrationalisation that is taking place.
Earnings per share, SEKNet income for the year divided by the averagenumber of shares.
Cash earnings per share, SEKTotal net increase/decrease in cash and bankfor the year divided by the average number ofshares. The reason why this cash flow mea-sure is used is that it represents the cash flowthat can be used for dividend payments. Thecash flows from operating, investing andfinancing activities are only sub totals of thetotal cash flow and are thus less interestingfrom a shareholders’ perspective.
Definitions

Alfa Laval in brief
Alfa Laval is a leading globalprovider of specialized productsand engineered solutions.
Our equipment, systems andservices are dedicated to helpingcustomers to optimize the perfor-mance of their processes. Timeand time again.
We help our customers to heat,cool, separate and transport prod-ucts such as oil, water, chemicals,beverages, foodstuffs, starch andpharmaceuticals.
Our worldwide organizationworks closely with customers inalmost 100 countries to help themstay ahead.
How to contact Alfa Laval
Contact details for all countries arecontinually updated on our website.
Please visit www.alfalaval.comto access the information.
CC00066EN 0404