annual report 2002 - fujitec.com€¦ · annual report 2002 year ended march 31, 2002. contents ......
TRANSCRIPT

Annual Report 2002Year ended March 31, 2002
Annual Report 2002Year ended March 31, 2002

Contents
Consolidated Financial Highlights 1
To Our Shareholders 2
Review of Operations 5
Financial Section 15
Board of Directors 35
Stock Price Range and Trading Volumeon the Tokyo Stock Exchange 35
Global Network 36
Shareholders’ Information 37
Fujitec Co., Ltd. is a global manufacturer of people-moving systems, including
elevators, escalators and moving walkways. We also manufacture various
equipment for parking systems. Since its founding in 1948, Fujitec has been
contributing to the betterment of urban life by providing high-quality people-moving
systems. Fujitec’s position as a recognized market leader in today’s extensive global market
has been achieved through the research and development, marketing, manufacturing,
installation, and service maintenance of superior products.
The delivery of the highest quality products and service is assured by the unique five-
pole business structure of Fujitec Co., Ltd. Through its operational headquarters, located
in the Americas, Japan, South Asia, East Asia and Europe, the Company shares its ideas,
technologies and resources with people around the world, contributing to the economic
growth of the various countries in which Fujitec conducts business.

1
For the year
Net sales ............................................................. ¥ 95,657 ¥ 81,173 $ 719,226 +17.8%
Operating income................................................ 4,255 1,324 31,993 +221.4%
Net income ......................................................... 1,059 718 7,962 +47.5%
At year-end
Total assets ......................................................... ¥133,227 ¥121,317 $ 1,001,707 +9.8%
Shareholders’ equity .......................................... 56,884 53,730 427,699 +5.9%
Per share of common stock
Net income ......................................................... ¥ 11.30 ¥ 7.66 $ 0.08 +47.5%
Cash dividends ................................................... 8.00 10.50 0.06 -23.8%
Notes: 1. U.S. dollar amounts are translated from Japanese yen, for convenience only, at the rate of ¥133 to U.S.$ 1.2. Net income per share amounts are computed based on the weighted average number of shares outstanding during each year.
C O N S O L I D A T E D F I N A N C I A L H I G H L I G H T SFujitec Co., Ltd. and Consolidated SubsidiariesYears ended March 31, 2002 and 2001
Millions of Yen
Yen U.S. Dollars
Thousands of U.S. Dollars Percent change
2002 2001 2002 2002/2001
0
1
2
3
4
5
0
20
40
60
80
100
0
10
20
30
40
50
60
70
76.1
83.5
78.281.2
’98FY ’99 ’00 ’01 ’02
4.3 4.3
(0.3)
0.7
’98FY ’99 ’01 ’02
65.868.7
66.3
53.7
’98FY ’99 ’00 ’01 ’02
95.7
’00
1.1
56.9
Net sales(Billion ¥)
Net income (loss)(Billion ¥)
Shareholders’ equity(Billion ¥)

2
mid a challenging business environment, Fujitec has attained increases in both sales
and profits in fiscal 2002, bolstered by the steady backlog worldwide. Much of this
success was attributable to the aggressive pursuit of our Go for the Gold three-year
strategic plan, which was launched in fiscal 2002, in order to build an even stronger business
foundation in the 21st century.
Performance
During the fiscal year ended March 31,
2002, Fujitec Group was faced with
difficult market conditions. With the
exception of China, which has been
experiencing continuing rapid growth,
total demand turned downward, in line
with the slowdown in the world
economy. This, coupled with the
sluggish demand in Japan, further
intensified price competition, especially
in the domestic market.
To address these challenges, the Company tailored its business operations to the specific requirements
of each region, based on the “World Five-Pole Management Structure.” As a result, consolidated net sales
for the fiscal year rose 17.8 percent from the previous year, reaching a record high ¥95,657 million
(U.S.$719 million). In terms of profit, amid an accelerating downward price trend, we have focused on
improving profitability through selective receipt of orders and cost reduction efforts. Consequently,
operating income for the year soared 221.4 percent, to ¥4,255 million (U.S.$32 million), and net income
also climbed, by 47.5 percent, to ¥1,059 million (U.S.$8 million).
Honing Our Competitive Edge
During the fiscal year, the Company boosted its competitiveness in two fields in the global market:
production, and research and development.
T O O U R S H A R E H O L D E R S
A

In order to further expand our production capabilities in China, we constructed two additional plants.
The first was erected at Huasheng Fujitec Elevator Co., Ltd., a joint venture company located in Langfang
City, Hebei Province, near Beijing. The second was built at Shanghai Huasheng Fujitec Escalator Co.,
Ltd., a newly established joint venture company in Shanghai. Both plants have been operational since
March 2002. This expansion is a response to brisk market demand in China’s steadily growing economy,
and is designed to develop and enhance the production of global-standard products that can emerge
victorious in the ever more price-competitive international market.
In the field of research and development, we are very proud of the number of accomplishments we
made during the period. For example, we have been working aggressively to develop universal platform
technology. Also worth noting are the efforts of Fujitec America, Fujitec Singapore, Fujitec Japan and
the Research and Development Division of Fujitec World Headquarters in their joint development of an
innovative elevator drive system named TALONTM, the first of its kind in the world. We plan to
incorporate this exciting next-generation drive system into elevators we launch into the world market in
and after 2003.
Go for the Gold
With its Go for the Gold three-year strategic plan starting in fiscal 2002, Fujitec is taking on many
challenges. In meeting these challenges, the Company is expected to make significant strides towards
ushering in a wave of innovation and growth for the 21st century. In conjunction with the plan, the
Company is addressing four management issues:
■Prioritizing consolidated profits and cash flows
■Expanding market share and securing appropriate profits
■Promoting environmentally friendly product development
■Achieving unrivaled competitiveness in the areas of cost and lead-time, through supply-chain management
By steadily implementing the Go for the Gold strategic plan, we aim to achieve our long-term business
target of 10 percent ROE.
3

4
Committed to Excellence in Management
In the present harsh business environment, we at Fujitec are steadily pursuing the goals spelled out in the
Go for the Gold strategic plan, and striving to achieve excellence in management that meets the
expectations of our stakeholders.
We intend to differentiate ourselves from our competitors, thereby enhancing the presence of the
Fujitec brand. We intend to do this by: developing original products tailored to specifically meet the
requirements of each region; improving cost competitiveness by optimizing procurement and production
locations within the Global Fujitec Network; and building an unrivaled and constantly improving
organization to address customer needs and services.
In manufacturing, the Shiga plant, which began operations in April 2000, is successfully producing
cost-competitive, strategic models. In addition, the new plants in China are expected to enhance Fujitec’s
production capabilities and support operations in the region, as well as in the global market. Furthermore,
we aim to optimize production structure on a global scale, in order to maximize the production
capabilities of each plant.
I would like to take this opportunity to express my appreciation to all our stakeholders for your
continued support and understanding.
June 26, 2002
Takakazu UchiyamaPresident and Chief Executive Officer

Review of Operations
5
Review of Operations
Amid a challenging business environment, we at
Fujitec Group focused on profitability improvements
worldwide. We also made a significant progress both in
enhancing the global production capabilities and in
achieving technological breakthroughs.
Amid a challenging business environment, we at
Fujitec Group focused on profitability improvements
worldwide. We also made a significant progress both in
enhancing the global production capabilities and in
achieving technological breakthroughs.

6 Academy Awards ceremony held in Kodak TheatrePhoto courtesy of Reuters, Kyodo News Service
Hollywood & Highland
Kodak Theatre

7
Sales in the Americas (Billion ¥)
0
5
10
15
20
25
11.4
14.5 14.3
22.6
’99FY ’00 ’01 ’02
otal demand in North America, which had been favorable for some time,
began trending downward in the middle of the fiscal year under review and
remained slow through the end of the year. In South America, demand was
sluggish as a whole. Despite such challenging conditions, sales in the
Americas increased substantially — 57.4 percent from the previous year — to
¥22,569 million (U.S.$170 million). This growth was due to strong backlog orders in
the United States, as well as to the effect of acquiring Serge Elevator Company of
New York. Sales in the Americas accounted for 23.6 percent of net sales.
Profitability in the Americas substantially improved, reflecting steady operating
income growth in the United States — a major market in the region.
As we face a decline in construction demand in North America, business
conditions are expected to be more challenging for fiscal 2003. In response to this
situation, we are striving to establish a foundation capable of withstanding business
fluctuations. We will achieve this by increasing orders a varied product mix. To
enhance our profitability, we will take full advantage of Serge Elevator Company’s
competitive edge. We are confident that this resource will strengthen all our
operations in the high-rise apartment building market, public works projects and the
modernization/product enhancement businesses.
Major projects in this region during fiscal 2002 are as follows.
In March, 2002, we delivered a total of 51 elevators and escalators to Hollywood
& Highland, an entertainment complex in Hollywood, where the Academy Awards
were held.
Fujitec elevators and escalators have
also been supplied to or are being installed
in new football stadiums across the United
States. These projects include the homes of
the NFL’s Cincinnati Bengals, Philadelphia
Eagles and Seattle Seahawks.
In Canada, we supplied a total of 23 high-
speed elevators and escalators to the 35-story head office building of the major energy
company Trans-Canada Pipeline.
A total of 20 Fujitec elevators and escalators will service the 32-story head
office building of Bank of Galicia in Buenos Aires, Argentina, and nine elevators
and 11 escalators will serve the newly renovated Maiquetia International Airport in
Caracas, Venezuela.
T H E A M E R I C A S
T
Paul Brown Stadium, the home of the NFL’sCincinnati Bengals
Fujitec elevators operating atthe head office building ofTrans-Canada Pipeline
Fujitec elevators are installed at ParkHyatt Mendoza Hotel in Argentina

8
Sales in Japan (Billion ¥)
0
25
50
40.939.0
44.2 44.7
’99FY ’00 ’01 ’02
ue to a prolonged decline in total demand resulting from the economic
slowdown, the Company faced challenges, which further intensified
price competition.
Sales in Japan rose 1.3 percent from the previous year, to ¥44,744
million (U.S.$336 million), representing 46.8 percent of net sales. Meanwhile,
operating income climbed 40.1 percent, to ¥1,059 million (U.S.$8 million). These
achievements were attributable to enhanced production efficiency through TPM (Total
Production Management), and to reducing fixed costs.
For fiscal 2003, we expect that market competition will further intensify as real
estate investment in both the public and private sectors will remain stagnant. In
spite of this severe environment, we will strive to improve earnings by furthering
our cost-cutting efforts. Likewise, we will also carefully focus on profitability in
receiving new orders.
During fiscal 2002, in Osaka, we delivered elevators to
the Hotel Nikko Bayside Osaka, adjacent to the Universal
Studios Japan, and 19 elevators and escalators to the major
cultural facility Minatomachi River Place. In Kobe, 12 of
our elevators are in service at the Hyogo Prefectural
Museum of Art, the largest facility of its kind in western
Japan. In the Tokyo Metropolitan area, we supplied 20
elevators and escalators to Tokyo Rinkai Hospital in
Edogawa-ku, a general hospital that provides state-of-the-
art medical services; 21 elevators and escalators to the
Celestine Shiba Mitsui Building; and 43 elevators and
escalators to the Ito-Yokado Yamato Tsuruma Store, one
of the largest shopping malls in Kanagawa.
Notable new orders we received during the fiscal year include 17 elevators and
escalators to be installed at Shinagawa Seaside Forest, a redevelopment project
underway in the East Shinagawa area, and nine elevators for
the Hama Rikyu Kashima Building in Minato-ku, Tokyo; 23
elevators and escalators for Olympic Niza Store, a major
commercial facility in Saitama; eight elevators for the new
building at Kanazawa Medical University Hospital in
Ishikawa; and 15 elevators and escalators for HERBIS II, a
large redevelopment project located west of Osaka Station.
J A PA N
D
Fujitec elevators working at RoppongiHills Gate Tower in Tokyo
Hyogo PrefecturalMuseum of Art
Hotel Nikko Bayside Osaka

9
Sales in South Asia(Billion ¥)
0
5
10
15
12.6
9.8
7.38.1
’99FY ’00 ’01 ’02
espite a market slump in the region, South Asia also attained an
increase in sales, a notable 10.0 percent gain from the previous year,
to ¥8,087 million (U.S.$61 million). This figure accounted for 8.5
percent of net sales. Operating income declined 12.7 percent, to
¥1,224 million (U.S.$9 million), due to intensified price competition.
In Singapore, construction demand showed a sharp decline, especially in the
private sector, as the country slid into a severe recession. Fortunately, an
increasing number of government-led public construction projects are underway
in order to stimulate economic growth. Accordingly, we are focusing on
winning orders on public sector projects such
as HDB (Housing and Development Board)
renovation, and are maintaining our selective
stance on private sector projects.
Noteworthy projects completed during
fiscal 2002 include the delivery of 64 elevators
and escalators, featuring the top-of-the line
neural network computer-assisted group
supervisory control system, to the HDB HUB
building and commercial complex, and 26
elevators to the Great Eastern Life Center, both in Singapore.
Major orders we received during the fiscal year include 48
elevators and escalators to be installed at government facilities in
Putrajaya, Malaysia.
S O U T H A S I A
D
The Great Eastern Life Centerin Singapore
Fujitec escalators working at theFirst World Hotel in Malaysia
The HDB HUB buildingin Singapore

10
Sales in East Asia (Billion ¥)
0
10
20
17.8
13.4 12.9
16.4
’99FY ’00 ’01 ’02
upported by steady sales growth in mainland China and Hong Kong, sales
in East Asia climbed 27.2 percent, to ¥16,436 million (U.S.$124 million),
comprising 17.2 percent of net sales. Operating income significantly
increased, by 133.1 percent, to ¥3,007 million (U.S.$23 million). This
notable increase was attributable to our cost-cutting efforts, made by optimizing
Fujitec’s procurement and production network, and by maximizing sales on
profitable models.
In Hong Kong, a plunge in the demand for
office buildings resulted in severe price
competition, which led to a low order volume.
By contrast, the number of orders increased
steadily in Taiwan, led by our success in
expanding major customer accounts.
In China, housing construction is robust,
reflecting the country’s brisk economy. However, amid severe price competition in the
market, we are focusing our sales promotion on profitable standard products.
During the fiscal year under review, we delivered 31 elevators
to Leighton Hill, an eight-tower luxury housing complex in Hong
Kong; 13 elevators and escalators, including panoramic models,
to the Korea Design Center in Sungnam, South Korea; 41
elevators and escalators to the Shin Kong Mitsukoshi Department
Store Taipei Hsin Yi Annex; 34 elevators and escalators to Breeze
Center, a large shopping mall, in Taipei, Taiwan; and a large
number of elevators to residential buildings and other sites throughout China.
Notable new orders received in China include 61 elevators for Bo Lin Ai Yue, a
high-rise apartment complex in Beijing; 58
elevators and escalators for Sunny Region, a large-
scale luxury building complex, 27 elevators for Tian
Yi Square, a prominent commercial establishment
in Ningbo, Zhejiang; and a substantial number of
elevators for large apartment buildings in Tianjin
and Shanghai. In South Korea, we have received
orders for 25 escalators for Seoul Subway Line 5.
E A S T A S I A
S
Shin Kong Mitsukoshi Department StoreTaipei Hsin Yi Annex
Fujitec escalators in service at theKorea Design Center in South Korea
Fujitec moving walkways operating atRegal Airport Hotel in Hong Kong

11
Sales in Europe (Billion ¥)
0
1
2
3
4
0.8
1.4
2.4
3.8
’99FY ’00 ’01 ’02
erformance in Europe during the
year substantially improved from the
previous year. Sales in Europe
continued to increase significantly,
by 58.6 percent, to ¥3,821 million (U.S.$29
million), due mainly to new installation
business growth. In particular, sales for our
space-saving machine room-less elevator
FUSIONDRIVETM contributed to this sizeable
sales rise. To further improve profitability in
the region, we are contiously making efforts to
streamline our operations in Germany and the United Kingdom. Sales in Europe
accounted for 4.0 percent of net sales.
Notable projects completed during fiscal 2002 include: the delivery of 34 elevators
and moving walkways to nine office buildings of the Bundestag (Federal goverment)
in Germany, which are connected to the
Reichstag (Parliament Building) by our
moving walkways on the basement
floor; and 46 elevators and escalators to
the headquarters building of HSBC
(Hong Kong Shanghai Bank Group) in
Canary Wharf, the United Kingdom.
New orders received during the fiscal
year include 30 elevators to be installed at
three stations on the new line extending
from London to the Channel Tunnel.
E U R O P E
P
Fujitec panoramic elevators installed atthe office building of the Bundestag (right)in Germany
The headquarters building of HSBC inthe United Kingdom
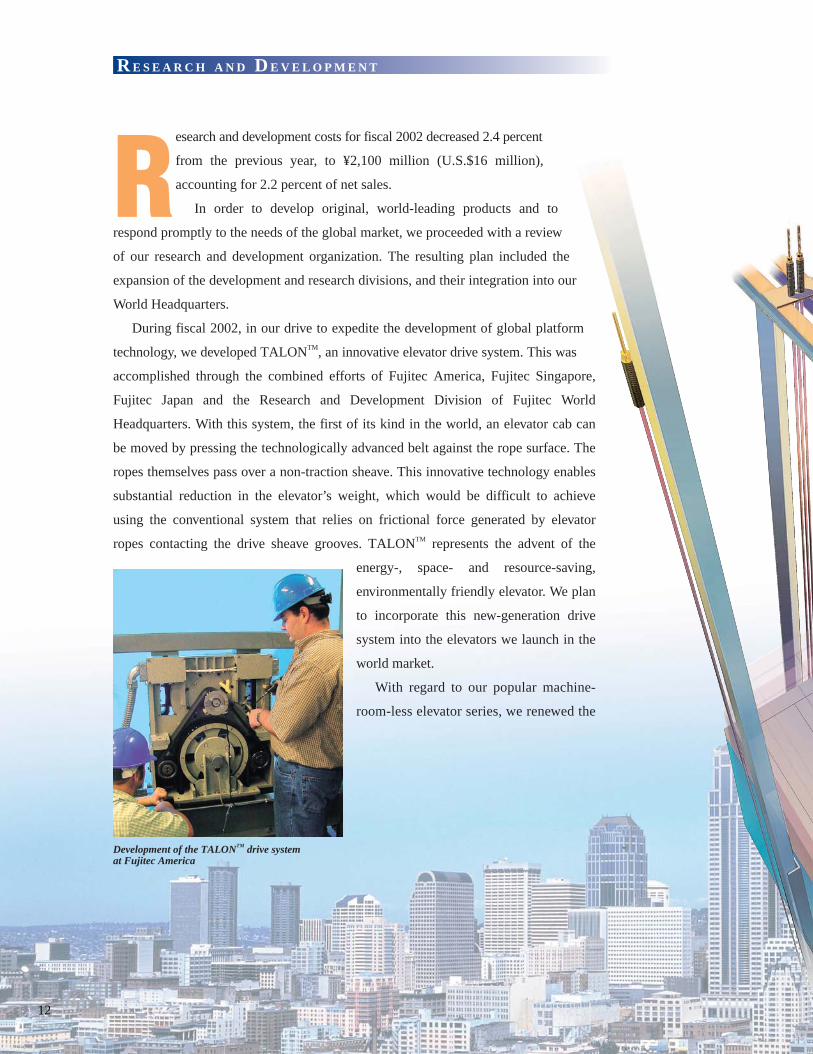
esearch and development costs for fiscal 2002 decreased 2.4 percent
from the previous year, to ¥2,100 million (U.S.$16 million),
accounting for 2.2 percent of net sales.
In order to develop original, world-leading products and to
respond promptly to the needs of the global market, we proceeded with a review
of our research and development organization. The resulting plan included the
expansion of the development and research divisions, and their integration into our
World Headquarters.
During fiscal 2002, in our drive to expedite the development of global platform
technology, we developed TALONTM, an innovative elevator drive system. This was
accomplished through the combined efforts of Fujitec America, Fujitec Singapore,
Fujitec Japan and the Research and Development Division of Fujitec World
Headquarters. With this system, the first of its kind in the world, an elevator cab can
be moved by pressing the technologically advanced belt against the rope surface. The
ropes themselves pass over a non-traction sheave. This innovative technology enables
substantial reduction in the elevator’s weight, which would be difficult to achieve
using the conventional system that relies on frictional force generated by elevator
ropes contacting the drive sheave grooves. TALONTM represents the advent of the
energy-, space- and resource-saving,
environmentally friendly elevator. We plan
to incorporate this new-generation drive
system into the elevators we launch in the
world market.
With regard to our popular machine-
room-less elevator series, we renewed the
R E S E A R C H A N D D E V E L O P M E N T
R
12
Development of the TALONTM drive systemat Fujitec America

13
R&D costs(Billion ¥)
0
1
2
3
1.9
2.2
’99FY ’00 ’01 ’02
2.2 2.1
mechanism, design and functions of the conventional models, and
launched the ECEEDTM-e2 in Japan, ECEEDiiTM in South
Asia and FUSIONDRIVETM in other regions.
Equipped with an ultra-thin, gearless hoist machine
— its thickness is less than one fifth that of its
predecessor — the ECEEDTM-e2 not only achieves
space saving and weight reduction but also reduces
installation cost. Furthermore, it adopts a universal
design to improve operability for the visually impaired,
and can be equipped with a device that reduces power
consumption. Thus, it is an elevator friendly both to
people and the environment.
For the North American market, we launched an elevator
incorporating a space-saving machine room.
In terms of escalators, while cost reduction remained our
top priority, we also marketed a high quality, global
standard escalator with a renewed design and mechanism, as
well as a space-saving model that can be installed in existing
railway station buildings and platforms where space is limited.
In the field of mechanized parking systems for automobiles,
we developed GEOTECHNOS PARKTM-S, which can
accommodate 20 to 40 automobiles through effective use of
underground space, while requiring only one-third the installed
capacity of a conventional type car park. The product is expected to
find increasing demand in the market.
Image sketch of the TALONTM drive system

14
Capital investment (Billion ¥)
0
1
2
3
4
3.4
3.9
2.5
2.2
’99FY ’00 ’01 ’02
apital investment for fiscal 2002 decreased 11.3 percent from the
previous year, to ¥2,239 million (U.S.$17 million), representing 2.3
percent of net sales.
The urban infrastructure of China is being dramatically upgraded in
conjunction with the country’s membership in the WTO, and the Beijing Olympic
Games, scheduled for 2008. In light of the anticipated demand increase, we have
strengthened our production base in China, in order to expand our market share in the
country, while enhancing our capacity to produce and supply price-competitive
products to the world market.
In December 2001, we established
Shanghai Huasheng Fujitec Escalator Co.,
Ltd. in Shanghai. Serving as the Fujitec
Group’s “escalator plant for the world,” the
facility has been in full operation since
March, 2002.
The Shanghai plant — Fujitec’s 12th
production base — has a site area of about
40,000 square meters and a total floor area of
about 25,000 square meters. We set the first-stage annual production target for
escalators and moving walkway at this plant at 1,000 units, with plans to double
production to 2,000 units in the second stage, beginning in 2005.
At Huasheng Fujitec Elevator Co., Ltd., located in Langfang City, Hebei Province,
a second plant was completed, adjacent to the head office plant, and has been in
operation since March.
With the completion of this new plant, the total site area has been expanded from
20,000 to 80,000 square meters, and the floor area of the plant building from 10,000
to 35,000 square meters.
Thus, Huasheng Fujitec becomes a leading presence — the most advanced
elevator manufacturing company in China — with an annual production capacity of
3,000 units. Together, the second Huasheng
Fujitec plant and the new Shanghai
Huasheng Fujitec facility are expected to
contribute to the expansion of our business
in the global market.
M A N U FA C T U R I N G
C
An escalator production line atShanghai Huasheng Fujitec
Shanghai Huasheng Fujitec Escalator Co., Ltd.
Huasheng Fujitec Elevator Co., Ltd.

15
Contents
Consolidated Financial Review 16
Consolidated Balance Sheets 18
Consolidated Statements of Incomeand Retained Earnings 20
Consolidated Statements of Cash Flows 21
Notes to Consolidated Financial Statements 22
Report of Independent CertifiedPublic Accountans 33
Financial Section

16
Operating ResultsDemand for elevators, escalators and other people-moving systems grew throughout the first half of the fiscal year,but suffered during the second half, ended March 31, 2002. This decrease in demand was due to the accelerateddeterioration of the business environment worldwide in the second half of the fiscal year, sparked by the terroristattacks in the United States. In China, demand remained robust, while demand in the rest of Asia and Europe wasslow. In Japan, cutbacks in public investments as well as a decline in private sector capital investments had achilling effect throughout the construction sector, further intensifying price competition in our industry.
Despite these harsh business conditions, net sales for fiscal 2002 rose 17.8 percent, from ¥81,173 million infiscal 2001, to ¥95,657 million (U.S.$719 million). While sales in Japan increased by only 1.3 percent, sales in theAmericas grew 57.4 percent. This increase was led by significant sales growth in North America, arising from alarge backlog at the previous year-end, in addition to acquisitions of local companies. In East Asia, sales climbed27.2 percent, reflecting sales expansion in China. Sales in South Asia and Europe also rose. As a result, thepercentage of overseas sales to net sales increased from 47.0 to 54.7 percent.
Operating income soared 221.4 percent from the previous year, to ¥4,255 million (U.S.$32 million), due mainly toprofitability improvements in various regions, including a cost cut in Japan, a significant reduction of operating losses in theAmericas, increased sales in China, greater selectivity in accepting orders in Hong Kong, and reduced deficits in Europe.The ratio of operating income to net sales improved from 1.6 percent in the previous year to 4.4 percent in fiscal 2002.
Net income for fiscal 2002 increased 47.5 percent, to ¥1,059 million (U.S.$8 million). This came about in spiteof a write-down of investment securities amounting to ¥2,320 million (U.S.$17 million) held by Fujitec Co., Ltd.,resulting from the stock price plunge in Japan. Net income per share of common stock stood at ¥11.30(U.S.$0.08).
Financial PositionTotal assets at the end of fiscal 2002 increased by ¥11,910 million (U.S.$90 million) from the previous year, to¥133,227 million (U.S.$1,002 million). This was mainly attributable to increases in time deposits, trade notes andaccounts receivable resulting from sales growth, and acquisitions of businesses, coupled with the depreciation of theyen against major foreign currencies during the period.
Cash and cash equivalents decreased by ¥3,056 million (U.S.$23 million), to ¥19,366 million (U.S.$146million), as some were shifted to time deposits held more than three months. Due to this shift, time deposits rose by¥5,883 million (U.S.$44 million), to ¥9,596 million (U.S.$72 million). Trade notes and accounts receivable climbedby ¥5,136 million (U.S.$39 million), to ¥27,413 million (U.S.$206 million), due to expanded sales. Total current
C O N S O L I D A T E D F I N A N C I A L R E V I E W
0
20
40
60
80
100
FY’98 ’99 ’00 ’01 ’02 FY’98 ’99 ’00 ’01 ’02 FY’98 ’99 ’00 ’01 ’02 FY’98 ’99 ’00 ’01 ’02
Domestic salesOverseas sales
0
2
4
6
8
10
Operating incomeNet income
0
50
100
150
Total assetsShareholders’ equity
1
2
3
4
Capital investmentDepreciation and amortization
Domestic sales and overseas sales
Operating income and net income (loss)
Total assets and shareholders’ equity
Capital investment, anddepreciation and amortization
Billion ¥ Billion ¥ Billion ¥ Billion ¥
0
95.7
76.1
83.5
78.281.2
8.48.0
5.4
1.31.1
133.2
123.0117.2
121.7 121.3
65.8 68.7 66.3
53.756.9
2.2
2.6
3.4
3.9
2.5
1.8
1.3
1.6 1.61.74.34.3 4.3
(0.3)
0.7
38.2
43.0
40.0
38.2
45.1
38.443.9 43.4
32.2
52.3

17
assets increased by ¥9,319 million (U.S.$70 million) from the previous year, to ¥97,697 million (U.S.$735 million).Investment and advances fell by ¥1,444 million (U.S.$11 million), primarily due to the write-down of investmentsecurities. Among other assets, intangible assets rose by ¥3,098 million (U.S.$23 million), a gain principallyattributable to acquisitions of businesses.
On the liabilities side, total liabilities climbed by ¥4,684 million (U.S.$35 million) from the previous year, to¥49,988 million (U.S.$376 million). Total current liabilities increased by ¥4,813 million (U.S.$36 million). Thisrise was brought about by ¥3,650 million (U.S.$27 million) in increases of mainly short-term debt held by FujitecCo., Ltd. and its subsidiary in the United States, and a gain of ¥1,161 million (U.S.$9 million) in trade notes andaccounts payable. Total fixed liabilities dropped by ¥129 million (U.S.$1 million) from the previous year.
Shareholders’ equity grew from the previous year by ¥3,154 million (U.S.$24 million), to ¥56,884 million(U.S.$428 million), resulting mainly from an increase in net income, combined with a reduction of ¥2,713 million(U.S.$20 million) for adjustment arising from translation of foreign subsidiaries' accounts, due to the depreciation ofthe yen. The equity ratio declined by 1.6 percentage points from the previous year, to 42.7 percent, reflectingincreased liabilities and minority interest. Based on the number of shares outstanding, shareholders’ equity pershare of common stock climbed by ¥33.74 (U.S.$0.25), to ¥606.95 (U.S.$4.56).
Cash FlowsCash and cash equivalents at end of year fell by ¥3,056 million (U.S.$23 million), to ¥19,366 million (U.S.$146million), despite the ¥1,314 million (U.S.$10 million) generated by the positive effect of exchange rate changes oncash and cash equivalents.
Net cash provided by operating activities increased by ¥9,198 million (U.S.$69 million), to ¥3,605 million(U.S.$27 million), mainly due to a decrease in inventories resulting from sales growth, and the write-down ofinvestment securities due to the stock price plunge in Japan.
Net cash used in investing activities amounted to ¥9,077 million (U.S.$68 million) in fiscal 2002, up from¥1,253 million in fiscal 2001. This was primarily attributable to a net increase of ¥5,348 million (U.S.$40 million) intime deposits held more than three months, and expenditures of ¥2,725 million (U.S.$20 million) for acquisitions ofbusinesses in North America. Acquisitions of property, plants and equipment, including the cost for the expansion ofthe elevator plant in China, totaled ¥2,239 million (U.S.$17 million).
Net cash provided by financing activities decreased from ¥6,919 million in fiscal 2001, to ¥1,102 million(U.S.$8 million) in fiscal 2002. The major reason for this decrease was a decline of ¥5,102 million (U.S.$38 million)in proceeds from long-term debt.
FY’98 ’01’00’99 ’02
Operating income to net sales
%
FY’98 ’01’00’99 ’02
Shareholders’ equity to total assets
%
FY’98 ’01’00’99 ’02
Current ratio
%
FY’98 ’01’00’99 ’02
Net sales to total assets
Time
0
150
300
450
600
750
FY’98 ’99 ’00 ’01 ’02
Shareholders’ equityper share
¥
0
4
8
12
0
20
40
60
0
100
200
300
400
0.0
0.2
0.4
0.6
0.8
607.0
702.3733.1
706.8
573.2
4.4
11.0
9.6
6.9
1.6
42.7
53.5
58.7
54.5
44.3
253
279
311
262 261
0.6
0.7 0.7
0.7
0.8

Current assets:
Cash and cash equivalents ............................................................. ¥ 19,366 ¥ 22,422 $ 145,609
Time deposits ................................................................................ 9,596 3,713 72,150
Marketable securities (Note 4) ....................................................... 21,865 19,230 164,398
Trade notes and accounts receivable:
Unconsolidated subsidiaries and affiliates .................................. 123 201 925
Other ........................................................................................... 27,556 22,223 207,188
Allowance for doubtful accounts ................................................ (266) (147) (2,000)
27,413 22,277 206,113
Inventories (Note 5) ....................................................................... 17,813 18,827 133,932
Deferred income taxes (Note 6) ..................................................... 888 689 6,677
Other current assets ........................................................................ 756 1,220 5,685
Total current assets ............................................................. 97,697 88,378 734,564
Investments and advances:
Unconsolidated subsidiaries and affiliates ..................................... 1,706 1,321 12,827
Investment securities (Note 4) ....................................................... 4,354 6,189 32,737
Advances ....................................................................................... 56 50 421
6,116 7,560 45,985
Property, plant and equipment, at cost (Note 7):
Buildings ........................................................................................ 14,670 13,990 110,301
Machinery and equipment ............................................................. 17,240 16,191 129,624
31,910 30,181 239,925
Accumulated depreciation ............................................................. (18,644) (17,317) (140,181)
13,266 12,864 99,744
Land ............................................................................................... 5,773 5,735 43,406
Construction in progress ................................................................ 879 60 6,609
19,918 18,659 149,759
Other assets:
Deferred income taxes (Note 6) ..................................................... 2,350 2,507 17,669
Intangible assets ............................................................................. 4,688 1,590 35,248
Other............................................................................................... 2,458 2,623 18,482
¥133,227 ¥121,317 $1,001,707
The accompanying notes are an integral part of these statements.
C O N S O L I D A T E D B A L A N C E S H E E T SFujitec Co., Ltd. and Consolidated SubsidiariesMarch 31, 2002 and 2001
Millions of Yen
Thousands of U.S. Dollars
(Note 1)
2002 2001 2002ASSETS
18

19
Current liabilities:
Short-term debt (Note 7) ................................................................ ¥ 11,201 ¥ 7,551 $ 84,218
Current portion of long-term debt (Note 7).................................... 67 70 504
Trade notes and accounts payable:
Unconsolidated subsidiaries and affiliates .................................. 22 49 166
Other............................................................................................ 10,735 9,547 80,714
Advances from customers .............................................................. 7,286 6,931 54,782
Accrued income taxes (Note 6)...................................................... 263 483 1,977
Accrued bonuses ............................................................................ 1,745 1,850 13,120
Provision for losses on contracts.................................................... 2,377 2,629 17,872
Other current liabilities .................................................................. 4,974 4,747 37,399
Total current liabilities........................................................ 38,670 33,857 290,752
Long-term debt (Note 7) .................................................................... 5,165 5,228 38,835
Deferred income taxes (Note 6)......................................................... 91 107 684
Accrued pension and severance payments (Note 12) ...................... 6,062 6,112 45,579
Total liabilities .................................................................... 49,988 45,304 375,850
Minority interest in consolidated subsidiaries (Note 8) .................. 26,355 22,283 198,158
Contingent liabilities (Note 9)
Shareholders’ equity (Note 11):
Common stock, no par value;
Authorized 200,000,000 shares;
Issued and outstanding:
93,767,317 shares at March 31, 2002 and 2001.......................... 12,534 12,534 94,241
Additional paid-in capital .............................................................. 14,566 14,566 109,519
Retained earnings ........................................................................... 38,948 38,792 292,842
Net unrealized losses on securities................................................. (198) (490) (1,489)
Adjustment arising from translation of foreign subsidiaries’ accounts ...................................................... (8,926) (11,639) (67,113)
56,924 53,763 428,000
Treasury stock, at cost, 47,024 shares at March 31, 2002 and
31,705 shares at March 31, 2001 ................................................. (40) (33) (301)
Total shareholders’ equity .................................................. 56,884 53,730 427,699
¥133,227 ¥121,317 $1,001,707
Millions of Yen
Thousands of U.S. Dollars
(Note 1)
2002 2001 2002LIABILITIES AND SHAREHOLDERS’ EQUITY

Net sales .............................................................................................. ¥95,657 ¥81,173 $719,226
Cost and expenses:Cost of sales ................................................................................... 75,708 65,213 569,233Selling, general and administrative ................................................ 15,694 14,636 118,000
91,402 79,849 687,233Operating income ....................................................................... 4,255 1,324 31,993
Other income (expenses):Interest and dividend income ......................................................... 1,543 2,180 11,601Interest expense .............................................................................. (924) (941) (6,947)Foreign currency exchange gain ................................................... 273 342 2,053Other, net ....................................................................................... (86) (145) (647)
806 1,436 6,060Special items:
Gains on sales of property, plant and equipment .......................... 30 1 226Loss on disposal and sales of property, plant and equipment ........ (66) (45) (496)Write-down of investment securities ............................................. (2,320) (207) (17,444)Write-down of investment securities in unconsolidated subsidiaries ....... (180) — (1,353)Loss on sales of investment securities ........................................... (35) — (263)Other, net ....................................................................................... (17) (49) (129)
(2,588) (300) (19,459)Income before income taxes and minority interest ..................... 2,473 2,460 18,594
Income taxes (Note 6):Current ........................................................................................... 884 1,330 6,647Deferred ......................................................................................... (237) (212) (1,782)
647 1,118 4,865Income before minority interest .................................................. 1,826 1,342 13,729
Minority interest in income of consolidated subsidiaries ............... 767 624 5,767Net income ................................................................................. 1,059 718 7,962
Retained earnings:Balance at beginning of year.......................................................... 38,792 39,185 291,669Cash dividends ............................................................................... (843) (1,031) (6,338)Bonuses to directors and corporate auditors .................................. (60) (80) (451)Balance at end of year .................................................................... ¥38,948 ¥38,792 $292,842
Per share:Net income, based on the weighted average number of shares outstanding....................................................... ¥ 11.30 ¥ 7.66 $ 0.08
Cash dividends, applicable to the period........................................ 8.00 10.50 0.06
The accompanying notes are an integral part of these statements.
C O N S O L I D A T E D S T A T E M E N T S O F I N C O M E A N D R E T A I N E D E A R N I N G SFujitec Co., Ltd. and Consolidated SubsidiariesYears ended March 31, 2002 and 2001
Millions of Yen
Thousands of U.S. Dollars
(Note 1)
YenU.S. Dollars
(Note 1)
2002 2001 2002
20

Cash f lows from operating activities:Income before income taxes and minority interest ....................... ¥ 2,473 ¥ 2,460 $ 18,594Depreciation and amortization ....................................................... 1,839 1,733 13,827Provision for allowance for doubtful accounts .............................. 323 183 2,429Provision for bonuses to employees............................................... (132) (197) (992)Provision for losses on contracts.................................................... (422) 992 (3,173)Interest and dividend income ......................................................... (1,543) (2,180) (11,601)Interest expense .............................................................................. 924 941 6,947Write-down of investment securities ............................................. 2,320 207 17,444Write-down of investment in unconsolidated subsidiaries ............ 180 — 1,353Increase in trade notes and accounts receivable............................. (3,832) (4,822) (28,812)Decrease (increase) in inventories.................................................. 1,805 (3,986) 13,571Increase in trade notes and accounts payable................................. 707 704 5,316Other, net ....................................................................................... 105 840 789Bonuses paid to directors and corporate auditors........................... (60) (80) (452)
Sub-total ...................................................................................... 4,687 (3,205) 35,240
Payment of income taxes ............................................................... (1,082) (2,388) (8,135)Net cash provided by (used in) operating activities............ 3,605 (5,593) 27,105
Cash f lows from investing activities:Increase in time deposits, net ......................................................... (5,348) (472) (40,210)Payment for purchase of marketable securities.............................. (100) (109) (752)Proceeds from sales of marketable securities ................................ 100 127 752Acquisitions of property, plant and equipment .............................. (2,239) (2,525) (16,834)Proceeds from sale of property, plant and equipment ................... 89 4 669Payment for purchase of investment securities .............................. (7) (218) (53)Investment in unconsolidated subsidiary ....................................... (759) — (5,707)Acquisitions of businesses, net of cash acquired ........................... (2,725) — (20,489)Payment for long-term advances.................................................... (24) (175) (180)Collections on long-term advances ................................................ 205 — 1,541Proceeds from interest and dividend income ................................ 1,610 2,103 12,105Other, net ....................................................................................... 121 12 910
Net cash used in investing activities ................................... (9,077) (1,253) (68,248)
Cash f lows from financing activities:Net proceeds from short-term debt ................................................ 3,068 4,062 23,068Proceeds from long-term debt ....................................................... 6 5,108 45Repayment of long-term debt ........................................................ (67) (10) (504)Proceeds from minority shareholders’ payments .......................... 184 — 1,383Payment of interest ........................................................................ (961) (949) (7,226)Cash dividend paid ......................................................................... (843) (1,031) (6,338)Cash dividend paid to minority shareholders................................. (263) (236) (1,977)Other, net ....................................................................................... (22) (25) (165)
Net cash provided by financing activities .......................... 1,102 6,919 8,286
Effect of exchange rate changes on cash and cash equivalents ........ 1,314 2,136 9,880Net (decrease) increase in cash and cash equivalents ..................... (3,056) 2,209 (22,977)
Cash and cash equivalents at beginning of year ............................. 22,422 20,213 168,586Cash and cash equivalents at end of year ........................................ ¥19,366 ¥22,422 $145,609
The accompanying notes are an integral part of these statements.
C O N S O L I D A T E D S T A T E M E N T S O F C A S H F L O W SFujitec Co., Ltd. and Consolidated SubsidiariesYears ended March 31, 2002 and 2001
Millions of Yen
Thousands of U.S. Dollars
(Note 1)
2002 2001 2002
21

22
1. Basis of Presenting Consolidated Financial Statements
The accompanying consolidated financial statements of Fujitec Co., Ltd. (the “Company”) and its consolidated
subsidiaries have been prepared from the consolidated financial statements filed with the Director of the Kanto
Local Finance Bureau, as required by the Securities and Exchange Law of Japan, in conformity with accounting
principles and practices generally accepted in Japan.
For the purpose of this Annual Report, certain reclassifications have been made to the consolidated financial
statements issued domestically, in order to present these statements in a form which is more familiar to readers of
these statements outside Japan. However, such reclassifications have no effect on net income or retained earnings.
The United States dollar amounts included in the consolidated financial statements and notes thereto
represent the arithmetical results of translating Japanese yen into United States dollars on a basis of ¥133 = U.S.
$1, the approximate effective rate of exchange at March 31, 2002. The inclusion of such United States dollar
amounts is solely for convenience and is not intended to imply that Japanese yen, and assets and liabilities
originating in Japanese yen, have been or could be readily converted, realized or settled in United States dollars
at ¥133 = U.S. $1 or at any other rate.
2. Summary of Significant Accounting Policies
(A) Principles of consolidation The consolidated financial statements include the accounts of the Company and the following thirteen significant
subsidiaries (together the “Companies”).
Fujitec America, Inc. (U.S.A.)
Fujitec Capital Corporation (U.S.A.)
Fujitec Canada, Inc. (Canada)
Fujitec Brasil Ltda. (Brazil)
Fujitec (HK) Co., Ltd. (Hong Kong)
Rich Mark Engineering Limited (Hong Kong)
Huasheng Fujitec Elevator Co., Ltd. (China)
Fujitec Singapore Corpn. Ltd. (Singapore)
P.T. Fujitec Indonesia (Indonesia)
Fujitec Taiwan Co., Ltd. (Taiwan)
Fujitec Korea Co., Ltd. (Korea)
Fujitec UK Ltd. (United Kingdom)
Fujitec Deutschland GmbH (Germany)
With respect to the closing dates of the consolidated subsidiaries, the closing date of two foreign subsidiaries,
Fujitec (HK) Co., Ltd. and Rich Mark Engineering Limited is the same as the consolidated balance sheet date
(March 31), while the closing date of the other eleven foreign subsidiaries is December 31.
In preparing the consolidated financial statements, using consolidated subsidiaries’ accounts, based on their
own closing dates, the necessary adjustments were made for the intercompany transactions incurred from the
consolidated subsidiaries’ closing date to the consolidated balance sheet date.
All significant intercompany transactions and accounts have been eliminated. Investments in unconsolidated
subsidiaries (more than 50% owned) and affiliates (20% to 50% owned) are carried at cost due to their
immateriality as a whole. If a decline in value below the cost of an individual security is judged to be material,
and other than temporary, the carrying value of the individual security is written down.
N O T E S T O C O N S O L I D A T E D F I N A N C I A L S T A T E M E N T SFujitec Co., Ltd. and Consolidated SubsidiariesYears ended March 31, 2002 and 2001

23
(B) Translation of foreign currency transactionsPrior to April 1, 2000, the accounts of the Company denominated in foreign currencies were translated into
Japanese yen at historical rates of exchange in effect at the transaction dates.
Effective April 1, 2000, the Company adopted the revised Accounting Standards for Foreign Currency Transactions
issued by the Business Accounting Deliberation Council. Under the new method, every monetary asset and liability
denominated in foreign currency is translated into yen at the rate of exchange in effect at the balance sheet date.
(C) Translation of foreign currency financial statementsThe accounts of foreign consolidated subsidiaries are translated into Japanese yen in accordance with the
statements issued by the Business Accounting Deliberation Council. As specified by the statements, assets and
liabilities of foreign consolidated subsidiaries are translated into Japanese yen at the exchange rates in effect at
the balance sheet dates, and the items of shareholders’ equity are translated at the historical rates at the dates of
acquisition. Profit and loss accounts are translated into Japanese yen at the annual average rates.
Any resulting translation differences are stated as “Adjustment arising from translation of foreign
subsidiaries’ accounts” in the accompanying consolidated financial statements.
From the fiscal year ended March 31, 2001, “Adjustment arising from translation of foreign subsidiaries’
accounts,” which had been previously classified as an asset in the consolidated balance sheets, has been reclassified
to be included within “Shareholders’ equity” and reflected in “Minority interest in consolidated subsidiaries” in the
consolidated balance sheets, according to the revised Accounting Standards for Foreign Currency Transactions.
(D) Revenue recognitionGenerally, the majority of the contracts are on a short-term basis and the Companies record profits or losses on
the completed contract method, except for certain foreign subsidiaries which record income from long-term
construction contracts on the percentage-of-completion method. Maintenance services not covered by warranty
are provided on a fee basis and revenues from such services are included in net sales.
Certain subsidiaries recognize total estimated losses on contracts when estimates indicate that a loss will be incurred.
(E) Marketable securities, investment securities and investments in unconsolidated subsidiaries and affiliates Prior to April 1, 2000, marketable securities, except for commercial paper which was stated at amortized cost,
investment securities and investments in unconsolidated subsidiaries and affiliates, were valued at cost, as
determined by the moving average method. If a decline in value below the cost of an individual security was
judged to be material and other than temporary, the carrying value of the individual security was written down.
Effective April 1, 2000, the Company adopted the Accounting Standards for Financial Instruments, which
was issued by the Business Accounting Deliberation Council. In accordance with the new standards, securities
are classified into trading securities, held-to-maturity debt securities, equity investments in unconsolidated
subsidiaries and affiliates, and other securities that are not classified in any of the above categories.
Held-to-maturity debt securities are stated at amortized cost adjusted for the amortization of premiums and the
accretion of discounts to maturity. Investments in unconsolidated subsidiaries and affiliates are valued at cost, as
determined by the moving average method. Marketable equity securities and debt securities not classified as held-to-
maturity are classified as other securities. Other securities with a fair market value are carried at fair value with unrealized
gains and losses, net of tax, reported as a separate component of shareholders’ equity. The amortized cost of debt
securities in this category is adjusted for the amortization of premiums and the accretion of discounts to maturity. Realized
gains and losses, and significant declines in value judged to be other than temporary on those securities are charged to
income. Securities without a fair market value have been stated at cost as determined by the moving average method.
(F) InventoriesInventories are stated at cost, which is determined primarily by the specific identification method for finished
goods and work in process, and by the average method for all other inventories, except for certain foreign
subsidiaries’ inventories, which are all stated at the lower of cost determined by FIFO method or market.
24
(G) Property, plant and equipment, and depreciationProperty, plant and equipment, including significant renewals and additions, are carried at cost.
Depreciation is principally computed by the declining-balance method over the estimated useful lives of the
assets, except for foreign subsidiaries which adopt the straight-line method.
Until the year ended March 31, 1998, the depreciation for buildings of the domestic companies was
computed by the declining balance method. Buildings which were acquired on or after April 1, 1998 are
depreciated by the straight-line method, according to the revision in Japanese corporation income tax law.
Maintenance and repairs, including minor renewals and improvements, are charged to income as incurred.
(H) Intangible assetsGoodwill, which represents the excess of purchase price over fair value of net assets acquired, has been
amortized on a straight-line basis over periods of between 20 to 40 years.
Amortization of other intangible assets is calculated on the straight-line basis over the estimated useful lives.
The Company reviews the carrying amount of intangible assets for impairment whenever events or
circumstances indicate that the carrying amount may not be recoverable.
(I) Severance payments and pension planThe Company has two retirement benefit plans, an unfunded lump-sum severance payment and a defined benefit
pension plan, which cover substantially all employees of the Company. Upon retirement or termination of
employment, employees are generally entitled to a lump-sum payment or annuity, in addition to a certain lump-
sum payment, and the amount of the benefit is determined by their current basic rate of pay, length of service
and conditions under which the termination occurs.
Effective for the year ended March 31, 2001, the Company adopted the new Japanese accounting standard for
retirement benefits, which is effective for the periods beginning on or after April 1, 2000. In accordance with the
new standard, the accrued pension and severance payments for employees at the balance sheets dates represent the
estimated present value of projected benefit obligation in excess of the fair value of the plan assets. The adoption of
the new method had no material impact on the consolidated financial statements for the year ended March 31, 2001.
The U.S. subsidiary (Fujitec America, Inc.) has a defined contribution pension plan covering substantially all
its employees.
The Korean subsidiary accrues annually the liability for employees’ severance benefits at 100% of the
amounts that would be required if all its employees were to terminate their employment under voluntary
conditions at the balance sheet dates.
The Company accrues the unfunded retirement liability for a lump-sum benefit to directors and corporate
auditors of the Company based on the established guidelines. The prior service costs at the adoption of the
method are amortized over five years from the year ended March 31, 1997, and are charged to income as a
special loss item in each year. Payment of such benefits is subject to approval at the shareholders’ meeting.
(J) LeasesUnder accounting principles generally accepted in Japan, finance leases other than those which are deemed to
transfer the ownership of the leased assets to lessees are accounted for by a method similar to that applicable to
ordinary operating leases.
(K) Research and development costs Research and development costs are charged against income as incurred.
(L) Income taxes The Company adopts the asset and liability method of tax effect accounting, in accordance with the Financial
Accounting Standard on Accounting for Income Taxes, issued by the Business Accounting Deliberation Council.
Under the standard, the deferred tax assets and liabilities are recognized for the future tax consequences of temporary
differences between the financial statement carrying amounts of existing assets and liabilities and their respective tax bases.

(M) Derivative and hedging activitiesThe Companies use derivative financial instruments to manage their exposure to foreign exchange and interest
rate fluctuations. Foreign exchange forward contracts and interest rate swap contracts are utilized by the
Companies to reduce foreign currency exchange risk and interest rate risk. The Companies do not enter into
derivatives for trading or speculative purposes.
Effective April 1, 2000, the Companies adopted a new accounting standard for derivative financial
instruments and a revised accounting standard for foreign currency transactions. These standards require that: a)
all derivatives be recognized as either assets or liabilities and measured at fair value, and gains or losses on
derivative transactions be recognized in the income statement and b) if a derivative qualifies for hedge
accounting because of a high correlation and effectiveness between the hedging instrument and the hedged item,
the gains or losses are deferred until maturity of the hedged transaction.
Time deposits denominated in foreign currencies for which foreign exchange forward contracts are used to
hedge the foreign currency fluctuations are translated at the contracted rate if the forward contract qualifies for
hedge accounting.
Interest rate swaps are utilized to hedge interest rate exposure of long-term debt. The interest rate swaps, which
qualify for hedge accounting and meet specific matching criteria, are not remeasured at market value but the differential
paid or received under the swap agreements are recognized and included in interest expense or income as incurred.
(N) Net income and cash dividends per share Net income per share of common stock is based upon the weighted average number of shares of common stock
outstanding during each year. Cash dividends per share represent actual amounts applicable to the respective
years for which the dividends were proposed by the Board of Directors of the Company. Dividends are charged
to retained earnings in the year which they are paid.
(O) Cash and cash equivalentsThe Companies consider all highly liquid debt instruments with original maturities of three months or less to be
cash equivalents.
(P) Reclassification of accountsCertain reclassifications have been made to the 2001 financial statements to conform to the presentation for 2002.
3. Supplemental Cash Flow Information
On February 1, 2001, Fujitec Canada, Inc. acquired the operations of Canadian Elevator Ltd. and on April 1,
2001, Fujitec America, Inc. purchased certain operating assets of Serge Elevator Co., Inc. The total fair values of
the net assets acquired at the dates of acquisition, and the related acquisition cost were as follows:
25
Current assets ................................................................................ ¥ 162 $ 1,218Property, plant and equipment ...................................................... 61 459Goodwill ........................................................................................ 2,556 19,218Current liabilities ........................................................................... (15) (113)Cost of assets acquired ................................................................... 2,764 20,782Accrued accounts payable ............................................................. (39) (293)Net payment for acquisitions of businesses ................................... ¥2,725 $20,489
Millions of Yen
Thousands of U.S. Dollars
(Note 1)

5. Inventories
Inventories at March 31, 2002 and 2001 were comprised of the following:
Finished goods and semi-finished goods.................................. ¥ 3,035 ¥ 4,386 $ 22,820Work in process ........................................................................ 9,891 9,482 74,368Raw materials and supplies ...................................................... 4,887 4,959 36,744
¥17,813 ¥18,827 $133,932
26
Thousands of U.S. Dollars (Note 1)
2002
Grossunrealized
gainsCost
Grossunrealized
losses
Book value(Estimatedfair value)
Equity securities .................................................... $33,444 $1,887 $4,203 $31,128Bonds and debentures............................................ 75 — — 75Other ..................................................................... 850 — 256 594
$34,369 $1,887 $4,459 $31,797
Millions of Yen
Thousands of U.S. Dollars
(Note 1)
2002 2001 2002
The carrying amounts of equity securities whose fair value is not readily determinable were ¥125 million(U.S.$940 thousand) at March 31, 2002 and 2001.
Millions of Yen
2002
Grossunrealized
gainsCost
Grossunrealized
losses
Book value(Estimatedfair value)
Equity securities ........ ¥4,448 ¥251 ¥559 ¥4,140 ¥6,786 ¥656 ¥1,470 ¥5,972
Bonds and debentures ... 10 — — 10 10 — — 10
Other .......................... 113 — 34 79 123 — 31 92
¥4,571 ¥251 ¥593 ¥4,229 ¥6,919 ¥656 ¥1,501 ¥6,074
2001
Grossunrealized
gainsCost
Grossunrealized
losses
Book value(Estimatedfair value)
Other securities:
Thousands of U.S. Dollars (Note 1)
2002
Grossunrealized
gains
Book value(Carryingamount)
Grossunrealized
losses
Book value(Estimatedfair value)
Commercial paper ................................................. $164,398 $ — $ — $164,398
Millions of Yen
2002
Grossunrealized
gains
Book value(Carryingamount)
Grossunrealized
losses
Book value(Estimatedfair value)
Commercial paper ....... ¥21,865 ¥ — ¥ — ¥21,865 ¥19,220 ¥ — ¥ — ¥19,220
2001
Grossunrealized
gains
Book value(Carryingamount)
Grossunrealized
losses
Book value(Estimatedfair value)
Held-to-maturity debt securities:
4. Marketable Securities and Investment Securities
At March 31, 2002 and 2001, held-to-maturity debt securities and other securities were as follows:

6. Income Taxes
The Company is subject to corporate income tax, inhabitant tax and enterprise tax, based on income which, in the
aggregate, indicates a normal statutory tax rate of approximately 42.05% for the years ended March 31, 2002 and 2001.
Income of the consolidated foreign subsidiaries is taxed at the rate of corporate income taxes, ranging from
16% to 40% for the year ended March 31, 2002.
At March 31, 2002 and 2001, a reconciliation of the Company’s statutory tax rate and the effective income
tax rate was as follows:
The tax effects of temporary differences that gave rise to significant deferred tax assets and liabilities at
March 31, 2002 and 2001 are presented below:
Statutory tax rate ........................................................................... 42.05% 42.05%Non-deductible expenses ............................................................ 1.39 2.11Per capita inhabitant tax .............................................................. 4.45 4.06Effect of foreign tax rate differences........................................... (23.66) (21.92)Others ......................................................................................... 1.92 19.15
Effective tax rate ............................................................................ 26.15% 45.45%
27
2002 2001
Deferred tax assets:Accrued pension and severance payments .................................. ¥2,328 ¥2,360 $17,504Accrued bonuses ......................................................................... 384 304 2,887Provision for losses on contracts................................................. 360 397 2,707Unrealized losses on securities.................................................... 144 356 1,083Others .......................................................................................... 299 296 2,248
Total deferred tax assets ........................................................... 3,515 3,713 26,429Deferred tax liabilities:
Unrealized losses from inventories ............................................. (33) (278) (248)Depreciation ................................................................................ (91) (107) (684)Others .......................................................................................... (244) (239) (1,835)
Total deferred tax liabilities...................................................... (368) (624) (2,767)Net deferred tax assets ........................................................ ¥3,147 ¥3,089 $23,662
Millions of Yen
Thousands of U.S. Dollars
(Note 1)
2002 2001 2002
7. Short-Term Debt and Long-Term Debt
Short-term debt represents notes payable to banks with an average interest rate of 1.78% per annum at March 31, 2002.
Long-term debt at March 31, 2002 and 2001 consisted of the following:
With collateral:Loans, from O.D.F.C. in the United States, due through 2005 with interest rate at 2.0% per annum .............. ¥ 48 ¥ 54 $ 361
Other............................................................................................... 9 8 68
Without collateral:Loans, from Haofeng (H.K.) Co. Ltd. in Hong Kongdue through 2002 with interest rate at 5.8% per annum .............. 53 92 399
Loans, from banks and insurance companies due through 2004 at average interest rate 0.53% per annum ...... 5,100 5,100 38,346
Other............................................................................................... 22 44 1655,232 5,298 39,339
Less, portion due within one year .................................................. 67 70 504¥5,165 ¥5,228 $38,835
Millions of Yen
Thousands of U.S. Dollars
(Note 1)
2002 2001 2002

28
The aggregate annual maturities of long-term debt outstanding as of March 31, 2002 are as follows:
At March 31, 2002, the following assets are pledged as collateral for loans and construction contracts:
In addition, all the assets of the Singapore subsidiary are pledged as collateral for its construction contracts,
totaling 9,048 thousand Singapore dollars (U.S.$4,838 thousand) as of December 31, 2001.
8. Minority Interest
The consolidated financial statements include the assets, liabilities and earnings of Fujitec Capital Corporation (FCC),
which was incorporated in the United States with the limited purpose of issuing shares of Auction Preferred Stock and
acquiring, owning and managing assets, primarily cash and short-term money market instruments (principally,
commercial paper). All the common stock of FCC is owned by Fujitec America, Inc. (FAI), a wholly-owned U.S.
subsidiary of the Company. FCC has issued Auction Preferred Stock totaling U.S.$150 million, none of which is owned
by FAI: the preferred interest in FCC is reflected as a part of minority interest in the consolidated financial statements.
9. Contingent Liabilities
At March 31, 2002, contingent liabilities were as follows:
Millions of Yen
Thousands of U.S. Dollars
(Note 1)Year ending March 31,2003 ............................................................................................... ¥ 67 $ 5042004 ............................................................................................... 5,124 38,5262005 ............................................................................................... 17 1282006 ............................................................................................... 7 532007 ............................................................................................... 11 832008 and thereafter ........................................................................ 6 45
¥5,232 $39,339
Millions of Yen
Thousands of U.S. Dollars
(Note 1)
Property, plant and equipment (at net book value) ........................ ¥2,040 $15,338
Other assets .................................................................................... 87 654
¥2,127 $15,992
10. Leases
The Company and its consolidated subsidiaries lease certain machinery and equipment. Total lease payments under these
leases were ¥137 million (U.S.$1,030 thousand) and ¥132 million for the years ended March 31, 2002 and 2001, respectively.
Pro forma information relating to acquisition costs, accumulated depreciation and future minimum lease
payments for property held under finance leases which do not transfer ownership of the leased property to the
lessee on an “as if capitalized” basis for the years ended March 31, 2002 and 2001, is as follows:
Guarantees of bank loans ............................................................ ¥5,648 $42,466Trade notes receivable discounted .............................................. 133 1,000
Total ............................................................................................ ¥5,781 $43,466
Millions of Yen
Thousands of U.S. Dollars
(Note 1)

29
Machinery and equipmentAcquisition cost........................................................................... ¥1,159 ¥1,156 $8,714Accumulated depreciation .......................................................... 369 281 2,774
Net leased property ..................................................................... ¥ 790 ¥ 875 $5,940
Millions of Yen
Thousands of U.S. Dollars
(Note 1)
2002 2001 2002
Due within one year .................................................................... ¥ 137 ¥132 $1,030Due after one year ....................................................................... 653 743 4,910
Total ............................................................................................ ¥790 ¥875 $5,940
Millions of Yen
Thousands of U.S. Dollars
(Note 1)
2002 2001 2002
Due within one year .................................................................... ¥ 26 ¥ 27 $196Due after one year ....................................................................... 81 98 609
Total ............................................................................................ ¥107 ¥125 $805
Millions of Yen
Thousands of U.S. Dollars
(Note 1)
2002 2001 2002
Future minimum lease payments under finance leases as of March 31, 2002 and 2001 were as follows:
The acquisition cost and future minimum lease payments under finance leases include imputed interest expense.
Depreciation expense which is not reflected in the accompanying consolidated statements of income, computed by the
straight-line method, would have been ¥137 million (U.S.$1,030 thousand) and ¥132 million for the years ended March
31, 2002 and 2001, respectively.
Obligations under non-cancelable operating leases as of March 31, 2002 and 2001 were as follows:
11. Shareholders’ Equity
On October 1, 2001, an amendment (the “Amendment”) to the Commercial Code of Japan became effective.
The Amendment eliminates the stated par value of the Company’s outstanding shares, which results in all outstanding
shares having no par value as of October 1, 2001. The Amendment also provides that shares issued after September 30,
2001 will have no par value. Before the Amendment, the Company’s shares had a par value of ¥50 per share.
Under the Commercial Code, at least 50% of the newly issued share price is required to be designated as the
stated capital. Accordingly, proceeds in excess of the amount designated as stated capital have been credited to
additional paid-in capital.
The Commercial Code of Japan provides that an amount equal to at least 10% of cash dividends and other
distributions from retained earnings paid by the Company be appropriated as a legal reserve until an aggregated
amount of additional paid-in capital and the legal reserve equals 25% of stated capital, and this legal reserve and
additional paid-in capital exceeding 25% of stated capital may be reduced by resolution of the shareholders.
The Company may transfer portions of additional paid-in capital and the legal reserve to stated capital by
resolution of the Board of Directors.
The legal reserves appropriated by the Company were included in retained earnings on the accompanying
consolidated balance sheets. The reserves at March 31, 2002 and 2001 were ¥1,337 million (U.S.$10,052
thousand) and ¥1,284 million, respectively.

30
12. Severance Payments and Pension Plan
The following tables set forth the changes in benefit obligation, plan assets and funded status of the Company at
March 31, 2002 and 2001.
Severance and pension costs of the Company for the years ended March 31, 2002 and 2001were as follows:
Assumption used in the accounting for the defined benefit plans for the years ended March 31, 2002 and 2001 is as follows:Method of attributing benefit to periods of service straight-line basisDiscount rate 3.0%Long-term rate of return on plan assets 3.0%Amortization period for actuarial losses 10 years
Accrued severance payments to directors and corporate auditors of the Company amounting to ¥544 million(U.S.$4,090 thousand) as of March 31, 2002 were included in “Acccrued pension and severance payments” inthe accompanying consolidated balance sheets.
Service cost .............................................................................. ¥551 ¥ 535 $4,143Interest cost .............................................................................. 273 266 2,053Expected return on plan assets ................................................. (104) (103) (782)Amortization:
Prior service cost ................................................................... — 8 —Actuarial losses ..................................................................... 29 — 218
Net periodic benefit cost .......................................................... ¥749 ¥ 706 $5,632
13 Research and Development Costs
Research and development costs for the years ended March 31, 2002 and 2001 were ¥2,100 million (U.S.$15,789
thousand) and ¥2,152 million, respectively.
Projected benefit obligation...................................................... ¥9,730 ¥ 9,300 $ 73,158Fair value of plan assets .......................................................... (3,741) (3,470) (28,128)Funded status:
Benefit obligation in excess of plan assets ............................... 5,989 5,830 45,030Unrecognized actuarial differences .......................................... (471) (289) (3,541)Accrued pension liability recognized
in the consolidation balance sheets ........................................ ¥5,518 ¥ 5,541 $41,489
Millions of Yen
Thousands of U.S. Dollars
(Note 1)
2002 2001 2002
Millions of Yen
Thousands of U.S. Dollars
(Note 1)
2002 2001 2002
Dividends are approved by the shareholders at a meeting held subsequent to the fiscal year to which the
dividends are applicable. Semiannual interim dividends may also be paid upon resolution of the Board of
Directors, subject to certain limitations imposed by the Commercial Code.

31
14. Segment Information
Information by geographic area for the years ended March 31, 2002 and 2001 is summarized as follows:
(A) Geographic segment information
JapanNet sales: Customers ...................................................... ¥ 44,744 ¥44,154 $336,421
Intersegment .................................................. 5,667 6,326 42,60950,411 50,480 379,030
Operating expenses .......................................................... 49,352 49,724 371,068Operating income.............................................................. 1,059 756 7,962
The AmericasNet sales: Customers ...................................................... 22,569 14,339 169,692
Intersegment .................................................. 30 18 22622,599 14,357 169,918
Operating expenses ........................................................... 22,759 15,993 171,120Operating loss ................................................................... (160) (1,636) (1,202)
EuropeNet sales: Customers ...................................................... 3,821 2,409 28,729
Intersegment .................................................. 7 58 533,828 2,467 28,782
Operating expenses ........................................................... 4,167 3,098 31,331Operating loss ................................................................... (339) (631) (2,549)
South AsiaNet sales: Customers ...................................................... 8,087 7,349 60,805
Intersegment .................................................. 32 59 2408,119 7,408 61,045
Operating expenses ........................................................... 6,895 6,006 51,842Operating income.............................................................. 1,224 1,402 9,203
East AsiaNet sales: Customers ...................................................... 16,436 12,922 123,579
Intersegment .................................................. 595 457 4,47317,031 13,379 128,052
Operating expenses ........................................................... 14,024 12,089 105,443Operating income.............................................................. 3,007 1,290 22,609
TotalNet sales: Customers ...................................................... ¥ 95,657 ¥81,173 $719,226
Intersegment .................................................. 6,331 6,918 47,601101,988 88,091 766,827
Elimination ....................................................................... (6,331) (6,918) (47,601)Consolidated net sales ...................................................... 95,657 81,173 719,226
Operating expenses ........................................................... 97,197 86,910 730,804Elimination ....................................................................... (5,795) (7,061) (43,571)Consolidated operating expenses ..................................... 91,402 79,849 687,233
Operating income.............................................................. 4,791 1,181 36,023Elimination ....................................................................... (536) 143 (4,030)Consolidated operating income ........................................ ¥ 4,255 ¥ 1,324 $ 31,993
Millions of Yen
Thousands of U.S. Dollars
(Note 1)
2002 2001 2002
Note: Each segment outside Japan represents the following nations and regions:(1) The Americas ...... U.S.A., Canada and Brazil(2) Europe ................. United Kingdom and Germany(3) South Asia ........... Singapore and Indonesia(4) East Asia .............. Hong Kong, Taiwan, China and Korea
(1) Operating income (loss):
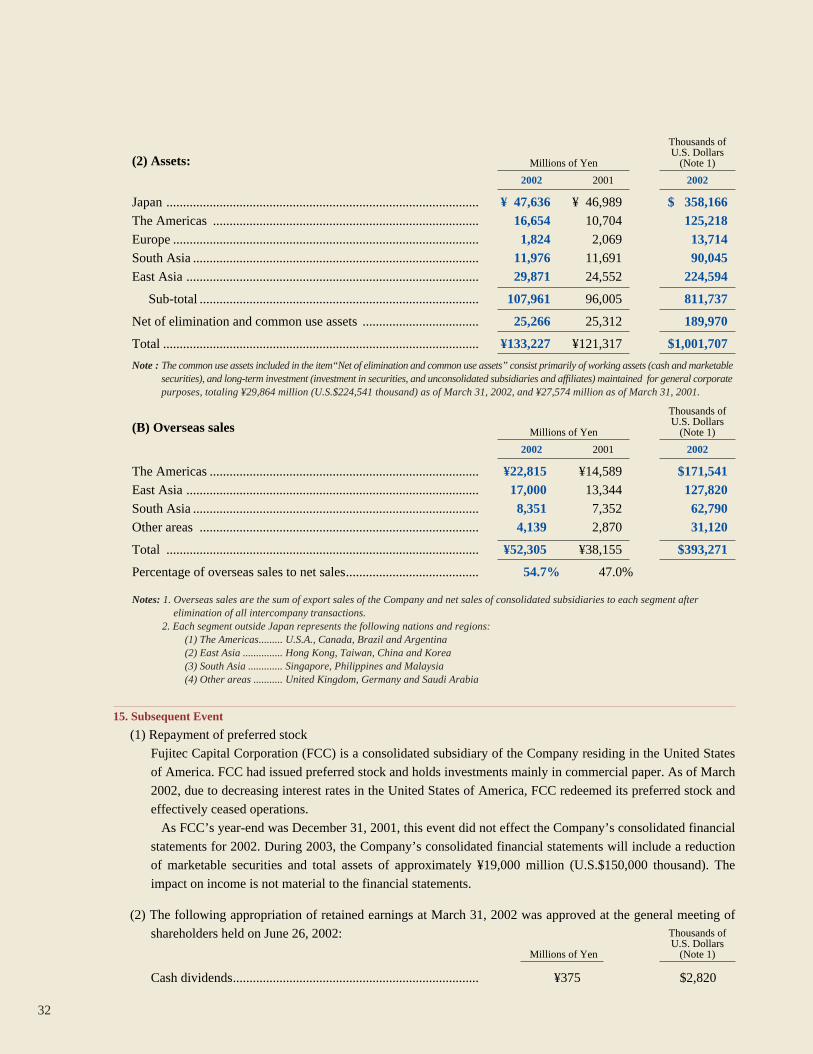
32
Note : The common use assets included in the item“Net of elimination and common use assets” consist primarily of working assets (cash and marketablesecurities), and long-term investment (investment in securities, and unconsolidated subsidiaries and affiliates) maintained for general corporatepurposes, totaling ¥29,864 million (U.S.$224,541 thousand) as of March 31, 2002, and ¥27,574 million as of March 31, 2001.
Notes: 1. Overseas sales are the sum of export sales of the Company and net sales of consolidated subsidiaries to each segment afterelimination of all intercompany transactions.
2. Each segment outside Japan represents the following nations and regions:(1) The Americas......... U.S.A., Canada, Brazil and Argentina(2) East Asia ............... Hong Kong, Taiwan, China and Korea(3) South Asia ............. Singapore, Philippines and Malaysia(4) Other areas ........... United Kingdom, Germany and Saudi Arabia
15. Subsequent Event
(1) Repayment of preferred stock
Fujitec Capital Corporation (FCC) is a consolidated subsidiary of the Company residing in the United States
of America. FCC had issued preferred stock and holds investments mainly in commercial paper. As of March
2002, due to decreasing interest rates in the United States of America, FCC redeemed its preferred stock and
effectively ceased operations.
As FCC’s year-end was December 31, 2001, this event did not effect the Company’s consolidated financial
statements for 2002. During 2003, the Company’s consolidated financial statements will include a reduction
of marketable securities and total assets of approximately ¥19,000 million (U.S.$150,000 thousand). The
impact on income is not material to the financial statements.
(2) The following appropriation of retained earnings at March 31, 2002 was approved at the general meeting of
shareholders held on June 26, 2002:
Japan .............................................................................................. ¥ 47,636 ¥ 46,989 $ 358,166The Americas ................................................................................ 16,654 10,704 125,218 Europe ............................................................................................ 1,824 2,069 13,714 South Asia ...................................................................................... 11,976 11,691 90,045 East Asia ........................................................................................ 29,871 24,552 224,594
Sub-total .................................................................................... 107,961 96,005 811,737
Net of elimination and common use assets ................................... 25,266 25,312 189,970
Total ............................................................................................... ¥133,227 ¥121,317 $1,001,707
Millions of Yen
Thousands of U.S. Dollars
(Note 1)
2002 2001 2002
(2) Assets:
The Americas ................................................................................. ¥22,815 ¥14,589 $171,541East Asia ........................................................................................ 17,000 13,344 127,820South Asia ...................................................................................... 8,351 7,352 62,790Other areas .................................................................................... 4,139 2,870 31,120
Total .............................................................................................. ¥52,305 ¥38,155 $393,271
Percentage of overseas sales to net sales........................................ 54.7% 47.0%
Millions of Yen
Thousands of U.S. Dollars
(Note 1)
2002 2001 2002
(B) Overseas sales
Millions of Yen
Thousands of U.S. Dollars
(Note 1)
Cash dividends.......................................................................... ¥375 $2,820

33
The Board of Directors Fujitec Co., Ltd.
We have audited the consolidated balance sheets of Fujitec Co., Ltd. and consolidated
subsidiaries as of March 31, 2002 and 2001, and the related consolidated statements of income
and retained earnings and cash flows for the years then ended, all expressed in Japanese yen.
Our audits were made in accordance with auditing standards, procedures and practices
generally accepted and applied in Japan and, accordingly, included such tests of the accounting
records and such other auditing procedures as we considered necessary in the circumstances.
In our opinion, the consolidated financial statements referred to above, expressed in Japanese
yen, present fairly the consolidated financial position of Fujitec Co., Ltd. and consolidated
subsidiaries as of March 31, 2002 and 2001, and the consolidated results of their operations
and their cash flows for the years then ended, in conformity with accounting principles and
practices generally accepted in Japan applied on a consistent basis, except as noted in the
following paragraph.
As described in Note 2, during the year ended March 31, 2001, Fujitec Co., Ltd. adopted new
Japanese accounting standards for retirement benefits, financial instruments and foreign
currency translation.
The amounts stated in U.S. dollars have been translated on the basis set forth in Note 1 to the
consolidated financial statements.
Osaka, Japan
June 26, 2002
YUKOH AUDITCORPORATIONCertified Public Accountants
R E P O R T O F I N D E P E N D E N T C E R T I F I E D P U B L I C A C C O U N T A N T S

34
For the year
Net sales ......................................................... ¥ 95,657 ¥ 81,173 ¥ 78,169 ¥ 83,495 ¥ 76,094 $ 719,226
Domestic .................................................... 43,352 43,018 38,139 38,402 43,847 325,955
Overseas ..................................................... 52,305 38,155 40,030 45,093 32,247 393,271
Operating income ........................................... 4,255 1,324 5,362 8,039 8,383 31,993
Net income (loss) ........................................... 1,059 718 (343) 4,276 4,264 7,962
Depreciation and amortization ....................... 1,839 1,733 1,639 1,588 1,324 13,827
Acquisition of property, plant and equipment ................................................... 2,239 2,525 3,866 3,388 2,641 16,834
At year-end
Total assets ..................................................... ¥133,227 ¥121,317 ¥121,693 ¥117,171 ¥123,047 $1,001,707
Shareholders’ equity....................................... 56,884 53,730 66,265 68,741 65,849 427,699
Per share of common stock
Net income (loss) ........................................... ¥ 11.30 ¥ 7.66 ¥ (3.66) ¥ 45.61 ¥ 46.65 $ 0.08
Cash dividends ............................................... 8.00 10.50 11.00 11.00 13.50 0.06
Shareholders’ equity....................................... 606.95 573.21 706.82 733.11 702.27 4.56
C O N S O L I D A T E D 5 - Y E A R S U M M A R Y
Fujitec Co., Ltd. and Consolidated SubsidiariesYears ended March 31
Millions of Yen
Yen U.S. Dollars
Thousands of U.S. Dollars
2002 2001 2000 1999 1998 2002
Notes: 1. During fiscal 1998, the accounts of Huasheng FujitecElevator Co., Ltd. were newly included in consolidation.
2. During fiscal 2000, the accounts of Fujitec Brasil Ltda.were newly included in consolidation.
3. Net income(loss) per share amounts are computed based on theweighted average number of shares outstanding during each year.
4. U.S. dollar amounts are translated from Japanese yen, forconvenience only, at the rate of ¥133 to U.S.$ 1.

B O A R D O F D I R E C T O R S
Honorary Chairman
Shotaro Uchiyama
Chairman
Kenji Otani*
President and Chief Executive Officer
Takakazu Uchiyama*
Executive Vice Presidents
Masamichi Hayashi*
Kazumasu Kazama*
Yasuhiro Kamitakehara*
Haruo Sahara*
*Representative Directors
Directors
Akira Sumimoto
Masakazu Kawai
Iwataro Sekiguchi
Katsuhiro Harada
Takeo Kato
Corporate Auditors
Hidechika Waki
Tomozo Taya
Tomihisa Kuroishi
As of June 26, 2002
2,000
1,500
1,000
500
0
(Yen)
I II III IV
1998
I II III IV
1999
I II III IV
2000
I II III IV
2001
I II III IV
2002
30
20
10
0
(Trading volume: million shares)
I II III IV
1998
I II III IV
1999
I II III IV
2000
I II III IV
2001
I II III IV
2002
S T O C K P R I C E R A N G E A N D
T R A D I N G V O L U M E O N T H E
T O K Y O S T O C K E X C H A N G E
35

36
G L O B A L N E T W O R K
Overseas Liaison Offices
The Americas
United States
Fujitec America, Inc. R&D, manufacturing, marketing, installationand maintenance
Canada
Fujitec Canada, Inc. Marketing, installation and maintenance
Venezuela
Fujitec Venezuela C.A. Marketing, installation and maintenance
Argentina
Fujitec Argentina S.A. Marketing, installation and maintenance
Guam
Fujitec Pacific, Inc.Marketing, installation and maintenance
Japan
Fujitec Co., Ltd. R&D, manufacturing, marketing, installationand maintenance
South Asia
Singapore
Fujitec Singapore Corpn. Ltd. R&D, manufacturing, marketing, installationand maintenance
Philippines
Fujitec, Inc. Marketing, installation and maintenance
Indonesia
P.T. Fujitec IndonesiaManufacturing, installation and maintenance
Malaysia
Fujitec (Malaysia) Sdn. Bhd. Marketing, installation and maintenance
East Asia
Hong Kong
Fujitec (HK) Co., Ltd. Manufacturing, marketing, installation andmaintenance
Korea
Fujitec Korea Co., Ltd. Manufacturing, marketing, installation andmaintenance
Taiwan
Fujitec Taiwan Co., Ltd. Manufacturing, marketing, installation andmaintenance
China
Huasheng Fujitec Elevator Co., Ltd.Manufacturing, marketing, installation andmaintenance
Shanghai Huasheng Fujitec EscalatorCo., Ltd.Manufacturing, marketing, installation andmaintenance
Europe
United Kingdom
Fujitec UK Ltd. Marketing, installation and maintenance
Germany
Fujitec Deutschland GmbH Marketing, installation and maintenance
Saudi Arabia
Fujitec Saudi Arabia Co., Ltd. Marketing, installation and maintenance
Egypt
Fujitec Egypt Co., Ltd. Marketing, installation and maintenance
Beijing, Shanghai, Bangkok,Jakarta, Pune, Cairo, Dubai,and Montevideo

333
Fujitec Co., Ltd. 28-10, Shoh 1-chome, Ibaraki,Osaka 567-8510, Japan Telephone: 0726-22-8136Facsimile: 0726-22-4472
Date of EstablishmentFebruary 9, 1948
Paid-in Capital ¥12,533,933,095
Common Stock Authorized: 200,000,000 shares Issued: 93,767,317 shares Number of shareholders: 6,894
Major Shareholders
Annual Meeting of Shareholders The annual meeting of shareholders of the Company isnormally held in June each year in Ibaraki, Osaka, Japan.
Stock Exchange Listings Japan: Tokyo and Osaka stock exchanges Overseas: Luxembourg and Singapore stock exchanges
Transfer Agent The Chuo Mitsui Trust and Banking Company, Limited Stock Transfer Agency Department 33-1, Shiba 3-chome, Minato-ku, Tokyo 105-8574, Japan Its business officeThe Chuo Mitsui Trust and Banking Company, Limited Osaka BranchStock Transfer Agency Department2-21, Kitahama 2-chome, Chuo-ku, Osaka 541-0041, JapanTelephone: 06-6202-7361
AuditorsYukoh Audit Corporation
As of March 31, 2002
Number of Percentage of shares held total number of
(Thousands) shares in issue (%)
Uchiyama International, Limited 9,056 9.7 Boston Safe Deposit BSDTTreaty Clients Omnibus 6,265 6.7
Fuji Electric Co., Ltd. 5,089 5.4 The Daiwa Bank, Limited 4,273 4.6The Fuji Bank, Limited 3,327 3.5 The Mitsubishi Trust and Banking Corporation 2,917 3.1Matsushita Electric Industrial Co., Ltd. 2,867 3.1The Asahi Bank, Ltd. 2,836 3.0Asahi Mutual Life Insurance Company 2,484 2.6Aozora Bank, Ltd 2,388 2.5
S H A R E H O L D E R S ’ I N F O R M A T I O N

Printed in Japan on recycled paperhttp://www.fujitec.com