annual report 2 14
TRANSCRIPT

NANOSONICS LIMITED ABN 11 095 076 896
ANNUAL REPORT
2 14
For
per
sona
l use
onl
y
Financials at a glance 2
Nanosonics 2014 highlights 4
Chairman’s letter 6
CEO’s report 8
US regional highlights 11
Europe regional highlights 12
Asia Pacific regional highlights 13
trophon® EPR: innovative technology delivering improved standards of care 14
Clinical evidence 16
Information on the directors, company secretaries and senior management 18
Directors’ report 22
Corporate governance statement 53
Contents of the financial statements 58
Auditor’s independence declaration 59
Financial statements 60
Notes to the financial statements 64
Directors’ declaration 103
Independent auditor’s report to the members 104
Shareholder information 106
Glossary 108
Corporate directory and information for investors 109
Contents
For
per
sona
l use
onl
y

1
We improve the safety of patients, clinics, their staff and the environment by transforming the way infection prevention practices are understood and conducted, and introducing innovative technologies that deliver improved standards of care.
Company overviewNanosonics (ASX: NAN) is developing a portfolio of decontamination products designed to reduce
the spread of infection. The Company owns intellectual property relating to a unique disinfection and
sterilisation technology which can be suited to a variety of markets.
Initial market applications are designed for the reprocessing of reusable medical instruments. The
Company’s first product, the trophon® EPR, is designed to disinfect ultrasound transducers and is
commercially available in Australia, New Zealand, the US, Europe and other markets.
Nanosonics Ltd is headquartered in Sydney, Australia with offices in the US and Europe.
Mission statement
For
per
sona
l use
onl
y
nanosonics limited | annual report 2014
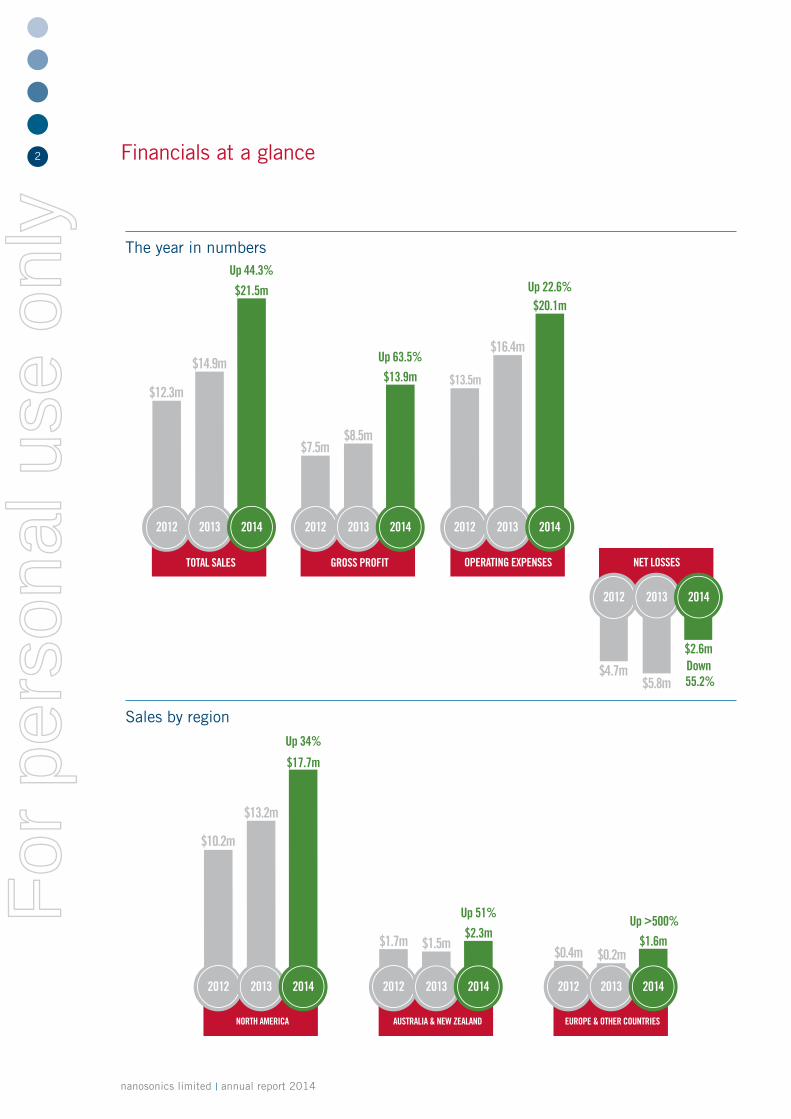
2 Financials at a glance
The year in numbers
Sales by region
NET LOSSES
$13.5m
$16.4m
OPERATING EXPENSES
2012 2013
$20.1m
2014
$14.9m
$12.3m
TOTAL SALES
2012 2013
$21.5m
2014
$5.8m$4.7m
2012
$2.6m
$8.5m$7.5m
GROSS PROFIT
2012 2013
$13.9m
2014
2013 2014
Up 44.3%
NORTH AMERICA
2012 2013 2014
$13.2m
$10.2m
$17.7m
Up 34%
EUROPE & OTHER COUNTRIES
2012 2013 2014
$0.2m$0.4m$1.6m
Up >500%
Up 63.5%
Up 22.6%
Down 55.2%
AUSTRALIA & NEW ZEALAND
2012 2013 2014
Up 51%
$1.5m$2.3m$1.7m
For
per
sona
l use
onl
y

3
2014 $’000
2013 $’000
2012 $’000
2011 $’000
2010 $’000
2009 $’000
Revenue
Operating revenue 21,492 14,899 12,301 2,247 763 309
Less cost of sales (7,571) (6,428) (4,799) (981) (284) (121)
Gross profit 13,921 8,471 7,502 1,266 479 188
Other income
Government grants received 1,666 1,498 150 – 161 150
Other 1,709 – – – –
Expenses
Operating expenses (excluding depreciation and amortisation) (19,141) (15,335) (12,634) (13,229) (8,827) (9,867)
EBITDA (1,845) (5,366) (4,982) (11,963) (8,187) (9,529)
Depreciation and amortisation (975) (1,044) (914) (1,010) (771) (419)
EBIT (2,820) (6,410) (5,896) (12,973) (8,958) (9,948)
Interest income 739 1,192 586 1,052 785 1,194
Interest expense (555) (517) – – – –
Operating loss before tax (2,636) (5,735) (5,310) (11,921) (8,173) (8,754)
Net income tax benefit 31 (33) 631 707 – –
Operating loss after tax (2,605) (5,768) (4,679) (11,214) (8,173) (8,754)
Cash assets
Cash and cash equivalents 21,233 24,064 29,310 12,356 21,144 13,881
For
per
sona
l use
onl
y

nanosonics limited | annual report 2014
4 Nanosonics 2014 Highlights
NANOSONICS NAMED HEALTHCARE INDUSTRY’S COMPANY OF THE YEAR
AT JANSSEN 2013 INDUSTRY EXCELLENCE AWARDS
NEW LEADERSHIP
MICHAEL KAVANAGH COMMENCES AS CEO
AND PRESIDENT
GE AND NANOSONICS ANNOUNCE NEW MARKETING AND SALES AGREEMENT
FOR NORTH AMERICAN REGION
FIRST UK
HOSPITAL ADOPTS trophon® EPR
LEADING UK HOSPITAL, KING’S MILL, ADOPTS
trophon EPR
APPROVEDSOUTH KOREA’S MINISTRY
OF FOOD AND DRUG SAFETY APPROVES trophon EPR
FOR USE
NEW AGREEMENT
AUSTRALIAN STUDY HIGHLIGHTS
RISKS OF CROSS INFECTION USING CONVENTIONAL DISINFECTION
AUSTRALIAN STUDY HIGHLIGHTS
RISKS
HEALTHCARE INDUSTRY’S COMPANY
OF THE YEAR
For
per
sona
l use
onl
y

5
STRATEGIC PARTNERSHIP
NANOSONICS SIGNS STRATEGIC PARTNERSHIP WITH MIELE
PROFESSIONAL TO DISTRIBUTE trophon EPR IN GERMANY
STUDY PUBLISHED IN JOURNAL OF INFECTION AND PUBLIC HEALTH SHOWS trophon EPR MET A RANGE
OF MAJOR INTERNATIONAL STANDARDS FOR HIGH LEVEL
DISINFECTION
STUDY PUBLISHED
GUIDELINES UPDATED
NEW AMERICAN INSTITUTE OF ULTRASOUND IN MEDICINE (AIUM)
GUIDELINES RECOMMEND “HYDROGEN PEROXIDE NANODROPLET EMULSION”
(trophon EPR’S TECHNOLOGY) FOR EFFECTIVE HIGH LEVEL DISINFECTION WITHOUT
TOXICITY
trophon EPR RECEIVES AWARD
IN GERMANY, trophon EPR RECEIVED MANAGEMENT & KRANKENHAUS
AWARD 2014 IN LABOR AND HYGIENE CATEGORY
TOP
HOSPITAL USE40 OF 50 US TOP HOSPITALS
NOW USE trophon EPR
For
per
sona
l use
onl
y
nanosonics limited | annual report 2014
6 Chairman’s letter
I am pleased to present, on behalf of the Board of
Nanosonics, our 2014 Annual Report.
The past year has seen significant evolution of the
Company’s growth and performance, with a strong
emphasis on our international markets. The Nanosonics
team has strengthened globally and the Board recognises
the significant contribution of Mr Michael Kavanagh,
the CEO and President, together with a number of new
international appointments in our European markets.
This 2014 Annual Report highlights achievements in each
and every dimension of the Company’s activities which have
resulted in a year of strong financial results and impressive
achievements within our overall strategic plan. On a daily
basis we see confirmation of the growing awareness of the
need for compliance with infection control guidelines and
the increasing recognition that the automated trophon EPR
is now the emerging standard of care.
The awareness of imaging-related healthcare acquired
infections continues to grow along with a global trend
towards strengthening requirements in guidelines for high
level disinfection (HLD). In May this year, the American
Institute of Ultrasound (AIUM) released updated guidelines
reinforcing stricter controls for HLD of ultrasound probes.
The AIUM is recognised and respected by the health
profession internationally and changes to guidelines from
organisations such as this are an important step towards
achieving our goal of establishing trophon EPR as the new
global standard of care for HLD of ultrasound probes.
Nanosonics, together with its global strategic partners
including GE Healthcare, Toshiba and Miele Professional, is
leveraging mounting clinical evidence to support high level
disinfection technologies like trophon EPR and the rejection
of traditional, toxic chemical methods.
There were notable highlights in all markets throughout
the year. As reported in August 2013, in North America,
the trophon EPR is now being marketed and sold by the
Ultrasound Division of GE Healthcare and supported by a
substantial sales and marketing investment by GE Ventures.
This realigned agreement has resulted in real momentum
in the North American market where sales increased
34% for the period. The trophon EPR is now installed at
40 of the top 50 Hospitals in the US (US News & World
Report rankings).
As recognition of healthcare acquired infections relating to
ultrasound grows, audit compliance has become crucial.
Customers using the trophon EPR achieved successful
audits with no known rejections from third party auditors
(The Joint Commission). This is an important endorsement
for our product.
Market penetration is tracking well in Europe where we
have employed dedicated Country Managers to commence
market development in the UK, Germany and France. Sales
in the region showed a five fold increase over last year,
supported by the adoption of trophon EPR in the UK where
Nanosonics has strategic partnerships with Toshiba and GE
Healthcare, as well as growing direct sales.
For
per
sona
l use
onl
y
7
In March, a new strategic partnership for the German
market with Miele Professional, a world leading authority
and provider of medical disinfection and sterilisation
equipment, was announced. Miele launched the
trophon EPR at the DGKH-congress (German Society of
Hospital Hygiene) in Berlin in March, and has now started
broad market awareness and education programs across
the country.
Sales in Australia and New Zealand grew 51% driven by
sales in leading corporate imaging centres as well as the
public sector, and were supported by an underlying
growth in sales of consumables as the installed base
continued to grow.
Well earned recognition of Nanosonics’ achievements came
when the Company was named the Australian Healthcare
Industry’s Company of the Year for 2013 at the Janssen
Industry Excellence Awards.
The Company achieved its first global Environmental
Management System (EMS) certification and is now
certified to ISO14001-EMS, an important certification
for healthcare organisations which require suppliers to
demonstrate their commitment to the environment. This
certification highlights the many environmental benefits
associated with trophon EPR.
Nanosonics continues to demonstrate world leading
expertise across the full spectrum of its activities which is
driving our increasing commercial success into multiple
global markets.
Our commitment is to leverage our technical capabilities,
our R&D pipeline and our evolving distribution network to
drive shareholder value now and well into the future. The
market for microbial control is a large and growing one and
Nanosonics is well positioned to help our customers and
partners meet the increasing demands for better infection
control with integrated solutions underpinned by strong
annuity revenue.
I take this opportunity to recognise the enormous efforts
and talent of the growing Nanosonics team and the
important contribution of our Board. Nanosonics has
achieved many milestones during the year and a strong
2014 result.
Finally, our success to date has been underpinned by
our shareholders whose support and shared vision will
enable Nanosonics to continue on the path of innovation
and growth.
Mr Maurie Stang
Chairman
Sydney
21 August 2014
For
per
sona
l use
onl
y

nanosonics limited | annual report 2014
8 CEO’s report
The 2014 financial year has been a period of strong sales
growth and global expansion for Nanosonics. This year we
laid the foundations to support our next phase of growth
and accelerate our transition from an emerging company
with proven technology to an internationally recognised
leader in the field of infection control.
Global sales momentum buildingGlobal sales were up 44.3% at the end of the year with all
regions contributing towards this growth. Sales were up
34% in North America, 51% in Australia and New Zealand,
and more than five fold in Europe and other countries.
In the first quarter we announced an updated marketing
and sales agreement with GE which included a significant
investment by GE Ventures. Nanosonics is now working
closely with GE Healthcare and GE Ventures to accelerate
growth in the North American market which is a prime
region for us.
Momentum is also building in Europe where the
appointment of dedicated Country Managers resulted in
growing sales figures for the region. The increase in sales
for the region was mainly due to adoption of trophon EPR in
the UK where Nanosonics has strategic partnerships with
Toshiba and GE Healthcare, as well as direct
sales operations.
In March we were delighted to announce a new strategic
partnership with Miele Professional for the German market.
Miele Professional is a world leading authority and provider
of medical disinfection and sterilisation equipment.
In light of anticipated changes to UK guidelines and new
strategic partnerships, we’re looking forward to continued
growth in the European region over the next year.
Plans for expansion in Asia Pacific are beginning to take
shape. Regulatory approvals were received for both
Korea and Japan in the period and we are finalising
commercialisation strategies for these markets. Japan is a
significant market globally from an ultrasound perspective
and hence represents an important opportunity for
our technology.
Throughout the year, market fundamentals have
strengthened the outlook for our flagship product, the
trophon EPR. These fundamentals are transforming our
business and, in the process, are creating an opportunity
to establish trophon EPR as the global standard of care for
ultrasound disinfection. These fundamentals include:
• Growing awareness of imaging procedure Healthcare
Acquired Infections (HAIs).
• Trends towards stricter controls for high level
disinfection (HLD) and for automation.
• Growing importance of risk mitigation.
• Mounting clinical evidence for trophon EPR adoption.
• Growing recognition and adoption of trophon EPR.
• Current toxic HLD solutions progressively being rejected
by customers and regulators.
Growing awareness Awareness of HAIs associated with imaging is growing. An
increasing number of clinical studies demonstrate that, with
traditional methods of ultrasound probe disinfection, probes
can remain contaminated with pathogens and pose a risk of
cross infection. There have been reported cases of hepatitis
B and hepatitis C infections being transmitted and, in both
cases, improper ultrasound transducer disinfection was
pinpointed as a likely cause.
Trends towards stricter controls for HLD and for automationGuideline changes are key to establishing trophon EPR as
the global standard of care. As the issue of poor infection
control practices receives greater attention, moves to
For
per
sona
l use
onl
y

9
strengthen and tighten global regulations and guidelines for
HLD are underway.
While a number of international healthcare authorities
already recommend automated reprocessing over
manual methods, changes to the American Institute of
Ultrasound (AIUM) guidelines reinforcing stricter controls
for ultrasound probe disinfection were a significant highlight
this year.
Furthermore, in the UK, health board reviews of ultrasound
decontamination procedures and guidelines in England,
Scotland and Wales are under review. We expect the
resulting changes to be positive for trophon EPR as
they should also focus on implementing stricter, more
effective controls.
Growing importance of risk mitigation HAIs are a huge financial burden. With the cost of
healthcare a major focus for governments, insurers and
consumers worldwide, healthcare facilities are increasingly
being required to publically report HAI-related data. As
this trend continues, risk mitigation and audit compliance
becomes increasingly recognized as an important factor in
accountable healthcare models.
In May, The Joint Commission (TJC), which is a third
party auditor in the US, released a Quick Safety advisory
highlighting improperly sterilised or high level disinfected
medical equipment as one of the top five non-compliant
accreditation requirements for 2013. On another very
positive note for trophon EPR, I’m pleased to report
that customers in the US have achieved uniform high
compliance and no known rejections from TJC to date.
In essence, this validates that adoption of the trophon
EPR provides high levels of assurance of compliance for
our customers.
Mounting clinical evidence Clinical evidence supporting adoption of trophon EPR is a
key driver of changes to guidelines. During the past year,
clinical evidence continued to mount and a number of
significant studies were published highlighting the efficacy
issues and OHS risks associated with traditional disinfection
practices. To summarise, these studies showed:
• Chemicals traditionally used in manual disinfection are
suboptimal and may pose a risk of cross contamination.
• Automated systems are more effective than manual
methods, which are prone to human errors.
• The superior efficacy of trophon EPR.
We have included further details of the clinical evidence
that emerged during the past year in this report. We plan
to continue investing in this important aspect of our market
growth strategy in FY15.
Growing recognition and adoption of trophon EPROur Strategic Growth Plan is tracking well. In the US,
trophon EPR is now installed at 40 of the 50 top ranked
hospitals (US News & World Report). Key to the plan is
our strategic partnerships with global brands that position
us to penetrate important markets. While our partnerships
with GE in North America and Toshiba in the UK are now
well established, in March we were delighted to sign a new
agreement with Miele Professional in Germany.
Working with these leading global brands is a real testimony
to the innovation of the trophon EPR and validation of its
market potential.
Nanosonics received further recognition this year when we
were named the healthcare industry’s Company of the Year
for 2013 at the Janssen Industry Excellence Awards while
in Germany the trophon EPR received the M&K Award
2014 in the Labor and Hygiene category. Management &
Krankenhaus is the leading publication for decision makers
in the German health industry.
Current toxic HLD solutions progressively being
rejected by customers and regulatorsThere is a growing awareness of the occupational health
risks for healthcare professionals using toxic chemicals
to perform traditional ultrasound disinfection procedures.
Consequently, customers and regulators are turning to safer
alternatives such as the trophon EPR, which addresses the
OHS risks posed by traditional chemical soaking methods.
Trend towards Point of Care adoption The toxic chemicals used in traditional disinfection methods
involve soaking in chemicals and usually require a separate
For
per
sona
l use
onl
y

nanosonics limited | annual report 2014
10
room with ventilation. According to reports to TJC’s Office
of Quality Monitoring, space issues are a contributing factor
preventing proper sterilisation or high level disinfection of
medical equipment.
One of the many benefits of trophon EPR is that it is safe
and easy to use at the point of care. This not only saves
space, it creates workflow efficiencies and eliminates
transportation of probes, thus reducing the potential for
probe damage.
OperationsOperating expenses of $20.1 million and a net loss of $2.6
million represent a substantial reduction of about 55% that
supports our path to profitability. R&D activity focused on
refining and improving our product offering and identifying
new opportunities to leverage our platform technology into
the second generation of products. The company has a
strong and growing intellectual property portfolio. Since
April 2013, the number of granted/accepted patents has
more than doubled – from 47 to 95.
Validation work with ultrasound probe manufacturers
also progressed and the trophon EPR is now approved
for use with more than 600 probe models across 14
manufacturers. This is an important selling point for our
product. In addition, the figure includes surface probes,
which have the potential to become an important part of
our model as evidence emerges supporting the requirement
for disinfecting these devices.
We continued to implement our strategic LEAN program
to enable scalable manufacturing processes. In addition
to achieving improved planning and visibility, we achieved
100% on time delivery throughout the year.
Regulatory and Quality Assurance highlights for the year
included successful NRTL, KFDA and TüV recertification
audits as well as audits by Miele Professional and the
Korean Ministry of Food and Drug Safety. In addition, in
August we announced regulatory approval in Japan.
Throughout the year we also expanded our global
customer support and service capabilities into each of our
international markets with service infrastructure now set up
across all regions.
Focusing the varied activities of a global technology
company like Nanosonics is crucial to our success. During
the year, the Senior Leadership Team formalised a new
Corporate Mission statement supported by five Core
Corporate Objectives. These objectives are designed to
provide a clear direction to support our business and are:
Customer Experience, Product Innovation, Operational
Excellence, People Engagement and Value Creation.
Specific core strategies underpinning the objectives have
also been developed and are now directing the three year
growth plan for the Company.
OutlookLooking forward, our aim is to consolidate and expand on
the achievements of FY14 to create sustainable value
for shareholders.
I’m confident we have the foundations in place to achieve
our goals and support our growth strategies, and that our
device is uniquely positioned to take advantage of the
tremendous opportunities that are presenting as the market
fundamentals strengthen.
I would like to thank everyone in the Nanosonics team for
their dedication and efforts this year. This is an exciting
time for the company as we emerge as a fully-fledged
international medical technology organisation. We remain
focused on the necessary activities as well as building
company and shareholder wealth into the future.
Michael Kavanagh
CEO and President
Sydney
21 August 2014
For
per
sona
l use
onl
y

11
2014 was an exciting time in the US. The strategy of implementing trophon EPR with large hospital groups is paying off.
Some key highlights this year include:
Luminary US Institution, The Johns Hopkins Hospital, embraces trophon EPR“The trophon EPR has been the biggest thing to hit ultrasound since colour Doppler,” said the head of ultrasound radiology
at The Johns Hopkins Hospital (JHM) following the introduction of trophon EPR.
Headquartered in Baltimore, JHM is a $6.7 billion integrated global health enterprise and widely regarded as one of
the world’s leading hospitals. It was ranked by U.S. News & World Report as the best overall hospital in America for 21
consecutive years (1991-2011), and was rated as the top institution in 2013.
After an evaluation of ultrasound probe disinfection practices, the hospital’s Radiology Department decided to move
away from chemical soaking methods and purchased 26 trophon EPR units to
reprocess its intracavitary and surface transducers.
“The amount of time and energy needed for chemical soaking was greatly
impacting patient workflow to the point where I was pushing to hire a person to
just HLD the transducers,” said Robert De Jong Jr., RDMS, RDCS, RVT, Radiology
Technical Manager, Ultrasound.
“The chemicals were also creating a separation between layers of the transducer,
causing air to be introduced. This resulted in artefacts and degraded images.
I have not had to replace a transducer for these issues since the switch to the
trophon EPR.”
The hospital has experienced other benefits such as eliminating much of the protective gear that was required for chemical
soaking and being able to use the trophon EPR at the point of care. The latter means the department no longer needs a
room dedicated to HLD. Word about the trophon EPR spread throughout the hospital and JHM now has more than 40 units
across its radiology, obstetrics/gynaecology and emergency departments.
“The reduced time waiting for the transducer to be ready has been a major plus and staff members love the ease of use of
the trophon EPR. We’re now trying to ‘trophon’ every transducer after use, not just endocavitary,” said Mr De Jong.
“Trophon was an answered prayer! It has solved so many HLD issues while offering more complete and safer protection for
our patients and staff – in half the time.”
US regional highlights
• Amended contract executed with GE Healthcare to
continue as exclusive North America distributor with GE
funding the Nanosonics US Sales Force.
• GE Healthcare and GE Ventures sales and
marketing investment to accelerate the North American
growth strategy.
• trophon EPR installed at 40 of the top 50 Ob/Gyn best
US hospitals.*
• The trophon EPR was presented at national trade
shows and more than 20 regional infection control
scientific meetings.
• Service and repair capability in Indianapolis completed
and operational.
* US News and World Report
For
per
sona
l use
onl
y

12 Europe regional highlights
Strategic partnerships with leading global brands is a key part of our global expansion strategy. Our partnership with
Toshiba is reaping rewards and the Company now has a number of UK sites with multiple trophon EPRs installed. In
March Nanosonics signed a strategic partnership with Miele Professional to distribute trophon EPR in Germany. Miele
conducted a national launch in March and has started broad market awareness and education programs for trophon EPR
across Germany.
Other key highlights this year include:
trophon EPR provides reassurance for staff and patients at King’s Mill HospitalAchieving clinical governance goals is just one of the benefits experienced by the ultrasound department at King’s Mill
Hospital, UK following the installation of eleven trophon EPR units.
Staff also reported feeling reassured that probes are now being ‘deep cleaned’
in-line with international best practice. “We like this disinfection process
because it removes any user subjectivity, assuring staff that the disinfection
process is reproduced perfectly each and every cycle,” said Clinical Lead
Sonographer, Ann Allen.
“It has also had a positive impact on patient confidence as they know the probe
has been automatically reprocessed rather than manually cleaned.”
The 600 bed King’s Mill Hospital has one of the UK’s most highly regarded
ultrasound departments and turned to the trophon EPR when it was looking for
a solution to high level disinfect its probes following two MHRA alerts*. An initial
purchase of six units was quickly followed by a further five units.
“The trophon EPR is extremely easy to use and fits well into our workflow,” said Mrs Allen. “It has not caused any extension
in examination times, which is crucial in a busy ultrasound department.
“While there is an additional cost required to implement the trophon EPR versus the alternative HLD wipe system we
looked at, there are very significant cost savings year on year.”
* The first MHRA (Medicines and Healthcare products Regulatory Agency alert advised users to appropriately decontaminate all types of reusable ultrasound probes while the second advised users ensure detergent and disinfectant wipes are compatible with the medical device to avoid damage to the plastic surfaces.
• The trophon EPR has now been adopted in a number
of hospitals throughout the UK including key university
hospitals in London and Cardiff.
• Health board reviews are underway in England,
Scotland and Wales to amend ultrasound
decontamination procedures and guidelines following
MHRA alerts*. The changes, which will be released in
the foreseeable future, are expected to be positive for
trophon EPR.
• In Germany,
trophon EPR
received
Management &
Krankenhaus
Award 2014.
For
per
sona
l use
onl
y

13Asia Pacific regional highlights
The Australian market for the trophon EPR continued to grow this year. Two significant studies coming out of Australia
added to the mounting clinical evidence that will help us establish trophon EPR as the standard of care globally.
Some key highlights this year include:
trophon EPR “offers the best disinfection procedure” One of the major benefits of the trophon EPR is that it delivers effective, high level disinfection of the entire ultrasound
probe, including the shaft and handle. Some probe manufacturers advise against immersing the probe in liquid
disinfectant, which Dr Andrew Ngu, Principal of East Melbourne Ultrasound, said may pose a risk of cross infection
for patients.
Dr Ngu, who is also President elect for the International Society of Ultrasound in
Obstetrics and Gynaecology (ISUOG) and on the executive of the Australasian
Society of Ultrasound in Medicine (ASUM), has been using the trophon EPR
since February 2012.
“Before trophon we were using various methods, one of which was soaking the
probes in chemical solution,” Dr Ngu said. “It wasn’t very satisfactory as we
could only disinfect part of the probe.”
Dr Ngu co-authored a study which was presented at the ISUOG World Congress
in October 2013.
The study showed that more than 70% of manually disinfected probes still
showed signs of contamination on the handles, with a large portion of the contaminants being well known pathogens
including methicillin resistant Staphylococcus aureus (MRSA). In comparison, trophon EPR completely eliminated bacteria
on the probe handles.
“With the trophon EPR I can be assured that I’m giving patients the best service all round including, most importantly, the
best disinfection procedure for probes,” Dr Ngu said.
“The staff are also relieved they don’t have to do all the [protective equipment] procedures to protect themselves from the
chemical solution.
“It’s a very easy process to go through and we’re very happy with it. In fact, now we wouldn’t look at anything else.”
• The trophon EPR was approved for use in South Korea
following receipt of a product licence from the Korean
Food and Drug Administration (KFDA).
• Nanosonics successfully passed its first Environmental
Management System (EMS) certification audit and is
now certified to ISO14001-EMS.
• Named the healthcare industry’s Company of the
Year for 2013. The Janssen 2013 Industry Excellence
Awards recognise excellence in the commercialisation
of innovative healthcare solutions by Australian
biotechnology companies.
For
per
sona
l use
onl
y

nanosonics limited | annual report 2014
14 trophon® EPR: innovative technology delivering improved standards of care
Nanosonics’ trophon EPR provides fast, automated high level disinfection of ultrasound probes. The fully enclosed system
reduces the risk of chemical exposure and can be conveniently located at the point of care to improve clinic workflow.
For
per
sona
l use
onl
y

15
The trophon EPR product range
Nansonics has a range of consumables and accessories
to meet the needs of customers and allow them to more
effectively provide and monitor the high level disinfection
process. These products expand Nanosonics’ offering in
the market and provide additional revenue streams from
service contracts and consumables supply.
trophon® Connect
trophon Connect software is an audit and accreditation tool
that enables disinfection data to be downloaded from the
trophon EPR to a PC to provide fast, non-editable reports.
trophon® Printer
The trophon Printer delivers an easy-to-use traceability
solution for quality system documentation requirements.
The trophon Printer can print up to four labels per
disinfection cycle based on the operator, site or procedure
preferences and links the probe and disinfection procedure
to the patient.
trophon® Wall Mount and trophon® Cart
Enables the trophon EPR to be mounted on a wall where
there are space constraints or makes the device fully mobile
for convenient point of care use.
Chemical Indicators
Chemical Indicators validate each disinfection cycle by
providing a qualitative colour change.
Sonex™/NanoNebulant™
The trophon EPR uses cartridges of Nanosonics’ proprietary
disinfectant liquid. Each cartridge is sealed and easy
to insert into the trophon EPR. The device pierces the
cartridge once the cartridge is inserted so the user does
not come into contact with the liquid. Empty cartridges
are recyclable.
Fast
Fast automated high level
disinfection at point of care
Helps Protect
Fully enclosed system limits
exposure to harmful chemicals
Consistent
Quality assured
consistency
Traceability
Best practice
documentation solution
Probe Friendly
Probe friendly process. Compatible
with more than 600 probe models
Cost Efficient
Integrates into HLD process at
point of care and improves workflows
Effective
Clinically validated trophon EPR disinfects
both probe shaft AND handle
Environmentally Friendly
Harmless oxygen and water by-products.
More than 70% recyclable components
Auto
For
per
sona
l use
onl
y

nanosonics limited | annual report 2014
16
Changes to decontamination procedures and guidelines are an important factor in establishing trophon EPR as the new
standard of care.
These changes are starting to happen due to growing awareness of healthcare acquired infections (HAIs) related to imaging
procedures and recognition of the risks associated with improperly sterilised or high level disinfected medical equipment.
Most notable were the recent changes in the new guidelines from the American Institute of Ultrasound Medicine (AIUM).
The guidelines reinforce stricter controls for high level disinfection of ultrasound probes and included the statement “a
hydrogen peroxide nanodroplet emulsion might provide an effective high level disinfectant without toxicity”.
Clinical evidence is another important factor in driving these changes. During the last year some significant findings were
published highlighting the efficacy issues and OHS risks associated with traditional disinfection practices, as well as studies
that further support the need to adopt automated high level disinfection in ultrasound imaging.
Clinical evidence supporting adoption of trophon EPR continues to mount
Susceptibility of high-risk human papillomavirus type 16to clinical disinfectants
Jordan Meyers1†‡, Eric Ryndock2†, Michael J. Conway2§, Craig Meyers2* and Richard Robison1
1Department of Microbiology and Molecular Biology, Brigham Young University, Provo, UT 84602, USA; 2Department of Microbiology andImmunology, Pennsylvania State College of Medicine, Hershey, PA 17033, USA
*Corresponding author. Tel: +1-717-531-6240; Fax: +1-717-531-4600; E-mail: [email protected]†Authors contributed equally.
‡Present address: Department of Medicine, Brigham and Woman’s Hospital, Boston, MA 02115, USA.§Present address: Department of Foundational Sciences, Central Michigan University, Mount Pleasant, MI 48859, USA.
Received 7 October 2013; returned 18 November 2013; revised 31 December 2013; accepted 6 January 2014
Objectives: Little to nothing is known about human papillomavirus (HPV) susceptibility to disinfection. HPV is esti-mated to be among themost common sexually transmitted diseases in humans. HPV is also the causative agentof cervical cancers and other anogenital cancers and is responsible for a significant portion of oropharyngeal can-cers.While sexual transmission is well documented, vertical and non-sexual transmissionmayalso be important.
Methods: Using recombinant HPV16 particles (quasivirions) and authentic HPV16 grown in three-dimensionalorganotypic human epithelial culture, we tested the susceptibility of high-risk HPV to clinical disinfectants.Infectious viral particles were incubated with 11 common clinical disinfectants, appropriate neutralizers wereadded to inactivate the disinfectant and solutions were filter centrifuged. Changes in the infectivity titres ofthe disinfectant-treated virus were measured compared with untreated virus.
Results:HPV16 is a highly resistant virus; more so than other non-enveloped viruses previously tested. The HPV16quasivirions showed similar resistance to native virions, except for being susceptible to isopropanol, the triplephenolic and the lower concentration peracetic acid-silver (PAA-silver)-based disinfectant. Authentic virus andquasivirus were resistant to glutaraldehyde and ortho-phthalaldehyde and susceptible to hypochlorite and thehigher concentration PAA-silver-based disinfectant.
Conclusions:We present the first disinfectant susceptibility data on HPV16 native virions, which show that com-monly used clinical disinfectants, including those used as sterilants in medical and dental healthcare facilities,have no effect on HPV16 infectivity. Policy changes concerning disinfectant use are needed. The unusually highresistance of HPV16 to disinfection supports other data suggesting the possibility of fomite or non-sexual trans-mission of HPV16.
Keywords: hospital sterilants, papillomavirus, cancer, glutaraldehydes, ortho-phthalaldehydes
IntroductionDue to the specific life cycle requirements of human papilloma-virus (HPV), infectious virus has been difficult to produce in labora-tories and an assay for infectious virus has only recently becomeavailable. The ability to produce infectious virus outside of hostanimals is a great benefit to basic research; it often requires lesstime and is more cost-effective. HPV has a life cycle stringentlytied to differentiated epithelial tissue. This has required the devel-opment of special systems to make in vitro propagation possible.Because of the historical difficulty in producing high enough titresof infectious HPV particles and the lack of a suitable assay to testfor infectivity, little to nothing is known about HPV susceptibility to
disinfection. Disinfectants have been tested againstmany import-ant viruses and these studies are important to public health asthey provide information that can be used to reduce the preva-lence of infection, transmission and reinfection. Presently, hospi-tals’ and other healthcare institutes’ use of disinfectants toinactivate HPV is based on what is used for other viruses or simplyon what someone thinks should be effective. Two systems(recombinant based and organotypic) have been developed toproduce high amounts of infectious HPV particles in the labora-tory. Infectivity can now be measured by using reverse transcrip-tion quantitative PCR (RT-qPCR) that detects the viral E1^E4transcript. Detection of this transcript signals infectious particlesthat were able to achieve cell entry and start their early viral
# The Author 2014. Published by Oxford University Press on behalf of the British Society for Antimicrobial Chemotherapy. All rights reserved.For Permissions, please e-mail: [email protected]
J Antimicrob Chemotherdoi:10.1093/jac/dku006
1 of 5
Journal of Antimicrobial Chemotherapy Advance Access published February 4, 2014
by Jonathan Burdach on M
arch 2, 2014http://jac.oxfordjournals.org/
Dow
nloaded from
Evaluation of a Hydrogen Peroxide-BasedSystem for High-Level Disinfection ofVaginal Ultrasound Probes
valuation of the female pelvis with ultrasound involves bothtransabdominal and transvaginal images for increasedspecificity and sensitivity. Because nondisposable invasive
ultrasound probes are needed for transvaginal image acquisition,there is a potential for contamination of these instruments withblood, pathogens, or debris and, thus, cross-contamination in futurepatients.
Stephen Johnson, MD, Matthew Proctor, MD, Edward Bluth, MD, Dana Smetherman, MD,Katherine Baumgarten, MD, Laurie Troxclair, BS, Michele Bienvenu, BS
Received January 8, 2013, from the Departmentsof Radiology (S.J., M.P., E.B., D.S., L.T., M.B.) andInfectious Disease (K.B.), Ochsner ClinicFoundation, and University of Queensland Schoolof Medicine, Ochsner Clinical School (E.B.),New Orleans, Louisiana USA. Revision requestedJanuary 25, 2013. Revised manuscript acceptedfor publication February 19, 2013.
Address correspondence to Edward I. Bluth,MD, Department of Radiology, Ochsner ClinicFoundation, 1514 Jefferson Hwy, New Orleans,LA 70121 USA.
E-mail: [email protected]
AbbreviationsFDA, Food and Drug Administration
E
©2013 by the American Institute of Ultrasound in Medicine | J Ultrasound Med 2013; 32:1799–1804 | 0278-4297 | www.aium.org
ORIGINAL RESEARCH
Objectives—Because of the complex process and the risk of errors associated with theglutaraldehyde-based solutions previously used at our institution for disinfection, ourdepartment has implemented a new method for high-level disinfection of vaginal ultra-sound probes: the hydrogen peroxide-based Trophon system (Nanosonics, Alexandria,New South Wales, Australia). The aim of this study was to compare the time difference,safety, and sonographers’ satisfaction between the glutaraldehyde-based Cidex (CIVCOMedical Solutions, Kalona, IA) and the hydrogen peroxide-based Trophon disinfectionsystems.
Methods—The Institutional Review Board approved a 14-question survey adminis-tered to the 13 sonographers in our department. Survey questions addressed a varietyof aspects of the disinfection processes with graded responses over a standardized 5-point scale. A process diagram was developed for each disinfection method with seg-mental timing analysis, and a cost analysis was performed.
Results—Nonvariegated analysis of the survey data with the Wilcoxon signed rank testshowed a statistical difference in survey responses in favor of the hydrogen peroxide-based system over the glutaraldehyde-based system regarding efficiency (P = .0013),ease of use (P = .0013), ability to maintain work flow (P = .026), safety (P = .0026),fixing problems (P = .0158), time (P = .0011), and overall satisfaction (P = .0018).The glutaraldehyde-based system took 32 minutes versus 14 minutes for the hydrogenperoxide-based system; the hydrogen peroxide-based system saved on average 7.5 hoursper week. The cost of the hydrogen peroxide-based system and weekly maintenancepays for itself if 1.5 more ultrasound examinations are performed each week.
Conclusions—The hydrogen peroxide-based disinfection system was proven to be moreefficient and viewed to be easier and safer to use than the glutaraldehyde-based system.The adoption of the hydrogen peroxide-based system led to higher satisfaction amongsonographers.
Key Words—infection control; transvaginal ultrasound; ultrasound technology
doi:10.7863/ultra.32.10.1799
3210jum_online_Layout 1 9/19/13 8:45 AM Page 1799
Review
Infectious risk of endovaginal and transrectalultrasonography: systematic review and meta-analysis
S. Leroy*
Epidemiology of Emerging Diseases Unit, Institut Pasteur, Paris, France
A R T I C L E I N F O
Article history:Received 16 November 2011Accepted 23 July 2012Available online xxx
Keywords:ContaminationDisinfectionEndovaginalRiskTransrectal ultrasonography
S U M M A R Y
Background: Appropriate endovaginal/rectal ultrasound transducer disinfection has beenan ongoing and vexed question in gynaecology, obstetrics and urology. However, theroutine use of probe covers followed by low-level disinfection (wipes/spray) is usuallyapplied between patients in some countries (e.g. France).Aim: To perform a systematic review and meta-analysis of the scientific literature in orderto identify case reports of contamination following endovaginal/rectal probe use, and toestimate the infection prevalence related to the use of these probes in common dailypractice.Methods: Systematic review and meta-analysis.Results: From the 867 potentially eligible references, 32 articles were finally included.Very few cases with an established route of contamination had been reported. Indeed,apart from occurrence of outbreaks, it is difficult if not impossible to detect viralcontamination through the use of endovaginal/rectal ultrasound probes. However, therewas a pooled prevalence of 12.9% (95% confidence interval: 1.7e24.3) for pathogenicbacteria, and 1.0% (0.0e10.0) for frequently occurring virus (human papillomavirus,herpes simplex virus, and cytomegalovirus) for endovaginal/rectal probes, both after low-level disinfection. The pooled prevalence of infected patients after transrectal ultrasoundand guided biopsies was estimated to be 3.1% (1.6e4.3).Conclusions: There appears to be a risk of transmitting bacterial or viral infections viaendovaginal/rectal ultrasound transducer, and the present meta-analysis provides anestimate of this risk. Further research with sophisticated modelling is warranted toquantify the risk.ª 2012 The Healthcare Infection Society. Published by Elsevier Ltd. All rights reserved.
Introduction
Appropriate ultrasound transducer disinfection has been anongoing and vexed question, and hygiene of ultrasound probescontinues to be discussed in gynaecology, obstetrics andurology. The cost of transducers precludes a single-use-only
strategy. The key infection control issue concerns the risk ofcontamination and the need for specific cleaning/disinfectionprocedures to ensure a high degree of protection againstinfectious disease transmission, even when a disposable coveris used. Endovaginal and transrectal ultrasound are consideredas at least medium-risk procedures involving contact withmucous membranes.1e3 The main pathogens of concern arehuman immunodeficiency virus (HIV), cytomegalovirus (CMV),human papilloma virus (HPV), enteric Gram-negative patho-gens (e.g. Escherichia coli, Klebsiella spp.), for both ultra-sound examinations, and C. difficile more specifically for
* Address: Epidemiology of Emerging Diseases Unit, Institut Pasteur,25 rue Du Dr Roux, 75015 Paris, France. Tel.: þ33 1 40 61 39 58;fax: þ33 1 45 68 88 76.
E-mail address: [email protected].
Available online at www.sciencedirect.com
Journal of Hospital Infection
journal homepage: www.elsevierhealth.com/journals / jhin
0195-6701/$ e see front matter ª 2012 The Healthcare Infection Society. Published by Elsevier Ltd. All rights reserved.http://dx.doi.org/10.1016/j.jhin.2012.07.014
Journal of Hospital Infection xxx (2012) 1e8
Please cite this article in press as: Leroy S, Infectious risk of endovaginal and transrectal ultrasonography: systematic review and meta-analysis,Journal of Hospital Infection (2012), http://dx.doi.org/10.1016/j.jhin.2012.07.014
Original research article
Assessing the risk of disease transmission to patients when there is a failureto follow recommended disinfection and sterilization guidelines
David J. Weber MD, MPH a,b,*, William A. Rutala PhD, MPH a,b
aDepartment of Medicine, University of North Carolina at Chapel Hill, Chapel Hill, NCbDepartment of Hospital Epidemiology, UNC Health Care, Chapel Hill, NC
Key Words:BronchoscopyHealth care-associated infectionFailureEndoscopy
Medical devices that enter body tissues should be sterile, whereas devices that contact mucousmembranes should be high-level disinfected between patients. Failure to ensure proper cleaning andsterilization or disinfection may lead to patient-to-patient transmission of pathogens. This paperdescribes a protocol that can guide an institution in managing potential disinfection and sterilizationfailures.
Copyright � 2013 by the Association for Professionals in Infection Control and Epidemiology, Inc.Published by Elsevier Inc. All rights reserved.
Each year in the United States, approximately 101millionmedicalprocedures are performed, including approximately 10.8 milliongastrointestinal endoscopies and approximately 440,000 bronchos-copies.1 All invasive procedures involve contact by a medical deviceor surgical instrument with a patient’s sterile tissue or mucousmembranes. Amajor risk of all such procedures is the introduction ofpathogens that can lead to infection. Failure to properly disinfector sterilize equipment carries not only the risk associated withbreach of host barriers but also a risk for person-to-person trans-mission (eg, hepatitis B virus, hepatitis C virus, Salmonella spp,Mycobacterium tuberculosis) and transmission of environmentalpathogens (eg, Pseudomonas aeruginosa, non-tuberculous mycobac-teria, environmental fungi). Thus, achieving disinfection and sterili-zation through the proper cleaning of usedmedical devices followedby proper use of disinfectants and sterilization practices is essentialfor ensuring that medical and surgical instruments do not transmitinfectious pathogens to patients.2,3
More than 45 years ago, Spaulding devised a rationale approachto disinfection and sterilization of patient care items or equip-ment.2-4 This classification scheme is so clear and logical that it hasbeen retained and refined and continues to be used when planningmethods for disinfection and sterilization. Spaulding dividedmedical devices into 3 categories (ie, critical, semicritical, noncrit-ical) based on the risk of infection involved in the use of the items.
Critical devices are items that enter sterile tissue or the vascularsystem and include surgical instruments, implants, and intravenousor intra-arterial catheters. Items in this category should bepurchased as sterile or should be sterilized by steam sterilization(preferred). Semicritical items are those that come into contactwith mucous membranes or nonintact skin and include gastroin-testinal endoscopes, bronchoscopes, laryngoscope blades andhandles, and diaphragm fitting rings. These medical devices shouldbe free of all microorganisms (ie, mycobacteria, fungi, viruses, andbacteria), although small numbers of bacterial spores may bepresent. The minimal requirement for semicritical items is high-level disinfection using US Food and Drug Administration-cleared,high-level chemical disinfectants. Noncritical items are those thatcome in contact with intact skin but not mucous membranes(eg, bedpans, blood-pressure cuffs, bed rails). Such items should beundergo low-level disinfection after use when shared by differentpatients. The Spaulding classification provides an excellent guidefor disinfection and sterilization of medical devices, but it should benoted that the scheme is an oversimplification and that preventingtransmission of infection bymedical devicesmay require additionalmodifications.3,5
Multiple studies in many countries have documented lack ofcompliance with established guidelines for disinfection and steril-ization.3 Failure to comply with scientifically based guidelineshas led to numerous outbreaks. Deficiencies leading to infectionhave occurred either from failure to adhere to scientifically basedguidelines ormisuse of the disinfection or sterilization processes.6-9
Patient notifications because of improper reprocessing of semi-critical (eg, endoscopes) and critical medical instruments haveoccurred regularly and generally involve single institutions but mayalso involve multiple institutions.10 Seoane-Vazquez et al reported
* Address correspondence to David J. Weber, MD, MPH, 2163 Bioinformatics,CB 7030, Chapel Hill, NC 27599-7030.
E-mail address: [email protected] (D.J. Weber).Publication of this articlewas supported by Advanced Sterilization Products (ASP).Conflicts of interest: W.A.R. reports income from ASP and Clorox, and D.J.W.
reports income from Clorox.
Contents lists available at ScienceDirect
American Journal of Infection Control
journal homepage: www.aj ic journal .org
American Journal of Infection Control
0196-6553/$36.00 - Copyright � 2013 by the Association for Professionals in Infection Control and Epidemiology, Inc. Published by Elsevier Inc. All rights reserved.http://dx.doi.org/10.1016/j.ajic.2012.10.031
American Journal of Infection Control 41 (2013) S67-S71
For
per
sona
l use
onl
y

17
1. M’Zali, F., et al (2014). “Persistence of Microbial Contamination on Transvaginal Ultrasound Probes despite Low-Level Disinfection Procedure.” PLoS One 9(4): e933682. Leroy, S. (2013). Infectious risk of endovaginal and transrectal ultrasonography: systematic review and meta-analysis. J Hosp Infect 83(2): 99-106.3. Weber, D. J., Rutala W (2013). Assessing the risk of disease transmission to patients when there is a failure to follow recommended disinfection and sterilization guidelines. Am J Infect
Control 41(5 Suppl): S67-71.4. Ferhi, K., et al., Hepatitis C transmission after prostate biopsy. Case Rep Urol, 2013. 2013: p. 797248.5. Medicines and Healthcare products Regulatory Agency (UK), Medical Device Alert Ref: MDA/2012/037, Issued: 28 June 2012 at 14:00.6. McNally G, Ngu A, ISUOG World Congress, Sydney, Oct 2013.7. S.Klett, P. Heeg. Stellungnahme zu den Publikationen von Herrn PD Dr G Schrader in Hygiene und Medizin, 2014.8. Meyers, J., et al., J Antimicrob Chemother, 2014.9. Johnson et al. J Ultrasound Med. 2013 Oct;32(10):1799-804. 10. Vickery et al., Evaluation of an automated high-level disinfection technology for ultrasound transducers. J Infect Public Health. 2013 Dec.
• A study evaluating contamination levels on ultrasound
probes covered by a sheath and disinfected using wipes,
demonstrated a substantial persistence of potentially
pathogenic microorganisms. Human papilloma virus
(HPV) DNA was found on 7% of the probes (HPV can
cause cervical and other cancers). Staphylococcus
aureus on 4% and Chlamydia trachomatis, which can
also cause serious illness, were found on 2% of samples
post decontamination.1
• A meta-analysis of studies involving wipes for disinfection
has shown residual pathogenic bacterial contamination
(12.9%) and viral contamination (1.0%) on transvaginal
and transrectal transducers.2
• Manual disinfection of medical devices has been
shown to lead to an increased risk of operator error if
protocols are not followed correctly and poor protocol
compliance can lead to an increased risk of transmission
for patients.3
• A case of hepatitis C infection was reported in a patient
after a prostate biopsy. This follows another case of a fatal
hepatitis B infection after an imaging procedure. In both
cases improper ultrasound transducer disinfection may
have been involved.4,5
• A study found that more than 70% of manually
disinfected probes still showed signs of contamination
on the handles, with a large portion of the contaminants
being well known pathogens including methicillin
resistant Staphylococcus aureus (MRSA). While handles
do not enter body cavities they can harbour pathogens
and pose a risk of cross infection for patients.
The study called for stricter disinfection standards which
require use of devices – such as the trophon EPR – or
techniques that ensure high level disinfection of the
whole probe, handle included.6
• Manual disinfection processes are often difficult to
validate to ensure all critical process parameters are
consistently met.7
• Nurses with regular daily exposure to sterilizing agents
(including glutaraldehyde) during pregnancy, are
more than twice as likely to undergo late spontaneous
abortion compared to nurses who are not exposed to
these chemicals.8
• An evaluation of the trophon EPR concluded that the
trophon EPR was proven to be more efficient and viewed
to be easier and safer to use than a glutaraldehyde-based
method. The study showed that the trophon EPR process
took 14 minutes (this figure includes related activities
such as pre-cleaning the probe, wiping after disinfection
process and logging patient information) compared to 32
minutes for a glutaraldehyde-based disinfection system
and that the trophon EPR saved an average of 7.5 hours
per week.9
• A peer-reviewed study published in the Journal of
Infection and Public Health reported on the performance
of the trophon EPR when tested against 21 different
species of bacteria, fungi and viruses according
to accepted international standards for high level
disinfection. The study showed trophon EPR met all
standards for high level disinfection.10
For
per
sona
l use
onl
y

nanosonics limited | annual report 2014
18
Information on the directors, company secretaries and senior management
1. Maurie Stang
Non-Executive Chairman
Mr Stang has been Non-Executive Director and Chairman
since March 2007 and a member of the Board since
November 2000.
Mr Stang has more than two decades of experience
building and managing companies in the healthcare and
biotechnology industry in Australia and internationally. His
strong business development and marketing skills have
resulted in the successful commercialisation of intellectual
property across global markets. He is a Non-Executive
Director of Vectus Biosystems and has been Non-Executive
Chairman of Aeris Environmental Ltd (ASX:AEI) since 2002.
2. Michael Kavanagh BSc, MBA (Advanced)
CEO and President (from 21 October 2013)
Mr Kavanagh joined Nanosonics as CEO and President
effective 21 October 2013. He was a Non-Executive
Director of the Board from 30 July 2012 to 20
October 2013.
Mr Kavanagh has more than 20 years of international
commercial experience in the healthcare market having
held local, regional and global roles in Medical Device and
Pharmaceutical industries.
Before joining Nanosonics, he was Senior Vice President
of Global Marketing for the major medical device company
Cochlear Ltd, a position he held for more than 10 years.
Mr Kavanagh has no other current and former directorships
in the last three years.
3. Richard England FCA, MAICD
Non-Executive Director
Mr England joined the Board in February 2010. He is a
chartered accountant and professional Non-Executive
Director. Since 2002, Mr England has been a director and
Chairman of Ruralco Holdings Limited (ASX:RHL).
Since February 2008 he has been a director and Chairman
of Chandler Macleod Group Limited (ASX:CMG). He has
been director of Macquarie Atla Roads Limited (ASX:MQA)
since June 2010 and a director of Japara Healthcare
Limited (ASX:JHC) since April 2014.
4. David Fisher BRurSc (Hons), MAppFin, PhD, FFin
Non-Executive Director
Dr Fisher has been a member of the Board since July 2001.
Dr Fisher is founding partner of Brandon Capital Partners,
a leading Australian venture capital provider. He has more
than 25 years’ of extensive operating experience in the
biotechnology and healthcare industry in Australia and
overseas. He held senior positions with Pharmacia AB (now
part of Pfizer, Inc) and was CEO of Peptech Limited (now
part of Cephalon Inc. (Nasdaq:CEPH). He was a director
of Aeris Environmental Ltd (ASX:AEI) from May 2011 to
July 2014.
5. Ron Weinberger BSc (Hons), PhD
President Technology Development/Commercialisation
(from 21 October 2013)
Dr Weinberger joined the Company in August 2004 and
was appointed as Executive Director in July 2008 then
Managing Director and Chief Executive Officer in December
2011 with a period as acting CEO from May 2011. Since
October 2013, he has been President of Technology
Development/Commercialisation and is responsible for the
direction of the Company’s technology development and
commercialisation strategy.
Dr Weinberger has more than two decades of experience in
medical research and biotechnology. He is co-inventor
of several of Nanosonics’ key technology patents.
Dr Weinberger has not had any other directorships of
listed companies in the last three years.
1 2 3 4 5
For
per
sona
l use
onl
y
19
6. McGregor Grant BEc, CA, GAICD
Chief Financial Officer and Company Secretary
Mr Grant joined Nanosonics in April 2011 and is
responsible for the overall financial management of the
Company and, together with Mr Kavanagh, has joint
responsibility for investor relations. Mr Grant has more
than 18 years of business experience in a number
of senior roles in the medical device and healthcare
industries located in Australia and the United States.
Previously Mr Grant worked for Coopers & Lybrand in
Australia and Europe.
7. Gerard Putt BSc
Chief Operations Officer
Mr Putt joined Nanosonics full time in 2011 after 18
months on the Nanosonics advisory board. Mr Putt
has more than 15 years of experience in the Medical
Device industry as a leader of development, engineering,
production and operations teams. He has particular
experience in the implementation of new products
into manufacturing and rapid scaling of production to
international market needs.
8. Michael Potas BE (E&C)
Head of Research, Design and Development
Mr Potas joined Nanosonics in August 2006 and has
more than 16 years’ experience in the development and
commercialisation of new products and technologies.
Since joining Nanosonics in 2006, Mr Potas has been
instrumental in the research, design and development of
the trophon EPR and associated core intellectual property.
9. Vincent Wang BSc, MSc, MBA
Head of Global Support and Services
Mr Wang has extensive experience in developing and
implementing global service and support strategy,
establishing and managing customer support, technical
service and service marketing functions in global medical
device businesses. Before joining Nanosonics in May
2011, Mr Wang led and managed Technical Services and
Service Operations for Sonova Hearing Healthcare Group
and Cochlear Ltd respectively.
10. Ruth Cremin MSc
Head of Quality and Regulatory
Ms Cremin joined Nanosonics in July 2011 and has
extensive regulatory affairs experience. Previously
she worked at Cochlear as a Senior Regulatory Affairs
Specialist for the Asia Pacific Region; at Pfizer Australia as
a QA & Regulatory Officer and at Bio-Medical Research
Ltd in Galway, Ireland as a Regulatory Affairs Associate.
11. Kirste Courtney BA
Human Resources Manager
Ms Courtney joined Nanosonics in 2008 and has more
than 16 years of human resources experience having
worked in a variety of industry sectors including chartered
accounting, media, logistics and banking.
6 7 8 11109
For
per
sona
l use
onl
y

nanosonics limited | annual report 2014
20
Information on the directors, company secretaries and senior management (continued)
12. Ronald J Bacskai BSME, MBA (Hons)
President and CEO, Nanosonics Inc.
Mr Bacskai joined Nanosonics in 2010 and is responsible
for leading Nanosonics’ business in the United States.
Mr Bacskai is an experienced executive having worked in
multiple industries with a broad technical, marketing and
sales, and technology commercialisation background. Mr
Bacskai has significant experience as President, CEO and
board member of several public and private organisations
as well as serving on the advisory board of a speciality
environmental firm.
13. Bryn Tudor-Owens BSc
Country Manager – UK
Mr. Tudor-Owen has 20 years’ experience gained within
the medical device industry. Prior to Nanosonics he
held senior positions with both GE Medical Systems and
Cardinal Health for more than 15 years before more
recently driving the UK startup operations of a German
Healthcare SME. He joined Nanosonics in August 2012.
14. Ralf Schmähling BA (Hons)
Country Manager – Germany
Mr. Schmähling joined Nanosonics in September 2012.
He has more than 12 years experience in various
business, sales and marketing management and
leadership functions within blue chip medical device
companies. He has a successful track record on strategic
and tactical sales execution in the German health
care market.
15. Julien Laronze BBA, BA
Country Manager – France
Mr. Laronze joined Nanosonics in March 2014. He
has more than 15 years senior sales management and
executive level experience, with a proven track record
in driving growth both domestically and internationally,
in the medical technology industry with large and small
companies. Prior to joining Nanosonics, he held Sales
Director positions with Sophysa and Edap-Tms.
16. Robert Waring BEc (Sydney), CA, FCIS, FFin, FAICD
Company Secretary
Mr Waring was appointed Company Secretary in October
2010 and held this position at the time of the Company’s
IPO in May 2007. He is a director of corporate advisory
firm, Oakhill Hamilton Pty Ltd.
1612 151413
For
per
sona
l use
onl
y

21
For
per
sona
l use
onl
y
nanosonics limited | annual report 2014
22 Directors’ report
Your directors submit their report together with the Consolidated Financial Report of the Group, being
Nanosonics Limited and its subsidiaries, for the year ended 30 June 2014.
Principal activities
During the year the principal activities of the Group consisted of:
• Manufacturing and distribution of the trophon® EPR ultrasound probe disinfector and its associated consumables and
accessories; and
• Research, development and commercialisation of infection control and decontamination products and
related technologies.
There have been no significant changes in the nature of these activities during the year.
Operating and financial review
Revenue from sales for the year amounted to $21,492,000 (2013: $14,899,000), an increase of $6,593,000 or $44.3%.
Global sales were up with all regions contributing towards this growth. Sales were up 34% in North America, 51% in
Australia and New Zealand, and fivefold in Europe and other countries.
Other income amounted to $4,114,000 (2013: $2,690,000), which included the R&D tax refund of $1,516,000 (2013:
$1,348,000); Export Market Development grant of $150,000 (2013: 150,000); reimbursement of costs by a distributor of
$1,707,000 (2013: nil) and interest earned on cash investments of $739,000 (2013: $1,192,000).
Operating expenditure for the year amounted to $20,116,000 (2013: $16,379,000), an increase of $3,737,000 or 22.8%
driven by higher employment and related operating costs to support the growth of the business.
Other expense for the year of $555,000 ($517,000) relates to borrowing costs on convertible notes.
The consolidated loss after tax amounted to $2,605,000 (2013: $5,768,000), a substantial reduction of 55%.
The Group ended the year with $21,233,000 of cash and equivalents (2013: $24,064,000). The Group has adequate cash
to fund the operations of the business.
Other information on the operations of the Group and its business strategies and prospects are discussed in the review of
operations included in the CEO report and the regional reviews on pages 8 to 13 of this report
Significant changes in the state of affairs
In the opinion of the directors, there were no significant changes in the state of affairs of the Group during the financial year
under review and to the date of this report.
Dividends – Nanosonics Limited
The directors do not recommend the payment of a dividend for the financial year ended 30 June 2014. No dividends were
proposed, declared or paid during the financial year (2013: Nil).
The Company’s dividend policy in the future, the extent of future dividends and any franking of dividends will depend upon
the profitability and the financial and taxation position of the Group at the relevant time.
For
per
sona
l use
onl
y

23
Matters subsequent to the end of the financial year
No matter or circumstance has arisen since 30 June 2014 that has significantly affected, or may significantly affect:
a. the Group’s operations in future financial years;
b. the results of those operations in future financial years; or
c. the Group’s state of affairs in future financial years.
Likely developments and expected results of operations
Comments on expected results of the operations of the Group are included in the review of operations on pages 8 to 13.
Further information on likely developments in the operations of the Group and the expected results of operations have not
been included in this annual report because the Directors believe it would be likely to result in unreasonable prejudice to
the Group.
Environmental regulation
The Group is subject to meeting statutory environmental regulations. To demonstrate its commitment to meeting these
regulations, the Group has put in place an Environmental Management system, which is currently certified to ISO14001.
Directors
During the year and to the date of this report, the Board of Nanosonics Limited comprised of Maurie Stang, David Fisher,
Richard England, Michael Kavanagh, and Ron Weinberger.
As at the date of this report, Nanosonics Limited has the following committees of the Board: Audit and Risk, Remuneration,
Nomination, and R&D and Innovation. Details of members of the committees of the Board during the year are included
on page 27.
Information on the directors, company secretaries and senior management is a part of the Directors’ report and can be
found on pages 18 to 20 of the Annual Report.
Meetings of directors
The number of directors’ meetings, including meetings of the committees, held during the year ended 30 June 2014,
and numbers of meetings attended by each of the directors were as follows:
Full meetings of directors
Meetings of committees
AuditGovernance and
Nomination Remuneration
Held1 Attended Held1 Attended Held1 Attended Held1 Attended
Maurie Stang 12 10 3 2 2 2 4 3
Richard England 12 12 3 3 2 2 4 4
David Fisher 12 11 3 3 2 2 4 4
Ron Weinberger 12 12
Michael Kavanagh 12 11 3 3
1 Represents the number of meetings that a director is eligible to attend.
For
per
sona
l use
onl
y

nanosonics limited | annual report 2014
24 Directors’ report (continued)
Share-based payments
Shares issued under the DESP and options granted under ESOP and GSOP during the year are detailed below.
Shares issued
During the year ended 30 June 2014, the Company issued a total of 1,835,108 (2013:2,005,800) new ordinary shares in
Nanosonics Limited as detailed below. To the date of this report, the Company issued a total of 2,169,108 new ordinary
shares as detailed below. No amount was unpaid on any of the shares so issued.
Shares issued Number of shares issued
Share options exercised under Share Option Plans 1,835,108
Total new shares issued during the year 1,835,108
Share options exercised under Share Option Plans post balance date 334,000
Total new shares issued and to the date of this report 2,169,108
As at 30 June 2014 there were 263,823,826 (2013: 261,988,718) ordinary shares in Nanosonics Limited on issue. At
the date of this report, there were 264,157,826 shares on issue. Further information on issued shares is provided in the
Contributed equity and the Share-based compensation notes to the financial statements.
Share options granted
During the financial year and to the date of this report, the Company granted, for no consideration, 3,115,869 (2013:
3,023,929) unquoted options over unissued ordinary shares in Nanosonics Limited. Further information on the grants is
provided below, in section 5 of the Remuneration report on pages 42 to 47 and in the Share-based compensation note to
the financial statements.
Share options granted Number of options granted
Employee Share Option Plan (ESOP) 2,981,494
General Share Option Plan (GSOP) –
Total new options granted during the year 2,981,494
Employee Share Option Plan (ESOP) 134,375
Total options granted to the date of this report 3,115,869
For
per
sona
l use
onl
y

25
Shares under option
At the date of this report, there were 6,159,975 unissued ordinary shares of Nanosonics Limited under option as detailed
below. As at 30 June 2014, there were 6,525,597 (2013: 5,418,625) unissued ordinary shares of Nanosonics Limited
under option. Further information on the options is provided in the Share-based compensation note to the financial statements.
Share option plan Number of shares under option
Employee Share Option Plan (ESOP) 5,972,263
General Share Option Plan (GSOP) 553,334
Total shares under option at 30 June 2014 6,525,597
Share options exercised under Share Option Plans post balance date (334,000)
Share options forfeited under Share Option Plans post balance date (165,997)
Share options issued under Employee Share Option Plan (ESOP) post balance date 134,375
Total shares under option to the date of this report 6,159,975
The options entitle the holder to participate in a share issue of the Company provided the options are exercised on or after
their vesting date and prior to their expiry date. No option holder has any right under the options to participate in any other
share issue of the Company or any other entity.
For
per
sona
l use
onl
y

nanosonics limited | annual report 2014
26 Directors’ report (continued)
Remuneration report - audited
Table of contentsSection Title Description
1 Introduction Describes the scope of the Remuneration report and the individuals whose remuneration details are disclosed.
2 Remuneration governance
Describes the role of the Board and the Remuneration Committee and the use of remuneration consultants when making remuneration decisions.
3 Non-executive director remuneration
Provides detail regarding the fees paid to Non-Executive Directors including all required disclosures.
4 Executive remuneration
Outlines the Company’s remuneration strategy and principles applied to executive remuneration decisions and the framework used to deliver it including the performance and remuneration linkages, and all required executive remuneration disclosures.
5 Equity plan disclosures
Provides detail regarding the Company’s employee equity plans including that information required by the Corporation Act and applicable accounting standards.
6 Employment agreements
Provides details regarding the contractual arrangements between the Company and the executives whose remuneration details are disclosed.
7 Key Management Personnel transactions
Provides details of loans and other transactions with Key Management Personnel and their related parties.
1.0 Introduction
Nanosonics is an emerging medical technology company with operations in a number of locations. The Board has a strong
growth focus and the executive remuneration policies are designed to direct behaviours towards achieving sustainable
growth in shareholder value over the medium to long term. However, it must be understood that to attract, motivate
and retain high performing executives and in the face of strong competition for talent, some flexibility in our approach
is required.
The Board’s executive remuneration strategy is to provide ‘fair and appropriate’ remuneration balanced on a risk and
reward framework that supports its business strategy in the short and long term. Board and executive remuneration are
reviewed independently on a regular basis. The last formal review was undertaken during the year ended 30 June 2014.
The Board believes that Nanosonics’ approach to executive Key Management Personnel (KMP) remuneration is
appropriately balanced to fairly reward and motivate an experienced executive team to deliver profitable business growth
which meets the expectations of our shareholders.
1.1 Scope
This Remuneration report sets out, in accordance with the relevant Corporations Act 2001 (Cth) (Corporations Act) and
accounting standard requirements, the remuneration arrangements in place for Key Management Personnel of Nanosonics
Limited (Nanosonics) during the financial year ended 30 June 2014 (2014 Financial Year).
For
per
sona
l use
onl
y

27
1.2 Key Management Personnel
Key Management Personnel have authority and responsibility for planning, directing and controlling the activities of
Nanosonics and comprise the Non-Executive Directors, Executive Directors and Executive KMP. Details of the Key
Management Personnel as at year end are set out in the table below.
Name Title (at year end) Change in 2014 Financial Year
Non-Executive Directors
Maurie Stang Chairman
Member, Audit and Risk Committee
Member, Remuneration Committee
Member, Nomination Committee
Member, R&D and Innovation Committee
Full year
Appointed member, R&D and Innovation Committee, July 2014
Richard England Director
Chairman, Audit and Risk Committee
Chairman, Remuneration Committee
Chairman, Nomination Committee
Full year
Chairman, Remuneration Committee from 16 October 2013
David Fisher Director
Member, Audit and Risk Committee
Member, Remuneration Committee
Member, Nomination Committee
Chairman, R&D and Innovation Committee
Full year
Appointed Chairman, R&D and Innovation Committee, July 2014
Executive Directors
Michael Kavanagh Chief Executive Officer (CEO) and President, Managing Director
Member, R&D and Innovation Committee
Appointed 21 October 2013 (Non-executive Director from 30 July 2012 to 20 October 2013)
Chairman, Remuneration Committee to 15 October 2013
Appointed member, R&D and Innovation Committee, July 2014
Ron Weinberger Director and President, Technology Development /Commercialisation Member, R&D and Innovation Committee
Full year
CEO and Managing Director from 19 December 2011 to 20 October 2013
Appointed member, R&D and Innovation Committee, July 2014
Executive KMP
McGregor Grant Chief Financial Officer(CFO) and Company Secretary
Full year
Gerard Putt Chief Operations Officer Full year
For
per
sona
l use
onl
y

nanosonics limited | annual report 2014
28
2.0 Remuneration governance
This section of the Remuneration Report describes the role of the Board, the Remuneration Committee, and the use of
Remuneration Consultants when making remuneration decisions.
2.1 Role of the Board and the Remuneration Committee
The Board is responsible for Nanosonics’ remuneration strategy and policy. Consistent with this responsibility, the Board
has established a Remuneration Committee which comprises a majority of independent Non-Executive Directors. The
members of the Remuneration Committee over the 2014 Financial Year were Richard England, Maurie Stang, David Fisher
and Michael Kavanagh (until 20 October 2013).
The role and responsibilities of the Remuneration Committee is set out in its Charter, which was last revised and approved
by the Board in July 2014. In summary the Remuneration Committee’s role is to:
• Review and approve Nanosonics’ remuneration strategy and policy and ensure that appropriate processes and
procedures are in place to assess the remuneration levels of the Board and executive KMP and all other employees
across the Group;
• Consider and propose to the Board the remuneration of the CEO and consider and approve the remuneration of all
designated senior executives;
• Review and approve Nanosonics’ incentive schemes, including amounts, terms and offer processes and
procedures; and
• Determine and approve equity awards in accordance with policy and shareholder approvals, including testing of vesting
and termination provisions.
The Remuneration Committee’s role and its interaction with the Board, internal and external advisors, are illustrated below:
The Board
Reviews, applies judgement and, as appropriate, approves the Remuneration Committee’s recommendations.
The Remuneration Committee
The Remuneration Committee operates under the delegated authority of the Board.
The Remuneration Committee is empowered to source any internal resources and obtain external independent professional advice it considers necessary to enable it to make recommendations to the Board on the following:
Remuneration policy, composition and
quantum of remuneration components for Executive
KMP, including STI performance targets
Remuneration policy in respect of
Non-Executive Directors
Recruitment, retention and termination
policies and practices
Design features of employee and executive
LTI Plan awards, including setting of
performance and other vesting criteria
External Consultants Internal Resources
Directors’ report (continued)
For
per
sona
l use
onl
y

29
Further information on the Remuneration Committee’s role, responsibilities and membership is contained in the Corporate
Governance Statement on pages 53 to 57 of this Annual Report. The Remuneration Committee Charter can be viewed in
the Corporate Governance section of Nanosonics’ website at www.nanosonics.com.au.
2.2 Use of remuneration consultants
From 1 July 2011, all proposed remuneration consultancy contracts (within the meaning of section 206K of the
Corporations Act 2001) are subject to prior approval by the Board or the Remuneration Committee in accordance with the
Corporations Act 2001.
During the year ended 30 June 2014, several remuneration consultancy contracts were entered into by Nanosonics and
accordingly the disclosures required under section 300A (1) (h) of the Corporations Act 2001 are set out below.
Advisor/Consultant FY2014 Service Provided Remuneration Consultant for the purposes of the Corporations Act 2001
Ian Crichton, Remuneration Consultant, CRA Plan Managers Pty Limited
Benchmarking of CEO and President, Chairman and Non-Executive Director remuneration.
Yes
Key questions regarding use of remuneration consultants
Did a remuneration consultant provide remuneration recommendations in relation to any of the Executive KMP for the financial year?
No. Benchmark data and analysis provided only.
How much was the remuneration consultant paid by the Company for remuneration related and other services?
CRA – Remuneration Services $21,585; Other Services $30,624.
What arrangements did the Company make to ensure that the making of the remuneration recommendation would be free from undue influence by Executive KMP?
The Company made the following arrangements:
• The company implemented a protocol to govern the procedure for procuring advice relating to KMP remuneration. The protocol contained a summary of the process for the engagement of remuneration consultants, the provision of information to the remuneration consultant, and the communication of remuneration recommendations.
• The remuneration consultant agreed to adhere to the protocol procedures and was required to advise the Remuneration Committee whether or not it had been subjected to undue influence and provided a Statement of Independence.
Is the Board satisfied that the remuneration recommendation was free from any such undue influence? What are the reasons for the Board being so satisfied?
Yes, the Board is satisfied for the following reasons:
• The protocol with respect to the procurement of remuneration related advice was adhered to, including with respect to engagement of the remuneration consultant, the provision of information to the remuneration consultant in the communication of the remit for remuneration recommendations;
• At appropriate times, the remuneration consultant provided written confirmation that it had not been subjected to any undue influence;
• The Chairman of the Remuneration Committee met with the Remuneration Consultant in the absence of Executive KMP. There were no concerns raised by the Remuneration Consultant with respect to any undue influence being exerted by the Executive KMP; and
• The Remuneration Committee did not observe any evidence that undue influence had been applied.
For
per
sona
l use
onl
y

nanosonics limited | annual report 2014
30
3.0 Non-executive Director remuneration
3.1 Non-executive Director remuneration philosophy
Principle Comment
Fees are set by reference to key considerations
Fees for Non-Executive Directors are based on the nature of the directors’ work and their responsibilities, taking into account the nature and complexity of the Company and the skills and experience of the Director. In determining the level of fees, survey data on comparable companies are considered. Non-Executive Directors’ fees are recommended by the Remuneration Committee and determined by the Board. Shareholders approve the aggregate amount available for the remuneration of Non-Executive Directors. During the year the Remuneration Committee engaged a remuneration consultant to conduct a benchmarking study of Chairman and Non-Executive Director remuneration. Following this study the fees for the Non-Executive Directors were increased effective 1 January 2014 to ensure they remain reasonable and appropriate so as to attract and retain directors with the skills and experience commensurate with the requirements of the role. No increase in fees is proposed for the 2015 Financial Year.
Remuneration is structured to preserve independence whilst creating alignment
To preserve independence and impartiality, Non-Executive Directors are not entitled to any form of incentive payments and the level of their fees is not set with references to measures of Company performance.
Aggregate Board Fees are approved by shareholders.
The total amount of fees paid to Non-Executive Directors in the year ended 30 June 2014 is within the aggregate amount approved at a general meeting of the Company on 19 September 2006 of $500,000 a year. No increase in the pool limit is proposed.
Flexibility in how fees are received
Non-Executive Directors can elect how they wish to receive their total fees – i.e. as a contribution of cash, superannuation contributions or charitable donations.
3.2 Non-executive Director fees and other benefits
Elements Details
Board fees per annum – 20141
Board Chairman fee $145,000
Board NED fee $80,000
Post-employment benefits
Superannuation Superannuation contributions are included in the Board fees and are made at a rate of 9.25% of base fee (up to the Government’s prescribed maximum contributions limit) which satisfies the Company’s statutory superannuation contributions. The rate has been increased to 9.5% effective from 1 July 2014.
Other benefits
Equity instruments Non-Executive Directors do not receive any performance related remuneration, options or performance shares. Options previously granted have either lapsed or been exercised.
Other fees/benefits Non-Executive Directors are reimbursed for out-of-pocket expenses that are directly related to Nanosonics’ business.
1. Committee fees are not paid to the members of each Committee.
Directors’ report (continued)
For
per
sona
l use
onl
y

31
3.3 Non-Executive Director total remuneration
Year Fees Options Superannuation Total
Maurie Stang 2014 111,362 – 10,301 121,663
2013 90,000 – 8,100 98,100
Richard England 2014 66,613 – 6,162 72,775
2013 60,000 879 5,400 66,279
David Fisher 2014 66,613 – 6,162 72,775
2013 60,000 – 5,400 65,400
Michael Kavanagh1 2014 18,043 – 1,669 19,712
2013 55,450 – 4,991 60,441
Total 2014 262,631 – 24,294 286,925
2013 265,450 879 23,891 290,220
1. Includes remuneration paid to Mr Kavanagh until his appointment as an Executive Director on 21 October 2013.
4.0 Executive remuneration
4.1 Executive KMP remuneration
Nanosonics’ executive remuneration strategy is designed to attract, retain and motivate its executives. Fixed remuneration
components are determined having regard to the specific skills and competencies of the executive with reference to
both internal and external relativities, particularly local market conditions. The ‘at risk’ components of remuneration are
strategically directed to encourage management (and all participating executives) to strive for superior (risk balanced)
performance by rewarding the achievement of targets that are challenging, clearly defined, understood and communicated
and within the ambit of accountability of the relevant executive.
For
per
sona
l use
onl
y

nanosonics limited | annual report 2014
32
Executive KMP remuneration objectives are exemplified through three categories of remuneration, as illustrated below:
Executive KMP Remuneration Objectives
An appropriate balance of ‘fixed’ and ‘at-risk’ components.
Attract, motivate and retain executive talent.
The creation of reward differentiation to drive performance and behaviours.
Shareholder value creation through equity components.
Total Target Remuneration (TTR) is set by reference to the relevant market and internal relativities
Fixed At risk
Total Fixed Remuneration (TFR) Short-Term Incentives (STI) Long-Term Incentives (LTI)
Fixed remuneration is set based on relevant market relativities, reflecting responsibilities, performance, qualifications, experience and location.
STI performance criteria are set by reference to Company and Individual performance targets relevant to the specific position.
LTI targets are linked to both Nanosonics group internal (Revenue) and external (relative Total Shareholder Return (TSR)) outperformance measures.
Remuneration for each component will be delivered as:
Base Salary plus any fixed elements related to local markets, including superannuation or equivalents.
Part cash and part equity. The equity component is deferred for 1 year. The deferred equity component remains’ at risk until vesting.
Equity is held subject to performance and service for 3 years from grant date. The equity is ‘at risk’ until vesting.
Strategic intent and market positioning
TFR will generally be positioned at the median (+/-) compared to relevant market based data considering expertise and performance in the role.
Performance incentive is directed to achieving demanding growth targets. TFR + STI is intended to be positioned in 3rd quartile of relevant benchmark.
LTI is intended to align executive KMP with long term growth strategy aligned with shareholders’ interests. TFR + STI + LTI is intended to be positioned in the 3rd quartile.
Total Target Remuneration (TTR)
TTR is intended to be positioned in the 3rd quartile compared to relevant market based comparisons. 4th quartile TTR may result if outperformance is achieved. This strategy is intended to ensure that top quartile remuneration is only
received if the Company exceeds the performance objectives set by the Board.
Directors’ report (continued)
For
per
sona
l use
onl
y

33
4.2 Remuneration mix and timing of receipt
4.2.1 Remuneration mix
Position TFR (Cash) STI (Cash and Equity) LTI (Equity)
CEO and President 100% 33.3% of Base Salary 33.3% of Base Salary1
President, Technology Development/Commercialisation2 100% 33% of Base Salary 33% of Base Salary
Senior Executives (Executive KMP) 100% 25% of Base Salary 25% of Base Salary
1. In connection with the appointment of Mr Kavanagh as CEO and President, at the 2013 AGM shareholders approved the granting of 1,500,000 Performance Rights to Mr Kavanagh. Details of the vesting conditions associated with these Performance Rights are provided in Section 4.4.2 Long Term Incentives.
2. Effective 1 July 2014, the STI and LTI opportunity has been adjusted to 25% of Base Salary.
4.2.2 Remuneration – timing of receipt of the benefit
The three complementary components of Executive KMP remuneration are ‘earned’ over multiple time ranges.
This is illustrated in the following chart.
Year 1 Year 2 Year 3 Year 4 Year 5
TFR
Year 1 STI cash opportunity STI equity deferral
LTI
TFR
Year 2 STI cash opportunity STI equity deferral
LTI
TFR
Year 3 STI cash opportunity STI equity deferral
LTI
Each year, fixed remuneration and benefits are paid (monthly) and short term incentives are awarded based on
achievement of annual performance targets set. A portion of any STI earned is ‘invested’ in service rights and deferred for a
minimum of 12 months. Each year, a long term equity incentive is provided to eligible and invited executives. The LTI vests
after three years if the specified conditions are satisfied. In this way executives are rewarded for short, medium and long
term performance aligned to shareholder interests and expectations.
For
per
sona
l use
onl
y

nanosonics limited | annual report 2014
34
4.3 Total Fixed Remuneration (TFR) explained
Total Fixed Remuneration (TFR) includes all remuneration and benefits paid to an Executive KMP calculated on a
Total Employment Cost (TEC) basis. Executive KMP TFR is tested regularly for market competitiveness by reference to
appropriate independent and externally sourced comparable benchmark information. Usually, TFR adjustments are only
made in response to individual performance (as measured), an increase in job roles, changing market circumstances or
promotion. Any adjustment to Executive KMP remuneration is approved by the Board, based on recommendations by the
CEO and President and the Remuneration Committee.
4.4 Variable ‘at risk’ remuneration explained
As set out in Section 4.2, variable remuneration forms a significant portion of the CEO and President and other Executive
KMP remuneration opportunity. Apart from being market competitive, the purpose of variable remuneration is to direct
executives’ behaviours towards maximising Nanosonics’ short, medium and long term performance, as measured. The key
aspects are summarised below.
4.4.1 Short Term Incentives (STI)
Purpose The STI arrangements at Nanosonics are designed to reward executives for the achievements against annual performance targets set by the Board at the beginning of the performance period. The STI program is reviewed annually by the Remuneration Committee and approved by the Board.
All STI awards to the CEO and President and other Executive KMP are approved by the Remuneration Committee and the Board.
Performance targets The key performance objectives of Nanosonics are currently directed to achieving a PBT target complemented by the achievement of individual performance goals.
The weighting between the PBT target and individual performance goals will depend on the responsibilities and scope of influence of the relevant executive.
All targets are set having regard to prior year performance, market conditions and the Board approved budgets. The specific targets are not provided in detail due to their commercial sensitivity.
Any anomalies or discretionary elements are approved and validated by the Board.
Rewarding performance The actual STI awards for Executive KMP in 2014 are as set out in the table in Section 4.6.1.
Payment of STI To ensure there is an appropriate retention element of STI and to reinforce alignment with shareholders there is a mandatory deferral of a portion of STI. The STI is delivered as follows:
• 50% of STI paid in cash
• 50% of STI delivered as Nanosonics Performance Rights deferred for one year
The equity component will be determined based on the 5 day Volume Weighted Average Market Price of Nanosonics shares as at 31 August each year.
As the STI amount awarded as equity has already been earned, there are no further performance measures attached to the Performance Rights. However, they are subject to service conditions until the vesting date.
Directors’ report (continued)
For
per
sona
l use
onl
y

35
4.4.2 Long Term Incentives (LTI)
The LTI provides an annual opportunity for selected executives to receive an equity award deferred for three years that is
intended to align a significant portion of an executives overall remuneration to shareholder value over the longer term. All
LTI awards remain at risk and subject to clawback (forfeiture or lapse) until vesting and must meet or exceed the defined
performance hurdles over the vesting period.
Purpose To retain key executives and align their remuneration opportunity with shareholder value.
Type of equity awarded Under the Nanosonics Long Term Incentive Scheme (LTIS) selected senior executives are offered Performance Rights (being options to acquire ordinary shares of Nanosonics Limited for a nil exercise price)under the terms of the Nanosonics Employee Share Option Plan (ESOP). See Section 5.1 for further details. Performance Rights do not carry any dividend or voting rights prior to exercise.
Timing Grants are made each year after shareholder approval to issue securities to Directors has been obtained at the relevant AGM.
LTI allocation The size of individual LTI grants for the CEO and President and other Executive KMP is determined in accordance with the Board approved remuneration strategy mix. See Section 4.2. The target LTI $ value for each executive once determined is then converted into a number of Performance Rights based on a valuation methodology determined at the grant date, as follows:
Performance Rights allocated = LTI $ value divided by 5 day Volume Weighted Average Market Price of Nanosonics shares as at the date of the AGM each year.
Performance hurdles Equity grants to the CEO and President and other Executive KMP are subject to both internal (Revenue) and external (relative Total Shareholder Return – TSR) Performance Conditions.
CEO and President 2013 Long Term Incentive Scheme (2013 LTIS)
At the 2013 AGM, shareholders approved the granting of 1,500,000 Performance Rights to Mr Kavanagh. The number of Performance Rights granted to Mr Kavanagh was determined at the Board’s discretion in connection with Mr Kavanagh’s appointment as CEO and President. The 1,500,000 Performance Rights granted to Mr Kavanagh was made in respect of the 2013 and 2014 LTIS grant years. Accordingly, no additional LTIS grant will be made to Mr Kavanagh in respect of the 2014 LTIS.
Full details of the vesting conditions associated with the Performance Rights granted to Mr Kavanagh are included in the explanatory notes included with the Notice of the 2013 AGM (Resolution 10) and are summarised below.
For
per
sona
l use
onl
y

nanosonics limited | annual report 2014
36
CEO and President 2013 Long Term Incentive Scheme (2013 LTIS) – continued
2016 Performance Conditions
Ranking of TSR vs. 2013 LTIS Comparator Group1 Revenue Hurdle
Tranche 1: 25% of total Performance Rights granted (375,000)
Tranche 2: 25% of total Performance Rights granted (375,000)
Performance % of Performance Rights to vest(1)
Revenue in Financial Year 2016
% of Performance Rights to vest(1)
< 50th percentile 0% < $25.7 million 0%
50th to 75th percentile 50% to 100% pro-rata $25.7 million 25%
At 75th percentile 100% $29.1 million 50%
$32.7 million 75%
$36.7 million 100%
2017 Performance Conditions
Ranking of TSR vs. 2013 LTIS Comparator Group2 Revenue Hurdle
Tranche 3: 25% of total Performance Rights granted
(375,000)
Tranche 4: 25% of total Performance Rights granted (375,000)
Performance % of Performance Rights to vest1
Revenue in Financial Year 2017
% of Performance Rights to vest1
< 50th percentile 0% < $30.9 million 0%
50th to 75th percentile 50% to 100% pro-rata $30.9 million 25%
At 75th percentile 100% $36.4 million 50%
$42.6 million 75%
$49.5 million 100%
1. TSR measurement period is 8 November 2013 to the date of the release of Nanosonics’ FY16 financial statements.2. TSR measurement period is 8 November 2013 to the date of the release of Nanosonics’ FY17 financial statements.3. Straight line interpolation will apply to incremental results.
Service Conditions
In addition to the above performance conditions, the Performance Rights will only vest if Mr Kavanagh remains in continuous employment with Nanosonics from the date of the grant to the respective vesting date of each Tranche.
Special provisions, in accordance with company policies, may apply in the event of termination of employment or a change of control.
Directors’ report (continued)
For
per
sona
l use
onl
y

37
Other Executive KMP 2013 Long Term Incentive Scheme (2013 LTIS)
A summary of the vesting conditions associated with the Performance Rights granted to other Executive KMP under the 2013 LTIS are summarised below.
Ranking of TSR vs. 2013 LTIS Comparator Group1 Revenue Hurdle
Tranche 1: 50% of total Performance Rights granted Tranche 2: 50% of total Performance Rights granted
Performance % of Performance Rights to vest1
Revenue in Financial Year 2016
% of equity to vest1
< 50th percentile 0% < $25.7 million 0%
50th to 75th percentile 50% to 100% pro-rata $25.7 million 25%
At 75th percentile 100% $29.1 million 50%
$32.7 million 75%
$36.7 million 100%
1. TSR measurement period is 8 November 2013 to the date of the release of Nanosonics’ FY16 financial statements.2. Straight line interpolation will apply to incremental results.
Service Conditions
In addition to the above performance conditions, the Performance Rights will only vest if the Executive KMP remains in continuous employment with Nanosonics from the date of the grant to the respective vesting date of each Tranche.
Special provisions, in accordance with company policies, may apply in the event of termination of employment or a change of control.
Other Executive KMP 2012 Long Term Incentive Scheme (2012 LTIS)
In August 2013, Performance Rights were granted to other Executive KMP under the 2012 LTIS with an FY15 revenue hurdle of $50.0 million or more and Net Profit After Tax hurdle of 12% of revenue or more. In addition to the performance conditions, the Performance Rights will only vest if the Executive KMP remains in continuous employment with Nanosonics from the date of the grant to the respective vesting date. 100% of the Performance Rights will vest once the performance hurdles and service conditions are achieved.
For
per
sona
l use
onl
y

nanosonics limited | annual report 2014
38
4.5 Other remuneration elements and disclosures relevant to Executive KMP
4.5.1 Clawback
In accordance with the ASX Corporate Governance Guidelines the Board has clear policies regarding the deferral of
performance-based remuneration as set out in Section 4.4.1. Policies concerning the reduction, cancellation or clawback
of performance-based remuneration in the event of serious misconduct or a material misstatement in the entity’s financial
statements have not been determined, as yet. These policies will be developed as clear market trends emerge.
4.5.2 Securities trading restrictions
Under the Nanosonics Limited Securities Trading Policy and in accordance with the Corporations Act 2001, securities
granted under Nanosonics’ equity incentive schemes must remain at risk until vested, or until exercised if options or
performance rights. It is a specific condition of grant that no schemes are entered into by an individual or their associates,
that specifically protects the unvested value of shares, options or performance rights allocated.
KMPs are not permitted to deal at any time in financial products such as options, warrants, futures or other financial
products issued over Nanosonics’ securities by third parties such as banks and other institutions without the prior approval
of the Board. An exception may apply where the securities form a component of a listed portfolio or index product.
KMPs are not permitted to enter into transactions in products associated with the securities without the prior approval of the
Board, which operate to limit the economic risk of their security holding in the Company (e.g. hedging arrangements).
Nanosonics, as required under the ASX Listing Rules, has a formal policy setting down how and when employees, including
KMPs of Nanosonics Limited, may deal in Nanosonics securities. A copy of the Company’s Securities Trading Policy is
available on the Nanosonics website, www.nanosonics.com under Investor Centre, Corporate Governance.
4.5.3 Cessation of employment provisions
The provisions that apply for STI and LTI awards in the case of cessation of employment are detailed in Section 6.
4.5.4 Change of control
The provisions that apply for STI and LTI awards in the case of a change of control are detailed in Section 6.
4.5.5 Conditions of LTI grants
The conditions under which LTI awards (Performance Rights) are granted are approved by the Board in accordance with
the relevant scheme rules as summarised in Section 5.
4.6 Relationship between Nanosonics’ performance and Executive KMP remuneration
As explained in Section 4.2, Nanosonics’ remuneration framework aims to incentivise executive KMP towards sustainable
growth of the business and the creation of shareholder value in the short, medium and long term.
Directors’ report (continued)
For
per
sona
l use
onl
y

39
4.6.1 Short Term Incentives
Executive KMP STI opportunity and actual 2014 STI awarded are set out in the table below:
Executive KMP Position Maximum STI % of
2014 TFR1
STI awarded as a % of potential1
STI cash award in
2014 ($)2
Deferred equity STI award ($)3
% Forfeited4
Michael Kavanagh
CEO and President, Managing Director
43% 100% 65,305 65,306 –
Ron Weinberger President, Technology Development/Commercialisation 27% 96% 49,104 49,104 4%
McGregor Grant CFO and Company Secretary 23% 97.5% 35,751 35,751 2.5%
Gerard Putt Chief Operations Officer 23% 92.5% 26,551 26,551 7.5%
1. Relates to STI % both cash and deferred equity opportunity. The deferred equity will be awarded the following year.2. Amounts included in the remuneration for the financial year represent the maximum cash STI opportunity related to the financial year based on the
achievement of individual goals and satisfaction of specified performance criteria. The amount was finally determined on 8 August 2014 after performance reviews were completed and approved by the Board.
3. The equivalent number of Performance Rights to be awarded in the following year will be determined as set out in section 4.4.1 of the Remuneration Report.
4. The amounts forfeited are due to the performance criteria not being fully met in relation to the current financial year.
Short Term Incentives have been accrued in respect of the 2014 because the performance conditions set by the Board
have been met.
4.6.2 Long Term Incentives
Executive KMP are only entitled to a benefit under the current Company’s LTI scheme if both Revenue and relative Total
Shareholder Return (TSR) targets are met.
Revenue growth is considered a priority for Nanosonics at this stage of its development, in the opinion of the Board.
Relative TSR is a generally accepted proxy for creation of shareholder value. The Board believes a balance between these
two performance criteria is a sound guide to medium and long term performance.
Revenue
The table below summarises Nanosonics’ revenue for the financial years ended 30 June, 2012, 2013 and 2014.
Financial year Revenue $’000
2014 21,492
2013 14,899
2012 12,301
A portion of the 2013 LTI grant to all Executive KMP, including the CEO and President, requires that revenues in FY16 equal
or exceed $36.7 million for full vesting. A portion of the 2013 LTI grant for the CEO and President requires that revenues in
FY17 equal or exceed $49.5 million for full vesting. This represents a 70.8% and 130.3% increase respectively relative to
the 2014 Financial Year for the maximum opportunity to be realised. Momentum achieved in the 2014 Financial Year will
need to continue into the 2015 Financial Year and beyond for these targets to be met. If they are met the Board believes an
appropriate balance of results and benefit will have been achieved.
Relative Total Shareholder Return
Testing of performance against the relevant comparator group will only occur at the vesting date of each grant. To date, no
equity grant subject to a TSR hurdle has vested. The TSR hurdle set and the relative vesting schedule meet contemporary
market standards according to independent advice received by the Board.
For
per
sona
l use
onl
y

nanosonics limited | annual report 2014
40
4.7 Executive remuneration tables
Fixed Remuneration Variable Remuneration Total Proportion of Total Remuneration
Short-term benefits Long-term benefits TotalShort-
termEquity
Compensation TotalPerformance
related
Non-performance
related2
Value of options
and rights
Year
Salary and
fees8
Non-monetary benefits Other Superannuation
Other long term
benefits8Cash
bonus6
Options and performance
rights7 % % %
Michael Kavanagh1
2014 267,446 – – 13,094 20,903 301,443 65,305 232,933 298,238 599,681 50% 0% 39%
2013 – – – – – – – – – – – – –
Ron Weinberger
2014 290,923 39,459 – 17,885 30,473 378,740 49,104 147,533 196,637 575,377 34% 0% 26%
2013 300,077 42,886 3,100 16,470 24,116 386,649 32,901 125,877 158,778 545,427 28% 1% 23%
McGregor Grant3
2014 273,037 – 506 17,775 22,933 314,251 35,751 107,373 143,124 457,375 16% 15% 23%
2013 270,892 – 527 16,470 13,909 301,798 29,751 173,075 202,826 504,624 11% 29% 34%
Gerard Putt4
2014 214,575 – – 17,775 17,819 250,169 26,551 59,737 86,288 336,457 18% 8% 18%
2013 208,546 – 231 16,470 21,031 246,278 24,227 79,424 103,651 349,929 13% 17% 23%
Total 2014 1,045,981 39,459 506 66,529 92,128 1,244,603 176,711 547,576 724,287 1,968,890 5% 32% 28%
Total (restated)5 2013 779,515 42,886 3,858 49,410 59,056 934,725 86,879 378,376 465,255 1,399,980 15% 18% 27%
1. Includes remuneration paid to Mr Kavanagh since his appointment as an Executive Director on 21 October 2013.
2. Non-performance related remuneration relates to options granted as part of employment contracts subject to service conditions.
3. Mr Grant joined the Company on 28 April 2011 and in connection with his appointment, he was granted 1,000,000 options which vest in 4 tranches, subject to service conditions.
4. Mr Putt joined the Company on 27 April 2011 and in connection with his appointment, he was granted 400,000 options, which vest in 4 tranches, subject to service conditions.
5. The 2013 KMP remuneration disclosure was restated to exclude executives Michael Potas, Kirste Courtney and Vincent Wang who were previously included as one of the five named executives who received the highest remuneration in 2013.
6. The cash bonus is for the performance during the respective financial year based the criteria set out in Section 4.4.1. 2014 amounts represent the maximum cash STI opportunity related to the financial year based on the achievement of individual goals and satisfaction of specified performance criteria. Actual cash STI award is disclosed in Section 4.6.1.
7. The amount disclosed is the amount of the fair value of the options and rights recognised as an expense in each reporting period. The ability to exercise the options and rights are subject to vesting conditions. The fair values of the options and rights that are subject to non-market performance conditions are calculated at the date of the grant using Binomial Approximation model. The fair values of performance rights that are subject to TSR performance conditions are calculated at the date of the grant using the Monte-Carlo simulation model.
8. As disclosed in the note 2 to the financial statements, the Group changed its accounting policy in respect of employee benefits with the adoption of AASB119 Employee Benefits. As a result of this change, annual leave is included in other long term benefits, previously shown as a short term employee benefit. Consistent with that change, cash compensated annual leave absences and accrual is now classified as other long term benefit in both current and prior periods. Other long term benefits include annual leave and long service leave benefits.
Directors’ report (continued)
For
per
sona
l use
onl
y
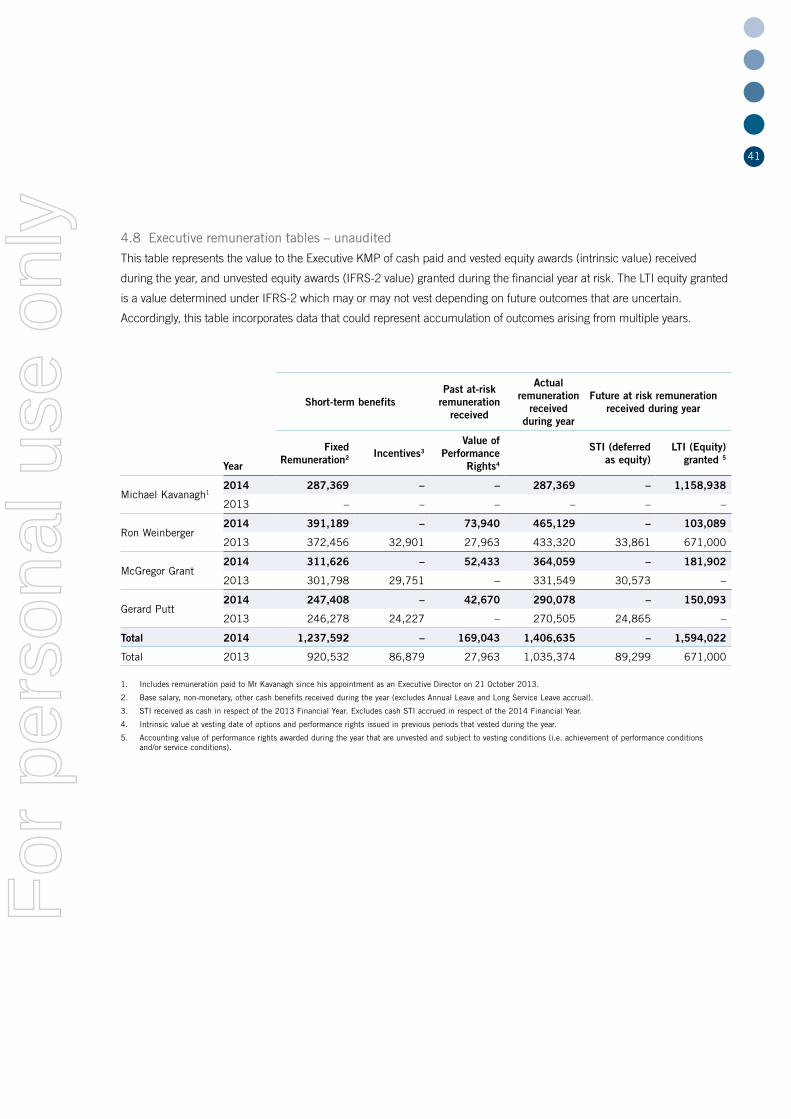
41
4.8 Executive remuneration tables – unaudited
This table represents the value to the Executive KMP of cash paid and vested equity awards (intrinsic value) received
during the year, and unvested equity awards (IFRS-2 value) granted during the financial year at risk. The LTI equity granted
is a value determined under IFRS-2 which may or may not vest depending on future outcomes that are uncertain.
Accordingly, this table incorporates data that could represent accumulation of outcomes arising from multiple years.
Short-term benefitsPast at-risk
remuneration received
Actual remuneration
received during year
Future at risk remuneration received during year
Year
Fixed Remuneration2 Incentives3
Value of Performance
Rights4 STI (deferred
as equity)LTI (Equity)
granted 5
Michael Kavanagh12014 287,369 – – 287,369 – 1,158,938
2013 – – – – – –
Ron Weinberger2014 391,189 – 73,940 465,129 – 103,089
2013 372,456 32,901 27,963 433,320 33,861 671,000
McGregor Grant2014 311,626 – 52,433 364,059 – 181,902
2013 301,798 29,751 – 331,549 30,573 –
Gerard Putt2014 247,408 – 42,670 290,078 – 150,093
2013 246,278 24,227 – 270,505 24,865 –
Total 2014 1,237,592 – 169,043 1,406,635 – 1,594,022
Total 2013 920,532 86,879 27,963 1,035,374 89,299 671,000
1. Includes remuneration paid to Mr Kavanagh since his appointment as an Executive Director on 21 October 2013.
2. Base salary, non-monetary, other cash benefits received during the year (excludes Annual Leave and Long Service Leave accrual).
3. STI received as cash in respect of the 2013 Financial Year. Excludes cash STI accrued in respect of the 2014 Financial Year.
4. Intrinsic value at vesting date of options and performance rights issued in previous periods that vested during the year.
5. Accounting value of performance rights awarded during the year that are unvested and subject to vesting conditions (i.e. achievement of performance conditions and/or service conditions).
For
per
sona
l use
onl
y

nanosonics limited | annual report 2014
42
5.0 Employee Share Scheme information
This section provides:
1. A description of the Employee Share Schemes (ESS) Nanosonics uses to provide equity rewards to
Nanosonics employees;
2. Disclosures required in relation to ESS grants provided to KMP;
3. Disclosures required about ESS instruments that Nanosonics has issued; and
4. Disclosures required in relation to Nanosonics’ shares and other ESS instruments held by KMP.
5.1 Employee Share Schemes operated by Nanosonics
Plan Name Type of Instruments Purpose Details
Nanosonics Deferred Employee Share Plan (DESP)
Established in 2007
Date last approved by shareholders: 8 November 2013
Ordinary Shares The purpose of the Share Plans is to provide eligible employees (including Executive Directors but excluding Non-Executive Directors) with performance incentives through opportunities to acquire beneficial ownership of shares in the Company and to access the taxation concessions available under the Income Tax Assessment Act. The DESP is also used for the settlement of shares on exercise of options in the Share Option Plans.
Since the DESP was last approved 673,697 shares (from the exercise of ESOP options) have been issued to the Plan. As at the date of this report 1,111,874 shares remain outstanding.
Nanosonics Exempt Employee Share Plan (EESP)
Established in 2007
Date last approved by shareholders: 8 November 2013
No grants to date have been made under the EESP.
Nanosonics Employee Share Option Plan (ESOP)
Established in 2007
Date last approved by shareholders: 8 November 2013
Options The purpose of the Share Option Plans is to permit the Company, as part of its overall remuneration programs, to provide long-term incentives for employees (including Executive Directors), consultants and contractors to Nanosonics who deliver long-term shareholder returns. The Plans provide participants with an opportunity to acquire a beneficial ownership of shares in the Company and to access the taxation concessions available under the Income Tax Assessment Act.
Since the ESOP was last approved 2,402,899 options have been issued and 1,073,697 options exercised. As at the date of this report 5,656,641 options remain outstanding.
Nanosonics General Share Option Plan (GSOP)
Established in 2007
Date last approved by shareholders: 8 November 2013
Since the GSOP was last approved 261,666 options have been exercised. There have been no new issues. As at the date of this report 503,334 options remain outstanding.
Directors’ report (continued)
For
per
sona
l use
onl
y

43
5.2 ESS grants to KMP
5.2.1 Analysis of share-based payments granted as remuneration
Details of the vesting profiles for the year and as at 30 June 2014 of the Options and Performance Rights granted as
remuneration to each Executive KMP are set out below:
Options/Performance Rights Vesting in future years
DescriptionGrant Date
Expiry Date
Exercise Price
Number granted
Number vested
during the year
% vested during
the year
Number vested to
date
Number lapsed/
forfeited during the
year% lapsed/
forfeitedBalance at
year end
Intrinsic value at year end 2015 2016 2017 2018
Michael Kavanagh
2013 LTIS Tranche 1 Nov-13 30-Sep-16 $0.00 375,000 – – – – – 375,000 296,250 375,000
2013 LTIS Tranche 2 Nov-13 30-Sep-16 $0.00 375,000 – – – – – 375,000 296,250 375,000
2013 LTIS Tranche 3 Nov-13 30-Sep-17 $0.00 375,000 – – – – – 375,000 296,250 375,000
2013 LTIS Tranche 4 Nov-13 30-Sep-17 $0.00 375,000 – – – – – 375,000 296,250 375,000
Ron Weinberger
2013 LTIS Tranche 1 Nov-13 30-Sep-16 $0.00 67,409 – – – – – 67,409 53,253 67,409
2013 LTIS Tranche 2 Nov-13 30-Sep-16 $0.00 67,409 – – – – – 67,409 53,253 67,409
2013 Deferred STI Apr-13 01-Apr-14 $0.00 38,726 38,726 100% 38,726 – – – –
2012 LTIS Nov-12 30-Sep-15 $0.00 1,220,000 – – – – 1,220,000 963,800 1,220,000
2012 Deferred STI Nov-12 01-Oct-13 $0.00 29,881 29,881 100% 29,881 – – – –
Options Jul-10 19-Jul-14 $0.56 200,000 68,000 34% 200,000 – – 200,000 46,800
McGregor Grant
2013 LTIS Tranche 1 Mar-14 30-Sep-16 $0.00 47,888 – – – – – 47,888 37,832 47,888
2013 LTIS Tranche 2 Mar-14 30-Sep-16 $0.00 47,889 – – – – – 47,889 37,832 47,889
2013 Deferred STI Apr-13 01-Apr-14 $0.00 35,578 35,578 100% 35,578 – – – –
2012 LTIS Aug-13 30-Sep-15 $0.00 145,307 – – – – – 145,307 114,793 145,307
2012 Deferred STI Nov-12 01-Oct-13 $0.00 26,478 26,478 100% 26,478 – – – –
Options May-11 28-Apr-16 $0.85 1,000,000 333,333 33% 833,334 – – 1,000,000 – 166,666
Gerard Putt
2013 LTIS Tranche 1 Mar-14 30-Sep-16 $0.00 39,514 – – – – – 39,514 31,216 39,514
2013 LTIS Tranche 2 Mar-14 30-Sep-16 $0.00 39,515 – – – – – 39,515 31,217 39,515
2013 Deferred STI Apr-13 01-Apr-14 $0.00 29,357 29,357 100% 29,357 – – – –
2012 LTIS Aug-13 30-Sep-15 $0.00 119,898 – – – – – 119,898 94,719 119,898
2012 Deferred STI Nov-12 01-Oct-13 $0.00 21,189 21,189 100% 21,189 – – – –
Options May-11 27-Apr-16 $0.85 400,000 133,333 33% 333,334 – – 400,000 – 66,666
For
per
sona
l use
onl
y
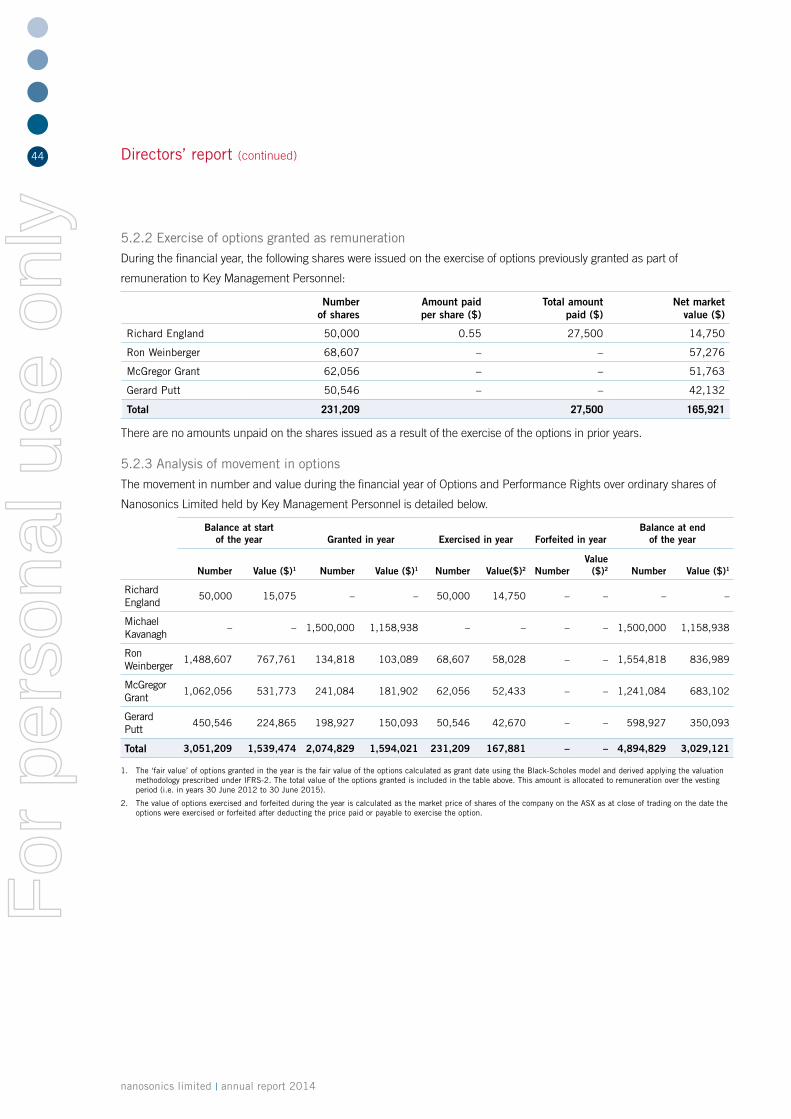
nanosonics limited | annual report 2014
44 Directors’ report (continued)
5.2.2 Exercise of options granted as remuneration
During the financial year, the following shares were issued on the exercise of options previously granted as part of
remuneration to Key Management Personnel:
Number
of sharesAmount paid per share ($)
Total amount paid ($)
Net market value ($)
Richard England 50,000 0.55 27,500 14,750
Ron Weinberger 68,607 – – 57,276
McGregor Grant 62,056 – – 51,763
Gerard Putt 50,546 – – 42,132
Total 231,209 27,500 165,921
There are no amounts unpaid on the shares issued as a result of the exercise of the options in prior years.
5.2.3 Analysis of movement in options
The movement in number and value during the financial year of Options and Performance Rights over ordinary shares of
Nanosonics Limited held by Key Management Personnel is detailed below.
Balance at start of the year Granted in year Exercised in year Forfeited in year
Balance at end of the year
Number Value ($)1 Number Value ($)1 Number Value($)2 NumberValue
($)2 Number Value ($)1
Richard England
50,000 15,075 – – 50,000 14,750 – – – –
Michael Kavanagh
– – 1,500,000 1,158,938 – – – – 1,500,000 1,158,938
Ron Weinberger
1,488,607 767,761 134,818 103,089 68,607 58,028 – – 1,554,818 836,989
McGregor Grant
1,062,056 531,773 241,084 181,902 62,056 52,433 – – 1,241,084 683,102
Gerard Putt
450,546 224,865 198,927 150,093 50,546 42,670 – – 598,927 350,093
Total 3,051,209 1,539,474 2,074,829 1,594,021 231,209 167,881 – – 4,894,829 3,029,121
1. The ‘fair value’ of options granted in the year is the fair value of the options calculated as grant date using the Black-Scholes model and derived applying the valuation methodology prescribed under IFRS-2. The total value of the options granted is included in the table above. This amount is allocated to remuneration over the vesting period (i.e. in years 30 June 2012 to 30 June 2015).
2. The value of options exercised and forfeited during the year is calculated as the market price of shares of the company on the ASX as at close of trading on the date the options were exercised or forfeited after deducting the price paid or payable to exercise the option.
For
per
sona
l use
onl
y

45
5.3 Fair value of share-based compensation
The following factors and assumptions were used in determining the fair value on grant date of options and performance
rights granted to directors and Key Management Personnel under ESOP which were unexpired on 30 June 2014, including
those granted during the period:
Option/ Performance Rights Description
Vesting Conditions
Grant date Expiry date
Share price at
grant date($)
Exercise price ($)
Valuation Model
Estimated volatility
Risk free interest
rate
Fair Value of
option($)
OptionsService Condition
Aug-10 19-Jul-14 0.54 0.56 Binomial 74.87% 4.77% 0.31
OptionsService condition
May-11 28-Apr-16 0.80 0.85 Binomial 73.62% 5.14% 0.50
2012 LTISFY15 Revenue, net profit after tax and service
Nov-12 30-Sep-15 0.55 – Binomial 45.46% 2.58% 0.55
2012 LTISFY15 Revenue, net profit after tax and service
Aug-13 30-Sep-15 0.78 – Binomial 45.49% 2.35% 0.78
2013 LTIS Tranche 1 - CEO
Relative TSR performance and service
Nov-13 30-Sep-16 0.85 –Monte Carlo
45.00% 3.00% 0.68
2013 LTIS Tranche 2 - CEO
FY16 Revenue and service
Nov-13 30-Sep-16 0.85 – Binomial 45.00% 3.00% 0.85
2013 LTIS Tranche 3 - CEO
Relative TSR performance and service
Nov-13 30-Sep-17 0.85 –Monte Carlo
45.00% 3.20% 0.71
2013 LTIS Tranche 4 - CEO
FY17 Revenue and service
Nov-13 30-Sep-17 0.85 – Binomial 45.00% 3.20% 0.85
2013 LTIS Tranche 1 - Other KMP
Relative TSR performance and service condition
Mar-14 30-Sep-16 0.80 –Monte Carlo
45.00% 2.68% 0.63
2013 LTIS Tranche 2 - Other KMP
FY16 Revenue and service
Mar-14 30-Sep-16 0.80 – Binomial 45.00% 2.68% 0.80
For
per
sona
l use
onl
y

nanosonics limited | annual report 2014
46 Directors’ report (continued)
5.4 KMP equity interests
In accordance with the Corporations Act (section 205G (1)), Nanosonics is required to notify the interests (shares and rights
to shares) of directors to the ASX. In the interests of transparency and completeness of disclosure we have provided this
information for each director (as required under the Corporations Act) and all other Executive KMP.
Equity interests as at 30 June 2014
Nanosonics Limited ordinary shares1
Options over Nanosonics Limited ordinary shares
Total intrinsic value of NAN securities as at year end ($)2/3
Non-Executive Directors
Maurie Stang 28,402,424 – 22,437,915
Richard England 128,301 – 101,358
David Fisher 812,705 – 642,037
Executive Directors
Michael Kavanagh 150,000 1,500,000 1,303,500
Ron Weinberger 68,607 1,554,818 1,171,306
Other Executive KMP
McGregor Grant 77,056 1,241,084 251,331
Gerard Putt 69,046 598,927 211,699
1. Includes the number of Nanosonics shares issued to Executives under the DESP.
2. The intrinsic value of Nanosonics shares calculated as at the closing NAN price on 30 June 2014 times the number of shares.
3. The intrinsic value of options calculated as at the closing NAN price on 30 June 2014 less the applicable exercise price times the number of options.
Equity interests as at the date of this report Nanosonics Limited ordinary shares1
Options over Nanosonics Limited ordinary shares
Non-Executive Directors
Maurie Stang 28,402,424 –
Richard England 128,301 –
David Fisher 812,705 –
Executive Directors
Michael Kavanagh 150,000 1,500,000
Ron Weinberger 120,607 1,354,818
Other Executive KMP
McGregor Grant 77,056 1,241,084
Gerard Putt 69,046 598,927
1. Includes the number of Nanosonics shares issued to Executives under the DESP.
Refer to Section 4.5.2 regarding Securities Trading Restrictions.For
per
sona
l use
onl
y

47
5.5 KMP Share movement
The numbers of shares in the Company held during the financial year by Key Management Personnel, including their
personally-related parties, are set out below.
Balance at start of the year
Received during the year on the
exercise of optionsOther net changes
during the yearBalance at
end of the year
Non-Executive Directors
Maurie Stang 28,402,424 – – 28,402,424
Richard England 78,301 50,000 – 128,301
David Fisher 812,705 – – 812,705
Executive Directors
Michael Kavanagh 100,000 – 50,000 150,000
Ron Weinberger 859,672 68,607 (859,672) 68,607
Other Executive KMP
McGregor Grant 15,0001 62,056 – 77,056
Gerard Putt 18,5001 50,546 – 69,046
1. This represents shareholding of a close family member of the KMP.
For
per
sona
l use
onl
y
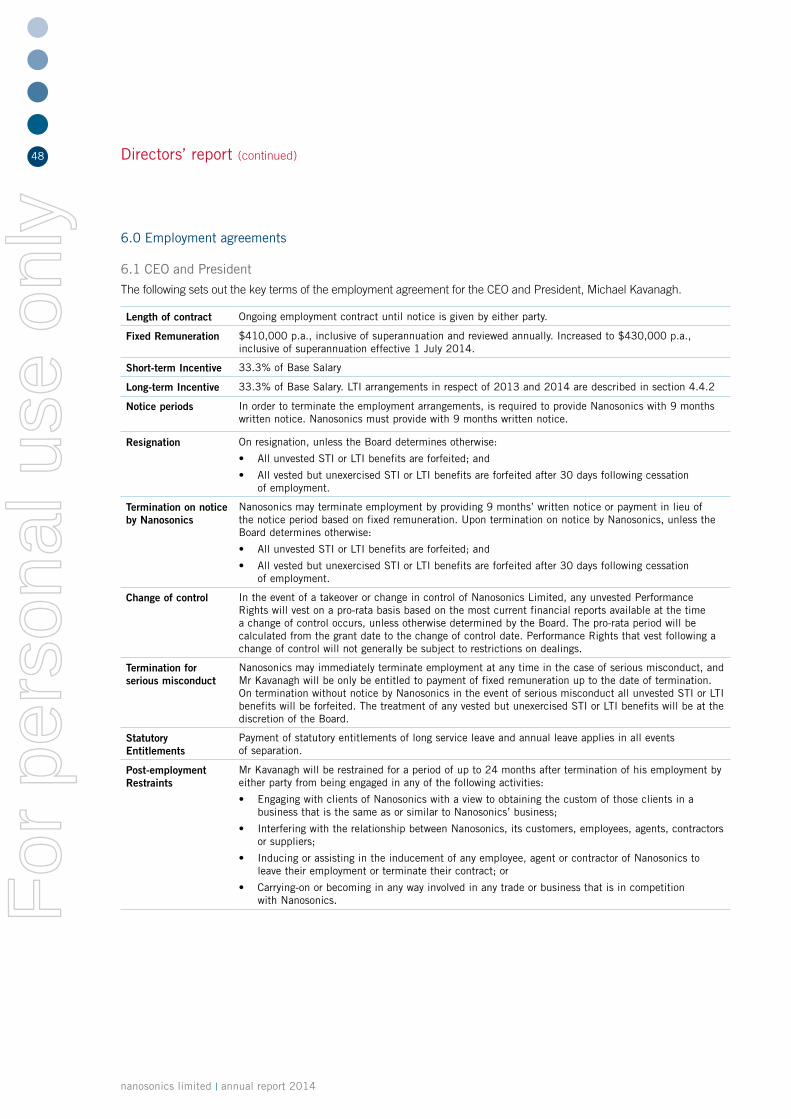
nanosonics limited | annual report 2014
48 Directors’ report (continued)
6.0 Employment agreements
6.1 CEO and President
The following sets out the key terms of the employment agreement for the CEO and President, Michael Kavanagh.
Length of contract Ongoing employment contract until notice is given by either party.
Fixed Remuneration $410,000 p.a., inclusive of superannuation and reviewed annually. Increased to $430,000 p.a., inclusive of superannuation effective 1 July 2014.
Short-term Incentive 33.3% of Base Salary
Long-term Incentive 33.3% of Base Salary. LTI arrangements in respect of 2013 and 2014 are described in section 4.4.2
Notice periods In order to terminate the employment arrangements, is required to provide Nanosonics with 9 months written notice. Nanosonics must provide with 9 months written notice.
Resignation On resignation, unless the Board determines otherwise:
• All unvested STI or LTI benefits are forfeited; and
• All vested but unexercised STI or LTI benefits are forfeited after 30 days following cessation of employment.
Termination on notice by Nanosonics
Nanosonics may terminate employment by providing 9 months’ written notice or payment in lieu of the notice period based on fixed remuneration. Upon termination on notice by Nanosonics, unless the Board determines otherwise:
• All unvested STI or LTI benefits are forfeited; and
• All vested but unexercised STI or LTI benefits are forfeited after 30 days following cessation of employment.
Change of control In the event of a takeover or change in control of Nanosonics Limited, any unvested Performance Rights will vest on a pro-rata basis based on the most current financial reports available at the time a change of control occurs, unless otherwise determined by the Board. The pro-rata period will be calculated from the grant date to the change of control date. Performance Rights that vest following a change of control will not generally be subject to restrictions on dealings.
Termination for serious misconduct
Nanosonics may immediately terminate employment at any time in the case of serious misconduct, and Mr Kavanagh will be only be entitled to payment of fixed remuneration up to the date of termination. On termination without notice by Nanosonics in the event of serious misconduct all unvested STI or LTI benefits will be forfeited. The treatment of any vested but unexercised STI or LTI benefits will be at the discretion of the Board.
Statutory Entitlements
Payment of statutory entitlements of long service leave and annual leave applies in all events of separation.
Post-employment Restraints
Mr Kavanagh will be restrained for a period of up to 24 months after termination of his employment by either party from being engaged in any of the following activities:
• Engaging with clients of Nanosonics with a view to obtaining the custom of those clients in a business that is the same as or similar to Nanosonics’ business;
• Interfering with the relationship between Nanosonics, its customers, employees, agents, contractors or suppliers;
• Inducing or assisting in the inducement of any employee, agent or contractor of Nanosonics to leave their employment or terminate their contract; or
• Carrying-on or becoming in any way involved in any trade or business that is in competition with Nanosonics.For
per
sona
l use
onl
y

49
6.2 Other Executive KMP
The following sets out details of the employment agreements relating to other Executive KMP. The terms for all other
Executive KMP are similar, but do on occasion, vary to suit different needs.
Length of contract Ongoing employment contract until notice is given by either party.
Notice periods In order to terminate the employment arrangements, either Nanosonics or the Executive KMP are required to provide the other party with written notice as summarised below:
• Ron Weinberger: 6 months
• McGregor Grant: 4 months
• Gerard Putt: 3 months
Resignation On resignation, unless the Board determines otherwise:
• All unvested STI or LTI benefits are forfeited; and
• All vested but unexercised STI or LTI benefits are forfeited after 30 days following cessation of employment.
Termination on notice by Nanosonics
Nanosonics may terminate employment by providing the relevant written notice or payment in lieu of the notice period based on fixed remuneration. On termination on notice by Nanosonics, unless the Board determines otherwise:
• All unvested STI or LTI benefits are forfeited; and
• All vested but unexercised STI or LTI benefits are forfeited after 30 days following cessation of employment.
Change of control In the event of a takeover or change in control of Nanosonics Limited, any unvested Performance Rights will vest on a pro-rata basis based on the most current financial reports available at the time a change of control occurs, unless otherwise determined by the Board. The pro-rata period will be calculated from the grant date to the change of control date. Performance Rights that vest following a change of control will not generally be subject to restrictions on dealings.
Termination for serious misconduct
Nanosonics may immediately terminate employment at any time in the case of serious misconduct, and the Executive KMP will only be entitled to payment of fixed remuneration up to the date of termination.
On termination without notice by Nanosonics in the event of serious misconduct, all unvested STI or LTI benefits will be forfeited. The treatment of any vested but unexercised STI or LTI benefits will be at the discretion of the Board.
Statutory Entitlements
Payment of statutory entitlements of long service leave and annual leave applies in all events of separation.
Post-employment Restraints
All Executive KMP will be restrained for a period of up to 24 months after termination of their employment by either party from being engaged in any of the following activities:
• Engaging with clients of Nanosonics with a view to obtaining the custom of those clients in a business that is the same as or similar to Nanosonics’ business.
• Interfering with the relationship between Nanosonics, its customers, employees, agents, contractors or suppliers.
• Inducing or assisting in the inducement of any employee, agent or contractor of Nanosonics to leave their employment or terminate their contract.
• Carrying-on or becoming in any way involved in any trade or business that is in competition with Nanosonics.For
per
sona
l use
onl
y
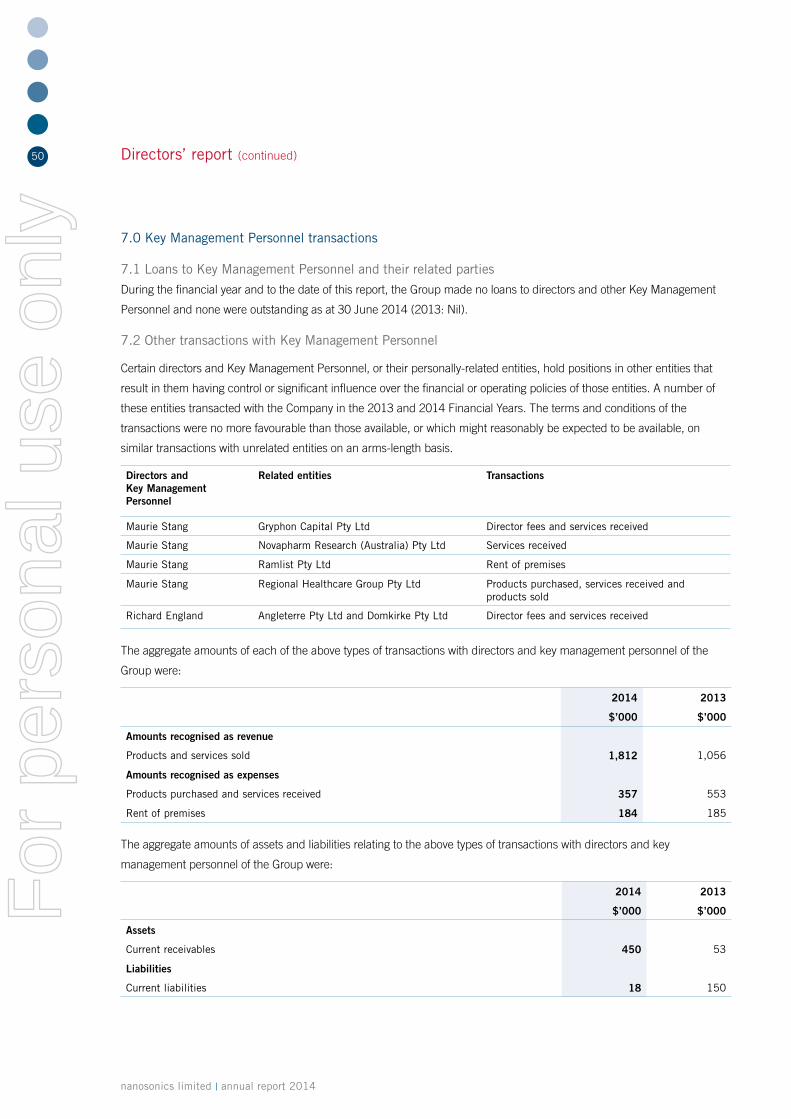
nanosonics limited | annual report 2014
50 Directors’ report (continued)
7.0 Key Management Personnel transactions
7.1 Loans to Key Management Personnel and their related parties
During the financial year and to the date of this report, the Group made no loans to directors and other Key Management
Personnel and none were outstanding as at 30 June 2014 (2013: Nil).
7.2 Other transactions with Key Management Personnel
Certain directors and Key Management Personnel, or their personally-related entities, hold positions in other entities that
result in them having control or significant influence over the financial or operating policies of those entities. A number of
these entities transacted with the Company in the 2013 and 2014 Financial Years. The terms and conditions of the
transactions were no more favourable than those available, or which might reasonably be expected to be available, on
similar transactions with unrelated entities on an arms-length basis.
Directors and Key Management Personnel
Related entities Transactions
Maurie Stang Gryphon Capital Pty Ltd Director fees and services received
Maurie Stang Novapharm Research (Australia) Pty Ltd Services received
Maurie Stang Ramlist Pty Ltd Rent of premises
Maurie Stang Regional Healthcare Group Pty Ltd Products purchased, services received and products sold
Richard England Angleterre Pty Ltd and Domkirke Pty Ltd Director fees and services received
The aggregate amounts of each of the above types of transactions with directors and key management personnel of the
Group were:
2014 2013
$’000 $’000
Amounts recognised as revenue
Products and services sold 1,812 1,056
Amounts recognised as expenses
Products purchased and services received 357 553
Rent of premises 184 185
The aggregate amounts of assets and liabilities relating to the above types of transactions with directors and key
management personnel of the Group were:
2014 2013
$’000 $’000
Assets
Current receivables 450 53
Liabilities
Current liabilities 18 150
For
per
sona
l use
onl
y

51
Indemnifying officers or auditor
During the financial year, the Company paid insurance premiums to insure the directors and secretary and Key Management
Personnel of the Company and its controlled entities.
The liabilities insured are legal costs that may be incurred in defending civil or criminal proceedings that may be brought
against the officers in their capacity as officers of entities in the Group, and any other payments arising from liabilities
incurred by the officers in connection with such proceedings. This does not include such liabilities that arise from conduct
involving a wilful breach of duty by the officers or the improper use by the officers of their positions or of information to
gain advantage for themselves or someone else or to cause detriment to the Company. It is not possible to apportion the
premium between amounts relating to the insurance against legal costs and those relating to other liabilities.
The directors have not included in this report the amount of the premium paid in respect of the insurance policy, as such
disclosure is prohibited under the terms of the contract.
No indemnities have been given or insurance premiums paid, during or since the financial year, for any person who is or
has been an auditor for the Group.
Proceedings on behalf of the Company
No person has applied to the Court under section 237 of the Corporations Act 2001 for leave to bring proceedings on behalf
of the Company or intervene in any proceedings to which the Company is a party, for the purpose of taking responsibility on
behalf of the Company for all or part of those proceedings.
No proceedings have been brought or intervened in on behalf of the Company with leave of the Court under section 237 of
the Corporations Act 2001.
Rounding
The amounts contained in this report and in the financial report have been rounded to the nearest $1,000 (where rounding
is applicable) and where noted ($’000) under the option available to the Company under ASIC CO 98/100. The Company is
an entity to which the class order applies.
Non-audit services
The Company may decide to employ the auditor on assignments additional to their statutory audit duties where the auditor’s
expertise and experience with the Company and/or the Group are important.
The Board of directors has considered the position and, in accordance with advice received from the Audit and Risk
Committee, is satisfied that the provision of the non-audit services by the auditor, if any, did not compromise the auditor
independence requirements of the Corporations Act 2001 for the following reasons:
a. all non-audit services have been reviewed by the Audit and Risk Committee to ensure they do not impact the
impartiality and objectivity of the auditor; and
b. none of the services undermines the general principles relating to auditor independence as set out in APES 110 Code of
Ethics for Professional Accountants.
The auditor of the Group, UHY Haines Norton and its related practice firms did not provide any non-audit services during
the year.
For
per
sona
l use
onl
y

nanosonics limited | annual report 2014
52 Directors’ report (continued)
Officers of the Company who are former audit partner of UHY Haines Norton
There are no officers of the company who are former audit partners of UHY Haines Norton.
Auditor’s independence declaration
A copy of the auditor’s independence declaration as required under section 307C of the Corporations Act 2001 is included
on page 59 of this report.
Auditor
UHY Haines Norton continues in office as auditor in accordance with section 327 of the Corporations Act 2001.
This report, which includes the review of operations (on pages 8 to 13) and the Information on the directors, company
secretaries and senior management (on pages 18 to 20), is made and signed in accordance with a resolution of directors,
pursuant to section 298 (2)(a) of the Corporations Act 2001, on 21 August 2014.
Richard England
Director
Sydney
21 August 2014
For
per
sona
l use
onl
y

53
The Board of directors of Nanosonics Limited is committed
to ensuring that its policies and practices reflect good
corporate governance consistent with the ASX Listing
Rules and the ASX Corporate Governance Principles and
Recommendations with 2010 Amendments (2nd Edition).
The Company has commenced work on implementing
the recommendations in the March 2014 Amendments
(3rd Edition).
This Corporate Governance Statement sets out Nanosonics
Limited’s key corporate governance principles and practices
and was approved by the Board on 28 July 2014. A copy
is available on the Company’s website at http://www.
nanosonics.com.au/Investor-Centre/Corporate-Governance.
Principle 1 – Lay solid foundations for management and oversight
Role of the Chairman
The Chairman is responsible for leading the Board, its
meetings and directors, so that all directors are able to
contribute effectively, all matters are properly considered
and there is clear decision-making. The Chairman has
ultimate responsibility for corporate governance.
Role of the BoardUnder the leadership of the Chairman, the role of the Board
is to provide strategic guidance to the Company and to
provide effective oversight of its management for the benefit
of all stakeholders.
The Board acts on behalf of shareholders and is
accountable to the shareholders for the overall strategy,
governance and performance of the Company. The Board
retains ultimate authority over the management of the
Group; however day-to-day management of the Group’s
affairs and the implementation of its strategies are formally
delegated by the Board to the CEO and President (Managing
Director) and senior executives. The respective roles and
responsibilities of the Board and senior executives, and how
they are separate, are set out in detail in the Company’s
Board Charter.
The Board meets regularly in accordance with an agreed
schedule and special meetings are held as required. Details
of directors’ attendances at meetings of the Board are
shown in the Directors’ report contained in the
Company’s Annual Report.
Roles of senior executivesThe Company sets responsibilities and performance
expectations for all senior executives, including executive
directors, as described in Information on directors,
company secretaries and senior management and in the
remuneration report in the Company’s Annual Report.
The Nanosonics Performance and Development Program
requires individual appraisals by a director at least annually
for all senior executives, including executive directors but
excluding the CEO and President, who is assessed by the
Non-Executive Directors. In accordance with that program,
individual appraisals of the performance of all senior
executives were undertaken by the CEO and President
during the year.
Committees of the BoardThe Board is assisted by committees, which are responsible
for aspects of the operation of the Group and which act by
examining relevant matters and making recommendations
to the Board. The Board may establish additional
committees to assist it in carrying out its responsibilities.
The Board may also delegate specified responsibilities to
ad-hoc committees. The directors must be satisfied that the
members of a committee are competent and will
exercise their delegated functions in accordance with
directors’ duties.
Currently there are four committees of the Board: the
Nomination Committee, the Audit and Risk Committee,
the Remuneration Committee and the R&D and Innovation
Committee. Details of directors’ attendances at meetings of
the committees are shown in the Directors’ report contained
in the Company’s Annual Report.
Principle 2 – Structure the board to add value The Board currently consists of three Non-Executive
Directors and two executive directors.
Corporate governance statement
For
per
sona
l use
onl
y

nanosonics limited | annual report 2014
54
The role of the Chairman is separate from that of the Chief
Executive Officer.
• Mr Maurie Stang is non-executive Chairman:
appointed director 14 November 2000.
• Dr David Fisher is an independent non-executive
director: appointed director 30 July 2001.
• Mr Richard England is an independent non-executive
director: appointed director 5 February 2010.
• Mr Michael Kavanagh is an executive director and CEO
and President: appointed non-executive director 30 July
2012 and became an executive director on
21 October 2013.
• Dr Ron Weinberger is an executive director and the
President Technology Development / Commercialisation:
appointed as an executive director 2 July 2008.
Details of each director, including their qualifications and
experience, are set out in the Information on the directors,
company secretaries and senior management on pages
18 to 20 of the Annual Report and on the Nanosonics
website, www.nanosonics.com.au.
Directors’ independenceDirectors’ independence is assessed according to the
provisions set out in the Company’s Board Charter
and in the ASX Corporate Governance Principles and
Recommendations with 2010 Amendments (2nd
Edition). Accordingly:
• Mr Stang is not considered to be an independent
director as: he is a founder of the Company; he held
executive office in the Company until March 2007; he
is a major shareholder of the Company; and he is a
director and/or shareholder of companies with which
the Company had significant transactions during
the year (refer to the Directors report included in the
Annual Report).
• Mr Kavanagh is not considered to be an independent
director as he is an executive of the Company.
• Dr Weinberger is not considered to be an independent
director as he is an executive of the Company.
• Dr Fisher is considered to be an independent director,
except that he served as interim executive director for
the period 14 December 2007 to 16 June 2008. For the
period 9 May 2011 to 29 March 2013 Dr Fisher served
as Managing Director of Aeris Environmental Ltd where
Mr Stang is the non-executive Chairman.
• Mr England is considered to be an independent director.
The Board is considering opportunities to appoint additional
suitably qualified and experienced independent directors.
At the time when the Company has appointed other
independent directors, the Board will also consider its
opportunities to appoint an independent chairman.
Nomination Committee
The members of the Nomination Committee are: Mr Richard
England (Chairman), Dr David Fisher, and Mr Maurie
Stang. The Committee comprises a majority of independent
directors and is chaired by an independent director.
The Nomination Committee is appointed by the Board to
assist the Board to discharge its responsibilities in relation to:
• The composition, structure and operation of the Board
and ensuring the Board is comprised of individuals
who are best able to discharge their responsibilities as
Directors; and
• Ensuring the Company meets the requirements of the
ASX Diversity Guidelines.
A copy of the Nomination Committee Charter is available on
the Company’s website.
Selection and appointment of directors
The Nomination Committee is responsible for the
identification and selection of suitable candidates for
appointment as a director. The Committee assesses
potential directors to ensure the Board includes an
appropriate mix of skills to allow the Board to maximise its
effectiveness and contribution to the Company. Selection
criteria include relevant experience and qualifications,
availability, communication capabilities, community
standing and integrity. After assessment, candidates are
recommended to the Board by the Committee.
Induction, education and access of directors Every new director receives an appointment letter
accompanied by:
• Director’s Deed of Access;
• Director’s Handbook (containing Company policies and
charters); and
• Induction training.
Corporate governance statement (continued)
For
per
sona
l use
onl
y

55
Directors and the Board have the right, in connection with
their duties and responsibilities, to obtain independent
professional advice at the Company’s expense. Subject
to prior approval from within the Board, which will not
reasonably be withheld, a director may have direct access
to any employee or contractor of the Group and seek any
information from any employee in order to perform his or
her responsibilities.
Board performance evaluation
The Board requires that each director has the appropriate
competencies to fulfil their role and that they perform
effectively in their respective role and on the Board. The
Nomination Committee is responsible for recommending
a framework for the assessment and evaluation of the
performance of each director individually, of each committee
and of the Board as a whole. The performance of the Board
and each of the Board committees is reviewed annually with
the most recent being completed in October 2013.
Principle 3 – Promote ethical and responsible decision-making
Code of ConductAll directors, officers, employees, advisors, consultants and
contractors of the Group are expected to act with integrity
and objectivity and to maintain the highest possible ethical
standards which have been formalised and set out in the
Company’s Code of Conduct and Ethics which is available
on the Company’s website.
Securities trading policyThe Company has a Securities Trading Policy, which applies
to all Designated Persons, comprising its directors, officers,
employees, advisors, consultants and contractors and such
other persons as the Board nominates. Designated Persons
may only deal in the Company’s securities in accordance
with the policy and the Company regularly reviews share
trading reports and its share register to ensure compliance
with the policy. A copy of the Securities Trading Policy is
available on the Company’s website.
Whistleblower policyThe Company recognises its responsibilities to conduct
its business in accordance with both Australian and
internationally accepted practices and procedures. As part
of this, the Company is committed to maintaining a culture
where all directors, staff, contractors and consultants to the
Company are encouraged to raise concerns about poor and/
or unacceptable practices and misconduct.
The Company has a Whistleblower Policy to provide a
process through which staff, contractors and consultants
to the Company can express serious concerns and report
misconduct. The Whistleblower policy is available on the
Company’s website.
Diversity
Nanosonics believes that the pursuit of diversity in the
workplace increases its ability to attract, retain and develop
the best talent available, creates an engaged workforce,
delivers the highest quality services to its customers,
enhances individual work-life balance, encourages personal
achievement, improves co-operation and assists in the
optimisation of organisational performance. Diversity in the
workplace mirrors the diversity of the broader community,
encompassing age, gender, ethnicity, cultural and other
personal factors. The Company respects the diversity of
all employees, consultants and contractors, and cultivates
an environment of fairness, respect and equal opportunity.
A copy of Nanosonics’ Diversity policy is available on the
Company’s website.
Set out below are the diversity objectives established by
the Board.
• Hiring: The Board will ensure that appropriate
selection criteria, based on diverse skills, experience
and perspectives, are used when recruiting new staff
and directors.
• Job specifications, advertisements, application
forms and contracts will not contain any direct or
inferred discrimination.
• Training: All internal and external training opportunities
will be based on merit, and Company and individual
needs. The Board will consider senior management
training and executive mentoring programmes to
develop skills and experience to prepare employees for
senior management and Board positions.
• Career Advancement: All decisions associated with
career advancement, including promotions, transfers,
and other assignments, will meet the Company’s needs,
and be determined on skill and merit.
For
per
sona
l use
onl
y

nanosonics limited | annual report 2014
56
• Work Environment: The Company will ensure that
all officers, employees, consultants and contractors
have access to a work environment that is free from
harassment and unwanted conduct in relation to
personal circumstances or characteristics. Directors,
managers and supervisors will ensure that complainants
or reports of sexual, racial or other harassment are
treated seriously, confidentially and sympathetically by
the Company.
The Board assesses annually the above diversity objectives
and Company’s progress in achieving these objectives.
As at 30 June 2014, women represented 36% (2013: 33%)
of the Group’s workforce, 31% in key executive positions
(2013: 36%) and 0% at Board level (2013: 0%)
Principle 4 – Safeguard integrity in financial reporting
Audit and Risk Committee
The members of the Audit and Risk Committee are:
Mr Richard England (Chairman), Dr David Fisher and
Mr Maurie Stang. The Committee comprises only Non-
Executive Directors and has a majority of independent
directors. The Committee Chairman is an independent
director who is appropriately qualified and financially literate
and who is not Chairman of the Board.
The purpose of the Audit and Risk Committee is to assist
the Board to discharge its responsibilities in relation to the
oversight and monitoring of:
• Corporate reporting processes, including the financial
reporting process;
• External audit;
• Risk management and internal control;
• Compliance with laws, regulations, internal policies and
industry standards; and
• Activities to prevent, deter, detect and report on fraud.
A copy of the Audit and Risk Committee Charter is available
on the Company’s website.
External auditors The Audit and Risk Committee is responsible for selecting
and recommending the appointment of the external auditor.
The Committee considers a number of criteria in appointing
the external auditor, such as audit approach, governance
processes, key personnel and cost. The Committee then
provides the Board with its recommendation. In line with
current professional standards the external auditor is
required to rotate after 5 years and cannot return as auditor
for a further 2 years.
It is the external auditor’s role to provide an independent
opinion that the Company’s financial reports are true and fair
and comply with the Australian Accounting Standards and
the Corporations Act 2001.
Principle 5 – Make timely and balanced disclosure The Company has a Continuous Disclosure and Shareholder
Communications Policy to ensure compliance with the
disclosure requirements of the ASX Listing Rules and to
ensure individual accountability at senior executive level
for that compliance. In determining whether information
should be disclosed, the Board takes into consideration
the needs and interests of the Group’s shareholders and
other stakeholders in the context of the Board’s obligations
under the Corporations Act 2001 and the ASX Listing Rules.
ASX announcements are prepared directly when the Board
or executive management becomes aware of information
required to be disclosed to the market.
A copy of the Continuous Disclosure and Shareholder
Communications Policy is available on the
Company’s website
Principle 6 – Respect the rights of shareholders The Company recognises and respects the rights of
shareholders and seeks to facilitate the effective exercise
of those rights within the limitations of the continuous
disclosure provisions of the ASX Listing Rules. Nanosonics’
policy for communication with shareholders and
encouraging their participation at general meetings is
contained in the Company’s Continuous Disclosure and
Shareholder Communications Policy.
The Company encourages shareholder participation,
particularly attendance of the general meetings of the
Company. The external auditor attends the annual general
meeting and is available to answer shareholder questions
about the conduct of the audit of the Company and the
Corporate governance statement (continued)
For
per
sona
l use
onl
y

57
preparation and content of the auditor’s report on the
financial statements of the Company.
The Company ensures relevant corporate information is
complete and available in a timely manner on its website:
www.nanosonics.com.au. Measures include:
• Placing all announcements to the market on the
Company website after they have been released to
the ASX.
• Posting webcasts or recordings of teleconferences to
the website.
• Including at least the last three years’ financial data on
the website.
• Providing updates and reports to shareholders by email.
Shareholders and prospective shareholders are welcome,
by prior appointment, to speak with executive managers
responsible for investor relations and to view the
Company’s operations.
Principle 7 – Recognise and manage risk The Company has established and documented an
enterprise risk management program for the oversight and
management of the Company’s material business risks. The
Audit and Risk Committee is responsible for overseeing and
monitoring risk and compliance management. A summary
of the Audit and Risk Committee’s responsibilities in relation
to risk and compliance are included in the Audit and Risk
Committee Charter.
Nanosonics’ enterprise risk management system is based
on the International Risk Standard AS/NZS ISO 31000:2009
and is complemented by an internal control program based
upon the principles set out in the Australian Compliance
Standard AS 3806:2006.
Nanosonics has developed a common risk language
through which it considers internal risks such as those
arising from financial and human resource management
and external risks such as those arising from dealings with
key stakeholders and macro environmental issues such
as regulatory changes or economic events beyond the
Company’s control. In assessing material business risks,
each identified risk is individually assessed in terms of
the likelihood of the risk event occurring and the potential
consequences in the event that the risk event was to occur.
During the year the Company implemented an electronic
risk and compliance system, which facilitates linking
of material business risks to mitigating controls so that
the performance of the Company’s enterprise risk and
compliance programs can be monitored continuously.
Management reports to the Board on the effectiveness of
the Company’s management of its material business risks
with the most recent report being provided in July 2014.
The CEO and President and Chief Financial Officer have
jointly confirmed to the Board that the declaration provided
in the Annual Report in accordance with section 295A of the
Corporations Act 2001 is founded upon sound systems of
internal control and that the systems are operating effectively
in all material respects in relation to financial reporting risks.
Principle 8 – Remunerate fairly and responsiblyThe Company’s remuneration philosophy and policies are
set out in the Remuneration Report in the Annual Report.
The Remuneration Committee oversees remuneration
policies and strategies to ensure that performance is
rewarded in a manner that is competitive and appropriate
for the results delivered.
Remuneration Committee
The members of the Remuneration Committee are: Mr
Richard England (Chairman), Dr David Fisher and Mr
Maurie Stang. The Committee is chaired by an independent
director and has a majority of independent directors.
The purpose of the Remuneration Committee is to assist the
Board to discharge its responsibilities by:
• Recommending appropriate remuneration policies to the
Board and monitoring their implementation;
• Establishing systems designed to enhance the
performance of individual employees and Directors of
the Company and of the Company as a whole;
• Fairly and responsibly rewarding executives and other
employees having regard to the performance of the
Company, the performance of the executive or employee
and the general pay environment; and
• Recommending to the Board a system of performance
appraisal for Directors and the Board of the Company
as a whole.
A comprehensive summary of the Company’s remuneration
strategy together with details of securities trading
restrictions are set out in the Remuneration Report in the
Annual Report.
For
per
sona
l use
onl
y

nanosonics limited | annual report 2014
58 Contents of the financial statementsFor the year ended 30 June 2014
Auditor’s independence declaration 59
Financial statements 60
Notes to the financial statements 64
1. Corporate information ................................................................................................................................................64
2. Summary of significant accounting policies ................................................................................................................64
3. Financial risk management ........................................................................................................................................75
4. Critical accounting estimates and judgments .............................................................................................................80
5. Segment information .................................................................................................................................................81
6. Other income ........................................................................................................................................................... 82
7. Loss before income tax expense ................................................................................................................................82
8. Taxation ....................................................................................................................................................................83
9. Current assets – Cash and cash equivalents ..............................................................................................................84
10. Current assets – Trade and other receivables..............................................................................................................84
11. Current assets – Inventories .......................................................................................................................................86
12. Current assets – Other ...............................................................................................................................................86
13. Non-current assets – Property plant and equipment ..................................................................................................87
14. Non-current assets – Intangible assets ......................................................................................................................88
15. Non-current assets – Other .......................................................................................................................................88
16. Current liabilities – Trade and other payables .............................................................................................................88
17. Current liabilities – Deferred revenue .........................................................................................................................88
18. Employee provisions..................................................................................................................................................89
19. Borrowings ...............................................................................................................................................................89
20. Convertible notes ......................................................................................................................................................90
21. Contributed equity ....................................................................................................................................................90
22. Reserves ...................................................................................................................................................................91
23. Dividends .................................................................................................................................................................91
24. Capital and leasing commitments ..............................................................................................................................91
25. Auditor’s remuneration...............................................................................................................................................92
26. Information relating to subsidiaries ............................................................................................................................92
27. Related party disclosures ...........................................................................................................................................93
28. Notes to the cash flow statements... ..........................................................................................................................95
29. Loss per share ..........................................................................................................................................................96
30. Share-based compensation ......................................................................................................................................96
31. Parent entity information .........................................................................................................................................102
32. Events subsequent to reporting date .......................................................................................................................102
Directors’ declaration 103
Independent auditor’s report to the members 104
For
per
sona
l use
onl
y

59Auditor’s independence declaration
For
per
sona
l use
onl
y

nanosonics limited | annual report 2014
60
Consolidated statement of profit or loss and other comprehensive incomeFor the year ended 30 June 2014
Notes2014 $’000
2013 $’000
Continuing operations
Sale of goods and services 5 21,492 14,899
Cost of sales (7,571) (6,428)
Gross profit 13,921 8,471
Other income 6 4,114 2,690
Operating expenses
Staffing costs 7 12,005 9,177
Intellectual property 594 459
Quality & regulatory management 298 247
Business development 1,094 988
Premises, plant & equipment 1,635 1,567
External consultants & advisors 1,534 1,861
Other operating costs 2,956 2,080
Total operating expenses 20,116 16,379
Other expense
Borrowing costs 20 555 517
Operating loss before income tax (2,636) (5,735)
Income tax benefit (expense) 8 31 (33)
Net loss after income tax expense attributable to owners of the parent entity (2,605) (5,768)
Other comprehensive income Items that may be reclassified subsequently to profit or loss
Exchange difference on foreign currency translation (7) 38
Income tax on items of other comprehensive income – –
Total items that may be reclassified subsequently to profit or loss (7) 38
Total other comprehensive income (7) 38
Total comprehensive income for the period attributable to owners of the parent entity (2,612) (5,730)
(Loss) per share for losses attributable to ordinary shareholders of the company Cents Cents
Basic (loss) per share 29 (1.0) (2.2)
Diluted (loss) per share 29 (1.0) (2.2)
The above consolidated statement of profit or loss and other comprehensive income should be read in conjunction with the accompanying notes.
For
per
sona
l use
onl
y

61Consolidated statement of financial positionAs at 30 June 2014
Notes2014 $’000
2013 $’000
Current assets
Cash and cash equivalents 9 21,233 24,064
Trade and other receivables 10 5,712 4,199
Inventories 11 4,237 2,909
Other current assets 12 440 488
Total current assets 31,622 31,660
Non-current assets
Property, plant and equipment 13 1,778 1,812
Intangible assets 14 – 37
Other non-current assets 15 144 144
Total non-current assets 1,922 1,993
Total assets 33,544 33,653
Current liabilities
Trade and other payables 16 3,000 3,002
Derivative financial instruments 3 – 198
Deferred revenue 17 308 209
Employees provisions 18 1,521 783
Borrowings 19 6 6
Total current liabilities 4,835 4,198
Non-current liabilities
Employees provisions 18 159 183
Borrowings 19 18 24
Convertible notes 20 8,097 7,541
Total non-current liabilities 8,274 7,748
Total liabilities 13,109 11,946
Net assets 20,435 21,707
Equity
Contributed equity 21 74,410 74,068
Option premium on convertible notes 20 376 376
Reserves 22 3,691 2,700
Accumulated loss (58,042) (55,437)
Total equity 20,435 21,707
The above consolidated statement of financial position should be read in conjunction with the accompanying notes.
For
per
sona
l use
onl
y

nanosonics limited | annual report 2014
62 Consolidated statement of changes in equityFor the year ended 30 June 2014
Contributed equity
Option premium on convertible
note
Employee equity
benefits reserve
Foreign currency
translation reserve
Accumulated losses Total equity
Note 21 $’000
Note 20 $’000
Note 22 $’000
Note 22 $’000 $’000 $’000
At 30 June 2012 73,532 376 1,775 (11) (49,669) 26,003
Loss for the period – – – – (5,768) (5,768)
Other comprehensive income – – – 38 – 38
Total comprehensive income (loss) – – – 38 (5,768) (5,730)
Transactions with owners in their capacity as owners
Shares issued 381 – – – – 381
Transaction costs (48) – – – – (48)
Share-based payment 203 – 898 – – 1,101
At 30 June 2013 74,068 376 2,673 27 (55,437) 21,707
Loss for the period – – – – (2,605) (2,605)
Other comprehensive income – – – (7) – (7)
Total comprehensive income (loss) – – – (7) (2,605) (2,612)
Transactions with owners in their capacity as owners
Shares issued – – – – – –
Share-based payment 342 – 998 – – 1,340
At 30 June 2014 74,410 376 3,671 20 (58,042) 20,435
The above consolidated statement of changes in equity should be read in conjunction with the accompanying notes.
For
per
sona
l use
onl
y

63
Notes2014 $’000
2013 $’000
Cash flows from operating activities
Receipts from customers (inclusive of GST) 23,027 14,025
Receipts from government grants (inclusive of refundable R&D tax offset) 6 1,666 1,498
Payments to suppliers and employees (inclusive of GST) (28,020) (21,086)
Interest received 727 1,096
Income taxes paid 6 (39)
Net cash used in operating activities 28 (2,594) (4,506)
Cash flows from investing activities
Purchase of property, plant and equipment (479) (1,359)
Net cash used in investing activities (479) (1,359)
Cash flow from financing activities
Net proceeds from issue of shares and exercise of options 342 536
Repayment of borrowings (6) (6)
Net cash provided by financing activities 336 530
Net increase (decrease) in cash and cash equivalents (2,737) (5,335)
Cash and cash equivalents at the beginning of the financial year 24,064 29,310
Effects of exchange rate changes on cash and cash equivalents (94) 89
Cash and cash equivalents at the end of year 9 21,233 24,064
The above consolidated statement of cash flows should be read in conjunction with the accompanying notes.
Consolidated statement of cash flowsFor the year ended 30 June 2014
For
per
sona
l use
onl
y
nanosonics limited | annual report 2014
64
1. Corporate informationThe financial report on pages 60 to 102 covers Nanosonics Limited as a consolidated entity consisting of Nanosonics Limited (the Company) and its subsidiaries (the Group).
Nanosonics Limited is a publicly listed company, limited by shares, incorporated and domiciled in Australia and listed on the Australian Securities Exchange (ASX code NAN). The Company’s registered office and principal place of business is:
Unit 24, 566 Gardeners Road Alexandria, NSW 2015 Australia
A description of the nature of the Group’s operations and its principal activities is included in the review of operations on pages 8 to 13 and in the Directors’ report on page 22, both of which are not part of this financial report.
The financial report was authorised for issue in accordance with the resolution of the directors on 21 August 2014.
2. Summary of significant accounting policies
a. Basis of preparationThe financial report is a general purpose financial report, which has been prepared in accordance with the requirements of the Corporations Act 2001, Australian Accounting Standards, and other authoritative pronouncements of the Australian Accounting Standards Board. The financial report has also been prepared on a historical cost basis and do not take into account changes in money values, except for derivative financial instruments, which have been measured at fair value.
The Company is of a kind referred to in ASIC Class Order 98/100 dated 10 July 1998 and in accordance with that Class Order, all financial information presented in Australian dollars has been rounded to the nearest one thousand dollars ($’000) unless otherwise stated.
b. Compliance with IFRSThe financial report of Nanosonics Limited also complies with International Financial Reporting Standards (IFRS) as issued by the International Accounting Standards Board (IASB).
c. New accounting standards and interpretations1) Changes in accounting policy and disclosures
The accounting policies adopted are consistent with those of the previous financial year except as follows:
The Group has adopted the following new and amended Australian Accounting Standards and AASB Interpretations as of 1 July 2013:
• AASB 10 Consolidated Financial Statements, AASB 127 Separate Financial Statements
• AASB 11 Joint Arrangements, AASB 128 Investments on Associates and Joint Ventures
• AASB 12 Disclosure of Interests in Other Entities
• AASB 13 Fair Value Measurement
• AASB 119 Employee Benefits (revised 2011)
• AASB 2012-2 Amendments to AASB 7 Financial Instruments: Disclosures – Offsetting Financial Assets and
Financial Liabilities
• AASB 2012-5 Improvements to AASBs 2009-2011 Cycle
• AASB 2012-9 Withdrawal of interpretation 1039
• AASB 2011-4 Amendments to Australian Accounting Standards to Remove Individual Key Management Personnel
Disclosure Requirements
• AASB CF 2013-1 Australian Conceptual Framework
Notes to the financial statementsFor the year ended 30 June 2014
For
per
sona
l use
onl
y

65
The effect of the adoption of the above standards or interpretations or other amendments applied for the first time are disclosed below:
• AASB 119 Employee Benefits – The revised standard introduced changes to accounting for defined benefit plans,
termination benefits and definition of short term employee benefits. The distinction between short-term and other long-
term employee benefits is now based on whether the benefits are expected to be settled wholly within 12 months after
the reporting date. Consequential amendments were also made to other standards via AASB 2011-10. The adoption of
this standard by the Group impacted the measurement of annual leave obligations. The effect of change in the annual
leave expense and provision as previously reported in 2013 is not material.
• AASB 13 Fair Value Measurement – AASB 13 establishes a single source of guidance for all fair value measurements.
AASB 13 does not change when an entity is required to use fair value, but rather, provides guidance on how to
measure fair value under Australian Accounting Standards. AASB 13 defines fair value as an exit price. As a result of
the guidance in AASB 13, the Group reassessed its policies for measuring fair values, in particular, its valuation inputs
such as non-performance risk for fair value measurement of liabilities. AASB 13 also requires additional disclosures.
Application of AASB13 has not materially impacted the fair value measurements of the Group. Additional disclosures
where required, are provided in the individual notes relating to the assets and liabilities whose fair values were
determined. Fair value hierarchy is provided in note 3.
• AASB 2011-4 Amendments to Australian Accounting Standards and revised Corporations Regulations 2M.3.03 –
Transfer of Individual KMP disclosures to the Remuneration Report. The amendments removed the individual Key
Management Personnel (KMP) disclosures about equity holdings, loans and other transactions with KMP from the
notes to the financial statements and were transferred to the Remuneration Report. Comparative information is not
required for these items in the Remuneration Report. Accordingly, individual KMP disclosures are now included in the
Remuneration report on page 26 to 50.
Adoption of the other standards affected the disclosures but did not have a material impact on the financial statements of the Group.
2) Accounting Standards and Interpretations issued but not yet effective
Australian Accounting Standards and Interpretations that have recently been issued or amended but are not yet effective and have not been adopted by the Group for the annual reporting period ended 30 June 2014, are outlined below:
Standards effective 1 Jan 2014, applicable to the Group by 1 July 2014• AASB 2012-3 Amendments to Australian Accounting Standards – Offsetting Financial Assets and Financial Liabilities.
AASB 2012-3 adds application guidance to AASB 132 to address inconsistencies identified in applying some of the
offsetting criteria of AASB 132, including clarifying the meaning of “currently has a legally enforceable right of set-
off” and that some gross settlement systems may be considered equivalent to net settlement. When AASB 2012-3 is
first adopted for the year ending 30 June 2015, there will be no impact on the entitiy as this standard merely clarifies
existing requirements in AASB 132.
• AASB 2013-3 Amendments to AASB 136 – Recoverable Amount Disclosure for Non-Financial Assets. The
amendments include the requirement to disclose additional information about the fair value measurement when
the recoverable amount of impaired assets is based on fair value less cost of disposal. When these amendments are
adopted for the first time, they are unlikely to have any significant impact to the Group given that they are largely of the
nature of clarification of existing requirements.
For
per
sona
l use
onl
y

nanosonics limited | annual report 2014
66 Notes to the financial statements (continued)
For the year ended 30 June 2014
• Annual improvements 2010-2012 Cycle – Annual Improvements to IFRSs 2010-2012 Cycle. Annual Improvements to
IFRSs 2010-2012 Cycle is a collection of amendments to IFRSs in response to eight issues addressed during the
2010-2012 cycle for annual improvements to IFRSs. The amendments have not yet been adopted by the AASB.
Among the items addressed by this standard, the following are relevant to the Group:
– IFRS 2 – Clarifies the definition of ‘vesting conditions’ and ‘market condition’ and introduces the definition of
‘performance condition’ and ‘service condition’. The group is yet to assess the effect if any of this amendment on its
accounting of share-based payments.
– IFRS 8 – Requires entities to disclose factors used to identify the entity’s reportable segments when operating
segments have been aggregated. An entity is also required to provide reconciliation of total reportable segments’
assets to the entity’s total assets.
– IAS 16 & IAS 38 – Clarifies the determination of accumulated depreciation does not depend on the selection of
valuation technique and that it is calculated as the difference between the gross and net carrying amounts.
– IAS 24 – Defines a management entity providing KMP services as a related party of the reporting entity. The
amendments added an exemption from the detailed disclosure requirements in paragraph 17 of IAS 24 for KMP
services provided by a management entity. Payments made to a management entity in respect of KMP services
should be separately disclosed.
• Annual Improvements 2011-2013 Cycle – Annual Improvements to IFRSs 2011-2013 Cycle. Annual Improvements
to IFRSs 2011-2013 Cycle is a collection of amendments to IFRSs in response to four issues addressed during the
2011-2013 cycle. Among other improvements, the amendments clarify that an entity should assess whether an
acquired property is an investment property under IAS 40 Investment Property and perform a separate assessment
under IFRS 3 Business Combinations to determine whether the acquisition of the investment property constitutes a
business combination. The amendments have not yet been adopted by the AASB.
• AASB 1031 Materiality – The revised AASB 1031 is an interim standard that cross-references to other Standards and
the Framework (issued December 2013) that contain guidance on materiality. AASB 1031 will be withdrawn when
references to AASB 1031 in all Standards and Interpretations have been removed.
Unless otherwise stated above, the adoption of the above standards is not expected to have a significant effect on the way the Group accounts for and presents its financial results.
Standards to be applied by the Group beyond 1 July 2014• Amendments to IAS 16 and IAS 38 – Clarification on the Acceptable Methods of Depreciation and Amortisation
(Amendments to IAS 16 and IAS 38), effective I January 2016, applicable 1 July 2016. IAS 16 and IAS 38 both
establish the principle for the basis of depreciation and amortisation as being the expected pattern of consumption of
the future economic benefits of an asset. The IASB has clarified that the use of revenue-based methods to calculate the
depreciation of an asset is not appropriate because revenue generated by an activity that includes the use of an asset
generally reflects factors other than the consumption of the economic benefits embodied in the asset. The IASB also
clarified that revenue is generally presumed to be an inappropriate basis for measuring the consumption of the economic
benefits embodied in an intangible asset. This presumption, however, can be rebutted in certain limited circumstances.
• IFRS 15 Revenue from Contracts with Customers, effective 1 January 2017, applicable 1 July 2017. IFRS 15
establishes principles for reporting useful information to users of financial statements about the nature, amount, timing
and uncertainty of revenue and cash flows arising from an entity’s contracts with customers. The core principle of IFRS
15 is that an entity recognises revenue to depict the transfer of promised goods or services to customers in an amount
that reflects the consideration to which the entity expects to be entitled in exchange for those goods or services. An
entity recognises revenue in accordance with that core principle by applying the following steps:
For
per
sona
l use
onl
y
67
– Step 1: Identify the contract(s) with a customer.
– Step 2: Identify the performance obligations in the contract.
– Step 3: Determine the transaction price.
– Step 4: Allocate the transaction price to the performance obligations in the contract.
– Step 5: Recognise revenue when (or as) the entity satisfies a performance obligation.
• AASB 9 Financial Instruments, effective 1 January 2018, applicable 1 July 2018. AASB 9 includes requirements for
the classification and measurement of financial assets. It was further amended by AASB 2010-7 and AASB 2012-6 to
reflect amendments to the accounting for financial liabilities. These requirements improve and simplify the approach for
classification and measurement of financial assets compared with the requirements of AASB 139.
The Group has not yet assessed the full impact of the above standards that will be applied by the Group beyond 1 July 2014.
d. Basis of consolidationThe consolidated financial statements comprise the financial statements of Nanosonics Limited (‘Company’ or ‘parent entity’) and its subsidiaries as at 30 June each year. Nanosonics Limited and its subsidiaries together are referred to in this financial report as the Group or the consolidated entity.
Business combinations The Group accounts for business combinations using the acquisition method when control is transferred to the Group. The consideration transferred in the acquisition is generally measured at fair value, as are the identifiable net assets acquired. Any goodwill that arises is tested annually for impairment. Any gain or a bargain purchase is recognised in profit or loss immediately. Transaction costs are expensed as incurred, except if related to the issue of debt or equity securities.
The consideration transferred does not include amounts related to the settlement of pre-existing relationships. Such amounts are generally recognised in profit or loss.
SubsidiariesSubsidiaries are entities controlled by the Group. The Group controls an entity when it is exposed to, or has rights to, variable returns from its involvement with the entity and has the ability to affect those returns through its power over the entity. Subsidiaries are fully consolidated from the date on which control is transferred to the Group. They are de-consolidated from the date that control ceases.
Information on subsidiaries is contained in note 26 to the financial statements.
The financial statements of the subsidiaries are prepared for the same reporting period as the parent company, using consistent accounting policies.
Loss of controlWhen the Group loses control over a subsidiary, it derecognises the assets and liabilities of the subsidiary, and any related non-controlling interests and other components of equity. Any resulting gain or loss is recognised in profit or loss. Any interest retained in the former subsidiary is measured at fair value when control is lost.
Transactions eliminated on consolidationIn preparing the consolidated financial statements, all inter-company balances and transactions between entities in the Group, including any unrealised profits or losses, have been eliminated in full.
e. Operating segmentsOperating segments are reported in a manner consistent with the internal reporting provided to the Managing Director and CEO, who is the Group’s chief operating decision maker. The chief operating decision maker is responsible for allocating resources and assessing performance of the operating segments.
f. Foreign currency(i) Functional and presentation currencyItems included in the financial statements of each of the Group’s entities are measured using the currency of the primary economic environment in which the entity operates (‘the functional currency’). The consolidated financial statements are presented in Australian dollars, which is Nanosonics Limited’s functional and presentation currency.
For
per
sona
l use
onl
y
nanosonics limited | annual report 2014
68 Notes to the financial statements (continued)
For the year ended 30 June 2014
(ii) Transactions and balancesForeign currency transactions are translated into the functional currency using the exchange rates prevailing at the dates of the transactions. Foreign exchange gains and losses resulting from the settlement of such transactions and from the translation at year end exchange rates of monetary assets and liabilities denominated in foreign currencies are recognised in the statement of profit or loss, except when they are deferred in equity as qualifying cash flow hedges and qualifying net investment hedges or are attributable to part of the net investment in a foreign operation.
Translation differences on assets and liabilities carried at fair value are reported as part of the fair value gain or loss. Translation differences on non-monetary financial assets and liabilities are recognised in profit or loss as part of the fair value gain or loss.
(iii) Group companiesThe functional currency of the overseas subsidiaries is as follows:
• Nanosonics Europe GMBH is Euro; and
• Nanosonics Inc. is US dollars.
The results and financial position of all the Group entities (none of which has the currency of a hyperinflationary economy) that have a functional currency different from the presentation currency are translated into the presentation currency as follows:
• assets and liabilities for each balance sheet presented are translated at the closing rate at the date of that statement of
financial position
• income and expenses for each income statement are translated at average exchange rates (unless this is not a
reasonable approximation of the cumulative effect of the rates prevailing on the transaction dates, in which case income
and expenses are translated at the dates of the transactions), and
• all resulting exchange differences are recognised in other comprehensive income – foreign currency translation reserve.
On consolidation, exchange differences arising from the translation of any net investment in foreign entities, and of borrowings and other financial instruments designated as hedges of such investments, are recognised in other comprehensive income. When a foreign operation is sold or any borrowings forming part of the net investment are repaid, a proportionate share of such exchange differences is reclassified to profit or loss, as part of the gain or loss on sale where applicable.
g. Revenue recognitionRevenue is measured at the fair value of the consideration received or receivable, taking into account defined terms of payment and excluding taxes or duty. Amounts disclosed as revenue are net of returns, trade allowances, rebates and amounts collected on behalf of third parties. The Group recognises revenue when the amount of revenue can be reliably measured, it is probable that future economic benefits will flow to the entity and specific criteria have been met for each of the Group’s activities as described below. The amount of revenue is not considered to be reliably measurable until all contingencies relating to the sale have been resolved. The Group bases its estimates on historical results, taking into consideration the type of customer, the type of transaction and the specifics of each arrangement.
Revenue is recognised for the major business activities as follows:
(i) Sale of goodsRevenue is recognised when the significant risks and rewards of ownership have been transferred to the distributor or end customer. Sales are recorded based on the prices specified in the sales contracts net of any discounts and returns at the time of sale. No element of financing is deemed to be present as the sales are made with credit terms which are consistent with practices in each market.
(ii) Sale of servicesRevenue from trophon® EPR maintenance and repairs are recognised as services are rendered. Revenue from service contracts are recognised as services are rendered over the service period, typically over one year. Unearned service revenue is deferred and recognised as liability in the Statement of financial position.
(iii) Interest incomeInterest income is recognised on a time proportion basis using the effective interest method.
h. Government grantsGrants from government are recognised at their fair value where there is a reasonable assurance that the grant will be received and the Group will comply with the attached conditions.
For
per
sona
l use
onl
y

69
i. Income tax and other taxesThe income tax expense or revenue for the period is the tax payable on the current period’s taxable income based on the national income tax rate for each jurisdiction adjusted by changes in deferred tax assets and liabilities attributable to temporary differences and to unused tax losses.
The current income tax charge is calculated on the basis of the tax laws enacted or substantively enacted at the end of the reporting period in the countries where the Company’s subsidiaries and associates operate and generate taxable income. Management periodically evaluates positions taken in tax returns with respect to situations in which applicable tax regulation is subject to interpretation. It establishes provisions where appropriate on the basis of amounts expected to be paid to the tax authorities.
Deferred income tax is provided in full, using the liability method, on temporary differences arising between the tax bases of assets and liabilities and their carrying amounts in the consolidated financial statements. However, deferred income tax is not accounted for if it arises from initial recognition of an asset or liability in a transaction, other than a business combination, that at the time of the transaction affects neither accounting nor taxable profit or loss. Deferred income tax is determined using tax rates (and laws) that have been enacted or substantially enacted by the balance date and are expected to apply when the related deferred income tax asset is realised or the deferred income tax liability is settled.
Deferred income tax assets are recognised for deductible temporary differences and unused tax losses only if it is probable that future taxable amounts will be available to utilise those temporary differences and losses and on the assumption that no adverse change will occur in income tax legislation enabling the benefit to be realised and comply with the conditions of deductibility imposed by the law.
Deferred tax assets and liabilities are offset when there is a legally enforceable right to offset current tax assets and liabilities and when the deferred tax balances relate to the same taxation authority. Current tax assets and liabilities are offset where the entity has a legally enforceable right to offset and intends either to settle on a net basis, or to realise the asset and settle the liability simultaneously.
Current and deferred tax is recognised in profit or loss, except to the extent that it relates to items recognised in other comprehensive income or directly in equity. In this case, the tax is also recognised in other comprehensive income or directly in equity, respectively.
Tax consolidationNanosonics Limited and its wholly-owned Australian controlled entity, Saban Ventures Pty Limited, are part of a tax consolidated group.
The head entity, Nanosonics Limited, and the controlled entity in the tax consolidated group account for their own current and deferred tax amounts. These tax amounts are measured as if each entity in the tax consolidated group continues to be a standalone taxpayer in its own right.
In addition to its own current and deferred tax amounts, Nanosonics Limited also recognises the current tax liabilities (or assets) and the deferred tax assets arising from unused tax losses and unused tax credits assumed from controlled entities in the tax consolidated group.
Goods and services tax (GST), Value added tax (VAT)Revenues, expenses and assets are recognised net of the amount of associated GST or VAT as applicable, unless the GST/ VAT incurred is not recoverable from the taxation authority, in which case, the GST/VAT is recognised as part of the cost of acquisition of the asset or as part of the expense.
Receivables and payables are stated inclusive of the amount of GST/VAT receivable or payable. The net amount of GST/ VAT recoverable from, or payable to, the taxation authority is included with other current receivables or payables in the statement of financial position.
Cash flows are presented on a gross basis. The GST/VAT components of cash flows arising from investing or financing activities which are recoverable from, or payable to, the taxation authority are presented as operating cash flows.
j. LeasesThe determination of whether an arrangement is, or contains, a lease is based on the substance of the arrangement at inception date, whether fulfilment of the arrangement is dependent on the use of a specific asset or assets or the arrangement conveys a right to use the asset, even if that right is not explicitly specified in an arrangement.
Group as a lesseeFinance leases that transfer to the Group substantially all the risks and benefits incidental to ownership of the leased item, are capitalised at the commencement of the lease at the fair value of the leased property or, if lower, at the present value of the minimum lease payments. Lease payments are apportioned between finance charges and reduction of the lease
For
per
sona
l use
onl
y

nanosonics limited | annual report 2014
70 Notes to the financial statements (continued)
For the year ended 30 June 2014
liability so as to achieve a constant rate of interest on the remaining balance of the liability. Finance charges are recognised in finance costs in the profit or loss.
A leased asset is depreciated over the useful life of the asset. However, if there is no reasonable certainty that the Group will obtain ownership by the end of the lease term, the asset is depreciated over the shorter of the estimated useful life of the asset and the lease term.
Leases in which a significant portion of the risks and rewards of ownership are not transferred to the Group as lessee are classified as operating leases. Payments made under operating leases (net of any incentives received from the lessor) are charged to the income statement on a straight-line basis over the period of the lease.
Group as a lessorLeases in which the Group does not transfer all the risks and benefits of ownership of an asset are classified as operating leases. Initial direct costs incurred in negotiating an operating lease are added to the carrying amount of the leased asset and recognized over the lease term on the same basis as rental income. Contingent rents are recognised as revenue in the period in which they are earned.
k. Borrowing costsBorrowing costs are expensed in the period they occur. Borrowing costs consist of interest and other costs that an entity incurs in connection with the borrowing of funds.
l. Cash and cash equivalentsFor cash flow statement presentation purposes, cash and cash equivalents includes cash on hand, deposits held at call with financial institutions, other short-term, highly liquid investments presented at market value that are readily convertible to known amounts of cash and which are subject to an insignificant risk of changes in value, and bank overdrafts. Bank overdrafts are shown within borrowings in current liabilities in the statement of financial position.
m. InventoriesRaw materials, starting components, consumable stores, work in progress and finished goods are stated at the lower of cost and net realisable value.
Costs of purchased inventory are determined to be actual costs on a batch basis, after including import duties, taxes (other than those subsequently recoverable by the entity), transport, handling and other costs directly attributable to the acquisition of the inventory, and after deducting rebates and discounts.
Costs of work in progress and finished goods comprise purchased materials at cost, direct labour and an appropriate proportion of variable and fixed overhead expenditure, the latter being allocated on the basis of normal operating capacity.
Net realisable value is the estimated selling price in the ordinary course of business less the estimated costs of completion and the estimated costs necessary to make the sale.
n. Financial assetsClassificationFinancial assets are classified at initial recognition as financial assets at fair value through profit or loss, loans and receivables, held-to-maturity investments, available-for-sale financial assets, or as derivatives designated as hedging instruments in an effective hedge, as appropriate.
The Group’s financial assets include cash and short-term deposits, trade and other receivables, and derivative financial instruments.
Held-to-maturity investments are non-derivative financial assets with fixed or determinable payments and fixed maturities that the Group’s management has the positive intention and ability to hold to maturity. All of the Group’s cash term investments are captured in this category. Cash term investments, which are highly liquid irrespective of their maturity dates, are classified as current assets, as they may not necessarily be held for their full term.
Loans and receivables are non-derivative financial assets with fixed or determinable payments that are not quoted in an active market. Trade receivables generally have 30 to 60 days credit terms. Loans and receivables are included in current assets, except for those with maturities greater than 12 months after the reporting period which are classified as non-current assets. Receivables are disclosed in trade and other receivables (note 10) in the statement of financial position.
Derivative financial instruments are classified as held for trading unless they are designated as effective hedging instruments.
For
per
sona
l use
onl
y

71
Recognition and derecognitionAll financial assets are recognised initially at fair value plus, in the case of financial assets not recorded at fair value through profit or loss, transaction costs that are attributable to the acquisition of the financial assets.
Purchases or sales of financial assets that require delivery of assets within a time frame established by regulation or convention in the market place (regular way trades) are recognised on the trade dates. i.e. the date that the Group commits to purchase or sell the asset.
Financial assets carried at fair value through profit or loss are initially recognised at fair value and transaction costs are expensed in profit or loss.
Financial assets are derecognised when the rights to receive cash flows from the financial assets have expired or have been transferred and the Group has transferred substantially all the risks and rewards of ownership.
Subsequent measurementReceivables and held-to-maturity investments are carried at amortised cost using the effective interest method, less impairment. Amortised cost is calculated by taking into account any discount or premium on acquisition and fees and costs that are an integral part of the effective interest rate. The losses arising from impairment are recognised in the statement of profit or loss.
Receivables and held-to-maturity investments are carried at amortised cost using the effective interest method.
Investments in controlled entities are carried in the Company’s financial statements at the lower of cost and recoverable amount.
Impairment of financial assetsFor financial assets carried at amortised cost, at each reporting date, the Group assesses whether there is objective evidence that a financial asset is impaired. For trade receivables, collectability is reviewed on an on-going basis. An impairment exists if one or more events that has occurred since the initial recognition of the assets (an incurred “loss event”) has an impact on the estimated future cash flows of the financial asset or the group of financial assets that can be reliably estimated. Evidence of impairment may include indications that the debtors or group of debtors is experiencing significant financial difficulty, default or delinquency in payments, the probability that they will enter bankruptcy or other financial reorganisation and observable data indicating that there is a measurable decrease in the estimated future cash flows, such as changes in arrears or economic conditions that correlate with defaults.
If any such evidence exists, the amount of any impairment loss is measured as the difference between the assets carrying amount and the present value of estimated future cash flows (excluding future expected credit losses that have not yet been incurred). The present value of the estimated future cash flows is discounted at the financial assets original effective interest rate.
The carrying amount of the asset is reduced through the use of an allowance account and the loss is recognised in the statement of profit or loss. Receivables together with the associated allowance are written off when there is no realistic prospect of future recovery. If in a subsequent year, the amount of the estimated impairment loss increases or decreases because of an event occurring after the impairment were recognised, the previously recognised impairment loss is increased or reduced by adjusting the allowance account. If a write-off is later recovered, the recovery is credited to other expense in the statement of profit or loss.
o. Derivative financial instruments and hedge accountingThe Group uses derivative financial instruments, i.e. forward currency contracts, to hedge its foreign currency risks. Such derivative financial instruments are initially recognised at fair value on the date on which a derivative contract is entered into and are subsequently remeasured at fair value. Derivatives are carried as financial assets when the fair value is positive and as financial liabilities when the fair value is negative.
The fair values of forward currency contracts are calculated by reference to current forward exchange rates for contracts with similar maturity profiles.
Any gains or losses arising from changes in the fair value of derivatives are taken directly to the income statement, except for the effective portion of cash flow hedges, which is recognised in other comprehensive income.
For the purposes of hedge accounting, hedges are classified as:
• fair value hedges, when they hedge the exposure to changes in the fair value of a recognised asset or liability; or
• cash flow hedges, when they hedge the exposure to variability in cash flows that is attributable either to a particular risk
associated with a recognised asset or liability or to a forecast transaction.
For
per
sona
l use
onl
y
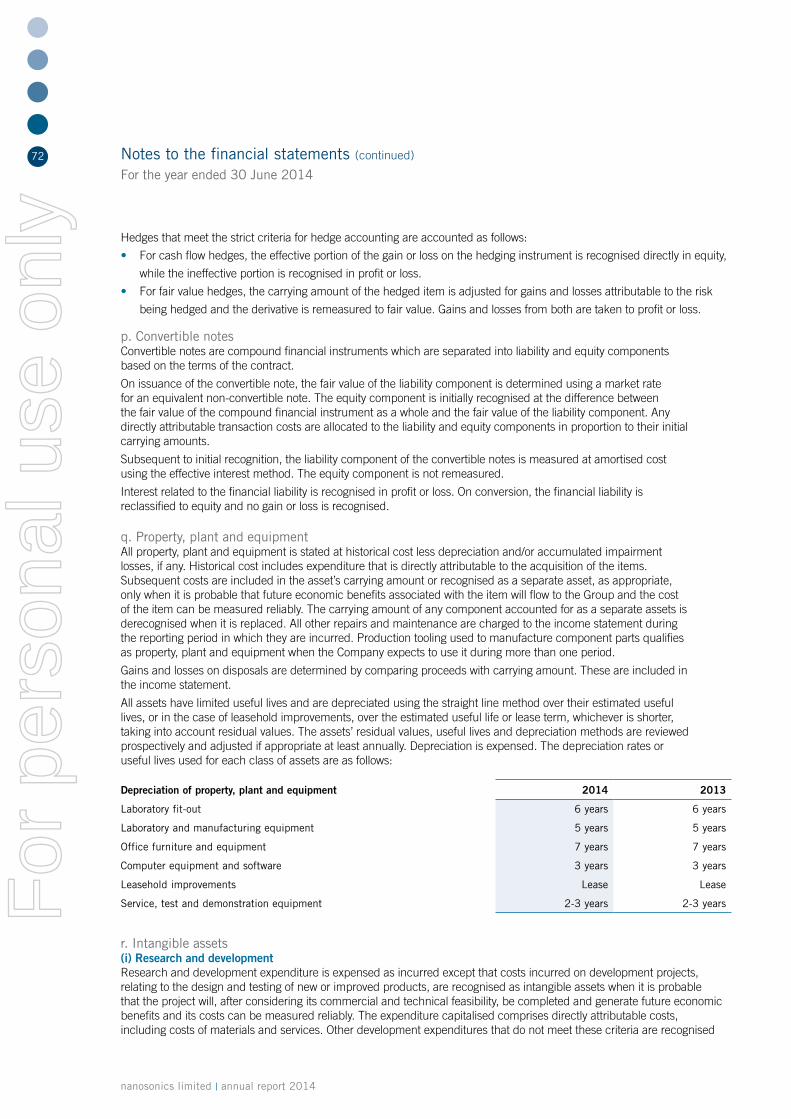
nanosonics limited | annual report 2014
72 Notes to the financial statements (continued)
For the year ended 30 June 2014
Hedges that meet the strict criteria for hedge accounting are accounted as follows:
• For cash flow hedges, the effective portion of the gain or loss on the hedging instrument is recognised directly in equity,
while the ineffective portion is recognised in profit or loss.
• For fair value hedges, the carrying amount of the hedged item is adjusted for gains and losses attributable to the risk
being hedged and the derivative is remeasured to fair value. Gains and losses from both are taken to profit or loss.
p. Convertible notesConvertible notes are compound financial instruments which are separated into liability and equity components based on the terms of the contract.
On issuance of the convertible note, the fair value of the liability component is determined using a market rate for an equivalent non-convertible note. The equity component is initially recognised at the difference between the fair value of the compound financial instrument as a whole and the fair value of the liability component. Any directly attributable transaction costs are allocated to the liability and equity components in proportion to their initial carrying amounts.
Subsequent to initial recognition, the liability component of the convertible notes is measured at amortised cost using the effective interest method. The equity component is not remeasured.
Interest related to the financial liability is recognised in profit or loss. On conversion, the financial liability is reclassified to equity and no gain or loss is recognised.
q. Property, plant and equipmentAll property, plant and equipment is stated at historical cost less depreciation and/or accumulated impairment losses, if any. Historical cost includes expenditure that is directly attributable to the acquisition of the items. Subsequent costs are included in the asset’s carrying amount or recognised as a separate asset, as appropriate, only when it is probable that future economic benefits associated with the item will flow to the Group and the cost of the item can be measured reliably. The carrying amount of any component accounted for as a separate assets is derecognised when it is replaced. All other repairs and maintenance are charged to the income statement during the reporting period in which they are incurred. Production tooling used to manufacture component parts qualifies as property, plant and equipment when the Company expects to use it during more than one period.
Gains and losses on disposals are determined by comparing proceeds with carrying amount. These are included in the income statement.
All assets have limited useful lives and are depreciated using the straight line method over their estimated useful lives, or in the case of leasehold improvements, over the estimated useful life or lease term, whichever is shorter, taking into account residual values. The assets’ residual values, useful lives and depreciation methods are reviewed prospectively and adjusted if appropriate at least annually. Depreciation is expensed. The depreciation rates or useful lives used for each class of assets are as follows:
Depreciation of property, plant and equipment 2014 2013
Laboratory fit-out 6 years 6 years
Laboratory and manufacturing equipment 5 years 5 years
Office furniture and equipment 7 years 7 years
Computer equipment and software 3 years 3 years
Leasehold improvements Lease Lease
Service, test and demonstration equipment 2-3 years 2-3 years
r. Intangible assets(i) Research and developmentResearch and development expenditure is expensed as incurred except that costs incurred on development projects, relating to the design and testing of new or improved products, are recognised as intangible assets when it is probable that the project will, after considering its commercial and technical feasibility, be completed and generate future economic benefits and its costs can be measured reliably. The expenditure capitalised comprises directly attributable costs, including costs of materials and services. Other development expenditures that do not meet these criteria are recognised
For
per
sona
l use
onl
y

73
as an expense as incurred. Development costs previously recognised as an expense are not recognised as an asset in a subsequent period.
Capitalised development expenditure which has a finite life is recorded as an intangible asset from the point at which the asset is ready for use and amortised on a straight-line basis over the period during which the related benefits are expected to be realised.
(ii) Patents and TrademarksThe costs of registering and protecting patents and trademarks are expensed as incurred.
s. Impairment of non-financial assetsThe Group assesses at each reporting date whether there is an indication that an asset may be impaired. Intangible assets are tested annually for impairment or more frequently if events or changes in circumstances indicate that they might be impaired. Other assets are reviewed for impairment whenever events or changes in circumstances indicate that the carrying amount may not be recoverable. An impairment loss is recognised for the amount by which the assets carrying amount exceeds its recoverable amount. The recoverable amount is the higher of an asset’s fair value less costs to sell and value in use. For the purposes of assessing impairment, assets are grouped at the lowest levels for which there are separately identifiable cash inflows which are largely independent of the cash inflows from other assets or groups of assets (cash- generating units). Non-financial assets other than goodwill that suffered impairment are reviewed for possible reversal of the impairment at each reporting date.
Impairment losses of continuing operations, including impairment on inventories, are recognised in the income statement in expense categories consistent with the function of the impaired asset.
t. Trade and other payablesTrade and other payables are carried at amortised cost. These amounts represent liabilities for goods and services provided to the Group prior to the end of financial year which are unpaid and arise when the Group becomes obliged to make future payment in respect of the purchase of these goods and services. The amounts are unsecured and are usually paid within 60 days of recognition.
u. ProvisionsProvisions for legal claims, service warranties and other obligations are recognised when the Group has a present legal or constructive obligation as a result of past events, it is probable that an outflow of resources will be required to settle the obligation and the amount has been reasonably estimated. Provisions are not recognised for future operating losses.
Provisions are measured at the present value of management’s best estimate of the expenditure required to settle the present obligation at the reporting date. The discount rate used is to determine the present value reflects current market assessments of the time value of money and the risks specific to the liability. An increase in the provision due to the passage of time is recognised as interest expense.
Provision for warrantiesProvision is made in respect of the Group’s estimated liability on all products under warranty at balance date. The provision is measured at current values estimated to be required to settle the warranty obligation. The initial estimate of warranty- related costs is revised annually. The provision is included in Current liabilities – trade and other payables in the statement of financial position.
v. Employee benefitsWages, salaries and annual leave and sick leaveLiabilities for employee benefits, including wages, salaries and non-monetary benefits, and accumulating annual and other leave, represent present obligations resulting from employees’ services provided to reporting date. Employee benefits have been measured at the amounts expected to be paid when the liability is settled and are recognised in the provision for employee benefits. Sick leaves are recognised when the leave is taken and are measured at the rates paid or payable.
Long service leaveThe liability for long-service leave is recognised in the provision for employee benefits and measured as the present value of expected future payments to be made in respect of services provided by employees up to the reporting date. Consideration is given to expected future wage and salary levels, experience of employee departures and periods of service. Expected future payments are discounted using market yields at the reporting date on national government bonds with terms to maturity that match as closely as possible, the estimated future cash outflows.
For
per
sona
l use
onl
y

nanosonics limited | annual report 2014
74 Notes to the financial statements (continued)
For the year ended 30 June 2014
BonusesThe Group recognises a liability and an expense for bonuses. The Group recognises a provision where contractually obliged and where there is a past practice that has created a constructive obligation.
Termination benefitsTermination benefits are payable when employment is terminated before the normal retirement or end of employment contract date, or when an employee accepts voluntary redundancy in exchange for these benefits. The Group recognises termination benefits when it is demonstrably committed to either terminating the employment of current employees according to a formal plan without possibility of withdrawal or providing termination benefits as a result of an offer made to encourage voluntary redundancy.
Share-based compensationShare-based compensation benefits are equity-settled transactions provided to employees via the Nanosonics share-based compensation plans. Information relating to the plans is set out in note 30 to the financial statements.
Share option plansThe assessed fair value on the date options are granted is independently determined using the appropriate valuation model that takes into account the exercise price, the term of the option, the impact of dilution, the share price at grant date and expected price volatility of the underlying share, the expected dividend yield and the risk-free interest rate for the term of the option.
General Share Option Plan (GSOP)The assessed fair values of options granted under the GSOP are expensed in full in the month in which they are granted with a corresponding increase in a share based payments reserve as part of shareholders’ equity, except where the options are granted as part of a capital raising programme, in which case no cost is recognised.
Employee Share Option Plan (ESOP)The fair value of options and performance rights granted under the ESOP is recognised as an employee benefit expense with a corresponding increase in equity, over the period in which the performance and/or service conditions are fulfilled. The cumulative expense recognised for share-based payments at each reporting date until the vesting date reflects the extent to which the vesting period has expired and the Group’s best estimate of the number of equity instruments that will ultimately vest. The statement of profit or loss expense or credit for a period represents the movement in cumulative expense recognised as at the beginning and end of the period.
No expense is recognised for awards that do not ultimately vest, except for equity-settled transactions for which vesting are conditional upon a market or non-vesting condition. These are treated as vesting irrespective of whether or not the market or non-vesting condition is satisfied, provided that all other performance and/or service conditions are satisfied.
When the terms of an equity-settled award are modified, the minimum expense recognised is the expense had the terms had not been modified. If the original terms of the award are met. An additional expense is recognised for any modification that increases the total fair value of the share-based payment transaction, or is otherwise beneficial to the employee as measured at the date of modification.
Deferred Employee Share Plan (DESP)The issue price of DESP shares granted during the year is calculated as the 5-day weighted average market price of shares of the Company on the Australian Securities Exchange as at close of trading on the date the shares are granted. The fair value of DESP shares granted is taken to be the issue price.
The assessed fair values of DESP shares are expensed in full in the month in which they are granted with a corresponding increase in equity, except if they are granted with a vesting condition, in which case the fair value of DESP shares granted is apportioned on a straight line monthly basis over the period between grant date and the date on which the shares all vest.
At the end of a period the Company assesses the probability of achievement of a benefit, being the percentage probability that employees will achieve at least the fair value of the unvested shares. The value of DESP shares with vesting conditions expensed in any period is calculated as that portion of the fair value applicable to the period factored by the probability of achievement and a share based payments reserve is created as part of shareholders’ equity.
w. Contributed equityOrdinary shares are classified as equity. Incremental costs directly attributable to the issue of new shares or options are shown in equity as a deduction, net of tax, from the proceeds.
x. Earnings per share(i) Basic earnings per shareBasic earnings per share (“EPS”) is calculated by dividing the net profit or loss attributable to equity holders of the Company for the reporting period, by the weighted average number of ordinary shares of the Company outstanding during the financial year.
For
per
sona
l use
onl
y

75
(ii) Diluted earnings per shareDiluted EPS adjusts the figures used in the determination of basic EPS to take into account the after income tax effect of interest and other financing costs associated with dilutive potential ordinary shares and the weighted average number of additional ordinary shares that would have been outstanding assuming the conversion of all dilutive potential ordinary shares.
y. Current versus non-current classificationThe Group presents assets and liabilities in statement of financial position based on current/non-current classification. An asset is current when it is:
• Expected to be realised or intended to be sold or consumed in normal operating cycle
• Held primarily for the purpose of trading
• Expected to be realised within twelve months after the reporting period, or
• Cash or cash equivalents unless restricted from being exchanged or used to settle a liability for at least twelve months
after the reporting period.
All other assets are classified as non-current. A liability is current when it is:
• Expected to be settled in normal operating cycle
• Held primarily for the purpose of trading
• Due to be settled within twelve months after the reporting period, or
• There is no unconditional right to defer the settlement of the liability for at least twelve months after the reporting period
The Group classifies all other liabilities as non-current.
Deferred tax asset and liabilities, if recognised, are classified as non-current assets and liabilities.
3. Financial risk managementThe Group is exposed to financial risks, predominantly interest rate risk, foreign currency risk and credit risk and it has a financial risk management program which seeks to minimise potential adverse effects on financial performance. The Board provides written principles for investment of the Group’s cash reserves, so as to ensure operational liquidity whilst optimising interest earnings from a mix of instruments with one or more of Australia’s four main banks.
The Group held the following financial instruments and their classification:
Financial assets Notes2014 $’000
2013 $’000
Loans and receivables
Trade and other receivables 10 5,712 4,199
Other financial assets
Cash and cash equivalents 9 21,233 24,064
Total Financial assets 26,945 28,263
Financial liabilities
Fair value through profit or loss
Derivative financial instruments – 198
Other financial liabilities
Trade and other payables 16 2,104 2,553
Convertible notes 20 8,097 7,541
Borrowings 19 24 30
Total Financial liabilities 10,225 10,322
For
per
sona
l use
onl
y
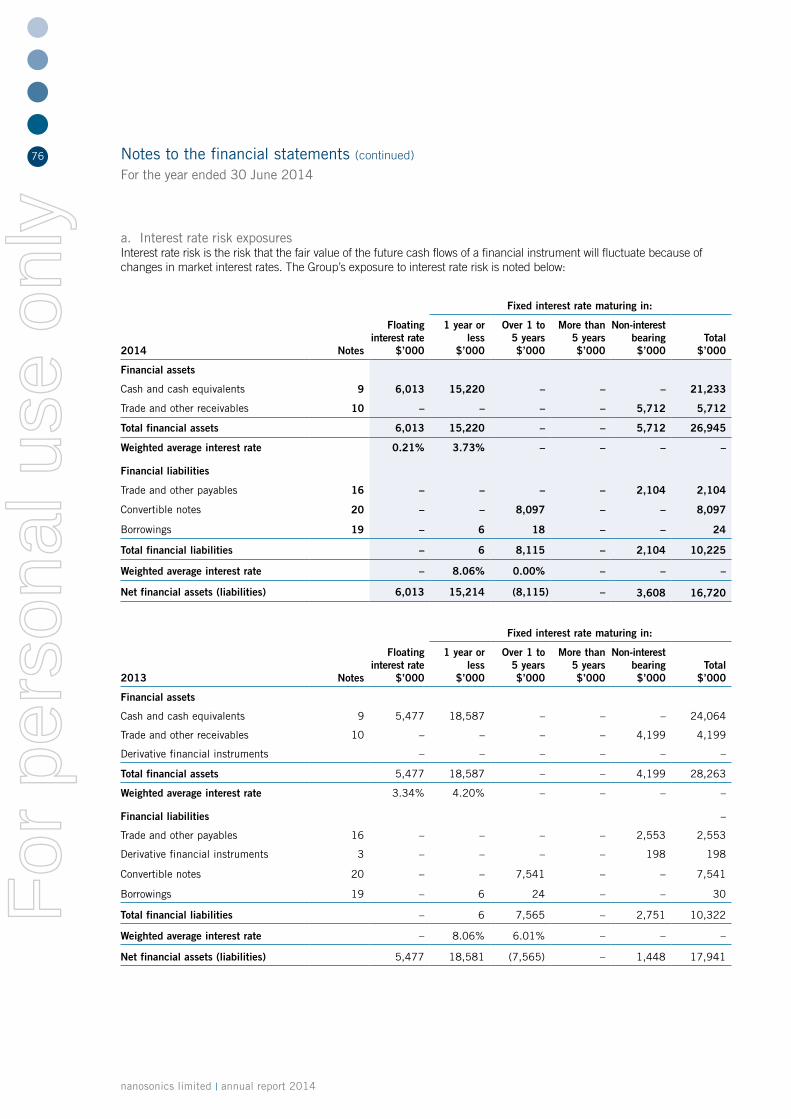
nanosonics limited | annual report 2014
76 Notes to the financial statements (continued)
For the year ended 30 June 2014
a. Interest rate risk exposuresInterest rate risk is the risk that the fair value of the future cash flows of a financial instrument will fluctuate because of changes in market interest rates. The Group’s exposure to interest rate risk is noted below:
2014 Notes
Floating interest rate
$’000
Fixed interest rate maturing in:
1 year or less
$’000
Over 1 to 5 years $’000
More than 5 years $’000
Non-interest bearing $’000
Total $’000
Financial assets
Cash and cash equivalents 9 6,013 15,220 – – – 21,233
Trade and other receivables 10 – – – – 5,712 5,712
Total financial assets 6,013 15,220 – – 5,712 26,945
Weighted average interest rate 0.21% 3.73% – – – –
Financial liabilities
Trade and other payables 16 – – – – 2,104 2,104
Convertible notes 20 – – 8,097 – – 8,097
Borrowings 19 – 6 18 – – 24
Total financial liabilities – 6 8,115 – 2,104 10,225
Weighted average interest rate – 8.06% 0.00% – – –
Net financial assets (liabilities) 6,013 15,214 (8,115) – 3,608 16,720
2013 Notes
Floating interest rate
$’000
Fixed interest rate maturing in:
1 year or less
$’000
Over 1 to 5 years $’000
More than 5 years $’000
Non-interest bearing $’000
Total $’000
Financial assets
Cash and cash equivalents 9 5,477 18,587 – – – 24,064
Trade and other receivables 10 – – – – 4,199 4,199
Derivative financial instruments – – – – – –
Total financial assets 5,477 18,587 – – 4,199 28,263
Weighted average interest rate 3.34% 4.20% – – – –
Financial liabilities –
Trade and other payables 16 – – – – 2,553 2,553
Derivative financial instruments 3 – – – – 198 198
Convertible notes 20 – – 7,541 – – 7,541
Borrowings 19 – 6 24 – – 30
Total financial liabilities – 6 7,565 – 2,751 10,322
Weighted average interest rate – 8.06% 6.01% – – –
Net financial assets (liabilities) 5,477 18,581 (7,565) – 1,448 17,941
For
per
sona
l use
onl
y

77
Interest rate sensitivityThe following table demonstrates the sensitivity to a reasonable possible change in interest rates, with all other variables held constant:
Increase /decrease in basis points
Effect on profit before tax and other comprehensive income
$’000
2014 + 25 57
– 25 (57)
2013 + 75 200
– 100 (266)
b. Foreign currency risk exposuresForeign currency risk is the risk that the fair value or future cash flows of a financial instrument will fluctuate because of changes in foreign exchange rates. The Group’s exposure to the risk of changes in foreign exchange rates relates primarily to the Group’s operating activities (when revenue or expense is denominated in different currency from the Group’s functional currency) and the Group’s net investments in foreign subsidiaries. The Group enters into foreign currency forward contracts to mitigate its foreign currency risk on its trade receivables.
The Groups’ exposure to foreign currency risk at the reporting date comprised:
2014 2013
Euro €’000
USD $’000
GBP £’000
Euro €’000
USD $’000
Cash and cash equivalents 104 4,580 152 22 695
Trade and other receivables 178 4,125 223 16 3,503
Trade and other payables (88) (525) (83) (27) (174)
194 8,180 292 11 4,024
Foreign currency sensitivityThe following table demonstrates the sensitivity to a reasonable possible change in the US dollar, Euro and Sterling pound against the Australian dollar, with all other variables held constant:
Change in USD rate
Effect on profit before tax and other
comprehensive income $’000
Change in EUR rate
Effect on profit before tax and other
comprehensive income €’000
Change in GBP rate
Effect on profit before tax and other
comprehensive income £’000
2014 3% 245 3% 6 3% 9
– 8% (654) – 10% (19) – 6% (18)
2013 3% 121 4% – – –
– 7% (282) – 9% (1) – –
For
per
sona
l use
onl
y

nanosonics limited | annual report 2014
78 Notes to the financial statements (continued)
For the year ended 30 June 2014
c. Operational riskOperational risk is the risk of direct and indirect loss arising from a wide variety of causes associated with company processes, personnel, technology and infrastructure, and from external factors other than credit, market and liquidity risks such as those arising from legal and regulatory requirements and generally accepted standards of corporate behaviour. Operational risks arise from all of the Company’s operations.
An objective of the Company is to manage operational risk so as to balance the avoidance of financial losses and damage to the Company’s reputation with overall cost effectiveness and to avoid control procedures that restrict initiative and creativity.
The primary responsibility for the development and implementation of control to address operational risk is assigned to the Audit and Financial Risk Management Committee. This responsibility is supported by the development of standards for the management of operational risk in the following areas:
• requirements for appropriate segregation of duties, including the independent authorisation of transactions;
• requirements for the reconciliation and monitoring of transactions;
• compliance with regulatory and other legal requirements;
• documentation of controls and procedures;
• requirements for the periodic assessment of operational risks faced, and the adequacy of controls and procedures to
address the risks identified;
• development of contingency plans;
• training and professional development;
• ethical and business standards; and
• risk mitigation, including insurance where this is effective.
d. Credit riskCredit risk arises from holdings in cash and cash equivalents, trade receivables, and derivative financial instruments.
The Group invests only in deposits and floating rate notes offered by Australia’s four main banks.
The Company has limited number of customers. The Company, by policy, performs customer credit assessment prior to entering into a distribution agreement or sales and routinely assesses the financial strength of its customers and reviews distribution agreements. As a result, the Company believes that its accounts receivable credit risk exposure is mitigated and has not experienced significant write-downs in its accounts receivable balances. As of 30 June 2014, GE Healthcare and Regional Healthcare, combined, accounts for over 91% of the trade receivables (2013: GE Healthcare and Regional Healthcare, combined, accounts for over 99% of the trade receivables).
The credit risk arising from derivative financial instruments is not significant.
The maximum exposure to credit risk as at the reporting date is the carrying amount of the financial assets as set out above. The carrying amount is determined according to the Group’s accounting policies.
e. Liquidity riskThe Group manages liquidity risk by continuously monitoring forecast and actual cash flows and matching the maturity profiles of financial assets and liabilities. Surplus funds are invested in short and medium term instruments which are tradeable in highly liquid markets.
For
per
sona
l use
onl
y

79
Maturity profileFollowing is the contractual maturity profiles of undiscounted cash flows from financial liabilities:
On demand $’000
Less than 3 months
$’000
3 to 12 months $’000
1 to 5 years $’000
Over 5 years $’000
Total $’000
2014
Trade and other payables – 2,104 – – – 2,104
Borrowings – 2 6 19 – 27
Convertible notes – – 450 8,850 – 9,300
Total financial liabilities – 2,106 456 8,869 – 11,431
2013
Trade and other payables – 2,553 – – – 2,553
Borrowings – 2 6 28 – 36
Derivative financial instruments – 198 – – – 198
Convertible notes – – – 9,300 – 9,300
Total financial liabilities – 2,753 6 9,328 – 12,087
Fair valuesSet out below is a comparison by class of the carrying amounts and fair value of the Group’s financial instruments that are carried in the financial statements
2014 $’000
2013 $’000
Notes Carrying amount Fair value Carrying amount Fair value
Financial assets
Cash and cash equivalents 9 21,233 21,233 24,064 24,064
Trade and other receivables 10 5,712 5,712 4,199 4,199
26,945 26,945 28,263 28,263
Financial liabilities
Fair value through profit and loss
Derivative financial instruments – – (198) (198)
Not measured at fair value
Other financial liabilities
Trade and other payables 16 (2,104) (2,104) (2,553) (2,553)
Convertible notes 20 (8,097) (8,097) (7,541) (7,541)
Borrowings 19 (24) (24) (30) (30)
(10,225) (10,225) (10,322) (10,322)
For
per
sona
l use
onl
y

nanosonics limited | annual report 2014
80 Notes to the financial statements (continued)
For the year ended 30 June 2014
The fair value of the financial assets and liabilities is included at the amount at which the instrument could be exchanged in a current transaction between willing parties, other than in a forced or liquidation sale. The following methods and assumptions were used to estimate fair values:
• Cash and cash equivalents, trade and other receivables, trade and other payables approximate their carrying amounts
largely due to the short term maturities of these instruments.
• The Group enters into derivative financial instruments with various counterparties principally with Australia’s major
banks. Derivatives valued using valuation techniques with market observable inputs are mainly foreign exchange
forward contract. The valuation technique is described below.
Fair value hierarchyThe Group uses the following hierarchy above for determining and disclosing the fair value of financial instruments by valuation technique:
• Level 1: quoted (unadjusted) prices in active markets for identical assets or liabilities.
• Level 2: other techniques for which all inputs that have a significant effect on the recorded fair value are observable,
either directly or indirectly.
• Level 3: techniques that use inputs that have a significant effect on the recorded fair value that are not based on
observable market data.
The valuation techniques used in measuring Level 2 fair values:
Type Valuation technique
Derivative financial instruments – foreign exchange forward contracts
Market comparison technique: The fair values are based on bank quotes. Similar contracts are traded in an active market and the quotes reflect the actual transactions in similar instruments.
As at 30 June 2014, the Group did not hold any derivative financial instruments carried at fair value (2013: derivative financial liability $198,000).
Level 1 Level 2 Level 3
$’000 $’000 $’000 $’000
Foreign exchange forward contracts 30 June 2014 – – – –
Foreign exchange forward contracts 30 June 2013 (198) – (198) –
4. Critical accounting estimates and judgmentsThe preparation of financial statements in conformity with IFRS requires the use of certain critical accounting estimates and requires management to exercise judgment in the process of applying the Group’s accounting policies. Estimates and associated assumptions and judgments affect the recognised amounts of assets, liabilities, revenues and expenses and the disclosure of contingent liabilities and are based on historical experience and various other factors that are believed to be reasonable under the circumstances, the results of which form the basis of making judgments about the carrying values of assets and liabilities that are not readily apparent from other sources. Actual results may differ from these estimates. The estimates and underlying assumptions are reviewed on an ongoing basis. Revisions to accounting estimates are recognised in the period in which the estimate is revised if the revision affects only that period or in the period of the revision and future periods if the revision affects both current and future periods.
The key estimates and assumptions that have a significant risk of causing a material adjustment to the carrying amount of certain assets and liabilities are:
Provision for warrantyThe Group has recognised a provision in accordance with the accounting policy describe in note 2. The Group has made assumptions in relation to the values estimated to be required to settle the warranty obligation on all products under warranty at balance date.
For
per
sona
l use
onl
y

81
Share-based payment transactionsThe Group measures the cost of equity-settled transactions with employees by reference to the fair value of the equity instruments at the date at which they are granted. Estimating the fair value for share based payment transactions requires determining the most appropriate valuation model, which is depended on the terms and conditions of the grant. This estimate also requires determining the most appropriate inputs to the valuation model including the expected life of the share option, volatility and dividend yield and making assumptions about them. The assumptions and models used for estimating fair value for share based-payment transactions are disclosed in note 30 to the financial statements.
Recognition of deferred tax assetsDeferred tax assets are only recognised for unused tax losses to the extent that it is probable that taxable profit will be available against which the losses can be utilised. Significant management judgement is required to determine the amount of deferred tax asset that can be recognised, based upon the likely timing and level of future taxable profits together with future tax planning strategies. Details of the unrecognised deferred tax assets on unused tax losses and non-refundable R&D tax offset are disclosed in note 8 to the financial statements.
5. Segment informationThe Group has identified its operating segments based on the internal reports that are reviewed and used by the Managing Director and CEO (the chief operating decision maker) in assessing performance and in determining the allocation of resources. The Group operates in a single operating segment, being the healthcare equipment segment.
Types of products and servicesThe principal products and services of the healthcare equipment segment are the manufacture and commercialisation of infection control and decontamination products and related technologies.
Major customersThe Group has a number of customers to which it provides products and services. The most significant customer accounts for 82% (2013: 88%) of external revenue. The next most significant customer accounts for 8.4% of external revenue (2013: 7%).
Geographical informationGeographically, the Group operates in the global markets. Australia is the home country of the parent entity.
Revenue from external customers by geographical location is detailed below.
2014 $’000
2013 $’000
North America 17,665 13,165
Australia and New Zealand 2,267 1,497
Europe and other countries 1,560 237
Total revenue 21,492 14,899
Revenues above are allocated based on the country in which the customer is located.
The analysis of the location of non-current assets is as follows:
2014 $’000
2013 $’000
North America 10 17
Australia and New Zealand 1,903 1,962
Europe and other countries 9 14
Total assets 1,922 1,993
Non-current assets for this purpose consist of property, plant and equipment, intangible assets and other non-current assets. Assets and capital expenditure are allocated based on where the assets are located.
For
per
sona
l use
onl
y

nanosonics limited | annual report 2014
82 Notes to the financial statements (continued)
For the year ended 30 June 2014
6. Other income 2014 $’000
2013 $’000
Government grants 1,666 1,498
Interest income 739 1,192
Other income 1,709 –
Total 4,114 2,690
Government grants comprise
• payments under the Export Market Development Grant scheme,
• 45% research and development refundable tax offset received during the year.
There were no unfulfilled conditions or other contingencies attaching to these grants. The Group did not benefit directly from any other form of governmental assistance.
Other income includes reimbursement of cost by a distributor of $1,707,000. The related costs are included in the operating expenses.
7. Loss before income tax expense 2014 $’000
2013 $’000
The loss from ordinary activities before income tax includes:
Expenses
Staffing costs broken into :
Salaries and wages 10,118 7,859
Superannuation and social security contribution 1,001 849
Workers compensation costs 98 112
Other employee benefits and staffing costs 2,677 2,126
Share based payments 997 898
Less: Staffing costs included in cost of sales (2,886) (2,667)
Total staffing costs 12,005 9,177
Depreciation and amortisation 975 1,044
Research and development costs 4,103 3,167
Rental expenses relating to operating leases 576 537
Bad debts provision (reversal) 5 (1)
Inventories provision / write off 536 197
Unrealised loss (gain) on foreign exchange forward contracts – 198
Realised loss (gain) on foreign exchange forward contracts 32 40
Net foreign exchange losses (gains) 414 (221)
No development costs were capitalised during the year (2013: Nil).For
per
sona
l use
onl
y

83
8. Taxation 2014 $’000
2013 $’000
(a) Income tax expense
Operating loss from ordinary activities 2,636 5,735
The prima facie income tax benefit applicable to the operating loss is calculated at 28.3% (2013:30%) 745 1,721
Non-assessable income
Research and development tax offset received during the year 455 404
Other deductible items 307 –
Non-deductible items:
Research and development expense (1,231) (950)
Equity based benefits (282) (157)
Entertainment (1) (13)
Other temporary differences (270) 10
(277) 1,015
Deferred tax benefit not recognised (1,459) (1,048)
Non-refundable research and development tax offset 1,641 –
Adjustment in respect of current income tax of previous years 126 –
Income tax benefit (expense) reported on the Consolidated statement of profit or loss and other comprehensive income 31 (33)
(b) Deferred tax assets
The potential deferred tax assets in a controlled entity, which is a company, arising from tax losses, non-refundable tax offsets and timing differences are only recognised when it is probable that future taxable amounts will be available to utilise those tax losses and temporary differences.
2014 $’000
2013 $’000
Unrecognised deferred tax assets include:
Estimated tax losses carried forward 16,241 16,157
Non-refundable R&D tax offset 1,375 –
17,616 16,157
Estimated tax losses carried forward:
Beginning of the year unrecognised tax losses carried forward 53,856 50,201
Adjustment in respect of unrecognised tax losses carried forward from previous year 281 273
Tax losses for the year – 3,382
54,137 53,856
Estimated non-refundable R&D tax offset at the end of the year 3,438 –
The potential future income tax benefit of tax losses carried forward and non-refundable R&D tax offset will only be obtained if:
(i) the Company and the Group derive future assessable income of a nature and an amount sufficient to enable the benefit to be realised
(ii) the Company and the Group continue to comply with the conditions for deductibility imposed by the law; and
(iii) no changes in tax legislation adversely affect the Company and the Group is realising the benefit.
For
per
sona
l use
onl
y

nanosonics limited | annual report 2014
84 Notes to the financial statements (continued)
For the year ended 30 June 2014
9. Current assets – Cash and cash equivalents2014 $’000
2013 $’000
Cash at bank and on hand 5,705 972
Deposits on call 308 1,005
Short term deposits 15,220 22,087
21,233 24,064
Cash term investments which are highly liquid irrespective of their maturity dates are classified as current assets at market value as they may not necessarily be held by the Company for their full term.
The Group’s exposure to interest rate risk is discussed in note 3. The maximum exposure to credit risk at the reporting date is the carrying amount of each class of cash and cash equivalents mentioned above.
10. Current assets – Trade and other receivables 2014 $’000
2013 $’000
Trade receivables net of allowance for impairment loss 5,338 3,972
GST receivable 59 91
VAT receivable 204 18
Interest and other receivables 111 118
5, 712 4,199
Trade receivables by geographic region were as follows: Carrying amount
2014 $’000
2013 $’000
North America 4,382 3,846
Australia and New Zealand 472 97
Europe and other countries 484 29
5,338 3,972
Maximum exposure to credit risk for trade receivable by type of counterparty was as follows: Carrying amount
2014 $’000
2013 $’000
Distributors 5,310 3,944
Others 28 28
5,338 3,972
For
per
sona
l use
onl
y

85
As at 30 June 2014, the aging analysis of trade receivables is as follows:
Past due but not impaired
Total $’000
Neither past due nor impaired
$’000<30 days
$’00030-60 days
$’000>60 days
$’000
2014 5,338 5,295 28 1 14
2013 3,972 3,964 2 1 5
An analysis of the credit policy of trade receivables that are neither past due nor impaired is as follows:
2014 $’000
2013 $’000
External financial ratings at least 1A from Dun & Bradstreet 4,826 3,878
Other customers:
Four or more years trading history with the Group 453 53
Less than four years of trading history with the Group 16 33
5,295 3,964
Information about the Group’s exposure to foreign currency risk in relation to trade and other receivables is provided in
note 3.
Due to the short-term nature of the receivables, their carrying amount is assumed to approximate their fair value.
The maximum exposure to credit risk at the reporting date is the carrying amount of each class of receivables mentioned above.
Collateral is not held as security, nor is it the Group’s policy to transfer (on-sell) receivables to special purpose entities.
As at 30 June 2014, trade receivables with a nominal value of $5,000 (2013: Nil) were considered impaired.
The movement in allowance for impairment in respect of trade and other receivables during the year was as follows:
$000
At 1 July 2012 1
Increase for the year _
Utilised –
Unused amount reversed (1)
At 30 June 2013 –
Increase for the year 5
Utilised –
Unused amount reversed –
At 30 June 2014 5For
per
sona
l use
onl
y

nanosonics limited | annual report 2014
86 Notes to the financial statements (continued)
For the year ended 30 June 2014
11. Current assets – Inventories 2014 $’000
2013 $’000
Raw materials and stores – at net realisable 2,211 1,854
Work in progress – at cost 737 673
Finished goods – at net realisable value 1,289 382
4,237 2,909
Write-downs of inventories to net realisable values during the year ended 30 June 2014 amounted to $536,000 (2013:$197,000). The expense has been included in other operating costs in profit or loss.
Roll forward of provision for inventories: 2014 $’000
2013 $’000
Beginning balance 147 485
Provided during this year 536 197
Utilised during this year (326) (535)
Ending balance 357 147
12. Current assets – Other 2014 $’000
2013 $’000
Prepaid expenses 388 475
Prepaid foreign income tax 31 10
Service work in progress 21 3
440 488
For
per
sona
l use
onl
y

87
13. Non-current assets – Property plant and equipment
Laboratory
fit outLaboratory equipment
Office furniture & equipment
Leasehold improvements
Manufacturing equipment
Service, test & demo
equipment
Computer equipment & software
Capital Work in
Progress Total
Year ended 30 June 2013
Opening net book amount 13 65 118 149 674 159 290 – 1,468
Additions – 27 14 6 88 838 275 97 1,345
Retirement and others – – – – – – – – –
Depreciation charge (3) (26) (49) (138) (300) (283) (205) –
(1,004)
Foreign currency translation effect (net) – – – – – 2 1 3
Closing net book amount at 30 June 2013 10 66 83 17 462 716 361 97 1,812
At 30 June 2013
Cost 343 351 817 882 1,546 1,462 1,057 97 6,555
Accumulated depreciation (333) (285) (734) (865) (1,084) (746) (696) –
(4,743)
Net book amount at 30 June 2013 10 66 83 17 462 716 361 97 1,812
Year ended 30 June 2014
Opening net book amount 10 66 83 17 462 716 361 97 1,812
Additions – 32 98 58 96 601 179 17 1,081
Retirement and others – – – – – (177) – – (177)
Depreciation charge (3) (29) (41) (37) (250) (353) (225) – (938)
Foreign currency translation effect (net) – – – – – – – – –
Closing net book amount at 30 June 2014 7 69 140 38 308 787 315 114 1,778
At 30 June 2014
Cost or fair value 343 383 915 940 1,642 1,804 1,235 114 7,376
Accumulated depreciation (336) (314) (775) (902) (1,334) (1,017) (920) – (5,598)
Net book amount at 30 June 2014 7 69 140 38 308 787 315 114 1,778
For
per
sona
l use
onl
y

nanosonics limited | annual report 2014
88 Notes to the financial statements (continued)
For the year ended 30 June 2014
14. Non-current assets – Intangible assets 2014 $’000
2013 $’000
Development Costs
At cost 201 201
Accumulated amortisation (201) (164)
Net book value – 37
Development costs relate to the trophon® EPR project and are carried at cost less accumulated amortisation. The intangible asset has been assessed as having a finite life and is amortised using the straight line method over a period of 5 years. Amortisation of $37,000 (2013:$40,000) is included in depreciation and amortisation expense in the statement of profit or loss.
15. Non-current assets – Other 2014 $’000
2013 $’000
Refundable deposits and bonds 144 144
Total 144 144
16. Current liabilities – Trade and other payables 2014 $’000
2013 $’000
Trade payables 575 1,302
Other payables 1,529 1,251
Provision for warranty 896 449
Total 3,000 3,002
Roll forward of provision for warranty: 2014 $’000
2013 $’000
Beginning balance 449 368
Provided during this year 701 638
Utilised during this year (254) (557)
Balance as at 30 June 896 449
The Group has recognised a provision for warranty in accordance with the accounting policy describe in note 2. The Group has made assumptions in relation to the values estimated to be required to settle the warranty obligation on all products under warranty at balance date.
17. Current liabilities – Deferred revenue 2014 $’000
2013 $’000
Beginning balance 209 91
Deferred during the year 616 416
Released to profit or loss (517) (298)
Ending balance 308 209For
per
sona
l use
onl
y
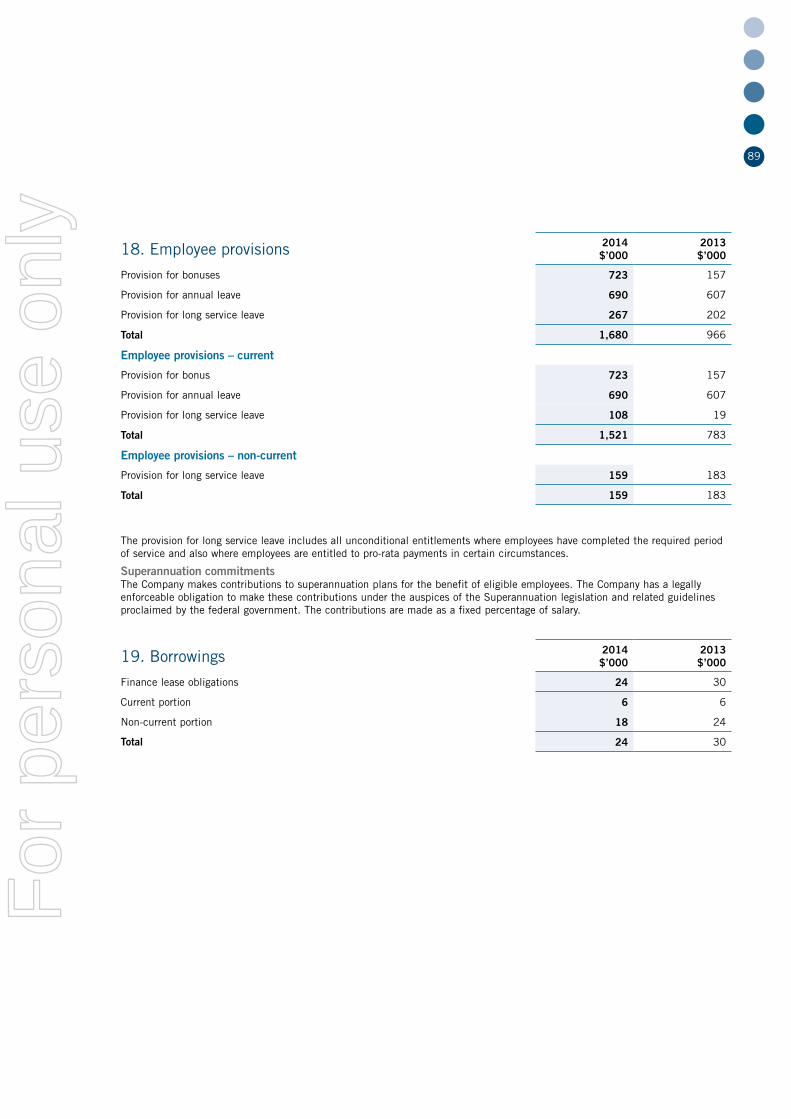
89
18. Employee provisions 2014 $’000
2013 $’000
Provision for bonuses 723 157
Provision for annual leave 690 607
Provision for long service leave 267 202
Total 1,680 966
Employee provisions – current
Provision for bonus 723 157
Provision for annual leave 690 607
Provision for long service leave 108 19
Total 1,521 783
Employee provisions – non-current
Provision for long service leave 159 183
Total 159 183
The provision for long service leave includes all unconditional entitlements where employees have completed the required period of service and also where employees are entitled to pro-rata payments in certain circumstances.
Superannuation commitmentsThe Company makes contributions to superannuation plans for the benefit of eligible employees. The Company has a legally enforceable obligation to make these contributions under the auspices of the Superannuation legislation and related guidelines proclaimed by the federal government. The contributions are made as a fixed percentage of salary.
19. Borrowings 2014 $’000
2013 $’000
Finance lease obligations 24 30
Current portion 6 6
Non-current portion 18 24
Total 24 30
For
per
sona
l use
onl
y

nanosonics limited | annual report 2014
90 Notes to the financial statements (continued)
For the year ended 30 June 2014
20. Convertible notes 2014 $’000
2013 $’000
Non-current liabilities
Convertible notes at amortised value 8,097 7,541
Equity
Option premium on convertible notes 376 376
On 28 June 2012, the Company issued unsecured Tranche A convertible note of $4,000,000 and Tranche B convertible note of $3,500,000 which matures 4 years after the issue date. The convertible notes bear 6% interest per annum on a simple interest basis calculated on each anniversary of the issue date. No interest repayment will be made to the noteholder in the first two years but the interest will accrue and form part of the face value of the note but will not bear any further interest. After that period, the noteholder may elect whether to receive interest in cash or to have such interest accrue and form part of the Face Value (but this will not bear further interest). The convertible notes may be converted at any time up until the Maturity Date at $0.75 per share, subject to certain adjustments. The effective interest on convertible notes is 7.364%.
As at 30 June 2014, the amortised value of convertible notes recognised in non-current liabilities including accrued interest amounted to $8,097,000 (2013: $7,541,000) and borrowing costs related to the convertible notes amounted to $555,000 (2013: 517,000).
21. Contributed equity
Share capital
263,823,826 ordinary fully paid shares (2013: 261,988,718 )
Number of shares $’000
Movements in ordinary shares on issue
At 30 June 2012 259,982,918 73,532
Share options exercised 1,287,604 203
Share issued 718,196 333
At 30 June 2013 261,988,718 74,068
Share options exercised 1,835,108 342
Shares issued – –
At 30 June 2014 263,823,826 74,410
All ordinary shares are fully paid. Ordinary shares carry one vote per share and entitle the holder to participate in dividends and the proceeds on winding up of the Company in proportion to the number of shares held. On a show of hands, every ordinary shareholder present at a meeting in person or by proxy is entitled to one vote and upon a poll each share is entitled to one vote. Ordinary shares have no par value and the Company does not have a limited amount of authorised capital.
At 30 June 2014 there were 6,525,597 (2013: 5,418,625) options to acquire one ordinary share each outstanding, of which 1,705,668 (2013: 1,397,002) had vested and were exercisable.
Information relating to the Company’s employee share-based payment schemes, including details of shares and options issued, options exercised and options lapsed during the financial year, as well as options outstanding at the end of the financial year, is set out in note 30.
Capital ManagementManagement controls the capital of the Group to ensure that the Group can fund its operations and continue as a going concern.
The Group’s capital includes ordinary share capital and financial liabilities supported by financial assets. There are no externally imposed capital requirements. Management effectively manages the Group’s capital by assessing the Group’s financial risks and adjusting its capital structure in response to changes in these risks and in the market. These responses include the management of share issues.
There have been no changes in the strategy adopted by management to control the capital of the Group since the prior year.
For
per
sona
l use
onl
y
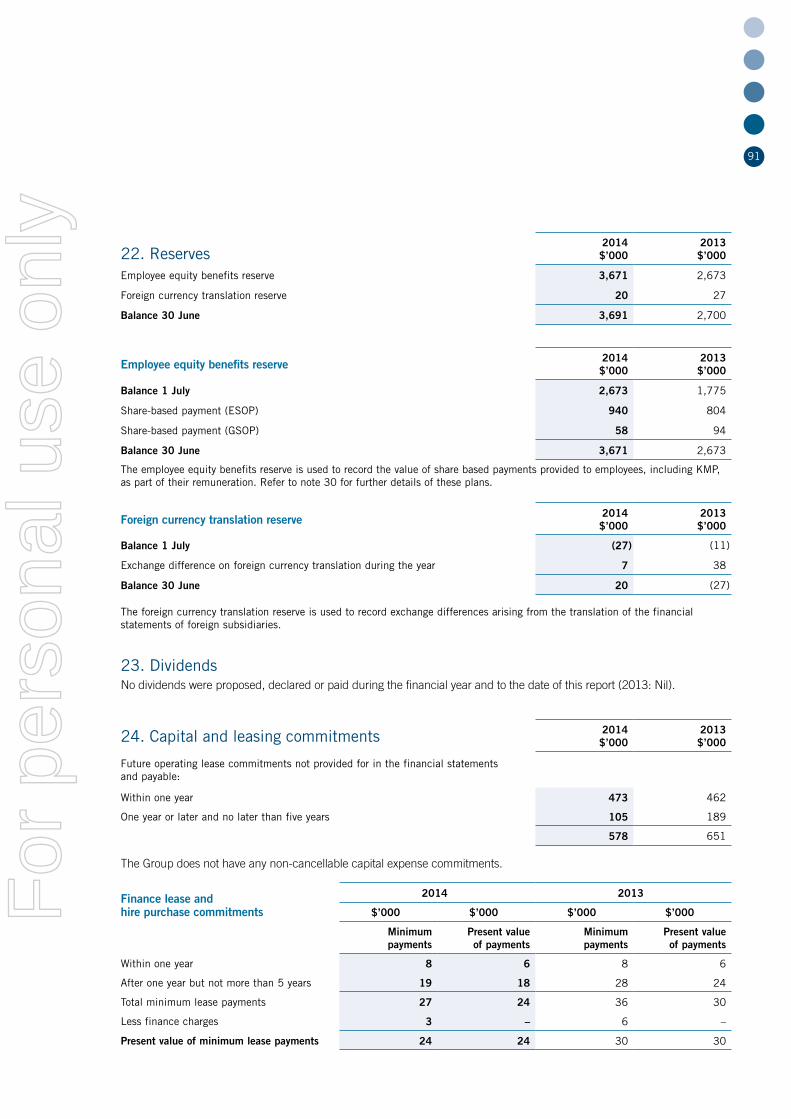
91
22. Reserves2014 $’000
2013 $’000
Employee equity benefits reserve 3,671 2,673
Foreign currency translation reserve 20 27
Balance 30 June 3,691 2,700
Employee equity benefits reserve 2014 $’000
2013 $’000
Balance 1 July 2,673 1,775
Share-based payment (ESOP) 940 804
Share-based payment (GSOP) 58 94
Balance 30 June 3,671 2,673
The employee equity benefits reserve is used to record the value of share based payments provided to employees, including KMP, as part of their remuneration. Refer to note 30 for further details of these plans.
Foreign currency translation reserve 2014 $’000
2013 $’000
Balance 1 July (27) (11)
Exchange difference on foreign currency translation during the year 7 38
Balance 30 June 20 (27)
The foreign currency translation reserve is used to record exchange differences arising from the translation of the financial statements of foreign subsidiaries.
23. DividendsNo dividends were proposed, declared or paid during the financial year and to the date of this report (2013: Nil).
24. Capital and leasing commitments 2014 $’000
2013 $’000
Future operating lease commitments not provided for in the financial statements and payable:
Within one year 473 462
One year or later and no later than five years 105 189
578 651
The Group does not have any non-cancellable capital expense commitments.
Finance lease and hire purchase commitments
2014 2013
$’000 $’000 $’000 $’000
Minimum payments
Present value of payments
Minimum payments
Present value of payments
Within one year 8 6 8 6
After one year but not more than 5 years 19 18 28 24
Total minimum lease payments 27 24 36 30
Less finance charges 3 – 6 –
Present value of minimum lease payments 24 24 30 30
For
per
sona
l use
onl
y

nanosonics limited | annual report 2014
92 Notes to the financial statements (continued)
For the year ended 30 June 2014
25. Auditor’s remuneration
2014 $’000
2013 $’000
Audit services
Audit and review of financial reports 56,000 52,000
Total remuneration for audit services 56,000 52,000
Non-audit services
Assurance related services
Audit of regulatory returns – –
Total remuneration for assurance related services – –
Total remuneration for non-audit services – –
26. Information relating to subsidiaries
The consolidated financial statements of the Group include:
Country of incorporation
Class of shares
Equity Holdings
Name of controlled entity Principal activities 2014 2013
Nanosonics Europe GmbH Provision of sales and customer support services to Nanosonics Limited in Germany
Germany Ordinary 100% 100%
Saban Ventures Pty Limited Owner of the registered intellectual property of the Group
Australia Ordinary 100% 100%
Nanosonics Inc. Provision of sales and customer support services to Nanosonics Limited in USA
USA Ordinary 100% 100%
Parent entityThe parent entity within the Group is Nanosonics Limited which is based and listed in Australia.
For
per
sona
l use
onl
y

93
27. Related party disclosuresNote 26 provides the information about the Group’s structure including the details of the subsidiaries and the parent entity.
(a) Transactions with related partiesCertain directors and Key Management Personnel, or their personally-related entities, hold positions in other entities that result in them having control or significant influence over the financial or operating policies of those entities. Details of the type of transactions that were entered into with directors and KMP are as follows:
Directors and Key Management Personnel Related entities Transactions
Maurie Stang Gryphon Capital Pty Ltd Director fees and services received
Maurie Stang Novapharm Research (Australia) Pty Ltd Services received
Maurie Stang Ramlist Pty Ltd Rent of premises
Maurie Stang Regional Healthcare Group Pty Ltd Products purchased, services received and products sold
Richard England Angleterre Pty Ltd and Domkirke Pty Ltd Director fees and services received
The following transactions occurred with related parties:
2014 $’000
2013 $’000
Key Management Personnel – Other directors’ interests
Sales of goods and services
Sale of products to related parties 1,812 1,056
Purchases of goods
Purchases of goods and services from related parties 357 553
Other transactions
Rent of premises and equipment from related parties 184 185
(b) Outstanding balances arising from sales/purchases of goods and servicesThe following balances are outstanding at the reporting date in relation to transactions with related parties:
2014 $’000
2013 $’000
Key Management Personnel – Other directors’ interests
Current receivables (supply of goods and services) 450 53
Current payables (purchases of goods and services) 18 37
There were no provisions for doubtful debts relating to the outstanding balances from related parties (2013: Nil) and there were no expenses recognized during the period in respect of doubtful debts from related parties.F
or p
erso
nal u
se o
nly
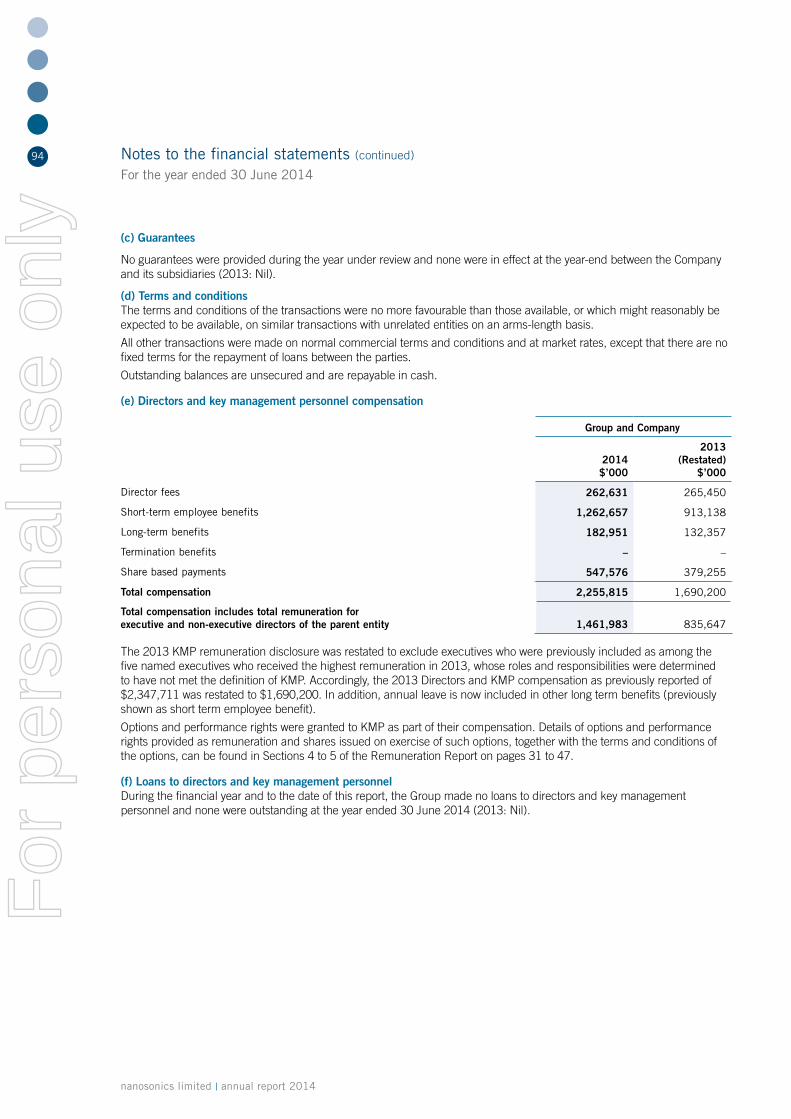
nanosonics limited | annual report 2014
94 Notes to the financial statements (continued)
For the year ended 30 June 2014
(c) Guarantees
No guarantees were provided during the year under review and none were in effect at the year-end between the Company and its subsidiaries (2013: Nil).
(d) Terms and conditionsThe terms and conditions of the transactions were no more favourable than those available, or which might reasonably be expected to be available, on similar transactions with unrelated entities on an arms-length basis.
All other transactions were made on normal commercial terms and conditions and at market rates, except that there are no fixed terms for the repayment of loans between the parties.
Outstanding balances are unsecured and are repayable in cash.
(e) Directors and key management personnel compensation
Group and Company
2014 $’000
2013 (Restated)
$’000
Director fees 262,631 265,450
Short-term employee benefits 1,262,657 913,138
Long-term benefits 182,951 132,357
Termination benefits – –
Share based payments 547,576 379,255
Total compensation 2,255,815 1,690,200
Total compensation includes total remuneration for executive and non-executive directors of the parent entity 1,461,983 835,647
The 2013 KMP remuneration disclosure was restated to exclude executives who were previously included as among the five named executives who received the highest remuneration in 2013, whose roles and responsibilities were determined to have not met the definition of KMP. Accordingly, the 2013 Directors and KMP compensation as previously reported of $2,347,711 was restated to $1,690,200. In addition, annual leave is now included in other long term benefits (previously shown as short term employee benefit).
Options and performance rights were granted to KMP as part of their compensation. Details of options and performance rights provided as remuneration and shares issued on exercise of such options, together with the terms and conditions of the options, can be found in Sections 4 to 5 of the Remuneration Report on pages 31 to 47.
(f) Loans to directors and key management personnelDuring the financial year and to the date of this report, the Group made no loans to directors and key management personnel and none were outstanding at the year ended 30 June 2014 (2013: Nil).
For
per
sona
l use
onl
y

95
28. Notes to the cash flow statements
(a) Reconciliation of cash
2014 $’000
2013 $’000
Cash and cash equivalents 21,233 24,064
For the purpose of the Statement of cash flows, cash includes cash on hand and at bank, deposits on call and short term deposits, net of outstanding bank overdrafts. Cash at the end of the financial year as shown in the Statement of cash flow is reconciled to the related items in the statement of financial position as follows:
(b) Reconciliation of operating loss after income tax to net cash provided by operating activities
2014 $’000
2013 $’000
Operating loss after income tax (2,605) (5,768)
Adjustment for :
Depreciation and amortisation 975 1,044
Share based payments expense 997 898
Borrowing costs on convertible notes 555 517
Unrealised foreign exchange loss (gain) 119 (70)
Changes in assets and liabilities
(Increase) / decrease in receivables (1,573) (1,171)
(Increase) / decrease in inventories (1,752) (512)
(Increase) / decrease in other current assets 51 (285)
(Increase) / decrease in other non-current assets – (3)
Increase / (decrease) in derivative financial instruments (198) 238
Increase /(decrease) in trade and other payables (728) 130
Increase /(decrease) in provisions 717 (151)
Increase / (decrease) in other current liabilities 854 623
Increase / (decrease) in current tax liabilities (6) 4
Net cash used in operating activities (2,594) (4,506)
(c) Credit standby arrangements unused
Facility
Limit
$’000
Facility
used by
$’000
Facility
available at
$’000
Borrowing facilities 30 June 2014 256 50 206
30 June 2013 256 74 182For
per
sona
l use
onl
y

nanosonics limited | annual report 2014
96 Notes to the financial statements (continued)
For the year ended 30 June 2014
29. Loss per share
2014 Cents
2013 Cents
(a) Basic loss per share
Loss attributable to ordinary shareholders of the Company (1.0) (2.2)
(b) Diluted loss per share
Loss attributable to ordinary shareholders of the Company (1.0) (2.2)
(c) Losses used in calculating loss per share
Net loss after income tax expense attributable to shareholders (2,605) (5,768)
(d) Weighted average number of shares used
For basic earnings per share 263,072,467 261,201,368
For diluted earnings per share 263,072,467 261,201,368
(e) Information concerning options granted
Options granted under the Nanosonics Employee Share Option Plan and the Nanosonics General Share Option Plan are considered to be potential ordinary shares and have been excluded from the calculation of diluted loss per share as the effect would have been anti-dilutive. Details relating to the options are set out in note 30 to these financial statements.
30. Share-based compensationThe Company’s share based compensation schemes comprise option plans and share plans. Options have been granted under the option plans. Shares have been granted under the Deferred Employee Share Plan. To the date of this report no shares have been granted under the Exempt Employee Share Plan.
(a) Option plansThe Nanosonics Employee Share Option Plan (ESOP) and the Nanosonics General Share Option Plan (GSOP) were established in 2007 and last approved by the shareholders in the 2013 Annual General Meeting (AGM) on 8 November 2013. Under the plans, participants are granted options for no consideration. Options may only be excercised on or after any vesting dates specified by the Board at the time of offer. The exercise price of options is determined by the Board at the time of issue. Participation in the plans is at the Board’s discretion and no individual has a contractual right to participate in a plan or to receive any guaranteed benefits.
General Share Option Plan (GSOP)The General Share Option Plan is designed to provide incentive, recognition and reward for non-employees, usually consultants and contractors, who create long-term value for the Company.
No share options were issued under the GSOP during the financial year (2013: 536,038 issued).
For
per
sona
l use
onl
y

97
Employee Share Option Plan (ESOP)The Employee Share Option Plan is designed to provide the deferred equity component of the short-term incentive and long-term incentives for employees (including executive directors) to deliver long-term shareholder returns. All employees and directors are eligible to participate in the ESOP at the invitation of the Board. The maximum number of options able to be on issue under the ESOP during any five-year period is 5% of the total number of shares on issue. 2,981,494 share options were issued under the ESOP during the financial year (2013: 2,487,891 issued).
(b) Exercise of optionsOptions are granted under the plans for no consideration and options carry no dividend or voting rights. When exercisable, each option is convertible into one ordinary share that ranks equally with any other share on issue in respect of dividends and voting rights. The exercise prices of all options issued to the date of this report were fixed on the dates the options were granted. Details are provided in section (c) of this note.
(c) Reconciliation of outstanding share options and performance rightsThe number and weighted average exercise price (WAEP) of share options and performance rights under the share option plans were as follows:
Number of Options
ESOP GSOP All Option Plans
2014 2013 2014 2013 2014 2013
Number of options and
rightsWAEP
($)
Number of options and
rightsWAEP
($)
Number of options and rights
WAEP ($)
Number of options and rights
WAEP ($)
Number of options and
rights
Number of options and
rights
Unexpired options as at 1 July
4,603,625 0.35 3,330,719 0.54 815,000 0.55 427,550 0.56 5,418,625 3,758,269
Granted during the year
2,981,494 – 2,487,891 – – – 536,038 0.45 2,981,494 3,023,929
Exercised during the year
(1,573,442) 0.13 (1,173,016) 0.16 (261,666) 0.53 (114,588) 0.15 (1,835,108) (1,287,604)
Forfeited during the year
(39,414) – (41,969) – – – (34,000) 0.35 (39,414) (75,969)
Expired during the year
– – – – – – – – – –
Unexpired options as at 30 June
5,972,263 0.24 4,603,625 0.35 553,334 0.57 815,000 0.55 6,525,597 5,418,625
Number of holders as at 30 June
20 68 5 6 25 74
For
per
sona
l use
onl
y

nanosonics limited | annual report 2014
98 Notes to the financial statements (continued)
For the year ended 30 June 2014
Set out below are details of unexpired options granted under the plans as at 30 June 2014:
Option Plan
Exercise price
Grant date
Assessed fair value
at grant date Expiry date
Number at start of the
year
Number granted
during the year
Number exercised
during the year
Number forfeited
during the year
Number at end of the
year
Number vested and exercisable
at end of year
GSOP $0.55 Jan-10 $0.30 05-Jan-14 50,000 – (50,000) – – –
ESOP $0.56 Aug-10 $0.31 19-Jul-14 500,000 – (166,000) – 334,000 334,000
GSOP $0.78 Oct-10 $0.49 01-Oct-14 100,000 – – – 100,000 100,000
ESOP $0.56 Mar-11 $0.63 19-Jul-14 200,000 – (200,000) – – –
ESOP $0.92 Mar-11 $0.58 23-Feb-15 30,000 – – – 30,000 30,000
ESOP $0.85 May-11 $0.50 28-Apr-16 1,400,000 – – – 1,400,000 1,166,668
GSOP $0.53 Nov-11 $0.38 21-Nov-15 195,000 – (80,000) – 115,000 50,000
ESOP $0.00 Jun-12 $0.49 01-Apr-15 13,537 – (6,768) – 6,769 –
ESOP $0.00 Nov-12 $0.55 30-Sep-15 1,220,000 – – 1,220,000 –
ESOP $0.00 Nov-12 $0.55 01-Oct-13 544,191 – (533,745) (10,446) – –
GSOP $0.51 Nov-12 $0.27 24-Nov-16 195,000 – (40,000) – 155,000 25,000
GSOP $0.52 Dec-12 $0.20 21-Nov-16 275,000 – (91,666) – 183,334 -
ESOP $0.00 Apr-13 $0.45 01-Apr-14 695,897 – (666,929) (28,968) – –
ESOP $0.00 Aug-13 $0.78 30-Sep-15 – 712,970 – – 712,970 –
ESOP $0.00 Nov-13 $0.68 30-Sep-16 – 442,409 – – 442,409 –
ESOP $0.00 Nov-13 $0.85 30-Sep-16 – 442,409 – – 442,409 –
ESOP $0.00 Nov-13 $0.71 30-Sep-17 – 375,000 – – 375,000 –
ESOP $0.00 Nov-13 $0.85 30-Sep-17 – 375,000 – – 375,000 –
ESOP $0.00 Mar-14 $0.63 30-Sep-16 – 316,847 – – 316,847 –
ESOP $0.00 Mar-14 $0.80 30-Sep-16 – 316,859 – – 316,859 –
Total 5,418,625 2,981,494 (1,835,108) (39,414) 6,525,597 1,705,668
(d) Fair value of options and performance rights grantedThe assessed fair value on the date options were granted was independently determined using an appropriate option valuation model that takes into account the exercise price, the term of the option, the impact of dilution, the share price at grant date and expected price volatility of the underlying share, the expected dividend yield and the risk-free interest rate for the term of the option.
Terms and condition of the options and performance rights granted and the inputs to the valuations of options and performance rights granted and not expired to 30 June 2014 included:
For
per
sona
l use
onl
y

99
Option type Vesting Conditions
Exercise price
Grant date
Expiry date
Estimated share price
at grant date
Valuation model
Expected price volatility of
the company’s shares
Expected dividend
yield
Risk-free interest
rate
Assessed fair value
at grant date
Granted during the year:
ESOP (a)
FY15 Revenue, net profit after tax and service condition
$0.00 Aug-13 30-Sep-15 $0.78 Binomial 45.49% 0% 2.35% $0.78
ESOP (b)
Relative TSR performance and service condition
$0.00 Nov-13 30-Sep-16 $0.85 Monte Carlo
45.00% 0% 3.00% $0.68
ESOP (c)
FY16 Revenue, net profit after tax and service condition
$0.00 Nov-13 30-Sep-16 $0.85 Binomial 45.00% 0% 3.00% $0.85
ESOP (d)
Relative TSR performance and service condition
$0.00 Nov-13 30-Sep-17 $0.85 Monte Carlo
45.00% 0% 3.20% $0.71
ESOP (e)
FY17 Revenue, net profit after tax and service condition
$0.00 Nov-13 30-Sep-17 $0.85 Binomial 45.00% 0% 3.20% $0.85
ESOP (f)
Relative TSR performance and service condition
$0.00 Mar-14 30-Sep-16 $0.80 Monte Carlo
45.00% 0% 2.68% $0.63
ESOP (g)
FY16 Revenue, net profit after tax and service condition
$0.00 Mar-14 30-Sep-16 $0.80 Binomial 45.00% 0% 2.68% $0.80
Granted in prior periods and unexpired at report date:
ESOP Service Condition until first exercise date of each tranche
$0.56 Aug-10 19-Jul-14 $0.54 Black & Scholes
74.87% 0% 4.77% $0.31
GSOP Not applicable $0.78 Oct-10 01-Oct-14 $0.80 Black & Scholes
77.58% 0% 4.95% $0.49
ESOP Service Condition until first exercise date of each tranche
$0.92 Mar-11 23-Feb-15 $0.93 Black & Scholes
80.48% 0% 5.15% $0.58
ESOP Service Condition until first exercise date of each tranche
$0.85 May-11 28-Apr-16 $0.80 Black & Scholes
73.62% 0% 5.14% $0.50
GSOP Service Condition until first exercise date of each tranche
$0.53 Nov-11 21-Nov-15 $0.63 Black & Scholes
73.09% 0% 3.44% $0.38
ESOP Service Condition until first exercise date of each tranche
$0.00 Jun-12 01-Apr-15 $0.49 Binomial 49.04% 0% 2.43% $0.49
ESOP (a)
FY15 Revenue, net profit after tax and service condition
$0.00 Nov-12 30-Sep-15 $0.55 Binomial 45.46% 0% 2.58% $0.55
GSOP Service Condition until first exercise date of each tranche
$0.51 Nov-12 24-Nov-16 $0.56 Binomial 54.96% 0% 2.71% $0.27
GSOP Service Condition until first exercise date of each tranche
$0.52 Dec-12 21-Nov-16 $0.49 Binomial 53.13% 0% 2.87% $0.20
Options marked as per below were granted to key management personnel. Further information is included in section 5 of the Remuneration report.
a. 2012 LTIS granted to key management personnelb. 2013 LTIS - Tranche 1 granted to the CEO and the Executive Directorc. 2013 LTIS - Tranche 2 granted to the CEO and the Executive Directord. 2013 LTIS - Tranche 3 granted to the CEOe. 2013 LTIS - Tranche 4 granted to the CEOf. 2013 LTIS - Tranche 1 granted to other key management personnel and senior employeesg. 2013 LTIS - Tranche 2 granted to other key management personnel and senior employees
For
per
sona
l use
onl
y

nanosonics limited | annual report 2014
100 Notes to the financial statements (continued)
For the year ended 30 June 2014
(e) Recognition of expense of options grantedGeneral Share Option Plan (GSOP)The assessed fair values of options granted under the GSOP are expensed in full in the month in which they are granted and a share based payments reserve is created as part of shareholders’ equity, except where the options are granted as part of a capital raising program, in which case no cost is recognised.
Employee Share Option Plan (ESOP)
Options granted under the ESOP require the holder to be an employee of the Company at the time the options are exercised, except that they may be exercised, if vested, up to 30 days after voluntary termination of employment. The assessed fair value of ESOP options granted is apportioned on a straight line monthly basis over the period between grant date and the date on which the options all vest. At the end of a period the Company assesses the probability of achievement of a benefit, being the percentage probability that employees will achieve a benefit if the options are exercised. The value of ESOP options expensed in any period is calculated as that portion of the assessed fair value applicable to the period factored by the probability of achievement and a share based payments reserve is created as part of shareholders’ equity.
(f) Employee share plansThe Company has two Employee Share Plans, being the Exempt Employee Share Plan (“EESP”) and the Deferred Employee Share Plan (“DESP”).
The EESP and DESP was established in 2007 and last approved at a general meeting of shareholders on 8 November 2013. Shareholder approval was also granted to enable the Company to grant financial assistance under both the EESP and the DESP in accordance with the Corporations Act 2001.
Exempt Employee Share Plan (“EESP”)The EESP enables eligible employees, including directors, to acquire up to $1,000 worth of Nanosonics shares each year on a tax-exempt basis in accordance with enabling tax legislation. As a contemporary company the Board believes allowing employees to acquire equity in the Company on tax-preferred terms should be encouraged. No shares have been issued under the EESP to the date of this report.
Nanosonics Deferred Employee Share Plan (“DESP”)The DESP allows invited eligible employees, including directors, to receive Nanosonics shares as a bonus or incentive or as remuneration sacrifice and, subject to certain conditions, not to pay tax for up to 10 years on the benefit in accordance with enabling tax legislation. The DESP is designed to allow the Company to meet contemporary executive equity incentive practices. No shares were issued under the DESP during the financial year.
(g) Shares granted
During the financial year there were no shares directly granted under the DESP. Details of shares granted under the DESP to the date of this report are set out below.
Share Plan Share issue price Grant dateAssessed fair value at
grant dateClosing share price on
grant date Number granted
DESP 0.2880 23 March 2009 0.2880 0.2950 336,424
DESP 0.4251 26 June 2009 0.4251 0.4100 176,400
DESP 0.4251 26 June 2009 0.4251 0.4100 75,000
DESP 0.9080 3 May 2011 0.9080 0.9080 102,403
Total Employee Shares granted to date 690,227
Share issued on the exercise of zero-priced options granted to employees as part of their performance bonus or short term incentive has been issued to the DESP.
No shares have been granted to the date of this report under the EESP.
(h) Fair value of shares grantedThe issue price for shares granted is calculated as the 5-day weighted average market price of shares of the Company on the Australian Securities Exchange as at close of trading on the date the shares were granted. The fair value of shares granted is taken to be the issue price.
For
per
sona
l use
onl
y

101
(i) Recognition of expense of shares grantedDeferred Employee Share Plan (DESP)The assessed fair values of shares granted under the DESP are expensed in full in the month in which they are granted, except if they are granted with a vesting condition, in which case the fair value of DESP shares granted is apportioned on a straight line monthly basis over the period between grant date and the date on which the shares all vest. At the end of a period, the Company assesses the probability of achievement of a benefit, being the percentage probability that employees will achieve at least the fair value of the unvested shares. The value of DESP shares expensed in any period is calculated as that portion of the fair value applicable to the period factored by the probability of achievement. A share based payments reserve is created as part of shareholders’ equity.
(j) Shares on issue under employee share plans
Number of Shares
DESP EESP All Share Plans
2014 2013 2014 2013 2014 2013
Employee Shares on issue as at 1 July 779,053 305,483 – – 779,053 305,483
Granted during the year – – – – – –
Issued on exercise of zero-priced options during the year 1,207,442 626,416 – – 1,207,442 626,416
Issued on share purchase plan allotment during the year – 7,548 – – – 7,548
Withdrawn during the year (861,026) (160,394) – – (861,026) (160,394)
Forfeited during the year – – – –
Employee Shares on issue as at 30 June 1,125,469 779,053 – – 1,125,469 779,053
Number of holders as at 30 June 40 37 – – 40 37
(k) Expenses arising from share-based compensation transactions 2014 $’000
2013 $’000
Options issued under ESOP 940 804
Options issued under GSOP 57 94
Shares issued under DESP – –
Total share-based compensation 997 898
For
per
sona
l use
onl
y
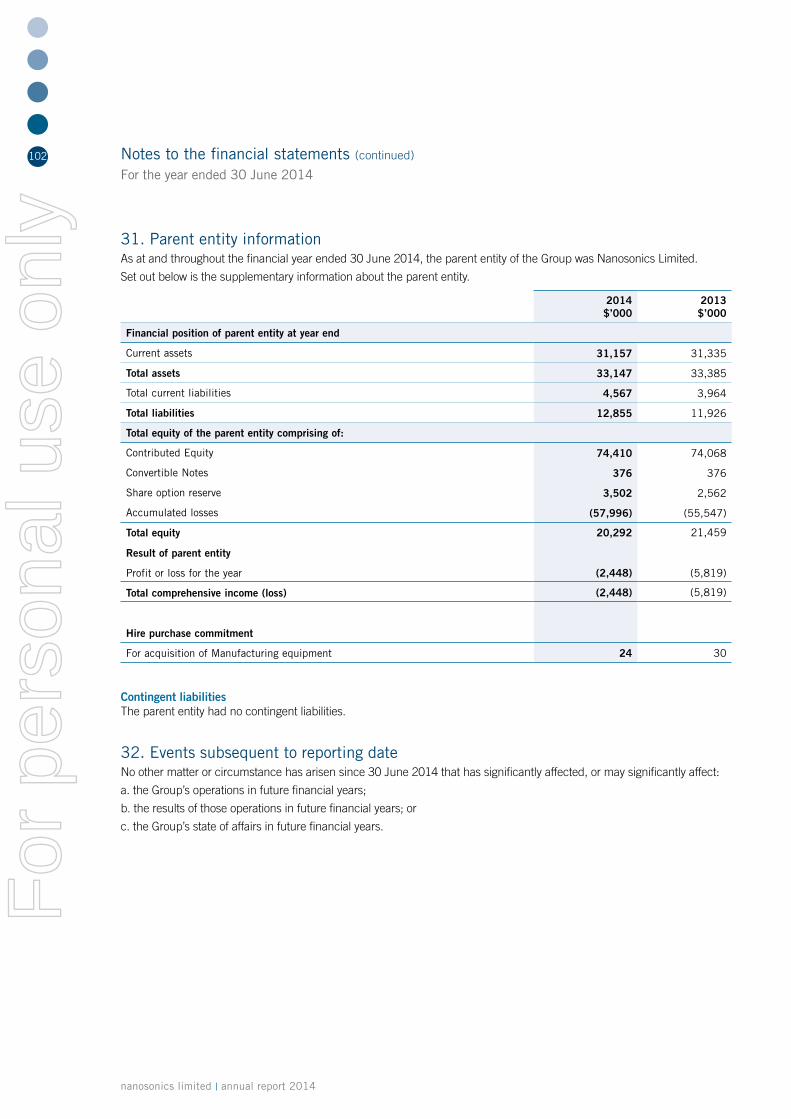
nanosonics limited | annual report 2014
102 Notes to the financial statements (continued)
For the year ended 30 June 2014
31. Parent entity informationAs at and throughout the financial year ended 30 June 2014, the parent entity of the Group was Nanosonics Limited.
Set out below is the supplementary information about the parent entity.
2014 $’000
2013 $’000
Financial position of parent entity at year end
Current assets 31,157 31,335
Total assets 33,147 33,385
Total current liabilities 4,567 3,964
Total liabilities 12,855 11,926
Total equity of the parent entity comprising of:
Contributed Equity 74,410 74,068
Convertible Notes 376 376
Share option reserve 3,502 2,562
Accumulated losses (57,996) (55,547)
Total equity 20,292 21,459
Result of parent entity
Profit or loss for the year (2,448) (5,819)
Total comprehensive income (loss) (2,448) (5,819)
Hire purchase commitment
For acquisition of Manufacturing equipment 24 30
Contingent liabilitiesThe parent entity had no contingent liabilities.
32. Events subsequent to reporting dateNo other matter or circumstance has arisen since 30 June 2014 that has significantly affected, or may significantly affect:
a. the Group’s operations in future financial years;
b. the results of those operations in future financial years; or
c. the Group’s state of affairs in future financial years.
For
per
sona
l use
onl
y

103
In the directors’ opinion:
1. the financial statements and notes set out on pages 60 to 102 are in accordance with the Corporations Act 2001, including:
a. complying with Accounting Standards, the Corporations Regulations 2001 and other mandatory professional reporting requirements, and
b. giving a true and fair view of the Company’s and Group’s financial position as at 30 June 2014 and of their performance for the financial year ended on that date; and
2. there are reasonable grounds to believe that the Company and its subsidiaries will be able to pay their debts as and when they become due and payable.
The directors have been given the declarations by the Managing Director and CEO and Chief Financial Officer required by section 295A of the Corporations Act 2001.
This declaration is made in accordance with a resolution of directors.
Richard England
Director
Sydney
21 August 2014
Directors’ declaration
For
per
sona
l use
onl
y

nanosonics limited | annual report 2014
104 Independent auditor’s report to the members
For
per
sona
l use
onl
y

105Independent auditor’s report to the members (continued)
For
per
sona
l use
onl
y

nanosonics limited | annual report 2014
106 Shareholder information
The shareholder information set out below was applicable as at 12 August 2014.
A. Equity security holdersTwenty largest holders of quoted equity securities
Ordinary sharesNumber of quoted
shares held Percentage
Mr Maurie Stang1 28,402,424 10.75%
Mr Bernard Stang 27,713,255 10.49%
Citicorp Nominees Pty Limited 26,169,408 9.91%
National Nominees Limited 25,006,402 9.47%
J P Morgan Nominees Australia Limited 23,198,503 8.78%
Mr Steve Kritzler 10,651,439 4.03%
HSBC Custody Nominees (Australia) Limited 8,337,727 3.16%
Link Traders (Aust) Pty Ltd 3,252,381 1.23%
Asia Union Investments Pty Ltd 3,000,000 1.14%
BNP Paribas Noms Pty Ltd <drp> 2,256,243 0.85%
Dr Harry Hirschowitz 2,010,000 0.76%
Armada Trading Pty Ltd 2,000,000 0.76%
Bennelong Resources Pty Limited <John Egan super fund a/c> 1,500,000 0.57%
Citicorp Nominees Pty Limited <Colonial First State Inv a/c> 1,491,521 0.56%
RBC Investor Services Australia Nominees Pty Limited <gsam a/c> 1,295,489 0.49%
Bevan Holdings Pty Ltd <Phillip David Stricker family > 1,229,317 0.47%
Hofbauer Nominees Pty Ltd 1,200,000 0.45%
Nan Employee Share Plan Managers Pty Limited <desp a/c> 1,111,874 0.42%
Moore Family Nominee Pty Ltd <Moore family super fund a/c> 1,044,315 0.40%
Bentale Pty Ltd <Allambi Road family a/c> 1,025,000 0.39%
Total top 20 holders 171,895,298 65.07%
Total all other holders 92,262,528 34.93%
Total shares on issue 264,157,826 100%1 Includes indirect holdings of 116,368 shares.
Unquoted equity securitiesNumber of options
over ordinary shares Number of holders
Options on issue
General Share Options to take up unissued ordinary shares 503,334 4
Employee Share Options to take up unissued ordinary shares 5,656,641 24
Total options on issue 6,159,975 28 For
per
sona
l use
onl
y
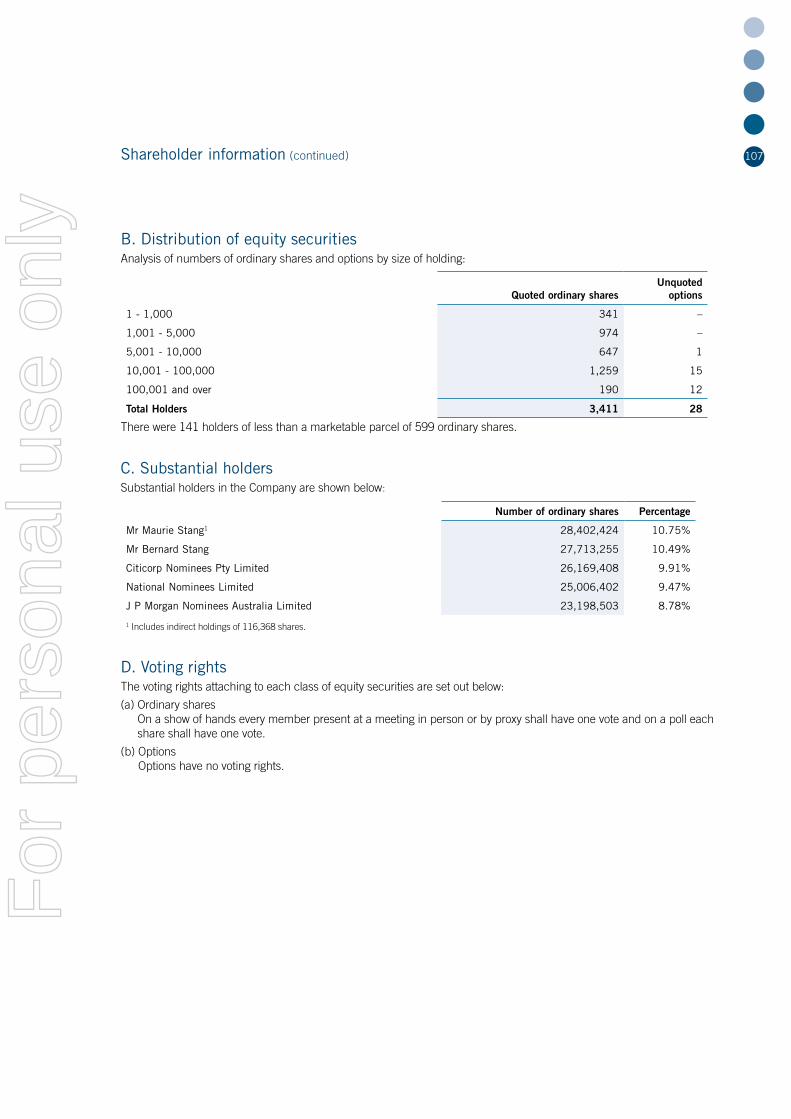
107Shareholder information (continued)
B. Distribution of equity securitiesAnalysis of numbers of ordinary shares and options by size of holding:
Quoted ordinary sharesUnquoted
options
1 - 1,000 341 –
1,001 - 5,000 974 –
5,001 - 10,000 647 1
10,001 - 100,000 1,259 15
100,001 and over 190 12
Total Holders 3,411 28
There were 141 holders of less than a marketable parcel of 599 ordinary shares.
C. Substantial holdersSubstantial holders in the Company are shown below:
Number of ordinary shares Percentage
Mr Maurie Stang1 28,402,424 10.75%
Mr Bernard Stang 27,713,255 10.49%
Citicorp Nominees Pty Limited 26,169,408 9.91%
National Nominees Limited 25,006,402 9.47%
J P Morgan Nominees Australia Limited 23,198,503 8.78%
1 Includes indirect holdings of 116,368 shares.
D. Voting rightsThe voting rights attaching to each class of equity securities are set out below:
(a) Ordinary shares On a show of hands every member present at a meeting in person or by proxy shall have one vote and on a poll each share shall have one vote.
(b) Options Options have no voting rights.
For
per
sona
l use
onl
y
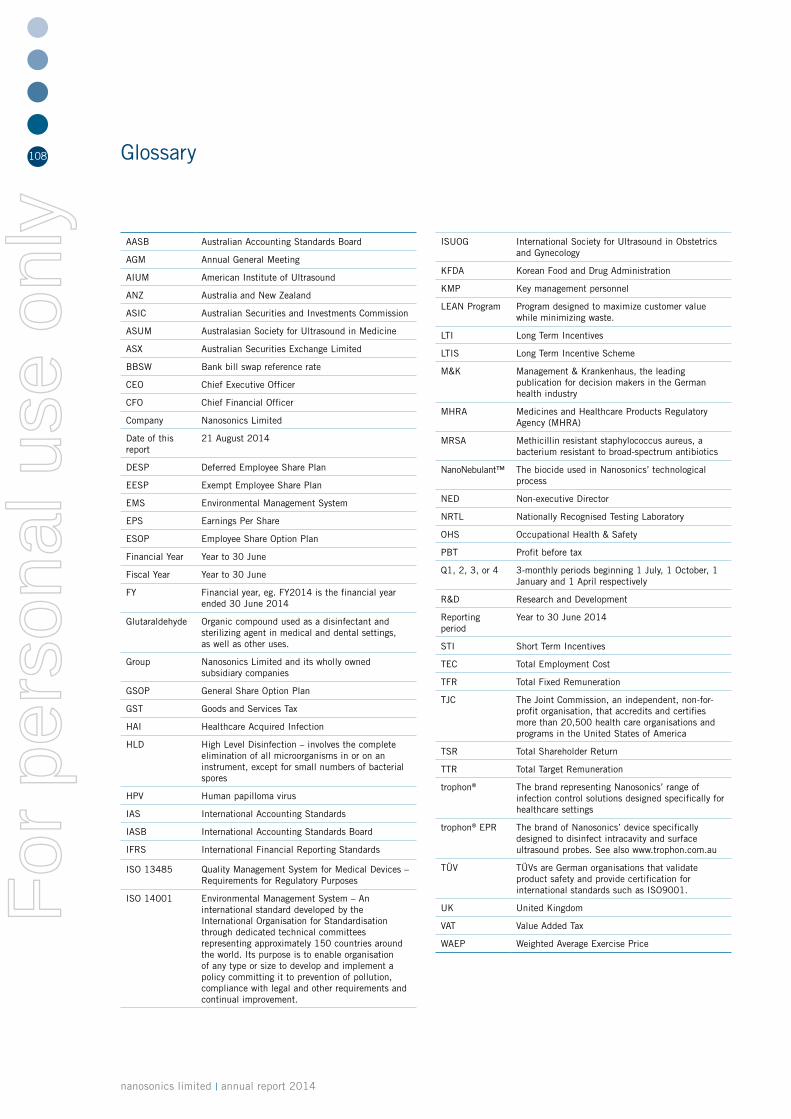
nanosonics limited | annual report 2014
108
AASB Australian Accounting Standards Board
AGM Annual General Meeting
AIUM American Institute of Ultrasound
ANZ Australia and New Zealand
ASIC Australian Securities and Investments Commission
ASUM Australasian Society for Ultrasound in Medicine
ASX Australian Securities Exchange Limited
BBSW Bank bill swap reference rate
CEO Chief Executive Officer
CFO Chief Financial Officer
Company Nanosonics Limited
Date of this report
21 August 2014
DESP Deferred Employee Share Plan
EESP Exempt Employee Share Plan
EMS Environmental Management System
EPS Earnings Per Share
ESOP Employee Share Option Plan
Financial Year Year to 30 June
Fiscal Year Year to 30 June
FY Financial year, eg. FY2014 is the financial year ended 30 June 2014
Glutaraldehyde Organic compound used as a disinfectant and sterilizing agent in medical and dental settings, as well as other uses.
Group Nanosonics Limited and its wholly owned subsidiary companies
GSOP General Share Option Plan
GST Goods and Services Tax
HAI Healthcare Acquired Infection
HLD High Level Disinfection – involves the complete elimination of all microorganisms in or on an instrument, except for small numbers of bacterial spores
HPV Human papilloma virus
IAS International Accounting Standards
IASB International Accounting Standards Board
IFRS International Financial Reporting Standards
ISO 13485 Quality Management System for Medical Devices – Requirements for Regulatory Purposes
ISO 14001 Environmental Management System – An international standard developed by the International Organisation for Standardisation through dedicated technical committees representing approximately 150 countries around the world. Its purpose is to enable organisation of any type or size to develop and implement a policy committing it to prevention of pollution, compliance with legal and other requirements and continual improvement.
ISUOG International Society for Ultrasound in Obstetrics and Gynecology
KFDA Korean Food and Drug Administration
KMP Key management personnel
LEAN Program Program designed to maximize customer value while minimizing waste.
LTI Long Term Incentives
LTIS Long Term Incentive Scheme
M&K Management & Krankenhaus, the leading publication for decision makers in the German health industry
MHRA Medicines and Healthcare Products Regulatory Agency (MHRA)
MRSA Methicillin resistant staphylococcus aureus, a bacterium resistant to broad-spectrum antibiotics
NanoNebulant™ The biocide used in Nanosonics’ technological process
NED Non-executive Director
NRTL Nationally Recognised Testing Laboratory
OHS Occupational Health & Safety
PBT Profit before tax
Q1, 2, 3, or 4 3-monthly periods beginning 1 July, 1 October, 1 January and 1 April respectively
R&D Research and Development
Reporting period
Year to 30 June 2014
STI Short Term Incentives
TEC Total Employment Cost
TFR Total Fixed Remuneration
TJC The Joint Commission, an independent, non-for-profit organisation, that accredits and certifies more than 20,500 health care organisations and programs in the United States of America
TSR Total Shareholder Return
TTR Total Target Remuneration
trophon® The brand representing Nanosonics’ range of infection control solutions designed specifically for healthcare settings
trophon® EPR The brand of Nanosonics’ device specifically designed to disinfect intracavity and surface ultrasound probes. See also www.trophon.com.au
TÜV TÜVs are German organisations that validate product safety and provide certification for international standards such as ISO9001.
UK United Kingdom
VAT Value Added Tax
WAEP Weighted Average Exercise Price
Glossary
For
per
sona
l use
onl
y

109Corporate directory and information for investorsNanosonics Limited ABN 11 095 076 896 incorporated 14 November 2000
Directors
Maurie Stang
Richard England
David Fisher
Michael Kavanagh
Ron Weinberger
Company Secretaries
McGregor Grant
Robert Waring
Registered Office
Unit 24, 566 Gardeners Road
Alexandria NSW 2015 Australia
Ph: +61 2 8063 1600
European Office
Nanosonics Europe GmbH
Falkenried 88. House A
D-20251 Hamburg Germany
Ph: +49 40 468 56885
Share Register
Computershare Investor Services Pty Ltd
GPO Box 2975
Melbourne, VIC 3001 Australia
Ph: +61 3 9415 4088
Ph: 1300 555 159 (within Australia)
www.au.computershare.com/au/contact
Investor/Media Relations
Buchan Consulting
Ph: +61 3 9866 4722
Ph: 1300 557 010 (within Australia)
McGregor Grant – Company Secretary
Ph: +61 2 8063 1600
Email: [email protected]
Auditor
UHY Haines Norton Level 11,
1 York Street
Sydney NSW 2000 Australia
Legal Advisors
Shelston IP
Level 21, 60 Margaret Street
Sydney NSW 2000 Australia
Baker & McKenzie
AMP Centre
Level 27, 50 Bridge Street
Sydney NSW 2000 Australia
Dibbs Barker
Level 8, Angel Place
123 Pitt Street
Sydney NSW 2000 Australia
Bankers
ANZ Banking Group Limited,
Level 17, 242 Pitt Street
Sydney NSW 2000 Australia
National Australia Bank Limited
Level 36, 100 Miller Street
North Sydney NSW 2060 Australia
Deutsche Bank AG,
Eppendorfer Landstrasse 70
Hamburg 20249 Germany
PNC
1015 S Bethlehem Pike
Ambler PA 19002 USA
Stock Exchange Listings
Nanosonics Limited shares are listed on the
Australian Securities Exchange
ASX code: NAN
Industry Group: Healthcare Equipment & Services
2014 Annual General Meeting
The 2014 AGM of Nanosonics Limited will be held:
At 11.00am on Friday 7th November 2014
Level 3, Sydney Harbour Marriott Hotel
30 Pitt Street Sydney
Website Address
www.nanosonics.com.au
For
per
sona
l use
onl
y

NANOSONICS LIMITED ABN 11 095 076 896
Nanosonics Limited
Unit 24, 566 Gardeners Road Alexandria NSW 2015 Australia
T +61 2 8063 1600 E [email protected]
www.nanosonics.com.au
For
per
sona
l use
onl
y