annual radiological environ operating rept for bfnp for
TRANSCRIPT

Operations Services/Technical Programs
Q,vanLtLI+0[g+(ojIIQo ljQogo OCK[]IRAQ'5Ijl7OoIKIYQQSElQKlj
QOPo(e,[PQjgIIPg go
[@(5, Po Qo ling
le Browns FerryNuclear Plant
I 992
t 9305040i90 930430PDR ADOCK 05000259'
PDR

yl~
l
tr
ANNUAL RADIOLOGICAL ENVIRONMENTAL OPERATING REPORT
BROWNS FERRY NUCLEAR PLANT
1992
TENNESSEE VALLEY AUTHORITY
OPERATIONS SERVICES
TECHNICAL PROGRAMS
April 1993
~l
t~
(i
TABLE OF CONTENTS
Table of Contents .
List of Tables ~ ~ ~ ~ 0 ~ ~ ~ ~ ~ iv
List of Figures .
Executive Summary .
Introduction ~ ~ ~ ~ ~ ~ ~ ~ ~ ~ ~ ~
Naturally Occurring and Background Radioactivity .
Electric Power Production
S)te/Plant Description
t Environmental Radiological Monitoring Program
Direct Radiation Monitoring .
LMeasurement Techniques .
Results ~ ~ ~ ~ ~ ~ ~ ~
Atmospheric MonitoringSample Collection and Analysis .
Results
v
22
5
8
10
141416
191921
LTerrestrial Monitoring
Sample Collection and Analysis .
Results
222224
Aquatic MonitoringSample Collection and Analysis .
Results s ~ ~ ~ ~ ~ ~ ~ ~ ~ ~ ~ ~
262628
Assessment and Evaluation .
ResultsConclusions
., 313234
References
Appendix A Environmental RadiologicalSampling Locations
Appendix B 1992 Program Modifications
Monitoring Program and
35
40
53

II
OlIIIIIIi
II

Appendix C Program Deviations.
Appendix D Analytical Procedures ,
t Appendix E Nominal Lower Limits of Detection
Appendix F Quality Assurance/Quality Control
Appendix G Land Use Survey .
Appendix H Data Tables .
(LLD)
Program .
56
59
62
68
77
83

it
0)

IIg
t Table l
Table 2
LIST OF TABLES
Maximum Permissible Concentrations forNonoccupational Exposure .
Maximum Dose Due to Radioactive EffluentReleases .
36
~ ~ ~ ~ ~ ~ 0 37

gllL
1

LIST OF FIGURES
Figure 1 Tennessee Valley Region . . . . . . . . . . . . . . . . . 38
Figure 2 Environmental Exposure Pathways of Man Due to Releasesof Radioactive Material to the Atmosphere and Lake . . . 39

II
I
III
Ii

EXECUTIVE SUMMARY
This report describes the environmental radiological monitoring program
conducted by TVA in the vicinity of Browns Ferry Nuclear Plant (BFN) in
1992. The program includes the collection of samples from the
environment and the determination of the concentrations of radioactive
materials in the samples. Samples are taken from stations in the general
area of the plant and from areas not influenced by plant operations.
Station locations are selected after careful consideration of the weather
patterns and projected radiation doses to the various areas around the
plant. Material sampled includes air, water, milk, foods, vegetation,
soil, fish, sediment, and direct radiation levels. Results from stations
near the plant are compared with concentrations from control stations and
with preoperational measurements to determine potential impacts of plant
operations.
The vast majority of the exposures calculated from environmental samples
were contributed by naturally occurring radioactive materials or from
materials commonly found in the environment as a result of atmospheric
nuclear weapons fallout.
Small amounts of Co-60 and Cs-134 were found in sediment samples
downstream from the plant. This activity in stream sediment would result
in no measurable increase over background in the dose to the genera)
public.
)0

I
I
I
1
tI

INTRODUCTION,
This report describes and summarizes a large volume of data, the results of
thousands of measurements and laboratory analyses. The measurements are made
to comply with regulations and to determine potential effects on public health
and safety. This report satisfies the annual reporting requirements of the
BFN Offsite Dose Calculation Manual (ODCM). In addition, estimates of the
maximum potential doses to the surrounding population are made from
radioactivity measured both in plant effluents and in environmental samples.
Some of the data presented are prescribed by specific requirements while other
data are included which may be useful or interesting to individuals who do not
work with this material routinely.
r Naturall Occurrin and Back round Radioactivit
Most materials in our world contain trace amounts of naturally occurring
radioactivity. Approximately 0.01 percent of all potassium is radioactive
potassium-40. Potassium-40 (K-40), with a half-life of 1.3 billion years, is
one of the major types of radioactive materials found naturally in our
environment. An individual weighing 150 pounds contains about 140 grams of
potassium (Reference 1). This is equivalent to approximately 100,000 pCi of
K-40 which delivers a dose of 15 to 20 mrem per year to the bone and soft
tissue of the body. Naturally occurring radioactive materials have always
been in our environment. Other examples of naturally occurring radioactive
rmaterials are bismuth-212,214, lead-212,214, thallium-208, actinium-228,
uranium-238, uranium-235, thorium-234, radium-226, radon-222, carbon-14, and
i0hydrogen-3 (generally called tritium). These naturally occurring radioactive
materials are in the soil, our food, our drinking water,

gl,l~
yl
L
L
)

and our bodies. The radiation from these materials makes up a part of the
low-level natural background radiation. The remainder of the natural
background radiation comes from outer space. He are all exposed to this
The average dose equivalent at sea level resulting from radiation from outer
space (part of natural background radiation) is about 27 mrem/year. This
essentially doubles with each 6600-foot increase in altitude in the lower
atmosphere. Another part of natural background radiation comes from naturally
occurring radioactive materials in the soil and rocks. Because the quantity
of naturally occurring radioactive material varies according to geographical
location, the part of the natural background radiation coming from this
radioactive material also depends upon the geographical location. Most of the
remainder of the natural background radiation comes from the radioactive
materials within each individual's body. He absorb these materials from the
food we eat which contains naturally occurring radioactive materials from the
soil. An example of this is K-40 as described above. Even building materials
affect the natural background radiation levels in the environment. Living or
working in a building which is largely made of earthen material, such as
concrete or brick, will generally result in a higher natural background
radiation level than would exist if the same structure were made of wood.
This is due to the naturally occurring radioisotopes in the concrete or brick,
such as trace amounts of uranium, radium, thorium, etc.
IO
Because the city of Denver, Colorado, is over 5000 feet in altitude and the
soil and rocks there contain more radioactive material than the U.S. average,
the people of Denver receive around 350 mrem/year total natural background

@l

radiation dose equivalent compared to about 295 mrem/year for the national
average. People in some locations of the world receive over 1000 mrem/year
natural background radiation dose equivalent, primarily because of the greater
quantity of radioactive materials in the soil and rocks in those locations.
Scientists have never been able to show that these levels of radiation have
caused physical harm to anyone.
It is possible to get an idea of the relative hazard of different types of
radiation sources by evaluating the amount of radiation the U.S. population
receives from each general type of radiation source. The information below is
primarily adapted from References 2 and 3.
U.S. GENERAL POPULATION AVERAGE DOSE EQUIVALENT ESTIMATES
Source Mi 1 1irem/Year Per Person
Natural background dose equivalentCosmicCosmogenicTerrestrialIn the bodyRadon
Total
271
2839
200295
Release of radioactive material innatural gas, mining, ore processing, etc.
Medical (effective dose equivalent)
Nuclear weapons fallout
Nuclear energy
Consumer products
Total
53
less than 1
0.28
0.03
355 (approximately)

g)L
~
L
I

As can be seen from the table, natural background radiation dose equivalent to
the U.S. population normally exceeds that from nuclear plants by several
hundred times. This indicates that nuclear plant operations normally result
in a population radiation dose equivalent which is insignificant compared to
that which results from natural background radiation. It should be noted that
the use of radiation and radioactive materials for medical uses has resulted
in a similar effective dose equivalent to the U.S. population as that caused
by natural background cosmic and terrestrial radiation.
Significant discussion recently has centered around exposures from radon.
Radon is an inert gas given off as a result of the decay of naturally
occurring radium-226 in soil. Hhen dispersed in the atmosphere, radon
concentrations are relatively low. However, when the gas is trapped in closed
I spaces, it can build up until concentrations become significant. The National
Council of Radiation Protection and Measurements (Reference 2) has estimated
l that the average annual effective dose equivalent from radon in the United
States is approximately 200 mrem/year. This estimated dose is approximately
twice the average dose equivalent from all other natural background sources.
Electric Power Production
Nuclear power plants are similar in many respects to conventional coal burning
(or other fossil.,fuel) electrical generating plants. The basic process behind
electrical power production in both types of plants is that fuel is used to
heat water to produce steam which provides the force to turn turbines and
generators.

)

lyHowever, nuclear plants include many complex systems to control the nuclear
fission process and to safeguard against the possibility of reactor
malfunction, which could lead to the release of radioactive materials. Very
small amounts of these fission and activation products are released into the
plant systems. This radioactive material can be transported throughout plant
systems and some of it released to the environment.
All paths through which radioactivity is released are monitored. Liquid and
gaseous effluent monitors record the radiation levels for each release. These
monitors also provide alarm mechanisms to prompt termination of any release
above limits.
Releases are monitored at the onsite points of release and through an
environmental monitoring program which measures the environmental radiation in
outlying areas around the plant. In this way, not only is the release of
radioactive materials from the plant tightly controlled, but measurements are
made in surrounding areas to verify that the population is not being exposed
to significant levels of radiation or radioactive materials.
The BFN ODCH, which is required by the plant Technical Specifications,
prescribes limits for the release of radioactive effluents, as well as limits
for doses to the general public from the release of these effluents.


,I
lyThe dose to a member of the general public from radioactive materials releasedto unrestricted areas, as given in NRC guidelines and in the ODCM. is limitedas follows:
Ll uid Effluents
Total bodyAny organ
<3 mrem/year<10 mrem/year
Gaseous Effluents
Noble gases:
Gamma radiationBeta radiation
Particulates:
Any organ
<10 mrad/year<20 mrad/year
<15 mrem/year
The Environmental Protection Agency (EPA) limits for the total dose to the
public in the vicinity of a nuclear power plant, established in the
Environmental Dose Standard of 40 CFR 190, are as follows:
Tota'l bodyThyroidAny other organ
25 mrem/year75 mrem/year25 mrem/year
In addition, 10 CFR 20.106 prescribes maximum permissible concentrations
(MPCs) for radioactive materials released to unrestricted areas. MPCs for the
principal radionuclides associated with nuclear power plant effluents are
presented in Table 1.

II
~ )

SITE/PLANT DESCRIPTION
Browns Ferry Nuclear Plant (BFN) is located on the north shore of Hheeler
Reservoir at Tennessee River Hile 294 in Limestone County in north Alabama.
Nheeler Reservoir averages, 1 to l-l/2 miles in width in the vicinity of the
plant. The site, containing approximately 840 acres, is approximately 10
miles southwest of Athens, Alabama, and 10 miles northwest of the center of
Decatur, Alabama (Figure 1). The dominant character of land use is small,
scattered villages and homes in an agricultural area. A number of relatively
large farming operations occupy much of the land on the north side of the
river immediately surrounding the plant. The principal crop grown in the
area is cotton. At least two dairy farms are located within a 10-mile radius
of the plant.
Approximately 2000 people live within a 5-mile radius of the plant. The town
of Athens has a population of about 15,000, while approximately 40,000 people
live in the city of Decatur. The largest city in the area with approximately
150,000 people is Huntsville, Alabama, located about 24 miles east of the site.
Area recreation facilities are being developed along the Tennessee River. The
nearest facilities are two county parks located about 8 miles west-northwest
of the site and a commercial boat dock across the river from the site. The
city of Decatur has developed a large municipal recreation area, Point Hallard
Park, approximately 15 miles upstream from the site. The Tennessee River is
also a popular sport fishing area.
i0


BFN consists of three boiling water reactors; each unit is rated at 1098
megawatts (electrical) . Unit 1 achieved criticality on August 17, 1973, and
i began commercial operation on August 1, 1974. Unit 2 began commercial
operation on March 1, 1975. However, a fire in the cable trays on March 22,
I 1975, forced the shutdown of both reactors. Units 1 and 2 resumed operation
and Unit 3 began testing in August 1976. Unit 3 began commercial operation in
March 1977. All three units were taken out of service in March 1985. Unit 2
was restarted May 24, 1991.


ENVIRONMENTAL RADIOLOGICAL MONITORING PROGRAM
The unique environmental concern associated with a nuclear power plant is its
production of radioactive materials and radiation. The vast majority of this
radiation and radioactivity is contained within the reactor itself or one of
the other plant systems designed to keep the material in the plant. The
retention of the materials in each level of control is achieved by system
engineering, design, construction, and operation. Environmental monitoring is
a final verification that the systems are performing as planned. The
monitoring program is designed to check the pathways between the plant and the
people in the immediate vicinity and to most efficiently monitor these
pathways. Sample types are chosen so that the potential for detection of
radioactivity in the environment will be maximized. The environmental
radiological monitoring program is outlined in Appendix A.
There are two primary pathways by which radioactivity can move through the
environment to humans: air and water (see Figure 2). The air pathway can be
separated into two components: the direct (airborne) pathway and the indirect
(ground or terrestrial) pathway. The direct airborne pathway consists of
direct radiation and inhalation by humans. In the terrestrial pathway,
radioactive materials may be deposited on the ground or on plants and
subsequently be ingested by animals and/or humans. Human exposure through the
liquid pathway may result from drinking water, eating fish, or by direct
exposure at the shoreline. The types of samples collected in this program are
designed to monitor these pathways.
)0 -10-

>
i@I
I
ti
)

A number of factors were considered in determining the locations for
i collecting environmental samples. The locations for the atmospheric
monitoring stations were determined from a critical pathway analysis based on
weather patterns, dose projections, population distribution, and land use.
Terrestrial sampling stations were selected after reviewing such things as the
locations of dairy animals and gardens in conjunction with the air pathway
analysis. Liquid pathway stations were selected based on, dose projections,
water use information, and availability of media such as fish and sediment.
Table A-2 (Appendix A, Table 2: This identification system is used for all
tables and figures given in the appendices.) lists the sampling stations and
the types of samples collected from each. Hodifications made to the program
in 1992 are described in Appendix B and exceptions to the sampling and
analysis schedule are presented in Appendix C.
Iyr
To determine the amount of radioactivity in the environment prior to the
operation of BFN, a preoperational environmental radiological monitoring
program was initiated in 1968 and operated until the plant began operation in
1973. Heasurements of the same types of radioactive materials that are
measured currently were assessed during the preoperational phase to establish
normal background levels for various radionuclides in the environment.
The preoperational monitoring program is a very important part of the overall
program. During the 1950s, 60s, and 70s, atmospheric nuclear weapons testing
released radioactive material to the environment causing fluctuations in
background radiation levels. This radioactive material is the same type as
that produced in the BFN reactors. Preoperational knowledge of preexisting
radionuclide patterns in the environment permits a determination, through
-11-

~
plii
I
I
IL
is

comparison and trending analyses, of whether the operation of BFN is impacting
the environment and thus the surrounding population.
The determination of impact during the operating phase also considers the
presence of control stations that have been established in the environment.
Results of environmental samples taken at control stations (far from the
plant) are compared with those from indicator stations (near the plant) to
establish the extent of BFN influence.
I
All samples are analyzed by the Radioanalytical Laboratory of TVA's
Environmental Radiological Monitoring and Instrumentation Department located
at the Western Area Radiological Laboratory (WARL) in Muscle Shoals, Alabama.
All analyses are conducted in accordance with written and approved procedures
and are based on accepted methods. A summary of the analysis techniques and
methodology is presented in Appendix D. Data tables summarizing the sample
analysis results are presented in Appendix H.
The sophisticated radiation detection devices used to determine the
radionuclide content of samples collected in the environment are generally
quite sensitive to small amounts of radioactivity. In the field of radiation
measurement, the sensitivity of the measurement process is discussed in terms
of the lower limit of detection (LLD). A description of the nominal LLDs for
the Radioanalytical Laboratory is presented in Appendix E.
The Radioanalyti cal Laboratory employs .a comprehensive quality assurance/
quality control program to monitor laboratory performance throughout the
-12-

I
I
~l
I

year. The program is intended to detect any problems in the measurement
process as soon as possible so they can be corrected. This program includes
equipment checks to ensure that the complex radiation detection devices are
working properly and the analysis of special samples which are included
alongside routine environmental samples. The laboratory participates in the
EPA Interlaboratory Comparison Program. In addition, samples split with the
EPA and the State of Alabama provide an independent verification of the
overall performance of the laboratory. A complete description of the program
is presented in Appendix F.
-13-

li
g

DIRECT RADIATION MONITORING
Direct radiation levels are measured at a number of stations around the plant
site. These measurements include contributions from cosmic radiation,
radioactivity in the ground, fallout from atmospheric nuclear weapons tests
conducted in the past, and radioactivity that may be present as a result of
plant operations. Because of the relative large variations in background
radiation as compared to the small levels from the plant, contributions from
the plant may be difficu'lt to distinguish.
Iy
Radiation levels measured in the area around the BFN site in 1992 were
consistent with levels from previous years and with levels measured at other
locations in the region.
Measurement Techni ues
Direct radiation measurements are made with thermoluminescent dosimeters
(TLDs). Hhen certain materials are exposed to ionizing radiation, many of the
electrons which become displaced are trapped in the crystalline structure of
the material. They remain trapped for long periods of time as long as the
material is not heated. Hhen heated (thermo-), the electrons are released,
producing a pulse of light (-luminescence). The intensity of the light pulse
is proportional to the amount of radiation to which the material was exposed.
Materials which display these characteristics are used in the manufacture of
TLDs.
From 1968 through 1989, TVA used a Victoreen dosimeter consisting of a
-14-

I~

manganese activated calcium fluoride (Ca>F:Mn) TLD material encased in a glass
bulb. In 1989, TVA began the process of changing from the Victoreen dosimeter
to the Panasonic Model UD-814 dosimeter, and completely changed to the
Panasonic dosimeter in 1990. This dosimeter contains four elements consisting
of one lithium borate and three calcium sulfate phosphors. The calcium
sulfate phosphors are shielded by approximately 1000 mg/cm'lastic and lead
to compensate for the over-response of the detector to low energy radiation.
The TLDs are placed approximately 1 meter above the ground, with three TLDs at
each station. Sixteen stations are located around the plant near the site
boundary, one station in each of the sixteen compass sectors. Dosimeters are
also placed at the perimeter and remote air monitoring sites and at 19
additional stations out to approximately 32 miles from the site. The TLDs are
exchanged every 3 months and the accumulated exposure on the detectors is read
with a Panasonic Model UD-710A automatic reader interfaced with a Hewlett
Packard Model 9000 computer system. Nine of the locations also have TLD
devices processed by the NRC. The results from the NRC measurements are
reported in NUREG 0837.
Since the calcium sulfate phosphor is much more sensitive that the lithium
borate, the measured exposure is taken as the median of the results obtained
from the nine calcium sulfate phosphors in three detectors. The values are
corrected for gamma response, system variations, and transit exposure, with
individual gamma response calibrations for each element. The system meets or
exceeds the performance specifications outlined in Regulatory Guide 4.13 for
environmental applications of TLDs.
-15-

~
yl,,~
I
il
a'

All results are normalized to a standard quarter (91.25 days or 2190 hours).
The stations are grouped according to the distance from the plant. The first
group consists of all stations within 1 mile of the plant. The second group
lies between 1 and 2 miles, the third group between 2 and 4 miles, the fourth
between 4 and 6 miles, and the fifth group is made up of all stations more
than 6 miles from the plant. Past data have shown that the results from all
stations greater than 2 miles from the plant are essentially the same.
Therefore, for purposes of this report, all stations 2 miles or less from the
plant are identified as "onsite" stations and all others are considered
"offsite."
Prior to 1976, direct radiation measurements in the environment were made with
dosimeters that were not as precise at lower exposures. Consequently, the
environmental radiation levels reported in the preoperational phase of the
monitoring program exceed current measurements of background radiation
levels. For this reason, data collected prior to 1976 are not included in
this report. For comparison purposes, direct radiation measurements made in
the Watts Bar Nuclear Plant (WBN) environmental radiological monitoring
program are referenced. The WBN is a non-operating plant under construction
near Spring City, Tennessee.
The quarterly gamma radiation levels determined from the TLDs deployed around
BFN in 1992 are given in Table H-l. The rounded average annual exposures are
shown below.
i~ -16-

I
~
ii
)i

Annual AverageDirect Radiation Levels
mR/ earBFN WBN
Onsite Stations
Offsite Stations
68
60
65
57
The data in Table H-1 indicate that the average quarterly radiation levels at
the BFN onsite stations are approximately 2 mR/quarter higher than levels at
the offsite stations. This difference is also noted at the stations at WBN
and other nonoperating nuclear power plant construction sites where the
average levels onsite are generally 2-6 mR/quarter higher than levels
offsite. The causes of these differences have not been isolated; however, itis postulated that the differences are probably attributable to combinations
of, influences such as natural variations in environmental radiation levels,
earth-moving activities onsite, and the mass of concrete employed in the
i construction of the plant. Other undetermined influences may also play a
part. These conclusions are supported by the fact that similar differences
between onsite and offsite stations were measured in the vicinity of the WBN
construction site.
Figure H-1 compares plots of the environmental gamma radiation levels from the
onsite or site boundary stations with those from the offsite stations over the
period from 1976 through 1992. To reduce the seasonal variations present in
the data sets, a 4-quarter moving average was constructed for each data set.
Figure H-2 presents a trend plot of the direct radiation levels as defined by
the moving averages. The data follow the same general trend as the raw data,
but the curves are much smoother. Figures H-3 and H-4 depict the environmental
-17-

~l
Il
)~

gamma radiation levels measured during the construction of TVA's HBN to the
r present. Note that the data follow a similar pattern to the BFN data and
that, as discussed above, the levels reported at onsite stations are similarly
higher than the levels at offsite stations.
All results reported in 1992 are consistent with direct radiation levels
identified at locations which are not influenced by the operation of BFN.
There is no indication that BFN activities =increase the background radiation
levels normally observed in the areas surrounding the plant.
-18-

i

lyATMOSPHERIC MONITORING
ly
The atmospheric monitoring network is divided into three groups identified as
local, perimeter, and remote. In the current program, five local air
monitoring stations are located on or adjacent to the plant site in the
general directions of greatest wind frequency. One additional station is
located at the point of maximum predicted offsite concentration of
radionuclides based on preoperational meteorological data. Three perimeter
air monitoring stations are located in communities out to about 13 miles from
the plant, and two remote air monitors are located out to 32 miles. The
monitoring program and the locations of monitoring stations are identified in
the tables and figures of Appendix A. The remote stations are used as control
or baseline stations.
Results from the analysis of samples in the atmospheric pathway ar'e presented
in Tables H-2 and H-3. Radioactivity levels identified in this reporting
period are consistent with background and radionuclides produced as a result
of fallout from previous nuclear weapons tests. There is no indication of an
increase in atmospheric radioactivity as a result of BFN.
Sam le Collection and Anal sis
Air particulates are collected by continuously sampling air at a flow rate of
approximately 2 cubic feet per minute (cfm) through a 2-inch Hollingsworth and
I Vose LB52ll glass fiber filter. The sampling system consists of a pump, a
magnehelic gauge for measuring the drop in pressure across the system, and a
dry gas meter. This allows an accurate determination of the volume of air
passing through the filter.-19-

Iyl
I
I

This system is housed in a building approximately 2 feet by 3 feet by 4 feet.
l The filter is contained in a sampling head mounted on the outside of the
Lmonitor building. The filter= is replaced every 7 days. Each filter is
analyzed for gross beta activity about 3 days after collection to allow time
for the radon daughters to decay. Every 4 weeks composites of the filtersfrom each location are analyzed by gamma spectroscopy.
On March 27, 1989, two monitors, one local and one remote, were equipped with
a second sampler. The filters from these samplers are analyzed weekly for
gross alpha and composited quarterly for analysis of transuranic isotopes and
for Sr-89,90.
lyGaseous radioiodine is collected using a commercially available cartridge
containing TEDA-impregnated charcoal. This system is designed to collect
iodine in both the elemental form and as organic compounds. The cartridge is
located in the same sampling head as the air particulate filter and is
downstream of the particulate filter. The cartridge is changed at the same
time as the particulate filter and samples the same volume of air. Each
cartridge is analyzed for I-131. If activity above a specified limit is
detected, a complete gamma spectroscopy analysis is performed.
)0
Rainwater is collected by use of a collection tray attached to the monitor
building. The collection tray is protected from debris by a screen cover. As
water drains from the tray, it is collected in one of two 5-gallon jugs inside
the monitor building. A 1-gallon sample is removed from the container every 4
weeks. Any excess water, is discarded. Samples are held to be analyzed only
if the air particulate samples indicate the presence of elevated activity-20-

III
Ol
IIIrI
Ol

levels or if fallout is expected. For example, rainwater samples were
analyzed during the period of fallout following the accident at Chernobyl in
Results
The results from the analysis of air particulate samples are summarized in
Table H-2. Gross beta activity in 1992 was consistent with levels reported in
previous years. The average level at both indicator and control stations was
0.019 pCi/m'. The annual averages of the gross beta activity in air
particulate filters at these stations for the years 1968-1992 are presented in
Figure H-5. Increased levels due to fallout from atmospheric nuclear weapons
testing are evident, especially in 1969, 1970, 1971, 1977, 1978, and 1981.
Evidence of a small increase resulting from the Chernobyl accident can also be
seen in 1986. These patterns are consistent with data from monitoring
programs conducted by TVA at nonoperating nuclear power plant construction
si tes.
Only natural radioactive materials were identified by the monthly gamma
spectral analysis of the air particulate samples. No fission or activation
products were found at levels greater than the LLDs. As shown in Table H-3,
iodine-131 was not detected in any of the charcoal canister samples collected
in 1992.
Since no plant-related air activity was detected, no rainwater samples from
the vicinity of BFN were analyzed during this reporting period.
)0 -21-

Ipl
tt
gi
I'
Ilt~
>i

lytL
TERRESTRIAL MONITORING
Terrestrial monitoring is accomplished by co1lecting.samples of environmenta1
media that may transport radioactive materia1 from the atmosphere to humans.
For example, radioactive material may be deposited on a vegetab1e garden and
be ingested along with the vegetables or it may be deposited on pasture grass
where dairy cattle are grazing. Nhen the cow ingests the radioactive
material, some of it may be transferred to the milk and consumed by humans who
drink the milk. Therefore, samples of milk, vegetation, soil, and food crops
are collected and analyzed to determine the potential impacts from exposure to
this pathway. The results from the analysis of these samples are shown in
Tables H-4 through H-13.
A land use survey is conducted annually to locate milk producing animals and
gardens within a 5-mile radius of the plant. Only one dairy farm is located
in this area; however, one additional dairy farm has been identified within 7
miles of the plant. These two dairies are considered indicator stations and
routinely provide milk samples. No other milk-producing animals have been
identified within 3 miles of the plant. The results of the 1992 land use
survey are presented in Appendix G.
Sam le Collection and Anal sis
Milk samples are purchased every 2 weeks from two dairies within 7 miles of
the plant and from at least one of two control farms. These samples are
placed on ice for transport to the radioanalytical laboratory. A specific
analysis for I-131 and a gamma spectral analysis are performed on each sample
and Sr-89,90 analysis is performed every 4 weeks.
-22-

Iel
it
I
OlL
I
iL
Ii

Samples of vegetation are collected every 4 weeks for I-131 analysis. The
samples are collected from one farm which previously produced milk and from
rone control dairy farm. During this 1992 reporting period one additional
sample was collected from one control air monitor location. The samples are
i collected by cutting or breaking enough vegetation to provide between 100 and
200 grams of sample. Care is taken not to include any soil with the
vegetation. The sample is placed in a container with 1650 ml of 0.5 N NaOH
for transport back to the radioanalytical laboratory. A second sample of
between 750 and 1000 grams is also collected from'ach location. After drying
and grinding, this sample is analyzed by gamma spectroscopy. Once each
quarter, the sample is ashed after the gamma analysis is completed and
analyzed for Sr-89,90.
Soil samples are collected annually from the air monitoring locations. The
samples are collected with either a "cookie cutter" or an auger type sampler.
After drying and grinding, the sample is analyzed by gamma spectroscopy. Hhen
the gamma analysis is complete, the sample is ashed and analyzed for
Sr-89,90. Analyses for transuranic isotopes are also performed on samples
from the two monitoring stations with the second air samplers.
Samples representative of food crops raised in the area near the plant are
obtained from individual gardens, corner markets, or cooperatives. Types of
foods may vary from year to year as a result of changes in the local vegetable
gardens. In 1992 samples of cabbage, corn, green beans, potatoes, and
tomatoes were collected from local vegetable gardens. In addition, samples of
apples and beef were also obtained from the
arear'he
edible portion of each
sample is analyzed by gamma spectroscopy.
-23-

I
gl
IIIri
)I

Results
radioactivity which could be attributed to BFN was identified. All I-131
results were less than the established nominal LLD of 0.2 pCi/liter.
Strontium-90 was found in less than half of the samples. These levels are
consistent with concentrations measured in samples collected prior to plant
operation and with concentrations reported in milk as a result of fallout from
atmospheric nuclear weapons tests (Reference 1). Figure H-6 displays the
average Sr-90 concentrations measured in milk since 1968. The concentrations
have steadily decreased as a result of the 28-year half-life of Sr-90 and the
washout and transport of the element through the soil over the period. The
lopCi/liter while the concentration from control stations was approximately
2.5 pCi/liter. By far the predominant isotope reported in milk samples was
the naturally occurring K-40. An average of approximately 1300 pCi/liter of
K-40 was identified in all milk samples.
Similar results were reported for vegetation samples (Table H-5). All I-131
and Cs-137 values were less than the nominal LLD. Strontium-90 was not
identified in any samples. Again, the largest concentrations identified were
for the naturally occurring isotopes K-40 and Be-7.
The only fission or activation products identified in soil samples was
LCs-137. The maximum concentration of was approximately 0.9 pCi/g in a sample
from one of the control stations. These concentrations are consistent with
levels previously reported from fallout. All other radionuclides reported
were naturally occurring isotopes (Table H-6).
-24-

III
I
I
I

A plot of the annual average Cs-137 concentrations in soil is presented in
Figure H-7. Like the levels of Sr-90 in milk, concentrations of Cs-137 in
soil are steadily decreasing as a result of the cessation of weapons testing
in the atmosphere, the 30-year half-life of Cs-137 and transport through the
environment.
Analyses for transuranic isotopes (Am-241; Pu-238; Pu-239,240; Cm-242; and
Cm-244) in soil have been performed since 1989. The results have generally
agreed with the concentrations reported by the Electric Power Research
Institute (EPRI) in Reference 4. The EPRI report concludes that essentially
all of the radionuclides in soils from around the nuclear power plants
participating in the study (including BFN) were of fallout origin and that the
variations in concentrations were a function of soil texture, soil
permeability, and/or disturbances of the soil surface. The concentrations
measured in 1992 are included in Table H-6.
Only naturally occurring radioactivity was identified in food crops.
Cesium-137 at a concentration slightly above the lower limit of detection was
identified in one beef sample. As noted earlier, K-40 is one of the major
radionuclides found naturally in the environment and is the predominant
radioactive component in normal foods and human tissue. Analysis of these
samples indicated no contribution from plant activities. The results are
reported in Tables H-7 through H-13.
ii)~ -25-

pl
I

A UATIC MONITORING
Potential exposures from the liquid pathway can occur from drinking water,
ingestion of fish and clams, or from direct radiation exposure to radioactive
materials deposited in the river sediment. The aquatic monitoring program
includes the collection of samples of surface (river/reservoir) water,
groundwater, drinking water supplies, fish, Asiatic clams, and bottom
sediment. Samples from the reservoir are collected both upstream and
downstream from the plant.
Results from the analysis of aquatic samples are presented in Tables H-14
through H-21. Radioactivity levels in water, fish and clams were consistent
with background and/or fallout levels previously reported. The presence of
Co-60, Cs-134, and Cs-137 was identified in sediment samples; however, the
pro]ected exposure to the public from this medium is significantly less than
0.1 mrem/year.
Sam le Collection and Anal sis
Samples of surface water are collected from the Tennessee River using
automatic sampling pumps from two downstream stations and one upstream
station. A timer turns on the pump approximately once every hour. The line
is flushed and a sample collected into a collection container. A 1-gallon
sample is removed from the container every 4 weeks and the remaining water in
the jug is discarded. The 4-week composite sample is analyzed by gamma
spectroscopy and for gross beta activity. A quarterly composite sample is
analyzed for Sr-89,90 and tritium.
-26-

pl
III
Ol
II
iI
i

Samples are also collected by an automatic sampling pump at the firstdownstream drinking water intake. These samples are collected in the same
i manner as the surface water samples. These monthly samples are analyzed by
gamma spectroscopy and for gross beta activity. At other selected locations,
i grab samples are collected from drinking water systems which use the Tennessee
River as their source. These samples are analyzed every 4 weeks by gamma
spectroscopy and for gross beta activity. A quarterly composite sample from
each station is analyzed for Sr-89,90 and tritium. The sample collected by
the automatic pumping device is taken directly from the river at the intake
structure. Since the sample at this point is raw water, not water processed
through the water treatment plant, the control sample should also be
unprocessed water. Therefore, the upstream surface water sample is also
considered as a control sample for drinking water.
A groundwater well onsite is equipped with an automatic water sampler;
however, permanent power to this well was not available during 1992.
Temporary power has been made available to the sampler so that grab samples
could be taken each month. Water is also collected from a private well in an
area unaffected by BFN. Samples from the wells are collected every 4 weeks
and analyzed by gamma spectroscopy. A quarterly composite sample is analyzed
for Sr-89,90 and tritium.
Samples of commercial and game fish species are collected semiannually from
each of two reservoirs: the reservoir on which the plant is located (Wheeler
Reservoir) and the upstream reservoir (Guntersville Reservoir). The samples
are collected using a combination of netting techniques and electrofishing.
-27-

~
glL
~
@I
II
)~

Most of the fish are filleted, but one group is processed whole for analysis.
After drying and grinding, the samples are analyzed by gamma spectroscopy.
Bottom sediment is collected semiannually from selected Tennessee River Mile
(TRM) locations using a dredging apparatus or Scuba divers. The samples are
dried and ground and analyzed by gamma spectroscopy. After this analysis is
complete, the samples are ashed and analyzed for Sr-89,90.
Samples of Asiatic clams are collected from one location below the plant and
one location above the plant. The clams are usually collected in the dredging
or diving process with the sediment. Enough clams are collected to produce
r approximately 50 grams of wet flesh. The flesh is separated from the shells,
and the dried flesh samples are analyzed by gamma spectroscopy. Sufficient
I quantities of clams to provide a sample are becoming more and more difficult
to find.
Results
L
gO
All radioactivity in surface water samples was below the LLD except the gross
beta activity and naturally occurring isotopes. Strontium-89 was reported in
one sample from a control station. The apparent identification of Sr-89 is an
artifact of the calculational process and the low concentrations the
laboratory is attempting to detect. These results are consistent with
previously reported levels. A trend plot of the gross beta activity in
surface water samples from 1968 through 1992 is presented in Figure H-8. A
summary table of the results for this reporting period is shown in Table H-14.
-28-

For drinking water, average gross beta activity was 2.6 pCi/liter at the
downstream stations and 2.8 pCi/liter at the control stations. The results
are shown in Table H-15 and a trend plot of the gross beta activity in
drinking water from 1968 to the present is presented in Figure H-9.
Concentrations of fission and activation products in groundwater samples were
all below the LLDs. Only naturally occurring radon decay products (81-214 and
Pb-214) were identified in these samples. Results from the analysis of
groundwater samples are presented in Table H-16.
Cesium-137 was identified in two fish samples. The downstream sample had an
average concentration of 0.06 pCi/g while the concentration in the upstream
sample was 0.09 pCi/g. The only other radioisotope found in fish were
naturally occurring. Concentrations of K-40 ranged from 6.1 pCi/g to
16.9 pCi/g. The results are summarized in Tables H-'7, H-18, and H-19. Plots
of the annual average Cs-137 concentrations in fish are presented in Figures
H-10, H-ll, and H-12. Since the concentrations downstream are essentially
equivalent to the upstream levels, the Cs-137 activity is probably a result of
fallout or other upstream effluents rather than activities at BFN.
tr)0
Radionuclides of the types produced by nuclear power plant operations were
identified in sediment samples. The materials identified were Cs-137, Co-60
and Cs-134. The average levels of Cs-137 were 0.43 pCi/g in downstream
samples and 0.21 pCi/g upstream. The Cs-137 concentration at downstream
stations is approximately double the activity in upstream samples.
-29-
o'

A similar relationship was reported from these stations during the
preoperational phase of the monitoring at BFN, indicating that the levels
i reported herein are probably not the result of BFN operations. This
relationship is graphically represented in Figure H-13 which presents a plot
of the Cs-137 concentrations in sediment since 1968.
Cobalt-60 concentrations in downstream samples averaged 0.05 pCi/g, while
concentrations in upstream samples averaged 0.02 pCi/g. The maximum
concentration downstream was 0.07 pCi/g. Figure H-14 presents a graph of the
Co-60 concentrations measured in sediment since 1968.
Cesium-134 concentrations in upstream samples were all below the LLD. Levels
in two downstream samples averaged 0.02 pCi/g, with a maximum of 0.02 pCi/g.
The remaining samples showed no Cs-134 activity. A realistic assessment of
the impact to the general public from these radioisotopes produces a
negligible dose equivalent. Results from the analysis of sediment samples are
shown in Table H-20.
Only naturally occurring radioisotopes were identified in clam flesh samples.
The results are presented in Table H-21.
iO -30-

I
oi
I
iI
)L

ASSESSMENT AND EVALUATION
Potential doses to the public are estimated from measured effluents using
computer models. These models were developed by TVA and are based on
methodology provided by the NRC in Regulatory Guide 1.109 for determining the
potential dose to individuals and populations living in the vicinity of a
nuclear power plant. The doses calculated are a representation of the dose to
a "maximally exposed individual." Some of the factors used in these
calculations (such as ingestion rates) are maximum expected values which will
tend to overestimate the dose to this "hypothetical" person. In reality, the
expected dose to actual individuals is lower.
The area around the plant is analyzed to determine the pathways through which
the public may receive an exposure. As indicated in Figure 2, the two major
ways by which radioactivity is introduced into the environment are through
liquid and gaseous effluents.
For liquid effluents, the public can be exposed to radiation from three
sources: drinking water from the Tennessee river, eating fish caught in the
Tennessee River, and direct exposure to radioactive material due to activities
on the banks of the river (recreational activities). Data used to determine
these doses are based on guidance given by the NRC for maximum ingestion
rates, exposure times, and distribution of the material in the river.
Nhenever possible, data used in the dose calculation are based on specific
conditions for the BFN area.
-31-

iL
IL

For gaseous effluents, the public can be exposed to radiation from several
sources: direct radiation from the radioactivity in the air, direct radiation
from radioactivity deposited on the ground, inhalation of radioactivity in the
air, ingestion of vegetation which contains radioactivity deposited from the
atmosphere, and ingestion of milk or meat from animals which consumed
vegetation containing deposited radioactivity. The concentrations of
radioactivity in the air and the soil are estimated by computer models which
use the actual meteorological conditions to determine the distribution of the
effluents in the atmosphere. Again, as many of the parameters as possible are
based on actual site-specific data.
Results
The estimated doses to the maximally exposed individual due to radioactivity
released from BFN in 1992 are presented in Table 2. These estimates were made
using the concentrations of the liquids and gases measured at the effluent
monitoring points. Also shown are the ODCM limits for these doses and a
comparison between the calculated dose and the corresponding limit. The
maximum calculated whole body dose equivalent from measured liquid effluents
as presented in Table 2 is 0.13 mrem/year, or 4.3 percent of the limit. The
maximum organ dose equivalent from gaseous effluents is 0.13 mrem/year. This
represents 0.87 percent of the ODCM limit. A more complete description of the
effluents released from BFN and the corresponding doses projected from these
effluents can be found in the BFN "Semiannual Radioactive Effluent Release
Reports."
IAs stated earlier in the report, the estimated increase in radiation dose
-32-

yl
L
li~
L
)I
lt equivalent to the general public resulting from the operation of BFN,is
1 undetectably small when compared to the dose from natural background radiation.
The results from each environmental sample are compared with the
concentrations from the corresponding control stations and appropriate
preoperational and background data to determine influences from the plant.
During this report period, Co-60, Cs-134 and Cs-137 were seen in aquatic
media. The distribution of Cs-137 in sediment is consistent with fallout
levels identified in samples both upstream and downstream from the plant
during the preoperational phase of the monitoring program. Co-60 and Cs-134
were identified in sediment samples downstream from the plant in
concentrations which would produce no measurable increase in the dose to the
general public. No increases of radioactivity have been seen in water samples.
Dose estimates were made from concentrations of radioactivity found in samples
of environmental media. Media evaluated include, but are not limited to, air,
milk, food products, drinking water, and fish. Inhalation and ingestion doses
estimated for persons at the indicator locations were essentially identical to
those determined for persons at control stations. More than 95 percent of
those doses were contributed by the naturally occurring radionuclide K-40 and
by Sr-90 and Cs-137, which are long-lived radioisotopes found in fallout from
nuclear weapons testing. Concentrations of Sr-90 and Cs-137 are consistent
with levels measured in TVA's preoperational environmental radiological
monitoring programs.
-33-
~l
i~
~
Si
L
)L

Conclusions
It is concluded from the above analysis of the environmental sampling results
and from the trend plots presented in appendix H that the exposure to members
of the general public which may have been attributable to BFN is negligible.
The radioactivity reported herein is primarily the result of fallout or
natural background radiation, Any activity which may be present as a result
of plant operations does not represent a significant contribution to the
exposure of members of the public.
gO -34-

OL

iyREFERENCES
Merril Eisenbud, Environmental Radioactivit, Academic Press, Inc., New
York, NY, 1987.
2. National Council on Radiation Protection and Measurements, Report No. 93,"Ionizing Radiation Exposure of the Population of the United States,"September 1987.
3. United States Nuclear Regulatory Comm)ssion, Regulatory Guide 8.29,"Instruction Concerning Risks From Occupational Radiation Exposure," July1981.
4. Electric Power Research Institute, Report No. EPRI EA-2045, Project 1059,"Transuranium and Other Long-Lived Radionuclides in the TerrestrialEnvirons of Nuclear Power Plants," September 1981.
i0 -35-

gll
~
~l
L
i)

Table 1
HAXIHUH PERHISSIBLE CONCENTRATIONS
FOR NONOCCUPATIONAL EXPOSURE
Iy
Gross beta
H-3
Cs-137
Ru-103,106
Ce-144
2r-95 — Nb-95
Ba-140 — La-140
I-131
Zn-65
Hn-54
Co-60
Sr-89
Sr-90
Cr-51
Cs-134
Co-58
In Water~C1 /1*
3,000
3,000,000
20,000
10,000
10,000
60,000
20,000
300
100,000
100,000
30,000
3,000
300
2,000,000
9,000
90,000
HPCIn AirgC3 /m'*
100
200,000
500
200
100
1,000
1,000
100
2,000
1,000
300
300
30
80,000
400
2,000
*1 pCi = 3.7 x 10 'q.Source: 10 CFR, Part 20, Appendix B, Table II.
i0 -36-

goal~

Table 2
Maximum Dose due to Radioactive Effluent ReleasesBrowns Ferry Nuclear Plant
1992mrem/year
Li uid Effluents
1992Dose
Total Body 0.13
Any Organ 0.19
NRC
Limit
10
Percent ofNRC Limit
4.3
1.9
EPALimit
25
25
Percent ofEPA Limit
0.5
0.76
lyNoble Gas(Gamma)
Noble Gas(Beta)
Any Organ
1992Dose
0.024
0.014
0. 13
NRC
Limit
10
20
15
Gaseous Effluents
Percent ofNRC Limit
0.24
0.07
0. 87
EPALimit
25
25
25
Percent ofEPA Limit
0.10
0.06
0.52
-37-

gl

GO+ERG GREENR
NE MRS G
sw a
~ 4 J'
I A 8 A M~A
I
M I S S - WATTS BAR tIUCLEAR PLANT~ -SEOUOYAH NUCLEAR PLANTJEH - BELLEFONTE NUCLEAR PI.ANT9@[ BRO'4NS FERRY tIUCLEAR PLANT
GEQRG I A
LOLRSVR.LE
',j 1.; TENNESSEE VALLEY REGION i(TVA NUCLEAR PLANT SITES) i, ~ y
K E N T U C K Y
M'g R>OVCRH rI' ~ v'
Q I')
ERGRi(
.5' / )('t
NL Hgfg
/ OAR ROGEp tN .PC AR
rI /JACxrrONi I WSN
PI )I \ I/r
SOH J..JR- —--—../I C-,( -„,.
l~
SLN ~ / g~ t+HVNfGytLLEi ~
NVSCLE™ lg /
LEGEgp


Figure 2
ENVIRONMENTALEXPOSURE PATHWAYS OF MANDUE TO RELEASES OF RADIOACTIVE MATERIALTO THE ATMOSPHERE AND LAKE.
\
S,: 'I '.; ~,'..... ~
Diluted By Atmosphere
~ ~ ~
Airborne Releases
Plume Exposure
lyLiquid ReleasesDiluted By Lake
MAN
Animals(Milk,Meat)
ConsumedBy Animals
Consumed By Man
ShorelineExposure
DrinkingWater
rII J
~'
Fish
IOVegetationUptake From Soil
-39-

l

APPENDIX A
ENVIRONMENTAL RADIOLOGICAL MONITORING PROGRAM AND
SAMPLING LOCATIONS
40

lti
gl

~ ~Table A-1
BROMNS FERRY NUCLEAR PLANTEnvironmental Radiological Honitoring
Program'xposure
Pathway Number of Samples and Sampling and Type and Frequency
AIRBORNE
Particulates
Radioiodine
Rainwater
Six samples from 1 ocati ons(in different sectors) at ornear boundary site (LH-l, LH-2LH-3, LH-4, LH-6, and LH-7)
Two samples from controllocations greater thanIO miles from the plant(RH-1 and RH-6)
Three samples from locationsin communities approximately10 miles from the plantPH-l, PH-2, and PH-3)
Same locations as airparticulates
Same location as airparticulate
Continuous sampler operationwith sample co'llection asrequired by dust loading butat least once per 7 days
Continuous sampler operationwith charcoal canistercollection at least onceper 7 days
Composite sample at leastonce per 31 days
Parti cul ate sampler.Analyze for gross betaradioactivity greater thanor equal to 24 hoursfol')owing filter change.Perform gaaea isotopicanalysis on each samplewhen gross beta activityis greater than 10 timesthe average of controlsamples. Perform gammaisotopic analysis oncomposite (by location)sample at least once per31 days.
I-131 every 7 days
Analyzed for gamma nuclidesonly if radioactivity in othermedia indicates the presence ofincreased levels of fallout

yltt
I
I
II

Table A-1
BROWNS FERRY NUCLEAR PLANTEnvironmental Radiological Honitoring Program~
Exposure Pathway Number of Samples and Sampling and Type and Frequency
Soil
Direct
Samples from same locationsas air particulates
Two or more dosimeters placedat locations (in differentsectors) at or near the siteboundary in each of the 16sectors
Two or more dosimeters placedat stations located approximately5 miles from the plantin each of the 16 sectors
Once every year
At least once per 92 days
At least once per 92 days
Gamma scan, Sr-89, Sr-90 onceper year
Gamma dose once per 92 days
Gamma dose once per 92 days
WATERBORNE
Surface Water
Drinking Water
Two or more dosimeters in atleast 8 additional locationsof special interest
One sample upstream (TRH 305.0)One sample immediately down-stream of discharge (TRH 293.5)One sample downstream fromplant (TRH 285.2)
One sample at the firstpotable surface ~atersupply downstream from theplant (TRH 282.6)
Collected by automaticsequential-type samplerwith composite sample takenat least once per 7
days'ollected
by automaticsequential-type samplerwith composite sample takenat least once per 31 days
Gross beta and ganja scan on4-week composite. Compositefor Sr-89, Sr-90, and tritiumat least once per 92 days
Gross beta and gamma scan on4-week composite. Compositefor Sr-89, Sr-90, and tritiumat least once per 92 days

yl
tL
)L
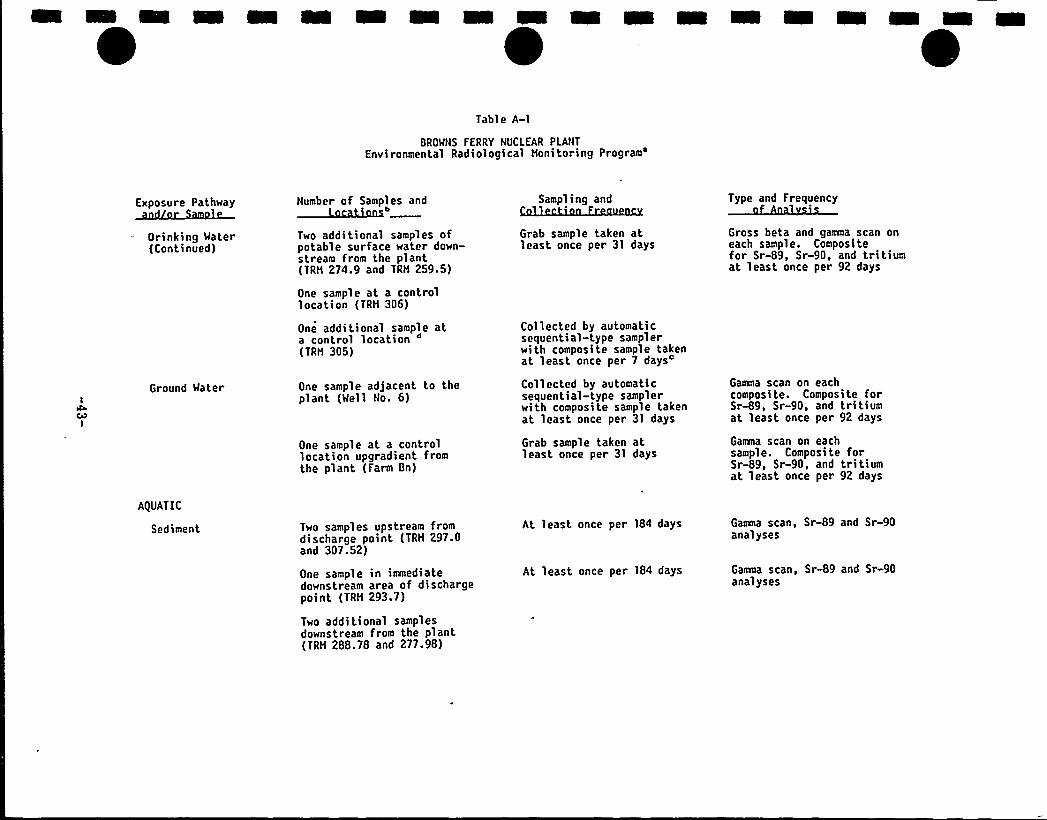
Table A-1
BROWNS FERRY NUCLEAR PLANTEnvironmental Radiological Honitoring
Program'xposure
Path~ay Number of Samples and Sampling and Type and Frequency
Drinking Water(Continued)
Two additional samples ofpotable surface water down-stream from the plant(TRH 274.9 and TRH 259.5)
Grab sample taken atleast once per 31 days
Gross beta and gamma scan oneach sample. Compositefor Sr-89, Sr-90, and tritiumat least once per 92 days
Ground Water
One sample at a controllocation (TRH 306)
One additional sample ata control location 4
(TRH 305)
One sample adjacent to theplant (Well No. 6)
One sample at a controllocation upgradient fromthe plant (Farm Bn)
Collected by automaticsequential-type samplerwith composite sample takenat least once per 7 days
Collected by automaticsequential-type samplerwith composite sample takenat least once per 31 days
Grab sample taken atleast once per 31 days
Ganja scan on eachcomposite. Composite forSr-89, Sr-90, and tritiumat least once per 92 days
Gamma scan on eachsample. Composite forSr-89, Sr-90, and tritiumat least once per 92 days
A(VATIC
Sediment Two samples upstream fromdischarge point (TRH 297.0and 307.52)
One sample in immediatedownstream area of dischargepoint (TRH 293.7)
Two additional samplesdownstream from the plant(TRH 288.78 and 277.98)
At least once per 184 days
At least once per 184 days
Gamma scan, Sr-89 and Sr-90analyses
Galena scan, Sr-89 and Sr-90analyses

I
Ol
IItL
I

~ ~Table A-1
BROGANS FERRY NUCLEAR PLANTEnvironmental Radiological monitoring
Program'xposure
Pathway Number of Samples and Sampling and Type and Frequency
INGESTION
Hi 1 k
Fish
Clams
At least 2 samples fromdairy farms in the immediatevicinity of the plant (Farms8 and Bn)
At least one sample fromcontrol location (Farm Beand/or GL)
Three samples representingcommercial and game speciesin Gunter'sville Reservoirabove the plant
Three samples representingcommercial and game speciesin Hheeler Reservoir near theplant.
One sample downstream fromthe discharge
At least once per 15 dayswhen animals are on pasture;at least once per 31 daysat other times
At least once per 184 days
At least once per 184 days
Gamma scan and I-131 on eachsample. Sr-89 and Sr-90 at leastonce per 31 days
Gamma scan at leastonce per 184 days onedible portions
Gamma scan on flesh only
One sample upstream fromthe plant
(No permanent stations established;depends on location of clams)

gl
rI
Og

Table A-l
BROWNS FERRY NUCLEAR PLANTEnvironmental Radiological monitoring
Program'xposure
Pathway Number of Samples and Sampling and Type and Frequency
Fruits and Vegetables
Vegetation
Samples of food crops such ascorn, green beans'omatoes,and potatoes grown at privategardens and/or farms in theimmediate vicinity of theplant
One sample of each of thesame foods grown at greaterthan 10 miles distance fromthe plant
Samples from farmsproducing milk but notproviding a milk sample(Farm T)
Control samples from onecontrol dairy (Farm GL)
At least once per year attime of harvest
Once per 31 days
Gaama scan on edible portion
I-131, gamma scan once per 31days
a ~
b.
c ~
d.
The sampling program outlined in this table is that which was in effect at the end of 1992.Sampling locations, sector and distance from plant, are described in Table A-2 and A-3 and shown inFigures A-l, A'-2, and A-3.Composite samples shall be collected by collecting an aliquot at intervals not exceeding 2 hours.The surface water control sample shall be considered a control for the drinking water sample.

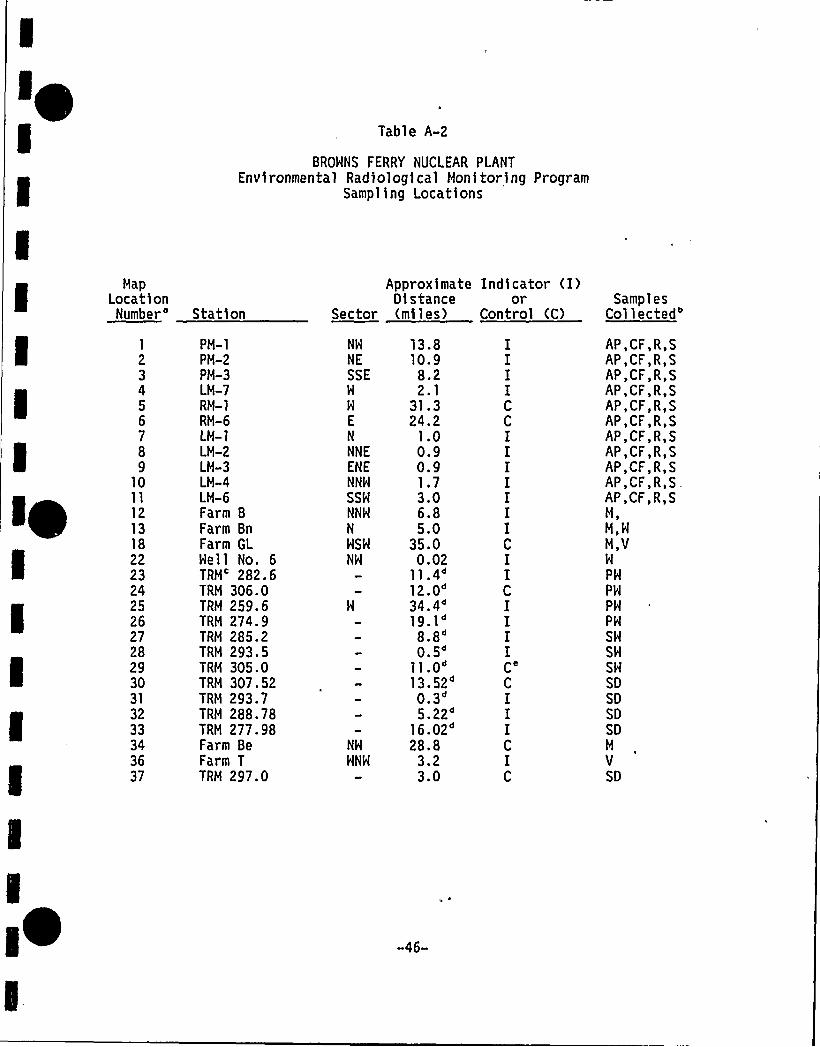
Table A-2
BROWNS FERRY NUCLEAR PLANTEnvironmental Radiological Monitoring Program
Sampling Locations
MapLocationNumber'tation
Approximate Indicator (I)Distance or
Sector (miles) Control (C)Samples
Collected'
23456789
10ll12131822232425262728293031
3233343637
PH-1PM-2PH-3LH-7RM-1RM-6LM-1LM-2LM-3LM-4LM-6Farm 8Farm BnFarm GLWell No. 6TRH'82.6TRH 306.0TRH 259.6TRH 274.9TRH 285.2TRM 293.5TRH 305.0TRH 307.52TRH 293,7TRM 288.78TRH 277.98Farm BeFarm TTRH 297.0
NW
NE
SSEW
W
E
N
NNE
ENENNW
SSW
NNW
N
WSW
NW
NW
WNW
13.810.98.22.1
31.324.2
'1 .00.90.91.73.06.85.0
35.00.02
11.412.0'4
4~
19.1'.s'.5'1.0'3.52',3'.22'6.O2'8.8
3.23.0
IIIICC
IIIIIIIC
IICIIIIC'
IIIC
IC
AP,CF,R,SAP,CF,R,SAP,CF,R,SAP,CF,R,SAP,CF,R,SAP,CF,R,SAP,CF,R,SAP,CF,R,SAP,CF,R,SAP,CF,R,S.AP,CF,R,SH,M,WH,VW
PW
PW
PW
PW
SW
SW
SW
SD
SDSD
SD
H
VSD
IO -46-

I
ol
tL
L
I
II
I

Table A-2
BROHNS FERRY NUCLEAR PLANTEnvironmental Radiological. Monitoring Program
Sampling Locations(Continued)
MapLocationNumber'tation
Approximate Indicator (I)Distance or
Sector (miles) Control (C)Samples
Collected'heeler
Reservoir'TRH
275-349)Guntersville
Reservoir'RM
(349-424)
F,CL
a. See figures A-l, A-2, and A-3.b. Sample Codes:
AP Air particulate filterCF Charcoal filter (Iodine)CL ClamsF FishH MilkPH Public drinking water
c. TRM Tennessee River Miled. Hiles from plant discharge (TRH 294).e. Also used as a control for public water.
R RainwaterS SoilSD = SedimentSN - Surface waterV VegetationN Nell water
-47-

Ilii
<

Table A-3
BROHNS FERRY NUCLEAR PLANTThermoluminescent Dosimeter (TLD) Locations
MapLocation
Number'
2356789
103839404142434445464748495051
52535455565758596061
626364656667
Station
NH-3NE-3SSE-2W-3E-3N-1NNE-1ENE-1NNW-2N-2NNE-2NNE-3NE-1NE-2ENE-2E-1E-2ESE-1ESE-2SE-1SE-2SSE-1S-lS-2SSH-1SSH-2SH-1SH-2SH-3HSW-1HSW-2WSH-3H-1H-2H-4HNH-1WNH-2NW-1NH-2
Sector
NH
NE
SSEH
E
N
NNE
ENENNH
N
NNE
NNE
NE
NE
ENE
E
E
ESE
ESE
SE
SESSES
S
SSHSSHSHSH
SW
WSW
HSHHSH
H
H
WNH
HNH
NW
NH
ApproximateDistance(miles)
13.810.98.2
31.324.20.970.880.921.75.00.75.20.85.06.20.85.20.93 '0.55.45.13.14.83.04.41.94.76.02.75.1
10.51.94.7
32.13.34.42.25.3
Onsite(On)'r
Offsite (Off)
OffOffOffOffOffOnOnOnOnOffOnOffOnOffOffOnOffOnOffOnOffOffOffOffOffOffOnOffOffOffOffOffOnOffOffOffOffOffOff
-48-

yl
~
)

Ly
iHap
LocationNumber'8
69
Station
NNH-1NNH-3
Sector
NNH
NNH
ApproximateDistance(miles)
1.05.2
Onsite(On)'r
Offsite (Off)
OnOff
Table A-3
BROHNS FERRY NUCLEAR PLANTThermoluminescent Dosimeter (TLD) Locations
(Continued)
a. See figures A-l, A-2, and A-3.b. TLDs designated onsi te are those located 2 miles or less from the plant.
TLDs designated offsite are those located more than 2 miles from the plant.
I~ -49-

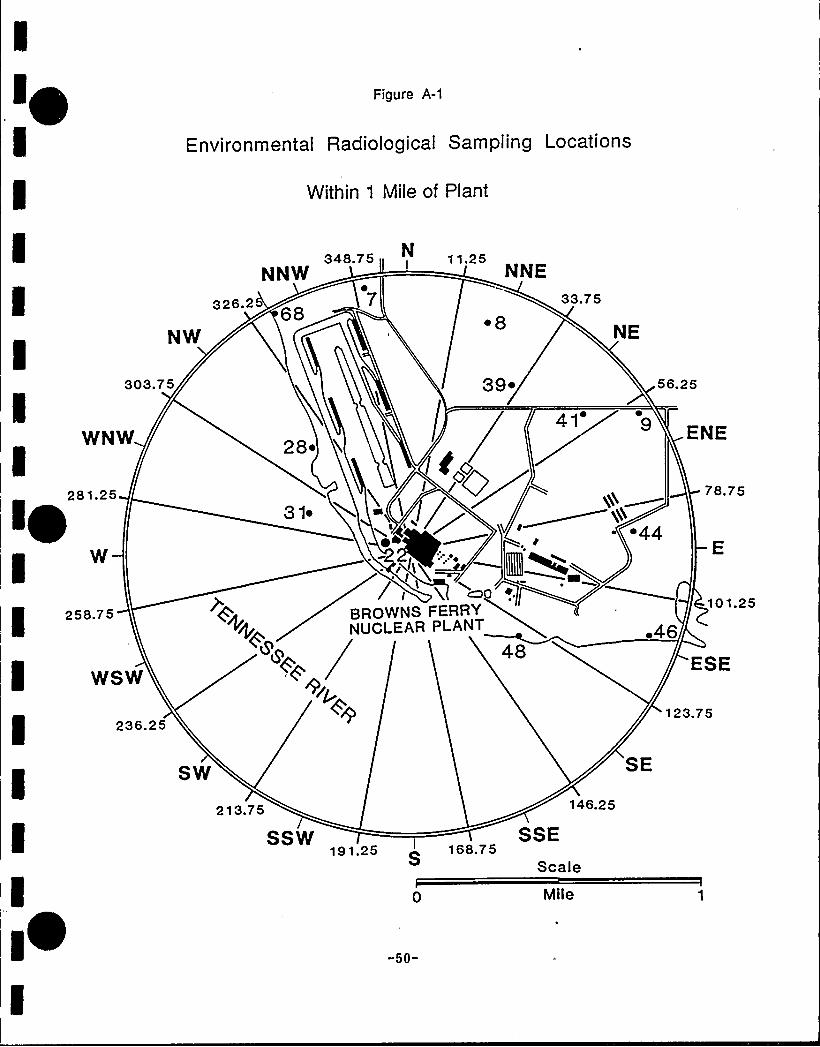
Ig Figure A-1
Environmental Radiological Sampling Locations
Within 1 Mile of Plant
326.2
348.75 1 1.25
7
NNE33.75
~ 8 NE
303.75
WNW 28
39
41'
56.25
ENE
IyI w
WSW
oQ/
IIIIIII
'8
/ H<x ~o ~.]
BROWNS FERRYNUCLEAR PLANT
44
~46
78. 75
10 1.25
ESE
236.25123.75
I
SW
213.75
SSW
146.25
SSE
Mile
-50-
191.25 168.75Scale
SE
I
II
iOl
II
ti
OiI
Iyti
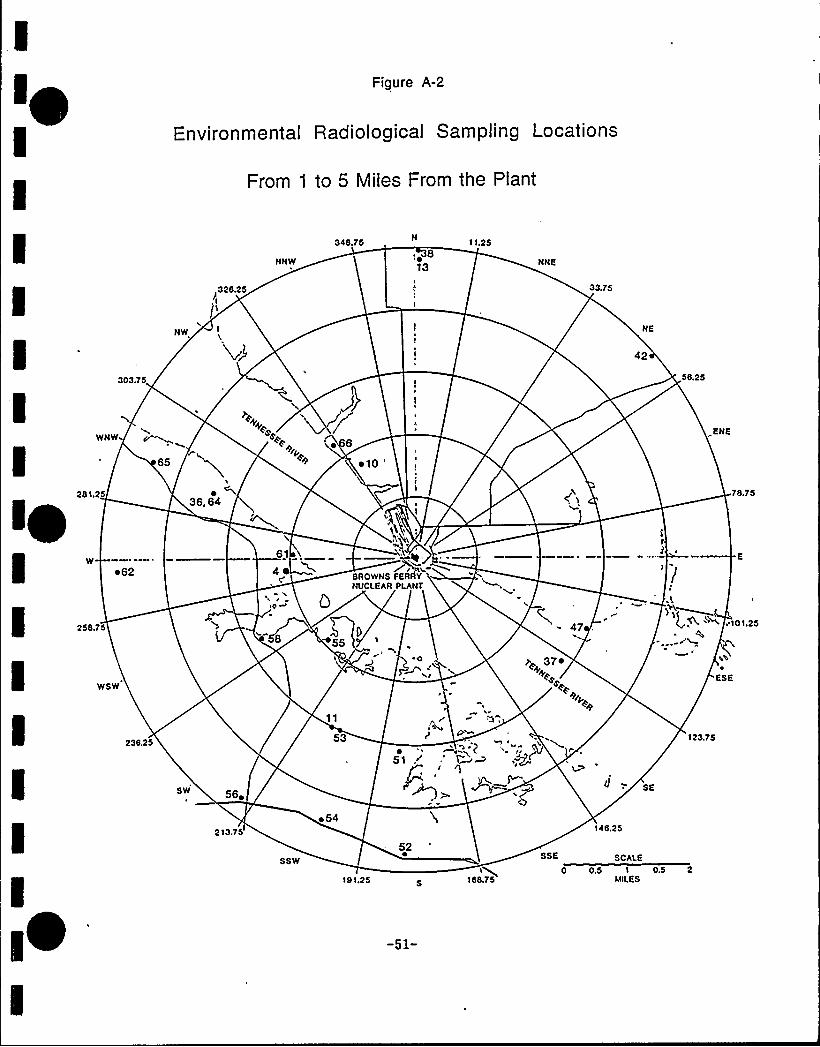
Figure A-2
Environmental Radiological Sampling Locations
From 1 to 5 Miles From the Plant
326.25
NW
NNW
348.75
; ~ 613
1 1.25
NNE
33.75
NE
303 75
42
56.25
WNW
65
~ 6
~ 10
'NE281.25
36, 6478.75
W-~ 62
61
BROWNS FERI1YNUCLEAR PLANt
258.75 101.25
WSW
76. 37 ~+~
/g,
ESE
236.25 53 123.75
Sw'6 SE
213.75
SSW
~ 54
19L25
52
168.75
SSE
146.25
SCALE
0.5 1 0.5 2MILES
-51-

I
II
I
L
l(
I
Iytt
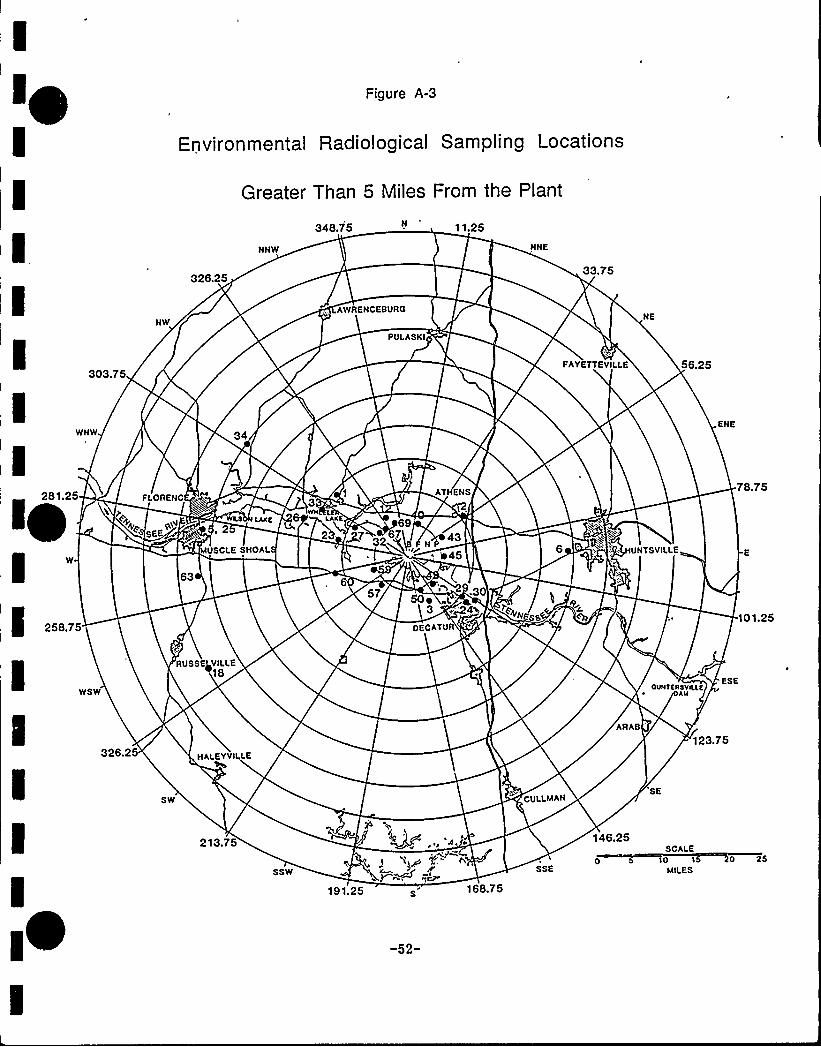
Figure A-3
Environmental Radiological Sampling Locations
Greater Than 5 Miles From the Plant
NNW
348.75 11.25
NNE
326.2533.75
NWAW ENCEBURO
PULASKI
NE
303.75FAYETTEVILLE 56.25
ilyI
WNW
P
hgS
BLVE
63
FLORENC
34
I 2LAKE
U CLE SHOAL
1
3WH
LAKE 692 7 7$
ATHENS
43
)i45
Pgy
U NTSVILL
ENE
78.75
258.75
57 I l 3500 eL
3
OECATUR
+" ssC
101.25
WSW
RUSSE VILLE18
ESEOUNIEAEVKLE
AN
326.2 HALEYVILLE
ARAB
123.75
SW CULLMANSE
213.75
SSW
191.25 168.75
SSE
146.25SCALE
0 10 1 0 25MILES
-52-

II
Ot
tt
Ii
I

APPENDIX 8
1992 PROGRAM MODIFICATIONS
-53-

I
Ol
I
I

APPENDIX 8
Environmental Radiolo ical Monitorin Pro ram Modifications
t During 1992, only slight modifications were made in the environmental
monitoring program. Gross beta analyses of food samples were discontinued
because they are of little use in the evaluation of plant impacts and they
require extensive sample preparation. The location from which the well water
control sample is collected was changed to an operating dairy farm. In order
to more efficiently analyze charcoal cartridges and to permit the detection of
all gamma-emitting radionuclides, a germanium spectroscopy system is now used
for these samples rather than a single channel analyzer designed to detect
only I-131. Strontium analyses have been discontinued for all air filtercomposites except those analyzed for transuranic isotopes.
The following table lists the changes in the monitoring program in 1992.

gl
L
I)

Table B-1
Environmental Radiolo ical Monitorin Pro ram Modifications
Date Station Location Remarks
1/1/92 Air All exceptSampling LM-1 andStations LM-6
Strontium analysis of air filtercomposites was discontinued for allmonitoring stations except thosefrom which samples are analyzed fortransuranics.
1/1/92 Farm L 5.9 miles ENE Milk sampling was discontinued fromthis farm in October 1990 when itwent out of the dairy business. Atthe end of 1991, well water samplingwas also discontinued at this farm.
1/24/92
6/1/92
Farm Bn 5.0 miles N
Food Sample AllLocations
Well water sampling was initiated atthis farm to provide a controlsample for the onsite well.
Gross beta analysis of food sampleswas discontinued.
9/14/92 AirSamplingStations
All Effective September 14, 1992,charcoal cartridges were counted forI-131 activity by germaniumspectroscopy rather than by a NaIdetector set up as a single channelanalyzer.
-55-
I
IOl
I'
ii
OLI

APPENDIX C
PROGRAM DEVIATIONS
-56-

yl
~
)

IyAppendix C
Pro ram Deviations
During 1992, a small number of samples were not collected. Those occurrences
resulted in deviations from the scheduled program but not from the minimum
program required in the Offsite Dose Calculation Manual. Table C-1 lists
these occurrences. A general description follows.
Permanent electrical power to the automatic well water sampler was out of
service for the entire year. Because of the location of the well, a design
change is required before power to the sampler can be restored. A Design
Change Request has been issued to restore power to the well sampler. In the
l meantime, temporary power permits the collection of monthly grab samples from
the well.
One public water sample was not collected because of the malfunction of the
pump motor. The pump motor was repaired and the remaining samples collected
as scheduled.
Two sets of air particulate and charcoal filter samples were missed when the
sampling systems malfunctioned. The systems were repaired during the same
week.
-57-

I
~l~

Table C-1
Environmental Radiolo ical Monitorin Pro ram Deviations
Date
12/30/91
Station
LM-6 BF
Location
3.0 miles SSH
Remarks
Air particulate filter andcharcoal filter samples were notcollected as a result of themalfunction of the samplingsystem. The system was repairedand subsequent samples collected.
1/24/92 Hell 6— 12/23/92
Onsite Permanent power to the automaticwell sampler was out of servicefor the whole year.Consequently, no well watersamples were taken by automaticsampler from the indicator well.Grab samples were taken monthlyduring 1992.
1/21/92 Champion'Paper Co.
11.4 milesdownstream
Public water sample not collectedas a result of samplermalfunction. The sampler wasrepaired and subsequent samplescollected.
8/3/92 PM-1 BF 13.8 miles NH Air particulate filter andcharcoal filter samples were notcollected as a result of themalfunction of the samplingsystem. The system was repairedand subsequent samples collected.

I
III
I

APPENDIX 0
ANALYTICALPROCEDURES
-59-

~l
L
Ig

APPENDIX D
Anal tical Procedures
Analyses of environmental samples are performed by the radioanalytical
laboratory located at the Hestern Area Radiological Laboratory facility in
Muscle Shoals. All analysis procedures are based on accepted methods. A
summary of the analysis techniques and methodology follows.
The gross beta measurements are made with an automatic low background counting
system. Normal counting times are 50 minutes. Water samples are prepared by
evaporating 500 ml of samples to near dryness, transferring to a stainless
steel planchet and completing the evaporation process. For solid samples, a
specified amount of the sample is packed into a deep stainless steel
planchet. Air particulate filters are counted directly in a shallow planchet.
The specific analysis of I-131 in milk, water, or vegetation samples is
performed by first isolating and purifying the iodine by radiochemical
separation and then counting the final precipitate on a beta-gamma coincidence
counting system. The normal count time is 100 minutes. With the beta-gamma
coincidence counting system, background counts are virtually eliminated and
extremely low levels of detection can be obtained.
After a radiochemical separation, samples analyzed for Sr-89,90 are counted on
a low background beta counting system. The sample is counted a second time
after a 7-day ingrowth period. From the two counts the Sr-89 and Sr-.90
concentrations can be determined.
-60-

Il)
I

Water samples are analyzed for tritium content by first distilling a portion
of the sample and then counting by liquid scintillation. A commercially
available scintillation cocktail is used.
Gamma analyses are performed in various counting geometries depending on the
sample type and volume.'ll gamma counts are obtained with germanium type
detectors interfaced with a computer based mutlichannel analyzer system.
Spectral data reduction is performed by the computer program HYPERMET.
The charcoal cartridges used to sample gaseous radioiodine were analyzed with
well-type NaI detectors interfaced with a single channel analyzer until
September ll, 1992. The system is calibrated to measure I-131. After that
date, all charcoal cartridges have been analyzed by gamma spectroscopy using a
All of the necessary efficiency values, weight-efficiency curves, and geometry
tables are established and maintained on each detector and counting system. A
series of daily and periodic quality control checks are performed to monitor
counting instrumentation. System logbooks and control charts are used to
document the results of the quality control checks.
The analysis of transuranic isotopes in soil and air filters is performed by
leaching the sample with acid and then separating the isotopes of interest
from the acid leach by an ion exchange technique. The ion exchange technique
separates the samples into two fractions, one containing plutonium and the
other containing both americium and curium. The Pu fraction and the Am/Cm
fractions are electroplated onto separate stainless steel discs, and counted
for 1200 minutes on an alpha spectrometer employing a surface barrier detector.
-61-

~
y,liiI
@IiL
t~
I)
i

APPENDIX E
NOMINAL LONER LIMITS OF DETECTION (LLD)
-62-

I

Appendix E
Nominal Lower Limits of Detection
Sensitive radiation detection devices can give a signal or reading even when
no radioactivity is present in a sample being analyzed. This signal may come
from trace amounts of radioactivity in the components of the device, from
cosmic rays, from naturally occurring radon gas, or from electronic noise.
Thus, there is always some sort of signal on these sensitive devices. The
signal registered when no activity is present in the sample is called the
background.
The point at which the signal is determined to represent radioactivity in the
sample is called the critical level. This point is based on statistical
analysis of the background readings from any particular device. However, any
sample measured over and over in the same device will give different readings,
some higher than others. The sample should have a well-defined average
reading, but any individual reading will vary from that average. In order to
determine the activity present in a sample that will produce a reading above
the critical level, additional statistical analysis of the background readings
is requ/red. The hypothetical activity calculated from this analysis is
called the lower limit of detection (LLD). A listing of typical LLD values
that a laboratory publishes is a guide to the sensitivity of the analytical
measurements performed by the laboratory.
aEvery time an activity is calculated from a sample, the background must be
subtracted from the sample signal. For the very low levels encountered in
-63-

II
I
II
II

environmental monitoring, the sample signals are often very close to the
background. The measuring equipment is being used at the limit of its
capability. For a sample with no measurable activity, which often happens,
about half the time its signal should fall below the average machine
background and half the time it should be above the background. If a signal
above the background is present, the calculated activity is compared to the
calculated LLD to determine if there is really activity present or if the
number is an artifact of the way radioactivity is measured.
A number of factors influence the LLD, including sample size, count time,
counting efficiency, chemical processes, radioactive decay factors, and
interfering isotopes encountered in the sample. The most likely values for
these factors have been evaluated for the various analyses performed in the
environmental monitoring program. The nominal LLDs calculated from these
values, in accordance with the methodology prescribed in the ODCH, are
presented in table E-1. The maximum values for the lower limits of detection
specified in the ODCH are shown in table E-2.
The LLDs are also presented in the data tables. For analyses for which LLDs
have not been established, an LLD of zero is assumed in determining if a
measured activity is greater than the LLD.
-64-

yliI
I
ii
it

Table E-1
Nominal LLD ValuesA. Radiochemical Procedures
Gross BetaTritiumIodine-131Strontium-89Strontium-90
Air FiltersLuQlm*l
0.002
0.00060.0003
CharcoalFiltersLuCilm~i
.020'aterCuCilLl
1.7250
1.03.01.4
Hi 1kLIKilll
0.22.52.0
Fish FleshCuQLastul
0.30.04
Mhole FishMiLaslul
0.70.09
SedimentFood Crops and SoilLuCill~u~ tuQ~Iul
1.00.3
Gross BetaIodine-131Strontium-89Strontium-90
Wet Vegetation
414060
Clam FleshLIKiLa~
0.2
HeatLuGiQ~~
15
The LLD for I-131 in charcoal filters analyzed by germanium spectroscopy is 0.03 PCi/m~.

@I
I

Table E-I
Nominal LLD ValuesB. Galena Analyses (Geti)
AirParticulates~KUm3
Haterand Milk~LL
Vegetationand GrainaUl~c
HetVegetationaCiLl~ai,
Soil and Foods TomatoesSediment Fish Clam Flesh Potatoes, etc.
Meat andPoultry
Rhlh~X
Ce-141Ce-144Cr-51T-131Ru-103Ru-106Cs-134Cs-137Zr-95Nb-95Co-58Mn-54Zn-65Co-60K-40Ba-140La-140Fe-59Be-7Pb-212Pb-214Bi-214Bi-212Tl-208Ra-224Ra-226Ac-228Pa-234m
.005.01.02
.005
.005.02
.005
.005
.005
.005
.005
.005
.005
.005,Q4.01
.005
.005.02
.005
.005
.005
.001
.014
10334510
540
55
10555
105
I 5025
85
4520202053
7
25700
.07
.25
.45
.09
.05
.48
.07
.06
.11
.06
.05
.05
.11
.071.00
.23
.11
.10
.50
.10
.20
.12
.40
.03
.10
28100180
3620
1902824442420204428
40092444Q
2004080484026
80
.02
.06
.10
.02
.01
.09
.01
.01
.02
.01
.01
.01
.01
.01
.20
.05
.02
.01
.10
.02
.02
.04
.25
.02
.30
.05
.103.00
.07
.25~ 45.09.05.48.07.06.11.06.05.05.11.07
1.00.23.11.10.50.10.20.12.40.03
.10
.15
.50
.94
.18
.11
.95~ ll.10.19.11.10.10.21.11
2.00.47.17.13.90.25.25.25
.35
1.00
10334510
540
55
10555
105
15025
85
4520202053
7
22
2550902015951515251515152515
.300502015
100404040
22

y,lii
gl
1
i)
i
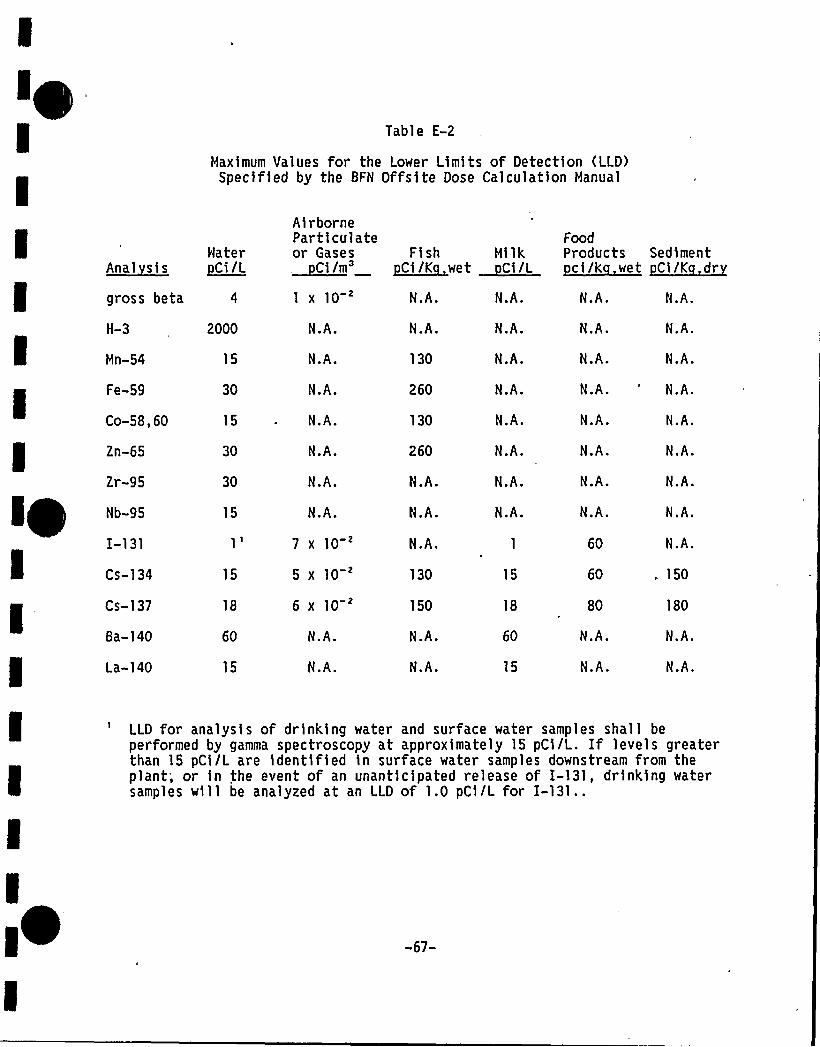
Table E-2
Maximum Values for the Lower Limits of Detection (LLD)Specified by the BFN Offsite Dose Calculation Manual-
HaterA~nal eie AC>/L
AirborneParticulateor Gases Fish Milk.~C1/w'C1 /K wet ~C1 /k
FoodProducts Sediment~ci/k wet ~C1/K dr
Nb-95
I-131
Cs-134
Cs-137
Ba-'l40
La-140
15
15
18
60
15
gross beta 4
H-3 2000
Mn-54 15
Fe-59 30
Co-58,60 15
2n-65 30
Zr-95 30
1 x10~
N.A.
N.A.
N.A.
N.A.
N.A.
N.A.
N.A.
7x10'x 10
'x]0~
N.A.
N.A.
N.A.
130
260
130
260
N.A.
NBA.
N.A.
130
150
N.A.
N.A.
N.A.
N.A.
N.A.
N.A.
N.A.
N.A.
N.A.
N.A.
15
18
60
15
N.A.
N.A.
N.A.
N.A.
N.A.
N.A.
N.A.
N.AD
60
60
80
N.A.
N.A.
N.A.
N.A.
N.A.
N.A.
N.A.
N.A.
N.A.
N.A.
N.A.
. 150
180
N.A.
N.A.
LLD for analysis of drinking water and surface water samples shall beperformed by gamma spectroscopy at approximately 1S pCi/L. If levels greaterthan 1S pCi/L are identified in surface water samples downstream from theplant; or in the event of an unanticipated release of I-131, drinking watersamples will be analyzed at an LLD of 1.0 pCi/L for I-131..

glll
I

APPENDIX F
QUALITY ASSURANCE/QUALITY CONTROL PROGRAM
-68-

I
iI
iI
I

Ig Appendix F
ual i t Assurance/ ual it Control Pro ram
A thorough quality assurance program is employed by the laboratory to ensure
that the environmental monitoring data are reliable. This program includes
the use of written, approved procedures in performing the work, a
nonconformance and corrective action tracking system, systematic internal
audits, a complete training and retraining system, audits by various external
organizations, and a laboratory quality control program.
IO
The quality control program employed by the radioanalytical laboratory is
designed to ensure that the sampling and analysis process is working as
intended. The program includes equipment checks and the analysis of special
samples along with routine samples.
Radiation detection devices are complex and can be tested in a number of
ways. There are two primary tests which are performed on all devices. In the
first type, the device is operated without a sample on the detector to
determine the background count rate. The background counts are usually low
values and are due to machine noise, cosmic rays, or trace amounts of
radioactivity in the materials used to construct the detector. Charts of
background counts are kept and monitored to ensure that no unusually high or
low values are encountered.
In the second test, the device is operated with a known amount of
-69-
I
iI
I

radioactivity present. The number of counts registered from such a
r radioactive standard should be very reproducible. These reproducibility
checks are also monitored to ensure that they are neither higher nor lower
than expected. Nhen counts from either test fall outside the expected range,
the device is inspected for malfunction or contamination. It is not placed
into service until it is operating properly.
In addition to these two general checks, other quality control checks are
performed on the variety of detectors used in the laboratory. The exact
nature of these checks depends on the type of device and the method it uses to
detect radiation or store the information obtained.
lyQuality control samples of a variety of types are used by the laboratory to
verify the performance of different portions of the analytical process. These
quality control samples may be blanks, replicate samples, blind samples, or
cross-checks.
Blanks are samples which contain no measurable radioactivity or no activity of
the type being measured. Such samples are analyzed to determine whether there
is any contamination of equipment or commercial laboratory chemicals,
cross-contamination in the chemical process, or interference from isotopes
other than the one being measured.
tl)6
Duplicate samples are generated at random by the same computer program which
schedules the collection of the routine samples. For example, if the routine
program calls for four milk samples every week, on a random basis each farm
-70-

I
III
tL
I

might provide an additional sample several times a year. These duplicate
samples are analyzed along with the other routine samples. They provide
rinformation about the variability of radioactive content in the various sample
media.
If enough sample is available for a particular analysis, the laboratory
analyst can split it into two portions. Such a sample can provide information
about the variability of the analytical process since two identical portions
of material are analyzed side by side.
I~
Analytical knowns are another category of quality control sample. A known
amount of radioactivity is added to a sample medium by the quality control
staff or by the analysts themselves. The analysts are told the radioactive
content of the sample. Hhenever'possible, the analytical knowns contain the
same amount of radioactivity each time they are run. In this way, the
analysts have immediate knowledge of the quality of the measurement process.
A portion of these samples are also blanks.
Blind spikes are samples containing radioactivity which are introduced into
the analysis process disguised as ordinary environmental samples. The analys't
does not know they contain radioactivity. Since the bulk of the ordinary
workload of the environmental laboratory contains no measurable activity or
only naturally occurring radioisotopes, blind spikes can be used to test the
detection capability of the laboratory or they can be used to test the data
review process. If an analysis routinely generates numerous zeroes for a
)~ -71-

I
I
II
I
I~
<

particular isotope, the presence of the isotope is brought to the attention of
l the laboratory supervisor in the daily review process. Blind spikes test this
L- process since they contain radioactivity at levels high enough to be
detected. Furthermore, the activity can be put into such samples at the
extreme limit of detection (near the LLD) to determine whether or not the
laboratory can find any unusual radioactivity whatsoever.
At present, 5 percent of the laboratory workload is in the category of
internal cross-checks. These samples have a known amount of radioactivity
added and are presented to the analysts labeled as cross-check samples. This
means that the quality control staff knows the radioactive content or "right
answer" but the analysts do not. They are aware they are being tested. Such
samples test the best performance of the laboratory by determining if the
analysts can find the "right answer." These samples provide information about
the accuracy of the measurement process. Further information is available
about the variability of the process if multiple analyses are requested on the
same sample. Internal cross-checks can also tell if there is a difference in
performance between two analysts. Like blind spikes or analytical knowns,
these samples can also be spiked with low levels of activity to test detection
limits.
A series of cross-checks is produced by the EPA in Las Vegas. These
interlaboratory comparison samples or "EPA cross-checks" are considered to be
the primary indicator of laboratory performance. They provide an independent
check of the entire measurement process that cannot be easily provided by the
laboratory itself. That is, unlike internal cross-checks, EPA cross-checks
-72-

~l
iL
)

test the calibration of the laboratory detection devices since different
t radioactive standards produced by individuals outside TVA are used in the
cross-checks. The results of the analysis of these samples are reported back
to EPA which then issues a report of all the results of all participants.
These reports are examined very closely by laboratory supervisory and quality
control personnel. They indicate how well the laboratory is doing compared to
others across the nation. Like internal cross-checks, the EPA cross-checks
provide information to the laboratory about the precision and accuracy of the
radioanalytical work it does.
The results of TVA's participation in the EPA Interlaboratory Comparison
Program are presented .in table F-1. For 1992, all EPA cross-check sample
concentrations measured by TVA's laboratory were within ~ 3-sigma of the EPA
reported values.
TVA splits certain environmental samples with laboratories operated by the
States of Alabama and Tennessee and the EPA National, Air and Radiation
Environmental Laboratory in Montgomery, Alabama. Hhen radioactivity has been
present in the environment in measurable quantities, such as following
atmospheric nuclear weapons testing, following the Chernobyl incident, or as
naturally occurring radionuclides, the split samples have provided TVA with
yet another level of information about laboratory performance. These samples
demonstrate performance on actual environmental sample matrices rather than on
the constructed matrices used in cross-check programs.
gO
All the quality control data are routinely collected, examined, and reported
-73-

~l
L
L
)t
to laboratory supervisory personnel. They are checked for trends, problem
areas, or other indications that a portion of the analytical process needs
rcorrection or improvement. The end result is a measurement process that
provides reliable and verifiable data and is sensitive enough to measure, the
presence of radioactivity far below the levels which could be harmful to
humans.
-74-

yl
II'
)

QR W W M~ 0 0
Table F-1
RESULTS OBTAINED IN INTERLABORATORY COMPARISON PROGRAM
A. Air Filter (pCi/Filter)
EPA Value TVA EPA Value TVA EPA Value TVA EPA Value TVAL=MmaL hxa L3.mme ha. L3 'AIL.ha MmmnL hg.
3/92 7 9 8 41=9 43 15 9 12 10 9 98/92 30 14 32 69 17 72 25 9 23 18 9 17
B. Radiochemical Analysis of Water (pCi/L)
EPA Value 1'VA
h3.~~a) 8za.EPA ValueL.'Mmnl
TVA EPA Value TVA EPA Value TVA EPA Value TVAL3.domal hm L3 ~Btl )ha. ~Z L). hm.
1/922/924/92'/92
6/928/929/9210/9210/924
30=9
44=9
50 9
31
40
50
51 9
15 929 9
8 9 10 95962 1032 5851
9
46 20=9 217904 1368 7975
11 17e9 1827 89 9
2125~ 601 1963
59 10 55
45 10 43

gl

Table F-1
RESULTS OBTAINED IN INTERLABORATORY COMPARISON PROGRAM (Continued)
C. Ganja-Spectral Analysis of Water (pCi/L)
EPA Value TVA EPA Value TVA
43.domal Bra L3.mmeEPA Value TVA EPA Value TVA EPA Value TVA EPA Value TVA EPA Value TVA
L='~ma). hg. L3.mme hg EsMmnl ha h3 ~ul @ca L-.'Laical ha.
1/922/924/92'/92
8/9210/9210/92$
76 14
98 17
74 12
77
96
73
40=9 3956.9 5520 9 20
10 9 1015 9 15
99 17
148 26
102
153
148 26 142 203 35
141 24
175e31
182 31 9 2824 9 23
125 15 9 13
161 8=9 85=9 5
49 922 915 9
8=98 9
17 3 16492215
9 2
D. Milk (pCi/L)
EPA Value TVA EPA Value TVA EPA Value TVA EPA Value TVA EPA Value TVA
L3 maul )ha l.'~bL). hug L='Mme hm ~wl ha L'~ma). hm
4/92 38 9 34 29 9 24 78=14 82 39-99/92 15 9 12 15~9 14 100 17 99 15 9
40 1710 149 180315 1750~152 1741
a. Performance Evaluation Intercomparison Study.b. Units are milligrams of total potassium per liter rather than picocuries of K-40 per liter.

yl
iIi
si

APPENDIX G
LAND USE SURVEY
-77-

~l
iIr
si

Appendix G
Land Use Surve
A land use survey is conducted annually to identify the location of the
nearest milk animal, the nearest residence, and the nearest garden of greater
than 500 square feet producing fresh leafy vegetables in each of 16
meteorological sectors within a distance of 5 miles from the plant. The land
use survey also identifies the location of all milk animals and gardens of
greater than 500 square feet producing fresh leafy vegetables within a
distance of 3 miles from the plant.
The land use survey is conducted between April 1 and October 1 using
appropriate techniques such as door-to-door survey, mail survey, telephone
survey, aerial survey, or information from local agricultural authorities or
other reliable sources.
In order to identify the locations around BFN which have the greatest relative
potential for impact by the plant, radiation doses are projected for
individuals living near. BFN. These projections use the data obtained in the
survey and historical meteorological data'hey also assume that the plant is
operating and that releases are equivalent t'o the design basis sourceterms'he
calculated doses are relative in nature and do not reflect actual
exposures to individuals living near BFN. Calculated doses to individuals
based on measured effluents from the plant are well below applicable dose
limits (see Assessment and,Evaluation).
-78-

ili
Ii

Doses from breathing air (air submersion) are calculated for the nearest
resident in each sector, while doses from drinking milk or eating foods
produced near the plant are calculated for the areas with milk producing
animals and gardens, respectively.
Air submersion doses were calculated for the same locations as in 1991, with
the resulting values similar to those calculated in 1991. Doses calculated
for ingestion of home-grown foods changed in some sectors, reflecting shifts
in the location of the nearest garden. The most notable changes occurred in
the east southeast sector where gardens were not identified in 1991.
For milk ingestion, projected annual doses were slightly lower than those
calcualted in 1991. Only two locations with milk producing animals were
identified. Samples are being taken from both of these farms.
Tables G-l, G-2, and G-3 show the comparative calculated doses for 1991 and
1992.
-79-

ylII
ili
g

Table G-1
BROWNS FERRY NUCLEAR PLANT
Relative Pro]ected Annual Air SubmersionDose to the Nearest Resident
(Within 5 miles)mrem/year/reactor
1991 SurveApproximate
Sector Distance (Hiles) Annual Dose
1992 Surve
Annual DoseApproximate
Distance (Miles)
N 1.51 0.19NNE 2.27 0.11NE 2.34 0.13ENE 'I .07 0. 11
E 2.37 '.10r ESE 2.08 0.07
SE 5.03 0.07SSE 4.17 0.08S 2.82 0.12SSW 2.60 0.14SW 3.15 0.12WSW 2.70 0.07W 1.63 0.09WNW 2.75 0.12NW 2.27 0.22NNW 1.03 0.33
2.081.612.341.422.37 .
1.335.034.262.822.603.152.561.512.842.270.95
0.190.090.130.090.090.060.070.080.110.140.120.070. 100.120.220.38
-80-
I
I
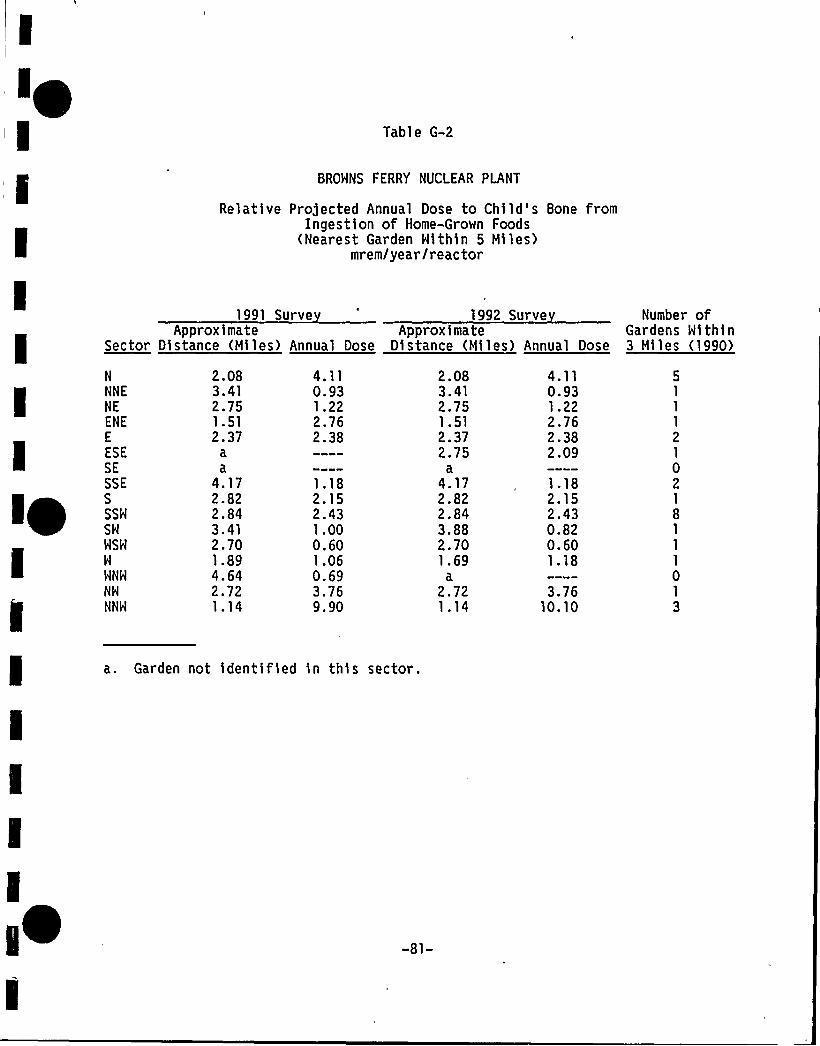
Table G-2
BROWNS FERRY NUCLEAR PLANT
Relative Projected Annual Dose to Child's Bone fromIngestion of Home-Grown Foods
(Nearest Garden Within 5 Miles)mrem/year/reactor
1991 SurveApproximate
Sector Distance (Miles) Annual Dose
1992 SurveApproximate
Distance (Miles) Annual Dose
Number ofGardens Within3 Miles (1990)
N 2.08 4.11
i NNE 3.41 0.93NE 2.75 1.22ENE 1.51 2.76
rE 2.37 2.38ESE aSE aSSE 4.17 1.18
I S 2.82 2.15SSW 2.84 2.43SW 3.41 1.00HSH 2.70 0.60H 1.89 1.06WNH 4.64 0.69NW 2.72 3.76NNH 1.14 9.90
2.083.412.751.512.372.75
a4.172.822.843.882.701.69
a2.721.14
4.110.931.222.762.382.09
1.182.152.430.820.601.18
3.7610.10
a. Garden not identified in this sector.
-81-


Table G-3
BRONNS FERRY NUCLEAR PLANT
Relative Projected Annual Dose to Receptor Thyroidfrom Ingestion of Milk
mrem/year/reactor
Location SectorApproximate Distance
(Miles)Annual Dose
1991 1992X/Q
s/m'arm
Bn'Farm B'NN 4.9
6.80.010.03
0.0080.02
1.82 E -81.75 E -8
a. Milk being sampled at these locations.
-82-

~
gl
)

APPENDIX H
DATA TABLES
-83-

gl

Table H-1
DIRECT RADIATION LEVELS
Average External Gamma Radiation Levels at Various Distances fromBrowns Ferry Nuclear Plant for Each Quarter — 1992
mR/Quarter'istance
Hiles
0-1
1-2
2-4
4-6
> 6
1st uarter
16.0 R 1.4
17.7 a 3.2
14.1 a 1.1
14.5 4 0.9
14.4 x 2.7
2nd uarter
20.5 0 1.6
19.6 R 1.4
18.1 a 1.3
18.4 a 0 9
18.1 a 1.1
3rd uarter
15.1 a 1.6
13.8 a 0.7
14.8 a 3.3
13. 1 t 1.4
13.0 4 2.3
Avera e External Gamma Radiation Levels'thuarter
16.5 x1.6'6.0
x 1.5
14.4 a 1.3
14.4 R 1.0
14.1 N 0.8
Average,0-2 miles(onsite) 16.4 a 2.2 20.3 a 1.6 14.7 a 1.6 16.4 a 1.6
Average,> 2 miles(offsite) 14.4 a 1.7 18.2 a 1.0 13.4 a 2.3 14.3 N 1.0
a. Data normalized to one quarter (2190 hours).b. Averages of the individual measurements in the set ~ 1 standard deviation
of the set.c. Value reported in 1991 was incorrectly shown as 1.61. The value should
have been 16.1.

I
I

TENNESSEE VALLEY AUTHORITYCHEMISTRY AND RADIOLOGICAL SERVICES
ENVIRONMENTAL RADIOLOGICAL MONITORING AND INSTRUHEHTATIONliESTERH AREA RADIOLOGICAL LABORATORY
ENVIRONMENTAL MONITORING REPORTING SYSTEH
RADIOACTIVITY IN AIR FILTERPCI/M3 - 0.037 BQ/H3
NAHE OF FACILITY: BROSIS FERRY NUCLEAR PLANT
LOCAT IOH OF FACILITY: LIMESTONE ALABAMA
DOCVET HO.: 50-259,260,296REPORTIHG PERIOD: 1992
TYPE AND
TOTAL NUMBER
OF ANALYSISPERFORMED
L(S LIMIT ALLOF INDICATOR LOCATIOHS LOCATIOH 'MITH NIGHEST ANHUAL MEAN
DETECTIOH MEAN (F) NAME MEAN (F)(LLD) RANGE DISTANCE AND DIRECTION RANGE
SEE NOTE 1 SEE NOTE 2 SEE NOTE 2
COHTROLLOCATIONS
MEAN (F)RANGE
SEE NOTE 2
NUMBER OF
NONROUTIHEREPORTED
MEASUREMEHTS
GROSS ALPHA
GROSS BETA
1047.00E.04 9.09E-04( 7/ 52) LM-1 BF
7.21E-04- 1.11E-03 1.0 HILES H
570
9.09E-04( 7/ 52) 9.10E 04( 7/ 52)7.21E.04- 1.11E-03 7.39E-04- 1.39E.03
2.00E-03 1.91E-02( 466/ 466) PH-2 BF ATHENS AL6.69E-03 4.27E-02 10.9 MILES NE
1.99E-02( 52/ 52) 1.90E.02( 104/ 104)1.32E-02- 4.27E-02 8.00E-03. 4.24E.02
GAMMA SCAN (GELI)143
BE 7
8 I.214
PB-214
SR 89
2.00E-02
5.00E-03
5.00E-03
8.35E 02( 117/ 117) PM-2 BF ATHENS AL4.29E-02- 1.22E-01 10.9 HILES NE
7.73E-03( 44/ 117) LH4 BF TRAILER P
5.00E-03. 1.66E-02 1.7 MILES NNll8.09E-03( 33/ 117) LH4 BF TRAILER P
5.00E-03. 1.68E-02 1.7 MILES NNU
8.64E-02(4.38E-02-
9.42E-03(5.10E 03-
1.00E-02(5.40E-03-
13/ 13)1.15E-DI6/ 13)
1.66E-025/ 13)
1.68E-02
8.05E-02(4.59E-02-
8.01E.03(5.00E-03-
7.04E-03(5.00E.03-
26/ 26)1.11E.OI7/ 26)
1.22E.029/ 26)
1.25E-02
SR 90
AH 241
CM 244
PU 239,240
PU 238
CM 242
6.00E-04 4 VALUES < LLD LMI BF NORTNNEST1.0 MILE N
3.00E.04 4 VALUES < LLD
82.50E-05 4 VALUES < LLD
2.50E-05 4 VALUES < LLD
2.50E-05 4 VALUES < LLD
82.50E-05 4 VALUES < LLD
82.50E-05 4 VALUES < LLD
4 VALUES < LLD 6.02E-04( 1/ 4)6.02E-04- 6.02E.04
4 VALUES < LLD
4 VALUES < LLD
4 VALUES < LLD
4 VALUES < LLD
4 VALUES < LLD
4 VALUES < LLD
NOTE: 1- HOMIHAL LONER LIMIT OF DETECTIOH (LLD) AS DESCRIBED IH TABLE E-1
NOTE: 2. MEAN AND RANGE BASED UPON DETECTABLE MEASUREMEHTS ONLY. FRACTION OF DETECTABLE MEASUREMEHTS AT SPECIFIEO
LOCATIONS IS INDICATED IH PARENTHESES (F) ~

I~
g

0TENNESSEE VALLEY AUTHORITY
CHEMISTRY AND RADIOLOGICAL SERVICESEHVIRONHEHTAL RADIOLOGICAL HONITORIHG AHD INSTRUHENTATIOH
WESTERN AREA RADIOLOGICAL LABORATORY
ENVIRONMENTAL HOHITORING REPORTIHG SYSTEM
RADIOACTIVITY IH CHARCOAL FILTERPCI/M3 . 0.037 BQ/H3
NAME OF FACILITY: BROWNS FERRY NUCLEAR PLANT
LOCATION OF FACILITY: LIMESTONE ALABAMA
DOCKET NO.: 50-259,260,296REPORTIHG PERIOD: 1992
TYPE AND
TOTAL NUMBER
OF ANALYSISPERFORMED
LOWER LIMIT ALLOF INDICATOR LOCATIONS LOCATIOH WITH HIGHEST ANHUAL MEAN
DETECTION MEAN (F) NAME MEAN (F)(LLD) RANGE DISTANCE AND DIRECTION RANGE
SEE NOTE 1 SEE NOTE 2 SEE NOTE 2
CONTROL
LOCATIONSMEAN (F)
RANGE
SEE NOTE 2
NUMBER OF
HONROUT IHEREPORTED
HEASUREMENTS
IODINE 131405
GAMMA SCAN (GELI)165
BI.214
PB-212
PB-214
2.00E.02 331 VALUES < LLD
NOT ESTAB
NOT ESTAB
NOT ESTAB
4.81E.02( 2/ 135) LH1 Bf NORTHWEST
4.20E-02. 5.42E-02 1 ~ 0 MILE H
6.43E-03( 3/ 135) LM4 BF TRAILER P
4.00E-04- 1.37E.02 1.7 MILES NNW
3.55E-02( 31/ 135) LM1 BF NORTHWEST
3.00E.03. ?.21E-02 1.0 MILE N
74 VALUES < LLD
5.42E-02( 1/ 15) 30 VALUES < LLD5.42E-02- 5.42E.02
9.45E.03( 2/ 15) 30 VALUES < LLD5.20E.03- 1.37E-02
4.48E-02( 5/ 15) 3.09E-02( 6/ 30)1.70E-02- 7.21E.02 2.06E-02- 5.35E-02
NOTE: l. NOMINAL LOWER LIHIT Of DETECTION (LLD) AS DESCRIBED IN TABLE E-1
NOTE: 2. MEAN AND RANGE BASED UPON DETECTABLE MEASUREMEHTS ONLY. FRACTION OF DETECTABLE MEASUREMEHTS AT SPECIFIED
LOCATIONS IS INDICATED IN PAREHTNESES (F).

I
II
I~
gl
I
I
I

TENNESSEE VALLEY AUTHORITY
CNEHISTRY AND RADIOLOGICAL SERVICES
EHVIRONHEHTAL RADIOLOGICAL MONITORING AND INSTRUMEHTATIOH
MESTERH AREA RADIOLOGICAL LABORATORY
EHVIRONMEHTAL MONITORING REPORTIHG SYSTEM
RADIOACTIVITY IN MILKPCI/L - 0.037 BO/L
NAME OF FACILITY: BRQINS FERRT NUCLEAR PLANT
LOCATION OF FACILITY: LIMESTONE ALABAMA
DOCKET NO.: 50-259,260,296REPORTING PERIOD: 1992
TYPE ANDTO'IAL NUMBER
OF ANALYSISPERFORMED
LSIER LIMIT ALLOF INDICATOR LOCATIONS LOCATIOH 'NITH HIGHEST ANNUAL MEAN
DETECTION MEAN (F) NAME MEAN (F)(LLD) RAHGE DISTANCE AND DIRECTION RANGE
SEE HOTE I SEE NOTE 2 SEE NOTE 2
CONTROLLOCATIOHS
MEAN (F)RANGE
SEE NOTE 2
NUMBER OF
NOHROUT INEREPORTED
MEASUREMEHTS
IODINE-131104
2.00E.01 52 VALUES < LLD 52 VALUES < LLD
GAMMA SCAN (GELI)104
BI -214
K-40
PB.214
TL-208
SR 89
2.DOE+01
1.50E+02
2.DOE+01
7.DOE+00
3.88E+01( 7/ 52)2.21E+01. 6.83E+01
1.31E+03( 52/ 52)9.70E+02- 1.51E+03
3.84E+01( 4/ 52)2.24E+01. 6.29E+0152 VALUES < LLD
SMITH/BENNETT FARM
5.0 MILES N
BROOKS FARH 6.8 MILES NNN
SMITH/BENNETT FARH
5.0 MILES N
SMITH/BENNETT FARM
5.0 MILES H
4.47E+01( 4/ 26)2.21E+01- 6.83E+01
1.36E+03( 26/ 26)1.28E>03- 1.48E+03
4.24E+01( 3/ 26)2.24E+01- 6.29E+0126 VALUES < LLD
3.08E+01(2.11E+01-
1.36E+03(1.24Et03.
2.67E+01(2.54E+01-
2.30E+01(2.30E+01-
6/ 52)5.09Ei0152/ 52)1.52E+034/ 52)
2.96E+011/ 52)
2.30E+01
SR 90
522.50E+00 26 VALUES < LLD
52
26 VALUES < LLD
2.DOE+00 2.69E+00( 11/ 26) SMITH/BENNETT FARH 3.34E+00( 3/ 13) 2.11E+00( 2/ 26)2.04E+00 4.55E+00 5.0 HILES H 2.17E+00 4.55E+00 2.DOE+00- 2.22E+00
NOTE: 1. NOMINAL L(VER LIHIT OF DETECTION (LLD) AS DESCRIBED IN TABLE E-1
NOIE: 2. MEAN AND RANGE BASED UPON DETECTABLE MEASUREMEHTS ONLY. FRACTIOH OF DETECTABLE MEASUREHEHTS AT SPECIFIED
LOCATIONS IS INDICATED IH PAREHTHESES (F).

l
I
I
li)
g
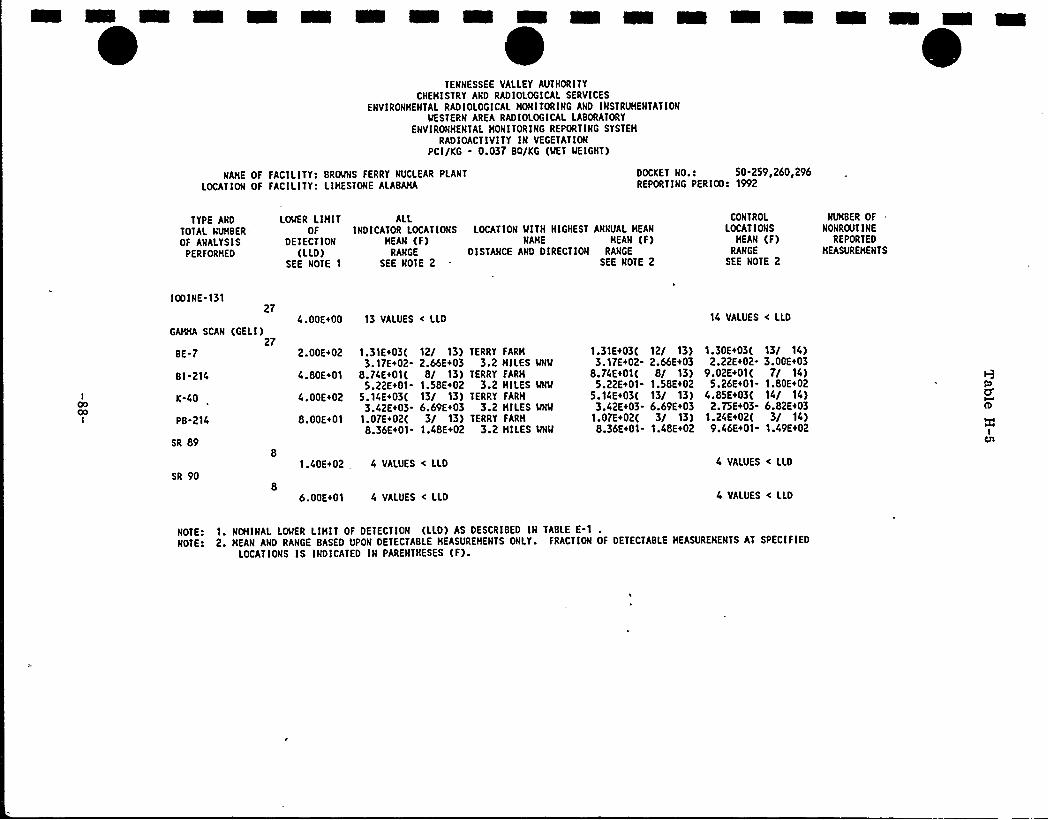
TENNESSEE VALLEY AUTKORITYCNEHISTRY AND RADIOLOGICAL SERVICES
ENVIRONHENTAL RADIOLOGICAL HONITORING AND INSTRUHENTATIONMESTERN AREA RADIOLOGICAL LABORATORY
ENVIRONHENTAL HOHITORING REPORTING SYSTEH
RADIOACTIVITY IH VEGETATIONPCI/KG - 0.037 BQ/KG (WET WEIGHT)
HAHE OF FACILITY: BROMNS FERRY NUCLEAR PLANT
LOCATION OF FACILITY: LIHESTONE ALABAHA
DOCKET NO.: 50.259,260,296REPORTING PERIOD: 1992
TYPE AND
TOTAL NUHBER
OF ANALYSISPERFORHED
LOWER LIHITOF
DETEC'IION(LLD)
SEE HOTE 1
ALLINDICATOR LOCATIONS LOCATION 'WITH HIGHEST AHNUAL HEAN
HEAN (F) NAHE HEAN (F)RANGE DISTANCE AND DIRECTION RANGE
SEE NOTE 2 SEE NOTE 2
COHTROI.
LOCATIONSHEAR (F)
RANGE
SEE NOTE 2
NUHBER OF
NONROUT INEREPORTED
HEASUREHENTS
I OO I NE. 13127
4.DOE+00 13 VALUES < LLD 14 VALUES < LLD
GAHHA SCAN (DELI)27
BE-7
81-214
K-40
PB-214
SR 89
2.DOE+02
4.80E+01
4.DOE+02
8.DOE+01
1.31E+03( 12/ 13) TERRY FARH
3.17E+02. 2.66E+03 3.2 HILES WNM
8.74E+01( 8/ 13) TERRY FARH
5.22E+01- 1.58E+02 3.2 HILES WNW
5.14E+03( 13/ 13) TERRY FARH
3.42E+03 6.69E+03 3.2 HILES IINW
1.07E+02( 3/ 13) TERRY FARH
8.36E+01 1.48E+02 3.2 HILES MNW
1.31E+03( 12/ 13)3.17E+02- 2.66E+03
8.74E+01( 8/ 13)5.22E+01- 1.58E+02
5.14E+03( 13/ 13)3.42E+03. 6.69E+03
1.07E+02( 3/ 13)8.36E+01- 1.48E+02
1.30E+03( 13/ 14)2.22E+02- 3.00Et03
9.02E+01( 7/ 14)5.26Et01- 1.80E+02
4.85E+03( 14/ 14)2.75E403- 6.82E+03
1.24E+02( 3/ 14)9.46E+01- 1.49E+02
SR 901.40E+02 4 VALUES < LLD
86.DOE+01 4 VALUES < LLD
4 VALUES < LLD
4 VALUES < LLD
NOTE: 1. NOMINAL LOWER L IHIT OF DETECTION (LLD) AS DESCRIBED IN TABLE E-1
NOTE: 2. XEAN AND RANGE BASED UPON DETECTABLE HEASUREHENTS ONLY. FRACTION OF DETECTABLE HEASUREHEHTS AT SPECIFIED
LOCATIOHS IS INDICATED IN PARENTHESES (F).

I
yl
I

TEHNESSEE VALLEY AU1'NORITY
CNEHISTRY AND RADIOLOGICAL SERVICESENVIRONMENTAL RADIOLOGICAL NONITORING AMD INSTRUMENTATION
IIESTERN AREA RADIOLOGICAL LABORATORY
ENVIRONNENTAL MOHITORING REPORTIHG SYSTEN
RADIOAC'TIVITY IN SOlLPCI/GN - 0.037 BQ/G (DRY lIEIGNT)
HANE OF FACILITY: BROWS FERRY NUCLEAR PLANT
LOCATION OF FACILITYI LIMESTONE ALABAMA
DOCKET HO.: 50-259,260,296REPORTING PERIOD: 1992
T'YPE AND
TOTAL NUMBER
OF ANALYSISPERFORMED
LONER LIMIT ALLOF IHDICATOR LOCATIONS LOCATIOH MITH HIGHEST ANNUAL MEAN
DETECTION MEAN (F) NAME NEAH (F)(LLD) RAHGE DISTANCE AND DIRECTION RANGE
SEE NOTE 1 SEE MOTE 2 SEE HOTE 2
CONTROL
LOCATIOHSMEAN (F)
RANGE
SEE NOTE 2
NUHBER OF
NONROUT I HE
REPORTED
MEASUREHEHTS
GROSS ALPHA2
NOT ESTAB 3.05E+00( 1/ 1) LN1 BF NORTNNEST
3.05E+00- 3.05E+00 1.0 MILE N
3.05E+00( 1/ 1) 1.57E+00( 1/ 1)3.05E+00 3.05E+00 1.57Et00- 1.57E+00
GAMMA SCAH (GELI)11
AC.228
81.212
81-214
CS.137
K-40
PB.212
PS-214
RA-224
RA-226
TL 208
SR 89
1.00E-01
2.50E-01
4.00E-02
1.00E-02
2.00E.01
2.00E-02
2.00E-02
3.00E-01
5.00E-02
2.00E.02
1.17E+00(6.01E-01
1.25E+00(6.72E-01-
9.52E-01(6.17E-01-
2.99E. 01(7.45E.02-
5.25E+00(2.88E+00-
1.15E+00(5.57E-01-
1.05E+00(6.61E.01-
1.25E+00(6.53E-01-
9.52E.01(6.17E 01-
3.92E.01(1.93E.01.
9/ 9)1.54E+009/ 9)
1.60E+009/ 9)
1.20E+009/ 9)
7.64E-019/ 9)
7.57E+009/ 9)
1.54E+009/ 9)
1.29E+007/ 9)
1.72E+009/ 9)
1.20E+009/ 9)
5.10E-01
PH.3 BF DECATUR AL8.2 MILES SSE
PH 3 BF DECATUR AL8.2 HILES SSE
LM4 BF TRAILER P
1.7 MILES NMIILM-6BF BAKER BOTTON
3.0 MILES SSU
LM1 BF NORTHWEST
1.0 NILE M
PN-3 BF DECATUR AL8.2 MILES SSE
LM4 BF TRAILER P
1.7 MILES NN'N
PH.3 BF DECATUR AL8.2 MILES SSE
LM4 BF TRAILER P
1.7 MILES NNilPN.3 BF DECATUR AL
8.2 HILES SSE
1.54E+00(1.54E+00
1.60E+00(1.60E+00
1.20E+00(1.20E+00-
7.64E-01(7.64E-01-
7.57E+00(T.57E+00-
1.54E<00(1.54E+00-
1.29E+00(1.29E>00
1.72E+00(1.72E+00-
1.20E+00(1.20E+00-
5.10E 01(5.10E-01-
1/ 1)1.54E+001/ 1)
1.60E+001/ 1)
1.20E+001/ 1)
7.64E.011/ 1)
7.57E+001/ 1)
1.54E+001/ 1)
1.29E>001/ 1)
1.72E+001/ 1)
1.20E+001/ 1)
5.10E-01
7.19E 01( 2/ 2)6.55E.01- 7.83E-01
8.57E.01( 2/ 2)7.47E-OI- 9.67E.01
8.05E.01( 2/ 2)6.57E.01- 9.54E-01
6.26E.01( 2/ 2)3.50E-01- 9.03E.01
4.17E<00( 2/ 2)3.01E+00 5.32Ei00
7.06E 01( 2/ 2)6.54E-01- 7.57E-01
9.01E.01( 2/ 2)7.37E-01- T.OTEi00
8.90E-01( 2/ 2)6.94E.01- 1.09Ei00
8.05E 01( 2/ 2)6.57E.01. 9.54E.01
2.52E-01( 2/ 2)2.15E-01- 2.90E-01
SR 90,
AN 241
111.DOE+00 9 VALUES < LLO
3.00E-01 9 VALUES < LLO
2 VALUES < LLD
2 VALUES < LLO
2HOT ESTAB 1 VALUES < LLD LNT BF NORTMMEST
1.0 NILE H
1 VALUES < LLD 1 VALUES < LI.D
MOTET 1. NOMINAL LOIER LIMIT OF DETEC'IIOH (LLD) AS DESCRIBED IH TABLE E-1
NOTE- 2. HEAH ANO RANGE BASED UPON DETECTABLE MEASURENEHTS ONLY. FRACTION OF DETECTABLE NEASUREMEHTS AT SPECIFIED
LOCATIONS IS INDICATED IH PARENTHESES (F).

glII
l
yl
I
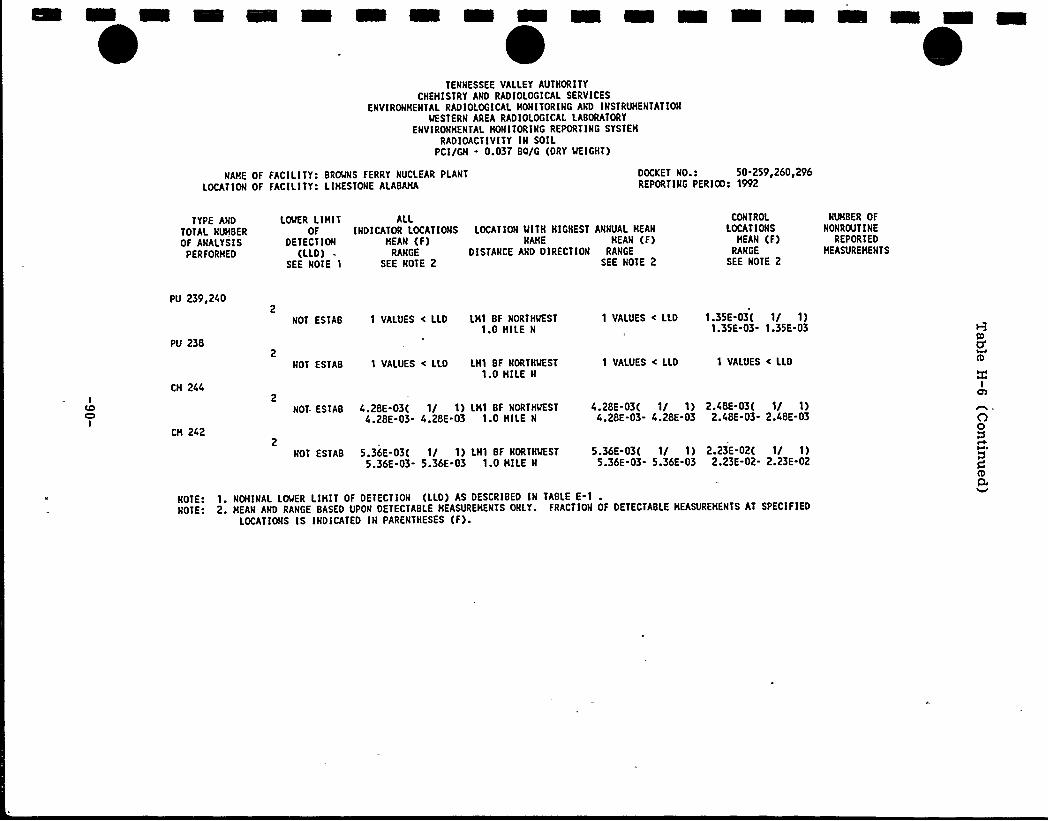
IEHNESSEE VALLET AUTHORITYCNEHISIRY AND RADIOLOGICAL SERVICES
ENVIRONMENTAL RADIOLOGICAL MONITOR IHG AND INSTRUHEHIATION
WESTERN AREA RADIOLOGICAL LABORATORY
ENVIRONMENTAL MONITORING REPORIIHG STSTEM
RADIOACTIVITY IH SOILPCI/GM - 0.037 BQ/G (DRY MEIGHT)
NAME OF FACILITY: BRONNS FERRT NUCLEAR PLANT
LOCAtlOH OF FACILITT: LIMESTOHE ALABAMA
DOCKET NO.: 50 259,260,296REPORTING PERIOD: 1992
IYPE AND
TOTAL HUHBEROF ANALYSIS
PERFORMED
LSIER LIMIT ALLOF IHDICATOR LOCATIONS LOCATIOH NITH HIGHESt AHHUAL MEAN
DETECTIOH MEAN (F) NAME MEAN (F)(LLD) RANGE DISTANCE AND DIRECTION RANGE
SEE NOTE 1 SEE NOTE 2 SEE NOTE 2
CONTROL
LOCATIOHSMEAH (F)
RANGE
SEE HOTE 2
NUMBER OF
HOHROUTIHEREPORIED
MEASUREMENIS
PU 239,240
PU 238
NOT ESTAB 1 VALUES < LLD LM1 BF NORTNNESI 1 VALUES < LLD 1.35E-03( 1/ 1)1.0 HILE N 1.35E-03- 1.35E.03
CM 244
NOT ESTAB 1 VALUES < LLD LM1 BF NORTHNEST
1.0 MILE N
1 VALUES < LLD 1 VALUES < LLD
ICDCDI
CM 242
2NOT ESTAB 4.28E 03( 1/ 1) LH1 BF NORTHNESI 4.28E-03( 1/ 1) 2.48E-03( 1/ 1)
4.28E-03. 4.28E.03 1.0 HILE H 4.28E-03- 4.28E-03 2.48E-03- 2.48E-03
NOT ESTAB 5.36E-03( 1/ 1) LM1 BF NORTHNEST
5.36E-03- 5.36E-03 1.0 MILE H
5.36E-03( 1/ 1) 2.23E-02( 1/ 1)5.36E-03- 5.36E-03 2.23E-02- 2.23E.02
NOTE: 1. NOMIHAL LOMER LIHIT OF DETECTION (LLD) AS DESCRIBED IN TABLE E.1
NOTE: 2. MEAN AND RANGE BASED UPON DETECTABLE MEASUREMEHTS ONLT- FRACTION OF DETECTABLE MEASUREHENTS AT SPECIFIED
LOCATIONS IS IHDICATED IH PARENTHESES (F).

I
OLI
ri
I

TEHNESSEE VALLEY AUTHORITYCHEMISTRY AND RADIOLOGICAL SERVICES
EHVIRONMENTAL RADIOLOGICAL MOHITORING AHD IHSTRUMEHTATIOHNESTERH AREA RADIOLOGICAL LABORATORY
EHVIRONMEHTAL MONITORING REPORTIHG SYSTEHRADIOACTIVIT'Y IH APPLESPCI/KG - 0.037 BQ/KG (NET llT)
NAME OF FACILI'IY: BROMNS FERRY NUCLEAR PLANT
LOCAT IOH OF FACILITY: LIMESTONE ALABAMA
DOCKET NO. I 50-259,260,296REPORTIHG PERIQ): 1992
TYPE AND
TOTAL NUMBER
OF ANALYSISPERFORMED
LOIER LIMIT ALLOF INDICATOR LOCATIONS LOCATIOH IIITH HIGHEST ANNUAL MEAH
DETECTION MEAN (F) NAME MEAN (F)(LLD) RANGE DISTANCE AHD DIRECTION RANGE
SEE NOTE 1 SEE NOTE 2 SEE HOlE 2
CONTROL
LOCATION S
MEAN (F)RANGE
SEE NOTE 2
NUMBER OFHDHROUT IHE
REPORTEDMEASUREMEH'TS
GAMMA SCAN (GELI)2
K-CO 1.50E+02 1.02E>03( 1/ 1) 7 MILES NNH
1.02Et03. 1.02E+031.02E+03( 1/ 1) 1.19E>03( 1/ 1)
1.02E+03- 1.02E+03 1. 19E+03- 1.19E+03
NOTE: 1. NOMINAL LOMER LIMIT OF DETECTION (LLD) AS DESCRIBED IH TABLE E-1
NOTE: 2. MEAH AND RANGE BASED UPON DETECTABLE MEASUREMEHTS ONLY. fRACTION OF DETECTABLE MEASUREHENTS AT SPECIFIEDLOCATIONS IS INDICATED IN PARENTHESES (F).
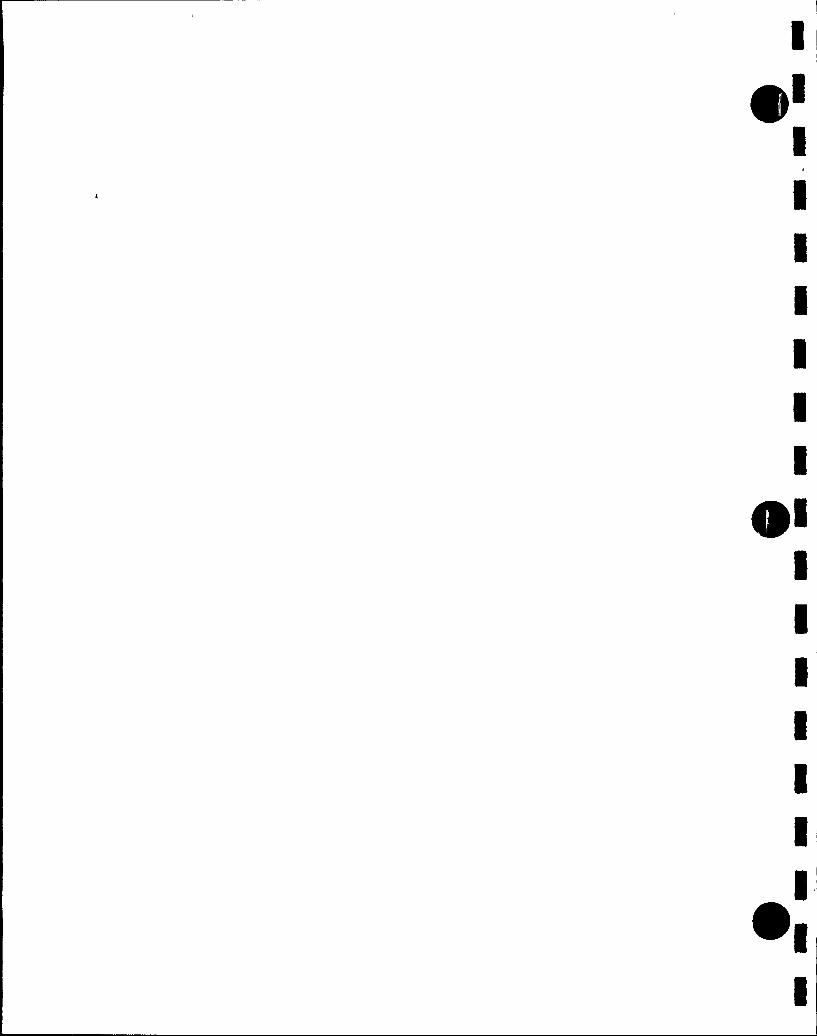
II
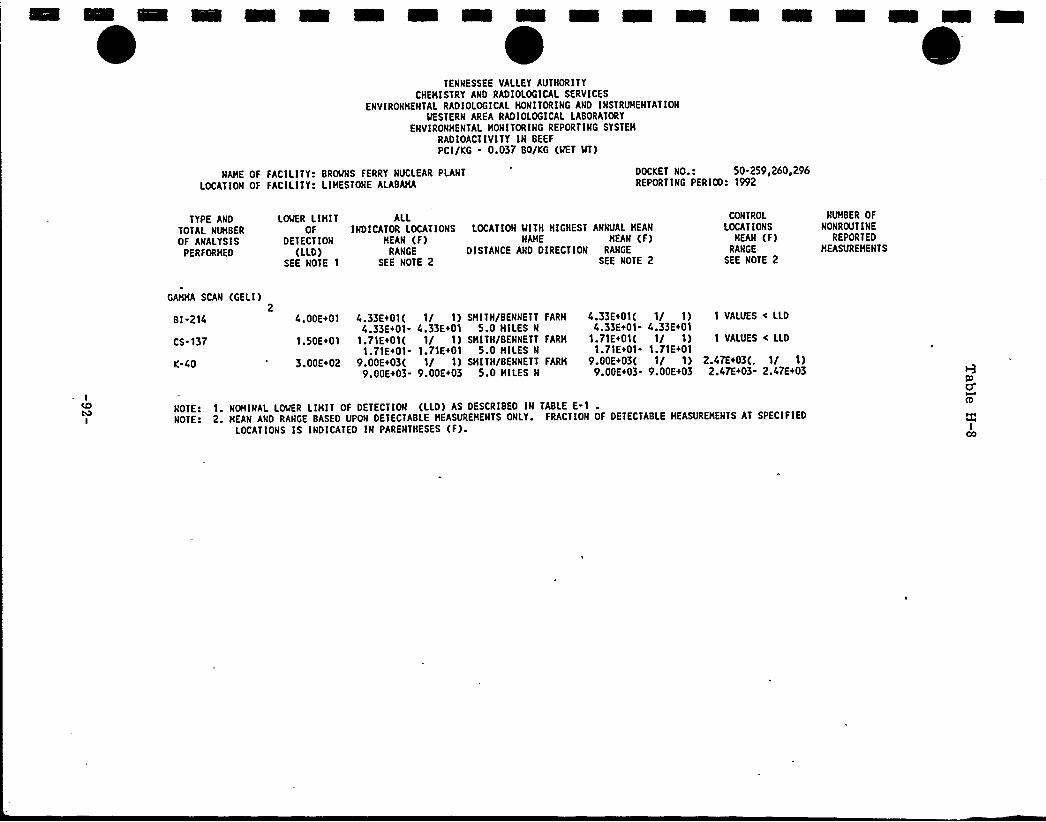
TENNESSEE VALLEY AUTHORITYCHEMISTRY AND RADIOLOGICAL SERVICES
ENVIRONMEHTAL RADIOLOGICAL MONITORING AND IHSTRUMEHTATIOH
NESTERN AREA RADIOLOGICAL LABORATORY
ENVIRONMENTAL MOHITORIHG REPORTING SYSTEH
RADIOACTIVITY IH BEEFPCI/KG - 0.037 BO/KG (NET NT)
NAME OF FACILITY: BROMHS FERRY NUCLEAR PLAHT
LOCATION OF FACILITY: LIMESTONE ALABAHA
DOCKET NO.: 50-259,260,296REPORTING PERIOD: 1992
TYPE AND
TOTAL NUMBER
OF AHALTSISPERFORMED
LOMER LIMIT ALLOF INDICATOR LOCATIONS LOCATIOH lllTH HIGNES'I ANNUAL MEAN
DETECTION MEAN (F) NAME MEAN (F)(LLD) RANGE DISTANCE AND DIRECTION RANGE
SEE NOTE 1 SEE NOTE 2 SEE HOTE 2
CONTROL
LOCATIONSMEAN (F)
RANGE
SEE NOTE 2
NUMBER OF
NONROUT IHEREPORTED
MEASUREMEH'TS
GAMMA SCAH (GELI)2
BI.214
CS.137
K-CO
4.DOE+01 4.33E+01( 1/ 1) SMITH/BENNETT4.33E+01- 4.33E+01 5.0 MILES H
1.50E+01 1.71E+01( 1/ 1) SHITH/BENNETT1.71E+01 1.71E+01 5.0 MILES N
3.DOE+02 9.DOE+03( 1/ 1) SHI'IH/BENHET'I9.DOE+03- 9.DOE+03 5.0 HILES N
FARH
FARM
FARH
4.33EIOI( 1/ 1) 1 VALUES < LLD4.33E+01- 4.33E+01
1.71E+01( 1/ 1) 1 VALUES < LLD1.71EtOI. 1.71E+01
9.DOE+03( 1/ 1) 2.47Ei03(. 1/ 1)9.DOE+03. 9.DOE+03 2.47E+03- 2.C7E+03
NOTE: 1. NOMINAL LOMER LIMIT OF DETECTIOH (LLD) AS DESCRIBEO IH 'TABLE E-1
NOTE: 2. MEAN AND RAHGE BASED UPON DETECTABLE MEASUREMEHTS ONLY. FRACTION OF DETECTABLE MEASUREMEHTS AT SPECIFIED
LOCATIONS IS INDICATED IH PAREHIHESES (F)-

ill
I
I
iL
Ol
II
tl
II

TENHESSEE VALLEY AUTNORIT'Y
CHEMISTRY AND RADIOLOGICAL SERVICESEHVIROHMENTAL RADIOLOGICAL MOHITORING AND INSTRUMENTATION
l!ESTERH AREA RADIOLOGICAL LABORATORY
ENVIRONMENTAL MONITORING REPORTING SYSTEM
RADIOACTIVITY IN CABBAGE
PCI/KG - 0.037 BQ/KG (HET IIT)
NAME OF FACILITY: BRONHS FERRY NUCLEAR PLAHT
LOCATION OF FACILITY: LIMESTONE ALABAMA
DOCKET NO.: 50.259,260,296REPORTIHG PERIOD: 1992
TYPE AND
TOTAL NUMBER
OF ANALYSISPERFORMED
LONER LIMIT ALLOF INDICATOR LOCATIOHS LOCAllOH HITH HIGHES'I ANNUAL MEAN
OETECTIOH MEAN (F) NAME MEAN (F)(LLD) RANGE DISTANCE AND DIRECTION RANGE
SEE NOTE 1 SEE NOTE 2 SEE NOTE 2
CONTROL
LOCATIOHSMEAN (F)
RANGE
SEE NOTE 2
NUHBER OF
HOHROUT IHE
REPORTED
MEASUREHENTS
GAMMA SCAN (GELI)2
81.214
K-40
PB-214
2.DOE+01 1 VALUES < LLD 2 MILES HNM
1.50E+02 1.90E+03( 1/ 1) 2 MILES NNH
1.90Et03- 1.90E+032.DOE+01 1 VAIUES < LLD 2 MILES HHM
1 VALUES < LLD 1.24E+02( 1/ 1)1.24E>02- 1.24E+02
1.90E+03( 1/ 1) 1.91E+03( I/ 1)1.90E+03- 1.90E+03 1.91E+03- 1.91E+03
1 VALUES < LLD 1.11E+02( 1/ 1)1.11E+02- 1.11E+02
NOTE: 1. NOMINAL LSIER LIMIT OF DETECTION (LLD) AS DESCRIBED IH TABLE E 1
NOTE: 2. MEAN AND RANGE BASED UPON DETECTABLE MEASUREMEHTS OHLY~ FRACTION OF DETECTABLE MEASUREHENTS AT SPECIFIED
LOCATIOHS IS INDICATED IH PARENTHESES (F).

yl

TEHHESSEE VALLEY AUTHORITYCNEMISTRT AHD RADIOLOGICAL SERVICES
EHVIRONMEHTAL RADIOLOGICAL MOHITORIHG AND IHSIRUMENIA'(IONMESTERH AREA RADIOLOGICAL LABORATORY
EHVIRONMEH'IAL MONITORING REPORTING STSTEM
RADIOACIIVITT IN CORM
PCI/KG - 0.037 BD/KG (llET NT)
MANE OF FACILITY: BROHNS FERRY NUCLEAR PLANT
LOCATIOH OF FACILITT: LIMESTONE ALABAMA
DOCKET HO.: 50.259,260,296REPORTIMG PERIOD: 1992
TYPE AMDTO'IAL NUMBER
OF ANALYSISPERFORMED
LONER LIMIT ALLOF IHDICATOR LOCATIONS LOCATION IIITH HIGHEST ANNUAL MEAM
DETECTION MEAN (F) HAME MEAN (F)(LLD) RANGE DISTANCE AHD DIRECT IOH RANGE
SEE HOTE I SEE HOIE 2 SEE NOTE 2
CONTROL
LOCAIIDMS
MEAN (F)RANGE
SEE HOIE 2
NUMBER OFNOHROUTINE
REPORTEDMEASUREMENIS
GAMMA SCAN (GELI)2
BI -214
K 40
2.DOE+01
1.50E+02
2.02E+01( 1/ I) LM5 BF DAVIS F
2.02E+01- 2.02E+01 2.5 MILES IISll2.37E+03( 1/ 1) LM5 BF DAVIS F
2.37E+03- 2.37E+03 2.5 MILES WSM
2.02E+01( 1/ 1) 1 VALUES < LLO2.02Et01- 2.02Et01
2.37E+03( 1/ 1) 2.07E<03( I/ 1)2.37E+03- 2.37E+03 2.07E+03- 2.07E+03
NOTE: 1. HOMINAL LQIER LIMI'I OF DETEC'IIOH (LLD) AS DESCRIBED IN TABLE E-1
NOTE: 2. MEAM AND RAHGE BASED UPON DETECTABLE MEASUREMEHTS ONLT. FRACTIOH OF DETECTABLE MEASUREMEHTS AT SPECIFIED
LOCATIONS IS INDICATED IH PAREHTNESES (F)

I
I
tt
g

TENNESSEE VALLEY AUTHORITYCNENISTRT AND RADIOLOGICAL SERVICES
ENVIRONMENTAL RADIOLOGICAL HONITORIHG AMD IHSTRUMEHTATIOMIIESTERN AREA RADIOLOGICAL LABORATORY
EHVIRONNEHTAL MONITORING REPORTIMG STSTEM
RADIOACTIVITY IN GREEN BEANS
PCI/KG - 0.037 BO/KG (KET NT)
KAME OF FACILITT: BROWS FERRY NUCLEAR PLANT
LOCATIOH OF FACILITY: LIMESTOHE ALABAHA
DOCKET NO.: 50-259,260,296REPORT IHG PERIOD: 1992
TTPE AMD
TOTAL NUMBER
OF ANALTSISPERFORNED
LONER LIMIT ALLOF INDICATOR LOCATIONS LOCATION IIITH HIGHEST ANNUAL NEAN
DETECTION MEAN (F) KAME MEAN (F)(LLD) RAHGE DISTANCE AND DIRECTION RAHGE
SEE NOTE 1 SEE HOTE 2 SEE NOTE 2
CONTROL
LOCATIONSMEAN (F)
RANGE
SEE MOTE 2
NUMBER OF
NONROUTIMEREPORTED
MEASUREHEHTS
CANNA SCAN (GELI)2
81-214
K CO
PB-214
2.DOE+01
1.50E+02
2.DOE+01
7.8?E+01( 1/ 1) C MILES H
7.87E+01- 7.87E+012.24E+03( 1/ 1) 4 MILES N
2.24E+03. 2.24E+034.38E+01( 1/ 1) 4 MILES N
4.38E+01- C.38E 01
7.87E+01( 1/ 1)?.8?E+01- 7.87E+01
2.24E+03( 1/ 1)2.2CE<03- 2.24E+03
4.38E+01( 1/ 1)4.38E+01- 4.38E+01
2.89E+01( 1/ 1)2.89Ei01- 2.89E+01
2.05E+03( 1/ 1)2.05E+03- 2.05E+03
2.85E+01( 1/ 1)2.85E+01- 2.85E+01
KOTE: 1. NOMINAL LOGIER LIMIT OF DETECTIOH (LI.D) AS DESCRIBED IH TABLE E-1
HOTE: 2. MEAN AND RANGE BASED UPON DETECTABLE MEASUREHEMTS OHLT. FRACTION OF DETECTABLE MEASUREMEHTS AT SPECIFIED
LOCATIONS IS INDICATED IN PARENTHESES (F).


%5 m W m~ ~
TEHNESSEE VALLEY AUTHORITYCHEHISTRY AND RADIOLOGICAL SERVICES
ENVIRONMENTAL RADIOLOGICAL MONITORING AND INSTRUHEHTATIOHllESTERN AREA RADIOLOGICAL LABORATORY
ENVIRONHEHTAL MONITORING REPORTING SYSTEH
RADIOACTIVITY IN POTATOES
PCI/KG - 0.037 BO/KG (IIET NT)
NAME OF FACILITY: BROMNS FERRY NUCLEAR PLANTLOCA'TIOH OF FACILITY: LIMESTONE ALABAMA
DOCKET MO.: 50-259,260,296REPORTING PERIOD: 1992
TYPE AND
TOTAL NUMBER
OF ANALYSISPERFORMED
LONER LIHIT ALLOF INDICATOR LOCA'TIONS LOCATION NITH HIGHEST ANNUAL MEAN
DETECTIOH MEAN (F) MAHE MEAN (F)(LLD) RAHGE DISTANCE AND DIRECTION RANGE
SEE NOTE 1 SEE NOTE 2 SEE NOTE 2
COHTROL
LOCATI DMS
HEAR (F)RANGE
SEE MOTE 2
NUMBER OFNOMROUTINE
REPORTEDHEASUREHENTS
GAHHA SCAH (GELI)2
BI.214
K-40
PB-214
2.DOE+01
1.50E+02
2.DOE+01
1 VALUES < LLD 2 HILES HNH
3.74E+03( 1/ 1) 2 HILES NNN
3.74E+03- 3.74E+031 VALUES < LLD 2 HILES NNH
1 VALUES < LLD 3.19E+01( 1/ 1)3.19E+01- 3.19E+01
3.74E+03( 1/ 1) 3.25E+03( 1/ 1)3.74E+03- 3.74E+03 3.25E+03. 3.25E+03
1 VALUES < LLD 2.55E+01( 1/ 1)2.55E+01- 2.55E+01
ICOCb
1
NOTE: 1. HOMINAL LONER LIMIT OF DETECTIOM (LLD) AS DESCRIBED IH TABLE E-1NOTE: 2. MEAN AMD RANGE BASED UPON DETECTABLE MEASUREMENTS ONLY. FRACTIOH OF DETECTABLE MEASUREMENTS AT SPECIFIED
LOCATIOHS IS INDICATED lk PARENTHESES (F).

~ W ~ m m m

TEHNESSEE VALLEY AUTHORITYCHEMISTRY AND RADIOLOGICAL SERVICES
ENVIROHMEHTAL RADIOLOGICAL MONITORING AND INSTRUMENTATION
NESTERH AREA RADIOLOGICAL LABDRATOR'Y
ENVIRONMENTAL MONITORING REPORTIHG SYSTEM
RADIOACTIVITY IH TOMATOES
PCI/KG - 0.037 BQ/KG (NET Nt)
NAME OF FACILITY: BROWS FERRY NUCLEAR PLAHt
LOCATION OF FACILITY: LIMESTONE ALABAMA
DOCKET HO.: 50-259,260,296REPORTING PERIOD: 1992
TYPE AND
TOTAL NUMBER
OF AHALYSIS'ERFORMED
LQIER LIMIT ALLOF INDICATOR LOCATIONS
DETECTIOH MEAN (F)(LLD) RAHGE
SEE NOTE 1 SEE HOTE 2
LOCATION lllTH HIGHEST ANNUAL MEAN
NAME MEAN (F)DISTANCE AND DIRECTION RANGE
SEE NOTE 2
CONTROL
LOCATIOHSMEAN (F)
RANGE
SEE NOTE 2
NUMBER OF
NONROUT INEREPORTED
MEASUREMEHTS
GAMMA SCAN (GELI)2
8 I.214
K-40
PB-214
2.DOE+01
1.50E+02
2.DOE+01
1.29E+02( 1/ 1) 2 MILES NHH
1.29E+02- 1.29E+021.72E+03( 1/ 1) 2 MILES HHII
1.72E+03- 1.72E+031.05E+02( 1/ 1) 2 MILES NNH
1.05E+02 1.05E+02
1.29E+02(1.29E+02-
1.72E+03(1.72E+03-
1.05E+02(1.05Ei02-
1/ 1)1.29E+021/ 1)
1.72E+031/ 1)
1.05E+02
2.54E+01( 1/ 1)2.54E401- 2.54E+01
2.20E+03( 1/ 1)2.20E+03- 2.20E+03
2.38Et01( 1/ 1)2.38E+01. 2.38E+01
NO'IE: 1. NOMINAL LONER LIMIT OF DETECTIOH (LLD) AS DESCRIBED IN TABLE E-1 ~
NOTE: 2. MEAN AND RANGE BASED UPON DETECTABLE MEASUREMENTS ONLY. FRACTION OF DETECTABLE MEASUREMEHTS AT SPECIFIED
LOCATIONS IS INDICATED IH PAREHTNESES (F).

M0
TEHHESSEE VALLEY AUTNORITYCHEMISTRY AND RADIOLOGICAL SERVICES
ENVIRONMENTAL RADIOLOGICAL MONITORIHG AND INSTRUMENTATIOHIIESTERN AREA RADIOLOGICAL LABORATORY
ENVIROHMEHTAL MOHITORIHG REPORTIHG SYSTEM
RADIOACTIVITY IH SURFACE MATER(Total)PCI/L - 0.037 BO/L
MANE OF FACILITY: BROOMS FERRY NUCLEAR PLAHT
LOCATION OF FACILITY: LIMESTONE ALABAMA
DOCKET NO.: 50-259,260,296REPORTING PERIOD: 1992
TYPE AND
TOTAL NUMBER
OF ANALYSISPERFORHEO
LONER LIHIT ALLOF INDICATOR LOCATIONS LOCATION lllTH HIGHEST ANNUAL MEAH
DETECTIOH MEAN (F) HAME MEAN (F)(LLO) RANGE DISTANCE AND DIRECTION RANGE
SEE NOTE 1 SEE NOTE 2 SEE HOIE 2
COHTROL
LOCATIONSMEAN (F)
RANGE
SEE NOTE 2
NUHBER OF
NONROUTINEREPORTED
MEASUREHENTS
GROSS BETA39
1.70E+00 3.12E+00( 26/ 26) TRH 293.52.04E<00. 6.06E+00
3.32E+00( 13/ 13) 3.09E+00( 13/ 13)2.32E+00- 6.06E<00 2. 13E+00- 4.32E+00
GAMMA SCAN (GELI)39
8 I.214
PB=?14
2.DOE<01
2.DOE+01
3.15E<OI( 2/ 26) TRM 293.52.99E>OI. 3.31E+01
2.64Et01( 1/ 26) 'IRM 293.5
3. ISEi01( 2/ 13) 2.20E+01( 1/ 13)2.99E<OI- 3.31E+01 2.20E+01- 2.20EtOI
2.64E>OI( 1/ 13) 13 VALUES < LLD
SR 89
SR 90
TRITIUM
4.05E+Ol. 4.05Et01
123.00E>00 8 VALUES < LLD TRM 285.2
121.40E+00 8 VALUES < LLD
4.05Ei01- 4.05E+01
4 VALUES < LLD 3.22Ei00( 1/ 4)3.22Et00. 3.22Et00
4 VALUES < LLO
122.50E+02 8 VALUES < LLO 4 VALUES < LLD
NOTE: 1. NOMINAL LONER LIMI'I OF DETECTIOH (LLD) AS DESCRIBEO IH TABLE E-1
NOTE: 2. MEAN AND RANGE BASED UPON DETECTABLE MEASUREMENTS OHLY~ FRACTION OF DETECTABLE MEASUREMEHTS AT SPECIFIEO
LOCATIONS IS IHDICATED IH PARENTHESES (F).

~
glL
~
it
tg
i

TENNESSEE VALLET AUTHORITYCHEMISIRT AND RADIOLOGICAL SERVICES
ENVIRONMENTAL RADIOLOGICAL MONITORING AND IHSTRUMEHTATIOHMESTERH AREA RADIOLOGICAL LABORATORY
EHVIRONMEHTAL MONITORING REPORTING S'YSTEH
RADIOACTIVITY IN PUBLIC IIATER(Total)PCI/L - 0.037 BD/L
NAHE OF FACILITYI BROMNS FERRY NUCLEAR PLANT
LOCATION OF FACILITYI LIMESTONE ALABAMA
DOCKET NO.I 50.259,260,296REPORTING PERIOD: 1992
TYPE AND
TOTAL NUMBER
OF ANALTSISPERFORMED
LOMER LIMIT ALLOF INDICATOR LOCATIOHS LOCATIOH MITH HIGHEST ANNUAL MEAN
DETECTION MEAN (F) HAHE HEAN (F)(LLD) RAHGE DISTANCE AHD DIRECTIOH RANGE
SEE NOTE 1 SEE NOTE 2 SEE NOTE 2
CONTROLLOCATIONS
MEAN (F)RANGE
SEE NOTE 2
NUHBER OF
HONROUTINEREPORTED
KEASUREHEHTS
GROSS BETA
GAMMA SCAH (GELI)64
8 I.214
PB.214
SR 8920
SR 90
1.70E+00 2.57E+00( 35/ 38) CHAMPION PAPER
1.73E+00- 3.65E+00 TRM 282.6
2.00E+Ol
2.DOE+01
3.34E+01( 2/ 38) CHAMPION PAPER2.26E+01- 4.42E+01 TRM 282.6
2.17E+01( 1/ 38) CHAHP ION PAPER2.17E+01- 2.17E+01 TRH 282.6
3.DOE+00 12 VALUES < LLD CHAMPION PAPERTRM 282.6
2 '6E+00( 10/ 12) 2.77E+00( 24/ 26)1.73Et00- 3. 19E+00 2-02E+00- 4.32Ec00
4.42E+Ol( 1/ 12) 2.20E+Ol ( 1/ 26)4.42Ei01- 4.42E+01 2.20E+01- 2.20E+01
2.17E+01( 1/ 12) 26 VALUES < LLD2.17E+01- 2.17E+01
4 VALUES < LLD 3.22E+00( 1/ 8)3.22E+00. 3.22E+00
TR I T IUM
201.40E+00 12 VALUES < LLD
202.50E+02 12 VALUES < LLD
8 VALUES < LLD
8 VALUES < LLD
NOTE: 1. NOMINAL L(NER LIMIT OF DETECTIOH (LLD) AS DESCRIBED IN TABLE E-1
HOTEI 2. MEAN AND RANGE BASED UPON DETECTABLE MEASUREMEHTS ONLT. FRACTIOH OF DETECTABLE MEASUREMENTS AT SPECIFIEDLOCATIONS IS INDICATEO IH PAREHTHESES (F).

Iii
ili
gi

w w w w w w w w w w w w w w w m't t 0TEKHESSEE VAI.LEY AUTHORITY
CHEHISTRY AND RADIOLOGICAL SERVICESENVIRONMENTAL RADIOLOGICAL MOHITORIHG AND INSTRUMENTATION
WESTERH AREA RADIOLOGICAL LABORATORY
EHVIRONMEHTAL MONITORING REPORTIHG SYSTEMRADIOACTIVITY IK WELL WATER(total)
PCI/L - 0.037 BQ/L
NAME OF FACILITY: BROWNS FERRY NUCLEAR PLANT
LOCATIOH OF FACILITY: LIMESTONE AI.AGAMA
DOCKET NO.: 50-259,260,296REPORTING PERIQ): 1992
TYPE AND
TOTAL NUMBER
OF ANALYSISPERFORMED
LOWER LIMIT ALLOF INDICATOR LOCATIONS LOCATIOH WITH HIGHEST ANNUAL MEAN
DETECTIOK MEAN (F) kAME MEAN (F)(LLD) RANGE DISTANCE AND DIRECTION RANGE
SEE NOTE 1 SEE NOTE 2 SEE NOTE 2
CONTROL
LOCATIOHSMEAN (F)
RAHGE
SEE KOTE 2
NUMBER OF
NONROUT INEREPORTED
MEASUREMEHTS
GAMMA SCAM (GELI)26
8 I.214
PB-214
SR 89
2.DOE+01
2.DOE+01
6.75E+01( 2/ 13) BFN WELL ¹65.67E+Ol- 7.82E+01 0.02 MILES W
6.76E+01( 2/ 13) BFN WELL «65.82E+01- 7.71E+01 0.02 MILES W
6.75E+01( 2/ 13) 4.86E+02( 12/ 13)5.67E+01- 7.82EtOI 3.72E+02- 6.23Et02
6.76E+01( 2/ 13) 4.76E+02( 12/ 13)5.82E+O'I- 7.71E+01 3.66E+02 5.94Ei02
I
C)C)I
SR 90
TRITIUM
3.DOE+00 4 VALUES < LLD
1.40E+00 4 VALUES < LLD
2.50E+02 4 VALUES < LLD
4 VALUES < LLD
4 VALUES < LLD
4 VALUES < LLD
NOTE: 1. NOMINAL LOWER LIMIT OF DETEC'tlON (LLD) AS DESCRIBED IK TABLE E-1
NOTE: 2. MEAN AND RANGE BASED UPON DETECTABLE MEASUREMEHTS OHLY. FRACTION OF DETECTABLE MEASUREHEHTS AT SPECIFIEDLOCATIONS IS IkDICATED Ik PARENTHESES (F).

It
yl
i~
IiI
)L

TENNESSEE VALLEY AUTHORITYCHEHISTRY AND RADIOLOGICAL SERVICES
EHVIROHHEHTAL RADIOLOGICAL MONITORING AND INSTRUMENTATIONNESTERN AREA RADIOLOGICAL LABORATORY
EHVIRONMEHIAL MOHITORING REPORTIHG SYSTEHRADIOACTIVITY IH CRAPPIE FLESH
PCI/GM - 0.037 BQ/G (DRY HEIGHT)
NAME OF FACILITY: BR(WNS FERRY NUCLEAR PLANT
LOCA'IION OF FACILITY: LIMESTONE ALABAMA
DOCNET NO.: 50-259,260,296REPOR'TING PERIM: 1992
TYPE AND
TOTAL NUMBER
OF AHALYSISPERFORMED
L(VER LIMIT ALLOF INDICATOR LOCATIONS LOCATION lllTH HIGHEST ANNUAL MEAN
DETECTIOH MEAN (F) HAHE MEAN (F)(LLD) RANGE DISTANCE AND DIRECTION RANGE
SEE NOTE 1 SEE NOTE 2 SEE NOTE 2
COHTROL
LOCATIONSMEAN (F)
RANGE
SEE NOTE 2
NUHBER OF
NOHROUTINEREPORTED
MEASUREMEHTS
GAMMA SCAN (GELI)4
CS-137
K-40
6.00E.02 6.43E.02( 2/ 2) NNEELER RES6.31E-02- 6.55E.02 TRM 275-349
1.DOE+00 1.41E+01( 2/ 2) NHEELER RES1.32E+01- 1.50E+01 TRH 275-349
6.43E.02( 2/ 2) 8.88E.02( 2/ 2)6.31E-02 6.55E-02 6.77E 02- 1.10E-01
1.41E+01( 2/ 2) 1.57E>01( 2/ 2)1.32E+01- 1.50E+01 1 44E+01- 1.69E+01
NOTE: 1. NOMIHAL LONER LIMIT OF DETECTIOH (LLD) AS DESCRIBED IN TABLE E-1
NOTE: 2. MEAN AND RANGE BASED UPOH DETECTABLE MEASUREHENTS OHLY. FRACTION OF DETECTABLE MEASUREMEHTS AT SPECIFIEDLOCATIONS IS INDICATED IN PARENTHESES (F).

~
~l
ti
a

TENNESSEE VALLEY AUTHORITYCHEHISTRY AND RADIOLOGICAL SERVICES
ENVIROHHEN'IAL RADIOLOGICAL MOHI10RIHG AND INSTRUMEHTATION
MESTERN AREA RADIOLOGICAL LABORATORY
ENVIROHHEHTAL MONITORIHG REPORTING SYSTEM
RADIOACTIVIT'T IH SHALLMOUTH BUFFALO FLESH
PCI/GM - 0.037 BO/G (DRY MEIGHT)
NAME OF FACILITYI BROMNS FERR'Y NUCLEAR PLANT
LOCATION OF FACILITYI LIMESTOHE ALABAMA
DOCKET NO.I 50.259,260,296REPORT IHG PERIOD: 1992
TYPE ANDTO'TAL HUNGER
OF ANALYSISPERFORHED
LOMER L IMI 'I ALLOF INDICATOR LOCATIONS LOCATION NITH HIGHEST ANNUAL MEAN
DETECTION MEAN (F) HAME MEAN (F)(LLD) RANGE DISTANCE AND DIRECTION RANGE
SEE NOTE 1 SEE NOTE 2 SEE NOTE 2
CONTROLLOCATIONS
MEAN (F)RANGE
SEE NOTE 2
NUMBER OF
NONROUT I HE
REPORTEDMEASUREHEHTS
GAMHA SCAH (GELI)4
81.21C
K 40
1.20E-01
1.DOE+00
1.22E-01( 1/ 2) NHEELER RES1.22E.01- 1.22E-01 TRH 275-349
8.64E+00( 2/ 2) llNEELER RES
8.45E+00 8.84E+00 TRM 275 3C9
1.22E-01( 1/ 2) 2 VALUES < LLD1.22E-01- 1.22E 01
8.64Et00( 2/ 2) 1.05E+01( 2/ 2)8.CSE+00- 8.84E+00 8.30E+00- 1.28E+01
NOTE: 1. NOMINAL LOMER LIHIT OF DETECTION (LLD) AS DESCRIBED IN TABLE E.T
HOTE: 2. MEAN AND RANGE BASED UPON DETECTABLE HEASUREMENTS ONLY. FRACTION OF DETECTABLE MEASUREHENTS AT SPECIFIED
LOCATIONS IS INDICATED IN PARENTHESES (F).

gl
L
~
~
ig

TEHHESSEE VALLEY AUTHORITYCHEHISTRY AND RADIOLOGICAL SERVICES
EHVIROHMEHTAL RADIOLOGICAL MONITORIHG AND IHSTRUMENTATIOH
MESTERH AREA RADIOLOGICAL LABORATORY
EHVIRONMEHTAL MONITORING REPORTIHG SYSTEM
RADIOACTIVITY IH SMALLMOUTH BUFFALO WOLEPCI/GH - 0.037 84/G (DRY HEIGHT)
NAME OF FACILITY: BROWS FERRY NUCLEAR PLANT
LOCATION OF FACILITY: LIMESTONE ALABAMA
DOCKET NO.: - 50-259,260,296REPORTIHG PERIOD: 1992
TYPE AND
TOTAL NUMBER
OF ANALYSISPERFORMED
LOWER LIMIT ALLOF INDICATOR LOCATIONS LOCATION NITH HIGHES'I ANNUAL MEAN
DETECTION MEAN (F) NAME MEAN (F)(LLD) RANGE DISTANCE AND DIRECTION RANGE
SEE NOTE 1 SEE NOTE 2 SEE NOTE 2
CONTROL
LOCATIONSMEAN (F)
RAHGE
SEE NOTE 2
NUMBER OF
NONROUTIHEREPORTED
MEASUREHEHTS
GAMMA SCAN (GELI)4
BI-214
K-CO
1.20E-OI 2 VALUES < LLD HHEELER RESTRM 275-349
1.DOE+00 6.97E+00( 2/ 2) WEELER RES
6. 11E+00. 7.83E+00 TRH 275.349
2 VALUES < LLD 1.49E-01( 1/ 2)1.49E-01- 1.49E-01
6.97E+00( 2/ 2) 7.06E>00( 2/ 2)6.11E+00- 7.83E+00 5.08E+00. 9.03E+OD
NOTE: 1. NOMINAL LOMER LIMIT OF DETECTIOH (LLD) AS DESCRIBED IN TABLE E-1
NOTE: 2. MEAN AND RAHGE BASED UPON DETECTABLE MEASUREMENTS OHLY- FRACTION OF DETECTABLE MEASUREMEHTS AT SPECIFIED
LOCATIONS IS INDICATED IH PARENTHESES (F).

~
gl
iI
g

TENNESSEE VALLEY AUTHORITYCHEHISIRY AND RADIOLOGICAL SERVICES
EHVIRONHENTAL RADIOLOGICAL MONITORING AND INSTRUHEHI'ATIOHNESTERN AREA RADIOLOGICAL LABORATOR'I
EHVIRONHEHIAL HONITORING REPORTING SYSIEHRADIOACTIVITY IH SEDIHENI
PCI/GH - 0.037 BQ/G (DRY IIEIGHT)
NANE OF FACILITY: BROMHS FERRY NUCLEAR PLAHT
LOCATION OF FACILITY: LIHESTONE ALABAHA
DOCKET NO.: 50-259,260,296REPORTING PERIOD: 1992
TYPE AND
TOTAL NUHBER
OF ANALYSISPERFORHED
LOMER LIHIT ALLOF INDICATOR LOCATIOHS LOCATIOH lllTH HIGHEST ANNUAL HEAN
DETECIIOH HEAH (F) HAHE HEAH (F)(LLD) RANGE'lSl'ANCE AND DIRECTION RANGE
SEE NOTE 1 SEE NOTE 2 SEE NOTE 2
COHTROL
LOCAIION S
HEAR (F)RANGE
SEE NOTE 2
NUHBER OF
NONROUT IHEREPORTED
HEASURENEHTS
GANHA SCAN (GELI)10
AC-228
BI.212
8 I.214
C0.60
CS-134
CS.137
K-CO
PB.212
PB.214
RA 224
RA-226
TL-208
SR 89
1.00E 01
2.50E-01
4.00E.02
1.00E.02
1.00E-02
1.00E-02
2.00E-01
2 ~ OOE-02
2.00E-02
3.00E-01
5.00E.02
2.00E.02
1.08E+00(5.30E.01-
1.15E+00(5.75E-01-
9.73E-01(5.15E 01-
4.75E-02(1.30E.02-
1.93E-02(1.60E-02
4.34E.01(9.65E-02
8.72E+00(2.51E+00.
1.04E+00(5.07E-01-
1.08Et00(5.81E 01-
1.15E+00(6.78E.01-
9.73E-01(5.15E.01-
3.59E-01(1.76E.01-
6/ 6)1.59E+006/ 6)
1.61E+006/ 6)
1.ClE+005/ 6)
7.49E-022/ 6)
2.25E.026/ 6)
6.66E.OI6/ 6)
1.29E+016/ 6)
1.46E+006/ 6)
1.50E+005/ 6)
1.45E+006/ 6)
1.41E+006/ 6)
5.14E 01
TRH 288.78
TRH 293.7BFN DISCHARGE
TRH 293.7BFN DISCHARGE
TRH 293.7BFN DISCHARGE
TRH 293.7BFH DISCHARGE
IRH 288.78
TRH 2M.78
TRH 293.7BFH DISCHARGE
IRH 293.7BFN DISCHARGE
TRH 293.7BFN DISCHARGE
TRH 293.7BFH DISCHARGE
TRH 293.7BFN DISCHARGE
1.34E+00(1.08Et00-
1.42E<00(1.32E+00-
1.22E+00(1.12E+00-
6.75E.02(6.00E.02-
2.25E-02(2.25E.02.
6.43E.01(6.19E-01-
1.22E+01(1.1CE+01-
1.33E>00(1.22E+00.
1.41E+00(1.33E+00-
1.32E+00(1.25E+00-
1.22E<00(1.12E>00-
4.52E.OI(4.30E-01-
2/ 2)1.59E+002/ 2)
1.51E+002/ 2)
1.33E+002/ 2)
7.49E-021/ 2)
2.25E-022/ 2)
6.66E-012/ 2)
1.29E+012/ 2)
1.44E+002/ 2)
1.50E+002/ 2)
1.38E+002/ 2)
1.33E+002/ 2)
4.74E-01
T. IOEt00( 4/ 4)9.74E-01- 1.22E+00
1.18Et00( 4/ 4)1.11E+00. 1.25E+00
1.04E+00( 4/ 4)9.24E-OI- 1.14Et00
2.11E-02( 1/ 4)2.11E-02- 2.11E.02
4 VALUES < LLD
2.12E.01( 4/ 4)1.20E.01- 3.24E-OI
1.22E+01( 4/ 4)T. I TEt01- 1.34E+01
1.07Ei00( 4/ 4)9.61E-DI- 1.21Ei00
1.15E>00( 4/ 4)1.03E+00. 1.28F+00
I.TOE>00( 3/ 4)1.02E+00. 1.15E+00
1.04E+00( 4/ 4)9.2CE.OI. 1.1CE+00
3.71E-O'I( 4/ 4)3.43E-01- 3.94E-01
SR 90
101.DOE+00 6 VALUES < LLD
103.00E 01 6 VALUES < LLD
4 VALUES < LLD
4 VALUES < LLD
NOTE: 1. HOHINAL LSIER LIHII OF DETECIIOH (LLD) AS DESCRIBED IN TABLE E-1
NOTE: 2. HEAH AND RANGE BASED UPON DETECTABLE HEASUREHEHTS ONLY- FRACTION OF DETECTABLE NEASUREHEHTS AT SPECIFIEO
LOCATIONS IS INDICATED IN PAREHTNESES (F).

gl~
~
I
iL
(

0 0TENHESSEE VALLEY AUTHORITY
CHEMISTRY AND RADIOLOGICAL SERVICESENVIRONMENTAL RADIOLOGICAL MONITORING AND IHSTRUMEHTATIOH
HESTERH AREA RADIOLOGICAL LABORATORY
ENVIRONMENTAL MONITORING REPORTING SYSTEM
RADIOACTIVITY IH CLAM FLESHPCI/GM - 0.037 BQ/G (DRY HEIGHT)
NAME OF fACILITY: BRDNNS FERRY NUCLEARPLANT'OCATION
OF FACILITY: LIMESTONE ALABAMA
DOCKET NO.: 50-259,260,296REPOR'TING PERIOD: 1992
TYPE AND
TOTAL NUMBER
OF ANALYSISPERFORMED
LONER LIMIT ALLOF INDICATOR LOCATIONS LOCATION MITN HIGHEST ANHUAL MEAN
DETECT ION MEAN (F) NAME MEAN (F)(LI.D) RANGE DISTANCE AND DIRECTION RANGE
SEE NOTE 1 SEE NOTE 2 SEE NOTE 2
CONTROL
LOCATIONSMEAN (F)
RANGE
SEE NOTE 2
NUMBER OF
NOHRDUT I NE
REPORTEDMEASUREMEHTS
GAMMA SCAH (GELI)4
BI-214
PB.214
2.50E.01 2.43E+00( 2/ 2) DONNSTREAM LOCATION 2.43E+00( 2/ 2) 1.36E+00( 2/ 2)1.13E+00. 3.72E+00 DDNNSTREAM 1.13E+00- 3.72E+00 1.13E+00 1.58Ei00
2.50E-01 2.26E+00( 2/ 2) DDNHSTREAM LOCATION 2.26E+00( 2/ 2) 1.43E400( 2/ 2)1.17E+00 3.35E+00 DONNSTREAM 1.17E+00- 3.35E<00 1.19E+00- 1.67E<00
NOIE: 1. NOMINAL LONER LIMIT OF DETECTIOH (LLD) AS DESCRIBED IN TABLE E-1
NOTE: 2. MEAN AND RANGE BASED UPON DE'IECTABLE MEASUREMEHTS ONLY. FRACTION OF DETECTABLE MEASUREMENTS AT SPECIFIED
LOCATIONS IS INDICATED IH PAREHTNESES (F).
Iel
I
lI
III
Or

Direct Radiation LevelsBrogans Ferry Nuclear Plant
I
C)Cb
I
0 Onslte
X Offsfte
MM~~XM~~J ~6 77 78 79 88 81 82 83 BI BS 86 87 68 89 98 Bf 92 93
Year/Quarter

yl

~ ~Direct Radiation Levels
Br owns Fe r ry Nuc 1 e ar P 1 ant4 —Quarter Moving Rverage
S
f0
I Q
reQCKl
KKE
2SLl-
0 Onslte
X Offslte
6 77 78 79 68 8j 82 83 64 85 66 87 88 69 98 91 92 93
Year~Quarter

yl
I~
g

Direct Radiation LevelsNatts Bar Nuclear Plant
25
S
Kl 2
C3C700
S1
KlaCKl
mCEE
0 Ons1te
X Offslte
78 79 6e — 81 82 83 84 65 86 67 88 8S 98 91,
S2 93
Year ~Quar ter

Il
yl
l'
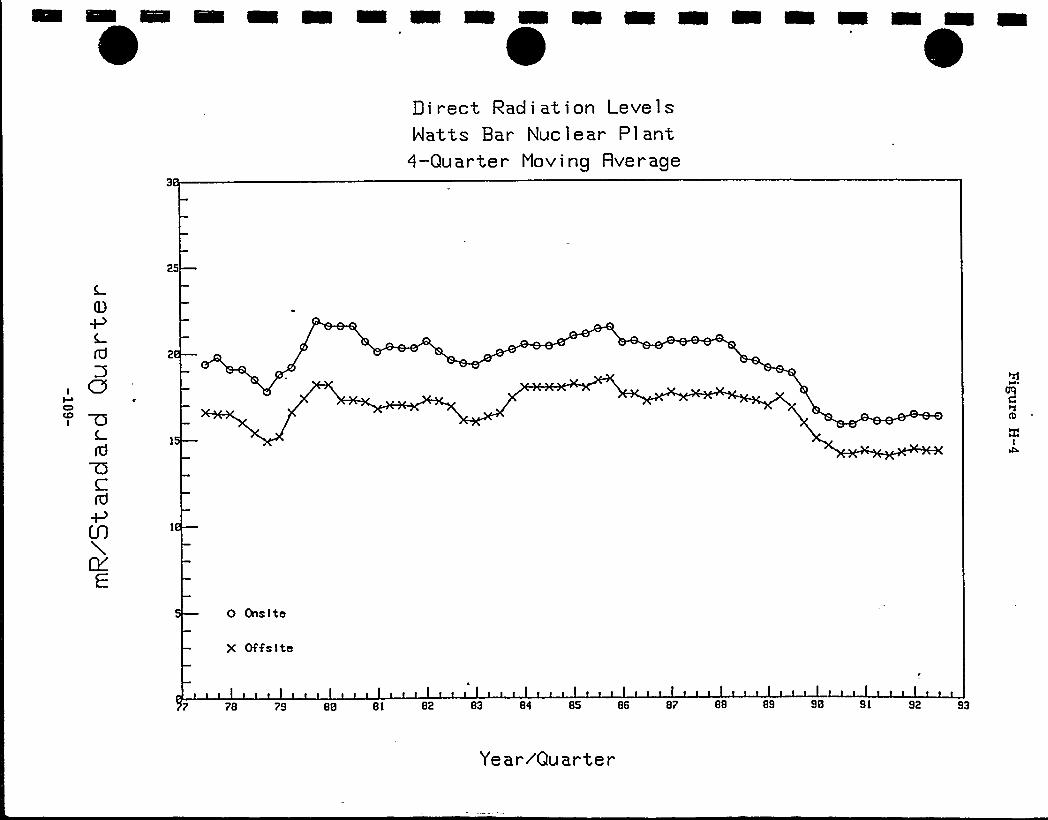
Direct Radiation Levelswatts Bar Nuc l e ar P 1 ant
0 —Quarter Moving Rverage
25
0 Onslte
X Offslte
Za rS ee el e2 63 8< 85 86 ex 88 BS I Sl S2 S3
Ye ar/Quar te r

I
IIiL
I

pC
Annual Average Gross Beta ActivityAir Filters (pCi/Cubic Meter)Browns Ferry Nuclear Plant
~ Indicator H Control
0.25C
0.2
b 0.15I
0.1
0.05M
P reoperationalPhase
Operational Phase
//
Preoperational Average
(D
/ /
e
e
r
68 69 70 71 7273 73 74 75767778 79 8081p 0
Year
I
82 83 84 85 86 87 88 89 90 91 92

L
1
I
L
L
g

~ ~Annual Average: Sr-90 in Milk
Browns Ferry Nuclear Plant
- Indicator ~ Control
20 T
p 18C 16i 14I 12L 10i 8
6
e 4r 2
0
P reoperationalPhase
Operational Phase
Preoperational Average
+7 0 0 g p0 ~—0 5 0—~g ~~o=o —o-o 0
68 69 70 71 72 73 73 74 75 76 77 78 79 80 8I 82 83 84 85 86 87 88 89 90 91 92p 0
Year

I
g

Annual Average: Cs-137 in SoilBrowns Ferry Nuclear Plant
2.5
pC
2
1.5
gI
Q 5m
Preoperational~ Phase
- Indicator '~ Control
Operational Phase
Preoperational Average
~—o~ ~ 0 aY'e~ o—~—Wo ~ ~ g ~p68 69 70 71 72 73 73 74 75 76 77 78 79 80 81 82 83 84 85 86 87 88 89 90 91 92
p 0
Year
Note: Detector system changed from Nal to GeLi in 1977.

glli
~l
lL
rg

W W W W & W W M W Mt ~ 0Annual Average Gross Beta Activity
Surface Water (pCi/Liter)Browns Ferry Nuclear Plant
.- Downstream '~ Upstream
pc '/L 3
I ~
P reoperationalPhase
Operational Phase
Preoperational Average
gQp
e
68 69 70 71 72 73p73o 74 75 76 77 79 80 81 82 83 84 85 86 87 88 89 90 g1 g2Year

~l
L
~
g~

Annual Average Gross Beta ActivityDrinking Water (pCi/Liter)
Browns Ferry Nuclear Plant
- Indicator ~ Control
pc '
4/L 3
I
t 2
e1
r
Preoperational,Phase
~—~
0
Operational Phase
Preoperational Average
68 69 70 71 72 73p73o 74 75 76 77 78 79 80 81 82 83 84 85 86 87 88 89 90 91 92Year

yl
L
i)
l

%8
~ ~Annual Average
Cs-137 in Fish: CrappieBrowns Ferry Nuclear Plant
- Downstream ~ Upstream
0.4
p0.35
C 0.3
0.25
0.2g
0.15a 0.1m 005
0—0—g0
PreoperationalPhase
Preo erational Avera e
Q
Q~~—o~ +WAN~ ~ (7
0Operational Phase ~~
~—I—I
69 70 71 72 73p73o 74 75 76 77 78 79 80 81 82 83 84 85 86 87 88 89 90 91 92Year
Note: Detector system changed from Nal to GeLi in 1978.

I
I

HN t~ ~Annual Average
Cs-137 in Fish: Smallmouth Buffalo, FleshBrowns Ferry Nuclear Plant
.- Downstream .~ Upstream
0.20.180.160.14
/ 0.120.1
0.080.060.040.02
0
PreoperationalPhase
0
Operational Phase
Preoperational Average
~~ g~ Q—~
69 70 71.72 73p73o 74 75 76 77 78 79 80 81 82 83 84 85 86 87 88 89 90 91 92Year
Note: Detector system changed from Nal to GeLi in 1978.


CR W W W W M W W M I'Annual Average
Cs-137 in Fish: Smallmouth Buffalo, WholeBrowns Ferry Nuclear Plant
- Downstream ~ Upstream
0.180.16
pC 0'4
0.120.1
g 0.08r 006
0 04
0. 02
0
P reoperationalPhase
Operational Phase
Preoperational Average
0— ~ 0—0—0—0—0—0
~~
~~
69 70 71 7273p73o 74 75 76 77 78 79 80 81 82 83 84 85 86 87 88 89 90 91 92Year
Note: Detector system changed from Nal to GeLi in 1978.


M W M
Annual Average: Cs-137 in SedimentBrowns Ferry Nuclear Plant
- Downstream ~ Upstream
5T~ Preoperational
Phasep 4C 35I
2.5 ~gr
1.5
m0.5
0
Operational Phase
Preoperational Average
X@r %0.~~~ o~ ~ I
~~~ O~~o—o— o— cv ~~ ~o—o—o—o
69 70 71 72 73 74 75 76 77 78 79 80 81 82 83 84 85 86 87 88 89 90 9I 92Year
Note: Detector system changed from Nal to GeLi in 1977.

il
gI

Annual Average: Co-60 in SedimentBrowns Ferry Nuclear Plant
- Downstream ~ Upstream
0.6
C 0.5I
0.4
0.7 ~Preoperational
PhaseOperational Phase
Preoperational Average
g 0.3
am 0 1
0
69 70 71 72 73 74 75 76 77 78 79 80 81 82 83 84 85 86 87 88 89 90 91 92Year
Note: Detector system changed from Nal to GeLi in 1977.

gl
L
ig
t