annual press conference of audi ag · forecast 2014 clear increase slight increase within the...
TRANSCRIPT

Annual Press Conference of AUDI AG
Axel Strotbek
Member of the Board of Management,
Finance and Organization

Audi Annual Report 2013
2011 2012 2013
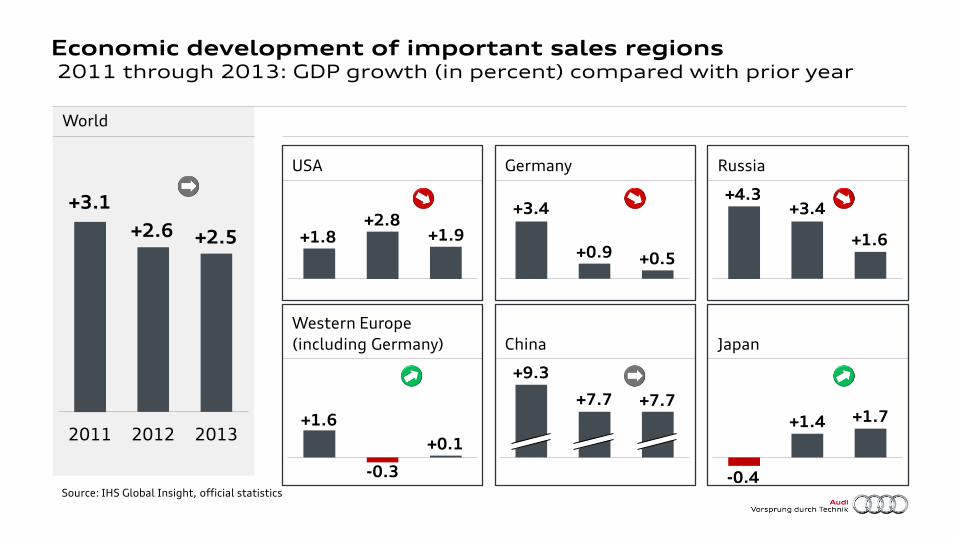
Economic development of important sales regions 2011 through 2013: GDP growth (in percent) compared with prior year
Source: IHS Global Insight, official statistics
World
USA Germany Russia
Western Europe
(including Germany) China Japan
+0.5 +0.9
+3.4
+1.6
+3.4 +4.3
+1.9 +2.8
+1.8 +2.5 +2.6
+3.1
+1.4
-0.4
+1.7
-0.3
+1.6 +7.7 +7.7
+9.3
+0.1

Car markets worldwide versus Audi deliveries to customers 2013 compared with 2012 (in percent)
World
North America Western Europe Central & Eastern Europe
South America Africa & Middle East Asia-Pacific
-1.3 -1.9
+4.1
-3.9
+12.7 +7.3
+8.3
+5.0
+20.9
+8.6 +8.3
-0.7
+7.8 +7.5 Car
market

Audi Group revenue (IFRS) EUR million
48,771 49,880
2012 2013
+2.3%

Audi Group revenue (IFRS) EUR million
48,771 49,880
2012 2013
Motorcycles segment
EUR 573 million
Automotive segment
EUR 49,307 million
+2.3%

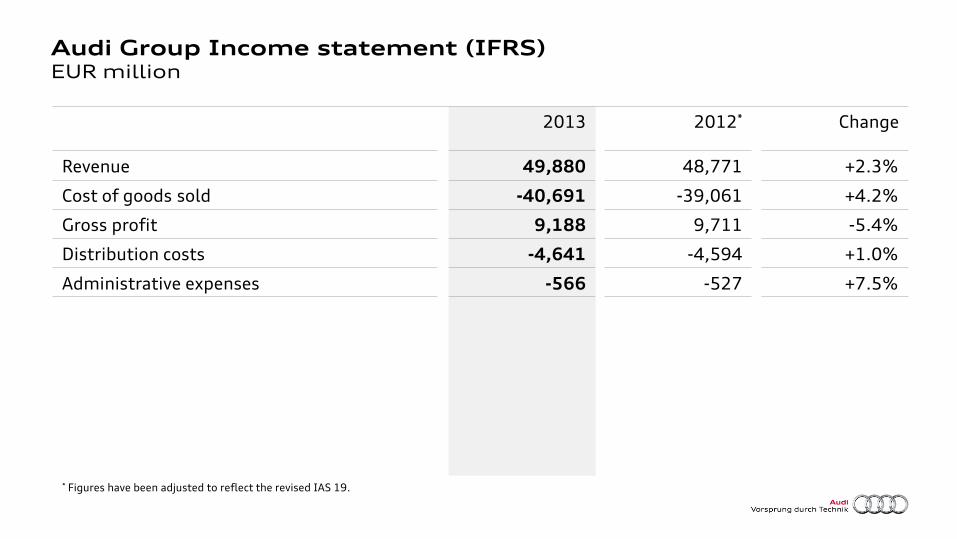
2013 2012* Change
Audi Group Income statement (IFRS) EUR million
Revenue
Cost of goods sold
* Figures have been adjusted to reflect the revised IAS 19.
49,880
-40,691
48,771
-39,061
+2.3%
+4.2%

2013 2012* Change
Revenue
Cost of goods sold
Gross profit
* Figures have been adjusted to reflect the revised IAS 19.
49,880
-40,691
9,188
48,771
-39,061
9,711
+2.3%
+4.2%
-5.4%
Audi Group Income statement (IFRS) EUR million

2013 2012* Change
Revenue
Cost of goods sold
Gross profit
Distribution costs
49,880
-40,691
9,188
-4,641
48,771
-39,061
9,711
-4,594
+2.3%
+4.2%
-5.4%
+1.0%
* Figures have been adjusted to reflect the revised IAS 19.
Audi Group Income statement (IFRS) EUR million
2013 2012* Change
Revenue
Cost of goods sold
Gross profit
Distribution costs
Administrative expenses
49,880
-40,691
9,188
-4,641
-566
48,771
-39,061
9,711
-4,594
-527
+2.3%
+4.2%
-5.4%
+1.0%
+7.5%
* Figures have been adjusted to reflect the revised IAS 19.
Audi Group Income statement (IFRS) EUR million
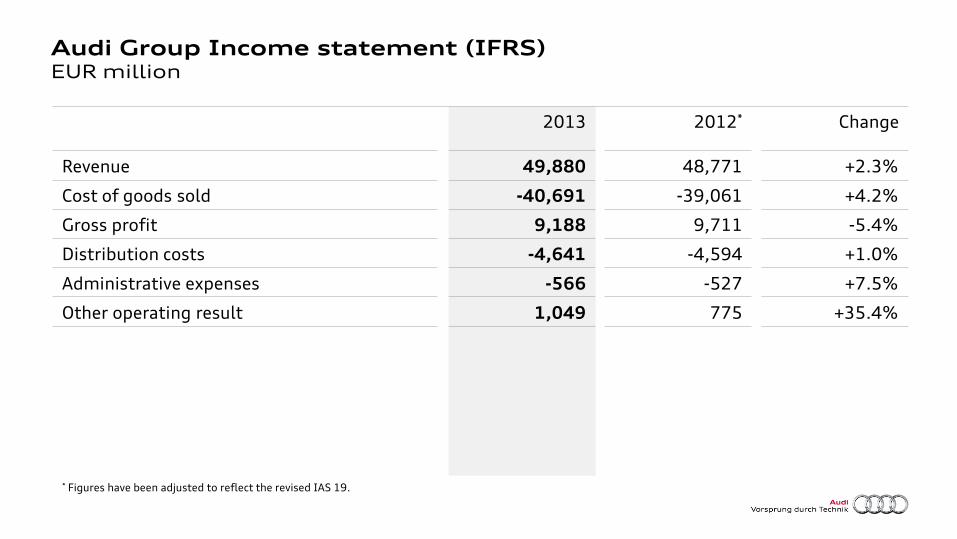
2013 2012* Change
Revenue
Cost of goods sold
Gross profit
Distribution costs
Administrative expenses
Other operating result
49,880
-40,691
9,188
-4,641
-566
1,049
48,771
-39,061
9,711
-4,594
-527
775
+2.3%
+4.2%
-5.4%
+1.0%
+7.5%
+35.4%
* Figures have been adjusted to reflect the revised IAS 19.
Audi Group Income statement (IFRS) EUR million
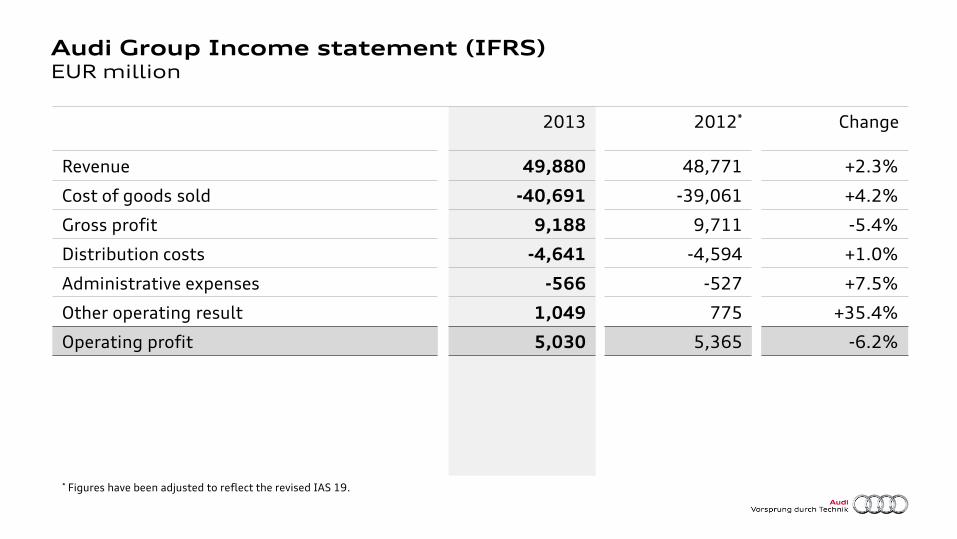
2013 2012* Change
Revenue
Cost of goods sold
Gross profit
Distribution costs
Administrative expenses
Other operating result
Operating profit
49,880
-40,691
9,188
-4,641
-566
1,049
5,030
48,771
-39,061
9,711
-4,594
-527
775
5,365
+2.3%
+4.2%
-5.4%
+1.0%
+7.5%
+35.4%
-6.2%
* Figures have been adjusted to reflect the revised IAS 19.
Audi Group Income statement (IFRS) EUR million

Audi Group analysis of operating profit (IFRS) EUR million
Profit drivers
• Volume
• Product costs
Negative factors
• Intensity of competition
• Investments in worldwide production network
• Development of new models and innovative drive systems
5,365* 5,030
2012 2013
-6.2%
* Figure has been adjusted to reflect the revised IAS 19.
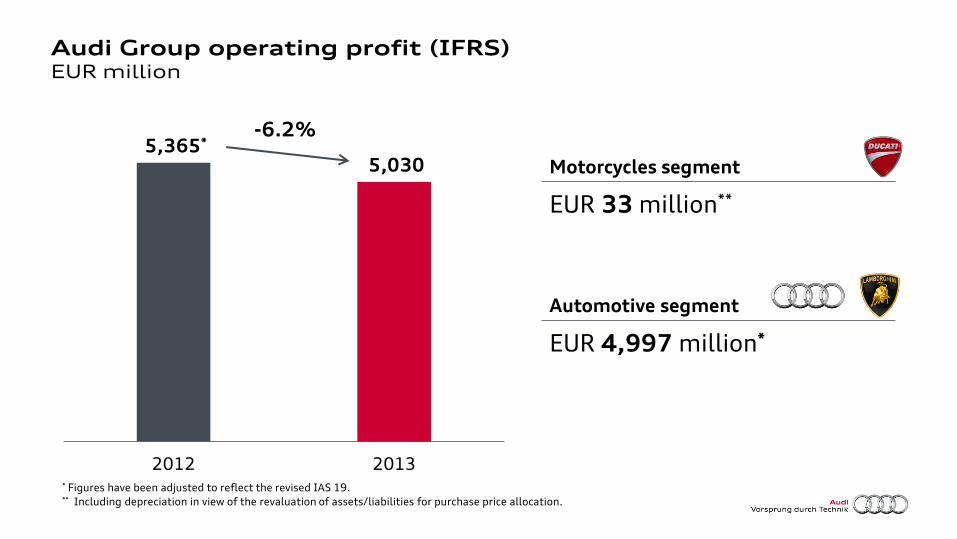
Audi Group operating profit (IFRS) EUR million
Motorcycles segment
EUR 33 million**
Automotive segment
EUR 4,997 million*
5,365* 5,030
2012 2013
-6.2%
* Figures have been adjusted to reflect the revised IAS 19. ** Including depreciation in view of the revaluation of assets/liabilities for purchase price allocation.

2013 2012* Change
Audi Group Income statement (IFRS) EUR million
Operating profit
Financial result
Profit before tax
5,030
293
5,323
5,365
586
5,951
-6.2%
-50.0%
-10.5%
* Figures have been adjusted to reflect the revised IAS 19.

Audi Group: Return on sales in percent
Operating return on sales Return on sales before tax
11.0 10.1
2012* 2013
12.2
10.7
2012* 2013 * Figures have been adjusted to reflect the revised IAS 19.

2013 2012 Change
Audi Group Cash flow statement EUR million
Cash flow from operating activities 6,778 6,144 +10.3%
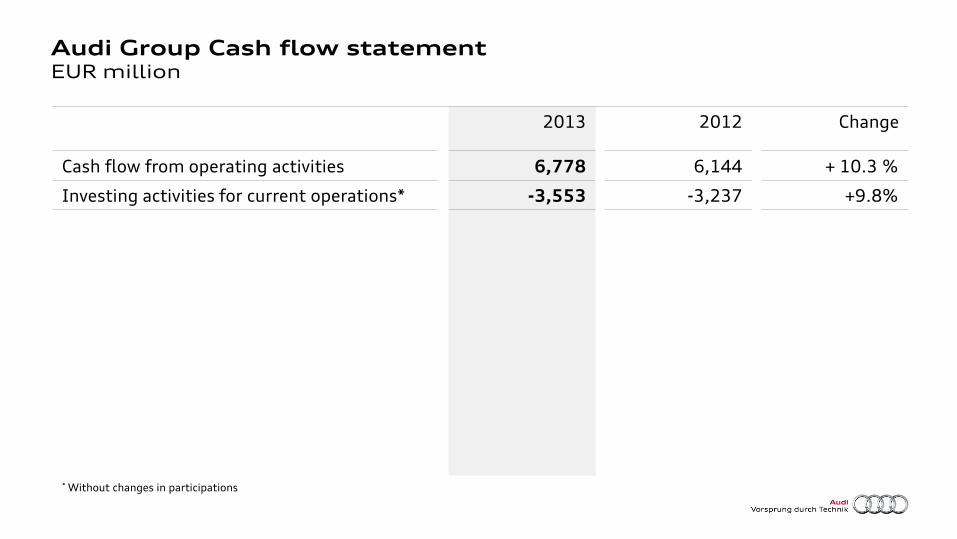
2013 2012 Change
Audi Group Cash flow statement EUR million
Cash flow from operating activities
Investing activities for current operations*
6,778
-3,553
6,144
-3,237
+ 10.3 %
+9.8%
* Without changes in participations
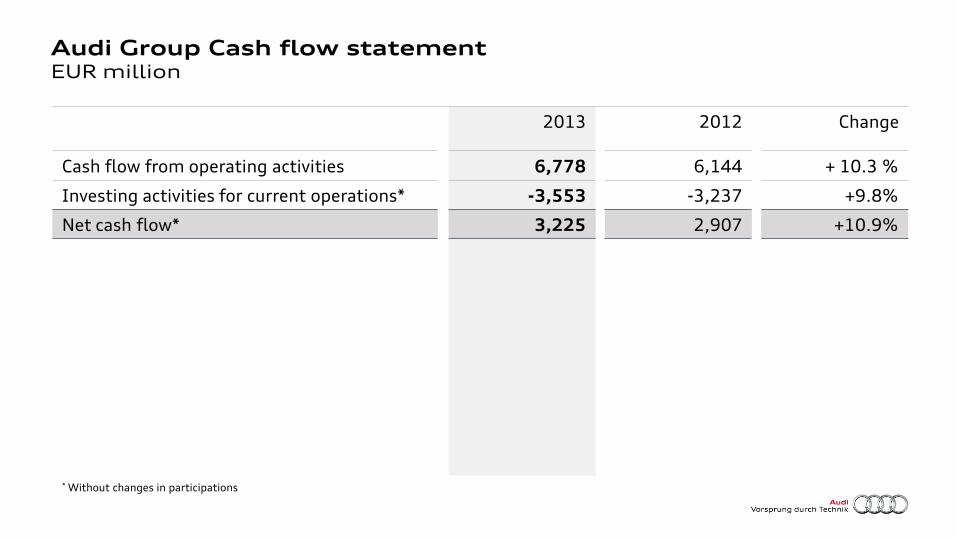
2013 2012 Change
Audi Group Cash flow statement EUR million
Cash flow from operating activities
Investing activities for current operations*
Net cash flow*
6,144
-3,237
2,907
+ 10.3 %
+9.8%
+10.9%
6,778
-3,553
3,225
* Without changes in participations

2013 2012 Change
Audi Group Cash flow statement EUR million
Cash flow from operating activities
Investing activities for current operations*
Net cash flow*
Net liquidity
6,778
-3,553
3,225
14,716
6,144
-3,237
2,907
13,396
+ 10.3 %
+9.8%
+10.9%
+9.8%
* Without changes in participations
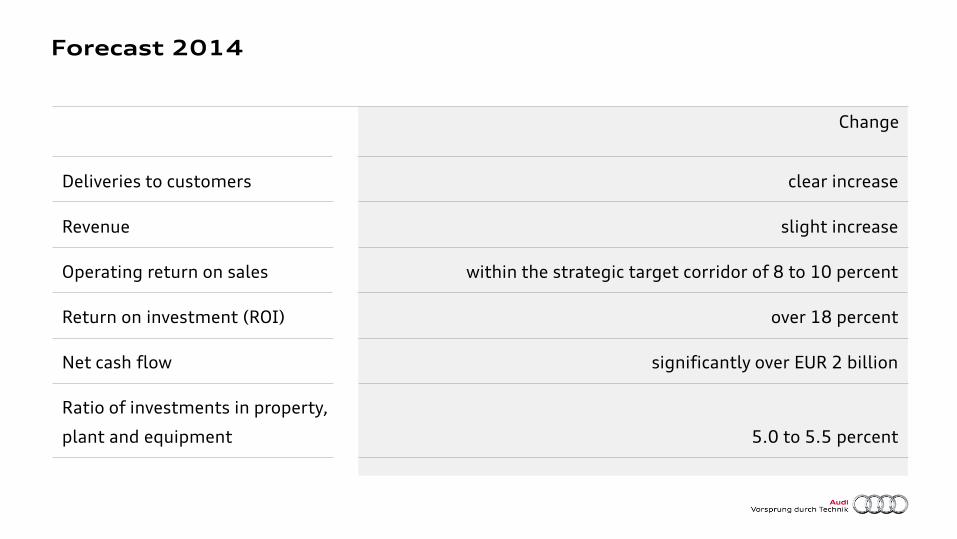
Forecast 2014
clear increase
slight increase
within the strategic target corridor of 8 to 10 percent
over 18 percent
significantly over EUR 2 billion
5.0 to 5.5 percent
Deliveries to customers
Revenue
Operating return on sales
Return on investment (ROI)
Net cash flow
Ratio of investments in property,
plant and equipment
Change

Record investment program creates basis for future growth
bis 2018 Gesamtinvestitionen
von rund 22 Mrd. EUR,
vor allem für:
► neue Modelle
► innovative Technologien
► kontinuierliche Erweiterung
unserer Produktionskapazitäten
► new models
► innovative technologies
► continuous expansion for our production capacities
By 2018,
total investment
of approx. EUR 22 billion,
mainly for: