annual press conference and annual analyst conference€¦ · annual press conference and annual...
TRANSCRIPT
Annual press conference and annual analyst conference Page 1
Annual press conference and annual analyst conference
Annual press conference and annual analyst conference Page 2
Kurt Siegenthaler, Chairman Philip Mosimann, CEO Roger Baillod, CFO
Annual press conference and annual analyst conference Page 3
Annual press conference and annual analyst conference
Annual press conference and annual analyst conference Page 4
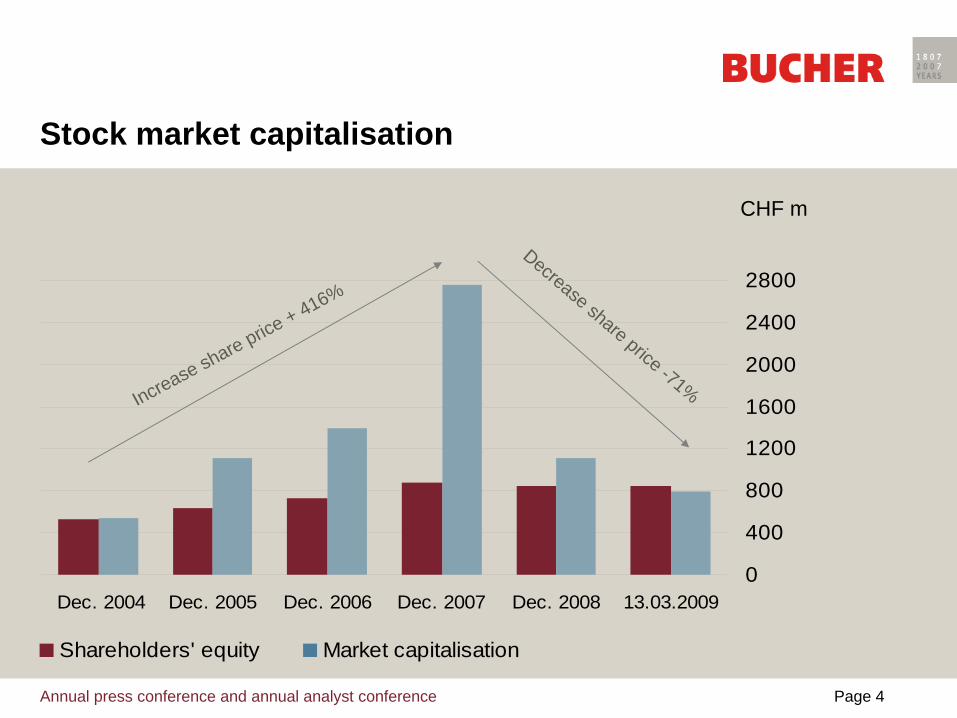
Stock market capitalisation
0
400
800
1200
1600
2000
2400
2800
Dec. 2004 Dec. 2005 Dec. 2006 Dec. 2007 Dec. 2008 13.03.2009
Shareholders' equity Market capitalisation
CHF m
Decrease share price -71%Increase share price + 416%
Annual press conference and annual analyst conference Page 5
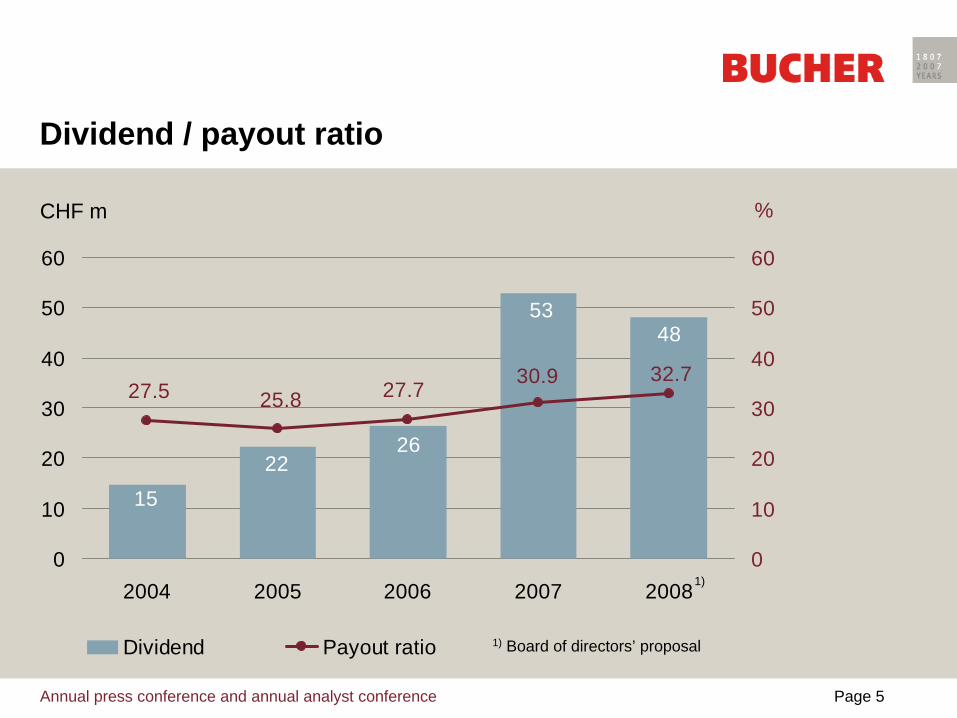
Dividend / payout ratio
22
15
26
4853
27.5 25.832.730.9
27.7
0
10
20
30
40
50
60
200820072006200520040
10
20
30
40
50
60
Dividend Payout ratio
CHF m %
1) Board of directors’ proposal
1)
Annual press conference and annual analyst conference Page 6
Annual Report 2008 Philip Mosimann, CEO
Annual press conference and annual analyst conference Page 7
Group at a glance
• Continued strong organic sales growth- 16% last year- Sales doubled since 2002
• EBIT margin before impairment charges improved in all the divisions except Bucher Hydraulics
• Group sales increased by 13% to CHF 2.8 billion• High currency impact on sales (-6% / CHF -149 million), net
financial items (CHF -23 million) and equity (CHF -123 million)• Economic slump and CHF 39 million in impairment charges due to
the financial crisis• Profit for the year of CHF 145 million, 15% down year on year
Annual press conference and annual analyst conference Page 8
Group at a glance (continued)
• Solid operating ratios- EBITDA margin up from 11.6% to 12.2% - EBIT margin up from 9.3% to 9.9% (before impairment charges) - Operating return of 18.5% RONOA after tax, exceeding the target of 16%
• Market and technology leadership expanded- Kuhn Group: Blanchard (sprayers)
Geldrop (balers and bale wrappers)- Bucher Hydraulics: Monarch Hydraulics Inc.
Command Controls Corp. (cartridge valves)
• Solid balance sheet- Low net debt of CHF 111 million- Unchanged equity ratio of 41%
Annual press conference and annual analyst conference Page 9
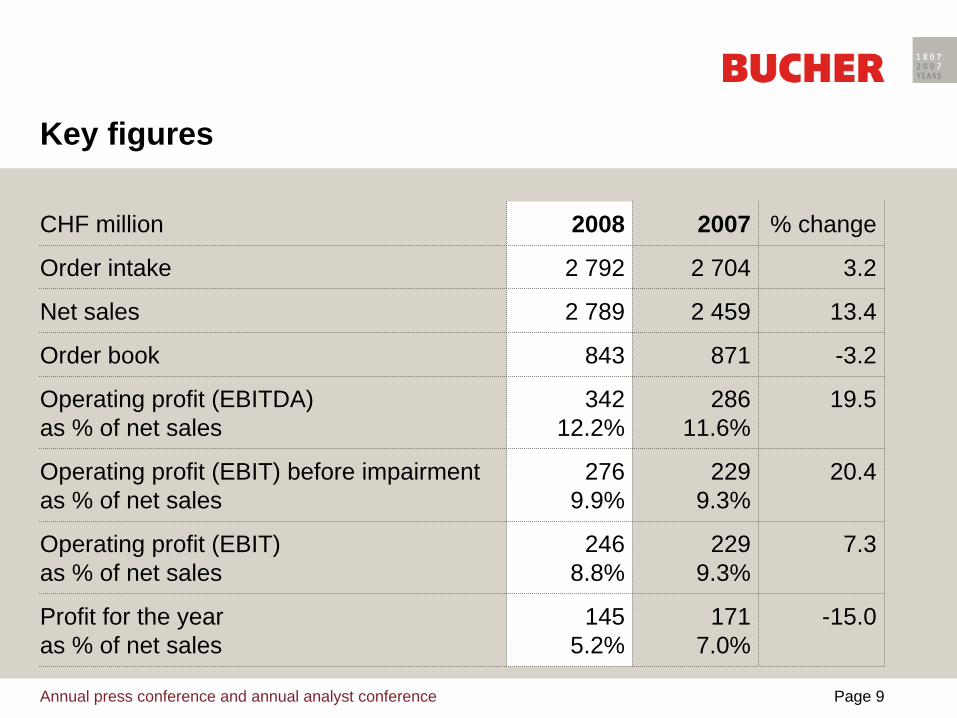
Key figures
CHF million 2008 2007 % change
Order intake 2 792 2 704 3.2
Net sales 2 789 2 459 13.4
Order book 843 871 -3.2
Operating profit (EBITDA) as % of net sales
34212.2%
286 11.6%
19.5
Operating profit (EBIT) before impairmentas % of net sales
2769.9%
2299.3%
20.4
Operating profit (EBIT) as % of net sales
2468.8%
229 9.3%
7.3
Profit for the year as % of net sales
1455.2%
171 7.0%
-15.0
Annual press conference and annual analyst conference Page 10
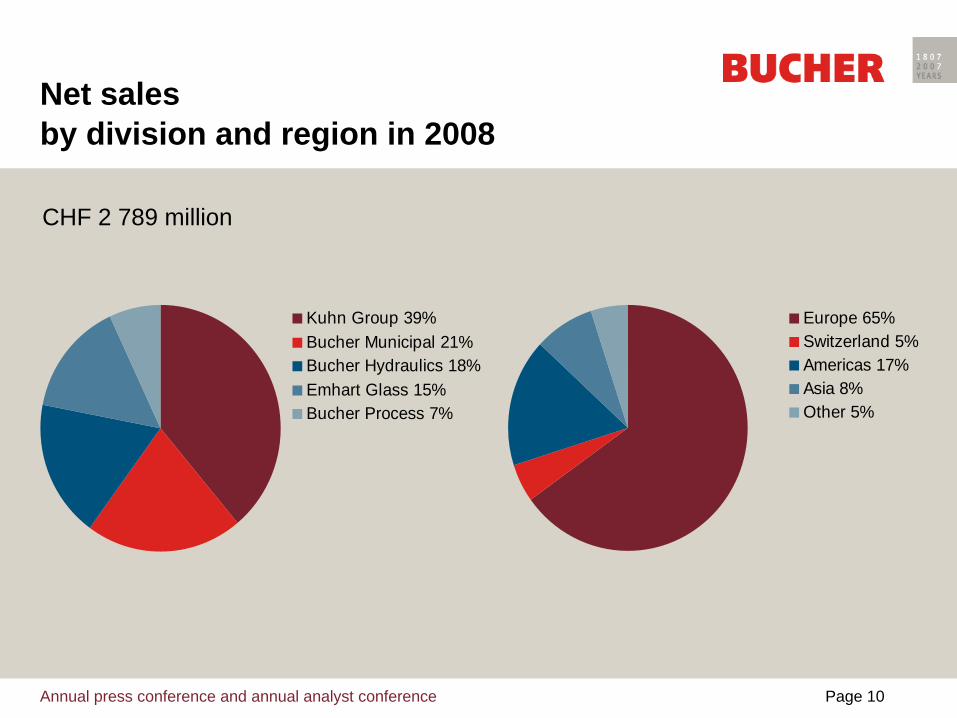
Net sales by division and region in 2008
CHF 2 789 million
Kuhn Group 39%Bucher Municipal 21%Bucher Hydraulics 18%Emhart Glass 15%Bucher Process 7%
Europe 65%Switzerland 5%Americas 17%Asia 8%Other 5%
Annual press conference and annual analyst conference Page 11
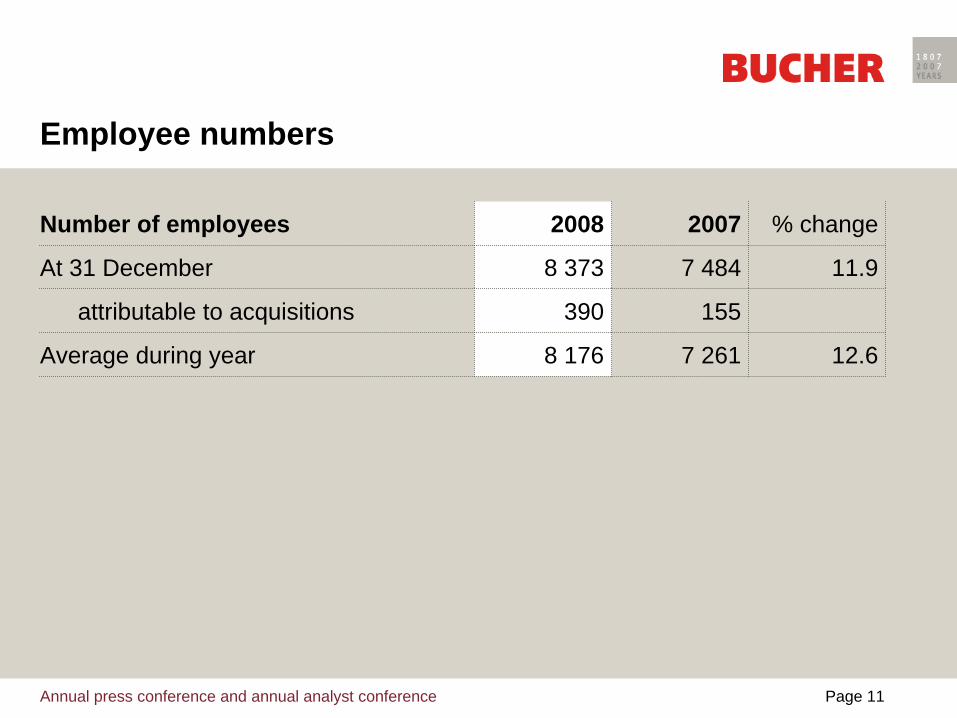
Employee numbers
Number of employees 2008 2007 % change
At 31 December 8 373 7 484 11.9
attributable to acquisitions 390 155
Average during year 8 176 7 261 12.6
Annual press conference and annual analyst conference Page 12
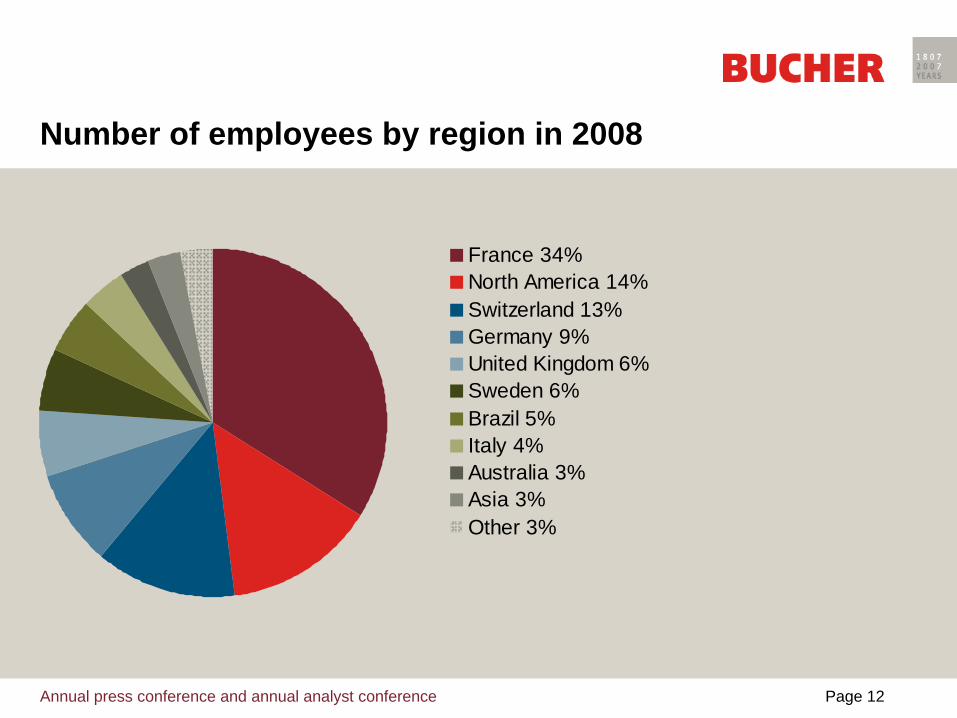
Number of employees by region in 2008
France 34%North America 14%Switzerland 13%Germany 9%United Kingdom 6%Sweden 6%Brazil 5%Italy 4%Australia 3%Asia 3%Other 3%
Annual press conference and annual analyst conference Page 13
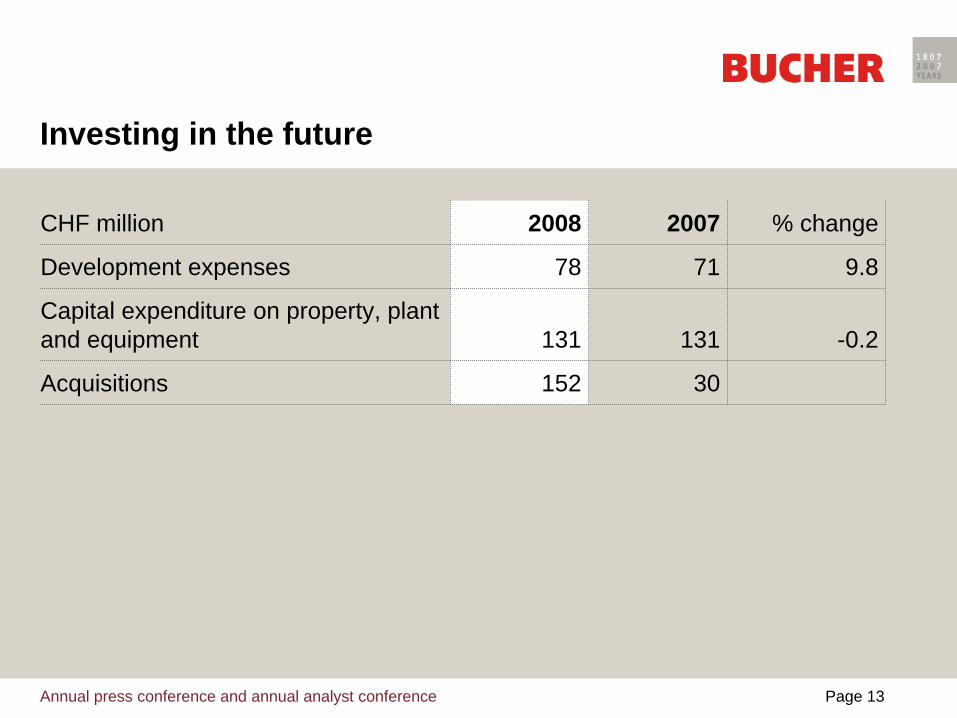
Investing in the future
CHF million 2008 2007 % change
Development expenses 78 71 9.8
Capital expenditure on property, plant and equipment 131 131 -0.2
Acquisitions 152 30
Annual press conference and annual analyst conference Page 14
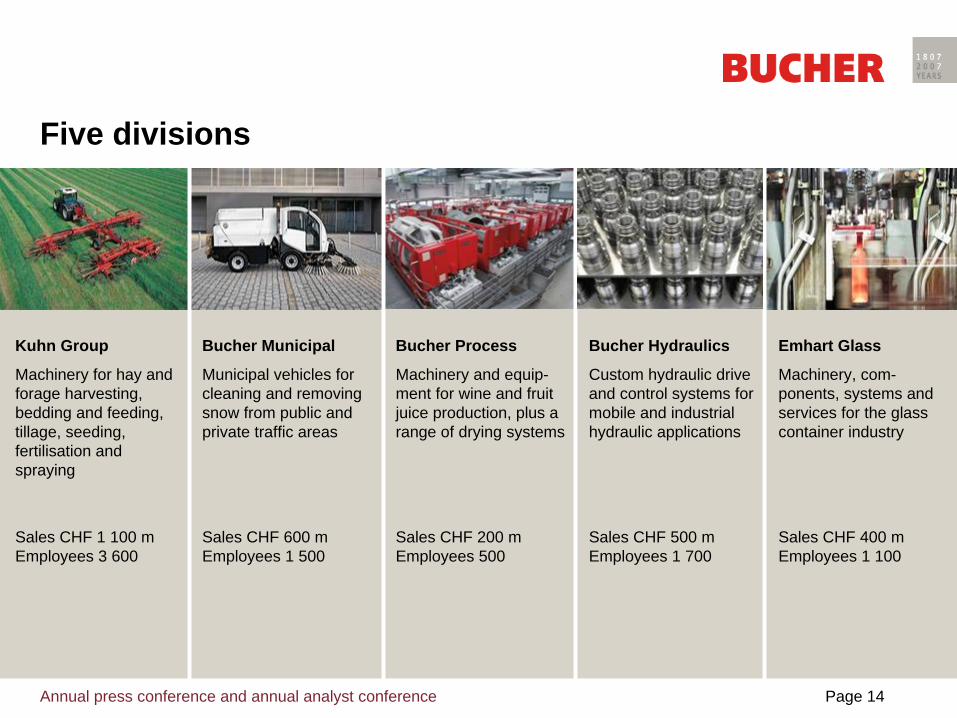
Kuhn Group
Machinery for hay and forage harvesting, bedding and feeding, tillage, seeding, fertilisation and spraying
Sales CHF 1 100 m Employees 3 600
Bucher Municipal
Municipal vehicles for cleaning and removing snow from public and private traffic areas
Sales CHF 600 m Employees 1 500
Bucher Process
Machinery and equip- ment for wine and fruit juice production, plus a range of drying systems
Sales CHF 200 m Employees 500
Bucher Hydraulics
Custom hydraulic drive and control systems for mobile and industrial hydraulic applications
Sales CHF 500 m Employees 1 700
Emhart Glass
Machinery, com- ponents, systems and services for the glass container industry
Sales CHF 400 m Employees 1 100
Five divisions
Annual press conference and annual analyst conference Page 15
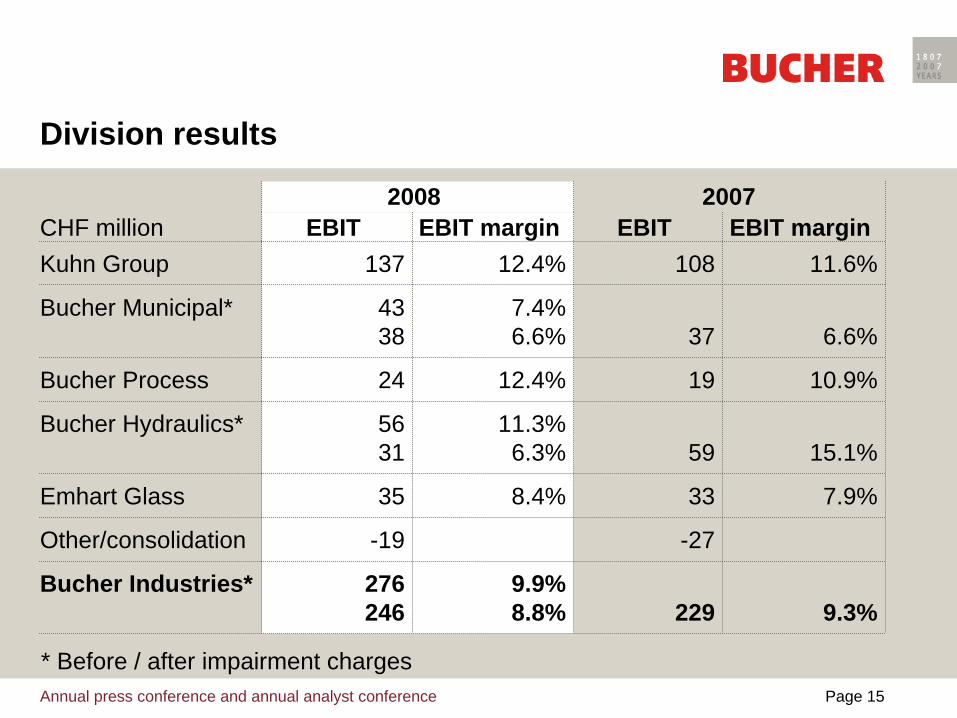
Division results
2008 2007CHF million EBIT EBIT margin EBIT EBIT marginKuhn Group 137 12.4% 108 11.6%
Bucher Municipal* 4338
7.4%6.6% 37 6.6%
Bucher Process 24 12.4% 19 10.9%
Bucher Hydraulics* 5631
11.3%6.3% 59 15.1%
Emhart Glass 35 8.4% 33 7.9%
Other/consolidation -19 -27
Bucher Industries* 276246
9.9%8.8% 229 9.3%
* Before / after impairment charges
Annual press conference and annual analyst conference Page 16
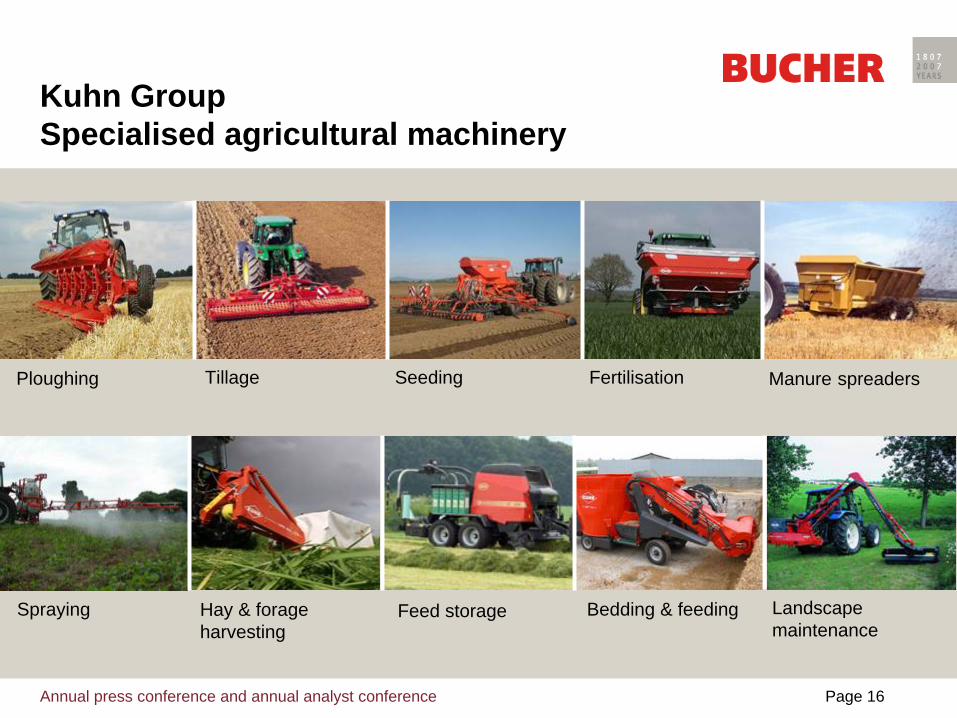
Spraying Landscapemaintenance
Bedding & feedingFeed storageHay & forageharvesting
Kuhn GroupSpecialised agricultural machinery
Ploughing Seeding Fertilisation Manure spreadersTillage

Annual press conference and annual analyst conference Page 17
Kuhn Group 2008 highlights
• Very good performance: sales of CHF 1 106 million- Local-currency sales growth of 26%- Order intake up 24% in local currency
• All geographical markets contributed to the growth, with Brazil surpassing the previous record reached in 2004
• Operating EBIT of CHF 137 million, up 27%• Continued improvement in the EBIT margin from 11.6% to 12.4%• Assembly plant in France commissioned early• Product portfolio strengthened selectively
• Blanchard: sprayers (sales 2008: EUR 25 million)• Geldrop: balers and bale wrappers (sales 2008: EUR 117 million)
Annual press conference and annual analyst conference Page 18
Inauguration assembly plant in France with French minister of agriculture Mr Barnier
Annual press conference and annual analyst conference Page 19
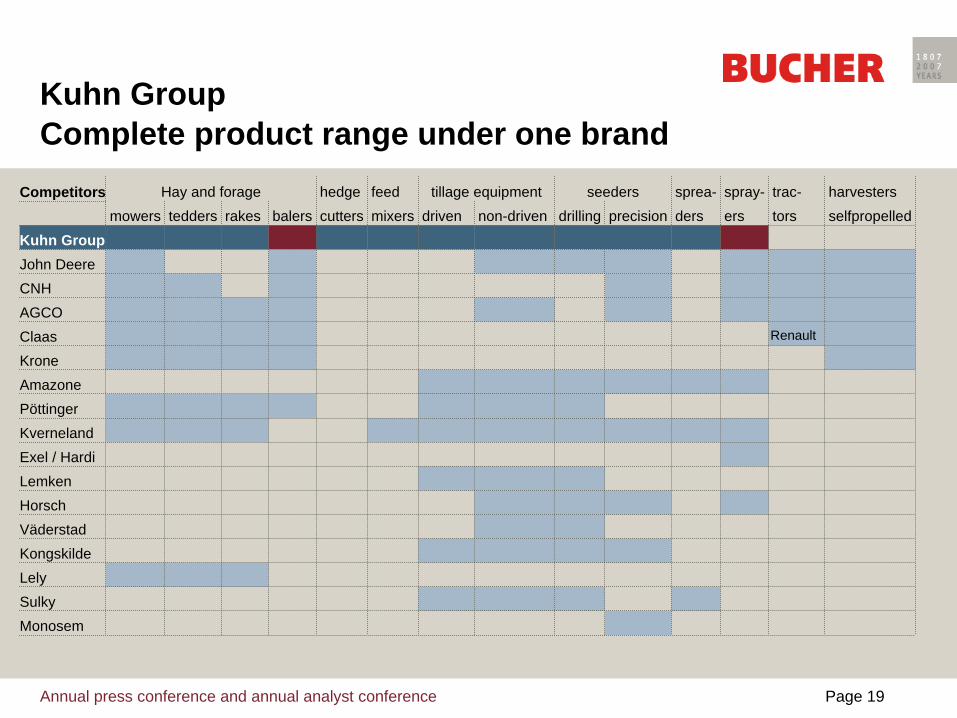
Kuhn Group Complete product range under one brand
Competitors Hay and forage hedge feed tillage equipment seeders sprea- spray- trac- harvestersmowers tedders rakes balers cutters mixers driven non-driven drilling precision ders ers tors selfpropelled
Kuhn GroupJohn DeereCNHAGCOClaas Renault
KroneAmazonePöttingerKvernelandExel / HardiLemkenHorschVäderstadKongskildeLelySulkyMonosem
Annual press conference and annual analyst conference Page 20
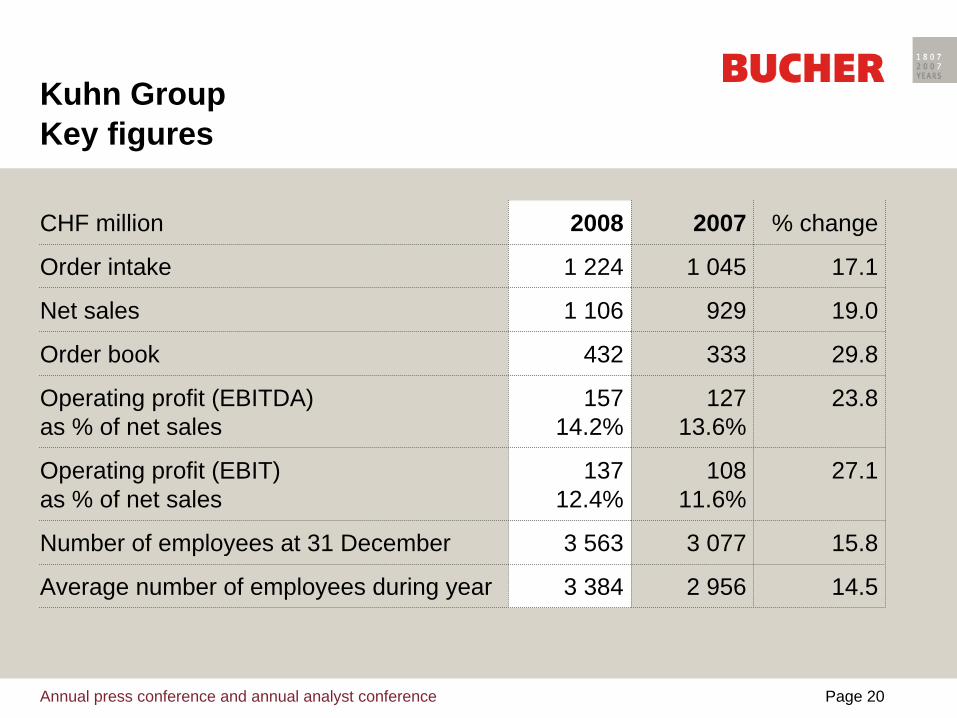
Kuhn Group Key figures
CHF million 2008 2007 % change
Order intake 1 224 1 045 17.1
Net sales 1 106 929 19.0
Order book 432 333 29.8
Operating profit (EBITDA) as % of net sales
15714.2%
127 13.6%
23.8
Operating profit (EBIT) as % of net sales
13712.4%
108 11.6%
27.1
Number of employees at 31 December 3 563 3 077 15.8
Average number of employees during year 3 384 2 956 14.5
Annual press conference and annual analyst conference Page 21
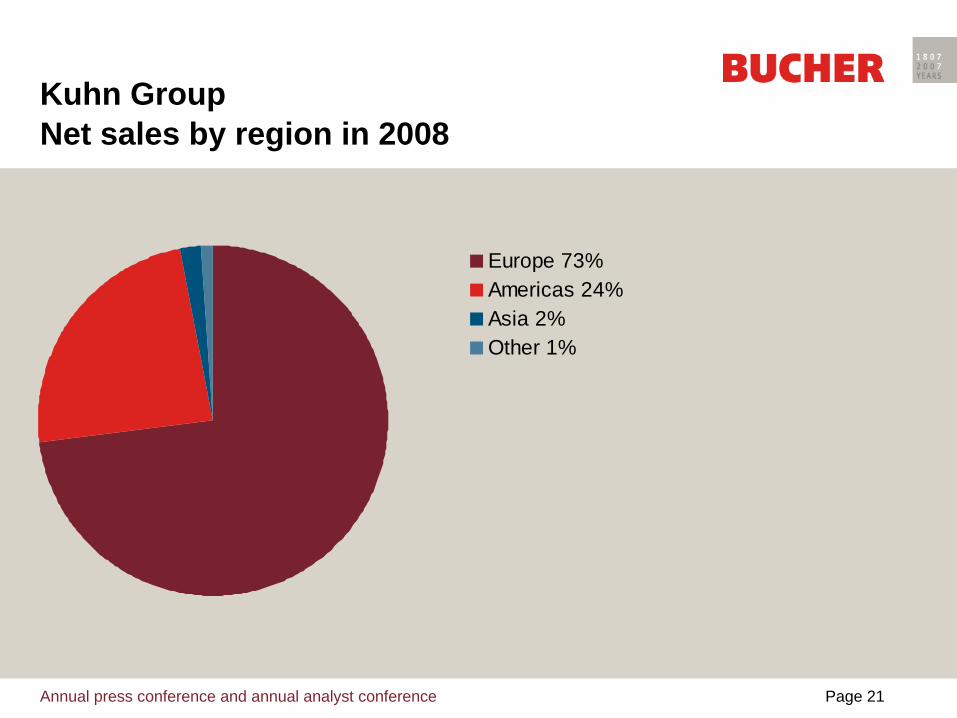
Kuhn Group Net sales by region in 2008
Europe 73%Americas 24%Asia 2%Other 1%
Annual press conference and annual analyst conference Page 22
Kuhn Group Outlook for 2009
• Sluggish lending- Hitting growth regions of Eastern Europe, Russia and Brazil particularly
hard- Also affecting main markets of Western Europe and North America
• Milk and meat prices falling • Future prospects for agriculture remaining bright• Strong order book, with sales supported by acquisitions of
Kuhn-Blanchard and Kuhn-Geldrop• Flexible cost structures to support capacity utilisation• Sales expected to be about level with 2008 with a slightly lower
EBIT margin
Annual press conference and annual analyst conference Page 23
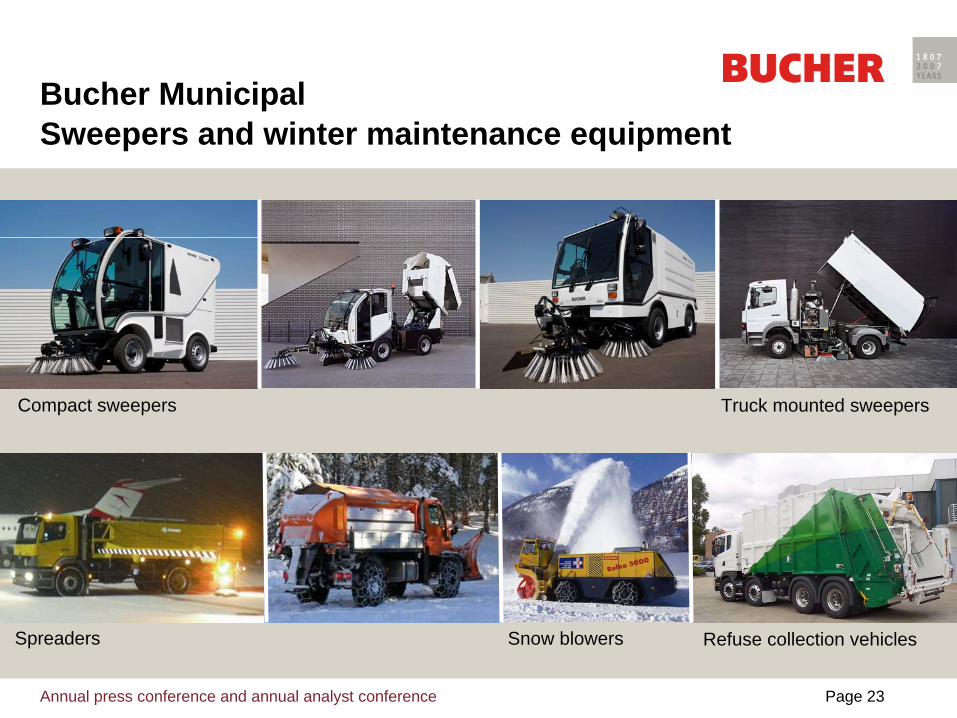
Bucher MunicipalSweepers and winter maintenance equipment
Compact sweepers Truck mounted sweepers
Spreaders Refuse collection vehiclesSnow blowers
Annual press conference and annual analyst conference Page 24
Bucher Municipal 2008 highlights
• Strong order book at the beginning of 2008 and good market position in Europe and Australia
• Large orders to supply 104 truck mounted sweepers to Bangkok• Winter maintenance business fuelled by snowy winter• Expansion of the Latvian assembly and component plant• New generations of sweepers on track, bringing economies of
scale in purchasing and production• Development of a fuel-cell-driven compact sweeper• CHF 5 million goodwill impairment charges for Gmeiner GmbH in
Germany due to the bleak market outlook• 7.4% EBIT margin before impairment charges

Annual press conference and annual analyst conference Page 25
Bucher Municipal Key figures
CHF million 2008 2007 % change
Order intake 528 603 -12.4
Net sales 579 557 4.1
Order book 115 178 -35.7
Operating profit (EBITDA) as % of net sales
518.8%
46 8.2%
11.4
Operating profit (EBIT) before impairmentas % of net sales
437.4%
37 6.6%
15.7
Operating profit (EBIT) as % of net sales
386.6%
37 6.6%
3.0
Number of employees at 31 December 1 543 1 535 0.5
Average number of employees during year 1 569 1 508 4.0
Annual press conference and annual analyst conference Page 26
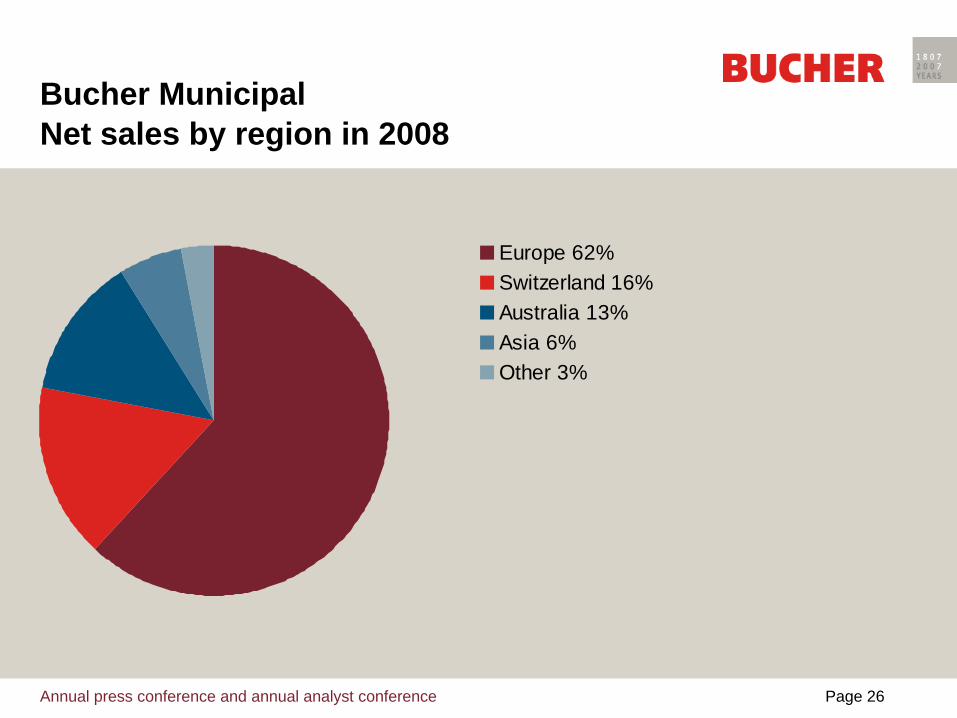
Bucher MunicipalNet sales by region in 2008
Europe 62%Switzerland 16%Australia 13%Asia 6%Other 3%
Annual press conference and annual analyst conference Page 27
Bucher Municipal Outlook for 2009
• No recovery in demand in sight • Local authorities with lower tax revenues and (still?) without
programmes to boost economic activity• Private sweeper fleet operators largely holding back due to
strict lending practices• Some major invitations to tender seem to be materialising,
offering good opportunities for Bucher Municipal • Harsh winter 2008/9 should have a positive impact on demand
for spreaders and snow blowers• Following the absolute record high in 2008, sales are expected
to be considerably lower with reduced profitability
Annual press conference and annual analyst conference Page 28
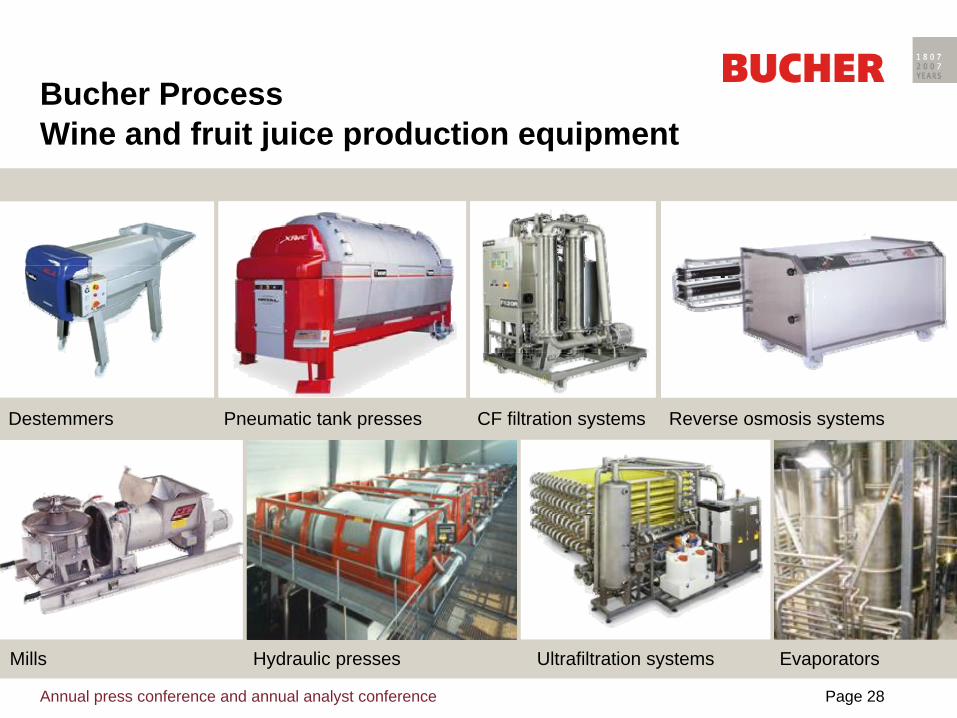
Bucher ProcessWine and fruit juice production equipment
Destemmers Pneumatic tank presses CF filtration systems Reverse osmosis systems
Ultrafiltration systemsHydraulic presses EvaporatorsMills
Annual press conference and annual analyst conference Page 29
Bucher Process 2008 highlights
• Encouraging demand for winemaking equipment in France, Italy, South Africa and New Zealand
• Southern hemisphere suffering severely from the financial crisis• Excellent handling of major orders to supply equipment for
producing apple juice concentrate to the UK and China• Innovative products for quality wines
- Jumbo wine press with a capacity of 750 hectolitres- Award for optical grape sorting machine
• Orders from Sweden for sludge dewatering equipment • Record operating profit of CHF 24 million and an EBIT margin
of 12.4%
Annual press conference and annual analyst conference Page 30
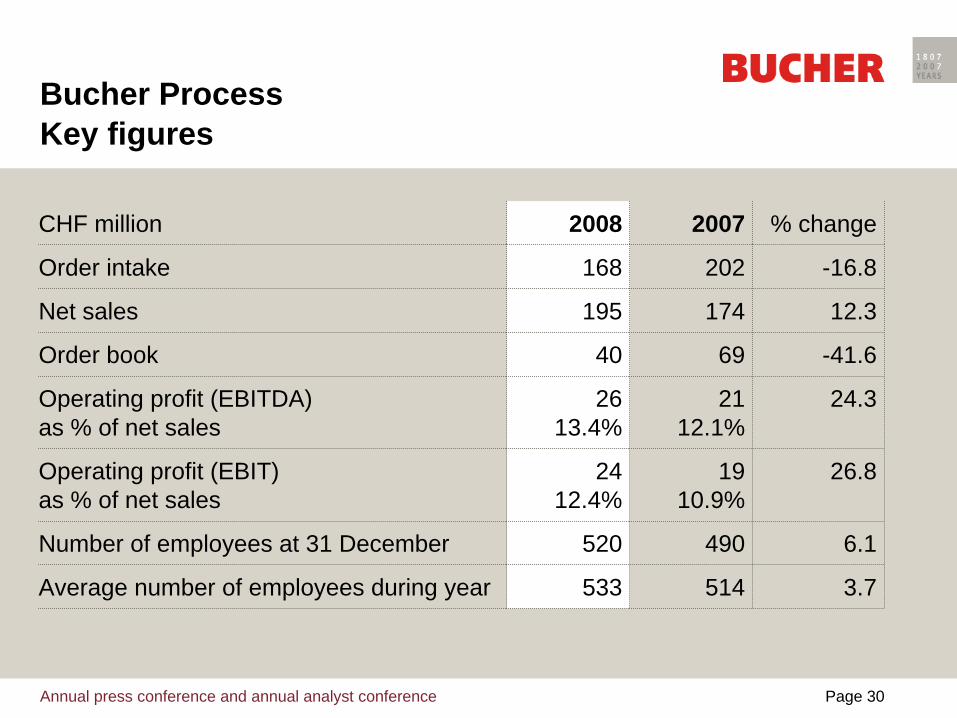
Bucher Process Key figures
CHF million 2008 2007 % change
Order intake 168 202 -16.8
Net sales 195 174 12.3
Order book 40 69 -41.6
Operating profit (EBITDA) as % of net sales
2613.4%
2112.1%
24.3
Operating profit (EBIT) as % of net sales
2412.4%
19 10.9%
26.8
Number of employees at 31 December 520 490 6.1
Average number of employees during year 533 514 3.7
Annual press conference and annual analyst conference Page 31
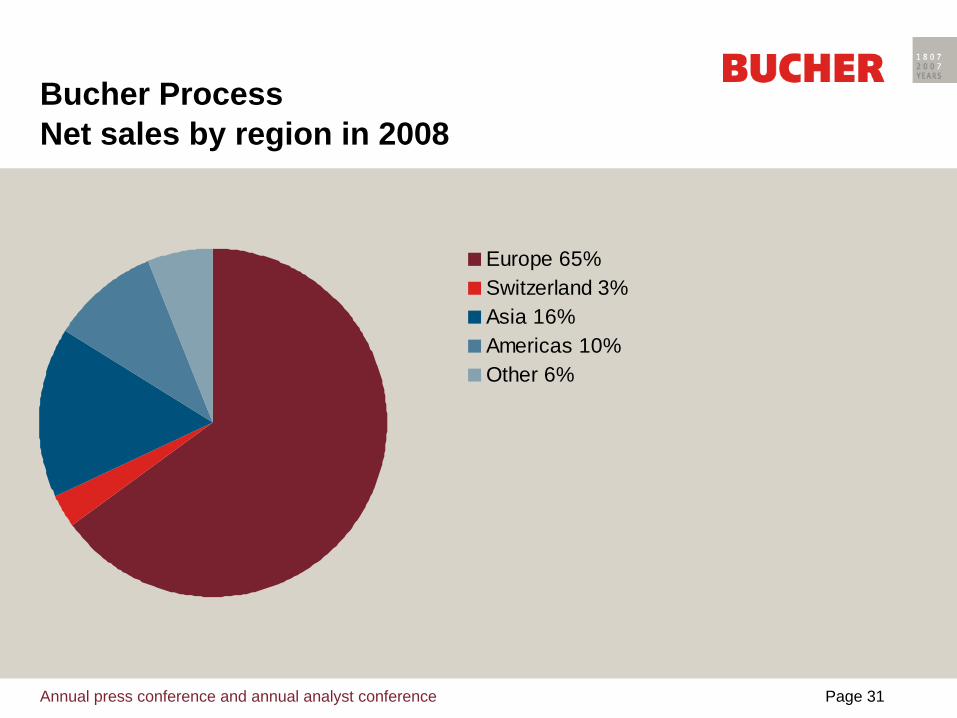
Bucher ProcessNet sales by region in 2008
Europe 65%Switzerland 3%Asia 16%Americas 10%Other 6%
Annual press conference and annual analyst conference Page 32
Bucher Process Outlook for 2009
• Projects delayed because of restrictive lending practices• Subsidies announced in Europe for winemaking equipment
should have a positive impact• Prices falling this year following the peak prices for apple juice
concentrate reached in 2008• Major projects for apple juice concentrate worth CHF 40 million
in 2008- Handled without building up fixed costs- No prospect of substitutes of a similar magnitude in 2009
• Substantially lower sales and operating profit expected
Annual press conference and annual analyst conference Page 33
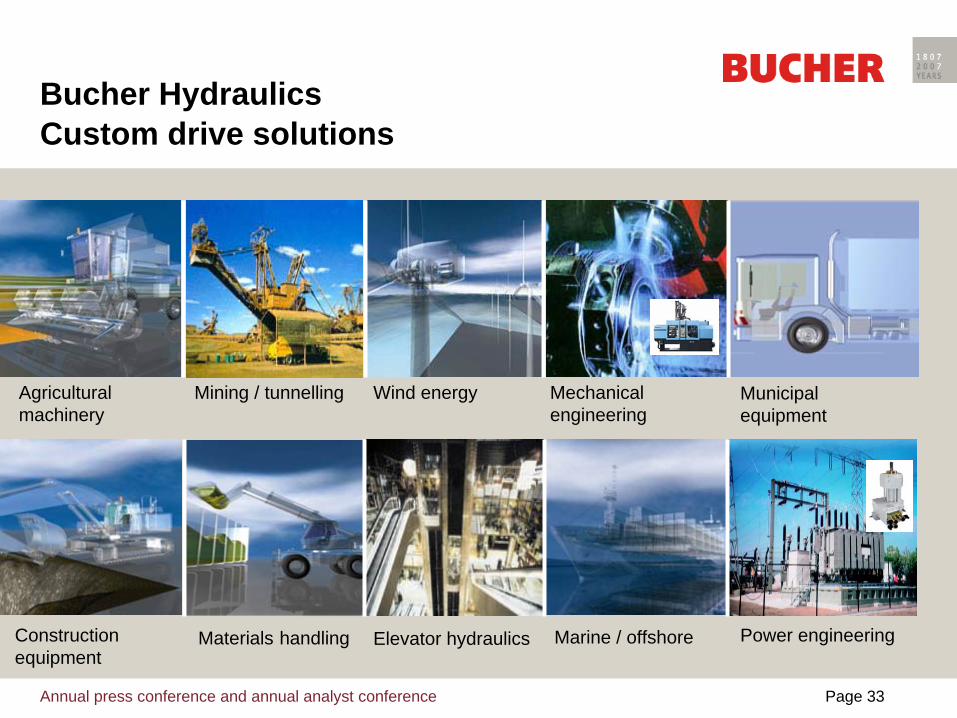
Materials handling Marine / offshore
Mechanical engineering
Elevator hydraulics Power engineering
Agricultural machinery
Mining / tunnelling
Construction equipment
Municipal equipment
Wind energy
Bucher HydraulicsCustom drive solutions
Annual press conference and annual analyst conference Page 34
Bucher Hydraulics 2008 highlights
• Very strong demand in all important market segments, followed by a sharp decline in the fourth quarter
• Full capacity utilisation until October 2008• Agricultural machinery segment defied the financial crisis last year• Position expanded in the USA
- Integration of Monarch Hydraulics Inc. from the beginning of the year- Purchase of Command Controls Corp. (US cartridge valves)
• Rapid response to the drop in order intake- Reduction of untaken holidays, flexitime and overtime balances, temporary
jobs; workers put on short time; a few job cuts- Manufacturing brought back in-house
• Impairment charges of CHF 25 million in USA
Annual press conference and annual analyst conference Page 35
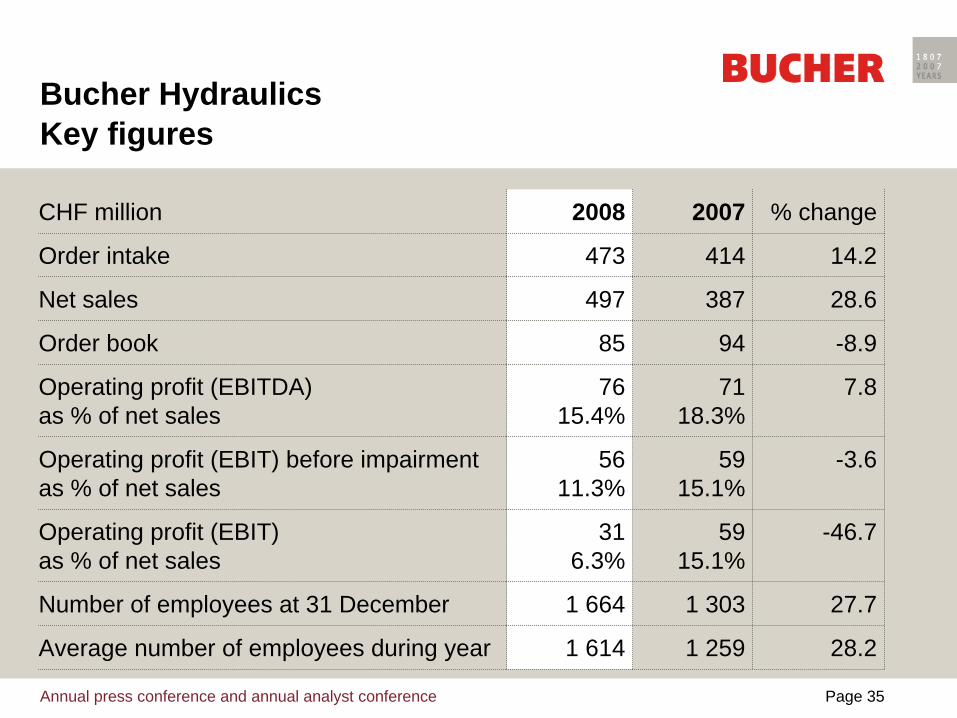
Bucher Hydraulics Key figures
CHF million 2008 2007 % change
Order intake 473 414 14.2
Net sales 497 387 28.6
Order book 85 94 -8.9
Operating profit (EBITDA) as % of net sales
7615.4%
71 18.3%
7.8
Operating profit (EBIT) before impairmentas % of net sales
5611.3%
59 15.1%
-3.6
Operating profit (EBIT) as % of net sales
316.3%
59 15.1%
-46.7
Number of employees at 31 December 1 664 1 303 27.7
Average number of employees during year 1 614 1 259 28.2
Annual press conference and annual analyst conference Page 36
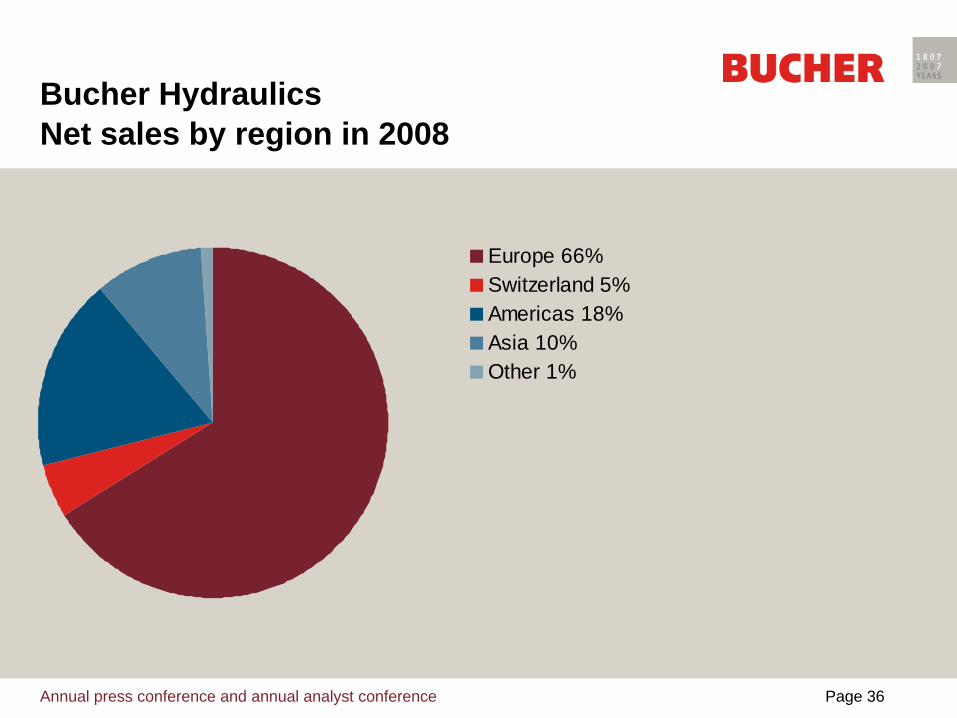
Bucher Hydraulics Net sales by region in 2008
Europe 66%Switzerland 5%Americas 18%Asia 10%Other 1%
Annual press conference and annual analyst conference Page 37
Bucher Hydraulics Outlook for 2009
• As a component supplier, the division is directly dependent on how well its customers’ business goes
• First-half order intake additionally declining due to customers running down inventories
• Very uncertain forecasts due to strong slumps in order intake• Having remained stable in 2008, the market segments for
agricultural machinery and power engineering are also affected this year
• A marked decrease in sales is expected for 2009• Operating profit about level with last year due to the goodwill
impairment charges of CHF 25 million recognised in 2008
Annual press conference and annual analyst conference Page 38
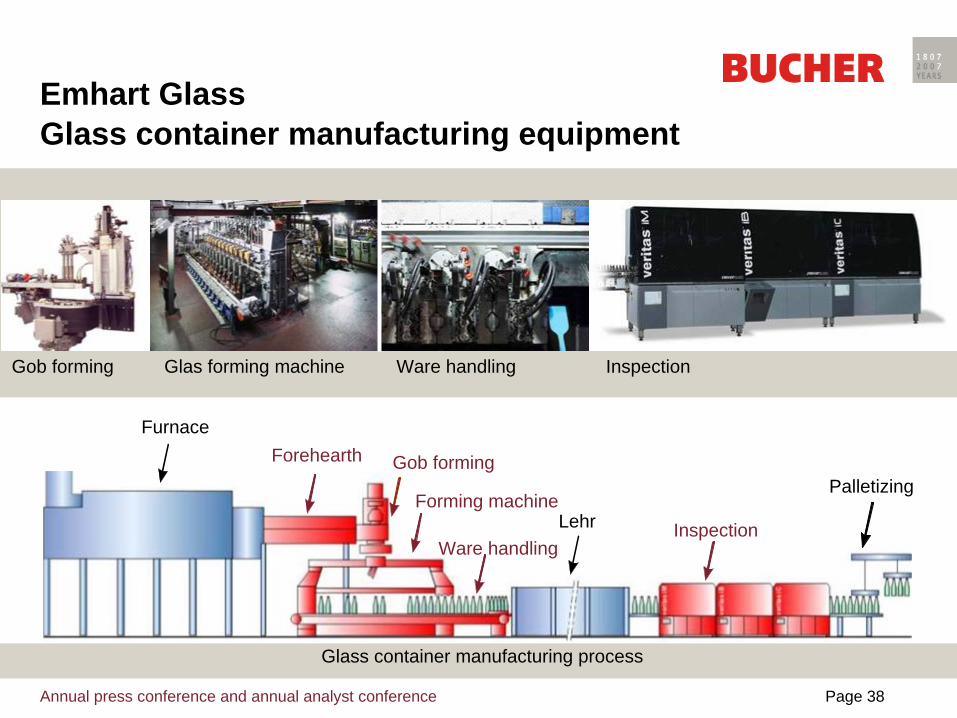
Lehr
Emhart Glass Glass container manufacturing equipment
Forehearth
Glass container manufacturing process
Furnace
Lehr
Palletizing
Gob forming Glas forming machine Ware handling Inspection
Inspection
Gob forming
Ware handling
Forming machine
Annual press conference and annual analyst conference Page 39
Emhart Glass 2008 highlights
• Good prices and strong demand for glass containers• Heavy capital spending on expanding and modernising glass
container manufacturing facilities• Smooth integration of ICS / Inex, the US inspection machine
manufacturer acquired a year earlier• Very high and constant capacity utilisation rate• Development reinforced by R&D centre
- Tempered glass machines on track; optimisation for industrial viability- New inspection machine replacing 3 previous ones
• Assembly efficiency in Sweden improved by 44%• Operating profit of CHF 35 million, up 5%• Malaysian assembly plant commissioned in early 2009
Annual press conference and annual analyst conference Page 40
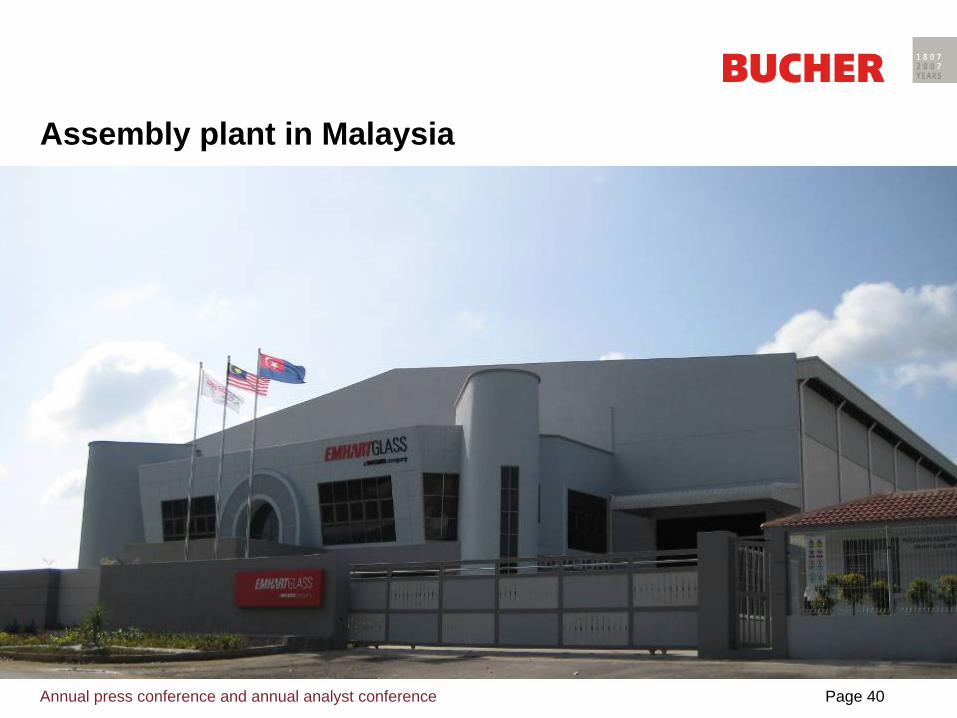
Assembly plant in Malaysia
Annual press conference and annual analyst conference Page 41
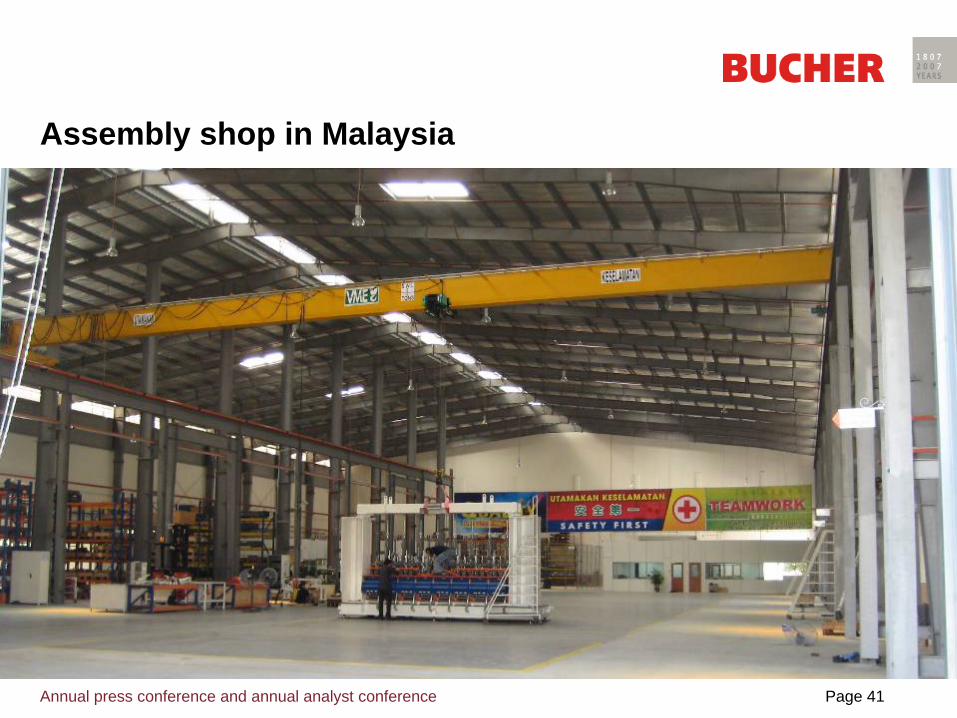
Assembly shop in Malaysia
Annual press conference and annual analyst conference Page 42
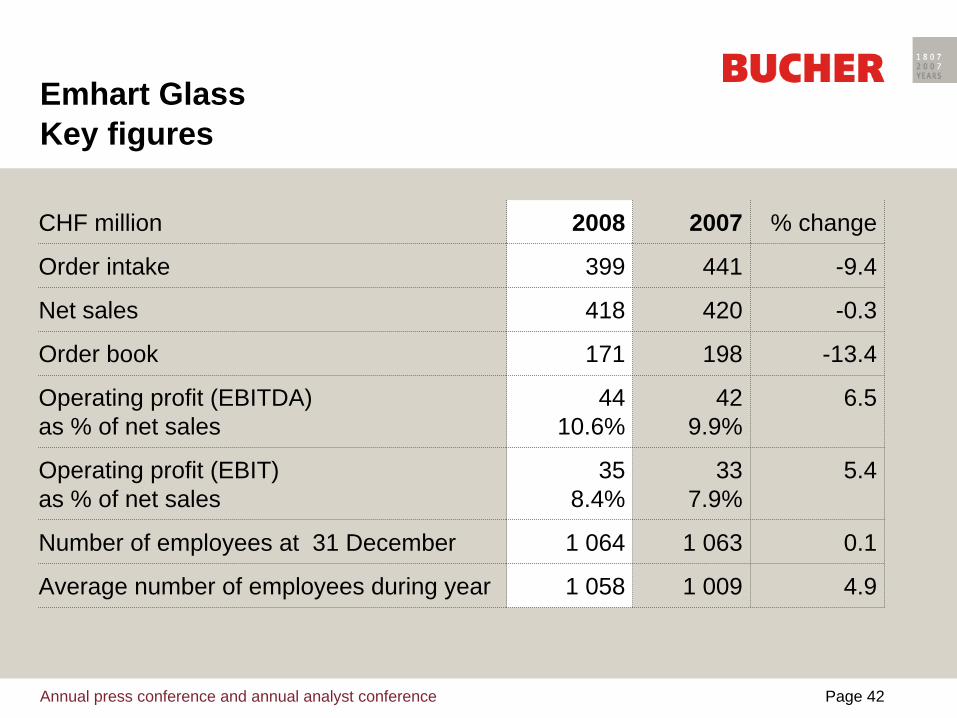
Emhart Glass Key figures
CHF million 2008 2007 % change
Order intake 399 441 -9.4
Net sales 418 420 -0.3
Order book 171 198 -13.4
Operating profit (EBITDA) as % of net sales
4410.6%
42 9.9%
6.5
Operating profit (EBIT) as % of net sales
358.4%
33 7.9%
5.4
Number of employees at 31 December 1 064 1 063 0.1
Average number of employees during year 1 058 1 009 4.9
Annual press conference and annual analyst conference Page 43
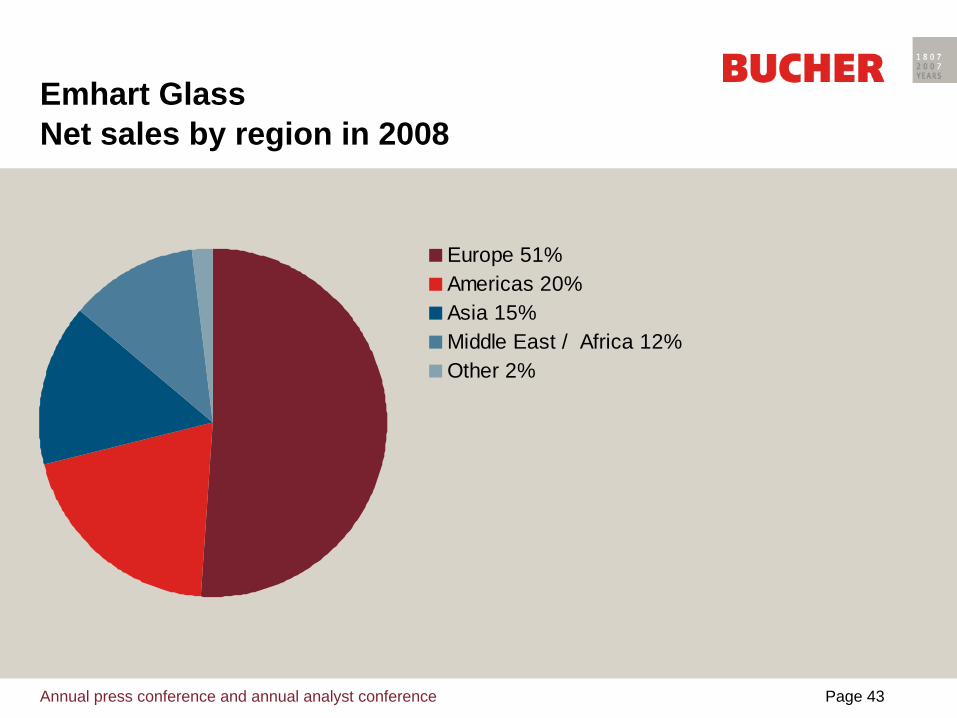
Emhart Glass Net sales by region in 2008
Europe 51%Americas 20%Asia 15%Middle East / Africa 12%Other 2%
Annual press conference and annual analyst conference Page 44
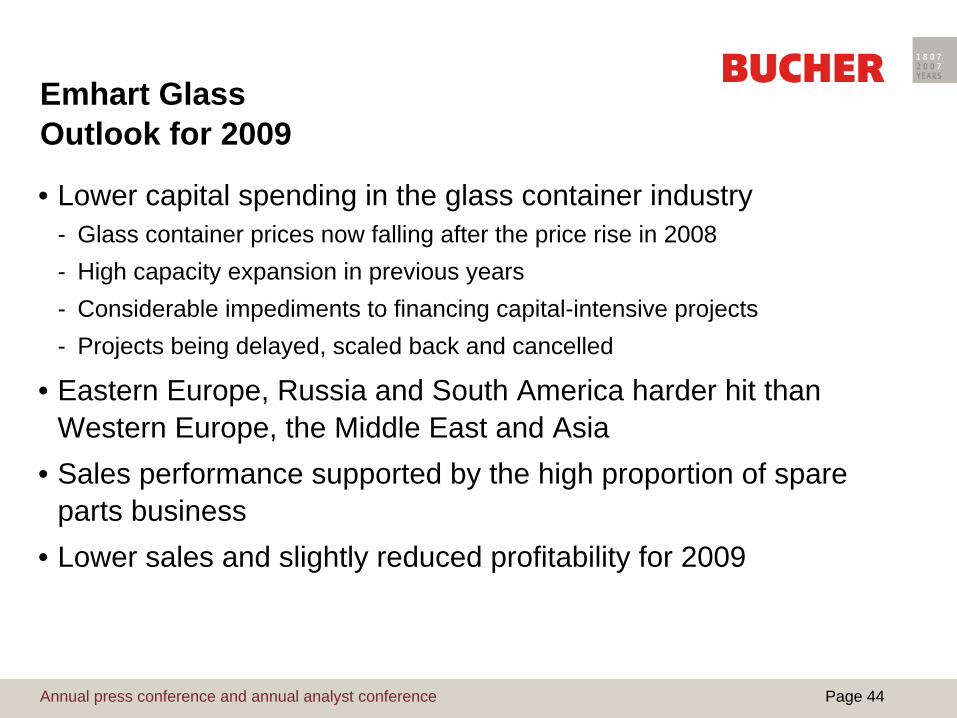
Emhart Glass Outlook for 2009
• Lower capital spending in the glass container industry- Glass container prices now falling after the price rise in 2008- High capacity expansion in previous years- Considerable impediments to financing capital-intensive projects- Projects being delayed, scaled back and cancelled
• Eastern Europe, Russia and South America harder hit than Western Europe, the Middle East and Asia
• Sales performance supported by the high proportion of spare parts business
• Lower sales and slightly reduced profitability for 2009
Annual press conference and annual analyst conference Page 45
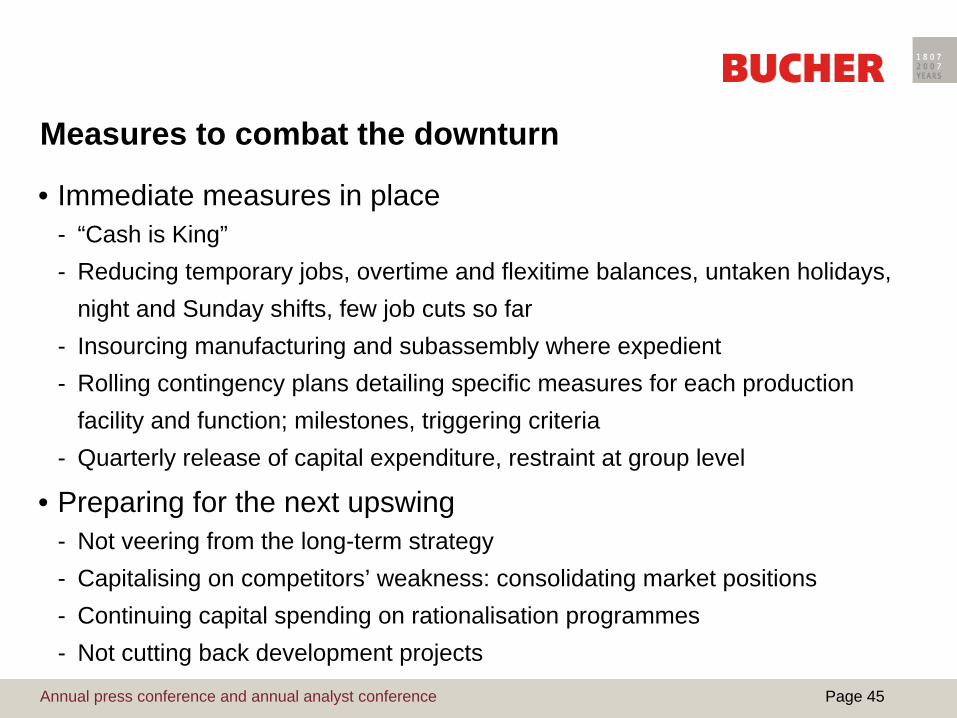
Measures to combat the downturn
• Immediate measures in place- “Cash is King”- Reducing temporary jobs, overtime and flexitime balances, untaken holidays,
night and Sunday shifts, few job cuts so far- Insourcing manufacturing and subassembly where expedient- Rolling contingency plans detailing specific measures for each production
facility and function; milestones, triggering criteria- Quarterly release of capital expenditure, restraint at group level
• Preparing for the next upswing- Not veering from the long-term strategy- Capitalising on competitors’ weakness: consolidating market positions- Continuing capital spending on rationalisation programmes - Not cutting back development projects
Annual press conference and annual analyst conference Page 46
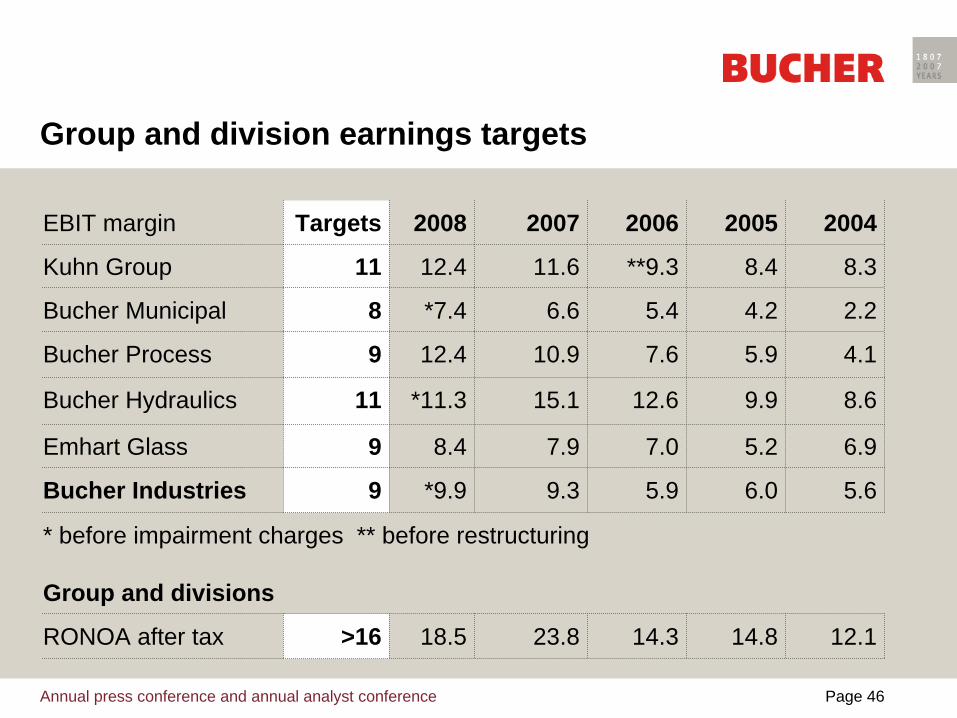
Group and division earnings targets
EBIT margin Targets 2008 2007 2006 2005 2004
Kuhn Group 11 12.4 11.6 **9.3 8.4 8.3
Bucher Municipal 8 *7.4 6.6 5.4 4.2 2.2
Bucher Process 9 12.4 10.9 7.6 5.9 4.1
Bucher Hydraulics 11 *11.3 15.1 12.6 9.9 8.6
Emhart Glass 9 8.4 7.9 7.0 5.2 6.9
Bucher Industries 9 *9.9 9.3 5.9 6.0 5.6
* before impairment charges ** before restructuring
Group and divisions
RONOA after tax >16 18.5 23.8 14.3 14.8 12.1
Annual press conference and annual analyst conference Page 47
Group outlook for 2009
• Great uncertainty surrounding forecasts• Eastern Europe, Russia and Brazil hit hard, with the main sales
markets of Western Europe and the USA also affected• Customers’ projects facing financing problems, delays, rescaling
and cancellations• Order intake additionally slowed down by importers, dealers and
OEMs running down their inventories• Performance adversely impacted by currency volatility,
particularly affecting countries with weak currencies• Sales supported by the order book and acquisitions• Sales, operating profit and net profit expected to be down on last
year; goal: contain the decline in the Group’s EBIT margin
Annual press conference and annual analyst conference Page 48
Financial Report 2008 Roger Baillod, CFO
Annual press conference and annual analyst conference Page 49
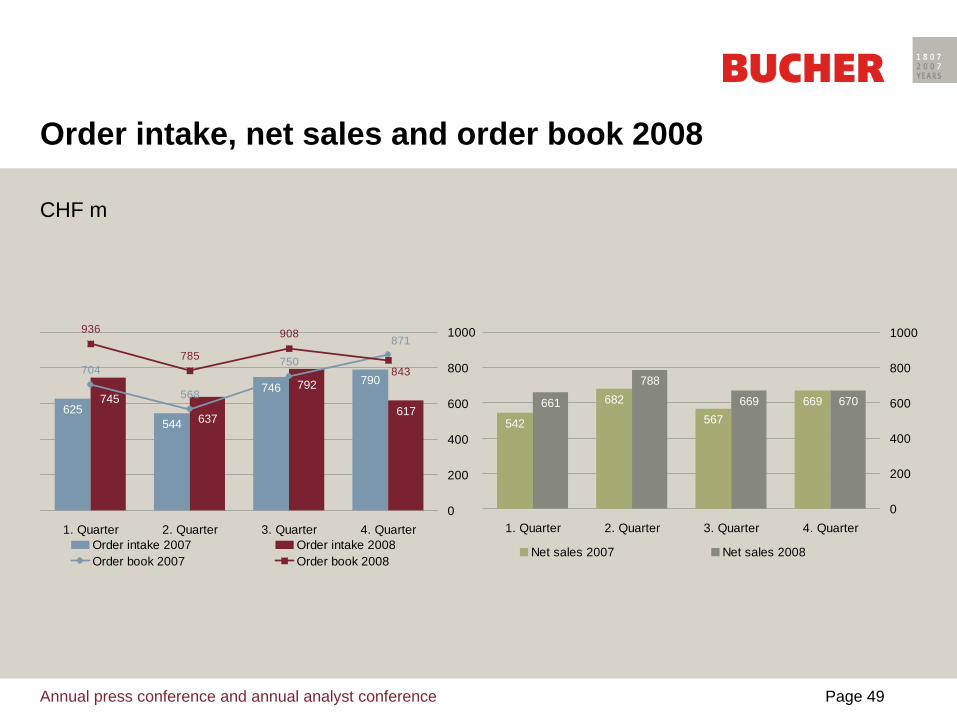
Order intake, net sales and order book 2008
625544
746 790
617
792
637
745
704
568
750785
908 871
843
936
0
200
400
600
800
1000
1. Quarter 2. Quarter 3. Quarter 4. QuarterOrder intake 2007 Order intake 2008Order book 2007 Order book 2008
CHF m
542
682
567669661
788
669 670
0
200
400
600
800
1000
1. Quarter 2. Quarter 3. Quarter 4. Quarter
Net sales 2007 Net sales 2008
Annual press conference and annual analyst conference Page 50
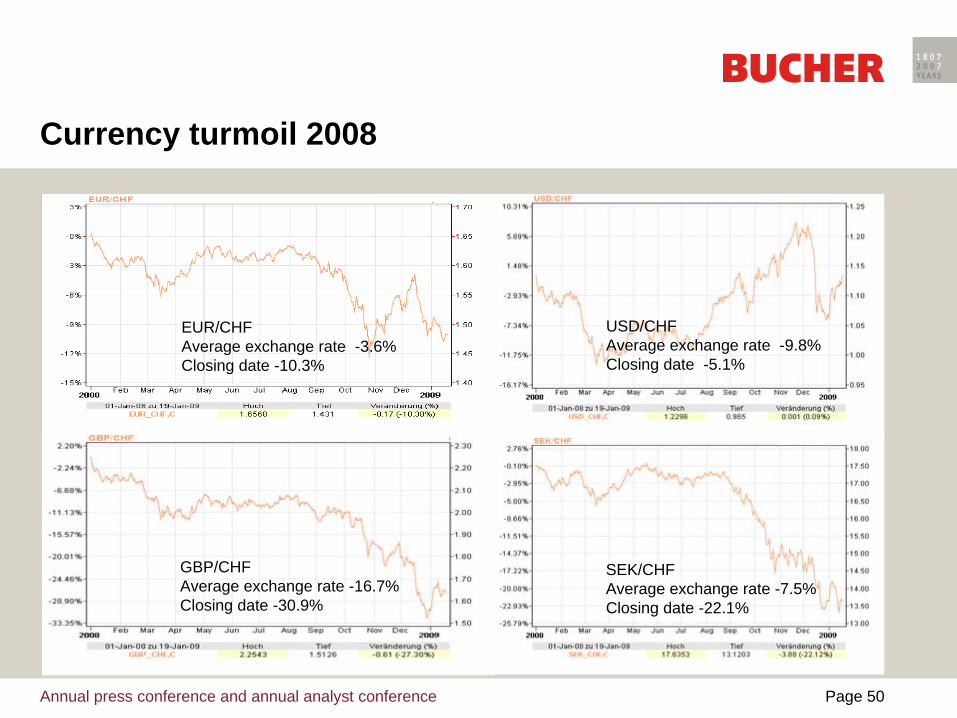
Currency turmoil 2008
EUR/CHF Average exchange rate -3.6%Closing date -10.3%
SEK/CHF Average exchange rate -7.5%Closing date -22.1%
GBP/CHF Average exchange rate -16.7%Closing date -30.9%
USD/CHF Average exchange rate -9.8%Closing date -5.1%
Annual press conference and annual analyst conference Page 51
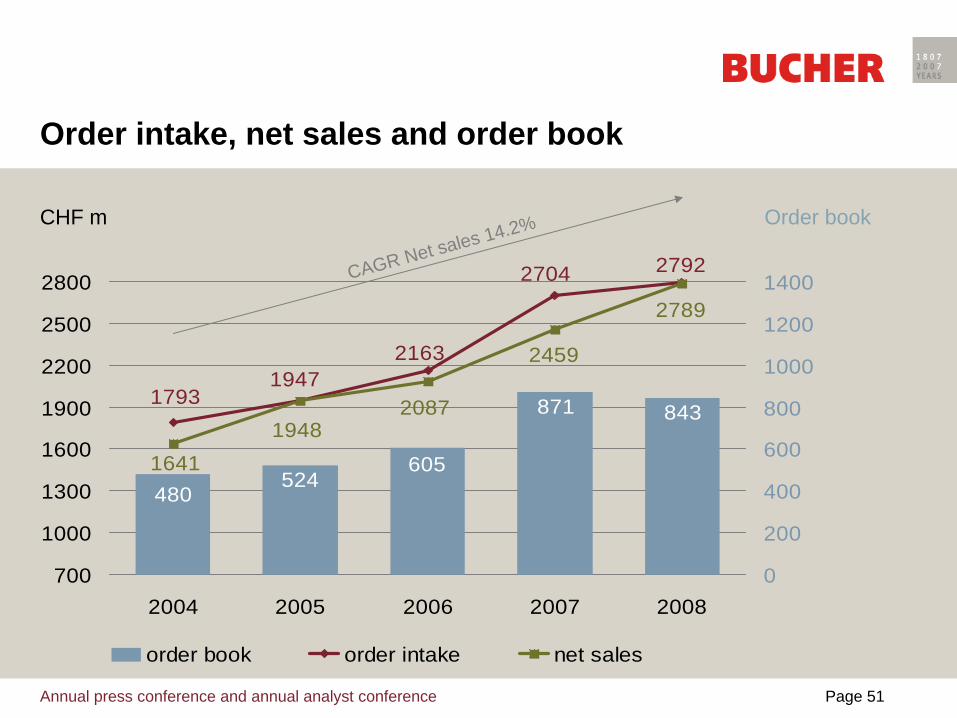
Order intake, net sales and order book
480524
605
871 8431793
19472163
2704 2792
16411948
2087
2459
2789
0
200
400
600
800
1000
1200
1400
2004 2005 2006 2007 2008700
1000
1300
1600
1900
2200
2500
2800
order book order intake net sales
Order bookCHF m
CAGR Net sales 14.2%
Annual press conference and annual analyst conference Page 52
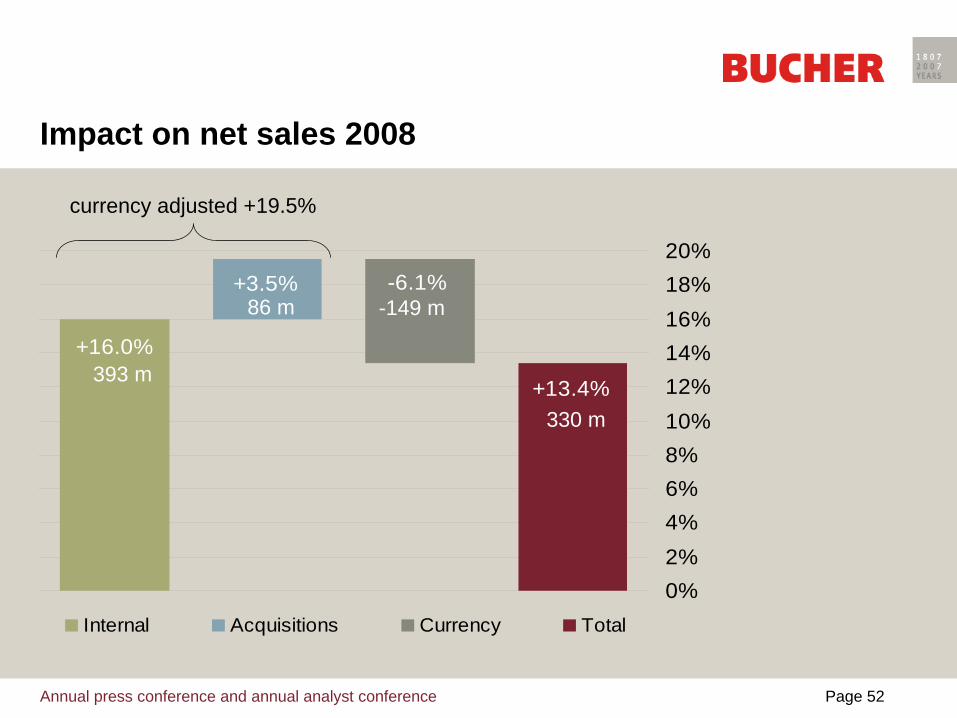
Impact on net sales 2008
+16.0%
+13.4%
-6.1%+3.5%
0%2%4%6%8%10%12%14%16%18%20%
Internal Acquisitions Currency Total
currency adjusted +19.5%
393 m
-149 m86 m
330 m
Annual press conference and annual analyst conference Page 53
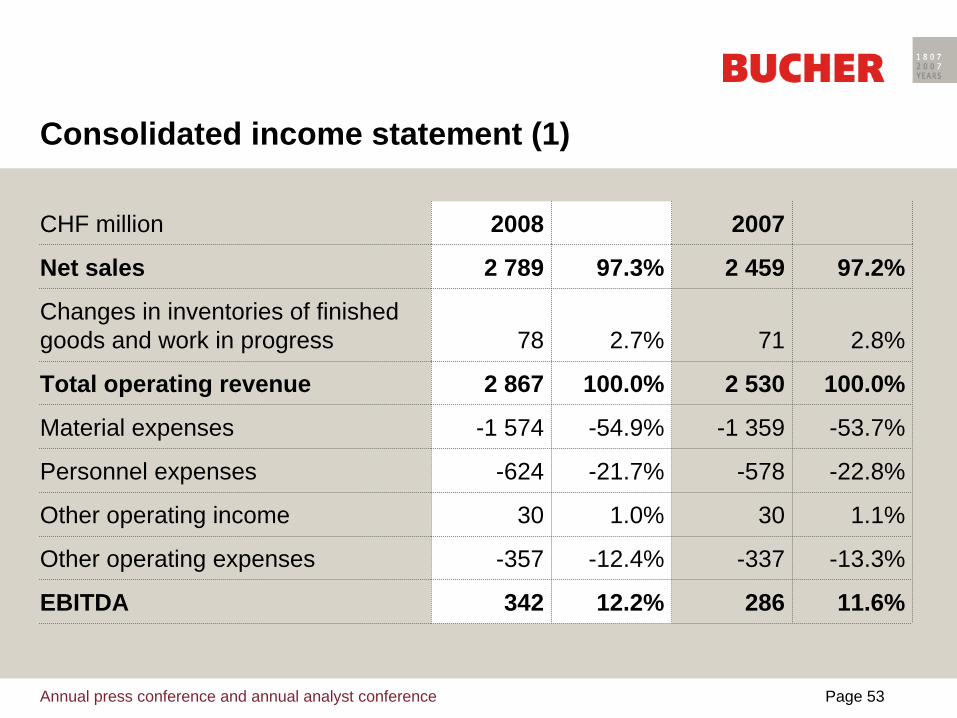
CHF million 2008 2007
Net sales 2 789 97.3% 2 459 97.2%
Changes in inventories of finished goods and work in progress 78 2.7% 71 2.8%
Total operating revenue 2 867 100.0% 2 530 100.0%
Material expenses -1 574 -54.9% -1 359 -53.7%
Personnel expenses -624 -21.7% -578 -22.8%
Other operating income 30 1.0% 30 1.1%
Other operating expenses -357 -12.4% -337 -13.3%
EBITDA 342 12.2% 286 11.6%
Consolidated income statement (1)
Annual press conference and annual analyst conference Page 54
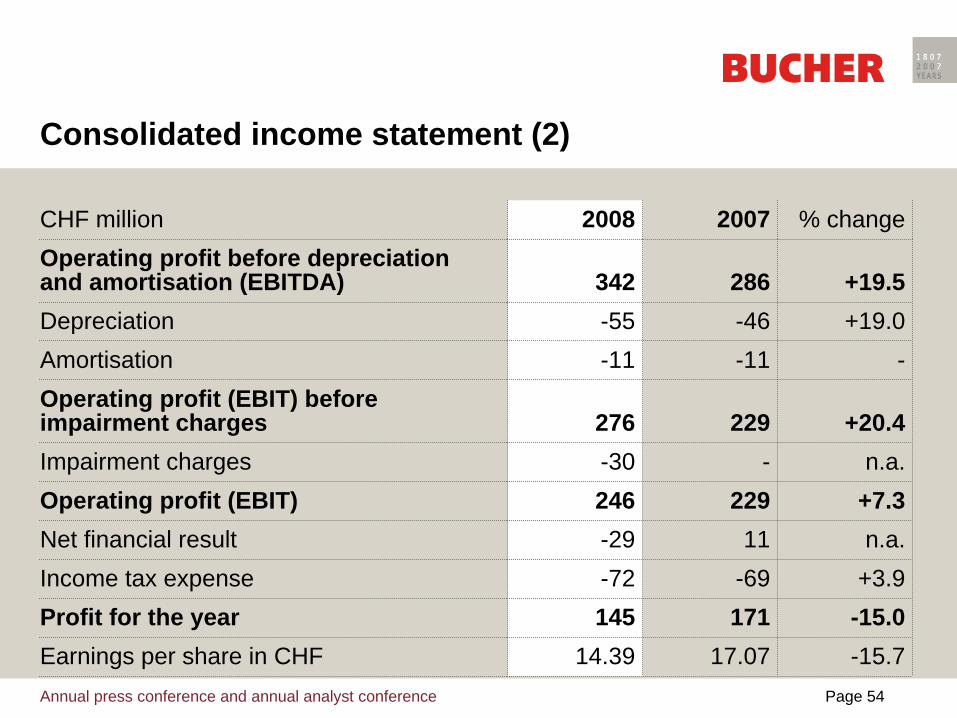
CHF million 2008 2007 % changeOperating profit before depreciation and amortisation (EBITDA) 342 286 +19.5Depreciation -55 -46 +19.0Amortisation -11 -11 -Operating profit (EBIT) before impairment charges 276 229 +20.4Impairment charges -30 - n.a.Operating profit (EBIT) 246 229 +7.3Net financial result -29 11 n.a.Income tax expense -72 -69 +3.9Profit for the year 145 171 -15.0Earnings per share in CHF 14.39 17.07 -15.7
Consolidated income statement (2)
Annual press conference and annual analyst conference Page 55
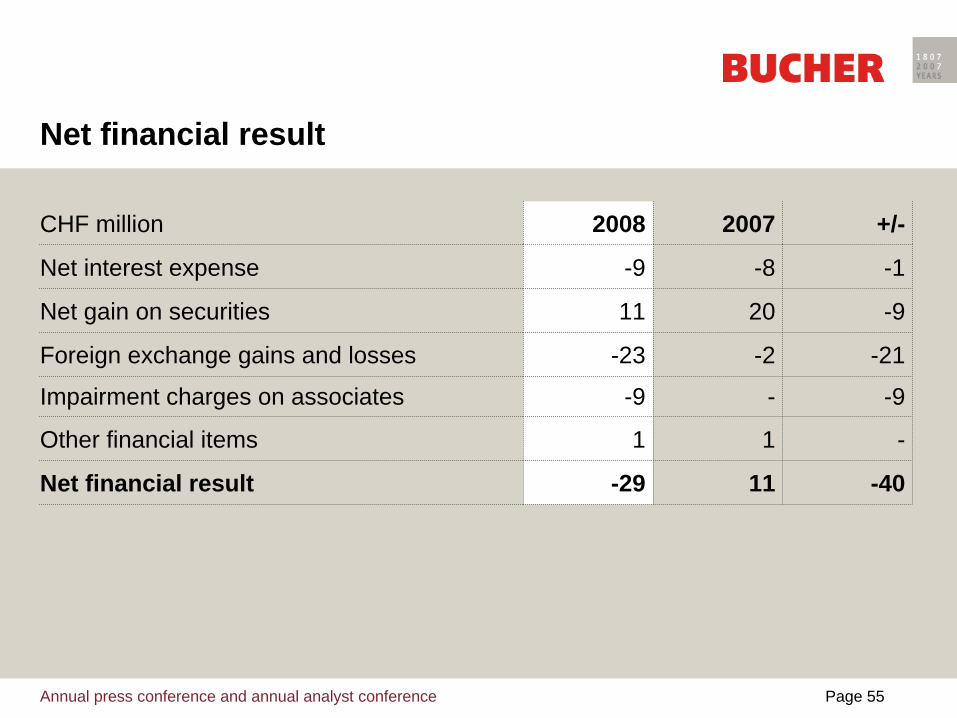
Net financial result
CHF million 2008 2007 +/-
Net interest expense -9 -8 -1
Net gain on securities 11 20 -9
Foreign exchange gains and losses -23 -2 -21
Impairment charges on associates -9 - -9
Other financial items 1 1 -
Net financial result -29 11 -40
Annual press conference and annual analyst conference Page 56
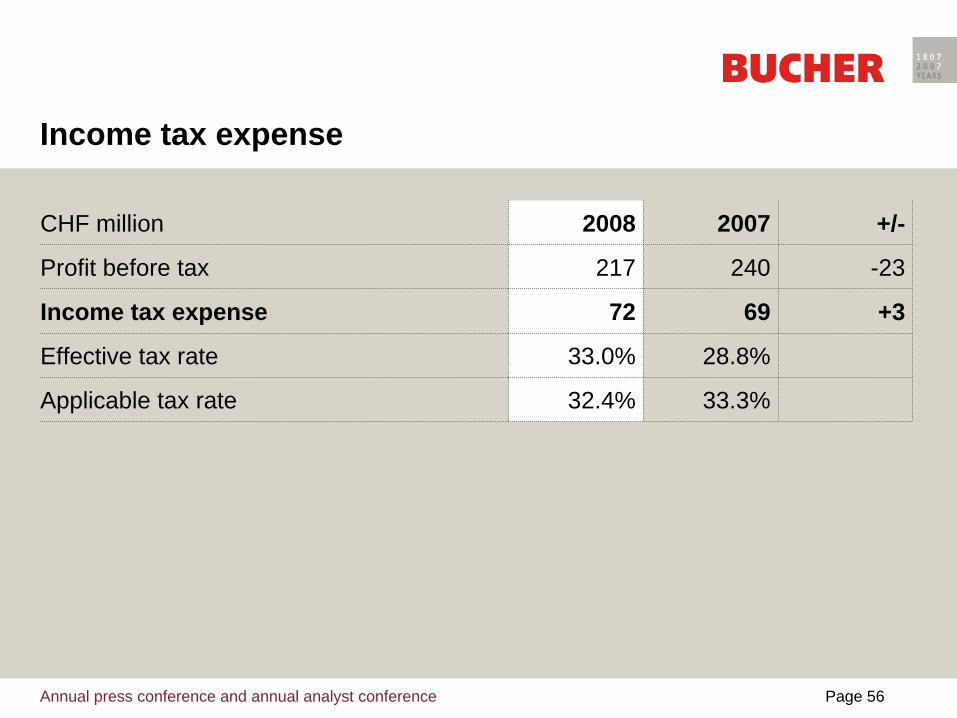
Income tax expense
CHF million 2008 2007 +/-
Profit before tax 217 240 -23
Income tax expense 72 69 +3
Effective tax rate 33.0% 28.8%
Applicable tax rate 32.4% 33.3%
Annual press conference and annual analyst conference Page 57
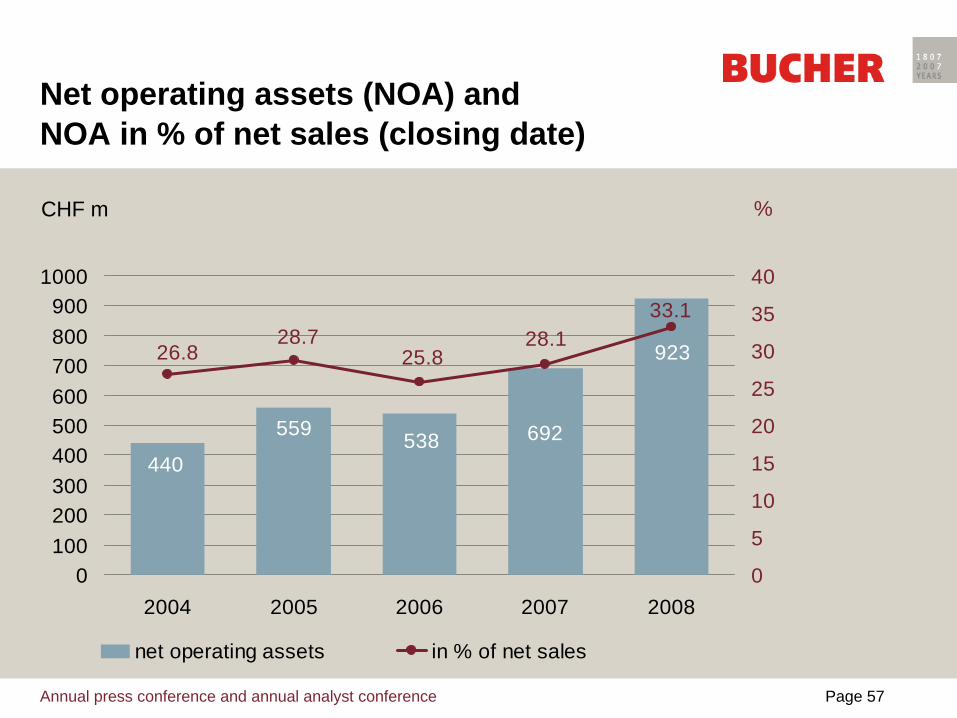
Net operating assets (NOA) andNOA in % of net sales (closing date)
923
692538440
559
26.828.7
33.128.1
25.8
0100200300400500600700800900
1000
200820072006200520040
5
10
15
20
25
30
35
40
net operating assets in % of net sales
CHF m %
Annual press conference and annual analyst conference Page 58
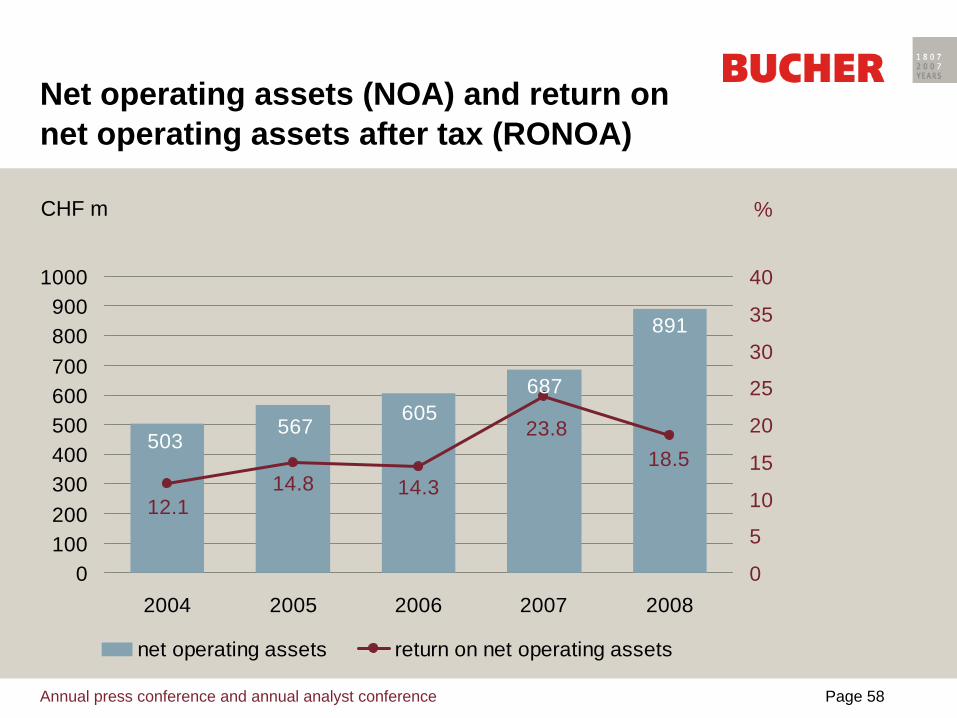
503567
605687
891
14.3
23.818.5
14.812.1
0100200300400500600700800900
1000
200820072006200520040
5
10
15
20
25
30
35
40
net operating assets return on net operating assets
Net operating assets (NOA) and return on net operating assets after tax (RONOA)
CHF m %
Annual press conference and annual analyst conference Page 59
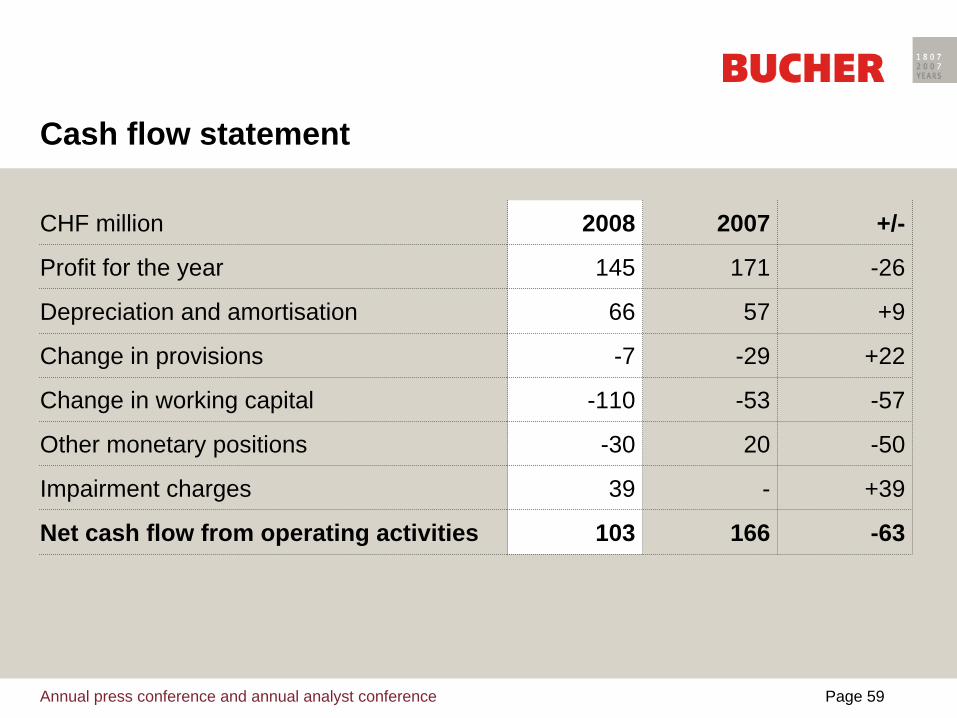
CHF million 2008 2007 +/-
Profit for the year 145 171 -26
Depreciation and amortisation 66 57 +9
Change in provisions -7 -29 +22
Change in working capital -110 -53 -57
Other monetary positions -30 20 -50
Impairment charges 39 - +39
Net cash flow from operating activities 103 166 -63
Cash flow statement
Annual press conference and annual analyst conference Page 60
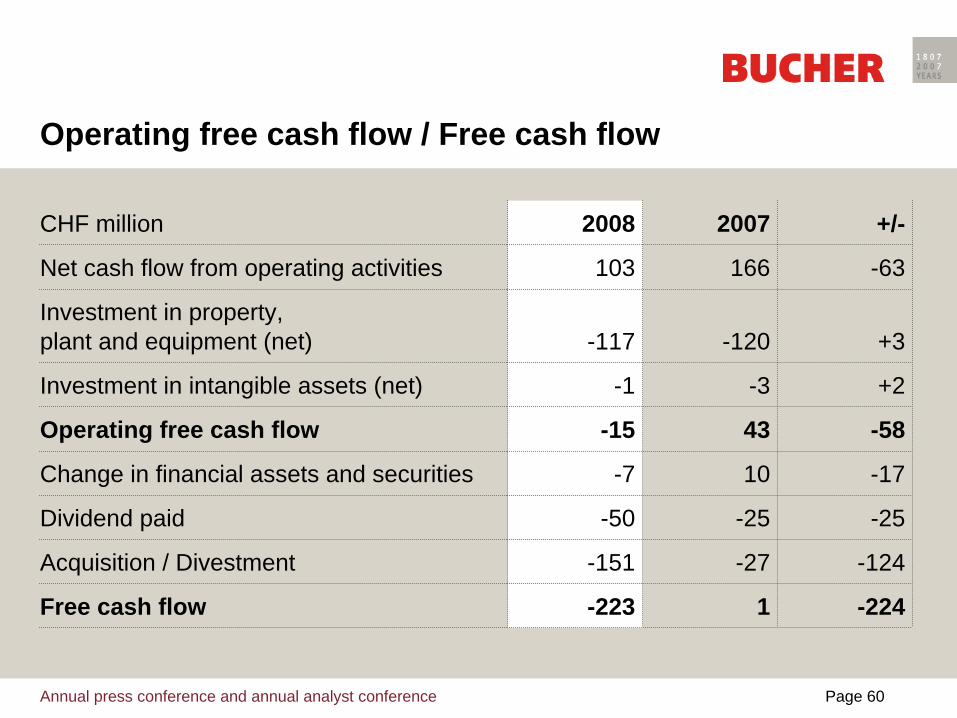
Operating free cash flow / Free cash flow
CHF million 2008 2007 +/-
Net cash flow from operating activities 103 166 -63
Investment in property, plant and equipment (net) -117 -120 +3
Investment in intangible assets (net) -1 -3 +2
Operating free cash flow -15 43 -58
Change in financial assets and securities -7 10 -17
Dividend paid -50 -25 -25
Acquisition / Divestment -151 -27 -124
Free cash flow -223 1 -224
Annual press conference and annual analyst conference Page 61
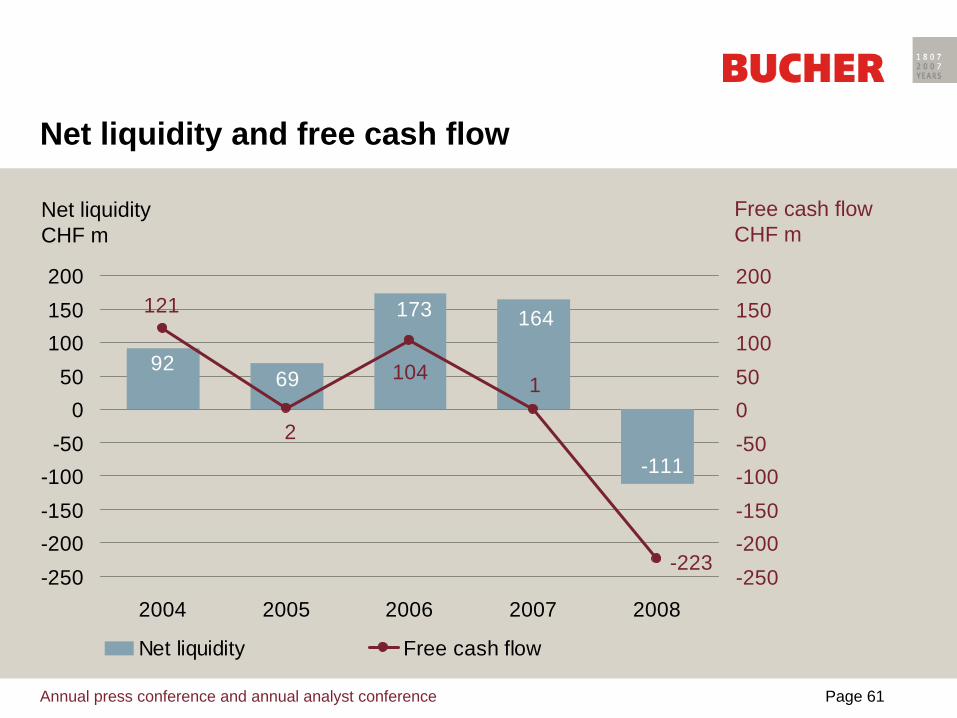
Net liquidity and free cash flow
9269
173 164
-111
104 1
-223
2
121
-250-200-150-100
-500
50100150200
20082007200620052004-250-200-150-100-50050100150200
Net liquidity Free cash flow
Net liquidity CHF m
Free cash flow CHF m
Annual press conference and annual analyst conference Page 62
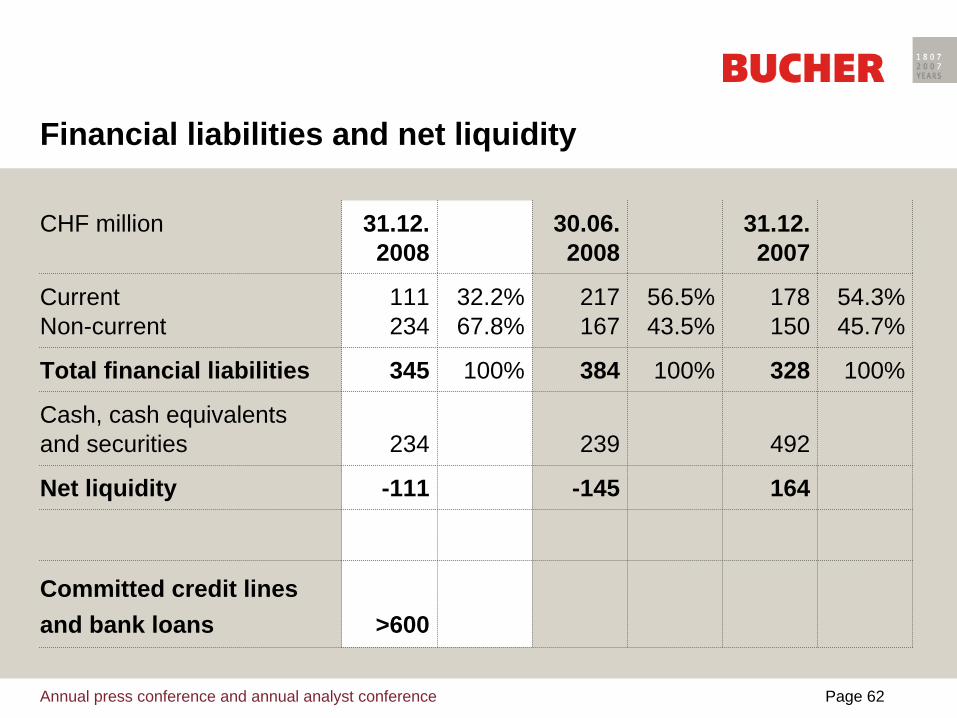
Financial liabilities and net liquidity
CHF million 31.12. 2008
30.06. 2008
31.12. 2007
Current Non-current
111 234
32.2% 67.8%
217 167
56.5% 43.5%
178 150
54.3% 45.7%
Total financial liabilities 345 100% 384 100% 328 100%
Cash, cash equivalents and securities 234 239 492
Net liquidity -111 -145 164
Committed credit lines and bank loans >600
Annual press conference and annual analyst conference Page 63
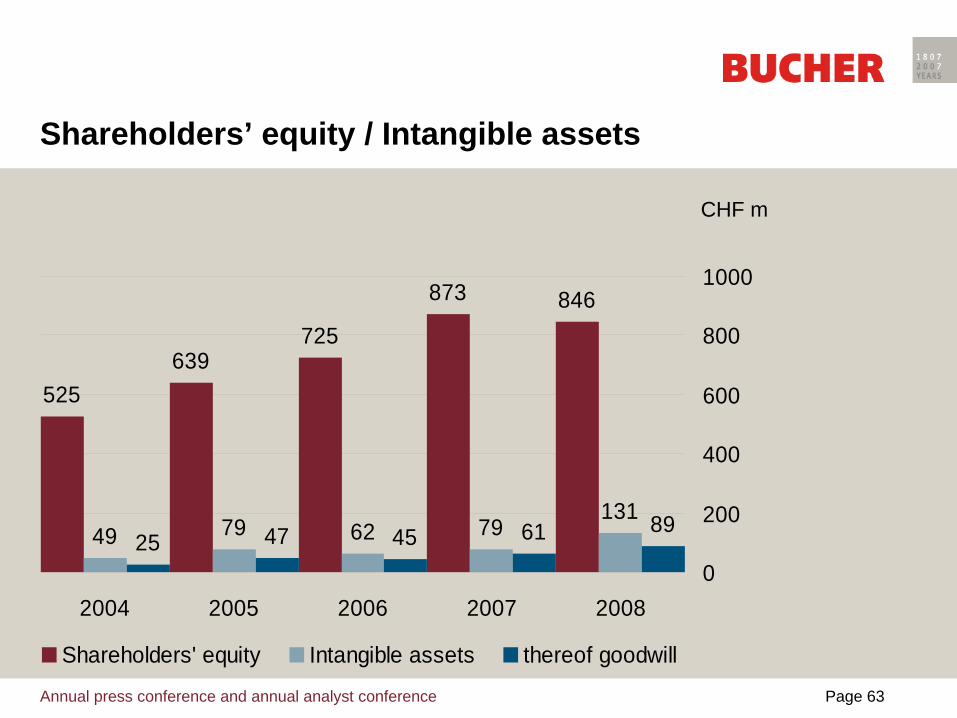
Shareholders’ equity / Intangible assets
525639
725
873 846
49 79 62 79131
25 47 45 61 89
0
200
400
600
800
1000
2004 2005 2006 2007 2008
Shareholders' equity Intangible assets thereof goodwill
CHF m
Annual press conference and annual analyst conference Page 64
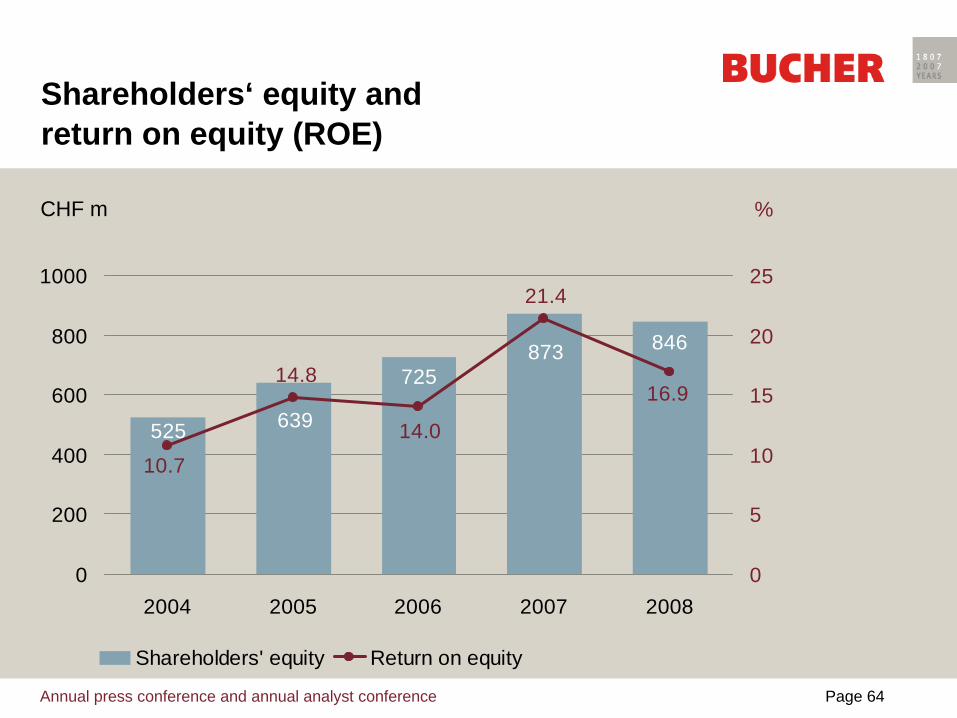
Shareholders‘ equity and return on equity (ROE)
873 846
725
525 639 14.0
21.4
16.914.8
10.7
0
200
400
600
800
1000
200820072006200520040
5
10
15
20
25
Shareholders' equity Return on equity
CHF m %
Annual press conference and annual analyst conference Page 65
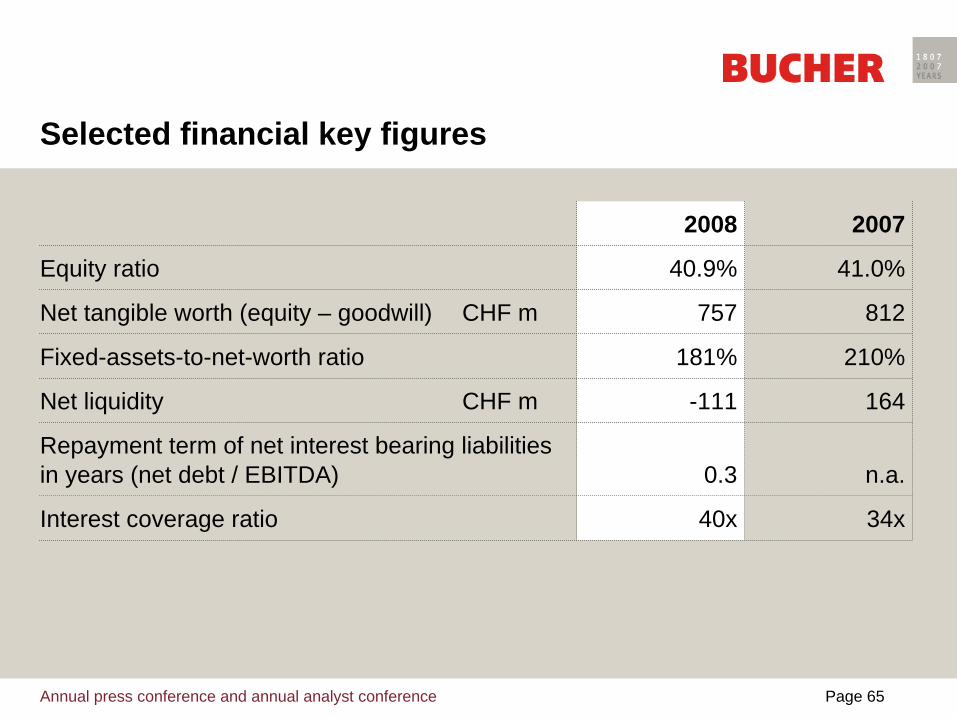
Selected financial key figures
2008 2007
Equity ratio 40.9% 41.0%
Net tangible worth (equity – goodwill) CHF m 757 812
Fixed-assets-to-net-worth ratio 181% 210%
Net liquidity CHF m -111 164
Repayment term of net interest bearing liabilities in years (net debt / EBITDA) 0.3 n.a.
Interest coverage ratio 40x 34x
Annual press conference and annual analyst conference Page 66
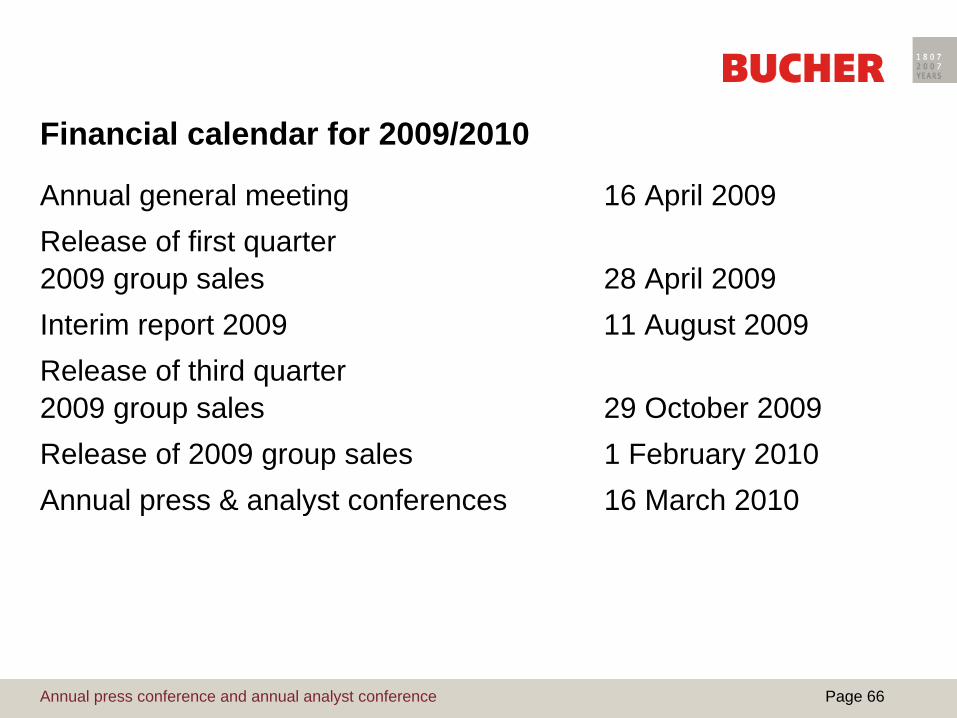
Financial calendar for 2009/2010
Annual general meeting 16 April 2009Release of first quarter 2009 group sales 28 April 2009Interim report 2009 11 August 2009Release of third quarter 2009 group sales 29 October 2009Release of 2009 group sales 1 February 2010Annual press & analyst conferences 16 March 2010