annual portfolio monitoring report 2017 · active portfolio and its performance ratings and (ii)...
TRANSCRIPT

GEF/C.53/03 November 9, 2017
53rd GEF Council Meeting November 28 – 30, 2017 Washington, D.C.
Agenda Item 14
ANNUAL PORTFOLIO MONITORING REPORT
2017
i
Recommended Council Decision
The Council, having reviewed GEF/C.53/03, Annual Portfolio Monitoring Report 2017 welcomes the overall finding that the GEF portfolio under implementation in FY17 performed satisfactorily across all focal areas. The Council also welcomes the latest GEF Corporate Scorecard.

ii
TABLE OF CONTENTS
Executive Summary ........................................................................................................................ vii Introduction .................................................................................................................................... 1
Projects Under Implementation ..................................................................................................... 1
a. Size and Composition of the Portfolio ................................................................................. 1
b. Performance Ratings ............................................................................................................ 4
Drawing Lessons: Forward-Looking Analysis on the Project Cycle and Results Capture ............... 8
a. Speed of Project Preparation and Implementation ............................................................ 8
b. Capturing the Multiple Benefits of GEF Projects ............................................................... 15
Annex I: GEF-6 Funding Approvals ................................................................................................ 22
Annex II: GEF At a Glance Since 1991 ........................................................................................... 25
Annex III: Small Grants Programme .............................................................................................. 27
Annex IV: GEF Corporate Scorecard ............................................................................................. 30

iii
LIST OF TABLES
Table 1: Number of CEO Endorsed, GEF-5 FSPs by focal area and expected GEBs, as of October 23, 2017 ........................................................................................................................................ 18
Table 2: Number of CEO Endorsed, GEF-6 FSPs by focal area and GEB indicator, as of October 23, 2017 .............................................................................................................................................. 20
Table 3: GEF at a Glance since 1991, as of June 30, 2017 ............................................................ 25
Table 4: GEF Cumulative Funding by Modality, as of June 30, 2017 ............................................ 26
LIST OF FIGURES
Figure 1: Distribution of GEF Funding and Projects by Region, as of June 30, 2017 ...................... 2
Figure 2: Distribution of GEF Funding and Projects by Agency, as of June 30, 2017 ..................... 3
Figure 3: Enabling Activities by Agency .......................................................................................... 4
Figure 4: Implementation Progress Ratings for Active Projects, as of June 30, 2017 .................... 5
Figure 5: Development Objective Ratings for Active Projects, as of June 30, 2017 ....................... 5
Figure 6: Development Objective and Implementation Progress Ratings by Region, as of June 30, 2017 ................................................................................................................................................ 6
Figure 7: Development Objective and Implementation Progress Ratings by Agency, as of June 30, 2017 ................................................................................................................................................ 7
Figure 8: Share of Approved FPSs by Months elapsed from Council Approval to Submission for CEO Endorsement ........................................................................................................................... 8
Figure 9: share of CEO Endorsed FSPs by Months Elapsed from Council Approval to CEO Endorsement ................................................................................................................................... 9
Figure 10: share of FSPs by months elapsed from CEO Endorsement to first disbursement ...... 10
Figure 11: Expected Implementation Duration versus Actual Time Elapsed from First Disbursement to Terminal Evaluation (in years) .......................................................................... 11
Figure 12: Disbursement Rates in Groups of Projects by Years Under Implementation ............. 12
Figure 13: Disbursement Rates by Focal Area .............................................................................. 13
Figure 14: Disbursement Rates by Region .................................................................................... 14
Figure 15: Share of CEO Endorsed, GEF-5 FSPs by focal area ....................................................... 17
Figure 16: Share of CEO Endorsed, GEF-6 FSPs by focal area ....................................................... 19
Figure 17: Project and Program Approvals by Amount and Number of Projects by Fiscal Year, as of June 30, 2017 ............................................................................................................................ 22

iv
Figure 18: Share of Grants by Agency in GEF-6 (FY15, FY16 and FY17) ........................................ 23
Figure 19: GEF-6 Funding Approvals by Focal Area and Theme, as of June 30, 2017 .................. 24
Figure 20: Cumulative Funding Approvals, as of June 30, 2017 ................................................... 26

v
ABBREVIATIONS AND ACRONYMS
ABS Access and Benefit Sharing ADB Asian Development Bank AfDB African Development Bank AFR Africa APMR Annual Portfolio Monitoring Report AREF African Renewable Energy Fund BD Biodiversity BOAD West African Development Bank CBD Convention on Biological Diversity CBO Community-Based Organization CC Climate Change CCA Climate Change Adaptation CCM Climate Change Mitigation CEO Chief Executive Officer CI Conservation International Cities-IAP Sustainable Cities Integrated Approach Pilot CO2 e Carbon Dioxide Equivalent Commodity-IAP Taking Deforestation out of Commodity Supply Chains COP Conference of the Parties CPMT Central Programme Management Team CSO Civil Society Organization DBSA Development Bank of Southern Africa DO Development Objectives EA Enabling Activity EAP East Asia and Pacific EBRD European Bank for Reconstruction and Development ECA Europe and Central Asia FA Focal Area FAO Food and Agriculture Organization of the United Nations Food-IAP Fostering Sustainability and Resilience for Food Security in Sub-Saharan Africa FSP Full-Sized Project FUNBIO Brazilian Biodiversity Fund FY Fiscal Year GEBs Global Environmental Benefits GEF Global Environment Facility GEF EO Global Environment Facility Evaluation Office GEFTF Global Environment Facility Trust Fund HCFC Hydro-chlorofluorocarbon IAP Integrated Approaches Program

vi
IDB Inter-American Development Bank IBRD International Bank for Reconstruction and Development (World Bank) ICT Information and Communications Technology IFAD International Fund for Agricultural Development IFC International Finance Corporation IP Implementation Progress IUCN International Union for Conservation of Nature IW International Waters LAC Latin America and the Caribbean LD Land Degradation LDCF Least Developed Countries Fund MEAs Multilateral Environmental Agreements MDB Multilateral Development Bank MFA Multi-Focal Area M&E Monitoring and Evaluation MSP Medium-Sized Project MTF Multi Trust Fund NBSAP National Biodiversity Strategies and Action Plan NGO Non-governmental organization NIP National Implementing Partner ODS Ozone Depleting Substances PV Photovoltaic PIF Project Identification Form PIR Project Implementation Report PMIS Project Management Information System POPs Persistent Organic Pollutants PPG Project Preparation Grant PPP Public Private Partnership RBM Results-Based Management SA South Asia SCCF Special Climate Change Fund SPG Small Grants Programme STAP Scientific and Technical Advisory Panel TE Terminal Evaluation UNCCD United Nations Convention to Combat Desertification UNDP United Nations Development Program UNEP United Nations Environment Program UNFCCC United Nations Framework Convention on Climate Change UNIDO United Nations Industrial Development Organization WB World Bank WWF World Wildlife Fund

vii
EXECUTIVE SUMMARY
1. This APMR specifically covers the following topics: (i) size and composition of the GEF’s active portfolio and its performance ratings and (ii) key portfolio issues of relevance to GEF-7.
2. The active GEF portfolio comprised 818 projects that had begun implementation on or before June 30, 2016 and that were under implementation during at least part of fiscal year 2017 (FY17, July 1, 2016 to June 30, 2017), accounting for a total of USD 3,681 million in GEF project financing. Asia had the largest share of the GEF funds committed towards projects under implementation, USD 1,218 million (33% of total), followed by Africa (26%) and Latin America and the Caribbean (22%). Europe and Central Asia accounted for 11% of the funding, and Global and Regional projects received 6% and 2% of the funding respectively.
3. The World Bank had the largest share of GEF funding for projects under implementation, amounting to USD1,164 million (or 32% of total commitments). It was followed by UNDP with USD 1,045 million (or 28%) and UNIDO with USD 393 million (or 11%).
4. Overall, most projects/programs under implementation (87%) were rated Moderately Satisfactory or higher (i.e. Satisfactory or Highly Satisfactory) in terms of progress towards their development objectives. Similarly, 81% of the projects/programs were rated Moderately Satisfactory or higher (i.e. Satisfactory or Highly Satisfactory) for implementation progress.
5. In addition to trends in portfolio-level performance, the report presents forward-looking analysis on key issues of relevance as the GEF prepares for the seventh replenishment of the GEF Trust Fund (GEF-7), namely the speed of project preparation and implementation, and capturing the multiple global environmental benefits of GEF projects.
6. Firstly, the GEF continues to make progress in improving the speed of project preparation. Agencies have complied fully with the deadlines set in the Cancellation Policy in terms of the submission of projects for CEO Endorsement/Approval. Still, considerable room for improvement remains in terms of the time elapsed from Council approval to actual CEO endorsement, as well as the speed of project start-up and implementation.
7. There is strong evaluative evidence to suggest that GEF investments in all focal areas hold at least some potential to achieve GEBs in multiple focal areas. However, an analysis of CEO endorsed GEF-5 and GEF-6 projects carried out for this report finds that the potential for multiple benefits is not fully reflected in project-level results frameworks or tracking tools. As a result, multiple benefits will not be fully captured at the portfolio level. While such ‘leakage’ has been reduced as a result of the rapid growth of the MFA portfolio from GEF-5 to GEF-6, more could be done to systematically capture the full range of relevant GEBs sought and achieved through all GEF investments. To achieve this, it is crucial that the GEF continue to simplify its results architecture in order to encourage target-setting, monitoring and reporting across multiple GEBs; and clearer guidance should be provided across the GEF Partnership.

viii
8. Looking forward to GEF-7, the Secretariat is working with Agencies to address the issues identified with respect to operational efficiency and results capture.

1
INTRODUCTION
1. This Annual Portfolio Monitoring Report (APMR) provides information on the overall health of the GEF Trust Fund’s active portfolio of projects and programs, as of June 30, 2017. It also presents forward-looking analysis on key issues of relevance as the GEF prepares for the seventh replenishment of the GEF Trust Fund (GEF-7), namely the speed of project preparation and implementation, and capturing the multiple global environmental benefits of GEF projects.
2. The information that underpins this analysis was provided by the GEF Agencies in their annual project implementation reviews, mid-term reviews and terminal evaluations.
3. Looking forward, and as presented in the context of the GEF-7 process, the Secretariat – in close collaboration with Agencies – has initiated work to strengthen its policies, procedures, systems and capabilities for capturing, monitoring, analyzing, and reporting data and information across all aspects of the GEF’s operations. This will include an upgraded IT platform (GEF Portal); a simplified results framework based on a limited number of core indicators; as well as clearer, more consistent, and more robust definitions and methodologies. Through these reforms, the Secretariat will be able to deliver higher quality, more timely and more comprehensive data and information on financing, operational efficiency and results. As such, there is an opportunity and a need to review and improve on the Secretariat’s current practices for portfolio-level monitoring and reporting – including the APMR and the Corporate Scorecard – for GEF-7.
PROJECTS UNDER IMPLEMENTATION
a. Size and Composition of the Portfolio
4. This section is focused on projects that had begun implementation on or before June 30, 2016 and that were under implementation during at least part of fiscal year 2017 (FY17, July 1, 2016 to June 30, 2017). This active portfolio comprised 818 projects, of which 623 were full-sized projects (FSP) and 195 were medium-sized projects (MSP), with total GEF project financing amounting to USD 3,681 million (excluding project preparation grants and Agency fees), as of 30 June, 20171.
Active Projects by Region
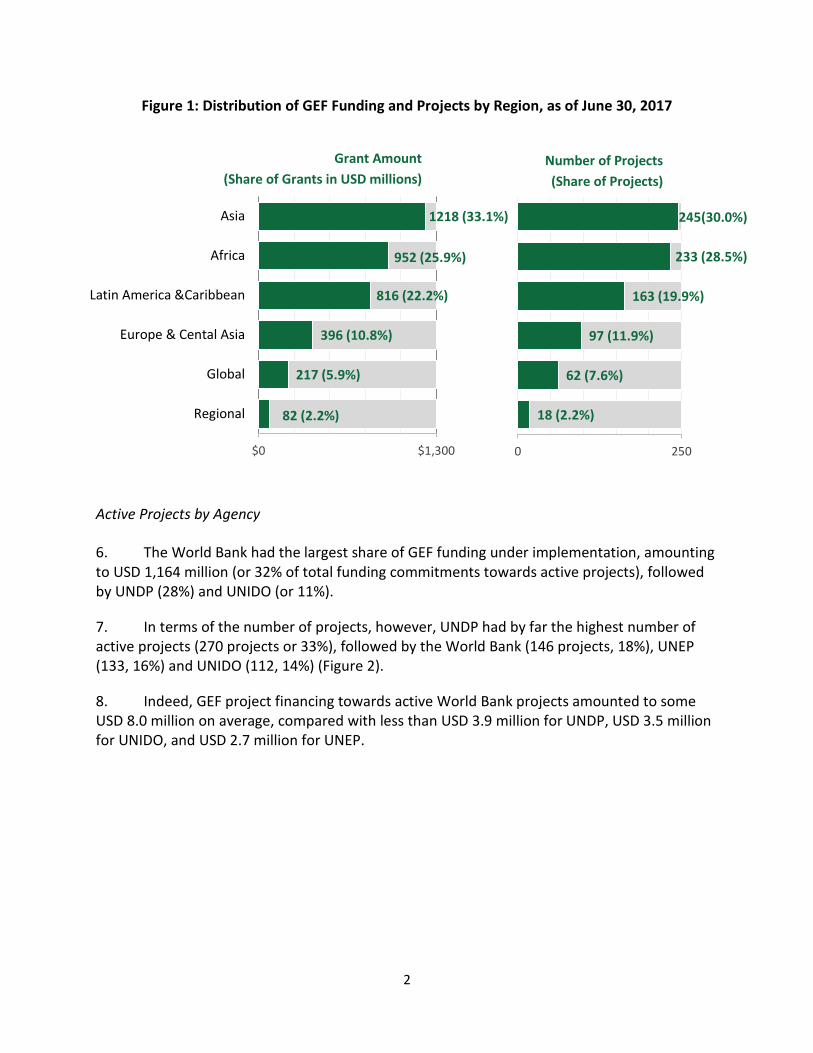
5. Consistent with trends since inception, Asia had the largest share of the GEF project financing for active projects, at USD 1,218 million (33% of total funding commitments), followed by Africa (26%) and Latin America and the Caribbean (22%). Global and regional projects accounted for a combined 8% of funding commitments towards active projects. In terms of the number of active projects, the regional distribution follows a similar pattern. (Figure 1)
1 See Annexes I and II for the GEF-6 funding approvals and GEF at a glance since 1991 respectively.
2
Figure 1: Distribution of GEF Funding and Projects by Region, as of June 30, 2017
Active Projects by Agency
6. The World Bank had the largest share of GEF funding under implementation, amounting to USD 1,164 million (or 32% of total funding commitments towards active projects), followed by UNDP (28%) and UNIDO (or 11%).
7. In terms of the number of projects, however, UNDP had by far the highest number of active projects (270 projects or 33%), followed by the World Bank (146 projects, 18%), UNEP (133, 16%) and UNIDO (112, 14%) (Figure 2).
8. Indeed, GEF project financing towards active World Bank projects amounted to some USD 8.0 million on average, compared with less than USD 3.9 million for UNDP, USD 3.5 million for UNIDO, and USD 2.7 million for UNEP.
Grant Amount (Share of Grants in USD millions)
Number of Projects (Share of Projects)
82 (2.2%)
217 (5.9%)
396 (10.8%)
816 (22.2%)
952 (25.9%)
1218 (33.1%)
$0 $1,300
Regional
Global
Europe & Cental Asia
Latin America &Caribbean
Africa
Asia
18 (2.2%)
62 (7.6%)
97 (11.9%)
163 (19.9%)
233 (28.5%)
245(30.0%)
0 250

3
Figure 2: Distribution of GEF Funding and Projects by Agency, as of June 30, 2017
Enabling Activities
9. Apart from FSPs and MSPs, the GEF funds Enabling Activities (EA), which are projects designed to assist countries to prepare plans, strategies or reports to fulfill their commitments under the five global environment conventions2 that the GEF serves as the/a financial mechanism.
10. At the end of FY17, the GEF had financed a total of 592 EAs totaling USD 250 million since inception, including 48 EAs that were approved in FY17 (USD 16 million). Agencies reported that 384 EAs (USD 199 million) were under implementation in FY17.
11. As of June 30, 2017, six Agencies had implemented EAs. Of these, UNDP had the largest share of GEF funding for EAs (47%), closely followed by UNEP (45%). In terms of the number of
2 Convention on Biological Diversity, UN Framework Convention on Climate Change, UN Convention to Combat Desertification, Stockholm Convention on Persistent Organic Pollutants, and Minamata Convention on Mercury.
1 (0.1%)
4 (0.5%)
7 (0.9%)
7 (0.9%)
8 (1%)
9 (1.1%)
16 (2%)
31 (3.8%)
43 (5.3%)
31 (3.8%)
133 (16.3%)
112 (13.7%)
270 (33.0%)
146 (17.8%)
0 350
1
2
3
4
5
6
7
8
9
10
11
12
13
14
1 (0.03%)
12 (0.3%)
20 (0.5%)
27 (0.7%)
41 (1.1%)
64 (1.7%)
83 (2.3%)
137 (3.7%)
160 (4.3%)
180 (4.9%)
355 (9.6%)
393 (10.7%)
1164 (31.6%)
0 1,500
WWF
IUCN
CI
Joint Agency
AfDB
EBRD
IFAD
ADB
FAO
IDB
UNEP
UNIDO
UNDP
World Bank
1045 (28.4%)
Grant Amount (Share of Grants in USD millions)
Number of Projects (Share of Projects)

4
EAs, UNEP had the highest number (64% or 377 EAs) (Figure 3). The UNDP portfolio includes three ‘umbrella EAs’ made of multiple ‘child EAs’ that add up to USD 60.5 million.
Figure 3: Enabling Activities by Agency
Small Grants Programme3
12. The Small Grants Programme (SGP), which is being implemented by UNDP, supports community-led initiatives that address global environmental issues. SGP empowers local civil society and community-based organizations, including women, indigenous peoples, youth, and people with disabilities, through a decentralized delivery mechanism at the country level, with dedicated GEF resources and leveraging co-financing from communities, governments, and other donors.
13. Since its inception in 1992, SGP has implemented 21,468 projects in 133 countries, providing grants totaling USD 568 million. During FY17, SGP provided grant funding for 1,120 new projects, committing a total amount of USD 36 million. The total number of projects under implementation was 3,125, with total GEF commitments amounting to USD 107.8 million. (See Annex III for further details).
b. Performance Ratings
14. Each Agency provides annual performance ratings of their active projects across the following two dimensions: progress towards development objectives (DO) and implementation progress (IP). The ratings are provided on a six-point scale: Highly Unsatisfactory (HU), Unsatisfactory (U), Moderately Unsatisfactory (MU), Moderately Satisfactory (MS) Satisfactory (S), and Highly Satisfactory (HS).
3 Source: Annual Monitoring Key Results Report for the SGP FY17 (UNDP).

5
15. The IP ratings represent progress that has been made during a given reporting period. The DO ratings reflect the likelihood that a project would achieve its stated objectives at completion.
16. For FY17, performance ratings were received for 746 of the 818 active FSPs and MSPs, representing 91% of the active portfolio. In terms of implementation progress, 81% (i.e. 607 projects) were rated Moderately Satisfactory or better (Figure 4).
Figure 4: Implementation Progress Ratings for Active Projects, as of June 30, 2017
17. In terms of the DO ratings, 86% of projects (i.e. 645 projects) were rated Moderately Satisfactory or better (Figure 5).
Figure 5: Development Objective Ratings for Active Projects, as of June 30, 2017
4 projects (0.5%) 27 (3.6%)
108 (14.5%)
239 (32.0%)
328 (44.0%)
40 (5.4%)
0
500
HighlyUnsatisfactory
Unsatisfactory ModeratelyUnsatisfactory
ModeratelySatisfactory
Satisfactory HighlySatisfactory
607 projects (81%) were rated as moderately satisfactory or above
2 projects (0.3%) 19 (2.5%)80 (10.7%)
221 (29.6%)
377 (50.5%)
47 (6.3%)
0
500
HighlyUnsatisfactory
Unsatisfactory ModeratelyUnsatisfactory
ModeratelySatisfactory
Satisfactory HighlySatisfactory
645 projects (87%) were rated as moderately satisfactory or above

6
18. With respect to both the DO and IP ratings by region, global and regional projects received the highest ratings (Figure 6).
Figure 6: Development Objective and Implementation Progress Ratings by Region, as of June 30, 20174
4 For the cohort of 746 projects, 645 projects were rated moderately satisfactory or above for their development objective and 607 were rated moderately satisfactory or above for their implementation progress.
607 projects
49 projects
13 projects
82 projects
183 projects
172 projects
108 projects
0%
94%
93%
89%
84%
79%
71%
645 projects
48 projects
13 projects
83 projects
192 projects
186 projects
123 projects
0%
92%
93%
90%
88%
85%
81%
Total
Global
Regional
Europe & Central Asia
Africa
Asia
Latin America & the Caribbean
Implementation ProgressPercentage of Projects Rated
Moderately Satisfactoryor above
Development ObjectivePercentage of Projects Rated
Moderately Satisfactory or above

7
19. The majority of Agencies rated their active projects in the satisfactory range (i.e. Moderately Satisfactory or better) both in terms of progress towards development objectives and in terms of implementation progress (Figure 7).
Figure 7: Development Objective and Implementation Progress Ratings by Agency, as of June 30, 20175
20. UNDP made substantial changes to the its PIR methodology in 2017, and as a result the DO and IP ratings cannot be reliably compared with 2016 and earlier ratings. Therefore, the lower ratings in 2017 do not indicate that UNDP projects are performing less well.
5 For the cohort of 746 projects, 645 projects were rated moderately satisfactory or above for their development objective and 607 were rated moderately satisfactory or above for their implementation progress.
607 projects
8 projects
8 projects
5 projects
3 projects
1 projects
109 projects
18 projects
120 projects
102 projects
20 projects
20 projects
188 projects
5 projects
100%
100%
100%
100%
100%
98%
95%
90%
80%
80%
74%
70%
63%
645 projects
8 projects
8 projects
5 projects
3 projects
1 projects
109 projects
18 projects
121 projects
105 projects
23 projects
22 projects
216 projects
6 projects
0%
100%
100%
100%
100%
100%
98%
95%
91%
82%
92%
81%
80%
75%
Total
AfDB
EBRD
Joint Agency
IUCN
WWF
UNIDO
FAO
UNEP
World Bank
ADB
IDB
UNDP
IFAD
Implementation ProgressPercentage of Projects Rated
Moderately Satisfactory or above
Development ObjectivePercentage of Projects Rated
Moderately Satisfactory or above

8
DRAWING LESSONS: FORWARD-LOOKING ANALYSIS ON THE PROJECT CYCLE AND RESULTS CAPTURE
21. This section provides forward-looking analysis on key issues of relevance as the GEF prepares for the seventh replenishment of the GEF Trust Fund (GEF-7), namely the speed of project preparation and implementation, and capturing the multiple global environmental benefits of GEF projects.
a. Speed of Project Preparation and Implementation
22. The Cancellation Policy6, which was approved by the Council in FY15, reiterated the following time standards approved by the GEF Council for the preparation of GEF projects: (a) FSPs receive CEO endorsement no later than 18 months after the Council approves the relevant work program that includes the Project Identification Form (PIF), and (b) MSPs receive CEO approval no later than 12 months after the CEO approves the MSP PIF. 23. The Policy further introduced the following measures to enable its implementation: after 18 months from the date of Council approval of an FSP PIF, or after 12 months from the date of CEO approval of an MSP PIF, if the project has not been submitted for CEO endorsement/approval with complete documentation, then it is subject to cancellation. 24. The Cancellation Policy has had a positive impact on the speed of project preparation. As of August 2017, for all FSPs approved in fiscal year 2015 (July 2014 to June 2015), Requests for CEO Endorsement were submitted for Secretariat review within 18 months from Council Approval. In comparison, for fiscal years 2011 to 2014, between 24% and 56% of projects were not submitted within 18 months (Figure 8).
Figure 8: Share of Approved FPSs by Months elapsed from Council Approval to Submission for CEO Endorsement
6 OP/PL/01 (http://www.thegef.org/sites/default/files/documents/Cancellation_Policy_June_2015_0.pdf)
76%
93%
61%
84%
55%
87%
44%
76%
100% 100%
0%
20%
40%
60%
80%
100%
1 2 3 4 5 6 7 8 9 10 11 12 13 14 15 16 17 18 19 20 21 22 23 24
% o
f pro
ject
s app
rove
d
FY 11 FY 12 FY 13 FY 14 FY 15

9
25. As indicated in Figure 9, most projects continue to underperform against the agreed time standard of 18 months from Council Approval to CEO Endorsement. The new cancellation rules appear to have reduced the number of projects with very severe delays: after 24 months, 83% of projects submitted in FY15 had received CEO Endorsement, compared with 69% or less in the three years before. Meanwhile fewer than half of all FSPs meet the 18-month time standard: of the FSPs approved by the Council in FY15, 46% received CEO Endorsement within 18 months. This confirms that most projects, even when submitted on time, undergo several iterations, and in some cases additional Council review, all of which contributes towards a longer time elapsed from approval to endorsement.
Figure 9: share of CEO Endorsed FSPs by Months Elapsed from Council Approval to CEO Endorsement
(GEF-6 has seen fewer outliers in terms of project preparation)
26. Another relevant measure of the speed of project preparation is the time elapsed from CEO endorsement to implementation start. Data over the last five years suggests that there is considerable scope to further accelerate project preparation and startup. Between 18% and 32% of FSPs that have begun implementation in recent years did not reach first disbursement within one year from CEO Endorsement (Figure 10). The data does not suggest any clear trend in this respect, and the reasons for delays have been difficult to pinpoint. In 2016 the Secretariat, in cooperation with Agencies, carried out an analysis of factors behind the time taken for first disbursement. The three most common reasons identified across all Agencies were 1) lengthy government approval processes, 2) recruitments, and 3) capacity constraints among executing partners.
58%
84%
32%25%
69%
19%
53%46%
83%
0%
20%
40%
60%
80%
100%
1 2 3 4 5 6 7 8 9 10 11 12 13 14 15 16 17 18 19 20 21 22 23 24
% o
f pro
ject
s app
rove
d
Number of months from PIF approval to CEO endorsementFY 11 FY 12 FY 13 FY 14 FY 15

10
Figure 10: share of FSPs by months elapsed from CEO Endorsement to first disbursement
(As for the time elapsed to first disbursement, data over the past five years does not reveal a clear trend)
27. The delay in the first disbursement is a major factor behind project extensions beyond their intended implementation period. Analysis of 99 GEF-4/5 FSPs for which terminal evaluations had been received as of June 30, 2017 indicates that the average actual time elapsed from 1st disbursement date to TE submission date was 67 months, whereas the expected implementation duration provided at CEO Endorsement was 49 months (Figure 11). Of those 99 projects, 24% submitted TEs within one year from their intended completion date, and for 64% of projects TEs were submitted within two years. It should be noted that most GEF-4 and GEF-5 projects had not been completed at the time of this analysis, and the completed projects are likely at the faster end of the spectrum.
91%
94%92%
82%
72%
95%
68%
91%
0%
20%
40%
60%
80%
100%
1 2 3 4 5 6 7 8 9 10 11 12 13 14 15 16 17 18 19 20 21 22 23 24
% o
f prje
cts d
isbur
sed
Number of months from endorsement to first disbursement
FY 11 FY 12 FY 13 FY 14 FY 15

11
Figure 11: Expected Implementation Duration versus Actual Time Elapsed from First Disbursement to Terminal Evaluation (in years)
28. In addition to project performance against intended implementation periods, the Secretariat undertook analysis of the rate at which projects disburse GEF financing. Of 735 active GEF-4 and GEF-5 projects reviewed, with GEF funding commitments amounting to USD 2,789 million, 722 provided data on the total, cumulative amount of GEF project financing disbursed as of June 30, 2017. The actual disbursements reported amounted to USD 2,166 million or 79% of the USD 2,753 million committed towards the projects for which disbursement data was provided. This cohort of projects represents approximately 45% of total GEF-4 and GEF-5 funding approvals.
29. A breakdown of the above disbursement data sheds some on how GEF funds are disbursed at the project level, at different stages of implementation. For projects that had been under implementation for less than three years as of June 30, 2017, cumulative disbursements amounted to 27% of the GEF project financing commitments, on average. For projects with 4–6 years of implementation, 69% had been disbursed on average, and for projects under implementation for 7–9 years, average disbursements amounted to 87% within nine years. The data also highlights a few projects that had significant amounts of undisbursed funds after nine years of implementation (Figure 12).
3
6 6
4
6 5 5
8
6
5
3
4 4
-
4 4 4
5
4 4
-
1
2
3
4
5
6
7
8
9
Average of actual implementation period Average of expected implementation period

12
Figure 12: Disbursement Rates in Groups of Projects by Years Under Implementation
(actual, cumulative amounts of GEF project financing disbursed as of June 30, 2017 as a share of total GEF project financing committed, in groups of projects by years under implementation)
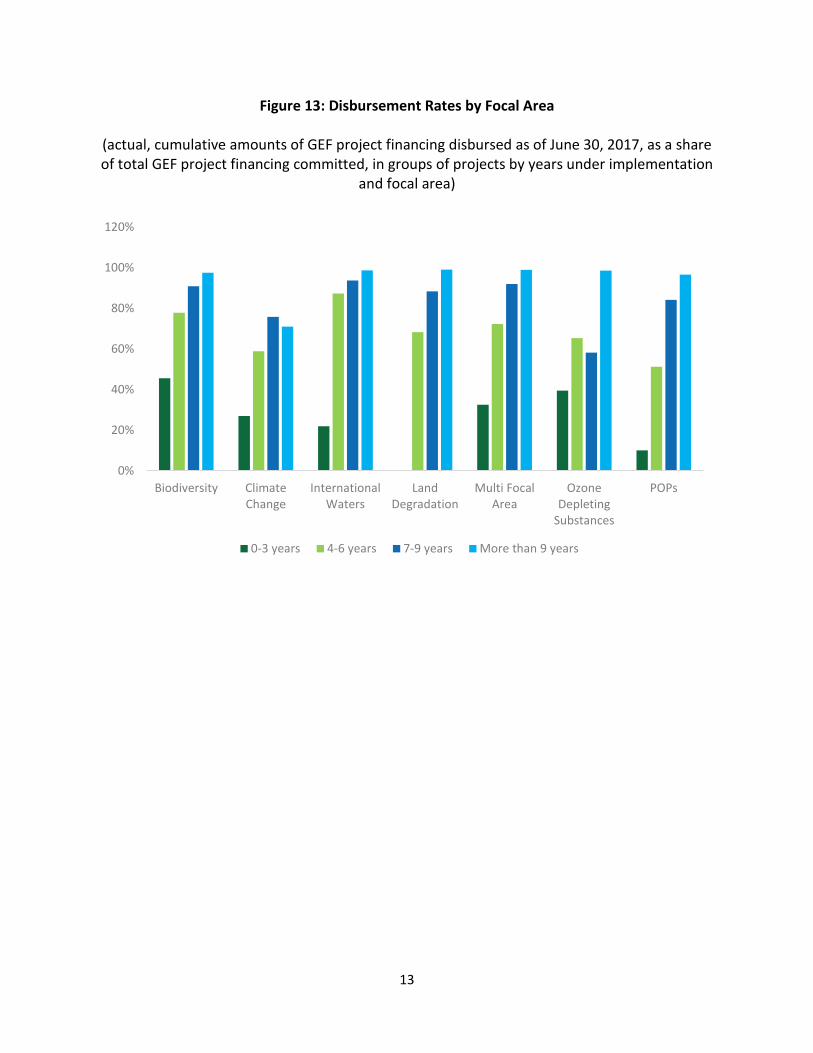
30. A more detailed look at the above data suggests that trends are broadly similar across different regions and focal areas (Figure 13 and 14). It should be noted, however, that the numbers of projects in some of the groups are small, and not necessarily representative of broader performance within a particular region or focal area.
27%
69%
87% 89%
0%
10%
20%
30%
40%
50%
60%
70%
80%
90%
100%
0-3 years 4-6 years 7-9 years More than 9 years
13
Figure 13: Disbursement Rates by Focal Area
(actual, cumulative amounts of GEF project financing disbursed as of June 30, 2017, as a share of total GEF project financing committed, in groups of projects by years under implementation
and focal area)
0%
20%
40%
60%
80%
100%
120%
Biodiversity ClimateChange
InternationalWaters
LandDegradation
Multi FocalArea
OzoneDepleting
Substances
POPs
0-3 years 4-6 years 7-9 years More than 9 years

14
Figure 14: Disbursement Rates by Region
(actual, cumulative amounts of GEF project financing disbursed as of June 30, 2017, as a share of total GEF project financing committed, in groups of projects by years under implementation
and region)
31. As discussed in the Secretariat’s GEF-7 policy agenda presented at the second GEF-7 replenishment meeting7, evidence suggests that the Cancellation Policy has contributed towards some acceleration of project preparation, albeit with room for improvement. Beyond preparation, there may be a need and an opportunity to improve the efficiency and effectiveness of project implementation. Underpinning such measures, it is crucial that the GEF improve the flow of information on operational progress throughout the project cycle.
32. To ensure progress in GEF-7, the Secretariat has initiated an in-depth dialogue with all Agencies to further investigate the ways in which the GEF can accelerate its project cycle. Options under consideration include, inter alia, updating the cancellation policy to establish deadlines for actual CEO Endorsement/Approval rather than for the submission of complete documentation alone, tranche payments of Agency fees tied to agreed implementation milestones, and stronger requirements for project-level reporting during implementation. This dialogue is underway and it will inform relevant GEF-7 policy recommendations that will be presented at the third replenishment meeting in January 2018.
33. Moreover, the Secretariat expects to launch an upgraded IT platform to coincide with the start of GEF-7. The GEF Portal is expected to introduce a step-change in terms of the GEF’s 7 GEF/R.7/06, Programming Directions and Policy Agenda (http://www.thegef.org/sites/default/files/council-meeting-documents/GEF-7%20Programming%20Directions%20and%20Policy%20Agenda%2C%20Second%20Replenishment%20Mee.._.pdf)
0%
20%
40%
60%
80%
100%
120%
AFR Asia ECA LAC Global Regional
0-3 years 4-6 years 7-9 years More than 9 years

15
ability to capture, aggregate, analyze and report on data related to financing, operational progress and results across the Partnership and for the general public, with associated improvements in efficiency and transparency. Through the direct entry of project proposals and implementation reports by Agencies, automated reporting, as well as a management dashboard for oversight, the GEF Portal will improve the quality and timeliness of a range of mission-critical information, and substantially improve the transparency of the GEF by making public information available in a more timely and accessible manner. With the GEF Portal in operation from the onset of GEF-7, the GEF will be able to begin publishing data to the International Aid Transparency Initiative (IATI) Registry8 before the end of calendar year 2019.
b. Capturing the Multiple Benefits of GEF Projects
34. The GEF’s five focal areas are inextricably linked. Investments aiming to generate global environmental benefits (GEB) in one focal area often produce benefits in other areas as well. Yet the GEF’s systems for monitoring and reporting on results do not always fully capture the multiple benefits sought and achieved. This section examines the degree to which such results ‘leakage’ occurs and what it means for the GEF’s efforts to develop a more effective results architecture for GEF-7.
35. The section is organized into three parts. The first one explores the available evidence of the multiple benefits of GEF investments, drawing in particular on recent evaluations carried out by the Independent Evaluation Office (IEO). The second part quantifies the degree to which multiple benefits are in fact targeted in GEF-5 and GEF-6 projects and programs. The third part, finally, presents conclusions and suggests possible implications for a future results architecture and target-setting.
Evidence of multiple benefits
36. A growing share of GEF projects and programs are financed under multiple focal areas (MFA), and seek multiple GEBs. That share has increased from 22% in GEF-4, to 35% in GEF-5, and 56% in GEF-6 as of October 24, 2017. Through MFA projects and programs, the GEF is increasingly seizing the many opportunities for synergies across its focal areas.
37. Other recent evaluations suggest, however, that single-focal area (SFA) projects and programs may also have important multiple benefits. For example:
• IEO’s Chemicals and Waste Focal Area Study9 found six SFA, chemicals and waste (CW) projects that set targets for reduced greenhouse gas (GHG) emissions.
8 (https://www.iatiregistry.org/) 9 GEF/ME/C.52/Inf.03 (http://www.thegef.org/sites/default/files/council-meeting-documents/EN_GEF.ME_C.52_Inf.03_Chemical_and_Waste_May_2017.pdf)

16
• In the land degradation (LD) focal area, IEO found that investments have frequently had positive impacts in the biodiversity (BD) and climate change (CC) focal areas10.
• In both the land degradation and biodiversity focal areas, value for money analyses conducted by IEO11 have estimated the returns on GEF investments in terms of carbon sequestration, suggesting that climate change co-benefits represent a key component of the value for money of GEF investments in these focal areas12.
• The International Waters Focal Area Study13 suggests that international waters (IW) projects and programs could have significant benefits in terms of climate change mitigation and adaptation – in addition to the biodiversity benefits associated with fisheries projects.
• In climate change, finally, IEO concluded that “[a]ctivities funded by other focal areas and initiatives, along with MFA projects, are poised to deliver significant [GHG emission reductions] that may be greater than those achieved by activities financed by the climate change focal area alone”14.
38. The Scientific and Technical Advisory Panel (STAP) has also addressed the synergies and multiple benefits across focal areas on multiple occasions15.
39. In summary, therefore, there is strong evidence to suggest that GEF investments in all focal areas hold at least some potential to achieve GEBs in multiple focal areas.
Expected Global Environmental Benefits: Evidence from GEF-5 and GEF-6
10 GEF/ME/C.52/Inf.02, Land Degradation Focal Area Study (http://www.thegef.org/sites/default/files/council-meeting-documents/EN_GEF.ME_C.52_Inf.02_Land_Degradation_May_2017.pdf) 11 GEF/ME/C.53/Inf.01, Draft Final Report of the Sixth Comprehensive Evaluation of the GEF (OPS6) (http://www.thegef.org/sites/default/files/council-meeting-documents/EN_GEF.ME_C.53_Inf.01_OPS6_Nov_2017_0.pdf) 12 GEF/ME/C.51/Inf.02, Value for Money Analysis for the Land Degradation Projects of the GEF (http://www.thegef.org/sites/default/files/council-meeting-documents/EN_GEF.ME_C.51.Inf_02_VFM%20Analysis%20for%20LD%20Projects%20of%20GEF.pdf) 13 GEF/ME/C.51/Inf.01 (http://www.thegef.org/sites/default/files/council-meeting-documents/EN_GEF.ME_C51_IW_Study_Report_Oct_2016_final.pdf) 14 GEF/ME/C.53/Inf.02, Climate Change Focal Area Study (http://www.thegef.org/sites/default/files/council-meeting-documents/EN_GEF.ME_C.53_Inf.02_Climate_Change_F_A_Study_Nov2017.pdf) 15 See e.g. GEF/STAP/C.52/Inf.02, A Review of the Science of Integrated Approaches to Natural Resource Management (http://www.thegef.org/sites/default/files/council-meeting-documents/EN_GEF.STAP_.C.52.Inf_.02_Science_of_IAs_to_NRM.pdf); and GEF/R.7/Inf.10, Draft STAP Working Paper: Why the scientific community is moving toward integration of environmental, social, and economic issues to solve complicated problems (http://www.thegef.org/sites/default/files/council-meeting-documents/STAP%20Draft%20Working%20Paper%20on%20Integrated%20approach%20-%20GEF_R.7_Inf.10.pdf)

17
40. This section considers the degree to which expected, multiple global environmental benefits are identified and sought across a sub-set of full-sized GEF-5 and GEF-6 projects that have received CEO Endorsement.
GEF-5 projects
41. As of October 23, 2017, 447 full-sized projects (FSP) that were approved by the Council in GEF-5 (July 1, 2010 to June 30, 2014) had received CEO Endorsement. Of these, 28% were MFA projects, and 25% and 23% were financed under the climate change and biodiversity focal areas, respectively. Single-focal area projects in the chemicals and waste, international waters and land degradation focal areas accounted for a combined 24% of CEO Endorsed, GEF-6 FSPs (Figure 15).
Figure 15: Share of CEO Endorsed, GEF-5 FSPs by focal area (share of total number of projects, as of October 23, 2017)
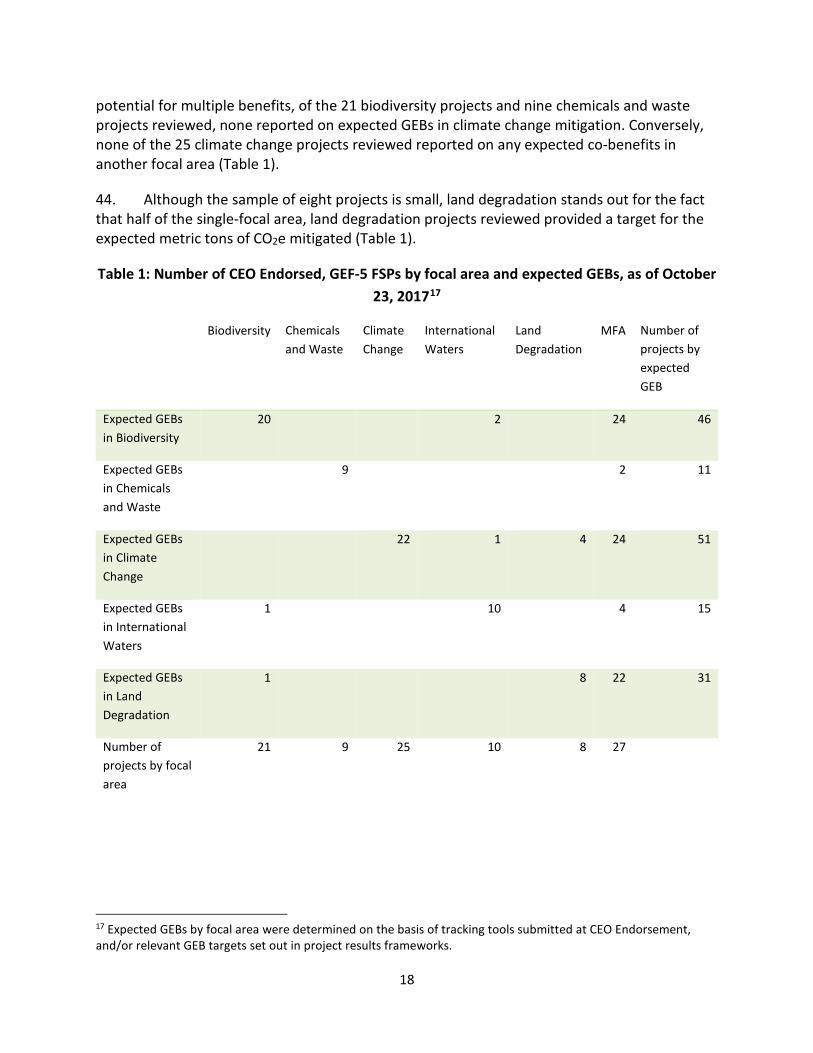
42. To assess the degree to which the CEO Endorsed GEF-5 projects seek and report on multiple benefits, a random sample of 100 projects was selected. Of these, 27 are MFA projects, which reported on expected GEBs16 across all five focal areas; particularly in biodiversity, climate change and land degradation. Indeed, each MFA project set targets for GEBs across three different focal areas on average (Table 1).
43. In contrast, among the remaining, 73 SFA projects reviewed, a small minority reported on expected GEBs in more than one focal area. Specifically, notwithstanding the demonstrated
16 Expected GEBs by focal area were determined using the tracking tools submitted at CEO Endorsement, and/or relevant GEB targets set out in project results frameworks.
23%
11%
25%
8%
5%
28%
Biodiversity Chemicals and Waste Climate Change
International Waters Land Degradation Multi Focal Area
18
potential for multiple benefits, of the 21 biodiversity projects and nine chemicals and waste projects reviewed, none reported on expected GEBs in climate change mitigation. Conversely, none of the 25 climate change projects reviewed reported on any expected co-benefits in another focal area (Table 1).
44. Although the sample of eight projects is small, land degradation stands out for the fact that half of the single-focal area, land degradation projects reviewed provided a target for the expected metric tons of CO2e mitigated (Table 1).
Table 1: Number of CEO Endorsed, GEF-5 FSPs by focal area and expected GEBs, as of October 23, 201717
Biodiversity Chemicals
and Waste Climate Change
International Waters
Land Degradation
MFA Number of projects by expected GEB
Expected GEBs in Biodiversity
20
2
24 46
Expected GEBs in Chemicals and Waste
9
2 11
Expected GEBs in Climate Change
22 1 4 24 51
Expected GEBs in International Waters
1
10
4 15
Expected GEBs in Land Degradation
1
8 22 31
Number of projects by focal area
21 9 25 10 8 27
17 Expected GEBs by focal area were determined on the basis of tracking tools submitted at CEO Endorsement, and/or relevant GEB targets set out in project results frameworks.
19
GEF-6 projects
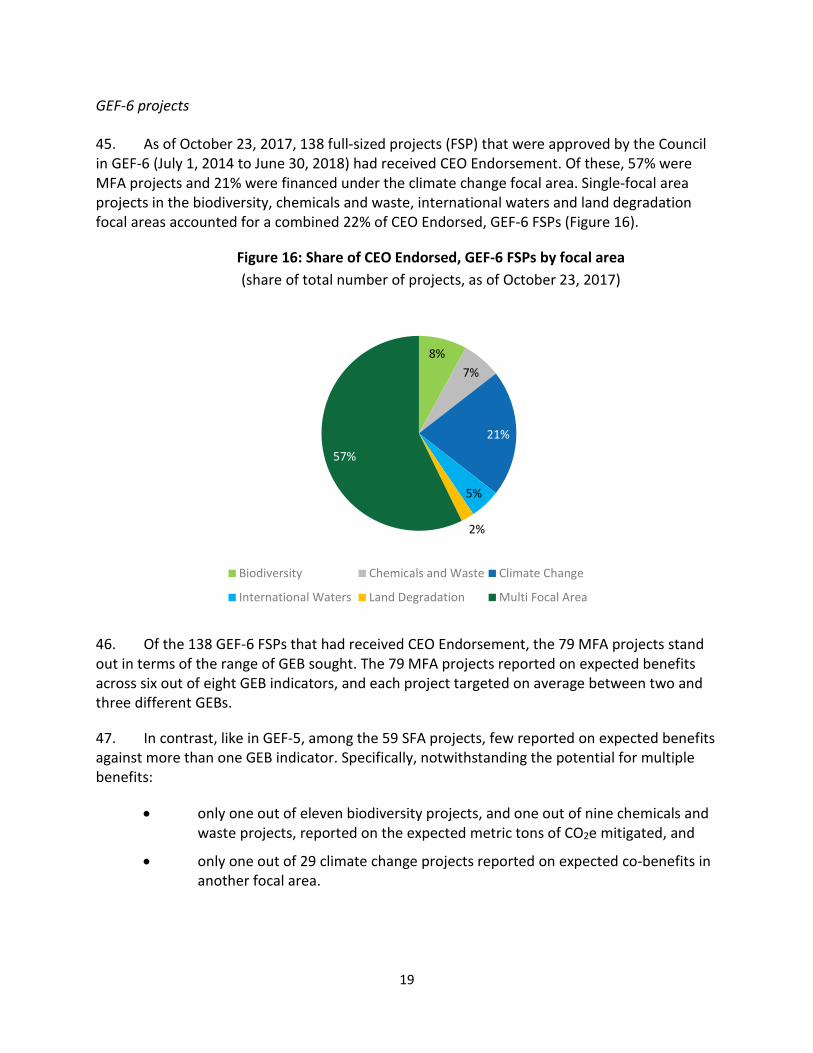
45. As of October 23, 2017, 138 full-sized projects (FSP) that were approved by the Council in GEF-6 (July 1, 2014 to June 30, 2018) had received CEO Endorsement. Of these, 57% were MFA projects and 21% were financed under the climate change focal area. Single-focal area projects in the biodiversity, chemicals and waste, international waters and land degradation focal areas accounted for a combined 22% of CEO Endorsed, GEF-6 FSPs (Figure 16).
Figure 16: Share of CEO Endorsed, GEF-6 FSPs by focal area (share of total number of projects, as of October 23, 2017)
46. Of the 138 GEF-6 FSPs that had received CEO Endorsement, the 79 MFA projects stand out in terms of the range of GEB sought. The 79 MFA projects reported on expected benefits across six out of eight GEB indicators, and each project targeted on average between two and three different GEBs.
47. In contrast, like in GEF-5, among the 59 SFA projects, few reported on expected benefits against more than one GEB indicator. Specifically, notwithstanding the potential for multiple benefits:
• only one out of eleven biodiversity projects, and one out of nine chemicals and waste projects, reported on the expected metric tons of CO2e mitigated, and
• only one out of 29 climate change projects reported on expected co-benefits in another focal area.
8%7%
21%
5%
2%
57%
Biodiversity Chemicals and Waste Climate Change
International Waters Land Degradation Multi Focal Area

20
Table 2: Number of CEO Endorsed, GEF-6 FSPs by focal area and GEB indicator, as of October 23, 2017
Biodiversity Chemicals
and Waste Climate Change
International Waters
Land Degradation
MFA Number of projects by indicator
Landscapes and seascapes under improved management for biodiversity conservation
10
2 1 61 74
Production landscapes under improved management
2
1
3 55 61
Number of freshwater basins in which water-food-energy-ecosystem security and conjunctive management of surface and groundwater is taking place
4
3 7
Globally over-exploited fisheries moved to more sustainable levels
1
8 9
CO2e mitigated 1 1 28
2 60 92
POPs (PCBs, obsolete pesticides) disposed
4
2 6
Mercury reduced
2
2
ODP (HCFC) reduced/ phased out
Number of projects by focal area
11 9 29 7 3 79

21
Conclusions: implications for the GEF-7 results architecture and target setting
48. Independent evaluations provide ample evidence of the potential for synergies and multiple benefits across the GEF’s five focal areas. At the same time, evidence from GEF-5 and GEF-6 suggests that project-level indicators and targets for GEBs are determined to a large degree based on the source of funding. As a result, multiple benefits are sought and pursued almost exclusively through projects that are financed from multiple focal area allocations. Indeed, limited evidence from the project documents submitted at CEO Endorsement suggests that the potential for multiple benefits is frequently recognized, but often not quantified, possibly due to the associated transaction costs and complexity.
49. In conclusion, therefore, the GEF may hold the potential to achieve greater results than it actively aims to capture. While the risk of such ‘leakage’ has been reduced as a result of the rapid growth of the MFA portfolio from GEF-5 to GEF-6, more could be done to systematically capture the full range of relevant GEBs sought and achieved through all GEF investments. To achieve this, it is crucial that the GEF continue to simplify its results architecture in order to encourage target-setting, monitoring and reporting across multiple GEBs; and clearer guidance should be provided across the GEF Partnership. Moreover, a stronger expectation of multiple benefits should inform the proposed, replenishment targets for GEF-7.

22
ANNEX I: GEF-6 FUNDING APPROVALS
1. This Annex provides an analysis of GEF-6 project approvals as of June 30, 2017. At theend of FY17, the GEF had programed USD 2,39018 million in GEF-6 resources for 450 projectsand programs; of which 241 were FSPs, 91 were MSPs, and 118 were EAs.
GEF-6 Programing
2. The volume of programing and the number of projects approved vary significantlybetween fiscal years. Figure 17 provides an overview on total approvals and grant amounts byfiscal year across the last three replenishment periods19.
Figure 17: Project and Program Approvals by Amount and Number of Projects by Fiscal Year, as of June 30, 2017
18 The total grant amount includes the grant for projects plus the Project Preparation Grant (PPG). 19 The third replenishment (GEF-3) period includes four fiscal years (2003-2006). The fourth replenishment (GEF-4) period includes four fiscal years (2007-2010), the fifth replenishment (GEF-5) period includes four fiscal years (2011-2014), and the sixth replenishment (GEF-6) period includes four fiscal years (2015-2018).
232187
160132
152
219263
202
40
250 265
361
100
177
128
0
375
'03 '04 '05 '06 '07 '08 '09 '10 '11 '12 '13 '14 '15 '16 '17
Number of ApprovedProjects
$542 $630 $612 $552
$971
$676
$910
$552
$280
$1,249
$881 $899 $875 $879
$605
$-
$1,300
'03 '04 '05 '06 '07 '08 '09 '10 '11 '12 '13 '14 '15 '16 '17
Approval Amount(in USD Million)
23
3. This highlights the cycle of project approvals through replenishment periods, with additional dynamics in the graph reflecting various policies and approaches.20
Project and Program Approvals in GEF-621
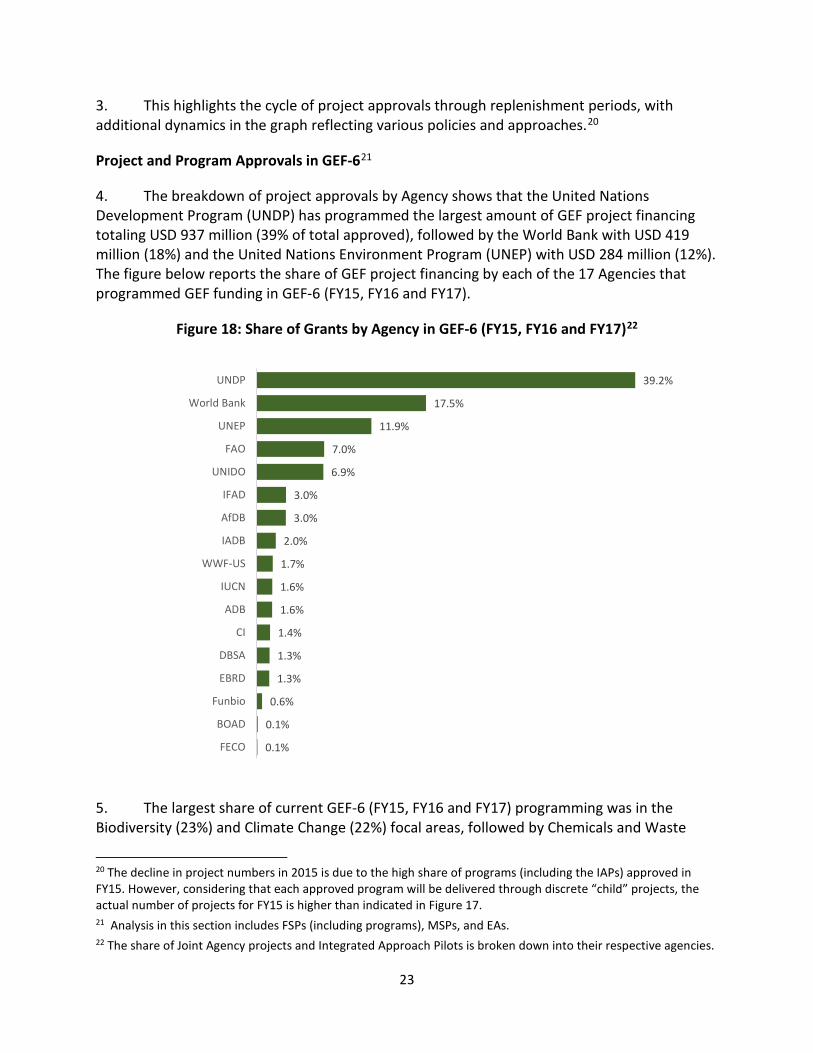
4. The breakdown of project approvals by Agency shows that the United Nations Development Program (UNDP) has programmed the largest amount of GEF project financing totaling USD 937 million (39% of total approved), followed by the World Bank with USD 419 million (18%) and the United Nations Environment Program (UNEP) with USD 284 million (12%). The figure below reports the share of GEF project financing by each of the 17 Agencies that programmed GEF funding in GEF-6 (FY15, FY16 and FY17).
Figure 18: Share of Grants by Agency in GEF-6 (FY15, FY16 and FY17)22
5. The largest share of current GEF-6 (FY15, FY16 and FY17) programming was in the Biodiversity (23%) and Climate Change (22%) focal areas, followed by Chemicals and Waste
20 The decline in project numbers in 2015 is due to the high share of programs (including the IAPs) approved in FY15. However, considering that each approved program will be delivered through discrete “child” projects, the actual number of projects for FY15 is higher than indicated in Figure 17. 21 Analysis in this section includes FSPs (including programs), MSPs, and EAs. 22 The share of Joint Agency projects and Integrated Approach Pilots is broken down into their respective agencies.
0.1%
0.1%
0.6%
1.3%
1.3%
1.4%
1.6%
1.6%
1.7%
2.0%
3.0%
3.0%
6.9%
7.0%
11.9%
17.5%
39.2%
FECO
BOAD
Funbio
EBRD
DBSA
CI
ADB
IUCN
WWF-US
IADB
AfDB
IFAD
UNIDO
FAO
UNEP
World Bank
UNDP

24
(14%), the SFM program (8%), Land Degradation (8%), and International Waters (8%). The Integrated Approach Pilot (IAP) programs amounted to (6%) of GEF-6 funding approvals as of June 30, 201723.
Figure 19: GEF-6 Funding Approvals by Focal Area and Theme, as of June 30, 2017
23 This amount captures only the non-STAR element of the IAPs.
1.0%
3.8%
5.6%
6.1%
8.0%
8.1%
8.2%
14.1%
22.2%
22.9%
Cross Cutting Capacity Development (CCCD)
Non-Grant Pilot
Small Grant Program
IAPs
International Waters
Land Degradation
SFM Program
Chemicals and Waste
Climate Change
Biodiversity

25
ANNEX II: GEF AT A GLANCE SINCE 1991
1. This Annex is a summary of the GEF’s cumulative project and program approvals (Table 3). The information presented in the following section is based on data retrieved from the Secretariat’s Project Management Information System (PMIS).
GEF Programing Snapshot
Table 3: GEF at a Glance since 1991, as of June 30, 2017 Cumulative – Project Approvals Number of approvals 4,149 Value of Approvals USD 15,284 million Indicative Co-financing USD 81,901 million Ratio of $ GEF: $ Indicative Co-financing 1:5.4 FY 17– Project Approvals Number of Approvals 128 Value of Approvals USD 605 million FY 17 – Projects Under Implementation Number of Projects 818 Value of Projects USD 3,681 million FY 17– Projects Performance Ratings Percentage of projects that have received a moderately satisfactory or better rating for their Development Objective
86.5%
Percentage of projects that have received a moderately satisfactory or better rating for their Implementation Progress
81.4%
Cumulative GEF Project Approvals
2. GEF funding approvals from inception to June 30, 2017 totaled USD 15,284 million in GEF project financing, including programs, enabling activities (EAs), project preparation grants (PPGs), and the Small Grants Programme (SGP). In FY17, project approvals amounted to USD 605 million in GEF project financing for 128 projects: 50 full-sized projects (FSPs), 41 medium-sized projects (MSPs), and 37 EAs. The GEF cumulative funding by modality from 1991-2017 is presented in the table and figure below.

26
Table 4: GEF Cumulative Funding by Modality, as of June 30, 201724
Modality
Amount (USD million)
FSPs and MSPs 10,934 Programs 2,594 Small Grants Programme 904 Enabling Activities 490 Project Preparation Grants 362 Total 15,284
3. The cumulative funding approvals (excluding Agency fees) are presented in USD million from 1991 to 2017 in the Figure 20.
Figure 20: Cumulative Funding Approvals, as of June 30, 2017
24 The amounts include GEF Trust Fund projects and GEF portions of Multi Trust Fund projects. Also, agency fees included.
USD 262 million in 1991
USD 15,284 million in 2017
0
3,000
6,000
9,000
12,000
15,000
'91 '92 '93 '94 '95 '96 '97 '98 '99 '00 '01 '02 '03 '04 '05 '06 '07 '08 '09 '10 '11 '12 '13 '14 '15 '16 '17
USD Million

27
ANNEX III: SMALL GRANTS PROGRAMME
SGP’s Portfolio Monitoring and Management System
1. SGP has developed a systemic and adaptable approach for its portfolio monitoring and management based on its experience over 25 years. It undertakes monitoring and evaluation at three levels at the global, country, and project levels. At the project level grantees are enabled to adaptively manage projects; the country level where the SGP national teams monitor projects results as they relate to the indicators and targets in the SGP Country Programme Strategies, and at the global level where the SGP CPMT gathers information from countries and reports annually to the GEF and other partners on the results achieved by projects through the Annual Monitoring Report and partnership results report.
Regional and Country Coverage
2. In FY17, Africa and the Latin America/Caribbean had the largest share of GEF grants for the SGP (32% each), followed by Asia/Pacific (25%), and Europe/CIS and the Arab States accounted for the rest (5% each). A total of 125 countries were supported by the SGP through the global and upgraded country programs, with 63 percent of the global programs present in Least Developed Countries and Small Island Developing States.
Portfolio Performance and Broader Adoption
3. The Joint GEF-UNDP Evaluation of the Small grants Programme25, conducted in 2015, concluded that the Program continues to play a key role in promoting the GEF’s objectives. It specifically noted that SGP continues to support communities with projects that are effective, efficient and relevant in achieving global environmental benefits, while addressing livelihoods and poverty as well as promoting gender equality and empowering women.
4. While the individual project investments are small (averaging $25,000 per project), significant efforts have been made by SGP country programs to ensure replication, scaling up, sustainability and mainstreaming of the program activities and results. During this reporting period, 15 SGP country programs partnered with the GEF Full Size and Medium Size Projects to scale up and mainstream successful approaches and results.
Focal Areas Results
5. Among the SGP portfolio in FY17, the biodiversity focal area remained as the largest portfolio (38%), followed by climate change mitigation (22%), land degradation (21%), international waters (3%), chemicals and wastes (3%), and capacity development (6%). While
25 GEF/ME/C.48/Inf.02 (https://www.thegef.org/sites/default/files/council-meeting-documents/EN_GEF.ME_.C.48.Inf_.02_SGP.pdf)

28
SGP grants are tracked through their primary focal area, most are multi-focal and identify relevance to more or more additional focal areas.
6. In FY17, SGP projects supported improved sustainability of 126 protected areas, covering 7.5 million hectares; mainstreaming biodiversity conservation and sustainable use in 139 target landscapes/seascapes, covering 3.7 million hectares. SGP projects maintained or improved conservation status of 443 significant species, and assisted production of 359 biodiversity and agrobiodiversity products, while building on traditional knowledge.
7. In FY17, 67% of SGP’s climate change portfolio concentrated on the application of low carbon technologies. These projects have supported 23,907 households in achieving energy access co-benefits, including increased income, health benefits and improved environmental services. Eighty-six typologies of locally adapted energy access solutions were also successfully demonstrated, scaled up and replicated.
8. In FY17, over 86,308 hectares of land were brought under improved management practices. These projects mainly targeted rural communities that are highly dependent on agriculture and forest ecosystems. During the reporting year, total of 147,308 community members demonstrated improved agricultural, land and water management practices. Further, more than 4,380 farmer leaders were involved in successful demonstrations of practices, such as incorporating measures to reduce farm based emissions and enhance resilience to climate change; and 1,009 farmer organizations and networks disseminated improved climate smart agro-ecological practices. In addition, 42,556 hectares of forest and non-forest lands have been restored through sustainable forest management practices.
9. In FY17, the projects under the international waters focal area demonstrated community based actions and practices in 14 international water bodies which supported 40 seascapes and inland freshwater landscapes. Over 280 tons of land-based pollution, such as solid waste, sewage, waste water, and agricultural waste has been prevented from entering the waterbodies; 27,468 hectares of marine/coastal areas or fishing grounds have been brought under sustainable management through interventions such as mangroves replantation, seagrass protection, coral reefs rehabilitation; and 24,537 hectares of seascapes have been covered under improved community conservation and sustainable use management systems.
10. The chemicals and waste focal area projects support reduction and elimination of release of harmful chemicals into the environment. With SGP support, use of 21,900 kilograms of pesticides has been avoided; 345,704 kilograms of solid waste has been reduced through reducing plastics, domestic waste, and agricultural waste; release/utilization of 764 kilograms of harmful chemicals has been avoided; 297,601 kilograms of e-waste has been collected or recycled; and 1,620 kilograms of mercury has been reduced or sustainably managed.
Socio-Economic Benefits
11. SGP projects’ contribution to improved livelihood and wellbeing of local communities plays a key role for sustainable natural resource management and generation of global

29
environmental benefits. During the reporting year, 79% of projects have reported on improved livelihoods of communities. Specifically, efforts were noted across SGP’s portfolio with 76% of country programs employing strategies to increase and/or diversify income; 61% to increase food security; and 57% to increase access to technology.
12. Gender equality and women’s empowerment continue to be a critical element of SGP efforts: during this reporting period, 29% of projects were led by women; and 93% of total projects were reported as gender responsive (increase from 81% in FY16). Projects led by and involving indigenous peoples have accounted for 19% of the portfolio during this reporting period: a positive increase from 12% in FY16. With SGP support, a total of 1,059 indigenous leaders were supported in developing their capacities on project development and policy advocacy.
Portfolio Management Opportunities and Challenges
13. The SGP has proven to be a faster and flexible modality that promotes civil society organization and community-based organizations to participate in GEF related activities. The focus of SGP intervention at the grassroots level often involves building capacities of civil society organizations to support effective project to address global environmental issues. Limited grantee capacity remains a key challenge, with 59% of SGP country programs identifying this as a key challenge in effectively implementing projects. Capacity development grants have been made available to support portfolio wide country program capacity needs. Various stakeholder workshops, exchanges, and mentoring activities had been organized, including on knowledge management, project monitoring and reporting, and other elements of project management to develop grantee capacity. SGP also provides planning grants to potential grantees to further support project development.
14. On the monitoring and evaluation system, SGP will continue to build its capacity and system that supports measurement of environmental and socio-economic results, and provides evidence-based, results-based management. Building on the recommendations of Joint GEF-UNDP Evaluation, efforts are being made to improve the existing M&E system, design more streamlined and useful M&E tools and activities that balance the need and capacity of the local communities in monitoring project activities.

30
ANNEX IV: GEF CORPORATE SCORECARD
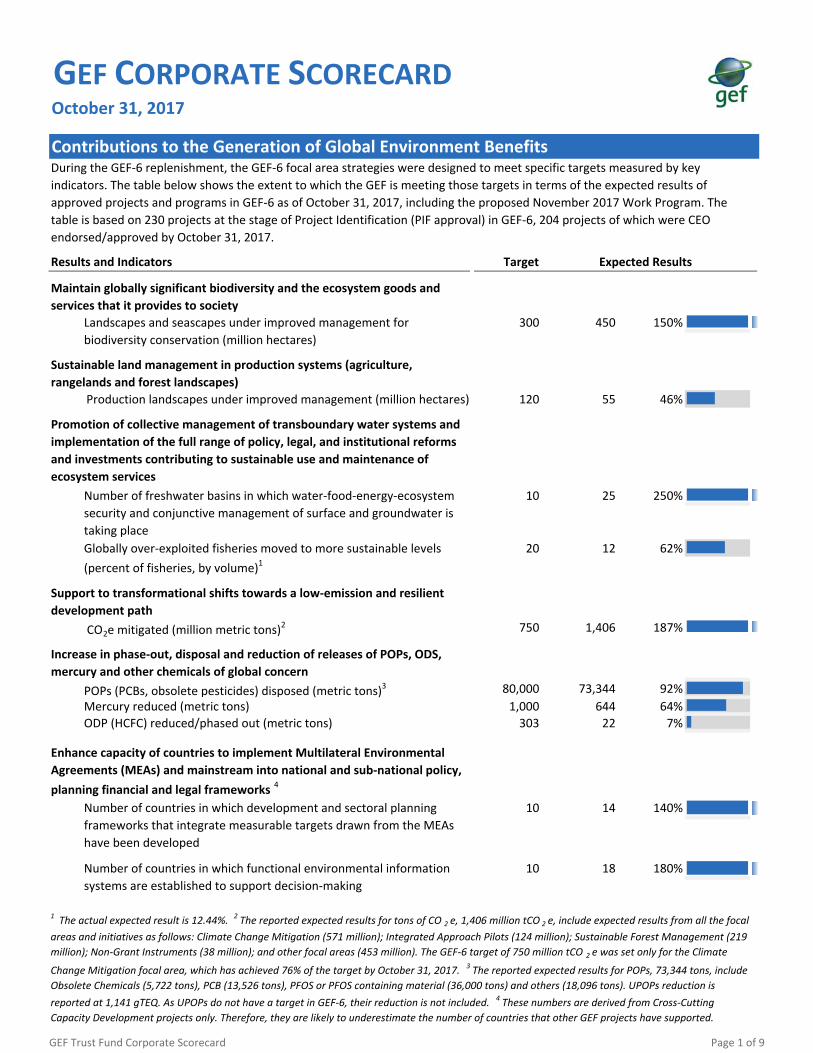
1. During the GEF-6 replenishment, the GEF-6 focal area strategies were designed to meet specific targets measured by key indicators. The GEF Scorecard presents the extent to which the GEF is meeting those targets in terms of the expected results of approved projects and programs in GEF-6 as of October 31, 2017.
2. The Scorecard summarizes the progress made in programing GEF-6 resources as of October 31, 2017. It provides a cumulative summary of GEF-6 utilization of funds against the programing targets that were established by the Council during the GEF-6 replenishment.
3. It also provides the GEF-6 utilization rates of funds by region and focal area and displays the utilization of funds by GEF Constituency.
4. As part of the GEF-6 replenishment process, a number of indicators were established to track the effectiveness of the GEF which are also tracked in the Scorecard.
GEF CORPORATE SCORECARDOctober 31, 2017
Contributions to the Generation of Global Environment Benefits
Results and Indicators Target
300 450 150%
120 55 46%
10 25 250%
20 12 62%
750 1,406 187%
80,000 73,344 92%
1,000 644 64%
303 22 7%
10 14 140%
10 18 180%
Number of countries in which development and sectoral planning
frameworks that integrate measurable targets drawn from the MEAs
have been developed
Production landscapes under improved management (million hectares)
Maintain globally significant biodiversity and the ecosystem goods and
services that it provides to society
Increase in phase‐out, disposal and reduction of releases of POPs, ODS,
mercury and other chemicals of global concern
ODP (HCFC) reduced/phased out (metric tons)
Enhance capacity of countries to implement Multilateral Environmental
Agreements (MEAs) and mainstream into national and sub‐national policy,
planning financial and legal frameworks 4
Globally over‐exploited fisheries moved to more sustainable levels
(percent of fisheries, by volume)1
CO2e mitigated (million metric tons)2
During the GEF‐6 replenishment, the GEF‐6 focal area strategies were designed to meet specific targets measured by key
indicators. The table below shows the extent to which the GEF is meeting those targets in terms of the expected results of
approved projects and programs in GEF‐6 as of October 31, 2017, including the proposed November 2017 Work Program. The
table is based on 230 projects at the stage of Project Identification (PIF approval) in GEF‐6, 204 projects of which were CEO
endorsed/approved by October 31, 2017.
1 The actual expected result is 12.44%. 2 The reported expected results for tons of CO 2 e, 1,406 million tCO 2 e, include expected results from all the focal
areas and initiatives as follows: Climate Change Mitigation (571 million); Integrated Approach Pilots (124 million); Sustainable Forest Management (219
million); Non‐Grant Instruments (38 million); and other focal areas (453 million). The GEF‐6 target of 750 million tCO 2 e was set only for the Climate
Change Mitigation focal area, which has achieved 76% of the target by October 31, 2017. 3 The reported expected results for POPs, 73,344 tons, include
Obsolete Chemicals (5,722 tons), PCB (13,526 tons), PFOS or PFOS containing material (36,000 tons) and others (18,096 tons). UPOPs reduction is
reported at 1,141 gTEQ. As UPOPs do not have a target in GEF‐6, their reduction is not included. 4 These numbers are derived from Cross‐Cutting
Capacity Development projects only. Therefore, they are likely to underestimate the number of countries that other GEF projects have supported.
POPs (PCBs, obsolete pesticides) disposed (metric tons)3
Expected Results
Number of countries in which functional environmental information
systems are established to support decision‐making
Support to transformational shifts towards a low‐emission and resilient
development path
Landscapes and seascapes under improved management for
biodiversity conservation (million hectares)
Sustainable land management in production systems (agriculture,
rangelands and forest landscapes)
Promotion of collective management of transboundary water systems and
implementation of the full range of policy, legal, and institutional reforms
and investments contributing to sustainable use and maintenance of
ecosystem services
Number of freshwater basins in which water‐food‐energy‐ecosystem
security and conjunctive management of surface and groundwater is
taking place
Mercury reduced (metric tons)
GEF Trust Fund Corporate Scorecard Page 1 of 9

Programming Report as of October 31, 2017
Target Programmed
Focal AreasBiodiversity 1,101 812.9 74%
Climate Change 1,130 698.4 62%
Land Degradation 371 287.0 77%
International Waters 456 303.0 66%
Chemicals and Waste
Persistent Organic Pollutants (POPs) 375 286.4 76%
Mercury 141 142.7 101%
Strategic Approach to International Chemicals Management (SAICM) 13 10.5 81%
Ozone Depleting Substances (ODS) 25 9.2 37%
Integrated Approach Pilot (IAP)Commodities 45 44.7 99%
Sustainable Cities 55 55.0 100%
Food Security 60 60.0 100%
Sustainable Forest Management (SFM) Program 230 227.4 99%
Non‐Grant Pilot 110 109.3 99%
Corporate Programs
Cross‐Cutting Capacity Development (CCCD) 34 26.2 77%
Small Grants Program (SGP) 140 140.0 100%
Country Support Program (CSP) 23 16.1 70%
STAR Utilization Percentages as of October 31, 2017
Africa 90% 80% 88%
Asia 67% 63% 72%
Europe and Central Asia 33% 42% 70%
69% 62% 81%
93% 93% 70%
The System for Transparent Allocation of Resources (STAR) is the GEF’s resource allocation system for the biodiversity, climate
change and land degradation focal areas. The table provides the GEF‐6 utilization rates of funds by region and focal area, including
the November 2017 Work Program. Whilst this shows the percentages of funds utilized against GEF‐6 STAR allocations, the Trustee
projects a GEF‐6 resource shortfall. Please find details in the Council document "Update on GEF‐6 Resource Availability"
(GEF/C.53/inf.04).
This section summarizes the progress made in programing GEF‐6 resources as of October 31, 2017, including the proposed
November 2017 Work Program. It provides a cumulative summary of GEF‐6 utilization of funds against the programing targets
that were established by the Council during the GEF‐6 replenishment.
Utilization Rate
GEF Region
Small Island Developing
States
Land Degradation
(USD
millions)
Biodiversity
Latin America and the
Caribbean
(USD
millions)
Climate Change
GEF Trust Fund Corporate Scorecard Page 2 of 9

Utilization and Allocation by Constituency as of October 31, 2017
STAR
Allocation6
STAR
Utilization
Afghanistan, Jordan, Iraq, Lebanon, Pakistan, Syria, Yemen 66 37.3 57% 16.3
58 39.0 67% 12.1
Algeria, Egypt, Libya, Morocco, Tunisia 57 31.5 56% 4.0
142 120.3 85% 78.0
105 99.3 94% 19.7
Argentina, Bolivia, Chile, Paraguay, Peru, Uruguay 135 84.2 63% 35.6
Armenia, Belarus 18 12.4 67% 12.2
27 16.8 63% 0.5
73 67.4 92% 22.0
Bangladesh, Bhutan, India, Maldives, Nepal, Sri Lanka 174 129.1 74% 33.9
Benin, Cote d'Ivoire, Ghana, Guinea, Liberia, Nigeria, Sierra Leone, Togo 82 68.8 84% 63.8
Brazil, Colombia, Ecuador 209 157.1 75% 95.2
80 74.2 93% 59.6
88 68.0 77% 30.3
143 97.3 68% 46.2
China 195 114.2 59% 82.4
179 174.0 97% 82.5
0.97424
223 162.1 73% 46.0
175 104.6 60% 52.3
100%
Comoros, Djibouti, Eritrea, Ethiopia, Kenya, Madagascar, Mauritius, Rwanda,
Seychelles, Somalia, South Sudan, Sudan, Tanzania, Uganda
6 The current STAR allocation reflects the correct GEF‐6 amount. In the previous scorecards, the allocation amount was inaccurate.
Cook Islands, Fiji, Indonesia, Kiribati, Marshall Islands, Micronesia, Nauru,
Niue, Palau, Papua New Guinea, Philippines, Samoa, Solomon Islands, Timor
Leste, Tonga, Tuvalu, Vanuatu
Costa Rica, El Salvador, Guatemala, Honduras, Mexico, Nicaragua, Panama,
Venezuela
Burkina Faso, Cabo Verde, Chad, Guinea‐Bissau, Mali, Mauritania, Niger,
Senegal, Gambia
5 Countries that have zero allocation and/or zero utilization have not been included in this list. However, non‐recipient countries, which are part
of constituencies, remain included in the list in italics.
This table displays the utilization of funds by GEF Constituency5, including the November 2017 Work Program. Both STAR and non‐
STAR allocations are included. The constituency classifications are described on the GEF website. Whilst the chart below shows the
percentages of funds utilized against GEF‐6 STAR allocations, the Trustee projects a GEF‐6 resource shortfall. Please find details in
the Council document "Update on GEF‐6 Resource Availability" (GEF/C.53/inf.04).
STAR
Utilization
Rate
(USD
millions)
(USD
millions)
Non‐STAR
Utilization
Cambodia, Lao People's Democratic Republic, Malaysia, Mongolia, Myanmar,
Thailand, Vietnam
Burundi, Cameroon, Central African Republic, Congo, Democratic Republic of
Congo, Equatorial Guinea, Gabon, Sao Tome and Principe
Angola, Botswana, Lesotho, Malawi, Mozambique, Namibia, South Africa,
Swaziland, Zambia, Zimbabwe
Antigua And Barbuda, Bahamas, Barbados, Belize, Cuba, Dominica,
Dominican Republic, Grenada, Guyana, Haiti, Jamaica, St. Kitts And Nevis, St.
Lucia, St. Vincent and Grenadines, Suriname, Trinidad and Tobago
Austria 5 , Belgium 5 , Czech Republic 5 , Hungary 5 , Luxembourg 5 , Slovak
Republic 5 , Slovenia 5 , Turkey
Azerbaijan, Kazakhstan, Kyrgyz Republic, Switzerland 5 , Tajikistan,
Turkmenistan, Uzbekistan
Albania, Bulgaria 5 , Bosnia‐Herzegovina, Croatia 5 , Georgia, Macedonia,
Moldova, Montenegro, Poland 5 , Romania 5 , Serbia, Ukraine
(USD
millions)Constituency List
GEF Trust Fund Corporate Scorecard Page 3 of 9

Corporate Efficiency and Effectiveness
Project Cycle Effectiveness
Full‐Sized Projects
First Disbursement Medium‐Sized Projects Full‐Sized Projects
Definition
Indicator on track
Indicator to watch
Red light Indicator off track
In FY17, excluding GEF‐5 overdue
projects, the average duration of time
between PIF approval and CEO
Endorsement/ Approval for FSPs met
the 18‐month target, while for MSPs,
the duration of time slightly exceeded
the 12‐month target, as shown by the
dashed lines.
As nearly half of CEO approved MSPs
and CEO endorsed FSPs in FY17 were
GEF‐5 overdue projects, the overall
average duration of time exceeded
both targets, as shown by the solid
lines.
As part of the GEF‐6 replenishment process, a number of indicators were established to track the effectiveness of the GEF 7 . These
indicators now apply to all projects at CEO endorsement/approval, regardless of their replenishment cycles.
The analysis is based on cohorts of
GEF projects that were endorsed/
approved from FY11 to FY16. The
analysis is based on 972 projects
(661 full‐sized projects and 311 mid‐
sized projects).
Average time (months) between PIF
approval and CEO endorsement/
approval
7 As suggested by the Council in June 2016, the Corporate Scorecard now applies a traffic light system to corporate efficiency and effectiveness
indicators:
Traffic light
Yellow light
Green light
The percentage of projects that
have had their first disbursement
within 1, 2 and 3 years after CEO
endorsement/ approval
Medium‐Sized Projects
17
20
24
15 15
1921
10
0
30
FY11 12 13 14 15 16 17
Number of months 22
2021 21
22
2625
13
0
30
FY11 12 13 14 15 16 17
66%
88% 91%
0%
100%
Within 1year
Within 2years
Within 3years
63%
76% 78%
0%
100%
Within 1year
Within 2years
Within 3years
13
without overdue projects
17
withoutoverdue projects
GEF Trust Fund Corporate Scorecard Page 4 of 9
Corporate Efficiency and Effectiveness (continued)
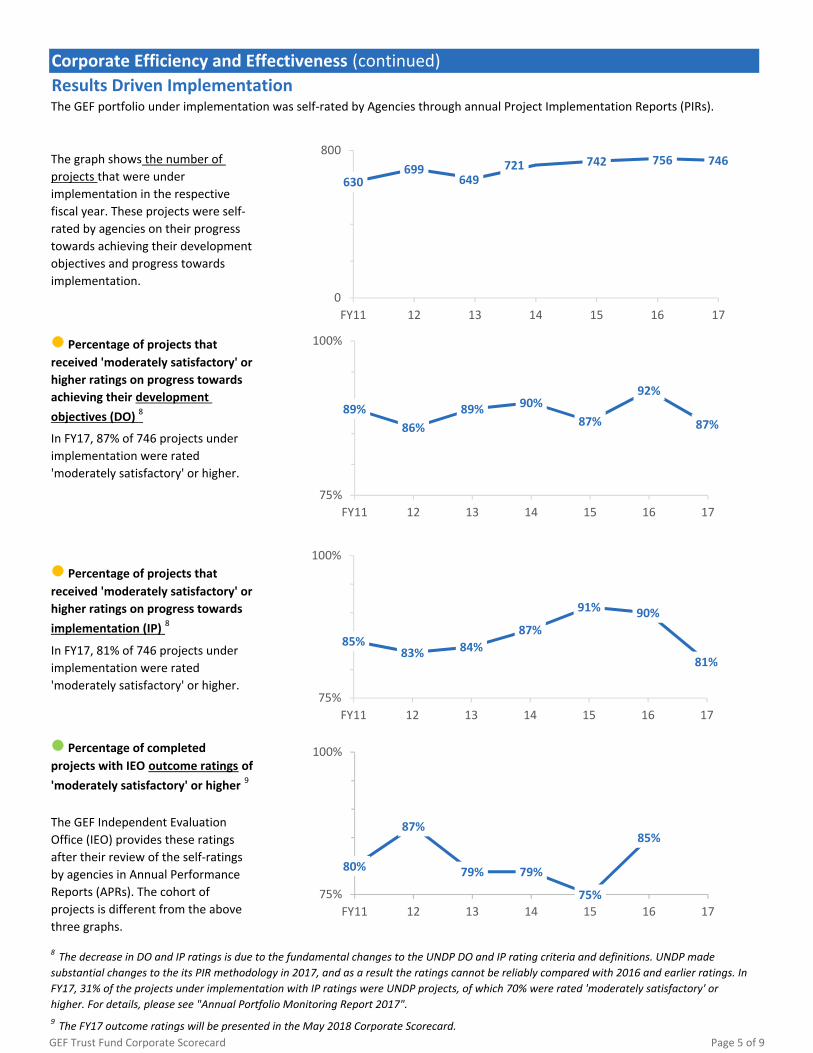
Results Driven Implementation
The graph shows the number of
projects that were under
implementation in the respective
fiscal year. These projects were self‐
rated by agencies on their progress
towards achieving their development
objectives and progress towards
implementation.
In FY17, 87% of 746 projects under
implementation were rated
'moderately satisfactory' or higher.
The GEF portfolio under implementation was self‐rated by Agencies through annual Project Implementation Reports (PIRs).
The GEF Independent Evaluation
Office (IEO) provides these ratings
after their review of the self‐ratings
by agencies in Annual Performance
Reports (APRs). The cohort of
projects is different from the above
three graphs.
Percentage of completed
projects with IEO outcome ratings of
'moderately satisfactory' or higher 9
Percentage of projects that
received 'moderately satisfactory' or
higher ratings on progress towards
implementation (IP) 8
In FY17, 81% of 746 projects under
implementation were rated
'moderately satisfactory' or higher.
Percentage of projects that
received 'moderately satisfactory' or
higher ratings on progress towards
achieving their development
objectives (DO) 8
8 The decrease in DO and IP ratings is due to the fundamental changes to the UNDP DO and IP rating criteria and definitions. UNDP made
substantial changes to the its PIR methodology in 2017, and as a result the ratings cannot be reliably compared with 2016 and earlier ratings. In
FY17, 31% of the projects under implementation with IP ratings were UNDP projects, of which 70% were rated 'moderately satisfactory' or
higher. For details, please see "Annual Portfolio Monitoring Report 2017".
9 The FY17 outcome ratings will be presented in the May 2018 Corporate Scorecard.
630699
649721 742 756 746
0
800
FY11 12 13 14 15 16 17
89%
86%
89% 90%
87%
92%
87%
75%
100%
FY11 12 13 14 15 16 17
80%
87%
79% 79%
75%
85%
75%
100%
FY11 12 13 14 15 16 17
85%83% 84%
87%
91% 90%
81%
75%
100%
FY11 12 13 14 15 16 17
GEF Trust Fund Corporate Scorecard Page 5 of 9

Corporate Efficiency and Effectiveness (continued)
The analysis is based on a review of
233 projects that submitted mid‐
term and terminal evaluation reports
in FY15 and FY16. These were mainly
GEF‐4 and GEF‐5 projects. It is
important to note that this analysis is
limited to a cohort of projects
received in the respective financial
years. Graphs show trends by
replenishment period. FY17
monitoring and evaluation reports
are due by December 2017,
therefore, the updated graphs will be
presented in the next Corporate
Scorecard.
12 The decrease in the percentages from the numbers presented in previous scorecards is partly due to the slight revision in the criteria applied.
Projects that were rated as having conducted a gender analysis in this review explicitly referred to having completed a gender analysis as part of
project design or provided enough evidence, explicitly or otherwise, in the project documents to suggest that robust gender considerations were
included as part of project design.
13 The analysis does not include projects implemented by the World Bank that have reached mid‐term, because the structure and reporting
format used by the World Bank is different from the other agencies.
10 Information on the core gender indicator 4, "share of convention related national reports that incorporate gender dimensions" will be
compiled for the 2018 May Council.
Gender
11 The baseline information and percentages are presented in the GEF Gender Equality Action Plan (GEF/C.47/09/Rev.01).
14 The analysis of quality of implementation is based on the methodology and criteria introduced in the April 2016 Scorecard. For further
information on methodology, criteria and findings please see progress report on the Gender Action Plan (GEF/C.52/inf.09).
The quality of entry analysis is based
on a review of 200 GEF‐6 projects.
These are 129 full‐sized and 71 mid‐
sized projects, endorsed/approved
between July 2014 and October
2017.
This section covers the GEF‐6 Core Gender Indicators that were agreed upon in the "GEF‐6 Results Framework for Gender
Mainstreaming" (GEF/C.47/09/Rev.01).10
Quality at Implementation: Review of Monitoring and Evaluation Reports 13
Quality at Entry: Gender in GEF‐6 CEO Endorsed Full and Mid‐Sized Projects 11, 12
18%
60%
0%
25%
50%
75%
100%
Baseline GEF‐6
Percentage of projects that
have conducted a gender analysis
57%
77%
Baseline GEF‐6
Percentage of projects that
have incorporated elements of a gender responsive results framework
Percentage of monitoring
and evaluation reports that incorporate gender14
Share of women and men as
direct beneficiaries of projects
30%38%
0%
25%
50%
75%
100%
GEF‐4 cohort GEF‐5 cohort
48%
64%
GEF‐4 cohort GEF‐5 cohort
The percentages are based on projects that reported sex‐disaggregated information on beneficiaries.
GEF Trust Fund Corporate Scorecard Page 6 of 9
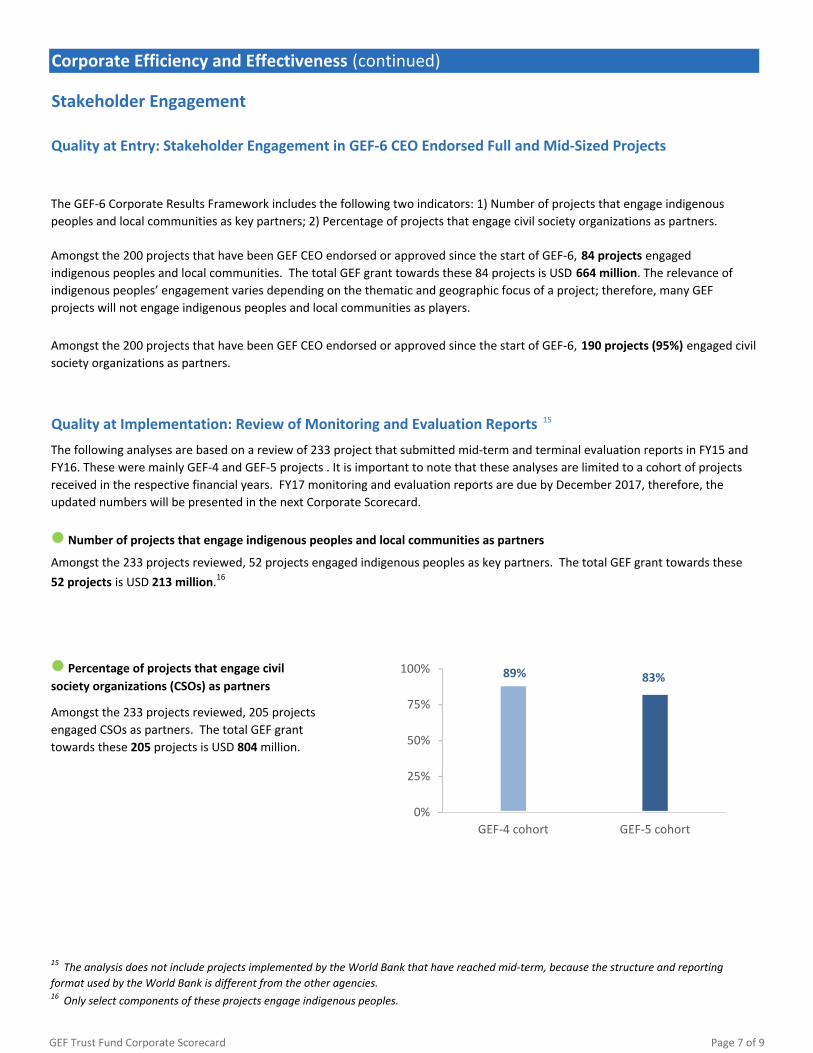
Corporate Efficiency and Effectiveness (continued)
Stakeholder Engagement
15 The analysis does not include projects implemented by the World Bank that have reached mid‐term, because the structure and reporting
format used by the World Bank is different from the other agencies.
Amongst the 233 projects reviewed, 205 projects
engaged CSOs as partners. The total GEF grant
towards these 205 projects is USD 804 million.
The following analyses are based on a review of 233 project that submitted mid‐term and terminal evaluation reports in FY15 and
FY16. These were mainly GEF‐4 and GEF‐5 projects . It is important to note that these analyses are limited to a cohort of projects
received in the respective financial years. FY17 monitoring and evaluation reports are due by December 2017, therefore, the
updated numbers will be presented in the next Corporate Scorecard.
Percentage of projects that engage civil
society organizations (CSOs) as partners
Quality at Entry: Stakeholder Engagement in GEF‐6 CEO Endorsed Full and Mid‐Sized Projects
16 Only select components of these projects engage indigenous peoples.
The GEF‐6 Corporate Results Framework includes the following two indicators: 1) Number of projects that engage indigenous
peoples and local communities as key partners; 2) Percentage of projects that engage civil society organizations as partners.
Amongst the 200 projects that have been GEF CEO endorsed or approved since the start of GEF‐6, 84 projects engaged
indigenous peoples and local communities. The total GEF grant towards these 84 projects is USD 664 million. The relevance of
indigenous peoples’ engagement varies depending on the thematic and geographic focus of a project; therefore, many GEF
projects will not engage indigenous peoples and local communities as players.
Number of projects that engage indigenous peoples and local communities as partners
Amongst the 233 projects reviewed, 52 projects engaged indigenous peoples as key partners. The total GEF grant towards these
52 projects is USD 213 million.16
Amongst the 200 projects that have been GEF CEO endorsed or approved since the start of GEF‐6, 190 projects (95%) engaged civil
society organizations as partners.
Quality at Implementation: Review of Monitoring and Evaluation Reports 15
89% 83%
0%
25%
50%
75%
100%
GEF‐4 cohort GEF‐5 cohort
GEF Trust Fund Corporate Scorecard Page 7 of 9

Corporate Efficiency and Effectiveness (continued)
Co‐Financing Ratio 17
Corporate Efficiency and Effectiveness ‐ GEF Secretariat
Diversity in the GEF Secretariat Staffing
GEF OutreachThe graphs below display the number of GEF stories and mentions in the media, and the number of users of GEF online and social
media platforms. The media mentions are the number of online articles (news, web stories, blogs, etc.) that mentioned the GEF,
the CEO, or the LDCF/SCCF during FY17. The numbers also include new GEF content (stories, publications, videos, etc.) accessible
from the GEF website. The number of online users is the sum of visitors to GEF online content and subscribers to GEF social media
channels.
The Diversity Index follows the definition of the
World Bank; it is a normalized, weighted average
of several indicators. The Diversity Index = (0.4 x
the share of staff from Sub‐Saharan Africa) + (0.2
x the share of professional female staff) + (0.2 x
the share of part II country managers) + (0.2 x the
share of female managers). The World Bank
target is to reach and maintain a staff diversity
index of at least 0.95 by FY17.
17 Compared with projects approved in previous years, in FY17 there are more projects in the least developed countries and small island
developing states. Therefore, the co‐financing ratio in FY17 is lower than the ratios in other years in GEF‐6.
This section displays the ratio of the cumulative project co‐financing for GEF grants in GEF‐5 and GEF‐6 through FY17. The overall
GEF‐6 portfolio encourages a co‐financing ratio of 6:1.
11:1
8:1
6:15:1
7:18:1
6:1
0
12
FY 11 12 13 14 15 16 17
6.9 : 1 7.0 : 1
0
12
GEF‐5 GEF‐6
0.86
0.93 0.93
0.88
0.8
1
FY14 15 16 17
Target 0.95
1,203
5,036
1,085 521
1,287
6,482
7,119
‐
8,000
FY11 12 13 14 15 16 17
Number of GEF Stories and Media‐mentions
359 431
503
661 661 703 705
0
800
FY11 12 13 14 15 16 17
Number of Users of GEF Electronic Media (thousands)
GEF Trust Fund Corporate Scorecard Page 8 of 9

Corporate Efficiency and Effectiveness ‐ GEF Secretariat (continued)
GEF Outreach in GEF‐6
Afghanistan, Jordan, Iraq, Lebanon, Pakistan, Syria, YemenAlgeria, Egypt, Libya, Morocco, Tunisia
Argentina, Bolivia, Chile, Paraguay, Peru, Uruguay
Brazil, Colombia, Ecuador
Armenia, Belarus
Bangladesh, Bhutan, India, Maldives, Nepal, Sri Lanka
China
Benin, Cote d'Ivoire, Ghana, Guinea, Liberia, Nigeria, Sierra Leone, Togo 3 219 2 30
Overall 39 3430 49 719
100%
3 290 4
343 3
3
1 16
52
Antigua And Barbuda, Bahamas, Barbados, Belize, Cuba, Dominica, Dominican
Republic, Grenada, Guyana, Haiti, Jamaica, St. Kitts And Nevis, St. Lucia, St.
Vincent and Grenadines, Suriname, Trinidad and Tobago
3
5
195
Number of
Workshops
Number of
Participants
Constituency Meetings
Number of
Meetings
Number of
Participants
261Azerbaijan, Kazakhstan, Kyrgyz Republic, Switzerland 18 , Tajikistan, Turkmenistan,
Uzbekistan
Angola, Botswana, Lesotho, Malawi, Mozambique, Namibia, South Africa,
Swaziland, Zambia, Zimbabwe
03 222
51
3 277 8 65
3 68
3 270
Costa Rica, El Salvador, Guatemala, Honduras, Mexico, Nicaragua, Panama,
Venezuela3 237 22
Burkina Faso, Cabo Verde, Chad, Guinea‐Bissau, Mali, Mauritania, Niger, Senegal,
Gambia3 234
Cambodia, Lao People's Democratic Republic, Malaysia, Mongolia, Myanmar,
Thailand, Vietnam
Comoros, Djibouti, Eritrea, Ethiopia, Kenya, Madagascar, Mauritius, Rwanda,
Seychelles, Somalia, South Sudan, Sudan, Tanzania, Uganda
Cook Islands, Fiji, Indonesia, Kiribati, Marshall Islands, Micronesia, Nauru, Niue,
Palau, Papua New Guinea, Philippines, Samoa, Solomon Islands, Timor Leste,
Tonga, Tuvalu, Vanuatu
3 260 2
3 376
2
4
7
107
0Burundi, Cameroon, Central African Republic, Congo, Democratic Republic of
Congo, Equatorial Guinea, Gabon, Sao Tome and Principe
112
78
Country
Austria 18 , Belgium 18 , Czech Republic 18 , Hungary 18 , Luxembourg 18 , Slovak
Republic 18 , Slovenia 18 , Turkey
Expanded Constituency
Workshops
3 246 8
Albania, Bulgaria 18 , Bosnia‐Herzegovina, Croatia 18 , Georgia, Macedonia, 18 18
This analysis is based on data collected through the Country Support Program in GEF‐6. The Country Support Program is the main
tool for implementation of the Country Relations Strategy, which includes components such as Expanded Constituency Workshops
and Constituency Meetings. The number of Constituency Meetings varies in different Constituencies, because they depend on the
requests from Council members.
3
88
30
18 Non‐recipient countries, which are part of constituencies, remain included in the list in italics.
GEF Trust Fund Corporate Scorecard Page 9 of 9