annual performance report 2016/2017 - yorkshirewater.com water... · 02 change log – annual...
TRANSCRIPT

Annual Performance Report 2016/2017The changes we have made December 2018

02
Change Log – Annual Performance Report 2017/2018
Contents1. Purpose of this document 03
In this section, we talk about why we have created this document, what you can expect to find in this document and links to our assurance publications.
2. Your thoughts on this document 05 In this section, we have included some of the feedback our customers have provided us on this publication.
3. Summary of the things we will do differently 07 Here, we summarise what we have learnt from this process and the actions we will take to improve.
4. Summary of the changes we made 09 In this section, we list the changes we have made to our Annual Performance Report (APR). We provide a description for each change and the page number of where the change was made in the APR.
5. The detail behind each change 14 In this section, we describe the changes we have made to our APR in more detail. We show what the section in the APR looked like before and after we made the change.

Change Log – Annual Performance Report 2017/2018
03
1. Purpose of this document

Informationwe publish
Trusting the
Our data assurance summary for 2017/2018
INFORMATION
W
E PUBLISH
TR
USTING THE
Our Final assurance plan for 2017/18 and 2018/19
Change Log – Annual Performance Report 2017/2018
04
The information in our APR goes through several checks before it reaches you, this is to reduce the risk of errors within it. Sometimes, despite our checks, minor errors find their way into our report. Rather than just correcting those errors in our APR, we thought it would be better to be open and transparent and tell you about them.
To achieve our aim of being more transparent and providing the information that is needed, we have expanded some of the explanations in our APR. These are the ‘improvements’ shown in this document.
Our objective is to have zero errors in our APR, so every correction we have had to make, even though it’s a fraction of the potential errors that could have been made, is one too many.
We want to make sure we deal with any changes appropriately and in a timely fashion. We want to be proactive with how we tell you about them at the earliest opportunity. That’s why we have produced this document.
We want to improve our performance in future years, so we will learn from these corrections and improvements, building the learning into our risks, strengths and weaknesses statement and our assurance plan for next year.
If you’d like to learn more about the process we use to check our reports and information, which we call our three levels of assurance, click here to view our reports page, where you can find our final assurance plan and data assurance summary. yorkshirewater.com/reports
This document summarises the changes we have made to our Annual Performance Report (APR) since its first publication on 13th July 2018. You can find our updated APR on our reports page yorkshirewater.com/reports
For each change we have used the following format:
• Observation
• Description of the change
• What the section used to look like
• What it looks like now
• What are we doing differently to make sure it never happens again.
We have made a total of 20 changes to our APR this year. This is made up of:
• nine corrections,
• eight improvements, and
• three which are both correction and improvement.

Change Log – Annual Performance Report 2017/2018
05
2. Your thoughts on this document

44% 33% 20% 3% 0%
Change Log – Annual Performance Report 2017/2018
06
This is what our customers told us77% of our participants strongly or slightly agreed with the statement that the change log has improved the transparency of Yorkshire Water.
We asked our Your Water community of around 1000 customers their opinion on the change log and we also asked them whether they thought the change log has
improved the transparency of Yorkshire Water.
We would like to thank all of our customers who participated in the questionnaire. We had 75 responses. The feedback we received has been overwhelmingly positive.
Our customers told us that it was important for us to publish a change log and that it improves the transparency of Yorkshire Water. Some of our customers told us that
the change log was comprehensive but could be shorter.
“Page 4 is rather
well written”
Strongly agree
Slightly agree
neither agree nor disagree
Slightly disagree
Strongly disagree
“I think it’s important that
Yorkshire Water publishes this document, even if only a few people read it. The document does indeed
improve how transparent Yorkshire Water’s annual reporting data is. I
think a minor improvement would be to condense the document into
a smaller one that still retains all the essential information.”
“It is important for YW to publish this document as it proves to customers and interested
parties that the organisation is committed to providing correct and
relevant information. Ofwat requires such reporting
and I am convinced that publishing any corrections highlights YW’s commitment to their
customers as well as detailing
overall transparency.”
“Very important for transparency,
builds up trust between consumer
and provider.”
“The only improvements I can think of would be to make it shorter, as it
is a long read!”“It shows that YW
is a company of integrity and honesty and holds
its hands up when it makes mistakes - and
then it does something to improve
the situation.”
“I think it’s really respectable that YW publish this
information. I think it makes them seem much more trustworthy as a
company as I’m not sure that other companies
would do this.”

Change Log – Annual Performance Report 2017/2018
07
3. Summary of the things we will do differently

Change Log – Annual Performance Report 2017/2018
08
What we have learnt and the action we will take
Data
Learning: There are still
opportunities for us to prevent the
small number of errors in the data
we publish.
Action: We will share these cases
with our reporting and assurance
communities to make sure they
are aware of the data checks they
need to carry out to prevent errors
from happening.
Reporting
Learning: Each year we seek
to improve our reporting,
which can lead to a change
from previous years.
Action: We will explain
clearly where we have made
improvements to reporting and
any material impacts this has
on the data.
Data
Learning: On occasions our
reported data can be out of line
with the historical trend.
Action: Where data is materially
different from previous years we
will improve our explanation of
the trend it is showing.
Reporting
Learning: We need to be confident
that every piece of information is
in the correct format.
Action: We will strengthen
our internal processes to ensure
that the data is reported in the
correct format and is in line with
the guidance.

Change Log – Annual Performance Report 2017/2018
09
4. Summary of the changes we made

Change Log – Annual Performance Report 2017/2018
10
Summary of the changes we madeWe have made a total of 20 changes to our APR. We have grouped some of the changes together where they are closely related. All the changes to our APR have been made in Section 7. Regulatory Information. In summary, the changes are:
Change number
Page number in the updated APR
Table / Line ObservationDescription of the change and the action we have taken
Classification of change
1 244 Table 4Q, line 4Q.19
There has been a significant decrease in 4Q.19, 'Number of lead communication pipes replaced for water quality' reported, from 10,051 at 2016/2017 to 246 in 2017/2018.
We have provided additional narrative to explain the decrease in the number of lead communication pipes replaced for water quality, line 4Q.19, resulting from the successful completion of our improvement plan in 2016/2017.
Improvement
2 244 Table 4Q, lines 4Q.24 and 4Q.25
There has been a significant decrease in 4Q.25, 'Energy consumption - water resources' and increase in 4Q.24, 'Energy consumption - network plus' from the 2016/2017 figures.
We have provided additional narrative to explain the decrease in energy consumption - water resources and increase in energy consumption - network plus. The observed changes resulted from us making further improvements to our reporting this year. We carried out work with our technical optimisation engineers in both clean water and waste water to further refine the detailed understanding of the boundaries between price controls.
Improvement
3 190 Table 4H, lines 4H.6 and 4H.11
Dividends used to pay head office costs and Kelda Finance interest was deducted from gross dividend when calculating dividend yield and dividend cover values in table 4H.
We have provided additional narrative to explain why we deducted ‘dividends used to pay head office costs and Kelda Finance interest’ from our gross dividend when calculating dividend yield and dividend cover values.
We have updated line 4H.6 ‘Dividend yield’ from 0.00% to 1.73% and updated line 4H.11 ‘Dividend cover’ from 0.00 to 2.39.
Correction and improvement
4 124 Table 1F An older version of the financial flows table (table 1F) and associated guidance was used.
We have updated our financial flows table to include lines 1a and 1b and followed the updated guidance.
Correction
5 193 Table 4H, lines 4H.13
No formula or explanation was provided for how we calculated our interest cover (cash) in table 4H.
We have provided the precise formula used and additional narrative on how we calculated our interest cover (cash) in table 4H.
Improvement
Change Log – Annual Performance Report 2017/2018
11
Change number
Page number in the updated APR
Table / Line ObservationDescription of the change and the action we have taken
Classification of change
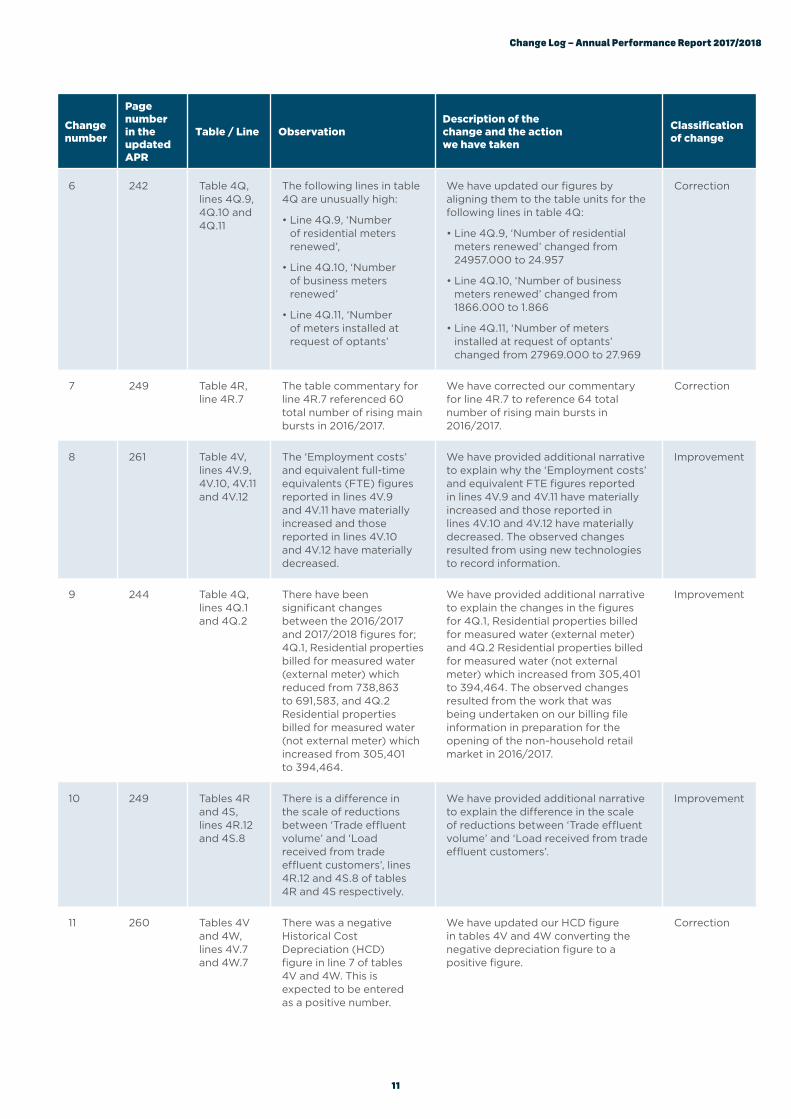
6 242 Table 4Q, lines 4Q.9, 4Q.10 and 4Q.11
The following lines in table 4Q are unusually high:
• Line 4Q.9, ‘Number of residential meters renewed’,
• Line 4Q.10, ‘Number of business meters renewed’
• Line 4Q.11, ‘Number of meters installed at request of optants’
We have updated our figures by aligning them to the table units for the following lines in table 4Q:
• Line 4Q.9, ‘Number of residential meters renewed’ changed from 24957.000 to 24.957
• Line 4Q.10, ‘Number of business meters renewed’ changed from 1866.000 to 1.866
• Line 4Q.11, ‘Number of meters installed at request of optants’ changed from 27969.000 to 27.969
Correction
7 249 Table 4R, line 4R.7
The table commentary for line 4R.7 referenced 60 total number of rising main bursts in 2016/2017.
We have corrected our commentary for line 4R.7 to reference 64 total number of rising main bursts in 2016/2017.
Correction
8 261 Table 4V, lines 4V.9, 4V.10, 4V.11 and 4V.12
The ‘Employment costs’ and equivalent full-time equivalents (FTE) figures reported in lines 4V.9 and 4V.11 have materially increased and those reported in lines 4V.10 and 4V.12 have materially decreased.
We have provided additional narrative to explain why the ‘Employment costs’ and equivalent FTE figures reported in lines 4V.9 and 4V.11 have materially increased and those reported in lines 4V.10 and 4V.12 have materially decreased. The observed changes resulted from using new technologies to record information.
Improvement
9 244 Table 4Q, lines 4Q.1 and 4Q.2
There have been significant changes between the 2016/2017 and 2017/2018 figures for; 4Q.1, Residential properties billed for measured water (external meter) which reduced from 738,863 to 691,583, and 4Q.2 Residential properties billed for measured water (not external meter) which increased from 305,401 to 394,464.
We have provided additional narrative to explain the changes in the figures for 4Q.1, Residential properties billed for measured water (external meter) and 4Q.2 Residential properties billed for measured water (not external meter) which increased from 305,401 to 394,464. The observed changes resulted from the work that was being undertaken on our billing file information in preparation for the opening of the non-household retail market in 2016/2017.
Improvement
10 249 Tables 4R and 4S, lines 4R.12 and 4S.8
There is a difference in the scale of reductions between ‘Trade effluent volume’ and ‘Load received from trade effluent customers’, lines 4R.12 and 4S.8 of tables 4R and 4S respectively.
We have provided additional narrative to explain the difference in the scale of reductions between ‘Trade effluent volume’ and ‘Load received from trade effluent customers’.
Improvement
11 260 Tables 4V and 4W, lines 4V.7 and 4W.7
There was a negative Historical Cost Depreciation (HCD) figure in line 7 of tables 4V and 4W. This is expected to be entered as a positive number.
We have updated our HCD figure in tables 4V and 4W converting the negative depreciation figure to a positive figure.
Correction

Change Log – Annual Performance Report 2017/2018
12
Change number
Page number in the updated APR
Table / Line ObservationDescription of the change and the action we have taken
Classification of change
12 262 Table 4W, line 4W.21
The Traffic Management Act costs reported in table 4W have significantly increased in 2017/2018 and has been reported solely in network plus sewage treatment when previously they have been reported in network plus sewage transport.
We have provided additional narrative on why the Traffic Management Act costs reported in table 4W have significantly increased in 2017/2018, and why we have reported it in network plus sewage collection rather than network plus sewage treatment.
We have updated line 4W.21 ‘Costs associated with Traffic Management Act’ by reporting the figure under ‘Network plus sewage collection’.
Correction and improvement
13 229 Table 4O, lines 4O.10 and 4O.15
For Brighouse/Upper sewage treatment works (STW), line 4O.10 there was a >8-fold increase in Flow passed to full treatment (FFT) from 19,541 to 162,289m3/d.
For Scarborough STW, line 4O.10 there was a >3-fold increase in FFT from 6,686 to 21,809m3/d.
For Blackburn Meadows STW, line 4O.15 the estimated terminal pumping expenditure increased from £6,000 in 2016/2017 to £403,000 in 2017/2018.
We have updated the FFT figure for Brighouse/Upper STW, line 4O.10 from 162,289 m3/d to 22,942 m3/d.
We have provided additional narrative to explain the >3-fold increase in FFT for Scarborough STW which resulted from the transposing of figures for the 2016/2017 submission.
We also explain why the estimated terminal pumping expenditure has increased from £6,000 in 2016/2017 to £403,000 in 2017/2018. This resulted from an increase in power costs to run terminal pumps and due to our ongoing improvement in cost allocation.
Correction and improvement
14 227 Table 4N There are large percentage changes in many lines in table 4N from values submitted in 2016/2017 compared to 2017/2018. In particular, there is an increase of 88% in the Opex cost of size band 3 STWs and reduction of 51.8% in the Opex cost of size band 4 STWs.
We have provided additional narrative to explain the large percentage changes in table 4N. The observed changes resulted from our enhanced cost allocation process for 2017/2018.
Improvement
15 248 Table 4R, lines 4R.3 and 4R.4
There is an increase in lines 4R.3 and 4R.4 in 2017/2018 compared to previous years.
We have included historic data for lines 4R.3 and 4R.4 to avoid a step jump in the reported numbers from previous years and provided additional narrative to explain the observed increase.
Improvement
16 252 Table 4S, line 4S.22
There is a significant difference between the resident population equivalent reported in table WWn4 block I line 22 for 2017 in our PR19 data table and that reported in table 4S of our 2017/2018 APR (0 in our PR19 data table vs. 5,134 in our APR).
Our PR19 data tables can be viewed here: yorkshirewater.com/appendices
We have updated the ‘Current population equivalent served by STWs with tightened/new N consents’ figure in table 4S of our APR, line 4S.22 from 5,134 to 0. This is due to a capital scheme being incorrectly categorised. This change causes lines 4M.15 and 4M.16 to change described in change 17 below.
Correction
Change Log – Annual Performance Report 2017/2018
13
Change number
Page number in the updated APR
Table / Line ObservationDescription of the change and the action we have taken
Classification of change
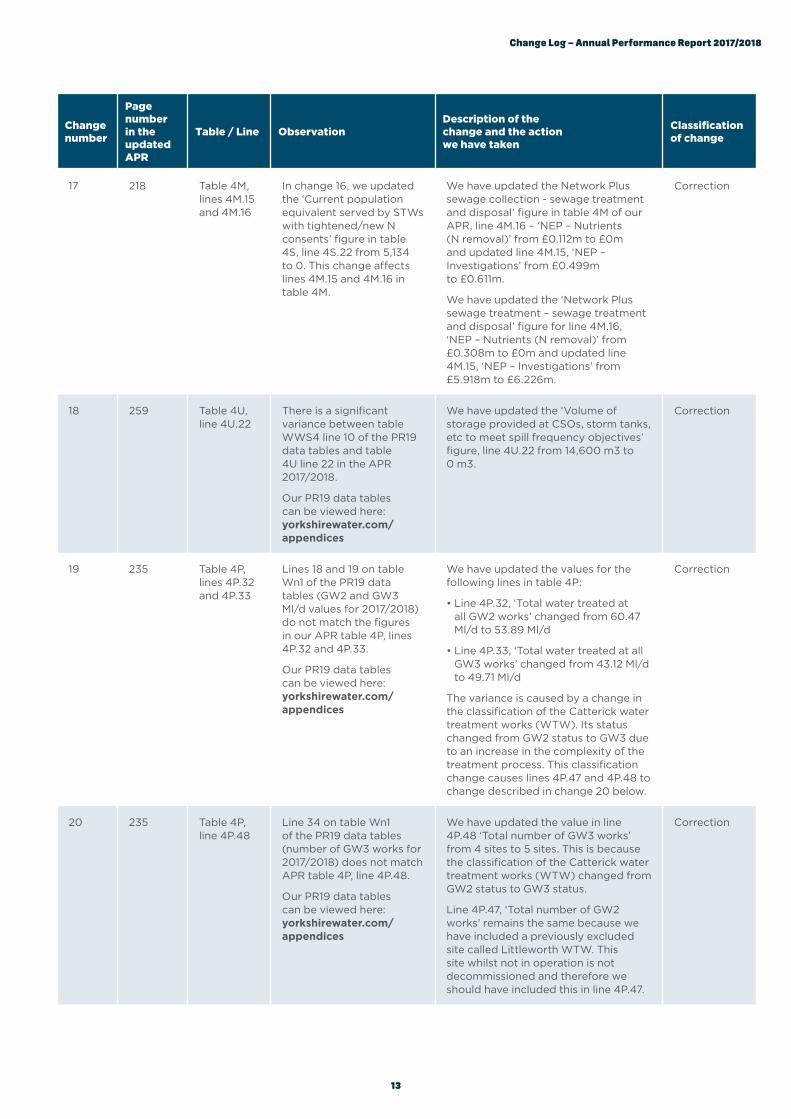
17 218 Table 4M, lines 4M.15 and 4M.16
In change 16, we updated the ‘Current population equivalent served by STWs with tightened/new N consents’ figure in table 4S, line 4S.22 from 5,134 to 0. This change affects lines 4M.15 and 4M.16 in table 4M.
We have updated the Network Plus sewage collection - sewage treatment and disposal’ figure in table 4M of our APR, line 4M.16 – ‘NEP – Nutrients (N removal)’ from £0.112m to £0m and updated line 4M.15, ‘NEP – Investigations’ from £0.499m to £0.611m.
We have updated the ‘Network Plus sewage treatment – sewage treatment and disposal’ figure for line 4M.16, ‘NEP – Nutrients (N removal)’ from £0.308m to £0m and updated line 4M.15, ‘NEP – Investigations’ from £5.918m to £6.226m.
Correction
18 259 Table 4U, line 4U.22
There is a significant variance between table WWS4 line 10 of the PR19 data tables and table 4U line 22 in the APR 2017/2018.
Our PR19 data tables can be viewed here: yorkshirewater.com/appendices
We have updated the ‘Volume of storage provided at CSOs, storm tanks, etc to meet spill frequency objectives’ figure, line 4U.22 from 14,600 m3 to 0 m3.
Correction
19 235 Table 4P, lines 4P.32 and 4P.33
Lines 18 and 19 on table Wn1 of the PR19 data tables (GW2 and GW3 Ml/d values for 2017/2018) do not match the figures in our APR table 4P, lines 4P.32 and 4P.33.
Our PR19 data tables can be viewed here: yorkshirewater.com/appendices
We have updated the values for the following lines in table 4P:
• Line 4P.32, ‘Total water treated at all GW2 works’ changed from 60.47 Ml/d to 53.89 Ml/d
• Line 4P.33, ‘Total water treated at all GW3 works’ changed from 43.12 Ml/d to 49.71 Ml/d
The variance is caused by a change in the classification of the Catterick water treatment works (WTW). Its status changed from GW2 status to GW3 due to an increase in the complexity of the treatment process. This classification change causes lines 4P.47 and 4P.48 to change described in change 20 below.
Correction
20 235 Table 4P, line 4P.48
Line 34 on table Wn1 of the PR19 data tables (number of GW3 works for 2017/2018) does not match APR table 4P, line 4P.48.
Our PR19 data tables can be viewed here: yorkshirewater.com/appendices
We have updated the value in line 4P.48 ‘Total number of GW3 works’ from 4 sites to 5 sites. This is because the classification of the Catterick water treatment works (WTW) changed from GW2 status to GW3 status.
Line 4P.47, ‘Total number of GW2 works’ remains the same because we have included a previously excluded site called Littleworth WTW. This site whilst not in operation is not decommissioned and therefore we should have included this in line 4P.47.
Correction

Change Log – Annual Performance Report 2017/2018
14
5. The detail behind each change

Change Log – Annual Performance Report 2017/2018
15
Change 1 Improvement
Observation
There has been a significant decrease in 4Q.19, ‘Number of lead communication pipes replaced for water quality’ reported, from 10,051 at 2016/2017 to 246 in 2017/2018.
Description of the change
We have provided additional narrative to explain the decrease in the number of lead communication pipes replaced for water quality, line 4Q.19, resulting from the successful completion of our improvement plan in 2016/2017.
What the section used to look like
We didn’t provide any narrative on this line.
We have added the following narrative
Line 19. Number of lead communication pipes replaced for water quality
Line 19 shows a significant reduction when compared to previous years because most of the lead replacement work was completed in 2015/2016 and 2016/2017. A few jobs remained due to a Highways Agency embargo, which have been subsequently completed in 2017/2018 (Yr3 - 246). The reduced number of lead replacement work completed in Year 3 aligns with the Final Determination.
What are we going to do differently?
Where our figures significantly change from previous years, or do not follow a trend from previous years, we will explain clearly why the change has occurred.

Change Log – Annual Performance Report 2017/2018
16
Change 2 Improvement
Observation
There has been a significant decrease in 4Q.25, ‘Energy consumption - water resources’ and increase in 4Q.24, ‘Energy consumption - network plus’ from the 2016/2017 figures.
Description of the change
We have provided additional narrative to explain the decrease in energy consumption - water resources and increase in energy consumption - network plus. The observed changes resulted from us making further improvements to our reporting this year. We carried out work with our technical optimisation engineers in both clean water and waste water to further refine the detailed understanding of the boundaries between price controls.
What the section used to look like
Line 25. Energy consumption – Water resources. This line is the Energy Consumed that falls within the water resources boundary split for water treatment. This covers everything from raw water pumping from rivers to boreholes and in some cases small holding reservoirs. It does not include energy that is used in WTW or grid pumping. For collocated sites that contain both WTW and water resource assets, a percentage split is applied to the main incoming supply based upon the equipment located on the site and the knowledge of company experts. Overall electrical consumption has increased this year. This is attributed to the need to pull from rivers and boreholes earlier than normally required.Office electrical consumption has increased by 10% due to improvements in the way the data is reported. Annually there has been a 0.5GWh increase possibly due to occupancy levels.
We have added the following narrative
We have made further improvements to our reporting this year. Work has been carried out with our technical optimisation engineers in both clean water and waste water to further refine the detailed understanding of the boundaries between price controls. The refined process for allocating consumption resulted in an increase in assets falling within the water network plus boundary.
In summary:
• All major clean water sites are now broken out to a process level allowing better boundary splits to be reported. This has resulted in an individual percentage split for each large site depending upon what equipment is installed.
• Other refinements include the allocation of boreholes and raw water pumping stations.
• Office consumption is now based on the type of occupancy levels in the buildings as opposed to a generic 25% split.
The net result is an increase to energy consumption within water network plus and a decrease in energy consumption in water resources.
What are we going to do differently?
Where we have made improvements to our reporting processes and procedures which lead to a significant difference in the reported figures we will indicate this more clearly in our explanations.

Change Log – Annual Performance Report 2017/2018
17
Change 3 Correction and improvement
Observation
Dividends used to pay head office costs and Kelda Finance interest was deducted from gross dividend when calculating dividend yield and dividend cover values in table 4H.
Description of the change
We have provided additional narrative to explain why we deducted ‘dividends used to pay head office costs and Kelda Finance interest’ from our gross dividend when calculating dividend yield and dividend cover values.
We have updated line 4H.6 ‘Dividend yield’ from 0.00% to 1.73% and updated line 4H.11 ‘Dividend cover’ from 0.00 to 2.39.
What the section used to look like
We didn’t provide any narrative on this line.
Table change

Change Log – Annual Performance Report 2017/2018
18
Change 3 Correction and improvement
What it looks like now
Narrative change
Lines 6 and 11: Dividend yield and Dividend cover
For previous submissions, we elected to use the figure that transparently presents the dividend received by the ultimate shareholders, as an equity return, in the year in question. This year, we have updated our figures for dividend yield and dividend cover to remain unadjusted.
What are we going to do differently?
We improve our explanation of the difference between dividends paid from Yorkshire Water and how they are used to pay other legitimate costs of running the company before any remaining dividend is paid to shareholders.
Table change

Change Log – Annual Performance Report 2017/2018
19
Change 4 Correction
Observation
An older version of the financial flows table (table 1F) and associated guidance was used.
Description of the change
We have updated our financial flows table to include lines 1a and 1b and followed the updated guidance.
What the section used to look like

Change Log – Annual Performance Report 2017/2018
20
Change 4 Correction
What it looks like now
Annual Performance Report 2017/2018
127126
Line 4 – Variance in corporation taxThis has been calculated in line with Ofwat guidance, the calculation is shown below:
Line 1 – Regulatory return on equity This value has been taken from the final determination weighted average cost of capital, this is 5.65% for the period 2015-2020.
Line 1A – Actual performance adjustment 2010-2015This has been calculated by taking the PR09 out / (under) performance adjustments contained within our PR14 final determination, divided by our regulated equity.
Line 2 – Regulatory equity baseNotional This has been calculated as 62.5% of the average RCV value which was published within our final determination, this value was given in 2012-2013 average prices and therefore no conversion was required.
Actual This has been calculated using the actual average gearing level, using the opening and closing net debt as published within Table 1E of the APR.
Line 3 – GearingThis has been calculated in line with the Ofwat guidance, the variance between the actual average gearing (using the opening and closing net debt as published within Table 1E of the APR) and the notional gearing has been multiplied by the variance in the cost of equity to debt.
We have included within the calculation the amount of tax that would have been payable on our appointed activities prior to the adjustments made to capital allowances and the utilisation of group relief.
After the impact of group relief and capital allowances the amount within the accounts for 2015-16 was shown as a receipt of £2.5m for prior years adjustments, 2016-17 showed a nil tax payment and 2017-18 showed a payment of £15m which was for group relief.
Line 5 – Group reliefThis has been calculated in line with Ofwat guidance, the calculation is shown below:
Up until a change in our accounting policy in 2017-18 we did not show a payment for group relief within our accounts, the above table reflects this position.
Price base 2015/2016 2016/2017 2017/2018
Group relief utilised 2012/2013 avg 36.4 25.0 13
Group relief paid 2012/2013 avg - - (13)
Line 1F.5 Group Relief 2012/2013 avg 36.4 25.0 -
Price base 2015/2016 2016/2017 2017/2018
Taxation 2012/2013 avg 1.4 6.8 5.1
Tax payable on profit/loss 2012/2013 avg (12.2) (18.1) (6.5)
Prior year adjustments - HMRC 2012/2013 avg 2.4 - -
Accelerated CA 2012/2013 avg - - -
Deferred CA 2012/2013 avg (24.2) (6.9) (6.9)
Average equity RCV 2,022.0 2,071.5 2,109.2
Variance in corporation tax 2012/2013 avg (32.7) (18.2) (8.3)
Annual Performance Report 2017/2018
125124
Table 1F – Financial flows For the 12 months ended 31 March 2018 (Price Base - 2012-13 RPI Average)
Line description Units DPs
%
Notional returns and notional regulatory equity
Actual returns and notional regulatory equity
Actual returns and actual regulatory equity
A
1 Return on regulatory equity % 2 5.65% 3.79% 5.65%
1a Actual performance adjustment 2010-2015 % 2 1.67% 1.12% 1.67%
1b Adjusted Return on regulatory equity % 2 7.32% 4.91% 7.32%
2 Regulatory equity base £ 0 2,109 2,109 1,415
B - Financing
3 Gearing % 2 0.00% 1.56% 2.32%
4 Variance in corporation tax % 2 0.00% -0.39% -0.59%
5 Group relief % 2 0.00% 0.00% 0.00%
6 Cost of debt % 2 0.00% 2.08% 3.71%
7 Hedging instruments % 2 0.00% -1.63% -2.91%
8 Sub total % 2 7.32% 6.52% 9.85%
C - Operational Performance
9 Totex out / (under) performance % 2 0.00% -1.09% -1.63%
10 ODI out / (under) performance % 2 0.00% 0.60% 0.89%
11 Retail out / (under) performance % 2 0.00% -0.41% -0.61%
12 Sub Total % 2 0.00% -0.90% -1.34%
13 Total earnings % 2 7.32% 5.62% 8.51%
14 RCV growth % 2 3.74% 3.74% 3.74%
15 Total shareholder return % 2 11.06% 9.36% 12.25%
16 Net dividend % 2 4.00% 1.20% 1.79%
17 Retained Value % 2 7.06% 8.16% 10.45%
D - Dividends reconciliation
18 Gross Dividend % 2 4.00% 3.75% 5.59%
19 Interest Receivable on Intercompany loans % 2 0.00% 2.55% 3.80%
20 Net dividend % 2 4.00% 1.20% 1.79%
£
Notional returns and notional regulatory equity
Actual returns and notional regulatory equity
Actual returns and actual regulatory equity
119.2 80.0 80.0
35.2 23.6 23.6
154.4 103.6 103.6
0.0 32.8 32.8
0.0 -8.3 -8.3
0.0 0.0 0.0
0.0 43.8 52.5
0.0 -34.4 -41.2
154.4 137.6 139.4
0.0 -23.0 -23.0
0.0 12.6 12.6
0.0 -8.6 -8.6
0.0 -19.0 -19.0
154.4 118.6 120.5
78.8 78.8 52.9
233.2 197.4 173.3
84.4 25.4 25.4
148.8 172.0 147.9
84.4 79.1 79.1
0.0 53.7 53.7
84.4 25.4 25.4
Key
Input cell Calculated cell using the data in the ‘RPI Indices tab Linked or self calculating cells Totals

Change Log – Annual Performance Report 2017/2018
21
What are we going to do differently?
We will strengthen our internal processes for monitoring the release of updated material to us regardless of the route into Yorkshire Water.
Change 4 Correction
What it looks like now
Annual Performance Report 2017/2018
129128
ii. Price control and additional segmental reportingThe information in this section comprises various financial analyses as required by Ofwat, with a brief description of significant variances compared to previous years:
Table 2A: Further analysis of the income statement by business segment
Table 2B: Analysis of totex (operating and capital expenditure) costs
Table 2C: Retail operating cost analysis
Table 2D: Historical cost analysis of fixed assets - wholesale and retail
Table 2E: Analysis of capital contributions and land sales - wholesale
Table 2F, 2G & 2H: Analysis of the household and non-household revenue by customer type
Table 2I: Revenue analysis and wholesale control reconciliation
Table 2J: Analysis of new connections – network reinforcement
Where further explanation of specific information is required, technical notes are included as appropriate.
Line 6 - Cost of debtThe total cost of debt impact has been calculated in line with Ofwat guidance.
The net actual interest paid as reported in table 1A has been adjusted for inter-company interest and then divided by our average net debt (using the opening and closing net debt as reported in table 1E) to calculate the actual nominal cost of debt.
Average RPI within the year has then been deducted from the actual nominal cost of debt to calculate the actual real cost of debt. (A simple deduction has been applied in line with Ofwat’s guidance, rather than using the Fischer equation).
The difference between the actual real cost of debt and the 2.59% that was included within the PR14 WACC is then calculated.
Notional The difference calculated above is then multiplied by the average RCV and the notional level of gearing (62.5%).
An adjustment is then made for corporation tax at the standard rate.
An adjustment is then made to exclude the element of this variance which is attributed to Hedging instruments, reported in line 7.
Actual The difference calculated above is then multiplied by the average RCV and the actual average level of gearing (using the opening and closing net debt reported in table 1E).
An adjustment is then made for corporation tax at the standard rate.
An adjustment is then made to exclude the element of this variance which is attributed to Hedging instruments, reported in line 7.
Line 7 – Hedging instrumentsWe have assessed the impact of our hedging instruments on our overall cost of debt. In the current year this impact has been assessed as 1.21%.
Line 9 – totex out/(under) performanceThis is taken from the APR calculation for table 4H.5 RORE.
Line 10 – ODI out/(under) performanceThis is taken from the APR calculation for table 4H.5 RORE.
Line 11 – Retail out/(under) performanceThis is taken from the APR calculation for table 4H.5 RORE.
Line 18 - Gross DividendWe have included the gross dividend that was paid from the appointed company within the relevant years.
This has been deflated to 2012-13 average prices.
Line 19 - Interest Receivable on Intercompany loansWe have included the value that the appointed company receives in the year on inter-company loans.
This has been deflated to 2012-13 average prices.

Change Log – Annual Performance Report 2017/2018
22
Change 5 Improvement
Observation
No formula or explanation was provided for how we calculated our interest cover (cash) in table 4H.
Description of the change
We have provided the precise formula used and additional narrative on how we calculated our interest cover (cash) in table 4H.
What the section used to look like
We didn’t provide any narrative on this line.
We have added the following narrative and calculation formulas
What are we going to do differently?
We will improve the explanation of our calculations, especially where they are technically complex or relate to data that may not be immediately available in the APR.

Change Log – Annual Performance Report 2017/2018
23
Change 6 Correction
Observation
The following lines in table 4Q are unusually high:
• Line 4Q.9, ‘Number of residential meters renewed’,
• Line 4Q.10, ‘Number of business meters renewed’
• Line 4Q.11, ‘Number of meters installed at request of optants’.
Description of the change
We have updated our figures by aligning them to the table units for the following lines in table 4Q:
• Line 4Q.9, ‘Number of residential meters renewed’ changed from 24957.000 to 24.957
• Line 4Q.10, ‘Number of business meters renewed’ changed from 1866.000 to 1.866
• Line 4Q.11, ‘Number of meters installed at request of optants’ changed from 27969.000 to 27.969
What the section used to look like

Change Log – Annual Performance Report 2017/2018
24
Change 6 Correction
What the table looks like now
What are we going to do differently?
We will review the guidance we provide to our level 1 and level 2 assurance providers to make sure they thoroughly check the data unit requirements in the published table guidance. We will also embed a process to check back against previous years reported figures which would highlight any significant changes in the figures.

Change Log – Annual Performance Report 2017/2018
25
Change 7 Correction
Observation
The table commentary for line 4R.7 referenced 60 total number of rising main bursts in 2016/2017.
Description of the change
We have corrected our commentary for line 4R.7 to reference 64 total number of rising main bursts in 2016/2017.
What the section used to look like
Line 7. Total number of rising main bursts. There have been 94 bursts in 2017/2018 which is an increase compared to 60 failures in 2016/2017. A number of mains have suffered multiple failures and are included in a sewer rehabilitation programme.
What it looks like now
Line 7. Total number of rising main bursts. There have been 94 bursts in 2017/2018 which is an increase compared to 64 failures in 2016/2017. A number of mains have suffered multiple failures and are included in a sewer rehabilitation programme.
What are we going to do differently?
We will review and improve our assurance processes to make sure that our level 1 and level 2 assurance providers are aware of the need to check the numbers reported in the explanatory text are consistent with previous year’s and are correct.
Change Log – Annual Performance Report 2017/2018
26
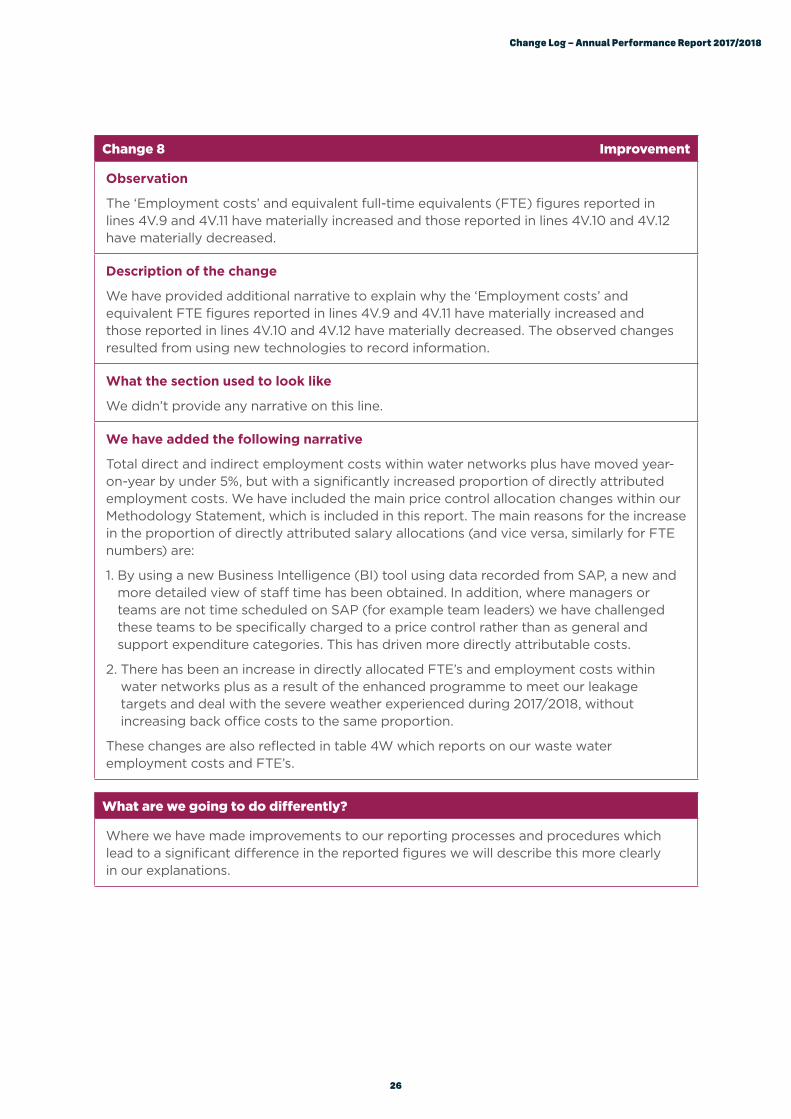
Change 8 Improvement
Observation
The ‘Employment costs’ and equivalent full-time equivalents (FTE) figures reported in lines 4V.9 and 4V.11 have materially increased and those reported in lines 4V.10 and 4V.12 have materially decreased.
Description of the change
We have provided additional narrative to explain why the ‘Employment costs’ and equivalent FTE figures reported in lines 4V.9 and 4V.11 have materially increased and those reported in lines 4V.10 and 4V.12 have materially decreased. The observed changes resulted from using new technologies to record information.
What the section used to look like
We didn’t provide any narrative on this line.
We have added the following narrative
Total direct and indirect employment costs within water networks plus have moved year-on-year by under 5%, but with a significantly increased proportion of directly attributed employment costs. We have included the main price control allocation changes within our Methodology Statement, which is included in this report. The main reasons for the increase in the proportion of directly attributed salary allocations (and vice versa, similarly for FTE numbers) are:
1. By using a new Business Intelligence (BI) tool using data recorded from SAP, a new and more detailed view of staff time has been obtained. In addition, where managers or teams are not time scheduled on SAP (for example team leaders) we have challenged these teams to be specifically charged to a price control rather than as general and support expenditure categories. This has driven more directly attributable costs.
2. There has been an increase in directly allocated FTE’s and employment costs within water networks plus as a result of the enhanced programme to meet our leakage targets and deal with the severe weather experienced during 2017/2018, without increasing back office costs to the same proportion.
These changes are also reflected in table 4W which reports on our waste water employment costs and FTE’s.
What are we going to do differently?
Where we have made improvements to our reporting processes and procedures which lead to a significant difference in the reported figures we will describe this more clearly in our explanations.

Change Log – Annual Performance Report 2017/2018
27
Change 9 Improvement
Observation
There have been significant changes between the 2016/2017 and 2017/2018 figures for; 4Q.1, Residential properties billed for measured water (external meter) which reduced from 738,863 to 691,583, and 4Q.2 Residential properties billed for measured water (not external meter) which increased from 305,401 to 394,464.
Description of the change
We have provided additional narrative to explain the changes in the figures for 4Q.1, Residential properties billed for measured water (external meter) and 4Q.2 Residential properties billed for measured water (not external meter) which increased from 305,401 to 394,464. The observed changes resulted from the work that was being undertaken on our billing file information in preparation for the opening of the non-household retail market in 2016/2017.
What the section used to look like
We have added the following narrative and historic data
What are we going to do differently?
Where we have made improvements to our reporting processes and procedures which lead to a significant difference in the reported figures we will describe this more clearly in our explanations.
Table Description Unit 2011-12 2012-13 2013-14 2014-15 2015-16 2016-17 2017-18
4Q.1 Residential properties billed for measured water (external meter) 000’s 538.372 564.460 592.087 620.875 648.892 738.863 691.583
4Q.2 Residential properties billed for measured water (not external meter) 000’s 275.925 298.048 319.864 334.504 348.818 305.401 394.464
Residential properties billed for measured water (external meter) % 66% 65% 65% 65% 65% 71% 64%
Residential properties billed for measured water (not external meter) % 34% 35% 35% 35% 35% 29% 36%
There have been significant changes on lines 4Q.1 and 4Q.2 between 2016/2017 and 2017/2018, due to the work that was being undertaken on the billing files in preparation for the opening of the non-household retail market in 2016/2017. The reported figure for this year is correct and in line with historical trend between 2011/2012 and 2016/2017 as shown in the table below.

Change Log – Annual Performance Report 2017/2018
28
Change 10 Improvement
Observation
There is a difference in the scale of reductions between ‘Trade effluent volume’ and ‘Load received from trade effluent customers’, lines 4R.12 and 4S.8 of tables 4R and 4S respectively.
Description of the change
We have provided additional narrative to explain the difference in the scale of reductions between ‘Trade effluent volume’ and ‘Load received from trade effluent customers’.
What the section used to look like
We didn’t provide any narrative on this line.
We have added the following narrative
Line 12: Volume of trade effluent (We have also included this narrative under table 4S.)
Changes within industry have played a part in the reported reductions. We have observed that some traders have reduced the scale of their operations. Dependent upon the specific traders involved, volume and load can move differently.
In addition, this has been the first year of operating the non-household retail market and the management of trade effluent has transferred from our internal billing system to the new Central Market Operating System, which is designed to cope with all wholesalers billing arrangements. During the year we have identified a number of required improvements in the billing of wholesale services including trade effluent. We observed some unexpected results which we have been working to understand throughout the year and continue to work on this year. This has accounted for some of the reduction in the volume of trade effluent.
Our expectation is that these improvements to our reporting will be in place for next year’s reporting. We observe, that the load to flow ratio remains consistent with that of other companies.
What are we going to do differently?
Where we have made improvements to our reporting processes and procedures which lead to a significant difference in the reported figures we will indicate this more clearly in our explanations.

Change Log – Annual Performance Report 2017/2018
29
Change 11 Correction
Observation
There was a negative Historical Cost Depreciation (HCD) figure in line 7 of tables 4V and 4W. This is expected to be entered as a positive number.
Description of the change
We have updated our HCD figure in tables 4V and 4W converting the negative depreciation figure to a positive figure.
What the section used to look like

Change Log – Annual Performance Report 2017/2018
30
Change 11 Correction
What it looks like now

Change Log – Annual Performance Report 2017/2018
31
Change 11 Correction
What it looks like now
What are we going to do differently?
We will review our assurance processes to make sure our level 1 and level 2 assurance providers check that our reported numbers are in line with the guidance and raise specific awareness that the same number can be reported in more than one table but with a different sign.

Change Log – Annual Performance Report 2017/2018
32
Change 12 Correction and Improvement
Observation
The Traffic Management Act costs reported in table 4W have significantly increased in 2017/2018 and has been reported solely in network plus sewage treatment when previously they have been reported in network plus sewage transport.
Description of the change
We have provided additional narrative on why the Traffic Management Act costs reported in table 4W have significantly increased in 2017/2018, and why we have reported it in network plus sewage collection rather than network plus sewage treatment.
We have updated line 4W.21 ‘Costs associated with Traffic Management Act’ by reporting the figure under ‘Network plus sewage collection’.
What the section used to look like
The traffic management act (TMA) costs have been provided by our internal permitting team, and only include the direct costs of the permits, and exclude the oncosts associated with Local Authority Charges.
See change 11 to view table 4W prior to the change.
We have added the following narrative
The traffic management act (TMA) costs have been provided by our internal permitting team, and only include the direct costs of the permits, and exclude the oncosts associated with Local Authority Charges. The Traffic Management Act costs reported in table 4W have significantly increased year on year based on the requirements from local authorities who are implementing permitting schemes and increasing their annual usage of permits across varying road types.
The costs for Traffic Management Act on table 4W has been reported in Network plus sewage collection.
What are we going to do differently?
We will review our assurance processes to make sure our level 1 and level 2 assurance providers check that our reported numbers are in line with the guidance.

Change Log – Annual Performance Report 2017/2018
33
Change 13 Correction and Improvement
Observation
For Brighouse/Upper sewage treatment works (STW), line 4O.10 there was a >8-fold increase in Flow passed to full treatment (FFT) from 19,541 to 162,289m3/d. For Scarborough STW, line 4O.10 there was a >3-fold increase in FFT from 6,686 to 21,809m3/d.
For Blackburn Meadows STW, line 4O.15 the estimated terminal pumping expenditure increased from £6,000 in 2016/2017 to £403,000 in 2017/2018.
Description of the change
We have updated the FFT figure for Brighouse/Upper STW, line 4O.10 from 162,289 m3/d to 22,942 m3/d.
We have provided additional narrative to explain the >3-fold increase in FFT for Scarborough STW which resulted from the transposing of figures for the 2016/2017 submission.
We also explain why the estimated terminal pumping expenditure has increased from £6,000 in 2016/2017 to £403,000 in 2017/2018. This resulted from an increase in power costs to run terminal pumps and due to our ongoing improvement in cost allocation.
What the section used to look like
Table

Change Log – Annual Performance Report 2017/2018
34
Change 13 Correction and Improvement
What the section used to look like
Commentary
This table follows on from 4N, lines 7-10 inclusive. All the sites above are separately costed within Yorkshire Water’s accounting systems.
This table (Lines 1-10) contains detailed information relating to the large WWTWs with a population equivalent greater than 25000. Each of the 36 Yorkshire Water sites is listed together with its treatment type, population equivalent, consent information for common parameters, and flow and load received in 2017/2018.
Clarification received from Ofwat confirms this table should reconcile to line 7 and 8 in table 4N and follows the same principles explained in table 4N.
What the section looks like now
Table change

Change Log – Annual Performance Report 2017/2018
35
Change 13 Correction and Improvement
What the section used to look like
We have included the following additional narrative
Line 10: Scarborough STW The >3-fold increase in FFT from 6,686 to 21,809m3/d for line 10 Scarborough STW from last year to this year is due to the transposing of figures for the 2016/2017 submission. Last year, the figure for Selby No2 STW was used for Scarborough STW and vice versa. This has been corrected for this submission.
Line 15: Blackburn Meadows STW The terminal pumping expenditure has increased for Blackburn Meadows STW because of the power costs to run terminal pumps. The costs for estimated terminal pumping expenditure have been reviewed for 2017/2018 submission with operational colleagues in much more detail than before as part of our ongoing improvement in cost allocation.
What are we going to do differently?
Where our figures significantly change from previous years, or do not follow a trend from previous years, we will explain clearly why the change has occurred.

Change Log – Annual Performance Report 2017/2018
36
Change 14 Improvement
Observation
There are large percentage changes in many lines in table 4N from values submitted in 2016/2017 compared to 2017/2018. In particular, there is an increase of 88% in the Opex cost of size band 3 STWs and reduction of 51.8% in the Opex cost of size band 4 STWs.
Description of the change
We have provided additional narrative to explain the large percentage changes in table 4N. The observed changes resulted from our enhanced cost allocation process for 2017/2018.
What the section used to look like
This is a new table in 2017/2018 which analyses the costs of different size sewage treatment works. We have allocated all direct costs to site where possible, with nearly all large works separately costed. For minor works, which are grouped into areas for materiality reasons, the costs were sub-divided into the following categories for optimum allocation.
• Site specific.
• Area site costs.
• Employee direct costs.
• Maintenance.
• Facilities and Business Rates.
• General and support.
The requirement of the table is to have all the above costs directly /indirectly allocated in Bands 1-6 which are defined in the RAGs 4.07. The information to split the sites into bands and STW loads was supplied from the asset inventory system. Estimated terminal pumping percentages were supplied by energy experts within the business.
Clarity received from Ofwat on line 7 to include service charges and terminal pumping costs therefore lines 9 and 10 in this table are shown as disclosure items. These costs exclude business rates but include any atypical costs which is consistent with table 4E.
We have added the following narrative
We have enhanced the cost allocation process for 2017/2018, following Ofwat feedback at a cost assessment meeting that showed Yorkshire Water sites showed few economies of scale as band size increased. Other companies reflected economies of scale, with average unit costs of a band 3 STW higher than a band 4 STW. Our current submission brings our unit price data in line with industry norms, and the data in table 4N should remain as submitted. Our intention has been to make our data more useful when combined / compared with that of other companies.
Examples of cost allocation improvements made this year includes:
• Maintenance - we have worked with the maintenance team and asset inventory team to determine maintenance costs by site, so they can be allocated to bands accurately.
• Power – each site has been reviewed to ensure accurate consumption and costs are reflected for sewage treatment.
In the future, as stated in the accounting separation methodology, we are refreshing our corporate SAP systems, whereby each site will have a separate cost centre therefore separating costs.
What are we going to do differently?
Where we have made improvements to our reporting processes and procedures which lead to a significant difference in the reported figures, we will indicate this more clearly in our explanations.

Change Log – Annual Performance Report 2017/2018
37
Change 15 Improvement
Observation
There is an increase in lines 4R.3 and 4R.4 in 2017/2018 compared to previous years.
Description of the change
We have included historic data for lines 4R.3 and 4R.4 to avoid a step jump in the reported numbers from previous years and provided additional narrative to explain the observed increase.
What the section used to look like
Line 3. Total pumping station capacity. Total pumping station capacity in 2017/2018 is 70,022Kw, an increase of 13.4% from 61,740Kw in 2016/2017. The majority of the increase is due to the inclusion of inlet pumping after clarification from OFWAT and a revision of the ‘average Kw’ capacity value used for transferred sites. There were 21 private sewage pumping stations transferred to our network in 2017/2018 which have contributed to the increase in capacity.
Line 4. Number of Network Pumping Stations. There has been a 6.7% increase in the number of network pumping stations to 2,488 in 2017/2018. This increase is related to the inclusion of inlet pumping after clarification from Ofwat. There have been 21 private sewage pumping stations identified for transfer in 2017/2018 which have also contributed to the reported increase.
We have added the following narrative and historic data
The table below shows the historic data for lines 4R.3 and 4R.4 for the period 2011-2012 to 2016-2017.
The introduction of the Water Act 2011 on 1/10/2016, resulted in a transfer of approximately 370 eligible private pumping stations to Yorkshire Water in 2016/2017, this increase can be observed on line 4R.4 in the table above.
Where pumping station kW capacity was unknown, due to being recently transferred under the Water Act 2011, we used the 2017/2018 post audit average values (5.4kW for pumping stations transferred 1/10/2016; 29.9kW for network SPS; 69.1kW for inlet pumping stations) were applied historically to prevent variation in the average calculation.
Due to the replacement of pumps at pumping stations, there may be some variation in the total pumping station capacity. This is due to slight differences in pump kW ratings.
What are we going to do differently?
Where we have made improvements to our reporting processes and procedures which lead to a significant difference in the reported figures, we will indicate this more clearly in our explanations.

Change Log – Annual Performance Report 2017/2018
38
Change 16 Correction
Observation
There is a significant difference between the resident population equivalent reported in table WWn4 block I line 22 for 2017 in our PR19 data table and that reported in table 4S of our 2017/2018 APR (0 in our PR19 data table vs. 5,134 in our APR).
Our PR19 data tables can be viewed here: yorkshirewater.com/appendices
Description of the change
We have updated the ‘Current population equivalent served by STWs with tightened/new N consents’ figure in table 4S of our APR, line 4S.22 from 5,134 to 0. This is due to a capital scheme being incorrectly categorised. This change causes lines 4M.15 and 4M.16 to change described in change 17 below.
What the table used to look like
What the table looks like now
What are we going to do differently?
We will review our assurance processes to make sure our level 1 and level 2 assurance providers check that our reported numbers are in line with the guidance.

Change Log – Annual Performance Report 2017/2018
39
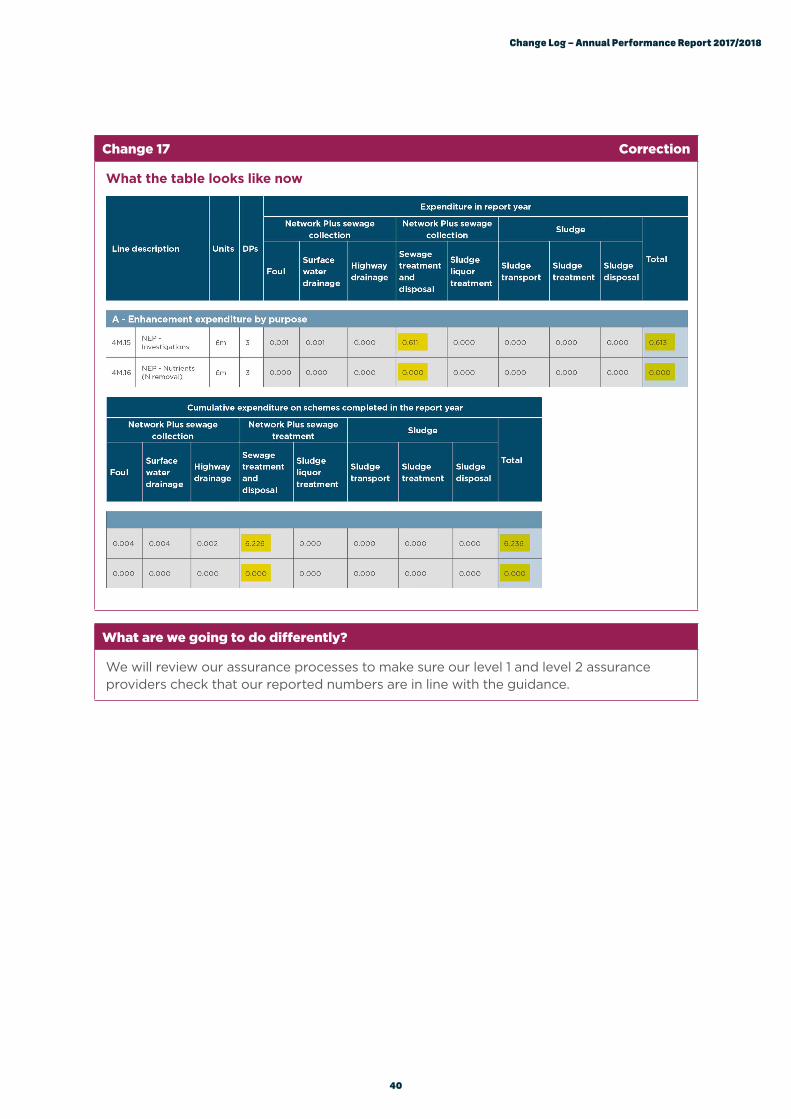
Change 17 Correction
Observation
In change 16, we updated the ‘Current population equivalent served by STWs with tightened/new N consents’ figure in table 4S, line 4S.22 from 5,134 to 0. This change affects lines 4M.15 and 4M.16 in table 4M.
Description of the change
We have updated the Network Plus sewage collection - sewage treatment and disposal’ figure in table 4M of our APR, line 4M.16 – ‘NEP – Nutrients (N removal)’ from £0.112m to £0m and updated line 4M.15, ‘NEP – Investigations’ from £0.499m to £0.611m.
We have updated the ‘Network Plus sewage treatment – sewage treatment and disposal’ figure for line 4M.16, ‘NEP – Nutrients (N removal)’ from £0.308m to £0m and updated line 4M.15, ‘NEP – Investigations’ from £5.918m to £6.226m.
What the table used to look like
Change Log – Annual Performance Report 2017/2018
40
Change 17 Correction
What the table looks like now
What are we going to do differently?
We will review our assurance processes to make sure our level 1 and level 2 assurance providers check that our reported numbers are in line with the guidance.

Change Log – Annual Performance Report 2017/2018
41
Change 18 Correction
Observation
There is a significant variance between table WWS4 line 10 of the PR19 data tables and table 4U line 22 in the APR 2017/2018.
Our PR19 data tables can be viewed here: yorkshirewater.com/appendices
Description of the change
We have updated the ‘Volume of storage provided at CSOs, storm tanks, etc to meet spill frequency objectives’ figure, line 4U.22 from 14,600 m3 to 0 m3.
What the table used to look like
What the table looks like now
What are we going to do differently?
We will review our assurance processes to make sure our level 1 and level 2 assurance providers check that our reported numbers are in line with the guidance.

Change Log – Annual Performance Report 2017/2018
42
Change 19 Correction
Observation
Lines 18 and 19 on table Wn1 of the PR19 data tables (GW2 and GW3 Ml/d values for 2017/2018) do not match the figures in our APR table 4P, lines 4P.32 and 4P.33.
Our PR19 data tables can be viewed here: yorkshirewater.com/appendices
Description of the change
We have updated the values for the following lines in table 4P: • Line 4P.32, ‘Total water treated at all GW2 works’ changed from 60.47 Ml/d to 53.89 Ml/d • Line 4P.33, ‘Total water treated at all GW3 works’ changed from 43.12 Ml/d to 49.71 Ml/d
The variance is caused by a change in the classification of the Catterick water treatment works (WTW). Its status changed from GW2 status to GW3 due to an increase in the complexity of the treatment process. This classification change causes lines 4P.47 and 4P.48 to change described in change 20 below.
What the table used to look like

Change Log – Annual Performance Report 2017/2018
43
Change 19 Correction
What the table looks like now
What are we going to do differently?
We will review our assurance processes to make sure our level 1 and level 2 assurance providers check that our reported numbers are in line with the guidance.

Change Log – Annual Performance Report 2017/2018
44
Change 20 Correction
Observation
Line 34 on table Wn1 of the PR19 data tables (number of GW3 works for 2017/2018) does not match APR table 4P, line 4P.48.
Our PR19 data tables can be viewed here: yorkshirewater.com/appendices
Description of the change
We have updated the value in line 4P.48 ‘Total number of GW3 works’ from 4 sites to 5 sites. This is because the classification of the Catterick water treatment works (WTW) changed from GW2 status to GW3 status.
Line 4P.47, ‘Total number of GW2 works’ remains the same because we have included a previously excluded site called Littleworth WTW. This site whilst not in operation is not decommissioned and therefore we should have included this in line 4P.47.
What the table used to look like
What the table looks like now
What are we going to do differently?
We will review our assurance processes to make sure our level 1 and level 2 assurance providers check that our reported numbers are in line with the guidance.

Yorkshire Water Services Limited, Western House, Halifax Road, Bradford, BD6 2SZ. Registered in England and Wales No.2366682
YORKSHIREWATER.COM