annual performance plan | 2018/2019
TRANSCRIPT

ANNUAL PERFORMANCE PLAN | 2018/2019


iii
ANNUAL PERFORMANCE PLAN2018/2019


v
TABLE OF CONTENTS List of Acronyms vi
Foreword 1
Official Signing off 4
Part A: Strategic Overview of the Department 5
1. Updated situational analysis . . . . . . . . . . . . . . . . . . . . . . . . . . . . . . . . . . . . . . . . . . . . . . . . . 6
1.1. Performance delivery environment . . . . . . . . . . . . . . . . . . . . . . . . . . . . . . . . . . . . . . . . . 6
1.2. Organisational environment . . . . . . . . . . . . . . . . . . . . . . . . . . . . . . . . . . . . . . . . . . . . 17
2. Revision of Legislative and other mandates . . . . . . . . . . . . . . . . . . . . . . . . . . . . . . . . . . . . . . . . 18
2.1. Regulations . . . . . . . . . . . . . . . . . . . . . . . . . . . . . . . . . . . . . . . . . . . . . . . . . . . . . . 18
2.2. Pending Court cases . . . . . . . . . . . . . . . . . . . . . . . . . . . . . . . . . . . . . . . . . . . . . . . . . 19
3. Overview of 2018/2019 budget and MTEF estimates . . . . . . . . . . . . . . . . . . . . . . . . . . . . . . . . . . . 20
3.1. Expenditure estimates . . . . . . . . . . . . . . . . . . . . . . . . . . . . . . . . . . . . . . . . . . . . . . . . 20
3.2. Relating expenditure trends to strategic outcome-oriented goals . . . . . . . . . . . . . . . . . . . . . . . . 21
PART B: PROGRAMME AND SUB-PROGRAMME PLANS 26
4. Departmental Programmes: Strategic Objectives, Programme Performance Indicators and Annual Targets for 2018/2019 . . . . . . . . . . . . . . . . . . . . . . . . . . . . . . . . . . . . . . . . . . . . . . . 26
4.1. Programme 1: Administration . . . . . . . . . . . . . . . . . . . . . . . . . . . . . . . . . . . . . . . . . . . 26
4.2. Programme 2: Curriculum Policy, Support and Monitoring . . . . . . . . . . . . . . . . . . . . . . . . . . . 30
4.3. Programme 3: Teachers, Education Human Resources and Institutional Development . . . . . . . . . . . . 42
4.4. Programme 4: Planning, Information and Assessment . . . . . . . . . . . . . . . . . . . . . . . . . . . . . . 48
4.5. Programme 5: Educational Enrichment Services . . . . . . . . . . . . . . . . . . . . . . . . . . . . . . . . . 60
PART C: LINKS TO OTHER PLANS 66
5. Links to long-term infrastructure and other capital plans . . . . . . . . . . . . . . . . . . . . . . . . . . . . . . . . 66
5.1. Accelerated Schools Infrastructure Delivery Initiative (ASIDI) . . . . . . . . . . . . . . . . . . . . . . . . . . 66
5.2. Conditional Grants . . . . . . . . . . . . . . . . . . . . . . . . . . . . . . . . . . . . . . . . . . . . . . . . . . 66
5.3. Public entities . . . . . . . . . . . . . . . . . . . . . . . . . . . . . . . . . . . . . . . . . . . . . . . . . . . . 68
5.4. Public-Private Partnerships . . . . . . . . . . . . . . . . . . . . . . . . . . . . . . . . . . . . . . . . . . . . . 68
PART D: ANNEXURES 69
6. Updates in the Department of Basic Education Strategic Plan . . . . . . . . . . . . . . . . . . . . . . . . . . . . . . 69
7. Technical Indicator Descriptions . . . . . . . . . . . . . . . . . . . . . . . . . . . . . . . . . . . . . . . . . . . . . . 74

vi
List of AcronymsAIDS Acquired Immune Deficiency Syndrome
ANA Annual National Assessment
ASIDI Accelerated Schools Infrastructure Delivery Initiative
BAS Basic Accounting System
BELA Basic Education Laws Amendment
CAPS Curriculum and Assessment Policy Statements
CD Compact Disc
CoE Compensation of Employees
CSPID Children with Severe to Profound Intellectual Disabilities
CSTL Care and Support for Teaching and Learning
DBE Department of Basic Education
DBSTs District-Based Support Teams
DHET Department of Higher Education and Training
DM District Managers
DoC Department of Communication
DoH Department of Health
DORA Division of Revenue Act
DPME Department of Planning, Monitoring and Evaluation
DSD Department of Social Development
DST Department of Science and Technology
DTPS Department of Telecommunications and Postal Services
DVDs Digital Versatile Discs
EBR Evidence-Based Report
ECD Early Childhood Development
ECDoE Eastern Cape Department of Education
ECF Education Collaboration Framework
EFAL English First Additional Language
EGRA Early Grade Reading Assessment
EGRS Early Grade Reading Study
EIG Education Infrastructure Grant
E-LTSM Electronic Learning and Teaching Support Materials
EMIS Education Management Information Systems
EPMD Educator Performance Management and Development
EU European Union
FAL First Additional Language
FET Further Education and Training
GEM/BEM Girls’ and Boys’ Education Movement
GENFEQA General and Further Education and Training Quality Assurance
GET General Education and Training

vii
GHS General Household Survey
GIS Geographical Information System
GITO Government Information and Technology
HEDCOM Heads of Education Departments Committee
HEI Higher Education Institution
HIV Human Immunodeficiency Virus
HPV Human Papilloma Virus
HSRC Human Sciences Research Council
ICASA Independent Communications Authority of South Africa
ICT Information and Communications Technology
IIAL Incremental Introduction of African Languages
IQMS Integrated Quality Management System
IR&MA International Relations and Multilateral Affairs
IT Information Technology
LoLT Language of Learning and Teaching
LSPID Learners with Severe to Profound Intellectual Disability
LTSM Learning and Teaching Support Material
LURITS Learner Unit Record Information Tracking System
MPAT Management Performance Assessment Tool
MST Mathematics, Science and Technology
MTEF Medium-Term Expenditure Framework
MTSF Medium-Term Strategic Framework
NCS National Curriculum Statement
NDP National Development Plan
NECT National Education Collaboration Trust
NEEDU National Education Evaluation and Development Unit
NEPA National Education Policy Act
NGOs Non-Governmental Organisations
NHC National Heritage Council
NIAF National Integrated Assessment Framework
NQF National Qualifications Framework
NSC National Senior Certificate
NSFAS National Student Financial Aid Scheme
NSLA National Strategy for Learner Attainment
NSNP National School Nutrition Programme
NSSF National School Safety Framework
PDOU Planning and Delivery Oversight Unit
PEDs Provincial Education Departments
PFMA Public Finance Management Act
PID Profoundly Intellectually Disabled
PIRLS Progress in International Reading and Literacy Study

viii
PLAY Powerful Learning Around You
PMDS Performance Management and Development Scheme
PPMs Programme Performance Measures
PPN Post-Provisioning Norm
PPP Public-Private Partnership
PSS Psycho-social Support Services
QLTC Quality Learning and Teaching Campaign
SACE South African Council of Educators
SACMEQ Southern and Eastern Africa Consortium for Monitoring Educational Quality
SAPS South African Police Service
SASAMS South African School Administration and Management System
SASCE South African Schools Choral Eisteddfod
SASL South African Sign Language
SBA School-Based Assessment
SC Senior Certificate
SDG Sustainable Development Goal
SDIP Service Delivery Improvement Plan
SE Systemic Evaluation
SGBs School Governing Bodies
SIAS Screening, Identification, Assessment and Support
SIBIG School Infrastructure Backlogs Indirect Grant
SMME Small and Medium Micro Enterprise
SMS Senior Management Services
SPID Severe to Profound Intellectual Disabilities
SPSP Sector Policy Support Programme
SRH Sexual Reproductive Health
TALIS Teaching and Learning International Survey
TARMII Teacher Assessment Resources for Monitoring and Improving Instruction
TB Tuberculosis
TIMSS Trends in International Mathematics and Science Study
TO Technical Occupational
TV Television
UNESCO United Nations Educational, Scientific and Cultural Organisation
UNICEF United Nations International Children’s Emergency Fund
USAO Universal Service and Access Obligations
USB Universal Serial Bus
WSE Whole School Evaluation
YCAP Youth Citizen Action Programme

1
ForewordThe year 2018 has been declared the “Nelson Mandela Centenary 2018, Be the Legacy”. Nelson Mandela’s love of children was aptly illustrated when he said that “Education is the most powerful weapon which you can use to change the world”.
The provision of basic education to children in South Africa continues to be guided by the five (5) internationally accepted principles, namely: access, redress, equity, quality and efficiency. The Department has a stable system that looks at the whole development of a child. High levels of access in the public schooling system, and progress in the equitable allocation of funding characterise our achievements. We concede that despite the notable stability of, and improvements in our system, much more needs to be done in the areas of efficiency and quality, especially in terms of learning outcomes for children from a previously disadvantaged background.
We have made a great effort in repositioning and realigning the Basic Education Sector and our sector plans with the National Development Plan (NDP). Amongst our efforts to improve the sector, new Provincial Performance Measures (PPMs) were developed to align the Department’s as well as the Provincial Education Departments’ (PEDs) plans with the Medium-Term Strategic Framework (MTSF) and the NDP. The repositioning and realignment processes of our sector will continue to focus on accountability imperatives throughout the system. The process also brings the funding of the projects close to each other, thus giving real effect to the National Education Policy Act (NEPA).
The Constitution, the UNESCO Sustainable Development Goal (SDG) 4, the Continental Education Strategy for Africa on the African Agenda 2063, the NDP – Vision 2030, and our Action Plan to 2019: Towards the realisation of Schooling 2030, all provide a clear direction on improving access, redress, equity, efficiency, inclusivity and quality of learning outcomes through the implementation of the MTSF and our National Strategy for Learner Attainment (NSLA). Credible data and information, as well as credible research, continue to help us to identify where there is inefficient co-ordination. There is tangibly more understanding and co-operation within the Basic Education Sector – among officials, partners, business, organised labour, and other stakeholders.
We can confidently report that we are increasingly prioritising interventions, policies and strategies that target an improved quality of learning and teaching, and implementing accountability systems to ensure that quality outcomes in the Basic Education Sector are achieved. Our work with the Select and Portfolio Committees on Education, on oversight and support in the sector, is critical. This has led us to examine more closely the alignment of plans and programmes of the Department and the broader sector against our national development goals. The Basic Education Law Amendment (BELA) Bill review has commenced and will ensure that our schools are institutions which will assist the Government in its efforts in building democracy and social cohesion in the country.
We congratulate the Class of 2017 and teachers for all the hard work that was done throughout the 2017 school year. The 2017 National Senior Certificate (NSC) overall pass rate, with progressed learners excluded, stands at 76.5%, a 0.3% improvement from the 76.2% achieved in 2016. With the progressed learners included, the overall pass rate, stands at 75.1%, a 2.6% improvement from the 72.5% achieved in 2016. This represents a total of 401 435 candidates, who have passed the 2017 NSC examinations. Clearly, the progression policy and the Second Chance Programme, with continued support, are yielding good fruit. Through these two (2) initiatives, the Department is responding to the NDP’s directive of increasing throughput and retention rates. We note, however, that instruction in literacy and numeracy in the early Grades still requires attention.
The National Integrated Assessment Framework (NIAF) has been developed, having considered historical lessons and criticisms levelled at the Annual National Assessment (ANA) to improve its design, efficiency and take-up by teachers. The Department regards the NIAF as a model that places a high emphasis on assessment design that is fit for purpose and will naturally accommodate the policy requirements of established assessment programmes in the General Education and Training (GET) Band. The NIAF includes three (3) tiers of assessment: Systemic Evaluations, Diagnostic Assessment and Summative Assessment, with the first Systemic Evaluations cycle taking place from 2018 to 2020. We look to our partners to enhance technical, analytical and developmental skills sets these three (3) tiers attempt to address.

2
During the current Medium-Term Expenditure Framework (MTEF) period, we will focus on the learning outcomes of the young learners in the Foundation Phase. We have to extend instruction time, create opportunities for reading and learning as well as showing care and support to our learners. Research and evidence show that the root causes of dropping out of school towards the end of secondary schooling, are weak learning foundations in the early Grades. Our co-ordination and accountability structures amongst other efforts must begin to address this important indicator. Measures have been taken to capacitate Foundation Phase subject advisors to train and support teachers in schools. One of the platforms through which we are trying to achieve this is the Early Grade Reading Assessment (EGRA). We are grateful to the team of the “Read to lead” literacy campaign ambassadors who have been appointed to assist the Department in promoting a reading revolution in the country. We are particularly indebted to the private sector in joining Government in their efforts of nurturing a daily reading culture in public schools and in homes. More work still needs to be done on the basic infrastructure in schools and in society for developing language and literacy skills in the African languages. In addition, classroom management and parental support of learning requires dedicated and innovative support and expansion.
In improving the outcomes of the schooling system, we are continuing with improvements in the fundamental quality of teaching and learning well before Grade 12. Interventions and policies are increasingly prioritised by the Department to ensure that there is improved quality of teaching and learning and the implementation of accountability systems. Early Grade literacy has been specifically prioritised in order to respond to the concerns raised in the recent Progress in International Reading Literacy Study (PIRLS) 2016 report that found that our learners still have challenges with their cognitive levels of literacy. The Early Grade Reading Study (EGRS), a groundbreaking results-based study, aims to identify effective ways of teaching reading in African languages. The project aims to build on the work that has already been started in the North West with Setswana, by expanding it to other provinces. There is now sufficient evidence to increase the impact and learning outcomes of reading in African languages. Furthermore, the honourable President, Mr Matamela Cyril Ramaphosa in his recent State of the Nation Address indicated that from the beginning of 2018, all public schools have begun offering an African language.
The Department will continue to work with sister Departments to formalise Grade R, and will ensure that the provisioning of appropriately qualified and experienced Early Childhood Development (ECD) practitioners, as well as age-appropriate Learning and Teaching Support Materials (LTSM) are prioritised. We will be developing a school readiness assessment tool which will be used in understanding and supporting young children’s development. The adherence to the strict LTSM sector plan timelines ensured that the 2018 school year started as planned. We are working to deepen our monitoring of curriculum coverage so that it is extended beyond just compliance, to include learning progression.
The use of Information and Communication Technology (ICT) – the “Fourth Industrial Revolution” in education is an important medium for complementing the delivery of curriculum in most developing countries including South Africa. We have seen the importance of ICT in Education in the way it has simplified learning. The integration of e-innovation, e-governance and e-administration to enhance the use of ICT in teaching and learning will be the continued focus of our Operation Phakisa interventions, which are aimed at developing and modernising the skills of our teachers and learners to match the needs of the changing world.
The NDP states that educators recruited to the teaching profession must be high calibre candidates, who will commit to improve teaching and learning outcomes in the classroom. Using the Funza Lushaka Bursary Scheme, the Department, as stated in this plan, will continue to identify and recruit young teachers of high calibre. The investment we, together with our partners, have made in teacher resource centres, particularly the continued roll-out of ICTs in teacher development, has enabled us to multiply and expand the reach of our efforts at supporting our teachers in subject content knowledge and teaching practice.
We appreciate the continued support from Government in the delivery of state-of-the-art schools, which is funded through the Education Infrastructure Grant (EIG) and the Accelerated Schools Infrastructure Delivery Initiative (ASIDI). Coupled with the state-of-the-art schools, is the provision of potable water, hygienic sanitation, and reliable electricity to our school infrastructure. It must be noted that the state-of-the-art schools come with media centres, nutrition centres, science laboratories, and administrative blocks – thus these schools are not only safe and conducive learning and teaching environments, but also help to restore the dignity of our learners and teachers. In the 2018/19 financial year, the EIG and ASIDI will be merged into the Infrastructure Delivery Programme.

3
The challenges of poverty, unemployment and the divisions around race, class and gender make it difficult to arrive at a socially cohesive and united society fast enough. However, the Department continues to develop and implement pro-poor policies and programmes for democratic transformation in the Basic Education Sector. The interventions packaged under the Care and Support for Teaching and Learning (CSTL) of ensuring that we minimise the impact of poverty, unemployment and inequality in order to improve the quality of learning in schools, have been pleasing. Some of these include monitoring and improving the implementation of our programmes such as the National School Nutrition Programme (NSNP), the No-Fee schools, the Deworming and HPV Vaccine programme as well as activities to support Sexual and Reproductive Health.
Sector plans on key interventions in Inclusive Education have been developed to assist in the implementation of the Profoundly Intellectually Disabled (PID) Policy and Learning Programme. The National Treasury has introduced a new Conditional Grant for Learners with Severe to Profound Intellectual Disabilities (LSPID), aimed at providing access to quality publicly-funded education and support to learners with profound intellectual disabilities. The Department has made inroads in the three (3) curriculum streams which promote differentiation for more effective inclusive education. These three (3) curriculum streams include academic, technical-vocational and technical occupational streams, designed to improve curriculum choices and post-school opportunities and career choices for young people country-wide. Technical Occupational (TO) subjects have been made available to PEDs and will be piloted this year. We all agree that young people should be skilled to participate actively in the “Fourth Industrial Revolution” and become gainful employees and entrepreneurs. Also of significance, is the implementation of the first National Senior Certificate (NSC) examination on South African Sign Language, which will be offered to deaf learners at the end of 2018.
The Department has also strengthened its plans around the rural education programme. Additional funding will be introduced in this financial year to monitor the implementation of the Multi-Grade toolkits for schools with Multi-Grade classes as well as the rural education assistance programme. This approach will see rural schools being supported in order to provide quality education and subsequently learner performance in rural schools.
The Department will continue to use its engagements with education districts to ensure that schools receive optimal support, and that early warning systems, for speedy resolution of challenges, are part of monitoring and evaluating the sector at all levels. We therefore ask our PEDs to ensure that all districts are adequately resourced and supported in order to turn them into efficient and functional delivery points of our basic education system. In support of the evidence-based approach, data information and analysis capacity will continue to be strengthened among our officials at all levels in decision making.
We look forward to incorporating within the Basic Education Sector a harmonised system of reporting on Outcomes, Service Delivery Improvement Plan (SDIP) and Management Performance Assessment Tool (MPAT) in our normal reporting processes.
We are confident that the plans expressed in this Annual Performance Plan, the Provincial Annual Performance Plans, as well as in the Basic Education Sector Plan – Action Plan to 2019: Towards the Realisation of Schooling 2030, are solid efforts which will go a long way in taking forward Mandela’s legacy of education.
Mrs AM Motshekga, MP Mr ME Surty, MPMinister Deputy Minister

4
Official Signing offIt is hereby certified that this Annual Performance Plan:
• Was developed by the management of the Department of Basic Education under the guidance of the Minister of Basic Education;
• Was prepared in line with the current Strategic Plan of the Department of Basic Education; and
• Accurately reflects the performance targets which the Department of Basic Education will endeavour to achieve given the resources made available in the budget for 2018/2019.
____________________Ms N MolalekoaChief Financial Officer
_____________________Ms P TyobekaA/Deputy Director-General, Office of the Director-General
_____________________Mr HM MweliDirector-General
Approved by:
______________________Mrs AM Motshekga, MPMinister

5
Part A: Strategic Overview of the Department The Department of Basic Education was formed when the former National Department of Education was split into two: Department of Basic Education (DBE) and the Department of Higher Education and Training (DHET). The DBE deals with all schools from Grade R to Grade 12, including Adult Literacy Programmes.
AIM
• To develop, maintain and support a South African school education system for the 21st century.
VISION
• To see a South Africa in which all our people will have access to lifelong learning, education and training opportunities, which will, in turn, contribute towards improving the quality of life and building a peaceful, prosperous and democratic South Africa.
MISSION
• To provide leadership in the establishment of a South African education system for the 21st century.
VALUES
People – upholding the Constitution, being accountable to the Minister, the Government and the people of South Africa.
Excellence – maintaining high standards of performance and professionalism by aiming for excellence in everything we do, including being fair, ethical and trustworthy in all that we do.
Teamwork – co-operating with one another and with our partners in education in an open and supportive way to achieve shared goals.
Learning – creating a learning organisation in which staff members seek and share knowledge and information while committing themselves to personal growth.
Innovation – striving to address the training needs for high-quality service and seeking ways to achieve our goals.
This Annual Performance Plan represents the fourth year of activities towards achieving the objectives contained in the DBE Strategic Plan 2015/16-2019/20. The DBE’s Strategic Plan is anchored in the Government’s long term plan; The National Development Plan: Our Future Make it work and the Medium-Term Strategic Framework 2014-2019 (MTSF).
Over the current term, the Department has identified the following key focus areas for the sector (these focus areas also form the basis for the 2014-2019 MTSF for the sector):
· Improved quality of teaching and learning through the development, supply and effective utilisation of teachers;
· Improved quality of teaching and learning through the provision of adequate, quality infrastructure and Learning and Teaching Support Materials (LTSM);
· Improving assessment for learning to ensure quality and efficiency in academic achievement;
· Expanded access to Early Childhood Development and improvement of the quality of Grade R, with support for pre-Grade R provision;
· Strengthening accountability and improving management at the school, community and district levels; and
· Partnerships for education reform and improved quality.

6
1. Updated situational analysisThe National Development Plan stresses that South Africa has set itself the goals of eradicating poverty, reducing inequality, growing the economy by an average of 5.4 percent, and cutting the unemployment rate to 6 percent by 2030. Education, training and innovation are critical to the attainment of these goals. Therefore improved learner performance, especially in subjects such as Mathematics, Science and Technology (MST), is critical in the Basic Education Sector. The introduction of the MST Conditional Grant was a response towards promoting the teaching and learning of these subjects. Over the MTEF period, the Grant will focus on strengthening the implementation of the NDP and the Action Plan to 2019 by increasing the number of learners taking Mathematics, Science and Technology subjects and improving the pass rates.
This has to be undertaken within the economic climate that is not growing as it should. An educated and highly skilled citizenry is perhaps one of the single urgently needed resources to ensure that the economy of the country is on the positive trajectory and quality basic education is at the centre of this vision.
1.1. Performance delivery environmentGovernment and the DBE clearly acknowledge the need to achieve better schooling outcomes. The Medium-Term Strategic Framework (MTSF) of Government, which is based on the National Development Plan, emphasises the need to improve the quality of basic education significantly. The NDP’s vision for 2030 is that South Africans should have access to education and training of the highest quality, leading to significantly improved learning outcomes. The Department of Basic Education’s sector plan pays close attention to measures of learner competencies in key learning areas such as Reading and Mathematics. The low level of South Africa’s performance in various international standardised testing programmes is a widely discussed subject. What is less widely known is that these testing programmes have pointed to substantial improvements in recent years, off a low base. However, as recently as 2011, South African Grade 9 learners tended to perform one to two years behind learners in the same Grade in Botswana, which is itself a relatively poorly performing country. What is clear is that the quality of teaching and learning in schools has on the whole been too low, and that this has impacted negatively on the numbers of youths who are truly able to cope with higher education level studies. Work, however, continues to be done to address the quality of teaching and learning through training and teacher assessment initiatives as well as through the provision of qualified teachers who are dedicated to our learners.
Access to Educational Institutions
The enrolment of children aged 7 to 15, which has been well above 95% for at least a decade, has moved closer to 100%, the enrolment ratio for 2016 being 98.9% and the highest ever recorded. Recent improvements have been partly driven by improvements in the Western Cape, which has moved from a level slightly below the national average, to a level roughly equal to the national average. The figures indicate that nationally around 57 000 children aged 7 to 14, all of whom should by law be attending school, are out of school at any point in time. Better strategies to deal with this problem are needed, including the better use of the DBE’s Learner Unit Record Information Tracking System (LURITS) to identify when learners drop out of school.
Percentage of 16 to 18-year-old learners attending educational institutions (2002 to 2016)
Educational attendance amongst 16 to 18-year-olds from 2002 to 2016 remains fairly stable with the 2002 figure at 82.6% and the 2016 figure at 85.1% respectively.
Overall Performance of the Basic Education Sector
The Department of Basic Education, being responsible for a concurrent function, has made strides in monitoring specific areas of performance. The figures below reflect an overview of that performance as expressed in the 2016 General Household Survey (GHS).

7
Figure 1: 0-4 year old attending ECD facilities, 2002-2016
Source: Statistics South Africa, General Household Survey (GHS), DBE own calculations.
Figure 1 shows the proportion of 0 to 4-year-olds attending Early Childhood Development (ECD) facilities since 2009. There has been an increase in the rate of attendance at educational institutions amongst this age group. In 2009 about 30.4% of children were attending ECD facilities; by 2016 this proportion was over 40.4%. Given that this is for children younger than five (5) it is unlikely that the expansion of the Grade R programme can fully account for this increase. It must therefore also reflect a growing demand amongst families for educational opportunities for young children. This remains a positive sign not only about what the Government is doing to provide ECD educational opportunities but also about the value society places on such opportunities. The offering of publicly-funded Grade R has moreover allowed households to devote more money to pre-Grade R services.
Figure 2: Provincial Grade R enrolment ratios
0
10
20
30
40
50
60
70
80
90
100
EC FS GP KN LP MP NC NW WC SA
Estim
ated
% o
f one
age
coh
ort e
nrol
led
All Grade R (2014-2015) Just school Grade R (2015)
Source: General Household Survey dataset 2014 and enrolment publications of DBE.Note: The ‘All Grade R (2014-2015)’ columns reflect the average across the two final columns. The ‘Just school Grade R (2015)’ columns reflect 2015 Grade R enrolment over Grade 2 enrolment, in both public and independent schools. Grade 2 was considered a better denominator as Grade 1 is characterised by exceptionally high levels of Grade repetition.
Figure 2 shows that by 2015, nationally an estimated 95% of children were receiving Grade R before proceeding to Grade 1. This indicator ranged from around 99% in the case of the Eastern Cape to 85% in Gauteng. Gauteng is a special case, despite relatively low levels of school-based Grade R, and despite fewer households reporting that children are in ‘Grade R’, Gauteng clearly displays exceptionally high levels of enrolment for children all the way down to age zero. The low Grade R values for Gauteng partly reflect a different understanding of the term ‘Grade R’ in this Province.

8
Figure 3: Grade 9 and 12 attainment amongst youths
Source: General Household Survey datasets. Note: Grade 9 completion is shown for 19 to 21-year-olds and Grade 12 completion is shown for 23 to 25-year-olds.
Figure 3 shows that overall there has been a steady increase in individuals who completed Grade 9 and 12 across the years amongst the youth.
Access to workbooks and textbooks
Table 1: Percentage of Grades 1 - 9 learners by status of access to Language and Mathematics workbooks, 2016
ProvinceMathematics workbooks Language workbooks
Yes No Do not know Total Yes No Do not know Total
EC 96.8 2.5 0.7 100.0 96.7 2.6 0.7 100.0
FS 98.3 1.7 0.0 100.0 97.5 2.5 0.0 100.0
GP 94.3 5.5 0.2 100.0 94.6 5.3 0.1 100.0
KZN 94.5 5.0 0.5 100.0 96.2 3.4 0.4 100.0
LP 97.6 2.4 0.0 100.0 97.9 2.1 0.0 100.0
MP 96.0 3.9 0.1 100.0 96.7 3.2 0.1 100.0
NW 96.4 3.4 0.2 100.0 97.4 2.6 0.0 100.0
NC 95.7 3.1 1.2 100.0 96.5 3.2 0.3 100.0
WC 98.0 2.0 0.1 100.0 98.1 1.8 0.1 100.0
National 96.0 3.7 0.3 100.0 96.6 3.2 0.3 100.0
Source: Statistics South Africa, General Household Survey (GHS), DBE own calculations
Table 1 shows access to workbooks and textbooks according to those responding to the General Household Survey. The table indicates that there is a high percentage of coverage when it comes to Mathematics and Language workbooks. Workbooks are produced by the Department of Basic Education to augment the supply of LTSM which is generally a provincial function. Workbooks have been welcomed as a valuable teaching and learning resource that assists in dealing with the pace and depth of lessons in the classroom.

9
Figure 4: Access to Textbooks in Grades 10 – 12 by Province, 2016
Source: Statistics South Africa, General Household Survey (GHS), DBE own calculations
Figure 5: Access to Textbooks in Grades 10 - 12, 2016
Source: Statistics South Africa, General Household Survey (GHS), DBE own calculations
Figure 4 and 5 shows access to textbooks for Grade 10-12 according to those responding to the General Household Survey. The tables indicate that there is a high percentage of access when it comes to textbooks for Grade 10-12 learners.
Efficiency
Grade repetition figures reflected in figure 7 below remain high especially amongst boys, and can be seen as a reflection of the inability of many schools to get teaching and learning right and the burden of home background disadvantage. Figure 6 and 7

10
show Grade repetition according to the General household Survey. It is clear that Grade repetition is higher in secondary school than in primary school, and is especially high in Grades 10 and 11. The issue of standardised assessments contributes to the high repetition in Grade 10 and 11.
Figure 6: Percentage of Grade 1-12 repeaters from 2009-2016
Source: Statistics South Africa, General Household Survey (GHS), DBE own calculations
Figure 7: Percentage of Grade 1-12 repeaters by gender, 2016
Source: Statistics South Africa, General Household Survey (GHS), DBE own calculations
LURITS is beginning to provide more accurate Grade repetition figures, after years of uncertainty around this problem. The figures from LURITS confirm that at the Grades R and 1 levels, there is under-reporting of Grade repetition in the General Household Survey (GHS). However, for all other Grades, the two data sources, GHS and LURITS, display a remarkable similarity, as Figure 8 shows. It is now clear that particularly high levels of repetition are found in Grade 10 and Grade 1, where in 2015 23% of learners repeated Grade 10, and 15% of learners repeated Grade 1. Overall, 12% of learners repeated their Grade in 2015. The trend has been for those provinces with the highest levels of repetition, in particular Limpopo, to reduce the high rate of repetition. For instance, Grade 11 repetition in this province was reduced from 27% in 2013 to 15% in 2015, partly in response to national policy limiting the number of times a learner could repeat Grades 10 to 12. Even at the primary level certain provinces, such as Mpumalanga and the Free State, have substantially reduced repetition.

11
The overall level of repetition (12%) does not appear to be changing substantially. A part of the sector’s strategy on improving the teaching of reading in the initial Grades must be a focus on reducing class sizes in schools where these are clearly excessive. As pointed out in the Action Plan to 2019, a high percentage of learners are in classes exceeding a critical threshold of 45 learners. In the Foundation Phase, around 30% of learners are in classes exceeding this threshold. It is the aim of the Government to pay special attention to reducing this phenomenon, in part by reducing very high levels of Grade repetition, in order to create classroom environments which are more conducive to quality teaching. The level of repetition in Grade 1 remains exceptionally high, despite the progressive introduction of schools-based Grade R. In some provinces, the percentage of Grade 1 learners who are repeating this Grade is as high as 20%. This is true in the case of Eastern Cape, Northern Cape and Mpumalanga.
Figure 8: Percentage of learners repeating
Note: All ordinary schools, public and independent, are considered here. The statistic reflected here is the percentage of enrolled learners who did the same Grade in the previous year. This should not be confused with the repeater rate, which describes the percentage of learners in a Grade who will end up repeating in the next year. The Grade repetition statistics obtained from LURITS are based on a sub-set of the data which excludes schools which were considered to have insufficient data, in particular poor levels of linkages of learners across years. This exclusion is unlikely to affect aggregate statistics to a large degree (especially considering the high level of correspondence with the household data), yet figures need to be interpreted cautiously. Blips in the trend, for instance the increase in Grade 8 repetition in 2015 seen in the above graph, might be the result of the fact that certain schools were excluded.
Barriers to effective learning and pro-poor support interventions
There are still many South African children who walk significant distances to school. Table 2 shows a slight decrease in the proportion of 7 to 15-year-old children who walk to school for more than 30 minutes. The 2017 figure nationally is 11.72%, a decrease from 12.2% in 2016 but it is as high as 21% for KwaZulu-Natal which has also showed a decrease from the previous figure of 23% in 2015. The figures are in fact slightly higher for 16 to 18-year-old learners. The scholar transport programme is one initiative aimed at reducing this burden on many children in poor and rural areas. A formal evaluation of the scholar transport programme is planned to be undertaken in the course of 2018.

12
Table 2: Percentage of 7 to 15-year-old children walking to school for more than 30 minutes by province, 2009-2016
Province 2009 2010 2011 2012 2013 2014 2015 2016
EC 14.8 16.3 13.0 13.1 17.3 13.4 13.9 11.3
FS 10.9 10.9 9.8 7.8 9.7 7.3 9.0 8.4
GP 12.2 6.0 5.4 5.4 6.9 3.8 4.5 5.4
KZN 28.0 26.5 24.6 23.7 24.0 23.5 23.4 21.3
LP 11.4 14.8 12.3 12.2 9.6 10.2 10.6 10.4
MP 12.6 12.5 7.8 9.5 7.6 7.9 6.0 8.7
NW 10.9 11.6 14.6 15.5 12.0 10.1 11.4 10.8
NC 5.8 3.9 5.4 9.1 9.8 9.3 9.4 7.0
WC 3.2 2.6 3.1 1.8 3.0 1.3 1.0 3.8
National 15.4 14.8 13.1 13.1 13.5 12.0 12.2 11.7
Source: Statistics South Africa, General Household Survey (GHS), DBE own calculations
One of the encouraging trends observed in the General Household Survey over recent years is a decrease in the reported constraints to attending school. The next table shows that by 2016 approximately 66% of children were at schools that did not charge any fees. This estimate is probably an underestimate of the official number of non-fee charging schools in South Africa, as some parents may have interpreted a collection made by the school of perhaps R100 or R200 as fees, when in fact the schools are officially non-fee charging schools. The slight increase in the proportions of children paying high levels of school fees since 2009 is probably partly a reflection of inflation and partly a reflection of the growing demand for high quality education amongst the middle-class population.
Table 3: Percentage of learners who paid school fees, 2009-2016
Tuition 2009 2010 2011 2012 2013 2014 2015 2016
None 47.0 57.7 59.6 62.6 62.8 66.0 65.2 66.1
R1 - R100 16.2 10.2 8.0 6.6 5.9 4.7 5.4 4.8
R101 - R200 10.9 7.2 7.0 4.9 5.8 4.3 4.1 3.9
R201 - R300 5.0 3.9 3.5 3.1 2.9 2.6 2.5 2.6
R301 - R500 3.8 3.4 3.6 3.3 3.0 2.5 2.7 2.5
R501 - R1 000 4.1 4.0 4.0 4.0 3.5 3.2 3.5 3.1
R1 001 - R2 000 2.8 2.8 2.6 2.6 3.2 3.4 3.0 3.4
R2 001 - R3 000 1.7 1.5 1.6 1.5 1.6 1.3 1.3 1.4
R3 001 - R4 000 1.9 2.0 1.8 1.6 1.7 1.6 1.5 1.3
R4 001 - R8 000 3.7 3.7 4.1 4.5 3.7 3.8 3.7 3.6
R8 001 - R12 000 1.3 1.5 1.8 2.2 2.5 2.6 2.7 2.8
R12 001 - R16 000 0.6 0.6 0.9 1.0 1.2 1.5 1.6 1.8
R16 001 - R20 000 0.3 0.6 0.4 0.8 0.8 1.1 0.9 1.1
More than R20 000 0.8 0.9 1.0 1.5 1.4 1.6 1.8 1.8
Total 100.0 100.0 100.0 100.0 100.0 100.0 100.0 100.0
Source: Statistics South Africa, General Household Survey (GHS), DBE own calculations

13
Table 4 indicates the continued expansion of the National School Nutrition Programme (NSNP). This household survey data indicates that over 80% of South African children are now benefiting from the school feeding programme. The programme also clearly targets higher proportions of children in poorer provinces. A recent evaluation of the National School Nutrition Programme indicates that the programme is now well targeted to cover almost all those for whom the need exists. In order to further improve the benefits from this programme, it is now necessary to focus on the administration of meals at schools, in particular in ensuring that meals are served on time by 10:00 at the latest.
Table 4: Percentage of learners benefiting from the school feeding scheme by province, 2010-2016
Province 2010 2011 2012 2013 2014 2015 2016
EC 75.3 82.9 85.3 86.7 88.3 88.9 90.1
FS 65.8 75.3 77.0 78.7 78.0 80.3 82.1
GP 53.8 55.3 55.3 59.8 63.4 63.1 65.4
KZN 67.5 76.0 79.2 80.5 79.4 81.0 83.4
LP 84.7 94.4 94.7 93.5 94.3 93.9 92.2
MP 75.5 84.2 85.9 85.7 88.8 87.1 89.1
NW 69.6 80.7 83.4 82.8 85.3 85.1 83.4
NC 89.3 89.7 88.0 84.7 84.0 89.3 89.9
WC 66.7 64.0 63.4 66.0 65.0 67.2 67.8
National 69.9 76.2 77.4 78.7 79.7 80.2 81.4
Source: Statistics South Africa, General Household Survey (GHS), DBE own calculations
Quality
The results of recent international studies, such as the Trends in International Mathematics and Science Study (TIMSS) 2015 and the Southern and Eastern Africa Consortium for Monitoring Educational Quality (SACMEQ IV) show that the performance of South African learners is improving. The TIMSS 2015 results confirmed noteworthy growth patterns; which when compared with other countries since 2003 at the Grade 9 level, South Africa has shown the largest improvement of 87 points in Mathematics, and 90 points in Science (see Figure 9).
This latest round of the SACMEQ IV Grade 6 results for 2017 showcases an exciting milestone for the sector. Our Grade 6 learners for the first time scored an average in Reading and Mathematics that was above the 500 centre point. The levels and quality of educational outcomes achieved by our learners represent a remarkable achievement with significant growth points observed in Reading and Mathematics. This implies we have moved beyond a critical threshold set out in the SACMEQ achievement scale. The SACMEQ IV study results point towards the following key gains:
• The highest improvement margins among participating countries in the region.
• A narrowing of the gap between urban and rural provinces (reduced provincial inequality), with eight (8) out of nine (9) provinces scoring above the 500 centre point.
• A significant reduction in the number of non-numerate and non-literate learners at the Grade 6 level, confirming that the early acquisition of the foundational skills of reading and numeracy is a critical goal that requires focused attention in our schools and sustained support from parents.

14
Figure 9: Change in achievement between 2003 and 2015 (TIMSS)
The National Curriculum Statement Examinations 2017
The total number of candidates who wrote the NSC Examinations in 2017 is 534 484, and the number of learners passing matric from the class of 2017 is 401 435 (75.1 %). This represents an improvement of 2.6 % from the 72.6% achieved in the 2016 NSC Examinations. The class of 2017 recorded the third highest enrolment of Grade 12 learners in the history of the South African basic education system. The total number of candidates who registered for the November 2017 NSC examinations was at 802 431; 173 276 part-time and 629 155 full-time candidates.
Table 5: 2017 NSC Examination Overall performance
Province2017
Total Wrote Total Achieved % Achieved
Eastern Cape 67 648 43 981 65.0
Free State 25 130 21 631 86.1
Gauteng 97 284 82 826 85.1
KwaZulu-Natal 124 317 90 589 72.9
Limpopo 83 228 54 625 65.6
Mpumalanga 48 483 36 273 74.8
North West 30 792 24 462 79.4
Northern Cape 8 735 6 608 75.6
Western Cape 48 867 40 440 82.8
National 534 484 401 435 75.1

15
Figure 10: Comparison of NSC performance 2008 - 2017
The NSC Examination performance has demonstrated a steady improvement since the downward trajectory of 2015 which reaffirms that the interventions put in place by the Department are beginning to yield results. Improved education policy, school management plans and commitments by principals, teachers and parents are proving to be effective in achieving improved teaching and learning outcomes.
Figure 11: Bachelor pass trends of NSC performance 2010-2017
One of the goals highlighted in the National Development Plan is to improve the number of Grade 12 learners who become eligible for a Bachelor’s Programme at a higher education institution. The class of 2017 has shown an improvement in the percentage of bachelor passes as it is the second highest over the past seven years (indicated in Figure 11).
MAJOR STRENGTHS OF THE EDUCATION SYSTEM
Accessibility to education has improved significantly over the years ensuring that South Africans are exposed to education in all levels to ensure that socio-economic challenges in the country are addressed.
The Inclusive Education system plays a major role in ensuring that there is access to quality basic education for leaners with special needs. This inclusive education system contributes immensely towards the achievement of an inclusive economy and inclusive society.

16
Through the Department and its partners, the Early Childhood Development programme has ensured that early child development is expanded to all socio-economic levels of society. This programme ensures that school readiness is a priority among South Africans and equal basic education is achieved by the Government.
Evaluation and research has been a serious deficiency in the country and the education sector, but over the years with the introduction of Monitoring, Research and Evaluation in the Sector, performance has also improved. There is substantial research conducted within the sector which assists in identifying gaps and also creates a platform to monitor the sector through evidence-based evaluations.
WEAKNESSES OF THE SYSTEM
The Department in monitoring the implementation of the Medium-Term Strategic Framework (MTSF) has identified misalignments between the MTSF and the Department’s Annual Performance Plan in reaching the goals set out in the National Development Plan (NDP). In seeking to align the plans of the Department and those of the provinces with the MTSF, a gap analysis was conducted to identify areas that require strengthening and to ensure that there are plans in place to drive the achievements of the whole sector. This will require strengthened Programme Performance Indicators driven towards the achievement of the five-year medium-term plan of government.
The findings of the PIRLS 2016 report have shown that South Africa is not a reading nation when compared to other countries participating in this study, although there have been improvements since 2006. Poor reading skills and the inability to answer comprehension questions by learners especially in the Foundation Phase were part of the key challenges that were discussed at the 2018 Basic Education Sector Lekgotla. Amongst the Department’s efforts in addressing this challenge is the Early Grade Reading Study which has been specifically prioritised in order to respond to the concerns raised in the report. This groundbreaking results-based study aims to identify effective ways of teaching reading in African languages. The effects of the project are encouraging as it focuses on foundation phase Quintile 1-3 learners in African language. The education system continues to work towards increasing instruction, teacher development and learning outcomes.
Another major challenge of the sector over the years has been the provision and maintenance of school infrastructure. The main challenge has been achieving the set targets within the planned and prescribe period as a result of poor management of projects by the Implementing Agents. Some of the Implementing agents have been placed on terms with some receiving notices of termination. Evaluation of the tenders have commenced and the Department is working diligently in order to finalise the procurement process of new Implementing Agents who will be closely monitored.
Furthermore, profiling of teacher development needs in key school subjects is a challenge the education system faces, however, processes for the development of computer based assessments of teachers are underway. The training of teachers in key subjects and the appointment of young and qualified educators in schools is an on-going effort by the Department.
In terms of the need to strengthen the human capacity of the State, the Department will continue in its efforts to capacitate its employees to be more efficient and effective in their current work, through the Workplace Skills Plan and the skills and personnel development plans of its officials.
The use of ICT in teaching and learning through our Operation Phakisa interventions, aimed at developing and modernising the skills of our teachers and learners to match the needs of the changing world still remains a challenge with very few schools being supplied with the ICT resources. The Department’s efforts on monitoring and oversight on ICT implementation are starting to bear fruit.
OPPORTUNITIES FOR THE SYSTEM
In terms of how systems of instruction and learning can be reformed to secure the gains we seek for our learners through ICT, the Department can learn best practice methods from other countries on the continent, in the region, as well as globally.
In responding to the current youth unemployment challenge which the country faces, the Department through its Rural Education Assistant Project will be giving an opportunity to unemployed matriculants who will assist with a variety of in-class and co-curricular support. This type of support will serve to empower youth with skills and improve their chances of finding

17
work. About 40% of these matriculants will be targeted for teacher training qualifications.
The Department in its mandate to provide quality basic education has always been afforded opportunities for partnerships through corporate and international partnerships. The implementation of the ICT based programmes in schools has brought significant partnerships to the Sector. International partnerships on improving Early Childhood Development (ECD) programmes through the Read to Lead campaign, has seen the Department partnering with the private sector, Non-Governmental Organisations (NGOs) and individuals to sensitise children on the importance of reading.
THREATS TO THE EDUCATION SYSTEM
Community protests often pose a serious threat to the infrastructure of communities in South Africa since infrastructure is mostly a target of service delivery protests. Educational infrastructure is usually the target of such protest which threatens improvements in the quality of education in the country as a whole. The Department, through the Quality Learning and Teaching Campaign (QLTC), has provided much needed relief and solutions to this crisis that the system faces.
Violence that has been taking place recently in schools around the country has raised serious safety concerns in schools, especially for parents and other important education stakeholders. Various forms of violence have been reported including matters such as rape of learners to learners entering school premises with guns. The Department has put all necessary safety measures in place as well as collaborating with the South African Police Service (SAPS), and has established School Safety Committees to address such threats to the system and to ensure the safety of all learners, educators and any stakeholders in the school environment. A National School Safety Framework (NSSF) has also been developed as a management tool for Provincial and District officials.
1.2. Organisational environmentThe Department of Basic Education (DBE) has made significant progress in the process of reconfiguring the organisational structure to meet the needs of the sector, especially to take full responsibility for monitoring and overseeing the implementation of programmes by Provincial Education Departments (PEDs). An annual performance assessment of staff, rewarding excellent performance and ensuring that officials who did not perform well are given the necessary developmental support, has been done.
Capacity building of employees is continuously done through the Workplace Skills Plan and the personal development plans of officials in the DBE. Training interventions for employees are informed by the Department’s performance management outcomes, as well as the demands of the Action Plan to 2019. Furthermore, in response to natural attrition at middle and senior management levels, the Department has put in place a development plan to address the issues related to career-pathing and succession planning. To this end, the DBE sends over 250 officials a year to attend courses for professional and personal development.
In terms of human resources, the Department has the capacity to implement and deliver on this plan. The final results of the Management Performance Assessment Tool (MPAT) 2016/17 cycle were received from the Department of Planning, Monitoring and Evaluation (DPME) and the Department has improved by scoring an aggregate of 80% of scores above level 2. The DPME measures all scores above Level 2 as being satisfactory as this means that the Department is compliant with the basic legal/regulatory requirements.
Improvement plans based on 2016/17 MPAT performance have been developed to ensure that weaknesses and inefficiencies relating to management and administration are attended to.
In 2018, the Department will focus on developing standards in identified weak areas in the sector. This is done to strengthen the DBE’s role of oversight and monitoring PEDs. The Department intends to develop these standards as a way of setting acceptable levels of operation and implementation across all PEDs. The expected levels of performance of PEDs will be based on compliance with the set standards. Over the past few years the sector plan on LTSM has defined the standards required to enable the sector to procure and deliver LTSM on time.

18
2. Revision of Legislative and other mandatesThere are no revisions.
2.1. RegulationsConstitutional mandate Brief Description
The Constitution of South Africa, 1996 (Act 108 of 1996)
The Constitution requires education to be transformed and democratised in accordance with the values of human dignity, equality, human rights and freedom, non-racism and non-sexism. It guarantees basic education for all, with the provision that everyone has the right to basic education, including adult basic education.
The National Education Policy Act, 1996 (Act 27 of 1996) (NEPA)
The NEPA inscribed into law the policies, the legislative and monitoring responsibilities of the Minister of Education, as well as the formal relations between national and provincial authorities. It laid the foundation for the establishment of the Council of Education Ministers, as well as the Heads of Education Departments Committee (HEDCOM), as inter-Governmental forums that would collaborate in the development of a new education system. NEPA therefore provided for the formulation of national policy in both the general and further education and training bands, policies for, inter alia, curriculum, assessment, language, and quality assurance. NEPA embodies the principle of cooperative governance, elaborated upon in Schedule 3 of the Constitution.
South African Schools Act, 1996 (Act 84 of 1996), as amended (SASA)
SASA provides for a uniform system for the organisation, governance and funding of schools. It ensures that all learners have the right of access to quality education without discrimination, and makes schooling compulsory for children aged 7 to 14 years.
Public Finance Management Act, 1999 (Act 1 of 1999) (PFMA)
The PFMA regulates financial management in the national and provincial Governments and ensures that Government resources are managed efficiently and effectively.
The Division of Revenue Act, 2013 (Act 2 of 2013)(DORA)
The DoRA provides for equitable division of revenue raised nationally and provincially.
Employment of Educators Act, 1998 (Act 76 of 1998)
The Employment of Educators Act provides for the employment of educators by the state and for regulation of the conditions of service, discipline, retirement and discharge of educators. This act and the resultant professional council, the South African Council of Educators (SACE), regulate the teaching corps.
Public Service Act, 1994 (Act 103 of 1994), as amended
This act provides for the organisation and administration of the public service as well as the regulation of the conditions of employment, terms of office, discipline, retirement and discharge of members of the public service.
South African Qualifications Authority Act, 1995 (Act 58 of 1995)
The South African Qualifications Authority Act provides for the establishment of the National Qualifications Framework (NQF), which forms the scaffolding for a national learning system that integrates education and training at all levels. The launch of the Human Resources Development Strategy by the Minister of Labour and the Minister of Education on 23 April 2001 reinforced the resolve to establish an integrated education, training and development strategy that would harness the potential of our adult learners. The design of the NQF was refined with the publication of the Higher Education Qualifications Framework in Government Gazette No. 928, 5 October 2007, to provide ten levels of the NQF. The school and college level qualifications occupy levels 1 to 4 as in the original formulation, with plans to accommodate some of the college level qualifications at level 5. Higher education qualifications in the new formulation of the NQF occupy six levels, levels 5 to 10. Levels 5 to 7 are under-graduate and levels 8 to 10 are postgraduate.

19
2.2. Pending Court cases1. EQUAL EDUCATION AND OTHERS V MINISTER OF BASIC EDUCATION AND OTHERS
The Applicants brought an application to challenge certain provisions of the Regulations on the Norms and Standards for Public School Infrastructure. The matter has not yet been set down for hearing.
2. SOLIDARITEIT HELPENDE HAND NPC V MINISTER OF BASIC EDUCATION AND ANOTHER
The Applicant applied for a declaratory order that certain criteria for the awarding of a Funza Lushaka bursary for the Foundation Phase be declared to be inconsistent with the Constitution. The Applicant specifically challenged the criteria which require candidates to specialise in an indigenous African language and which give preference to candidates from rural areas. The Applicant’s contention is that this criteria/indirectly unfairly discriminates against white learners and should be declared to be inconsistent with the Constitution. The Department’s contention is that the criteria does not unfairly discriminate against white learners. Nowhere in the criteria is race mentioned. Furthermore, the criteria addresses a specific dire need which is to provide teachers in the Foundation Phase who can teach in an indigenous language in the foundation and in rural areas. The matter was argued in court on 22 June 2017. Judgment was reserved.
3. CENTRE FOR CHILD LAW V MINISTER OF BASIC EDUCATION
The Applicants applied for amongst others the following orders:
(i) That a circular issued by the Eastern Cape Education Department be set aside. The circular indicated that Norms and Standards, post provisioning allocation and the National School Nutrition Programme (NSNP) transfers to schools in the Eastern Cape will be based only on learner numbers where valid identity, permit or passport numbers have been captured in the SASAMS system;
(ii) Directing that no learner may be excluded from a public school on the basis that he or she does not have an identity number, permit or passport.
(iii) Directing the Respondents and all public schools to admit a learner who does not have a South African identity number, passport or permit number provided that such learner provides valid proof of identity and where such proof is not obtainable, a sworn statement or an affidavit in a format prescribed by the Respondents that may be acceptable.
The Respondents filed their answering affidavit on 25 August 2017.The matter has not yet been set down for hearing.

20
3. O
verv
iew
of 2
018/
2019
bud
get a
nd M
TEF
estim
ates
3.1.
Exp
endi
ture
est
imat
es
Prog
ram
me
Audi
ted
Outc
omes
R’00
0Ad
just
ed
appr
opria
tion
R’00
0Me
dium
-term
expe
nditu
re es
timat
e R’00
0
2014
/1520
15/16
2016
/1720
17/18
2018
/1920
19/20
2020
/21
1Ad
minis
tratio
n 38
0 799
38
6 475
41
8 301
42
6 583
45
0 476
48
3 746
51
4 132
2Cu
rricu
lum P
olicy
, Sup
port
and
Monit
oring
1 68
5 219
1
797 7
40
1 82
6 691
1
783 0
16
1 90
5 011
2
010 0
53
2 13
7 917
3Te
ache
rs, E
duca
tion H
uman
Re
sour
ces a
nd In
stitut
ional
Deve
lopme
nt 1
314 4
62
1 16
3 548
1
177 3
97
1 25
2 104
1
290 4
80
1 36
6 210
1
442 8
60
4Pl
annin
g, Inf
orma
tion a
nd
Asse
ssme
nt 10
428 8
75
11 51
1 906
11
719 9
53
12 80
1 940
11
971 3
42
12 24
6 594
13
071 8
01
5.Ed
ucati
onal
Enric
hmen
t Ser
vices
5 71
9 548
5
936 4
56
6 33
3 722
6
729 9
77
7 10
5 128
7
508 7
16
8 03
7 133
TOTA
L 19
528 9
03
20 79
6 125
21
476 0
64
22 99
3 620
22
722 4
37
23 61
5 319
25
203 8
43

21
3.2. Relating expenditure trends to strategic outcome-oriented goals
The Department of Basic Education is responsible for Outcome 1 (quality basic education) of Government’s 2014-2019 Medium-Term Strategic Framework. Over the MTEF period, the Department will focus on: improving school infrastructure; improving curriculum delivery; increasing the number of learners completing Grade 12; providing educational opportunities to learners with severe to profound intellectual disabilities; ensuring the adequate supply of quality teachers; assessing the quality of teaching and learning; and continuing the National School Nutrition Programme.
It should be noted that the bulk of the Department’s allocation is made out of Conditional Grants, Transfers and Earmarked Funds. Although the Department did consider reprioritising from the operational budget, it was not feasible to reprioritise within the operational budget. The area where the Department was able to reprioritise from in the 2017 MTEF was the Kha Ri Gude Campaign. The campaign is drawing to a close.
Improving school infrastructure
In ensuring that all schools have access to water, sanitation, electricity and safe structures as per the Minimum Norms and Standards for Public Schools, infrastructure is a priority over the medium-term. The Department is revising the target date for this objective as the previous date of November 2016, was not met. Spending on infrastructure takes up most of the Department’s budget over the medium-term. Most of the funds for infrastructure are provided through Grants to Provincial Departments of Education, which are responsible for the delivery of infrastructure.
The Education Infrastructure Grant allocation is reduced to R31.7 billion over the MTEF period, or 44.7%. These funds are to be used to build new schools, upgrade and maintain existing infrastructure, and provide school furniture. Over the MTEF period R8.8 billion has been shifted from the Education Infrastructure Grant, of which R7.3 billion is shifted back to the School Infrastructure Backlogs Indirect Grant for the completion of the current ASIDI projects, and R1.5 billion has been reprioritised from the remaining unallocated portion of the Education Infrastructure Grant for the maintenance of school infrastructure to ensure that all schools are repaired and functioning as intended to meet basic infrastructure Norms and Standards. The allocation is ensuring that all infrastructure projects are planned and funded in line with cost-control measures introduced over the construction of new schools and additional buildings at existing schools. The Department for the 2018/19 Financial Year expects to have replaced 50 inappropriate and unsafe schools with newly built schools and provide water to 325 schools and sanitation to 286 schools.
Improving curriculum delivery
Ensuring access to high quality learning and teaching support materials is key to improving curriculum delivery. The Department’s efforts to improve curriculum delivery over the medium-term will therefore focus on providing well-designed printed and digital content to teachers and learners, expanding access to and improving the use of ICT at schools, and providing teachers with the support and tools they need to be effective.
The Department plans to print and distribute about 183 million workbooks which will be delivered to more than 22 700 public schools, at a projected cost of R3.5 billion over the MTEF period, through the Curriculum and Quality Enhancement Programme. This will include the development of 344 titles of Home Language (Grades 1-6) in 11 languages; English First Additional Language (Grade 1-6); Mathematics (Grades 1-3) in 11 languages; Mathematics (Grades 4-9) in English and Afrikaans; Life Skills (Grades 1-3) in 11 languages and Grade R in 11 languages. As part of the ongoing process of quality assurance, these workbooks are edited on a yearly basis and based on inputs from schools. The DBE will also continue to develop workbooks for other content subjects such as Incremental Introduction of African Languages (IIAL), Afrikaans First Additional Language (FAL), Natural Science and Technology. The workbooks contain activities that ensure learners work to the required standard, and assist teachers in planning their work so that the curriculum can be completed on time.

22
To improve access to and the use of ICT in basic education, the DBE provided training to the following: Provincial officials, Subject advisors, Teacher Centre Managers and e-Learning Specialists on ICT integration. This will be further complemented by ICT professional development for principals and teachers on how to integrate a Learning Management System into education. A total of R11 million has been allocated to the procurement and provision of the following: offline e-Library solutions to 100 schools which will also serve as content access sites for Second Chance Centres, distribution of TV Broadcast Reception equipment to 200 schools in Limpopo, the Eastern Cape and KwaZulu-Natal Provinces, provision of e-Libraries to 500 schools and the upgrading of the Thutong Education Portal.
Furthermore, in order to expand broadband and connectivity towards special needs schools, the DBE, in collaboration with the Department of Telecommunications and Postal Services (DTPS) and Independent Communications Authority of South Africa (ICASA), will provide all special needs schools with ICT infrastructure and connectivity as part of the Universal Service and Access Obligations (USAO) initiative.
The Department has developed a national reading diagnostics assessment tool to assist teachers in measuring the reading progress of learners at different intervals in Grades 1 to 3. The tool will help track and monitor learners’ reading ability, and seeks to improve learners’ reading proficiency levels in the Foundation Phase in underperforming rural and township schools throughout the country. The roll-out of the Early Grade Reading Assessment (EGRA) over the MTEF period will include the provisioning of the EGRA Toolkits (Teacher Guide and Learner Assessment Charts), Teacher training and support material as well as monitoring and evaluation of a sample of schools nationally. In 2017, Phase 2 of the EGRA was rolled out to 1 670 schools and 180 000 learners benefitted. 11 500 teachers were capacitated to implement the EGRA in Language of Learning and Teaching (LoLT) and English First Additional Language (EFAL) in Grades 1 to 3, monitoring and evaluation was done in 50 schools. In the 2018/19 Financial Year the roll-out will be expanded to 5 000 schools and will benefit 600 000 learners over the MTEF period in Grades 1 to 3 in all 11 official languages offered as the LoLT and EFAL nationally.
As at 31 March 2017, the MST Conditional Grant has contributed to the following achievements: 713 schools supplied with Mathematics and Science kits; 713 laboratories supplied with apparatus for Mathematics and Science subjects in accordance with the minimum specifications; and 226 workshops supplied with machinery, tools and equipment for Technology subjects in accordance with the minimum specifications.
The Department will also provide support and resources such as laboratories and workshop equipment, apparatus and consumables, computer hardware, software, and learner and teacher support materials to 1 000 schools to improve skills in Mathematics, Science and Technology. This is projected to cost R1.2 billion over the medium-term, and is funded through the Maths, Science and Technology Grant in the Curriculum Policy, Support and Monitoring programme. 10 % (R38 648 300) of the 2018/19 budget allocation has been allocated to ICT resources including ICT integration training for educators.
Increasing the number of learners completing Grade 12 (matric)
In order to increase the number of young people obtaining a matric, and increase learner retention, the Department has been allocated R261 million over the MTEF period through the Curriculum Policy, Support and Monitoring programme. The Department plans to use these funds to have the programme enrol, by 2020/21, between 10 000 and 35 000 learners who qualify to write the relevant examinations. In the 2018/19 Financial Year the programme plans to offer support for the 11 gateway subjects as well as the 11 Home Languages. Face-to-face classes will be extended to 80 venues throughout the country with two (2) (teachers per subject, per venue. Support is also provided at 40 Broadcasting centres nationally which will broadcast lessons on the HD Open view Channel to approximately one (1) million households. All content will be available to candidates on DVDs. Online support will be provided on the DBE website (dedicated webpage) as well as the DBE cloud and the Facebook page. The DBE cloud is funded by the Operation Phakisa initiative at an estimated cost of R3 million and the Facebook page is currently managed by one (1) DBE Contract staff member (Level 5) and through the radio programme initiative at an estimated cost of R7 million.

23
Offline support will be provided via Content Access Points (CAPs) at 82 sites nationally. In addition all content will be available to candidates on DVDs. Online and offline support will be accessed at the National Libraries, Vodacom Centres and Teacher Centres etc. LTSM will be printed and distributed to sites and to learners on demand.
Supporting learners with intellectual disabilities
The focus of Learners with Severe to Profound Intellectual Disabilities (LSPID) Grant is to provide access to quality, publicly funded education and support to children/learners of school going age, with Severe to Profound Intellectual Disability (SPID) who are currently not enrolled in schools and whose education is not publicly funded. In 2017/2018, the focus of the Grant was to establish structures and systems, procure tools and equipment, and to recruit staff that will enable access to quality education for Learners with SPID. Provincial Co-ordinators were appointed in all nine (9) provinces. The appointment of the 155 Outreach Team members, procurement of the tools of trade and the development of the database and data management system as well as the auditing of these centres, will be finalised before March 2018. The newly appointed Provincial Co-ordinators and Outreach Teams members will be trained on the nationally approved Learning Programme for Children with SPID before March 2018. They will conduct an audit of 285 care centres, assess the learners, train caregivers on the learning programme and establish a working relationship with the Department of Social Development (DSD) and the Department of Health (DoH) to improve the provision of quality education and support to LSPIDs who are not in schools. This will work towards ensuring that learners are incrementally included in schools and that their inclusion is mediated. The Provincial Co-ordinators and Outreach Teams will also strengthen the capacity of District-Based Support Teams (DBSTs). More care centres have been identified in some provinces resulting in an additional 125 Provincial Co-ordinators and Outreach Teams being appointed in the 2018/19 Financial Year.
The Grant will fund training of education officials, Provincial Co-ordinators, outreach team members, care givers in 320 care centres and teachers in 79 selected schools that have enrolled Learners with SPID and schools that will support targeted care centres. The Grant will further be used to enable 6 654 children/learners with SPID who are out of school and children who are currently enrolled in the 79 targeted schools, to utilise the Learning Programme for C/LSPID and access to therapeutic and psycho-social support services that will enable them to improve their participation in learning. Toolkits, LTSM and other equipment that will enable the learners to learn and tools of trade will be procured using the Grant allocation. The Grant is allocated at R649 million over the medium-term through the Curriculum Policy, Support and Monitoring programme.
Improving the quality and equity of education in rural schools
Among the challenges facing the Basic Education Sector is the task of improving the quality of education and learner performance in rural schools. The sector has committed to focus on improving literacy, numeracy and reading skills for rural learners as research shows that developing a child holistically by striking a balance between curriculum, LTSM and also co-curricular activities improves learner performance. The Rural Education Assistance Project is aimed at improving the quality of education and subsequently learner performance in rural schools and at the same time start to reduce the level of youth unemployment. This project will pilot and evaluate the use of education assistants in rural schools in three (3) districts in KwaZulu-Natal. Unemployed matriculants will assist with a variety of in-class and co-curricular support, particularly improving numeracy, literacy and reading skills; and co-ordinating Homework Clubs, Maths Clubs, Reading Clubs, Creative Arts Clubs and Agricultural Clubs. This type of support is within the capacity of matriculants (i.e. it will not be expecting more than what is possible considering the skill levels), but will serve to empower youth with skills and improve their chances of finding work – therefore strong links to Outcome 4. About 40% of these matriculants will be targeted for teacher training qualifications. This project will also improve the quality of education in the rural context where Multi-Grade teaching is still a feature. The findings of this project will inform the development of a Framework for Rural Education Assistants and a Strategy for Teacher Recruitment for Rural Schools for continuity and sustainability.

24
Ensuring the adequate supply of quality teachers
Over the medium-term the Department aims to improve the supply of newly qualified teachers by providing 39 500 Funza Lushaka bursaries to prospective teachers in priority subject areas such as Mathematics, Science and Technology. A total of R 3.7 billion has been allocated over the medium-term for this. The decline is as a result of an increase of 8 percent in university fees for 2018 announced by the Minister of Higher Education and Training. Furthermore if this trend continues over the medium-term, the number of students supported is expected to decline from 13 500 in 2017/18 to 12 500 in 2020/21. These bursaries are provided through the National Student Financial Aid Scheme, funded by transfers from the Department in the Education Human Resources Development sub-programme in the Teachers, Education Human Resources and Institutional Development programme.
Assessing the quality of teaching and learning
The Department aims to ensure that the Basic Education Sector assesses the quality of teaching and learning, and provides remedial action in identified areas to improve learning outcomes in numeracy and literacy. The National Assessments and Public Examinations provides standardised national assessments for Grade 3, 6 and 9 learners; the regulation and standardisation of assessment through the implementation of an integrated assessment framework for Grades 4 to 11; and administers credible public examinations in Grade 12. This provides reliable data on learner performance to support the improvement of the quality of basic education.
The Annual National Assessments (ANA), the Department’s diagnostic of teaching and learning in the Foundation and Intermediate Phases of schooling, have been discontinued and replaced by the National Integrated Assessment Framework (NIAF) which has considered historical lessons and criticisms levelled at the ANA to improve its design, efficiency and take-up by the teachers. The NIAF is made up of three (3) different, yet complementary, tiers of assessment programmes:
a. Systemic Evaluation (SE) programme that takes place on a three (3) year cycle in Grades 3, 6, and 9. The first cycle will commence in 2018 and end in 2020. Over this 3 year period, the evaluation cycle involves test development, questionnaire development, field testing of instruments and process, refinement, training, administration, analysis, verification and report writing. Cost drivers attached to these processes (e.g. work done by service providers) will be scaled according to phases and proportional payments will be made on a quarterly period. Linked to the roll out of systemic evaluations, is a commitment for the Department to participate in international assessments (TIMSS, PIRLS, SACMEQ) and system component surveys (TALIS). These international programmes have an implementation cycle of 4-5 years and within this cycle payments are made towards annual participation subscriptions and the project work done by research institutions (e.g. the Human Science Research Council).
b. The Diagnostic Assessment programme comprises supplying assessment tools, manuals, digital applications, and exemplar tests and test items to support and strengthen teachers’ classroom assessments. This exercise will be repeated annually and will involve the appointment of expert teachers, researchers and consultants to generate these materials. The Department bears the cost of packaging and distributing these materials to Provincial Education Departments. This tier also comprises the development of a Grade R readiness assessment which will be piloted in 2018 in a sample of schools and provinces and up-scaled in 2019 and 2020.
c. The Summative Assessment programme comprising the setting and processing of an end-of-year examination in selected Grades and subjects, and providing electronic applications (e.g. TARMII) to support teachers in accessing high quality test items and generating tests. This exercise will involve the development of examination papers, examination guidelines on conduct and administration, and the synchronisation of IT systems to support and process results.
The cost breakdown of the NIAF over the MTEF period will be as follows: R 81 237 999.80 in 2017/18, R 109 537 096.00 in 2018/19 and R 120 429 249.86 in 2019/20.

25
With regards to Early Grade Reading Assessment (EGRA), R30 million has been allocated for its implementation over the MTEF period. Phase 1 of the EGRA was implemented in 2015-2017 in 1 000 schools and 120 000 learners in Grades 1-3 benefitted. In 2017-18 the EGRA was rolled out in 1 670 schools and 180 000 learners individual reading proficiency levels have been measured in both LoLT and EFAL at the end of each term of each Grade. Approximately 20 000 Foundation Phase teachers have been capacitated to utilise the EGRA Toolkit nationally since 2015. The EGRA implementation has been monitored since 2015 through school visits and desk top monitoring.
The EGRA will be expanded incrementally to 5 000 schools in 2018-19 in Grades 1-3 in all 11 official languages offered as the Language of Learning and Teaching (LoLT) and English First Additional Language. In 2019-20 the EGRA will be implemented in 8 000 schools. By the end of the MTEF period the EGRA would have been rolled out to 16 000 schools.
The EGRA will be rolled out to underperforming rural and township schools in targeted districts. The roll-out will be supported with the provisioning of EGRA Toolkits (Teacher Guide and Learner Assessment Charts), teacher training workshops and monitoring and evaluation by National, provincial and district officials every quarter.
School Monitoring Survey
The School Monitoring Survey is a national survey in public ordinary schools which monitors progress towards the achievement of key goals and indicators in the Action Plan to 2019 as well as the Medium-Term Strategic Framework 2014-2019. In 2018/19, R23 million has been reprioritised from the Annual National Assessment (ANA) to School Monitoring Survey. The need to make a shift is to provide the Basic Education Sector with updated information on Action Plan to 2019 indicators and the Delivery Agreement where no other data sources are available.
The first School Monitoring Survey was commissioned in 2011 and the second survey is currently underway. This survey will focus only on key areas for sector progress, replicating the work of the SMS 2011/12, but taking the work further by measuring outcomes in the basic education sector during the MTSF 2014-2019. This includes measuring three (3) of the five (5) MTSF outcomes on improved quality of teaching and learning through development, supply and effective utilisation of teachers; improved quality of teaching and learning through provision of infrastructure and learning materials; and a credible, outcomes-focused planning and accountability system (building the capacity of the state to intervene and support quality education). This would be complimented with measuring priority areas in the sector plan.
The funding will be allocated to the Research Co-ordination, Monitoring and Evaluation programme.
National School Nutrition Programme (NSNP)
The Department’s National School Nutrition Programme will continue to contribute to the National Development Plan’s priority of eliminating poverty and supporting food security. A policy review with regard to the budget weightings is as follows: 95.3% of the budget will go towards school feeding in 19 800 schools to feed about nine (9) million learners in Quintiles 1-3 schools, 0.7% will go towards cooking facilities, equipment and utensils and 4% will go towards nutrition education and administration.
The total allocation to the Grant over the medium-term is R21.7 billion, funded through the Educational Enrichment Services programme.

26
PART B: PROGRAMME AND SUB-PROGRAMME PLANS
4. Departmental Programmes: Strategic Objectives, Programme Performance Indicators and Annual Targets for 2018/2019
Changes to the budget programme structure:
None.
NO. PROGRAMME NAME PURPOSE 1 Administration To provide strategic leadership, management and support services to the Department.
2 Curriculum Support, Policy and Implementation
Develop curriculum and assessment policy and support; monitor and evaluate curriculum implementation.
3 Teachers, Education Human Resources and Institutional Development
To promote quality teaching and institutional performance through the effective supply, development and utilisation of human resources.
4 Planning, Information and Assessment To promote education quality and effective service delivery in the basic education system through monitoring and evaluation, planning and assessment.
5 Educational Enrichment Services To develop policies and programmes to improve the quality of learning in schools.
4.1. Programme 1: AdministrationProgramme Purpose: To provide strategic leadership, management and support services to the Department.
Sub-programmes: Programme Management: Administration: Ministry; Department Management; Corporate Services; Office of the Chief Financial Officer; Internal Audit and Risk Management; and Legal and Legislative Services.
Strategic Objective:
• To improve the administrative and governance systems through compliance to the key legislation governing administration in order to support the delivery of education and to strengthen accountability.
Programme Performance Indicators and Annual Targets for 2018/2019 to 2020/2021
The Administration Programme is responsible for managing the Department through the provision of strategic leadership, management and support services. The programme contributes to ensuring quality in the basic education system through effective institutional service delivery processes, planning and provisioning.
Vacancy management, human resources development and performance management have been prioritised to increase the efficiency and capacity of the Department to deliver its mandate in terms of delivery of services to the public and the professional development of staff. The indicators in this programme are directed towards performance improvement and development, compliance, accountability and sound financial systems. The activities of the programme support Action Plan to 2019: Towards the Realisation of Schooling 2030 and cut across all its goals.
Key processes will be strengthened in 2018 to support the Department in respect of administrative procedures and systems. The Management Performance Assessment Tool (MPAT) is co-ordinated by the Department of Planning, Monitoring and Evaluation (DPME). The DPME conducts annual assessments of the quality of generic management practices in Departments. The aim of

27
these assessments is to get managers to monitor regularly the effectiveness of their management practices and to implement improvement plans where necessary. Following through on the recommendations of the 2016/17 MPAT and responding to the findings of the Auditor-General in respect of institutional performance, improvements will be priorities in the 2018/2019 Financial Year.
The Department will strengthen the use of systems associated with performance information and data in 2018, with the assistance of the office of the Chief Information Officer and internal auditing procedures, to improve institutional management and outcomes at national level and in PEDs.
The Department will strive for an unqualified audit report with no matters of emphasis. The Internal Audit function will be supported to strengthen good governance, control processes and compliance with regulations. The Department will strengthen the management of litigation through its legal unit, which will provide legal advice and monitor and support PEDs in the management of court cases.
The Department will continue to avail cutting edge staff development programmes to improve skills and capacity.

28
Stra
tegi
c O
bjec
tive
Annu
al Ta
rget
s for
201
8/20
19 to
202
0/20
21
Stra
tegi
c obj
ectiv
eAu
dite
d/Ac
tual
perfo
rman
ceEs
timat
ed
perfo
rman
ce
2017
/18
Medi
um-te
rm ta
rget
s
2014
/1520
15/16
2016
/1720
18/19
2019
/2020
20/21
1.1 To
impr
ove t
he ad
minis
trativ
e and
gove
rnan
ce sy
stems
thro
ugh
comp
lianc
e to t
he ke
y leg
islati
ons g
over
ning a
dmini
strati
on in
orde
r to
supp
ort th
e deli
very
of ed
ucati
on an
d to s
treng
then a
ccou
ntabil
ity.
56%
MPA
T sc
ores
at le
vel 3
an
d 4
66%
MPA
T sc
ores
at le
vel 3
an
d 4
80%
MPA
T sc
ores
at le
vel 3
an
d 4
82%
MPA
T sc
ores
at le
vel 3
an
d 4
84%
MPA
T sc
ores
at
level
3 and
4
86%
MPA
T sc
ores
at
level
3 and
4
88%
MPA
T sc
ores
at
level
3 and
4
Prog
ram
me
perf
orm
ance
indi
cato
rs a
nd a
nnua
l tar
gets
for 2
018/
2019
to 2
020/
2021
Stra
tegi
c obj
ectiv
ePr
ogra
mm
e Per
form
ance
Indi
cato
rSt
rate
gic
Plan
Targ
etAu
dite
d/Ac
tual
perfo
rman
ceEs
timat
ed
perfo
rman
ce
2017
/18
Medi
um-te
rm ta
rget
s
2014
/1520
15/16
2016
/1720
18/19
2019
/2020
20/21
1.1 To
impr
ove t
he ad
minis
trativ
e an
d gov
erna
nce s
ystem
s thr
ough
co
mplia
nce t
o the
key l
egisl
ation
s go
vern
ing ad
minis
tratio
n in o
rder
to
supp
ort th
e deli
very
of ed
ucati
on
and t
o stre
ngthe
n acc
ounta
bility
.
1.1.1
Perce
ntage
of se
rvice
prov
ider in
voice
s wi
thin t
he pr
ocur
emen
t unit
paid
withi
n 30
days
.10
0%-
-99
.9%10
0%10
0%10
0%10
0%
1.1.2.
Per
centa
ge of
rece
ived m
iscon
duct
case
s res
olved
with
in 90
days
.90
%50
%50
%80
%85
%85
%90
%90
%
1.1.3.
Per
centa
ge of
rece
ived g
rieva
nces
ca
ses r
esolv
ed w
ithin
30 da
ys.
90%
70%
70%
80%
80%
85%
90%
90%
Qua
rter
ly ta
rget
s for
201
8/19
Prog
ram
me P
erfo
rman
ce In
dica
tor
Repo
rting
pe
riod
Annu
al ta
rget
20
18/19
Quar
terly
targ
ets
1st
2nd3rd
4th
1.1.1
Perce
ntage
of se
rvice
prov
ider in
voice
s with
in the
proc
urem
ent u
nit pa
id wi
thin 3
0 day
s.Qu
arter
ly10
0%10
0%10
0%10
0%10
0%
1.1.2
Perce
ntage
of re
ceive
d misc
ondu
ct ca
ses r
esolv
ed w
ithin
90 da
ys.
Annu
ally
85%
--
-85
%
1.1.3
Perce
ntage
of re
ceive
d grie
vanc
es ca
ses r
esolv
ed w
ithin
30 da
ys.
Annu
ally
85%
--
-85
%

29
Reco
ncili
ng P
erfo
rman
ce Ta
rget
s with
the
Budg
et a
nd M
TEF
Sub-
Prog
ram
me
Audi
ted O
utco
mes
R’00
0Ad
just
ed
appr
opria
tion
R’00
0Me
dium
-term
expe
nditu
re es
timat
e R’00
0
2014
/1520
15/16
2016
/1720
17/18
2018
/1920
19/20
2020
/21Mi
nistry
27 42
3 28
157
31 43
9 28
056
30 77
9 32
408
34 63
0 De
partm
ental
Man
agem
ent
81 19
0 65
088
79 87
2 80
696
74 14
2 79
705
85 35
3 Co
rpor
ate S
ervic
es54
078
55 72
7 63
853
63 70
1 68
026
76 09
3 81
077
Offic
e of th
e Chie
f Fina
ncial
Offic
er55
847
64 17
6 62
723
63 18
7 72
276
77 73
6 83
108
Inter
nal A
udit a
nd R
isk M
anag
emen
t5 6
08
8 085
5 7
75
7 275
7 7
71
8 617
9 2
51
Offic
e Acc
ommo
datio
n15
6 653
16
5 242
17
4 639
18
3 668
19
7 482
20
9 187
22
0 713
To
tal38
0 799
38
6 475
41
8 301
42
6 583
45
0 476
48
3 746
51
4 132
Ec
onom
ic Cl
assifi
catio
nCu
rrent
paym
ents
363 8
18
367 3
39
404 2
93
414 8
58
438 6
47
471 1
77
500 8
67
Comp
ensa
tion o
f emp
loyee
s12
5 057
14
3 760
15
1 227
15
9 508
16
7 427
18
0 466
19
3 980
Go
ods a
nd se
rvice
s18
9 779
17
6 055
20
6 745
20
6 713
21
9 762
23
6 371
24
9 558
Co
mpute
r ser
vices
22 08
0 17
415
21 57
7 19
400
20 88
0 24
369
25 70
9 Op
erati
ng Le
ase
732
760
613
1 818
1 8
41
1 949
2 0
56
Prop
erty
paym
ents
93 06
3 10
2 211
11
9 011
12
5 172
13
5 470
14
3 584
15
1 501
Tr
avel
and s
ubsis
tence
16 39
8 14
519
15 13
7 18
415
19 14
6 20
316
21 43
6 In
tere
st an
d re
nt o
n lan
d of
whi
ch:
48 98
2 47
524
46 32
1 48
637
51 45
8 54
340
57 32
9 Tr
ansfe
rs an
d su
bsid
ies63
8 1 0
14
2 364
52
2 41
7 42
9 45
3 De
partm
ental
agen
cies a
nd ac
coun
ts17
7 60
2 17
0 40
541
742
945
0Fo
reign
Gov
ernm
ent a
nd In
terna
tiona
l Org
anisa
tions
--
--
--
-Ho
useh
olds
461
412
2 194
11
7-
-
-Pa
ymen
ts fo
r cap
ital a
sset
s16
343
18 00
0 11
583
11 20
3 11
412
12 14
0 12
812
Build
ings a
nd ot
her fi
xed s
tructu
res
13 47
3 14
226
7 216
7 5
77
8 016
8 4
65
8 931
Ma
chine
ry an
d equ
ipmen
t2 8
70
3 774
4 3
67
3 366
3 0
89
3 340
3 5
25
Softw
are a
nd ot
her in
tangib
le as
sets
--
-26
0 30
7 33
5 35
6 Pa
ymen
ts fo
r fina
ncial
asse
ts -
122
61
--
Total
380 7
99
386 4
75
418 3
01
426 5
83
450 4
76
483 7
46
514 1
32

30
Performance and expenditure trends: Programme 1
This programme has been experiencing budget pressures from operational activities such as high audit fees, Legal Services, Information Technology (GITO) etc. which were adjusted in the 2017 MTEF through reprioritisation on the Kha Ri Gude budget allocation. In this MTEF process the Department considered increasing the allocation for the Office Accommodation as there are currently budget pressure due to change of CPI which is normally announced by the Department of Statistic South Africa once the Estimates of National Expenditure has been finalised. The pressure in this project is as the result of high costs in electricity and the unitary fee to the private party. An amount of R11.6 million has been repriotised from Programme 4: Planning, Information and Assessment on the project Systemic Evaluation. This reprioritisation will not affect any service delivery from the programme or the project.
4.2. Programme 2: Curriculum Policy, Support and MonitoringProgramme Purpose: Develop curriculum and assessment policies, and monitor and support its implementation.
Sub-programmes: Programme Management: Curriculum Policy, Support and Monitoring: Curriculum Implementation and Monitoring; Curriculum and Quality Enhancement Programmes; Kha Ri Gude Literacy Project
Strategic Objectives:
· Increase the number of learners who complete Grade 12 by providing the Second Chance matric programme to learners who failed to meet the National Senior Certificate requirements annually.
· Improve the learning and teaching of critical foundational skills by developing, printing and distributing two volumes of Grade 1-6 Literacy/Languages, Grades 1-3 Life Skills (Quintiles 1-3), Grades 1-9 Numeracy/Mathematics, Grades 1-6 English First Additional Language and Grade R workbooks to all learners in public schools each year.
· Improve learners’ reading proficiency levels in the Foundation Phase in underperforming rural and township schools nationally using the Early Grade Reading Assessment tool to assess individual learners’ reading levels. This will include learners’ phonic knowledge, word recognition, fluency and comprehension skills in the early Grades each year.
· Fast-track the rollout and implementation of ICT in schools by providing teacher training, ICT devices, digital content, software, connectivity, IT support to schools, and online learner and teacher support material annually.
· Increase learner participation and success rates in Mathematics, Science and Technology by providing ICT equipment, machinery, subject-specific resources and teacher development to schools each year over the medium-term by:
- supporting 300 teachers in ICT integration training;
- supplying 300 schools with subject-specific computer hardware;
- supplying 300 schools with subject-related software in accordance with the minimum specifications;
- repairing, maintaining or replacing workshop equipment and machinery for technology subjects at 200 technical schools;
- providing 200 schools with funds for the maintenance of equipment and machinery;
- providing 1 000 schools with laboratory equipment, apparatus and consumables, including manipulatives for Mathematics;
- supporting 50 000 learners in co-curricular services related to Mathematics, Science and Technology;
- supporting 1 500 teachers and subject advisors in Curriculum Assessment Policy Statement training; and
- supporting 1 000 teachers in structured teacher development programmes specific to Mathematics, Science and Technology.
· Develop, monitor and support the implementation of policies and programmes for improving the quality of education in rural schools.

31
Action Plan Goals on Learner Performance
Goal 1 ► Increase the number of learners in Grade 3 who, by the end of the year, have mastered the minimum language and numeracy competencies for Grade 3.
Goal 2 ► Increase the number of learners in Grade 6 who, by the end of the year, have mastered the minimum language and Mathematics competencies for Grade 6.
Goal 3 ► Increase the number of learners in Grade 9 who, by the end of the year, have mastered the minimum language and Mathematics competencies for Grade 9.
Goal 4 ► Increase the number of Grade 12 learners who become eligible for a Bachelor’s programme at a university.
Goal 5 ► Increase the number of Grade 12 learners who pass Mathematics.
Goal 6 ► Increase the number of Grade 12 learners who pass Physical Science.
Goal 7 ► Improve the average performance of Grade 6 learners in languages.
Goal 8 ► Improve the average performance of Grade 6 learners in Mathematics.
Goal 9 ► Improve the average performance of Grade 8 learners in Mathematics.
Goal10 ► Ensure that all children remain effectively enrolled in school at least up to the year in which they turn 15.
Goal 11 ► Improve the access of children to quality Early Childhood Development (ECD) below Grade 1.
Goal 12 ► Improve the Grade promotion of learners through Grades 1 to 9.
Goal 13 ► Improve the access of the youth to Further Education and Training (FET) beyond Grade 9.
Goal 19 ► Ensure that every learner has access to the minimum set of textbooks and workbooks required according to national policy.
Goal 20 ► Increase access among learners to a wide range of media, including computers, which enrich their education.
Goal 26 ►Increase the number of schools that effectively implement the inclusive education policy and have access to centres that offer specialist services.
Early Childhood Development (ECD)
The consortium of UNICEF, the Lego Foundation and Cotlands, in partnership with the DBE, has begun to develop an online training programme aimed at in-service training to 150 000 ECD practitioners, Grade R and Foundation Phase educators across South Africa. The online training programme- Powerful Learning Around You (PLAY)-based learning will be delivered over the next two (2) years and will:
• Monitor and support the implementation of the National Curriculum Framework for Children from Birth to 4 years;
• Monitor and Support Implementation of the National Strategy for Learner Attainment (NSLA) as it pertains to ECD;
• Monitor and support the training of ECD practitioners in PEDs;
• Strengthen inter-provincial collaboration through the Inter-Provincial ECD Committee; and
• Strengthen inter-Departmental collaboration through the Training and Curriculum Sub-committee.
Curriculum Implementation and Quality Improvement: General Education and Training (GET) Grade R – 9
• Monitor and support of the Implementation of Curriculum and Assessment Policy Statement (CAPS);
• Develop reading Norms and Standards to improve Reading and Literacy/Language outcomes in Grades R to 9;
• Use the Early Grade Reading Assessment (EGRA) diagnostic report to improve reading proficiency in Grades 1 – 3;
• Implement the Incremental Introduction of African Languages (IIAL) Strategy Sector Plan in schools which do not offer a previously marginalised African Language as a subject;
• Strengthen the implementation of School-Based Assessment to improve the quality of learner attainment in Grades R - 9;

32
• Engage with PEDs through subject committee meetings and interprovincial fora to strengthen the implementation of the CAPS;
• Implement English Across the Curriculum in all subjects in the GET to strengthen access to learning and to improve learner attainment;
• Monitor and support the implementation of the National Strategy for Learner Attainment (NSLA);
• Monitor and support the implementation of the Language Framework ; and
• Conduct oversight visits to monitor special intervention programmes to improve learner performance.
Curriculum Implementation and Quality Improvement: Further Education and Training (FET) Grade 10 – 12
• Monitor and support the implementation of the Curriculum and Assessment Policy Statement (CAPS);
• Develop subject specific guidelines for all subjects to support the implementation of the CAPS;
• Strengthen the implementation of assessment to improve the quality of learner attainment in Grades 10 - 12;
• Engage with PEDs through subject committee meetings and interprovincial fora to strengthen the implementation of the CAPS;
• Develop Standardisation Reports for the National Senior Certificate;
• Conduct item and error analysis of Grade 12 NSC learner responses;
• Develop diagnostic reports for high enrolment subjects and improvement plans for all subjects in the FET phase;
• Monitor and support implementation of the National Strategy for Learner Attainment (NSLA);
• Develop the Evidence-Based Report (EBR);
• Monitor and provide support for the implementation of the Language Framework;
• Conduct oversight visits to monitor special interventions to improve learner performance; and
• Provide support to learners who have not met all the requirements of the NSC through the Second Chance Matric Programme which offers various platforms of support viz. printed books, direct tuition, digital online and offline support, and radio and television broadcasting solutions.
Learning and Teaching Support Material (LTSM)
• Conduct research, develop and monitor the provisioning of textbooks for selected subjects and selected Grades;
• Gradually develop textbooks for selected subjects and selected Grades;
• Ensure that the sector provides core textbooks per learner, per subject and per Grade;
• Centralise procurement of LTSM in order to gain from economies of scale for PEDs;
• Develop and strengthen the Norms and Standards for retrieval of textbooks at school level; and
• Limit titles and price caps to improve value for money and efficiency.
The Department will provide approximately 61.5 million workbooks to learners in public schools in the following Grades and subjects:
• Grade R workbooks (one per learner per term);
• Grades 1–3 Mathematics in 11 official languages;
• Grade 1–3 Life Skills for Quintiles 1 to 3 schools;
• Grades 1–6 Languages in all official languages;

33
• Grades 1–6 English First Additional Language; and
• Grades 4–9 Mathematics in Afrikaans and English.
The Department aims to provide 100% of workbook orders received from PEDs.
Mathematics, Science and Technology Improvement Strategy
• The thrust is to ensure that all schools offer Mathematics as a subject, and that the number of learners offering Mathematical Literacy is reduced significantly, in order to offer learners a chance in their future careers;
• Progression has to be improved from Grade to Grade, and performance be strengthened from the lower levels to ensure a better success rate in the NSC; and
• Technical subjects are to be supported through the MST Conditional Grant.
Information and Communication Technology (ICT)
Increasing ICT access and utilisation by learners and teachers in support of curriculum implementation for improved learning outcomes will involve the following actions:
• Monitor and support curriculum innovation throughout the sector;
• Monitor and support ICT infrastructure roll-out to all public schools;
• Develop requirements for cost-effective and appropriate broadband connectivity for schools;
• Monitor and support the provision of connectivity to all public schools;
• Monitor and support the implementation of effective ICT teacher development programmes for teachers;
• Develop and distribute quality digital content for teaching and learning;
• Develop and monitor the implementation of the ICT implementation plan;
• Collaborate with the Department of Science and Technology (DST), Department of Communication (DoC), Department of Telecommunications and Postal Service (DTPS), Department of Higher Education and Training (DHET), the private sector and NGOs to increase ICT access and utilisation;
• Monitor the alignment of the PEDs’ ICT plans to the White Paper on e-Education;
• Monitor the impact of ICT support for curriculum implementation in terms of learner outcomes;
• Develop and ensure the implementation of Norms and Standards in line with section 3 and 8 of the National Education Policy Act;
• Develop and implement a strategy to promote the utilisation of data to enhance quality and efficiency; and
• Develop and implement business processes on the work done to inform Norms and Standards.
Inclusive Education
The Department will ensure that schools effectively implement the Inclusive Education policy and have access to specialised support by the following:
• Monitor and support the implementation of Screening, Identification, Assessment and Support (SIAS) policy as a mechanism for early identification of barriers to learning and intervention;
• Monitor and support the implementation of the South African Sign Language (SASL) Curriculum and Assessment Policy Statement (CAPS) Grades R-12;
• Institutionalise Curriculum Differentiation to reduce the learner dropout rate and improve retention;

34
• Monitor and support the implementation of the National Strategy for Learner Attainment (NSLA) in respect of Inclusive Education and Home Education;
• Implement Norms and Standards in line with provisions of Sections 3 and 8 of the National Education Policy Act (NEPA);
• Monitor and support the implementation of the Home Education Policy; and
• Monitor and support the implementation of the Technical Occupational Stream.
The Department through the Learners with Severe to Profound Intellectual Disabilities (LSPID) Grant will be monitoring:
• Capacity building for LSPID officials and teachers;
• Outreach service support provided to learners;
• Management of selected schools and centre databases; and
• Human resource specific to inclusive education.
Rural Education
To co-ordinate a multi-disciplinary approach in supporting rural schools to provide quality education by:
• Managing the development, implementation and evaluation of policy, regulations, strategies and programmes for supporting rural schools;
• Creating and maintaining a data bank for collecting and disseminating information on rural schools;
• Monitoring and supporting activities within the sector that relate to rural education;
• Co-ordinate inter-Departmental and sectoral programmes for supporting rural education; and
• Develop and implement a strategy to promote the utilisation of data to enhance quality and efficiency.

35
Stra
tegi
c ob
jecti
ve a
nnua
l tar
gets
for 2
018/
2019
to 2
020/
2021
Stra
tegi
c obj
ectiv
eAu
dite
d/Ac
tual
perfo
rman
ceEs
timat
ed
perfo
rman
ce20
17/18
Medi
um-te
rm ta
rget
s
2014
/1520
15/16
2016
/1720
18/19
2019
/2020
20/21
2.1 D
evelo
p and
distr
ibute
digita
l co
ntent
annu
ally t
o pro
mote
e-lea
rning
in sc
hools
.
--
Distr
ibuted
10De
velop
ed 05
Distr
ibuted
12De
velop
ed 06
Distr
ibuted
15De
velop
ed 08
Distr
ibuted
18De
velop
ed 10
Distr
ibuted
20De
velop
ed 12
2.2 D
evelo
p, pr
int an
d dist
ribute
wo
rkboo
ks to
scho
ols an
nuall
y for
Gra
des R
-9 in
orde
r to s
uppo
rt tea
ching
and l
earn
ing.
--
Deve
loped
, prin
ted
and d
istrib
uted
100%
wor
kboo
ks
Deve
loped
, prin
ted
and d
istrib
uted 1
00%
wo
rkboo
ks
Deve
loped
, prin
ted an
d dis
tribute
d 100
% w
orkb
ooks
De
velop
ed, p
rinted
an
d dist
ribute
d 100
%
workb
ooks
Deve
loped
, prin
ted
and d
istrib
uted
100%
wor
kboo
ks
2.3 M
onito
r and
supp
ort th
e im
pleme
ntatio
n of th
e Nati
onal
Curri
culum
Stat
emen
ts (N
CS) o
n Re
ading
in G
rade
s R-9
each
year
in
orde
r to i
mpro
ve te
achin
g and
lea
rning
.
--
Monit
ored
60
scho
ols on
Rea
ding
in Gr
ades
R-9
Monit
ored
90 sc
hools
on
Rea
ding i
n Gra
des
R-9
Monit
ored
115 s
choo
ls on
Re
ading
in G
rade
s R-9
Mo
nitor
ed 14
0 sch
ools
on R
eadin
g in G
rade
s R-
9
Monit
ored
185
scho
ols on
Rea
ding
in Gr
ades
R-9
2.4 D
evelo
p and
revie
w the
MST
Fr
amew
ork t
o sup
port
prov
inces
in
impr
oving
lear
ner p
erfor
manc
e in
Mathe
matic
s, Sc
ience
and
Tech
nolog
y sub
jects.
--
Less
on pl
ans a
nd
teach
er gu
ides f
or
all M
ST su
bjects
ide
ntifie
d thr
ough
Di
agno
stic A
nalys
is de
velop
ed
Less
on pl
ans a
nd
teach
er gu
ides f
or al
l MS
T su
bjects
iden
tified
thr
ough
Diag
nosti
c An
alysis
deve
loped
Less
on pl
ans a
nd te
ache
r gu
ides f
or al
l MST
subje
cts
identi
fied t
hrou
gh D
iagno
stic
Analy
sis de
velop
ed an
d mo
nitor
ed
Less
on pl
ans a
nd
teach
er gu
ides f
or al
l MS
T su
bjects
iden
tified
thr
ough
Diag
nosti
c An
alysis
deve
loped
and
monit
ored
Monit
or an
d sup
port
the ut
ilisati
on of
the
MST
Less
on P
lans
and T
each
er G
uides
2.5 D
evelo
p, mo
nitor
and s
uppo
rt the
imple
menta
tion o
f poli
cies
and p
rogr
amme
s for
impr
oving
the
quali
ty of
educ
ation
in ru
ral
scho
ols.
--
-Th
e Mult
i-Gra
de To
olkit
prov
ided t
o sch
ools
with
Multi-
Grad
e cla
sses
.Fin
alise
the R
ural
Educ
ation
Poli
cy
Monit
or th
e imp
lemen
tation
of
the M
ulti-G
rade
Toolk
it in t
wo
(2) s
choo
ls pe
r dist
rict
Advo
cacy
camp
aign o
n the
Rur
al Ed
ucati
on P
olicy
co
nduc
ted in
all 9
prov
inces
Monit
or th
e im
pleme
ntatio
n of th
e Mu
lti-Gr
ade T
oolki
t in
two s
choo
ls pe
r dist
rict
Monit
or th
e im
pleme
ntatio
n of
the M
ulti-G
rade
To
olkit i
n two
sc
hools
per d
istric
t
2.6 P
rovid
e sup
port
to lea
rner
s wh
o hav
e not
achie
ved a
ll the
re
quire
ments
of th
e NSC
thro
ugh
the S
econ
d Cha
nce M
atric
Prog
ramm
e.
--
Admi
nister
ed
Seco
nd ch
ance
NSC
an
d SC
Exam
inatio
n
Admi
nister
ed S
econ
d ch
ance
NSC
and S
C Ex
amina
tion
Adm
iniste
red S
econ
d cha
nce
NSC
and S
C Ex
amina
tion
Admi
nister
ed S
econ
d ch
ance
NSC
and S
C Ex
amina
tion
Admi
nister
ed
Seco
nd ch
ance
NSC
an
d SC
Exam
inatio
n
2.7 To
ensu
re th
at lea
rner
s with
seve
re
to pr
ofoun
d inte
llectu
al dis
abilit
ies
acce
ss qu
ality
publi
cly fu
nded
ed
ucati
on an
d sup
port.
--
--
Sup
porte
d all l
earn
ers i
n ide
ntifie
d car
e cen
tres
Supp
orted
all le
arne
rs in
identi
fied c
are
centr
es
-

36
Prog
ram
me
perf
orm
ance
indi
cato
rs a
nd a
nnua
l tar
gets
for 2
018/
2019
to 2
020/
2021
Stra
tegi
c Obj
ectiv
ePr
ogra
mm
e Per
form
ance
Indi
cato
rSt
rate
gic
Plan
Targ
etAu
dite
d/Ac
tual
perfo
rman
ceEs
timat
ed
perfo
rman
ce
2017
/18
Medi
um-te
rm ta
rget
s
2014
/1520
15/16
2016
/1720
18/19
2019
/2020
20/21
2.1 D
evelo
p and
distr
ibute
digita
l con
tent a
nnua
lly
to pr
omote
e-lea
rning
in
scho
ols.
2.1.1.
Num
ber o
f off-
line d
igital
conte
nt pa
ckag
ed an
d dist
ribute
d to p
rovin
ces
55-
-10
1215
1820
2.1.2.
Num
ber o
f sch
ools
per p
rovin
ce
monit
ored
for u
tilisa
tion o
f ICT
reso
urce
s10
8-
-30
27 (3
per
prov
ince)
27 (3
per
prov
ince)
27 (3
per
prov
ince)
27 (3
per
prov
ince)
2.1.3.
Num
ber o
f off-
line d
igital
conte
nt re
sour
ces d
evelo
ped a
nnua
lly28
--
56
810
12
2.2 D
evelo
p, pr
int an
d dis
tribute
wor
kboo
ks to
sc
hools
annu
ally f
or G
rade
s R-
9 in o
rder
to su
ppor
t tea
ching
and l
earn
ing.
2.2.1.
Per
centa
ge of
pub
lic sc
hools
wi
th Ho
me La
ngua
ge w
orkb
ooks
for
learn
ers i
n Gra
des 1
-610
0%97
%97
-100
%10
0%10
0%10
0%10
0%10
0%
2.2.2.
Per
centa
ge of
publi
c sch
ools
with
Mathe
matic
s wor
kboo
ks fo
r lea
rner
s in G
rade
s 1-9
100%
97%
100%
100%
100%
100%
100%
100%
2.2.3.
Per
centa
ge of
publi
c sch
ools
with
workb
ooks
for G
rade
R10
0%-
100%
100%
100%
100%
100%
100%
2.3 M
onito
r and
supp
ort
the im
pleme
ntatio
n of
the N
ation
al Cu
rricu
lum
State
ments
(NCS
) on
Read
ing in
Gra
des R
-9
each
year
in or
der t
o im
prov
e tea
ching
and
learn
ing.
2.3.1.
Num
ber o
f sch
ools
monit
ored
on
the i
mplem
entat
ion of
the r
eadin
g no
rms
80-
-20
2020
2030
2.3.2.
Num
ber o
f sch
ools
monit
ored
on
the im
pleme
ntatio
n of th
e Inc
reme
ntal
Intro
ducti
on to
Afric
an La
ngua
ges
natio
nally
80-
-20
2020
2030
2.3.3.
Num
ber o
f und
erpe
rform
ing
scho
ols m
onito
red o
n the
im
pleme
ntatio
n of th
e Ear
ly Gr
ade
Read
ing A
sses
smen
t (EG
RA)
245
--
2050
7510
012
5
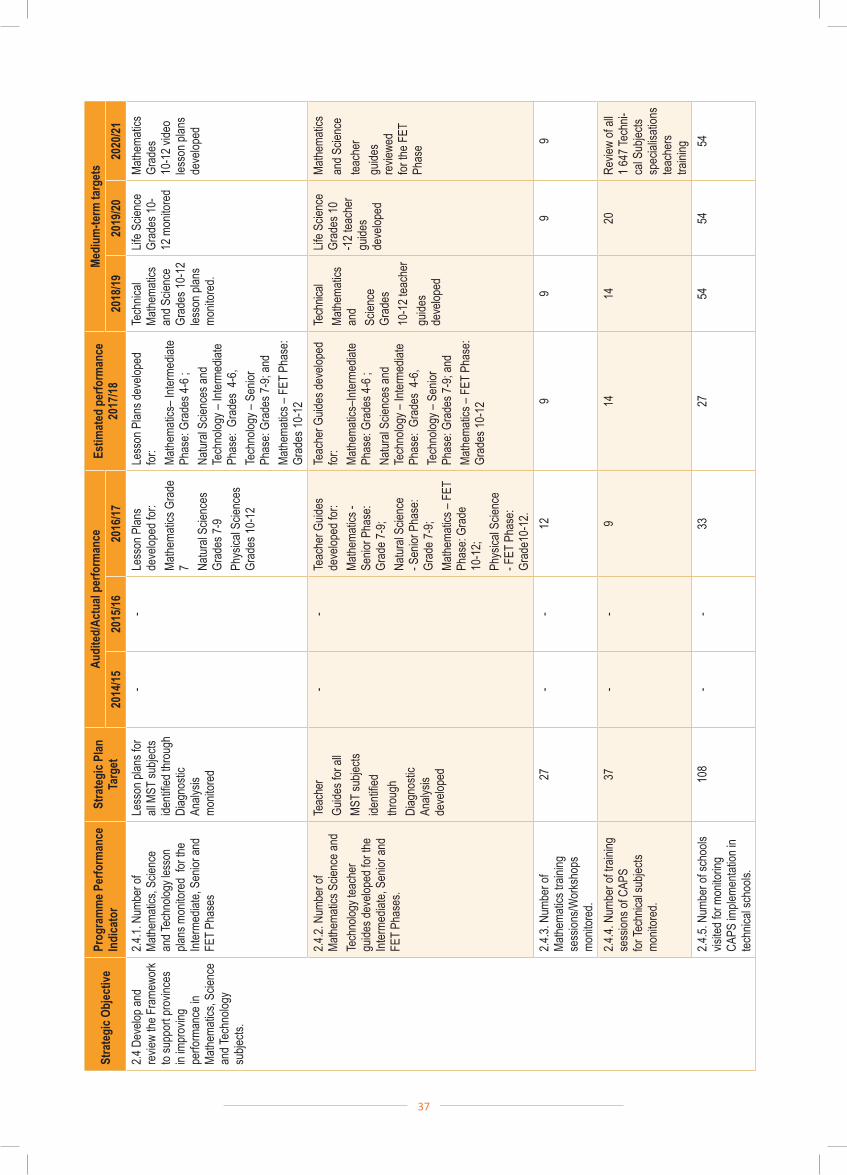
37
Stra
tegi
c Obj
ectiv
ePr
ogra
mm
e Per
form
ance
In
dica
tor
Stra
tegi
c Plan
Ta
rget
Audi
ted/
Actu
al pe
rform
ance
Estim
ated
per
form
ance
20
17/18
Medi
um-te
rm ta
rget
s20
14/15
2015
/1620
16/17
2018
/1920
19/20
2020
/212.4
Dev
elop a
nd
revie
w the
Fra
mewo
rk to
supp
ort p
rovin
ces
in im
prov
ing
perfo
rman
ce in
Ma
thema
tics,
Scien
ce
and T
echn
ology
su
bjects
.
2.4.1.
Num
ber o
f Ma
thema
tics,
Scien
ce
and T
echn
ology
less
on
plans
mon
itore
d for
the
Inter
media
te, S
enior
and
FET
Phas
es
Less
on pl
ans f
or
all M
ST su
bjects
ide
ntifie
d thr
ough
Di
agno
stic
Analy
sis
monit
ored
--
Less
on P
lans
deve
loped
for:
Mathe
matic
s Gra
de
7 Natur
al Sc
ience
s Gr
ades
7-9
Phys
ical S
cienc
es
Grad
es 10
-12
Less
on P
lans d
evelo
ped
for:
Mathe
matic
s– In
terme
diate
Phas
e: Gr
ades
4-6 ;
Na
tural
Scien
ces a
nd
Tech
nolog
y – In
terme
diate
Phas
e: G
rade
s 4-
6, Te
chno
logy –
Sen
ior
Phas
e: Gr
ades
7-9;
and
Mathe
matic
s – F
ET P
hase
: Gr
ades
10-1
2
Tech
nical
Mathe
matic
s an
d Scie
nce
Grad
es 10
-12
lesso
n plan
s mo
nitor
ed.
Life S
cienc
e Gr
ades
10-
12 m
onito
red
Mathe
matic
s Gr
ades
10
-12 v
ideo
lesso
n plan
s de
velop
ed
2.4.2.
Num
ber o
f Ma
thema
tics S
cienc
e and
Tech
nolog
y tea
cher
gu
ides d
evelo
ped f
or th
e Int
erme
diate,
Sen
ior an
d FE
T Ph
ases
.
Teac
her
Guide
s for
all
MST
subje
ctside
ntifie
dthr
ough
Diag
nosti
c An
alysis
de
velop
ed
--
Teac
her G
uides
de
velop
ed fo
r:Ma
thema
tics -
Se
nior P
hase
: Gr
ade 7
-9;
Natur
al Sc
ience
- S
enior
Pha
se:
Grad
e 7-9
;Ma
thema
tics –
FET
Ph
ase:
Grad
e 10
-12;
Phys
ical S
cienc
e - F
ET P
hase
: Gr
ade1
0-12
.
Teac
her G
uides
deve
loped
for
:Ma
thema
tics–
Inter
media
te Ph
ase:
Grad
es 4-
6 ;
Natur
al Sc
ience
s and
Te
chno
logy –
Inter
media
te Ph
ase:
Gra
des
4-6,
Tech
nolog
y – S
enior
Ph
ase:
Grad
es 7-
9; an
d Ma
thema
tics –
FET
Pha
se:
Grad
es 10
-12
Tech
nical
Mathe
matic
s an
dSc
ience
Gr
ades
10-1
2 tea
cher
guide
s de
velop
ed
Life S
cienc
e Gr
ades
10
-12 t
each
er
guide
s de
velop
ed
Mathe
matic
san
d Scie
nce
teach
ergu
ides
revie
wed
for th
e FET
Ph
ase
2.4.3.
Num
ber o
f Ma
thema
tics t
raini
ng
sess
ions/W
orks
hops
mo
nitor
ed.
27-
-12
99
99
2.4.4.
Num
ber o
f train
ing
sess
ions o
f CAP
S for
Tech
nical
subje
cts
monit
ored
.
37-
-9
1414
20Re
view
of all
1 6
47 Te
chni-
cal S
ubjec
ts sp
ecial
isatio
ns
teach
ers
traini
ng2.4
.5. N
umbe
r of s
choo
ls vis
ited f
or m
onito
ring
CAPS
imple
menta
tion i
n tec
hnica
l sch
ools.
108
--
3327
5454
54

38
Stra
tegi
c Obj
ectiv
ePr
ogra
mm
e Per
form
ance
In
dica
tor
Stra
tegi
c Plan
Ta
rget
Audi
ted/
Actu
al pe
rform
ance
Estim
ated
per
form
ance
20
17/18
Medi
um-te
rm ta
rget
s20
14/15
2015
/1620
16/17
2018
/1920
19/20
2020
/212.5
Dev
elop,
monit
or
and s
uppo
rt the
im
pleme
ntatio
n of
polic
ies an
d pr
ogra
mmes
for
impr
oving
the q
uality
of
educ
ation
in ru
ral
scho
ols.
2.5.1.
Num
ber o
f sch
ools
with
Multi-
Grad
e clas
ses
imple
menti
ng th
e Mult
i-Gr
ade T
oolki
t mon
itore
d.
280
--
--
140
140
-
2.5.2.
Num
ber o
f adv
ocac
y ca
mpaig
ns co
nduc
ted on
the
Rur
al Ed
ucati
on P
olicy
in
the pr
ovinc
es.
9-
--
-9
99
2.6 P
rovid
e sup
port
to lea
rner
s who
ha
ve no
t ach
ieved
all
the r
equir
emen
ts of
the N
SC th
roug
h the
Sec
ond C
hanc
e Ma
tric P
rogr
amme
.
2.6.1.
Num
ber o
f lear
ners
obtai
ning s
ubjec
t pas
ses
towar
ds a
Natio
nal
Senio
r Cer
tifica
te (N
SC)
or ex
tende
d Sen
ior
Certifi
cate,
inclu
ding
upgr
aded
NSC
per y
ear.
80 00
0-
-5 6
3520
000
25 00
030
000
35 00
0
2.7 To
ensu
re
that L
earn
ers
with
Seve
re to
Pr
ofoun
d Inte
llectu
al Di
sabil
ities a
cces
s qu
ality
publi
cly
funde
d edu
catio
n and
su
ppor
t.
2.7.1.
Num
ber o
f Chil
dren
/ Le
arne
rs wi
th Se
vere
to
Profo
und I
ntelle
ctual
Disa
bility
(C/LS
PID)
wh
o utili
se th
e Lea
rning
Pr
ogra
mme f
or C
/LSPI
D.
--
--
-3 3
273 3
273 5
27
2.7.2.
Num
ber o
f Chil
dren
/ Le
arne
rs wi
th Se
vere
to
Profo
und I
ntelle
ctual
Disa
bility
(C/LS
PID)
with
ac
cess
to th
erap
eutic
and
psyc
ho-so
cial s
uppo
rt se
rvice
s tha
t will
enab
le the
m to
impr
ove t
heir
partic
ipatio
n in l
earn
ing.
--
--
-3 3
273 3
273 5
27

39
Qua
rter
ly T
arge
ts 2
018/
19
Prog
ram
me P
erfo
rman
ce In
dica
tor
Repo
rting
pe
riod
Annu
al ta
rget
2018
/19Qu
arte
rly ta
rget
s
1st2nd
3rd4th
2.1.1
Numb
er of
off-li
ne di
gital
conte
nt pa
ckag
ed an
d dist
ribute
d to p
rovin
ces.
Quar
terly
155
55
0
2.1.2
Numb
er of
scho
ols pe
r pro
vince
mon
itore
d for
utilis
ation
of IC
T re
sour
ces.
Quar
terly
27 (3
per p
rovin
ce)
99
90
2.1.3
Numb
er of
off-li
ne di
gital
conte
nt re
sour
ces d
evelo
ped a
nnua
lly.
Annu
ally
8-
--
8
2.2.1
Perce
ntage
of pu
blic s
choo
ls wi
th Ho
me La
ngua
ge w
orkb
ooks
for le
arne
rs in
Grad
es 1-
6.An
nuall
y10
0%-
--
100%
2.2.2
Perce
ntage
of pu
blic s
choo
ls wi
th Ma
thema
tics w
orkb
ooks
for le
arne
rs in
Grad
es 1-
9.An
nuall
y10
0%-
--
100%
2.2.3
Perce
ntage
of pu
blic s
choo
ls wi
th wo
rkboo
ks fo
r Gra
de R.
Annu
ally
100%
--
-10
0%
2.3.1
Numb
er of
scho
ols m
onito
red o
n the
imple
menta
tion o
f the r
eadin
g nor
ms.
Annu
ally
20-
--
20
2.3.2
Numb
er of
scho
ols m
onito
red o
n the
imple
menta
tion o
f the I
ncre
menta
l Intro
ducti
on to
Af
rican
Lang
uage
s (IIA
L) na
tiona
lly.
Annu
ally
20-
--
20
2.3.3
Numb
er of
unde
rper
formi
ng sc
hools
mon
itore
d on t
he im
pleme
ntatio
n of th
e Ear
ly Gr
ade
Read
ing A
sses
smen
t (EGR
A).
Annu
ally
75-
--
75
2.4.1
Numb
er of
Math
emati
cs, S
cienc
e and
Tech
nolog
y les
son p
lans m
onito
red f
or th
e Int
erme
diate,
Sen
ior an
d FET
Pha
ses.
Annu
ally
Tech
nical
Mathe
matic
s an
d Scie
nce G
rade
s 10-
12
lesso
n plan
s mon
itore
d.-
--
Tech
nical
Mathe
matic
s an
d Scie
nce G
rade
s 10-
12
lesso
n plan
s mon
itore
d
2.4.2
Numb
er of
Math
emati
cs, S
cienc
e and
Tech
nolog
y tea
cher
guide
s dev
elope
d for
the
Inter
media
te, S
enior
and F
ET P
hase
s.An
nuall
yTe
chnic
al Ma
thema
tics
and S
cienc
e Gra
des 1
0-12
tea
cher
guide
s dev
elope
d-
--
Tech
nical
Mathe
matic
s an
d Scie
nce G
rade
s 10-
12
teach
er gu
ides d
evelo
ped
2.4.3
Numb
er of
Math
emati
cs tr
aining
sess
ions/W
orks
hops
mon
itore
d.Bi
-ann
ually
9-
5-
4
2.4.4
Numb
er of
train
ing se
ssion
s of C
APS
for Te
chnic
al su
bjects
mon
itore
d.Bi
-ann
ually
147
7-
-
2.4.5
Numb
er of
scho
ols vi
sited
for m
onito
ring C
APS i
mplem
entat
ion in
tech
nical
scho
ols.
Quar
terly
5418
18-
18
2.5.1
Numb
er of
scho
ols w
ith M
ulti-G
rade
clas
ses i
mplem
entin
g the
Mult
i-Gra
de To
olkit
monit
ored
.Qu
arter
ly14
035
3535
35
2.5.2
Numb
er of
advo
cacy
camp
aigns
cond
ucted
on th
e Rur
al Ed
ucati
on P
olicy
in th
e pr
ovinc
es.
Quar
terly
92
33
1
2.6.1
Numb
er of
lear
ners
obtai
ning s
ubjec
t pas
ses t
owar
ds a
Natio
nal S
enior
Cer
tifica
te (N
SC)
or ex
tende
d Sen
ior C
ertifi
cate,
inclu
ding u
pgra
ded N
SC pe
r yea
r.Bi
-ann
ually
25
000
-15
000
-10
000
2.7.1.
Num
ber o
f Chil
dren
/ Lea
rner
s with
Sev
ere t
o Pro
found
Intel
lectua
l Disa
bility
(C/LS
PID)
wh
o utili
se th
e Lea
rning
Pro
gram
me fo
r C/LS
PID.
Annu
ally
3 327
--
-3 3
27
2.7.2.
Num
ber o
f Chil
dren
/ Lea
rner
s with
Sev
ere t
o Pro
found
Intel
lectua
l Disa
bility
(C/LS
PID)
wi
th ac
cess
to th
erap
eutic
and p
sych
o-so
cial s
uppo
rt se
rvice
s tha
t will
enab
le the
m to
impr
ove
their p
artic
ipatio
n in l
earn
ing.
Annu
ally
3 327
--
-3 3
27

40
Reco
ncili
ng p
erfo
rman
ce ta
rget
s with
the
Budg
et a
nd M
TEF
Expe
nditu
re e
stim
ates
Sub-
Prog
ram
me
Audi
ted O
utco
mes
R’00
0Ad
justed
ap
prop
riatio
n R’
000
Medi
um-te
rm ex
pend
iture
estim
ate R
’000
2014
/1520
15/16
2016
/1720
17/18
2018
/1920
19/20
2020
20/21
Prog
ramm
e Man
agem
ent: C
urric
ulum
Polic
y, Su
ppor
t and
Mon
itorin
g2 9
88
2 433
3 4
47
3 811
3 5
12
3 829
4 1
36
Curri
culum
Imple
menta
tion a
nd M
onito
ring
72 60
1 40
396
81 27
6 22
1 152
32
8 695
38
4 088
41
7 254
Kha R
i Gud
e Lite
racy
Cam
paign
386 9
56
467 1
78
358 9
95
87 26
8 7 5
72
7 900
8 3
58
Curri
culum
and Q
uality
Enh
ance
ment
Prog
ramm
es1 2
22 67
4 1 2
87 73
3 1 3
82 97
3 1 4
70 78
5 1 5
65 23
2 1 6
14 23
6 1 7
08 16
9
Total
1 685
219
1 797
740
1 826
691
1 783
016
1 905
011
2 010
053
2 137
917
Econ
omic
class
ifica
tion
Curre
nt Pa
ymen
ts1 3
48 24
11 4
79 75
21 4
63 44
5 1 3
42 24
6 1 3
45 02
3 1 3
91 98
4 1 4
75 18
9
Comp
ensa
tion o
f emp
loyee
s73
168
76 07
772
019
87 18
3 91
065
99 46
3 10
6 954
Good
s and
servi
ces o
f whic
h:1 2
75 07
41 4
03 67
51 3
91 42
61 2
55 06
3 1 2
53 95
8 1 2
92 52
1 1 3
68 23
5
Agen
cy an
d sup
port/
outso
urce
d ser
vices
4 707
5 506
8 509
15 58
9 29
497
33 50
2 35
648
Inven
tory:
Lear
ning a
nd te
achin
g sup
port
mater
ial84
9 174
968 7
2698
1 531
1 035
450
1 091
934
1 150
992
1 213
945
Cons
umab
les: s
tation
ery,
ing an
d offic
e sup
plies
33 91
723
114
52 46
027
365
60 89
7 32
098
40 70
9
Trav
el an
d sub
sisten
ce23
013
10 27
910
586
29 67
0 16
795
15 85
7 17
559
Oper
ating
paym
ents
316 4
3934
9 126
296 8
1565
026
17 73
0 11
736
7 245
Tran
sfers
and
subs
idies
336 3
5031
7 210
362 8
1843
7 771
55
6 132
61
2 273
65
6 319

41
Sub-
Prog
ram
me
Audi
ted O
utco
mes
R’00
0Ad
justed
ap
prop
riatio
n R’
000
Medi
um-te
rm ex
pend
iture
estim
ate R
’000
2014
/1520
15/16
2016
/1720
17/18
2018
/1920
19/20
2020
20/21
Prov
inces
and m
unici
paliti
es33
6 159
316 9
4236
2 444
437 1
45
555 9
54
612 0
87
656 1
23
Fore
ign
Gove
rnm
ents
and
inte
rnat
iona
l org
anisa
tions
124
157
131
170
178
186
196
Hous
ehold
s67
111
243
456
--
-
Paym
ents
for c
apita
l ass
ets
627
745
423
2 999
3 8
56
5 796
6 4
09
Mach
inery
and e
quipm
ent
618
745
423
989
656
796
1 134
Softw
are a
nd ot
her in
tangib
le as
sets
9-
-2 0
10
3 200
5 0
00
5 275
Paym
ents
for fi
nanc
ial as
sets
-33
5-
--
-
Total
1 685
219
1 797
740
1 877
954
1 783
016
1 905
011
2 010
053
2 137
917

42
Performance and expenditure trends: Programme 2
In this programme no major changes have been made in terms of reprioritisation on operational budget. The Kha Ri Gude project was utilised to fund other priorities within the Department. At the moment the project is drawing to a close.
Expenditure Analysis on this project
Workbooks
The Department plans to print and distribute about 183 million workbooks which will be delivered to more than 22 700 public schools, at a projected cost of R3.5 billion over the MTEF period, through the Curriculum and Quality Enhancement Programme. This will include the development of 344 titles of Home Language (Grades 1-6) in 11 languages; English First Additional Language (Grade 1-6); Mathematics (Grades 1-3) in 11 languages; Mathematics (Grades 4-9) in English and Afrikaans; Life Skills (Grades 1-3) in 11 languages and Grade R in 11 languages which was completed. As part of the ongoing process of quality assurance, these workbooks are edited on a yearly basis and based on inputs from schools. The DBE will also continue to develop workbooks for other content subjects such as IIAL, Afrikaans FAL, Natural Science and Technology.
4.3. Programme 3: Teachers, Education Human Resources and Institutional Development
Programme Purpose: To promote quality teaching and institutional performance through the effective supply, development and utilisation of human resources
Sub-programmes: Programme Management: Teachers, Education Human Resources and Institutional Development: Education Human Resources Management; Education Human Resources Development; and Curriculum and Professional Development
Strategic Objectives:
• Ensure the adequate supply of qualified recruits in the system by placing Funza Lushaka bursary holders, by June of the year after qualifying, in each year over the medium-term.
• Improve the quality of teaching and learning by ensuring an adequate supply of young and qualified teachers through awarding 13 500 Funza Lushaka bursaries to prospective teachers in 2018/19.
• Improve the quality of teaching and learning by monitoring and supporting the implementation of the educator post provisioning policy in all nine Provincial Education Departments annually.
• Enhance accountability each year by monitoring and supporting the implementation of educator performance management systems and school evaluations.

43
Programme performance indicators and annual targets for 2018/2019 to 2020/2021
Action Plan Goals on Teacher Supply, Development and Utilisation
Goal 14 ► Attract a new group of young, motivated and appropriately trained teachers to the teaching profession every year.
Goal 15 ► Ensure that the availability and utilisation of teachers are such that excessively large classes are avoided.
Goal 16 ► Improve the professionalism, teaching skills, subject knowledge and computer literacy of teachers throughout their entire careers.
Goal 17 ► Strive for a teacher workforce that is healthy and enjoys a sense of job satisfaction.
Goal 18 ► Ensure that learners cover all the topics and skills areas that they should cover within their current school year.
Goal 21 ► Ensure that the basic annual management process takes place across all schools in the country in a way that contributes towards a functional school environment.
Goal 22 ► Improve parent and community participation in the governance of schools, partly by improving access to important information via the e-Education strategy.
Teacher Recruitment, Placement and Utilisation
• Attracting young people into the profession to ensure an adequate supply of qualified educators into the system;
• Manage the Funza Lushaka bursary programme;
• Monitoring of the placement of Funza Lushaka bursary graduates;
• Monitoring the filling of vacant substantive educator posts at schools;
• Monitoring the rate of placement of young qualified educators;
• Monitor annual implementation of the post provisioning norms; and
• Strengthening the placement processes of Funza Lushaka graduates in all provinces.
Teacher Development and Professionalism
• Strengthening and expanding pre-Grade R and Grade R necessitates better training of ECD practitioners to improve the quality of ECD services;
• Implementation of a teacher development framework ensures that content-related training is offered to teachers on an ongoing basis;
• Grade R expansion in schools necessitates a fast-tracked development of Grade R educators/practitioners to meet the requirements of the Foundation Phase teaching. Currently, PEDs are training at different levels in terms of the NQF;
• Increased remuneration of ECD teachers (if implemented by all PEDs) will soon put a strain on the personnel budgets of the PEDs;
• Development of ICT integration programmes for teachers; provide Training of Trainers on the programme and support PEDs in cascading the programme; and
• Programmes such as Funza Lushaka need to be strengthened at provincial level by ensuring that all Funza Lushaka bursary holders are absorbed after completion of their studies.

44
Perf
orm
ance
Man
agem
ent S
yste
m
• Su
ppor
t and
mon
itor t
he im
plem
enta
tion
of t
he In
tegr
ated
Qua
lity
Man
agem
ent S
yste
m(IQ
MS)
(Col
lecti
ve A
gree
men
t No.
8 o
f 200
3) in
ord
er to
pro
mot
e ac
coun
tabi
lity
and
perf
orm
ance
impr
ovem
ent o
f edu
cato
rs th
roug
h on
-goi
ng le
arni
ng a
nd d
evel
opm
ent;
• M
onito
r and
supp
ort t
he im
plem
enta
tion
of P
MDS
by
office
-bas
ed e
duca
tors
in o
rder
to im
prov
e th
e qu
ality
and
effi
cien
cy o
f ser
vice
s to
scho
ols;
and
• M
onito
r and
supp
ort P
EDs t
o co
nduc
t ext
erna
l and
scho
ol se
lf-ev
alua
tions
that
are
aim
ed a
t im
prov
ing
lear
ner p
erfo
rman
ce, t
each
ing
prac
tice
and
scho
ol fu
nctio
nalit
y.
Stra
tegi
c ob
jecti
ve a
nnua
l tar
gets
for 2
018/
2019
to 2
020/
2021
Stra
tegi
c obj
ectiv
eAu
dite
d/Ac
tual
perfo
rman
ceEs
timat
ed
perfo
rman
ce20
17/18
Medi
um-te
rm ta
rget
s
2014
/1520
15/16
2016
/1720
18/19
2019
/2020
20/21
3.1 M
onito
r the
bas
ic fun
ction
ality
of sc
hools
an
d Sc
hool
Gove
rning
Bod
ies (
SGBs
) on
an
annu
al ba
sis t
o im
prov
e sc
hool
effec
tiven
ess
and a
ccou
ntabil
ity.
--
Monit
ored
all
samp
led sc
hools
Monit
ored
all
samp
led sc
hools
Monit
ored
all
samp
led sc
hools
Monit
ored
all
samp
led sc
hools
Monit
ored
all
samp
led sc
hools
3.2 I
denti
fy an
d re
cruit
the y
outh
from
all
prov
inces
for
the
Fu
nza
Lush
aka
Bursa
ry an
nuall
y in o
rder
to in
creas
e the
supp
ly of
youn
g tea
cher
s in t
he ed
ucati
on sy
stem.
Awar
ded
bursa
ries
to se
lected
re
gister
ed yo
uth
Awar
ded
bursa
ries
to se
lected
re
gister
ed yo
uth
Awar
ded
bursa
ries
to se
lected
re
gister
ed yo
uth
Awar
ded
bursa
ries
to se
lected
re
gister
ed yo
uth
Awar
ded
bursa
ries t
o se
lected
unive
rsity
regis
tered
youth
Awar
ded
bursa
ries t
o se
lected
unive
rsity
regis
tered
youth
Awar
ded
bursa
ries t
o se
lected
unive
rsity
regis
tered
youth
3.3
To
ide
ntify
and
deter
mine
co
ntent
know
ledge
of t
each
ers
in Ma
thema
tics,
Engli
sh
First
Addit
ional
Lang
uage
, Ph
ysica
l Sc
ience
s an
d Ac
coun
ting
throu
gh
Diag
nosti
c Se
lf-As
sess
ments
.-
Math
emati
cs
and A
ccou
nting
Di
agno
stics
Tests
ad
minis
tered
Mathe
matic
s an
d Acc
ounti
ng
Diag
nosti
cs Te
sts
admi
nister
ed
Math
emati
cs,
EFAL
, Phy
sical
Scien
ce an
d Ac
coun
ting
Diag
nosti
c Tes
ts ad
minis
tered
Mathe
matic
s, EF
AL, P
hysic
al Sc
ience
and
Acco
untin
g Di
agno
stic T
ests
admi
nister
ed
Mathe
matic
s, EF
AL, P
hysic
al Sc
ience
and
Acco
untin
g Di
agno
stic T
ests
admi
nister
ed
Mathe
matic
s, EF
AL, P
hysic
al Sc
ience
and
Acco
untin
g Di
agno
stic T
ests
admi
nister
ed
3.4 To
mon
itor th
e imp
lemen
tation
of pe
rform
ance
ma
nage
ment
syste
ms in
Pro
vincia
l Edu
catio
n De
partm
ents
(PED
s) an
nuall
y in
orde
r to
stren
gthen
acc
ounta
bility
of s
choo
l and
offic
e-ba
sed e
duca
tors.
--
Monit
ored
PED
s on
IQMS
& P
MDS
imple
menta
tion
Mon
itore
d PED
s on
IQMS
& P
MDS
imple
menta
tion
Mon
itore
d PED
s on
IQMS
& P
MDS
imple
menta
tion
Monit
ored
PED
s on
IQMS
& P
MDS
imple
menta
tion
Monit
ored
PED
s on
IQMS
& P
MDS
imple
menta
tion
3.5 M
onito
r the
imp
lemen
tation
of
the p
ost
prov
ision
ing p
olicy
and
the
mode
l ann
ually
per
pr
ovinc
e to
ensu
re th
at the
re is
an
equit
able
distrib
ution
of te
ache
rs.-
-Mo
nitor
ed al
l PE
DsMo
nitor
ed al
l PE
DsMo
nitor
ed al
l PE
DsMo
nitor
ed al
l PE
DsMo
nitor
ed al
l PE
Ds

45
Prog
ram
me
perf
orm
ance
indi
cato
rs a
nd a
nnua
l tar
gets
for 2
018/
2019
to 2
020/
2021
Stra
tegi
c Ob
jectiv
ePr
ogra
mm
e Per
form
ance
Indi
cato
rSt
rate
gic
Plan
Targ
etAu
dite
d/Ac
tual
perfo
rman
ceEs
timat
ed
perfo
rman
ce
2017
/18
Medi
um-te
rm ta
rget
s
2014
/1520
15/16
2016
/1720
18/19
2019
/2020
20/21
3.1. M
onito
r the
basic
fun
ction
ality
of sc
hools
and
Scho
ol Go
vern
ing B
odies
on
an an
nual
basis
in or
der t
o im
prov
e sch
ool e
ffecti
vene
ss
and a
ccou
ntabil
ity.
3.1.1.
Per
centa
ge of
SGB
s tha
t me
et mi
nimum
crite
ria in
term
s of
effec
tiven
ess.
90%
of
samp
led
SGBs
60%
of
samp
led
SGBs
84 %
of
samp
led
SGBs
91.9%
of 2
000 s
ample
d SG
Bs
70%
of
2 000
samp
led
SGBs
80%
of
2 000
sa
mpled
SG
Bs
90%
of
2 000
sa
mpled
SG
Bs
50%
of
2 000
sa
mpled
SG
Bs1
3.1.2.
Per
centa
ge of
scho
ols pr
oduc
ing
the m
inimu
m se
t of m
anag
emen
t do
cume
nts at
a re
quire
d stan
dard
.
90%
of th
e 2 0
00
samp
led
scho
ols-
-90
.5% of
the
2 00
0 sa
mpled
sc
hools
70%
of th
e 2 0
00 sa
mpled
sc
hools
80%
of
the 2
000
samp
led
scho
ols
90%
of
the 2
000
samp
led
scho
ols
100%
of
the 2
000
samp
led
scho
ols3.2
. Iden
tify an
d rec
ruit t
he
youth
from
all p
rovin
ces f
or
the F
unza
Lush
aka B
ursa
ry an
nuall
y in o
rder
to in
creas
e the
supp
ly of
youn
g tea
cher
s in
the ed
ucati
on sy
stem.
3.2.1.
Num
ber o
f Fun
za Lu
shak
a bu
rsarie
s awa
rded
to st
uden
ts en
rolle
d for
initia
l teac
her e
duca
tion.
66 00
014
349
13 98
014
343
13 50
013
500
13 00
012
5002
3.3. T
o ide
ntify
and d
eterm
ine
conte
nt kn
owled
ge of
teac
hers
in Ma
thema
tics,
Engli
sh F
irst
Addit
ional
Lang
uage
, Phy
sical
Scien
ces a
nd A
ccou
nting
thr
ough
Diag
nosti
c Self
-As
sess
ments
.
3.3.1.
Num
ber o
f teac
hers
partic
ipatin
g in
the E
FAL d
iagno
stic t
ests.
44 00
0-
487
2 242
10 00
02 0
002 5
003 0
00
3.3.2.
Num
ber o
f teac
hers
partic
ipatin
g in
the P
hysic
al Sc
ience
diag
nosti
c tes
ts.6 0
00-
--
2 000
2 000
2 500
3 000
3.3.3.
Num
ber o
f teac
hers
partic
ipatin
g in
the A
ccou
nting
diag
nosti
c tes
ts.6 0
00-
--
2 000
2 000
2 500
3 000
3.3.4.
Num
ber o
f teac
hers
partic
ipatin
g in
the M
athem
atics
diag
nosti
c tes
ts.44
000
-65
31 8
9210
000
2 000
2 500
3 000
3.4 To
mon
itor t
he
imple
menta
tion o
f per
forma
nce
mana
geme
nt sy
stems
in P
EDs
annu
ally i
n ord
er to
stre
ngthe
n ac
coun
tabilit
y of s
choo
ls an
d offi
ce-b
ased
educ
ators.
3.4.1.
Num
ber o
f PED
s mon
itore
d on
the im
pleme
ntatio
n of IQ
MS.
6 PED
s mo
nitor
ed
annu
ally
--
18 sc
hools
in
6 PED
s mo
nitor
ed
annu
ally
6 PED
s mo
nitor
ed
annu
ally
6 PED
s mo
nitor
ed
annu
ally
6 PED
s mo
nitor
ed
annu
ally
6 PED
s mo
nitor
ed
annu
ally
3.4.2.
Num
ber o
f PED
s mon
itore
d on
the im
pleme
ntatio
n of P
MDS.
6 PED
s mo
nitor
ed
annu
ally
--
6 PED
s mo
nitor
ed
annu
ally
6 PED
smo
nitor
ed
annu
ally
6 PED
smo
nitor
ed
annu
ally
6 PED
s mo
nitor
ed
annu
ally
6 PED
s mo
nitor
ed
annu
ally
3.5 M
onito
r the
imple
menta
tion
of the
post
prov
ision
ing
annu
ally p
er pr
ovinc
e to e
nsur
e tha
t ther
e is a
n equ
itable
dis
tributi
on of
teac
hers.
3.5.1.
Num
ber o
f PED
s tha
t had
their
po
st pr
ovisi
oning
proc
ess a
sses
sed f
or
comp
lianc
e with
the p
ost p
rovis
ioning
No
rms a
nd S
tanda
rds.
9 PED
s-
-Al
l nine
(9)
PEDs
All n
ine (9
) PE
DsAl
l nine
(9)
PEDs
All n
ine (9
) PE
DsAl
l nine
(9)
PEDs
1 SG
B el
ectio
ns a
re co
nduc
ted
ever
y 3
year
s. A
fter e
very
elec
tion,
new
mem
bers
get
elec
ted
and
have
to b
e tr
aine
d an
d pr
epar
ed fo
r the
unf
amili
ar ro
le. Th
eir e
ffect
iven
ess i
s low
er at
this
stag
e an
d in
crea
ses a
s the
yea
rs g
o by
.2
The
decl
ine
in th
e nu
mbe
r of s
tude
nts s
uppo
rted
is a
s a re
sult
of in
crea
sed
univ
ersit
y fe
es o
ver t
he m
ediu
m-t
erm

46
Quarterly targets for 2018/2019
Programme Performance Indicator Reporting period
Annual target 2018/19
Quarterly targets
1st 2nd 3rd 4th
3.1.1 Percentage of SGBs that meet minimum criteria in terms of effectiveness. Annually 80% of 2 000
sampled SGBs - - - 80%
3.1.2 Percentage of schools producing the minimum set of management documents at a required standard.
Annually 80% of 2 000 sampled schools - - - 80%
3.2.1 Number of Funza Lushaka bursaries awarded to students enrolled for initial teacher education.
Annually 13 500 - - - 13 500
3.3.1. Number of teachers participating in the EFAL diagnostic tests. Annually 2 000 - - - 2 000
3.3.2. Number of teachers participating in the Physical Science diagnostic tests. Annually 2 000 - - - 2 000
3.3.3. Number of teachers participating in the Accounting diagnostic tests. Annually 2 000 - - - 2 000
3.3.4. Number of teachers participating in the Mathematics diagnostic tests. Annually 2 000 - - - 2 000
3.4.1 Number of PEDs monitored on the implementation of IQMS. Quarterly 6 PEDs monitored
annually2 PEDs
Monitored2 PEDs
Monitored1 PED
Monitored1 PED
Monitored
3.4.2 Number of PEDs monitored on the implementation of PMDS. Quarterly 6 PEDs
Monitored annually2 PEDs
Monitored2 PEDs
Monitored1 PED
Monitored1 PED
Monitored
3.5.1 Number of PEDs that had their post provisioning process assessed for compliance with the post provisioning Norms and Standards.
Annually All nine (9) PEDs - - - All nine (9) PEDs

47
Performance targets with the Budget and MTEF Expenditure estimates
Sub-ProgrammeAudited Outcomes R’000
Adjusted appropriation
R’000Medium-term expenditure
estimate R’000
2014/15 2015/16 2016/17 2017/18 2018/19 2019/20 2020/21Programme Management: Teachers, Education Human Resources and Institutional Development
1 476 2 508 2 428 3 087 3 132 3 379 3 624
Education Human Resources Management 285 510 137 249 75 790 60 061 66 693 69 582 74 203 Education Human Resources Development 1 003 969 1 012 096 1 089 931 1 173 736 1 205 679 1 276 552 1 347 245 Curriculum and Professional Development Unit 23 507 11 695 9 248 15 220 14 976 16 697 17 788 Total 1 314 462 1 163 548 1 177 397 1 252 104 1 290 480 1 366 210 1 442 860
Economic classificationCurrent payments 139 043 87 877 112 298 131 023 99 125 105 093 112 382 Compensation of employees 62 074 69 017 71 411 68 362 72 173 75 257 80 904 Goods and services of which: 76 969 18 860 40 887 62 661 26 952 29 836 31 478 Communication (G&S) 309 359 4 465 291 538 569 600 Consultants and special services: business and advisory services
600 900 - - - - -
Consumables: stationery, printing and office supplies
3 193 819 575 1 188 1 029 1 044 1 101
Travel and subsistence 32 156 8 929 19 756 27 398 17 300 19 806 20 895 Transfers and subsidies 1 175 024 1 075 280 1 064 685 1 120 268 1 190 927 1 260 716 1 330 055 Provinces and Municipalities 213 000 66 275 - - - -Departmental agencies and accounts 9 743 16 000 20 000 21 100 Foreign Government 13 930 17 706 15 717 14 731 15 579 16 445 17 349 Non-profit institutions - - - - - - -Households 948 094 991 299 1 043 968 1 095 794 1 159 348 1 224 271 1 291 606 Payments for capital assets 395 281 223 813 428 401 423 Machinery and equipment 395 281 223 813 428 401 423 Payments for financial assets - 110 191 - - - -Total 1 314 462 1 163 548 1 177 397 1 252 104 1 290 480 1 366 210 1 442 860
National Student Financial Aid Scheme 947 499 991 084 1 043 611 1 095 792 1 159 348 1 224 271 1 291 606 South African Council for Educators 9 743 16 000 20 000 21 100 Household Social benefits current 580 212 321 - - - -Employee Social benefits 580 212 321 - - - -
Foreign Government and international Government
13 930 17 706 15 717 14 731 15 579 16 445 17 349
United Nations Educational, Scientific and Cultural Organisation
13 815 17 553 15 587 14 585 15 431 16 295 17 191
Association for the Development of Education in Africa
115 153 130 146 148 150 158
Provinces and Municipalities - - - -Occupational Specific Dispensation for Sector Therapist Grant
213 000 67 000 - - - - -

48
Performance and expenditure trends: Programme 3
The programme normally experiences budget pressure towards the National Teacher Awards which was previously funded through the European Union (EU) funding. Since the Departmental operation is at pressure, it was not feasible to reprioritise from this project. During 2017 Estimate of National Expenditure an amount of R45.7 million was reprioritised towards the South African Council for Educators (SACE).
Funza Lushaka
Over the medium-term the Department aims to improve the supply of newly qualified teachers by providing 39 500 Funza Lushaka bursaries to prospective teachers in priority subject areas such as Mathematics, Science and Technology. A total of R 3.7 billion has been allocated over the medium-term for this. The decline is as a result of an increase of 8 percent in university fees for 2018 announced by the Minister of Higher Education and Training. Furthermore if this trend continues over the medium-term, the number of students supported is expected to decline from 15 148 in 2017/18 to 13 500 in 2018/19, where it is set to remain over the medium-term. These bursaries are provided through the National Student Financial Aid Scheme, funded by transfers from the Department in the Education Human Resources Development sub-programme in the Teachers, Education Human Resources and Institutional Development programme.
4.4. Programme 4: Planning, Information and AssessmentProgramme Purpose: To promote quality and effective service delivery in the basic education system through Planning, Implementation and Assessment
Sub-programmes: Programme Management: Planning, Information and Assessment: Financial Planning, Information and Management Systems; National Assessment and Public Examinations; School Infrastructure; the National Education Evaluation and Development Unit; and the Planning and Delivery Oversight Unit
Strategic Objectives:
• Track improvements in the quality of teaching and learning by providing standardised national annual assessments for Grade 3, 6 and 9 learners, as well as the administration of a credible public examination in Grade 12 each year.
• Improve the delivery of school infrastructure over the medium-term by providing oversight and support to provinces through quarterly reporting on schools’ furniture needs and deliveries, the National Education Infrastructure Management System, and the Education Infrastructure Grant.
• Contribute to improved teaching and learning through improving and upgrading infrastructure by 2018/19 by:
- building 50 schools to replace all unsafe structures;
- providing water to 325 schools; and
- providing sanitation to 286 schools.
• Strengthen the capacity of district offices to support schools through quarterly provincial visits that monitor, evaluate and make recommendations on curriculum oversight and institutional management and governance support provided to human resource management operations.
Programme performance indicators and annual targets for 2018/2019 to 2020/2021
Action Plan Goals on Physical, Financial Planning and District Support
Goal 23 ► Ensure that all schools are funded at least at the minimum per learner levels determined nationally and that funds are utilised transparently and effectively.
Goal 24 ► Ensure that the physical infrastructure and environment of every school inspire learners to want to come to school and learn, and teachers to come and teach.
Goal 27 ► Improve the frequency and quality of the monitoring and support provided to schools by district offices, partly through better use of e-Education.

49
National Assessment
• Development of a National Integrated Assessment Framework (NIAF) for GET Assessment;
• Provision of standardised diagnostic assessments to all Grade 3, 6 and 9 learners;
• Regulation and standardisation of assessment through the implementation of an Integrated Assessment Framework for Grades 4 -11;
• Quality assurance of classroom-based assessment by introducing moderation of School-Based Assessment (SBA) in the GET band; and
• Assessment of the performance of the education system through independent administration of Systemic Evaluation once every three years.
National Senior Certificate Examinations
• Facilitate the quality assurance of School Based Assessment (SBA) in the FET band;
• Facilitate the implementation of high quality and standardised marking of the NSC and SC;
• Provision of valid and reliable instruments for the NSC; and
• Provision of reliable data and feedback of the NSC examinations.
Educational Management Information Systems (EMIS)
The Department develops and maintains an Integrated Education Management Information System (EMIS) based on individual learner records through the implementation of business application and support; data management and quality assurance; reporting; publication and information dissemination; business analysis; policy monitoring and government partnerships; and management of EMIS projects. EMIS responsibilities include:
• Publication of the annual Education Statistics in South Africa report, and the preliminary release of the annual 10th School Day learner data (School Realities);
• Publishing the Register of Schools (master list) updated four times per annum and posted on the DBE website;
• The development and maintenance of a national Education Management Information System for the Schools (Ordinary and SNE) and Early Childhood Development (ECD);
• Development and provision of education management advice to PEDs on information systems;
• Development of a strategy, and facilitation of capacity development and training on the Education Management Information System;
• Facilitation of the development of national policy and guidelines on education management information systems;
• Processing and disseminating education and training data; and
• Providing technical assistance for monitoring the performance of the education and training system.
Financial Planning and Provincial Budget Monitoring
The Department will ensure the effective monitoring of the budgets of the PEDs and spending in line with their Annual Performance Plans and Strategic Plans and will ensure that education Norms and Standards for funding policies are developed and monitored.
• To ensure the effective monitoring of the PEDs budgets and spending in line with the APPs and strategic plans;
• To ensure improved quality of the PEDs budgets and funding of education priorities;

50
• To ensure education Norms and Standards funding policies are developed and monitored;
• To provide support to the DBE and the PEDs; and
• Monitor and support the PEDs relating to the merger and closure of schools.
Economic Analysis
To promote and support optimal budgeting processes as well as to monitor and evaluate the utilisation of resources in the Basic Education Sector:
• To monitor and evaluate the allocation and utilisation of financial resources in education by Provincial Education Departments (PEDs);
• To facilitate standard and uniform reporting formats and programme structures of PEDs;
• To assess future financial needs of education in relation to policy; and
• To ensure South Africa’s basic education’s expenditure reporting obligations adhere to the UIS.
Grant Management
The DBE contributes to the realisation of Outcome 1: Improved quality of basic education by managing, co-ordinating, monitoring, evaluating and reporting on donor and conditional grant funding; compliance by the PEDs with bilateral financial agreements, Division of Revenue Act (DORA), as well as Treasury Practice Notes, in relation to discharging responsibilities as the national transferring authority of basic education conditional grants. Provincial monitoring and support visits are undertaken in order to support PEDs in the quest to obtain clean audits by identifying and dealing with bottlenecks inhibiting the uptake of conditional grant funds, and thus improving performance.
The Provincial Audit Monitoring and Support Directorate’s (Sector Audit Outcomes) purpose is to assist Provincial Education Departments in improving sector audit outcomes by providing advice, interventions and developing recommendations for enhancement or improvement to the governance, risk management and control processes. Advice and interventions are aimed at the following controls:
• The information systems environment;
• The reliability and integrity of financial and operational information;
• The effectiveness of operations;
• Safeguarding of assets; and
• Compliance with laws, regulations and controls.
The Department will work towards adherence to Section 4 of NEPA where a national policy for governance and monitoring and evaluation will be developed for the management and governance of the national education system. This will also be aligned to Chapter 9 of the 2014 -2019 MTSF for building a responsive, accountable, effective and efficient Government system. Efforts are underway to address guidelines for the auditing of schools with regulated audit bodies. This will streamline audit processes in the sector allowing a reduction in audit findings by the Auditor-General of South Africa. Mechanisms were implemented to improve the communication of new audit procedures/guidelines through the use of a link between the Departmental website and the Provincial Education Departments’ websites. The webpage will be updated on a continuous basis to inform Provincial Heads on audit matters. Processes will be strengthened in ensuring that school financial statements are audited by registered auditors. Plans will be implemented to ensure that the SA-SAMS Financial Assistant Module is used on a compulsory basis to assist in the preparation of school financial statements. The gap analysis conducted for SA-SAMS will allow for changes to be made to SA-SAMS for a fully effective and functional system.

51
Physical Planning
South African public schools’ infrastructure backlog remains a big challenge for the sector. In order to support the improvement of learning, emphasis will be placed on the following:
• Reducing inappropriate school structures by constructing new ones and maintaining existing structures;
• Prioritising the provision of basic services to schools (water and sanitation);
• Implementation and adherence to the Infrastructure Norms and Standards in all new projects (which may increase the costs of some projects further);
• Progressive maintenance and provision of school furniture for each learner; and
• Developing and supporting the roll-out of a school maintenance strategy for schools to maintain upgraded structures.
During 2013 the Department released the Regulations relating to Norms and Standards for Public Schools Infrastructure. This puts South Africa on a much better footing to deal with the complex matter of standards and targeting in the improvement of school infrastructure. The regulations envisage four (4) key goals:
• By 2016, all schools should meet minimum standards with respect to water, toilets, electricity and the materials used for school buildings;
• By 2020, all schools should have at least a minimum number of classrooms, relative to enrolments, as well as electronic connectivity and perimeter fencing;
• By 2023, all schools should have the required libraries and laboratories; and
• By 2030, all remaining standards should have been met. Accelerated Schools Infrastructure Delivery Initiative (ASIDI) schools will comply with all standards and thus serve as models and the testing ground for the policy. Part of the challenge in moving forward is to sustain the momentum of current initiatives. Over the MTSF the Department will emphasise maintenance, reporting and the introduction of more innovative approaches, to achieve greater success in the delivery of school infrastructure.
National Education Collaboration Trust (NECT)
The work of the NECT is informed by the six (6) themes presented in the Education Collaboration Framework (ECF) which guide its programme design and interventions:
• Professionalisation of the teaching service;
• Supporting courageous leadership;
• Improving the resourcing of education;
• Enhancing support for learners and promoting their wellbeing;
• Involving parents and communities in education; and
• Improving Government capacity to deliver.
The interventions provided by the NECT include district-based improvement programmes which prioritise the country’s poorly performing districts. Considerable attention is being taken by the NECT in ensuring that there is a systemic impact across the country’s education sector and promotes innovative education interventions to improve quality in education. Support is provided by the NECT to local interventions that are implemented by various organisations, both corporate and Government, with the aim of increasing their impact and yielding better results on investments. The NECT co-ordinates the Education DialogueSA programme which is aimed at providing an opportunity for key stakeholder to engage on key needs, approaches and issues in the provision of quality schooling to the country.

52
Partnerships
Partnerships in education delivery are critical to close the gaps that cannot be met due to financial constraints and can be achieved through strengthening partnerships with other stakeholders to improve the delivery of education through collaboration.
Quality Learning and Teaching Campaign (QLTC)
The major task of QLTC in education is to be a catalyst for positive change, quality improvement and transformation. It derives the focus of its strategic campaigns from Cabinet and the Ministerial Programme of Action. The major thrust of the QLTC is to provide a platform for communities and broader society to become actively and constructively involved in the improvement of teaching and learning. These efforts will be strengthened over the MTSF, in order to ensure that communities participate fully in education.
Project Management
The Project Management administers and manages the processes relating to donor funding and the related projects. The current mandate is to ensure that the European Union (EU) donor funding that, has been earmarked for the Primary Sector Policy Support Programme (Primed-SPSP) is properly administered and that appropriate control measures are in place to ensure compliance.
The South African National Commission for UNESCO
The South African National Commission for UNESCO will continue to co-ordinate and monitor the implementation of post-UNESCO General Conference obligations and serve as a liaison agency with Government Departments, statutory bodies, parastatals, Non-Government Organisations, education institutions and the South African public, working for the advancement of education, culture, science, communication and information.
International Relations and Multilateral Affairs (IR&MA)
The most common diplomatic endeavour between countries happens at a bilateral level. Bilateral engagements provide direct access to South Africa’s partner countries in the region, the continent and the world, thus enabling South Africa to structure mutually beneficial relations from a developmental perspective. The DBE will continue with bilateral engagements that are to the benefit of the Basic Education Sector.
Districts
The Department will continue to co-ordinate, monitor and support education districts by strengthening the regulatory environment and the capacity of district offices. The regular engagements by the Minister with districts will continue to be a platform of sharing good practices and to tackle challenges in the sector.
The Department, through the Planning and Delivery Oversight Unit, monitors the planning and delivery of selected priorities and assists the PEDs with these. The Department will work with provinces to ensure that provincial initiatives are aligned with national priorities, and to provide institutional support for their effective delivery. Furthermore, the Department will also oversee the partnership established with business and social partners through the National Education Collaboration Trust to improve learning outcomes by piloting interventions in selected districts.
National Education Evaluation and Development Unit (NEEDU)
The NEEDU facilitates school improvement through systematic evaluation. The unit will evaluate how district offices, PEDs and the National Department monitor and support schools, School Governing Bodies and teachers. This entails identifying critical factors that inhibit or advance the attainment of sector goals and school improvement, and making focused recommendations for addressing problem areas that undermine school improvement and the attainment of sector goals.

53
Stra
tegi
c ob
jecti
ve a
nnua
l tar
gets
for 2
018/
2019
to 2
020/
2021
Stra
tegi
c obj
ectiv
eAu
dite
d/Ac
tual
perfo
rman
ceEs
timat
ed
perfo
rman
ce
2017
/18
Medi
um-te
rm ta
rget
s
2014
/1520
15/16
2016
/1720
18/19
2019
/2020
20/21
4.1-4
.2 Pr
ovide
data
on le
arne
r per
forma
nce
throu
gh t
he s
etting
of
ques
tion
pape
rs,
admi
nister
ing th
e ex
amina
tions
and
data
an
alysis
of t
he N
ation
al Ex
amina
tions
and
as
sess
ments
cond
ucted
perio
dicall
y.
• Nati
onal
ANA
repo
rt
•ANA
Diag
nosti
c re
port
•NSC
Tech
nical
Repo
rt
•NCS
Deta
iled
Scho
ols st
atisti
cs
Repo
rt
•NSC
Diag
nosti
c re
port
in se
lected
su
bjects
• Nati
onal
ANA
repo
rt
•ANA
Diag
nosti
c re
port
•Ann
ual A
NA
Distr
ict R
epor
t
•NSC
Tech
nical
Repo
rt
•NCS
Det
ailed
Sc
hools
stat
istics
Re
port
•NSC
Diag
nosti
c re
port
in se
lecte
d su
bjects
• NA
Diag
nosti
c tes
t ite
ms i
n La
ngua
ge
and
Mat
hem
atics
pr
ovide
d
• NSC
Exa
mina
tions
Re
port
•NSC
Sch
ools
statis
tics R
epor
t
•NSC
Diag
nosti
c Re
port
in se
lected
su
bjects
•NSC
Sch
ools
Subje
ct Re
port
•Sen
ior C
ertifi
cate
Repo
rt
•NA
Diag
nosti
c te
st ite
ms i
n La
ngua
ge a
nd
Mat
hem
atics
pr
ovide
d
•NSC
Ex
amina
tions
Re
port
•NSC
Sch
ools
statis
tics R
epor
t
•NSC
Diag
nosti
c Re
port
in se
lected
su
bjects
•NSC
Sch
ools
Subje
ct Re
port
•NA
Diag
nosti
c te
st ite
ms i
n La
ngua
ge a
nd
Mat
hem
atics
pr
ovide
d
•NSC
Ex
amina
tions
Re
port
•NSC
Sch
ools
statis
tics R
epor
t
•NSC
Diag
nosti
c Re
port
in se
lected
su
bjects
•NSC
Sch
ools
Subje
ct Re
port
• NA
Diag
nosti
c te
st ite
ms i
n La
ngua
ge a
nd
Mat
hem
atics
pr
ovide
d
•NSC
Ex
amina
tions
Re
port
•NSC
Sch
ools
statis
tics R
epor
t
•NSC
Diag
nosti
c Re
port
in se
lected
su
bjects
•NSC
Sch
ools
Subje
ct Re
port
• NA
Diag
nosti
c te
st ite
ms i
n La
ngua
ge a
nd
Mat
hem
atics
pr
ovide
d
•NSC
Ex
amina
tions
Re
port
•NSC
Sch
ools
statis
tics R
epor
t
•NSC
Diag
nosti
c Re
port
in se
lected
su
bjects
•NSC
Sch
ools
Subje
ct Re
port
4.3 P
rovid
e ba
sic in
frastr
uctur
e se
rvice
s (w
ater,
sanit
ation
, elec
tricity
) an
d re
place
sc
hools
buil
t usin
g ina
ppro
priat
e ma
terial
s on
an
annu
al ba
sis in
ord
er to
impr
ove
the
cond
itions
unde
r whic
h lea
rner
s are
taug
ht.
--
Scho
ol Inf
rastr
uctur
e pr
ojects
imple
mente
d
Scho
ol Inf
rastr
uctur
e pr
ojects
im
pleme
nted
Wate
r, san
itatio
n an
d sch
ool
repla
ceme
nt pr
ojects
im
pleme
nted
Scho
ol re
place
ment
pr
ojects
im
pleme
nted
Scho
ol re
place
ment
proje
cts
imple
mente
d
4.4
To
prom
ote
the
functi
onali
ty of
scho
ols t
hrou
gh t
he i
nstitu
tiona
lising
of
a sta
ndar
dised
sc
hool
admi
nistra
tion
syste
m, d
esign
ed t
o as
sist
with
scho
ol ma
nage
ment
and
repo
rting
to a
natio
nal
infor
matio
n sys
tem on
an on
going
basis
.
--
Monit
ored
the
scho
ol ma
nage
ment
and
repo
rting i
nform
ation
sy
stem
Monit
ored
the
sch
ool
mana
geme
nt an
d rep
ortin
g inf
orma
tion s
ystem
Monit
ored
the
sch
ool
mana
geme
nt an
d rep
ortin
g inf
orma
tion s
ystem
Monit
ored
the
sch
ool
mana
geme
nt an
d rep
ortin
g inf
orma
tion s
ystem
Monit
ored
the
sch
ool
mana
geme
nt an
d rep
ortin
g inf
orma
tion s
ystem
4.5 M
entor
and
ass
ess t
he p
erfor
manc
e of
distric
ts an
d dis
trict o
fficial
s on
an
annu
al ba
sis in
orde
r to s
treng
then t
he ca
pacit
y of
distric
ts to
supp
ort s
choo
ls-
-Su
ppor
t pro
vided
to
all ta
rgete
d dist
ricts
Supp
ort p
rovid
ed
to all
targ
eted
distric
ts
Supp
ort p
rovid
ed
to all
targ
eted
distric
ts
Supp
ort p
rovid
ed
to all
targ
eted
distric
ts
Supp
ort p
rovid
ed
to all
targ
eted
distric
ts

54
Prog
ram
me
perf
orm
ance
indi
cato
rs a
nd a
nnua
l tar
gets
for 2
018/
2019
to 2
020/
2021
Stra
tegi
c Obj
ectiv
ePr
ogra
mm
e Pe
rform
ance
In
dica
tor
Stra
tegi
c Plan
Ta
rget
Audi
ted/
Actu
al pe
rform
ance
Estim
ated
pe
rform
ance
20
17/18
Medi
um-te
rm ta
rget
s
2014
/1520
15/16
2016
/1720
18/19
2019
/2020
20/21
4.1 P
rovid
e data
on
learn
er pe
rform
ance
thr
ough
the s
etting
of
ques
tion p
aper
s, ad
minis
tering
the
exam
inatio
ns an
d data
an
alysis
of th
e Nati
onal
Exam
inatio
ns an
d as
sess
ments
cond
ucted
pe
riodic
ally
4.1.1.
Num
ber o
f Na
tiona
l Ass
essm
ent
repo
rts pr
oduc
ed
2 Rep
orts
• Nati
onal
ANA
repo
rt
• Diag
nosti
c rep
ort
• Nati
onal
ANA
repo
rt
• Diag
nosti
c re
port
• Nati
onal
ANA
repo
rt
• Diag
nosti
c re
port
• Ann
ual A
NA
distric
t rep
ort
- -
- 3-
-
4.1.2.
A ba
nk of
La
ngua
ge an
d Ma
thema
tics t
est
items
for G
rade
s 3,6
& 9 d
evelo
ped
--
-70
1 item
s wer
e de
velop
ed fo
r both
La
ngua
ge an
d Ma
thema
tics f
or
Grad
es 3,
6 an
d 9.
150 t
est it
ems
deve
loped
in
Grad
es 3,
6,9
Mathe
matic
s an
d Lan
guag
es
200 t
est it
ems
deve
loped
in
Grad
es 3,
6,9
Mathe
matic
s an
d Lan
guag
es
250 t
est it
ems
deve
loped
in
Grad
es 3,
6,9
Mathe
matic
s an
d Lan
guag
es
300 t
est it
ems
deve
loped
in
Grad
es 3,
6,9
Mathe
matic
s an
d Lan
guag
es4.2
Pro
vide d
ata on
lea
rner
perfo
rman
ce
throu
gh th
e sett
ing
of qu
estio
n pap
ers,
admi
nister
ing th
e ex
amina
tions
and d
ata
analy
sis of
the N
ation
al Ex
amina
tions
and
asse
ssme
nts co
nduc
ted
perio
dicall
y
4.2.1.
Num
ber
of NS
C re
ports
pr
oduc
ed
4 Nati
onal
Exam
Re
ports
on le
arne
r pe
rform
ance
in
Grad
e 12:
• Tec
hnica
l Rep
ort;
• Deta
iled S
choo
ls sta
tistic
s Rep
ort;
• Diag
nosti
c rep
ort
in se
lected
su
bjects
; and
• Rep
ort o
n sc
hools
stati
stics
ind
icatin
g 3-ye
ar
perfo
rman
ce
in se
lected
su
bjects
.
The f
ollow
ing
repo
rts w
ere
prod
uced
:
• Te
chnic
al Re
port.
• Sc
hool
statis
tics
repo
rt.
• Sc
hool
subje
ct re
ports
.
Four
repo
rts
prod
uced
:
• Di
agno
stic
repo
rt
• Sc
hool
Perfo
rman
ce
Repo
rt
• Sc
hool
Subje
ct Re
port
• Te
chnic
al Re
port.
5 Rep
orts
and 1
inf
orma
tion b
ookle
t we
re pr
oduc
ed
• Ex
amina
tions
re
port
• Sc
hools
’ pe
rform
ance
re
port
• Sc
hools
’ sub
ject
repo
rt
• Di
agno
stic R
epor
t
• Inf
orma
tion
book
let
• Re
port
on th
e 20
16 S
C
4 Rep
orts
• NSC
Ex
amina
tions
Re
port
• NSC
Sch
ools
Stati
stics
Re
port
• NSC
Di
agno
stic
Repo
rt in
selec
ted
subje
cts
• NSC
Sch
ools
Subje
ct Re
port
4 Rep
orts
• NSC
Ex
amina
tions
Re
port
• NSC
Sch
ools
Stati
stics
Re
port
• NSC
Di
agno
stic
Repo
rt in
selec
ted
subje
cts
• NSC
Sch
ools
Subje
ct Re
port
4 Rep
orts
• NSC
Ex
amina
tions
Re
port
• NSC
Sch
ools
Stati
stics
Re
port
• NSC
Di
agno
stic
Repo
rt in
selec
ted
subje
cts
• NSC
Sch
ools
Subje
ct Re
port
4 Rep
orts
• NSC
Ex
amina
tions
Re
port
• NSC
Sch
ools
Stati
stics
Re
port
• NSC
Di
agno
stic
Repo
rt in
selec
ted
subje
cts
• NSC
Sch
ools
Subje
ct Re
port
4.2.2.
Num
ber o
f qu
estio
n pap
ers s
et an
nuall
y for
NSC
an
d SC
--
-36
6 que
stion
pape
rs se
t ann
ually
for N
SC
and S
C
348 q
uesti
on
pape
rs se
t an
nuall
y for
NS
C an
d SC
260 q
uesti
on
pape
rs se
t an
nuall
y for
NS
C an
d SC
260 q
uesti
on
pape
rs se
t an
nuall
y for
NS
C an
d SC
260 q
uesti
on
pape
rs se
t an
nuall
y for
NS
C an
d SC
3 N
atio
nal A
sses
smen
ts a
re b
eing
rem
odel
led,
and
if th
ese
asse
ssm
ents
are
not
writ
ten
annu
ally
the
targ
ets f
or th
e re
mai
ning
yea
rs w
ill b
e ad
just
ed a
ccor
ding
ly.

55
Stra
tegi
c Obj
ectiv
ePr
ogra
mm
e Pe
rform
ance
In
dica
tor
Stra
tegi
c Plan
Ta
rget
Audi
ted/
Actu
al pe
rform
ance
Estim
ated
pe
rform
ance
20
17/18
Medi
um-te
rm ta
rget
s
2014
/1520
15/16
2016
/1720
18/19
2019
/2020
20/21
4.3 P
rovid
e bas
ic inf
rastr
uctur
e ser
vices
(w
ater, s
anita
tion,
electr
icity)
and r
eplac
e sc
hools
built
using
ina
ppro
priat
e mate
rials
on
an an
nual
basis
in or
der
to im
prov
e the
cond
itions
un
der w
hich l
earn
ers a
re
taugh
t.
4.3.1.
Num
ber o
f ne
w sc
hools
built
and c
omple
ted
throu
gh A
SIDI
.
178
--
16 in
2016
/17
179 i
n tota
l
115
5017
15
4.3.2.
Num
ber o
f sc
hools
prov
ided
with
sanit
ation
fac
ilities
thro
ugh
ASID
I.
370
--
9 in 2
016/1
7
425 i
n tota
l
257
286
-4-4
4.3.3.
Num
ber o
f sc
hools
prov
ided
with
water
thro
ugh
ASID
I.
739
--.
10 in
2016
/17
615 i
n tota
l
344
325
-4-4
4.3.4.
Num
ber o
f sc
hools
prov
ided
with
electr
icity
throu
gh A
SIDI
.
625
--
0 in 2
016/1
7
306 i
n tota
l
134
--
-
4.4 To
prom
ote
the fu
nctio
nality
of
scho
ols th
roug
h the
ins
titutio
nalis
ing of
a sta
ndar
dised
scho
ol ad
minis
tratio
n sys
tem,
desig
ned t
o ass
ist w
ith
scho
ol ma
nage
ment
and
repo
rting t
o a na
tiona
l inf
orma
tion s
ystem
on an
on
going
basis
.
4.4.1
Perce
ntage
of
publi
c sch
ools
using
the
stan
dard
ised
scho
ol ad
minis
tratio
n sy
stem,
SA-S
AMS
for re
portin
g.
99%
-Al
l qua
rters
–88.4
%21
233 u
sing
SA-S
AMS/
24 03
0 tota
l no.
of sc
hools
95.9%
21 35
4/22 2
69
98%
98%
98%
99%
4.4.2
Numb
er of
pr
ovinc
es m
onito
red
by D
BE of
ficial
s for
im
pleme
ntatio
n of
LURI
TS an
nuall
y.
--
--
-1 r
epor
t co
verin
g 9
prov
inces
mo
nitor
ed
1 rep
ort
cove
ring 9
pr
ovinc
es
monit
ored
1 rep
ort
cove
ring 9
pr
ovinc
es
monit
ored
4 A
SID
I is p
lann
ed to
wra
p up
in 2
018/
19 in
resp
ect o
f san
itatio
n an
d w
ater
pro
visio
n

56
Stra
tegi
c Obj
ectiv
ePr
ogra
mm
e Pe
rform
ance
In
dica
tor
Stra
tegi
c Plan
Ta
rget
Audi
ted/
Actu
al pe
rform
ance
Estim
ated
pe
rform
ance
20
17/18
Medi
um-te
rm ta
rget
s
2014
/1520
15/16
2016
/1720
18/19
2019
/2020
20/21
4.5 M
entor
and a
sses
s the
perfo
rman
ce of
dis
tricts
on an
annu
al ba
sis in
orde
r to
stren
gthen
the c
apac
ity
of dis
tricts
to su
ppor
t sc
hools
.
4.5.1.
Num
ber o
f offi
cials
from
distric
ts tha
t ach
ieved
be
low th
e nati
onal
benc
hmar
k in t
he
NSC
partic
ipatin
g in
a men
toring
pr
ogra
mme.
138
3136
3630
3030
35
4.5.2.
Per
centa
ge
of sc
hool
princ
ipals
ratin
g the
supp
ort
servi
ces o
f dist
ricts
as be
ing sa
tisfac
tory.
75%
-69
.3%
629 p
rincip
als
rated
supp
ort a
s
satis
factor
y/
908 p
rincip
als
partic
ipated
in
the su
rvey
72%
511/7
08
An
impr
ovem
ent
plan
71%
75%
79%
4.5.3.
Per
centa
ge
of dis
trict m
anag
ers
asse
ssed
again
st de
velop
ed cr
iteria
.
95%
-65
.4%
53 D
istric
t Ma
nage
rs as
sess
ed/
81 di
strict
s
74%
52/70
85%
90%
95%
95%

57
Quarterly targets for 2018/2019
Programme Performance Indicator Reporting period
Annual target 2018/19
Quarterly targets
1st 2nd 3rd 4th
4.1.2 A bank of Language and Mathematics test items for Grade 3, 6 and 9 developed.
Annually 200 - - - 200
4.2.1 Number of NSC reports produced. Annually 4 - - - 4
4.2.2 Number of question papers set annually for NSC and SC. Annually 260 - - - 260
4.3.1 Number of new schools built and completed through ASIDI. Annually 50 - - - 50
4.3.2 Number of schools provided with sanitation facilities through ASIDI. Annually 286 - - - 286
4.3.3 Number of schools provided with water through ASIDI. Annually 325 - - - 325
4.3.4 Number of schools provided with electricity through ASIDI. Annually - - - - -
4.4.1 Percentage of public schools using the standardised school administration system, SA-SAMS for reporting.
Annually 98% - - - 98%
4.4.2 Number of provinces monitored by DBE officials for implementation of LURITS annually.
Annually1 report covering
9 provinces monitored
- - -1 report covering
9 provinces monitored
4.5.1 Number of officials from districts that achieved below the national benchmark in the NSC participating in a mentoring programme.
Annually 30 - - - 30
4.5.2 Percentage of school principals rating the support services of districts as being satisfactory.
Annually 71% - - - 71%
4.5.3 Percentage of district managers assessed against developed criteria.
Annually 90% - - - 90%

58
Reconciling performance targets with the Budget and MTEF Expenditure estimates
Sub-ProgrammeAudited Outcomes R’000
Adjusted appropriation
R’000
Medium-term expenditure estimate R’000
2014/15 2015/16 2016/17 2017/18 2018/19 2019/20 2020/21Programme Management: Planning Information and Assessment
2 896 3 100 2 963 3 170 3 371 3 574 3 827
Information Management Systems
47 111 39 704 47 068 39 156 40 173 43 100 45 060
School Infrastructure 9 878 095 10 985 280 11 257 963 12 232 019 11 398 577 11 650 895 12 446 218 National Assessments and Public Examination
378 317 377 131 289 205 383 523 371 670 381 166 399 170
National Education Evaluation and Development Unit
26 281 25 580 26 185 20 863 21 317 22 825 24 355
Planning and Delivery Oversight Unit
96 175 81 111 96 569 123 209 136 234 145 034 153 171
Total 10 428 875 11 511 906 11 719 953 12 801 940 11 971 342 12 246 594 13 071 801
Economic ClassificationCurrent Payments 514 756 612 435 531 872 505 432 489 031 505 581 504 869 Compensation of employees 120 449 119 782 126 111 124 272 133 248 142 753 153 444 Goods and Services of which: 394 307 492 653 405 761 381 160 355 783 362 828 351 425 Computer services 43 621 47 865 50 675 44 205 50 699 52 963 53 978 Consultants: business and advisory services
73 619 120 287 167 667 133 291 130 000 134 326 118 190
Consumables: stationery, printing and office supplies
3 021 21 531 2 458 24 341 25 771 18 488 18 054
Travel and subsistence 45 122 53 166 64 428 83 727 100 145 107 809 109 211 Transfers and subsidies 7 500 403 9 530 823 10 131 882 10 273 583 10 160 556 10 570 590 11 737 167 Provinces and municipalities 7 326 584 9 354 443 9 933 282 10 045 562 9 917 734 10 314 159 11 466 632 Departmental agencies and accounts
107 854 112 705 118 678 124 612 128 543 135 741 143 207
Foreign Government 2 600 3 135 3 348 3 571 3 295 3 480 3 671

59
Sub-ProgrammeAudited Outcomes R’000
Adjusted appropriation
R’000
Medium-term expenditure estimate R’000
2014/15 2015/16 2016/17 2017/18 2018/19 2019/20 2020/21Non Profit institutions 63 000 60 000 72 120 99 413 110 984 117 210 123 657 Households 365 540 454 425 - - -Payments for capital assets 2 408 716 1 368 609 1 051 061 2 022 925 1 321 755 1 170 423 829 765 Building and other fixed structure
2 407 887 1 368 285 1 049 535 2 021 421 1 321 045 1 169 848 829 151
Machinery and equipment 829 324 1 526 1 504 710 575 614 Software and other intangible assets
- - - - - - -
Payments for financial assets 5 000 39 5 138 - - - -Total 10 428 875 11 511 906 11 719 953 12 801 940 11 971 342 12 246 594 13 071 801
Departmental agencies and accounts
107 354 112 705 118 678 124 612 128 543 135 741 143 207
Umalusi, Council for Quality Assurance and Further Education and Training, Human Resources Research Council
107 354 112 705 118 678 124 612 128 543 135 741 143 207
Household Social benefits current
365 540 454 1 - - -
Employee Social benefits 365 540 454 1 - - -
Foreign govern and international organisations
2 600 3 135 3 348 3 571 3 295 3 480 3 671
Southern and Eastern Consortium for Monitoring Education Quality
2 600 3 135 3 265 3 571 3 295 3 480 3 671
Current 63 000 60 000 76 120 99 413 110 984 117 210 123 657National initiative to improve learning outcomes
63 000 60 000 76 120 99 413 110 984 117 210 123 657
Provincial Revenue FundsCapital 7 326 584 9 354 443 9 933 282 10 045 562 9 917 734 10 314 159 11 466 632 Education Infrastructure Grant 7 326 584 9 354 443 9 933 282 10 045 562 9 917 734 10 314 159 11 466 632

60
Performance and expenditure trends: Programme 4
Education Infrastructure Grant and ASIDI
The Education Infrastructure Grant allocation is reduced to R35.3 billion over the MTEF period, or 44.7%. These funds are to be used to build new schools, upgrade and maintain existing infrastructure, and provide school furniture. Over the MTEF period R8.8 billion have been shifted from the Education Infrastructure Grant, of which R7.3 billion is shifted back to the School Infrastructure Backlogs indirect Grant for the completion of the current ASIDI projects, and R1.5 billion has been repriotised from the remaining unallocated portion of the Education Infrastructure Grant for the maintenance of school infrastructure to ensure that all schools are repaired and functioning as intended, to meet basic infrastructure Norms and Standards. The allocation is ensuring that all infrastructure projects are planned and funded in line with cost-control measures introduced over the construction of new schools and additional buildings at existing schools. The Department expects to have replaced 50 inappropriate and unsafe schools with newly built schools and to provide water to 325 schools and sanitation to 286 schools.
Challenges of School Infrastructure Backlog:
§ Poor performance by the Professional Service Providers resulting in inferior quality of work which had to be redone;
§ The process of rationalisation and mergers of schools on the ASIDI programme also contributed to the set targets not being achieved; and
§ Construction works disruptions due to community unrest.
4.5. Programme 5: Educational Enrichment ServicesProgramme Purpose: Monitor and support provinces to implement care and support programmes for learning and teaching.
Sub-programmes: Programme Management: Educational Enrichment Services; Care and Support in Schools; and Partnership in Education
Strategic Objectives:
§ Improve learner health and wellness through the implementation of school health programmes, including the provision of nutritious meals to all learners in Quintiles 1 to 3 primary, secondary and identified special schools on an annual basis.
§ Reduce barriers to learning through the implementation of school sport, safety and social cohesion programmes each year over the medium-term to ensure the holistic development of learners, enhance their learning experience and maximise their school performance.
Programme performance indicators and annual targets for 2016/2017 to 2018/2019
Action Plan Goal on Learner Well-Being
Goal 25 ► Use schools as vehicles for promoting access to a range of public services among learners in areas such as health, poverty alleviation, psychosocial support, sport and culture.
Learner Well-Being
In its quest to improve its programmes on learner wellness, the Department of Basic Education is also strengthening the psycho-social support programme to ensure that learners who experience psychological, emotional and social problems, are supported. The overall aim is to strengthen the capacity of PEDs, districts and schools to institutionalise/mainstream Psycho-social Support Services (PSS)
For the Financial Year 2018/2019, the Department will:
• Work with two (2) provinces to institutionalise and implement the strategy on Psycho-social Support in Basic Education;
• Popularise the SIAS process for PSS;
• Monitor and support the cascading of the provincial training on supporting traumatised learners; and
• Support the training of Learner Support Agents on PSS.

61
SCHOOL SAFETY
The Department will monitor and support the implementation of the National School Safety Framework (NSSF) in 185 Hot Spot Schools across 81 education districts. The intention is to ensure that the learning environment is characterised not only by good quality education, but that it is also safe and free from insecurity and threats of violence.
The Department is committed to preventing, managing and responding to safety incidents, and in so doing, creating a safe and supportive learning and teaching environment. Numerous aspects interact when it comes to ensuring a safe and supportive school environment that enables children to develop their full potential to become happy and productive citizens of South Africa.
School safety programmes are aligned to local, specific and targeted interventions based on locally-identified needs. They include safety procedures that are expected at a school, district and provincial level; standardised data collection and built-in monitoring tools; as well as standardised indicators of which data should be collected and reported on. Programmes that strengthen the implementation of the NSSF include addressing bullying in schools, learner road safety, implementing the DBE-SAPS Protocols, addressing violence in schools and implementing the national strategy for the management of drug and substance abuse. The Medium-Term targets of 900 Hot Spot Schools monitored per year is informed by the capacity of each province to host these workshops, supported by the DBE. The pool of professionals (adjudicators, conductors and data capturers) that are trained at professional level will then conduct similar trainings at a district level to increase the reach.
SCHOOL SPORT AND ENRICHMENT
School sport is integral to the holistic development of the learner and also a critical catalyst in fostering social cohesion, team building and youth development, as well as individual and group discipline. Physical activity and sport advance good health and strengthen children’s physical and social development. Sport promotes and actions many of the values which underpin a modern democracy – those of fairness, equality, respect and compliance – all those beliefs, values and behaviours that make up healthy communities and responsible citizenry. Participation in school sports and school sport leagues is an important vehicle to achieving our goals.
SOCIAL COHESION
Since 1994, South Africa has faced particular challenges relating to the building of a peaceful democracy, watched closely by the rest of the world. The apartheid past was characterised by racial intolerance, state-sponsored political violence and mass resistance. The current democratic Government has attempted to address transformation through changes to legislation, redress and fundamental shifts in the education system.
The educational needs of learners in the 21st century are becoming dramatically different given the conditions and challenges we are facing as a nation and as a society. This prompts the education system to bear a particular responsibility in building a peace-loving society, with a shared sense of national identity and greater social cohesion, thus inculcating a sense of values at school. It is intended to help young people achieve higher levels of moral judgement. The Department also believes that education does not exist simply to serve the market, but to serve society, and that means instilling in learners a broad sense of values that can emerge only from a balanced exposure to the humanities as well as the sciences.
In its effort to build social capital and foster greater social cohesion in schools and communities, the Department uses several platforms and opportunities to engage young people on the issues of values in society, and how these values form the basis for harmony, peace and well-being of the nation. The Department provides support and content to the key pillars of education, namely curriculum, teacher development, enrichment and extracurricular programmes. In terms of curriculum support, content on human rights, nation building and constitutional awareness are provided for in workbooks. In terms of training, support is provided for teachers in addressing gender-based violence in schools and implementing the oral history programme and Bill of Responsibilities in the classroom, among others. The following key programmes are being implemented in partnership with other Government Departments and external partners: the iNkosi Albert Luthuli Oral History Competition, the Schools Moot Court Competition, the Youth Citizen Action Programme, the Techno Girls Empowerment Programme and the Schools Democracy Programme.
The strategies and the multi-stakeholder approach applied in implementing the above is founded on the notion that the Constitution expresses South Africans’ shared aspirations, and the moral and ethical direction the Constitution has set for the future. The latter resonates well within the National Development Plan’s six (6) Pillars and objectives. It is the intention of the Department of Basic Education to make the NDP vision of a society based on equity, justice and freedom, a reality.

62
Stra
tegi
c ob
jecti
ves a
nd a
nnua
l tar
gets
for 2
018/
2019
to 2
020/
2021
Stra
tegi
c obj
ectiv
eAu
dite
d/Ac
tual
perfo
rman
ceEs
timat
ed
perfo
rman
ce
2017
/18
Medi
um-te
rm ta
rget
s
2014
/1520
15/16
2016
/1720
18/19
2019
/2020
20/21
5.1 To
mon
itor t
he pr
ovisi
on of
nutrit
ious
meals
serve
d in i
denti
fied p
ublic
scho
ols
annu
ally t
o enh
ance
lear
ning c
apac
ity an
d we
ll-bein
g of le
arne
rs.
Monit
ored
ide
ntifie
d sch
ools
in 33
Dist
rics o
n the
prov
ision
of
nutrit
ious m
eals
Monit
ored
ide
ntifie
d sch
ools
in 35
Dist
rics o
n the
prov
ision
of
nutrit
ious m
eals
Monit
ored
ide
ntifie
d sch
ools
in 43
Dist
rics o
n the
prov
ision
of
nutrit
ious m
eals
Monit
or id
entifi
ed
scho
ols in
53
Distr
ics on
the
prov
ision
of
nutrit
ious m
eals
Monit
or id
entifi
ed
scho
ols in
63
Distr
ics on
the
prov
ision
of
nutrit
ious m
eals
Monit
or id
entifi
ed
scho
ols in
81
Distr
ics on
the
prov
ision
of
nutrit
ious m
eals
Monit
or id
entifi
ed
scho
ols in
81
Distr
ics on
the
prov
ision
of
nutrit
ious m
eals
5.2 P
romo
te the
partic
ipatio
n of le
arne
rs in
enric
hmen
t and
co-cu
rricu
lar ac
tivitie
s in
orde
r to m
ake a
posit
ive im
pact
on le
arnin
g.
--
Monit
ored
and
hoste
d:§ S
ASCE
§ Sch
ool S
port
Even
ts§ S
pellin
g Bee
§ R
eadin
g Club
s § M
oot C
ourt
prog
ramm
e§ N
kosi
Albe
rt Lu
thuli O
ral
Histo
ry Co
mpeti
tion
§Bi
ll of
Resp
onsib
ility
prog
ramm
es
Monit
or an
d hos
t:§ S
ASCE
§ Sch
ool S
port
Even
ts§ S
pellin
g Bee
§ R
eadin
g Club
s § M
oot C
ourt
prog
ramm
e§ N
kosi
Albe
rt Lu
thuli O
ral
Histo
ry Co
mpeti
tion
§Bi
ll of
Resp
onsib
ility
prog
ramm
es
Monit
or an
d hos
t:§ S
ASCE
§ Sch
ool S
port
Ev
ents
§ Spe
lling B
ee
§ Rea
ding C
lubs
§ Moo
t Cou
rt pr
ogra
mme
§ Nko
si Al
bert
Luthu
li Ora
l Hi
story
Comp
etitio
n§
Bill o
f Re
spon
sibilit
y pr
ogra
mmes
Monit
or an
d hos
t:§ S
ASCE
§ Sch
ool S
port
Even
ts§ S
pellin
g Bee
§ R
eadin
g Club
s § M
oot C
ourt
prog
ramm
e§ N
kosi
Albe
rt Lu
thuli O
ral
Histo
ry Co
mpeti
tion
§Bi
ll of
Resp
onsib
ility
prog
ramm
es
Monit
or an
d hos
t:§ S
ASCE
§ Sch
ool S
port
Even
ts§ S
pellin
g Bee
§ R
eadin
g Club
s § M
oot C
ourt
prog
ramm
e§ N
kosi
Albe
rt Lu
thuli O
ral
Histo
ry Co
mpeti
tion
§Bi
ll of
Resp
onsib
ility
prog
ramm
es
5.3 M
onito
r the
imple
menta
tion o
f the
Natio
nal S
choo
l Safe
ty Fr
amew
ork (
NSSF
) in
185 H
ot Sp
ot Sc
hools
by 20
19/20
in or
der
to att
ain S
afe, C
aring
and V
iolen
ce-fr
ee
scho
ol en
viron
ments
.
--
Monit
or
imple
menta
tion o
f the
NSS
F in
Hot
Spot
Scho
ols
Monit
or
imple
menta
tion o
f the
NSS
F in
Hot
Spot
Scho
ols
Monit
or
imple
menta
tion o
f the
NSS
F in
Hot
Spot
Scho
ols
Monit
or
imple
menta
tion o
f the
NSS
F in
Hot
Spot
Scho
ols
Monit
or
imple
menta
tion o
f the
NSS
F in
Hot
Spot
Scho
ols

63
Perf
orm
ance
Indi
cato
rs a
nd M
TEF
Targ
ets
Stra
tegi
c Obj
ectiv
ePr
ogra
mm
e Per
form
ance
Indi
cato
rSt
rate
gic
Plan
Targ
et
Audi
ted/
Actu
al pe
rform
ance
Estim
ated
pe
rform
ance
20
17/18
Medi
um-te
rm ta
rget
s
2014
/1520
15/16
2016
/1720
18/19
2019
/2020
20/21
5.1 To
mon
itor t
he p
rovis
ion o
f nutr
itious
me
als se
rved i
n ide
ntifie
d pub
lic sc
hools
an
nuall
y to
enha
nce
learn
ing c
apac
ity
and w
ell-b
eing o
f lear
ners.
5.1.1.
Num
ber o
f sch
ools
monit
ored
for
the p
rovis
ion of
nutrit
ious m
eals.
470
--
151
130
110
110
115
5.2 P
romo
te the
partic
ipatio
n of le
arne
rs in
enric
hmen
t and
co-cu
rricu
lar ac
tivitie
s in
orde
r to
make
a p
ositiv
e im
pact
on
learn
ing.
5.2.1.
Nu
mber
of
profe
ssion
als
traine
d in S
ASCE
prog
ramm
es.
3 60
0-
-1 0
8290
090
090
090
0 5
5.2.2.
Num
ber o
f lea
rner
s, tea
cher
s, offi
cials,
SG
Bs
and
comm
unity
or
ganis
ation
mem
bers
partic
ipatin
g in
socia
l coh
esion
and
gen
der e
quity
pr
ogra
mmes
.
30 50
0-
5 843
5 924
6 000
7 000
7 500
8 000
5.3 M
onito
r the
imple
menta
tion
of the
Na
tiona
l Sc
hool
Safet
y Fr
amew
ork
(NSS
F) in
185
Hot
Spot
Scho
ols b
y 20
19/20
in o
rder
to a
ttain
Safe,
Car
ing
and V
iolen
ce-fr
ee sc
hool
envir
onme
nts.
5.3.1.
Num
ber o
f Hot
Spot
Scho
ols
monit
ored
towa
rds I
mplem
entat
ion of
the
NSS
F.18
5-
4648
4647
6581
5 Th
e ta
rget
of 9
00 p
er y
ear i
s inf
orm
ed b
y th
e ca
paci
ty o
f eac
h pr
ovin
ce to
hos
t the
se w
orks
hops
, sup
port
ed b
y th
e D
BE. Th
e po
ol o
f pro
fess
iona
ls (a
djud
icat
ors,
cond
ucto
rs a
nd d
ata
capt
urer
s) th
at a
re tr
aine
d at
pro
fess
iona
l le
vel w
ill th
en co
nduc
t sim
ilar t
rain
ings
at a
dist
rict l
evel
to in
crea
se th
e re
ach

64
QUARTELY TARGTES FOR 2018/19
Programme Performance Indicator Reporting period
Annual target 2018/19
Quarterly targets1st 2nd 3rd 4th
5.1.1 Number of schools monitored for the provision of nutritious meals. Quarterly 110 10 40 20 40
5.2.1 Number of professionals trained in SASCE programmes. Annually 900 - - - 900
5.2.2 Number of learners, teachers, officials, SGBs and community organisation members participating in social cohesion and gender equity programmes.
Quarterly 7 000 2 000 2 500 - 2 500
5.3.1 Number of Hot Spot Schools monitored towards Implementation of the NSSF. Quarterly 47 12 12 12 11
Reconciling performance targets with the Budget and MTEF Expenditure estimates
Sub-ProgrammeAudited Outcomes R’000
Adjusted appropria-tion R’000
Medium-term expenditure estimate R’000
2014/15 2015/16 2016/17 2017/18 2018/19 2019/20 2020/21Programme Management: Educational Enrichment Services
2 438 2 191 3 062 3 124 3 321 3 622 3 888
Partnership in Education 20 487 17 686 22 014 27 465 27 127 30 346 32 379
Care and Support in Schools 5 696 623 5 916 579 6 308 646 6 699 388 7 074 680 7 474 748 8 000 866
Total 5 719 548 5 936 456 6 333 722 6 729 977 7 105 128 7 508 716 8 037 133
Economic classification
Current payments 44 864 41 909 49 499 57 957 59 339 65 553 70 052 Compensation of employees 31 996 30 836 33 607 37 769 40 677 45 112 48 497
Goods and services 12 868 11 073 15 892 20 188 18 662 20 441 21 555
Minor Assets 20 6 8 1 406 67 74 79
Agency and Support/outsourced services
47 262 764 - - - -
Consumables : stationery, printing and office supplies
1 952 529 758 1 711 1 797 2 180 2 358
Travel and subsistence 6 156 6 196 7 727 11 388 12 518 13 674 14 371
Transfers and subsidies 5 674 310 5 894 235 6 284 014 6 671 682 7 045 379 7 442 735 7 966 618 Provinces and municipalities 5 674 053 5 894 111 6 282 842 6 671 621 7 045 314 7 442 666 7 966 545
Non-profit institutions 53 55 58 61 65 69 73
Household 204 69 114 - - - -
Payments for capital assets 374 102 203 338 410 428 463 Machinery and Equipment 322 102 203 338 410 428 463
Software and other intangible assets 52 - - - - - -Payments for financial assets - 210 - - - - -Total 5 719 548 5 936 456 6 333 722 6 729 977 7 105 128 7 508 716 8 037 133

65
Sub-ProgrammeAudited Outcomes R’000
Adjusted appropria-tion R’000
Medium-term expenditure estimate R’000
2014/15 2015/16 2016/17 2017/18 2018/19 2019/20 2020/21Details of selected transfers and subsidiesCurrent -
Transfers 5 674 053 5 894 111 6 290 662 6 671 682 7 045 379 7 442 735 7 966 618 National School Nutrition Programme 5 461 915 5 685 381 6 059 655 6 426 313 6 802 079 7 185 715 7 695 901
HIV and AIDS (Life Skills Educators) Grant
212 138 208 730 224 187 245 308 243 235 256 951 270 644
Current 53 55 58 61 65 69 73
Childline South Africa 53 55 58 61 65 69 73
Performance and Expenditure Trends: Programme 5
National School Nutrition Programme (NSNP)
The Department’s National School Nutrition Programme will continue to contribute to the National Development Plan’s priority of eliminating poverty and supporting food security by providing meals to 19 800 schools each year. Due to the high food prices as a result of drought, the Grant has increased over the 2017 MTEF. The total allocation to the Grant amounts to R21.7 billion over the 2018 MTEF period through the National School Nutrition Programme Grant in the Educational Enrichment Services programme. The programme was at 98.2% spending trend.
The programme aims to improve the following:
An integrated nutrition system is adopted and implemented for the wellbeing of learners. To improve the quality of meals and service delivery for the programme, national guidelines, monitoring tools, Norms and Standards are developed, approved and implemented to improve efficiency of the National School Nutrition Programme. A system of local procurement of fresh quality produce is conceptualised, piloted and Implemented by the Department in collaboration with, but not limited to, the Department of Agriculture and Municipalities to boost local economic development. This is done in order to institutionalise the NSNP for greater impact by documenting costs, commitment to long term programme funding and up-scaling the programme.

66
PART C: LINKS TO OTHER PLANSThe Action Plan to 2019: Towards the Realisation of Schooling 2030 and the sectoral Basic Education Delivery Agreement for Outcome 1: Improved quality of basic education will be the strategic drivers of all sector activities, based on credible research, evidence and consultation. The focus on a credible diagnosis of priorities has enabled the Department to introduce interventions which have started to yield results. Engagement and interaction with all in the sector, along with our partners, has ensured that sectoral planning is coherent. Together with our Strategic Plan 2015–2019, this Annual Performance Plan indicates how we will take the basic education mandate forward in 2018/19 and over the medium-term.
5. Links to long-term infrastructure and other capital plans
5.1. Accelerated Schools Infrastructure Delivery Initiative (ASIDI)The objective of the ASIDI programme was to address infrastructure backlogs at all schools that do not meet the basic safety Norms and Standards; to replace those schools constructed from inappropriate material, and provide schools without basic services with water, sanitation, electricity and fencing. These schools were identified in consultation with the Provincial Education Departments (PEDs).
The ASIDI programme has been implemented throughout the country and has not gone without challenges as there were issues with poor performance from Implementing Agents, Professional Service Providers, and Project Management. In addressing challenges faced, the Department has ensured that all targets that have not been met are being prioritised in the MTEF.
For the 2018/19 Financial Year, there are 50 schools, 286 sanitation and 325 water projects to be completed.
5.2. Conditional Grants5.2.1. National School Nutrition Programme Conditional Grant
Purpose To provide nutritious meals to targeted learners.
Performance indicator Number of schools provided with nutritious meals on all school days.
Continuation The National School Nutrition Programme (NSNP) is a Government programme for poverty alleviation, specifically initiated to uphold the rights of children to basic food and education. The Conditional Grant Framework enables the Department of Basic Education (DBE) to play an oversight role in the implementation of all the NSNP activities in schools.
Motivation To enhance learning and improve access to education by ensuring that the programme continues in all Quintile 1 to 3 primary and secondary schools, as well as targeted special schools, on all school days.

67
5.2.2. HIV and AIDS (Life Skills Education) Conditional Grant
Purpose • To support South Africa’s HIV prevention strategy by increasing sexual and reproductive health knowledge, skills and appropriate decision making among learners and educators.
• To mitigate the impact of HIV and TB by providing a caring, supportive and enabling environment for learners and educators.
• To ensure the provision of a safe, rights-based environment in schools that is free of discrimination, stigma and any form of sexual harassment/abuse.
• To reduce the vulnerability of children to HIV, TB and Sexually Transmitted Infections (STIs), with a particular focus on orphaned and vulnerable children.
Performance indicator • Number of educators trained to implement Sexual and Reproductive Health (SRH) programmes for learners.
• Number of LTSM on Sexual Reproductive Health (SRH) distributed to schools.
Continuation The Grant will be reviewed on an ongoing basis in response to the nature of the pandemic.
Motivation To strengthen HIV and AIDS and TB programmes in schools by reviewing current interventions and developing a new integrated and comprehensive programme over the MTEF period.
5.2.3. Mathematics, Science and Technology Conditional Grant
Purpose To promote Mathematics, Physical Science and Technology teaching and learning and improve teachers’ content knowledge of Mathematics and Physical Science.
Performance indicator Percentage of Grade 12 learners achieving 50% or more in Mathematics Percentage of Grade 12 learners achieving 50% or more in Physical Science.
Continuation The Grant will be reviewed on an ongoing basis.
Motivation Over the MTEF period, the Grant will focus on strengthening the implementation of the National Development Plan (NDP) and the Action Plan to 2019 by increasing the number of learners taking Mathematics, Science and Technology subjects and improving the pass rates.
5.2.4. Education Infrastructure Conditional Grant to Provinces
Purpose To help accelerate construction, maintenance, upgrading and rehabilitation of new and existing infrastructure in education, address schools affected by disaster and enhance capacity to deliver infrastructure in education.
Performance indicator Number of new schools completed and ready for occupation (includes replacement schools).Number of additional specialist rooms built in public ordinary schools (includes replacement schools).
Continuation Ongoing.
Motivation This Grant has been awarded to supplement the ongoing infrastructure programme in provinces.
5.2.5. School Infrastructure Backlogs Indirect Grant (SIBIG)
Purpose To eradicate the Basic Safety Norms backlog in schools without water, sanitation and electricity and to replace those schools constructed from inappropriate material, including mud schools, to contribute towards levels of optimum learning and teaching.
Performance indicator Number of schools provided with sanitation facilities through ASIDINumber of schools provided with water through ASIDINumber of schools provided with electricity through ASIDINumber of new schools built and completed through ASIDI
Continuation ASIDI is implemented through the SIBIG. The projects in ASIDI are implemented over multiple years. The performance indicator projections above are for the delivery of ASIDI projects in the 2018/2019 Financial Year.
Motivation The Grant has been awarded to eradicate the basic safety norms backlog in schools to ensure that schools reach basic functionality levels.

68
5.2.6. Learners with Severe to Profound Intellectual Disabilities (LSPID) Grant
Purpose To provide the necessary support, resources and equipment to identified care centres and schools for the provision of education to Children with Severe to Profound Intellectual Disabilities (CSPID)
Performance indicator • Number of Children/ Learners with Severe to Profound Intellectual Disability (C/LSPID) who utilise the Learning Programme for C/LSPID.
• Number of Children/ Learners with Severe to Profound Intellectual Disability (C/LSPID) with access to therapeutic and psycho-social support services that will enable them to improve their participation in learning.
Continuation The Grant will be reviewed on an ongoing basis but the current MTEF allocation projections are for the 2018/19 and 2019/20 financial years.
Motivation To improve access to quality basic education for children with severe to profound intellectual disabilities in conditions that ensure dignity, promote self-reliance and facilitate active participation in the community.
5.3. Public entitiesName of public entity Mandate Outputs Current annual
budget (R’000)
South African Council of Educators (SACE)
SACE has a legislated mandate to strengthen and uphold the teaching profession, including the development of professional standards for the teaching profession in South Africa as contemplated on the South African Council for Educators Act, No. 31 of 2000.
• Register professionally qualified educators.• Develop the profession and promote standards of professional
ethics.
R16 000
Umalusi Umalusi is the quality council for general and further education and training as contemplated in the National Qualifications Framework Act and has the functions contemplated in section 28 of that Act and section 2 of the General and Further Education and Training Quality Assurance Act, No. 58 of 2001 (GENFETQA).
• Promote quality and internationally comparative standards in General Education and Training (GET) and Further Education and Training (FET).
• Maintain and improve educational standards through the development and evaluation of qualifications and curriculum.
• Quality assurance of assessment, and provision of education, training and assessment.
• Continually develop in-depth knowledge and expertise in mandated areas through rigorous research.
• Report on the quality of education and training within the mandate.• Issue appropriate and credible certificates of learner achievement
in terms of specific qualifications and subjects on the General Education and Training (GET) and Further Education and Training (FET) Framework of Qualifications.
• Provide reliable and credible leadership and guidance in standard setting and quality assurance.
R128 543
5.4. Public-Private Partnerships The Public Private Partnership (PPP) agreement is in year 8 of a 25 year contract where a Consortium has taken the responsibility to manage the building on behalf of the Department. The operational phase continues to proceed satisfactorily with a real spirit of partnership that is prevailing between the two parties. Monthly Steering Committee meetings and weekly operations meetings are held to discuss challenges and to facilitate mutual co-operation.

69
PART D: ANNEXURES6. Updates in the Department of Basic Education
Strategic PlanKha Ri Gude
The Department has made minor revisions to the 2015/16 – 2019/20 Strategic Plan due to the discontinuation of the Kha Ri Gude Literacy programme. The Kha Ri Gude Literacy programme was started in 2008 and has reached the target that was set. The Financial Year 2016/17 marked the end of the programme.
Second Chance Matric Programme
A new focus for the Department over the medium-term is the Second Chance Matric Programme intended to give learners an opportunity to rewrite the NSC examination. The implementation of the Second Chance matric programme commenced during the 2016/17 Financial Year. As a result, a new strategic objective and relevant Technical Indicator Description for Matric Second Chance Programme has been developed as indicated below:
Strategic Objective details
2.6 Provide support to learners who have not achieved all the requirements of the NSC through the Second Chance Matric
Short definition The Second Chance Matric Programme is intended to afford young people who have failed to meet the requirements of the NSC a second chance to obtain a matric thereby improving their quality of life.
Purpose/Importance To increase secondary school completion rates
Source/Collection of data Database of registered learners for the programme
Method of calculation Count the number of learners registered
Data limitations None
Type of strategic objective Output
Calculation type Cumulative: The total number of learners on the Second Chance Matric Programme from 2016 to 2019
Reporting cycle Bi-annually
New Strategic Objective Yes
Desired performance High number of learners completing the National Senior Certificate
Strategic Objective responsibility
Branch C: Curriculum Policy, Support and Monitoring
Strategic Objective Details Improve learner completion rates and retention
Objective statement Provide support to learners who have not achieved all the requirements of the NSC through the Second Chance Matric Programme
Baseline NIL
Justification Improve school completion rates and increase access to job opportunities
Links
“South Africa loses half of every cohort that enters the school system by the end of the 12 year schooling period, wasting significant human potential and harming the life-chances of many young people. Secondary school completion rates are 77% in the United States, 87% (to the age of 16) in the UK and 93% in Japan. South Africa should aim for a comparable completion rate of between 80 – 90%...”
National Planning Commission: National Development Plan, November 2011
Five year Target 50 000

70
Rural Education
The Department has increased its priorities to focus on Rural Education for the 2018/19 Financial Year and the remainder of the current medium-term. The Department aims to improve the quality and equity of education in rural schools through improving literacy, numeracy and reading skills as well as striking a balance in curriculum and curricular activities to improve learner performance. The following indicators have been developed to monitor the implementation of the project:
Strategic Objective Details 2.5 Improve the quality of education in rural schools
Objective statement Develop, monitor and support the implementation of policies and programmes for improving the quality of education in rural schools.
Baseline Nil
Justification Learner performance remains very low in rural schools and there is lack of adequate provisioning of teaching and support staff in the schools.
Links National Development Plan; The Action Plan to 2019: Towards the Realisation of Schooling 2030; and the Rural Education Policy.
Five year Target Improved provision of teaching and support staff to, and learner performance in the rural schools.
Indicator details 2.5.1. Number of schools with Multi-Grade classes implementing the Multi-Grade Toolkit monitored
Short definition The Multi-Grade Toolkit is a resource kit that was developed to support curriculum delivery in schools with Multi-Grade classes. The Multi-Grade Toolkit caters for all subjects in the General Education Band from Grades 1 to 9.
Purpose/Importance To provide teachers with Multi-Grade Annual Teaching Plans, lesson plans and assessment tasks geared to enhance the mediation of the curriculum in schools with Multi-Grade classes.
Source/Collection of data • Sample Multi-Grade Toolkit • Completed monitoring instruments• List of schools monitored per quarter• A report on findings of the monitoring
Method of calculation Count the number of schools monitored
Data limitations Provinces will also provide data on schools monitored
Type of indicator Output
Calculation type Cumulative
Reporting cycle Quarterly
New indicator Yes
Desired performance To achieve improved curriculum coverage in schools with Multi-Grade classes
Indicator responsibility Branch C: Curriculum Policy, Support and Monitoring

71
Indicator details 2.5.2. Number of advocacy campaign events on the Rural Education Policy conducted in all nine provinces
Short definition The Rural Education Policy has been developed aimed at improving the quality of education in rural areas.
Purpose/Importance To improve the quality of education in small rural schools and to ensure that the provisioning of education is responsive to the needs of learners in rural areas.
Source/Collection of data • List of advocacy campaign events conducted• Attendance registers • A report on the advocacy campaign
Method of calculation Count the number of campaign events conducted
Data limitations None
Type of indicator Output
Calculation type Cumulative
Reporting cycle Quarterly
New indicator Yes
Desired performance Improved quality of education in rural schools, schools with Multi-Grade classes, and in small schools.
Indicator responsibility Branch C: Curriculum Policy, Support and Monitoring
Inclusive Education
The Department will be providing support to learners with intellectual disabilities through the Learners with Severe to Profound Intellectual Disabilities (LSPID) Grant which is planned for roll-out in the next MTEF. The strategic objective of the Department is to ensure that learners with severe to profound intellectual disabilities access quality public funded education and support. The following is the identified strategic objective and performance indicators:
Strategic Objective details 2.6 To ensure that Learners with Severe to Profound Intellectual Disabilities access quality publicly funded education and support.
Short definition A number of children of school-going age with severe to profound intellectual disability are not enrolled in schools but in registered and unregistered special care centres. Unlike other children of the same age, these learners do not follow a nationally approved learning programme and do not have access to public funded therapeutic intervention that enables optimal participation in learning development.
Purpose/Importance To provide the necessary support, resources and equipment to identified care centres and schools for the provision of education of education to children with severe to profound intellectual disabilities.
Source/Collection of data The data will come from targeted care centres and will be captured by PEDs using the EMIS systems
Method of calculation Count the number of Children/Learners with Severe to Profound Intellectual Disability who access the LSPID Learning Programme, and Therapeutic and Psycho-Social Support Services.
Data limitations The General Household data does not provide statistical information on the number of C/LSPID who are out of school.
Type of strategic objective Output
Calculation type Non-cumulative
Reporting cycle Annually
New Strategic Objective Yes
Desired performance An increase in the number of C/LSPID receiving the necessary support and resources for effective learning and development.
Strategic Objective responsibility
Branch C: Curriculum Policy, Support and Monitoring

72
Strategic Objective Details 2.7 Provide support to Learners with Severe to Profound Intellectual Disabilities
Objective statement To ensure that Learners with Severe to Profound Intellectual Disabilities access quality publicly funded education and support.
Baseline 6 654 learners
JustificationThe programme through LSPID Grant caters for learners who are intellectually challenged to access public funded educational support in order to ensure dignity, promote self-reliance and facilitate active participation in the community.
Links Action Plan to 2019 Goal 26 Increase the number of schools that effectively implement the inclusive education policy and have access to centres that offer specialist services.
Five year Target To provide support to all learners and identified care centres for 2018/19 and 2019/20.
Indicator title 2.7.1. Number of Children/ Learners with Severe to Profound Intellectual Disability (C/LSPID) who utilise the Learning Programme for C/LSPID
Short definitions A number of children of school-going age with severe to profound intellectual disability are not enrolled in schools but in registered and unregistered special care centres. Unlike other children of the same age, these learners do not follow a nationally approved learning programme
Purpose of indicator This indicator is intended to show an improvement in the number of children of school-going age with severe to profound intellectual disability who are enrolled and are participating in the Learning Programme for C/LSPID
Source/Collection of data The data will come from targeted care centres and captured by PEDs using the EMIS systems
Method of calculation Count the number of Children/ Learners with Severe to Profound Intellectual Disability (C/LSPID) who utilise the Learning Programme for C/LSPID
Data limitations The General Household data does not provide statistical information on the number of C/LSPID who are out of school. This makes it difficult to determine the extent to which the intervention provided by the Grant is contributing in reducing the number of C/LSPID who are not accessing the Learning Programme for C/LSPID nationally
Type of indicator Output
Calculation type Non-cumulative
Reporting cycle Annually
New Indicator Yes
Desired performance An increase in the number of C/LSPID who are enrolled in the Learning Programme for C/LSPID
Indicator responsibility Branch C: Curriculum Policy, Support and Monitoring

73
Indicator title 2.7.2. Number of Children/ Learners with Severe to Profound Intellectual Disability (C/LSPID) with access to therapeutic and psycho-social support services that will enable them to improve their participation in learning
Short definitions A number of children of school-going age with severe to profound intellectual disability are not enrolled in schools but in registered and unregistered special care centres, and do not have access to public funded therapeutic intervention that enable optimal participation in learning development.
Purpose of indicator This indicator is intended to show an improvement in the number of C/LSPID who are participating in the Learning Programme for C/LSPID, and have access to therapeutic and psycho-social support services.
Source/Collection of data The data will come from targeted care centres and be captured by PEDs using the EMIS systems
Method of calculation Count the number of Children/ Learners with Severe to Profound Intellectual Disability (C/LSPID) with access to therapeutic and psycho-social support services
Data limitations The General Household data does not provide statistical information on the number of C/LSPID who are out of school. This makes it difficult to determine the extent to which the intervention provided by the Grant is contributing in reducing the number of C/LSPID who are not accessing the Learning Programme for C/LSPID nationally.
Type of indicator Output
Calculation type Non-cumulative
Reporting cycle Annually
New Indicator Yes
Desired performance An increase in the number of C/LSPID who are enrolled in the Learning Programme for C/LSPID that have access to therapeutic and psycho-social services
Indicator responsibility Branch C: Curriculum Policy, Support and Monitoring
Mathematics, Science and Technology lesson plans
The Department has completed the process of developing lesson plans as per the Strategic Plan, and in the 2018/19 Financial Year, the Department will focus on the monitoring of the implementation of lesson plans by teachers to assist with curriculum coverage. The Department in collaboration with Provincial Education Departments (PEDs) is in the process of integrating ICT into learning and teaching which will include the developing digital content.
Diagnostic Self-Assessments for Teachers
In the 2016/17 Financial Year the Department has experienced challenges in administering the teacher diagnostic self- assessments. The challenges were there as a result of the contestation by teacher unions in enabling the teachers to undertake the diagnostic self-assessments. The Department in the 2017/18 Financial Year has been engaging with the teachers and unions in resolving the matter. The funding for the provision of the tests has also been a challenge and as a result the Department has adjusted and reduced the targets for the Diagnostic Self- Assessment tests for Teachers in EFAL and Mathematics from 10 000 to 2 000 for the 2018/19 to 2020/2021 financial years. The reduction of the targets will not compromise the quality of the data that will inform future interventions of improving the administering of the Diagnostic Self- Assessments.
The strategic Objective 3.3 has been updated from “Administer Diagnostic Self-assessments tests to Mathematics, English First Additional Language, Physical Sciences and Accounting teachers in order to determine their content knowledge” to “To identify and determine content knowledge of teachers in Mathematics, English First Additional Language, Physical Sciences and Accounting through Diagnostic Self-Assessments”. This amendment in the strategic objective statement is to align with the framework for Strategic and Annual Performance Plans where a strategic objective should measure outcomes rather than activities.

74
7. Technical Indicator DescriptionsPROGRAMME 1: ADMINISTRATION
Indicator details 1.1.1. Percentage of service provider invoices within the procurement unit paid within 30 days.
Short definition Service providers within the procurement unit are referred to as suppliers for goods and services, e.g. stationery, printing, repairs. The 30 days will be calculated from the date of receipt of invoice.
Purpose/Importance It is the contribution of the Department in growing the economy of the country through State Departments supporting SMMEs.
Source/Collection of data • Data sourced from the Basic Accounting System (BAS) on a monthly basis will be drawn and compiled into a quarterly report with invoices received and invoices paid.
• An accrual report will also be drawn when invoices are not paid• Records of all invoices received by the procurement unit.
Method of calculation Total number of service providers’ invoices paid within 30 days/ Total number of service providers’ invoices paidX100
Data limitations None
Type of indicator Output
Calculation type Non–cumulative: The quarters will be reported independently
Reporting cycle Quarterly
New indicator No
Desired performance All invoices received and paid within 30 days
Indicator responsibility Branch A: Finance and Administration
Indicator details 1.1.2. Percentage of received misconduct cases resolved within 90 days
Short definition The indicator measures the misconduct cases received by the Department and those resolved within 90 days as stipulated. The 90 days prescribed period is not provided for in the legislation except the 60 days period prescribed for precautionary suspension plus the 30 days extension which could be given by the Presiding Officer in terms of the Collective Agreement 1 of 2003 Clause 7.2(a) as well SMS Handbook, Chapter 7 clause 2.7(2)(b) Where employees are put on precautionary suspension, misconduct cases should be finalised within the prescribed timeframe. This enables the affected parties to account for their conduct promptly.
Purpose/importance To ensure consequence management as well as the serving of justice within the prescribed period
Source/collection of data • Number of formal cases submitted by line managers to the Directorate: Labour Relations to initiate/institute a disciplinary process.
• A list of those cases resolved by the Directorate: Labour Relations
Method of calculation Total number of misconduct cases finalised within the 90 days period/Total number of formal misconduct cases received X 100
Data limitations Postponements of cases have a negative impact on compliance with the timeframe.
Type of indicator Output
Calculation type Non-cumulative
Reporting cycle Annually
New indicator No
Desired performance All disciplinary cases should be finalised within the specified period on 90 days
Indicator responsibility Branch A: Finance and Administration

75
Indicator details 1.1.3. Percentage of received grievance cases resolved within 30 days
Short definition The Department adheres to the Guidelines on the Management of Grievances in the Public Services which provides that employee concerns and complaints should be resolved within 30 days after being reported to the Designated Employee.
Purpose/importance To ensure sound human relations and avoid extended disgruntlement among employees in the work place.
Source/collection of data • A list of formal grievances submitted by officials to the Directorate: Labour Relations.• The list of grievance cases resolved by the Directorate: Labour Relations
Method of calculation Total number of grievance cases finalised within the 30 days period/ Total number of formal grievances received X 100.
Data limitations Some of the solutions sought by the aggrieved employees are unattainable and such grievances are not resolved in the manner prescribed by the procedure manual.
Type of indicator Output
Calculation type Non-cumulative
Reporting cycle Annually
New indicator No
Desired performance Reduction of the number of grievances and that all reported grievances are finalised within the specified period of 30 days.
Indicator responsibility Branch A: Finance and Administration

76
PROGRAMME 2: CURRICULUM POLICY, SUPPORT AND MONITORING
Indicator details 2.1.1. Number of off-line digital content packaged and distributed to provinces
Short definition
Digital content resources are curriculum aligned and enrichment electronic Learning and Teaching Support Material (e-LTSM) consisting of workbooks, textbooks, resource material for Grade R, video lessons, study guides and other learning materials. The digital content is stored on electronic storage devices such as USB, DVD/CDs and external Hard Drives. It is packaged into ‘packs’ according to content format, type, subjects, Grades and phases on DVD/CD. The DBE distributes the digital content packs to provinces, districts, schools and other stakeholders. The offline digital content on the packs is accessed by users without using the internet, hence referred to as ‘offline’. The following content packs will be distributed to provinces:1. Grade R Resource Pack 2. Grade R – 7 Worksheets3. Grade 1 – 3 Graded Readers & Big books4. Grade 4 – 6 Natural Science & Technology textbooks5. Grade 4 – 6 Mathematics textbooks & Teacher Guide6. Grade 7 – 9 Technology textbooks7. Grade 7 – 9 Natural Science textbooks8. Grade 7 – 9 Mathematics textbooks9. Grade 10 Life Science textbook & Teacher Guide10. Grade 10 – 11 Technical Mathematics Learner Book & Teacher Guide11. Grade 10 – 11 Technical Science textbooks & Teacher Guide12. Grade 10 – 12 Mathematics textbooks13. Grade 10 – 12 Physical Science textbooks14. Grade 10 – 12 Study Guides 15. Grade 10 – 12 Agricultural Technology textbooks
Purpose/Importance To provide additional LTSM in digital format and complement implementation of ICT in schools
Source/Collection of data • Signed distribution register/Delivery note.• Copies of offline content packs delivered to provinces
Method of calculation Count the number of packages distributed to provinces Data limitations NoneType of indicator OutputCalculation type CumulativeReporting cycle Quarterly New indicator NoDesired performance All public schools with ICT infrastructure to have access to digital content resources.Indicator responsibility Branch C: Curriculum Policy, Support and Monitoring
Indicator details 2.1.2. Number of schools per province monitored for provisioning of ICT resourcesShort definition To monitor all the nine provinces on the provisioning of ICT resources in schools. The monitoring will include
a visit to the provincial office and to three identified schools in the province.Three schools in each province will be drawn from ongoing ICT projects.
Purpose/Importance To determine the status of ICT implementation in each of the provinces.Source/Collection of data • Completed monitoring instruments
• A consolidated monitoring status reportMethod of calculation Count the number of schools monitored per provinceData limitations NoneType of indicator OutputCalculation type CumulativeReporting cycle Quarterly New indicator NoDesired performance All schools have access to ICT resources.Indicator responsibility Branch C: Curriculum Policy, Support and Monitoring
–

77
Indicator details 2.1.3. Number of off-line digital content resources developed annually
Short definition This refers to the state-owned curriculum-aligned textbooks developed by the DBE through partnerships with the private sector. The textbook development process entails authoring of the content material by a team of writers, screening and quality assurance of the authored content by provincial and DBE curriculum specialists. The print-ready PDF files are then converted into e-textbooks/e-books/e-publications that are packaged onto CD/DVD for distribution to provinces.1. Grade 4 Natural Science & Technology (Learner Book)2. Grade 5 Natural Science & Technology (Learner Book)3. Grade 6 Natural Science & Technology (Learner Book)4. Grade 7 Technology (Learner Book)5. Grade 8 Technology (Learner Book)6. Grade 9 Technology (Learner Book)7. Grade 8 Natural Science (Learner Book)8. Grade 9 Natural Science (Learner Book)
Purpose/Importance To create a pool of digital content resources that can be used for teaching and learning in schools.
Source/Collection of data Developed content resources
Method of calculation Count the number of offline digital content resources developed
Data limitations None
Type of indicator Output
Calculation type Non-Cumulative
Reporting cycle Annually
New indicator No
Desired performance All schools with ICT infrastructure are provided with digital content.
Indicator responsibility Branch C: Curriculum Policy, Support and Monitoring
Indicator details 2.2.1. Percentage of public schools with Home Language workbooks for learners in Grades 1–6.
Short definition Public Schools refer to schools offering Grades 1 to 6 and which have placed Home Language workbook orders according to the provincial data submitted to the DBE.Grade 1-6 workbooks are produced and delivered as follows:
Item Description Delivery PlanVolume 1 Volume 2
Grades 1 to 6 Home language Oct - Nov 2017 Jan - Feb 2018
Purpose/Importance To improve languages outcomes in Grades 1 to 6.
Source/Collection of data Approved copies of workbooks/ proof of deliveries.
Method of calculation Total number of public ordinary schools provided with Home Language workbooksTotal number public ordinary schools that have ordered Grades 1-6 workbooks X 100.
Data limitations None
Type of indicator Output
Calculation type Non-cumulative: based on the time specified under short definition
Reporting cycle Annually
New indicator No
Desired performance Public schools with Grades 1-6 which have placed orders have access to Home Language workbooks in the correct language.
Indicator responsibility Branch C: Curriculum Policy, Support and Monitoring

78
Indicator details 2.2.2. Percentage of public schools with Mathematics workbooks for learners in Grades 1–9
Short definition Public Schools refer to schools offering Grades 1 to 9 and which have placed Mathematics workbook orders according to the provincial data submitted to the DBE. Grade 1-9 workbooks are produced and delivered are as follows:
Item Description Delivery PlanVolume 1 Volume 2
Grades 1 to 9 Mathematics Oct - Nov 2017 Jan - Feb 2018
Purpose/Importance To improve mathematical outcomes in Grades 1 to 9
Source/Collection of data Approved copies of workbooks/ proof of deliveries.
Method of calculation Total number of public ordinary schools provided with Mathematics workbooks in Grades 1-9Total number of public ordinary schools that have ordered Grades 1-9 workbooks X 100.
Data limitations None
Type of indicator Output
Calculation type Non-cumulative: based on the time specified under short definition
Reporting cycle Annually
New indicator No
Desired performance Public schools with Grades 1–9 which have placed orders have access to Mathematics workbooks.
Indicator responsibility Branch C: Curriculum Policy, Support and Monitoring
Indicator details 2.2.3 Percentage of public schools with workbooks for Grade R.
Short definition Public Schools refer to schools offering Grade R and which have placed workbook orders according to the provincial data submitted to the DBE. Grade R workbooks are produced and delivered as Volume 1-4 as follows:
Grades Description Delivery Plan
Grade R
Book 1Oct – Nov 2017
Book 2Book 3
Jan – Feb 2018Book 4
Purpose/Importance Workbooks are aimed at improving reading and literacy outcomes in Grade R
Source/Collection of data Approved copies of workbooks/ proof of deliveries.
Method of calculation Total number of public ordinary schools provided with Grade R workbooks/Total number of public ordinary schools that have ordered Grade R workbooks X 100.
Data limitations None
Type of indicator Output
Calculation type Non-Cumulative: based on the time specified under short definition.
Reporting cycle Annually
New indicator No
Desired performance Public schools with Grade R and which placed workbook orders have access to workbooks
Indicator responsibility Branch C: Curriculum Policy, Support and Monitoring

79
Indicator details 2.3.1 Number of schools monitored on the implementation of the reading norms
Short definition This refers to the number of public ordinary schools that offer Grades R-9 monitored on Reading Norms. These are standardised benchmarks for reading and writing that are aligned to the curriculum for Home Language and First Additional Language for Grades R to 9. School visits and desktop monitoring will be used. 10 School visits will be conducted and 10 schools will be evaluated using desktop monitoring. The desktop monitoring will entail emailing the monitoring instrument to the schools. District offices will verify the information submitted by completing the relevant sections on the evaluation tool during their school visits and submit the evaluation tools to the DBE.
Purpose/Importance Reading norms are aimed at improving reading and literacy outcomes in Grades R to 9.
Source/Collection of data Completed monitoring tools
Method of calculation Count the number of schools monitored
Data limitations Some of the data is dependent on information from provinces which the Department cannot confirm the accuracy thereof.
Type of indicator Output
Calculation type Non-cumulative
Reporting cycle Annually
New indicator No
Desired performance To improve reading proficiency levels in public schools. To achieve the targets in the Action Plan to 2019
Indicator responsibility Branch C: Curriculum Policy, Support and Monitoring
Indicator details 2.3.2 Number of schools monitored on the implementation of the Incremental Introduction to African Languages nationally
Short definition The IIAL strategy is aimed at promoting the utilisation of previously marginalised African languages in all public schools in Grades 1-9. School visits and desktop monitoring will be used. 10 School visits will be conducted and 10 school visits will be evaluated using the desktop monitoring. The desktop monitoring will entail emailing the monitoring instrument to the relevant schools. District offices will verify the information submitted by completing the relevant sections on the evaluation tool during their school visits. The DBE will further verify the information submitted during the provincial oversight visits.
Purpose/Importance The IIAL is aimed at enhancing multilingualism and social cohesion.
Source/Collection of data Completed monitoring tools
Method of calculation Count the number of schools monitored
Data limitations Some of the data is dependent on information from provinces which the Department cannot confirm the accuracy thereof
Type of indicator Output
Calculation type Non-cumulative
Reporting cycle Annually
New indicator No
Desired performance To achieve the targets in the Action Plan to 2019
Indicator responsibility Branch C: Curriculum Policy, Support and Monitoring

80
Indicator details 2.3.3 Number of underperforming schools monitored on the implementation of the Early Grade Reading Assessment (EGRA).
Short definition EGRA is a diagnostic reading assessment that is aimed at improving reading proficiency levels in the early Grades. The schools to be monitored are selected from those performing below 50% in the 2013 ANA results. The monitoring will focus on Grade 2 and 3 classes. Monitoring will be done through school visits and desk-top analysis. School visits will be conducted and schools will be evaluated using the desktop monitoring method. The desktop monitoring will entail emailing the monitoring instrument to the schools. District offices will verify the information submitted by completing the relevant sections on the evaluation tool during their school visits. The DBE will further verify the information submitted during the provincial oversight visits.
Purpose/Importance The EGRA is aimed at improving reading and literacy outcomes in Grades R to 9.
Source/Collection of data Completed monitoring tools
Method of calculation Count the number of schools monitored
Data limitations Some of the data is dependent on information from provinces which the Department cannot confirm the accuracy thereof.
Type of indicator Output
Calculation type Non-cumulative
Reporting cycle Annually
New indicator No
Desired performance To improve reading proficiency levels in public schools. To achieve the targets in the Action Plan to 2019
Indicator responsibility Branch C: Curriculum Policy, Support and Monitoring
Indicator details 2.4.1 Number of Mathematics, Science and Technology lesson plans monitored for the Intermediate, Senior and FET Phases
Short definition Lesson plans are developed to assist teachers to align their teaching plans with the Learning and Teaching Support Material (LTSM) in Mathematics, Natural Sciences and Technology at Intermediate Phase, Technology at Senior Phase and Mathematics in the FET Phase. It assists the teacher in meeting the requirements of curriculum coverage in the following subjects and Grades:• Mathematics – Intermediate Phase: Grades 4-6; • Natural Sciences and Technology – Intermediate Phase: Grades 4-6;• Technology – Senior Phase: Grades 7-9; and • Mathematics – FET Phase: Grades 10-12During 2018/19, Technical Mathematics and Technical Science Grades 10-12 lesson plans will be monitored.
Purpose/Importance To assist the teachers in meeting the requirements for curriculum coverage in Mathematics, Science and Technology at Intermediate, Senior and FET Phases.
Source/Collection of data • Completed monitoring instruments• Consolidated report on the findings of the monitoring of lesson plans in addressing curriculum
coverage
Method of calculation Count the number of lessons plans monitored
Data limitations None
Type of indicator Output
Calculation type Non-cumulative
Reporting cycle Annually
New indicator No
Desired performance Improvement of learner performance in Mathematics, Natural Sciences and Technology
Indicator responsibility Branch C: Curriculum Policy, Support and Monitoring

81
Indicator details 2.4.2 Number of Mathematics, Science and Technology teacher guides developed for the Intermediate, Senior and FET Phases
Short definition Teacher guides are documents that provide an additional resource explained at a higher and detailed level to better equip teachers to deliver on the subject content. For the period under review, teacher guides for the following Grades and Subjects will be produced:• Mathematics – Intermediate Phase: Grades 4-6;• Natural Sciences and Technology – Intermediate Phase: Grades 4-6; • Technology – Senior Phase: Grades 7-9; and• Mathematics – Senior Phase: Grades 10-12.During 2018/19, Technical Mathematics and Technical Science Grades 10-12 Teacher Guides will be developed.
Purpose/Importance To improve teaching delivery so as to improve learner performance in Mathematics, Science and Technology at Intermediate, Senior and FET Phases.
Source/Collection of data Teacher guides developed for Intermediate, Senior and FET Phases
Method of calculation Count the number teacher guides developed
Data limitations None
Type of indicator Output
Calculation type Non-cumulative
Reporting cycle Annually
New indicator No
Desired performance Improvement of learner performance in Mathematics, Natural Sciences and Technology at Intermediate Phase, Technology at Senior Phase and Mathematics at Further Education and Training (FET) Phase.
Indicator responsibility Branch C: Curriculum Policy, Support and Monitoring
Indicator details 2.4.3 Number of Mathematics training sessions monitored
Short definition Monitoring of the Mathematics training sessions to improve learning outcomes in the Senior Phase
Purpose/Importance To monitor the training sessions aimed at improving the teaching and learning of Mathematics in the Senior Phase
Source/Collection of data • Completed monitoring instruments • Attendance registers of participants• Proof of communication from the DBE to the PEDs
Method of calculation Count the number of training sessions monitored
Data limitations None
Type of indicator Output
Calculation type Cumulative: Year End
Reporting cycle Bi-annually
New indicator No
Desired performance Improvement of Mathematics performance in Grade 8 and 9
Indicator responsibility Branch C: Curriculum Policy, Support and Monitoring

82
Indicator details 2.4.4 Number of training sessions of CAPS for Technical subjects monitored
Short definition Monitoring visits are conducted to assess the progress made with regard to the training manuals that were developed to assist training centre facilitators to conduct training during the CAPS training for Technical Schools in preparation for implementation of the new curriculum in Grade 12 in 2018.
Purpose/Importance To improve teaching of technical subjects in schools
Source/Collection of data • Completed monitoring instruments• Attendance registers of the training sessions
Method of calculation Count the number of training sessions monitored
Data limitations None
Type of indicator Output
Calculation type Cumulative: Year End
Reporting cycle Bi-annually
New indicator No
Desired performance Improvement of implementation of the training for CAPS for Technical Schools
Indicator responsibility Branch C: Curriculum Policy, Support and Monitoring
Indicator details 2.4.5 Number of schools visited for monitoring CAPS implementation in Technical SchoolsShort definition The indicator refers to high schools/ secondary schools offering Grade 10-12 that will be visited for
monitoring of the Implementation of the CAPS for Technical Schools. Monitoring visits are conducted to assess the progress made with regard to the implementation of the CAPS for Technical Schools and to institute improvement plans where applicable. A total of 54 schools will be visited per year.
Purpose/Importance To assess the extent of implementation of the CAPS for Technical Schools at identified schools.Source/Collection of data • Completed monitoring instruments
• Copy of school log books for the visits • List of all the schools visited per quarter
Method of calculation Count the number of actual schools visited for monitoringData limitations NoneType of indicator OutputCalculation type Cumulative: Year EndReporting cycle QuarterlyNew indicator NoDesired performance Improvement of implementation of the CAPS for Technical Schools.Indicator responsibility Branch C: Curriculum Policy, Support and Monitoring

83
Indicator details 2.5.1. Number of schools with Multi-Grade classes implementing the Multi-Grade Toolkit monitored
Short definition The Multi-Grade Toolkit is a resource kit that was developed to support curriculum delivery in schools with Multi-Grade classes. The Multi-Grade Toolkit caters for all subjects in the General Education and Training Band from Grades 1 to 9.
Purpose/Importance To provide teachers with Multi-Grade Annual Teaching Plans, lesson plans and assessment tasks geared to enhance the mediation of the curriculum in schools with Multi-Grade classes.
Source/Collection of data • Sample Multi-Grade Toolkit • Completed monitoring Instruments• List of schools monitored per quarter• A report on findings of the monitoring
Method of calculation Count the number of schools monitored
Data limitations Provinces will also provide data on schools monitored
Type of indicator Output
Calculation type Cumulative
Reporting cycle Quarterly
New indicator Yes
Desired performance To achieve improved curriculum coverage in schools with Multi-Grade classes
Indicator responsibility Branch C: Curriculum Policy, Support and Monitoring
Indicator details 2.5.2. Number of advocacy campaign events on the Rural Education Policy conducted in all nine provinces
Short definition The Rural Education Policy has been developed aimed at improving the quality of education in rural areas.
Purpose/Importance To improve the quality of education in small rural schools and to ensure that the provisioning of education is responsive to the needs of learners in rural areas.
Source/Collection of data • List of advocacy campaign events conducted• Attendance registers • A report on the advocacy campaign
Method of calculation Count the number of campaign events conducted
Data limitations None
Type of indicator Output
Calculation type Cumulative
Reporting cycle Quarterly
New indicator Yes
Desired performance Improved quality of education in rural schools, schools with Multi-Grade classes, and in small schools.
Indicator responsibility Branch C: Curriculum Policy, Support and Monitoring

84
Indicator details 2.6.1. Number of learners obtaining subject passes towards a National Senior Certificate (NSC) or extended Senior Certificate, including upgraded NSC per year
Short definition Subject passes towards a NSC or extended SC by accessing resources from the Second Chance Matric Programme which provides the following models of support:• Direct tuition• Radio and television broadcasting • Online Digital Programme (DBE Cloud and Vodacom E School)• Print resources These learners include: • Supplementary learners (including those who did not meet the NSC requirements for Diploma or
Degree pass) who will sit for the March examinations• Progressed learners who modularised and will sit for the June examinations • Candidates writing the extended Senior Certificate in June• Part time NSC candidates writing the November examinations (including candidates upgrading their
pass status)
Purpose/Importance To increase learner retention and improve NSC (including upgrading certificates) and extended SC passes
Source/Collection of data Lists of results of learners, registered on the examinations database, who have achieved subject passes towards a Bachelors Degree, Diploma, or certificate verdict towards NSC or an extended Senior Certificate. This includes learners who have upgraded their Grade 12.
Method of calculation Count the number of learners who have subject passes through the Second Chance Matric Programme for NSC and amended SC using the examinations database
Data limitations • The DBE is reliant on data from external sources - Examinations Database, registration of learners , Data from DBE Cloud/website and Vodacom E School, District offices, Data from Broadcasters which is not learner specific.
• Learners accessing support are unable to provide examination or ID numbers at venues.• The target achieved in the fourth quarter emanates from the supplementary examinations which are
written in February/ March of the 2018/19 academic year. However results are only available in May 2019.
• Out of school candidates do not take all subjects but a few subjects a year and will therefore not necessarily obtain an NSC in one year. However their subject passes are still an achievement as they are credited towards the qualification.
Type of indicator Output
Calculation type Cumulative
Reporting cycle Bi-annually
New indicator No
Desired performance High number of learners passing NSC and extended SC or upgraded NSC pass which will improve opportunities at tertiary institutions
Indicator responsibility Branch C: Curriculum Policy, Support and Monitoring

85
Indicator title 2.7.1. Number of Children/ Learners with Severe to Profound Intellectual Disability (C/LSPID) who utilise the Learning Programme for C/LSPID
Short definitions A number of children/learners of school-going age with severe to profound intellectual disability are not enrolled in schools but in registered and unregistered special care centres. Unlike other children of the same age, these learners do not follow a nationally approved learning programme
Purpose of indicator This indicator is intended to show an improvement in the number of children of school-going age with severe to profound intellectual disability who are enrolled and are participating in the Learning Programme for C/LSPID
Source/Collection of data The data will come from targeted care centres and captured by PEDs using EMIS systems
Method of calculation Count the number of Children/ Learners with Severe to Profound Intellectual Disability (C/LSPID) who utilise the Learning Programme for C/LSPID
Data limitations The General Household data does not provide statistical information on the number of C/LSPID who are out of school. This makes it difficult to determine the extent to which the intervention provided by the Grant is contributing in reducing the number of C/LSPID who are not accessing the Learning Programme for C/LSPID nationally.
Type of indicator Output
Calculation type Non-cumulative
Reporting cycle Annually
New Indicator Yes
Desired performance An increase in the number of C/LSPID who are enrolled on the Learning Programme for C/LSPID
Indicator responsibility Branch C: Curriculum Policy, Support and Monitoring
Indicator title 2.7.2. Number of Children/Learners with Severe to Profound Intellectual Disability (C/LSPID) with access to therapeutic and psycho-social support services that will enable them to improve their participation in learning
Short definitions A number of children/learners of school-going age with severe to profound intellectual disability are not enrolled in schools but in registered and unregistered special care centres, and do not have access to public funded therapeutic intervention that enable optimal participation in learning development.
Purpose of indicator This indicator is intended to show an improvement in the number of C/LSPID who are participating in the Learning Programme for C/LSPID, and have access to therapeutic and psycho-social support services.
Source/Collection of data The data will come from targeted care centres and be captured by PEDs using EMIS systems
Method of calculation Count the number of Children/Learners with Severe to Profound Intellectual Disability (C/LSPID) with access to therapeutic and psycho-social support services
Data limitations The General Household data does not provide statistical information on the number of C/LSPID who are out of school. This makes it difficult to determine the extent to which the intervention provided by the Grant is contributing in reducing the number of C/LSPID who are not accessing the Learning Programme for C/LSPID nationally.
Type of indicator Output
Calculation type Non-cumulative
Reporting cycle Annually
New Indicator Yes
Desired performance An increase in the number of C/LSPID who are enrolled on the Learning Programme for C/LSPID that have access to therapeutic and psycho-social services
Indicator responsibility Branch C: Curriculum Policy, Support and Monitoring

86
PROGRAMME 3: TEACHERS, EDUCATION HUMAN RESOURCES AND INSTITUTIONAL DEVELOPMENT
Indicator details 3.1.1 Percentage of SGBs that meet minimum criteria in terms of effectiveness.
Short definition Number of schools where School Governing Bodies (SGB) meet minimum criteria in terms of effectiveness expressed as a percentage of total number of schools. The following must be in place for the SGB to meet the minimum criteria for effectiveness: Constitution of the SGB in terms of membership, attendance and minutes of meetings. The survey will be conducted in sampled schools. A simple random sample of 7% will be drawn from a population of all schools in the system. The 50% will be drawn from the sampled schools.
Purpose/Importance To measure the effectiveness of SGBs in schools.
Source/Collection of data DBE Sample survey tool in the form of a questionnaire and checklistList of schools sampled Lists of schools that meet minimum criteria
Method of calculation Total number of schools sampled that meet the minimum criteria/Total number of schools sampled X 100
Data limitations Reliability of data from schools
Type of indicator Output
Calculation type Non-cumulative: Results of survey conducted once a year
Reporting cycle Annually
New indicator No
Desired performance All schools should have effective SGBs to support effective teaching and learning.
Indicator responsibility Branch T: Teachers, Education Human Resources and Institutional Development
Indicator details 3.1.2 Percentage of schools producing the minimum set of management documents at a required standard.
Short definition The percentage of schools that have functional documents: school budget, a school improvement plan, an annual report, learner and teacher attendance registers and a quarterly record of learner marks.
Purpose/Importance Every school is expected to produce basic documents to guide the management of the school. These are documents that every school should have and utilise effectively as their availability and utilisation serves as an indication a functional school.
Source/Collection of data • List of visited sampled schools• Completed survey tool• List of schools with minimum set of management documents• Method of sampling
Method of calculation Total number of schools from the sample selected found to be functional by having produced the basic set of documents / Total number of schools surveyed X 100
Data limitations Officials conducting the survey may not interpret the findings in a uniform manner
Type of indicator Impact indicator
Calculation type Non-cumulative
Reporting cycle Annually
New indicator No
Desired performance All schools must be able to produce minimum management documents
Indicator responsibility Branch T: Teachers, Education Human Resources and Institutional Development

87
Indicator details 3.2.1 Number of Funza Lushaka bursaries awarded to students enrolled for initial teacher education.
Short definition Number of Funza Lushaka bursaries awarded to first, second, third and fourth-year students, as well as PGCE students, enrolled for initial teacher education programmes and programmes that offer teaching subjects but are not teacher education qualifications in higher education institutions. The following are examples of qualifications awarded:(B.Ed or a B Com, B Sc, B Tech, B Soc Sc followed by a PGCE). The bursaries are awarded to students (Identified through ID numbers), meaning that the lists with names of students selected according to the criteria set
Purpose/Importance To measure the number of beneficiaries of the Funza Lushaka Bursary programme.Source/Collection of data • A list of beneficiaries of Funza Lushaka Programme
• Sample of university documents that proves their enrollment at universities for the year of the award of the bursary.
Method of calculation Count the number of Funza Lushaka bursaries awarded to first, second, third and fourth year students, as well as PGCE students, enrolled for initial teacher education programmes and programmes that offer teaching subjects but are not teacher education qualifications in higher education institutions.
Data limitations As a result of fees changes in institutions, the number of students awarded the bursary may not be the exact number enrolled.
Type of indicator OutputCalculation type Non-cumulative: a list of enrolled students is drawn from registration once a yearReporting cycle Annually New indicator NoDesired performance To utilise the bursary to train more graduates for the education profession.Indicator responsibility Branch T: Teachers, Education Human Resources and Institutional Development
Indicator details 3.3.1 Number of teachers participating in the EFAL diagnostic tests
Short definition A number of teachers assessed in both content and pedagogical skills in EFAL. These teachers are teachers appointed in all types of appointments that is: permanent, temporary, relief teachers at any level of the school system, who volunteer to take the diagnostic test.
Purpose/Importance To measure the teacher content knowledge and pedagogical skills through diagnostic assessments and provide focused teacher development programmes
Source/Collection of data • List of teachers per province who volunteer to take the EFAL Diagnostic Test• A sample of the diagnostic test administered.
Method of calculation Count the number of teachers who volunteer to take the assessments per province and per district
Data limitations Willingness of teachers to volunteer to take the diagnostic test.
Type of indicator Output
Calculation type Non-cumulative: Analysis of qualitative and quantitative data cumulatively.
Reporting cycle Annually
New indicator No
Desired performance To utilise the results of assessments to provide focused teacher development programmes
Indicator responsibility Branch T: Teachers, Education Human Resources and Institutional Development

88
Indicator details 3.3.2 Number of teachers participating in the Physical Science diagnostic tests
Short definition A number of teachers assessed in both content and pedagogical skills in Physical Science. These teachers are teachers appointed in all types of appointments that is: permanent, temporary, relief teachers at any level of the school system, who volunteer to take the diagnostic test.
Purpose/Importance To measure the teacher content knowledge and pedagogical skills through diagnostic assessments and provide focused teacher development programmes
Source/Collection of data • List of teachers per province who volunteer to take the Physical Science Diagnostic Test• A sample of the diagnostic test administered.
Method of calculation Count the number of teachers who volunteer to take the assessments per province and per district
Data limitations Willingness of teachers to volunteer to take the diagnostic test.
Type of indicator Output
Calculation type Non-cumulative: Analysis of qualitative and quantitative data cumulatively.
Reporting cycle Annually
New indicator No
Desired performance To utilise the results of assessments to provide focused teacher development programmes
Indicator responsibility Branch T: Teachers, Education Human Resources and Institutional Development
Indicator details 3.3.3 Number of teachers participating in the Accounting diagnostic tests
Short definition A number of teachers assessed in both content and pedagogical skills in Accounting. These teachers are teachers appointed in all types of appointments that is: permanent, temporary, relief teachers at any level of the school system, who volunteer to take the diagnostic test.
Purpose/Importance To measure the teacher content knowledge and pedagogical skills through diagnostic assessments and provide focused teacher development programmes
Source/Collection of data • List of teachers per province who volunteer to take the Accounting Diagnostic Test• A sample of the diagnostic test administered.
Method of calculation Count the number of teachers who volunteer to take the assessments per province and per district
Data limitations Willingness of teachers to volunteer to take the diagnostic test.
Type of indicator Output
Calculation type Non-cumulative: Analysis of qualitative and quantitative data cumulatively.
Reporting cycle Annually
New indicator No
Desired performance To utilise the results of assessments to provide focused teacher development programmes
Indicator responsibility Branch T: Teachers, Education Human Resources and Institutional Development

89
Indicator details 3.3.4 Number of teachers participating in the Mathematics diagnostic tests
Short definition A number of teachers assessed in both content and pedagogical skills in Mathematics. These teachers are teachers appointed in all types of appointments that is: permanent, temporary, relief teachers at any level of the school system, who volunteer to take the diagnostic test.
Purpose/Importance To measure the teacher content knowledge and pedagogical skills through diagnostic assessments and provide focused teacher development programmes
Source/Collection of data • List of teachers per province who volunteer to take the Mathematics Diagnostic Test• A sample of the diagnostic test administered.
Method of calculation Count the number of teachers who volunteer to take the assessments per province and per district
Data limitations Willingness of teachers to volunteer to take the diagnostic test.
Type of indicator Output
Calculation type Non-cumulative: Analysis of qualitative and quantitative data cumulatively.
Reporting cycle Annually
New indicator No
Desired performance To utilise the results of assessments to provide focused teacher development programmes
Indicator responsibility Branch T: Teachers, Education Human Resources and Institutional Development
Indicator details 3.4.1 Number of PEDs monitored on the implementation of IQMS
Short definition The purpose of IQMS is to evaluate an educator’s performance annually and to identify specific needs of educators for support and development. School-based educators whose performances meet the agreed standards are eligible for pay progression. The DBE monitors the implementation of the IQMS in a minimum of three schools, a district office and the provincial office in each of the 6 identified PEDs.
Purpose/Importance To monitor the implementation of IQMS in PEDs, in order to strengthen the accountability of school-based educators.
Source/Collection of data • Monitoring instruments developed by DBE for IQMS implementation • List of PEDs and the schools monitored per quarter
Method of calculation Count the number of PEDs monitored
Data limitations Incomplete information and non-availability of summative evaluation reports at schools, district and provin-cial office.
Type of indicator Output
Calculation type Cumulative: Year End
Reporting cycle Quarterly
New indicator No
Desired performance Teacher performance and learner achievement improves through enhanced implementation of IQMS.
Indicator responsibility Branch T: Teachers, Education Human Resources and Institutional Development

90
Indicator details 3.4.2 Number of PEDs monitored on the implementation of PMDS
Short definition The purpose of PMDS is to evaluate office-based educators’ performance and to identify specific needs for development. Monitoring of the implementation of the PMDS processes and procedures will be conducted in the provincial office and 1 district office in each of the 6 identified PEDs. A random sampling method will be used to select the district to be monitored.
Purpose/Importance To monitor the implementation of PMDS in PEDs, in order to strengthen the accountability of office-based educators.
Source/Collection of data • Monitoring instruments developed by DBE for PMDS implementation • List of provincial officials evaluated• List of district officials evaluated
Method of calculation Count the number of PEDS monitored
Data limitations Incomplete information and non-availability of summative evaluation reports in PEDs.
Type of indicator Output
Calculation type Cumulative: Year End
Reporting cycle Quarterly
New indicator No
Desired performance Educator performance and learner achievement improves through enhanced implementation of PMDS.
Indicator responsibility Branch T: Teachers, Education Human Resources and Institutional Development
Indicator details 3.5.1. Number of PEDs that had their post provisioning process assessed for compliance with the post provisioning Norms and Standards
Short definition The monitoring of the implementation of the Norms and Standards is done both at process and technical levels to ensure all the factors and weightings as stipulated in the model are applied.Processes assessed include distribution of posts to schools; declaration of excess posts and vacancies; identification of excess educators; redeployment of excess educators and filling of vacancies.Technical assessment includes review of data used; factors and weightings used etc. Provinces avail data used to determine the post establishment and model used with all the original factors and weightings.
Purpose/Importance To assess the extent to which PEDs comply with the PPN Norms and Standards, both in terms of implementation processes and technical compliance with the prescribed norms.
Source/Collection of data • PED post-provisioning plans• List of PEDs that have been visited for assessment of compliance with the PPN Norms and Standards• Report on findings of the monitoring visits
Method of calculation Count the number of PEDs assessedData limitations NoneType of indicator InputCalculation type Non-cumulativeReporting cycle AnnuallyNew indicator NoDesired performance All PEDs visited and their implementation processes assessed.Indicator responsibility Branch T: Teachers, Education Human Resources and Institutional Development

91
PROGRAMME 4: PLANNING, INFORMATION AND ASSESSMENT
Indicator details 4.1.2 A bank of Language and Mathematics test items for Grades 3, 6 and 9 developed.
Short definition The bank is a pool of assessment questions prepared in a year, so that assessments may be drawn from such a pool of items. A total of 200 test items will be produced in Languages and Mathematics for Grades 3, 6 and 9. All the test items go through a process of setting, moderation and testing before it is finalised to be stored in the item bank.
Purpose/importance Banked items will meet the changing purposes of the assessment. Items will be selected to develop an assessment tasks/test according to the test framework. It assesses whether learning and teaching takes place and informs targeted intervention strategies.
Source/collection of data • A list of number of items produced per Grade• Proof of moderation of 200 test items produced
Method of calculation Count the number of test items produced
Data limitations The actual tests will not be provided until the examination is written.
Type of indicator Output
Calculation type Non-cumulative. Bank Items will be produced during the last quarter of the Financial Year
Reporting cycle Annually
New indicator No
Desired performance Maintenance of a valid and credible ANA database.
Indicator responsibility Branch P: Planning, Information and Assessments
Indicator details 4.2.1 Number of NSC reports produced.
Short definition The NSC reports will contain data on learner performance data through the National Senior Certificate examination. The reports will be in the form of a Diagnostic and Technical report which will contain details on overall performance and problem areas of the assessment.
Purpose/importance To evaluate the NSC examinations and remedial action to be taken to improve on learner performance.
Source/collection of data National NSC reports on learner performance (database hosted by SITA mainframe).
Method of calculation Count the number of NSC Reports produced
Data limitations None
Type of indicator Output
Calculation type Non-cumulative
Reporting cycle Annually
New indicator No
Desired performance Maintenance of a valid and credible NSC database
Indicator responsibility Branch P: Planning, Information and Assessments

92
Indicator details 4.2.2 Number of question papers set annually for the NSC and SC
Short definition Setting question papers for the year in question takes place under very stringent rules and regulations. Identified examiners are appointed and set the examination question papers. Moderation of the question paper is also part of the process of setting question papers.
Purpose/importance To set high quality question papers.
Source/collection of data • Number of question papers set• Copies of question papers set for the academic year in question, produced after the writing of the
examinations
Method of calculation Count the number of question papers set from the list provided
Data limitations Question papers are highly confidential documents that cannot be provided as evidence to anyone until the results have been released.
Type of indicator Output
Calculation type Non-cumulative
Reporting cycle Annually
New indicator No
Desired performance Administration of valid and credible NSC examination.
Indicator responsibility Branch P: Planning, Information and Assessments
Indicator details 4.3.1 Number of new schools built and completed through ASIDI
Short definition Replace schools built of inappropriate materials such as mud, asbestos, wood, zinc, etc.
Purpose/Importance To provide infrastructures that is conducive to effective teaching and learning
Source/Collection of data • Lists from PEDs of schools that had the infrastructure backlog • Lists of schools built from inappropriate material
Method of calculation Count the number of schools that have reached practical completion.
Data limitations None
Type of indicator Output
Calculation type Non-cumulativeAt the end of the Financial Year, a total figure of the project will be given from when the ASIDI programme started until the end of the last Financial Year
Reporting cycle Annually
New indicator No
Desired performance All schools provided with appropriate buildings
Indicator responsibility Branch I: Infrastructure

93
Indicator details 4.3.2 Number of schools provided with sanitation facilities through ASIDI
Short definition Number of public ordinary schools that are provided with different types of sanitation facilities based on assessment of the location of the school. This would determine the type of sanitation provided. The types of sanitation that are provided are:• Water borne sanitation• Septic or Conservancy Tank system• Ventilated Improved Pit Latrine• Composting Toilets• Small Bore Sewer Reticulation
Purpose/Importance To determine the number of schools that meets the basic sanitation standards.
Source/Collection of data • List of schools from PEDs with infrastructure backlogs• List of schools that have reached practical completion in provision of sanitation
Method of calculation Count the number of schools provided with sanitation facilities through ASIDI that have reached practical completion
Data limitations Vandalism and natural disasters may lead to more schools that do not meet minimum sanitation standards.
Type of indicator Output
Calculation type Non-cumulativeAt the end of the Financial Year a total figure of the project will be given from when the ASIDI programme started till end of the last Financial Year.
Reporting cycle Annually
New indicator No (Amended). Previous indicators reflected schools in implementation. This indicator reflects schools that have been completed.
Desired performance All schools to comply with nationally determined minimum sanitation standards.
Indicator responsibility Branch I: Infrastructure
Indicator details 4.3.3 Number of schools provided with water through ASIDI.
Short definition Number of public ordinary schools provided with different types of water facilities such as:• Taps• Boreholes• Water tanks
Purpose/Importance To determine the number of schools where teachers and learners have access to water.
Source/Collection of data • List of schools from PEDs with infrastructure backlogs• List of schools that have reached practical completion in provision of water facilities.
Method of calculation Count the number of schools provided with water facilities through ASIDI that have reached practical completion stage
Data limitations None
Type of indicator Output
Calculation type Non-cumulativeAt the end of the Financial Year a total figure of the project will be given from when the ASIDI programme started till end of the last Financial Year
Reporting cycle Annually
New indicator No
Desired performance All schools to be provided with water.
Indicator responsibility Branch I: Infrastructure

94
Indicator details 4.3.4 Number of schools provided with electricity through ASIDI.
Short definition Number of public ordinary schools that have electricity.
Purpose/Importance To establish the number of schools that have electricity.
Source/Collection of data • List of schools from PEDs with infrastructure backlog in electricity facilities• List of schools that have reached practical completion in provision of electricity
Method of calculation Count the number of schools provided with electricity through ASIDI that have reached practical completion stage
Data limitations Delay of information from Department of Energy/ ESKOM
Type of indicator Output
Calculation type Non-cumulativeAt the end of the Financial Year a total figure of the project will be given from when the ASIDI programme started until end of the last Financial Year
Reporting cycle Annually
New indicator No
Desired performance All schools to have access to electricity.
Indicator responsibility Branch I: Infrastructure
Indicator details 4.4.1 Percentage of public schools using the standardised school administration system, SA- SAMS for reporting.
Short definition South African School Administration and Management System (SA-SAMS) is a cost effective, easy to use and a fully integrated computer application that assists schools with their administrative, management and governance information needs. The application is provided at no cost to schools in the country. Provinces support schools in using the latest versions of SA-SAMS. The application is policy driven and is therefore developed and maintained by the DBE. As a standardised application, it is designed to capture and record unit school administrative data and is the primary source of information in LURITS. SA-SAMS also assists schools with quarterly or ad hoc reporting as required by the circuit/district, provincial departments and the DBE. The percentage will be drawn from a population of all the public schools except those schools in Western Cape as the province is currently not using SA-SAMS for reporting.
Purpose/Importance To measure the improvement in the provision of data collected from schools.
Source/Collection of data • A summary report of all provinces for public schools using SA-SAMS.• List of all public schools using SA-SAMS (numerator) • List of schools provided by provinces (denominator)• An analysis of the quality of information as reported by DQA.
Method of calculation Total number of public schools reporting using SA-SAMS/Total number of public schools (reported by provinces) excluding Western Cape X 100. This indicator will be measured using the school year and not the Financial Year. In this case the 2018 school year.
Data limitations Currently the Western Cape does not report through the SA-SAMS. Therefore no reports will be received from the Western Cape
Type of Indicator Output
Calculation type Non-cumulative: A new school may be reported every year at the end of academic year (31st December).
Reporting cycle Annually
New Indicator No
Desired performance All public schools to use SA-SAMS to generate performance reports quarterly; and to submit these reports with the electronic data to the districts (province) for uploading onto information systems
Indicator responsibility Branch P: Planning, Information and Assessments

95
Indicator details 4.4.2 Number of provinces monitored by DBE officials for implementation of LURITS annually
Short definition Provinces are required to upload quality learners, schools and educators information onto LURITS on a quarterly basis. The monitoring of implementation of LURITS includes, implementation report with recommendations on quality outputs, improvement in relation to data uploaded onto LURITS, including all five EMIS priorities (SA-SAMS, LURITS, Data Quality Audits, Geographical Information System (GIS) and Business Intelligence (BI).
Purpose/Importance To measure performance of provinces in implementation of LURITS, in order to identify areas where provinces are struggling, with DBE providing support and training.
Source/Collection of data • Completed monitoring tools• A monitoring report
Method of calculation Count the number of provinces monitored
Data limitations None
Type of indicator Output
Calculation type Non-cumulative
Reporting cycle Annually
New indicator Yes
Desired performance All provincial EMIS offices visited by DBE officials for monitoring, support and training purpose at least once a year.
Indicator responsibility Branch P: Planning, Information and Assessments
Indicator details 4.5.1 Number of district officials that achieved below the national benchmark in the NSC participating in a mentoring programme.
Short definition A mentoring programme for district and circuit managers in districts that achieved below the national benchmark in the NSC results. The identified officials from the 10 lowest underperforming districts are taken through a mentoring programme, where they are assigned a mentor to support them. The mentor holds sessions with the mentee and sometimes with officials in the district office. Districts performing below the national benchmark in the NSC refer to districts performing below 60% in 2016 NSC. The same group is mentored every year until the desired results are achieved, that is districts performing above 60%. The selected districts are 10 districts that achieved the lowest in the 2014 NSC results.
Purpose/Importance To assist districts to perform at a level that they can support their schools to perform better, thus increasing their 2014 level of district performance, below 60% in the NSC.
Source/Collection of data • Annual Report from each mentor.• Records of mentoring sessions where mentee signs for attending session. This may be one- on-one
sessions, or group sessions in the form of workshops, seminars and other forms of contact sessions
Method of calculation Count the number of district officials mentored.
Data limitations None
Type of indicator Output
Calculation type Non-cumulative: Same numbers of officials are mentored every quarter.
Reporting cycle Annually
New indicator No
Desired performance Support districts to improve average learner performance in the NSC above the national average.
Indicator responsibility Branch PDOU: Planning and Delivery Oversight Unit

96
Indicator details 4.5.2 Percentage of school principals rating the support services of districts as being satisfactory.
Short definition Percentage of school principals rating the support services of districts as being satisfactory.
Purpose/Importance To measure how principals view the support provided to their schools by school facing district officials, e.g. Circuit Managers and Subject Advisors.
Source/Collection of data • Sample Survey• Database of school principals participating in the survey
Method of calculation Total number of school principals expressing satisfaction/Total number of principals participating in the survey X 100.
Data limitations Schools not participating resulting in low response rate for reporting.
Type of indicator Output
Calculation type Non-cumulative
Reporting cycle Annually
New indicator No
Desired performance Schools must receive optimum support from education districts, especially in areas of management and governance, curriculum provision as well as learner welfare to ensure that all schools provide quality basic education across the province. At least 95% of principals should rate the support received as satisfactory.
Indicator responsibility Branch PDOU: Planning and Delivery Oversight Unit
Indicator details 4.5.3 Percentage of district managers assessed against developed criteria.
Short definition Conduct competency-based assessments for District Directors in line with the Public Service Regulations regarding recruitment and appointment of Senior Management Service (SMS) members. District Directors are encouraged to take the assessment to assess their own competencies and weak areas where they need support and capacity building.
Purpose/Importance To establish a baseline and database of the competency of District Directors for support and capacity building.
Source/Collection of data • Provincial Monitoring and Competency Assessment reports.• Database of participating District Managers (DM).
Method of calculation Total number of District Managers participating /Total number of District Managers X 100.
Data limitations Managers in acting positions will not be assessed. Competency assessments are confidential and cannot be provided.
Type of indicator Output
Calculation type Non-cumulative: Year End
Reporting cycle Annually
New indicator No
Desired performance Baseline of District Directors’ competencies established; and, support and capacity building provided on the basis of the competency assessment outcomes.
Indicator responsibility Branch PDOU: Planning and Delivery Oversight Unit

97
PROGRAMME 5: EDUCATIONAL ENRICHMENT SERVICES
Indicator details 5.1.1 Number of schools monitored for the provision of nutritious meals
Short definition The South African dietary base guideline is a national document on health nutrition from the Department of Health. All guidelines, including DBE guidelines, are derived from this national document. According to the guideline, a nutritious meal is made up of a protein, starch and a green/red/orange vegetable or a fruit. The schools that will be monitored are public ordinary schools in Quintiles 1-3 and identified special schools. It must be noted that there are also public ordinary schools in Quintiles 4 and 5 that have been identified as in need of the NSNP.
Purpose/Importance To assess schools on compliance with minimum requirements of a nutritious meal according to the food specification and school specific menu.
Source/Collection of data • Sample of completed monitoring tool• List of schools monitored in a quarter• Report on findings of the monitoring
Method of calculation Count the number of schools monitored.
Data limitations None
Type of indicator Output
Calculation type Cumulative: Year End
Reporting cycle Quarterly
New indicator No
Desired performance All schools serving a nutritious meal made up of a protein, starch, green/yellow/orange vegetable or a fruit.
Indicator responsibility Branch S: Social Mobilisation and Support Services
Indicator details 5.2.1 Number of professionals trained in the SASCE programmes
Short definition SASCE is a strategic programme in the Department’s quest to promote unity in diversity, national reconciliation, social cohesion, and a national identity among young South Africans of school-going age. Development programmes aim to facilitate the conducting and performance of music by schools thereby ensuring sustainability of the programme.
The development programme implemented is for the following professionals:
Adjudicators: An adjudicator is a qualified individual tasked with the responsibility to score/adjudicate choristers who ascend the stage during a formal singing competition. This leg also feeds into the data-capturers, whom, when the need arises, can also be trained.
Conductors: Conductors are based in schools, training learners (choirs) on current music syllabus to prepare them for the Eisteddfod.
Purpose/Importance To capacitate and develop professionals to ensure sustainability of the Eisteddfod programme
Source/Collection of data Attendance registers
Method of calculation Count the number of attendees
Data limitations None
Type of indicator Input
Calculation type Non-cumulative:
Reporting cycle Annually
New indicator No
Desired performance An increased pool of professionals trained to deliver the programme
Indicator responsibility Branch S: Social Mobilisation and Support Services

Indicator details 5.2.2 Number of learners, teachers, officials, SGBs and community organisation members partici-pating in social cohesion programmes
Short definition Total number of learners, teachers, officials and SGBs who participate in citizenship, human rights and re-sponsibilities education, constitutional values activities and commemoration of Significant Historical Events co-ordinated in collaboration with other stakeholders. Social Cohesion Programmes include:• GEM/BEM Clubs• Future Choices Programme • INkosi Albert Luthuli Oral History Programme• Moot Court• Bill of Responsibility Programme • Youth Citizen Action Programme (YCAP)• National Heritage Council (NHC) Programmes• Democracy and voter education Programmes• Human Rights clubs• TRC Financial Assistance Programme Democracy and voter education Programmes• TRC Financial Assistance Programme
Purpose/Importance These activities aim to entrench social values, promote knowledge and understanding of rights and responsibilities, constitutional values, oral history, heritage and culture to promote patriotism.
Source/Collection of data Participation registers of learners, teachers, officials, SGBs and community organisation membersMethod of calculation Count the number of participantsData limitations NoneType of indicator OutputCalculation type Cumulative: Year EndReporting cycle Quarterly New indicator NoDesired performance All learners, educators, officials and SGBs in the schooling system participate in the citizenship, rights and
responsibilities, and constitutional values activities.Indicator responsibility Branch S: Social Mobilisation and Support Services
Indicator details 5.3.1 Number of Hot Spot Schools monitored towards Implementation of the NSSF.Short definition The NSSF seeks to address the prevalence of crime and violence in identified Hot Spot Schools. Hot Spot
Schools are schools located in areas that have a high prevalence of crime and violence as determined by the South African Police Services (SAPS)
Purpose/importance To ensure that schools are safe, caring environments in support of learning and teachingSource/collection of data • Sample of completed monitoring tool
• Lists of all schools monitored• School visitors’ register signed
Method of calculation Count the number of schools monitoredData limitations NoneType of indicator OutputCalculation type Cumulative: Year EndReporting cycle QuarterlyNew indicator NoDesired performance Reduction in the number of Hot Spot SchoolsIndicator responsibility Branch S: Social Mobilisation and Support Services


DEPARTMENT OF BASIC EDUCATION
ISBN: 978-1-4315-3228-5
PHYSICAL ADDRESS:222 Struben Street
Pretoria0001
POSTAL ADDRESS:Private Bag X895
Pretoria0001
TELEPHONE:012 357 3000 (switchboard)
0800 202 933 (Toll free)
FAX:012 323 0601
EMAIL:[email protected]
Website: Facebook: Twitter:
www.education.gov.za www.facebook.com/BasicEd www.twitter.com/dbe_sa